UNITED STATES
SECURITIES AND EXCHANGE COMMISSION
Washington, D.C. 20549
FORM N-CSR
CERTIFIED SHAREHOLDER REPORT OF REGISTERED
MANAGEMENT INVESTMENT COMPANIES
Investment Company Act file number 811-22717
| First Trust Exchange-Traded Fund VI |
| (Exact name of registrant as specified in charter) |
120 East Liberty Drive, Suite 400
Wheaton, IL 60187 |
| (Address of principal executive offices) |
W. Scott Jardine, Esq.
First Trust Portfolios L.P.
120 East Liberty Drive, Suite 400
Wheaton, IL 60187 |
| (Name and address of agent for service) |
Registrant’s telephone number, including
area code: (630) 765-8000
Date of fiscal year end: March 31
Date of reporting period: March 31, 2023
Form N-CSR is to be used by management investment
companies to file reports with the Commission not later than 10 days after the transmission to stockholders of any report that is required
to be transmitted to stockholders under Rule 30e-1 under the Investment Company Act of 1940 (17 CFR 270.30e-1). The Commission may use
the information provided on Form N-CSR in its regulatory, disclosure review, inspection, and policymaking roles.
A registrant is required to disclose the information
specified by Form N-CSR, and the Commission will make this information public. A registrant is not required to respond to the collection
of information contained in Form N-CSR unless the Form displays a currently valid Office of Management and Budget (“OMB”)
control number. Please direct comments concerning the accuracy of the information collection burden estimate and any suggestions for reducing
the burden to Secretary, Securities and Exchange Commission, 100 F Street, NE, Washington, DC 20549. The OMB has reviewed this collection
of information under the clearance requirements of 44 U.S.C. § 3507.
Item 1. Report to Stockholders.
| (a) | | The registrant’s annual report transmitted to shareholders pursuant to Rule 30e-1 under
the Investment Company Act of 1940 is as follows: |
First Trust Exchange-Traded Fund VI
First Trust Nasdaq Bank ETF (FTXO)
First Trust Nasdaq Food & Beverage ETF (FTXG)
First Trust Nasdaq Oil & Gas ETF (FTXN)
First Trust Nasdaq Pharmaceuticals ETF (FTXH)
First Trust S-Network E-Commerce ETF (ISHP)
First Trust Nasdaq Semiconductor ETF (FTXL)
First Trust Nasdaq Transportation ETF (FTXR)
First Trust S-Network Streaming & Gaming ETF (BNGE)
Annual Report
For the Year Ended
March 31, 2023
First Trust Exchange-Traded Fund
VI
Annual Report
March 31, 2023
Caution Regarding
Forward-Looking Statements
This report contains
certain forward-looking statements within the meaning of the Securities Act of 1933, as amended, and the Securities Exchange Act of 1934, as amended. Forward-looking statements include statements regarding the goals,
beliefs, plans or current expectations of First Trust Advisors L.P. (“First Trust” or the “Advisor”) and its representatives, taking into account the information currently available to them.
Forward-looking statements include all statements that do not relate solely to current or historical fact. For example, forward-looking statements include the use of words such as “anticipate,”
“estimate,” “intend,” “expect,” “believe,” “plan,” “may,” “should,” “would” or other words that convey uncertainty of
future events or outcomes.
Forward-looking
statements involve known and unknown risks, uncertainties and other factors that may cause the actual results, performance or achievements of any series of First Trust Exchange-Traded Fund VI (the “Trust”)
described in this report (each such series is referred to as a “Fund” and collectively, the “Funds”) to be materially different from any future results, performance or achievements expressed or
implied by the forward-looking statements. When evaluating the information included in this report, you are cautioned not to place undue reliance on these forward-looking statements, which reflect the judgment of the
Advisor and its representatives only as of the date hereof. We undertake no obligation to publicly revise or update these forward-looking statements to reflect events and circumstances that arise after the date
hereof.
Performance and Risk
Disclosure
There is no assurance
that any Fund described in this report will achieve its investment objective. Each Fund is subject to market risk, which is the possibility that the market values of securities owned by the Fund will decline and that
the value of the Fund’s shares may therefore be less than what you paid for them. Accordingly, you can lose money by investing in a Fund. See “Risk Considerations” in the Additional Information
section of this report for a discussion of certain other risks of investing in the Funds.
Performance data quoted
represents past performance, which is no guarantee of future results, and current performance may be lower or higher than the figures shown. For the most recent month-end performance figures, please visit www.ftportfolios.com or speak with your financial advisor. Investment returns, net asset value and share price will fluctuate and Fund shares, when sold, may be
worth more or less than their original cost.
The Advisor may also
periodically provide additional information on Fund performance on each Fund’s web page at www.ftportfolios.com.
How to Read This
Report
This report contains
information that may help you evaluate your investment. It includes details about each Fund and presents data and analysis that provide insight into each Fund’s performance and investment approach.
By reading the market
overview by Robert F. Carey, Chief Market Strategist of the Advisor, you may obtain an understanding of how the market environment affected the performance of each Fund. The statistical information that follows may
help you understand each Fund’s performance compared to that of relevant market benchmarks.
It is important to keep
in mind that the opinions expressed by personnel of the Advisor are just that: informed opinions. They should not be considered to be promises or advice. The opinions, like the statistics, cover the period through the
date on the cover of this report. The material risks of investing in each Fund are spelled out in the prospectus, the statement of additional information, and other Fund regulatory filings.
First Trust Exchange-Traded Fund
VI
Annual Letter from the Chairman and
CEO
March 31, 2023
Dear Shareholders,
First Trust is pleased
to provide you with the annual report for certain series of the First Trust Exchange-Traded Fund VI (the “Funds”), which contains detailed information about the Funds for the twelve months ended March 31,
2023.
I am constantly amazed
by the depth and breadth of innovation that occurs when people from different geographic, economic, cultural, and educational backgrounds come together to solve problems. Many of the greatest companies to ever exist
found their humble beginnings in the simple premise that problems are best solved through ingenuity and cooperation. That idea is still alive and well today, in my opinion. Take, as examples, the recent flood of
interest sparked by artificial intelligence programs, advances in robotics, new medicines, more fuel-efficient gasoline engines, electric and hybrid vehicles, quantum computing, developments in wind and solar power;
the list goes on and on. That said, the global economy is facing serious issues such as stubborn inflation and the specter of slowing economic growth to name a few.
As many investors know,
the global financial system is currently navigating the fallout of the banking crisis that took lending markets by storm in March 2023. The turmoil that started in the U.S. with the failure of Silicon Valley Bank
quickly spread around the globe, leading the Swiss government to broker the merger of two of Switzerland’s largest banks. In the U.S., the Federal Reserve (the “Fed”) created the Bank Term Funding
Program, which allocated capital to help assure that banks can meet the needs of their depositors. Furthermore, inflation remains elevated on a global scale. Each of the countries that comprise the so-called Group of
Ten is currently battling levels of inflation that are higher than the targets set by their central banks, according to data from Bloomberg. Additionally, political unrest stemming from the war between Russia and
Ukraine remains a significant factor, with the potential to disturb global fuel and energy supplies as well as provoke interference from other foreign powers.
In the U.S., inflation,
as measured by the trailing 12-month rate on the Consumer Price Index, stood at 5.0% as of March 31, 2023, well above the Fed’s stated goal of 2.0%. Despite signals pointing to a potential slowdown in economic
growth in the U.S., the Fed stayed the course with regards to interest rate policy. Since February 28, 2022, the Fed raised the Federal Funds target rate (upper bound) a total of nine times, increasing the rate from
0.25%, where it stood on February 28, 2022, to 5.00% as of March 31, 2023.
Global markets have been
resilient over time, and the S&P 500® Index has never failed to recover from a bear market. While the issues plaguing the U.S. and global economies are severe, they are not
insurmountable, in my view. As Brian Wesbury, Chief Economist at First Trust, recently wrote: “what made America strong is…its human resources and freedom.” We will continue to work the problems
before us with ingenuity and resolve, as we always have.
Thank you for giving
First Trust the opportunity to play a role in your financial future. We value our relationship with you and will report on the Funds again in six months.
Sincerely,
James A. Bowen
Chairman of the Board of Trustees
Chief Executive Officer of First Trust
Advisors L.P.
First Trust Exchange-Traded Fund
VI
Annual Report
March 31, 2023
Robert
F. Carey, CFA
Senior Vice President
and Chief Market Strategist
First Trust Advisors
L.P.
Mr.
Carey is responsible for the overall management of research and analysis of the First Trust product line. Mr. Carey has more than 30 years of experience as an Equity and Fixed-Income Analyst and is a recipient of the
Chartered Financial Analyst (“CFA”) designation. He is a graduate of the University of Illinois at Champaign-Urbana with a B.S. in Physics. He is also a member of the Investment Analysts Society of Chicago
and the CFA Institute. Mr. Carey has appeared as a guest on such programs as Bloomberg TV, CNBC, and WBBM Radio, and has been quoted by several publications, including The Wall Street Journal, The Wall Street Reporter, Bloomberg News Service, and Registered Rep.
State of the Global
Economy
The latest global growth
forecast from the International Monetary Fund (“IMF”) released in April 2023 sees real gross domestic product growth rising by 2.8% worldwide in 2023, down from its 2.9% projection in January 2023. The IMF
is calling for a 1.6% growth rate for the U.S., up from its January 2023 estimate of 1.4%. Emerging Market and Developing Economies are expected to grow by 3.9% this year, down from the IMF’s 4.0% estimate in
January 2023. The IMF notes that risks to their global outlook are squarely to the downside, especially given the recent turmoil in the Financials sector as well as stubbornly high inflation.
In the U.S., inflation,
as measured by the Consumer Price Index (“CPI”), stood at 5.0% on a trailing 12-month basis at the end of March 2023, according to the U.S. Bureau of Labor Statistics. While this is significantly lower
than the most recent high of 9.1% in June 2022, the CPI remains above its 30-year average of 2.5% as of March 31, 2023, and even further from the Federal Reserve’s (the “Fed”) target of 2.0%.
Performance of Global
Stocks and Bonds
The major U.S. stock
indices delivered negative results over the past 12 months. The S&P 500® (the “Index”), S&P MidCap 400® and S&P SmallCap 600® Indices posted total returns of -7.73%, -5.12% and -8.82%, respectively, for the 12-month period ended March 31, 2023. Three of the 11 major
sectors that comprise the Index were positive on a total return basis. The top performer was the Energy sector, up 13.63%, while the worst showing came from the Real Estate sector, down 19.75%.
A Bloomberg survey of
twenty-four equity strategists found that their average 2023 year-end price target for the Index was 4,025, as of April 19, 2023, according to its own release. The highest and lowest estimates were 4,750 and 3,225,
respectively. Brian Wesbury, Chief Economist at First Trust, announced in December 2022 that his 2023 year-end price target stood at 3,900. The Index closed trading on March 31, 2023 at 4,109. The outlook for
corporate earnings in 2023 has turned negative. Bloomberg’s consensus year-over-year earnings growth rate estimates for the Index for the 2023 and 2024 calendar years stood at -2.67% and 11.56%, respectively, as
of April 21, 2023.
The broader foreign stock
indices experienced negative total returns over the past year. For the 12-months ended March 31, 2023, the MSCI World ex USA and MSCI Emerging Markets equity indices posted total returns of -2.74% (USD) and -10.70%
(USD), respectively, according to Bloomberg. The major foreign bond indices were also down during the same period. The Bloomberg Global Aggregate Index of higher quality debt posted a total return of -8.07% (USD),
while the Bloomberg EM Hard Currency Aggregate Index of emerging markets debt fell by 5.41% (USD), according to Bloomberg. The U.S. Dollar rose 4.27% over the past 12 months against a basket of major currencies, as
measured by the U.S. Dollar Index (DXY). The increase in the U.S. Dollar provided a drag on the performance of both foreign stock and bond indices, in our opinion.
In the U.S. bond market,
the results were also disappointing. The top performing major debt group we track was intermediate corporate bonds. The Bloomberg Intermediate Corporate Index posted a total return of -1.99% for the 12-month period
ended March 31, 2023. The worst-performing U.S. debt group that we track was U.S. aggregate bonds. The Bloomberg U.S. Aggregate Bond Index posted a total return of -4.78%. The yield on the benchmark 10-Year Treasury
Note (“T-Note”) fell by 113 basis points in the period to close at 3.47% on March 31, 2023, according to Bloomberg. For comparative purposes, the average yield on the 10-Year T-Note was 2.19% for the
10-year period ended March 31, 2023.
Fund Performance
Overview (Unaudited)
First Trust Nasdaq Bank ETF (FTXO)
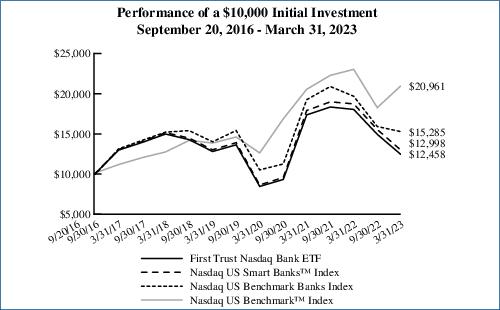
The First Trust Nasdaq
Bank ETF (the “Fund”) seeks investment results that correspond generally to the price and yield (before the Fund’s fees and expenses) of an equity index called the Nasdaq US Smart BanksTM Index (the “Index”). The shares of the Fund are listed and trade on The Nasdaq Stock Market LLC under the ticker symbol
“FTXO.” The Fund will normally invest at least 90% of its net assets (including investment borrowings) in the common stocks and depositary receipts that comprise the Index. The Index is owned and is
developed, maintained and sponsored by Nasdaq, Inc. (the “Index Provider”).
The Index is designed to
provide exposure to U.S. companies comprising the banking sector that have been selected based upon their liquidity and weighted based upon their cumulative score on four investing factors: net income, return on
assets, momentum and book value. The Index’s initial selection universe consists of the component securities of the Nasdaq US BenchmarkTM Index that have been classified as comprising the banking sector according to the Industry Classification Benchmark. The Nasdaq US
BenchmarkTM Index is an index seeking to track the performance of small, mid and large capitalization U.S. companies. This classification includes
companies providing a broad range of financial services, including retail banking, loans and money transmissions.
| Performance
|
|
|
|
|
|
|
|
|
| Average Annual Total Returns
|
| Cumulative Total Returns
|
|
| 1 Year
Ended
3/31/23
| 5 Years
Ended
3/31/23
| Inception
(9/20/16)
to 3/31/23
|
| 5 Years
Ended
3/31/23
| Inception
(9/20/16)
to 3/31/23
|
| Fund Performance
|
|
|
|
|
|
|
| NAV
| -30.94%
| -3.62%
| 3.43%
|
| -16.85%
| 24.58%
|
| Market Price
| -31.05%
| -3.66%
| 3.41%
|
| -17.01%
| 24.46%
|
| Index Performance
|
|
|
|
|
|
|
| Nasdaq US Smart BanksTM Index
| -30.60%
| -3.01%
| 4.10%
|
| -14.18%
| 29.98%
|
| Nasdaq US Benchmark Banks Index
| -22.33%
| 0.08%
| 6.72%
|
| 0.42%
| 52.85%
|
| Nasdaq US BenchmarkTM Index
| -8.97%
| 10.44%
| 12.01%
|
| 64.29%
| 109.61%
|
(See Notes to Fund
Performance Overview on page 20.)
Performance Review
The Fund generated a net
asset value (“NAV”) return of -30.94% during the period covered by this report. During the same period, the Nasdaq US Benchmark Banks Index (the “Benchmark”) generated a return of -22.33%.
The Banks industry carried the majority of the weight in the Fund as well as in the Benchmark. This industry had a weight of 90.9% in the Fund during the period covered by this report. The Banks Industry contributed
-27.3% to the Fund’s total return, which was the most negative of any industry. No industry contributed positively to the Fund’s total return.
Nasdaq® and Nasdaq US Smart BanksTM Index are registered trademarks and service marks of Nasdaq, Inc. (together with its affiliates hereinafter referred to as the
“Corporations”) and are licensed for use by First Trust. The Fund has not been passed on by the Corporations as to its legality or suitability. The Fund is not issued, endorsed, sold or promoted by the
Corporations. THE CORPORATIONS MAKE NO WARRANTIES AND BEAR NO LIABILITY WITH RESPECT TO THE FUND.
Fund Performance
Overview (Unaudited) (Continued)
First Trust Nasdaq Bank ETF (FTXO)
(Continued)
| Sector Allocation
| % of Total
Investments
|
| Financials
| 100.0%
|
| Total
| 100.0%
|
| Top Ten Holdings
| % of Total
Investments
|
| Citigroup, Inc.
| 9.3%
|
| JPMorgan Chase & Co.
| 9.1
|
| Bank of America Corp.
| 8.3
|
| Wells Fargo & Co.
| 8.0
|
| Truist Financial Corp.
| 7.3
|
| PNC Financial Services Group (The), Inc.
| 4.0
|
| M&T Bank Corp.
| 3.9
|
| US Bancorp
| 3.8
|
| Fifth Third Bancorp
| 3.7
|
| Citizens Financial Group, Inc.
| 3.6
|
| Total
| 61.0%
|
Performance figures assume reinvestment of all distributions and do not reflect the deduction of taxes that a shareholder would pay on Fund distributions or the redemption or sale of Fund shares. An index is a
statistical composite that tracks a specified financial market or sector. Unlike the Fund, the indices do not actually hold a portfolio of securities and therefore do not incur the expenses incurred by the Fund.
These expenses negatively impact the performance of the Fund. The Fund’s past performance does not predict future performance.
Frequency
Distribution of Discounts and Premiums
Information
showing the number of days the market price of the Fund’s shares was greater (at a premium) and less (at a discount) than the Fund’s net asset value for the most recently completed year, and the most
recently completed calendar quarters since that year (or life of the Fund, if shorter), is available at https://www.ftportfolios.com/Retail/etf/home.aspx.
Fund Performance
Overview (Unaudited) (Continued)
First Trust Nasdaq Food & Beverage ETF
(FTXG)
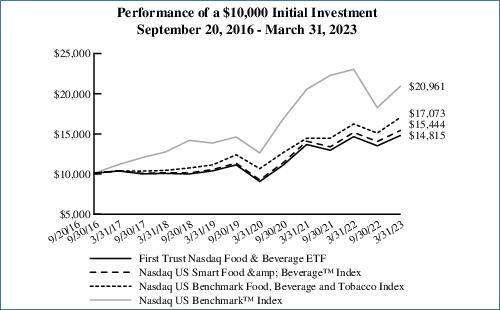
The First Trust Nasdaq
Food & Beverage ETF (the “Fund”) seeks investment results that correspond generally to the price and yield (before the Fund’s fees and expenses) of an equity index called the Nasdaq US Smart Food
& BeverageTM Index (the “Index”). The shares of the Fund are listed and trade on The Nasdaq Stock Market LLC under the ticker symbol
“FTXG.” The Fund will normally invest at least 90% of its net assets (including investment borrowings) in the common stocks and depositary receipts that comprise the Index. The Index is owned and is
developed, maintained and sponsored by Nasdaq, Inc. (the “Index Provider”).
The Index is designed to
provide exposure to U.S. companies comprising the food and beverage sector that have been selected based upon their liquidity and weighted based upon their cumulative score on four investing factors: gross income,
return on assets, momentum and cash flow. The Index’s initial selection universe consists of the component securities of the Nasdaq US BenchmarkTM Index that have been classified as comprising either the beverages sector or food producers sector according to the Industry Classification
Benchmark (“ICB”). The Nasdaq US BenchmarkTM Index is an index seeking to track the performance of small, mid and large capitalization U.S. companies. These classifications include: (i)
manufacturers and shippers of cider or malt products; (ii) producers, distillers, vintners, blenders and shippers of wine and spirits; (iii) manufacturers, bottlers and distributors of non-alcoholic beverages; (iv)
companies that grow crops or raise livestock, operate fisheries or own non-tobacco plantations; (v) food producers, including meatpacking, snacks, fruits, vegetables, dairy products and frozen seafood; (vi) producers
of pet food; and (vii) manufacturers of dietary supplements, vitamins and related items.
| Performance
|
|
|
|
|
|
|
|
|
| Average Annual Total Returns
|
| Cumulative Total Returns
|
|
| 1 Year
Ended
3/31/23
| 5 Years
Ended
3/31/23
| Inception
(9/20/16)
to 3/31/23
|
| 5 Years
Ended
3/31/23
| Inception
(9/20/16)
to 3/31/23
|
| Fund Performance
|
|
|
|
|
|
|
| NAV
| 1.10%
| 8.00%
| 6.21%
|
| 46.92%
| 48.15%
|
| Market Price
| 0.87%
| 7.95%
| 6.19%
|
| 46.58%
| 48.03%
|
| Index Performance
|
|
|
|
|
|
|
| Nasdaq US Smart Food & BeverageTM Index
| 1.70%
| 8.69%
| 6.89%
|
| 51.70%
| 54.44%
|
| Nasdaq US Benchmark Food, Beverage and Tobacco Index
| 5.17%
| 10.29%
| 8.54%
|
| 63.18%
| 70.73%
|
| Nasdaq US BenchmarkTM Index
| -8.97%
| 10.44%
| 12.01%
|
| 64.29%
| 109.61%
|
(See Notes to Fund
Performance Overview on page 20.)
Performance Review
The Fund generated a NAV
return of 1.10% during the period covered by this report. During the same period, the Nasdaq US Benchmark Food, Beverage and Tobacco Index (the “Benchmark”) generated a return of 5.17%. During the same
period, the Fund was most heavily weighted toward investments in the Food Products GICS sub-industry, which had an average weight of 69.2%. The Beverages sub-industry, however, contributed the most toward the
Fund’s return during the period, with a 1.5% contribution. The Personal Care products sub-industry, which had a relatively low weighting of 0.8% during the period, was the only negative contributor to the
Fund’s return, generating -0.3%.
Nasdaq® and Nasdaq US Smart Food & BeverageTM Index are registered trademarks and service marks of Nasdaq, Inc. (together with its affiliates hereinafter referred to as the
“Corporations”) and are licensed for use by First Trust. The Fund has not been passed on by the Corporations as to its legality or suitability. The Fund is not issued, endorsed, sold or promoted by the
Corporations. THE CORPORATIONS MAKE NO WARRANTIES AND BEAR NO LIABILITY WITH RESPECT TO THE FUND.
Fund Performance
Overview (Unaudited) (Continued)
First Trust Nasdaq Food & Beverage ETF
(FTXG) (Continued)
| Sector Allocation
| % of Total
Investments
|
| Consumer Staples
| 96.3%
|
| Materials
| 3.7
|
| Total
| 100.0%
|
| Top Ten Holdings
| % of Total
Investments
|
| General Mills, Inc.
| 8.3%
|
| Mondelez International, Inc., Class A
| 8.2
|
| PepsiCo, Inc.
| 8.1
|
| Coca-Cola (The) Co.
| 8.0
|
| Archer-Daniels-Midland Co.
| 7.7
|
| Hershey (The) Co.
| 4.1
|
| J.M. Smucker (The) Co.
| 4.1
|
| Campbell Soup Co.
| 4.0
|
| Conagra Brands, Inc.
| 4.0
|
| Keurig Dr. Pepper, Inc.
| 3.9
|
| Total
| 60.4%
|
Performance figures assume reinvestment of all distributions and do not reflect the deduction of taxes that a shareholder would pay on Fund distributions or the redemption or sale of Fund shares. An index is a
statistical composite that tracks a specified financial market or sector. Unlike the Fund, the indices do not actually hold a portfolio of securities and therefore do not incur the expenses incurred by the Fund.
These expenses negatively impact the performance of the Fund. The Fund’s past performance does not predict future performance.
Frequency
Distribution of Discounts and Premiums
Information
showing the number of days the market price of the Fund’s shares was greater (at a premium) and less (at a discount) than the Fund’s net asset value for the most recently completed year, and the most
recently completed calendar quarters since that year (or life of the Fund, if shorter), is available at https://www.ftportfolios.com/Retail/etf/home.aspx.
Fund Performance
Overview (Unaudited) (Continued)
First Trust Nasdaq Oil & Gas ETF
(FTXN)
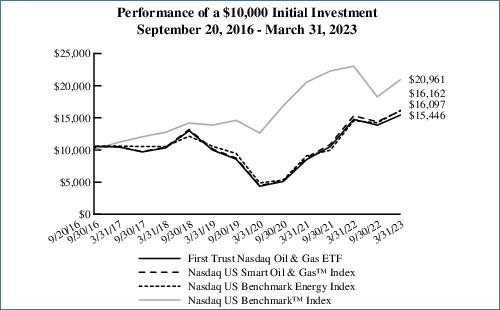
The First Trust Nasdaq
Oil & Gas ETF (the “Fund”) seeks investment results that correspond generally to the price and yield (before the Fund’s fees and expenses) of an equity index called the Nasdaq US Smart Oil &
GasTM Index (the “Index”). The shares of the Fund are listed and trade on The Nasdaq Stock Market LLC under the ticker symbol
“FTXN.” The Fund will normally invest at least 90% of its net assets (including investment borrowings) in the common stocks and depositary receipts that comprise the Index. The Index is owned and is
developed, maintained and sponsored by Nasdaq, Inc. (the “Index Provider”).
The Index is designed to
provide exposure to U.S. companies comprising the oil and gas sector that have been selected based upon their liquidity and weighted based upon their cumulative score on four investing factors: gross income, return on
assets, momentum and cash flow. The Index’s initial selection universe consists of the component securities of the Nasdaq US BenchmarkTM Index that have been classified as comprising either the oil & gas producers sector or the oil equipment, services & distribution sector
according to the Industry Classification Benchmark (“ICB”). The Nasdaq US BenchmarkTM Index is an index seeking to track the performance of small, mid and large capitalization U.S. companies. These classifications include: (i)
companies engaged in the exploration for and drilling, production, refining and supply of oil and gas products; (ii) integrated oil and gas companies engaged in the exploration for, and drilling, production, refining,
distribution and retail sales of, oil and gas products; (iii) suppliers of equipment and services to oil fields and offshore platforms, such as drilling, exploration, seismic-information services and platform
construction; and (iv) operators of pipelines carrying oil, gas or other forms of fuel.
| Performance
|
|
|
|
|
|
|
|
|
| Average Annual Total Returns
|
| Cumulative Total Returns
|
|
| 1 Year
Ended
3/31/23
|
5 Years
Ended
3/31/23 | Inception
(9/20/16)
to 3/31/23
|
| 5 Years
Ended
3/31/23
| Inception
(9/20/16)
to 3/31/23
|
| Fund Performance
|
|
|
|
|
|
|
| NAV
| 4.66%
| 8.40%
| 6.89%
|
| 49.66%
| 54.46%
|
| Market Price
| 4.62%
| 8.37%
| 6.88%
|
| 49.46%
| 54.41%
|
| Index Performance
|
|
|
|
|
|
|
| Nasdaq US Smart Oil & GasTM Index
| 5.14%
| 9.08%
| 7.57%
|
| 54.39%
| 60.97%
|
| Nasdaq US Benchmark Energy Index
| 11.05%
| 8.91%
| 7.63%
|
| 53.25%
| 61.62%
|
| Nasdaq US BenchmarkTM Index
| -8.97%
| 10.44%
| 12.01%
|
| 64.29%
| 109.61%
|
(See Notes to Fund
Performance Overview on page 20.)
Performance Review
The Fund generated a NAV
return of 4.66% during the period covered by this report. During the same period, the Nasdaq US Benchmark Energy Index (the “Benchmark”) generated a return of 11.05%. The Oil, Gas & Consumable
Fuels industry received a 97.2% allocation in the Fund during the same period and provided the largest contribution to the Fund’s return at 5.4%. No industry had a negative contribution to the Fund’s
return during the period.
Nasdaq® and Nasdaq US Smart Oil & GasTM Index are registered trademarks and service marks of Nasdaq, Inc. (together with its affiliates hereinafter referred to as the
“Corporations”) and are licensed for use by First Trust. The Fund has not been passed on by the Corporations as to its legality or suitability. The Fund is not issued, endorsed, sold or promoted by the
Corporations. THE CORPORATIONS MAKE NO WARRANTIES AND BEAR NO LIABILITY WITH RESPECT TO THE FUND.
Fund Performance
Overview (Unaudited) (Continued)
First Trust Nasdaq Oil & Gas ETF
(FTXN) (Continued)
| Sector Allocation
| % of Total
Investments
|
| Energy
| 100.0%
|
| Total
| 100.0%
|
| Top Ten Holdings
| % of Total
Investments
|
| Chevron Corp.
| 8.0%
|
| Exxon Mobil Corp.
| 7.9
|
| ConocoPhillips
| 7.6
|
| Occidental Petroleum Corp.
| 7.5
|
| Marathon Petroleum Corp.
| 7.5
|
| Valero Energy Corp.
| 4.2
|
| Pioneer Natural Resources Co.
| 4.0
|
| EOG Resources, Inc.
| 4.0
|
| Cheniere Energy, Inc.
| 4.0
|
| Phillips 66
| 3.9
|
| Total
| 58.6%
|
Performance figures assume reinvestment of all distributions and do not reflect the deduction of taxes that a shareholder would pay on Fund distributions or the redemption or sale of Fund shares. An index is a
statistical composite that tracks a specified financial market or sector. Unlike the Fund, the indices do not actually hold a portfolio of securities and therefore do not incur the expenses incurred by the Fund.
These expenses negatively impact the performance of the Fund. The Fund’s past performance does not predict future performance.
Frequency
Distribution of Discounts and Premiums
Information
showing the number of days the market price of the Fund’s shares was greater (at a premium) and less (at a discount) than the Fund’s net asset value for the most recently completed year, and the most
recently completed calendar quarters since that year (or life of the Fund, if shorter), is available at https://www.ftportfolios.com/Retail/etf/home.aspx.
Fund Performance
Overview (Unaudited) (Continued)
First Trust Nasdaq Pharmaceuticals ETF
(FTXH)
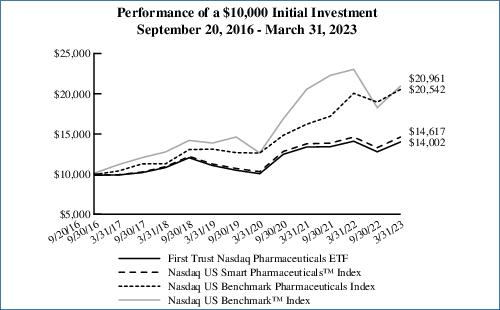
The First Trust Nasdaq
Pharmaceuticals ETF (the “Fund”) seeks investment results that correspond generally to the price and yield (before the Fund’s fees and expenses) of an equity index called the Nasdaq US Smart
PharmaceuticalsTM Index (the “Index”). The shares of the Fund are listed and trade on The Nasdaq Stock Market LLC under the ticker symbol
“FTXH.” The Fund will normally invest at least 90% of its net assets (including investment borrowings) in the common stocks and depositary receipts that comprise the Index. The Index is owned and is
developed, maintained and sponsored by Nasdaq, Inc. (the “Index Provider”).
The Index is designed to
provide exposure to U.S. companies comprising the pharmaceutical sector that have been selected based upon their liquidity and weighted based upon their cumulative score on four investing factors: gross income, return
on assets, momentum and cash flow. The Index’s initial selection universe consists of the component securities of the Nasdaq US BenchmarkTM Index that have been classified as comprising the pharmaceuticals and biotechnology sub-sectors according to the Industry Classification Benchmark.
The Nasdaq US BenchmarkTM Index is an index seeking to track the performance of small, mid and large capitalization U.S. companies. This classification includes vaccine
producers and manufacturers of prescription or over-the-counter drugs.
| Performance
|
|
|
|
|
|
|
|
|
| Average Annual Total Returns
|
| Cumulative Total Returns
|
|
| 1 Year
Ended
3/31/23
| 5 Years
Ended
3/31/23
| Inception
(9/20/16)
to 3/31/23
|
| 5 Years
Ended
3/31/23
| Inception
(9/20/16)
to 3/31/23
|
| Fund Performance
|
|
|
|
|
|
|
| NAV
| -0.61%
| 5.31%
| 5.29%
|
| 29.50%
| 40.02%
|
| Market Price
| -0.46%
| 5.29%
| 5.29%
|
| 29.39%
| 39.96%
|
| Index Performance
|
|
|
|
|
|
|
| Nasdaq US Smart PharmaceuticalsTM Index
| 0.07%
| 5.99%
| 5.99%
|
| 33.79%
| 46.17%
|
| Nasdaq US Benchmark Pharmaceuticals Index
| 2.49%
| 12.74%
| 11.66%
|
| 82.17%
| 105.42%
|
| Nasdaq US BenchmarkTM Index
| -8.97%
| 10.44%
| 12.01%
|
| 64.29%
| 109.61%
|
(See Notes to Fund
Performance Overview on page 20.)
Performance Review
The Fund generated a NAV
return of -0.61% during the period covered by this report. During the same period, the Nasdaq US Benchmark Pharmaceuticals Index (the “Benchmark”) generated a return of 2.49%. During the same period, the
Fund was most heavily weighted toward investments in the Pharmaceuticals and Biotechnology industries, with an average portfolio weight of 51.3% and 43.9%, respectively. The Biotechnology industry was a relative
outperformer for the period covered by this report, contributing 4.5% to the Fund’s return, which was the largest contribution. The largest negative contribution to the Fund’s return was from the
Pharmaceuticals industry at -4.8%.
Nasdaq® and Nasdaq US Smart PharmaceuticalsTM Index are registered trademarks and service marks of Nasdaq, Inc. (together with its affiliates hereinafter referred to as the
“Corporations”) and are licensed for use by First Trust. The Fund has not been passed on by the Corporations as to its legality or suitability. The Fund is not issued, endorsed, sold or promoted by the
Corporations. THE CORPORATIONS MAKE NO WARRANTIES AND BEAR NO LIABILITY WITH RESPECT TO THE FUND.
Fund Performance
Overview (Unaudited) (Continued)
First Trust Nasdaq Pharmaceuticals ETF
(FTXH) (Continued)
| Sector Allocation
| % of Total
Investments
|
| Health Care
| 100.0%
|
| Total
| 100.0%
|
| Top Ten Holdings
| % of Total
Investments
|
| AbbVie, Inc.
| 7.4%
|
| Johnson & Johnson
| 7.2
|
| Pfizer, Inc.
| 7.2
|
| Bristol-Myers Squibb Co.
| 7.2
|
| Merck & Co., Inc.
| 7.2
|
| Moderna, Inc.
| 4.0
|
| Eli Lilly & Co.
| 3.9
|
| Vertex Pharmaceuticals, Inc.
| 3.9
|
| Regeneron Pharmaceuticals, Inc.
| 3.9
|
| Amgen, Inc.
| 3.7
|
| Total
| 55.6%
|
Performance figures assume reinvestment of all distributions and do not reflect the deduction of taxes that a shareholder would pay on Fund distributions or the redemption or sale of Fund shares. An index is a
statistical composite that tracks a specified financial market or sector. Unlike the Fund, the indices do not actually hold a portfolio of securities and therefore do not incur the expenses incurred by the Fund.
These expenses negatively impact the performance of the Fund. The Fund’s past performance does not predict future performance.
Frequency
Distribution of Discounts and Premiums
Information
showing the number of days the market price of the Fund’s shares was greater (at a premium) and less (at a discount) than the Fund’s net asset value for the most recently completed year, and the most
recently completed calendar quarters since that year (or life of the Fund, if shorter), is available at https://www.ftportfolios.com/Retail/etf/home.aspx.
Fund Performance
Overview (Unaudited) (Continued)
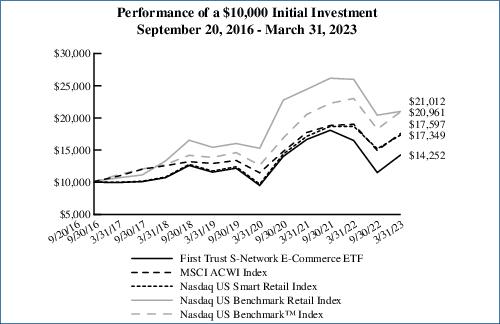
First Trust S-Network E-Commerce ETF
(ISHP)
The First Trust S-Network
E-Commerce ETF (the “Fund”) seeks investment results that correspond generally to the price and yield (before the Fund’s fees and expenses) of an equity index called the S-Network Global E-Commerce
IndexTM (the “Index”). The Fund lists and principally trades its shares on The Nasdaq Stock Market LLC under the symbol “ISHP.” The
Fund will normally invest at least 90% of its net assets (plus any borrowings for investment purposes) in the common stocks and depository receipts that comprise the Index.
The Index seeks to
provide exposure to companies with securities listed on recognized global securities exchanges that are principally engaged in the global e-commerce industry. According to VettaFi LLC, to be eligible for inclusion in
the Index, a security must be issued by a company engaged in at least one of the four following business segments comprising the global e-commerce industry: (1) content navigation; (2) online retail; (3) online
marketplace; and (4) e-commerce infrastructure. The Index is owned and is developed, maintained and sponsored by VettaFi LLC.
| Performance
|
|
|
|
|
|
|
|
|
| Average Annual Total Returns
|
| Cumulative Total Returns
|
|
| 1 Year
Ended
3/31/23
| 5 Years
Ended
3/31/23
| Inception
(9/20/16)
to 3/31/23
|
| 5 Years
Ended
3/31/23
| Inception
(9/20/16)
to 3/31/23
|
| Fund Performance
|
|
|
|
|
|
|
| NAV
| -13.57%
| 5.87%
| 5.58%
|
| 30.01%
| 42.52%
|
| Market Price
| -15.24%
| 5.42%
| 5.24%
|
| 30.20%
| 39.58%
|
| Index Performance
|
|
|
|
|
|
|
| S-Network Global E-Commerce IndexTM(1)(2)
| -13.91%
| N/A
| N/A
|
| N/A
| N/A
|
| MSCI ACWI Index(3)
| -7.44%
| 6.94%
| 9.05%
|
| 39.88%
| 75.97%
|
| Nasdaq US Smart Retail Index
| -7.15%
| 9.91%
| 8.81%
|
| 60.39%
| 73.49%
|
| Nasdaq US Benchmark Retail Index
| -19.16%
| 9.54%
| 12.05%
|
| 57.71%
| 110.12%
|
| Nasdaq US BenchmarkTM Index
| -8.97%
| 10.44%
| 12.01%
|
| 64.29%
| 109.61%
|
(See Notes to Fund
Performance Overview on page 20.)
Performance Review
The Fund generated a NAV
return of -13.57% during the period covered by this report. During the same period, the MSCI ACWI Index (the “Benchmark”) generated a return of -7.44%. During the same period, the Fund was most heavily
weighted toward investments in the Internet & Direct Marketing Retail industry and the Interactive Media & Services industry, which had an average weight of 24.2% and 21.3%, respectively. Investments in the
Interactive Media & Services industry also contributed the most negatively to the Fund’s return, generating -4.0%. The most positive contribution to the Fund’s return came from the Real Estate
Management & Development and Air Freight & Logistics industries, with each contributing 0.6% to the Fund’s return, while only being weighted 3.4% and 5.9%, respectively.
| (1)
| On January 26, 2022, the Fund’s underlying index changed from the Nasdaq US Smart Retail Index to the S-Network Global E-Commerce IndexTM. Therefore, performance and historical returns shown for the periods prior to January 26, 2022, are not necessarily indicative of the
performance of the Fund, based on its current Index, would have generated.
|
| (2)
| Because the Fund’s new underlying Index had an inception date of April 30, 2021, performance data is not available for all the periods shown in the table for the Index because performance data
does not exist for some of the entire periods.
|
| (3)
| The MSCI ACWI Index serves as the Fund’s new primary benchmark index. The Fund’s investment advisor determined that the MSCI ACWI Index provides a more appropriate comparison to Fund
returns.
|
S-Network and S-Network
Global E-Commerce IndexTM are service marks of VettaFi LLC and have been licensed for use by First Trust Advisors L.P. The Fund is not issued, sponsored, endorsed, sold or
promoted by VettaFi LLC or its affiliates (collectively, “VettaFi”). VettaFi makes no representation or warranty, express or implied, to the purchasers or owners of the Fund or any member of the public
regarding the advisability of investing in securities generally or in the Fund particularly or the ability of the Index to track general market performance.
Fund Performance
Overview (Unaudited) (Continued)
First Trust S-Network E-Commerce ETF
(ISHP) (Continued)
| Sector Allocation
| % of Total
Investments
|
| Consumer Discretionary
| 34.9%
|
| Communication Services
| 26.7
|
| Industrials
| 15.6
|
| Financials
| 11.3
|
| Real Estate
| 5.0
|
| Consumer Staples
| 4.4
|
| Information Technology
| 2.1
|
| Total
| 100.0%
|
| Top Ten Holdings
| % of Total
Investments
|
| Meta Platforms, Inc., Class A
| 2.5%
|
| Shopify, Inc., Class A
| 2.1
|
| MercadoLibre, Inc.
| 2.1
|
| Airbnb, Inc., Class A
| 2.1
|
| DoorDash, Inc., Class A
| 2.0
|
| Copart, Inc.
| 2.0
|
| FedEx Corp.
| 2.0
|
| Booking Holdings, Inc.
| 1.9
|
| Snap, Inc., Class A
| 1.9
|
| REA Group Ltd.
| 1.9
|
| Total
| 20.5%
|
Performance figures assume reinvestment of all distributions and do not reflect the deduction of taxes that a shareholder would pay on Fund distributions or the redemption or sale of Fund shares. An index is a
statistical composite that tracks a specified financial market or sector. Unlike the Fund, the indices do not actually hold a portfolio of securities and therefore do not incur the expenses incurred by the Fund.
These expenses negatively impact the performance of the Fund. The Fund’s past performance does not predict future performance.
Frequency
Distribution of Discounts and Premiums
Information
showing the number of days the market price of the Fund’s shares was greater (at a premium) and less (at a discount) than the Fund’s net asset value for the most recently completed year, and the most
recently completed calendar quarters since that year (or life of the Fund, if shorter), is available at https://www.ftportfolios.com/Retail/etf/home.aspx.
Fund Performance
Overview (Unaudited) (Continued)
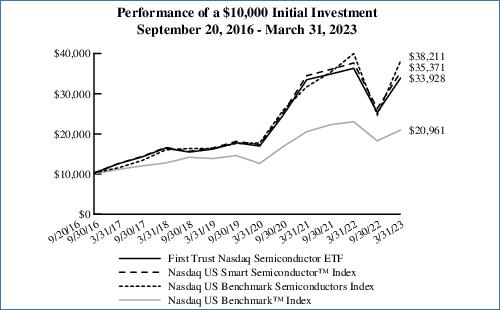
First Trust Nasdaq Semiconductor ETF
(FTXL)
The First Trust Nasdaq
Semiconductor ETF (the “Fund”) seeks investment results that correspond generally to the price and yield (before the Fund’s fees and expenses) of an equity index called the Nasdaq US Smart
SemiconductorTM Index (the “Index”). The shares of the Fund are listed and trade on The Nasdaq Stock Market LLC under the ticker symbol
“FTXL.” The Fund will normally invest at least 90% of its net assets (including investment borrowings) in the common stocks and depositary receipts that comprise the Index. The Index is owned and is
developed, maintained and sponsored by Nasdaq, Inc. (the “Index Provider”).
The Index is designed to
provide exposure to U.S. companies comprising the semiconductor sector that have been selected based upon their liquidity and weighted based upon their cumulative score on four investing factors: gross income, return
on assets, momentum and cash flow. The Index’s initial selection universe consists of the component securities of the Nasdaq US BenchmarkTM Index that have been classified as comprising the semiconductors sub-sector according to the Industry Classification Benchmark. The Nasdaq US
BenchmarkTM Index is an index seeking to track the performance of small, mid and large capitalization U.S. companies. This classification includes producers
and distributors of semiconductors and other integrated chips, including other products related to the semiconductor industry, such as semiconductor capital equipment and motherboards.
| Performance
|
|
|
|
|
|
|
|
|
| Average Annual Total Returns
|
| Cumulative Total Returns
|
|
| 1 Year
Ended
3/31/23
| 5 Years
Ended
3/31/23
| Inception
(9/20/16)
to 3/31/23
|
| 5 Years
Ended
3/31/23
| Inception
(9/20/16)
to 3/31/23
|
| Fund Performance
|
|
|
|
|
|
|
| NAV
| -6.54%
| 15.55%
| 20.59%
|
| 106.03%
| 239.28%
|
| Market Price
| -6.68%
| 15.55%
| 20.58%
|
| 106.00%
| 239.23%
|
| Index Performance
|
|
|
|
|
|
|
| Nasdaq US Smart SemiconductorTM Index
| -6.01%
| 16.28%
| 21.36%
|
| 112.55%
| 253.71%
|
| Nasdaq US Benchmark Semiconductors Index
| -4.38%
| 19.00%
| 22.80%
|
| 138.60%
| 282.11%
|
| Nasdaq US BenchmarkTM Index
| -8.97%
| 10.44%
| 12.01%
|
| 64.29%
| 109.61%
|
(See Notes to Fund
Performance Overview on page 20.)
Performance Review
The Fund generated a NAV
return of -6.54% during the period covered by this report. During the same period, the Nasdaq US Benchmark Semiconductors Index (the “Benchmark”) generated a return of -4.38%. During the same period, the
Fund was most heavily weighted toward investments in the Semiconductors industry as expected, with 79.9% weighted towards the Semiconductors sub-industry, and 14.5% toward the Semiconductor Materials and Equipment
sub-industry. The largest negative contributions to the Fund’s return were the investments in the Semiconductors and Electronic Components sub-industries, which contributed -3.2% and -2.6% to the Fund’s
return, respectively. The largest positive contribution to the Fund’s return was from the Electronic Manufacturing Services sub-industry at 0.7%.
Nasdaq® and Nasdaq US Smart SemiconductorTM Index are registered trademarks and service marks of Nasdaq, Inc. (together with its affiliates hereinafter referred to as the
“Corporations”) and are licensed for use by First Trust. The Fund has not been passed on by the Corporations as to its legality or suitability. The Fund is not issued, endorsed, sold or promoted by the
Corporations. THE CORPORATIONS MAKE NO WARRANTIES AND BEAR NO LIABILITY WITH RESPECT TO THE FUND.
Fund Performance
Overview (Unaudited) (Continued)
First Trust Nasdaq Semiconductor ETF
(FTXL) (Continued)
| Sector Allocation
| % of Total
Investments
|
| Information Technology
| 100.0%
|
| Total
| 100.0%
|
| Top Ten Holdings
| % of Total
Investments
|
| Intel Corp.
| 9.6%
|
| Texas Instruments, Inc.
| 8.0
|
| Broadcom, Inc.
| 7.9
|
| Micron Technology, Inc.
| 7.7
|
| QUALCOMM, Inc.
| 7.6
|
| NVIDIA Corp.
| 4.4
|
| Lam Research Corp.
| 4.0
|
| Analog Devices, Inc.
| 3.9
|
| ON Semiconductor Corp.
| 3.9
|
| Applied Materials, Inc.
| 3.9
|
| Total
| 60.9%
|
Performance figures assume reinvestment of all distributions and do not reflect the deduction of taxes that a shareholder would pay on Fund distributions or the redemption or sale of Fund shares. An index is a
statistical composite that tracks a specified financial market or sector. Unlike the Fund, the indices do not actually hold a portfolio of securities and therefore do not incur the expenses incurred by the Fund.
These expenses negatively impact the performance of the Fund. The Fund’s past performance does not predict future performance.
Frequency
Distribution of Discounts and Premiums
Information
showing the number of days the market price of the Fund’s shares was greater (at a premium) and less (at a discount) than the Fund’s net asset value for the most recently completed year, and the most
recently completed calendar quarters since that year (or life of the Fund, if shorter), is available at https://www.ftportfolios.com/Retail/etf/home.aspx.
Fund Performance
Overview (Unaudited) (Continued)
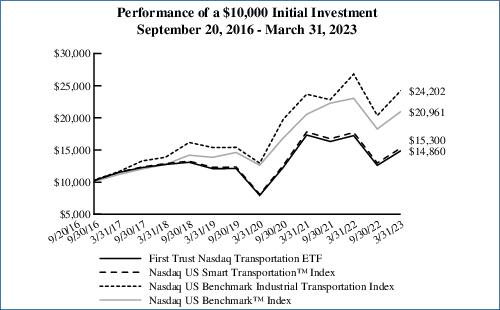
First Trust Nasdaq Transportation ETF
(FTXR)
The First Trust Nasdaq
Transportation ETF (the “Fund”) seeks investment results that correspond generally to the price and yield (before the Fund’s fees and expenses) of an equity index called the Nasdaq US Smart
TransportationTM Index (the “Index”). The shares of the Fund are listed and trade on The Nasdaq Stock Market LLC under the ticker symbol
“FTXR.” The Fund will normally invest at least 90% of its net assets (including investment borrowings) in the common stocks and depositary receipts that comprise the Index. The Index is owned and is
developed, maintained and sponsored by Nasdaq, Inc. (the “Index Provider”).
The Index is designed to
provide exposure to U.S. companies comprising the transportation sector that have been selected based upon their liquidity and weighted based upon their cumulative score on four investing factors: gross income, return
on assets, momentum and cash flow. The Index’s initial selection universe consists of the component securities of the Nasdaq US BenchmarkTM Index that have been classified as comprising the industrial transportation sector, the automobiles & parts sector or the airlines sub-sector
according to the Industry Classification Benchmark. The Nasdaq US BenchmarkTM Index is an index seeking to track the performance of small, mid and large capitalization U.S. companies. These classifications include: (i)
operators of mail and package delivery services; (ii) providers of on-water transportation for commercial markets; (iii) providers of industrial railway transportation and railway lines; (iv) companies that manage
airports, train depots, roads, bridges, tunnels, ports, and providers of logistic services to shippers of goods; (v) companies that provide commercial trucking services; (vi) makers of motorcycles and passenger
vehicles; (vii) manufacturers and distributors of new and replacement parts for motorcycles and automobiles; (viii) manufacturers, distributors and retreaders of automobile, truck and motorcycle tires; and (ix)
companies providing primarily passenger air transport.
| Performance
|
|
|
|
|
|
|
|
|
| Average Annual Total Returns
|
| Cumulative Total Returns
|
|
| 1 Year
Ended
3/31/23
| 5 Years
Ended
3/31/23
| Inception
(9/20/16)
to 3/31/23
|
| 5 Years
Ended
3/31/23
| Inception
(9/20/16)
to 3/31/23
|
| Fund Performance
|
|
|
|
|
|
|
| NAV
| -13.76%
| 3.11%
| 6.26%
|
| 16.55%
| 48.60%
|
| Market Price
| -13.78%
| 3.08%
| 6.26%
|
| 16.37%
| 48.59%
|
| Index Performance
|
|
|
|
|
|
|
| Nasdaq US Smart TransportationTM Index
| -13.63%
| 3.50%
| 6.73%
|
| 18.75%
| 53.00%
|
| Nasdaq US Benchmark Industrial Transportation Index
| -9.67%
| 11.77%
| 14.50%
|
| 74.43%
| 142.02%
|
| Nasdaq US BenchmarkTM Index
| -8.97%
| 10.44%
| 12.01%
|
| 64.29%
| 109.61%
|
(See Notes to Fund
Performance Overview on page 20.)
Performance Review
The Fund generated a NAV
return of -13.76% during the period covered by this report. During the same period, the Nasdaq US Benchmark Industrial Transportation Index (the “Benchmark”) generated a return of -9.67%. The Ground
Transportation industry’s 28.9% allocation was the largest weight in the Fund during the period. This industry also had the greatest negative contribution to the Fund’s return, generating -6.8% during the
period. The greatest contribution to the Fund’s return was the 1.0% from the Distributors industry.
Nasdaq® and Nasdaq US Smart TransportationTM Index are registered trademarks and service marks of Nasdaq, Inc. (together with its affiliates hereinafter referred to as the
“Corporations”) and are licensed for use by First Trust. The Fund has not been passed on by the Corporations as to its legality or suitability. The Fund is not issued, endorsed, sold or promoted by the
Corporations. THE CORPORATIONS MAKE NO WARRANTIES AND BEAR NO LIABILITY WITH RESPECT TO THE FUND.
Fund Performance
Overview (Unaudited) (Continued)
First Trust Nasdaq Transportation ETF
(FTXR) (Continued)
| Sector Allocation
| % of Total
Investments
|
| Industrials
| 74.7%
|
| Consumer Discretionary
| 25.3
|
| Total
| 100.0%
|
| Top Ten Holdings
| % of Total
Investments
|
| FedEx Corp.
| 9.1%
|
| United Parcel Service, Inc., Class B
| 8.6
|
| Tesla, Inc.
| 8.1
|
| Union Pacific Corp.
| 7.8
|
| General Motors Co.
| 7.6
|
| PACCAR, Inc.
| 4.0
|
| CSX Corp.
| 4.0
|
| Norfolk Southern Corp.
| 3.8
|
| Delta Air Lines, Inc.
| 3.7
|
| United Airlines Holdings, Inc.
| 3.4
|
| Total
| 60.1%
|
Performance figures assume reinvestment of all distributions and do not reflect the deduction of taxes that a shareholder would pay on Fund distributions or the redemption or sale of Fund shares. An index is a
statistical composite that tracks a specified financial market or sector. Unlike the Fund, the indices do not actually hold a portfolio of securities and therefore do not incur the expenses incurred by the Fund.
These expenses negatively impact the performance of the Fund. The Fund’s past performance does not predict future performance.
Frequency
Distribution of Discounts and Premiums
Information
showing the number of days the market price of the Fund’s shares was greater (at a premium) and less (at a discount) than the Fund’s net asset value for the most recently completed year, and the most
recently completed calendar quarters since that year (or life of the Fund, if shorter), is available at https://www.ftportfolios.com/Retail/etf/home.aspx.
Fund Performance
Overview (Unaudited) (Continued)
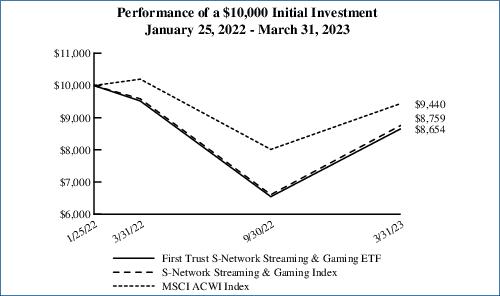
First Trust S-Network Streaming &
Gaming ETF (BNGE)
The First Trust S-Network
Streaming & Gaming ETF (the “Fund”) seeks investment results that correspond generally to the price and yield (before the Fund’s fees and expenses) of an index called the S-Network Streaming &
Gaming Index (the “Index”). The Fund lists and principally trades its shares on The NYSE Arca, Inc. under the ticker symbol “BNGE.” The Fund will normally invest at least 80% of its net assets
(including investment borrowings) in the common stocks and depositary receipts that comprise the Index. The Fund, using an indexing investment approach, attempts to replicate, before fees and expenses, the performance
of the Index.
According to VettaFi LLC
(the “Index Provider”), the Index is composed of common stock and depositary receipts issued by U.S. and non-U.S. companies that enable remote users to access online content; publish online content;
participate in prospective wagering; spectate or participate in competitive video gaming; and that provide the products, services and technology that are necessary for the streaming and gaming industries. The Index is
owned and is developed, maintained and sponsored by VettaFi LLC. The Index Provider retains the right at any time, upon prior written notice, to modify the Index methodology.
| Performance
|
|
|
|
|
|
| Average Annual
Total Returns
| Cumulative
Total Returns
|
|
| 1 Year Ended
3/31/23
| Inception (1/25/22)
to 3/31/23
| Inception (1/25/22)
to 3/31/23
|
| Fund Performance
|
|
|
|
| NAV
| -9.08%
| -11.55%
| -13.46%
|
| Market Price
| -9.37%
| -11.37%
| -13.25%
|
| Index Performance
|
|
|
|
| S-Network Streaming & Gaming Index
| -8.64%
| -10.64%
| -12.41%
|
| MSCI ACWI Index
| -7.44%
| -4.78%
| -5.60%
|
(See Notes to Fund
Performance Overview on page 20.)
Performance Review
The Fund generated a NAV
return of -9.08% during the period covered by this report. During the same period, the MSCI ACWI Index (the “Benchmark”) generated a return of -7.44%. The United States was the highest weighted country in
the Fund during the period with an allocation of 53.0%. Investments in this country contributed -7.9% to the Fund’s return, which was the greatest drag on the Fund’s return of any country in the Fund. The
greatest positive contribution to the Fund’s return came from investments in Ireland with a contribution of 2.2%. Exposure to foreign currency contributed -1.7% to the Fund’s total return for the
period.
S-Network and S-Network
Streaming & Gaming Index are service marks of VettaFi LLC and have been licensed for use by First Trust Advisors L.P. The Fund is not issued, sponsored, endorsed, sold
or promoted by VettaFi LLC or its affiliates (collectively, “VettaFi”). VettaFi makes no representation or warranty, express or implied, to the purchasers or owners of the Fund or any member of the public
regarding the advisability of investing in securities generally or in the Fund particularly or the ability of the Index to track general market performance.
Fund Performance
Overview (Unaudited) (Continued)
First Trust S-Network Streaming &
Gaming ETF (BNGE) (Continued)
| Portfolio Sector Allocation
| % of Total
Long-Term
Investments
|
| Communication Services
| 57.2%
|
| Consumer Discretionary
| 24.1
|
| Information Technology
| 18.7
|
| Total
| 100.0%
|
| Top Ten Holdings
| % of Total
Long-Term
Investments
|
| NVIDIA Corp.
| 6.9%
|
| Advanced Micro Devices, Inc.
| 5.7
|
| Warner Bros Discovery, Inc.
| 4.7
|
| Flutter Entertainment PLC
| 4.7
|
| Activision Blizzard, Inc.
| 4.6
|
| Intel Corp.
| 4.4
|
| Sony Group Corp.
| 4.4
|
| Netflix, Inc.
| 4.3
|
| Tencent Holdings Ltd.
| 4.3
|
| NetEase, Inc., ADR
| 4.3
|
| Total
| 48.3%
|
Performance figures assume reinvestment of all distributions and do not reflect the deduction of taxes that a shareholder would pay on Fund distributions or the redemption or sale of Fund shares. An index is a
statistical composite that tracks a specified financial market or sector. Unlike the Fund, the indices do not actually hold a portfolio of securities and therefore do not incur the expenses incurred by the Fund.
These expenses negatively impact the performance of the Fund. The Fund’s past performance does not predict future performance.
Frequency
Distribution of Discounts and Premiums
Information
showing the number of days the market price of the Fund’s shares was greater (at a premium) and less (at a discount) than the Fund’s net asset value for the most recently completed year, and the most
recently completed calendar quarters since that year (or life of the Fund, if shorter), is available at https://www.ftportfolios.com/Retail/etf/home.aspx.
Notes to Fund
Performance Overview (Unaudited)
Total returns for the
periods since inception are calculated from the inception date of each Fund. “Average Annual Total Returns” represent the average annual change in value of an investment over the periods indicated.
“Cumulative Total Returns” represent the total change in value of an investment over the periods indicated.
Each Fund’s per
share net asset value (“NAV”) is the value of one share of the Fund and is computed by dividing the value of all assets of the Fund (including accrued interest and dividends), less all liabilities
(including accrued expenses and dividends declared but unpaid), by the total number of outstanding shares. The price used to calculate market return (“Market Price”) is determined by using the midpoint of
the national best bid and offer price (“NBBO”) as of the time that the Fund’s NAV is calculated. Under SEC rules, the NBBO consists of the highest displayed buy and lowest sell prices among the
various exchanges trading the Fund at the time the Fund’s NAV is calculated. Prior to January 1, 2019, the price used was the midpoint between the highest bid and the lowest offer on the stock exchange on which
shares of the Fund were listed for trading as of the time that the Fund’s NAV was calculated. Since shares of each Fund did not trade in the secondary market until after the Fund’s inception, for the
period from inception to the first day of secondary market trading in shares of the Fund, the NAV of each Fund is used as a proxy for the secondary market trading price to calculate market returns. NAV and market
returns assume that all distributions have been reinvested in each Fund at NAV and Market Price, respectively.
An index is a statistical
composite that tracks a specified financial market or sector. Unlike each Fund, the indices do not actually hold a portfolio of securities and therefore do not incur the expenses incurred by each Fund. These expenses
negatively impact the performance of each Fund. Also, market returns do not include brokerage commissions that may be payable on secondary market transactions. If brokerage commissions were included, market returns
would be lower. The total returns presented reflect the reinvestment of dividends on securities in the indices. The returns presented do not reflect the deduction of taxes that a shareholder would pay on Fund
distributions or the redemption or sale of Fund shares. The investment return and principal value of shares of each Fund will vary with changes in market conditions. Shares of each Fund may be worth more or less than
their original cost when they are redeemed or sold in the market. Each Fund’s past performance is no guarantee of future performance.
First Trust Exchange-Traded Fund VI
Understanding Your Fund
Expenses
March 31, 2023
(Unaudited)
As a shareholder of First
Trust Nasdaq Bank ETF, First Trust Nasdaq Food & Beverage ETF, First Trust Nasdaq Oil & Gas ETF, First Trust Nasdaq Pharmaceuticals ETF, First Trust S-Network E-Commerce ETF, First Trust Nasdaq Semiconductor
ETF, First Trust Nasdaq Transportation ETF or First Trust S-Network Streaming & Gaming ETF (each a “Fund” and collectively, the “Funds”), you incur two types of costs: (1) transaction costs;
and (2) ongoing costs, including management fees, distribution and/or service (12b-1) fees, if any, and other Fund expenses. This Example is intended to help you understand your ongoing costs of investing in the
Funds and to compare these costs with the ongoing costs of investing in other funds.
The Example is based on
an investment of $1,000 invested at the beginning of the period and held through the six-month period ended March 31, 2023.
Actual Expenses
The first line in the
following table provides information about actual account values and actual expenses. You may use the information in this line, together with the amount you invested, to estimate the expenses that you paid over the
period. Simply divide your account value by $1,000 (for example, an $8,600 account value divided by $1,000 = 8.6), then multiply the result by the number in the first line under the heading entitled “Expenses
Paid During the Six-Month Period” to estimate the expenses you paid on your account during this six-month period.
Hypothetical Example for
Comparison Purposes
The second line in the
following table provides information about hypothetical account values and hypothetical expenses based on each Fund’s actual expense ratio and an assumed rate of return of 5% per year before expenses, which is
not each Fund’s actual return. The hypothetical account values and expenses may not be used to estimate the actual ending account balance or expenses you paid for the period. You may use this information to
compare the ongoing costs of investing in the Funds and other funds. To do so, compare this 5% hypothetical example with the 5% hypothetical examples that appear in the shareholder reports of the other funds.
Please note that the
expenses shown in the table are meant to highlight your ongoing costs only and do not reflect any transactional costs such as brokerage commissions. Therefore, the second line in the table is useful in comparing
ongoing costs only, and will not help you determine the relative total costs of owning different funds. In addition, if these transactional costs were included, your costs would have been higher.
|
| Beginning
Account Value
October 1, 2022
| Ending
Account Value
March 31, 2023
| Annualized
Expense Ratio
Based on the
Six-Month
Period
| Expenses Paid
During the
Six-Month
Period (a)
|
| First Trust Nasdaq Bank ETF (FTXO)
|
| Actual
| $1,000.00
| $833.60
| 0.60%
| $2.74
|
| Hypothetical (5% return before expenses)
| $1,000.00
| $1,021.94
| 0.60%
| $3.02
|
| First Trust Nasdaq Food & Beverage ETF (FTXG)
|
| Actual
| $1,000.00
| $1,096.00
| 0.60%
| $3.14
|
| Hypothetical (5% return before expenses)
| $1,000.00
| $1,021.94
| 0.60%
| $3.02
|
| First Trust Nasdaq Oil & Gas ETF (FTXN)
|
| Actual
| $1,000.00
| $1,114.90
| 0.60%
| $3.16
|
| Hypothetical (5% return before expenses)
| $1,000.00
| $1,021.94
| 0.60%
| $3.02
|
| First Trust Nasdaq Pharmaceuticals ETF (FTXH)
|
| Actual
| $1,000.00
| $1,096.20
| 0.60%
| $3.14
|
| Hypothetical (5% return before expenses)
| $1,000.00
| $1,021.94
| 0.60%
| $3.02
|
| First Trust S-Network E-Commerce ETF (ISHP)
|
| Actual
| $1,000.00
| $1,238.60
| 0.60%
| $3.35
|
| Hypothetical (5% return before expenses)
| $1,000.00
| $1,021.94
| 0.60%
| $3.02
|
| First Trust Nasdaq Semiconductor ETF (FTXL)
|
| Actual
| $1,000.00
| $1,339.10
| 0.60%
| $3.50
|
| Hypothetical (5% return before expenses)
| $1,000.00
| $1,021.94
| 0.60%
| $3.02
|
First Trust Exchange-Traded Fund VI
Understanding Your Fund
Expenses (Continued)
March 31, 2023
(Unaudited)
|
| Beginning
Account Value
October 1, 2022
| Ending
Account Value
March 31, 2023
| Annualized
Expense Ratio
Based on the
Six-Month
Period
| Expenses Paid
During the
Six-Month
Period (a)
|
| First Trust Nasdaq Transportation ETF (FTXR)
|
| Actual
| $1,000.00
| $1,178.80
| 0.60%
| $3.26
|
| Hypothetical (5% return before expenses)
| $1,000.00
| $1,021.94
| 0.60%
| $3.02
|
| First Trust S-Network Streaming & Gaming ETF (BNGE)
|
| Actual
| $1,000.00
| $1,322.20
| 0.70%
| $4.05
|
| Hypothetical (5% return before expenses)
| $1,000.00
| $1,021.44
| 0.70%
| $3.53
|
| (a)
| Expenses are equal to the annualized expense ratios as indicated in the table multiplied by the average account value over the period (October 1, 2022 through
March 31, 2023), multiplied by 182/365 (to reflect the six-month period).
|
First Trust Nasdaq Bank ETF (FTXO)
Portfolio of Investments
March 31, 2023
| Shares
|
| Description
|
| Value
|
| COMMON STOCKS – 99.7%
|
|
|
| Banks – 96.7%
|
|
|
| 27,479
|
| Ameris Bancorp
|
| $1,005,182
|
| 67,909
|
| Associated Banc-Corp.
|
| 1,221,004
|
| 27,558
|
| Atlantic Union Bankshares Corp.
|
| 965,908
|
| 11,438
|
| BancFirst Corp.
|
| 950,498
|
| 479,179
|
| Bank of America Corp.
|
| 13,704,519
|
| 38,883
|
| Bank OZK
|
| 1,329,799
|
| 18,402
|
| BOK Financial Corp.
|
| 1,553,313
|
| 24,053
|
| Cathay General Bancorp
|
| 830,310
|
| 324,241
|
| Citigroup, Inc.
|
| 15,203,660
|
| 196,787
|
| Citizens Financial Group, Inc.
|
| 5,976,421
|
| 28,094
|
| Comerica, Inc.
|
| 1,219,841
|
| 15,605
|
| Commerce Bancshares, Inc.
|
| 910,552
|
| 9,338
|
| Cullen/Frost Bankers, Inc.
|
| 983,665
|
| 32,307
|
| East West Bancorp, Inc.
|
| 1,793,038
|
| 226,387
|
| Fifth Third Bancorp
|
| 6,030,950
|
| 4,922
|
| First Citizens BancShares, Inc., Class A
|
| 4,789,598
|
| 37,744
|
| First Hawaiian, Inc.
|
| 778,659
|
| 159,885
|
| FNB Corp.
|
| 1,854,666
|
| 61,703
|
| Fulton Financial Corp.
|
| 852,735
|
| 27,994
|
| Hancock Whitney Corp.
|
| 1,018,982
|
| 60,197
|
| Home BancShares, Inc.
|
| 1,306,877
|
| 417,944
|
| Huntington Bancshares, Inc.
|
| 4,680,973
|
| 14,905
|
| Independent Bank Corp.
|
| 978,066
|
| 21,273
|
| International Bancshares Corp.
|
| 910,910
|
| 114,654
|
| JPMorgan Chase & Co.
|
| 14,940,563
|
| 246,383
|
| KeyCorp
|
| 3,084,715
|
| 52,921
|
| M&T Bank Corp.
|
| 6,327,764
|
| 114,036
|
| Old National Bancorp
|
| 1,644,399
|
| 35,510
|
| Pacific Premier Bancorp, Inc.
|
| 852,950
|
| 29,441
|
| Pinnacle Financial Partners, Inc.
|
| 1,623,966
|
| 52,038
|
| PNC Financial Services Group (The), Inc.
|
| 6,614,030
|
| 23,459
|
| Popular, Inc.
|
| 1,346,781
|
| 37,502
|
| Prosperity Bancshares, Inc.
|
| 2,307,123
|
| 252,057
|
| Regions Financial Corp.
|
| 4,678,178
|
| 25,877
|
| SouthState Corp.
|
| 1,843,995
|
| 38,755
|
| Synovus Financial Corp.
|
| 1,194,817
|
| 17,116
|
| Texas Capital Bancshares, Inc. (a)
|
| 837,999
|
| 350,069
|
| Truist Financial Corp.
|
| 11,937,353
|
| 12,103
|
| UMB Financial Corp.
|
| 698,585
|
| 45,571
|
| United Bankshares, Inc.
|
| 1,604,099
|
| 172,174
|
| US Bancorp
|
| 6,206,873
|
| 219,945
|
| Valley National Bancorp
|
| 2,032,292
|
| 57,993
|
| Webster Financial Corp.
|
| 2,286,084
|
| 351,418
|
| Wells Fargo & Co.
|
| 13,136,005
|
| 28,045
|
| Western Alliance Bancorp
|
| 996,719
|
| 19,578
|
| Wintrust Financial Corp.
|
| 1,428,215
|
| 20,686
|
| WSFS Financial Corp.
|
| 778,000
|
|
|
|
|
| 159,251,631
|
| Shares
|
| Description
|
| Value
|
|
|
|
|
| Consumer Finance – 3.0%
|
|
|
| 49,711
|
| Discover Financial Services
|
| $4,913,435
|
|
|
| Total Investments – 99.7%
|
| 164,165,066
|
|
|
| (Cost $194,286,325)
|
|
|
|
|
| Net Other Assets and Liabilities – 0.3%
|
| 542,958
|
|
|
| Net Assets – 100.0%
|
| $164,708,024
|
| (a)
| Non-income producing security.
|
Valuation Inputs
A summary of the inputs
used to value the Fund’s investments as of March 31, 2023 is as follows (see Note 2A - Portfolio Valuation in the Notes to Financial Statements):
|
| Total
Value at
3/31/2023
| Level 1
Quoted
Prices
| Level 2
Significant
Observable
Inputs
| Level 3
Significant
Unobservable
Inputs
|
| Common Stocks*
| $ 164,165,066
| $ 164,165,066
| $ —
| $ —
|
| *
| See Portfolio of Investments for industry breakout.
|
See Notes to Financial
Statements
Page 23
First Trust Nasdaq Food & Beverage ETF
(FTXG)
Portfolio of Investments
March 31, 2023
| Shares
|
| Description
|
| Value
|
| COMMON STOCKS – 99.9%
|
|
|
| Beverages – 27.4%
|
|
|
| 581,855
|
| Brown-Forman Corp., Class B
|
| $37,395,821
|
| 1,268,544
|
| Coca-Cola (The) Co.
|
| 78,687,785
|
| 46,148
|
| Coca-Cola Consolidated, Inc.
|
| 24,692,872
|
| 1,092,492
|
| Keurig Dr. Pepper, Inc.
|
| 38,543,118
|
| 94,309
|
| Monster Beverage Corp. (a)
|
| 5,093,629
|
| 120,442
|
| National Beverage Corp. (a)
|
| 6,349,702
|
| 435,031
|
| PepsiCo, Inc.
|
| 79,306,151
|
|
|
|
|
| 270,069,078
|
|
|
| Chemicals – 3.7%
|
|
|
| 605,952
|
| Corteva, Inc.
|
| 36,544,965
|
|
|
| Consumer Staples
Distribution & Retail – 3.4%
|
|
|
| 897,496
|
| US Foods Holding Corp. (a)
|
| 33,153,502
|
|
|
| Food Products – 64.9%
|
|
|
| 948,389
|
| Archer-Daniels-Midland Co.
|
| 75,548,668
|
| 50,255
|
| Bunge Ltd.
|
| 4,800,358
|
| 718,685
|
| Campbell Soup Co.
|
| 39,513,301
|
| 1,036,674
|
| Conagra Brands, Inc.
|
| 38,937,475
|
| 566,314
|
| Flowers Foods, Inc.
|
| 15,522,667
|
| 949,426
|
| General Mills, Inc.
|
| 81,137,946
|
| 158,356
|
| Hershey (The) Co.
|
| 40,287,350
|
| 850,525
|
| Hormel Foods Corp.
|
| 33,918,937
|
| 450,342
|
| Hostess Brands, Inc. (a)
|
| 11,204,509
|
| 58,252
|
| Ingredion, Inc.
|
| 5,925,976
|
| 255,231
|
| J.M. Smucker (The) Co.
|
| 40,165,702
|
| 572,418
|
| Kellogg Co.
|
| 38,329,109
|
| 969,309
|
| Kraft Heinz (The) Co.
|
| 37,483,179
|
| 218,511
|
| Lamb Weston Holdings, Inc.
|
| 22,838,770
|
| 46,449
|
| Lancaster Colony Corp.
|
| 9,423,573
|
| 1,158,200
|
| Mondelez International, Inc., Class A
|
| 80,749,704
|
| 159,886
|
| Post Holdings, Inc. (a)
|
| 14,368,955
|
| 138,491
|
| Simply Good Foods (The), Co. (a)
|
| 5,507,787
|
| 98,371
|
| TreeHouse Foods, Inc. (a)
|
| 4,960,849
|
| 637,130
|
| Tyson Foods, Inc., Class A
|
| 37,794,552
|
|
|
|
|
| 638,419,367
|
|
|
| Personal Care Products – 0.5%
|
|
|
| 155,442
|
| BellRing Brands, Inc. (a)
|
| 5,285,028
|
|
|
| Total Investments – 99.9%
|
| 983,471,940
|
|
|
| (Cost $968,528,695)
|
|
|
|
|
| Net Other Assets and Liabilities – 0.1%
|
| 867,494
|
|
|
| Net Assets – 100.0%
|
| $984,339,434
|
| (a)
| Non-income producing security.
|
Valuation Inputs
A summary of the inputs
used to value the Fund’s investments as of March 31, 2023 is as follows (see Note 2A - Portfolio Valuation in the Notes to Financial Statements):
|
| Total
Value at
3/31/2023
| Level 1
Quoted
Prices
| Level 2
Significant
Observable
Inputs
| Level 3
Significant
Unobservable
Inputs
|
| Common Stocks*
| $ 983,471,940
| $ 983,471,940
| $ —
| $ —
|
| *
| See Portfolio of Investments for industry breakout.
|
Page 24
See Notes to Financial
Statements
First Trust Nasdaq Oil & Gas ETF
(FTXN)
Portfolio of Investments
March 31, 2023
| Shares
|
| Description
|
| Value
|
| COMMON STOCKS – 99.8%
|
|
|
| Energy Equipment &
Services – 4.4%
|
|
|
| 80,592
|
| Baker Hughes Co.
|
| $2,325,885
|
| 51,811
|
| ChampionX Corp.
|
| 1,405,632
|
| 90,159
|
| Halliburton Co.
|
| 2,852,631
|
| 104,186
|
| Liberty Energy, Inc.
|
| 1,334,622
|
| 94,478
|
| Schlumberger N.V.
|
| 4,638,870
|
| 23,911
|
| Weatherford International PLC (a)
|
| 1,419,118
|
|
|
|
|
| 13,976,758
|
|
|
| Oil, Gas & Consumable Fuels – 95.4%
|
|
|
| 187,817
|
| APA Corp.
|
| 6,772,681
|
| 78,910
|
| Cheniere Energy, Inc.
|
| 12,436,216
|
| 73,962
|
| Chesapeake Energy Corp.
|
| 5,624,070
|
| 154,686
|
| Chevron Corp.
|
| 25,238,568
|
| 20,409
|
| Chord Energy Corp.
|
| 2,747,051
|
| 50,789
|
| Civitas Resources, Inc.
|
| 3,470,920
|
| 203,317
|
| Comstock Resources, Inc.
|
| 2,193,790
|
| 240,410
|
| ConocoPhillips
|
| 23,851,076
|
| 314,173
|
| Coterra Energy, Inc.
|
| 7,709,805
|
| 49,830
|
| CVR Energy, Inc.
|
| 1,633,427
|
| 18,914
|
| Denbury, Inc. (a)
|
| 1,657,434
|
| 229,251
|
| Devon Energy Corp.
|
| 11,602,393
|
| 64,932
|
| Diamondback Energy, Inc.
|
| 8,776,858
|
| 109,828
|
| EOG Resources, Inc.
|
| 12,589,584
|
| 152,278
|
| EQT Corp.
|
| 4,859,191
|
| 226,214
|
| Exxon Mobil Corp.
|
| 24,806,627
|
| 42,708
|
| Hess Corp.
|
| 5,651,977
|
| 110,336
|
| HF Sinclair Corp.
|
| 5,338,056
|
| 202,768
|
| Kosmos Energy Ltd. (a)
|
| 1,508,594
|
| 85,723
|
| Magnolia Oil & Gas Corp., Class A
|
| 1,875,619
|
| 311,153
|
| Marathon Oil Corp.
|
| 7,455,226
|
| 174,490
|
| Marathon Petroleum Corp.
|
| 23,526,487
|
| 53,647
|
| Matador Resources, Co.
|
| 2,556,280
|
| 78,664
|
| Murphy Oil Corp.
|
| 2,908,995
|
| 378,479
|
| Occidental Petroleum Corp.
|
| 23,628,444
|
| 65,009
|
| ONEOK, Inc.
|
| 4,130,672
|
| 120,421
|
| Ovintiv, Inc.
|
| 4,344,790
|
| 160,105
|
| PBF Energy, Inc., Class A
|
| 6,942,153
|
| 59,910
|
| PDC Energy, Inc.
|
| 3,845,024
|
| 172,513
|
| Permian Resources Corp.
|
| 1,811,387
|
| 121,116
|
| Phillips 66
|
| 12,278,740
|
| 62,031
|
| Pioneer Natural Resources Co.
|
| 12,669,211
|
| 58,810
|
| Range Resources Corp.
|
| 1,556,701
|
| 846,191
|
| Southwestern Energy Co. (a)
|
| 4,230,955
|
| 45,996
|
| Targa Resources Corp.
|
| 3,355,408
|
| 786
|
| Texas Pacific Land Corp.
|
| 1,337,002
|
| Shares
|
| Description
|
| Value
|
|
|
|
|
| Oil, Gas & Consumable
Fuels (Continued)
|
|
|
| 94,222
|
| Valero Energy Corp.
|
| $13,153,391
|
|
|
|
|
| 300,074,803
|
|
|
| Total Investments – 99.8%
|
| 314,051,561
|
|
|
| (Cost $309,207,818)
|
|
|
|
|
| Net Other Assets and Liabilities – 0.2%
|
| 544,677
|
|
|
| Net Assets – 100.0%
|
| $314,596,238
|
| (a)
| Non-income producing security.
|
Valuation Inputs
A summary of the inputs
used to value the Fund’s investments as of March 31, 2023 is as follows (see Note 2A - Portfolio Valuation in the Notes to Financial Statements):
|
| Total
Value at
3/31/2023
| Level 1
Quoted
Prices
| Level 2
Significant
Observable
Inputs
| Level 3
Significant
Unobservable
Inputs
|
| Common Stocks*
| $ 314,051,561
| $ 314,051,561
| $ —
| $ —
|
| *
| See Portfolio of Investments for industry breakout.
|
See Notes to Financial
Statements
Page 25
First Trust Nasdaq Pharmaceuticals ETF
(FTXH)
Portfolio of Investments
March 31, 2023
| Shares
|
| Description
|
| Value
|
| COMMON STOCKS – 99.9%
|
|
|
| Biotechnology – 44.2%
|
|
|
| 15,163
|
| AbbVie, Inc.
|
| $2,416,527
|
| 7,838
|
| ACADIA Pharmaceuticals, Inc. (a)
|
| 147,511
|
| 6,065
|
| Alkermes PLC (a)
|
| 170,972
|
| 847
|
| Alnylam Pharmaceuticals, Inc. (a)
|
| 169,671
|
| 5,036
|
| Amgen, Inc.
|
| 1,217,453
|
| 12,296
|
| Amicus Therapeutics, Inc. (a)
|
| 136,363
|
| 3,862
|
| Biogen, Inc. (a)
|
| 1,073,752
|
| 1,629
|
| BioMarin Pharmaceutical, Inc. (a)
|
| 158,404
|
| 2,602
|
| Exact Sciences Corp. (a)
|
| 176,442
|
| 15,179
|
| Exelixis, Inc. (a)
|
| 294,624
|
| 14,489
|
| Gilead Sciences, Inc.
|
| 1,202,152
|
| 4,657
|
| Halozyme Therapeutics, Inc. (a)
|
| 177,851
|
| 9,690
|
| Incyte Corp. (a)
|
| 700,296
|
| 4,517
|
| Ionis Pharmaceuticals, Inc. (a)
|
| 161,438
|
| 7,804
|
| IVERIC bio, Inc. (a)
|
| 189,871
|
| 813
|
| Karuna Therapeutics, Inc. (a)
|
| 147,673
|
| 8,405
|
| Moderna, Inc. (a)
|
| 1,290,840
|
| 1,875
|
| Neurocrine Biosciences, Inc. (a)
|
| 189,788
|
| 1,325
|
| Prometheus Biosciences, Inc. (a)
|
| 142,199
|
| 2,909
|
| Prothena Corp. PLC (a)
|
| 140,999
|
| 3,713
|
| PTC Therapeutics, Inc. (a)
|
| 179,858
|
| 1,535
|
| Regeneron Pharmaceuticals, Inc. (a)
|
| 1,261,263
|
| 20,046
|
| Roivant Sciences Ltd. (a)
|
| 147,940
|
| 1,328
|
| Sarepta Therapeutics, Inc. (a)
|
| 183,038
|
| 903
|
| Seagen, Inc. (a)
|
| 182,830
|
| 2,685
|
| United Therapeutics Corp. (a)
|
| 601,333
|
| 3,958
|
| Vaxcyte, Inc. (a)
|
| 148,346
|
| 4,019
|
| Vertex Pharmaceuticals, Inc. (a)
|
| 1,266,266
|
| 7,113
|
| Vir Biotechnology, Inc. (a)
|
| 165,520
|
|
|
|
|
| 14,441,220
|
|
|
| Health Care Equipment &
Supplies – 0.4%
|
|
|
| 2,107
|
| Novocure Ltd. (a)
|
| 126,715
|
|
|
| Health Care Providers &
Services – 3.6%
|
|
|
| 15,411
|
| Cardinal Health, Inc.
|
| 1,163,530
|
|
|
| Life Sciences Tools &
Services – 3.5%
|
|
|
| 2,421
|
| Charles River Laboratories International, Inc. (a)
|
| 488,606
|
| 1,846
|
| Medpace Holdings, Inc. (a)
|
| 347,141
|
| 8,600
|
| Syneos Health, Inc. (a)
|
| 306,332
|
|
|
|
|
| 1,142,079
|
|
|
| Pharmaceuticals – 48.2%
|
|
|
| 2,379
|
| Axsome Therapeutics, Inc. (a)
|
| 146,737
|
| 33,840
|
| Bristol-Myers Squibb Co.
|
| 2,345,450
|
| 4,113
|
| Catalent, Inc. (a)
|
| 270,265
|
| 14,139
|
| Elanco Animal Health, Inc. (a)
|
| 132,907
|
| Shares
|
| Description
|
| Value
|
|
|
|
|
| Pharmaceuticals (Continued)
|
|
|
| 3,749
|
| Eli Lilly & Co.
|
| $1,287,482
|
| 3,683
|
| Harmony Biosciences Holdings, Inc. (a)
|
| 120,250
|
| 7,241
|
| Jazz Pharmaceuticals PLC (a)
|
| 1,059,576
|
| 15,226
|
| Johnson & Johnson
|
| 2,360,030
|
| 21,965
|
| Merck & Co., Inc.
|
| 2,336,856
|
| 30,293
|
| Organon & Co.
|
| 712,491
|
| 6,587
|
| Perrigo Co. PLC
|
| 236,276
|
| 57,519
|
| Pfizer, Inc.
|
| 2,346,775
|
| 3,548
|
| Prestige Consumer Healthcare, Inc. (a)
|
| 222,211
|
| 102,348
|
| Viatris, Inc.
|
| 984,588
|
| 6,987
|
| Zoetis, Inc.
|
| 1,162,916
|
|
|
|
|
| 15,724,810
|
|
|
| Total Investments – 99.9%
|
| 32,598,354
|
|
|
| (Cost $32,505,824)
|
|
|
|
|
| Net Other Assets and Liabilities – 0.1%
|
| 41,349
|
|
|
| Net Assets – 100.0%
|
| $32,639,703
|
| (a)
| Non-income producing security.
|
Valuation Inputs
A summary of the inputs
used to value the Fund’s investments as of March 31, 2023 is as follows (see Note 2A - Portfolio Valuation in the Notes to Financial Statements):
|
| Total
Value at
3/31/2023
| Level 1
Quoted
Prices
| Level 2
Significant
Observable
Inputs
| Level 3
Significant
Unobservable
Inputs
|
| Common Stocks*
| $ 32,598,354
| $ 32,598,354
| $ —
| $ —
|
| *
| See Portfolio of Investments for industry breakout.
|
Page 26
See Notes to Financial
Statements
First Trust S-Network E-Commerce ETF
(ISHP)
Portfolio of Investments
March 31, 2023
| Shares
|
| Description
|
| Value
|
| COMMON STOCKS – 97.6%
|
|
|
| Air Freight & Logistics – 7.2%
|
|
|
| 2,111
|
| Deutsche Post AG (a)
|
| $98,870
|
| 452
|
| FedEx Corp.
|
| 103,278
|
| 474
|
| United Parcel Service, Inc., Class B
|
| 91,951
|
| 3,047
|
| ZTO Express Cayman, Inc., ADR (b)
|
| 87,327
|
|
|
|
|
| 381,426
|
|
|
| Banks – 1.4%
|
|
|
| 3,901
|
| KakoaBank Corp. (a)
|
| 72,910
|
|
|
| Broadline Retail – 15.4%
|
|
|
| 766
|
| Alibaba Group Holding Ltd., ADR (b)
|
| 78,270
|
| 909
|
| Amazon.com, Inc. (b)
|
| 93,891
|
| 5,124
|
| Coupang, Inc. (b)
|
| 81,984
|
| 1,866
|
| eBay, Inc.
|
| 82,794
|
| 658
|
| Etsy, Inc. (b)
|
| 73,255
|
| 1,372
|
| JD.com, Inc., ADR
|
| 60,217
|
| 85
|
| MercadoLibre, Inc. (b)
|
| 112,035
|
| 444
|
| Naspers Ltd., Class N (a)
|
| 82,271
|
| 927
|
| PDD Holdings, Inc., ADR (b)
|
| 70,359
|
| 1,066
|
| Prosus N.V. (a)
|
| 83,472
|
|
|
|
|
| 818,548
|
|
|
| Commercial Services &
Supplies – 1.9%
|
|
|
| 1,385
|
| Copart, Inc. (b)
|
| 104,166
|
|
|
| Consumer Staples
Distribution & Retail – 4.3%
|
|
|
| 92,000
|
| Alibaba Health Information Technology Ltd. (a) (b)
|
| 66,352
|
| 10,106
|
| JD Health International, Inc. (a) (b) (c) (d)
|
| 74,936
|
| 598
|
| Walmart, Inc.
|
| 88,175
|
|
|
|
|
| 229,463
|
|
|
| Financial Services – 9.8%
|
|
|
| 61
|
| Adyen N.V. (a) (b) (c) (d)
|
| 97,199
|
| 1,251
|
| Fidelity National Information Services, Inc.
|
| 67,967
|
| 846
|
| Fiserv, Inc. (b)
|
| 95,623
|
| 445
|
| FleetCor Technologies, Inc. (b)
|
| 93,828
|
| 800
|
| Global Payments, Inc.
|
| 84,192
|
| 1,086
|
| PayPal Holdings, Inc. (b)
|
| 82,471
|
|
|
|
|
| 521,280
|
|
|
| Ground Transportation – 1.8%
|
|
|
| 2,984
|
| Uber Technologies, Inc. (b)
|
| 94,593
|
|
|
| Hotels, Restaurants &
Leisure – 11.5%
|
|
|
| 880
|
| Airbnb, Inc., Class A (b)
|
| 109,472
|
| 38
|
| Booking Holdings, Inc. (b)
|
| 100,792
|
| 1,604
|
| Delivery Hero SE (a) (b) (c) (d)
|
| 54,720
|
| Shares
|
| Description
|
| Value
|
|
|
|
|
| Hotels, Restaurants &
Leisure (Continued)
|
|
|
| 1,665
|
| DoorDash, Inc., Class A (b)
|
| $105,827
|
| 841
|
| Expedia Group, Inc. (b)
|
| 81,602
|
| 3,907
|
| Meituan, Class B (a) (b) (c) (d)
|
| 70,882
|
| 2,343
|
| Trip.com Group Ltd., ADR (b)
|
| 88,261
|
|
|
|
|
| 611,556
|
|
|
| Interactive Media & Services – 24.8%
|
|
|
| 951
|
| Alphabet, Inc., Class A (b)
|
| 98,647
|
| 12,901
|
| Auto Trader Group PLC (a) (c) (d)
|
| 98,405
|
| 635
|
| Baidu, Inc., ADR (b)
|
| 95,834
|
| 5,715
|
| carsales.com Ltd. (a)
|
| 85,411
|
| 9,200
|
| Kuaishou Technology (a) (b) (c) (d)
|
| 70,742
|
| 634
|
| Meta Platforms, Inc., Class A (b)
|
| 134,370
|
| 555
|
| NAVER Corp. (a)
|
| 86,963
|
| 3,277
|
| Pinterest, Inc., Class A (b)
|
| 89,364
|
| 1,078
|
| REA Group Ltd. (a)
|
| 100,516
|
| 13,062
|
| Rightmove PLC (a)
|
| 90,920
|
| 5,600
|
| SEEK Ltd. (a)
|
| 90,525
|
| 8,987
|
| Snap, Inc., Class A (b)
|
| 100,744
|
| 4,328
|
| Weibo Corp., ADR (b)
|
| 86,820
|
| 6,796
|
| Yandex N.V., Class A (a) (b) (e) (f)
|
| 0
|
| 32,800
|
| Z Holdings Corp. (a)
|
| 93,003
|
|
|
|
|
| 1,322,264
|
|
|
| IT Services – 2.1%
|
|
|
| 2,357
|
| Shopify, Inc., Class A (b)
|
| 112,995
|
|
|
| Marine Transportation – 3.2%
|
|
|
| 41
|
| AP Moller - Maersk A.S., Class B (a)
|
| 74,526
|
| 84,500
|
| COSCO SHIPPING Holdings Co., Ltd., Class H (a)
|
| 95,263
|
|
|
|
|
| 169,789
|
|
|
| Professional Services – 1.4%
|
|
|
| 1,079
|
| CoStar Group, Inc. (b)
|
| 74,289
|
|
|
| Real Estate Management &
Development – 3.3%
|
|
|
| 4,601
|
| KE Holdings, Inc., ADR (b)
|
| 86,683
|
| 2,004
|
| Zillow Group, Inc., Class C (b)
|
| 89,118
|
|
|
|
|
| 175,801
|
|
|
| Specialty Retail – 5.9%
|
|
|
| 1,003
|
| Best Buy Co., Inc.
|
| 78,505
|
| 1,295
|
| CarMax, Inc. (b)
|
| 83,243
|
| 1,980
|
| Chewy, Inc., Class A (b)
|
| 74,012
|
| 1,914
|
| Zalando SE (a) (b) (c) (d)
|
| 80,217
|
|
|
|
|
| 315,977
|
See Notes to Financial
Statements
Page 27
First Trust S-Network E-Commerce ETF
(ISHP)
Portfolio of Investments
(Continued)
March 31, 2023
| Shares
|
| Description
|
| Value
|
| COMMON STOCKS (Continued)
|
|
|
| Textiles, Apparel & Luxury
Goods – 1.9%
|
|
|
| 275
|
| Lululemon Athletica, Inc. (b)
|
| $100,152
|
|
|
| Wireless Telecommunication
Services – 1.7%
|
|
|
| 27,243
|
| Taiwan Mobile Co., Ltd. (a)
|
| 90,394
|
|
|
| Total Common Stocks
|
| 5,195,603
|
|
|
| (Cost $6,137,705)
|
|
|
| REAL ESTATE INVESTMENT TRUSTS – 1.6%
|
|
|
| Industrial REITs – 1.6%
|
|
|
| 709
|
| Prologis, Inc.
|
| 88,462
|
|
|
| (Cost $108,155)
|
|
|
|
|
| Total Investments – 99.2%
|
| 5,284,065
|
|
|
| (Cost $6,245,860)
|
|
|
|
|
| Net Other Assets and Liabilities – 0.8%
|
| 40,163
|
|
|
| Net Assets – 100.0%
|
| $5,324,228
|
| (a)
| This security is fair valued by the Advisor’s Pricing Committee in accordance with procedures approved by the Trust’s Board of Trustees and in accordance with provisions
of the Investment Company Act of 1940 and rules thereunder, as amended. At March 31, 2023, securities noted as such are valued at $1,758,497 or 33.0% of net assets. Certain of these securities are fair valued using a
factor provided by a third-party pricing service due to the change in value between the foreign markets’ close and the New York Stock Exchange close exceeding a certain threshold. On days when this threshold is
not exceeded, these securities are typically valued at the last sale price on the exchange on which they are principally traded.
|
| (b)
| Non-income producing security.
|
| (c)
| This security may be resold to qualified foreign investors and foreign institutional buyers under Regulation S of the Securities Act of 1933, as amended (the “1933 Act”).
|
| (d)
| This security is exempt from registration upon resale under Rule 144A of the 1933 Act and may be resold in transactions exempt from registration, normally to qualified institutional
buyers. This security is not restricted on the foreign exchange where it trades freely without any additional registration. As such, it does not require the additional disclosure required of restricted securities.
|
| (e)
| Pursuant to procedures adopted by the Trust’s Board of Trustees, this security has been determined to be illiquid by the Advisor.
|
| (f)
| This security’s value was determined using significant unobservable inputs (see Note 2A – Portfolio Valuation in the Notes to Financial Statements).
|
| ADR
| American Depositary Receipt
|
Currency Exposure
Diversification
| % of Total
Investments
|
| United States Dollar
| 66.7%
|
| Euro
| 7.8
|
| Hong Kong Dollar
| 7.2
|
| Australian Dollar
| 5.2
|
| British Pound Sterling
| 3.6
|
| South Korean Won
| 3.0
|
| Japanese Yen
| 1.8
|
| New Taiwan Dollar
| 1.7
|
| South African Rand
| 1.6
|
| Danish Krone
| 1.4
|
| Total
| 100.0%
|
Valuation Inputs
A summary of the inputs
used to value the Fund’s investments as of March 31, 2023 is as follows (see Note 2A - Portfolio Valuation in the Notes to Financial Statements):
|
| Total
Value at
3/31/2023
| Level 1
Quoted
Prices
| Level 2
Significant
Observable
Inputs
| Level 3
Significant
Unobservable
Inputs
|
| Common Stocks:
|
|
|
|
|
| Air Freight & Logistics
| $ 381,426
| $ 282,556
| $ 98,870
| $ —
|
| Banks
| 72,910
| —
| 72,910
| —
|
| Broadline Retail
| 818,548
| 652,805
| 165,743
| —
|
| Consumer Staples Distribution & Retail
| 229,463
| 88,175
| 141,288
| —
|
| Financial Services
| 521,280
| 424,081
| 97,199
| —
|
| Hotels, Restaurants & Leisure
| 611,556
| 485,954
| 125,602
| —
|
| Interactive Media & Services
| 1,322,264
| 605,779
| 716,485
| —**
|
| Marine Transportation
| 169,789
| —
| 169,789
| —
|
| Specialty Retail
| 315,977
| 235,760
| 80,217
| —
|
| Wireless Telecommunication Services
| 90,394
| —
| 90,394
| —
|
| Other Industry Categories*
| 661,996
| 661,996
| —
| —
|
| Real Estate Investment Trusts*
| 88,462
| 88,462
| —
| —
|
| Total Investments
| $ 5,284,065
| $ 3,525,568
| $ 1,758,497
| $—**
|
| *
| See Portfolio of Investments for industry breakout.
|
| **
| Investment is valued at $0.
|
Level 3 investments are
fair valued by the Advisor’s Pricing Committee and are footnoted in the Portfolio of Investments. The Level 3 investments values are based on unobservable and non-quantitative inputs.
Page 28
See Notes to Financial
Statements
First Trust Nasdaq Semiconductor ETF
(FTXL)
Portfolio of Investments
March 31, 2023
| Shares
|
| Description
|
| Value
|
| COMMON STOCKS – 99.8%
|
|
|
| Electronic Equipment,
Instruments & Components – 4.2%
|
|
|
| 77,179
|
| Advanced Energy Industries, Inc.
|
| $7,563,542
|
| 102,171
|
| Avnet, Inc.
|
| 4,618,129
|
| 63,145
|
| IPG Photonics Corp. (a)
|
| 7,786,410
|
| 961,048
|
| Vishay Intertechnology, Inc.
|
| 21,738,906
|
|
|
|
|
| 41,706,987
|
|
|
| Semiconductors &
Semiconductor Equipment – 95.6%
|
|
|
| 128,417
|
| Allegro MicroSystems, Inc. (a)
|
| 6,162,732
|
| 1,405,440
|
| Amkor Technology, Inc.
|
| 36,569,549
|
| 197,334
|
| Analog Devices, Inc.
|
| 38,918,212
|
| 311,709
|
| Applied Materials, Inc.
|
| 38,287,216
|
| 65,891
|
| Axcelis Technologies, Inc. (a)
|
| 8,779,976
|
| 121,715
|
| Broadcom, Inc.
|
| 78,085,041
|
| 203,132
|
| Cirrus Logic, Inc. (a)
|
| 22,218,578
|
| 169,878
|
| Diodes, Inc. (a)
|
| 15,757,883
|
| 2,904,509
|
| Intel Corp.
|
| 94,890,309
|
| 95,460
|
| KLA Corp.
|
| 38,104,768
|
| 74,430
|
| Lam Research Corp.
|
| 39,456,832
|
| 101,251
|
| Lattice Semiconductor Corp. (a)
|
| 9,669,471
|
| 91,786
|
| MACOM Technology Solutions Holdings, Inc. (a)
|
| 6,502,120
|
| 446,822
|
| Microchip Technology, Inc.
|
| 37,434,747
|
| 1,252,327
|
| Micron Technology, Inc.
|
| 75,565,411
|
| 14,012
|
| Monolithic Power Systems, Inc.
|
| 7,013,566
|
| 155,867
|
| NVIDIA Corp.
|
| 43,295,177
|
| 202,828
|
| NXP Semiconductors N.V.
|
| 37,822,351
|
| 467,582
|
| ON Semiconductor Corp. (a)
|
| 38,491,350
|
| 60,709
|
| Onto Innovation, Inc. (a)
|
| 5,335,107
|
| 102,492
|
| Power Integrations, Inc.
|
| 8,674,923
|
| 358,967
|
| Qorvo, Inc. (a)
|
| 36,460,278
|
| 586,203
|
| QUALCOMM, Inc.
|
| 74,787,779
|
| 25,615
|
| Silicon Laboratories, Inc. (a)
|
| 4,484,930
|
| 324,517
|
| Skyworks Solutions, Inc.
|
| 38,286,516
|
| 227,530
|
| Teradyne, Inc.
|
| 24,461,750
|
| 422,412
|
| Texas Instruments, Inc.
|
| 78,572,856
|
|
|
|
|
| 944,089,428
|
|
|
| Total Investments – 99.8%
|
| 985,796,415
|
|
|
| (Cost $945,362,146)
|
|
|
|
|
| Net Other Assets and Liabilities – 0.2%
|
| 2,299,635
|
|
|
| Net Assets – 100.0%
|
| $988,096,050
|
| (a)
| Non-income producing security.
|
Valuation Inputs
A summary of the inputs
used to value the Fund’s investments as of March 31, 2023 is as follows (see Note 2A - Portfolio Valuation in the Notes to Financial Statements):
|
| Total
Value at
3/31/2023
| Level 1
Quoted
Prices
| Level 2
Significant
Observable
Inputs
| Level 3
Significant
Unobservable
Inputs
|
| Common Stocks*
| $ 985,796,415
| $ 985,796,415
| $ —
| $ —
|
| *
| See Portfolio of Investments for industry breakout.
|
See Notes to Financial
Statements
Page 29
First Trust Nasdaq Transportation ETF
(FTXR)
Portfolio of Investments
March 31, 2023
| Shares
|
| Description
|
| Value
|
| COMMON STOCKS – 99.9%
|
|
|
| Air Freight & Logistics – 23.6%
|
|
|
| 9,818
|
| CH Robinson Worldwide, Inc.
|
| $975,615
|
| 12,287
|
| Expeditors International of Washington, Inc.
|
| 1,353,044
|
| 18,897
|
| FedEx Corp.
|
| 4,317,776
|
| 2,361
|
| Forward Air Corp.
|
| 254,421
|
| 2,998
|
| Hub Group, Inc., Class A (a)
|
| 251,652
|
| 21,044
|
| United Parcel Service, Inc., Class B
|
| 4,082,326
|
|
|
|
|
| 11,234,834
|
|
|
| Automobile Components – 6.1%
|
|
|
| 6,317
|
| Aptiv PLC (a)
|
| 708,704
|
| 19,387
|
| BorgWarner, Inc.
|
| 952,096
|
| 2,618
|
| Dorman Products, Inc. (a)
|
| 225,829
|
| 8,530
|
| Gentex Corp.
|
| 239,096
|
| 4,097
|
| Lear Corp.
|
| 571,490
|
| 1,457
|
| Visteon Corp. (a)
|
| 228,501
|
|
|
|
|
| 2,925,716
|
|
|
| Automobiles – 15.7%
|
|
|
| 99,127
|
| General Motors Co.
|
| 3,635,978
|
| 18,669
|
| Tesla, Inc. (a)
|
| 3,873,071
|
|
|
|
|
| 7,509,049
|
|
|
| Construction & Engineering – 0.9%
|
|
|
| 8,708
|
| WillScot Mobile Mini Holdings Corp. (a)
|
| 408,231
|
|
|
| Distributors – 3.3%
|
|
|
| 5,041
|
| Genuine Parts Co.
|
| 843,410
|
| 13,257
|
| LKQ Corp.
|
| 752,467
|
|
|
|
|
| 1,595,877
|
|
|
| Ground Transportation – 27.5%
|
|
|
| 62,974
|
| CSX Corp.
|
| 1,885,442
|
| 5,966
|
| JB Hunt Transport Services, Inc.
|
| 1,046,794
|
| 15,809
|
| Knight-Swift Transportation Holdings, Inc.
|
| 894,473
|
| 2,112
|
| Landstar System, Inc.
|
| 378,597
|
| 8,541
|
| Norfolk Southern Corp.
|
| 1,810,692
|
| 3,075
|
| Old Dominion Freight Line, Inc.
|
| 1,048,083
|
| 14,395
|
| Ryder System, Inc.
|
| 1,284,610
|
| 1,085
|
| Saia, Inc. (a)
|
| 295,207
|
| 18,527
|
| Union Pacific Corp.
|
| 3,728,744
|
| 5,903
|
| Werner Enterprises, Inc.
|
| 268,527
|
| 14,292
|
| XPO, Inc. (a)
|
| 455,915
|
|
|
|
|
| 13,097,084
|
|
|
| Machinery – 6.6%
|
|
|
| 8,369
|
| Allison Transmission Holdings, Inc.
|
| 378,614
|
| Shares
|
| Description
|
| Value
|
|
|
|
|
| Machinery (Continued)
|
|
|
| 4,616
|
| Federal Signal Corp.
|
| $250,233
|
| 25,885
|
| PACCAR, Inc.
|
| 1,894,782
|
| 5,976
|
| Westinghouse Air Brake Technologies Corp.
|
| 603,934
|
|
|
|
|
| 3,127,563
|
|
|
| Passenger Airlines – 9.6%
|
|
|
| 81,604
|
| American Airlines Group, Inc. (a)
|
| 1,203,659
|
| 50,079
|
| Delta Air Lines, Inc. (a)
|
| 1,748,759
|
| 36,952
|
| United Airlines Holdings, Inc. (a)
|
| 1,635,126
|
|
|
|
|
| 4,587,544
|
|
|
| Trading Companies &
Distributors – 6.6%
|
|
|
| 3,881
|
| Herc Holdings, Inc.
|
| 442,046
|
| 16,897
|
| Triton International Ltd.
|
| 1,068,228
|
| 4,098
|
| United Rentals, Inc.
|
| 1,621,825
|
|
|
|
|
| 3,132,099
|
|
|
| Total Investments – 99.9%
|
| 47,617,997
|
|
|
| (Cost $50,036,810)
|
|
|
|
|
| Net Other Assets and Liabilities – 0.1%
|
| 47,311
|
|
|
| Net Assets – 100.0%
|
| $47,665,308
|
| (a)
| Non-income producing security.
|
Valuation Inputs
A summary of the inputs
used to value the Fund’s investments as of March 31, 2023 is as follows (see Note 2A - Portfolio Valuation in the Notes to Financial Statements):
|
| Total
Value at
3/31/2023
| Level 1
Quoted
Prices
| Level 2
Significant
Observable
Inputs
| Level 3
Significant
Unobservable
Inputs
|
| Common Stocks*
| $ 47,617,997
| $ 47,617,997
| $ —
| $ —
|
| *
| See Portfolio of Investments for industry breakout.
|
Page 30
See Notes to Financial
Statements
First Trust S-Network Streaming &
Gaming ETF (BNGE)
Portfolio of Investments
March 31, 2023
| Shares
|
| Description
|
| Value
|
| COMMON STOCKS (a) – 99.5%
|
|
|
| Australia – 2.6%
|
|
|
| 3,706
|
| Aristocrat Leisure Ltd. (b)
|
| $92,659
|
| 25,027
|
| Tabcorp Holdings Ltd. (b)
|
| 16,687
|
|
|
|
|
| 109,346
|
|
|
| Cayman Islands – 19.0%
|
|
|
| 2,004
|
| Bilibili, Inc., ADR (c) (d)
|
| 47,094
|
| 1,889
|
| Hello Group, Inc., ADR
|
| 17,190
|
| 5,077
|
| iQIYI, Inc., ADR (d)
|
| 36,961
|
| 4,774
|
| JOYY, Inc., ADR
|
| 148,853
|
| 13,775
|
| Kuaishou Technology (b) (d) (e) (f)
|
| 105,921
|
| 2,014
|
| NetEase, Inc., ADR
|
| 178,118
|
| 3,671
|
| Tencent Holdings Ltd. (b)
|
| 179,399
|
| 10,636
|
| Tencent Music Entertainment Group, ADR (d)
|
| 88,066
|
|
|
|
|
| 801,602
|
|
|
| Greece – 0.5%
|
|
|
| 1,338
|
| OPAP S.A. (b)
|
| 21,460
|
|
|
| Ireland – 4.6%
|
|
|
| 1,084
|
| Flutter Entertainment PLC (b) (d)
|
| 195,599
|
|
|
| Isle Of Man (U.K.) – 1.3%
|
|
|
| 3,673
|
| Entain PLC (b)
|
| 57,042
|
|
|
| Japan – 9.8%
|
|
|
| 2,861
|
| Nexon Co., Ltd. (b)
|
| 68,317
|
| 4,090
|
| Nintendo Co., Ltd. (b)
|
| 158,862
|
| 2,023
|
| Sony Group Corp. (b)
|
| 184,262
|
|
|
|
|
| 411,441
|
|
|
| Luxembourg – 2.7%
|
|
|
| 837
|
| Spotify Technology S.A. (d)
|
| 111,840
|
|
|
| Malta – 0.5%
|
|
|
| 1,717
|
| Kindred Group PLC, SDR (b)
|
| 19,227
|
|
|
| South Korea – 0.5%
|
|
|
| 302
|
| AfreecaTV Co., Ltd. (b)
|
| 19,849
|
|
|
| Sweden – 4.1%
|
|
|
| 1,132
|
| Evolution AB (b) (e) (f)
|
| 151,664
|
| 896
|
| Viaplay Group AB (b) (d)
|
| 22,905
|
|
|
|
|
| 174,569
|
|
|
| United States – 53.9%
|
|
|
| 2,233
|
| Activision Blizzard, Inc.
|
| 191,122
|
| 2,426
|
| Advanced Micro Devices, Inc. (d)
|
| 237,772
|
| 893
|
| Bally’s Corp. (d)
|
| 17,431
|
| 2,431
|
| Draftkings, Inc., Class A (d)
|
| 47,064
|
| 1,359
|
| Electronic Arts, Inc.
|
| 163,692
|
| 9,131
|
| fuboTV, Inc. (d)
|
| 11,049
|
| 1,633
|
| GameStop Corp., Class A (c) (d)
|
| 37,592
|
| 2,562
|
| iHeartMedia, Inc., Class A (d)
|
| 9,992
|
| Shares
|
| Description
|
| Value
|
|
|
|
|
| United States (Continued)
|
|
|
| 5,670
|
| Intel Corp.
|
| $185,239
|
| 587
|
| Light & Wonder, Inc. (d)
|
| 35,249
|
| 2,011
|
| MGM Resorts International
|
| 89,329
|
| 520
|
| Netflix, Inc. (d)
|
| 179,650
|
| 1,040
|
| NVIDIA Corp.
|
| 288,881
|
| 975
|
| Penn Entertainment, Inc. (d)
|
| 28,918
|
| 2,661
|
| ROBLOX Corp., Class A (d)
|
| 119,692
|
| 770
|
| Roku, Inc. (d)
|
| 50,681
|
| 4,512
|
| Rush Street Interactive, Inc. (d)
|
| 14,032
|
| 981
|
| Take-Two Interactive Software, Inc. (d)
|
| 117,033
|
| 1,613
|
| Unity Software, Inc. (d)
|
| 52,326
|
| 1,721
|
| Walt Disney (The) Co. (d)
|
| 172,324
|
| 13,061
|
| Warner Bros Discovery, Inc. (d)
|
| 197,221
|
| 1,926
|
| Xperi, Inc.
|
| 21,051
|
|
|
|
|
| 2,267,340
|
|
|
| Total Common Stocks
|
| 4,189,315
|
|
|
| (Cost $4,213,648)
|
|
|
| WARRANTS (a) – 0.0%
|
|
|
| Australia – 0.0%
|
|
|
| 339
|
| PointsBet Holdings Ltd., expiring 7/28/24 (b) (d) (g)
|
| 0
|
|
|
| (Cost $0)
|
|
|
| MONEY MARKET FUNDS – 1.7%
|
| 71,857
|
| Goldman Sachs Financial Square Treasury Obligations Fund - Institutional Class - 4.69% (h) (i)
|
| 71,857
|
|
|
| (Cost $71,857)
|
|
|
Principal
Value
|
| Description
|
| Value
|
| REPURCHASE AGREEMENTS – 0.3%
|
| $11,568
|
| BNP Paribas, 4.74% (h), dated 03/31/23, due 04/03/23 with a maturity value of $11,572. Collateralized by U.S. Treasury
Securities, interest rates of 1.50% to 2.125%, due 05/15/2025 to 11/30/2028. The value of the collateral including accrued interest is 11,835. (i)
|
| 11,568
|
|
|
| (Cost $11,568)
|
|
|
|
|
| Total Investments – 101.5%
|
| 4,272,740
|
|
|
| (Cost $4,297,073)
|
|
|
|
|
| Net Other Assets and Liabilities – (1.5)%
|
| (63,174)
|
|
|
| Net Assets – 100.0%
|
| $4,209,566
|
See Notes to
Financial Statements
Page 31
First Trust S-Network Streaming &
Gaming ETF (BNGE)
Portfolio of Investments
(Continued)
March 31, 2023
| (a)
| Portfolio securities are categorized based upon their country of incorporation, which can be different from the country categorization of the Fund’s underlying index. For a
breakdown of the portfolio securities by sector, please see the Fund Performance Overview.
|
| (b)
| This security is fair valued by the Advisor’s Pricing Committee in accordance with procedures approved by the Trust’s Board of Trustees and in accordance with provisions
of the Investment Company Act of 1940 and rules thereunder, as amended. At March 31, 2023, securities noted as such are valued at $1,293,853 or 30.7% of net assets. Certain of these securities are fair valued using a
factor provided by a third-party pricing service due to the change in value between the foreign markets’ close and the New York Stock Exchange close exceeding a certain threshold. On days when this threshold is
not exceeded, these securities are typically valued at the last sale price on the exchange on which they are principally traded.
|
| (c)
| All or a portion of this security is on loan (See Note 2E - Securities Lending in the Notes to Financial Statements). The remaining contractual maturity of all of the securities
lending transactions is overnight and continuous. The aggregate value of such securities is $79,180 and the total value of the collateral held by the Fund is $83,425.
|
| (d)
| Non-income producing security.
|
| (e)
| This security may be resold to qualified foreign investors and foreign institutional buyers under Regulation S of the Securities Act of 1933, as amended (the “1933 Act”).
|
| (f)
| This security is exempt from registration upon resale under Rule 144A of the 1933 Act and may be resold in transactions exempt from registration, normally to qualified institutional
buyers. This security is not restricted on the foreign exchange where it trades freely without any additional registration. As such, it does not require the additional disclosure required of restricted securities.
|
| (g)
| Pursuant to procedures adopted by the Trust’s Board of Trustees, this security has been determined to be illiquid by the Advisor.
|
| (h)
| Rate shown reflects yield as of March 31, 2023.
|
| (i)
| This security serves as collateral for securities on loan.
|
| ADR
| American Depositary Receipt
|
| SDR
| Swedish Depositary Receipt
|
Offsetting Assets and Liabilities
Offsetting assets and
liabilities requires entities to disclose both gross and net information about instruments and transactions eligible for offset, and to disclose instruments and transactions subject to master netting or similar
agreements (see Note 2D – Offsetting on the Statements of Assets and Liabilities in the Notes to Financial Statements).
The Fund’s loaned
securities were all subject to an enforceable Securities Lending Agency Agreement. Securities lent in accordance with the Securities Lending Agency Agreement on a gross basis were as follows:
| Securities Lending Agency Agreement
|
|
| Total gross amount presented on the Statements of Assets and Liabilities (1)
| $79,180
|
| Non-cash Collateral (2)
| (79,180)
|
| Net Amount
| $—
|
| (1)
| The amount presented on the Statements of Assets and Liabilities, which is included in “Investments, at value,” is not offset and is shown on a gross basis.
|
| (2)
| At March 31, 2023, the value of the collateral received from each borrower exceeded the value of the related securites loaned. This amount is disclosed on the
Portfolio of Investments.
|
The Fund’s
investments in repurchase agreements were all subject to an enforceable Master Repurchase Agreement. Repurchase Agreements on a gross basis were as follows:
| Repurchase Agreements
|
|
| Total gross amount presented on the Statements of Assets and Liabilities (3)
| $11,568
|
| Non-cash Collateral (4)
| (11,568)
|
| Net Amount
| $—
|
| (3)
| The amount is included in “Investments, at value” on the Statements of Assets and Liabilities.
|
| (4)
| At March 31, 2023, the value of the collateral received from each seller exceeded the value of the repurchase agreements.
|
Currency Exposure
Diversification
| % of Total
Investments
|
| United States Dollar
| 69.7%
|
| Japanese Yen
| 9.6
|
| Hong Kong Dollar
| 6.7
|
| British Pound Sterling
| 5.9
|
| Swedish Krona
| 4.5
|
| Australian Dollar
| 2.6
|
| Euro
| 0.5
|
| South Korean Won
| 0.5
|
| Total
| 100.0%
|
Page 32
See Notes to Financial
Statements
First Trust S-Network Streaming &
Gaming ETF (BNGE)
Portfolio of Investments
(Continued)
March 31, 2023
Valuation Inputs
A summary of the inputs
used to value the Fund’s investments as of March 31, 2023 is as follows (see Note 2A - Portfolio Valuation in the Notes to Financial Statements):
|
| Total
Value at
3/31/2023
| Level 1
Quoted
Prices
| Level 2
Significant
Observable
Inputs
| Level 3
Significant
Unobservable
Inputs
|
| Common Stocks:
|
|
|
|
|
| Cayman Islands
| $ 801,602
| $ 516,282
| $ 285,320
| $ —
|
| Luxembourg
| 111,840
| 111,840
| —
| —
|
| United States
| 2,267,340
| 2,267,340
| —
| —
|
| Other Country Categories*
| 1,008,533
| —
| 1,008,533
| —
|
| Warrants*
| —**
| —
| —**
| —
|
| Money Market Funds
| 71,857
| 71,857
| —
| —
|
| Repurchase Agreements
| 11,568
| —
| 11,568
| —
|
| Total Investments
| $ 4,272,740
| $ 2,967,319
| $ 1,305,421
| $—
|
| *
| See Portfolio of Investments for country breakout.
|
| **
| Investment is valued at $0.
|
See Notes to Financial Statements
Page 33
First Trust Exchange-Traded Fund VI
Statements of Assets and
Liabilities
March 31, 2023
|
| First Trust
Nasdaq
Bank
ETF
(FTXO)
|
| First Trust
Nasdaq
Food &
Beverage
ETF
(FTXG)
|
| First Trust
Nasdaq
Oil & Gas
ETF
(FTXN)
|
| ASSETS:
|
|
|
|
|
|
Investments, at value
| $ 164,165,066
|
| $ 983,471,940
|
| $ 314,051,561
|
Cash
| 76,277
|
| 341,165
|
| 434,206
|
Foreign currency
| —
|
| —
|
| —
|
Due from authorized participant
| —
|
| —
|
| 242,635,773
|
| Receivables:
|
|
|
|
|
|
Fund shares sold
| —
|
| 4,030,886
|
| 1,350,154
|
Dividends
| 574,981
|
| 1,045,983
|
| 445,275
|
Dividend reclaims
| —
|
| —
|
| —
|
Securities lending income
| —
|
| —
|
| —
|
Investment securities sold
| 5,252,136
|
| 1,336,802
|
| 4,011,137
|
Miscellaneous
| —
|
| —
|
| 229,350
|
Total Assets
| 170,068,460
|
| 990,226,776
|
| 563,157,456
|
| LIABILITIES:
|
|
|
|
|
|
| Payables:
|
|
|
|
|
|
Investment securities purchased
| —
|
| 4,027,935
|
| 1,347,180
|
Investment advisory fees
| 94,536
|
| 521,643
|
| 563,893
|
Collateral for securities on loan
| —
|
| —
|
| —
|
Fund shares redeemed
| 5,265,900
|
| 1,337,764
|
| 246,650,145
|
Total Liabilities
| 5,360,436
|
| 5,887,342
|
| 248,561,218
|
NET ASSETS
| $164,708,024
|
| $984,339,434
|
| $314,596,238
|
| NET ASSETS consist of:
|
|
|
|
|
|
Paid-in capital
| $ 344,117,195
|
| $ 1,034,664,153
|
| $ 410,543,839
|
Par value
| 77,500
|
| 365,500
|
| 116,500
|
Accumulated distributable earnings (loss)
| (179,486,671)
|
| (50,690,219)
|
| (96,064,101)
|
NET ASSETS
| $164,708,024
|
| $984,339,434
|
| $314,596,238
|
NET ASSET VALUE, per share
| $21.25
|
| $26.93
|
| $27.00
|
Number of shares outstanding (unlimited number of shares authorized, par value $0.01 per share)
| 7,750,002
|
| 36,550,002
|
| 11,650,002
|
Investments, at cost
| $194,286,325
|
| $968,528,695
|
| $309,207,818
|
Foreign currency, at cost (proceeds)
| $—
|
| $—
|
| $—
|
Securities on loan, at value
| $—
|
| $—
|
| $—
|
Page 34
See Notes to Financial Statements
First Trust
Nasdaq
Pharmaceuticals
ETF
(FTXH)
|
| First Trust
S-Network
E-Commerce
ETF
(ISHP)
|
| First Trust
Nasdaq
Semiconductor
ETF
(FTXL)
|
| First Trust
Nasdaq
Transportation
ETF
(FTXR)
|
| First Trust
S-Network
Streaming
& Gaming ETF
(BNGE)
|
|
|
|
|
|
|
|
|
|
|
| $ 32,598,354
|
| $ 5,284,065
|
| $ 985,796,415
|
| $ 47,617,997
|
| $ 4,272,740
|
| 30,351
|
| 5,451
|
| 2,023,674
|
| 28,299
|
| 10,757
|
| —
|
| 19,111
|
| —
|
| —
|
| —
|
| —
|
| —
|
| —
|
| —
|
| —
|
|
|
|
|
|
|
|
|
|
|
| —
|
| —
|
| —
|
| —
|
| —
|
| 28,901
|
| 9,411
|
| 53,791
|
| 26,858
|
| 5,371
|
| 286
|
| 8,788
|
| —
|
| 79
|
| 354
|
| —
|
| —
|
| —
|
| 18,852
|
| 149
|
| —
|
| —
|
| 3,232,090
|
| —
|
| 8,344
|
| —
|
| —
|
| 342,265
|
| —
|
| —
|
| 32,657,892
|
| 5,326,826
|
| 991,448,235
|
| 47,692,085
|
| 4,297,715
|
|
|
|
|
|
|
|
|
|
|
|
|
|
|
|
|
|
|
|
|
| —
|
| —
|
| —
|
| —
|
| 2,377
|
| 18,189
|
| 2,598
|
| 112,533
|
| 26,777
|
| 2,347
|
| —
|
| —
|
| —
|
| —
|
| 83,425
|
| —
|
| —
|
| 3,239,652
|
| —
|
| —
|
| 18,189
|
| 2,598
|
| 3,352,185
|
| 26,777
|
| 88,149
|
| $ 32,639,703
|
| $ 5,324,228
|
| $ 988,096,050
|
| $ 47,665,308
|
| $ 4,209,566
|
|
|
|
|
|
|
|
|
|
|
| $ 37,818,562
|
| $ 11,336,914
|
| $ 968,156,049
|
| $ 111,954,016
|
| $ 4,614,814
|
| 12,500
|
| 2,000
|
| 152,500
|
| 17,500
|
| 2,000
|
| (5,191,359)
|
| (6,014,686)
|
| 19,787,501
|
| (64,306,208)
|
| (407,248)
|
| $ 32,639,703
|
| $ 5,324,228
|
| $ 988,096,050
|
| $ 47,665,308
|
| $ 4,209,566
|
| $26.11
|
| $26.62
|
| $64.79
|
| $27.24
|
| $21.05
|
| 1,250,002
|
| 200,002
|
| 15,250,002
|
| 1,750,002
|
| 200,002
|
| $32,505,824
|
| $6,245,860
|
| $945,362,146
|
| $50,036,810
|
| $4,297,073
|
| $—
|
| $19,146
|
| $—
|
| $—
|
| $—
|
| $—
|
| $—
|
| $—
|
| $—
|
| $79,180
|
See Notes to Financial Statements
Page 35
First Trust Exchange-Traded Fund VI
Statements of Operations
For the Year Ended March
31, 2023
|
| First Trust
Nasdaq
Bank
ETF
(FTXO)
|
| First Trust
Nasdaq
Food &
Beverage
ETF
(FTXG)
|
| First Trust
Nasdaq
Oil & Gas
ETF
(FTXN)
|
| INVESTMENT INCOME:
|
|
|
|
|
|
Dividends
| $ 7,917,357
|
| $ 19,320,693
|
| $ 36,677,003
|
Interest
| 8,412
|
| 26,560
|
| 40,458
|
Securities lending income (net of fees)
| —
|
| —
|
| —
|
Foreign withholding tax
| (52,336)
|
| —
|
| —
|
Other
| —
|
| —
|
| —
|
Total investment income
| 7,873,433
|
| 19,347,253
|
| 36,717,461
|
| EXPENSES:
|
|
|
|
|
|
Investment advisory fees
| 1,405,400
|
| 5,021,610
|
| 7,013,809
|
Total expenses
| 1,405,400
|
| 5,021,610
|
| 7,013,809
|
NET INVESTMENT INCOME (LOSS)
| 6,468,033
|
| 14,325,643
|
| 29,703,652
|
| NET REALIZED AND UNREALIZED GAIN (LOSS):
|
|
|
|
|
|
| Net realized gain (loss) on:
|
|
|
|
|
|
Investments
| (69,162,767)
|
| (70,568,399)
|
| (128,492,612)
|
In-kind redemptions
| 267,718
|
| 14,210,368
|
| 213,604,191
|
Foreign currency transactions
| —
|
| —
|
| —
|
Net realized gain (loss)
| (68,895,049)
|
| (56,358,031)
|
| 85,111,579
|
| Net change in unrealized appreciation (depreciation) on:
|
|
|
|
|
|
Investments
| (24,928,953)
|
| 14,148,675
|
| (160,545,326)
|
Foreign currency translation
| —
|
| —
|
| —
|
Net change in unrealized appreciation (depreciation)
| (24,928,953)
|
| 14,148,675
|
| (160,545,326)
|
NET REALIZED AND UNREALIZED GAIN (LOSS)
| (93,824,002)
|
| (42,209,356)
|
| (75,433,747)
|
NET INCREASE (DECREASE) IN NET ASSETS RESULTING FROM OPERATIONS
| $(87,355,969)
|
| $(27,883,713)
|
| $(45,730,095)
|
Page 36
See Notes to Financial Statements
|
| First Trust
Nasdaq
Pharmaceuticals
ETF
(FTXH)
|
| First Trust
S-Network
E-Commerce
ETF
(ISHP)
|
| First Trust
Nasdaq
Semiconductor
ETF
(FTXL)
|
| First Trust
Nasdaq
Transportation
ETF
(FTXR)
|
| First Trust
S-Network
Streaming
& Gaming ETF
(BNGE)
|
|
|
|
|
|
|
|
|
|
|
|
|
| $708,752
|
| $65,572
|
| $1,314,577
|
| $1,585,755
|
| $29,871
|
|
| 1,159
|
| 720
|
| 3,725
|
| 2,364
|
| —
|
|
| —
|
| —
|
| —
|
| 319,005
|
| 1,106
|
|
| —
|
| (7,262)
|
| (10,478)
|
| —
|
| (957)
|
|
| —
|
| 154
|
| —
|
| —
|
| 6
|
|
| 709,911
|
| 59,184
|
| 1,307,824
|
| 1,907,124
|
| 30,026
|
|
|
|
|
|
|
|
|
|
|
|
|
| 212,943
|
| 43,089
|
| 566,621
|
| 567,449
|
| 24,152
|
|
| 212,943
|
| 43,089
|
| 566,621
|
| 567,449
|
| 24,152
|
|
| 496,968
|
| 16,095
|
| 741,203
|
| 1,339,675
|
| 5,874
|
|
|
|
|
|
|
|
|
|
|
|
|
|
|
|
|
|
|
|
|
|
|
|
| (3,427,408)
|
| (1,821,734)
|
| (15,068,450)
|
| (25,263,128)
|
| (379,392)
|
|
| 4,266,164
|
| (2,213,337)
|
| 7,202,562
|
| (24,343,883)
|
| —
|
|
| —
|
| (222)
|
| —
|
| —
|
| 274
|
|
| 838,756
|
| (4,035,293)
|
| (7,865,888)
|
| (49,607,011)
|
| (379,118)
|
|
|
|
|
|
|
|
|
|
|
|
|
| (1,491,531)
|
| 886,232
|
| 39,410,046
|
| 10,350,564
|
| 146,392
|
|
| —
|
| (177)
|
| —
|
| —
|
| (14)
|
|
| (1,491,531)
|
| 886,055
|
| 39,410,046
|
| 10,350,564
|
| 146,378
|
|
| (652,775)
|
| (3,149,238)
|
| 31,544,158
|
| (39,256,447)
|
| (232,740)
|
|
| $(155,807)
|
| $(3,133,143)
|
| $32,285,361
|
| $(37,916,772)
|
| $(226,866)
|
See Notes to Financial Statements
Page 37
First Trust Exchange-Traded Fund VI
Statements of Changes in
Net Assets
|
| First Trust Nasdaq
Bank ETF (FTXO)
|
| First Trust Nasdaq
Food & Beverage ETF (FTXG)
|
|
| Year
Ended
3/31/2023
|
| Year
Ended
3/31/2022
|
| Year
Ended
3/31/2023
|
| Year
Ended
3/31/2022
|
| OPERATIONS:
|
|
|
|
|
|
|
|
Net investment income (loss)
| $ 6,468,033
|
| $ 5,262,818
|
| $ 14,325,643
|
| $ 109,767
|
Net realized gain (loss)
| (68,895,049)
|
| (1,019,467)
|
| (56,358,031)
|
| (349,011)
|
Net change in unrealized appreciation (depreciation)
| (24,928,953)
|
| (11,467,228)
|
| 14,148,675
|
| 692,861
|
Net increase (decrease) in net assets resulting from operations
| (87,355,969)
|
| (7,223,877)
|
| (27,883,713)
|
| 453,617
|
| DISTRIBUTIONS TO SHAREHOLDERS FROM:
|
|
|
|
|
|
|
|
Investment operations
| (6,261,407)
|
| (5,155,141)
|
| (13,322,256)
|
| (116,496)
|
Return of capital
| —
|
| —
|
| —
|
| —
|
Total distributions to shareholders
| (6,261,407)
|
| (5,155,141)
|
| (13,322,256)
|
| (116,496)
|
| SHAREHOLDER TRANSACTIONS:
|
|
|
|
|
|
|
|
Proceeds from shares sold
| 38,456,834
|
| 231,246,175
|
| 1,447,529,232
|
| 9,224,482
|
Cost of shares redeemed
| (142,068,023)
|
| (84,224,058)
|
| (432,794,312)
|
| (3,884,145)
|
Net increase (decrease) in net assets resulting from shareholder transactions
| (103,611,189)
|
| 147,022,117
|
| 1,014,734,920
|
| 5,340,337
|
Total increase (decrease) in net assets
| (197,228,565)
|
| 134,643,099
|
| 973,528,951
|
| 5,677,458
|
| NET ASSETS:
|
|
|
|
|
|
|
|
Beginning of period
| 361,936,589
|
| 227,293,490
|
| 10,810,483
|
| 5,133,025
|
End of period
| $164,708,024
|
| $361,936,589
|
| $984,339,434
|
| $10,810,483
|
| CHANGES IN SHARES OUTSTANDING:
|
|
|
|
|
|
|
|
Shares outstanding, beginning of period
| 11,400,002
|
| 7,300,002
|
| 400,002
|
| 200,002
|
Shares sold
| 1,400,000
|
| 6,750,000
|
| 52,250,000
|
| 350,000
|
Shares redeemed
| (5,050,000)
|
| (2,650,000)
|
| (16,100,000)
|
| (150,000)
|
Shares outstanding, end of period
| 7,750,002
|
| 11,400,002
|
| 36,550,002
|
| 400,002
|
Page 38
See Notes to Financial Statements
First Trust Nasdaq
Oil & Gas ETF (FTXN)
|
| First Trust Nasdaq
Pharmaceuticals ETF (FTXH)
|
| First Trust S-Network
E-Commerce ETF (ISHP)
|
Year
Ended
3/31/2023
|
| Year
Ended
3/31/2022
|
| Year
Ended
3/31/2023
|
| Year
Ended
3/31/2022
|
| Year
Ended
3/31/2023
|
| Year
Ended
3/31/2022
|
|
|
|
|
|
|
|
|
|
|
|
|
| $ 29,703,652
|
| $ 6,902,387
|
| $ 496,968
|
| $ 185,875
|
| $ 16,095
|
| $ 174,149
|
| 85,111,579
|
| 170,957,349
|
| 838,756
|
| 387,327
|
| (4,035,293)
|
| 359,766
|
| (160,545,326)
|
| 162,037,630
|
| (1,491,531)
|
| 444,270
|
| 886,055
|
| (2,624,610)
|
| (45,730,095)
|
| 339,897,366
|
| (155,807)
|
| 1,017,472
|
| (3,133,143)
|
| (2,090,695)
|
|
|
|
|
|
|
|
|
|
|
|
|
| (27,976,256)
|
| (6,320,716)
|
| (500,150)
|
| (176,100)
|
| (39,201)
|
| (143,821)
|
| —
|
| —
|
| —
|
| —
|
| —
|
| —
|
| (27,976,256)
|
| (6,320,716)
|
| (500,150)
|
| (176,100)
|
| (39,201)
|
| (143,821)
|
|
|
|
|
|
|
|
|
|
|
|
|
| 1,343,270,023
|
| 1,655,064,859
|
| 50,373,967
|
| 2,582,284
|
| —
|
| 36,521,440
|
| (2,102,598,406)
|
| (877,458,299)
|
| (34,389,637)
|
| (5,245,253)
|
| (10,089,830)
|
| (25,144,637)
|
| (759,328,383)
|
| 777,606,560
|
| 15,984,330
|
| (2,662,969)
|
| (10,089,830)
|
| 11,376,803
|
| (833,034,734)
|
| 1,111,183,210
|
| 15,328,373
|
| (1,821,597)
|
| (13,262,174)
|
| 9,142,287
|
|
|
|
|
|
|
|
|
|
|
|
|
| 1,147,630,972
|
| 36,447,762
|
| 17,311,330
|
| 19,132,927
|
| 18,586,402
|
| 9,444,115
|
| $314,596,238
|
| $1,147,630,972
|
| $32,639,703
|
| $17,311,330
|
| $5,324,228
|
| $18,586,402
|
|
|
|
|
|
|
|
|
|
|
|
|
| 43,350,002
|
| 2,350,002
|
| 650,002
|
| 750,002
|
| 600,002
|
| 300,002
|
| 50,450,000
|
| 76,750,000
|
| 1,900,000
|
| 100,000
|
| —
|
| 1,050,000
|
| (82,150,000)
|
| (35,750,000)
|
| (1,300,000)
|
| (200,000)
|
| (400,000)
|
| (750,000)
|
| 11,650,002
|
| 43,350,002
|
| 1,250,002
|
| 650,002
|
| 200,002
|
| 600,002
|
See Notes to Financial
Statements
Page 39
First Trust Exchange-Traded Fund VI
Statements of Changes in
Net Assets (Continued)
|
| First Trust Nasdaq
Semiconductor ETF (FTXL)
|
| First Trust Nasdaq
Transportation ETF (FTXR)
|
|
| Year
Ended
3/31/2023
|
| Year
Ended
3/31/2022
|
| Year
Ended
3/31/2023
|
| Year
Ended
3/31/2022
|
| OPERATIONS:
|
|
|
|
|
|
|
|
Net investment income (loss)
| $ 741,203
|
| $ 361,146
|
| $ 1,339,675
|
| $ 10,254,406
|
Net realized gain (loss)
| (7,865,888)
|
| 14,839,706
|
| (49,607,011)
|
| 18,134,255
|
Net change in unrealized appreciation (depreciation)
| 39,410,046
|
| (11,810,521)
|
| 10,350,564
|
| (109,717,327)
|
Net increase (decrease) in net assets resulting from operations
| 32,285,361
|
| 3,390,331
|
| (37,916,772)
|
| (81,328,666)
|
| DISTRIBUTIONS TO SHAREHOLDERS FROM:
|
|
|
|
|
|
|
|
Investment operations
| (931,111)
|
| (338,211)
|
| (1,511,736)
|
| (10,039,966)
|
Return of capital
| —
|
| —
|
| —
|
| —
|
Total distributions to shareholders
| (931,111)
|
| (338,211)
|
| (1,511,736)
|
| (10,039,966)
|
| SHAREHOLDER TRANSACTIONS:
|
|
|
|
|
|
|
|
Proceeds from shares sold
| 903,564,157
|
| 93,443,236
|
| 2,951,382
|
| 720,128,082
|
Cost of shares redeemed
| (55,273,060)
|
| (72,200,805)
|
| (196,699,292)
|
| (1,419,772,038)
|
Net increase (decrease) in net assets resulting from shareholder transactions
| 848,291,097
|
| 21,242,431
|
| (193,747,910)
|
| (699,643,956)
|
Total increase (decrease) in net assets
| 879,645,347
|
| 24,294,551
|
| (233,176,418)
|
| (791,012,588)
|
| NET ASSETS:
|
|
|
|
|
|
|
|
Beginning of period
| 108,450,703
|
| 84,156,152
|
| 280,841,726
|
| 1,071,854,314
|
End of period
| $988,096,050
|
| $108,450,703
|
| $47,665,308
|
| $280,841,726
|
| CHANGES IN SHARES OUTSTANDING:
|
|
|
|
|
|
|
|
Shares outstanding, beginning of period
| 1,550,002
|
| 1,300,002
|
| 8,700,002
|
| 32,600,002
|
Shares sold
| 14,600,000
|
| 1,300,000
|
| 100,000
|
| 22,150,000
|
Shares redeemed
| (900,000)
|
| (1,050,000)
|
| (7,050,000)
|
| (46,050,000)
|
Shares outstanding, end of period
| 15,250,002
|
| 1,550,002
|
| 1,750,002
|
| 8,700,002
|
| (a)
| Inception date is January 25, 2022, which is consistent with the commencement of investment operations and is the date the initial creation units were established.
|
Page 40
See Notes to Financial Statements
First Trust
S-Network Streaming
& Gaming ETF (BNGE)
|
Year
Ended
3/31/2023
|
| Period
Ended
3/31/2022 (a)
|
|
|
|
|
| $ 5,874
|
| $ 2,572
|
| (379,118)
|
| 91
|
| 146,378
|
| (170,718)
|
| (226,866)
|
| (168,055)
|
|
|
|
|
| (11,922)
|
| (405)
|
| (3,048)
|
| —
|
| (14,970)
|
| (405)
|
|
|
|
|
| 959,545
|
| 3,660,317
|
| —
|
| —
|
| 959,545
|
| 3,660,317
|
| 717,709
|
| 3,491,857
|
|
|
|
|
| 3,491,857
|
| —
|
| $ 4,209,566
|
| $ 3,491,857
|
|
|
|
|
| 150,002
|
| —
|
| 50,000
|
| 150,002
|
| —
|
| —
|
| 200,002
|
| 150,002
|
See Notes to Financial Statements
Page 41
First Trust Exchange-Traded Fund VI
Financial Highlights
For a share outstanding
throughout each period
First Trust Nasdaq Bank ETF
(FTXO)
|
| Year Ended March 31,
|
| 2023
|
| 2022
|
| 2021
|
| 2020
|
| 2019
|
Net asset value, beginning of period
| $ 31.75
|
| $ 31.14
|
| $ 15.64
|
| $ 24.41
|
| $ 29.50
|
| Income from investment operations:
|
|
|
|
|
|
|
|
|
|
Net investment income (loss)
| 0.83
|
| 0.61
|
| 0.59 (a)
|
| 0.73
|
| 0.84
|
Net realized and unrealized gain (loss)
| (10.54)
|
| 0.61 (b)
|
| 15.50
|
| (8.77)
|
| (5.14)
|
Total from investment operations
| (9.71)
|
| 1.22
|
| 16.09
|
| (8.04)
|
| (4.30)
|
| Distributions paid to shareholders from:
|
|
|
|
|
|
|
|
|
|
Net investment income
| (0.79)
|
| (0.61)
|
| (0.59)
|
| (0.73)
|
| (0.79)
|
Net asset value, end of period
| $21.25
|
| $31.75
|
| $31.14
|
| $15.64
|
| $24.41
|
Total return (c)
| (30.94)%
|
| 3.89%
|
| 105.13%
|
| (33.93)%
|
| (14.49)%
|
| Ratios to average net assets/supplemental data:
|
|
|
|
|
|
|
|
|
|
Net assets, end of period (in 000’s)
| $ 164,708
|
| $ 361,937
|
| $ 227,293
|
| $ 58,658
|
| $ 168,447
|
Ratio of total expenses to average net assets
| 0.60%
|
| 0.60%
|
| 0.60%
|
| 0.60%
|
| 0.60%
|
Ratio of net investment income (loss) to average net assets
| 2.76%
|
| 1.91%
|
| 2.65%
|
| 2.69%
|
| 1.83%
|
Portfolio turnover rate (d)
| 69%
|
| 78%
|
| 176%
|
| 59%
|
| 87%
|
| (a)
| Based on average shares outstanding.
|
| (b)
| The per share amount does not correlate with the aggregate realized and unrealized gain (loss) due to the timing of the Fund share sales and repurchases in relation to market value
fluctuation of the underlying investments.
|
| (c)
| Total return is calculated assuming an initial investment made at the net asset value at the beginning of the period, reinvestment of all distributions at net asset value during the
period, and redemption at net asset value on the last day of the period. The returns presented do not reflect the deduction of taxes that a shareholder would pay on Fund distributions or the redemption or sale of Fund
shares. Total return is calculated for the time period presented and is not annualized for periods of less than a year.
|
| (d)
| Portfolio turnover is calculated for the time period presented and is not annualized for periods of less than a year and does not include securities received or
delivered from processing creations or redemptions and in-kind transactions.
|
Page 42
See Notes to Financial Statements
First Trust Exchange-Traded Fund VI
Financial Highlights
(Continued)
For a share outstanding
throughout each period
First Trust Nasdaq Food & Beverage ETF
(FTXG)
|
| Year Ended March 31,
|
| 2023
|
| 2022
|
| 2021
|
| 2020
|
| 2019
|
Net asset value, beginning of period
| $ 27.03
|
| $ 25.66
|
| $ 17.28
|
| $ 20.06
|
| $ 19.71
|
| Income from investment operations:
|
|
|
|
|
|
|
|
|
|
Net investment income (loss)
| 0.41
|
| 0.41
|
| 0.32
|
| 0.27
|
| 0.27
|
Net realized and unrealized gain (loss)
| (0.13)
|
| 1.39
|
| 8.38
|
| (2.77)
|
| 0.33
|
Total from investment operations
| 0.28
|
| 1.80
|
| 8.70
|
| (2.50)
|
| 0.60
|
| Distributions paid to shareholders from:
|
|
|
|
|
|
|
|
|
|
Net investment income
| (0.38)
|
| (0.43)
|
| (0.32)
|
| (0.28)
|
| (0.25)
|
Net asset value, end of period
| $26.93
|
| $27.03
|
| $25.66
|
| $17.28
|
| $20.06
|
Total return (a)
| 1.10%
|
| 7.13%
|
| 50.65%
|
| (12.69)%
|
| 3.13%
|
| Ratios to average net assets/supplemental data:
|
|
|
|
|
|
|
|
|
|
Net assets, end of period (in 000’s)
| $ 984,339
|
| $ 10,810
|
| $ 5,133
|
| $ 2,592
|
| $ 2,006
|
Ratio of total expenses to average net assets
| 0.60%
|
| 0.60%
|
| 0.60%
|
| 0.60%
|
| 0.60%
|
Ratio of net investment income (loss) to average net assets
| 1.71%
|
| 1.61%
|
| 1.44%
|
| 1.58%
|
| 1.55%
|
Portfolio turnover rate (b)
| 78%
|
| 77%
|
| 131%
|
| 59%
|
| 108%
|
| (a)
| Total return is calculated assuming an initial investment made at the net asset value at the beginning of the period, reinvestment of all distributions at net asset value during the
period, and redemption at net asset value on the last day of the period. The returns presented do not reflect the deduction of taxes that a shareholder would pay on Fund distributions or the redemption or sale of Fund
shares. Total return is calculated for the time period presented and is not annualized for periods of less than a year.
|
| (b)
| Portfolio turnover is calculated for the time period presented and is not annualized for periods of less than a year and does not include securities received or
delivered from processing creations or redemptions and in-kind transactions.
|
See Notes to Financial Statements
Page 43
First Trust Exchange-Traded Fund VI
Financial Highlights
(Continued)
For a share outstanding
throughout each period
First Trust Nasdaq Oil & Gas ETF
(FTXN)
|
| Year Ended March 31,
|
| 2023
|
| 2022
|
| 2021
|
| 2020
|
| 2019
|
Net asset value, beginning of period
| $ 26.47
|
| $ 15.51
|
| $ 8.10
|
| $ 18.91
|
| $ 19.95
|
| Income from investment operations:
|
|
|
|
|
|
|
|
|
|
Net investment income (loss)
| 0.69 (a)
|
| 0.31
|
| 0.22
|
| 0.31
|
| 0.41
|
Net realized and unrealized gain (loss)
| 0.50 (b)
|
| 10.96
|
| 7.39
|
| (10.79)
|
| (1.06)
|
Total from investment operations
| 1.19
|
| 11.27
|
| 7.61
|
| (10.48)
|
| (0.65)
|
| Distributions paid to shareholders from:
|
|
|
|
|
|
|
|
|
|
Net investment income
| (0.66)
|
| (0.31)
|
| (0.20)
|
| (0.32)
|
| (0.39)
|
Return of capital
| —
|
| —
|
| —
|
| (0.01)
|
| —
|
Total distributions
| (0.66)
|
| (0.31)
|
| (0.20)
|
| (0.33)
|
| (0.39)
|
Net asset value, end of period
| $27.00
|
| $26.47
|
| $15.51
|
| $8.10
|
| $18.91
|
Total return (c)
| 4.66%
|
| 73.19%
|
| 95.16%
|
| (56.26)%
|
| (3.27)%
|
| Ratios to average net assets/supplemental data:
|
|
|
|
|
|
|
|
|
|
Net assets, end of period (in 000’s)
| $ 314,596
|
| $ 1,147,631
|
| $ 36,448
|
| $ 6,885
|
| $ 12,294
|
Ratio of total expenses to average net assets
| 0.60%
|
| 0.60%
|
| 0.60%
|
| 0.60%
|
| 0.60%
|
Ratio of net investment income (loss) to average net assets
| 2.54%
|
| 1.87%
|
| 2.01%
|
| 2.14%
|
| 1.69%
|
Portfolio turnover rate (d)
| 100%
|
| 139%
|
| 136%
|
| 76%
|
| 126%
|
| (a)
| Based on average shares outstanding.
|
| (b)
| The per share amount does not correlate with the aggregate realized and unrealized gain (loss) due to the timing of the Fund share sales and repurchases in relation to market value
fluctuation of the underlying investments.
|
| (c)
| Total return is calculated assuming an initial investment made at the net asset value at the beginning of the period, reinvestment of all distributions at net asset value during the
period, and redemption at net asset value on the last day of the period. The returns presented do not reflect the deduction of taxes that a shareholder would pay on Fund distributions or the redemption or sale of Fund
shares. Total return is calculated for the time period presented and is not annualized for periods of less than a year.
|
| (d)
| Portfolio turnover is calculated for the time period presented and is not annualized for periods of less than a year and does not include securities received or
delivered from processing creations or redemptions and in-kind transactions.
|
Page 44
See Notes to Financial Statements
First Trust Exchange-Traded Fund VI
Financial Highlights
(Continued)
For a share outstanding
throughout each period
First Trust Nasdaq Pharmaceuticals ETF
(FTXH)
|
| Year Ended March 31,
|
| 2023
|
| 2022
|
| 2021
|
| 2020
|
| 2019
|
Net asset value, beginning of period
| $ 26.63
|
| $ 25.51
|
| $ 19.36
|
| $ 21.50
|
| $ 21.14
|
| Income from investment operations:
|
|
|
|
|
|
|
|
|
|
Net investment income (loss)
| 0.33
|
| 0.27
|
| 0.24
|
| 0.18
|
| 0.13
|
Net realized and unrealized gain (loss)
| (0.50)
|
| 1.10
|
| 6.14
|
| (2.13)
|
| 0.35
|
Total from investment operations
| (0.17)
|
| 1.37
|
| 6.38
|
| (1.95)
|
| 0.48
|
| Distributions paid to shareholders from:
|
|
|
|
|
|
|
|
|
|
Net investment income
| (0.35)
|
| (0.25)
|
| (0.23)
|
| (0.19)
|
| (0.12)
|
Net asset value, end of period
| $26.11
|
| $26.63
|
| $25.51
|
| $19.36
|
| $21.50
|
Total return (a)
| (0.61)%
|
| 5.39%
|
| 33.00%
|
| (9.13)%
|
| 2.30%
|
| Ratios to average net assets/supplemental data:
|
|
|
|
|
|
|
|
|
|
Net assets, end of period (in 000’s)
| $ 32,640
|
| $ 17,311
|
| $ 19,133
|
| $ 5,810
|
| $ 5,376
|
Ratio of total expenses to average net assets
| 0.60%
|
| 0.60%
|
| 0.60%
|
| 0.60%
|
| 0.60%
|
Ratio of net investment income (loss) to average net assets
| 1.39%
|
| 0.97%
|
| 1.07%
|
| 0.85%
|
| 0.69%
|
Portfolio turnover rate (b)
| 76%
|
| 77%
|
| 83%
|
| 42%
|
| 107%
|
| (a)
| Total return is calculated assuming an initial investment made at the net asset value at the beginning of the period, reinvestment of all distributions at net asset value during the
period, and redemption at net asset value on the last day of the period. The returns presented do not reflect the deduction of taxes that a shareholder would pay on Fund distributions or the redemption or sale of Fund
shares. Total return is calculated for the time period presented and is not annualized for periods of less than a year.
|
| (b)
| Portfolio turnover is calculated for the time period presented and is not annualized for periods of less than a year and does not include securities received or
delivered from processing creations or redemptions and in-kind transactions.
|
See Notes to Financial Statements
Page 45
First Trust Exchange-Traded Fund VI
Financial Highlights
(Continued)
For a share outstanding
throughout each period
First Trust S-Network E-Commerce ETF
(ISHP)
|
| Year Ended March 31,
|
| 2023
|
| 2022
|
| 2021
|
| 2020
|
| 2019
|
Net asset value, beginning of period
| $ 30.98
|
| $ 31.48
|
| $ 18.10
|
| $ 22.34
|
| $ 20.86
|
| Income from investment operations:
|
|
|
|
|
|
|
|
|
|
Net investment income (loss)
| 0.06 (a)
|
| 0.26
|
| 0.19
|
| 0.27
|
| 0.21
|
Net realized and unrealized gain (loss)
| (4.28)
|
| (0.54)
|
| 13.39
|
| (4.22)
|
| 1.45
|
Total from investment operations
| (4.22)
|
| (0.28)
|
| 13.58
|
| (3.95)
|
| 1.66
|
| Distributions paid to shareholders from:
|
|
|
|
|
|
|
|
|
|
Net investment income
| (0.14)
|
| (0.22)
|
| (0.20)
|
| (0.29)
|
| (0.18)
|
Net asset value, end of period
| $26.62
|
| $30.98
|
| $31.48
|
| $18.10
|
| $22.34
|
Total return (b)
| (13.57)%
|
| (0.94)%
|
| 75.23%
|
| (17.90)%
|
| 7.98%
|
| Ratios to average net assets/supplemental data:
|
|
|
|
|
|
|
|
|
|
Net assets, end of period (in 000’s)
| $ 5,324
|
| $ 18,586
|
| $ 9,444
|
| $ 3,619
|
| $ 8,934
|
Ratio of total expenses to average net assets
| 0.60%
|
| 0.60%
|
| 0.60%
|
| 0.60%
|
| 0.60%
|
Ratio of net investment income (loss) to average net assets
| 0.23%
|
| 0.91%
|
| 0.70%
|
| 1.11%
|
| 1.41%
|
Portfolio turnover rate (c)
| 95%
|
| 213%
|
| 114%
|
| 65%
|
| 127%
|
| (a)
| Based on average shares outstanding.
|
| (b)
| Total return is calculated assuming an initial investment made at the net asset value at the beginning of the period, reinvestment of all distributions at net asset value during the
period, and redemption at net asset value on the last day of the period. The returns presented do not reflect the deduction of taxes that a shareholder would pay on Fund distributions or the redemption or sale of Fund
shares. Total return is calculated for the time period presented and is not annualized for periods of less than a year.
|
| (c)
| Portfolio turnover is calculated for the time period presented and is not annualized for periods of less than a year and does not include securities received or
delivered from processing creations or redemptions and in-kind transactions.
|
Page 46
See Notes to Financial Statements
First Trust Exchange-Traded Fund VI
Financial Highlights
(Continued)
For a share outstanding
throughout each period
First Trust Nasdaq Semiconductor ETF
(FTXL)
|
| Year Ended March 31,
|
| 2023
|
| 2022
|
| 2021
|
| 2020
|
| 2019
|
Net asset value, beginning of period
| $ 69.97
|
| $ 64.74
|
| $ 33.00
|
| $ 31.83
|
| $ 32.58
|
| Income from investment operations:
|
|
|
|
|
|
|
|
|
|
Net investment income (loss)
| 0.46
|
| 0.27
|
| 0.23
|
| 0.38
|
| 0.25
|
Net realized and unrealized gain (loss)
| (5.14) (a)
|
| 5.22
|
| 31.75
|
| 1.18
|
| (0.79)
|
Total from investment operations
| (4.68)
|
| 5.49
|
| 31.98
|
| 1.56
|
| (0.54)
|
| Distributions paid to shareholders from:
|
|
|
|
|
|
|
|
|
|
Net investment income
| (0.50)
|
| (0.26)
|
| (0.24)
|
| (0.39)
|
| (0.21)
|
Net asset value, end of period
| $64.79
|
| $69.97
|
| $64.74
|
| $33.00
|
| $31.83
|
Total return (b)
| (6.54)%
|
| 8.46%
|
| 97.11%
|
| 4.82%
|
| (1.62)%
|
| Ratios to average net assets/supplemental data:
|
|
|
|
|
|
|
|
|
|
Net assets, end of period (in 000’s)
| $ 988,096
|
| $ 108,451
|
| $ 84,156
|
| $ 31,353
|
| $ 30,242
|
Ratio of total expenses to average net assets
| 0.60%
|
| 0.60%
|
| 0.60%
|
| 0.60%
|
| 0.60%
|
Ratio of net investment income (loss) to average net assets
| 0.78%
|
| 0.40%
|
| 0.45%
|
| 1.00%
|
| 0.78%
|
Portfolio turnover rate (c)
| 46%
|
| 58%
|
| 113%
|
| 64%
|
| 94%
|
| (a)
| The per share amount does not correlate with the aggregate realized and unrealized gain (loss) due to the timing of the Fund share sales and repurchases in relation to market value
fluctuation of the underlying investments.
|
| (b)
| Total return is calculated assuming an initial investment made at the net asset value at the beginning of the period, reinvestment of all distributions at net asset value during the
period, and redemption at net asset value on the last day of the period. The returns presented do not reflect the deduction of taxes that a shareholder would pay on Fund distributions or the redemption or sale of Fund
shares. Total return is calculated for the time period presented and is not annualized for periods of less than a year.
|
| (c)
| Portfolio turnover is calculated for the time period presented and is not annualized for periods of less than a year and does not include securities received or
delivered from processing creations or redemptions and in-kind transactions.
|
See Notes to Financial Statements
Page 47
First Trust Exchange-Traded Fund VI
Financial Highlights
(Continued)
For a share outstanding
throughout each period
First Trust Nasdaq Transportation ETF
(FTXR)
|
| Year Ended March 31,
|
| 2023
|
| 2022
|
| 2021
|
| 2020
|
| 2019
|
Net asset value, beginning of period
| $ 32.28
|
| $ 32.88
|
| $ 15.11
|
| $ 23.33
|
| $ 24.93
|
| Income from investment operations:
|
|
|
|
|
|
|
|
|
|
Net investment income (loss)
| 0.56
|
| 0.45
|
| 0.04
|
| 0.30
|
| 0.35
|
Net realized and unrealized gain (loss)
| (5.04)
|
| (0.62)
|
| 17.79
|
| (8.22)
|
| (1.62)
|
Total from investment operations
| (4.48)
|
| (0.17)
|
| 17.83
|
| (7.92)
|
| (1.27)
|
| Distributions paid to shareholders from:
|
|
|
|
|
|
|
|
|
|
Net investment income
| (0.56)
|
| (0.43)
|
| (0.06)
|
| (0.30)
|
| (0.33)
|
Net asset value, end of period
| $27.24
|
| $32.28
|
| $32.88
|
| $15.11
|
| $23.33
|
Total return (a)
| (13.76)%
|
| (0.53)%
|
| 118.10%
|
| (34.35)%
|
| (5.11)%
|
| Ratios to average net assets/supplemental data:
|
|
|
|
|
|
|
|
|
|
Net assets, end of period (in 000’s)
| $ 47,665
|
| $ 280,842
|
| $ 1,071,854
|
| $ 1,511
|
| $ 2,333
|
Ratio of total expenses to average net assets
| 0.60%
|
| 0.60%
|
| 0.60%
|
| 0.60%
|
| 0.60%
|
Ratio of net investment income (loss) to average net assets
| 1.42%
|
| 0.92%
|
| 0.10%
|
| 1.04%
|
| 1.38%
|
Portfolio turnover rate (b)
| 71%
|
| 43%
|
| 129%
|
| 89%
|
| 108%
|
| (a)
| Total return is calculated assuming an initial investment made at the net asset value at the beginning of the period, reinvestment of all distributions at net asset value during the
period, and redemption at net asset value on the last day of the period. The returns presented do not reflect the deduction of taxes that a shareholder would pay on Fund distributions or the redemption or sale of Fund
shares. Total return is calculated for the time period presented and is not annualized for periods of less than a year.
|
| (b)
| Portfolio turnover is calculated for the time period presented and is not annualized for periods of less than a year and does not include securities received or
delivered from processing creations or redemptions and in-kind transactions.
|
Page 48
See Notes to Financial Statements
First Trust Exchange-Traded Fund VI
Financial Highlights
(Continued)
For a share outstanding
throughout each period
First Trust S-Network Streaming &
Gaming ETF (BNGE)
|
| Year Ended
3/31/2023
|
| Period
Ended
3/31/2022 (a)
|
Net asset value, beginning of period
| $ 23.28
|
| $ 24.46
|
| Income from investment operations:
|
|
|
|
Net investment income (loss)
| 0.04
|
| 0.03
|
Net realized and unrealized gain (loss)
| (2.17)
|
| (1.20)
|
Total from investment operations
| (2.13)
|
| (1.17)
|
| Distributions paid to shareholders from:
|
|
|
|
Net investment income
| (0.08)
|
| (0.00) (b)
|
Net realized gain
| (0.02)
|
| -
|
Total distributions
| (0.10)
|
| (0.00)
|
Net asset value, end of period
| $21.05
|
| $23.28
|
Total return (c)
| (9.08)%
|
| (4.81)%
|
| Ratios to average net assets/supplemental data:
|
|
|
|
Net assets, end of period (in 000’s)
| $ 4,210
|
| $ 3,492
|
Ratio of total expenses to average net assets
| 0.70%
|
| 0.71% (d)
|
Ratio of net investment income (loss) to average net assets
| 0.17%
|
| 0.47% (d)
|
Portfolio turnover rate (e)
| 42%
|
| 0%
|
| (a)
| Inception date is January 25, 2022, which is consistent with the commencement of investment operations and is the date the initial creation units were established.
|
| (b)
| Amount is less than $0.01.
|
| (c)
| Total return is calculated assuming an initial investment made at the net asset value at the beginning of the period, reinvestment of all distributions at net asset value during the
period, and redemption at net asset value on the last day of the period. The returns presented do not reflect the deduction of taxes that a shareholder would pay on Fund distributions or the redemption or sale of Fund
shares. Total return is calculated for the time period presented and is not annualized for periods of less than a year.
|
| (d)
| Annualized.
|
| (e)
| Portfolio turnover is calculated for the time period presented and is not annualized for periods of less than a year and does not include securities received or
delivered from processing creations or redemptions and in-kind transactions.
|
See Notes to Financial Statements
Page 49
Notes to Financial Statements
First Trust
Exchange-Traded Fund VI
March 31, 2023
1. Organization
First Trust
Exchange-Traded Fund VI (the “Trust”) is an open-end management investment company organized as a Massachusetts business trust on June 4, 2012, and is registered with the Securities and Exchange Commission
under the Investment Company Act of 1940, as amended (the “1940 Act”).
The Trust currently
consists of thirty-three exchange-traded funds that are offering shares. This report covers the eight funds (each a “Fund” and collectively, the “Funds”) listed below, each a non-diversified
series of the Trust and listed and traded on The Nasdaq Stock Market LLC (“Nasdaq”) with the exception of BNGE which is listed and traded on The NYSE Arca, Inc.
First
Trust Nasdaq Bank ETF - (ticker “FTXO”)
First
Trust Nasdaq Food & Beverage ETF - (ticker “FTXG”)
First
Trust Nasdaq Oil & Gas ETF - (ticker “FTXN”)
First Trust Nasdaq Pharmaceuticals ETF -
(ticker “FTXH”)
First
Trust S-Network E-Commerce ETF - (ticker “ISHP”)
First
Trust Nasdaq Semiconductor ETF - (ticker “FTXL”)
First
Trust Nasdaq Transportation ETF - (ticker “FTXR”)
First
Trust S-Network Streaming & Gaming ETF - (ticker “BNGE”)
Each Fund represents a
separate series of shares of beneficial interest in the Trust. Unlike conventional mutual funds, each Fund issues and redeems shares on a continuous basis, at net asset value (“NAV”), only in large blocks
of shares known as “Creation Units.” The investment objective of each Fund is to seek investment results that correspond generally to the price and yield (before the Fund’s fees and expenses) of the
following indices:
| Fund
| Index
|
| First Trust Nasdaq Bank ETF
| Nasdaq US Smart BanksTM Index
|
| First Trust Nasdaq Food & Beverage ETF
| Nasdaq US Smart Food & BeverageTM Index
|
| First Trust Nasdaq Oil & Gas ETF
| Nasdaq US Smart Oil & GasTM Index
|
| First Trust Nasdaq Pharmaceuticals ETF
| Nasdaq US Smart PharmaceuticalsTM Index
|
| First Trust S-Network E-Commerce ETF
| S-Network Global E-Commerce IndexTM
|
| First Trust Nasdaq Semiconductor ETF
| Nasdaq US Smart SemiconductorTM Index
|
| First Trust Nasdaq Transportation ETF
| Nasdaq US Smart TransportationTM Index
|
| First Trust S-Network Streaming & Gaming ETF
| S-Network Streaming & Gaming Index
|
2. Significant
Accounting Policies
The Funds are each
considered an investment company and follow accounting and reporting guidance under Financial Accounting Standards Board Accounting Standards Codification Topic 946, “Financial Services-Investment
Companies.” The following is a summary of significant accounting policies consistently followed by the Funds in the preparation of the financial statements. The preparation of the financial statements in
accordance with accounting principles generally accepted in the United States of America (“U.S. GAAP”) requires management to make estimates and assumptions that affect the reported amounts and disclosures
in the financial statements. Actual results could differ from those estimates.
A. Portfolio
Valuation
Each Fund’s NAV is
determined daily as of the close of regular trading on the New York Stock Exchange (“NYSE”), normally 4:00 p.m. Eastern time, on each day the NYSE is open for trading. If the NYSE closes early on a
valuation day, the NAV is determined as of that time. Foreign securities are priced using data reflecting the earlier closing of the principal markets for those securities. Each Fund’s NAV is calculated by
dividing the value of all assets of each Fund (including accrued interest and dividends), less all liabilities (including accrued expenses and dividends declared but unpaid), by the total number of shares
outstanding.
Each Fund’s
investments are valued daily at market value or, in the absence of market value with respect to any portfolio securities, at fair value. Market value prices represent readily available market quotations such as last
sale or official closing prices from a national or foreign exchange (i.e., a regulated market) and are primarily obtained from third-party pricing services. Fair value prices represent any prices not considered market
value prices and are either obtained from a third-party pricing service or are determined by the Pricing Committee of the Funds’ investment advisor, First Trust Advisors L.P. (“First Trust” or the
“Advisor”), in accordance with valuation procedures approved by the Trust’s Board of Trustees, and in accordance with provisions of the 1940 Act and rules thereunder. Investments valued by the
Advisor’s Pricing Committee, if any, are footnoted as such in the footnotes to the Portfolio of Investments. Each Fund’s investments are valued as follows:
Notes to Financial Statements (Continued)
First Trust
Exchange-Traded Fund VI
March 31, 2023
Common
stocks, real estate investment trusts (“REITs”), and other equity securities listed on any national or foreign exchange (excluding Nasdaq and the London Stock Exchange Alternative Investment Market
(“AIM”)) are valued at the last sale price on the exchange on which they are principally traded or, for Nasdaq and AIM securities, the official closing price. Securities traded on more than one securities
exchange are valued at the last sale price or official closing price, as applicable, at the close of the securities exchange representing the primary exchange for such securities.
Securities trading on foreign exchanges or over-the-counter markets that close prior to the NYSE close may be valued using a systematic fair valuation model provided by a third-party pricing service. If these
foreign securities meet certain criteria in relation to the valuation model, their valuation is systematically adjusted to reflect the impact of movement in the U.S. market after the close of the foreign markets.
Shares
of open-end funds are valued based on NAV per share.
Securities traded in an over-the-counter market are valued at the mean of their most recent bid and asked price, if available, and otherwise at their last trade price.
Overnight repurchase agreements are valued at amortized cost when it represents the most appropriate reflection of fair market value.
Certain securities may
not be able to be priced by pre-established pricing methods. Such securities may be valued by the Advisor’s Pricing Committee at fair value. These securities generally include, but are not limited to, restricted
securities (securities which may not be publicly sold without registration under the Securities Act of 1933, as amended) for which a third-party pricing service is unable to provide a market price; securities whose
trading has been formally suspended; a security whose market or fair value price is not available from a pre-established pricing source; a security with respect to which an event has occurred that is likely to
materially affect the value of the security after the market has closed but before the calculation of a Fund’s NAV or make it difficult or impossible to obtain a reliable market quotation; and a security whose
price, as provided by the third-party pricing service, does not reflect the security’s fair value. As a general principle, the current fair value of a security would appear to be the amount which the owner might
reasonably expect to receive for the security upon its current sale. When fair value prices are used, generally they will differ from market quotations or official closing prices on the applicable exchanges. A variety
of factors may be considered in determining the fair value of such securities, including, but not limited to, the following:
| 1)
| the last sale price on the exchange on which they are principally traded or, for Nasdaq and AIM securities, the official closing price;
|
| 2)
| the type of security;
|
| 3)
| the size of the holding;
|
| 4)
| the initial cost of the security;
|
| 5)
| transactions in comparable securities;
|
| 6)
| price quotes from dealers and/or third-party pricing services;
|
| 7)
| relationships among various securities;
|
| 8)
| information obtained by contacting the issuer, analysts, or the appropriate stock exchange;
|
| 9)
| an analysis of the issuer’s financial statements;
|
| 10)
| the existence of merger proposals or tender offers that might affect the value of the security; and
|
| 11)
| other relevant factors.
|
If the securities in
question are foreign securities, the following additional information may be considered:
| 1)
| the value of similar foreign securities traded on other foreign markets;
|
| 2)
| ADR trading of similar securities;
|
| 3)
| closed-end fund or exchange-traded fund trading of similar securities;
|
| 4)
| foreign currency exchange activity;
|
| 5)
| the trading prices of financial products that are tied to baskets of foreign securities;
|
| 6)
| factors relating to the event that precipitated the pricing problem;
|
| 7)
| whether the event is likely to recur;
|
| 8)
| whether the effects of the event are isolated or whether they affect entire markets, countries or regions; and
|
| 9)
| other relevant factors.
|
In addition, differences
between the prices used to calculate a Fund’s NAV and the prices used by such Fund’s corresponding index could result in a difference between a Fund’s performance and the performance of its
underlying index.
Notes to Financial Statements (Continued)
First Trust
Exchange-Traded Fund VI
March 31, 2023
Because foreign markets
may be open on different days than the days during which investors may transact in the shares of a Fund, the value of the Fund’s securities may change on the days when investors are not able to transact in the
shares of the Fund. The value of securities denominated in foreign currencies is converted into U.S. dollars using exchange rates determined daily as of the close of regular trading on the NYSE. Any use of a different
rate from the rates used by a relevant index may adversely affect the Fund’s ability to track the index.
The Funds are subject to
fair value accounting standards that define fair value, establish the framework for measuring fair value and provide a three-level hierarchy for fair valuation based upon the inputs to the valuation as of the
measurement date. The three levels of the fair value hierarchy are as follows:
| •
| Level 1 – Level 1 inputs are quoted prices in active markets for identical investments. An active market is a market in which transactions for the investment occur with sufficient frequency and
volume to provide pricing information on an ongoing basis.
|
| •
| Level 2 – Level 2 inputs are observable inputs, either directly or indirectly, and include the following:
|
| o
| Quoted prices for similar investments in active markets.
|
| o
| Quoted prices for identical or similar investments in markets that are non-active. A non-active market is a market where there are few transactions for the investment, the prices are not current, or
price quotations vary substantially either over time or among market makers, or in which little information is released publicly.
|
| o
| Inputs other than quoted prices that are observable for the investment (for example, interest rates and yield curves observable at commonly quoted intervals, volatilities, prepayment speeds, loss
severities, credit risks, and default rates).
|
| o
| Inputs that are derived principally from or corroborated by observable market data by correlation or other means.
|
| •
| Level 3 – Level 3 inputs are unobservable inputs. Unobservable inputs may reflect the reporting entity’s own assumptions about the assumptions that market participants would use in pricing
the investment.
|
The inputs or
methodologies used for valuing investments are not necessarily an indication of the risk associated with investing in those investments. A summary of the inputs used to value each Fund’s investments as of March
31, 2023, is included with each Fund’s Portfolio of Investments.
B. Securities
Transactions and Investment Income
Securities transactions
are recorded as of the trade date. Realized gains and losses from securities transactions are recorded on the identified cost basis. Dividend income is recorded on the ex-dividend date except that certain dividends
from foreign securities are recorded as soon as the information becomes available after the ex-dividend date. Interest income, if any, is recorded on the accrual basis.
Withholding taxes and tax
reclaims on foreign dividends have been provided for in accordance with each Fund’s understanding of the applicable country’s tax rules and rates.
Distributions received
from a Fund’s investments in REITs may be comprised of return of capital, capital gains, and income. The actual character of the amounts received during the year are not known until after the REITs’ fiscal
year end. A Fund records the character of distributions received from the REITs during the year based on estimates available. The characterization of distributions received by a Fund may be subsequently revised based
on information received from the REITs after their tax reporting periods conclude.
C. Foreign
Currency
The books and records of
the Funds are maintained in U.S. dollars. Foreign currencies, investments and other assets and liabilities are translated into U.S. dollars at the exchange rates prevailing at the end of the period. Purchases and
sales of investments and items of income and expense are translated on the respective dates of such transactions. Unrealized gains and losses on assets and liabilities, other than investments in securities, which
result from changes in foreign currency exchange rates have been included in “Net change in unrealized appreciation (depreciation) on foreign currency translation” on the Statements of Operations.
Unrealized gains and losses on investments in securities which result from changes in foreign exchange rates are included with fluctuations arising from changes in market price and are included in “Net change in
unrealized appreciation (depreciation) on investments” on the Statements of Operations. Net realized foreign currency gains and losses include the effect of changes in exchange rates between trade date and
settlement date on investment security transactions, foreign currency transactions and interest and dividends received and are included in “Net realized gain (loss) on foreign currency transactions” on the
Statements of Operations. The portion of foreign currency gains and losses related to fluctuations in exchange rates between the initial purchase settlement date and subsequent sale trade date is included in
“Net realized gain (loss) on investments” on the Statements of Operations.
Notes to Financial Statements (Continued)
First Trust
Exchange-Traded Fund VI
March 31, 2023
D. Offsetting on the
Statements of Assets and Liabilities
Offsetting assets and
liabilities requires entities to disclose both gross and net information about instruments and transactions eligible for offset on the Statements of Assets and Liabilities and disclose instruments and transactions
subject to master netting or similar agreements. These disclosure requirements are intended to help investors and other financial statement users better assess the effect or potential effect of offsetting arrangements
on a Fund’s financial position. The transactions subject to offsetting disclosures are derivative instruments, repurchase agreements and reverse repurchase agreements, and securities borrowing and securities
lending transactions.
This disclosure, if
applicable, is included within each Fund’s Portfolio of Investments under the heading “Offsetting Assets and Liabilities.” For financial reporting purposes, the Funds do not offset financial assets
and financial liabilities that are subject to master netting arrangements (“MNAs”) or similar agreements on the Statements of Assets and Liabilities. MNAs provide the right, in the event of default
(including bankruptcy and insolvency), for the non-defaulting counterparty to liquidate the collateral and calculate the net exposure to the defaulting party or request additional collateral.
E. Securities
Lending
The Funds may lend
securities representing up to 33 1/3% of the value of their total assets to broker-dealers, banks and other institutions to generate additional income. When a Fund loans its portfolio securities, it will receive, at
the inception of each loan, collateral equal to at least 102% (for domestic securities) or 105% (for international securities) of the market value of the loaned securities. The collateral amount is valued at the
beginning of each business day and is compared to the market value of the loaned securities from the prior business day to determine if additional collateral is required. If additional collateral is required, a
request is sent to the borrower. Securities lending involves the risk that the Fund may lose money because the borrower of the Fund’s loaned securities fails to return the securities in a timely manner or at
all. The Fund could also lose money in the event of (i) a decline in the value of the collateral provided for the loaned securities, (ii) a decline in the value of any investments made with cash collateral or (iii) an
increase in the value of the loaned securities if the borrower does not increase the collateral accordingly and the borrower fails to return the securities. These events could also trigger adverse tax consequences for
the Funds.
Under the Funds’
Securities Lending Agency Agreement, the securities lending agent will generally bear the risk that a borrower may default on its obligation to return loaned securities. Brown Brothers Harriman & Co.
(“BBH”) acts as the Funds’ securities lending agent and is responsible for executing the lending of the portfolio securities to creditworthy borrowers. The Funds, however, will be responsible for the
risks associated with the investment of cash collateral. A Fund may lose money on its investment of cash collateral, which may affect its ability to repay the collateral to the borrower without the use of other Fund
assets. Each Fund that engages in securities lending receives compensation (net of any rebate and securities lending agent fees) for lending its securities. Compensation can be in the form of fees received from the
securities lending agent or dividends or interest earned from the investment of cash collateral. The fees received from the securities lending agent are accrued daily. The dividend and interest earned on the
securities loaned is accounted for in the same manner as other dividend and interest income. At March 31, 2023, only BNGE had securities in the securities lending program. During the fiscal year ended March 31, 2023,
only FTXR and BNGE participated in the securities lending program.
In the event of a default
by a borrower with respect to any loan, BBH will exercise any and all remedies provided under the applicable borrower agreement to make the Funds whole. These remedies include purchasing replacement securities by
applying the collateral held from the defaulting broker against the purchase cost of the replacement securities. If, despite such efforts by BBH to exercise these remedies, a Fund sustains losses as a result of a
borrower’s default, BBH will indemnify the Fund by purchasing replacement securities at its own expense, or paying the Funds an amount equal to the market value of the replacement securities, subject to certain
limitations which are set forth in detail in the Securities Lending Agency Agreement between the Trust on behalf of the Funds and BBH.
F. Repurchase
Agreements
Repurchase agreements
involve the purchase of securities subject to the seller’s agreement to repurchase the securities at a mutually agreed upon date and price, under the terms of a Master Repurchase Agreement (“MRA”).
During the term of a repurchase agreement, the value of the underlying securities held as collateral on behalf of a Fund, including accrued interest, is required to exceed the value of the repurchase agreement,
including accrued interest. The underlying securities for all repurchase agreements are held at the Funds’ custodian or designated sub-custodians under tri-party repurchase agreements.
MRAs govern transactions
between a Fund and select counterparties. The MRAs maintain provisions for, among other things, initiation, income payments, events of default, and maintenance of collateral for repurchase agreements.
Repurchase agreements
received for lending securities are collateralized by U.S. Treasury securities. The U.S. Treasury securities are held in a joint custody account at BBH on behalf of the Funds participating in the securities lending
program. In the event the
Notes to Financial Statements (Continued)
First Trust
Exchange-Traded Fund VI
March 31, 2023
counterparty defaults on the repurchase
agreement, the U.S. Treasury securities can either be maintained as part of a Fund’s portfolio or sold for cash. A Fund could suffer a loss to the extent that the proceeds from the sale of the underlying
collateral held by the Fund are less than the repurchase price and the Fund’s costs associated with the delay and enforcement of the MRA.
While the Funds may
invest in repurchase agreements, any repurchase agreements held by the Funds during the fiscal year ended March 31, 2023, were received as collateral for lending securities.
G. Dividends and
Distributions to Shareholders
Dividends from net
investment income, if any, are declared and paid quarterly by each Fund, or as the Board of Trustees may determine from time to time. Distributions of net realized capital gains earned by each Fund, if any, are
distributed at least annually. A Fund may also designate a portion of the amount paid to redeeming shareholders as a distribution for tax purposes.
Distributions from net
investment income and realized capital gains are determined in accordance with federal income tax regulations, which may differ from U.S. GAAP. Certain capital accounts in the financial statements are periodically
adjusted for permanent differences in order to reflect their tax character. These permanent differences are primarily due to the varying treatment of income and gain/loss on portfolio securities held by the Funds and
have no impact on net assets or NAV per share. Temporary differences, which arise from recognizing certain items of income, expense and gain/loss in different periods for financial statement and tax purposes, will
reverse at some time in the future.
The tax character of
distributions paid by each Fund during the fiscal year ended March 31, 2023, was as follows:
|
| Distributions
paid from
Ordinary
Income
|
| Distributions
paid from
Capital
Gains
|
| Distributions
paid from
Return of
Capital
|
First Trust Nasdaq Bank ETF
| $ 6,261,407
|
| $ —
|
| $ —
|
First Trust Nasdaq Food & Beverage ETF
| 13,322,256
|
| —
|
| —
|
First Trust Nasdaq Oil & Gas ETF
| 27,976,256
|
| —
|
| —
|
First Trust Nasdaq Pharmaceuticals ETF
| 500,150
|
| —
|
| —
|
First Trust S-Network E-Commerce ETF
| 39,201
|
| —
|
| —
|
First Trust Nasdaq Semiconductor ETF
| 931,111
|
| —
|
| —
|
First Trust Nasdaq Transportation ETF
| 1,511,736
|
| —
|
| —
|
First Trust S-Network Streaming & Gaming ETF
| 11,922
|
| —
|
| 3,048
|
The tax character of
distributions paid by each Fund during the fiscal period ended March 31, 2022, was as follows:
|
| Distributions
paid from
Ordinary
Income
|
| Distributions
paid from
Capital
Gains
|
| Distributions
paid from
Return of
Capital
|
First Trust Nasdaq Bank ETF
| $ 5,155,141
|
| $ —
|
| $ —
|
First Trust Nasdaq Food & Beverage ETF
| 116,496
|
| —
|
| —
|
First Trust Nasdaq Oil & Gas ETF
| 6,320,716
|
| —
|
| —
|
First Trust Nasdaq Pharmaceuticals ETF
| 176,100
|
| —
|
| —
|
First Trust S-Network E-Commerce ETF
| 143,821
|
| —
|
| —
|
First Trust Nasdaq Semiconductor ETF
| 338,211
|
| —
|
| —
|
First Trust Nasdaq Transportation ETF
| 10,039,966
|
| —
|
| —
|
First Trust S-Network Streaming & Gaming ETF
| 405
|
| —
|
| —
|
Notes to Financial Statements (Continued)
First Trust
Exchange-Traded Fund VI
March 31, 2023
As of March 31, 2023, the
components of distributable earnings on a tax basis for each Fund were as follows:
|
| Undistributed
Ordinary
Income
|
| Accumulated
Capital and
Other
Gain (Loss)
|
| Net
Unrealized
Appreciation
(Depreciation)
|
First Trust Nasdaq Bank ETF
| $ 536,448
|
| $ (148,409,375)
|
| $ (31,613,744)
|
First Trust Nasdaq Food & Beverage ETF
| 1,003,387
|
| (63,514,879)
|
| 11,821,273
|
First Trust Nasdaq Oil & Gas ETF
| 2,351,864
|
| (93,410,183)
|
| (5,005,782)
|
First Trust Nasdaq Pharmaceuticals ETF
| 18,103
|
| (5,088,267)
|
| (121,195)
|
First Trust S-Network E-Commerce ETF
| 67,042
|
| (5,050,919)
|
| (1,030,809)
|
First Trust Nasdaq Semiconductor ETF
| —
|
| (18,825,804)
|
| 38,613,305
|
First Trust Nasdaq Transportation ETF
| 42,379
|
| (61,692,799)
|
| (2,655,788)
|
First Trust S-Network Streaming & Gaming ETF
| —
|
| (287,109)
|
| (120,139)
|
H. Income Taxes
Each Fund intends to
continue to qualify as a regulated investment company by complying with the requirements under Subchapter M of the Internal Revenue Code of 1986, as amended, which includes distributing substantially all of its net
investment income and net realized gains to shareholders. Accordingly, no provision has been made for federal and state income taxes. However, due to the timing and amount of distributions, each Fund may be subject to
an excise tax of 4% of the amount by which approximately 98% of each Fund’s taxable income exceeds the distributions from such taxable income for the calendar year.
The Funds are subject to
accounting standards that establish a minimum threshold for recognizing, and a system for measuring, the benefits of a tax position taken or expected to be taken in a tax return. For all the Funds, with the exception
of BNGE, the taxable years ended 2020, 2021, 2022, and 2023 remain open to federal and state audit. For BNGE, the taxable period ended 2022 and year ended 2023 remain open to federal and state audit. As of March 31,
2023, management has evaluated the application of these standards to the Funds and has determined that no provision for income tax is required in the Funds’ financial statements for uncertain tax positions.
The Funds intend to
utilize provisions of the federal income tax laws, which allow them to carry a realized capital loss forward indefinitely following the year of the loss and offset such loss against any future realized capital gains.
The Funds are subject to certain limitations under U.S. tax rules on the use of capital loss carryforwards and net unrealized built-in losses. These limitations apply when there has been a 50% change in ownership. At
March 31, 2023, for federal income tax purposes, the Funds had a capital loss carryforward available that is shown in the following table, to the extent provided by regulations, to offset future capital gains.
|
| Non-Expiring
Capital Loss
Carryforward
|
First Trust Nasdaq Bank ETF
| $ 148,409,375
|
First Trust Nasdaq Food & Beverage ETF
| 63,514,879
|
First Trust Nasdaq Oil & Gas ETF
| 93,410,183
|
First Trust Nasdaq Pharmaceuticals ETF
| 5,088,267
|
First Trust S-Network E-Commerce ETF
| 5,050,919
|
First Trust Nasdaq Semiconductor ETF
| 18,825,804
|
First Trust Nasdaq Transportation ETF
| 61,692,799
|
First Trust S-Network Streaming & Gaming ETF
| 287,109
|
In order to present
paid-in capital and accumulated distributable earnings (loss) (which consists of accumulated net investment income (loss), accumulated net realized gain (loss) on investments and net unrealized appreciation
(depreciation) on investments) on the Statements of Assets and Liabilities that more closely represent their tax character, certain adjustments have been made to paid-in capital, accumulated net investment income
(loss) and accumulated net realized gain (loss) on investments. These adjustments are primarily due to the difference between book and tax treatments of income and gains on various investment securities held by the
Notes to Financial Statements (Continued)
First Trust
Exchange-Traded Fund VI
March 31, 2023
Funds and in-kind transactions. The
results of operations and net assets were not affected by these adjustments. For the fiscal year ended March 31, 2023, the adjustments for each Fund were as follows:
|
| Accumulated
Net
Investment
Income (Loss)
|
| Accumulated
Net Realized
Gain (Loss)
on Investments
|
| Paid-in
Capital
|
First Trust Nasdaq Bank ETF
| $ —
|
| $ 3,314,741
|
| $ (3,314,741)
|
First Trust Nasdaq Food & Beverage ETF
| —
|
| (9,096,158)
|
| 9,096,158
|
First Trust Nasdaq Oil & Gas ETF
| —
|
| (167,616,837)
|
| 167,616,837
|
First Trust Nasdaq Pharmaceuticals ETF
| —
|
| (3,873,156)
|
| 3,873,156
|
First Trust S-Network E-Commerce ETF
| 30,380
|
| 2,208,454
|
| (2,238,834)
|
First Trust Nasdaq Semiconductor ETF
| 144,387
|
| (5,559,816)
|
| 5,415,429
|
First Trust Nasdaq Transportation ETF
| —
|
| 25,029,562
|
| (25,029,562)
|
First Trust S-Network Streaming & Gaming ETF
| 2,763
|
| (2,763)
|
| —
|
As of March 31, 2023, the
aggregate cost, gross unrealized appreciation, gross unrealized depreciation, and net unrealized appreciation/(depreciation) on investments (including short positions and derivatives, if any) for federal income tax
purposes were as follows:
|
| Tax Cost
|
| Gross
Unrealized
Appreciation
|
| Gross
Unrealized
(Depreciation)
|
| Net Unrealized
Appreciation
(Depreciation)
|
First Trust Nasdaq Bank ETF
| $ 195,778,810
|
| $ 1,960,847
|
| $ (33,574,591)
|
| $ (31,613,744)
|
First Trust Nasdaq Food & Beverage ETF
| 971,650,667
|
| 46,101,647
|
| (34,280,374)
|
| 11,821,273
|
First Trust Nasdaq Oil & Gas ETF
| 319,057,343
|
| 11,090,775
|
| (16,096,557)
|
| (5,005,782)
|
First Trust Nasdaq Pharmaceuticals ETF
| 32,719,549
|
| 1,416,176
|
| (1,537,371)
|
| (121,195)
|
First Trust S-Network E-Commerce ETF
| 6,314,726
|
| 193,839
|
| (1,224,500)
|
| (1,030,661)
|
First Trust Nasdaq Semiconductor ETF
| 947,183,110
|
| 40,698,040
|
| (2,084,735)
|
| 38,613,305
|
First Trust Nasdaq Transportation ETF
| 50,273,785
|
| 1,491,259
|
| (4,147,047)
|
| (2,655,788)
|
First Trust S-Network Streaming & Gaming ETF
| 4,392,872
|
| 411,931
|
| (532,063)
|
| (120,132)
|
I. Expenses
Expenses, other than the
investment advisory fee and other excluded expenses, are paid by the Advisor (See Note 3).
First Trust has entered
into licensing agreements with Nasdaq, Inc. and VettaFi LLC (each, a “Licensor”), as applicable, for the Funds. The respective license agreement allows for the use by First Trust of each Fund’s
respective index and of certain trademarks and trade names of the Licensor. The Funds are sub-licensees to the applicable license agreements.
3. Investment
Advisory Fee, Affiliated Transactions and Other Fee Arrangements
First Trust, the
investment advisor to the Funds, is a limited partnership with one limited partner, Grace Partners of DuPage L.P., and one general partner, The Charger Corporation. The Charger Corporation is an Illinois corporation
controlled by James A. Bowen, Chief Executive Officer of First Trust. First Trust is responsible for the selection and ongoing monitoring of the securities in each Fund’s portfolio, managing the Funds’
business affairs and providing certain administrative services necessary for the management of the Funds.
First Trust is
responsible for the expenses of each Fund including the cost of transfer agency, custody, fund administration, licensing fees, legal, audit, and other services, but excluding fee payments under the Investment
Management Agreement, interest, taxes, brokerage commissions and other expenses associated with the execution of portfolio transactions, distribution and service fees pursuant to a Rule 12b-1 plan, if any, acquired
fund fees and expenses, and extraordinary expenses, which are paid by each respective Fund. First Trust also provides fund reporting services to the Funds for a flat annual fee in the amount of $9,250 per Fund, which
is covered under the annual unitary management fee. Effective November 1, 2022, the annual unitary management fee payable by each Fund to First Trust for these services will be reduced at certain levels of each
Fund’s net assets (“breakpoints”) and calculated pursuant to the following schedules:
Notes to Financial Statements (Continued)
First Trust
Exchange-Traded Fund VI
March 31, 2023
| Breakpoints
| ISHP
| BNGE
|
|
|
| Fund net assets up to and including $2.5 billion
| 0.600%
| 0.7000%
|
|
|
| Fund net assets greater than $2.5 billion up to and including $5 billion
| 0.585%
| 0.6825%
|
|
|
| Fund net assets greater than $5 billion up to and including $7.5 billion
| 0.570%
| 0.6650%
|
|
|
| Fund net assets greater than $7.5 billion up to and including $10 billion
| 0.555%
| 0.6475%
|
|
|
| Fund net assets greater than $10 billion
| 0.540%
| 0.6300%
|
|
|
For FTXO, FTXG, FTXN,
FTXH, FTXL, and FTXR, the annual unitary management fee payable by each Fund will be calculated pursuant to the schedule below:
| Breakpoints
|
|
|
|
|
| Fund net assets up to and including $2.5 billion
| 0.600%
|
|
|
|
| Fund net assets greater than $2.5 billion up to and including $5 billion
| 0.585%
|
|
|
|
| Fund net assets greater than $5 billion up to and including $7.5 billion
| 0.570%
|
|
|
|
| Fund net assets greater than $7.5 billion up to and including $10 billion
| 0.555%
|
|
|
|
| Fund net assets greater than $10 billion up to and including $15 billion
| 0.540%
|
|
|
|
| Fund net assets greater than $15 billion
| 0.510%
|
|
|
|
Prior to November 1,
2022, First Trust was paid an annual unitary management fee of 0.60% of each Fund’s average daily net assets, except for BNGE which paid 0.70% of its average daily net assets.
The Trust has multiple
service agreements with Brown Brothers Harriman & Co. (“BBH”). Under the service agreements, BBH performs custodial, fund accounting, certain administrative services, and transfer agency services for
the Funds. As custodian, BBH is responsible for custody of each Fund’s assets. As fund accountant and administrator, BBH is responsible for maintaining the books and records of each Fund’s securities and
cash. As transfer agent, BBH is responsible for maintaining shareholder records for each Fund.
Each Trustee who is not
an officer or employee of First Trust, any sub-advisor or any of their affiliates (“Independent Trustees”) is paid a fixed annual retainer that is allocated equally among each fund in the First Trust Fund
Complex. Each Independent Trustee is also paid an annual per fund fee that varies based on whether the fund is a closed-end or other actively managed fund, a target outcome fund or an index fund.
Additionally, the Lead
Independent Trustee and the Chairs of the Audit Committee, Nominating and Governance Committee and Valuation Committee are paid annual fees to serve in such capacities, with such compensation allocated pro rata among
each fund in the First Trust Fund Complex based on net assets. Independent Trustees are reimbursed for travel and out-of-pocket expenses in connection with all meetings. The Lead Independent Trustee and Committee
Chairs rotate every three years. The officers and “Interested” Trustee receive no compensation from the Trust for acting in such capacities.
4. Purchases and
Sales of Securities
For the fiscal year ended
March 31, 2023, the cost of purchases and proceeds from sales of investment securities for each Fund, excluding short-term investments and in-kind transactions, were as follows:
|
| Purchases
|
| Sales
|
| First Trust Nasdaq Bank ETF
| $ 163,288,117
|
| $ 163,386,739
|
| First Trust Nasdaq Food & Beverage ETF
| 652,278,295
|
| 650,499,250
|
| First Trust Nasdaq Oil & Gas ETF
| 1,113,943,820
|
| 1,107,446,926
|
| First Trust Nasdaq Pharmaceuticals ETF
| 26,135,114
|
| 26,091,375
|
| First Trust S-Network E-Commerce ETF
| 7,006,172
|
| 7,353,055
|
| First Trust Nasdaq Semiconductor ETF
| 70,762,140
|
| 70,770,237
|
| First Trust Nasdaq Transportation ETF
| 71,370,257
|
| 71,021,714
|
| First Trust S-Network Streaming & Gaming ETF
| 1,526,516
|
| 1,457,582
|
|
|
|
|
|
Notes to Financial Statements (Continued)
First Trust
Exchange-Traded Fund VI
March 31, 2023
For the fiscal year ended
March 31, 2023, the cost of in-kind purchases and proceeds from in-kind sales for each Fund were as follows:
|
| Purchases
|
| Sales
|
| First Trust Nasdaq Bank ETF
| $ 38,350,486
|
| $ 141,397,126
|
| First Trust Nasdaq Food & Beverage ETF
| 1,445,381,618
|
| 432,281,025
|
| First Trust Nasdaq Oil & Gas ETF
| 1,337,669,413
|
| 2,097,484,023
|
| First Trust Nasdaq Pharmaceuticals ETF
| 50,258,672
|
| 34,341,137
|
| First Trust S-Network E-Commerce ETF
| —
|
| 9,745,589
|
| First Trust Nasdaq Semiconductor ETF
| 901,172,793
|
| 55,163,431
|
| First Trust Nasdaq Transportation ETF
| 2,948,082
|
| 196,275,531
|
| First Trust S-Network Streaming & Gaming ETF
| 876,675
|
| —
|
5. Creations,
Redemptions and Transaction Fees
Each Fund generally
issues and redeems its shares in primary market transactions through a creation and redemption mechanism and does not sell or redeem individual shares. Instead, financial entities known as “Authorized
Participants” have contractual arrangements with a Fund or one of the Fund’s service providers to purchase and redeem Fund shares directly with the Fund in large blocks of shares known as “Creation
Units.” Prior to the start of trading on every business day, a Fund publishes through the National Securities Clearing Corporation (“NSCC”) the “basket” of securities, cash or other
assets that it will accept in exchange for a Creation Unit of the Fund’s shares. An Authorized Participant that wishes to effectuate a creation of a Fund’s shares deposits with the Fund the
“basket” of securities, cash or other assets identified by the Fund that day, and then receives the Creation Unit of the Fund’s shares in return for those assets. After purchasing a Creation Unit,
the Authorized Participant may continue to hold the Fund’s shares or sell them in the secondary market. The redemption process is the reverse of the purchase process: the Authorized Participant redeems a
Creation Unit of a Fund’s shares for a basket of securities, cash or other assets. The combination of the creation and redemption process with secondary market trading in a Fund’s shares and underlying
securities provides arbitrage opportunities that are designed to help keep the market price of a Fund’s shares at or close to the NAV per share of the Fund.
Each Fund imposes fees in
connection with the purchase of Creation Units. These fees may vary based upon various fact-based circumstances, including, but not limited to, the composition of the securities included in the Creation Unit or the
countries in which the transactions are settled. The price for each Creation Unit will equal the daily NAV per share of a Fund times the number of shares in a Creation Unit, plus the fees described above and, if
applicable, any operational processing and brokerage costs, transfer fees, stamp taxes and part or all of the spread between the expected bid and offer side of the market related to the securities comprising the
creation basket.
Each Fund also imposes
fees in connection with the redemption of Creation Units. These fees may vary based upon various fact-based circumstances, including, but not limited to, the composition of the securities included in the Creation Unit
or the countries in which the transactions are settled. The price received for each Creation Unit will equal the daily NAV per share of a Fund times the number of shares in a Creation Unit, minus the fees described
above and, if applicable, any operational processing and brokerage costs, transfer fees, stamp taxes and part or all of the spread between the expected bid and offer side of the market related to the securities
comprising the redemption basket. Investors who use the services of a broker or other such intermediary in addition to an Authorized Participant to effect a redemption of a Creation Unit may also be assessed an amount
to cover the cost of such services. The redemption fee charged by a Fund will comply with Rule 22c-2 of the 1940 Act which limits redemption fees to no more than 2% of the value of the shares redeemed.
6. Distribution
Plan
The Board of Trustees
adopted a Distribution and Service Plan pursuant to Rule 12b-1 under the 1940 Act. In accordance with the Rule 12b-1 plan, each Fund is authorized to pay an amount up to 0.25% of its average daily net assets each year
to reimburse First Trust Portfolios L.P. (“FTP”), the distributor of the Funds, for amounts expended to finance activities primarily intended to result in the sale of Creation Units or to provide investor
services. FTP may also use this amount to compensate securities dealers or other persons that are Authorized Participants for providing distribution assistance, including broker-dealer and shareholder support and
educational and promotional services.
No 12b-1 fees are
currently paid by the Funds, and pursuant to a contractual arrangement, no 12b-1 fees will be paid any time before July 31, 2023.
Notes to Financial Statements (Continued)
First Trust
Exchange-Traded Fund VI
March 31, 2023
7. Indemnification
The Trust, on behalf of
the Funds, has a variety of indemnification obligations under contracts with its service providers. The Trust’s maximum exposure under these arrangements is unknown. However, the Trust has not had prior claims
or losses pursuant to these contracts and expects the risk of loss to be remote.
8. Subsequent
Events
Management has evaluated
the impact of all subsequent events on the Funds through the date the financial statements were issued, and has determined that there was the following subsequent event:
Pursuant to approval by
the Trust’s Board of Trustees, The Bank of New York Mellon, 240 Greenwich Street, New York, New York, 10286, replaced Brown Brothers Harriman & Co. as the administrator, custodian, fund accountant and
transfer agent for FTXO, FTXG, FTXN, FTXH, FTXL and FTXR on May 8, 2023.
Report of Independent
Registered Public Accounting Firm
To the Shareholders and the
Board of Trustees of First Trust Exchange-Traded Fund VI:
Opinion on the Financial
Statements and Financial Highlights
We have audited the
accompanying statements of assets and liabilities of First Trust Nasdaq Bank ETF, First Trust Nasdaq Food & Beverage ETF, First Trust Nasdaq Oil & Gas ETF, First Trust Nasdaq Pharmaceuticals ETF, First Trust
S-Network E-Commerce ETF, First Trust Nasdaq Semiconductor ETF, First Trust Nasdaq Transportation ETF, and First Trust S-Network Streaming & Gaming ETF (the “Funds”), each a series of First Trust
Exchange-Traded Fund VI, including the portfolios of investments, as of March 31, 2023, the related statements of operations for the year then ended, the statements of changes in net assets and the financial
highlights for the periods indicated in the table below for the Funds, and the related notes. In our opinion, the financial statements and financial highlights present fairly, in all material respects, the financial
position of each of the Funds as of March 31, 2023, and the results of their operations for the year then ended, and the changes in their net assets and the financial highlights for the periods indicated in the table
below, in conformity with accounting principles generally accepted in the United States of America.
| Individual Funds Included in the Trust
| Statements of
Changes in
Net Assets
| Financial
Highlights
|
| First Trust Nasdaq Bank ETF
| For the years ended March 31, 2023 and 2022
| For the years ended March 31, 2023, 2022, 2021, 2020, and 2019
|
| First Trust Nasdaq Food & Beverage ETF
|
| First Trust Nasdaq Oil & Gas ETF
|
| First Trust Nasdaq Pharmaceuticals ETF
|
| First Trust S-Network E-Commerce ETF
|
| First Trust Nasdaq Semiconductor ETF
|
| First Trust Nasdaq Transportation ETF
|
| First Trust S-Network Streaming & Gaming ETF
| For the year ended March 31, 2023, and for the period from January 25, 2022 (commencement of
operations) through March 31, 2022
|
Basis for Opinion
These financial
statements and financial highlights are the responsibility of the Funds’ management. Our responsibility is to express an opinion on the Funds’ financial statements and financial highlights based on our
audits. We are a public accounting firm registered with the Public Company Accounting Oversight Board (United States) (PCAOB) and are required to be independent with respect to the Funds in accordance with the U.S.
federal securities laws and the applicable rules and regulations of the Securities and Exchange Commission and the PCAOB.
We conducted our
audits in accordance with the standards of the PCAOB. Those standards require that we plan and perform the audit to obtain reasonable assurance about whether the financial statements and financial highlights are free
of material misstatement, whether due to error or fraud. The Funds are not required to have, nor were we engaged to perform, an audit of their internal control over financial reporting. As part of our audits we are
required to obtain an understanding of internal control over financial reporting but not for the purpose of expressing an opinion on the effectiveness of the Funds’ internal control over financial reporting.
Accordingly, we express no such opinion.
Our audits included
performing procedures to assess the risks of material misstatement of the financial statements and financial highlights, whether due to error or fraud, and performing procedures that respond to those risks. Such
procedures included examining, on a test basis, evidence regarding the amounts and disclosures in the financial statements and financial highlights. Our audits also included evaluating the accounting principles used
and significant estimates made by management, as well as evaluating the overall presentation of the financial statements and financial highlights. Our procedures included confirmation of securities owned as of March
31, 2023, by correspondence with the custodian and brokers; when replies were not received from brokers, we performed other auditing procedures. We believe that our audits provide a reasonable basis for our
opinion.
Chicago, Illinois
May 23, 2023
We have served as the
auditor of one or more First Trust investment companies since 2001.
Additional Information
First Trust
Exchange-Traded Fund VI
March 31, 2023
(Unaudited)
Proxy Voting Policies
and Procedures
A description of the
policies and procedures that the Trust uses to determine how to vote proxies and information on how each Fund voted proxies relating to portfolio securities during the most recent 12-month period ended June 30 is
available (1) without charge, upon request, by calling (800) 988-5891; (2) on each Fund’s website at www.ftportfolios.com; and (3) on the Securities and Exchange Commission’s (“SEC”) website at www.sec.gov.
Portfolio Holdings
Each Fund files portfolio
holdings information for each month in a fiscal quarter within 60 days after the end of the relevant fiscal quarter on Form N-PORT. Portfolio holdings information for the third month of each fiscal quarter will be
publicly available on the SEC’s website at www.sec.gov. Each Fund’s complete schedule of portfolio holdings for the second and fourth quarters of each fiscal year is included in the semi-annual and
annual reports to shareholders, respectively, and is filed with the SEC on Form N-CSR. The semi-annual and annual report for each Fund is available to investors within 60 days after the period to which it relates.
Each Fund’s Forms N-PORT and Forms N-CSR are available on the SEC’s website listed above.
Federal Tax
Information
For the taxable year
ended March 31, 2023, the following percentages of income dividends paid by the Funds qualify for the dividends received deduction available to corporations:
|
| Dividends
Received Deduction
|
First Trust Nasdaq Bank ETF
| 100.00%
|
First Trust Nasdaq Food & Beverage ETF
| 100.00%
|
First Trust Nasdaq Oil & Gas ETF
| 100.00%
|
First Trust Nasdaq Pharmaceuticals ETF
| 100.00%
|
First Trust S-Network E-Commerce ETF
| 72.31%
|
First Trust Nasdaq Semiconductor ETF
| 100.00%
|
First Trust Nasdaq Transportation ETF
| 100.00%
|
First Trust S-Network Streaming & Gaming ETF
| 22.61%
|
For the taxable year
ended March 31, 2023, the following percentages of income dividends paid by the Funds are hereby designated as qualified dividend income:
|
| Qualified
Dividend Income
|
First Trust Nasdaq Bank ETF
| 100.00%
|
First Trust Nasdaq Food & Beverage ETF
| 100.00%
|
First Trust Nasdaq Oil & Gas ETF
| 100.00%
|
First Trust Nasdaq Pharmaceuticals ETF
| 100.00%
|
First Trust S-Network E-Commerce ETF
| 100.00%
|
First Trust Nasdaq Semiconductor ETF
| 100.00%
|
First Trust Nasdaq Transportation ETF
| 100.00%
|
First Trust S-Network Streaming & Gaming ETF
| 50.00%
|
A portion of the ordinary
dividends (including short-term capital gains) that ISHP paid to shareholders during the taxable year ended March 31, 2023, may be eligible for the Qualified Business Income (QBI) Deduction under the Internal Revenue
Code of 1986, as amended, Section 199A for the aggregate dividends the Fund received from the underlying Real Estate Investment Trusts (REITs) it invests in.
Risk Considerations
Risks are inherent in all
investing. Certain general risks that may be applicable to a Fund are identified below, but not all of the material risks relevant to each Fund are included in this report and not all of the risks below apply to each
Fund. The material risks of investing in each Fund are spelled out in its prospectus, statement of additional information and other regulatory filings. Before investing, you should consider each Fund’s
investment objective, risks, charges and expenses, and read each
Additional Information (Continued)
First Trust
Exchange-Traded Fund VI
March 31, 2023
(Unaudited)
Fund’s prospectus and statement of
additional information carefully. You can download each Fund’s prospectus at www.ftportfolios.com or contact First Trust Portfolios L.P. at (800) 621-1675 to request a prospectus, which contains this and other
information about each Fund.
Concentration Risk. To the extent that a fund is able to invest a significant percentage of its assets in a single asset class or the securities of issuers within the same country, state, region, industry or
sector, an adverse economic, business or political development may affect the value of the fund’s investments more than if the fund were more broadly diversified. A fund that tracks an index will be concentrated
to the extent the fund’s corresponding index is concentrated. A concentration makes a fund more susceptible to any single occurrence and may subject the fund to greater market risk than a fund that is more
broadly diversified.
Credit Risk. Credit risk is the risk that an issuer of a security will be unable or unwilling to make dividend, interest and/or principal payments when due and the related risk that the value of a
security may decline because of concerns about the issuer’s ability to make such payments.
Cyber Security Risk. The funds are susceptible to potential operational risks through breaches in cyber security. A breach in cyber security refers to both intentional and unintentional events that may cause a
fund to lose proprietary information, suffer data corruption or lose operational capacity. Such events could cause a fund to incur regulatory penalties, reputational damage, additional compliance costs associated with
corrective measures and/or financial loss. In addition, cyber security breaches of a fund’s third-party service providers, such as its administrator, transfer agent, custodian, or sub-advisor, as applicable, or
issuers in which the fund invests, can also subject a fund to many of the same risks associated with direct cyber security breaches.
Defined Outcome Funds
Risk. To the extent a fund’s investment strategy is designed to deliver returns tied to the price performance of an underlying ETF, an investor may not realize the returns the fund seeks
to achieve if that investor does not hold shares for the entire target outcome period. In the event an investor purchases shares after the first day of the target outcome period or sells shares prior to the end of the
target outcome period, the buffer that the fund seeks to provide against a decline in the value of the underlying ETF may not be available, the enhanced returns that the fund seeks to provide (if any) may not be
available and the investor may not participate in a gain in the value of the underlying ETF up to the cap for the investor’s investment period. Additionally, the fund will not participate in gains of the
underlying ETF above the cap and a shareholder may lose their entire investment. If the fund seeks enhanced returns, there are certain time periods when the value of the fund may fall faster than the value of the
underlying ETF, and it is very unlikely that, on any given day during which the underlying ETF share price increases in value, the fund’s share price will increase at the same rate as the enhanced returns sought
by the fund, which is designed for an entire target outcome period. Trading flexible exchange options involves risks different from, or possibly greater than, the risks associated with investing directly in
securities, such as less liquidity and correlation and valuation risks. A fund may experience substantial downside from specific flexible exchange option positions and certain positions may expire worthless.
Derivatives Risk. To the extent a fund uses derivative instruments such as futures contracts, options contracts and swaps, the fund may experience losses because of adverse movements in the price or value
of the underlying asset, index or rate, which may be magnified by certain features of the derivative. These risks are heightened when a fund’s portfolio managers use derivatives to enhance the fund’s
return or as a substitute for a position or security, rather than solely to hedge (or offset) the risk of a position or security held by the fund.
Equity Securities
Risk. To the extent a fund invests in equity securities, the value of the fund’s shares will fluctuate with changes in the value of the equity securities. Equity securities prices
fluctuate for several reasons, including changes in investors’ perceptions of the financial condition of an issuer or the general condition of the relevant stock market, such as market volatility, or when
political or economic events affecting the issuers occur. In addition, common stock prices may be particularly sensitive to rising interest rates, as the cost of capital rises and borrowing costs increase. Equity
securities may decline significantly in price over short or extended periods of time, and such declines may occur in the equity market as a whole, or they may occur in only a particular country, company, industry or
sector of the market.
ETF Risk. The shares of an ETF trade like common stock and represent an interest in a portfolio of securities. The risks of owning an ETF generally reflect the risks of owning the underlying
securities, although lack of liquidity in an ETF could result in it being more volatile and ETFs have management fees that increase their costs. Shares of an ETF trade on an exchange at market prices rather than net
asset value, which may cause the shares to trade at a price greater than net asset value (premium) or less than net asset value (discount). In times of market stress, decisions by market makers to reduce or step away
from their role of providing a market for an ETF’s shares, or decisions by an ETF’s authorized participants that they are unable or unwilling to proceed with creation and/or redemption orders of an
ETF’s shares, could result in shares of the ETF trading at a discount to net asset value and in greater than normal intraday bid-ask spreads.
Additional Information (Continued)
First Trust
Exchange-Traded Fund VI
March 31, 2023
(Unaudited)
Fixed Income Securities
Risk. To the extent a fund invests in fixed income securities, the fund will be subject to credit risk, income risk, interest rate risk, liquidity risk and prepayment risk. Income risk is the
risk that income from a fund’s fixed income investments could decline during periods of falling interest rates. Interest rate risk is the risk that the value of a fund’s fixed income securities will
decline because of rising interest rates. Liquidity risk is the risk that a security cannot be purchased or sold at the time desired, or cannot be purchased or sold without adversely affecting the price. Prepayment
risk is the risk that the securities will be redeemed or prepaid by the issuer, resulting in lower interest payments received by the fund. In addition to these risks, high yield securities, or “junk”
bonds, are subject to greater market fluctuations and risk of loss than securities with higher ratings, and the market for high yield securities is generally smaller and less liquid than that for investment grade
securities.
Index or Model Constituent
Risk. Certain funds may be a constituent of one or more indices or ETF models. As a result, such a fund may be included in one or more index-tracking exchange-traded funds or mutual funds. Being
a component security of such a vehicle could greatly affect the trading activity involving a fund, the size of the fund and the market volatility of the fund. Inclusion in an index could increase demand for the fund
and removal from an index could result in outsized selling activity in a relatively short period of time. As a result, a fund’s net asset value could be negatively impacted and the fund’s market price may
be significantly below its net asset value during certain periods. In addition, index rebalances may potentially result in increased trading activity in a fund’s shares.
Index Provider Risk. To the extent a fund seeks to track an index, it is subject to Index Provider Risk. There is no assurance that the Index Provider will compile the Index accurately, or that the Index will
be determined, maintained, constructed, reconstituted, rebalanced, composed, calculated or disseminated accurately. To correct any such error, the Index Provider may carry out an unscheduled rebalance or other
modification of the Index constituents or weightings, which may increase the fund’s costs. The Index Provider does not provide any representation or warranty in relation to the quality, accuracy or completeness
of data in the Index, and it does not guarantee that the Index will be calculated in accordance with its stated methodology. Losses or costs associated with any Index Provider errors generally will be borne by the
fund and its shareholders.
Investment Companies
Risk. To the extent a fund invests in the securities of other investment vehicles, the fund will incur additional fees and expenses that would not be present in a direct investment in those
investment vehicles. Furthermore, the fund’s investment performance and risks are directly related to the investment performance and risks of the investment vehicles in which the fund invests.
LIBOR Risk. To the extent a fund invests in floating or variable rate obligations that use the London Interbank Offered Rate (“LIBOR”) as a reference interest rate, it is subject to LIBOR
Risk. The United Kingdom’s Financial Conduct Authority, which regulates LIBOR has ceased making LIBOR available as a reference rate over a phase-out period that began December 31, 2021. There is no assurance
that any alternative reference rate, including the Secured Overnight Financing Rate (“SOFR”) will be similar to or produce the same value or economic equivalence as LIBOR or that instruments using an
alternative rate will have the same volume or liquidity. The unavailability or replacement of LIBOR may affect the value, liquidity or return on certain fund investments and may result in costs incurred in connection
with closing out positions and entering into new trades. Any potential effects of the transition away from LIBOR on the fund or on certain instruments in which the fund invests can be difficult to ascertain, and they
may vary depending on a variety of factors, and they could result in losses to the fund.
Management Risk. To the extent that a fund is actively managed, it is subject to management risk. In managing an actively-managed fund’s investment portfolio, the fund’s portfolio managers will
apply investment techniques and risk analyses that may not have the desired result. There can be no guarantee that a fund will meet its investment objective.
Market Risk. Market risk is the risk that a particular security, or shares of a fund in general, may fall in value. Securities held by a fund, as well as shares of a fund itself, are subject to
market fluctuations caused by factors such as general economic conditions, political events, regulatory or market developments, changes in interest rates and perceived trends in securities prices. Shares of
a fund could decline in value or underperform other investments as a result of the risk of loss associated with these market fluctuations. In addition, local, regional or global events such as war, acts of
terrorism, spread of infectious diseases or other public health issues, recessions, or other events could have a significant negative impact on a fund and its investments. Such events may affect certain
geographic regions, countries, sectors and industries more significantly than others. In February 2022, Russia invaded Ukraine which has caused and could continue to cause significant market disruptions and
volatility within the markets in Russia, Europe, and the United States. The hostilities and sanctions resulting from those hostilities could have a significant impact on certain fund investments as well as
fund performance. The COVID-19 global pandemic and the ensuing policies enacted by governments and central banks have caused and may continue to cause significant volatility and uncertainty in global
financial markets. While the U.S. has resumed “reasonably” normal business activity, many countries continue to impose lockdown measures. Additionally, there is no guarantee that vaccines will be
effective against emerging variants of the disease. These events also adversely affect the prices and liquidity of a fund’s portfolio securities or other instruments and could result in disruptions in the
trading markets. Any of such circumstances could have a materially negative impact on the value of a fund’s shares and result in increased market volatility. During any such events, a fund’s
shares may trade at increased premiums or discounts to their net asset value and the bid/ask spread on a fund’s shares may widen.
Additional Information (Continued)
First Trust
Exchange-Traded Fund VI
March 31, 2023
(Unaudited)
Non-U.S. Securities
Risk. To the extent a fund invests in non-U.S. securities, it is subject to additional risks not associated with securities of domestic issuers. Non-U.S. securities are subject to higher
volatility than securities of domestic issuers due to: possible adverse political, social or economic developments; restrictions on foreign investment or exchange of securities; capital controls; lack of liquidity;
currency exchange rates; excessive taxation; government seizure of assets; the imposition of sanctions by foreign governments; different legal or accounting standards; and less government supervision and regulation of
exchanges in foreign countries. Investments in non-U.S. securities may involve higher costs than investments in U.S. securities, including higher transaction and custody costs, as well as additional taxes imposed by
non-U.S. governments. These risks may be heightened for securities of companies located, or with significant operations, in emerging market countries.
Operational Risk. Each fund is subject to risks arising from various operational factors, including, but not limited to, human error, processing and communication errors, errors of a fund’s service
providers, counterparties or other third-parties, failed or inadequate processes and technology or systems failures. Each fund relies on third-parties for a range of services, including custody. Any delay or failure
relating to engaging or maintaining such service providers may affect a fund’s ability to meet its investment objective. Although the funds and the funds’ investment advisor seek to reduce these
operational risks through controls and procedures, there is no way to completely protect against such risks.
Passive Investment
Risk. To the extent a fund seeks to track an index, the fund will invest in the securities included in, or representative of, the index regardless of their investment merit. A fund generally
will not attempt to take defensive positions in declining markets.
Preferred Securities
Risk. Preferred securities combine some of the characteristics of both common stocks and bonds. Preferred securities are typically subordinated to bonds and other debt securities in a
company’s capital structure in terms of priority to corporate income, subjecting them to greater credit risk than those debt securities. Generally, holders of preferred securities have no voting rights with
respect to the issuing company unless preferred dividends have been in arrears for a specified number of periods, at which time the preferred security holders may obtain limited rights. In certain circumstances, an
issuer of preferred securities may defer payment on the securities and, in some cases, redeem the securities prior to a specified date. Preferred securities may also be substantially less liquid than other securities,
including common stock.
Valuation Risk. The valuation of certain securities may carry more risk than that of common stock. Uncertainties in the conditions of the financial markets, unreliable reference data, lack of transparency
and inconsistency of valuation models and processes may lead to inaccurate asset pricing. A fund may hold investments in sizes smaller than institutionally sized round lot positions (sometimes referred to as odd
lots). However, third-party pricing services generally provide evaluations on the basis of institutionally-sized round lots. If a fund sells certain of its investments in an odd lot transaction, the sale price may be
less than the value at which such securities have been held by the fund. Odd lots often trade at lower prices than institutional round lots. There is no assurance that the fund will be able to sell a portfolio
security at the price established by the pricing service, which could result in a loss to the fund.
| NOT FDIC INSURED
| NOT BANK GUARANTEED
| MAY LOSE VALUE
|
Advisory Agreements
Board Considerations
Regarding Approval of Amendments to the Investment Management Agreements
The Board of Trustees of
First Trust Exchange-Traded Fund VI (the “Trust”), including the Independent Trustees, unanimously approved the amendment (as applicable to a specific Fund, the “Amendment” and collectively,
the “Amendments”) of the Investment Management Agreements (as applicable to a specific Fund, the “Agreement” and collectively, the “Agreements”) with First Trust Advisors L.P. (the
“Advisor”) on behalf of the following eight series of the Trust (each a “Fund” and collectively, the “Funds”):
First
Trust Nasdaq Bank ETF (FTXO)
First
Trust Nasdaq Food & Beverage ETF (FTXG)
First
Trust Nasdaq Oil & Gas ETF (FTXN)
First
Trust Nasdaq Pharmaceuticals ETF (FTXH)
First
Trust S-Network E-Commerce ETF (ISHP)
First
Trust Nasdaq Semiconductor ETF (FTXL)
First
Trust Nasdaq Transportation ETF (FTXR)
First
Trust S-Network Streaming & Gaming ETF (BNGE)
The Board approved the
Amendment for each Fund at a meeting held on October 24, 2022. As part of the review process, the Board reviewed information and had preliminary discussions with the Advisor regarding the proposed Amendments at
meetings held on April 18, 2022, June 12–13, 2022 and September 18–19, 2022. Following those preliminary discussions, the Board requested and
Additional Information (Continued)
First Trust
Exchange-Traded Fund VI
March 31, 2023
(Unaudited)
received information from the Advisor
regarding the proposed Amendments, and that information was considered at an executive session of the Independent Trustees and their counsel held prior to the October 24, 2022 meeting, as well as at the October
meeting.
In reviewing the
Amendment for each Fund, the Board considered that the purpose of the Amendments is to modify the unitary fee rate for each Fund under the applicable Agreement by introducing a breakpoint schedule pursuant to which
the unitary fee rate paid by each Fund to the Advisor will be reduced as assets of such Fund meet certain thresholds. The Board noted the Advisor’s representations that the quality and quantity of the
services provided to each Fund by the Advisor under the applicable Agreement will not be reduced or modified as a result of the applicable Amendment, and that the obligations of the Advisor under each Agreement will
remain the same in all respects.
The Board noted that it,
including the Independent Trustees, last approved the continuation of the applicable Agreement for each Fund other than BNGE for a one-year period ending June 30, 2023 at a meeting held on June 12–13, 2022.
The Board noted that in connection with such approval it had determined for each Fund, based upon the information provided, that the terms of the applicable Agreement were fair and reasonable and that the
continuation of the applicable Agreement was in the best interests of the Fund in light of the nature, extent and quality of the services provided and such other matters as the Board considered to be relevant in the
exercise of its business judgment.
The Board also noted that
it, including the Independent Trustees, approved the applicable Agreement for BNGE for an initial two-year period ending May 24, 2023 at a meeting held on April 26, 2021. The Board noted that in connection with such
approval it had determined, based upon the information provided, that the terms of the applicable Agreement were fair and reasonable and that the approval of the applicable Agreement was in the best interests of the
Fund in light of the nature, extent and quality of the services expected to be provided and such other matters as the Board considered to be relevant in the exercise of its business judgment.
Based on all of the
information considered, the Board, including the Independent Trustees, unanimously determined that the terms of the Amendments are fair and reasonable and that the Amendments are in the best interests of each Fund.
Board of Trustees and Officers
First Trust
Exchange-Traded Fund VI
March 31, 2023
(Unaudited)
The following tables
identify the Trustees and Officers of the Trust. Unless otherwise indicated, the address of all persons is 120 East Liberty Drive, Suite 400, Wheaton, IL 60187.
The Trust’s
statement of additional information includes additional information about the Trustees and is available, without charge, upon request, by calling (800) 988-5891.
| Name, Year of Birth and Position with the Trust
| Term of Office and Year First Elected or Appointed
| Principal Occupations
During Past 5 Years
| Number of Portfolios in the First Trust Fund Complex Overseen by Trustee
| Other Trusteeships or Directorships Held by Trustee During Past 5 Years
|
| INDEPENDENT TRUSTEES
|
Richard E. Erickson, Trustee
(1951)
| • Indefinite Term
• Since Inception
| Physician, Edward-Elmhurst Medical Group; Physician and Officer, Wheaton Orthopedics (1990 to 2021)
| 228
| None
|
Thomas R. Kadlec, Trustee
(1957)
| • Indefinite Term
• Since Inception
| Retired; President, ADM Investor Services, Inc. (Futures Commission Merchant) (2010 to July 2022)
| 228
| Director, National Futures Association and ADMIS Singapore Ltd.; Formerly, Director of ADM Investor Services, Inc., ADM Investor Services International, ADMIS Hong Kong Ltd., and
Futures Industry Association
|
Denise M. Keefe, Trustee
(1964)
| • Indefinite Term
• Since 2021
| Executive Vice President, Advocate Aurora Health and President, Advocate Aurora Continuing Health Division (Integrated Healthcare System)
| 228
| Director and Board Chair of Advocate Home Health Services, Advocate Home Care Products and Advocate Hospice; Director and Board Chair of Aurora At Home (since 2018); Director of
Advocate Physician Partners Accountable Care Organization; Director and Board Chair of RML Long Term Acute Care Hospitals; and Director of Senior Helpers (since 2021)
|
Robert F. Keith, Trustee
(1956)
| • Indefinite Term
• Since Inception
| President, Hibs Enterprises (Financial and Management Consulting)
| 228
| Formerly, Director of Trust Company of Illinois
|
Niel B. Nielson, Trustee
(1954)
| • Indefinite Term
• Since Inception
| Senior Advisor (2018 to Present), Managing Director and Chief Operating Officer (2015 to 2018), Pelita Harapan Educational Foundation (Educational Products and
Services)
| 228
| None
|
| INTERESTED TRUSTEE
|
James A. Bowen(1), Trustee and
Chairman of the Board
(1955)
| • Indefinite Term
• Since Inception
| Chief Executive Officer, First Trust Advisors L.P. and First Trust Portfolios L.P.; Chairman of the Board of Directors, BondWave LLC (Software
Development Company) and Stonebridge Advisors LLC (Investment Advisor)
| 228
| None
|
| (1)
| Mr. Bowen is deemed an “interested person” of the Trust due to his position as CEO of First Trust Advisors L.P., investment advisor of the Trust.
|
Board of Trustees and Officers (Continued)
First Trust
Exchange-Traded Fund VI
March 31, 2023
(Unaudited)
| Name and Year of Birth
| Position and Offices with Trust
| Term of Office and Length of Service
| Principal Occupations
During Past 5 Years
|
| OFFICERS(2)
|
James M. Dykas
(1966)
| President and Chief Executive Officer
| • Indefinite Term
• Since 2016
| Managing Director and Chief Financial Officer, First Trust Advisors L.P. and First Trust Portfolios L.P.; Chief Financial Officer, BondWave LLC (Software Development Company) and
Stonebridge Advisors LLC (Investment Advisor)
|
Donald P. Swade
(1972)
| Treasurer, Chief Financial Officer and Chief Accounting Officer
| • Indefinite Term
• Since 2016
| Senior Vice President, First Trust Advisors L.P. and First Trust Portfolios L.P.
|
W. Scott Jardine
(1960)
| Secretary and Chief Legal Officer
| • Indefinite Term
• Since Inception
| General Counsel, First Trust Advisors L.P. and First Trust Portfolios L.P.; Secretary and General Counsel, BondWave LLC; Secretary, Stonebridge Advisors LLC
|
Daniel J. Lindquist
(1970)
| Vice President
| • Indefinite Term
• Since Inception
| Managing Director, First Trust Advisors L.P. and First Trust Portfolios L.P.
|
Kristi A. Maher
(1966)
| Chief Compliance Officer and Assistant Secretary
| • Indefinite Term
• Since Inception
| Deputy General Counsel, First Trust Advisors L.P. and First Trust Portfolios L.P.
|
Roger F. Testin
(1966)
| Vice President
| • Indefinite Term
• Since Inception
| Senior Vice President, First Trust Advisors L.P. and First Trust Portfolios L.P.
|
Stan Ueland
(1970)
| Vice President
| • Indefinite Term
• Since Inception
| Senior Vice President, First Trust Advisors L.P. and First Trust Portfolios L.P.
|
| (2)
| The term “officer” means the president, vice president, secretary, treasurer, controller or any other officer who performs a policy making function.
|
Privacy Policy
First Trust
Exchange-Traded Fund VI
March 31, 2023
(Unaudited)
Privacy Policy
First Trust values our
relationship with you and considers your privacy an important priority in maintaining that relationship. We are committed to protecting the security and confidentiality of your personal information.
Sources of Information
We collect nonpublic
personal information about you from the following sources:
| •
| Information we receive from you and your broker-dealer, investment professional or financial representative through interviews, applications, agreements or other forms;
|
| •
| Information about your transactions with us, our affiliates or others;
|
| •
| Information we receive from your inquiries by mail, e-mail or telephone; and
|
| •
| Information we collect on our website through the use of “cookies.” For example, we may identify the pages on our website that your browser requests or visits.
|
Information Collected
The type of data we
collect may include your name, address, social security number, age, financial status, assets, income, tax information, retirement and estate plan information, transaction history, account balance, payment history,
investment objectives, marital status, family relationships and other personal information.
Disclosure of
Information
We do not disclose any
nonpublic personal information about our customers or former customers to anyone, except as permitted by law. In addition to using this information to verify your identity (as required under law), the permitted uses
may also include the disclosure of such information to unaffiliated companies for the following reasons:
| •
| In order to provide you with products and services and to effect transactions that you request or authorize, we may disclose your personal information as described above to unaffiliated financial
service providers and other companies that perform administrative or other services on our behalf, such as transfer agents, custodians and trustees, or that assist us in the distribution of investor materials such as
trustees, banks, financial representatives, proxy services, solicitors and printers.
|
| •
| We may release information we have about you if you direct us to do so, if we are compelled by law to do so, or in other legally limited circumstances (for example to protect your
account from fraud).
|
In addition, in order to
alert you to our other financial products and services, we may share your personal information within First Trust.
Use of Website
Analytics
We currently use third
party analytics tools, Google Analytics and AddThis, to gather information for purposes of improving First Trust’s website and marketing our products and services to you. These tools employ cookies, which are
small pieces of text stored in a file by your web browser and sent to websites that you visit, to collect information, track website usage and viewing trends such as the number of hits, pages visited, videos and PDFs
viewed and the length of user sessions in order to evaluate website performance and enhance navigation of the website. We may also collect other anonymous information, which is generally limited to technical and
web navigation information such as the IP address of your device, internet browser type and operating system for purposes of analyzing the data to make First Trust’s website better and more useful to our users.
The information collected does not include any personal identifiable information such as your name, address, phone number or email address unless you provide that information through the website for us to
contact you in order to answer your questions or respond to your requests. To find out how to opt-out of these services click on: Google Analytics and AddThis.
Confidentiality and
Security
With regard to our
internal security procedures, First Trust restricts access to your nonpublic personal information to those First Trust employees who need to know that information to provide products or services to you. We maintain
physical, electronic and procedural safeguards to protect your nonpublic personal information.
Policy Updates and
Inquiries
As required by federal
law, we will notify you of our privacy policy annually. We reserve the right to modify this policy at any time, however, if we do change it, we will tell you promptly. For questions about our policy, or for additional
copies of this notice, please go to www.ftportfolios.com, or contact us at 1-800-621-1675 (First Trust Portfolios) or 1-800-222-6822 (First Trust Advisors).
March 2023
First Trust Exchange-Traded Fund VI
INVESTMENT ADVISOR
First Trust Advisors L.P.
120 East Liberty Drive, Suite
400
Wheaton, IL 60187
ADMINISTRATOR, CUSTODIAN,
FUND ACCOUNTANT &
TRANSFER AGENT*
Brown Brothers Harriman &
Co.
50 Post Office Square
Boston, MA 02110
INDEPENDENT REGISTERED
PUBLIC ACCOUNTING FIRM
Deloitte & Touche LLP
111 S. Wacker Drive
Chicago, IL 60606
LEGAL COUNSEL
Chapman and Cutler LLP
320 South Canal Street
Chicago, IL 60606
* Effective May 8,
2023, the Administrator, Custodian, Fund Accountant & Transfer Agent for First Trust Nasdaq Bank ETF, First Trust Nasdaq Food & Beverage ETF, First Trust Nasdaq Oil & Gas ETF, First Trust Nasdaq
Pharmaceuticals ETF, First Trust Nasdaq Semiconductor ETF and First Trust Nasdaq Transportation ETF changed to The Bank of New York Mellon, 240 Greenwich Street, New York, New York, 10286.
First Trust Exchange-Traded Fund VI
Developed International Equity Select ETF (RNDM)
Emerging Markets Equity Select ETF (RNEM)
Large Cap US Equity Select ETF (RNLC)
Mid Cap US Equity Select ETF (RNMC)
Small Cap US Equity Select ETF (RNSC)
US Equity Dividend Select ETF (RNDV)
Annual Report
For the Year Ended
March 31, 2023
First Trust Exchange-Traded Fund
VI
Annual Report
March 31, 2023
Caution Regarding
Forward-Looking Statements
This report contains
certain forward-looking statements within the meaning of the Securities Act of 1933, as amended, and the Securities Exchange Act of 1934, as amended. Forward-looking statements include statements regarding the goals,
beliefs, plans or current expectations of First Trust Advisors L.P. (“First Trust” or the “Advisor”) and its representatives, taking into account the information currently available to them.
Forward-looking statements include all statements that do not relate solely to current or historical fact. For example, forward-looking statements include the use of words such as “anticipate,”
“estimate,” “intend,” “expect,” “believe,” “plan,” “may,” “should,” “would” or other words that convey uncertainty of
future events or outcomes.
Forward-looking
statements involve known and unknown risks, uncertainties and other factors that may cause the actual results, performance or achievements of any series of First Trust Exchange-Traded Fund VI (the “Trust”)
described in this report (each such series is referred to as a “Fund” and collectively, the “Funds”) to be materially different from any future results, performance or achievements expressed or
implied by the forward-looking statements. When evaluating the information included in this report, you are cautioned not to place undue reliance on these forward-looking statements, which reflect the judgment of the
Advisor and its representatives only as of the date hereof. We undertake no obligation to publicly revise or update these forward-looking statements to reflect events and circumstances that arise after the date
hereof.
Performance and Risk
Disclosure
There is no assurance
that any Fund described in this report will achieve its investment objective. Each Fund is subject to market risk, which is the possibility that the market values of securities owned by the Fund will decline and that
the value of the Fund’s shares may therefore be less than what you paid for them. Accordingly, you can lose money by investing in a Fund. See “Risk Considerations” in the Additional Information
section of this report for a discussion of certain other risks of investing in the Funds.
Performance data quoted
represents past performance, which is no guarantee of future results, and current performance may be lower or higher than the figures shown. For the most recent month-end performance figures, please visit www.ftportfolios.com or speak with your financial advisor. Investment returns, net asset value and share price will fluctuate and Fund shares, when sold, may be
worth more or less than their original cost.
The Advisor may also
periodically provide additional information on Fund performance on each Fund’s web page at www.ftportfolios.com.
How to Read This
Report
This report contains
information that may help you evaluate your investment. It includes details about each Fund and presents data and analysis that provide insight into each Fund’s performance and investment approach.
By reading the market
overview by Robert F. Carey, Chief Market Strategist of the Advisor, you may obtain an understanding of how the market environment affected the performance of each Fund. The statistical information that follows may
help you understand each Fund’s performance compared to that of relevant market benchmarks.
It is important to keep
in mind that the opinions expressed by personnel of the Advisor are just that: informed opinions. They should not be considered to be promises or advice. The opinions, like the statistics, cover the period through the
date on the cover of this report. The material risks of investing in each Fund are spelled out in the prospectus, the statement of additional information, and other Fund regulatory filings.
First Trust Exchange-Traded Fund
VI
Annual Letter from the Chairman and
CEO
March 31, 2023
Dear Shareholders,
First Trust is pleased
to provide you with the annual report for certain series of First Trust Exchange-Traded Fund VI (the “Funds”), which contains detailed information about the Funds for the twelve months ended March 31,
2023.
I am constantly amazed
by the depth and breadth of innovation that occurs when people from different geographic, economic, cultural, and educational backgrounds come together to solve problems. Many of the greatest companies to ever exist
found their humble beginnings in the simple premise that problems are best solved through ingenuity and cooperation. That idea is still alive and well today, in my opinion. Take, as examples, the recent flood of
interest sparked by artificial intelligence programs, advances in robotics, new medicines, more fuel-efficient gasoline engines, electric and hybrid vehicles, quantum computing, developments in wind and solar power;
the list goes on and on. That said, the global economy is facing serious issues such as stubborn inflation and the specter of slowing economic growth to name a few.
As many investors know,
the global financial system is currently navigating the fallout of the banking crisis that took lending markets by storm in March 2023. The turmoil that started in the U.S. with the failure of Silicon Valley Bank
quickly spread around the globe, leading the Swiss government to broker the merger of two of Switzerland’s largest banks. In the U.S., the Federal Reserve (the “Fed”) created the Bank Term Funding
Program, which allocated capital to help assure that banks can meet the needs of their depositors. Furthermore, inflation remains elevated on a global scale. Each of the countries that comprise the so-called Group of
Ten is currently battling levels of inflation that are higher than the targets set by their central banks, according to data from Bloomberg. Additionally, political unrest stemming from the war between Russia and
Ukraine remains a significant factor, with the potential to disturb global fuel and energy supplies as well as provoke interference from other foreign powers.
In the U.S., inflation,
as measured by the trailing 12-month rate on the Consumer Price Index, stood at 5.0% as of March 31, 2023, well above the Fed’s stated goal of 2.0%. Despite signals pointing to a potential slowdown in economic
growth in the U.S., the Fed stayed the course with regards to interest rate policy. Since February 28, 2022, the Fed raised the Federal Funds target rate (upper bound) a total of nine times, increasing the rate from
0.25%, where it stood on February 28, 2022, to 5.00% as of March 31, 2023.
Global markets have been
resilient over time, and the S&P 500® Index has never failed to recover from a bear market. While the issues plaguing the U.S. and global economies are severe, they are not
insurmountable, in my view. As Brian Wesbury, Chief Economist at First Trust, recently wrote: “what made America strong is…its human resources and freedom.” We will continue to work the problems
before us with ingenuity and resolve, as we always have.
Thank you for giving
First Trust the opportunity to play a role in your financial future. We value our relationship with you and will report on the Funds again in six months.
Sincerely,
James A. Bowen
Chairman of the Board of Trustees
Chief Executive Officer of First Trust
Advisors L.P.
First Trust Exchange-Traded Fund
VI
Annual Report
March 31, 2023
Robert
F. Carey, CFA
Senior Vice President
and Chief Market Strategist
First Trust Advisors
L.P.
Mr.
Carey is responsible for the overall management of research and analysis of the First Trust product line. Mr. Carey has more than 30 years of experience as an Equity and Fixed-Income Analyst and is a recipient of the
Chartered Financial Analyst (“CFA”) designation. He is a graduate of the University of Illinois at Champaign-Urbana with a B.S. in Physics. He is also a member of the Investment Analysts Society of Chicago
and the CFA Institute. Mr. Carey has appeared as a guest on such programs as Bloomberg TV, CNBC, and WBBM Radio, and has been quoted by several publications, including The Wall Street Journal, The Wall Street Reporter, Bloomberg News Service, and Registered Rep.
State of the Global
Economy
The latest global growth
forecast from the International Monetary Fund (“IMF”) released in April 2023 sees real gross domestic product growth rising by 2.8% worldwide in 2023, down from its 2.9% projection in January 2023. The IMF
is calling for a 1.6% growth rate for the U.S., up from its January 2023 estimate of 1.4%. Emerging Market and Developing Economies are expected to grow by 3.9% this year, down from the IMF’s 4.0% estimate in
January 2023. The IMF notes that risks to their global outlook are squarely to the downside, especially given the recent turmoil in the Financials sector as well as stubbornly high inflation.
In the U.S., inflation,
as measured by the Consumer Price Index (“CPI”), stood at 5.0% on a trailing 12-month basis at the end of March 2023, according to the U.S. Bureau of Labor Statistics. While this is significantly lower
than the most recent high of 9.1% in June 2022, the CPI remains above its 30-year average of 2.5% as of March 31, 2023, and even further from the Federal Reserve’s (the “Fed”) target of
2.0%.
Performance of Global
Stocks and Bonds
The major U.S. stock
indices delivered negative results over the past 12 months. The S&P 500® (the “Index”), S&P MidCap 400® and S&P SmallCap 600® Indices posted total returns of -7.73%, -5.12% and -8.82%, respectively, for the 12-month period ended March 31, 2023. Three of the 11 major
sectors that comprise the Index were positive on a total return basis. The top performer was the Energy sector, up 13.63%, while the worst showing came from the Real Estate sector, down 19.75%.
A Bloomberg survey of
twenty-four equity strategists found that their average 2023 year-end price target for the Index was 4,025, as of April 19, 2023, according to its own release. The highest and lowest estimates were 4,750 and 3,225,
respectively. Brian Wesbury, Chief Economist at First Trust, announced in December 2022 that his 2023 year-end price target stood at 3,900. The Index closed trading on March 31, 2023 at 4,109. The outlook for
corporate earnings in 2023 has turned negative. Bloomberg’s consensus year-over-year earnings growth rate estimates for the Index for the 2023 and 2024 calendar years stood at -2.67% and 11.56%, respectively, as
of April 21, 2023.
The broader foreign stock
indices experienced negative total returns over the past year. For the 12-months ended March 31, 2023, the MSCI World ex USA and MSCI Emerging Markets equity indices posted total returns of -2.74% (USD) and -10.70%
(USD), respectively, according to Bloomberg. The major foreign bond indices were also down during the same period. The Bloomberg Global Aggregate Index of higher quality debt posted a total return of -8.07% (USD),
while the Bloomberg EM Hard Currency Aggregate Index of emerging markets debt fell by 5.41% (USD), according to Bloomberg. The U.S. Dollar rose 4.27% over the past 12 months against a basket of major currencies, as
measured by the U.S. Dollar Index (DXY). The increase in the U.S. Dollar provided a drag on the performance of both foreign stock and bond indices, in our opinion.
In the U.S. bond market,
the results were also disappointing. The top performing major debt group we track was intermediate corporate bonds. The Bloomberg Intermediate Corporate Index posted a total return of -1.99% for the 12-month period
ended March 31, 2023. The worst-performing U.S. debt group that we track was U.S. aggregate bonds. The Bloomberg U.S. Aggregate Bond Index posted a total return of -4.78%. The yield on the benchmark 10-Year Treasury
Note (“T-Note”) fell by 113 basis points in the period to close at 3.47% on March 31, 2023, according to Bloomberg. For comparative purposes, the average yield on the 10-Year T-Note was 2.19% for the
10-year period ended March 31, 2023.
Fund Performance
Overview (Unaudited)
Developed International Equity Select ETF
(RNDM)
The Developed
International Equity Select ETF (the “Fund”) seeks investment results that correspond generally to the price and yield (before the Fund’s fees and expenses) of an equity index called the Nasdaq
Riskalyze Developed MarketsTM Index (the “Index”). The shares of the Fund are listed and trade on The Nasdaq Stock Market LLC under the ticker symbol
“RNDM.” The Fund normally invests at least 90% of its net assets (plus any borrowings for investment purposes) in the common stocks, depositary receipts, preferred shares and real estate investment trusts
that comprise the Index.
The Index is owned and
was developed and sponsored by Riskalyze, Inc. (the “Index Provider”). According to the Index Provider, the Index is designed to select low volatility developed markets (excluding the United States)
securities that are included in the Nasdaq Developed Markets Ex-US Large Mid CapTM Index (the “Base Index”) and have a minimum three-month average daily dollar trading volume of $5 million. The Base Index is a
comprehensive, rules-based index designed to measure stock market performance of companies in developed markets (excluding the United States), as determined by Nasdaq, Inc. A country is classified as
“developed” based on a number of criteria, including national income per capita, national market capitalization and national trading volume. Companies are classified as operating in a country primarily by
their country of incorporation, domicile and primary exchange listing.
| Performance
|
|
|
|
|
|
|
|
|
| Average Annual Total Returns
|
| Cumulative Total Returns
|
|
| 1 Year
Ended
3/31/23
| 5 Years
Ended
3/31/23
| Inception
(6/20/17)
to 3/31/23
|
| 5 Years
Ended
3/31/23
| Inception
(6/20/17)
to 3/31/23
|
| Fund Performance
|
|
|
|
|
|
|
| NAV
| -3.60%
| 1.45%
| 2.00%
|
| 7.44%
| 12.14%
|
| Market Price
| -3.33%
| 1.39%
| 2.04%
|
| 7.15%
| 12.35%
|
| Index Performance
|
|
|
|
|
|
|
| Nasdaq Riskalyze Developed MarketsTM Index
| -3.36%
| 2.73%
| 3.22%
|
| 14.42%
| 20.08%
|
| Nasdaq Developed Markets Ex-US Large Mid CapTM Index
| -2.90%
| 4.15%
| 5.04%
|
| 22.54%
| 32.85%
|
| MSCI World ex USA Index
| -2.74%
| 3.83%
| 4.65%
|
| 20.70%
| 30.03%
|
(See Notes to Fund
Performance Overview on page 16.)
Performance Review
The Fund generated a net
asset value (“NAV”) return of -3.60% during the period covered by this report. During the same period, the Nasdaq Developed Markets Ex-US Large Mid CapTM Index (the “Benchmark”) generated a return of -2.90%. Investments in Japan received the greatest allocation of any country in the Fund
during the same period. Japanese securities carried an average weight of 19.3% and contributed 0.7% to the Fund’s return which tied with Germany for the greatest impact of any country allocation in the Fund. The
most negative contribution to the Fund’s return came from investments in Canada, which contributed -1.3%. Exposure to foreign currency contributed -4.4% to the Fund’s total return for the period.
Riskalyze and Nasdaq
Riskalyze Developed MarketsTM Index are trademarks or service marks of Riskalyze, Inc. (“Riskalyze”) and have been licensed for use for certain purposes by First
Trust. The Fund is not sponsored, endorsed, sold or promoted by Riskalyze, and Riskalyze makes no representation regarding the advisability of trading in the Fund. The Nasdaq Riskalyze Developed MarketsTM Index (“Riskalyze Index”) is a product of Riskalyze, Inc. (“Riskalyze”). RISKALYZE® and NASDAQ RISKALYZE DEVELOPED MARKETSTM INDEX are trademarks of Riskalyze. Nasdaq® is a trademark of Nasdaq, Inc.
Fund Performance
Overview (Unaudited) (Continued)
Developed International Equity Select ETF
(RNDM) (Continued)
| Sector Allocation
| % of Total
Investments
|
| Financials
| 22.0%
|
| Industrials
| 17.9
|
| Health Care
| 13.1
|
| Consumer Discretionary
| 11.7
|
| Consumer Staples
| 11.3
|
| Communication Services
| 6.9
|
| Materials
| 4.2
|
| Utilities
| 4.0
|
| Information Technology
| 3.8
|
| Energy
| 2.9
|
| Real Estate
| 2.2
|
| Total
| 100.0%
|
| Top Ten Holdings
| % of Total
Investments
|
| Sekisui House Ltd.
| 3.1%
|
| McDonald’s Holdings Co., Japan Ltd.
| 3.0
|
| Secom Co., Ltd.
| 2.7
|
| Tobu Railway Co., Ltd.
| 2.5
|
| Enbridge, Inc.
| 1.9
|
| RELX PLC
| 1.5
|
| Takeda Pharmaceutical Co., Ltd.
| 1.3
|
| Phoenix Group Holdings PLC
| 1.1
|
| London Stock Exchange Group PLC
| 1.1
|
| SEB S.A.
| 1.1
|
| Total
| 19.3%
|
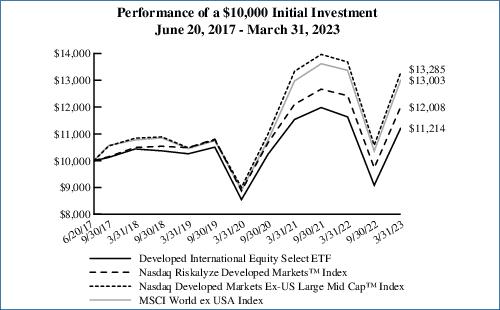
Performance figures assume reinvestment of all distributions and do not reflect the deduction of taxes that a shareholder would pay on Fund distributions or the redemption or sale of Fund shares. An index is a
statistical composite that tracks a specified financial market or sector. Unlike the Fund, the indices do not actually hold a portfolio of securities and therefore do not incur the expenses incurred by the Fund. These
expenses negatively impact the performance of the Fund. The Fund’s past performance does not predict future performance.
Frequency
Distribution of Discounts and Premiums
Information
showing the number of days the market price of the Fund’s shares was greater (at a premium) and less (at a discount) than the Fund’s net asset value for the most recently completed year, and the most
recently completed calendar quarters since that year (or life of the Fund, if shorter), is available at https://www.ftportfolios.com/Retail/etf/home.aspx.
Fund Performance
Overview (Unaudited) (Continued)
Emerging Markets Equity Select ETF
(RNEM)
The Emerging Markets
Equity Select ETF (the “Fund”) seeks investment results that correspond generally to the price and yield (before the Fund’s fees and expenses) of an equity index called the Nasdaq Riskalyze Emerging
MarketsTM Index (the “Index”). The shares of the Fund are listed and trade on The Nasdaq Stock Market LLC under the ticker symbol
“RNEM.” The Fund normally invests at least 90% of its net assets (plus any borrowings for investment purposes) in the common stocks, depositary receipts, preferred shares and real estate investment trusts
that comprise the Index.
The Index is owned and
was developed and sponsored by Riskalyze, Inc. (the “Index Provider”). According to the Index Provider, the Index is designed to select low volatility emerging markets securities that are included in the
Nasdaq Emerging Large Mid CapTM Index (the “Base Index”) and have a minimum three-month average daily dollar trading volume of $5 million. The Base Index is a
comprehensive, rules-based index designed to measure stock market performance of companies in emerging markets, as determined by Nasdaq, Inc. A country is classified as “emerging” based on a number of
criteria, including national income per capita, national market capitalization and national trading volume. Emerging markets are generally characterized by lower market efficiency and less strict standards in
accounting and securities regulation than developed markets. Companies are classified as operating in a country primarily by their country of incorporation, domicile and primary exchange listing.
| Performance
|
|
|
|
|
|
|
|
|
| Average Annual Total Returns
|
| Cumulative Total Returns
|
|
| 1 Year
Ended
3/31/23
| 5 Years
Ended
3/31/23
| Inception
(6/20/17)
to 3/31/23
|
| 5 Years
Ended
3/31/23
| Inception
(6/20/17)
to 3/31/23
|
| Fund Performance
|
|
|
|
|
|
|
| NAV
| -4.97%
| -1.03%
| 1.25%
|
| -5.06%
| 7.42%
|
| Market Price
| -5.34%
| -1.25%
| 1.19%
|
| -6.08%
| 7.06%
|
| Index Performance
|
|
|
|
|
|
|
| Nasdaq Riskalyze Emerging MarketsTM Index
| -3.56%
| 1.00%
| 3.18%
|
| 5.08%
| 19.85%
|
| Nasdaq Emerging Large Mid CapTM Index
| -8.71%
| 0.16%
| 3.10%
|
| 0.78%
| 19.30%
|
| MSCI Emerging Markets Index
| -10.70%
| -0.88%
| 2.12%
|
| -4.32%
| 12.88%
|
(See Notes to Fund
Performance Overview on page 16.)
Performance Review
The Fund generated a NAV
return of -4.97% during the period covered by this report. During the same period, the Nasdaq Emerging Large Mid CapTM Index (the “Benchmark”) generated a return of -8.71%. Securities from India and Taiwan received the greatest allocation of any country
in the Fund during the same period carrying an average weight of 25.4% and 24.9%, respectively. Investments in Brazil were the largest negatively contributing country with a contribution to the Fund’s return of
-1.7%. Investments in China contributed 0.6% to the Fund’s total return, which was the greatest of any country. Exposure to foreign currency contributed -4.7% to the Fund’s total return for the period.
Riskalyze and Nasdaq
Riskalyze Emerging MarketsTM Index are trademarks or service marks of Riskalyze, Inc. (“Riskalyze”) and have been licensed for use for certain purposes by First
Trust. The Fund is not sponsored, endorsed, sold or promoted by Riskalyze, and Riskalyze makes no representation regarding the advisability of trading in the Fund. The Nasdaq Riskalyze Emerging MarketsTM Index (“Riskalyze Index”) is a product of Riskalyze, Inc. (“Riskalyze”). RISKALYZE® and NASDAQ RISKALYZE EMERGING MARKETSTM INDEX are trademarks of Riskalyze. Nasdaq® is a trademark of Nasdaq, Inc.
Fund Performance
Overview (Unaudited) (Continued)
Emerging Markets Equity Select ETF (RNEM)
(Continued)
| Sector Allocation
| % of Total
Investments
|
| Financials
| 32.3%
|
| Information Technology
| 22.0
|
| Materials
| 10.4
|
| Consumer Staples
| 7.9
|
| Industrials
| 6.2
|
| Consumer Discretionary
| 5.0
|
| Energy
| 4.4
|
| Communication Services
| 3.6
|
| Utilities
| 3.3
|
| Health Care
| 2.8
|
| Real Estate
| 2.1
|
| Total
| 100.0%
|
| Top Ten Holdings
| % of Total
Investments
|
| Wistron Corp.
| 3.8%
|
| Inventec Corp.
| 3.4
|
| Powertech Technology, Inc.
| 2.9
|
| Compal Electronics, Inc.
| 2.8
|
| WPG Holdings Ltd.
| 2.6
|
| Power Finance Corp., Ltd.
| 2.6
|
| Hon Hai Precision Industry Co., Ltd.
| 2.5
|
| REC Ltd.
| 2.2
|
| Larsen & Toubro Ltd.
| 2.1
|
| HDFC Bank Ltd.
| 2.0
|
| Total
| 26.9%
|
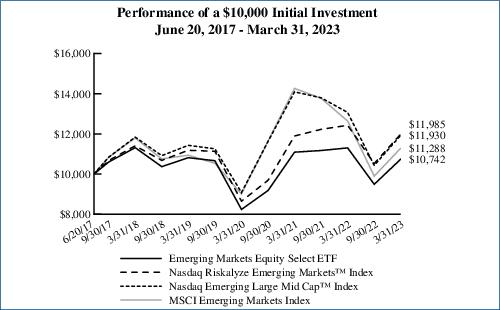
Performance figures assume reinvestment of all distributions and do not reflect the deduction of taxes that a shareholder would pay on Fund distributions or the redemption or sale of Fund shares. An index is a
statistical composite that tracks a specified financial market or sector. Unlike the Fund, the indices do not actually hold a portfolio of securities and therefore do not incur the expenses incurred by the Fund. These
expenses negatively impact the performance of the Fund. The Fund’s past performance does not predict future performance.
Frequency
Distribution of Discounts and Premiums
Information
showing the number of days the market price of the Fund’s shares was greater (at a premium) and less (at a discount) than the Fund’s net asset value for the most recently completed year, and the most
recently completed calendar quarters since that year (or life of the Fund, if shorter), is available at https://www.ftportfolios.com/Retail/etf/home.aspx.
Fund Performance
Overview (Unaudited) (Continued)
Large Cap US Equity Select ETF (RNLC)
The Large Cap US Equity
Select ETF (the “Fund”) seeks investment results that correspond generally to the price and yield (before the Fund’s fees and expenses) of an equity index called the Nasdaq Riskalyze US Large
CapTM Index (the “Index”). The shares of the Fund are listed and trade on The Nasdaq Stock Market LLC under the ticker symbol
“RNLC.” The Fund normally invests at least 90% of its net assets (plus any borrowings for investment purposes) in the common stocks and real estate investment trusts that comprise the Index.
The Index is owned and
was developed and sponsored by Riskalyze, Inc. (the “Index Provider”). According to the Index Provider, the Index is designed to select dividend-paying US large cap securities that are included in the
Nasdaq US 500 Large CapTM Index (the “Base Index”) and have paid a dividend in the trailing twelve months (based on ex-date). The Base Index is a
comprehensive, rules-based index designed to measure stock market performance of large cap US companies, as determined by Nasdaq, Inc.
| Performance
|
|
|
|
|
|
|
|
|
| Average Annual Total Returns
|
| Cumulative Total Returns
|
|
| 1 Year
Ended
3/31/23
| 5 Years
Ended
3/31/23
| Inception
(6/20/17)
to 3/31/23
|
| 5 Years
Ended
3/31/23
| Inception
(6/20/17)
to 3/31/23
|
| Fund Performance
|
|
|
|
|
|
|
| NAV
| -5.57%
| 9.28%
| 9.70%
|
| 55.83%
| 70.70%
|
| Market Price
| -5.62%
| 9.26%
| 9.70%
|
| 55.68%
| 70.69%
|
| Index Performance
|
|
|
|
|
|
|
| Nasdaq Riskalyze US Large CapTM Index
| -5.02%
| 9.96%
| 10.37%
|
| 60.75%
| 76.88%
|
| Nasdaq US 500 Large CapTM Index
| -8.29%
| 11.04%
| 11.34%
|
| 68.84%
| 86.01%
|
| S&P 500® Index
| -7.73%
| 11.19%
| 11.43%
|
| 69.94%
| 86.93%
|
(See Notes to Fund
Performance Overview on page 16.)
Performance Review
The Fund generated a NAV
return of -5.57% during the period covered by this report. During the same period, the Nasdaq US 500 Large CapTM Index (the “Benchmark”) generated a return of -8.29%. The Information Technology sector received the greatest allocation and also
contributed the greatest drag to the Fund’s overall return during the same period. This sector carried an average weight of 28.5% and contributed -2.1% to the Fund’s return. During the same period, the
Consumer Discretionary and Energy sectors had the greatest positive contributions to the Fund’s return, with a 0.3% contribution for each.
Riskalyze and Nasdaq
Riskalyze US Large CapTM Index are trademarks or service marks of Riskalyze, Inc. (“Riskalyze”) and have been licensed for use for certain purposes by First
Trust. The Fund is not sponsored, endorsed, sold or promoted by Riskalyze, and Riskalyze makes no representation regarding the advisability of trading in the Fund. The Nasdaq Riskalyze US Large CapTM Index (“Riskalyze Index”) is a product of Riskalyze, Inc. (“Riskalyze”). RISKALYZE® and NASDAQ RISKALYZE US LARGE CAPTM INDEX are trademarks of Riskalyze. Nasdaq® is a trademark of Nasdaq, Inc.
Fund Performance
Overview (Unaudited) (Continued)
Large Cap US Equity Select ETF (RNLC)
(Continued)
| Sector Allocation
| % of Total
Investments
|
| Information Technology
| 27.7%
|
| Health Care
| 15.0
|
| Industrials
| 12.3
|
| Financials
| 11.2
|
| Consumer Discretionary
| 9.6
|
| Consumer Staples
| 7.4
|
| Energy
| 5.0
|
| Communication Services
| 3.3
|
| Materials
| 2.9
|
| Utilities
| 2.8
|
| Real Estate
| 2.8
|
| Total
| 100.0%
|
| Top Ten Holdings
| % of Total
Investments
|
| NVIDIA Corp.
| 1.3%
|
| Monolithic Power Systems, Inc.
| 1.0
|
| Skyworks Solutions, Inc.
| 0.9
|
| Apple, Inc.
| 0.9
|
| Lam Research Corp.
| 0.9
|
| Applied Materials, Inc.
| 0.9
|
| Seagate Technology Holdings PLC
| 0.9
|
| Entegris, Inc.
| 0.9
|
| Intel Corp.
| 0.8
|
| Teradyne, Inc.
| 0.8
|
| Total
| 9.3%
|
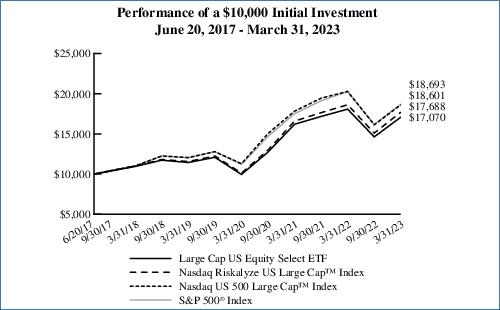
Performance figures assume reinvestment of all distributions and do not reflect the deduction of taxes that a shareholder would pay on Fund distributions or the redemption or sale of Fund shares. An index is a
statistical composite that tracks a specified financial market or sector. Unlike the Fund, the indices do not actually hold a portfolio of securities and therefore do not incur the expenses incurred by the Fund. These
expenses negatively impact the performance of the Fund. The Fund’s past performance does not predict future performance.
Frequency
Distribution of Discounts and Premiums
Information
showing the number of days the market price of the Fund’s shares was greater (at a premium) and less (at a discount) than the Fund’s net asset value for the most recently completed year, and the most
recently completed calendar quarters since that year (or life of the Fund, if shorter), is available at https://www.ftportfolios.com/Retail/etf/home.aspx.
Fund Performance
Overview (Unaudited) (Continued)
Mid Cap US Equity Select ETF (RNMC)
The Mid Cap US Equity
Select ETF (the “Fund”) seeks investment results that correspond generally to the price and yield (before the Fund’s fees and expenses) of an equity index called the Nasdaq Riskalyze US Mid CapTM Index (the “Index”). The shares of the Fund are listed and trade on The Nasdaq Stock Market LLC under the ticker symbol
“RNMC.” The Fund normally invests at least 90% of its net assets (plus any borrowings for investment purposes) in the common stocks and real estate investment trusts that comprise the Index.
The Index is owned and
was developed and sponsored by Riskalyze, Inc. (the “Index Provider”). According to the Index Provider, the Index is designed to select dividend-paying US mid cap securities that are included in the Nasdaq
US 600 Mid CapTM Index (the “Base Index”) and have paid a dividend in the trailing twelve months (based on ex-date). The Base Index is a
comprehensive, rules-based index designed to measure stock market performance of mid cap US companies, as determined by Nasdaq, Inc.
| Performance
|
|
|
|
|
|
|
|
|
| Average Annual Total Returns
|
| Cumulative Total Returns
|
|
| 1 Year
Ended
3/31/23
| 5 Years
Ended
3/31/23
| Inception
(6/20/17)
to 3/31/23
|
| 5 Years
Ended
3/31/23
| Inception
(6/20/17)
to 3/31/23
|
| Fund Performance
|
|
|
|
|
|
|
| NAV
| -4.47%
| 7.09%
| 7.54%
|
| 40.87%
| 52.19%
|
| Market Price
| -4.48%
| 7.08%
| 7.53%
|
| 40.75%
| 52.13%
|
| Index Performance
|
|
|
|
|
|
|
| Nasdaq Riskalyze US Mid CapTM Index
| -3.94%
| 7.74%
| 8.19%
|
| 45.20%
| 57.63%
|
| Nasdaq US 600 Mid CapTM Index
| -9.77%
| 6.73%
| 7.78%
|
| 38.46%
| 54.18%
|
| S&P MidCap 400® Index
| -5.12%
| 7.67%
| 8.20%
|
| 44.72%
| 57.70%
|
(See Notes to Fund
Performance Overview on page 16.)
Performance Review
The Fund generated a NAV
return of -4.47% during the period covered by this report. During the same period, the Nasdaq US 600 Mid CapTM Index (the “Benchmark”) generated a return of -9.77%. Multiple sectors received nearly the same allocation in the Fund during the
same period. The greatest allocation in the Fund was the Industrials sector, which had an average weight of 18.3% and a contribution of 1.2% to the Fund’s total return, which was also the greatest of any sector.
The greatest drag on the Fund’s return came from the investments in the Financials and Real Estate sectors. Investments in these sectors contributed approximately -1.9% each to Fund’s return.
Riskalyze and Nasdaq
Riskalyze US Mid CapTM Index are trademarks or service marks of Riskalyze, Inc. (“Riskalyze”) and have been licensed for use for certain purposes by First
Trust. The Fund is not sponsored, endorsed, sold or promoted by Riskalyze, and Riskalyze makes no representation regarding the advisability of trading in the Fund. The Nasdaq Riskalyze US Mid CapTM Index (“Riskalyze Index”) is a product of Riskalyze, Inc. (“Riskalyze”). RISKALYZE® and NASDAQ RISKALYZE US MID CAPTM INDEX are trademarks of Riskalyze. Nasdaq® is a trademark of Nasdaq, Inc.
Fund Performance
Overview (Unaudited) (Continued)
Mid Cap US Equity Select ETF (RNMC)
(Continued)
| Sector Allocation
| % of Total
Investments
|
| Industrials
| 20.0%
|
| Consumer Discretionary
| 16.2
|
| Financials
| 14.9
|
| Health Care
| 11.6
|
| Information Technology
| 10.7
|
| Materials
| 6.7
|
| Real Estate
| 6.5
|
| Energy
| 4.0
|
| Utilities
| 3.9
|
| Consumer Staples
| 3.0
|
| Communication Services
| 2.5
|
| Total
| 100.0%
|
| Top Ten Holdings
| % of Total
Investments
|
| DENTSPLY SIRONA, Inc.
| 1.2%
|
| Bruker Corp.
| 1.1
|
| Universal Display Corp.
| 1.1
|
| National Instruments Corp.
| 1.1
|
| Chemed Corp.
| 1.0
|
| Perrigo Co. PLC
| 1.0
|
| Select Medical Holdings Corp.
| 1.0
|
| Teleflex, Inc.
| 1.0
|
| Ensign Group (The), Inc.
| 1.0
|
| Jabil, Inc.
| 1.0
|
| Total
| 10.5%
|

Performance figures assume reinvestment of all distributions and do not reflect the deduction of taxes that a shareholder would pay on Fund distributions or the redemption or sale of Fund shares. An index is a
statistical composite that tracks a specified financial market or sector. Unlike the Fund, the indices do not actually hold a portfolio of securities and therefore do not incur the expenses incurred by the Fund. These
expenses negatively impact the performance of the Fund. The Fund’s past performance does not predict future performance.
Frequency
Distribution of Discounts and Premiums
Information
showing the number of days the market price of the Fund’s shares was greater (at a premium) and less (at a discount) than the Fund’s net asset value for the most recently completed year, and the most
recently completed calendar quarters since that year (or life of the Fund, if shorter), is available at https://www.ftportfolios.com/Retail/etf/home.aspx.
Fund Performance
Overview (Unaudited) (Continued)
Small Cap US Equity Select ETF (RNSC)
The Small Cap US Equity
Select ETF (the “Fund”) seeks investment results that correspond generally to the price and yield (before the Fund’s fees and expenses) of an equity index called the Nasdaq Riskalyze US Small
CapTM Index (the “Index”). The shares of the Fund are listed and trade on The Nasdaq Stock Market LLC under the ticker symbol
“RNSC.” The Fund normally invests at least 90% of its net assets (plus any borrowings for investment purposes) in the common stocks and real estate investment trusts that comprise the Index.
The Index is owned and
was developed and sponsored by Riskalyze, Inc. (the “Index Provider”). According to the Index Provider, the Index is designed to select dividend-paying US small cap securities that are included in the
Nasdaq US 700 Small CapTM Index (the “Base Index”) and have paid a dividend in the trailing twelve months (based on ex-date). The Base Index is a
comprehensive, rules-based index designed to measure stock market performance of small cap US companies, as determined by Nasdaq, Inc.
| Performance
|
|
|
|
|
|
|
|
|
| Average Annual Total Returns
|
| Cumulative Total Returns
|
|
| 1 Year
Ended
3/31/23
| 5 Years
Ended
3/31/23
| Inception
(6/20/17)
to 3/31/23
|
| 5 Years
Ended
3/31/23
| Inception
(6/20/17)
to 3/31/23
|
| Fund Performance
|
|
|
|
|
|
|
| NAV
| -6.28%
| 6.80%
| 7.15%
|
| 38.97%
| 49.05%
|
| Market Price
| -6.41%
| 6.77%
| 7.14%
|
| 38.77%
| 48.98%
|
| Index Performance
|
|
|
|
|
|
|
| Nasdaq Riskalyze US Small CapTM Index
| -5.73%
| 7.50%
| 7.86%
|
| 43.59%
| 54.81%
|
| Nasdaq US 700 Small CapTM Index
| -12.49%
| 6.33%
| 7.19%
|
| 35.91%
| 49.39%
|
| S&P SmallCap 600® Index
| -8.82%
| 6.30%
| 7.52%
|
| 35.71%
| 52.06%
|
(See Notes to Fund
Performance Overview on page 16.)
Performance Review
The Fund generated a NAV
return of -6.28% during the period covered by this report. During the same period, the Nasdaq US 700 Small CapTM Index (the “Benchmark”) generated a return of -12.49%. The Fund’s allocation to the Financials sector during the same period
was the greatest of any sector at 17.8%. This sector also contributed the greatest drag to the Fund’s return at -3.4%. The greatest positive contributor to the Fund’s return was the Information Technology
sector. Investments in this sector carried an average weight of 12.8% and contributed 2.4% to the Fund’s return.
Riskalyze and Nasdaq
Riskalyze US Small CapTM Index are trademarks or service marks of Riskalyze, Inc. (“Riskalyze”) and have been licensed for use for certain purposes by First
Trust. The Fund is not sponsored, endorsed, sold or promoted by Riskalyze, and Riskalyze makes no representation regarding the advisability of trading in the Fund. The Nasdaq Riskalyze US Small CapTM Index (“Riskalyze Index”) is a product of Riskalyze, Inc. (“Riskalyze”). RISKALYZE® and NASDAQ RISKALYZE US SMALL CAPTM INDEX are trademarks of Riskalyze. Nasdaq® is a trademark of Nasdaq, Inc.
Fund Performance
Overview (Unaudited) (Continued)
Small Cap US Equity Select ETF (RNSC)
(Continued)
| Sector Allocation
| % of Total
Investments
|
| Industrials
| 16.9%
|
| Financials
| 15.5
|
| Health Care
| 15.2
|
| Consumer Discretionary
| 12.5
|
| Information Technology
| 11.7
|
| Real Estate
| 6.5
|
| Consumer Staples
| 5.8
|
| Energy
| 5.2
|
| Materials
| 4.4
|
| Communication Services
| 3.9
|
| Utilities
| 2.4
|
| Total
| 100.0%
|
| Top Ten Holdings
| % of Total
Investments
|
| U.S. Physical Therapy, Inc.
| 3.0%
|
| CONMED Corp.
| 2.9
|
| Atrion Corp.
| 2.8
|
| Embecta Corp.
| 2.8
|
| Patterson Cos., Inc.
| 2.4
|
| Pegasystems, Inc.
| 1.6
|
| Shutterstock, Inc.
| 1.5
|
| CTS Corp.
| 1.4
|
| Simulations Plus, Inc.
| 1.3
|
| Advanced Energy Industries, Inc.
| 1.3
|
| Total
| 21.0%
|
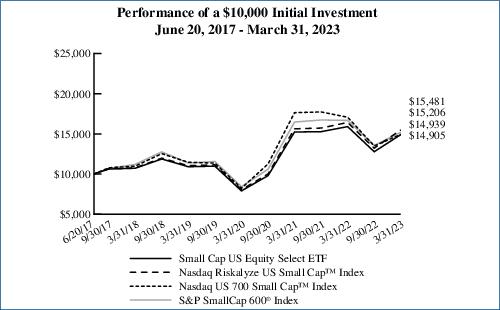
Performance figures assume reinvestment of all distributions and do not reflect the deduction of taxes that a shareholder would pay on Fund distributions or the redemption or sale of Fund shares. An index is a
statistical composite that tracks a specified financial market or sector. Unlike the Fund, the indices do not actually hold a portfolio of securities and therefore do not incur the expenses incurred by the Fund. These
expenses negatively impact the performance of the Fund. The Fund’s past performance does not predict future performance.
Frequency
Distribution of Discounts and Premiums
Information
showing the number of days the market price of the Fund’s shares was greater (at a premium) and less (at a discount) than the Fund’s net asset value for the most recently completed year, and the most
recently completed calendar quarters since that year (or life of the Fund, if shorter), is available at https://www.ftportfolios.com/Retail/etf/home.aspx.
Fund Performance
Overview (Unaudited) (Continued)
US Equity Dividend Select ETF (RNDV)
The US Equity Dividend
Select ETF (the “Fund”) seeks investment results that correspond generally to the price and yield (before the Fund’s fees and expenses) of an equity index called the Nasdaq Riskalyze US Large Cap
Select DividendTM Index (the “Index”). The shares of the Fund are listed and trade on The Nasdaq Stock Market LLC under the ticker symbol
“RNDV.” The Fund normally invests at least 90% of its net assets (plus any borrowings for investment purposes) in the common stocks and real estate investment trusts that comprise the Index.
The Index is owned and
was developed and sponsored by Riskalyze, Inc. (the “Index Provider”). According to the Index Provider, the Index is designed to select dividend-paying US securities that (i) are included in the Nasdaq US
500 Large CapTM Index (the “Base Index”); (ii) have paid a dividend in the trailing twelve months (based on the ex-date); and (iii) have a trailing
twelve-month dividend yield higher than the index yield of the Base Index. The Base Index is a comprehensive, rules-based index designed to measure stock market performance of large cap US companies, as determined by
Nasdaq, Inc.
| Performance
|
|
|
|
|
|
|
|
|
| Average Annual Total Returns
|
| Cumulative Total Returns
|
|
| 1 Year
Ended
3/31/23
| 5 Years
Ended
3/31/23
| Inception
(6/20/17)
to 3/31/23
|
| 5 Years
Ended
3/31/23
| Inception
(6/20/17)
to 3/31/23
|
| Fund Performance
|
|
|
|
|
|
|
| NAV
| -4.28%
| 9.18%
| 9.35%
|
| 55.17%
| 67.58%
|
| Market Price
| -4.40%
| 9.17%
| 9.35%
|
| 55.09%
| 67.65%
|
| Index Performance
|
|
|
|
|
|
|
| Nasdaq Riskalyze US Large Cap Select DividendTM Index
| -3.83%
| 9.79%
| 9.95%
|
| 59.49%
| 72.95%
|
| Nasdaq US 500 Large CapTM Index
| -8.29%
| 11.04%
| 11.34%
|
| 68.84%
| 86.01%
|
| S&P 500® Index
| -7.73%
| 11.19%
| 11.43%
|
| 69.94%
| 86.93%
|
(See Notes to Fund
Performance Overview on page 16.)
Performance Review
The Fund generated a NAV
return of -4.28% during the period covered by this report. During the same period, the Nasdaq US 500 Large CapTM Index (the “Benchmark”) generated a return of -8.29%. Investments in the Information Technology sector were by far the largest
allocation in the Fund during the same period. The Information Technology sector holdings in the Fund carried an average weight of 28.5%. The Financials sector was the largest drag to the Fund’s total return
with a contribution of -1.9%. The sector with the greatest contribution to the Fund’s return was the Health Care sector with a contribution of 0.8%.
Riskalyze and Nasdaq
Riskalyze US Large Cap Select DividendTM Index are trademarks or service marks of Riskalyze, Inc. (“Riskalyze”) and have been licensed for use for certain purposes by First
Trust. The Fund is not sponsored, endorsed, sold or promoted by Riskalyze, and Riskalyze makes no representation regarding the advisability of trading in the Fund. The Nasdaq Riskalyze US Large Cap Select
DividendTM Index (“Riskalyze Index”) is a product of Riskalyze, Inc. (“Riskalyze”). RISKALYZE® and NASDAQ RISKALYZE US LARGE CAP SELECT DIVIDENDTM INDEX are trademarks of Riskalyze. Nasdaq® is a trademark of Nasdaq, Inc.
Fund Performance
Overview (Unaudited) (Continued)
US Equity Dividend Select ETF (RNDV)
(Continued)
| Sector Allocation
| % of Total
Investments
|
| Information Technology
| 27.7%
|
| Health Care
| 14.3
|
| Financials
| 11.3
|
| Industrials
| 10.6
|
| Consumer Discretionary
| 10.0
|
| Consumer Staples
| 7.0
|
| Communication Services
| 5.2
|
| Energy
| 5.2
|
| Utilities
| 3.1
|
| Materials
| 2.8
|
| Real Estate
| 2.8
|
| Total
| 100.0%
|
| Top Ten Holdings
| % of Total
Investments
|
| Intel Corp.
| 3.3%
|
| Seagate Technology Holdings PLC
| 3.2
|
| International Business Machines Corp.
| 2.1
|
| HP, Inc.
| 2.0
|
| Paramount Global, Class B
| 1.9
|
| Medtronic PLC
| 1.8
|
| Corning, Inc.
| 1.8
|
| AbbVie, Inc.
| 1.8
|
| NetApp, Inc.
| 1.7
|
| Gilead Sciences, Inc.
| 1.7
|
| Total
| 21.3%
|
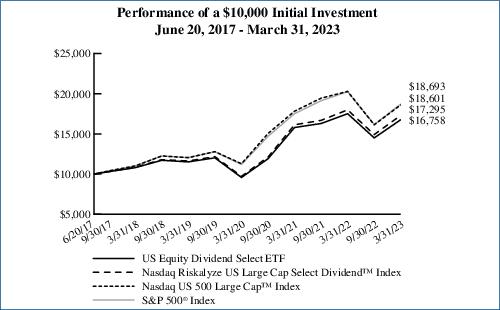
Performance figures assume reinvestment of all distributions and do not reflect the deduction of taxes that a shareholder would pay on Fund distributions or the redemption or sale of Fund shares. An index is a
statistical composite that tracks a specified financial market or sector. Unlike the Fund, the indices do not actually hold a portfolio of securities and therefore do not incur the expenses incurred by the Fund. These
expenses negatively impact the performance of the Fund. The Fund’s past performance does not predict future performance.
Frequency
Distribution of Discounts and Premiums
Information
showing the number of days the market price of the Fund’s shares was greater (at a premium) and less (at a discount) than the Fund’s net asset value for the most recently completed year, and the most
recently completed calendar quarters since that year (or life of the Fund, if shorter), is available at https://www.ftportfolios.com/Retail/etf/home.aspx.
Notes to Fund
Performance Overview (Unaudited)
Total returns for the
periods since inception are calculated from the inception date of each Fund. “Average Annual Total Returns” represent the average annual change in value of an investment over the periods indicated.
“Cumulative Total Returns” represent the total change in value of an investment over the periods indicated.
Each Fund’s per
share net asset value (“NAV”) is the value of one share of the Fund and is computed by dividing the value of all assets of the Fund (including accrued interest and dividends), less all liabilities
(including accrued expenses and dividends declared but unpaid), by the total number of outstanding shares. The price used to calculate market return (“Market Price”) is determined by using the midpoint of
the national best bid and offer price (“NBBO”) as of the time that the Fund’s NAV is calculated. Under SEC rules, the NBBO consists of the highest displayed buy and lowest sell prices among the
various exchanges trading the Fund at the time the Fund’s NAV is calculated. Prior to January 1, 2019, the price used was the midpoint between the highest bid and the lowest offer on the stock exchange on
which shares of the Fund were listed for trading as of the time that the Fund’s NAV was calculated. Since shares of each Fund did not trade in the secondary market until after the Fund’s inception, for the
period from inception to the first day of secondary market trading in shares of the Fund, the NAV of each Fund is used as a proxy for the secondary market trading price to calculate market returns. NAV and market
returns assume that all distributions have been reinvested in each Fund at NAV and Market Price, respectively.
An index is a statistical
composite that tracks a specified financial market or sector. Unlike each Fund, the indices do not actually hold a portfolio of securities and therefore do not incur the expenses incurred by each Fund. These expenses
negatively impact the performance of each Fund. Also, market returns do not include brokerage commissions that may be payable on secondary market transactions. If brokerage commissions were included, market returns
would be lower. The total returns presented reflect the reinvestment of dividends on securities in the indices. The returns presented do not reflect the deduction of taxes that a shareholder would pay on Fund
distributions or the redemption or sale of Fund shares. The investment return and principal value of shares of each Fund will vary with changes in market conditions. Shares of each Fund may be worth more or less than
their original cost when they are redeemed or sold in the market. Each Fund’s past performance is no guarantee of future performance.
First Trust Exchange-Traded Fund VI
Understanding Your Fund
Expenses
March 31, 2023
(Unaudited)
As a shareholder of
Developed International Equity Select ETF, Emerging Markets Equity Select ETF, Large Cap US Equity Select ETF, Mid Cap US Equity Select ETF, Small Cap US Equity Select ETF or US Equity Dividend Select ETF (each a
“Fund” and collectively, the “Funds”), you incur two types of costs: (1) transaction costs; and (2) ongoing costs, including management fees, distribution and/or service (12b-1) fees, if any,
and other Fund expenses. This Example is intended to help you understand your ongoing costs of investing in the Funds and to compare these costs with the ongoing costs (in U.S. dollars) of investing in other funds.
The Example is based on
an investment of $1,000 invested at the beginning of the period and held through the six-month period ended March 31, 2023.
Actual Expenses
The first line in the
following table provides information about actual account values and actual expenses. You may use the information in this line, together with the amount you invested, to estimate the expenses that you paid over the
period. Simply divide your account value by $1,000 (for example, an $8,600 account value divided by $1,000 = 8.6), then multiply the result by the number in the first line under the heading entitled “Expenses
Paid During the Six-Month Period” to estimate the expenses you paid on your account during this six-month period.
Hypothetical Example for
Comparison Purposes
The second line in the
following table provides information about hypothetical account values and hypothetical expenses based on each Fund’s actual expense ratio and an assumed rate of return of 5% per year before expenses, which is
not each Fund’s actual return. The hypothetical account values and expenses may not be used to estimate the actual ending account balance or expenses you paid for the period. You may use this information to
compare the ongoing costs of investing in the Funds and other funds. To do so, compare this 5% hypothetical example with the 5% hypothetical examples that appear in the shareholder reports of the other funds.
Please note that the
expenses shown in the table are meant to highlight your ongoing costs only and do not reflect any transactional costs such as brokerage commissions. Therefore, the second line in the table is useful in comparing
ongoing costs only, and will not help you determine the relative total costs of owning different funds. In addition, if these transactional costs were included, your costs would have been higher.
|
| Beginning
Account Value
October 1, 2022
| Ending
Account Value
March 31, 2023
| Annualized
Expense Ratio
Based on the
Six-Month
Period
| Expenses Paid
During the
Six-Month
Period (a)
|
| Developed International Equity Select ETF (RNDM)
|
| Actual
| $1,000.00
| $1,234.50
| 0.65%
| $3.62
|
| Hypothetical (5% return before expenses)
| $1,000.00
| $1,021.69
| 0.65%
| $3.28
|
| Emerging Markets Equity Select ETF (RNEM)
|
| Actual
| $1,000.00
| $1,131.90
| 0.75%
| $3.99
|
| Hypothetical (5% return before expenses)
| $1,000.00
| $1,021.19
| 0.75%
| $3.78
|
| Large Cap US Equity Select ETF (RNLC)
|
| Actual
| $1,000.00
| $1,167.00
| 0.60%
| $3.24
|
| Hypothetical (5% return before expenses)
| $1,000.00
| $1,021.94
| 0.60%
| $3.02
|
| Mid Cap US Equity Select ETF (RNMC)
|
| Actual
| $1,000.00
| $1,159.00
| 0.60%
| $3.23
|
| Hypothetical (5% return before expenses)
| $1,000.00
| $1,021.94
| 0.60%
| $3.02
|
| Small Cap US Equity Select ETF (RNSC)
|
| Actual
| $1,000.00
| $1,166.00
| 0.60%
| $3.24
|
| Hypothetical (5% return before expenses)
| $1,000.00
| $1,021.94
| 0.60%
| $3.02
|
| US Equity Dividend Select ETF (RNDV)
|
| Actual
| $1,000.00
| $1,155.60
| 0.50%
| $2.69
|
| Hypothetical (5% return before expenses)
| $1,000.00
| $1,022.44
| 0.50%
| $2.52
|
| (a)
| Expenses are equal to the annualized expense ratios as indicated in the table multiplied by the average account value over the period (October 1, 2022 through
March 31, 2023), multiplied by 182/365 (to reflect the six-month period).
|
Developed International Equity Select ETF
(RNDM)
Portfolio of Investments
March 31, 2023
| Shares
|
| Description
|
| Value
|
| COMMON STOCKS (a) – 97.7%
|
|
|
| Australia – 5.2%
|
|
|
| 3,679
|
| ANZ Group Holdings Ltd. (b)
|
| $56,694
|
| 7,097
|
| APA Group (b)
|
| 48,211
|
| 1,169
|
| ASX Ltd. (b)
|
| 51,051
|
| 6,241
|
| Aurizon Holdings Ltd. (b)
|
| 14,057
|
| 1,887
|
| Brambles Ltd. (b)
|
| 17,014
|
| 2,074
|
| Coles Group Ltd. (b)
|
| 25,060
|
| 925
|
| Commonwealth Bank of Australia (b)
|
| 61,074
|
| 394
|
| CSL Ltd. (b)
|
| 76,306
|
| 18,236
|
| Insurance Australia Group Ltd. (b)
|
| 57,401
|
| 2,414
|
| Lendlease Corp., Ltd. (b)
|
| 11,748
|
| 24,174
|
| Medibank Pvt Ltd. (b)
|
| 54,553
|
| 2,912
|
| National Australia Bank Ltd. (b)
|
| 54,260
|
| 1,270
|
| Seven Group Holdings Ltd. (b)
|
| 19,728
|
| 3,668
|
| Sonic Healthcare Ltd. (b)
|
| 85,989
|
| 8,363
|
| Suncorp Group Ltd. (b)
|
| 67,950
|
| 14,884
|
| Telstra Corp., Ltd. (b)
|
| 42,143
|
| 1,745
|
| Transurban Group (b)
|
| 16,662
|
| 2,711
|
| Treasury Wine Estates Ltd. (b)
|
| 23,799
|
| 2,560
|
| Washington H Soul Pattinson & Co., Ltd. (b)
|
| 51,883
|
| 2,983
|
| Wesfarmers Ltd. (b)
|
| 100,821
|
| 4,064
|
| Westpac Banking Corp. (b)
|
| 59,170
|
| 1,004
|
| Woolworths Group Ltd. (b)
|
| 25,524
|
|
|
|
|
| 1,021,098
|
|
|
| Austria – 0.2%
|
|
|
| 91
|
| ANDRITZ AG (b)
|
| 6,157
|
| 421
|
| Erste Group Bank AG (b)
|
| 13,948
|
| 185
|
| OMV AG (b)
|
| 8,496
|
| 154
|
| Verbund AG (b)
|
| 13,395
|
|
|
|
|
| 41,996
|
|
|
| Belgium – 0.9%
|
|
|
| 241
|
| Ageas S.A./N.V. (b)
|
| 10,425
|
| 1,208
|
| Anheuser-Busch InBev S.A./N.V. (b)
|
| 80,525
|
| 30
|
| D’ieteren Group (b)
|
| 5,837
|
| 49
|
| Elia Group S.A./N.V. (b)
|
| 6,471
|
| 126
|
| Groupe Bruxelles Lambert S.A. (b)
|
| 10,753
|
| 186
|
| KBC Group N.V. (b)
|
| 12,780
|
| 176
|
| Proximus S.A.D.P. (b)
|
| 1,702
|
| 51
|
| Sofina S.A. (b)
|
| 11,455
|
| 88
|
| Solvay S.A. (b)
|
| 10,064
|
| 249
|
| UCB S.A. (b)
|
| 22,255
|
| 234
|
| Umicore S.A. (b)
|
| 7,938
|
|
|
|
|
| 180,205
|
|
|
| Bermuda – 0.0%
|
|
|
| 1,200
|
| Hongkong Land Holdings Ltd. (b)
|
| 5,279
|
| Shares
|
| Description
|
| Value
|
|
|
|
|
| Canada – 7.9%
|
|
|
| 1,599
|
| Algonquin Power & Utilities Corp.
|
| $13,417
|
| 763
|
| Bank of Montreal
|
| 67,961
|
| 1,405
|
| Bank of Nova Scotia (The)
|
| 70,764
|
| 1,204
|
| BCE, Inc.
|
| 53,933
|
| 1,527
|
| Canadian Imperial Bank of Commerce
|
| 64,752
|
| 671
|
| Canadian Utilities Ltd., Class A
|
| 18,698
|
| 514
|
| Capital Power Corp.
|
| 15,836
|
| 432
|
| Emera, Inc.
|
| 17,747
|
| 9,463
|
| Enbridge, Inc.
|
| 360,805
|
| 460
|
| Fortis, Inc.
|
| 19,554
|
| 237
|
| George Weston Ltd.
|
| 31,407
|
| 3,096
|
| Great-West Lifeco, Inc.
|
| 82,056
|
| 714
|
| Hydro One Ltd. (c) (d)
|
| 20,329
|
| 472
|
| Intact Financial Corp.
|
| 67,550
|
| 495
|
| Metro, Inc.
|
| 27,228
|
| 1,066
|
| National Bank of Canada
|
| 76,249
|
| 596
|
| Northland Power, Inc. (CAD)
|
| 14,941
|
| 2,966
|
| Power Corp. of Canada
|
| 75,801
|
| 742
|
| Royal Bank of Canada
|
| 70,961
|
| 1,681
|
| Sun Life Financial, Inc.
|
| 78,534
|
| 2,542
|
| TELUS Corp.
|
| 50,464
|
| 651
|
| Thomson Reuters Corp.
|
| 84,700
|
| 727
|
| TMX Group Ltd.
|
| 73,426
|
| 1,090
|
| Toronto-Dominion Bank (The)
|
| 65,287
|
| 129
|
| Waste Connections, Inc.
|
| 17,954
|
|
|
|
|
| 1,540,354
|
|
|
| Cayman Islands – 0.5%
|
|
|
| 2,123
|
| CK Asset Holdings Ltd. (b)
|
| 12,871
|
| 2,093
|
| CK Hutchison Holdings Ltd. (b)
|
| 12,949
|
| 5,200
|
| Sands China Ltd. (b) (e)
|
| 18,065
|
| 7,200
|
| Shimao Group Holdings Ltd. (e) (f) (g)
|
| 2,027
|
| 14,446
|
| Sino Biopharmaceutical Ltd. (b)
|
| 8,097
|
| 6,667
|
| SITC International Holdings Co., Ltd. (b)
|
| 14,328
|
| 9,731
|
| WH Group Ltd. (b) (c) (d)
|
| 5,801
|
| 2,400
|
| Wharf Real Estate Investment Co., Ltd. (b)
|
| 13,818
|
|
|
|
|
| 87,956
|
|
|
| Denmark – 2.7%
|
|
|
| 13
|
| AP Moller - Maersk A.S., Class B (b)
|
| 23,630
|
| 127
|
| Carlsberg A.S., Class B (b)
|
| 19,706
|
| 680
|
| Chr Hansen Holding A.S. (b)
|
| 51,728
|
| 328
|
| Coloplast A.S., Class B (b)
|
| 43,187
|
| 822
|
| Danske Bank A.S. (b) (e)
|
| 16,538
|
| 1,348
|
| Demant A.S. (b) (e)
|
| 47,323
|
| 196
|
| DSV A.S. (b)
|
| 38,004
|
| 104
|
| Genmab A.S. (b) (e)
|
| 39,313
|
| 1,900
|
| GN Store Nord A.S. (b) (e)
|
| 42,603
|
| 10,477
|
| H Lundbeck A.S. (b)
|
| 48,480
|
Page 18
See Notes to Financial
Statements
Developed International Equity Select ETF
(RNDM)
Portfolio of Investments
(Continued)
March 31, 2023
| Shares
|
| Description
|
| Value
|
| COMMON STOCKS (a) (Continued)
|
|
|
| Denmark (Continued)
|
|
|
| 335
|
| Novo Nordisk A.S., Class B (b)
|
| $53,205
|
| 665
|
| Novozymes A.S., Class B (b)
|
| 34,050
|
| 244
|
| Orsted A.S. (b) (c) (d)
|
| 20,805
|
| 105
|
| Pandora A.S. (b)
|
| 10,079
|
| 497
|
| Tryg A.S. (b)
|
| 10,867
|
| 1,236
|
| Vestas Wind Systems A/S (b)
|
| 36,023
|
|
|
|
|
| 535,541
|
|
|
| Finland – 1.3%
|
|
|
| 429
|
| Elisa Oyj (b)
|
| 25,874
|
| 561
|
| Fortum Oyj (b)
|
| 8,594
|
| 348
|
| Kesko Oyj, Class B (b)
|
| 7,479
|
| 222
|
| Kone Oyj, Class B (b)
|
| 11,578
|
| 1,281
|
| Metso Outotec Oyj (b)
|
| 13,988
|
| 555
|
| Neste Oyj (b)
|
| 27,419
|
| 4,502
|
| Nokia Oyj (b)
|
| 22,100
|
| 3,514
|
| Nordea Bank Abp (b)
|
| 37,523
|
| 128
|
| Orion Oyj, Class B (b)
|
| 5,721
|
| 707
|
| Sampo Oyj, Class A (b)
|
| 33,360
|
| 1,290
|
| Stora Enso Oyj, Class R (b)
|
| 16,783
|
| 518
|
| UPM-Kymmene Oyj (b)
|
| 17,398
|
| 422
|
| Valmet Oyj (b)
|
| 13,700
|
| 1,334
|
| Wartsila OYJ Abp (b)
|
| 12,589
|
|
|
|
|
| 254,106
|
|
|
| France – 9.7%
|
|
|
| 716
|
| Air Liquide S.A. (b)
|
| 119,850
|
| 2,293
|
| AXA S.A. (b)
|
| 69,977
|
| 8,439
|
| Bollore SE (b)
|
| 52,167
|
| 1,484
|
| Bouygues S.A. (b)
|
| 50,050
|
| 1,734
|
| Bureau Veritas S.A. (b)
|
| 49,822
|
| 2,261
|
| Carrefour S.A. (b)
|
| 45,712
|
| 662
|
| Danone S.A. (b)
|
| 41,192
|
| 841
|
| Edenred (b)
|
| 49,774
|
| 483
|
| Eiffage S.A. (b)
|
| 52,268
|
| 3,985
|
| Engie S.A. (b)
|
| 63,061
|
| 685
|
| EssilorLuxottica S.A. (b)
|
| 123,521
|
| 957
|
| Eurazeo SE (b)
|
| 68,120
|
| 2,506
|
| Getlink SE (b)
|
| 41,273
|
| 3,825
|
| La Francaise des Jeux SAEM (b) (c) (d)
|
| 159,417
|
| 598
|
| Legrand S.A. (b)
|
| 54,641
|
| 353
|
| L’Oreal S.A. (b)
|
| 157,736
|
| 2,227
|
| Orange S.A. (b)
|
| 26,457
|
| 170
|
| Pernod Ricard S.A. (b)
|
| 38,493
|
| 1,226
|
| Sanofi (b)
|
| 132,995
|
| 1,801
|
| SEB S.A. (b)
|
| 204,925
|
| 153
|
| Teleperformance (b)
|
| 36,970
|
| 353
|
| Thales S.A. (b)
|
| 52,190
|
| 479
|
| Vinci S.A. (b)
|
| 54,914
|
| 14,620
|
| Vivendi SE (b)
|
| 147,831
|
|
|
|
|
| 1,893,356
|
|
|
| Germany – 8.5%
|
|
|
| 314
|
| Allianz SE (b)
|
| 72,483
|
| Shares
|
| Description
|
| Value
|
|
|
|
|
| Germany (Continued)
|
|
|
| 640
|
| Bayer AG (b)
|
| $40,884
|
| 1,865
|
| Bayerische Motoren Werke AG (b)
|
| 204,402
|
| 199
|
| Beiersdorf AG (b)
|
| 25,887
|
| 460
|
| Brenntag SE (b)
|
| 34,618
|
| 302
|
| Deutsche Boerse AG (b)
|
| 58,802
|
| 2,015
|
| Deutsche Post AG (b)
|
| 94,374
|
| 2,832
|
| Deutsche Telekom AG (b)
|
| 68,626
|
| 3,385
|
| E.ON SE (b)
|
| 42,227
|
| 1,664
|
| Evonik Industries AG (b)
|
| 35,009
|
| 1,045
|
| Fresenius Medical Care AG & Co., KGaA (b)
|
| 44,354
|
| 1,382
|
| Fresenius SE & Co., KGaA (b)
|
| 37,318
|
| 1,881
|
| GEA Group AG (b)
|
| 85,807
|
| 330
|
| Hannover Rueck SE (b)
|
| 64,542
|
| 1,535
|
| HeidelbergCement AG (b)
|
| 112,081
|
| 2,139
|
| Henkel AG & Co., KGaA (Preference Shares) (b)
|
| 167,343
|
| 243
|
| LEG Immobilien SE (b)
|
| 13,354
|
| 182
|
| Merck KGaA (b)
|
| 33,931
|
| 206
|
| Muenchener Rueckversicherungs-Gesellschaft AG in Muenchen (b)
|
| 72,025
|
| 707
|
| RWE AG (b)
|
| 30,421
|
| 945
|
| SAP SE (b)
|
| 119,326
|
| 1,537
|
| Scout24 AG (b) (c) (d)
|
| 91,419
|
| 286
|
| Symrise AG (b)
|
| 31,124
|
| 23,900
|
| Telefonica Deutschland Holding AG (b)
|
| 73,570
|
| 672
|
| Vonovia SE (b)
|
| 12,657
|
|
|
|
|
| 1,666,584
|
|
|
| Greece – 0.0%
|
|
|
| 254
|
| Hellenic Telecommunications Organization S.A. (b)
|
| 3,720
|
| 243
|
| OPAP S.A. (b)
|
| 3,898
|
|
|
|
|
| 7,618
|
|
|
| Hong Kong – 1.9%
|
|
|
| 7,451
|
| AIA Group Ltd. (b)
|
| 78,141
|
| 1,870
|
| CLP Holdings, Ltd. (b)
|
| 13,513
|
| 2,111
|
| Galaxy Entertainment Group Ltd. (b) (e)
|
| 14,121
|
| 6,838
|
| Hang Lung Properties Ltd. (b)
|
| 12,795
|
| 4,124
|
| Hang Seng Bank Ltd. (b)
|
| 58,624
|
| 3,782
|
| Henderson Land Development Co., Ltd. (b)
|
| 13,085
|
| 14,417
|
| Hong Kong & China Gas Co., Ltd. (b)
|
| 12,693
|
| 1,815
|
| Hong Kong Exchanges & Clearing Ltd. (b)
|
| 80,449
|
| 2,902
|
| MTR Corp., Ltd. (b)
|
| 14,006
|
| 4,393
|
| New World Development Co., Ltd. (b)
|
| 11,776
|
See Notes to Financial
Statements
Page 19
Developed International Equity Select ETF
(RNDM)
Portfolio of Investments
(Continued)
March 31, 2023
| Shares
|
| Description
|
| Value
|
| COMMON STOCKS (a) (Continued)
|
|
|
| Hong Kong (Continued)
|
|
|
| 2,419
|
| Power Assets Holdings Ltd. (b)
|
| $12,978
|
| 8,905
|
| Sino Land Co., Ltd. (b)
|
| 12,043
|
| 966
|
| Sun Hung Kai Properties Ltd. (b)
|
| 13,533
|
| 640
|
| Swire Pacific Ltd., Class A (b)
|
| 4,918
|
| 1,158
|
| Techtronic Industries Co., Ltd. (b)
|
| 12,547
|
|
|
|
|
| 365,222
|
|
|
| Ireland – 0.8%
|
|
|
| 2,244
|
| AIB Group PLC (b)
|
| 9,083
|
| 837
|
| Bank of Ireland Group PLC (b)
|
| 8,469
|
| 605
|
| CRH PLC (b)
|
| 30,565
|
| 555
|
| DCC PLC (b)
|
| 32,351
|
| 189
|
| Kerry Group PLC, Class A (b)
|
| 18,848
|
| 432
|
| Kingspan Group PLC (b)
|
| 29,603
|
| 289
|
| Ryanair Holdings PLC, ADR (e)
|
| 27,250
|
|
|
|
|
| 156,169
|
|
|
| Israel – 0.4%
|
|
|
| 46
|
| Azrieli Group Ltd. (b)
|
| 2,643
|
| 1,184
|
| Bank Hapoalim BM (b)
|
| 9,854
|
| 1,193
|
| Bank Leumi Le-Israel BM (b)
|
| 9,025
|
| 6,270
|
| Bezeq Israeli Telecommunication Corp., Ltd. (b)
|
| 8,536
|
| 29
|
| Elbit Systems Ltd. (b)
|
| 4,939
|
| 796
|
| ICL Group Ltd. (b)
|
| 5,394
|
| 2,054
|
| Israel Discount Bank Ltd., Class A (b)
|
| 10,090
|
| 287
|
| Mizrahi Tefahot Bank Ltd. (b)
|
| 8,997
|
| 54
|
| Nice, Ltd. (b) (e)
|
| 12,301
|
| 1,344
|
| Teva Pharmaceutical Industries Ltd. (b) (e)
|
| 11,934
|
|
|
|
|
| 83,713
|
|
|
| Italy – 1.9%
|
|
|
| 129
|
| Amplifon S.p.A. (b)
|
| 4,471
|
| 1,139
|
| Assicurazioni Generali S.p.A. (b)
|
| 22,694
|
| 2,467
|
| Banca Mediolanum S.p.A. (b)
|
| 22,331
|
| 31
|
| DiaSorin S.p.A. (b)
|
| 3,267
|
| 4,389
|
| Enel S.p.A. (b)
|
| 26,768
|
| 1,650
|
| Eni S.p.A. (b)
|
| 23,012
|
| 1,253
|
| FinecoBank Banca Fineco S.p.A. (b)
|
| 19,197
|
| 436
|
| Infrastrutture Wireless Italiane S.p.A. (b) (c) (d)
|
| 5,728
|
| 289
|
| Interpump Group S.p.A. (b)
|
| 16,207
|
| 9,374
|
| Intesa Sanpaolo S.p.A. (b)
|
| 24,058
|
| 3,882
|
| Italgas S.p.A. (b)
|
| 23,678
|
| 1,330
|
| Leonardo S.p.A. (b)
|
| 15,598
|
| 1,981
|
| Mediobanca Banca di Credito Finanziario S.p.A. (b)
|
| 19,907
|
| 268
|
| Moncler S.p.A. (b)
|
| 18,511
|
| 1,160
|
| Nexi S.P.A (b) (c) (d) (e)
|
| 9,427
|
| 2,049
|
| Poste Italiane S.p.A. (b) (c) (d)
|
| 20,895
|
| 327
|
| Prysmian S.p.A. (b)
|
| 13,731
|
| Shares
|
| Description
|
| Value
|
|
|
|
|
| Italy (Continued)
|
|
|
| 92
|
| Recordati Industria Chimica e Farmaceutica S.p.A. (b)
|
| $3,892
|
| 4,342
|
| Snam S.p.A. (b)
|
| 23,021
|
| 20,543
|
| Telecom Italia S.p.A. (b) (e)
|
| 6,775
|
| 2,966
|
| Terna-Rete Elettrica Nazionale S.p.A. (b)
|
| 24,343
|
| 1,526
|
| UniCredit S.p.A. (b)
|
| 28,762
|
|
|
|
|
| 376,273
|
|
|
| Japan – 18.8%
|
|
|
| 14,800
|
| Japan Post Holdings Co., Ltd. (b)
|
| 120,116
|
| 3,200
|
| Japan Tobacco, Inc. (b)
|
| 67,595
|
| 3,200
|
| KDDI Corp. (b)
|
| 98,681
|
| 3,400
|
| Kirin Holdings Co., Ltd. (b)
|
| 53,791
|
| 13,800
|
| McDonald’s Holdings Co., Japan Ltd. (b)
|
| 573,774
|
| 2,400
|
| MEIJI Holdings Co., Ltd. (b)
|
| 57,080
|
| 22,700
|
| Mitsubishi HC Capital, Inc. (b)
|
| 117,217
|
| 9,100
|
| Mizuho Financial Group, Inc. (b)
|
| 128,925
|
| 3,400
|
| Nippon Telegraph & Telephone Corp. (b)
|
| 101,601
|
| 800
|
| Nissin Foods Holdings Co., Ltd. (b)
|
| 73,152
|
| 6,200
|
| Otsuka Holdings Co., Ltd. (b)
|
| 196,848
|
| 8,400
|
| Secom Co., Ltd. (b)
|
| 517,673
|
| 29,100
|
| Sekisui House Ltd. (b)
|
| 593,094
|
| 9,300
|
| SoftBank Corp. (b)
|
| 107,357
|
| 3,500
|
| Sumitomo Mitsui Financial Group, Inc. (b)
|
| 140,061
|
| 7,500
|
| Takeda Pharmaceutical Co., Ltd. (b)
|
| 246,327
|
| 20,500
|
| Tobu Railway Co., Ltd. (b)
|
| 490,786
|
|
|
|
|
| 3,684,078
|
|
|
| Jersey – 0.2%
|
|
|
| 979
|
| Experian PLC (b)
|
| 32,236
|
|
|
| Luxembourg – 0.2%
|
|
|
| 471
|
| ArcelorMittal S.A. (b)
|
| 14,269
|
| 1,357
|
| Tenaris S.A. (b)
|
| 19,228
|
|
|
|
|
| 33,497
|
|
|
| Netherlands – 4.4%
|
|
|
| 549
|
| Aalberts N.V. (b)
|
| 25,933
|
| 1,549
|
| ABN AMRO Bank N.V. (b) (c) (d)
|
| 24,563
|
| 14
|
| Adyen N.V. (b) (c) (d) (e)
|
| 22,308
|
| 3,485
|
| Aegon N.V. (b)
|
| 14,962
|
| 167
|
| Akzo Nobel N.V. (b)
|
| 13,062
|
| 48
|
| Argenx SE (b) (e)
|
| 17,825
|
| 338
|
| ASM International N.V. (b)
|
| 137,195
|
| 182
|
| ASML Holding N.V. (b)
|
| 124,024
|
| 361
|
| ASR Nederland N.V. (b)
|
| 14,364
|
| 680
|
| Davide Campari-Milano N.V. (b)
|
| 8,297
|
| 792
|
| Euronext N.V. (b) (c) (d)
|
| 60,647
|
Page 20
See Notes to Financial
Statements
Developed International Equity Select ETF
(RNDM)
Portfolio of Investments
(Continued)
March 31, 2023
| Shares
|
| Description
|
| Value
|
| COMMON STOCKS (a) (Continued)
|
|
|
| Netherlands (Continued)
|
|
|
| 330
|
| Heineken Holding N.V. (b)
|
| $30,277
|
| 259
|
| Heineken N.V. (b)
|
| 27,830
|
| 79
|
| IMCD N.V. (b)
|
| 12,918
|
| 1,614
|
| ING Groep N.V. (b)
|
| 19,167
|
| 891
|
| Koninklijke Ahold Delhaize N.V. (b)
|
| 30,441
|
| 198
|
| Koninklijke DSM N.V. (b)
|
| 23,432
|
| 3,723
|
| Koninklijke KPN N.V. (b)
|
| 13,155
|
| 1,020
|
| Koninklijke Philips N.V. (b)
|
| 18,734
|
| 358
|
| NN Group N.V. (b)
|
| 12,999
|
| 259
|
| OCI N.V. (b)
|
| 8,780
|
| 1,465
|
| Prosus N.V. (b)
|
| 114,715
|
| 416
|
| Randstad N.V. (b)
|
| 24,696
|
| 1,379
|
| Universal Music Group N.V. (b)
|
| 34,923
|
| 267
|
| Wolters Kluwer N.V. (b)
|
| 33,705
|
|
|
|
|
| 868,952
|
|
|
| New Zealand – 0.2%
|
|
|
| 2,588
|
| Auckland International Airport Ltd. (b) (e)
|
| 14,084
|
| 1,019
|
| Fisher & Paykel Healthcare Corp., Ltd. (b)
|
| 17,034
|
| 2,383
|
| Spark New Zealand Ltd. (b)
|
| 7,550
|
| 153
|
| Xero Ltd. (b) (e)
|
| 9,280
|
|
|
|
|
| 47,948
|
|
|
| Norway – 0.7%
|
|
|
| 1,015
|
| Aker BP ASA (b)
|
| 24,893
|
| 1,269
|
| DNB Bank ASA (b)
|
| 22,710
|
| 899
|
| Equinor ASA (b)
|
| 25,557
|
| 127
|
| Kongsberg Gruppen ASA (b)
|
| 5,134
|
| 437
|
| Mowi ASA (b)
|
| 8,083
|
| 1,339
|
| Norsk Hydro ASA (b)
|
| 9,993
|
| 755
|
| Orkla ASA (b)
|
| 5,355
|
| 163
|
| Salmar ASA (b)
|
| 7,100
|
| 820
|
| Telenor ASA (b)
|
| 9,614
|
| 220
|
| TOMRA Systems ASA (b)
|
| 3,714
|
| 210
|
| Yara International ASA (b)
|
| 9,127
|
|
|
|
|
| 131,280
|
|
|
| Portugal – 0.2%
|
|
|
| 3,372
|
| EDP - Energias de Portugal S.A. (b)
|
| 18,374
|
| 1,068
|
| Galp Energia SGPS S.A. (b)
|
| 12,084
|
| 353
|
| Jeronimo Martins SGPS S.A. (b)
|
| 8,286
|
|
|
|
|
| 38,744
|
|
|
| Singapore – 1.2%
|
|
|
| 2,200
|
| Capitaland Investment Ltd. (b)
|
| 6,104
|
| 1,000
|
| City Developments Ltd. (b)
|
| 5,549
|
| 1,500
|
| DBS Group Holdings Ltd. (b)
|
| 37,293
|
| 7,800
|
| Genting Singapore Ltd. (b)
|
| 6,583
|
| 200
|
| Jardine Cycle & Carriage Ltd. (b)
|
| 4,710
|
| 2,700
|
| Keppel Corp., Ltd. (b)
|
| 11,455
|
| Shares
|
| Description
|
| Value
|
|
|
|
|
| Singapore (Continued)
|
|
|
| 4,200
|
| Oversea-Chinese Banking Corp., Ltd. (b)
|
| $39,151
|
| 1,200
|
| Singapore Airlines Ltd. (b)
|
| 5,176
|
| 5,300
|
| Singapore Exchange Ltd. (b)
|
| 37,532
|
| 2,000
|
| Singapore Technologies Engineering Ltd. (b)
|
| 5,506
|
| 10,100
|
| Singapore Telecommunications Ltd. (b)
|
| 18,714
|
| 1,900
|
| United Overseas Bank Ltd. (b)
|
| 42,615
|
| 1,200
|
| UOL Group Ltd. (b)
|
| 6,266
|
| 4,100
|
| Wilmar International Ltd. (b)
|
| 12,989
|
|
|
|
|
| 239,643
|
|
|
| South Korea – 4.3%
|
|
|
| 33
|
| CJ CheilJedang Corp. (b)
|
| 8,267
|
| 349
|
| Hana Financial Group, Inc. (b)
|
| 10,930
|
| 100
|
| Hyundai Glovis Co., Ltd. (b)
|
| 12,213
|
| 150
|
| Hyundai Mobis Co., Ltd. (b)
|
| 24,913
|
| 162
|
| Hyundai Motor Co. (b)
|
| 23,048
|
| 1,299
|
| Industrial Bank of Korea (b)
|
| 10,103
|
| 283
|
| KB Financial Group, Inc. (b)
|
| 10,336
|
| 398
|
| Kia Corp. (b)
|
| 24,838
|
| 351
|
| Korea Electric Power Corp. (b) (e)
|
| 4,864
|
| 1,296
|
| Korean Air Lines Co., Ltd. (b)
|
| 23,139
|
| 642
|
| KT Corp., ADR
|
| 7,280
|
| 153
|
| KT&G Corp. (b)
|
| 9,833
|
| 219
|
| LG Corp. (b)
|
| 13,945
|
| 754
|
| NAVER Corp. (b)
|
| 118,145
|
| 346
|
| POSCO Holdings, Inc. (b)
|
| 97,891
|
| 64
|
| Samsung Biologics Co., Ltd. (b) (c) (d) (e)
|
| 38,795
|
| 157
|
| Samsung C&T Corp. (b)
|
| 13,075
|
| 2,749
|
| Samsung Electronics Co., Ltd. (b)
|
| 135,941
|
| 67
|
| Samsung Fire & Marine Insurance Co., Ltd. (b)
|
| 10,591
|
| 198
|
| Samsung Life Insurance Co., Ltd. (b)
|
| 9,548
|
| 1,269
|
| Samsung SDS Co., Ltd. (b)
|
| 113,487
|
| 369
|
| Shinhan Financial Group Co., Ltd. (b)
|
| 10,024
|
| 229
|
| SK Telecom Co., Ltd. (b)
|
| 8,496
|
| 760
|
| SK, Inc. (b)
|
| 101,264
|
| 1,156
|
| Woori Financial Group, Inc. (b)
|
| 10,169
|
|
|
|
|
| 851,135
|
|
|
| Spain – 2.5%
|
|
|
| 53
|
| Acciona S.A. (b)
|
| 10,634
|
| 413
|
| ACS Actividades de Construccion y Servicios S.A. (b)
|
| 13,154
|
| 89
|
| Aena SME S.A. (b) (c) (d) (e)
|
| 14,392
|
| 522
|
| Amadeus IT Group S.A. (b) (e)
|
| 35,018
|
See Notes to Financial
Statements
Page 21
Developed International Equity Select ETF
(RNDM)
Portfolio of Investments
(Continued)
March 31, 2023
| Shares
|
| Description
|
| Value
|
| COMMON STOCKS (a) (Continued)
|
|
|
| Spain (Continued)
|
|
|
| 5,727
|
| Banco Bilbao Vizcaya Argentaria S.A. (b)
|
| $40,944
|
| 11,037
|
| Banco Santander S.A. (b)
|
| 41,129
|
| 7,992
|
| CaixaBank S.A. (b)
|
| 31,184
|
| 741
|
| Cellnex Telecom S.A. (b) (c) (d)
|
| 28,816
|
| 807
|
| Enagas S.A. (b)
|
| 15,507
|
| 1,518
|
| Endesa S.A. (b)
|
| 32,971
|
| 409
|
| Ferrovial S.A. (b)
|
| 12,044
|
| 616
|
| Grifols S.A. (b) (e)
|
| 6,097
|
| 2,442
|
| Iberdrola S.A. (b)
|
| 30,422
|
| 1,464
|
| Industria de Diseno Textil S.A. (b)
|
| 49,183
|
| 16,642
|
| Mapfre S.A. (b)
|
| 33,540
|
| 986
|
| Naturgy Energy Group S.A. (b)
|
| 29,682
|
| 1,490
|
| Red Electrica Corp. S.A. (b)
|
| 26,219
|
| 1,083
|
| Repsol S.A. (b)
|
| 16,654
|
| 6,975
|
| Telefonica S.A. (b)
|
| 30,040
|
|
|
|
|
| 497,630
|
|
|
| Sweden – 2.9%
|
|
|
| 939
|
| Alfa Laval AB (b)
|
| 33,529
|
| 1,246
|
| Assa Abloy AB, Class B (b)
|
| 29,845
|
| 2,494
|
| Atlas Copco AB, Class A (b)
|
| 31,595
|
| 482
|
| Axfood AB (b)
|
| 11,771
|
| 1,632
|
| Epiroc AB, Class A (b)
|
| 32,395
|
| 556
|
| Essity AB, Class B (b)
|
| 15,881
|
| 1,439
|
| H & M Hennes & Mauritz AB, Class B (b)
|
| 20,574
|
| 2,741
|
| Hexagon AB, Class B (b)
|
| 31,547
|
| 314
|
| Holmen AB, Class B (b)
|
| 12,105
|
| 1,118
|
| Industrivarden AB, Class C (b)
|
| 30,146
|
| 1,433
|
| Indutrade AB (b)
|
| 30,496
|
| 1,526
|
| Investor AB, Class B (b)
|
| 30,399
|
| 1,713
|
| Sandvik AB (b)
|
| 36,360
|
| 2,337
|
| Skandinaviska Enskilda Banken AB, Class A (b)
|
| 25,796
|
| 1,874
|
| Skanska AB, Class B (b)
|
| 28,703
|
| 887
|
| SKF AB, Class B (b)
|
| 17,471
|
| 938
|
| Svenska Cellulosa AB SCA, Class B (b)
|
| 12,354
|
| 2,724
|
| Svenska Handelsbanken AB, Class A (b)
|
| 23,592
|
| 1,700
|
| Swedbank AB, Class A (b)
|
| 27,956
|
| 445
|
| Swedish Orphan Biovitrum AB (b) (e)
|
| 10,369
|
| 1,496
|
| Tele2 AB, Class B (b)
|
| 14,890
|
| 2,193
|
| Telefonaktiebolaget LM Ericsson, Class B (b)
|
| 12,855
|
| 4,485
|
| Telia Co., AB (b)
|
| 11,389
|
| 1,653
|
| Volvo AB, Class B (b)
|
| 34,063
|
|
|
|
|
| 566,081
|
|
|
| Switzerland – 9.6%
|
|
|
| 1,226
|
| ABB Ltd. (b)
|
| 42,176
|
| 2,717
|
| Alcon, Inc. (b)
|
| 192,873
|
| Shares
|
| Description
|
| Value
|
|
|
|
|
| Switzerland (Continued)
|
|
|
| 316
|
| Baloise Holding AG (b)
|
| $49,206
|
| 427
|
| Banque Cantonale Vaudoise (b)
|
| 40,294
|
| 71
|
| Barry Callebaut AG (b)
|
| 150,433
|
| 14
|
| Chocoladefabriken Lindt & Spruengli AG (b)
|
| 165,349
|
| 31
|
| EMS-Chemie Holding AG (b)
|
| 25,626
|
| 215
|
| Flughafen Zurich AG (b) (e)
|
| 39,392
|
| 74
|
| Geberit AG (b)
|
| 41,325
|
| 7
|
| Givaudan S.A. (b)
|
| 22,784
|
| 431
|
| Helvetia Holding AG (b)
|
| 60,077
|
| 772
|
| Holcim AG (b)
|
| 49,787
|
| 325
|
| Lonza Group AG (b)
|
| 195,650
|
| 1,236
|
| Nestle S.A. (b)
|
| 150,706
|
| 2,092
|
| Novartis AG (b)
|
| 192,084
|
| 67
|
| PSP Swiss Property AG (b)
|
| 7,625
|
| 488
|
| Roche Holding AG (b)
|
| 139,442
|
| 204
|
| Schindler Holding AG (b)
|
| 45,202
|
| 15
|
| SGS S.A. (b)
|
| 33,086
|
| 1,567
|
| SIG Group AG (b)
|
| 40,371
|
| 91
|
| Swiss Life Holding AG (b)
|
| 56,157
|
| 84
|
| Swiss Prime Site AG (b)
|
| 6,985
|
| 547
|
| Swiss Re AG (b)
|
| 56,195
|
| 33
|
| Swisscom AG (b)
|
| 21,060
|
| 101
|
| Zurich Insurance Group AG (b)
|
| 48,399
|
|
|
|
|
| 1,872,284
|
|
|
| United Kingdom – 10.5%
|
|
|
| 1,461
|
| AstraZeneca PLC (b)
|
| 202,428
|
| 3,298
|
| BAE Systems PLC (b)
|
| 39,893
|
| 1,790
|
| British American Tobacco PLC (b)
|
| 62,747
|
| 944
|
| Bunzl PLC (b)
|
| 35,657
|
| 1,520
|
| Diageo PLC (b)
|
| 67,837
|
| 11,128
|
| GSK PLC (b)
|
| 196,624
|
| 3,113
|
| Imperial Brands PLC (b)
|
| 71,586
|
| 703
|
| Intertek Group PLC (b)
|
| 35,210
|
| 33,127
|
| J Sainsbury PLC (b)
|
| 113,996
|
| 2,203
|
| London Stock Exchange Group PLC (b)
|
| 213,977
|
| 2,152
|
| National Grid PLC (b)
|
| 29,110
|
| 31,904
|
| Phoenix Group Holdings PLC (b)
|
| 215,557
|
| 966
|
| Reckitt Benckiser Group PLC (b)
|
| 73,491
|
| 9,209
|
| RELX PLC (b)
|
| 298,251
|
| 5,454
|
| Rentokil Initial PLC (b)
|
| 39,861
|
| 2,669
|
| Sage Group (The) PLC (b)
|
| 25,613
|
| 851
|
| Severn Trent PLC (b)
|
| 30,230
|
| 1,725
|
| Smiths Group PLC (b)
|
| 36,585
|
| 1,312
|
| SSE PLC (b)
|
| 29,276
|
| 27,921
|
| Tesco PLC (b)
|
| 91,537
|
| 1,455
|
| Unilever PLC (b)
|
| 75,397
|
| 2,254
|
| United Utilities Group PLC (b)
|
| 29,499
|
| 39,474
|
| Vodafone Group PLC (b)
|
| 43,544
|
|
|
|
|
| 2,057,906
|
Page 22
See Notes to Financial
Statements
Developed International Equity Select ETF
(RNDM)
Portfolio of Investments
(Continued)
March 31, 2023
| Shares
|
| Description
|
| Value
|
| COMMON STOCKS (a) (Continued)
|
|
|
| United States – 0.1%
|
|
|
| 196
|
| Autoliv, Inc., SDR (b)
|
| $18,310
|
|
|
| Total Common Stocks
|
| 19,155,194
|
|
|
| (Cost $18,077,496)
|
|
|
| REAL ESTATE INVESTMENT TRUSTS (a) – 1.3%
|
|
|
| Australia – 0.4%
|
|
|
| 4,036
|
| Dexus (b)
|
| 20,405
|
| 8,135
|
| GPT (The) Group (b)
|
| 23,248
|
| 9,529
|
| Stockland (b)
|
| 25,517
|
|
|
|
|
| 69,170
|
|
|
| Belgium – 0.0%
|
|
|
| 181
|
| Warehouses De Pauw CVA (b)
|
| 5,382
|
|
|
| Hong Kong – 0.1%
|
|
|
| 1,608
|
| Link REIT (b)
|
| 10,340
|
|
|
| Japan – 0.6%
|
|
|
| 8
|
| Daiwa House REIT Investment Corp. (b)
|
| 16,392
|
| 16
|
| GLP J-REIT (b)
|
| 17,295
|
| 23
|
| Japan Metropolitan Fund Investment Corp. (b)
|
| 16,796
|
| 4
|
| Japan Real Estate Investment Corp. (b)
|
| 15,941
|
| 4
|
| Nippon Building Fund, Inc. (b)
|
| 16,650
|
| 8
|
| Nippon Prologis REIT, Inc. (b)
|
| 16,936
|
| 16
|
| Nomura Real Estate Master Fund, Inc. (b)
|
| 17,930
|
|
|
|
|
| 117,940
|
|
|
| Multinational – 0.0%
|
|
|
| 108
|
| Unibail-Rodamco-Westfield (b) (e)
|
| 5,811
|
|
|
| Singapore – 0.2%
|
|
|
| 2,900
|
| CapitaLand Ascendas REIT (b)
|
| 6,253
|
| 4,001
|
| CapitaLand Integrated Commercial Trust (b)
|
| 5,967
|
| 3,200
|
| Mapletree Industrial Trust (b)
|
| 5,713
|
| 4,900
|
| Mapletree Logistics Trust (b)
|
| 6,321
|
| 4,500
|
| Mapletree Pan Asia Commercial Trust (b)
|
| 6,101
|
|
|
|
|
| 30,355
|
| Shares
|
| Description
|
| Value
|
|
|
|
|
| Spain – 0.0%
|
|
|
| 407
|
| Merlin Properties Socimi S.A. (b)
|
| $3,561
|
|
|
| Total Real Estate Investment Trusts
|
| 242,559
|
|
|
| (Cost $276,109)
|
|
|
|
|
| Total Investments – 99.0%
|
| 19,397,753
|
|
|
| (Cost $18,353,605)
|
|
|
|
|
| Net Other Assets and Liabilities – 1.0%
|
| 205,794
|
|
|
| Net Assets – 100.0%
|
| $19,603,547
|
| (a)
| Portfolio securities are categorized based upon their country of incorporation, which can be different from the country categorization of the Fund’s underlying index. For a
breakdown of the portfolio securities by sector, please see the Fund Performance Overview.
|
| (b)
| This security is fair valued by the Advisor’s Pricing Committee in accordance with procedures approved by the Trust’s Board of Trustees and in accordance with provisions
of the Investment Company Act of 1940 and rules thereunder, as amended. At March 31, 2023, securities noted as such are valued at $17,822,869 or 90.9% of net assets. Certain of these securities are fair valued using a
factor provided by a third-party pricing service due to the change in value between the foreign markets’ close and the New York Stock Exchange close exceeding a certain threshold. On days when this threshold is
not exceeded, these securities are typically valued at the last sale price on the exchange on which they are principally traded.
|
| (c)
| This security may be resold to qualified foreign investors and foreign institutional buyers under Regulation S of the Securities Act of 1933, as amended (the “1933 Act”).
|
| (d)
| This security is exempt from registration upon resale under Rule 144A of the 1933 Act and may be resold in transactions exempt from registration, normally to qualified institutional
buyers. This security is not restricted on the foreign exchange where it trades freely without any additional registration. As such, it does not require the additional disclosure required of restricted securities.
|
| (e)
| Non-income producing security.
|
| (f)
| Pursuant to procedures adopted by the Trust’s Board of Trustees, this security has been determined to be illiquid by First Trust Advisors L.P., the Fund’s advisor.
|
| (g)
| This security’s value was determined using significant unobservable inputs (see Note 2A – Portfolio Valuation in the Notes to Financial Statements).
|
| ADR
| American Depositary Receipt
|
| CAD
| Canadian Dollar
|
| SDR
| Swedish Depositary Receipt
|
See Notes to Financial
Statements
Page 23
Developed International Equity Select ETF
(RNDM)
Portfolio of Investments
(Continued)
March 31, 2023
Currency Exposure
Diversification
| % of Total
Investments
|
| Euro
| 30.6%
|
| Japanese Yen
| 19.6
|
| British Pound Sterling
| 10.9
|
| Swiss Franc
| 9.7
|
| Canadian Dollar
| 7.9
|
| Australian Dollar
| 5.7
|
| South Korean Won
| 4.3
|
| Swedish Krona
| 3.2
|
| Danish Krone
| 2.8
|
| Hong Kong Dollar
| 2.4
|
| Singapore Dollar
| 1.4
|
| Norwegian Krone
| 0.7
|
| Israeli Shekel
| 0.4
|
| United States Dollar
| 0.2
|
| New Zealand Dollar
| 0.2
|
| Total
| 100.0%
|
Valuation Inputs
A summary of the inputs
used to value the Fund’s investments as of March 31, 2023 is as follows (see Note 2A - Portfolio Valuation in the Notes to Financial Statements):
|
| Total
Value at
3/31/2023
| Level 1
Quoted
Prices
| Level 2
Significant
Observable
Inputs
| Level 3
Significant
Unobservable
Inputs
|
| Common Stocks:
|
|
|
|
|
| Canada
| $ 1,540,354
| $ 1,540,354
| $ —
| $ —
|
| Cayman Islands
| 87,956
| —
| 85,929
| 2,027
|
| Ireland
| 156,169
| 27,250
| 128,919
| —
|
| South Korea
| 851,135
| 7,280
| 843,855
| —
|
| Other Country Categories*
| 16,519,580
| —
| 16,519,580
| —
|
| Real Estate Investment Trusts*
| 242,559
| —
| 242,559
| —
|
| Total Investments
| $ 19,397,753
| $ 1,574,884
| $ 17,820,842
| $ 2,027
|
| *
| See Portfolio of Investments for country breakout.
|
Level 3 investments are
fair valued by the Advisor’s Pricing Committee and are footnoted in the Portfolio of Investments. Level 3 investments values are based on unobservable and non-quantitative inputs.
Page 24
See Notes to Financial Statements
Emerging Markets Equity Select ETF
(RNEM)
Portfolio of Investments
March 31, 2023
| Shares
|
| Description
|
| Value
|
| COMMON STOCKS (a) – 99.7%
|
|
|
| Bermuda – 0.2%
|
|
|
| 130
|
| Credicorp Ltd.
|
| $17,211
|
|
|
| Brazil – 8.7%
|
|
|
| 6,017
|
| Ambev S.A.
|
| 17,012
|
| 4,837
|
| Atacadao S.A.
|
| 11,824
|
| 12,602
|
| Banco Bradesco S.A. (Preference Shares)
|
| 32,745
|
| 6,239
|
| Banco do Brasil S.A.
|
| 48,143
|
| 7,921
|
| Banco Santander Brasil S.A.
|
| 41,883
|
| 9,045
|
| BB Seguridade Participacoes S.A.
|
| 58,016
|
| 1,029
|
| Cia de Saneamento Basico do Estado de Sao Paulo
|
| 10,275
|
| 4,741
|
| Cia Energetica de Minas Gerais (Preference Shares)
|
| 10,701
|
| 7,753
|
| Cia Paranaense de Energia, Class B (Preference Shares)
|
| 10,616
|
| 41,429
|
| Cosan S.A.
|
| 123,344
|
| 2,337
|
| EDP - Energias do Brasil S.A.
|
| 10,301
|
| 1,218
|
| Energisa S.A.
|
| 9,656
|
| 1,325
|
| Engie Brasil Energia S.A.
|
| 10,501
|
| 1,896
|
| Equatorial Energia S.A.
|
| 10,085
|
| 3,255
|
| Hypera S.A.
|
| 24,211
|
| 8,565
|
| Itau Unibanco Holding S.A. (Preference Shares)
|
| 41,807
|
| 27,170
|
| Itausa S.A. (Preference Shares)
|
| 44,064
|
| 3,722
|
| JBS S.A.
|
| 13,108
|
| 22,947
|
| Klabin S.A.
|
| 81,901
|
| 11,374
|
| Porto Seguro S.A.
|
| 52,781
|
| 4,114
|
| Raia Drogasil S.A.
|
| 19,846
|
| 9,359
|
| Suzano S.A.
|
| 76,815
|
| 781
|
| Telefonica Brasil S.A.
|
| 5,957
|
| 2,619
|
| TIM S.A.
|
| 6,501
|
| 1,310
|
| Transmissora Alianca de Energia Eletrica S.A.
|
| 9,002
|
|
|
|
|
| 781,095
|
|
|
| Cayman Islands – 2.3%
|
|
|
| 47,466
|
| ESR Group Ltd. (b) (c) (d)
|
| 85,120
|
| 8,833
|
| Hengan International Group Co., Ltd. (b)
|
| 40,915
|
| 24,000
|
| Tingyi Cayman Islands Holding Corp. (b)
|
| 40,163
|
| 58,666
|
| Want Want China Holdings Ltd. (b)
|
| 37,745
|
|
|
|
|
| 203,943
|
|
|
| Chile – 0.9%
|
|
|
| 120,664
|
| Banco de Chile
|
| 11,719
|
| 303,871
|
| Banco Santander Chile
|
| 13,475
|
| 7,764
|
| Cencosud S.A.
|
| 15,003
|
| 40,223
|
| Cia Sud Americana de Vapores S.A. (b)
|
| 4,009
|
| 929
|
| Empresas Copec S.A.
|
| 6,556
|
| 2,198
|
| Falabella S.A. (b)
|
| 5,061
|
| Shares
|
| Description
|
| Value
|
|
|
|
|
| Chile (Continued)
|
|
|
| 373
|
| Sociedad Quimica y Minera de Chile S.A., Class B (Preference Shares) (b)
|
| $29,972
|
|
|
|
|
| 85,795
|
|
|
| China – 11.6%
|
|
|
| 128,761
|
| Agricultural Bank of China Ltd., Class H (b)
|
| 47,683
|
| 117,194
|
| Bank of China Ltd., Class H (b)
|
| 44,928
|
| 72,897
|
| Bank of Communications Co., Ltd., Class H (b)
|
| 45,845
|
| 155,000
|
| CGN Power Co., Ltd., Class H (b) (c) (d)
|
| 37,109
|
| 96,534
|
| China CITIC Bank Corp., Ltd., Class H (b)
|
| 48,563
|
| 66,598
|
| China Construction Bank Corp., Class H (b)
|
| 43,102
|
| 30,000
|
| China Life Insurance Co., Ltd., Class H (b)
|
| 49,232
|
| 134,598
|
| China Minsheng Banking Corp., Ltd., Class H (b)
|
| 46,120
|
| 145,999
|
| China Petroleum & Chemical Corp., Class H (b)
|
| 86,157
|
| 192,999
|
| China Railway Group Ltd., Class H (b)
|
| 117,775
|
| 511,331
|
| China Tower Corp., Ltd., Class H (b) (c) (d)
|
| 61,886
|
| 22,500
|
| CITIC Securities Co., Ltd., Class H (b)
|
| 48,127
|
| 82,398
|
| Industrial & Commercial Bank of China Ltd., Class H (b)
|
| 43,790
|
| 20,233
|
| New China Life Insurance Co., Ltd., Class H (b)
|
| 48,054
|
| 133,000
|
| People’s Insurance Co. Group of China (The) Ltd., Class H (b)
|
| 44,380
|
| 152,000
|
| PetroChina Co., Ltd., Class H (b)
|
| 89,792
|
| 38,000
|
| PICC Property & Casualty Co., Ltd., Class H (b)
|
| 38,764
|
| 65,000
|
| Postal Savings Bank of China Co., Ltd., Class H (b) (c) (d)
|
| 38,549
|
| 19,200
|
| Sinopharm Group Co., Ltd., Class H (b)
|
| 58,018
|
|
|
|
|
| 1,037,874
|
|
|
| Czech Republic – 0.3%
|
|
|
| 372
|
| CEZ A.S.
|
| 18,067
|
| 175
|
| Komercni Banka A.S. (b)
|
| 5,807
|
|
|
|
|
| 23,874
|
|
|
| Egypt – 0.1%
|
|
|
| 5,273
|
| Commercial International Bank Egypt SAE (b)
|
| 8,727
|
|
|
| Hong Kong – 0.9%
|
|
|
| 11,600
|
| BOC Hong Kong Holdings Ltd. (b)
|
| 36,114
|
See Notes to Financial
Statements
Page 25
Emerging Markets Equity Select ETF
(RNEM)
Portfolio of Investments
(Continued)
March 31, 2023
| Shares
|
| Description
|
| Value
|
| COMMON STOCKS (a) (Continued)
|
|
|
| Hong Kong (Continued)
|
|
|
| 42,400
|
| Guangdong Investment Ltd. (b)
|
| $43,374
|
|
|
|
|
| 79,488
|
|
|
| Hungary – 0.2%
|
|
|
| 1,039
|
| MOL Hungarian Oil & Gas PLC (b)
|
| 7,610
|
| 510
|
| OTP Bank Nyrt (b)
|
| 14,560
|
|
|
|
|
| 22,170
|
|
|
| India – 26.7%
|
|
|
| 2,517
|
| Bajaj Auto Ltd. (b)
|
| 119,066
|
| 21,019
|
| Berger Paints India Ltd. (b)
|
| 149,064
|
| 7,164
|
| Bharti Airtel Ltd. (b)
|
| 65,332
|
| 625
|
| Britannia Industries Ltd. (b)
|
| 32,944
|
| 3,016
|
| Cipla Ltd. (b)
|
| 33,103
|
| 1,474
|
| Colgate-Palmolive India Ltd. (b)
|
| 27,066
|
| 4,191
|
| Dabur India Ltd. (b)
|
| 27,828
|
| 776
|
| Dr. Reddy’s Laboratories Ltd. (b)
|
| 43,758
|
| 9,662
|
| HCL Technologies Ltd. (b)
|
| 128,269
|
| 9,237
|
| HDFC Bank Ltd. (b)
|
| 181,681
|
| 891
|
| Hindustan Unilever Ltd. (b)
|
| 27,825
|
| 15,230
|
| ICICI Bank Ltd. (b)
|
| 162,754
|
| 6,374
|
| Infosys Ltd. (b)
|
| 111,437
|
| 7,229
|
| ITC Ltd. (b)
|
| 33,824
|
| 7,019
|
| Larsen & Toubro Ltd. (b)
|
| 185,276
|
| 4,465
|
| Marico Ltd. (b)
|
| 26,112
|
| 109
|
| MRF Ltd. (b)
|
| 111,641
|
| 125
|
| Nestle India Ltd. (b)
|
| 30,013
|
| 2,937
|
| Pidilite Industries Ltd. (b)
|
| 84,249
|
| 125,511
|
| Power Finance Corp., Ltd. (b)
|
| 232,325
|
| 22,945
|
| Power Grid Corp. of India Ltd. (b)
|
| 63,169
|
| 139,664
|
| REC Ltd. (b)
|
| 196,834
|
| 24,743
|
| State Bank of India (b)
|
| 158,171
|
| 3,545
|
| Sun Pharmaceutical Industries Ltd. (b)
|
| 42,477
|
| 3,059
|
| Tata Consultancy Services Ltd. (b)
|
| 119,906
|
|
|
|
|
| 2,394,124
|
|
|
| Indonesia – 3.2%
|
|
|
| 18,637
|
| Adaro Energy Indonesia Tbk PT (b)
|
| 3,613
|
| 33,429
|
| Aneka Tambang Tbk (b)
|
| 4,666
|
| 46,661
|
| Astra International Tbk PT (b)
|
| 18,697
|
| 56,158
|
| Bank Central Asia Tbk PT (b)
|
| 32,855
|
| 72,750
|
| Bank Jago Tbk PT (b) (e)
|
| 11,790
|
| 50,945
|
| Bank Mandiri Persero Tbk PT (b)
|
| 35,083
|
| 53,499
|
| Bank Negara Indonesia Persero Tbk PT (b)
|
| 33,476
|
| 106,938
|
| Bank Rakyat Indonesia Persero Tbk PT (b)
|
| 33,884
|
| 203,487
|
| Berkah Beton Sadaya Tbk PT (b) (f)
|
| 8,075
|
| Shares
|
| Description
|
| Value
|
|
|
|
|
| Indonesia (Continued)
|
|
|
| 1,928,415
|
| Bukalapak.com PT Tbk (b) (e)
|
| $32,077
|
| 17,698
|
| Bukit Asam Tbk PT (b)
|
| 4,714
|
| 463,234
|
| Bumi Resources Minerals Tbk PT (b) (e)
|
| 5,258
|
| 1,782
|
| Indo Tambangraya Megah Tbk PT (b)
|
| 4,688
|
| 16,460
|
| Merdeka Copper Gold Tbk PT (b) (e)
|
| 4,610
|
| 24,029
|
| Perusahaan Gas Negara Tbk PT (b)
|
| 2,218
|
| 131,759
|
| Sarana Menara Nusantara Tbk PT (b)
|
| 8,150
|
| 2,034,029
|
| Smartfren Telecom Tbk PT (b) (e)
|
| 8,306
|
| 36,485
|
| Telkom Indonesia Persero Tbk PT (b)
|
| 9,907
|
| 57,499
|
| Tower Bersama Infrastructure Tbk PT (b)
|
| 8,293
|
| 5,038
|
| United Tractors Tbk PT (b)
|
| 9,791
|
| 10,133
|
| Vale Indonesia Tbk PT (b) (e)
|
| 4,502
|
|
|
|
|
| 284,653
|
|
|
| Luxembourg – 0.1%
|
|
|
| 1,217
|
| Allegro.eu S.A. (b) (c) (d) (e)
|
| 8,309
|
|
|
| Malaysia – 1.2%
|
|
|
| 13,300
|
| CIMB Group Holdings Bhd (b)
|
| 16,029
|
| 13,800
|
| Hartalega Holdings Bhd (b)
|
| 5,960
|
| 3,300
|
| Hong Leong Bank Bhd (b)
|
| 15,137
|
| 3,900
|
| IHH Healthcare Bhd (b)
|
| 5,080
|
| 4,800
|
| Inari Amertron Bhd (b)
|
| 2,694
|
| 7,900
|
| Malayan Banking Bhd (b)
|
| 15,354
|
| 5,600
|
| Petronas Chemicals Group Bhd (b)
|
| 8,999
|
| 11,700
|
| Press Metal Aluminium Holdings Bhd (b)
|
| 12,959
|
| 16,100
|
| Public Bank Bhd (b)
|
| 14,611
|
| 12,200
|
| RHB Bank Bhd (b)
|
| 15,436
|
|
|
|
|
| 112,259
|
|
|
| Mexico – 4.3%
|
|
|
| 1,969
|
| Arca Continental S.A.B. de C.V.
|
| 17,852
|
| 45,636
|
| Cemex S.A.B. de C.V., Series CPO (e)
|
| 25,123
|
| 2,262
|
| Fomento Economico Mexicano S.A.B. de C.V., Series UBD
|
| 21,534
|
| 1,480
|
| Gruma S.A.B. de C.V., Class B
|
| 21,925
|
| 1,244
|
| Grupo Aeroportuario del Pacifico S.A.B. de C.V., Class B
|
| 24,268
|
| 798
|
| Grupo Aeroportuario del Sureste S.A.B. de C.V., Class B
|
| 24,409
|
| 4,023
|
| Grupo Bimbo S.A.B. de C.V., Series A
|
| 20,222
|
| 10,087
|
| Grupo Financiero Banorte S.A.B. de C.V., Class O
|
| 84,928
|
Page 26
See Notes to Financial
Statements
Emerging Markets Equity Select ETF
(RNEM)
Portfolio of Investments
(Continued)
March 31, 2023
| Shares
|
| Description
|
| Value
|
| COMMON STOCKS (a) (Continued)
|
|
|
| Mexico (Continued)
|
|
|
| 8,416
|
| Grupo Mexico S.A.B. de C.V., Series B
|
| $39,810
|
| 10,610
|
| Kimberly-Clark de Mexico S.A.B. de C.V., Class A
|
| 22,368
|
| 9,376
|
| Orbia Advance Corp. S.A.B. de C.V.
|
| 20,391
|
| 14,761
|
| Wal-Mart de Mexico S.A.B. de C.V.
|
| 58,979
|
|
|
|
|
| 381,809
|
|
|
| Netherlands – 0.1%
|
|
|
| 958
|
| NEPI Rockcastle N.V.
|
| 5,559
|
| 247
|
| X5 Retail Group N.V., GDR (b) (c) (e) (f) (g)
|
| 0
|
|
|
|
|
| 5,559
|
|
|
| Philippines – 1.6%
|
|
|
| 40,010
|
| Ayala Land, Inc. (b)
|
| 19,609
|
| 13,054
|
| BDO Unibank, Inc. (b)
|
| 30,960
|
| 9,520
|
| International Container Terminal Services, Inc. (b)
|
| 37,379
|
| 2,060
|
| SM Investments Corp. (b)
|
| 33,814
|
| 30,300
|
| SM Prime Holdings, Inc. (b)
|
| 18,333
|
|
|
|
|
| 140,095
|
|
|
| Poland – 0.8%
|
|
|
| 550
|
| Bank Polska Kasa Opieki S.A. (b)
|
| 10,941
|
| 262
|
| CD Projekt S.A. (b)
|
| 6,783
|
| 111
|
| Dino Polska S.A. (b) (c) (d) (e)
|
| 10,082
|
| 267
|
| KGHM Polska Miedz S.A. (b)
|
| 7,584
|
| 852
|
| Polski Koncern Naftowy ORLEN S.A. (b)
|
| 11,500
|
| 1,529
|
| Powszechna Kasa Oszczednosci Bank Polski S.A. (b)
|
| 10,147
|
| 1,442
|
| Powszechny Zaklad Ubezpieczen S.A. (b)
|
| 11,742
|
|
|
|
|
| 68,779
|
|
|
| Russia – 0.0%
|
|
|
| 7,696
|
| Alrosa PJSC (b) (e) (f) (g)
|
| 0
|
| 40,399
|
| Credit Bank of Moscow PJSC (b) (e) (f) (g)
|
| 0
|
| 172,018
|
| Inter RAO UES PJSC (b) (f) (g)
|
| 0
|
| 96
|
| Magnit PJSC (b) (e) (f) (g)
|
| 0
|
| 15,021
|
| Magnitogorsk Iron & Steel Works PJSC (b) (e) (f) (g)
|
| 0
|
| 47
|
| MMC Norilsk Nickel PJSC (b) (f) (g)
|
| 0
|
| 2,140
|
| Mobile TeleSystems PJSC (b) (f) (g)
|
| 0
|
| 1,668
|
| Moscow Exchange MICEX-RTS PJSC (b) (e) (f) (g)
|
| 0
|
| 4,741
|
| Novolipetsk Steel PJSC (b) (f) (g)
|
| 0
|
| Shares
|
| Description
|
| Value
|
|
|
|
|
| Russia (Continued)
|
|
|
| 85
|
| Polyus PJSC (b) (e) (f) (g)
|
| $0
|
| 676
|
| Severstal PAO (b) (e) (f) (g)
|
| 0
|
| 10,776
|
| Sistema PJSFC (b) (e) (f) (g)
|
| 0
|
| 3,253
|
| Tatneft PJSC (b) (f) (g)
|
| 0
|
|
|
|
|
| 0
|
|
|
| South Africa – 4.1%
|
|
|
| 1,490
|
| Absa Group Ltd. (b)
|
| 15,230
|
| 3,252
|
| African Rainbow Minerals Ltd. (b)
|
| 42,295
|
| 3,185
|
| AngloGold Ashanti Ltd. (b)
|
| 77,570
|
| 730
|
| Aspen Pharmacare Holdings Ltd. (b)
|
| 7,548
|
| 604
|
| Bid Corp., Ltd.
|
| 13,518
|
| 565
|
| Bidvest Group (The) Ltd.
|
| 8,042
|
| 169
|
| Capitec Bank Holdings Ltd.
|
| 16,019
|
| 590
|
| Clicks Group Ltd. (b)
|
| 8,487
|
| 2,507
|
| Discovery Ltd. (b) (e)
|
| 19,668
|
| 814
|
| Exxaro Resources Ltd. (b)
|
| 8,508
|
| 4,332
|
| FirstRand Ltd. (b)
|
| 14,683
|
| 608
|
| Foschini Group (The) Ltd. (b)
|
| 3,104
|
| 414
|
| Mr Price Group Ltd.
|
| 3,353
|
| 1,806
|
| MTN Group Ltd. (b)
|
| 12,939
|
| 1,872
|
| MultiChoice Group (b)
|
| 13,009
|
| 1,317
|
| Nedbank Group Ltd. (b)
|
| 16,070
|
| 26,902
|
| Old Mutual Ltd. (b)
|
| 17,833
|
| 3,442
|
| Pepkor Holdings Ltd. (c) (d)
|
| 3,333
|
| 1,982
|
| Remgro Ltd.
|
| 14,964
|
| 5,100
|
| Sanlam Ltd.
|
| 16,146
|
| 776
|
| Shoprite Holdings Ltd. (b)
|
| 9,684
|
| 1,827
|
| Standard Bank Group Ltd. (b)
|
| 17,714
|
| 1,171
|
| Woolworths Holdings Ltd. (b)
|
| 4,206
|
|
|
|
|
| 363,923
|
|
|
| Taiwan – 26.8%
|
|
|
| 54,181
|
| Asia Cement Corp. (b)
|
| 77,152
|
| 74,337
|
| Chang Hwa Commercial Bank Ltd. (b)
|
| 42,438
|
| 64,341
|
| Cheng Shin Rubber Industry Co., Ltd. (b)
|
| 77,371
|
| 6,696
|
| Chunghwa Telecom Co., Ltd. (b)
|
| 26,321
|
| 302,878
|
| Compal Electronics, Inc. (b)
|
| 251,542
|
| 49,510
|
| E.Sun Financial Holding Co., Ltd. (b)
|
| 41,231
|
| 48,598
|
| Far Eastern New Century Corp. (b)
|
| 50,018
|
| 10,544
|
| Far EasTone Telecommunications Co., Ltd. (b)
|
| 26,058
|
| 49,034
|
| First Financial Holding Co., Ltd. (b)
|
| 42,679
|
| 22,752
|
| Formosa Chemicals & Fibre Corp. (b)
|
| 51,639
|
| 7,811
|
| Highwealth Construction Corp. (b)
|
| 10,570
|
See Notes to Financial
Statements
Page 27
Emerging Markets Equity Select ETF
(RNEM)
Portfolio of Investments
(Continued)
March 31, 2023
| Shares
|
| Description
|
| Value
|
| COMMON STOCKS (a) (Continued)
|
|
|
| Taiwan (Continued)
|
|
|
| 64,436
|
| Hon Hai Precision Industry Co., Ltd. (b)
|
| $220,564
|
| 57,298
|
| Hua Nan Financial Holdings Co., Ltd. (b)
|
| 42,151
|
| 287,007
|
| Inventec Corp. (b)
|
| 301,668
|
| 40,927
|
| Mega Financial Holding Co., Ltd. (b)
|
| 44,356
|
| 85,246
|
| Powertech Technology, Inc. (b)
|
| 255,314
|
| 2,371
|
| President Chain Store Corp. (b)
|
| 21,013
|
| 26,249
|
| Shanghai Commercial & Savings Bank (The) Ltd. (b)
|
| 40,514
|
| 74,195
|
| SinoPac Financial Holdings Co., Ltd. (b)
|
| 40,566
|
| 63,158
|
| Taiwan Cement Corp. (b)
|
| 75,537
|
| 48,567
|
| Taiwan Cooperative Financial Holding Co., Ltd. (b)
|
| 41,707
|
| 7,985
|
| Taiwan Mobile Co., Ltd. (b)
|
| 26,495
|
| 9,952
|
| Uni-President Enterprises Corp. (b)
|
| 23,526
|
| 247,550
|
| Wistron Corp. (b)
|
| 340,792
|
| 141,495
|
| WPG Holdings Ltd. (b)
|
| 233,789
|
|
|
|
|
| 2,405,011
|
|
|
| Thailand – 4.5%
|
|
|
| 2,600
|
| Advanced Info Service PCL
|
| 16,119
|
| 6,100
|
| Airports of Thailand PCL (e)
|
| 12,666
|
| 4,500
|
| Bangkok Bank PCL (b)
|
| 19,958
|
| 40,500
|
| Bangkok Dusit Medical Services PCL, Class F
|
| 34,939
|
| 48,300
|
| Bangkok Expressway & Metro PCL
|
| 12,501
|
| 47,100
|
| BTS Group Holdings PCL
|
| 9,779
|
| 14,500
|
| Charoen Pokphand Foods PCL
|
| 8,990
|
| 6,400
|
| CP ALL PCL (b)
|
| 11,607
|
| 5,400
|
| Electricity Generating PCL
|
| 24,556
|
| 29,000
|
| Home Product Center PCL
|
| 12,212
|
| 7,000
|
| Intouch Holdings PCL, Class F
|
| 15,148
|
| 4,300
|
| Kasikornbank PCL (b)
|
| 16,684
|
| 36,800
|
| Krung Thai Bank PCL
|
| 17,757
|
| 10,700
|
| Krungthai Card PCL
|
| 16,975
|
| 87,400
|
| Land & Houses PCL
|
| 25,176
|
| 13,300
|
| Osotspa PCL
|
| 11,960
|
| 10,000
|
| PTT Global Chemical PCL
|
| 13,379
|
| 36,200
|
| PTT Oil & Retail Business PCL
|
| 22,549
|
| 27,400
|
| PTT PCL (b)
|
| 25,406
|
| 21,800
|
| Ratch Group PCL
|
| 24,545
|
| 8,500
|
| SCG Packaging PCL
|
| 11,497
|
| 1,400
|
| Siam Cement (The) PCL
|
| 12,897
|
| 20,308
|
| Siam Global House PCL
|
| 10,987
|
| 23,000
|
| Thai Beverage PCL (b)
|
| 10,906
|
| 19,400
|
| Thai Union Group PCL, Class F
|
| 7,999
|
|
|
|
|
| 407,192
|
|
|
| Turkey – 1.1%
|
|
|
| 5,440
|
| Akbank T.A.S. (b)
|
| 4,814
|
| Shares
|
| Description
|
| Value
|
|
|
|
|
| Turkey (Continued)
|
|
|
| 297
|
| Aksa Enerji Uretim A.S.
|
| $434
|
| 865
|
| Arcelik A.S. (b)
|
| 5,292
|
| 3,198
|
| Aselsan Elektronik Sanayi Ve Ticaret A.S. (b)
|
| 8,668
|
| 1,240
|
| BIM Birlesik Magazalar A.S. (b)
|
| 9,631
|
| 3,147
|
| Eregli Demir ve Celik Fabrikalari T.A.S. (b) (e)
|
| 5,823
|
| 178
|
| Ford Otomotiv Sanayi A.S. (b)
|
| 5,436
|
| 2,382
|
| Haci Omer Sabanci Holding A.S. (b)
|
| 4,926
|
| 2,350
|
| KOC Holding A.S. (b)
|
| 9,387
|
| 635
|
| Tofas Turk Otomobil Fabrikasi A.S. (b)
|
| 6,196
|
| 823
|
| Turk Hava Yollari AO (b) (e)
|
| 5,096
|
| 2,739
|
| Turkcell Iletisim Hizmetleri A.S. (b)
|
| 4,583
|
| 3,161
|
| Turkiye Garanti Bankasi A.S. (b)
|
| 4,603
|
| 8,167
|
| Turkiye Is Bankasi A.S., Class C (b)
|
| 5,529
|
| 368
|
| Turkiye Petrol Rafinerileri A.S. (b)
|
| 10,188
|
| 3,686
|
| Turkiye Sise ve Cam Fabrikalari A.S. (b)
|
| 8,141
|
|
|
|
|
| 98,747
|
|
|
| Total Common Stocks
|
| 8,930,637
|
|
|
| (Cost $8,670,810)
|
|
|
| REAL ESTATE INVESTMENT TRUSTS (a) – 0.3%
|
|
|
| Mexico – 0.2%
|
|
|
| 11,411
|
| Fibra Uno Administracion S.A. de C.V.
|
| 15,977
|
|
|
| South Africa – 0.1%
|
|
|
| 6,586
|
| Growthpoint Properties Ltd. (b)
|
| 4,838
|
|
|
| Total Real Estate Investment Trusts
|
| 20,815
|
|
|
| (Cost $20,291)
|
|
|
|
|
| Total Investments – 100.0%
|
| 8,951,452
|
|
|
| (Cost $8,691,101)
|
|
|
|
|
| Net Other Assets and Liabilities – 0.0%
|
| 4,267
|
|
|
| Net Assets – 100.0%
|
| $8,955,719
|
| (a)
| Portfolio securities are categorized based upon their country of incorporation, which can be different from the country categorization of the Fund’s
underlying index. For a breakdown of the portfolio securities by sector, please see the Fund Performance Overview.
|
Page 28
See Notes to Financial
Statements
Emerging Markets Equity Select ETF
(RNEM)
Portfolio of Investments
(Continued)
March 31, 2023
| (b)
| This security is fair valued by the Advisor’s Pricing Committee in accordance with procedures approved by the Trust’s Board of Trustees and in accordance with provisions
of the Investment Company Act of 1940 and rules thereunder, as amended. At March 31, 2023, securities noted as such are valued at $7,286,541 or 81.4% of net assets. Certain of these securities are fair valued using a
factor provided by a third-party pricing service due to the change in value between the foreign markets’ close and the New York Stock Exchange close exceeding a certain threshold. On days when this threshold is
not exceeded, these securities are typically valued at the last sale price on the exchange on which they are principally traded.
|
| (c)
| This security may be resold to qualified foreign investors and foreign institutional buyers under Regulation S of the Securities Act of 1933, as amended (the “1933 Act”).
|
| (d)
| This security is exempt from registration upon resale under Rule 144A of the 1933 Act and may be resold in transactions exempt from registration, normally to qualified institutional
buyers. This security is not restricted on the foreign exchange where it trades freely without any additional registration. As such, it does not require the additional disclosure required of restricted securities.
|
| (e)
| Non-income producing security.
|
| (f)
| Pursuant to procedures adopted by the Trust’s Board of Trustees, this security has been determined to be illiquid by First Trust Advisors L.P., the Fund’s advisor.
|
| (g)
| This security’s value was determined using significant unobservable inputs (see Note 2A – Portfolio Valuation in the Notes to Financial Statements).
|
| GDR
| Global Depositary Receipt
|
Currency Exposure
Diversification
| % of Total
Investments
|
| New Taiwan Dollar
| 26.9%
|
| Indian Rupee
| 26.7
|
| Hong Kong Dollar
| 14.8
|
| Brazilian Real
| 8.7
|
| Mexican Peso
| 4.4
|
| Thai Baht
| 4.4
|
| South African Rand
| 4.2
|
| Indonesian Rupiah
| 3.2
|
| Philippine Peso
| 1.6
|
| Malaysian Ringgit
| 1.2
|
| Turkish Lira
| 1.1
|
| Chilean Peso
| 1.0
|
| Polish Zloty
| 0.9
|
| Czech Republic Koruna
| 0.3
|
| Hungarian Forint
| 0.2
|
| United States Dollar
| 0.2
|
| Singapore Dollar
| 0.1
|
| Egyptian Pound
| 0.1
|
| Russian Ruble
| 0.0*
|
| Total
| 100.0%
|
| *
| Investment is valued at $0.
|
See Notes to Financial
Statements
Page 29
Emerging Markets Equity Select ETF
(RNEM)
Portfolio of Investments
(Continued)
March 31, 2023
Valuation Inputs
A summary of the inputs
used to value the Fund’s investments as of March 31, 2023 is as follows (see Note 2A - Portfolio Valuation in the Notes to Financial Statements):
|
| Total
Value at
3/31/2023
| Level 1
Quoted
Prices
| Level 2
Significant
Observable
Inputs
| Level 3
Significant
Unobservable
Inputs
|
| Common Stocks:
|
|
|
|
|
| Bermuda
| $ 17,211
| $ 17,211
| $ —
| $ —
|
| Brazil
| 781,095
| 781,095
| —
| —
|
| Chile
| 85,795
| 46,753
| 39,042
| —
|
| Czech Republic
| 23,874
| 18,067
| 5,807
| —
|
| Mexico
| 381,809
| 381,809
| —
| —
|
| Netherlands
| 5,559
| 5,559
| —
| —*
|
| Russia
| —*
| —
| —
| —*
|
| South Africa
| 363,923
| 75,375
| 288,548
| —
|
| Turkey
| 98,747
| 434
| 98,313
| —
|
| Other Country Categories**
| 7,172,624
| —
| 7,172,624
| —
|
| Real Estate Investment Trusts:
|
|
|
|
|
| Mexico
| 15,977
| 15,977
| —
| —
|
| South Africa
| 4,838
| —
| 4,838
| —
|
| Total Investments
| $ 8,951,452
| $ 1,342,280
| $ 7,609,172
| $—*
|
| *
| Investment is valued at $0.
|
| **
| See Portfolio of Investments for country breakout.
|
Level 3 investments are
fair valued by the Advisor’s Pricing Committee and are footnoted in the Portfolio of Investments. Level 3 investments values are based on unobservable and non-quantitative inputs.
Page 30
See Notes to Financial Statements
Large Cap US Equity Select ETF (RNLC)
Portfolio of Investments
March 31, 2023
| Shares
|
| Description
|
| Value
|
| COMMON STOCKS – 97.0%
|
|
|
| Aerospace & Defense – 1.4%
|
|
|
| 124
|
| General Dynamics Corp.
|
| $28,298
|
| 201
|
| HEICO Corp.
|
| 34,379
|
| 783
|
| Howmet Aerospace, Inc.
|
| 33,176
|
| 148
|
| L3Harris Technologies, Inc.
|
| 29,043
|
| 63
|
| Lockheed Martin Corp.
|
| 29,782
|
| 57
|
| Northrop Grumman Corp.
|
| 26,318
|
| 306
|
| Raytheon Technologies Corp.
|
| 29,967
|
| 436
|
| Textron, Inc.
|
| 30,795
|
|
|
|
|
| 241,758
|
|
|
| Air Freight & Logistics – 0.8%
|
|
|
| 337
|
| CH Robinson Worldwide, Inc.
|
| 33,488
|
| 297
|
| Expeditors International of Washington, Inc.
|
| 32,706
|
| 178
|
| FedEx Corp.
|
| 40,671
|
| 178
|
| United Parcel Service, Inc., Class B
|
| 34,530
|
|
|
|
|
| 141,395
|
|
|
| Automobiles – 0.8%
|
|
|
| 5,582
|
| Ford Motor Co.
|
| 70,333
|
| 1,837
|
| General Motors Co.
|
| 67,381
|
|
|
|
|
| 137,714
|
|
|
| Banks – 2.1%
|
|
|
| 964
|
| Bank of America Corp.
|
| 27,570
|
| 706
|
| Citigroup, Inc.
|
| 33,104
|
| 811
|
| Citizens Financial Group, Inc.
|
| 24,630
|
| 973
|
| Fifth Third Bancorp
|
| 25,921
|
| 262
|
| First Republic Bank
|
| 3,665
|
| 2,264
|
| Huntington Bancshares, Inc.
|
| 25,357
|
| 238
|
| JPMorgan Chase & Co.
|
| 31,014
|
| 1,832
|
| KeyCorp
|
| 22,937
|
| 220
|
| M&T Bank Corp.
|
| 26,305
|
| 202
|
| PNC Financial Services Group (The), Inc.
|
| 25,674
|
| 1,480
|
| Regions Financial Corp.
|
| 27,469
|
| 742
|
| Truist Financial Corp.
|
| 25,302
|
| 732
|
| US Bancorp
|
| 26,389
|
| 773
|
| Wells Fargo & Co.
|
| 28,895
|
|
|
|
|
| 354,232
|
|
|
| Beverages – 1.0%
|
|
|
| 520
|
| Brown-Forman Corp., Class B
|
| 33,420
|
| 537
|
| Coca-Cola (The) Co.
|
| 33,310
|
| 147
|
| Constellation Brands, Inc., Class A
|
| 33,206
|
| 958
|
| Keurig Dr. Pepper, Inc.
|
| 33,798
|
| 189
|
| PepsiCo, Inc.
|
| 34,455
|
|
|
|
|
| 168,189
|
|
|
| Biotechnology – 1.3%
|
|
|
| 486
|
| AbbVie, Inc.
|
| 77,454
|
| 299
|
| Amgen, Inc.
|
| 72,283
|
| Shares
|
| Description
|
| Value
|
|
|
|
|
| Biotechnology (Continued)
|
|
|
| 915
|
| Gilead Sciences, Inc.
|
| $75,918
|
|
|
|
|
| 225,655
|
|
|
| Broadline Retail – 0.4%
|
|
|
| 1,490
|
| eBay, Inc.
|
| 66,111
|
|
|
| Building Products – 0.9%
|
|
|
| 131
|
| Carlisle Cos., Inc.
|
| 29,615
|
| 748
|
| Carrier Global Corp.
|
| 34,221
|
| 482
|
| Johnson Controls International PLC
|
| 29,026
|
| 662
|
| Masco Corp.
|
| 32,915
|
| 184
|
| Trane Technologies PLC
|
| 33,852
|
|
|
|
|
| 159,629
|
|
|
| Capital Markets – 4.3%
|
|
|
| 103
|
| Ameriprise Financial, Inc.
|
| 31,570
|
| 701
|
| Bank of New York Mellon (The) Corp.
|
| 31,853
|
| 45
|
| BlackRock, Inc.
|
| 30,110
|
| 430
|
| Blackstone, Inc.
|
| 37,771
|
| 1,070
|
| Carlyle Group (The), Inc.
|
| 33,234
|
| 254
|
| Cboe Global Markets, Inc.
|
| 34,097
|
| 383
|
| Charles Schwab (The) Corp.
|
| 20,062
|
| 190
|
| CME Group, Inc.
|
| 36,389
|
| 80
|
| FactSet Research Systems, Inc.
|
| 33,207
|
| 1,210
|
| Franklin Resources, Inc.
|
| 32,597
|
| 93
|
| Goldman Sachs Group (The), Inc.
|
| 30,421
|
| 311
|
| Intercontinental Exchange, Inc.
|
| 32,434
|
| 688
|
| KKR & Co., Inc.
|
| 36,134
|
| 148
|
| LPL Financial Holdings, Inc.
|
| 29,955
|
| 115
|
| Moody’s Corp.
|
| 35,192
|
| 375
|
| Morgan Stanley
|
| 32,925
|
| 69
|
| MSCI, Inc.
|
| 38,619
|
| 520
|
| Nasdaq, Inc.
|
| 28,428
|
| 361
|
| Northern Trust Corp.
|
| 31,815
|
| 299
|
| Raymond James Financial, Inc.
|
| 27,888
|
| 95
|
| S&P Global, Inc.
|
| 32,753
|
| 411
|
| State Street Corp.
|
| 31,109
|
| 293
|
| T. Rowe Price Group, Inc.
|
| 33,080
|
|
|
|
|
| 741,643
|
|
|
| Chemicals – 1.7%
|
|
|
| 41
|
| Air Products and Chemicals, Inc.
|
| 11,776
|
| 58
|
| Albemarle Corp.
|
| 12,820
|
| 123
|
| Celanese Corp.
|
| 13,393
|
| 147
|
| CF Industries Holdings, Inc.
|
| 10,656
|
| 581
|
| Corteva, Inc.
|
| 35,040
|
| 249
|
| Dow, Inc.
|
| 13,650
|
| 450
|
| DuPont de Nemours, Inc.
|
| 32,297
|
| 154
|
| Eastman Chemical Co.
|
| 12,988
|
| 86
|
| Ecolab, Inc.
|
| 14,236
|
| 100
|
| FMC Corp.
|
| 12,213
|
| 120
|
| International Flavors & Fragrances, Inc.
|
| 11,035
|
See Notes to Financial
Statements
Page 31
Large Cap US Equity Select ETF (RNLC)
Portfolio of Investments
(Continued)
March 31, 2023
| Shares
|
| Description
|
| Value
|
| COMMON STOCKS (Continued)
|
|
|
| Chemicals (Continued)
|
|
|
| 151
|
| LyondellBasell Industries N.V., Class A
|
| $14,177
|
| 286
|
| Mosaic (The) Co.
|
| 13,122
|
| 246
|
| PPG Industries, Inc.
|
| 32,861
|
| 130
|
| Sherwin-Williams (The) Co.
|
| 29,220
|
| 122
|
| Westlake Corp.
|
| 14,150
|
|
|
|
|
| 283,634
|
|
|
| Commercial Services &
Supplies – 0.8%
|
|
|
| 68
|
| Cintas Corp.
|
| 31,462
|
| 143
|
| Republic Services, Inc.
|
| 19,337
|
| 1,691
|
| Rollins, Inc.
|
| 63,463
|
| 118
|
| Waste Management, Inc.
|
| 19,254
|
|
|
|
|
| 133,516
|
|
|
| Communications Equipment – 1.1%
|
|
|
| 1,838
|
| Cisco Systems, Inc.
|
| 96,082
|
| 340
|
| Motorola Solutions, Inc.
|
| 97,284
|
|
|
|
|
| 193,366
|
|
|
| Construction & Engineering – 0.2%
|
|
|
| 217
|
| Quanta Services, Inc.
|
| 36,161
|
|
|
| Construction Materials – 0.4%
|
|
|
| 91
|
| Martin Marietta Materials, Inc.
|
| 32,310
|
| 176
|
| Vulcan Materials Co.
|
| 30,195
|
|
|
|
|
| 62,505
|
|
|
| Consumer Finance – 0.7%
|
|
|
| 209
|
| American Express Co.
|
| 34,475
|
| 332
|
| Capital One Financial Corp.
|
| 31,925
|
| 326
|
| Discover Financial Services
|
| 32,222
|
| 940
|
| Synchrony Financial
|
| 27,335
|
|
|
|
|
| 125,957
|
|
|
| Consumer Staples
Distribution & Retail – 2.1%
|
|
|
| 135
|
| Costco Wholesale Corp.
|
| 67,077
|
| 251
|
| Dollar General Corp.
|
| 52,826
|
| 766
|
| Kroger (The) Co.
|
| 37,817
|
| 447
|
| Sysco Corp.
|
| 34,522
|
| 415
|
| Target Corp.
|
| 68,737
|
| 914
|
| Walgreens Boots Alliance, Inc.
|
| 31,606
|
| 436
|
| Walmart, Inc.
|
| 64,288
|
|
|
|
|
| 356,873
|
|
|
| Containers & Packaging – 0.5%
|
|
|
| 69
|
| Avery Dennison Corp.
|
| 12,346
|
| 604
|
| Ball Corp.
|
| 33,286
|
| 362
|
| International Paper Co.
|
| 13,054
|
| Shares
|
| Description
|
| Value
|
|
|
|
|
| Containers &
Packaging (Continued)
|
|
|
| 241
|
| Packaging Corp. of America
|
| $33,458
|
|
|
|
|
| 92,144
|
|
|
| Distributors – 1.1%
|
|
|
| 356
|
| Genuine Parts Co.
|
| 59,562
|
| 1,157
|
| LKQ Corp.
|
| 65,671
|
| 204
|
| Pool Corp.
|
| 69,858
|
|
|
|
|
| 195,091
|
|
|
| Diversified Telecommunication
Services – 1.0%
|
|
|
| 4,756
|
| AT&T, Inc.
|
| 91,553
|
| 2,222
|
| Verizon Communications, Inc.
|
| 86,414
|
|
|
|
|
| 177,967
|
|
|
| Electric Utilities – 1.5%
|
|
|
| 334
|
| Alliant Energy Corp.
|
| 17,836
|
| 194
|
| American Electric Power Co., Inc.
|
| 17,652
|
| 214
|
| Constellation Energy Corp.
|
| 16,799
|
| 179
|
| Duke Energy Corp.
|
| 17,268
|
| 290
|
| Edison International
|
| 20,471
|
| 164
|
| Entergy Corp.
|
| 17,669
|
| 293
|
| Evergy, Inc.
|
| 17,908
|
| 220
|
| Eversource Energy
|
| 17,217
|
| 427
|
| Exelon Corp.
|
| 17,887
|
| 440
|
| FirstEnergy Corp.
|
| 17,626
|
| 221
|
| NextEra Energy, Inc.
|
| 17,035
|
| 631
|
| PPL Corp.
|
| 17,536
|
| 258
|
| Southern (The) Co.
|
| 17,952
|
| 263
|
| Xcel Energy, Inc.
|
| 17,737
|
|
|
|
|
| 248,593
|
|
|
| Electrical Equipment – 0.8%
|
|
|
| 221
|
| AMETEK, Inc.
|
| 32,118
|
| 197
|
| Eaton Corp. PLC
|
| 33,754
|
| 321
|
| Emerson Electric Co.
|
| 27,972
|
| 120
|
| Rockwell Automation, Inc.
|
| 35,214
|
|
|
|
|
| 129,058
|
|
|
| Electronic Equipment,
Instruments & Components – 3.0%
|
|
|
| 1,522
|
| Amphenol Corp., Class A
|
| 124,378
|
| 649
|
| CDW Corp.
|
| 126,484
|
| 3,628
|
| Corning, Inc.
|
| 127,996
|
| 1,009
|
| TE Connectivity Ltd.
|
| 132,330
|
|
|
|
|
| 511,188
|
|
|
| Energy Equipment &
Services – 0.6%
|
|
|
| 1,197
|
| Baker Hughes Co.
|
| 34,545
|
| 898
|
| Halliburton Co.
|
| 28,413
|
Page 32
See Notes to Financial
Statements
Large Cap US Equity Select ETF (RNLC)
Portfolio of Investments
(Continued)
March 31, 2023
| Shares
|
| Description
|
| Value
|
| COMMON STOCKS (Continued)
|
|
|
| Energy Equipment &
Services (Continued)
|
|
|
| 661
|
| Schlumberger N.V.
|
| $32,455
|
|
|
|
|
| 95,413
|
|
|
| Entertainment – 0.4%
|
|
|
| 506
|
| Electronic Arts, Inc.
|
| 60,948
|
|
|
| Financial Services – 1.1%
|
|
|
| 500
|
| Apollo Global Management, Inc.
|
| 31,580
|
| 455
|
| Fidelity National Information Services, Inc.
|
| 24,720
|
| 311
|
| Global Payments, Inc.
|
| 32,730
|
| 176
|
| Jack Henry & Associates, Inc.
|
| 26,527
|
| 89
|
| Mastercard, Inc., Class A
|
| 32,343
|
| 149
|
| Visa, Inc., Class A
|
| 33,594
|
|
|
|
|
| 181,494
|
|
|
| Food Products – 2.5%
|
|
|
| 368
|
| Archer-Daniels-Midland Co.
|
| 29,315
|
| 342
|
| Bunge Ltd.
|
| 32,668
|
| 602
|
| Campbell Soup Co.
|
| 33,098
|
| 883
|
| Conagra Brands, Inc.
|
| 33,165
|
| 407
|
| General Mills, Inc.
|
| 34,782
|
| 148
|
| Hershey (The) Co.
|
| 37,653
|
| 750
|
| Hormel Foods Corp.
|
| 29,910
|
| 216
|
| J.M. Smucker (The) Co.
|
| 33,992
|
| 479
|
| Kellogg Co.
|
| 32,074
|
| 839
|
| Kraft Heinz (The) Co.
|
| 32,444
|
| 412
|
| McCormick & Co., Inc.
|
| 34,282
|
| 513
|
| Mondelez International, Inc., Class A
|
| 35,766
|
| 549
|
| Tyson Foods, Inc., Class A
|
| 32,567
|
|
|
|
|
| 431,716
|
|
|
| Gas Utilities – 0.1%
|
|
|
| 165
|
| Atmos Energy Corp.
|
| 18,539
|
|
|
| Ground Transportation – 0.9%
|
|
|
| 997
|
| CSX Corp.
|
| 29,850
|
| 177
|
| JB Hunt Transport Services, Inc.
|
| 31,056
|
| 125
|
| Norfolk Southern Corp.
|
| 26,500
|
| 109
|
| Old Dominion Freight Line, Inc.
|
| 37,152
|
| 149
|
| Union Pacific Corp.
|
| 29,988
|
|
|
|
|
| 154,546
|
|
|
| Health Care Equipment &
Supplies – 4.2%
|
|
|
| 715
|
| Abbott Laboratories
|
| 72,401
|
| 1,541
|
| Baxter International, Inc.
|
| 62,503
|
| 309
|
| Becton Dickinson and Co.
|
| 76,490
|
| 238
|
| Cooper (The) Cos., Inc.
|
| 88,859
|
| 1,011
|
| Medtronic PLC
|
| 81,507
|
| 377
|
| ResMed, Inc.
|
| 82,559
|
| 425
|
| STERIS PLC
|
| 81,294
|
| 321
|
| Stryker Corp.
|
| 91,636
|
| Shares
|
| Description
|
| Value
|
|
|
|
|
| Health Care Equipment &
Supplies (Continued)
|
|
|
| 616
|
| Zimmer Biomet Holdings, Inc.
|
| $79,587
|
|
|
|
|
| 716,836
|
|
|
| Health Care Providers &
Services – 4.0%
|
|
|
| 206
|
| AmerisourceBergen Corp.
|
| 32,983
|
| 1,022
|
| Cardinal Health, Inc.
|
| 77,161
|
| 237
|
| Cigna (The) Group
|
| 60,561
|
| 367
|
| CVS Health Corp.
|
| 27,272
|
| 153
|
| Elevance Health, Inc.
|
| 70,351
|
| 327
|
| HCA Healthcare, Inc.
|
| 86,223
|
| 153
|
| Humana, Inc.
|
| 74,275
|
| 334
|
| Laboratory Corp of America Holdings
|
| 76,626
|
| 91
|
| McKesson Corp.
|
| 32,401
|
| 502
|
| Quest Diagnostics, Inc.
|
| 71,023
|
| 148
|
| UnitedHealth Group, Inc.
|
| 69,943
|
|
|
|
|
| 678,819
|
|
|
| Hotels, Restaurants &
Leisure – 3.2%
|
|
|
| 447
|
| Darden Restaurants, Inc.
|
| 69,356
|
| 178
|
| Domino’s Pizza, Inc.
|
| 58,717
|
| 489
|
| Hilton Worldwide Holdings, Inc.
|
| 68,885
|
| 415
|
| Marriott International, Inc., Class A
|
| 68,907
|
| 234
|
| McDonald’s Corp.
|
| 65,429
|
| 1,843
|
| MGM Resorts International
|
| 81,866
|
| 623
|
| Starbucks Corp.
|
| 64,873
|
| 482
|
| Yum! Brands, Inc.
|
| 63,663
|
|
|
|
|
| 541,696
|
|
|
| Household Durables – 1.2%
|
|
|
| 693
|
| DR Horton, Inc.
|
| 67,699
|
| 669
|
| Garmin Ltd.
|
| 67,516
|
| 683
|
| Lennar Corp., Class A
|
| 71,790
|
|
|
|
|
| 207,005
|
|
|
| Household Products – 1.0%
|
|
|
| 424
|
| Church & Dwight Co., Inc.
|
| 37,486
|
| 243
|
| Clorox (The) Co.
|
| 38,452
|
| 434
|
| Colgate-Palmolive Co.
|
| 32,615
|
| 252
|
| Kimberly-Clark Corp.
|
| 33,824
|
| 225
|
| Procter & Gamble (The) Co.
|
| 33,455
|
|
|
|
|
| 175,832
|
|
|
| Independent Power &
Renewable Electricity Producers – 0.1%
|
|
|
| 641
|
| AES (The) Corp.
|
| 15,435
|
|
|
| Industrial Conglomerates – 0.5%
|
|
|
| 257
|
| 3M Co.
|
| 27,013
|
| 368
|
| General Electric Co.
|
| 35,181
|
See Notes to Financial
Statements
Page 33
Large Cap US Equity Select ETF (RNLC)
Portfolio of Investments
(Continued)
March 31, 2023
| Shares
|
| Description
|
| Value
|
| COMMON STOCKS (Continued)
|
|
|
| Industrial
Conglomerates (Continued)
|
|
|
| 144
|
| Honeywell International, Inc.
|
| $27,521
|
|
|
|
|
| 89,715
|
|
|
| Insurance – 3.0%
|
|
|
| 444
|
| Aflac, Inc.
|
| 28,647
|
| 235
|
| Allstate (The) Corp.
|
| 26,040
|
| 505
|
| American International Group, Inc.
|
| 25,432
|
| 106
|
| Aon PLC, Class A
|
| 33,421
|
| 169
|
| Arthur J. Gallagher & Co.
|
| 32,331
|
| 560
|
| Brown & Brown, Inc.
|
| 32,155
|
| 145
|
| Chubb Ltd.
|
| 28,156
|
| 312
|
| Cincinnati Financial Corp.
|
| 34,969
|
| 421
|
| Hartford Financial Services Group (The), Inc.
|
| 29,339
|
| 547
|
| Loews Corp.
|
| 31,737
|
| 193
|
| Marsh & McLennan Cos., Inc.
|
| 32,144
|
| 441
|
| MetLife, Inc.
|
| 25,552
|
| 380
|
| Principal Financial Group, Inc.
|
| 28,242
|
| 246
|
| Progressive (The) Corp.
|
| 35,193
|
| 321
|
| Prudential Financial, Inc.
|
| 26,560
|
| 170
|
| Travelers (The) Cos., Inc.
|
| 29,140
|
| 440
|
| W.R. Berkley Corp.
|
| 27,394
|
|
|
|
|
| 506,452
|
|
|
| IT Services – 1.6%
|
|
|
| 116
|
| Accenture PLC, Class A
|
| 33,154
|
| 2,026
|
| Cognizant Technology Solutions Corp., Class A
|
| 123,444
|
| 823
|
| International Business Machines Corp.
|
| 107,887
|
|
|
|
|
| 264,485
|
|
|
| Life Sciences Tools &
Services – 2.9%
|
|
|
| 525
|
| Agilent Technologies, Inc.
|
| 72,628
|
| 948
|
| Bio-Techne Corp.
|
| 70,332
|
| 296
|
| Danaher Corp.
|
| 74,604
|
| 560
|
| PerkinElmer, Inc.
|
| 74,626
|
| 143
|
| Thermo Fisher Scientific, Inc.
|
| 82,421
|
| 334
|
| West Pharmaceutical Services, Inc.
|
| 115,721
|
|
|
|
|
| 490,332
|
|
|
| Machinery – 2.8%
|
|
|
| 129
|
| Caterpillar, Inc.
|
| 29,520
|
| 127
|
| Cummins, Inc.
|
| 30,338
|
| 72
|
| Deere & Co.
|
| 29,727
|
| 228
|
| Dover Corp.
|
| 34,642
|
| 481
|
| Fortive Corp.
|
| 32,790
|
| 135
|
| IDEX Corp.
|
| 31,189
|
| 140
|
| Illinois Tool Works, Inc.
|
| 34,083
|
| 591
|
| Ingersoll Rand, Inc.
|
| 34,384
|
| 130
|
| Nordson Corp.
|
| 28,894
|
| Shares
|
| Description
|
| Value
|
|
|
|
|
| Machinery (Continued)
|
|
|
| 394
|
| Otis Worldwide Corp.
|
| $33,254
|
| 468
|
| PACCAR, Inc.
|
| 34,258
|
| 106
|
| Parker-Hannifin Corp.
|
| 35,628
|
| 411
|
| Stanley Black & Decker, Inc.
|
| 33,118
|
| 309
|
| Westinghouse Air Brake Technologies Corp.
|
| 31,228
|
| 279
|
| Xylem, Inc.
|
| 29,211
|
|
|
|
|
| 482,264
|
|
|
| Media – 1.9%
|
|
|
| 2,504
|
| Comcast Corp., Class A
|
| 94,927
|
| 2,034
|
| Fox Corp., Class A
|
| 69,258
|
| 757
|
| Omnicom Group, Inc.
|
| 71,415
|
| 3,660
|
| Paramount Global, Class B
|
| 81,654
|
|
|
|
|
| 317,254
|
|
|
| Metals & Mining – 0.3%
|
|
|
| 330
|
| Freeport-McMoRan, Inc.
|
| 13,500
|
| 266
|
| Newmont Corp.
|
| 13,039
|
| 95
|
| Nucor Corp.
|
| 14,675
|
| 128
|
| Steel Dynamics, Inc.
|
| 14,472
|
|
|
|
|
| 55,686
|
|
|
| Multi-Utilities – 0.9%
|
|
|
| 207
|
| Ameren Corp.
|
| 17,883
|
| 615
|
| CenterPoint Energy, Inc.
|
| 18,118
|
| 291
|
| CMS Energy Corp.
|
| 17,861
|
| 193
|
| Consolidated Edison, Inc.
|
| 18,464
|
| 301
|
| Dominion Energy, Inc.
|
| 16,829
|
| 157
|
| DTE Energy Co.
|
| 17,198
|
| 301
|
| Public Service Enterprise Group, Inc.
|
| 18,797
|
| 119
|
| Sempra Energy
|
| 17,988
|
| 197
|
| WEC Energy Group, Inc.
|
| 18,674
|
|
|
|
|
| 161,812
|
|
|
| Oil, Gas & Consumable Fuels – 4.4%
|
|
|
| 757
|
| APA Corp.
|
| 27,297
|
| 236
|
| Cheniere Energy, Inc.
|
| 37,194
|
| 197
|
| Chevron Corp.
|
| 32,143
|
| 300
|
| ConocoPhillips
|
| 29,763
|
| 1,439
|
| Coterra Energy, Inc.
|
| 35,313
|
| 575
|
| Devon Energy Corp.
|
| 29,101
|
| 258
|
| Diamondback Energy, Inc.
|
| 34,874
|
| 273
|
| EOG Resources, Inc.
|
| 31,294
|
| 1,045
|
| EQT Corp.
|
| 33,346
|
| 320
|
| Exxon Mobil Corp.
|
| 35,091
|
| 249
|
| Hess Corp.
|
| 32,953
|
| 1,955
|
| Kinder Morgan, Inc.
|
| 34,232
|
| 1,306
|
| Marathon Oil Corp.
|
| 31,292
|
| 304
|
| Marathon Petroleum Corp.
|
| 40,988
|
| 561
|
| Occidental Petroleum Corp.
|
| 35,023
|
| 538
|
| ONEOK, Inc.
|
| 34,184
|
| 697
|
| Ovintiv, Inc.
|
| 25,148
|
| 340
|
| Phillips 66
|
| 34,469
|
Page 34
See Notes to Financial
Statements
Large Cap US Equity Select ETF (RNLC)
Portfolio of Investments
(Continued)
March 31, 2023
| Shares
|
| Description
|
| Value
|
| COMMON STOCKS (Continued)
|
|
|
| Oil, Gas & Consumable
Fuels (Continued)
|
|
|
| 155
|
| Pioneer Natural Resources Co.
|
| $31,657
|
| 481
|
| Targa Resources Corp.
|
| 35,089
|
| 15
|
| Texas Pacific Land Corp.
|
| 25,515
|
| 279
|
| Valero Energy Corp.
|
| 38,948
|
| 1,074
|
| Williams (The) Cos., Inc.
|
| 32,070
|
|
|
|
|
| 756,984
|
|
|
| Personal Care Products – 0.4%
|
|
|
| 249
|
| Estee Lauder (The) Cos., Inc., Class A
|
| 61,369
|
|
|
| Pharmaceuticals – 2.6%
|
|
|
| 1,092
|
| Bristol-Myers Squibb Co.
|
| 75,687
|
| 215
|
| Eli Lilly & Co.
|
| 73,835
|
| 445
|
| Johnson & Johnson
|
| 68,975
|
| 708
|
| Merck & Co., Inc.
|
| 75,324
|
| 1,533
|
| Pfizer, Inc.
|
| 62,546
|
| 536
|
| Zoetis, Inc.
|
| 89,212
|
|
|
|
|
| 445,579
|
|
|
| Professional Services – 2.8%
|
|
|
| 129
|
| Automatic Data Processing, Inc.
|
| 28,719
|
| 295
|
| Booz Allen Hamilton Holding Corp.
|
| 27,344
|
| 238
|
| Broadridge Financial Solutions, Inc.
|
| 34,884
|
| 159
|
| Equifax, Inc.
|
| 32,252
|
| 257
|
| Jacobs Solutions, Inc.
|
| 30,200
|
| 1,102
|
| Leidos Holdings, Inc.
|
| 101,450
|
| 267
|
| Paychex, Inc.
|
| 30,596
|
| 2,226
|
| SS&C Technologies Holdings, Inc.
|
| 125,702
|
| 544
|
| TransUnion
|
| 33,804
|
| 175
|
| Verisk Analytics, Inc.
|
| 33,575
|
|
|
|
|
| 478,526
|
|
|
| Semiconductors &
Semiconductor Equipment – 14.5%
|
|
|
| 706
|
| Analog Devices, Inc.
|
| 139,237
|
| 1,190
|
| Applied Materials, Inc.
|
| 146,168
|
| 207
|
| Broadcom, Inc.
|
| 132,799
|
| 1,767
|
| Entegris, Inc.
|
| 144,912
|
| 4,385
|
| Intel Corp.
|
| 143,258
|
| 307
|
| KLA Corp.
|
| 122,545
|
| 276
|
| Lam Research Corp.
|
| 146,313
|
| 3,129
|
| Marvell Technology, Inc.
|
| 135,486
|
| 1,650
|
| Microchip Technology, Inc.
|
| 138,237
|
| 2,319
|
| Micron Technology, Inc.
|
| 139,928
|
| 328
|
| Monolithic Power Systems, Inc.
|
| 164,177
|
| 793
|
| NVIDIA Corp.
|
| 220,272
|
| 733
|
| NXP Semiconductors N.V.
|
| 136,686
|
| 1,054
|
| QUALCOMM, Inc.
|
| 134,469
|
| 1,272
|
| Skyworks Solutions, Inc.
|
| 150,070
|
| Shares
|
| Description
|
| Value
|
|
|
|
|
| Semiconductors &
Semiconductor Equipment (Continued)
|
|
|
| 1,327
|
| Teradyne, Inc.
|
| $142,666
|
| 701
|
| Texas Instruments, Inc.
|
| 130,393
|
|
|
|
|
| 2,467,616
|
|
|
| Software – 3.6%
|
|
|
| 5,408
|
| Gen Digital, Inc.
|
| 92,801
|
| 298
|
| Intuit, Inc.
|
| 132,857
|
| 483
|
| Microsoft Corp.
|
| 139,249
|
| 1,418
|
| Oracle Corp.
|
| 131,761
|
| 268
|
| Roper Technologies, Inc.
|
| 118,105
|
|
|
|
|
| 614,773
|
|
|
| Specialty Retail – 2.1%
|
|
|
| 770
|
| Best Buy Co., Inc.
|
| 60,268
|
| 196
|
| Home Depot (The), Inc.
|
| 57,844
|
| 310
|
| Lowe’s Cos., Inc.
|
| 61,991
|
| 532
|
| Ross Stores, Inc.
|
| 56,461
|
| 776
|
| TJX (The) Cos., Inc.
|
| 60,807
|
| 275
|
| Tractor Supply Co.
|
| 64,636
|
|
|
|
|
| 362,007
|
|
|
| Technology Hardware,
Storage & Peripherals – 3.9%
|
|
|
| 892
|
| Apple, Inc.
|
| 147,091
|
| 7,261
|
| Hewlett Packard Enterprise Co.
|
| 115,668
|
| 4,313
|
| HP, Inc.
|
| 126,586
|
| 1,929
|
| NetApp, Inc.
|
| 123,167
|
| 2,203
|
| Seagate Technology Holdings PLC
|
| 145,662
|
|
|
|
|
| 658,174
|
|
|
| Textiles, Apparel & Luxury
Goods – 0.7%
|
|
|
| 528
|
| NIKE, Inc., Class B
|
| 64,754
|
| 2,238
|
| VF Corp.
|
| 51,272
|
|
|
|
|
| 116,026
|
|
|
| Tobacco – 0.4%
|
|
|
| 747
|
| Altria Group, Inc.
|
| 33,331
|
| 338
|
| Philip Morris International, Inc.
|
| 32,871
|
|
|
|
|
| 66,202
|
|
|
| Trading Companies &
Distributors – 0.3%
|
|
|
| 265
|
| Fastenal Co.
|
| 14,294
|
| 56
|
| WW Grainger, Inc.
|
| 38,573
|
|
|
|
|
| 52,867
|
|
|
| Water Utilities – 0.2%
|
|
|
| 121
|
| American Water Works Co., Inc.
|
| 17,725
|
See Notes to Financial
Statements
Page 35
Large Cap US Equity Select ETF (RNLC)
Portfolio of Investments
(Continued)
March 31, 2023
| Shares
|
| Description
|
| Value
|
| COMMON STOCKS (Continued)
|
|
|
| Water Utilities (Continued)
|
|
|
| 386
|
| Essential Utilities, Inc.
|
| $16,849
|
|
|
|
|
| 34,574
|
|
|
| Total Common Stocks
|
| 16,543,355
|
|
|
| (Cost $16,310,372)
|
|
|
| REAL ESTATE INVESTMENT TRUSTS – 2.8%
|
|
|
| Diversified REITs – 0.1%
|
|
|
| 189
|
| WP Carey, Inc.
|
| 14,638
|
|
|
| Health Care REITs – 0.3%
|
|
|
| 590
|
| Healthpeak Properties, Inc.
|
| 12,962
|
| 328
|
| Ventas, Inc.
|
| 14,219
|
| 226
|
| Welltower, Inc.
|
| 16,202
|
|
|
|
|
| 43,383
|
|
|
| Hotel & Resort REITs – 0.1%
|
|
|
| 922
|
| Host Hotels & Resorts, Inc.
|
| 15,204
|
|
|
| Industrial REITs – 0.1%
|
|
|
| 131
|
| Prologis, Inc.
|
| 16,345
|
|
|
| Office REITs – 0.1%
|
|
|
| 102
|
| Alexandria Real Estate Equities, Inc.
|
| 12,810
|
| 219
|
| Boston Properties, Inc.
|
| 11,852
|
|
|
|
|
| 24,662
|
|
|
| Residential REITs – 0.9%
|
|
|
| 491
|
| American Homes 4 Rent, Class A
|
| 15,442
|
| 92
|
| AvalonBay Communities, Inc.
|
| 15,461
|
| 132
|
| Camden Property Trust
|
| 13,839
|
| 229
|
| Equity LifeStyle Properties, Inc.
|
| 15,373
|
| 251
|
| Equity Residential
|
| 15,060
|
| 70
|
| Essex Property Trust, Inc.
|
| 14,640
|
| 499
|
| Invitation Homes, Inc.
|
| 15,584
|
| 94
|
| Mid-America Apartment Communities, Inc.
|
| 14,198
|
| 103
|
| Sun Communities, Inc.
|
| 14,510
|
| 382
|
| UDR, Inc.
|
| 15,685
|
|
|
|
|
| 149,792
|
|
|
| Retail REITs – 0.2%
|
|
|
| 698
|
| Kimco Realty Corp.
|
| 13,632
|
| 233
|
| Realty Income Corp.
|
| 14,754
|
| 126
|
| Simon Property Group, Inc.
|
| 14,108
|
|
|
|
|
| 42,494
|
|
|
| Specialized REITs – 1.0%
|
|
|
| 70
|
| American Tower Corp.
|
| 14,304
|
| 109
|
| Crown Castle, Inc.
|
| 14,589
|
| 148
|
| Digital Realty Trust, Inc.
|
| 14,550
|
| 23
|
| Equinix, Inc.
|
| 16,584
|
| 101
|
| Extra Space Storage, Inc.
|
| 16,456
|
| 284
|
| Gaming and Leisure Properties, Inc.
|
| 14,785
|
| Shares
|
| Description
|
| Value
|
|
|
|
|
| Specialized REITs (Continued)
|
|
|
| 297
|
| Iron Mountain, Inc.
|
| $15,714
|
| 53
|
| Public Storage
|
| 16,013
|
| 53
|
| SBA Communications Corp.
|
| 13,837
|
| 457
|
| VICI Properties, Inc.
|
| 14,907
|
| 477
|
| Weyerhaeuser Co.
|
| 14,372
|
|
|
|
|
| 166,111
|
|
|
| Total Real Estate Investment Trusts
|
| 472,629
|
|
|
| (Cost $513,719)
|
|
|
|
|
| Total Investments – 99.8%
|
| 17,015,984
|
|
|
| (Cost $16,824,091)
|
|
|
|
|
| Net Other Assets and Liabilities – 0.2%
|
| 29,529
|
|
|
| Net Assets – 100.0%
|
| $17,045,513
|
Valuation Inputs
A summary of the inputs
used to value the Fund’s investments as of March 31, 2023 is as follows (see Note 2A - Portfolio Valuation in the Notes to Financial Statements):
|
| Total
Value at
3/31/2023
| Level 1
Quoted
Prices
| Level 2
Significant
Observable
Inputs
| Level 3
Significant
Unobservable
Inputs
|
| Common Stocks*
| $ 16,543,355
| $ 16,543,355
| $ —
| $ —
|
| Real Estate Investment Trusts*
| 472,629
| 472,629
| —
| —
|
| Total Investments
| $ 17,015,984
| $ 17,015,984
| $—
| $—
|
| *
| See Portfolio of Investments for industry breakout.
|
Page 36
See Notes to Financial
Statements
Mid Cap US Equity Select ETF (RNMC)
Portfolio of Investments
March 31, 2023
| Shares
|
| Description
|
| Value
|
| COMMON STOCKS – 92.5%
|
|
|
| Aerospace & Defense – 1.6%
|
|
|
| 543
|
| BWX Technologies, Inc.
|
| $34,231
|
| 189
|
| Curtiss-Wright Corp.
|
| 33,313
|
| 417
|
| Hexcel Corp.
|
| 28,460
|
| 137
|
| Huntington Ingalls Industries, Inc.
|
| 28,362
|
| 1,066
|
| Spirit AeroSystems Holdings, Inc., Class A
|
| 36,809
|
| 327
|
| Woodward, Inc.
|
| 31,840
|
|
|
|
|
| 193,015
|
|
|
| Automobile Components – 1.5%
|
|
|
| 996
|
| BorgWarner, Inc.
|
| 48,914
|
| 1,470
|
| Gentex Corp.
|
| 41,204
|
| 434
|
| LCI Industries
|
| 47,684
|
| 323
|
| Lear Corp.
|
| 45,055
|
|
|
|
|
| 182,857
|
|
|
| Automobiles – 0.6%
|
|
|
| 964
|
| Harley-Davidson, Inc.
|
| 36,603
|
| 531
|
| Thor Industries, Inc.
|
| 42,289
|
|
|
|
|
| 78,892
|
|
|
| Banks – 5.4%
|
|
|
| 261
|
| BancFirst Corp.
|
| 21,689
|
| 576
|
| Bank OZK
|
| 19,699
|
| 222
|
| BOK Financial Corp.
|
| 18,739
|
| 935
|
| Cadence Bank
|
| 19,411
|
| 345
|
| Comerica, Inc.
|
| 14,980
|
| 339
|
| Commerce Bancshares, Inc.
|
| 19,781
|
| 366
|
| Community Bank System, Inc.
|
| 19,211
|
| 172
|
| Cullen/Frost Bankers, Inc.
|
| 18,118
|
| 894
|
| CVB Financial Corp.
|
| 14,912
|
| 350
|
| East West Bancorp, Inc.
|
| 19,425
|
| 1,337
|
| Eastern Bankshares, Inc.
|
| 16,873
|
| 31
|
| First Citizens BancShares, Inc., Class A
|
| 30,166
|
| 669
|
| First Financial Bankshares, Inc.
|
| 21,341
|
| 596
|
| First Interstate BancSystem, Inc., Class A
|
| 17,797
|
| 1,767
|
| FNB Corp.
|
| 20,497
|
| 467
|
| Glacier Bancorp, Inc.
|
| 19,619
|
| 476
|
| Hancock Whitney Corp.
|
| 17,326
|
| 1,012
|
| Home BancShares, Inc.
|
| 21,970
|
| 273
|
| Independent Bank Corp.
|
| 17,914
|
| 2,681
|
| New York Community Bancorp, Inc.
|
| 24,236
|
| 1,280
|
| Old National Bancorp
|
| 18,458
|
| 314
|
| Pinnacle Financial Partners, Inc.
|
| 17,320
|
| 348
|
| Popular, Inc.
|
| 19,979
|
| 317
|
| Prosperity Bancshares, Inc.
|
| 19,502
|
| 335
|
| ServisFirst Bancshares, Inc.
|
| 18,301
|
| 302
|
| SouthState Corp.
|
| 21,520
|
| 614
|
| Synovus Financial Corp.
|
| 18,930
|
| 276
|
| UMB Financial Corp.
|
| 15,931
|
| Shares
|
| Description
|
| Value
|
|
|
|
|
| Banks (Continued)
|
|
|
| 569
|
| United Bankshares, Inc.
|
| $20,029
|
| 681
|
| United Community Banks, Inc.
|
| 19,150
|
| 2,039
|
| Valley National Bancorp
|
| 18,840
|
| 487
|
| Webster Financial Corp.
|
| 19,198
|
| 387
|
| Western Alliance Bancorp
|
| 13,754
|
| 273
|
| Wintrust Financial Corp.
|
| 19,915
|
| 469
|
| Zions Bancorp N.A.
|
| 14,037
|
|
|
|
|
| 668,568
|
|
|
| Beverages – 0.7%
|
|
|
| 78
|
| Coca-Cola Consolidated, Inc.
|
| 41,736
|
| 776
|
| Molson Coors Beverage Co., Class B
|
| 40,104
|
|
|
|
|
| 81,840
|
|
|
| Broadline Retail – 0.9%
|
|
|
| 1,588
|
| Kohl’s Corp.
|
| 37,381
|
| 1,942
|
| Macy’s, Inc.
|
| 33,966
|
| 2,484
|
| Nordstrom, Inc.
|
| 40,415
|
|
|
|
|
| 111,762
|
|
|
| Building Products – 2.7%
|
|
|
| 551
|
| A.O. Smith Corp.
|
| 38,101
|
| 385
|
| Advanced Drainage Systems, Inc.
|
| 32,421
|
| 300
|
| Allegion PLC
|
| 32,019
|
| 460
|
| Armstrong World Industries, Inc.
|
| 32,770
|
| 552
|
| Fortune Brands Innovations, Inc.
|
| 32,419
|
| 132
|
| Lennox International, Inc.
|
| 33,169
|
| 370
|
| Owens Corning
|
| 35,446
|
| 356
|
| Simpson Manufacturing Co., Inc.
|
| 39,032
|
| 310
|
| UFP Industries, Inc.
|
| 24,636
|
| 1,492
|
| Zurn Elkay Water Solutions Corp.
|
| 31,869
|
|
|
|
|
| 331,882
|
|
|
| Capital Markets – 2.7%
|
|
|
| 146
|
| Affiliated Managers Group, Inc.
|
| 20,793
|
| 337
|
| Ares Management Corp., Class A
|
| 28,119
|
| 357
|
| Cohen & Steers, Inc.
|
| 22,834
|
| 211
|
| Evercore, Inc., Class A
|
| 24,345
|
| 265
|
| Houlihan Lokey, Inc.
|
| 23,185
|
| 319
|
| Interactive Brokers Group, Inc., Class A
|
| 26,337
|
| 1,282
|
| Invesco, Ltd.
|
| 21,025
|
| 673
|
| Jefferies Financial Group, Inc.
|
| 21,361
|
| 664
|
| Lazard Ltd., Class A
|
| 21,985
|
| 83
|
| MarketAxess Holdings, Inc.
|
| 32,477
|
| 106
|
| Morningstar, Inc.
|
| 21,521
|
| 395
|
| SEI Investments Co.
|
| 22,732
|
| 395
|
| Stifel Financial Corp.
|
| 23,341
|
| 355
|
| Tradeweb Markets, Inc., Class A
|
| 28,052
|
|
|
|
|
| 338,107
|
|
|
| Chemicals – 2.9%
|
|
|
| 228
|
| Ashland, Inc.
|
| 23,418
|
See Notes to Financial
Statements
Page 37
Mid Cap US Equity Select ETF (RNMC)
Portfolio of Investments
(Continued)
March 31, 2023
| Shares
|
| Description
|
| Value
|
| COMMON STOCKS (Continued)
|
|
|
| Chemicals (Continued)
|
|
|
| 727
|
| Avient Corp.
|
| $29,923
|
| 201
|
| Balchem Corp.
|
| 25,422
|
| 367
|
| Cabot Corp.
|
| 28,127
|
| 802
|
| Chemours (The) Co.
|
| 24,012
|
| 1,350
|
| Element Solutions, Inc.
|
| 26,068
|
| 440
|
| HB Fuller Co.
|
| 30,118
|
| 892
|
| Huntsman Corp.
|
| 24,405
|
| 464
|
| Olin Corp.
|
| 25,752
|
| 324
|
| RPM International, Inc.
|
| 28,266
|
| 505
|
| Scotts Miracle-Gro (The) Co.
|
| 35,219
|
| 337
|
| Sensient Technologies Corp.
|
| 25,801
|
| 751
|
| Valvoline, Inc.
|
| 26,240
|
|
|
|
|
| 352,771
|
|
|
| Commercial Services &
Supplies – 0.5%
|
|
|
| 219
|
| MSA Safety, Inc.
|
| 29,237
|
| 217
|
| Tetra Tech, Inc.
|
| 31,879
|
|
|
|
|
| 61,116
|
|
|
| Communications Equipment – 0.6%
|
|
|
| 2,181
|
| Juniper Networks, Inc.
|
| 75,070
|
|
|
| Construction & Engineering – 1.4%
|
|
|
| 371
|
| AECOM
|
| 31,283
|
| 274
|
| Comfort Systems USA, Inc.
|
| 39,993
|
| 213
|
| EMCOR Group, Inc.
|
| 34,632
|
| 1,040
|
| MDU Resources Group, Inc.
|
| 31,699
|
| 95
|
| Valmont Industries, Inc.
|
| 30,331
|
|
|
|
|
| 167,938
|
|
|
| Construction Materials – 0.3%
|
|
|
| 237
|
| Eagle Materials, Inc.
|
| 34,780
|
|
|
| Consumer Finance – 0.7%
|
|
|
| 943
|
| Ally Financial, Inc.
|
| 24,037
|
| 265
|
| FirstCash Holdings, Inc.
|
| 25,273
|
| 692
|
| OneMain Holdings, Inc.
|
| 25,659
|
| 1,389
|
| SLM Corp.
|
| 17,210
|
|
|
|
|
| 92,179
|
|
|
| Consumer Staples
Distribution & Retail – 0.3%
|
|
|
| 178
|
| Casey’s General Stores, Inc.
|
| 38,530
|
|
|
| Containers & Packaging – 2.3%
|
|
|
| 287
|
| AptarGroup, Inc.
|
| 33,920
|
| 522
|
| Berry Global Group, Inc.
|
| 30,746
|
| 384
|
| Crown Holdings, Inc.
|
| 31,761
|
| 1,418
|
| Graphic Packaging Holding Co.
|
| 36,145
|
| 470
|
| Greif, Inc., Class A
|
| 29,784
|
| 632
|
| Sealed Air Corp.
|
| 29,015
|
| 609
|
| Silgan Holdings, Inc.
|
| 32,685
|
| Shares
|
| Description
|
| Value
|
|
|
|
|
| Containers &
Packaging (Continued)
|
|
|
| 520
|
| Sonoco Products Co.
|
| $31,720
|
| 896
|
| WestRock Co.
|
| 27,301
|
|
|
|
|
| 283,077
|
|
|
| Diversified Consumer
Services – 0.8%
|
|
|
| 3,478
|
| ADT, Inc.
|
| 25,146
|
| 1,098
|
| H&R Block, Inc.
|
| 38,705
|
| 580
|
| Service Corp. International
|
| 39,892
|
|
|
|
|
| 103,743
|
|
|
| Diversified Telecommunication
Services – 0.3%
|
|
|
| 13,352
|
| Lumen Technologies, Inc.
|
| 35,383
|
|
|
| Electric Utilities – 1.5%
|
|
|
| 419
|
| ALLETE, Inc.
|
| 26,971
|
| 647
|
| Hawaiian Electric Industries, Inc.
|
| 24,845
|
| 251
|
| IDACORP, Inc.
|
| 27,191
|
| 849
|
| NRG Energy, Inc.
|
| 29,112
|
| 683
|
| OGE Energy Corp.
|
| 25,722
|
| 356
|
| Pinnacle West Capital Corp.
|
| 28,209
|
| 552
|
| Portland General Electric Co.
|
| 26,987
|
|
|
|
|
| 189,037
|
|
|
| Electrical Equipment – 1.6%
|
|
|
| 190
|
| Acuity Brands, Inc.
|
| 34,719
|
| 134
|
| Hubbell, Inc.
|
| 32,603
|
| 263
|
| Regal Rexnord Corp.
|
| 37,012
|
| 6,765
|
| Vertiv Holdings Co.
|
| 96,807
|
|
|
|
|
| 201,141
|
|
|
| Electronic Equipment,
Instruments & Components – 4.5%
|
|
|
| 2,222
|
| Avnet, Inc.
|
| 100,434
|
| 670
|
| Cognex Corp.
|
| 33,198
|
| 1,355
|
| Jabil, Inc.
|
| 119,457
|
| 143
|
| Littelfuse, Inc.
|
| 38,337
|
| 2,504
|
| National Instruments Corp.
|
| 131,235
|
| 976
|
| TD SYNNEX Corp.
|
| 94,467
|
| 1,632
|
| Vontier Corp.
|
| 44,619
|
|
|
|
|
| 561,747
|
|
|
| Energy Equipment &
Services – 0.7%
|
|
|
| 963
|
| ChampionX Corp.
|
| 26,126
|
| 563
|
| Helmerich & Payne, Inc.
|
| 20,127
|
| 1,337
|
| NOV, Inc.
|
| 24,748
|
| 1,658
|
| Patterson-UTI Energy, Inc.
|
| 19,399
|
|
|
|
|
| 90,400
|
|
|
| Entertainment – 0.3%
|
|
|
| 1,145
|
| Warner Music Group Corp., Class A
|
| 38,209
|
Page 38
See Notes to Financial
Statements
Mid Cap US Equity Select ETF (RNMC)
Portfolio of Investments
(Continued)
March 31, 2023
| Shares
|
| Description
|
| Value
|
| COMMON STOCKS (Continued)
|
|
|
| Financial Services – 1.4%
|
|
|
| 802
|
| Equitable Holdings, Inc.
|
| $20,363
|
| 593
|
| Essent Group Ltd.
|
| 23,750
|
| 1,774
|
| MGIC Investment Corp.
|
| 23,807
|
| 1,209
|
| Radian Group, Inc.
|
| 26,719
|
| 375
|
| Voya Financial, Inc.
|
| 26,797
|
| 294
|
| Walker & Dunlop, Inc.
|
| 22,394
|
| 2,291
|
| Western Union (The) Co.
|
| 25,545
|
|
|
|
|
| 169,375
|
|
|
| Food Products – 1.7%
|
|
|
| 1,391
|
| Flowers Foods, Inc.
|
| 38,127
|
| 408
|
| Ingredion, Inc.
|
| 41,506
|
| 447
|
| Lamb Weston Holdings, Inc.
|
| 46,720
|
| 203
|
| Lancaster Colony Corp.
|
| 41,185
|
| 11
|
| Seaboard Corp.
|
| 41,470
|
|
|
|
|
| 209,008
|
|
|
| Gas Utilities – 1.3%
|
|
|
| 427
|
| National Fuel Gas Co.
|
| 24,655
|
| 545
|
| New Jersey Resources Corp.
|
| 28,994
|
| 357
|
| ONE Gas, Inc.
|
| 28,285
|
| 437
|
| Southwest Gas Holdings, Inc.
|
| 27,291
|
| 393
|
| Spire, Inc.
|
| 27,565
|
| 729
|
| UGI Corp.
|
| 25,340
|
|
|
|
|
| 162,130
|
|
|
| Ground Transportation – 0.8%
|
|
|
| 602
|
| Knight-Swift Transportation Holdings, Inc.
|
| 34,061
|
| 194
|
| Landstar System, Inc.
|
| 34,776
|
| 377
|
| Ryder System, Inc.
|
| 33,644
|
|
|
|
|
| 102,481
|
|
|
| Health Care Equipment &
Supplies – 2.2%
|
|
|
| 3,753
|
| DENTSPLY SIRONA, Inc.
|
| 147,418
|
| 479
|
| Teleflex, Inc.
|
| 121,335
|
|
|
|
|
| 268,753
|
|
|
| Health Care Providers &
Services – 5.6%
|
|
|
| 234
|
| Chemed Corp.
|
| 125,833
|
| 1,998
|
| Encompass Health Corp.
|
| 108,092
|
| 1,263
|
| Ensign Group (The), Inc.
|
| 120,667
|
| 3,416
|
| Premier, Inc., Class A
|
| 110,576
|
| 4,813
|
| Select Medical Holdings Corp.
|
| 124,416
|
| 848
|
| Universal Health Services, Inc., Class B
|
| 107,781
|
|
|
|
|
| 697,365
|
|
|
| Hotels, Restaurants &
Leisure – 4.1%
|
|
|
| 970
|
| Aramark
|
| 34,726
|
| 735
|
| Boyd Gaming Corp.
|
| 47,128
|
| 356
|
| Choice Hotels International, Inc.
|
| 41,720
|
| Shares
|
| Description
|
| Value
|
|
|
|
|
| Hotels, Restaurants &
Leisure (Continued)
|
|
|
| 190
|
| Churchill Downs, Inc.
|
| $48,840
|
| 298
|
| Marriott Vacations Worldwide Corp.
|
| 40,188
|
| 487
|
| Papa John’s International, Inc.
|
| 36,491
|
| 441
|
| Texas Roadhouse, Inc.
|
| 47,654
|
| 1,102
|
| Travel + Leisure Co.
|
| 43,198
|
| 168
|
| Vail Resorts, Inc.
|
| 39,258
|
| 1,772
|
| Wendy’s (The) Co.
|
| 38,594
|
| 291
|
| Wingstop, Inc.
|
| 53,422
|
| 562
|
| Wyndham Hotels & Resorts, Inc.
|
| 38,132
|
|
|
|
|
| 509,351
|
|
|
| Household Durables – 2.1%
|
|
|
| 1,244
|
| Leggett & Platt, Inc.
|
| 39,659
|
| 3,065
|
| Newell Brands, Inc.
|
| 38,128
|
| 881
|
| PulteGroup, Inc.
|
| 51,345
|
| 1,168
|
| Tempur Sealy International, Inc.
|
| 46,124
|
| 803
|
| Toll Brothers, Inc.
|
| 48,204
|
| 283
|
| Whirlpool Corp.
|
| 37,362
|
|
|
|
|
| 260,822
|
|
|
| Household Products – 0.3%
|
|
|
| 1,333
|
| Reynolds Consumer Products, Inc.
|
| 36,658
|
|
|
| Independent Power &
Renewable Electricity Producers – 0.7%
|
|
|
| 848
|
| Clearway Energy, Inc., Class C
|
| 26,568
|
| 313
|
| Ormat Technologies, Inc.
|
| 26,533
|
| 1,165
|
| Vistra Corp.
|
| 27,960
|
|
|
|
|
| 81,061
|
|
|
| Insurance – 3.8%
|
|
|
| 505
|
| American Equity Investment Life Holding Co.
|
| 18,427
|
| 173
|
| American Financial Group, Inc.
|
| 21,020
|
| 184
|
| Assurant, Inc.
|
| 22,093
|
| 370
|
| Assured Guaranty Ltd.
|
| 18,600
|
| 426
|
| Axis Capital Holdings Ltd.
|
| 23,226
|
| 93
|
| Erie Indemnity Co., Class A
|
| 21,544
|
| 70
|
| Everest Re Group Ltd.
|
| 25,061
|
| 613
|
| Fidelity National Financial, Inc.
|
| 21,412
|
| 441
|
| First American Financial Corp.
|
| 24,546
|
| 191
|
| Globe Life, Inc.
|
| 21,014
|
| 171
|
| Hanover Insurance Group (The), Inc.
|
| 21,974
|
| 88
|
| Kinsale Capital Group, Inc.
|
| 26,413
|
| 751
|
| Lincoln National Corp.
|
| 16,875
|
| 955
|
| Old Republic International Corp.
|
| 23,846
|
| 163
|
| Primerica, Inc.
|
| 28,075
|
| 162
|
| Reinsurance Group of America, Inc.
|
| 21,507
|
| 125
|
| RenaissanceRe Holdings Ltd.
|
| 25,042
|
| 176
|
| RLI Corp.
|
| 23,392
|
See Notes to Financial
Statements
Page 39
Mid Cap US Equity Select ETF (RNMC)
Portfolio of Investments
(Continued)
March 31, 2023
| Shares
|
| Description
|
| Value
|
| COMMON STOCKS (Continued)
|
|
|
| Insurance (Continued)
|
|
|
| 260
|
| Selective Insurance Group, Inc.
|
| $24,786
|
| 562
|
| Unum Group
|
| 22,233
|
| 16
|
| White Mountains Insurance Group Ltd.
|
| 22,040
|
|
|
|
|
| 473,126
|
|
|
| Leisure Products – 1.3%
|
|
|
| 944
|
| Acushnet Holdings Corp.
|
| 48,088
|
| 438
|
| Brunswick Corp.
|
| 35,916
|
| 657
|
| Hasbro, Inc.
|
| 35,274
|
| 397
|
| Polaris, Inc.
|
| 43,920
|
|
|
|
|
| 163,198
|
|
|
| Life Sciences Tools &
Services – 1.1%
|
|
|
| 1,748
|
| Bruker Corp.
|
| 137,812
|
|
|
| Machinery – 4.4%
|
|
|
| 227
|
| AGCO Corp.
|
| 30,690
|
| 758
|
| Allison Transmission Holdings, Inc.
|
| 34,292
|
| 314
|
| Crane Holdings Co.
|
| 35,639
|
| 536
|
| Donaldson Co., Inc.
|
| 35,022
|
| 1,028
|
| Flowserve Corp.
|
| 34,952
|
| 396
|
| Franklin Electric Co., Inc.
|
| 37,263
|
| 469
|
| Graco, Inc.
|
| 34,242
|
| 389
|
| ITT, Inc.
|
| 33,571
|
| 345
|
| John Bean Technologies Corp.
|
| 37,705
|
| 218
|
| Lincoln Electric Holdings, Inc.
|
| 36,864
|
| 416
|
| Mueller Industries, Inc.
|
| 30,568
|
| 358
|
| Oshkosh Corp.
|
| 29,778
|
| 138
|
| Snap-on, Inc.
|
| 34,071
|
| 347
|
| Timken (The) Co.
|
| 28,357
|
| 279
|
| Toro (The) Co.
|
| 31,014
|
| 216
|
| Watts Water Technologies, Inc., Class A
|
| 36,357
|
|
|
|
|
| 540,385
|
|
|
| Marine Transportation – 0.2%
|
|
|
| 505
|
| Matson, Inc.
|
| 30,133
|
|
|
| Media – 1.9%
|
|
|
| 98
|
| Cable One, Inc.
|
| 68,796
|
| 1,204
|
| Interpublic Group of (The) Cos., Inc.
|
| 44,837
|
| 1,235
|
| New York Times (The) Co., Class A
|
| 48,017
|
| 2,203
|
| News Corp., Class A
|
| 38,046
|
| 229
|
| Nexstar Media Group, Inc.
|
| 39,539
|
|
|
|
|
| 239,235
|
|
|
| Metals & Mining – 1.1%
|
|
|
| 540
|
| Alcoa Corp.
|
| 22,982
|
| 508
|
| Commercial Metals Co.
|
| 24,841
|
| 121
|
| Reliance Steel & Aluminum Co.
|
| 31,066
|
| 218
|
| Royal Gold, Inc.
|
| 28,277
|
| Shares
|
| Description
|
| Value
|
|
|
|
|
| Metals & Mining (Continued)
|
|
|
| 980
|
| United States Steel Corp.
|
| $25,578
|
|
|
|
|
| 132,744
|
|
|
| Multi-Utilities – 0.4%
|
|
|
| 385
|
| Black Hills Corp.
|
| 24,293
|
| 987
|
| NiSource, Inc.
|
| 27,597
|
|
|
|
|
| 51,890
|
|
|
| Oil, Gas & Consumable Fuels – 3.3%
|
|
|
| 2,588
|
| Antero Midstream Corp.
|
| 27,148
|
| 641
|
| California Resources Corp.
|
| 24,679
|
| 296
|
| Chesapeake Energy Corp.
|
| 22,508
|
| 204
|
| Chord Energy Corp.
|
| 27,458
|
| 482
|
| Civitas Resources, Inc.
|
| 32,940
|
| 2,037
|
| Comstock Resources, Inc.
|
| 21,979
|
| 505
|
| DT Midstream, Inc.
|
| 24,932
|
| 527
|
| Enviva Inc.
|
| 15,220
|
| 538
|
| HF Sinclair Corp.
|
| 26,028
|
| 1,191
|
| Magnolia Oil & Gas Corp., Class A
|
| 26,059
|
| 488
|
| Matador Resources, Co.
|
| 23,253
|
| 648
|
| Murphy Oil Corp.
|
| 23,963
|
| 685
|
| PBF Energy, Inc., Class A
|
| 29,702
|
| 440
|
| PDC Energy, Inc.
|
| 28,239
|
| 1,116
|
| Range Resources Corp.
|
| 29,541
|
| 802
|
| SM Energy Co.
|
| 22,584
|
|
|
|
|
| 406,233
|
|
|
| Paper & Forest Products – 0.2%
|
|
|
| 533
|
| Louisiana-Pacific Corp.
|
| 28,894
|
|
|
| Pharmaceuticals – 2.7%
|
|
|
| 4,278
|
| Organon & Co.
|
| 100,619
|
| 3,505
|
| Perrigo Co. PLC
|
| 125,724
|
| 10,737
|
| Viatris, Inc.
|
| 103,290
|
|
|
|
|
| 329,633
|
|
|
| Professional Services – 5.0%
|
|
|
| 694
|
| Concentrix Corp.
|
| 84,356
|
| 7,538
|
| Dun & Bradstreet Holdings, Inc.
|
| 88,496
|
| 318
|
| Exponent, Inc.
|
| 31,701
|
| 681
|
| Genpact Ltd.
|
| 31,476
|
| 278
|
| Insperity, Inc.
|
| 33,791
|
| 1,750
|
| KBR, Inc.
|
| 96,338
|
| 623
|
| Korn Ferry
|
| 32,234
|
| 379
|
| ManpowerGroup, Inc.
|
| 31,279
|
| 430
|
| Maximus, Inc.
|
| 33,841
|
| 427
|
| Robert Half International, Inc.
|
| 34,403
|
| 833
|
| Science Applications International Corp.
|
| 89,514
|
| 715
|
| TTEC Holdings, Inc.
|
| 26,619
|
|
|
|
|
| 614,048
|
Page 40
See Notes to Financial
Statements
Mid Cap US Equity Select ETF (RNMC)
Portfolio of Investments
(Continued)
March 31, 2023
| Shares
|
| Description
|
| Value
|
| COMMON STOCKS (Continued)
|
|
|
| Semiconductors &
Semiconductor Equipment – 3.0%
|
|
|
| 3,854
|
| Amkor Technology, Inc.
|
| $100,281
|
| 372
|
| MKS Instruments, Inc.
|
| 32,967
|
| 1,288
|
| Power Integrations, Inc.
|
| 109,016
|
| 855
|
| Universal Display Corp.
|
| 132,636
|
|
|
|
|
| 374,900
|
|
|
| Software – 1.8%
|
|
|
| 2,500
|
| Bentley Systems, Inc., Class B
|
| 107,475
|
| 1,310
|
| Dolby Laboratories, Inc., Class A
|
| 111,900
|
|
|
|
|
| 219,375
|
|
|
| Specialty Retail – 3.0%
|
|
|
| 763
|
| Academy Sports & Outdoors, Inc.
|
| 49,786
|
| 273
|
| Advance Auto Parts, Inc.
|
| 33,200
|
| 951
|
| Bath & Body Works, Inc.
|
| 34,788
|
| 333
|
| Dick’s Sporting Goods, Inc.
|
| 47,249
|
| 3,554
|
| Gap (The), Inc.
|
| 35,682
|
| 196
|
| Lithia Motors, Inc.
|
| 44,870
|
| 143
|
| Murphy USA, Inc.
|
| 36,901
|
| 349
|
| Penske Automotive Group, Inc.
|
| 49,492
|
| 349
|
| Williams-Sonoma, Inc.
|
| 42,459
|
|
|
|
|
| 374,427
|
|
|
| Technology Hardware,
Storage & Peripherals – 0.7%
|
|
|
| 2,298
|
| Dell Technologies, Inc., Class C
|
| 92,403
|
|
|
| Textiles, Apparel & Luxury
Goods – 1.7%
|
|
|
| 458
|
| Columbia Sportswear Co.
|
| 41,330
|
| 6,304
|
| Hanesbrands, Inc.
|
| 33,159
|
| 568
|
| PVH Corp.
|
| 50,643
|
| 379
|
| Ralph Lauren Corp.
|
| 44,218
|
| 1,053
|
| Tapestry, Inc.
|
| 45,395
|
|
|
|
|
| 214,745
|
|
|
| Trading Companies &
Distributors – 1.9%
|
|
|
| 821
|
| Air Lease Corp.
|
| 32,323
|
| 250
|
| Applied Industrial Technologies, Inc.
|
| 35,532
|
| 297
|
| GATX Corp.
|
| 32,676
|
| 240
|
| Herc Holdings, Inc.
|
| 27,336
|
| 386
|
| MSC Industrial Direct Co., Inc., Class A
|
| 32,424
|
| 459
|
| Triton International Ltd.
|
| 29,018
|
| 126
|
| Watsco, Inc.
|
| 40,088
|
|
|
|
|
| 229,397
|
|
|
| Total Common Stocks
|
| 11,461,626
|
|
|
| (Cost $11,819,403)
|
|
|
| Shares
|
| Description
|
| Value
|
| REAL ESTATE INVESTMENT TRUSTS – 7.4%
|
|
|
| Diversified REITs – 0.2%
|
|
|
| 1,382
|
| Broadstone Net Lease, Inc.
|
| $23,508
|
|
|
| Health Care REITs – 0.8%
|
|
|
| 1,164
|
| Healthcare Realty Trust, Inc.
|
| 22,500
|
| 2,014
|
| Medical Properties Trust, Inc.
|
| 16,555
|
| 803
|
| Omega Healthcare Investors, Inc.
|
| 22,010
|
| 1,550
|
| Physicians Realty Trust
|
| 23,141
|
| 1,805
|
| Sabra Health Care REIT, Inc.
|
| 20,758
|
|
|
|
|
| 104,964
|
|
|
| Hotel & Resort REITs – 0.6%
|
|
|
| 1,422
|
| Apple Hospitality REIT, Inc.
|
| 22,070
|
| 1,903
|
| Park Hotels & Resorts, Inc.
|
| 23,521
|
| 274
|
| Ryman Hospitality Properties, Inc.
|
| 24,586
|
|
|
|
|
| 70,177
|
|
|
| Industrial REITs – 1.2%
|
|
|
| 791
|
| Americold Realty Trust
|
| 22,504
|
| 152
|
| EastGroup Properties, Inc.
|
| 25,129
|
| 465
|
| First Industrial Realty Trust, Inc.
|
| 24,738
|
| 411
|
| Rexford Industrial Realty, Inc.
|
| 24,516
|
| 693
|
| STAG Industrial, Inc.
|
| 23,437
|
| 394
|
| Terreno Realty Corp.
|
| 25,452
|
|
|
|
|
| 145,776
|
|
|
| Mortgage Real Estate
Investment Trusts – 0.9%
|
|
|
| 2,228
|
| AGNC Investment Corp.
|
| 22,458
|
| 1,094
|
| Annaly Capital Management, Inc.
|
| 20,906
|
| 1,089
|
| Blackstone Mortgage Trust, Inc., Class A
|
| 19,439
|
| 2,822
|
| Rithm Capital Corp.
|
| 22,576
|
| 1,258
|
| Starwood Property Trust, Inc.
|
| 22,254
|
|
|
|
|
| 107,633
|
|
|
| Office REITs – 0.7%
|
|
|
| 886
|
| Cousins Properties, Inc.
|
| 18,943
|
| 1,431
|
| Douglas Emmett, Inc.
|
| 17,644
|
| 802
|
| Highwoods Properties, Inc.
|
| 18,598
|
| 579
|
| Kilroy Realty Corp.
|
| 18,760
|
| 1,078
|
| Vornado Realty Trust
|
| 16,569
|
|
|
|
|
| 90,514
|
|
|
| Other Specialized REITs – 0.4%
|
|
|
| 595
|
| EPR Properties
|
| 22,669
|
| 238
|
| Lamar Advertising Co., Class A
|
| 23,774
|
|
|
|
|
| 46,443
|
|
|
| Residential REITs – 0.4%
|
|
|
| 653
|
| Apartment Income REIT Corp.
|
| 23,384
|
| 1,328
|
| Independence Realty Trust, Inc.
|
| 21,288
|
|
|
|
|
| 44,672
|
See Notes to Financial
Statements
Page 41
Mid Cap US Equity Select ETF (RNMC)
Portfolio of Investments
(Continued)
March 31, 2023
| Shares
|
| Description
|
| Value
|
| REAL ESTATE INVESTMENT TRUSTS (Continued)
|
|
|
| Retail REITs – 1.2%
|
|
|
| 316
|
| Agree Realty Corp.
|
| $21,681
|
| 990
|
| Brixmor Property Group, Inc.
|
| 21,305
|
| 1,066
|
| Kite Realty Group Trust
|
| 22,301
|
| 490
|
| National Retail Properties, Inc.
|
| 21,633
|
| 705
|
| Phillips Edison & Co, Inc.
|
| 22,997
|
| 359
|
| Regency Centers Corp.
|
| 21,964
|
| 562
|
| Spirit Realty Capital, Inc.
|
| 22,390
|
|
|
|
|
| 154,271
|
|
|
| Self-Storage REITs – 0.2%
|
|
|
| 228
|
| Life Storage, Inc.
|
| 29,888
|
|
|
| Specialized REITs – 0.8%
|
|
|
| 557
|
| CubeSmart
|
| 25,745
|
| 621
|
| National Storage Affiliates Trust
|
| 25,945
|
| 510
|
| PotlatchDeltic Corp.
|
| 25,245
|
| 680
|
| Rayonier, Inc.
|
| 22,617
|
|
|
|
|
| 99,552
|
|
|
| Total Real Estate Investment Trusts
|
| 917,398
|
|
|
| (Cost $1,125,366)
|
|
|
|
|
| Total Investments – 99.9%
|
| 12,379,024
|
|
|
| (Cost $12,944,769)
|
|
|
|
|
| Net Other Assets and Liabilities – 0.1%
|
| 17,854
|
|
|
| Net Assets – 100.0%
|
| $12,396,878
|
Valuation Inputs
A summary of the inputs
used to value the Fund’s investments as of March 31, 2023 is as follows (see Note 2A - Portfolio Valuation in the Notes to Financial Statements):
|
| Total
Value at
3/31/2023
| Level 1
Quoted
Prices
| Level 2
Significant
Observable
Inputs
| Level 3
Significant
Unobservable
Inputs
|
| Common Stocks*
| $ 11,461,626
| $ 11,461,626
| $ —
| $ —
|
| Real Estate Investment Trusts*
| 917,398
| 917,398
| —
| —
|
| Total Investments
| $ 12,379,024
| $ 12,379,024
| $—
| $—
|
| *
| See Portfolio of Investments for industry breakout.
|
Page 42
See Notes to Financial Statements
Small Cap US Equity Select ETF (RNSC)
Portfolio of Investments
March 31, 2023
| Shares
|
| Description
|
| Value
|
| COMMON STOCKS – 92.3%
|
|
|
| Aerospace & Defense – 0.4%
|
|
|
| 972
|
| Moog, Inc., Class A
|
| $97,929
|
|
|
| Air Freight & Logistics – 0.3%
|
|
|
| 814
|
| Forward Air Corp.
|
| 87,717
|
|
|
| Automobile Components – 0.7%
|
|
|
| 6,280
|
| Dana, Inc.
|
| 94,514
|
| 1,408
|
| Patrick Industries, Inc.
|
| 96,884
|
|
|
|
|
| 191,398
|
|
|
| Automobiles – 0.4%
|
|
|
| 1,803
|
| Winnebago Industries, Inc.
|
| 104,033
|
|
|
| Banks – 8.2%
|
|
|
| 945
|
| 1st Source Corp.
|
| 40,777
|
| 1,064
|
| Ameris Bancorp
|
| 38,921
|
| 2,172
|
| Associated Banc-Corp.
|
| 39,052
|
| 1,427
|
| Atlantic Union Bankshares Corp.
|
| 50,016
|
| 647
|
| Bank of Hawaii Corp.
|
| 33,696
|
| 1,477
|
| BankUnited, Inc.
|
| 33,351
|
| 794
|
| Banner Corp.
|
| 43,170
|
| 1,678
|
| Berkshire Hills Bancorp, Inc.
|
| 42,051
|
| 5,799
|
| Capitol Federal Financial, Inc.
|
| 39,027
|
| 1,230
|
| Cathay General Bancorp
|
| 42,460
|
| 539
|
| City Holding Co.
|
| 48,984
|
| 1,665
|
| Columbia Banking System, Inc.
|
| 35,664
|
| 1,576
|
| Dime Community Bancshares, Inc.
|
| 35,807
|
| 1,138
|
| Eagle Bancorp, Inc.
|
| 38,089
|
| 1,025
|
| Enterprise Financial Services Corp.
|
| 45,705
|
| 1,388
|
| FB Financial Corp.
|
| 43,139
|
| 1,171
|
| First Bancorp
|
| 41,594
|
| 3,944
|
| First BanCorp
|
| 45,040
|
| 2,029
|
| First Busey Corp.
|
| 41,270
|
| 3,591
|
| First Commonwealth Financial Corp.
|
| 44,636
|
| 2,070
|
| First Financial Bancorp
|
| 45,064
|
| 3,500
|
| First Foundation, Inc.
|
| 26,075
|
| 1,926
|
| First Hawaiian, Inc.
|
| 39,733
|
| 1,220
|
| First Merchants Corp.
|
| 40,199
|
| 2,981
|
| Fulton Financial Corp.
|
| 41,197
|
| 1,076
|
| Heartland Financial USA, Inc.
|
| 41,275
|
| 1,672
|
| Hilltop Holdings, Inc.
|
| 49,608
|
| 3,916
|
| Hope Bancorp, Inc.
|
| 38,455
|
| 835
|
| Independent Bank Group, Inc.
|
| 38,702
|
| 1,096
|
| International Bancshares Corp.
|
| 46,931
|
| 687
|
| Lakeland Financial Corp.
|
| 43,034
|
| 1,661
|
| Live Oak Bancshares, Inc.
|
| 40,479
|
| 1,192
|
| National Bank Holdings Corp., Class A
|
| 39,884
|
| 1,155
|
| NBT Bancorp, Inc.
|
| 38,935
|
| 3,588
|
| Northwest Bancshares, Inc.
|
| 43,164
|
| 2,361
|
| OceanFirst Financial Corp.
|
| 43,631
|
| 1,820
|
| OFG Bancorp
|
| 45,391
|
| Shares
|
| Description
|
| Value
|
|
|
|
|
| Banks (Continued)
|
|
|
| 1,589
|
| Pacific Premier Bancorp, Inc.
|
| $38,168
|
| 2,186
|
| PacWest Bancorp
|
| 21,270
|
| 356
|
| Park National Corp.
|
| 42,211
|
| 2,348
|
| Provident Financial Services, Inc.
|
| 45,035
|
| 1,334
|
| Renasant Corp.
|
| 40,794
|
| 1,468
|
| S&T Bancorp, Inc.
|
| 46,169
|
| 1,424
|
| Sandy Spring Bancorp, Inc.
|
| 36,995
|
| 1,608
|
| Seacoast Banking Corp. of Florida
|
| 38,110
|
| 2,324
|
| Simmons First National Corp., Class A
|
| 40,647
|
| 1,394
|
| Southside Bancshares, Inc.
|
| 46,281
|
| 772
|
| Stock Yards Bancorp, Inc.
|
| 42,568
|
| 1,627
|
| Towne Bank
|
| 43,359
|
| 984
|
| TriCo Bancshares
|
| 40,924
|
| 1,437
|
| Trustmark Corp.
|
| 35,494
|
| 1,786
|
| Veritex Holdings, Inc.
|
| 32,612
|
| 1,495
|
| Washington Federal, Inc.
|
| 45,029
|
| 1,356
|
| WesBanco, Inc.
|
| 41,629
|
| 850
|
| Westamerica BanCorp
|
| 37,655
|
| 1,106
|
| WSFS Financial Corp.
|
| 41,597
|
|
|
|
|
| 2,280,753
|
|
|
| Beverages – 0.2%
|
|
|
| 669
|
| MGP Ingredients, Inc.
|
| 64,706
|
|
|
| Broadline Retail – 0.3%
|
|
|
| 294
|
| Dillard’s, Inc., Class A
|
| 90,458
|
|
|
| Building Products – 1.0%
|
|
|
| 1,133
|
| AAON, Inc.
|
| 109,550
|
| 736
|
| CSW Industrials, Inc.
|
| 102,252
|
| 2,384
|
| Griffon Corp.
|
| 76,312
|
|
|
|
|
| 288,114
|
|
|
| Capital Markets – 2.5%
|
|
|
| 1,689
|
| Artisan Partners Asset Management, Inc., Class A
|
| 54,014
|
| 1,467
|
| B. Riley Financial, Inc. (a)
|
| 41,648
|
| 13,306
|
| BGC Partners, Inc., Class A
|
| 69,590
|
| 1,381
|
| Federated Hermes, Inc.
|
| 55,433
|
| 785
|
| Hamilton Lane, Inc., Class A
|
| 58,074
|
| 1,307
|
| Moelis & Co., Class A
|
| 50,241
|
| 385
|
| Piper Sandler Cos.
|
| 53,365
|
| 681
|
| PJT Partners, Inc., Class A
|
| 49,162
|
| 1,992
|
| StepStone Group, Inc., Class A
|
| 48,346
|
| 1,802
|
| TPG, Inc.
|
| 52,853
|
| 1,870
|
| Victory Capital Holdings, Inc., Class A
|
| 54,735
|
| 2,458
|
| Virtu Financial, Inc., Class A
|
| 46,456
|
| 262
|
| Virtus Investment Partners, Inc.
|
| 49,882
|
|
|
|
|
| 683,799
|
|
|
| Chemicals – 1.5%
|
|
|
| 519
|
| Innospec, Inc.
|
| 53,286
|
| 2,557
|
| Mativ Holdings, Inc.
|
| 54,899
|
See Notes to Financial
Statements
Page 43
Small Cap US Equity Select ETF (RNSC)
Portfolio of Investments
(Continued)
March 31, 2023
| Shares
|
| Description
|
| Value
|
| COMMON STOCKS (Continued)
|
|
|
| Chemicals (Continued)
|
|
|
| 880
|
| Minerals Technologies, Inc.
|
| $53,170
|
| 172
|
| NewMarket Corp.
|
| 62,776
|
| 320
|
| Quaker Chemical Corp.
|
| 63,344
|
| 502
|
| Stepan Co.
|
| 51,721
|
| 3,757
|
| Trinseo PLC
|
| 78,333
|
|
|
|
|
| 417,529
|
|
|
| Commercial Services &
Supplies – 2.0%
|
|
|
| 1,921
|
| ABM Industries, Inc.
|
| 86,330
|
| 1,812
|
| Brady Corp., Class A
|
| 97,359
|
| 1,589
|
| Brink’s (The) Co.
|
| 106,145
|
| 3,342
|
| HNI Corp.
|
| 93,041
|
| 4,523
|
| MillerKnoll, Inc.
|
| 92,495
|
| 442
|
| UniFirst Corp.
|
| 77,894
|
|
|
|
|
| 553,264
|
|
|
| Communications Equipment – 0.4%
|
|
|
| 7,310
|
| ADTRAN Holdings, Inc.
|
| 115,937
|
|
|
| Construction & Engineering – 1.2%
|
|
|
| 2,067
|
| Arcosa, Inc.
|
| 130,448
|
| 2,433
|
| Granite Construction, Inc.
|
| 99,948
|
| 3,889
|
| Primoris Services Corp.
|
| 95,903
|
|
|
|
|
| 326,299
|
|
|
| Consumer Finance – 0.6%
|
|
|
| 2,266
|
| Bread Financial Holdings, Inc.
|
| 68,705
|
| 3,049
|
| Navient Corp.
|
| 48,754
|
| 553
|
| Nelnet, Inc., Class A
|
| 50,815
|
|
|
|
|
| 168,274
|
|
|
| Consumer Staples
Distribution & Retail – 1.2%
|
|
|
| 2,033
|
| Andersons (The), Inc.
|
| 84,004
|
| 737
|
| Ingles Markets, Inc., Class A
|
| 65,372
|
| 1,563
|
| PriceSmart, Inc.
|
| 111,723
|
| 864
|
| Weis Markets, Inc.
|
| 73,155
|
|
|
|
|
| 334,254
|
|
|
| Containers & Packaging – 0.5%
|
|
|
| 7,512
|
| Pactiv Evergreen, Inc.
|
| 60,096
|
| 3,076
|
| TriMas Corp.
|
| 85,697
|
|
|
|
|
| 145,793
|
|
|
| Diversified Consumer
Services – 0.7%
|
|
|
| 157
|
| Graham Holdings Co., Class B
|
| 93,547
|
| 1,213
|
| Strategic Education, Inc.
|
| 108,964
|
|
|
|
|
| 202,511
|
|
|
| Diversified REITs – 0.1%
|
|
|
| 1,005
|
| Star Holdings
|
| 17,477
|
| Shares
|
| Description
|
| Value
|
|
|
|
|
| Diversified Telecommunication
Services – 0.5%
|
|
|
| 2,406
|
| Cogent Communications Holdings, Inc.
|
| $153,310
|
|
|
| Electric Utilities – 0.6%
|
|
|
| 880
|
| MGE Energy, Inc.
|
| 68,350
|
| 1,453
|
| Otter Tail Corp.
|
| 105,008
|
|
|
|
|
| 173,358
|
|
|
| Electrical Equipment – 1.0%
|
|
|
| 620
|
| Encore Wire Corp.
|
| 114,905
|
| 1,156
|
| EnerSys
|
| 100,433
|
| 11,225
|
| GrafTech International Ltd.
|
| 54,553
|
|
|
|
|
| 269,891
|
|
|
| Electronic Equipment,
Instruments & Components – 5.6%
|
|
|
| 3,569
|
| Advanced Energy Industries, Inc.
|
| 349,762
|
| 783
|
| Badger Meter, Inc.
|
| 95,385
|
| 1,187
|
| Belden, Inc.
|
| 102,996
|
| 7,765
|
| CTS Corp.
|
| 384,057
|
| 6,899
|
| Methode Electronics, Inc.
|
| 302,728
|
| 14,192
|
| Vishay Intertechnology, Inc.
|
| 321,023
|
|
|
|
|
| 1,555,951
|
|
|
| Energy Equipment &
Services – 1.4%
|
|
|
| 12,511
|
| Archrock, Inc.
|
| 122,232
|
| 2,235
|
| Cactus, Inc., Class A
|
| 92,149
|
| 7,017
|
| Liberty Energy, Inc.
|
| 89,888
|
| 12,637
|
| RPC, Inc.
|
| 97,179
|
|
|
|
|
| 401,448
|
|
|
| Entertainment – 0.5%
|
|
|
| 1,387
|
| World Wrestling Entertainment, Inc., Class A
|
| 126,578
|
|
|
| Financial Services – 0.9%
|
|
|
| 2,752
|
| Compass Diversified Holdings
|
| 52,508
|
| 2,635
|
| EVERTEC, Inc.
|
| 88,931
|
| 1,442
|
| Jackson Financial, Inc., Class A
|
| 53,945
|
| 885
|
| PennyMac Financial Services, Inc.
|
| 52,755
|
|
|
|
|
| 248,139
|
|
|
| Food Products – 1.7%
|
|
|
| 6,379
|
| B&G Foods, Inc.
|
| 99,066
|
| 1,306
|
| Cal-Maine Foods, Inc.
|
| 79,522
|
| 2,716
|
| Fresh Del Monte Produce, Inc.
|
| 81,779
|
| 475
|
| J&J Snack Foods Corp.
|
| 70,405
|
| 1,721
|
| Tootsie Roll Industries, Inc.
|
| 77,290
|
| 4,485
|
| Utz Brands, Inc.
|
| 73,868
|
|
|
|
|
| 481,930
|
|
|
| Gas Utilities – 0.5%
|
|
|
| 524
|
| Chesapeake Utilities Corp.
|
| 67,067
|
Page 44
See Notes to Financial
Statements
Small Cap US Equity Select ETF (RNSC)
Portfolio of Investments
(Continued)
March 31, 2023
| Shares
|
| Description
|
| Value
|
| COMMON STOCKS (Continued)
|
|
|
| Gas Utilities (Continued)
|
|
|
| 1,302
|
| Northwest Natural Holding Co.
|
| $61,923
|
|
|
|
|
| 128,990
|
|
|
| Ground Transportation – 1.7%
|
|
|
| 1,218
|
| ArcBest Corp.
|
| 112,568
|
| 5,563
|
| Heartland Express, Inc.
|
| 88,563
|
| 4,314
|
| Marten Transport Ltd.
|
| 90,378
|
| 3,647
|
| Schneider National, Inc., Class B
|
| 97,557
|
| 2,120
|
| Werner Enterprises, Inc.
|
| 96,439
|
|
|
|
|
| 485,505
|
|
|
| Health Care Equipment &
Supplies – 8.5%
|
|
|
| 1,242
|
| Atrion Corp.
|
| 779,864
|
| 7,841
|
| CONMED Corp.
|
| 814,366
|
| 27,482
|
| Embecta Corp.
|
| 772,794
|
|
|
|
|
| 2,367,024
|
|
|
| Health Care Providers &
Services – 5.4%
|
|
|
| 24,795
|
| Patterson Cos., Inc.
|
| 663,762
|
| 8,577
|
| U.S. Physical Therapy, Inc.
|
| 839,774
|
|
|
|
|
| 1,503,536
|
|
|
| Health Care Technology – 1.3%
|
|
|
| 8,371
|
| Simulations Plus, Inc.
|
| 367,822
|
|
|
| Hotels, Restaurants &
Leisure – 2.9%
|
|
|
| 4,723
|
| Bloomin’ Brands, Inc.
|
| 121,145
|
| 2,996
|
| Cheesecake Factory (The), Inc.
|
| 105,010
|
| 1,003
|
| Cracker Barrel Old Country Store, Inc.
|
| 113,941
|
| 1,471
|
| Dine Brands Global, Inc.
|
| 99,498
|
| 1,393
|
| Jack in the Box, Inc.
|
| 122,013
|
| 9,207
|
| Krispy Kreme, Inc.
|
| 143,169
|
| 2,375
|
| Red Rock Resorts, Inc., Class A
|
| 105,853
|
|
|
|
|
| 810,629
|
|
|
| Household Durables – 2.1%
|
|
|
| 1,900
|
| Century Communities, Inc.
|
| 121,448
|
| 997
|
| Installed Building Products, Inc.
|
| 113,688
|
| 2,983
|
| KB Home
|
| 119,857
|
| 4,164
|
| La-Z-Boy, Inc.
|
| 121,089
|
| 3,007
|
| MDC Holdings, Inc.
|
| 116,882
|
|
|
|
|
| 592,964
|
|
|
| Household Products – 0.8%
|
|
|
| 2,120
|
| Energizer Holdings, Inc.
|
| 73,564
|
| 1,168
|
| Spectrum Brands Holdings, Inc.
|
| 77,345
|
| 441
|
| WD-40 Co.
|
| 78,520
|
|
|
|
|
| 229,429
|
|
|
| Insurance – 1.2%
|
|
|
| 2,195
|
| CNO Financial Group, Inc.
|
| 48,707
|
| Shares
|
| Description
|
| Value
|
|
|
|
|
| Insurance (Continued)
|
|
|
| 1,342
|
| Horace Mann Educators Corp.
|
| $44,930
|
| 1,020
|
| Kemper Corp.
|
| 55,753
|
| 1,467
|
| Mercury General Corp.
|
| 46,563
|
| 2,871
|
| ProAssurance Corp.
|
| 53,056
|
| 595
|
| Safety Insurance Group, Inc.
|
| 44,339
|
| 1,174
|
| Stewart Information Services Corp.
|
| 47,371
|
|
|
|
|
| 340,719
|
|
|
| Interactive Media & Services – 1.5%
|
|
|
| 5,806
|
| Shutterstock, Inc.
|
| 421,516
|
|
|
| Machinery – 5.7%
|
|
|
| 603
|
| Alamo Group, Inc.
|
| 111,048
|
| 866
|
| Albany International Corp., Class A
|
| 77,386
|
| 2,089
|
| Barnes Group, Inc.
|
| 84,145
|
| 3,353
|
| Enerpac Tool Group Corp.
|
| 85,501
|
| 785
|
| EnPro Industries, Inc.
|
| 81,554
|
| 1,819
|
| Esab Corp.
|
| 107,448
|
| 975
|
| ESCO Technologies, Inc.
|
| 93,064
|
| 1,836
|
| Federal Signal Corp.
|
| 99,529
|
| 1,567
|
| Helios Technologies, Inc.
|
| 102,482
|
| 2,000
|
| Hillenbrand, Inc.
|
| 95,060
|
| 480
|
| Kadant, Inc.
|
| 100,090
|
| 3,547
|
| Kennametal, Inc.
|
| 97,826
|
| 524
|
| Lindsay Corp.
|
| 79,192
|
| 7,931
|
| Mueller Water Products, Inc., Class A
|
| 110,558
|
| 1,386
|
| Tennant Co.
|
| 94,983
|
| 1,997
|
| Terex Corp.
|
| 96,615
|
| 2,886
|
| Trinity Industries, Inc.
|
| 70,303
|
|
|
|
|
| 1,586,784
|
|
|
| Media – 0.9%
|
|
|
| 8,491
|
| Gray Television, Inc.
|
| 74,042
|
| 2,372
|
| John Wiley & Sons, Inc., Class A
|
| 91,962
|
| 2,408
|
| Scholastic Corp.
|
| 82,402
|
|
|
|
|
| 248,406
|
|
|
| Metals & Mining – 2.2%
|
|
|
| 767
|
| Alpha Metallurgical Resources, Inc.
|
| 119,652
|
| 1,446
|
| Carpenter Technology Corp.
|
| 64,723
|
| 1,303
|
| Compass Minerals International, Inc.
|
| 44,680
|
| 9,610
|
| Hecla Mining Co.
|
| 60,831
|
| 703
|
| Kaiser Aluminum Corp.
|
| 52,465
|
| 611
|
| Materion Corp.
|
| 70,876
|
| 3,243
|
| Warrior Met Coal, Inc.
|
| 119,050
|
| 1,075
|
| Worthington Industries, Inc.
|
| 69,499
|
|
|
|
|
| 601,776
|
See Notes to Financial
Statements
Page 45
Small Cap US Equity Select ETF (RNSC)
Portfolio of Investments
(Continued)
March 31, 2023
| Shares
|
| Description
|
| Value
|
| COMMON STOCKS (Continued)
|
|
|
| Mortgage Real Estate
Investment Trusts – 0.1%
|
|
|
| 3,410
|
| Claros Mortgage Trust, Inc.
|
| $39,727
|
|
|
| Multi-Utilities – 0.4%
|
|
|
| 1,398
|
| Avista Corp.
|
| 59,345
|
| 1,044
|
| NorthWestern Corp.
|
| 60,406
|
|
|
|
|
| 119,751
|
|
|
| Oil, Gas & Consumable Fuels – 3.8%
|
|
|
| 787
|
| Arch Resources, Inc.
|
| 103,459
|
| 1,728
|
| CONSOL Energy, Inc.
|
| 100,691
|
| 3,585
|
| CVR Energy, Inc.
|
| 117,516
|
| 4,161
|
| Delek US Holdings, Inc.
|
| 95,495
|
| 16,768
|
| Equitrans Midstream Corp.
|
| 96,919
|
| 2,305
|
| International Seaways, Inc.
|
| 96,072
|
| 3,396
|
| Kinetik Holdings, Inc.
|
| 106,295
|
| 3,645
|
| Northern Oil and Gas, Inc.
|
| 110,626
|
| 11,952
|
| Permian Resources Corp.
|
| 125,496
|
| 4,111
|
| World Fuel Services Corp.
|
| 105,036
|
|
|
|
|
| 1,057,605
|
|
|
| Paper & Forest Products – 0.2%
|
|
|
| 1,100
|
| Sylvamo Corp.
|
| 50,886
|
|
|
| Personal Care Products – 1.3%
|
|
|
| 1,846
|
| Edgewell Personal Care Co.
|
| 78,307
|
| 984
|
| Inter Parfums, Inc.
|
| 139,964
|
| 617
|
| Medifast, Inc.
|
| 63,965
|
| 1,687
|
| Nu Skin Enterprises, Inc., Class A
|
| 66,316
|
|
|
|
|
| 348,552
|
|
|
| Professional Services – 1.7%
|
|
|
| 5,352
|
| CSG Systems International, Inc.
|
| 287,402
|
| 862
|
| ICF International, Inc.
|
| 94,561
|
| 1,556
|
| Kforce, Inc.
|
| 98,402
|
|
|
|
|
| 480,365
|
|
|
| Real Estate Management &
Development – 0.9%
|
|
|
| 3,764
|
| DigitalBridge Group, Inc.
|
| 45,130
|
| 3,716
|
| eXp World Holdings, Inc.
|
| 47,156
|
| 2,618
|
| Kennedy-Wilson Holdings, Inc.
|
| 43,433
|
| 1,195
|
| Marcus & Millichap, Inc.
|
| 38,371
|
| 5,167
|
| Newmark Group, Inc., Class A
|
| 36,582
|
| 1,065
|
| St. Joe (The) Co.
|
| 44,315
|
|
|
|
|
| 254,987
|
|
|
| Software – 4.6%
|
|
|
| 32,290
|
| Adeia, Inc.
|
| 286,090
|
| 2,776
|
| InterDigital, Inc.
|
| 202,370
|
| 8,940
|
| Pegasystems, Inc.
|
| 433,411
|
| 6,068
|
| Progress Software Corp.
|
| 348,607
|
|
|
|
|
| 1,270,478
|
| Shares
|
| Description
|
| Value
|
|
|
|
|
| Specialty Retail – 2.9%
|
|
|
| 6,807
|
| American Eagle Outfitters, Inc.
|
| $91,486
|
| 2,095
|
| Buckle (The), Inc.
|
| 74,771
|
| 2,514
|
| Foot Locker, Inc.
|
| 99,781
|
| 3,989
|
| Franchise Group, Inc.
|
| 108,700
|
| 527
|
| Group 1 Automotive, Inc.
|
| 119,323
|
| 2,102
|
| Monro, Inc.
|
| 103,902
|
| 4,214
|
| Rent-A-Center, Inc.
|
| 103,285
|
| 1,397
|
| Signet Jewelers Ltd.
|
| 108,659
|
|
|
|
|
| 809,907
|
|
|
| Technology Hardware,
Storage & Peripherals – 1.2%
|
|
|
| 20,967
|
| Xerox Holdings Corp.
|
| 322,892
|
|
|
| Textiles, Apparel & Luxury
Goods – 2.4%
|
|
|
| 1,274
|
| Carter’s, Inc.
|
| 91,626
|
| 2,376
|
| Kontoor Brands, Inc.
|
| 114,974
|
| 6,122
|
| Levi Strauss & Co., Class A
|
| 111,604
|
| 1,020
|
| Oxford Industries, Inc.
|
| 107,702
|
| 2,973
|
| Steven Madden Ltd.
|
| 107,028
|
| 8,693
|
| Wolverine World Wide, Inc.
|
| 148,216
|
|
|
|
|
| 681,150
|
|
|
| Tobacco – 0.5%
|
|
|
| 1,347
|
| Universal Corp.
|
| 71,243
|
| 5,997
|
| Vector Group Ltd.
|
| 72,024
|
|
|
|
|
| 143,267
|
|
|
| Trading Companies &
Distributors – 1.8%
|
|
|
| 778
|
| Boise Cascade Co.
|
| 49,209
|
| 4,038
|
| Global Industrial Co.
|
| 108,380
|
| 1,880
|
| H&E Equipment Services, Inc.
|
| 83,152
|
| 864
|
| McGrath RentCorp
|
| 80,620
|
| 1,817
|
| Rush Enterprises, Inc., Class A
|
| 99,208
|
| 701
|
| Veritiv Corp
|
| 94,733
|
|
|
|
|
| 515,302
|
|
|
| Water Utilities – 0.9%
|
|
|
| 670
|
| American States Water Co.
|
| 59,556
|
| 1,022
|
| California Water Service Group
|
| 59,480
|
| 788
|
| Middlesex Water Co.
|
| 61,559
|
| 763
|
| SJW Group
|
| 58,087
|
|
|
|
|
| 238,682
|
|
|
| Wireless Telecommunication
Services – 0.5%
|
|
|
| 13,095
|
| Telephone and Data Systems, Inc.
|
| 137,628
|
|
|
| Total Common Stocks
|
| 25,737,129
|
|
|
| (Cost $25,426,169)
|
|
|
| REAL ESTATE INVESTMENT TRUSTS – 7.3%
|
|
|
| Diversified REITs – 0.7%
|
|
|
| 2,199
|
| Alexander & Baldwin, Inc.
|
| 41,583
|
Page 46
See Notes to Financial
Statements
Small Cap US Equity Select ETF (RNSC)
Portfolio of Investments
(Continued)
March 31, 2023
| Shares
|
| Description
|
| Value
|
| REAL ESTATE INVESTMENT TRUSTS (Continued)
|
|
|
| Diversified REITs (Continued)
|
|
|
| 1,554
|
| American Assets Trust, Inc.
|
| $28,889
|
| 6,110
|
| Empire State Realty Trust, Inc., Class A
|
| 39,654
|
| 1,755
|
| Essential Properties Realty Trust, Inc.
|
| 43,612
|
| 3,276
|
| Global Net Lease, Inc.
|
| 42,129
|
|
|
|
|
| 195,867
|
|
|
| Health Care REITs – 0.5%
|
|
|
| 2,216
|
| CareTrust REIT, Inc.
|
| 43,389
|
| 1,159
|
| LTC Properties, Inc.
|
| 40,716
|
| 789
|
| National Health Investors, Inc.
|
| 40,697
|
|
|
|
|
| 124,802
|
|
|
| Hotel & Resort REITs – 0.8%
|
|
|
| 5,028
|
| DiamondRock Hospitality Co.
|
| 40,878
|
| 3,075
|
| Pebblebrook Hotel Trust
|
| 43,173
|
| 3,888
|
| RLJ Lodging Trust
|
| 41,213
|
| 4,263
|
| Sunstone Hotel Investors, Inc.
|
| 42,118
|
| 3,124
|
| Xenia Hotels & Resorts, Inc.
|
| 40,893
|
|
|
|
|
| 208,275
|
|
|
| Industrial REITs – 0.3%
|
|
|
| 406
|
| Innovative Industrial Properties, Inc.
|
| 30,852
|
| 4,110
|
| LXP Industrial Trust
|
| 42,374
|
|
|
|
|
| 73,226
|
|
|
| Mortgage Real Estate
Investment Trusts – 1.8%
|
|
|
| 4,662
|
| Apollo Commercial Real Estate Finance, Inc.
|
| 43,403
|
| 3,803
|
| Arbor Realty Trust, Inc.
|
| 43,696
|
| 9,120
|
| Chimera Investment Corp.
|
| 51,437
|
| 3,889
|
| Franklin BSP Realty Trust, Inc.
|
| 46,396
|
| 1,421
|
| Hannon Armstrong Sustainable Infrastructure Capital, Inc.
|
| 40,641
|
| 3,593
|
| KKR Real Estate Finance Trust, Inc.
|
| 40,924
|
| 4,996
|
| Ladder Capital Corp.
|
| 47,212
|
| 5,093
|
| MFA Financial, Inc.
|
| 50,523
|
| 4,898
|
| New York Mortgage Trust, Inc.
|
| 48,784
|
| 4,049
|
| PennyMac Mortgage Investment Trust
|
| 49,924
|
| 3,181
|
| Two Harbors Investment Corp.
|
| 46,793
|
|
|
|
|
| 509,733
|
|
|
| Office REITs – 0.9%
|
|
|
| 6,696
|
| Brandywine Realty Trust
|
| 31,672
|
| 1,587
|
| Corporate Office Properties Trust
|
| 37,628
|
| 2,886
|
| Easterly Government Properties, Inc.
|
| 39,654
|
| 4,232
|
| Hudson Pacific Properties, Inc.
|
| 28,143
|
| 2,170
|
| JBG SMITH Properties
|
| 32,680
|
| 6,932
|
| Paramount Group, Inc.
|
| 31,610
|
| Shares
|
| Description
|
| Value
|
|
|
|
|
| Office REITs (Continued)
|
|
|
| 4,491
|
| Piedmont Office Realty Trust, Inc., Class A
|
| $32,784
|
| 1,221
|
| SL Green Realty Corp.
|
| 28,718
|
|
|
|
|
| 262,889
|
|
|
| Residential REITs – 0.4%
|
|
|
| 702
|
| Centerspace
|
| 38,350
|
| 2,313
|
| Elme Communities
|
| 41,310
|
| 946
|
| NexPoint Residential Trust, Inc.
|
| 41,312
|
|
|
|
|
| 120,972
|
|
|
| Retail REITs – 1.4%
|
|
|
| 2,870
|
| Acadia Realty Trust
|
| 40,037
|
| 187
|
| Alexander’s, Inc.
|
| 36,231
|
| 1,216
|
| Getty Realty Corp.
|
| 43,813
|
| 1,740
|
| InvenTrust Properties Corp.
|
| 40,716
|
| 3,657
|
| Macerich (The) Co.
|
| 38,764
|
| 2,740
|
| Retail Opportunity Investments Corp.
|
| 38,250
|
| 1,012
|
| Saul Centers, Inc.
|
| 39,468
|
| 3,015
|
| SITE Centers Corp.
|
| 37,024
|
| 2,295
|
| Tanger Factory Outlet Centers, Inc.
|
| 45,051
|
| 2,923
|
| Urban Edge Properties
|
| 44,020
|
|
|
|
|
| 403,374
|
|
|
| Specialized REITs – 0.5%
|
|
|
| 1,588
|
| Four Corners Property Trust, Inc.
|
| 42,654
|
| 2,484
|
| Outfront Media, Inc.
|
| 40,315
|
| 1,051
|
| Safehold, Inc.
|
| 30,868
|
| 7,446
|
| Uniti Group, Inc.
|
| 26,433
|
|
|
|
|
| 140,270
|
|
|
| Total Real Estate Investment Trusts
|
| 2,039,408
|
|
|
| (Cost $2,639,506)
|
|
|
COMMON STOCKS – BUSINESS DEVELOPMENT
COMPANIES - 0.2%
|
|
|
| Capital Markets – 0.2%
|
|
|
| 3,812
|
| Golub Capital BDC, Inc.
|
| 51,691
|
|
|
| (Cost $57,216)
|
|
|
| MONEY MARKET FUNDS – 0.1%
|
| 34,796
|
| Goldman Sachs Financial Square Treasury Obligations Fund - Institutional Class - 4.69% (b) (c)
|
| 34,796
|
|
|
| (Cost $34,796)
|
|
|
See Notes to Financial
Statements
Page 47
Small Cap US Equity Select ETF (RNSC)
Portfolio of Investments
(Continued)
March 31, 2023
Principal
Value
|
| Description
|
| Value
|
| REPURCHASE AGREEMENTS – 0.0%
|
| $5,601
|
| BNP Paribas S.A., 4.74% (b), dated 3/31/23, due 4/3/23, with a maturity value of $5,602. Collateralized by U.S. Treasury
Notes, interest rates of 1.50% to 2.13%, due 5/15/25 to 11/30/28. The value of the collateral including accrued interest is $5,731. (c)
|
| $5,601
|
|
|
| (Cost $5,601)
|
|
|
|
|
| Total Investments – 99.9%
|
| 27,868,625
|
|
|
| (Cost $28,163,288)
|
|
|
|
|
| Net Other Assets and Liabilities – 0.1%
|
| 17,973
|
|
|
| Net Assets – 100.0%
|
| $27,886,598
|
| (a)
| All or a portion of this security is on loan (see Note 2E - Securities Lending in the Notes to Financial Statements). The remaining contractual maturity of all of the securities
lending transactions is overnight and continuous. The aggregate value of such securities is $39,547 and the total value of the collateral held by the Fund is $40,397.
|
| (b)
| Rate shown reflects yield as of March 31, 2023.
|
| (c)
| This security serves as collateral for securities on loan.
|
Offsetting Assets and Liabilities
Offsetting assets and
liabilities requires entities to disclose both gross and net information about instruments and transactions eligible for offset, and to disclose instruments and transactions subject to master netting or similar
agreements (see Note 2D – Offsetting on the Statements of Assets and Liabilities in the Notes to Financial Statements).
The Fund’s loaned
securities were all subject to an enforceable Securities Lending Agency Agreement. Securities lent in accordance with the Securities Lending Agency Agreement on a gross basis were as follows:
| Securities Lending Agency Agreement
|
|
| Total gross amount presented on the Statements of Assets and Liabilities (1)
| $39,547
|
| Non-cash Collateral (2)
| (39,547)
|
| Net Amount
| $—
|
| (1)
| The amount presented on the Statement of Assets and Liabilities, which is included in “Investments, at value,” is not offset and is shown on a gross basis.
|
| (2)
| At March 31, 2023, the value of collateral received from each borrower exceeded the value of the related securities loaned. This amount is disclosed on the
Portfolio of Investments.
|
The Fund’s investments in
repurchase agreements were all subject to an enforceable Master Repurchase Agreement. Repurchase Agreements on a gross basis were as follows:
| Repurchase Agreements
|
|
| Total gross amount presented on the Statements of Assets and Liabilities (3)
| $5,601
|
| Non-cash Collateral (4)
| (5,601)
|
| Net Amount
| $—
|
| (3)
| The amount is included in “Investments, at value” on the Statements of Assets and Liabilities.
|
| (4)
| At March 31, 2023, the value of the collateral received from each seller exceeded the value of the repurchase agreements.
|
Valuation Inputs
A summary of the inputs
used to value the Fund’s investments as of March 31, 2023 is as follows (see Note 2A - Portfolio Valuation in the Notes to Financial Statements):
|
| Total
Value at
3/31/2023
| Level 1
Quoted
Prices
| Level 2
Significant
Observable
Inputs
| Level 3
Significant
Unobservable
Inputs
|
| Common Stocks*
| $ 25,737,129
| $ 25,737,129
| $ —
| $ —
|
| Real Estate Investment Trusts*
| 2,039,408
| 2,039,408
| —
| —
|
| Common Stocks - Business Development Companies*
| 51,691
| 51,691
| —
| —
|
| Money Market Funds
| 34,796
| 34,796
| —
| —
|
| Repurchase Agreements
| 5,601
| —
| 5,601
| —
|
| Total Investments
| $ 27,868,625
| $ 27,863,024
| $ 5,601
| $—
|
| *
| See Portfolio of Investments for industry breakout.
|
Page 48
See Notes to Financial
Statements
US Equity Dividend Select ETF (RNDV)
Portfolio of Investments
March 31, 2023
| Shares
|
| Description
|
| Value
|
| COMMON STOCKS – 96.9%
|
|
|
| Aerospace & Defense – 1.5%
|
|
|
| 372
|
| General Dynamics Corp.
|
| $84,894
|
| 476
|
| L3Harris Technologies, Inc.
|
| 93,410
|
| 222
|
| Lockheed Martin Corp.
|
| 104,946
|
| 977
|
| Raytheon Technologies Corp.
|
| 95,678
|
|
|
|
|
| 378,928
|
|
|
| Air Freight & Logistics – 1.8%
|
|
|
| 1,243
|
| CH Robinson Worldwide, Inc.
|
| 123,517
|
| 646
|
| FedEx Corp.
|
| 147,604
|
| 928
|
| United Parcel Service, Inc., Class B
|
| 180,023
|
|
|
|
|
| 451,144
|
|
|
| Automobiles – 1.3%
|
|
|
| 25,424
|
| Ford Motor Co.
|
| 320,342
|
|
|
| Banks – 3.7%
|
|
|
| 1,813
|
| Bank of America Corp.
|
| 51,852
|
| 2,305
|
| Citigroup, Inc.
|
| 108,081
|
| 2,416
|
| Citizens Financial Group, Inc.
|
| 73,374
|
| 2,706
|
| Fifth Third Bancorp
|
| 72,088
|
| 7,210
|
| Huntington Bancshares, Inc.
|
| 80,752
|
| 515
|
| JPMorgan Chase & Co.
|
| 67,110
|
| 6,018
|
| KeyCorp
|
| 75,345
|
| 527
|
| M&T Bank Corp.
|
| 63,013
|
| 533
|
| PNC Financial Services Group (The), Inc.
|
| 67,744
|
| 3,680
|
| Regions Financial Corp.
|
| 68,301
|
| 2,497
|
| Truist Financial Corp.
|
| 85,148
|
| 2,285
|
| US Bancorp
|
| 82,374
|
| 1,492
|
| Wells Fargo & Co.
|
| 55,771
|
|
|
|
|
| 950,953
|
|
|
| Beverages – 0.6%
|
|
|
| 985
|
| Coca-Cola (The) Co.
|
| 61,099
|
| 1,357
|
| Keurig Dr. Pepper, Inc.
|
| 47,875
|
| 313
|
| PepsiCo, Inc.
|
| 57,060
|
|
|
|
|
| 166,034
|
|
|
| Biotechnology – 4.9%
|
|
|
| 2,833
|
| AbbVie, Inc.
|
| 451,495
|
| 1,476
|
| Amgen, Inc.
|
| 356,823
|
| 5,199
|
| Gilead Sciences, Inc.
|
| 431,361
|
|
|
|
|
| 1,239,679
|
|
|
| Broadline Retail – 0.6%
|
|
|
| 3,350
|
| eBay, Inc.
|
| 148,639
|
|
|
| Building Products – 0.8%
|
|
|
| 1,576
|
| Johnson Controls International PLC
|
| 94,907
|
| 2,371
|
| Masco Corp.
|
| 117,886
|
|
|
|
|
| 212,793
|
| Shares
|
| Description
|
| Value
|
|
|
|
|
| Capital Markets – 3.8%
|
|
|
| 1,584
|
| Bank of New York Mellon (The) Corp.
|
| $71,977
|
| 90
|
| BlackRock, Inc.
|
| 60,221
|
| 2,075
|
| Blackstone, Inc.
|
| 182,268
|
| 3,181
|
| Carlyle Group (The), Inc.
|
| 98,802
|
| 327
|
| CME Group, Inc.
|
| 62,627
|
| 3,887
|
| Franklin Resources, Inc.
|
| 104,716
|
| 177
|
| Goldman Sachs Group (The), Inc.
|
| 57,899
|
| 943
|
| Morgan Stanley
|
| 82,795
|
| 857
|
| Northern Trust Corp.
|
| 75,527
|
| 922
|
| State Street Corp.
|
| 69,786
|
| 933
|
| T. Rowe Price Group, Inc.
|
| 105,336
|
|
|
|
|
| 971,954
|
|
|
| Chemicals – 1.7%
|
|
|
| 64
|
| Air Products and Chemicals, Inc.
|
| 18,381
|
| 246
|
| Celanese Corp.
|
| 26,787
|
| 194
|
| CF Industries Holdings, Inc.
|
| 14,063
|
| 1,030
|
| Dow, Inc.
|
| 56,465
|
| 1,292
|
| DuPont de Nemours, Inc.
|
| 92,727
|
| 434
|
| Eastman Chemical Co.
|
| 36,603
|
| 130
|
| FMC Corp.
|
| 15,877
|
| 273
|
| International Flavors & Fragrances, Inc.
|
| 25,105
|
| 637
|
| LyondellBasell Industries N.V., Class A
|
| 59,808
|
| 705
|
| PPG Industries, Inc.
|
| 94,174
|
|
|
|
|
| 439,990
|
|
|
| Communications Equipment – 0.5%
|
|
|
| 2,384
|
| Cisco Systems, Inc.
|
| 124,624
|
|
|
| Consumer Finance – 1.1%
|
|
|
| 1,280
|
| Capital One Financial Corp.
|
| 123,085
|
| 556
|
| Discover Financial Services
|
| 54,955
|
| 3,842
|
| Synchrony Financial
|
| 111,725
|
|
|
|
|
| 289,765
|
|
|
| Consumer Staples
Distribution & Retail – 1.6%
|
|
|
| 1,070
|
| Kroger (The) Co.
|
| 52,826
|
| 743
|
| Sysco Corp.
|
| 57,382
|
| 1,167
|
| Target Corp.
|
| 193,290
|
| 3,106
|
| Walgreens Boots Alliance, Inc.
|
| 107,405
|
|
|
|
|
| 410,903
|
|
|
| Containers & Packaging – 0.9%
|
|
|
| 1,442
|
| International Paper Co.
|
| 51,998
|
| 1,338
|
| Packaging Corp. of America
|
| 185,755
|
|
|
|
|
| 237,753
|
|
|
| Distributors – 1.0%
|
|
|
| 778
|
| Genuine Parts Co.
|
| 130,167
|
See Notes to Financial
Statements
Page 49
US Equity Dividend Select ETF (RNDV)
Portfolio of Investments
(Continued)
March 31, 2023
| Shares
|
| Description
|
| Value
|
| COMMON STOCKS (Continued)
|
|
|
| Distributors (Continued)
|
|
|
| 2,352
|
| LKQ Corp.
|
| $133,500
|
|
|
|
|
| 263,667
|
|
|
| Diversified Telecommunication
Services – 1.9%
|
|
|
| 12,955
|
| AT&T, Inc.
|
| 249,384
|
| 5,940
|
| Verizon Communications, Inc.
|
| 231,006
|
|
|
|
|
| 480,390
|
|
|
| Electric Utilities – 1.7%
|
|
|
| 584
|
| Alliant Energy Corp.
|
| 31,186
|
| 364
|
| American Electric Power Co., Inc.
|
| 33,120
|
| 391
|
| Duke Energy Corp.
|
| 37,720
|
| 727
|
| Edison International
|
| 51,319
|
| 336
|
| Entergy Corp.
|
| 36,201
|
| 610
|
| Evergy, Inc.
|
| 37,283
|
| 376
|
| Eversource Energy
|
| 29,426
|
| 752
|
| Exelon Corp.
|
| 31,501
|
| 920
|
| FirstEnergy Corp.
|
| 36,855
|
| 253
|
| NextEra Energy, Inc.
|
| 19,501
|
| 1,067
|
| PPL Corp.
|
| 29,652
|
| 550
|
| Southern (The) Co.
|
| 38,269
|
| 413
|
| Xcel Energy, Inc.
|
| 27,853
|
|
|
|
|
| 439,886
|
|
|
| Electrical Equipment – 1.1%
|
|
|
| 607
|
| Eaton Corp. PLC
|
| 104,004
|
| 1,031
|
| Emerson Electric Co.
|
| 89,841
|
| 316
|
| Rockwell Automation, Inc.
|
| 92,730
|
|
|
|
|
| 286,575
|
|
|
| Electronic Equipment,
Instruments & Components – 2.9%
|
|
|
| 13,064
|
| Corning, Inc.
|
| 460,898
|
| 2,041
|
| TE Connectivity Ltd.
|
| 267,677
|
|
|
|
|
| 728,575
|
|
|
| Energy Equipment &
Services – 0.2%
|
|
|
| 1,480
|
| Baker Hughes Co.
|
| 42,713
|
|
|
| Financial Services – 0.6%
|
|
|
| 908
|
| Apollo Global Management, Inc.
|
| 57,349
|
| 1,883
|
| Fidelity National Information Services, Inc.
|
| 102,304
|
|
|
|
|
| 159,653
|
|
|
| Food Products – 2.6%
|
|
|
| 523
|
| Bunge Ltd.
|
| 49,957
|
| 1,040
|
| Campbell Soup Co.
|
| 57,179
|
| 1,942
|
| Conagra Brands, Inc.
|
| 72,942
|
| 676
|
| General Mills, Inc.
|
| 57,771
|
| 1,134
|
| Hormel Foods Corp.
|
| 45,224
|
| 362
|
| J.M. Smucker (The) Co.
|
| 56,968
|
| Shares
|
| Description
|
| Value
|
|
|
|
|
| Food Products (Continued)
|
|
|
| 1,044
|
| Kellogg Co.
|
| $69,906
|
| 2,185
|
| Kraft Heinz (The) Co.
|
| 84,494
|
| 496
|
| McCormick & Co., Inc.
|
| 41,272
|
| 749
|
| Mondelez International, Inc., Class A
|
| 52,220
|
| 1,086
|
| Tyson Foods, Inc., Class A
|
| 64,422
|
|
|
|
|
| 652,355
|
|
|
| Gas Utilities – 0.1%
|
|
|
| 230
|
| Atmos Energy Corp.
|
| 25,843
|
|
|
| Ground Transportation – 0.7%
|
|
|
| 377
|
| Norfolk Southern Corp.
|
| 79,924
|
| 546
|
| Union Pacific Corp.
|
| 109,888
|
|
|
|
|
| 189,812
|
|
|
| Health Care Equipment &
Supplies – 2.8%
|
|
|
| 5,809
|
| Baxter International, Inc.
|
| 235,613
|
| 5,800
|
| Medtronic PLC
|
| 467,596
|
|
|
|
|
| 703,209
|
|
|
| Health Care Providers &
Services – 1.5%
|
|
|
| 4,393
|
| Cardinal Health, Inc.
|
| 331,671
|
| 574
|
| CVS Health Corp.
|
| 42,654
|
|
|
|
|
| 374,325
|
|
|
| Hotels, Restaurants &
Leisure – 2.6%
|
|
|
| 1,581
|
| Darden Restaurants, Inc.
|
| 245,308
|
| 534
|
| McDonald’s Corp.
|
| 149,311
|
| 1,331
|
| Starbucks Corp.
|
| 138,597
|
| 910
|
| Yum! Brands, Inc.
|
| 120,193
|
|
|
|
|
| 653,409
|
|
|
| Household Durables – 0.9%
|
|
|
| 2,198
|
| Garmin Ltd.
|
| 221,822
|
|
|
| Household Products – 1.0%
|
|
|
| 538
|
| Clorox (The) Co.
|
| 85,133
|
| 678
|
| Colgate-Palmolive Co.
|
| 50,952
|
| 570
|
| Kimberly-Clark Corp.
|
| 76,505
|
| 356
|
| Procter & Gamble (The) Co.
|
| 52,934
|
|
|
|
|
| 265,524
|
|
|
| Independent Power &
Renewable Electricity Producers – 0.1%
|
|
|
| 795
|
| AES (The) Corp.
|
| 19,144
|
|
|
| Industrial Conglomerates – 1.1%
|
|
|
| 1,910
|
| 3M Co.
|
| 200,760
|
| 398
|
| Honeywell International, Inc.
|
| 76,066
|
|
|
|
|
| 276,826
|
Page 50
See Notes to Financial
Statements
US Equity Dividend Select ETF (RNDV)
Portfolio of Investments
(Continued)
March 31, 2023
| Shares
|
| Description
|
| Value
|
| COMMON STOCKS (Continued)
|
|
|
| Insurance – 1.9%
|
|
|
| 715
|
| Aflac, Inc.
|
| $46,132
|
| 428
|
| Allstate (The) Corp.
|
| 47,427
|
| 740
|
| American International Group, Inc.
|
| 37,266
|
| 609
|
| Cincinnati Financial Corp.
|
| 68,257
|
| 635
|
| Hartford Financial Services Group (The), Inc.
|
| 44,253
|
| 874
|
| MetLife, Inc.
|
| 50,640
|
| 841
|
| Principal Financial Group, Inc.
|
| 62,503
|
| 1,121
|
| Prudential Financial, Inc.
|
| 92,751
|
| 241
|
| Travelers (The) Cos., Inc.
|
| 41,310
|
|
|
|
|
| 490,539
|
|
|
| IT Services – 3.1%
|
|
|
| 4,074
|
| Cognizant Technology Solutions Corp., Class A
|
| 248,229
|
| 4,097
|
| International Business Machines Corp.
|
| 537,075
|
|
|
|
|
| 785,304
|
|
|
| Machinery – 2.4%
|
|
|
| 371
|
| Caterpillar, Inc.
|
| 84,900
|
| 474
|
| Cummins, Inc.
|
| 113,229
|
| 481
|
| Illinois Tool Works, Inc.
|
| 117,099
|
| 273
|
| Parker-Hannifin Corp.
|
| 91,758
|
| 2,597
|
| Stanley Black & Decker, Inc.
|
| 209,266
|
|
|
|
|
| 616,252
|
|
|
| Media – 3.3%
|
|
|
| 2,374
|
| Comcast Corp., Class A
|
| 89,998
|
| 2,755
|
| Omnicom Group, Inc.
|
| 259,907
|
| 22,055
|
| Paramount Global, Class B
|
| 492,047
|
|
|
|
|
| 841,952
|
|
|
| Metals & Mining – 0.2%
|
|
|
| 923
|
| Newmont Corp.
|
| 45,245
|
|
|
| Multi-Utilities – 1.1%
|
|
|
| 309
|
| Ameren Corp.
|
| 26,694
|
| 810
|
| CenterPoint Energy, Inc.
|
| 23,863
|
| 475
|
| CMS Energy Corp.
|
| 29,155
|
| 362
|
| Consolidated Edison, Inc.
|
| 34,632
|
| 737
|
| Dominion Energy, Inc.
|
| 41,206
|
| 272
|
| DTE Energy Co.
|
| 29,795
|
| 597
|
| Public Service Enterprise Group, Inc.
|
| 37,283
|
| 199
|
| Sempra Energy
|
| 30,081
|
| 343
|
| WEC Energy Group, Inc.
|
| 32,513
|
|
|
|
|
| 285,222
|
|
|
| Oil, Gas & Consumable Fuels – 5.0%
|
|
|
| 311
|
| Chevron Corp.
|
| 50,743
|
| 633
|
| ConocoPhillips
|
| 62,800
|
| 5,975
|
| Coterra Energy, Inc.
|
| 146,626
|
| Shares
|
| Description
|
| Value
|
|
|
|
|
| Oil, Gas & Consumable
Fuels (Continued)
|
|
|
| 2,416
|
| Devon Energy Corp.
|
| $122,274
|
| 847
|
| Diamondback Energy, Inc.
|
| 114,489
|
| 318
|
| EOG Resources, Inc.
|
| 36,452
|
| 516
|
| Exxon Mobil Corp.
|
| 56,585
|
| 5,963
|
| Kinder Morgan, Inc.
|
| 104,412
|
| 325
|
| Marathon Petroleum Corp.
|
| 43,820
|
| 1,532
|
| ONEOK, Inc.
|
| 97,343
|
| 655
|
| Ovintiv, Inc.
|
| 23,632
|
| 625
|
| Phillips 66
|
| 63,363
|
| 862
|
| Pioneer Natural Resources Co.
|
| 176,055
|
| 460
|
| Targa Resources Corp.
|
| 33,557
|
| 431
|
| Valero Energy Corp.
|
| 60,168
|
| 2,777
|
| Williams (The) Cos., Inc.
|
| 82,921
|
|
|
|
|
| 1,275,240
|
|
|
| Pharmaceuticals – 5.1%
|
|
|
| 5,475
|
| Bristol-Myers Squibb Co.
|
| 379,472
|
| 1,871
|
| Johnson & Johnson
|
| 290,005
|
| 2,985
|
| Merck & Co., Inc.
|
| 317,574
|
| 7,997
|
| Pfizer, Inc.
|
| 326,278
|
|
|
|
|
| 1,313,329
|
|
|
| Professional Services – 1.0%
|
|
|
| 353
|
| Automatic Data Processing, Inc.
|
| 78,588
|
| 350
|
| Broadridge Financial Solutions, Inc.
|
| 51,300
|
| 1,046
|
| Paychex, Inc.
|
| 119,861
|
|
|
|
|
| 249,749
|
|
|
| Semiconductors &
Semiconductor Equipment – 11.9%
|
|
|
| 1,394
|
| Analog Devices, Inc.
|
| 274,925
|
| 667
|
| Broadcom, Inc.
|
| 427,907
|
| 25,792
|
| Intel Corp.
|
| 842,625
|
| 1,670
|
| NXP Semiconductors N.V.
|
| 311,413
|
| 2,991
|
| QUALCOMM, Inc.
|
| 381,592
|
| 3,507
|
| Skyworks Solutions, Inc.
|
| 413,756
|
| 2,120
|
| Texas Instruments, Inc.
|
| 394,341
|
|
|
|
|
| 3,046,559
|
|
|
| Software – 0.9%
|
|
|
| 13,435
|
| Gen Digital, Inc.
|
| 230,545
|
|
|
| Specialty Retail – 2.2%
|
|
|
| 3,582
|
| Best Buy Co., Inc.
|
| 280,363
|
| 499
|
| Home Depot (The), Inc.
|
| 147,265
|
| 610
|
| Lowe’s Cos., Inc.
|
| 121,982
|
|
|
|
|
| 549,610
|
|
|
| Technology Hardware,
Storage & Peripherals – 8.4%
|
|
|
| 23,254
|
| Hewlett Packard Enterprise Co.
|
| 370,436
|
| 17,305
|
| HP, Inc.
|
| 507,902
|
| 6,842
|
| NetApp, Inc.
|
| 436,862
|
See Notes to Financial
Statements
Page 51
US Equity Dividend Select ETF (RNDV)
Portfolio of Investments
(Continued)
March 31, 2023
| Shares
|
| Description
|
| Value
|
| COMMON STOCKS (Continued)
|
|
|
| Technology Hardware,
Storage & Peripherals (Continued)
|
|
|
| 12,484
|
| Seagate Technology Holdings PLC
|
| $825,442
|
|
|
|
|
| 2,140,642
|
|
|
| Textiles, Apparel & Luxury
Goods – 1.5%
|
|
|
| 17,260
|
| VF Corp.
|
| 395,427
|
|
|
| Tobacco – 1.1%
|
|
|
| 3,986
|
| Altria Group, Inc.
|
| 177,855
|
| 1,114
|
| Philip Morris International, Inc.
|
| 108,337
|
|
|
|
|
| 286,192
|
|
|
| Trading Companies &
Distributors – 0.1%
|
|
|
| 520
|
| Fastenal Co.
|
| 28,049
|
|
|
| Water Utilities – 0.1%
|
|
|
| 507
|
| Essential Utilities, Inc.
|
| 22,131
|
|
|
| Total Common Stocks
|
| 24,729,216
|
|
|
| (Cost $25,201,098)
|
|
|
| REAL ESTATE INVESTMENT TRUSTS – 2.8%
|
|
|
| Diversified REITs – 0.1%
|
|
|
| 428
|
| WP Carey, Inc.
|
| 33,149
|
|
|
| Health Care REITs – 0.3%
|
|
|
| 1,181
|
| Healthpeak Properties, Inc.
|
| 25,946
|
| 548
|
| Ventas, Inc.
|
| 23,756
|
| 349
|
| Welltower, Inc.
|
| 25,020
|
|
|
|
|
| 74,722
|
|
|
| Hotel & Resort REITs – 0.1%
|
|
|
| 792
|
| Host Hotels & Resorts, Inc.
|
| 13,060
|
|
|
| Industrial REITs – 0.1%
|
|
|
| 154
|
| Prologis, Inc.
|
| 19,214
|
|
|
| Office REITs – 0.2%
|
|
|
| 137
|
| Alexandria Real Estate Equities, Inc.
|
| 17,206
|
| 530
|
| Boston Properties, Inc.
|
| 28,683
|
|
|
|
|
| 45,889
|
|
|
| Residential REITs – 0.8%
|
|
|
| 490
|
| American Homes 4 Rent, Class A
|
| 15,411
|
| 150
|
| AvalonBay Communities, Inc.
|
| 25,209
|
| 185
|
| Camden Property Trust
|
| 19,395
|
| 244
|
| Equity LifeStyle Properties, Inc.
|
| 16,380
|
| 443
|
| Equity Residential
|
| 26,580
|
| 121
|
| Essex Property Trust, Inc.
|
| 25,306
|
| 619
|
| Invitation Homes, Inc.
|
| 19,331
|
| 116
|
| Mid-America Apartment Communities, Inc.
|
| 17,521
|
| Shares
|
| Description
|
| Value
|
|
|
|
|
| Residential REITs (Continued)
|
|
|
| 106
|
| Sun Communities, Inc.
|
| $14,933
|
| 619
|
| UDR, Inc.
|
| 25,416
|
|
|
|
|
| 205,482
|
|
|
| Retail REITs – 0.3%
|
|
|
| 1,158
|
| Kimco Realty Corp.
|
| 22,616
|
| 454
|
| Realty Income Corp.
|
| 28,747
|
| 309
|
| Simon Property Group, Inc.
|
| 34,599
|
|
|
|
|
| 85,962
|
|
|
| Specialized REITs – 0.9%
|
|
|
| 80
|
| American Tower Corp.
|
| 16,347
|
| 200
|
| Crown Castle, Inc.
|
| 26,768
|
| 299
|
| Digital Realty Trust, Inc.
|
| 29,395
|
| 18
|
| Equinix, Inc.
|
| 12,979
|
| 170
|
| Extra Space Storage, Inc.
|
| 27,698
|
| 640
|
| Gaming and Leisure Properties, Inc.
|
| 33,318
|
| 613
|
| Iron Mountain, Inc.
|
| 32,434
|
| 62
|
| Public Storage
|
| 18,733
|
| 884
|
| VICI Properties, Inc.
|
| 28,836
|
| 464
|
| Weyerhaeuser Co.
|
| 13,980
|
|
|
|
|
| 240,488
|
|
|
| Total Real Estate Investment Trusts
|
| 717,966
|
|
|
| (Cost $779,113)
|
|
|
|
|
| Total Investments – 99.7%
|
| 25,447,182
|
|
|
| (Cost $25,980,211)
|
|
|
|
|
| Net Other Assets and Liabilities – 0.3%
|
| 87,142
|
|
|
| Net Assets – 100.0%
|
| $25,534,324
|
Valuation Inputs
A summary of the inputs
used to value the Fund’s investments as of March 31, 2023 is as follows (see Note 2A - Portfolio Valuation in the Notes to Financial Statements):
|
| Total
Value at
3/31/2023
| Level 1
Quoted
Prices
| Level 2
Significant
Observable
Inputs
| Level 3
Significant
Unobservable
Inputs
|
| Common Stocks*
| $ 24,729,216
| $ 24,729,216
| $ —
| $ —
|
| Real Estate Investment Trusts*
| 717,966
| 717,966
| —
| —
|
| Total Investments
| $ 25,447,182
| $ 25,447,182
| $—
| $—
|
| *
| See Portfolio of Investments for industry breakout.
|
Page 52
See Notes to Financial
Statements
This page intentionally
left blank
First Trust Exchange-Traded Fund VI
Statements of Assets and
Liabilities
March 31, 2023
|
| Developed
International
Equity Select
ETF
(RNDM)
|
| Emerging
Markets
Equity Select
ETF
(RNEM)
|
| Large Cap US
Equity Select
ETF
(RNLC)
|
| ASSETS:
|
|
|
|
|
|
Investments, at value
| $ 19,397,753
|
| $ 8,951,452
|
| $ 17,015,984
|
Cash
| 53,138
|
| 26,720
|
| 13,568
|
Foreign currency
| 16,445
|
| 1,354
|
| —
|
| Receivables:
|
|
|
|
|
|
Dividends
| 92,438
|
| 17,252
|
| 21,400
|
Dividend reclaims
| 53,921
|
| 726
|
| 3,046
|
Securities lending income
| 12
|
| —
|
| —
|
Miscellaneous
| 331
|
| —
|
| —
|
Total Assets
| 19,614,038
|
| 8,997,504
|
| 17,053,998
|
| LIABILITIES:
|
|
|
|
|
|
| Payables:
|
|
|
|
|
|
Investment advisory fees
| 10,491
|
| 5,568
|
| 8,485
|
Collateral for securities on loan
| —
|
| —
|
| —
|
Deferred foreign capital gains tax
| —
|
| 36,217
|
| —
|
Total Liabilities
| 10,491
|
| 41,785
|
| 8,485
|
NET ASSETS
| $19,603,547
|
| $8,955,719
|
| $17,045,513
|
| NET ASSETS consist of:
|
|
|
|
|
|
Paid-in capital
| $ 22,657,485
|
| $ 10,563,616
|
| $ 18,929,172
|
Par value
| 4,000
|
| 2,000
|
| 5,500
|
Accumulated distributable earnings (loss)
| (3,057,938)
|
| (1,609,897)
|
| (1,889,159)
|
NET ASSETS
| $19,603,547
|
| $8,955,719
|
| $17,045,513
|
NET ASSET VALUE, per share
| $49.01
|
| $44.78
|
| $30.99
|
Number of shares outstanding (unlimited number of shares authorized, par value $0.01 per share)
| 400,002
|
| 200,002
|
| 550,002
|
Investments, at cost
| $18,353,605
|
| $8,691,101
|
| $16,824,091
|
Foreign currency, at cost (proceeds)
| $16,459
|
| $1,353
|
| $—
|
Securities on loan, at value
| $—
|
| $—
|
| $—
|
Page 54
See Notes to Financial Statements
Mid Cap US
Equity Select
ETF
(RNMC)
|
| Small Cap US
Equity Select
ETF
(RNSC)
|
| US Equity
Dividend Select
ETF
(RNDV)
|
|
|
|
|
|
|
| $ 12,379,024
|
| $ 27,868,625
|
| $ 25,447,182
|
| 5,511
|
| 21,844
|
| 35,053
|
| —
|
| —
|
| —
|
|
|
|
|
|
|
| 18,092
|
| 50,746
|
| 58,254
|
| 521
|
| —
|
| 3,909
|
| —
|
| 186
|
| —
|
| —
|
| —
|
| —
|
| 12,403,148
|
| 27,941,401
|
| 25,544,398
|
|
|
|
|
|
|
|
|
|
|
|
|
| 6,270
|
| 14,406
|
| 10,074
|
| —
|
| 40,397
|
| —
|
| —
|
| —
|
| —
|
| 6,270
|
| 54,803
|
| 10,074
|
| $ 12,396,878
|
| $ 27,886,598
|
| $ 25,534,324
|
|
|
|
|
|
|
| $ 15,834,871
|
| $ 31,509,407
|
| $ 27,529,845
|
| 4,500
|
| 10,500
|
| 9,000
|
| (3,442,493)
|
| (3,633,309)
|
| (2,004,521)
|
| $ 12,396,878
|
| $ 27,886,598
|
| $ 25,534,324
|
| $27.55
|
| $26.56
|
| $28.37
|
| 450,002
|
| 1,050,002
|
| 900,002
|
| $12,944,769
|
| $28,163,288
|
| $25,980,211
|
| $—
|
| $—
|
| $—
|
| $—
|
| $39,547
|
| $—
|
See Notes to Financial Statements
Page 55
First Trust Exchange-Traded Fund VI
Statements of Operations
For the Year Ended March
31, 2023
|
| Developed
International
Equity Select
ETF
(RNDM)
|
| Emerging
Markets
Equity Select
ETF
(RNEM)
|
| Large Cap US
Equity Select
ETF
(RNLC)
|
| INVESTMENT INCOME:
|
|
|
|
|
|
Dividends
| $ 714,761
|
| $ 432,981
|
| $ 430,135
|
Interest
| 1,019
|
| 680
|
| 600
|
Securities lending income (net of fees)
| 580
|
| —
|
| —
|
Foreign withholding tax
| (70,230)
|
| (63,821)
|
| (619)
|
Other
| 103
|
| 6
|
| 21
|
Total investment income
| 646,233
|
| 369,846
|
| 430,137
|
| EXPENSES:
|
|
|
|
|
|
Investment advisory fees
| 120,773
|
| 63,551
|
| 117,468
|
Total expenses
| 120,773
|
| 63,551
|
| 117,468
|
NET INVESTMENT INCOME (LOSS)
| 525,460
|
| 306,295
|
| 312,669
|
| NET REALIZED AND UNREALIZED GAIN (LOSS):
|
|
|
|
|
|
| Net realized gain (loss) on:
|
|
|
|
|
|
Investments
| (1,806,910)
|
| (721,088)
|
| (466,587)
|
In-kind redemptions
| 128,841
|
| —
|
| 1,032,727
|
Foreign currency transactions
| (9,698)
|
| 4,758
|
| —
|
Foreign capital gains tax
| —
|
| (8,220)
|
| —
|
Net realized gain (loss)
| (1,687,767)
|
| (724,550)
|
| 566,140
|
| Net change in unrealized appreciation (depreciation) on:
|
|
|
|
|
|
Investments
| 543,788
|
| 45,503
|
| (2,385,080)
|
Foreign currency translation
| (1,290)
|
| 167
|
| —
|
Deferred foreign capital gains tax
| —
|
| (14,656)
|
| —
|
Net change in unrealized appreciation (depreciation)
| 542,498
|
| 31,014
|
| (2,385,080)
|
NET REALIZED AND UNREALIZED GAIN (LOSS)
| (1,145,269)
|
| (693,536)
|
| (1,818,940)
|
NET INCREASE (DECREASE) IN NET ASSETS RESULTING FROM OPERATIONS
| $(619,809)
|
| $(387,241)
|
| $(1,506,271)
|
Page 56
See Notes to Financial Statements
|
| Mid Cap US
Equity Select
ETF
(RNMC)
|
| Small Cap US
Equity Select
ETF
(RNSC)
|
| US Equity
Dividend Select
ETF
(RNDV)
|
|
|
|
|
|
|
|
|
| $367,764
|
| $714,391
|
| $712,007
|
|
| 585
|
| 1,139
|
| 936
|
|
| —
|
| 3,830
|
| —
|
|
| (88)
|
| (356)
|
| (729)
|
|
| 85
|
| 44
|
| 9
|
|
| 368,346
|
| 719,048
|
| 712,223
|
|
|
|
|
|
|
|
|
| 95,812
|
| 153,050
|
| 101,764
|
|
| 95,812
|
| 153,050
|
| 101,764
|
|
| 272,534
|
| 565,998
|
| 610,459
|
|
|
|
|
|
|
|
|
|
|
|
|
|
|
|
| (975,284)
|
| (2,304,105)
|
| (322,868)
|
|
| 1,653,605
|
| 1,435,864
|
| 56
|
|
| —
|
| —
|
| —
|
|
| —
|
| —
|
| —
|
|
| 678,321
|
| (868,241)
|
| (322,812)
|
|
|
|
|
|
|
|
|
| (1,588,315)
|
| (1,064,889)
|
| (1,049,183)
|
|
| —
|
| —
|
| —
|
|
| —
|
| —
|
| —
|
|
| (1,588,315)
|
| (1,064,889)
|
| (1,049,183)
|
|
| (909,994)
|
| (1,933,130)
|
| (1,371,995)
|
|
| $(637,460)
|
| $(1,367,132)
|
| $(761,536)
|
See Notes to Financial Statements
Page 57
First Trust Exchange-Traded Fund VI
Statements of Changes in
Net Assets
|
| Developed
International
Equity Select
ETF (RNDM)
|
| Emerging Markets
Equity Select
ETF (RNEM)
|
|
| Year
Ended
3/31/2023
|
| Year
Ended
3/31/2022
|
| Year
Ended
3/31/2023
|
| Year
Ended
3/31/2022
|
| OPERATIONS:
|
|
|
|
|
|
|
|
Net investment income (loss)
| $ 525,460
|
| $ 612,626
|
| $ 306,295
|
| $ 242,593
|
Net realized gain (loss)
| (1,687,767)
|
| 2,370,496
|
| (724,550)
|
| 364,099
|
Net change in unrealized appreciation (depreciation)
| 542,498
|
| (2,937,328)
|
| 31,014
|
| (464,909)
|
Net increase (decrease) in net assets resulting from operations
| (619,809)
|
| 45,794
|
| (387,241)
|
| 141,783
|
| DISTRIBUTIONS TO SHAREHOLDERS FROM:
|
|
|
|
|
|
|
|
Investment operations
| (486,763)
|
| (703,193)
|
| (254,643)
|
| (180,487)
|
Return of capital
| —
|
| —
|
| —
|
| (49,961)
|
Total distributions to shareholders
| (486,763)
|
| (703,193)
|
| (254,643)
|
| (230,448)
|
| SHAREHOLDER TRANSACTIONS:
|
|
|
|
|
|
|
|
Proceeds from shares sold
| 4,346,583
|
| 5,595,303
|
| 2,305,295
|
| —
|
Cost of shares redeemed
| (7,143,304)
|
| (5,356,575)
|
| —
|
| —
|
Net increase (decrease) in net assets resulting from shareholder transactions
| (2,796,721)
|
| 238,728
|
| 2,305,295
|
| —
|
Total increase (decrease) in net assets
| (3,903,293)
|
| (418,671)
|
| 1,663,411
|
| (88,665)
|
| NET ASSETS:
|
|
|
|
|
|
|
|
Beginning of period
| 23,506,840
|
| 23,925,511
|
| 7,292,308
|
| 7,380,973
|
End of period
| $19,603,547
|
| $23,506,840
|
| $8,955,719
|
| $7,292,308
|
| CHANGES IN SHARES OUTSTANDING:
|
|
|
|
|
|
|
|
Shares outstanding, beginning of period
| 450,002
|
| 450,002
|
| 150,002
|
| 150,002
|
Shares sold
| 100,000
|
| 100,000
|
| 50,000
|
| —
|
Shares redeemed
| (150,000)
|
| (100,000)
|
| —
|
| —
|
Shares outstanding, end of period
| 400,002
|
| 450,002
|
| 200,002
|
| 150,002
|
Page 58
See Notes to Financial Statements
Large Cap US
Equity Select
ETF (RNLC)
|
| Mid Cap US
Equity Select
ETF (RNMC)
|
| Small Cap US
Equity Select
ETF (RNSC)
|
| US Equity
Dividend Select
ETF (RNDV)
|
Year
Ended
3/31/2023
|
| Year
Ended
3/31/2022
|
| Year
Ended
3/31/2023
|
| Year
Ended
3/31/2022
|
| Year
Ended
3/31/2023
|
| Year
Ended
3/31/2022
|
| Year
Ended
3/31/2023
|
| Year
Ended
3/31/2022
|
|
|
|
|
|
|
|
|
|
|
|
|
|
|
|
|
| $ 312,669
|
| $ 322,827
|
| $ 272,534
|
| $ 241,500
|
| $ 565,998
|
| $ 274,780
|
| $ 610,459
|
| $ 374,454
|
| 566,140
|
| 6,041,882
|
| 678,321
|
| 3,693,023
|
| (868,241)
|
| 2,198,102
|
| (322,812)
|
| 1,755,695
|
| (2,385,080)
|
| (3,315,959)
|
| (1,588,315)
|
| (2,661,207)
|
| (1,064,889)
|
| (1,832,012)
|
| (1,049,183)
|
| (644,056)
|
| (1,506,271)
|
| 3,048,750
|
| (637,460)
|
| 1,273,316
|
| (1,367,132)
|
| 640,870
|
| (761,536)
|
| 1,486,093
|
|
|
|
|
|
|
|
|
|
|
|
|
|
|
|
|
| (305,626)
|
| (328,071)
|
| (277,601)
|
| (244,191)
|
| (545,516)
|
| (261,631)
|
| (571,256)
|
| (359,126)
|
| —
|
| —
|
| —
|
| —
|
| —
|
| —
|
| —
|
| —
|
| (305,626)
|
| (328,071)
|
| (277,601)
|
| (244,191)
|
| (545,516)
|
| (261,631)
|
| (571,256)
|
| (359,126)
|
|
|
|
|
|
|
|
|
|
|
|
|
|
|
|
|
| 3,125,444
|
| 11,195,391
|
| 5,684,608
|
| 13,029,289
|
| 16,257,937
|
| 18,629,899
|
| 8,576,223
|
| 19,135,641
|
| (5,945,869)
|
| (17,927,661)
|
| (8,543,272)
|
| (14,535,290)
|
| (8,184,037)
|
| (7,148,164)
|
| —
|
| (10,393,637)
|
| (2,820,425)
|
| (6,732,270)
|
| (2,858,664)
|
| (1,506,001)
|
| 8,073,900
|
| 11,481,735
|
| 8,576,223
|
| 8,742,004
|
| (4,632,322)
|
| (4,011,591)
|
| (3,773,725)
|
| (476,876)
|
| 6,161,252
|
| 11,860,974
|
| 7,243,431
|
| 9,868,971
|
|
|
|
|
|
|
|
|
|
|
|
|
|
|
|
|
| 21,677,835
|
| 25,689,426
|
| 16,170,603
|
| 16,647,479
|
| 21,725,346
|
| 9,864,372
|
| 18,290,893
|
| 8,421,922
|
| $17,045,513
|
| $21,677,835
|
| $12,396,878
|
| $16,170,603
|
| $27,886,598
|
| $21,725,346
|
| $25,534,324
|
| $18,290,893
|
|
|
|
|
|
|
|
|
|
|
|
|
|
|
|
|
| 650,002
|
| 850,002
|
| 550,002
|
| 600,002
|
| 750,002
|
| 350,002
|
| 600,002
|
| 300,002
|
| 100,000
|
| 350,000
|
| 200,000
|
| 450,000
|
| 600,000
|
| 650,000
|
| 300,000
|
| 650,000
|
| (200,000)
|
| (550,000)
|
| (300,000)
|
| (500,000)
|
| (300,000)
|
| (250,000)
|
| —
|
| (350,000)
|
| 550,002
|
| 650,002
|
| 450,002
|
| 550,002
|
| 1,050,002
|
| 750,002
|
| 900,002
|
| 600,002
|
See Notes to Financial Statements
Page 59
First Trust Exchange-Traded Fund VI
Financial Highlights
For a share outstanding
throughout each period
Developed International Equity Select ETF
(RNDM)
|
| Year Ended March 31,
|
| 2023
|
| 2022
|
| 2021
|
| 2020
|
| 2019
|
Net asset value, beginning of period
| $ 52.24
|
| $ 53.17
|
| $ 39.88
|
| $ 49.45
|
| $ 51.38
|
| Income from investment operations:
|
|
|
|
|
|
|
|
|
|
Net investment income (loss)
| 1.33
|
| 1.24
|
| 0.90
|
| 1.11
|
| 1.07
|
Net realized and unrealized gain (loss)
| (3.34)
|
| (0.73)
|
| 13.01
|
| (9.02)
|
| (1.90)
|
Total from investment operations
| (2.01)
|
| 0.51
|
| 13.91
|
| (7.91)
|
| (0.83)
|
| Distributions paid to shareholders from:
|
|
|
|
|
|
|
|
|
|
Net investment income
| (1.22)
|
| (1.44)
|
| (0.62)
|
| (1.66)
|
| (1.10)
|
Net asset value, end of period
| $49.01
|
| $52.24
|
| $53.17
|
| $39.88
|
| $49.45
|
Total return (a)
| (3.60)%
|
| 0.82%
|
| 34.93%
|
| (16.64)%
|
| (1.71)%
|
| Ratios to average net assets/supplemental data:
|
|
|
|
|
|
|
|
|
|
Net assets, end of period (in 000’s)
| $ 19,604
|
| $ 23,507
|
| $ 23,926
|
| $ 23,929
|
| $ 24,727
|
Ratio of total expenses to average net assets
| 0.65%
|
| 0.65%
|
| 0.65%
|
| 0.65%
|
| 0.65%
|
Ratio of net investment income (loss) to average net assets
| 2.83%
|
| 2.26%
|
| 1.86%
|
| 2.24%
|
| 2.32%
|
Portfolio turnover rate (b)
| 73%
|
| 69%
|
| 89%
|
| 62%
|
| 52%
|
| (a)
| Total return is calculated assuming an initial investment made at the net asset value at the beginning of the period, reinvestment of all distributions at net asset value during the
period, and redemption at net asset value on the last day of the period. The returns presented do not reflect the deduction of taxes that a shareholder would pay on Fund distributions or the redemption or sale of Fund
shares. Total return is calculated for the time period presented and is not annualized for periods of less than a year.
|
| (b)
| Portfolio turnover is calculated for the time period presented and is not annualized for periods of less than a year and does not include securities received or
delivered from processing creations or redemptions and in-kind transactions.
|
Page 60
See Notes to Financial Statements
First Trust Exchange-Traded Fund VI
Financial Highlights
(Continued)
For a share outstanding
throughout each period
Emerging Markets Equity Select ETF
(RNEM)
|
| Year Ended March 31,
|
| 2023
|
| 2022
|
| 2021
|
| 2020
|
| 2019
|
Net asset value, beginning of period
| $ 48.61
|
| $ 49.21
|
| $ 37.80
|
| $ 50.89
|
| $ 54.94
|
| Income from investment operations:
|
|
|
|
|
|
|
|
|
|
Net investment income (loss)
| 1.57
|
| 1.61
|
| 1.15
|
| 1.50
|
| 1.10
|
Net realized and unrealized gain (loss)
| (4.13)
|
| (0.67)
|
| 11.64
|
| (13.22)
|
| (3.62)
|
Total from investment operations
| (2.56)
|
| 0.94
|
| 12.79
|
| (11.72)
|
| (2.52)
|
| Distributions paid to shareholders from:
|
|
|
|
|
|
|
|
|
|
Net investment income
| (1.27)
|
| (1.20)
|
| (1.38)
|
| (1.37)
|
| (1.19)
|
Net realized gain
| —
|
| —
|
| —
|
| —
|
| (0.34)
|
Return of capital
| —
|
| (0.34)
|
| —
|
| —
|
| —
|
Total distributions
| (1.27)
|
| (1.54)
|
| (1.38)
|
| (1.37)
|
| (1.53)
|
Net asset value, end of period
| $44.78
|
| $48.61
|
| $49.21
|
| $37.80
|
| $50.89
|
Total return (a)
| (4.97)%
|
| 1.91%
|
| 34.44%
|
| (23.66)%
|
| (4.48)%
|
| Ratios to average net assets/supplemental data:
|
|
|
|
|
|
|
|
|
|
Net assets, end of period (in 000’s)
| $ 8,956
|
| $ 7,292
|
| $ 7,381
|
| $ 7,561
|
| $ 12,723
|
Ratio of total expenses to average net assets
| 0.75%
|
| 0.75%
|
| 0.75%
|
| 0.75%
|
| 0.75%
|
Ratio of net investment income (loss) to average net assets
| 3.61%
|
| 3.30%
|
| 2.94%
|
| 2.83%
|
| 2.04%
|
Portfolio turnover rate (b)
| 65%
|
| 72%
|
| 75%
|
| 82%
|
| 69%
|
| (a)
| Total return is calculated assuming an initial investment made at the net asset value at the beginning of the period, reinvestment of all distributions at net asset value during the
period, and redemption at net asset value on the last day of the period. The returns presented do not reflect the deduction of taxes that a shareholder would pay on Fund distributions or the redemption or sale of Fund
shares. Total return is calculated for the time period presented and is not annualized for periods of less than a year.
|
| (b)
| Portfolio turnover is calculated for the time period presented and is not annualized for periods of less than a year and does not include securities received or
delivered from processing creations or redemptions and in-kind transactions.
|
See Notes to Financial Statements
Page 61
First Trust Exchange-Traded Fund VI
Financial Highlights
(Continued)
For a share outstanding
throughout each period
Large Cap US Equity Select ETF
(RNLC)
|
| Year Ended March 31,
|
| 2023
|
| 2022
|
| 2021
|
| 2020
|
| 2019
|
Net asset value, beginning of period
| $ 33.35
|
| $ 30.22
|
| $ 18.85
|
| $ 22.12
|
| $ 21.54
|
| Income from investment operations:
|
|
|
|
|
|
|
|
|
|
Net investment income (loss)
| 0.49
|
| 0.38
|
| 0.34
|
| 0.46
|
| 0.38
|
Net realized and unrealized gain (loss)
| (2.38)
|
| 3.13
|
| 11.39
|
| (3.27)
|
| 0.56
|
Total from investment operations
| (1.89)
|
| 3.51
|
| 11.73
|
| (2.81)
|
| 0.94
|
| Distributions paid to shareholders from:
|
|
|
|
|
|
|
|
|
|
Net investment income
| (0.47)
|
| (0.38)
|
| (0.36)
|
| (0.46)
|
| (0.36)
|
Net asset value, end of period
| $30.99
|
| $33.35
|
| $30.22
|
| $18.85
|
| $22.12
|
Total return (a)
| (5.57)%
|
| 11.62%
|
| 62.65%
|
| (12.98)%
|
| 4.45%
|
| Ratios to average net assets/supplemental data:
|
|
|
|
|
|
|
|
|
|
Net assets, end of period (in 000’s)
| $ 17,046
|
| $ 21,678
|
| $ 25,689
|
| $ 15,081
|
| $ 18,800
|
Ratio of total expenses to average net assets
| 0.60%
|
| 0.60%
|
| 0.60%
|
| 0.60%
|
| 0.60%
|
Ratio of net investment income (loss) to average net assets
| 1.60%
|
| 1.13%
|
| 1.41%
|
| 2.03%
|
| 1.72%
|
Portfolio turnover rate (b)
| 30%
|
| 21%
|
| 34%
|
| 24%
|
| 28%
|
| (a)
| Total return is calculated assuming an initial investment made at the net asset value at the beginning of the period, reinvestment of all distributions at net asset value during the
period, and redemption at net asset value on the last day of the period. The returns presented do not reflect the deduction of taxes that a shareholder would pay on Fund distributions or the redemption or sale of Fund
shares. Total return is calculated for the time period presented and is not annualized for periods of less than a year.
|
| (b)
| Portfolio turnover is calculated for the time period presented and is not annualized for periods of less than a year and does not include securities received or
delivered from processing creations or redemptions and in-kind transactions.
|
Page 62
See Notes to Financial Statements
First Trust Exchange-Traded Fund VI
Financial Highlights
(Continued)
For a share outstanding
throughout each period
Mid Cap US Equity Select ETF
(RNMC)
|
| Year Ended March 31,
|
| 2023
|
| 2022
|
| 2021
|
| 2020
|
| 2019
|
Net asset value, beginning of period
| $ 29.40
|
| $ 27.75
|
| $ 15.85
|
| $ 21.31
|
| $ 21.18
|
| Income from investment operations:
|
|
|
|
|
|
|
|
|
|
Net investment income (loss)
| 0.49
|
| 0.35
|
| 0.33
|
| 0.39
|
| 0.32
|
Net realized and unrealized gain (loss)
| (1.84)
|
| 1.65
|
| 11.90
|
| (5.45)
|
| 0.12
|
Total from investment operations
| (1.35)
|
| 2.00
|
| 12.23
|
| (5.06)
|
| 0.44
|
| Distributions paid to shareholders from:
|
|
|
|
|
|
|
|
|
|
Net investment income
| (0.50)
|
| (0.35)
|
| (0.33)
|
| (0.40)
|
| (0.31)
|
Net asset value, end of period
| $27.55
|
| $29.40
|
| $27.75
|
| $15.85
|
| $21.31
|
Total return (a)
| (4.47)%
|
| 7.26%
|
| 77.60%
|
| (24.23)%
|
| 2.16%
|
| Ratios to average net assets/supplemental data:
|
|
|
|
|
|
|
|
|
|
Net assets, end of period (in 000’s)
| $ 12,397
|
| $ 16,171
|
| $ 16,647
|
| $ 11,096
|
| $ 13,853
|
Ratio of total expenses to average net assets
| 0.60%
|
| 0.60%
|
| 0.60%
|
| 0.60%
|
| 0.60%
|
Ratio of net investment income (loss) to average net assets
| 1.71%
|
| 1.22%
|
| 1.46%
|
| 1.76%
|
| 1.70%
|
Portfolio turnover rate (b)
| 51%
|
| 43%
|
| 60%
|
| 43%
|
| 42%
|
| (a)
| Total return is calculated assuming an initial investment made at the net asset value at the beginning of the period, reinvestment of all distributions at net asset value during the
period, and redemption at net asset value on the last day of the period. The returns presented do not reflect the deduction of taxes that a shareholder would pay on Fund distributions or the redemption or sale of Fund
shares. Total return is calculated for the time period presented and is not annualized for periods of less than a year.
|
| (b)
| Portfolio turnover is calculated for the time period presented and is not annualized for periods of less than a year and does not include securities received or
delivered from processing creations or redemptions and in-kind transactions.
|
See Notes to Financial Statements
Page 63
First Trust Exchange-Traded Fund VI
Financial Highlights
(Continued)
For a share outstanding
throughout each period
Small Cap US Equity Select ETF
(RNSC)
|
| Year Ended March 31,
|
| 2023
|
| 2022
|
| 2021
|
| 2020
|
| 2019
|
Net asset value, beginning of period
| $ 28.97
|
| $ 28.18
|
| $ 14.87
|
| $ 20.84
|
| $ 20.88
|
| Income from investment operations:
|
|
|
|
|
|
|
|
|
|
Net investment income (loss)
| 0.56
|
| 0.46
|
| 0.28
|
| 0.36
|
| 0.46
|
Net realized and unrealized gain (loss)
| (2.42)
|
| 0.78
|
| 13.34
|
| (5.98)
|
| (0.09)
|
Total from investment operations
| (1.86)
|
| 1.24
|
| 13.62
|
| (5.62)
|
| 0.37
|
| Distributions paid to shareholders from:
|
|
|
|
|
|
|
|
|
|
Net investment income
| (0.55)
|
| (0.45)
|
| (0.31)
|
| (0.35)
|
| (0.41)
|
Net asset value, end of period
| $26.56
|
| $28.97
|
| $28.18
|
| $14.87
|
| $20.84
|
Total return (a)
| (6.28)%
|
| 4.39%
|
| 92.49%
|
| (27.51)%
|
| 1.78%
|
| Ratios to average net assets/supplemental data:
|
|
|
|
|
|
|
|
|
|
Net assets, end of period (in 000’s)
| $ 27,887
|
| $ 21,725
|
| $ 9,864
|
| $ 5,946
|
| $ 5,210
|
Ratio of total expenses to average net assets
| 0.60%
|
| 0.60%
|
| 0.60%
|
| 0.60%
|
| 0.60%
|
Ratio of net investment income (loss) to average net assets
| 2.22%
|
| 1.79%
|
| 1.37%
|
| 1.97%
|
| 2.25%
|
Portfolio turnover rate (b)
| 72%
|
| 49%
|
| 71%
|
| 52%
|
| 52%
|
| (a)
| Total return is calculated assuming an initial investment made at the net asset value at the beginning of the period, reinvestment of all distributions at net asset value during the
period, and redemption at net asset value on the last day of the period. The returns presented do not reflect the deduction of taxes that a shareholder would pay on Fund distributions or the redemption or sale of Fund
shares. Total return is calculated for the time period presented and is not annualized for periods of less than a year.
|
| (b)
| Portfolio turnover is calculated for the time period presented and is not annualized for periods of less than a year and does not include securities received or
delivered from processing creations or redemptions and in-kind transactions.
|
Page 64
See Notes to Financial Statements
First Trust Exchange-Traded Fund VI
Financial Highlights
(Continued)
For a share outstanding
throughout each period
US Equity Dividend Select ETF
(RNDV)
|
| Year Ended March 31,
|
| 2023
|
| 2022
|
| 2021
|
| 2020
|
| 2019
|
Net asset value, beginning of period
| $ 30.48
|
| $ 28.07
|
| $ 17.50
|
| $ 21.73
|
| $ 21.09
|
| Income from investment operations:
|
|
|
|
|
|
|
|
|
|
Net investment income (loss)
| 0.79
|
| 0.64
|
| 0.58
|
| 0.73
|
| 0.78
|
Net realized and unrealized gain (loss)
| (2.14)
|
| 2.40
|
| 10.61
|
| (4.24)
|
| 0.58
|
Total from investment operations
| (1.35)
|
| 3.04
|
| 11.19
|
| (3.51)
|
| 1.36
|
| Distributions paid to shareholders from:
|
|
|
|
|
|
|
|
|
|
Net investment income
| (0.76)
|
| (0.63)
|
| (0.62)
|
| (0.72)
|
| (0.72)
|
Net asset value, end of period
| $28.37
|
| $30.48
|
| $28.07
|
| $17.50
|
| $21.73
|
Total return (a)
| (4.28)%
|
| 10.86%
|
| 64.82%
|
| (16.81)%
|
| 6.64%
|
| Ratios to average net assets/supplemental data:
|
|
|
|
|
|
|
|
|
|
Net assets, end of period (in 000’s)
| $ 25,534
|
| $ 18,291
|
| $ 8,422
|
| $ 4,375
|
| $ 5,434
|
Ratio of total expenses to average net assets
| 0.50%
|
| 0.50%
|
| 0.50%
|
| 0.50%
|
| 0.50%
|
Ratio of net investment income (loss) to average net assets
| 3.00%
|
| 2.33%
|
| 2.65%
|
| 3.23%
|
| 2.98%
|
Portfolio turnover rate (b)
| 52%
|
| 41%
|
| 89%
|
| 78%
|
| 98%
|
| (a)
| Total return is calculated assuming an initial investment made at the net asset value at the beginning of the period, reinvestment of all distributions at net asset value during the
period, and redemption at net asset value on the last day of the period. The returns presented do not reflect the deduction of taxes that a shareholder would pay on Fund distributions or the redemption or sale of Fund
shares. Total return is calculated for the time period presented and is not annualized for periods of less than a year.
|
| (b)
| Portfolio turnover is calculated for the time period presented and is not annualized for periods of less than a year and does not include securities received or
delivered from processing creations or redemptions and in-kind transactions.
|
See Notes to Financial Statements
Page 65
Notes to Financial Statements
First Trust
Exchange-Traded Fund VI
March 31, 2023
1. Organization
First Trust
Exchange-Traded Fund VI (the “Trust”) is an open-end management investment company organized as a Massachusetts business trust on June 4, 2012, and is registered with the Securities and Exchange Commission
under the Investment Company Act of 1940, as amended (the “1940 Act”).
The Trust currently
consists of thirty-three exchange-traded funds that are offering shares. This report covers the six funds (each a “Fund” and collectively, the “Funds”) listed below, each a diversified series
of the Trust and listed and traded on The Nasdaq Stock Market LLC (“Nasdaq”).
Developed International Equity Select ETF - (ticker “RNDM”)
Emerging Markets Equity Select ETF - (ticker “RNEM”)
Large
Cap US Equity Select ETF - (ticker “RNLC”)
Mid
Cap US Equity Select ETF - (ticker “RNMC”)
Small
Cap US Equity Select ETF - (ticker “RNSC”)
US
Equity Dividend Select ETF - (ticker “RNDV”)
Each Fund represents a
separate series of beneficial interest in the Trust. Unlike conventional mutual funds, each Fund issues and redeems shares on a continuous basis, at net asset value (“NAV”), only in large blocks of shares
known as “Creation Units.” The investment objective of each Fund is to seek investment results that correspond generally to the price and yield (before the Fund’s fees and expenses) of the following
indices:
| Fund
| Index
|
Developed International Equity Select ETF
Emerging Markets Equity Select ETF
Large Cap US Equity Select ETF
Mid Cap US Equity Select ETF
Small Cap US Equity Select ETF
US Equity Dividend Select ETF
| Nasdaq Riskalyze Developed MarketsTM Index
Nasdaq Riskalyze Emerging MarketsTM Index
Nasdaq Riskalyze US Large CapTM Index
Nasdaq Riskalyze US Mid CapTM Index
Nasdaq Riskalyze US Small CapTM Index
Nasdaq Riskalyze US Large Cap Select DividendTM Index
|
2. Significant
Accounting Policies
The Funds are each
considered an investment company and follow accounting and reporting guidance under Financial Accounting Standards Board Accounting Standards Codification Topic 946, “Financial Services-Investment
Companies.” The following is a summary of significant accounting policies consistently followed by the Funds in the preparation of the financial statements. The preparation of the financial statements in
accordance with accounting principles generally accepted in the United States of America (“U.S. GAAP”) requires management to make estimates and assumptions that affect the reported amounts and disclosures
in the financial statements. Actual results could differ from those estimates.
A. Portfolio
Valuation
Each Fund’s NAV is
determined daily as of the close of regular trading on the New York Stock Exchange (“NYSE”), normally 4:00 p.m. Eastern time, on each day the NYSE is open for trading. If the NYSE closes early on a
valuation day, the NAV is determined as of that time. Foreign securities are priced using data reflecting the earlier closing of the principal markets for those securities. Each Fund’s NAV is calculated by
dividing the value of all assets of each Fund (including accrued interest and dividends), less all liabilities (including accrued expenses and dividends declared but unpaid), by the total number of shares
outstanding.
Each Fund’s
investments are valued daily at market value or, in the absence of market value with respect to any portfolio securities, at fair value. Market value prices represent readily available market quotations such as last
sale or official closing prices from a national or foreign exchange (i.e., a regulated market) and are primarily obtained from third-party pricing services. Fair value prices represent any prices not considered market
value prices and are either obtained from a third-party pricing service or are determined by the Pricing Committee of the Funds’ investment advisor, First Trust Advisors L.P. (“First Trust” or the
“Advisor”), in accordance with valuation procedures approved by the Trust’s Board of Trustees, and in accordance with provisions of the 1940 Act and rules thereunder. Investments valued by the
Advisor’s Pricing Committee, if any, are footnoted as such in the footnotes to the Portfolio of Investments. Each Fund’s investments are valued as follows:
Common
stocks, real estate investment trusts (“REITs”), and other equity securities listed on any national or foreign exchange (excluding Nasdaq and the London Stock Exchange Alternative Investment Market
(“AIM”)) are valued at the last sale price on the exchange on which they are principally traded or, for Nasdaq and AIM securities, the official closing price. Securities traded
Notes to Financial Statements (Continued)
First Trust
Exchange-Traded Fund VI
March 31, 2023
on more than one
securities exchange are valued at the last sale price or official closing price, as applicable, at the close of the securities exchange representing the primary exchange for such securities.
Securities trading on foreign exchanges or over-the-counter markets that close prior to the NYSE close may be valued using a systematic fair valuation model provided by a third-party pricing service. If these
foreign securities meet certain criteria in relation to the valuation model, their valuation is systematically adjusted to reflect the impact of movement in the U.S. market after the close of the foreign markets.
Shares
of open-end funds are valued based on NAV per share.
Securities traded in an over-the-counter market are valued at the mean of their most recent bid and asked price, if available, and otherwise at their last trade price.
Overnight repurchase agreements are valued at amortized cost when it represents the most appropriate reflection of fair market value.
Certain securities may
not be able to be priced by pre-established pricing methods. Such securities may be valued by the Advisor’s Pricing Committee at fair value. These securities generally include, but are not limited to, restricted
securities (securities which may not be publicly sold without registration under the Securities Act of 1933, as amended) for which a third-party pricing service is unable to provide a market price; securities whose
trading has been formally suspended; a security whose market or fair value price is not available from a pre-established pricing source; a security with respect to which an event has occurred that is likely to
materially affect the value of the security after the market has closed but before the calculation of a Fund’s NAV or make it difficult or impossible to obtain a reliable market quotation; and a security whose
price, as provided by the third-party pricing service, does not reflect the security’s fair value. As a general principle, the current fair value of a security would appear to be the amount which the owner might
reasonably expect to receive for the security upon its current sale. When fair value prices are used, generally they will differ from market quotations or official closing prices on the applicable exchanges. A variety
of factors may be considered in determining the fair value of such securities, including, but not limited to, the following:
| 1)
| the last sale price on the exchange on which they are principally traded or, for Nasdaq and AIM securities, the official closing price;
|
| 2)
| the type of security;
|
| 3)
| the size of the holding;
|
| 4)
| the initial cost of the security;
|
| 5)
| transactions in comparable securities;
|
| 6)
| price quotes from dealers and/or third-party pricing services;
|
| 7)
| relationships among various securities;
|
| 8)
| information obtained by contacting the issuer, analysts, or the appropriate stock exchange;
|
| 9)
| an analysis of the issuer’s financial statements;
|
| 10)
| the existence of merger proposals or tender offers that might affect the value of the security; and
|
| 11)
| other relevant factors.
|
If the securities in
question are foreign securities, the following additional information may be considered:
| 1)
| the value of similar foreign securities traded on other foreign markets;
|
| 2)
| ADR trading of similar securities;
|
| 3)
| closed-end fund or exchange-traded fund trading of similar securities;
|
| 4)
| foreign currency exchange activity;
|
| 5)
| the trading prices of financial products that are tied to baskets of foreign securities;
|
| 6)
| factors relating to the event that precipitated the pricing problem;
|
| 7)
| whether the event is likely to recur;
|
| 8)
| whether the effects of the event are isolated or whether they affect entire markets, countries or regions; and
|
| 9)
| other relevant factors.
|
In addition, differences
between the prices used to calculate a Fund’s NAV and the prices used by such Fund’s corresponding index could result in a difference between a Fund’s performance and the performance of its
underlying index.
Because foreign markets
may be open on different days than the days during which investors may transact in the shares of a Fund, the value of the Fund’s securities may change on the days when investors are not able to transact in the
shares of the Fund. The value of
Notes to Financial Statements (Continued)
First Trust
Exchange-Traded Fund VI
March 31, 2023
securities denominated in foreign
currencies is converted into U.S. dollars using exchange rates determined daily as of the close of regular trading on the NYSE. Any use of a different rate from the rates used by a relevant index may adversely affect
the Fund’s ability to track the index.
The Funds are subject to
fair value accounting standards that define fair value, establish the framework for measuring fair value and provide a three-level hierarchy for fair valuation based upon the inputs to the valuation as of the
measurement date. The three levels of the fair value hierarchy are as follows:
| •
| Level 1 – Level 1 inputs are quoted prices in active markets for identical investments. An active market is a market in which transactions for the investment occur with sufficient frequency and
volume to provide pricing information on an ongoing basis.
|
| •
| Level 2 – Level 2 inputs are observable inputs, either directly or indirectly, and include the following:
|
| o
| Quoted prices for similar investments in active markets.
|
| o
| Quoted prices for identical or similar investments in markets that are non-active. A non-active market is a market where there are few transactions for the investment, the prices are not current, or
price quotations vary substantially either over time or among market makers, or in which little information is released publicly.
|
| o
| Inputs other than quoted prices that are observable for the investment (for example, interest rates and yield curves observable at commonly quoted intervals, volatilities, prepayment speeds, loss
severities, credit risks, and default rates).
|
| o
| Inputs that are derived principally from or corroborated by observable market data by correlation or other means.
|
| •
| Level 3 – Level 3 inputs are unobservable inputs. Unobservable inputs may reflect the reporting entity’s own assumptions about the assumptions that market participants would use in pricing
the investment.
|
The inputs or
methodologies used for valuing investments are not necessarily an indication of the risk associated with investing in those investments. A summary of the inputs used to value each Fund’s investments as of March
31, 2023, is included with each Fund’s Portfolio of Investments.
B. Securities
Transactions and Investment Income
Securities transactions
are recorded as of the trade date. Realized gains and losses from securities transactions are recorded on the identified cost basis. Dividend income is recorded on the ex-dividend date except that certain dividends
from foreign securities are recorded as soon as the information becomes available after the ex-dividend date. Interest income, if any, is recorded on the accrual basis.
Withholding taxes and tax
reclaims on foreign dividends have been provided for in accordance with each Fund’s understanding of the applicable country’s tax rules and rates.
Distributions received
from a Fund’s investments in REITs may be comprised of return of capital, capital gains, and income. The actual character of the amounts received during the year are not known until after the REITs’ fiscal
year end. A Fund records the character of distributions received from the REITs during the year based on estimates available. The characterization of distributions received by a Fund may be subsequently revised based
on information received from the REITs after their tax reporting periods conclude.
C. Foreign
Currency
The books and records of
the Funds are maintained in U.S. dollars. Foreign currencies, investments and other assets and liabilities are translated into U.S. dollars at the exchange rates prevailing at the end of the period. Purchases and
sales of investments and items of income and expense are translated on the respective dates of such transactions. Unrealized gains and losses on assets and liabilities, other than investments in securities, which
result from changes in foreign currency exchange rates have been included in “Net change in unrealized appreciation (depreciation) on foreign currency translation” on the Statements of Operations.
Unrealized gains and losses on investments in securities which result from changes in foreign exchange rates are included with fluctuations arising from changes in market price and are shown in “Net change in
unrealized appreciation (depreciation) on investments” on the Statements of Operations. Net realized foreign currency gains and losses include the effect of changes in exchange rates between trade date and
settlement date on investment security transactions, foreign currency transactions and interest and dividends received and are shown in “Net realized gain (loss) on foreign currency transactions” on the
Statements of Operations. The portion of foreign currency gains and losses related to fluctuation in exchange rates between the initial purchase settlement date and subsequent sale trade date is included in “Net
realized gain (loss) on investments” on the Statements of Operations.
Notes to Financial Statements (Continued)
First Trust
Exchange-Traded Fund VI
March 31, 2023
D. Offsetting on the
Statements of Assets and Liabilities
Offsetting assets and
liabilities requires entities to disclose both gross and net information about instruments and transactions eligible for offset on the Statements of Assets and Liabilities and disclose instruments and transactions
subject to master netting or similar agreements. These disclosure requirements are intended to help investors and other financial statement users better assess the effect or potential effect of offsetting arrangements
on a Fund’s financial position. The transactions subject to offsetting disclosures are derivative instruments, repurchase agreements and reverse repurchase agreements, and securities borrowing and securities
lending transactions.
This disclosure, if
applicable, is included within each Fund’s Portfolio of Investments under the heading “Offsetting Assets and Liabilities.” For financial reporting purposes, the Funds do not offset financial assets
and financial liabilities that are subject to master netting arrangements (“MNAs”) or similar agreements on the Statements of Assets and Liabilities. MNAs provide the right, in the event of default
(including bankruptcy and insolvency), for the non-defaulting counterparty to liquidate the collateral and calculate the net exposure to the defaulting party or request additional collateral.
E. Securities
Lending
The Funds may lend
securities representing up to 33 1/3% of the value of their total assets to broker-dealers, banks and other institutions to generate additional income. When a Fund loans its portfolio securities, it will receive, at
the inception of each loan, collateral equal to at least 102% (for domestic securities) or 105% (for international securities) of the market value of the loaned securities. The collateral amount is valued at the
beginning of each business day and is compared to the market value of the loaned securities from the prior business day to determine if additional collateral is required. If additional collateral is required, a
request is sent to the borrower. Securities lending involves the risk that the Fund may lose money because the borrower of the Fund’s loaned securities fails to return the securities in a timely manner or at
all. The Fund could also lose money in the event of (i) a decline in the value of the collateral provided for the loaned securities, (ii) a decline in the value of any investments made with cash collateral or (iii) an
increase in the value of the loaned securities if the borrower does not increase the collateral accordingly and the borrower fails to return the securities. These events could also trigger adverse tax consequences for
the Funds.
Under the Funds’
Securities Lending Agency Agreement, the securities lending agent will generally bear the risk that a borrower may default on its obligation to return loaned securities. Brown Brothers Harriman & Co.
(“BBH”) acts as the Funds’ securities lending agent and is responsible for executing the lending of the portfolio securities to creditworthy borrowers. The Funds, however, will be responsible for the
risks associated with the investment of cash collateral. A Fund may lose money on its investment of cash collateral, which may affect its ability to repay the collateral to the borrower without the use of other Fund
assets. Each Fund that engages in securities lending receives compensation (net of any rebate and securities lending agent fees) for lending its securities. Compensation can be in the form of fees received from the
securities lending agent or dividends or interest earned from the investment of cash collateral. The fees received from the securities lending agent are accrued daily. The dividend and interest earned on the
securities loaned is accounted for in the same manner as other dividend and interest income. At March 31, 2023, only RNSC had securities in the securities lending program. During the fiscal year ended March 31, 2023,
RNDM and RNSC participated in the securities lending program.
In the event of a default
by a borrower with respect to any loan, BBH will exercise any and all remedies provided under the applicable borrower agreement to make the Funds whole. These remedies include purchasing replacement securities by
applying the collateral held from the defaulting broker against the purchase cost of the replacement securities. If, despite such efforts by BBH to exercise these remedies, a Fund sustains losses as a result of a
borrower’s default, BBH will indemnify the Fund by purchasing replacement securities at its own expense, or paying the Funds an amount equal to the market value of the replacement securities, subject to certain
limitations which are set forth in detail in the Securities Lending Agency Agreement between the Trust on behalf of the Funds and BBH.
F. Repurchase
Agreements
Repurchase agreements
involve the purchase of securities subject to the seller’s agreement to repurchase the securities at a mutually agreed upon date and price, under the terms of a Master Repurchase Agreement (“MRA”).
During the term of a repurchase agreement, the value of the underlying securities held as collateral on behalf of a Fund, including accrued interest, is required to exceed the value of the repurchase agreement,
including accrued interest. The underlying securities for all repurchase agreements are held at the Funds’ custodian or designated sub-custodians under tri-party repurchase agreements.
MRAs govern transactions
between a Fund and select counterparties. The MRAs maintain provisions for, among other things, initiation, income payments, events of default, and maintenance of collateral for repurchase agreements.
Repurchase agreements
received for lending securities are collateralized by U.S. Treasury securities. The U.S. Treasury securities are held in a joint custody account at BBH on behalf of the Funds participating in the securities lending
program. In the event the
Notes to Financial Statements (Continued)
First Trust
Exchange-Traded Fund VI
March 31, 2023
counterparty defaults on the repurchase
agreement, the U.S. Treasury securities can either be maintained as part of a Fund’s portfolio or sold for cash. A Fund could suffer a loss to the extent that the proceeds from the sale of the underlying
collateral held by the Fund are less than the repurchase price and the Fund’s costs associated with the delay and enforcement of the MRA.
While the Funds may
invest in repurchase agreements, any repurchase agreements held by the Funds during the fiscal year ended March 31, 2023, were received as collateral for lending securities.
G. Dividends and
Distributions to Shareholders
Dividends from net
investment income, if any, are declared and paid quarterly by each Fund, or as the Board of Trustees may determine from time to time. Distributions of net realized capital gains earned by each Fund, if any, are
distributed at least annually. A Fund may also designate a portion of the amount paid to redeeming shareholders as a distribution for tax purposes.
Distributions from net
investment income and realized capital gains are determined in accordance with federal income tax regulations, which may differ from U.S. GAAP. Certain capital accounts in the financial statements are periodically
adjusted for permanent differences in order to reflect their tax character. These permanent differences are primarily due to the varying treatment of income and gain/loss on portfolio securities held by the Funds and
have no impact on net assets or NAV per share. Temporary differences, which arise from recognizing certain items of income, expense and gain/loss in different periods for financial statement and tax purposes, will
reverse at some point in the future.
The tax character of
distributions paid by each Fund during the fiscal year ended March 31, 2023, was as follows:
|
| Distributions
paid from
Ordinary
Income
|
| Distributions
paid from
Capital
Gains
|
| Distributions
paid from
Return of
Capital
|
Developed International Equity Select ETF
| $ 486,763
|
| $ —
|
| $ —
|
Emerging Markets Equity Select ETF
| 254,643
|
| —
|
| —
|
Large Cap US Equity Select ETF
| 305,626
|
| —
|
| —
|
Mid Cap US Equity Select ETF
| 277,601
|
| —
|
| —
|
Small Cap US Equity Select ETF
| 545,516
|
| —
|
| —
|
US Equity Dividend Select ETF
| 571,256
|
| —
|
| —
|
The tax character of
distributions paid by each Fund during the fiscal year ended March 31, 2022, was as follows:
|
| Distributions
paid from
Ordinary
Income
|
| Distributions
paid from
Capital
Gains
|
| Distributions
paid from
Return of
Capital
|
Developed International Equity Select ETF
| $ 703,193
|
| $ —
|
| $ —
|
Emerging Markets Equity Select ETF
| 180,487
|
| —
|
| 49,961
|
Large Cap US Equity Select ETF
| 328,071
|
| —
|
| —
|
Mid Cap US Equity Select ETF
| 244,191
|
| —
|
| —
|
Small Cap US Equity Select ETF
| 261,631
|
| —
|
| —
|
US Equity Dividend Select ETF
| 359,126
|
| —
|
| —
|
Notes to Financial Statements (Continued)
First Trust
Exchange-Traded Fund VI
March 31, 2023
As of March 31, 2023, the
components of distributable earnings on a tax basis for each Fund were as follows:
|
| Undistributed
Ordinary
Income
|
| Accumulated
Capital and
Other
Gain (Loss)
|
| Net
Unrealized
Appreciation
(Depreciation)
|
Developed International Equity Select ETF
| $ 105,700
|
| $ (4,165,895)
|
| $ 1,002,257
|
Emerging Markets Equity Select ETF
| 32,465
|
| (1,750,106)
|
| 107,744
|
Large Cap US Equity Select ETF
| 19,487
|
| (1,989,412)
|
| 80,766
|
Mid Cap US Equity Select ETF
| 7,814
|
| (2,665,399)
|
| (784,908)
|
Small Cap US Equity Select ETF
| 37,020
|
| (2,797,779)
|
| (872,550)
|
US Equity Dividend Select ETF
| 63,315
|
| (1,226,146)
|
| (841,690)
|
H. Income and Other
Taxes
Each Fund intends to
continue to qualify as a regulated investment company by complying with the requirements under Subchapter M of the Internal Revenue Code of 1986, as amended, which includes distributing substantially all of its net
investment income and net realized gains to shareholders. Accordingly, no provision has been made for federal and state income taxes. However, due to the timing and amount of distributions, each Fund may be subject to
an excise tax of 4% of the amount by which approximately 98% of each Fund’s taxable income exceeds the distributions from such taxable income for the calendar year.
Certain countries assess
a capital gains tax on securities sold in their local markets. This tax is accrued as the securities in these foreign markets appreciate in value and is paid at the time of sale to the extent a capital gain is
realized. Taxes accrued on securities in an unrealized appreciation position are included in “Net change in unrealized appreciation (depreciation) on deferred foreign capital gains tax” on the Statements
of Operations. The capital gains tax paid on securities sold, if any, is included in “Net realized gain (loss) on foreign capital gains tax” on the Statements of Operations.
India’s Finance
Bill, 2018 (“Finance Bill, 2018”) was enacted into law on March 29, 2018 and amongst other provisions, it introduced a long-term capital gains tax beginning April 1, 2018. Long-term capital gains on the
sale of listed shares in excess of INR 0.1 million are taxed at the rate of 10% (plus applicable surcharge and cess (which is a type of tax)) subject to satisfaction of certain conditions. Long-term capital gains
accruing as of January 31, 2018 are considered exempt due to a grandfather clause in the provision. The aforesaid exemption from long-term capital gains tax is available with respect to shares acquired between October
1, 2004 and March 31, 2018 only if on such acquisitions Securities Transaction Tax (“STT”) was chargeable. Certain exceptions in this regard, such as acquisition of shares in a public offer, bonus, rights
issued, etc. for which the condition of chargeability of STT on acquisition is not applicable, have been notified.
In the case of the sale
of listed shares held by a Fund for one year or less, the income is classified as short-term capital gains and is taxable at 15% (plus applicable surcharge and cess) provided the shares are sold on the stock exchange
and subjected to STT. For above purposes, the applicable rate of surcharge is 2% or 5% (depending on the level of income of the Fund). The Finance Bill, 2018 increases the cess imposed on the sum of tax and surcharge
from 3% to 4%. The cess 4% rate is applied to the capital gains tax, resulting in a higher effective rate of capital gains tax.
Where the sale of shares
is outside the stock exchange and not subject to STT, the long-term capital gains are taxed at 10% (plus applicable surcharge and cess) and short-term capital gains are taxed at 30% (plus applicable surcharge and
cess). The Finance Bill, 2018, approves the carry forward of long-term capital losses to be offset against long-term capital gains. Short-term losses can be netted against both short-term gains and long-term gains.
Until March 31, 2020,
dividends received by a Fund from Indian companies were exempt from tax in India because Indian companies were required to pay dividend distribution tax. The Indian Finance Act, 2020 has amended the dividend taxation
framework effective April 1, 2020 and accordingly dividends would now be taxable in the hands of the shareholders at 20%, plus applicable surcharge and cess. Subsequent to the Indian Finance Act, 2020, “The
Taxation and Other Laws (Relaxation and Amendment of Certain Provisions) Bill, 2020” (the “Bill”) was enacted into law and is effective retroactively to April 1, 2020. The Bill caps the maximum
surcharge at 15% of the tax on dividend income earned by the Fund. The highest effective tax rate proposed for non-corporate entities on dividends will be 23.92%. Note, the Fund will not obtain relief under the
US-India tax treaty as the treaty rate of 25% is higher than the domestic rate. Any excess taxes withheld can be off-set against capital gains tax liability during the year or claimed as a refund in the annual tax
return.
Notes to Financial Statements (Continued)
First Trust
Exchange-Traded Fund VI
March 31, 2023
Please note that the
above description is based on current provisions of Indian law, and any change or modification made by subsequent legislation, regulation, or administrative or judicial decision could increase the Indian tax liability
of a Fund and thus reduce the return to a Fund’s shareholders. There can be no assurance that the Indian tax authorities and/or regulators will not take a position contrary to the views expressed herein. If the
Indian tax authorities and/or regulators take a position contrary to the views expressed herein, adverse unpredictable consequences may follow.
The Funds are subject to
accounting standards that establish a minimum threshold for recognizing, and a system for measuring, the benefits of a tax position taken or expected to be taken in a tax return. Taxable years ended 2020, 2021, 2022,
and 2023 remain open to federal and state audit. As of March 31, 2023, management has evaluated the application of these standards to the Funds and has determined that no provision for income tax is required in the
Funds’ financial statements for uncertain tax positions.
The Funds intend to
utilize provisions of the federal income tax laws, which allow them to carry a realized capital loss forward indefinitely following the year of the loss and offset such loss against any future realized capital gains.
The Funds are subject to certain limitations under U.S. tax rules on the use of capital loss carryforwards and net unrealized built-in losses. These limitations apply when there has been a 50% change in ownership. At
March 31, 2023, for federal income tax purposes, the Funds had a capital loss carryforward available that is shown in the following table, to the extent provided by regulations, to offset future capital gains.
|
| Non-Expiring
Capital Loss
Carryforward
|
Developed International Equity Select ETF
| $ 4,165,895
|
Emerging Markets Equity Select ETF
| 1,750,106
|
Large Cap US Equity Select ETF
| 1,989,412
|
Mid Cap US Equity Select ETF
| 2,665,399
|
Small Cap US Equity Select ETF
| 2,797,779
|
US Equity Dividend Select ETF
| 1,226,146
|
In order to present
paid-in capital and accumulated distributable earnings (loss) (which consists of accumulated net investment income (loss), accumulated net realized gain (loss) on investments and net unrealized appreciation
(depreciation) on investments) on the Statements of Assets and Liabilities that more closely represent their tax character, certain adjustments have been made to paid-in capital, accumulated net investment income
(loss) and accumulated net realized gain (loss) on investments. These adjustments are primarily due to the difference between book and tax treatments of income and gains on various investment securities held by the
Funds and in-kind transactions. The results of operations and net assets were not affected by these adjustments. For the fiscal year ended March 31, 2023, the adjustments for each Fund were as follows:
|
| Accumulated
Net
Investment
Income (Loss)
|
| Accumulated
Net Realized
Gain (Loss)
on Investments
|
| Paid-in
Capital
|
Developed International Equity Select ETF
| $ 8,147
|
| $ (101,524)
|
| $ 93,377
|
Emerging Markets Equity Select ETF
| (3,456)
|
| 3,456
|
| —
|
Large Cap US Equity Select ETF
| —
|
| (992,769)
|
| 992,769
|
Mid Cap US Equity Select ETF
| 753
|
| (1,541,392)
|
| 1,540,639
|
Small Cap US Equity Select ETF
| —
|
| (1,164,877)
|
| 1,164,877
|
US Equity Dividend Select ETF
| —
|
| (56)
|
| 56
|
Notes to Financial Statements (Continued)
First Trust
Exchange-Traded Fund VI
March 31, 2023
As of March 31, 2023, the
aggregate cost, gross unrealized appreciation, gross unrealized depreciation, and net unrealized appreciation/(depreciation) on investments (including short positions and derivatives, if any) for federal income tax
purposes were as follows:
|
| Tax Cost
|
| Gross
Unrealized
Appreciation
|
| Gross
Unrealized
(Depreciation)
|
| Net Unrealized
Appreciation
(Depreciation)
|
Developed International Equity Select ETF
| $ 18,394,837
|
| $ 2,033,851
|
| $ (1,030,935)
|
| $ 1,002,916
|
Emerging Markets Equity Select ETF
| 8,807,805
|
| 1,023,237
|
| (879,590)
|
| 143,647
|
Large Cap US Equity Select ETF
| 16,935,218
|
| 1,621,288
|
| (1,540,522)
|
| 80,766
|
Mid Cap US Equity Select ETF
| 13,163,932
|
| 971,394
|
| (1,756,302)
|
| (784,908)
|
Small Cap US Equity Select ETF
| 28,741,175
|
| 2,086,217
|
| (2,958,767)
|
| (872,550)
|
US Equity Dividend Select ETF
| 26,288,872
|
| 1,243,556
|
| (2,085,246)
|
| (841,690)
|
I. Expenses
Expenses, other than the
investment advisory fee and other excluded expenses, are paid by the Advisor (See Note 3).
First Trust has entered
into licensing agreements with Riskalyze, Inc. (“Licensor”) for the Funds. The respective license agreements allow for the use by First Trust of each Fund’s respective index and of certain trademarks
and trade names of the Licensor. The Funds are sub-licensees to the applicable license agreements.
3. Investment
Advisory Fee, Affiliated Transactions and Other Fee Arrangements
First Trust, the
investment advisor to the Funds, is a limited partnership with one limited partner, Grace Partners of DuPage L.P., and one general partner, The Charger Corporation. The Charger Corporation is an Illinois corporation
controlled by James A. Bowen, Chief Executive Officer of First Trust. First Trust is responsible for the selection and ongoing monitoring of the securities in each Fund’s portfolio, managing the Funds’
business affairs and providing certain administrative services necessary for the management of the Funds.
First Trust is
responsible for the expenses of each Fund including the cost of transfer agency, custody, fund administration, licensing fees, legal, audit and other services, but excluding fee payments under the Investment
Management Agreement, interest, taxes, brokerage commissions and other expenses associated with the execution of portfolio transactions, acquired fund fees and expenses, distribution and service fees pursuant to a
Rule 12b-1 plan, if any, and extraordinary expenses, which are paid by each respective Fund. First Trust also provides fund reporting services to the Funds for a flat annual fee in the amount of $9,250 per Fund, which
is covered under the annual unitary management fee. Effective November 1, 2022, the annual unitary management fee payable by each Fund to First Trust for these services will be reduced at certain levels of each
Fund’s net assets (“breakpoints”) and calculated pursuant to the following schedules:
| Breakpoints
| RNDM
| RNEM
|
| Fund net assets up to and including $2.5 billion
| 0.65000%
| 0.75000%
|
| Fund net assets greater than $2.5 billion up to and including $5 billion
| 0.63375%
| 0.73125%
|
| Fund net assets greater than $5 billion up to and including $7.5 billion
| 0.61750%
| 0.71250%
|
| Fund net assets greater than $7.5 billion up to and including $10 billion
| 0.60125%
| 0.69375%
|
| Fund net assets greater than $10 billion
| 0.58500%
| 0.67500%
|
| Breakpoints
| RNLC
| RNMC
| RNSC
| RNDV
|
| Fund net assets up to and including $2.5 billion
| 0.600%
| 0.600%
| 0.600%
| 0.5000%
|
| Fund net assets greater than $2.5 billion up to and including $5 billion
| 0.585%
| 0.585%
| 0.585%
| 0.4875%
|
| Fund net assets greater than $5 billion up to and including $7.5 billion
| 0.570%
| 0.570%
| 0.570%
| 0.4750%
|
| Fund net assets greater than $7.5 billion up to and including $10 billion
| 0.555%
| 0.555%
| 0.555%
| 0.4625%
|
| Fund net assets greater than $10 billion up to and including $15 billion
| 0.540%
| 0.540%
| 0.540%
| 0.4500%
|
| Fund net assets greater than $15 billion
| 0.510%
| 0.510%
| 0.510%
| 0.4250%
|
Notes to Financial Statements (Continued)
First Trust
Exchange-Traded Fund VI
March 31, 2023
Prior to November 1,
2022, the Funds paid First Trust an annual unitary management fee based on each Fund’s average daily net assets at the following rates:
| Developed International Equity Select ETF
| 0.65%
|
| Emerging Markets Equity Select ETF
| 0.75%
|
| Large Cap US Equity Select ETF
| 0.60%
|
| Mid Cap US Equity Select ETF
| 0.60%
|
| Small Cap US Equity Select ETF
| 0.60%
|
| US Equity Dividend Select ETF
| 0.50%
|
The Trust has multiple
service agreements with BBH. Under the service agreements, BBH performs custodial, fund accounting, certain administrative services, and transfer agency services for the Funds. As custodian, BBH is responsible for
custody of each Fund’s assets. As fund accountant and administrator, BBH is responsible for maintaining the books and records of each Fund’s securities and cash. As transfer agent, BBH is responsible for
maintaining shareholder records for each Fund.
Each Trustee who is not
an officer or employee of First Trust, any sub-advisor or any of their affiliates (“Independent Trustees”) is paid a fixed annual retainer that is allocated equally among each fund in the First Trust Fund
Complex. Each Independent Trustee is also paid an annual per fund fee that varies based on whether the fund is a closed-end or other actively managed fund, a target outcome fund or an index fund.
Additionally, the Lead
Independent Trustee and the Chairs of the Audit Committee, Nominating and Governance Committee and Valuation Committee are paid annual fees to serve in such capacities, with such compensation allocated pro rata among
each fund in the First Trust Fund Complex based on net assets. Independent Trustees are reimbursed for travel and out-of-pocket expenses in connection with all meetings. The Lead Independent Trustee and Committee
Chairs rotate every three years. The officers and “Interested” Trustee receive no compensation from the Trust for acting in such capacities.
4. Purchases and
Sales of Securities
For the fiscal year ended
March 31, 2023, the cost of purchases and proceeds from sales of investment securities for each Fund, excluding short-term investments and in-kind transactions, were as follows:
|
| Purchases
|
| Sales
|
| Developed International Equity Select ETF
| $ 13,592,378
|
| $ 13,598,041
|
| Emerging Markets Equity Select ETF
| 7,329,360
|
| 5,412,565
|
| Large Cap US Equity Select ETF
| 5,947,051
|
| 5,948,037
|
| Mid Cap US Equity Select ETF
| 8,031,405
|
| 8,003,313
|
| Small Cap US Equity Select ETF
| 18,203,839
|
| 18,044,498
|
| US Equity Dividend Select ETF
| 10,622,529
|
| 10,574,808
|
|
|
|
|
|
For the fiscal year ended
March 31, 2023, the cost of in-kind purchases and proceeds from in-kind sales for each Fund were as follows:
|
| Purchases
|
| Sales
|
| Developed International Equity Select ETF
| $ 3,977,903
|
| $ 6,742,375
|
| Emerging Markets Equity Select ETF
| 462,995
|
| —
|
| Large Cap US Equity Select ETF
| 3,120,346
|
| 5,929,031
|
| Mid Cap US Equity Select ETF
| 5,678,930
|
| 8,527,661
|
| Small Cap US Equity Select ETF
| 16,189,913
|
| 8,171,684
|
| US Equity Dividend Select ETF
| 8,535,600
|
| —
|
Notes to Financial Statements (Continued)
First Trust
Exchange-Traded Fund VI
March 31, 2023
5. Creations,
Redemptions and Transaction Fees
Each Fund generally
issues and redeems its shares in primary market transactions through a creation and redemption mechanism and does not sell or redeem individual shares. Instead, financial entities known as “Authorized
Participants” have contractual arrangements with a Fund or one of the Fund’s service providers to purchase and redeem Fund shares directly with the Fund in large blocks of shares known as “Creation
Units.” Prior to the start of trading on every business day, a Fund publishes through the National Securities Clearing Corporation (“NSCC”) the “basket” of securities, cash or other
assets that it will accept in exchange for a Creation Unit of the Fund’s shares. An Authorized Participant that wishes to effectuate a creation of a Fund’s shares deposits with the Fund the
“basket” of securities, cash or other assets identified by the Fund that day, and then receives the Creation Unit of the Fund’s shares in return for those assets. After purchasing a Creation Unit,
the Authorized Participant may continue to hold the Fund’s shares or sell them in the secondary market. The redemption process is the reverse of the purchase process: the Authorized Participant redeems a
Creation Unit of a Fund’s shares for a basket of securities, cash or other assets. The combination of the creation and redemption process with secondary market trading in a Fund’s shares and underlying
securities provides arbitrage opportunities that are designed to help keep the market price of a Fund’s shares at or close to the NAV per share of the Fund.
Each Fund imposes fees in
connection with the purchase of Creation Units. These fees may vary based upon various fact-based circumstances, including, but not limited to, the composition of the securities included in the Creation Unit or the
countries in which the transactions are settled. The price for each Creation Unit will equal the daily NAV per share of a Fund times the number of shares in a Creation Unit, plus the fees described above and, if
applicable, any operational processing and brokerage costs, transfer fees, stamp taxes and part or all of the spread between the expected bid and offer side of the market related to the securities comprising the
creation basket.
Each Fund also imposes
fees in connection with the redemption of Creation Units. These fees may vary based upon various fact-based circumstances, including, but not limited to, the composition of the securities included in the Creation Unit
or the countries in which the transactions are settled. The price received for each Creation Unit will equal the daily NAV per share of a Fund times the number of shares in a Creation Unit, minus the fees described
above and, if applicable, any operational processing and brokerage costs, transfer fees, stamp taxes and part or all of the spread between the expected bid and offer side of the market related to the securities
comprising the redemption basket. Investors who use the services of a broker or other such intermediary in addition to an Authorized Participant to effect a redemption of a Creation Unit may also be assessed an amount
to cover the cost of such services. The redemption fee charged by a Fund will comply with Rule 22c-2 of the 1940 Act which limits redemption fees to no more than 2% of the value of the shares redeemed.
6. Distribution
Plan
The Board of Trustees
adopted a Distribution and Service Plan pursuant to Rule 12b-1 under the 1940 Act. In accordance with the Rule 12b-1 plan, each Fund is authorized to pay an amount up to 0.25% of its average daily net assets each year
to reimburse First Trust Portfolios L.P. (“FTP”), the distributor of the Funds, for amounts expended to finance activities primarily intended to result in the sale of Creation Units or to provide investor
services. FTP may also use this amount to compensate securities dealers or other persons that are Authorized Participants for providing distribution assistance, including broker-dealer and shareholder support and
educational and promotional services.
No 12b-1 fees are
currently paid by the Funds, and pursuant to a contractual arrangement, no 12b-1 fees will be paid any time before July 31, 2023.
7. Indemnification
The Trust, on behalf of
the Funds, has a variety of indemnification obligations under contracts with its service providers. The Trust’s maximum exposure under these arrangements is unknown. However, the Trust has not had prior claims
or losses pursuant to these contracts and expects the risk of loss to be remote.
8. Subsequent
Events
Management has evaluated
the impact of all subsequent events to the Funds through the date the financial statements were issued and has determined that there were no subsequent events requiring recognition or disclosure in the financial
statements that have not already been disclosed.
Report of Independent
Registered Public Accounting Firm
To the Shareholders and the
Board of Trustees of First Trust Exchange-Traded Fund VI:
Opinion on the Financial
Statements and Financial Highlights
We have audited the
accompanying statements of assets and liabilities of Developed International Equity Select ETF, Emerging Markets Equity Select ETF, Large Cap US Equity Select ETF, Mid Cap US Equity Select ETF, Small Cap US Equity
Select ETF, US Equity Dividend Select ETF (the “Funds”), each a series of First Trust Exchange-Traded Fund VI, including the portfolios of investments, as of March 31, 2023, the related statements of
operations for the year then ended, the statements of changes in net assets for each of the two years in the period then ended, and the financial highlights for each of the five years in the period then ended, and the
related notes. In our opinion, the financial statements and financial highlights present fairly, in all material respects, the financial position of each of the Funds as of March 31, 2023, and the results of their
operations for the year then ended, the changes in their net assets for each of the two years in the period then ended, and the financial highlights for each of the five years in the period then ended, in conformity
with accounting principles generally accepted in the United States of America.
Basis for Opinion
These financial
statements and financial highlights are the responsibility of the Funds’ management. Our responsibility is to express an opinion on the Funds’ financial statements and financial highlights based on our
audits. We are a public accounting firm registered with the Public Company Accounting Oversight Board (United States) (PCAOB) and are required to be independent with respect to the Funds in accordance with the U.S.
federal securities laws and the applicable rules and regulations of the Securities and Exchange Commission and the PCAOB.
We conducted our audits
in accordance with the standards of the PCAOB. Those standards require that we plan and perform the audit to obtain reasonable assurance about whether the financial statements and financial highlights are free of
material misstatement, whether due to error or fraud. The Funds are not required to have, nor were we engaged to perform, an audit of their internal control over financial reporting. As part of our audits we are
required to obtain an understanding of internal control over financial reporting but not for the purpose of expressing an opinion on the effectiveness of the Funds’ internal control over financial reporting.
Accordingly, we express no such opinion.
Our audits included
performing procedures to assess the risks of material misstatement of the financial statements and financial highlights, whether due to error or fraud, and performing procedures that respond to those risks. Such
procedures included examining, on a test basis, evidence regarding the amounts and disclosures in the financial statements and financial highlights. Our audits also included evaluating the accounting principles used
and significant estimates made by management, as well as evaluating the overall presentation of the financial statements and financial highlights. Our procedures included confirmation of securities owned as of March
31, 2023, by correspondence with the custodian and brokers; when replies were not received from brokers, we performed other auditing procedures. We believe that our audits provide a reasonable basis for our
opinion.
Chicago, Illinois
May 23, 2023
We have served as the
auditor of one or more First Trust investment companies since 2001.
Additional Information
First Trust
Exchange-Traded Fund VI
March 31, 2023
(Unaudited)
Proxy Voting Policies
and Procedures
A description of the
policies and procedures that the Trust uses to determine how to vote proxies and information on how each Fund voted proxies relating to portfolio securities during the most recent 12-month period ended June 30 is
available (1) without charge, upon request, by calling (800) 988-5891; (2) on each Fund’s website at www.ftportfolios.com; and (3) on the Securities and Exchange Commission’s (“SEC”) website at www.sec.gov.
Portfolio Holdings
Each Fund files portfolio
holdings information for each month in a fiscal quarter within 60 days after the end of the relevant fiscal quarter on Form N-PORT. Portfolio holdings information for the third month of each fiscal quarter will be
publicly available on the SEC’s website at www.sec.gov. Each Fund’s complete schedule of portfolio holdings for the second and fourth quarters of each fiscal year is included in the semi-annual and
annual reports to shareholders, respectively, and is filed with the SEC on Form N-CSR. The semi-annual and annual report for each Fund is available to investors within 60 days after the period to which it relates.
Each Fund’s Forms N-PORT and Forms N-CSR are available on the SEC’s website listed above.
Federal Tax
Information
For the taxable year
ended March 31, 2023, the following percentages of income dividends paid by the Funds qualify for the dividends received deduction available to corporations:
|
| Dividends
Received Deduction
|
Developed International Equity Select ETF
| 0.00%
|
Emerging Markets Equity Select ETF
| 0.00%
|
Large Cap US Equity Select ETF
| 100.00%
|
Mid Cap US Equity Select ETF
| 100.00%
|
Small Cap US Equity Select ETF
| 100.00%
|
US Equity Dividend Select ETF
| 100.00%
|
For the taxable
year ended March 31, 2023, the following percentages of income dividends paid by the Funds are hereby designated as qualified dividend income:
|
| Qualified
Dividend Income
|
Developed International Equity Select ETF
| 100.00%
|
Emerging Markets Equity Select ETF
| 59.84%
|
Large Cap US Equity Select ETF
| 100.00%
|
Mid Cap US Equity Select ETF
| 100.00%
|
Small Cap US Equity Select ETF
| 100.00%
|
US Equity Dividend Select ETF
| 100.00%
|
A portion of the ordinary
dividends (including short-term capital gains) that RNLC, RNMC, RNSC, and RNDV paid to shareholders during the taxable year ended March 31, 2023, may be eligible for the Qualified Business Income (QBI) Deduction under
the Internal Revenue Code of 1986, as amended (the “Code”), Section 199A for the aggregate dividends the Funds received from the underlying Real Estate Investment Trusts (REITs) they invest in.
The following Funds met
the requirements of Section 853 of the Code and elect to pass through to their shareholders credit for foreign taxes paid. For the taxable year ended March 31, 2023, the total amount of income received by the Funds
from sources within foreign countries and possessions of the United States and of taxes paid to such countries are as follows:
|
| Gross Foreign Income
|
| Foreign Taxes Paid
|
|
| Amount
|
| Per Share
|
| Amount
|
| Per Share
|
Developed International Equity Select ETF
| $707,408
|
| $1.77
|
| $69,016
|
| $0.17
|
Emerging Markets Equity Select ETF
| $432,334
|
| $2.16
|
| $71,766
|
| $0.36
|
Additional Information (Continued)
First Trust
Exchange-Traded Fund VI
March 31, 2023
(Unaudited)
The foreign taxes paid
will be reported to shareholders on Form 1099-DIV which will be sent to shareholders shortly after the calendar year end. Gross foreign income and foreign taxes paid will be posted on each Fund’s website and
disclosed in the tax letter.
Risk Considerations
Risks are inherent in all
investing. Certain general risks that may be applicable to a Fund are identified below, but not all of the material risks relevant to each Fund are included in this report and not all of the risks below apply to each
Fund. The material risks of investing in each Fund are spelled out in its prospectus, statement of additional information and other regulatory filings. Before investing, you should consider each Fund’s
investment objective, risks, charges and expenses, and read each Fund’s prospectus and statement of additional information carefully. You can download each Fund’s prospectus at www.ftportfolios.com or
contact First Trust Portfolios L.P. at (800) 621-1675 to request a prospectus, which contains this and other information about each Fund.
Concentration Risk. To the extent that a fund is able to invest a significant percentage of its assets in a single asset class or the securities of issuers within the same country, state, region, industry or
sector, an adverse economic, business or political development may affect the value of the fund’s investments more than if the fund were more broadly diversified. A fund that tracks an index will be concentrated
to the extent the fund’s corresponding index is concentrated. A concentration makes a fund more susceptible to any single occurrence and may subject the fund to greater market risk than a fund that is more
broadly diversified.
Credit Risk. Credit risk is the risk that an issuer of a security will be unable or unwilling to make dividend, interest and/or principal payments when due and the related risk that the value of a
security may decline because of concerns about the issuer’s ability to make such payments.
Cyber Security Risk. The funds are susceptible to potential operational risks through breaches in cyber security. A breach in cyber security refers to both intentional and unintentional events that may cause a
fund to lose proprietary information, suffer data corruption or lose operational capacity. Such events could cause a fund to incur regulatory penalties, reputational damage, additional compliance costs associated with
corrective measures and/or financial loss. In addition, cyber security breaches of a fund’s third-party service providers, such as its administrator, transfer agent, custodian, or sub-advisor, as applicable, or
issuers in which the fund invests, can also subject a fund to many of the same risks associated with direct cyber security breaches.
Defined Outcome Funds
Risk. To the extent a fund’s investment strategy is designed to deliver returns tied to the price performance of an underlying ETF, an investor may not realize the returns the fund seeks
to achieve if that investor does not hold shares for the entire target outcome period. In the event an investor purchases shares after the first day of the target outcome period or sells shares prior to the end of the
target outcome period, the buffer that the fund seeks to provide against a decline in the value of the underlying ETF may not be available, the enhanced returns that the fund seeks to provide (if any) may not be
available and the investor may not participate in a gain in the value of the underlying ETF up to the cap for the investor’s investment period. Additionally, the fund will not participate in gains of the
underlying ETF above the cap and a shareholder may lose their entire investment. If the fund seeks enhanced returns, there are certain time periods when the value of the fund may fall faster than the value of the
underlying ETF, and it is very unlikely that, on any given day during which the underlying ETF share price increases in value, the fund’s share price will increase at the same rate as the enhanced returns sought
by the fund, which is designed for an entire target outcome period. Trading flexible exchange options involves risks different from, or possibly greater than, the risks associated with investing directly in
securities, such as less liquidity and correlation and valuation risks. A fund may experience substantial downside from specific flexible exchange option positions and certain positions may expire worthless.
Derivatives Risk. To the extent a fund uses derivative instruments such as futures contracts, options contracts and swaps, the fund may experience losses because of adverse movements in the price or value
of the underlying asset, index or rate, which may be magnified by certain features of the derivative. These risks are heightened when a fund’s portfolio managers use derivatives to enhance the fund’s
return or as a substitute for a position or security, rather than solely to hedge (or offset) the risk of a position or security held by the fund.
Equity Securities
Risk. To the extent a fund invests in equity securities, the value of the fund’s shares will fluctuate with changes in the value of the equity securities. Equity securities prices
fluctuate for several reasons, including changes in investors’ perceptions of the financial condition of an issuer or the general condition of the relevant stock market, such as market volatility, or when
political or economic events affecting the issuers occur. In addition, common stock prices may be particularly sensitive to rising interest rates, as the cost of capital rises and borrowing costs increase. Equity
securities may decline significantly in price over short or extended periods of time, and such declines may occur in the equity market as a whole, or they may occur in only a particular country, company, industry or
sector of the market.
Additional Information (Continued)
First Trust
Exchange-Traded Fund VI
March 31, 2023
(Unaudited)
ETF Risk. The shares of an ETF trade like common stock and represent an interest in a portfolio of securities. The risks of owning an ETF generally reflect the risks of owning the underlying
securities, although lack of liquidity in an ETF could result in it being more volatile and ETFs have management fees that increase their costs. Shares of an ETF trade on an exchange at market prices rather than net
asset value, which may cause the shares to trade at a price greater than net asset value (premium) or less than net asset value (discount). In times of market stress, decisions by market makers to reduce or step away
from their role of providing a market for an ETF’s shares, or decisions by an ETF’s authorized participants that they are unable or unwilling to proceed with creation and/or redemption orders of an
ETF’s shares, could result in shares of the ETF trading at a discount to net asset value and in greater than normal intraday bid-ask spreads.
Fixed Income Securities
Risk. To the extent a fund invests in fixed income securities, the fund will be subject to credit risk, income risk, interest rate risk, liquidity risk and prepayment risk. Income risk is the
risk that income from a fund’s fixed income investments could decline during periods of falling interest rates. Interest rate risk is the risk that the value of a fund’s fixed income securities will
decline because of rising interest rates. Liquidity risk is the risk that a security cannot be purchased or sold at the time desired, or cannot be purchased or sold without adversely affecting the price. Prepayment
risk is the risk that the securities will be redeemed or prepaid by the issuer, resulting in lower interest payments received by the fund. In addition to these risks, high yield securities, or “junk”
bonds, are subject to greater market fluctuations and risk of loss than securities with higher ratings, and the market for high yield securities is generally smaller and less liquid than that for investment grade
securities.
Index or Model Constituent
Risk. Certain funds may be a constituent of one or more indices or ETF models. As a result, such a fund may be included in one or more index-tracking exchange-traded funds or mutual funds. Being
a component security of such a vehicle could greatly affect the trading activity involving a fund, the size of the fund and the market volatility of the fund. Inclusion in an index could increase demand for the fund
and removal from an index could result in outsized selling activity in a relatively short period of time. As a result, a fund’s net asset value could be negatively impacted and the fund’s market price may
be significantly below its net asset value during certain periods. In addition, index rebalances may potentially result in increased trading activity in a fund’s shares.
Index Provider Risk. To the extent a fund seeks to track an index, it is subject to Index Provider Risk. There is no assurance that the Index Provider will compile the Index accurately, or that the Index will
be determined, maintained, constructed, reconstituted, rebalanced, composed, calculated or disseminated accurately. To correct any such error, the Index Provider may carry out an unscheduled rebalance or other
modification of the Index constituents or weightings, which may increase the fund’s costs. The Index Provider does not provide any representation or warranty in relation to the quality, accuracy or completeness
of data in the Index, and it does not guarantee that the Index will be calculated in accordance with its stated methodology. Losses or costs associated with any Index Provider errors generally will be borne by the
fund and its shareholders.
Investment Companies
Risk. To the extent a fund invests in the securities of other investment vehicles, the fund will incur additional fees and expenses that would not be present in a direct investment in those
investment vehicles. Furthermore, the fund’s investment performance and risks are directly related to the investment performance and risks of the investment vehicles in which the fund invests.
LIBOR Risk. To the extent a fund invests in floating or variable rate obligations that use the London Interbank Offered Rate (“LIBOR”) as a reference interest rate, it is subject to LIBOR
Risk. The United Kingdom’s Financial Conduct Authority, which regulates LIBOR has ceased making LIBOR available as a reference rate over a phase-out period that began December 31, 2021. There is no assurance
that any alternative reference rate, including the Secured Overnight Financing Rate (“SOFR”) will be similar to or produce the same value or economic equivalence as LIBOR or that instruments using an
alternative rate will have the same volume or liquidity. The unavailability or replacement of LIBOR may affect the value, liquidity or return on certain fund investments and may result in costs incurred in connection
with closing out positions and entering into new trades. Any potential effects of the transition away from LIBOR on the fund or on certain instruments in which the fund invests can be difficult to ascertain, and they
may vary depending on a variety of factors, and they could result in losses to the fund.
Management Risk. To the extent that a fund is actively managed, it is subject to management risk. In managing an actively-managed fund’s investment portfolio, the fund’s portfolio managers will
apply investment techniques and risk analyses that may not have the desired result. There can be no guarantee that a fund will meet its investment objective.
Market Risk. Market risk is the risk that a particular security, or shares of a fund in general, may fall in value. Securities held by a fund, as well as shares of a fund itself, are subject to
market fluctuations caused by factors such as general economic conditions, political events, regulatory or market developments, changes in interest rates and perceived trends in securities prices. Shares of
a fund could decline in value or underperform other investments as a result of the risk of loss associated with these market fluctuations. In addition, local, regional or global events such as war, acts of
terrorism, spread of infectious diseases or other public health issues, recessions, or other events could have a significant negative impact on a fund and its investments. Such events may affect certain
geographic regions, countries, sectors and industries more significantly than others. In February 2022, Russia invaded Ukraine which has caused and could continue to cause significant market disruptions and
volatility within the markets in Russia, Europe, and the
Additional Information (Continued)
First Trust
Exchange-Traded Fund VI
March 31, 2023
(Unaudited)
United States. The hostilities and
sanctions resulting from those hostilities could have a significant impact on certain fund investments as well as fund performance. The COVID-19 global pandemic and the ensuing policies enacted
by governments and central banks have caused and may continue to cause significant volatility and uncertainty in global financial markets. While the U.S. has resumed “reasonably” normal business
activity, many countries continue to impose lockdown measures. Additionally, there is no guarantee that vaccines will be effective against emerging variants of the disease. These events also adversely affect
the prices and liquidity of a fund’s portfolio securities or other instruments and could result in disruptions in the trading markets. Any of such circumstances could have a materially negative impact on
the value of a fund’s shares and result in increased market volatility. During any such events, a fund’s shares may trade at increased premiums or discounts to their net asset value and the
bid/ask spread on a fund’s shares may widen.
Non-U.S. Securities
Risk. To the extent a fund invests in non-U.S. securities, it is subject to additional risks not associated with securities of domestic issuers. Non-U.S. securities are subject to higher
volatility than securities of domestic issuers due to: possible adverse political, social or economic developments; restrictions on foreign investment or exchange of securities; capital controls; lack of liquidity;
currency exchange rates; excessive taxation; government seizure of assets; the imposition of sanctions by foreign governments; different legal or accounting standards; and less government supervision and regulation of
exchanges in foreign countries. Investments in non-U.S. securities may involve higher costs than investments in U.S. securities, including higher transaction and custody costs, as well as additional taxes imposed by
non-U.S. governments. These risks may be heightened for securities of companies located, or with significant operations, in emerging market countries.
Operational Risk. Each fund is subject to risks arising from various operational factors, including, but not limited to, human error, processing and communication errors, errors of a fund’s service
providers, counterparties or other third-parties, failed or inadequate processes and technology or systems failures. Each fund relies on third-parties for a range of services, including custody. Any delay or failure
relating to engaging or maintaining such service providers may affect a fund’s ability to meet its investment objective. Although the funds and the funds’ investment advisor seek to reduce these
operational risks through controls and procedures, there is no way to completely protect against such risks.
Passive Investment
Risk. To the extent a fund seeks to track an index, the fund will invest in the securities included in, or representative of, the index regardless of their investment merit. A fund generally
will not attempt to take defensive positions in declining markets.
Preferred Securities
Risk. Preferred securities combine some of the characteristics of both common stocks and bonds. Preferred securities are typically subordinated to bonds and other debt securities in a
company’s capital structure in terms of priority to corporate income, subjecting them to greater credit risk than those debt securities. Generally, holders of preferred securities have no voting rights with
respect to the issuing company unless preferred dividends have been in arrears for a specified number of periods, at which time the preferred security holders may obtain limited rights. In certain circumstances, an
issuer of preferred securities may defer payment on the securities and, in some cases, redeem the securities prior to a specified date. Preferred securities may also be substantially less liquid than other securities,
including common stock.
Valuation Risk. The valuation of certain securities may carry more risk than that of common stock. Uncertainties in the conditions of the financial markets, unreliable reference data, lack of transparency
and inconsistency of valuation models and processes may lead to inaccurate asset pricing. A fund may hold investments in sizes smaller than institutionally sized round lot positions (sometimes referred to as odd
lots). However, third-party pricing services generally provide evaluations on the basis of institutionally-sized round lots. If a fund sells certain of its investments in an odd lot transaction, the sale price may be
less than the value at which such securities have been held by the fund. Odd lots often trade at lower prices than institutional round lots. There is no assurance that the fund will be able to sell a portfolio
security at the price established by the pricing service, which could result in a loss to the fund.
Variable Interest Entities
Risk. In order to gain exposure to certain Chinese companies that are included in a Fund’s Index but are unavailable to direct investment by foreign investors, certain Funds invest
significantly in non-Chinese shell companies that have created structures known as variable interest entities (“VIEs”) in order to gain exposure to such Chinese companies. In China, direct ownership of
companies in certain sectors by foreign individuals and entities is prohibited. In order to allow for foreign investment in these businesses, many Chinese companies have created VIE structures to enable indirect
foreign ownership. In such an arrangement, a Chinese operating company typically establishes an offshore shell company in another jurisdiction, such as the Cayman Islands. That shell company enters into service and
other contracts with the Chinese issuer or operating company to obtain economic exposure to the Chinese company, then issues shares on an exchange outside of mainland China, and U.S. investors hold stock in the
non-Chinese shell company rather than directly in the Chinese issuer or operating company. This arrangement allows U.S. investors, such as the Fund, to obtain economic exposure to the Chinese issuer or operating
company through contractual means rather than through formal equity ownership. Because neither the shell company nor the Fund owns actual equity interests in the Chinese operating company, they do not have the voting
rights or other types of control that an equity holder would expect to benefit from. Although VIEs are a longstanding industry practice and well known to officials and regulators in China, VIEs are not formally
recognized under Chinese law.
Additional Information (Continued)
First Trust
Exchange-Traded Fund VI
March 31, 2023
(Unaudited)
Intervention by the Chinese government
with respect to VIEs could significantly affect the Chinese company’s performance and the enforceability of the VIE’s contractual arrangements that establish the links between the Chinese company and the
shell company in which the Fund invests. This could considerably impact the financial condition of the shell company in which the Fund invests by limiting its ability to consolidate the financial results of the
Chinese operating company into its own financial statements, as well as make the value of the shares held by the Fund effectively worthless. Further, if Chinese officials prohibit the existence of VIEs, the market
value of the Fund’s associated holdings would likely suffer significant, and possibly permanent effects, which could negatively impact the Fund’s net asset value and could result in substantial losses.
Further, it is uncertain whether any new laws, rules or regulations relating to VIE structures will be adopted or, if adopted, what impact they would have on the value of the Fund’s shares.
VIEs are also subject
to the investment risks associated with the underlying Chinese issuer or operating company. Chinese companies are not subject to the same degree of regulatory requirements or accounting standards and oversight as
companies in more developed countries. As a result, information about the Chinese securities and VIEs in which the Fund invests may be less reliable and incomplete. There also may be significant obstacles to obtaining
information necessary for investigations into or litigation against Chinese companies and VIEs, and shareholders may have limited legal remedies, which could negatively impact the Fund. Additionally, U.S.-listed VIEs
may be delisted if they do not meet U.S. accounting standards and auditor oversight requirements. Delisting would significantly decrease the liquidity and value of the securities, decrease the ability of the Fund to
invest in such securities and may increase the cost of the Fund if required to seek alternative markets in which to invest in such securities.
| NOT FDIC INSURED
| NOT BANK GUARANTEED
| MAY LOSE VALUE
|
Advisory Agreement
Board Considerations
Regarding Approval of Amendment to the Investment Management Agreement
The Board of Trustees of
First Trust Exchange-Traded Fund VI (the “Trust”), including the Independent Trustees, unanimously approved the amendment (the “Amendment”) of the Investment Management Agreement (the
“Agreement”) with First Trust Advisors L.P. (the “Advisor”) on behalf of the following six series of the Trust (each a “Fund” and collectively, the “Funds”):
Developed International Equity Select ETF (RNDM)
Emerging Markets Equity Select ETF (RNEM)
Large
Cap US Equity Select ETF (RNLC)
Mid Cap US Equity Select ETF (RNMC)
Small Cap US Equity Select ETF (RNSC)
US Equity Dividend Select ETF (RNDV)
The Board approved the
Amendment for each Fund at a meeting held on October 24, 2022. As part of the review process, the Board reviewed information and had preliminary discussions with the Advisor regarding the proposed Amendment at
meetings held on April 18, 2022, June 12–13, 2022 and September 18–19, 2022. Following those preliminary discussions, the Board requested and received information from the Advisor regarding the
proposed Amendment, and that information was considered at an executive session of the Independent Trustees and their counsel held prior to the October 24, 2022 meeting, as well as at the October meeting.
In reviewing the
Amendment for each Fund, the Board considered that the purpose of the Amendment is to modify the unitary fee rate for each Fund under the Agreement by introducing a breakpoint schedule pursuant to which the unitary
fee rate paid by each Fund to the Advisor will be reduced as assets of such Fund meet certain thresholds. The Board noted the Advisor’s representations that the quality and quantity of the services
provided to each Fund by the Advisor under the Agreement will not be reduced or modified as a result of the Amendment, and that the obligations of the Advisor under the Agreement will remain the same in all
respects.
The Board noted that it,
including the Independent Trustees, last approved the continuation of the Agreement for each Fund for a one-year period ending June 30, 2023 at a meeting held on June 12–13, 2022. The Board noted that in
connection with such approval it had determined for each Fund, based upon the information provided, that the terms of the Agreement were fair and reasonable and that the continuation of the Agreement was in the best
interests of the Fund in light of the nature, extent and quality of the services provided and such other matters as the Board considered to be relevant in the exercise of its business judgment.
Based on all of the
information considered, the Board, including the Independent Trustees, unanimously determined that the terms of the Amendment are fair and reasonable and that the Amendment is in the best interests of each Fund.
Board of Trustees and Officers
First Trust
Exchange-Traded Fund VI
March 31, 2023
(Unaudited)
The following tables
identify the Trustees and Officers of the Trust. Unless otherwise indicated, the address of all persons is 120 East Liberty Drive, Suite 400, Wheaton, IL 60187.
The Trust’s
statement of additional information includes additional information about the Trustees and is available, without charge, upon request, by calling (800) 988-5891.
| Name, Year of Birth and Position with the Trust
| Term of Office and Year First Elected or Appointed
| Principal Occupations
During Past 5 Years
| Number of Portfolios in the First Trust Fund Complex Overseen by Trustee
| Other Trusteeships or Directorships Held by Trustee During Past 5 Years
|
| INDEPENDENT TRUSTEES
|
Richard E. Erickson, Trustee
(1951)
| • Indefinite Term
• Since Inception
| Physician, Edward-Elmhurst Medical Group; Physician and Officer, Wheaton Orthopedics (1990 to 2021)
| 228
| None
|
Thomas R. Kadlec, Trustee
(1957)
| • Indefinite Term
• Since Inception
| Retired; President, ADM Investor Services, Inc. (Futures Commission Merchant) (2010 to July 2022)
| 228
| Director, National Futures Association and ADMIS Singapore Ltd.; Formerly, Director of ADM Investor Services, Inc., ADM Investor Services International, ADMIS Hong Kong Ltd., and
Futures Industry Association
|
Denise M. Keefe, Trustee
(1964)
| • Indefinite Term
• Since 2021
| Executive Vice President, Advocate Aurora Health and President, Advocate Aurora Continuing Health Division (Integrated Healthcare System)
| 228
| Director and Board Chair of Advocate Home Health Services, Advocate Home Care Products and Advocate Hospice; Director and Board Chair of Aurora At Home (since 2018); Director of
Advocate Physician Partners Accountable Care Organization; Director and Board Chair of RML Long Term Acute Care Hospitals; and Director of Senior Helpers (since 2021)
|
Robert F. Keith, Trustee
(1956)
| • Indefinite Term
• Since Inception
| President, Hibs Enterprises (Financial and Management Consulting)
| 228
| Formerly, Director of Trust Company of Illinois
|
Niel B. Nielson, Trustee
(1954)
| • Indefinite Term
• Since Inception
| Senior Advisor (2018 to Present), Managing Director and Chief Operating Officer (2015 to 2018), Pelita Harapan Educational Foundation (Educational Products and
Services)
| 228
| None
|
| INTERESTED TRUSTEE
|
James A. Bowen(1), Trustee and
Chairman of the Board
(1955)
| • Indefinite Term
• Since Inception
| Chief Executive Officer, First Trust Advisors L.P. and First Trust Portfolios L.P.; Chairman of the Board of Directors, BondWave LLC (Software
Development Company) and Stonebridge Advisors LLC (Investment Advisor)
| 228
| None
|
| (1)
| Mr. Bowen is deemed an “interested person” of the Trust due to his position as CEO of First Trust Advisors L.P., investment advisor of the Trust.
|
Board of Trustees and Officers (Continued)
First Trust
Exchange-Traded Fund VI
March 31, 2023
(Unaudited)
| Name and Year of Birth
| Position and Offices with Trust
| Term of Office and Length of Service
| Principal Occupations
During Past 5 Years
|
| OFFICERS(2)
|
James M. Dykas
(1966)
| President and Chief Executive Officer
| • Indefinite Term
• Since 2016
| Managing Director and Chief Financial Officer, First Trust Advisors L.P. and First Trust Portfolios L.P.; Chief Financial Officer, BondWave LLC (Software Development Company) and
Stonebridge Advisors LLC (Investment Advisor)
|
Donald P. Swade
(1972)
| Treasurer, Chief Financial Officer and Chief Accounting Officer
| • Indefinite Term
• Since 2016
| Senior Vice President, First Trust Advisors L.P. and First Trust Portfolios L.P.
|
W. Scott Jardine
(1960)
| Secretary and Chief Legal Officer
| • Indefinite Term
• Since Inception
| General Counsel, First Trust Advisors L.P. and First Trust Portfolios L.P.; Secretary and General Counsel, BondWave LLC; Secretary, Stonebridge Advisors LLC
|
Daniel J. Lindquist
(1970)
| Vice President
| • Indefinite Term
• Since Inception
| Managing Director, First Trust Advisors L.P. and First Trust Portfolios L.P.
|
Kristi A. Maher
(1966)
| Chief Compliance Officer and Assistant Secretary
| • Indefinite Term
• Since Inception
| Deputy General Counsel, First Trust Advisors L.P. and First Trust Portfolios L.P.
|
Roger F. Testin
(1966)
| Vice President
| • Indefinite Term
• Since Inception
| Senior Vice President, First Trust Advisors L.P. and First Trust Portfolios L.P.
|
Stan Ueland
(1970)
| Vice President
| • Indefinite Term
• Since Inception
| Senior Vice President, First Trust Advisors L.P. and First Trust Portfolios L.P.
|
| (2)
| The term “officer” means the president, vice president, secretary, treasurer, controller or any other officer who performs a policy making function.
|
Privacy Policy
First Trust
Exchange-Traded Fund VI
March 31, 2023
(Unaudited)
Privacy Policy
First Trust values our
relationship with you and considers your privacy an important priority in maintaining that relationship. We are committed to protecting the security and confidentiality of your personal information.
Sources of Information
We collect nonpublic
personal information about you from the following sources:
| •
| Information we receive from you and your broker-dealer, investment professional or financial representative through interviews, applications, agreements or other forms;
|
| •
| Information about your transactions with us, our affiliates or others;
|
| •
| Information we receive from your inquiries by mail, e-mail or telephone; and
|
| •
| Information we collect on our website through the use of “cookies.” For example, we may identify the pages on our website that your browser requests or visits.
|
Information Collected
The type of data we
collect may include your name, address, social security number, age, financial status, assets, income, tax information, retirement and estate plan information, transaction history, account balance, payment history,
investment objectives, marital status, family relationships and other personal information.
Disclosure of
Information
We do not disclose any
nonpublic personal information about our customers or former customers to anyone, except as permitted by law. In addition to using this information to verify your identity (as required under law), the permitted uses
may also include the disclosure of such information to unaffiliated companies for the following reasons:
| •
| In order to provide you with products and services and to effect transactions that you request or authorize, we may disclose your personal information as described above to unaffiliated financial
service providers and other companies that perform administrative or other services on our behalf, such as transfer agents, custodians and trustees, or that assist us in the distribution of investor materials such as
trustees, banks, financial representatives, proxy services, solicitors and printers.
|
| •
| We may release information we have about you if you direct us to do so, if we are compelled by law to do so, or in other legally limited circumstances (for example to protect your
account from fraud).
|
In addition, in order to
alert you to our other financial products and services, we may share your personal information within First Trust.
Use of Website
Analytics
We currently use third
party analytics tools, Google Analytics and AddThis, to gather information for purposes of improving First Trust’s website and marketing our products and services to you. These tools employ cookies, which are
small pieces of text stored in a file by your web browser and sent to websites that you visit, to collect information, track website usage and viewing trends such as the number of hits, pages visited, videos and PDFs
viewed and the length of user sessions in order to evaluate website performance and enhance navigation of the website. We may also collect other anonymous information, which is generally limited to technical and
web navigation information such as the IP address of your device, internet browser type and operating system for purposes of analyzing the data to make First Trust’s website better and more useful to our users.
The information collected does not include any personal identifiable information such as your name, address, phone number or email address unless you provide that information through the website for us to
contact you in order to answer your questions or respond to your requests. To find out how to opt-out of these services click on: Google Analytics and AddThis.
Confidentiality and
Security
With regard to our
internal security procedures, First Trust restricts access to your nonpublic personal information to those First Trust employees who need to know that information to provide products or services to you. We maintain
physical, electronic and procedural safeguards to protect your nonpublic personal information.
Policy Updates and
Inquiries
As required by federal
law, we will notify you of our privacy policy annually. We reserve the right to modify this policy at any time, however, if we do change it, we will tell you promptly. For questions about our policy, or for additional
copies of this notice, please go to www.ftportfolios.com, or contact us at 1-800-621-1675 (First Trust Portfolios) or 1-800-222-6822 (First Trust Advisors).
March 2023
First Trust Exchange-Traded Fund VI
INVESTMENT ADVISOR
First Trust Advisors L.P.
120 East Liberty Drive, Suite
400
Wheaton, IL 60187
ADMINISTRATOR, CUSTODIAN,
FUND ACCOUNTANT &
TRANSFER AGENT
Brown Brothers Harriman &
Co.
50 Post Office Square
Boston, MA 02110
INDEPENDENT REGISTERED
PUBLIC ACCOUNTING FIRM
Deloitte & Touche LLP
111 S. Wacker Drive
Chicago, IL 60606
LEGAL COUNSEL
Chapman and Cutler LLP
320 South Canal Street
Chicago, IL 60606
First Trust Exchange-Traded Fund VI
First Trust Indxx Medical Devices ETF (MDEV)
Annual Report
For the Year Ended
March 31, 2023
First Trust Indxx Medical Devices
ETF (MDEV)
Annual Report
March 31, 2023
| 1
|
| 2
|
| 3
|
| 5
|
| 6
|
| 8
|
| 9
|
| 10
|
| 11
|
| 12
|
| 18
|
| 19
|
| 24
|
| 26
|
Caution Regarding
Forward-Looking Statements
This report contains
certain forward-looking statements within the meaning of the Securities Act of 1933, as amended, and the Securities Exchange Act of 1934, as amended. Forward-looking statements include statements regarding the goals,
beliefs, plans or current expectations of First Trust Advisors L.P. (“First Trust” or the “Advisor”) and its representatives, taking into account the information currently available to them.
Forward-looking statements include all statements that do not relate solely to current or historical fact. For example, forward-looking statements include the use of words such as “anticipate,”
“estimate,” “intend,” “expect,” “believe,” “plan,” “may,” “should,” “would” or other words that convey uncertainty of
future events or outcomes.
Forward-looking
statements involve known and unknown risks, uncertainties and other factors that may cause the actual results, performance or achievements of the series of First Trust Exchange-Traded Fund VI (the “Trust”)
described in this report (First Trust Indxx Medical Devices ETF; hereinafter referred to as the “Fund”) to be materially different from any future results, performance or achievements expressed or implied
by the forward-looking statements. When evaluating the information included in this report, you are cautioned not to place undue reliance on these forward-looking statements, which reflect the judgment of the Advisor
and its representatives only as of the date hereof. We undertake no obligation to publicly revise or update these forward-looking statements to reflect events and circumstances that arise after the date hereof.
Performance and Risk
Disclosure
There is no assurance
that the Fund will achieve its investment objective. The Fund is subject to market risk, which is the possibility that the market values of securities owned by the Fund will decline and that the value of the
Fund’s shares may therefore be less than what you paid for them. Accordingly, you can lose money by investing in the Fund. See “Risk Considerations” in the Additional Information section of this
report for a discussion of certain other risks of investing in the Fund.
Performance data quoted
represents past performance, which is no guarantee of future results, and current performance may be lower or higher than the figures shown. For the most recent month-end performance figures, please visit www.ftportfolios.com or speak with your financial advisor. Investment returns, net asset value and share price will fluctuate and Fund shares, when sold, may be
worth more or less than their original cost.
The Advisor may also
periodically provide additional information on Fund performance on the Fund’s web page at www.ftportfolios.com.
How to Read This
Report
This report contains
information that may help you evaluate your investment in the Fund. It includes details about the Fund and presents data and analysis that provide insight into the Fund’s performance and investment approach.
By reading the market
overview by Robert F. Carey, Chief Market Strategist of the Advisor, you may obtain an understanding of how the market environment affected the Fund’s performance. The statistical information that follows may
help you understand the Fund’s performance compared to that of relevant market benchmarks.
It is important to keep
in mind that the opinions expressed by personnel of the Advisor are just that: informed opinions. They should not be considered to be promises or advice. The opinions, like the statistics, cover the period through the
date on the cover of this report. The material risks of investing in the Fund are spelled out in the prospectus, the statement of additional information, and other Fund regulatory filings.
First Trust Indxx Medical Devices
ETF (MDEV)
Annual Letter from the Chairman and
CEO
March 31, 2023
Dear Shareholders,
First Trust is pleased
to provide you with the annual report for the First Trust Indxx Medical Devices ETF (the “Fund”), which contains detailed information about the Fund for the twelve months ended March 31, 2023.
I am constantly amazed
by the depth and breadth of innovation that occurs when people from different geographic, economic, cultural, and educational backgrounds come together to solve problems. Many of the greatest companies to ever exist
found their humble beginnings in the simple premise that problems are best solved through ingenuity and cooperation. That idea is still alive and well today, in my opinion. Take, as examples, the recent flood of
interest sparked by artificial intelligence programs, advances in robotics, new medicines, more fuel-efficient gasoline engines, electric and hybrid vehicles, quantum computing, developments in wind and solar power;
the list goes on and on. That said, the global economy is facing serious issues such as stubborn inflation and the specter of slowing economic growth to name a few.
As many investors know,
the global financial system is currently navigating the fallout of the banking crisis that took lending markets by storm in March 2023. The turmoil that started in the U.S. with the failure of Silicon Valley Bank
quickly spread around the globe, leading the Swiss government to broker the merger of two of Switzerland’s largest banks. In the U.S., the Federal Reserve (the “Fed”) created the Bank Term Funding
Program, which allocated capital to help assure that banks can meet the needs of their depositors. Furthermore, inflation remains elevated on a global scale. Each of the countries that comprise the so-called Group of
Ten is currently battling levels of inflation that are higher than the targets set by their central banks, according to data from Bloomberg. Additionally, political unrest stemming from the war between Russia and
Ukraine remains a significant factor, with the potential to disturb global fuel and energy supplies as well as provoke interference from other foreign powers.
In the U.S., inflation,
as measured by the trailing 12-month rate on the Consumer Price Index, stood at 5.0% as of March 31, 2023, well above the Fed’s stated goal of 2.0%. Despite signals pointing to a potential slowdown in economic
growth in the U.S., the Fed stayed the course with regards to interest rate policy. Since February 28, 2022, the Fed raised the Federal Funds target rate (upper bound) a total of nine times, increasing the rate from
0.25%, where it stood on February 28, 2022, to 5.00% as of March 31, 2023.
Global markets have been
resilient over time, and the S&P 500® Index has never failed to recover from a bear market. While the issues plaguing the U.S. and global economies are severe, they are not
insurmountable, in my view. As Brian Wesbury, Chief Economist at First Trust, recently wrote: “what made America strong is…its human resources and freedom.” We will continue to work the problems
before us with ingenuity and resolve, as we always have.
Thank you for giving
First Trust the opportunity to play a role in your financial future. We value our relationship with you and will report on the Fund again in six months.
Sincerely,
James A. Bowen
Chairman of the Board of Trustees
Chief Executive Officer of First Trust
Advisors L.P.
First Trust Indxx Medical Devices
ETF
Annual Report
March 31, 2023
Robert
F. Carey, CFA
Senior Vice President
and Chief Market Strategist
First Trust Advisors
L.P.
Mr.
Carey is responsible for the overall management of research and analysis of the First Trust product line. Mr. Carey has more than 30 years of experience as an Equity and Fixed-Income Analyst and is a recipient of the
Chartered Financial Analyst (“CFA”) designation. He is a graduate of the University of Illinois at Champaign-Urbana with a B.S. in Physics. He is also a member of the Investment Analysts Society of Chicago
and the CFA Institute. Mr. Carey has appeared as a guest on such programs as Bloomberg TV, CNBC, and WBBM Radio, and has been quoted by several publications, including The Wall Street Journal, The Wall Street Reporter, Bloomberg News Service, and Registered Rep.
State of the Global
Economy
The latest global
growth forecast from the International Monetary Fund (“IMF”) released in April 2023 sees real gross domestic product growth rising by 2.8% worldwide in 2023, down from its 2.9% projection in January 2023.
The IMF is calling for a 1.6% growth rate for the U.S., up from its January 2023 estimate of 1.4%. Emerging Market and Developing Economies are expected to grow by 3.9% this year, down from the IMF’s 4.0%
estimate in January 2023. The IMF notes that risks to their global outlook are squarely to the downside, especially given the recent turmoil in the Financials sector as well as stubbornly high inflation.
In the U.S.,
inflation, as measured by the Consumer Price Index (“CPI”), stood at 5.0% on a trailing 12-month basis at the end of March 2023, according to the U.S. Bureau of Labor Statistics. While this is
significantly lower than the most recent high of 9.1% in June 2022, the CPI remains above its 30-year average of 2.5% as of March 31, 2023, and even further from the Federal Reserve’s (the “Fed”)
target of 2.0%.
Performance of Global
Stocks and Bonds
The major U.S. stock
indices delivered negative results over the past 12 months. The S&P 500® (the “Index”), S&P MidCap 400® and S&P SmallCap 600® Indices posted total returns of -7.73%, -5.12% and -8.82%, respectively, for the 12-month period ended March 31, 2023. Three of the 11 major
sectors that comprise the Index were positive on a total return basis. The top performer was the Energy sector, up 13.63%, while the worst showing came from the Real Estate sector, down 19.75%.
A Bloomberg survey of
twenty-four equity strategists found that their average 2023 year-end price target for the Index was 4,025, as of April 19, 2023, according to its own release. The highest and lowest estimates were 4,750 and 3,225,
respectively. Brian Wesbury, Chief Economist at First Trust, announced in December 2022 that his 2023 year-end price target stood at 3,900. The Index closed trading on March 31, 2023 at 4,109. The outlook for
corporate earnings in 2023 has turned negative. Bloomberg’s consensus year-over-year earnings growth rate estimates for the Index for the 2023 and 2024 calendar years stood at -2.67% and 11.56%, respectively, as
of April 21, 2023.
The broader foreign
stock indices experienced negative total returns over the past year. For the 12-months ended March 31, 2023, the MSCI World ex USA and MSCI Emerging Markets equity indices posted total returns of -2.74% (USD) and
-10.70% (USD), respectively, according to Bloomberg. The major foreign bond indices were also down during the same period. The Bloomberg Global Aggregate Index of higher quality debt posted a total return of -8.07%
(USD), while the Bloomberg EM Hard Currency Aggregate Index of emerging markets debt fell by 5.41% (USD), according to Bloomberg. The U.S. Dollar rose 4.27% over the past 12 months against a basket of major
currencies, as measured by the U.S. Dollar Index (DXY). The increase in the U.S. Dollar provided a drag on the performance of both foreign stock and bond indices, in our opinion.
In the U.S. bond
market, the results were also disappointing. The top performing major debt group we track was intermediate corporate bonds. The Bloomberg Intermediate Corporate Index posted a total return of -1.99% for the 12-month
period ended March 31, 2023. The worst-performing U.S. debt group that we track was U.S. aggregate bonds. The Bloomberg U.S. Aggregate Bond Index posted a total return of -4.78%. The yield on the benchmark 10-Year
Treasury Note (“T-Note”) fell by 113 basis points in the period to close at 3.47% on March 31, 2023, according to Bloomberg. For comparative purposes, the average yield on the 10-Year T-Note was 2.19% for
the 10-year period ended March 31, 2023.
Fund Performance
Overview (Unaudited)
First Trust Indxx Medical Devices
ETF (MDEV)
The First Trust Indxx
Medical Devices ETF (the “Fund”) seeks investment results that correspond generally to the price and yield (before the Fund’s fees and expenses) of an index called the Indxx Global Medical Equipment
Index (the “Index”). The shares of the Fund are listed and traded on Cboe BZX Exchange, Inc. under the ticker symbol “MDEV.”
Under normal market
conditions, the Fund will invest at least 80% of its net assets (plus any borrowings for investment purposes) in the common stocks and depositary receipts that comprise the Index. The Index is developed, maintained
and sponsored by Indxx, Inc. (the “Index Provider”). The Index is composed of common stock and depositary receipts issued by U.S. and non-U.S. companies that comprise the medical devices industry, as
determined by the Index Provider. Companies comprising the medical devices industry are those companies that focus on developing equipment, instruments, and machines to diagnose, monitor, and treat diseases.
| Performance
|
|
|
|
|
|
| Average Annual
Total Returns
| Cumulative
Total Returns
|
|
| 1 Year Ended
3/31/23
| Inception (6/22/21)
to 3/31/23
| Inception (6/22/21)
to 3/31/23
|
| Fund Performance
|
|
|
|
| NAV
| -9.05%
| -11.20%
| -18.99%
|
| Market Price
| -9.27%
| -11.25%
| -19.07%
|
| Index Performance
|
|
|
|
| Indxx Global Medical Equipment Index
| -8.98%
| -10.71%
| -18.19%
|
| MSCI World Health Care Index
| -3.69%
| 1.10%
| 1.95%
|
The Fund generated a net
asset value (“NAV”) return of -9.05% during the period covered by this report. During the same period, the MSCI World Health Care Index (the “Benchmark”) generated a return of -3.69%. During
the period, the United States was the highest weighted country in the Fund with an allocation of 56.1%. Investments in this country contributed -2.5% to the Fund’s return, which was the greatest drag on the
Fund’s return of any sector in the Fund. The greatest contribution to the Fund’s performance came from investments in New Zealand, which received a 2.1% weight and contributed 0.2% to the Fund’s
return. Exposure to foreign currency contributed -1.3% to the Fund’s total return for the period.
Total returns for the
period since inception are calculated from the inception date of the Fund. “Average Annual Total Returns” represent the average annual change in value of an investment over the period indicated.
“Cumulative Total Returns” represent the total change in value of an investment over the period indicated.
The Fund’s per
share net asset value (“NAV”) is the value of one share of the Fund and is computed by dividing the value of all assets of the Fund (including accrued interest and dividends), less all liabilities
(including accrued expenses and dividends declared but unpaid), by the total number of outstanding shares. The price used to calculate market return (“Market Price”) is determined by using the midpoint of
the national best bid and offer price (“NBBO”) as of the time that the Fund’s NAV is calculated. Under SEC rules, the NBBO consists of the highest displayed buy and lowest sell prices among the
various exchanges trading the Fund at the time the Fund’s NAV is calculated. Since shares of the Fund did not trade in the secondary market until after its inception, for the period from inception to the
first day of secondary market trading in shares of the Fund, the NAV of the Fund is used as a proxy for the secondary market trading price to calculate market returns. NAV and market returns assume that all
distributions have been reinvested in the Fund at NAV and Market Price, respectively.
An index is a statistical
composite that tracks a specified financial market or sector. Unlike the Fund, the indices do not actually hold a portfolio of securities and therefore do not incur the expenses incurred by the Fund. These expenses
negatively impact the performance of the Fund. Also, market returns do not include brokerage commissions that may be payable on secondary market transactions. If brokerage commissions were included, market returns
would be lower. The total returns presented reflect the reinvestment of dividends on securities in the indices. The returns presented do not reflect the deduction of taxes that a shareholder would pay on Fund
distributions or the redemption or sale of Fund shares. The investment return and principal value of shares of the Fund will vary with changes in market conditions. Shares of the Fund may be worth more or less than
their original cost when they are redeemed or sold in the market. The Fund’s past performance is no guarantee of future performance.
Indxx and the Index are
trademarks of Indxx, Inc. (“Indxx”) and have been licensed for use for certain purposes by First Trust. The Fund is not sponsored, endorsed, sold or promoted by Indxx, and Indxx makes no representation
regarding the advisability of trading in such product. The Index is determined, composed and calculated by Indxx without regard to First Trust or the Fund.
Fund Performance
Overview (Unaudited) (Continued)
First Trust Indxx Medical Devices
ETF (MDEV) (Continued)
| Sector Allocation
| % of Total
Investments
|
| Health Care
| 100.0%
|
| Total
| 100.0%
|
| Top Ten Holdings
| % of Total
Investments
|
| Exact Sciences Corp.
| 3.7%
|
| Align Technology, Inc.
| 2.7
|
| Fisher & Paykel Healthcare Corp., Ltd.
| 2.6
|
| Straumann Holding AG
| 2.6
|
| Cooper (The) Cos., Inc.
| 2.5
|
| Insulet Corp.
| 2.4
|
| Amplifon S.p.A.
| 2.4
|
| Koninklijke Philips N.V.
| 2.3
|
| West Pharmaceutical Services, Inc.
| 2.3
|
| Intuitive Surgical, Inc.
| 2.3
|
| Total
| 25.8%
|
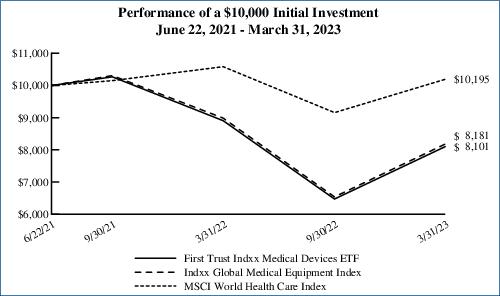
Performance figures assume reinvestment of all distributions and do not reflect the deduction of taxes that a shareholder would pay on Fund distributions or the redemption or sale of Fund shares. An index is a
statistical composite that tracks a specified financial market or sector. Unlike the Fund, the indices do not actually hold a portfolio of securities and therefore do not incur the expenses incurred by the Fund.
These expenses negatively impact the performance of the Fund. The Fund’s past performance does not predict future performance.
Frequency
Distribution of Discounts and Premiums
Information
showing the number of days the market price of the Fund’s shares was greater (at a premium) and less (at a discount) than the Fund’s net asset value for the most recently completed year, and the most
recently completed calendar quarters since that year (or life of the Fund, if shorter), is available at https://www.ftportfolios.com/Retail/etf/home.aspx.
First Trust Indxx Medical Devices ETF
(MDEV)
Understanding Your Fund
Expenses
March 31, 2023
(Unaudited)
As a shareholder of the
First Trust Indxx Medical Devices ETF (the “Fund”), you incur two types of costs: (1) transaction costs; and (2) ongoing costs, including management fees, distribution and/or service (12b-1) fees, if any,
and other Fund expenses. This Example is intended to help you understand your ongoing costs of investing in the Fund and to compare these costs with the ongoing costs of investing in other funds.
The Example is based on
an investment of $1,000 invested at the beginning of the period and held through the six-month period ended March 31, 2023.
Actual Expenses
The first line in the
following table provides information about actual account values and actual expenses. You may use the information in this line, together with the amount you invested, to estimate the expenses that you paid over the
period. Simply divide your account value by $1,000 (for example, an $8,600 account value divided by $1,000 = 8.6), then multiply the result by the number in the first line under the heading entitled “Expenses
Paid During the Six-Month Period” to estimate the expenses you paid on your account during this six-month period.
Hypothetical Example for
Comparison Purposes
The second line in the
following table provides information about hypothetical account values and hypothetical expenses based on the Fund’s actual expense ratio and an assumed rate of return of 5% per year before expenses, which is
not the Fund’s actual return. The hypothetical account values and expenses may not be used to estimate the actual ending account balance or expenses you paid for the period. You may use this information to
compare the ongoing costs of investing in the Fund and other funds. To do so, compare this 5% hypothetical example with the 5% hypothetical examples that appear in the shareholder reports of the other funds.
Please note that the
expenses shown in the table are meant to highlight your ongoing costs only and do not reflect any transactional costs such as brokerage commissions. Therefore, the second line in the table is useful in comparing
ongoing costs only, and will not help you determine the relative total costs of owning different funds. In addition, if these transactional costs were included, your costs would have been higher.
|
| Beginning
Account Value
October 1, 2022
| Ending
Account Value
March 31, 2023
| Annualized
Expense Ratio
Based on the
Six-Month
Period
| Expenses Paid
During the
Six-Month
Period (a)
|
| First Trust Indxx Medical Devices ETF (MDEV)
|
| Actual
| $1,000.00
| $1,251.70
| 0.70%
| $3.93
|
| Hypothetical (5% return before expenses)
| $1,000.00
| $1,021.44
| 0.70%
| $3.53
|
| (a)
| Expenses are equal to the annualized expense ratios as indicated in the table multiplied by the average account value over the period (October 1, 2022 through
March 31, 2023), multiplied by 182/365 (to reflect the six-month period).
|
First Trust Indxx Medical Devices
ETF (MDEV)
Portfolio of Investments
March 31, 2023
| Shares
|
| Description
|
| Value
|
| COMMON STOCKS – 99.7%
|
|
|
| Biotechnology – 3.7%
|
|
|
| 1,104
|
| Exact Sciences Corp. (a)
|
| $74,862
|
|
|
| Health Care Equipment &
Supplies – 74.6%
|
|
|
| 332
|
| Abbott Laboratories
|
| 33,618
|
| 574
|
| Alcon, Inc. (b)
|
| 40,747
|
| 166
|
| Align Technology, Inc. (a)
|
| 55,467
|
| 615
|
| Baxter International, Inc.
|
| 24,944
|
| 149
|
| Becton Dickinson and Co.
|
| 36,883
|
| 419
|
| BioMerieux (b)
|
| 44,169
|
| 838
|
| Boston Scientific Corp. (a)
|
| 41,925
|
| 296
|
| Carl Zeiss Meditec AG (b)
|
| 41,230
|
| 274
|
| Cochlear Ltd. (b)
|
| 43,621
|
| 328
|
| Coloplast A.S., Class B (b)
|
| 43,187
|
| 135
|
| Cooper (The) Cos., Inc.
|
| 50,404
|
| 1,263
|
| Demant A.S. (a) (b)
|
| 44,339
|
| 1,177
|
| DENTSPLY SIRONA, Inc.
|
| 46,233
|
| 344
|
| DexCom, Inc. (a)
|
| 39,966
|
| 407
|
| Edwards Lifesciences Corp. (a)
|
| 33,671
|
| 3,209
|
| Fisher & Paykel Healthcare Corp., Ltd. (b)
|
| 53,645
|
| 551
|
| Globus Medical, Inc., Class A (a)
|
| 31,209
|
| 536
|
| Hologic, Inc. (a)
|
| 43,255
|
| 294
|
| Hoya Corp. (b)
|
| 32,491
|
| 152
|
| Insulet Corp. (a)
|
| 48,482
|
| 183
|
| Intuitive Surgical, Inc. (a)
|
| 46,751
|
| 2,549
|
| Koninklijke Philips N.V. (b)
|
| 46,817
|
| 253
|
| Masimo Corp. (a)
|
| 46,689
|
| 411
|
| Medtronic PLC
|
| 33,135
|
| 458
|
| Novocure Ltd. (a)
|
| 27,544
|
| 1,640
|
| Olympus Corp. (b)
|
| 28,803
|
| 158
|
| ResMed, Inc.
|
| 34,600
|
| 788
|
| Siemens Healthineers AG (b) (c) (d)
|
| 45,430
|
| 2,981
|
| Smith & Nephew PLC (b)
|
| 41,438
|
| 151
|
| Sonova Holding AG (b)
|
| 44,543
|
| 202
|
| STERIS PLC
|
| 38,639
|
| 357
|
| Straumann Holding AG (b)
|
| 53,545
|
| 160
|
| Stryker Corp.
|
| 45,675
|
| 678
|
| Sysmex Corp. (b)
|
| 44,498
|
| 171
|
| Teleflex, Inc.
|
| 43,316
|
| 1,130
|
| Terumo Corp. (b)
|
| 30,561
|
| 313
|
| Zimmer Biomet Holdings, Inc.
|
| 40,440
|
|
|
|
|
| 1,521,910
|
|
|
| Health Care Providers &
Services – 2.4%
|
|
|
| 1,391
|
| Amplifon S.p.A. (b)
|
| 48,213
|
|
|
| Life Sciences Tools &
Services – 19.0%
|
|
|
| 267
|
| Agilent Technologies, Inc.
|
| 36,937
|
| 85
|
| Bio-Rad Laboratories, Inc., Class A (a)
|
| 40,717
|
| 132
|
| Danaher Corp.
|
| 33,269
|
| Shares
|
| Description
|
| Value
|
|
|
|
|
| Life Sciences Tools &
Services (Continued)
|
|
|
| 30
|
| Mettler-Toledo International, Inc. (a)
|
| $45,906
|
| 279
|
| PerkinElmer, Inc.
|
| 37,180
|
| 102
|
| Sartorius Stedim Biotech (b)
|
| 31,293
|
| 67
|
| Thermo Fisher Scientific, Inc.
|
| 38,617
|
| 123
|
| Waters Corp. (a)
|
| 38,084
|
| 135
|
| West Pharmaceutical Services, Inc.
|
| 46,773
|
| 3,752
|
| WuXi AppTec Co., Ltd.,
Class H (b) (c) (d)
|
| 39,294
|
|
|
|
|
| 388,070
|
|
|
| Total Investments – 99.7%
|
| 2,033,055
|
|
|
| (Cost $2,636,776)
|
|
|
|
|
| Net Other Assets and Liabilities – 0.3%
|
| 6,420
|
|
|
| Net Assets – 100.0%
|
| $2,039,475
|
| (a)
| Non-income producing security.
|
| (b)
| This security is fair valued by the Advisor’s Pricing Committee in accordance with procedures approved by the Trust’s Board of Trustees and in accordance with provisions
of the Investment Company Act of 1940 and rules thereunder, as amended. At March 31, 2023, securities noted as such are valued at $797,864 or 39.1% of net assets. Certain of these securities are fair valued using a
factor provided by a third-party pricing service due to the change in value between the foreign markets’ close and the New York Stock Exchange close exceeding a certain threshold. On days when this threshold is
not exceeded, these securities are typically valued at the last sale price on the exchange on which they are principally traded.
|
| (c)
| This security may be resold to qualified foreign investors and foreign institutional buyers under Regulation S of the Securities Act of 1933, as amended (the “1933 Act”).
|
| (d)
| This security is exempt from registration upon resale under Rule 144A of the 1933 Act and may be resold in transactions exempt from registration, normally to
qualified institutional buyers. This security is not restricted on the foreign exchange where it trades freely without any additional registration. As such, it does not require the additional disclosure required of
restricted securities.
|
Page 6
See Notes to Financial
Statements
First Trust Indxx Medical Devices
ETF (MDEV)
Portfolio of Investments
(Continued)
March 31, 2023
Currency Exposure
Diversification
| % of Total
Investments
|
| United States Dollar
| 60.8%
|
| Euro
| 12.7
|
| Swiss Franc
| 6.8
|
| Japanese Yen
| 6.7
|
| Danish Krone
| 4.3
|
| New Zealand Dollar
| 2.6
|
| Australian Dollar
| 2.2
|
| British Pound Sterling
| 2.0
|
| Hong Kong Dollar
| 1.9
|
| Total
| 100.0%
|
Valuation Inputs
A summary of the inputs
used to value the Fund’s investments as of March 31, 2023 is as follows (see Note 2A - Portfolio Valuation in the Notes to Financial Statements):
|
| Total
Value at
3/31/2023
| Level 1
Quoted
Prices
| Level 2
Significant
Observable
Inputs
| Level 3
Significant
Unobservable
Inputs
|
| Common Stocks:
|
|
|
|
|
| Biotechnology
| $ 74,862
| $ 74,862
| $ —
| $ —
|
| Health Care Equipment & Supplies
| 1,521,910
| 842,846
| 679,064
| —
|
| Health Care Providers & Services
| 48,213
| —
| 48,213
| —
|
| Life Sciences Tools & Services
| 388,070
| 317,483
| 70,587
| —
|
| Total Investments
| $ 2,033,055
| $ 1,235,191
| $ 797,864
| $—
|
See Notes to Financial Statements
Page 7
First Trust Indxx Medical Devices
ETF (MDEV)
Statement of Assets and
Liabilities
March 31, 2023
| ASSETS:
|
|
Investments, at value
(Cost $2,636,776)
| $ 2,033,055
|
Cash
| 3,995
|
| Receivables:
|
|
Dividends
| 2,524
|
Dividend reclaims
| 1,062
|
Total Assets
| 2,040,636
|
| LIABILITIES:
|
|
Investment advisory fees payable
| 1,161
|
Total Liabilities
| 1,161
|
NET ASSETS
| $2,039,475
|
| NET ASSETS consist of:
|
|
Paid-in capital
| $ 2,835,932
|
Par value
| 1,000
|
Accumulated distributable earnings (loss)
| (797,457)
|
NET ASSETS
| $2,039,475
|
NET ASSET VALUE, per share
| $20.39
|
Number of shares outstanding (unlimited number of shares authorized, par value $0.01 per share)
| 100,002
|
Page 8
See Notes to Financial Statements
First Trust Indxx Medical Devices
ETF (MDEV)
Statement of Operations
For the Year Ended March
31, 2023
| INVESTMENT INCOME:
|
|
Dividends
| $ 15,024
|
Foreign withholding tax
| (998)
|
Other
| 10
|
Total investment income
| 14,036
|
| EXPENSES:
|
|
Investment advisory fees
| 13,307
|
Total expenses
| 13,307
|
NET INVESTMENT INCOME (LOSS)
| 729
|
| NET REALIZED AND UNREALIZED GAIN (LOSS):
|
|
| Net realized gain (loss) on:
|
|
Investments
| (175,015)
|
Foreign currency transactions
| (1,049)
|
Net realized gain (loss)
| (176,064)
|
| Net change in unrealized appreciation (depreciation) on:
|
|
Investments
| (27,552)
|
Foreign currency translation
| (16)
|
Net change in unrealized appreciation (depreciation)
| (27,568)
|
NET REALIZED AND UNREALIZED GAIN (LOSS)
| (203,632)
|
NET INCREASE (DECREASE) IN NET ASSETS RESULTING FROM OPERATIONS
| $(202,903)
|
See Notes to Financial Statements
Page 9
First Trust Indxx Medical Devices
ETF (MDEV)
Statements of Changes in
Net Assets
|
| Year
Ended
3/31/2023
|
| Period
Ended
3/31/2022 (a)
|
| OPERATIONS:
|
|
|
|
Net investment income (loss)
| $ 729
|
| $ (46,130)
|
Net realized gain (loss)
| (176,064)
|
| 131,318
|
Net change in unrealized appreciation (depreciation)
| (27,568)
|
| (576,197)
|
Net increase (decrease) in net assets resulting from operations
| (202,903)
|
| (491,009)
|
| SHAREHOLDER TRANSACTIONS:
|
|
|
|
Proceeds from shares sold
| —
|
| 40,832,103
|
Cost of shares redeemed
| —
|
| (38,098,716)
|
Net increase (decrease) in net assets resulting from shareholder transactions
| —
|
| 2,733,387
|
Total increase (decrease) in net assets
| (202,903)
|
| 2,242,378
|
| NET ASSETS:
|
|
|
|
Beginning of period
| 2,242,378
|
| —
|
End of period
| $2,039,475
|
| $2,242,378
|
| CHANGES IN SHARES OUTSTANDING:
|
|
|
|
Shares outstanding, beginning of period
| 100,002
|
| —
|
Shares sold
| —
|
| 1,600,002
|
Shares redeemed
| —
|
| (1,500,000)
|
Shares outstanding, end of period
| 100,002
|
| 100,002
|
| (a)
| Inception date is June 22, 2021, which is consistent with the commencement of investment operations and is the date the initial creation units were established.
|
Page 10
See Notes to Financial Statements
First Trust Indxx Medical Devices
ETF (MDEV)
Financial Highlights
For a share outstanding
throughout each period
|
| Year Ended
3/31/2023
|
| Period
Ended
3/31/2022 (a)
|
Net asset value, beginning of period
| $ 22.42
|
| $ 25.17
|
| Income from investment operations:
|
|
|
|
Net investment income (loss)
| 0.01
|
| (0.46)
|
Net realized and unrealized gain (loss)
| (2.04)
|
| (2.29)
|
Total from investment operations
| (2.03)
|
| (2.75)
|
Net asset value, end of period
| $20.39
|
| $22.42
|
Total return (b)
| (9.05)%
|
| (10.93)%
|
| Ratios to average net assets/supplemental data:
|
|
|
|
Net assets, end of period (in 000’s)
| $ 2,039
|
| $ 2,242
|
Ratio of total expenses to average net assets
| 0.70%
|
| 0.70% (c)
|
Ratio of net investment income (loss) to average net assets
| 0.04%
|
| (0.36)% (c)
|
Portfolio turnover rate (d)
| 22%
|
| 13%
|
| (a)
| Inception date is June 22, 2021, which is consistent with the commencement of investment operations and is the date the initial creation units were established.
|
| (b)
| Total return is calculated assuming an initial investment made at the net asset value at the beginning of the period, reinvestment of all distributions at net asset value during the
period, and redemption at net asset value on the last day of the period. The returns presented do not reflect the deduction of taxes that a shareholder would pay on Fund distributions or the redemption or sale of Fund
shares. Total return is calculated for the time period presented and is not annualized for periods of less than a year.
|
| (c)
| Annualized.
|
| (d)
| Portfolio turnover is calculated for the time period presented and is not annualized for periods of less than a year and does not include securities received or
delivered from processing creations or redemptions and in-kind transactions.
|
See Notes to Financial Statements
Page 11
Notes to Financial Statements
First Trust Indxx
Medical Devices ETF (MDEV)
March 31, 2023
1. Organization
First Trust
Exchange-Traded Fund VI (the “Trust”) is an open-end management investment company organized as a Massachusetts business trust on June 4, 2012, and is registered with the Securities and Exchange Commission
under the Investment Company Act of 1940, as amended (the “1940 Act”).
The Trust currently
consists of thirty-three funds that are offering shares. This report covers the First Trust Indxx Medical Devices ETF (the “Fund”), a non-diversified series of the Trust, which trades under the ticker
“MDEV” on the CBOE BZX Exchange, Inc. Unlike conventional mutual funds, the Fund issues and redeems shares on a continuous basis, at net asset value (“NAV”), only in large blocks of shares
known as “Creation Units.”
The investment objective
of the Fund seeks investment results that correspond generally to the price and yield (before the Fund’s fees and expenses) of an index called the Indxx Global Medical Equipment Index. Under normal market
conditions, the Fund seeks to achieve its investment objective by investing at least 80% of its net assets (plus any borrowings for investment purposes) in the common stocks and depositary receipts that comprise the
Index. There can be no assurances that the Fund will achieve its investment objective. The Fund may not be appropriate for all investors.
2. Significant
Accounting Policies
The Fund is considered an
investment company and follows accounting and reporting guidance under Financial Accounting Standards Board Accounting Standards Codification Topic 946, “Financial Services-Investment Companies.” The
following is a summary of significant accounting policies consistently followed by the Fund in the preparation of the financial statements. The preparation of the financial statements in accordance with accounting
principles generally accepted in the United States of America (“U.S. GAAP”) requires management to make estimates and assumptions that affect the reported amounts and disclosures in the financial
statements. Actual results could differ from those estimates.
A. Portfolio
Valuation
The Fund’s NAV is
determined daily as of the close of regular trading on the New York Stock Exchange (“NYSE”), normally 4:00 p.m. Eastern time, on each day the NYSE is open for trading. If the NYSE closes early on a
valuation day, the NAV is determined as of that time. Foreign securities are priced using data reflecting the earlier closing of the principal markets for those securities. The Fund’s NAV is calculated by
dividing the value of all assets of the Fund (including accrued interest and dividends), less all liabilities (including accrued expenses and dividends declared but unpaid), by the total number of shares
outstanding.
The Fund’s
investments are valued daily at market value or, in the absence of market value with respect to any portfolio securities, at fair value. Market value prices represent readily available market quotations such as last
sale or official closing prices from a national or foreign exchange (i.e., a regulated market) and are primarily obtained from third-party pricing services. Fair value prices represent any prices not considered market
value prices and are either obtained from a third-party pricing service or are determined by the Pricing Committee of the Fund’s investment advisor, First Trust Advisors L.P. (“First Trust” or the
“Advisor”), in accordance with valuation procedures approved by the Trust’s Board of Trustees, and in accordance with provisions of the 1940 Act and rules thereunder. Investments valued by the
Advisor’s Pricing Committee, if any, are footnoted as such in the footnotes to the Portfolio of Investments. The Fund’s investments are valued as follows:
Common
stocks and other equity securities listed on any national or foreign exchange (excluding Nasdaq and the London Stock Exchange Alternative Investment Market (“AIM”)) are valued at the last sale price on the
exchange on which they are principally traded or, for Nasdaq and AIM securities, the official closing price. Securities traded on more than one securities exchange are valued at the last sale price or official closing
price, as applicable, at the close of the securities exchange representing the primary exchange for such securities.
Securities trading on foreign exchanges or over-the-counter markets that close prior to the NYSE close may be valued using a systematic fair valuation model provided by a third-party pricing service. If these
foreign securities meet certain criteria in relation to the valuation model, their valuation is systematically adjusted to reflect the impact of movement in the U.S. market after the close of the foreign markets.
Securities traded in an over-the-counter market are valued at the mean of their most recent bid and asked price, if available, and otherwise at their last trade price.
Certain securities may
not be able to be priced by pre-established pricing methods. Such securities may be valued by the Advisor’s Pricing Committee at fair value. These securities generally include, but are not limited to, restricted
securities (securities which may not be publicly sold without registration under the Securities Act of 1933, as amended) for which a third-party pricing service is unable to provide a market price; securities whose
trading has been formally suspended; a security whose market or fair value price is not
Notes to Financial Statements (Continued)
First Trust Indxx
Medical Devices ETF (MDEV)
March 31, 2023
available from a pre-established pricing
source; a security with respect to which an event has occurred that is likely to materially affect the value of the security after the market has closed but before the calculation of the Fund’s NAV or make it
difficult or impossible to obtain a reliable market quotation; and a security whose price, as provided by the third-party pricing service, does not reflect the security’s fair value. As a general principle, the
current fair value of a security would appear to be the amount which the owner might reasonably expect to receive for the security upon its current sale. When fair value prices are used, generally they will differ
from market quotations or official closing prices on the applicable exchanges. A variety of factors may be considered in determining the fair value of such securities, including, but not limited to, the following:
| 1)
| the last sale price on the exchange on which they are principally traded or, for Nasdaq and AIM securities, the official closing price;
|
| 2)
| the type of security;
|
| 3)
| the size of the holding;
|
| 4)
| the initial cost of the security;
|
| 5)
| transactions in comparable securities;
|
| 6)
| price quotes from dealers and/or third-party pricing services;
|
| 7)
| relationships among various securities;
|
| 8)
| information obtained by contacting the issuer, analysts, or the appropriate stock exchange;
|
| 9)
| an analysis of the issuer’s financial statements;
|
| 10)
| the existence of merger proposals or tender offers that might affect the value of the security; and
|
| 11)
| other relevant factors.
|
If the securities in
question are foreign securities, the following additional information may be considered:
| 1)
| the value of similar foreign securities traded on other foreign markets;
|
| 2)
| ADR trading of similar securities;
|
| 3)
| closed-end fund or exchange-traded fund trading of similar securities;
|
| 4)
| foreign currency exchange activity;
|
| 5)
| the trading prices of financial products that are tied to baskets of foreign securities;
|
| 6)
| factors relating to the event that precipitated the pricing problem;
|
| 7)
| whether the event is likely to recur;
|
| 8)
| whether the effects of the event are isolated or whether they affect entire markets, countries or regions; and
|
| 9)
| other relevant factors.
|
In addition, differences
between the prices used to calculate a Fund’s NAV and the prices used by such Fund’s corresponding index could result in a difference between a Fund’s performance and the performance of its
underlying index.
Because foreign markets
may be open on different days than the days during which investors may transact in the shares of the Fund, the value of the Fund’s securities may change on the days when investors are not able to transact in the
shares of the Fund. The value of securities denominated in foreign currencies is converted into U.S. dollars using exchange rates determined daily as of the close of regular trading on the NYSE. Any use of a different
rate from the rates used by a relevant index may adversely affect the Fund’s ability to track the index.
The Fund is subject to
fair value accounting standards that define fair value, establish the framework for measuring fair value and provide a three-level hierarchy for fair valuation based upon the inputs to the valuation as of the
measurement date. The three levels of the fair value hierarchy are as follows:
| •
| Level 1 – Level 1 inputs are quoted prices in active markets for identical investments. An active market is a market in which transactions for the investment occur with sufficient frequency and
volume to provide pricing information on an ongoing basis.
|
| •
| Level 2 – Level 2 inputs are observable inputs, either directly or indirectly, and include the following:
|
| o
| Quoted prices for similar investments in active markets.
|
| o
| Quoted prices for identical or similar investments in markets that are non-active. A non-active market is a market where there are few transactions for the investment, the prices are not current, or
price quotations vary substantially either over time or among market makers, or in which little information is released publicly.
|
| o
| Inputs other than quoted prices that are observable for the investment (for example, interest rates and yield curves observable at commonly quoted intervals, volatilities, prepayment speeds, loss
severities, credit risks, and default rates).
|
Notes to Financial Statements (Continued)
First Trust Indxx
Medical Devices ETF (MDEV)
March 31, 2023
| o
| Inputs that are derived principally from or corroborated by observable market data by correlation or other means.
|
| •
| Level 3 – Level 3 inputs are unobservable inputs. Unobservable inputs may reflect the reporting entity’s own assumptions about the assumptions that market participants would use in pricing
the investment.
|
The inputs or
methodologies used for valuing investments are not necessarily an indication of the risk associated with investing in those investments. A summary of the inputs used to value the Fund’s investments as of March
31, 2023, is included with the Fund’s Portfolio of Investments.
B. Securities
Transactions and Investment Income
Securities transactions
are recorded as of the trade date. Realized gains and losses from securities transactions are recorded on the identified cost basis. Dividend income is recorded on the ex-dividend date. Interest income, if any, is
recorded on the accrual basis.
Withholding taxes and tax
reclaims on foreign dividends have been provided for in accordance with the Fund’s understanding of the applicable country’s tax rules and rates.
C. Foreign
Currency
The books and records of
the Fund are maintained in U.S. dollars. Foreign currencies, investments and other assets and liabilities are translated into U.S. dollars at the exchange rates prevailing at the end of the period. Purchases and sales
of investments and items of income and expense are translated on the respective dates of such transactions. Unrealized gains and losses on assets and liabilities, other than investments in securities, which result
from changes in foreign currency exchange rates have been included in “Net change in unrealized appreciation (depreciation) on foreign currency translation” on the Statement of Operations. Unrealized gains
and losses on investments in securities which result from changes in foreign exchange rates are included with fluctuations arising from changes in market price and are shown in “Net change in unrealized
appreciation (depreciation) on investments” on the Statement of Operations. Net realized foreign currency gains and losses include the effect of changes in exchange rates between trade date and settlement date
on investment security transactions, foreign currency transactions and interest and dividends received and are shown in “Net realized gain (loss) on foreign currency transactions” on the Statement of
Operations. The portion of foreign currency gains and losses related to fluctuation in exchange rates between the initial purchase settlement date and subsequent sale trade date is included in “Net realized gain
(loss) on investments” on the Statement of Operations.
D. Dividends and
Distributions to Shareholders
Dividends from net
investment income, if any, are declared and paid quarterly by the Fund, or as the Board of Trustees may determine from time to time. Distributions of net realized capital gains earned by the Fund, if any, are
distributed at least annually. The Fund may also designate a portion of the amount paid to redeeming shareholders as a distribution for tax purposes.
Distributions from net
investment income and realized capital gains are determined in accordance with federal income tax regulations, which may differ from U.S. GAAP. Certain capital accounts in the financial statements are periodically
adjusted for permanent differences in order to reflect their tax character. These permanent differences are primarily due to the varying treatment of income and gain/loss on portfolio securities held by the Fund and
have no impact on net assets or NAV per share. Temporary differences, which arise from recognizing certain items of income, expense and gain/loss in different periods for financial statement and tax purposes, will
reverse at some time in the future.
During the fiscal periods
ended March 31, 2023 and 2022, no distributions were paid by the Fund.
As of March 31, 2023, the
components of distributable earnings on a tax basis for the Fund were as follows:
Undistributed ordinary income
| $—
|
Accumulated capital and other gain (loss)
| (186,936)
|
Net unrealized appreciation (depreciation)
| (610,521)
|
E. Income Taxes
The Fund intends to
continue to qualify as a regulated investment company by complying with the requirements under Subchapter M of the Internal Revenue Code of 1986, as amended, which includes distributing substantially all of its net
investment income and net realized gains to shareholders. Accordingly, no provision has been made for federal and state income taxes. However, due to the timing and amount of distributions, the Fund may be subject to
an excise tax of 4% of the amount by which approximately 98% of the Fund’s taxable income exceeds the distributions from such taxable income for the calendar year.
Notes to Financial Statements (Continued)
First Trust Indxx
Medical Devices ETF (MDEV)
March 31, 2023
The Fund is subject to
accounting standards that establish a minimum threshold for recognizing, and a system for measuring, the benefits of a tax position taken or expected to be taken in a tax return. Taxable periods ended 2022 and 2023
remain open to federal and state audit. As of March 31, 2023, management has evaluated the application of these standards to the Fund and has determined that no provision for income tax is required in the Fund’s
financial statements for uncertain tax positions.
The Fund intends to
utilize provisions of the federal income tax laws, which allow it to carry a realized capital loss forward indefinitely following the year of the loss and offset such loss against any future realized capital gains.
The Fund is subject to certain limitations under U.S. tax rules on the use of capital loss carryforwards and net unrealized built-in losses. These limitations apply when there has been a 50% change in ownership. At
March 31, 2023, for federal income tax purposes, the Fund had $186,936 of non-expiring capital loss carryforwards available, to the extent provided by regulations, to offset future capital gains.
In order to present
paid-in capital and accumulated distributable earnings (loss) (which consists of accumulated net investment income (loss), accumulated net realized gain (loss) on investments and net unrealized appreciation
(depreciation) on investments) on the Statement of Assets and Liabilities that more closely represent their tax character, certain adjustments have been made to paid-in capital, accumulated net investment income
(loss) and accumulated net realized gain (loss) on investments. These adjustments are primarily due to the difference between book and tax treatments of income and gains on various investment securities held by the
Fund. The results of operations and net assets were not affected by these adjustments. For the fiscal year ended March 31, 2023, the adjustments for the Fund were as follows:
Accumulated
Net Investment
Income (Loss)
|
| Accumulated
Net Realized
Gain (Loss)
on Investments
|
| Paid-in
Capital
|
| $4,157
|
| $1,049
|
| $(5,206)
|
As of March 31, 2023, the
aggregate cost, gross unrealized appreciation, gross unrealized depreciation, and net unrealized appreciation/(depreciation) on investments (including short positions and derivatives, if any) for federal income tax
purposes were as follows:
| Tax Cost
|
| Gross
Unrealized
Appreciation
|
| Gross
Unrealized
(Depreciation)
|
| Net Unrealized
Appreciation
(Depreciation)
|
| $2,643,532
|
| $13,619
|
| $(624,096)
|
| $(610,477)
|
F. Expenses
Expenses, other than the
investment advisory fee and other excluded expenses, are paid by the Advisor (See Note 3).
First Trust has entered
into a license agreement with Indxx, Inc. (the “Licensor”), for the Fund. The license agreement allows for the use by First Trust of the Fund’s index and of certain trademarks and trade names of the
Licensor. The Fund is a sub-licensee to the applicable agreement.
3. Investment
Advisory Fee, Affiliated Transactions and Other Fee Arrangements
First Trust, the
investment advisor to the Fund, is a limited partnership with one limited partner, Grace Partners of DuPage L.P., and one general partner, The Charger Corporation. The Charger Corporation is an Illinois corporation
controlled by James A. Bowen, Chief Executive Officer of First Trust. First Trust is responsible for the selection and ongoing monitoring of the securities in the Fund’s portfolio, managing the Fund’s
business affairs and providing certain administrative services necessary for the management of the Fund.
Pursuant to the
Investment Management Agreement between the Trust, on behalf of the Fund, and the Advisor, First Trust manages the investment of the Fund’s assets and is responsible for the Fund’s expenses, including the
cost of transfer agency, custody, fund administration, licensing fees, legal, audit and other services, but excluding fee payments under the Investment Management Agreement, interest, taxes, brokerage commissions and
other expenses connected with the execution of portfolio transactions, distribution and service fees pursuant to a Rule 12b-1 plan, if any, expenses attributable to investments in other investment companies
(“acquired fund fees and expenses”), expenses associated with short sales transactions and extraordinary expenses. First Trust also provides fund reporting services to the Fund for a flat annual fee in the
amount of $9,250, which is covered under the annual unitary
Notes to Financial Statements (Continued)
First Trust Indxx
Medical Devices ETF (MDEV)
March 31, 2023
management fee. Effective November 1,
2022, the annual unitary management fee payable by the Fund to First Trust for these services will be reduced at certain levels of the Fund’s net assets (“breakpoints”) and calculated pursuant to the
schedule below:
| Breakpoints
|
|
|
|
|
| Fund net assets up to and including $2.5 billion
| 0.7000%
|
|
|
|
| Fund net assets greater than $2.5 billion up to and including $5 billion
| 0.6825%
|
|
|
|
| Fund net assets greater than $5 billion up to and including $7.5 billion
| 0.6650%
|
|
|
|
| Fund net assets greater than $7.5 billion up to and including $10 billion
| 0.6475%
|
|
|
|
| Fund net assets greater than $10 billion
| 0.6300%
|
|
|
|
Prior to November 1,
2022, the Fund paid First Trust an annual unitary management fee equal to 0.70% of its average daily net assets.
The Trust has multiple
service agreements with Brown Brothers Harriman & Co. (“BBH”). Under the service agreements, BBH performs custodial, fund accounting, certain administrative services, and transfer agency services for
the Fund. As custodian, BBH is responsible for custody of the Fund’s assets. As fund accountant and administrator, BBH is responsible for maintaining the books and records of the Fund’s securities and
cash. As transfer agent, BBH is responsible for maintaining shareholder records for the Fund.
Each Trustee who is not
an officer or employee of First Trust, any sub-advisor or any of their affiliates (“Independent Trustees”) is paid a fixed annual retainer that is allocated equally among each fund in the First Trust Fund
Complex. Each Independent Trustee is also paid an annual per fund fee that varies based on whether the fund is a closed-end or other actively managed fund, a target outcome fund or an index fund.
Additionally, the Lead
Independent Trustee and the Chairs of the Audit Committee, Nominating and Governance Committee and Valuation Committee are paid annual fees to serve in such capacities, with such compensation allocated pro rata among
each fund in the First Trust Fund Complex based on net assets. Independent Trustees are reimbursed for travel and out-of-pocket expenses in connection with all meetings. The Lead Independent Trustee and Committee
Chairs rotate every three years. The officers and “Interested” Trustee receive no compensation from the Trust for acting in such capacities.
4. Purchases and
Sales of Securities
For the fiscal year ended
March 31, 2023, the cost of purchases and proceeds from sales of investments, excluding short term investments and in-kind transactions, were $426,695 and $425,115, respectively.
For the fiscal year ended
March 31, 2023, the Fund had no in-kind transactions.
5. Creations,
Redemptions and Transaction Fees
The Fund generally issues
and redeems its shares in primary market transactions through a creation and redemption mechanism and does not sell or redeem individual shares. Instead, financial entities known as “Authorized
Participants” have contractual arrangements with the Fund or one of the Fund’s service providers to purchase and redeem Fund shares directly with the Fund in large blocks of shares known as “Creation
Units.” Prior to the start of trading on every business day, the Fund publishes through the National Securities Clearing Corporation (“NSCC”) the “basket” of securities, cash or other
assets that it will accept in exchange for a Creation Unit of the Fund’s shares. An Authorized Participant that wishes to effectuate a creation of the Fund’s shares deposits with the Fund the
“basket” of securities, cash or other assets identified by the Fund that day, and then receives the Creation Unit of the Fund’s shares in return for those assets. After purchasing a Creation Unit,
the Authorized Participant may continue to hold the Fund’s shares or sell them in the secondary market. The redemption process is the reverse of the purchase process: the Authorized Participant redeems a
Creation Unit of the Fund’s shares for a basket of securities, cash or other assets. The combination of the creation and redemption process with secondary market trading in the Fund’s shares and underlying
securities provides arbitrage opportunities that are designed to help keep the market price of the Fund’s shares at or close to the NAV per share of the Fund.
The Fund imposes fees in
connection with the purchase of Creation Units. These fees may vary based upon various fact-based circumstances, including, but not limited to, the composition of the securities included in the Creation Unit or the
countries in which the transactions are settled. The price for each Creation Unit will equal the daily NAV per share of the Fund times the number of shares in a Creation Unit, plus the fees described above and, if
applicable, any operational processing and brokerage costs, transfer fees, stamp taxes and part or all of the spread between the expected bid and offer side of the market related to the securities comprising the
creation basket.
The Fund also imposes
fees in connection with the redemption of Creation Units. These fees may vary based upon various fact-based circumstances, including, but not limited to, the composition of the securities included in the Creation Unit
or the countries in which
Notes to Financial Statements (Continued)
First Trust Indxx
Medical Devices ETF (MDEV)
March 31, 2023
the transactions are settled. The price
received for each Creation Unit will equal the daily NAV per share of the Fund times the number of shares in a Creation Unit, minus the fees described above and, if applicable, any operational processing and brokerage
costs, transfer fees, stamp taxes and part or all of the spread between the expected bid and offer side of the market related to the securities comprising the redemption basket. Investors who use the services of a
broker or other such intermediary in addition to an Authorized Participant to effect a redemption of a Creation Unit may also be assessed an amount to cover the cost of such services. The redemption fee charged by the
Fund will comply with Rule 22c-2 of the 1940 Act which limits redemption fees to no more than 2% of the value of the shares redeemed.
6. Distribution
Plan
The Board of Trustees
adopted a Distribution and Service Plan pursuant to Rule 12b-1 under the 1940 Act. In accordance with the Rule 12b-1 plan, the Fund is authorized to pay an amount up to 0.25% of its average daily net assets each year
to reimburse First Trust Portfolios L.P. (“FTP”), the distributor of the Fund, for amounts expended to finance activities primarily intended to result in the sale of Creation Units or to provide investor
services. FTP may also use this amount to compensate securities dealers or other persons that are Authorized Participants for providing distribution assistance, including broker-dealer and shareholder support and
educational and promotional services.
No 12b-1 fees are
currently paid by the Fund, and pursuant to a contractual arrangement, no 12b-1 fees will be paid any time before July 31, 2023.
7. Indemnification
The Trust, on behalf of
the Fund, has a variety of indemnification obligations under contracts with its service providers. The Trust’s maximum exposure under these arrangements is unknown. However, the Trust has not had prior claims or
losses pursuant to these contracts and expects the risk of loss to be remote.
8. Subsequent
Events
Management has evaluated
the impact of all subsequent events to the Fund through the date the financial statements were issued and has determined that there were no subsequent events requiring recognition or disclosure in the financial
statements that have not already been disclosed.
Report of Independent
Registered Public Accounting Firm
To the Shareholders and the
Board of Trustees of First Trust Exchange-Traded Fund VI:
Opinion on the Financial
Statements and Financial Highlights
We have audited the
accompanying statement of assets and liabilities of First Trust Indxx Medical Devices ETF (the “Fund”), a series of First Trust Exchange-Traded Fund VI, including the portfolio of investments, as of March
31, 2023, the related statement of operations for the year then ended, the statements of changes in net assets and the financial highlights for the year ended March 31, 2023, and for the period from June 22, 2021
(commencement of operations) through March 31, 2022, and the related notes. In our opinion, the financial statements and financial highlights present fairly, in all material respects, the financial position of the
Fund as of March 31, 2023, and the results of its operations for the year then ended, the changes in its net assets and the financial highlights for the year ended March 31, 2023, and for the period from June 22, 2021
(commencement of operations) through March 31, 2022, in conformity with accounting principles generally accepted in the United States of America.
Basis for Opinion
These financial
statements and financial highlights are the responsibility of the Fund’s management. Our responsibility is to express an opinion on the Fund’s financial statements and financial highlights based on our
audit. We are a public accounting firm registered with the Public Company Accounting Oversight Board (United States) (PCAOB) and are required to be independent with respect to the Fund in accordance with the U.S.
federal securities laws and the applicable rules and regulations of the Securities and Exchange Commission and the PCAOB.
We conducted our audit in
accordance with the standards of the PCAOB. Those standards require that we plan and perform the audit to obtain reasonable assurance about whether the financial statements and financial highlights are free of
material misstatement, whether due to error or fraud. The Fund is not required to have, nor were we engaged to perform, an audit of its internal control over financial reporting. As part of our audit we are required
to obtain an understanding of internal control over financial reporting but not for the purpose of expressing an opinion on the effectiveness of the Fund’s internal control over financial reporting. Accordingly,
we express no such opinion.
Our audit included
performing procedures to assess the risks of material misstatement of the financial statements and financial highlights, whether due to error or fraud, and performing procedures that respond to those risks. Such
procedures included examining, on a test basis, evidence regarding the amounts and disclosures in the financial statements and financial highlights. Our audit also included evaluating the accounting principles used
and significant estimates made by management, as well as evaluating the overall presentation of the financial statements and financial highlights. Our procedures included confirmation of securities owned as of March
31, 2023, by correspondence with the custodian and brokers; when replies were not received from brokers, we performed other auditing procedures. We believe that our audit provides a reasonable basis for our
opinion.
Chicago, Illinois
May 23, 2023
We have served as the
auditor of one or more First Trust investment companies since 2001.
Additional Information
First Trust Indxx
Medical Devices ETF (MDEV)
March 31, 2023
(Unaudited)
Proxy Voting Policies
and Procedures
A description of the
policies and procedures that the Trust uses to determine how to vote proxies and information on how the Fund voted proxies relating to portfolio securities during the most recent 12-month period ended June 30 is
available (1) without charge, upon request, by calling (800) 988-5891; (2) on the Fund’s website at www.ftportfolios.com; and (3) on the Securities and Exchange Commission’s (“SEC”) website at www.sec.gov.
Portfolio Holdings
The Fund files portfolio
holdings information for each month in a fiscal quarter within 60 days after the end of the relevant fiscal quarter on Form N-PORT. Portfolio holdings information for the third month of each fiscal quarter will be
publicly available on the SEC’s website at www.sec.gov. The Fund’s complete schedule of portfolio holdings for the second and fourth quarters of each fiscal year is included in the semi-annual and
annual reports to shareholders, respectively, and is filed with the SEC on Form N-CSR. The semi-annual and annual report for the Fund is available to investors within 60 days after the period to which it relates. The
Fund’s Forms N-PORT and Forms N-CSR are available on the SEC’s website listed above.
Risk Considerations
Risks are inherent in all
investing. Certain general risks that may be applicable to a Fund are identified below, but not all of the material risks relevant to each Fund are included in this report and not all of the risks below apply to each
Fund. The material risks of investing in each Fund are spelled out in its prospectus, statement of additional information and other regulatory filings. Before investing, you should consider each Fund’s
investment objective, risks, charges and expenses, and read each Fund’s prospectus and statement of additional information carefully. You can download each Fund’s prospectus at www.ftportfolios.com or
contact First Trust Portfolios L.P. at (800) 621-1675 to request a prospectus, which contains this and other information about each Fund.
Concentration Risk. To the extent that a fund is able to invest a significant percentage of its assets in a single asset class or the securities of issuers within the same country, state, region, industry or
sector, an adverse economic, business or political development may affect the value of the fund’s investments more than if the fund were more broadly diversified. A fund that tracks an index will be concentrated
to the extent the fund’s corresponding index is concentrated. A concentration makes a fund more susceptible to any single occurrence and may subject the fund to greater market risk than a fund that is more
broadly diversified.
Credit Risk. Credit risk is the risk that an issuer of a security will be unable or unwilling to make dividend, interest and/or principal payments when due and the related risk that the value of a
security may decline because of concerns about the issuer’s ability to make such payments.
Cyber Security Risk. The funds are susceptible to potential operational risks through breaches in cyber security. A breach in cyber security refers to both intentional and unintentional events that may cause a
fund to lose proprietary information, suffer data corruption or lose operational capacity. Such events could cause a fund to incur regulatory penalties, reputational damage, additional compliance costs associated with
corrective measures and/or financial loss. In addition, cyber security breaches of a fund’s third-party service providers, such as its administrator, transfer agent, custodian, or sub-advisor, as applicable, or
issuers in which the fund invests, can also subject a fund to many of the same risks associated with direct cyber security breaches.
Defined Outcome Funds
Risk. To the extent a fund’s investment strategy is designed to deliver returns tied to the price performance of an underlying ETF, an investor may not realize the returns the fund seeks
to achieve if that investor does not hold shares for the entire target outcome period. In the event an investor purchases shares after the first day of the target outcome period or sells shares prior to the end of the
target outcome period, the buffer that the fund seeks to provide against a decline in the value of the underlying ETF may not be available, the enhanced returns that the fund seeks to provide (if any) may not be
available and the investor may not participate in a gain in the value of the underlying ETF up to the cap for the investor’s investment period. Additionally, the fund will not participate in gains of the
underlying ETF above the cap and a shareholder may lose their entire investment. If the fund seeks enhanced returns, there are certain time periods when the value of the fund may fall faster than the value of the
underlying ETF, and it is very unlikely that, on any given day during which the underlying ETF share price increases in value, the fund’s share price will increase at the same rate as the enhanced returns sought
by the fund, which is designed for an entire target outcome period. Trading flexible exchange options involves risks different from, or possibly greater than, the risks associated with investing directly in
securities, such as less liquidity and correlation and valuation risks. A fund may experience substantial downside from specific flexible exchange option positions and certain positions may expire worthless.
Derivatives Risk. To the extent a fund uses derivative instruments such as futures contracts, options contracts and swaps, the fund may experience losses because of adverse movements in the price or value
of the underlying asset, index or rate, which may be magnified
Additional Information (Continued)
First Trust Indxx
Medical Devices ETF (MDEV)
March 31, 2023
(Unaudited)
by certain features of the derivative.
These risks are heightened when a fund’s portfolio managers use derivatives to enhance the fund’s return or as a substitute for a position or security, rather than solely to hedge (or offset) the risk of a
position or security held by the fund.
Equity Securities
Risk. To the extent a fund invests in equity securities, the value of the fund’s shares will fluctuate with changes in the value of the equity securities. Equity securities prices
fluctuate for several reasons, including changes in investors’ perceptions of the financial condition of an issuer or the general condition of the relevant stock market, such as market volatility, or when
political or economic events affecting the issuers occur. In addition, common stock prices may be particularly sensitive to rising interest rates, as the cost of capital rises and borrowing costs increase. Equity
securities may decline significantly in price over short or extended periods of time, and such declines may occur in the equity market as a whole, or they may occur in only a particular country, company, industry or
sector of the market.
ETF Risk. The shares of an ETF trade like common stock and represent an interest in a portfolio of securities. The risks of owning an ETF generally reflect the risks of owning the underlying
securities, although lack of liquidity in an ETF could result in it being more volatile and ETFs have management fees that increase their costs. Shares of an ETF trade on an exchange at market prices rather than net
asset value, which may cause the shares to trade at a price greater than net asset value (premium) or less than net asset value (discount). In times of market stress, decisions by market makers to reduce or step away
from their role of providing a market for an ETF’s shares, or decisions by an ETF’s authorized participants that they are unable or unwilling to proceed with creation and/or redemption orders of an
ETF’s shares, could result in shares of the ETF trading at a discount to net asset value and in greater than normal intraday bid-ask spreads.
Fixed Income Securities
Risk. To the extent a fund invests in fixed income securities, the fund will be subject to credit risk, income risk, interest rate risk, liquidity risk and prepayment risk. Income risk is the
risk that income from a fund’s fixed income investments could decline during periods of falling interest rates. Interest rate risk is the risk that the value of a fund’s fixed income securities will
decline because of rising interest rates. Liquidity risk is the risk that a security cannot be purchased or sold at the time desired, or cannot be purchased or sold without adversely affecting the price. Prepayment
risk is the risk that the securities will be redeemed or prepaid by the issuer, resulting in lower interest payments received by the fund. In addition to these risks, high yield securities, or “junk”
bonds, are subject to greater market fluctuations and risk of loss than securities with higher ratings, and the market for high yield securities is generally smaller and less liquid than that for investment grade
securities.
Index or Model Constituent
Risk. Certain funds may be a constituent of one or more indices or ETF models. As a result, such a fund may be included in one or more index-tracking exchange-traded funds or mutual funds. Being
a component security of such a vehicle could greatly affect the trading activity involving a fund, the size of the fund and the market volatility of the fund. Inclusion in an index could increase demand for the fund
and removal from an index could result in outsized selling activity in a relatively short period of time. As a result, a fund’s net asset value could be negatively impacted and the fund’s market price may
be significantly below its net asset value during certain periods. In addition, index rebalances may potentially result in increased trading activity in a fund’s shares.
Index Provider Risk. To the extent a fund seeks to track an index, it is subject to Index Provider Risk. There is no assurance that the Index Provider will compile the Index accurately, or that the Index will
be determined, maintained, constructed, reconstituted, rebalanced, composed, calculated or disseminated accurately. To correct any such error, the Index Provider may carry out an unscheduled rebalance or other
modification of the Index constituents or weightings, which may increase the fund’s costs. The Index Provider does not provide any representation or warranty in relation to the quality, accuracy or completeness
of data in the Index, and it does not guarantee that the Index will be calculated in accordance with its stated methodology. Losses or costs associated with any Index Provider errors generally will be borne by the
fund and its shareholders.
Investment Companies
Risk. To the extent a fund invests in the securities of other investment vehicles, the fund will incur additional fees and expenses that would not be present in a direct investment in those
investment vehicles. Furthermore, the fund’s investment performance and risks are directly related to the investment performance and risks of the investment vehicles in which the fund invests.
LIBOR Risk. To the extent a fund invests in floating or variable rate obligations that use the London Interbank Offered Rate (“LIBOR”) as a reference interest rate, it is subject to LIBOR
Risk. The United Kingdom’s Financial Conduct Authority, which regulates LIBOR has ceased making LIBOR available as a reference rate over a phase-out period that began December 31, 2021. There is no assurance
that any alternative reference rate, including the Secured Overnight Financing Rate (“SOFR”) will be similar to or produce the same value or economic equivalence as LIBOR or that instruments using an
alternative rate will have the same volume or liquidity. The unavailability or replacement of LIBOR may affect the value, liquidity or return on certain fund investments and may result in costs incurred in connection
with closing out positions and entering into new trades. Any potential effects of the transition away from LIBOR on the fund or on certain instruments in which the fund invests can be difficult to ascertain, and they
may vary depending on a variety of factors, and they could result in losses to the fund.
Additional Information (Continued)
First Trust Indxx
Medical Devices ETF (MDEV)
March 31, 2023
(Unaudited)
Management Risk. To the extent that a fund is actively managed, it is subject to management risk. In managing an actively-managed fund’s investment portfolio, the fund’s portfolio managers will
apply investment techniques and risk analyses that may not have the desired result. There can be no guarantee that a fund will meet its investment objective.
Market Risk. Market risk is the risk that a particular security, or shares of a fund in general, may fall in value. Securities held by a fund, as well as shares of a fund itself, are subject to
market fluctuations caused by factors such as general economic conditions, political events, regulatory or market developments, changes in interest rates and perceived trends in securities prices. Shares of
a fund could decline in value or underperform other investments as a result of the risk of loss associated with these market fluctuations. In addition, local, regional or global events such as war, acts of
terrorism, spread of infectious diseases or other public health issues, recessions, or other events could have a significant negative impact on a fund and its investments. Such events may affect certain
geographic regions, countries, sectors and industries more significantly than others. In February 2022, Russia invaded Ukraine which has caused and could continue to cause significant market disruptions and
volatility within the markets in Russia, Europe, and the United States. The hostilities and sanctions resulting from those hostilities could have a significant impact on certain fund investments as well as
fund performance. The COVID-19 global pandemic and the ensuing policies enacted by governments and central banks have caused and may continue to cause significant volatility and uncertainty in global
financial markets. While the U.S. has resumed “reasonably” normal business activity, many countries continue to impose lockdown measures. Additionally, there is no guarantee that vaccines will be
effective against emerging variants of the disease. These events also adversely affect the prices and liquidity of a fund’s portfolio securities or other instruments and could result in disruptions in the
trading markets. Any of such circumstances could have a materially negative impact on the value of a fund’s shares and result in increased market volatility. During any such events, a fund’s
shares may trade at increased premiums or discounts to their net asset value and the bid/ask spread on a fund’s shares may widen.
Non-U.S. Securities
Risk. To the extent a fund invests in non-U.S. securities, it is subject to additional risks not associated with securities of domestic issuers. Non-U.S. securities are subject to higher
volatility than securities of domestic issuers due to: possible adverse political, social or economic developments; restrictions on foreign investment or exchange of securities; capital controls; lack of liquidity;
currency exchange rates; excessive taxation; government seizure of assets; the imposition of sanctions by foreign governments; different legal or accounting standards; and less government supervision and regulation of
exchanges in foreign countries. Investments in non-U.S. securities may involve higher costs than investments in U.S. securities, including higher transaction and custody costs, as well as additional taxes imposed by
non-U.S. governments. These risks may be heightened for securities of companies located, or with significant operations, in emerging market countries.
Operational Risk. Each fund is subject to risks arising from various operational factors, including, but not limited to, human error, processing and communication errors, errors of a fund’s service
providers, counterparties or other third-parties, failed or inadequate processes and technology or systems failures. Each fund relies on third-parties for a range of services, including custody. Any delay or failure
relating to engaging or maintaining such service providers may affect a fund’s ability to meet its investment objective. Although the funds and the funds’ investment advisor seek to reduce these
operational risks through controls and procedures, there is no way to completely protect against such risks.
Passive Investment
Risk. To the extent a fund seeks to track an index, the fund will invest in the securities included in, or representative of, the index regardless of their investment merit. A fund generally
will not attempt to take defensive positions in declining markets.
Preferred Securities
Risk. Preferred securities combine some of the characteristics of both common stocks and bonds. Preferred securities are typically subordinated to bonds and other debt securities in a
company’s capital structure in terms of priority to corporate income, subjecting them to greater credit risk than those debt securities. Generally, holders of preferred securities have no voting rights with
respect to the issuing company unless preferred dividends have been in arrears for a specified number of periods, at which time the preferred security holders may obtain limited rights. In certain circumstances, an
issuer of preferred securities may defer payment on the securities and, in some cases, redeem the securities prior to a specified date. Preferred securities may also be substantially less liquid than other securities,
including common stock.
Valuation Risk. The valuation of certain securities may carry more risk than that of common stock. Uncertainties in the conditions of the financial markets, unreliable reference data, lack of transparency
and inconsistency of valuation models and processes may lead to inaccurate asset pricing. A fund may hold investments in sizes smaller than institutionally sized round lot positions (sometimes referred to as odd
lots). However, third-party pricing services generally provide evaluations on the basis of institutionally-sized round lots. If a fund sells certain of its investments in an odd lot transaction, the sale price may be
less than the value at which such securities
Additional Information (Continued)
First Trust Indxx
Medical Devices ETF (MDEV)
March 31, 2023
(Unaudited)
have been held by the fund. Odd lots
often trade at lower prices than institutional round lots. There is no assurance that the fund will be able to sell a portfolio security at the price established by the pricing service, which could result in a loss to
the fund.
| NOT FDIC INSURED
| NOT BANK GUARANTEED
| MAY LOSE VALUE
|
Advisory Agreement
Board Considerations
Regarding Approval of Amendement to the Investment Management Agreement
The Board of Trustees of
First Trust Exchange-Traded Fund VI (the “Trust”), including the Independent Trustees, unanimously approved the amendment (the “Amendment”) of the Investment Management Agreement (the
“Agreement”) with First Trust Advisors L.P. (the “Advisor”) on behalf of the First Trust Indxx Medical Devices ETF (the “Fund”).
The Board approved the
Amendment at a meeting held on October 24, 2022. As part of the review process, the Board reviewed information and had preliminary discussions with the Advisor regarding the proposed Amendment at meetings
held on April 18, 2022, June 12–13, 2022 and September 18–19, 2022. Following those preliminary discussions, the Board requested and received information from the Advisor regarding the
proposed Amendment, and that information was considered at an executive session of the Independent Trustees and their counsel held prior to the October 24, 2022 meeting, as well as at the October
meeting.
In reviewing the
Amendment, the Board considered that the purpose of the Amendment is to modify the unitary fee rate for the Fund under the Agreement by introducing a breakpoint schedule pursuant to which the unitary fee rate paid by
the Fund to the Advisor will be reduced as assets of the Fund meet certain thresholds. The Board noted the Advisor’s representations that the quality and quantity of the services provided to the Fund by
the Advisor under the Agreement will not be reduced or modified as a result of the Amendment, and that the obligations of the Advisor under the Agreement will remain the same in all respects.
The Board noted that it,
including the Independent Trustees, last approved the continuation of the Agreement for a one-year period ending June 30, 2023 at a meeting held on June 12–13, 2022. The Board noted that in
connection with such approval it had determined, based upon the information provided, that the terms of the Agreement were fair and reasonable and that the continuation of the Agreement was in the best interests of
the Fund in light of the nature, extent and quality of the services provided and such other matters as the Board considered to be relevant in the exercise of its business judgment.
Based on all of the
information considered, the Board, including the Independent Trustees, unanimously determined that the terms of the Amendment are fair and reasonable and that the Amendment is in the best interests of the
Fund.
Remuneration
First Trust Advisors L.P.
(“First Trust”) is authorised and regulated by the U.S. Securities and Exchange Commission and is entitled to market shares of certain funds it manages, including First Trust Indxx Medical Devices
ETF (the “Fund”), in certain member states in the European Economic Area in accordance with the cooperation arrangements in Article 42 of the Alternative Investment Fund Managers Directive (the
“Directive”). First Trust is required under the Directive to make disclosures in respect of remuneration. The following disclosures are made in line with First Trust’s interpretation of currently
available regulatory guidance on remuneration disclosures.
During the year ended
December 31, 2022, the amount of remuneration paid (or to be paid) by First Trust Advisors L.P. in respect of the Fund is $1,613. This figure is comprised of $63 paid (or to be paid) in fixed compensation and $1,550
paid (or to be paid) in variable compensation. There were a total of 24 beneficiaries of the remuneration described above. Those amounts include $851 paid (or to be paid) to senior management of First Trust Advisors
L.P. and $762 paid (or to be paid) to other employees whose professional activities have a material impact on the risk profiles of First Trust Advisors L.P. or the Fund (collectively, “Code Staff”).
Code Staff included in
the aggregated figures disclosed above are rewarded in line with First Trust’s remuneration policy (the “Remuneration Policy”) which is determined and implemented by First Trust’s senior
management. The Remuneration Policy reflects First Trust’s ethos of good governance and encapsulates the following principal objectives:
i. to
provide a clear link between remuneration and performance of First Trust and to avoid rewarding for failure;
ii. to
promote sound and effective risk management consistent with the risk profiles of the funds managed by First Trust; and
iii. to remunerate staff in line with the business strategy, objectives, values and interests of First Trust and the funds managed by First Trust in a manner that avoids conflicts of interest.
Additional Information (Continued)
First Trust Indxx
Medical Devices ETF (MDEV)
March 31, 2023
(Unaudited)
First Trust assesses
various risk factors which it is exposed to when considering and implementing remuneration for Code Staff and considers whether any potential award to such person(s) would give rise to a conflict of interest. First
Trust does not reward failure, or consider the taking of risk or failure to take risk in its remuneration of Code Staff.
First Trust assesses
performance for the purposes of determining payments in respect of performance-related remuneration of Code Staff by reference to a broad range of measures including (i) individual performance (using financial and
non-financial criteria), and (ii) the overall performance of First Trust. Remuneration is not based upon the performance of the Fund.
The elements of
remuneration are balanced between fixed and variable and the senior management sets fixed salaries at a level sufficient to ensure that variable remuneration incentivises and rewards strong individual performance but
does not encourage excessive risk taking.
No individual is involved
in setting his or her own remuneration.
Board of Trustees and Officers
First Trust Indxx
Medical Devices ETF (MDEV)
March 31, 2023
(Unaudited)
The following tables
identify the Trustees and Officers of the Trust. Unless otherwise indicated, the address of all persons is 120 East Liberty Drive, Suite 400, Wheaton, IL 60187.
The Trust’s
statement of additional information includes additional information about the Trustees and is available, without charge, upon request, by calling (800) 988-5891.
| Name, Year of Birth and Position with the Trust
| Term of Office and Year First Elected or Appointed
| Principal Occupations
During Past 5 Years
| Number of Portfolios in the First Trust Fund Complex Overseen by Trustee
| Other Trusteeships or Directorships Held by Trustee During Past 5 Years
|
| INDEPENDENT TRUSTEES
|
Richard E. Erickson, Trustee
(1951)
| • Indefinite Term
• Since Inception
| Physician, Edward-Elmhurst Medical Group; Physician and Officer, Wheaton Orthopedics (1990 to 2021)
| 228
| None
|
Thomas R. Kadlec, Trustee
(1957)
| • Indefinite Term
• Since Inception
| Retired; President, ADM Investor Services, Inc. (Futures Commission Merchant) (2010 to July 2022)
| 228
| Director, National Futures Association and ADMIS Singapore Ltd.; Formerly, Director of ADM Investor Services, Inc., ADM Investor Services International, ADMIS Hong Kong Ltd., and
Futures Industry Association
|
Denise M. Keefe, Trustee
(1964)
| • Indefinite Term
• Since 2021
| Executive Vice President, Advocate Aurora Health and President, Advocate Aurora Continuing Health Division (Integrated Healthcare System)
| 228
| Director and Board Chair of Advocate Home Health Services, Advocate Home Care Products and Advocate Hospice; Director and Board Chair of Aurora At Home (since 2018); Director of
Advocate Physician Partners Accountable Care Organization; Director and Board Chair of RML Long Term Acute Care Hospitals; and Director of Senior Helpers (since 2021)
|
Robert F. Keith, Trustee
(1956)
| • Indefinite Term
• Since Inception
| President, Hibs Enterprises (Financial and Management Consulting)
| 228
| Formerly, Director of Trust Company of Illinois
|
Niel B. Nielson, Trustee
(1954)
| • Indefinite Term
• Since Inception
| Senior Advisor (2018 to Present), Managing Director and Chief Operating Officer (2015 to 2018), Pelita Harapan Educational Foundation (Educational Products and
Services)
| 228
| None
|
| INTERESTED TRUSTEE
|
James A. Bowen(1), Trustee and
Chairman of the Board
(1955)
| • Indefinite Term
• Since Inception
| Chief Executive Officer, First Trust Advisors L.P. and First Trust Portfolios L.P.; Chairman of the Board of Directors, BondWave LLC (Software
Development Company) and Stonebridge Advisors LLC (Investment Advisor)
| 228
| None
|
| (1)
| Mr. Bowen is deemed an “interested person” of the Trust due to his position as CEO of First Trust Advisors L.P., investment advisor of the Trust.
|
Board of Trustees and Officers (Continued)
First Trust Indxx
Medical Devices ETF (MDEV)
March 31, 2023
(Unaudited)
| Name and Year of Birth
| Position and Offices with Trust
| Term of Office and Length of Service
| Principal Occupations
During Past 5 Years
|
| OFFICERS(2)
|
James M. Dykas
(1966)
| President and Chief Executive Officer
| • Indefinite Term
• Since 2016
| Managing Director and Chief Financial Officer, First Trust Advisors L.P. and First Trust Portfolios L.P.; Chief Financial Officer, BondWave LLC (Software Development Company) and
Stonebridge Advisors LLC (Investment Advisor)
|
Donald P. Swade
(1972)
| Treasurer, Chief Financial Officer and Chief Accounting Officer
| • Indefinite Term
• Since 2016
| Senior Vice President, First Trust Advisors L.P. and First Trust Portfolios L.P.
|
W. Scott Jardine
(1960)
| Secretary and Chief Legal Officer
| • Indefinite Term
• Since Inception
| General Counsel, First Trust Advisors L.P. and First Trust Portfolios L.P.; Secretary and General Counsel, BondWave LLC; Secretary, Stonebridge Advisors LLC
|
Daniel J. Lindquist
(1970)
| Vice President
| • Indefinite Term
• Since Inception
| Managing Director, First Trust Advisors L.P. and First Trust Portfolios L.P.
|
Kristi A. Maher
(1966)
| Chief Compliance Officer and Assistant Secretary
| • Indefinite Term
• Since Inception
| Deputy General Counsel, First Trust Advisors L.P. and First Trust Portfolios L.P.
|
Roger F. Testin
(1966)
| Vice President
| • Indefinite Term
• Since Inception
| Senior Vice President, First Trust Advisors L.P. and First Trust Portfolios L.P.
|
Stan Ueland
(1970)
| Vice President
| • Indefinite Term
• Since Inception
| Senior Vice President, First Trust Advisors L.P. and First Trust Portfolios L.P.
|
| (2)
| The term “officer” means the president, vice president, secretary, treasurer, controller or any other officer who performs a policy making function.
|
Privacy Policy
First Trust Indxx
Medical Devices ETF (MDEV)
March 31, 2023
(Unaudited)
Privacy Policy
First Trust values our
relationship with you and considers your privacy an important priority in maintaining that relationship. We are committed to protecting the security and confidentiality of your personal information.
Sources of Information
We collect nonpublic
personal information about you from the following sources:
| •
| Information we receive from you and your broker-dealer, investment professional or financial representative through interviews, applications, agreements or other forms;
|
| •
| Information about your transactions with us, our affiliates or others;
|
| •
| Information we receive from your inquiries by mail, e-mail or telephone; and
|
| •
| Information we collect on our website through the use of “cookies.” For example, we may identify the pages on our website that your browser requests or visits.
|
Information Collected
The type of data we
collect may include your name, address, social security number, age, financial status, assets, income, tax information, retirement and estate plan information, transaction history, account balance, payment history,
investment objectives, marital status, family relationships and other personal information.
Disclosure of
Information
We do not disclose any
nonpublic personal information about our customers or former customers to anyone, except as permitted by law. In addition to using this information to verify your identity (as required under law), the permitted uses
may also include the disclosure of such information to unaffiliated companies for the following reasons:
| •
| In order to provide you with products and services and to effect transactions that you request or authorize, we may disclose your personal information as described above to unaffiliated financial
service providers and other companies that perform administrative or other services on our behalf, such as transfer agents, custodians and trustees, or that assist us in the distribution of investor materials such as
trustees, banks, financial representatives, proxy services, solicitors and printers.
|
| •
| We may release information we have about you if you direct us to do so, if we are compelled by law to do so, or in other legally limited circumstances (for example to protect your
account from fraud).
|
In addition, in order to
alert you to our other financial products and services, we may share your personal information within First Trust.
Use of Website
Analytics
We currently use third
party analytics tools, Google Analytics and AddThis, to gather information for purposes of improving First Trust’s website and marketing our products and services to you. These tools employ cookies, which are
small pieces of text stored in a file by your web browser and sent to websites that you visit, to collect information, track website usage and viewing trends such as the number of hits, pages visited, videos and PDFs
viewed and the length of user sessions in order to evaluate website performance and enhance navigation of the website. We may also collect other anonymous information, which is generally limited to technical and
web navigation information such as the IP address of your device, internet browser type and operating system for purposes of analyzing the data to make First Trust’s website better and more useful to our users.
The information collected does not include any personal identifiable information such as your name, address, phone number or email address unless you provide that information through the website for us to
contact you in order to answer your questions or respond to your requests. To find out how to opt-out of these services click on: Google Analytics and AddThis.
Confidentiality and
Security
With regard to our
internal security procedures, First Trust restricts access to your nonpublic personal information to those First Trust employees who need to know that information to provide products or services to you. We maintain
physical, electronic and procedural safeguards to protect your nonpublic personal information.
Policy Updates and
Inquiries
As required by federal
law, we will notify you of our privacy policy annually. We reserve the right to modify this policy at any time, however, if we do change it, we will tell you promptly. For questions about our policy, or for additional
copies of this notice, please go to www.ftportfolios.com, or contact us at 1-800-621-1675 (First Trust Portfolios) or 1-800-222-6822 (First Trust Advisors).
March 2023
This page intentionally left blank
This page intentionally left blank
First Trust Exchange-Traded Fund VI
INVESTMENT ADVISOR
First Trust Advisors L.P.
120 East Liberty Drive, Suite
400
Wheaton, IL 60187
ADMINISTRATOR, CUSTODIAN,
FUND ACCOUNTANT &
TRANSFER AGENT
Brown Brothers Harriman &
Co.
50 Post Office Square
Boston, MA 02110
INDEPENDENT REGISTERED
PUBLIC ACCOUNTING FIRM
Deloitte & Touche LLP
111 S. Wacker Drive
Chicago, IL 60606
LEGAL COUNSEL
Chapman and Cutler LLP
320 South Canal Street
Chicago, IL 60606
Item 2. Code of Ethics.
| (a) | | The registrant, as of the end of the period covered by this report, has adopted a code of
ethics that applies to the registrant’s principal executive officer, principal financial officer, principal accounting officer
or controller, or persons performing similar functions, regardless of whether these individuals are employed by the registrant or a third
party. |
| (c) | | There have been no amendments, during the period covered by this report, to a provision of
the code of ethics that applies to the registrant’s principal executive officer, principal financial officer, principal accounting
officer or controller, or persons performing similar functions, regardless of whether these individuals are employed by the registrant
or a third party, and that relates to any element of the code of ethics description. |
| (d) | | The registrant, during the period covered by this report, has not granted any waivers, including
an implicit waiver, from a provision of the code of ethics that applies to the registrant’s principal executive officer, principal
financial officer, principal accounting officer or controller, or persons performing similar functions, regardless of whether these individuals
are employed by the registrant or a third party, that relates to one or more of the items set forth in paragraph (b) of this item’s
instructions. |
| (f) | | A copy of the code of ethics that applies to the registrant’s principal executive officer,
principal financial officer, principal accounting officer or controller is filed as an exhibit pursuant to Item 13(a)(1). |
Item 3. Audit Committee Financial Expert.
As of the end of the period covered by the report,
the registrant’s Board of Trustees has determined that Thomas R. Kadlec and Robert F. Keith are qualified to serve as audit committee
financial experts serving on its audit committee and that each of them is “independent,” as defined by Item 3 of Form N-CSR.
Item 4. Principal Accountant Fees and Services.
(a) Audit
Fees (Registrant) -- The aggregate fees billed for professional services rendered by the principal accountant for the audit of the registrant’s
annual financial statements or services that are normally provided by the accountant in connection with statutory and regulatory filings
or engagements were $306,750 for the fiscal year ended March 31, 2022 and $304,626 for the fiscal year ended March 31, 2023.
(b) Audit-Related
Fees (Registrant) -- The aggregate fees billed for assurance and related services by the principal accountant that are reasonably related
to the performance of the audit of the registrant’s financial statements and are not reported under paragraph (a) of this Item were
$0 for the fiscal year ended March 31, 2022 and $0 for the fiscal year ended March 31, 2023.
Audit-Related Fees (Investment
Advisor and Distributor) -- The aggregate fees billed for assurance and related services by the principal accountant that are reasonably
related to the performance of the audit of the registrant’s financial statements and are not reported under paragraph (a) of this
Item were $0 for the fiscal year ended March 31, 2022 and $0 for the fiscal year ended March 31, 2023.
(c) Tax
Fees (Registrant) -- The aggregate fees billed for professional services rendered by the principal accountant for tax compliance, tax
advice, and tax planning to the registrant were $69,178 for the fiscal year ended March 31, 2022 and $78,357 for the fiscal year ended
March 31, 2023. These fees were for tax consultation and/or tax return preparation and professional services rendered for PFIC (Passive
Foreign Investment Company) Identification Services.
Tax Fees (Investment Advisor and
Distributor) -- The aggregate fees billed for professional services rendered by the principal accountant for tax compliance, tax advice,
and tax planning to the registrant’s advisor and distributor were $0 for the fiscal year ended March 31, 2022 and $0 for the fiscal
year ended March 31, 2023.
(d) All
Other Fees (Registrant) -- The aggregate fees billed for products and services provided by the principal accountant to the registrant,
other than the services reported in paragraphs (a) through (c) of this Item were $0 for the fiscal year ended March 31, 2022 and $0 for
the fiscal year ended March 31, 2023.
All Other Fees (Investment Advisor
and Distributor) -- The aggregate fees billed for products and services provided by the principal accountant to the registrant’s
investment advisor and distributor, other than the services reported in paragraphs (a) through (c) of this Item were $0 for the fiscal
year ended March 31, 2022 and $0 for the fiscal year ended March 31, 2023.
(e)(1) Disclose
the audit committee’s pre-approval policies and procedures described in paragraph (c) (7) of Rule 2-01 of Regulation S-X.
Pursuant to its charter and its
Audit and Non-Audit Services Pre-Approval Policy, the Audit Committee (the “Committee”) is responsible for the pre-approval
of all audit services and permitted non-audit services (including the fees and terms thereof) to be performed for the registrant by its
independent auditors. The Chairman of the Committee is authorized to give such pre-approvals on behalf of the Committee up to $25,000
and report any such pre-approval to the full Committee.
The Committee is also responsible
for the pre-approval of the independent auditor’s engagements for non-audit services with the registrant’s advisor (not including
a sub-advisor whose role is primarily portfolio management and is sub-contracted or overseen by another investment advisor) and any entity
controlling, controlled by or under common control with the investment advisor that provides ongoing services to the registrant, if the
engagement relates directly to the operations and financial reporting of the registrant, subject to the de minimis exceptions for
non-audit services described in Rule 2-01 of Regulation S-X. If the independent auditor has provided non-audit services to the registrant’s
advisor (other than any sub-advisor whose role is primarily portfolio management and is sub-contracted with or overseen by another investment
advisor) and any entity controlling, controlled by or under common control with the investment advisor that provides ongoing services
to the registrant that were not pre-approved pursuant to its policies, the Committee will consider whether the provision of such non-audit
services is compatible with the auditor’s independence.
(e)(2) The
percentage of services described in each of paragraphs (b) through (d) for the registrant and the registrant’s investment advisor
and distributor of this Item that were approved by the audit committee pursuant to the pre-approval exceptions included in paragraph (c)(7)(i)(C)
or paragraph(C)(7)(ii) of Rule 2-01 of Regulation S-X are as follows:
| |
Registrant: | |
Advisor and Distributor: |
|
| |
(b) 0% | |
(b) 0% |
|
| |
(c) 0% | |
(c) 0% |
|
| |
(d) 0% | |
(d) 0% |
|
(f) The
percentage of hours expended on the principal accountant’s engagement to audit the registrant’s financial statements for the
most recent fiscal year that were attributed to work performed by persons other than the principal accountant’s full-time, permanent
employees was less than fifty percent.
(g) The
aggregate non-audit fees billed by the registrant’s accountant for services rendered to the registrant, and rendered to the registrant’s
investment advisor (not including any sub-advisor whose role is primarily portfolio management and is subcontracted with or overseen by
another investment advisor), and any entity controlling, controlled by, or under common control with the adviser that provides ongoing
services to the registrant for the fiscal year ended March 31, 2022, were $69,178 for the registrant, $16,500 for the registrant’s
investment advisor, and $29,500 for the registrant’s distributor and for the fiscal year ended March 31, 2023, were $78,357 for
the registrant, $18,000 for the registrant’s investment advisor, and $30,500 for the registrant’s distributor.
(h) The
registrant’s audit committee of its Board of Trustees has determined that the provision of non-audit services that were rendered
to the registrant’s investment advisor (not including any sub-advisor whose role is primarily portfolio management and is subcontracted
with or overseen by another investment advisor), and any entity controlling, controlled by, or under common control with the investment
advisor that provides ongoing services to the registrant that were not pre-approved pursuant to paragraph (c)(7)(ii) of Rule 2-01 of Regulation
S-X is compatible with maintaining the principal accountant’s independence.
(i) Not
applicable.
(j) Not
applicable.
Item 5. Audit Committee of Listed Registrants.
The registrant has a separately designated
standing audit committee established in accordance with Section 3(a)(58)(A) of the Securities Exchange Act of 1934. The audit committee
of the registrant is comprised of: Richard E. Erickson, Thomas R. Kadlec, Denise M. Keefe, Robert F. Keith and Niel B. Nielson.
Item 6. Investments.
| (a) | | The Schedule of Investments in securities of unaffiliated issuers as of the close of the
reporting period is included as part of the report to shareholders filed under Item 1 of this form. |
Item 7. Disclosure of Proxy Voting Policies
and Procedures for Closed-End Management Investment Companies.
Not applicable.
Item 8. Portfolio Managers of Closed-End
Management Investment Companies.
Not applicable.
Item 9. Purchases of Equity Securities by
Closed-End Management Investment Company and Affiliated Purchasers.
Not applicable.
Item 10. Submission of Matters to a Vote
of Security Holders.
There have been no material changes to the
procedures by which the shareholders may recommend nominees to the registrant’s board of directors, where those changes were implemented
after the registrant last provided disclosure in response to the requirements of Item 407 (c) (2) (iv) of Regulation S-K (17 CFR 229.407)
(as required by Item 22 (b) (15) of Schedule 14A (17 CFR 240.14a-101)), or this Item.
Item 11. Controls and Procedures.
| (a) | | The registrant’s principal executive and principal financial officers, or persons performing
similar functions, regarding the effectiveness of the registrant’s disclosure controls and procedures (as defined in Rule 30a-3(c)
under the Act (17 CFR 270.30a-3(c))) as of a date within 90 days of the filing date of the report that includes the disclosure required
by this paragraph, based on the evaluation of these controls and procedures required by Rule 30a-3(b) under the Act (17 CFR 270.30a-3(b))
and Rules 13a-15(b) or 15d-15(b) under the Exchange Act (17 CFR 240.13a-15(b) or 240.15d-15(b)). |
| (b) | | There were no changes in the registrant’s internal control over financial reporting
(as defined in Rule 30a-3(d) under the 1940 Act (17 CFR 270.30a-3(d)) that occurred during the period covered by this report that have
materially affected, or are reasonably likely to materially affect, the registrant’s internal control over financial reporting. |
Item 12. Disclosure of Securities Lending Activities for Closed-End
Management Investment Companies.
Not applicable.
Item 13. Exhibits.
SIGNATURES
Pursuant to the requirements of the Securities Exchange
Act of 1934 and the Investment Company Act of 1940, the registrant has duly caused this report to be signed on its behalf by the undersigned,
thereunto duly authorized.
| (registrant) |
|
First Trust Exchange-Traded Fund VI |
| By (Signature and Title)* |
|
/s/ James M. Dykas |
| |
|
James M. Dykas, President and Chief Executive Officer
(principal executive
officer)
|
Pursuant
to the requirements of the Securities Exchange Act of 1934 and the Investment Company Act of 1940, this report has been signed
below by the following persons on behalf of the registrant and in the capacities and on the dates indicated.
| By (Signature and Title)* |
|
/s/ James M. Dykas |
| |
|
James M. Dykas, President and Chief Executive Officer
(principal executive
officer)
|
| By (Signature and Title)* |
|
/s/ Donald P. Swade |
| |
|
Donald P. Swade, Treasurer, Chief Financial Officer
and Chief Accounting Officer
(principal financial officer)
|
* Print the name and title of each signing officer under
his or her signature.
SENIOR FINANCIAL OFFICER
CODE OF CONDUCT
I. Introduction
This code of conduct is being
adopted by the investment companies advised by First Trust Advisors L.P., from time to time, (the "FUNDS"). The reputation and
integrity of the Funds are valuable assets that are vital to the Funds' success. Each officer of the Funds, and officers and employees
of the investment adviser to the Funds who work on Fund matters, including each of the Funds' senior financial officers ("SFOS"),
is responsible for conducting each Fund's business in a manner that demonstrates a commitment to the highest standards of integrity.
SFOs include the Principal Executive Officer (who is the President), the Controller (who is the principal accounting officer),
and the Treasurer (who is the principal financial officer), and any person who performs a similar function.
The Funds, First Trust Advisors
L.P. and First Trust Portfolios have adopted Codes of Ethics under Rule 17j-1 under the Investment Company Act of 1940 (the "RULE
17J-1 CODE"). These Codes of Ethics are designed to prevent certain conflicts of interest that may arise when officers, employees,
or directors of the Funds and the foregoing entities know about present or future Fund transactions and/or have the power to influence
those transactions, and engage in transactions with respect to those same securities in their personal account(s) or otherwise
take advantage of their position and knowledge with respect to those securities. In an effort to prevent these conflicts and in
accordance with Rule 17j-1, the Funds adopted their Rule 17j-1 Code to prohibit transactions and conduct that create conflicts
of interest, and to establish compliance procedures.
The Sarbanes-Oxley Act of
2002 was designed to address corporate malfeasance and to help assure investors that the companies in which they invest are accurately
and completely disclosing financial information. Under Section 406 of the Act, all public companies (including the Funds) must
either have a code of ethics for their SFOs, or disclose why they do not. The Act was intended to prevent future situations (such
as occurred in well-reported situations involving such companies as Enron and WorldCom) where a company creates an environment
in which employees are afraid to express their opinions or to question unethical and potentially illegal business practices.
The Funds have chosen to
adopt a senior financial officer Code of Conduct to encourage their SFOs, and other Fund officers and employees of First Trust
Advisors or First Trust Portfolios to act ethically and to question potentially unethical or illegal practices, and to strive
to ensure that the Funds' financial disclosures are complete, accurate, and understandable.
II. Purposes of This Code of Conduct
The purposes of this Code
are:
A. To promote honest and
ethical conduct, including the ethical handling of actual or apparent conflicts of interest between personal and professional
relationships;
B. To promote full, fair,
accurate, timely, and understandable disclosure in reports and documents that the Funds file with, or submits to, the SEC and
in other public communications the Funds make;
C. To promote compliance
with applicable governmental laws, rules and regulations;
D. To encourage the prompt
internal reporting to an appropriate person of violations of the Code; and
E. To establish accountability
for adherence to the Code.
III. Questions About This Code
The Funds' Boards of Trustees
have designated W. Scott Jardine or other appropriate officer designated by the President of the respective Funds to be the Compliance
Coordinator for the implementation and administration of the Code.
IV. Handling of Financial Information
The Funds have adopted guidelines
under which its SFOs perform their duties. However, the Funds expect that all officers or employees of the adviser or distributor
who participate in the preparation of any part of any Fund's financial statements follow these guidelines with respect to each
Fund:
A. Act with honesty and
integrity and avoid violations of this Code, including actual or apparent conflicts of interest with the Fund in personal and
professional relationships.
B. Disclose to the Fund's
Compliance Coordinator any material transaction or relationship that reasonably could be expected to give rise to any violations
of the Code, including actual or apparent conflicts of interest with the Fund. You should disclose these transactions or relationships
whether you are involved or have only observed the transaction or relationship. If it is not possible to disclose the matter to
the Compliance Coordinator, it should be disclosed to the Fund's Principal Financial Officer or Principal Executive Officer.
C. Provide information
to the Fund's other officers and appropriate employees of service providers (adviser, administrator, outside auditor, outside
counsel, custodian, etc.) that is accurate, complete, objective, relevant, timely, and understandable.
D. Endeavor to ensure
full, fair, timely, accurate, and understandable disclosure in the Fund's periodic reports.
E. Comply with the federal
securities laws and other applicable laws and rules, such as the Internal Revenue Code.
F. Act in good faith,
responsibly, and with due care, competence and diligence, without misrepresenting material facts or allowing your independent
judgment to be subordinated.
G. Respect the confidentiality
of information acquired in the course of your work except when you have Fund approval to disclose it or where disclosure is otherwise
legally mandated. You may not use confidential information acquired in the course of your work for personal advantage.
H. Share and maintain
skills important and relevant to the Fund's needs.
I. Proactively promote
ethical behavior among peers in your work environment.
J. Responsibly use and
control all assets and resources employed or entrusted to you.
K. Record or participate
in the recording of entries in the Fund's books and records that are accurate to the best of your knowledge.
V. Waivers of This Code
SFOs and other parties subject
to this Code may request a waiver of a provision of this Code (or certain provisions of the Fund's Rule 17j-1 Code) by submitting
their request in writing to the Compliance Coordinator for appropriate review. An executive officer of the Fund or the Audit Committee
will decide whether to grant a waiver. All waivers of this Code must be disclosed to the Fund's shareholders to the extent required
by SEC rules. A good faith interpretation of the provisions of this Code, however, shall not constitute a waiver.
VI. Annual Certification
Each SFO will be asked to
certify on an annual basis that he/she is in full compliance with the Code and any related policy statements.
VII. Reporting Suspected Violations
A. SFOs or other officers
of the Funds or employees of the First Trust group who work on Fund matters who observe, learn of, or, in good faith, suspect
a violation of the Code MUST immediately report the violation to the Compliance Coordinator, another member of the Funds' or First
Trust's senior management, or to the Audit Committee of the Fund Board. An example of a possible Code violation is the preparation
and filing of financial disclosure that omits material facts, or that is accurate but is written in a way that obscures its meaning.
B. Because service providers
such as an administrator, outside accounting firm, and custodian provide much of the work relating to the Funds' financial statements,
you should be alert for actions by service providers that may be illegal, or that could be viewed as dishonest or unethical conduct.
You should report these actions to the Compliance Coordinator even if you know, or think, that the service provider has its own
code of ethics for its SFOs or employees.
C. SFOs or other officers
or employees who report violations or suspected violations in good faith will not be subject to retaliation of any kind. Reported
violations will be investigated and addressed promptly and will be treated confidentially to the extent possible.
VIII. Violations of The Code
A. Dishonest, unethical or
illegal conduct will constitute a violation of this Code, regardless of whether this Code specifically refers to that particular
conduct. A violation of this Code may result in disciplinary action, up to and including termination of employment. A variety
of laws apply to the Funds and their operations, including the Securities Act of 1933, the Investment Company Act of 1940, state
laws relating to duties owed by Fund directors and officers, and criminal laws. The federal securities laws generally prohibit
the Funds from making material misstatements in its prospectus and other documents filed with the SEC, or from omitting to state
a material fact. These material misstatements and omissions include financial statements that are misleading or omit materials
facts.
B. Examples of criminal violations
of the law include stealing, embezzling, misapplying corporate or bank funds, making a payment for an expressed purpose on a Fund's
behalf to an individual who intends to use it for a different purpose; or making payments, whether corporate or personal, of cash
or other items of value that are intended to influence the judgment or actions of political candidates, government officials or
businesses in connection with any of the Funds' activities. The Funds must and will report all suspected criminal violations to
the appropriate authorities for possible prosecution, and will investigate, address and report, as appropriate, non-criminal violations.
Amended: June 1, 2009
Certification Pursuant to Rule 30a-2(a) under
the 1940 Act and Section 302
of the Sarbanes-Oxley Act
I, James M. Dykas, certify that:
| 1. | | I have reviewed this report on Form N-CSR of First Trust Exchange-Traded Fund VI; |
| 2. | | Based on my knowledge, this report does not contain any untrue statement of a material fact
or omit to state a material fact necessary to make the statements made, in light of the circumstances under which such statements were
made, not misleading with respect to the period covered by this report; |
| 3. | | Based on my knowledge, the financial statements, and other financial information included
in this report, fairly present in all material respects the financial condition, results of operations, changes in net assets, and cash
flows (if the financial statements are required to include a statement of cash flows) of the registrant as of, and for, the periods presented
in this report; |
| 4. | | The registrant’s other certifying officer(s) and I are responsible for establishing
and maintaining disclosure controls and procedures (as defined in Rule 30a-3(c) under the Investment Company Act of 1940) and internal
control over financial reporting (as defined in Rule 30a-3(d) under the Investment Company Act of 1940) for the registrant and have: |
| (a) | | Designed such disclosure controls and procedures, or caused such disclosure controls and
procedures to be designed under our supervision, to ensure that material information relating to the registrant, including its consolidated
subsidiaries, is made known to us by others within those entities, particularly during the period in which this report is being prepared; |
| (b) | | Designed such internal control over financial reporting, or caused such internal control
over financial reporting to be designed under our supervision, to provide reasonable assurance regarding the reliability of financial
reporting and the preparation of financial statements for external purposes in accordance with generally accepted accounting principles; |
| (c) | | Evaluated the effectiveness of the registrant’s disclosure controls and procedures
and presented in this report our conclusions about the effectiveness of the disclosure controls and procedures, as of a date within 90
days prior to the filing date of this report based on such evaluation; and |
| (d) | | Disclosed in this report any change in the registrant’s internal control over financial
reporting that occurred during the period covered by this report that has materially affected, or is reasonably likely to materially
affect, the registrant’s internal control over financial reporting; and |
| 5. | | The registrant’s other certifying officer(s) and I have disclosed to the registrant’s
auditors and the audit committee of the registrant’s board of directors (or persons performing the equivalent functions): |
| (a) | | All significant deficiencies and material weaknesses in the design or operation of internal
control over financial reporting which are reasonably likely to adversely affect the registrant’s ability to record, process, summarize,
and report financial information; and |
| (b) | | Any fraud, whether or not material, that involves management or other employees who have
a significant role in the registrant’s internal control over financial reporting. |
| Date: |
|
June 9, 2023 |
|
/s/ James M. Dykas |
|
| |
|
|
|
James M. Dykas, President and Chief Executive Officer
(principal executive officer) |
|
Certification Pursuant to Rule 30a-2(a) under
the 1940 Act and Section 302
of the Sarbanes-Oxley Act
I, Donald P. Swade, certify that:
| 1. | | I have reviewed this report on Form N-CSR of First Trust Exchange-Traded Fund VI; |
| 2. | | Based on my knowledge, this report does not contain any untrue statement of a material fact
or omit to state a material fact necessary to make the statements made, in light of the circumstances under which such statements were
made, not misleading with respect to the period covered by this report; |
| 3. | | Based on my knowledge, the financial statements, and other financial information included
in this report, fairly present in all material respects the financial condition, results of operations, changes in net assets, and cash
flows (if the financial statements are required to include a statement of cash flows) of the registrant as of, and for, the periods presented
in this report; |
| 4. | | The registrant’s other certifying officer(s) and I are responsible for establishing
and maintaining disclosure controls and procedures (as defined in Rule 30a-3(c) under the Investment Company Act of 1940) and internal
control over financial reporting (as defined in Rule 30a-3(d) under the Investment Company Act of 1940) for the registrant and have: |
| (a) | | Designed such disclosure controls and procedures, or caused such disclosure controls and
procedures to be designed under our supervision, to ensure that material information relating to the registrant, including its consolidated
subsidiaries, is made known to us by others within those entities, particularly during the period in which this report is being prepared; |
| (b) | | Designed such internal control over financial reporting, or caused such internal control
over financial reporting to be designed under our supervision, to provide reasonable assurance regarding the reliability of financial
reporting and the preparation of financial statements for external purposes in accordance with generally accepted accounting principles; |
| (c) | | Evaluated the effectiveness of the registrant’s disclosure controls and procedures
and presented in this report our conclusions about the effectiveness of the disclosure controls and procedures, as of a date within 90
days prior to the filing date of this report based on such evaluation; and |
| (d) | | Disclosed in this report any change in the registrant’s internal control over financial
reporting that occurred during the period covered by this report that has materially affected, or is reasonably likely to materially
affect, the registrant’s internal control over financial reporting; and |
| 5. | | The registrant’s other certifying officer(s) and I have disclosed to the registrant’s
auditors and the audit committee of the registrant’s board of directors (or persons performing the equivalent functions): |
| (a) | | All significant deficiencies and material weaknesses in the design or operation of internal
control over financial reporting which are reasonably likely to adversely affect the registrant’s ability to record, process, summarize,
and report financial information; and |
| (b) | | Any fraud, whether or not material, that involves management or other employees who have
a significant role in the registrant’s internal control over financial reporting. |
| Date: |
|
June 9, 2023 |
|
/s/ Donald P. Swade |
|
| |
|
|
|
Donald P. Swade, Treasurer, Chief Financial Officer
and
Chief Accounting Officer
(principal financial officer) |
|
Certification Pursuant to Rule 30a-2(b) under the
1940 Act and Section 906
of the Sarbanes-Oxley Act
I, James M. Dykas, President and Chief Executive Officer
of First Trust Exchange-Traded Fund VI (the “Registrant”), certify that:
| 1. | The Form N-CSR of the Registrant (the “Report”) fully complies with the requirements of Section
13(a) or 15(d) of the Securities Exchange Act of 1934, as amended; and |
| 2. | The information contained in the Report fairly presents, in all material respects, the financial condition
and results of operations of the Registrant. |
| Date: |
|
June 9, 2023 |
|
/s/ James M. Dykas |
|
| |
|
|
|
James M. Dykas, President and Chief Executive Officer
(principal executive officer) |
|
I, Donald P. Swade, Treasurer, Chief Financial Officer
and Chief Accounting Officer of First Trust Exchange-Traded Fund VI (the “Registrant”), certify that:
| 1. | The Form N-CSR of the Registrant (the “Report”) fully complies with the requirements of Section
13(a) or 15(d) of the Securities Exchange Act of 1934, as amended; and |
| 2. | The information contained in the Report fairly presents, in all material respects, the financial condition
and results of operations of the Registrant. |
| Date: |
|
June 9, 2023 |
|
/s/ Donald P. Swade |
|
| |
|
|
|
Donald P. Swade, Treasurer, Chief Financial Officer
and
Chief Accounting Officer
(principal financial officer) |
|