UNITED STATES
SECURITIES AND EXCHANGE COMMISSION
Washington, D.C. 20549
FORM N-CSR
CERTIFIED SHAREHOLDER REPORT OF REGISTERED
MANAGEMENT INVESTMENT COMPANIES
Investment Company Act file number 811-22717
First Trust Exchange-Traded Fund VI
(Exact name of registrant as specified in charter)
120 East Liberty Drive, Suite 400
Wheaton, IL 60187
(Address of principal executive offices) (Zip code)
W. Scott Jardine, Esq.
First Trust Portfolios L.P.
120 East Liberty Drive, Suite 400
Wheaton, IL 60187
(Name and address of agent for service)
Registrant’s telephone number, including
area code: (630) 765-8000
Date of fiscal year end: September 30
Date of reporting period: March 31, 2023
Form N-CSR is to be used by management investment
companies to file reports with the Commission not later than 10 days after the transmission to stockholders of any report that is required
to be transmitted to stockholders under Rule 30e-1 under the Investment Company Act of 1940 (17 CFR 270.30e-1). The Commission may use
the information provided on Form N-CSR in its regulatory, disclosure review, inspection, and policymaking roles.
A registrant is required to disclose the information
specified by Form N-CSR, and the Commission will make this information public. A registrant is not required to respond to the collection
of information contained in Form N-CSR unless the Form displays a currently valid Office of Management and Budget (“OMB”)
control number. Please direct comments concerning the accuracy of the information collection burden estimate and any suggestions for reducing
the burden to Secretary, Securities and Exchange Commission, 100 F Street, NE, Washington, DC 20549p. The OMB has reviewed this collection
of information under the clearance requirements of 44 U.S.C. § 3507.
Item 1. Report to Stockholders.
| (a) | | The registrant’s semi-annual report transmitted to shareholders pursuant to Rule 30e-1
under the Investment Company Act of 1940 is as follows: |
First Trust Exchange-Traded Fund VI
Book 1
First Trust NASDAQ Technology Dividend Index Fund (TDIV)
Multi-Asset Diversified Income Index Fund (MDIV)
First Trust S&P International Dividend Aristocrats ETF (FID)
First Trust BuyWrite Income ETF (FTHI)
First Trust Nasdaq BuyWrite Income ETF (FTQI)
First Trust Rising Dividend Achievers ETF (RDVY)
First Trust Dorsey Wright Focus 5 ETF (FV)
First Trust RBA American Industrial Renaissance®
ETF (AIRR)
First Trust Dorsey Wright Momentum & Dividend ETF (DDIV)
First Trust Dorsey Wright International Focus 5 ETF (IFV)
First Trust Dorsey Wright Dynamic Focus 5 ETF (FVC)
First Trust Indxx Innovative Transaction & Process ETF (LEGR)
First Trust Nasdaq Artificial Intelligence and Robotics ETF (ROBT)
First Trust International Developed Capital Strength ETF (FICS)
Semi-Annual Report
For the Six Months Ended
March 31, 2023
First Trust Exchange-Traded Fund
VI
Semi-Annual Report
March 31, 2023
Caution Regarding
Forward-Looking Statements
This report contains
certain forward-looking statements within the meaning of the Securities Act of 1933, as amended, and the Securities Exchange Act of 1934, as amended. Forward-looking statements include statements regarding the goals,
beliefs, plans or current expectations of First Trust Advisors L.P. (“First Trust” or the “Advisor”) and its representatives, taking into account the information currently available to them.
Forward-looking statements include all statements that do not relate solely to current or historical fact. For example, forward-looking statements include the use of words such as “anticipate,”
“estimate,” “intend,” “expect,” “believe,” “plan,” “may,” “should,” “would” or other words that convey uncertainty of
future events or outcomes.
Forward-looking
statements involve known and unknown risks, uncertainties and other factors that may cause the actual results, performance or achievements of any series of First Trust Exchange-Traded Fund VI (the “Trust”)
described in this report (each such series is referred to as a “Fund” and collectively, the “Funds”) to be materially different from any future results, performance or achievements expressed or
implied by the forward-looking statements. When evaluating the information included in this report, you are cautioned not to place undue reliance on these forward-looking statements, which reflect the judgment of the
Advisor and its representatives only as of the date hereof. We undertake no obligation to publicly revise or update these forward-looking statements to reflect events and circumstances that arise after the date
hereof.
Performance and Risk
Disclosure
There is no assurance
that any Fund described in this report will achieve its investment objectives. Each Fund is subject to market risk, which is the possibility that the market values of securities owned by the Fund will decline and that
the value of the Fund’s shares may therefore be less than what you paid for them. Accordingly, you can lose money by investing in a Fund. See “Risk Considerations” in the Additional Information
section of this report for a discussion of certain other risks of investing in the Funds.
Performance data quoted
represents past performance, which is no guarantee of future results, and current performance may be lower or higher than the figures shown. For the most recent month-end performance figures, please visit www.ftportfolios.com or speak with your financial advisor. Investment returns, net asset value and share price will fluctuate and Fund shares, when sold, may be
worth more or less than their original cost.
The Advisor may also
periodically provide additional information on Fund performance on each Fund’s web page at www.ftportfolios.com.
How to Read This
Report
This report contains
information that may help you evaluate your investment. It includes details about each Fund and presents data and analysis that provide insight into each Fund’s performance and investment approach.
By reading the market
overview by Robert F. Carey, Chief Market Strategist of the Advisor, you may obtain an understanding of how the market environment affected the performance of each Fund. The statistical information that follows may
help you understand each Fund’s performance compared to that of relevant market benchmarks.
It is important to keep
in mind that the opinions expressed by personnel of the Advisor are just that: informed opinions. They should not be considered to be promises or advice. The opinions, like the statistics, cover the period through the
date on the cover of this report. The material risks of investing in each Fund are spelled out in the prospectus, the statement of additional information, and other Fund regulatory filings.
First Trust Exchange-Traded Fund
VI
Semi-Annual Letter from the Chairman
and CEO
March 31, 2023
Dear Shareholders,
First Trust is pleased
to provide you with the semi-annual report for certain series of the First Trust Exchange-Traded Fund VI (the “Funds”), which contains detailed information about the Funds for the six months ended
March 31, 2023.
I am constantly amazed
by the depth and breadth of innovation that occurs when people from different geographic, economic, cultural, and educational backgrounds come together to solve problems. Many of the greatest companies to ever exist
found their humble beginnings in the simple premise that problems are best solved through ingenuity and cooperation. That idea is still alive and well today, in my opinion. Take, as examples, the recent flood of
interest sparked by artificial intelligence programs, advances in robotics, new medicines, more fuel-efficient gasoline engines, electric and hybrid vehicles, quantum computing, developments in wind and solar power;
the list goes on and on. That said, the global economy is facing serious issues such as stubborn inflation and the specter of slowing economic growth to name a few.
As many investors know,
the global financial system is currently navigating the fallout of the banking crisis that took lending markets by storm in March 2023. The turmoil that started in the U.S. with the failure of Silicon Valley Bank
quickly spread around the globe, leading the Swiss government to broker the merger of two of Switzerland’s largest banks. In the U.S., the Federal Reserve (the “Fed”) created the Bank Term Funding
Program, which allocated capital to help assure that banks can meet the needs of their depositors. Furthermore, inflation remains elevated on a global scale. Each of the countries that comprise the so-called Group of
Ten is currently battling levels of inflation that are higher than the targets set by their central banks, according to data from Bloomberg. Additionally, political unrest stemming from the war between Russia and
Ukraine remains a significant factor, with the potential to disturb global fuel and energy supplies as well as provoke interference from other foreign powers.
In the U.S., inflation,
as measured by the trailing 12-month rate on the Consumer Price Index, stood at 5.0% as of March 31, 2023, well above the Fed’s stated goal of 2.0%. Despite signals pointing to a potential slowdown in economic
growth in the U.S., the Fed stayed the course with regards to interest rate policy. Since February 28, 2022, the Fed raised the Federal Funds target rate (upper bound) a total of nine times, increasing the rate from
0.25%, where it stood on February 28, 2022, to 5.00% as of March 31, 2023.
Global markets have been
resilient over time, and the S&P 500® Index has never failed to recover from a bear market. While the issues plaguing the U.S. and global economies are severe, they are not
insurmountable, in my view. As Brian Wesbury, Chief Economist at First Trust, recently wrote: “what made America strong is…its human resources and freedom.” We will continue to work the problems
before us with ingenuity and resolve, as we always have.
Thank you for giving
First Trust the opportunity to play a role in your financial future. We value our relationship with you and will report on the Funds again in six months.
Sincerely,
James A. Bowen
Chairman of the Board of Trustees
Chief Executive Officer of First Trust
Advisors L.P.
First Trust Exchange-Traded Fund
VI
Semi-Annual Report
March 31, 2023
Robert
F. Carey, CFA
Senior Vice President
and Chief Market Strategist
First Trust Advisors
L.P.
Mr.
Carey is responsible for the overall management of research and analysis of the First Trust product line. Mr. Carey has more than 30 years of experience as an Equity and Fixed-Income Analyst and is a recipient of the
Chartered Financial Analyst (“CFA”) designation. He is a graduate of the University of Illinois at Champaign-Urbana with a B.S. in Physics. He is also a member of the Investment Analysts Society of Chicago
and the CFA Institute. Mr. Carey has appeared as a guest on such programs as Bloomberg TV, CNBC, and WBBM Radio, and has been quoted by several publications, including The Wall Street Journal, The Wall Street Reporter, Bloomberg News Service, and Registered Rep.
State of the Global
Economy
The latest global growth
forecast from the International Monetary Fund (“IMF”) released in April 2023 sees real gross domestic product growth rising by 2.8% worldwide in 2023, down from its 2.9% projection in January 2023. The IMF
is calling for a 1.6% growth rate for the U.S., up from its January 2023 estimate of 1.4%. Emerging Market and Developing Economies are expected to grow by 3.9% this year, down from the IMF’s 4.0% estimate in
January 2023. The IMF notes that risks to their global outlook are squarely to the downside, especially given the recent turmoil in the Financials sector as well as stubbornly high inflation.
In the U.S., inflation,
as measured by the Consumer Price Index (“CPI”), stood at 5.0% on a trailing 12-month basis at the end of March 2023, according to the U.S. Bureau of Labor Statistics. While this is significantly lower
than the most recent high of 9.1% in June 2022, the CPI remains above its 30-year average of 2.5% as of March 31, 2023, and even further from the Federal Reserve’s (the “Fed”) target of 2.0%.
Performance of Global
Stocks and Bonds
The major U.S. stock
indices delivered positive results over the past six months. The S&P 500® (the “Index”), S&P MidCap 400® and S&P SmallCap 600® Indices posted total returns of 15.62%, 15.00% and 12.00%, respectively, for the six-month period ended March 31, 2023. Each of the 11 major
sectors that comprise the Index were up on a total return basis. The top performer was the Information Technology sector, up 27.59%, while the worst showing came from the Consumer Discretionary sector, up 4.31%.
A Bloomberg survey of
twenty-four equity strategists found that their average 2023 year-end price target for the Index was 4,025, as of April 19, 2023, according to its own release. The highest and lowest estimates were 4,750 and 3,225,
respectively. Brian Wesbury, Chief Economist at First Trust, announced in December 2022 that his 2023 year-end price target stood at 3,900. The Index closed trading on March 31, 2023, at 4,109. The outlook for
corporate earnings in 2023 has turned negative. Bloomberg’s consensus year-over-year earnings growth rate estimates for the Index for the 2023 and 2024 calendar years stood at -2.67% and 11.56%, respectively, as
of April 21, 2023.
The broader foreign stock
indices posted positive total returns over the past six months. Between September 30, 2022, and March 31, 2023, the MSCI World ex USA and MSCI Emerging Markets equity indices posted total returns of 25.50% (USD) and
14.04% (USD), respectively, according to Bloomberg. The major foreign bond indices were also up over the same period. The Bloomberg Global Aggregate Index of higher quality debt posted a total return of 7.69% (USD),
while the Bloomberg EM Hard Currency Aggregate Index of emerging markets debt increased by 9.87% (USD), according to Bloomberg. The U.S. dollar fell by 8.57% over the past six months against a basket of major
currencies, as measured by the U.S. Dollar Index (DXY). The sizable decline in the dollar provided a boost to the performance of both foreign stock and bond indices, in our opinion.
Results were also
positive in the U.S. bond market over the period. The top performing major debt group we track was long-term municipal bonds. The Bloomberg Municipal Bond: Long Bond (22+ Years) Index posted a total return of
9.68% for the six-month period ended March 31, 2023. The worst-performing U.S. debt group that we track was intermediate U.S. Treasuries. The Bloomberg U.S. Treasury: Intermediate Index posted a total return of
3.31%. The yield on the benchmark 10-Year Treasury Note (“T-Note”) fell by 36 basis points in the period to close at 3.47% on March 31, 2023, according to Bloomberg. For comparative purposes, the average
yield on the 10-Year T-Note was 2.19% for the 10-year period ended March 31, 2023.
Fund Performance
Overview (Unaudited)
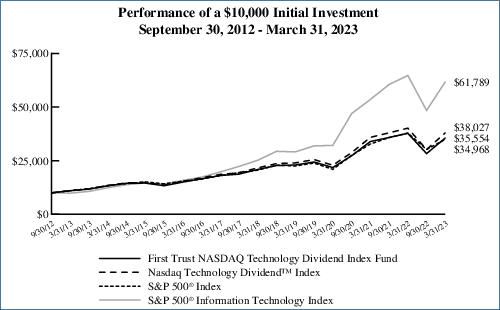
First Trust NASDAQ Technology Dividend
Index Fund (TDIV)
The First Trust NASDAQ
Technology Dividend Index Fund (the “Fund”) seeks investment results that correspond generally to the price and yield (before the Fund’s fees and expenses) of an equity index called the Nasdaq
Technology DividendTM Index (the “Index”). The shares of the Fund are listed and trade on The Nasdaq Stock Market LLC under the ticker symbol
“TDIV.” The Fund normally invests at least 90% of its net assets (including investment borrowings) in the common stocks and depositary receipts that comprise the Index.
The Index includes up to
100 technology and telecommunications companies that pay a regular or common dividend. To be selected for the Index, a company must be classified as a technology or telecommunications company under the Industry
Classification Benchmark and have a minimum market capitalization of $500 million. The Index may include U.S.-listed securities of non-U.S. companies, including companies located in emerging market countries.
| Performance
|
|
|
|
|
|
|
|
|
|
|
|
|
| Average Annual Total Returns
|
| Cumulative Total Returns
|
|
| 6 Months
Ended
3/31/23
| 1 Year
Ended
3/31/23
| 5 Years
Ended
3/31/23
| 10 Years
Ended
3/31/23
| Inception
(8/13/12)
to 3/31/23
|
| 5 Years
Ended
3/31/23
| 10 Years
Ended
3/31/23
| Inception
(8/13/12)
to 3/31/23
|
| Fund Performance
|
|
|
|
|
|
|
|
|
|
| NAV
| 25.53%
| -5.86%
| 11.20%
| 12.45%
| 12.60%
|
| 70.02%
| 223.38%
| 252.97%
|
| Market Price
| 25.48%
| -5.97%
| 11.16%
| 12.44%
| 12.59%
|
| 69.75%
| 223.13%
| 252.87%
|
| Index Performance
|
|
|
|
|
|
|
|
|
|
| Nasdaq Technology DividendTM Index
| 25.99%
| -5.33%
| 11.91%
| 13.17%
| 13.32%
|
| 75.52%
| 244.71%
| 277.81%
|
| S&P 500® Index
| 15.62%
| -7.73%
| 11.19%
| 12.24%
| 12.80%
|
| 69.94%
| 217.36%
| 259.84%
|
| S&P 500® Information Technology Index
| 27.59%
| -4.55%
| 19.64%
| 20.14%
| 18.96%
|
| 145.10%
| 526.59%
| 533.14%
|
(See Notes to Fund
Performance Overview on page 33.)
Nasdaq® and Nasdaq Technology DividendTM Index are registered trademarks and service marks of Nasdaq, Inc. (together with its affiliates hereinafter referred to as the
“Corporations”) and are licensed for use by First Trust. The Fund has not been passed on by the Corporations as to their legality or suitability. The Fund is not issued, endorsed, sold, or promoted by the
Corporations. THE CORPORATIONS MAKE NO WARRANTIES AND BEAR NO LIABILITY WITH RESPECT TO THE FUND.
Fund Performance
Overview (Unaudited) (Continued)
First Trust NASDAQ Technology Dividend
Index Fund (TDIV) (Continued)
| Sector Allocation
| % of Total
Investments
|
| Information Technology
| 87.1%
|
| Communication Services
| 11.9
|
| Industrials
| 1.0
|
| Health Care
| 0.0*
|
| Total
| 100.0%
|
| *
| Amount is less than 0.1%.
|
| Top Ten Holdings
| % of Total
Investments
|
| Intel Corp.
| 9.7%
|
| Microsoft Corp.
| 8.6
|
| Apple, Inc.
| 8.3
|
| Broadcom, Inc.
| 8.0
|
| International Business Machines Corp.
| 7.5
|
| Texas Instruments, Inc.
| 4.0
|
| Oracle Corp.
| 4.0
|
| QUALCOMM, Inc.
| 3.8
|
| Analog Devices, Inc.
| 2.5
|
| Motorola Solutions, Inc.
| 2.0
|
| Total
| 58.4%
|
Performance figures assume reinvestment of all distributions and do not reflect the deduction of taxes that a shareholder would pay on Fund distributions or the redemption or sale of Fund shares. An index is a
statistical composite that tracks a specified financial market or sector. Unlike the Fund, the indices do not actually hold a portfolio of securities and therefore do not incur the expenses incurred by the Fund.
These expenses negatively impact the performance of the Fund. The Fund’s past performance does not predict future performance.
Frequency
Distribution of Discounts and Premiums
Information
showing the number of days the market price of the Fund’s shares was greater (at a premium) and less (at a discount) than the Fund’s net asset value for the most recently completed year, and the most
recently completed calendar quarters since that year (or life of the Fund, if shorter), is available at https://www.ftportfolios.com/Retail/etf/home.aspx.
Fund Performance
Overview (Unaudited) (Continued)
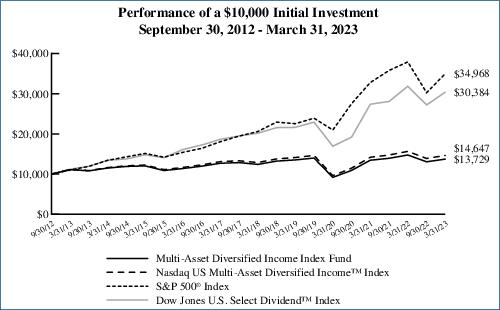
Multi-Asset Diversified Income Index Fund
(MDIV)
The Multi-Asset
Diversified Income Index Fund (the “Fund”) seeks investment results that correspond generally to the price and yield (before the Fund’s fees and expenses) of an index called the Nasdaq US Multi-Asset
Diversified IncomeTM Index (the “Index”). The shares of the Fund are listed and trade on The Nasdaq Stock Market LLC under the ticker symbol
“MDIV.” The Fund normally invests at least 90% of its net assets (including investment borrowings) in the common stocks and/or depositary receipts, real estate investment trusts (“REITs”),
preferred securities, master limited partnerships (“MLPs”) and exchange-traded fund (“ETF”) that comprise the Index. The Index allocates 20% of its weight to the equity securities
segment, 20% of its weight to the REIT segment, 20% of its weight to the preferred stocks segment, 20% of its weight to the MLP segment and 20% of its weight to an ETF that invests in high yield corporate debt
securities. The ETF in which the Fund invests may be advised by First Trust Advisors L.P.
The Index is designed to
provide exposure to five asset segments, each selected to result in a consistent and high yield for the Index. The Index is reconstituted and rebalanced quarterly and the Fund will make corresponding changes to
its portfolio shortly after the Index changes are made public.
| Performance
|
|
|
|
|
|
|
|
|
|
|
|
|
| Average Annual Total Returns
|
| Cumulative Total Returns
|
|
| 6 Months
Ended
3/31/23
| 1 Year
Ended
3/31/23
| 5 Years
Ended
3/31/23
| 10 Years
Ended
3/31/23
| Inception
(8/13/12)
to 3/31/23
|
| 5 Years
Ended
3/31/23
| 10 Years
Ended
3/31/23
| Inception
(8/13/12)
to 3/31/23
|
| Fund Performance
|
|
|
|
|
|
|
|
|
|
| NAV
| 5.13%
| -6.93%
| 2.05%
| 2.14%
| 3.14%
|
| 10.70%
| 23.63%
| 38.92%
|
| Market Price
| 5.41%
| -6.62%
| 2.11%
| 2.17%
| 3.17%
|
| 11.02%
| 23.94%
| 39.39%
|
| Index Performance
|
|
|
|
|
|
|
|
|
|
| Nasdaq US Multi-Asset Diversified IncomeTM Index
| 5.47%
| -6.41%
| 2.61%
| 2.76%
| 3.78%
|
| 13.77%
| 31.34%
| 48.40%
|
| S&P 500® Index
| 15.62%
| -7.73%
| 11.19%
| 12.24%
| 12.80%
|
| 69.94%
| 217.36%
| 259.84%
|
| Dow Jones U.S. Select DividendTM Index*
| 11.69%
| -4.58%
| 8.54%
| 10.48%
| 11.16%
|
| 50.62%
| 170.80%
| 207.92%
|
(See Notes to Fund
Performance Overview on page 33.)
| *
| The Dow Jones U.S. Select DividendTM Index represents 100 of the United States’ leading stocks by dividend yield.
|
Nasdaq® and Nasdaq US Multi-Asset Diversified IncomeTM Index are registered trademarks and service marks of Nasdaq, Inc. (together with its affiliates hereinafter referred to as the
“Corporations”) and are licensed for use by First Trust. The Fund has not been passed on by the Corporations as to their legality or suitability. The Fund is not issued, endorsed, sold, or promoted by the
Corporations. THE CORPORATIONS MAKE NO WARRANTIES AND BEAR NO LIABILITY WITH RESPECT TO THE FUND.
Fund Performance
Overview (Unaudited) (Continued)
Multi-Asset Diversified Income Index Fund
(MDIV) (Continued)
| Sector Allocation
| % of Total
Investments
|
| Financials
| 23.0%
|
| Energy
| 21.9
|
| Other*
| 21.1
|
| Real Estate
| 17.0
|
| Utilities
| 3.9
|
| Consumer Staples
| 3.3
|
| Industrials
| 3.0
|
| Communication Services
| 2.4
|
| Consumer Discretionary
| 2.1
|
| Materials
| 1.6
|
| Information Technology
| 0.4
|
| Health Care
| 0.3
|
| Total
| 100.0%
|
| *
| Exchange-traded fund with holdings representing multiple sectors.
|
| Top Ten Holdings
| % of Total
Investments
|
| First Trust Tactical High Yield ETF
| 21.1%
|
| Ready Capital Corp.
| 1.5
|
| Icahn Enterprises, L.P.
| 1.5
|
| Dorchester Minerals, L.P.
| 1.3
|
| Starwood Property Trust, Inc.
| 1.2
|
| Kimbell Royalty Partners, L.P.
| 1.2
|
| Arbor Realty Trust, Inc.
| 1.1
|
| Black Stone Minerals, L.P.
| 1.1
|
| Sturm Ruger & Co., Inc.
| 1.1
|
| WESCO International, Inc., Series A
| 1.1
|
| Total
| 32.2%
|
Performance figures assume reinvestment of all distributions and do not reflect the deduction of taxes that a shareholder would pay on Fund distributions or the redemption or sale of Fund shares. An index is a
statistical composite that tracks a specified financial market or sector. Unlike the Fund, the indices do not actually hold a portfolio of securities and therefore do not incur the expenses incurred by the Fund.
These expenses negatively impact the performance of the Fund. The Fund’s past performance does not predict future performance.
Frequency
Distribution of Discounts and Premiums
Information
showing the number of days the market price of the Fund’s shares was greater (at a premium) and less (at a discount) than the Fund’s net asset value for the most recently completed year, and the most
recently completed calendar quarters since that year (or life of the Fund, if shorter), is available at https://www.ftportfolios.com/Retail/etf/home.aspx.
Fund Performance
Overview (Unaudited) (Continued)
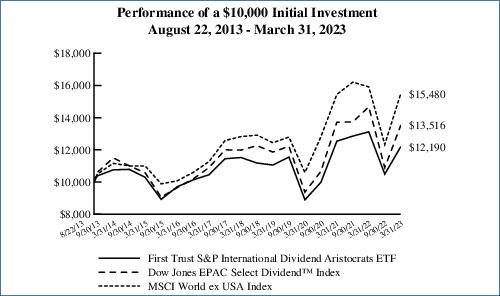
First Trust S&P International Dividend
Aristocrats ETF (FID)
The First Trust S&P
International Dividend Aristocrats ETF (the “Fund”) seeks investment results that correspond generally to the price and yield (before the Fund’s fees and expenses) of an index called the S&P
International Dividend Aristocrats Index (the “Index”). The shares of the Fund are listed and trade on The Nasdaq Stock Market LLC under the ticker symbol “FID.” The Fund normally invests at
least 90% of its net assets (including investment borrowings) in the equity securities that comprise the Index. The Index measures the performance of high dividend yielding companies that have followed a
managed-dividends policy of increasing or maintaining dividends for at least ten consecutive years.
| Performance
|
|
|
|
|
|
|
|
|
|
|
| Average Annual Total Returns
|
| Cumulative Total Returns
|
|
| 6 Months
Ended
3/31/23
| 1 Year
Ended
3/31/23
| 5 Years
Ended
3/31/23
| Inception
(8/22/13)
to 3/31/23
|
| 5 Years
Ended
3/31/23
| Inception
(8/22/13)
to 3/31/23
|
| Fund Performance
|
|
|
|
|
|
|
|
| NAV
| 16.18%
| -7.08%
| 1.13%
| 2.08%
|
| 5.79%
| 21.90%
|
| Market Price
| 16.25%
| -7.17%
| 1.07%
| 2.10%
|
| 5.45%
| 22.05%
|
| Index Performance
|
|
|
|
|
|
|
|
| S&P International Dividend Aristocrats Index(1)
| 16.56%
| -6.46%
| N/A
| N/A
|
| N/A
| N/A
|
| Dow Jones EPAC Select DividendTM Index(2)
| 24.05%
| -7.90%
| 2.44%
| 3.19%
|
| 12.79%
| 35.16%
|
| MSCI World ex USA Index
| 25.50%
| -2.74%
| 3.83%
| 4.65%
|
| 20.70%
| 54.80%
|
(See Notes to Fund
Performance Overview on page 33.)
| (1)
| On August 30, 2018, the Fund’s underlying index changed from the Nasdaq International Multi-Asset Diversified IncomeTM Index to the S&P International Dividend Aristocrats Index (the “Index”). Therefore, the Fund’s performance and
historical returns shown for the periods prior to August 30, 2018, are not necessarily indicative of the performance that the Fund, based on its current index, would have generated. Since the Index had an inception
date of April 30, 2018, it was not in existence for all of the periods disclosed. The old index was terminated on November 23, 2018, so performance data does not exist for these time periods.
|
| (2)
| The Dow Jones EPAC Select DividendTM Index measures the performance of a selected group of companies, from non-U.S. developed markets (Europe, Pacific Asia, and Canada), that have
provided relatively high dividend yields on a consistent basis over time.
|
S&P International
Dividend Aristocrats Index (“Index”) is a product of S&P Dow Jones Indices LLC or its affiliates (“SPDJI”) and has been licensed for use by First Trust. S&P® is a registered trademark of Standard & Poor’s Financial Services LLC (“S&P”); Dow Jones® is a registered trademark of Dow Jones Trademark Holdings LLC (“Dow Jones”); and these trademarks have been licensed for use by
SPDJI and sublicensed for certain purposes by First Trust. The Fund is not sponsored, endorsed, sold or promoted by SPDJI, Dow Jones, S&P, or their respective affiliates and none of such parties make any
representation regarding the advisability of investing in such product nor do they have any liability for any errors, omissions, or interruptions of the Index.
Fund Performance
Overview (Unaudited) (Continued)
First Trust S&P International Dividend
Aristocrats ETF (FID) (Continued)
| Sector Allocation
| % of Total
Investments
|
| Financials
| 25.3%
|
| Real Estate
| 16.1
|
| Utilities
| 15.5
|
| Industrials
| 12.4
|
| Consumer Discretionary
| 6.9
|
| Materials
| 6.7
|
| Energy
| 5.2
|
| Communication Services
| 3.7
|
| Consumer Staples
| 3.6
|
| Information Technology
| 3.5
|
| Health Care
| 1.1
|
| Total
| 100.0%
|
| Country Allocation
| % of Total
Investments
|
| Canada
| 25.5%
|
| Japan
| 19.0
|
| Hong Kong
| 13.5
|
| Switzerland
| 9.2
|
| United Kingdom
| 7.7
|
| Bermuda
| 4.6
|
| Germany
| 4.2
|
| Italy
| 3.1
|
| Australia
| 2.7
|
| France
| 1.7
|
| Cayman Islands
| 1.6
|
| Taiwan
| 1.5
|
| Singapore
| 1.4
|
| Ireland
| 1.1
|
| South Korea
| 1.1
|
| China
| 1.1
|
| Norway
| 1.0
|
| Total
| 100.0%
|
| Top Ten Holdings
| % of Total
Investments
|
| New World Development Co., Ltd.
| 2.0%
|
| Adecco Group AG
| 2.0
|
| Lenovo Group Ltd.
| 2.0
|
| A2A S.p.A.
| 2.0
|
| Guangdong Investment Ltd.
| 1.7
|
| BASF SE
| 1.7
|
| Bouygues S.A.
| 1.7
|
| Legal & General Group PLC
| 1.6
|
| Longfor Group Holdings Ltd.
| 1.6
|
| JB Hi-Fi Ltd.
| 1.6
|
| Total
| 17.9%
|
Fund Performance
Overview (Unaudited) (Continued)
First Trust S&P International Dividend
Aristocrats ETF (FID) (Continued)
Performance figures assume reinvestment of all distributions and do not reflect the deduction of taxes that a shareholder would pay on Fund distributions or the redemption or sale of Fund shares. An index is a
statistical composite that tracks a specified financial market or sector. Unlike the Fund, the indices do not actually hold a portfolio of securities and therefore do not incur the expenses incurred by the Fund.
These expenses negatively impact the performance of the Fund. The Fund’s past performance does not predict future performance.
Frequency Distribution of
Discounts and Premiums
Information showing the
number of days the market price of the Fund’s shares was greater (at a premium) and less (at a discount) than the Fund’s net asset value for the most recently completed year, and the most recently
completed calendar quarters since that year (or life of the Fund, if shorter), is available at https://www.ftportfolios.com/Retail/etf/home.aspx.
Fund Performance
Overview (Unaudited) (Continued)
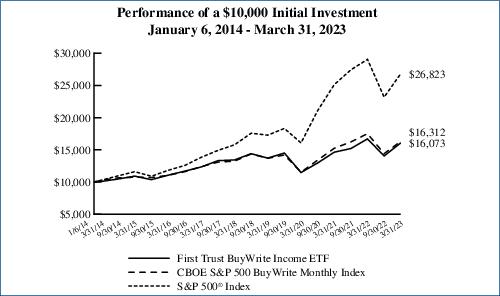
First Trust BuyWrite Income ETF (FTHI)
The First Trust BuyWrite
Income ETF (the “Fund”) is an actively managed exchange-traded fund. The Fund’s primary investment objective is to provide current income. The Fund’s secondary investment objective is to
provide capital appreciation. Under normal market conditions, the Fund invests primarily in equity securities listed on U.S. exchanges. The Fund also employs an “option strategy” in which it will write
(sell) U.S. exchange-traded call options on the S&P 500® Index (the “Index”) to seek additional cash flow in the form of premiums on the options that may be distributed to shareholders on
a monthly basis. The equity securities held by the Fund are selected using a mathematical optimization process which attempts to favor higher dividend paying common stocks for the Fund’s portfolio. The shares of
the Fund are listed and trade on the Nasdaq Stock Market LLC under the ticker symbol “FTHI.”
Portfolio Management
Team
Portfolio management
decisions are made under the direction of the following Portfolio Managers:
John Gambla, CFA, FRM,
PRM, Senior Portfolio Manager of First Trust
Rob A. Guttschow, CFA,
Senior Portfolio Manager of First Trust
Each portfolio manager
has served in such capacity for the Fund since 2014.
| Performance
|
|
|
|
|
|
|
|
|
|
|
| Average Annual Total Returns
|
| Cumulative Total Returns
|
|
| 6 Months
Ended
3/31/23
| 1 Year
Ended
3/31/23
| 5 Years
Ended
3/31/23
| Inception
(1/6/14)
to 3/31/23
|
| 5 Years
Ended
3/31/23
| Inception
(1/6/14)
to 3/31/23
|
| Fund Performance
|
|
|
|
|
|
|
|
| NAV
| 14.38%
| -3.77%
| 3.66%
| 5.28%
|
| 19.68%
| 60.73%
|
| Market Price
| 14.12%
| -3.82%
| 3.56%
| 5.28%
|
| 19.13%
| 60.80%
|
| Index Performance
|
|
|
|
|
|
|
|
| CBOE S&P 500 BuyWrite Monthly Index(1)
| 13.15%
| -6.86%
| 4.25%
| 5.44%
|
| 23.13%
| 63.12%
|
| S&P 500® Index
| 15.62%
| -7.73%
| 11.19%
| 11.28%
|
| 69.94%
| 168.23%
|
(See Notes to Fund
Performance Overview on page 33.)
| (1)
| The CBOE S&P 500 BuyWrite Monthly Index is a benchmark index designed to track the performance of a hypothetical buy-write strategy on the S&P 500® Index.
|
Fund Performance
Overview (Unaudited) (Continued)
First Trust BuyWrite Income ETF (FTHI)
(Continued)
| Sector Allocation
| % of Total
Investments
|
| Information Technology
| 25.0%
|
| Financials
| 16.7
|
| Health Care
| 13.7
|
| Consumer Discretionary
| 9.5
|
| Consumer Staples
| 9.0
|
| Communication Services
| 7.6
|
| Industrials
| 6.2
|
| Energy
| 4.9
|
| Materials
| 3.9
|
| Utilities
| 1.9
|
| Real Estate
| 1.6
|
| Total
| 100.0%
|
| Fund Allocation
| % of Net Assets
|
| Common Stocks
| 96.4%
|
| Real Estate Investment Trusts
| 3.8
|
| Master Limited Partnerships
| 0.8
|
| Call Options Written
| (2.8)
|
| Net Other Assets and Liabilities
| 1.8
|
| Total
| 100.0%
|
| Top Ten Holdings
| % of Total
Investments
|
| Apple, Inc.
| 7.1%
|
| Microsoft Corp.
| 6.3
|
| Amazon.com, Inc.
| 2.7
|
| NVIDIA Corp.
| 2.0
|
| Alphabet, Inc., Class A
| 1.8
|
| Tesla, Inc.
| 1.7
|
| Berkshire Hathaway, Inc., Class B
| 1.6
|
| Alphabet, Inc., Class C
| 1.6
|
| AGNC Investment Corp.
| 1.4
|
| UnitedHealth Group, Inc.
| 1.4
|
| Total
| 27.6%
|
Performance figures assume reinvestment of all distributions and do not reflect the deduction of taxes that a shareholder would pay on Fund distributions or the redemption or sale of Fund shares. An index is a
statistical composite that tracks a specified financial market or sector. Unlike the Fund, the indices do not actually hold a portfolio of securities and therefore do not incur the expenses incurred by the Fund.
These expenses negatively impact the performance of the Fund. The Fund’s past performance does not predict future performance.
Frequency
Distribution of Discounts and Premiums
Information
showing the number of days the market price of the Fund’s shares was greater (at a premium) and less (at a discount) than the Fund’s net asset value for the most recently completed year, and the most
recently completed calendar quarters since that year (or life of the Fund, if shorter), is available at https://www.ftportfolios.com/Retail/etf/home.aspx.
Fund Performance
Overview (Unaudited) (Continued)
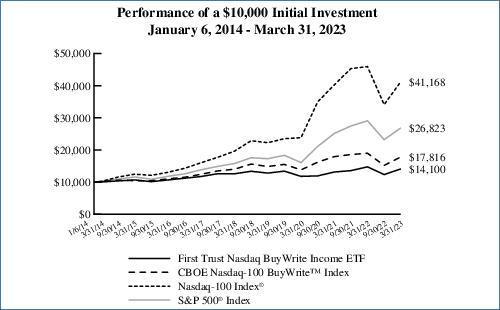
First Trust Nasdaq BuyWrite Income ETF
(FTQI)
The First Trust Nasdaq
BuyWrite Income ETF (the “Fund”) is an actively managed exchange-traded fund. The Fund’s investment objective is to provide current income. Under normal market conditions, the Fund will pursue
its investment objective by investing primarily in equity securities listed on U.S. exchanges and by utilizing an “option strategy” consisting of writing (selling) U.S. exchange-traded call options on the
Nasdaq-100 Index®. Under normal market conditions, the Fund will invest at least 80% of its net assets (plus any borrowings for investment purposes) in the
components of the Nasdaq Composite Index. The Fund will employ an option strategy in which it will write U.S. exchange-traded call options on the Nasdaq-100 Index® in order to seek additional cash flow in the form of premiums on the options. A premium is the income received by an investor who sells an
option contract to another party. In exchange for the premiums received in connection with its written U.S. exchange-traded call options on the Nasdaq-100 Index®, the Fund forfeits any upside potential of the Nasdaq-100 Index® above the strike price of the written call options. It is expected that the Fund will distribute premiums to shareholders on a monthly basis.
The premiums received from the sale of call options are expected to be the Fund’s primary source of income. Under normal market conditions, the Fund will seek to distribute the majority of the option premiums
collected. The Fund does not target a specific income level, but seeks to provide investors with current income primarily from options premiums through writing calls with a notional value of 50-100% of the
Fund’s assets. The shares of the Fund are listed and trade on The Nasdaq Stock Market LLC under the ticker symbol “FTQI.”
Portfolio Management
Team
Portfolio management
decisions are made under the direction of the following Portfolio Managers:
John Gambla, CFA, FRM,
PRM, Senior Portfolio Manager of First Trust
Rob A. Guttschow, CFA,
Senior Portfolio Manager of First Trust
Each portfolio manager
has served in such capacity for the Fund since 2014.
| Performance
|
|
|
|
|
|
|
|
|
|
|
| Average Annual Total Returns
|
| Cumulative Total Returns
|
|
| 6 Months
Ended
3/31/23
| 1 Year
Ended
3/31/23
| 5 Years
Ended
3/31/23
| Inception
(1/6/14)
to 3/31/23
|
| 5 Years
Ended
3/31/23
| Inception
(1/6/14)
to 3/31/23
|
| Fund Performance
|
|
|
|
|
|
|
|
| NAV
| 14.14%
| -4.42%
| 2.27%
| 3.79%
|
| 11.89%
| 41.00%
|
| Market Price
| 13.60%
| -4.79%
| 2.18%
| 3.76%
|
| 11.39%
| 40.60%
|
| Index Performance
|
|
|
|
|
|
|
|
| CBOE Nasdaq-100 BuyWriteTM Index(1)
| 17.19%
| -6.12%
| 4.92%
| 6.46%
|
| 27.12%
| 78.16%
|
| S&P 500® Index
| 15.62%
| -7.73%
| 11.19%
| 11.28%
|
| 69.94%
| 168.23%
|
| Nasdaq-100 Index®(2)
| 20.72%
| -10.35%
| 15.96%
| 16.57%
|
| 109.65%
| 311.68%
|
(See Notes to Fund
Performance Overview on page 33.)
| (1)
| The Cboe Nasdaq-100 BuyWriteTM Index is a benchmark index designed to track the performance of a hypothetical buy-write strategy on the Nasdaq-100 Index®. The index is a passive total return index based on (1) buying the Nasdaq-100 Index® stock index portfolio, and (2) “writing” (or selling) the near-term Nasdaq-100 Index® “covered” call option.
|
| (2)
| On May 11, 2022, the Fund’s primary benchmark changed from the S&P 500® Index to the Nasdaq-100 Index® because the Advisor believes that the Nasdaq-100 Index® better reflects the investment strategies of the Fund.
|
Fund Performance
Overview (Unaudited) (Continued)
First Trust Nasdaq BuyWrite Income ETF
(FTQI) (Continued)
| Sector Allocation
| % of Total
Investments
|
| Information Technology
| 51.4%
|
| Communication Services
| 11.7
|
| Consumer Discretionary
| 10.6
|
| Health Care
| 8.1
|
| Consumer Staples
| 7.1
|
| Financials
| 4.2
|
| Real Estate
| 2.3
|
| Industrials
| 2.1
|
| Utilities
| 2.0
|
| Materials
| 0.5
|
| Total
| 100.0%
|
| Fund Allocation
| % of Net Assets
|
| Common Stocks
| 101.9%
|
| Real Estate Investment Trusts
| 2.1
|
| Call Options Written
| (5.3)
|
| Net Other Assets and Liabilities
| 1.3
|
| Total
| 100.0%
|
| Top Ten Holdings
| % of Total
Investments
|
| Apple, Inc.
| 12.9%
|
| Microsoft Corp.
| 10.6
|
| NVIDIA Corp.
| 4.2
|
| PepsiCo, Inc.
| 3.1
|
| Amazon.com, Inc.
| 3.1
|
| Tesla, Inc.
| 2.6
|
| Meta Platforms, Inc., Class A
| 2.4
|
| Broadcom, Inc.
| 2.2
|
| Alphabet, Inc., Class A
| 2.0
|
| Alphabet, Inc., Class C
| 2.0
|
| Total
| 45.1%
|
Performance figures assume reinvestment of all distributions and do not reflect the deduction of taxes that a shareholder would pay on Fund distributions or the redemption or sale of Fund shares. An index is a
statistical composite that tracks a specified financial market or sector. Unlike the Fund, the indices do not actually hold a portfolio of securities and therefore do not incur the expenses incurred by the Fund.
These expenses negatively impact the performance of the Fund. The Fund’s past performance does not predict future performance.
Frequency
Distribution of Discounts and Premiums
Information
showing the number of days the market price of the Fund’s shares was greater (at a premium) and less (at a discount) than the Fund’s net asset value for the most recently completed year, and the most
recently completed calendar quarters since that year (or life of the Fund, if shorter), is available at https://www.ftportfolios.com/Retail/etf/home.aspx.
Fund Performance
Overview (Unaudited) (Continued)
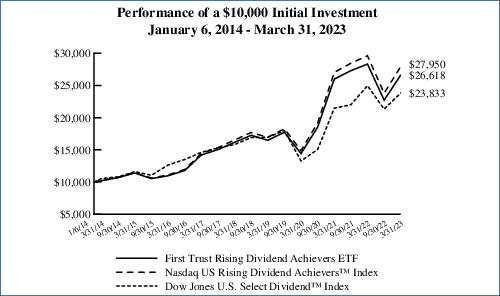
First Trust Rising Dividend Achievers ETF
(RDVY)
The First Trust Rising
Dividend Achievers ETF (the “Fund”) seeks investment results that correspond generally to the price and yield (before the Fund’s fees and expenses) of an index called Nasdaq US Rising Dividend
AchieversTM Index (the “Index”). The Fund normally invests at least 90% of its net assets (including investment borrowings) in the common stocks
and depositary receipts that comprise the Index. The Index includes 50 U.S. exchange-traded equity securities, including securities issued by non-U.S. companies that trade on U.S. securities exchanges in the form of
depositary receipts. The Index is designed to provide access to a diversified portfolio of small, mid and large capitalization companies with a history of raising their dividends while exhibiting the characteristics
to continue to do so in the future by including companies with strong cash balances, low debt and increasing earnings. The shares of the Fund are listed and trade on The Nasdaq Stock Market LLC under the ticker symbol
“RDVY.”
| Performance
|
|
|
|
|
|
|
|
|
|
|
| Average Annual Total Returns
|
| Cumulative Total Returns
|
|
| 6 Months
Ended
3/31/23
| 1 Year
Ended
3/31/23
| 5 Years
Ended
3/31/23
| Inception
(1/6/14)
to 3/31/23
|
| 5 Years
Ended
3/31/23
| Inception
(1/6/14)
to 3/31/23
|
| Fund Performance
|
|
|
|
|
|
|
|
| NAV
| 17.12%
| -6.07%
| 10.49%
| 11.19%
|
| 64.68%
| 166.18%
|
| Market Price
| 17.04%
| -6.15%
| 10.48%
| 11.18%
|
| 64.60%
| 166.05%
|
| Index Performance
|
|
|
|
|
|
|
|
| Nasdaq US Rising Dividend AchieversTM Index
| 17.44%
| -5.66%
| 11.07%
| 11.78%
|
| 69.07%
| 179.50%
|
| Dow Jones U.S. Select DividendTM Index*
| 11.69%
| -4.58%
| 8.54%
| 9.87%
|
| 50.62%
| 138.33%
|
(See Notes to Fund
Performance Overview on page 33.)
| *
| The Dow Jones U.S. Select DividendTM Index represents 100 of the United States’ leading stocks by dividend yield.
|
Nasdaq® and Nasdaq US Rising Dividend AchieversTM Index are registered trademarks and service marks of Nasdaq, Inc. (together with its affiliates hereinafter referred to as the
“Corporations”) and are licensed for use by First Trust. The Fund has not been passed on by the Corporations as to their legality or suitability. The Fund is not issued, endorsed, sold, or promoted by the
Corporations. THE CORPORATIONS MAKE NO WARRANTIES AND BEAR NO LIABILITY WITH RESPECT TO THE FUND.
Fund Performance
Overview (Unaudited) (Continued)
First Trust Rising Dividend Achievers ETF
(RDVY) (Continued)
| Sector Allocation
| % of Total
Investments
|
| Financials
| 39.8%
|
| Information Technology
| 16.0
|
| Energy
| 12.4
|
| Materials
| 12.1
|
| Health Care
| 7.6
|
| Communication Services
| 4.2
|
| Industrials
| 4.0
|
| Consumer Staples
| 2.0
|
| Consumer Discretionary
| 1.9
|
| Total
| 100.0%
|
| Top Ten Holdings
| % of Total
Investments
|
| Accenture PLC, Class A
| 2.2%
|
| Freeport-McMoRan, Inc.
| 2.1
|
| Popular, Inc.
| 2.1
|
| Magnolia Oil & Gas Corp., Class A
| 2.1
|
| Civitas Resources, Inc.
| 2.1
|
| Chord Energy Corp.
| 2.1
|
| Interpublic Group of (The) Cos., Inc.
| 2.1
|
| Exxon Mobil Corp.
| 2.1
|
| Omnicom Group, Inc.
| 2.1
|
| Steel Dynamics, Inc.
| 2.1
|
| Total
| 21.1%
|
Performance figures assume reinvestment of all distributions and do not reflect the deduction of taxes that a shareholder would pay on Fund distributions or the redemption or sale of Fund shares. An index is a
statistical composite that tracks a specified financial market or sector. Unlike the Fund, the indices do not actually hold a portfolio of securities and therefore do not incur the expenses incurred by the Fund.
These expenses negatively impact the performance of the Fund. The Fund’s past performance does not predict future performance.
Frequency
Distribution of Discounts and Premiums
Information
showing the number of days the market price of the Fund’s shares was greater (at a premium) and less (at a discount) than the Fund’s net asset value for the most recently completed year, and the most
recently completed calendar quarters since that year (or life of the Fund, if shorter), is available at https://www.ftportfolios.com/Retail/etf/home.aspx.
Fund Performance
Overview (Unaudited) (Continued)
First Trust Dorsey Wright Focus 5 ETF
(FV)
The First Trust Dorsey
Wright Focus 5 ETF (the “Fund”) seeks investment results that correspond generally to the price and yield (before the Fund’s fees and expenses) of an index called the Dorsey Wright Focus FiveTM Index (the “Index”). The Fund normally invests at least 90% of its net assets (including investment borrowings) in the exchange-traded
funds (“ETFs”) that comprise the Index. The ETFs comprising the Index selection universe are advised by First Trust Advisors L.P. (“First Trust”), the Fund’s investment advisor. The Index
is constructed pursuant to Dorsey, Wright & Associates, LLC’s (the “Index Provider”) proprietary methodology, which takes into account the performance of each of the First Trust sector-based ETFs
relative to one another. The Index is designed to provide targeted exposure to the five First Trust sector-based ETFs that the Index Provider believes offer the greatest potential to outperform the other ETFs in the
selection universe and that satisfy certain trading volume and liquidity requirements. The shares of the Fund are listed and trade on The Nasdaq Stock Market LLC under the ticker symbol “FV.”
| Performance
|
|
|
|
|
|
|
|
|
|
|
| Average Annual Total Returns
|
| Cumulative Total Returns
|
|
| 6 Months
Ended
3/31/23
| 1 Year
Ended
3/31/23
| 5 Years
Ended
3/31/23
| Inception
(3/5/14)
to 3/31/23
|
| 5 Years
Ended
3/31/23
| Inception
(3/5/14)
to 3/31/23
|
| Fund Performance
|
|
|
|
|
|
|
|
| NAV
| 10.71%
| -3.94%
| 10.08%
| 9.93%
|
| 61.67%
| 136.03%
|
| Market Price
| 10.84%
| -3.84%
| 10.09%
| 9.94%
|
| 61.68%
| 136.14%
|
| Index Performance
|
|
|
|
|
|
|
|
| Dorsey Wright Focus FiveTM Index
| 10.97%
| -3.57%
| 10.42%
| 10.32%
|
| 64.13%
| 143.65%
|
| S&P 500® Index
| 15.62%
| -7.73%
| 11.19%
| 11.13%
|
| 69.94%
| 160.55%
|
(See Notes to Fund
Performance Overview on page 33.)
Nasdaq® and Dorsey Wright Focus FiveTM Index are registered trademarks and service marks of Nasdaq, Inc. (together with its affiliates hereinafter referred to as the
“Corporations”) and are licensed for use by First Trust. The Fund has not been passed on by the Corporations as to their legality or suitability. The Fund is not issued, endorsed, sold, or promoted by the
Corporations. THE CORPORATIONS MAKE NO WARRANTIES AND BEAR NO LIABILITY WITH RESPECT TO THE FUND.
Fund Performance
Overview (Unaudited) (Continued)
First Trust Dorsey Wright Focus 5 ETF (FV)
(Continued)

Performance figures assume reinvestment of all distributions and do not reflect the deduction of taxes that a shareholder would pay on Fund distributions or the redemption or sale of Fund shares. An index is a
statistical composite that tracks a specified financial market or sector. Unlike the Fund, the indices do not actually hold a portfolio of securities and therefore do not incur the expenses incurred by the Fund.
These expenses negatively impact the performance of the Fund. The Fund’s past performance does not predict future performance.
Frequency Distribution of
Discounts and Premiums
Information showing the
number of days the market price of the Fund’s shares was greater (at a premium) and less (at a discount) than the Fund’s net asset value for the most recently completed year, and the most recently
completed calendar quarters since that year (or life of the Fund, if shorter), is available at https://www.ftportfolios.com/Retail/etf/home.aspx.
Fund Performance
Overview (Unaudited) (Continued)
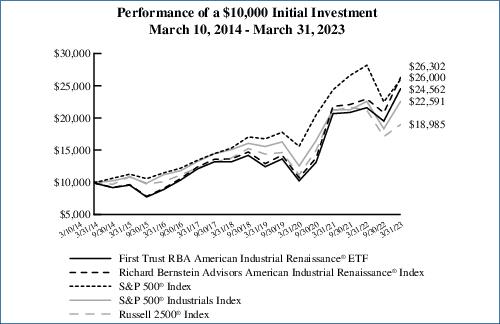
First Trust RBA American Industrial
Renaissance® ETF (AIRR)
The First Trust RBA
American Industrial Renaissance® ETF (the “Fund”) seeks investment results that correspond generally to the price and yield (before the Fund’s fees and
expenses) of an index called the Richard Bernstein Advisors American Industrial Renaissance® Index (the “Index”). The Fund normally invests at least 90% of its net assets (including investment borrowings) in the equity
securities that comprise the Index. The Index is designed to measure the performance of small- and mid-cap U.S. companies in the industrial and community banking sectors. The shares of the Fund are listed and trade on
The Nasdaq Stock Market LLC under the ticker symbol “AIRR.”
| Performance
|
|
|
|
|
|
|
|
|
|
|
| Average Annual Total Returns
|
| Cumulative Total Returns
|
|
| 6 Months
Ended
3/31/23
| 1 Year
Ended
3/31/23
| 5 Years
Ended
3/31/23
| Inception
(3/10/14)
to 3/31/23
|
| 5 Years
Ended
3/31/23
| Inception
(3/10/14)
to 3/31/23
|
| Fund Performance
|
|
|
|
|
|
|
|
| NAV
| 25.90%
| 13.79%
| 13.27%
| 10.43%
|
| 86.44%
| 145.62%
|
| Market Price
| 25.71%
| 13.80%
| 13.30%
| 10.43%
|
| 86.69%
| 145.58%
|
| Index Performance
|
|
|
|
|
|
|
|
| Richard Bernstein Advisors American Industrial Renaissance® Index
| 26.38%
| 14.63%
| 14.08%
| 11.27%
|
| 93.25%
| 163.02%
|
| S&P 500® Index
| 15.62%
| -7.73%
| 11.19%
| 11.13%
|
| 69.94%
| 160.00%
|
| S&P 500® Industrials Index
| 23.36%
| 0.17%
| 8.43%
| 9.41%
|
| 49.91%
| 125.91%
|
| Russell 2500® Index
| 11.07%
| -10.39%
| 6.65%
| 7.33%
|
| 37.95%
| 89.85%
|
(See Notes to Fund
Performance Overview on page 33.)
Richard Bernstein Advisors
and Richard Bernstein Advisors American Industrial Renaissance® Index (“Index”) are trademarks and trade names of Richard Bernstein Advisors (“RBA”). The Fund is not sponsored,
endorsed, sold or promoted by RBA and RBA makes no representation or warranty, express or implied, to the owners of the Fund or any member of the public regarding the advisability of trading in the Fund. RBA’s
only relationship to First Trust is the licensing of certain trademarks and trade names of RBA and of the Index, which is determined, composed and calculated by RBA without regard to First Trust or the Fund. RBA has
no obligation to take the needs of First Trust or the owners of the Fund into consideration in determining, composing or calculating the Index. RBA is not responsible for and has not participated in the determination
of the timing of, prices at, or quantities of the Fund to be listed or in the determination or calculation of the equation by which the Fund is to be converted into cash. RBA has no obligation or liability in
connection with the administration, marketing or trading of the Fund.
Fund Performance
Overview (Unaudited) (Continued)
First Trust RBA American Industrial
Renaissance® ETF (AIRR) (Continued)
| Sector Allocation
| % of Total
Investments
|
| Industrials
| 91.8%
|
| Financials
| 8.2
|
| Total
| 100.0%
|
| Top Ten Holdings
| % of Total
Investments
|
| Encore Wire Corp.
| 4.0%
|
| Comfort Systems USA, Inc.
| 3.9
|
| Proto Labs, Inc.
| 3.8
|
| Mueller Water Products, Inc., Class A
| 3.6
|
| Clean Harbors, Inc.
| 3.6
|
| Atkore, Inc.
| 3.6
|
| Greenbrier (The) Cos., Inc.
| 3.6
|
| Quanta Services, Inc.
| 3.5
|
| APi Group Corp.
| 3.5
|
| Arcosa, Inc.
| 3.5
|
| Total
| 36.6%
|
Performance figures assume reinvestment of all distributions and do not reflect the deduction of taxes that a shareholder would pay on Fund distributions or the redemption or sale of Fund shares. An index is a
statistical composite that tracks a specified financial market or sector. Unlike the Fund, the indices do not actually hold a portfolio of securities and therefore do not incur the expenses incurred by the Fund.
These expenses negatively impact the performance of the Fund. The Fund’s past performance does not predict future performance.
Frequency
Distribution of Discounts and Premiums
Information
showing the number of days the market price of the Fund’s shares was greater (at a premium) and less (at a discount) than the Fund’s net asset value for the most recently completed year, and the most
recently completed calendar quarters since that year (or life of the Fund, if shorter), is available at https://www.ftportfolios.com/Retail/etf/home.aspx.
Fund Performance
Overview (Unaudited) (Continued)
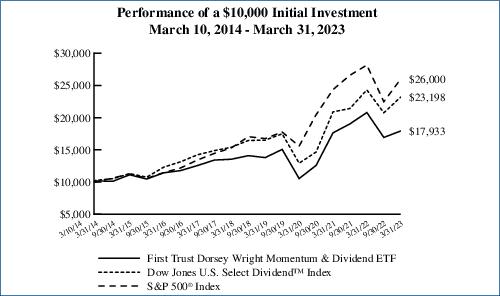
First Trust Dorsey Wright Momentum &
Dividend ETF (DDIV)
The First Trust Dorsey
Wright Momentum & Dividend ETF (the “Fund”) seeks investment results that correspond generally to the price and yield (before the Fund’s fees and expenses) of an index called the Dorsey Wright
Momentum Plus Dividend YieldTM Index (the “Index”). Under normal conditions, the Fund invests at least 90% of its net assets (including investment borrowings) in the
equity securities that comprise the Index. The Index is a rules-based equity index designed to track the overall performance of the 50 stocks with the highest dividend yield comprising the Nasdaq US Large Mid™
Index that still maintain high levels of “relative strength.” A relative strength analysis is a momentum-based investment strategy that emphasizes a security’s forward price momentum in the
security selection process. The Fund, using an indexing investment approach, attempts to replicate, before fees and expenses, the performance of the Index. The shares of the Fund are listed and trade on The Nasdaq
Stock Market LLC under the ticker symbol “DDIV.”
| Performance
|
|
|
|
|
|
|
|
|
|
|
| Average Annual Total Returns
|
| Cumulative Total Returns
|
|
| 6 Months
Ended
3/31/23
| 1 Year
Ended
3/31/23
| 5 Years
Ended
3/31/23
| Inception
(3/10/14)
to 3/31/23
|
| 5 Years
Ended
3/31/23
| Inception
(3/10/14)
to 3/31/23
|
| Fund Performance
|
|
|
|
|
|
|
|
| NAV
| 5.92%
| -13.80%
| 5.78%
| 6.66%
|
| 32.44%
| 79.33%
|
| Market Price
| 5.85%
| -13.85%
| 5.75%
| 6.66%
|
| 32.23%
| 79.29%
|
| Index Performance
|
|
|
|
|
|
|
|
| Dorsey Wright Momentum Plus Dividend YieldTM Index(1)
| 6.36%
| -13.29%
| N/A
| N/A
|
| N/A
| N/A
|
| Dow Jones U.S. Select DividendTM Index(2)
| 11.69%
| -4.58%
| 8.54%
| 9.74%
|
| 50.62%
| 131.98%
|
| S&P 500® Index
| 15.62%
| -7.73%
| 11.19%
| 11.13%
|
| 69.94%
| 160.00%
|
(See Notes to Fund
Performance Overview on page 33.)
| (1)
| On September 6, 2018, the Fund’s underlying index changed from the Richard Bernstein Advisors Quality Income Index to the Dorsey Wright Momentum Plus Dividend YieldTM Index (the “Index”). Therefore, the Fund’s performance and historical returns shown for the periods prior to September 6, 2018,
are not necessarily indicative of the performance that the Fund, based on its current index, would have generated. Since the Index had an inception date of July 2, 2018, it was not in existence for all of the periods
disclosed.
|
| (2)
| The Dow Jones U.S. Select DividendTM Index represents 100 of the United States’ leading stocks by dividend yield.
|
Nasdaq® and Dorsey Wright Momentum Plus Dividend YieldTM Index are registered trademarks and service marks of Nasdaq, Inc. (together with its affiliates hereinafter referred to as the
“Corporations”) and are licensed for use by First Trust. The Fund has not been passed on by the Corporations as to its legality or suitability. The Fund is not issued, endorsed, sold or promoted by the
Corporations. THE CORPORATIONS MAKE NO WARRANTIES AND BEAR NO LIABILITY WITH RESPECT TO THE FUND.
Fund Performance
Overview (Unaudited) (Continued)
First Trust Dorsey Wright Momentum &
Dividend ETF (DDIV) (Continued)
| Sector Allocation
| % of Total
Investments
|
| Financials
| 30.8%
|
| Real Estate
| 26.5
|
| Energy
| 17.5
|
| Health Care
| 6.4
|
| Consumer Staples
| 5.7
|
| Information Technology
| 3.4
|
| Utilities
| 2.8
|
| Industrials
| 2.2
|
| Consumer Discretionary
| 2.1
|
| Communication Services
| 1.5
|
| Materials
| 1.1
|
| Total
| 100.0%
|
| Top Ten Holdings
| % of Total
Investments
|
| OneMain Holdings, Inc.
| 5.3%
|
| Starwood Property Trust, Inc.
| 4.9
|
| Antero Midstream Corp.
| 4.2
|
| Spirit Realty Capital, Inc.
| 3.6
|
| Simon Property Group, Inc.
| 3.3
|
| Gaming and Leisure Properties, Inc.
| 3.2
|
| Kinder Morgan, Inc.
| 3.1
|
| Iron Mountain, Inc.
| 3.0
|
| Lamar Advertising Co., Class A
| 2.9
|
| ONEOK, Inc.
| 2.8
|
| Total
| 36.3%
|
Performance figures assume reinvestment of all distributions and do not reflect the deduction of taxes that a shareholder would pay on Fund distributions or the redemption or sale of Fund shares. An index is a
statistical composite that tracks a specified financial market or sector. Unlike the Fund, the indices do not actually hold a portfolio of securities and therefore do not incur the expenses incurred by the Fund.
These expenses negatively impact the performance of the Fund. The Fund’s past performance does not predict future performance.
Frequency
Distribution of Discounts and Premiums
Information
showing the number of days the market price of the Fund’s shares was greater (at a premium) and less (at a discount) than the Fund’s net asset value for the most recently completed year, and the most
recently completed calendar quarters since that year (or life of the Fund, if shorter), is available at https://www.ftportfolios.com/Retail/etf/home.aspx.
Fund Performance
Overview (Unaudited) (Continued)
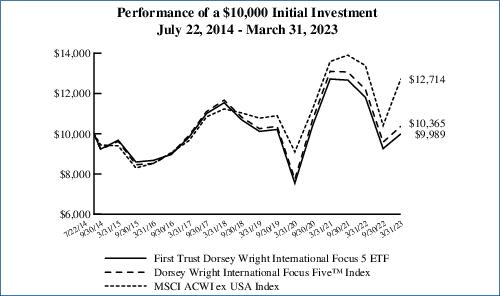
First Trust Dorsey Wright International
Focus 5 ETF (IFV)
The First Trust Dorsey
Wright International Focus 5 ETF (the “Fund”) seeks investment results that correspond generally to the price and yield (before the Fund’s fees and expenses) of an index called the Dorsey Wright
International Focus FiveTM Index (the “Index”). The Fund normally invests at least 90% of its net assets (including investment borrowings) in the exchange-traded
funds (“ETFs”) that comprise the Index. The ETFs comprising the Index selection universe are advised by First Trust Advisors L.P. (“First Trust”), the Fund’s investment advisor. The Index
is constructed pursuant to Dorsey, Wright & Associates, LLC’s (the “Index Provider”) proprietary methodology, which takes into account the performance of certain First Trust international ETFs
relative to one another. The Index is designed to provide targeted exposure to the five First Trust country/region-based ETFs that the Index Provider believes offer the greatest potential to outperform the other ETFs
in the selection universe. The shares of the Fund are listed and trade on The Nasdaq Stock Market LLC under the ticker symbol “IFV.”
| Performance
|
|
|
|
|
|
|
|
|
|
|
| Average Annual Total Returns
|
| Cumulative Total Returns
|
|
| 6 Months
Ended
3/31/23
| 1 Year
Ended
3/31/23
| 5 Years
Ended
3/31/23
| Inception
(7/22/14)
to 3/31/23
|
| 5 Years
Ended
3/31/23
| Inception
(7/22/14)
to 3/31/23
|
| Fund Performance
|
|
|
|
|
|
|
|
| NAV
| 7.85%
| -15.44%
| -2.85%
| -0.01%
|
| -13.48%
| -0.11%
|
| Market Price
| 7.97%
| -15.49%
| -2.78%
| 0.01%
|
| -13.17%
| 0.08%
|
| Index Performance
|
|
|
|
|
|
|
|
| Dorsey Wright International Focus FiveTM Index
| 8.15%
| -15.09%
| -2.35%
| 0.41%
|
| -11.20%
| 3.65%
|
| MSCI ACWI ex USA Index
| 22.13%
| -5.07%
| 2.51%
| 2.80%
|
| 13.17%
| 27.14%
|
(See Notes to Fund
Performance Overview on page 33.)
Nasdaq® and Dorsey Wright International Focus FiveTM Index are registered trademarks and service marks of Nasdaq, Inc. (together with its affiliates hereinafter referred to as the
“Corporations”) and are licensed for use by First Trust. The Fund has not been passed on by the Corporations as to their legality or suitability. The Fund is not issued, endorsed, sold, or promoted by the
Corporations. THE CORPORATIONS MAKE NO WARRANTIES AND BEAR NO LIABILITY WITH RESPECT TO THE FUND.
Fund Performance
Overview (Unaudited) (Continued)
First Trust Dorsey Wright International
Focus 5 ETF (IFV) (Continued)
Performance figures assume reinvestment of all distributions and do not reflect the deduction of taxes that a shareholder would pay on Fund distributions or the redemption or sale of Fund shares. An index is a
statistical composite that tracks a specified financial market or sector. Unlike the Fund, the indices do not actually hold a portfolio of securities and therefore do not incur the expenses incurred by the Fund.
These expenses negatively impact the performance of the Fund. The Fund’s past performance does not predict future performance.
Frequency Distribution of
Discounts and Premiums
Information showing the
number of days the market price of the Fund’s shares was greater (at a premium) and less (at a discount) than the Fund’s net asset value for the most recently completed year, and the most recently
completed calendar quarters since that year (or life of the Fund, if shorter), is available at https://www.ftportfolios.com/Retail/etf/home.aspx.
Fund Performance
Overview (Unaudited) (Continued)
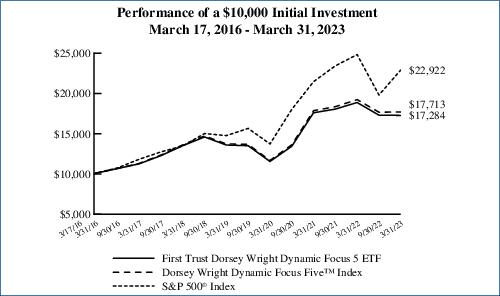
First Trust Dorsey Wright Dynamic Focus 5
ETF (FVC)
The First Trust Dorsey
Wright Dynamic Focus 5 ETF (the “Fund”) seeks investment results that correspond generally to the price and yield (before the Fund’s fees and expenses) of an index called the Dorsey Wright Dynamic
Focus FiveTM Index (the “Index”). The Fund normally invests at least 80% of its net assets (including investment borrowings) in the exchange-traded
funds (“ETFs”) that comprise the Index, including the First Trust Enhanced Short Maturity ETF (“FTSM”), an ultra-short duration ETF. The ETFs comprising the Index selection universe are advised
by First Trust Advisors L.P. (“First Trust”), the Fund’s investment advisor. The Index is constructed pursuant to Dorsey, Wright & Associates, LLC’s (the “Index Provider”)
proprietary methodology, which takes into account the performance of each of the First Trust sector and industry-based ETFs relative to one another. The Index is designed to provide targeted exposure to the five First
Trust sector and industry-based ETFs that the Index Provider determines offer the greatest potential to outperform the other First Trust sector and industry-based ETFs and that satisfy certain trading volume and
liquidity requirements. In addition to the First Trust sector and industry-based ETFs, the Index may select FTSM. FTSM is also evaluated and its inclusion and weight in the Index is adjusted based upon its rank
relative to the selection universe of sector and industry-based ETFs chosen by the Index. The shares of the Fund are listed and trade on The Nasdaq Stock Market LLC under the ticker symbol “FVC.”
| Performance
|
|
|
|
|
|
|
|
|
|
|
| Average Annual Total Returns
|
| Cumulative Total Returns
|
|
| 6 Months
Ended
3/31/23
| 1 Year
Ended
3/31/23
| 5 Years
Ended
3/31/23
| Inception
(3/17/16)
to 3/31/23
|
| 5 Years
Ended
3/31/23
| Inception
(3/17/16)
to 3/31/23
|
| Fund Performance
|
|
|
|
|
|
|
|
| NAV
| -0.18%
| -8.49%
| 5.04%
| 8.08%
|
| 27.86%
| 72.84%
|
| Market Price
| -0.33%
| -8.47%
| 5.04%
| 8.08%
|
| 27.86%
| 72.83%
|
| Index Performance
|
|
|
|
|
|
|
|
| Dorsey Wright Dynamic Focus FiveTM Index
| 0.17%
| -7.97%
| 5.40%
| 8.46%
|
| 30.10%
| 77.13%
|
| S&P 500® Index
| 15.62%
| -7.73%
| 11.19%
| 12.51%
|
| 69.94%
| 129.22%
|
(See Notes to Fund
Performance Overview on page 33.)
Nasdaq® and Dorsey Wright Dynamic Focus FiveTM Index are registered trademarks and service marks of Nasdaq, Inc. (together with its affiliates hereinafter referred to as the
“Corporations”) and are licensed for use by First Trust. The Fund has not been passed on by the Corporations as to their legality or suitability. The Fund is not issued, endorsed, sold, or promoted by the
Corporations. THE CORPORATIONS MAKE NO WARRANTIES AND BEAR NO LIABILITY WITH RESPECT TO THE FUND.
Fund Performance
Overview (Unaudited) (Continued)
First Trust Dorsey Wright Dynamic Focus 5
ETF (FVC) (Continued)
Performance figures assume reinvestment of all distributions and do not reflect the deduction of taxes that a shareholder would pay on Fund distributions or the redemption or sale of Fund shares. An index is a
statistical composite that tracks a specified financial market or sector. Unlike the Fund, the indices do not actually hold a portfolio of securities and therefore do not incur the expenses incurred by the Fund.
These expenses negatively impact the performance of the Fund. The Fund’s past performance does not predict future performance.
Frequency Distribution of
Discounts and Premiums
Information showing the
number of days the market price of the Fund’s shares was greater (at a premium) and less (at a discount) than the Fund’s net asset value for the most recently completed year, and the most recently
completed calendar quarters since that year (or life of the Fund, if shorter), is available at https://www.ftportfolios.com/Retail/etf/home.aspx.
Fund Performance
Overview (Unaudited) (Continued)
First Trust Indxx Innovative Transaction
& Process ETF (LEGR)
The First Trust Indxx
Innovative Transaction & Process ETF (the “Fund”) seeks investment results that correspond generally to the price and yield (before the Fund’s fees and expenses) of an index called the Indxx
Blockchain Index (the “Index”). The Fund will normally invest at least 90% of its net assets (including investment borrowings) in the common stocks and depositary receipts that comprise the Index. The
Index is designed to track the performance of companies that are either actively using, investing in, developing, or have products that are poised to benefit from blockchain technology and/or the potential for
increased efficiency that it provides to various business processes. The Index seeks to include only companies that have devoted material resources to the use of blockchain technologies. The shares of the Fund are
listed and traded on The Nasdaq Stock Market LLC, under the ticker symbol “LEGR.”
| Performance
|
|
|
|
|
|
|
|
|
|
|
| Average Annual Total Returns
|
| Cumulative Total Returns
|
|
| 6 Months
Ended
3/31/23
| 1 Year
Ended
3/31/23
| 5 Years
Ended
3/31/23
| Inception
(1/24/18)
to 3/31/23
|
| 5 Years
Ended
3/31/23
| Inception
(1/24/18)
to 3/31/23
|
| Fund Performance
|
|
|
|
|
|
|
|
| NAV
| 23.94%
| -4.31%
| 7.23%
| 6.24%
|
| 41.79%
| 36.85%
|
| Market Price
| 24.31%
| -4.38%
| 7.19%
| 6.24%
|
| 41.51%
| 36.86%
|
| Index Performance
|
|
|
|
|
|
|
|
| Indxx Blockchain Index
| 24.16%
| -3.95%
| 8.22%
| 7.19%
|
| 48.40%
| 43.27%
|
| S&P 500® Index
| 15.62%
| -7.73%
| 11.19%
| 9.33%
|
| 69.94%
| 58.77%
|
(See Notes to Fund
Performance Overview on page 33.)
Indxx and Indxx Blockchain
Index (“Index”) are trademarks of Indxx, Inc. (“Indxx”) and have been licensed for use for certain purposes by First Trust. The Fund is not sponsored, endorsed, sold or promoted by Indxx
and Indxx makes no representation regarding the advisability of trading in such product. The Index is determined, composed and calculated by Indxx without regard to First Trust or the Fund.
Fund Performance
Overview (Unaudited) (Continued)
First Trust Indxx Innovative Transaction
& Process ETF (LEGR) (Continued)
| Sector Allocation
| % of Total
Long-Term
Investments
|
| Financials
| 37.1%
|
| Information Technology
| 30.2
|
| Communication Services
| 9.5
|
| Consumer Discretionary
| 9.3
|
| Industrials
| 5.5
|
| Utilities
| 3.0
|
| Consumer Staples
| 1.7
|
| Materials
| 1.6
|
| Health Care
| 1.3
|
| Energy
| 0.8
|
| Total
| 100.0%
|
| Top Ten Holdings
| % of Total
Long-Term
Investments
|
| Intel Corp.
| 1.5%
|
| Alibaba Group Holding Ltd., ADR
| 1.5
|
| NVIDIA Corp.
| 1.5
|
| Advanced Micro Devices, Inc.
| 1.5
|
| Baidu, Inc., ADR
| 1.4
|
| Microsoft Corp.
| 1.4
|
| Amazon.com, Inc.
| 1.4
|
| Salesforce, Inc.
| 1.4
|
| Accenture PLC, Class A
| 1.4
|
| Samsung Electronics Co., Ltd.
| 1.4
|
| Total
| 14.4%
|
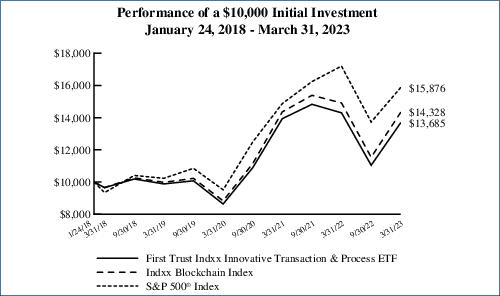
Performance figures assume reinvestment of all distributions and do not reflect the deduction of taxes that a shareholder would pay on Fund distributions or the redemption or sale of Fund shares. An index is a
statistical composite that tracks a specified financial market or sector. Unlike the Fund, the indices do not actually hold a portfolio of securities and therefore do not incur the expenses incurred by the Fund.
These expenses negatively impact the performance of the Fund. The Fund’s past performance does not predict future performance.
Frequency
Distribution of Discounts and Premiums
Information
showing the number of days the market price of the Fund’s shares was greater (at a premium) and less (at a discount) than the Fund’s net asset value for the most recently completed year, and the most
recently completed calendar quarters since that year (or life of the Fund, if shorter), is available at https://www.ftportfolios.com/Retail/etf/home.aspx.
Fund Performance
Overview (Unaudited) (Continued)
First Trust Nasdaq Artificial Intelligence
and Robotics ETF (ROBT)
The First Trust Nasdaq
Artificial Intelligence and Robotics ETF (the “Fund”) seeks investment results that correspond generally to the price and yield (before the Fund’s fees and expenses) of an index called the Nasdaq CTA
Artificial Intelligence and RoboticsTM Index (the “Index”). The Fund will normally invest at least 90% of its net assets (including investment borrowings) in the common
stocks and depositary receipts that comprise the Index. The Index is designed to track the performance of companies engaged in the artificial intelligence and robotics segments of the technology, industrial and other
economic sectors. The shares of the Fund are listed and traded on The Nasdaq Stock Market LLC, under the ticker symbol “ROBT.”
| Performance
|
|
|
|
|
|
|
|
|
|
|
| Average Annual Total Returns
|
| Cumulative Total Returns
|
|
| 6 Months
Ended
3/31/23
| 1 Year
Ended
3/31/23
| 5 Years
Ended
3/31/23
| Inception
(2/21/18)
to 3/31/23
|
| 5 Years
Ended
3/31/23
| Inception
(2/21/18)
to 3/31/23
|
| Fund Performance
|
|
|
|
|
|
|
|
| NAV
| 26.86%
| -9.42%
| 8.00%
| 7.48%
|
| 46.91%
| 44.53%
|
| Market Price
| 27.08%
| -9.36%
| 8.00%
| 7.51%
|
| 46.93%
| 44.70%
|
| Index Performance
|
|
|
|
|
|
|
|
| Nasdaq CTA Artificial Intelligence and RoboticsTM Index
| 26.73%
| -9.68%
| 8.75%
| 8.12%
|
| 52.12%
| 48.99%
|
| S&P 500® Index
| 15.62%
| -7.73%
| 11.19%
| 10.50%
|
| 69.64%
| 66.47%
|
(See Notes to Fund
Performance Overview on page 33.)
Nasdaq® and Nasdaq CTA Artificial Intelligence and RoboticsTM Index are registered trademarks and service marks of Nasdaq, Inc. (together with its affiliates hereinafter referred to as the
“Corporations”) and are licensed for use by First Trust. The Fund has not been passed on by the Corporations as to their legality or suitability. The Fund is not issued, endorsed, sold, or promoted by the
Corporations. THE CORPORATIONS MAKE NO WARRANTIES AND BEAR NO LIABILITY WITH RESPECT TO THE FUND.
Fund Performance
Overview (Unaudited) (Continued)
First Trust Nasdaq Artificial Intelligence
and Robotics ETF (ROBT) (Continued)
| Sector Allocation
| % of Total
Long-Term
Investments
|
| Information Technology
| 59.7%
|
| Industrials
| 21.1
|
| Consumer Discretionary
| 10.8
|
| Health Care
| 5.4
|
| Communication Services
| 2.3
|
| Real Estate
| 0.4
|
| Consumer Staples
| 0.3
|
| Total
| 100.0%
|
| Top Ten Holdings
| % of Total
Long-Term
Investments
|
| C3.ai, Inc., Class A
| 2.8%
|
| UiPath, Inc., Class A
| 2.2
|
| BlackBerry Ltd.
| 2.2
|
| Illumina, Inc.
| 2.2
|
| Nice Ltd., ADR
| 2.0
|
| ANSYS, Inc.
| 2.0
|
| Mobileye Global, Inc., Class A
| 2.0
|
| Ciena Corp.
| 2.0
|
| Cadence Design Systems, Inc.
| 2.0
|
| ServiceNow, Inc.
| 2.0
|
| Total
| 21.4%
|
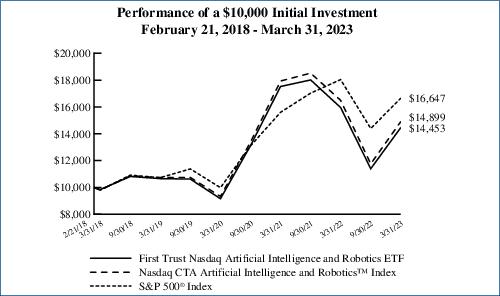
Performance figures assume reinvestment of all distributions and do not reflect the deduction of taxes that a shareholder would pay on Fund distributions or the redemption or sale of Fund shares. An index is a
statistical composite that tracks a specified financial market or sector. Unlike the Fund, the indices do not actually hold a portfolio of securities and therefore do not incur the expenses incurred by the Fund.
These expenses negatively impact the performance of the Fund. The Fund’s past performance does not predict future performance.
Frequency
Distribution of Discounts and Premiums
Information
showing the number of days the market price of the Fund’s shares was greater (at a premium) and less (at a discount) than the Fund’s net asset value for the most recently completed year, and the most
recently completed calendar quarters since that year (or life of the Fund, if shorter), is available at https://www.ftportfolios.com/Retail/etf/home.aspx.
Fund Performance
Overview (Unaudited) (Continued)
First Trust International Developed
Capital Strength ETF (FICS)
The First Trust
International Developed Capital Strength ETF (the “Fund”) seeks investment results that correspond generally to the price and yield (before the Fund’s fees and expenses) of an index called The
International Developed Capital StrengthTM Index (the “Index”). The Fund seeks to achieve its investment objective by investing, under normal market conditions, at least 90% of its
net assets (including investment borrowings) in the common stocks and real estate investment trusts that comprise the Index. The Index seeks to provide exposure to well-capitalized companies in the developed markets
outside of the U.S. with strong market positions that have the potential to provide a greater degree of stability and performance over time. The shares of the Fund are listed and traded on The Nasdaq Stock Market LLC,
under the ticker symbol “FICS.”
| Performance
|
|
|
|
|
|
|
|
| Average Annual
Total Returns
| Cumulative
Total Returns
|
|
| 6 Months Ended
3/31/23
| 1 Year Ended
3/31/23
| Inception (12/15/20)
to 3/31/23
| Inception (12/15/20)
to 3/31/23
|
| Fund Performance
|
|
|
|
|
| NAV
| 22.00%
| -2.58%
| 3.43%
| 8.03%
|
| Market Price
| 21.63%
| -2.78%
| 3.48%
| 8.16%
|
| Index Performance
|
|
|
|
|
| The International Developed Capital StrengthTM Index
| 21.26%
| -3.11%
| 4.18%
| 9.82%
|
| MSCI World ex USA Index
| 25.50%
| -2.74%
| 2.69%
| 6.27%
|
(See Notes to Fund
Performance Overview on page 33.)
Nasdaq® and The International Developed Capital StrengthTM Index are registered trademarks and service marks of Nasdaq, Inc. (together with its affiliates hereinafter referred to as the
“Corporations”) and are licensed for use by First Trust. The Fund has not been passed on by the Corporations as to their legality or suitability. The Fund is not issued, endorsed, sold, or promoted by the
Corporations. THE CORPORATIONS MAKE NO WARRANTIES AND BEAR NO LIABILITY WITH RESPECT TO THE FUND.
Fund Performance
Overview (Unaudited) (Continued)
First Trust International Developed
Capital Strength ETF (FICS) (Continued)
| Sector Allocation
| % of Total
Investments
|
| Industrials
| 22.0%
|
| Consumer Staples
| 16.6
|
| Financials
| 15.3
|
| Information Technology
| 14.2
|
| Consumer Discretionary
| 12.8
|
| Health Care
| 11.1
|
| Materials
| 4.6
|
| Real Estate
| 1.8
|
| Communication Services
| 1.6
|
| Total
| 100.0%
|
| Top Ten Holdings
| % of Total
Investments
|
| Shin-Etsu Chemical Co., Ltd.
| 2.8%
|
| LVMH Moet Hennessy Louis Vuitton SE
| 2.5
|
| L’Oreal S.A.
| 2.5
|
| Kering S.A.
| 2.5
|
| Schindler Holding AG
| 2.3
|
| Constellation Software, Inc.
| 2.3
|
| Hong Kong Exchanges & Clearing Ltd.
| 2.3
|
| Carlsberg A.S., Class B
| 2.2
|
| Kia Corp.
| 2.2
|
| Brenntag SE
| 2.2
|
| Total
| 23.8%
|
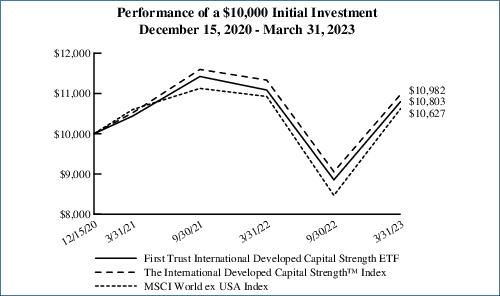
Performance figures assume reinvestment of all distributions and do not reflect the deduction of taxes that a shareholder would pay on Fund distributions or the redemption or sale of Fund shares. An index is a
statistical composite that tracks a specified financial market or sector. Unlike the Fund, the indices do not actually hold a portfolio of securities and therefore do not incur the expenses incurred by the Fund.
These expenses negatively impact the performance of the Fund. The Fund’s past performance does not predict future performance.
Frequency
Distribution of Discounts and Premiums
Information
showing the number of days the market price of the Fund’s shares was greater (at a premium) and less (at a discount) than the Fund’s net asset value for the most recently completed year, and the most
recently completed calendar quarters since that year (or life of the Fund, if shorter), is available at https://www.ftportfolios.com/Retail/etf/home.aspx.
Notes to Fund
Performance Overview (Unaudited)
Total returns for the
periods since inception are calculated from the inception date of each Fund. “Average Annual Total Returns” represent the average annual change in value of an investment over the periods indicated.
“Cumulative Total Returns” represent the total change in value of an investment over the periods indicated.
Each Fund’s per
share net asset value (“NAV”) is the value of one share of the Fund and is computed by dividing the value of all assets of the Fund (including accrued interest and dividends), less all liabilities
(including accrued expenses and dividends declared but unpaid), by the total number of outstanding shares. The price used to calculate market return (“Market Price”) is determined by using the midpoint of
the national best bid and offer price (“NBBO”) as of the time that the Fund’s NAV is calculated. Under SEC rules, the NBBO consists of the highest displayed buy and lowest sell prices among the
various exchanges trading the Fund at the time the Fund’s NAV is calculated. Prior to January 1, 2019, the price used was the midpoint between the highest bid and the lowest offer on the stock exchange on which
shares of the Fund were listed for trading as of the time that the Fund’s NAV was calculated. Since shares of each Fund did not trade in the secondary market until after the Fund’s inception, for the
period from inception to the first day of secondary market trading in shares of the Fund, the NAV of each Fund is used as a proxy for the secondary market trading price to calculate market returns. NAV and market
returns assume that all distributions have been reinvested in each Fund at NAV and Market Price, respectively.
An index is a statistical
composite that tracks a specified financial market or sector. Unlike each Fund, the indices do not actually hold a portfolio of securities and therefore do not incur the expenses incurred by each Fund. These expenses
negatively impact the performance of each Fund. Also, market returns do not include brokerage commissions that may be payable on secondary market transactions. If brokerage commissions were included, market returns
would be lower. The total returns presented reflect the reinvestment of dividends on securities in the indices. The returns presented do not reflect the deduction of taxes that a shareholder would pay on Fund
distributions or the redemption or sale of Fund shares. The investment return and principal value of shares of each Fund will vary with changes in market conditions. Shares of each Fund may be worth more or less than
their original cost when they are redeemed or sold in the market. Each Fund’s past performance is no guarantee of future performance.
First Trust Exchange-Traded Fund VI
Understanding Your Fund
Expenses
March 31, 2023
(Unaudited)
As a shareholder of First
Trust NASDAQ Technology Dividend Index Fund, Multi-Asset Diversified Income Index Fund, First Trust S&P International Dividend Aristocrats ETF, First Trust BuyWrite Income ETF, First Trust Nasdaq BuyWrite Income
ETF, First Trust Rising Dividend Achievers ETF, First Trust Dorsey Wright Focus 5 ETF, First Trust RBA American Industrial Renaissance® ETF, First Trust Dorsey Wright Momentum & Dividend ETF, First Trust Dorsey Wright International Focus 5 ETF, First Trust Dorsey Wright
Dynamic Focus 5 ETF, First Trust Indxx Innovative Transaction & Process ETF, First Trust Nasdaq Artificial Intelligence and Robotics ETF, or First Trust International Developed Capital Strength ETF (each a
“Fund” and collectively, the “Funds”), you incur two types of costs: (1) transaction costs; and (2) ongoing costs, including management fees, distribution and/or service (12b-1) fees, if any,
and other Fund expenses. This Example is intended to help you understand your ongoing costs of investing in the Funds and to compare these costs with the ongoing costs (in U.S. dollars) of investing in other funds.
The Example is based on
an investment of $1,000 invested at the beginning of the period and held through the six-month period ended March 31, 2023.
Actual Expenses
The first line in the
following table provides information about actual account values and actual expenses. You may use the information in this line, together with the amount you invested, to estimate the expenses that you paid over the
period. Simply divide your account value by $1,000 (for example, an $8,600 account value divided by $1,000 = 8.6), then multiply the result by the number in the first line under the heading entitled “Expenses
Paid During the Six-Month Period” to estimate the expenses you paid on your account during this six-month period.
Hypothetical Example for
Comparison Purposes
The second line in the
following table provides information about hypothetical account values and hypothetical expenses based on each Fund’s actual expense ratio and an assumed rate of return of 5% per year before expenses, which is
not each Fund’s actual return. The hypothetical account values and expenses may not be used to estimate the actual ending account balance or expenses you paid for the period. You may use this information to
compare the ongoing costs of investing in the Funds and other funds. To do so, compare this 5% hypothetical example with the 5% hypothetical examples that appear in the shareholder reports of the other funds.
Please note that the
expenses shown in the table are meant to highlight your ongoing costs only and do not reflect any transactional costs such as brokerage commissions. Therefore, the second line in the table is useful in comparing
ongoing costs only, and will not help you determine the relative total costs of owning different funds. In addition, if these transactional costs were included, your costs would have been higher.
|
| Beginning
Account Value
October 1, 2022
| Ending
Account Value
March 31, 2023
| Annualized
Expense Ratio
Based on the
Six-Month
Period
| Expenses Paid
During the
Six-Month
Period (a)
|
| First Trust NASDAQ Technology Dividend Index Fund (TDIV)
|
| Actual
| $1,000.00
| $1,255.30
| 0.50%
| $2.81
|
| Hypothetical (5% return before expenses)
| $1,000.00
| $1,022.44
| 0.50%
| $2.52
|
| Multi-Asset Diversified Income Index Fund (MDIV) (b) (c)
|
| Actual
| $1,000.00
| $1,051.30
| 0.48%
| $2.45
|
| Hypothetical (5% return before expenses)
| $1,000.00
| $1,022.54
| 0.48%
| $2.42
|
| First Trust S&P International Dividend Aristocrats ETF (FID)
|
| Actual
| $1,000.00
| $1,161.80
| 0.60%
| $3.23
|
| Hypothetical (5% return before expenses)
| $1,000.00
| $1,021.94
| 0.60%
| $3.02
|
| First Trust BuyWrite Income ETF (FTHI)
|
| Actual
| $1,000.00
| $1,143.80
| 0.85%
| $4.54
|
| Hypothetical (5% return before expenses)
| $1,000.00
| $1,020.69
| 0.85%
| $4.28
|
| First Trust Nasdaq BuyWrite Income ETF (FTQI)
|
| Actual
| $1,000.00
| $1,141.40
| 0.85%
| $4.54
|
| Hypothetical (5% return before expenses)
| $1,000.00
| $1,020.69
| 0.85%
| $4.28
|
First Trust Exchange-Traded Fund VI
Understanding Your Fund
Expenses (Continued)
March 31, 2023
(Unaudited)
|
| Beginning
Account Value
October 1, 2022
| Ending
Account Value
March 31, 2023
| Annualized
Expense Ratio
Based on the
Six-Month
Period
| Expenses Paid
During the
Six-Month
Period (a)
|
| First Trust Rising Dividend Achievers ETF (RDVY)
|
| Actual
| $1,000.00
| $1,171.20
| 0.49%
| $2.65
|
| Hypothetical (5% return before expenses)
| $1,000.00
| $1,022.49
| 0.49%
| $2.47
|
| First Trust Dorsey Wright Focus 5 ETF (FV) (b)
|
| Actual
| $1,000.00
| $1,107.10
| 0.30%
| $1.58
|
| Hypothetical (5% return before expenses)
| $1,000.00
| $1,023.44
| 0.30%
| $1.51
|
| First Trust RBA American Industrial Renaissance® ETF (AIRR)
|
| Actual
| $1,000.00
| $1,259.00
| 0.70%
| $3.94
|
| Hypothetical (5% return before expenses)
| $1,000.00
| $1,021.44
| 0.70%
| $3.53
|
| First Trust Dorsey Wright Momentum & Dividend ETF (DDIV)
|
| Actual
| $1,000.00
| $1,059.20
| 0.60%
| $3.08
|
| Hypothetical (5% return before expenses)
| $1,000.00
| $1,021.94
| 0.60%
| $3.02
|
| First Trust Dorsey Wright International Focus 5 ETF (IFV) (b)
|
| Actual
| $1,000.00
| $1,078.50
| 0.30%
| $1.55
|
| Hypothetical (5% return before expenses)
| $1,000.00
| $1,023.44
| 0.30%
| $1.51
|
| First Trust Dorsey Wright Dynamic Focus 5 ETF (FVC) (b)
|
| Actual
| $1,000.00
| $998.20
| 0.30%
| $1.49
|
| Hypothetical (5% return before expenses)
| $1,000.00
| $1,023.44
| 0.30%
| $1.51
|
| First Trust Indxx Innovative Transaction & Process ETF (LEGR)
|
| Actual
| $1,000.00
| $1,239.40
| 0.65%
| $3.63
|
| Hypothetical (5% return before expenses)
| $1,000.00
| $1,021.69
| 0.65%
| $3.28
|
| First Trust Nasdaq Artificial Intelligence and Robotics ETF (ROBT)
|
| Actual
| $1,000.00
| $1,268.60
| 0.65%
| $3.68
|
| Hypothetical (5% return before expenses)
| $1,000.00
| $1,021.69
| 0.65%
| $3.28
|
| First Trust International Developed Capital Strength ETF (FICS)
|
| Actual
| $1,000.00
| $1,220.00
| 0.70%
| $3.87
|
| Hypothetical (5% return before expenses)
| $1,000.00
| $1,021.44
| 0.70%
| $3.53
|
| (a)
| Expenses are equal to the annualized expense ratios as indicated in the table multiplied by the average account value over the period (October 1, 2022 through March 31, 2023),
multiplied by 182/365 (to reflect the six-month period).
|
| (b)
| Annualized expense ratio and expenses paid during the six-month period do not include fees and expenses of the underlying funds in which the Fund invests.
|
| (c)
| MDIV expense ratios reflect an expense waiver. See Note 3 in the Notes to Financial Statements.
|
First Trust NASDAQ Technology Dividend
Index Fund (TDIV)
Portfolio of Investments
March 31, 2023
(Unaudited)
| Shares
|
| Description
|
| Value
|
| COMMON STOCKS – 99.8%
|
|
|
| Communications Equipment – 7.2%
|
|
|
| 137,073
|
| ADTRAN Holdings, Inc.
|
| $2,173,978
|
| 60,268
|
| AudioCodes Ltd.
|
| 908,841
|
| 664,197
|
| Cisco Systems, Inc.
|
| 34,720,898
|
| 752,263
|
| Juniper Networks, Inc.
|
| 25,892,893
|
| 122,373
|
| Motorola Solutions, Inc.
|
| 35,014,587
|
| 1,318,875
|
| Nokia Oyj, ADR
|
| 6,475,676
|
| 1,202,539
|
| Telefonaktiebolaget LM Ericsson, ADR
|
| 7,034,853
|
| 46,006
|
| Ubiquiti, Inc.
|
| 12,499,370
|
|
|
|
|
| 124,721,096
|
|
|
| Diversified Telecommunication
Services – 6.8%
|
|
|
| 22,968
|
| ATN International, Inc.
|
| 939,851
|
| 726,793
|
| BCE, Inc.
|
| 32,553,058
|
| 225,671
|
| Cogent Communications Holdings, Inc.
|
| 14,379,756
|
| 471,215
|
| Telefonica S.A., ADR
|
| 2,016,800
|
| 128,647
|
| Telkom Indonesia Persero Tbk PT, ADR
|
| 3,508,204
|
| 1,617,726
|
| TELUS Corp.
|
| 32,128,038
|
| 828,668
|
| Verizon Communications, Inc.
|
| 32,226,899
|
|
|
|
|
| 117,752,606
|
|
|
| Electronic Equipment,
Instruments & Components – 4.3%
|
|
|
| 159,540
|
| Amphenol Corp., Class A
|
| 13,037,609
|
| 57,730
|
| Avnet, Inc.
|
| 2,609,396
|
| 25,069
|
| Benchmark Electronics, Inc.
|
| 593,885
|
| 35,949
|
| CDW Corp.
|
| 7,006,101
|
| 691,533
|
| Corning, Inc.
|
| 24,397,284
|
| 10,654
|
| Methode Electronics, Inc.
|
| 467,497
|
| 74,868
|
| National Instruments Corp.
|
| 3,923,832
|
| 31,710
|
| TD SYNNEX Corp.
|
| 3,069,211
|
| 139,136
|
| TE Connectivity Ltd.
|
| 18,247,686
|
| 62,105
|
| Vishay Intertechnology, Inc.
|
| 1,404,815
|
|
|
|
|
| 74,757,316
|
|
|
| Health Care Technology – 0.0%
|
|
|
| 3,292
|
| Simulations Plus, Inc.
|
| 144,650
|
|
|
| Interactive Media & Services – 0.2%
|
|
|
| 96,746
|
| JOYY, Inc., ADR
|
| 3,016,540
|
| 11,743
|
| Shutterstock, Inc.
|
| 852,542
|
|
|
|
|
| 3,869,082
|
|
|
| IT Services – 9.0%
|
|
|
| 53,514
|
| Amdocs Ltd.
|
| 5,138,949
|
| 225,519
|
| Cognizant Technology Solutions Corp., Class A
|
| 13,740,873
|
| 16,272
|
| Hackett Group (The), Inc.
|
| 300,707
|
| Shares
|
| Description
|
| Value
|
|
|
|
|
| IT Services (Continued)
|
|
|
| 309,986
|
| Infosys Ltd., ADR
|
| $5,406,156
|
| 994,912
|
| International Business Machines Corp.
|
| 130,423,014
|
| 55,353
|
| Wipro Ltd., ADR
|
| 248,535
|
|
|
|
|
| 155,258,234
|
|
|
| Media – 2.2%
|
|
|
| 7,902
|
| Cable One, Inc.
|
| 5,547,204
|
| 865,230
|
| Comcast Corp., Class A
|
| 32,800,869
|
|
|
|
|
| 38,348,073
|
|
|
| Professional Services – 1.0%
|
|
|
| 10,259
|
| Concentrix Corp.
|
| 1,246,981
|
| 15,146
|
| CSG Systems International, Inc.
|
| 813,340
|
| 93,160
|
| Dun & Bradstreet Holdings, Inc.
|
| 1,093,698
|
| 30,549
|
| KBR, Inc.
|
| 1,681,723
|
| 52,160
|
| Leidos Holdings, Inc.
|
| 4,801,850
|
| 19,465
|
| Science Applications International Corp.
|
| 2,091,709
|
| 87,744
|
| SS&C Technologies Holdings, Inc.
|
| 4,954,904
|
|
|
|
|
| 16,684,205
|
|
|
| Semiconductors &
Semiconductor Equipment – 37.8%
|
|
|
| 55,016
|
| Amkor Technology, Inc.
|
| 1,431,516
|
| 215,231
|
| Analog Devices, Inc.
|
| 42,447,858
|
| 190,572
|
| Applied Materials, Inc.
|
| 23,407,959
|
| 262,972
|
| ASE Technology Holding Co., Ltd., ADR
|
| 2,095,887
|
| 24,231
|
| ASML Holding N.V.
|
| 16,494,284
|
| 216,467
|
| Broadcom, Inc.
|
| 138,872,239
|
| 22,502
|
| Entegris, Inc.
|
| 1,845,389
|
| 458,501
|
| Himax Technologies, Inc., ADR
|
| 3,727,613
|
| 5,160,124
|
| Intel Corp.
|
| 168,581,251
|
| 44,056
|
| KLA Corp.
|
| 17,585,834
|
| 19,119
|
| Kulicke & Soffa Industries, Inc.
|
| 1,007,380
|
| 45,987
|
| Lam Research Corp.
|
| 24,378,628
|
| 116,462
|
| Marvell Technology, Inc.
|
| 5,042,805
|
| 201,029
|
| Microchip Technology, Inc.
|
| 16,842,210
|
| 215,645
|
| Micron Technology, Inc.
|
| 13,012,019
|
| 7,527
|
| Monolithic Power Systems, Inc.
|
| 3,767,565
|
| 126,019
|
| NXP Semiconductors N.V.
|
| 23,499,393
|
| 12,810
|
| Power Integrations, Inc.
|
| 1,084,238
|
| 520,690
|
| QUALCOMM, Inc.
|
| 66,429,630
|
| 86,352
|
| Skyworks Solutions, Inc.
|
| 10,187,809
|
| 8,892
|
| STMicroelectronics N.V.
|
| 475,633
|
| 375,157
|
| Texas Instruments, Inc.
|
| 69,782,954
|
| 212,932
|
| United Microelectronics Corp., ADR
|
| 1,865,284
|
| 10,721
|
| Universal Display Corp.
|
| 1,663,149
|
|
|
|
|
| 655,528,527
|
|
|
| Software – 15.6%
|
|
|
| 26,250
|
| A10 Networks, Inc.
|
| 406,613
|
Page 36
See Notes to Financial
Statements
First Trust NASDAQ Technology Dividend
Index Fund (TDIV)
Portfolio of Investments
(Continued)
March 31, 2023
(Unaudited)
| Shares
|
| Description
|
| Value
|
| COMMON STOCKS (Continued)
|
|
|
| Software (Continued)
|
|
|
| 39,025
|
| Absolute Software Corp.
|
| $305,566
|
| 54,717
|
| Adeia, Inc.
|
| 484,793
|
| 19,019
|
| Dolby Laboratories, Inc., Class A
|
| 1,624,603
|
| 13,694
|
| Ebix, Inc.
|
| 180,624
|
| 420,599
|
| Gen Digital, Inc.
|
| 7,217,479
|
| 48,425
|
| InterDigital, Inc.
|
| 3,530,182
|
| 51,666
|
| Intuit, Inc.
|
| 23,034,253
|
| 515,760
|
| Microsoft Corp.
|
| 148,693,608
|
| 187,416
|
| Open Text Corp.
|
| 7,224,887
|
| 735,938
|
| Oracle Corp.
|
| 68,383,359
|
| 13,563
|
| Progress Software Corp.
|
| 779,194
|
| 16,122
|
| Roper Technologies, Inc.
|
| 7,104,804
|
| 50,095
|
| Sapiens International Corp., N.V.
|
| 1,088,063
|
|
|
|
|
| 270,058,028
|
|
|
| Technology Hardware,
Storage & Peripherals – 13.1%
|
|
|
| 872,679
|
| Apple, Inc.
|
| 143,904,767
|
| 202,084
|
| Dell Technologies, Inc., Class C
|
| 8,125,798
|
| 1,023,959
|
| Hewlett Packard Enterprise Co.
|
| 16,311,667
|
| 867,818
|
| HP, Inc.
|
| 25,470,458
|
| 73,257
|
| Logitech International S.A.
|
| 4,253,301
|
| 171,517
|
| NetApp, Inc.
|
| 10,951,361
|
| 229,961
|
| Seagate Technology Holdings PLC
|
| 15,205,021
|
| 243,601
|
| Xerox Holdings Corp.
|
| 3,751,455
|
|
|
|
|
| 227,973,828
|
|
|
| Wireless Telecommunication
Services – 2.6%
|
|
|
| 422,505
|
| America Movil S.A.B. de C.V., ADR (a)
|
| 8,893,730
|
| 1,324,111
|
| Mobile TeleSystems PJSC, ADR (b) (c) (d)
|
| 0
|
| 673,095
|
| Rogers Communications, Inc., Class B
|
| 31,204,684
|
| 507,151
|
| Telephone and Data Systems, Inc.
|
| 5,330,157
|
|
|
|
|
| 45,428,571
|
|
|
| Total Investments – 99.8%
|
| 1,730,524,216
|
|
|
| (Cost $1,551,683,672)
|
|
|
|
|
| Net Other Assets and Liabilities – 0.2%
|
| 3,264,281
|
|
|
| Net Assets – 100.0%
|
| $1,733,788,497
|
| (a)
| Non-income producing security.
|
| (b)
| This security is fair valued by the Advisor’s Pricing Committee in accordance with procedures approved by the Trust’s Board of Trustees, and in
accordance with the provisions of the Investment Company Act of 1940 and rules thereunder, as amended. At March 31, 2023, securities noted as such are valued at $0 or 0.0% of net assets.
|
| (c)
| Pursuant to procedures adopted by the Trust’s Board of Trustees, this security has been determined to be illiquid by First Trust Advisors, L.P., the Fund’s Advisor.
|
| (d)
| This security’s value was determined using significant unobservable inputs (see Note 2A – Portfolio Valuation in the Notes to Financial Statements).
|
| ADR
| American Depositary Receipt
|
Valuation Inputs
A summary of the inputs
used to value the Fund’s investments as of March 31, 2023 is as follows (see Note 2A - Portfolio Valuation in the Notes to Financial Statements):
|
| Total
Value at
3/31/2023
| Level 1
Quoted
Prices
| Level 2
Significant
Observable
Inputs
| Level 3
Significant
Unobservable
Inputs
|
| Common Stocks:
|
|
|
|
|
| Wireless Telecommunication Services
| $ 45,428,571
| $ 45,428,571
| $ —
| $— *
|
| Other Industry Categories **
| 1,685,095,645
| 1,685,095,645
| —
| —
|
| Total Investments
| $ 1,730,524,216
| $ 1,730,524,216
| $—
| $ —*
|
| *
| Investment is valued at $0.
|
| **
| See Portfolio of Investments for industry breakout.
|
Level 3 investments are
fair valued by the Advisor’s Pricing Committee and are footnoted in the Portfolio of Investments. Level 3 investments values are based on unobservable and non-quantitative inputs.
See Notes to Financial
Statements
Page 37
Multi-Asset Diversified Income Index Fund
(MDIV)
Portfolio of Investments
March 31, 2023
(Unaudited)
Shares/
Units
|
| Description
|
| Value
|
| EXCHANGE-TRADED FUNDS – 21.0%
|
|
|
| Capital Markets – 21.0%
|
|
|
| 2,284,925
|
| First Trust Tactical High Yield ETF (a)
|
| $90,848,618
|
|
|
| (Cost $108,928,601)
|
|
|
| MASTER LIMITED PARTNERSHIPS – 20.4%
|
|
|
| Energy Equipment & Services – 1.0%
|
|
|
| 211,557
|
| USA Compression Partners, L.P.
|
| 4,470,200
|
|
|
| Industrial Conglomerates – 1.4%
|
|
|
| 120,703
|
| Icahn Enterprises, L.P.
|
| 6,241,552
|
|
|
| Marine Transportation – 0.1%
|
|
|
| 11,952
|
| Navios Maritime Partners, L.P.
|
| 288,282
|
|
|
| Oil, Gas & Consumable Fuels – 17.9%
|
|
|
| 178,880
|
| Alliance Resource Partners, L.P.
|
| 3,608,009
|
| 300,857
|
| Black Stone Minerals, L.P.
|
| 4,720,446
|
| 68,755
|
| Cheniere Energy Partners, L.P.
|
| 3,253,487
|
| 171,899
|
| Crestwood Equity Partners, L.P.
|
| 4,285,442
|
| 189,323
|
| CrossAmerica Partners, L.P.
|
| 4,068,551
|
| 68,018
|
| Delek Logistics Partners, L.P.
|
| 3,225,413
|
| 181,620
|
| Dorchester Minerals, L.P.
|
| 5,501,270
|
| 259,610
|
| Energy Transfer, L.P.
|
| 3,237,337
|
| 140,941
|
| EnLink Midstream, LLC (b)
|
| 1,527,800
|
| 127,220
|
| Enterprise Products Partners, L.P.
|
| 3,294,998
|
| 114,539
|
| Global Partners, L.P.
|
| 3,553,000
|
| 179,201
|
| Holly Energy Partners, L.P.
|
| 3,112,721
|
| 326,452
|
| Kimbell Royalty Partners, L.P. (b)
|
| 4,971,864
|
| 64,114
|
| Magellan Midstream Partners, L.P.
|
| 3,478,826
|
| 106,834
|
| MPLX, L.P.
|
| 3,680,431
|
| 42,683
|
| Natural Resource Partners, L.P.
|
| 2,228,053
|
| 267,087
|
| NuStar Energy, L.P.
|
| 4,177,241
|
| 243,223
|
| Plains All American Pipeline, L.P.
|
| 3,032,991
|
| 220,533
|
| Plains GP Holdings, L.P., Class A (b)
|
| 2,893,393
|
| 66,392
|
| Sunoco, L.P.
|
| 2,913,945
|
| 117,159
|
| Viper Energy Partners, L.P. (b)
|
| 3,280,452
|
| 124,210
|
| Western Midstream Partners, L.P.
|
| 3,275,418
|
|
|
|
|
| 77,321,088
|
|
|
| Total Master Limited Partnerships
|
| 88,321,122
|
|
|
| (Cost $64,370,906)
|
|
|
| REAL ESTATE INVESTMENT TRUSTS – 19.3%
|
|
|
| Diversified REITs – 1.3%
|
|
|
| 102,708
|
| Essential Properties Realty Trust, Inc.
|
| 2,552,294
|
| 38,324
|
| WP Carey, Inc.
|
| 2,968,194
|
|
|
|
|
| 5,520,488
|
|
|
| Health Care REITs – 1.4%
|
|
|
| 113,819
|
| Healthpeak Properties, Inc.
|
| 2,500,604
|
| 104,633
|
| LTC Properties, Inc.
|
| 3,675,757
|
|
|
|
|
| 6,176,361
|
|
|
| Hotel & Resort REITs – 0.7%
|
|
|
| 186,386
|
| Apple Hospitality REIT, Inc.
|
| 2,892,711
|
|
|
| Mortgage REITs – 4.8%
|
|
|
| 428,953
|
| Arbor Realty Trust, Inc.
|
| 4,928,670
|
Page 38
See Notes to Financial Statements
Multi-Asset Diversified Income Index Fund
(MDIV)
Portfolio of Investments
(Continued)
March 31, 2023
(Unaudited)
Shares/
Units
|
| Description
|
| Value
|
| REAL ESTATE INVESTMENT TRUSTS (Continued)
|
|
|
| Mortgage REITs (Continued)
|
|
|
| 436,050
|
| Ladder Capital Corp.
|
| $4,120,672
|
| 642,053
|
| Ready Capital Corp.
|
| 6,529,679
|
| 300,826
|
| Starwood Property Trust, Inc.
|
| 5,321,612
|
|
|
|
|
| 20,900,633
|
|
|
| Office REITs – 2.2%
|
|
|
| 50,366
|
| Boston Properties, Inc.
|
| 2,725,808
|
| 89,936
|
| Kilroy Realty Corp.
|
| 2,913,926
|
| 543,126
|
| Piedmont Office Realty Trust, Inc., Class A
|
| 3,964,820
|
|
|
|
|
| 9,604,554
|
|
|
| Retail REITs – 3.3%
|
|
|
| 115,366
|
| Brixmor Property Group, Inc.
|
| 2,482,676
|
| 83,240
|
| Getty Realty Corp.
|
| 2,999,137
|
| 63,709
|
| National Retail Properties, Inc.
|
| 2,812,752
|
| 27,591
|
| Simon Property Group, Inc.
|
| 3,089,364
|
| 145,926
|
| Tanger Factory Outlet Centers, Inc.
|
| 2,864,528
|
|
|
|
|
| 14,248,457
|
|
|
| Specialized REITs – 5.6%
|
|
|
| 19,350
|
| Crown Castle, Inc.
|
| 2,589,804
|
| 119,285
|
| EPR Properties
|
| 4,544,759
|
| 107,418
|
| Four Corners Property Trust, Inc.
|
| 2,885,247
|
| 60,956
|
| Gaming and Leisure Properties, Inc.
|
| 3,173,369
|
| 53,888
|
| Iron Mountain, Inc.
|
| 2,851,214
|
| 28,149
|
| Lamar Advertising Co., Class A
|
| 2,811,804
|
| 20,997
|
| Life Storage, Inc.
|
| 2,752,497
|
| 82,081
|
| VICI Properties, Inc.
|
| 2,677,482
|
|
|
|
|
| 24,286,176
|
|
|
| Total Real Estate Investment Trusts
|
| 83,629,380
|
|
|
| (Cost $89,348,045)
|
|
|
| COMMON STOCKS – 19.2%
|
|
|
| Banks – 5.3%
|
|
|
| 113,212
|
| Brookline Bancorp, Inc.
|
| 1,188,726
|
| 422,821
|
| Capitol Federal Financial, Inc.
|
| 2,845,585
|
| 27,906
|
| Citigroup, Inc.
|
| 1,308,512
|
| 33,027
|
| Citizens Financial Group, Inc.
|
| 1,003,030
|
| 47,285
|
| Columbia Banking System, Inc.
|
| 1,012,845
|
| 50,180
|
| First Hawaiian, Inc.
|
| 1,035,213
|
| 49,976
|
| First Interstate BancSystem, Inc., Class A
|
| 1,492,283
|
| 122,804
|
| Hope Bancorp, Inc.
|
| 1,205,935
|
| 96,600
|
| Huntington Bancshares, Inc.
|
| 1,081,920
|
| 82,533
|
| KeyCorp
|
| 1,033,313
|
| 277,564
|
| New York Community Bancorp, Inc.
|
| 2,509,179
|
| 148,238
|
| Northwest Bancshares, Inc.
|
| 1,783,303
|
| 45,588
|
| Pacific Premier Bancorp, Inc.
|
| 1,095,024
|
| 63,458
|
| Provident Financial Services, Inc.
|
| 1,217,125
|
| 44,219
|
| Sandy Spring Bancorp, Inc.
|
| 1,148,810
|
| 31,856
|
| Truist Financial Corp.
|
| 1,086,290
|
| 28,639
|
| US Bancorp
|
| 1,032,436
|
|
|
|
|
| 23,079,529
|
|
|
| Biotechnology – 0.3%
|
|
|
| 9,092
|
| AbbVie, Inc.
|
| 1,448,992
|
See Notes to Financial Statements
Page 39
Multi-Asset Diversified Income Index Fund
(MDIV)
Portfolio of Investments
(Continued)
March 31, 2023
(Unaudited)
Shares/
Units
|
| Description
|
| Value
|
| COMMON STOCKS (Continued)
|
|
|
| Capital Markets – 0.8%
|
|
|
| 47,638
|
| Lazard Ltd., Class A
|
| $1,577,294
|
| 97,942
|
| Virtu Financial, Inc., Class A
|
| 1,851,104
|
|
|
|
|
| 3,428,398
|
|
|
| Chemicals – 1.2%
|
|
|
| 29,864
|
| Dow, Inc.
|
| 1,637,145
|
| 38,623
|
| LyondellBasell Industries N.V., Class A
|
| 3,626,313
|
|
|
|
|
| 5,263,458
|
|
|
| Consumer Staples Distribution & Retail – 0.4%
|
|
|
| 53,018
|
| Walgreens Boots Alliance, Inc.
|
| 1,833,362
|
|
|
| Containers & Packaging – 0.4%
|
|
|
| 44,018
|
| International Paper Co.
|
| 1,587,289
|
|
|
| Diversified Telecommunication Services – 1.0%
|
|
|
| 104,344
|
| AT&T, Inc.
|
| 2,008,622
|
| 58,019
|
| Verizon Communications, Inc.
|
| 2,256,359
|
|
|
|
|
| 4,264,981
|
|
|
| Electric Utilities – 2.5%
|
|
|
| 25,134
|
| ALLETE, Inc.
|
| 1,617,876
|
| 14,998
|
| Duke Energy Corp.
|
| 1,446,857
|
| 22,523
|
| Edison International
|
| 1,589,898
|
| 13,524
|
| Entergy Corp.
|
| 1,457,076
|
| 42,494
|
| OGE Energy Corp.
|
| 1,600,324
|
| 28,459
|
| Portland General Electric Co.
|
| 1,391,360
|
| 23,077
|
| Southern (The) Co.
|
| 1,605,698
|
|
|
|
|
| 10,709,089
|
|
|
| Financial Services – 0.5%
|
|
|
| 185,346
|
| Western Union (The) Co.
|
| 2,066,608
|
|
|
| Food Products – 0.3%
|
|
|
| 36,709
|
| Kraft Heinz (The) Co.
|
| 1,419,537
|
|
|
| Gas Utilities – 0.3%
|
|
|
| 19,762
|
| Spire, Inc.
|
| 1,386,107
|
|
|
| Household Durables – 0.4%
|
|
|
| 49,966
|
| Leggett & Platt, Inc.
|
| 1,592,916
|
|
|
| Industrial Conglomerates – 0.4%
|
|
|
| 17,434
|
| 3M Co.
|
| 1,832,488
|
|
|
| Insurance – 0.9%
|
|
|
| 36,520
|
| Fidelity National Financial, Inc.
|
| 1,275,644
|
| 16,734
|
| Prudential Financial, Inc.
|
| 1,384,571
|
| 19,143
|
| Safety Insurance Group, Inc.
|
| 1,426,536
|
|
|
|
|
| 4,086,751
|
|
|
| IT Services – 0.4%
|
|
|
| 13,718
|
| International Business Machines Corp.
|
| 1,798,293
|
|
|
| Leisure Products – 1.5%
|
|
|
| 31,150
|
| Hasbro, Inc.
|
| 1,672,443
|
| 81,036
|
| Sturm Ruger & Co., Inc.
|
| 4,654,708
|
|
|
|
|
| 6,327,151
|
Page 40
See Notes to Financial Statements
Multi-Asset Diversified Income Index Fund
(MDIV)
Portfolio of Investments
(Continued)
March 31, 2023
(Unaudited)
Shares/
Units
|
| Description
|
| Value
|
| COMMON STOCKS (Continued)
|
|
|
| Multi-Utilities – 0.4%
|
|
|
| 27,313
|
| Dominion Energy, Inc.
|
| $1,527,070
|
|
|
| Oil, Gas & Consumable Fuels – 0.3%
|
|
|
| 13,945
|
| Phillips 66
|
| 1,413,744
|
|
|
| Specialty Retail – 0.3%
|
|
|
| 9,843
|
| Advance Auto Parts, Inc.
|
| 1,197,007
|
|
|
| Tobacco – 1.6%
|
|
|
| 63,722
|
| Altria Group, Inc.
|
| 2,843,276
|
| 41,468
|
| Universal Corp.
|
| 2,193,242
|
| 168,571
|
| Vector Group Ltd.
|
| 2,024,538
|
|
|
|
|
| 7,061,056
|
|
|
| Total Common Stocks
|
| 83,323,826
|
|
|
| (Cost $89,165,883)
|
|
|
| Shares
|
| Description
|
| Stated
Rate
|
| Stated
Maturity
|
| Value
|
| $25 PAR PREFERRED SECURITIES – 19.4%
|
|
|
| Banks – 2.2%
|
|
|
|
|
|
|
| 133,271
|
| Citigroup, Inc., Series J (c)
|
| 7.13%
|
| (d)
|
| 3,335,773
|
| 129,771
|
| Citigroup, Inc., Series K (c)
|
| 6.88%
|
| (d)
|
| 3,217,023
|
| 125,245
|
| Wells Fargo & Co., Series R (c)
|
| 6.63%
|
| (d)
|
| 3,043,454
|
|
|
|
|
| 9,596,250
|
|
|
| Capital Markets – 1.5%
|
|
|
|
|
|
|
| 132,852
|
| Morgan Stanley, Series E (c)
|
| 7.13%
|
| (d)
|
| 3,334,585
|
| 130,229
|
| Morgan Stanley, Series F (c)
|
| 6.88%
|
| (d)
|
| 3,216,657
|
|
|
|
|
| 6,551,242
|
|
|
| Diversified Telecommunication Services – 1.3%
|
|
|
|
|
|
|
| 202,744
|
| Qwest Corp.
|
| 6.50%
|
| 09/01/56
|
| 2,891,129
|
| 200,135
|
| Qwest Corp.
|
| 6.75%
|
| 06/15/57
|
| 2,972,005
|
|
|
|
|
| 5,863,134
|
|
|
| Financial Services – 2.1%
|
|
|
|
|
|
|
| 123,289
|
| Apollo Asset Management, Inc., Class A
|
| 6.38%
|
| (d)
|
| 2,601,398
|
| 125,641
|
| Apollo Asset Management, Inc., Series B
|
| 6.38%
|
| (d)
|
| 2,814,358
|
| 129,491
|
| Citigroup Capital XIII, 3 Mo. LIBOR + 6.37% (e)
|
| 11.17%
|
| 10/30/40
|
| 3,695,673
|
|
|
|
|
| 9,111,429
|
|
|
| Food Products – 0.9%
|
|
|
|
|
|
|
| 142,223
|
| CHS, Inc., Series 1
|
| 7.88%
|
| (d)
|
| 3,795,932
|
|
|
| Insurance – 0.6%
|
|
|
|
|
|
|
| 131,221
|
| Axis Capital Holdings Ltd., Series E
|
| 5.50%
|
| (d)
|
| 2,780,573
|
|
|
| Mortgage Real Estate Investment Trusts – 4.0%
|
|
|
|
|
|
|
| 142,125
|
| AGNC Investment Corp., Series C, 3 Mo. LIBOR + 5.11% (e)
|
| 9.90%
|
| (d)
|
| 3,342,780
|
| 156,332
|
| AGNC Investment Corp., Series E (c)
|
| 6.50%
|
| (d)
|
| 3,159,470
|
| 158,701
|
| AGNC Investment Corp., Series F (c)
|
| 6.13%
|
| (d)
|
| 3,096,256
|
| 193,873
|
| Chimera Investment Corp., Series B (c)
|
| 8.00%
|
| (d)
|
| 3,714,607
|
| 204,054
|
| Two Harbors Investment Corp., Series B (c)
|
| 7.63%
|
| (d)
|
| 4,158,620
|
|
|
|
|
| 17,471,733
|
See Notes to Financial Statements
Page 41
Multi-Asset Diversified Income Index Fund
(MDIV)
Portfolio of Investments
(Continued)
March 31, 2023
(Unaudited)
| Shares
|
| Description
|
| Stated
Rate
|
| Stated
Maturity
|
| Value
|
| $25 PAR PREFERRED SECURITIES (Continued)
|
|
|
| Multi-Utilities – 0.7%
|
|
|
|
|
|
|
| 122,743
|
| NiSource, Inc., Series B (c)
|
| 6.50%
|
| (d)
|
| $2,945,832
|
|
|
| Oil, Gas & Consumable Fuels – 2.6%
|
|
|
|
|
|
|
| 123,120
|
| Enbridge, Inc., Series B (c)
|
| 6.38%
|
| 04/15/78
|
| 3,126,017
|
| 157,559
|
| Energy Transfer L.P., Series E (c)
|
| 7.60%
|
| (d)
|
| 3,809,776
|
| 164,613
|
| NuStar Logistics L.P., 3 Mo. LIBOR + 6.73% (e)
|
| 11.53%
|
| 01/15/43
|
| 4,164,709
|
|
|
|
|
| 11,100,502
|
|
|
| Real Estate Management & Development – 2.4%
|
|
|
|
|
|
|
| 179,872
|
| DigitalBridge Group, Inc., Class H
|
| 7.13%
|
| (d)
|
| 3,381,594
|
| 178,845
|
| DigitalBridge Group, Inc., Series I
|
| 7.15%
|
| (d)
|
| 3,430,247
|
| 180,471
|
| DigitalBridge Group, Inc., Series J
|
| 7.13%
|
| (d)
|
| 3,389,245
|
|
|
|
|
| 10,201,086
|
|
|
| Trading Companies & Distributors – 1.1%
|
|
|
|
|
|
|
| 170,899
|
| WESCO International, Inc., Series A (c)
|
| 10.63%
|
| (d)
|
| 4,633,072
|
|
|
| Total $25 Par Preferred Securities
|
| 84,050,785
|
|
|
| (Cost $93,689,482)
|
|
|
|
|
|
|
|
| Total Investments – 99.3%
|
| 430,173,731
|
|
| (Cost $445,502,917)
|
|
|
|
| Net Other Assets and Liabilities – 0.7%
|
| 2,820,181
|
|
| Net Assets – 100.0%
|
| $432,993,912
|
| (a)
| Investment in an affiliated fund.
|
| (b)
| This security is taxed as a “C” corporation for federal income tax purposes.
|
| (c)
| Fixed-to-floating or fixed-to-variable rate security. The interest rate shown reflects the fixed rate in effect at March 31, 2023. At a predetermined date, the fixed rate will change
to a floating rate or a variable rate.
|
| (d)
| Perpetual maturity.
|
| (e)
| Floating rate security.
|
| LIBOR
| London Interbank Offered Rate
|
Valuation Inputs
A summary of the inputs
used to value the Fund’s investments as of March 31, 2023 is as follows (see Note 2A - Portfolio Valuation in the Notes to Financial Statements):
|
| Total
Value at
3/31/2023
| Level 1
Quoted
Prices
| Level 2
Significant
Observable
Inputs
| Level 3
Significant
Unobservable
Inputs
|
Exchange-Traded Funds*
| $ 90,848,618
| $ 90,848,618
| $ —
| $ —
|
Master Limited Partnerships*
| 88,321,122
| 88,321,122
| —
| —
|
Real Estate Investment Trusts*
| 83,629,380
| 83,629,380
| —
| —
|
Common Stocks*
| 83,323,826
| 83,323,826
| —
| —
|
$25 Par Preferred Securities*
| 84,050,785
| 84,050,785
| —
| —
|
Total Investments
| $ 430,173,731
| $ 430,173,731
| $—
| $—
|
| *
| See Portfolio of Investments for industry breakout.
|
Page 42
See Notes to Financial Statements
First Trust S&P International Dividend
Aristocrats ETF (FID)
Portfolio of Investments
March 31, 2023
(Unaudited)
| Shares
|
| Description
|
| Value
|
| COMMON STOCKS – 91.6%
|
|
|
| Aerospace & Defense – 1.3%
|
|
|
| 379,000
|
| Singapore Technologies Engineering Ltd. (a)
|
| $1,043,333
|
|
|
| Air Freight & Logistics – 1.3%
|
|
|
| 22,253
|
| Deutsche Post AG (a)
|
| 1,042,234
|
|
|
| Automobile Components – 1.3%
|
|
|
| 87,800
|
| Toyo Tire Corp. (a)
|
| 1,027,696
|
|
|
| Banks – 5.5%
|
|
|
| 7,896
|
| Bank of Montreal
|
| 703,308
|
| 20,105
|
| Bank of Nova Scotia (The)
|
| 1,012,614
|
| 23,875
|
| Canadian Imperial Bank of Commerce
|
| 1,012,413
|
| 44,183
|
| Canadian Western Bank
|
| 809,449
|
| 21,300
|
| Sumitomo Mitsui Trust Holdings, Inc. (a)
|
| 731,782
|
|
|
|
|
| 4,269,566
|
|
|
| Broadline Retail – 1.3%
|
|
|
| 7,501
|
| Canadian Tire Corp., Ltd., Class A
|
| 978,876
|
|
|
| Building Products – 1.1%
|
|
|
| 53,000
|
| Lixil Corp. (a)
|
| 874,811
|
|
|
| Capital Markets – 5.9%
|
|
|
| 102,333
|
| IG Group Holdings PLC (a)
|
| 883,080
|
| 32,321
|
| IGM Financial, Inc.
|
| 965,923
|
| 64,900
|
| JAFCO Group Co., Ltd. (a)
|
| 929,594
|
| 50,900
|
| SBI Holdings, Inc. (a)
|
| 1,010,866
|
| 143,813
|
| Schroders PLC (a)
|
| 820,088
|
|
|
|
|
| 4,609,551
|
|
|
| Chemicals – 2.8%
|
|
|
| 24,187
|
| BASF SE (a)
|
| 1,269,786
|
| 59,100
|
| Mitsubishi Gas Chemical Co., Inc. (a)
|
| 879,398
|
|
|
|
|
| 2,149,184
|
|
|
| Construction & Engineering – 3.8%
|
|
|
| 37,294
|
| Bouygues S.A. (a)
|
| 1,257,781
|
| 44,400
|
| COMSYS Holdings Corp. (a)
|
| 820,032
|
| 48,700
|
| EXEO Group, Inc. (a)
|
| 881,509
|
|
|
|
|
| 2,959,322
|
|
|
| Construction Materials – 1.3%
|
|
|
| 15,199
|
| Holcim AG (a)
|
| 980,204
|
|
|
| Containers & Packaging – 1.5%
|
|
|
| 82,100
|
| Toyo Seikan Group Holdings Ltd. (a)
|
| 1,134,567
|
| Shares
|
| Description
|
| Value
|
|
|
|
|
| Diversified Telecommunication
Services – 3.7%
|
|
|
| 23,712
|
| BCE, Inc.
|
| $1,062,171
|
| 1,398
|
| Swisscom AG (a)
|
| 892,165
|
| 45,199
|
| TELUS Corp.
|
| 897,291
|
|
|
|
|
| 2,851,627
|
|
|
| Electric Utilities – 5.3%
|
|
|
| 205,114
|
| CK Infrastructure Holdings Ltd. (a)
|
| 1,116,000
|
| 23,551
|
| Emera, Inc.
|
| 967,482
|
| 220,407
|
| Power Assets Holdings Ltd. (a)
|
| 1,182,444
|
| 102,739
|
| Terna-Rete Elettrica Nazionale S.p.A. (a)
|
| 843,219
|
|
|
|
|
| 4,109,145
|
|
|
| Food Products – 1.0%
|
|
|
| 107,232
|
| Orkla ASA (a)
|
| 760,544
|
|
|
| Gas Utilities – 3.1%
|
|
|
| 128,595
|
| APA Group (a)
|
| 873,573
|
| 588,183
|
| China Gas Holdings Ltd. (a)
|
| 828,124
|
| 190,092
|
| China Resources Gas Group Ltd. (a)
|
| 699,236
|
|
|
|
|
| 2,400,933
|
|
|
| Household Durables – 2.6%
|
|
|
| 44,600
|
| Sekisui House Ltd. (a)
|
| 909,003
|
| 55,600
|
| Sumitomo Forestry Co., Ltd. (a)
|
| 1,104,517
|
|
|
|
|
| 2,013,520
|
|
|
| Independent Power &
Renewable Electricity Producers – 1.0%
|
|
|
| 26,525
|
| Capital Power Corp.
|
| 817,241
|
|
|
| Industrial Conglomerates – 1.1%
|
|
|
| 14,821
|
| DCC PLC (a)
|
| 863,936
|
|
|
| Insurance – 13.3%
|
|
|
| 3,964
|
| Allianz SE (a)
|
| 915,034
|
| 5,307
|
| Baloise Holding AG (a)
|
| 826,387
|
| 40,821
|
| Great-West Lifeco, Inc.
|
| 1,081,915
|
| 7,210
|
| Helvetia Holding AG (a)
|
| 1,004,991
|
| 418,653
|
| Legal & General Group PLC (a)
|
| 1,238,212
|
| 48,011
|
| Manulife Financial Corp.
|
| 881,001
|
| 26,100
|
| MS&AD Insurance Group Holdings, Inc. (a)
|
| 808,862
|
| 123,143
|
| Ping An Insurance Group Co. of China Ltd., Class H (a)
|
| 796,638
|
| 39,424
|
| Power Corp. of Canada
|
| 1,007,551
|
| 1,580
|
| Swiss Life Holding AG (a)
|
| 975,029
|
| 1,673
|
| Zurich Insurance Group AG (a)
|
| 801,699
|
|
|
|
|
| 10,337,319
|
See Notes to Financial
Statements
Page 43
First Trust S&P International Dividend
Aristocrats ETF (FID)
Portfolio of Investments
(Continued)
March 31, 2023
(Unaudited)
| Shares
|
| Description
|
| Value
|
| COMMON STOCKS (Continued)
|
|
|
| Metals & Mining – 1.0%
|
|
|
| 33,400
|
| Mitsui Mining & Smelting Co., Ltd. (a)
|
| $812,584
|
|
|
| Multi-Utilities – 3.0%
|
|
|
| 940,207
|
| A2A S.p.A. (a)
|
| 1,500,395
|
| 30,578
|
| Canadian Utilities Ltd., Class A
|
| 852,066
|
|
|
|
|
| 2,352,461
|
|
|
| Oil, Gas & Consumable Fuels – 5.1%
|
|
|
| 255,600
|
| ENEOS Holdings, Inc. (a)
|
| 896,775
|
| 49,809
|
| Keyera Corp.
|
| 1,090,528
|
| 28,121
|
| Pembina Pipeline Corp.
|
| 910,941
|
| 27,521
|
| TC Energy Corp.
|
| 1,070,499
|
|
|
|
|
| 3,968,743
|
|
|
| Pharmaceuticals – 1.1%
|
|
|
| 25,600
|
| Takeda Pharmaceutical Co., Ltd. (a)
|
| 840,795
|
|
|
| Professional Services – 2.0%
|
|
|
| 42,266
|
| Adecco Group AG (a)
|
| 1,539,541
|
|
|
| Real Estate Management &
Development – 9.7%
|
|
|
| 326,567
|
| Henderson Land Development Co., Ltd. (a)
|
| 1,129,855
|
| 186,800
|
| Hongkong Land Holdings Ltd. (a)
|
| 821,820
|
| 434,107
|
| Longfor Group Holdings Ltd. (a) (b) (c)
|
| 1,224,341
|
| 581,098
|
| New World Development Co., Ltd. (a)
|
| 1,557,693
|
| 824,871
|
| Sino Land Co., Ltd. (a)
|
| 1,115,491
|
| 60,934
|
| Sun Hung Kai Properties Ltd. (a)
|
| 853,661
|
| 319,106
|
| Swire Properties Ltd. (a)
|
| 821,284
|
|
|
|
|
| 7,524,145
|
|
|
| Semiconductors &
Semiconductor Equipment – 1.5%
|
|
|
| 359,400
|
| Vanguard International Semiconductor Corp. (a)
|
| 1,149,724
|
|
|
| Specialty Retail – 1.5%
|
|
|
| 42,246
|
| JB Hi-Fi Ltd. (a)
|
| 1,205,673
|
|
|
| Technology Hardware,
Storage & Peripherals – 1.9%
|
|
|
| 1,399,764
|
| Lenovo Group Ltd. (a)
|
| 1,516,525
|
|
|
| Tobacco – 2.5%
|
|
|
| 32,235
|
| British American Tobacco PLC (a)
|
| 1,129,979
|
| 12,833
|
| KT&G Corp. (a)
|
| 824,751
|
|
|
|
|
| 1,954,730
|
| Shares
|
| Description
|
| Value
|
|
|
|
|
| Trading Companies &
Distributors – 1.4%
|
|
|
| 42,094
|
| Russel Metals, Inc.
|
| $1,069,247
|
|
|
| Water Utilities – 2.7%
|
|
|
| 1,254,817
|
| Guangdong Investment Ltd. (a)
|
| 1,283,645
|
| 63,932
|
| United Utilities Group PLC (a)
|
| 836,708
|
|
|
|
|
| 2,120,353
|
|
|
| Total Common Stocks
|
| 71,278,130
|
|
|
| (Cost $74,080,745)
|
|
|
| REAL ESTATE INVESTMENT TRUSTS – 6.1%
|
|
|
| Health Care REITs – 1.3%
|
|
|
| 766,590
|
| Primary Health Properties PLC (a)
|
| 960,044
|
|
|
| Office REITs – 1.3%
|
|
|
| 56,522
|
| Allied Properties Real Estate Investment Trust
|
| 1,018,776
|
|
|
| Retail REITs – 3.5%
|
|
|
| 1,067
|
| Japan Metropolitan Fund Investment Corp. (a)
|
| 779,180
|
| 125,090
|
| Link REIT (a)
|
| 804,358
|
| 58,445
|
| SmartCentres Real Estate Investment Trust
|
| 1,149,008
|
|
|
|
|
| 2,732,546
|
|
|
| Total Real Estate Investment Trusts
|
| 4,711,366
|
|
|
| (Cost $5,818,993)
|
|
|
|
|
| Total Investments – 97.7%
|
| 75,989,496
|
|
|
| (Cost $79,899,738)
|
|
|
|
|
| Net Other Assets and Liabilities – 2.3%
|
| 1,785,798
|
|
|
| Net Assets – 100.0%
|
| $77,775,294
|
| (a)
| This security is fair valued by the Advisor’s Pricing Committee in accordance with procedures approved by the Trust’s Board of Trustees and in accordance with provisions
of the Investment Company Act of 1940 and rules thereunder, as amended. At March 31, 2023, securities noted as such are valued at $56,631,196 or 72.8% of net assets. Certain of these securities are fair valued using a
factor provided by a third-party pricing service due to the change in value between the foreign markets’ close and the New York Stock Exchange close exceeding a certain threshold. On days when this threshold is
not exceeded, these securities are typically valued at the last sale price on the exchange on which they are principally traded.
|
| (b)
| This security may be resold to qualified foreign investors and foreign institutional buyers under Regulation S of the Securities Act of 1933, as amended (the
“1933 Act”).
|
Page 44
See Notes to Financial
Statements
First Trust S&P International Dividend
Aristocrats ETF (FID)
Portfolio of Investments
(Continued)
March 31, 2023
(Unaudited)
| (c)
| This security is exempt from registration upon resale under Rule 144A of the 1933 Act and may be resold in transactions exempt from registration, normally to
qualified institutional buyers. This security is not restricted on the foreign exchange where it trades freely without any additional registration. As such, it does not require the additional disclosure required of
restricted securities.
|
Currency Exposure
Diversification
| % of Total
Investments
|
| Canadian Dollar
| 25.5%
|
| Hong Kong Dollar
| 19.7
|
| Japanese Yen
| 19.0
|
| Swiss Franc
| 9.2
|
| Euro
| 9.0
|
| British Pound Sterling
| 8.8
|
| Australian Dollar
| 2.7
|
| New Taiwan Dollar
| 1.5
|
| Singapore Dollar
| 1.4
|
| South Korean Won
| 1.1
|
| United States Dollar
| 1.1
|
| Norwegian Krone
| 1.0
|
| Total
| 100.0%
|
Valuation Inputs
A summary of the inputs
used to value the Fund’s investments as of March 31, 2023 is as follows (see Note 2A - Portfolio Valuation in the Notes to Financial Statements):
|
| Total
Value at
3/31/2023
| Level 1
Quoted
Prices
| Level 2
Significant
Observable
Inputs
| Level 3
Significant
Unobservable
Inputs
|
| Common Stocks:
|
|
|
|
|
| Banks
| $ 4,269,566
| $ 3,537,784
| $ 731,782
| $ —
|
| Broadline Retail
| 978,876
| 978,876
| —
| —
|
| Capital Markets
| 4,609,551
| 965,923
| 3,643,628
| —
|
| Diversified Telecommunication Services
| 2,851,627
| 1,959,462
| 892,165
| —
|
| Electric Utilities
| 4,109,145
| 967,482
| 3,141,663
| —
|
| Independent Power & Renewable Electricity Producers
| 817,241
| 817,241
| —
| —
|
| Insurance
| 10,337,319
| 2,970,467
| 7,366,852
| —
|
| Multi-Utilities
| 2,352,461
| 852,066
| 1,500,395
| —
|
| Oil, Gas & Consumable Fuels
| 3,968,743
| 3,071,968
| 896,775
| —
|
| Trading Companies & Distributors
| 1,069,247
| 1,069,247
| —
| —
|
| Other Industry Categories*
| 35,914,354
| —
| 35,914,354
| —
|
| Real Estate Investment Trusts:
|
|
|
|
|
| Health Care REITs
| 960,044
| —
| 960,044
| —
|
| Office REITs
| 1,018,776
| 1,018,776
| —
| —
|
| Retail REITs
| 2,732,546
| 1,149,008
| 1,583,538
| —
|
| Total Investments
| $ 75,989,496
| $ 19,358,300
| $ 56,631,196
| $—
|
| *
| See Portfolio of Investments for industry breakout.
|
See Notes to Financial
Statements
Page 45
First Trust BuyWrite Income ETF (FTHI)
Portfolio of Investments
March 31, 2023
(Unaudited)
| Shares
|
| Description
|
| Value
|
| COMMON STOCKS – 96.4%
|
|
|
| Aerospace & Defense – 1.3%
|
|
|
| 2,504
|
| Boeing (The) Co. (a)
|
| $531,925
|
| 2,551
|
| HEICO Corp., Class A
|
| 346,681
|
| 1,124
|
| Lockheed Martin Corp.
|
| 531,348
|
| 7,016
|
| Raytheon Technologies Corp.
|
| 687,077
|
|
|
|
|
| 2,097,031
|
|
|
| Air Freight & Logistics – 0.4%
|
|
|
| 3,403
|
| United Parcel Service, Inc., Class B
|
| 660,148
|
|
|
| Automobiles – 2.0%
|
|
|
| 997
|
| Ferrari N.V.
|
| 270,127
|
| 12,771
|
| Stellantis N.V.
|
| 232,304
|
| 12,771
|
| Tesla, Inc. (a)
|
| 2,649,472
|
|
|
|
|
| 3,151,903
|
|
|
| Banks – 4.6%
|
|
|
| 32,968
|
| Bank of America Corp.
|
| 942,885
|
| 8,973
|
| Citigroup, Inc.
|
| 420,744
|
| 7,703
|
| Commerce Bancshares, Inc.
|
| 449,470
|
| 10,368
|
| First Hawaiian, Inc.
|
| 213,892
|
| 16,887
|
| FNB Corp.
|
| 195,889
|
| 18,454
|
| Fulton Financial Corp.
|
| 255,034
|
| 7,415
|
| HDFC Bank, Ltd., ADR
|
| 494,358
|
| 4,198
|
| Independent Bank Corp.
|
| 275,473
|
| 13,650
|
| JPMorgan Chase & Co. (b)
|
| 1,778,731
|
| 7,696
|
| Royal Bank of Canada
|
| 735,584
|
| 7,256
|
| Texas Capital Bancshares, Inc. (a)
|
| 355,254
|
| 53,770
|
| Valley National Bancorp
|
| 496,835
|
| 18,217
|
| Wells Fargo & Co.
|
| 680,951
|
|
|
|
|
| 7,295,100
|
|
|
| Beverages – 2.5%
|
|
|
| 8,586
|
| Anheuser-Busch InBev S.A., ADR
|
| 572,944
|
| 18,645
|
| Coca-Cola (The) Co.
|
| 1,156,549
|
| 15,964
|
| Coca-Cola Europacific Partners PLC
|
| 944,909
|
| 6,742
|
| PepsiCo, Inc.
|
| 1,229,067
|
|
|
|
|
| 3,903,469
|
|
|
| Biotechnology – 1.7%
|
|
|
| 8,434
|
| AbbVie, Inc. (b)
|
| 1,344,127
|
| 11,791
|
| Agios Pharmaceuticals, Inc. (a)
|
| 270,839
|
| 2,608
|
| Amgen, Inc.
|
| 630,484
|
| 6,133
|
| Gilead Sciences, Inc.
|
| 508,855
|
|
|
|
|
| 2,754,305
|
|
|
| Broadline Retail – 2.7%
|
|
|
| 41,527
|
| Amazon.com, Inc. (a) (b)
|
| 4,289,324
|
|
|
| Capital Markets – 2.6%
|
|
|
| 9,505
|
| Artisan Partners Asset Management, Inc., Class A
|
| 303,970
|
| 730
|
| BlackRock, Inc.
|
| 488,458
|
| 7,541
|
| Charles Schwab (The) Corp.
|
| 394,998
|
| 1,840
|
| Evercore, Inc., Class A
|
| 212,299
|
| 1,631
|
| Goldman Sachs Group (The), Inc.
|
| 533,516
|
| 22,794
|
| Jefferies Financial Group, Inc.
|
| 723,481
|
| 11,164
|
| Moelis & Co., Class A
|
| 429,144
|
| 6,191
|
| Morgan Stanley
|
| 543,570
|
Page 46
See Notes to Financial Statements
First Trust BuyWrite Income ETF (FTHI)
Portfolio of Investments
(Continued)
March 31, 2023
(Unaudited)
| Shares
|
| Description
|
| Value
|
| COMMON STOCKS (Continued)
|
|
|
| Capital Markets (Continued)
|
|
|
| 1,577
|
| S&P Global, Inc.
|
| $543,702
|
|
|
|
|
| 4,173,138
|
|
|
| Chemicals – 1.7%
|
|
|
| 9,045
|
| Avient Corp.
|
| 372,292
|
| 13,796
|
| Axalta Coating Systems Ltd. (a)
|
| 417,881
|
| 8,227
|
| Huntsman Corp.
|
| 225,091
|
| 2,209
|
| Linde PLC
|
| 785,167
|
| 1,024
|
| NewMarket Corp.
|
| 373,740
|
| 16,108
|
| Valvoline, Inc.
|
| 562,813
|
|
|
|
|
| 2,736,984
|
|
|
| Communications Equipment – 0.8%
|
|
|
| 19,459
|
| Cisco Systems, Inc.
|
| 1,017,219
|
| 22,596
|
| Viavi Solutions, Inc. (a)
|
| 244,715
|
|
|
|
|
| 1,261,934
|
|
|
| Construction Materials – 0.2%
|
|
|
| 2,195
|
| Eagle Materials, Inc.
|
| 322,116
|
|
|
| Consumer Finance – 1.2%
|
|
|
| 14,189
|
| Ally Financial, Inc.
|
| 361,678
|
| 2,757
|
| American Express Co.
|
| 454,767
|
| 18,344
|
| Navient Corp.
|
| 293,320
|
| 20,089
|
| OneMain Holdings, Inc.
|
| 744,900
|
|
|
|
|
| 1,854,665
|
|
|
| Consumer Staples Distribution & Retail – 1.6%
|
|
|
| 2,157
|
| Costco Wholesale Corp.
|
| 1,071,749
|
| 10,314
|
| US Foods Holding Corp. (a)
|
| 380,999
|
| 6,873
|
| Walmart, Inc.
|
| 1,013,424
|
|
|
|
|
| 2,466,172
|
|
|
| Containers & Packaging – 1.7%
|
|
|
| 6,699
|
| Berry Global Group, Inc.
|
| 394,571
|
| 19,628
|
| Crown Holdings, Inc. (b)
|
| 1,623,432
|
| 9,844
|
| Graphic Packaging Holding Co.
|
| 250,924
|
| 5,940
|
| Sonoco Products Co. (b)
|
| 362,340
|
|
|
|
|
| 2,631,267
|
|
|
| Diversified Consumer Services – 0.5%
|
|
|
| 8,386
|
| Frontdoor, Inc. (a)
|
| 233,802
|
| 4,186
|
| Grand Canyon Education, Inc. (a)
|
| 476,785
|
|
|
|
|
| 710,587
|
|
|
| Diversified Telecommunication Services – 1.4%
|
|
|
| 35,295
|
| AT&T, Inc. (b)
|
| 679,429
|
| 3,950
|
| Iridium Communications, Inc.
|
| 244,623
|
| 21,737
|
| Liberty Global PLC, Class C (a)
|
| 443,000
|
| 20,513
|
| Verizon Communications, Inc.
|
| 797,751
|
|
|
|
|
| 2,164,803
|
|
|
| Electric Utilities – 1.1%
|
|
|
| 7,289
|
| Hawaiian Electric Industries, Inc.
|
| 279,898
|
| 4,564
|
| IDACORP, Inc.
|
| 494,418
|
| 9,379
|
| NextEra Energy, Inc.
|
| 722,933
|
See Notes to Financial Statements
Page 47
First Trust BuyWrite Income ETF (FTHI)
Portfolio of Investments
(Continued)
March 31, 2023
(Unaudited)
| Shares
|
| Description
|
| Value
|
| COMMON STOCKS (Continued)
|
|
|
| Electric Utilities (Continued)
|
|
|
| 3,317
|
| Otter Tail Corp.
|
| $239,720
|
|
|
|
|
| 1,736,969
|
|
|
| Electrical Equipment – 0.2%
|
|
|
| 1,949
|
| Acuity Brands, Inc.
|
| 356,141
|
|
|
| Electronic Equipment, Instruments & Components – 0.2%
|
|
|
| 2,784
|
| Belden, Inc.
|
| 241,568
|
|
|
| Energy Equipment & Services – 0.4%
|
|
|
| 49,101
|
| TechnipFMC PLC (a)
|
| 670,229
|
|
|
| Entertainment – 1.0%
|
|
|
| 2,123
|
| Netflix, Inc. (a)
|
| 733,454
|
| 8,585
|
| Walt Disney (The) Co. (a)
|
| 859,616
|
|
|
|
|
| 1,593,070
|
|
|
| Financial Services – 4.9%
|
|
|
| 8,335
|
| Berkshire Hathaway, Inc., Class B (a) (b)
|
| 2,573,598
|
| 40,047
|
| Equitable Holdings, Inc.
|
| 1,016,793
|
| 3,942
|
| Mastercard, Inc., Class A (b)
|
| 1,432,562
|
| 7,654
|
| Visa, Inc., Class A (b)
|
| 1,725,671
|
| 11,534
|
| Voya Financial, Inc.
|
| 824,220
|
| 2,783
|
| Walker & Dunlop, Inc.
|
| 211,981
|
|
|
|
|
| 7,784,825
|
|
|
| Food Products – 1.5%
|
|
|
| 6,436
|
| Cal-Maine Foods, Inc. (b)
|
| 391,888
|
| 29,787
|
| Flowers Foods, Inc.
|
| 816,462
|
| 4,860
|
| Ingredion, Inc.
|
| 494,408
|
| 6,570
|
| Mondelez International, Inc., Class A
|
| 458,060
|
| 5,370
|
| TreeHouse Foods, Inc. (a)
|
| 270,809
|
|
|
|
|
| 2,431,627
|
|
|
| Gas Utilities – 0.5%
|
|
|
| 9,803
|
| ONE Gas, Inc.
|
| 776,692
|
|
|
| Ground Transportation – 0.4%
|
|
|
| 2,752
|
| Union Pacific Corp.
|
| 553,868
|
|
|
| Health Care Equipment & Supplies – 1.9%
|
|
|
| 8,241
|
| Abbott Laboratories
|
| 834,484
|
| 6,221
|
| Enovis Corp. (a)
|
| 332,761
|
| 14,265
|
| Envista Holdings Corp. (a)
|
| 583,153
|
| 2,293
|
| GE HealthCare Technologies, Inc. (a)
|
| 188,095
|
| 6,508
|
| Medtronic PLC
|
| 524,675
|
| 1,590
|
| Stryker Corp.
|
| 453,897
|
|
|
|
|
| 2,917,065
|
|
|
| Health Care Providers & Services – 3.0%
|
|
|
| 1,007
|
| Chemed Corp.
|
| 541,514
|
| 1,520
|
| Cigna (The) Group
|
| 388,406
|
| 6,512
|
| CVS Health Corp. (b)
|
| 483,907
|
| 1,154
|
| Elevance Health, Inc.
|
| 530,621
|
| 5,260
|
| Encompass Health Corp.
|
| 284,566
|
| 11,758
|
| Premier, Inc., Class A
|
| 380,606
|
| 4,594
|
| UnitedHealth Group, Inc.
|
| 2,171,078
|
|
|
|
|
| 4,780,698
|
Page 48
See Notes to Financial Statements
First Trust BuyWrite Income ETF (FTHI)
Portfolio of Investments
(Continued)
March 31, 2023
(Unaudited)
| Shares
|
| Description
|
| Value
|
| COMMON STOCKS (Continued)
|
|
|
| Hotels, Restaurants & Leisure – 1.4%
|
|
|
| 171
|
| Booking Holdings, Inc. (a)
|
| $453,562
|
| 11,529
|
| International Game Technology PLC
|
| 308,977
|
| 3,472
|
| McDonald’s Corp.
|
| 970,806
|
| 5,287
|
| Starbucks Corp.
|
| 550,536
|
|
|
|
|
| 2,283,881
|
|
|
| Household Durables – 0.5%
|
|
|
| 7,079
|
| Leggett & Platt, Inc.
|
| 225,679
|
| 8,335
|
| Toll Brothers, Inc.
|
| 500,350
|
|
|
|
|
| 726,029
|
|
|
| Household Products – 1.1%
|
|
|
| 11,357
|
| Procter & Gamble (The) Co. (b)
|
| 1,688,672
|
|
|
| Independent Power & Renewable Electricity Producers – 0.2%
|
|
|
| 8,354
|
| Atlantica Sustainable Infrastructure PLC
|
| 246,944
|
|
|
| Industrial Conglomerates – 0.7%
|
|
|
| 4,955
|
| General Electric Co.
|
| 473,698
|
| 3,167
|
| Honeywell International, Inc.
|
| 605,277
|
|
|
|
|
| 1,078,975
|
|
|
| Insurance – 1.2%
|
|
|
| 2,019
|
| Chubb Ltd.
|
| 392,049
|
| 7,113
|
| First American Financial Corp.
|
| 395,910
|
| 3,115
|
| Hanover Insurance Group (The), Inc.
|
| 400,277
|
| 1,203
|
| Kinsale Capital Group, Inc.
|
| 361,080
|
| 2,084
|
| RenaissanceRe Holdings Ltd.
|
| 417,509
|
|
|
|
|
| 1,966,825
|
|
|
| Interactive Media & Services – 4.7%
|
|
|
| 27,031
|
| Alphabet, Inc., Class A (a)
|
| 2,803,925
|
| 23,911
|
| Alphabet, Inc., Class C (a)
|
| 2,486,744
|
| 9,639
|
| Meta Platforms, Inc., Class A (a)
|
| 2,042,890
|
|
|
|
|
| 7,333,559
|
|
|
| IT Services – 1.2%
|
|
|
| 3,006
|
| Accenture PLC, Class A
|
| 859,145
|
| 5,595
|
| Amdocs Ltd.
|
| 537,288
|
| 4,373
|
| International Business Machines Corp.
|
| 573,256
|
|
|
|
|
| 1,969,689
|
|
|
| Life Sciences Tools & Services – 1.3%
|
|
|
| 3,157
|
| Bruker Corp.
|
| 248,898
|
| 3,152
|
| Danaher Corp.
|
| 794,430
|
| 1,853
|
| Thermo Fisher Scientific, Inc.
|
| 1,068,014
|
|
|
|
|
| 2,111,342
|
|
|
| Machinery – 1.2%
|
|
|
| 11,456
|
| Allison Transmission Holdings, Inc.
|
| 518,269
|
| 2,347
|
| Caterpillar, Inc.
|
| 537,088
|
| 1,281
|
| Deere & Co.
|
| 528,899
|
| 4,883
|
| Graco, Inc.
|
| 356,508
|
|
|
|
|
| 1,940,764
|
|
|
| Marine Transportation – 0.2%
|
|
|
| 5,875
|
| Matson, Inc.
|
| 350,561
|
See Notes to Financial Statements
Page 49
First Trust BuyWrite Income ETF (FTHI)
Portfolio of Investments
(Continued)
March 31, 2023
(Unaudited)
| Shares
|
| Description
|
| Value
|
| COMMON STOCKS (Continued)
|
|
|
| Media – 0.7%
|
|
|
| 20,912
|
| Comcast Corp., Class A
|
| $792,774
|
| 1,411
|
| Nexstar Media Group, Inc.
|
| 243,623
|
|
|
|
|
| 1,036,397
|
|
|
| Metals & Mining – 0.4%
|
|
|
| 7,262
|
| Southern Copper Corp.
|
| 553,727
|
|
|
| Oil, Gas & Consumable Fuels – 3.7%
|
|
|
| 7,344
|
| Arch Resources, Inc.
|
| 965,442
|
| 8,347
|
| Chevron Corp. (b)
|
| 1,361,897
|
| 5,780
|
| ConocoPhillips
|
| 573,434
|
| 19,075
|
| Exxon Mobil Corp. (b)
|
| 2,091,764
|
| 7,300
|
| Murphy Oil Corp.
|
| 269,954
|
| 6,476
|
| Ovintiv, Inc.
|
| 233,654
|
| 4,552
|
| PDC Energy, Inc.
|
| 292,147
|
|
|
|
|
| 5,788,292
|
|
|
| Passenger Airlines – 0.2%
|
|
|
| 48,752
|
| JetBlue Airways Corp. (a)
|
| 354,915
|
|
|
| Personal Care Products – 2.0%
|
|
|
| 7,659
|
| BellRing Brands, Inc. (a)
|
| 260,406
|
| 61,984
|
| Coty, Inc., Class A (a)
|
| 747,527
|
| 40,161
|
| Unilever PLC, ADR
|
| 2,085,561
|
|
|
|
|
| 3,093,494
|
|
|
| Pharmaceuticals – 5.9%
|
|
|
| 95,609
|
| Bausch Health Cos., Inc. (a)
|
| 774,433
|
| 10,480
|
| Bristol-Myers Squibb Co.
|
| 726,369
|
| 3,872
|
| Eli Lilly & Co. (b)
|
| 1,329,722
|
| 12,722
|
| Johnson & Johnson (b)
|
| 1,971,910
|
| 12,080
|
| Merck & Co., Inc. (b)
|
| 1,285,191
|
| 11,330
|
| Novo Nordisk A/S, ADR (b)
|
| 1,803,056
|
| 27,559
|
| Pfizer, Inc.
|
| 1,124,407
|
| 8,346
|
| Royalty Pharma PLC, Class A
|
| 300,707
|
|
|
|
|
| 9,315,795
|
|
|
| Professional Services – 0.4%
|
|
|
| 1,971
|
| Automatic Data Processing, Inc.
|
| 438,804
|
| 5,438
|
| Genpact Ltd.
|
| 251,344
|
|
|
|
|
| 690,148
|
|
|
| Semiconductors & Semiconductor Equipment – 5.3%
|
|
|
| 7,284
|
| Advanced Micro Devices, Inc. (a)
|
| 713,905
|
| 2,446
|
| Analog Devices, Inc.
|
| 482,400
|
| 3,891
|
| Applied Materials, Inc.
|
| 477,932
|
| 1,778
|
| Broadcom, Inc.
|
| 1,140,658
|
| 18,872
|
| Intel Corp.
|
| 616,548
|
| 11,548
|
| NVIDIA Corp.
|
| 3,207,688
|
| 5,471
|
| QUALCOMM, Inc.
|
| 697,990
|
| 1,367
|
| Silicon Laboratories, Inc. (a)
|
| 239,348
|
| 4,266
|
| Texas Instruments, Inc.
|
| 793,519
|
|
|
|
|
| 8,369,988
|
|
|
| Software – 9.5%
|
|
|
| 2,086
|
| Adobe, Inc. (a)
|
| 803,882
|
| 4,788
|
| Check Point Software Technologies Ltd. (a)
|
| 622,440
|
Page 50
See Notes to Financial Statements
First Trust BuyWrite Income ETF (FTHI)
Portfolio of Investments
(Continued)
March 31, 2023
(Unaudited)
| Shares
|
| Description
|
| Value
|
| COMMON STOCKS (Continued)
|
|
|
| Software (Continued)
|
|
|
| 4,062
|
| CommVault Systems, Inc. (a)
|
| $230,478
|
| 2,880
|
| Dolby Laboratories, Inc., Class A
|
| 246,010
|
| 21,421
|
| Dropbox, Inc., Class A (a)
|
| 463,122
|
| 1,368
|
| Intuit, Inc.
|
| 609,895
|
| 34,789
|
| Microsoft Corp. (b)
|
| 10,029,669
|
| 7,300
|
| Oracle Corp.
|
| 678,316
|
| 4,119
|
| Salesforce, Inc. (a)
|
| 822,894
|
| 916
|
| ServiceNow, Inc. (a)
|
| 425,683
|
|
|
|
|
| 14,932,389
|
|
|
| Specialty Retail – 1.7%
|
|
|
| 6,401
|
| Buckle (The), Inc.
|
| 228,452
|
| 4,938
|
| Home Depot (The), Inc. (b)
|
| 1,457,303
|
| 2,983
|
| Lowe’s Cos., Inc.
|
| 596,510
|
| 5,548
|
| TJX (The) Cos., Inc.
|
| 434,741
|
|
|
|
|
| 2,717,006
|
|
|
| Technology Hardware, Storage & Peripherals – 8.3%
|
|
|
| 68,633
|
| Apple, Inc.
|
| 11,317,582
|
| 32,645
|
| Dell Technologies, Inc., Class C
|
| 1,312,655
|
| 27,455
|
| Xerox Holdings Corp.
|
| 422,807
|
|
|
|
|
| 13,053,044
|
|
|
| Textiles, Apparel & Luxury Goods – 0.8%
|
|
|
| 3,290
|
| Carter’s, Inc.
|
| 236,617
|
| 6,856
|
| Kontoor Brands, Inc.
|
| 331,762
|
| 6,007
|
| NIKE, Inc., Class B
|
| 736,698
|
|
|
|
|
| 1,305,077
|
|
|
| Tobacco – 0.5%
|
|
|
| 7,440
|
| Philip Morris International, Inc.
|
| 723,540
|
|
|
| Trading Companies & Distributors – 1.1%
|
|
|
| 4,569
|
| Beacon Roofing Supply, Inc. (a)
|
| 268,886
|
| 3,238
|
| Ferguson PLC
|
| 433,082
|
| 3,082
|
| SiteOne Landscape Supply, Inc. (a)
|
| 421,833
|
| 9,063
|
| Triton International Ltd.
|
| 572,963
|
|
|
|
|
| 1,696,764
|
|
|
| Water Utilities – 0.2%
|
|
|
| 3,639
|
| American States Water Co.
|
| 323,471
|
|
|
| Total Common Stocks
|
| 151,966,986
|
|
|
| (Cost $148,189,734)
|
|
|
| REAL ESTATE INVESTMENT TRUSTS – 3.8%
|
|
|
| Health Care REITs – 0.2%
|
|
|
| 5,313
|
| National Health Investors, Inc.
|
| 274,044
|
|
|
| Hotel & Resort REITs – 0.1%
|
|
|
| 14,261
|
| Apple Hospitality REIT, Inc.
|
| 221,331
|
|
|
| Industrial REITs – 0.3%
|
|
|
| 4,273
|
| Prologis, Inc.
|
| 533,142
|
|
|
| Mortgage Real Estate Investment Trusts – 2.2%
|
|
|
| 223,914
|
| AGNC Investment Corp. (b)
|
| 2,257,053
|
| 39,253
|
| Chimera Investment Corp.
|
| 221,387
|
See Notes to Financial Statements
Page 51
First Trust BuyWrite Income ETF (FTHI)
Portfolio of Investments
(Continued)
March 31, 2023
(Unaudited)
| Shares
|
| Description
|
| Value
|
| REAL ESTATE INVESTMENT TRUSTS (Continued)
|
|
|
| Mortgage Real Estate Investment Trusts (Continued)
|
|
|
| 79,023
|
| Rithm Capital Corp.
|
| $632,184
|
| 23,930
|
| Two Harbors Investment Corp.
|
| 352,010
|
|
|
|
|
| 3,462,634
|
|
|
| Office REITs – 0.6%
|
|
|
| 13,401
|
| Corporate Office Properties Trust
|
| 317,738
|
| 25,977
|
| Equity Commonwealth
|
| 537,983
|
|
|
|
|
| 855,721
|
|
|
| Retail REITs – 0.1%
|
|
|
| 19,831
|
| Macerich (The) Co.
|
| 210,209
|
|
|
| Specialized REITs – 0.3%
|
|
|
| 2,240
|
| American Tower Corp.
|
| 457,722
|
|
|
| Total Real Estate Investment Trusts
|
| 6,014,803
|
|
|
| (Cost $6,241,523)
|
|
|
| Units
|
| Description
|
| Value
|
| MASTER LIMITED PARTNERSHIPS – 0.8%
|
|
|
| Oil, Gas & Consumable Fuels – 0.8%
|
|
|
| 27,648
|
| Energy Transfer, L.P.
|
| 344,771
|
| 6,691
|
| Magellan Midstream Partners, L.P.
|
| 363,054
|
| 16,299
|
| MPLX, L.P.
|
| 561,500
|
|
|
| Total Master Limited Partnerships
|
| 1,269,325
|
|
|
| (Cost $1,209,677)
|
|
|
|
|
| Total Investments – 101.0%
|
| 159,251,114
|
|
|
| (Cost $155,640,934)
|
|
|
| Number of Contracts
|
| Description
|
| Notional Amount
|
| Exercise Price
|
| Expiration Date
|
| Value
|
| CALL OPTIONS WRITTEN – (2.8)%
|
| (37)
|
| S&P 500® Index
|
| $(15,204,447)
|
| $3,925.00
|
| 04/21/23
|
| (726,051)
|
| (47)
|
| S&P 500® Index
|
| (19,313,757)
|
| 3,975.00
|
| 04/21/23
|
| (754,303)
|
| (75)
|
| S&P 500® Index
|
| (30,819,825)
|
| 4,000.00
|
| 04/21/23
|
| (1,079,250)
|
| (35)
|
| S&P 500® Index
|
| (14,382,585)
|
| 4,025.00
|
| 04/21/23
|
| (400,225)
|
| (10)
|
| S&P 500® Index
|
| (4,109,310)
|
| 4,050.00
|
| 04/21/23
|
| (95,890)
|
| (37)
|
| S&P 500® Index
|
| (15,204,447)
|
| 3,950.00
|
| 05/19/23
|
| (803,048)
|
| (30)
|
| S&P 500® Index
|
| (12,327,930)
|
| 4,000.00
|
| 05/19/23
|
| (563,700)
|
|
|
| Total Call Options Written
|
| (4,422,467)
|
|
|
| (Premiums received $2,341,683)
|
|
|
|
|
|
|
|
|
|
| Net Other Assets and Liabilities – 1.8%
|
| 2,784,619
|
|
| Net Assets – 100.0%
|
| $157,613,266
|
| (a)
| Non-income producing security.
|
| (b)
| All or a portion of this security is pledged as collateral for the options written. At March 31, 2023, the segregated value of these securities amounts to
$15,595,351.
|
| ADR
| American Depositary Receipt
|
Page 52
See Notes to Financial Statements
First Trust BuyWrite Income ETF (FTHI)
Portfolio of Investments
(Continued)
March 31, 2023
(Unaudited)
Valuation Inputs
A summary of the inputs
used to value the Fund’s investments as of March 31, 2023 is as follows (see Note 2A - Portfolio Valuation in the Notes to Financial Statements):
| ASSETS TABLE
|
|
| Total
Value at
3/31/2023
| Level 1
Quoted
Prices
| Level 2
Significant
Observable
Inputs
| Level 3
Significant
Unobservable
Inputs
|
Common Stocks*
| $ 151,966,986
| $ 151,966,986
| $ —
| $ —
|
Real Estate Investment Trusts*
| 6,014,803
| 6,014,803
| —
| —
|
Master Limited Partnerships*
| 1,269,325
| 1,269,325
| —
| —
|
Total Investments
| $ 159,251,114
| $ 159,251,114
| $—
| $—
|
|
|
| LIABILITIES TABLE
|
|
| Total
Value at
3/31/2023
| Level 1
Quoted
Prices
| Level 2
Significant
Observable
Inputs
| Level 3
Significant
Unobservable
Inputs
|
Call Options Written
| $ (4,422,467)
| $ (4,422,467)
| $ —
| $ —
|
| *
| See Portfolio of Investments for industry breakout.
|
See Notes to Financial Statements
Page 53
First Trust Nasdaq BuyWrite Income ETF
(FTQI)
Portfolio of Investments
March 31, 2023
(Unaudited)
| Shares
|
| Description
|
| Value
|
| COMMON STOCKS – 101.9%
|
|
|
| Air Freight & Logistics – 0.3%
|
|
|
| 721
|
| Expeditors International of Washington, Inc.
|
| $79,397
|
|
|
| Automobiles – 2.7%
|
|
|
| 3,921
|
| Tesla, Inc. (a)
|
| 813,451
|
|
|
| Banks – 0.4%
|
|
|
| 537
|
| JPMorgan Chase & Co.
|
| 69,976
|
| 6,554
|
| Valley National Bancorp
|
| 60,559
|
|
|
|
|
| 130,535
|
|
|
| Beverages – 3.6%
|
|
|
| 1,706
|
| Coca-Cola Europacific Partners PLC
|
| 100,978
|
| 5,386
|
| PepsiCo, Inc.
|
| 981,868
|
|
|
|
|
| 1,082,846
|
|
|
| Biotechnology – 1.3%
|
|
|
| 948
|
| AbbVie, Inc.
|
| 151,083
|
| 354
|
| BeiGene Ltd., ADR (a)
|
| 76,298
|
| 747
|
| BioMarin Pharmaceutical, Inc. (a)
|
| 72,638
|
| 2,029
|
| Genmab A/S, ADR (a)
|
| 76,615
|
|
|
|
|
| 376,634
|
|
|
| Broadline Retail – 3.4%
|
|
|
| 9,363
|
| Amazon.com, Inc. (a) (b)
|
| 967,104
|
| 632
|
| Etsy, Inc. (a)
|
| 70,361
|
|
|
|
|
| 1,037,465
|
|
|
| Capital Markets – 3.2%
|
|
|
| 16,379
|
| BGC Partners, Inc., Class A
|
| 85,662
|
| 971
|
| Charles Schwab (The) Corp.
|
| 50,861
|
| 922
|
| CME Group, Inc.
|
| 176,581
|
| 265
|
| Moody’s Corp.
|
| 81,095
|
| 2,743
|
| Nasdaq, Inc.
|
| 149,960
|
| 826
|
| Northern Trust Corp.
|
| 72,795
|
| 293
|
| S&P Global, Inc.
|
| 101,018
|
| 1,413
|
| T. Rowe Price Group, Inc.
|
| 159,528
|
| 1,086
|
| Tradeweb Markets, Inc., Class A
|
| 85,816
|
|
|
|
|
| 963,316
|
|
|
| Chemicals – 0.5%
|
|
|
| 221
|
| Linde PLC
|
| 78,552
|
| 346
|
| Sherwin-Williams (The) Co.
|
| 77,771
|
|
|
|
|
| 156,323
|
|
|
| Communications Equipment – 2.1%
|
|
|
| 10,576
|
| Cisco Systems, Inc.
|
| 552,860
|
| 545
|
| F5, Inc. (a)
|
| 79,401
|
|
|
|
|
| 632,261
|
|
|
| Consumer Finance – 0.2%
|
|
|
| 11,871
|
| SoFi Technologies, Inc. (a)
|
| 72,057
|
|
|
| Consumer Staples Distribution & Retail – 2.9%
|
|
|
| 365
|
| Casey’s General Stores, Inc.
|
| 79,008
|
| 1,184
|
| Costco Wholesale Corp. (b)
|
| 588,294
|
| 358
|
| Dollar General Corp.
|
| 75,345
|
Page 54
See Notes to Financial Statements
First Trust Nasdaq BuyWrite Income ETF
(FTQI)
Portfolio of Investments
(Continued)
March 31, 2023
(Unaudited)
| Shares
|
| Description
|
| Value
|
| COMMON STOCKS (Continued)
|
|
|
| Consumer Staples Distribution & Retail (Continued)
|
|
|
| 838
|
| Target Corp.
|
| $138,798
|
|
|
|
|
| 881,445
|
|
|
| Distributors – 0.3%
|
|
|
| 263
|
| Pool Corp.
|
| 90,062
|
|
|
| Diversified Consumer Services – 0.4%
|
|
|
| 852
|
| Duolingo, Inc. (a)
|
| 121,487
|
|
|
| Electric Utilities – 1.8%
|
|
|
| 3,518
|
| Alliant Energy Corp.
|
| 187,861
|
| 798
|
| Duke Energy Corp.
|
| 76,983
|
| 1,524
|
| Evergy, Inc.
|
| 93,147
|
| 1,434
|
| NextEra Energy, Inc.
|
| 110,533
|
| 1,189
|
| Southern (The) Co.
|
| 82,730
|
|
|
|
|
| 551,254
|
|
|
| Electronic Equipment, Instruments & Components – 1.0%
|
|
|
| 798
|
| CDW Corp.
|
| 155,522
|
| 1,486
|
| Trimble, Inc. (a)
|
| 77,896
|
| 259
|
| Zebra Technologies Corp., Class A (a)
|
| 82,362
|
|
|
|
|
| 315,780
|
|
|
| Entertainment – 2.0%
|
|
|
| 1,242
|
| Netflix, Inc. (a) (b)
|
| 429,086
|
| 697
|
| Take-Two Interactive Software, Inc. (a)
|
| 83,152
|
| 773
|
| Walt Disney (The) Co. (a)
|
| 77,401
|
|
|
|
|
| 589,639
|
|
|
| Financial Services – 0.3%
|
|
|
| 540
|
| Jack Henry & Associates, Inc.
|
| 81,389
|
|
|
| Ground Transportation – 0.3%
|
|
|
| 580
|
| JB Hunt Transport Services, Inc.
|
| 101,767
|
|
|
| Health Care Equipment & Supplies – 1.9%
|
|
|
| 2,266
|
| Abbott Laboratories
|
| 229,455
|
| 2,223
|
| DENTSPLY SIRONA, Inc.
|
| 87,319
|
| 990
|
| Edwards Lifesciences Corp. (a)
|
| 81,903
|
| 1,014
|
| GE HealthCare Technologies, Inc. (a)
|
| 83,178
|
| 457
|
| Masimo Corp. (a)
|
| 84,335
|
|
|
|
|
| 566,190
|
|
|
| Health Care Providers & Services – 0.5%
|
|
|
| 902
|
| CVS Health Corp.
|
| 67,028
|
| 206
|
| UnitedHealth Group, Inc.
|
| 97,353
|
|
|
|
|
| 164,381
|
|
|
| Health Care Technology – 0.3%
|
|
|
| 4,260
|
| Certara, Inc. (a)
|
| 102,709
|
|
|
| Hotels, Restaurants & Leisure – 1.2%
|
|
|
| 770
|
| Expedia Group, Inc. (a)
|
| 74,713
|
| 2,801
|
| Starbucks Corp.
|
| 291,668
|
|
|
|
|
| 366,381
|
|
|
| Household Products – 0.3%
|
|
|
| 1,048
|
| Colgate-Palmolive Co.
|
| 78,757
|
See Notes to Financial Statements
Page 55
First Trust Nasdaq BuyWrite Income ETF
(FTQI)
Portfolio of Investments
(Continued)
March 31, 2023
(Unaudited)
| Shares
|
| Description
|
| Value
|
| COMMON STOCKS (Continued)
|
|
|
| Insurance – 0.3%
|
|
|
| 328
|
| Willis Towers Watson PLC
|
| $76,221
|
|
|
| Interactive Media & Services – 6.8%
|
|
|
| 5,939
|
| Alphabet, Inc., Class A (a)
|
| 616,052
|
| 5,922
|
| Alphabet, Inc., Class C (a) (b)
|
| 615,888
|
| 3,485
|
| Meta Platforms, Inc., Class A (a)
|
| 738,611
|
| 950
|
| Ziff Davis, Inc. (a)
|
| 74,148
|
|
|
|
|
| 2,044,699
|
|
|
| IT Services – 2.7%
|
|
|
| 942
|
| Accenture PLC, Class A
|
| 269,233
|
| 1,857
|
| Akamai Technologies, Inc. (a)
|
| 145,403
|
| 833
|
| Amdocs Ltd.
|
| 79,993
|
| 245
|
| EPAM Systems, Inc. (a)
|
| 73,255
|
| 586
|
| International Business Machines Corp.
|
| 76,819
|
| 370
|
| MongoDB, Inc. (a)
|
| 86,254
|
| 1,095
|
| Perficient, Inc. (a)
|
| 79,048
|
|
|
|
|
| 810,005
|
|
|
| Life Sciences Tools & Services – 1.8%
|
|
|
| 538
|
| Agilent Technologies, Inc.
|
| 74,427
|
| 1,056
|
| Bio-Techne Corp.
|
| 78,344
|
| 1,108
|
| Bruker Corp.
|
| 87,355
|
| 435
|
| Danaher Corp.
|
| 109,637
|
| 438
|
| Repligen Corp. (a)
|
| 73,742
|
| 186
|
| Thermo Fisher Scientific, Inc.
|
| 107,205
|
|
|
|
|
| 530,710
|
|
|
| Machinery – 0.5%
|
|
|
| 183
|
| Deere & Co.
|
| 75,557
|
| 348
|
| Nordson Corp.
|
| 77,347
|
|
|
|
|
| 152,904
|
|
|
| Media – 1.8%
|
|
|
| 10,336
|
| Comcast Corp., Class A
|
| 391,838
|
| 867
|
| Liberty Broadband Corp., Class C (a)
|
| 70,834
|
| 2,044
|
| TechTarget, Inc. (a)
|
| 73,829
|
|
|
|
|
| 536,501
|
|
|
| Multi-Utilities – 0.3%
|
|
|
| 1,363
|
| Dominion Energy, Inc.
|
| 76,205
|
|
|
| Passenger Airlines – 0.3%
|
|
|
| 830
|
| Ryanair Holdings PLC, ADR (a)
|
| 78,261
|
|
|
| Personal Care Products – 0.3%
|
|
|
| 354
|
| Estee Lauder (The) Cos., Inc., Class A
|
| 87,247
|
|
|
| Pharmaceuticals – 2.7%
|
|
|
| 428
|
| Eli Lilly & Co.
|
| 146,984
|
| 1,114
|
| Johnson & Johnson
|
| 172,670
|
| 1,255
|
| Merck & Co., Inc.
|
| 133,519
|
| 2,607
|
| Pfizer, Inc.
|
| 106,366
|
| 2,116
|
| Royalty Pharma PLC, Class A
|
| 76,239
|
| 970
|
| Zoetis, Inc.
|
| 161,447
|
|
|
|
|
| 797,225
|
Page 56
See Notes to Financial Statements
First Trust Nasdaq BuyWrite Income ETF
(FTQI)
Portfolio of Investments
(Continued)
March 31, 2023
(Unaudited)
| Shares
|
| Description
|
| Value
|
| COMMON STOCKS (Continued)
|
|
|
| Professional Services – 0.7%
|
|
|
| 743
|
| Exponent, Inc.
|
| $74,070
|
| 1,446
|
| SS&C Technologies Holdings, Inc.
|
| 81,655
|
| 1,605
|
| TTEC Holdings, Inc.
|
| 59,754
|
|
|
|
|
| 215,479
|
|
|
| Real Estate Management & Development – 0.2%
|
|
|
| 660
|
| Colliers International Group, Inc.
|
| 69,663
|
|
|
| Semiconductors & Semiconductor Equipment – 15.0%
|
|
|
| 3,747
|
| Advanced Micro Devices, Inc. (a)
|
| 367,243
|
| 1,780
|
| Allegro MicroSystems, Inc. (a)
|
| 85,422
|
| 832
|
| Ambarella, Inc. (a)
|
| 64,413
|
| 3,924
|
| Applied Materials, Inc. (b)
|
| 481,985
|
| 1,069
|
| Broadcom, Inc. (b)
|
| 685,806
|
| 906
|
| Entegris, Inc.
|
| 74,301
|
| 825
|
| MKS Instruments, Inc.
|
| 73,112
|
| 186
|
| Monolithic Power Systems, Inc.
|
| 93,100
|
| 4,683
|
| NVIDIA Corp.
|
| 1,300,797
|
| 983
|
| ON Semiconductor Corp. (a)
|
| 80,921
|
| 758
|
| Qorvo, Inc. (a)
|
| 76,990
|
| 2,602
|
| QUALCOMM, Inc.
|
| 331,963
|
| 435
|
| Silicon Laboratories, Inc. (a)
|
| 76,164
|
| 646
|
| SiTime Corp. (a)
|
| 91,881
|
| 645
|
| Synaptics, Inc. (a)
|
| 71,692
|
| 757
|
| Teradyne, Inc.
|
| 81,385
|
| 2,577
|
| Texas Instruments, Inc. (b)
|
| 479,348
|
|
|
|
|
| 4,516,523
|
|
|
| Software – 18.7%
|
|
|
| 2,934
|
| ACI Worldwide, Inc. (a)
|
| 79,159
|
| 1,246
|
| Adobe, Inc. (a) (b)
|
| 480,171
|
| 1,507
|
| Alarm.com Holdings, Inc. (a)
|
| 75,772
|
| 5,754
|
| Amplitude, Inc., Class A (a)
|
| 71,580
|
| 359
|
| Aspen Technology, Inc. (a)
|
| 82,164
|
| 1,950
|
| Bentley Systems, Inc., Class B
|
| 83,830
|
| 2,450
|
| Braze, Inc., Class A (a)
|
| 84,696
|
| 616
|
| Check Point Software Technologies Ltd. (a)
|
| 80,080
|
| 1,290
|
| CommVault Systems, Inc. (a)
|
| 73,195
|
| 1,036
|
| Descartes Systems Group (The), Inc. (a)
|
| 83,512
|
| 3,817
|
| Gen Digital, Inc.
|
| 65,500
|
| 1,748
|
| Gitlab, Inc., Class A (a)
|
| 59,939
|
| 3,573
|
| Jamf Holding Corp. (a)
|
| 69,388
|
| 11,533
|
| Microsoft Corp. (b)
|
| 3,324,964
|
| 483
|
| Monday.com Ltd. (a)
|
| 68,948
|
| 2,804
|
| nCino, Inc. (a)
|
| 69,483
|
| 1,651
|
| Oracle Corp.
|
| 153,411
|
| 1,729
|
| Pegasystems, Inc.
|
| 83,822
|
| 608
|
| PTC, Inc. (a)
|
| 77,964
|
| 708
|
| Salesforce, Inc. (a)
|
| 141,444
|
| 178
|
| ServiceNow, Inc. (a)
|
| 82,720
|
| 523
|
| SPS Commerce, Inc. (a)
|
| 79,653
|
| 236
|
| Tyler Technologies, Inc. (a)
|
| 83,695
|
| 2,782
|
| Varonis Systems, Inc. (a)
|
| 72,360
|
|
|
|
|
| 5,627,450
|
See Notes to Financial Statements
Page 57
First Trust Nasdaq BuyWrite Income ETF
(FTQI)
Portfolio of Investments
(Continued)
March 31, 2023
(Unaudited)
| Shares
|
| Description
|
| Value
|
| COMMON STOCKS (Continued)
|
|
|
| Specialty Retail – 2.4%
|
|
|
| 375
|
| Five Below, Inc. (a)
|
| $77,239
|
| 949
|
| Home Depot (The), Inc.
|
| 280,069
|
| 376
|
| Lowe’s Cos., Inc.
|
| 75,189
|
| 1,099
|
| TJX (The) Cos., Inc.
|
| 86,117
|
| 572
|
| Tractor Supply Co.
|
| 134,443
|
| 147
|
| Ulta Beauty, Inc. (a)
|
| 80,213
|
|
|
|
|
| 733,270
|
|
|
| Technology Hardware, Storage & Peripherals – 13.9%
|
|
|
| 24,399
|
| Apple, Inc.
|
| 4,023,395
|
| 1,177
|
| NetApp, Inc.
|
| 75,152
|
| 1,400
|
| Seagate Technology Holdings PLC
|
| 92,568
|
|
|
|
|
| 4,191,115
|
|
|
| Textiles, Apparel & Luxury Goods – 0.6%
|
|
|
| 621
|
| Crocs, Inc. (a)
|
| 78,519
|
| 716
|
| NIKE, Inc., Class B
|
| 87,810
|
|
|
|
|
| 166,329
|
|
|
| Tobacco – 0.3%
|
|
|
| 782
|
| Philip Morris International, Inc.
|
| 76,049
|
|
|
| Trading Companies & Distributors – 0.1%
|
|
|
| 2,494
|
| Xometry, Inc., Class A (a)
|
| 37,335
|
|
|
| Wireless Telecommunication Services – 1.6%
|
|
|
| 3,288
|
| T-Mobile US, Inc. (a)
|
| 476,234
|
|
|
| Total Common Stocks
|
| 30,654,951
|
|
|
| (Cost $28,827,569)
|
|
|
| REAL ESTATE INVESTMENT TRUSTS – 2.1%
|
|
|
| Specialized REITs – 2.1%
|
|
|
| 780
|
| American Tower Corp.
|
| 159,385
|
| 921
|
| Crown Castle, Inc.
|
| 123,267
|
| 379
|
| Equinix, Inc.
|
| 273,274
|
| 297
|
| SBA Communications Corp.
|
| 77,538
|
|
|
| Total Real Estate Investment Trusts
|
| 633,464
|
|
|
| (Cost $612,608)
|
|
|
|
|
| Total Investments – 104.0%
|
| 31,288,415
|
|
|
| (Cost $29,440,177)
|
|
|
| Number of Contracts
|
| Description
|
| Notional Amount
|
| Exercise Price
|
| Expiration Date
|
| Value
|
| CALL OPTIONS WRITTEN – (5.3)%
|
| (7)
|
| Nasdaq-100 Index®
|
| $(9,226,945)
|
| $12,250.00
|
| 04/21/23
|
| (655,053)
|
| (6)
|
| Nasdaq-100 Index®
|
| (7,908,810)
|
| 12,500.00
|
| 04/21/23
|
| (459,624)
|
| (4)
|
| Nasdaq-100 Index®
|
| (5,272,540)
|
| 12,750.00
|
| 04/21/23
|
| (205,340)
|
| (4)
|
| Nasdaq-100 Index®
|
| (5,272,540)
|
| 12,750.00
|
| 05/19/23
|
| (262,240)
|
|
|
| Total Call Options Written
|
| (1,582,257)
|
|
|
| (Premiums received $759,410)
|
|
|
|
|
|
|
|
|
|
| Net Other Assets and Liabilities – 1.3%
|
| 366,341
|
|
| Net Assets – 100.0%
|
| $30,072,499
|
Page 58
See Notes to Financial Statements
First Trust Nasdaq BuyWrite Income ETF
(FTQI)
Portfolio of Investments
(Continued)
March 31, 2023
(Unaudited)
| (a)
| Non-income producing security.
|
| (b)
| All or a portion of this security is pledged as collateral for the options written. At March 31, 2023, the segregated value of these securities amounts to
$4,930,600.
|
| ADR
| American Depositary Receipt
|
Valuation Inputs
A summary of the inputs
used to value the Fund’s investments as of March 31, 2023 is as follows (see Note 2A - Portfolio Valuation in the Notes to Financial Statements):
| ASSETS TABLE
|
|
| Total
Value at
3/31/2023
| Level 1
Quoted
Prices
| Level 2
Significant
Observable
Inputs
| Level 3
Significant
Unobservable
Inputs
|
Common Stocks*
| $ 30,654,951
| $ 30,654,951
| $ —
| $ —
|
Real Estate Investment Trusts*
| 633,464
| 633,464
| —
| —
|
Total Investments
| $ 31,288,415
| $ 31,288,415
| $—
| $—
|
|
|
| LIABILITIES TABLE
|
|
| Total
Value at
3/31/2023
| Level 1
Quoted
Prices
| Level 2
Significant
Observable
Inputs
| Level 3
Significant
Unobservable
Inputs
|
Call Options Written
| $ (1,582,257)
| $ (1,582,257)
| $ —
| $ —
|
| *
| See Portfolio of Investments for industry breakout.
|
See Notes to Financial Statements
Page 59
First Trust Rising Dividend Achievers ETF
(RDVY)
Portfolio of Investments
March 31, 2023
(Unaudited)
| Shares
|
| Description
|
| Value
|
| COMMON STOCKS – 99.8%
|
|
|
| Banks – 15.7%
|
|
|
| 5,307,007
|
| Bank of America Corp.
|
| $151,780,400
|
| 4,779,604
|
| Citizens Financial Group, Inc.
|
| 145,156,574
|
| 3,383,777
|
| Comerica, Inc.
|
| 146,923,597
|
| 14,264,849
|
| Huntington Bancshares, Inc.
|
| 159,766,309
|
| 1,172,093
|
| JPMorgan Chase & Co.
|
| 152,735,439
|
| 1,192,194
|
| PNC Financial Services Group (The), Inc.
|
| 151,527,857
|
| 2,900,651
|
| Popular, Inc.
|
| 166,526,374
|
| 8,244,713
|
| Regions Financial Corp.
|
| 153,021,873
|
|
|
|
|
| 1,227,438,423
|
|
|
| Capital Markets – 4.0%
|
|
|
| 485,928
|
| Goldman Sachs Group (The), Inc.
|
| 158,951,908
|
| 1,752,180
|
| Morgan Stanley
|
| 153,841,404
|
|
|
|
|
| 312,793,312
|
|
|
| Chemicals – 1.9%
|
|
|
| 2,079,499
|
| CF Industries Holdings, Inc.
|
| 150,742,883
|
|
|
| Communications Equipment – 2.0%
|
|
|
| 2,938,795
|
| Cisco Systems, Inc.
|
| 153,625,509
|
|
|
| Consumer Finance – 8.0%
|
|
|
| 942,361
|
| American Express Co.
|
| 155,442,447
|
| 1,644,171
|
| Capital One Financial Corp.
|
| 158,103,483
|
| 1,599,070
|
| Discover Financial Services
|
| 158,052,079
|
| 5,177,191
|
| Synchrony Financial
|
| 150,552,714
|
|
|
|
|
| 622,150,723
|
|
|
| Financial Services – 8.0%
|
|
|
| 6,287,266
|
| Equitable Holdings, Inc.
|
| 159,633,684
|
| 421,834
|
| Mastercard, Inc., Class A
|
| 153,298,694
|
| 11,904,592
|
| MGIC Investment Corp.
|
| 159,759,625
|
| 678,497
|
| Visa, Inc., Class A
|
| 152,973,933
|
|
|
|
|
| 625,665,936
|
|
|
| Food Products – 2.0%
|
|
|
| 1,986,246
|
| Archer-Daniels-Midland Co.
|
| 158,224,356
|
|
|
| Health Care Equipment &
Supplies – 2.0%
|
|
|
| 1,520,830
|
| Abbott Laboratories
|
| 153,999,246
|
|
|
| Health Care Providers &
Services – 3.7%
|
|
|
| 318,452
|
| Elevance Health, Inc.
|
| 146,427,414
|
| 297,644
|
| Humana, Inc.
|
| 144,494,256
|
|
|
|
|
| 290,921,670
|
|
|
| Household Durables – 1.9%
|
|
|
| 1,424,688
|
| Lennar Corp., Class A
|
| 149,748,956
|
|
|
| Insurance – 4.0%
|
|
|
| 2,406,564
|
| Aflac, Inc.
|
| 155,271,509
|
| Shares
|
| Description
|
| Value
|
|
|
|
|
| Insurance (Continued)
|
|
|
| 2,107,429
|
| Principal Financial Group, Inc.
|
| $156,624,124
|
|
|
|
|
| 311,895,633
|
|
|
| IT Services – 4.1%
|
|
|
| 589,994
|
| Accenture PLC, Class A
|
| 168,626,185
|
| 2,552,321
|
| Cognizant Technology Solutions Corp., Class A
|
| 155,512,919
|
|
|
|
|
| 324,139,104
|
|
|
| Machinery – 4.0%
|
|
|
| 2,092,768
|
| Mueller Industries, Inc.
|
| 153,776,593
|
| 636,481
|
| Snap-on, Inc.
|
| 157,140,794
|
|
|
|
|
| 310,917,387
|
|
|
| Media – 4.2%
|
|
|
| 4,372,911
|
| Interpublic Group of (The) Cos., Inc.
|
| 162,847,205
|
| 1,710,499
|
| Omnicom Group, Inc.
|
| 161,368,476
|
|
|
|
|
| 324,215,681
|
|
|
| Metals & Mining – 8.2%
|
|
|
| 4,071,153
|
| Freeport-McMoRan, Inc.
|
| 166,550,869
|
| 1,023,444
|
| Nucor Corp.
|
| 158,091,395
|
| 613,352
|
| Reliance Steel & Aluminum Co.
|
| 157,471,992
|
| 1,419,483
|
| Steel Dynamics, Inc.
|
| 160,486,748
|
|
|
|
|
| 642,601,004
|
|
|
| Oil, Gas & Consumable Fuels – 12.4%
|
|
|
| 969,067
|
| Chevron Corp.
|
| 158,112,972
|
| 1,213,870
|
| Chord Energy Corp.
|
| 163,386,902
|
| 2,391,733
|
| Civitas Resources, Inc.
|
| 163,451,033
|
| 1,562,647
|
| ConocoPhillips
|
| 155,030,209
|
| 1,477,721
|
| Exxon Mobil Corp.
|
| 162,046,885
|
| 7,510,069
|
| Magnolia Oil & Gas Corp., Class A
|
| 164,320,309
|
|
|
|
|
| 966,348,310
|
|
|
| Paper & Forest Products – 1.9%
|
|
|
| 2,712,369
|
| Louisiana-Pacific Corp.
|
| 147,037,523
|
|
|
| Pharmaceuticals – 1.9%
|
|
|
| 3,675,211
|
| Pfizer, Inc.
|
| 149,948,609
|
|
|
| Semiconductors &
Semiconductor Equipment – 6.0%
|
|
|
| 290,137
|
| Lam Research Corp.
|
| 153,807,426
|
| 2,603,219
|
| Micron Technology, Inc.
|
| 157,078,235
|
| 839,443
|
| Texas Instruments, Inc.
|
| 156,144,792
|
|
|
|
|
| 467,030,453
|
|
|
| Software – 1.9%
|
|
|
| 527,852
|
| Microsoft Corp.
|
| 152,179,732
|
Page 60
See Notes to Financial
Statements
First Trust Rising Dividend Achievers ETF
(RDVY)
Portfolio of Investments
(Continued)
March 31, 2023
(Unaudited)
| Shares
|
| Description
|
| Value
|
| COMMON STOCKS (Continued)
|
|
|
| Technology Hardware,
Storage & Peripherals – 2.0%
|
|
|
| 2,399,520
|
| NetApp, Inc.
|
| $153,209,352
|
|
|
| Total Investments – 99.8%
|
| 7,794,833,802
|
|
|
| (Cost $7,780,351,561)
|
|
|
|
|
| Net Other Assets and Liabilities – 0.2%
|
| 12,537,508
|
|
|
| Net Assets – 100.0%
|
| $7,807,371,310
|
Valuation Inputs
A summary of the inputs
used to value the Fund’s investments as of March 31, 2023 is as follows (see Note 2A - Portfolio Valuation in the Notes to Financial Statements):
|
| Total
Value at
3/31/2023
| Level 1
Quoted
Prices
| Level 2
Significant
Observable
Inputs
| Level 3
Significant
Unobservable
Inputs
|
| Common Stocks*
| $ 7,794,833,802
| $ 7,794,833,802
| $ —
| $ —
|
| *
| See Portfolio of Investments for industry breakout.
|
See Notes to Financial Statements
Page 61
First Trust Dorsey Wright Focus 5 ETF
(FV)
Portfolio of Investments
March 31, 2023
(Unaudited)
| Shares
|
| Description
|
| Value
|
| EXCHANGE-TRADED FUNDS – 99.8%
|
|
|
| Capital Markets (a) – 99.8%
|
|
|
| 12,309,910
|
| First Trust Consumer Discretionary AlphaDEX® Fund
|
| $639,253,626
|
| 11,493,642
|
| First Trust Industrials/Producer Durables AlphaDEX® Fund
|
| 638,471,813
|
| 9,738,120
|
| First Trust Materials AlphaDEX® Fund
|
| 636,093,999
|
| 23,696,341
|
| First Trust Nasdaq Food & Beverage ETF
|
| 636,957,646
|
| 9,950,938
|
| First Trust Nasdaq Semiconductor ETF
|
| 644,920,292
|
|
|
| Total Investments – 99.8%
|
| 3,195,697,376
|
|
|
| (Cost $3,145,616,040)
|
|
|
|
|
| Net Other Assets and Liabilities – 0.2%
|
| 7,694,725
|
|
|
| Net Assets – 100.0%
|
| $3,203,392,101
|
| (a)
| Represents investments in affiliated funds.
|
Valuation Inputs
A summary of the inputs
used to value the Fund’s investments as of March 31, 2023 is as follows (see Note 2A - Portfolio Valuation in the Notes to Financial Statements):
|
| Total
Value at
3/31/2023
| Level 1
Quoted
Prices
| Level 2
Significant
Observable
Inputs
| Level 3
Significant
Unobservable
Inputs
|
| Exchange-Traded Funds*
| $ 3,195,697,376
| $ 3,195,697,376
| $ —
| $ —
|
| *
| See Portfolio of Investments for industry breakout.
|
Page 62
See Notes to Financial
Statements
First Trust RBA American Industrial
Renaissance® ETF (AIRR)
Portfolio of Investments
March 31, 2023
(Unaudited)
| Shares
|
| Description
|
| Value
|
| COMMON STOCKS – 99.8%
|
|
|
| Banks – 8.1%
|
|
|
| 29,065
|
| 1st Source Corp.
|
| $1,254,155
|
| 67,409
|
| Associated Banc-Corp.
|
| 1,212,014
|
| 64,131
|
| CNB Financial Corp.
|
| 1,231,315
|
| 108,137
|
| First Commonwealth Financial Corp.
|
| 1,344,143
|
| 63,755
|
| First Financial Bancorp
|
| 1,387,946
|
| 33,904
|
| First Financial Corp.
|
| 1,270,722
|
| 37,328
|
| First Merchants Corp.
|
| 1,229,958
|
| 117,443
|
| FNB Corp.
|
| 1,362,339
|
| 93,089
|
| Fulton Financial Corp.
|
| 1,286,490
|
| 41,022
|
| German American Bancorp, Inc.
|
| 1,368,904
|
| 33,139
|
| Heartland Financial USA, Inc.
|
| 1,271,212
|
| 20,075
|
| Lakeland Financial Corp.
|
| 1,257,498
|
| 42,236
|
| Mercantile Bank Corp.
|
| 1,291,577
|
| 50,554
|
| Mid Penn Bancorp, Inc.
|
| 1,294,688
|
| 46,625
|
| MidWestOne Financial Group, Inc.
|
| 1,138,582
|
| 84,082
|
| Old National Bancorp
|
| 1,212,462
|
| 10,988
|
| Park National Corp.
|
| 1,302,847
|
| 54,558
|
| Peoples Bancorp, Inc.
|
| 1,404,868
|
| 30,735
|
| QCR Holdings, Inc.
|
| 1,349,574
|
| 17,869
|
| Wintrust Financial Corp.
|
| 1,303,544
|
|
|
|
|
| 25,774,838
|
|
|
| Commercial Services &
Supplies – 6.5%
|
|
|
| 440,989
|
| Aris Water Solution, Inc., Class A (a)
|
| 3,435,304
|
| 80,750
|
| Clean Harbors, Inc. (b)
|
| 11,511,720
|
| 155,777
|
| Heritage-Crystal Clean, Inc. (b)
|
| 5,547,219
|
|
|
|
|
| 20,494,243
|
|
|
| Construction & Engineering – 38.8%
|
|
|
| 490,632
|
| APi Group Corp. (b)
|
| 11,029,407
|
| 174,730
|
| Arcosa, Inc.
|
| 11,027,210
|
| 121,871
|
| Argan, Inc.
|
| 4,932,119
|
| 84,102
|
| Comfort Systems USA, Inc.
|
| 12,275,528
|
| 361,641
|
| Construction Partners, Inc., Class A (b)
|
| 9,742,609
|
| 103,355
|
| Dycom Industries, Inc. (b)
|
| 9,679,196
|
| 67,475
|
| EMCOR Group, Inc.
|
| 10,970,760
|
| 105,971
|
| MasTec, Inc. (b)
|
| 10,007,901
|
| 328,731
|
| MDU Resources Group, Inc.
|
| 10,019,721
|
| 55,730
|
| Northwest Pipe Co. (b)
|
| 1,740,448
|
| 298,218
|
| Primoris Services Corp.
|
| 7,354,056
|
| 66,696
|
| Quanta Services, Inc.
|
| 11,114,222
|
| 269,427
|
| Sterling Infrastructure, Inc. (b)
|
| 10,205,895
|
| 479,211
|
| Tutor Perini Corp. (b)
|
| 2,956,732
|
|
|
|
|
| 123,055,804
|
|
|
| Electrical Equipment – 18.8%
|
|
|
| 422,833
|
| Array Technologies, Inc. (b)
|
| 9,251,586
|
| 81,754
|
| Atkore, Inc. (b)
|
| 11,484,802
|
| 68,373
|
| Encore Wire Corp.
|
| 12,671,568
|
| Shares
|
| Description
|
| Value
|
|
|
|
|
| Electrical
Equipment (Continued)
|
|
|
| 43,012
|
| Hubbell, Inc.
|
| $10,465,250
|
| 180,751
|
| Powell Industries, Inc.
|
| 7,698,185
|
| 347,207
|
| Shoals Technologies Group, Inc., Class A (b)
|
| 7,912,848
|
|
|
|
|
| 59,484,239
|
|
|
| Machinery – 27.6%
|
|
|
| 160,234
|
| Astec Industries, Inc.
|
| 6,609,652
|
| 264,275
|
| Blue Bird Corp. (b)
|
| 5,399,138
|
| 87,684
|
| Douglas Dynamics, Inc.
|
| 2,796,243
|
| 203,179
|
| Federal Signal Corp.
|
| 11,014,334
|
| 354,517
|
| Greenbrier (The) Cos., Inc.
|
| 11,404,812
|
| 827,258
|
| Mueller Water Products, Inc., Class A
|
| 11,531,976
|
| 367,118
|
| Proto Labs, Inc. (b)
|
| 12,169,962
|
| 42,936
|
| RBC Bearings, Inc. (b)
|
| 9,992,495
|
| 285,348
|
| Shyft Group (The), Inc.
|
| 6,491,667
|
| 141,408
|
| SPX Technologies, Inc. (b)
|
| 9,980,577
|
|
|
|
|
| 87,390,856
|
|
|
| Total Common Stocks
|
| 316,199,980
|
|
|
| (Cost $291,836,638)
|
|
|
| MONEY MARKET FUNDS – 0.0%
|
| 76,678
|
| Goldman Sachs Financial Square Treasury Obligations Fund - Institutional Class - 4.69% (c) (d)
|
| 76,678
|
|
|
| (Cost $76,678)
|
|
|
Principal
Value
|
| Description
|
| Value
|
| REPURCHASE AGREEMENTS – 0.0%
|
| $12,344
|
| BNP Paribas S.A., 4.74% (c), dated 3/31/23, due 4/3/23, with a maturity value of $12,349. Collateralized by U.S. Treasury
Notes, interest rates of 1.50% to 2.13%, due 5/15/25 to 11/30/28. The value of the collateral including accrued interest is $12,629. (d)
|
| 12,344
|
|
|
| (Cost $12,344)
|
|
|
|
|
| Total Investments – 99.8%
|
| 316,289,002
|
|
|
| (Cost $291,925,660)
|
|
|
|
|
| Net Other Assets and Liabilities – 0.2%
|
| 597,590
|
|
|
| Net Assets – 100.0%
|
| $316,886,592
|
See Notes to
Financial Statements
Page 63
First Trust RBA American Industrial
Renaissance® ETF (AIRR)
Portfolio of Investments
(Continued)
March 31, 2023
(Unaudited)
| (a)
| All or a portion of this security is on loan (see Note 2G - Securities Lending in the Notes to Financial Statements). The remaining contractual maturity of all of the securities
lending transactions is overnight and continuous. The aggregate value of such securities is $86,469 and the total value of the collateral held by the Fund is $89,022.
|
| (b)
| Non-income producing security.
|
| (c)
| Rate shown reflects yield as of March 31, 2023.
|
| (d)
| This security serves as collateral for securities on loan.
|
Offsetting Assets and Liabilities
Offsetting assets and
liabilities requires entities to disclose both gross and net information about instruments and transactions eligible for offset, and to disclose instruments and transactions subject to master netting or similar
agreements (see Note 2F – Offsetting on the Statements of Assets and Liabilities in the Notes to Financial Statements).
The Fund’s loaned
securities were all subject to an enforceable Securities Lending Agency Agreement. Securities lent in accordance with the Securities Lending Agency Agreement on a gross basis were as follows:
| Securities Lending Agency Agreement
|
|
| Total gross amount presented on the Statements of Assets and Liabilities (1)
| $86,469
|
| Non-cash Collateral (2)
| (86,469)
|
| Net Amount
| $—
|
| (1)
| The amount presented on the Statements of Assets and Liabilities, which is included in “Investments, at value,” is not offset and is shown on a gross basis.
|
| (2)
| At March 31, 2023, the value of the collateral received from each borrower exceeded the value of the related securities loaned. This amount is disclosed on the
Portfolio of Investments.
|
The Fund’s
investments in repurchase agreements were all subject to an enforceable Master Repurchase Agreement. Repurchase Agreements on a gross basis were as follows:
| Repurchase Agreements
|
|
| Total gross amount presented on the Statements of Assets and Liabilities (3)
| $12,344
|
| Non-cash Collateral (4)
| (12,344)
|
| Net Amount
| $—
|
| (3)
| The amount is included in “Investments, at value” on the Statements of Assets and Liabilities.
|
| (4)
| At March 31, 2023, the value of the collateral received from each seller exceeded the value of the repurchase agreements.
|
Valuation Inputs
A summary of the inputs
used to value the Fund’s investments as of March 31, 2023 is as follows (see Note 2A - Portfolio Valuation in the Notes to Financial Statements):
|
| Total
Value at
3/31/2023
| Level 1
Quoted
Prices
| Level 2
Significant
Observable
Inputs
| Level 3
Significant
Unobservable
Inputs
|
| Common Stocks*
| $ 316,199,980
| $ 316,199,980
| $ —
| $ —
|
| Money Market Funds
| 76,678
| 76,678
| —
| —
|
| Repurchase Agreements
| 12,344
| —
| 12,344
| —
|
| Total Investments
| $ 316,289,002
| $ 316,276,658
| $ 12,344
| $—
|
| *
| See Portfolio of Investments for industry breakout.
|
Page 64
See Notes to Financial
Statements
First Trust Dorsey Wright Momentum &
Dividend ETF (DDIV)
Portfolio of Investments
March 31, 2023
(Unaudited)
| Shares
|
| Description
|
| Value
|
| COMMON STOCKS – 68.2%
|
|
|
| Banks – 7.3%
|
|
|
| 18,843
|
| Bank OZK
|
| $644,431
|
| 20,983
|
| Home BancShares, Inc.
|
| 455,541
|
| 89,237
|
| Huntington Bancshares, Inc.
|
| 999,454
|
| 44,508
|
| Regions Financial Corp.
|
| 826,068
|
| 22,533
|
| United Bankshares, Inc.
|
| 793,162
|
|
|
|
|
| 3,718,656
|
|
|
| Beverages – 1.0%
|
|
|
| 9,983
|
| Molson Coors Beverage Co., Class B
|
| 515,922
|
|
|
| Biotechnology – 2.0%
|
|
|
| 6,401
|
| AbbVie, Inc.
|
| 1,020,127
|
|
|
| Capital Markets – 7.4%
|
|
|
| 42,824
|
| Franklin Resources, Inc.
|
| 1,153,678
|
| 1,224
|
| Goldman Sachs Group (The), Inc.
|
| 400,383
|
| 59,382
|
| Invesco, Ltd.
|
| 973,865
|
| 13,381
|
| Jefferies Financial Group, Inc.
|
| 424,713
|
| 9,769
|
| Morgan Stanley
|
| 857,718
|
|
|
|
|
| 3,810,357
|
|
|
| Chemicals – 1.1%
|
|
|
| 18,090
|
| Chemours (The) Co.
|
| 541,615
|
|
|
| Communications Equipment – 1.1%
|
|
|
| 11,092
|
| Cisco Systems, Inc.
|
| 579,834
|
|
|
| Consumer Finance – 6.1%
|
|
|
| 72,937
|
| OneMain Holdings, Inc.
|
| 2,704,504
|
| 13,702
|
| Synchrony Financial
|
| 398,454
|
|
|
|
|
| 3,102,958
|
|
|
| Food Products – 1.9%
|
|
|
| 25,165
|
| Kraft Heinz (The) Co.
|
| 973,131
|
|
|
| Gas Utilities – 1.0%
|
|
|
| 9,193
|
| National Fuel Gas Co.
|
| 530,804
|
|
|
| Hotels, Restaurants &
Leisure – 1.2%
|
|
|
| 3,984
|
| Darden Restaurants, Inc.
|
| 618,158
|
|
|
| Independent Power &
Renewable Electricity Producers – 1.7%
|
|
|
| 37,278
|
| Vistra Corp.
|
| 894,672
|
|
|
| Insurance – 5.1%
|
|
|
| 5,941
|
| MetLife, Inc.
|
| 344,222
|
| 5,617
|
| Principal Financial Group, Inc.
|
| 417,455
|
| 14,404
|
| Prudential Financial, Inc.
|
| 1,191,787
|
| 16,247
|
| Unum Group
|
| 642,731
|
|
|
|
|
| 2,596,195
|
| Shares
|
| Description
|
| Value
|
|
|
|
|
| Media – 1.5%
|
|
|
| 20,076
|
| Interpublic Group of (The) Cos., Inc.
|
| $747,630
|
|
|
| Oil, Gas & Consumable Fuels – 17.4%
|
|
|
| 204,010
|
| Antero Midstream Corp.
|
| 2,140,065
|
| 3,922
|
| Chevron Corp.
|
| 639,913
|
| 25,910
|
| DT Midstream, Inc.
|
| 1,279,177
|
| 6,757
|
| Exxon Mobil Corp.
|
| 740,973
|
| 91,249
|
| Kinder Morgan, Inc.
|
| 1,597,770
|
| 22,728
|
| ONEOK, Inc.
|
| 1,444,137
|
| 10,938
|
| Phillips 66
|
| 1,108,894
|
|
|
|
|
| 8,950,929
|
|
|
| Pharmaceuticals – 4.4%
|
|
|
| 8,653
|
| Bristol-Myers Squibb Co.
|
| 599,739
|
| 16,864
|
| Pfizer, Inc.
|
| 688,051
|
| 102,180
|
| Viatris, Inc.
|
| 982,972
|
|
|
|
|
| 2,270,762
|
|
|
| Semiconductors &
Semiconductor Equipment – 2.2%
|
|
|
| 1,117
|
| Broadcom, Inc.
|
| 716,600
|
| 2,319
|
| Texas Instruments, Inc.
|
| 431,358
|
|
|
|
|
| 1,147,958
|
|
|
| Textiles, Apparel & Luxury
Goods – 0.9%
|
|
|
| 11,046
|
| Tapestry, Inc.
|
| 476,193
|
|
|
| Tobacco – 2.7%
|
|
|
| 14,352
|
| Philip Morris International, Inc.
|
| 1,395,732
|
|
|
| Trading Companies &
Distributors – 2.2%
|
|
|
| 3,464
|
| Watsco, Inc.
|
| 1,102,106
|
|
|
| Total Common Stocks
|
| 34,993,739
|
|
|
| (Cost $35,986,980)
|
|
|
| REAL ESTATE INVESTMENT TRUSTS – 31.2%
|
|
|
| Mortgage Real Estate
Investment Trusts – 4.9%
|
|
|
| 140,914
|
| Starwood Property Trust, Inc.
|
| 2,492,769
|
|
|
| Retail REITs – 14.5%
|
|
|
| 66,238
|
| Kimco Realty Corp.
|
| 1,293,628
|
| 30,875
|
| National Retail Properties, Inc.
|
| 1,363,131
|
| 20,433
|
| Regency Centers Corp.
|
| 1,250,091
|
| 15,156
|
| Simon Property Group, Inc.
|
| 1,697,018
|
| 46,492
|
| Spirit Realty Capital, Inc.
|
| 1,852,241
|
|
|
|
|
| 7,456,109
|
|
|
| Specialized REITs – 11.8%
|
|
|
| 31,540
|
| Gaming and Leisure Properties, Inc.
|
| 1,641,972
|
| 29,042
|
| Iron Mountain, Inc.
|
| 1,536,612
|
See Notes to Financial
Statements
Page 65
First Trust Dorsey Wright Momentum &
Dividend ETF (DDIV)
Portfolio of Investments
(Continued)
March 31, 2023
(Unaudited)
| Shares
|
| Description
|
| Value
|
| REAL ESTATE INVESTMENT TRUSTS (Continued)
|
|
|
| Specialized REITs (Continued)
|
|
|
| 14,694
|
| Lamar Advertising Co., Class A
|
| $1,467,784
|
| 44,086
|
| VICI Properties, Inc.
|
| 1,438,085
|
|
|
|
|
| 6,084,453
|
|
|
| Total Real Estate Investment Trusts
|
| 16,033,331
|
|
|
| (Cost $17,641,250)
|
|
|
|
|
| Total Investments – 99.4%
|
| 51,027,070
|
|
|
| (Cost $53,628,230)
|
|
|
|
|
| Net Other Assets and Liabilities – 0.6%
|
| 288,910
|
|
|
| Net Assets – 100.0%
|
| $51,315,980
|
Valuation Inputs
A summary of the inputs
used to value the Fund’s investments as of March 31, 2023 is as follows (see Note 2A - Portfolio Valuation in the Notes to Financial Statements):
|
| Total
Value at
3/31/2023
| Level 1
Quoted
Prices
| Level 2
Significant
Observable
Inputs
| Level 3
Significant
Unobservable
Inputs
|
| Common Stocks*
| $ 34,993,739
| $ 34,993,739
| $ —
| $ —
|
| Real Estate Investment Trusts*
| 16,033,331
| 16,033,331
| —
| —
|
| Total Investments
| $ 51,027,070
| $ 51,027,070
| $—
| $—
|
| *
| See Portfolio of Investments for industry breakout.
|
Page 66
See Notes to Financial Statements
First Trust Dorsey Wright International
Focus 5 ETF (IFV)
Portfolio of Investments
March 31, 2023
(Unaudited)
| Shares
|
| Description
|
| Value
|
| EXCHANGE-TRADED FUNDS – 99.9%
|
|
|
| Capital Markets (a) – 99.9%
|
|
|
| 1,898,905
|
| First Trust Dow Jones Global Select Dividend Index Fund
|
| $41,984,790
|
| 951,825
|
| First Trust India NIFTY 50 Equal Weight ETF
|
| 39,967,132
|
| 988,597
|
| First Trust Japan AlphaDEX® Fund
|
| 44,810,037
|
| 2,613,963
|
| First Trust Latin America AlphaDEX® Fund
|
| 45,232,016
|
| 755,642
|
| First Trust Switzerland AlphaDEX® Fund
|
| 46,068,999
|
|
|
| Total Investments – 99.9%
|
| 218,062,974
|
|
|
| (Cost $215,343,107)
|
|
|
|
|
| Net Other Assets and Liabilities – 0.1%
|
| 121,289
|
|
|
| Net Assets – 100.0%
|
| $218,184,263
|
| (a)
| Represents investments in affiliated funds.
|
Valuation Inputs
A summary of the inputs
used to value the Fund’s investments as of March 31, 2023 is as follows (see Note 2A - Portfolio Valuation in the Notes to Financial Statements):
|
| Total
Value at
3/31/2023
| Level 1
Quoted
Prices
| Level 2
Significant
Observable
Inputs
| Level 3
Significant
Unobservable
Inputs
|
| Exchange-Traded Funds*
| $ 218,062,974
| $ 218,062,974
| $ —
| $ —
|
| *
| See Portfolio of Investments for industry breakout.
|
See Notes to Financial
Statements
Page 67
First Trust Dorsey Wright Dynamic Focus 5
ETF (FVC)
Portfolio of Investments
March 31, 2023
(Unaudited)
| Shares
|
| Description
|
| Value
|
| EXCHANGE-TRADED FUNDS – 99.8%
|
|
|
| Capital Markets (a) – 99.8%
|
|
|
| 658,962
|
| First Trust Consumer Discretionary AlphaDEX® Fund
|
| $34,219,897
|
| 1,376,397
|
| First Trust Enhanced Short Maturity ETF
|
| 81,909,386
|
| 615,268
|
| First Trust Industrials/Producer Durables AlphaDEX® Fund
|
| 34,178,137
|
| 521,292
|
| First Trust Materials AlphaDEX® Fund
|
| 34,050,793
|
| 1,268,489
|
| First Trust Nasdaq Food & Beverage ETF
|
| 34,096,984
|
| 532,684
|
| First Trust Nasdaq Semiconductor ETF
|
| 34,523,250
|
|
|
| Total Investments – 99.8%
|
| 252,978,447
|
|
|
| (Cost $248,306,884)
|
|
|
|
|
| Net Other Assets and Liabilities – 0.2%
|
| 567,404
|
|
|
| Net Assets – 100.0%
|
| $253,545,851
|
| (a)
| Represents investments in affiliated funds.
|
Valuation Inputs
A summary of the inputs
used to value the Fund’s investments as of March 31, 2023 is as follows (see Note 2A - Portfolio Valuation in the Notes to Financial Statements):
|
| Total
Value at
3/31/2023
| Level 1
Quoted
Prices
| Level 2
Significant
Observable
Inputs
| Level 3
Significant
Unobservable
Inputs
|
| Exchange-Traded Funds*
| $ 252,978,447
| $ 252,978,447
| $ —
| $ —
|
| *
| See Portfolio of Investments for industry breakout.
|
Page 68
See Notes to Financial
Statements
First Trust Indxx Innovative Transaction
& Process ETF (LEGR)
Portfolio of Investments
March 31, 2023
(Unaudited)
| Shares
|
| Description
|
| Value
|
| COMMON STOCKS – 99.2%
|
|
|
| Aerospace & Defense – 2.4%
|
|
|
| 7,112
|
| Airbus SE (a)
|
| $949,932
|
| 4,650
|
| Boeing (The) Co. (b)
|
| 987,800
|
| 1,967
|
| Lockheed Martin Corp.
|
| 929,860
|
|
|
|
|
| 2,867,592
|
|
|
| Automobiles – 3.4%
|
|
|
| 8,896
|
| Bayerische Motoren Werke AG (a)
|
| 974,990
|
| 75,162
|
| Ford Motor Co.
|
| 947,041
|
| 11,841
|
| Mercedes-Benz Group AG (a)
|
| 910,606
|
| 5,412
|
| Tesla, Inc. (b)
|
| 1,122,773
|
|
|
|
|
| 3,955,410
|
|
|
| Banks – 22.5%
|
|
|
| 57,758
|
| ANZ Group Holdings Ltd. (a)
|
| 890,058
|
| 88,402
|
| Axis Bank Ltd. (a)
|
| 926,167
|
| 121,302
|
| Banco Bilbao Vizcaya Argentaria S.A. (a) (c)
|
| 867,232
|
| 234,944
|
| Banco Santander S.A. (a)
|
| 875,514
|
| 30,641
|
| Bank of America Corp.
|
| 876,333
|
| 2,482,018
|
| Bank of China Ltd., Class H (a)
|
| 951,524
|
| 1,537,049
|
| Bank of Communications Co., Ltd., Class H (a)
|
| 966,657
|
| 480,763
|
| Barclays PLC (a)
|
| 865,328
|
| 14,134
|
| BNP Paribas S.A. (a)
|
| 844,048
|
| 267,290
|
| BOC Hong Kong Holdings Ltd. (a)
|
| 832,142
|
| 3,105,637
|
| China CITIC Bank Corp., Ltd., Class H (a)
|
| 1,562,329
|
| 183,873
|
| China Merchants Bank Co., Ltd., Class H (a)
|
| 933,711
|
| 19,254
|
| Citigroup, Inc.
|
| 902,820
|
| 37,800
|
| DBS Group Holdings Ltd. (a)
|
| 939,774
|
| 243,740
|
| First Abu Dhabi Bank PJSC (a)
|
| 856,066
|
| 14,140
|
| HDFC Bank, Ltd., ADR
|
| 942,714
|
| 126,495
|
| HSBC Holdings PLC (a)
|
| 859,724
|
| 71,258
|
| ICICI Bank, Ltd., ADR
|
| 1,537,748
|
| 2,802,536
|
| Industrial & Commercial Bank of China Ltd., Class H (a)
|
| 1,489,379
|
| 69,264
|
| ING Groep N.V., ADR (c)
|
| 822,164
|
| 7,179
|
| JPMorgan Chase & Co.
|
| 935,495
|
| 44,688
|
| Kotak Mahindra Bank Ltd. (a)
|
| 944,564
|
| 389,901
|
| Lloyds Banking Group PLC, ADR
|
| 904,570
|
| 117,359
|
| Nordea Bank Abp (a)
|
| 1,253,983
|
| 1,480,634
|
| Postal Savings Bank of China Co., Ltd., Class H (a) (d) (e)
|
| 878,100
|
| 9,512
|
| Royal Bank of Canada
|
| 909,675
|
| 447,328
|
| Sberbank of Russia PJSC (a) (b) (f) (g)
|
| 0
|
| 63,204
|
| Westpac Banking Corp. (a)
|
| 920,225
|
|
|
|
|
| 26,488,044
|
| Shares
|
| Description
|
| Value
|
|
|
|
|
| Broadline Retail – 4.2%
|
|
|
| 17,556
|
| Alibaba Group Holding Ltd., ADR (b)
|
| $1,793,872
|
| 15,866
|
| Amazon.com, Inc. (b)
|
| 1,638,799
|
| 35,116
|
| JD.com, Inc., ADR
|
| 1,541,241
|
|
|
|
|
| 4,973,912
|
|
|
| Capital Markets – 6.5%
|
|
|
| 19,495
|
| Bank of New York Mellon (The) Corp.
|
| 885,853
|
| 5,273
|
| CME Group, Inc.
|
| 1,009,885
|
| 5,303
|
| Deutsche Boerse AG (a)
|
| 1,032,548
|
| 2,735
|
| Goldman Sachs Group (The), Inc.
|
| 894,646
|
| 10,637
|
| London Stock Exchange Group PLC (a)
|
| 1,033,169
|
| 1,009
|
| Partners Group Holding AG (a)
|
| 950,198
|
| 2,802
|
| S&P Global, Inc.
|
| 966,045
|
| 43,637
|
| UBS Group AG (a)
|
| 923,394
|
|
|
|
|
| 7,695,738
|
|
|
| Communications Equipment – 3.0%
|
|
|
| 19,172
|
| Cisco Systems, Inc.
|
| 1,002,216
|
| 197,418
|
| Nokia Oyj, ADR
|
| 969,322
|
| 259,604
|
| Telefonaktiebolaget LM Ericsson, Class B (a) (c)
|
| 1,521,754
|
|
|
|
|
| 3,493,292
|
|
|
| Consumer Staples
Distribution & Retail – 1.7%
|
|
|
| 19,805
|
| Kroger (The) Co.
|
| 977,773
|
| 6,822
|
| Walmart, Inc.
|
| 1,005,904
|
|
|
|
|
| 1,983,677
|
|
|
| Diversified Telecommunication
Services – 5.8%
|
|
|
| 79,892
|
| AT&T, Inc.
|
| 1,537,921
|
| 64,202
|
| Deutsche Telekom AG (a)
|
| 1,555,762
|
| 211,630
|
| Emirates Telecommunications Group Co., PJSC (a)
|
| 1,271,569
|
| 2,341
|
| Swisscom AG (a)
|
| 1,493,960
|
| 25,602
|
| Verizon Communications, Inc.
|
| 995,662
|
|
|
|
|
| 6,854,874
|
|
|
| Electric Utilities – 1.7%
|
|
|
| 82,708
|
| Iberdrola S.A. (a)
|
| 1,030,360
|
| 11,158
|
| Verbund AG (a)
|
| 970,554
|
|
|
|
|
| 2,000,914
|
|
|
| Electronic Equipment,
Instruments & Components – 0.8%
|
|
|
| 1,690
|
| Samsung SDI Co., Ltd. (a)
|
| 959,986
|
|
|
| Financial Services – 3.3%
|
|
|
| 4,129
|
| Mastercard, Inc., Class A
|
| 1,500,520
|
See Notes to Financial
Statements
Page 69
First Trust Indxx Innovative Transaction
& Process ETF (LEGR)
Portfolio of Investments
(Continued)
March 31, 2023
(Unaudited)
| Shares
|
| Description
|
| Value
|
| COMMON STOCKS (Continued)
|
|
|
| Financial Services (Continued)
|
|
|
| 19,276
|
| PayPal Holdings, Inc. (b)
|
| $1,463,820
|
| 4,253
|
| Visa, Inc., Class A
|
| 958,881
|
|
|
|
|
| 3,923,221
|
|
|
| Household Durables – 0.8%
|
|
|
| 10,811
|
| Sony Group Corp., ADR
|
| 980,017
|
|
|
| Industrial Conglomerates – 2.0%
|
|
|
| 7,588
|
| Honeywell International, Inc.
|
| 1,450,218
|
| 5,857
|
| Siemens AG (a)
|
| 948,857
|
|
|
|
|
| 2,399,075
|
|
|
| Insurance – 4.5%
|
|
|
| 85,873
|
| AIA Group Ltd. (a)
|
| 900,581
|
| 3,976
|
| Allianz SE (a)
|
| 917,804
|
| 16,770
|
| American International Group, Inc.
|
| 844,537
|
| 29,415
|
| AXA S.A. (a)
|
| 897,675
|
| 14,470
|
| MetLife, Inc.
|
| 838,392
|
| 140,552
|
| Ping An Insurance Group Co. of China Ltd., Class H (a)
|
| 909,261
|
|
|
|
|
| 5,308,250
|
|
|
| Interactive Media & Services – 2.3%
|
|
|
| 11,134
|
| Baidu, Inc., ADR (b)
|
| 1,680,343
|
| 21,598
|
| Tencent Holdings Ltd. (a)
|
| 1,055,480
|
|
|
|
|
| 2,735,823
|
|
|
| IT Services – 8.7%
|
|
|
| 5,635
|
| Accenture PLC, Class A
|
| 1,610,539
|
| 7,704
|
| Capgemini SE (a)
|
| 1,431,677
|
| 24,029
|
| Cognizant Technology Solutions Corp., Class A
|
| 1,464,087
|
| 82,598
|
| Infosys Ltd., ADR
|
| 1,440,509
|
| 11,601
|
| International Business Machines Corp.
|
| 1,520,775
|
| 35,959
|
| Tata Consultancy Services Ltd. (a)
|
| 1,409,516
|
| 309,435
|
| Wipro Ltd., ADR
|
| 1,389,363
|
|
|
|
|
| 10,266,466
|
|
|
| Marine Transportation – 1.0%
|
|
|
| 641
|
| AP Moller - Maersk A.S., Class B (a)
|
| 1,165,152
|
|
|
| Metals & Mining – 1.6%
|
|
|
| 30,361
|
| BHP Group Ltd. (a)
|
| 959,831
|
| 13,717
|
| Rio Tinto PLC, ADR (c)
|
| 940,986
|
|
|
|
|
| 1,900,817
|
|
|
| Multi-Utilities – 1.3%
|
|
|
| 98,215
|
| Engie S.A. (a)
|
| 1,554,223
|
| Shares
|
| Description
|
| Value
|
|
|
|
|
| Oil, Gas & Consumable Fuels – 0.8%
|
|
|
| 42,503
|
| Gazprom PJSC, ADR (a) (b) (f) (g)
|
| $0
|
| 364,010
|
| Gazprom PJSC, ADR (a) (b) (f) (g)
|
| 0
|
| 15,426
|
| Shell PLC, ADR
|
| 887,612
|
|
|
|
|
| 887,612
|
|
|
| Pharmaceuticals – 1.2%
|
|
|
| 8,739
|
| Zoetis, Inc.
|
| 1,454,519
|
|
|
| Semiconductors &
Semiconductor Equipment – 8.5%
|
|
|
| 17,418
|
| Advanced Micro Devices, Inc. (b)
|
| 1,707,138
|
| 38,623
|
| Infineon Technologies AG (a)
|
| 1,586,062
|
| 55,357
|
| Intel Corp.
|
| 1,808,513
|
| 26,324
|
| Micron Technology, Inc.
|
| 1,588,390
|
| 6,245
|
| NVIDIA Corp.
|
| 1,734,674
|
| 16,467
|
| Taiwan Semiconductor Manufacturing Co., Ltd., ADR
|
| 1,531,760
|
|
|
|
|
| 9,956,537
|
|
|
| Software – 7.7%
|
|
|
| 5,801
|
| Microsoft Corp.
|
| 1,672,428
|
| 16,849
|
| Oracle Corp.
|
| 1,565,609
|
| 8,190
|
| Salesforce, Inc. (b)
|
| 1,636,198
|
| 12,427
|
| SAP SE (a)
|
| 1,569,164
|
| 12,369
|
| VMware, Inc., Class A (b)
|
| 1,544,270
|
| 5,157
|
| Workday, Inc., Class A (b)
|
| 1,065,127
|
|
|
|
|
| 9,052,796
|
|
|
| Specialty Retail – 0.8%
|
|
|
| 3,249
|
| Home Depot (The), Inc.
|
| 958,845
|
|
|
| Technology Hardware,
Storage & Peripherals – 1.4%
|
|
|
| 32,201
|
| Samsung Electronics Co., Ltd. (a)
|
| 1,592,370
|
|
|
| Wireless Telecommunication
Services – 1.3%
|
|
|
| 128,000
|
| SoftBank Corp. (a)
|
| 1,477,607
|
|
|
| Total Common Stocks
|
| 116,886,769
|
|
|
| (Cost $121,750,768)
|
|
|
| MONEY MARKET FUNDS – 1.5%
|
| 1,800,849
|
| Goldman Sachs Financial Square Treasury Obligations Fund - Institutional Class - 4.69% (h) (i)
|
| 1,800,849
|
|
|
| (Cost $1,800,849)
|
|
|
Page 70
See Notes to Financial
Statements
First Trust Indxx Innovative Transaction
& Process ETF (LEGR)
Portfolio of Investments
(Continued)
March 31, 2023
(Unaudited)
Principal
Value
|
| Description
|
| Value
|
| REPURCHASE AGREEMENTS – 0.3%
|
| $289,901
|
| BNP Paribas S.A., 4.74% (h), dated 3/31/23, due 4/3/23, with a maturity value of $290,015. Collateralized by U.S. Treasury
Notes, interest rates of 1.50% to 2.13%, due 5/15/25 to 11/30/28. The value of the collateral including accrued interest is $296,593. (i)
|
| $289,901
|
|
|
| (Cost $289,901)
|
|
|
|
|
| Total Investments – 101.0%
|
| 118,977,519
|
|
|
| (Cost $123,841,518)
|
|
|
|
|
| Net Other Assets and Liabilities – (1.0)%
|
| (1,205,799)
|
|
|
| Net Assets – 100.0%
|
| $117,771,720
|
| (a)
| This security is fair valued by the Advisor’s Pricing Committee in accordance with procedures approved by the Trust’s Board of Trustees and in accordance with provisions
of the Investment Company Act of 1940 and rules thereunder, as amended. At March 31, 2023, securities noted as such are valued at $52,610,567 or 44.7% of net assets. Certain of these securities are fair valued using a
factor provided by a third-party pricing service due to the change in value between the foreign markets’ close and the New York Stock Exchange close exceeding a certain threshold. On days when this threshold is
not exceeded, these securities are typically valued at the last sale price on the exchange on which they are principally traded.
|
| (b)
| Non-income producing security.
|
| (c)
| All or a portion of this security is on loan (see Note 2G - Securities Lending in the Notes to Financial Statements). The remaining contractual maturity of all of the securities
lending transactions is overnight and continuous. The aggregate value of such securities is $2,012,799 and the total value of the collateral held by the Fund is $2,090,750.
|
| (d)
| This security may be resold to qualified foreign investors and foreign institutional buyers under Regulation S of the Securities Act of 1933, as amended (the “1933 Act”).
|
| (e)
| This security is exempt from registration upon resale under Rule 144A of the 1933 Act and may be resold in transactions exempt from registration, normally to qualified institutional
buyers. This security is not restricted on the foreign exchange where it trades freely without any additional registration. As such, it does not require the additional disclosure required of restricted securities.
|
| (f)
| Pursuant to procedures adopted by the Trust’s Board of Trustees, this security has been determined to be illiquid by First Trust Advisors L.P., the Fund’s advisor.
|
| (g)
| This security’s value was determined using significant unobservable inputs (see Note 2A – Portfolio Valuation in the Notes to Financial Statements).
|
| (h)
| Rate shown reflects yield as of March 31, 2023.
|
| (i)
| This security serves as collateral for securities on loan.
|
| ADR
| American Depositary Receipt
|
Offsetting Assets and Liabilities
Offsetting assets and
liabilities requires entities to disclose both gross and net information about instruments and transactions eligible for offset, and to disclose instruments and transactions subject to master netting or similar
agreements (see Note 2F – Offsetting on the Statements of Assets and Liabilities in the Notes to Financial Statements).
The Fund’s loaned
securities were all subject to an enforceable Securities Lending Agency Agreement. Securities lent in accordance with the Securities Lending Agency Agreement on a gross basis were as follows:
| Securities Lending Agency Agreement
|
|
| Total gross amount presented on the Statements of Assets and Liabilities (1)
| $2,012,799
|
| Non-cash Collateral (2)
| (2,012,799)
|
| Net Amount
| $—
|
| (1)
| The amount presented on the Statements of Assets and Liabilities, which is included in “Investments, at value,” is not offset and is shown on a gross basis.
|
| (2)
| At March 31, 2023, the value of the collateral received from each borrower exceeded the value of the related securities loaned. This amount is disclosed on the
Portfolio of Investments.
|
The Fund’s
investments in repurchase agreements were all subject to an enforceable Master Repurchase Agreement. Repurchase Agreements on a gross basis were as follows:
| Repurchase Agreements
|
|
| Total gross amount presented on the Statements of Assets and Liabilities (3)
| $289,901
|
| Non-cash Collateral (4)
| (289,901)
|
| Net Amount
| $—
|
| (3)
| The amount is included in “Investments, at value” on the Statements of Assets and Liabilities.
|
| (4)
| At March 31, 2023, the value of the collateral received from each seller exceeded the value of the repurchase agreements.
|
See Notes
to Financial Statements
Page 71
First Trust Indxx Innovative Transaction
& Process ETF (LEGR)
Portfolio of Investments
(Continued)
March 31, 2023
(Unaudited)
Currency Exposure
Diversification
| % of Total
Investments
|
| United States Dollar
| 55.0%
|
| Euro
| 17.0
|
| Hong Kong Dollar
| 8.8
|
| Swiss Franc
| 2.8
|
| Indian Rupee
| 2.8
|
| Australian Dollar
| 2.3
|
| British Pound Sterling
| 2.3
|
| South Korean Won
| 2.1
|
| United Arab Emirates Dirham
| 1.8
|
| Swedish Krona
| 1.3
|
| Japanese Yen
| 1.2
|
| Danish Krone
| 1.0
|
| Singapore Dollar
| 0.8
|
| Canadian Dollar
| 0.8
|
| Total
| 100.0%
|
Page 72
See Notes to Financial Statements
First Trust Indxx Innovative Transaction
& Process ETF (LEGR)
Portfolio of Investments
(Continued)
March 31, 2023
(Unaudited)
Valuation Inputs
A summary of the inputs
used to value the Fund’s investments as of March 31, 2023 is as follows (see Note 2A - Portfolio Valuation in the Notes to Financial Statements):
|
| Total
Value at
3/31/2023
| Level 1
Quoted
Prices
| Level 2
Significant
Observable
Inputs
| Level 3
Significant
Unobservable
Inputs
|
| Common Stocks:
|
|
|
|
|
Aerospace & Defense
| $ 2,867,592
| $ 1,917,660
| $ 949,932
| $ —
|
Automobiles
| 3,955,410
| 2,069,814
| 1,885,596
| —
|
Banks
| 26,488,044
| 7,831,519
| 18,656,525
| — *
|
Capital Markets
| 7,695,738
| 3,756,429
| 3,939,309
| —
|
Communications Equipment
| 3,493,292
| 1,971,538
| 1,521,754
| —
|
Diversified Telecommunication Services
| 6,854,874
| 2,533,583
| 4,321,291
| —
|
Electric Utilities
| 2,000,914
| —
| 2,000,914
| —
|
Electronic Equipment, Instruments & Components
| 959,986
| —
| 959,986
| —
|
Industrial Conglomerates
| 2,399,075
| 1,450,218
| 948,857
| —
|
Insurance
| 5,308,250
| 1,682,929
| 3,625,321
| —
|
Interactive Media & Services
| 2,735,823
| 1,680,343
| 1,055,480
| —
|
IT Services
| 10,266,466
| 7,425,273
| 2,841,193
| —
|
Marine Transportation
| 1,165,152
| —
| 1,165,152
| —
|
Metals & Mining
| 1,900,817
| 940,986
| 959,831
| —
|
Multi-Utilities
| 1,554,223
| —
| 1,554,223
| —
|
Oil, Gas & Consumable Fuels
| 887,612
| 887,612
| —
| — *
|
Semiconductors & Semiconductor Equipment
| 9,956,537
| 8,370,475
| 1,586,062
| —
|
Software
| 9,052,796
| 7,483,632
| 1,569,164
| —
|
Technology Hardware, Storage & Peripherals
| 1,592,370
| —
| 1,592,370
| —
|
Wireless Telecommunication Services
| 1,477,607
| —
| 1,477,607
| —
|
Other Industry Categories **
| 14,274,191
| 14,274,191
| —
| —
|
Money Market Funds
| 1,800,849
| 1,800,849
| —
| —
|
Repurchase Agreements
| 289,901
| —
| 289,901
| —
|
Total Investments
| $ 118,977,519
| $ 66,077,051
| $ 52,900,468
| $ —*
|
| *
| Investment is valued at $0.
|
| **
| See Portfolio of Investments for industry breakout.
|
Level 3 investments are
fair valued by the Advisor’s Pricing Committee and are footnoted in the Portfolio of Investments. Level 3 investments values are based on unobservable and non-quantitative inputs.
See Notes to Financial Statements
Page 73
First Trust Nasdaq Artificial Intelligence
and Robotics ETF (ROBT)
Portfolio of Investments
March 31, 2023
(Unaudited)
| Shares
|
| Description
|
| Value
|
| COMMON STOCKS – 99.3%
|
|
|
| Aerospace & Defense – 6.0%
|
|
|
| 51,859
|
| AeroVironment, Inc. (a)
|
| $4,753,396
|
| 26,219
|
| Elbit Systems Ltd. (b)
|
| 4,465,374
|
| 1,855
|
| Northrop Grumman Corp.
|
| 856,491
|
| 1,087,250
|
| QinetiQ Group PLC (b)
|
| 4,367,963
|
|
|
|
|
| 14,443,224
|
|
|
| Air Freight & Logistics – 0.4%
|
|
|
| 17,380
|
| GXO Logistics, Inc. (a)
|
| 876,995
|
|
|
| Automobile Components – 8.4%
|
|
|
| 7,411
|
| Aptiv PLC (a)
|
| 831,440
|
| 11,947
|
| Continental AG (b)
|
| 895,182
|
| 16,000
|
| Denso Corp. (b)
|
| 903,159
|
| 155,739
|
| Gentex Corp.
|
| 4,365,364
|
| 496,801
|
| Luminar Technologies, Inc. (a) (c)
|
| 3,224,238
|
| 15,459
|
| Magna International, Inc.
|
| 828,139
|
| 112,539
|
| Mobileye Global, Inc., Class A (a) (c)
|
| 4,869,563
|
| 212,451
|
| Valeo (b)
|
| 4,359,449
|
|
|
|
|
| 20,276,534
|
|
|
| Automobiles – 0.8%
|
|
|
| 91,745
|
| NIO, Inc., ADR (a)
|
| 964,240
|
| 4,188
|
| Tesla, Inc. (a)
|
| 868,842
|
|
|
|
|
| 1,833,082
|
|
|
| Broadline Retail – 1.2%
|
|
|
| 9,814
|
| Alibaba Group Holding Ltd., ADR (a)
|
| 1,002,795
|
| 9,143
|
| Amazon.com, Inc. (a)
|
| 944,380
|
| 19,387
|
| JD.com, Inc., ADR
|
| 850,895
|
|
|
|
|
| 2,798,070
|
|
|
| Communications Equipment – 2.0%
|
|
|
| 92,210
|
| Ciena Corp. (a)
|
| 4,842,869
|
|
|
| Consumer Staples
Distribution & Retail – 0.3%
|
|
|
| 129,661
|
| Ocado Group PLC (a) (b)
|
| 858,538
|
|
|
| Electrical Equipment – 3.5%
|
|
|
| 47,802
|
| ABB Ltd. (b)
|
| 1,644,462
|
| 10,415
|
| Emerson Electric Co.
|
| 907,563
|
| 76,600
|
| Mitsubishi Electric Corp. (b)
|
| 915,380
|
| 31,600
|
| Nidec Corp. (b)
|
| 1,644,496
|
| 5,410
|
| Rockwell Automation, Inc.
|
| 1,587,564
|
| 9,891
|
| Schneider Electric SE (b)
|
| 1,653,023
|
|
|
|
|
| 8,352,488
|
|
|
| Electronic Equipment,
Instruments & Components – 13.2%
|
|
|
| 33,644
|
| Cognex Corp.
|
| 1,667,060
|
| Shares
|
| Description
|
| Value
|
|
|
|
|
| Electronic Equipment,
Instruments & Components (Continued)
|
|
|
| 169,664
|
| Delta Electronics, Inc. (b)
|
| $1,683,345
|
| 58,652
|
| FARO Technologies, Inc. (a)
|
| 1,443,426
|
| 169,720
|
| Halma PLC (b)
|
| 4,685,376
|
| 399,221
|
| Hexagon AB, Class B (b)
|
| 4,594,797
|
| 3,600
|
| Keyence Corp. (b)
|
| 1,764,391
|
| 31,587
|
| National Instruments Corp.
|
| 1,655,475
|
| 29,900
|
| Omron Corp. (b)
|
| 1,749,954
|
| 338,200
|
| Topcon Corp. (b)
|
| 4,576,379
|
| 85,409
|
| Trimble, Inc. (a)
|
| 4,477,140
|
| 106,700
|
| Yokogawa Electric Corp. (b)
|
| 1,737,453
|
| 5,313
|
| Zebra Technologies Corp., Class A (a)
|
| 1,689,534
|
|
|
|
|
| 31,724,330
|
|
|
| Health Care Equipment &
Supplies – 1.9%
|
|
|
| 6,957
|
| Intuitive Surgical, Inc. (a)
|
| 1,777,305
|
| 10,404
|
| Medtronic PLC
|
| 838,771
|
| 15,824
|
| Omnicell, Inc. (a)
|
| 928,394
|
| 3,277
|
| Stryker Corp.
|
| 935,485
|
|
|
|
|
| 4,479,955
|
|
|
| Health Care Technology – 0.3%
|
|
|
| 32,522
|
| Teladoc Health, Inc. (a)
|
| 842,320
|
|
|
| Household Durables – 0.4%
|
|
|
| 10,300
|
| Sony Group Corp. (b)
|
| 938,159
|
|
|
| Industrial Conglomerates – 0.4%
|
|
|
| 5,615
|
| Siemens AG (b)
|
| 909,652
|
|
|
| Interactive Media & Services – 1.9%
|
|
|
| 9,567
|
| Alphabet, Inc., Class A (a)
|
| 992,385
|
| 6,255
|
| Baidu, Inc., ADR (a)
|
| 944,005
|
| 18,270
|
| Kakao Corp. (b)
|
| 865,246
|
| 5,466
|
| NAVER Corp. (b)
|
| 856,473
|
| 19,686
|
| Tencent Holdings Ltd. (b)
|
| 962,041
|
|
|
|
|
| 4,620,150
|
|
|
| IT Services – 2.7%
|
|
|
| 11,866
|
| Akamai Technologies, Inc. (a)
|
| 929,108
|
| 311,960
|
| Atos SE (a) (b)
|
| 3,869,958
|
| 6,663
|
| International Business Machines Corp.
|
| 873,453
|
| 24,656
|
| Netcompany Group
A.S. (a) (b) (d) (e)
|
| 899,798
|
|
|
|
|
| 6,572,317
|
|
|
| Life Sciences Tools &
Services – 2.9%
|
|
|
| 22,323
|
| Illumina, Inc. (a)
|
| 5,191,214
|
Page 74
See Notes to Financial
Statements
First Trust Nasdaq Artificial Intelligence
and Robotics ETF (ROBT)
Portfolio of Investments
(Continued)
March 31, 2023
(Unaudited)
| Shares
|
| Description
|
| Value
|
| COMMON STOCKS (Continued)
|
|
|
| Life Sciences Tools &
Services (Continued)
|
|
|
| 3,928
|
| Tecan Group AG (b)
|
| $1,720,620
|
|
|
|
|
| 6,911,834
|
|
|
| Machinery – 10.8%
|
|
|
| 162,956
|
| 3D Systems Corp. (a)
|
| 1,746,888
|
| 25,738
|
| ANDRITZ AG (b)
|
| 1,741,541
|
| 39,454
|
| ATS Corp. (a)
|
| 1,652,018
|
| 2,126,893
|
| AutoStore Holdings
Ltd. (a) (b) (c) (d) (e)
|
| 4,591,465
|
| 31,222
|
| Cargotec OYJ, Class B (b)
|
| 1,519,909
|
| 88,200
|
| Daifuku Co., Ltd. (b)
|
| 1,637,625
|
| 2,054
|
| Deere & Co.
|
| 848,056
|
| 42,139
|
| Duerr AG (b)
|
| 1,514,151
|
| 47,000
|
| FANUC Corp. (b)
|
| 1,697,273
|
| 14,386
|
| John Bean Technologies Corp.
|
| 1,572,246
|
| 39,300
|
| Kawasaki Heavy Industries, Ltd. (b)
|
| 860,342
|
| 50,742
|
| Proto Labs, Inc. (a)
|
| 1,682,097
|
| 68,600
|
| Shibaura Machine Co., Ltd. (b)
|
| 1,638,697
|
| 48,109
|
| Valmet Oyj (b)
|
| 1,561,801
|
| 40,700
|
| Yaskawa Electric Corp. (b)
|
| 1,785,098
|
|
|
|
|
| 26,049,207
|
|
|
| Pharmaceuticals – 0.4%
|
|
|
| 5,622
|
| Johnson & Johnson
|
| 871,410
|
|
|
| Semiconductors &
Semiconductor Equipment – 8.1%
|
|
|
| 10,963
|
| Advanced Micro Devices, Inc. (a)
|
| 1,074,484
|
| 47,146
|
| Ambarella, Inc. (a)
|
| 3,650,043
|
| 34,557
|
| Intel Corp.
|
| 1,128,977
|
| 4,204
|
| KLA Corp.
|
| 1,678,111
|
| 27,591
|
| Micron Technology, Inc.
|
| 1,664,841
|
| 6,872
|
| NVIDIA Corp.
|
| 1,908,836
|
| 8,938
|
| NXP Semiconductors N.V.
|
| 1,666,714
|
| 12,914
|
| QUALCOMM, Inc.
|
| 1,647,568
|
| 123,200
|
| Renesas Electronics Corp. (a) (b)
|
| 1,784,036
|
| 18,322
|
| Taiwan Semiconductor Manufacturing Co., Ltd., ADR
|
| 1,704,312
|
| 15,775
|
| Teradyne, Inc.
|
| 1,695,970
|
|
|
|
|
| 19,603,892
|
|
|
| Software – 32.7%
|
|
|
| 14,647
|
| ANSYS, Inc. (a)
|
| 4,874,521
|
| 107,270
|
| Appian Corp., Class A (a)
|
| 4,760,642
|
| 4,334
|
| Autodesk, Inc. (a)
|
| 902,165
|
| 1,145,973
|
| BlackBerry Ltd. (a)
|
| 5,225,637
|
| 4,381,022
|
| BrainChip Holdings Ltd. (a) (b) (c)
|
| 1,409,707
|
| 196,918
|
| C3.ai, Inc., Class A (a) (c)
|
| 6,610,537
|
| 23,046
|
| Cadence Design Systems, Inc. (a)
|
| 4,841,734
|
| Shares
|
| Description
|
| Value
|
|
|
|
|
| Software (Continued)
|
|
|
| 114,617
|
| Dassault Systemes SE (b)
|
| $4,728,071
|
| 104,546
|
| Dynatrace, Inc. (a)
|
| 4,422,296
|
| 3,456
|
| Microsoft Corp.
|
| 996,365
|
| 21,439
|
| Nice Ltd., ADR (a)
|
| 4,907,173
|
| 23,605
|
| Palo Alto Networks, Inc. (a)
|
| 4,714,863
|
| 95,867
|
| Pegasystems, Inc.
|
| 4,647,632
|
| 293,500
|
| PKSHA Technology, Inc. (a) (b)
|
| 4,028,683
|
| 170,424
|
| PROS Holdings, Inc. (a)
|
| 4,669,618
|
| 6,874
|
| PTC, Inc. (a)
|
| 881,453
|
| 10,288
|
| ServiceNow, Inc. (a)
|
| 4,781,039
|
| 12,223
|
| Synopsys, Inc. (a)
|
| 4,721,134
|
| 299,623
|
| UiPath, Inc., Class A (a)
|
| 5,261,380
|
| 225,012
|
| Veritone, Inc. (a)
|
| 1,311,820
|
|
|
|
|
| 78,696,470
|
|
|
| Technology Hardware,
Storage & Peripherals – 0.7%
|
|
|
| 18,809
|
| Samsung Electronics Co., Ltd. (b)
|
| 930,123
|
| 62,700
|
| Seiko Epson Corp. (b) (c)
|
| 895,861
|
|
|
|
|
| 1,825,984
|
|
|
| Wireless Telecommunication
Services – 0.3%
|
|
|
| 21,300
|
| SoftBank Group Corp. (b)
|
| 837,378
|
|
|
| Total Common Stocks
|
| 239,164,858
|
|
|
| (Cost $248,597,828)
|
|
|
| REAL ESTATE INVESTMENT TRUSTS – 0.4%
|
|
|
| Specialized REITs – 0.4%
|
|
|
| 1,251
|
| Equinix, Inc.
|
| 902,021
|
|
|
| (Cost $876,490)
|
|
|
| MONEY MARKET FUNDS – 6.3%
|
| 15,059,617
|
| Goldman Sachs Financial Square Treasury Obligations Fund - Institutional Class - 4.69% (f) (g)
|
| 15,059,617
|
|
|
| (Cost $15,059,617)
|
|
|
See Notes to Financial
Statements
Page 75
First Trust Nasdaq Artificial Intelligence
and Robotics ETF (ROBT)
Portfolio of Investments
(Continued)
March 31, 2023
(Unaudited)
Principal
Value
|
| Description
|
| Value
|
| REPURCHASE AGREEMENTS – 1.0%
|
| $2,424,298
|
| BNP Paribas S.A., 4.74% (f), dated 3/31/23, due 4/3/23, with a maturity value of $2,425,255. Collateralized by U.S.
Treasury Notes, interest rates of 1.50% to 2.13%, due 5/15/25 to 11/30/28. The value of the collateral including accrued interest is $2,480,263. (g)
|
| $2,424,298
|
|
|
| (Cost $2,424,298)
|
|
|
|
|
| Total Investments – 107.0%
|
| 257,550,794
|
|
|
| (Cost $266,958,233)
|
|
|
|
|
| Net Other Assets and Liabilities – (7.0)%
|
| (16,860,473)
|
|
|
| Net Assets – 100.0%
|
| $240,690,321
|
| (a)
| Non-income producing security.
|
| (b)
| This security is fair valued by the Advisor’s Pricing Committee in accordance with procedures approved by the Trust’s Board of Trustees and in accordance with provisions
of the Investment Company Act of 1940 and rules thereunder, as amended. At March 31, 2023, securities noted as such are valued at $86,682,429 or 36.0% of net assets. Certain of these securities are fair valued using a
factor provided by a third-party pricing service due to the change in value between the foreign markets’ close and the New York Stock Exchange close exceeding a certain threshold. On days when this threshold is
not exceeded, these securities are typically valued at the last sale price on the exchange on which they are principally traded.
|
| (c)
| All or a portion of this security is on loan (see Note 2G - Securities Lending in the Notes to Financial Statements). The remaining contractual maturity of all of the securities
lending transactions is overnight and continuous. The aggregate value of such securities is $18,124,198 and the total value of the collateral held by the Fund is $17,483,915.
|
| (d)
| This security may be resold to qualified foreign investors and foreign institutional buyers under Regulation S of the Securities Act of 1933, as amended (the “1933 Act”).
|
| (e)
| This security is exempt from registration upon resale under Rule 144A of the 1933 Act and may be resold in transactions exempt from registration, normally to qualified institutional
buyers. This security is not restricted on the foreign exchange where it trades freely without any additional registration. As such, it does not require the additional disclosure required of restricted securities.
|
| (f)
| Rate shown reflects yield as of March 31, 2023.
|
| (g)
| This security serves as collateral for securities on loan.
|
| ADR
| American Depositary Receipt
|
Offsetting Assets and Liabilities
Offsetting assets and
liabilities requires entities to disclose both gross and net information about instruments and transactions eligible for offset, and to disclose instruments and transactions
subject to master netting or similar
agreements (see Note 2F – Offsetting on the Statements of Assets and Liabilities in the Notes to Financial Statements).
The Fund’s loaned
securities were all subject to an enforceable Securities Lending Agency Agreement. Securities lent in accordance with the Securities Lending Agency Agreement on a gross basis were as follows:
| Securities Lending Agency Agreement
|
|
| Total gross amount presented on the Statements of Assets and Liabilities (1)
| $18,124,198
|
| Non-cash Collateral (2)
| (17,483,915)
|
| Net Amount
| $ 640,283
|
| (1)
| The amount presented on the Statements of Assets and Liabilities, which is included in “Investments, at value,” is not offset and is shown on a gross basis.
|
| (2)
| The collateral requirements are determined at the beginning of each business day based on the market value of the loaned securities from the end of the prior day.
On March 31, 2023, the last business day of the period, there was sufficient collateral based on the end of day market value from the prior business day; however, as a result of market movement from March 30 to March
31, the value of the related securities loaned was above the collateral value received. See Note 2G - Securities Lending in the Notes to Financial Statements.
|
The Fund’s
investments in repurchase agreements were all subject to an enforceable Master Repurchase Agreement. Repurchase Agreements on a gross basis were as follows:
| Repurchase Agreements
|
|
| Total gross amount presented on the Statements of Assets and Liabilities (3)
| $2,424,298
|
| Non-cash Collateral (4)
| (2,424,298)
|
| Net Amount
| $—
|
| (3)
| The amount is included in “Investments, at value” on the Statements of Assets and Liabilities.
|
| (4)
| At March 31, 2023, the value of the collateral received from each seller exceeded the value of the repurchase agreements.
|
Page 76
See Notes to Financial
Statements
First Trust Nasdaq Artificial Intelligence
and Robotics ETF (ROBT)
Portfolio of Investments
(Continued)
March 31, 2023
(Unaudited)
Currency Exposure
Diversification
| % of Total
Investments
|
| United States Dollar
| 65.7%
|
| Japanese Yen
| 11.4
|
| Euro
| 8.8
|
| British Pound Sterling
| 3.9
|
| Swedish Krona
| 1.8
|
| Norwegian Krone
| 1.8
|
| Israeli Shekel
| 1.7
|
| Swiss Franc
| 1.3
|
| South Korean Won
| 1.0
|
| New Taiwan Dollar
| 0.7
|
| Canadian Dollar
| 0.6
|
| Australian Dollar
| 0.5
|
| Hong Kong Dollar
| 0.4
|
| Danish Krone
| 0.4
|
| Total
| 100.0%
|
Valuation Inputs
A summary of the inputs
used to value the Fund’s investments as of March 31, 2023 is as follows (see Note 2A - Portfolio Valuation in the Notes to Financial Statements):
|
| Total
Value at
3/31/2023
| Level 1
Quoted
Prices
| Level 2
Significant
Observable
Inputs
| Level 3
Significant
Unobservable
Inputs
|
| Common Stocks:
|
|
|
|
|
Aerospace & Defense
| $ 14,443,224
| $ 5,609,887
| $ 8,833,337
| $ —
|
Automobile Components
| 20,276,534
| 14,118,744
| 6,157,790
| —
|
Consumer Staples Distribution & Retail
| 858,538
| —
| 858,538
| —
|
Electrical Equipment
| 8,352,488
| 2,495,127
| 5,857,361
| —
|
Electronic Equipment, Instruments & Components
| 31,724,330
| 10,932,635
| 20,791,695
| —
|
Household Durables
| 938,159
| —
| 938,159
| —
|
Industrial Conglomerates
| 909,652
| —
| 909,652
| —
|
Interactive Media & Services
| 4,620,150
| 1,936,390
| 2,683,760
| —
|
IT Services
| 6,572,317
| 1,802,561
| 4,769,756
| —
|
Life Sciences Tools & Services
| 6,911,834
| 5,191,214
| 1,720,620
| —
|
Machinery
| 26,049,207
| 7,501,305
| 18,547,902
| —
|
Semiconductors & Semiconductor Equipment
| 19,603,892
| 17,819,856
| 1,784,036
| —
|
Software
| 78,696,470
| 68,530,009
| 10,166,461
| —
|
Technology Hardware, Storage & Peripherals
| 1,825,984
| —
| 1,825,984
| —
|
Wireless Telecommunication Services
| 837,378
| —
| 837,378
| —
|
Other Industry Categories*
| 16,544,701
| 16,544,701
| —
| —
|
Real Estate Investment Trusts*
| 902,021
| 902,021
| —
| —
|
Money Market Funds
| 15,059,617
| 15,059,617
| —
| —
|
Repurchase Agreements
| 2,424,298
| —
| 2,424,298
| —
|
Total Investments
| $ 257,550,794
| $ 168,444,067
| $ 89,106,727
| $—
|
| *
| See Portfolio of Investments for industry breakout.
|
See Notes to Financial Statements
Page 77
First Trust International Developed
Capital Strength ETF (FICS)
Portfolio of Investments
March 31, 2023
(Unaudited)
| Shares
|
| Description
|
| Value
|
| COMMON STOCKS – 99.3%
|
|
|
| Air Freight & Logistics – 1.9%
|
|
|
| 49,300
|
| SG Holdings Co., Ltd. (a)
|
| $731,028
|
|
|
| Automobiles – 2.2%
|
|
|
| 13,817
|
| Kia Corp. (a)
|
| 862,293
|
|
|
| Banks – 1.6%
|
|
|
| 10,381
|
| Toronto-Dominion Bank (The)
|
| 621,785
|
|
|
| Beverages – 4.3%
|
|
|
| 5,619
|
| Carlsberg A.S., Class B (a)
|
| 871,883
|
| 7,725
|
| Heineken N.V. (a)
|
| 830,058
|
|
|
|
|
| 1,701,941
|
|
|
| Biotechnology – 1.9%
|
|
|
| 3,824
|
| CSL Ltd. (a)
|
| 740,596
|
|
|
| Capital Markets – 6.3%
|
|
|
| 4,132
|
| Deutsche Boerse AG (a)
|
| 804,543
|
| 20,312
|
| Hong Kong Exchanges & Clearing Ltd. (a)
|
| 900,324
|
| 49,900
|
| Japan Exchange Group, Inc. (a)
|
| 763,164
|
|
|
|
|
| 2,468,031
|
|
|
| Chemicals – 4.6%
|
|
|
| 8,921
|
| Croda International PLC (a)
|
| 717,012
|
| 33,500
|
| Shin-Etsu Chemical Co., Ltd. (a)
|
| 1,087,445
|
|
|
|
|
| 1,804,457
|
|
|
| Consumer Staples
Distribution & Retail – 2.0%
|
|
|
| 15,396
|
| Alimentation Couche-Tard, Inc.
|
| 774,072
|
|
|
| Electrical Equipment – 4.3%
|
|
|
| 24,398
|
| ABB Ltd. (a)
|
| 839,328
|
| 9,195
|
| Legrand S.A. (a)
|
| 840,169
|
|
|
|
|
| 1,679,497
|
|
|
| Electronic Equipment,
Instruments & Components – 2.1%
|
|
|
| 15,100
|
| Hamamatsu Photonics K.K. (a)
|
| 814,521
|
|
|
| Entertainment – 1.6%
|
|
|
| 16,100
|
| Nintendo Co., Ltd. (a)
|
| 625,350
|
|
|
| Food Products – 3.8%
|
|
|
| 355
|
| Barry Callebaut AG (a)
|
| 752,163
|
| 6,180
|
| Nestle S.A. (a)
|
| 753,531
|
|
|
|
|
| 1,505,694
|
|
|
| Ground Transportation – 1.7%
|
|
|
| 5,821
|
| Canadian National Railway Co.
|
| 686,848
|
|
|
| Health Care Providers &
Services – 2.0%
|
|
|
| 33,953
|
| Sonic Healthcare Ltd. (a)
|
| 795,959
|
| Shares
|
| Description
|
| Value
|
|
|
|
|
| Hotels, Restaurants &
Leisure – 4.0%
|
|
|
| 29,676
|
| Aristocrat Leisure Ltd. (a)
|
| $741,974
|
| 32,225
|
| Compass Group PLC (a)
|
| 809,865
|
|
|
|
|
| 1,551,839
|
|
|
| Household Products – 1.9%
|
|
|
| 9,804
|
| Reckitt Benckiser Group PLC (a)
|
| 745,864
|
|
|
| Industrial Conglomerates – 1.6%
|
|
|
| 18,200
|
| Toshiba Corp. (a)
|
| 611,148
|
|
|
| Insurance – 7.3%
|
|
|
| 4,656
|
| Intact Financial Corp.
|
| 666,344
|
| 14,599
|
| Sampo Oyj, Class A (a)
|
| 688,856
|
| 15,903
|
| Sun Life Financial, Inc.
|
| 742,964
|
| 1,601
|
| Zurich Insurance Group AG (a)
|
| 767,197
|
|
|
|
|
| 2,865,361
|
|
|
| IT Services – 5.6%
|
|
|
| 8,600
|
| CGI, Inc. (b)
|
| 828,820
|
| 27,600
|
| Nomura Research Institute Ltd. (a)
|
| 645,501
|
| 4,700
|
| Obic Co., Ltd. (a)
|
| 744,449
|
|
|
|
|
| 2,218,770
|
|
|
| Leisure Products – 1.6%
|
|
|
| 30,000
|
| Bandai Namco Holdings, Inc. (a)
|
| 646,774
|
|
|
| Machinery – 2.3%
|
|
|
| 4,123
|
| Schindler Holding AG (a)
|
| 913,565
|
|
|
| Personal Care Products – 4.4%
|
|
|
| 2,147
|
| L’Oreal S.A. (a)
|
| 959,371
|
| 14,869
|
| Unilever PLC (a)
|
| 770,497
|
|
|
|
|
| 1,729,868
|
|
|
| Pharmaceuticals – 7.2%
|
|
|
| 27,324
|
| Chugai Pharmaceutical Co., Ltd. (a)
|
| 674,701
|
| 4,130
|
| Merck KGaA (a)
|
| 769,976
|
| 8,594
|
| Novartis AG (a)
|
| 789,089
|
| 2,028
|
| Roche Holding AG (a)
|
| 579,486
|
|
|
|
|
| 2,813,252
|
|
|
| Professional Services – 5.9%
|
|
|
| 27,644
|
| Bureau Veritas S.A. (a)
|
| 794,281
|
| 306
|
| SGS S.A. (a)
|
| 674,959
|
| 6,628
|
| Wolters Kluwer N.V. (a)
|
| 836,696
|
|
|
|
|
| 2,305,936
|
|
|
| Real Estate Management &
Development – 1.7%
|
|
|
| 6,900
|
| Daito Trust Construction Co., Ltd. (a)
|
| 687,446
|
|
|
| Software – 4.3%
|
|
|
| 480
|
| Constellation Software, Inc.
|
| 902,432
|
Page 78
See Notes to Financial
Statements
First Trust International Developed
Capital Strength ETF (FICS)
Portfolio of Investments
(Continued)
March 31, 2023
(Unaudited)
| Shares
|
| Description
|
| Value
|
| COMMON STOCKS (Continued)
|
|
|
| Software (Continued)
|
|
|
| 82,177
|
| Sage Group (The) PLC (a)
|
| $788,607
|
|
|
|
|
| 1,691,039
|
|
|
| Technology Hardware,
Storage & Peripherals – 2.1%
|
|
|
| 16,820
|
| Samsung Electronics Co., Ltd. (a)
|
| 831,765
|
|
|
| Textiles, Apparel & Luxury
Goods – 4.9%
|
|
|
| 1,469
|
| Kering S.A. (a)
|
| 958,417
|
| 1,051
|
| LVMH Moet Hennessy Louis Vuitton SE (a)
|
| 964,722
|
|
|
|
|
| 1,923,139
|
|
|
| Trading Companies &
Distributors – 4.2%
|
|
|
| 11,297
|
| Brenntag SE (a)
|
| 850,169
|
| 21,655
|
| Bunzl PLC (a)
|
| 817,966
|
|
|
|
|
| 1,668,135
|
|
|
| Total Investments – 99.3%
|
| 39,015,973
|
|
|
| (Cost $36,602,054)
|
|
|
|
|
| Net Other Assets and Liabilities – 0.7%
|
| 260,905
|
|
|
| Net Assets – 100.0%
|
| $39,276,878
|
| (a)
| This security is fair valued by the Advisor’s Pricing Committee in accordance with procedures approved by the Trust’s Board of Trustees and in accordance with provisions
of the Investment Company Act of 1940 and rules thereunder, as amended. At March 31, 2023, securities noted as such are valued at $33,792,708 or 86.0% of net assets. Certain of these securities are fair valued using a
factor provided by a third-party pricing service due to the change in value between the foreign markets’ close and the New York Stock Exchange close exceeding a certain threshold. On days when this threshold is
not exceeded, these securities are typically valued at the last sale price on the exchange on which they are principally traded.
|
| (b)
| Non-income producing security.
|
Currency Exposure
Diversification
| % of Total
Investments
|
| Euro
| 23.8%
|
| Japanese Yen
| 20.6
|
| Swiss Franc
| 15.6
|
| Canadian Dollar
| 13.4
|
| British Pound Sterling
| 11.9
|
| Australian Dollar
| 5.8
|
| South Korean Won
| 4.4
|
| Hong Kong Dollar
| 2.3
|
| Danish Krone
| 2.2
|
| Total
| 100.0%
|
Valuation Inputs
A summary of the inputs
used to value the Fund’s investments as of March 31, 2023 is as follows (see Note 2A - Portfolio Valuation in the Notes to Financial Statements):
|
| Total
Value at
3/31/2023
| Level 1
Quoted
Prices
| Level 2
Significant
Observable
Inputs
| Level 3
Significant
Unobservable
Inputs
|
| Common Stocks:
|
|
|
|
|
| Banks
| $ 621,785
| $ 621,785
| $ —
| $ —
|
| Consumer Staples Distribution & Retail
| 774,072
| 774,072
| —
| —
|
| Ground Transportation
| 686,848
| 686,848
| —
| —
|
| Insurance
| 2,865,361
| 1,409,308
| 1,456,053
| —
|
| IT Services
| 2,218,770
| 828,820
| 1,389,950
| —
|
| Software
| 1,691,039
| 902,432
| 788,607
| —
|
| Other Industry Categories*
| 30,158,098
| —
| 30,158,098
| —
|
| Total Investments
| $ 39,015,973
| $ 5,223,265
| $ 33,792,708
| $—
|
| *
| See Portfolio of Investments for industry breakout.
|
See Notes to Financial
Statements
Page 79
First Trust Exchange-Traded Fund VI
Statements of Assets and
Liabilities
March 31, 2023
(Unaudited)
|
| First Trust
NASDAQ
Technology
Dividend
Index
Fund
(TDIV)
|
| Multi-Asset
Diversified
Income
Index
Fund
(MDIV)
|
| First Trust
S&P
International
Dividend
Aristocrats
ETF
(FID)
|
| First Trust
BuyWrite
Income
ETF
(FTHI)
|
| ASSETS:
|
|
|
|
|
|
|
|
Investments, at value - Unaffiliated
| $ 1,730,524,216
|
| $ 339,325,113
|
| $ 75,989,496
|
| $ 159,251,114
|
Investments, at value - Affiliated
| —
|
| 90,848,618
|
| —
|
| —
|
Total investments, at value
| 1,730,524,216
|
| 430,173,731
|
| 75,989,496
|
| 159,251,114
|
Cash
| 1,332,118
|
| 1,041,106
|
| 1,064,775
|
| 2,751,086
|
Foreign currency
| —
|
| —
|
| 32,067
|
| 253
|
| Receivables:
|
|
|
|
|
|
|
|
Fund shares sold
| 13,361,613
|
| 2,178,150
|
| —
|
| 2,014,403
|
Dividends
| 2,371,637
|
| 1,940,155
|
| 618,658
|
| 181,120
|
Dividend reclaims
| 226,146
|
| —
|
| 141,676
|
| 5,692
|
Investment securities sold
| —
|
| —
|
| 946,115
|
| —
|
Securities lending income
| —
|
| —
|
| —
|
| —
|
Total Assets
| 1,747,815,730
|
| 435,333,142
|
| 78,792,787
|
| 164,203,668
|
| LIABILITIES:
|
|
|
|
|
|
|
|
Options written, at value
| —
|
| —
|
| —
|
| 4,422,467
|
Due to custodian
| —
|
| —
|
| —
|
| —
|
Due to broker
| —
|
| —
|
| —
|
| 28,328
|
| Payables:
|
|
|
|
|
|
|
|
Investment securities purchased
| 13,340,384
|
| 2,163,304
|
| 978,998
|
| 2,035,085
|
Investment advisory fees
| 686,849
|
| 175,926
|
| 38,495
|
| 104,522
|
Deferred foreign capital gains tax
| —
|
| —
|
| —
|
| —
|
Fund shares redeemed
| —
|
| —
|
| —
|
| —
|
Collateral for securities on loan
| —
|
| —
|
| —
|
| —
|
Total Liabilities
| 14,027,233
|
| 2,339,230
|
| 1,017,493
|
| 6,590,402
|
NET ASSETS
| $1,733,788,497
|
| $432,993,912
|
| $77,775,294
|
| $157,613,266
|
| NET ASSETS consist of:
|
|
|
|
|
|
|
|
Paid-in capital
| $ 1,808,474,684
|
| $ 703,963,677
|
| $ 88,226,203
|
| $ 176,358,938
|
Par value
| 320,550
|
| 296,000
|
| 49,500
|
| 78,242
|
Accumulated distributable earnings (loss)
| (75,006,737)
|
| (271,265,765)
|
| (10,500,409)
|
| (18,823,914)
|
NET ASSETS
| $1,733,788,497
|
| $432,993,912
|
| $77,775,294
|
| $157,613,266
|
NET ASSET VALUE, per share
| $54.09
|
| $14.63
|
| $15.71
|
| $20.14
|
Number of shares outstanding (unlimited number of shares authorized, par value $0.01 per share)
| 32,055,000
|
| 29,600,002
|
| 4,950,002
|
| 7,824,201
|
Investments, at cost - Unaffiliated
| $1,551,683,672
|
| $336,574,316
|
| $79,899,738
|
| $155,640,934
|
Investments, at cost - Affiliated
| $—
|
| $108,928,601
|
| $—
|
| $—
|
Total investments, at cost
| $1,551,683,672
|
| $445,502,917
|
| $79,899,738
|
| $155,640,934
|
Foreign currency, at cost (proceeds)
| $—
|
| $—
|
| $32,024
|
| $262
|
Securities on loan, at value
| $—
|
| $—
|
| $—
|
| $—
|
Premiums received on options written
| $—
|
| $—
|
| $—
|
| $2,341,683
|
Page 80
See Notes to Financial Statements
First Trust
Nasdaq
BuyWrite
Income
ETF
(FTQI)
|
| First Trust
Rising
Dividend
Achievers
ETF
(RDVY)
|
| First Trust
Dorsey
Wright
Focus 5
ETF
(FV)
|
| First Trust
RBA American
Industrial
Renaissance®
ETF
(AIRR)
|
| First Trust
Dorsey Wright
Momentum &
Dividend ETF
(DDIV)
|
| First Trust
Dorsey
Wright
International
Focus 5
ETF
(IFV)
|
|
|
|
|
|
|
|
|
|
|
|
|
| $ 31,288,415
|
| $ 7,794,833,802
|
| $—
|
| $ 316,289,002
|
| $ 51,027,070
|
| $—
|
| —
|
| —
|
| 3,195,697,376
|
| —
|
| —
|
| 218,062,974
|
| 31,288,415
|
| 7,794,833,802
|
| 3,195,697,376
|
| 316,289,002
|
| 51,027,070
|
| 218,062,974
|
| 380,240
|
| 7,261,140
|
| 3,119,296
|
| 760,206
|
| 82,335
|
| —
|
| —
|
| —
|
| —
|
| —
|
| —
|
| —
|
|
|
|
|
|
|
|
|
|
|
|
|
| —
|
| —
|
| 2,255,856
|
| —
|
| —
|
| 1,707,738
|
| 6,454
|
| 8,502,383
|
| 5,377,064
|
| 99,935
|
| 238,116
|
| 295,828
|
| 1,189
|
| —
|
| —
|
| —
|
| 3,076
|
| —
|
| —
|
| 8,868,323
|
| —
|
| —
|
| 1,379,259
|
| —
|
| —
|
| —
|
| —
|
| —
|
| —
|
| —
|
| 31,676,298
|
| 7,819,465,648
|
| 3,206,449,592
|
| 317,149,143
|
| 52,729,856
|
| 220,066,540
|
|
|
|
|
|
|
|
|
|
|
|
|
| 1,582,257
|
| —
|
| —
|
| —
|
| —
|
| —
|
| —
|
| —
|
| —
|
| —
|
| —
|
| 121,999
|
| 754
|
| —
|
| —
|
| —
|
| —
|
| —
|
|
|
|
|
|
|
|
|
|
|
|
|
| —
|
| —
|
| 2,250,529
|
| —
|
| —
|
| 1,706,727
|
| 20,788
|
| 3,214,496
|
| 806,962
|
| 173,529
|
| 26,970
|
| 53,551
|
| —
|
| —
|
| —
|
| —
|
| —
|
| —
|
| —
|
| 8,879,842
|
| —
|
| —
|
| 1,386,906
|
| —
|
| —
|
| —
|
| —
|
| 89,022
|
| —
|
| —
|
| 1,603,799
|
| 12,094,338
|
| 3,057,491
|
| 262,551
|
| 1,413,876
|
| 1,882,277
|
| $ 30,072,499
|
| $ 7,807,371,310
|
| $ 3,203,392,101
|
| $ 316,886,592
|
| $ 51,315,980
|
| $ 218,184,263
|
|
|
|
|
|
|
|
|
|
|
|
|
| $ 32,509,955
|
| $ 8,619,244,207
|
| $ 3,743,756,540
|
| $ 327,236,715
|
| $ 81,884,477
|
| $ 375,253,464
|
| 15,500
|
| 1,739,500
|
| 710,000
|
| 66,000
|
| 18,500
|
| 127,000
|
| (2,452,956)
|
| (813,612,397)
|
| (541,074,439)
|
| (10,416,123)
|
| (30,586,997)
|
| (157,196,201)
|
| $ 30,072,499
|
| $ 7,807,371,310
|
| $ 3,203,392,101
|
| $ 316,886,592
|
| $ 51,315,980
|
| $ 218,184,263
|
| $19.40
|
| $44.88
|
| $45.12
|
| $48.01
|
| $27.74
|
| $17.18
|
| 1,550,002
|
| 173,950,002
|
| 71,000,002
|
| 6,600,002
|
| 1,850,002
|
| 12,700,002
|
| $29,440,177
|
| $7,780,351,561
|
| $—
|
| $291,925,660
|
| $53,628,230
|
| $—
|
| $—
|
| $—
|
| $3,145,616,040
|
| $—
|
| $—
|
| $215,343,107
|
| $29,440,177
|
| $7,780,351,561
|
| $3,145,616,040
|
| $291,925,660
|
| $53,628,230
|
| $215,343,107
|
| $—
|
| $—
|
| $—
|
| $—
|
| $—
|
| $—
|
| $—
|
| $—
|
| $—
|
| $86,469
|
| $—
|
| $—
|
| $759,410
|
| $—
|
| $—
|
| $—
|
| $—
|
| $—
|
See Notes to Financial
Statements
Page 81
First Trust Exchange-Traded Fund VI
Statements of Assets and
Liabilities (Continued)
March 31, 2023
(Unaudited)
|
| First Trust
Dorsey
Wright
Dynamic
Focus 5
ETF
(FVC)
|
| First Trust
Indxx
Innovative
Transaction &
Process
ETF
(LEGR)
|
| First Trust
Nasdaq
Artificial
Intelligence
and Robotics
ETF
(ROBT)
|
| First Trust
International
Developed
Capital
Strength
ETF
(FICS)
|
| ASSETS:
|
|
|
|
|
|
|
|
Investments, at value - Unaffiliated
| $—
|
| $ 118,977,519
|
| $ 257,550,794
|
| $ 39,015,973
|
Investments, at value - Affiliated
| 252,978,447
|
| —
|
| —
|
| —
|
Total investments, at value
| 252,978,447
|
| 118,977,519
|
| 257,550,794
|
| 39,015,973
|
Cash
| —
|
| 57,605
|
| 243,571
|
| 14,238
|
Foreign currency
| —
|
| 322,349
|
| 406
|
| 11,698
|
| Receivables:
|
|
|
|
|
|
|
|
Fund shares sold
| —
|
| —
|
| —
|
| —
|
Dividends
| 737,756
|
| 285,355
|
| 336,614
|
| 158,159
|
Dividend reclaims
| —
|
| 283,301
|
| 110,609
|
| 83,645
|
Investment securities sold
| 1,642,727
|
| —
|
| —
|
| 15,583
|
Securities lending income
| —
|
| 754
|
| 54,291
|
| —
|
Total Assets
| 255,358,930
|
| 119,926,883
|
| 258,296,285
|
| 39,299,296
|
| LIABILITIES:
|
|
|
|
|
|
|
|
Options written, at value
| —
|
| —
|
| —
|
| —
|
Due to custodian
| 98,372
|
| —
|
| —
|
| —
|
Due to broker
| —
|
| —
|
| —
|
| —
|
| Payables:
|
|
|
|
|
|
|
|
Investment securities purchased
| —
|
| —
|
| —
|
| —
|
Investment advisory fees
| 68,398
|
| 60,651
|
| 122,049
|
| 22,418
|
Deferred foreign capital gains tax
| —
|
| 3,762
|
| —
|
| —
|
Fund shares redeemed
| 1,646,309
|
| —
|
| —
|
| —
|
Collateral for securities on loan
| —
|
| 2,090,750
|
| 17,483,915
|
| —
|
Total Liabilities
| 1,813,079
|
| 2,155,163
|
| 17,605,964
|
| 22,418
|
NET ASSETS
| $253,545,851
|
| $117,771,720
|
| $240,690,321
|
| $39,276,878
|
| NET ASSETS consist of:
|
|
|
|
|
|
|
|
Paid-in capital
| $ 329,965,555
|
| $ 126,301,150
|
| $ 294,295,947
|
| $ 40,785,599
|
Par value
| 77,000
|
| 31,500
|
| 56,500
|
| 12,500
|
Accumulated distributable earnings (loss)
| (76,496,704)
|
| (8,560,930)
|
| (53,662,126)
|
| (1,521,221)
|
NET ASSETS
| $253,545,851
|
| $117,771,720
|
| $240,690,321
|
| $39,276,878
|
NET ASSET VALUE, per share
| $32.93
|
| $37.39
|
| $42.60
|
| $31.42
|
Number of shares outstanding (unlimited number of shares authorized, par value $0.01 per share)
| 7,700,002
|
| 3,150,002
|
| 5,650,002
|
| 1,250,002
|
Investments, at cost - Unaffiliated
| $—
|
| $123,841,518
|
| $266,958,233
|
| $36,602,054
|
Investments, at cost - Affiliated
| $248,306,884
|
| $—
|
| $—
|
| $—
|
Total investments, at cost
| $248,306,884
|
| $123,841,518
|
| $266,958,233
|
| $36,602,054
|
Foreign currency, at cost (proceeds)
| $—
|
| $322,986
|
| $406
|
| $11,689
|
Securities on loan, at value
| $—
|
| $2,012,799
|
| $18,124,198
|
| $—
|
Premiums received on options written
| $—
|
| $—
|
| $—
|
| $—
|
Page 82
See Notes to Financial Statements
This page intentionally
left blank
First Trust Exchange-Traded Fund VI
Statements of Operations
For the Six Months Ended
March 31, 2023 (Unaudited)
|
| First Trust
NASDAQ
Technology
Dividend
Index
Fund
(TDIV)
|
| Multi-Asset
Diversified
Income
Index
Fund
(MDIV)
|
| First Trust
S&P
International
Dividend
Aristocrats
ETF
(FID)
|
| First Trust
BuyWrite
Income
ETF
(FTHI)
|
| INVESTMENT INCOME:
|
|
|
|
|
|
|
|
Dividends - Unaffiliated
| $ 21,961,141
|
| $ 11,873,159
|
| $ 1,470,048
|
| $ 1,360,331
|
Dividends - Affiliated
| —
|
| 2,913,727
|
| —
|
| —
|
Interest
| 49,633
|
| 37,584
|
| —
|
| 22,062
|
Securities lending income (net of fees)
| —
|
| —
|
| —
|
| —
|
Foreign withholding tax
| (561,726)
|
| —
|
| (138,361)
|
| (5,818)
|
Other
| 9
|
| 46
|
| 48
|
| 6
|
Total investment income
| 21,449,057
|
| 14,824,516
|
| 1,331,735
|
| 1,376,581
|
| EXPENSES:
|
|
|
|
|
|
|
|
Investment advisory fees
| 3,943,985
|
| 1,374,798
|
| 175,890
|
| 467,862
|
Total expenses
| 3,943,985
|
| 1,374,798
|
| 175,890
|
| 467,862
|
Fees waived by the investment advisor
| —
|
| (275,752)
|
| —
|
| —
|
Net expenses
| 3,943,985
|
| 1,099,046
|
| 175,890
|
| 467,862
|
NET INVESTMENT INCOME (LOSS)
| 17,505,072
|
| 13,725,470
|
| 1,155,845
|
| 908,719
|
| NET REALIZED AND UNREALIZED GAIN (LOSS):
|
|
|
|
|
|
|
|
| Net realized gain (loss) on:
|
|
|
|
|
|
|
|
Investments - Unaffiliated
| (40,328,996)
|
| (24,166,400)
|
| (1,254,384)
|
| (3,458,595)
|
Investments - Affiliated
| —
|
| (629,431)
|
| —
|
| —
|
In-kind redemptions - Unaffiliated
| 23,134,223
|
| 3,214,374
|
| —
|
| 3,095,812
|
In-kind redemptions - Affiliated
| —
|
| (130,228)
|
| —
|
| —
|
Written options contracts
| —
|
| —
|
| —
|
| 4,415,128
|
Foreign currency transactions
| —
|
| —
|
| 22,579
|
| —
|
Foreign capital gains tax
| —
|
| —
|
| —
|
| —
|
Net realized gain (loss)
| (17,194,773)
|
| (21,711,685)
|
| (1,231,805)
|
| 4,052,345
|
| Net change in unrealized appreciation (depreciation) on:
|
|
|
|
|
|
|
|
Investments - Unaffiliated
| 353,607,039
|
| 25,821,880
|
| 7,079,679
|
| 12,462,514
|
Investments - Affiliated
| —
|
| 4,062,108
|
| —
|
| —
|
Written options contracts
| —
|
| —
|
| —
|
| (3,912,849)
|
Foreign currency translation
| —
|
| —
|
| 18,307
|
| 6
|
Deferred foreign capital gains tax
| —
|
| —
|
| —
|
| —
|
Net change in unrealized appreciation (depreciation)
| 353,607,039
|
| 29,883,988
|
| 7,097,986
|
| 8,549,671
|
NET REALIZED AND UNREALIZED GAIN (LOSS)
| 336,412,266
|
| 8,172,303
|
| 5,866,181
|
| 12,602,016
|
NET INCREASE (DECREASE) IN NET ASSETS RESULTING FROM OPERATIONS
| $ 353,917,338
|
| $ 21,897,773
|
| $ 7,022,026
|
| $ 13,510,735
|
Page 84
See Notes to Financial Statements
|
| First Trust
Nasdaq
BuyWrite
Income
ETF
(FTQI)
|
| First Trust
Rising
Dividend
Achievers
ETF
(RDVY)
|
| First Trust
Dorsey
Wright
Focus 5
ETF
(FV)
|
| First Trust
RBA American
Industrial
Renaissance®
ETF
(AIRR)
|
| First Trust
Dorsey Wright
Momentum &
Dividend ETF
(DDIV)
|
| First Trust
Dorsey
Wright
International
Focus 5
ETF
(IFV)
|
| First Trust
Dorsey
Wright
Dynamic
Focus 5
ETF
(FVC)
|
|
|
|
|
|
|
|
|
|
|
|
|
|
|
|
|
| $175,618
|
| $113,009,751
|
| $—
|
| $1,122,194
|
| $1,805,309
|
| $—
|
| $—
|
|
| —
|
| —
|
| 28,739,748
|
| —
|
| —
|
| 2,357,124
|
| 3,728,306
|
|
| 10,513
|
| 245,230
|
| 154,882
|
| 6,322
|
| 2,714
|
| 25,244
|
| 26,703
|
|
| —
|
| —
|
| —
|
| —
|
| —
|
| —
|
| —
|
|
| (112)
|
| —
|
| —
|
| —
|
| —
|
| —
|
| —
|
|
| —
|
| 23
|
| —
|
| 19
|
| —
|
| —
|
| —
|
|
| 186,019
|
| 113,255,004
|
| 28,894,630
|
| 1,128,535
|
| 1,808,023
|
| 2,382,368
|
| 3,755,009
|
|
|
|
|
|
|
|
|
|
|
|
|
|
|
|
|
| 124,682
|
| 19,561,079
|
| 4,681,400
|
| 823,462
|
| 192,761
|
| 263,580
|
| 398,886
|
|
| 124,682
|
| 19,561,079
|
| 4,681,400
|
| 823,462
|
| 192,761
|
| 263,580
|
| 398,886
|
|
| —
|
| —
|
| —
|
| —
|
| —
|
| —
|
| —
|
|
| 124,682
|
| 19,561,079
|
| 4,681,400
|
| 823,462
|
| 192,761
|
| 263,580
|
| 398,886
|
|
| 61,337
|
| 93,693,925
|
| 24,213,230
|
| 305,073
|
| 1,615,262
|
| 2,118,788
|
| 3,356,123
|
|
|
|
|
|
|
|
|
|
|
|
|
|
|
|
|
|
|
|
|
|
|
|
|
|
|
|
|
|
|
|
| (334,225)
|
| (658,005,171)
|
| —
|
| (7,589,382)
|
| (5,481,184)
|
| —
|
| —
|
|
| —
|
| —
|
| (21,652,736)
|
| —
|
| —
|
| (15,581,420)
|
| (22,323,635)
|
|
| 512,292
|
| 72,177,998
|
| —
|
| 8,751,368
|
| 703,156
|
| —
|
| —
|
|
| —
|
| —
|
| 13,608,990
|
| —
|
| —
|
| 406,145
|
| 2,898,829
|
|
| 535,854
|
| —
|
| —
|
| —
|
| —
|
| —
|
| —
|
|
| —
|
| —
|
| —
|
| —
|
| —
|
| —
|
| —
|
|
| —
|
| —
|
| —
|
| —
|
| —
|
| —
|
| —
|
|
| 713,921
|
| (585,827,173)
|
| (8,043,746)
|
| 1,161,986
|
| (4,778,028)
|
| (15,175,275)
|
| (19,424,806)
|
|
|
|
|
|
|
|
|
|
|
|
|
|
|
|
|
| 4,401,763
|
| 1,714,590,143
|
| —
|
| 43,828,362
|
| 8,054,055
|
| —
|
| —
|
|
| —
|
| —
|
| 249,042,763
|
| —
|
| —
|
| 24,917,948
|
| 13,573,013
|
|
| (1,203,844)
|
| —
|
| —
|
| —
|
| —
|
| —
|
| —
|
|
| —
|
| —
|
| —
|
| —
|
| —
|
| —
|
| —
|
|
| —
|
| —
|
| —
|
| —
|
| —
|
| —
|
| —
|
|
| 3,197,919
|
| 1,714,590,143
|
| 249,042,763
|
| 43,828,362
|
| 8,054,055
|
| 24,917,948
|
| 13,573,013
|
|
| 3,911,840
|
| 1,128,762,970
|
| 240,999,017
|
| 44,990,348
|
| 3,276,027
|
| 9,742,673
|
| (5,851,793)
|
|
| $3,973,177
|
| $1,222,456,895
|
| $265,212,247
|
| $45,295,421
|
| $4,891,289
|
| $11,861,461
|
| $(2,495,670)
|
See Notes to Financial
Statements
Page 85
First Trust Exchange-Traded Fund VI
Statements of Operations
(Continued)
For the Six Months Ended
March 31, 2023 (Unaudited)
|
| First Trust
Indxx
Innovative
Transaction &
Process
ETF
(LEGR)
|
| First Trust
Nasdaq
Artificial
Intelligence
and Robotics
ETF
(ROBT)
|
| First Trust
International
Developed
Capital
Strength
ETF
(FICS)
|
| INVESTMENT INCOME:
|
|
|
|
|
|
Dividends - Unaffiliated
| $ 1,546,540
|
| $ 758,603
|
| $ 428,556
|
Dividends - Affiliated
| —
|
| —
|
| —
|
Interest
| 2,873
|
| 9,635
|
| —
|
Securities lending income (net of fees)
| 3,247
|
| 161,619
|
| —
|
Foreign withholding tax
| (128,774)
|
| (67,317)
|
| (50,255)
|
Other
| 26
|
| 562
|
| 193
|
Total investment income
| 1,423,912
|
| 863,102
|
| 378,494
|
| EXPENSES:
|
|
|
|
|
|
Investment advisory fees
| 359,494
|
| 626,486
|
| 106,330
|
Total expenses
| 359,494
|
| 626,486
|
| 106,330
|
Fees waived by the investment advisor
| —
|
| —
|
| —
|
Net expenses
| 359,494
|
| 626,486
|
| 106,330
|
NET INVESTMENT INCOME (LOSS)
| 1,064,418
|
| 236,616
|
| 272,164
|
| NET REALIZED AND UNREALIZED GAIN (LOSS):
|
|
|
|
|
|
| Net realized gain (loss) on:
|
|
|
|
|
|
Investments - Unaffiliated
| (795,393)
|
| (18,309,058)
|
| (2,901,534)
|
Investments - Affiliated
| —
|
| —
|
| —
|
In-kind redemptions - Unaffiliated
| 2,974,908
|
| 1,586,411
|
| 5,283
|
In-kind redemptions - Affiliated
| —
|
| —
|
| —
|
Written options contracts
| —
|
| —
|
| —
|
Foreign currency transactions
| 10,359
|
| 8,720
|
| 33,343
|
Foreign capital gains tax
| (11,508)
|
| —
|
| —
|
Net realized gain (loss)
| 2,178,366
|
| (16,713,927)
|
| (2,862,908)
|
| Net change in unrealized appreciation (depreciation) on:
|
|
|
|
|
|
Investments - Unaffiliated
| 20,748,849
|
| 62,053,738
|
| 8,073,886
|
Investments - Affiliated
| —
|
| —
|
| —
|
Written options contracts
| —
|
| —
|
| —
|
Foreign currency translation
| 18,762
|
| 8,957
|
| 5,081
|
Deferred foreign capital gains tax
| (20,645)
|
| —
|
| —
|
Net change in unrealized appreciation (depreciation)
| 20,746,966
|
| 62,062,695
|
| 8,078,967
|
NET REALIZED AND UNREALIZED GAIN (LOSS)
| 22,925,332
|
| 45,348,768
|
| 5,216,059
|
NET INCREASE (DECREASE) IN NET ASSETS RESULTING FROM OPERATIONS
| $ 23,989,750
|
| $ 45,585,384
|
| $ 5,488,223
|
Page 86
See Notes to Financial Statements
This page intentionally
left blank
First Trust Exchange-Traded Fund VI
Statements of Changes in
Net Assets
|
| First Trust NASDAQ Technology
Dividend Index Fund (TDIV)
|
| Multi-Asset Diversified
Income Index Fund (MDIV)
|
|
| Six Months
Ended
3/31/2023
(Unaudited)
|
| Year
Ended
9/30/2022
|
| Six Months
Ended
3/31/2023
(Unaudited)
|
| Year
Ended
9/30/2022
|
| OPERATIONS:
|
|
|
|
|
|
|
|
Net investment income (loss)
| $ 17,505,072
|
| $ 39,013,530
|
| $ 13,725,470
|
| $ 21,144,380
|
Net realized gain (loss)
| (17,194,773)
|
| 77,346,934
|
| (21,711,685)
|
| 9,377,860
|
Net increase from payment by the advisor
| —
|
| —
|
| —
|
| —
|
Net change in unrealized appreciation (depreciation)
| 353,607,039
|
| (504,758,535)
|
| 29,883,988
|
| (63,041,345)
|
Net increase (decrease) in net assets resulting from operations
| 353,917,338
|
| (388,398,071)
|
| 21,897,773
|
| (32,519,105)
|
| DISTRIBUTIONS TO SHAREHOLDERS FROM:
|
|
|
|
|
|
|
|
Investment operations
| (19,254,180)
|
| (37,869,712)
|
| (15,875,406)
|
| (28,972,326)
|
Return of capital
| —
|
| —
|
| —
|
| (634,126)
|
Total distributions to shareholders
| (19,254,180)
|
| (37,869,712)
|
| (15,875,406)
|
| (29,606,452)
|
| SHAREHOLDER TRANSACTIONS:
|
|
|
|
|
|
|
|
Proceeds from shares sold
| 57,201,416
|
| 585,823,081
|
| 37,930,273
|
| 136,630,172
|
Cost of shares redeemed
| (88,687,034)
|
| (342,711,470)
|
| (57,059,672)
|
| (98,607,101)
|
Net increase (decrease) in net assets resulting from shareholder transactions
| (31,485,618)
|
| 243,111,611
|
| (19,129,399)
|
| 38,023,071
|
Total increase (decrease) in net assets
| 303,177,540
|
| (183,156,172)
|
| (13,107,032)
|
| (24,102,486)
|
| NET ASSETS:
|
|
|
|
|
|
|
|
Beginning of period
| 1,430,610,957
|
| 1,613,767,129
|
| 446,100,944
|
| 470,203,430
|
End of period
| $1,733,788,497
|
| $1,430,610,957
|
| $432,993,912
|
| $446,100,944
|
| CHANGES IN SHARES OUTSTANDING:
|
|
|
|
|
|
|
|
Shares outstanding, beginning of period
| 32,805,000
|
| 28,605,000
|
| 30,950,002
|
| 28,750,002
|
Shares sold
| 1,100,000
|
| 10,150,000
|
| 2,500,000
|
| 8,450,000
|
Shares redeemed
| (1,850,000)
|
| (5,950,000)
|
| (3,850,000)
|
| (6,250,000)
|
Shares outstanding, end of period
| 32,055,000
|
| 32,805,000
|
| 29,600,002
|
| 30,950,002
|
Page 88
See Notes to Financial Statements
First Trust S&P International
Dividend Aristocrats ETF (FID)
|
| First Trust BuyWrite
Income ETF (FTHI)
|
| First Trust Nasdaq
BuyWrite Income ETF (FTQI)
|
Six Months
Ended
3/31/2023
(Unaudited)
|
| Year
Ended
9/30/2022
|
| Six Months
Ended
3/31/2023
(Unaudited)
|
| Year
Ended
9/30/2022
|
| Six Months
Ended
3/31/2023
(Unaudited)
|
| Year
Ended
9/30/2022
|
|
|
|
|
|
|
|
|
|
|
|
|
| $ 1,155,845
|
| $ 2,200,759
|
| $ 908,719
|
| $ 434,135
|
| $ 61,337
|
| $ 32,486
|
| (1,231,805)
|
| (407,597)
|
| 4,052,345
|
| 1,233,335
|
| 713,921
|
| 528,556
|
| —
|
| —
|
| —
|
| —
|
| —
|
| —
|
| 7,097,986
|
| (12,316,027)
|
| 8,549,671
|
| (11,115,307)
|
| 3,197,919
|
| (2,670,841)
|
| 7,022,026
|
| (10,522,865)
|
| 13,510,735
|
| (9,447,837)
|
| 3,973,177
|
| (2,109,799)
|
|
|
|
|
|
|
|
|
|
|
|
|
| (829,765)
|
| (2,134,072)
|
| (4,738,974)
|
| (4,161,738)
|
| (1,682,602)
|
| (627,504)
|
| —
|
| —
|
| —
|
| —
|
| —
|
| (260,249)
|
| (829,765)
|
| (2,134,072)
|
| (4,738,974)
|
| (4,161,738)
|
| (1,682,602)
|
| (887,753)
|
|
|
|
|
|
|
|
|
|
|
|
|
| 27,671,515
|
| 17,543,449
|
| 88,837,084
|
| 58,793,688
|
| 14,562,964
|
| 15,486,123
|
| —
|
| (3,114,320)
|
| (29,522,467)
|
| (2,232,301)
|
| (5,668,602)
|
| (3,127,943)
|
| 27,671,515
|
| 14,429,129
|
| 59,314,617
|
| 56,561,387
|
| 8,894,362
|
| 12,358,180
|
| 33,863,776
|
| 1,772,192
|
| 68,086,378
|
| 42,951,812
|
| 11,184,937
|
| 9,360,628
|
|
|
|
|
|
|
|
|
|
|
|
|
| 43,911,518
|
| 42,139,326
|
| 89,526,888
|
| 46,575,076
|
| 18,887,562
|
| 9,526,934
|
| $77,775,294
|
| $43,911,518
|
| $157,613,266
|
| $89,526,888
|
| $30,072,499
|
| $18,887,562
|
|
|
|
|
|
|
|
|
|
|
|
|
| 3,200,002
|
| 2,400,002
|
| 4,874,201
|
| 2,174,201
|
| 1,050,002
|
| 450,002
|
| 1,750,000
|
| 1,000,000
|
| 4,500,000
|
| 2,800,000
|
| 800,000
|
| 750,000
|
| —
|
| (200,000)
|
| (1,550,000)
|
| (100,000)
|
| (300,000)
|
| (150,000)
|
| 4,950,002
|
| 3,200,002
|
| 7,824,201
|
| 4,874,201
|
| 1,550,002
|
| 1,050,002
|
See Notes to Financial
Statements
Page 89
First Trust Exchange-Traded Fund VI
Statements of Changes in
Net Assets (Continued)
|
| First Trust Rising
Dividend Achievers ETF (RDVY)
|
| First Trust Dorsey
Wright Focus 5 ETF (FV)
|
|
| Six Months
Ended
3/31/2023
(Unaudited)
|
| Year
Ended
9/30/2022
|
| Six Months
Ended
3/31/2023
(Unaudited)
|
| Year
Ended
9/30/2022
|
| OPERATIONS:
|
|
|
|
|
|
|
|
Net investment income (loss)
| $ 93,693,925
|
| $ 153,436,751
|
| $ 24,213,230
|
| $ 28,481,056
|
Net realized gain (loss)
| (585,827,173)
|
| 263,719,923
|
| (8,043,746)
|
| 817,506,326
|
Net increase from payment by the advisor
| —
|
| —
|
| —
|
| —
|
Net change in unrealized appreciation (depreciation)
| 1,714,590,143
|
| (2,185,334,312)
|
| 249,042,763
|
| (1,170,352,406)
|
Net increase (decrease) in net assets resulting from operations
| 1,222,456,895
|
| (1,768,177,638)
|
| 265,212,247
|
| (324,365,024)
|
| DISTRIBUTIONS TO SHAREHOLDERS FROM:
|
|
|
|
|
|
|
|
Investment operations
| (103,913,891)
|
| (140,979,372)
|
| (25,856,916)
|
| (27,189,651)
|
Return of capital
| —
|
| —
|
| —
|
| —
|
Total distributions to shareholders
| (103,913,891)
|
| (140,979,372)
|
| (25,856,916)
|
| (27,189,651)
|
| SHAREHOLDER TRANSACTIONS:
|
|
|
|
|
|
|
|
Proceeds from shares sold
| 117,683,723
|
| 5,962,228,272
|
| 492,114,821
|
| 2,838,226,345
|
Cost of shares redeemed
| (719,630,196)
|
| (2,501,951,722)
|
| (120,883,441)
|
| (2,588,053,448)
|
Net increase (decrease) in net assets resulting from shareholder transactions
| (601,946,473)
|
| 3,460,276,550
|
| 371,231,380
|
| 250,172,897
|
Total increase (decrease) in net assets
| 516,596,531
|
| 1,551,119,540
|
| 610,586,711
|
| (101,381,778)
|
| NET ASSETS:
|
|
|
|
|
|
|
|
Beginning of period
| 7,290,774,779
|
| 5,739,655,239
|
| 2,592,805,390
|
| 2,694,187,168
|
End of period
| $7,807,371,310
|
| $7,290,774,779
|
| $3,203,392,101
|
| $2,592,805,390
|
| CHANGES IN SHARES OUTSTANDING:
|
|
|
|
|
|
|
|
Shares outstanding, beginning of period
| 187,750,002
|
| 120,900,002
|
| 63,100,002
|
| 58,850,002
|
Shares sold
| 2,600,000
|
| 120,450,000
|
| 10,500,000
|
| 59,550,000
|
Shares redeemed
| (16,400,000)
|
| (53,600,000)
|
| (2,600,000)
|
| (55,300,000)
|
Shares outstanding, end of period
| 173,950,002
|
| 187,750,002
|
| 71,000,002
|
| 63,100,002
|
Page 90
See Notes to Financial Statements
First Trust RBA American Industrial
Renaissance® ETF (AIRR)
|
| First Trust Dorsey Wright
Momentum & Dividend ETF (DDIV)
|
| First Trust Dorsey Wright
International Focus 5 ETF (IFV)
|
Six Months
Ended
3/31/2023
(Unaudited)
|
| Year
Ended
9/30/2022
|
| Six Months
Ended
3/31/2023
(Unaudited)
|
| Year
Ended
9/30/2022
|
| Six Months
Ended
3/31/2023
(Unaudited)
|
| Year
Ended
9/30/2022
|
|
|
|
|
|
|
|
|
|
|
|
|
| $ 305,073
|
| $ 225,149
|
| $ 1,615,262
|
| $ 1,982,242
|
| $ 2,118,788
|
| $ 5,854,400
|
| 1,161,986
|
| 11,092,305
|
| (4,778,028)
|
| 200,303
|
| (15,175,275)
|
| (9,120,319)
|
| —
|
| —
|
| —
|
| —
|
| —
|
| —
|
| 43,828,362
|
| (26,897,678)
|
| 8,054,055
|
| (12,779,877)
|
| 24,917,948
|
| (51,259,930)
|
| 45,295,421
|
| (15,580,224)
|
| 4,891,289
|
| (10,597,332)
|
| 11,861,461
|
| (54,525,849)
|
|
|
|
|
|
|
|
|
|
|
|
|
| (436,540)
|
| (131,850)
|
| (1,513,731)
|
| (1,904,422)
|
| (1,940,690)
|
| (5,794,666)
|
| —
|
| —
|
| —
|
| —
|
| —
|
| —
|
| (436,540)
|
| (131,850)
|
| (1,513,731)
|
| (1,904,422)
|
| (1,940,690)
|
| (5,794,666)
|
|
|
|
|
|
|
|
|
|
|
|
|
| 138,811,251
|
| 67,434,447
|
| —
|
| 79,279,112
|
| 83,381,526
|
| 2,531,736
|
| (36,767,757)
|
| (102,287,438)
|
| (19,161,769)
|
| (38,540,592)
|
| (14,329,557)
|
| (67,969,588)
|
| 102,043,494
|
| (34,852,991)
|
| (19,161,769)
|
| 40,738,520
|
| 69,051,969
|
| (65,437,852)
|
| 146,902,375
|
| (50,565,065)
|
| (15,784,211)
|
| 28,236,766
|
| 78,972,740
|
| (125,758,367)
|
|
|
|
|
|
|
|
|
|
|
|
|
| 169,984,217
|
| 220,549,282
|
| 67,100,191
|
| 38,863,425
|
| 139,211,523
|
| 264,969,890
|
| $316,886,592
|
| $169,984,217
|
| $51,315,980
|
| $67,100,191
|
| $218,184,263
|
| $139,211,523
|
|
|
|
|
|
|
|
|
|
|
|
|
| 4,450,002
|
| 5,400,002
|
| 2,500,002
|
| 1,250,002
|
| 8,650,002
|
| 11,650,002
|
| 2,950,000
|
| 1,550,000
|
| —
|
| 2,400,000
|
| 4,900,000
|
| 150,000
|
| (800,000)
|
| (2,500,000)
|
| (650,000)
|
| (1,150,000)
|
| (850,000)
|
| (3,150,000)
|
| 6,600,002
|
| 4,450,002
|
| 1,850,002
|
| 2,500,002
|
| 12,700,002
|
| 8,650,002
|
See Notes to Financial
Statements
Page 91
First Trust Exchange-Traded Fund VI
Statements of Changes in
Net Assets (Continued)
|
| First Trust Dorsey Wright
Dynamic Focus 5 ETF (FVC)
|
| First Trust Indxx Innovative
Transaction & Process ETF (LEGR)
|
|
| Six Months
Ended
3/31/2023
(Unaudited)
|
| Year
Ended
9/30/2022
|
| Six Months
Ended
3/31/2023
(Unaudited)
|
| Year
Ended
9/30/2022
|
| OPERATIONS:
|
|
|
|
|
|
|
|
Net investment income (loss)
| $ 3,356,123
|
| $ 2,056,794
|
| $ 1,064,418
|
| $ 3,986,062
|
Net realized gain (loss)
| (19,424,806)
|
| 51,807,908
|
| 2,178,366
|
| (1,524,697)
|
Net increase from payment by the advisor
| —
|
| —
|
| —
|
| —
|
Net change in unrealized appreciation (depreciation)
| 13,573,013
|
| (67,491,422)
|
| 20,746,966
|
| (40,908,476)
|
Net increase (decrease) in net assets resulting from operations
| (2,495,670)
|
| (13,626,720)
|
| 23,989,750
|
| (38,447,111)
|
| DISTRIBUTIONS TO SHAREHOLDERS FROM:
|
|
|
|
|
|
|
|
Investment operations
| (3,312,211)
|
| (1,833,976)
|
| (643,860)
|
| (3,919,682)
|
Return of capital
| —
|
| —
|
| —
|
| —
|
Total distributions to shareholders
| (3,312,211)
|
| (1,833,976)
|
| (643,860)
|
| (3,919,682)
|
| SHAREHOLDER TRANSACTIONS:
|
|
|
|
|
|
|
|
Proceeds from shares sold
| 72,174,994
|
| 250,484,774
|
| 10,419,795
|
| 23,904,823
|
Cost of shares redeemed
| (43,300,933)
|
| (217,153,179)
|
| (16,123,694)
|
| (13,920,351)
|
Net increase (decrease) in net assets resulting from shareholder transactions
| 28,874,061
|
| 33,331,595
|
| (5,703,899)
|
| 9,984,472
|
Total increase (decrease) in net assets
| 23,066,180
|
| 17,870,899
|
| 17,641,991
|
| (32,382,321)
|
| NET ASSETS:
|
|
|
|
|
|
|
|
Beginning of period
| 230,479,671
|
| 212,608,772
|
| 100,129,729
|
| 132,512,050
|
End of period
| $253,545,851
|
| $230,479,671
|
| $117,771,720
|
| $100,129,729
|
| CHANGES IN SHARES OUTSTANDING:
|
|
|
|
|
|
|
|
Shares outstanding, beginning of period
| 6,900,002
|
| 6,050,002
|
| 3,300,002
|
| 3,150,002
|
Shares sold
| 2,050,000
|
| 6,900,000
|
| 300,000
|
| 550,000
|
Shares redeemed
| (1,250,000)
|
| (6,050,000)
|
| (450,000)
|
| (400,000)
|
Shares outstanding, end of period
| 7,700,002
|
| 6,900,002
|
| 3,150,002
|
| 3,300,002
|
Page 92
See Notes to Financial Statements
First Trust Nasdaq Artificial
Intelligence and Robotics ETF (ROBT)
|
| First Trust International
Developed Capital Strength ETF (FICS)
|
Six Months
Ended
3/31/2023
(Unaudited)
|
| Year
Ended
9/30/2022
|
| Six Months
Ended
3/31/2023
(Unaudited)
|
| Year
Ended
9/30/2022
|
|
|
|
|
|
|
|
|
| $ 236,616
|
| $ 410,956
|
| $ 272,164
|
| $ 504,080
|
| (16,713,927)
|
| (2,031,906)
|
| (2,862,908)
|
| (1,980,077)
|
| —
|
| 1,987
|
| —
|
| —
|
| 62,062,695
|
| (103,824,955)
|
| 8,078,967
|
| (5,651,836)
|
| 45,585,384
|
| (105,443,918)
|
| 5,488,223
|
| (7,127,833)
|
|
|
|
|
|
|
|
|
| (322,070)
|
| (369,695)
|
| (145,425)
|
| (503,611)
|
| —
|
| —
|
| —
|
| —
|
| (322,070)
|
| (369,695)
|
| (145,425)
|
| (503,611)
|
|
|
|
|
|
|
|
|
| 35,063,532
|
| 64,515,646
|
| 15,892,337
|
| 31,655,094
|
| (12,884,399)
|
| (51,946,180)
|
| (1,354,126)
|
| (14,840,804)
|
| 22,179,133
|
| 12,569,466
|
| 14,538,211
|
| 16,814,290
|
| 67,442,447
|
| (93,244,147)
|
| 19,881,009
|
| 9,182,846
|
|
|
|
|
|
|
|
|
| 173,247,874
|
| 266,492,021
|
| 19,395,869
|
| 10,213,023
|
| $240,690,321
|
| $173,247,874
|
| $39,276,878
|
| $19,395,869
|
|
|
|
|
|
|
|
|
| 5,150,002
|
| 5,000,002
|
| 750,002
|
| 300,002
|
| 850,000
|
| 1,250,000
|
| 550,000
|
| 950,000
|
| (350,000)
|
| (1,100,000)
|
| (50,000)
|
| (500,000)
|
| 5,650,002
|
| 5,150,002
|
| 1,250,002
|
| 750,002
|
See Notes to Financial Statements
Page 93
First Trust Exchange-Traded Fund VI
Financial Highlights
For a share outstanding
throughout each period
First Trust NASDAQ Technology Dividend
Index Fund (TDIV)
|
| Six Months
Ended
3/31/2023
(Unaudited)
|
| Year Ended September 30,
|
|
| 2022
|
| 2021
|
| 2020
|
| 2019
|
| 2018
|
|
Net asset value, beginning of period
| $ 43.61
|
| $ 56.42
|
| $ 43.84
|
| $ 40.09
|
| $ 38.38
|
| $ 32.39
|
| Income from investment operations:
|
|
|
|
|
|
|
|
|
|
|
|
Net investment income (loss)
| 0.55
|
| 1.24
|
| 1.10
|
| 0.93
|
| 0.97
|
| 0.96
|
Net realized and unrealized gain (loss)
| 10.53
|
| (12.83)
|
| 12.55
|
| 3.77
|
| 1.71
|
| 5.90
|
Total from investment operations
| 11.08
|
| (11.59)
|
| 13.65
|
| 4.70
|
| 2.68
|
| 6.86
|
| Distributions paid to shareholders from:
|
|
|
|
|
|
|
|
|
|
|
|
Net investment income
| (0.60)
|
| (1.22)
|
| (1.07)
|
| (0.95)
|
| (0.97)
|
| (0.87)
|
Net asset value, end of period
| $54.09
|
| $43.61
|
| $56.42
|
| $43.84
|
| $40.09
|
| $38.38
|
Total return (a)
| 25.53%
|
| (20.93)%
|
| 31.29%
|
| 11.91%
|
| 7.21%
|
| 21.37%
|
| Ratios to average net assets/supplemental data:
|
|
|
|
|
|
|
|
|
|
|
|
Net assets, end of period (in 000’s)
| $ 1,733,788
|
| $ 1,430,611
|
| $ 1,613,767
|
| $ 1,245,277
|
| $ 1,010,557
|
| $ 948,172
|
Ratio of total expenses to average net assets
| 0.50% (b)
|
| 0.50%
|
| 0.50%
|
| 0.50%
|
| 0.50%
|
| 0.50%
|
Ratio of net investment income (loss) to average net assets
| 2.22% (b)
|
| 2.26%
|
| 2.08%
|
| 2.28%
|
| 2.59%
|
| 2.70%
|
Portfolio turnover rate (c)
| 12%
|
| 36%
|
| 38%
|
| 49%
|
| 37%
|
| 27%
|
| (a)
| Total return is calculated assuming an initial investment made at the net asset value at the beginning of the period, reinvestment of all distributions at net asset value during the
period, and redemption at net asset value on the last day of the period. The returns presented do not reflect the deduction of taxes that a shareholder would pay on Fund distributions or the redemption or sale of Fund
shares. Total return is calculated for the time period presented and is not annualized for periods of less than a year.
|
| (b)
| Annualized.
|
| (c)
| Portfolio turnover is calculated for the time period presented and is not annualized for periods of less than a year and does not include securities received or
delivered from processing creations or redemptions and in-kind transactions.
|
Page 94
See Notes to Financial Statements
First Trust Exchange-Traded Fund VI
Financial Highlights
(Continued)
For a share outstanding
throughout each period
Multi-Asset Diversified Income Index Fund
(MDIV)
|
| Six Months
Ended
3/31/2023
(Unaudited)
|
| Year Ended September 30,
|
|
| 2022
|
| 2021
|
| 2020
|
| 2019
|
| 2018
|
|
Net asset value, beginning of period
| $ 14.41
|
| $ 16.35
|
| $ 13.52
|
| $ 18.43
|
| $ 18.54
|
| $ 19.22
|
| Income from investment operations:
|
|
|
|
|
|
|
|
|
|
|
|
Net investment income (loss)
| 0.45
|
| 0.72
|
| 0.49
|
| 0.57
|
| 0.83
|
| 0.87
|
Net realized and unrealized gain (loss)
| 0.30
|
| (1.67)
|
| 3.18
|
| (4.52)
|
| 0.18
|
| (0.36)
|
Total from investment operations
| 0.75
|
| (0.95)
|
| 3.67
|
| (3.95)
|
| 1.01
|
| 0.51
|
| Distributions paid to shareholders from:
|
|
|
|
|
|
|
|
|
|
|
|
Net investment income
| (0.53)
|
| (0.97)
|
| (0.64)
|
| (0.79)
|
| (0.77)
|
| (0.76)
|
Return of capital
| —
|
| (0.02)
|
| (0.20)
|
| (0.17)
|
| (0.35)
|
| (0.43)
|
Total distributions
| (0.53)
|
| (0.99)
|
| (0.84)
|
| (0.96)
|
| (1.12)
|
| (1.19)
|
Net asset value, end of period
| $14.63
|
| $14.41
|
| $16.35
|
| $13.52
|
| $18.43
|
| $18.54
|
Total return (a)
| 5.13%
|
| (6.25)%
|
| 27.50%
|
| (21.89)%
|
| 5.74%
|
| 2.82%
|
| Ratios to average net assets/supplemental data:
|
|
|
|
|
|
|
|
|
|
|
|
Net assets, end of period (in 000’s)
| $ 432,994
|
| $ 446,101
|
| $ 470,203
|
| $ 440,726
|
| $ 715,985
|
| $ 683,960
|
Ratio of total expenses to average net assets (b)
| 0.60% (c)
|
| 0.60%
|
| 0.60%
|
| 0.60%
|
| 0.60%
|
| 0.60%
|
Ratio of net expenses to average net assets
| 0.48% (c)
|
| 0.48%
|
| 0.48%
|
| 0.47%
|
| 0.48%
|
| 0.48%
|
Ratio of net investment income (loss) to average net assets
| 5.99% (c)
|
| 4.40%
|
| 3.03%
|
| 3.86%
|
| 4.58%
|
| 4.62%
|
Portfolio turnover rate (d)
| 34%
|
| 85%
|
| 100%
|
| 106%
|
| 73%
|
| 84%
|
| (a)
| Total return is calculated assuming an initial investment made at the net asset value at the beginning of the period, reinvestment of all distributions at net asset value during the
period, and redemption at net asset value on the last day of the period. The returns presented do not reflect the deduction of taxes that a shareholder would pay on Fund distributions or the redemption or sale of Fund
shares. Total return is calculated for the time period presented and is not annualized for periods of less than a year. The total returns would have been lower if certain fees had not been waived and expenses
reimbursed by the investment advisor.
|
| (b)
| The Fund indirectly bears its proportionate share of fees and expenses incurred by the underlying funds in which the Fund invests. This ratio does not include these indirect fees and
expenses.
|
| (c)
| Annualized.
|
| (d)
| Portfolio turnover is calculated for the time period presented and is not annualized for periods of less than a year and does not include securities received or
delivered from processing creations or redemptions and in-kind transactions.
|
See Notes to Financial Statements
Page 95
First Trust Exchange-Traded Fund VI
Financial Highlights
(Continued)
For a share outstanding
throughout each period
First Trust S&P International Dividend
Aristocrats ETF (FID)
|
| Six Months
Ended
3/31/2023
(Unaudited)
|
| Year Ended September 30,
|
|
| 2022
|
| 2021
|
| 2020
|
| 2019
|
| 2018
|
|
Net asset value, beginning of period
| $ 13.72
|
| $ 17.56
|
| $ 14.15
|
| $ 17.11
|
| $ 17.19
|
| $ 18.52
|
| Income from investment operations:
|
|
|
|
|
|
|
|
|
|
|
|
Net investment income (loss)
| 0.28
|
| 0.71
|
| 0.62
|
| 0.64
|
| 0.63
|
| 0.85
|
Net realized and unrealized gain (loss)
| 1.94
|
| (3.85)
|
| 3.43
|
| (2.93)
|
| (0.08)
|
| (1.26)
|
Total from investment operations
| 2.22
|
| (3.14)
|
| 4.05
|
| (2.29)
|
| 0.55
|
| (0.41)
|
| Distributions paid to shareholders from:
|
|
|
|
|
|
|
|
|
|
|
|
Net investment income
| (0.23)
|
| (0.70)
|
| (0.64)
|
| (0.67)
|
| (0.63)
|
| (0.92)
|
Net asset value, end of period
| $15.71
|
| $13.72
|
| $17.56
|
| $14.15
|
| $17.11
|
| $17.19
|
Total return (a)
| 16.18%
|
| (18.39)%
|
| 28.79%
|
| (13.62)%
|
| 3.38%
|
| (2.35)%
|
| Ratios to average net assets/supplemental data:
|
|
|
|
|
|
|
|
|
|
|
|
Net assets, end of period (in 000’s)
| $ 77,775
|
| $ 43,912
|
| $ 42,139
|
| $ 18,390
|
| $ 19,678
|
| $ 13,753
|
Ratio of total expenses to average net assets
| 0.60% (b)
|
| 0.60%
|
| 0.60%
|
| 0.60%
|
| 0.60%
|
| 0.69% (c)
|
Ratio of net investment income (loss) to average net assets
| 3.94% (b)
|
| 4.39%
|
| 4.10%
|
| 4.03%
|
| 4.01%
|
| 4.70%
|
Portfolio turnover rate (d)
| 58%
|
| 47%
|
| 57%
|
| 81%
|
| 44%
|
| 196% (e)
|
| (a)
| Total return is calculated assuming an initial investment made at the net asset value at the beginning of the period, reinvestment of all distributions at net asset value during the
period, and redemption at net asset value on the last day of the period. The returns presented do not reflect the deduction of taxes that a shareholder would pay on Fund distributions or the redemption or sale of Fund
shares. Total return is calculated for the time period presented and is not annualized for periods of less than a year.
|
| (b)
| Annualized.
|
| (c)
| On August 30, 2018, the Fund reduced the annual management fee payable to First Trust, from 0.70% of the Fund’s average daily net assets to 0.60% of the Fund’s average
daily net assets.
|
| (d)
| Portfolio turnover is calculated for the time period presented and is not annualized for periods of less than a year and does not include securities received or delivered from
processing creations or redemptions and in-kind transactions.
|
| (e)
| The variation in the portfolio turnover rate is due to the change in the Fund’s underlying index effective August 30, 2018, which resulted in a complete
rebalance of the Fund’s portfolio.
|
Page 96
See Notes to Financial Statements
First Trust Exchange-Traded Fund VI
Financial Highlights
(Continued)
For a share outstanding
throughout each period
First Trust BuyWrite Income ETF
(FTHI)
|
| Six Months
Ended
3/31/2023
(Unaudited)
|
| Year Ended September 30,
|
|
| 2022
|
| 2021
|
| 2020
|
| 2019
|
| 2018
|
|
Net asset value, beginning of period
| $ 18.37
|
| $ 21.42
|
| $ 19.12
|
| $ 22.43
|
| $ 23.28
|
| $ 22.54
|
| Income from investment operations:
|
|
|
|
|
|
|
|
|
|
|
|
Net investment income (loss)
| 0.16 (a)
|
| 0.17 (a)
|
| 0.12
|
| 0.23
|
| 0.40
|
| 0.35
|
Net realized and unrealized gain (loss)
| 2.46
|
| (1.64)
|
| 3.14
|
| (2.58)
|
| (0.29)
|
| 1.35
|
Total from investment operations
| 2.62
|
| (1.47)
|
| 3.26
|
| (2.35)
|
| 0.11
|
| 1.70
|
| Distributions paid to shareholders from:
|
|
|
|
|
|
|
|
|
|
|
|
Net investment income
| (0.85)
|
| (1.58)
|
| (0.96)
|
| (0.23)
|
| (0.86)
|
| (0.96)
|
Return of capital
| —
|
| —
|
| —
|
| (0.73)
|
| (0.10)
|
| —
|
Total distributions
| (0.85)
|
| (1.58)
|
| (0.96)
|
| (0.96)
|
| (0.96)
|
| (0.96)
|
Net asset value, end of period
| $20.14
|
| $18.37
|
| $21.42
|
| $19.12
|
| $22.43
|
| $23.28
|
Total return (b)
| 14.38%
|
| (7.60)%
|
| 17.31%
|
| (10.63)%
|
| 0.72%
|
| 8.12%
|
| Ratios to average net assets/supplemental data:
|
|
|
|
|
|
|
|
|
|
|
|
Net assets, end of period (in 000’s)
| $ 157,613
|
| $ 89,527
|
| $ 46,575
|
| $ 59,733
|
| $ 80,155
|
| $ 66,898
|
Ratio of total expenses to average net assets
| 0.85% (c)
|
| 0.85%
|
| 0.85%
|
| 0.85%
|
| 0.85%
|
| 0.85%
|
Ratio of net investment income (loss) to average net assets
| 1.65% (c)
|
| 0.81%
|
| 1.29%
|
| 1.10%
|
| 1.43%
|
| 1.34%
|
Portfolio turnover rate (d)
| 61%
|
| 90% (e)
|
| 199%
|
| 210%
|
| 209%
|
| 239%
|
| (a)
| Based on average shares outstanding.
|
| (b)
| Total return is calculated assuming an initial investment made at the net asset value at the beginning of the period, reinvestment of all distributions at net asset value during the
period, and redemption at net asset value on the last day of the period. The returns presented do not reflect the deduction of taxes that a shareholder would pay on Fund distributions or the redemption or sale of Fund
shares. Total return is calculated for the time period presented and is not annualized for periods of less than a year.
|
| (c)
| Annualized.
|
| (d)
| Portfolio turnover is calculated for the time period presented and is not annualized for periods of less than a year and does not include securities received or delivered from
processing creations or redemptions and in-kind transactions.
|
| (e)
| The variation in the portfolio turnover rate is due to lower than expected portfolio rebalancing, which was impacted by high levels of equity volatility and a
downtrend in the U.S. equity markets.
|
See Notes to Financial Statements
Page 97
First Trust Exchange-Traded Fund VI
Financial Highlights
(Continued)
For a share outstanding
throughout each period
First Trust Nasdaq BuyWrite Income ETF
(FTQI)
|
| Six Months
Ended
3/31/2023
(Unaudited)
|
| Year Ended September 30,
|
|
| 2022
|
| 2021
|
| 2020
|
| 2019
|
| 2018
|
|
Net asset value, beginning of period
| $ 17.99
|
| $ 21.17
|
| $ 19.23
|
| $ 22.30
|
| $ 22.92
|
| $ 22.27
|
| Income from investment operations:
|
|
|
|
|
|
|
|
|
|
|
|
Net investment income (loss)
| 0.02
|
| 0.06 (a)
|
| 0.34
|
| 0.21
|
| 0.27
|
| 0.40
|
Net realized and unrealized gain (loss)
| 2.46
|
| (1.83)
|
| 2.26
|
| (2.62)
|
| (0.23)
|
| 0.91
|
Total from investment operations
| 2.48
|
| (1.77)
|
| 2.60
|
| (2.41)
|
| 0.04
|
| 1.31
|
| Distributions paid to shareholders from:
|
|
|
|
|
|
|
|
|
|
|
|
Net investment income
| (1.07)
|
| (0.99)
|
| (0.66)
|
| (0.21)
|
| (0.58)
|
| (0.66)
|
Return of capital
| —
|
| (0.42)
|
| —
|
| (0.45)
|
| (0.08)
|
| —
|
Total distributions
| (1.07)
|
| (1.41)
|
| (0.66)
|
| (0.66)
|
| (0.66)
|
| (0.66)
|
Net asset value, end of period
| $19.40
|
| $17.99
|
| $21.17
|
| $19.23
|
| $22.30
|
| $22.92
|
Total return (b)
| 14.14%
|
| (9.00)%
|
| 13.66%
|
| (10.98)%
|
| 0.29%
|
| 5.95%
|
| Ratios to average net assets/supplemental data:
|
|
|
|
|
|
|
|
|
|
|
|
Net assets, end of period (in 000’s)
| $ 30,072
|
| $ 18,888
|
| $ 9,527
|
| $ 4,807
|
| $ 8,919
|
| $ 13,751
|
Ratio of total expenses to average net assets
| 0.85% (c)
|
| 0.85%
|
| 0.85%
|
| 0.85%
|
| 0.85%
|
| 0.85%
|
Ratio of net investment income (loss) to average net assets
| 0.42% (c)
|
| 0.27%
|
| 1.16%
|
| 0.96%
|
| 1.40%
|
| 1.32%
|
Portfolio turnover rate (d)
| 68%
|
| 107% (e)
|
| 182%
|
| 207%
|
| 205%
|
| 219%
|
| (a)
| Based on average shares outstanding.
|
| (b)
| Total return is calculated assuming an initial investment made at the net asset value at the beginning of the period, reinvestment of all distributions at net asset value during the
period, and redemption at net asset value on the last day of the period. The returns presented do not reflect the deduction of taxes that a shareholder would pay on Fund distributions or the redemption or sale of Fund
shares. Total return is calculated for the time period presented and is not annualized for periods of less than a year.
|
| (c)
| Annualized.
|
| (d)
| Portfolio turnover is calculated for the time period presented and is not annualized for periods of less than a year and does not include securities received or delivered from
processing creations or redemptions and in-kind transactions.
|
| (e)
| The variation in the portfolio turnover rate is due to the change in the Fund’s index and investment strategy effective May 11, 2022, which resulted in fewer
portfolio transactions.
|
Page 98
See Notes to Financial Statements
First Trust Exchange-Traded Fund VI
Financial Highlights
(Continued)
For a share outstanding
throughout each period
First Trust Rising Dividend Achievers ETF
(RDVY)
|
| Six Months
Ended
3/31/2023
(Unaudited)
|
| Year Ended September 30,
|
|
| 2022
|
| 2021
|
| 2020
|
| 2019
|
| 2018
|
|
Net asset value, beginning of period
| $ 38.83
|
| $ 47.47
|
| $ 32.67
|
| $ 31.82
|
| $ 31.54
|
| $ 27.84
|
| Income from investment operations:
|
|
|
|
|
|
|
|
|
|
|
|
Net investment income (loss)
| 0.54
|
| 0.82
|
| 0.59
|
| 0.58
|
| 0.54
|
| 0.41
|
Net realized and unrealized gain (loss)
| 6.10
|
| (8.70)
|
| 14.79
|
| 0.86
|
| 0.27
|
| 3.68
|
Total from investment operations
| 6.64
|
| (7.88)
|
| 15.38
|
| 1.44
|
| 0.81
|
| 4.09
|
| Distributions paid to shareholders from:
|
|
|
|
|
|
|
|
|
|
|
|
Net investment income
| (0.59)
|
| (0.76)
|
| (0.58)
|
| (0.59)
|
| (0.53)
|
| (0.39)
|
Net asset value, end of period
| $44.88
|
| $38.83
|
| $47.47
|
| $32.67
|
| $31.82
|
| $31.54
|
Total return (a)
| 17.12%
|
| (16.76)%
|
| 47.21%
|
| 4.61%
|
| 2.72%
|
| 14.78%
|
| Ratios to average net assets/supplemental data:
|
|
|
|
|
|
|
|
|
|
|
|
Net assets, end of period (in 000’s)
| $ 7,807,371
|
| $ 7,290,775
|
| $ 5,739,655
|
| $ 1,292,097
|
| $ 832,156
|
| $ 690,709
|
Ratio of total expenses to average net assets
| 0.49% (b)
|
| 0.50%
|
| 0.50%
|
| 0.50%
|
| 0.50%
|
| 0.50%
|
Ratio of net investment income (loss) to average net assets
| 2.34% (b)
|
| 1.85%
|
| 1.43%
|
| 1.89%
|
| 1.85%
|
| 1.50%
|
Portfolio turnover rate (c)
| 50%
|
| 59%
|
| 45%
|
| 62%
|
| 63%
|
| 40%
|
| (a)
| Total return is calculated assuming an initial investment made at the net asset value at the beginning of the period, reinvestment of all distributions at net asset value during the
period, and redemption at net asset value on the last day of the period. The returns presented do not reflect the deduction of taxes that a shareholder would pay on Fund distributions or the redemption or sale of Fund
shares. Total return is calculated for the time period presented and is not annualized for periods of less than a year.
|
| (b)
| Annualized.
|
| (c)
| Portfolio turnover is calculated for the time period presented and is not annualized for periods of less than a year and does not include securities received or
delivered from processing creations or redemptions and in-kind transactions.
|
See Notes to Financial Statements
Page 99
First Trust Exchange-Traded Fund VI
Financial Highlights
(Continued)
For a share outstanding
throughout each period
First Trust Dorsey Wright Focus 5 ETF
(FV)
|
| Six Months
Ended
3/31/2023
(Unaudited)
|
| Year Ended September 30,
|
|
| 2022
|
| 2021
|
| 2020
|
| 2019
|
| 2018
|
|
Net asset value, beginning of period
| $ 41.09
|
| $ 45.78
|
| $ 34.10
|
| $ 29.63
|
| $ 30.93
|
| $ 26.17
|
| Income from investment operations:
|
|
|
|
|
|
|
|
|
|
|
|
Net investment income (loss)
| 0.35
|
| 0.46
|
| 0.02
|
| 0.09
|
| 0.11
|
| 0.09
|
Net realized and unrealized gain (loss)
| 4.06
|
| (4.71)
|
| 11.68
|
| 4.49
|
| (1.31)
|
| 4.83
|
Total from investment operations
| 4.41
|
| (4.25)
|
| 11.70
|
| 4.58
|
| (1.20)
|
| 4.92
|
| Distributions paid to shareholders from:
|
|
|
|
|
|
|
|
|
|
|
|
Net investment income
| (0.38)
|
| (0.44)
|
| (0.02)
|
| (0.11)
|
| (0.10)
|
| (0.16)
|
Net asset value, end of period
| $45.12
|
| $41.09
|
| $45.78
|
| $34.10
|
| $29.63
|
| $30.93
|
Total return (a)
| 10.71%
|
| (9.32)%
|
| 34.31%
|
| 15.50%
|
| (3.92)%
|
| 18.91%
|
| Ratios to average net assets/supplemental data:
|
|
|
|
|
|
|
|
|
|
|
|
Net assets, end of period (in 000’s)
| $ 3,203,392
|
| $ 2,592,805
|
| $ 2,694,187
|
| $ 2,047,492
|
| $ 2,348,262
|
| $ 2,858,225
|
Ratio of total expenses to average net assets (b)
| 0.30% (c)
|
| 0.30%
|
| 0.30%
|
| 0.30%
|
| 0.30%
|
| 0.30%
|
Ratio of net investment income (loss) to average net assets
| 1.54% (c)
|
| 1.01%
|
| 0.04%
|
| 0.30%
|
| 0.34%
|
| 0.30%
|
Portfolio turnover rate (d)
| 63%
|
| 81%
|
| 20%
|
| 72%
|
| 65%
|
| 44%
|
| (a)
| Total return is calculated assuming an initial investment made at the net asset value at the beginning of the period, reinvestment of all distributions at net asset value during the
period, and redemption at net asset value on the last day of the period. The returns presented do not reflect the deduction of taxes that a shareholder would pay on Fund distributions or the redemption or sale of Fund
shares. Total return is calculated for the time period presented and is not annualized for periods of less than a year.
|
| (b)
| The Fund indirectly bears its proportionate share of fees and expenses incurred by the underlying funds in which the Fund invests. This ratio does not include these indirect fees and
expenses.
|
| (c)
| Annualized.
|
| (d)
| Portfolio turnover is calculated for the time period presented and is not annualized for periods of less than a year and does not include securities received or
delivered from processing creations or redemptions and in-kind transactions.
|
Page 100
See Notes to Financial Statements
First Trust Exchange-Traded Fund VI
Financial Highlights
(Continued)
For a share outstanding
throughout each period
First Trust RBA American Industrial
Renaissance® ETF (AIRR)
|
| Six Months
Ended
3/31/2023
(Unaudited)
|
| Year Ended September 30,
|
|
| 2022
|
| 2021
|
| 2020
|
| 2019
|
| 2018
|
|
Net asset value, beginning of period
| $ 38.20
|
| $ 40.84
|
| $ 25.68
|
| $ 26.76
|
| $ 27.93
|
| $ 26.04
|
| Income from investment operations:
|
|
|
|
|
|
|
|
|
|
|
|
Net investment income (loss)
| 0.05
|
| 0.04
|
| 0.03
|
| (0.03)
|
| 0.10 (a)
|
| 0.09
|
Net realized and unrealized gain (loss)
| 9.84
|
| (2.66)
|
| 15.16
|
| (0.98)
|
| (1.21)
|
| 1.88
|
Total from investment operations
| 9.89
|
| (2.62)
|
| 15.19
|
| (1.01)
|
| (1.11)
|
| 1.97
|
| Distributions paid to shareholders from:
|
|
|
|
|
|
|
|
|
|
|
|
Net investment income
| (0.08)
|
| (0.02)
|
| (0.03)
|
| (0.07)
|
| (0.06)
|
| (0.08)
|
Net asset value, end of period
| $48.01
|
| $38.20
|
| $40.84
|
| $25.68
|
| $26.76
|
| $27.93
|
Total return (b)
| 25.90%
|
| (6.41)%
|
| 59.15%
|
| (3.81)%
|
| (3.95)%
|
| 7.56%
|
| Ratios to average net assets/supplemental data:
|
|
|
|
|
|
|
|
|
|
|
|
Net assets, end of period (in 000’s)
| $ 316,887
|
| $ 169,984
|
| $ 220,549
|
| $ 47,513
|
| $ 66,900
|
| $ 195,500
|
Ratio of total expenses to average net assets
| 0.70% (c)
|
| 0.70%
|
| 0.70%
|
| 0.70%
|
| 0.70%
|
| 0.70%
|
Ratio of net investment income (loss) to average net assets
| 0.26% (c)
|
| 0.10%
|
| 0.07%
|
| (0.18)%
|
| 0.40%
|
| 0.32%
|
Portfolio turnover rate (d)
| 25%
|
| 37%
|
| 35%
|
| 45%
|
| 58%
|
| 35%
|
| (a)
| Based on average shares outstanding.
|
| (b)
| Total return is calculated assuming an initial investment made at the net asset value at the beginning of the period, reinvestment of all distributions at net asset value during the
period, and redemption at net asset value on the last day of the period. The returns presented do not reflect the deduction of taxes that a shareholder would pay on Fund distributions or the redemption or sale of Fund
shares. Total return is calculated for the time period presented and is not annualized for periods of less than a year.
|
| (c)
| Annualized.
|
| (d)
| Portfolio turnover is calculated for the time period presented and is not annualized for periods of less than a year and does not include securities received or
delivered from processing creations or redemptions and in-kind transactions.
|
See Notes to Financial Statements
Page 101
First Trust Exchange-Traded Fund VI
Financial Highlights
(Continued)
For a share outstanding
throughout each period
First Trust Dorsey Wright Momentum &
Dividend ETF (DDIV)
|
| Six Months
Ended
3/31/2023
(Unaudited)
|
| Year Ended September 30,
|
|
| 2022
|
| 2021
|
| 2020
|
| 2019
|
| 2018
|
|
Net asset value, beginning of period
| $ 26.84
|
| $ 31.09
|
| $ 21.06
|
| $ 26.07
|
| $ 25.15
|
| $ 24.54
|
| Income from investment operations:
|
|
|
|
|
|
|
|
|
|
|
|
Net investment income (loss)
| 0.79
|
| 0.88
|
| 0.73
|
| 0.68
|
| 0.78
|
| 0.65
|
Net realized and unrealized gain (loss)
| 0.81
|
| (4.22)
|
| 10.01
|
| (4.95)
|
| 0.86
|
| 0.59
|
Total from investment operations
| 1.60
|
| (3.34)
|
| 10.74
|
| (4.27)
|
| 1.64
|
| 1.24
|
| Distributions paid to shareholders from:
|
|
|
|
|
|
|
|
|
|
|
|
Net investment income
| (0.70)
|
| (0.91)
|
| (0.71)
|
| (0.74)
|
| (0.72)
|
| (0.63)
|
Net asset value, end of period
| $27.74
|
| $26.84
|
| $31.09
|
| $21.06
|
| $26.07
|
| $25.15
|
Total return (a)
| 5.92%
|
| (11.08)%
|
| 51.29%
|
| (16.49)%
|
| 6.87%
|
| 5.10%
|
| Ratios to average net assets/supplemental data:
|
|
|
|
|
|
|
|
|
|
|
|
Net assets, end of period (in 000’s)
| $ 51,316
|
| $ 67,100
|
| $ 38,863
|
| $ 29,484
|
| $ 44,313
|
| $ 37,727
|
Ratio of total expenses to average net assets
| 0.60% (b)
|
| 0.60%
|
| 0.60%
|
| 0.60%
|
| 0.60%
|
| 0.69% (c)
|
Ratio of net investment income (loss) to average net assets
| 5.03% (b)
|
| 3.00%
|
| 2.54%
|
| 2.81%
|
| 3.50%
|
| 2.79%
|
Portfolio turnover rate (d)
| 85%
|
| 172%
|
| 186%
|
| 193%
|
| 160%
|
| 297% (e)
|
| (a)
| Total return is calculated assuming an initial investment made at the net asset value at the beginning of the period, reinvestment of all distributions at net asset value during the
period, and redemption at net asset value on the last day of the period. The returns presented do not reflect the deduction of taxes that a shareholder would pay on Fund distributions or the redemption or sale of Fund
shares. Total return is calculated for the time period presented and is not annualized for periods of less than a year.
|
| (b)
| Annualized.
|
| (c)
| On September 6, 2018, the Fund reduced the annual management fee payable to First Trust, from 0.70% of the Fund’s average daily net assets to 0.60% of the Fund’s average
daily net assets.
|
| (d)
| Portfolio turnover is calculated for the time period presented and is not annualized for periods of less than a year and does not include securities received or delivered from
processing creations or redemptions and in-kind transactions.
|
| (e)
| The variation in the portfolio turnover rate is due to the change in the Fund’s underlying index effective September 6, 2018, which resulted in a complete
rebalance of the Fund’s portfolio.
|
Page 102
See Notes to Financial Statements
First Trust Exchange-Traded Fund VI
Financial Highlights
(Continued)
For a share outstanding
throughout each period
First Trust Dorsey Wright International
Focus 5 ETF (IFV)
|
| Six Months
Ended
3/31/2023
(Unaudited)
|
| Year Ended September 30,
|
|
| 2022
|
| 2021
|
| 2020
|
| 2019
|
| 2018
|
|
Net asset value, beginning of period
| $ 16.09
|
| $ 22.74
|
| $ 18.83
|
| $ 19.07
|
| $ 20.33
|
| $ 21.35
|
| Income from investment operations:
|
|
|
|
|
|
|
|
|
|
|
|
Net investment income (loss)
| 0.18
|
| 0.64
|
| 0.20
|
| 0.56
|
| 0.37
|
| 0.33
|
Net realized and unrealized gain (loss)
| 1.08
|
| (6.66)
|
| 3.93
|
| (0.23)
|
| (1.26)
|
| (0.93)
|
Total from investment operations
| 1.26
|
| (6.02)
|
| 4.13
|
| 0.33
|
| (0.89)
|
| (0.60)
|
| Distributions paid to shareholders from:
|
|
|
|
|
|
|
|
|
|
|
|
Net investment income
| (0.17)
|
| (0.63)
|
| (0.22)
|
| (0.57)
|
| (0.35)
|
| (0.42)
|
Return of capital
| —
|
| —
|
| —
|
| —
|
| (0.02)
|
| —
|
Total distributions
| (0.17)
|
| (0.63)
|
| (0.22)
|
| (0.57)
|
| (0.37)
|
| (0.42)
|
Net asset value, end of period
| $17.18
|
| $16.09
|
| $22.74
|
| $18.83
|
| $19.07
|
| $20.33
|
Total return (a)
| 7.85%
|
| (26.89)%
|
| 21.91%
|
| 1.75%
|
| (4.42)%
|
| (2.91)%
|
| Ratios to average net assets/supplemental data:
|
|
|
|
|
|
|
|
|
|
|
|
Net assets, end of period (in 000’s)
| $ 218,184
|
| $ 139,212
|
| $ 264,970
|
| $ 218,452
|
| $ 453,757
|
| $ 774,665
|
Ratio of total expenses to average net assets (b)
| 0.30% (c)
|
| 0.30%
|
| 0.30%
|
| 0.30%
|
| 0.30%
|
| 0.30%
|
Ratio of net investment income (loss) to average net assets
| 2.41% (c)
|
| 2.92%
|
| 0.87%
|
| 3.19%
|
| 1.89%
|
| 1.57%
|
Portfolio turnover rate (d)
| 75%
|
| 104%
|
| 66%
|
| 29%
|
| 42%
|
| 0%
|
| (a)
| Total return is calculated assuming an initial investment made at the net asset value at the beginning of the period, reinvestment of all distributions at net asset value during the
period, and redemption at net asset value on the last day of the period. The returns presented do not reflect the deduction of taxes that a shareholder would pay on Fund distributions or the redemption or sale of Fund
shares. Total return is calculated for the time period presented and is not annualized for periods of less than a year.
|
| (b)
| The Fund indirectly bears its proportionate share of fees and expenses incurred by the underlying funds in which the Fund invests. This ratio does not include these indirect fees and
expenses.
|
| (c)
| Annualized.
|
| (d)
| Portfolio turnover is calculated for the time period presented and is not annualized for periods of less than a year and does not include securities received or
delivered from processing creations or redemptions and in-kind transactions.
|
See Notes to Financial Statements
Page 103
First Trust Exchange-Traded Fund VI
Financial Highlights
(Continued)
For a share outstanding
throughout each period
First Trust Dorsey Wright Dynamic Focus 5
ETF (FVC)
|
| Six Months
Ended
3/31/2023
(Unaudited)
|
| Year Ended September 30,
|
|
| 2022
|
| 2021
|
| 2020
|
| 2019
|
| 2018
|
|
Net asset value, beginning of period
| $ 33.40
|
| $ 35.14
|
| $ 26.17
|
| $ 26.45
|
| $ 28.80
|
| $ 24.36
|
| Income from investment operations:
|
|
|
|
|
|
|
|
|
|
|
|
Net investment income (loss)
| 0.42
|
| 0.31
|
| 0.01
|
| 0.13
|
| 0.22
|
| 0.08
|
Net realized and unrealized gain (loss)
| (0.47)
|
| (1.77)
|
| 8.97
|
| (0.25)
|
| (2.37)
|
| 4.51
|
Total from investment operations
| (0.05)
|
| (1.46)
|
| 8.98
|
| (0.12)
|
| (2.15)
|
| 4.59
|
| Distributions paid to shareholders from:
|
|
|
|
|
|
|
|
|
|
|
|
Net investment income
| (0.42)
|
| (0.28)
|
| (0.01)
|
| (0.16)
|
| (0.20)
|
| (0.15)
|
Net asset value, end of period
| $32.93
|
| $33.40
|
| $35.14
|
| $26.17
|
| $26.45
|
| $28.80
|
Total return (a)
| (0.18)%
|
| (4.18)%
|
| 34.32%
|
| (0.46)%
|
| (7.46)%
|
| 18.91%
|
| Ratios to average net assets/supplemental data:
|
|
|
|
|
|
|
|
|
|
|
|
Net assets, end of period (in 000’s)
| $ 253,546
|
| $ 230,480
|
| $ 212,609
|
| $ 223,754
|
| $ 468,253
|
| $ 620,537
|
Ratio of total expenses to average net assets (b)
| 0.30% (c)
|
| 0.30%
|
| 0.30%
|
| 0.30%
|
| 0.30%
|
| 0.30%
|
Ratio of net investment income (loss) to average net assets
| 2.52% (c)
|
| 0.91%
|
| 0.02%
|
| 0.54%
|
| 0.79%
|
| 0.32%
|
Portfolio turnover rate (d)
| 197%
|
| 164%
|
| 20%
|
| 225%
|
| 90%
|
| 42%
|
| (a)
| Total return is calculated assuming an initial investment made at the net asset value at the beginning of the period, reinvestment of all distributions at net asset value during the
period, and redemption at net asset value on the last day of the period. The returns presented do not reflect the deduction of taxes that a shareholder would pay on Fund distributions or the redemption or sale of Fund
shares. Total return is calculated for the time period presented and is not annualized for periods of less than a year.
|
| (b)
| The Fund indirectly bears its proportionate share of fees and expenses incurred by the underlying funds in which the Fund invests. This ratio does not include these indirect fees and
expenses.
|
| (c)
| Annualized.
|
| (d)
| Portfolio turnover is calculated for the time period presented and is not annualized for periods of less than a year and does not include securities received or
delivered from processing creations or redemptions and in-kind transactions.
|
Page 104
See Notes to Financial Statements
First Trust Exchange-Traded Fund VI
Financial Highlights
(Continued)
For a share outstanding
throughout each period
First Trust Indxx Innovative Transaction
& Process ETF (LEGR)
|
| Six Months
Ended
3/31/2023
(Unaudited)
|
| Year Ended September 30,
|
| Period
Ended
9/30/2018 (a)
|
|
| 2022
|
| 2021
|
| 2020
|
| 2019
|
|
Net asset value, beginning of period
| $ 30.34
|
| $ 42.07
|
| $ 31.32
|
| $ 29.32
|
| $ 30.31
|
| $ 29.99
|
| Income from investment operations:
|
|
|
|
|
|
|
|
|
|
|
|
Net investment income (loss)
| 0.33
|
| 1.15
|
| 0.61
|
| 0.35
|
| 0.59
|
| 0.26
|
Net realized and unrealized gain (loss)
| 6.92
|
| (11.75)
|
| 10.70
|
| 2.02
|
| (0.93)
|
| 0.29
|
Total from investment operations
| 7.25
|
| (10.60)
|
| 11.31
|
| 2.37
|
| (0.34)
|
| 0.55
|
| Distributions paid to shareholders from:
|
|
|
|
|
|
|
|
|
|
|
|
Net investment income
| (0.20)
|
| (1.13)
|
| (0.56)
|
| (0.37)
|
| (0.65)
|
| (0.23)
|
Net asset value, end of period
| $37.39
|
| $30.34
|
| $42.07
|
| $31.32
|
| $29.32
|
| $30.31
|
Total return (b)
| 23.94%
|
| (25.55)%
|
| 36.13%
|
| 8.13%
|
| (1.08)%
|
| 1.87%
|
| Ratios to average net assets/supplemental data:
|
|
|
|
|
|
|
|
|
|
|
|
Net assets, end of period (in 000’s)
| $ 117,772
|
| $ 100,130
|
| $ 132,512
|
| $ 42,280
|
| $ 41,048
|
| $ 50,017
|
Ratio of total expenses to average net assets
| 0.65% (c)
|
| 0.65%
|
| 0.65%
|
| 0.65%
|
| 0.65%
|
| 0.65% (c)
|
Ratio of net investment income (loss) to average net assets
| 1.92% (c)
|
| 2.94%
|
| 1.84%
|
| 1.12%
|
| 1.95%
|
| 1.63% (c)
|
Portfolio turnover rate (d)
| 8%
|
| 23%
|
| 46%
|
| 25%
|
| 35%
|
| 53%
|
| (a)
| Inception date is January 24, 2018, which is consistent with the commencement of investment operations and is the date the initial creation units were established.
|
| (b)
| Total return is calculated assuming an initial investment made at the net asset value at the beginning of the period, reinvestment of all distributions at net asset value during the
period, and redemption at net asset value on the last day of the period. The returns presented do not reflect the deduction of taxes that a shareholder would pay on Fund distributions or the redemption or sale of Fund
shares. Total return is calculated for the time period presented and is not annualized for periods of less than a year.
|
| (c)
| Annualized.
|
| (d)
| Portfolio turnover is calculated for the time period presented and is not annualized for periods of less than a year and does not include securities received or
delivered from processing creations or redemptions and in-kind transactions.
|
See Notes to Financial Statements
Page 105
First Trust Exchange-Traded Fund VI
Financial Highlights
(Continued)
For a share outstanding
throughout each period
First Trust Nasdaq Artificial Intelligence
and Robotics ETF (ROBT)
|
| Six Months
Ended
3/31/2023
(Unaudited)
|
| Year Ended September 30,
|
| Period
Ended
9/30/2018 (a)
|
|
| 2022
|
| 2021
|
| 2020
|
| 2019
|
|
Net asset value, beginning of period
| $ 33.64
|
| $ 53.30
|
| $ 38.89
|
| $ 31.51
|
| $ 32.23
|
| $ 29.91
|
| Income from investment operations:
|
|
|
|
|
|
|
|
|
|
|
|
Net investment income (loss)
| 0.04
|
| 0.08
|
| 0.05
|
| 0.04
|
| 0.17
|
| 0.12
|
Net realized and unrealized gain (loss)
| 8.98
|
| (19.67) (b)
|
| 14.44
|
| 7.39
|
| (0.75)
|
| 2.31
|
Total from investment operations
| 9.02
|
| (19.59)
|
| 14.49
|
| 7.43
|
| (0.58)
|
| 2.43
|
| Distributions paid to shareholders from:
|
|
|
|
|
|
|
|
|
|
|
|
Net investment income
| (0.06)
|
| (0.07)
|
| (0.08)
|
| (0.05)
|
| (0.14)
|
| (0.11)
|
Net asset value, end of period
| $42.60
|
| $33.64
|
| $53.30
|
| $38.89
|
| $31.51
|
| $32.23
|
Total return (c)
| 26.86%
|
| (36.76)% (b)
|
| 37.27%
|
| 23.60%
|
| (1.81)%
|
| 8.15%
|
| Ratios to average net assets/supplemental data:
|
|
|
|
|
|
|
|
|
|
|
|
Net assets, end of period (in 000’s)
| $ 240,690
|
| $ 173,248
|
| $ 266,492
|
| $ 120,549
|
| $ 61,443
|
| $ 32,226
|
Ratio of total expenses to average net assets
| 0.65% (d)
|
| 0.65%
|
| 0.65%
|
| 0.65%
|
| 0.65%
|
| 0.65% (d)
|
Ratio of net investment income (loss) to average net assets
| 0.25% (d)
|
| 0.17%
|
| 0.10%
|
| 0.15%
|
| 0.68%
|
| 0.62% (d)
|
Portfolio turnover rate (e)
| 16%
|
| 36%
|
| 31%
|
| 34%
|
| 43%
|
| 67%
|
| (a)
| Inception date is February 21, 2018, which is consistent with the commencement of investment operations and is the date the initial creation units were established.
|
| (b)
| The Fund received a reimbursement from the advisor in the amount of $1,987 in connection with a trade error, which represents less than $0.01 per share. Since the advisor reimbursed
the Fund, there was no effect on the Fund’s total return.
|
| (c)
| Total return is calculated assuming an initial investment made at the net asset value at the beginning of the period, reinvestment of all distributions at net asset value during the
period, and redemption at net asset value on the last day of the period. The returns presented do not reflect the deduction of taxes that a shareholder would pay on Fund distributions or the redemption or sale of Fund
shares. Total return is calculated for the time period presented and is not annualized for periods of less than a year.
|
| (d)
| Annualized.
|
| (e)
| Portfolio turnover is calculated for the time period presented and is not annualized for periods of less than a year and does not include securities received or
delivered from processing creations or redemptions and in-kind transactions.
|
Page 106
See Notes to Financial Statements
First Trust Exchange-Traded Fund VI
Financial Highlights
(Continued)
For a share outstanding
throughout each period
First Trust International Developed Capital
Strength ETF (FICS)
|
| Six Months
Ended
3/31/2023
(Unaudited)
|
| Year Ended
9/30/2022
|
| Period
Ended
9/30/2021 (a)
|
Net asset value, beginning of period
| $ 25.86
|
| $ 34.04
|
| $ 30.09
|
| Income from investment operations:
|
|
|
|
|
|
Net investment income (loss)
| 0.22
|
| 0.57
|
| 0.36
|
Net realized and unrealized gain (loss)
| 5.47
|
| (8.16)
|
| 3.93
|
Total from investment operations
| 5.69
|
| (7.59)
|
| 4.29
|
| Distributions paid to shareholders from:
|
|
|
|
|
|
Net investment income
| (0.13)
|
| (0.59)
|
| (0.34)
|
Net asset value, end of period
| $31.42
|
| $25.86
|
| $34.04
|
Total return (b)
| 22.00%
|
| (22.50)%
|
| 14.25%
|
| Ratios to average net assets/supplemental data:
|
|
|
|
|
|
Net assets, end of period (in 000’s)
| $ 39,277
|
| $ 19,396
|
| $ 10,213
|
Ratio of total expenses to average net assets
| 0.70% (c)
|
| 0.70%
|
| 0.70% (c)
|
Ratio of net investment income (loss) to average net assets
| 1.79% (c)
|
| 2.10%
|
| 1.29% (c)
|
Portfolio turnover rate (d)
| 27%
|
| 77%
|
| 23%
|
| (a)
| Inception date is December 15, 2020, which is consistent with the commencement of investment operations and is the date the initial creation units were established.
|
| (b)
| Total return is calculated assuming an initial investment made at the net asset value at the beginning of the period, reinvestment of all distributions at net asset value during the
period, and redemption at net asset value on the last day of the period. The returns presented do not reflect the deduction of taxes that a shareholder would pay on Fund distributions or the redemption or sale of Fund
shares. Total return is calculated for the time period presented and is not annualized for periods of less than a year.
|
| (c)
| Annualized.
|
| (d)
| Portfolio turnover is calculated for the time period presented and is not annualized for periods of less than a year and does not include securities received or
delivered from processing creations or redemptions and in-kind transactions.
|
See Notes to Financial Statements
Page 107
Notes to Financial Statements
First Trust
Exchange-Traded Fund VI
March 31, 2023
(Unaudited)
1. Organization
First Trust
Exchange-Traded Fund VI (the “Trust”) is an open-end management investment company organized as a Massachusetts business trust on June 4, 2012, and is registered with the Securities and Exchange Commission
under the Investment Company Act of 1940, as amended (the “1940 Act”).
The Trust currently
consists of thirty-three exchange-traded funds that are offering shares. This report covers the fourteen funds (each a “Fund” and collectively, the “Funds”) listed below. The shares of each
Fund are listed and traded on The Nasdaq Stock Market LLC (“Nasdaq”).
First
Trust NASDAQ Technology Dividend Index Fund – (ticker “TDIV”)
Multi-Asset Diversified Income Index Fund – (ticker “MDIV”)
First
Trust S&P International Dividend Aristocrats ETF – (ticker “FID”)
First
Trust BuyWrite Income ETF – (ticker “FTHI”)
First
Trust Nasdaq BuyWrite Income ETF – (ticker “FTQI”)
First
Trust Rising Dividend Achievers ETF – (ticker “RDVY”)
First
Trust Dorsey Wright Focus 5 ETF – (ticker “FV”)
First
Trust RBA American Industrial Renaissance® ETF – (ticker “AIRR”)
First
Trust Dorsey Wright Momentum & Dividend ETF – (ticker “DDIV”)
First
Trust Dorsey Wright International Focus 5 ETF – (ticker “IFV”)
First
Trust Dorsey Wright Dynamic Focus 5 ETF – (ticker “FVC”)
First
Trust Indxx Innovative Transaction & Process ETF – (ticker “LEGR”)
First
Trust Nasdaq Artificial Intelligence and Robotics ETF – (ticker “ROBT”)
First
Trust International Developed Capital Strength ETF – (ticker “FICS”)
Both TDIV and FICS
operate as a non-diversified series of the Trust. Each of MDIV, FID, FTHI, FTQI, RDVY, FV, AIRR, DDIV, IFV, FVC, LEGR and ROBT operates as a diversified open-end management investment company as defined in Section
5(b) of the 1940 Act. Each Fund represents a separate series of shares of beneficial interest in the Trust. Unlike conventional mutual funds, each Fund issues and redeems shares on a continuous basis, at net asset
value (“NAV”), only in large blocks of shares known as “Creation Units.” The investment objective of each Fund, except for FTHI and FTQI, seeks investment results that correspond generally to
the price and yield (before the Fund’s fees and expenses) of the following indices:
| Fund
| Index
|
First Trust NASDAQ Technology Dividend Index Fund
Multi-Asset Diversified Income Index Fund
First Trust S&P International Dividend Aristocrats ETF
First Trust Rising Dividend Achievers ETF
First Trust Dorsey Wright Focus 5 ETF
First Trust RBA American Industrial Renaissance® ETF
First Trust Dorsey Wright Momentum & Dividend ETF
First Trust Dorsey Wright International Focus 5 ETF
First Trust Dorsey Wright Dynamic Focus 5 ETF
First Trust Indxx Innovative Transaction & Process ETF
First Trust Nasdaq Artificial Intelligence and Robotics ETF
First Trust International Developed Capital Strength ETF
| Nasdaq Technology DividendTM Index
Nasdaq US Multi-Asset Diversified IncomeTM Index
S&P International Dividend Aristocrats Index
Nasdaq US Rising Dividend AchieversTM Index
Dorsey Wright Focus FiveTM Index
Richard Bernstein Advisors American Industrial Renaissance® Index
Dorsey Wright Momentum Plus Dividend YieldTM Index
Dorsey Wright International Focus FiveTM Index
Dorsey Wright Dynamic Focus FiveTM Index
Indxx Blockchain Index
Nasdaq CTA Artificial Intelligence and RoboticsTM Index
The International Developed Capital StrengthTM Index
|
FTHI and FTQI are
actively managed exchange-traded funds. The primary investment objective of FTHI is to provide current income. FTHI’s secondary investment objective is to provide capital appreciation. Under normal market
conditions, FTHI pursues its investment objectives by investing primarily in equity securities listed on U.S. exchanges and by utilizing an “option strategy” consisting of writing (selling) U.S.
exchange-traded call options on the Standard & Poor’s 500® Index (the “S&P 500®”). The Fund employs an option strategy in which it writes U.S. exchange-traded call options on the S&P 500® in order to seek additional cash flow in the form of premiums on the options that may be distributed to shareholders on a monthly basis. A
premium is the income received by an investor who sells or writes an option contract to another party. The market value of the option strategy may be up to 20% of the Fund’s overall NAV.
The investment objective
of FTQI is to provide current income. Under normal market conditions, FTQI pursues its investment objective by investing primarily in equity securities listed on U.S. exchanges and by utilizing an “option
strategy” consisting of writing (selling) U.S. exchange-traded call options on the Nasdaq-100 Index® (the “Nasdaq-100®”). Under normal market conditions, FTQI will invest at least 80% of its net assets (plus any borrowings for investment purposes) in the
components of the Nasdaq Composite
Notes to Financial Statements (Continued)
First Trust
Exchange-Traded Fund VI
March 31, 2023
(Unaudited)
Index. FTQI employs an option strategy
in which it writes U.S. exchange-traded call options on the Nasdaq-100® in order to seek additional cash flow in the form of premiums on the options. A premium is the income received by an investor who sells an
option contract to another party. In exchange for the premiums received in connection with its written U.S. exchange-traded call options on the Nasdaq-100®, FTQI forfeits any upside potential of the Nasdaq-100® above the strike price of the written call options. It is expected that FTQI will distribute premiums to shareholders on a monthly basis. The
premiums received from the sale of call options are expected to be FTQI’s primary source of income. Under normal market conditions, FTQI will seek to distribute the majority of the option premiums collected.
FTQI does not target a specific income level, but seeks to provide investors with current income primarily from options premiums through writing calls with a notional value of 50-100% of FTQI’s assets.
2. Significant
Accounting Policies
The Funds are each
considered an investment company and follow accounting and reporting guidance under Financial Accounting Standards Board Accounting Standards Codification Topic 946, “Financial Services-Investment
Companies.” The following is a summary of significant accounting policies consistently followed by the Funds in the preparation of the financial statements. The preparation of the financial statements in
accordance with accounting principles generally accepted in the United States of America (“U.S. GAAP”) requires management to make estimates and assumptions that affect the reported amounts and disclosures
in the financial statements. Actual results could differ from those estimates.
A. Portfolio
Valuation
Each Fund’s NAV is
determined daily as of the close of regular trading on the New York Stock Exchange (“NYSE”), normally 4:00 p.m. Eastern time, on each day the NYSE is open for trading. If the NYSE closes early on a
valuation day, the NAV is determined as of that time. Foreign securities are priced using data reflecting the earlier closing of the principal markets for those securities. Each Fund’s NAV is calculated by
dividing the value of all assets of each Fund (including accrued interest and dividends), less all liabilities (including accrued expenses and dividends declared but unpaid), by the total number of shares
outstanding.
Each Fund’s
investments are valued daily at market value or, in the absence of market value with respect to any portfolio securities, at fair value. Market value prices represent readily available market quotations such as last
sale or official closing prices from a national or foreign exchange (i.e., a regulated market) and are primarily obtained from third-party pricing services. Fair value prices represent any prices not considered market
value prices and are either obtained from a third-party pricing service or are determined by the Pricing Committee of the Funds’ investment advisor, First Trust Advisors L.P. (“First Trust” or the
“Advisor”), in accordance with valuation procedures approved by the Trust’s Board of Trustees, and in accordance with provisions of the 1940 Act and rules thereunder. Investments valued by the
Advisor’s Pricing Committee, if any, are footnoted as such in the footnotes to the Portfolio of Investments. Each Fund’s investments are valued as follows:
Common
stocks, preferred stocks, master limited partnerships (“MLPs”), real estate investment trusts (“REITs”), exchange-traded funds, and other equity securities listed on any national or foreign
exchange (excluding Nasdaq and the London Stock Exchange Alternative Investment Market (“AIM”)) are valued at the last sale price on the exchange on which they are principally traded or, for Nasdaq and AIM
securities, the official closing price. Securities traded on more than one securities exchange are valued at the last sale price or official closing price, as applicable, at the close of the securities exchange
representing the primary exchange for such securities.
Securities trading on foreign exchanges or over-the-counter markets that close prior to the NYSE close may be valued using a systematic fair valuation model provided by a third-party pricing service. If these
foreign securities meet certain criteria in relation to the valuation model, their valuation is systematically adjusted to reflect the impact of movement in the U.S. market after the close of the foreign markets.
Shares
of open-end funds are valued based on NAV per share.
Securities traded in an over-the-counter market are valued at the mean of their most recent bid and asked price, if available, and otherwise at their last trade price.
Overnight repurchase agreements are valued at amortized cost when it represents the most appropriate reflection of fair market value.
Exchange-traded options contracts are valued at the closing price in the market where such contracts are principally traded. If no closing price is available, exchange-traded options contracts are valued at the mean
of their most recent bid and asked price, if available, and otherwise at their closing bid price. Over-the-counter options contracts are valued at the mean of their most recent bid and asked price, if available, and
otherwise at their closing bid price.
Notes to Financial Statements (Continued)
First Trust
Exchange-Traded Fund VI
March 31, 2023
(Unaudited)
U.S.
Treasuries are fair valued on the basis of valuations provided by a third-party pricing service approved by the Trust’s Board of Trustees.
Fixed
income and other debt securities having a remaining maturity of sixty days or less when purchased are fair valued at cost adjusted for amortization of premiums and accretion of discounts (amortized cost), provided the
Advisor’s Pricing Committee has determined that the use of amortized cost is an appropriate reflection of fair value given market and issuer-specific conditions existing at the time of the determination. Factors
that may be considered in determining the appropriateness of the use of amortized cost include, but are not limited to, the following:
| 1)
| the credit conditions in the relevant market and changes thereto;
|
| 2)
| the liquidity conditions in the relevant market and changes thereto;
|
| 3)
| the interest rate conditions in the relevant market and changes thereto (such as significant changes in interest rates);
|
| 4)
| issuer-specific conditions (such as significant credit deterioration); and
|
| 5)
| any other market-based data the Advisor’s Pricing Committee considers relevant. In this regard, the Advisor’s Pricing Committee may use last-obtained market-based data to assist it when
valuing portfolio securities using amortized cost.
|
Certain securities may
not be able to be priced by pre-established pricing methods. Such securities may be valued by the Advisor’s Pricing Committee at fair value. These securities generally include, but are not limited to, restricted
securities (securities which may not be publicly sold without registration under the Securities Act of 1933, as amended) for which a third-party pricing service is unable to provide a market price; securities whose
trading has been formally suspended; a security whose market or fair value price is not available from a pre-established pricing source; a security with respect to which an event has occurred that is likely to
materially affect the value of the security after the market has closed but before the calculation of a Fund’s NAV or make it difficult or impossible to obtain a reliable market quotation; and a security whose
price, as provided by the third-party pricing service, does not reflect the security’s fair value. As a general principle, the current fair value of a security would appear to be the amount which the owner might
reasonably expect to receive for the security upon its current sale. When fair value prices are used, generally they will differ from market quotations or official closing prices on the applicable exchanges. A variety
of factors may be considered in determining the fair value of such securities, including, but not limited to, the following:
| 1)
| the last sale price on the exchange on which they are principally traded or, for Nasdaq and AIM securities, the official closing price;
|
| 2)
| the type of security;
|
| 3)
| the size of the holding;
|
| 4)
| the initial cost of the security;
|
| 5)
| transactions in comparable securities;
|
| 6)
| price quotes from dealers and/or third-party pricing services;
|
| 7)
| relationships among various securities;
|
| 8)
| information obtained by contacting the issuer, analysts, or the appropriate stock exchange;
|
| 9)
| an analysis of the issuer’s financial statements;
|
| 10)
| the existence of merger proposals or tender offers that might affect the value of the security; and
|
| 11)
| other relevant factors.
|
If the securities in
question are foreign securities, the following additional information may be considered:
| 1)
| the value of similar foreign securities traded on other foreign markets;
|
| 2)
| ADR trading of similar securities;
|
| 3)
| closed-end fund or exchange-traded fund trading of similar securities;
|
| 4)
| foreign currency exchange activity;
|
| 5)
| the trading prices of financial products that are tied to baskets of foreign securities;
|
| 6)
| factors relating to the event that precipitated the pricing problem;
|
| 7)
| whether the event is likely to recur;
|
| 8)
| whether the effects of the event are isolated or whether they affect entire markets, countries or regions; and
|
| 9)
| other relevant factors.
|
In addition, differences
between the prices used to calculate a Fund’s NAV and the prices used by such Fund’s corresponding index could result in a difference between a Fund’s performance and the performance of its
underlying index.
Notes to Financial Statements (Continued)
First Trust
Exchange-Traded Fund VI
March 31, 2023
(Unaudited)
Because foreign markets
may be open on different days than the days during which investors may transact in the shares of a Fund, the value of the Fund’s securities may change on the days when investors are not able to transact in the
shares of the Fund. The value of securities denominated in foreign currencies is converted into U.S. dollars using exchange rates determined daily as of the close of regular trading on the NYSE. Any use of a different
rate from the rates used by a relevant index may adversely affect the Fund’s ability to track the index.
The Funds are subject to
fair value accounting standards that define fair value, establish the framework for measuring fair value and provide a three-level hierarchy for fair valuation based upon the inputs to the valuation as of the
measurement date. The three levels of the fair value hierarchy are as follows:
| •
| Level 1 – Level 1 inputs are quoted prices in active markets for identical investments. An active market is a market in which transactions for the investment occur with sufficient frequency and
volume to provide pricing information on an ongoing basis.
|
| •
| Level 2 – Level 2 inputs are observable inputs, either directly or indirectly, and include the following:
|
| o
| Quoted prices for similar investments in active markets.
|
| o
| Quoted prices for identical or similar investments in markets that are non-active. A non-active market is a market where there are few transactions for the investment, the prices are not current, or
price quotations vary substantially either over time or among market makers, or in which little information is released publicly.
|
| o
| Inputs other than quoted prices that are observable for the investment (for example, interest rates and yield curves observable at commonly quoted intervals, volatilities, prepayment speeds, loss
severities, credit risks, and default rates).
|
| o
| Inputs that are derived principally from or corroborated by observable market data by correlation or other means.
|
| •
| Level 3 – Level 3 inputs are unobservable inputs. Unobservable inputs may reflect the reporting entity’s own assumptions about the assumptions that market participants would use in pricing
the investment.
|
The inputs or
methodologies used for valuing investments are not necessarily an indication of the risk associated with investing in those investments. A summary of the inputs used to value each Fund’s investments as of March
31, 2023, is included with each Fund’s Portfolio of Investments.
B. Option
Contracts
FTHI and FTQI are subject
to equity price risk in the normal course of pursuing their investment objectives. FTHI may write (sell) U.S. exchange-traded call options on the S&P 500® and FTQI may write (sell) U.S. exchange-traded call options on the Nasdaq-100®, to hedge against changes in the value of equities. Additionally, these two Funds seek to generate additional income, in the form of premiums
received, from writing (selling) the options. FTHI may write (sell) call options or put options and FTQI may write (sell) call options (“options”) on all or a portion of the equity securities held in their
respective portfolios and on securities indices in their respective portfolios as determined to be appropriate by the Advisor, consistent with their investment objectives. Options on securities indices are designed to
reflect price fluctuations in a group of securities or segment of the securities market rather than price fluctuations in a single security and are similar to options on single securities, except that the exercise of
securities index options requires cash settlement payments and does not involve the actual purchase or sale of securities. When a Fund writes (sells) an option, an amount equal to the premium received by the Fund is
included in “Options written, at value” on the Statements of Assets and Liabilities. Options are marked-to-market daily and their value will be affected by changes in the value and dividend rates of the
underlying equity securities, changes in interest rates, changes in the actual or perceived volatility of the securities markets and the underlying equity securities and the remaining time to the options’
expiration. The value of options may also be adversely affected if the market for the options becomes less liquid or trading volume diminishes.
Options written (sold) by
FTHI and FTQI will either be exercised, expire, or be canceled pursuant to a closing transaction. If an index option written (sold) by either of these two Funds is exercised, the Fund would be obligated to deliver
cash equal to the difference between the closing price of the stock index and the exercise price of the option expressed in dollars times a specified multiple. If the price of the index is less than the option’s
strike price, the index option will likely expire without being exercised. In the case of a stock option, if the price of the underlying equity security exceeds the option’s exercise price, it is likely that the
option holder will exercise the option. In this case, the option premium received by the Fund will be added to the amount realized on the sale of the underlying security for purposes of determining gain or loss. If
the price of the underlying equity security is less than the option’s strike price, the option will likely expire without being exercised. The option premium received by each Fund will, in this case, be treated
as short-term capital gain on the expiration date of the option. Gain or loss on options is presented separately as “Net realized gain (loss) on written options contracts” on the Statements of
Operations.
Notes to Financial Statements (Continued)
First Trust
Exchange-Traded Fund VI
March 31, 2023
(Unaudited)
The index options that
FTHI and FTQI write (sell) give the option holder the right, but not the obligation, to receive an amount of cash based on the difference between the closing level of the stock index and the exercise price on or prior
to the option’s expiration date. The stock options that FTHI and FTQI write (sell) give the option holder the right, but not the obligation, to purchase securities from each Fund at the strike price on or prior
to the option’s expiration date. The ability to successfully implement the writing (selling) of call or put options depends on the ability of the Advisor to predict pertinent market movements, which cannot be
assured. As the writer (seller) of a call option, FTHI foregoes, during the option’s life, the opportunity to profit from increases in the market value of the security covering the option above the sum of the
premium and the strike price of the option, but has retained the risk of loss should the price of the underlying security decline. The writer (seller) of an option has no control over the time when it may be required
to fulfill its obligation as a writer (seller) of the option. Once an option writer (seller) has received an exercise notice, it cannot effect a closing purchase transaction in order to terminate its obligation under
the option and must deliver the underlying security to the option holder at the exercise price.
C. Securities
Transactions and Investment Income
Securities transactions
are recorded as of the trade date. Realized gains and losses from securities transactions are recorded on the identified cost basis. Dividend income is recorded on the ex-dividend date except that certain dividends
from foreign securities are recorded as soon as the information becomes available after the ex-dividend date. Interest income is recorded daily on the accrual basis.
Withholding taxes and tax
reclaims on foreign dividends have been provided for in accordance with each Fund’s understanding of the applicable country’s tax rules and rates.
Distributions received
from a Fund’s investments in MLPs generally are comprised of return of capital and investment income. A Fund records estimated return of capital and investment income based on historical information available
from each MLP. These estimates may subsequently be revised based on information received from the MLPs after their tax reporting periods are concluded.
Distributions received
from a Fund’s investments in REITs may be comprised of return of capital, capital gains, and income. The actual character of the amounts received during the year are not known until after the REITs’ fiscal
year end. A Fund records the character of distributions received from the REITs during the year based on estimates available. The characterization of distributions received by a Fund may be subsequently revised based
on information received from the REITs after their tax reporting periods conclude.
D. Foreign
Currency
The books and records of
the Funds are maintained in U.S. dollars. Foreign currencies, investments and other assets and liabilities are translated into U.S. dollars at the exchange rates prevailing at the end of the period. Purchases and
sales of investments and items of income and expense are translated on the respective dates of such transactions. Unrealized gains and losses on assets and liabilities, other than investments in securities, which
result from changes in foreign currency exchange rates have been included in “Net change in unrealized appreciation (depreciation) on foreign currency translation” on the Statements of Operations.
Unrealized gains and losses on investments in securities which result from changes in foreign exchange rates are included with fluctuations arising from changes in market price and are included in “Net change in
unrealized appreciation (depreciation) on investments” on the Statements of Operations. Net realized foreign currency gains and losses include the effect of changes in exchange rates between trade date and
settlement date on investment security transactions, foreign currency transactions and interest and dividends received and are included in “Net realized gain (loss) on foreign currency transactions” on the
Statements of Operations. The portion of foreign currency gains and losses related to fluctuations in exchange rates between the initial purchase settlement date and subsequent sale trade date is included in
“Net realized gain (loss) on investments” on the Statements of Operations.
E. Affiliated
Transactions
MDIV, FV, IFV, and FVC
invest in securities of affiliated funds. Each Fund’s investment performance and risks are related to the investment performance and risks of the affiliated funds.
Amounts relating to these
investments in MDIV at March 31, 2023, and for the six months then ended are:
| Security Name
| Shares at
3/31/2023
| Value at
9/30/2022
| Purchases
| Sales
| Change in
Unrealized
Appreciation
(Depreciation)
| Realized
Gain
(Loss)
| Value at
3/31/2023
| Dividend
Income
|
| First Trust Tactical High Yield ETF
| 2,284,925
| $ 91,828,017
| $ 9,994,186
| $ (14,276,034)
| $ 4,062,108
| $ (759,659)
| $ 90,848,618
| $ 2,913,727
|
Notes to Financial Statements (Continued)
First Trust
Exchange-Traded Fund VI
March 31, 2023
(Unaudited)
Amounts relating to these
investments in FV at March 31, 2023, and for the six months then ended are:
| Security Name
| Shares at
3/31/2023
| Value at
9/30/2022
|
| Purchases
|
| Sales
|
| Change in
Unrealized
Appreciation
(Depreciation)
|
| Realized
Gain
(Loss)
|
| Value at
3/31/2023
|
| Dividend
Income
|
| First Trust Consumer Discretionary AlphaDEX® Fund
| 12,309,910
| $ —
|
| $604,275,106
|
| $ (428,682)
|
| $35,403,734
|
| $3,468
|
| $639,253,626
|
| $ —
|
| First Trust Energy AlphaDEX® Fund
| —
| 581,212,875
|
| 89,345,705
|
| (727,944,152)
|
| 449,929
|
| 56,935,643
|
| —
|
| 4,990,364
|
| First Trust Financials AlphaDEX® Fund
| —
| —
|
| 674,340,221
|
| (527,783,992)
|
| —
|
| (146,556,229)
|
| —
|
| 3,106,028
|
| First Trust Industrials/Producer Durables AlphaDEX® Fund
| 11,493,642
| 505,548,471
|
| 97,102,417
|
| (73,621,390)
|
| 108,936,945
|
| 505,370
|
| 638,471,813
|
| 2,790,368
|
| First Trust Materials AlphaDEX® Fund
| 9,738,120
| 426,900,733
|
| 121,957,992
|
| (24,862,085)
|
| 110,519,363
|
| 1,577,996
|
| 636,093,999
|
| 4,672,755
|
| First Trust Nasdaq Food & Beverage ETF
| 23,696,341
| 532,524,093
|
| 148,757,193
|
| (87,819,338)
|
| 47,412,827
|
| (3,917,129)
|
| 636,957,646
|
| 4,968,322
|
| First Trust Nasdaq Oil & Gas ETF
| —
| 541,275,552
|
| 105,610,767
|
| (654,159,549)
|
| (76,138,600)
|
| 83,411,830
|
| —
|
| 8,211,911
|
| First Trust Nasdaq Semiconductor ETF
| 9,950,938
| —
|
| 622,900,077
|
| (433,655)
|
| 22,458,565
|
| (4,695)
|
| $644,920,292
|
| —
|
|
|
| $2,587,461,724
|
| $2,464,289,478
|
| $(2,097,052,843)
|
| $249,042,763
|
| $(8,043,746)
|
| $3,195,697,376
|
| $28,739,748
|
Notes to Financial Statements (Continued)
First Trust
Exchange-Traded Fund VI
March 31, 2023
(Unaudited)
Amounts relating to these
investments in IFV at March 31, 2023, and for the six months then ended are:
| Security Name
| Shares at
3/31/2023
| Value at
9/30/2022
|
| Purchases
|
| Sales
|
| Change in
Unrealized
Appreciation
(Depreciation)
|
| Realized
Gain
(Loss)
|
| Value at
3/31/2023
|
| Dividend
Income
|
| First Trust BICK Index Fund
| —
| $27,247,140
|
| $795,680
|
| $ (30,900,508)
|
| $2,920,019
|
| $ (62,331)
|
| $ —
|
| $ —
|
| First Trust Brazil AlphaDEX® Fund
| —
| —
|
| 41,876,650
|
| (39,225,682)
|
| —
|
| (2,650,968)
|
| —
|
| 361,882
|
| First Trust Chindia ETF
| —
| 27,506,086
|
| 1,833,202
|
| (28,053,438)
|
| 3,006,867
|
| (4,292,717)
|
| —
|
| —
|
| First Trust Dow Jones Global Select Dividend Index Fund
| 1,898,905
| 26,988,029
|
| 44,995,408
|
| (29,219,743)
|
| 7,858,526
|
| (8,637,430)
|
| 41,984,790
|
| 204,161
|
| First Trust India NIFTY 50 Equal Weight ETF
| 951,825
| 29,598,143
|
| 17,122,561
|
| (5,429,128)
|
| (1,600,892)
|
| 276,448
|
| 39,967,132
|
| 924,215
|
| First Trust Japan AlphaDEX® Fund
| 988,597
| —
|
| 45,222,756
|
| (2,838,939)
|
| 2,443,830
|
| (17,610)
|
| 44,810,037
|
| 230,456
|
| First Trust Latin America AlphaDEX® Fund
| 2,613,963
| 27,672,640
|
| 19,533,495
|
| (5,059,109)
|
| 3,387,044
|
| (302,054)
|
| 45,232,016
|
| 503,101
|
| First Trust Switzerland AlphaDEX® Fund
| 755,642
| —
|
| 45,367,707
|
| (6,712,649)
|
| 6,902,554
|
| 511,387
|
| 46,068,999
|
| 133,309
|
|
|
| $139,012,038
|
| $216,747,459
|
| $(147,439,196)
|
| $24,917,948
|
| $(15,175,275)
|
| $218,062,974
|
| $2,357,124
|
Amounts relating to these
investments in FVC at March 31, 2023, and for the six months then ended are:
| Security Name
| Shares at
3/31/2023
| Value at
9/30/2022
|
| Purchases
|
| Sales
|
| Change in
Unrealized
Appreciation
(Depreciation)
|
| Realized
Gain
(Loss)
|
| Value at
3/31/2023
|
| Dividend
Income
|
| First Trust Consumer Discretionary AlphaDEX® Fund
| 658,962
| $ —
|
| $33,581,396
|
| $ (1,303,726)
|
| $1,897,811
|
| $44,416
|
| $34,219,897
|
| $ —
|
| First Trust Energy AlphaDEX® Fund
| —
| 31,230,271
|
| 28,852,388
|
| (62,591,205)
|
| 94,476
|
| 2,414,070
|
| —
|
| 163,979
|
| First Trust Enhanced Short Maturity ETF
| 1,376,397
| 91,338,267
|
| 231,980,116
|
| (241,804,655)
|
| (18,027)
|
| 413,685
|
| 81,909,386
|
| 2,173,552
|
| First Trust Financials AlphaDEX® Fund
| —
| —
|
| 57,574,745
|
| (45,299,822)
|
| —
|
| (12,274,923)
|
| —
|
| 259,712
|
| First Trust Industrials/Producer Durables AlphaDEX® Fund
| 615,268
| 27,164,583
|
| 48,780,127
|
| (43,341,617)
|
| 4,468,436
|
| (2,893,392)
|
| 34,178,137
|
| 149,087
|
| First Trust Materials AlphaDEX® Fund
| 521,292
| 22,938,522
|
| 49,578,219
|
| (38,742,308)
|
| 5,338,803
|
| (5,062,443)
|
| 34,050,793
|
| 275,964
|
| First Trust Nasdaq Food & Beverage ETF
| 1,268,489
| 28,614,090
|
| 52,663,557
|
| (48,579,102)
|
| 3,590,040
|
| (2,191,601)
|
| 34,096,984
|
| 247,107
|
| First Trust Nasdaq Oil & Gas ETF
| —
| 29,084,238
|
| 52,260,542
|
| (78,436,951)
|
| (3,002,391)
|
| 94,562
|
| —
|
| 458,905
|
| First Trust Nasdaq Semiconductor ETF
| 532,684
| —
|
| 34,617,547
|
| (1,328,982)
|
| 1,203,865
|
| 30,820
|
| 34,523,250
|
| —
|
|
|
| $230,369,971
|
| $589,888,637
|
| $(561,428,368)
|
| $13,573,013
|
| $(19,424,806)
|
| $252,978,447
|
| $3,728,306
|
Notes to Financial Statements (Continued)
First Trust
Exchange-Traded Fund VI
March 31, 2023
(Unaudited)
F. Offsetting on the
Statements of Assets and Liabilities
Offsetting assets and
liabilities requires entities to disclose both gross and net information about instruments and transactions eligible for offset on the Statements of Assets and Liabilities and disclose instruments and transactions
subject to master netting or similar agreements. These disclosure requirements are intended to help investors and other financial statement users better assess the effect or potential effect of offsetting arrangements
on a Fund’s financial position. The transactions subject to offsetting disclosures are derivative instruments, repurchase agreements and reverse repurchase agreements, and securities borrowing and securities
lending transactions.
This disclosure, if
applicable, is included within each Fund’s Portfolio of Investments under the heading “Offsetting Assets and Liabilities.” For financial reporting purposes, the Funds do not offset financial assets
and financial liabilities that are subject to master netting arrangements (“MNAs”) or similar agreements on the Statements of Assets and Liabilities. MNAs provide the right, in the event of default
(including bankruptcy and insolvency), for the non-defaulting counterparty to liquidate the collateral and calculate the net exposure to the defaulting party or request additional collateral.
G. Securities
Lending
The Funds may lend
securities representing up to 33 1/3% of the value of their total assets to broker-dealers, banks and other institutions to generate additional income. When a Fund loans its portfolio securities, it will receive, at
the inception of each loan, collateral equal to at least 102% (for domestic securities) or 105% (for international securities) of the market value of the loaned securities. The collateral amount is valued at the
beginning of each business day and is compared to the market value of the loaned securities from the prior business day to determine if additional collateral is required. If additional collateral is required, a
request is sent to the borrower. Securities lending involves the risk that the Fund may lose money because the borrower of the Fund’s loaned securities fails to return the securities in a timely manner or at
all. The Fund could also lose money in the event of (i) a decline in the value of the collateral provided for the loaned securities, (ii) a decline in the value of any investments made with cash collateral or (iii) an
increase in the value of the loaned securities if the borrower does not increase the collateral accordingly and the borrower fails to return the securities. These events could also trigger adverse tax consequences for
the Funds.
Under the Funds’
Securities Lending Agency Agreement, the securities lending agent will generally bear the risk that a borrower may default on its obligation to return loaned securities. Brown Brothers Harriman & Co.
(“BBH”) acts as the Funds’ securities lending agent and is responsible for executing the lending of the portfolio securities to creditworthy borrowers. The Funds, however, will be responsible for the
risks associated with the investment of cash collateral. A Fund may lose money on its investment of cash collateral, which may affect its ability to repay the collateral to the borrower without the use of other Fund
assets. Each Fund that engages in securities lending receives compensation (net of any rebate and securities lending agent fees) for lending its securities. Compensation can be in the form of fees received from the
securities lending agent or dividends or interest earned from the investment of cash collateral. The fees received from the securities lending agent are accrued daily. The dividend and interest earned on the
securities loaned is accounted for in the same manner as other dividend and interest income. During the six months ended March 31, 2023, AIRR, LEGR and ROBT participated in the securities lending program.
In the event of a default
by a borrower with respect to any loan, BBH will exercise any and all remedies provided under the applicable borrower agreement to make the Funds whole. These remedies include purchasing replacement securities by
applying the collateral held from the defaulting broker against the purchase cost of the replacement securities. If, despite such efforts by BBH to exercise these remedies, a Fund sustains losses as a result of a
borrower’s default, BBH will indemnify the Fund by purchasing replacement securities at its own expense, or paying the Funds an amount equal to the market value of the replacement securities, subject to certain
limitations which are set forth in detail in the Securities Lending Agency Agreement between the Trust on behalf of the Funds and BBH.
H. Repurchase
Agreements
Repurchase agreements
involve the purchase of securities subject to the seller’s agreement to repurchase the securities at a mutually agreed upon date and price, under the terms of a Master Repurchase Agreement (“MRA”).
During the term of a repurchase agreement, the value of the underlying securities held as collateral on behalf of a Fund, including accrued interest, is required to exceed the value of the repurchase agreement,
including accrued interest. The underlying securities for all repurchase agreements are held at the Funds’ custodian or designated sub-custodians under tri-party repurchase agreements.
MRAs govern transactions
between a Fund and select counterparties. The MRAs maintain provisions for, among other things, initiation, income payments, events of default, and maintenance of collateral for repurchase agreements.
Repurchase agreements
received for lending securities are collateralized by U.S. Treasury securities. The U.S. Treasury securities are held in a joint custody account at BBH on behalf of the Funds participating in the securities lending
program. In the event the counterparty defaults on the repurchase agreement, the U.S. Treasury securities can either be maintained as part of a Fund’s portfolio
Notes to Financial Statements (Continued)
First Trust
Exchange-Traded Fund VI
March 31, 2023
(Unaudited)
or sold for cash. A Fund could suffer a
loss to the extent that the proceeds from the sale of the underlying collateral held by the Fund are less than the repurchase price and the Fund’s costs associated with the delay and enforcement of the MRA.
While the Funds may
invest in repurchase agreements, any repurchase agreements held by the Funds during the six months ended March 31, 2023, were received as collateral for lending securities.
I. Dividends and
Distributions to Shareholders
Dividends from net
investment income, if any, are declared and paid monthly for MDIV, FTHI, and FTQI and quarterly for TDIV, FID, RDVY, FV, AIRR, DDIV, IFV, FVC, LEGR, ROBT and FICS or as the Board of Trustees may determine from time to
time. Distributions of net realized capital gains earned by each Fund, if any, are distributed at least annually. A Fund may also designate a portion of the amount paid to redeeming shareholders as a distribution for
tax purposes.
Distributions from net
investment income and realized capital gains are determined in accordance with federal income tax regulations, which may differ from U.S. GAAP. Certain capital accounts in the financial statements are periodically
adjusted for permanent differences in order to reflect their tax character. These permanent differences are primarily due to the varying treatment of income and gain/loss on portfolio securities held by the Funds and
have no impact on net assets or NAV per share. Temporary differences, which arise from recognizing certain items of income, expense, and gain/loss in different periods for financial statement and tax purposes, will
reverse at some time in the future.
The tax character of
distributions paid by each Fund during the fiscal year ended September 30, 2022, was as follows:
|
| Distributions
paid from
Ordinary
Income
|
| Distributions
paid from
Capital
Gains
|
| Distributions
paid from
Return of
Capital
|
First Trust NASDAQ Technology Dividend Index Fund
| $ 37,869,712
|
| $ —
|
| $ —
|
Multi-Asset Diversified Income Index Fund
| 28,972,326
|
| —
|
| 634,126
|
First Trust S&P International Dividend Aristocrats ETF
| 2,134,072
|
| —
|
| —
|
First Trust BuyWrite Income ETF
| 4,161,738
|
| —
|
| —
|
First Trust Nasdaq BuyWrite Income ETF
| 627,504
|
| —
|
| 260,249
|
First Trust Rising Dividend Achievers ETF
| 140,979,372
|
| —
|
| —
|
First Trust Dorsey Wright Focus 5 ETF
| 27,189,651
|
| —
|
| —
|
First Trust RBA American Industrial Renaissance® ETF
| 131,850
|
| —
|
| —
|
First Trust Dorsey Wright Momentum & Dividend ETF
| 1,904,422
|
| —
|
| —
|
First Trust Dorsey Wright International Focus 5 ETF
| 5,794,666
|
| —
|
| —
|
First Trust Dorsey Wright Dynamic Focus 5 ETF
| 1,833,976
|
| —
|
| —
|
First Trust Indxx Innovative Transaction & Process ETF
| 3,919,682
|
| —
|
| —
|
First Trust Nasdaq Artificial Intelligence and Robotics ETF
| 369,695
|
| —
|
| —
|
First Trust International Developed Capital Strength ETF
| 503,611
|
| —
|
| —
|
Notes to Financial Statements (Continued)
First Trust
Exchange-Traded Fund VI
March 31, 2023
(Unaudited)
As of September 30, 2022,
the components of distributable earnings on a tax basis for each Fund were as follows:
|
| Undistributed
Ordinary
Income
|
| Accumulated
Capital and
Other
Gain (Loss)
|
| Net
Unrealized
Appreciation
(Depreciation)
|
First Trust NASDAQ Technology Dividend Index Fund
| $ 3,501,257
|
| $ (208,783,575)
|
| $ (204,387,577)
|
Multi-Asset Diversified Income Index Fund
| —
|
| (226,942,167)
|
| (50,345,965)
|
First Trust S&P International Dividend Aristocrats ETF
| 164,542
|
| (5,293,852)
|
| (11,563,360)
|
First Trust BuyWrite Income ETF
| —
|
| (18,375,410)
|
| (9,220,265)
|
First Trust Nasdaq BuyWrite Income ETF
| —
|
| (2,123,105)
|
| (2,620,426)
|
First Trust Rising Dividend Achievers ETF
| 15,703,375
|
| (149,050,822)
|
| (1,798,807,954)
|
First Trust Dorsey Wright Focus 5 ETF
| 1,291,405
|
| (579,723,679)
|
| (201,997,496)
|
First Trust RBA American Industrial Renaissance® ETF
| 142,573
|
| (33,161,068)
|
| (22,256,509)
|
First Trust Dorsey Wright Momentum & Dividend ETF
| 221,298
|
| (23,321,490)
|
| (10,864,363)
|
First Trust Dorsey Wright International Focus 5 ETF
| 81,382
|
| (144,990,579)
|
| (22,207,775)
|
First Trust Dorsey Wright Dynamic Focus 5 ETF
| 222,818
|
| (60,339,002)
|
| (10,572,639)
|
First Trust Indxx Innovative Transaction & Process ETF
| 115,148
|
| (4,605,254)
|
| (27,416,714)
|
First Trust Nasdaq Artificial Intelligence and Robotics ETF
| 319,975
|
| (23,210,981)
|
| (76,034,434)
|
First Trust International Developed Capital Strength ETF
| 20,290
|
| (1,161,324)
|
| (5,722,985)
|
J. Income Taxes
Each Fund intends to
continue to qualify as a regulated investment company by complying with the requirements under Subchapter M of the Internal Revenue Code of 1986, as amended, which includes distributing substantially all of its net
investment income and net realized gains to shareholders. Accordingly, no provision has been made for federal and state income taxes. However, due to the timing and amount of distributions, each Fund may be subject to
an excise tax of 4% of the amount by which approximately 98% of each Fund’s taxable income exceeds the distributions from such taxable income for the calendar year.
The Funds are subject to
accounting standards that establish a minimum threshold for recognizing, and a system for measuring, the benefits of a tax position taken or expected to be taken in a tax return. For all of the Funds, with the
exception of FICS, taxable years ended 2019, 2020, 2021 and 2022 remain open to federal and state audit. The taxable years ended 2021 and 2022 remain open to federal and state audit for FICS. As of March 31, 2023,
management has evaluated the application of these standards to the Funds and has determined that no provision for income tax is required in the Funds’ financial statements for uncertain tax positions.
The Funds intend to
utilize provisions of the federal income tax laws, which allow them to carry a realized capital loss forward indefinitely following the year of the loss and offset such loss against any future realized capital gains.
The Funds are subject to certain limitations under U.S. tax rules on the use of capital loss carryforwards and net unrealized built-in losses. These limitations apply when there has been a 50% change in ownership. At
September 30, 2022, for federal income tax purposes, each applicable Fund had a capital loss carryforward available that is shown in the following table, to the extent provided by regulations, to offset future capital
gains.
Notes to Financial Statements (Continued)
First Trust
Exchange-Traded Fund VI
March 31, 2023
(Unaudited)
|
| Non-Expiring
Capital Loss
Carryforward
|
First Trust NASDAQ Technology Dividend Index Fund
| $ 208,783,575
|
Multi-Asset Diversified Income Index Fund
| 226,942,167
|
First Trust S&P International Dividend Aristocrats ETF
| 5,293,852
|
First Trust BuyWrite Income ETF
| 18,375,410
|
First Trust Nasdaq BuyWrite Income ETF
| 2,123,105
|
First Trust Rising Dividend Achievers ETF
| 149,050,822
|
First Trust Dorsey Wright Focus 5 ETF
| 579,723,679
|
First Trust RBA American Industrial Renaissance® ETF
| 33,161,068
|
First Trust Dorsey Wright Momentum & Dividend ETF
| 23,321,490
|
First Trust Dorsey Wright International Focus 5 ETF
| 144,990,579
|
First Trust Dorsey Wright Dynamic Focus 5 ETF
| 60,339,002
|
First Trust Indxx Innovative Transaction & Process ETF
| 4,605,254
|
First Trust Nasdaq Artificial Intelligence and Robotics ETF
| 23,210,981
|
First Trust International Developed Capital Strength ETF
| 1,161,324
|
As of March 31, 2023, the
aggregate cost, gross unrealized appreciation, gross unrealized depreciation, and net unrealized appreciation/(depreciation) on investments (including short positions and derivatives, if any) for federal income tax
purposes were as follows:
|
| Tax Cost
|
| Gross
Unrealized
Appreciation
|
| Gross
Unrealized
(Depreciation)
|
| Net Unrealized
Appreciation
(Depreciation)
|
First Trust NASDAQ Technology Dividend Index Fund
| $ 1,551,683,672
|
| $ 282,595,275
|
| $ (103,754,731)
|
| $ 178,840,544
|
Multi-Asset Diversified Income Index Fund
| 445,502,917
|
| 29,928,415
|
| (45,257,601)
|
| (15,329,186)
|
First Trust S&P International Dividend Aristocrats ETF
| 79,899,738
|
| 1,880,704
|
| (5,790,946)
|
| (3,910,242)
|
First Trust BuyWrite Income ETF
| 153,299,251
|
| 7,760,595
|
| (6,231,199)
|
| 1,529,396
|
First Trust Nasdaq BuyWrite Income ETF
| 28,680,767
|
| 2,530,577
|
| (1,505,186)
|
| 1,025,391
|
First Trust Rising Dividend Achievers ETF
| 7,780,351,561
|
| 419,002,575
|
| (404,520,334)
|
| 14,482,241
|
First Trust Dorsey Wright Focus 5 ETF
| 3,145,616,040
|
| 90,265,362
|
| (40,184,026)
|
| 50,081,336
|
First Trust RBA American Industrial Renaissance® ETF
| 291,925,660
|
| 38,899,625
|
| (14,536,283)
|
| 24,363,342
|
First Trust Dorsey Wright Momentum & Dividend ETF
| 53,628,230
|
| 1,849,428
|
| (4,450,588)
|
| (2,601,160)
|
First Trust Dorsey Wright International Focus 5 ETF
| 215,343,107
|
| 9,346,384
|
| (6,626,517)
|
| 2,719,867
|
First Trust Dorsey Wright Dynamic Focus 5 ETF
| 248,306,884
|
| 4,946,843
|
| (275,280)
|
| 4,671,563
|
First Trust Indxx Innovative Transaction & Process ETF
| 123,841,518
|
| 9,146,882
|
| (14,010,881)
|
| (4,863,999)
|
First Trust Nasdaq Artificial Intelligence and Robotics ETF
| 266,958,233
|
| 20,450,940
|
| (29,858,379)
|
| (9,407,439)
|
First Trust International Developed Capital Strength ETF
| 36,602,054
|
| 3,517,659
|
| (1,103,740)
|
| 2,413,919
|
K. Expenses
Expenses that are
directly related to the Funds are charged to First Trust pursuant to the Investment Management Agreement, with the exception of advisory fees, distribution and service fees pursuant to a Rule 12b-1 plan, if any,
brokerage expenses, pro rata share of fees and expenses attributable to investments in other investment companies (“acquired fund fees and expenses”), taxes, interest, and extraordinary expenses, which are
paid by each respective Fund. See Note 3 relating to a reduction in MDIV’s annual unitary management fee. Expenses, other than the investment advisory fee and other excluded expenses, are paid by the Advisor.
Notes to Financial Statements (Continued)
First Trust
Exchange-Traded Fund VI
March 31, 2023
(Unaudited)
First Trust has entered
into licensing agreements with the following “Licensors” for the respective Funds:
| Fund
| Licensor
|
| First Trust NASDAQ Technology Dividend Index Fund
| Nasdaq, Inc.
|
| Multi-Asset Diversified Income Index Fund
| Nasdaq, Inc.
|
| First Trust S&P International Dividend Aristocrats ETF
| S&P Dow Jones Indices, LLC
|
| First Trust Rising Dividend Achievers ETF
| Nasdaq, Inc.
|
| First Trust Dorsey Wright Focus 5 ETF
| Dorsey, Wright & Associates, LLC
|
| First Trust RBA American Industrial Renaissance® ETF
| Richard Bernstein Advisors LLC
|
| First Trust Dorsey Wright Momentum & Dividend ETF
| Nasdaq, Inc.
|
| First Trust Dorsey Wright International Focus 5 ETF
| Dorsey, Wright & Associates, LLC
|
| First Trust Dorsey Wright Dynamic Focus 5 ETF
| Dorsey, Wright & Associates, LLC
|
| First Trust Indxx Innovative Transaction & Process ETF
| Indxx, Inc.
|
| First Trust Nasdaq Artificial Intelligence and Robotics ETF
| Nasdaq, Inc.
|
| First Trust International Developed Capital Strength ETF
| Nasdaq, Inc.
|
The respective license
agreements allow for the use by First Trust of each Fund’s respective index and of certain trademarks and trade names of the Licensor. The Funds are sub-licensees to the applicable license agreements.
3. Investment
Advisory Fee, Affiliated Transactions and Other Fee Arrangements
First Trust, the
investment advisor to the Funds, is a limited partnership with one limited partner, Grace Partners of DuPage L.P., and one general partner, The Charger Corporation. The Charger Corporation is an Illinois corporation
controlled by James A. Bowen, Chief Executive Officer of First Trust. First Trust is responsible for the selection and ongoing monitoring of the securities in each Fund’s portfolio, managing the Funds’
business affairs and providing certain administrative services necessary for the management of the Funds.
First Trust is
responsible for the expenses of each Fund including the cost of transfer agency, custody, fund administration, licensing fees, legal, audit and other services, but excluding fee payments under the Investment
Management Agreement, interest, taxes, brokerage commissions and other expenses associated with the execution of portfolio transactions, acquired fund fees and expenses, distribution and service fees pursuant to a
Rule 12b-1 plan, if any, and extraordinary expenses, which are paid by each respective Fund. First Trust also provides fund reporting services to the Funds for a flat annual fee in the amount of $9,250 per Fund, which
is covered under the annual unitary management fee. Effective November 1, 2022, the annual unitary management fee payable by each Fund to First Trust for these services will be reduced at certain levels of each
Fund’s net assets (“breakpoints”) and calculated pursuant to the following schedules:
| Breakpoints
| TDIV
| RDVY
| FV
| AIRR
|
|
|
|
| Fund net assets up to and including $2.5 billion
| 0.5000%
| 0.5000%
| 0.3000%
| 0.7000%
|
|
|
|
| Fund net assets greater than $2.5 billion up to and including $5 billion
| 0.4875%
| 0.4875%
| 0.2925%
| 0.6825%
|
|
|
|
| Fund net assets greater than $5 billion up to and including $7.5 billion
| 0.4750%
| 0.4750%
| 0.2850%
| 0.6650%
|
|
|
|
| Fund net assets greater than $7.5 billion up to and including $10 billion
| 0.4625%
| 0.4625%
| 0.2775%
| 0.6475%
|
|
|
|
| Fund net assets greater than $10 billion up to and including $15 billion
| 0.4500%
| 0.4500%
| 0.2700%
| 0.6300%
|
|
|
|
| Fund net assets greater than $15 billion
| 0.4250%
| 0.4250%
| 0.2550%
| 0.5950%
|
|
|
|
| Breakpoints
| DDIV
| IFV
| FVC
|
|
|
|
|
| Fund net assets up to and including $2.5 billion
| 0.600%
| 0.3000%
| 0.3000%
|
|
|
|
|
| Fund net assets greater than $2.5 billion up to and including $5 billion
| 0.585%
| 0.2925%
| 0.2925%
|
|
|
|
|
| Fund net assets greater than $5 billion up to and including $7.5 billion
| 0.570%
| 0.2850%
| 0.2850%
|
|
|
|
|
| Fund net assets greater than $7.5 billion up to and including $10 billion
| 0.555%
| 0.2775%
| 0.2775%
|
|
|
|
|
| Fund net assets greater than $10 billion up to and including $15 billion
| 0.540%
| 0.2700%
| 0.2700%
|
|
|
|
|
| Fund net assets greater than $15 billion
| 0.510%
| 0.2550%
| 0.2550%
|
|
|
|
|
Notes to Financial Statements (Continued)
First Trust
Exchange-Traded Fund VI
March 31, 2023
(Unaudited)
| Breakpoints
| MDIV
| FID
| FTHI
| FTQI
|
|
|
|
| Fund net assets up to and including $2.5 billion
| 0.600%
| 0.600%
| 0.85000%
| 0.85000%
|
|
|
|
| Fund net assets greater than $2.5 billion up to and including $5 billion
| 0.585%
| 0.585%
| 0.82875%
| 0.82875%
|
|
|
|
| Fund net assets greater than $5 billion up to and including $7.5 billion
| 0.570%
| 0.570%
| 0.80750%
| 0.80750%
|
|
|
|
| Fund net assets greater than $7.5 billion up to and including $10 billion
| 0.555%
| 0.555%
| 0.78625%
| 0.78625%
|
|
|
|
| Fund net assets greater than $10 billion
| 0.540%
| 0.540%
| 0.76500%
| 0.76500%
|
|
|
|
| Breakpoints
| LEGR
| ROBT
| FICS
|
|
|
|
|
| Fund net assets up to and including $2.5 billion
| 0.65000%
| 0.65000%
| 0.7000%
|
|
|
|
|
| Fund net assets greater than $2.5 billion up to and including $5 billion
| 0.63375%
| 0.63375%
| 0.6825%
|
|
|
|
|
| Fund net assets greater than $5 billion up to and including $7.5 billion
| 0.61750%
| 0.61750%
| 0.6650%
|
|
|
|
|
| Fund net assets greater than $7.5 billion up to and including $10 billion
| 0.60125%
| 0.60125%
| 0.6475%
|
|
|
|
|
| Fund net assets greater than $10 billion
| 0.58500%
| 0.58500%
| 0.6300%
|
|
|
|
|
Prior to November 1,
2022, the Funds paid First Trust an annual unitary management fee based on each Fund’s average daily net assets at the following rates:
| First Trust NASDAQ Technology Dividend Index Fund
| 0.50%
|
| Multi-Asset Diversified Income Index Fund
| 0.60%
|
| First Trust S&P International Dividend Aristocrats ETF
| 0.60%
|
| First Trust BuyWrite Income ETF
| 0.85%
|
| First Trust Nasdaq BuyWrite Income ETF
| 0.85%
|
| First Trust Rising Dividend Achievers ETF
| 0.50%
|
| First Trust Dorsey Wright Focus 5 ETF
| 0.30%
|
| First Trust RBA American Industrial Renaissance® ETF
| 0.70%
|
| First Trust Dorsey Wright Momentum & Dividend ETF
| 0.60%
|
| First Trust Dorsey Wright International Focus 5 ETF
| 0.30%
|
| First Trust Dorsey Wright Dynamic Focus 5 ETF
| 0.30%
|
| First Trust Indxx Innovative Transaction & Process ETF
| 0.65%
|
| First Trust Nasdaq Artificial Intelligence and Robotics ETF
| 0.65%
|
| First Trust International Developed Capital Strength ETF
| 0.70%
|
In addition, MDIV, FV,
IFV, and FVC incur pro rata share of fees and acquired fund fees and expenses. The total of the unitary management fee and acquired fund fees and expenses represents each Fund’s total annual operating
expenses.
During the fiscal year
ended September 30, 2022, ROBT received a payment from the Advisor of $1,987 in connection with a trade error.
Pursuant to a contractual
agreement between the Trust, on behalf of MDIV, and First Trust, the management fees paid to First Trust will be reduced by the proportional amount of the management fees earned by MDIV on assets invested in other
investment companies advised by First Trust. This contractual agreement shall continue until the earlier of (i) its termination at the direction of the Trust’s Board of Trustees or (ii) the termination of
MDIV’s investment management agreement with First Trust; however, it is expected to remain in place at least until January 31, 2024. First Trust does not have the right to recover the waived fees on the shares
of investment companies advised by First Trust. For the six months ended March 31, 2023, MDIV waived $275,752 of management fees.
The Trust has multiple
service agreements with Brown Brothers Harriman & Co. (“BBH”). Under the service agreements, BBH performs custodial, fund accounting, certain administrative services, and transfer agency services for
each Fund. As custodian, BBH is responsible for custody of each Fund’s assets. As fund accountant and administrator, BBH is responsible for maintaining the books and records of each Fund’s securities and
cash. As transfer agent, BBH is responsible for maintaining shareholder records for each Fund.
Each Trustee who is not
an officer or employee of First Trust, any sub-advisor or any of their affiliates (“Independent Trustees”) is paid a fixed annual retainer that is allocated equally among each fund in the First Trust Fund
Complex. Each Independent Trustee is also paid an annual per fund fee that varies based on whether the fund is a closed-end or other actively managed fund, a target outcome fund or an index fund.
Notes to Financial Statements (Continued)
First Trust
Exchange-Traded Fund VI
March 31, 2023
(Unaudited)
Additionally, the Lead
Independent Trustee and the Chairs of the Audit Committee, Nominating and Governance Committee and Valuation Committee are paid annual fees to serve in such capacities, with such compensation allocated pro rata among
each fund in the First Trust Fund Complex based on net assets. Independent Trustees are reimbursed for travel and out-of-pocket expenses in connection with all meetings. The Lead Independent Trustee and Committee
Chairs rotate every three years. The officers and “Interested” Trustee receive no compensation from the Trust for acting in such capacities.
4. Purchases and
Sales of Securities
For the six months ended
March 31, 2023, the cost of purchases and proceeds from sales of investment securities for each Fund, excluding short-term investments and in-kind transactions, were as follows:
|
| Purchases
|
| Sales
|
| First Trust NASDAQ Technology Dividend Index Fund
| $ 189,374,438
|
| $ 191,005,867
|
| Multi-Asset Diversified Income Index Fund
| 155,908,978
|
| 155,007,655
|
| First Trust S&P International Dividend Aristocrats ETF
| 38,373,894
|
| 33,502,372
|
| First Trust BuyWrite Income ETF
| 68,296,373
|
| 69,296,373
|
| First Trust Nasdaq BuyWrite Income ETF
| 19,340,307
|
| 19,855,494
|
| First Trust Rising Dividend Achievers ETF
| 3,964,071,923
|
| 3,972,949,531
|
| First Trust Dorsey Wright Focus 5 ETF
| 1,972,829,907
|
| 1,976,329,621
|
| First Trust RBA American Industrial Renaissance® ETF
| 60,746,133
|
| 61,348,422
|
| First Trust Dorsey Wright Momentum & Dividend ETF
| 54,881,064
|
| 54,702,231
|
| First Trust Dorsey Wright International Focus 5 ETF
| 133,383,526
|
| 133,102,227
|
| First Trust Dorsey Wright Dynamic Focus 5 ETF
| 517,787,607
|
| 518,177,200
|
| First Trust Indxx Innovative Transaction & Process ETF
| 8,706,913
|
| 8,728,252
|
| First Trust Nasdaq Artificial Intelligence and Robotics ETF
| 31,417,536
|
| 30,845,457
|
| First Trust International Developed Capital Strength ETF
| 9,038,216
|
| 8,230,722
|
|
|
|
|
|
For the six months ended
March 31, 2023, the cost of in-kind purchases and proceeds from in-kind sales for each Fund were as follows:
|
| Purchases
|
| Sales
|
| First Trust NASDAQ Technology Dividend Index Fund
| $ 57,048,975
|
| $ 88,462,931
|
| Multi-Asset Diversified Income Index Fund
| 37,717,808
|
| 56,667,487
|
| First Trust S&P International Dividend Aristocrats ETF
| 21,778,156
|
| —
|
| First Trust BuyWrite Income ETF
| 88,877,212
|
| 29,061,160
|
| First Trust Nasdaq BuyWrite Income ETF
| 14,365,188
|
| 5,582,060
|
| First Trust Rising Dividend Achievers ETF
| 116,948,155
|
| 716,674,290
|
| First Trust Dorsey Wright Focus 5 ETF
| 491,459,571
|
| 120,723,222
|
| First Trust RBA American Industrial Renaissance® ETF
| 138,602,629
|
| 36,686,736
|
| First Trust Dorsey Wright Momentum & Dividend ETF
| —
|
| 19,095,034
|
| First Trust Dorsey Wright International Focus 5 ETF
| 83,363,933
|
| 14,336,969
|
| First Trust Dorsey Wright Dynamic Focus 5 ETF
| 72,101,030
|
| 43,251,168
|
| First Trust Indxx Innovative Transaction & Process ETF
| 8,949,516
|
| 14,767,009
|
| First Trust Nasdaq Artificial Intelligence and Robotics ETF
| 34,031,567
|
| 12,097,135
|
| First Trust International Developed Capital Strength ETF
| 15,031,797
|
| 1,347,248
|
5. Derivative
Transactions
The following tables
present the type of derivatives held by each Fund at March 31, 2023, the primary underlying risk exposure and the location of these instruments as presented on the Statements of Assets and Liabilities.
Notes to Financial Statements (Continued)
First Trust
Exchange-Traded Fund VI
March 31, 2023
(Unaudited)
FTHI
|
|
|
|
| Asset Derivatives
|
| Liability Derivatives
|
Derivative
Instrument
|
| Risk
Exposure
|
| Statements of Assets and
Liabilities Location
|
| Value
|
| Statements of Assets and
Liabilities Location
|
| Value
|
| Options
|
| Equity Risk
|
| —
|
| $ —
|
| Options written, at value
|
| $ 4,422,467
|
FTQI
|
|
|
|
| Asset Derivatives
|
| Liability Derivatives
|
Derivative
Instrument
|
| Risk
Exposure
|
| Statements of Assets and
Liabilities Location
|
| Value
|
| Statements of Assets and
Liabilities Location
|
| Value
|
| Options
|
| Equity Risk
|
| —
|
| $ —
|
| Options written, at value
|
| $ 1,582,257
|
The following table
presents the amount of net realized gain (loss) and change in net unrealized appreciation (depreciation) recognized for the six months ended March 31, 2023, on derivative instruments, as well as the primary underlying
risk exposure associated with each instrument.
|
| Equity Risk
|
| Statements of Operations Location
| FTHI
| FTQI
|
| Net realized gain (loss) on Written options contracts
| $4,415,128
| $535,854
|
| Net change in unrealized gain (loss) on Written options contracts
| (3,912,849)
| (1,203,844)
|
During the six months
ended March 31, 2023, for FTHI, the premiums for written options opened were $9,276,611, and the premiums for written options closed, exercised and expired were $8,846,339.
During the six months
ended March 31, 2023, for FTQI, the premiums for written options opened were $3,392,445, and the premiums for written options closed, exercised and expired were $3,087,539.
FTHI and FTQI do not have
the right to offset on financial assets and financial liabilities related to options contracts on the Statements of Assets and Liabilities.
6. Creations,
Redemptions and Transaction Fees
Each Fund generally
issues and redeems its shares in primary market transactions through a creation and redemption mechanism and does not sell or redeem individual shares. Instead, financial entities known as “Authorized
Participants” have contractual arrangements with a Fund or one of the Fund’s service providers to purchase and redeem Fund shares directly with the Fund in large blocks of shares known as “Creation
Units.” Prior to the start of trading on every business day, a Fund publishes through the National Securities Clearing Corporation (“NSCC”) the “basket” of securities, cash or other
assets that it will accept in exchange for a Creation Unit of the Fund’s shares. An Authorized Participant that wishes to effectuate a creation of a Fund’s shares deposits with the Fund the
“basket” of securities, cash or other assets identified by the Fund that day, and then receives the Creation Unit of the Fund’s shares in return for those assets. After purchasing a Creation Unit,
the Authorized Participant may continue to hold the Fund’s shares or sell them in the secondary market. The redemption process is the reverse of the purchase process: the Authorized Participant redeems a
Creation Unit of a Fund’s shares for a basket of securities, cash or other assets. The combination of the creation and redemption process with secondary market trading in a Fund’s shares and underlying
securities provides arbitrage opportunities that are designed to help keep the market price of a Fund’s shares at or close to the NAV per share of the Fund.
Each Fund imposes fees in
connection with the purchase of Creation Units. These fees may vary based upon various fact-based circumstances, including, but not limited to, the composition of the securities included in the Creation Unit or the
countries in which the transactions are settled. The price for each Creation Unit will equal the daily NAV per share of a Fund times the number of shares in a Creation Unit, plus the fees described above and, if
applicable, any operational processing and brokerage costs, transfer fees, stamp taxes and part or all of the spread between the expected bid and offer side of the market related to the securities comprising the
creation basket.
Each Fund also imposes
fees in connection with the redemption of Creation Units. These fees may vary based upon various fact-based circumstances, including, but not limited to, the composition of the securities included in the Creation Unit
or the countries in which the transactions are settled. The price received for each Creation Unit will equal the daily NAV per share of a Fund times the number
Notes to Financial Statements (Continued)
First Trust
Exchange-Traded Fund VI
March 31, 2023
(Unaudited)
of shares in a Creation Unit, minus the
fees described above and, if applicable, any operational processing and brokerage costs, transfer fees, stamp taxes and part or all of the spread between the expected bid and offer side of the market related to the
securities comprising the redemption basket. Investors who use the services of a broker or other such intermediary in addition to an Authorized Participant to effect a redemption of a Creation Unit may also be
assessed an amount to cover the cost of such services. The redemption fee charged by a Fund will comply with Rule 22c-2 of the 1940 Act which limits redemption fees to no more than 2% of the value of the shares
redeemed.
7. Distribution
Plan
The Board of Trustees
adopted a Distribution and Service Plan pursuant to Rule 12b-1 under the 1940 Act. In accordance with the Rule 12b-1 plan, each Fund is authorized to pay an amount up to 0.25% of its average daily net assets each year
to reimburse First Trust Portfolios L.P. (“FTP”), the distributor of the Funds, for amounts expended to finance activities primarily intended to result in the sale of Creation Units or to provide investor
services. FTP may also use this amount to compensate securities dealers or other persons that are Authorized Participants for providing distribution assistance, including broker-dealer and shareholder support and
educational and promotional services.
No 12b-1 fees are
currently paid by the Funds, and pursuant to a contractual arrangement, no 12b-1 fees will be paid any time before January 31, 2024.
8. Indemnification
The Trust, on behalf of
the Funds, has a variety of indemnification obligations under contracts with its service providers. The Trust’s maximum exposure under these arrangements is unknown. However, the Trust has not had prior claims
or losses pursuant to these contracts and expects the risk of loss to be remote.
9. Subsequent
Events
Management has evaluated
the impact of all subsequent events to the Funds through the date the financial statements were issued and has determined that there were no subsequent events requiring recognition or disclosure in the financial
statements that have not already been disclosed.
Additional Information
First Trust
Exchange-Traded Fund VI
March 31, 2023
(Unaudited)
Proxy Voting Policies
and Procedures
A description of the
policies and procedures that the Trust uses to determine how to vote proxies and information on how each Fund voted proxies relating to portfolio securities during the most recent 12-month period ended June 30 is
available (1) without charge, upon request, by calling (800) 988-5891; (2) on each Fund’s website at www.ftportfolios.com; and (3) on the Securities and Exchange Commission’s (“SEC”) website at www.sec.gov.
Portfolio Holdings
Each Fund files portfolio
holdings information for each month in a fiscal quarter within 60 days after the end of the relevant fiscal quarter on Form N-PORT. Portfolio holdings information for the third month of each fiscal quarter will be
publicly available on the SEC’s website at www.sec.gov. Each Fund’s complete schedule of portfolio holdings for the second and fourth quarters of each fiscal year is included in the semi-annual and
annual reports to shareholders, respectively, and is filed with the SEC on Form N-CSR. The semi-annual and annual report for each Fund is available to investors within 60 days after the period to which it relates.
Each Fund’s Forms N-PORT and Forms N-CSR are available on the SEC’s website listed above.
Risk Considerations
Risks are inherent in all
investing. Certain general risks that may be applicable to a Fund are identified below, but not all of the material risks relevant to each Fund are included in this report and not all of the risks below apply to each
Fund. The material risks of investing in each Fund are spelled out in its prospectus, statement of additional information and other regulatory filings. Before investing, you should consider each Fund’s
investment objective, risks, charges and expenses, and read each Fund’s prospectus and statement of additional information carefully. You can download each Fund’s prospectus at www.ftportfolios.com or
contact First Trust Portfolios L.P. at (800) 621-1675 to request a prospectus, which contains this and other information about each Fund.
Concentration Risk. To the extent that a fund is able to invest a significant percentage of its assets in a single asset class or the securities of issuers within the same country, state, region, industry or
sector, an adverse economic, business or political development may affect the value of the fund’s investments more than if the fund were more broadly diversified. A fund that tracks an index will be concentrated
to the extent the fund’s corresponding index is concentrated. A concentration makes a fund more susceptible to any single occurrence and may subject the fund to greater market risk than a fund that is more
broadly diversified.
Credit Risk. Credit risk is the risk that an issuer of a security will be unable or unwilling to make dividend, interest and/or principal payments when due and the related risk that the value of a
security may decline because of concerns about the issuer’s ability to make such payments.
Cyber Security Risk. The funds are susceptible to potential operational risks through breaches in cyber security. A breach in cyber security refers to both intentional and unintentional events that may cause a
fund to lose proprietary information, suffer data corruption or lose operational capacity. Such events could cause a fund to incur regulatory penalties, reputational damage, additional compliance costs associated with
corrective measures and/or financial loss. In addition, cyber security breaches of a fund’s third-party service providers, such as its administrator, transfer agent, custodian, or sub-advisor, as applicable, or
issuers in which the fund invests, can also subject a fund to many of the same risks associated with direct cyber security breaches.
Defined Outcome Funds
Risk. To the extent a fund’s investment strategy is designed to deliver returns tied to the price performance of an underlying ETF, an investor may not realize the returns the fund seeks
to achieve if that investor does not hold shares for the entire target outcome period. In the event an investor purchases shares after the first day of the target outcome period or sells shares prior to the end of the
target outcome period, the buffer that the fund seeks to provide against a decline in the value of the underlying ETF may not be available, the enhanced returns that the fund seeks to provide (if any) may not be
available and the investor may not participate in a gain in the value of the underlying ETF up to the cap for the investor’s investment period. Additionally, the fund will not participate in gains of the
underlying ETF above the cap and a shareholder may lose their entire investment. If the fund seeks enhanced returns, there are certain time periods when the value of the fund may fall faster than the value of the
underlying ETF, and it is very unlikely that, on any given day during which the underlying ETF share price increases in value, the fund’s share price will increase at the same rate as the enhanced returns sought
by the fund, which is designed for an entire target outcome period. Trading flexible exchange options involves risks different from, or possibly greater than, the risks associated with investing directly in
securities, such as less liquidity and correlation and valuation risks. A fund may experience substantial downside from specific flexible exchange option positions and certain positions may expire worthless.
Derivatives Risk. To the extent a fund uses derivative instruments such as futures contracts, options contracts and swaps, the fund may experience losses because of adverse movements in the price or value
of the underlying asset, index or rate, which may be magnified
Additional Information (Continued)
First Trust
Exchange-Traded Fund VI
March 31, 2023
(Unaudited)
by certain features of the derivative.
These risks are heightened when a fund’s portfolio managers use derivatives to enhance the fund’s return or as a substitute for a position or security, rather than solely to hedge (or offset) the risk of a
position or security held by the fund.
Equity Securities
Risk. To the extent a fund invests in equity securities, the value of the fund’s shares will fluctuate with changes in the value of the equity securities. Equity securities prices
fluctuate for several reasons, including changes in investors’ perceptions of the financial condition of an issuer or the general condition of the relevant stock market, such as market volatility, or when
political or economic events affecting the issuers occur. In addition, common stock prices may be particularly sensitive to rising interest rates, as the cost of capital rises and borrowing costs increase. Equity
securities may decline significantly in price over short or extended periods of time, and such declines may occur in the equity market as a whole, or they may occur in only a particular country, company, industry or
sector of the market.
ETF Risk. The shares of an ETF trade like common stock and represent an interest in a portfolio of securities. The risks of owning an ETF generally reflect the risks of owning the underlying
securities, although lack of liquidity in an ETF could result in it being more volatile and ETFs have management fees that increase their costs. Shares of an ETF trade on an exchange at market prices rather than net
asset value, which may cause the shares to trade at a price greater than net asset value (premium) or less than net asset value (discount). In times of market stress, decisions by market makers to reduce or step away
from their role of providing a market for an ETF’s shares, or decisions by an ETF’s authorized participants that they are unable or unwilling to proceed with creation and/or redemption orders of an
ETF’s shares, could result in shares of the ETF trading at a discount to net asset value and in greater than normal intraday bid-ask spreads.
Fixed Income Securities
Risk. To the extent a fund invests in fixed income securities, the fund will be subject to credit risk, income risk, interest rate risk, liquidity risk and prepayment risk. Income risk is the
risk that income from a fund’s fixed income investments could decline during periods of falling interest rates. Interest rate risk is the risk that the value of a fund’s fixed income securities will
decline because of rising interest rates. Liquidity risk is the risk that a security cannot be purchased or sold at the time desired, or cannot be purchased or sold without adversely affecting the price. Prepayment
risk is the risk that the securities will be redeemed or prepaid by the issuer, resulting in lower interest payments received by the fund. In addition to these risks, high yield securities, or “junk”
bonds, are subject to greater market fluctuations and risk of loss than securities with higher ratings, and the market for high yield securities is generally smaller and less liquid than that for investment grade
securities.
Index or Model Constituent
Risk. Certain funds may be a constituent of one or more indices or ETF models. As a result, such a fund may be included in one or more index-tracking exchange-traded funds or mutual funds. Being
a component security of such a vehicle could greatly affect the trading activity involving a fund, the size of the fund and the market volatility of the fund. Inclusion in an index could increase demand for the fund
and removal from an index could result in outsized selling activity in a relatively short period of time. As a result, a fund’s net asset value could be negatively impacted and the fund’s market price may
be significantly below its net asset value during certain periods. In addition, index rebalances may potentially result in increased trading activity in a fund’s shares.
Index Provider Risk. To the extent a fund seeks to track an index, it is subject to Index Provider Risk. There is no assurance that the Index Provider will compile the Index accurately, or that the Index will
be determined, maintained, constructed, reconstituted, rebalanced, composed, calculated or disseminated accurately. To correct any such error, the Index Provider may carry out an unscheduled rebalance or other
modification of the Index constituents or weightings, which may increase the fund’s costs. The Index Provider does not provide any representation or warranty in relation to the quality, accuracy or completeness
of data in the Index, and it does not guarantee that the Index will be calculated in accordance with its stated methodology. Losses or costs associated with any Index Provider errors generally will be borne by the
fund and its shareholders.
Investment Companies
Risk. To the extent a fund invests in the securities of other investment vehicles, the fund will incur additional fees and expenses that would not be present in a direct investment in those
investment vehicles. Furthermore, the fund’s investment performance and risks are directly related to the investment performance and risks of the investment vehicles in which the fund invests.
LIBOR Risk. To the extent a fund invests in floating or variable rate obligations that use the London Interbank Offered Rate (“LIBOR”) as a reference interest rate, it is subject to LIBOR
Risk. The United Kingdom’s Financial Conduct Authority, which regulates LIBOR has ceased making LIBOR available as a reference rate over a phase-out period that began December 31, 2021. There is no assurance
that any alternative reference rate, including the Secured Overnight Financing Rate (“SOFR”) will be similar to or produce the same value or economic equivalence as LIBOR or that instruments using an
alternative rate will have the same volume or liquidity. The unavailability or replacement of LIBOR may affect the value, liquidity or return on certain fund investments and may result in costs incurred in connection
with closing out positions and entering into new trades. Any potential effects of the transition away from LIBOR on the fund or on certain instruments in which the fund invests can be difficult to ascertain, and they
may vary depending on a variety of factors, and they could result in losses to the fund.
Additional Information (Continued)
First Trust
Exchange-Traded Fund VI
March 31, 2023
(Unaudited)
Management Risk. To the extent that a fund is actively managed, it is subject to management risk. In managing an actively-managed fund’s investment portfolio, the fund’s portfolio managers will
apply investment techniques and risk analyses that may not have the desired result. There can be no guarantee that a fund will meet its investment objective.
Market Risk. Market risk is the risk that a particular security, or shares of a fund in general, may fall in value. Securities held by a fund, as well as shares of a fund itself, are subject to
market fluctuations caused by factors such as general economic conditions, political events, regulatory or market developments, changes in interest rates and perceived trends in securities prices. Shares of
a fund could decline in value or underperform other investments as a result of the risk of loss associated with these market fluctuations. In addition, local, regional or global events such as war, acts of
terrorism, spread of infectious diseases or other public health issues, recessions, or other events could have a significant negative impact on a fund and its investments. Such events may affect certain
geographic regions, countries, sectors and industries more significantly than others. In February 2022, Russia invaded Ukraine which has caused and could continue to cause significant market disruptions and
volatility within the markets in Russia, Europe, and the United States. The hostilities and sanctions resulting from those hostilities could have a significant impact on certain fund investments as well as
fund performance. The COVID-19 global pandemic and the ensuing policies enacted by governments and central banks have caused and may continue to cause significant volatility and uncertainty in global
financial markets. While the U.S. has resumed “reasonably” normal business activity, many countries continue to impose lockdown measures. Additionally, there is no guarantee that vaccines will be
effective against emerging variants of the disease. These events also adversely affect the prices and liquidity of a fund’s portfolio securities or other instruments and could result in disruptions in the
trading markets. Any of such circumstances could have a materially negative impact on the value of a fund’s shares and result in increased market volatility. During any such events, a fund’s
shares may trade at increased premiums or discounts to their net asset value and the bid/ask spread on a fund’s shares may widen.
Non-U.S. Securities
Risk. To the extent a fund invests in non-U.S. securities, it is subject to additional risks not associated with securities of domestic issuers. Non-U.S. securities are subject to higher
volatility than securities of domestic issuers due to: possible adverse political, social or economic developments; restrictions on foreign investment or exchange of securities; capital controls; lack of liquidity;
currency exchange rates; excessive taxation; government seizure of assets; the imposition of sanctions by foreign governments; different legal or accounting standards; and less government supervision and regulation of
exchanges in foreign countries. Investments in non-U.S. securities may involve higher costs than investments in U.S. securities, including higher transaction and custody costs, as well as additional taxes imposed by
non-U.S. governments. These risks may be heightened for securities of companies located, or with significant operations, in emerging market countries.
Operational Risk. Each fund is subject to risks arising from various operational factors, including, but not limited to, human error, processing and communication errors, errors of a fund’s service
providers, counterparties or other third-parties, failed or inadequate processes and technology or systems failures. Each fund relies on third-parties for a range of services, including custody. Any delay or failure
relating to engaging or maintaining such service providers may affect a fund’s ability to meet its investment objective. Although the funds and the funds’ investment advisor seek to reduce these
operational risks through controls and procedures, there is no way to completely protect against such risks.
Passive Investment
Risk. To the extent a fund seeks to track an index, the fund will invest in the securities included in, or representative of, the index regardless of their investment merit. A fund generally
will not attempt to take defensive positions in declining markets.
Preferred Securities
Risk. Preferred securities combine some of the characteristics of both common stocks and bonds. Preferred securities are typically subordinated to bonds and other debt securities in a
company’s capital structure in terms of priority to corporate income, subjecting them to greater credit risk than those debt securities. Generally, holders of preferred securities have no voting rights with
respect to the issuing company unless preferred dividends have been in arrears for a specified number of periods, at which time the preferred security holders may obtain limited rights. In certain circumstances, an
issuer of preferred securities may defer payment on the securities and, in some cases, redeem the securities prior to a specified date. Preferred securities may also be substantially less liquid than other securities,
including common stock.
Valuation Risk. The valuation of certain securities may carry more risk than that of common stock. Uncertainties in the conditions of the financial markets, unreliable reference data, lack of transparency
and inconsistency of valuation models and processes may lead to inaccurate asset pricing. A fund may hold investments in sizes smaller than institutionally sized round lot positions (sometimes referred to as odd
lots). However, third-party pricing services generally provide evaluations on the basis of institutionally-sized round lots. If a fund sells certain of its investments in an odd lot transaction, the sale price may be
less than the value at which such securities
Additional Information (Continued)
First Trust
Exchange-Traded Fund VI
March 31, 2023
(Unaudited)
have been held by the fund. Odd lots
often trade at lower prices than institutional round lots. There is no assurance that the fund will be able to sell a portfolio security at the price established by the pricing service, which could result in a loss to
the fund.
| NOT FDIC INSURED
| NOT BANK GUARANTEED
| MAY LOSE VALUE
|
Advisory Agreements
Board Considerations
Regarding Approval of Amendments to the Investment Management Agreements
The Board of Trustees of
First Trust Exchange-Traded Fund VI (the “Trust”), including the Independent Trustees, unanimously approved the amendment (as applicable to a specific Fund, the “Amendment” and collectively,
the “Amendments”) of the Investment Management Agreements (as applicable to a specific Fund, the “Agreement” and collectively, the “Agreements”) with First Trust Advisors L.P. (the
“Advisor”) on behalf of the following fourteen series of the Trust (each a “Fund” and collectively, the “Funds”):
First
Trust NASDAQ Technology Dividend Index Fund (TDIV)
Multi-Asset Diversified Income Index Fund (MDIV)
First
Trust S&P International Dividend Aristocrats ETF (FID)
First
Trust BuyWrite Income ETF (FTHI)
First
Trust Nasdaq BuyWrite Income ETF (FTQI)
First
Trust Rising Dividend Achievers ETF (RDVY)
First
Trust Dorsey Wright Focus 5 ETF (FV)
First
Trust RBA American Industrial Renaissance® ETF (AIRR)
First
Trust Dorsey Wright Momentum & Dividend ETF (DDIV)
First
Trust Dorsey Wright International Focus 5 ETF (IFV)
First
Trust Dorsey Wright Dynamic Focus 5 ETF (FVC)
First
Trust Indxx Innovative Transaction & Process ETF (LEGR)
First
Trust Nasdaq Artificial Intelligence and Robotics ETF (ROBT)
First
Trust International Developed Capital Strength ETF (FICS)
The Board approved the
Amendment for each Fund at a meeting held on October 24, 2022. As part of the review process, the Board reviewed information and had preliminary discussions with the Advisor regarding the proposed Amendments at
meetings held on April 18, 2022, June 12–13, 2022 and September 18–19, 2022. Following those preliminary discussions, the Board requested and received information from the Advisor regarding the
proposed Amendments, and that information was considered at an executive session of the Independent Trustees and their counsel held prior to the October 24, 2022 meeting, as well as at the October meeting.
In reviewing the
Amendment for each Fund, the Board considered that the purpose of the Amendments is to modify the unitary fee rate for each Fund under the applicable Agreement by introducing a breakpoint schedule pursuant to which
the unitary fee rate paid by each Fund to the Advisor will be reduced as assets of such Fund meet certain thresholds. The Board noted the Advisor’s representations that the quality and quantity of the
services provided to each Fund by the Advisor under the applicable Agreement will not be reduced or modified as a result of the applicable Amendment, and that the obligations of the Advisor under each Agreement will
remain the same in all respects.
The Board noted that it,
including the Independent Trustees, last approved the continuation of the applicable Agreement for each Fund for a one-year period ending June 30, 2023 at a meeting held on June 12–13, 2022. The Board
noted that in connection with such approval it had determined for each Fund, based upon the information provided, that the terms of the applicable Agreement were fair and reasonable and that the continuation of the
applicable Agreement was in the best interests of the Fund in light of the nature, extent and quality of the services provided and such other matters as the Board considered to be relevant in the exercise of its
business judgment.
Based on all of the
information considered, the Board, including the Independent Trustees, unanimously determined that the terms of the Amendments are fair and reasonable and that the Amendments are in the best interests of each Fund.
This page intentionally left blank
First Trust Exchange-Traded Fund VI
INVESTMENT ADVISOR
First Trust Advisors L.P.
120 East Liberty Drive, Suite
400
Wheaton, IL 60187
ADMINISTRATOR, CUSTODIAN,
FUND ACCOUNTANT &
TRANSFER AGENT
Brown Brothers Harriman &
Co.
50 Post Office Square
Boston, MA 02110
INDEPENDENT REGISTERED
PUBLIC ACCOUNTING FIRM
Deloitte & Touche LLP
111 S. Wacker Drive
Chicago, IL 60606
LEGAL COUNSEL
Chapman and Cutler LLP
320 South Canal Street
Chicago, IL 60606
First Trust Exchange-Traded Fund VI
Book 2
First Trust SMID Cap Rising Dividend Achievers ETF (SDVY)
First Trust Dorsey Wright Momentum & Value ETF (DVLU)
First Trust Dorsey Wright Momentum & Low Volatility ETF (DVOL)
Semi-Annual Report
For the Six Months Ended
March 31, 2023
First Trust Exchange-Traded Fund
VI
Semi-Annual Report
March 31, 2023
Caution Regarding
Forward-Looking Statements
This report contains
certain forward-looking statements within the meaning of the Securities Act of 1933, as amended, and the Securities Exchange Act of 1934, as amended. Forward-looking statements include statements regarding the goals,
beliefs, plans or current expectations of First Trust Advisors L.P. (“First Trust” or the “Advisor”) and its representatives, taking into account the information currently available to them.
Forward-looking statements include all statements that do not relate solely to current or historical fact. For example, forward-looking statements include the use of words such as “anticipate,”
“estimate,” “intend,” “expect,” “believe,” “plan,” “may,” “should,” “would” or other words that convey uncertainty of
future events or outcomes.
Forward-looking
statements involve known and unknown risks, uncertainties and other factors that may cause the actual results, performance or achievements of any series of First Trust Exchange-Traded Fund VI (the “Trust”)
described in this report (each such series is referred to as a “Fund” and collectively, the “Funds”) to be materially different from any future results, performance or achievements expressed or
implied by the forward-looking statements. When evaluating the information included in this report, you are cautioned not to place undue reliance on these forward-looking statements, which reflect the judgment of the
Advisor and its representatives only as of the date hereof. We undertake no obligation to publicly revise or update these forward-looking statements to reflect events and circumstances that arise after the date
hereof.
Performance and Risk
Disclosure
There is no assurance
that any Fund described in this report will achieve its investment objective. Each Fund is subject to market risk, which is the possibility that the market values of securities owned by the Fund will decline and that
the value of the Fund’s shares may therefore be less than what you paid for them. Accordingly, you can lose money by investing in a Fund. See “Risk Considerations” in the Additional Information
section of this report for a discussion of certain other risks of investing in the Funds.
Performance data quoted
represents past performance, which is no guarantee of future results, and current performance may be lower or higher than the figures shown. For the most recent month-end performance figures, please visit www.ftportfolios.com or speak with your financial advisor. Investment returns, net asset value and share price will fluctuate and Fund shares, when sold, may be
worth more or less than their original cost.
The Advisor may also
periodically provide additional information on Fund performance on each Fund’s web page at www.ftportfolios.com.
How to Read This
Report
This report contains
information that may help you evaluate your investment. It includes details about each Fund and presents data and analysis that provide insight into each Fund’s performance and investment approach.
By reading the market
overview by Robert F. Carey, Chief Market Strategist of the Advisor, you may obtain an understanding of how the market environment affected the performance of each Fund. The statistical information that follows may
help you understand each Fund’s performance compared to that of relevant market benchmarks.
It is important to keep
in mind that the opinions expressed by personnel of the Advisor are just that: informed opinions. They should not be considered to be promises or advice. The opinions, like the statistics, cover the period through the
date on the cover of this report. The material risks of investing in each Fund are spelled out in the prospectus, the statement of additional information, and other Fund regulatory filings.
First Trust Exchange-Traded Fund
VI
Semi-Annual Letter from the Chairman
and CEO
March 31, 2023
Dear Shareholders,
First Trust is pleased
to provide you with the semi-annual report for certain series of the First Trust Exchange-Traded Fund VI (the “Funds”), which contains detailed information about the Funds for the six months ended
March 31, 2023.
I am constantly amazed
by the depth and breadth of innovation that occurs when people from different geographic, economic, cultural, and educational backgrounds come together to solve problems. Many of the greatest companies to ever exist
found their humble beginnings in the simple premise that problems are best solved through ingenuity and cooperation. That idea is still alive and well today, in my opinion. Take, as examples, the recent flood of
interest sparked by artificial intelligence programs, advances in robotics, new medicines, more fuel-efficient gasoline engines, electric and hybrid vehicles, quantum computing, developments in wind and solar power;
the list goes on and on. That said, the global economy is facing serious issues such as stubborn inflation and the specter of slowing economic growth to name a few.
As many investors know,
the global financial system is currently navigating the fallout of the banking crisis that took lending markets by storm in March 2023. The turmoil that started in the U.S. with the failure of Silicon Valley Bank
quickly spread around the globe, leading the Swiss government to broker the merger of two of Switzerland’s largest banks. In the U.S., the Federal Reserve (the “Fed”) created the Bank Term Funding
Program, which allocated capital to help assure that banks can meet the needs of their depositors. Furthermore, inflation remains elevated on a global scale. Each of the countries that comprise the so-called Group of
Ten is currently battling levels of inflation that are higher than the targets set by their central banks, according to data from Bloomberg. Additionally, political unrest stemming from the war between Russia and
Ukraine remains a significant factor, with the potential to disturb global fuel and energy supplies as well as provoke interference from other foreign powers.
In the U.S., inflation,
as measured by the trailing 12-month rate on the Consumer Price Index, stood at 5.0% as of March 31, 2023, well above the Fed’s stated goal of 2.0%. Despite signals pointing to a potential slowdown in economic
growth in the U.S., the Fed stayed the course with regards to interest rate policy. Since February 28, 2022, the Fed raised the Federal Funds target rate (upper bound) a total of nine times, increasing the rate from
0.25%, where it stood on February 28, 2022, to 5.00% as of March 31, 2023.
Global markets have been
resilient over time, and the S&P 500® Index has never failed to recover from a bear market. While the issues plaguing the U.S. and global economies are severe, they are not
insurmountable, in my view. As Brian Wesbury, Chief Economist at First Trust, recently wrote: “what made America strong is…its human resources and freedom.” We will continue to work the problems
before us with ingenuity and resolve, as we always have.
Thank you for giving
First Trust the opportunity to play a role in your financial future. We value our relationship with you and will report on the Funds again in six months.
Sincerely,
James A. Bowen
Chairman of the Board of Trustees
Chief Executive Officer of First Trust
Advisors L.P.
First Trust Exchange-Traded Fund
VI
Semi-Annual Report
March 31, 2023
Robert
F. Carey, CFA
Senior Vice President
and Chief Market Strategist
First Trust Advisors
L.P.
Mr.
Carey is responsible for the overall management of research and analysis of the First Trust product line. Mr. Carey has more than 30 years of experience as an Equity and Fixed-Income Analyst and is a recipient of the
Chartered Financial Analyst (“CFA”) designation. He is a graduate of the University of Illinois at Champaign-Urbana with a B.S. in Physics. He is also a member of the Investment Analysts Society of Chicago
and the CFA Institute. Mr. Carey has appeared as a guest on such programs as Bloomberg TV, CNBC, and WBBM Radio, and has been quoted by several publications, including The Wall Street Journal, The Wall Street Reporter, Bloomberg News Service, and Registered Rep.
State of the Global
Economy
The latest global growth
forecast from the International Monetary Fund (“IMF”) released in April 2023 sees real gross domestic product growth rising by 2.8% worldwide in 2023, down from its 2.9% projection in January 2023. The IMF
is calling for a 1.6% growth rate for the U.S., up from its January 2023 estimate of 1.4%. Emerging Market and Developing Economies are expected to grow by 3.9% this year, down from the IMF’s 4.0% estimate in
January 2023. The IMF notes that risks to their global outlook are squarely to the downside, especially given the recent turmoil in the Financials sector as well as stubbornly high inflation.
In the U.S., inflation,
as measured by the Consumer Price Index (“CPI”), stood at 5.0% on a trailing 12-month basis at the end of March 2023, according to the U.S. Bureau of Labor Statistics. While this is significantly lower
than the most recent high of 9.1% in June 2022, the CPI remains above its 30-year average of 2.5% as of March 31, 2023, and even further from the Federal Reserve’s (the “Fed”) target of 2.0%.
Performance of Global
Stocks and Bonds
The major U.S. stock
indices delivered positive results over the past six months. The S&P 500® (the “Index”), S&P MidCap 400® and S&P SmallCap 600® Indices posted total returns of 15.62%, 15.00% and 12.00%, respectively, for the six-month period ended March 31, 2023. Each of the 11 major
sectors that comprise the Index were up on a total return basis. The top performer was the Information Technology sector, up 27.59%, while the worst showing came from the Consumer Discretionary sector, up 4.31%.
A Bloomberg survey of
twenty-four equity strategists found that their average 2023 year-end price target for the Index was 4,025, as of April 19, 2023, according to its own release. The highest and lowest estimates were 4,750 and 3,225,
respectively. Brian Wesbury, Chief Economist at First Trust, announced in December 2022 that his 2023 year-end price target stood at 3,900. The Index closed trading on March 31, 2023, at 4,109. The outlook for
corporate earnings in 2023 has turned negative. Bloomberg’s consensus year-over-year earnings growth rate estimates for the Index for the 2023 and 2024 calendar years stood at -2.67% and 11.56%, respectively, as
of April 21, 2023.
The broader foreign stock
indices posted positive total returns over the past six months. Between September 30, 2022, and March 31, 2023, the MSCI World ex USA and MSCI Emerging Markets equity indices posted total returns of 25.50% (USD) and
14.04% (USD), respectively, according to Bloomberg. The major foreign bond indices were also up over the same period. The Bloomberg Global Aggregate Index of higher quality debt posted a total return of 7.69% (USD),
while the Bloomberg EM Hard Currency Aggregate Index of emerging markets debt increased by 9.87% (USD), according to Bloomberg. The U.S. dollar fell by 8.57% over the past six months against a basket of major
currencies, as measured by the U.S. Dollar Index (DXY). The sizable decline in the dollar provided a boost to the performance of both foreign stock and bond indices, in our opinion.
Results were also
positive in the U.S. bond market over the period. The top performing major debt group we track was long-term municipal bonds. The Bloomberg Municipal Bond: Long Bond (22+ Years) Index posted a total return of 9.68%
for the six-month period ended March 31, 2023. The worst-performing U.S. debt group that we track was intermediate U.S. Treasuries. The Bloomberg U.S. Treasury: Intermediate Index posted a total return of 3.31%. The
yield on the benchmark 10-Year Treasury Note (“T-Note”) fell by 36 basis points in the period to close at 3.47% on March 31, 2023, according to Bloomberg. For comparative purposes, the average yield on the
10-Year T-Note was 2.19% for the 10-year period ended March 31, 2023.
Fund Performance
Overview (Unaudited)
First Trust SMID Cap Rising Dividend
Achievers ETF (SDVY)
The First Trust SMID Cap
Rising Dividend Achievers ETF (the “Fund”) seeks investment results that correspond generally to the price and yield (before the Fund’s fees and expenses) of an index called the Nasdaq US Small Mid
Cap Rising Dividend Achievers™ Index (the “Index”). The Fund will normally invest at least 90% of its net assets (including investment borrowings) in the common stocks that comprise the Index. The
Fund, using an indexing investment approach, attempts to replicate, before fees and expenses, the performance of the index. The Index is designed to provide access to a diversified portfolio of 100 small and mid cap
companies with a history of raising their dividends and exhibit the characteristics to continue to do so in the future. The shares of the Fund are listed and traded on The Nasdaq Stock Market LLC, under the ticker
symbol “SDVY.”
| Performance
|
|
|
|
|
|
|
|
|
|
|
| Average Annual Total Returns
|
| Cumulative Total Returns
|
|
| 6 Months
Ended
3/31/23
| 1 Year
Ended
3/31/23
| 5 Years
Ended
3/31/23
| Inception
(11/1/17)
to 3/31/23
|
| 5 Years
Ended
3/31/23
| Inception
(11/1/17)
to 3/31/23
|
| Fund Performance
|
|
|
|
|
|
|
|
| NAV
| 17.02%
| -1.67%
| 7.07%
| 7.35%
|
| 40.73%
| 46.75%
|
| Market Price
| 17.02%
| -1.67%
| 7.05%
| 7.35%
|
| 40.59%
| 46.75%
|
| Index Performance
|
|
|
|
|
|
|
|
| Nasdaq US Small Mid Cap Rising Dividend Achievers™ Index
| 17.45%
| -1.13%
| 7.72%
| 8.00%
|
| 45.01%
| 51.66%
|
| S&P 1000® Index
| 14.10%
| -6.24%
| 7.26%
| 7.40%
|
| 41.96%
| 47.12%
|
(See Notes to Fund
Performance Overview on page 10.)
Nasdaq® and Nasdaq US Small Mid Cap Rising Dividend Achievers™ Index are registered trademarks and service marks of Nasdaq, Inc. (together with
its affiliates hereinafter referred to as the “Corporations”) and are licensed for use by First Trust. The Fund has not been passed on by the Corporations as to their legality or suitability. The Fund is
not issued, endorsed, sold, or promoted by the Corporations. THE CORPORATIONS MAKE NO WARRANTIES AND BEAR NO LIABILITY WITH RESPECT TO THE FUND.
Fund Performance
Overview (Unaudited) (Continued)
First Trust SMID Cap Rising Dividend
Achievers ETF (SDVY) (Continued)
| Sector Allocation
| % of Total
Investments
|
| Financials
| 30.5%
|
| Industrials
| 25.1
|
| Consumer Discretionary
| 13.7
|
| Information Technology
| 10.1
|
| Energy
| 9.4
|
| Materials
| 6.1
|
| Communication Services
| 2.1
|
| Consumer Staples
| 2.0
|
| Real Estate
| 1.0
|
| Total
| 100.0%
|
| Top Ten Holdings
| % of Total
Investments
|
| Ally Financial, Inc.
| 1.1%
|
| AGCO Corp.
| 1.1
|
| Popular, Inc.
| 1.1
|
| Synovus Financial Corp.
| 1.1
|
| Civitas Resources, Inc.
| 1.1
|
| Cal-Maine Foods, Inc.
| 1.1
|
| Magnolia Oil & Gas Corp., Class A
| 1.1
|
| SM Energy Co.
| 1.1
|
| Commercial Metals Co.
| 1.1
|
| Interpublic Group of (The) Cos., Inc.
| 1.1
|
| Total
| 11.0%
|
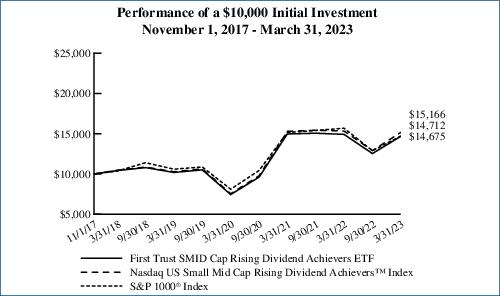
Performance figures assume reinvestment of all distributions and do not reflect the deduction of taxes that a shareholder would pay on Fund distributions or the redemption or sale of Fund shares. An index is a
statistical composite that tracks a specified financial market or sector. Unlike the Fund, the indices do not actually hold a portfolio of securities and therefore do not incur the expenses incurred by the Fund.
These expenses negatively impact the performance of the Fund. The Fund’s past performance does not predict future performance.
Frequency
Distribution of Discounts and Premiums
Information
showing the number of days the market price of the Fund’s shares was greater (at a premium) and less (at a discount) than the Fund’s net asset value for the most recently completed year, and the most
recently completed calendar quarters since that year (or life of the Fund, if shorter), is available at https://www.ftportfolios.com/Retail/etf/home.aspx.
Fund Performance
Overview (Unaudited) (Continued)
First Trust Dorsey Wright Momentum &
Value ETF (DVLU)
The First Trust Dorsey
Wright Momentum & Value ETF (the “Fund”) seeks investment results that correspond generally to the price and yield (before the Fund’s fees and expenses) of an index called the Dorsey Wright
Momentum Plus Value™ Index (the “Index”). Under normal conditions, the Fund will invest at least 90% of its net assets (including investment borrowings) in the equity securities that comprise the
Index. The Fund, using an indexing investment approach, attempts to replicate, before fees and expenses, the performance of the Index. The Index is a rules-based equity index designed to track the overall performance
of the 50 most undervalued stocks comprising the Nasdaq US Large Mid Cap Index™ that exhibit high levels of “relative strength.” A relative strength analysis is a momentum-based investment strategy
that emphasizes a security’s forward price momentum in the security selection process. The Index is owned and was developed by Nasdaq, Inc. The shares of the Fund are listed and traded on The Nasdaq Stock
Market LLC, under the ticker symbol “DVLU.”
| Performance
|
|
|
|
|
|
|
|
| Average Annual
Total Returns
| Cumulative
Total Returns
|
|
| 6 Months Ended
3/31/23
| 1 Year Ended
3/31/23
| Inception (9/5/18)
to 3/31/23
| Inception (9/5/18)
to 3/31/23
|
| Fund Performance
|
|
|
|
|
| NAV
| 10.33%
| -11.18%
| 4.14%
| 20.35%
|
| Market Price
| 10.22%
| -11.25%
| 4.13%
| 20.29%
|
| Index Performance
|
|
|
|
|
| Dorsey Wright Momentum Plus Value™ Index
| 10.72%
| -10.62%
| 4.79%
| 23.84%
|
| S&P 500® Index
| 15.62%
| -7.73%
| 9.93%
| 54.07%
|
(See Notes to Fund
Performance Overview on page 10.)
Nasdaq® and Dorsey Wright Momentum Plus Value™ Index are registered trademarks and service marks of Nasdaq, Inc. (together with its affiliates
hereinafter referred to as the “Corporations”) and are licensed for use by First Trust. The Fund has not been passed on by the Corporations as to their legality or suitability. The Fund is not issued,
endorsed, sold, or promoted by the Corporations. THE CORPORATIONS MAKE NO WARRANTIES AND BEAR NO LIABILITY WITH RESPECT TO THE FUND.
Fund Performance
Overview (Unaudited) (Continued)
First Trust Dorsey Wright Momentum &
Value ETF (DVLU) (Continued)
| Sector Allocation
| % of Total
Investments
|
| Financials
| 26.0%
|
| Materials
| 21.4
|
| Health Care
| 13.0
|
| Industrials
| 10.9
|
| Energy
| 10.5
|
| Consumer Discretionary
| 6.9
|
| Utilities
| 3.4
|
| Information Technology
| 2.9
|
| Communication Services
| 2.6
|
| Consumer Staples
| 2.4
|
| Total
| 100.0%
|
| Top Ten Holdings
| % of Total
Investments
|
| Builders FirstSource, Inc.
| 3.7%
|
| Reliance Steel & Aluminum Co.
| 3.3
|
| Marathon Petroleum Corp.
| 3.3
|
| Penske Automotive Group, Inc.
| 3.2
|
| Tenet Healthcare Corp.
| 3.1
|
| Westlake Corp.
| 2.9
|
| Phillips 66
| 2.9
|
| United States Steel Corp.
| 2.8
|
| Unum Group
| 2.8
|
| UFP Industries, Inc.
| 2.7
|
| Total
| 30.7%
|
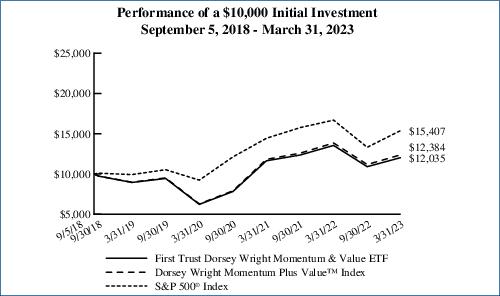
Performance figures assume reinvestment of all distributions and do not reflect the deduction of taxes that a shareholder would pay on Fund distributions or the redemption or sale of Fund shares. An index is a
statistical composite that tracks a specified financial market or sector. Unlike the Fund, the indices do not actually hold a portfolio of securities and therefore do not incur the expenses incurred by the Fund.
These expenses negatively impact the performance of the Fund. The Fund’s past performance does not predict future performance.
Frequency
Distribution of Discounts and Premiums
Information
showing the number of days the market price of the Fund’s shares was greater (at a premium) and less (at a discount) than the Fund’s net asset value for the most recently completed year, and the most
recently completed calendar quarters since that year (or life of the Fund, if shorter), is available at https://www.ftportfolios.com/Retail/etf/home.aspx.
Fund Performance
Overview (Unaudited) (Continued)
First Trust Dorsey Wright Momentum &
Low Volatility ETF (DVOL)
The First Trust Dorsey
Wright Momentum & Low Volatility ETF (the “Fund”) seeks investment results that correspond generally to the price and yield (before the Fund’s fees and expenses) of an index called the Dorsey
Wright Momentum Plus Low Volatility™ Index (the “Index”). Under normal conditions, the Fund will invest at least 90% of its net assets (including investment borrowings) in the equity securities that
comprise the Index. The Fund, using an indexing investment approach, attempts to replicate, before fees and expenses, the performance of the Index. The Index is a rules-based equity index designed to track the overall
performance of the 50 stocks comprising the Nasdaq US Large Mid Cap Index™ that exhibit the lowest levels of volatility while still maintaining high levels of “relative strength.” A relative
strength analysis is a momentum-based investment strategy that emphasizes a security’s forward price momentum in the security selection process. The Index is owned and was developed by Nasdaq, Inc. The shares of
the Fund are listed and traded on The Nasdaq Stock Exchange LLC, under the ticker symbol “DVOL.”
| Performance
|
|
|
|
|
|
|
|
| Average Annual
Total Returns
| Cumulative
Total Returns
|
|
| 6 Months Ended
3/31/23
| 1 Year Ended
3/31/23
| Inception (9/5/18)
to 3/31/23
| Inception (9/5/18)
to 3/31/23
|
| Fund Performance
|
|
|
|
|
| NAV
| 7.67%
| -9.23%
| 6.77%
| 34.89%
|
| Market Price
| 7.54%
| -9.30%
| 6.76%
| 34.84%
|
| Index Performance
|
|
|
|
|
| Dorsey Wright Momentum Plus Low Volatility™ Index
| 8.02%
| -8.71%
| 7.45%
| 38.86%
|
| S&P 500® Index
| 15.62%
| -7.73%
| 9.93%
| 54.07%
|
(See Notes to Fund
Performance Overview on page 10.)
Nasdaq® and Dorsey Wright Momentum Plus Low Volatility™ Index are registered trademarks and service marks of Nasdaq, Inc. (together with its
affiliates hereinafter referred to as the “Corporations”) and are licensed for use by First Trust. The Fund has not been passed on by the Corporations as to their legality or suitability. The Fund is not
issued, endorsed, sold, or promoted by the Corporations. THE CORPORATIONS MAKE NO WARRANTIES AND BEAR NO LIABILITY WITH RESPECT TO THE FUND.
Fund Performance
Overview (Unaudited) (Continued)
First Trust Dorsey Wright Momentum &
Low Volatility ETF (DVOL) (Continued)
| Sector Allocation
| % of Total
Investments
|
| Health Care
| 25.3%
|
| Financials
| 25.0
|
| Industrials
| 16.5
|
| Consumer Staples
| 12.9
|
| Consumer Discretionary
| 8.5
|
| Real Estate
| 5.9
|
| Utilities
| 3.7
|
| Materials
| 2.2
|
| Total
| 100.0%
|
| Top Ten Holdings
| % of Total
Investments
|
| Hershey (The) Co.
| 3.4%
|
| McDonald’s Corp.
| 3.2
|
| Republic Services, Inc.
| 3.1
|
| Bristol-Myers Squibb Co.
| 3.1
|
| Waste Management, Inc.
| 3.1
|
| Chemed Corp.
| 3.0
|
| Merck & Co., Inc.
| 3.0
|
| AbbVie, Inc.
| 2.8
|
| Procter & Gamble (The) Co.
| 2.8
|
| Yum! Brands, Inc.
| 2.7
|
| Total
| 30.2%
|
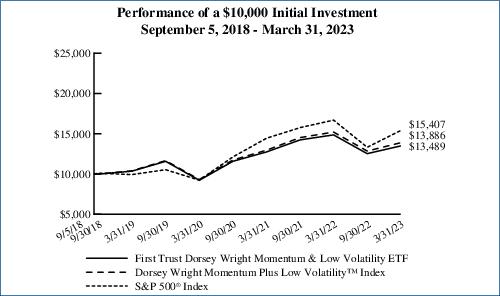
Performance figures assume reinvestment of all distributions and do not reflect the deduction of taxes that a shareholder would pay on Fund distributions or the redemption or sale of Fund shares. An index is a
statistical composite that tracks a specified financial market or sector. Unlike the Fund, the indices do not actually hold a portfolio of securities and therefore do not incur the expenses incurred by the Fund.
These expenses negatively impact the performance of the Fund. The Fund’s past performance does not predict future performance.
Frequency
Distribution of Discounts and Premiums
Information
showing the number of days the market price of the Fund’s shares was greater (at a premium) and less (at a discount) than the Fund’s net asset value for the most recently completed year, and the most
recently completed calendar quarters since that year (or life of the Fund, if shorter), is available at https://www.ftportfolios.com/Retail/etf/home.aspx.
Nasdaq® and
Dorsey Wright Momentum Plus Low Volatility™ Index are registered trademarks and service marks of Nasdaq, Inc. (together with its affiliates hereinafter referred to as the “Corporations”) and are
licensed for use by First Trust. The Fund has not been passed on by the Corporations as to their legality or suitability. The Fund is not issued, endorsed, sold, or promoted by the Corporations. THE CORPORATIONS MAKE
NO WARRANTIES AND BEAR NO LIABILITY WITH RESPECT TO THE FUND.
Notes to Fund
Performance Overview (Unaudited)
Total returns for the
periods since inception are calculated from the inception date of each Fund. “Average Annual Total Returns” represent the average annual change in value of an investment over the periods indicated.
“Cumulative Total Returns” represent the total change in value of an investment over the periods indicated.
Each Fund’s per
share net asset value (“NAV”) is the value of one share of the Fund and is computed by dividing the value of all assets of the Fund (including accrued interest and dividends), less all liabilities
(including accrued expenses and dividends declared but unpaid), by the total number of outstanding shares. The price used to calculate market return (“Market Price”) is determined by using the midpoint of
the national best bid and offer price (“NBBO”) as of the time that the Fund’s NAV is calculated. Under SEC rules, the NBBO consists of the highest displayed buy and lowest sell prices among the
various exchanges trading the Fund at the time the Fund’s NAV is calculated. Prior to January 1, 2019, the price used was the midpoint between the highest bid and the lowest offer on the stock exchange on which
shares of the Fund were listed for trading as of the time that the Fund’s NAV was calculated. Since shares of each Fund did not trade in the secondary market until after the Fund’s inception, for the
period from inception to the first day of secondary market trading in shares of the Fund, the NAV of each Fund is used as a proxy for the secondary market trading price to calculate market returns. NAV and market
returns assume that all distributions have been reinvested in each Fund at NAV and Market Price, respectively.
An index is a statistical
composite that tracks a specified financial market or sector. Unlike each Fund, the indices do not actually hold a portfolio of securities and therefore do not incur the expenses incurred by each Fund. These expenses
negatively impact the performance of each Fund. Also, market returns do not include brokerage commissions that may be payable on secondary market transactions. If brokerage commissions were included, market returns
would be lower. The total returns presented reflect the reinvestment of dividends on securities in the indices. The returns presented do not reflect the deduction of taxes that a shareholder would pay on Fund
distributions or the redemption or sale of Fund shares. The investment return and principal value of shares of each Fund will vary with changes in market conditions. Shares of each Fund may be worth more or less than
their original cost when they are redeemed or sold in the market. Each Fund’s past performance is no guarantee of future performance.
First Trust Exchange-Traded Fund VI
Understanding Your Fund
Expenses
March 31, 2023
(Unaudited)
As a shareholder of First
Trust SMID Cap Rising Dividend Achievers ETF, First Trust Dorsey Wright Momentum & Value ETF, or First Trust Dorsey Wright Momentum & Low Volatility ETF (each a “Fund” and collectively, the
“Funds”), you incur two types of costs: (1) transaction costs; and (2) ongoing costs, including management fees, distribution and/or service (12b-1) fees, if any, and other Fund expenses. This Example is
intended to help you understand your ongoing costs of investing in the Funds and to compare these costs with the ongoing costs of investing in other funds.
The Example is based on
an investment of $1,000 invested at the beginning of the period and held through the six-month period ended March 31, 2023.
Actual Expenses
The first line in the
following table provides information about actual account values and actual expenses. You may use the information in this line, together with the amount you invested, to estimate the expenses that you paid over the
period. Simply divide your account value by $1,000 (for example, an $8,600 account value divided by $1,000 = 8.6), then multiply the result by the number in the first line under the heading entitled “Expenses
Paid During the Six-Month Period” to estimate the expenses you paid on your account during this six-month period.
Hypothetical Example for
Comparison Purposes
The second line in the
following table provides information about hypothetical account values and hypothetical expenses based on each Fund’s actual expense ratio and an assumed rate of return of 5% per year before expenses, which is
not each Fund’s actual return. The hypothetical account values and expenses may not be used to estimate the actual ending account balance or expenses you paid for the period. You may use this information to
compare the ongoing costs of investing in the Funds and other funds. To do so, compare this 5% hypothetical example with the 5% hypothetical examples that appear in the shareholder reports of the other funds.
Please note that the
expenses shown in the table are meant to highlight your ongoing costs only and do not reflect any transactional costs such as brokerage commissions. Therefore, the second line in the table is useful in comparing
ongoing costs only, and will not help you determine the relative total costs of owning different funds. In addition, if these transactional costs were included, your costs would have been higher.
|
| Beginning
Account Value
October 1, 2022
| Ending
Account Value
March 31, 2023
| Annualized
Expense Ratio
Based on the
Six-Month
Period
| Expenses Paid
During the
Six-Month
Period (a)
|
| First Trust SMID Cap Rising Dividend Achievers ETF (SDVY)
|
| Actual
| $1,000.00
| $1,170.20
| 0.60%
| $3.25
|
| Hypothetical (5% return before expenses)
| $1,000.00
| $1,021.94
| 0.60%
| $3.02
|
| First Trust Dorsey Wright Momentum & Value ETF (DVLU)
|
| Actual
| $1,000.00
| $1,103.30
| 0.60%
| $3.15
|
| Hypothetical (5% return before expenses)
| $1,000.00
| $1,021.94
| 0.60%
| $3.02
|
| First Trust Dorsey Wright Momentum & Low Volatility ETF (DVOL)
|
| Actual
| $1,000.00
| $1,076.70
| 0.60%
| $3.11
|
| Hypothetical (5% return before expenses)
| $1,000.00
| $1,021.94
| 0.60%
| $3.02
|
| (a)
| Expenses are equal to the annualized expense ratios as indicated in the table multiplied by the average account value over the period (October 1, 2022 through
March 31, 2023), multiplied by 182/365 (to reflect the six-month period).
|
First Trust SMID Cap Rising Dividend
Achievers ETF (SDVY)
Portfolio of Investments
March 31, 2023
(Unaudited)
| Shares
|
| Description
|
| Value
|
| COMMON STOCKS – 99.8%
|
|
|
| Automobiles – 1.0%
|
|
|
| 182,365
|
| Winnebago Industries, Inc.
|
| $10,522,461
|
|
|
| Banks – 15.2%
|
|
|
| 285,807
|
| Bank OZK
|
| 9,774,599
|
| 486,710
|
| Cadence Bank
|
| 10,104,100
|
| 284,660
|
| Cathay General Bancorp
|
| 9,826,463
|
| 232,513
|
| Comerica, Inc.
|
| 10,095,714
|
| 285,375
|
| Eagle Bancorp, Inc.
|
| 9,551,501
|
| 186,491
|
| East West Bancorp, Inc.
|
| 10,350,250
|
| 913,556
|
| First BanCorp
|
| 10,432,810
|
| 1,340,282
|
| First Foundation, Inc.
|
| 9,985,101
|
| 238,365
|
| International Bancshares Corp.
|
| 10,206,789
|
| 398,674
|
| OFG Bancorp
|
| 9,942,930
|
| 408,407
|
| Pacific Premier Bancorp, Inc.
|
| 9,809,936
|
| 200,317
|
| Popular, Inc.
|
| 11,500,199
|
| 371,214
|
| Synovus Financial Corp.
|
| 11,444,528
|
| 538,095
|
| Veritex Holdings, Inc.
|
| 9,825,615
|
| 140,453
|
| Wintrust Financial Corp.
|
| 10,246,046
|
| 339,661
|
| Zions Bancorp N.A.
|
| 10,166,054
|
|
|
|
|
| 163,262,635
|
|
|
| Building Products – 3.0%
|
|
|
| 128,209
|
| Advanced Drainage Systems, Inc.
|
| 10,796,480
|
| 113,448
|
| Owens Corning
|
| 10,868,318
|
| 131,482
|
| UFP Industries, Inc.
|
| 10,448,875
|
|
|
|
|
| 32,113,673
|
|
|
| Capital Markets – 2.0%
|
|
|
| 90,282
|
| Evercore, Inc., Class A
|
| 10,416,737
|
| 186,180
|
| Stifel Financial Corp.
|
| 11,001,376
|
|
|
|
|
| 21,418,113
|
|
|
| Chemicals – 1.0%
|
|
|
| 96,862
|
| Westlake Corp.
|
| 11,234,055
|
|
|
| Commercial Services &
Supplies – 1.0%
|
|
|
| 73,542
|
| Tetra Tech, Inc.
|
| 10,804,055
|
|
|
| Communications Equipment – 1.0%
|
|
|
| 326,024
|
| Juniper Networks, Inc.
|
| 11,221,746
|
|
|
| Construction & Engineering – 1.0%
|
|
|
| 123,678
|
| AECOM
|
| 10,428,529
|
|
|
| Consumer Finance – 3.0%
|
|
|
| 456,983
|
| Ally Financial, Inc.
|
| 11,648,497
|
| 850,427
|
| SLM Corp.
|
| 10,536,790
|
| 357,534
|
| Synchrony Financial
|
| 10,397,089
|
|
|
|
|
| 32,582,376
|
|
|
| Electrical Equipment – 2.0%
|
|
|
| 43,589
|
| Hubbell, Inc.
|
| 10,605,640
|
| Shares
|
| Description
|
| Value
|
|
|
|
|
| Electrical
Equipment (Continued)
|
|
|
| 74,174
|
| Regal Rexnord Corp.
|
| $10,438,507
|
|
|
|
|
| 21,044,147
|
|
|
| Electronic Equipment,
Instruments & Components – 4.1%
|
|
|
| 109,355
|
| Advanced Energy Industries, Inc.
|
| 10,716,790
|
| 461,330
|
| Benchmark Electronics, Inc.
|
| 10,928,908
|
| 40,498
|
| Littelfuse, Inc.
|
| 10,857,109
|
| 485,438
|
| Vishay Intertechnology, Inc.
|
| 10,980,607
|
|
|
|
|
| 43,483,414
|
|
|
| Financial Services – 6.1%
|
|
|
| 434,193
|
| Equitable Holdings, Inc.
|
| 11,024,160
|
| 276,652
|
| Essent Group Ltd.
|
| 11,079,913
|
| 292,889
|
| Jackson Financial, Inc., Class A
|
| 10,956,978
|
| 822,127
|
| MGIC Investment Corp.
|
| 11,032,944
|
| 500,057
|
| Radian Group, Inc.
|
| 11,051,260
|
| 134,190
|
| Walker & Dunlop, Inc.
|
| 10,221,252
|
|
|
|
|
| 65,366,507
|
|
|
| Food Products – 1.0%
|
|
|
| 186,555
|
| Cal-Maine Foods, Inc.
|
| 11,359,334
|
|
|
| Ground Transportation – 2.0%
|
|
|
| 59,399
|
| Landstar System, Inc.
|
| 10,647,865
|
| 389,082
|
| Schneider National, Inc., Class B
|
| 10,407,943
|
|
|
|
|
| 21,055,808
|
|
|
| Household Durables – 6.0%
|
|
|
| 172,304
|
| Century Communities, Inc.
|
| 11,013,672
|
| 384,178
|
| Ethan Allen Interiors, Inc.
|
| 10,549,528
|
| 356,406
|
| La-Z-Boy, Inc.
|
| 10,364,286
|
| 277,477
|
| MDC Holdings, Inc.
|
| 10,785,531
|
| 184,602
|
| PulteGroup, Inc.
|
| 10,758,604
|
| 175,754
|
| Toll Brothers, Inc.
|
| 10,550,513
|
|
|
|
|
| 64,022,134
|
|
|
| Insurance – 4.1%
|
|
|
| 87,445
|
| American Financial Group, Inc.
|
| 10,624,568
|
| 317,229
|
| Fidelity National Financial, Inc.
|
| 11,080,809
|
| 145,537
|
| Principal Financial Group, Inc.
|
| 10,816,310
|
| 277,515
|
| Unum Group
|
| 10,978,493
|
|
|
|
|
| 43,500,180
|
|
|
| Leisure Products – 1.0%
|
|
|
| 185,909
|
| Sturm Ruger & Co., Inc.
|
| 10,678,613
|
|
|
| Machinery – 8.2%
|
|
|
| 85,599
|
| AGCO Corp.
|
| 11,572,985
|
| 92,267
|
| Crane Holdings Co.
|
| 10,472,304
|
| 151,468
|
| Graco, Inc.
|
| 11,058,679
|
| 47,215
|
| IDEX Corp.
|
| 10,908,081
|
| 129,215
|
| ITT, Inc.
|
| 11,151,254
|
| 144,870
|
| Mueller Industries, Inc.
|
| 10,645,048
|
| 44,139
|
| Snap-on, Inc.
|
| 10,897,478
|
Page 12
See Notes to Financial
Statements
First Trust SMID Cap Rising Dividend
Achievers ETF (SDVY)
Portfolio of Investments
(Continued)
March 31, 2023
(Unaudited)
| Shares
|
| Description
|
| Value
|
| COMMON STOCKS (Continued)
|
|
|
| Machinery (Continued)
|
|
|
| 224,810
|
| Terex Corp.
|
| $10,876,308
|
|
|
|
|
| 87,582,137
|
|
|
| Marine Transportation – 1.9%
|
|
|
| 223,377
|
| Eagle Bulk Shipping, Inc.
|
| 10,163,653
|
| 169,768
|
| Matson, Inc.
|
| 10,130,057
|
|
|
|
|
| 20,293,710
|
|
|
| Media – 2.1%
|
|
|
| 303,399
|
| Interpublic Group of (The) Cos., Inc.
|
| 11,298,579
|
| 118,233
|
| Omnicom Group, Inc.
|
| 11,154,101
|
|
|
|
|
| 22,452,680
|
|
|
| Metals & Mining – 4.1%
|
|
|
| 70,233
|
| Alpha Metallurgical Resources, Inc.
|
| 10,956,348
|
| 231,241
|
| Commercial Metals Co.
|
| 11,307,685
|
| 42,173
|
| Reliance Steel & Aluminum Co.
|
| 10,827,496
|
| 97,835
|
| Steel Dynamics, Inc.
|
| 11,061,225
|
|
|
|
|
| 44,152,754
|
|
|
| Oil, Gas & Consumable Fuels – 9.4%
|
|
|
| 286,371
|
| California Resources Corp.
|
| 11,025,284
|
| 83,829
|
| Chord Energy Corp.
|
| 11,283,383
|
| 166,271
|
| Civitas Resources, Inc.
|
| 11,362,960
|
| 191,181
|
| CONSOL Energy, Inc.
|
| 11,140,117
|
| 348,336
|
| EQT Corp.
|
| 11,115,402
|
| 518,643
|
| Magnolia Oil & Gas Corp., Class A
|
| 11,347,909
|
| 234,969
|
| Matador Resources, Co.
|
| 11,196,273
|
| 402,296
|
| SM Energy Co.
|
| 11,328,655
|
| 6,254
|
| Texas Pacific Land Corp.
|
| 10,638,179
|
|
|
|
|
| 100,438,162
|
|
|
| Paper & Forest Products – 0.9%
|
|
|
| 186,757
|
| Louisiana-Pacific Corp.
|
| 10,124,097
|
|
|
| Personal Care Products – 1.0%
|
|
|
| 99,539
|
| Medifast, Inc.
|
| 10,319,208
|
|
|
| Professional Services – 4.0%
|
|
|
| 233,178
|
| Genpact Ltd.
|
| 10,777,487
|
| 87,701
|
| Insperity, Inc.
|
| 10,660,057
|
| 593,945
|
| Resources Connection, Inc.
|
| 10,132,702
|
| 138,374
|
| Robert Half International, Inc.
|
| 11,148,793
|
|
|
|
|
| 42,719,039
|
|
|
| Real Estate Management &
Development – 1.0%
|
|
|
| 330,826
|
| Marcus & Millichap, Inc.
|
| 10,622,823
|
| Shares
|
| Description
|
| Value
|
|
|
|
|
| Semiconductors &
Semiconductor Equipment – 4.0%
|
|
|
| 408,324
|
| Amkor Technology, Inc.
|
| $10,624,590
|
| 89,516
|
| Skyworks Solutions, Inc.
|
| 10,561,098
|
| 97,092
|
| Teradyne, Inc.
|
| 10,438,361
|
| 71,718
|
| Universal Display Corp.
|
| 11,125,613
|
|
|
|
|
| 42,749,662
|
|
|
| Specialty Retail – 2.9%
|
|
|
| 132,608
|
| Best Buy Co., Inc.
|
| 10,379,228
|
| 290,149
|
| Buckle (The), Inc.
|
| 10,355,418
|
| 70,298
|
| Dick’s Sporting Goods, Inc.
|
| 9,974,583
|
|
|
|
|
| 30,709,229
|
|
|
| Technology Hardware,
Storage & Peripherals – 1.0%
|
|
|
| 165,518
|
| NetApp, Inc.
|
| 10,568,324
|
|
|
| Textiles, Apparel & Luxury
Goods – 2.8%
|
|
|
| 118,698
|
| Columbia Sportswear Co.
|
| 10,711,307
|
| 304,666
|
| Movado Group, Inc.
|
| 8,765,241
|
| 287,908
|
| Steven Madden Ltd.
|
| 10,364,688
|
|
|
|
|
| 29,841,236
|
|
|
| Trading Companies &
Distributors – 2.0%
|
|
|
| 166,570
|
| Boise Cascade Co.
|
| 10,535,552
|
| 34,380
|
| Watsco, Inc.
|
| 10,938,341
|
|
|
|
|
| 21,473,893
|
|
|
| Total Investments – 99.8%
|
| 1,068,144,734
|
|
|
| (Cost $1,086,442,976)
|
|
|
|
|
| Net Other Assets and Liabilities – 0.2%
|
| 2,041,620
|
|
|
| Net Assets – 100.0%
|
| $1,070,186,354
|
Valuation Inputs
A summary of the inputs
used to value the Fund’s investments as of March 31, 2023 is as follows (see Note 2A - Portfolio Valuation in the Notes to Financial Statements):
|
| Total
Value at
3/31/2023
| Level 1
Quoted
Prices
| Level 2
Significant
Observable
Inputs
| Level 3
Significant
Unobservable
Inputs
|
| Common Stocks*
| $ 1,068,144,734
| $ 1,068,144,734
| $ —
| $ —
|
| *
| See Portfolio of Investments for industry breakout.
|
See Notes to Financial
Statements
Page 13
First Trust Dorsey Wright Momentum &
Value ETF (DVLU)
Portfolio of Investments
March 31, 2023
(Unaudited)
| Shares
|
| Description
|
| Value
|
| COMMON STOCKS – 99.0%
|
|
|
| Banks – 0.9%
|
|
|
| 2,552
|
| Wintrust Financial Corp.
|
| $186,168
|
|
|
| Beverages – 2.4%
|
|
|
| 9,139
|
| Molson Coors Beverage Co., Class B
|
| 472,304
|
|
|
| Building Products – 6.4%
|
|
|
| 8,335
|
| Builders FirstSource, Inc. (a)
|
| 739,982
|
| 6,790
|
| UFP Industries, Inc.
|
| 539,601
|
|
|
|
|
| 1,279,583
|
|
|
| Capital Markets – 4.7%
|
|
|
| 8,779
|
| Franklin Resources, Inc.
|
| 236,506
|
| 600
|
| Goldman Sachs Group (The), Inc.
|
| 196,266
|
| 15,171
|
| Invesco, Ltd.
|
| 248,805
|
| 7,799
|
| Jefferies Financial Group, Inc.
|
| 247,540
|
|
|
|
|
| 929,117
|
|
|
| Chemicals – 6.0%
|
|
|
| 7,784
|
| Chemours (The) Co.
|
| 233,053
|
| 6,746
|
| Olin Corp.
|
| 374,403
|
| 5,023
|
| Westlake Corp.
|
| 582,568
|
|
|
|
|
| 1,190,024
|
|
|
| Consumer Finance – 5.1%
|
|
|
| 14,255
|
| OneMain Holdings, Inc.
|
| 528,575
|
| 16,682
|
| Synchrony Financial
|
| 485,113
|
|
|
|
|
| 1,013,688
|
|
|
| Containers & Packaging – 1.4%
|
|
|
| 10,902
|
| Graphic Packaging Holding Co.
|
| 277,892
|
|
|
| Electric Utilities – 1.1%
|
|
|
| 14,100
|
| PG&E Corp. (a)
|
| 227,997
|
|
|
| Electronic Equipment,
Instruments & Components – 1.7%
|
|
|
| 3,751
|
| Jabil, Inc.
|
| 330,688
|
|
|
| Financial Services – 2.4%
|
|
|
| 18,921
|
| Equitable Holdings, Inc.
|
| 480,404
|
|
|
| Ground Transportation – 2.0%
|
|
|
| 7,241
|
| Knight-Swift Transportation Holdings, Inc.
|
| 409,696
|
|
|
| Health Care Providers &
Services – 10.6%
|
|
|
| 4,611
|
| Cardinal Health, Inc.
|
| 348,131
|
| 5,076
|
| Centene Corp. (a)
|
| 320,854
|
| 758
|
| Cigna (The) Group
|
| 193,692
|
| 5,540
|
| CVS Health Corp.
|
| 411,677
|
| 617
|
| McKesson Corp.
|
| 219,683
|
| 10,434
|
| Tenet Healthcare Corp. (a)
|
| 619,988
|
|
|
|
|
| 2,114,025
|
| Shares
|
| Description
|
| Value
|
|
|
|
|
| Hotels, Restaurants &
Leisure – 1.0%
|
|
|
| 1,462
|
| Marriott Vacations Worldwide Corp.
|
| $197,165
|
|
|
| Independent Power &
Renewable Electricity Producers – 2.2%
|
|
|
| 18,543
|
| Vistra Energy Corp.
|
| 445,032
|
|
|
| Insurance – 12.0%
|
|
|
| 5,306
|
| American International Group, Inc.
|
| 267,210
|
| 7,541
|
| MetLife, Inc.
|
| 436,926
|
| 2,340
|
| Principal Financial Group, Inc.
|
| 173,909
|
| 5,596
|
| Prudential Financial, Inc.
|
| 463,013
|
| 3,774
|
| Reinsurance Group of America, Inc.
|
| 501,036
|
| 14,083
|
| Unum Group
|
| 557,123
|
|
|
|
|
| 2,399,217
|
|
|
| Media – 2.6%
|
|
|
| 2,987
|
| Nexstar Media Group, Inc.
|
| 515,735
|
|
|
| Metals & Mining – 12.8%
|
|
|
| 6,115
|
| Commercial Metals Co.
|
| 299,024
|
| 3,456
|
| Nucor Corp.
|
| 533,848
|
| 2,577
|
| Reliance Steel & Aluminum Co.
|
| 661,619
|
| 4,520
|
| Steel Dynamics, Inc.
|
| 511,031
|
| 21,460
|
| United States Steel Corp.
|
| 560,106
|
|
|
|
|
| 2,565,628
|
|
|
| Oil, Gas & Consumable Fuels – 10.5%
|
|
|
| 3,569
|
| Chesapeake Energy Corp.
|
| 271,387
|
| 1,584
|
| Chevron Corp.
|
| 258,446
|
| 3,162
|
| Exxon Mobil Corp.
|
| 346,745
|
| 4,839
|
| Marathon Petroleum Corp.
|
| 652,442
|
| 5,658
|
| Phillips 66
|
| 573,608
|
|
|
|
|
| 2,102,628
|
|
|
| Paper & Forest Products – 1.2%
|
|
|
| 4,278
|
| Louisiana-Pacific Corp.
|
| 231,910
|
|
|
| Pharmaceuticals – 2.4%
|
|
|
| 49,260
|
| Viatris, Inc.
|
| 473,881
|
|
|
| Semiconductors &
Semiconductor Equipment – 1.3%
|
|
|
| 9,799
|
| Amkor Technology, Inc.
|
| 254,970
|
|
|
| Specialty Retail – 5.9%
|
|
|
| 3,955
|
| AutoNation, Inc. (a)
|
| 531,394
|
| 4,569
|
| Penske Automotive Group, Inc.
|
| 647,930
|
|
|
|
|
| 1,179,324
|
Page 14
See Notes to Financial
Statements
First Trust Dorsey Wright Momentum &
Value ETF (DVLU)
Portfolio of Investments
(Continued)
March 31, 2023
(Unaudited)
| Shares
|
| Description
|
| Value
|
| COMMON STOCKS (Continued)
|
|
|
| Trading Companies &
Distributors – 2.4%
|
|
|
| 3,149
|
| WESCO International, Inc.
|
| $486,646
|
|
|
| Total Common Stocks
|
| 19,763,722
|
|
|
| (Cost $19,423,450)
|
|
|
| REAL ESTATE INVESTMENT TRUSTS – 0.9%
|
|
|
| Mortgage Real Estate
Investment Trusts – 0.9%
|
|
|
| 10,359
|
| Starwood Property Trust, Inc.
|
| 183,251
|
|
|
| (Cost $205,621)
|
|
|
|
|
| Total Investments – 99.9%
|
| 19,946,973
|
|
|
| (Cost $19,629,071)
|
|
|
|
|
| Net Other Assets and Liabilities – 0.1%
|
| 19,805
|
|
|
| Net Assets – 100.0%
|
| $19,966,778
|
| (a)
| Non-income producing security.
|
Valuation Inputs
A summary of the inputs
used to value the Fund’s investments as of March 31, 2023 is as follows (see Note 2A - Portfolio Valuation in the Notes to Financial Statements):
|
| Total
Value at
3/31/2023
| Level 1
Quoted
Prices
| Level 2
Significant
Observable
Inputs
| Level 3
Significant
Unobservable
Inputs
|
| Common Stocks*
| $ 19,763,722
| $ 19,763,722
| $ —
| $ —
|
| Real Estate Investment Trusts*
| 183,251
| 183,251
| —
| —
|
| Total Investments
| $ 19,946,973
| $ 19,946,973
| $—
| $—
|
| *
| See Portfolio of Investments for industry breakout.
|
See Notes to Financial Statements
Page 15
First Trust Dorsey Wright Momentum &
Low Volatility ETF (DVOL)
Portfolio of Investments
March 31, 2023
(Unaudited)
| Shares
|
| Description
|
| Value
|
| COMMON STOCKS – 93.9%
|
|
|
| Aerospace & Defense – 1.0%
|
|
|
| 2,886
|
| Huntington Ingalls Industries, Inc.
|
| $597,460
|
|
|
| Banks – 1.2%
|
|
|
| 21,952
|
| United Bankshares, Inc.
|
| 772,710
|
|
|
| Beverages – 1.8%
|
|
|
| 5,004
|
| Constellation Brands, Inc., Class A
|
| 1,130,353
|
|
|
| Biotechnology – 2.8%
|
|
|
| 11,028
|
| AbbVie, Inc.
|
| 1,757,532
|
|
|
| Commercial Services &
Supplies – 6.1%
|
|
|
| 14,201
|
| Republic Services, Inc.
|
| 1,920,259
|
| 11,703
|
| Waste Management, Inc.
|
| 1,909,579
|
|
|
|
|
| 3,829,838
|
|
|
| Containers & Packaging – 2.2%
|
|
|
| 26,064
|
| Silgan Holdings, Inc.
|
| 1,398,855
|
|
|
| Distributors – 2.5%
|
|
|
| 9,354
|
| Genuine Parts Co.
|
| 1,565,018
|
|
|
| Electrical Equipment – 2.5%
|
|
|
| 10,692
|
| AMETEK, Inc.
|
| 1,553,868
|
|
|
| Financial Services – 1.6%
|
|
|
| 6,851
|
| Jack Henry & Associates, Inc.
|
| 1,032,583
|
|
|
| Food Products – 6.2%
|
|
|
| 8,258
|
| Hershey (The) Co.
|
| 2,100,918
|
| 25,143
|
| Kraft Heinz (The) Co.
|
| 972,280
|
| 8,790
|
| Post Holdings, Inc. (a)
|
| 789,957
|
|
|
|
|
| 3,863,155
|
|
|
| Gas Utilities – 1.0%
|
|
|
| 11,109
|
| National Fuel Gas Co.
|
| 641,434
|
|
|
| Health Care Providers &
Services – 16.4%
|
|
|
| 10,221
|
| AmerisourceBergen Corp.
|
| 1,636,484
|
| 10,064
|
| Cardinal Health, Inc.
|
| 759,832
|
| 3,500
|
| Chemed Corp.
|
| 1,882,125
|
| 2,455
|
| Cigna (The) Group
|
| 627,326
|
| 8,445
|
| CVS Health Corp.
|
| 627,548
|
| 4,381
|
| McKesson Corp.
|
| 1,559,855
|
| 10,829
|
| Quest Diagnostics, Inc.
|
| 1,532,087
|
| 3,442
|
| UnitedHealth Group, Inc.
|
| 1,626,655
|
|
|
|
|
| 10,251,912
|
|
|
| Hotels, Restaurants &
Leisure – 6.0%
|
|
|
| 7,259
|
| McDonald’s Corp.
|
| 2,029,689
|
| 12,976
|
| Yum! Brands, Inc.
|
| 1,713,870
|
|
|
|
|
| 3,743,559
|
| Shares
|
| Description
|
| Value
|
|
|
|
|
| Household Products – 2.8%
|
|
|
| 11,809
|
| Procter & Gamble (The) Co.
|
| $1,755,880
|
|
|
| Insurance – 22.1%
|
|
|
| 23,678
|
| Aflac, Inc.
|
| 1,527,704
|
| 4,912
|
| American Financial Group, Inc.
|
| 596,808
|
| 3,431
|
| Arthur J. Gallagher & Co.
|
| 656,385
|
| 7,748
|
| Chubb Ltd.
|
| 1,504,507
|
| 12,089
|
| Globe Life, Inc.
|
| 1,330,032
|
| 7,130
|
| Hanover Insurance Group (The), Inc.
|
| 916,205
|
| 5,851
|
| Marsh & McLennan Cos., Inc.
|
| 974,484
|
| 15,916
|
| MetLife, Inc.
|
| 922,173
|
| 7,740
|
| Progressive (The) Corp.
|
| 1,107,284
|
| 6,653
|
| RLI Corp.
|
| 884,250
|
| 7,865
|
| Selective Insurance Group, Inc.
|
| 749,770
|
| 9,134
|
| Travelers (The) Cos., Inc.
|
| 1,565,659
|
| 17,272
|
| W.R. Berkley Corp.
|
| 1,075,355
|
|
|
|
|
| 13,810,616
|
|
|
| Machinery – 5.2%
|
|
|
| 3,981
|
| IDEX Corp.
|
| 919,730
|
| 3,552
|
| Illinois Tool Works, Inc.
|
| 864,734
|
| 2,621
|
| Nordson Corp.
|
| 582,544
|
| 3,495
|
| Snap-on, Inc.
|
| 862,881
|
|
|
|
|
| 3,229,889
|
|
|
| Multi-Utilities – 2.6%
|
|
|
| 56,173
|
| CenterPoint Energy, Inc.
|
| 1,654,857
|
|
|
| Pharmaceuticals – 6.0%
|
|
|
| 27,661
|
| Bristol-Myers Squibb Co.
|
| 1,917,184
|
| 17,542
|
| Merck & Co., Inc.
|
| 1,866,293
|
|
|
|
|
| 3,783,477
|
|
|
| Professional Services – 1.7%
|
|
|
| 11,797
|
| Leidos Holdings, Inc.
|
| 1,086,032
|
|
|
| Tobacco – 2.2%
|
|
|
| 13,839
|
| Philip Morris International, Inc.
|
| 1,345,843
|
|
|
| Total Common Stocks
|
| 58,804,871
|
|
|
| (Cost $58,467,796)
|
|
|
| REAL ESTATE INVESTMENT TRUSTS – 5.9%
|
|
|
| Retail REITs – 2.6%
|
|
|
| 37,622
|
| National Retail Properties, Inc.
|
| 1,661,011
|
|
|
| Specialized REITs – 3.3%
|
|
|
| 25,697
|
| Gaming and Leisure Properties, Inc.
|
| 1,337,786
|
Page 16
See Notes to Financial
Statements
First Trust Dorsey Wright Momentum &
Low Volatility ETF (DVOL)
Portfolio of Investments
(Continued)
March 31, 2023
(Unaudited)
| Shares
|
| Description
|
| Value
|
| REAL ESTATE INVESTMENT TRUSTS (Continued)
|
|
|
| Specialized REITs (Continued)
|
|
|
| 21,903
|
| VICI Properties, Inc.
|
| $714,476
|
|
|
|
|
| 2,052,262
|
|
|
| Total Real Estate Investment Trusts
|
| 3,713,273
|
|
|
| (Cost $3,609,014)
|
|
|
|
|
| Total Investments – 99.8%
|
| 62,518,144
|
|
|
| (Cost $62,076,810)
|
|
|
|
|
| Net Other Assets and Liabilities – 0.2%
|
| 98,067
|
|
|
| Net Assets – 100.0%
|
| $62,616,211
|
| (a)
| Non-income producing security.
|
Valuation Inputs
A summary of the inputs
used to value the Fund’s investments as of March 31, 2023 is as follows (see Note 2A - Portfolio Valuation in the Notes to Financial Statements):
|
| Total
Value at
3/31/2023
| Level 1
Quoted
Prices
| Level 2
Significant
Observable
Inputs
| Level 3
Significant
Unobservable
Inputs
|
| Common Stocks*
| $ 58,804,871
| $ 58,804,871
| $ —
| $ —
|
| Real Estate Investment Trusts*
| 3,713,273
| 3,713,273
| —
| —
|
| Total Investments
| $ 62,518,144
| $ 62,518,144
| $—
| $—
|
| *
| See Portfolio of Investments for industry breakout.
|
See Notes to Financial Statements
Page 17
First Trust Exchange-Traded Fund VI
Statements of Assets and
Liabilities
March 31, 2023
(Unaudited)
|
| First Trust
SMID
Cap Rising
Dividend
Achievers
ETF
(SDVY)
|
| First Trust
Dorsey Wright
Momentum &
Value ETF
(DVLU)
|
| First Trust
Dorsey Wright
Momentum &
Low Volatility ETF
(DVOL)
|
| ASSETS:
|
|
|
|
|
|
Investments, at value
| $ 1,068,144,734
|
| $ 19,946,973
|
| $ 62,518,144
|
Cash
| 715,288
|
| 14,072
|
| 40,231
|
| Receivables:
|
|
|
|
|
|
Dividends
| 1,870,416
|
| 15,980
|
| 89,235
|
Dividend reclaims
| 11,453
|
| —
|
| —
|
Total Assets
| 1,070,741,891
|
| 19,977,025
|
| 62,647,610
|
| LIABILITIES:
|
|
|
|
|
|
| Payables:
|
|
|
|
|
|
Investment advisory fees
| 555,537
|
| 10,247
|
| 31,399
|
Total Liabilities
| 555,537
|
| 10,247
|
| 31,399
|
NET ASSETS
| $1,070,186,354
|
| $19,966,778
|
| $62,616,211
|
| NET ASSETS consist of:
|
|
|
|
|
|
Paid-in capital
| $ 1,165,053,438
|
| $ 31,731,833
|
| $ 86,808,708
|
Par value
| 401,500
|
| 9,000
|
| 24,500
|
Accumulated distributable earnings (loss)
| (95,268,584)
|
| (11,774,055)
|
| (24,216,997)
|
NET ASSETS
| $1,070,186,354
|
| $19,966,778
|
| $62,616,211
|
NET ASSET VALUE, per share
| $26.65
|
| $22.19
|
| $25.56
|
Number of shares outstanding (unlimited number of shares authorized, par value $0.01 per share)
| 40,150,002
|
| 900,002
|
| 2,450,002
|
Investments, at cost
| $1,086,442,976
|
| $19,629,071
|
| $62,076,810
|
Page 18
See Notes to Financial Statements
First Trust Exchange-Traded Fund VI
Statements of Operations
For the Six Months Ended
March 31, 2023 (Unaudited)
|
| First Trust
SMID
Cap Rising
Dividend
Achievers
ETF
(SDVY)
|
| First Trust
Dorsey Wright
Momentum &
Value ETF
(DVLU)
|
| First Trust
Dorsey Wright
Momentum &
Low Volatility ETF
(DVOL)
|
| INVESTMENT INCOME:
|
|
|
|
|
|
Dividends
| $ 17,052,870
|
| $ 351,052
|
| $ 736,321
|
Interest
| 34,492
|
| 574
|
| 1,564
|
Foreign withholding tax
| (43,295)
|
| (359)
|
| —
|
Other
| 31
|
| —
|
| —
|
Total investment income
| 17,044,098
|
| 351,267
|
| 737,885
|
| EXPENSES:
|
|
|
|
|
|
Investment advisory fees
| 3,018,682
|
| 65,266
|
| 213,879
|
Total expenses
| 3,018,682
|
| 65,266
|
| 213,879
|
NET INVESTMENT INCOME (LOSS)
| 14,025,416
|
| 286,001
|
| 524,006
|
| NET REALIZED AND UNREALIZED GAIN (LOSS):
|
|
|
|
|
|
| Net realized gain (loss) on:
|
|
|
|
|
|
Investments
| (57,421,905)
|
| (549,322)
|
| (4,663,542)
|
In-kind redemptions
| 9,254,692
|
| 187,062
|
| 563,047
|
Net realized gain (loss)
| (48,167,213)
|
| (362,260)
|
| (4,100,495)
|
| Net change in unrealized appreciation (depreciation) on:
|
|
|
|
|
|
Investments
| 168,592,364
|
| 2,185,917
|
| 9,711,660
|
NET REALIZED AND UNREALIZED GAIN (LOSS)
| 120,425,151
|
| 1,823,657
|
| 5,611,165
|
NET INCREASE (DECREASE) IN NET ASSETS RESULTING FROM OPERATIONS
| $ 134,450,567
|
| $ 2,109,658
|
| $ 6,135,171
|
See Notes to Financial Statements
Page 19
First Trust Exchange-Traded Fund VI
Statements of Changes in
Net Assets
|
| First Trust
SMID
Cap Rising
Dividend Achievers
ETF
(SDVY)
|
| First Trust
Dorsey Wright
Momentum &
Value ETF
(DVLU)
|
|
| Six Months
Ended
3/31/2023
(Unaudited)
|
| Year
Ended
9/30/2022
|
| Six Months
Ended
3/31/2023
(Unaudited)
|
| Year
Ended
9/30/2022
|
| OPERATIONS:
|
|
|
|
|
|
|
|
Net investment income (loss)
| $ 14,025,416
|
| $ 15,508,578
|
| $ 286,001
|
| $ 401,682
|
Net realized gain (loss)
| (48,167,213)
|
| (24,538,123)
|
| (362,260)
|
| (1,579,870)
|
Net change in unrealized appreciation (depreciation)
| 168,592,364
|
| (182,334,771)
|
| 2,185,917
|
| (1,474,104)
|
Net increase (decrease) in net assets resulting from operations
| 134,450,567
|
| (191,364,316)
|
| 2,109,658
|
| (2,652,292)
|
| DISTRIBUTIONS TO SHAREHOLDERS FROM:
|
|
|
|
|
|
|
|
Investment operations
| (13,823,521)
|
| (14,025,016)
|
| (284,306)
|
| (416,941)
|
| SHAREHOLDER TRANSACTIONS:
|
|
|
|
|
|
|
|
Proceeds from shares sold
| 210,359,374
|
| 937,688,574
|
| 1,092,214
|
| 5,097,895
|
Cost of shares redeemed
| (80,421,269)
|
| (123,351,150)
|
| (2,320,003)
|
| (8,523,685)
|
Net increase (decrease) in net assets resulting from shareholder transactions
| 129,938,105
|
| 814,337,424
|
| (1,227,789)
|
| (3,425,790)
|
Total increase (decrease) in net assets
| 250,565,151
|
| 608,948,092
|
| 597,563
|
| (6,495,023)
|
| NET ASSETS:
|
|
|
|
|
|
|
|
Beginning of period
| 819,621,203
|
| 210,673,111
|
| 19,369,215
|
| 25,864,238
|
End of period
| $1,070,186,354
|
| $819,621,203
|
| $19,966,778
|
| $19,369,215
|
| CHANGES IN SHARES OUTSTANDING:
|
|
|
|
|
|
|
|
Shares outstanding, beginning of period
| 35,500,002
|
| 7,450,002
|
| 950,002
|
| 1,100,002
|
Shares sold
| 7,700,000
|
| 32,800,000
|
| 50,000
|
| 200,000
|
Shares redeemed
| (3,050,000)
|
| (4,750,000)
|
| (100,000)
|
| (350,000)
|
Shares outstanding, end of period
| 40,150,002
|
| 35,500,002
|
| 900,002
|
| 950,002
|
Page 20
See Notes to Financial Statements
First Trust
Dorsey Wright
Momentum &
Low Volatility
ETF (DVOL)
|
Six Months
Ended
3/31/2023
(Unaudited)
|
| Year
Ended
9/30/2022
|
|
|
|
|
| $ 524,006
|
| $ 1,144,440
|
| (4,100,495)
|
| 4,581,875
|
| 9,711,660
|
| (18,738,146)
|
| 6,135,171
|
| (13,011,831)
|
|
|
|
|
| (629,266)
|
| (1,071,096)
|
|
|
|
|
| 2,655,083
|
| 93,110,294
|
| (26,998,338)
|
| (118,688,168)
|
| (24,343,255)
|
| (25,577,874)
|
| (18,837,350)
|
| (39,660,801)
|
|
|
|
|
| 81,453,561
|
| 121,114,362
|
| $62,616,211
|
| $81,453,561
|
|
|
|
|
| 3,400,002
|
| 4,400,002
|
| 100,000
|
| 3,300,000
|
| (1,050,000)
|
| (4,300,000)
|
| 2,450,002
|
| 3,400,002
|
See Notes to Financial Statements
Page 21
First Trust Exchange-Traded Fund VI
Financial Highlights
For a share outstanding
throughout each period
First Trust SMID Cap Rising Dividend
Achievers ETF (SDVY)
|
| Six Months
Ended
3/31/2023
(Unaudited)
|
| Year Ended September 30,
|
| Period
Ended
9/30/2018 (a)
|
|
| 2022
|
| 2021
|
| 2020
|
| 2019
|
|
Net asset value, beginning of period
| $ 23.09
|
| $ 28.28
|
| $ 18.27
|
| $ 20.37
|
| $ 21.28
|
| $ 19.94
|
| Income from investment operations:
|
|
|
|
|
|
|
|
|
|
|
|
Net investment income (loss)
| 0.36
|
| 0.51
|
| 0.36
|
| 0.33
|
| 0.35
|
| 0.26
|
Net realized and unrealized gain (loss)
| 3.56
|
| (5.21)
|
| 9.99
|
| (2.08)
|
| (0.92)
|
| 1.31
|
Total from investment operations
| 3.92
|
| (4.70)
|
| 10.35
|
| (1.75)
|
| (0.57)
|
| 1.57
|
| Distributions paid to shareholders from:
|
|
|
|
|
|
|
|
|
|
|
|
Net investment income
| (0.36)
|
| (0.49)
|
| (0.34)
|
| (0.35)
|
| (0.34)
|
| (0.23)
|
Net asset value, end of period
| $26.65
|
| $23.09
|
| $28.28
|
| $18.27
|
| $20.37
|
| $21.28
|
Total return (b)
| 17.02%
|
| (16.78)%
|
| 56.77%
|
| (8.56)%
|
| (2.59)%
|
| 7.92%
|
| Ratios to average net assets/supplemental data:
|
|
|
|
|
|
|
|
|
|
|
|
Net assets, end of period (in 000’s)
| $ 1,070,186
|
| $ 819,621
|
| $ 210,673
|
| $ 10,050
|
| $ 7,128
|
| $ 4,257
|
Ratio of total expenses to average net assets
| 0.60% (c)
|
| 0.60%
|
| 0.60%
|
| 0.60%
|
| 0.60%
|
| 0.60% (c)
|
Ratio of net investment income (loss) to average net assets
| 2.79% (c)
|
| 2.25%
|
| 1.77%
|
| 1.83%
|
| 1.95%
|
| 1.49% (c)
|
Portfolio turnover rate (d)
| 48%
|
| 86%
|
| 36%
|
| 76%
|
| 78%
|
| 72%
|
| (a)
| Inception date is November 1, 2017, which is consistent with the commencement of investment operations and is the date the initial creation units were established.
|
| (b)
| Total return is calculated assuming an initial investment made at the net asset value at the beginning of the period, reinvestment of all distributions at net asset value during the
period, and redemption at net asset value on the last day of the period. The returns presented do not reflect the deduction of taxes that a shareholder would pay on Fund distributions or the redemption or sale of Fund
shares. Total return is calculated for the time period presented and is not annualized for periods of less than a year.
|
| (c)
| Annualized.
|
| (d)
| Portfolio turnover is calculated for the time period presented and is not annualized for periods of less than a year and does not include securities received or
delivered from processing creations or redemptions and in-kind transactions.
|
Page 22
See Notes to Financial Statements
First Trust Exchange-Traded Fund VI
Financial Highlights
(Continued)
For a share outstanding
throughout each period
First Trust Dorsey Wright Momentum &
Value ETF (DVLU)
|
| Six Months
Ended
3/31/2023
(Unaudited)
|
| Year Ended September 30,
|
| Period
Ended
9/30/2018 (a)
|
|
| 2022
|
| 2021
|
| 2020
|
| 2019
|
|
Net asset value, beginning of period
| $ 20.39
|
| $ 23.51
|
| $ 15.07
|
| $ 18.52
|
| $ 19.46
|
| $ 19.98
|
| Income from investment operations:
|
|
|
|
|
|
|
|
|
|
|
|
Net investment income (loss)
| 0.30
|
| 0.40
|
| 0.29
|
| 0.25
|
| 0.33
|
| 0.02
|
Net realized and unrealized gain (loss)
| 1.80
|
| (3.11)
|
| 8.42
|
| (3.44)
|
| (0.94)
|
| (0.54)
|
Total from investment operations
| 2.10
|
| (2.71)
|
| 8.71
|
| (3.19)
|
| (0.61)
|
| (0.52)
|
| Distributions paid to shareholders from:
|
|
|
|
|
|
|
|
|
|
|
|
Net investment income
| (0.30)
|
| (0.41)
|
| (0.27)
|
| (0.26)
|
| (0.33)
|
| —
|
Net asset value, end of period
| $22.19
|
| $20.39
|
| $23.51
|
| $15.07
|
| $18.52
|
| $19.46
|
Total return (b)
| 10.33%
|
| (11.71)%
|
| 57.98%
|
| (17.19)%
|
| (3.04)%
|
| (2.60)%
|
| Ratios to average net assets/supplemental data:
|
|
|
|
|
|
|
|
|
|
|
|
Net assets, end of period (in 000’s)
| $ 19,967
|
| $ 19,369
|
| $ 25,864
|
| $ 14,320
|
| $ 19,451
|
| $ 13,625
|
Ratio of total expenses to average net assets
| 0.60% (c)
|
| 0.60%
|
| 0.60%
|
| 0.60%
|
| 0.60%
|
| 0.60% (c)
|
Ratio of net investment income (loss) to average net assets
| 2.63% (c)
|
| 1.64%
|
| 1.68%
|
| 1.56%
|
| 2.01%
|
| 3.61% (c)
|
Portfolio turnover rate (d)
| 97%
|
| 230%
|
| 195%
|
| 205%
|
| 152%
|
| 0%
|
| (a)
| Inception date is September 5, 2018, which is consistent with the commencement of investment operations and is the date the initial creation units were established.
|
| (b)
| Total return is calculated assuming an initial investment made at the net asset value at the beginning of the period, reinvestment of all distributions at net asset value during the
period, and redemption at net asset value on the last day of the period. The returns presented do not reflect the deduction of taxes that a shareholder would pay on Fund distributions or the redemption or sale of Fund
shares. Total return is calculated for the time period presented and is not annualized for periods of less than a year.
|
| (c)
| Annualized.
|
| (d)
| Portfolio turnover is calculated for the time period presented and is not annualized for periods of less than a year and does not include securities received or
delivered from processing creations or redemptions and in-kind transactions.
|
See Notes to Financial Statements
Page 23
First Trust Exchange-Traded Fund VI
Financial Highlights
(Continued)
For a share outstanding
throughout each period
First Trust Dorsey Wright Momentum &
Low Volatility ETF (DVOL)
|
| Six Months
Ended
3/31/2023
(Unaudited)
|
| Year Ended September 30,
|
| Period
Ended
9/30/2018 (a)
|
|
| 2022
|
| 2021
|
| 2020
|
| 2019
|
|
Net asset value, beginning of period
| $ 23.96
|
| $ 27.53
|
| $ 22.46
|
| $ 22.81
|
| $ 19.94
|
| $ 19.97
|
| Income from investment operations:
|
|
|
|
|
|
|
|
|
|
|
|
Net investment income (loss)
| 0.21
|
| 0.32
|
| 0.10
|
| 0.28
|
| 0.29
|
| 0.03
|
Net realized and unrealized gain (loss)
| 1.63
|
| (3.60)
|
| 5.06
|
| (0.30)
|
| 2.85
|
| (0.06)
|
Total from investment operations
| 1.84
|
| (3.28)
|
| 5.16
|
| (0.02)
|
| 3.14
|
| (0.03)
|
| Distributions paid to shareholders from:
|
|
|
|
|
|
|
|
|
|
|
|
Net investment income
| (0.24)
|
| (0.29)
|
| (0.09)
|
| (0.33)
|
| (0.27)
|
| —
|
Net asset value, end of period
| $25.56
|
| $23.96
|
| $27.53
|
| $22.46
|
| $22.81
|
| $19.94
|
Total return (b)
| 7.67%
|
| (12.02)%
|
| 22.98%
|
| 0.03%
|
| 15.93%
|
| (0.15)%
|
| Ratios to average net assets/supplemental data:
|
|
|
|
|
|
|
|
|
|
|
|
Net assets, end of period (in 000’s)
| $ 62,616
|
| $ 81,454
|
| $ 121,114
|
| $ 124,674
|
| $ 131,169
|
| $ 13,960
|
Ratio of total expenses to average net assets
| 0.60% (c)
|
| 0.60%
|
| 0.60%
|
| 0.60%
|
| 0.60%
|
| 0.60% (c)
|
Ratio of net investment income (loss) to average net assets
| 1.47% (c)
|
| 1.04%
|
| 0.36%
|
| 1.21%
|
| 2.37%
|
| 3.81% (c)
|
Portfolio turnover rate (d)
| 63%
|
| 169%
|
| 136%
|
| 187%
|
| 81%
|
| 0%
|
| (a)
| Inception date is September 5, 2018, which is consistent with the commencement of investment operations and is the date the initial creation units were established.
|
| (b)
| Total return is calculated assuming an initial investment made at the net asset value at the beginning of the period, reinvestment of all distributions at net asset value during the
period, and redemption at net asset value on the last day of the period. The returns presented do not reflect the deduction of taxes that a shareholder would pay on Fund distributions or the redemption or sale of Fund
shares. Total return is calculated for the time period presented and is not annualized for periods of less than a year.
|
| (c)
| Annualized.
|
| (d)
| Portfolio turnover is calculated for the time period presented and is not annualized for periods of less than a year and does not include securities received or
delivered from processing creations or redemptions and in-kind transactions.
|
Page 24
See Notes to Financial Statements
Notes to Financial Statements
First Trust
Exchange-Traded Fund VI
March 31, 2023
(Unaudited)
1. Organization
First Trust
Exchange-Traded Fund VI (the “Trust”) is an open-end management investment company organized as a Massachusetts business trust on June 4, 2012, and is registered with the Securities and Exchange Commission
under the Investment Company Act of 1940, as amended (the “1940 Act”).
The Trust currently
consists of thirty-three exchange-traded funds that are offering shares. This report covers the three funds (each a “Fund” and collectively, the “Funds”) listed below. The shares of each Fund
are listed and traded on The Nasdaq Stock Market LLC (“Nasdaq”).
First
Trust SMID Cap Rising Dividend Achievers ETF – (ticker “SDVY”)
First
Trust Dorsey Wright Momentum & Value ETF – (ticker “DVLU”)
First
Trust Dorsey Wright Momentum & Low Volatility ETF – (ticker “DVOL”)
Each Fund represents a
separate series of shares of beneficial interest in the Trust. Unlike conventional mutual funds, each Fund issues and redeems shares on a continuous basis, at net asset value (“NAV”), only in large blocks
of shares known as “Creation Units.” The investment objective of each Fund is to seek investment results that correspond generally to the price and yield (before the Fund’s fees and expenses) of the
following indices:
| Fund
| Index
|
| First Trust SMID Cap Rising Dividend Achievers ETF
| Nasdaq US Small Mid Cap Rising Dividend AchieversTM Index
|
| First Trust Dorsey Wright Momentum & Value ETF
| DorseyWright Momentum Plus ValueTM Index
|
| First Trust Dorsey Wright Momentum & Low Volatility ETF
| DorseyWright Momentum Plus Low VolatilityTM Index
|
2. Significant
Accounting Policies
The Funds are each
considered an investment company and follow accounting and reporting guidance under Financial Accounting Standards Board Accounting Standards Codification Topic 946, “Financial Services-Investment
Companies.” The following is a summary of significant accounting policies consistently followed by the Funds in the preparation of the financial statements. The preparation of the financial statements in
accordance with accounting principles generally accepted in the United States of America (“U.S. GAAP”) requires management to make estimates and assumptions that affect the reported amounts and disclosures
in the financial statements. Actual results could differ from those estimates.
A. Portfolio
Valuation
Each Fund’s NAV is
determined daily as of the close of regular trading on the New York Stock Exchange (“NYSE”), normally 4:00 p.m. Eastern time, on each day the NYSE is open for trading. If the NYSE closes early on a
valuation day, the NAV is determined as of that time. Each Fund’s NAV is calculated by dividing the value of all assets of each Fund (including accrued interest and dividends), less all liabilities (including
accrued expenses and dividends declared but unpaid), by the total number of shares outstanding.
Each Fund’s
investments are valued daily at market value or, in the absence of market value with respect to any portfolio securities, at fair value. Market value prices represent readily available market quotations such as last
sale or official closing prices from a national or foreign exchange (i.e., a regulated market) and are primarily obtained from third-party pricing services. Fair value prices represent any prices not considered market
value prices and are either obtained from a third-party pricing service or are determined by the Pricing Committee of the Funds’ investment advisor, First Trust Advisors L.P. (“First Trust” or the
“Advisor”), in accordance with valuation procedures approved by the Trust’s Board of Trustees, and in accordance with provisions of the 1940 Act and rules thereunder. Investments valued by the
Advisor’s Pricing Committee, if any, are footnoted as such in the footnotes to the Portfolio of Investments. Each Fund’s investments are valued as follows:
Common
stocks, real estate investment trusts (“REITs”), and other equity securities listed on any national or foreign exchange (excluding Nasdaq and the London Stock Exchange Alternative Investment Market
(“AIM”)) are valued at the last sale price on the exchange on which they are principally traded or, for Nasdaq and AIM securities, the official closing price. Securities traded on more than one securities
exchange are valued at the last sale price or official closing price, as applicable, at the close of the securities exchange representing the primary exchange for such securities.
Securities traded in an over-the-counter market are valued at the mean of their most recent bid and asked price, if available, and otherwise at their last trade price.
Certain securities may
not be able to be priced by pre-established pricing methods. Such securities may be valued by the Advisor’s Pricing Committee at fair value. These securities generally include, but are not limited to, restricted
securities (securities which may
Notes to Financial Statements (Continued)
First Trust
Exchange-Traded Fund VI
March 31, 2023
(Unaudited)
not be publicly sold without
registration under the Securities Act of 1933, as amended) for which a third-party pricing service is unable to provide a market price; securities whose trading has been formally suspended; a security whose market or
fair value price is not available from a pre-established pricing source; a security with respect to which an event has occurred that is likely to materially affect the value of the security after the market has closed
but before the calculation of a Fund’s NAV or make it difficult or impossible to obtain a reliable market quotation; and a security whose price, as provided by the third-party pricing service, does not reflect
the security’s fair value. As a general principle, the current fair value of a security would appear to be the amount which the owner might reasonably expect to receive for the security upon its current sale.
When fair value prices are used, generally they will differ from market quotations or official closing prices on the applicable exchanges. A variety of factors may be considered in determining the fair value of such
securities, including, but not limited to, the following:
| 1)
| the last sale price on the exchange on which they are principally traded or, for Nasdaq and AIM securities, the official closing price;
|
| 2)
| the type of security;
|
| 3)
| the size of the holding;
|
| 4)
| the initial cost of the security;
|
| 5)
| transactions in comparable securities;
|
| 6)
| price quotes from dealers and/or third-party pricing services;
|
| 7)
| relationships among various securities;
|
| 8)
| information obtained by contacting the issuer, analysts, or the appropriate stock exchange;
|
| 9)
| an analysis of the issuer’s financial statements;
|
| 10)
| the existence of merger proposals or tender offers that might affect the value of the security; and
|
| 11)
| other relevant factors.
|
In addition, differences
between the prices used to calculate a Fund’s NAV and the prices used by such Fund’s corresponding index could result in a difference between a Fund’s performance and the performance of its
underlying index.
The Funds are subject to
fair value accounting standards that define fair value, establish the framework for measuring fair value and provide a three-level hierarchy for fair valuation based upon the inputs to the valuation as of the
measurement date. The three levels of the fair value hierarchy are as follows:
| •
| Level 1 – Level 1 inputs are quoted prices in active markets for identical investments. An active market is a market in which transactions for the investment occur with sufficient frequency and
volume to provide pricing information on an ongoing basis.
|
| •
| Level 2 – Level 2 inputs are observable inputs, either directly or indirectly, and include the following:
|
| o
| Quoted prices for similar investments in active markets.
|
| o
| Quoted prices for identical or similar investments in markets that are non-active. A non-active market is a market where there are few transactions for the investment, the prices are not current, or
price quotations vary substantially either over time or among market makers, or in which little information is released publicly.
|
| o
| Inputs other than quoted prices that are observable for the investment (for example, interest rates and yield curves observable at commonly quoted intervals, volatilities, prepayment speeds, loss
severities, credit risks, and default rates).
|
| o
| Inputs that are derived principally from or corroborated by observable market data by correlation or other means.
|
| •
| Level 3 – Level 3 inputs are unobservable inputs. Unobservable inputs may reflect the reporting entity’s own assumptions about the assumptions that market participants would use in pricing
the investment.
|
The inputs or
methodologies used for valuing investments are not necessarily an indication of the risk associated with investing in those investments. A summary of the inputs used to value each Fund’s investments as of March
31, 2023, is included with each Fund’s Portfolio of Investments.
B. Securities
Transactions and Investment Income
Securities transactions
are recorded as of the trade date. Realized gains and losses from securities transactions are recorded on the identified cost basis. Dividend income is recorded on the ex-dividend date. Interest income, if any, is
recorded daily on the accrual basis.
Withholding taxes and tax
reclaims on foreign dividends have been provided for in accordance with each Fund’s understanding of the applicable country’s tax rules and rates.
Notes to Financial Statements (Continued)
First Trust
Exchange-Traded Fund VI
March 31, 2023
(Unaudited)
Distributions received
from a Fund’s investments in REITs may be comprised of return of capital, capital gains, and income. The actual character of the amounts received during the year are not known until after the REITs’ fiscal
year end. A Fund records the character of distributions received from the REITs during the year based on estimates available. The characterization of distributions received by a Fund may be subsequently revised based
on information received from the REITs after their tax reporting periods conclude.
C. Dividends and
Distributions to Shareholders
Dividends from net
investment income, if any, are declared and paid quarterly, or as the Board of Trustees may determine from time to time. Distributions of net realized capital gains earned by each Fund, if any, are distributed at
least annually. A Fund may also designate a portion of the amount paid to redeeming shareholders as a distribution for tax purposes.
Distributions from net
investment income and realized capital gains are determined in accordance with federal income tax regulations, which may differ from U.S. GAAP. Certain capital accounts in the financial statements are periodically
adjusted for permanent differences in order to reflect their tax character. These permanent differences are primarily due to the varying treatment of income and gain/loss on portfolio securities held by the Funds and
have no impact on net assets or NAV per share. Temporary differences, which arise from recognizing certain items of income, expense, and gain/loss in different periods for financial statement and tax purposes, will
reverse at some time in the future.
The tax character of
distributions paid by each Fund during the fiscal year ended September 30, 2022, was as follows:
|
| Distributions
paid from
Ordinary
Income
|
| Distributions
paid from
Capital
Gains
|
| Distributions
paid from
Return of
Capital
|
First Trust SMID Cap Rising Dividend Achievers ETF
| $ 14,025,016
|
| $ —
|
| $ —
|
First Trust Dorsey Wright Momentum & Value ETF
| 416,941
|
| —
|
| —
|
First Trust Dorsey Wright Momentum & Low Volatility ETF
| 1,071,096
|
| —
|
| —
|
As of September 30, 2022,
the components of distributable earnings on a tax basis for each Fund were as follows:
|
| Undistributed
Ordinary
Income
|
| Accumulated
Capital and
Other
Gain (Loss)
|
| Net
Unrealized
Appreciation
(Depreciation)
|
First Trust SMID Cap Rising Dividend Achievers ETF
| $ 1,623,821
|
| $ (17,877,189)
|
| $ (199,642,262)
|
First Trust Dorsey Wright Momentum & Value ETF
| 27,114
|
| (11,751,888)
|
| (1,874,633)
|
First Trust Dorsey Wright Momentum & Low Volatility ETF
| 149,989
|
| (20,592,809)
|
| (9,280,082)
|
D. Income Taxes
Each Fund intends to
continue to qualify as a regulated investment company by complying with the requirements under Subchapter M of the Internal Revenue Code of 1986, as amended, which includes distributing substantially all of its net
investment income and net realized gains to shareholders. Accordingly, no provision has been made for federal and state income taxes. However, due to the timing and amount of distributions, each Fund may be subject to
an excise tax of 4% of the amount by which approximately 98% of each Fund’s taxable income exceeds the distributions from such taxable income for the calendar year.
The Funds are subject to
accounting standards that establish a minimum threshold for recognizing, and a system for measuring, the benefits of a tax position taken or expected to be taken in a tax return. Taxable years ended 2019, 2020, 2021
and 2022 remain open to federal and state audit. As of March 31, 2023, management has evaluated the application of these standards to the Funds and has determined that no provision for income tax is required in the
Funds’ financial statements for uncertain tax positions.
The Funds intend to
utilize provisions of the federal income tax laws, which allow them to carry a realized capital loss forward indefinitely following the year of the loss and offset such loss against any future realized capital gains.
The Funds are subject to certain limitations under U.S. tax rules on the use of capital loss carryforwards and net unrealized built-in losses. These limitations apply when there has been a 50% change in ownership. At
September 30, 2022, for federal income tax purposes, each applicable Fund had a capital loss carryforward available that is shown in the table below, to the extent provided by regulations, to offset future capital
gains.
Notes to Financial Statements (Continued)
First Trust
Exchange-Traded Fund VI
March 31, 2023
(Unaudited)
|
| Non-Expiring
Capital Loss
Carryforward
|
First Trust SMID Cap Rising Dividend Achievers ETF
| $ 17,877,189
|
First Trust Dorsey Wright Momentum & Value ETF
| 11,751,888
|
First Trust Dorsey Wright Momentum & Low Volatility ETF
| 20,592,809
|
As of March 31, 2023, the
aggregate cost, gross unrealized appreciation, gross unrealized depreciation, and net unrealized appreciation/(depreciation) on investments (including short positions and derivatives, if any) for federal income tax
purposes were as follows:
|
| Tax Cost
|
| Gross
Unrealized
Appreciation
|
| Gross
Unrealized
(Depreciation)
|
| Net Unrealized
Appreciation
(Depreciation)
|
First Trust SMID Cap Rising Dividend Achievers ETF
| $ 1,086,442,976
|
| $ 52,107,364
|
| $ (70,405,606)
|
| $ (18,298,242)
|
First Trust Dorsey Wright Momentum & Value ETF
| 19,629,071
|
| 1,613,345
|
| (1,295,443)
|
| 317,902
|
First Trust Dorsey Wright Momentum & Low Volatility ETF
| 62,076,810
|
| 2,427,339
|
| (1,986,005)
|
| 441,334
|
E. Expenses
Expenses, other than the
investment advisory fee and other excluded expenses, are paid by the Advisor (See Note 3).
First Trust has entered
into licensing agreements with Nasdaq, Inc. (“Licensor”) for the Funds. The respective license agreements allow for the use by First Trust of each Fund’s respective index and of certain trademarks
and trade names of the Licensor. The Funds are sub-licensees to the applicable license agreements.
3. Investment
Advisory Fee, Affiliated Transactions and Other Fee Arrangements
First Trust, the
investment advisor to the Funds, is a limited partnership with one limited partner, Grace Partners of DuPage L.P., and one general partner, The Charger Corporation. The Charger Corporation is an Illinois corporation
controlled by James A. Bowen, Chief Executive Officer of First Trust. First Trust is responsible for the selection and ongoing monitoring of the securities in each Fund’s portfolio, managing the Funds’
business affairs and providing certain administrative services necessary for the management of the Funds.
First Trust is
responsible for the expenses of each Fund including the cost of transfer agency, custody, fund administration, licensing fees, legal, audit and other services, but excluding fee payments under the Investment
Management Agreement, interest, taxes, brokerage commissions and other expenses associated with the execution of portfolio transactions, acquired fund fees and expenses, distribution and service fees pursuant to a
Rule 12b-1 plan, if any, and extraordinary expenses, which are paid by each respective Fund. First Trust also provides fund reporting services to the Funds for a flat annual fee in the amount of $9,250 per Fund, which
is covered under the annual unitary management fee. Effective November 1, 2022, the annual unitary management fee payable by each Fund to First Trust for these services will be reduced at certain levels of each
Fund’s net assets (“breakpoints”) and calculated pursuant to the following schedules:
| Breakpoints
| SDVY
| DVLU
| DVOL
|
|
|
|
|
| Fund net assets up to and including $2.5 billion
| 0.600%
| 0.600%
| 0.600%
|
|
|
|
|
| Fund net assets greater than $2.5 billion up to and including $5 billion
| 0.585%
| 0.585%
| 0.585%
|
|
|
|
|
| Fund net assets greater than $5 billion up to and including $7.5 billion
| 0.570%
| 0.570%
| 0.570%
|
|
|
|
|
| Fund net assets greater than $7.5 billion up to and including $10 billion
| 0.555%
| 0.555%
| 0.555%
|
|
|
|
|
| Fund net assets greater than $10 billion up to and including $15 billion
| 0.540%
| 0.540%
| 0.540%
|
|
|
|
|
| Fund net assets greater than $15 billion
| 0.510%
| 0.510%
| 0.510%
|
|
|
|
|
Prior to November 1,
2022, each Fund paid First Trust an annual unitary management fee equal to 0.60% of its average daily net assets.
Notes to Financial Statements (Continued)
First Trust
Exchange-Traded Fund VI
March 31, 2023
(Unaudited)
The Trust has multiple
service agreements with BBH. Under the service agreements, BBH performs custodial, fund accounting, certain administrative services, and transfer agency services for each Fund. As custodian, BBH is responsible for
custody of each Fund’s assets. As fund accountant and administrator, BBH is responsible for maintaining the books and records of each Fund’s securities and cash. As transfer agent, BBH is responsible for
maintaining shareholder records for each Fund.
Each Trustee who is not
an officer or employee of First Trust, any sub-advisor or any of their affiliates (“Independent Trustees”) is paid a fixed annual retainer that is allocated equally among each fund in the First Trust Fund
Complex. Each Independent Trustee is also paid an annual per fund fee that varies based on whether the fund is a closed-end or other actively managed fund, a target outcome fund or an index fund.
Additionally, the Lead
Independent Trustee and the Chairs of the Audit Committee, Nominating and Governance Committee and Valuation Committee are paid annual fees to serve in such capacities, with such compensation allocated pro rata among
each fund in the First Trust Fund Complex based on net assets. Independent Trustees are reimbursed for travel and out-of-pocket expenses in connection with all meetings. The Lead Independent Trustee and Committee
Chairs rotate every three years. The officers and “Interested” Trustee receive no compensation from the Trust for acting in such capacities.
4. Purchases and
Sales of Securities
For the six months ended
March 31, 2023, the cost of purchases and proceeds from sales of investment securities for each Fund, excluding short-term investments and in-kind transactions, were as follows:
|
| Purchases
|
| Sales
|
| First Trust SMID Cap Rising Dividend Achievers ETF
| $ 484,915,624
|
| $ 484,969,559
|
| First Trust Dorsey Wright Momentum & Value ETF
| 20,987,923
|
| 20,994,318
|
| First Trust Dorsey Wright Momentum & Low Volatility ETF
| 45,737,504
|
| 45,800,279
|
|
|
|
|
|
For the six months ended
March 31, 2023, the cost of in-kind purchases and proceeds from in-kind sales for each Fund were as follows:
|
| Purchases
|
| Sales
|
| First Trust SMID Cap Rising Dividend Achievers ETF
| $ 209,544,975
|
| $ 80,094,245
|
| First Trust Dorsey Wright Momentum & Value ETF
| 1,089,751
|
| 2,297,106
|
| First Trust Dorsey Wright Momentum & Low Volatility ETF
| 2,651,215
|
| 26,940,433
|
5. Creations,
Redemptions and Transaction Fees
Each Fund generally
issues and redeems its shares in primary market transactions through a creation and redemption mechanism and does not sell or redeem individual shares. Instead, financial entities known as “Authorized
Participants” have contractual arrangements with a Fund or one of the Fund’s service providers to purchase and redeem Fund shares directly with the Fund in large blocks of shares known as “Creation
Units.” Prior to the start of trading on every business day, a Fund publishes through the National Securities Clearing Corporation (“NSCC”) the “basket” of securities, cash or other
assets that it will accept in exchange for a Creation Unit of the Fund’s shares. An Authorized Participant that wishes to effectuate a creation of a Fund’s shares deposits with the Fund the
“basket” of securities, cash or other assets identified by the Fund that day, and then receives the Creation Unit of the Fund’s shares in return for those assets. After purchasing a Creation Unit,
the Authorized Participant may continue to hold the Fund’s shares or sell them in the secondary market. The redemption process is the reverse of the purchase process: the Authorized Participant redeems a
Creation Unit of a Fund’s shares for a basket of securities, cash or other assets. The combination of the creation and redemption process with secondary market trading in a Fund’s shares and underlying
securities provides arbitrage opportunities that are designed to help keep the market price of a Fund’s shares at or close to the NAV per share of the Fund.
Each Fund imposes fees in
connection with the purchase of Creation Units. These fees may vary based upon various fact-based circumstances, including, but not limited to, the composition of the securities included in the Creation Unit or the
countries in which the transactions are settled. The price for each Creation Unit will equal the daily NAV per share of a Fund times the number of shares in a Creation Unit, plus the fees described above and, if
applicable, any operational processing and brokerage costs, transfer fees, stamp taxes and part or all of the spread between the expected bid and offer side of the market related to the securities comprising the
creation basket.
Notes to Financial Statements (Continued)
First Trust
Exchange-Traded Fund VI
March 31, 2023
(Unaudited)
Each Fund also imposes
fees in connection with the redemption of Creation Units. These fees may vary based upon various fact-based circumstances, including, but not limited to, the composition of the securities included in the Creation Unit
or the countries in which the transactions are settled. The price received for each Creation Unit will equal the daily NAV per share of a Fund times the number of shares in a Creation Unit, minus the fees described
above and, if applicable, any operational processing and brokerage costs, transfer fees, stamp taxes and part or all of the spread between the expected bid and offer side of the market related to the securities
comprising the redemption basket. Investors who use the services of a broker or other such intermediary in addition to an Authorized Participant to effect a redemption of a Creation Unit may also be assessed an amount
to cover the cost of such services. The redemption fee charged by a Fund will comply with Rule 22c-2 of the 1940 Act which limits redemption fees to no more than 2% of the value of the shares redeemed.
6. Distribution
Plan
The Board of Trustees
adopted a Distribution and Service Plan pursuant to Rule 12b-1 under the 1940 Act. In accordance with the Rule 12b-1 plan, each Fund is authorized to pay an amount up to 0.25% of its average daily net assets each year
to reimburse First Trust Portfolios L.P. (“FTP”), the distributor of the Funds, for amounts expended to finance activities primarily intended to result in the sale of Creation Units or to provide investor
services. FTP may also use this amount to compensate securities dealers or other persons that are Authorized Participants for providing distribution assistance, including broker-dealer and shareholder support and
educational and promotional services.
No 12b-1 fees are
currently paid by the Funds, and pursuant to a contractual arrangement, no 12b-1 fees will be paid any time before January 31, 2024.
7. Indemnification
The Trust, on behalf of
the Fund, has a variety of indemnification obligations under contracts with its service providers. The Trust’s maximum exposure under these arrangements is unknown. However, the Trust has not had prior claims or
losses pursuant to these contracts and expects the risk of loss to be remote.
8. Subsequent
Events
Management has evaluated
the impact of all subsequent events to the Funds through the date the financial statements were issued and has determined that there were no subsequent events requiring recognition or disclosure in the financial
statements that have not already been disclosed.
Additional Information
First Trust
Exchange-Traded Fund VI
March 31, 2023
(Unaudited)
Proxy Voting Policies
and Procedures
A description of the
policies and procedures that the Trust uses to determine how to vote proxies and information on how each Fund voted proxies relating to portfolio securities during the most recent 12-month period ended June 30 is
available (1) without charge, upon request, by calling (800) 988-5891; (2) on each Fund’s website at www.ftportfolios.com; and (3) on the Securities and Exchange Commission’s (“SEC”) website at www.sec.gov.
Portfolio Holdings
Each Fund files portfolio
holdings information for each month in a fiscal quarter within 60 days after the end of the relevant fiscal quarter on Form N-PORT. Portfolio holdings information for the third month of each fiscal quarter will be
publicly available on the SEC’s website at www.sec.gov. Each Fund’s complete schedule of portfolio holdings for the second and fourth quarters of each fiscal year is included in the semi-annual and
annual reports to shareholders, respectively, and is filed with the SEC on Form N-CSR. The semi-annual and annual report for each Fund is available to investors within 60 days after the period to which it relates.
Each Fund’s Forms N-PORT and Forms N-CSR are available on the SEC’s website listed above.
Risk Considerations
Risks are inherent in all
investing. Certain general risks that may be applicable to a Fund are identified below, but not all of the material risks relevant to each Fund are included in this report and not all of the risks below apply to each
Fund. The material risks of investing in each Fund are spelled out in its prospectus, statement of additional information and other regulatory filings. Before investing, you should consider each Fund’s
investment objective, risks, charges and expenses, and read each Fund’s prospectus and statement of additional information carefully. You can download each Fund’s prospectus at www.ftportfolios.com or
contact First Trust Portfolios L.P. at (800) 621-1675 to request a prospectus, which contains this and other information about each Fund.
Concentration Risk. To the extent that a fund is able to invest a significant percentage of its assets in a single asset class or the securities of issuers within the same country, state, region, industry or
sector, an adverse economic, business or political development may affect the value of the fund’s investments more than if the fund were more broadly diversified. A fund that tracks an index will be concentrated
to the extent the fund’s corresponding index is concentrated. A concentration makes a fund more susceptible to any single occurrence and may subject the fund to greater market risk than a fund that is more
broadly diversified.
Credit Risk. Credit risk is the risk that an issuer of a security will be unable or unwilling to make dividend, interest and/or principal payments when due and the related risk that the value of a
security may decline because of concerns about the issuer’s ability to make such payments.
Cyber Security Risk. The funds are susceptible to potential operational risks through breaches in cyber security. A breach in cyber security refers to both intentional and unintentional events that may cause a
fund to lose proprietary information, suffer data corruption or lose operational capacity. Such events could cause a fund to incur regulatory penalties, reputational damage, additional compliance costs associated with
corrective measures and/or financial loss. In addition, cyber security breaches of a fund’s third-party service providers, such as its administrator, transfer agent, custodian, or sub-advisor, as applicable, or
issuers in which the fund invests, can also subject a fund to many of the same risks associated with direct cyber security breaches.
Defined Outcome Funds
Risk. To the extent a fund’s investment strategy is designed to deliver returns tied to the price performance of an underlying ETF, an investor may not realize the returns the fund seeks
to achieve if that investor does not hold shares for the entire target outcome period. In the event an investor purchases shares after the first day of the target outcome period or sells shares prior to the end of the
target outcome period, the buffer that the fund seeks to provide against a decline in the value of the underlying ETF may not be available, the enhanced returns that the fund seeks to provide (if any) may not be
available and the investor may not participate in a gain in the value of the underlying ETF up to the cap for the investor’s investment period. Additionally, the fund will not participate in gains of the
underlying ETF above the cap and a shareholder may lose their entire investment. If the fund seeks enhanced returns, there are certain time periods when the value of the fund may fall faster than the value of the
underlying ETF, and it is very unlikely that, on any given day during which the underlying ETF share price increases in value, the fund’s share price will increase at the same rate as the enhanced returns sought
by the fund, which is designed for an entire target outcome period. Trading flexible exchange options involves risks different from, or possibly greater than, the risks associated with investing directly in
securities, such as less liquidity and correlation and valuation risks. A fund may experience substantial downside from specific flexible exchange option positions and certain positions may expire worthless.
Derivatives Risk. To the extent a fund uses derivative instruments such as futures contracts, options contracts and swaps, the fund may experience losses because of adverse movements in the price or value
of the underlying asset, index or rate, which may be magnified
Additional Information (Continued)
First Trust
Exchange-Traded Fund VI
March 31, 2023
(Unaudited)
by certain features of the derivative.
These risks are heightened when a fund’s portfolio managers use derivatives to enhance the fund’s return or as a substitute for a position or security, rather than solely to hedge (or offset) the risk of a
position or security held by the fund.
Equity Securities
Risk. To the extent a fund invests in equity securities, the value of the fund’s shares will fluctuate with changes in the value of the equity securities. Equity securities prices
fluctuate for several reasons, including changes in investors’ perceptions of the financial condition of an issuer or the general condition of the relevant stock market, such as market volatility, or when
political or economic events affecting the issuers occur. In addition, common stock prices may be particularly sensitive to rising interest rates, as the cost of capital rises and borrowing costs increase. Equity
securities may decline significantly in price over short or extended periods of time, and such declines may occur in the equity market as a whole, or they may occur in only a particular country, company, industry or
sector of the market.
ETF Risk. The shares of an ETF trade like common stock and represent an interest in a portfolio of securities. The risks of owning an ETF generally reflect the risks of owning the underlying
securities, although lack of liquidity in an ETF could result in it being more volatile and ETFs have management fees that increase their costs. Shares of an ETF trade on an exchange at market prices rather than net
asset value, which may cause the shares to trade at a price greater than net asset value (premium) or less than net asset value (discount). In times of market stress, decisions by market makers to reduce or step away
from their role of providing a market for an ETF’s shares, or decisions by an ETF’s authorized participants that they are unable or unwilling to proceed with creation and/or redemption orders of an
ETF’s shares, could result in shares of the ETF trading at a discount to net asset value and in greater than normal intraday bid-ask spreads.
Fixed Income Securities
Risk. To the extent a fund invests in fixed income securities, the fund will be subject to credit risk, income risk, interest rate risk, liquidity risk and prepayment risk. Income risk is the
risk that income from a fund’s fixed income investments could decline during periods of falling interest rates. Interest rate risk is the risk that the value of a fund’s fixed income securities will
decline because of rising interest rates. Liquidity risk is the risk that a security cannot be purchased or sold at the time desired, or cannot be purchased or sold without adversely affecting the price. Prepayment
risk is the risk that the securities will be redeemed or prepaid by the issuer, resulting in lower interest payments received by the fund. In addition to these risks, high yield securities, or “junk”
bonds, are subject to greater market fluctuations and risk of loss than securities with higher ratings, and the market for high yield securities is generally smaller and less liquid than that for investment grade
securities.
Index or Model Constituent
Risk. Certain funds may be a constituent of one or more indices or ETF models. As a result, such a fund may be included in one or more index-tracking exchange-traded funds or mutual funds. Being
a component security of such a vehicle could greatly affect the trading activity involving a fund, the size of the fund and the market volatility of the fund. Inclusion in an index could increase demand for the fund
and removal from an index could result in outsized selling activity in a relatively short period of time. As a result, a fund’s net asset value could be negatively impacted and the fund’s market price may
be significantly below its net asset value during certain periods. In addition, index rebalances may potentially result in increased trading activity in a fund’s shares.
Index Provider Risk. To the extent a fund seeks to track an index, it is subject to Index Provider Risk. There is no assurance that the Index Provider will compile the Index accurately, or that the Index will
be determined, maintained, constructed, reconstituted, rebalanced, composed, calculated or disseminated accurately. To correct any such error, the Index Provider may carry out an unscheduled rebalance or other
modification of the Index constituents or weightings, which may increase the fund’s costs. The Index Provider does not provide any representation or warranty in relation to the quality, accuracy or completeness
of data in the Index, and it does not guarantee that the Index will be calculated in accordance with its stated methodology. Losses or costs associated with any Index Provider errors generally will be borne by the
fund and its shareholders.
Investment Companies
Risk. To the extent a fund invests in the securities of other investment vehicles, the fund will incur additional fees and expenses that would not be present in a direct investment in those
investment vehicles. Furthermore, the fund’s investment performance and risks are directly related to the investment performance and risks of the investment vehicles in which the fund invests.
LIBOR Risk. To the extent a fund invests in floating or variable rate obligations that use the London Interbank Offered Rate (“LIBOR”) as a reference interest rate, it is subject to LIBOR
Risk. The United Kingdom’s Financial Conduct Authority, which regulates LIBOR has ceased making LIBOR available as a reference rate over a phase-out period that began December 31, 2021. There is no assurance
that any alternative reference rate, including the Secured Overnight Financing Rate (“SOFR”) will be similar to or produce the same value or economic equivalence as LIBOR or that instruments using an
alternative rate will have the same volume or liquidity. The unavailability or replacement of LIBOR may affect the value, liquidity or return on certain fund investments and may result in costs incurred in connection
with closing out positions and entering into new trades. Any potential effects of the transition away from LIBOR on the fund or on certain instruments in which the fund invests can be difficult to ascertain, and they
may vary depending on a variety of factors, and they could result in losses to the fund.
Additional Information (Continued)
First Trust
Exchange-Traded Fund VI
March 31, 2023
(Unaudited)
Management Risk. To the extent that a fund is actively managed, it is subject to management risk. In managing an actively-managed fund’s investment portfolio, the fund’s portfolio managers will
apply investment techniques and risk analyses that may not have the desired result. There can be no guarantee that a fund will meet its investment objective.
Market Risk. Market risk is the risk that a particular security, or shares of a fund in general, may fall in value. Securities held by a fund, as well as shares of a fund itself, are subject to
market fluctuations caused by factors such as general economic conditions, political events, regulatory or market developments, changes in interest rates and perceived trends in securities prices. Shares of
a fund could decline in value or underperform other investments as a result of the risk of loss associated with these market fluctuations. In addition, local, regional or global events such as war, acts of
terrorism, spread of infectious diseases or other public health issues, recessions, or other events could have a significant negative impact on a fund and its investments. Such events may affect certain
geographic regions, countries, sectors and industries more significantly than others. In February 2022, Russia invaded Ukraine which has caused and could continue to cause significant market disruptions and
volatility within the markets in Russia, Europe, and the United States. The hostilities and sanctions resulting from those hostilities could have a significant impact on certain fund investments as well as
fund performance. The COVID-19 global pandemic and the ensuing policies enacted by governments and central banks have caused and may continue to cause significant volatility and uncertainty in global
financial markets. While the U.S. has resumed “reasonably” normal business activity, many countries continue to impose lockdown measures. Additionally, there is no guarantee that vaccines will be
effective against emerging variants of the disease. These events also adversely affect the prices and liquidity of a fund’s portfolio securities or other instruments and could result in disruptions in the
trading markets. Any of such circumstances could have a materially negative impact on the value of a fund’s shares and result in increased market volatility. During any such events, a fund’s
shares may trade at increased premiums or discounts to their net asset value and the bid/ask spread on a fund’s shares may widen.
Non-U.S. Securities
Risk. To the extent a fund invests in non-U.S. securities, it is subject to additional risks not associated with securities of domestic issuers. Non-U.S. securities are subject to higher
volatility than securities of domestic issuers due to: possible adverse political, social or economic developments; restrictions on foreign investment or exchange of securities; capital controls; lack of liquidity;
currency exchange rates; excessive taxation; government seizure of assets; the imposition of sanctions by foreign governments; different legal or accounting standards; and less government supervision and regulation of
exchanges in foreign countries. Investments in non-U.S. securities may involve higher costs than investments in U.S. securities, including higher transaction and custody costs, as well as additional taxes imposed by
non-U.S. governments. These risks may be heightened for securities of companies located, or with significant operations, in emerging market countries.
Operational Risk. Each fund is subject to risks arising from various operational factors, including, but not limited to, human error, processing and communication errors, errors of a fund’s service
providers, counterparties or other third-parties, failed or inadequate processes and technology or systems failures. Each fund relies on third-parties for a range of services, including custody. Any delay or failure
relating to engaging or maintaining such service providers may affect a fund’s ability to meet its investment objective. Although the funds and the funds’ investment advisor seek to reduce these
operational risks through controls and procedures, there is no way to completely protect against such risks.
Passive Investment
Risk. To the extent a fund seeks to track an index, the fund will invest in the securities included in, or representative of, the index regardless of their investment merit. A fund generally
will not attempt to take defensive positions in declining markets.
Preferred Securities
Risk. Preferred securities combine some of the characteristics of both common stocks and bonds. Preferred securities are typically subordinated to bonds and other debt securities in a
company’s capital structure in terms of priority to corporate income, subjecting them to greater credit risk than those debt securities. Generally, holders of preferred securities have no voting rights with
respect to the issuing company unless preferred dividends have been in arrears for a specified number of periods, at which time the preferred security holders may obtain limited rights. In certain circumstances, an
issuer of preferred securities may defer payment on the securities and, in some cases, redeem the securities prior to a specified date. Preferred securities may also be substantially less liquid than other securities,
including common stock.
Valuation Risk. The valuation of certain securities may carry more risk than that of common stock. Uncertainties in the conditions of the financial markets, unreliable reference data, lack of transparency
and inconsistency of valuation models and processes may lead to inaccurate asset pricing. A fund may hold investments in sizes smaller than institutionally sized round lot positions (sometimes referred to as odd
lots). However, third-party pricing services generally provide evaluations on the basis of institutionally-sized round lots. If a fund sells certain of its investments in an odd lot transaction, the sale price may be
less than the value at which such securities
Additional Information (Continued)
First Trust
Exchange-Traded Fund VI
March 31, 2023
(Unaudited)
have been held by the fund. Odd lots
often trade at lower prices than institutional round lots. There is no assurance that the fund will be able to sell a portfolio security at the price established by the pricing service, which could result in a loss to
the fund.
| NOT FDIC INSURED
| NOT BANK GUARANTEED
| MAY LOSE VALUE
|
Advisory Agreements
Board Considerations
Regarding Approval of Amendments to the Investment Management Agreements
The Board of Trustees of
First Trust Exchange-Traded Fund VI (the “Trust”), including the Independent Trustees, unanimously approved the amendment (as applicable to a specific Fund, the “Amendment” and collectively,
the “Amendments”) of the Investment Management Agreements (as applicable to a specific Fund, the “Agreement” and collectively, the “Agreements”) with First Trust Advisors L.P. (the
“Advisor”) on behalf of the following three series of the Trust (each a “Fund” and collectively, the “Funds”):
First Trust SMID Cap Rising Dividend
Achievers ETF (SDVY)
First Trust Dorsey Wright Momentum &
Value ETF (DVLU)
First Trust Dorsey Wright Momentum &
Low Volatility ETF (DVOL)
The Board approved the
Amendment for each Fund at a meeting held on October 24, 2022. As part of the review process, the Board reviewed information and had preliminary discussions with the Advisor regarding the proposed Amendments at
meetings held on April 18, 2022, June 12–13, 2022 and September 18–19, 2022. Following those preliminary discussions, the Board requested and received information from the Advisor regarding the
proposed Amendments, and that information was considered at an executive session of the Independent Trustees and their counsel held prior to the October 24, 2022 meeting, as well as at the October meeting.
In reviewing the
Amendment for each Fund, the Board considered that the purpose of the Amendments is to modify the unitary fee rate for each Fund under the applicable Agreement by introducing a breakpoint schedule pursuant to which
the unitary fee rate paid by each Fund to the Advisor will be reduced as assets of such Fund meet certain thresholds. The Board noted the Advisor’s representations that the quality and quantity of the
services provided to each Fund by the Advisor under the applicable Agreement will not be reduced or modified as a result of the applicable Amendment, and that the obligations of the Advisor under each Agreement will
remain the same in all respects.
The Board noted that it,
including the Independent Trustees, last approved the continuation of the applicable Agreement for each Fund for a one-year period ending June 30, 2023 at a meeting held on June 12–13, 2022. The Board
noted that in connection with such approval it had determined for each Fund, based upon the information provided, that the terms of the applicable Agreement were fair and reasonable and that the continuation of the
applicable Agreement was in the best interests of the Fund in light of the nature, extent and quality of the services provided and such other matters as the Board considered to be relevant in the exercise of its
business judgment.
Based on all of the
information considered, the Board, including the Independent Trustees, unanimously determined that the terms of the Amendments are fair and reasonable and that the Amendments are in the best interests of each Fund.
This page intentionally left blank
This page intentionally left blank
First Trust Exchange-Traded Fund VI
INVESTMENT ADVISOR
First Trust Advisors L.P.
120 East Liberty Drive, Suite
400
Wheaton, IL 60187
ADMINISTRATOR, CUSTODIAN,
FUND ACCOUNTANT &
TRANSFER AGENT
Brown Brothers Harriman &
Co.
50 Post Office Square
Boston, MA 02110
INDEPENDENT REGISTERED
PUBLIC ACCOUNTING FIRM
Deloitte & Touche LLP
111 S. Wacker Drive
Chicago, IL 60606
LEGAL COUNSEL
Chapman and Cutler LLP
320 South Canal Street
Chicago, IL 60606
Item 2. Code of Ethics.
Not applicable.
Item 3. Audit Committee Financial Expert.
Not applicable.
Item 4. Principal Accountant Fees and Services.
Not applicable.
Item 5. Audit Committee of Listed Registrants.
Not applicable.
Item 6. Schedule of Investments.
| (a) | | Schedules of Investments in securities of unaffiliated issuers as of the close of the reporting
period are included as part of the report to shareholders filed under Item 1 of this form. |
Item 7. Disclosure of Proxy Voting Policies
and Procedures for Closed-End Management Investment Companies.
Not applicable.
Item 8. Portfolio Managers of Closed-End Management Investment
Companies.
Not applicable.
Item 9. Purchases of Equity Securities
by Closed-End Management Investment Company and Affiliated Purchasers.
Not applicable.
Item 10. Submission of Matters to a Vote
of Security Holders.
There have been no material changes to the
procedures by which the shareholders may recommend nominees to the registrant’s board of directors, where those changes were implemented
after the registrant last provided disclosure in response to the requirements of Item 407(c)(2)(iv) of Regulation S-K (17 CFR 229.407)
(as required by Item 22(b)(15) of Schedule 14A (17 CFR 240.14a-101)), or this Item.
Item 11. Controls and Procedures.
| (a) | | The registrant’s principal executive and principal financial officers, or persons performing
similar functions, have concluded that the registrant’s disclosure controls and procedures (as defined in Rule 30a-3(c) under the
Investment Company Act of 1940, as amended (the “1940 Act”) (17 CFR 270.30a-3 (c))) are effective, as of a date within 90
days of the filing date of the report that includes the disclosure required by this paragraph, based on their evaluation of these controls
and procedures required by Rule 30a-3(b) under the 1940 Act (17 CFR 270.30a-3(b)) and Rules 13a-15(b) or 15d-15(b) under the Securities
Exchange Act of 1934, as amended (17 CFR 240.13a-15(b) or 240.15d-15 (b)). |
| (b) | | There were no changes in the registrant’s internal control over financial reporting
(as defined in Rule 30a-3(d) under the 1940 Act (17 CFR 270.30a-3(d)) that occurred during the period covered by this report have materially
affected, or are reasonably likely to materially affect, the registrant’s internal control over financial reporting. |
Item 12. Disclosure of Securities Lending
Activities for Closed-End Management Investment Companies.
Item 13. Exhibits.
SIGNATURES
Pursuant to the requirements of the Securities Exchange
Act of 1934 and the Investment Company Act of 1940, the registrant has duly caused this report to be signed on its behalf by the undersigned,
thereunto duly authorized.
| (registrant) |
|
First Trust Exchange-Traded Fund VI |
| By (Signature and Title)* |
|
/s/ James M. Dykas |
| |
|
James M. Dykas, President and Chief Executive Officer
(principal executive
officer)
|
Pursuant
to the requirements of the Securities Exchange Act of 1934 and the Investment Company Act of 1940, this report has been signed
below by the following persons on behalf of the registrant and in the capacities and on the dates indicated.
| By (Signature and Title)* |
|
/s/ James M. Dykas |
| |
|
James M. Dykas, President and Chief Executive Officer
(principal executive
officer)
|
| By (Signature and Title)* |
|
/s/ Donald P. Swade |
| |
|
Donald P. Swade, Treasurer, Chief Financial Officer
and Chief Accounting Officer
(principal financial officer)
|
* Print the name and title of each signing officer under
his or her signature.
Certification Pursuant to Rule 30a-2(a) under
the 1940 Act and Section 302
of the Sarbanes-Oxley Act
I, James M. Dykas, certify that:
| 1. | | I have reviewed this report on Form N-CSR of First Trust Exchange-Traded Fund VI; |
| 2. | | Based on my knowledge, this report does not contain any untrue statement of a material fact
or omit to state a material fact necessary to make the statements made, in light of the circumstances under which such statements were
made, not misleading with respect to the period covered by this report; |
| 3. | | Based on my knowledge, the financial statements, and other financial information included
in this report, fairly present in all material respects the financial condition, results of operations, changes in net assets, and cash
flows (if the financial statements are required to include a statement of cash flows) of the registrant as of, and for, the periods presented
in this report; |
| 4. | | The registrant’s other certifying officer(s) and I are responsible for establishing
and maintaining disclosure controls and procedures (as defined in Rule 30a-3(c) under the Investment Company Act of 1940) and internal
control over financial reporting (as defined in Rule 30a-3(d) under the Investment Company Act of 1940) for the registrant and have: |
| (a) | | Designed such disclosure controls and procedures, or caused such disclosure controls and
procedures to be designed under our supervision, to ensure that material information relating to the registrant, including its consolidated
subsidiaries, is made known to us by others within those entities, particularly during the period in which this report is being prepared; |
| (b) | | Designed such internal control over financial reporting, or caused such internal control
over financial reporting to be designed under our supervision, to provide reasonable assurance regarding the reliability of financial
reporting and the preparation of financial statements for external purposes in accordance with generally accepted accounting principles; |
| (c) | | Evaluated the effectiveness of the registrant’s disclosure controls and procedures
and presented in this report our conclusions about the effectiveness of the disclosure controls and procedures, as of a date within 90
days prior to the filing date of this report based on such evaluation; and |
| (d) | | Disclosed in this report any change in the registrant’s internal control over financial
reporting that occurred during the period covered by this report that has materially affected, or is reasonably likely to materially
affect, the registrant’s internal control over financial reporting; and |
| 5. | | The registrant’s other certifying officer(s) and I have disclosed to the registrant’s
auditors and the audit committee of the registrant’s board of directors (or persons performing the equivalent functions): |
| (a) | | All significant deficiencies and material weaknesses in the design or operation of internal
control over financial reporting which are reasonably likely to adversely affect the registrant’s ability to record, process, summarize,
and report financial information; and |
| (b) | | Any fraud, whether or not material, that involves management or other employees who have
a significant role in the registrant’s internal control over financial reporting. |
| Date: |
|
June 9, 2023 |
|
/s/ James M. Dykas |
|
| |
|
|
|
James M. Dykas, President and Chief Executive Officer
(principal executive officer) |
|
Certification Pursuant to Rule 30a-2(a) under
the 1940 Act and Section 302
of the Sarbanes-Oxley Act
I, Donald P. Swade, certify that:
| 1. | | I have reviewed this report on Form N-CSR of First Trust Exchange-Traded Fund VI; |
| 2. | | Based on my knowledge, this report does not contain any untrue statement of a material fact
or omit to state a material fact necessary to make the statements made, in light of the circumstances under which such statements were
made, not misleading with respect to the period covered by this report; |
| 3. | | Based on my knowledge, the financial statements, and other financial information included
in this report, fairly present in all material respects the financial condition, results of operations, changes in net assets, and cash
flows (if the financial statements are required to include a statement of cash flows) of the registrant as of, and for, the periods presented
in this report; |
| 4. | | The registrant’s other certifying officer(s) and I are responsible for establishing
and maintaining disclosure controls and procedures (as defined in Rule 30a-3(c) under the Investment Company Act of 1940) and internal
control over financial reporting (as defined in Rule 30a-3(d) under the Investment Company Act of 1940) for the registrant and have: |
| (a) | | Designed such disclosure controls and procedures, or caused such disclosure controls and
procedures to be designed under our supervision, to ensure that material information relating to the registrant, including its consolidated
subsidiaries, is made known to us by others within those entities, particularly during the period in which this report is being prepared; |
| (b) | | Designed such internal control over financial reporting, or caused such internal control
over financial reporting to be designed under our supervision, to provide reasonable assurance regarding the reliability of financial
reporting and the preparation of financial statements for external purposes in accordance with generally accepted accounting principles; |
| (c) | | Evaluated the effectiveness of the registrant’s disclosure controls and procedures
and presented in this report our conclusions about the effectiveness of the disclosure controls and procedures, as of a date within 90
days prior to the filing date of this report based on such evaluation; and |
| (d) | | Disclosed in this report any change in the registrant’s internal control over financial
reporting that occurred during the period covered by this report that has materially affected, or is reasonably likely to materially
affect, the registrant’s internal control over financial reporting; and |
| 5. | | The registrant’s other certifying officer(s) and I have disclosed to the registrant’s
auditors and the audit committee of the registrant’s board of directors (or persons performing the equivalent functions): |
| (a) | | All significant deficiencies and material weaknesses in the design or operation of internal
control over financial reporting which are reasonably likely to adversely affect the registrant’s ability to record, process, summarize,
and report financial information; and |
| (b) | | Any fraud, whether or not material, that involves management or other employees who have
a significant role in the registrant’s internal control over financial reporting. |
| Date: |
|
June 9, 2023 |
|
/s/ Donald P. Swade |
|
| |
|
|
|
Donald P. Swade, Treasurer, Chief Financial Officer
and
Chief Accounting Officer
(principal financial officer) |
|
Certification Pursuant to Rule 30a-2(b) under the
1940 Act and Section 906
of the Sarbanes-Oxley Act
I, James M. Dykas, President and Chief Executive Officer
of First Trust Exchange-Traded Fund VI (the “Registrant”), certify that:
| 1. | The Form N-CSR of the Registrant (the “Report”) fully complies with the requirements of Section
13(a) or 15(d) of the Securities Exchange Act of 1934, as amended; and |
| 2. | The information contained in the Report fairly presents, in all material respects, the financial condition
and results of operations of the Registrant. |
| Date: |
|
June 9, 2023 |
|
/s/ James M. Dykas |
|
| |
|
|
|
James M. Dykas, President and Chief Executive Officer
(principal executive officer) |
|
I, Donald P. Swade, Treasurer, Chief Financial Officer
and Chief Accounting Officer of First Trust Exchange-Traded Fund VI (the “Registrant”), certify that:
| 1. | The Form N-CSR of the Registrant (the “Report”) fully complies with the requirements of Section
13(a) or 15(d) of the Securities Exchange Act of 1934, as amended; and |
| 2. | The information contained in the Report fairly presents, in all material respects, the financial condition
and results of operations of the Registrant. |
| Date: |
|
June 9, 2023 |
|
/s/ Donald P. Swade |
|
| |
|
|
|
Donald P. Swade, Treasurer, Chief Financial Officer
and
Chief Accounting Officer
(principal financial officer) |
|