2.1
2.3
10.5
2.1
2.1
9.1
12.1
8.6
2.2
8.6
2.6
2.0
13.9
18.8
11.5
2.3
4.7
29.8
0.1
16.7
3.5
5.1
5.4
18.8
7.1
2.3
2.5
5.4
2.2
1.9
3.4
2.5
3.7
2.5
19.7
4.9
7.9
2.3
5.7
2.5
4.6
2.2
0.3
0.3
2.3
2.2
1.0
3.9
3.5
1.0
2.1
2.3
2.1
2.3
0.1
4.8
5.1
2.1
4.6
1.8
0.6
2.1
4.1
4.2
2.0
0.3
2.5
7.8
4.2
2.3
2.1
2.1
29.8
2.6
18.8
0.5
4.6
1.8
2.1
4.9
4.9
2.5
18.7
5.7
3.6
16.7
8.6
5.7
0.6
11.4
29.8
6.6
2.3
4.6
2.1
66.2
4.6
19.7
2.4
3.0
1.9
9.1
2.2
3.9
3.2
3.5
2.1
2.6
4.2
7.1
4.9
2.5
16.7
1.9
2.1
2.6
7.1
4.6
13.9
2.3
2.5
6.6
4.6
3.0
3.3
3.4
3.6
2.2
6.6
4.6
4.6
12.1
4.3
3.7
2.1
3.2
1.9
2.2
5.6
3.1
7.9
12.1
2.2
2.1
29.8
2.2
16.7
0.1
2.3
4.9
4.7
11.5
2.3
5.6
2.1
9.1
3.2
2.5
1.9
0.1
11.4
2.6
2.3
4.3
16.7
3.0
9.1
1.8
4.9
3.9
0.6
16.7
3.9
6.6
16.7
8.7
10.5
7.8
4.5
5.1
19.7
2.1
13.9
6.6
2.1
19.7
19.7
19.7
11.4
7.8
4.7
2.1
4.2
5.6
2.1
2.1
0.3
2.5
0.5
3.9
4.6
10.5
3.9
3.4
4.6
6.6
3.0
4.9
3.9
66.2
4.8
4.5
3.7
5.6
2.3
3.2
12.1
4.6
4.6
7.9
3.1
2.4
2.6
2.3
11.4
2.8
3.6
3.0
4.9
2.2
5.4
2.3
5.4
2.1
8.7
2.8
2.0
3.1
2.8
0.5
11.4
4.3
2.5
2.0
3.9
3.6
2.5
18.8
1.9
2.2
2.1
7.9
2.2
4.1
1.0
2.2
2.3
3.3
2.3
7.8
10.5
2.8
66.2
6.6
2.2
3.4
2.1
4.6
8.6
3.0
4.6
2.2
3.7
2.1
2.3
4.6
2.3
3.0
2.5
2.2
13.9
66.2
4.8
2.5
4.3
0.5
2.5
2.6
6.6
4.5
8.7
2.3
3.3
19.7
2.2
2.4
11.4
18.7
0.6
2.1
4.7
16.7
5.7
2.2
5.7
4.8
2.3
18.7
2.5
4.5
3.3
5.7
11.5
4.1
1.0
7.1
8.7
0000914775
false
N-1A
N-CSRS
0000914775
bmafi:C000001288Member
2024-08-29
2025-02-28
0000914775
bmafi:C000001289Member
2024-08-29
2025-02-28
0000914775
bmafi:C000001358Member
2024-08-29
2025-02-28
0000914775
bmafi:C000001360Member
2024-08-29
2025-02-28
0000914775
bmafi:C000001361Member
2024-08-29
2025-02-28
0000914775
bmafi:C000001368Member
2024-08-29
2025-02-28
0000914775
bmafi:C000001370Member
2024-08-29
2025-02-28
0000914775
bmafi:C000001371Member
2024-08-29
2025-02-28
0000914775
bmafi:C000064720Member
2024-08-29
2025-02-28
0000914775
bmafi:C000064721Member
2024-08-29
2025-02-28
0000914775
bmafi:C000130426Member
2024-08-29
2025-02-28
0000914775
bmafi:C000130427Member
2024-08-29
2025-02-28
0000914775
bmafi:C000174005Member
2024-08-29
2025-02-28
0000914775
bmafi:C000174006Member
2024-08-29
2025-02-28
0000914775
bmafi:C000174007Member
2024-08-29
2025-02-28
0000914775
2024-08-29
2025-02-28
0000914775
bmafi:C000001288Member
2025-02-28
0000914775
bmafi:C000001288Member
bmafi:AramarkMember
2025-02-28
0000914775
bmafi:C000001288Member
bmafi:AssurantIncMember
2025-02-28
0000914775
bmafi:C000001288Member
bmafi:BurlingtonStoresIncMember
2025-02-28
0000914775
bmafi:C000001288Member
oef:CommunicationsSectorMember
2025-02-28
0000914775
bmafi:C000001288Member
oef:ConsumerDiscretionarySectorMember
2025-02-28
0000914775
bmafi:C000001288Member
oef:ConsumerStaplesSectorMember
2025-02-28
0000914775
bmafi:C000001288Member
bmafi:DigitalRealtyTrustIncMember
2025-02-28
0000914775
bmafi:C000001288Member
bmafi:DominionEnergyIncMember
2025-02-28
0000914775
bmafi:C000001288Member
us-gaap:EnergySectorMember
2025-02-28
0000914775
bmafi:C000001288Member
bmafi:ExpediaGroupIncMember
2025-02-28
0000914775
bmafi:C000001288Member
us-gaap:FinancialServicesSectorMember
2025-02-28
0000914775
bmafi:C000001288Member
bmafi:FirstHorizonCorpMember
2025-02-28
0000914775
bmafi:C000001288Member
us-gaap:HealthcareSectorMember
2025-02-28
0000914775
bmafi:C000001288Member
oef:IndustrialSectorMember
2025-02-28
0000914775
bmafi:C000001288Member
oef:InformationTechnologySectorMember
2025-02-28
0000914775
bmafi:C000001288Member
bmafi:InvestmentCompaniesMember
2025-02-28
0000914775
bmafi:C000001288Member
bmafi:JohnsonControlsInternationalPLCMember
2025-02-28
0000914775
bmafi:C000001288Member
bmafi:KenvueIncMember
2025-02-28
0000914775
bmafi:C000001288Member
oef:MaterialsSectorMember
2025-02-28
0000914775
bmafi:C000001288Member
bmafi:NetOtherAssetsAndLiabilitiesMember
2025-02-28
0000914775
bmafi:C000001288Member
bmafi:NewmontCorpMember
2025-02-28
0000914775
bmafi:C000001288Member
us-gaap:RealEstateSectorMember
2025-02-28
0000914775
bmafi:C000001288Member
oef:UtilitiesSectorMember
2025-02-28
0000914775
bmafi:C000001289Member
2025-02-28
0000914775
bmafi:C000001289Member
bmafi:AlamosGoldIncClAMember
2025-02-28
0000914775
bmafi:C000001289Member
bmafi:ClearwayEnergyIncClCMember
2025-02-28
0000914775
bmafi:C000001289Member
oef:CommunicationsSectorMember
2025-02-28
0000914775
bmafi:C000001289Member
oef:ConsumerDiscretionarySectorMember
2025-02-28
0000914775
bmafi:C000001289Member
oef:ConsumerStaplesSectorMember
2025-02-28
0000914775
bmafi:C000001289Member
us-gaap:EnergySectorMember
2025-02-28
0000914775
bmafi:C000001289Member
us-gaap:FinancialServicesSectorMember
2025-02-28
0000914775
bmafi:C000001289Member
bmafi:FirstHorizonCorpMember
2025-02-28
0000914775
bmafi:C000001289Member
bmafi:GeniusSportsLtdMember
2025-02-28
0000914775
bmafi:C000001289Member
us-gaap:HealthcareSectorMember
2025-02-28
0000914775
bmafi:C000001289Member
oef:IndustrialSectorMember
2025-02-28
0000914775
bmafi:C000001289Member
oef:InformationTechnologySectorMember
2025-02-28
0000914775
bmafi:C000001289Member
bmafi:InsmedIncMember
2025-02-28
0000914775
bmafi:C000001289Member
bmafi:InvestmentCompaniesMember
2025-02-28
0000914775
bmafi:C000001289Member
bmafi:MagniteIncMember
2025-02-28
0000914775
bmafi:C000001289Member
oef:MaterialsSectorMember
2025-02-28
0000914775
bmafi:C000001289Member
bmafi:NetOtherAssetsAndLiabilitiesMember
2025-02-28
0000914775
bmafi:C000001289Member
us-gaap:RealEstateSectorMember
2025-02-28
0000914775
bmafi:C000001289Member
bmafi:SkyWestIncMember
2025-02-28
0000914775
bmafi:C000001289Member
bmafi:TexasCapitalBancsharesIncMember
2025-02-28
0000914775
bmafi:C000001289Member
bmafi:TheBaldwinInsuranceGroupIncMember
2025-02-28
0000914775
bmafi:C000001289Member
oef:UtilitiesSectorMember
2025-02-28
0000914775
bmafi:C000001289Member
bmafi:ValmontIndustriesIncMember
2025-02-28
0000914775
bmafi:C000001358Member
2025-02-28
0000914775
bmafi:C000001358Member
bmafi:AonPLCClAMember
2025-02-28
0000914775
bmafi:C000001358Member
bmafi:ATAndTIncMember
2025-02-28
0000914775
bmafi:C000001358Member
bmafi:BankOfAmericaCorpMember
2025-02-28
0000914775
bmafi:C000001358Member
bmafi:BerkshireHathawayIncClBMember
2025-02-28
0000914775
bmafi:C000001358Member
bmafi:CiscoSystemsIncMember
2025-02-28
0000914775
bmafi:C000001358Member
oef:CommunicationsSectorMember
2025-02-28
0000914775
bmafi:C000001358Member
oef:ConsumerDiscretionarySectorMember
2025-02-28
0000914775
bmafi:C000001358Member
oef:ConsumerStaplesSectorMember
2025-02-28
0000914775
bmafi:C000001358Member
bmafi:DanaherCorpMember
2025-02-28
0000914775
bmafi:C000001358Member
us-gaap:EnergySectorMember
2025-02-28
0000914775
bmafi:C000001358Member
us-gaap:FinancialServicesSectorMember
2025-02-28
0000914775
bmafi:C000001358Member
us-gaap:HealthcareSectorMember
2025-02-28
0000914775
bmafi:C000001358Member
oef:IndustrialSectorMember
2025-02-28
0000914775
bmafi:C000001358Member
oef:InformationTechnologySectorMember
2025-02-28
0000914775
bmafi:C000001358Member
bmafi:JPMorganChaseAndCoMember
2025-02-28
0000914775
bmafi:C000001358Member
oef:MaterialsSectorMember
2025-02-28
0000914775
bmafi:C000001358Member
bmafi:MedtronicPLCMember
2025-02-28
0000914775
bmafi:C000001358Member
bmafi:NetOtherAssetsAndLiabilitiesMember
2025-02-28
0000914775
bmafi:C000001358Member
bmafi:Phillips66Member
2025-02-28
0000914775
bmafi:C000001358Member
bmafi:UnitedHealthGroupIncMember
2025-02-28
0000914775
bmafi:C000001358Member
oef:UtilitiesSectorMember
2025-02-28
0000914775
bmafi:C000001360Member
2025-02-28
0000914775
bmafi:C000001360Member
bmafi:AonPLCClAMember
2025-02-28
0000914775
bmafi:C000001360Member
bmafi:ATAndTIncMember
2025-02-28
0000914775
bmafi:C000001360Member
bmafi:BankOfAmericaCorpMember
2025-02-28
0000914775
bmafi:C000001360Member
bmafi:BerkshireHathawayIncClBMember
2025-02-28
0000914775
bmafi:C000001360Member
bmafi:CiscoSystemsIncMember
2025-02-28
0000914775
bmafi:C000001360Member
oef:CommunicationsSectorMember
2025-02-28
0000914775
bmafi:C000001360Member
oef:ConsumerDiscretionarySectorMember
2025-02-28
0000914775
bmafi:C000001360Member
oef:ConsumerStaplesSectorMember
2025-02-28
0000914775
bmafi:C000001360Member
bmafi:DanaherCorpMember
2025-02-28
0000914775
bmafi:C000001360Member
us-gaap:EnergySectorMember
2025-02-28
0000914775
bmafi:C000001360Member
us-gaap:FinancialServicesSectorMember
2025-02-28
0000914775
bmafi:C000001360Member
us-gaap:HealthcareSectorMember
2025-02-28
0000914775
bmafi:C000001360Member
oef:IndustrialSectorMember
2025-02-28
0000914775
bmafi:C000001360Member
oef:InformationTechnologySectorMember
2025-02-28
0000914775
bmafi:C000001360Member
bmafi:JPMorganChaseAndCoMember
2025-02-28
0000914775
bmafi:C000001360Member
oef:MaterialsSectorMember
2025-02-28
0000914775
bmafi:C000001360Member
bmafi:MedtronicPLCMember
2025-02-28
0000914775
bmafi:C000001360Member
bmafi:NetOtherAssetsAndLiabilitiesMember
2025-02-28
0000914775
bmafi:C000001360Member
bmafi:Phillips66Member
2025-02-28
0000914775
bmafi:C000001360Member
bmafi:UnitedHealthGroupIncMember
2025-02-28
0000914775
bmafi:C000001360Member
oef:UtilitiesSectorMember
2025-02-28
0000914775
bmafi:C000001361Member
2025-02-28
0000914775
bmafi:C000001361Member
bmafi:AonPLCClAMember
2025-02-28
0000914775
bmafi:C000001361Member
bmafi:ATAndTIncMember
2025-02-28
0000914775
bmafi:C000001361Member
bmafi:BankOfAmericaCorpMember
2025-02-28
0000914775
bmafi:C000001361Member
bmafi:BerkshireHathawayIncClBMember
2025-02-28
0000914775
bmafi:C000001361Member
bmafi:CiscoSystemsIncMember
2025-02-28
0000914775
bmafi:C000001361Member
oef:CommunicationsSectorMember
2025-02-28
0000914775
bmafi:C000001361Member
oef:ConsumerDiscretionarySectorMember
2025-02-28
0000914775
bmafi:C000001361Member
oef:ConsumerStaplesSectorMember
2025-02-28
0000914775
bmafi:C000001361Member
bmafi:DanaherCorpMember
2025-02-28
0000914775
bmafi:C000001361Member
us-gaap:EnergySectorMember
2025-02-28
0000914775
bmafi:C000001361Member
us-gaap:FinancialServicesSectorMember
2025-02-28
0000914775
bmafi:C000001361Member
us-gaap:HealthcareSectorMember
2025-02-28
0000914775
bmafi:C000001361Member
oef:IndustrialSectorMember
2025-02-28
0000914775
bmafi:C000001361Member
oef:InformationTechnologySectorMember
2025-02-28
0000914775
bmafi:C000001361Member
bmafi:JPMorganChaseAndCoMember
2025-02-28
0000914775
bmafi:C000001361Member
oef:MaterialsSectorMember
2025-02-28
0000914775
bmafi:C000001361Member
bmafi:MedtronicPLCMember
2025-02-28
0000914775
bmafi:C000001361Member
bmafi:NetOtherAssetsAndLiabilitiesMember
2025-02-28
0000914775
bmafi:C000001361Member
bmafi:Phillips66Member
2025-02-28
0000914775
bmafi:C000001361Member
bmafi:UnitedHealthGroupIncMember
2025-02-28
0000914775
bmafi:C000001361Member
oef:UtilitiesSectorMember
2025-02-28
0000914775
bmafi:C000001368Member
2025-02-28
0000914775
bmafi:C000001368Member
bmafi:AlphabetIncClCMember
2025-02-28
0000914775
bmafi:C000001368Member
bmafi:AmazonComIncMember
2025-02-28
0000914775
bmafi:C000001368Member
oef:CommunicationsSectorMember
2025-02-28
0000914775
bmafi:C000001368Member
oef:ConsumerDiscretionarySectorMember
2025-02-28
0000914775
bmafi:C000001368Member
us-gaap:HealthcareSectorMember
2025-02-28
0000914775
bmafi:C000001368Member
oef:IndustrialSectorMember
2025-02-28
0000914775
bmafi:C000001368Member
oef:InformationTechnologySectorMember
2025-02-28
0000914775
bmafi:C000001368Member
bmafi:InvestmentCompaniesMember
2025-02-28
0000914775
bmafi:C000001368Member
bmafi:MetaPlatformsIncClAMember
2025-02-28
0000914775
bmafi:C000001368Member
bmafi:MicrosoftCorpMember
2025-02-28
0000914775
bmafi:C000001368Member
bmafi:NetflixIncMember
2025-02-28
0000914775
bmafi:C000001368Member
bmafi:NetOtherAssetsAndLiabilitiesMember
2025-02-28
0000914775
bmafi:C000001368Member
bmafi:NVIDIACorpMember
2025-02-28
0000914775
bmafi:C000001368Member
bmafi:OracleCorpMember
2025-02-28
0000914775
bmafi:C000001368Member
us-gaap:RealEstateSectorMember
2025-02-28
0000914775
bmafi:C000001368Member
bmafi:ServiceNowIncMember
2025-02-28
0000914775
bmafi:C000001368Member
bmafi:ShopifyIncClAMember
2025-02-28
0000914775
bmafi:C000001368Member
bmafi:TaiwanSemiconductorManufacturingCoLtdADRMember
2025-02-28
0000914775
bmafi:C000001370Member
2025-02-28
0000914775
bmafi:C000001370Member
bmafi:AlphabetIncClCMember
2025-02-28
0000914775
bmafi:C000001370Member
bmafi:AmazonComIncMember
2025-02-28
0000914775
bmafi:C000001370Member
oef:CommunicationsSectorMember
2025-02-28
0000914775
bmafi:C000001370Member
oef:ConsumerDiscretionarySectorMember
2025-02-28
0000914775
bmafi:C000001370Member
us-gaap:HealthcareSectorMember
2025-02-28
0000914775
bmafi:C000001370Member
oef:IndustrialSectorMember
2025-02-28
0000914775
bmafi:C000001370Member
oef:InformationTechnologySectorMember
2025-02-28
0000914775
bmafi:C000001370Member
bmafi:InvestmentCompaniesMember
2025-02-28
0000914775
bmafi:C000001370Member
bmafi:MetaPlatformsIncClAMember
2025-02-28
0000914775
bmafi:C000001370Member
bmafi:MicrosoftCorpMember
2025-02-28
0000914775
bmafi:C000001370Member
bmafi:NetflixIncMember
2025-02-28
0000914775
bmafi:C000001370Member
bmafi:NetOtherAssetsAndLiabilitiesMember
2025-02-28
0000914775
bmafi:C000001370Member
bmafi:NVIDIACorpMember
2025-02-28
0000914775
bmafi:C000001370Member
bmafi:OracleCorpMember
2025-02-28
0000914775
bmafi:C000001370Member
us-gaap:RealEstateSectorMember
2025-02-28
0000914775
bmafi:C000001370Member
bmafi:ServiceNowIncMember
2025-02-28
0000914775
bmafi:C000001370Member
bmafi:ShopifyIncClAMember
2025-02-28
0000914775
bmafi:C000001370Member
bmafi:TaiwanSemiconductorManufacturingCoLtdADRMember
2025-02-28
0000914775
bmafi:C000001371Member
2025-02-28
0000914775
bmafi:C000001371Member
bmafi:AlphabetIncClCMember
2025-02-28
0000914775
bmafi:C000001371Member
bmafi:AmazonComIncMember
2025-02-28
0000914775
bmafi:C000001371Member
oef:CommunicationsSectorMember
2025-02-28
0000914775
bmafi:C000001371Member
oef:ConsumerDiscretionarySectorMember
2025-02-28
0000914775
bmafi:C000001371Member
us-gaap:HealthcareSectorMember
2025-02-28
0000914775
bmafi:C000001371Member
oef:IndustrialSectorMember
2025-02-28
0000914775
bmafi:C000001371Member
oef:InformationTechnologySectorMember
2025-02-28
0000914775
bmafi:C000001371Member
bmafi:InvestmentCompaniesMember
2025-02-28
0000914775
bmafi:C000001371Member
bmafi:MetaPlatformsIncClAMember
2025-02-28
0000914775
bmafi:C000001371Member
bmafi:MicrosoftCorpMember
2025-02-28
0000914775
bmafi:C000001371Member
bmafi:NetflixIncMember
2025-02-28
0000914775
bmafi:C000001371Member
bmafi:NetOtherAssetsAndLiabilitiesMember
2025-02-28
0000914775
bmafi:C000001371Member
bmafi:NVIDIACorpMember
2025-02-28
0000914775
bmafi:C000001371Member
bmafi:OracleCorpMember
2025-02-28
0000914775
bmafi:C000001371Member
us-gaap:RealEstateSectorMember
2025-02-28
0000914775
bmafi:C000001371Member
bmafi:ServiceNowIncMember
2025-02-28
0000914775
bmafi:C000001371Member
bmafi:ShopifyIncClAMember
2025-02-28
0000914775
bmafi:C000001371Member
bmafi:TaiwanSemiconductorManufacturingCoLtdADRMember
2025-02-28
0000914775
bmafi:C000064720Member
2025-02-28
0000914775
bmafi:C000064720Member
bmafi:AramarkMember
2025-02-28
0000914775
bmafi:C000064720Member
bmafi:AssurantIncMember
2025-02-28
0000914775
bmafi:C000064720Member
bmafi:BurlingtonStoresIncMember
2025-02-28
0000914775
bmafi:C000064720Member
oef:CommunicationsSectorMember
2025-02-28
0000914775
bmafi:C000064720Member
oef:ConsumerDiscretionarySectorMember
2025-02-28
0000914775
bmafi:C000064720Member
oef:ConsumerStaplesSectorMember
2025-02-28
0000914775
bmafi:C000064720Member
bmafi:DigitalRealtyTrustIncMember
2025-02-28
0000914775
bmafi:C000064720Member
bmafi:DominionEnergyIncMember
2025-02-28
0000914775
bmafi:C000064720Member
us-gaap:EnergySectorMember
2025-02-28
0000914775
bmafi:C000064720Member
bmafi:ExpediaGroupIncMember
2025-02-28
0000914775
bmafi:C000064720Member
us-gaap:FinancialServicesSectorMember
2025-02-28
0000914775
bmafi:C000064720Member
bmafi:FirstHorizonCorpMember
2025-02-28
0000914775
bmafi:C000064720Member
us-gaap:HealthcareSectorMember
2025-02-28
0000914775
bmafi:C000064720Member
oef:IndustrialSectorMember
2025-02-28
0000914775
bmafi:C000064720Member
oef:InformationTechnologySectorMember
2025-02-28
0000914775
bmafi:C000064720Member
bmafi:InvestmentCompaniesMember
2025-02-28
0000914775
bmafi:C000064720Member
bmafi:JohnsonControlsInternationalPLCMember
2025-02-28
0000914775
bmafi:C000064720Member
bmafi:KenvueIncMember
2025-02-28
0000914775
bmafi:C000064720Member
oef:MaterialsSectorMember
2025-02-28
0000914775
bmafi:C000064720Member
bmafi:NetOtherAssetsAndLiabilitiesMember
2025-02-28
0000914775
bmafi:C000064720Member
bmafi:NewmontCorpMember
2025-02-28
0000914775
bmafi:C000064720Member
us-gaap:RealEstateSectorMember
2025-02-28
0000914775
bmafi:C000064720Member
oef:UtilitiesSectorMember
2025-02-28
0000914775
bmafi:C000064721Member
2025-02-28
0000914775
bmafi:C000064721Member
bmafi:AramarkMember
2025-02-28
0000914775
bmafi:C000064721Member
bmafi:AssurantIncMember
2025-02-28
0000914775
bmafi:C000064721Member
bmafi:BurlingtonStoresIncMember
2025-02-28
0000914775
bmafi:C000064721Member
oef:CommunicationsSectorMember
2025-02-28
0000914775
bmafi:C000064721Member
oef:ConsumerDiscretionarySectorMember
2025-02-28
0000914775
bmafi:C000064721Member
oef:ConsumerStaplesSectorMember
2025-02-28
0000914775
bmafi:C000064721Member
bmafi:DigitalRealtyTrustIncMember
2025-02-28
0000914775
bmafi:C000064721Member
bmafi:DominionEnergyIncMember
2025-02-28
0000914775
bmafi:C000064721Member
us-gaap:EnergySectorMember
2025-02-28
0000914775
bmafi:C000064721Member
bmafi:ExpediaGroupIncMember
2025-02-28
0000914775
bmafi:C000064721Member
us-gaap:FinancialServicesSectorMember
2025-02-28
0000914775
bmafi:C000064721Member
bmafi:FirstHorizonCorpMember
2025-02-28
0000914775
bmafi:C000064721Member
us-gaap:HealthcareSectorMember
2025-02-28
0000914775
bmafi:C000064721Member
oef:IndustrialSectorMember
2025-02-28
0000914775
bmafi:C000064721Member
oef:InformationTechnologySectorMember
2025-02-28
0000914775
bmafi:C000064721Member
bmafi:InvestmentCompaniesMember
2025-02-28
0000914775
bmafi:C000064721Member
bmafi:JohnsonControlsInternationalPLCMember
2025-02-28
0000914775
bmafi:C000064721Member
bmafi:KenvueIncMember
2025-02-28
0000914775
bmafi:C000064721Member
oef:MaterialsSectorMember
2025-02-28
0000914775
bmafi:C000064721Member
bmafi:NetOtherAssetsAndLiabilitiesMember
2025-02-28
0000914775
bmafi:C000064721Member
bmafi:NewmontCorpMember
2025-02-28
0000914775
bmafi:C000064721Member
us-gaap:RealEstateSectorMember
2025-02-28
0000914775
bmafi:C000064721Member
oef:UtilitiesSectorMember
2025-02-28
0000914775
bmafi:C000130426Member
2025-02-28
0000914775
bmafi:C000130426Member
bmafi:AramarkMember
2025-02-28
0000914775
bmafi:C000130426Member
bmafi:AssurantIncMember
2025-02-28
0000914775
bmafi:C000130426Member
bmafi:BurlingtonStoresIncMember
2025-02-28
0000914775
bmafi:C000130426Member
oef:CommunicationsSectorMember
2025-02-28
0000914775
bmafi:C000130426Member
oef:ConsumerDiscretionarySectorMember
2025-02-28
0000914775
bmafi:C000130426Member
oef:ConsumerStaplesSectorMember
2025-02-28
0000914775
bmafi:C000130426Member
bmafi:DigitalRealtyTrustIncMember
2025-02-28
0000914775
bmafi:C000130426Member
bmafi:DominionEnergyIncMember
2025-02-28
0000914775
bmafi:C000130426Member
us-gaap:EnergySectorMember
2025-02-28
0000914775
bmafi:C000130426Member
bmafi:ExpediaGroupIncMember
2025-02-28
0000914775
bmafi:C000130426Member
us-gaap:FinancialServicesSectorMember
2025-02-28
0000914775
bmafi:C000130426Member
bmafi:FirstHorizonCorpMember
2025-02-28
0000914775
bmafi:C000130426Member
us-gaap:HealthcareSectorMember
2025-02-28
0000914775
bmafi:C000130426Member
oef:IndustrialSectorMember
2025-02-28
0000914775
bmafi:C000130426Member
oef:InformationTechnologySectorMember
2025-02-28
0000914775
bmafi:C000130426Member
bmafi:InvestmentCompaniesMember
2025-02-28
0000914775
bmafi:C000130426Member
bmafi:JohnsonControlsInternationalPLCMember
2025-02-28
0000914775
bmafi:C000130426Member
bmafi:KenvueIncMember
2025-02-28
0000914775
bmafi:C000130426Member
oef:MaterialsSectorMember
2025-02-28
0000914775
bmafi:C000130426Member
bmafi:NetOtherAssetsAndLiabilitiesMember
2025-02-28
0000914775
bmafi:C000130426Member
bmafi:NewmontCorpMember
2025-02-28
0000914775
bmafi:C000130426Member
us-gaap:RealEstateSectorMember
2025-02-28
0000914775
bmafi:C000130426Member
oef:UtilitiesSectorMember
2025-02-28
0000914775
bmafi:C000130427Member
2025-02-28
0000914775
bmafi:C000130427Member
bmafi:AonPLCClAMember
2025-02-28
0000914775
bmafi:C000130427Member
bmafi:ATAndTIncMember
2025-02-28
0000914775
bmafi:C000130427Member
bmafi:BankOfAmericaCorpMember
2025-02-28
0000914775
bmafi:C000130427Member
bmafi:BerkshireHathawayIncClBMember
2025-02-28
0000914775
bmafi:C000130427Member
bmafi:CiscoSystemsIncMember
2025-02-28
0000914775
bmafi:C000130427Member
oef:CommunicationsSectorMember
2025-02-28
0000914775
bmafi:C000130427Member
oef:ConsumerDiscretionarySectorMember
2025-02-28
0000914775
bmafi:C000130427Member
oef:ConsumerStaplesSectorMember
2025-02-28
0000914775
bmafi:C000130427Member
bmafi:DanaherCorpMember
2025-02-28
0000914775
bmafi:C000130427Member
us-gaap:EnergySectorMember
2025-02-28
0000914775
bmafi:C000130427Member
us-gaap:FinancialServicesSectorMember
2025-02-28
0000914775
bmafi:C000130427Member
us-gaap:HealthcareSectorMember
2025-02-28
0000914775
bmafi:C000130427Member
oef:IndustrialSectorMember
2025-02-28
0000914775
bmafi:C000130427Member
oef:InformationTechnologySectorMember
2025-02-28
0000914775
bmafi:C000130427Member
bmafi:JPMorganChaseAndCoMember
2025-02-28
0000914775
bmafi:C000130427Member
oef:MaterialsSectorMember
2025-02-28
0000914775
bmafi:C000130427Member
bmafi:MedtronicPLCMember
2025-02-28
0000914775
bmafi:C000130427Member
bmafi:NetOtherAssetsAndLiabilitiesMember
2025-02-28
0000914775
bmafi:C000130427Member
bmafi:Phillips66Member
2025-02-28
0000914775
bmafi:C000130427Member
bmafi:UnitedHealthGroupIncMember
2025-02-28
0000914775
bmafi:C000130427Member
oef:UtilitiesSectorMember
2025-02-28
0000914775
bmafi:C000174005Member
2025-02-28
0000914775
bmafi:C000174005Member
bmafi:AlamosGoldIncClAMember
2025-02-28
0000914775
bmafi:C000174005Member
bmafi:ClearwayEnergyIncClCMember
2025-02-28
0000914775
bmafi:C000174005Member
oef:CommunicationsSectorMember
2025-02-28
0000914775
bmafi:C000174005Member
oef:ConsumerDiscretionarySectorMember
2025-02-28
0000914775
bmafi:C000174005Member
oef:ConsumerStaplesSectorMember
2025-02-28
0000914775
bmafi:C000174005Member
us-gaap:EnergySectorMember
2025-02-28
0000914775
bmafi:C000174005Member
us-gaap:FinancialServicesSectorMember
2025-02-28
0000914775
bmafi:C000174005Member
bmafi:FirstHorizonCorpMember
2025-02-28
0000914775
bmafi:C000174005Member
bmafi:GeniusSportsLtdMember
2025-02-28
0000914775
bmafi:C000174005Member
us-gaap:HealthcareSectorMember
2025-02-28
0000914775
bmafi:C000174005Member
oef:IndustrialSectorMember
2025-02-28
0000914775
bmafi:C000174005Member
oef:InformationTechnologySectorMember
2025-02-28
0000914775
bmafi:C000174005Member
bmafi:InsmedIncMember
2025-02-28
0000914775
bmafi:C000174005Member
bmafi:InvestmentCompaniesMember
2025-02-28
0000914775
bmafi:C000174005Member
bmafi:MagniteIncMember
2025-02-28
0000914775
bmafi:C000174005Member
oef:MaterialsSectorMember
2025-02-28
0000914775
bmafi:C000174005Member
bmafi:NetOtherAssetsAndLiabilitiesMember
2025-02-28
0000914775
bmafi:C000174005Member
us-gaap:RealEstateSectorMember
2025-02-28
0000914775
bmafi:C000174005Member
bmafi:SkyWestIncMember
2025-02-28
0000914775
bmafi:C000174005Member
bmafi:TexasCapitalBancsharesIncMember
2025-02-28
0000914775
bmafi:C000174005Member
bmafi:TheBaldwinInsuranceGroupIncMember
2025-02-28
0000914775
bmafi:C000174005Member
oef:UtilitiesSectorMember
2025-02-28
0000914775
bmafi:C000174005Member
bmafi:ValmontIndustriesIncMember
2025-02-28
0000914775
bmafi:C000174006Member
2025-02-28
0000914775
bmafi:C000174006Member
bmafi:AlamosGoldIncClAMember
2025-02-28
0000914775
bmafi:C000174006Member
bmafi:ClearwayEnergyIncClCMember
2025-02-28
0000914775
bmafi:C000174006Member
oef:CommunicationsSectorMember
2025-02-28
0000914775
bmafi:C000174006Member
oef:ConsumerDiscretionarySectorMember
2025-02-28
0000914775
bmafi:C000174006Member
oef:ConsumerStaplesSectorMember
2025-02-28
0000914775
bmafi:C000174006Member
us-gaap:EnergySectorMember
2025-02-28
0000914775
bmafi:C000174006Member
us-gaap:FinancialServicesSectorMember
2025-02-28
0000914775
bmafi:C000174006Member
bmafi:FirstHorizonCorpMember
2025-02-28
0000914775
bmafi:C000174006Member
bmafi:GeniusSportsLtdMember
2025-02-28
0000914775
bmafi:C000174006Member
us-gaap:HealthcareSectorMember
2025-02-28
0000914775
bmafi:C000174006Member
oef:IndustrialSectorMember
2025-02-28
0000914775
bmafi:C000174006Member
oef:InformationTechnologySectorMember
2025-02-28
0000914775
bmafi:C000174006Member
bmafi:InsmedIncMember
2025-02-28
0000914775
bmafi:C000174006Member
bmafi:InvestmentCompaniesMember
2025-02-28
0000914775
bmafi:C000174006Member
bmafi:MagniteIncMember
2025-02-28
0000914775
bmafi:C000174006Member
oef:MaterialsSectorMember
2025-02-28
0000914775
bmafi:C000174006Member
bmafi:NetOtherAssetsAndLiabilitiesMember
2025-02-28
0000914775
bmafi:C000174006Member
us-gaap:RealEstateSectorMember
2025-02-28
0000914775
bmafi:C000174006Member
bmafi:SkyWestIncMember
2025-02-28
0000914775
bmafi:C000174006Member
bmafi:TexasCapitalBancsharesIncMember
2025-02-28
0000914775
bmafi:C000174006Member
bmafi:TheBaldwinInsuranceGroupIncMember
2025-02-28
0000914775
bmafi:C000174006Member
oef:UtilitiesSectorMember
2025-02-28
0000914775
bmafi:C000174006Member
bmafi:ValmontIndustriesIncMember
2025-02-28
0000914775
bmafi:C000174007Member
2025-02-28
0000914775
bmafi:C000174007Member
bmafi:AlphabetIncClCMember
2025-02-28
0000914775
bmafi:C000174007Member
bmafi:AmazonComIncMember
2025-02-28
0000914775
bmafi:C000174007Member
oef:CommunicationsSectorMember
2025-02-28
0000914775
bmafi:C000174007Member
oef:ConsumerDiscretionarySectorMember
2025-02-28
0000914775
bmafi:C000174007Member
us-gaap:HealthcareSectorMember
2025-02-28
0000914775
bmafi:C000174007Member
oef:IndustrialSectorMember
2025-02-28
0000914775
bmafi:C000174007Member
oef:InformationTechnologySectorMember
2025-02-28
0000914775
bmafi:C000174007Member
bmafi:InvestmentCompaniesMember
2025-02-28
0000914775
bmafi:C000174007Member
bmafi:MetaPlatformsIncClAMember
2025-02-28
0000914775
bmafi:C000174007Member
bmafi:MicrosoftCorpMember
2025-02-28
0000914775
bmafi:C000174007Member
bmafi:NetflixIncMember
2025-02-28
0000914775
bmafi:C000174007Member
bmafi:NetOtherAssetsAndLiabilitiesMember
2025-02-28
0000914775
bmafi:C000174007Member
bmafi:NVIDIACorpMember
2025-02-28
0000914775
bmafi:C000174007Member
bmafi:OracleCorpMember
2025-02-28
0000914775
bmafi:C000174007Member
us-gaap:RealEstateSectorMember
2025-02-28
0000914775
bmafi:C000174007Member
bmafi:ServiceNowIncMember
2025-02-28
0000914775
bmafi:C000174007Member
bmafi:ShopifyIncClAMember
2025-02-28
0000914775
bmafi:C000174007Member
bmafi:TaiwanSemiconductorManufacturingCoLtdADRMember
2025-02-28
iso4217:USDiso4217:USDxbrli:sharesxbrli:purexbrli:sharesutr:Dbmafi:Holding
UNITED STATES
SECURITIES AND EXCHANGE COMMISSION
Washington, D.C. 20549
FORM N-CSR
CERTIFIED SHAREHOLDER REPORT OF REGISTERED MANAGEMENT INVESTMENT COMPANIES
Investment Company Act file number
BNY Mellon Advantage Funds, Inc.
(Exact name of registrant as specified in charter)
c/o BNY Mellon Investment Adviser, Inc.
240 Greenwich Street
New York, New York 10286
(Address of Principal Executive Officer) (Zip Code)
Deirdre Cunnane, Esq.
240 Greenwich Street
New York, New York 10286
(Name and Address of Agent for Service)
Registrant's telephone number, including area code:
Date of reporting period:
The following N-CSR relates only to the Registrant's series listed below and does not relate to any series of the Registrant with a different fiscal year end and, therefore, different N-CSR reporting requirements. A separate N-CSR will be filed for any series with a different fiscal year end, as appropriate.
BNY Mellon Dynamic Value Fund
BNY Mellon Opportunistic Midcap Value Fund
BNY Mellon Opportunistic Small Cap Fund
BNY Mellon Technology Growth Fund
ITEM 1 - Reports to Stockholders
BNY Mellon Dynamic Value Fund
SEMI-ANNUAL
SHAREHOLDER
REPORT
February 28, 2025
Class A – DAGVX
This semi-annual shareholder report contains important information about BNY Mellon Dynamic Value Fund (the “Fund”) for the period of September 1, 2024 to February 28, 2025. You can find additional information about the Fund at bny.com/investments/literaturecenter. You can also request this information by calling 1-800-373-9387 (inside the U.S. only) or by sending an e-mail request to info@bny.com.
What were the Fund’s costs for the last six months ?
(based on a hypothetical $10,000 investment)
| Share Class |
Costs of a $10,000 investment |
Costs paid as a percentage of a $10,000 investment |
| Class A* |
$48 |
0.93%** |
| * |
During the period, fees were waived and/or expenses reimbursed pursuant to an agreement with the Fund’s investment adviser, BNY Mellon Investment Adviser, Inc. If this agreement is not extended in the future, expenses could be higher. |
| ** |
Annualized. |
KEY FUND STATISTICS (AS OF 2/28/25 )
Fund Size (Millions) |
Number of Holdings |
Portfolio Turnover |
| $7,865 |
71 |
46.48% |
| Not FDIC Insured. Not Bank-Guaranteed. May Lose Value |
Portfolio Holdings (as of 2/28/25 )
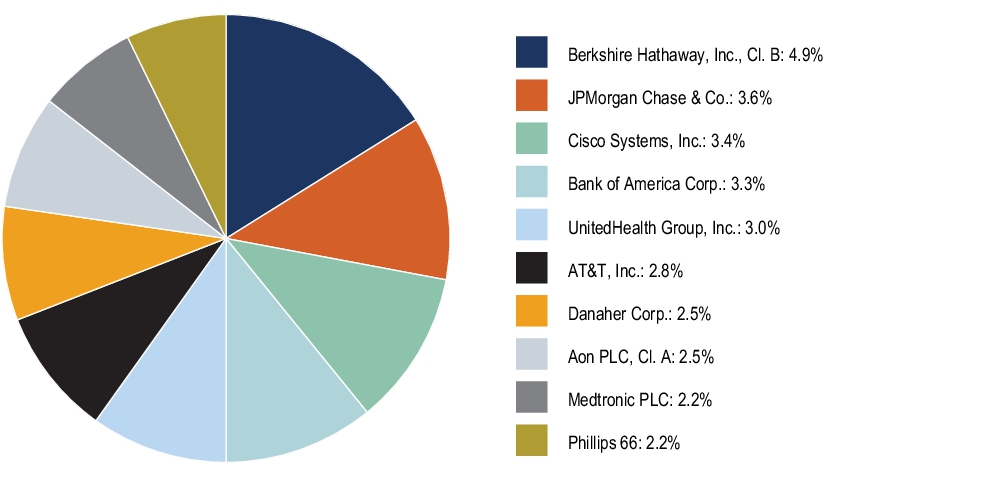
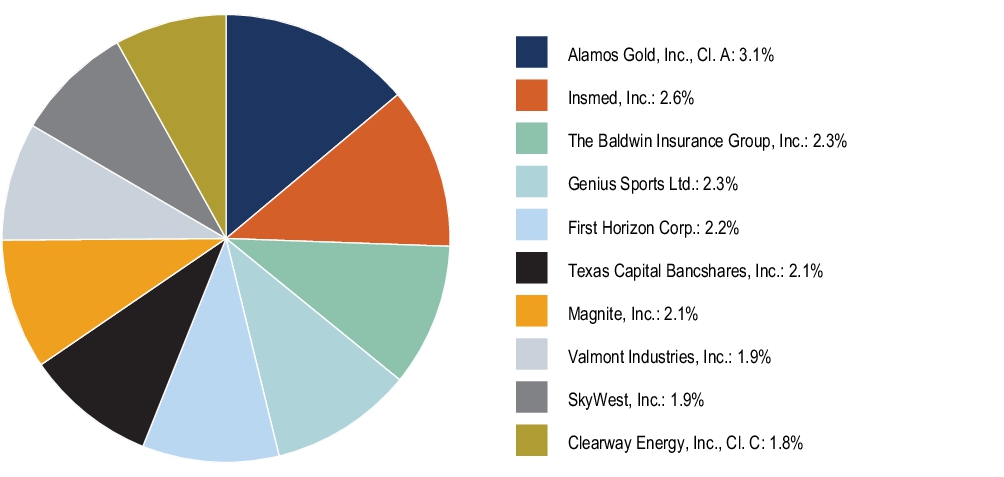
Top Ten Holdings (Based on Net Assets) *
* Excludes money market funds or other short-term securities held for the investment of cash and cash collateral for securities loaned, if any.
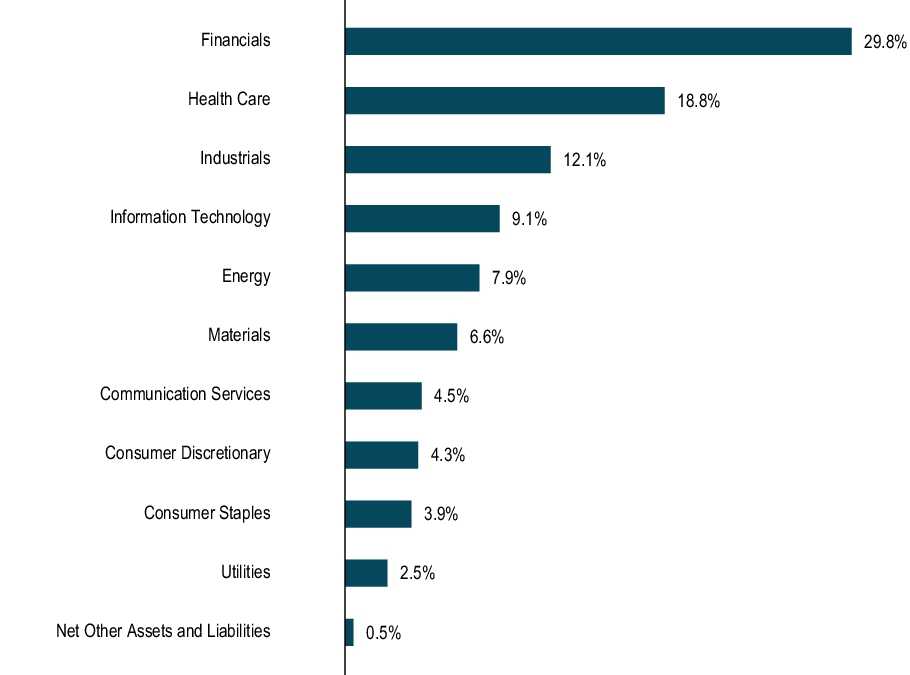
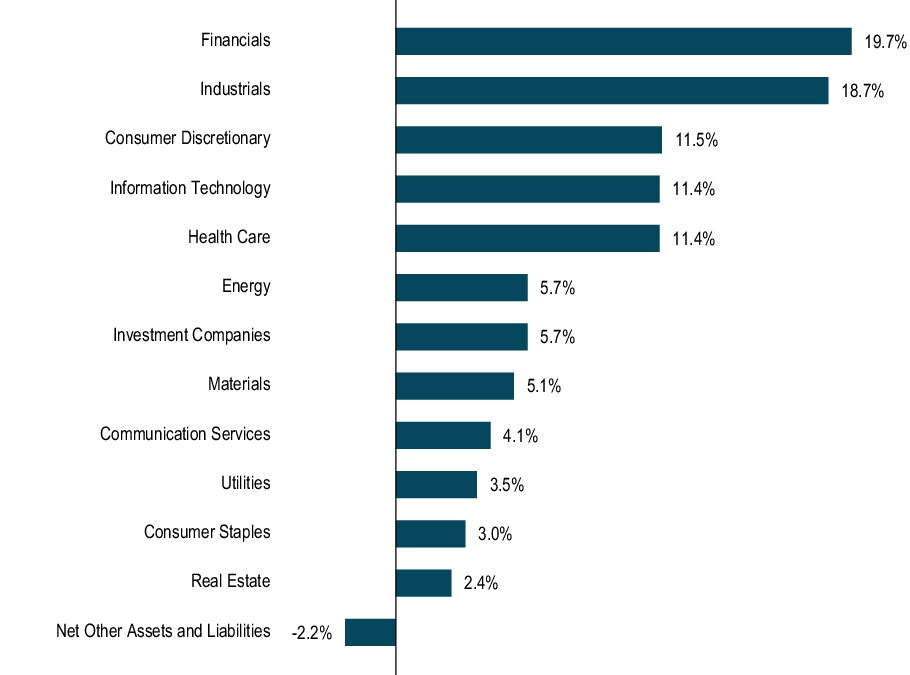
Sector Allocation (Based on Net Assets)
For additional information about the Fund, including its prospectus, financial information, portfolio holdings and proxy voting information, please visit bny.com/investments/literaturecenter .
© 2025 BNY Mellon Securities Corporation, Distributor,
240 Greenwich Street, 9th Floor, New York, NY 10286
Code-0257SA0225
BNY Mellon Dynamic Value Fund
SEMI-ANNUAL
SHAREHOLDER
REPORT
February 28, 2025
Class C – DCGVX
This semi-annual shareholder report contains important information about BNY Mellon Dynamic Value Fund (the “Fund”) for the period of September 1, 2024 to February 28, 2025. You can find additional information about the Fund at bny.com/investments/literaturecenter. You can also request this information by calling 1-800-373-9387 (inside the U.S. only) or by sending an e-mail request to info@bny.com.
What were the Fund’s costs for the last six months ?
(based on a hypothetical $10,000 investment)
| Share Class |
Costs of a $10,000 investment |
Costs paid as a percentage of a $10,000 investment |
| Class C* |
$86 |
1.68%** |
| * |
During the period, fees were waived and/or expenses reimbursed pursuant to an agreement with the Fund’s investment adviser, BNY Mellon Investment Adviser, Inc. If this agreement is not extended in the future, expenses could be higher. |
| ** |
Annualized. |
KEY FUND STATISTICS (AS OF 2/28/25 )
Fund Size (Millions) |
Number of Holdings |
Portfolio Turnover |
| $7,865 |
71 |
46.48% |
| Not FDIC Insured. Not Bank-Guaranteed. May Lose Value |
Portfolio Holdings (as of 2/28/25 )
Top Ten Holdings (Based on Net Assets) *
* Excludes money market funds or other short-term securities held for the investment of cash and cash collateral for securities loaned, if any.
Sector Allocation (Based on Net Assets)
For additional information about the Fund, including its prospectus, financial information, portfolio holdings and proxy voting information, please visit bny.com/investments/literaturecenter .
© 2025 BNY Mellon Securities Corporation, Distributor,
240 Greenwich Street, 9th Floor, New York, NY 10286
Code-0667SA0225
BNY Mellon Dynamic Value Fund
SEMI-ANNUAL
SHAREHOLDER
REPORT
February 28, 2025
Class I – DRGVX
This semi-annual shareholder report contains important information about BNY Mellon Dynamic Value Fund (the “Fund”) for the period of September 1, 2024 to February 28, 2025. You can find additional information about the Fund at bny.com/investments/literaturecenter. You can also request this information by calling 1-800-373-9387 (inside the U.S. only) or by sending an e-mail request to info@bny.com.
What were the Fund’s costs for the last six months ?
(based on a hypothetical $10,000 investment)
| Share Class |
Costs of a $10,000 investment |
Costs paid as a percentage of a $10,000 investment |
| Class I* |
$35 |
0.68%** |
| * |
During the period, fees were waived and/or expenses reimbursed pursuant to an agreement with the Fund’s investment adviser, BNY Mellon Investment Adviser, Inc. If this agreement is not extended in the future, expenses could be higher. |
| ** |
Annualized. |
KEY FUND STATISTICS (AS OF 2/28/25 )
Fund Size (Millions) |
Number of Holdings |
Portfolio Turnover |
| $7,865 |
71 |
46.48% |
| Not FDIC Insured. Not Bank-Guaranteed. May Lose Value |
Portfolio Holdings (as of 2/28/25 )
Top Ten Holdings (Based on Net Assets) *
* Excludes money market funds or other short-term securities held for the investment of cash and cash collateral for securities loaned, if any.
Sector Allocation (Based on Net Assets)
For additional information about the Fund, including its prospectus, financial information, portfolio holdings and proxy voting information, please visit bny.com/investments/literaturecenter .
© 2025 BNY Mellon Securities Corporation, Distributor,
240 Greenwich Street, 9th Floor, New York, NY 10286
Code-0668SA0225
BNY Mellon Dynamic Value Fund
SEMI-ANNUAL
SHAREHOLDER
REPORT
February 28, 2025
Class Y – DRGYX
This semi-annual shareholder report contains important information about BNY Mellon Dynamic Value Fund (the “Fund”) for the period of September 1, 2024 to February 28, 2025. You can find additional information about the Fund at bny.com/investments/literaturecenter. You can also request this information by calling 1-800-373-9387 (inside the U.S. only) or by sending an e-mail request to info@bny.com.
What were the Fund’s costs for the last six months ?
(based on a hypothetical $10,000 investment)
| Share Class |
Costs of a $10,000 investment |
Costs paid as a percentage of a $10,000 investment |
| Class Y |
$32 |
0.63%* |
KEY FUND STATISTICS (AS OF 2/28/25 )
Fund Size (Millions) |
Number of Holdings |
Portfolio Turnover |
| $7,865 |
71 |
46.48% |
| Not FDIC Insured. Not Bank-Guaranteed. May Lose Value |
Portfolio Holdings (as of 2/28/25 )
Top Ten Holdings (Based on Net Assets) *
* Excludes money market funds or other short-term securities held for the investment of cash and cash collateral for securities loaned, if any.
Sector Allocation (Based on Net Assets)
For additional information about the Fund, including its prospectus, financial information, portfolio holdings and proxy voting information, please visit bny.com/investments/literaturecenter .
© 2025 BNY Mellon Securities Corporation, Distributor,
240 Greenwich Street, 9th Floor, New York, NY 10286
Code-0711SA0225
BNY Mellon Opportunistic Midcap Value Fund
SEMI-ANNUAL
SHAREHOLDER
REPORT
February 28, 2025
Class A – DMCVX
This semi-annual shareholder report contains important information about BNY Mellon Opportunistic Midcap Value Fund (the “Fund”) for the period of September 1, 2024 to February 28, 2025. You can find additional information about the Fund at bny.com/investments/literaturecenter. You can also request this information by calling 1-800-373-9387 (inside the U.S. only) or by sending an e-mail request to info@bny.com.
What were the Fund’s costs for the last six months ?
(based on a hypothetical $10,000 investment)
| Share Class |
Costs of a $10,000 investment |
Costs paid as a percentage of a $10,000 investment |
| Class A |
$58 |
1.16%* |
KEY FUND STATISTICS (AS OF 2/28/25 )
Fund Size (Millions) |
Number of Holdings |
Portfolio Turnover |
| $392 |
68 |
21.71% |
| Not FDIC Insured. Not Bank-Guaranteed. May Lose Value |
Portfolio Holdings (as of 2/28/25 )
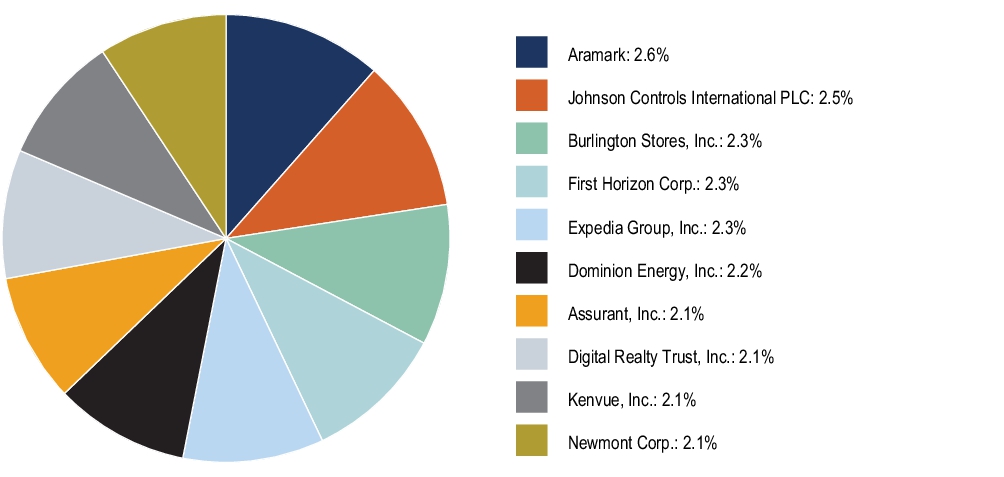
Top Ten Holdings (Based on Net Assets) *
* Excludes money market funds or other short-term securities held for the investment of cash and cash collateral for securities loaned, if any.
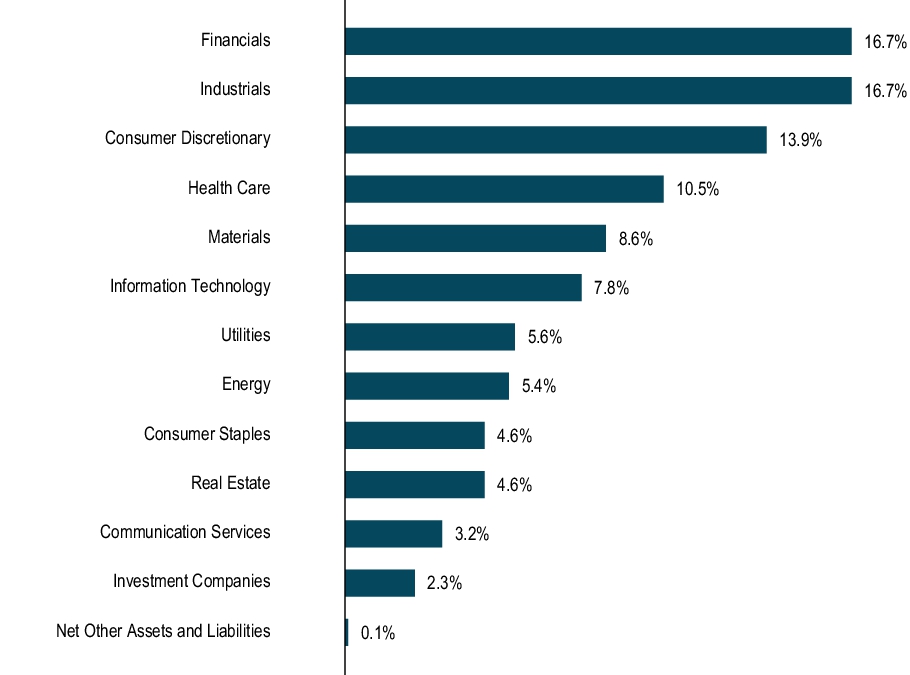
Sector Allocation (Based on Net Assets)
For additional information about the Fund, including its prospectus, financial information, portfolio holdings and proxy voting information, please visit bny.com/investments/literaturecenter .
© 2025 BNY Mellon Securities Corporation, Distributor,
240 Greenwich Street, 9th Floor, New York, NY 10286
Code-0258SA0225
BNY Mellon Opportunistic Midcap Value Fund
SEMI-ANNUAL
SHAREHOLDER
REPORT
February 28, 2025
Class C – DVLCX
This semi-annual shareholder report contains important information about BNY Mellon Opportunistic Midcap Value Fund (the “Fund”) for the period of September 1, 2024 to February 28, 2025. You can find additional information about the Fund at bny.com/investments/literaturecenter. You can also request this information by calling 1-800-373-9387 (inside the U.S. only) or by sending an e-mail request to info@bny.com.
What were the Fund’s costs for the last six months ?
(based on a hypothetical $10,000 investment)
| Share Class |
Costs of a $10,000 investment |
Costs paid as a percentage of a $10,000 investment |
| Class C |
$99 |
1.98%* |
KEY FUND STATISTICS (AS OF 2/28/25 )
Fund Size (Millions) |
Number of Holdings |
Portfolio Turnover |
| $392 |
68 |
21.71% |
| Not FDIC Insured. Not Bank-Guaranteed. May Lose Value |
Portfolio Holdings (as of 2/28/25 )
Top Ten Holdings (Based on Net Assets) *
* Excludes money market funds or other short-term securities held for the investment of cash and cash collateral for securities loaned, if any.
Sector Allocation (Based on Net Assets)
For additional information about the Fund, including its prospectus, financial information, portfolio holdings and proxy voting information, please visit bny.com/investments/literaturecenter .
© 2025 BNY Mellon Securities Corporation, Distributor,
240 Greenwich Street, 9th Floor, New York, NY 10286
Code-6229SA0225
BNY Mellon Opportunistic Midcap Value Fund
SEMI-ANNUAL
SHAREHOLDER
REPORT
February 28, 2025
Class I – DVLIX
This semi-annual shareholder report contains important information about BNY Mellon Opportunistic Midcap Value Fund (the “Fund”) for the period of September 1, 2024 to February 28, 2025. You can find additional information about the Fund at bny.com/investments/literaturecenter. You can also request this information by calling 1-800-373-9387 (inside the U.S. only) or by sending an e-mail request to info@bny.com.
What were the Fund’s costs for the last six months ?
(based on a hypothetical $10,000 investment)
| Share Class |
Costs of a $10,000 investment |
Costs paid as a percentage of a $10,000 investment |
| Class I |
$48 |
0.96%* |
KEY FUND STATISTICS (AS OF 2/28/25 )
Fund Size (Millions) |
Number of Holdings |
Portfolio Turnover |
| $392 |
68 |
21.71% |
| Not FDIC Insured. Not Bank-Guaranteed. May Lose Value |
Portfolio Holdings (as of 2/28/25 )
Top Ten Holdings (Based on Net Assets) *
* Excludes money market funds or other short-term securities held for the investment of cash and cash collateral for securities loaned, if any.
Sector Allocation (Based on Net Assets)
For additional information about the Fund, including its prospectus, financial information, portfolio holdings and proxy voting information, please visit bny.com/investments/literaturecenter .
© 2025 BNY Mellon Securities Corporation, Distributor,
240 Greenwich Street, 9th Floor, New York, NY 10286
Code-6230SA0225
BNY Mellon Opportunistic Midcap Value Fund
SEMI-ANNUAL
SHAREHOLDER
REPORT
February 28, 2025
Class Y – DMCYX
This semi-annual shareholder report contains important information about BNY Mellon Opportunistic Midcap Value Fund (the “Fund”) for the period of September 1, 2024 to February 28, 2025. You can find additional information about the Fund at bny.com/investments/literaturecenter. You can also request this information by calling 1-800-373-9387 (inside the U.S. only) or by sending an e-mail request to info@bny.com.
What were the Fund’s costs for the last six months ?
(based on a hypothetical $10,000 investment)
| Share Class |
Costs of a $10,000 investment |
Costs paid as a percentage of a $10,000 investment |
| Class Y |
$43 |
0.86%* |
KEY FUND STATISTICS (AS OF 2/28/25 )
Fund Size (Millions) |
Number of Holdings |
Portfolio Turnover |
| $392 |
68 |
21.71% |
| Not FDIC Insured. Not Bank-Guaranteed. May Lose Value |
Portfolio Holdings (as of 2/28/25 )
Top Ten Holdings (Based on Net Assets) *
* Excludes money market funds or other short-term securities held for the investment of cash and cash collateral for securities loaned, if any.
Sector Allocation (Based on Net Assets)
For additional information about the Fund, including its prospectus, financial information, portfolio holdings and proxy voting information, please visit bny.com/investments/literaturecenter .
© 2025 BNY Mellon Securities Corporation, Distributor,
240 Greenwich Street, 9th Floor, New York, NY 10286
Code-0371SA0225
BNY Mellon Opportunistic Small Cap Fund
SEMI-ANNUAL
SHAREHOLDER
REPORT
February 28, 2025
Class I – DOPIX
This semi-annual shareholder report contains important information about BNY Mellon Opportunistic Small Cap Fund (the “Fund”) for the period of September 1, 2024 to February 28, 2025. You can find additional information about the Fund at bny.com/investments/literaturecenter. You can also request this information by calling 1-800-373-9387 (inside the U.S. only) or by sending an e-mail request to info@bny.com.
This report describes changes to the Fund that occurred during the reporting period.
What were the Fund’s costs for the last six months ?
(based on a hypothetical $10,000 investment)
| Share Class |
Costs of a $10,000 investment |
Costs paid as a percentage of a $10,000 investment |
| Class I* |
$44 |
0.90%** |
| * |
During the period, fees were waived and/or expenses reimbursed pursuant to an agreement with the Fund’s investment adviser, BNY Mellon Investment Adviser, Inc. If this agreement is not extended in the future, expenses could be higher. |
| ** |
Annualized. |
KEY FUND STATISTICS (AS OF 2/28/25 )
Fund Size (Millions) |
Number of Holdings |
Portfolio Turnover |
| $229 |
97 |
33.41% |
| Not FDIC Insured. Not Bank-Guaranteed. May Lose Value |
Portfolio Holdings (as of 2/28/25 )
Top Ten Holdings (Based on Net Assets) *
* Excludes money market funds or other short-term securities held for the investment of cash and cash collateral for securities loaned, if any.
Sector Allocation (Based on Net Assets)
How has the Fund changed?
-
Effective September 1, 2024, the Fund’s investment adviser, BNY Mellon Investment Adviser, Inc., has contractually agreed to waive receipt of a portion of its management fee in the amount of .10% of the value of the Fund’s average daily net assets until December 31, 2025. On or after December 31, 2025, BNY Mellon Investment Adviser, Inc. may terminate this waiver agreement at any time.
This is a summary of certain changes to the Fund since September 1, 2024 . For more complete information, you may review the Fund’s current prospectus dated December 31, 2024 at bny.com/investments/literaturecenter or upon request at 1-800-373-9387.
For additional information about the Fund, including its prospectus, financial information, portfolio holdings and proxy voting information, please visit bny.com/investments/literaturecenter .
© 2025 BNY Mellon Securities Corporation, Distributor,
240 Greenwich Street, 9th Floor, New York, NY 10286
Code-4048SA0225
BNY Mellon Opportunistic Small Cap Fund
SEMI-ANNUAL
SHAREHOLDER
REPORT
February 28, 2025
Class Y – DSCYX
This semi-annual shareholder report contains important information about BNY Mellon Opportunistic Small Cap Fund (the “Fund”) for the period of September 1, 2024 to February 28, 2025. You can find additional information about the Fund at bny.com/investments/literaturecenter. You can also request this information by calling 1-800-373-9387 (inside the U.S. only) or by sending an e-mail request to info@bny.com.
This report describes changes to the Fund that occurred during the reporting period.
What were the Fund’s costs for the last six months ?
(based on a hypothetical $10,000 investment)
| Share Class |
Costs of a $10,000 investment |
Costs paid as a percentage of a $10,000 investment |
| Class Y* |
$38 |
0.78%** |
| * |
During the period, fees were waived and/or expenses reimbursed pursuant to an agreement with the Fund’s investment adviser, BNY Mellon Investment Adviser, Inc. If this agreement is not extended in the future, expenses could be higher.
|
| ** |
Annualized.
|
KEY FUND STATISTICS (AS OF 2/28/25 )
Fund Size (Millions) |
Number of Holdings |
Portfolio Turnover |
| $229 |
97 |
33.41% |
| Not FDIC Insured. Not Bank-Guaranteed. May Lose Value |
Portfolio Holdings (as of 2/28/25 )
Top Ten Holdings (Based on Net Assets) *
* Excludes money market funds or other short-term securities held for the investment of cash and cash collateral for securities loaned, if any.
Sector Allocation (Based on Net Assets)
How has the Fund changed?
-
Effective September 1, 2024, the Fund’s investment adviser, BNY Mellon Investment Adviser, Inc., has contractually agreed to waive receipt of a portion of its management fee in the amount of .10% of the value of the Fund’s average daily net assets until December 31, 2025. On or after December 31, 2025, BNY Mellon Investment Adviser, Inc. may terminate this waiver agreement at any time.
This is a summary of certain changes to the Fund since September 1, 2024 . For more complete information, you may review the Fund’s current prospectus dated December 31, 2024 at bny.com/investments/literaturecenter or upon request at 1-800-373-9387.
For additional information about the Fund, including its prospectus, financial information, portfolio holdings and proxy voting information, please visit bny.com/investments/literaturecenter .
© 2025 BNY Mellon Securities Corporation, Distributor,
240 Greenwich Street, 9th Floor, New York, NY 10286
Code-0315SA0225
BNY Mellon Opportunistic Small Cap Fund
SEMI-ANNUAL
SHAREHOLDER
REPORT
February 28, 2025
Investor Shares – DSCVX
This semi-annual shareholder report contains important information about BNY Mellon Opportunistic Small Cap Fund (the “Fund”) for the period of September 1, 2024 to February 28, 2025. You can find additional information about the Fund at bny.com/investments/literaturecenter. You can also request this information by calling 1-800-373-9387 (inside the U.S. only) or by sending an e-mail request to info@bny.com.
This report describes changes to the Fund that occurred during the reporting period.
What were the Fund’s costs for the last six months ?
(based on a hypothetical $10,000 investment)
| Share Class |
Costs of a $10,000 investment |
Costs paid as a percentage of a $10,000 investment |
| Investor Shares* |
$52 |
1.08%** |
| * |
During the period, fees were waived and/or expenses reimbursed pursuant to an agreement with the Fund’s investment adviser, BNY Mellon Investment Adviser, Inc. If this agreement is not extended in the future, expenses could be higher.
|
| ** |
Annualized.
|
KEY FUND STATISTICS (AS OF 2/28/25 )
Fund Size (Millions) |
Number of Holdings |
Portfolio Turnover |
| $229 |
97 |
33.41% |
| Not FDIC Insured. Not Bank-Guaranteed. May Lose Value |
Portfolio Holdings (as of 2/28/25 )
Top Ten Holdings (Based on Net Assets) *
* Excludes money market funds or other short-term securities held for the investment of cash and cash collateral for securities loaned, if any.
Sector Allocation (Based on Net Assets)
How has the Fund changed?
-
Effective September 1, 2024, the Fund’s investment adviser, BNY Mellon Investment Adviser, Inc., has contractually agreed to waive receipt of a portion of its management fee in the amount of .10% of the value of the Fund’s average daily net assets until December 31, 2025. On or after December 31, 2025, BNY Mellon Investment Adviser, Inc. may terminate this waiver agreement at any time.
This is a summary of certain changes to the Fund since September 1, 2024 . For more complete information, you may review the Fund’s current prospectus dated December 31, 2024 at bny.com/investments/literaturecenter or upon request at 1-800-373-9387.
For additional information about the Fund, including its prospectus, financial information, portfolio holdings and proxy voting information, please visit bny.com/investments/literaturecenter .
© 2025 BNY Mellon Securities Corporation, Distributor,
240 Greenwich Street, 9th Floor, New York, NY 10286
Code-0253SA0225
BNY Mellon Technology Growth Fund
SEMI-ANNUAL
SHAREHOLDER
REPORT
February 28, 2025
Class A – DTGRX
This semi-annual shareholder report contains important information about BNY Mellon Technology Growth Fund (the “Fund”) for the period of September 1, 2024 to February 28, 2025. You can find additional information about the Fund at bny.com/investments/literaturecenter. You can also request this information by calling 1-800-373-9387 (inside the U.S. only) or by sending an e-mail request to info@bny.com.
What were the Fund’s costs for the last six months ?
(based on a hypothetical $10,000 investment)
| Share Class |
Costs of a $10,000 investment |
Costs paid as a percentage of a $10,000 investment |
| Class A |
$60 |
1.17%* |
KEY FUND STATISTICS (AS OF 2/28/25 )
Fund Size (Millions) |
Number of Holdings |
Portfolio Turnover |
| $378 |
44 |
20.80% |
| Not FDIC Insured. Not Bank-Guaranteed. May Lose Value |
Portfolio Holdings (as of 2/28/25 )
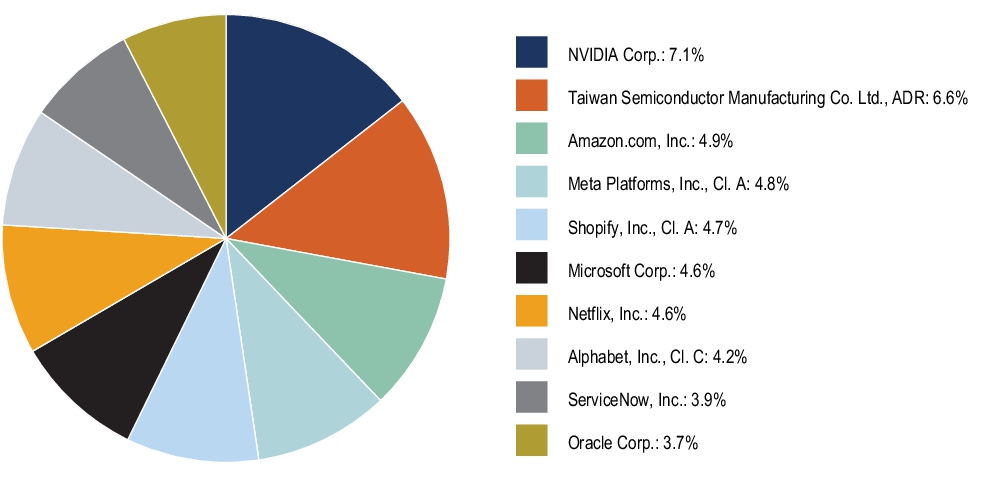
Top Ten Holdings (Based on Net Assets) *
* Excludes money market funds or other short-term securities held for the investment of cash and cash collateral for securities loaned, if any.
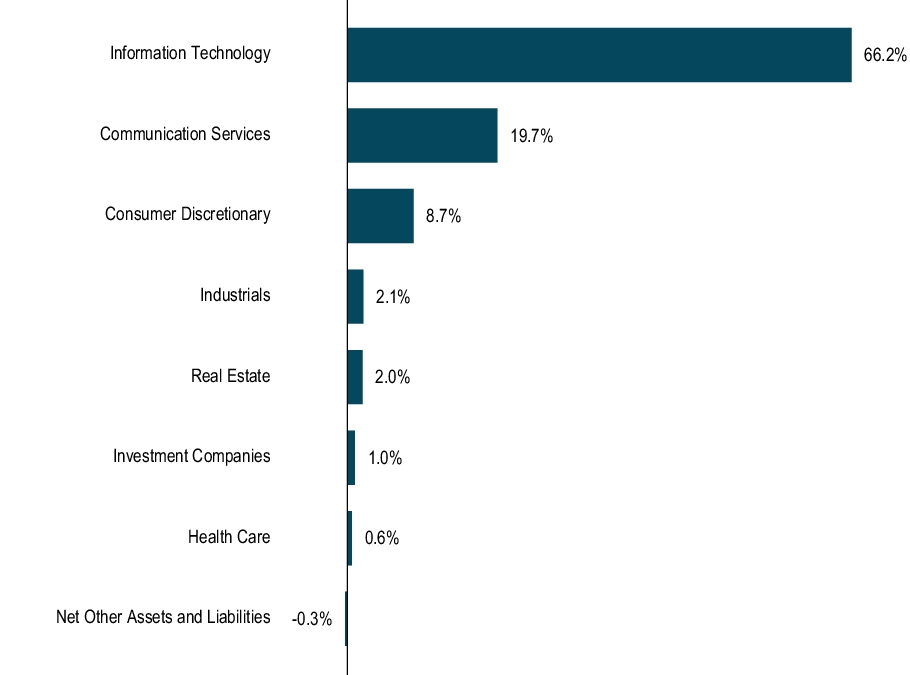
Sector Allocation (Based on Net Assets)
For additional information about the Fund, including its prospectus, financial information, portfolio holdings and proxy voting information, please visit bny.com/investments/literaturecenter .
© 2025 BNY Mellon Securities Corporation, Distributor,
240 Greenwich Street, 9th Floor, New York, NY 10286
Code-0255SA0225
BNY Mellon Technology Growth Fund
SEMI-ANNUAL
SHAREHOLDER
REPORT
February 28, 2025
Class C – DTGCX
This semi-annual shareholder report contains important information about BNY Mellon Technology Growth Fund (the “Fund”) for the period of September 1, 2024 to February 28, 2025. You can find additional information about the Fund at bny.com/investments/literaturecenter. You can also request this information by calling 1-800-373-9387 (inside the U.S. only) or by sending an e-mail request to info@bny.com.
What were the Fund’s costs for the last six months ?
(based on a hypothetical $10,000 investment)
| Share Class |
Costs of a $10,000 investment |
Costs paid as a percentage of a $10,000 investment |
| Class C |
$101 |
1.97%* |
KEY FUND STATISTICS (AS OF 2/28/25 )
Fund Size (Millions) |
Number of Holdings |
Portfolio Turnover |
| $378 |
44 |
20.80% |
| Not FDIC Insured. Not Bank-Guaranteed. May Lose Value |
Portfolio Holdings (as of 2/28/25 )
Top Ten Holdings (Based on Net Assets) *
* Excludes money market funds or other short-term securities held for the investment of cash and cash collateral for securities loaned, if any.
Sector Allocation (Based on Net Assets)
For additional information about the Fund, including its prospectus, financial information, portfolio holdings and proxy voting information, please visit bny.com/investments/literaturecenter .
© 2025 BNY Mellon Securities Corporation, Distributor,
240 Greenwich Street, 9th Floor, New York, NY 10286
Code-0261SA0225
BNY Mellon Technology Growth Fund
SEMI-ANNUAL
SHAREHOLDER
REPORT
February 28, 2025
Class I – DGVRX
This semi-annual shareholder report contains important information about BNY Mellon Technology Growth Fund (the “Fund”) for the period of September 1, 2024 to February 28, 2025. You can find additional information about the Fund at bny.com/investments/literaturecenter. You can also request this information by calling 1-800-373-9387 (inside the U.S. only) or by sending an e-mail request to info@bny.com.
What were the Fund’s costs for the last six months ?
(based on a hypothetical $10,000 investment)
| Share Class |
Costs of a $10,000 investment |
Costs paid as a percentage of a $10,000 investment |
| Class I |
$48 |
0.94%* |
KEY FUND STATISTICS (AS OF 2/28/25 )
Fund Size (Millions) |
Number of Holdings |
Portfolio Turnover |
| $378 |
44 |
20.80% |
| Not FDIC Insured. Not Bank-Guaranteed. May Lose Value |
Portfolio Holdings (as of 2/28/25 )
Top Ten Holdings (Based on Net Assets) *
* Excludes money market funds or other short-term securities held for the investment of cash and cash collateral for securities loaned, if any.
Sector Allocation (Based on Net Assets)
For additional information about the Fund, including its prospectus, financial information, portfolio holdings and proxy voting information, please visit bny.com/investments/literaturecenter .
© 2025 BNY Mellon Securities Corporation, Distributor,
240 Greenwich Street, 9th Floor, New York, NY 10286
Code-0262SA0225
BNY Mellon Technology Growth Fund
SEMI-ANNUAL
SHAREHOLDER
REPORT
February 28, 2025
Class Y – DTEYX
This semi-annual shareholder report contains important information about BNY Mellon Technology Growth Fund (the “Fund”) for the period of September 1, 2024 to February 28, 2025. You can find additional information about the Fund at bny.com/investments/literaturecenter. You can also request this information by calling 1-800-373-9387 (inside the U.S. only) or by sending an e-mail request to info@bny.com.
What were the Fund’s costs for the last six months ?
(based on a hypothetical $10,000 investment)
| Share Class |
Costs of a $10,000 investment |
Costs paid as a percentage of a $10,000 investment |
| Class Y |
$44 |
0.85%* |
KEY FUND STATISTICS (AS OF 2/28/25 )
Fund Size (Millions) |
Number of Holdings |
Portfolio Turnover |
| $378 |
44 |
20.80% |
| Not FDIC Insured. Not Bank-Guaranteed. May Lose Value |
Portfolio Holdings (as of 2/28/25 )
Top Ten Holdings (Based on Net Assets) *
* Excludes money market funds or other short-term securities held for the investment of cash and cash collateral for securities loaned, if any.
Sector Allocation (Based on Net Assets)
For additional information about the Fund, including its prospectus, financial information, portfolio holdings and proxy voting information, please visit bny.com/investments/literaturecenter .
© 2025 BNY Mellon Securities Corporation, Distributor,
240 Greenwich Street, 9th Floor, New York, NY 10286
Code-0313SA0225
Not FDIC Insured. Not Bank-Guaranteed. May Lose Value
Not applicable.
|
Item 3. |
Audit Committee Financial Expert. |
Not applicable.
|
Item 4. |
Principal Accountant Fees and Services. |
Not applicable.
|
Item 5. |
Audit Committee of Listed Registrants. |
Not applicable.
Not applicable.
BNY Mellon Dynamic Value Fund
SEMI-ANNUAL FINANCIALS
AND OTHER INFORMATION
Save
time. Save paper. View your next shareholder report online as soon as it’s available. Log into www.bny.com/investments
and sign up for eCommunications. It’s simple and only takes a few minutes.
The
views expressed in this report reflect those of the portfolio manager(s) only through the end of the period
covered and do not necessarily represent the views of BNY Mellon Investment Adviser, Inc. or any other
person in the BNY Mellon Investment Adviser, Inc. organization. Any such views are subject to change
at any time based upon market or other conditions and BNY Mellon Investment Adviser, Inc. disclaims
any responsibility to update such views. These views may not be relied on as investment advice and,
because investment decisions for a fund in the BNY Mellon Family of Funds are based on numerous factors,
may not be relied on as an indication of trading intent on behalf of any fund in the BNY Mellon
Family of
Funds.
Not FDIC-Insured
• Not Bank-Guaranteed • May Lose Value
Contents
Please note
the Semi-Annual Financials and Other Information only contains Items 7-11
required in Form N-CSR. All other required items will be filed with the Securities and Exchange
Commission (the “SEC”).
Item
7. Financial Statements and Financial Highlights for Open-End Management Investment Companies.
BNY Mellon Dynamic Value Fund
Statement of Investments
February
28, 2025 (Unaudited)
|
|
|
|
|
|
|
|
|
Automobiles
& Components — .5% |
|
|
|
|
|
|
|
|
|
|
|
|
|
|
|
|
|
|
|
|
|
|
|
|
|
|
|
|
|
|
The
PNC Financial Services Group, Inc. |
|
|
|
|
|
|
|
|
|
|
|
|
|
|
|
|
|
|
|
|
|
|
|
|
|
|
|
|
Ferguson
Enterprises, Inc. |
|
|
|
|
|
|
|
|
|
|
|
|
Honeywell
International, Inc. |
|
|
|
|
|
|
|
|
|
|
|
|
|
|
|
|
|
|
|
Johnson
Controls International PLC |
|
|
|
|
|
|
|
|
|
|
|
|
Commercial
& Professional Services — .8% |
|
|
|
|
|
|
|
Consumer
Discretionary Distribution & Retail — .6% |
|
|
|
|
|
|
|
Consumer
Durables & Apparel — .4% |
Skechers
USA, Inc., Cl. A (a)
|
|
|
|
|
|
|
|
|
|
|
|
|
|
|
Royal
Caribbean Cruises Ltd. |
|
|
|
|
|
|
|
|
|
|
|
|
|
|
|
|
|
|
|
|
|
|
|
|
|
|
|
|
|
|
|
|
|
|
|
|
|
|
|
|
|
|
|
|
|
|
|
|
|
|
|
|
|
|
|
|
Financial
Services — 11.8% |
Berkshire
Hathaway, Inc., Cl. B (a)
|
|
|
|
|
|
Capital
One Financial Corp. |
|
|
|
|
|
|
|
|
|
|
|
|
Intercontinental
Exchange, Inc. |
|
|
|
|
|
The
Goldman Sachs Group, Inc. |
|
|
|
|
|
|
|
|
|
|
|
|
|
|
|
|
|
|
|
Food,
Beverage & Tobacco — 1.9% |
Philip
Morris International, Inc. |
|
|
|
|
|
Health
Care Equipment & Services — 9.7% |
|
|
|
|
|
|
|
Baxter
International, Inc. |
|
|
|
|
|
Edwards
Lifesciences Corp. (a)
|
|
|
|
|
|
Statement of Investments (Unaudited)
(continued)
|
|
|
|
|
|
|
Common
Stocks — 99.5% (continued) |
Health
Care Equipment & Services — 9.7% (continued) |
|
|
|
|
|
|
|
|
|
|
|
|
|
|
|
|
|
|
|
|
|
|
|
|
|
|
|
|
Household
& Personal Products — 2.0% |
|
|
|
|
|
|
|
|
|
American
International Group, Inc. |
|
|
|
|
|
|
|
|
|
|
|
|
|
|
|
|
|
|
|
|
|
|
|
|
|
|
|
|
|
|
|
|
|
RenaissanceRe
Holdings Ltd. |
|
|
|
|
|
|
|
|
|
|
|
|
|
|
|
|
|
|
|
|
|
|
|
|
|
|
|
|
|
|
|
|
|
|
|
|
|
|
|
|
|
|
|
|
|
|
|
|
|
|
|
|
|
|
|
|
Media
& Entertainment — 1.8% |
|
|
|
|
|
|
|
Pharmaceuticals,
Biotechnology & Life Sciences — 9.1% |
|
|
|
|
|
|
|
|
|
|
|
|
|
|
|
|
|
|
|
|
|
|
|
|
|
|
|
|
|
|
|
|
|
|
|
|
|
|
|
|
|
|
|
|
|
|
|
|
|
Semiconductors
& Semiconductor Equipment — 1.3% |
|
|
|
|
|
|
|
|
|
|
|
|
|
|
|
|
|
|
|
|
|
|
|
|
|
|
|
|
Software
& Services — 3.3% |
Akamai
Technologies, Inc. (a)
|
|
|
|
|
|
Dolby
Laboratories, Inc., Cl. A |
|
|
|
|
|
International
Business Machines Corp. |
|
|
|
|
|
|
|
|
|
|
|
|
Technology
Hardware & Equipment — 4.5% |
|
|
|
|
|
|
|
Dell
Technologies, Inc., Cl. C |
|
|
|
|
|
|
|
|
|
|
|
|
|
|
|
|
|
|
|
Telecommunication
Services — 2.8% |
|
|
|
|
|
|
|
|
|
|
|
|
|
|
|
|
|
|
|
|
|
|
|
Common
Stocks — 99.5% (continued) |
Transportation
— 2.6% (continued) |
|
|
|
|
|
|
|
|
|
|
|
|
|
|
|
|
|
|
|
|
|
|
|
Constellation
Energy Corp. |
|
|
|
|
|
|
|
|
|
|
|
|
|
|
|
|
|
|
|
Total
Common Stocks
(cost
$6,808,603,492) |
|
|
|
|
|
|
|
|
|
|
|
|
Investment
Companies — .5% |
Registered
Investment Companies — .5% |
Dreyfus
Institutional Preferred Government Plus Money Market Fund, Institutional
(cost
$37,028,311) |
|
|
|
|
|
Total
Investments (cost $6,845,631,803)
|
|
|
|
Cash
and Receivables (Net) |
|
|
|
|
|
|
|
ADR—American
Depositary Receipt |
|
|
Non-income
producing security. |
|
|
Investment
in affiliated issuer. The investment objective of this investment company is publicly available and can be found within the investment
company’s
prospectus.
|
|
|
|
|
|
|
|
|
Dividends/
Distributions
($) |
Registered
Investment Companies - .5% |
Dreyfus
Institutional Preferred Government Plus Money
Market
Fund, Institutional Shares - .5% |
|
|
|
|
|
Investment
of Cash Collateral for Securities Loaned - .0% |
Dreyfus
Institutional Preferred Government Plus Money
Market
Fund, Institutional Shares - .0% |
|
|
|
|
|
|
|
|
|
|
|
|
|
|
Includes
reinvested dividends/distributions. |
|
|
Represents
securities lending income earned from the reinvestment of cash collateral from loaned securities, net of fees and collateral investment
expenses, and
other
payments to and from borrowers of securities. |
See notes to financial
statements.
STATEMENT
OF ASSETS AND LIABILITIES
February 28, 2025
(Unaudited)
|
|
|
|
|
|
|
|
Investments
in securities—See Statement of Investments: |
|
|
|
|
|
|
|
|
|
|
|
|
|
|
Receivable
for shares of Common Stock subscribed |
|
|
Dividends
and securities lending income receivable |
|
|
Receivable
for investment securities sold |
|
|
Tax
reclaim receivable—Note 1(b)
|
|
|
|
|
|
|
|
|
|
|
|
|
|
|
Due
to BNY Mellon Investment Adviser, Inc. and affiliates—Note
3(c)
|
|
|
Payable
for investment securities purchased |
|
|
Payable
for shares of Common Stock redeemed |
|
|
Directors’
fees and expenses payable |
|
|
|
|
|
|
|
|
|
|
|
|
|
|
Composition
of Net Assets ($): |
|
|
|
|
|
|
Total
distributable earnings (loss) |
|
|
|
|
|
|
Net
Asset Value Per Share |
|
|
|
|
|
|
|
|
|
|
|
|
|
|
|
|
Net
Asset Value Per Share ($) |
|
|
|
|
See notes to financial
statements.
Six Months Ended February
28, 2025 (Unaudited)
|
|
|
|
|
|
|
|
|
Cash
dividends (net of $7,638 foreign taxes withheld at source): |
|
|
|
|
|
|
|
Affiliated
income net of rebates from securities lending—Note
1(c)
|
|
|
|
|
|
|
|
|
|
|
|
|
|
Shareholder
servicing costs—Note 3(c)
|
|
Directors’
fees and expenses—Note 3(d)
|
|
Distribution
Plan fees—Note 3(b)
|
|
Prospectus
and shareholders’ reports |
|
|
|
|
Loan
commitment fees—Note 2 |
|
|
|
|
|
|
|
Chief
Compliance Officer fees—Note 3(c)
|
|
|
|
|
|
|
|
|
|
|
Less—reduction
in expenses due to undertaking—Note 3(a)
|
|
|
|
|
|
|
|
Realized
and Unrealized Gain (Loss) on Investments—Note 4 ($):
|
|
Net
realized gain (loss) on investments |
|
Net
change in unrealized appreciation (depreciation) on investments and foreign currency transactions |
|
Net
Realized and Unrealized Gain (Loss) on Investments |
|
Net
Increase in Net Assets Resulting from Operations |
|
See notes to financial
statements.
STATEMENT
OF CHANGES IN NET ASSETS
|
|
Six
Months Ended
February
28, 2025
(Unaudited) |
Year
Ended
August
31, 2024
|
|
|
|
|
|
|
|
|
|
|
Net
realized gain (loss) on investments |
|
|
Net
change in unrealized appreciation (depreciation) on investments |
|
|
Net
Increase (Decrease) in Net Assets Resulting from Operations |
|
|
|
|
|
|
Distributions
to shareholders: |
|
|
|
|
|
|
|
|
|
|
|
|
|
|
|
|
|
|
|
|
|
|
Capital
Stock Transactions ($): |
|
|
Net
proceeds from shares sold: |
|
|
|
|
|
|
|
|
|
|
|
|
|
|
|
|
|
|
Distributions
reinvested: |
|
|
|
|
|
|
|
|
|
|
|
|
|
|
|
|
|
|
|
|
|
|
|
|
|
|
|
|
|
|
|
|
|
|
|
|
|
|
Increase
(Decrease) in Net Assets from Capital Stock Transactions |
|
|
Total
Increase (Decrease) in Net Assets |
|
|
|
|
|
|
|
|
|
|
|
|
|
|
|
|
Six
Months Ended
February
28, 2025
(Unaudited) |
Year
Ended
August
31, 2024
|
|
|
Capital
Share Transactions (Shares): |
|
|
|
|
|
|
|
|
|
|
Shares
issued for distributions reinvested |
|
|
|
|
|
|
Net
Increase (Decrease) in Shares Outstanding |
|
|
|
|
|
|
|
|
|
|
Shares
issued for distributions reinvested |
|
|
|
|
|
|
Net
Increase (Decrease) in Shares Outstanding |
|
|
|
|
|
|
|
|
|
|
Shares
issued for distributions reinvested |
|
|
|
|
|
|
Net
Increase (Decrease) in Shares Outstanding |
|
|
|
|
|
|
|
|
|
|
Shares
issued for distributions reinvested |
|
|
|
|
|
|
Net
Increase (Decrease) in Shares Outstanding |
|
|
|
|
During
the period ended February 28, 2025, 142 Class C shares representing $5,858 were automatically converted to 124 Class A shares and during
the period
ended
August 31, 2024, 929 Class C shares representing $34,672 were automatically converted to 817 Class A shares. |
|
|
During
the period ended February 28, 2025, 10,128 Class A shares representing $470,359 were exchanged for 10,046 Class I shares and 2,065 Class
Y shares
representing
$100,034 were exchanged for 2,059 Class I shares. During the period ended August 31, 2024,
20,238 Class A shares representing $929,038 were exchanged for 20,075 Class I shares,
781 Class A shares representing $32,657 were exchanged for 778 Class Y
shares
and 16,041 Class Y shares representing $688,093 were exchanged for 16,001 Class I shares. |
See notes to financial
statements.
The
following tables describe the performance for each share class for the fiscal periods indicated. All information (except portfolio turnover
rate) reflects financial results for
a single fund share. Net asset value total return is calculated assuming an initial investment made at the net asset
value at the beginning of the period, reinvestment of all dividends and distributions at net asset value during the period, and redemption
at net asset value on the last day
of the period. Net asset value total return includes adjustments in accordance with accounting principles generally
accepted in the United States of America and as such, the net asset value for financial reporting purposes and the returns based upon
those net asset values may differ from the net asset
value and returns for shareholder transactions.
|
|
Six
Months Ended
February
28, 2025
(Unaudited)
|
|
|
|
|
|
|
|
|
|
|
|
|
|
|
|
Net
asset value, beginning of period |
|
|
|
|
|
|
|
|
|
|
|
|
|
|
|
|
|
|
|
|
|
Net
realized and unrealized gain (loss) on
investments
|
|
|
|
|
|
|
Total
from Investment Operations |
|
|
|
|
|
|
|
|
|
|
|
|
|
|
Dividends
from net investment income |
|
|
|
|
|
|
Dividends
from net realized gain on investments |
|
|
|
|
|
|
|
|
|
|
|
|
|
|
Net
asset value, end of period |
|
|
|
|
|
|
|
|
|
|
|
|
|
|
Ratios/Supplemental
Data (%): |
|
|
|
|
|
Ratio
of total expenses to average net assets |
|
|
|
|
|
|
Ratio
of net expenses to average net assets(e)
|
|
|
|
|
|
|
Ratio
of net investment income to average net
|
|
|
|
|
|
|
|
|
|
|
|
|
|
|
Net
Assets, end of period ($ x 1,000) |
|
|
|
|
|
|
|
|
Based
on average shares outstanding. |
|
|
Exclusive
of sales charge. |
|
|
|
|
|
|
|
|
Amount
inclusive of reductions in expenses pursuant to undertaking. |
|
|
Amount
inclusive of reductions in fees due to earnings credits. |
See notes to financial statements.
|
|
Six
Months Ended
February
28, 2025
(Unaudited)
|
|
|
|
|
|
|
|
|
|
|
|
|
|
|
|
Net
asset value, beginning of period |
|
|
|
|
|
|
|
|
|
|
|
|
|
|
|
|
|
|
|
|
|
Net
realized and unrealized gain (loss) on
investments
|
|
|
|
|
|
|
Total
from Investment Operations |
|
|
|
|
|
|
|
|
|
|
|
|
|
|
Dividends
from net investment income |
|
|
|
|
|
|
Dividends
from net realized gain on investments |
|
|
|
|
|
|
|
|
|
|
|
|
|
|
Net
asset value, end of period |
|
|
|
|
|
|
|
|
|
|
|
|
|
|
Ratios/Supplemental
Data (%): |
|
|
|
|
|
Ratio
of total expenses to average net assets |
|
|
|
|
|
|
Ratio
of net expenses to average net assets(e)
|
|
|
|
|
|
|
Ratio
of net investment income to average net
|
|
|
|
|
|
|
|
|
|
|
|
|
|
|
Net
Assets, end of period ($ x 1,000) |
|
|
|
|
|
|
|
|
Based
on average shares outstanding. |
|
|
Exclusive
of sales charge. |
|
|
|
|
|
|
|
|
Amount
inclusive of reductions in expenses pursuant to undertaking. |
|
|
Amount
inclusive of reductions in fees due to earnings credits. |
See notes to financial statements.
FINANCIAL
HIGHLIGHTS (continued)
|
|
Six
Months Ended
February
28, 2025
(Unaudited)
|
|
|
|
|
|
|
|
|
|
|
|
|
|
|
|
Net
asset value, beginning of period |
|
|
|
|
|
|
|
|
|
|
|
|
|
|
|
|
|
|
|
|
|
Net
realized and unrealized gain (loss) on
investments
|
|
|
|
|
|
|
Total
from Investment Operations |
|
|
|
|
|
|
|
|
|
|
|
|
|
|
Dividends
from net investment income |
|
|
|
|
|
|
Dividends
from net realized gain on investments |
|
|
|
|
|
|
|
|
|
|
|
|
|
|
Net
asset value, end of period |
|
|
|
|
|
|
|
|
|
|
|
|
|
|
Ratios/Supplemental
Data (%): |
|
|
|
|
|
Ratio
of total expenses to average net assets |
|
|
|
|
|
|
Ratio
of net expenses to average net assets(e)
|
|
|
|
|
|
|
Ratio
of net investment income to average net
|
|
|
|
|
|
|
|
|
|
|
|
|
|
|
Net
Assets, end of period ($ x 1,000) |
|
|
|
|
|
|
|
|
Based
on average shares outstanding. |
|
|
Amount
represents less than $.01 per share. |
|
|
|
|
|
|
|
|
Amount
inclusive of reductions in expenses pursuant to undertaking. |
|
|
Amount
inclusive of reductions in fees due to earnings credits. |
See notes to financial statements.
|
|
Six
Months Ended
February
28, 2025
(Unaudited)
|
|
|
|
|
|
|
|
|
|
|
|
|
|
|
|
Net
asset value, beginning of period |
|
|
|
|
|
|
|
|
|
|
|
|
|
|
|
|
|
|
|
|
|
Net
realized and unrealized gain (loss) on
investments
|
|
|
|
|
|
|
Total
from Investment Operations |
|
|
|
|
|
|
|
|
|
|
|
|
|
|
Dividends
from net investment income |
|
|
|
|
|
|
Dividends
from net realized gain on investments |
|
|
|
|
|
|
|
|
|
|
|
|
|
|
Net
asset value, end of period |
|
|
|
|
|
|
|
|
|
|
|
|
|
|
Ratios/Supplemental
Data (%): |
|
|
|
|
|
Ratio
of total expenses to average net assets |
|
|
|
|
|
|
Ratio
of net expenses to average net assets |
|
|
|
|
|
|
Ratio
of net investment income to average net assets |
|
|
|
|
|
|
|
|
|
|
|
|
|
|
Net
Assets, end of period ($ x 1,000) |
|
|
|
|
|
|
|
|
Based
on average shares outstanding. |
|
|
|
|
|
|
|
|
Amount
inclusive of reductions in fees due to earnings credits. |
See notes to financial
statements.
NOTES
TO FINANCIAL STATEMENTS (Unaudited)
NOTE
1—
Significant
Accounting Policies:
BNY Mellon
Dynamic Value Fund (the “fund”)
is a separate diversified series of BNY Mellon Advantage Funds, Inc. (the “Company”),
which is registered under the Investment
Company Act of 1940, as amended (the “Act”),
as an open-end management investment company
and operates as a series company currently offering seven series, including the fund. The fund’s investment objective is to seek
capital appreciation. BNY Mellon
Investment Adviser, Inc. (the “Adviser”),
a wholly-owned subsidiary of The Bank of New York Mellon Corporation
(“BNY”),
serves as the fund’s investment adviser. Newton Investment Management North America, LLC (the “Sub-Adviser”
or “NIMNA”),
an indirect wholly-owned subsidiary of BNY and an affiliate of the Adviser, serves as the fund’s sub-adviser. NIMNA
has entered into a sub-sub-investment advisory agreement with its affiliate, Newton Investment Management Limited (“NIM”),
which enables NIM to provide certain advisory services to the Sub-Adviser for the benefit of the fund, including, but not limited
to, portfolio management services. NIM is subject to the supervision of NIMNA and the Adviser. NIM is also an affiliate of the Adviser.
NIM, located at 160 Queen Victoria Street, London, EC4V, 4LA, England, was formed in 1978. NIM is an indirect subsidiary of
BNY.
BNY Mellon
Securities Corporation (the “Distributor”), a wholly-owned subsidiary of the Adviser, is the distributor of the fund’s
shares. The fund is authorized to
issue 800 million shares of $.001 par value of Common Stock. The fund currently has authorized four classes of
shares: Class A (300 million shares authorized), Class C (100 million shares authorized), Class I (250 million shares authorized) and
Class Y (150 million shares authorized).
Class A and Class C shares are sold primarily to retail investors through financial intermediaries and
bear Distribution and/or Shareholder Services Plan fees. Class A shares generally are subject to a sales charge imposed at the time of
purchase. Class A shares bought
without an initial sales charge as part of an investment of $1 million or more may be charged a contingent
deferred sales charge (“CDSC”) of 1.00% if redeemed within one year. Class C shares are subject to a CDSC imposed on Class
C shares redeemed within one year of purchase. Class C shares automatically convert to Class A shares eight years after the date of purchase,
without the imposition of a sales charge. Class I shares are sold primarily to bank trust departments and other financial service providers
(including BNY and its affiliates), acting on behalf of customers having a qualified trust or an investment account or relationship
at such institution, and bear no Distribution or Shareholder Services Plan fees. Class Y shares are sold at net asset value per share
generally to institutional investors,
and bear no Distribution or Shareholder Services Plan fees. Class I and Class Y shares are offered without
a front-end sales charge or CDSC. Other differences between the classes include the services offered to and the expenses borne by
each class, the allocation of certain transfer agency costs and certain voting rights. Income, expenses (other than expenses attributable
to a specific class), and realized
and unrealized gains or losses on investments are allocated to each class of shares based on its relative net assets.
The Company
accounts separately for the assets, liabilities and operations of each series. Expenses directly attributable to each series are charged
to that series’ operations; expenses which are applicable to all series are allocated among them on a pro rata basis.
The Financial
Accounting Standards Board (“FASB”) Accounting Standards Codification (“ASC”) is the exclusive reference of authoritative
U.S. generally accepted accounting principles (“GAAP”) recognized by the FASB to be applied by nongovernmental entities. Rules
and interpretive releases of the SEC under authority of federal laws are also sources of authoritative GAAP for SEC registrants.
The fund is an investment company
and applies the accounting and reporting guidance of the FASB ASC Topic 946 Financial Services-Investment
Companies. The fund’s financial statements are prepared in accordance with GAAP, which may require the use of management
estimates and assumptions. Actual results could differ from those estimates.
The Company
enters into contracts that contain a variety of indemnifications. The fund’s maximum exposure under these arrangements is
unknown. The fund does not anticipate recognizing any loss related to these arrangements.
(a) Portfolio
valuation: The fair value of a financial instrument
is the amount that would be received to sell an asset or paid to transfer a
liability in an orderly transaction between market participants at the measurement date (i.e., the exit price). GAAP establishes a fair
value hierarchy that prioritizes
the inputs of valuation techniques used to measure fair value. This hierarchy gives the highest priority to unadjusted
quoted prices in active markets for identical assets or liabilities (Level 1 measurements) and the lowest priority to unobservable
inputs (Level 3 measurements).
Additionally,
GAAP provides guidance on determining whether the volume and activity in a market has decreased significantly and whether
such a decrease in activity results in transactions that are not orderly. GAAP requires enhanced disclosures around valuation inputs
and techniques used during annual and interim periods.
NOTES
TO FINANCIAL STATEMENTS (Unaudited) (continued)
Various
inputs are used in determining the value of the fund’s investments relating to fair value measurements. These inputs are summarized
in the three broad levels listed below:
Level 1—unadjusted
quoted prices in active markets for identical investments.
Level 2—other
significant observable inputs (including quoted prices for similar investments, interest rates, prepayment speeds, credit
risk, etc.).
Level 3—significant
unobservable inputs (including the fund’s own assumptions in determining the fair value of investments).
The inputs
or methodology used for valuing securities are not necessarily an indication of the risk associated with investing in those securities.
Changes in
valuation techniques may result in transfers in or out of an assigned level within the disclosure hierarchy. Valuation techniques
used to value the fund’s investments are as follows:
The Company’s
Board of Directors (the “Board”)
has designated the Adviser as the fund’s valuation designee to make all fair value determinations
with respect to the fund’s portfolio investments, subject to the Board’s oversight and pursuant to Rule 2a-5 under the
Act.
Investments
in equity securities are valued at the last sales price on the securities exchange or national securities market on which such securities
are primarily traded. Securities listed on the National Market System for which market quotations are available are valued at the
official closing price or, if there is no official closing price that day, at the last sales price. For open short positions, asked prices
are used for valuation purposes.
Bid price is used when no asked price is available. Registered investment companies that are not traded on an
exchange are valued at their net asset value. All of the preceding securities are generally categorized within Level 1 of the fair value
hierarchy.
Securities
not listed on an exchange or the national securities market, or securities for which there were no transactions, are valued at the average
of the most recent bid and asked prices. These securities are generally categorized within Level 2 of the fair value hierarchy.
Fair valuing
of securities may be determined with the assistance of a pricing service using calculations based on indices of domestic securities
and other appropriate indicators, such as prices of relevant American Depositary Receipts and futures. Utilizing these techniques
may result in transfers between Level 1 and Level 2 of the fair value hierarchy.
When market
quotations or official closing prices are not readily available, or are determined not to accurately reflect fair value, such as when
the value of a security has been significantly affected by events after the close of the exchange or market on which the security is principally
traded (for example, a foreign exchange or market), but before the fund calculates its net asset value,
the fund may value these investments
at fair value as determined in accordance with the procedures approved by the Board. Certain factors may be considered when
fair valuing investments such as: fundamental analytical data, the nature and duration of restrictions on disposition, an evaluation of
the forces that influence the market in which the securities are purchased and sold, and public trading in similar securities of the issuer
or comparable issuers. These securities
are either categorized within Level 2 or 3 of the fair value hierarchy depending on the relevant inputs
used.
For securities
where observable inputs are limited, assumptions about market activity and risk are used and such securities are generally categorized
within Level 3 of the fair value hierarchy.
Investments denominated in
foreign currencies are translated to U.S. dollars at the prevailing rates of exchange.
NOTES
TO FINANCIAL STATEMENTS (Unaudited) (continued)
The following
is a summary of the inputs used as of February 28, 2025 in valuing the fund’s investments:
|
|
Level
1 -
Unadjusted
Quoted
Prices |
Level
2- Other
Significant
Observable
Inputs |
Level
3-
Significant
Unobservable
Inputs
|
|
|
|
|
|
|
|
Investments
in Securities:†
|
|
|
|
|
Equity
Securities - Common Stocks |
|
|
|
|
|
|
|
|
|
|
|
|
|
|
|
|
|
|
See
Statement of Investments for additional detailed categorizations, if any. |
(b) Foreign
currency transactions: The fund does not isolate
that portion of the results of operations resulting from changes in foreign
exchange rates on investments from the fluctuations arising from changes in the market prices of securities held. Such fluctuations
are included with the net realized and unrealized gain or loss on investments.
Net realized
foreign exchange gains or losses arise from sales of foreign currencies, currency gains or losses realized on securities transactions
between trade and settlement date, and the difference between the amounts of dividends, interest and foreign withholding taxes recorded
on the fund’s books and the U.S. dollar equivalent of the amounts actually received or paid. Net unrealized foreign exchange gains
and losses arise from changes in the value of assets and liabilities other than investments resulting from changes in exchange rates.
Foreign currency gains and losses
on foreign currency transactions are also included with net realized and unrealized gain or loss on investments.
Foreign taxes:
The fund may be subject to foreign taxes (a portion of which may be reclaimable) on income, stock dividends, realized and
unrealized capital gains on investments or certain foreign currency transactions. Foreign taxes are recorded in accordance with the applicable
foreign tax regulations and rates that exist in the foreign jurisdictions in which the fund invests. These foreign taxes, if any, are
paid by the fund and are reflected
in the Statement of Operations, if applicable. Foreign taxes payable or deferred or those subject to reclaims
as of February 28, 2025, if any, are disclosed in the fund’s Statement of Assets and Liabilities.
(c) Securities
transactions and investment income: Securities transactions
are recorded on a trade date basis. Realized gains and losses
from securities transactions are recorded on the identified cost basis. Dividend income is recognized on the ex-dividend date and interest
income, including, where applicable, accretion of discount and amortization of premium on investments, is recognized on the accrual
basis.
Pursuant to
a securities lending agreement with BNY, the fund may lend securities to qualified institutions. It is the fund’s policy that, at
origination, all loans are secured by collateral of at least 102% of the value of U.S. securities loaned and 105% of the value of foreign
securities loaned. Collateral equivalent
to at least 100% of the market value of securities on loan is maintained at all times. Collateral is either
in the form of cash, which can be invested in certain money market mutual funds managed by the Adviser, or U.S. Government and
Agency securities. Any non-cash collateral received cannot be sold or re-pledged by the fund, except in the event of borrower default,
and is not reflected in the Statement of Assets and Liabilities. The securities on loan, if any, are also disclosed in the fund’s
Statement of Investments. The fund
is entitled to receive all dividends, interest and distributions on securities loaned, in addition to income
earned as a result of the lending transaction. Should a borrower fail to return the securities in a timely manner, BNY is required to
replace the securities for the benefit of the fund or credit the fund with the market value of the unreturned securities and is subrogated
to the fund’s rights against
the borrower and the collateral. Additionally, the contractual maturity of security lending transactions are on an
overnight and continuous basis. During the period ended February 28, 2025, BNY earned $4,837 from the lending of the fund’s portfolio
securities, pursuant to the securities lending agreement.
For financial
reporting purposes, the fund elects not to offset assets and liabilities subject to a securities lending agreement, if any, in the Statement
of Assets and Liabilities. Therefore, all qualifying transactions are presented on a gross basis in the Statement of Assets and Liabilities.
As of February 28, 2025, the fund had no securities on loan.
(d) Affiliated
issuers: Investments in other investment companies
advised by the Adviser are considered “affiliated” under the Act.
(e) Market
Risk: The value of the securities in which the fund
invests may be affected by political, regulatory, economic and social
NOTES
TO FINANCIAL STATEMENTS (Unaudited) (continued)
developments,
and developments that impact specific economic sectors, industries or segments of the market. In addition, turbulence in financial
markets and reduced liquidity in equity, credit and/or fixed-income markets may negatively affect many issuers, which could adversely
affect the fund. Global economies and financial markets are becoming increasingly interconnected, and conditions and events in
one country, region or financial market may adversely impact issuers in a different country, region or financial market. These risks may
be magnified if certain events or developments adversely interrupt the global supply chain; in these and other circumstances, such risks
might affect companies world-wide.
Foreign Investment Risk:
To the extent the fund invests in foreign securities, the fund’s performance will be influenced by political, social
and economic factors affecting investments in foreign issuers. Special risks associated with investments in foreign issuers include exposure
to currency fluctuations, less liquidity, less developed or less efficient trading markets, lack of comprehensive company information,
political and economic instability and differing auditing and legal standards.
(f) Dividends
and distributions to shareholders:
Dividends and distributions are recorded on the ex-dividend date. Dividends from net
investment income and dividends from net realized capital gains, if any, are normally declared and paid annually, but the fund may make
distributions on a more frequent basis to comply with the distribution requirements of the Internal Revenue Code of 1986, as amended
(the “Code”). To the extent that net realized capital gains can be offset by capital loss carryovers, it is the policy of
the fund not to distribute such
gains. Income and capital gain distributions are determined in accordance with income tax regulations, which may differ
from GAAP.
(g) Federal
income taxes: It is the policy of the fund to continue
to qualify as a regulated investment company, if such qualification is in
the best interests of its shareholders, by complying with the applicable provisions of the Code, and to make distributions of taxable
income and net realized capital gain sufficient to
relieve it from substantially all federal income and excise taxes.
As of and
during the period ended February 28, 2025, the fund did not have any liabilities for any uncertain tax positions. The fund recognizes
interest and penalties, if any, related to uncertain tax positions as income tax expense in the Statement of Operations. During the
period ended February 28, 2025, the fund did not incur any interest or penalties.
Each tax year
in the three-year period ended August 31, 2024 remains subject to examination by the Internal Revenue Service and state taxing
authorities.
The tax character
of distributions paid to shareholders during the fiscal year ended August 31, 2024 were as follows: ordinary income $35,499,698
and long-term capital gains $161,009,776. The tax character of current year distributions will be determined at the end of the
current fiscal year.
(h) Operating
segment reporting: In this reporting period, the
fund adopted FASB Accounting Standards Update 2023-07, Segment Reporting
(Topic 280) - Improvements to Reportable Segment Disclosures (“ASU 2023-07”). Adoption of the new standard impacted financial
statement disclosures only and did not affect the fund’s financial position or the results of its operations. The ASU 2023-07 is
effective for public entities for
fiscal years beginning after December 15, 2023, and requires retrospective application for all prior periods presented
within the financial statements.
Since its
commencement, the fund operates and is managed as a single reportable segment deriving returns in the form of dividends, interest
and/or gains from the investments made in pursuit of its single stated investment objective as outlined in the fund’s prospectus.
The accounting policies of the fund
are consistent with those described in these Notes to Financial Statements. The chief operating decision
maker (“CODM”) is represented by BNY Investments, the management of the Adviser, comprising Senior Management and Directors.
The CODM considers net increase in net assets resulting from operations in deciding whether to purchase additional investments
or to make distributions to fund shareholders. Detailed financial information for the fund is disclosed within these financial
statements with total assets and
liabilities disclosed on the Statement of Assets and Liabilities, investments held on the Statement of Investments,
results of operations and significant segment expenses on the Statement of Operations and other information about the fund’s
performance, including total return, portfolio turnover and ratios within the Financial Highlights.
NOTE
2—
Bank
Lines of Credit:
The fund participates with
other long-term open-end funds managed by the Adviser in a $738 million unsecured credit facility led by Citibank,
N.A. (the “Citibank Credit Facility”) and a $300 million unsecured credit facility provided by BNY (the “BNY Credit
Facility”), each to be utilized
primarily for temporary or emergency purposes, including the financing of redemptions (each, a “Facility”).
The Citibank Credit Facility is available in two tranches: (i) Tranche A is in an amount equal to $618 million and is available to all
long-term open-ended funds, including
the fund, and (ii) Tranche B is in an amount equal to $120 million and is available only to the BNY
Mellon Floating Rate Income Fund, a series of BNY Mellon Investment Funds IV, Inc. In connection therewith, the fund has
NOTES
TO FINANCIAL STATEMENTS (Unaudited) (continued)
agreed
to pay its pro rata portion of commitment fees for Tranche A of the Citibank Credit Facility and the BNY Credit Facility. Interest is
charged to the fund based on rates determined pursuant to the terms of the respective Facility at the time of borrowing.
During the
period ended February 28, 2025, the fund was charged $4,922 for interest expense. These fees are included in Interest expense
in the Statement of Operations. The average amount of borrowings outstanding under the Citibank Credit Facility during the period
ended February 28, 2025 was approximately $181,768 with a related weighted average annualized interest rate of 5.46%. As of February
28, 2025, the fund has no outstanding loan balance from either Facility.
NOTE
3—
Management
Fee, Sub-Advisory Fee
and Other Transactions with Affiliates:
(a) Pursuant
to a management agreement with the Adviser, the management fee is computed at the annual rate of .60% of the value of the
fund’s average daily net assets and is payable monthly. The Adviser has contractually agreed, from September 1, 2024 through December
31, 2025, to waive receipt of its fees and/or assume the direct expenses of the fund so that the direct expenses of none of the fund’s
share classes (excluding Rule 12b-1 Distribution Plan fees, Shareholder Services Plan fees, taxes, interest expense, brokerage commissions, commitment
fees on borrowings and extraordinary expenses) exceed .68% of the value of the fund’s average daily net assets.
On or after December 31, 2025, the Adviser may terminate this expense limitation at any time. The reduction in expenses, pursuant
to the undertaking, amounted to $439,460 during the period ended February 28, 2025.
Pursuant to
a sub-investment advisory agreement between the Adviser and the Sub-Adviser, the Adviser pays the Sub-Adviser a monthly fee
at an annual rate of .288% of the value of the fund’s average daily net assets.
During the
period ended February 28, 2025, the Distributor retained $70,919 from commissions earned on sales of the fund’s Class A shares and $5,629
and $12,189 from CDSC fees on redemptions of the fund’s Class A and Class C shares, respectively.
(b) Under
the Distribution Plan adopted pursuant to Rule 12b-1 under the Act, Class C shares pay the Distributor for distributing its shares
at an annual rate of .75% of the value of its average daily net assets. The Distributor may pay one or more Service Agents in respect
of advertising, marketing and other distribution services, and determines the amounts, if any, to be paid to Service Agents and the
basis on which such payments are made. During the period ended February 28, 2025, Class C shares were charged $278,079
pursuant to the Distribution Plan.
(c) Under
the Shareholder Services Plan, Class A and Class C shares pay the Distributor at an annual rate of .25% of the value of their average
daily net assets for the provision of certain services. The services provided may include personal services relating to shareholder accounts,
such as answering shareholder inquiries regarding the fund, and services related to the maintenance of shareholder accounts. The
Distributor may make payments to Service Agents (securities dealers, financial institutions or other industry professionals) with respect
to these services. During the period ended February 28, 2025, Class A and Class C shares were charged $1,614,565 and $92,693,
respectively, pursuant to the Shareholder Services Plan.
The fund has
an arrangement with BNY Mellon Transfer, Inc., (the “Transfer Agent”), a subsidiary of BNY and an affiliate of the Adviser,
whereby the fund may receive earnings credits when positive cash balances are maintained, which are used to offset Transfer Agent
fees. For financial reporting purposes, the fund includes transfer agent net earnings credits, if any, as an expense offset in the Statement
of Operations.
The fund has
an arrangement with The Bank of New York Mellon (the “Custodian”), a subsidiary of BNY and an affiliate of the Adviser, whereby
the fund will receive interest income or be charged overdraft fees when cash balances are maintained. For financial reporting purposes,
the fund includes this interest income and overdraft fees, if any, as interest income in the Statement of Operations.
The fund compensates
the Transfer Agent, under a transfer agency agreement, for providing transfer agency and cash management services
for the fund. The majority of Transfer Agent fees are comprised of amounts paid on a per account basis, while cash management fees
are related to fund subscriptions and redemptions. During the period ended February 28, 2025, the fund was charged $94,969 for transfer
agency services. These fees are included in Shareholder servicing costs in the Statement of Operations.
The fund compensates
the Custodian, under a custody agreement, for providing custodial services for the fund. These fees are determined
based on net assets, geographic region and transaction activity. During the period ended February 28, 2025, the fund was charged
$53,982 pursuant to the custody agreement.
During the
period ended February 28, 2025, the fund was charged $15,431 for services performed by the fund’s Chief Compliance Officer
and his staff. These fees are included in Chief Compliance Officer fees in the Statement of Operations.
The components
of “Due to BNY Mellon Investment Adviser, Inc. and affiliates” in the Statement of Assets and Liabilities consist of:
Management fee of $3,541,918, Distribution Plan fees of $47,292, Shareholder Services Plan fees of $273,400, Custodian fees of
NOTES
TO FINANCIAL STATEMENTS (Unaudited) (continued)
$43,852,
Chief Compliance Officer fees of $7,006 and Transfer Agent fees of $52,743, which are offset against an expense reimbursement
currently in effect in the amount of $72,903.
(d) Each
board member of the fund also serves as a board member of other funds in the BNY Mellon Family of Funds complex. Annual retainer
fees and attendance fees are allocated to each fund based on net assets.
NOTE
4—
Securities
Transactions:
The aggregate
amount of purchases and sales of investment securities, excluding short-term securities, during the period ended February
28, 2025, amounted to $4,329,092,621 and $3,277,190,667, respectively.
At February
28, 2025, accumulated net unrealized appreciation on investments was $1,017,743,429, consisting of $1,142,059,177
gross unrealized appreciation and $124,315,748 gross unrealized depreciation.
At February
28, 2025, the cost of investments for federal income tax purposes was substantially the same as the cost for financial reporting
purposes (see the Statement of Investments).
Item
8. Changes in and Disagreements with Accountants for Open-End Management Investment Companies
(Unaudited)
Item
9. Proxy Disclosures for Open-End Management Investment Companies (Unaudited)
Item
10. Remuneration Paid to Directors, Officers, and Others of Open-End Management Investment Companies
(Unaudited)
Each
board member also serves as a board member of other funds in the BNY Mellon Family of Funds complex. Annual retainer fees and
attendance fees are allocated to each fund based on net assets. Directors fees paid by the fund are within Item 7. Statement of Operations
as Directors’ fees and expenses.
Item
11. Statement Regarding Basis for Approval of Investment Advisory Contracts (Unaudited)
©
2025 BNY Mellon Securities Corporation
Code-0257NCSRSA0225
BNY Mellon Opportunistic Midcap
Value Fund
SEMI-ANNUAL FINANCIALS
AND OTHER INFORMATION
Save
time. Save paper. View your next shareholder report online as soon as it’s available. Log into www.bny.com/investments
and sign up for eCommunications. It’s simple and only takes a few minutes.
The
views expressed in this report reflect those of the portfolio manager(s) only through the end of the period
covered and do not necessarily represent the views of BNY Mellon Investment Adviser, Inc. or any other
person in the BNY Mellon Investment Adviser, Inc. organization. Any such views are subject to change
at any time based upon market or other conditions and BNY Mellon Investment Adviser, Inc. disclaims
any responsibility to update such views. These views may not be relied on as investment advice and,
because investment decisions for a fund in the BNY Mellon Family of Funds are based on numerous factors,
may not be relied on as an indication of trading intent on behalf of any fund in the BNY Mellon
Family of
Funds.
Not FDIC-Insured
• Not Bank-Guaranteed • May Lose Value
Contents
Please note
the Semi-Annual Financials and Other Information only contains Items 7-11
required in Form N-CSR. All other required items will be filed with the Securities and Exchange
Commission (the “SEC”).
Item
7. Financial Statements and Financial Highlights for Open-End Management Investment Companies.
BNY Mellon Opportunistic Midcap Value
Fund
Statement of Investments
February
28, 2025 (Unaudited)
|
|
|
|
|
|
|
|
|
|
|
|
|
|
|
|
|
|
|
|
|
|
|
|
|
|
|
|
|
|
|
|
|
|
|
|
|
|
|
|
|
Ferguson
Enterprises, Inc. |
|
|
|
|
|
|
|
|
|
|
|
|
|
|
|
|
|
|
|
Johnson
Controls International PLC |
|
|
|
|
|
|
|
|
|
|
|
|
|
|
|
|
|
|
|
Commercial
& Professional Services — 4.3% |
CACI
International, Inc., Cl. A (a)
|
|
|
|
|
|
|
|
|
|
|
|
|
|
|
|
|
|
|
|
|
|
|
|
|
|
|
Consumer
Discretionary Distribution & Retail — 4.7% |
|
|
|
|
|
|
|
Burlington
Stores, Inc. (a)
|
|
|
|
|
|
|
|
|
|
|
|
|
|
|
|
|
|
|
|
Consumer
Durables & Apparel — 3.1% |
|
|
|
|
|
|
|
Skechers
USA, Inc., Cl. A (a)
|
|
|
|
|
|
|
|
|
|
|
|
|
|
|
|
|
|
|
|
|
|
|
|
|
|
|
|
|
|
|
|
|
|
|
|
|
|
|
|
|
|
|
|
|
Antero
Resources Corp. (a)
|
|
|
|
|
|
|
|
|
|
|
|
|
|
|
|
|
|
|
|
|
|
|
|
|
|
|
|
|
|
|
|
|
|
Equity
Real Estate Investment Trusts — 3.8% |
Digital
Realty Trust, Inc. (b)
|
|
|
|
|
|
|
|
|
|
|
|
|
|
|
|
|
|
|
|
Financial
Services — 5.7% |
Fidelity
National Information Services, Inc. |
|
|
|
|
|
|
|
|
|
|
|
|
LPL
Financial Holdings, Inc. |
|
|
|
|
|
|
|
|
|
|
|
|
|
|
|
|
|
|
|
Statement of Investments (Unaudited)
(continued)
|
|
|
|
|
|
|
Common
Stocks — 96.8% (continued) |
Food,
Beverage & Tobacco — 2.6% |
Molson
Coors Beverage Co., Cl. B |
|
|
|
|
|
|
|
|
|
|
|
|
|
|
|
|
|
|
|
Health
Care Equipment & Services — 8.2% |
Baxter
International, Inc. |
|
|
|
|
|
|
|
|
|
|
|
|
|
|
|
|
|
|
|
Globus
Medical, Inc., Cl. A (a)
|
|
|
|
|
|
|
|
|
|
|
|
|
|
|
|
|
|
|
|
Household
& Personal Products — 2.1% |
|
|
|
|
|
|
|
|
|
|
|
|
|
|
|
|
|
|
|
|
|
|
|
Reinsurance
Group of America, Inc. |
|
|
|
|
|
RenaissanceRe
Holdings Ltd. |
|
|
|
|
|
|
|
|
|
|
|
|
|
|
CF
Industries Holdings, Inc. |
|
|
|
|
|
|
|
|
|
|
|
|
|
|
|
|
|
|
|
|
|
|
|
|
|
|
|
|
|
|
|
|
|
|
|
|
|
|
|
|
|
|
|
|
|
|
|
Media
& Entertainment — 3.2% |
|
|
|
|
|
|
|
Pinterest,
Inc., Cl. A (a)
|
|
|
|
|
|
|
|
|
|
|
|
|
|
|
|
|
|
|
|
Pharmaceuticals,
Biotechnology & Life Sciences — 2.3% |
|
|
|
|
|
|
|
Charles
River Laboratories International, Inc. (a)
|
|
|
|
|
|
Sarepta
Therapeutics, Inc. (a)
|
|
|
|
|
|
|
|
|
|
|
|
|
Real
Estate Management & Development — .9% |
Zillow
Group, Inc., Cl. C (a)
|
|
|
|
|
|
Semiconductors
& Semiconductor Equipment — 1.3% |
|
|
|
|
|
|
|
Software
& Services — 5.7% |
Akamai
Technologies, Inc. (a)
|
|
|
|
|
|
Cognizant
Technology Solutions Corp., Cl. A |
|
|
|
|
|
Dolby
Laboratories, Inc., Cl. A |
|
|
|
|
|
|
|
|
|
|
|
|
|
|
|
|
|
|
|
|
|
Knight-Swift
Transportation Holdings, Inc. |
|
|
|
|
|
|
|
|
|
|
|
|
|
|
|
|
|
|
|
|
|
|
|
|
|
|
|
|
|
|
|
|
|
Common
Stocks — 96.8% (continued) |
|
|
Constellation
Energy Corp. |
|
|
|
|
|
|
|
|
|
|
|
|
|
|
|
|
|
|
|
|
|
|
|
|
|
|
Total
Common Stocks
(cost
$302,802,983) |
|
|
|
|
|
|
|
Software
& Services — .8% |
Databricks,
Inc., Ser. H (a),(c)
|
|
|
|
|
|
Databricks,
Inc., Ser. I (a),(c)
|
|
|
|
|
|
Total
Private Equity
(cost
$2,596,384) |
|
|
|
|
|
|
|
|
|
|
|
|
Investment
Companies — 2.3% |
Registered
Investment Companies — 2.3% |
Dreyfus
Institutional Preferred Government Plus Money Market Fund, Institutional Shares(d)
(cost
$9,023,326) |
|
|
|
|
|
Total
Investments (cost $314,422,693)
|
|
|
|
Cash
and Receivables (Net) |
|
|
|
|
|
|
|
ADR—American
Depositary Receipt |
|
|
Non-income
producing security. |
|
|
Investment
in real estate investment trust within the United States. |
|
|
The
fund held Level 3 securities at February 28, 2025. These securities were valued at $3,062,578 or .8% of net assets.
|
|
|
Investment
in affiliated issuer. The investment objective of this investment company is publicly available and can be found within the investment
company’s
prospectus.
|
|
|
|
|
|
|
|
|
Dividends/
Distributions
($) |
Registered
Investment Companies - 2.3% |
Dreyfus
Institutional Preferred Government Plus Money
Market
Fund, Institutional Shares - 2.3% |
|
|
|
|
|
Investment
of Cash Collateral for Securities Loaned - .0% |
Dreyfus
Institutional Preferred Government Plus Money
Market
Fund, Institutional Shares - .0% |
|
|
|
|
|
|
|
|
|
|
|
|
|
|
Includes
reinvested dividends/distributions. |
|
|
Represents
securities lending income earned from the reinvestment of cash collateral from loaned securities, net of fees and collateral investment
expenses, and
other
payments to and from borrowers of securities. |
See notes to financial
statements.
STATEMENT
OF ASSETS AND LIABILITIES
February 28, 2025
(Unaudited)
|
|
|
|
|
|
|
|
Investments
in securities—See Statement of Investments: |
|
|
|
|
|
|
|
|
|
|
Dividends
and securities lending income receivable |
|
|
Receivable
for investment securities sold |
|
|
Receivable
for shares of Common Stock subscribed |
|
|
Tax
reclaim receivable—Note 1(b)
|
|
|
|
|
|
|
|
|
|
|
|
|
|
|
Due
to BNY Mellon Investment Adviser, Inc. and affiliates—Note
3(c)
|
|
|
Payable
for shares of Common Stock redeemed |
|
|
Directors’
fees and expenses payable |
|
|
|
|
|
|
|
|
|
|
|
|
|
|
Composition
of Net Assets ($): |
|
|
|
|
|
|
Total
distributable earnings (loss) |
|
|
|
|
|
|
Net
Asset Value Per Share |
|
|
|
|
|
|
|
|
|
|
|
|
|
|
|
|
Net
Asset Value Per Share ($) |
|
|
|
|
See notes to financial
statements.
Six Months Ended February
28, 2025 (Unaudited)
|
|
|
|
|
|
|
|
|
Cash
dividends (net of $19,587 foreign taxes withheld at source): |
|
|
|
|
|
|
|
Affiliated
income net of rebates from securities lending—Note
1(c)
|
|
|
|
|
|
|
|
|
|
|
|
|
|
Shareholder
servicing costs—Note 3(c)
|
|
|
|
|
|
|
|
Prospectus
and shareholders’ reports |
|
Directors’
fees and expenses—Note 3(d)
|
|
Chief
Compliance Officer fees—Note 3(c)
|
|
Distribution
Plan fees—Note 3(b)
|
|
Loan
commitment fees—Note 2 |
|
|
|
|
|
|
|
|
|
|
|
|
|
Realized
and Unrealized Gain (Loss) on Investments—Note 4 ($):
|
|
Net
realized gain (loss) on investments |
|
Net
change in unrealized appreciation (depreciation) on investments and foreign currency transactions |
|
Net
Realized and Unrealized Gain (Loss) on Investments |
|
Net
Increase in Net Assets Resulting from Operations |
|
See notes to financial
statements.
STATEMENT
OF CHANGES IN NET ASSETS
|
|
Six
Months Ended
February
28, 2025
(Unaudited) |
Year
Ended
August
31, 2024
|
|
|
|
|
|
|
|
|
|
|
Net
realized gain (loss) on investments |
|
|
Net
change in unrealized appreciation (depreciation) on investments |
|
|
Net
Increase (Decrease) in Net Assets Resulting from Operations |
|
|
|
|
|
|
Distributions
to shareholders: |
|
|
|
|
|
|
|
|
|
|
|
|
|
|
|
|
|
|
|
|
|
|
Capital
Stock Transactions ($): |
|
|
Net
proceeds from shares sold: |
|
|
|
|
|
|
|
|
|
|
|
|
|
|
|
|
|
|
Distributions
reinvested: |
|
|
|
|
|
|
|
|
|
|
|
|
|
|
|
|
|
|
|
|
|
|
|
|
|
|
|
|
|
|
|
|
|
|
|
|
|
|
Increase
(Decrease) in Net Assets from Capital Stock Transactions |
|
|
Total
Increase (Decrease) in Net Assets |
|
|
|
|
|
|
|
|
|
|
|
|
|
|
|
|
Six
Months Ended
February
28, 2025
(Unaudited) |
Year
Ended
August
31, 2024
|
|
|
Capital
Share Transactions (Shares): |
|
|
|
|
|
|
|
|
|
|
Shares
issued for distributions reinvested |
|
|
|
|
|
|
Net
Increase (Decrease) in Shares Outstanding |
|
|
|
|
|
|
|
|
|
|
Shares
issued for distributions reinvested |
|
|
|
|
|
|
Net
Increase (Decrease) in Shares Outstanding |
|
|
|
|
|
|
|
|
|
|
Shares
issued for distributions reinvested |
|
|
|
|
|
|
Net
Increase (Decrease) in Shares Outstanding |
|
|
|
|
|
|
|
|
|
|
Shares
issued for distributions reinvested |
|
|
|
|
|
|
Net
Increase (Decrease) in Shares Outstanding |
|
|
|
|
During
the period ended February 28, 2025, 1,201 Class A shares representing $38,892 were exchanged for 1,208 Class I shares
|
|
|
During the period ended August 31, 2024, 480 Class C shares representing $10,892 were automatically converted to 368 Class A shares.
|
See notes to financial
statements.
The
following tables describe the performance for each share class for the fiscal periods indicated. All information (except portfolio turnover
rate) reflects financial results for
a single fund share. Net asset value total return is calculated assuming an initial investment made at the net asset
value at the beginning of the period, reinvestment of all dividends and distributions at net asset value during the period, and redemption
at net asset value on the last day
of the period. Net asset value total return includes adjustments in accordance with accounting principles generally
accepted in the United States of America and as such, the net asset value for financial reporting purposes and the returns based upon
those net asset values may differ from the net asset
value and returns for shareholder transactions.
|
|
Six
Months Ended
February
28, 2025
(Unaudited)
|
|
|
|
|
|
|
|
|
|
|
|
|
|
|
|
Net
asset value, beginning of period |
|
|
|
|
|
|
|
|
|
|
|
|
|
|
|
|
|
|
|
|
|
Net
realized and unrealized gain (loss) on
investments
|
|
|
|
|
|
|
Total
from Investment Operations |
|
|
|
|
|
|
|
|
|
|
|
|
|
|
Dividends
from net investment income |
|
|
|
|
|
|
Dividends
from net realized gain on investments |
|
|
|
|
|
|
|
|
|
|
|
|
|
|
Net
asset value, end of period |
|
|
|
|
|
|
|
|
|
|
|
|
|
|
Ratios/Supplemental
Data (%): |
|
|
|
|
|
Ratio
of total expenses to average net assets |
|
|
|
|
|
|
Ratio
of net expenses to average net assets |
|
|
|
|
|
|
Ratio
of net investment income to average net assets |
|
|
|
|
|
|
|
|
|
|
|
|
|
|
Net
Assets, end of period ($ x 1,000) |
|
|
|
|
|
|
|
|
Based
on average shares outstanding. |
|
|
Exclusive
of sales charge. |
|
|
|
|
|
|
|
|
Amount
inclusive of reductions in fees due to earnings credits. |
|
|
Amount
inclusive of reductions in expenses pursuant to undertaking. |
See notes to financial statements.
|
|
Six
Months Ended
February
28, 2025
(Unaudited)
|
|
|
|
|
|
|
|
|
|
|
|
|
|
|
|
Net
asset value, beginning of period |
|
|
|
|
|
|
|
|
|
|
|
|
|
|
|
|
|
|
|
|
|
Net
realized and unrealized gain (loss) on
investments
|
|
|
|
|
|
|
Total
from Investment Operations |
|
|
|
|
|
|
|
|
|
|
|
|
|
|
Dividends
from net investment income |
|
|
|
|
|
|
Dividends
from net realized gain on investments |
|
|
|
|
|
|
|
|
|
|
|
|
|
|
Net
asset value, end of period |
|
|
|
|
|
|
|
|
|
|
|
|
|
|
Ratios/Supplemental
Data (%): |
|
|
|
|
|
Ratio
of total expenses to average net assets |
|
|
|
|
|
|
Ratio
of net expenses to average net assets |
|
|
|
|
|
|
Ratio
of net investment (loss) to average net assets |
|
|
|
|
|
|
|
|
|
|
|
|
|
|
Net
Assets, end of period ($ x 1,000) |
|
|
|
|
|
|
|
|
Based
on average shares outstanding. |
|
|
Amount
represents less than $.01 per share. |
|
|
Exclusive
of sales charge. |
|
|
|
|
|
|
|
|
Amount
inclusive of reductions in fees due to earnings credits. |
|
|
Amount
inclusive of reductions in expenses pursuant to undertaking. |
See notes to financial statements.
FINANCIAL
HIGHLIGHTS (continued)
|
|
Six
Months Ended
February
28, 2025
(Unaudited)
|
|
|
|
|
|
|
|
|
|
|
|
|
|
|
|
Net
asset value, beginning of period |
|
|
|
|
|
|
|
|
|
|
|
|
|
|
|
|
|
|
|
|
|
Net
realized and unrealized gain (loss) on
investments
|
|
|
|
|
|
|
Total
from Investment Operations |
|
|
|
|
|
|
|
|
|
|
|
|
|
|
Dividends
from net investment income |
|
|
|
|
|
|
Dividends
from net realized gain on investments |
|
|
|
|
|
|
|
|
|
|
|
|
|
|
Net
asset value, end of period |
|
|
|
|
|
|
|
|
|
|
|
|
|
|
Ratios/Supplemental
Data (%): |
|
|
|
|
|
Ratio
of total expenses to average net assets |
|
|
|
|
|
|
Ratio
of net expenses to average net assets |
|
|
|
|
|
|
Ratio
of net investment income to average net assets |
|
|
|
|
|
|
|
|
|
|
|
|
|
|
Net
Assets, end of period ($ x 1,000) |
|
|
|
|
|
|
|
|
Based
on average shares outstanding. |
|
|
|
|
|
|
|
|
Amount
inclusive of reductions in fees due to earnings credits. |
|
|
Amount
inclusive of reductions in expenses pursuant to undertaking. |
See notes to financial statements.
|
|
Six
Months Ended
February
28, 2025
(Unaudited)
|
|
|
|
|
|
|
|
|
|
|
|
|
|
|
|
Net
asset value, beginning of period |
|
|
|
|
|
|
|
|
|
|
|
|
|
|
|
|
|
|
|
|
|
Net
realized and unrealized gain (loss) on
investments
|
|
|
|
|
|
|
Total
from Investment Operations |
|
|
|
|
|
|
|
|
|
|
|
|
|
|
Dividends
from net investment income |
|
|
|
|
|
|
Dividends
from net realized gain on investments |
|
|
|
|
|
|
|
|
|
|
|
|
|
|
Net
asset value, end of period |
|
|
|
|
|
|
|
|
|
|
|
|
|
|
Ratios/Supplemental
Data (%): |
|
|
|
|
|
Ratio
of total expenses to average net assets |
|
|
|
|
|
|
Ratio
of net expenses to average net assets |
|
|
|
|
|
|
Ratio
of net investment income to average net assets |
|
|
|
|
|
|
|
|
|
|
|
|
|
|
Net
Assets, end of period ($ x 1,000) |
|
|
|
|
|
|
|
|
Based
on average shares outstanding. |
|
|
|
|
|
|
|
|
Amount
inclusive of reductions in fees due to earnings credits. |
|
|
Amount
inclusive of reductions in expenses pursuant to undertaking. |
See notes to financial
statements.
NOTES
TO FINANCIAL STATEMENTS (Unaudited)
NOTE
1—
Significant
Accounting Policies:
BNY Mellon
Opportunistic Midcap Value Fund (the “fund”)
is a separate diversified series of BNY Mellon Advantage Funds, Inc. (the “Company”),
which is registered under the Investment Company Act of 1940, as amended (the “Act”),
as an open-end management investment
company and operates as a series company currently offering seven series, including the fund. The fund’s investment objective
is to seek to surpass the performance of the Russell Midcap® Value Index. BNY Mellon Investment Adviser, Inc. (the “Adviser”),
a wholly-owned subsidiary of The
Bank of New York Mellon Corporation (“BNY”),
serves as the fund’s investment adviser. Newton Investment
Management North America, LLC (the “Sub-Adviser”
or “NIMNA”),
an indirect wholly-owned subsidiary of BNY and an affiliate
of the Adviser, serves as the fund’s sub-adviser. NIMNA has entered into a sub-sub-investment advisory agreement with its affiliate,
Newton Investment Management Limited (“NIM”),
which enables NIM to provide certain advisory services to the Sub-Adviser
for the benefit of the fund, including, but not limited to, portfolio management services. NIM is subject to the supervision of NIMNA
and the Adviser. NIM is also an affiliate of the Adviser. NIM, located at 160 Queen Victoria Street, London, EC4V, 4LA, England,
was formed in 1978. NIM is an indirect subsidiary of BNY.
BNY Mellon
Securities Corporation (the “Distributor”), a wholly-owned subsidiary of the Adviser, is the distributor of the fund’s
shares. The fund is authorized to
issue 800 million shares of $.001 par value of Common Stock. The fund currently has authorized four classes of
shares: Class A (350 million shares authorized), Class C (125 million shares authorized), Class I (175 million shares authorized) and
Class Y (150 million shares authorized).
Class A and Class C shares are sold primarily to retail investors through financial intermediaries and
bear Distribution and/or Shareholder Services Plan fees. Class A shares generally are subject to a sales charge imposed at the time of
purchase. Class A shares bought
without an initial sales charge as part of an investment of $1 million or more may be charged a contingent
deferred sales charge (“CDSC”) of 1.00% if redeemed within one year. Class C shares are subject to a CDSC imposed on Class
C shares redeemed within one year of purchase. Class C shares automatically convert to Class A shares eight years after the date of purchase,
without the imposition of a sales charge. Class I shares are sold primarily to bank trust departments and other financial service providers
(including BNY and its affiliates), acting on behalf of customers having a qualified trust or an investment account or relationship
at such institution, and bear no Distribution or Shareholder Services Plan fees. Class Y shares are sold at net asset value per share
generally to institutional investors,
and bear no Distribution or Shareholder Services Plan fees. Class I and Class Y shares are offered without
a front-end sales charge or CDSC. Other differences between the classes include the services offered to and the expenses borne by
each class, the allocation of certain transfer agency costs and certain voting rights. Income, expenses (other than expenses attributable
to a specific class), and realized
and unrealized gains or losses on investments are allocated to each class of shares based on its relative net assets.
The Company
accounts separately for the assets, liabilities and operations of each series. Expenses directly attributable to each series are charged
to that series’ operations; expenses which are applicable to all series are allocated among them on a pro rata basis.
The Financial
Accounting Standards Board (“FASB”) Accounting Standards Codification (“ASC”) is the exclusive reference of authoritative
U.S. generally accepted accounting principles (“GAAP”) recognized by the FASB to be applied by nongovernmental entities. Rules
and interpretive releases of the SEC under authority of federal laws are also sources of authoritative GAAP for SEC registrants.
The fund is an investment company
and applies the accounting and reporting guidance of the FASB ASC Topic 946 Financial Services-Investment
Companies. The fund’s financial statements are prepared in accordance with GAAP, which may require the use of management
estimates and assumptions. Actual results could differ from those estimates.
The Company
enters into contracts that contain a variety of indemnifications. The fund’s maximum exposure under these arrangements is
unknown. The fund does not anticipate recognizing any loss related to these arrangements.
(a) Portfolio
valuation: The fair value of a financial instrument
is the amount that would be received to sell an asset or paid to transfer a
liability in an orderly transaction between market participants at the measurement date (i.e., the exit price). GAAP establishes a fair
value hierarchy that prioritizes
the inputs of valuation techniques used to measure fair value. This hierarchy gives the highest priority to unadjusted
quoted prices in active markets for identical assets or liabilities (Level 1 measurements) and the lowest priority to unobservable
inputs (Level 3 measurements).
Additionally,
GAAP provides guidance on determining whether the volume and activity in a market has decreased significantly and whether
such a decrease in activity results in transactions that are not orderly. GAAP requires enhanced disclosures around valuation inputs
and techniques used during annual and interim periods.
NOTES
TO FINANCIAL STATEMENTS (Unaudited) (continued)
Various
inputs are used in determining the value of the fund’s investments relating to fair value measurements. These inputs are summarized
in the three broad levels listed below:
Level 1—unadjusted
quoted prices in active markets for identical investments.
Level 2—other
significant observable inputs (including quoted prices for similar investments, interest rates, prepayment speeds, credit
risk, etc.).
Level 3—significant
unobservable inputs (including the fund’s own assumptions in determining the fair value of investments).
The inputs
or methodology used for valuing securities are not necessarily an indication of the risk associated with investing in those securities.
Changes in
valuation techniques may result in transfers in or out of an assigned level within the disclosure hierarchy. Valuation techniques
used to value the fund’s investments are as follows:
The Company’s
Board of Directors (the “Board”)
has designated the Adviser as the fund’s valuation designee to make all fair value determinations
with respect to the fund’s portfolio investments, subject to the Board’s oversight and pursuant to Rule 2a-5 under the
Act.
Investments
in equity securities are valued at the last sales price on the securities exchange or national securities market on which such securities
are primarily traded. Securities listed on the National Market System for which market quotations are available are valued at the
official closing price or, if there is no official closing price that day, at the last sales price. For open short positions, asked prices
are used for valuation purposes.
Bid price is used when no asked price is available. Registered investment companies that are not traded on an
exchange are valued at their net asset value. All of the preceding securities are generally categorized within Level 1 of the fair value
hierarchy.
Securities
not listed on an exchange or the national securities market, or securities for which there were no transactions, are valued at the average
of the most recent bid and asked prices. These securities are generally categorized within Level 2 of the fair value hierarchy.
Fair valuing
of securities may be determined with the assistance of a pricing service using calculations based on indices of domestic securities
and other appropriate indicators, such as prices of relevant ADRs and futures. Utilizing these techniques may result in transfers between
Level 1 and Level 2 of the fair value hierarchy.
When market
quotations or official closing prices are not readily available, or are determined not to accurately reflect fair value, such as when
the value of a security has been significantly affected by events after the close of the exchange or market on which the security is principally
traded (for example, a foreign exchange or market), but before the fund calculates its net asset value,
the fund may value these investments
at fair value as determined in accordance with the procedures approved by the Board. Certain factors may be considered when
fair valuing investments such as: fundamental analytical data, the nature and duration of restrictions on disposition, an evaluation of
the forces that influence the market in which the securities are purchased and sold, and public trading in similar securities of the issuer
or comparable issuers. These securities
are either categorized within Level 2 or 3 of the fair value hierarchy depending on the relevant inputs
used.
For securities
where observable inputs are limited, assumptions about market activity and risk are used and such securities are generally categorized
within Level 3 of the fair value hierarchy.
Investment
in private equity securities will be fair valued by the Board in accordance with valuation procedures approved by the Board. Those
portfolio valuations will be based on unobservable inputs and certain assumptions about how market participants would price the
instrument. The fund expects that inputs into the determination of fair value of those investments will require significant management
judgment or estimation. Because valuations may fluctuate over short periods of time and may be based on estimates, fair value determinations
may differ materially from the value received in an actual transaction. Additionally, valuations of private companies are inherently
uncertain. The fund’s net asset value could be adversely affected if the fund’s determinations regarding the fair value of
those investments were materially
higher or lower than the values that it ultimately realized upon the disposal of such investments. These securities
are categorized within Level 3 of the fair value hierarchy.
Investments denominated in
foreign currencies are translated to U.S. dollars at the prevailing rates of exchange.
NOTES
TO FINANCIAL STATEMENTS (Unaudited) (continued)
The following
is a summary of the inputs used as of February 28, 2025 in valuing the fund’s investments:
|
|
Level
1 -
Unadjusted
Quoted
Prices |
Level
2- Other
Significant
Observable
Inputs |
Level
3-
Significant
Unobservable
Inputs
|
|
|
|
|
|
|
|
Investments
in Securities:†
|
|
|
|
|
Equity
Securities - Common Stocks |
|
|
|
|
Equity
Securities - Private Equity |
|
|
|
|
|
|
|
|
|
|
|
|
|
|
|
|
|
|
See
Statement of Investments for additional detailed categorizations, if any. |
The following
table summarizes the significant unobservable inputs the fund used to value its investment categorized within Level 3 as of
February 28, 2025. In addition to the techniques and inputs noted in the table below, according to the fund’s valuation policy,
other valuation techniques and methodologies
when determining the fund’s fair value measurements may be used. The below table is not intended
to be all-inclusive, but rather provide information on the significant unobservable inputs as they are to the fund’s determination
of fair values.
|
|
|
Valuation
Techniques/
Methodologies
|
|
Amount
or Range/
Weighted
Average |
|
|
|
Market
Comparable
Companies
|
Changes
in Enterprise Market
Value
of Comparables during
the
quarter |
|
|
|
|
|
|
|
|
(b) Foreign
currency transactions: The fund does not isolate
that portion of the results of operations resulting from changes in foreign
exchange rates on investments from the fluctuations arising from changes in the market prices of securities held. Such fluctuations
are included with the net realized and unrealized gain or loss on investments.
Net realized
foreign exchange gains or losses arise from sales of foreign currencies, currency gains or losses realized on securities transactions
between trade and settlement date, and the difference between the amounts of dividends, interest and foreign withholding taxes recorded
on the fund’s books and the U.S. dollar equivalent of the amounts actually received or paid. Net unrealized foreign exchange gains
and losses arise from changes in the value of assets and liabilities other than investments resulting from changes in exchange rates.
Foreign currency gains and losses
on foreign currency transactions are also included with net realized and unrealized gain or loss on investments.
Foreign taxes:
The fund may be subject to foreign taxes (a portion of which may be reclaimable) on income, stock dividends, realized and
unrealized capital gains on investments or certain foreign currency transactions. Foreign taxes are recorded in accordance with the applicable
foreign tax regulations and rates that exist in the foreign jurisdictions in which the fund invests. These foreign taxes, if any, are
paid by the fund and are reflected
in the Statement of Operations, if applicable. Foreign taxes payable or deferred or those subject to reclaims
as of February 28, 2025, if any, are disclosed in the fund’s Statement of Assets and Liabilities.
(c) Securities
transactions and investment income: Securities transactions
are recorded on a trade date basis. Realized gains and losses
from securities transactions are recorded on the identified cost basis. Dividend income is recognized on the ex-dividend date and interest
income, including, where applicable, accretion of discount and amortization of premium on investments, is recognized on the accrual
basis.
Pursuant to
a securities lending agreement with BNY, the fund may lend securities to qualified institutions. It is the fund’s policy that, at
origination, all loans are secured by collateral of at least 102% of the value of U.S. securities loaned and 105% of the value of foreign
securities loaned. Collateral equivalent
to at least 100% of the market value of securities on loan is maintained at all times. Collateral is either
in the form of cash, which can be invested in certain money market mutual funds managed by the Adviser, or U.S. Government
NOTES
TO FINANCIAL STATEMENTS (Unaudited) (continued)
and
Agency securities. Any non-cash collateral received cannot be sold or re-pledged by the fund, except in the event of borrower default,
and is not reflected in the Statement of Assets and Liabilities. The securities on loan, if any, are also disclosed in the fund’s
Statement of Investments. The fund
is entitled to receive all dividends, interest and distributions on securities loaned, in addition to income
earned as a result of the lending transaction. Should a borrower fail to return the securities in a timely manner, BNY is required to
replace the securities for the benefit of the fund or credit the fund with the market value of the unreturned securities and is subrogated
to the fund’s rights against
the borrower and the collateral. Additionally, the contractual maturity of security lending transactions are on an
overnight and continuous basis. During the period ended February 28, 2025, BNY earned $1,619 from the lending of the fund’s portfolio
securities, pursuant to the securities lending agreement.
For financial
reporting purposes, the fund elects not to offset assets and liabilities subject to a securities lending agreement, if any, in the Statement
of Assets and Liabilities. Therefore, all qualifying transactions are presented on a gross basis in the Statement of Assets and Liabilities.
As of February 28, 2025, the fund had no securities on loan.
(d) Affiliated
issuers: Investments in other investment companies
advised by the Adviser are considered “affiliated” under the Act.
(e) Market
Risk: The value of the securities in which the fund
invests may be affected by political, regulatory, economic and social developments,
and developments that impact specific economic sectors, industries or segments of the market. In addition, turbulence in financial
markets and reduced liquidity in equity, credit and/or fixed-income markets may negatively affect many issuers, which could adversely
affect the fund. Global economies and financial markets are becoming increasingly interconnected, and conditions and events in
one country, region or financial market may adversely impact issuers in a different country, region or financial market. These risks may
be magnified if certain events or developments adversely interrupt the global supply chain; in these and other circumstances, such risks
might affect companies world-wide.
(f) Dividends
and distributions to shareholders:
Dividends and distributions are recorded on the ex-dividend date. Dividends from net
investment income and dividends from net realized capital gains, if any, are normally declared and paid annually, but the fund may make
distributions on a more frequent basis to comply with the distribution requirements of the Internal Revenue Code of 1986, as amended
(the “Code”). To the extent that net realized capital gains can be offset by capital loss carryovers, it is the policy of
the fund not to distribute such
gains. Income and capital gain distributions are determined in accordance with income tax regulations, which may differ
from GAAP.
(g) Federal
income taxes: It is the policy of the fund to continue
to qualify as a regulated investment company, if such qualification is in
the best interests of its shareholders, by complying with the applicable provisions of the Code, and to make distributions of taxable
income and net realized capital gain sufficient to
relieve it from substantially all federal income and excise taxes.
As of and
during the period ended February 28, 2025, the fund did not have any liabilities for any uncertain tax positions. The fund recognizes
interest and penalties, if any, related to uncertain tax positions as income tax expense in the Statement of Operations. During the
period ended February 28, 2025, the fund did not incur any interest or penalties.
Each tax year
in the three-year period ended August 31, 2024 remains subject to examination by the Internal Revenue Service and state taxing
authorities.
The tax character
of distributions paid to shareholders during the fiscal year ended August 31, 2024 were as follows: ordinary income $2,680,360
and long-term capital gains $12,835,264. The tax character of current year distributions will be determined at the end of the
current fiscal year.
(h) Operating
segment reporting: In this reporting period, the
fund adopted FASB Accounting Standards Update 2023-07, Segment Reporting
(Topic 280) - Improvements to Reportable Segment Disclosures (“ASU 2023-07”). Adoption of the new standard impacted financial
statement disclosures only and did not affect the fund’s financial position or the results of its operations. The ASU 2023-07 is
effective for public entities for
fiscal years beginning after December 15, 2023, and requires retrospective application for all prior periods presented
within the financial statements.
Since its
commencement, the fund operates and is managed as a single reportable segment deriving returns in the form of dividends, interest
and/or gains from the investments made in pursuit of its single stated investment objective as outlined in the fund’s prospectus.
The accounting policies of the fund
are consistent with those described in these Notes to Financial Statements. The chief operating decision
maker (“CODM”) is represented by BNY Investments, the management of the Adviser, comprising Senior Management and Directors.
The CODM considers net increase in net assets resulting from operations in deciding whether to purchase additional investments
or to make distributions to fund shareholders. Detailed financial information for the fund is disclosed within these financial
statements with total assets and
liabilities disclosed on the Statement of Assets and Liabilities, investments held on the Statement of
NOTES
TO FINANCIAL STATEMENTS (Unaudited) (continued)
Investments,
results of operations and significant segment expenses on the Statement of Operations and other information about the fund’s
performance, including total return, portfolio turnover and ratios within the Financial Highlights.
NOTE
2—
Bank
Lines of Credit:
The fund participates with
other long-term open-end funds managed by the Adviser in a $738 million unsecured credit facility led by Citibank,
N.A. (the “Citibank Credit Facility”) and a $300 million unsecured credit facility provided by BNY (the “BNY Credit
Facility”), each to be utilized
primarily for temporary or emergency purposes, including the financing of redemptions (each, a “Facility”).
The Citibank Credit Facility is available in two tranches: (i) Tranche A is in an amount equal to $618 million and is available to all
long-term open-ended funds, including
the fund, and (ii) Tranche B is in an amount equal to $120 million and is available only to the BNY
Mellon Floating Rate Income Fund, a series of BNY Mellon Investment Funds IV, Inc. In connection therewith, the fund has agreed
to pay its pro rata portion of commitment fees for Tranche A of the Citibank Credit Facility and the BNY Credit Facility. Interest is
charged to the fund based on rates determined pursuant to the terms of the respective Facility at the time of borrowing. During the period
ended February 28, 2025, the fund did not borrow under either Facility.
NOTE
3—
Management
Fee, Sub-Advisory Fee
and Other Transactions with Affiliates:
(a) Pursuant
to a management agreement with the Adviser, the management fee is computed at the annual rate of .75% of the value of the
fund’s average daily net assets and is payable monthly.
Pursuant to
a sub-investment advisory agreement between the Adviser and the Sub-Adviser, the Adviser pays the Sub-Adviser a monthly fee
at an annual rate of .36% of the value of the fund’s average daily net assets.
During the
period ended February 28, 2025, the Distributor retained $512 from commissions earned on sales of the fund’s Class A shares
and $34 from CDSC fees on redemptions of the fund’s Class C shares.
(b) Under
the Distribution Plan adopted pursuant to Rule 12b-1 under the Act, Class C shares pay the Distributor for distributing its shares
at an annual rate of .75% of the value of its average daily net assets. The Distributor may pay one or more Service Agents in respect
of advertising, marketing and other distribution services, and determines the amounts, if any, to be paid to Service Agents and the
basis on which such payments are made. During the period ended February 28, 2025, Class C shares were charged $12,618
pursuant to the Distribution Plan.
(c) Under
the Shareholder Services Plan, Class A and Class C shares pay the Distributor at an annual rate of .25% of the value of their average
daily net assets for the provision of certain services. The services provided may include personal services relating to shareholder accounts,
such as answering shareholder inquiries regarding the fund, and services related to the maintenance of shareholder accounts. The
Distributor may make payments to Service Agents (securities dealers, financial institutions or other industry professionals) with respect
to these services. The Distributor determines the amounts to be paid to Service Agents. During the period ended February 28, 2025,
Class A and Class C shares were charged $360,535 and $4,206, respectively, pursuant to the Shareholder Services Plan.
The fund has
an arrangement with BNY Mellon Transfer, Inc., (the “Transfer Agent”), a subsidiary of BNY and an affiliate of the Adviser,
whereby the fund may receive earnings credits when positive cash balances are maintained, which are used to offset Transfer Agent
fees. For financial reporting purposes, the fund includes transfer agent net earnings credits, if any, as an expense offset in the Statement
of Operations.
The fund has
an arrangement with The Bank of New York Mellon (the “Custodian”), a subsidiary of BNY and an affiliate of the Adviser, whereby
the fund will receive interest income or be charged overdraft fees when cash balances are maintained. For financial reporting purposes,
the fund includes this interest income and overdraft fees, if any, as interest income in the Statement of Operations.
The fund compensates
the Transfer Agent, under a transfer agency agreement, for providing transfer agency and cash management services
for the fund. The majority of Transfer Agent fees are comprised of amounts paid on a per account basis, while cash management fees
are related to fund subscriptions and redemptions. During the period ended February 28, 2025, the fund was charged $27,137 for transfer
agency services. These fees are included in Shareholder servicing costs in the Statement of Operations.
The fund compensates
the Custodian, under a custody agreement, for providing custodial services for the fund. These fees are determined
based on net assets, geographic region and transaction activity. During the period ended February 28, 2025, the fund was charged
$4,180 pursuant to the custody agreement.
During the
period ended February 28, 2025, the fund was charged $14,140 for services performed by the fund’s Chief Compliance Officer
and his staff. These fees are included in Chief Compliance Officer fees in the Statement of Operations.
NOTES
TO FINANCIAL STATEMENTS (Unaudited) (continued)
The
components of “Due to BNY Mellon Investment Adviser, Inc. and affiliates” in the Statement of Assets and Liabilities consist
of: Management fee of $230,763,
Distribution Plan fees of $1,665, Shareholder Services Plan fees of $55,471, Custodian fees of $3,451,
Chief Compliance Officer fees of $5,970 and Transfer Agent fees of $12,967.
(d) Each
board member of the fund also serves as a board member of other funds in the BNY Mellon Family of Funds complex. Annual retainer
fees and attendance fees are allocated to each fund based on net assets.
NOTE
4—
Securities
Transactions:
The aggregate
amount of purchases and sales of investment securities, excluding short-term securities, during the period ended February
28, 2025, amounted to $85,795,948 and $110,442,559, respectively.
At February
28, 2025, accumulated net unrealized appreciation on investments was $76,772,826, consisting of $91,567,597 gross unrealized
appreciation and $14,794,771 gross unrealized depreciation.
At February
28, 2025, the cost of investments for federal income tax purposes was substantially the same as the cost for financial reporting
purposes (see the Statement of Investments).
Item
8. Changes in and Disagreements with Accountants for Open-End Management Investment Companies
(Unaudited)
Item
9. Proxy Disclosures for Open-End Management Investment Companies (Unaudited)
Item
10. Remuneration Paid to Directors, Officers, and Others of Open-End Management Investment Companies
(Unaudited)
Each
board member also serves as a board member of other funds in the BNY Mellon Family of Funds complex. Annual retainer fees and
attendance fees are allocated to each fund based on net assets. Directors fees paid by the fund are within Item 7. Statement of Operations
as Directors’ fees and expenses.
Item
11. Statement Regarding Basis for Approval of Investment Advisory Contracts (Unaudited)
©
2025 BNY Mellon Securities Corporation
Code-0258NCSRSA0225
BNY Mellon Opportunistic Small
Cap Fund
SEMI-ANNUAL FINANCIALS
AND OTHER INFORMATION
Save
time. Save paper. View your next shareholder report online as soon as it’s available. Log into www.bny.com/investments
and sign up for eCommunications. It’s simple and only takes a few minutes.
The
views expressed in this report reflect those of the portfolio manager(s) only through the end of the period
covered and do not necessarily represent the views of BNY Mellon Investment Adviser, Inc. or any other
person in the BNY Mellon Investment Adviser, Inc. organization. Any such views are subject to change
at any time based upon market or other conditions and BNY Mellon Investment Adviser, Inc. disclaims
any responsibility to update such views. These views may not be relied on as investment advice and,
because investment decisions for a fund in the BNY Mellon Family of Funds are based on numerous factors,
may not be relied on as an indication of trading intent on behalf of any fund in the BNY Mellon
Family of
Funds.
Not FDIC-Insured
• Not Bank-Guaranteed • May Lose Value
Contents
Please note
the Semi-Annual Financials and Other Information only contains Items 7-11
required in Form N-CSR. All other required items will be filed with the Securities and Exchange
Commission (the “SEC”).
Item
7. Financial Statements and Financial Highlights for Open-End Management Investment Companies.
BNY Mellon Opportunistic Small Cap
Fund
Statement of Investments
February
28, 2025 (Unaudited)
|
|
|
|
|
|
|
|
|
Automobiles
& Components — .5% |
|
|
|
|
|
|
|
|
|
Columbia
Banking System, Inc. |
|
|
|
|
|
First
BanCorp./Puerto Rico |
|
|
|
|
|
|
|
|
|
|
|
|
|
|
|
|
|
|
|
|
|
|
|
|
|
|
Seacoast
Banking Corp. of Florida |
|
|
|
|
|
|
|
|
|
|
|
|
|
|
|
|
|
|
|
Texas
Capital Bancshares, Inc. (a)
|
|
|
|
|
|
|
|
|
|
|
|
|
|
|
|
|
|
|
|
|
|
|
|
|
|
|
|
|
|
|
|
|
|
|
|
|
|
|
|
|
|
|
Gates
Industrial Corp. PLC (a)
|
|
|
|
|
|
Helios
Technologies, Inc. |
|
|
|
|
|
|
|
|
|
|
|
|
|
|
|
|
|
|
|
The
Middleby Corp. (a),(b)
|
|
|
|
|
|
|
|
|
|
|
|
|
|
|
|
|
|
|
|
Commercial
& Professional Services — 3.7% |
ACV
Auctions, Inc., Cl. A (a)
|
|
|
|
|
|
|
|
|
|
|
|
|
Montrose
Environmental Group, Inc. (a),(b)
|
|
|
|
|
|
|
|
|
|
|
|
|
|
|
|
|
|
|
|
Consumer
Discretionary Distribution & Retail — 1.9% |
|
|
|
|
|
|
|
|
|
|
|
|
|
|
Ollie’s
Bargain Outlet Holdings, Inc. (a)
|
|
|
|
|
|
|
|
|
|
|
|
|
Consumer
Durables & Apparel — 3.8% |
Capri
Holdings Ltd. (a),(b)
|
|
|
|
|
|
Figs,
Inc., Cl. A (a),(b)
|
|
|
|
|
|
Levi
Strauss & Co., Cl. A |
|
|
|
|
|
Malibu
Boats, Inc., Cl. A (a)
|
|
|
|
|
|
|
|
|
|
|
|
|
The
Lovesac Company (a),(b)
|
|
|
|
|
|
|
|
|
|
|
|
|
|
|
|
|
|
|
|
|
|
|
|
|
|
|
|
|
Statement of Investments (Unaudited)
(continued)
|
|
|
|
|
|
|
Common
Stocks — 95.7% (continued) |
Consumer
Services — 5.3% (continued) |
Six
Flags Entertainment Corp. |
|
|
|
|
|
The
Cheesecake Factory, Inc. (b)
|
|
|
|
|
|
|
|
|
|
|
|
|
|
|
Centrus
Energy Corp., Cl. A (a),(b)
|
|
|
|
|
|
CNX
Resources Corp. (a),(b)
|
|
|
|
|
|
Crescent
Energy Co., Cl. A |
|
|
|
|
|
Oceaneering
International, Inc. (a)
|
|
|
|
|
|
|
|
|
|
|
|
|
|
|
|
|
|
|
|
|
|
|
|
|
|
|
|
|
|
|
|
|
|
Equity
Real Estate Investment Trusts — 2.2% |
|
|
|
|
|
|
|
Ryman
Hospitality Properties, Inc. (c)
|
|
|
|
|
|
STAG
Industrial, Inc. (c)
|
|
|
|
|
|
|
|
|
|
|
|
|
Financial
Services — 4.2% |
|
|
|
|
|
|
|
HA
Sustainable Infrastructure Capital, Inc. (b)
|
|
|
|
|
|
PJT
Partners, Inc., Cl. A |
|
|
|
|
|
|
|
|
|
|
|
|
|
|
|
|
|
|
|
Food,
Beverage & Tobacco — 1.4% |
|
|
|
|
|
|
|
Health
Care Equipment & Services — 5.9% |
Acadia
Healthcare Co., Inc. (a)
|
|
|
|
|
|
|
|
|
|
|
|
|
Envista
Holdings Corp. (a)
|
|
|
|
|
|
Evolent
Health, Inc., Cl. A (a)
|
|
|
|
|
|
Integer
Holdings Corp. (a),(b)
|
|
|
|
|
|
Privia
Health Group, Inc. (a)
|
|
|
|
|
|
|
|
|
|
|
|
|
|
|
|
|
|
|
|
Household
& Personal Products — 1.3% |
Spectrum
Brands Holdings, Inc. |
|
|
|
|
|
|
|
Oscar
Health, Inc., Cl. A (a),(b)
|
|
|
|
|
|
The
Baldwin Insurance Group, Inc. (a)
|
|
|
|
|
|
|
|
|
|
|
|
|
|
|
|
|
|
|
|
|
|
|
|
|
|
|
|
|
|
|
|
|
|
|
|
|
|
|
|
|
|
|
|
|
|
|
|
|
|
Media
& Entertainment — 4.1% |
John
Wiley & Sons, Inc., Cl. A |
|
|
|
|
|
|
|
|
|
|
|
|
|
|
|
|
|
|
|
|
|
|
|
|
|
|
|
|
|
|
|
|
|
Common
Stocks — 95.7% (continued) |
Pharmaceuticals,
Biotechnology & Life Sciences — 5.5% |
|
|
|
|
|
|
|
Denali
Therapeutics, Inc. (a)
|
|
|
|
|
|
|
|
|
|
|
|
|
Mirum
Pharmaceuticals, Inc. (a)
|
|
|
|
|
|
|
|
|
|
|
|
|
Semiconductors
& Semiconductor Equipment — 1.8% |
|
|
|
|
|
|
|
|
|
|
|
|
|
|
|
|
|
|
|
|
|
Software
& Services — 3.6% |
|
|
|
|
|
|
|
Dolby
Laboratories, Inc., Cl. A |
|
|
|
|
|
|
|
|
|
|
|
|
|
|
|
|
|
|
|
Technology
Hardware & Equipment — 5.7% |
Advanced
Energy Industries, Inc. |
|
|
|
|
|
|
|
|
|
|
|
|
|
|
|
|
|
|
|
|
|
|
|
|
|
|
Lumentum
Holdings, Inc. (a),(b)
|
|
|
|
|
|
|
|
|
|
|
|
|
Viavi
Solutions, Inc. (a)
|
|
|
|
|
|
|
|
|
|
|
|
|
|
|
|
|
|
|
|
|
|
|
|
|
|
|
|
|
|
|
|
|
|
|
|
Sun
Country Airlines Holdings, Inc. (a)
|
|
|
|
|
|
|
|
|
|
|
|
|
|
|
Clearway
Energy, Inc., Cl. C |
|
|
|
|
|
|
|
|
|
|
|
|
|
|
|
|
|
|
|
|
|
|
|
|
|
|
Total
Common Stocks
(cost
$184,966,197) |
|
|
|
|
|
|
|
Food,
Beverage & Tobacco — .4% |
Supplying
Demand, Inc., Ser. E (a),(d)
|
|
|
|
|
|
|
|
Roofstock,
Ser. E (a),(d)
|
|
|
|
|
|
Software
& Services — .3% |
Locus
Robotics, Ser. F (a),(d)
|
|
|
|
|
|
Total
Private Equity
(cost
$2,487,392) |
|
|
|
|
|
|
|
|
|
|
|
|
Investment
Companies — 3.7% |
Registered
Investment Companies — 3.7% |
Dreyfus
Institutional Preferred Government Plus Money Market Fund, Institutional Shares(e)
(cost
$8,488,221) |
|
|
|
|
|
Statement of Investments (Unaudited)
(continued)
|
|
|
|
|
|
|
Investment
of Cash Collateral for Securities Loaned — 2.0% |
|
|
|
|
|
Registered
Investment Companies — 2.0% |
|
|
|
|
|
Dreyfus
Institutional Preferred Government Plus Money Market Fund, Institutional Shares(e)
(cost
$4,648,332) |
|
|
|
|
|
Total
Investments (cost $200,590,142)
|
|
|
|
Liabilities,
Less Cash and Receivables |
|
|
|
|
|
|
|
|
|
Non-income
producing security. |
|
|
Security,
or portion thereof, on loan. At February 28, 2025, the value of the fund’s securities on loan was $20,308,379 and the value of the
collateral was
$21,137,806,
consisting of cash collateral of $4,648,332 and U.S. Government & Agency securities valued at $16,489,474. In addition, the
value of
collateral
may include pending sales that are also on loan. |
|
|
Investment
in real estate investment trust within the United States. |
|
|
The
fund held Level 3 securities at February 28, 2025. These securities were valued at $1,716,406 or .8% of net assets.
|
|
|
Investment
in affiliated issuer. The investment objective of this investment company is publicly available and can be found within the investment
company’s
prospectus.
|
|
|
|
|
|
|
|
|
Dividends/
Distributions
($) |
Registered
Investment Companies - 3.7% |
Dreyfus
Institutional Preferred Government Plus Money
Market
Fund, Institutional Shares - 3.7% |
|
|
|
|
|
Investment
of Cash Collateral for Securities Loaned - 2.0% |
Dreyfus
Institutional Preferred Government Plus Money
Market
Fund, Institutional Shares - 2.0% |
|
|
|
|
|
|
|
|
|
|
|
|
|
|
Includes
reinvested dividends/distributions. |
|
|
Represents
securities lending income earned from the reinvestment of cash collateral from loaned securities, net of fees and collateral investment
expenses, and
other
payments to and from borrowers of securities. |
See notes to financial
statements.
STATEMENT
OF ASSETS AND LIABILITIES
February 28, 2025
(Unaudited)
|
|
|
|
|
|
|
|
Investments
in securities—See Statement of Investments
(including
securities on loan, valued at $20,308,379)—Note
1(c): |
|
|
|
|
|
|
|
|
|
|
Dividends
and securities lending income receivable |
|
|
Receivable
for shares of Common Stock subscribed |
|
|
Tax
reclaim receivable—Note 1(b)
|
|
|
|
|
|
|
|
|
|
|
|
|
|
|
Due
to BNY Mellon Investment Adviser, Inc. and affiliates—Note
3(b)
|
|
|
Liability
for securities on loan—Note 1(c)
|
|
|
Payable
for shares of Common Stock redeemed |
|
|
Directors’
fees and expenses payable |
|
|
|
|
|
|
|
|
|
|
|
|
|
|
Composition
of Net Assets ($): |
|
|
|
|
|
|
Total
distributable earnings (loss) |
|
|
|
|
|
|
Net
Asset Value Per Share |
|
|
|
|
|
|
|
|
|
|
|
|
|
Net
Asset Value Per Share ($) |
|
|
|
See notes to financial
statements.
Six Months Ended February
28, 2025 (Unaudited)
|
|
|
|
|
|
|
|
|
Cash
dividends (net of $7,579 foreign taxes withheld at source): |
|
|
|
|
|
|
|
Affiliated
income net of rebates from securities lending—Note
1(c)
|
|
|
|
|
|
|
|
|
|
|
|
|
|
Shareholder
servicing costs—Note 3(b)
|
|
|
|
|
|
|
|
Prospectus
and shareholders’ reports |
|
Chief
Compliance Officer fees—Note 3(b)
|
|
Directors’
fees and expenses—Note 3(c)
|
|
|
|
|
Loan
commitment fees—Note 2 |
|
|
|
|
|
|
|
Less—reduction
in expenses due to undertaking—Note 3(a)
|
|
|
|
|
|
|
|
Realized
and Unrealized Gain (Loss) on Investments—Note 4 ($):
|
|
Net
realized gain (loss) on investments |
|
Net
change in unrealized appreciation (depreciation) on investments |
|
Net
Realized and Unrealized Gain (Loss) on Investments |
|
Net
Decrease in Net Assets Resulting from Operations |
|
See notes to financial
statements.
STATEMENT
OF CHANGES IN NET ASSETS
|
|
Six
Months Ended
February
28, 2025
(Unaudited) |
Year
Ended
August
31, 2024
|
|
|
|
|
|
|
|
|
|
|
Net
realized gain (loss) on investments |
|
|
Net
change in unrealized appreciation (depreciation) on investments |
|
|
Net
Increase (Decrease) in Net Assets Resulting from Operations |
|
|
|
|
|
|
Distributions
to shareholders: |
|
|
|
|
|
|
|
|
|
|
|
|
|
|
|
|
|
|
Capital
Stock Transactions ($): |
|
|
Net
proceeds from shares sold: |
|
|
|
|
|
|
|
|
|
|
|
|
|
|
Distributions
reinvested: |
|
|
|
|
|
|
|
|
|
|
|
|
|
|
|
|
|
|
|
|
|
|
|
|
|
|
|
|
|
|
Increase
(Decrease) in Net Assets from Capital Stock Transactions |
|
|
Total
Increase (Decrease) in Net Assets |
|
|
|
|
|
|
|
|
|
|
|
|
|
|
STATEMENT
OF CHANGES IN NET ASSETS (continued)
|
|
Six
Months Ended
February
28, 2025
(Unaudited) |
Year
Ended
August
31, 2024
|
|
|
Capital
Share Transactions (Shares): |
|
|
|
|
|
|
|
|
|
|
Shares
issued for distributions reinvested |
|
|
|
|
|
|
Net
Increase (Decrease) in Shares Outstanding |
|
|
|
|
|
|
|
|
|
|
Shares
issued for distributions reinvested |
|
|
|
|
|
|
Net
Increase (Decrease) in Shares Outstanding |
|
|
|
|
|
|
|
|
|
|
Shares
issued for distributions reinvested |
|
|
|
|
|
|
Net
Increase (Decrease) in Shares Outstanding |
|
|
|
|
During
the period ended February 28, 2025, 4,506 Class Y shares representing $141,480 were exchanged for 4,526 Class I shares. During the period
ended
August
31, 2024, 1,324 Investor shares representing $40,911 were exchanged for 1,307 Class I shares and 33,545 Class Y shares representing $971,862
were
exchanged
for 33,676 Class I shares. |
See notes to financial
statements.
The
following tables describe the performance for each share class for the fiscal periods indicated. All information (except portfolio turnover
rate) reflects financial results for
a single fund share. Net asset value total return is calculated assuming an initial investment made at the net asset
value at the beginning of the period, reinvestment of all dividends and distributions at net asset value during the period, and redemption
at net asset value on the last day
of the period. Net asset value total return includes adjustments in accordance with accounting principles generally
accepted in the United States of America and as such, the net asset value for financial reporting purposes and the returns based upon
those net asset values may differ from the net asset
value and returns for shareholder transactions.
|
|
Six
Months Ended
February
28, 2025
(Unaudited)
|
|
|
|
|
|
|
|
|
|
|
|
|
|
|
|
Net
asset value, beginning of period |
|
|
|
|
|
|
|
|
|
|
|
|
|
Net
investment income (loss)(a)
|
|
|
|
|
|
|
Net
realized and unrealized gain (loss) on
investments
|
|
|
|
|
|
|
Total
from Investment Operations |
|
|
|
|
|
|
|
|
|
|
|
|
|
|
Dividends
from net investment income |
|
|
|
|
|
|
Dividends
from net realized gain on investments |
|
|
|
|
|
|
|
|
|
|
|
|
|
|
Net
asset value, end of period |
|
|
|
|
|
|
|
|
|
|
|
|
|
|
Ratios/Supplemental
Data (%): |
|
|
|
|
|
Ratio
of total expenses to average net assets |
|
|
|
|
|
|
Ratio
of net expenses to average net assets |
|
|
|
|
|
|
Ratio
of net investment income (loss) to average net
assets
|
|
|
|
|
|
|
|
|
|
|
|
|
|
|
Net
Assets, end of period ($ x 1,000) |
|
|
|
|
|
|
|
|
Based
on average shares outstanding. |
|
|
|
|
|
|
|
|
Amount
inclusive of reductions in expenses pursuant to undertaking. |
|
|
Amount
inclusive of reductions in fees due to earnings credits. |
See notes to financial statements.
FINANCIAL
HIGHLIGHTS (continued)
|
|
Six
Months Ended
February
28, 2025
(Unaudited)
|
|
|
|
|
|
|
|
|
|
|
|
|
|
|
|
Net
asset value, beginning of period |
|
|
|
|
|
|
|
|
|
|
|
|
|
Net
investment income (loss)(a)
|
|
|
|
|
|
|
Net
realized and unrealized gain (loss) on
investments
|
|
|
|
|
|
|
Total
from Investment Operations |
|
|
|
|
|
|
|
|
|
|
|
|
|
|
Dividends
from net investment income |
|
|
|
|
|
|
Dividends
from net realized gain on investments |
|
|
|
|
|
|
|
|
|
|
|
|
|
|
Net
asset value, end of period |
|
|
|
|
|
|
|
|
|
|
|
|
|
|
Ratios/Supplemental
Data (%): |
|
|
|
|
|
Ratio
of total expenses to average net assets |
|
|
|
|
|
|
Ratio
of net expenses to average net assets |
|
|
|
|
|
|
Ratio
of net investment income (loss) to average net
assets
|
|
|
|
|
|
|
|
|
|
|
|
|
|
|
Net
Assets, end of period ($ x 1,000) |
|
|
|
|
|
|
|
|
Based
on average shares outstanding. |
|
|
|
|
|
|
|
|
Amount
inclusive of reductions in expenses pursuant to undertaking. |
|
|
Amount
inclusive of reductions in fees due to earnings credits. |
See notes to financial statements.
|
|
Six
Months Ended
February
28, 2025
(Unaudited)
|
|
|
|
|
|
|
|
|
|
|
|
|
|
|
|
Net
asset value, beginning of period |
|
|
|
|
|
|
|
|
|
|
|
|
|
Net
investment income (loss)(a)
|
|
|
|
|
|
|
Net
realized and unrealized gain (loss) on
investments
|
|
|
|
|
|
|
Total
from Investment Operations |
|
|
|
|
|
|
|
|
|
|
|
|
|
|
Dividends
from net investment income |
|
|
|
|
|
|
Dividends
from net realized gain on investments |
|
|
|
|
|
|
|
|
|
|
|
|
|
|
Net
asset value, end of period |
|
|
|
|
|
|
|
|
|
|
|
|
|
|
Ratios/Supplemental
Data (%): |
|
|
|
|
|
Ratio
of total expenses to average net assets |
|
|
|
|
|
|
Ratio
of net expenses to average net assets |
|
|
|
|
|
|
Ratio
of net investment income (loss) to average net
assets
|
|
|
|
|
|
|
|
|
|
|
|
|
|
|
Net
Assets, end of period ($ x 1,000) |
|
|
|
|
|
|
|
|
Based
on average shares outstanding. |
|
|
|
|
|
|
|
|
Amount
inclusive of reductions in expenses pursuant to undertaking. |
|
|
Amount
inclusive of reductions in fees due to earnings credits. |
See notes to financial
statements.
NOTES
TO FINANCIAL STATEMENTS (Unaudited)
NOTE
1—
Significant
Accounting Policies:
BNY Mellon
Opportunistic Small Cap Fund (the “fund”)
is a separate diversified series of BNY Mellon Advantage Funds, Inc. (the “Company”),
which is registered under the Investment Company Act of 1940, as amended (the “Act”),
as an open-end management investment
company and operates as a series company currently offering seven series, including the fund. The fund’s investment objective
is to seek capital appreciation. BNY Mellon Investment Adviser, Inc. (the “Adviser”),
a wholly-owned subsidiary of The Bank of New
York Mellon Corporation (“BNY”),
serves as the fund’s investment adviser. Newton Investment Management North America, LLC
(the “Sub-Adviser”
or “NIMNA”),
an indirect wholly-owned subsidiary of BNY and an affiliate of the Adviser, serves as the fund’s sub-adviser.
NIMNA has entered into a sub-sub-investment advisory agreement with its affiliate, Newton Investment Management Limited
(“NIM”),
which enables NIM to provide certain advisory services to the Sub-Adviser for the benefit of the fund, including, but not
limited to, portfolio management services. NIM is subject to the supervision of NIMNA and the Adviser. NIM is also an affiliate of the
Adviser. NIM, located at 160 Queen Victoria Street, London, EC4V, 4LA, England, was formed in 1978. NIM is an indirect subsidiary
of BNY.
BNY Mellon
Securities Corporation (the “Distributor”), a wholly-owned subsidiary of the Adviser, is the distributor of the fund’s
shares, which are sold without a
sales charge. The fund is authorized to issue 400 million shares of $.001 par value of Common Stock. The fund currently
has authorized three classes of shares: Investor (200 million shares authorized), Class I (100 million shares authorized) and Class
Y (100 million shares authorized). Investor shares are sold primarily to retail investors through financial intermediaries and bear Shareholder
Services Plan fees. Class I shares are sold primarily to bank trust departments and other financial service providers (including
BNY and its affiliates), acting on behalf of customers having a qualified trust or an investment account or relationship at such institution,
and bear no Shareholder Services Plan fees. Class Y shares are sold at net asset value per share generally to institutional investors,
and bear no Shareholder Service Plan fees. Other differences between the classes include the services offered to and the expenses
borne by each class, the allocation of certain transfer agency costs and certain voting rights. Income, expenses (other than expenses
attributable to a specific class), and realized and unrealized gains or losses on investments are allocated to each class of shares based
on its relative net assets.
The Company
accounts separately for the assets, liabilities and operations of each series. Expenses directly attributable to each series are charged
to that series’ operations; expenses which are applicable to all series are allocated among them on a pro rata basis.
The Financial
Accounting Standards Board (“FASB”) Accounting Standards Codification (“ASC”) is the exclusive reference of authoritative
U.S. generally accepted accounting principles (“GAAP”) recognized by the FASB to be applied by nongovernmental entities. Rules
and interpretive releases of the SEC under authority of federal laws are also sources of authoritative GAAP for SEC registrants.
The fund is an investment company
and applies the accounting and reporting guidance of the FASB ASC Topic 946 Financial Services-Investment
Companies. The fund’s financial statements are prepared in accordance with GAAP, which may require the use of management
estimates and assumptions. Actual results could differ from those estimates.
The Company
enters into contracts that contain a variety of indemnifications. The fund’s maximum exposure under these arrangements is
unknown. The fund does not anticipate recognizing any loss related to these arrangements.
(a) Portfolio
valuation: The fair value of a financial instrument
is the amount that would be received to sell an asset or paid to transfer a
liability in an orderly transaction between market participants at the measurement date (i.e., the exit price). GAAP establishes a fair
value hierarchy that prioritizes
the inputs of valuation techniques used to measure fair value. This hierarchy gives the highest priority to unadjusted
quoted prices in active markets for identical assets or liabilities (Level 1 measurements) and the lowest priority to unobservable
inputs (Level 3 measurements).
Additionally,
GAAP provides guidance on determining whether the volume and activity in a market has decreased significantly and whether
such a decrease in activity results in transactions that are not orderly. GAAP requires enhanced disclosures around valuation inputs
and techniques used during annual and interim periods.
Various inputs
are used in determining the value of the fund’s investments relating to fair value measurements. These inputs are summarized
in the three broad levels listed below:
Level 1—unadjusted
quoted prices in active markets for identical investments.
Level 2—other
significant observable inputs (including quoted prices for similar investments, interest rates, prepayment speeds, credit
risk, etc.).
Level 3—significant
unobservable inputs (including the fund’s own assumptions in determining the fair value of investments).
NOTES
TO FINANCIAL STATEMENTS (Unaudited) (continued)
The
inputs or methodology used for valuing securities are not necessarily an indication of the risk associated with investing in those securities.
Changes in
valuation techniques may result in transfers in or out of an assigned level within the disclosure hierarchy. Valuation techniques
used to value the fund’s investments are as follows:
The Company’s
Board of Directors (the “Board”)
has designated the Adviser as the fund’s valuation designee to make all fair value determinations
with respect to the fund’s portfolio investments, subject to the Board’s oversight and pursuant to Rule 2a-5 under the
Act.
Investments
in equity securities are valued at the last sales price on the securities exchange or national securities market on which such securities
are primarily traded. Securities listed on the National Market System for which market quotations are available are valued at the
official closing price or, if there is no official closing price that day, at the last sales price. For open short positions, asked prices
are used for valuation purposes.
Bid price is used when no asked price is available. Registered investment companies that are not traded on an
exchange are valued at their net asset value. All of the preceding securities are generally categorized within Level 1 of the fair value
hierarchy.
Securities
not listed on an exchange or the national securities market, or securities for which there were no transactions, are valued at the average
of the most recent bid and asked prices. These securities are generally categorized within Level 2 of the fair value hierarchy.
Fair valuing
of securities may be determined with the assistance of a pricing service using calculations based on indices of domestic securities
and other appropriate indicators, such as prices of relevant American Depositary Receipts and futures. Utilizing these techniques
may result in transfers between Level 1 and Level 2 of the fair value hierarchy.
When market
quotations or official closing prices are not readily available, or are determined not to accurately reflect fair value, such as when
the value of a security has been significantly affected by events after the close of the exchange or market on which the security is principally
traded, but before the fund calculates its net asset value, the fund may value these investments at fair value as determined in accordance
with the procedures approved by the Board. Certain factors may be considered when fair valuing investments such as: fundamental
analytical data, the nature and duration of restrictions on disposition, an evaluation of the forces that influence the market in which
the securities are purchased and sold, and public trading in similar securities of the issuer or comparable issuers. These securities
are either categorized within Level 2 or 3 of the
fair value hierarchy depending on the relevant inputs used.
For securities
where observable inputs are limited, assumptions about market activity and risk are used and such securities are generally categorized
within Level 3 of the fair value hierarchy.
Investment
in private equity securities will be fair valued by the Board in accordance with valuation procedures approved by the Board. Those
portfolio valuations will be based on unobservable inputs and certain assumptions about how market participants would price the
instrument. The fund expects that inputs into the determination of fair value of those investments will require significant management
judgment or estimation. Because valuations may fluctuate over short periods of time and may be based on estimates, fair value determinations
may differ materially from the value received in an actual transaction. Additionally, valuations of private companies are inherently
uncertain. The fund’s net asset value could be adversely affected if the fund’s determinations regarding the fair value of
those investments were materially
higher or lower than the values that it ultimately realized upon the disposal of such investments. These securities
are categorized within Level 3 of the fair value hierarchy.
The following is a summary
of the inputs used as of February 28, 2025 in valuing the fund’s investments:
|
|
Level
1 -
Unadjusted
Quoted
Prices |
Level
2- Other
Significant
Observable
Inputs |
Level
3-
Significant
Unobservable
Inputs
|
|
|
|
|
|
|
|
Investments
in Securities:†
|
|
|
|
|
Equity
Securities - Common Stocks |
|
|
|
|
NOTES
TO FINANCIAL STATEMENTS (Unaudited) (continued)
|
|
Level
1 -
Unadjusted
Quoted
Prices |
Level
2- Other
Significant
Observable
Inputs |
Level
3-
Significant
Unobservable
Inputs
|
|
|
|
|
|
|
|
Equity
Securities - Private Equity |
|
|
|
|
|
|
|
|
|
|
|
|
|
|
|
|
|
|
See
Statement of Investments for additional detailed categorizations, if any. |
The following
table summarizes the significant unobservable inputs the fund used to value its investment categorized within Level 3 as of
February 28, 2025. In addition to the techniques and inputs noted in the table below, according to the fund’s valuation policy,
other valuation techniques and methodologies
when determining the fund’s fair value measurements may be used. The below table is not intended
to be all-inclusive, but rather provide information on the significant unobservable inputs as they are to the fund’s determination
of fair values.
|
|
|
Valuation
Techniques/
Methodologies
|
|
Amount
or Range/
Weighted
Average |
|
|
|
Market
Comparable
Companies
|
Changes
in Enterprise Market
Value
of Comparables during
the
quarter |
|
|
|
|
|
Revenue
multiple during
the
quarter |
|
|
|
|
|
|
|
|
(b) Foreign
taxes: The fund may be subject to foreign taxes (a
portion of which may be reclaimable) on income, stock dividends, realized
and unrealized capital gains on investments or certain foreign currency transactions. Foreign taxes are recorded in accordance with
the applicable foreign tax regulations and rates that exist in the foreign jurisdictions in which the fund invests. These foreign taxes,
if any, are paid by the fund and
are reflected in the Statement of Operations, if applicable. Foreign taxes payable or deferred or those subject
to reclaims as of February 28, 2025, if any, are disclosed in the fund’s Statement of Assets and Liabilities.
(c) Securities
transactions and investment income: Securities transactions
are recorded on a trade date basis. Realized gains and losses
from securities transactions are recorded on the identified cost basis. Dividend income is recognized on the ex-dividend date and interest
income, including, where applicable, accretion of discount and amortization of premium on investments, is recognized on the accrual
basis.
Pursuant to
a securities lending agreement with BNY, the fund may lend securities to qualified institutions. It is the fund’s policy that, at
origination, all loans are secured by collateral of at least 102% of the value of U.S. securities loaned and 105% of the value of foreign
securities loaned. Collateral equivalent
to at least 100% of the market value of securities on loan is maintained at all times. Collateral is either
in the form of cash, which can be invested in certain money market mutual funds managed by the Adviser, or U.S. Government and
Agency securities. Any non-cash collateral received cannot be sold or re-pledged by the fund, except in the event of borrower default,
and is not reflected in the Statement of Assets and Liabilities. The securities on loan, if any, are also disclosed in the fund’s
Statement of Investments. The fund
is entitled to receive all dividends, interest and distributions on securities loaned, in addition to income
earned as a result of the lending transaction. Should a borrower fail to return the securities in a timely manner, BNY is required to
replace the securities for the benefit of the fund or credit the fund with the market value of the unreturned securities and is subrogated
to the fund’s rights against
the borrower and the collateral. Additionally, the contractual maturity of security lending transactions are on an
overnight and continuous basis. During the period ended February 28, 2025, BNY earned $2,371 from the lending of the fund’s portfolio
securities, pursuant to the securities lending agreement.
For financial
reporting purposes, the fund elects not to offset assets and liabilities subject to a securities lending agreement, if any, in the Statement
of Assets and Liabilities. Therefore, all qualifying transactions are presented on a gross basis in the Statement of Assets and Liabilities.
As of February 28, 2025, the fund had securities lending and the impact of netting of assets and liabilities and the offsetting
NOTES
TO FINANCIAL STATEMENTS (Unaudited) (continued)
of
collateral pledged or received, if any, based on contractual netting/set-off provisions in the securities lending agreement are detailed
in the following table:
|
|
|
|
Gross
amount of securities loaned, at
value,
as disclosed in the Statement
of
Assets and Liabilities |
|
|
Collateral
(received)/posted not offset
in
the Statement of
Assets
and Liabilities |
|
|
|
|
|
|
|
|
The
value of the related collateral received by the fund exceeded the value of the securities loaned by the fund pursuant to the securities
lending agreement. In addition,
the
value of collateral may include pending sales that are also on loan. See Statement of Investments for detailed information regarding collateral
received for open
securities
lending. |
(d) Affiliated
issuers: Investments in other investment companies
advised by the Adviser are considered “affiliated” under the Act.
(e) Market
Risk: The value of the securities in which the fund
invests may be affected by political, regulatory, economic and social developments,
and developments that impact specific economic sectors, industries or segments of the market. In addition, turbulence in financial
markets and reduced liquidity in equity, credit and/or fixed-income markets may negatively affect many issuers, which could adversely
affect the fund. Global economies and financial markets are becoming increasingly interconnected, and conditions and events in
one country, region or financial market may adversely impact issuers in a different country, region or financial market. These risks may
be magnified if certain events or developments adversely interrupt the global supply chain; in these and other circumstances, such risks
might affect companies world-wide.
(f) Dividends
and distributions to shareholders:
Dividends and distributions are recorded on the ex-dividend date. Dividends from net
investment income and dividends from net realized capital gains, if any, are normally declared and paid annually, but the fund may make
distributions on a more frequent basis to comply with the distribution requirements of the Internal Revenue Code of 1986, as amended
(the “Code”). To the extent that net realized capital gains can be offset by capital loss carryovers, it is the policy of
the fund not to distribute such
gains. Income and capital gain distributions are determined in accordance with income tax regulations, which may differ
from GAAP.
(g) Federal
income taxes: It is the policy of the fund to continue
to qualify as a regulated investment company, if such qualification is in
the best interests of its shareholders, by complying with the applicable provisions of the Code, and to make distributions of taxable
income and net realized capital gain sufficient to
relieve it from substantially all federal income and excise taxes.
As of and
during the period ended February 28, 2025, the fund did not have any liabilities for any uncertain tax positions. The fund recognizes
interest and penalties, if any, related to uncertain tax positions as income tax expense in the Statement of Operations. During the
period ended February 28, 2025, the fund did not incur any interest or penalties.
Each tax year
in the three-year period ended August 31, 2024 remains subject to examination by the Internal Revenue Service and state taxing
authorities.
The fund is
permitted to carry forward capital losses for an unlimited period. Furthermore, capital loss carryovers retain their character as
either short-term or long-term capital losses.
The fund has
an unused capital loss carryover of $13,888,621 available for federal income tax purposes to be applied against future net realized
capital gains, if any, realized subsequent to August 31, 2024. The fund has $13,739,058 of short-term capital losses and $149,563
of long-term capital losses which can be carried forward for an unlimited period.
The tax character
of distributions paid to shareholders during the fiscal year ended August 31, 2024 were as follows: ordinary income $1,468,332
and long-term capital gains $3,063,548. The tax character of current year distributions will be determined at the end of the current
fiscal year.
(h) Operating
segment reporting: In this reporting period, the
fund adopted FASB Accounting Standards Update 2023-07, Segment Reporting
(Topic 280) - Improvements to Reportable Segment Disclosures (“ASU 2023-07”). Adoption of the new standard impacted financial
statement disclosures only and did not affect the fund’s financial position or the results of its operations. The ASU 2023-07 is
effective for public entities for
fiscal years beginning after December 15, 2023, and requires retrospective application for all prior periods
NOTES
TO FINANCIAL STATEMENTS (Unaudited) (continued)
presented
within the financial statements.
Since its
commencement, the fund operates and is managed as a single reportable segment deriving returns in the form of dividends, interest
and/or gains from the investments made in pursuit of its single stated investment objective as outlined in the fund’s prospectus.
The accounting policies of the fund
are consistent with those described in these Notes to Financial Statements. The chief operating decision
maker (“CODM”) is represented by BNY Investments, the management of the Adviser, comprising Senior Management and Directors.
The CODM considers net increase in net assets resulting from operations in deciding whether to purchase additional investments
or to make distributions to fund shareholders. Detailed financial information for the fund is disclosed within these financial
statements with total assets and
liabilities disclosed on the Statement of Assets and Liabilities, investments held on the Statement of Investments,
results of operations and significant segment expenses on the Statement of Operations and other information about the fund’s
performance, including total return, portfolio turnover and ratios within the Financial Highlights.
NOTE
2—
Bank
Lines of Credit:
The fund participates with
other long-term open-end funds managed by the Adviser in a $738 million unsecured credit facility led by Citibank,
N.A. (the “Citibank Credit Facility”) and a $300 million unsecured credit facility provided by BNY (the “BNY Credit
Facility”), each to be utilized
primarily for temporary or emergency purposes, including the financing of redemptions (each, a “Facility”).
The Citibank Credit Facility is available in two tranches: (i) Tranche A is in an amount equal to $618 million and is available to all
long-term open-ended funds, including
the fund, and (ii) Tranche B is in an amount equal to $120 million and is available only to the BNY
Mellon Floating Rate Income Fund, a series of BNY Mellon Investment Funds IV, Inc. In connection therewith, the fund has agreed
to pay its pro rata portion of commitment fees for Tranche A of the Citibank Credit Facility and the BNY Credit Facility. Interest is
charged to the fund based on rates determined pursuant to the terms of the respective Facility at the time of borrowing. During the period
ended February 28, 2025, the fund did not borrow under either Facility.
NOTE
3—
Management
Fee, Sub-Advisory Fee
and Other Transactions with Affiliates:
(a) Pursuant
to a management agreement with the Adviser, the management fee is computed at the annual rate of .75% of the value of the
fund’s average daily net assets and is payable monthly. The Adviser has contractually agreed, from September 1, 2024 through December
31, 2025, to waive receipt of a portion of its management fee, in the amount of .10% of the value of the funds average daily net
assets. On or after December 31, 2025, the Adviser may terminate this waiver agreement at any time. The reduction in expenses, pursuant
to the undertaking, amounted to $123,530 during the period ended February 28, 2025.
Pursuant to
a sub-investment advisory agreement between the Adviser and the Sub-Adviser, the Adviser pays the Sub-Adviser a monthly fee
at an annual rate of .36% of the value of the fund’s average daily net assets.
(b) Under
the Shareholder Services Plan, Investor shares pay the Distributor at an annual rate of .25% of its average daily net assets for the
provision of certain services. The services provided may include personal services relating to shareholder accounts, such as answering
shareholder inquiries regarding
the fund, and services related to the maintenance of shareholder accounts. The Distributor may make payments
to Service Agents (securities dealers, financial institutions or other industry professionals) with respect to these services. The
Distributor determines the amounts
to be paid to Service Agents. During the period ended February 28, 2025, the fund was charged $264,966
pursuant to the Shareholder Services Plan.
The fund has
an arrangement with BNY Mellon Transfer, Inc., (the “Transfer Agent”), a subsidiary of BNY and an affiliate of the Adviser,
whereby the fund may receive earnings credits when positive cash balances are maintained, which are used to offset Transfer Agent
fees. For financial reporting purposes, the fund includes transfer agent net earnings credits, if any, as an expense offset in the Statement
of Operations.
The fund has
an arrangement with The Bank of New York Mellon (the “Custodian”), a subsidiary of BNY and an affiliate of the Adviser, whereby
the fund will receive interest income or be charged overdraft fees when cash balances are maintained. For financial reporting purposes,
the fund includes this interest income and overdraft fees, if any, as interest income in the Statement of Operations.
The fund compensates
the Transfer Agent, under a transfer agency agreement, for providing transfer agency and cash management services
for the fund. The majority of Transfer Agent fees are comprised of amounts paid on a per account basis, while cash management fees
are related to fund subscriptions and redemptions. During the period ended February 28, 2025, the fund was charged $34,677 for transfer
agency services. These fees are included in Shareholder servicing costs in the Statement of Operations.
NOTES
TO FINANCIAL STATEMENTS (Unaudited) (continued)
The
fund compensates the Custodian, under a custody agreement, for providing custodial services for the fund. These fees are determined
based on net assets, geographic region and transaction activity. During the period ended February 28, 2025, the fund was charged
$4,771 pursuant to the custody agreement.
During the
period ended February 28, 2025, the fund was charged $14,297 for services performed by the fund’s Chief Compliance Officer
and his staff. These fees are included in Chief Compliance Officer fees in the Statement of Operations.
The components
of “Due to BNY Mellon Investment Adviser, Inc. and affiliates” in the Statement of Assets and Liabilities consist of:
Management fee of $138,548, Shareholder Services Plan fees of $39,978, Custodian fees of $4,622, Chief Compliance Officer fees of
$6,141 and Transfer Agent fees of $17,756, which are offset against an expense reimbursement currently in effect in the amount of $18,117.
(c) Each
board member of the fund also serves as a board member of other funds in the BNY Mellon Family of Funds complex. Annual retainer
fees and attendance fees are allocated to each fund based on net assets.
NOTE
4—
Securities
Transactions:
The aggregate
amount of purchases and sales of investment securities, excluding short-term securities, during the period ended February
28, 2025, amounted to $81,096,928 and $106,864,345, respectively.
At February
28, 2025, accumulated net unrealized appreciation on investments was $33,353,357, consisting of $54,014,701 gross unrealized
appreciation and $20,661,344 gross unrealized depreciation.
At February
28, 2025, the cost of investments for federal income tax purposes was substantially the same as the cost for financial reporting
purposes (see the Statement of Investments).
Item
8. Changes in and Disagreements with Accountants for Open-End Management Investment Companies
(Unaudited)
Item
9. Proxy Disclosures for Open-End Management Investment Companies (Unaudited)
Item
10. Remuneration Paid to Directors, Officers, and Others of Open-End Management Investment Companies
(Unaudited)
Each
board member also serves as a board member of other funds in the BNY Mellon Family of Funds complex. Annual retainer fees and
attendance fees are allocated to each fund based on net assets. Directors fees paid by the fund are within Item 7. Statement of Operations
as Directors’ fees and expenses.
Item
11. Statement Regarding Basis for Approval of Investment Advisory Contracts (Unaudited)
©
2025 BNY Mellon Securities Corporation
Code-0253NCSRSA0225
BNY Mellon Technology Growth
Fund
SEMI-ANNUAL FINANCIALS
AND OTHER INFORMATION
Save
time. Save paper. View your next shareholder report online as soon as it’s available. Log into www.bny.com/investments
and sign up for eCommunications. It’s simple and only takes a few minutes.
The
views expressed in this report reflect those of the portfolio manager(s) only through the end of the period
covered and do not necessarily represent the views of BNY Mellon Investment Adviser, Inc. or any other
person in the BNY Mellon Investment Adviser, Inc. organization. Any such views are subject to change
at any time based upon market or other conditions and BNY Mellon Investment Adviser, Inc. disclaims
any responsibility to update such views. These views may not be relied on as investment advice and,
because investment decisions for a fund in the BNY Mellon Family of Funds are based on numerous factors,
may not be relied on as an indication of trading intent on behalf of any fund in the BNY Mellon
Family of
Funds.
Not FDIC-Insured
• Not Bank-Guaranteed • May Lose Value
Contents
Please note
the Semi-Annual Financials and Other Information only contains Items 7-11
required in Form N-CSR. All other required items will be filed with the Securities and Exchange
Commission (the “SEC”).
Item
7. Financial Statements and Financial Highlights for Open-End Management Investment Companies.
BNY Mellon Technology Growth Fund
Statement of Investments
February
28, 2025 (Unaudited)
|
|
|
|
|
|
|
|
|
Aerospace
& Defense — 2.1% |
Axon
Enterprise, Inc. (a)
|
|
|
|
|
|
Application
Software — 11.7% |
|
|
|
|
|
|
|
Atlassian
Corp., Cl. A (a)
|
|
|
|
|
|
|
|
|
|
|
|
|
|
|
|
|
|
|
|
|
|
|
|
|
|
|
|
|
|
|
|
|
|
|
|
|
|
|
|
|
|
|
|
|
|
|
|
|
|
|
|
|
|
|
|
|
PDD
Holdings, Inc., ADR (a)
|
|
|
|
|
|
|
|
|
|
|
|
|
|
|
|
|
|
|
|
|
|
Health
Care Equipment — .6% |
Intuitive
Surgical, Inc. (a)
|
|
|
|
|
|
Hotels,
Resorts & Cruise Lines — 1.3% |
|
|
|
|
|
|
|
Interactive
Media & Services — 12.4% |
|
|
|
|
|
|
|
Meta
Platforms, Inc., Cl. A |
|
|
|
|
|
Pinterest,
Inc., Cl. A (a)
|
|
|
|
|
|
Tencent
Holdings Ltd., ADR (b)
|
|
|
|
|
|
|
|
|
|
|
|
|
Internet
Services & Infrastructure — 7.2% |
Akamai
Technologies, Inc. (a)
|
|
|
|
|
|
|
|
|
|
|
|
|
Shopify,
Inc., Cl. A (a),(b)
|
|
|
|
|
|
|
|
|
|
|
|
|
Movies
& Entertainment — 7.3% |
|
|
|
|
|
|
|
Spotify
Technology SA (a)
|
|
|
|
|
|
|
|
|
|
|
|
|
Real
Estate Services — 2.0% |
|
|
|
|
|
|
|
Semiconductor
Materials & Equipment — 6.0% |
|
|
|
|
|
|
|
|
|
|
|
|
|
|
|
|
|
|
|
|
|
Onto
Innovation, Inc. (a)
|
|
|
|
|
|
|
|
|
|
|
|
|
|
|
Infineon
Technologies AG, ADR |
|
|
|
|
|
|
|
|
|
|
|
|
|
|
|
|
|
|
|
|
|
|
|
|
|
|
Statement of Investments (Unaudited)
(continued)
|
|
|
|
|
|
|
Common
Stocks — 98.2% (continued) |
Semiconductors
— 22.9% (continued) |
|
|
|
|
|
|
|
Taiwan
Semiconductor Manufacturing Co. Ltd., ADR |
|
|
|
|
|
|
|
|
|
|
|
|
|
|
|
|
|
|
|
|
|
|
|
|
|
|
|
|
|
|
|
|
|
|
|
|
|
|
|
|
|
|
|
|
|
|
|
|
|
Technology
Hardware, Storage & Peripherals — 3.6% |
|
|
|
|
|
|
|
Pure
Storage, Inc., Cl. A (a)
|
|
|
|
|
|
|
|
|
|
|
|
|
Total
Common Stocks
(cost
$219,901,048) |
|
|
|
|
|
|
|
Real
Estate Services — .1% |
Roofstock,
Ser. E (a),(c)
|
|
|
|
|
|
|
|
Databricks,
Inc., Ser. H (a),(c)
|
|
|
|
|
|
Databricks,
Inc., Ser. I (a),(c)
|
|
|
|
|
|
Databricks,
Inc., Ser. J (a),(c)
|
|
|
|
|
|
|
|
|
|
|
|
|
Total
Private Equity
(cost
$4,525,779) |
|
|
|
|
|
|
|
|
|
|
|
|
Investment
Companies — 1.0% |
|
|
|
|
|
Registered
Investment Companies — 1.0% |
|
|
|
|
|
Dreyfus
Institutional Preferred Government Plus Money Market Fund, Institutional
(cost
$3,821,331) |
|
|
|
|
|
Total
Investments (cost $228,248,158)
|
|
|
|
|
|
Liabilities,
Less Cash and Receivables |
|
|
|
|
|
|
|
|
|
|
|
|
ADR—American
Depositary Receipt |
|
|
Non-income
producing security. |
|
|
Security,
or portion thereof, on loan. At February 28, 2025, the value of the fund’s securities on loan was $20,719,052 and the value of the
collateral was
$21,278,147,
consisting of U.S. Government & Agency securities. In addition, the value of collateral may include pending sales that are also
on loan. |
|
|
The
fund held Level 3 securities at February 28, 2025. These securities were valued at $4,109,839 or 1.1% of net assets.
|
|
|
Investment
in affiliated issuer. The investment objective of this investment company is publicly available and can be found within the investment
company’s
prospectus.
|
|
|
|
|
|
|
|
|
Dividends/
Distributions
($) |
Registered
Investment Companies - 1.0% |
Dreyfus
Institutional Preferred Government Plus Money
Market
Fund, Institutional Shares - 1.0% |
|
|
|
|
|
Investment
of Cash Collateral for Securities Loaned - .0% |
Dreyfus
Institutional Preferred Government Plus Money
Market
Fund, Institutional Shares - .0% |
|
|
|
|
|
|
|
|
|
|
|
|
|
|
Includes
reinvested dividends/distributions. |
|
|
Represents
securities lending income earned from the reinvestment of cash collateral from loaned securities, net of fees and collateral investment
expenses, and
other
payments to and from borrowers of securities. |
See notes to financial
statements.
STATEMENT
OF ASSETS AND LIABILITIES
February 28, 2025 (Unaudited)
|
|
|
|
|
|
|
|
Investments
in securities—See Statement of Investments
(including
securities on loan, valued at $20,719,052)—Note
1(c): |
|
|
|
|
|
|
|
|
|
|
Cash
denominated in foreign currency |
|
|
Receivable
for shares of Common Stock subscribed |
|
|
Dividends
and securities lending income receivable |
|
|
Tax
reclaim receivable—Note 1(b)
|
|
|
|
|
|
|
|
|
|
|
|
|
|
|
Due
to BNY Mellon Investment Adviser, Inc. and affiliates—Note
3(c)
|
|
|
Payable
for shares of Common Stock redeemed |
|
|
Directors’
fees and expenses payable |
|
|
|
|
|
|
|
|
|
|
|
|
|
|
Composition
of Net Assets ($): |
|
|
|
|
|
|
Total
distributable earnings (loss) |
|
|
|
|
|
|
Net
Asset Value Per Share |
|
|
|
|
|
|
|
|
|
|
|
|
|
|
|
|
Net
Asset Value Per Share ($) |
|
|
|
|
See notes to financial
statements.
Six Months Ended February
28, 2025 (Unaudited)
|
|
|
|
|
|
|
|
|
Cash
dividends (net of $48,341 foreign taxes withheld at source): |
|
|
|
|
|
|
|
Affiliated
income net of rebates from securities lending—Note
1(c)
|
|
|
|
|
|
|
|
|
|
|
Shareholder
servicing costs—Note 3(c)
|
|
|
|
|
|
|
|
Prospectus
and shareholders’ reports |
|
Directors’
fees and expenses—Note 3(d)
|
|
Chief
Compliance Officer fees—Note 3(c)
|
|
Distribution
Plan fees—Note 3(b)
|
|
|
|
|
Loan
commitment fees—Note 2 |
|
|
|
|
|
|
|
|
|
|
Realized
and Unrealized Gain (Loss) on Investments—Note 4 ($):
|
|
Net
realized gain (loss) on investments |
|
Net
change in unrealized appreciation (depreciation) on investments and foreign currency transactions |
|
Net
Realized and Unrealized Gain (Loss) on Investments |
|
Net
Increase in Net Assets Resulting from Operations |
|
See notes to financial
statements.
STATEMENT
OF CHANGES IN NET ASSETS
|
|
Six
Months Ended
February
28, 2025
(Unaudited) |
Year
Ended
August
31, 2024
|
|
|
|
|
|
|
|
|
|
|
Net
realized gain (loss) on investments |
|
|
Net
change in unrealized appreciation (depreciation) on investments |
|
|
Net
Increase (Decrease) in Net Assets Resulting from Operations |
|
|
|
|
|
|
Distributions
to shareholders: |
|
|
|
|
|
|
|
|
|
|
|
|
|
|
|
|
|
|
|
|
|
|
Capital
Stock Transactions ($): |
|
|
Net
proceeds from shares sold: |
|
|
|
|
|
|
|
|
|
|
|
|
|
|
|
|
|
|
Distributions
reinvested: |
|
|
|
|
|
|
|
|
|
|
|
|
|
|
|
|
|
|
|
|
|
|
|
|
|
|
|
|
|
|
Increase
(Decrease) in Net Assets from Capital Stock Transactions |
|
|
Total
Increase (Decrease) in Net Assets |
|
|
|
|
|
|
|
|
|
|
|
|
|
|
|
|
Six
Months Ended
February
28, 2025
(Unaudited) |
Year
Ended
August
31, 2024
|
|
|
Capital
Share Transactions (Shares): |
|
|
|
|
|
|
|
|
|
|
Shares
issued for distributions reinvested |
|
|
|
|
|
|
Net
Increase (Decrease) in Shares Outstanding |
|
|
|
|
|
|
|
|
|
|
Shares
issued for distributions reinvested |
|
|
|
|
|
|
Net
Increase (Decrease) in Shares Outstanding |
|
|
|
|
|
|
|
|
|
|
Shares
issued for distributions reinvested |
|
|
|
|
|
|
Net
Increase (Decrease) in Shares Outstanding |
|
|
|
|
|
|
|
|
|
|
Net
Increase (Decrease) in Shares Outstanding |
|
|
|
|
During
the period ended August 31, 2024, 988 Class A shares representing $54,081 were exchanged for 807 Class I shares.
|
See notes to financial
statements.
The
following tables describe the performance for each share class for the fiscal periods indicated. All information (except portfolio turnover
rate) reflects financial results for
a single fund share. Net asset value total return is calculated assuming an initial investment made at the net asset
value at the beginning of the period, reinvestment of all dividends and distributions at net asset value during the period, and redemption
at net asset value on the last day
of the period. Net asset value total return includes adjustments in accordance with accounting principles generally
accepted in the United States of America and as such, the net asset value for financial reporting purposes and the returns based upon
those net asset values may differ from the net asset
value and returns for shareholder transactions.
|
|
Six
Months Ended
February
28, 2025
(Unaudited)
|
|
|
|
|
|
|
|
|
|
|
|
|
|
|
|
Net
asset value, beginning of period |
|
|
|
|
|
|
|
|
|
|
|
|
|
|
|
|
|
|
|
|
|
Net
realized and unrealized gain (loss) on
investments
|
|
|
|
|
|
|
Total
from Investment Operations |
|
|
|
|
|
|
|
|
|
|
|
|
|
|
Dividends
from net realized gain on investments |
|
|
|
|
|
|
Net
asset value, end of period |
|
|
|
|
|
|
|
|
|
|
|
|
|
|
Ratios/Supplemental
Data (%): |
|
|
|
|
|
Ratio
of total expenses to average net assets |
|
|
|
|
|
|
Ratio
of net expenses to average net assets |
|
|
|
|
|
|
Ratio
of net investment (loss) to average net assets |
|
|
|
|
|
|
|
|
|
|
|
|
|
|
Net
Assets, end of period ($ x 1,000) |
|
|
|
|
|
|
|
|
Based
on average shares outstanding. |
|
|
Exclusive
of sales charge. |
|
|
|
|
|
|
|
|
Amount
inclusive of reductions in expenses pursuant to undertaking. |
|
|
Amount
inclusive of reductions in fees due to earnings credits. |
See notes to financial statements.
|
|
Six
Months Ended
February
28, 2025
(Unaudited)
|
|
|
|
|
|
|
|
|
|
|
|
|
|
|
|
Net
asset value, beginning of period |
|
|
|
|
|
|
|
|
|
|
|
|
|
|
|
|
|
|
|
|
|
Net
realized and unrealized gain (loss) on
investments
|
|
|
|
|
|
|
Total
from Investment Operations |
|
|
|
|
|
|
|
|
|
|
|
|
|
|
Dividends
from net realized gain on investments |
|
|
|
|
|
|
Net
asset value, end of period |
|
|
|
|
|
|
|
|
|
|
|
|
|
|
Ratios/Supplemental
Data (%): |
|
|
|
|
|
Ratio
of total expenses to average net assets |
|
|
|
|
|
|
Ratio
of net expenses to average net assets |
|
|
|
|
|
|
Ratio
of net investment (loss) to average net assets |
|
|
|
|
|
|
|
|
|
|
|
|
|
|
Net
Assets, end of period ($ x 1,000) |
|
|
|
|
|
|
|
|
Based
on average shares outstanding. |
|
|
Exclusive
of sales charge. |
|
|
|
|
|
|
|
|
Amount
inclusive of reductions in expenses pursuant to undertaking. |
|
|
Amount
inclusive of reductions in fees due to earnings credits. |
See notes to financial statements.
FINANCIAL
HIGHLIGHTS (continued)
|
|
Six
Months Ended
February
28, 2025
(Unaudited)
|
|
|
|
|
|
|
|
|
|
|
|
|
|
|
|
Net
asset value, beginning of period |
|
|
|
|
|
|
|
|
|
|
|
|
|
|
|
|
|
|
|
|
|
Net
realized and unrealized gain (loss) on
investments
|
|
|
|
|
|
|
Total
from Investment Operations |
|
|
|
|
|
|
|
|
|
|
|
|
|
|
Dividends
from net realized gain on investments |
|
|
|
|
|
|
Net
asset value, end of period |
|
|
|
|
|
|
|
|
|
|
|
|
|
|
Ratios/Supplemental
Data (%): |
|
|
|
|
|
Ratio
of total expenses to average net assets |
|
|
|
|
|
|
Ratio
of net expenses to average net assets |
|
|
|
|
|
|
Ratio
of net investment (loss) to average net assets |
|
|
|
|
|
|
|
|
|
|
|
|
|
|
Net
Assets, end of period ($ x 1,000) |
|
|
|
|
|
|
|
|
Based
on average shares outstanding. |
|
|
|
|
|
|
|
|
Amount
inclusive of reductions in expenses pursuant to undertaking. |
|
|
Amount
inclusive of reductions in fees due to earnings credits. |
See notes to financial statements.
|
|
Six
Months Ended
February
28, 2025
(Unaudited)
|
|
|
|
|
|
|
|
|
|
|
|
|
|
|
|
Net
asset value, beginning of period |
|
|
|
|
|
|
|
|
|
|
|
|
|
Net
investment income (loss)(a)
|
|
|
|
|
|
|
Net
realized and unrealized gain (loss) on
investments
|
|
|
|
|
|
|
Total
from Investment Operations |
|
|
|
|
|
|
|
|
|
|
|
|
|
|
Dividends
from net realized gain on investments |
|
|
|
|
|
|
Net
asset value, end of period |
|
|
|
|
|
|
|
|
|
|
|
|
|
|
Ratios/Supplemental
Data (%): |
|
|
|
|
|
Ratio
of total expenses to average net assets |
|
|
|
|
|
|
Ratio
of net expenses to average net assets |
|
|
|
|
|
|
Ratio
of net investment income (loss) to average net
assets
|
|
|
|
|
|
|
|
|
|
|
|
|
|
|
Net
Assets, end of period ($ x 1,000) |
|
|
|
|
|
|
|
|
Based
on average shares outstanding. |
|
|
|
|
|
|
|
|
Amount
inclusive of reductions in expenses pursuant to undertaking. |
|
|
Amount
inclusive of reductions in fees due to earnings credits. |
See notes to financial
statements.
NOTES
TO FINANCIAL STATEMENTS (Unaudited)
NOTE
1—
Significant
Accounting Policies:
BNY Mellon
Technology Growth Fund (the “fund”)
is a separate diversified series of BNY Mellon Advantage Funds, Inc. (the “Company”),
which is registered under the Investment Company Act of 1940, as amended (the “Act”),
as an open-end management investment
company and operates as a series company currently offering seven series, including the fund. The fund’s investment objective is
to seek capital appreciation. BNY
Mellon Investment Adviser, Inc. (the “Adviser”),
a wholly-owned subsidiary of The Bank of New York Mellon
Corporation (“BNY”),
serves as the fund’s investment adviser. Newton Investment Management North America, LLC (the “Sub-Adviser”
or “NIMNA”),
an indirect wholly-owned subsidiary of BNY and an affiliate of the Adviser, serves as the fund’s sub-adviser.
NIMNA has entered into a sub-sub-investment advisory agreement with its affiliate, Newton Investment Management Limited (“NIM”),
which enables NIM to provide certain advisory services to the Sub-Adviser for the benefit of the fund, including, but not limited
to, portfolio management services. NIM is subject to the supervision of NIMNA and the Adviser. NIM is also an affiliate of the Adviser.
NIM, located at 160 Queen Victoria Street, London, EC4V, 4LA, England, was formed in 1978. NIM is an indirect subsidiary of
BNY.
BNY Mellon
Securities Corporation (the “Distributor”), a wholly-owned subsidiary of the Adviser, is the distributor of the fund’s
shares. The fund is authorized to
issue 700 million shares of $.001 par value of Common Stock. The fund currently has authorized four classes of
shares: Class A (200 million shares authorized), Class C (100 million shares authorized), Class I (250 million shares authorized) and
Class Y (150 million shares authorized).
Class A and Class C shares are sold primarily to retail investors through financial intermediaries and
bear Distribution and/or Shareholder Services Plan fees. Class A shares generally are subject to a sales charge imposed at the time of
purchase. Class A shares bought
without an initial sales charge as part of an investment of $1 million or more may be charged a contingent
deferred sales charge (“CDSC”) of 1.00% if redeemed within one year. Class C shares are subject to a CDSC imposed on Class
C shares redeemed within one year of purchase. Class C shares automatically convert to Class A shares eight years after the date of purchase,
without the imposition of a sales charge. Class I shares are sold primarily to bank trust departments and other financial service providers
(including BNY and its affiliates), acting on behalf of customers having a qualified trust or an investment account or relationship
at such institution, and bear no Distribution or Shareholder Services Plan fees. Class Y shares are sold at net asset value per share
generally to institutional investors,
and bear no Distribution or Shareholder Services Plan fees. Class I and Class Y shares are offered without
a front-end sales charge or CDSC. Other differences between the classes include the services offered to and the expenses borne by
each class, the allocation of certain transfer agency costs and certain voting rights. Income, expenses (other than expenses attributable
to a specific class), and realized
and unrealized gains or losses on investments are allocated to each class of shares based on its relative net assets.
As of February 28, 2025, MBC
Investments Corporation, an indirect subsidiary of BNY, held 217 Class Y shares of the fund.
The Company
accounts separately for the assets, liabilities and operations of each series. Expenses directly attributable to each series are charged
to that series’ operations; expenses which are applicable to all series are allocated among them on a pro rata basis.
The Financial
Accounting Standards Board (“FASB”) Accounting Standards Codification (“ASC”) is the exclusive reference of authoritative
U.S. generally accepted accounting principles (“GAAP”) recognized by the FASB to be applied by nongovernmental entities. Rules
and interpretive releases of the SEC under authority of federal laws are also sources of authoritative GAAP for SEC registrants.
The fund is an investment company
and applies the accounting and reporting guidance of the FASB ASC Topic 946 Financial Services-Investment
Companies. The fund’s financial statements are prepared in accordance with GAAP, which may require the use of management
estimates and assumptions. Actual results could differ from those estimates.
The Company
enters into contracts that contain a variety of indemnifications. The fund’s maximum exposure under these arrangements is
unknown. The fund does not anticipate recognizing any loss related to these arrangements.
(a) Portfolio
valuation: The fair value of a financial instrument
is the amount that would be received to sell an asset or paid to transfer a
liability in an orderly transaction between market participants at the measurement date (i.e., the exit price). GAAP establishes a fair
value hierarchy that prioritizes
the inputs of valuation techniques used to measure fair value. This hierarchy gives the highest priority to unadjusted
quoted prices in active markets for identical assets or liabilities (Level 1 measurements) and the lowest priority to unobservable
inputs (Level 3 measurements).
Additionally,
GAAP provides guidance on determining whether the volume and activity in a market has decreased significantly and whether
such a decrease in activity results in transactions that are not orderly. GAAP requires enhanced disclosures around valuation inputs
and techniques used during annual and interim periods.
NOTES
TO FINANCIAL STATEMENTS (Unaudited) (continued)
Various
inputs are used in determining the value of the fund’s investments relating to fair value measurements. These inputs are summarized
in the three broad levels listed below:
Level 1—unadjusted
quoted prices in active markets for identical investments.
Level 2—other
significant observable inputs (including quoted prices for similar investments, interest rates, prepayment speeds, credit
risk, etc.).
Level 3—significant
unobservable inputs (including the fund’s own assumptions in determining the fair value of investments).
The inputs
or methodology used for valuing securities are not necessarily an indication of the risk associated with investing in those securities.
Changes in
valuation techniques may result in transfers in or out of an assigned level within the disclosure hierarchy. Valuation techniques
used to value the fund’s investments are as follows:
The Company’s
Board of Directors (the “Board”)
has designated the Adviser as the fund’s valuation designee to make all fair value determinations
with respect to the fund’s portfolio investments, subject to the Board’s oversight and pursuant to Rule 2a-5 under the
Act.
Investments
in equity securities are valued at the last sales price on the securities exchange or national securities market on which such securities
are primarily traded. Securities listed on the National Market System for which market quotations are available are valued at the
official closing price or, if there is no official closing price that day, at the last sales price. For open short positions, asked prices
are used for valuation purposes.
Bid price is used when no asked price is available. Registered investment companies that are not traded on an
exchange are valued at their net asset value. All of the preceding securities are generally categorized within Level 1 of the fair value
hierarchy.
Securities
not listed on an exchange or the national securities market, or securities for which there were no transactions, are valued at the average
of the most recent bid and asked prices. These securities are generally categorized within Level 2 of the fair value hierarchy.
Fair valuing
of securities may be determined with the assistance of a pricing service using calculations based on indices of domestic securities
and other appropriate indicators, such as prices of relevant ADRs and futures. Utilizing these techniques may result in transfers between
Level 1 and Level 2 of the fair value hierarchy.
When market
quotations or official closing prices are not readily available, or are determined not to accurately reflect fair value, such as when
the value of a security has been significantly affected by events after the close of the exchange or market on which the security is principally
traded (for example, a foreign exchange or market), but before the fund calculates its net asset value,
the fund may value these investments
at fair value as determined in accordance with the procedures approved by the Board. Certain factors may be considered when
fair valuing investments such as: fundamental analytical data, the nature and duration of restrictions on disposition, an evaluation of
the forces that influence the market in which the securities are purchased and sold, and public trading in similar securities of the issuer
or comparable issuers. These securities
are either categorized within Level 2 or 3 of the fair value hierarchy depending on the relevant inputs
used.
For securities
where observable inputs are limited, assumptions about market activity and risk are used and such securities are generally categorized
within Level 3 of the fair value hierarchy.
Investment
in private equity securities will be fair valued by the Board in accordance with valuation procedures approved by the Board. Those
portfolio valuations will be based on unobservable inputs and certain assumptions about how market participants would price the
instrument. The fund expects that inputs into the determination of fair value of those investments will require significant management
judgment or estimation. Because valuations may fluctuate over short periods of time and may be based on estimates, fair value determinations
may differ materially from the value received in an actual transaction. Additionally, valuations of private companies are inherently
uncertain. The fund’s net asset value could be adversely affected if the fund’s determinations regarding the fair value of
those investments were materially
higher or lower than the values that it ultimately realized upon the disposal of such investments. These securities
are categorized within Level 3 of the fair value hierarchy.
Investments denominated in
foreign currencies are translated to U.S. dollars at the prevailing rates of exchange.
NOTES
TO FINANCIAL STATEMENTS (Unaudited) (continued)
The following
is a summary of the inputs used as of February 28, 2025 in valuing the fund’s investments:
|
|
Level
1 -
Unadjusted
Quoted
Prices |
Level
2- Other
Significant
Observable
Inputs |
Level
3-
Significant
Unobservable
Inputs
|
|
|
|
|
|
|
|
Investments
in Securities:†
|
|
|
|
|
Equity
Securities - Common Stocks |
|
|
|
|
Equity
Securities - Private Equity |
|
|
|
|
|
|
|
|
|
|
|
|
|
|
|
|
|
|
See
Statement of Investments for additional detailed categorizations, if any. |
The following is a reconciliation
of Level 3 assets for which significant unobservable inputs were used to determine fair value:
|
|
Equity
Securities-Private Equity ($) |
|
|
|
|
|
|
|
|
|
|
|
|
Change
in unrealized appreciation (depreciation) |
|
|
|
|
|
|
|
|
|
|
The
amount of total gains (losses) for the period included in earnings attributable to the change in
unrealized
appreciation (depreciation) relating to investments still held at 2/28/2025 |
|
|
|
Securities
deemed as Level 3 due to the lack of observable inputs by management assessment. |
The following
table summarizes the significant unobservable inputs the fund used to value its investment categorized within Level 3 as of
February 28, 2025. In addition to the techniques and inputs noted in the table below, according to the fund’s valuation policy,
other valuation techniques and methodologies
when determining the fund’s fair value measurements may be used. The below table is not intended
to be all-inclusive, but rather provide information on the significant unobservable inputs as they are to the fund’s determination
of fair values.
|
|
|
Valuation
Techniques/
Methodologies
|
|
Amount
or Range/
Weighted
Average |
|
|
|
Market
Comparable
Companies
|
Changes
in Enterprise Market
Value
of Comparables during
the
quarter |
|
|
|
|
|
Revenue
Multiple during
the
quarter |
|
|
|
|
|
|
|
|
(b) Foreign
currency transactions: The fund does not isolate
that portion of the results of operations resulting from changes in foreign
exchange rates on investments from the fluctuations arising from changes in the market prices of securities held. Such fluctuations
are included with the net realized and unrealized gain or loss on investments.
Net realized
foreign exchange gains or losses arise from sales of foreign currencies, currency gains or losses realized on securities transactions
between trade and settlement date, and the difference between the amounts of dividends, interest and foreign withholding taxes recorded
on the fund’s books and the U.S. dollar equivalent of the amounts actually received or paid. Net unrealized foreign exchange
NOTES
TO FINANCIAL STATEMENTS (Unaudited) (continued)
gains
and losses arise from changes in the value of assets and liabilities other than investments resulting from changes in exchange rates.
Foreign currency gains and losses
on foreign currency transactions are also included with net realized and unrealized gain or loss on investments.
Foreign taxes:
The fund may be subject to foreign taxes (a portion of which may be reclaimable) on income, stock dividends, realized and
unrealized capital gains on investments or certain foreign currency transactions. Foreign taxes are recorded in accordance with the applicable
foreign tax regulations and rates that exist in the foreign jurisdictions in which the fund invests. These foreign taxes, if any, are
paid by the fund and are reflected
in the Statement of Operations, if applicable. Foreign taxes payable or deferred or those subject to reclaims
as of February 28, 2025, if any, are disclosed in the fund’s Statement of Assets and Liabilities.
(c) Securities
transactions and investment income: Securities transactions
are recorded on a trade date basis. Realized gains and losses
from securities transactions are recorded on the identified cost basis. Dividend income is recognized on the ex-dividend date and interest
income, including, where applicable, accretion of discount and amortization of premium on investments, is recognized on the accrual
basis.
Pursuant to
a securities lending agreement with BNY, the fund may lend securities to qualified institutions. It is the fund’s policy that, at
origination, all loans are secured by collateral of at least 102% of the value of U.S. securities loaned and 105% of the value of foreign
securities loaned. Collateral equivalent
to at least 100% of the market value of securities on loan is maintained at all times. Collateral is either
in the form of cash, which can be invested in certain money market mutual funds managed by the Adviser, or U.S. Government and
Agency securities. Any non-cash collateral received cannot be sold or re-pledged by the fund, except in the event of borrower default,
and is not reflected in the Statement of Assets and Liabilities. The securities on loan, if any, are also disclosed in the fund’s
Statement of Investments. The fund
is entitled to receive all dividends, interest and distributions on securities loaned, in addition to income
earned as a result of the lending transaction. Should a borrower fail to return the securities in a timely manner, BNY is required to
replace the securities for the benefit of the fund or credit the fund with the market value of the unreturned securities and is subrogated
to the fund’s rights against
the borrower and the collateral. Additionally, the contractual maturity of security lending transactions are on an
overnight and continuous basis. During the period ended February 28, 2025, BNY earned $758 from the lending of the fund’s portfolio
securities, pursuant to the securities lending agreement.
For financial
reporting purposes, the fund elects not to offset assets and liabilities subject to a securities lending agreement, if any, in the Statement
of Assets and Liabilities. Therefore, all qualifying transactions are presented on a gross basis in the Statement of Assets and Liabilities.
As of February 28, 2025, the fund had securities lending and the impact of netting of assets and liabilities and the offsetting of
collateral pledged or received, if any, based on contractual netting/set-off provisions in the securities lending agreement are detailed
in the following table:
|
|
|
|
Gross
amount of securities loaned, at
value,
as disclosed in the Statement
of
Assets and Liabilities |
|
|
Collateral
(received)/posted not offset
in
the Statement of
Assets
and Liabilities |
|
|
|
|
|
|
|
|
The
value of the related collateral received by the fund exceeded the value of the securities loaned by the fund pursuant to the securities
lending agreement. In addition,
the
value of collateral may include pending sales that are also on loan. See Statement of Investments for detailed information regarding collateral
received for open
securities
lending. |
(d) Affiliated
issuers: Investments in other investment companies
advised by the Adviser are considered “affiliated” under the Act.
(e) Market
Risk: The value of the securities in which the fund
invests may be affected by political, regulatory, economic and social developments,
and developments that impact specific economic sectors, industries or segments of the market. In addition, turbulence in financial
markets and reduced liquidity in equity, credit and/or fixed-income markets may negatively affect many issuers, which could adversely
affect the fund. Global economies and financial markets are becoming increasingly interconnected, and conditions and events in
one country, region or financial market may adversely impact issuers in a different country, region or financial market. These risks may
be magnified if certain events or developments adversely interrupt the global supply chain; in these and other circumstances, such risks
might affect companies world-wide.
NOTES
TO FINANCIAL STATEMENTS (Unaudited) (continued)
Foreign
Investment Risk: To the extent the fund invests in
foreign securities, the fund’s performance will be influenced by political, social
and economic factors affecting investments in foreign issuers. Special risks associated with investments in foreign issuers include exposure
to currency fluctuations, less liquidity, less developed or less efficient trading markets, lack of comprehensive company information,
political and economic instability and differing auditing and legal standards.
Technology Company Risk:
The technology sector has been among the most volatile sectors of the stock market. Because the fund’s investments
are concentrated in the technology sector, its performance will be significantly affected by developments in that sector. Technology
companies, especially small-cap technology companies, involve greater risk because their revenue and/or earnings tend to be less
predictable (and some companies may be experiencing significant losses) and their share prices tend to be more volatile. Certain technology
companies may have limited product lines, markets or financial resources, or may depend on a limited management group. In
addition, these companies are strongly affected by worldwide technological developments, and their products and services may not be economically
successful or may quickly become outdated. Investor perception may play a greater role in determining the day-to-day value
of tech stocks than it does in other sectors. Fund investments made in anticipation of future products and services may decline dramatically
in value if the anticipated products or services are delayed or cancelled. The risks associated with technology companies are magnified
in the case of small-cap technology companies. The shares of smaller technology companies tend to trade less frequently than those
of larger, more established companies, which can have an adverse effect on the pricing of these securities and on the fund’s ability
to sell these securities.
(f) Dividends
and distributions to shareholders:
Dividends and distributions are recorded on the ex-dividend date. Dividends from net
investment income and dividends from net realized capital gains, if any, are normally declared and paid annually, but the fund may make
distributions on a more frequent basis to comply with the distribution requirements of the Internal Revenue Code of 1986, as amended
(the “Code”). To the extent that net realized capital gains can be offset by capital loss carryovers, it is the policy of
the fund not to distribute such
gains. Income and capital gain distributions are determined in accordance with income tax regulations, which may differ
from GAAP.
(g) Federal
income taxes: It is the policy of the fund to continue
to qualify as a regulated investment company, if such qualification is in
the best interests of its shareholders, by complying with the applicable provisions of the Code, and to make distributions of taxable
income and net realized capital gain sufficient to
relieve it from substantially all federal income and excise taxes.
As of and
during the period ended February 28, 2025, the fund did not have any liabilities for any uncertain tax positions. The fund recognizes
interest and penalties, if any, related to uncertain tax positions as income tax expense in the Statement of Operations. During the
period ended February 28, 2025, the fund did not incur any interest or penalties.
Each tax year
in the three-year period ended August 31, 2024 remains subject to examination by the Internal Revenue Service and state taxing
authorities.
(h) Operating
segment reporting: In this reporting period, the
fund adopted FASB Accounting Standards Update 2023-07, Segment Reporting
(Topic 280) - Improvements to Reportable Segment Disclosures (“ASU 2023-07”). Adoption of the new standard impacted financial
statement disclosures only and did not affect the fund’s financial position or the results of its operations. The ASU 2023-07 is
effective for public entities for
fiscal years beginning after December 15, 2023, and requires retrospective application for all prior periods presented
within the financial statements.
Since its
commencement, the fund operates and is managed as a single reportable segment deriving returns in the form of dividends, interest
and/or gains from the investments made in pursuit of its single stated investment objective as outlined in the fund’s prospectus.
The accounting policies of the fund
are consistent with those described in these Notes to Financial Statements. The chief operating decision
maker (“CODM”) is represented by BNY Investments, the management of the Adviser, comprising Senior Management and Directors.
The CODM considers net increase in net assets resulting from operations in deciding whether to purchase additional investments
or to make distributions to fund shareholders. Detailed financial information for the fund is disclosed within these financial
statements with total assets and
liabilities disclosed on the Statement of Assets and Liabilities, investments held on the Statement of Investments,
results of operations and significant segment expenses on the Statement of Operations and other information about the fund’s
performance, including total return, portfolio turnover and ratios within the Financial Highlights.
NOTE
2—
Bank
Lines of Credit:
The fund participates with
other long-term open-end funds managed by the Adviser in a $738 million unsecured credit facility led by Citibank,
N.A. (the “Citibank Credit Facility”) and a $300 million unsecured credit facility provided by BNY (the “BNY Credit
Facility”), each to be utilized
primarily for temporary or emergency purposes, including the financing of redemptions (each, a “Facil
NOTES
TO FINANCIAL STATEMENTS (Unaudited) (continued)
ity”).
The Citibank Credit Facility is available in two tranches: (i) Tranche A is in an amount equal to $618 million and is available to all
long-term open-ended funds, including
the fund, and (ii) Tranche B is in an amount equal to $120 million and is available only to the BNY
Mellon Floating Rate Income Fund, a series of BNY Mellon Investment Funds IV, Inc. In connection therewith, the fund has agreed
to pay its pro rata portion of commitment fees for Tranche A of the Citibank Credit Facility and the BNY Credit Facility. Interest is
charged to the fund based on rates determined pursuant to the terms of the respective Facility at the time of borrowing. During the period
ended February 28, 2025, the fund did not borrow under either Facility.
NOTE
3—
Management
Fee, Sub-Advisory Fee
and Other Transactions with Affiliates:
(a) Pursuant
to a management agreement with the Adviser, the management fee is computed at the annual rate of .75% of the value of the
fund’s average daily net assets and is payable monthly.
Pursuant to
a sub-investment advisory agreement between the Adviser and the Sub-Adviser, the Adviser pays the Sub-Adviser a monthly fee
at an annual rate of .36% of the value of the fund’s average daily net assets.
During the
period ended February 28, 2025, the Distributor retained $3,405 from commissions earned on sales of the fund’s Class A shares.
(b) Under
the Distribution Plan adopted pursuant to Rule 12b-1 under the Act, Class C shares pay the Distributor for distributing its shares
at an annual rate of .75% of the value of its average daily net assets. The Distributor may pay one or more Service Agents in respect
of advertising, marketing and other distribution services, and determines the amounts, if any, to be paid to Service Agents and the
basis on which such payments are made. During the period ended February 28, 2025, Class C shares were charged $13,839
pursuant to the Distribution Plan.
(c) Under
the Shareholder Services Plan, Class A and Class C shares pay the Distributor at an annual rate of .25% of the value of their average
daily net assets for the provision of certain services. The services provided may include personal services relating to shareholder accounts,
such as answering shareholder inquiries regarding the fund, and services related to the maintenance of shareholder accounts. The
Distributor may make payments to Service Agents (securities dealers, financial institutions or other industry professionals) with respect
to these services. The Distributor determines the amounts to be paid to Service Agents. During the period ended February 28, 2025,
Class A and Class C shares were charged $449,778 and $4,613, respectively, pursuant to the Shareholder Services Plan.
The fund has
an arrangement with BNY Mellon Transfer, Inc., (the “Transfer Agent”), a subsidiary of BNY and an affiliate of the Adviser,
whereby the fund may receive earnings credits when positive cash balances are maintained, which are used to offset Transfer Agent
fees. For financial reporting purposes, the fund includes transfer agent net earnings credits, if any, as an expense offset in the Statement
of Operations.
The fund has
an arrangement with The Bank of New York Mellon (the “Custodian”), a subsidiary of BNY and an affiliate of the Adviser, whereby
the fund will receive interest income or be charged overdraft fees when cash balances are maintained. For financial reporting purposes,
the fund includes this interest income and overdraft fees, if any, as interest income in the Statement of Operations.
The fund compensates
the Transfer Agent, under a transfer agency agreement, for providing transfer agency and cash management services
for the fund. The majority of Transfer Agent fees are comprised of amounts paid on a per account basis, while cash management fees
are related to fund subscriptions and redemptions. During the period ended February 28, 2025, the fund was charged $43,454 for transfer
agency services. These fees are included in Shareholder servicing costs in the Statement of Operations.
The fund compensates
the Custodian, under a custody agreement, for providing custodial services for the fund. These fees are determined
based on net assets, geographic region and transaction activity. During the period ended February 28, 2025, the fund was charged
$4,680 pursuant to the custody agreement.
During the
period ended February 28, 2025, the fund was charged $13,841 for services performed by the fund’s Chief Compliance Officer
and his staff. These fees are included in Chief Compliance Officer fees in the Statement of Operations.
The components
of “Due to BNY Mellon Investment Adviser, Inc. and affiliates” in the Statement of Assets and Liabilities consist of:
Management fee of $232,683, Distribution Plan fees of $2,173, Shareholder Services Plan fees of $72,593, Custodian fees of $3,189,
Chief Compliance Officer fees of $5,752 and Transfer Agent fees of $21,155.
(d) Each
board member of the fund also serves as a board member of other funds in the BNY Mellon Family of Funds complex. Annual retainer
fees and attendance fees are allocated to each fund based on net assets.
NOTES
TO FINANCIAL STATEMENTS (Unaudited) (continued)
NOTE
4—
Securities
Transactions:
The aggregate
amount of purchases and sales of investment securities, excluding short-term securities, during the period ended February
28, 2025, amounted to $79,972,870 and $102,397,344, respectively.
At February
28, 2025, accumulated net unrealized appreciation on investments was $151,054,376, consisting of $159,174,132 gross unrealized
appreciation and $8,119,756 gross unrealized depreciation.
At February
28, 2025, the cost of investments for federal income tax purposes was substantially the same as the cost for financial reporting
purposes (see the Statement of Investments).
Item
8. Changes in and Disagreements with Accountants for Open-End Management Investment Companies
(Unaudited)
Item
9. Proxy Disclosures for Open-End Management Investment Companies (Unaudited)
Item
10. Remuneration Paid to Directors, Officers, and Others of Open-End Management Investment Companies
(Unaudited)
Each
board member also serves as a board member of other funds in the BNY Mellon Family of Funds complex. Annual retainer fees and
attendance fees are allocated to each fund based on net assets. Directors fees paid by the fund are within Item 7. Statement of Operations
as Directors’ fees and expenses.
Item
11. Statement Regarding Basis for Approval of Investment Advisory Contracts (Unaudited)
©
2025 BNY Mellon Securities Corporation
Code-0255NCSRSA0225
|
Item 12. |
Disclosure of Proxy Voting Policies and Procedures for Closed-End Management Investment Companies. |
Not applicable.
|
Item 13. |
Portfolio Managers for Closed-End Management Investment Companies. |
Not applicable.
|
Item 14. |
Purchases of Equity Securities By Closed-End Management Investment Companies and Affiliated Purchasers.
|
Not applicable.
|
Item 15. |
Submission of Matters to a Vote of Security Holders. |
There have been no materials changes to the procedures
applicable to Item 15.
|
Item 16. |
Controls and Procedures. |
|
(a) |
The Registrant's principal executive and principal financial officers have concluded, based on their
evaluation of the Registrant's disclosure controls and procedures as of a date within 90 days of the filing date of this report, that
the Registrant's disclosure controls and procedures are reasonably designed to ensure that information required to be disclosed by the
Registrant on Form N-CSR is recorded, processed, summarized and reported within the required time periods and that information required
to be disclosed by the Registrant in the reports that it files or submits on Form N-CSR is accumulated and communicated to the Registrant's
management, including its principal executive and principal financial officers, as appropriate to allow timely decisions regarding required
disclosure. |
|
(b) |
There were no changes to the Registrant's internal control over financial reporting that occurred
during the period covered by this report that have materially affected, or are reasonably likely to materially affect, the Registrant's
internal control over financial reporting. |
|
Item 17. |
Disclosure of Securities Lending Activities for Closed-End Management Investment Companies. |
Not applicable.
|
Item 18. |
Recovery of Erroneously Awarded Compensation. |
Not applicable.
(a)(1) Not applicable.
(a)(2) Certifications of principal executive and principal financial officers as required by Rule 30a-2(a) under the Investment Company Act of 1940.
(a)(3) Not applicable.
(b) Certification of principal executive and principal financial officers as required by Rule 30a-2(b) under the Investment Company Act of 1940.
SIGNATURES
Pursuant
to
the
requirements
of
the
Securities
Exchange
Act
of
1934
and
the
Investment
Company
Act
of
1940,
the
Registrant
has
duly
caused
this
Report
to
be
signed
on
its
behalf
by
the
undersigned,
thereunto
duly
authorized.
BNY
Mellon
Advantage
Funds,
Inc.
By: /s/
David
J.
DiPetrillo
David
J.
DiPetrillo
President
(Principal
Executive
Officer)
Date: April
21,
2025
Pursuant
to
the
requirements
of
the
Securities
Exchange
Act
of
1934
and
the
Investment
Company
Act
of
1940,
this
Report
has
been
signed
below
by
the
following
persons
on
behalf
of
the
Registrant
and
in
the
capacities
and
on
the
dates
indicated.
By: /s/
David
J.
DiPetrillo
David
J.
DiPetrillo
President
(Principal
Executive
Officer)
Date: April
21,
2025
By: /s/
James
Windels
James
Windels
Treasurer
(Principal
Financial
Officer)
Date: April
21,
2025
EXHIBIT
INDEX
(a)(2) Certifications
of
principal
executive
and
principal
financial
officers
as
required
by
Rule
30a-2(a)
under
the
Investment
Company
Act
of
1940.
(EX-99.CERT)
(b) Certification
of
principal
executive
and
principal
financial
officers
as
required
by
Rule
30a-2(b)
under
the
Investment
Company
Act
of
1940.
(EX-99.906CERT)
[EX-99.CERT]—Exhibit (a)(2)
SECTION 302 CERTIFICATION
I, David J. DiPetrillo, certify that:
1. I have reviewed this report on Form N-CSR of
BNY Mellon Advantage Funds, Inc.;
2. Based on my knowledge, this report does not
contain any untrue statement of a material fact or omit to state a material fact necessary to make the statements made, in light of the
circumstances under which such statements were made, not misleading with respect to the period covered by this report;
3. Based on my knowledge, the financial statements,
and other financial information included in this report, fairly present in all material respects the financial condition, results of operations,
changes in net assets, and cash flows (if the financial statements are required to include a statement of cash flows) of the registrant
as of, and for, the periods presented in this report;
4. The registrant's other certifying officer(s)
and I are responsible for establishing and maintaining disclosure controls and procedures (as defined in Rule 30a-3(c) under the Investment
Company Act of 1940) and internal control over financial reporting (as defined in Rule 30a-3(d) under the Investment Company Act of 1940)
for the registrant and have:
(a) Designed such disclosure controls and
procedures, or caused such disclosure controls and procedures to be designed under our supervision, to ensure that material information
relating to the registrant, including its consolidated subsidiaries, is made known to us by others within those entities, particularly
during the period in which this report is being prepared;
(b) Designed such internal control over
financial reporting, or caused such internal control over financial reporting to be designed under our supervision, to provide reasonable
assurance regarding the reliability of financial reporting and the preparation of financial statements for external purposes in accordance
with generally accepted accounting principles;
(c) Evaluated the effectiveness of the
registrant's disclosure controls and procedures and presented in this report our conclusions about the effectiveness of the disclosure
controls and procedures, as of a date within 90 days prior to the filing date of this report based on such evaluation; and
(d) Disclosed in this report any change
in the registrant's internal control over financial reporting that occurred during the period covered by this report that has materially
affected, or is reasonably likely to materially affect, the registrant's internal control over financial reporting; and
5. The registrant's other certifying officer(s)
and I have disclosed to the registrant's auditors and the audit committee of the registrant's board of directors (or persons performing
the equivalent functions):
(a) All significant deficiencies and material
weaknesses in the design or operation of internal control over financial reporting which are reasonably likely to adversely affect the
registrant's ability to record, process, summarize, and report financial information; and
(b) Any fraud, whether or not material,
that involves management or other employees who have a significant role in the registrant's internal control over financial reporting.
By: /s/ David J.
DiPetrillo
David J. DiPetrillo
President (Principal Executive Officer)
Date: April 21, 2025
SECTION 302 CERTIFICATION
I, James Windels, certify that:
1. I have reviewed this report on Form N-CSR of
BNY Mellon Advantage Funds, Inc.;
2. Based on my knowledge, this report does not
contain any untrue statement of a material fact or omit to state a material fact necessary to make the statements made, in light of the
circumstances under which such statements were made, not misleading with respect to the period covered by this report;
3. Based on my knowledge, the financial statements,
and other financial information included in this report, fairly present in all material respects the financial condition, results of operations,
changes in net assets, and cash flows (if the financial statements are required to include a statement of cash flows) of the registrant
as of, and for, the periods presented in this report;
4. The registrant's other certifying officer(s)
and I are responsible for establishing and maintaining disclosure controls and procedures (as defined in Rule 30a-3(c) under the Investment
Company Act of 1940) and internal control over financial reporting (as defined in Rule 30a-3(d) under the Investment Company Act of 1940)
for the registrant and have:
(a) Designed such disclosure controls and
procedures, or caused such disclosure controls and procedures to be designed under our supervision, to ensure that material information
relating to the registrant, including its consolidated subsidiaries, is made known to us by others within those entities, particularly
during the period in which this report is being prepared;
(b) Designed such internal control over
financial reporting, or caused such internal control over financial reporting to be designed under our supervision, to provide reasonable
assurance regarding the reliability of financial reporting and the preparation of financial statements for external purposes in accordance
with generally accepted accounting principles;
(c) Evaluated the effectiveness of the
registrant's disclosure controls and procedures and presented in this report our conclusions about the effectiveness of the disclosure
controls and procedures, as of a date within 90 days prior to the filing date of this report based on such evaluation; and
(d) Disclosed in this report any change
in the registrant's internal control over financial reporting that occurred during the period covered by this report that has materially
affected, or is reasonably likely to materially affect, the registrant's internal control over financial reporting; and
5. The registrant's other certifying officer(s)
and I have disclosed to the registrant's auditors and the audit committee of the registrant's board of directors (or persons performing
the equivalent functions):
(a) All significant deficiencies and material
weaknesses in the design or operation of internal control over financial reporting which are reasonably likely to adversely affect the
registrant's ability to record, process, summarize, and report financial information; and
(b) Any fraud, whether or not material,
that involves management or other employees who have a significant role in the registrant's internal control over financial reporting.
By: /s/ James Windels
James Windels
Treasurer (Principal Financial Officer)
Date: April 21, 2025
[EX-99.906CERT]
Exhibit (b)
SECTION 906 CERTIFICATIONS
In connection with this report on Form
N-CSR for the Registrant as furnished to the Securities and Exchange Commission on the date hereof (the "Report"), the undersigned
hereby certify, pursuant to Section 906 of the Sarbanes-Oxley Act of 2002, that:
(1) the
Report fully complies with the requirements of Section 13(a) or 15(d) of the Securities Exchange Act of 1934, as applicable; and
(2) the
information contained in the Report fairly presents, in all material respects, the financial condition and results of operations of the
Registrant.
By: /s/ David J.
DiPetrillo
David J. DiPetrillo
President (Principal Executive Officer)
Date: April 21, 2025
By: /s/ James Windels
James Windels
Treasurer (Principal Financial Officer)
Date: April 21, 2025
This certificate is furnished pursuant to the requirements of Form N-CSR and
shall not be deemed "filed" for purposes of Section 18 of the Securities Exchange Act of 1934, or otherwise subject to the liability
of that section, and shall not be deemed to be incorporated by reference into any filing under the Securities Act of 1933 or the Securities
Exchange Act of 1934.
v3.25.1
| X |
- DefinitionBoolean flag that is true when the XBRL content amends previously-filed or accepted submission.
| Name: |
dei_AmendmentFlag |
| Namespace Prefix: |
dei_ |
| Data Type: |
xbrli:booleanItemType |
| Balance Type: |
na |
| Period Type: |
duration |
|
| X |
- DefinitionFor the EDGAR submission types of Form 8-K: the date of the report, the date of the earliest event reported; for the EDGAR submission types of Form N-1A: the filing date; for all other submission types: the end of the reporting or transition period. The format of the date is YYYY-MM-DD.
| Name: |
dei_DocumentPeriodEndDate |
| Namespace Prefix: |
dei_ |
| Data Type: |
xbrli:dateItemType |
| Balance Type: |
na |
| Period Type: |
duration |
|
| X |
- DefinitionThe type of document being provided (such as 10-K, 10-Q, 485BPOS, etc). The document type is limited to the same value as the supporting SEC submission type, or the word 'Other'.
| Name: |
dei_DocumentType |
| Namespace Prefix: |
dei_ |
| Data Type: |
dei:submissionTypeItemType |
| Balance Type: |
na |
| Period Type: |
duration |
|
| X |
- DefinitionA unique 10-digit SEC-issued value to identify entities that have filed disclosures with the SEC. It is commonly abbreviated as CIK. Reference 1: http://www.xbrl.org/2003/role/presentationRef
-Publisher SEC
-Name Exchange Act
-Number 240
-Section 12
-Subsection b-2
| Name: |
dei_EntityCentralIndexKey |
| Namespace Prefix: |
dei_ |
| Data Type: |
dei:centralIndexKeyItemType |
| Balance Type: |
na |
| Period Type: |
duration |
|
| X |
- DefinitionOne of: N-1A (Mutual Fund), N-1 (Open-End Separate Account with No Variable Annuities), N-2 (Closed-End Investment Company), N-3 (Separate Account Registered as Open-End Management Investment Company), N-4 (Variable Annuity UIT Separate Account), N-5 (Small Business Investment Company), N-6 (Variable Life UIT Separate Account), S-1 or S-3 (Face Amount Certificate Company), S-6 (UIT, Non-Insurance Product). Reference 1: http://www.xbrl.org/2003/role/presentationRef
-Publisher SEC
-Name Regulation S-T
-Number 232
-Section 313
| Name: |
dei_EntityInvCompanyType |
| Namespace Prefix: |
dei_ |
| Data Type: |
dei:invCompanyType |
| Balance Type: |
na |
| Period Type: |
duration |
|
| X |
- DefinitionThe exact name of the entity filing the report as specified in its charter, which is required by forms filed with the SEC. Reference 1: http://www.xbrl.org/2003/role/presentationRef
-Publisher SEC
-Name Exchange Act
-Number 240
-Section 12
-Subsection b-2
| Name: |
dei_EntityRegistrantName |
| Namespace Prefix: |
dei_ |
| Data Type: |
xbrli:normalizedStringItemType |
| Balance Type: |
na |
| Period Type: |
duration |
|
| X |
- ReferencesReference 1: http://www.xbrl.org/2003/role/presentationRef
-Publisher SEC
-Name Form N-1A
-Section 27A
-Subsection d
-Paragraph 2
-Subparagraph instruction
-Clause 7
| Name: |
oef_ShareholderReportLineItems |
| Namespace Prefix: |
oef_ |
| Data Type: |
xbrli:stringItemType |
| Balance Type: |
na |
| Period Type: |
duration |
|
v3.25.1
Shareholder Report
|
6 Months Ended |
|
Feb. 28, 2025
USD ($)
Holding
|
|---|
| Shareholder Report [Line Items] |
|
|
| Document Type |
N-CSRS
|
|
| Amendment Flag |
false
|
|
| Registrant Name |
BNY Mellon Advantage Funds, Inc.
|
|
| Entity Central Index Key |
0000914775
|
|
| Entity Investment Company Type |
N-1A
|
|
| Document Period End Date |
Feb. 28, 2025
|
|
| C000001288 [Member] |
|
|
| Shareholder Report [Line Items] |
|
|
| Fund Name |
BNY Mellon Opportunistic Midcap Value Fund
|
|
| Class Name |
Class A
|
|
| Trading Symbol |
DMCVX
|
|
| Annual or Semi-Annual Statement [Text Block] |
This semi-annual shareholder report contains important information about BNY Mellon Opportunistic Midcap Value Fund (the “Fund”) for the period of September 1, 2024 to February 28, 2025.
|
|
| Shareholder Report Annual or Semi-Annual |
semi-annual shareholder report
|
|
| Additional Information [Text Block] |
You can find additional information about the Fund at bny.com/investments/literaturecenter. You can also request this information by calling 1-800-373-9387 (inside the U.S. only) or by sending an e-mail request to info@bny.com.
|
|
| Additional Information Phone Number |
1-800-373-9387
|
|
| Additional Information Email |
info@bny.com
|
|
| Additional Information Website |
bny.com/investments/literaturecenter
|
|
| Expenses [Text Block] |
What were the Fund’s costs for the last six months ? (based on a hypothetical $10,000 investment)
| Share Class |
Costs of a $10,000 investment |
Costs paid as a percentage of a $10,000 investment |
| Class A |
$58 |
1.16%* |
|
|
| Expenses Paid, Amount |
$ 58
|
|
| Expense Ratio, Percent |
1.16%
|
[1] |
| Net Assets |
$ 392,000,000
|
|
| Holdings Count | Holding |
68
|
|
| Investment Company Portfolio Turnover |
21.71%
|
|
| Additional Fund Statistics [Text Block] |
KEY FUND STATISTICS (AS OF 2/28/25 )
Fund Size (Millions) |
Number of Holdings |
Portfolio Turnover |
| $392 |
68 |
21.71% |
|
|
| Holdings [Text Block] |
Portfolio Holdings (as of 2/28/25 ) Top Ten Holdings (Based on Net Assets) * * Excludes money market funds or other short-term securities held for the investment of cash and cash collateral for securities loaned, if any. Sector Allocation (Based on Net Assets)
|
|
| Largest Holdings [Text Block] |
Top Ten Holdings (Based on Net Assets) * * Excludes money market funds or other short-term securities held for the investment of cash and cash collateral for securities loaned, if any.
|
|
| C000064720 [Member] |
|
|
| Shareholder Report [Line Items] |
|
|
| Fund Name |
BNY Mellon Opportunistic Midcap Value Fund
|
|
| Class Name |
Class C
|
|
| Trading Symbol |
DVLCX
|
|
| Annual or Semi-Annual Statement [Text Block] |
This semi-annual shareholder report contains important information about BNY Mellon Opportunistic Midcap Value Fund (the “Fund”) for the period of September 1, 2024 to February 28, 2025.
|
|
| Shareholder Report Annual or Semi-Annual |
semi-annual shareholder report
|
|
| Additional Information [Text Block] |
You can find additional information about the Fund at bny.com/investments/literaturecenter. You can also request this information by calling 1-800-373-9387 (inside the U.S. only) or by sending an e-mail request to info@bny.com.
|
|
| Additional Information Phone Number |
1-800-373-9387
|
|
| Additional Information Email |
info@bny.com
|
|
| Additional Information Website |
bny.com/investments/literaturecenter
|
|
| Expenses [Text Block] |
What were the Fund’s costs for the last six months ? (based on a hypothetical $10,000 investment)
| Share Class |
Costs of a $10,000 investment |
Costs paid as a percentage of a $10,000 investment |
| Class C |
$99 |
1.98%* |
|
|
| Expenses Paid, Amount |
$ 99
|
|
| Expense Ratio, Percent |
1.98%
|
[2] |
| Net Assets |
$ 392,000,000
|
|
| Holdings Count | Holding |
68
|
|
| Investment Company Portfolio Turnover |
21.71%
|
|
| Additional Fund Statistics [Text Block] |
KEY FUND STATISTICS (AS OF 2/28/25 )
Fund Size (Millions) |
Number of Holdings |
Portfolio Turnover |
| $392 |
68 |
21.71% |
|
|
| Holdings [Text Block] |
Portfolio Holdings (as of 2/28/25 ) Top Ten Holdings (Based on Net Assets) * * Excludes money market funds or other short-term securities held for the investment of cash and cash collateral for securities loaned, if any. Sector Allocation (Based on Net Assets)
|
|
| Largest Holdings [Text Block] |
Top Ten Holdings (Based on Net Assets) * * Excludes money market funds or other short-term securities held for the investment of cash and cash collateral for securities loaned, if any.
|
|
| C000064721 [Member] |
|
|
| Shareholder Report [Line Items] |
|
|
| Fund Name |
BNY Mellon Opportunistic Midcap Value Fund
|
|
| Class Name |
Class I
|
|
| Trading Symbol |
DVLIX
|
|
| Annual or Semi-Annual Statement [Text Block] |
This semi-annual shareholder report contains important information about BNY Mellon Opportunistic Midcap Value Fund (the “Fund”) for the period of September 1, 2024 to February 28, 2025.
|
|
| Shareholder Report Annual or Semi-Annual |
semi-annual shareholder report
|
|
| Additional Information [Text Block] |
You can find additional information about the Fund at bny.com/investments/literaturecenter. You can also request this information by calling 1-800-373-9387 (inside the U.S. only) or by sending an e-mail request to info@bny.com.
|
|
| Additional Information Phone Number |
1-800-373-9387
|
|
| Additional Information Email |
info@bny.com
|
|
| Additional Information Website |
bny.com/investments/literaturecenter
|
|
| Expenses [Text Block] |
What were the Fund’s costs for the last six months ? (based on a hypothetical $10,000 investment)
| Share Class |
Costs of a $10,000 investment |
Costs paid as a percentage of a $10,000 investment |
| Class I |
$48 |
0.96%* |
|
|
| Expenses Paid, Amount |
$ 48
|
|
| Expense Ratio, Percent |
0.96%
|
[3] |
| Net Assets |
$ 392,000,000
|
|
| Holdings Count | Holding |
68
|
|
| Investment Company Portfolio Turnover |
21.71%
|
|
| Additional Fund Statistics [Text Block] |
KEY FUND STATISTICS (AS OF 2/28/25 )
Fund Size (Millions) |
Number of Holdings |
Portfolio Turnover |
| $392 |
68 |
21.71% |
|
|
| Holdings [Text Block] |
Portfolio Holdings (as of 2/28/25 ) Top Ten Holdings (Based on Net Assets) * * Excludes money market funds or other short-term securities held for the investment of cash and cash collateral for securities loaned, if any. Sector Allocation (Based on Net Assets)
|
|
| Largest Holdings [Text Block] |
Top Ten Holdings (Based on Net Assets) * * Excludes money market funds or other short-term securities held for the investment of cash and cash collateral for securities loaned, if any.
|
|
| C000130426 [Member] |
|
|
| Shareholder Report [Line Items] |
|
|
| Fund Name |
BNY Mellon Opportunistic Midcap Value Fund
|
|
| Class Name |
Class Y
|
|
| Trading Symbol |
DMCYX
|
|
| Annual or Semi-Annual Statement [Text Block] |
This semi-annual shareholder report contains important information about BNY Mellon Opportunistic Midcap Value Fund (the “Fund”) for the period of September 1, 2024 to February 28, 2025.
|
|
| Shareholder Report Annual or Semi-Annual |
semi-annual shareholder report
|
|
| Additional Information [Text Block] |
You can find additional information about the Fund at bny.com/investments/literaturecenter. You can also request this information by calling 1-800-373-9387 (inside the U.S. only) or by sending an e-mail request to info@bny.com.
|
|
| Additional Information Phone Number |
1-800-373-9387
|
|
| Additional Information Email |
info@bny.com
|
|
| Additional Information Website |
bny.com/investments/literaturecenter
|
|
| Expenses [Text Block] |
What were the Fund’s costs for the last six months ? (based on a hypothetical $10,000 investment)
| Share Class |
Costs of a $10,000 investment |
Costs paid as a percentage of a $10,000 investment |
| Class Y |
$43 |
0.86%* |
|
|
| Expenses Paid, Amount |
$ 43
|
|
| Expense Ratio, Percent |
0.86%
|
[4] |
| Net Assets |
$ 392,000,000
|
|
| Holdings Count | Holding |
68
|
|
| Investment Company Portfolio Turnover |
21.71%
|
|
| Additional Fund Statistics [Text Block] |
KEY FUND STATISTICS (AS OF 2/28/25 )
Fund Size (Millions) |
Number of Holdings |
Portfolio Turnover |
| $392 |
68 |
21.71% |
|
|
| Holdings [Text Block] |
Portfolio Holdings (as of 2/28/25 ) Top Ten Holdings (Based on Net Assets) * * Excludes money market funds or other short-term securities held for the investment of cash and cash collateral for securities loaned, if any. Sector Allocation (Based on Net Assets)
|
|
| Largest Holdings [Text Block] |
Top Ten Holdings (Based on Net Assets) * * Excludes money market funds or other short-term securities held for the investment of cash and cash collateral for securities loaned, if any.
|
|
| C000001289 [Member] |
|
|
| Shareholder Report [Line Items] |
|
|
| Fund Name |
BNY Mellon Opportunistic Small Cap Fund
|
|
| Class Name |
Investor Shares
|
|
| Trading Symbol |
DSCVX
|
|
| Annual or Semi-Annual Statement [Text Block] |
This semi-annual shareholder report contains important information about BNY Mellon Opportunistic Small Cap Fund (the “Fund”) for the period of September 1, 2024 to February 28, 2025.
|
|
| Shareholder Report Annual or Semi-Annual |
semi-annual shareholder report
|
|
| Additional Information [Text Block] |
You can find additional information about the Fund at bny.com/investments/literaturecenter. You can also request this information by calling 1-800-373-9387 (inside the U.S. only) or by sending an e-mail request to info@bny.com.
|
|
| Material Fund Change Notice [Text Block] |
This report describes changes to the Fund that occurred during the reporting period.
|
|
| Additional Information Phone Number |
1-800-373-9387
|
|
| Additional Information Email |
info@bny.com
|
|
| Additional Information Website |
bny.com/investments/literaturecenter
|
|
| Expenses [Text Block] |
What were the Fund’s costs for the last six months ?
(based on a hypothetical $10,000 investment)
| Share Class |
Costs of a $10,000 investment |
Costs paid as a percentage of a $10,000 investment |
| Investor Shares* |
$52 |
1.08%** |
| * |
During the period, fees were waived and/or expenses reimbursed pursuant to an agreement with the Fund’s investment adviser, BNY Mellon Investment Adviser, Inc. If this agreement is not extended in the future, expenses could be higher.
|
| ** |
Annualized.
|
|
|
| Expenses Paid, Amount |
$ 52
|
[5] |
| Expense Ratio, Percent |
1.08%
|
[5],[6] |
| Material Change Date |
Sep. 01, 2024
|
|
| Net Assets |
$ 229,000,000
|
|
| Holdings Count | Holding |
97
|
|
| Investment Company Portfolio Turnover |
33.41%
|
|
| Additional Fund Statistics [Text Block] |
KEY FUND STATISTICS (AS OF 2/28/25 )
Fund Size (Millions) |
Number of Holdings |
Portfolio Turnover |
| $229 |
97 |
33.41% |
|
|
| Holdings [Text Block] |
Portfolio Holdings (as of 2/28/25 )
Top Ten Holdings (Based on Net Assets) *
* Excludes money market funds or other short-term securities held for the investment of cash and cash collateral for securities loaned, if any.
Sector Allocation (Based on Net Assets)
|
|
| Largest Holdings [Text Block] |
Top Ten Holdings (Based on Net Assets) *
* Excludes money market funds or other short-term securities held for the investment of cash and cash collateral for securities loaned, if any.
|
|
| Material Fund Change [Text Block] |
How has the Fund changed?
-
Effective September 1, 2024, the Fund’s investment adviser, BNY Mellon Investment Adviser, Inc., has contractually agreed to waive receipt of a portion of its management fee in the amount of .10% of the value of the Fund’s average daily net assets until December 31, 2025. On or after December 31, 2025, BNY Mellon Investment Adviser, Inc. may terminate this waiver agreement at any time.
This is a summary of certain changes to the Fund since September 1, 2024 . For more complete information, you may review the Fund’s current prospectus dated December 31, 2024 at bny.com/investments/literaturecenter or upon request at 1-800-373-9387.
|
|
| Material Fund Change Expenses [Text Block] |
Effective September 1, 2024, the Fund’s investment adviser, BNY Mellon Investment Adviser, Inc., has contractually agreed to waive receipt of a portion of its management fee in the amount of .10% of the value of the Fund’s average daily net assets until December 31, 2025. On or after December 31, 2025, BNY Mellon Investment Adviser, Inc. may terminate this waiver agreement at any time.
|
|
| Summary of Change Legend [Text Block] |
This is a summary of certain changes to the Fund since September 1, 2024 . For more complete information, you may review the Fund’s current prospectus dated December 31, 2024 at bny.com/investments/literaturecenter or upon request at 1-800-373-9387.
|
|
| Updated Prospectus Phone Number |
1-800-373-9387
|
|
| Updated Prospectus Web Address |
bny.com/investments/literaturecenter
|
|
| C000174006 [Member] |
|
|
| Shareholder Report [Line Items] |
|
|
| Fund Name |
BNY Mellon Opportunistic Small Cap Fund
|
|
| Class Name |
Class I
|
|
| Trading Symbol |
DOPIX
|
|
| Annual or Semi-Annual Statement [Text Block] |
This semi-annual shareholder report contains important information about BNY Mellon Opportunistic Small Cap Fund (the “Fund”) for the period of September 1, 2024 to February 28, 2025.
|
|
| Shareholder Report Annual or Semi-Annual |
semi-annual shareholder report
|
|
| Additional Information [Text Block] |
You can find additional information about the Fund at bny.com/investments/literaturecenter. You can also request this information by calling 1-800-373-9387 (inside the U.S. only) or by sending an e-mail request to info@bny.com.
|
|
| Material Fund Change Notice [Text Block] |
This report describes changes to the Fund that occurred during the reporting period.
|
|
| Additional Information Phone Number |
1-800-373-9387
|
|
| Additional Information Email |
info@bny.com
|
|
| Additional Information Website |
bny.com/investments/literaturecenter
|
|
| Expenses [Text Block] |
What were the Fund’s costs for the last six months ? (based on a hypothetical $10,000 investment)
| Share Class |
Costs of a $10,000 investment |
Costs paid as a percentage of a $10,000 investment |
| Class I* |
$44 |
0.90%** |
| * |
During the period, fees were waived and/or expenses reimbursed pursuant to an agreement with the Fund’s investment adviser, BNY Mellon Investment Adviser, Inc. If this agreement is not extended in the future, expenses could be higher. |
| ** |
Annualized. |
|
|
| Expenses Paid, Amount |
$ 44
|
[7] |
| Expense Ratio, Percent |
0.90%
|
[7],[8] |
| Material Change Date |
Sep. 01, 2024
|
|
| Net Assets |
$ 229,000,000
|
|
| Holdings Count | Holding |
97
|
|
| Investment Company Portfolio Turnover |
33.41%
|
|
| Additional Fund Statistics [Text Block] |
KEY FUND STATISTICS (AS OF 2/28/25 )
Fund Size (Millions) |
Number of Holdings |
Portfolio Turnover |
| $229 |
97 |
33.41% |
|
|
| Holdings [Text Block] |
Portfolio Holdings (as of 2/28/25 ) Top Ten Holdings (Based on Net Assets) * * Excludes money market funds or other short-term securities held for the investment of cash and cash collateral for securities loaned, if any. Sector Allocation (Based on Net Assets)
|
|
| Largest Holdings [Text Block] |
Top Ten Holdings (Based on Net Assets) * * Excludes money market funds or other short-term securities held for the investment of cash and cash collateral for securities loaned, if any.
|
|
| Material Fund Change [Text Block] |
How has the Fund changed?
-
Effective September 1, 2024, the Fund’s investment adviser, BNY Mellon Investment Adviser, Inc., has contractually agreed to waive receipt of a portion of its management fee in the amount of .10% of the value of the Fund’s average daily net assets until December 31, 2025. On or after December 31, 2025, BNY Mellon Investment Adviser, Inc. may terminate this waiver agreement at any time. This is a summary of certain changes to the Fund since September 1, 2024 . For more complete information, you may review the Fund’s current prospectus dated December 31, 2024 at bny.com/investments/literaturecenter or upon request at 1-800-373-9387.
|
|
| Material Fund Change Expenses [Text Block] |
Effective September 1, 2024, the Fund’s investment adviser, BNY Mellon Investment Adviser, Inc., has contractually agreed to waive receipt of a portion of its management fee in the amount of .10% of the value of the Fund’s average daily net assets until December 31, 2025. On or after December 31, 2025, BNY Mellon Investment Adviser, Inc. may terminate this waiver agreement at any time.
|
|
| Summary of Change Legend [Text Block] |
This is a summary of certain changes to the Fund since September 1, 2024 . For more complete information, you may review the Fund’s current prospectus dated December 31, 2024 at bny.com/investments/literaturecenter or upon request at 1-800-373-9387.
|
|
| Updated Prospectus Phone Number |
1-800-373-9387
|
|
| Updated Prospectus Web Address |
bny.com/investments/literaturecenter
|
|
| C000174005 [Member] |
|
|
| Shareholder Report [Line Items] |
|
|
| Fund Name |
BNY Mellon Opportunistic Small Cap Fund
|
|
| Class Name |
Class Y
|
|
| Trading Symbol |
DSCYX
|
|
| Annual or Semi-Annual Statement [Text Block] |
This semi-annual shareholder report contains important information about BNY Mellon Opportunistic Small Cap Fund (the “Fund”) for the period of September 1, 2024 to February 28, 2025.
|
|
| Shareholder Report Annual or Semi-Annual |
semi-annual shareholder report
|
|
| Additional Information [Text Block] |
You can find additional information about the Fund at bny.com/investments/literaturecenter. You can also request this information by calling 1-800-373-9387 (inside the U.S. only) or by sending an e-mail request to info@bny.com.
|
|
| Material Fund Change Notice [Text Block] |
This report describes changes to the Fund that occurred during the reporting period.
|
|
| Additional Information Phone Number |
1-800-373-9387
|
|
| Additional Information Email |
info@bny.com
|
|
| Additional Information Website |
bny.com/investments/literaturecenter
|
|
| Expenses [Text Block] |
What were the Fund’s costs for the last six months ?
(based on a hypothetical $10,000 investment)
| Share Class |
Costs of a $10,000 investment |
Costs paid as a percentage of a $10,000 investment |
| Class Y* |
$38 |
0.78%** |
| * |
During the period, fees were waived and/or expenses reimbursed pursuant to an agreement with the Fund’s investment adviser, BNY Mellon Investment Adviser, Inc. If this agreement is not extended in the future, expenses could be higher.
|
| ** |
Annualized.
|
|
|
| Expenses Paid, Amount |
$ 38
|
[9] |
| Expense Ratio, Percent |
0.78%
|
[9],[10] |
| Material Change Date |
Sep. 01, 2024
|
|
| Net Assets |
$ 229,000,000
|
|
| Holdings Count | Holding |
97
|
|
| Investment Company Portfolio Turnover |
33.41%
|
|
| Additional Fund Statistics [Text Block] |
KEY FUND STATISTICS (AS OF 2/28/25 )
Fund Size (Millions) |
Number of Holdings |
Portfolio Turnover |
| $229 |
97 |
33.41% |
|
|
| Holdings [Text Block] |
Portfolio Holdings (as of 2/28/25 )
Top Ten Holdings (Based on Net Assets) *
* Excludes money market funds or other short-term securities held for the investment of cash and cash collateral for securities loaned, if any.
Sector Allocation (Based on Net Assets)
|
|
| Largest Holdings [Text Block] |
Top Ten Holdings (Based on Net Assets) *
* Excludes money market funds or other short-term securities held for the investment of cash and cash collateral for securities loaned, if any.
|
|
| Material Fund Change [Text Block] |
How has the Fund changed?
-
Effective September 1, 2024, the Fund’s investment adviser, BNY Mellon Investment Adviser, Inc., has contractually agreed to waive receipt of a portion of its management fee in the amount of .10% of the value of the Fund’s average daily net assets until December 31, 2025. On or after December 31, 2025, BNY Mellon Investment Adviser, Inc. may terminate this waiver agreement at any time.
This is a summary of certain changes to the Fund since September 1, 2024 . For more complete information, you may review the Fund’s current prospectus dated December 31, 2024 at bny.com/investments/literaturecenter or upon request at 1-800-373-9387.
|
|
| Material Fund Change Expenses [Text Block] |
Effective September 1, 2024, the Fund’s investment adviser, BNY Mellon Investment Adviser, Inc., has contractually agreed to waive receipt of a portion of its management fee in the amount of .10% of the value of the Fund’s average daily net assets until December 31, 2025. On or after December 31, 2025, BNY Mellon Investment Adviser, Inc. may terminate this waiver agreement at any time.
|
|
| Summary of Change Legend [Text Block] |
This is a summary of certain changes to the Fund since September 1, 2024 . For more complete information, you may review the Fund’s current prospectus dated December 31, 2024 at bny.com/investments/literaturecenter or upon request at 1-800-373-9387.
|
|
| Updated Prospectus Phone Number |
1-800-373-9387
|
|
| Updated Prospectus Web Address |
bny.com/investments/literaturecenter
|
|
| C000001358 [Member] |
|
|
| Shareholder Report [Line Items] |
|
|
| Fund Name |
BNY Mellon Dynamic Value Fund
|
|
| Class Name |
Class A
|
|
| Trading Symbol |
DAGVX
|
|
| Annual or Semi-Annual Statement [Text Block] |
This semi-annual shareholder report contains important information about BNY Mellon Dynamic Value Fund (the “Fund”) for the period of September 1, 2024 to February 28, 2025.
|
|
| Shareholder Report Annual or Semi-Annual |
semi-annual shareholder report
|
|
| Additional Information [Text Block] |
You can find additional information about the Fund at bny.com/investments/literaturecenter. You can also request this information by calling 1-800-373-9387 (inside the U.S. only) or by sending an e-mail request to info@bny.com.
|
|
| Additional Information Phone Number |
1-800-373-9387
|
|
| Additional Information Email |
info@bny.com
|
|
| Additional Information Website |
bny.com/investments/literaturecenter
|
|
| Expenses [Text Block] |
What were the Fund’s costs for the last six months ? (based on a hypothetical $10,000 investment)
| Share Class |
Costs of a $10,000 investment |
Costs paid as a percentage of a $10,000 investment |
| Class A* |
$48 |
0.93%** |
| * |
During the period, fees were waived and/or expenses reimbursed pursuant to an agreement with the Fund’s investment adviser, BNY Mellon Investment Adviser, Inc. If this agreement is not extended in the future, expenses could be higher. |
| ** |
Annualized. |
|
|
| Expenses Paid, Amount |
$ 48
|
[11] |
| Expense Ratio, Percent |
0.93%
|
[11],[12] |
| Net Assets |
$ 7,865,000,000
|
|
| Holdings Count | Holding |
71
|
|
| Investment Company Portfolio Turnover |
46.48%
|
|
| Additional Fund Statistics [Text Block] |
KEY FUND STATISTICS (AS OF 2/28/25 )
Fund Size (Millions) |
Number of Holdings |
Portfolio Turnover |
| $7,865 |
71 |
46.48% |
|
|
| Holdings [Text Block] |
Portfolio Holdings (as of 2/28/25 ) Top Ten Holdings (Based on Net Assets) * * Excludes money market funds or other short-term securities held for the investment of cash and cash collateral for securities loaned, if any. Sector Allocation (Based on Net Assets)
|
|
| Largest Holdings [Text Block] |
Top Ten Holdings (Based on Net Assets) * * Excludes money market funds or other short-term securities held for the investment of cash and cash collateral for securities loaned, if any.
|
|
| C000001360 [Member] |
|
|
| Shareholder Report [Line Items] |
|
|
| Fund Name |
BNY Mellon Dynamic Value Fund
|
|
| Class Name |
Class C
|
|
| Trading Symbol |
DCGVX
|
|
| Annual or Semi-Annual Statement [Text Block] |
This semi-annual shareholder report contains important information about BNY Mellon Dynamic Value Fund (the “Fund”) for the period of September 1, 2024 to February 28, 2025.
|
|
| Shareholder Report Annual or Semi-Annual |
semi-annual shareholder report
|
|
| Additional Information [Text Block] |
You can find additional information about the Fund at bny.com/investments/literaturecenter. You can also request this information by calling 1-800-373-9387 (inside the U.S. only) or by sending an e-mail request to info@bny.com.
|
|
| Additional Information Phone Number |
1-800-373-9387
|
|
| Additional Information Email |
info@bny.com
|
|
| Additional Information Website |
bny.com/investments/literaturecenter
|
|
| Expenses [Text Block] |
What were the Fund’s costs for the last six months ? (based on a hypothetical $10,000 investment)
| Share Class |
Costs of a $10,000 investment |
Costs paid as a percentage of a $10,000 investment |
| Class C* |
$86 |
1.68%** |
| * |
During the period, fees were waived and/or expenses reimbursed pursuant to an agreement with the Fund’s investment adviser, BNY Mellon Investment Adviser, Inc. If this agreement is not extended in the future, expenses could be higher. |
| ** |
Annualized. |
|
|
| Expenses Paid, Amount |
$ 86
|
[13] |
| Expense Ratio, Percent |
1.68%
|
[13],[14] |
| Net Assets |
$ 7,865,000,000
|
|
| Holdings Count | Holding |
71
|
|
| Investment Company Portfolio Turnover |
46.48%
|
|
| Additional Fund Statistics [Text Block] |
KEY FUND STATISTICS (AS OF 2/28/25 )
Fund Size (Millions) |
Number of Holdings |
Portfolio Turnover |
| $7,865 |
71 |
46.48% |
|
|
| Holdings [Text Block] |
Portfolio Holdings (as of 2/28/25 ) Top Ten Holdings (Based on Net Assets) * * Excludes money market funds or other short-term securities held for the investment of cash and cash collateral for securities loaned, if any. Sector Allocation (Based on Net Assets)
|
|
| Largest Holdings [Text Block] |
Top Ten Holdings (Based on Net Assets) * * Excludes money market funds or other short-term securities held for the investment of cash and cash collateral for securities loaned, if any.
|
|
| C000001361 [Member] |
|
|
| Shareholder Report [Line Items] |
|
|
| Fund Name |
BNY Mellon Dynamic Value Fund
|
|
| Class Name |
Class I
|
|
| Trading Symbol |
DRGVX
|
|
| Annual or Semi-Annual Statement [Text Block] |
This semi-annual shareholder report contains important information about BNY Mellon Dynamic Value Fund (the “Fund”) for the period of September 1, 2024 to February 28, 2025.
|
|
| Shareholder Report Annual or Semi-Annual |
semi-annual shareholder report
|
|
| Additional Information [Text Block] |
You can find additional information about the Fund at bny.com/investments/literaturecenter. You can also request this information by calling 1-800-373-9387 (inside the U.S. only) or by sending an e-mail request to info@bny.com.
|
|
| Additional Information Phone Number |
1-800-373-9387
|
|
| Additional Information Email |
info@bny.com
|
|
| Additional Information Website |
bny.com/investments/literaturecenter
|
|
| Expenses [Text Block] |
What were the Fund’s costs for the last six months ? (based on a hypothetical $10,000 investment)
| Share Class |
Costs of a $10,000 investment |
Costs paid as a percentage of a $10,000 investment |
| Class I* |
$35 |
0.68%** |
| * |
During the period, fees were waived and/or expenses reimbursed pursuant to an agreement with the Fund’s investment adviser, BNY Mellon Investment Adviser, Inc. If this agreement is not extended in the future, expenses could be higher. |
| ** |
Annualized. |
|
|
| Expenses Paid, Amount |
$ 35
|
[15] |
| Expense Ratio, Percent |
0.68%
|
[15],[16] |
| Net Assets |
$ 7,865,000,000
|
|
| Holdings Count | Holding |
71
|
|
| Investment Company Portfolio Turnover |
46.48%
|
|
| Additional Fund Statistics [Text Block] |
KEY FUND STATISTICS (AS OF 2/28/25 )
Fund Size (Millions) |
Number of Holdings |
Portfolio Turnover |
| $7,865 |
71 |
46.48% |
|
|
| Holdings [Text Block] |
Portfolio Holdings (as of 2/28/25 ) Top Ten Holdings (Based on Net Assets) * * Excludes money market funds or other short-term securities held for the investment of cash and cash collateral for securities loaned, if any. Sector Allocation (Based on Net Assets)
|
|
| Largest Holdings [Text Block] |
Top Ten Holdings (Based on Net Assets) * * Excludes money market funds or other short-term securities held for the investment of cash and cash collateral for securities loaned, if any.
|
|
| C000130427 [Member] |
|
|
| Shareholder Report [Line Items] |
|
|
| Fund Name |
BNY Mellon Dynamic Value Fund
|
|
| Class Name |
Class Y
|
|
| Trading Symbol |
DRGYX
|
|
| Annual or Semi-Annual Statement [Text Block] |
This semi-annual shareholder report contains important information about BNY Mellon Dynamic Value Fund (the “Fund”) for the period of September 1, 2024 to February 28, 2025.
|
|
| Shareholder Report Annual or Semi-Annual |
semi-annual shareholder report
|
|
| Additional Information [Text Block] |
You can find additional information about the Fund at bny.com/investments/literaturecenter. You can also request this information by calling 1-800-373-9387 (inside the U.S. only) or by sending an e-mail request to info@bny.com.
|
|
| Additional Information Phone Number |
1-800-373-9387
|
|
| Additional Information Email |
info@bny.com
|
|
| Additional Information Website |
bny.com/investments/literaturecenter
|
|
| Expenses [Text Block] |
What were the Fund’s costs for the last six months ?
(based on a hypothetical $10,000 investment)
| Share Class |
Costs of a $10,000 investment |
Costs paid as a percentage of a $10,000 investment |
| Class Y |
$32 |
0.63%* |
|
|
| Expenses Paid, Amount |
$ 32
|
|
| Expense Ratio, Percent |
0.63%
|
[17] |
| Net Assets |
$ 7,865,000,000
|
|
| Holdings Count | Holding |
71
|
|
| Investment Company Portfolio Turnover |
46.48%
|
|
| Additional Fund Statistics [Text Block] |
KEY FUND STATISTICS (AS OF 2/28/25 )
Fund Size (Millions) |
Number of Holdings |
Portfolio Turnover |
| $7,865 |
71 |
46.48% |
|
|
| Holdings [Text Block] |
Portfolio Holdings (as of 2/28/25 )
Top Ten Holdings (Based on Net Assets) *
* Excludes money market funds or other short-term securities held for the investment of cash and cash collateral for securities loaned, if any.
Sector Allocation (Based on Net Assets)
|
|
| Largest Holdings [Text Block] |
Top Ten Holdings (Based on Net Assets) *
* Excludes money market funds or other short-term securities held for the investment of cash and cash collateral for securities loaned, if any.
|
|
| C000001368 [Member] |
|
|
| Shareholder Report [Line Items] |
|
|
| Fund Name |
BNY Mellon Technology Growth Fund
|
|
| Class Name |
Class A
|
|
| Trading Symbol |
DTGRX
|
|
| Annual or Semi-Annual Statement [Text Block] |
This semi-annual shareholder report contains important information about BNY Mellon Technology Growth Fund (the “Fund”) for the period of September 1, 2024 to February 28, 2025.
|
|
| Shareholder Report Annual or Semi-Annual |
semi-annual shareholder report
|
|
| Additional Information [Text Block] |
You can find additional information about the Fund at bny.com/investments/literaturecenter. You can also request this information by calling 1-800-373-9387 (inside the U.S. only) or by sending an e-mail request to info@bny.com.
|
|
| Additional Information Phone Number |
1-800-373-9387
|
|
| Additional Information Email |
info@bny.com
|
|
| Additional Information Website |
bny.com/investments/literaturecenter
|
|
| Expenses [Text Block] |
What were the Fund’s costs for the last six months ?
(based on a hypothetical $10,000 investment)
| Share Class |
Costs of a $10,000 investment |
Costs paid as a percentage of a $10,000 investment |
| Class A |
$60 |
1.17%* |
|
|
| Expenses Paid, Amount |
$ 60
|
|
| Expense Ratio, Percent |
1.17%
|
[18] |
| Net Assets |
$ 378,000,000
|
|
| Holdings Count | Holding |
44
|
|
| Investment Company Portfolio Turnover |
20.80%
|
|
| Additional Fund Statistics [Text Block] |
KEY FUND STATISTICS (AS OF 2/28/25 )
Fund Size (Millions) |
Number of Holdings |
Portfolio Turnover |
| $378 |
44 |
20.80% |
|
|
| Holdings [Text Block] |
Portfolio Holdings (as of 2/28/25 )
Top Ten Holdings (Based on Net Assets) *
* Excludes money market funds or other short-term securities held for the investment of cash and cash collateral for securities loaned, if any.
Sector Allocation (Based on Net Assets)
|
|
| Largest Holdings [Text Block] |
Top Ten Holdings (Based on Net Assets) *
* Excludes money market funds or other short-term securities held for the investment of cash and cash collateral for securities loaned, if any.
|
|
| C000001370 [Member] |
|
|
| Shareholder Report [Line Items] |
|
|
| Fund Name |
BNY Mellon Technology Growth Fund
|
|
| Class Name |
Class C
|
|
| Trading Symbol |
DTGCX
|
|
| Annual or Semi-Annual Statement [Text Block] |
This semi-annual shareholder report contains important information about BNY Mellon Technology Growth Fund (the “Fund”) for the period of September 1, 2024 to February 28, 2025.
|
|
| Shareholder Report Annual or Semi-Annual |
semi-annual shareholder report
|
|
| Additional Information [Text Block] |
You can find additional information about the Fund at bny.com/investments/literaturecenter. You can also request this information by calling 1-800-373-9387 (inside the U.S. only) or by sending an e-mail request to info@bny.com.
|
|
| Additional Information Phone Number |
1-800-373-9387
|
|
| Additional Information Email |
info@bny.com
|
|
| Additional Information Website |
bny.com/investments/literaturecenter
|
|
| Expenses [Text Block] |
What were the Fund’s costs for the last six months ?
(based on a hypothetical $10,000 investment)
| Share Class |
Costs of a $10,000 investment |
Costs paid as a percentage of a $10,000 investment |
| Class C |
$101 |
1.97%* |
|
|
| Expenses Paid, Amount |
$ 101
|
|
| Expense Ratio, Percent |
1.97%
|
[19] |
| Net Assets |
$ 378,000,000
|
|
| Holdings Count | Holding |
44
|
|
| Investment Company Portfolio Turnover |
20.80%
|
|
| Additional Fund Statistics [Text Block] |
KEY FUND STATISTICS (AS OF 2/28/25 )
Fund Size (Millions) |
Number of Holdings |
Portfolio Turnover |
| $378 |
44 |
20.80% |
|
|
| Holdings [Text Block] |
Portfolio Holdings (as of 2/28/25 )
Top Ten Holdings (Based on Net Assets) *
* Excludes money market funds or other short-term securities held for the investment of cash and cash collateral for securities loaned, if any.
Sector Allocation (Based on Net Assets)
|
|
| Largest Holdings [Text Block] |
Top Ten Holdings (Based on Net Assets) * * Excludes money market funds or other short-term securities held for the investment of cash and cash collateral for securities loaned, if any.
|
|
| C000001371 [Member] |
|
|
| Shareholder Report [Line Items] |
|
|
| Fund Name |
BNY Mellon Technology Growth Fund
|
|
| Class Name |
Class I
|
|
| Trading Symbol |
DGVRX
|
|
| Annual or Semi-Annual Statement [Text Block] |
This semi-annual shareholder report contains important information about BNY Mellon Technology Growth Fund (the “Fund”) for the period of September 1, 2024 to February 28, 2025.
|
|
| Shareholder Report Annual or Semi-Annual |
semi-annual shareholder report
|
|
| Additional Information [Text Block] |
You can find additional information about the Fund at bny.com/investments/literaturecenter. You can also request this information by calling 1-800-373-9387 (inside the U.S. only) or by sending an e-mail request to info@bny.com.
|
|
| Additional Information Phone Number |
1-800-373-9387
|
|
| Additional Information Email |
info@bny.com
|
|
| Additional Information Website |
bny.com/investments/literaturecenter
|
|
| Expenses [Text Block] |
What were the Fund’s costs for the last six months ? (based on a hypothetical $10,000 investment)
| Share Class |
Costs of a $10,000 investment |
Costs paid as a percentage of a $10,000 investment |
| Class I |
$48 |
0.94%* |
|
|
| Expenses Paid, Amount |
$ 48
|
|
| Expense Ratio, Percent |
0.94%
|
[20] |
| Net Assets |
$ 378,000,000
|
|
| Holdings Count | Holding |
44
|
|
| Investment Company Portfolio Turnover |
20.80%
|
|
| Additional Fund Statistics [Text Block] |
KEY FUND STATISTICS (AS OF 2/28/25 )
Fund Size (Millions) |
Number of Holdings |
Portfolio Turnover |
| $378 |
44 |
20.80% |
|
|
| Holdings [Text Block] |
Portfolio Holdings (as of 2/28/25 ) Top Ten Holdings (Based on Net Assets) * * Excludes money market funds or other short-term securities held for the investment of cash and cash collateral for securities loaned, if any. Sector Allocation (Based on Net Assets)
|
|
| Largest Holdings [Text Block] |
Top Ten Holdings (Based on Net Assets) * * Excludes money market funds or other short-term securities held for the investment of cash and cash collateral for securities loaned, if any.
|
|
| C000174007 [Member] |
|
|
| Shareholder Report [Line Items] |
|
|
| Fund Name |
BNY Mellon Technology Growth Fund
|
|
| Class Name |
Class Y
|
|
| Trading Symbol |
DTEYX
|
|
| Annual or Semi-Annual Statement [Text Block] |
This semi-annual shareholder report contains important information about BNY Mellon Technology Growth Fund (the “Fund”) for the period of September 1, 2024 to February 28, 2025.
|
|
| Shareholder Report Annual or Semi-Annual |
semi-annual shareholder report
|
|
| Additional Information [Text Block] |
You can find additional information about the Fund at bny.com/investments/literaturecenter. You can also request this information by calling 1-800-373-9387 (inside the U.S. only) or by sending an e-mail request to info@bny.com.
|
|
| Additional Information Phone Number |
1-800-373-9387
|
|
| Additional Information Email |
info@bny.com
|
|
| Additional Information Website |
bny.com/investments/literaturecenter
|
|
| Expenses [Text Block] |
What were the Fund’s costs for the last six months ? (based on a hypothetical $10,000 investment)
| Share Class |
Costs of a $10,000 investment |
Costs paid as a percentage of a $10,000 investment |
| Class Y |
$44 |
0.85%* |
|
|
| Expenses Paid, Amount |
$ 44
|
|
| Expense Ratio, Percent |
0.85%
|
[21] |
| Net Assets |
$ 378,000,000
|
|
| Holdings Count | Holding |
44
|
|
| Investment Company Portfolio Turnover |
20.80%
|
|
| Additional Fund Statistics [Text Block] |
KEY FUND STATISTICS (AS OF 2/28/25 )
Fund Size (Millions) |
Number of Holdings |
Portfolio Turnover |
| $378 |
44 |
20.80% |
|
|
| Holdings [Text Block] |
Portfolio Holdings (as of 2/28/25 ) Top Ten Holdings (Based on Net Assets) * * Excludes money market funds or other short-term securities held for the investment of cash and cash collateral for securities loaned, if any. Sector Allocation (Based on Net Assets)
|
|
| Largest Holdings [Text Block] |
Top Ten Holdings (Based on Net Assets) * * Excludes money market funds or other short-term securities held for the investment of cash and cash collateral for securities loaned, if any.
|
|
|
|
| X |
- DefinitionBoolean flag that is true when the XBRL content amends previously-filed or accepted submission.
| Name: |
dei_AmendmentFlag |
| Namespace Prefix: |
dei_ |
| Data Type: |
xbrli:booleanItemType |
| Balance Type: |
na |
| Period Type: |
duration |
|
| X |
- DefinitionFor the EDGAR submission types of Form 8-K: the date of the report, the date of the earliest event reported; for the EDGAR submission types of Form N-1A: the filing date; for all other submission types: the end of the reporting or transition period. The format of the date is YYYY-MM-DD.
| Name: |
dei_DocumentPeriodEndDate |
| Namespace Prefix: |
dei_ |
| Data Type: |
xbrli:dateItemType |
| Balance Type: |
na |
| Period Type: |
duration |
|
| X |
- DefinitionThe type of document being provided (such as 10-K, 10-Q, 485BPOS, etc). The document type is limited to the same value as the supporting SEC submission type, or the word 'Other'.
| Name: |
dei_DocumentType |
| Namespace Prefix: |
dei_ |
| Data Type: |
dei:submissionTypeItemType |
| Balance Type: |
na |
| Period Type: |
duration |
|
| X |
- DefinitionA unique 10-digit SEC-issued value to identify entities that have filed disclosures with the SEC. It is commonly abbreviated as CIK. Reference 1: http://www.xbrl.org/2003/role/presentationRef
-Publisher SEC
-Name Exchange Act
-Number 240
-Section 12
-Subsection b-2
| Name: |
dei_EntityCentralIndexKey |
| Namespace Prefix: |
dei_ |
| Data Type: |
dei:centralIndexKeyItemType |
| Balance Type: |
na |
| Period Type: |
duration |
|
| X |
- DefinitionOne of: N-1A (Mutual Fund), N-1 (Open-End Separate Account with No Variable Annuities), N-2 (Closed-End Investment Company), N-3 (Separate Account Registered as Open-End Management Investment Company), N-4 (Variable Annuity UIT Separate Account), N-5 (Small Business Investment Company), N-6 (Variable Life UIT Separate Account), S-1 or S-3 (Face Amount Certificate Company), S-6 (UIT, Non-Insurance Product). Reference 1: http://www.xbrl.org/2003/role/presentationRef
-Publisher SEC
-Name Regulation S-T
-Number 232
-Section 313
| Name: |
dei_EntityInvCompanyType |
| Namespace Prefix: |
dei_ |
| Data Type: |
dei:invCompanyType |
| Balance Type: |
na |
| Period Type: |
duration |
|
| X |
- DefinitionThe exact name of the entity filing the report as specified in its charter, which is required by forms filed with the SEC. Reference 1: http://www.xbrl.org/2003/role/presentationRef
-Publisher SEC
-Name Exchange Act
-Number 240
-Section 12
-Subsection b-2
| Name: |
dei_EntityRegistrantName |
| Namespace Prefix: |
dei_ |
| Data Type: |
xbrli:normalizedStringItemType |
| Balance Type: |
na |
| Period Type: |
duration |
|
| X |
- DefinitionTrading symbol of an instrument as listed on an exchange.
| Name: |
dei_TradingSymbol |
| Namespace Prefix: |
dei_ |
| Data Type: |
dei:tradingSymbolItemType |
| Balance Type: |
na |
| Period Type: |
duration |
|
| X |
- ReferencesReference 1: http://www.xbrl.org/2003/role/presentationRef
-Publisher SEC
-Name Form N-1A
-Section 27A
-Subsection e
| Name: |
oef_AddlFundStatisticsTextBlock |
| Namespace Prefix: |
oef_ |
| Data Type: |
dtr-types:textBlockItemType |
| Balance Type: |
na |
| Period Type: |
duration |
|
| X |
- ReferencesReference 1: http://www.xbrl.org/2003/role/presentationRef
-Publisher SEC
-Name Form N-1A
-Section 27A
-Subsection b
-Paragraph instruction
-Subparagraph 2
| Name: |
oef_AddlInfoEmail |
| Namespace Prefix: |
oef_ |
| Data Type: |
xbrli:stringItemType |
| Balance Type: |
na |
| Period Type: |
duration |
|
| X |
- ReferencesReference 1: http://www.xbrl.org/2003/role/presentationRef
-Publisher SEC
-Name Form N-1A
-Section 27A
-Subsection b
-Paragraph instruction
-Subparagraph 2
| Name: |
oef_AddlInfoPhoneNumber |
| Namespace Prefix: |
oef_ |
| Data Type: |
xbrli:stringItemType |
| Balance Type: |
na |
| Period Type: |
duration |
|
| X |
- ReferencesReference 1: http://www.xbrl.org/2003/role/presentationRef
-Publisher SEC
-Name Form N-1A
-Section 27A
-Subsection b
-Paragraph 4
| Name: |
oef_AddlInfoTextBlock |
| Namespace Prefix: |
oef_ |
| Data Type: |
dtr-types:textBlockItemType |
| Balance Type: |
na |
| Period Type: |
duration |
|
| X |
- ReferencesReference 1: http://www.xbrl.org/2003/role/presentationRef
-Publisher SEC
-Name Form N-1A
-Section 27A
-Subsection b
-Paragraph instruction
-Subparagraph 2
| Name: |
oef_AddlInfoWebsite |
| Namespace Prefix: |
oef_ |
| Data Type: |
xbrli:stringItemType |
| Balance Type: |
na |
| Period Type: |
duration |
|
| X |
- ReferencesReference 1: http://www.xbrl.org/2003/role/presentationRef
-Publisher SEC
-Name Form N-1A
-Section 27A
-Subsection b
-Paragraph 3
| Name: |
oef_AnnlOrSemiAnnlStatementTextBlock |
| Namespace Prefix: |
oef_ |
| Data Type: |
dtr-types:textBlockItemType |
| Balance Type: |
na |
| Period Type: |
duration |
|
| X |
- ReferencesReference 1: http://www.xbrl.org/2003/role/presentationRef
-Publisher SEC
-Name Form N-1A
-Section 27A
-Subsection b
-Paragraph instruction
-Subparagraph 2
| Name: |
oef_ClassName |
| Namespace Prefix: |
oef_ |
| Data Type: |
dei:securityTitleItemType |
| Balance Type: |
na |
| Period Type: |
duration |
|
| X |
- ReferencesReference 1: http://www.xbrl.org/2003/role/presentationRef
-Publisher SEC
-Name Form N-1A
-Section 27A
-Subsection c
-Paragraph iii
| Name: |
oef_ExpenseRatioPct |
| Namespace Prefix: |
oef_ |
| Data Type: |
dtr-types:percentItemType |
| Balance Type: |
na |
| Period Type: |
duration |
|
| X |
- ReferencesReference 1: http://www.xbrl.org/2003/role/presentationRef
-Publisher SEC
-Name Form N-1A
-Section 27A
-Subsection c
-Paragraph ii
| Name: |
oef_ExpensesPaidAmt |
| Namespace Prefix: |
oef_ |
| Data Type: |
xbrli:monetaryItemType |
| Balance Type: |
na |
| Period Type: |
duration |
|
| X |
- ReferencesReference 1: http://www.xbrl.org/2003/role/presentationRef
-Publisher SEC
-Name Form N-1A
-Section 27A
-Subsection c
| Name: |
oef_ExpensesTextBlock |
| Namespace Prefix: |
oef_ |
| Data Type: |
dtr-types:textBlockItemType |
| Balance Type: |
na |
| Period Type: |
duration |
|
| X |
- ReferencesReference 1: http://www.xbrl.org/2003/role/presentationRef
-Publisher SEC
-Name Form N-1A
-Section 27A
-Subsection b
-Paragraph 1
| Name: |
oef_FundName |
| Namespace Prefix: |
oef_ |
| Data Type: |
xbrli:normalizedStringItemType |
| Balance Type: |
na |
| Period Type: |
duration |
|
| X |
- ReferencesReference 1: http://www.xbrl.org/2003/role/presentationRef
-Publisher SEC
-Name Form N-1A
-Section 27A
-Subsection e
| Name: |
oef_HoldingsCount |
| Namespace Prefix: |
oef_ |
| Data Type: |
xbrli:integerItemType |
| Balance Type: |
na |
| Period Type: |
instant |
|
| X |
- ReferencesReference 1: http://www.xbrl.org/2003/role/presentationRef
-Publisher SEC
-Name Form N-1A
-Section 27A
-Subsection f
| Name: |
oef_HoldingsTableTextBlock |
| Namespace Prefix: |
oef_ |
| Data Type: |
dtr-types:textBlockItemType |
| Balance Type: |
na |
| Period Type: |
duration |
|
| X |
- ReferencesReference 1: http://www.xbrl.org/2003/role/presentationRef
-Publisher SEC
-Name Form N-1A
-Section 27A
-Subsection f
| Name: |
oef_LargestHoldingsTableTextBlock |
| Namespace Prefix: |
oef_ |
| Data Type: |
dtr-types:textBlockItemType |
| Balance Type: |
na |
| Period Type: |
duration |
|
| X |
- ReferencesReference 1: http://www.xbrl.org/2003/role/presentationRef
-Publisher SEC
-Name Form N-1A
-Section 27A
-Subsection d
-Paragraph 2
-Subparagraph instruction
-Clause 14
| Name: |
oef_MaterialChngDate |
| Namespace Prefix: |
oef_ |
| Data Type: |
xbrli:dateItemType |
| Balance Type: |
na |
| Period Type: |
duration |
|
| X |
- ReferencesReference 1: http://www.xbrl.org/2003/role/presentationRef
-Publisher SEC
-Name Form N-1A
-Section 27A
-Subsection g
-Paragraph 3
| Name: |
oef_MaterialFundChngExpensesTextBlock |
| Namespace Prefix: |
oef_ |
| Data Type: |
dtr-types:textBlockItemType |
| Balance Type: |
na |
| Period Type: |
duration |
|
| X |
- ReferencesReference 1: http://www.xbrl.org/2003/role/presentationRef
-Publisher SEC
-Name Form N-1A
-Section 27A
-Subsection b
-Paragraph 5
| Name: |
oef_MaterialFundChngNoticeTextBlock |
| Namespace Prefix: |
oef_ |
| Data Type: |
dtr-types:textBlockItemType |
| Balance Type: |
na |
| Period Type: |
duration |
|
| X |
- ReferencesReference 1: http://www.xbrl.org/2003/role/presentationRef
-Publisher SEC
-Name Form N-1A
-Section 27A
-Subsection g
| Name: |
oef_MaterialFundChngTextBlock |
| Namespace Prefix: |
oef_ |
| Data Type: |
dtr-types:textBlockItemType |
| Balance Type: |
na |
| Period Type: |
duration |
|
| X |
- ReferencesReference 1: http://www.xbrl.org/2003/role/presentationRef
-Publisher SEC
-Name Form N-1A
-Section 27A
-Subsection b
-Paragraph 3
| Name: |
oef_ShareholderReportAnnualOrSemiAnnual |
| Namespace Prefix: |
oef_ |
| Data Type: |
oef:shareholderReportTypeItemType |
| Balance Type: |
na |
| Period Type: |
duration |
|
| X |
- ReferencesReference 1: http://www.xbrl.org/2003/role/presentationRef
-Publisher SEC
-Name Form N-1A
-Section 27A
-Subsection d
-Paragraph 2
-Subparagraph instruction
-Clause 7
| Name: |
oef_ShareholderReportLineItems |
| Namespace Prefix: |
oef_ |
| Data Type: |
xbrli:stringItemType |
| Balance Type: |
na |
| Period Type: |
duration |
|
| X |
- ReferencesReference 1: http://www.xbrl.org/2003/role/presentationRef
-Publisher SEC
-Name Form N-1A
-Section 27A
-Subsection g
-Paragraph instruction
-Subparagraph 2
| Name: |
oef_SummaryOfChngLegendTextBlock |
| Namespace Prefix: |
oef_ |
| Data Type: |
dtr-types:textBlockItemType |
| Balance Type: |
na |
| Period Type: |
duration |
|
| X |
- ReferencesReference 1: http://www.xbrl.org/2003/role/presentationRef
-Publisher SEC
-Name Form N-1A
-Section 27A
-Subsection g
-Paragraph instruction
-Subparagraph 2
| Name: |
oef_UpdProspectusPhoneNumber |
| Namespace Prefix: |
oef_ |
| Data Type: |
xbrli:stringItemType |
| Balance Type: |
na |
| Period Type: |
duration |
|
| X |
- ReferencesReference 1: http://www.xbrl.org/2003/role/presentationRef
-Publisher SEC
-Name Form N-1A
-Section 27A
-Subsection g
-Paragraph instruction
-Subparagraph 2
| Name: |
oef_UpdProspectusWebAddress |
| Namespace Prefix: |
oef_ |
| Data Type: |
xbrli:stringItemType |
| Balance Type: |
na |
| Period Type: |
duration |
|
| X |
- DefinitionAmount of net assets (liabilities). Reference 1: http://fasb.org/us-gaap/role/ref/legacyRef
-Name Accounting Standards Codification
-Section 50
-Paragraph 1
-SubTopic 30
-Topic 205
-Publisher FASB
-URI https://asc.fasb.org//1943274/2147479910/205-30-50-1
| Name: |
us-gaap_AssetsNet |
| Namespace Prefix: |
us-gaap_ |
| Data Type: |
xbrli:monetaryItemType |
| Balance Type: |
debit |
| Period Type: |
instant |
|
| X |
- DefinitionPercentage of lesser of purchase or sale of portfolio securities to average value of portfolio securities owned. Reference 1: http://www.xbrl.org/2009/role/commonPracticeRef
-Topic 946
-SubTopic 205
-Name Accounting Standards Codification
-Section 50
-Paragraph 27
-Publisher FASB
-URI https://asc.fasb.org//1943274/2147480737/946-205-50-27
| Name: |
us-gaap_InvestmentCompanyPortfolioTurnover |
| Namespace Prefix: |
us-gaap_ |
| Data Type: |
dtr-types:percentItemType |
| Balance Type: |
na |
| Period Type: |
duration |
|
| X |
- Details
| Name: |
oef_ClassAxis=bmafi_C000001288Member |
| Namespace Prefix: |
|
| Data Type: |
na |
| Balance Type: |
|
| Period Type: |
|
|
| X |
- Details
| Name: |
oef_ClassAxis=bmafi_C000064720Member |
| Namespace Prefix: |
|
| Data Type: |
na |
| Balance Type: |
|
| Period Type: |
|
|
| X |
- Details
| Name: |
oef_ClassAxis=bmafi_C000064721Member |
| Namespace Prefix: |
|
| Data Type: |
na |
| Balance Type: |
|
| Period Type: |
|
|
| X |
- Details
| Name: |
oef_ClassAxis=bmafi_C000130426Member |
| Namespace Prefix: |
|
| Data Type: |
na |
| Balance Type: |
|
| Period Type: |
|
|
| X |
- Details
| Name: |
oef_ClassAxis=bmafi_C000001289Member |
| Namespace Prefix: |
|
| Data Type: |
na |
| Balance Type: |
|
| Period Type: |
|
|
| X |
- Details
| Name: |
oef_ClassAxis=bmafi_C000174006Member |
| Namespace Prefix: |
|
| Data Type: |
na |
| Balance Type: |
|
| Period Type: |
|
|
| X |
- Details
| Name: |
oef_ClassAxis=bmafi_C000174005Member |
| Namespace Prefix: |
|
| Data Type: |
na |
| Balance Type: |
|
| Period Type: |
|
|
| X |
- Details
| Name: |
oef_ClassAxis=bmafi_C000001358Member |
| Namespace Prefix: |
|
| Data Type: |
na |
| Balance Type: |
|
| Period Type: |
|
|
| X |
- Details
| Name: |
oef_ClassAxis=bmafi_C000001360Member |
| Namespace Prefix: |
|
| Data Type: |
na |
| Balance Type: |
|
| Period Type: |
|
|
| X |
- Details
| Name: |
oef_ClassAxis=bmafi_C000001361Member |
| Namespace Prefix: |
|
| Data Type: |
na |
| Balance Type: |
|
| Period Type: |
|
|
| X |
- Details
| Name: |
oef_ClassAxis=bmafi_C000130427Member |
| Namespace Prefix: |
|
| Data Type: |
na |
| Balance Type: |
|
| Period Type: |
|
|
| X |
- Details
| Name: |
oef_ClassAxis=bmafi_C000001368Member |
| Namespace Prefix: |
|
| Data Type: |
na |
| Balance Type: |
|
| Period Type: |
|
|
| X |
- Details
| Name: |
oef_ClassAxis=bmafi_C000001370Member |
| Namespace Prefix: |
|
| Data Type: |
na |
| Balance Type: |
|
| Period Type: |
|
|
| X |
- Details
| Name: |
oef_ClassAxis=bmafi_C000001371Member |
| Namespace Prefix: |
|
| Data Type: |
na |
| Balance Type: |
|
| Period Type: |
|
|
| X |
- Details
| Name: |
oef_ClassAxis=bmafi_C000174007Member |
| Namespace Prefix: |
|
| Data Type: |
na |
| Balance Type: |
|
| Period Type: |
|
|
v3.25.1
| X |
- ReferencesReference 1: http://www.xbrl.org/2003/role/presentationRef
-Publisher SEC
-Name Form N-1A
-Section 27A
-Subsection f
| Name: |
oef_HoldingsLineItems |
| Namespace Prefix: |
oef_ |
| Data Type: |
xbrli:stringItemType |
| Balance Type: |
na |
| Period Type: |
duration |
|
| X |
- ReferencesReference 1: http://www.xbrl.org/2003/role/presentationRef
-Publisher SEC
-Name Form N-1A
-Section 27A
-Subsection f
| Name: |
oef_PctOfNav |
| Namespace Prefix: |
oef_ |
| Data Type: |
dtr-types:percentItemType |
| Balance Type: |
na |
| Period Type: |
instant |
|
| X |
- Details
| Name: |
oef_ClassAxis=bmafi_C000001288Member |
| Namespace Prefix: |
|
| Data Type: |
na |
| Balance Type: |
|
| Period Type: |
|
|
| X |
- Details
| Name: |
oef_LargestHoldingAxis=bmafi_AramarkMember |
| Namespace Prefix: |
|
| Data Type: |
na |
| Balance Type: |
|
| Period Type: |
|
|
| X |
- Details
| Name: |
oef_LargestHoldingAxis=bmafi_JohnsonControlsInternationalPLCMember |
| Namespace Prefix: |
|
| Data Type: |
na |
| Balance Type: |
|
| Period Type: |
|
|
| X |
- Details
| Name: |
oef_LargestHoldingAxis=bmafi_BurlingtonStoresIncMember |
| Namespace Prefix: |
|
| Data Type: |
na |
| Balance Type: |
|
| Period Type: |
|
|
| X |
- Details
| Name: |
oef_LargestHoldingAxis=bmafi_FirstHorizonCorpMember |
| Namespace Prefix: |
|
| Data Type: |
na |
| Balance Type: |
|
| Period Type: |
|
|
| X |
- Details
| Name: |
oef_LargestHoldingAxis=bmafi_ExpediaGroupIncMember |
| Namespace Prefix: |
|
| Data Type: |
na |
| Balance Type: |
|
| Period Type: |
|
|
| X |
- Details
| Name: |
oef_LargestHoldingAxis=bmafi_DominionEnergyIncMember |
| Namespace Prefix: |
|
| Data Type: |
na |
| Balance Type: |
|
| Period Type: |
|
|
| X |
- Details
| Name: |
oef_LargestHoldingAxis=bmafi_KenvueIncMember |
| Namespace Prefix: |
|
| Data Type: |
na |
| Balance Type: |
|
| Period Type: |
|
|
| X |
- Details
| Name: |
oef_LargestHoldingAxis=bmafi_NewmontCorpMember |
| Namespace Prefix: |
|
| Data Type: |
na |
| Balance Type: |
|
| Period Type: |
|
|
| X |
- Details
| Name: |
oef_LargestHoldingAxis=bmafi_AssurantIncMember |
| Namespace Prefix: |
|
| Data Type: |
na |
| Balance Type: |
|
| Period Type: |
|
|
| X |
- Details
| Name: |
oef_LargestHoldingAxis=bmafi_DigitalRealtyTrustIncMember |
| Namespace Prefix: |
|
| Data Type: |
na |
| Balance Type: |
|
| Period Type: |
|
|
| X |
- Details
| Name: |
oef_IndustrySectorAxis=us-gaap_EnergySectorMember |
| Namespace Prefix: |
|
| Data Type: |
na |
| Balance Type: |
|
| Period Type: |
|
|
| X |
- Details
| Name: |
oef_IndustrySectorAxis=us-gaap_FinancialServicesSectorMember |
| Namespace Prefix: |
|
| Data Type: |
na |
| Balance Type: |
|
| Period Type: |
|
|
| X |
- Details
| Name: |
oef_IndustrySectorAxis=us-gaap_HealthcareSectorMember |
| Namespace Prefix: |
|
| Data Type: |
na |
| Balance Type: |
|
| Period Type: |
|
|
| X |
- Details
| Name: |
oef_IndustrySectorAxis=oef_UtilitiesSectorMember |
| Namespace Prefix: |
|
| Data Type: |
na |
| Balance Type: |
|
| Period Type: |
|
|
| X |
- Details
| Name: |
oef_IndustrySectorAxis=oef_CommunicationsSectorMember |
| Namespace Prefix: |
|
| Data Type: |
na |
| Balance Type: |
|
| Period Type: |
|
|
| X |
- Details
| Name: |
oef_IndustrySectorAxis=oef_ConsumerDiscretionarySectorMember |
| Namespace Prefix: |
|
| Data Type: |
na |
| Balance Type: |
|
| Period Type: |
|
|
| X |
- Details
| Name: |
oef_IndustrySectorAxis=us-gaap_RealEstateSectorMember |
| Namespace Prefix: |
|
| Data Type: |
na |
| Balance Type: |
|
| Period Type: |
|
|
| X |
- Details
| Name: |
oef_IndustrySectorAxis=oef_ConsumerStaplesSectorMember |
| Namespace Prefix: |
|
| Data Type: |
na |
| Balance Type: |
|
| Period Type: |
|
|
| X |
- Details
| Name: |
oef_IndustrySectorAxis=oef_IndustrialSectorMember |
| Namespace Prefix: |
|
| Data Type: |
na |
| Balance Type: |
|
| Period Type: |
|
|
| X |
- Details
| Name: |
oef_IndustrySectorAxis=oef_MaterialsSectorMember |
| Namespace Prefix: |
|
| Data Type: |
na |
| Balance Type: |
|
| Period Type: |
|
|
| X |
- Details
| Name: |
us-gaap_InvestmentTypeAxis=bmafi_InvestmentCompaniesMember |
| Namespace Prefix: |
|
| Data Type: |
na |
| Balance Type: |
|
| Period Type: |
|
|
| X |
- Details
| Name: |
us-gaap_InvestmentTypeAxis=bmafi_NetOtherAssetsAndLiabilitiesMember |
| Namespace Prefix: |
|
| Data Type: |
na |
| Balance Type: |
|
| Period Type: |
|
|
| X |
- Details
| Name: |
oef_ClassAxis=bmafi_C000064720Member |
| Namespace Prefix: |
|
| Data Type: |
na |
| Balance Type: |
|
| Period Type: |
|
|
| X |
- Details
| Name: |
oef_ClassAxis=bmafi_C000064721Member |
| Namespace Prefix: |
|
| Data Type: |
na |
| Balance Type: |
|
| Period Type: |
|
|
| X |
- Details
| Name: |
oef_ClassAxis=bmafi_C000130426Member |
| Namespace Prefix: |
|
| Data Type: |
na |
| Balance Type: |
|
| Period Type: |
|
|
| X |
- Details
| Name: |
oef_ClassAxis=bmafi_C000001289Member |
| Namespace Prefix: |
|
| Data Type: |
na |
| Balance Type: |
|
| Period Type: |
|
|
| X |
- Details
| Name: |
oef_LargestHoldingAxis=bmafi_AlamosGoldIncClAMember |
| Namespace Prefix: |
|
| Data Type: |
na |
| Balance Type: |
|
| Period Type: |
|
|
| X |
- Details
| Name: |
oef_LargestHoldingAxis=bmafi_InsmedIncMember |
| Namespace Prefix: |
|
| Data Type: |
na |
| Balance Type: |
|
| Period Type: |
|
|
| X |
- Details
| Name: |
oef_LargestHoldingAxis=bmafi_TheBaldwinInsuranceGroupIncMember |
| Namespace Prefix: |
|
| Data Type: |
na |
| Balance Type: |
|
| Period Type: |
|
|
| X |
- Details
| Name: |
oef_LargestHoldingAxis=bmafi_GeniusSportsLtdMember |
| Namespace Prefix: |
|
| Data Type: |
na |
| Balance Type: |
|
| Period Type: |
|
|
| X |
- Details
| Name: |
oef_LargestHoldingAxis=bmafi_TexasCapitalBancsharesIncMember |
| Namespace Prefix: |
|
| Data Type: |
na |
| Balance Type: |
|
| Period Type: |
|
|
| X |
- Details
| Name: |
oef_LargestHoldingAxis=bmafi_MagniteIncMember |
| Namespace Prefix: |
|
| Data Type: |
na |
| Balance Type: |
|
| Period Type: |
|
|
| X |
- Details
| Name: |
oef_LargestHoldingAxis=bmafi_ValmontIndustriesIncMember |
| Namespace Prefix: |
|
| Data Type: |
na |
| Balance Type: |
|
| Period Type: |
|
|
| X |
- Details
| Name: |
oef_LargestHoldingAxis=bmafi_SkyWestIncMember |
| Namespace Prefix: |
|
| Data Type: |
na |
| Balance Type: |
|
| Period Type: |
|
|
| X |
- Details
| Name: |
oef_LargestHoldingAxis=bmafi_ClearwayEnergyIncClCMember |
| Namespace Prefix: |
|
| Data Type: |
na |
| Balance Type: |
|
| Period Type: |
|
|
| X |
- Details
| Name: |
oef_ClassAxis=bmafi_C000174006Member |
| Namespace Prefix: |
|
| Data Type: |
na |
| Balance Type: |
|
| Period Type: |
|
|
| X |
- Details
| Name: |
oef_ClassAxis=bmafi_C000174005Member |
| Namespace Prefix: |
|
| Data Type: |
na |
| Balance Type: |
|
| Period Type: |
|
|
| X |
- Details
| Name: |
oef_ClassAxis=bmafi_C000001358Member |
| Namespace Prefix: |
|
| Data Type: |
na |
| Balance Type: |
|
| Period Type: |
|
|
| X |
- Details
| Name: |
oef_LargestHoldingAxis=bmafi_JPMorganChaseAndCoMember |
| Namespace Prefix: |
|
| Data Type: |
na |
| Balance Type: |
|
| Period Type: |
|
|
| X |
- Details
| Name: |
oef_LargestHoldingAxis=bmafi_CiscoSystemsIncMember |
| Namespace Prefix: |
|
| Data Type: |
na |
| Balance Type: |
|
| Period Type: |
|
|
| X |
- Details
| Name: |
oef_LargestHoldingAxis=bmafi_BerkshireHathawayIncClBMember |
| Namespace Prefix: |
|
| Data Type: |
na |
| Balance Type: |
|
| Period Type: |
|
|
| X |
- Details
| Name: |
oef_LargestHoldingAxis=bmafi_DanaherCorpMember |
| Namespace Prefix: |
|
| Data Type: |
na |
| Balance Type: |
|
| Period Type: |
|
|
| X |
- Details
| Name: |
oef_LargestHoldingAxis=bmafi_ATAndTIncMember |
| Namespace Prefix: |
|
| Data Type: |
na |
| Balance Type: |
|
| Period Type: |
|
|
| X |
- Details
| Name: |
oef_LargestHoldingAxis=bmafi_BankOfAmericaCorpMember |
| Namespace Prefix: |
|
| Data Type: |
na |
| Balance Type: |
|
| Period Type: |
|
|
| X |
- Details
| Name: |
oef_LargestHoldingAxis=bmafi_Phillips66Member |
| Namespace Prefix: |
|
| Data Type: |
na |
| Balance Type: |
|
| Period Type: |
|
|
| X |
- Details
| Name: |
oef_LargestHoldingAxis=bmafi_AonPLCClAMember |
| Namespace Prefix: |
|
| Data Type: |
na |
| Balance Type: |
|
| Period Type: |
|
|
| X |
- Details
| Name: |
oef_LargestHoldingAxis=bmafi_MedtronicPLCMember |
| Namespace Prefix: |
|
| Data Type: |
na |
| Balance Type: |
|
| Period Type: |
|
|
| X |
- Details
| Name: |
oef_LargestHoldingAxis=bmafi_UnitedHealthGroupIncMember |
| Namespace Prefix: |
|
| Data Type: |
na |
| Balance Type: |
|
| Period Type: |
|
|
| X |
- Details
| Name: |
oef_ClassAxis=bmafi_C000001360Member |
| Namespace Prefix: |
|
| Data Type: |
na |
| Balance Type: |
|
| Period Type: |
|
|
| X |
- Details
| Name: |
oef_ClassAxis=bmafi_C000001361Member |
| Namespace Prefix: |
|
| Data Type: |
na |
| Balance Type: |
|
| Period Type: |
|
|
| X |
- Details
| Name: |
oef_ClassAxis=bmafi_C000130427Member |
| Namespace Prefix: |
|
| Data Type: |
na |
| Balance Type: |
|
| Period Type: |
|
|
| X |
- Details
| Name: |
oef_ClassAxis=bmafi_C000001368Member |
| Namespace Prefix: |
|
| Data Type: |
na |
| Balance Type: |
|
| Period Type: |
|
|
| X |
- Details
| Name: |
oef_LargestHoldingAxis=bmafi_OracleCorpMember |
| Namespace Prefix: |
|
| Data Type: |
na |
| Balance Type: |
|
| Period Type: |
|
|
| X |
- Details
| Name: |
oef_LargestHoldingAxis=bmafi_AlphabetIncClCMember |
| Namespace Prefix: |
|
| Data Type: |
na |
| Balance Type: |
|
| Period Type: |
|
|
| X |
- Details
| Name: |
oef_LargestHoldingAxis=bmafi_NetflixIncMember |
| Namespace Prefix: |
|
| Data Type: |
na |
| Balance Type: |
|
| Period Type: |
|
|
| X |
- Details
| Name: |
oef_LargestHoldingAxis=bmafi_ServiceNowIncMember |
| Namespace Prefix: |
|
| Data Type: |
na |
| Balance Type: |
|
| Period Type: |
|
|
| X |
- Details
| Name: |
oef_LargestHoldingAxis=bmafi_MicrosoftCorpMember |
| Namespace Prefix: |
|
| Data Type: |
na |
| Balance Type: |
|
| Period Type: |
|
|
| X |
- Details
| Name: |
oef_LargestHoldingAxis=bmafi_NVIDIACorpMember |
| Namespace Prefix: |
|
| Data Type: |
na |
| Balance Type: |
|
| Period Type: |
|
|
| X |
- Details
| Name: |
oef_LargestHoldingAxis=bmafi_TaiwanSemiconductorManufacturingCoLtdADRMember |
| Namespace Prefix: |
|
| Data Type: |
na |
| Balance Type: |
|
| Period Type: |
|
|
| X |
- Details
| Name: |
oef_LargestHoldingAxis=bmafi_AmazonComIncMember |
| Namespace Prefix: |
|
| Data Type: |
na |
| Balance Type: |
|
| Period Type: |
|
|
| X |
- Details
| Name: |
oef_LargestHoldingAxis=bmafi_ShopifyIncClAMember |
| Namespace Prefix: |
|
| Data Type: |
na |
| Balance Type: |
|
| Period Type: |
|
|
| X |
- Details
| Name: |
oef_ClassAxis=bmafi_C000001370Member |
| Namespace Prefix: |
|
| Data Type: |
na |
| Balance Type: |
|
| Period Type: |
|
|
| X |
- Details
| Name: |
oef_ClassAxis=bmafi_C000001371Member |
| Namespace Prefix: |
|
| Data Type: |
na |
| Balance Type: |
|
| Period Type: |
|
|
| X |
- Details
| Name: |
oef_ClassAxis=bmafi_C000174007Member |
| Namespace Prefix: |
|
| Data Type: |
na |
| Balance Type: |
|
| Period Type: |
|
|
{
"version": "2.2",
"instance": {
"output.htm": {
"nsprefix": "bmafi",
"nsuri": "http://www.bny.com/20250418",
"dts": {
"schema": {
"local": [
"bmafi-20250418.xsd"
],
"remote": [
"http://www.xbrl.org/2003/xbrl-instance-2003-12-31.xsd",
"http://www.xbrl.org/2003/xbrl-linkbase-2003-12-31.xsd",
"http://www.xbrl.org/2003/xl-2003-12-31.xsd",
"http://www.xbrl.org/2003/xlink-2003-12-31.xsd",
"http://www.xbrl.org/2005/xbrldt-2005.xsd",
"http://www.xbrl.org/2006/ref-2006-02-27.xsd",
"http://www.xbrl.org/lrr/arcrole/deprecated-2009-12-16.xsd",
"http://www.xbrl.org/lrr/role/deprecated-2009-12-16.xsd",
"http://www.xbrl.org/lrr/role/negated-2009-12-16.xsd",
"http://www.xbrl.org/lrr/role/reference-2009-12-16.xsd",
"https://www.xbrl.org/2020/extensible-enumerations-2.0.xsd",
"https://www.xbrl.org/dtr/type/2020-01-21/types.xsd",
"https://www.xbrl.org/dtr/type/2022-03-31/types.xsd",
"https://xbrl.fasb.org/srt/2023/elts/srt-2023.xsd",
"https://xbrl.fasb.org/srt/2023/elts/srt-roles-2023.xsd",
"https://xbrl.fasb.org/srt/2023/elts/srt-types-2023.xsd",
"https://xbrl.fasb.org/us-gaap/2023/elts/us-gaap-2023.xsd",
"https://xbrl.fasb.org/us-gaap/2023/elts/us-roles-2023.xsd",
"https://xbrl.fasb.org/us-gaap/2023/elts/us-types-2023.xsd",
"https://xbrl.sec.gov/country/2023/country-2023.xsd",
"https://xbrl.sec.gov/country/2023/country-2023_def.xsd",
"https://xbrl.sec.gov/dei/2023/dei-2023.xsd",
"https://xbrl.sec.gov/oef/2023/oef-2023.xsd",
"https://xbrl.sec.gov/oef/2023/oef-2023_lab.xsd",
"https://xbrl.sec.gov/oef/2023/oef-sr-2023.xsd"
]
},
"inline": {
"local": [
"output.htm"
]
}
},
"keyStandard": 32,
"keyCustom": 0,
"axisStandard": 4,
"axisCustom": 0,
"memberStandard": 11,
"memberCustom": 56,
"hidden": {
"total": 321,
"http://xbrl.sec.gov/oef/2023": 317,
"http://xbrl.sec.gov/dei/2023": 4
},
"contextCount": 348,
"entityCount": 1,
"segmentCount": 67,
"elementCount": 189,
"unitCount": 6,
"baseTaxonomies": {
"http://xbrl.sec.gov/oef/2023": 563,
"http://fasb.org/us-gaap/2023": 30,
"http://xbrl.sec.gov/dei/2023": 21
},
"report": {
"R1": {
"role": "http://xbrl.sec.gov/oef/role/NcsrCover",
"longName": "030000 - Disclosure - Form N-CSR Cover",
"shortName": "Form N-CSR Cover",
"isDefault": "true",
"groupType": "disclosure",
"subGroupType": "",
"menuCat": "Cover",
"order": "1",
"firstAnchor": {
"contextRef": "DefaultContext",
"name": "dei:EntityRegistrantName",
"unitRef": null,
"xsiNil": "false",
"lang": "en-US",
"decimals": null,
"ancestors": [
"div",
"div",
"div",
"div",
"div",
"div",
"div",
"div",
"body",
"html"
],
"reportCount": 1,
"baseRef": "output.htm",
"first": true
},
"uniqueAnchor": null
},
"R2": {
"role": "http://xbrl.sec.gov/oef/role/ShareholderReport",
"longName": "030001 - Disclosure - Shareholder Report",
"shortName": "Shareholder Report",
"isDefault": "false",
"groupType": "disclosure",
"subGroupType": "",
"menuCat": "Notes",
"order": "2",
"firstAnchor": {
"contextRef": "DefaultContext",
"name": "dei:EntityRegistrantName",
"unitRef": null,
"xsiNil": "false",
"lang": "en-US",
"decimals": null,
"ancestors": [
"div",
"div",
"div",
"div",
"div",
"div",
"div",
"div",
"body",
"html"
],
"reportCount": 1,
"baseRef": "output.htm",
"first": true
},
"uniqueAnchor": {
"contextRef": "D20240829_20250228_C000001288Member",
"name": "oef:FundName",
"unitRef": null,
"xsiNil": "false",
"lang": "en-US",
"decimals": null,
"ancestors": [
"div",
"div",
"div",
"div",
"div",
"div",
"div",
"div",
"div",
"div",
"body",
"html"
],
"reportCount": 1,
"baseRef": "output.htm",
"unique": true
}
},
"R3": {
"role": "http://xbrl.sec.gov/oef/role/ShareholderReportHoldingsDetails",
"longName": "040020 - Disclosure - Shareholder Report, Holdings (Details)",
"shortName": "Shareholder Report, Holdings (Details)",
"isDefault": "false",
"groupType": "disclosure",
"subGroupType": "details",
"menuCat": "Details",
"order": "3",
"firstAnchor": null,
"uniqueAnchor": null
}
},
"tag": {
"bmafi_ATAndTIncMember": {
"xbrltype": "domainItemType",
"nsuri": "http://www.bny.com/20250418",
"localname": "ATAndTIncMember",
"presentation": [
"http://xbrl.sec.gov/oef/role/ShareholderReportHoldingsDetails"
],
"lang": {
"en-us": {
"role": {
"label": "AT And T Inc [Member]"
}
}
},
"auth_ref": []
},
"oef_AccountValueLineItems": {
"xbrltype": "stringItemType",
"nsuri": "http://xbrl.sec.gov/oef/2023",
"localname": "AccountValueLineItems",
"presentation": [
"http://xbrl.sec.gov/oef/role/ShareholderReportLineGraphDetails"
],
"lang": {
"en-us": {
"role": {
"label": "Account Value [Line Items]"
}
}
},
"auth_ref": [
"r36"
]
},
"oef_AccountValueTable": {
"xbrltype": "stringItemType",
"nsuri": "http://xbrl.sec.gov/oef/2023",
"localname": "AccountValueTable",
"presentation": [
"http://xbrl.sec.gov/oef/role/ShareholderReportLineGraphDetails"
],
"lang": {
"en-us": {
"role": {
"label": "Account Value [Table]"
}
}
},
"auth_ref": [
"r36"
]
},
"oef_AccountValueTableAbstract": {
"xbrltype": "stringItemType",
"nsuri": "http://xbrl.sec.gov/oef/2023",
"localname": "AccountValueTableAbstract",
"lang": {
"en-us": {
"role": {
"label": "Account Value Table [Abstract]"
}
}
},
"auth_ref": [
"r36"
]
},
"oef_AccountantChngDate": {
"xbrltype": "dateItemType",
"nsuri": "http://xbrl.sec.gov/oef/2023",
"localname": "AccountantChngDate",
"presentation": [
"http://xbrl.sec.gov/oef/role/ShareholderReport"
],
"lang": {
"en-us": {
"role": {
"label": "Accountant Change Date"
}
}
},
"auth_ref": [
"r60"
]
},
"oef_AccountantChngDisagreementsTextBlock": {
"xbrltype": "textBlockItemType",
"nsuri": "http://xbrl.sec.gov/oef/2023",
"localname": "AccountantChngDisagreementsTextBlock",
"presentation": [
"http://xbrl.sec.gov/oef/role/ShareholderReport"
],
"lang": {
"en-us": {
"role": {
"label": "Accountant Change Disagreements [Text Block]"
}
}
},
"auth_ref": [
"r61"
]
},
"oef_AccountantChngStatementTextBlock": {
"xbrltype": "textBlockItemType",
"nsuri": "http://xbrl.sec.gov/oef/2023",
"localname": "AccountantChngStatementTextBlock",
"presentation": [
"http://xbrl.sec.gov/oef/role/ShareholderReport"
],
"lang": {
"en-us": {
"role": {
"label": "Accountant Change Statement [Text Block]"
}
}
},
"auth_ref": [
"r60"
]
},
"oef_AcctVal": {
"xbrltype": "monetaryItemType",
"nsuri": "http://xbrl.sec.gov/oef/2023",
"localname": "AcctVal",
"presentation": [
"http://xbrl.sec.gov/oef/role/ShareholderReportLineGraphDetails"
],
"lang": {
"en-us": {
"role": {
"label": "Account Value"
}
}
},
"auth_ref": [
"r37"
]
},
"oef_AdditionalIndexAxis": {
"xbrltype": "stringItemType",
"nsuri": "http://xbrl.sec.gov/oef/2023",
"localname": "AdditionalIndexAxis",
"presentation": [
"http://xbrl.sec.gov/oef/role/ShareholderReportLineGraphDetails"
],
"lang": {
"en-us": {
"role": {
"label": "Additional Index [Axis]"
}
}
},
"auth_ref": [
"r36"
]
},
"oef_AdditionalIndexDomain": {
"xbrltype": "domainItemType",
"nsuri": "http://xbrl.sec.gov/oef/2023",
"localname": "AdditionalIndexDomain",
"presentation": [
"http://xbrl.sec.gov/oef/role/ShareholderReportLineGraphDetails"
],
"lang": {
"en-us": {
"role": {
"label": "Additional Index [Domain]"
}
}
},
"auth_ref": [
"r36"
]
},
"oef_AddlFundStatisticsSignificanceOrLimitsTextBlock": {
"xbrltype": "textBlockItemType",
"nsuri": "http://xbrl.sec.gov/oef/2023",
"localname": "AddlFundStatisticsSignificanceOrLimitsTextBlock",
"presentation": [
"http://xbrl.sec.gov/oef/role/ShareholderReport"
],
"lang": {
"en-us": {
"role": {
"label": "Additional Fund Statistics Significance or Limits [Text Block]"
}
}
},
"auth_ref": [
"r50"
]
},
"oef_AddlFundStatisticsTextBlock": {
"xbrltype": "textBlockItemType",
"nsuri": "http://xbrl.sec.gov/oef/2023",
"localname": "AddlFundStatisticsTextBlock",
"presentation": [
"http://xbrl.sec.gov/oef/role/ShareholderReport"
],
"lang": {
"en-us": {
"role": {
"label": "Additional Fund Statistics [Text Block]"
}
}
},
"auth_ref": [
"r49"
]
},
"oef_AddlInfoEmail": {
"xbrltype": "stringItemType",
"nsuri": "http://xbrl.sec.gov/oef/2023",
"localname": "AddlInfoEmail",
"presentation": [
"http://xbrl.sec.gov/oef/role/ShareholderReport"
],
"lang": {
"en-us": {
"role": {
"label": "Additional Information Email"
}
}
},
"auth_ref": [
"r28"
]
},
"oef_AddlInfoPhoneNumber": {
"xbrltype": "stringItemType",
"nsuri": "http://xbrl.sec.gov/oef/2023",
"localname": "AddlInfoPhoneNumber",
"presentation": [
"http://xbrl.sec.gov/oef/role/ShareholderReport"
],
"lang": {
"en-us": {
"role": {
"label": "Additional Information Phone Number"
}
}
},
"auth_ref": [
"r28"
]
},
"oef_AddlInfoTextBlock": {
"xbrltype": "textBlockItemType",
"nsuri": "http://xbrl.sec.gov/oef/2023",
"localname": "AddlInfoTextBlock",
"presentation": [
"http://xbrl.sec.gov/oef/role/ShareholderReport"
],
"lang": {
"en-us": {
"role": {
"label": "Additional Information [Text Block]"
}
}
},
"auth_ref": [
"r26"
]
},
"oef_AddlInfoWebsite": {
"xbrltype": "stringItemType",
"nsuri": "http://xbrl.sec.gov/oef/2023",
"localname": "AddlInfoWebsite",
"presentation": [
"http://xbrl.sec.gov/oef/role/ShareholderReport"
],
"lang": {
"en-us": {
"role": {
"label": "Additional Information Website"
}
}
},
"auth_ref": [
"r28"
]
},
"oef_AdvisoryFeesPaidAmt": {
"xbrltype": "monetaryItemType",
"nsuri": "http://xbrl.sec.gov/oef/2023",
"localname": "AdvisoryFeesPaidAmt",
"presentation": [
"http://xbrl.sec.gov/oef/role/ShareholderReport"
],
"lang": {
"en-us": {
"role": {
"label": "Advisory Fees Paid, Amount"
}
}
},
"auth_ref": [
"r49"
]
},
"bmafi_AlamosGoldIncClAMember": {
"xbrltype": "domainItemType",
"nsuri": "http://www.bny.com/20250418",
"localname": "AlamosGoldIncClAMember",
"presentation": [
"http://xbrl.sec.gov/oef/role/ShareholderReportHoldingsDetails"
],
"lang": {
"en-us": {
"role": {
"label": "Alamos Gold Inc Cl A [Member]"
}
}
},
"auth_ref": []
},
"bmafi_AlphabetIncClCMember": {
"xbrltype": "domainItemType",
"nsuri": "http://www.bny.com/20250418",
"localname": "AlphabetIncClCMember",
"presentation": [
"http://xbrl.sec.gov/oef/role/ShareholderReportHoldingsDetails"
],
"lang": {
"en-us": {
"role": {
"label": "Alphabet Inc Cl C [Member]"
}
}
},
"auth_ref": []
},
"bmafi_AmazonComIncMember": {
"xbrltype": "domainItemType",
"nsuri": "http://www.bny.com/20250418",
"localname": "AmazonComIncMember",
"presentation": [
"http://xbrl.sec.gov/oef/role/ShareholderReportHoldingsDetails"
],
"lang": {
"en-us": {
"role": {
"label": "Amazon com Inc [Member]"
}
}
},
"auth_ref": []
},
"dei_AmendmentDescription": {
"xbrltype": "stringItemType",
"nsuri": "http://xbrl.sec.gov/dei/2023",
"localname": "AmendmentDescription",
"presentation": [
"http://xbrl.sec.gov/oef/role/NcsrCover",
"http://xbrl.sec.gov/oef/role/ShareholderReport"
],
"lang": {
"en-us": {
"role": {
"label": "Amendment Description",
"documentation": "Description of changes contained within amended document."
}
}
},
"auth_ref": []
},
"dei_AmendmentFlag": {
"xbrltype": "booleanItemType",
"nsuri": "http://xbrl.sec.gov/dei/2023",
"localname": "AmendmentFlag",
"presentation": [
"http://xbrl.sec.gov/oef/role/NcsrCover",
"http://xbrl.sec.gov/oef/role/ShareholderReport"
],
"lang": {
"en-us": {
"role": {
"label": "Amendment Flag",
"documentation": "Boolean flag that is true when the XBRL content amends previously-filed or accepted submission."
}
}
},
"auth_ref": []
},
"oef_AnnlOrSemiAnnlStatementTextBlock": {
"xbrltype": "textBlockItemType",
"nsuri": "http://xbrl.sec.gov/oef/2023",
"localname": "AnnlOrSemiAnnlStatementTextBlock",
"presentation": [
"http://xbrl.sec.gov/oef/role/ShareholderReport"
],
"lang": {
"en-us": {
"role": {
"label": "Annual or Semi-Annual Statement [Text Block]"
}
}
},
"auth_ref": [
"r25"
]
},
"bmafi_AonPLCClAMember": {
"xbrltype": "domainItemType",
"nsuri": "http://www.bny.com/20250418",
"localname": "AonPLCClAMember",
"presentation": [
"http://xbrl.sec.gov/oef/role/ShareholderReportHoldingsDetails"
],
"lang": {
"en-us": {
"role": {
"label": "Aon PLC Cl A [Member]"
}
}
},
"auth_ref": []
},
"bmafi_AramarkMember": {
"xbrltype": "domainItemType",
"nsuri": "http://www.bny.com/20250418",
"localname": "AramarkMember",
"presentation": [
"http://xbrl.sec.gov/oef/role/ShareholderReportHoldingsDetails"
],
"lang": {
"en-us": {
"role": {
"label": "Aramark [Member]"
}
}
},
"auth_ref": []
},
"us-gaap_AssetsNet": {
"xbrltype": "monetaryItemType",
"nsuri": "http://fasb.org/us-gaap/2023",
"localname": "AssetsNet",
"crdr": "debit",
"presentation": [
"http://xbrl.sec.gov/oef/role/ShareholderReport"
],
"lang": {
"en-us": {
"role": {
"label": "Net Assets",
"documentation": "Amount of net assets (liabilities)."
}
}
},
"auth_ref": [
"r0"
]
},
"bmafi_AssurantIncMember": {
"xbrltype": "domainItemType",
"nsuri": "http://www.bny.com/20250418",
"localname": "AssurantIncMember",
"presentation": [
"http://xbrl.sec.gov/oef/role/ShareholderReportHoldingsDetails"
],
"lang": {
"en-us": {
"role": {
"label": "Assurant Inc [Member]"
}
}
},
"auth_ref": []
},
"oef_AvgAnnlRtrPct": {
"xbrltype": "percentItemType",
"nsuri": "http://xbrl.sec.gov/oef/2023",
"localname": "AvgAnnlRtrPct",
"presentation": [
"http://xbrl.sec.gov/oef/role/ShareholderReportLineGraphDetails"
],
"lang": {
"en-us": {
"role": {
"label": "Average Annual Return, Percent"
}
}
},
"auth_ref": [
"r43"
]
},
"oef_AvgAnnlRtrTableTextBlock": {
"xbrltype": "textBlockItemType",
"nsuri": "http://xbrl.sec.gov/oef/2023",
"localname": "AvgAnnlRtrTableTextBlock",
"presentation": [
"http://xbrl.sec.gov/oef/role/ShareholderReport"
],
"lang": {
"en-us": {
"role": {
"label": "Average Annual Return [Table Text Block]"
}
}
},
"auth_ref": [
"r43"
]
},
"bmafi_BankOfAmericaCorpMember": {
"xbrltype": "domainItemType",
"nsuri": "http://www.bny.com/20250418",
"localname": "BankOfAmericaCorpMember",
"presentation": [
"http://xbrl.sec.gov/oef/role/ShareholderReportHoldingsDetails"
],
"lang": {
"en-us": {
"role": {
"label": "Bank of America Corp [Member]"
}
}
},
"auth_ref": []
},
"bmafi_BerkshireHathawayIncClBMember": {
"xbrltype": "domainItemType",
"nsuri": "http://www.bny.com/20250418",
"localname": "BerkshireHathawayIncClBMember",
"presentation": [
"http://xbrl.sec.gov/oef/role/ShareholderReportHoldingsDetails"
],
"lang": {
"en-us": {
"role": {
"label": "Berkshire Hathaway Inc Cl B [Member]"
}
}
},
"auth_ref": []
},
"oef_BroadBasedIndexAxis": {
"xbrltype": "stringItemType",
"nsuri": "http://xbrl.sec.gov/oef/2023",
"localname": "BroadBasedIndexAxis",
"presentation": [
"http://xbrl.sec.gov/oef/role/ShareholderReportLineGraphDetails"
],
"lang": {
"en-us": {
"role": {
"label": "Broad Based Index [Axis]"
}
}
},
"auth_ref": [
"r36"
]
},
"oef_BroadBasedIndexDomain": {
"xbrltype": "domainItemType",
"nsuri": "http://xbrl.sec.gov/oef/2023",
"localname": "BroadBasedIndexDomain",
"presentation": [
"http://xbrl.sec.gov/oef/role/ShareholderReportLineGraphDetails"
],
"lang": {
"en-us": {
"role": {
"label": "Broad Based Index [Domain]"
}
}
},
"auth_ref": [
"r36"
]
},
"bmafi_BurlingtonStoresIncMember": {
"xbrltype": "domainItemType",
"nsuri": "http://www.bny.com/20250418",
"localname": "BurlingtonStoresIncMember",
"presentation": [
"http://xbrl.sec.gov/oef/role/ShareholderReportHoldingsDetails"
],
"lang": {
"en-us": {
"role": {
"label": "Burlington Stores Inc [Member]"
}
}
},
"auth_ref": []
},
"bmafi_C000001288Member": {
"xbrltype": "domainItemType",
"nsuri": "http://www.bny.com/20250418",
"localname": "C000001288Member",
"presentation": [
"http://xbrl.sec.gov/oef/role/ShareholderReport",
"http://xbrl.sec.gov/oef/role/ShareholderReportHoldingsDetails",
"http://xbrl.sec.gov/oef/role/ShareholderReportLineGraphDetails"
],
"lang": {
"en-us": {
"role": {
"label": "C000001288 [Member]",
"terseLabel": "Class A"
}
}
},
"auth_ref": []
},
"bmafi_C000001289Member": {
"xbrltype": "domainItemType",
"nsuri": "http://www.bny.com/20250418",
"localname": "C000001289Member",
"presentation": [
"http://xbrl.sec.gov/oef/role/ShareholderReport",
"http://xbrl.sec.gov/oef/role/ShareholderReportHoldingsDetails",
"http://xbrl.sec.gov/oef/role/ShareholderReportLineGraphDetails"
],
"lang": {
"en-us": {
"role": {
"label": "C000001289 [Member]"
}
}
},
"auth_ref": []
},
"bmafi_C000001358Member": {
"xbrltype": "domainItemType",
"nsuri": "http://www.bny.com/20250418",
"localname": "C000001358Member",
"presentation": [
"http://xbrl.sec.gov/oef/role/ShareholderReport",
"http://xbrl.sec.gov/oef/role/ShareholderReportHoldingsDetails",
"http://xbrl.sec.gov/oef/role/ShareholderReportLineGraphDetails"
],
"lang": {
"en-us": {
"role": {
"label": "C000001358 [Member]"
}
}
},
"auth_ref": []
},
"bmafi_C000001360Member": {
"xbrltype": "domainItemType",
"nsuri": "http://www.bny.com/20250418",
"localname": "C000001360Member",
"presentation": [
"http://xbrl.sec.gov/oef/role/ShareholderReport",
"http://xbrl.sec.gov/oef/role/ShareholderReportHoldingsDetails",
"http://xbrl.sec.gov/oef/role/ShareholderReportLineGraphDetails"
],
"lang": {
"en-us": {
"role": {
"label": "C000001360 [Member]"
}
}
},
"auth_ref": []
},
"bmafi_C000001361Member": {
"xbrltype": "domainItemType",
"nsuri": "http://www.bny.com/20250418",
"localname": "C000001361Member",
"presentation": [
"http://xbrl.sec.gov/oef/role/ShareholderReport",
"http://xbrl.sec.gov/oef/role/ShareholderReportHoldingsDetails",
"http://xbrl.sec.gov/oef/role/ShareholderReportLineGraphDetails"
],
"lang": {
"en-us": {
"role": {
"label": "C000001361 [Member]"
}
}
},
"auth_ref": []
},
"bmafi_C000001368Member": {
"xbrltype": "domainItemType",
"nsuri": "http://www.bny.com/20250418",
"localname": "C000001368Member",
"presentation": [
"http://xbrl.sec.gov/oef/role/ShareholderReport",
"http://xbrl.sec.gov/oef/role/ShareholderReportHoldingsDetails",
"http://xbrl.sec.gov/oef/role/ShareholderReportLineGraphDetails"
],
"lang": {
"en-us": {
"role": {
"label": "C000001368 [Member]"
}
}
},
"auth_ref": []
},
"bmafi_C000001370Member": {
"xbrltype": "domainItemType",
"nsuri": "http://www.bny.com/20250418",
"localname": "C000001370Member",
"presentation": [
"http://xbrl.sec.gov/oef/role/ShareholderReport",
"http://xbrl.sec.gov/oef/role/ShareholderReportHoldingsDetails",
"http://xbrl.sec.gov/oef/role/ShareholderReportLineGraphDetails"
],
"lang": {
"en-us": {
"role": {
"label": "C000001370 [Member]"
}
}
},
"auth_ref": []
},
"bmafi_C000001371Member": {
"xbrltype": "domainItemType",
"nsuri": "http://www.bny.com/20250418",
"localname": "C000001371Member",
"presentation": [
"http://xbrl.sec.gov/oef/role/ShareholderReport",
"http://xbrl.sec.gov/oef/role/ShareholderReportHoldingsDetails",
"http://xbrl.sec.gov/oef/role/ShareholderReportLineGraphDetails"
],
"lang": {
"en-us": {
"role": {
"label": "C000001371 [Member]"
}
}
},
"auth_ref": []
},
"bmafi_C000064720Member": {
"xbrltype": "domainItemType",
"nsuri": "http://www.bny.com/20250418",
"localname": "C000064720Member",
"presentation": [
"http://xbrl.sec.gov/oef/role/ShareholderReport",
"http://xbrl.sec.gov/oef/role/ShareholderReportHoldingsDetails",
"http://xbrl.sec.gov/oef/role/ShareholderReportLineGraphDetails"
],
"lang": {
"en-us": {
"role": {
"label": "C000064720 [Member]",
"terseLabel": "Class C"
}
}
},
"auth_ref": []
},
"bmafi_C000064721Member": {
"xbrltype": "domainItemType",
"nsuri": "http://www.bny.com/20250418",
"localname": "C000064721Member",
"presentation": [
"http://xbrl.sec.gov/oef/role/ShareholderReport",
"http://xbrl.sec.gov/oef/role/ShareholderReportHoldingsDetails",
"http://xbrl.sec.gov/oef/role/ShareholderReportLineGraphDetails"
],
"lang": {
"en-us": {
"role": {
"label": "C000064721 [Member]",
"terseLabel": "Class I"
}
}
},
"auth_ref": []
},
"bmafi_C000130426Member": {
"xbrltype": "domainItemType",
"nsuri": "http://www.bny.com/20250418",
"localname": "C000130426Member",
"presentation": [
"http://xbrl.sec.gov/oef/role/ShareholderReport",
"http://xbrl.sec.gov/oef/role/ShareholderReportHoldingsDetails",
"http://xbrl.sec.gov/oef/role/ShareholderReportLineGraphDetails"
],
"lang": {
"en-us": {
"role": {
"label": "C000130426 [Member]",
"terseLabel": "Class Y"
}
}
},
"auth_ref": []
},
"bmafi_C000130427Member": {
"xbrltype": "domainItemType",
"nsuri": "http://www.bny.com/20250418",
"localname": "C000130427Member",
"presentation": [
"http://xbrl.sec.gov/oef/role/ShareholderReport",
"http://xbrl.sec.gov/oef/role/ShareholderReportHoldingsDetails",
"http://xbrl.sec.gov/oef/role/ShareholderReportLineGraphDetails"
],
"lang": {
"en-us": {
"role": {
"label": "C000130427 [Member]"
}
}
},
"auth_ref": []
},
"bmafi_C000174005Member": {
"xbrltype": "domainItemType",
"nsuri": "http://www.bny.com/20250418",
"localname": "C000174005Member",
"presentation": [
"http://xbrl.sec.gov/oef/role/ShareholderReport",
"http://xbrl.sec.gov/oef/role/ShareholderReportHoldingsDetails",
"http://xbrl.sec.gov/oef/role/ShareholderReportLineGraphDetails"
],
"lang": {
"en-us": {
"role": {
"label": "C000174005 [Member]",
"terseLabel": "Investor Shares"
}
}
},
"auth_ref": []
},
"bmafi_C000174006Member": {
"xbrltype": "domainItemType",
"nsuri": "http://www.bny.com/20250418",
"localname": "C000174006Member",
"presentation": [
"http://xbrl.sec.gov/oef/role/ShareholderReport",
"http://xbrl.sec.gov/oef/role/ShareholderReportHoldingsDetails",
"http://xbrl.sec.gov/oef/role/ShareholderReportLineGraphDetails"
],
"lang": {
"en-us": {
"role": {
"label": "C000174006 [Member]"
}
}
},
"auth_ref": []
},
"bmafi_C000174007Member": {
"xbrltype": "domainItemType",
"nsuri": "http://www.bny.com/20250418",
"localname": "C000174007Member",
"presentation": [
"http://xbrl.sec.gov/oef/role/ShareholderReport",
"http://xbrl.sec.gov/oef/role/ShareholderReportHoldingsDetails",
"http://xbrl.sec.gov/oef/role/ShareholderReportLineGraphDetails"
],
"lang": {
"en-us": {
"role": {
"label": "C000174007 [Member]"
}
}
},
"auth_ref": []
},
"bmafi_CiscoSystemsIncMember": {
"xbrltype": "domainItemType",
"nsuri": "http://www.bny.com/20250418",
"localname": "CiscoSystemsIncMember",
"presentation": [
"http://xbrl.sec.gov/oef/role/ShareholderReportHoldingsDetails"
],
"lang": {
"en-us": {
"role": {
"label": "Cisco Systems Inc [Member]"
}
}
},
"auth_ref": []
},
"oef_ClassAxis": {
"xbrltype": "stringItemType",
"nsuri": "http://xbrl.sec.gov/oef/2023",
"localname": "ClassAxis",
"presentation": [
"http://xbrl.sec.gov/oef/role/ShareholderReport",
"http://xbrl.sec.gov/oef/role/ShareholderReportHoldingsDetails",
"http://xbrl.sec.gov/oef/role/ShareholderReportLineGraphDetails"
],
"lang": {
"en-us": {
"role": {
"label": "Class [Axis]"
}
}
},
"auth_ref": [
"r23"
]
},
"oef_ClassName": {
"xbrltype": "securityTitleItemType",
"nsuri": "http://xbrl.sec.gov/oef/2023",
"localname": "ClassName",
"presentation": [
"http://xbrl.sec.gov/oef/role/ShareholderReport"
],
"lang": {
"en-us": {
"role": {
"label": "Class Name"
}
}
},
"auth_ref": [
"r28"
]
},
"bmafi_ClearwayEnergyIncClCMember": {
"xbrltype": "domainItemType",
"nsuri": "http://www.bny.com/20250418",
"localname": "ClearwayEnergyIncClCMember",
"presentation": [
"http://xbrl.sec.gov/oef/role/ShareholderReportHoldingsDetails"
],
"lang": {
"en-us": {
"role": {
"label": "Clearway Energy Inc Cl C [Member]"
}
}
},
"auth_ref": []
},
"oef_CommunicationsSectorMember": {
"xbrltype": "domainItemType",
"nsuri": "http://xbrl.sec.gov/oef/2023",
"localname": "CommunicationsSectorMember",
"presentation": [
"http://xbrl.sec.gov/oef/role/ShareholderReportHoldingsDetails"
],
"lang": {
"en-us": {
"role": {
"label": "Communications Sector [Member]"
}
}
},
"auth_ref": [
"r51"
]
},
"oef_ConsumerDiscretionarySectorMember": {
"xbrltype": "domainItemType",
"nsuri": "http://xbrl.sec.gov/oef/2023",
"localname": "ConsumerDiscretionarySectorMember",
"presentation": [
"http://xbrl.sec.gov/oef/role/ShareholderReportHoldingsDetails"
],
"lang": {
"en-us": {
"role": {
"label": "Consumer Discretionary Sector [Member]"
}
}
},
"auth_ref": [
"r51"
]
},
"oef_ConsumerStaplesSectorMember": {
"xbrltype": "domainItemType",
"nsuri": "http://xbrl.sec.gov/oef/2023",
"localname": "ConsumerStaplesSectorMember",
"presentation": [
"http://xbrl.sec.gov/oef/role/ShareholderReportHoldingsDetails"
],
"lang": {
"en-us": {
"role": {
"label": "Consumer Staples Sector [Member]"
}
}
},
"auth_ref": [
"r51"
]
},
"dei_CoverAbstract": {
"xbrltype": "stringItemType",
"nsuri": "http://xbrl.sec.gov/dei/2023",
"localname": "CoverAbstract",
"lang": {
"en-us": {
"role": {
"documentation": "Cover page."
}
}
},
"auth_ref": []
},
"oef_CreditQualityAxis": {
"xbrltype": "stringItemType",
"nsuri": "http://xbrl.sec.gov/oef/2023",
"localname": "CreditQualityAxis",
"presentation": [
"http://xbrl.sec.gov/oef/role/ShareholderReportHoldingsDetails"
],
"lang": {
"en-us": {
"role": {
"label": "Credit Quality [Axis]"
}
}
},
"auth_ref": [
"r51"
]
},
"oef_CreditQualityDomain": {
"xbrltype": "domainItemType",
"nsuri": "http://xbrl.sec.gov/oef/2023",
"localname": "CreditQualityDomain",
"presentation": [
"http://xbrl.sec.gov/oef/role/ShareholderReportHoldingsDetails"
],
"lang": {
"en-us": {
"role": {
"label": "Credit Quality [Domain]"
}
}
},
"auth_ref": [
"r51"
]
},
"oef_CreditQualityExplanationTextBlock": {
"xbrltype": "textBlockItemType",
"nsuri": "http://xbrl.sec.gov/oef/2023",
"localname": "CreditQualityExplanationTextBlock",
"presentation": [
"http://xbrl.sec.gov/oef/role/ShareholderReport"
],
"lang": {
"en-us": {
"role": {
"label": "Credit Quality Explanation [Text Block]"
}
}
},
"auth_ref": [
"r51"
]
},
"srt_CreditRatingAMBestAxis": {
"xbrltype": "stringItemType",
"nsuri": "http://fasb.org/srt/2023",
"localname": "CreditRatingAMBestAxis",
"presentation": [
"http://xbrl.sec.gov/oef/role/ShareholderReportHoldingsDetails"
],
"auth_ref": [
"r19",
"r65",
"r66",
"r67"
]
},
"srt_CreditRatingAMBestDomain": {
"xbrltype": "domainItemType",
"nsuri": "http://fasb.org/srt/2023",
"localname": "CreditRatingAMBestDomain",
"presentation": [
"http://xbrl.sec.gov/oef/role/ShareholderReportHoldingsDetails"
],
"auth_ref": []
},
"srt_CreditRatingFitchAxis": {
"xbrltype": "stringItemType",
"nsuri": "http://fasb.org/srt/2023",
"localname": "CreditRatingFitchAxis",
"presentation": [
"http://xbrl.sec.gov/oef/role/ShareholderReportHoldingsDetails"
],
"auth_ref": [
"r19",
"r65",
"r67"
]
},
"srt_CreditRatingMoodysAxis": {
"xbrltype": "stringItemType",
"nsuri": "http://fasb.org/srt/2023",
"localname": "CreditRatingMoodysAxis",
"presentation": [
"http://xbrl.sec.gov/oef/role/ShareholderReportHoldingsDetails"
],
"auth_ref": [
"r19",
"r65",
"r66",
"r67"
]
},
"srt_CreditRatingStandardPoorsAxis": {
"xbrltype": "stringItemType",
"nsuri": "http://fasb.org/srt/2023",
"localname": "CreditRatingStandardPoorsAxis",
"presentation": [
"http://xbrl.sec.gov/oef/role/ShareholderReportHoldingsDetails"
],
"auth_ref": [
"r19",
"r65",
"r66",
"r67"
]
},
"oef_CreditRatingsSelectionTextBlock": {
"xbrltype": "textBlockItemType",
"nsuri": "http://xbrl.sec.gov/oef/2023",
"localname": "CreditRatingsSelectionTextBlock",
"presentation": [
"http://xbrl.sec.gov/oef/role/ShareholderReport"
],
"lang": {
"en-us": {
"role": {
"label": "Credit Ratings Selection [Text Block]"
}
}
},
"auth_ref": [
"r51"
]
},
"bmafi_DanaherCorpMember": {
"xbrltype": "domainItemType",
"nsuri": "http://www.bny.com/20250418",
"localname": "DanaherCorpMember",
"presentation": [
"http://xbrl.sec.gov/oef/role/ShareholderReportHoldingsDetails"
],
"lang": {
"en-us": {
"role": {
"label": "Danaher Corp [Member]"
}
}
},
"auth_ref": []
},
"bmafi_DigitalRealtyTrustIncMember": {
"xbrltype": "domainItemType",
"nsuri": "http://www.bny.com/20250418",
"localname": "DigitalRealtyTrustIncMember",
"presentation": [
"http://xbrl.sec.gov/oef/role/ShareholderReportHoldingsDetails"
],
"lang": {
"en-us": {
"role": {
"label": "Digital Realty Trust Inc [Member]"
}
}
},
"auth_ref": []
},
"oef_DistOfCapitalTextBlock": {
"xbrltype": "textBlockItemType",
"nsuri": "http://xbrl.sec.gov/oef/2023",
"localname": "DistOfCapitalTextBlock",
"presentation": [
"http://xbrl.sec.gov/oef/role/ShareholderReport"
],
"lang": {
"en-us": {
"role": {
"label": "Distribution of Capital [Text Block]"
}
}
},
"auth_ref": [
"r45"
]
},
"dei_DocumentPeriodEndDate": {
"xbrltype": "dateItemType",
"nsuri": "http://xbrl.sec.gov/dei/2023",
"localname": "DocumentPeriodEndDate",
"presentation": [
"http://xbrl.sec.gov/oef/role/NcsrCover",
"http://xbrl.sec.gov/oef/role/ShareholderReport"
],
"lang": {
"en-us": {
"role": {
"label": "Document Period End Date",
"documentation": "For the EDGAR submission types of Form 8-K: the date of the report, the date of the earliest event reported; for the EDGAR submission types of Form N-1A: the filing date; for all other submission types: the end of the reporting or transition period. The format of the date is YYYY-MM-DD."
}
}
},
"auth_ref": []
},
"dei_DocumentType": {
"xbrltype": "submissionTypeItemType",
"nsuri": "http://xbrl.sec.gov/dei/2023",
"localname": "DocumentType",
"presentation": [
"http://xbrl.sec.gov/oef/role/NcsrCover",
"http://xbrl.sec.gov/oef/role/ShareholderReport"
],
"lang": {
"en-us": {
"role": {
"label": "Document Type",
"documentation": "The type of document being provided (such as 10-K, 10-Q, 485BPOS, etc). The document type is limited to the same value as the supporting SEC submission type, or the word 'Other'."
}
}
},
"auth_ref": []
},
"bmafi_DominionEnergyIncMember": {
"xbrltype": "domainItemType",
"nsuri": "http://www.bny.com/20250418",
"localname": "DominionEnergyIncMember",
"presentation": [
"http://xbrl.sec.gov/oef/role/ShareholderReportHoldingsDetails"
],
"lang": {
"en-us": {
"role": {
"label": "Dominion Energy Inc [Member]"
}
}
},
"auth_ref": []
},
"us-gaap_EnergySectorMember": {
"xbrltype": "domainItemType",
"nsuri": "http://fasb.org/us-gaap/2023",
"localname": "EnergySectorMember",
"presentation": [
"http://xbrl.sec.gov/oef/role/ShareholderReportHoldingsDetails"
],
"lang": {
"en-us": {
"role": {
"label": "Energy Sector [Member]",
"documentation": "Sector of economy consisting of companies engaged in business activity related to energy."
}
}
},
"auth_ref": [
"r69",
"r70",
"r71",
"r72"
]
},
"dei_EntityCentralIndexKey": {
"xbrltype": "centralIndexKeyItemType",
"nsuri": "http://xbrl.sec.gov/dei/2023",
"localname": "EntityCentralIndexKey",
"presentation": [
"http://xbrl.sec.gov/oef/role/NcsrCover",
"http://xbrl.sec.gov/oef/role/ShareholderReport"
],
"lang": {
"en-us": {
"role": {
"label": "Entity Central Index Key",
"documentation": "A unique 10-digit SEC-issued value to identify entities that have filed disclosures with the SEC. It is commonly abbreviated as CIK."
}
}
},
"auth_ref": [
"r21"
]
},
"dei_EntityInvCompanyType": {
"xbrltype": "invCompanyType",
"nsuri": "http://xbrl.sec.gov/dei/2023",
"localname": "EntityInvCompanyType",
"presentation": [
"http://xbrl.sec.gov/oef/role/NcsrCover",
"http://xbrl.sec.gov/oef/role/ShareholderReport"
],
"lang": {
"en-us": {
"role": {
"label": "Entity Investment Company Type",
"documentation": "One of: N-1A (Mutual Fund), N-1 (Open-End Separate Account with No Variable Annuities), N-2 (Closed-End Investment Company), N-3 (Separate Account Registered as Open-End Management Investment Company), N-4 (Variable Annuity UIT Separate Account), N-5 (Small Business Investment Company), N-6 (Variable Life UIT Separate Account), S-1 or S-3 (Face Amount Certificate Company), S-6 (UIT, Non-Insurance Product)."
}
}
},
"auth_ref": [
"r64"
]
},
"dei_EntityRegistrantName": {
"xbrltype": "normalizedStringItemType",
"nsuri": "http://xbrl.sec.gov/dei/2023",
"localname": "EntityRegistrantName",
"presentation": [
"http://xbrl.sec.gov/oef/role/NcsrCover",
"http://xbrl.sec.gov/oef/role/ShareholderReport"
],
"lang": {
"en-us": {
"role": {
"label": "Registrant Name",
"documentation": "The exact name of the entity filing the report as specified in its charter, which is required by forms filed with the SEC."
}
}
},
"auth_ref": [
"r21"
]
},
"oef_EtfDiscountNumDays": {
"xbrltype": "integerItemType",
"nsuri": "http://xbrl.sec.gov/oef/2023",
"localname": "EtfDiscountNumDays",
"presentation": [
"http://xbrl.sec.gov/oef/role/ShareholderReport"
],
"lang": {
"en-us": {
"role": {
"label": "ETF Discount, Number of Days"
}
}
},
"auth_ref": [
"r46"
]
},
"oef_EtfPastPerfTextBlock": {
"xbrltype": "textBlockItemType",
"nsuri": "http://xbrl.sec.gov/oef/2023",
"localname": "EtfPastPerfTextBlock",
"presentation": [
"http://xbrl.sec.gov/oef/role/ShareholderReport"
],
"lang": {
"en-us": {
"role": {
"label": "ETF Past Performance [Text Block]"
}
}
},
"auth_ref": [
"r48"
]
},
"oef_EtfPremiumDiscountTextBlock": {
"xbrltype": "textBlockItemType",
"nsuri": "http://xbrl.sec.gov/oef/2023",
"localname": "EtfPremiumDiscountTextBlock",
"presentation": [
"http://xbrl.sec.gov/oef/role/ShareholderReport"
],
"lang": {
"en-us": {
"role": {
"label": "ETF Premium Discount [Text Block]"
}
}
},
"auth_ref": [
"r46"
]
},
"oef_EtfPremiumNumDays": {
"xbrltype": "integerItemType",
"nsuri": "http://xbrl.sec.gov/oef/2023",
"localname": "EtfPremiumNumDays",
"presentation": [
"http://xbrl.sec.gov/oef/role/ShareholderReport"
],
"lang": {
"en-us": {
"role": {
"label": "ETF Premium, Number of Days"
}
}
},
"auth_ref": [
"r46"
]
},
"oef_EtfPurchaseExplanationTextBlock": {
"xbrltype": "textBlockItemType",
"nsuri": "http://xbrl.sec.gov/oef/2023",
"localname": "EtfPurchaseExplanationTextBlock",
"presentation": [
"http://xbrl.sec.gov/oef/role/ShareholderReport"
],
"lang": {
"en-us": {
"role": {
"label": "ETF Purchase Explanation [Text Block]"
}
}
},
"auth_ref": [
"r47"
]
},
"bmafi_ExpediaGroupIncMember": {
"xbrltype": "domainItemType",
"nsuri": "http://www.bny.com/20250418",
"localname": "ExpediaGroupIncMember",
"presentation": [
"http://xbrl.sec.gov/oef/role/ShareholderReportHoldingsDetails"
],
"lang": {
"en-us": {
"role": {
"label": "Expedia Group Inc [Member]"
}
}
},
"auth_ref": []
},
"oef_ExpenseRatioPct": {
"xbrltype": "percentItemType",
"nsuri": "http://xbrl.sec.gov/oef/2023",
"localname": "ExpenseRatioPct",
"presentation": [
"http://xbrl.sec.gov/oef/role/ShareholderReport"
],
"lang": {
"en-us": {
"role": {
"label": "Expense Ratio, Percent"
}
}
},
"auth_ref": [
"r31"
]
},
"oef_ExpensesExclExtraordinaryExpensesPct": {
"xbrltype": "percentItemType",
"nsuri": "http://xbrl.sec.gov/oef/2023",
"localname": "ExpensesExclExtraordinaryExpensesPct",
"presentation": [
"http://xbrl.sec.gov/oef/role/ShareholderReport"
],
"lang": {
"en-us": {
"role": {
"label": "Expenses Excluding Extraordinary Expenses, Percent"
}
}
},
"auth_ref": [
"r34"
]
},
"oef_ExpensesPaidAmt": {
"xbrltype": "monetaryItemType",
"nsuri": "http://xbrl.sec.gov/oef/2023",
"localname": "ExpensesPaidAmt",
"presentation": [
"http://xbrl.sec.gov/oef/role/ShareholderReport"
],
"lang": {
"en-us": {
"role": {
"label": "Expenses Paid, Amount"
}
}
},
"auth_ref": [
"r30"
]
},
"oef_ExpensesRepresentBothMasterAndFeeder": {
"xbrltype": "stringItemType",
"nsuri": "http://xbrl.sec.gov/oef/2023",
"localname": "ExpensesRepresentBothMasterAndFeeder",
"presentation": [
"http://xbrl.sec.gov/oef/role/ShareholderReport"
],
"lang": {
"en-us": {
"role": {
"label": "Expenses Represent Both Master and Feeder [Text]"
}
}
},
"auth_ref": [
"r32",
"r62"
]
},
"oef_ExpensesShortPeriodFnTextBlock": {
"xbrltype": "textBlockItemType",
"nsuri": "http://xbrl.sec.gov/oef/2023",
"localname": "ExpensesShortPeriodFnTextBlock",
"presentation": [
"http://xbrl.sec.gov/oef/role/ShareholderReport"
],
"lang": {
"en-us": {
"role": {
"label": "Expenses Short Period Footnote [Text Block]"
}
}
},
"auth_ref": [
"r33"
]
},
"oef_ExpensesTextBlock": {
"xbrltype": "textBlockItemType",
"nsuri": "http://xbrl.sec.gov/oef/2023",
"localname": "ExpensesTextBlock",
"presentation": [
"http://xbrl.sec.gov/oef/role/ShareholderReport"
],
"lang": {
"en-us": {
"role": {
"label": "Expenses [Text Block]"
}
}
},
"auth_ref": [
"r29"
]
},
"oef_ExposureBasisExplanationTextBlock": {
"xbrltype": "textBlockItemType",
"nsuri": "http://xbrl.sec.gov/oef/2023",
"localname": "ExposureBasisExplanationTextBlock",
"presentation": [
"http://xbrl.sec.gov/oef/role/ShareholderReport"
],
"lang": {
"en-us": {
"role": {
"label": "Exposure Basis Explanation [Text Block]"
}
}
},
"auth_ref": [
"r51"
]
},
"srt_ExternalCreditRatingFitchMember": {
"xbrltype": "domainItemType",
"nsuri": "http://fasb.org/srt/2023",
"localname": "ExternalCreditRatingFitchMember",
"presentation": [
"http://xbrl.sec.gov/oef/role/ShareholderReportHoldingsDetails"
],
"auth_ref": []
},
"srt_ExternalCreditRatingMoodysMember": {
"xbrltype": "domainItemType",
"nsuri": "http://fasb.org/srt/2023",
"localname": "ExternalCreditRatingMoodysMember",
"presentation": [
"http://xbrl.sec.gov/oef/role/ShareholderReportHoldingsDetails"
],
"auth_ref": []
},
"srt_ExternalCreditRatingStandardPoorsMember": {
"xbrltype": "domainItemType",
"nsuri": "http://fasb.org/srt/2023",
"localname": "ExternalCreditRatingStandardPoorsMember",
"presentation": [
"http://xbrl.sec.gov/oef/role/ShareholderReportHoldingsDetails"
],
"auth_ref": []
},
"oef_ExtraordinaryExpensesFnTextBlock": {
"xbrltype": "textBlockItemType",
"nsuri": "http://xbrl.sec.gov/oef/2023",
"localname": "ExtraordinaryExpensesFnTextBlock",
"presentation": [
"http://xbrl.sec.gov/oef/role/ShareholderReport"
],
"lang": {
"en-us": {
"role": {
"label": "Extraordinary Expenses Footnote [Text Block]"
}
}
},
"auth_ref": [
"r34"
]
},
"oef_FactorsAffectingPerfTextBlock": {
"xbrltype": "textBlockItemType",
"nsuri": "http://xbrl.sec.gov/oef/2023",
"localname": "FactorsAffectingPerfTextBlock",
"presentation": [
"http://xbrl.sec.gov/oef/role/ShareholderReport"
],
"lang": {
"en-us": {
"role": {
"label": "Factors Affecting Performance [Text Block]"
}
}
},
"auth_ref": [
"r35"
]
},
"us-gaap_FinancialServicesSectorMember": {
"xbrltype": "domainItemType",
"nsuri": "http://fasb.org/us-gaap/2023",
"localname": "FinancialServicesSectorMember",
"presentation": [
"http://xbrl.sec.gov/oef/role/ShareholderReportHoldingsDetails"
],
"lang": {
"en-us": {
"role": {
"label": "Financial Services Sector [Member]",
"documentation": "Sector of the economy consisting of companies engaged in financial services."
}
}
},
"auth_ref": [
"r20",
"r69",
"r70",
"r71",
"r72"
]
},
"bmafi_FirstHorizonCorpMember": {
"xbrltype": "domainItemType",
"nsuri": "http://www.bny.com/20250418",
"localname": "FirstHorizonCorpMember",
"presentation": [
"http://xbrl.sec.gov/oef/role/ShareholderReportHoldingsDetails"
],
"lang": {
"en-us": {
"role": {
"label": "First Horizon Corp [Member]"
}
}
},
"auth_ref": []
},
"oef_FundName": {
"xbrltype": "normalizedStringItemType",
"nsuri": "http://xbrl.sec.gov/oef/2023",
"localname": "FundName",
"presentation": [
"http://xbrl.sec.gov/oef/role/ShareholderReport"
],
"lang": {
"en-us": {
"role": {
"label": "Fund Name"
}
}
},
"auth_ref": [
"r24"
]
},
"bmafi_GeniusSportsLtdMember": {
"xbrltype": "domainItemType",
"nsuri": "http://www.bny.com/20250418",
"localname": "GeniusSportsLtdMember",
"presentation": [
"http://xbrl.sec.gov/oef/role/ShareholderReportHoldingsDetails"
],
"lang": {
"en-us": {
"role": {
"label": "Genius Sports Ltd [Member]"
}
}
},
"auth_ref": []
},
"oef_GeographicRegionAxis": {
"xbrltype": "stringItemType",
"nsuri": "http://xbrl.sec.gov/oef/2023",
"localname": "GeographicRegionAxis",
"presentation": [
"http://xbrl.sec.gov/oef/role/ShareholderReportHoldingsDetails"
],
"lang": {
"en-us": {
"role": {
"label": "Geographic Region [Axis]"
}
}
},
"auth_ref": [
"r51"
]
},
"oef_GeographicRegionDomain": {
"xbrltype": "domainItemType",
"nsuri": "http://xbrl.sec.gov/oef/2023",
"localname": "GeographicRegionDomain",
"presentation": [
"http://xbrl.sec.gov/oef/role/ShareholderReportHoldingsDetails"
],
"lang": {
"en-us": {
"role": {
"label": "Geographic Region [Domain]"
}
}
},
"auth_ref": [
"r51"
]
},
"us-gaap_HealthcareSectorMember": {
"xbrltype": "domainItemType",
"nsuri": "http://fasb.org/us-gaap/2023",
"localname": "HealthcareSectorMember",
"presentation": [
"http://xbrl.sec.gov/oef/role/ShareholderReportHoldingsDetails"
],
"lang": {
"en-us": {
"role": {
"label": "Healthcare Sector [Member]",
"documentation": "Sector of the economy consisting of companies engaged in healthcare-related business activities."
}
}
},
"auth_ref": [
"r20",
"r69",
"r70",
"r71",
"r72"
]
},
"oef_HoldingsAbstract": {
"xbrltype": "stringItemType",
"nsuri": "http://xbrl.sec.gov/oef/2023",
"localname": "HoldingsAbstract",
"lang": {
"en-us": {
"role": {
"label": "Holdings [Abstract]"
}
}
},
"auth_ref": [
"r51"
]
},
"oef_HoldingsCount": {
"xbrltype": "integerItemType",
"nsuri": "http://xbrl.sec.gov/oef/2023",
"localname": "HoldingsCount",
"presentation": [
"http://xbrl.sec.gov/oef/role/ShareholderReport"
],
"lang": {
"en-us": {
"role": {
"label": "Holdings Count"
}
}
},
"auth_ref": [
"r49"
]
},
"oef_HoldingsLineItems": {
"xbrltype": "stringItemType",
"nsuri": "http://xbrl.sec.gov/oef/2023",
"localname": "HoldingsLineItems",
"presentation": [
"http://xbrl.sec.gov/oef/role/ShareholderReportHoldingsDetails"
],
"lang": {
"en-us": {
"role": {
"label": "Holdings [Line Items]"
}
}
},
"auth_ref": [
"r51"
]
},
"oef_HoldingsTable": {
"xbrltype": "stringItemType",
"nsuri": "http://xbrl.sec.gov/oef/2023",
"localname": "HoldingsTable",
"presentation": [
"http://xbrl.sec.gov/oef/role/ShareholderReportHoldingsDetails"
],
"lang": {
"en-us": {
"role": {
"label": "Holdings [Table]"
}
}
},
"auth_ref": [
"r51"
]
},
"oef_HoldingsTableTextBlock": {
"xbrltype": "textBlockItemType",
"nsuri": "http://xbrl.sec.gov/oef/2023",
"localname": "HoldingsTableTextBlock",
"presentation": [
"http://xbrl.sec.gov/oef/role/ShareholderReport"
],
"lang": {
"en-us": {
"role": {
"label": "Holdings [Text Block]"
}
}
},
"auth_ref": [
"r51"
]
},
"oef_InabilityToMeetDistLevelTextBlock": {
"xbrltype": "textBlockItemType",
"nsuri": "http://xbrl.sec.gov/oef/2023",
"localname": "InabilityToMeetDistLevelTextBlock",
"presentation": [
"http://xbrl.sec.gov/oef/role/ShareholderReport"
],
"lang": {
"en-us": {
"role": {
"label": "Inability to Meet Distribution Level [Text Block]"
}
}
},
"auth_ref": [
"r45"
]
},
"oef_IndustrialSectorMember": {
"xbrltype": "domainItemType",
"nsuri": "http://xbrl.sec.gov/oef/2023",
"localname": "IndustrialSectorMember",
"presentation": [
"http://xbrl.sec.gov/oef/role/ShareholderReportHoldingsDetails"
],
"lang": {
"en-us": {
"role": {
"label": "Industrial Sector [Member]"
}
}
},
"auth_ref": [
"r51"
]
},
"oef_IndustrySectorAxis": {
"xbrltype": "stringItemType",
"nsuri": "http://xbrl.sec.gov/oef/2023",
"localname": "IndustrySectorAxis",
"presentation": [
"http://xbrl.sec.gov/oef/role/ShareholderReportHoldingsDetails"
],
"lang": {
"en-us": {
"role": {
"label": "Industry Sector [Axis]"
}
}
},
"auth_ref": [
"r51"
]
},
"oef_IndustrySectorDomain": {
"xbrltype": "domainItemType",
"nsuri": "http://xbrl.sec.gov/oef/2023",
"localname": "IndustrySectorDomain",
"presentation": [
"http://xbrl.sec.gov/oef/role/ShareholderReportHoldingsDetails"
],
"lang": {
"en-us": {
"role": {
"label": "Industry Sector [Domain]"
}
}
},
"auth_ref": [
"r51"
]
},
"oef_InformationTechnologySectorMember": {
"xbrltype": "domainItemType",
"nsuri": "http://xbrl.sec.gov/oef/2023",
"localname": "InformationTechnologySectorMember",
"presentation": [
"http://xbrl.sec.gov/oef/role/ShareholderReportHoldingsDetails"
],
"lang": {
"en-us": {
"role": {
"label": "Information Technology Sector [Member]"
}
}
},
"auth_ref": [
"r51"
]
},
"bmafi_InsmedIncMember": {
"xbrltype": "domainItemType",
"nsuri": "http://www.bny.com/20250418",
"localname": "InsmedIncMember",
"presentation": [
"http://xbrl.sec.gov/oef/role/ShareholderReportHoldingsDetails"
],
"lang": {
"en-us": {
"role": {
"label": "Insmed Inc [Member]"
}
}
},
"auth_ref": []
},
"bmafi_InvestmentCompaniesMember": {
"xbrltype": "domainItemType",
"nsuri": "http://www.bny.com/20250418",
"localname": "InvestmentCompaniesMember",
"presentation": [
"http://xbrl.sec.gov/oef/role/ShareholderReportHoldingsDetails"
],
"lang": {
"en-us": {
"role": {
"label": "Investment Companies [Member]"
}
}
},
"auth_ref": []
},
"us-gaap_InvestmentCompanyPortfolioTurnover": {
"xbrltype": "percentItemType",
"nsuri": "http://fasb.org/us-gaap/2023",
"localname": "InvestmentCompanyPortfolioTurnover",
"presentation": [
"http://xbrl.sec.gov/oef/role/ShareholderReport"
],
"lang": {
"en-us": {
"role": {
"label": "Investment Company Portfolio Turnover",
"documentation": "Percentage of lesser of purchase or sale of portfolio securities to average value of portfolio securities owned."
}
}
},
"auth_ref": [
"r68"
]
},
"us-gaap_InvestmentTypeAxis": {
"xbrltype": "stringItemType",
"nsuri": "http://fasb.org/us-gaap/2023",
"localname": "InvestmentTypeAxis",
"presentation": [
"http://xbrl.sec.gov/oef/role/ShareholderReportHoldingsDetails"
],
"lang": {
"en-us": {
"role": {
"label": "Investment Type [Axis]",
"documentation": "Information by type of investments."
}
}
},
"auth_ref": [
"r1",
"r2",
"r3",
"r4",
"r5",
"r6",
"r7",
"r8",
"r9",
"r10",
"r11",
"r12",
"r13",
"r14",
"r15",
"r16",
"r17",
"r20"
]
},
"us-gaap_InvestmentTypeCategorizationMember": {
"xbrltype": "domainItemType",
"nsuri": "http://fasb.org/us-gaap/2023",
"localname": "InvestmentTypeCategorizationMember",
"presentation": [
"http://xbrl.sec.gov/oef/role/ShareholderReportHoldingsDetails"
],
"lang": {
"en-us": {
"role": {
"documentation": "Asset obtained to generate income or appreciate in value."
}
}
},
"auth_ref": [
"r1",
"r2",
"r3",
"r4",
"r5",
"r6",
"r7",
"r8",
"r9",
"r10",
"r11",
"r12",
"r13",
"r14",
"r15",
"r16",
"r17",
"r20"
]
},
"bmafi_JPMorganChaseAndCoMember": {
"xbrltype": "domainItemType",
"nsuri": "http://www.bny.com/20250418",
"localname": "JPMorganChaseAndCoMember",
"presentation": [
"http://xbrl.sec.gov/oef/role/ShareholderReportHoldingsDetails"
],
"lang": {
"en-us": {
"role": {
"label": "JPMorgan Chase And Co [Member]"
}
}
},
"auth_ref": []
},
"bmafi_JohnsonControlsInternationalPLCMember": {
"xbrltype": "domainItemType",
"nsuri": "http://www.bny.com/20250418",
"localname": "JohnsonControlsInternationalPLCMember",
"presentation": [
"http://xbrl.sec.gov/oef/role/ShareholderReportHoldingsDetails"
],
"lang": {
"en-us": {
"role": {
"label": "Johnson Controls International PLC [Member]"
}
}
},
"auth_ref": []
},
"bmafi_KenvueIncMember": {
"xbrltype": "domainItemType",
"nsuri": "http://www.bny.com/20250418",
"localname": "KenvueIncMember",
"presentation": [
"http://xbrl.sec.gov/oef/role/ShareholderReportHoldingsDetails"
],
"lang": {
"en-us": {
"role": {
"label": "Kenvue Inc [Member]"
}
}
},
"auth_ref": []
},
"oef_LargestHoldingAxis": {
"xbrltype": "stringItemType",
"nsuri": "http://xbrl.sec.gov/oef/2023",
"localname": "LargestHoldingAxis",
"presentation": [
"http://xbrl.sec.gov/oef/role/ShareholderReportHoldingsDetails"
],
"lang": {
"en-us": {
"role": {
"label": "Largest Holding [Axis]"
}
}
},
"auth_ref": [
"r51"
]
},
"oef_LargestHoldingsDomain": {
"xbrltype": "domainItemType",
"nsuri": "http://xbrl.sec.gov/oef/2023",
"localname": "LargestHoldingsDomain",
"presentation": [
"http://xbrl.sec.gov/oef/role/ShareholderReportHoldingsDetails"
],
"lang": {
"en-us": {
"role": {
"label": "Largest Holdings [Domain]"
}
}
},
"auth_ref": [
"r51"
]
},
"oef_LargestHoldingsTableTextBlock": {
"xbrltype": "textBlockItemType",
"nsuri": "http://xbrl.sec.gov/oef/2023",
"localname": "LargestHoldingsTableTextBlock",
"presentation": [
"http://xbrl.sec.gov/oef/role/ShareholderReport"
],
"lang": {
"en-us": {
"role": {
"label": "Largest Holdings [Text Block]"
}
}
},
"auth_ref": [
"r51"
]
},
"oef_LineGraphAndTableMeasureName": {
"xbrltype": "stringItemType",
"nsuri": "http://xbrl.sec.gov/oef/2023",
"localname": "LineGraphAndTableMeasureName",
"presentation": [
"http://xbrl.sec.gov/oef/role/ShareholderReportLineGraphDetails"
],
"lang": {
"en-us": {
"role": {
"label": "Line Graph and Table Measure Name"
}
}
},
"auth_ref": [
"r37"
]
},
"oef_LineGraphTableTextBlock": {
"xbrltype": "textBlockItemType",
"nsuri": "http://xbrl.sec.gov/oef/2023",
"localname": "LineGraphTableTextBlock",
"presentation": [
"http://xbrl.sec.gov/oef/role/ShareholderReport"
],
"lang": {
"en-us": {
"role": {
"label": "Line Graph [Table Text Block]"
}
}
},
"auth_ref": [
"r36"
]
},
"bmafi_MagniteIncMember": {
"xbrltype": "domainItemType",
"nsuri": "http://www.bny.com/20250418",
"localname": "MagniteIncMember",
"presentation": [
"http://xbrl.sec.gov/oef/role/ShareholderReportHoldingsDetails"
],
"lang": {
"en-us": {
"role": {
"label": "Magnite Inc [Member]"
}
}
},
"auth_ref": []
},
"oef_MaterialChngDate": {
"xbrltype": "dateItemType",
"nsuri": "http://xbrl.sec.gov/oef/2023",
"localname": "MaterialChngDate",
"presentation": [
"http://xbrl.sec.gov/oef/role/ShareholderReport"
],
"lang": {
"en-us": {
"role": {
"label": "Material Change Date"
}
}
},
"auth_ref": [
"r41"
]
},
"oef_MaterialChngDescriptionTextBlock": {
"xbrltype": "textBlockItemType",
"nsuri": "http://xbrl.sec.gov/oef/2023",
"localname": "MaterialChngDescriptionTextBlock",
"presentation": [
"http://xbrl.sec.gov/oef/role/ShareholderReport"
],
"lang": {
"en-us": {
"role": {
"label": "Material Change Description [Text Block]"
}
}
},
"auth_ref": [
"r41"
]
},
"oef_MaterialFundChngAdviserTextBlock": {
"xbrltype": "textBlockItemType",
"nsuri": "http://xbrl.sec.gov/oef/2023",
"localname": "MaterialFundChngAdviserTextBlock",
"presentation": [
"http://xbrl.sec.gov/oef/role/ShareholderReport"
],
"lang": {
"en-us": {
"role": {
"label": "Material Fund Change Adviser [Text Block]"
}
}
},
"auth_ref": [
"r58"
]
},
"oef_MaterialFundChngExpensesTextBlock": {
"xbrltype": "textBlockItemType",
"nsuri": "http://xbrl.sec.gov/oef/2023",
"localname": "MaterialFundChngExpensesTextBlock",
"presentation": [
"http://xbrl.sec.gov/oef/role/ShareholderReport"
],
"lang": {
"en-us": {
"role": {
"label": "Material Fund Change Expenses [Text Block]"
}
}
},
"auth_ref": [
"r55"
]
},
"oef_MaterialFundChngNameTextBlock": {
"xbrltype": "textBlockItemType",
"nsuri": "http://xbrl.sec.gov/oef/2023",
"localname": "MaterialFundChngNameTextBlock",
"presentation": [
"http://xbrl.sec.gov/oef/role/ShareholderReport"
],
"lang": {
"en-us": {
"role": {
"label": "Material Fund Change Name [Text Block]"
}
}
},
"auth_ref": [
"r53"
]
},
"oef_MaterialFundChngNoticeTextBlock": {
"xbrltype": "textBlockItemType",
"nsuri": "http://xbrl.sec.gov/oef/2023",
"localname": "MaterialFundChngNoticeTextBlock",
"presentation": [
"http://xbrl.sec.gov/oef/role/ShareholderReport"
],
"lang": {
"en-us": {
"role": {
"label": "Material Fund Change Notice [Text Block]"
}
}
},
"auth_ref": [
"r27"
]
},
"oef_MaterialFundChngObjectivesTextBlock": {
"xbrltype": "textBlockItemType",
"nsuri": "http://xbrl.sec.gov/oef/2023",
"localname": "MaterialFundChngObjectivesTextBlock",
"presentation": [
"http://xbrl.sec.gov/oef/role/ShareholderReport"
],
"lang": {
"en-us": {
"role": {
"label": "Material Fund Change Objectives [Text Block]"
}
}
},
"auth_ref": [
"r54"
]
},
"oef_MaterialFundChngRisksChngTextBlock": {
"xbrltype": "textBlockItemType",
"nsuri": "http://xbrl.sec.gov/oef/2023",
"localname": "MaterialFundChngRisksChngTextBlock",
"presentation": [
"http://xbrl.sec.gov/oef/role/ShareholderReport"
],
"lang": {
"en-us": {
"role": {
"label": "Material Fund Change Risks Change [Text Block]"
}
}
},
"auth_ref": [
"r57"
]
},
"oef_MaterialFundChngStrategiesTextBlock": {
"xbrltype": "textBlockItemType",
"nsuri": "http://xbrl.sec.gov/oef/2023",
"localname": "MaterialFundChngStrategiesTextBlock",
"presentation": [
"http://xbrl.sec.gov/oef/role/ShareholderReport"
],
"lang": {
"en-us": {
"role": {
"label": "Material Fund Change Strategies [Text Block]"
}
}
},
"auth_ref": [
"r56"
]
},
"oef_MaterialFundChngTextBlock": {
"xbrltype": "textBlockItemType",
"nsuri": "http://xbrl.sec.gov/oef/2023",
"localname": "MaterialFundChngTextBlock",
"presentation": [
"http://xbrl.sec.gov/oef/role/ShareholderReport"
],
"lang": {
"en-us": {
"role": {
"label": "Material Fund Change [Text Block]"
}
}
},
"auth_ref": [
"r52"
]
},
"oef_MaterialsSectorMember": {
"xbrltype": "domainItemType",
"nsuri": "http://xbrl.sec.gov/oef/2023",
"localname": "MaterialsSectorMember",
"presentation": [
"http://xbrl.sec.gov/oef/role/ShareholderReportHoldingsDetails"
],
"lang": {
"en-us": {
"role": {
"label": "Materials Sector [Member]"
}
}
},
"auth_ref": [
"r51"
]
},
"oef_MaturityAxis": {
"xbrltype": "stringItemType",
"nsuri": "http://xbrl.sec.gov/oef/2023",
"localname": "MaturityAxis",
"presentation": [
"http://xbrl.sec.gov/oef/role/ShareholderReportHoldingsDetails"
],
"lang": {
"en-us": {
"role": {
"label": "Maturity [Axis]"
}
}
},
"auth_ref": [
"r51"
]
},
"oef_MaturityDomain": {
"xbrltype": "domainItemType",
"nsuri": "http://xbrl.sec.gov/oef/2023",
"localname": "MaturityDomain",
"presentation": [
"http://xbrl.sec.gov/oef/role/ShareholderReportHoldingsDetails"
],
"lang": {
"en-us": {
"role": {
"label": "Maturity [Domain]"
}
}
},
"auth_ref": [
"r51"
]
},
"bmafi_MedtronicPLCMember": {
"xbrltype": "domainItemType",
"nsuri": "http://www.bny.com/20250418",
"localname": "MedtronicPLCMember",
"presentation": [
"http://xbrl.sec.gov/oef/role/ShareholderReportHoldingsDetails"
],
"lang": {
"en-us": {
"role": {
"label": "Medtronic PLC [Member]"
}
}
},
"auth_ref": []
},
"bmafi_MetaPlatformsIncClAMember": {
"xbrltype": "domainItemType",
"nsuri": "http://www.bny.com/20250418",
"localname": "MetaPlatformsIncClAMember",
"presentation": [
"http://xbrl.sec.gov/oef/role/ShareholderReportHoldingsDetails"
],
"lang": {
"en-us": {
"role": {
"label": "Meta Platforms Inc Cl A [Member]"
}
}
},
"auth_ref": []
},
"bmafi_MicrosoftCorpMember": {
"xbrltype": "domainItemType",
"nsuri": "http://www.bny.com/20250418",
"localname": "MicrosoftCorpMember",
"presentation": [
"http://xbrl.sec.gov/oef/role/ShareholderReportHoldingsDetails"
],
"lang": {
"en-us": {
"role": {
"label": "Microsoft Corp [Member]"
}
}
},
"auth_ref": []
},
"bmafi_NVIDIACorpMember": {
"xbrltype": "domainItemType",
"nsuri": "http://www.bny.com/20250418",
"localname": "NVIDIACorpMember",
"presentation": [
"http://xbrl.sec.gov/oef/role/ShareholderReportHoldingsDetails"
],
"lang": {
"en-us": {
"role": {
"label": "NVIDIA Corp [Member]"
}
}
},
"auth_ref": []
},
"bmafi_NetOtherAssetsAndLiabilitiesMember": {
"xbrltype": "domainItemType",
"nsuri": "http://www.bny.com/20250418",
"localname": "NetOtherAssetsAndLiabilitiesMember",
"presentation": [
"http://xbrl.sec.gov/oef/role/ShareholderReportHoldingsDetails"
],
"lang": {
"en-us": {
"role": {
"label": "Net Other Assets and Liabilities [Member]"
}
}
},
"auth_ref": []
},
"bmafi_NetflixIncMember": {
"xbrltype": "domainItemType",
"nsuri": "http://www.bny.com/20250418",
"localname": "NetflixIncMember",
"presentation": [
"http://xbrl.sec.gov/oef/role/ShareholderReportHoldingsDetails"
],
"lang": {
"en-us": {
"role": {
"label": "Netflix Inc [Member]"
}
}
},
"auth_ref": []
},
"bmafi_NewmontCorpMember": {
"xbrltype": "domainItemType",
"nsuri": "http://www.bny.com/20250418",
"localname": "NewmontCorpMember",
"presentation": [
"http://xbrl.sec.gov/oef/role/ShareholderReportHoldingsDetails"
],
"lang": {
"en-us": {
"role": {
"label": "Newmont Corp [Member]"
}
}
},
"auth_ref": []
},
"oef_NoDeductionOfTaxesTextBlock": {
"xbrltype": "textBlockItemType",
"nsuri": "http://xbrl.sec.gov/oef/2023",
"localname": "NoDeductionOfTaxesTextBlock",
"presentation": [
"http://xbrl.sec.gov/oef/role/ShareholderReport"
],
"lang": {
"en-us": {
"role": {
"label": "No Deduction of Taxes [Text Block]"
}
}
},
"auth_ref": [
"r38"
]
},
"dei_NoTradingSymbolFlag": {
"xbrltype": "trueItemType",
"nsuri": "http://xbrl.sec.gov/dei/2023",
"localname": "NoTradingSymbolFlag",
"presentation": [
"http://xbrl.sec.gov/oef/role/ShareholderReport"
],
"lang": {
"en-us": {
"role": {
"label": "No Trading Symbol Flag",
"documentation": "Boolean flag that is true only for a security having no trading symbol."
}
}
},
"auth_ref": []
},
"bmafi_OracleCorpMember": {
"xbrltype": "domainItemType",
"nsuri": "http://www.bny.com/20250418",
"localname": "OracleCorpMember",
"presentation": [
"http://xbrl.sec.gov/oef/role/ShareholderReportHoldingsDetails"
],
"lang": {
"en-us": {
"role": {
"label": "Oracle Corp [Member]"
}
}
},
"auth_ref": []
},
"oef_OtherCategory1Axis": {
"xbrltype": "stringItemType",
"nsuri": "http://xbrl.sec.gov/oef/2023",
"localname": "OtherCategory1Axis",
"presentation": [
"http://xbrl.sec.gov/oef/role/ShareholderReportHoldingsDetails"
],
"lang": {
"en-us": {
"role": {
"label": "Other Category 1 [Axis]"
}
}
},
"auth_ref": [
"r51"
]
},
"oef_OtherCategory1Domain": {
"xbrltype": "domainItemType",
"nsuri": "http://xbrl.sec.gov/oef/2023",
"localname": "OtherCategory1Domain",
"presentation": [
"http://xbrl.sec.gov/oef/role/ShareholderReportHoldingsDetails"
],
"lang": {
"en-us": {
"role": {
"label": "Other Category 1 [Domain]"
}
}
},
"auth_ref": [
"r51"
]
},
"oef_OtherCategory2Axis": {
"xbrltype": "stringItemType",
"nsuri": "http://xbrl.sec.gov/oef/2023",
"localname": "OtherCategory2Axis",
"presentation": [
"http://xbrl.sec.gov/oef/role/ShareholderReportHoldingsDetails"
],
"lang": {
"en-us": {
"role": {
"label": "Other Category 2 [Axis]"
}
}
},
"auth_ref": [
"r51"
]
},
"oef_OtherCategory2Domain": {
"xbrltype": "domainItemType",
"nsuri": "http://xbrl.sec.gov/oef/2023",
"localname": "OtherCategory2Domain",
"presentation": [
"http://xbrl.sec.gov/oef/role/ShareholderReportHoldingsDetails"
],
"lang": {
"en-us": {
"role": {
"label": "Other Category 2 [Domain]"
}
}
},
"auth_ref": [
"r51"
]
},
"oef_PctOfNav": {
"xbrltype": "percentItemType",
"nsuri": "http://xbrl.sec.gov/oef/2023",
"localname": "PctOfNav",
"presentation": [
"http://xbrl.sec.gov/oef/role/ShareholderReportHoldingsDetails"
],
"lang": {
"en-us": {
"role": {
"label": "Percent of Net Asset Value"
}
}
},
"auth_ref": [
"r51"
]
},
"oef_PctOfNetLongExposure": {
"xbrltype": "percentItemType",
"nsuri": "http://xbrl.sec.gov/oef/2023",
"localname": "PctOfNetLongExposure",
"presentation": [
"http://xbrl.sec.gov/oef/role/ShareholderReportHoldingsDetails"
],
"lang": {
"en-us": {
"role": {
"label": "Percent of Net Long Exposure"
}
}
},
"auth_ref": [
"r51"
]
},
"oef_PctOfNetShortExposure": {
"xbrltype": "percentItemType",
"nsuri": "http://xbrl.sec.gov/oef/2023",
"localname": "PctOfNetShortExposure",
"presentation": [
"http://xbrl.sec.gov/oef/role/ShareholderReportHoldingsDetails"
],
"lang": {
"en-us": {
"role": {
"label": "Percent of Net Short Exposure"
}
}
},
"auth_ref": [
"r51"
]
},
"oef_PctOfTotalInv": {
"xbrltype": "percentItemType",
"nsuri": "http://xbrl.sec.gov/oef/2023",
"localname": "PctOfTotalInv",
"presentation": [
"http://xbrl.sec.gov/oef/role/ShareholderReportHoldingsDetails"
],
"lang": {
"en-us": {
"role": {
"label": "Percent of Total Investments"
}
}
},
"auth_ref": [
"r51"
]
},
"oef_PctOfTotalLongExposure": {
"xbrltype": "percentItemType",
"nsuri": "http://xbrl.sec.gov/oef/2023",
"localname": "PctOfTotalLongExposure",
"presentation": [
"http://xbrl.sec.gov/oef/role/ShareholderReportHoldingsDetails"
],
"lang": {
"en-us": {
"role": {
"label": "Percent of Total Long Exposure"
}
}
},
"auth_ref": [
"r51"
]
},
"oef_PctOfTotalShortExposure": {
"xbrltype": "percentItemType",
"nsuri": "http://xbrl.sec.gov/oef/2023",
"localname": "PctOfTotalShortExposure",
"presentation": [
"http://xbrl.sec.gov/oef/role/ShareholderReportHoldingsDetails"
],
"lang": {
"en-us": {
"role": {
"label": "Percent of Total Short Exposure"
}
}
},
"auth_ref": [
"r51"
]
},
"oef_PerfInceptionDate": {
"xbrltype": "dateItemType",
"nsuri": "http://xbrl.sec.gov/oef/2023",
"localname": "PerfInceptionDate",
"presentation": [
"http://xbrl.sec.gov/oef/role/ShareholderReport"
],
"lang": {
"en-us": {
"role": {
"label": "Performance Inception Date"
}
}
},
"auth_ref": [
"r37"
]
},
"oef_PerfTableMarketIndexChngdTextBlock": {
"xbrltype": "textBlockItemType",
"nsuri": "http://xbrl.sec.gov/oef/2023",
"localname": "PerfTableMarketIndexChngdTextBlock",
"presentation": [
"http://xbrl.sec.gov/oef/role/ShareholderReport"
],
"lang": {
"en-us": {
"role": {
"label": "Performance Table Market Index Changed [Text Block]"
}
}
},
"auth_ref": [
"r44"
]
},
"oef_PerformancePastDoesNotIndicateFuture": {
"xbrltype": "stringItemType",
"nsuri": "http://xbrl.sec.gov/oef/2023",
"localname": "PerformancePastDoesNotIndicateFuture",
"presentation": [
"http://xbrl.sec.gov/oef/role/ShareholderReport"
],
"lang": {
"en-us": {
"role": {
"label": "Performance Past Does Not Indicate Future [Text]"
}
}
},
"auth_ref": [
"r39",
"r63"
]
},
"bmafi_Phillips66Member": {
"xbrltype": "domainItemType",
"nsuri": "http://www.bny.com/20250418",
"localname": "Phillips66Member",
"presentation": [
"http://xbrl.sec.gov/oef/role/ShareholderReportHoldingsDetails"
],
"lang": {
"en-us": {
"role": {
"label": "Phillips 66 [Member]"
}
}
},
"auth_ref": []
},
"oef_PreviousInvestmentAdviserTextBlock": {
"xbrltype": "textBlockItemType",
"nsuri": "http://xbrl.sec.gov/oef/2023",
"localname": "PreviousInvestmentAdviserTextBlock",
"presentation": [
"http://xbrl.sec.gov/oef/role/ShareholderReport"
],
"lang": {
"en-us": {
"role": {
"label": "Previous Investment Adviser [Text Block]"
}
}
},
"auth_ref": [
"r40"
]
},
"oef_PriorMarketIndexComparisonTextBlock": {
"xbrltype": "textBlockItemType",
"nsuri": "http://xbrl.sec.gov/oef/2023",
"localname": "PriorMarketIndexComparisonTextBlock",
"presentation": [
"http://xbrl.sec.gov/oef/role/ShareholderReport"
],
"lang": {
"en-us": {
"role": {
"label": "Prior Market Index Comparison [Text Block]"
}
}
},
"auth_ref": [
"r44"
]
},
"us-gaap_RealEstateSectorMember": {
"xbrltype": "domainItemType",
"nsuri": "http://fasb.org/us-gaap/2023",
"localname": "RealEstateSectorMember",
"presentation": [
"http://xbrl.sec.gov/oef/role/ShareholderReportHoldingsDetails"
],
"lang": {
"en-us": {
"role": {
"label": "Real Estate Sector [Member]",
"documentation": "Sector of the economy consisting of companies engaged in real estate business activities."
}
}
},
"auth_ref": [
"r18",
"r69",
"r70",
"r71",
"r72"
]
},
"oef_SalesLoadAxis": {
"xbrltype": "stringItemType",
"nsuri": "http://xbrl.sec.gov/oef/2023",
"localname": "SalesLoadAxis",
"presentation": [
"http://xbrl.sec.gov/oef/role/ShareholderReportLineGraphDetails"
],
"lang": {
"en-us": {
"role": {
"label": "Sales Load [Axis]"
}
}
},
"auth_ref": [
"r43"
]
},
"dei_SecurityExchangeName": {
"xbrltype": "edgarExchangeCodeItemType",
"nsuri": "http://xbrl.sec.gov/dei/2023",
"localname": "SecurityExchangeName",
"presentation": [
"http://xbrl.sec.gov/oef/role/ShareholderReport"
],
"lang": {
"en-us": {
"role": {
"label": "Security Exchange Name",
"terseLabel": "Exchange",
"documentation": "Name of the Exchange on which a security is registered."
}
}
},
"auth_ref": [
"r22"
]
},
"bmafi_ServiceNowIncMember": {
"xbrltype": "domainItemType",
"nsuri": "http://www.bny.com/20250418",
"localname": "ServiceNowIncMember",
"presentation": [
"http://xbrl.sec.gov/oef/role/ShareholderReportHoldingsDetails"
],
"lang": {
"en-us": {
"role": {
"label": "ServiceNow Inc [Member]"
}
}
},
"auth_ref": []
},
"oef_ShareClassDomain": {
"xbrltype": "domainItemType",
"nsuri": "http://xbrl.sec.gov/oef/2023",
"localname": "ShareClassDomain",
"presentation": [
"http://xbrl.sec.gov/oef/role/ShareholderReport",
"http://xbrl.sec.gov/oef/role/ShareholderReportHoldingsDetails",
"http://xbrl.sec.gov/oef/role/ShareholderReportLineGraphDetails"
],
"lang": {
"en-us": {
"role": {
"label": "Share Classes"
}
}
},
"auth_ref": [
"r23"
]
},
"oef_ShareholderReportAbstract": {
"xbrltype": "stringItemType",
"nsuri": "http://xbrl.sec.gov/oef/2023",
"localname": "ShareholderReportAbstract",
"lang": {
"en-us": {
"role": {
"label": "Shareholder Report [Abstract]"
}
}
},
"auth_ref": [
"r43"
]
},
"oef_ShareholderReportAnnualOrSemiAnnual": {
"xbrltype": "shareholderReportTypeItemType",
"nsuri": "http://xbrl.sec.gov/oef/2023",
"localname": "ShareholderReportAnnualOrSemiAnnual",
"presentation": [
"http://xbrl.sec.gov/oef/role/ShareholderReport"
],
"lang": {
"en-us": {
"role": {
"label": "Shareholder Report Annual or Semi-Annual"
}
}
},
"auth_ref": [
"r25"
]
},
"oef_ShareholderReportLineItems": {
"xbrltype": "stringItemType",
"nsuri": "http://xbrl.sec.gov/oef/2023",
"localname": "ShareholderReportLineItems",
"presentation": [
"http://xbrl.sec.gov/oef/role/NcsrCover",
"http://xbrl.sec.gov/oef/role/ShareholderReport"
],
"lang": {
"en-us": {
"role": {
"label": "Shareholder Report [Line Items]"
}
}
},
"auth_ref": [
"r43"
]
},
"oef_ShareholderReportTable": {
"xbrltype": "stringItemType",
"nsuri": "http://xbrl.sec.gov/oef/2023",
"localname": "ShareholderReportTable",
"presentation": [
"http://xbrl.sec.gov/oef/role/NcsrCover",
"http://xbrl.sec.gov/oef/role/ShareholderReport"
],
"lang": {
"en-us": {
"role": {
"label": "Shareholder Report [Table]"
}
}
},
"auth_ref": [
"r43"
]
},
"bmafi_ShopifyIncClAMember": {
"xbrltype": "domainItemType",
"nsuri": "http://www.bny.com/20250418",
"localname": "ShopifyIncClAMember",
"presentation": [
"http://xbrl.sec.gov/oef/role/ShareholderReportHoldingsDetails"
],
"lang": {
"en-us": {
"role": {
"label": "Shopify Inc Cl A [Member]"
}
}
},
"auth_ref": []
},
"bmafi_SkyWestIncMember": {
"xbrltype": "domainItemType",
"nsuri": "http://www.bny.com/20250418",
"localname": "SkyWestIncMember",
"presentation": [
"http://xbrl.sec.gov/oef/role/ShareholderReportHoldingsDetails"
],
"lang": {
"en-us": {
"role": {
"label": "SkyWest Inc [Member]"
}
}
},
"auth_ref": []
},
"oef_SummaryOfChngLegendTextBlock": {
"xbrltype": "textBlockItemType",
"nsuri": "http://xbrl.sec.gov/oef/2023",
"localname": "SummaryOfChngLegendTextBlock",
"presentation": [
"http://xbrl.sec.gov/oef/role/ShareholderReport"
],
"lang": {
"en-us": {
"role": {
"label": "Summary of Change Legend [Text Block]"
}
}
},
"auth_ref": [
"r59"
]
},
"bmafi_TaiwanSemiconductorManufacturingCoLtdADRMember": {
"xbrltype": "domainItemType",
"nsuri": "http://www.bny.com/20250418",
"localname": "TaiwanSemiconductorManufacturingCoLtdADRMember",
"presentation": [
"http://xbrl.sec.gov/oef/role/ShareholderReportHoldingsDetails"
],
"lang": {
"en-us": {
"role": {
"label": "Taiwan Semiconductor Manufacturing Co Ltd ADR [Member]"
}
}
},
"auth_ref": []
},
"bmafi_TexasCapitalBancsharesIncMember": {
"xbrltype": "domainItemType",
"nsuri": "http://www.bny.com/20250418",
"localname": "TexasCapitalBancsharesIncMember",
"presentation": [
"http://xbrl.sec.gov/oef/role/ShareholderReportHoldingsDetails"
],
"lang": {
"en-us": {
"role": {
"label": "Texas Capital Bancshares Inc [Member]"
}
}
},
"auth_ref": []
},
"bmafi_TheBaldwinInsuranceGroupIncMember": {
"xbrltype": "domainItemType",
"nsuri": "http://www.bny.com/20250418",
"localname": "TheBaldwinInsuranceGroupIncMember",
"presentation": [
"http://xbrl.sec.gov/oef/role/ShareholderReportHoldingsDetails"
],
"lang": {
"en-us": {
"role": {
"label": "The Baldwin Insurance Group Inc [Member]"
}
}
},
"auth_ref": []
},
"dei_TradingSymbol": {
"xbrltype": "tradingSymbolItemType",
"nsuri": "http://xbrl.sec.gov/dei/2023",
"localname": "TradingSymbol",
"presentation": [
"http://xbrl.sec.gov/oef/role/ShareholderReport"
],
"lang": {
"en-us": {
"role": {
"label": "Trading Symbol",
"terseLabel": "Ticker",
"documentation": "Trading symbol of an instrument as listed on an exchange."
}
}
},
"auth_ref": []
},
"bmafi_UnitedHealthGroupIncMember": {
"xbrltype": "domainItemType",
"nsuri": "http://www.bny.com/20250418",
"localname": "UnitedHealthGroupIncMember",
"presentation": [
"http://xbrl.sec.gov/oef/role/ShareholderReportHoldingsDetails"
],
"lang": {
"en-us": {
"role": {
"label": "UnitedHealth Group Inc [Member]"
}
}
},
"auth_ref": []
},
"oef_UpdPerfInfoLocationTextBlock": {
"xbrltype": "textBlockItemType",
"nsuri": "http://xbrl.sec.gov/oef/2023",
"localname": "UpdPerfInfoLocationTextBlock",
"presentation": [
"http://xbrl.sec.gov/oef/role/ShareholderReport"
],
"lang": {
"en-us": {
"role": {
"label": "Updated Performance Information Location [Text Block]"
}
}
},
"auth_ref": [
"r42"
]
},
"oef_UpdProspectusEmailAddress": {
"xbrltype": "stringItemType",
"nsuri": "http://xbrl.sec.gov/oef/2023",
"localname": "UpdProspectusEmailAddress",
"presentation": [
"http://xbrl.sec.gov/oef/role/ShareholderReport"
],
"lang": {
"en-us": {
"role": {
"label": "Updated Prospectus Email Address"
}
}
},
"auth_ref": [
"r59"
]
},
"oef_UpdProspectusPhoneNumber": {
"xbrltype": "stringItemType",
"nsuri": "http://xbrl.sec.gov/oef/2023",
"localname": "UpdProspectusPhoneNumber",
"presentation": [
"http://xbrl.sec.gov/oef/role/ShareholderReport"
],
"lang": {
"en-us": {
"role": {
"label": "Updated Prospectus Phone Number"
}
}
},
"auth_ref": [
"r59"
]
},
"oef_UpdProspectusWebAddress": {
"xbrltype": "stringItemType",
"nsuri": "http://xbrl.sec.gov/oef/2023",
"localname": "UpdProspectusWebAddress",
"presentation": [
"http://xbrl.sec.gov/oef/role/ShareholderReport"
],
"lang": {
"en-us": {
"role": {
"label": "Updated Prospectus Web Address"
}
}
},
"auth_ref": [
"r59"
]
},
"oef_UtilitiesSectorMember": {
"xbrltype": "domainItemType",
"nsuri": "http://xbrl.sec.gov/oef/2023",
"localname": "UtilitiesSectorMember",
"presentation": [
"http://xbrl.sec.gov/oef/role/ShareholderReportHoldingsDetails"
],
"lang": {
"en-us": {
"role": {
"label": "Utilities Sector [Member]"
}
}
},
"auth_ref": [
"r51"
]
},
"bmafi_ValmontIndustriesIncMember": {
"xbrltype": "domainItemType",
"nsuri": "http://www.bny.com/20250418",
"localname": "ValmontIndustriesIncMember",
"presentation": [
"http://xbrl.sec.gov/oef/role/ShareholderReportHoldingsDetails"
],
"lang": {
"en-us": {
"role": {
"label": "Valmont Industries Inc [Member]"
}
}
},
"auth_ref": []
},
"oef_WithSalesLdMember": {
"xbrltype": "domainItemType",
"nsuri": "http://xbrl.sec.gov/oef/2023",
"localname": "WithSalesLoadMember",
"presentation": [
"http://xbrl.sec.gov/oef/role/ShareholderReportLineGraphDetails"
],
"lang": {
"en-us": {
"role": {
"label": "With Sales Load [Member]"
}
}
},
"auth_ref": [
"r43"
]
},
"oef_WithoutSalesLoadMember": {
"xbrltype": "domainItemType",
"nsuri": "http://xbrl.sec.gov/oef/2023",
"localname": "WithoutSalesLoadMember",
"presentation": [
"http://xbrl.sec.gov/oef/role/ShareholderReportLineGraphDetails"
],
"lang": {
"en-us": {
"role": {
"label": "Without Sales Load [Member]"
}
}
},
"auth_ref": [
"r43"
]
}
}
}
},
"std_ref": {
"r0": {
"role": "http://fasb.org/us-gaap/role/ref/legacyRef",
"Name": "Accounting Standards Codification",
"Section": "50",
"Paragraph": "1",
"SubTopic": "30",
"Topic": "205",
"Publisher": "FASB",
"URI": "https://asc.fasb.org//1943274/2147479910/205-30-50-1"
},
"r1": {
"role": "http://www.xbrl.org/2003/role/disclosureRef",
"Topic": "946",
"SubTopic": "210",
"Name": "Accounting Standards Codification",
"Section": "50",
"Paragraph": "1",
"Subparagraph": "(b)(1)",
"Publisher": "FASB",
"URI": "https://asc.fasb.org//1943274/2147480524/946-210-50-1"
},
"r2": {
"role": "http://www.xbrl.org/2003/role/disclosureRef",
"Topic": "946",
"SubTopic": "210",
"Name": "Accounting Standards Codification",
"Section": "50",
"Paragraph": "1",
"Subparagraph": "(c)(1)",
"Publisher": "FASB",
"URI": "https://asc.fasb.org//1943274/2147480524/946-210-50-1"
},
"r3": {
"role": "http://www.xbrl.org/2003/role/disclosureRef",
"Topic": "946",
"SubTopic": "210",
"Name": "Accounting Standards Codification",
"Section": "50",
"Paragraph": "1",
"Subparagraph": "(c)(2)",
"Publisher": "FASB",
"URI": "https://asc.fasb.org//1943274/2147480524/946-210-50-1"
},
"r4": {
"role": "http://www.xbrl.org/2003/role/disclosureRef",
"Topic": "946",
"SubTopic": "210",
"Name": "Accounting Standards Codification",
"Section": "50",
"Paragraph": "6",
"Subparagraph": "(a)(1)",
"Publisher": "FASB",
"URI": "https://asc.fasb.org//1943274/2147480524/946-210-50-6"
},
"r5": {
"role": "http://www.xbrl.org/2003/role/disclosureRef",
"Topic": "946",
"SubTopic": "210",
"Name": "Accounting Standards Codification",
"Section": "50",
"Paragraph": "6",
"Subparagraph": "(c)",
"Publisher": "FASB",
"URI": "https://asc.fasb.org//1943274/2147480524/946-210-50-6"
},
"r6": {
"role": "http://www.xbrl.org/2003/role/disclosureRef",
"Topic": "946",
"SubTopic": "320",
"Name": "Accounting Standards Codification",
"Section": "S99",
"Paragraph": "1",
"Subparagraph": "(SX 210.12-12(Column A)(Footnote 1))",
"Publisher": "FASB",
"URI": "https://asc.fasb.org//1943274/2147480032/946-320-S99-1"
},
"r7": {
"role": "http://www.xbrl.org/2003/role/disclosureRef",
"Topic": "946",
"SubTopic": "320",
"Name": "Accounting Standards Codification",
"Section": "S99",
"Paragraph": "1",
"Subparagraph": "(SX 210.12-12(Column C)(Footnote 5))",
"Publisher": "FASB",
"URI": "https://asc.fasb.org//1943274/2147480032/946-320-S99-1"
},
"r8": {
"role": "http://www.xbrl.org/2003/role/disclosureRef",
"Topic": "946",
"SubTopic": "320",
"Name": "Accounting Standards Codification",
"Section": "S99",
"Paragraph": "2",
"Subparagraph": "(SX 210.12-12A(Column C)(Footnote 4))",
"Publisher": "FASB",
"URI": "https://asc.fasb.org//1943274/2147480032/946-320-S99-2"
},
"r9": {
"role": "http://www.xbrl.org/2003/role/disclosureRef",
"Topic": "946",
"SubTopic": "320",
"Name": "Accounting Standards Codification",
"Section": "S99",
"Paragraph": "3",
"Subparagraph": "(SX 210.12-12B(Column A)(Footnote 7))",
"Publisher": "FASB",
"URI": "https://asc.fasb.org//1943274/2147480032/946-320-S99-3"
},
"r10": {
"role": "http://www.xbrl.org/2003/role/disclosureRef",
"Topic": "946",
"SubTopic": "320",
"Name": "Accounting Standards Codification",
"Section": "S99",
"Paragraph": "3",
"Subparagraph": "(SX 210.12-12B(Column C)(Footnote 2))",
"Publisher": "FASB",
"URI": "https://asc.fasb.org//1943274/2147480032/946-320-S99-3"
},
"r11": {
"role": "http://www.xbrl.org/2003/role/disclosureRef",
"Topic": "946",
"SubTopic": "320",
"Name": "Accounting Standards Codification",
"Section": "S99",
"Paragraph": "5D",
"Subparagraph": "(SX 210.12-13D(Column B)(Footnote 2))",
"Publisher": "FASB",
"URI": "https://asc.fasb.org//1943274/2147480032/946-320-S99-5D"
},
"r12": {
"role": "http://www.xbrl.org/2003/role/disclosureRef",
"Topic": "946",
"SubTopic": "320",
"Name": "Accounting Standards Codification",
"Section": "S99",
"Paragraph": "5D",
"Subparagraph": "(SX 210.12-13D(Column C)(Footnote 2))",
"Publisher": "FASB",
"URI": "https://asc.fasb.org//1943274/2147480032/946-320-S99-5D"
},
"r13": {
"role": "http://www.xbrl.org/2003/role/disclosureRef",
"Topic": "946",
"SubTopic": "320",
"Name": "Accounting Standards Codification",
"Section": "S99",
"Paragraph": "6",
"Subparagraph": "(SX 210.12-14(Column F)(Footnote 7))",
"Publisher": "FASB",
"URI": "https://asc.fasb.org//1943274/2147480032/946-320-S99-6"
},
"r14": {
"role": "http://www.xbrl.org/2003/role/disclosureRef",
"Topic": "946",
"SubTopic": "320",
"Name": "Accounting Standards Codification",
"Section": "S99",
"Paragraph": "7",
"Subparagraph": "(SX 210.12-15(Column A))",
"Publisher": "FASB",
"URI": "https://asc.fasb.org//1943274/2147480032/946-320-S99-7"
},
"r15": {
"role": "http://www.xbrl.org/2003/role/disclosureRef",
"Topic": "946",
"SubTopic": "320",
"Name": "Accounting Standards Codification",
"Section": "S99",
"Paragraph": "7",
"Subparagraph": "(SX 210.12-15(Column B))",
"Publisher": "FASB",
"URI": "https://asc.fasb.org//1943274/2147480032/946-320-S99-7"
},
"r16": {
"role": "http://www.xbrl.org/2003/role/disclosureRef",
"Topic": "946",
"SubTopic": "320",
"Name": "Accounting Standards Codification",
"Section": "S99",
"Paragraph": "7",
"Subparagraph": "(SX 210.12-15(Column C))",
"Publisher": "FASB",
"URI": "https://asc.fasb.org//1943274/2147480032/946-320-S99-7"
},
"r17": {
"role": "http://www.xbrl.org/2003/role/disclosureRef",
"Topic": "946",
"SubTopic": "320",
"Name": "Accounting Standards Codification",
"Section": "S99",
"Paragraph": "7",
"Subparagraph": "(SX 210.12-15(Column D))",
"Publisher": "FASB",
"URI": "https://asc.fasb.org//1943274/2147480032/946-320-S99-7"
},
"r18": {
"role": "http://www.xbrl.org/2003/role/exampleRef",
"Topic": "326",
"SubTopic": "20",
"Name": "Accounting Standards Codification",
"Section": "55",
"Paragraph": "12",
"Subparagraph": "(c)(1)",
"Publisher": "FASB",
"URI": "https://asc.fasb.org//1943274/2147479294/326-20-55-12"
},
"r19": {
"role": "http://www.xbrl.org/2003/role/exampleRef",
"Topic": "326",
"SubTopic": "20",
"Name": "Accounting Standards Codification",
"Section": "55",
"Paragraph": "15",
"Subparagraph": "(b)",
"Publisher": "FASB",
"URI": "https://asc.fasb.org//1943274/2147479294/326-20-55-15"
},
"r20": {
"role": "http://www.xbrl.org/2003/role/exampleRef",
"Topic": "946",
"SubTopic": "210",
"Name": "Accounting Standards Codification",
"Section": "55",
"Paragraph": "1",
"Publisher": "FASB",
"URI": "https://asc.fasb.org//1943274/2147480493/946-210-55-1"
},
"r21": {
"role": "http://www.xbrl.org/2003/role/presentationRef",
"Publisher": "SEC",
"Name": "Exchange Act",
"Number": "240",
"Section": "12",
"Subsection": "b-2"
},
"r22": {
"role": "http://www.xbrl.org/2003/role/presentationRef",
"Publisher": "SEC",
"Name": "Exchange Act",
"Number": "240",
"Section": "12",
"Subsection": "d1-1"
},
"r23": {
"role": "http://www.xbrl.org/2003/role/presentationRef",
"Publisher": "SEC",
"Name": "Form N-1A",
"Section": "1",
"Subsection": "a",
"Paragraph": "1"
},
"r24": {
"role": "http://www.xbrl.org/2003/role/presentationRef",
"Publisher": "SEC",
"Name": "Form N-1A",
"Section": "27A",
"Subsection": "b",
"Paragraph": "1"
},
"r25": {
"role": "http://www.xbrl.org/2003/role/presentationRef",
"Publisher": "SEC",
"Name": "Form N-1A",
"Section": "27A",
"Subsection": "b",
"Paragraph": "3"
},
"r26": {
"role": "http://www.xbrl.org/2003/role/presentationRef",
"Publisher": "SEC",
"Name": "Form N-1A",
"Section": "27A",
"Subsection": "b",
"Paragraph": "4"
},
"r27": {
"role": "http://www.xbrl.org/2003/role/presentationRef",
"Publisher": "SEC",
"Name": "Form N-1A",
"Section": "27A",
"Subsection": "b",
"Paragraph": "5"
},
"r28": {
"role": "http://www.xbrl.org/2003/role/presentationRef",
"Publisher": "SEC",
"Name": "Form N-1A",
"Section": "27A",
"Subsection": "b",
"Paragraph": "instruction",
"Subparagraph": "2"
},
"r29": {
"role": "http://www.xbrl.org/2003/role/presentationRef",
"Publisher": "SEC",
"Name": "Form N-1A",
"Section": "27A",
"Subsection": "c"
},
"r30": {
"role": "http://www.xbrl.org/2003/role/presentationRef",
"Publisher": "SEC",
"Name": "Form N-1A",
"Section": "27A",
"Subsection": "c",
"Paragraph": "ii"
},
"r31": {
"role": "http://www.xbrl.org/2003/role/presentationRef",
"Publisher": "SEC",
"Name": "Form N-1A",
"Section": "27A",
"Subsection": "c",
"Paragraph": "iii"
},
"r32": {
"role": "http://www.xbrl.org/2003/role/presentationRef",
"Publisher": "SEC",
"Name": "Form N-1A",
"Section": "27A",
"Subsection": "c",
"Paragraph": "instruction",
"Sentence": "1",
"Clause": "b"
},
"r33": {
"role": "http://www.xbrl.org/2003/role/presentationRef",
"Publisher": "SEC",
"Name": "Form N-1A",
"Section": "27A",
"Subsection": "c",
"Paragraph": "instruction",
"Subparagraph": "1",
"Clause": "c"
},
"r34": {
"role": "http://www.xbrl.org/2003/role/presentationRef",
"Publisher": "SEC",
"Name": "Form N-1A",
"Section": "27A",
"Subsection": "c",
"Paragraph": "instruction",
"Subparagraph": "1",
"Clause": "d"
},
"r35": {
"role": "http://www.xbrl.org/2003/role/presentationRef",
"Publisher": "SEC",
"Name": "Form N-1A",
"Section": "27A",
"Subsection": "d",
"Paragraph": "1"
},
"r36": {
"role": "http://www.xbrl.org/2003/role/presentationRef",
"Publisher": "SEC",
"Name": "Form N-1A",
"Section": "27A",
"Subsection": "d",
"Paragraph": "2"
},
"r37": {
"role": "http://www.xbrl.org/2003/role/presentationRef",
"Publisher": "SEC",
"Name": "Form N-1A",
"Section": "27A",
"Subsection": "d",
"Paragraph": "2",
"Subparagraph": "i"
},
"r38": {
"role": "http://www.xbrl.org/2003/role/presentationRef",
"Publisher": "SEC",
"Name": "Form N-1A",
"Section": "27A",
"Subsection": "d",
"Paragraph": "2",
"Subparagraph": "iii",
"Clause": "B"
},
"r39": {
"role": "http://www.xbrl.org/2003/role/presentationRef",
"Publisher": "SEC",
"Name": "Form N-1A",
"Section": "27A",
"Subsection": "d",
"Paragraph": "2",
"Subparagraph": "iiii",
"Clause": "A"
},
"r40": {
"role": "http://www.xbrl.org/2003/role/presentationRef",
"Publisher": "SEC",
"Name": "Form N-1A",
"Section": "27A",
"Subsection": "d",
"Paragraph": "2",
"Subparagraph": "instruction",
"Clause": "12"
},
"r41": {
"role": "http://www.xbrl.org/2003/role/presentationRef",
"Publisher": "SEC",
"Name": "Form N-1A",
"Section": "27A",
"Subsection": "d",
"Paragraph": "2",
"Subparagraph": "instruction",
"Clause": "14"
},
"r42": {
"role": "http://www.xbrl.org/2003/role/presentationRef",
"Publisher": "SEC",
"Name": "Form N-1A",
"Section": "27A",
"Subsection": "d",
"Paragraph": "2",
"Subparagraph": "instruction",
"Clause": "15"
},
"r43": {
"role": "http://www.xbrl.org/2003/role/presentationRef",
"Publisher": "SEC",
"Name": "Form N-1A",
"Section": "27A",
"Subsection": "d",
"Paragraph": "2",
"Subparagraph": "instruction",
"Clause": "7"
},
"r44": {
"role": "http://www.xbrl.org/2003/role/presentationRef",
"Publisher": "SEC",
"Name": "Form N-1A",
"Section": "27A",
"Subsection": "d",
"Paragraph": "2",
"Subparagraph": "instruction",
"Clause": "8"
},
"r45": {
"role": "http://www.xbrl.org/2003/role/presentationRef",
"Publisher": "SEC",
"Name": "Form N-1A",
"Section": "27A",
"Subsection": "d",
"Paragraph": "3"
},
"r46": {
"role": "http://www.xbrl.org/2003/role/presentationRef",
"Publisher": "SEC",
"Name": "Form N-1A",
"Section": "27A",
"Subsection": "d",
"Paragraph": "4"
},
"r47": {
"role": "http://www.xbrl.org/2003/role/presentationRef",
"Publisher": "SEC",
"Name": "Form N-1A",
"Section": "27A",
"Subsection": "d",
"Paragraph": "4",
"Subparagraph": "instruction",
"Clause": "3"
},
"r48": {
"role": "http://www.xbrl.org/2003/role/presentationRef",
"Publisher": "SEC",
"Name": "Form N-1A",
"Section": "27A",
"Subsection": "d",
"Paragraph": "4",
"Subparagraph": "instruction",
"Clause": "4"
},
"r49": {
"role": "http://www.xbrl.org/2003/role/presentationRef",
"Publisher": "SEC",
"Name": "Form N-1A",
"Section": "27A",
"Subsection": "e"
},
"r50": {
"role": "http://www.xbrl.org/2003/role/presentationRef",
"Publisher": "SEC",
"Name": "Form N-1A",
"Section": "27A",
"Subsection": "e",
"Paragraph": "instruction",
"Subparagraph": "6"
},
"r51": {
"role": "http://www.xbrl.org/2003/role/presentationRef",
"Publisher": "SEC",
"Name": "Form N-1A",
"Section": "27A",
"Subsection": "f"
},
"r52": {
"role": "http://www.xbrl.org/2003/role/presentationRef",
"Publisher": "SEC",
"Name": "Form N-1A",
"Section": "27A",
"Subsection": "g"
},
"r53": {
"role": "http://www.xbrl.org/2003/role/presentationRef",
"Publisher": "SEC",
"Name": "Form N-1A",
"Section": "27A",
"Subsection": "g",
"Paragraph": "1"
},
"r54": {
"role": "http://www.xbrl.org/2003/role/presentationRef",
"Publisher": "SEC",
"Name": "Form N-1A",
"Section": "27A",
"Subsection": "g",
"Paragraph": "2"
},
"r55": {
"role": "http://www.xbrl.org/2003/role/presentationRef",
"Publisher": "SEC",
"Name": "Form N-1A",
"Section": "27A",
"Subsection": "g",
"Paragraph": "3"
},
"r56": {
"role": "http://www.xbrl.org/2003/role/presentationRef",
"Publisher": "SEC",
"Name": "Form N-1A",
"Section": "27A",
"Subsection": "g",
"Paragraph": "4"
},
"r57": {
"role": "http://www.xbrl.org/2003/role/presentationRef",
"Publisher": "SEC",
"Name": "Form N-1A",
"Section": "27A",
"Subsection": "g",
"Paragraph": "5"
},
"r58": {
"role": "http://www.xbrl.org/2003/role/presentationRef",
"Publisher": "SEC",
"Name": "Form N-1A",
"Section": "27A",
"Subsection": "g",
"Paragraph": "6"
},
"r59": {
"role": "http://www.xbrl.org/2003/role/presentationRef",
"Publisher": "SEC",
"Name": "Form N-1A",
"Section": "27A",
"Subsection": "g",
"Paragraph": "instruction",
"Subparagraph": "2"
},
"r60": {
"role": "http://www.xbrl.org/2003/role/presentationRef",
"Publisher": "SEC",
"Name": "Form N-1A",
"Section": "27A",
"Subsection": "h",
"Paragraph": "1"
},
"r61": {
"role": "http://www.xbrl.org/2003/role/presentationRef",
"Publisher": "SEC",
"Name": "Form N-1A",
"Section": "27A",
"Subsection": "h",
"Paragraph": "2"
},
"r62": {
"role": "http://www.xbrl.org/2003/role/presentationRef",
"Publisher": "SEC",
"Name": "Form N-1A",
"Section": "3",
"Subsection": "instruction",
"Paragraph": "1",
"Subparagraph": "d",
"Sentence": "i"
},
"r63": {
"role": "http://www.xbrl.org/2003/role/presentationRef",
"Publisher": "SEC",
"Name": "Form N-1A",
"Section": "4",
"Subsection": "b",
"Paragraph": "2",
"Subparagraph": "i"
},
"r64": {
"role": "http://www.xbrl.org/2003/role/presentationRef",
"Publisher": "SEC",
"Name": "Regulation S-T",
"Number": "232",
"Section": "313"
},
"r65": {
"role": "http://www.xbrl.org/2009/role/commonPracticeRef",
"Topic": "310",
"SubTopic": "10",
"Name": "Accounting Standards Codification",
"Section": "50",
"Paragraph": "29",
"Publisher": "FASB",
"URI": "https://asc.fasb.org//1943274/2147481962/310-10-50-29"
},
"r66": {
"role": "http://www.xbrl.org/2009/role/commonPracticeRef",
"Topic": "326",
"SubTopic": "20",
"Name": "Accounting Standards Codification",
"Section": "50",
"Paragraph": "5",
"Publisher": "FASB",
"URI": "https://asc.fasb.org//1943274/2147479319/326-20-50-5"
},
"r67": {
"role": "http://www.xbrl.org/2009/role/commonPracticeRef",
"Topic": "815",
"SubTopic": "10",
"Name": "Accounting Standards Codification",
"Section": "50",
"Paragraph": "4K",
"Subparagraph": "(a)(4)",
"Publisher": "FASB",
"URI": "https://asc.fasb.org//1943274/2147480434/815-10-50-4K"
},
"r68": {
"role": "http://www.xbrl.org/2009/role/commonPracticeRef",
"Topic": "946",
"SubTopic": "205",
"Name": "Accounting Standards Codification",
"Section": "50",
"Paragraph": "27",
"Publisher": "FASB",
"URI": "https://asc.fasb.org//1943274/2147480737/946-205-50-27"
},
"r69": {
"role": "http://www.xbrl.org/2009/role/commonPracticeRef",
"Topic": "946",
"SubTopic": "320",
"Name": "Accounting Standards Codification",
"Section": "S99",
"Paragraph": "1",
"Subparagraph": "(SX 210.12-12(Column A)(Footnote 2)(ii))",
"Publisher": "FASB",
"URI": "https://asc.fasb.org//1943274/2147480032/946-320-S99-1"
},
"r70": {
"role": "http://www.xbrl.org/2009/role/commonPracticeRef",
"Topic": "946",
"SubTopic": "320",
"Name": "Accounting Standards Codification",
"Section": "S99",
"Paragraph": "2",
"Subparagraph": "(SX 210.12-12A(Column A)(Footnote 2))",
"Publisher": "FASB",
"URI": "https://asc.fasb.org//1943274/2147480032/946-320-S99-2"
},
"r71": {
"role": "http://www.xbrl.org/2009/role/commonPracticeRef",
"Topic": "946",
"SubTopic": "320",
"Name": "Accounting Standards Codification",
"Section": "S99",
"Paragraph": "3",
"Subparagraph": "(SX 210.12-12B(Column A)(Footnote 1)(b))",
"Publisher": "FASB",
"URI": "https://asc.fasb.org//1943274/2147480032/946-320-S99-3"
},
"r72": {
"role": "http://www.xbrl.org/2009/role/commonPracticeRef",
"Topic": "946",
"SubTopic": "320",
"Name": "Accounting Standards Codification",
"Section": "S99",
"Paragraph": "6",
"Subparagraph": "(SX 210.12-14(Column A)(Footnote 2))",
"Publisher": "FASB",
"URI": "https://asc.fasb.org//1943274/2147480032/946-320-S99-6"
}
}
}