Exhibit 99.1

| 2 | ||||
| 4 | ||||
| 5 | ||||
| 6 | ||||
| 10 | ||||
| 12 | ||||
| 24 | ||||
| 110 | ||||
| 130 | ||||
| 137 | ||||
| Corporate Governance Report (under the Hong Kong Listing Rules) |
140 | |||
| 169 | ||||
| (A) Financial statements prepared under International Financial Reporting Standards |
175 | |||
| 175 | ||||
| 177 | ||||
| 178 | ||||
| 181 | ||||
| 183 | ||||
| 185 | ||||
| 305 | ||||
| (B) Financial statements prepared under China Accounting Standards for Business Enterprises |
311 | |||
| 311 | ||||
| 313 | ||||
| 315 | ||||
| 317 | ||||
| 319 | ||||
| 321 | ||||
| 471 | ||||
| Written Confirmation Issued by Directors, Supervisors and Senior Management |
473 | |||
| 474 | ||||
| 476 | ||||
| I. | The Board of Directors and the Supervisory Committee of Sinopec Shanghai Petrochemical Company Limited (the “Company” or “SPC”) as well as its Directors, Supervisors and senior management warrant the truthfulness, accuracy and completeness of the information contained in the 2021 annual report, and warrant that there are no false representations or misleading statements contained in, or material omissions from, the 2021 annual report of the Company, and severally and jointly accept responsibility. |
| II. | All directors attended the Board meeting for approving the 2021 annual report of the Company. |
| III. | The financial statements for the year ended 31 December 2021 (the “Reporting Period”), prepared under the People’s Republic of China (“PRC” or “China”)’s Accounting Standards (“CAS”) as well as the International Financial Reporting Standards (“IFRS”), were audited by KPMG Huazhen LLP and KPMG, respectively, and both firms have issued unqualified opinions on the financial statements in their auditors’ reports. |
| IV. | Mr. Wu Haijun, Chairman and the responsible person of the Company; Mr. Du Jun, Vice President and Chief Financial Officer overseeing the accounting department; and Ms. Yang Yating, person in charge of the Accounting Department (Accounting Chief) and Director of Finance Department hereby warrant the truthfulness and completeness of the financial statements contained in the 2021 annual report. |
| V. | Plan for Profit Appropriation or Capital Reserve Capitalisation reviewed by the Board |
In 2021, the net profit attributable to equity shareholders of the parent company amounted to RMB2,000,506 thousand under CAS (net profit of RMB2,073,431 thousand attributable to shareholders of the Company under IFRS). According to the 2021 profit distribution plan approved by the Board on 23 March 2022, the Board proposed to distribute a dividend of RMB0.1 per share (including tax) (the “Final Dividend”) based on the total number of issued shares of the Company as at the record date for distributing dividend. The 2021 profit distribution plan will be implemented subject to approval of the Company’s 2021 annual general meeting (the “AGM”). The date and time of the AGM and book closure arrangement will be announced later. The notice of the AGM will be announced separately in accordance with the provisions of the Articles of Association of the Company. The notice of the AGM, the accompanying circular and proxy form will be dispatched to holders of H shares in accordance with the Rules Governing the Listing of Securities on The Stock Exchange of Hong Kong Limited (the “Hong Kong Listing Rules”).
If the Final Dividend is declared by the approval of the resolution by the shareholders of the Company at the AGM, the Final Dividend on H shares is expected to be distributed on or around Thursday, 28 July 2022 to shareholders whose names appear on the Register of Members of the Company’s H shares at the close of business on Tuesday, 5 July 2022. The Final Dividend is denominated and declared in Renminbi. The Final Dividend payable to the holders of the Company’s A shares shall be paid in Renminbi while those payable to the holders of the Company’s H shares shall be paid in Hong Kong dollars. The amount of Hong Kong dollars payable shall be calculated on the basis of the average closing exchange rates for Hong Kong dollars as announced by the Foreign Exchange Trading Centre of the PRC for one calendar week prior to the approval of the Final Dividend at the AGM.
The Company is expected to close the Register of Members of the Company’s H shares from Thursday, 30 June 2022 to Tuesday, 5 July 2022 (both days inclusive) in order to confirm the shareholders’ entitlement to receive the Final Dividend. The holders of the Company’s H shares who wish to receive the Final Dividend should lodge the completed transfer forms and relevant share certificates with Hong Kong Registrars Limited, at Shops 1712-1716, 17/F, Hopewell Centre, 183 Queen’s Road East, Wanchai, Hong Kong on or before 4:30 p.m. on Wednesday, 29 June 2022.
The record date for dividend distribution, distribution procedures and time for the distribution of dividends applicable to holders of the Company’s A shares will be announced separately.
2
| VI. | Declaration of Risks Involved in the Forward-looking Statements |
Forward-looking statements such as future plans and development strategies contained in this report do not constitute any substantive commitments of the Company to investors. The Company has alerted investors on the relevant investment risks.
| VII. | There was no appropriation of funds by the controlling shareholder of the Company and its connected parties for non-operation purposes. |
| VIII. | The Company did not provide any external guarantees in violation of the required decision-making procedures. |
| IX. | Major Risk Warning |
Potential risks are elaborated in this report. Please refer to Section II “Management Discussion and Analysis” under “Report of the Directors” for details of the potential risks arising from the future development of the Company.
| X. | The Annual Report is published in both Chinese and English. In the event of any discrepancy between the Chinese and English versions, the Chinese version shall prevail. |

3
In this report, unless the context otherwise specifies, the following terms shall have the following meanings:
| “Company” or “the Company” or “SPC” | Sinopec Shanghai Petrochemical Company Limited | |
| “Board” | the board of directors of the Company | |
| “Director(s)” | the Director(s) of the Company | |
| “Supervisory Committee” | the Supervisory Committee of the Company | |
| “Supervisor(s)” | the Supervisor(s) of the Company | |
| “PRC” or “China” or “State” | the People’s Republic of China | |
| “Reporting Period” | the year ended 31 December 2021 | |
| “Hong Kong Stock Exchange” | The Stock Exchange of Hong Kong Limited | |
| “Shanghai Stock Exchange” | The Shanghai Stock Exchange | |
| “Group” | the Company and its subsidiaries | |
| “Sinopec Group” | China Petrochemical Corporation | |
| “Sinopec Corp.” | China Petroleum & Chemical Corporation | |
| “Hong Kong Listing Rules” | The Rules Governing the Listing of Securities on the Hong Kong Stock Exchange | |
| “Shanghai Listing Rules” | The Rules Governing the Listing of Securities on the Shanghai Stock | |
| “Model Code for Securities Transactions” | the Model Code for Securities Transactions by Directors of Listed Issuers set out in Appendix 10 to the Hong Kong Listing Rules | |
| “Securities Law” | the PRC Securities Law | |
| “Company Law” | the PRC Company Law | |
| “CSRC” | China Securities Regulatory Commission | |
| “Articles of Association” | the articles of association of the Company | |
| “Hong Kong Stock Exchange website” | www.hkexnews.hk | |
| “Shanghai Stock Exchange website” | www.sse.com.cn | |
| “website of the Company” | www.spc.com.cn | |
| “HSE” | Health, Safety and Environment | |
| “LDAR” | Leak Detection and Repair | |
| “COD” | Chemical Oxygen Demand | |
| “VOCs” | Volatile Organic Compounds | |
| “SFO” | the Securities and Futures Ordinance of Hong Kong (Chapter 571 of the Laws of Hong Kong) | |
| “Corporate Governance Code” | the Corporate Governance Code set out in Appendix 14 to the Hong Kong Listing Rules | |
| “Share Option Incentive Scheme” | the A Share Option Incentive Scheme of the Company |
4
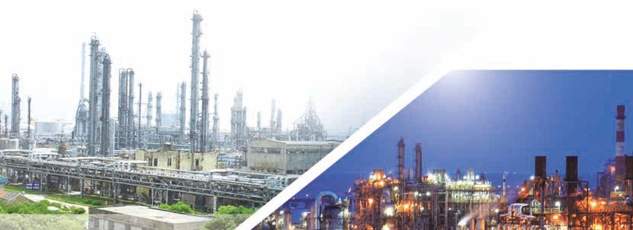
As one of the major integrated petrochemical enterprises in China with an integrated refinery and petrochemical capacity, the Company possesses competitive business scale and strength, which have made it a major manufacturer of refined oil, intermediate petrochemical products, synthetic resins and synthetic fibres. It also has self-owned utilities and environmental protection systems, as well as sea transport, inland shipping, rail transport and road transport ancillary facilities.
Located at Jinshanwei in the southwest of Shanghai, the Company is a highly integrated petrochemical enterprise which mainly processes crude oil into a broad range of petroleum products, intermediate petrochemical products, resins and plastics and synthetic fibers. The Company sells most of its products within the PRC domestic market and derives most of its revenues from customers in Eastern China, one of the fastest growing regions in the PRC.
The Company’s high-quality development is supported by the ever-increasing demand in the PRC for petrochemical products. Relying on the competitive advantage of its high degree of integration, the Company is optimizing its product mix, improving the quality and variety of its existing products, upgrading technology and increasing the capacity of its key upstream plants.
In July 1993, the Company became the first company incorporated under the laws of the PRC to make a global equity offering, and its shares were listed on the Shanghai Stock Exchange, the Hong Kong Stock Exchange and the New York Stock Exchange.
Since the listing of its shares, the Company has strived to continuously improve and enhance its operation and management efficiency with an aim to become a world-class petrochemical enterprise.
5
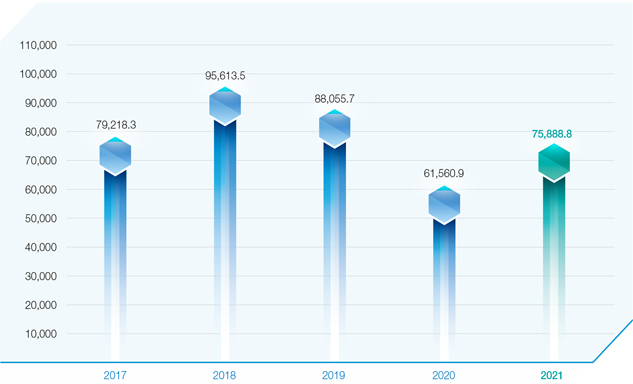
| (I) | Financial information prepared under IFRS (for the past five years) |
| Unit: RMB million | ||||||||||||||||||||
| Year ended 31 December |
2021 | 2020 | 2019 | 2018 | 2017 | |||||||||||||||
| Net sales |
75,888.8 | 61,560.9 | 88,055.7 | 95,613.5 | 79,218.3 | |||||||||||||||
| Profit before taxation |
2,721.1 | 590.8 | 2,656.1 | 6,808.1 | 7,852.9 | |||||||||||||||
| Profit after taxation |
2,076.6 | 656.4 | 2,227.2 | 5,336.2 | 6,154.2 | |||||||||||||||
| Profit attributable to equity shareholders of the Company |
2,073.4 | 645.1 | 2,215.7 | 5,336.3 | 6,143.2 | |||||||||||||||
| Basic earnings per share (RMB) |
0.192 | 0.060 | 0.205 | 0.493 | 0.569 | |||||||||||||||
| Diluted earnings per share (RMB) |
0.192 | 0.060 | 0.205 | 0.493 | 0.568 | |||||||||||||||
| As at 31 December: |
||||||||||||||||||||
| Total equity attributable to equity shareholders of the Company |
30,242.1 | 29,198.0 | 29,863.3 | 30,346.1 | 28,230.2 | |||||||||||||||
| Total assets |
46,920.6 | 44,619.1 | 45,494.1 | 44,385.9 | 39,443.5 | |||||||||||||||
| Total liabilities |
16,543.2 | 15,284.2 | 15,500.2 | 13,923.5 | 10,927.9 | |||||||||||||||
After the first exercise of the Company’s Share Option Incentive Scheme in August 2017, the total number of issued shares of the Company increased by 14,176,600 shares.
After the second exercise of the Company’s Share Option Incentive Scheme in January 2018, the total number of issued shares of the Company increased by 9,636,900 shares.
6
Main Financial Indicators (continued)
| (II) | Main accounting data and financial indicators in the past three years (Prepared under CAS) |
| Unit: RMB’000 | ||||||||||||||||
| Major accounting data |
2021 | 2020 | Increase/ decrease compared to the previous year (%) |
2019 | ||||||||||||
| Revenue |
89,280,415 | 74,705,183 | 19.51 | 100,346,048 | ||||||||||||
| Total profit |
2,648,161 | 573,816 | 361.50 | 2,654,116 | ||||||||||||
| Net profit attributable to equity shareholders of the Company |
2,000,506 | 628,110 | 218.50 | 2,213,716 | ||||||||||||
| Net profit attributable to equity shareholders of the Company excluding non-recurring items |
1,908,105 | 493,350 | 286.76 | 2,073,020 | ||||||||||||
| Net cash flow from operating activities |
4,060,026 | 1,751,217 | 131.84 | 5,121,209 | ||||||||||||
| End of 2021 | End of 2020 | Increase/ decrease compared to the previous year (%) |
End of 2019 | |||||||||||||
| Net assets attributable to equity shareholders of the Company |
30,260,172 | 29,218,033 | 3.57 | 29,885,341 | ||||||||||||
| Total assets |
47,038,622 | 44,749,173 | 5.12 | 45,636,128 | ||||||||||||
7
Main Financial Indicators (continued)
| Major financial indicators |
2021 | 2020 | Increase/ decrease compared to the previous year (%) |
2019 | ||||||||||||
| Basic earnings per share (RMB/Share) |
0.185 | 0.059 | 213.56 | 0.205 | ||||||||||||
| Diluted earnings per share (RMB/Share) |
0.185 | 0.059 | 213.56 | 0.205 | ||||||||||||
| Basic earnings per share excluding non-recurring items (RMB/Share) |
0.176 | 0.047 | 274.47 | 0.193 | ||||||||||||
| Return on net assets (weighted average) (%)* |
6.727 | 2.127 | |
Increased by 4.60 percentage points |
|
7.143 | ||||||||||
| Return on net assets excluding non-recurring items (weighted average) (%)* |
6.416 | 1.709 | |
Increased by 4.71 percentage points |
|
6.726 | ||||||||||
| Net cash flow per share generated from operating activities (RMB/ Share) |
0.375 | 0.162 | 131.48 | 0.473 | ||||||||||||
| End of 2021 | End of 2020 | Increase/ decrease compared to the previous year (%) |
End of 2019 | |||||||||||||
| Net assets per share attributable to equity shareholders of the Company (RMB/Share)* |
2.796 | 2.699 | 3.59 | 2.761 | ||||||||||||
| Gearing ratio (%) |
35.382 | 34.401 | |
Increased by 0.98 percentage points |
|
34.228 | ||||||||||
| * | The above-mentioned net assets do not include non-controlling shareholders’ interests. |
| (III) | Differences between financial statements prepared under CAS and IFRS |
| Unit: RMB’000 | ||||||||||||||||
| Net profit | Net asset | |||||||||||||||
| The Reporting Period |
Corresponding period of the previous year |
The Reporting Period |
Corresponding period of the previous year |
|||||||||||||
| Prepared under CAS |
2,003,681 | 639,436 | 30,395,431 | 29,355,018 | ||||||||||||
| Prepared under IFRS |
2,076,606 | 656,398 | 30,377,398 | 29,334,975 | ||||||||||||
For detailed differences between the financial statements prepared under CAS and IFRS, please refer to supplements to the financial statements prepared under CAS.
8
Main Financial Indicators (continued)
| (IV) | Major quarterly financial data in 2021 (Prepared under CAS) |
| Unit:RMB’000 | ||||||||||||||||
| First Quarter (January to March) |
Second Quarter (April to June) |
Third Quarter (July to September) |
Fourth Quarter (October to December) |
|||||||||||||
| Operating income |
20,379,079 | 16,757,527 | 24,726,487 | 27,417,322 | ||||||||||||
| Net profit attributable to equity shareholders of the Company |
1,173,484 | 70,705 | 720,861 | 35,456 | ||||||||||||
| Net profit attributable to equity shareholders of the Company excluding non-recurring items |
1,158,473 | 10,953 | 715,775 | 22,904 | ||||||||||||
| Net cash flow generated from operating activities |
-322,532 | -2,067,020 | 2,045,941 | 4,403,637 | ||||||||||||
| (V) | Non-recurring items (Prepared under CAS) |
| Unit: RMB’000 | ||||||||||||
| Non-recurring items |
2021 | 2020 | 2019 | |||||||||
| Gains on disposal of non-current assets |
48,671 | 72,296 | 158,551 | |||||||||
| Losses on disposal of long-term equity investment |
— | — | -60,951 | |||||||||
| Employee reduction expenses |
-12,232 | -20,060 | -45,394 | |||||||||
| Government grants recognised through profit or loss (excluding government grants pursuant to the State’s unified standard sum and quota closely related to the corporate business) |
45,944 | 71,296 | 79,678 | |||||||||
| Net gains/(losses) on disposal of derivative financial instruments |
9,859 | -912 | -15,316 | |||||||||
| Income from structured deposits |
97,921 | 132,690 | 86,848 | |||||||||
| Loss on selling of financial assets at fair value through other comprehensive income |
-4,685 | -9,513 | -19,513 | |||||||||
| Gains/(losses) from changes in fair value of financial assets and liabilities |
8,987 | -17,871 | 1,597 | |||||||||
| Other non-operating income and expenses other than those mentioned above |
-57,733 | -42,968 | -42,322 | |||||||||
| Effect on non-controlling interests (after tax) |
556 | 1,141 | 3,515 | |||||||||
| Tax effect for the above items |
-44,887 | -51,339 | -5,997 | |||||||||
| Total |
92,401 | 134,760 | 140,696 | |||||||||
9
The Group produces more than 60 different products, including various specifications of synthetic fibers, resins and plastics, intermediate petrochemical products and petroleum products.
The Company is a highly vertically integrated petrochemical company. Most of the petroleum products and intermediate petrochemical products produced by the Company are used in the production of the Company’s downstream products.
The following table sets forth the net sales of the Group’s major products in 2021 as a percentage of total net sales and their typical uses.
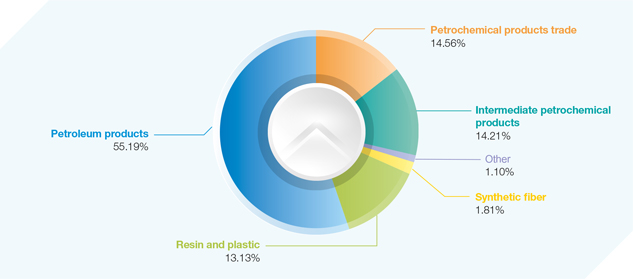
| Major products sold by the Company |
% of 2021 net sales |
Typical use | ||||
| Manufactured products |
||||||
| Synthetic Fibres |
||||||
| Polyester staple |
0.22 | Textiles and apparel | ||||
| Acrylic staple |
1.52 | Cotton type fabrics, wool type fabrics | ||||
| Others |
0.07 | |||||
|
|
|
|||||
| Subtotal: |
1.81 | |||||
|
|
|
|||||
10
Principal Products (continued)
| Major products sold by the Company |
% of 2021 net sales |
Typical use | ||||
| Resins and Plastics |
||||||
| Polyester chips |
2.22 | Polyester fibres, films and containers | ||||
| PE pellets |
5.67 | Films, ground sheeting, wire and cable compound and other injection moulding products such as housewares and toys | ||||
| PP pellets |
4.80 | Films or sheets, injection moulding products such as housewares, toys and household electrical appliances and automobile parts | ||||
| PVA |
0.01 | PVA fibres, building coating materials and textile starch | ||||
| Others |
0.43 | |||||
|
|
|
|||||
| Subtotal: |
13.13 | |||||
| Intermediate Petrochemical Products |
||||||
| Ethylene |
— | Feedstock for PE, EG, PVC and other intermediate petrochemical products which can be further processed into resins and plastics and synthetic fibre | ||||
| Ethylene Oxide |
2.91 | Intermediate for chemical and pharmaceutical industry, dyes, detergents and adjuvant | ||||
| Benzene |
2.42 | Intermediate petrochemical products, styrene, plastics, explosives, dyes, detergents, epoxies and polyamide fibre | ||||
| PX |
3.44 | Intermediate petrochemical, polyester | ||||
| Butadiene |
0.82 | Synthetic rubber and plastics | ||||
| Ethylene Glycol |
0.25 | Fine chemicals | ||||
| Others |
4.37 | |||||
|
|
|
|||||
| Subtotal: |
14.21 | |||||
| Petroleum Products |
||||||
| Gasoline |
22.70 | Transportation fuels | ||||
| Diesel |
18.13 | Transportation and agricultural machinery fuels | ||||
| Jet fuel |
4.83 | Transportation fuels | ||||
| Others |
9.53 | |||||
|
|
|
|||||
| Subtotal: |
55.19 | |||||
| Trading of petrochemical products |
14.56 | Import and export trade of petrochemical products (purchased from domestic and overseas suppliers) | ||||
|
|
|
|||||
| Others |
1.10 | |||||
|
|
|
|||||
| TOTAL: |
100 | |||||
|
|
|
|||||
11
Change in Share Capital of Ordinary Shares and Shareholders
| (I) | Changes in share capital of ordinary shares during the Reporting Period |
The Company had no changes in share capital of ordinary shares during the Reporting Period.
| (II) | Issue of shares |
| 1. | Issue of shares during the Reporting Period |
Please refer to item (13) under Section IV of Report of Directors for details of the Group’s issuance of non-financial enterprise debt financing instruments during the Reporting Period. Apart from that, the Company issued no shares during the Reporting Period.
| 2. | Changes in the Company’s total number of ordinary shares, shareholding structure and the Company’s assets and liabilities |
The Company had no changes in the Company’s total number of ordinary shares, shareholding structure and the Company’s assets and liabilities resulted in reasons such as stock dividend and dividends distribution during the Reporting Period.
| 3. | Employees shares |
The Company had no employees shares as at the end of the Reporting Period.
| (III) | Shareholders and de facto controller |
| 1. | Total number of shareholders |
| Number of shareholders of ordinary shares as at the end of the Reporting Period |
104,031 | |
| Number of shareholders of ordinary shares as at the end of the month immediately preceding the publication date of the annual report |
102,649 |
12
Change in Share Capital of Ordinary Shares and Shareholders (continued)
| 2. | Shareholding of the top ten shareholders as at the end of the Reporting Period |
| Shareholding of the top ten shareholders | ||||||||||||||||||||||||||||||||
| Number | ||||||||||||||||||||||||||||||||
| of shares | ||||||||||||||||||||||||||||||||
| Increase/decrease | held at the | Number of | ||||||||||||||||||||||||||||||
| of shareholding | end of the | Percentage | shares held | |||||||||||||||||||||||||||||
| during the | Reporting | of | with selling | Pledged/Marked/Frozen | ||||||||||||||||||||||||||||
| Reporting Period | Period | shareholding | restrictions | Status of | Number of | Nature of | ||||||||||||||||||||||||||
| Full name of shareholder |
Class of shares | (Shares) | (Shares) | (%) | (Shares) | Shares | Shares | shareholder | ||||||||||||||||||||||||
| China Petroleum & Chemical Corporation |
A shares | 0 | 5,459,455,000 | 50.44 | 0 | None | 0 | State-owned | ||||||||||||||||||||||||
| legal person | ||||||||||||||||||||||||||||||||
| HKSCC (Nominees) Limited |
H shares | -42,000 | 3,453,839,030 | 31.91 | 0 | Unknown | – | Overseas | ||||||||||||||||||||||||
| legal person | ||||||||||||||||||||||||||||||||
| HKSCC Limited |
A shares | 50,747,993 | 115,149,708 | 1.06 | 0 | None | 0 | Overseas | ||||||||||||||||||||||||
| legal person | ||||||||||||||||||||||||||||||||
| Wang Lei |
A shares | 67,655,800 | 67,655,800 | 0.71 | 0 | None | 0 | Domestic | ||||||||||||||||||||||||
| natural person | ||||||||||||||||||||||||||||||||
| GF Fund – Agricultural Bank of China – GF CSI Financial Asset Management Plan |
A shares | -13,275,420 | 64,401,715 | 0.42 | 0 | None | 0 | Others | ||||||||||||||||||||||||
| Dacheng Fund – Agricultural Bank of China – Dacheng CSI Financial Asset Management Plan |
A shares | 0 | 45,222,300 | 0.40 | 0 | None | 0 | Others | ||||||||||||||||||||||||
| Bosera Fund – Agricultural Bank of China – Bosera CSI Financial Asset Management Plan |
A shares | 0 | 43,531,469 | 0.40 | 0 | None | 0 | Others | ||||||||||||||||||||||||
| E Fund Fund – Agricultural Bank of China – E Fund CSI Financial Asset Management Plan |
A shares | 0 | 43,083,750 | 0.40 | 0 | None | 0 | Others | ||||||||||||||||||||||||
| China EU Fund – Agricultural Bank of China – China EU CSI Financial Asset Management Plan |
A shares | 0 | 43,083,700 | 0.40 | 0 | None | 0 | Others | ||||||||||||||||||||||||
| Yinhua Fund – Agricultural Bank of China – Yinhua CSI Financial Asset Management Plan |
A shares | 0 | 43,083,700 | 0.40 | 0 | None | 0 | Others | ||||||||||||||||||||||||
| Southern Fund – Agricultural Bank of China – Southern CSI Financial Asset Management Plan |
A shares | 0 | 43,083,700 | 0.40 | 0 | None | 0 | Others | ||||||||||||||||||||||||
| ICBC Credit Suisse Fund – Agricultural Bank of China – ICBC Credit Suisse CSI Financial Asset Management Plan |
A shares | 0 | 43,083,700 | 0.40 | 0 | None | 0 | Others | ||||||||||||||||||||||||
13
Change in Share Capital of Ordinary Shares and Shareholders (continued)
Note on connected relationship or acting in concert of the above shareholders:
Among the above-mentioned shareholders, Sinopec Corp., a State-owned legal person, does not have any connected relationship with the other shareholders, and does not constitute an act-in-concert party under the Administrative Measures on Acquisition of Listed Companies. Among the above-mentioned shareholders, HKSCC (Nominees) Limited is a nominee and HKSCC Limited is the nominal holder of the company’s Shanghai-Hong Kong Stock Connect. Apart from the above, the Company is not aware of any connected relationships among the other shareholders, or whether any other shareholder constitutes an act-in-concert party under the Administrative Measures on Acquisition of Listed Companies.
| (IV) | Details of the controlling shareholder and the de facto controller |
| 1. | Details of the controlling shareholder |
| (1) | Legal person |
| Name | China Petroleum & Chemical Corporation | |
| Responsible person or legal representative |
Ma Yongsheng | |
| Date of incorporation |
25 February 2000 | |
14
Change in Share Capital of Ordinary Shares and Shareholders (continued)
| Major business operations |
Bottled gas operation (limited to branches with licenses); hazardous chemical production, oil and gas exploration, safety management of development and production (limited to branches with safety production licenses); railway transportation; port operation; edible salt production, wholesale and retail (limited to branches with licenses and not in this city); food additive manufacturing (limited to branches in other cities); insurance agency business (limited to branches in other cities); insurance brokerage business (limited to branches in other cities); accommodation (limited to branches in other cities); catering services (limited to branches in other cities); thermal power generation (not operated in this city); power supply (limited to branches); power production, transmission and supply; operation of hazardous chemicals (limited to branches with hazardous chemicals operation license); oil and gas exploration; oil exploitation (the exploitation area and validity period shall be subject to the license); retail of prepackaged food, bulk food, dairy products (including infant formula milk powder) (limited to branches with food circulation license), health food (limited to branches with food circulation license); retail of cigarettes and cigars (limited to branches with tobacco monopoly retail license); retail of books, newspapers, periodicals, electronic publications and audio-visual products; road transportation (limited to branches, and the business scope shall be subject to the road transportation business license); petroleum refining; production, sales and storage of heavy oil, rubber and other petrochemical raw materials (excluding hazardous chemicals) and products; daily necessities and convenience stores; retail of textile, clothing, daily necessities, hardware, household appliances and electronic products and recharge cards; lottery agent sales, entrusted agents to collect water and electricity fees and ticket agency services; designing, producing, acting and publishing advertisements; car cleaning service; | |
15
Change in Share Capital of Ordinary Shares and Shareholders (continued)
| manufacturing, supervision and installation of petroleum and petrochemical machinery and equipment; procurement and sales of petroleum and petrochemical raw and auxiliary materials, equipment and parts; technology and information, research, development, application and consulting services of alternative energy products; contracting overseas electromechanical and petrochemical industry projects and domestic international bidding projects; automobile maintenance and decoration services; auxiliary operation of coastal engineering; oil spill emergency, safety guard and ship pollution removal; quality inspection technical services, environmental and ecological testing services in professional and technical services; freight forwarding agent; exploration, development, storage and transportation, pipeline transportation and sales of shale gas, coalbed methane, shale oil, combustible ice and other resources (not operating in this city); power technology development and service; installation and maintenance of power facilities (limited to branches); sales of furniture and building decoration materials (limited to branches in other cities); family labor services (limited to branches in other cities); warehousing services (limited to branches in other cities); leasing of gas storage facilities (limited to branches in other cities); rental of commercial and office buildings; car rental (excluding buses with nine seats or more); mechanical equipment leasing; import and export of goods; import and export agency; import and export of technology. Sales of lubricating oil, fuel oil, asphalt, textiles, clothing, daily necessities, hardware, household appliances and electronic products, recharge cards, cultural and sporting goods and equipment, automobiles, motorcycles and spare parts, motor vehicle charging, batteries, new energy vehicle power exchange facilities. (Market entities shall independently choose business projects and carry out business activities according to law; power generation, transmission and power supply as well as other projects subject to approval according to law shall be conducted as approved after the approval by relevant authorities; market entities shall not engage in business activities of the projects prohibited and restricted by national and municipal industrial policies.) | ||
| Shareholdings in other domestic and overseas companies during the Reporting Period |
Details of shareholding of Sinopec Corp. in other listed companies: | |
| Company Name |
Number of shares held |
Percentage of shareholding |
||||||
| Sinopec Shandong Taishan Petroleum Co., Ltd. |
118,140,120 | 24.57 | % | |||||
16
Change in Share Capital of Ordinary Shares and Shareholders (continued)
| 2. | Details of the de facto controller |
| (1) | Legal person |
| Name | China Petrochemical Corporation | |
| Responsible person or legal representative | Ma Yongsheng | |
| Date of incorporation | 24 July 1998 | |
| Major businesses operations | Organize the exploration, exploitation, storage and transportation (including pipeline transportation), sales and comprehensive utilization of oil and natural gas of affiliated enterprises; Organize the petroleum refining of affiliated enterprises; Organize the wholesale and retail of refined oil products of affiliated enterprises; Organize the production, sales, storage and transportation of petrochemical and other chemical products of affiliated enterprises; Industrial investment and investment management; Exploration design, construction, construction and installation of petroleum and petrochemical engineering; Maintenance of petroleum and petrochemical equipment; Mechanical and electrical equipment manufacturing; Technology and information, research, development, application and consulting services of alternative energy products; Import and export business. | |
| Shareholdings in other domestic and overseas companies during the Reporting Period |
Details of shareholding of Sinopec Group in other listed companies: | |
| Company Name |
Number of shares held |
Percentage of shareholding |
||||||
| China Petroleum & Chemical Corporation* |
82,709,227,393 | 68.31 | % | |||||
| Sinopec Engineering (Group) Co., Ltd. |
2,907,856,000 | 65.67 | % | |||||
| Sinopec Oilfield Service Corporation |
10,727,896,364 | 56.51 | % | |||||
| Sinopec Oilfield Equipment Corporation |
456,756,300 | 58.74 | % | |||||
| China Merchants Energy Shipping Co., Ltd. |
912,886,426 | 13.54 | % | |||||
| Note 1: In addition, the 623,454,000 H shares are held by Sinopec Century Bright Capital Investment Limited, an overseas wholly-owned subsidiary of Sinopec Group. |
| |||||||
| Note 2: In addition, the 2,595,786,987 H shares are held by Sinopec Century Bright Capital Investment Limited, an overseas wholly-owned subsidiary of Sinopec Group. |
| |||||||
17
Change in Share Capital of Ordinary Shares and Shareholders (continued)
| 3. | Diagram of the ownership and controlling relationship between the Company and the controlling shareholder and the de facto controller |
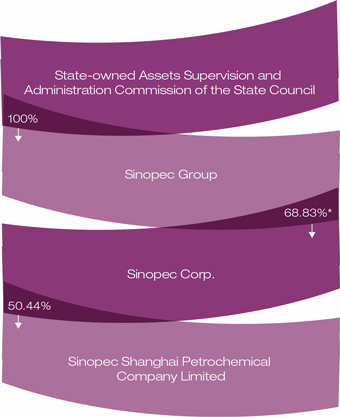
| * | Including 623,454,000 H shares in in Sinopec Group held by Sinopec Century Bright Capital Investment Limited, an overseas wholly-owned subsidiary of Sinopec Group, through HKSCC (Nominees) Limited. |
18
Change in Share Capital of Ordinary Shares and Shareholders (continued)
| (V) | Other legal person shareholders holding more than 10% of the Company’s shares |
As at 31 December 2021, HKSCC (Nominees) Limited held 3,453,839,030 H shares of the Company, representing 31.91% of the total number of issued shares of the Company.
| (VI) | Public float |
Based on the public information available to the Board, as at 23 March 2022, the Company had a public float which is in compliance with the minimum requirement under the Hong Kong Listing Rules.
| (VII) | Interests and short positions of the substantial shareholders of the Company in shares and underlying shares of the Company |
As at 31 December 2021, so far as was known to the Directors or chief executive of the Company, the interests and short positions of the Company’s substantial shareholders (being those who are entitled to exercise or control the exercise of 5% or more of the voting power at any general meeting of the Company but excluding the Directors, chief executive and Supervisors) in the shares and underlying shares of the Company who are required to disclose their interests pursuant to Divisions 2 and 3 of Part XV of the Securities and Futures Ordinance (the “SFO”) or as recorded in the register of interests required to be kept under section 336 of the SFO were as set out below:
19
Change in Share Capital of Ordinary Shares and Shareholders (continued)
Interests in ordinary shares of the Company
| Name of shareholders |
Interests held or deemed as held (shares) |
Note | Percentage of total issued shares of the Company (%) |
Percentage of total issued shares of the relevant class (%) |
Capacity | |||||||||||
| China Petroleum & Chemical |
5,460,000,000 A shares (L) Shares of legal person |
(1 | ) | 50.44 | (L) | 74.50 | (L) | Beneficial owner | ||||||||
| The Bank of New York Mellon Corporation |
337,085,754 H shares (L) |
(2 | ) | 3.11 | (L) | 9.64 | (L) | Interests of controlled corporation | ||||||||
| 313,998,300 H shares (S) |
2.90 | (S) | 8.98 | (S) | ||||||||||||
| 22,527,454 H shares (P) |
0.21 | (P) | 0.64 | (P) | ||||||||||||
| BlackRock, Inc. |
204,771,117 H shares (L) |
(3 | ) | 1.89 | (L) | 5.86 | (L) | Interests of controlled corporation | ||||||||
| Corn Capital Company Limited |
211,008,000 H shares (L) |
(4 | ) | 1.95 | (L) | 6.04 | (L) | Beneficial owner | ||||||||
| 200,020,000 H shares (S) |
1.85 | (S) | 5.72 | (S) | ||||||||||||
| Hung Hin Fai |
211,008,000 H shares (L) |
(4 | ) | 1.95 | (L) | 6.04 | (L) | Interests of controlled corporation | ||||||||
| 200,020,000 H shares (S) |
1.85 | (S) | 5.72 | (S) | ||||||||||||
| Yardley Finance Limited |
200,020,000 H shares (L) |
(5 | ) | 1.85 | (L) | 5.72 | (L) | Secured equity holders | ||||||||
| Chan Kin Sun |
200,020,000 H shares (L) |
(5 | ) | 1.85 | (L) | 5.72 | (L) | Interests of controlled corporation | ||||||||
(L): Long position; (S): Short position; (P): Lending Pool
20
Change in Share Capital of Ordinary Shares and Shareholders (continued)
Note:
| (1) | Based on the information obtained by the Directors from the website of the Hong Kong Stock Exchange and as far as the Directors are aware, Sinopec Group directly and indirectly owned 68.83% of the issued share capital of Sinopec Corp. as at 31 December 2021. By virtue of such relationship, Sinopec Group is deemed to have an interest in the 5,460,000,000 A shares of the Company directly owned by Sinopec Corp. |
| (2) | All the 337,085,754 H shares (long position) and 313,998,300 H shares (short position) are deemed to be held by The Bank of New York Mellon Corporation, due to control of multiple companies (among which 313,998,300 H shares (short position) are held through physical settlement unlisted derivatives). Below are the companies indirectly or wholly owned by The Bank of New York Mellon Corporation: |
| (2.1) | All the 30,000 H shares (long position) are held by BNY MELLON, NATIONAL ASSOCIATION. Since BNY MELLON, NATIONAL ASSOCIATION is wholly owned by The Bank of New York Mellon Corporation, The Bank of New York Mellon Corporation is deemed to have an interest in the 30,000 H shares (long position) of the Company held by BNY MELLON, NATIONAL ASSOCIATION. |
| (2.2) | All the 337,055,754 H shares (long position) and 313,998,300 H shares (short position) are held by The Bank of New York Mellon. Since The Bank of New York Mellon is wholly owned by The Bank of New York Mellon Corporation, The Bank of New York Mellon Corporation is deemed to have an interest in the 337,055,754 H shares (long position) and 313,998,300 H shares (short position) of the Company held by The Bank of New York Mellon. |
| (3) | All the 204,771,117 H shares (long position) (among which 110,000 H shares (long position) are held through cash settled unlisted derivatives) are deemed to be held by BlackRock, Inc., due to control of multiple companies. Below are the companies indirectly wholly owned by BlackRock, Inc: |
| (3.1) | All the 6,252,700 H shares (long position) are held by BlackRock Financial Management, Inc. Since BlackRock Financial Management, Inc. is indirectly wholly owned by BlackRock, Inc., BlackRock, Inc. is deemed to have an interest in the 6,252,700 H shares (long position) of the Company held by BlackRock Financial Management, Inc. In addition, BlackRock Financial Management, Inc. is interested in the shares of the Company through the following companies: |
| (3.1.1) | 29,936,000 H shares (long position) are held by BlackRock Institutional Trust Company, National Association. |
| (3.1.2) | 26,462,000 H shares (long position) are held by BlackRock Fund Advisors. |
21
Change in Share Capital of Ordinary Shares and Shareholders (continued)
| (3.2) | 86% of interest in BR Jersey International Holdings L.P. are indirectly held by BlackRock, Inc. BR Jersey International Holdings L.P. is interested in the shares of the Company through the following companies: |
| (3.2.1) | 25,194,604 H shares (long position) are held by BlackRock Japan Co., Ltd.. |
| (3.2.2) | 522,000 H shares (long position) are held by BlackRock Asset Management Canada Limited. |
| (3.2.3) | 579,497 H shares (long position) are held by BlackRock Asset Management North Asia Limited. |
| (3.2.4) | 926,000 H shares (long position) are held by BlackRock Investment Management (Australia) Limited. |
| (3.2.5) | 1,370,000 H shares (long position) are held by BlackRock (Singapore) Limited. |
| (3.3) | 100% of interest in BlackRock Group Limited is indirectly held by BR Jersey International Holdings L.P. (See (3.2) above). BlackRock Group Limited is interested in the shares of the Company through the following companies: |
| (3.3.1) | 396,248 H shares (long position) are held by BlackRock Investment Management (UK) Limited. |
| (3.3.2) | 8,512,171 H shares (long position) are held by BlackRock Fund Managers Limited. |
| (3.3.3) | 2,750,936 H shares (long position) are held by BlackRock Life Limited. |
| (3.3.4) | 10,411,981 H shares (long position) are held by BlackRock (Netherlands) B.V. |
| (3.3.5) | 48,174,000 H shares (long position) are held by BLACKROCK (Luxembourg) S.A. |
| (3.3.6) | 26,474,265 H shares (long position) are held by BlackRock Asset Management Ireland Limited. |
22
Change in Share Capital of Ordinary Shares and Shareholders (continued)
| (3.4) | BlackRock Investment Management, LLC is indirectly wholly owned by BlackRock, Inc., BlackRock Investment Management, LLC is indirectly interested in the shares of the Company through the following company: |
(3.4.1) 16,808,715 H shares (long position) are held by Aperio Group, LLC.
| (4) | These shares were held by Corn Capital Company Limited. Hung Hin Fai held 100% interests in Corn Capital Company Limited. Pursuant to the SFO, Hung Hin Fai was deemed to be interested in the shares held by Corn Capital Company Limited. |
| (5) | These shares were held by Yardley Finance Limited. Chan Kin Sun held 100% interests in Yardley Finance Limited. Pursuant to the SFO, Chan Kin Sun was deemed to be interested in the shares held by Yardley Finance Limited. |
Save as disclosed above, as at 31 December 2021, the Directors have not been notified by any person (other than the Directors, chief executive and Supervisors) who had interests or short positions in the shares and underlying shares of the Company which would fall to be disclosed to the Company pursuant to Divisions 2 and 3 of Part XV of the SFO or as recorded in the register of interests required to be kept by the Company under section 336 of the SFO.
23
Section I Business Overview
| (I) | Description of the principal business, operating model and industry in which the Company operated during the Reporting Period |
Located at Jinshanwei in the southwest of Shanghai, the Company is a highly integrated petrochemical enterprise which mainly processes crude oil into a broad range of petroleum products, intermediate petrochemical products, resins and plastics and synthetic fibres. The Company sells most of its products within the PRC domestic market and derives most of its revenues from customers in Eastern China, one of the fastest growing regions in the PRC.
China’s growing market demand for petrochemical products is the basis for our high-quality development. The Company utilizes its highly integrated advantages to actively adjust the product structure, while constantly improving the quality and variety of existing products, optimize technology and improve the ability of key upstream devices.
For details on the industry in which the Company operates its business, please refer to Section III of this chapter “Analysis on Operational Information of the Chemical Industry”.
| (II) | Analysis of core competitiveness during the Reporting Period |
As one of the major integrated petrochemical enterprises in China with an integrated refinery and petrochemical capacity, the Company possesses competitive business scale and strength, which have made it a major manufacturer of refined oil, intermediate petrochemical products, synthetic resins and synthetic fibres. It also has self-owned utilities and environmental protection systems, as well as sea transport, inland shipping, rail transport and road transport ancillary facilities.
The Company’s major competitive advantages include quality, geographical location and its vertically integrated production. The Company has 50 years of petrochemical production and management experience, and has accumulated extensive resources in the petrochemical industry, which has garnered multiple quality product awards from the central and local governments. Located at the core region of Yangtze River Delta, the most economically active region in China with a strong demand for petrochemical products, the Company built a comprehensive logistics system and supporting facilities to tap its geographic proximity with most of its clients and the convenient coastal and inland shipping. This gave it a competitive edge in terms of transportation costs and timely delivery. The Company has leveraged its advantages in integrated refinery and petrochemical capacity to actively strengthen product structure, while continuously developing new products and improving products quality and variety. It has also improved production technology and boosted capacity of key upstream equipment to maximize the use and the efficiency in the utilisation of its corporate resources, and is therefore able to achieve strong and sustainable development.
24
Report of the Directors (continued)
Section II Management Discussion and Analysis
| (I) | Management Discussion and Analysis |
(Unless otherwise specified, the financial information included in this “Management’s Discussion and Analysis” section has been extracted from the financial statements prepared under IFRS.)
| 1. | General – Review of the Company’s operations during the Reporting Period |
The year 2021 was a year of rapid recovery since the global economy experienced its biggest recession after World War II, but the economic recovery of countries and regions is severely differentiated. Among advanced economies, the economic growth rate of Germany and Japan was much slower than that of the United States and Eurozone. Asia has seen the strongest economic recovery among the emerging market and developing countries, while the sub-Saharan Africa’s economic growth performance was less than expected. China has maintained a worldwide leading in economic development and epidemic prevention and control, and the overall national economy is running in an appropriate range. Throughout 2021, China’s Gross Domestic Product (GDP) increased by 8.1%, an increase of 5.8 percentage points over the previous year, becoming a leader of global economy recovery. The petrochemical industry development maintained stable, and the major economic indicators grew rapidly. From the perspective of trend, it shows a feature of “high before and low after”, indicating the increase of the market volatility and downward pressure.
In 2021, facing the profound changes and epidemic that unseen in a century, the Group promoted the operation of the Health, Safety and Environment (HSE) management system, focused on system optimization, reform management, technological innovation and completed the production and operation goals and tasks relatively well. The total volume of crude oil processed for the year was 13.7644 million tons, a year-on-year decrease of 6.18%; the volume of refined oil produced for the year was 7.9688 million tons, representing a year-on-year decrease of 4.90%; the total volume of goods within the main commodities categories was 13.4468 million tons, representing a year-on-year decrease of 3.66%. In 2021, the Company’s turnover was RMB89,198 million, representing a year-on-year increase of 19.53%. The product sale rate was 100.05% and the payment return rate was 100%. Product quality continued to be well maintained and stable.
25
Report of the Directors (continued)
| (i) | Steadily Implement the HSE System |
In 2021, the Group launched a special safety campaign, released the HSE management system, and promoted the deepening of the system. The Group strictly implemented the production and operation management rules, continued to promote operation limit management, process alarm management and change management, strengthened preventive maintenance, and carried out in-depth investigation and management of invisible dangers. The annual general device operation rate reached 97.84%; unplanned lockout happened 8 times, decreased by 52.94%.
The Group continued to fight against pollution, conducted Leak Detection and Repair (LDAR) testing work and established tracing mechanism of the Volatile Organic Cornpounds (VOCs) boundary pollutant alarm. The annual average value of VOCs concentration at plant boundary reached 104.09 mircrograms per cubic meter. The Group intensified efforts to conserve energy and reduce carbon emission, implemented energy efficiency improvement projects and carried out energy-saving renovation of heating furnaces. The energy consumption per RMB10,000 in output value was reduced by 7.12 percentage points, the carbon emission intensity was reduced by 9.08 percentage points and 2.13 million tons of water was saved. The Group managed to reduce carbon emission compliance costs by RMB20.95 million. In 2021, the Company’s total comprehensive energy consumption was 6.323 million tons of standard coal. The comprehensive output value consumption was 0.991 tons of standard coal/RMB10,000, representing 49.02 million tons reduce over last year. The annual Chemical Oxygen Demand (COD) emissions decreased by 1.92%, sulfur dioxide emissions decreased by 4.96% and nitrogen oxide emission decreased by 12.78%, as compared with the same period last year. The comprehensive compliance rate of effluent wastewater was 99.95%, the compliance rate of controlled waste gas was 100%, and the rate of proper treatment and disposal of hazardous waste was 100%.
The Group successfully completed overhaul transformation through carefully confirming the shutdown plan, approving the maintenance project, implementing the contractor, and purchasing key materials. The Group realized zero confirmed or suspected confirm case by implementing the routine Covid-19 control measures and promoting the vaccination, the vaccination rate of employees was 91.01%.
26
Report of the Directors (continued)
| (ii) | The Imbalance between Supply and Demand and Other Factors Drive the Oil and Petrochemical Products Price Upwards. |
Driven by factors such as the imbalance between supply and demand and the excessive issuance of currency, the domestic oil and petrochemical products price rose significantly, and the price of some major chemicals hit a record high. As of 31 December 2021, the weighted average prices (excluding tax) of the Company’s synthetic fibers, resins and plastics, intermediate petrochemical products, and petroleum products had increased by 38.58%, 14.89%, 43.12% and 31.43%, respectively as compared with the previous year.
| (iii) | Overall Increase in International Crude Oil Price with a Drop in the Volume of Crude Oil Processed. |
In 2021, the international crude oil prices was on a volatile upward trend, the oil demand drove up the price. The disturbance brought by the epidemic was difficult to stop the process of demand recovery.
As of 31 December 2021, the Company had processed a total of 13.7644 million tons of crude oil (of which 404.7 thousand tons were processed on order), indicating a year-on-year decrease of 6.18%, mainly due to the implementation of the largest overhaul in the Company’s history this year. The cost of crude oil processing for the year 2021 was RMB3,232.29/ton, representing an increase of RMB852.27/ton or 35.81% year-on-year.
The total cost of crude oil processing for the year increased by RMB9,222 million, or 27.15%, compared with the same period last year, accounting for 58.12% of the total cost of sales.
27
Report of the Directors (continued)
| (iv) | Continuous Improvement in System Optimization |
In 2021, the Group prioritized effectiveness and emphasized the optimization of the whole chain of production, purchase, sale, storage and transportation. The Group adjusted the proportion of light and heavy crude oil procurement, and improve the flexibility and processing alternatives of the crude oil procurement. In order to ensure the energy supply, adjustments were introduced timely into plant operation, product structure, production in jet fuel, diesel oil and liquefied gas, and the fuel blending scheme for low-sulfur heavy ships was optimized. While the crude oil processing volume dropped by 6.18%, the gasoline production increased by 123,400 tons year-on-year; the diesel-gasoline ratio was 1.00, representing a year-on-year decrease of 0.22; the high-grade gasoline accounted for 43.17% with an increase of 8.19 percentage point year-on-year.
By optimizing the production plan, adjusting product structures, increasing the output and proportion of high value-added, new and differentiated products, and effectively utilizing the production capacity of profitable devices, the Group successfully increased production of propylene to 6,838 tons, hyperbaric polyethylene to 7,493 tons, and ethylene oxide to 22,600 tons and increased the yield of chemical light oil by 0.75 percentage points. The Group further deepened the integration of production, marketing, research and application, broadened sale channels of new products. The Group realized its first export of No.92 automotive gasoline and low-sulfur aviation coal with a total export of 39,100 tons and 46,500 tons respectively. The Groupcontinued to conduct cost control, improved the efficiency of input and output of costs, strengthened the management of funds at all levels, and refined the overall planning of funds. By accelerating the promotion of smart warehousing, Since April 2021, plastic products were fully used in shared trays.
28
Report of the Directors (continued)
| (v) | Innovation and Development Brought Vitality to the Company |
In 2021, the Group issued the 14th Five-Year Plan Outline, specifying the development strategy of oil refining to chemical industry, chemical industry to materials production, materials production to high-end quality, and parks to ecology. The oxidation carbonization production line in 1,500 tons/year PAN-based Carbon Fiber Phase II Project was completed in May 2021, and the trial loading of the hydrogen fuel battery supply centre (phase I) was complete by the end of December 2021. The Group completed the mass production of the carbon fiber torch, Feiyang, in Beijing 2022 Winter Olympics. The carbon fiber composite material was certified by the aerospace quality management system, and was successfully applied to the high-speed rail for the first time. The demonstration photovoltaic power station was successfully connected to the grid for power generation, creating a new engine for the transformation and development of the company.
In 2021, the Group established a carbon fiber company, a joint laboratory for Hydrogen Energy was established with East China University of Science and Technology, and a joint innovation laboratory with Donghua University. A total of 21 strategic cooperation agreements have been signed, and the pace of Industry, Academia, Research and Application has been accelerated. The Group adopted on-site safety control projects to help standardize the construction operation billing process, and officially put intelligent robots into use to improve the fine management of the warehouse.
29
Report of the Directors (continued)
| (vi) | Breakthrough in Reform Management |
In 2021, the Group comprehensively promoted the three-year action of deepening reforms, deepened the management improvement actions based on the world-class standard, expanded the connotation of Do It Right Now, and improved the level of information-based management. The Group comprehensively promoted the construction of standardized teams, standardized sites and standardized positions, started 5S (SEIRI, SEITON, SEISO, SEIKETSU and SHITSUKE) management work, and improved the appearance and working environment.
In 2021, the Group adjusted and optimized the management system, established a carbon fiber industry development center, completed the integration of the polyester department and the plastic department, and optimized the organizational management system and operation mechanism of the Refining Department, in order to improve the efficiency of organization operation. The Group also optimized and adjusted management functions and organizational structures such as joint ventures and cooperation, retiree management, and business research, etc.
In 2021, the Group explored the professional manager system, formulated the business performance assessment and salary management measures of management members, and completed the term system and contract signing of members of the management of the Company. The Group developed the construction of cadre competence model and improved the mechanism of open recruitment for cadres. The Group also explored a new mechanism of salary distribution for researchers, promoted market compensation benchmarking, and formulated an incentive implementation plan for the project chief responsibility system.
As of 31 December 2021, the net reduction of employees of the Group was 236 (including voluntary resignation and retirees), accounting for 2.79% of the total 8,466 employees registered at the beginning of the year.
30
Report of the Directors (continued)
| 2. | Accounting judgements and estimates |
The Group’s financial conditions and the results of its operations are susceptible to accounting methods, assumptions and estimates applied in preparing the financial statements. Such assumptions and estimates are based on the historical experience of the management of the Group and on various other assumptions that the management believes to be reasonable, and form the basis for the management to make judgements about matters that cannot be confirmed by other sources. On an on-going basis, the management evaluates its estimates. Actual results may differ from those estimates as the actual circumstances, environment and conditions change.
The selection of key accounting policies, the judgements and other uncertainties in the course of applying of those policies and the sensitivity of reported results to changes in conditions and assumptions are factors to be considered when reviewing the financial statements. The principal accounting policies are set forth in the financial statements. The Company’s management believes that the following critical accounting policies involve the most significant judgements and estimates used in the preparation of the financial statements.
| (i) | Classification of Financial Assets |
The classification depends on the Group’s business model for managing the financial assets and the contractual terms of the cash flows. The Group determines the business model for managing financial assets at the level of the financial asset portfolio. The factors considered include the way to evaluate and report the performance of financial assets to key management personnel, the risks affecting the performance of financial assets and their management methods, and the way for relevant business management personnel to obtain remuneration, etc.
When evaluating whether the contractual cash flow of financial assets is consistent with the basic lending arrangements, the Group has the following main judgments: whether the time distribution or amount of the principal may change in the duration due to prepayment and other reasons; whether the interest only includes the time value of money, credit risk, other basic lending risks and the consideration of cost and profit. For example, does the amount of prepayment only reflect the outstanding principal and the interest based on the outstanding principal, as well as the reasonable compensation paid for the early termination of the contract.
31
Report of the Directors (continued)
| (ii) | Net realizable value (“NRV”) of inventories |
Inventories are valued at the lower of cost and net realizable value. The net realizable value is determined based on the estimated selling prices in the ordinary course of business less the estimated costs to completion, and other costs necessary to make the sale. These estimates are based on the current market condition and historical experience of selling products of similar nature. It could change significantly as a result of competitor actions in response to changes in market conditions.
Management reassesses these estimations at the end of each reporting period to ensure inventory is shown at the lower of cost and net realizable value.
| (iii) | Impairments for non-current assets |
At the end of each reporting period, the Group estimates the recoverable amount of an asset or a cash-generating unit (“CGU”) (a portion of which related to certain production facilities), at the higher of its fair value less costs of disposal and its value in use, to determine the impairment losses. If circumstances indicate that the carrying amount of the asset or CGU may not be recoverable, the asset or CGU may be considered “impaired”, and an impairment loss may be recognized.
The recoverable amount of assets or CGUs is the higher of the fair value less costs of disposal and value in use. As the fair value of certain assets or CGUs may not be publicly available, the Group uses all readily available information in determining an amount that is a reasonable approximation of recoverable amount, including estimates based on reasonable and supportable assumptions for projections of product sales and operating costs and discount rate. In particular, in determining the value in use of the Group’s specific CGUs, significant judgements are required on the accounting estimates which are based on the assumptions relating to product sales growth rates, related costs growth rates and discount rate applied.
32
Report of the Directors (continued)
| (iv) | Useful life and residual value of property, plant and equipment |
Property, plant and equipment, are depreciated on a straight-line basis over the estimated useful lives of the assets, after taking into account the estimated residual value. Management reviews the estimated useful lives and estimated residual value of the assets annually in order to determine the amount of depreciation expense to be recorded during any reporting period. The useful lives are based on the Group’s historical experience with similar assets, taking into account anticipated technological changes. The depreciation expense for future periods is adjusted if there are significant changes from previous estimates.
| 3. | Comparison and analysis of results of the Company’s operations (Prepared under IFRS) |
| 3.1 | Summary |
The following table sets forth the Group’s sales volumes and net sales (net of sales taxes and surcharges) for the years indicated:
| For the years ended 31 December | ||||||||||||||||||||||||||||||||||||
| 2021 | 2020 | 2019 | ||||||||||||||||||||||||||||||||||
| Sales volume (‘000 tons) |
Net sales (RMB million) |
% | Sales volume (‘000 tons) |
Net sales (RMB million) |
% | Sales volume (‘000 tons) |
Net sales (RMB million) |
% | ||||||||||||||||||||||||||||
| Synthetic fibres |
101.9 | 1,374.8 | 1.8 | 151.4 | 1,472.4 | 2.4 | 177.9 | 2,158.9 | 2.5 | |||||||||||||||||||||||||||
| Resins and plastics |
1,254.9 | 9,962.7 | 13.1 | 1,365.4 | 9,419.7 | 15.3 | 1,292.4 | 9,979.9 | 11.3 | |||||||||||||||||||||||||||
| Intermediate petrochemical products |
1,989.1 | 10,780.5 | 14.2 | 2,168.0 | 8,205.8 | 13.3 | 2,193.7 | 10,313.6 | 11.7 | |||||||||||||||||||||||||||
| Petroleum products |
10,065.0 | 41,884.4 | 55.2 | 10,347.7 | 30,139.6 | 49.0 | 10,294.6 | 43,125.9 | 49.0 | |||||||||||||||||||||||||||
| Trading of petrochemical products |
— | 11,051.4 | 14.6 | — | 11,577.3 | 18.8 | — | 21,690.7 | 24.6 | |||||||||||||||||||||||||||
| Other segments |
— | 835.0 | 1.1 | — | 746.1 | 1.2 | — | 786.7 | 0.9 | |||||||||||||||||||||||||||
|
|
|
|
|
|
|
|
|
|
|
|
|
|
|
|
|
|
|
|||||||||||||||||||
| Total |
13,410.9 | 75,888.8 | 100.0 | 14,032.5 | 61,560.9 | 100.0 | 13,958.6 | 88,055.7 | 100.0 | |||||||||||||||||||||||||||
|
|
|
|
|
|
|
|
|
|
|
|
|
|
|
|
|
|
|
|||||||||||||||||||
33
Report of the Directors (continued)
The following table sets forth a summary of the Group’s consolidated statement of profit or loss for the years indicated (prepared under IFRS):
| For the years ended 31 December | ||||||||||||||||||||||||
| 2021 | 2020 | 2019 | ||||||||||||||||||||||
| RMB million |
% of net sales |
RMB million |
% of net sales |
RMB million |
% of net sales |
|||||||||||||||||||
| Synthetic fibres |
||||||||||||||||||||||||
| Net sales |
1,374.8 | 1.8 | 1,472.4 | 2.4 | 2,158.9 | 2.5 | ||||||||||||||||||
| Cost of sales and operating expenses |
(2,228.9 | ) | (2.9 | ) | (1,836.6 | ) | (3.0 | ) | (2,699.2 | ) | (3.1 | ) | ||||||||||||
|
|
|
|
|
|
|
|||||||||||||||||||
| Segment loss from operations |
(854.1 | ) | (1.1 | ) | (364.2 | ) | (0.6 | ) | (540.3 | ) | (0.6 | ) | ||||||||||||
|
|
|
|
|
|
|
|||||||||||||||||||
| Resins and plastics |
||||||||||||||||||||||||
| Net sales |
9,962.7 | 13.1 | 9,419.7 | 15.3 | 9,979.9 | 11.3 | ||||||||||||||||||
| Cost of sales and operating expenses |
(9,910.5 | ) | (13.1 | ) | (8,157.6 | ) | (13.3 | ) | (9,578.5 | ) | (10.9 | ) | ||||||||||||
|
|
|
|
|
|
|
|||||||||||||||||||
| Segment profit from operations |
52.2 | 0.1 | 1,262.1 | 2.0 | 401.4 | 0.4 | ||||||||||||||||||
|
|
|
|
|
|
|
|||||||||||||||||||
| Intermediate petrochemical products |
||||||||||||||||||||||||
| Net sales |
10,780.5 | 14.2 | 8,205.8 | 13.3 | 10,313.6 | 11.7 | ||||||||||||||||||
| Cost of sales and operating expenses |
(11,415.6 | ) | (15.0 | ) | (7,624.2 | ) | (12.4 | ) | (9,899.6 | ) | (11.2 | ) | ||||||||||||
|
|
|
|
|
|
|
|||||||||||||||||||
| Segment (loss)/profit from operations |
(635.1 | ) | (0.8 | ) | 581.6 | 0.9 | 414.0 | 0.5 | ||||||||||||||||
|
|
|
|
|
|
|
|||||||||||||||||||
| Petroleum products |
||||||||||||||||||||||||
| Net sales |
41,884.4 | 55.2 | 30,139.6 | 49.0 | 43,125.9 | 49.0 | ||||||||||||||||||
| Cost of sales and operating expenses |
(38,917.4 | ) | (51.3 | ) | (32,338.3 | ) | (52.5 | ) | (42,420.4 | ) | (48.2 | ) | ||||||||||||
|
|
|
|
|
|
|
|||||||||||||||||||
| Segment profit/(loss) from operations |
2,967.0 | 3.9 | (2,198.7 | ) | (3.5 | ) | 705.5 | 0.8 | ||||||||||||||||
|
|
|
|
|
|
|
|||||||||||||||||||
| Trading of petrochemical products |
||||||||||||||||||||||||
| Net sales |
11,051.4 | 14.6 | 11,577.3 | 18.8 | 21,690.7 | 24.6 | ||||||||||||||||||
| Cost of sales and operating expenses |
(11,007.7 | ) | (14.5 | ) | (11,535.3 | ) | (18.7 | ) | (21,637.5 | ) | (24.5 | ) | ||||||||||||
|
|
|
|
|
|
|
|
|
|
|
|
|
|||||||||||||
34
Report of the Directors (continued)
| For the years ended 31 December | ||||||||||||||||||||||||
| 2021 | 2020 | 2019 | ||||||||||||||||||||||
| RMB million |
% of net sales |
RMB million |
% of net sales |
RMB million |
% of net sales |
|||||||||||||||||||
| Segment profit from operations |
43.7 | 0.1 | 42.0 | 0.1 | 53.2 | 0.1 | ||||||||||||||||||
|
|
|
|
|
|
|
|||||||||||||||||||
| Other segments |
||||||||||||||||||||||||
| Net sales |
835.0 | 1.1 | 746.1 | 1.2 | 786.7 | 0.9 | ||||||||||||||||||
| Cost of sales and operating expenses |
(976.5 | ) | (1.3 | ) | (535.1 | ) | (0.9 | ) | (500.0 | ) | (0.6 | ) | ||||||||||||
|
|
|
|
|
|
|
|||||||||||||||||||
| Segment (loss)/profit from operations |
(141.5 | ) | (0.2 | ) | 211.0 | 0.3 | 286.7 | 0.3 | ||||||||||||||||
|
|
|
|
|
|
|
|||||||||||||||||||
| Total |
||||||||||||||||||||||||
| Net sales |
75,888.8 | 100.0 | 61,560.9 | 100.0 | 88,055.7 | 100.0 | ||||||||||||||||||
| Cost of sales and operating expenses |
(74,456.6 | ) | (98.1 | ) | (62,027.1) | (100.8 | ) | (86,735.2 | ) | (98.5 | ) | |||||||||||||
|
|
|
|
|
|
|
|||||||||||||||||||
| Operating profit/(loss) |
1,432.2 | 1.9 | (466.2 | ) | (0.8 | ) | 1,320.5 | 1.5 | ||||||||||||||||
| Net finance income |
414.6 | 0.5 | 332.3 | 0.5 | 363.0 | 0.4 | ||||||||||||||||||
| Share of profit of associates and joint ventures |
874.3 | 1.2 | 724.7 | 1.2 | 972.6 | 1.1 | ||||||||||||||||||
|
|
|
|
|
|
|
|||||||||||||||||||
| Profit before taxation |
2,721.1 | 3.6 | 590.8 | 0.9 | 2,656.1 | 3.0 | ||||||||||||||||||
| Income tax |
(644.5 | ) | (0.9 | ) | 65.6 | 0.1 | (429.0 | ) | (0.5 | ) | ||||||||||||||
|
|
|
|
|
|
|
|||||||||||||||||||
| Profit for the year |
2,076.6 | 2.7 | 656.4 | 1.0 | 2,227.1 | 2.5 | ||||||||||||||||||
|
|
|
|
|
|
|
|||||||||||||||||||
| Attributable to: |
||||||||||||||||||||||||
| Equity shareholders of the Company |
2,073.4 | 2.7 | 645.1 | 1.0 | 2,215.7 | 2.5 | ||||||||||||||||||
| Non-controlling interests |
3.2 | 0.0 | 11.3 | 0.0 | 11.4 | 0.0 | ||||||||||||||||||
|
|
|
|
|
|
|
|||||||||||||||||||
| Profit for the year |
2,076.6 | 2.7 | 656.4 | 1.0 | 2,227.1 | 2.5 | ||||||||||||||||||
|
|
|
|
|
|
|
|||||||||||||||||||
35
Report of the Directors (continued)
| 3.2 | Comparison and analysis |
Comparison between the year ended 31 December 2021 and the year ended 31 December 2020 is as follows:
| 3.2.A | Operating results |
| (1) | Net sales |
In 2021, net sales of the Group amounted to RMB75,888.8 million, an increase of 23.27% from the previous year’s RMB61,560.9 million. As of 31 December 2021, the weighted average prices (excluding tax) of synthetic fibers, resins and plastics, intermediate petrochemical products and petroleum products of the Group increased by 38.73%, 15.08%, 43.19% and 42.87% year-on-year respectively.
| (i) | Synthetic fibres |
In 2021, the Group’s net sales of synthetic fiber products amounted to RMB1,374.8 million, representing a decrease of 6.63% from the previous year’s RMB1,472.4 million, which was mainly due to the reduction in production resulted from the overhaul and perennial loss of acrylic fiber, and the lower sales during the Reporting Period resulted from the decrease of sales of synthetic fiber products. Sales volume of synthetic fibers decreased by 32.69% year-on-year, while the weighted average sales price increased by 38.73%. Meanwhile, the sales volume of acrylic fibers, the main product of the synthetic fibers segment, decreased by 36.90% year-on-year. Net sales of acrylic fibers, polyester fibers and other products accounted for 84.10%, 12.11% and 3.79% of the total sales of synthetic fibers segment respectively.
Net sales of synthetic fibers accounted for 1.8% of the Group’s net sales in the current year, representing a decrease of 0.6 percentage points from the previous year.
36
Report of the Directors (continued)
| (ii) | Resins and plastics |
In 2021, the Group’s net sales of resins and plastics products amounted to RMB9,962.7 million, an increase of 5.76% from the previous year’s RMB9,419.7 million, which was mainly due to the scene of the downstream market rebounded, and the sales prices of resin and plastic products generally rose, resulting in the increase of sales during the Reporting Period. The weighted average sales price of resins and plastics increased by 15.08%, while the sales volume of resins and plastics products decreased by 8.09% year-on-year. Meanwhile, the weighted average sales price of polyethylene and polypropylene increased by 18.23% and 11.68%, and the weighted average sales price of polyester chips increased by 28.93% year-on-year. The sales of polyethylene, polypropylene, polyester chips and other products accounted for 43.23%, 36.57%, 16.89% and 3.31% of the total sales of resins and plastics segment respectively.
The net sales of resins and plastics accounted for 13.10% of the Group’s net sales in the current year, a decrease of 2.2 percentage points from the previous year.
| (iii) | Intermediate petrochemical products |
In 2021, the Group’s net sales of intermediate petrochemical products amounted to RMB10,780.5 million, an increase of 31.38% from the previous year’s RMB8,205.8 million, which was mainly due to the rise in unit price of intermediate petrochemical products driven by the sharp rise in international crude oil prices. The weighted average sales price of intermediate petrochemical products increased by 43.19% year-on-year, and its sales volume decreased by 8.25% year-on-year. The sales of p-xylene, ethylene oxide, pure benzene, ethylene glycol and other products accounted for 24.24%, 20.52%, 17.01%, 1.78% and 36.45% of the total sales of intermediate petrochemical products respectively.
The net sales of intermediate petrochemical products accounted for 14.2% of the Group’s net sales in the current year, an increase of 0.9 percentage points from the previous year.
37
Report of the Directors (continued)
| (iv) | Petroleum products |
In 2021, the Group’s net sales of petroleum products amounted to RMB41,884.4 million, an increase of 38.97% from the previous year’s RMB30,139.6 million, which was mainly due to the rise in the price of petroleum products driven by the sharp rise in international crude oil prices. The weighted average sales price of petroleum products increased by 42.87% year-on-year, and sales volume decreased by 2.73%.
The net sales of petroleum products accounted for 55.2% of the Group’s net sales in the current year, an increase of 6.2 percentage points from the previous year.
| (v) | Trading of petrochemical products |
In 2021, the Group’s net sales of trading of petrochemical products amounted to RMB11,051.4 million, a decrease of 4.54% from the previous year’s RMB11,577.3 million. Mainly due to the decrease in customer purchase demand of the subsidiary China Jinshan Associated Trading Corporation and Shanghai Jinshan Trading Corporation, the sales of this year decreased by RMB57 million and RMB769 million respectively.
The net sales of trading of petrochemical products accounted for 14.6% of the Group’s net sales in the current year, a decrease of 4.2 percentage points from the previous year.
| (vi) | Others |
In 2021, the Group’s net sales of other products amounted to RMB835.0 million, an increase of 11.92% from the previous year’s RMB746.1 million.
The net sales of other products accounted for 1.1% of the Group’s net sales in the current year, a decrease of 0.1 percentage points from the previous year.
38
Report of the Directors (continued)
| (2) | Cost of sales and operating expenses |
Cost of sales and expense consist of cost of sales, sales and administrative expenses, other operating expenses and other operating income, etc.
In 2021, the Group’s cost of sales and expenses amounted to RMB74,456.6 million, an increase of 20.04% from RMB62,027.1 million in 2020. Cost of sales and expenses of synthetic fibers, resins and plastics, intermediate petrochemical products, petroleum products, petrochemical products and other products amounted to RMB2,228.9 million, RMB9,910.5 million, RMB11,415.6 million, RMB38,917.4 million, RMB11,007.7 million and RMB976.5 million respectively, representing an increase of 21.36%, an increase of 21.49%, an increase of 49.73%, an increase of 20.34%, a decrease of 4.57% and an increase of 82.49% year-on-year respectively.
Compared with the last year, the cost of sales and expenses of synthetic fibers, resins and plastics, intermediate petrochemical products, petroleum products, petrochemical products increased this year, which was mainly due to the sharp increase in crude oil prices and thus the increase in corresponding costs.
| • | Cost of sales |
In 2021, the Group’s cost of sales amounted to RMB74,298.0 million, an increase of 20.03% from previous year’s RMB61,901.1 million, which was mainly due to the rise in crude oil prices leading to the rise in costs and the lower-than-expected operating benefits of certain production facilities in 2021, and a number of production facilities were idle or backward production technology, resulting in the provision for impairment of long-term assets of RMB587.6 million. Cost of sales accounted for 97.90% of the net sales this year.
| • | Selling and administrative expenses |
In 2021, the Group’s sales and administrative expenses amounted to RMB368.2 million, a decrease of 24.29% from the previous year’s RMB486.3 million. This was primarily due to the handling and miscellaneous handling fees with amount of RMB120.9 million were reclassified to cost of sales.
39
Report of the Directors (continued)
| • | Other operating income |
In 2021, the Group’s other operating income amounted to RMB125.3 million, a decrease of 15.74% from previous year’s RMB148.7 million. This was mainly due to the decrease of RMB25 million in subsidies of R&D projects, leading to a reduction in other operating income.
| • | Other operating expenses |
In 2021, the Group’s other operating expenses amounted to RMB44.7 million, an increase of 80.97% from previous year’s RMB24.7 million. This was primarily due to an increase in other operating expenses as a result of the increase of RMB17.0 million for the purchases of rights of carbon emission during the year.
| (3) | Profit from operations |
In 2021, the Group’s operating profit amounted to RMB1,432.2 million, an increase of RMB1,898.4 million from the operating loss of RMB466.2 million in the previous year. Profit from operations was significantly higher as a result of the increase in the price of crude oil and the impact of the domestic economy recovers from COVID-19’s influence on downstream demand.
| (i) | Synthetic fibres |
In 2021, the operating loss of synthetic fibers amounted to RMB854.1 million, an increase of RMB489.9 million from the operating loss of RMB364.2 million in the previous year. The weak market demand of the textile industry, the downstream market of synthetic fibers segment, together with the low-capacity utilization rate impacted from major overhaul resulted in increase of operating losses in the synthetic fibers sector during the Reporting Period. Due to a number of production facilities were idle or backward production technology, the long-term asset impairment provision of RMB135.7 million was made for the synthetic fiber segment in 2021.
40
Report of the Directors (continued)
| (ii) | Resins and plastics |
In 2021, the operating profit of resins and plastics amounted to RMB52.2 million, a decrease of RMB1,209.9 million from the operating profit of RMB1,262.1 million in the previous year. The decrease in operating profit in the year was mainly because the rise in international crude oil prices resulted in the sharp rise in costs while the supply in the downstream market was saturated, and thus the increase in sales price was lower than that in cost price.
| (iii) | Intermediate petrochemical products |
In 2021, the operating loss of intermediate petrochemical products amounted to RMB635.1 million, a decrease of RMB1,216.7 million from the operating profit of RMB581.6 million in the previous year. The decrease in gross profit of petrochemical products as compared with the previous period was mainly because the rise in international crude oil prices resulted in the sharp rise in costs while the supply in the downstream market was saturated, and thus the increase in sales price was lower than that in cost price. In 2021, provision for impairment of long-term assets of RMB296.3 million was made for some devices as increasing production cost is not expected to be covered by the estimated selling price of the products due to deteriorating market conditions.
| (iv) | Petroleum products |
In 2021, the operating profit of petroleum products amounted to RMB2,967.0 million, an increase of RMB5,165.7 million from the operating loss of RMB2,198.7 million in the previous year. The increase in operating profit in the year was mainly due to an increase of sales price driven by a rise in international crude oil price.
| (v) | Trading of petrochemical products |
In 2021, the operating profit of the trading of petrochemical products amounted to RMB43.7 million, an increase of RMB1.7 million from the operating profit of RMB42.0 million in the previous year, which was no significant change compared with the previous year
41
Report of the Directors (continued)
| (vi) | Others |
In 2021, the Group’s other operating loss amounted to RMB141.5 million, a decrease of RMB352.5 million from the other operating profit of RMB211.0 million in the previous year, this was primarily due to higher gross loss on spontaneous power sales driven by the rise of coal prices.
| (4) | Net finance income |
In 2021, the Group’s net financial income amounted to RMB414.6 million, an increase of RMB82.3 million from the net financial income of RMB332.3 million in the previous year, mainly due to an increase in the average balance of deposit during the Reporting Period, resulting in an increase of our interest income by RMB77.6 million from RMB431.2 million in 2020 to RMB508.8 million in 2021.
| (5) | Profit before taxation |
In 2021, the Group’s profit before taxation amounted to RMB2,721.1 million, an increase of RMB2,130.3 million from the profit before taxation of RMB590.8 million in the previous year.
| (6) | Income tax |
The income tax expense of the Group amounted to RMB644.5 million in 2021 and the income tax benefit amounted to RMB65.6 million in 2020. This was primarily due to an increase in the profit before taxation of the Company which lead to a rise in tax payable.
In accordance with The Enterprise Income Tax Law of the PRC (amended in 2018), the income tax rate applicable to the Group in 2021 is 25% (2020: 25%).
42
Report of the Directors (continued)
| (7) | Profit for the year |
In 2021, the Group’s profit after tax amounted to RMB2,076.6 million, an increase of RMB1,420.2 million from the profit after tax of RMB656.4 million in the previous year.
| 3.2.B | Liquidity and capital sources |
The Group’s primary sources of capital are operating cash inflows and loans from related parties and banks, The Group’s primary uses of capital are costs of goods sold, other operating expenses and capital expenditure.
| (1) | Capital sources |
| (i) | Net cash flow generated from operating activities |
In 2021, the Group’s net cash inflows generated from operating activities amounted to RMB3,950.0 million, representing an increase of RMB2,270.2 million from the net cash inflows of RMB1,679.8 million in the previous year. During the Reporting Period, with profitability in operating, the Group’s cash inflows generated from operating activities in 2021 amounted to RMB4,411.7 million, representing an increase of RMB2,416.6 million from the cash inflows generated from operating activities of RMB1,995.1 million in the previous year. The income tax was paid in 2021 amounted to RMB351.6 million, an increase of RMB107.7 million from the income tax payment of RMB243.9 million in the previous year.
43
Report of the Directors (continued)
| (ii) | Borrowings |
By the end of 2021, the Group’s total borrowings decreased by RMB2,306.0 million to RMB2,259.8 million as compared to the end of last year, mainly due to the decrease of short-term bonds and short-term borrowings by RMB3,017.8 million and RMB8.0 million, respectively, and the increase of long-term borrowings by RMB700.0 million as well as the increase of long-term borrowings due within one year by RMB19.8 million.
The Group managed to maintain its gearing ratio at a safe level by strengthening its management of liabilities (such as borrowings) and enhancing its control over financial risks. The Group generally does not experience any seasonality in borrowings. However, due to the fact that the Group’s capital expenditure is, by nature, planned in advance, long-term bank loans can be suitably arranged in advance of expenditures, while short-term borrowings are used to meet operational needs. The terms of the Group’s existing borrowings do not restrict its ability to distribute dividends for its shares.
| (2) | Gearing ratio |
As of 31 December 2021, the Group’s gearing ratio was 35.26% (2020: 34.25%). The ratio is calculated using this formula: total liabilities/total assets multiply by 100%.
| 3.2C | Research and development, patents and licenses |
The Group owns various technology development departments, including Advanced Materials Innovation Research Institute, Petrochemical Research Institute, Plastic Research Institute and Environmental Protection Research Institute, which are responsible for research and development of new technologies, products, processes, equipment and environmental protection. The Group’s research and development expenses for 2019, 2020 and 2021 amounted to RMB93.0 million, RMB110.6 million and RMB94.3 million, respectively. The decrease was mainly due to the decrease in material cost for research and development of technology in equipment and products.
The Group does not rely on any patents, licenses, industrial, commercial or financial contracts or new production processes in any material respect.
44
Report of the Directors (continued)
| 3.2D | Off-Balance Sheet Arrangements |
Please refer to note 35 to the financial statements prepared under IFRS in the full text of the 2021 Annual Report for details of the Group’s capital commitments. The Group did not provide any guarantee to external parties during the Reporting Period.
| 3.2.E | Contractual obligations |
The following table sets forth the Group’s obligations to repay loan principal in future as at 31 December 2021:
| Payment due and payable by the following period as at 31 December 2021 |
||||||||||||||||||||
| Total (RMB’000) |
Within 1 year (RMB’000) |
After 1 year but within 2 years (RMB’000) |
After 2 years but within 5 years (RMB’000) |
Over 5 years (RMB’000) |
||||||||||||||||
| Contractual obligations |
||||||||||||||||||||
| Short-term borrowings |
1,559,800 | 1,559,800 | — | — | — | |||||||||||||||
| Long term borrowings |
700,000 | — | — | 700,000 | — | |||||||||||||||
|
|
|
|
|
|
|
|
|
|
|
|||||||||||
| Total contractual obligations |
2,259,800 | 1,559,800 | — | 700,000 | — | |||||||||||||||
|
|
|
|
|
|
|
|
|
|
|
|||||||||||
45
Report of the Directors (continued)
| 3.2.F | Analysis of performance and results of in which the Company has controlling interests or investment interests during the Reporting Period |
As at 31 December 2021, the Company had more than 50% equity interest in the following principal subsidiaries:
| Company name |
Place of registration |
Principal activities |
Place for principal activities |
Type of legal person |
Percentage of equity held by the Company (%) |
Percentage of equity held by the Group (%) |
Paid in capital | Net profit/ (loss) for the year 2021 (RMB’000) |
||||||||||||||||||||||||
| Shanghai Petrochemical Investment Development Company Limited (“Shanghai Investment Development”) |
China | |
Investment management |
|
China | |
Limited company |
|
100.00 | 100.00 | RMB1,000,000 | 126,415 | ||||||||||||||||||||
| China Jinshan Associated Trading Corporation (Jinshan Associated Trading) |
China | |
Import and export of petrochemical products and equipment |
|
China | |
Limited company |
|
67.33 | 67.33 | RMB25,000 | 32,195 | ||||||||||||||||||||
| Shanghai Jinchang Engineering Plastics Company Limited (“Shanghai Jinchang”) |
China | |
Production of polypropylene compound products |
|
China | |
Limited company |
|
– | 74.25 | USD9,154 | (32,624 | ) | |||||||||||||||||||
| Shanghai Golden Phillips Petrochemical Company Limited (“Shanghai Golden Phillips”) |
China | |
Production of polypropylene products |
|
China | |
Limited company |
|
– | 100.00 | RMB415,623 | 29,679 | ||||||||||||||||||||
| Shanghai Jinshan Trading Corporation (“JMGJ”) |
China | |
Import and export of petrochemical products and equipment |
|
China | |
Limited company |
|
– | 67.33 | RMB100,000 | 10,509 | ||||||||||||||||||||
| Zhejiang Jinlian Petrochemical Storage and Transportation Co., Ltd. (“Jinlian”) |
China | |
Trading of Petrochemical Products |
|
China | |
Limited company |
|
– | 100.00 | RMB400,000 | (19,528 | ) | |||||||||||||||||||
| Note: None of the subsidiaries have issued any debt securities. |
46
Report of the Directors (continued)
The Group’s share of interests in associates comprises a 38.26% interest in the Shanghai Chemical Industry Park Development Co., Ltd (“Chemical Industrial Park”) established in the PRC in the amount of RMB2,023.6 million, and a 20% interest in the Shanghai SECCO Petrochemical Company Limited (“Shanghai SECCO”) established in the PRC in the amount of RMB1,270.4 million. The principal businesses of the Chemical Industry Park Development Co., Ltd., include the planning, development and operation a chemical industrial park located in Shanghai of the PRC. The principal business of the Shanghai SECCO is the production and distribution of petrochemical products.
| (1) | Explanation of profits of major controlling companies and investing companies affecting more than 10% of the net profit of the Group |
In 2021, Shanghai SECCO recorded a revenue of RMB29,723.2 million, and its profit after tax reached RMB3,125.9 million, among which RMB633.4 million was attributed to the Company.
| (2) | Analysis of operational performance of major controlling companies and investing companies with a 30% or more year-on-year change |
| (a) | The operating results of Shanghai Investment Development decreased by 40.86% in 2021 as compared to the previous year, which was mainly due to the disposal of auxiliary plant resulting in an increase in gains from disposal of assets of RMB87.1 million in 2020, resulting in a decrease in the operating profit in 2021. |
| (b) | In 2021, the operating performance of Shanghai Jinchang decreased by 924.67% year on year which was primarily due to the increase in price of polypropylene, the main raw materials required by Shanghai Jinchang. |
| (c) | The operating performance of Shanghai Golden Phillips has seen a decrease of 71.49% year on year, which was mainly due to an increase in price of Ethylene, the main raw materials required by Shanghai Golden Phillips. This resulted in a decrease in operating results for 2021. |
| (d) | The operating performance of Zhejiang Jinlian has seen a decrease of 77.14% year on year, which was mainly due to the reconstruction project of Zhejiang Jinlian reservoir area has not been completed, resulting in operating losses for 2021. |
47
Report of the Directors (continued)
| 3.2.G | Major suppliers and customers |
The Group’s top five suppliers in 2021 were China International United Petroleum & Chemical Co., Ltd., Sinochem Oil Co. Ltd., Shanghai SECCO, East China Branch of Sinopec Sales Company Limited, and Sinopec Commercial Reserve Co., Ltd Total procurement costs involving these five suppliers, which amounted to RMB48,010.6 million, accounted for 69.01% of the total procurement costs of the Group for the year. Among the top five suppliers, the purchase amount of related parties was RMB44,075.2 million, accounting for 63.36% of the total annual purchase amount. The procurement from the largest supplier amounted to RMB35,378.0 million, representing 50.85% of the total costs of purchases by the Group for the year.
The Group’s top five customers in 2021 were East China Branch of Sinopec Sales Co., Ltd., China International United Petroleum & Chemical Co., Ltd., Shanghai SECCO, Sinopec Sales Company Limited and Sinopec Refinery Sales Co., Ltd Total sales to these five customers amounted to RMB57,169.8 million, representing 64.09% of the Group’s total turnover for the year. Among the sales of the top five customers, the sales of related parties was RMB57,169.8 million, accounting for 64.09% of the total annual sales. Sales to the Group’s largest customer amounted to RMB44,565.3 million, representing 49.96% of the Group’s total turnover for the year.
To the knowledge of the Board, among the suppliers and customers listed above, Shareholders and Directors of the Company and their close associates have no interest in Sinochem Oil Company Limited; Shanghai SECCO is an associate company of the Company; China International United Petroleum & Chemical Co., Ltd., East China Branch of Sinopec Sales Company Limited, East China Branch of Sinopec Sales Co., Ltd., Sinopec Sales Company Limited and Sinopec Refinery Sales Co., Ltd. are subsidiaries of Sinopec Corp., a controlling shareholder of the Company. Sinopec Commercial Reserve Co., Ltd. is a subsidiary of Sinopec Group, the ultimate controlling shareholder of the Company.
48
Report of the Directors (continued)
| (II) | The Principal Operations of the Company during the Reporting Period |
Discussion and analysis of the Company’s operation (Prepared under CAS)
| 1. | Analysis of the Company’s major businesses |
| 1.1 | Analysis of changes in the Consolidated Income Statement and the Consolidated Cash Flow Statement |
| Unit: RMB’000 | ||||||||||||
| Item |
Amount for the year ended 31 December 2021 |
Amount for the year ended 31 December 2020 |
Amount for the year ended 31 December 2019 |
|||||||||
| Revenue |
89,280,415 | 74,705,183 | 19.51 | |||||||||
| Cost of sales |
71,675,646 | 59,089,119 | 21.30 | |||||||||
| Selling and distribution expenses |
362,334 | 479,260 | -24.40 | |||||||||
| General and administrative expenses |
1,842,087 | 2,459,328 | -25.10 | |||||||||
| Financial expenses (“–” for financial income) |
-406,799 | -337,459 | 20.55 | |||||||||
| Research and Development Expenditure |
94,295 | 110,625 | -14.76 | |||||||||
| Net cash inflow generated from operating activities (“–” for net outflow) |
4,060,026 | 1,751,217 | |
Inflow increased by 131.84 |
% | |||||||
| increased by 131.84% |
||||||||||||
| Net cash inflow generated from investing activities (“–” for net outflow) |
-2,359,421 | -3,887,528 | |
Outflow decreased by 39.31 |
% | |||||||
| Net cash inflow generated from financing activities (“–” for net outflow) |
-3,503,142 | 1,610,421 | |
Inflow decreased by 317.53 |
% | |||||||
49
Report of the Directors (continued)
Analysis of major changes in the Consolidated Income Statement
| For the years ended 31 December |
Increase/ decrease |
Increase/ decrease |
Unit: RMB’000 | |||||||||||||||
| Item |
2021 | 2020 | amount | (%) | Major reason for change | |||||||||||||
| Impairment losses |
-766,897 | -308,458 | -458,439 | -148.62 | Due to the rise in crude oil prices led to the rise in costs and the lower than expected operating benefits of certain production facilities in 2021, and a number of production facilities were idle or backward production technology, resulting in the provision for impairment of long-term assets of RMB587.6 million. | |||||||||||||
| Operating profit Total profit Net profit |
|
2,725,595 2,648,161 2,003,681 |
|
|
636,660 573,816 639,436 |
|
|
2,088,935 2,074,345 1,364,245 |
|
|
328.11 361.50 213.35 |
|
The market demand for petroleum and petrochemical products has improved significantly during the Reporting Period, the product price has increased, and the Company’s profit has increased significantly. | |||||
| Income tax expense/ (benefit) |
644,480 | -65,620 | 710,100 | 1,082.14 | The Company has realized operating profits, resulting in a corresponding increase in income tax expenses. | |||||||||||||
50
Report of the Directors (continued)
Analysis of major changes in the Cash Flow Statement
| For the years ended 31 December |
Increase/ decrease |
Increase/ decrease |
Unit: RMB’000 | |||||||||||||||
| Item |
2021 | 2020 | amount | (%) | Major reason for change | |||||||||||||
| Net cash inflow generated from operating activities (“–” for net outflow) |
4,060,026 | 1,751,217 | |
Inflow increased by 2,308,809 |
|
|
Inflow increased by 131.84 |
|
A significant increase in demand for the market demand for petroleum and petrochemical products for the year has led to an increase in revenue-related sales and other inflows. | |||||||||
| Net cash inflow generated from investing activities (“–” for net outflow) |
-2,359,421 | -3,887,528 | |
Outflow decreased by 1,528,107 |
|
|
Outflow decreased by 39.31 |
|
Proceeds from capital reduction of an associate for the year, resulting in a decrease in net cash outflow from investing activities. | |||||||||
| Net cash inflow generated from financing activities (“–” for net outflow) |
-3,503,142 | 1,610,421 | |
Inflow decreased by 5,113,563 |
|
|
Inflow decreased by 317.53 |
|
During the Reporting Period, short-term financing bonds amounting to RMB3,000 million were paid, resulting in the net cash inflow in financing activities last year has turned into a net outflow. | |||||||||
51
Report of the Directors (continued)
| 1.2 | Operating income |
| (1) | Analysis of factors causing the changes in revenue |
| The weighted average prices (exclude VAT) of the Group’s synthetic fibres, resins and plastics, intermediate petrochemical products and petroleum products increased by 38.58%, 14.89%, 43.12% and 31.43% respectively, bringing a higher revenue in 2021 compared with the previous year. |
| (2) | Major customers |
| Please refer to 3.2.G for details of major customers of the Group. |
| 1.3 | Operating costs |
| (1) | Analysis of cost of sales |
| In 2021, the Group’s costs of sales were RMB71,675.6 million, an increase of 21.30% from the previous year’s RMB59,089.1 million. This was mainly due to the rise in international crude oil price in the year, which lead to an increase in cost. |
52
Report of the Directors (continued)
| The following table sets forth the details of the cost of sales of the Group during the Reporting Period: |
| For the years ended 31 December | ||||||||||||||||||||
| 2021 | 2020 | |||||||||||||||||||
| RMB million |
% of total cost of sales |
RMB million |
% of total cost of sales |
Increase/ decrease (%) |
||||||||||||||||
| Cost of raw materials |
||||||||||||||||||||
| Crude oil |
43,182.3 | 60.25 | 33,960.6 | 57.48 | 27.15 | |||||||||||||||
| Other raw materials, auxiliary materials and power |
11,275.3 | 15.73 | 8,121.7 | 13.74 | 38.83 | |||||||||||||||
| Depreciation and amortisation |
1,779.1 | 2.48 | 1,430.1 | 2.42 | 24.40 | |||||||||||||||
| Staff costs |
2,357.5 | 3.29 | 2,109.9 | 3.57 | 11.74 | |||||||||||||||
| Costs of trade |
10,929.1 | 15.25 | 11,467.4 | 19.41 | -4.69 | |||||||||||||||
| Others |
2,152.3 | 3.00 | 1,999.4 | 3.38 | 7.65 | |||||||||||||||
|
|
|
|
|
|
|
|
|
|
|
|||||||||||
| Total |
71,675.6 | 100.00 | 59,089.1 | 100.00 | 21.30 | |||||||||||||||
|
|
|
|
|
|
|
|
|
|
|
|||||||||||
| (2) | Major suppliers |
| Please refer to 3.2.G for details of major suppliers of the Group. |
53
Report of the Directors (continued)
| 1.4 | Expenses |
| Please refer to “Analysis of changes in the Consolidated Income Statement and the Consolidated Cash Flow Statement” set forth in the “Discussion and Analysis of the Company’s Operations” for details of the changes in expenses of the Group. |
| 1.5 | Research and development (“R&D”) expenditure |
| (1) | R&D expenditure |
| Unit: RMB ’000 | ||||
| Expensed R&D expenditure during the Reporting Period |
94,294.9 | |||
| Capitalised R&D expenditure during the Reporting Period |
— | |||
|
|
|
|||
| Total R&D expenditure |
94,294.9 | |||
|
|
|
|||
| % of R&D expenditure to revenue |
0.11 | |||
| % of capitalised R&D expenditures |
— | |||
54
Report of the Directors (continued)
| (2) | R&D personnel |
| Number of R&D personnel |
169 | |||
| % of number of R&D personnel to total number of staff |
2.02 | |||
| Educational structure of R & D personnel Education structure category |
|
Education structure number |
| |
| Doctor |
12 | |||
| Master |
30 | |||
| Undergraduate |
68 | |||
| professional training |
27 | |||
| High school and below |
32 | |||
| Age structure of R & D personnel Age structure category |
|
Age structure number |
| |
| Under 30 years old (excluding 30 years old) |
15 | |||
| 30-40 years old (including 30 years old and excluding 40 years old) |
33 | |||
| 40-50 years old (including 40 years old and excluding 50 years old) |
46 | |||
| 50-60 years old (including 50 years old and excluding 60 years old) |
75 | |||
| Over 60 years old |
0 |
| Please refer to 3.2.C for details of R&D, patents and licences of the Group. |
55
Report of the Directors (continued)
| 1.6 | Cash Flow |
| Please refer to “Analysis of Changes in the Consolidated Income Statement and the Consolidated Cash Flow Statement” in this section for details of the changes in cash flow statement. |
| 2. | Analysis of business operations by industry, product or geographical location segment |
| 2.1 | Principal operations by industry or product |
| Unit: RMB’000 | ||||||||||||||||||||||||
| By industry |
Revenue | Cost of sales | Gross profit/ (loss) margin (%) |
Gross profit/ (loss) margin (%) |
Gross profit/ (loss) margin (%) |
Gross profit/(loss) margin (%) |
||||||||||||||||||
| Petroleum products (Note) |
55,074,158 | 38,276,985 | 30.50 | 27.84 | % | 23.59 | % | |
Increased by 2.39 percentage points |
| ||||||||||||||
| Intermediate petrochemical products |
10,835,074 | 10,359,666 | 4.39 | 31.31 | % | 50.84 | % | |
Decreased by 12.38 percentage points |
| ||||||||||||||
| Trading of petrochemical products |
11,060,133 | 10,929,127 | 1.18 | -4.53 | % | -4.69 | % | |
Increased by 0.16 percentage points |
| ||||||||||||||
| Resins and plastics |
10,006,030 | 9,227,408 | 7.78 | 5.59 | % | 25.81 | % | Decreased by 14.82 | ||||||||||||||||
| Synthetic fibres |
1,380,998 | 1,911,682 | -38.43 | -6.73 | % | 8.34 | % | |
Decreased by 19.25 percentage points |
| ||||||||||||||
| Others |
435,309 | 577,485 | -32.66 | 3.04 | % | 39.08 | % | |
Decreased by 34.37 percentage points |
| ||||||||||||||
| Note: | Gross profit margin is calculated according to the price of petroleum products, which includes consumption tax. Gross profit margin of petroleum products after deducting consumption tax amounted to 11.89%. |
56
Report of the Directors (continued)
| 2.2 | Operating income by geographical location |
| Unit: RMB’000 | ||||||||
| Geographical location |
Revenue | Increase/decrease of revenue compared with the previous year (%) |
||||||
| Eastern China |
79,779,058 | 22.59 | % | |||||
| Other regions in China |
1,258,596 | -35.46 | % | |||||
| Exports |
8,242,761 | 7.38 | % | |||||
3. Analysis of assets and liabilities
| Unit: RMB’000 | ||||||||||||||||||||||
| As at 31 December 2021 | As at 31 December 2020 | Change of amount on 31 December 2021 compared to |
||||||||||||||||||||
| % of total | % of total | 31 December | ||||||||||||||||||||
| Item |
Amount | assets | Amount | assets | 2020 (%) | Major reason of the change | ||||||||||||||||
| Cash at bank and on hand |
12,498,617 | 26.57 | 7,920,852 | 16.84 | 57.79 | Time deposits with maturity less than one year increased. | ||||||||||||||||
| Inventories |
5,923,525 | 12.59 | 3,888,746 | 8.69 | 52.32 | As a result of the rise in international crude oil prices, the Company’s crude oil inventory unit cost increased sharply. | ||||||||||||||||
| Other current assets |
17,329 | 0.04 | 3,057,587 | 6.50 | -99.43 | Time deposits with maturity less than one year at 31 December 2020 matured and redeemed during 2021. | ||||||||||||||||
57
Report of the Directors (continued)
| Unit: RMB’000 | ||||||||||||||||||||||
| As at 31 December 2021 | As at 31 December 2020 | Change of amount on 31 December 2021 compared to |
||||||||||||||||||||
| % of total | % of total | 31 December | ||||||||||||||||||||
| Item |
Amount | assets | Amount | assets | 2020 (%) | Major reason of the change | ||||||||||||||||
| Construction in progress |
3,293,177 | 7.00 | 1,710,124 | 3.82 | 92.57 | Raw silks (24,000 ton/ year), 48K large-tow carbon fiber (12,000 ton/year) project and third circuit 220kV power incoming line project were accelerated for the year. | ||||||||||||||||
| Long-term deferred expenses |
775,963 | 1.65 | 410,191 | 0.92 | 89.17 | The Company conducted major overhaul and increased catalyst procurement for the year. | ||||||||||||||||
| Bills payable |
830,006 | 1.76 | 139,360 | 0.30 | 495.58 | More bills were issued by the Group to settle the payments for procurement of goods and service | ||||||||||||||||
| Other current liabilities |
1,441,320 | 3.06 | % | 3,072,150 | 6.87 | -53.08 | The balance of ultra short-term financing bonds decreased by RMB3,000 million, while the amount payable to related parties increased by RMB1,400 million. | |||||||||||||||
| Long-term loans |
700,000 | 1.49 | — | — | 100 | Long-term loan of RMB700 million was borrowed specially for building Raw silks (24,000 ton/year) and 48K large-tow carbon fiber (12,000 ton/year) project. | ||||||||||||||||
58
Report of the Directors (continued)
| Overseas assets |
| During the Reporting Period, the overseas assets held by the Company were RMB42,676 thousand, accounting for 0.091% of the total assets. |
| 4. | Others |
| (1) | Directors, Supervisors, senior management and employees |
| Please refer to the Chapter 5 “Directors, Supervisors, Senior Management and Employees” in this annual report. |
| (2) | Purchase, sale and investment |
| Save and except as disclosed in the 2021 annual report, there was no material purchase or sale of the Group’s subsidiaries, associates or joint ventures or any other material investments in 2021. |
| (3) | Pledge of assets |
| As at 31 December 2021, no fixed assets were pledged by the Group (31 December 2020: Nil). |
| (4) | Material events after the Reporting Period |
| The Board of directors has not noticed any significant events affecting the Group since the end of the Reporting Period. |
59
Report of the Directors (continued)
| 5. | Financial assets and financial liabilities held in foreign currencies |
| As | at 31 December 2021, bank deposits, trade receivables, other receivables, trade payables and other payables, and other financial asset and liabilities denominated in foreign currencies held by the Group equivalent to RMB61,114 thousand. |
| 6. | Investment of the Company |
| 6.1 | Entrusted wealth management and entrusted loans |
| (1) | Entrusted wealth management |
| The Company did not engage in any entrusted wealth management during the Reporting Period. |
| (2) | Entrusted loans |
| The Company did not engage in any Entrusted loans during the Reporting Period. |
| 6.2 | Analysis of the companies in which the Company has controlling interests or investment interests |
Please refer to 3.2.F “Analysis of performance and results of major companies in which the Company has controlling interests or investment interests during the Reporting Period” contained in section II “Management Discussion and Analysis” of this chapter for details on the analysis of the major companies in which the Company has controlling interests or investment interests.
60
Report of the Directors (continued)
| 6.3 | Non-fundraising projects |
In 2021, the capital expenditures of the Group amounted to RMB3,533.0 million, representing an increase of 67.68% as compared with RMB2,107.0 million in 2020. Major projects include the following:
| Major Project |
Total amount of project investment RMB’000 |
Amount of project investment during the Reporting Period RMB’000 |
Project progress as at 31 December 2021 |
|||||||||
| Shanghai Jinshan baling New Material Co., Ltd |
400,000 | 50,000 | |
Paid in RMB50 million |
| |||||||
| Sinopec Shanghai raw silks (24,000 ton/ year) and 48K large-tow carbon fiber (12,000 ton/year) project |
3,489,638 | 999,999 | |
Under construction |
| |||||||
| Oil cleaning project 400,000 tons/year clean gasoline components units |
781,657 | 39,999 | |
Put into operation |
| |||||||
| Second stage of PAN (Polyacrylonitrile) based carbon fiber project with annual production of 1,500 tons |
847,794 | 8,400 | |
Put into operation |
| |||||||
| Security risk rectification project of the central control room of the olefin section |
99,944 | 32,500 | |
Under construction |
| |||||||
| Shanghai Petrochemical third circuit 220kV power incoming line project |
507,120 | 250,000 | |
Under construction |
| |||||||
| Energy saving transformation of three GK-VI cracking furnaces in the old area of No. 2 olefin unit of olefin Department |
92,255 | 70,936 | |
Put into operation |
| |||||||
| Seawall safety hazard treatment project |
256,118 | 150,057 | |
Under construction |
| |||||||
| Note: | In addition to the major capital expenditure items disclosed in the above table, the total capital expenditure of other projects of the Company is RMB1,931 million. |
The Group’s capital expenditures for 2022 are estimated at approximately RMB3,500 million.
61
Report of the Directors (continued)
| (III) | Discussion and analysis on future development of the Company |
| 1. | Industry competition and development trends |
Since the action of global “carbon peak, carbon neutrality” to combat climate change bring great challenges to the development of global energy and petrochemical industry, countries have paid more attention to the energy transformation, the development of bio-based and other renewable energy sources and the digital transformation. As the traditional petrochemical industry is facing unprecedented pressure of transformation and upgrading, multinational oil giant has proposed green oil and gas transformation plans, and some enterprises plan to withdraw from traditional petrochemical business.
After China put forward the “3060” goal, China’s petrochemical industry’s efforts on promoting safe, environmentally friendly, green and low-carbon development can be reflected in the following aspects. First, the industry is transforming to the model of less oil and more chemical materials and is focusing on the latest process of directly producing chemicals from crude oil. Second, it is trying to reduce the diesel-gasoline ratio in the oil structure of the oil refining unit. Third, the traditional fossil energy industry focuses on the research and quality improvement on low-carbon energy-saving and emission-reduction, and strengthens the management of carbon assets. Fourth, the petrochemical industry is being marginalized by substitute derivatives as the battery industry and shale gas supply continue to grow in the market. Fifth, it is optimizing the strategy to develop high-end chemical industry. Sixth, the establishment of green supply chain in the petrochemical industry. Seventh, enterprises have actively participated in the standards making and pilot demonstration to implement carbon peak and carbon neutral target action plans.
There are three engines and three drivers in the world petrochemical industry. The three engines are North America, Northeast Asia and the Gulf. North America is represented by the United States, and the Gulf region is represented by Saudi Arabia. These two engines have benefited from the advantages of abundant low-cost oil and gas resources, and have become large-scale refining and chemical integrated units with the rapid development of olefins, polyolefins and the high-performance materials. Northeast Asia is represented by China and based on huge market demand for the production capacity of major petrochemical products. The three engines account for more than 60 percent of the global production capacity, production and consumption respectively, or even more than 80 percent. The three drivers refer to North America, Northeast Asia and Europe. North America is represented by the United States, Northeast Asia is represented by Japan, and Europe is represented by Germany, Britain, France and the Netherlands. The comprehensive manifestation of the three drivers is the overall high technical level and strong corporate competitiveness, typically such as the United States, Germany and Japan, whose petrochemical industry technology level, innovation ability, and corporate competitiveness belong to the world’s first class. A significant manifestation is that the proportion of high-end materials and cutting-edge products such as new chemical materials and specialty chemicals with high technical requirements is much higher than that of other regions in the world.
62
Report of the Directors (continued)
With the rapid advancement of private-financed refining and chemical projects, the accelerated entry of large foreign-founded companies, the market participants diversified, the industrial concentration degree will be improved constantly, the domestic petrochemical production capacity will enter the excess stage, and the market competition will be more intensive. Meanwhile, the low operating rate in sites with inefficient production capacity will be an increasingly severe problem, and the low-cost scale competition of private-financed production capacity and the advantages of the downstream industrial chain will bring a new shake-out. The leading effect of integrated refining and chemical enterprises with the advantages of the whole industry chain, large scale, high utilization rate of raw material oil, and diversified products will become more prominent. More enterprises will try to continue to extend upstream and downstream chains, and to realize the integrated layout of the whole industry chain, so that enterprises can form a comprehensive competitive advantage in terms of cost, product variety and efficiency.
| 2. | Development strategies of the Company |
The Group’s development objectives are to evolve itself into a “leading domestically, first-class globally” energy and chemical and new material enterprise. The key components of the Group’s development strategy are as follows: to take into account both low cost and differentiation, and to focus on both scale and refinement. The Company focuses on value and market orientation, creativity, talents as the backbone of the Company, the emphasis of environment and low carbon emissions and integrated development, to realize low cost and large scale of the upstream, and high value-added and refinement of the downstream. The Company will give full play to its advantages of wide product chain, diversified products and close monitoring of the market to enhance competitiveness. Under the guidance of the development strategy, according to the requirements of North-South Transformation raised by Shanghai Government, the Company will actively promote the transformation of oil refining to chemical industry, chemical industry to materials, materials to high-end products, and parks to ecology, will carry out comprehensive technological transformation and quality upgrades, and will further optimize refining product structure to better meet the market needs. The Company will strengthen the core industries of mid-to-high-end new materials such as carbon fiber, and take polyester, polyolefin, elastomer, and C-5 downstream fine chemical new materials as breakthrough and extension for the mid-to-high-end new materials which will help the North-South transformation and the construction of Carbon Valley Green Bay and local industrial parks in Jinshan District. The Company will develop wind, light, fire, and biological integrated power generation and green hydrogen production technology, and will realize the energy structure transformation from fossil energy to fossil energy combined with renewable energy to achieve energy saving. Through diversified industrial linkage development and cluster agglomeration, the Company will build an industrial base with green energy, fine chemical, and high-end material on the north bank of Hangzhou Bay with world-scale and first-class competitiveness.
63
Report of the Directors (continued)
| 3. | Business plans |
In 2022, the Group will continue to adhere to the principle of making improvements while maintaining stability during based on the new development stage, will build a solid base for environmental protection, will adhere to the benefit orientation to complete SOE three-year reform tasks and will achieve high-quality transformation and development. In 2022, the Company is looking to process a total of 13.65 million tons of crude oil and produce a total of 7.57 million tons of refined oil, 0.8252 million tons of ethylene, 0.666 million tons of paraxylene, 0.431 million tons of polyethylene, 0.453 million tons of polypropylene, 0.103 million tons of ethylene glycol and 0.021 million tons of acrylic fiber.
In order to realize the operation goals of 2022, the Group will put its mind on the following tasks:
| (1) | To consolidate environmental protection |
With the effective operation of the Company’s new HSE management system to consolidate environmental protection, to firmly establish the systematic thinking, to strengthen the process control of key parts and to improve the stable operation of the devices, the Company shall focus on safety improvement and try to comply with the relative law and regulations. The Company will pay its attention on staff skills training, continue to carry out Good Day activities to effectively improve employees’ job norms.
| (2) | To adhere to be benefit-orientated |
The Company will adhere to the benefit-oriented budget management and control to minimize costs and expenses. The Company will be devoted to optimizing and adjusting product structure in a timely manner to produce more high-tech, market-competitive, high-value-added products, and to scientifically formulate maintenance plans in line with the market demands. The Company will promote the cleanliness of fossil energy, the scale of clean energy and the low-carbon production process, and improve the level of energy conservation and consumption reduction to build an all-round optimization pattern for employees, the producing chain and the system, and to strive to achieve better business performance.
64
Report of the Directors (continued)
| (3) | To advance reformations further |
The Company will finish tasks raised by the SOE three-year reform plan and the campaign to benchmark against world-class management, and accelerate the improvement of the modern enterprise system with Chinese characteristics. The Company will fully implement the tenure system and contractual management of management members, optimize the management system for scientific and technological innovation, and enhance the ability of independent innovation. To optimize the organizational structure, establish a flexible and efficient organizational operation system, strengthen the process control of investment enterprises, and improve the return on investment, the Company will comprehensively carry out 5S management to improve working environment and to ensure the safety of construction sites.
| (4) | To focus on technology innovation so as to accelerate the layout of industrial chain |
The Company will accelerate the research on carbon fiber core technology to make sure the 1,500-ton/year PAN-based carbon fiber production line will be operated steadily. The Company will try its best to make breakthrough in the composite material forming technology based on large-tow carbon fiber as soon as possible. The Company will gradually smoothen the whole process from basic research, technology research and development, engineering research to industrialization. The Company will strengthen collaborative research with universities, research institutions, and science and technology enterprises to speed up the research on application of carbon fiber and its composite materials in different fields and to enhance the incubation and transformation of research achievements, and to promote the integration and connection of the innovation chain and the industrial chain. The Company will accelerate the layout of industrial chain. The Company will start construction of the elastomer project, pay more attention to the rubber industry, and extend the Company’s industrial chain. During the “14th Five-Year Plan” period, the Company will accelerate the implementation of comprehensive technological transformation and quality improvement. The Company will strive to build an industrial base with green energy, fine chemical, and high-end materials on the north bank of Hangzhou Bay with world-scale and first-class competitiveness.
65
Report of the Directors (continued)
| (5) | To practice the goal of “carbon peak, carbon neutrality” and implement in transformation and development |
In accordance with the “3060” national carbon emission requirement, the Company will conduct transformation and upgrading of carbon reduction process, optimize structure and control carbon emission, and strengthen the low-carbon competitiveness. The Company will strictly control the total consumption of coal and reduce the proportion of high-carbon energy sources such as coal coke. The Company will focus on promoting Nansuitang River projects and acrylic fiber roof photovoltaic projects, develop wind, solar, coal, and biochemistry integrated power generation and green hydrogen manufacturing technology, and realize the energy structure transformation from fossil energy to fossil energy and renewable energy. The product structure has changed from the traditional thermal power plant with a “heat, electricity and water” structure to the new comprehensive energy supply center with a “heat, electricity, cooling, water, vapour, and hydrogen”. The Company strives to become the Shanghai City Green Hydrogen Supply Center. The Company will accelerate the construction of the energy management system, carry out the exploration and application of CCUS technology (carbon capture, utilization and storage technology), continue to improve the professional management level of carbon assets, and ensure carbon quotas and carbon trading.
| (6) | To keep on talents team building |
The Company will strengthen exchanges among cadres on temporary posts and encourage young cadres to take temporary posts in batches and build a strong contingent of reserve cadres and talents. The Company promote the work of “five understandings, five abilities and five capacities”, pay close attention to the basic skills training of safety production skills, solidly carry out on-the-job training, deputy class learning and other work, and continue to carry out various business competitions. The Company strengthen the support capacity and mechanism construction of employees’ life logistics services, and care for employees’ mental health, take multiple measures to improve the happiness index of employees, and pay further attention to the construction of a workforce.
66
Report of the Directors (continued)
| 4. | Risk exposure |
| (1) | The cyclical characteristics of the petroleum and petrochemicals market and price volatility in crude oil and petrochemical products may have an adverse impact on the Group’s operations |
A large part of the Group’s revenue is derived from the sales of refined oil and petrochemical products. Historically, such products have been cyclical in nature and relatively sensitive to macroeconomic changes. Additionally, changes in regional and global economic conditions, productivity and output, prices and supply of raw materials, consumer demand and prices and supply of substitutes also have an effect. From time to time, these factors have a material impact on the prices of the Group’s products in regional and global markets. Given the reduction of tariffs and other import restrictions as well as the relaxation of control by the PRC government over the distribution and pricing of products, a substantial number of the Group’s products will increasingly be subject to the cyclical impact in the regional and global markets. In addition, the prices of crude oil and petrochemical products will remain volatile, and uncertain. Higher crude oil prices and lower petrochemical products prices are likely to have a negative impact on the Group’s business, operating results and financial condition.
| (2) | The Group may be exposed to risks associated with the procurement of imported crude oil and may not be able to pass on all increased costs due to rising crude oil price |
At present, the Group consumes a significant amount of crude oil for the production of petrochemical products. More than 95% of the crude oil consumption is imported. In recent years, crude oil prices have been subject to significant fluctuations due to a variety of factors, and the Group cannot rule out the possibility of any major unexpected event which may cause a suspension in crude oil supply. The Group has attempted to mitigate the effects of increased costs from rising crude oil prices by passing them on to the customers, but the ability to do so is limited because of market conditions and government control over the pricing of refined oil products. Since there is a time-lag between increases in crude oil prices and increases in petrochemical product prices, higher costs cannot be totally offset by raising the selling prices. In addition, the Chinese Government also imposes control over the distribution of some petroleum products within China. For instance, some of the Group’s petroleum products are required to be sold to designated customers (such as subsidiaries of Sinopec Corp). Hence, when crude oil prices are high, the higher costs cannot be totally offset by raising the selling prices of the Group’s petroleum products.
67
Report of the Directors (continued)
| (3) | Modest capital expenditures and financing requirements are required for the Group’s development plans, presenting a number of risks and uncertainties |
The petrochemical industry is a capital-intensive industry. The Group’s ability to maintain and raise income, net income and cash flows is closely connected with ongoing capital expenditures. The Group’s capital expenditures are estimated to amount to approximately RMB3,500 million in 2022, which will be met by financing activities and by internal funding. The Group’s effective capital expenditures may vary significantly due to the Group’s ability to generate sufficient cash flows from operations, investments and other factors that are beyond control. Furthermore, there is no assurance as to the completion, cost or outcome of the Group’s fund-raising projects.
The Group’s ability to secure external financing in the future is subject to a number of uncertainties which include the Company’s operating results, financial conditions and cash flow in the future; China’s economic conditions and the market conditions for the Group’s products; financing costs and conditions of the financial market, and issuance of government approval documents, as well as other risks associated with the development of infrastructure projects in China and so forth. The Group’s failure to secure sufficient financing required for its operations or development plans may have a negative impact on the Group’s business, operating results and financial condition.
| (4) | The Group’s business operations may be affected by existing or future environmental protection regulations |
The Group is subject to a number of environmental protection laws and regulations in China. Waste products (waste water, waste gas and waste residue) are generated during the Group’s production operations. Currently, the Group’s operations fully comply with all applicable Chinese environmental protection laws and regulations. However, the Chinese government may further enforce stricter environmental standards, and the Group cannot assure that the central or local governments will not issue more regulations or enforce stricter regulations which may cause the Group to incur additional expenses on environmental protection measures.
68
Report of the Directors (continued)
| (5) | Changes in the monetary policy and fluctuations in the value of Renminbi may have an adverse impact on the Group’s business and operating results |
The exchange rate of the Renminbi against the US Dollar and other foreign currencies may fluctuate and is subject to alterations due to changes on the Chinese political and economic situations. In July 2005, the PRC government overhauled its policy of pegging the value of the Renminbi to the US dollar by permitting the Renminbi to fluctuate within a certain band against a basket of foreign currencies. Since the adoption of this new policy, the value of the Renminbi against the US dollar fluctuates daily. In addition, the PRC government has been under international pressure to further ease its exchange rate policy, and may as a result further change its currency policy. A small portion of our cash and cash equivalents are denominated in foreign currencies, including the US dollar. Any increase in the value of Renminbi against foreign currencies, including the US dollar, may decrease the Renminbi value of our cash and cash equivalents that are denominated in foreign currencies. Most of our revenue is denominated in Renminbi, but a major part of our procurement of crude oil, certain equipment and certain debt repayments are denominated in foreign currencies. Any devaluation of Renminbi in the future will increase our costs and jeopardize profitability. Any devaluation of Renminbi may also have an adverse impact on the value of dividends payable in foreign currencies by the Group for H shares and American Depository Securities.
| (6) | Connected transactions may have an adverse impact on the Group’s business and economic efficiency |
The Group will, from time to time, continue to conduct transactions with the Group’s controlling shareholder Sinopec Corp. and Sinopec Corp.’s controlling shareholder Sinopec Group as well as their connected parties (subsidiaries or associates). These connected transactions include the provision of the following services by such connected parties to the Group: raw materials purchases, agency sale of petrochemical products, construction, installation and engineering design services, petrochemicals industry insurance services and financial services, and the sale of petroleum and petrochemical products by the Group to Sinopec Corp. and its connected parties. These connected transactions and services conducted by the Group are carried out under normal commercial terms and in accordance with the relevant agreements. However, if Sinopec Corp. and Sinopec Group refuse to conduct such transactions or revise the agreements between the Group and itself in a manner unfavorable to the Group, the Group’s business affairs and business efficiency will be adversely impacted. Furthermore, Sinopec Corp. has an interest in certain sectors that are directly or indirectly competing with or which may compete with the Group’s business. Since Sinopec Corp. is the controlling shareholder of the Group and its own interests may conflict with those of the Group, it may act for its own benefit regardless of the Group’s interests.
69
Report of the Directors (continued)
| (7) | Risks associated with control by the majority shareholder |
Sinopec Corp., the controlling shareholder of the Company, owns 5,460,000,000 shares of the Company, which represents 50.44% of the total number of shares of the Company and gives it an absolute controlling position. Sinopec Corp. may, by using its controlling position, exercise influence over the Group’s production operations, fund allocations, appointment or removal of senior staff and so forth, thereby adversely affecting the Group’s production operations as well as minority shareholders’ interests.
Section III Analysis of Operating Information in Chemical Industry
| (I) | Basic information of the industry |
| 1. | Industry policy and changes |
Since the strategic objectives of China’s carbon peaking and carbon neutralization were put forward, the central authorities have successively issued special policy documents for the “double carbon” goal and the “double control” goal of energy in 2021 to accelerate the definition of carbon peaking goals in all regions and industries, formulate carbon peaking action plans and promote the green transformation of the industry.
“Double carbon” goal. In March 2021, carbon peak and carbon neutralization were written into the government work report of the State Council for the first time. On 15 March 2021, the ninth meeting of the central financial and Economic Commission clearly pointed out in the deployment of key work in the future energy field that it is necessary to control the total amount of fossil energy and build a new power system with new energy as the main body. In October 2021, the State Council successively issued the opinions of the CPC Central Committee and the State Council on fully and accurately implementing the new development concept and doing a good job in carbon peak and carbon neutralization, and the action plan for carbon peak by 2030, which proposed the target of the proportion of non fossil energy consumption, the target of reducing energy consumption per unit of GDP and the target of carbon dioxide emission per unit of GDP by 2025 and 2030, so as to successfully achieve the target of carbon peak by 2030.
70
Report of the Directors (continued)
Restrict the development of “two high” projects. On 31 May 2021, the Ministry of ecology and environment issued the guidance on strengthening the prevention and control of the source of ecological environment of high energy consumption and high emission construction projects, strictly approving the environmental impact assessment of “two high” projects such as petrochemical and modern coal chemical industry, and resolutely curbing the blind development of “two high” projects. On 11 September 2021, the national development and Reform Commission issued the notice on improving the dual control scheme of energy consumption intensity and total amount, which further clarified the setting and decomposition implementation mechanism of “dual control” indicators of energy consumption. On 15 November 2021, five departments including the national development and Reform Commission jointly issued the benchmark level and benchmark level of energy efficiency in key areas of high energy consuming industries (2021 version), which aims to guide all localities to scientifically and orderly carry out the technological transformation of energy conservation and carbon reduction in high energy consuming industries and effectively curb the blind development of “two high” projects. The 2021 edition clearly stipulates the benchmark level and benchmark level of energy efficiency in 14 key areas of chemical industry, such as oil refining, coal to coke, coal to methanol, coal to olefin (ethylene and propylene), coal to ethylene glycol, ethylene (naphtha hydrocarbon) and p-xylene, which will be implemented from 1 January 2022. From 8 to 10 December 2021, the central economic work conference pointed out that achieving carbon peak and carbon neutralization is the internal requirement of promoting high-quality development, which should be unswervingly promoted, but it is impossible to accomplish its work in one battle, and made it clear that the new renewable energy and raw material energy consumption will not be included in the total energy consumption control.
Carbon emission reduction and circular economy. On 1 January 2021, the most stringent “plastic restriction order” in China’s history officially took effect across the country. Plastic restriction orders in key cities across the country have been fully implemented, and plastic restriction policies such as disposable non degradable plastic straws have entered the implementation stage. On 7 July 2021, the national development and Reform Commission issued the 14th five year plan for the development of circular economy, which requires that by 2025, the recycling capacity of renewable resources will be further improved and the substitution ratio of renewable resources to primary resources will be further increased. In the future, in the plastic packaging industry, the application proportion of environmentally friendly and green degradable plastics will continue to increase. On 30 July 2021, the meeting of the Political Bureau of the CPC Central Committee corrected the campaign carbon reduction of “breaking before legislation, following the trend, putting the market first and distorting action”, and proposed to adhere to the national game of chess and break after legislation. On 3 December 2021, the Ministry of industry and information technology issued the “14th five year plan” for industrial green development, which put forward the planning objectives of carbon emission intensity, pollutant emission intensity, energy consumption of added value of industrial units above Designated Size and recycling of main renewable resources by 2025.
71
Report of the Directors (continued)
Carbon asset management. On 14 July 2021, the EU launched the carbon border regulation mechanism (CBAM), which will drive China’s carbon emission reduction policy and carbon emission trading price to benchmark with Europe. On 16 July 2021, China’s national carbon market officially opened, and the first batch of power enterprises were brought into the market for performance. In November 2021, the people’s Bank of China launched two new structural monetary policy tools, one of which is the carbon emission reduction support tool.
Safety and environmental protection policies. On 1 February 2021, the regulations on the administration of occupational health in the workplace issued by the National Health Commission came into force, which adjusted and improved the management regulations, the detection frequency of occupational hazard factors, the main body and responsibilities of supervision and management. On 1 March 2021, the regulations on the administration of pollutant discharge permits issued and entered into force by the State Council made clear requirements on the main responsibility of pollutant discharge units and strictly stipulated the legal responsibility for illegal pollutant discharge. On 25 March 2021, Shanghai Municipal Bureau of ecological environment issued and implemented the Shanghai 2021 work plan on atmospheric environment and climate change response, which proposed that Shanghai PM2.5. The average annual concentration has reached the national secondary standard stably, and strive to further reduce the target, and the key and routine work have been deployed respectively. On 10 June 2021, the Standing Committee of the National People’s Congress issued the new production safety law of the people’s Republic of China, which came into force on September 1. This revision further improves the principles and requirements of work safety, strengthens and implements the main responsibilities of production and business units, defines the responsibilities of local governments and relevant departments for work safety supervision and management, and increases the punishment of production and business units and their principals for illegal acts of work safety. On 2 November 2021, the State Council issued the “opinions on deepening the battle of pollution prevention and control”, pointing out that by 2025, the ecological environment will continue to improve, the total emission of major pollutants will continue to decline, the carbon dioxide emission per unit of GDP will decrease by 18% compared with that in 2020, and the PM2 of cities at and above the prefecture level will increase 5. The concentration decreased by 10%, and the number of days with excellent air quality reached 87.5%. On December 1, the national development and Reform Commission and other departments jointly issued the national cleaner production implementation plan for the 14th five year plan to strengthen the cleaner production evaluation of high energy consumption and high emission projects during the 14th Five Year Plan period.
72
Report of the Directors (continued)
In the context of the “double carbon” goal, the green transformation of economic development requires the petrochemical industry to get rid of the dependence on high consumption, high emission and environmental damage. Realizing carbon peak and carbon neutralization is the internal requirement to promote the high-quality development of the petrochemical industry. Peak carbon neutralization is the grasp, measure and thrust of green transformation, which provides technical options and Implementation Paths for peak carbon neutralization in the petrochemical industry.
| 2. | Basic situation of major segments and the Company’s industry status |
In 2021, the global economy recovered strongly, which led to the general strong recovery of petrochemical enterprises. The economic performance of China’s petrochemical industry exceeded expectations, and the whole industry achieved an operating revenue of RMB14.45 trillion, a year-on-year increase of 30%; The total profit was RMB1.16 trillion, a year-on-year increase of 126.8%; The total import and export volume was USD860.08 billion. The annual production and operation of the subdivided industries are summarized as follows:
First, crude oil production increased and imports decreased. The annual output of crude oil increased by 99.42 billion tons or 2.4% year-on-year, which was the third consecutive year of growth; The import of crude oil was 513 million tons, a year-on-year decrease of 5.3%, which was the first decline in the case of an increase for 20 consecutive years. The external dependence on crude oil also decreased from 73.6% in the previous year to 72%. Benefiting from the increase in price and volume, the profit of the crude oil industry chain is generally thickened.
Second, the output and consumption of major petrochemical products increased. The crude oil processing volume exceeded 700 million tons, with a year-on-year increase of 4.3%, the output of refined oil increased by 7.9% (including gasoline increased by 17.3%, diesel increased by 2.7%), and the apparent consumption increased by 10.3% (including gasoline increased by 20.8%, diesel increased by 4.6%); The output of fuel oil increased by 22.1%, and the consumption increased by 16.6%; LPG imports increased by 24.6% and consumption increased by 11.7%; Ethylene production increased by 18.3%, imports increased by 4.5%, and consumption increased by 16.9%; The import of pure benzene increased by 41.1% and the consumption increased by 12.3%; The import of coatings increased by 19.5% and the consumption increased by 19.7%
Third, the output of main synthetic materials increased and the import volume decreased. According to statistics, the output of polyethylene increased by 9.7%, and the import decreased by 21.3%; The output of polypropylene increased by 10.5%, and the import decreased by 29.4%; The output of PVC increased by 2.1%, and the import decreased by 52.7%; The output of synthetic rubber increased by 2.6%, and the import decreased by 16.8%. Synthetic resin products have declined with the continuous increase of imports for many years, especially polyethylene, which has exceeded 10 million tons every year since the 13th five year plan, with a significant increase year after year, and the import in 2020 is as high as 18.534 million tons. The import of synthetic fiber monomer decreased by 25%, of which the import of ethylene glycol decreased by 20.1% and the import of acrylonitrile decreased by 33.5%.
73
Report of the Directors (continued)
In terms of price, the prices of bulk raw materials and major petrochemical products generally rose. The high point of international crude oil price is a seven-year high, which runs at a high level throughout the year. The annual average price of Brent oil price increased by 69.98% year-on-year. The price of domestic refined oil rose to a new high in the past five years. Among the 87 key monitored organic chemicals, 80 increased year-on-year, accounting for 92%. The performance of chemical products that meet the target demand of “double carbon” or that are not involved in large-scale refining and chemical planning is particularly bright. For example, driven by the development of photovoltaic industry, EVA and vinyl acetate continue to be in short supply, and the average annual price increase ranks 8th and 10th in the list of jinlianchuang chemical products respectively; The average annual price increase of BDO in the degradable plastics industry chain was 15913 yuan/ton, ranking second in the increase list. The average annual increase of triphenyl is close to or more than 50%, of which the average annual price of pure benzene is up to 80%. The increase of butadiene also led to a significant rise in the prices of downstream styrene butadiene and cis-1,4-polybutadiene rubber. Methanol and urea also rose by more than 40% due to factors such as coal prices and dual control policies. Propylene, polyethylene and polypropylene chains were relatively low-key due to the rapid expansion of domestic production capacity, with a general increase of less than 20%.
Although the total profit and profit margin of the chemical sector have reached a record high, there are great differences in the subdivided fields. Traditional bulk commodities, such as styrene, PX, methanol and PTA, have relatively sufficient supply due to large new production capacity. Although the annual price rises, they are still in a loss situation. Propylene, polyethylene and polypropylene also showed weakness. High oil prices and coal prices formed continuous cost pressure on the industry, resulting in rising product market prices but shrinking profits.
The Group is one of the major large-scale refining and chemical integration enterprises in China. As the production capacity of the group’s main products has not increased in recent years, while other domestic enterprises are expanding their capacity, the output of ethylene, p-xylene, ethylene glycol and other products produced by the Group continues to decline in the market share of similar products in China in 2021. In 2021, the output of the Group’s main products accounted for 1.5% – 2.5% of the national output of corresponding products.
74
Report of the Directors (continued)
| (II) | Products and production |
| 1. | Main operating model |
The Company’s main operating models are: crude oil procurement; processing and production of synthetic fibre, resin, plastic, intermediate petrochemical products and petroleum products; realizing profit through product sales.
| 2. | Main products |
| Product |
Industry segment |
Primary upstream |
Transport/storage |
Primary downstream |
Key price-influencing factors | |||||
| Diesel | Petroleum products | Petroleum | Pipeline transportation and shipping/storage tank | Transportation fuel, agricultural machinery fuel | International crude oil price, government control | |||||
| Gasoline | Petroleum products | Petroleum | Pipeline transportation and shipping/storage tank | Transportation fuel | International crude oil price, government control | |||||
| Jet Fuel | Petroleum products | Petroleum | Pipeline transportation and shipping/storage tank | Transportation fuel | International crude oil price, supply-demand balance | |||||
| PX | Intermediate petrochemicals | Naphtha | Road transportation/ storage tank | Intermediate petrochemical products and polyester | Raw material price, supply-demand balance | |||||
| Benzene | Intermediate petrochemicals | Naphtha | Road transportation, shipping, rail transportation/storage tank | Intermediate petrochemical products, styrene, plastic, explosive, dye, detergent, epoxy resin, chinlon | International crude oil price, market supply- demand condition | |||||
| Ethylene Glycol | Intermediate petrochemicals | Naphtha | Road transportation/ storage tank | Fine Chemicals engineering | International crude oil price, market supply- demand condition | |||||
| Ethylene Oxide | Intermediate petrochemicals | Naphtha | Road transportation, pipeline transportation/ storage tank | Chemical and medical industry intermediate products, including dyes, detergents and auxiliary | International crude oil price, market supply- demand condition | |||||
75
Report of the Directors (continued)
| Product |
Industry segment |
Primary upstream |
Transport/storage |
Primary downstream |
Key price-influencing factors | |||||
| Ethylene | Intermediate petrochemicals | Naphtha | Road transportation, pipeline transportation, shipping/storage tank | PE, EG, PVC and other raw material for further processing of intermediate petrochemical products such as resins, plastics and synthetic fibres | International crude oil price, supply-demand balance | |||||
| PE | Resins and plastics | Ethylene | Road transportation, shipping and rail transportation/ warehousing | Film, mulching film, cable insulation material and housewares, toys injection moulding products | Raw material price and market supply-demand condition | |||||
| PP | Resins and plastics | Propylene | Road transportation, shipping and rail transportation/ warehousing | Film, mulching film, housewares, toys, household appliances and auto parts injection moulding products | Raw material price and market supply-demand condition | |||||
| Polyester chips | Resins and plastics | PTA, EG | Road transportation, shipping and rail transportation/ warehousing | Polyester fibre or film, container | Raw material price and market supply-demand condition | |||||
| Acrylics | Synthetic fibres | Acrylonitrile | Road transportation, shipping and rail transportation/ warehousing | Simple spinning or blend with other material for texture or acrylic top | Raw material price and market supply-demand condition | |||||
| Polyester | Synthetic fibres | Polyester | Road transportation, shipping and rail transportation/ warehousing | Texture, apparel | Raw material price and market supply-demand condition | |||||
76
Report of the Directors (continued)
| Production | Sales | |||||||||||||||||||||||
| 2021 | 2020 | Year-on-year | 2021 | 2020 | Year-on-year | |||||||||||||||||||
| Products |
(10,000 tons) | (10,000 tons) | change | (10,000 tons) | (10,000 tons) | change | ||||||||||||||||||
| Diesel Note1 |
338.80 | 398.21 | -14.92 | % | 338.10 | 398.61 | -15.18 | % | ||||||||||||||||
| Gasoline |
339.64 | 327.30 | 3.77 | % | 340.23 | 328.18 | 3.67 | % | ||||||||||||||||
| Jet Fuel Note1 |
118.45 | 112.45 | 5.34 | % | 99.57 | 99.43 | 0.14 | % | ||||||||||||||||
| Paraxylene |
49.63 | 66.24 | -25.08 | % | 46.53 | 45.64 | 1.95 | % | ||||||||||||||||
| Benzene Note2 |
30.67 | 37.21 | -17.58 | % | 29.99 | 33.14 | -9.51 | % | ||||||||||||||||
| Ethylene Glycol |
15.07 | 23.67 | -36.33 | % | 4.14 | 12.73 | -67.48 | % | ||||||||||||||||
| Ethylene Oxide |
33.56 | 31.30 | 7.22 | % | 32.78 | 30.53 | 7.37 | % | ||||||||||||||||
| Ethylene Note2 |
71.28 | 82.52 | -13.62 | % | — | — | — | |||||||||||||||||
| Polyethylene |
49.62 | 58.12 | -14.62 | % | 49.63 | 57.85 | -14.21 | % | ||||||||||||||||
| Polypropylene |
45.59 | 49.29 | -7.51 | % | 42.26 | 45.16 | -6.42 | % | ||||||||||||||||
| Polyester Pellet Note2 |
34.34 | 33.99 | 1.03 | % | 30.24 | 29.33 | 3.10 | % | ||||||||||||||||
| Acrylic |
7.10 | 11.55 | -38.53 | % | 7.32 | 11.69 | -37.38 | % | ||||||||||||||||
| Polyester Staple |
2.62 | 3.37 | -22.26 | % | 2.73 | 3.40 | -19.71 | % | ||||||||||||||||
Note 1: Excludes sales volume on a sub-contract basis.
Note 2: The difference between production and sales are internal sales.
The above-mentioned sales volume and sales revenue do not include the trading of petrochemical products of the Group.
| 3. | R&D and Innovation |
Please refer to 3.2.C of the section Management Discussion and Analysis in this chapter for details of the R&D and innovation of the Group.
77
Report of the Directors (continued)
| 4. | Production techniques and processes |
The key component of the vertically integrated production facility of the Company is the ethylene facility producing ethylene and propylene and aromatics facility mainly producing paraxylene and benzene. Ethylene is the main raw material for the production of polyethylene and ethylene glycol, while ethylene glycol and PTA polymerization produces polyester. Propylene is the main raw material for the production of acrylics and polypropylene. The above-mentioned products all use crude oil as raw material and are processed through a series of petrochemical facilities. The chart below illustrates in brief the production processes of the Company.
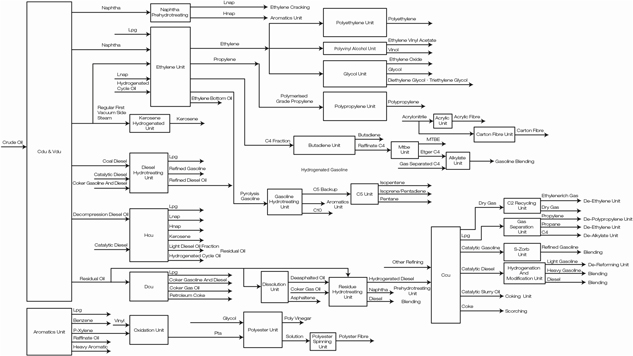
78
Report of the Directors (continued)
| 5. | Capacity and operation status |
| Key production facilities (number of sets) |
Designed capacity (tons) |
Capacity Utilization (%) |
||||||
| Crude oil distillation facility (2) |
14,000,000 | 95.32 | ||||||
| Hydrocracking facility (2) |
3,000,000 | 89.14 | ||||||
| Ethylene facility |
700,000 | 105.97 | ||||||
| * Aromatics facility (2) |
835,000 | 100.15 | ||||||
| PTA facility |
400,000 | 80.32 | ||||||
| Ethylene oxide/Ethylene glycol facility (2) |
525,000 | 86.26 | ||||||
| Catalytic cracking |
3,500,000 | 104.87 | ||||||
| Delayed coking (2) |
2,200,000 | 88.90 | ||||||
| ** Diesel hydrogenation (2) |
3,850,000 | 90.87 | ||||||
| ** Acrylonitrile facility |
650,000 | 93.23 | ||||||
| C-5 Separation (2) |
205,000 | 139.51 | ||||||
| *** Polyester facility (3) |
550,000 | 88.53 | ||||||
| **** Polyester staple fibre facility (2) |
158,000 | 88.27 | ||||||
| Polyester filament facility |
21,000 | — | ||||||
| Acrylics staple fibre facility (3) |
140,800 | 107.19 | ||||||
| Polyethylene facility (3) |
408,000 | 88.56 | ||||||
| Polypropylene facility (3) |
400,000 | 96.41 | ||||||
| Vinyl acetate facility |
86,000 | 105.22 | ||||||
| * | No.1 PX facility (235,000 tons/year) was suspended for the whole year. |
| ** | No.2 Diesel hydrogenation facility (1,200,000 tons/year) was revamped into acrylonitrile facility by the end of 2016. Annual production is 650,000 tons/year. |
| *** | No.3 polyester fibre facility (100,000 tons/year) was discontinued on 1 September 2013. |
| **** | No.1 Polyester staple fibre facility (4,000 tons/year) was suspended for the whole year. |
For capital expenditure items, please refer to “Non-fundraising projects” in the section headed “Discussion and analysis of the Company’s operations” in Section II Management Discussion and Analysis of this chapter.
79
Report of the Directors (continued)
| (III) | Raw material procurement |
| 1. | Basic information of major raw materials |
| Major raw materials |
Procurement mode | Settlement method | Year on year change rate of price (%) |
Purchase quantity |
Consumption | |||||||||||
| Crude Oil |
Agency procurement | Agreement settlement | 52.26 | % | |
13,486.9 thousand ton |
|
|
13,359.7 thousand tons |
| ||||||
Impact of price changes of major raw materials on the Company’s operating costs
The rise in the market price of crude oil led to a year-on-year increase in the unit price of the company’s crude oil procurement by 52.26% and an increase in the company’s operating cost by 15.89%.
| 2. | Basic information of major energy sources |
| Major energy |
Procurement |
Settlement method |
Year on year |
Purchase |
Consumption | |||||
| Coal |
Entrusted procurement | Conduct monthly assessment and settlement according to the benchmark price | 81.10% | 1747.9 thousand ton | 1752.1 thousand ton |
80
Report of the Directors (continued)
Impact of major energy sources price changes on the Company’s operating costs
The rise of coal market price led to a year-on-year increase of 81.10% in the unit cost of coal and an increase of 0.99% in the operating cost of the company.
| 3. | Measures to deal with the risk of raw material price fluctuation. |
A Brief account of holding derivatives and other financial products.
In 2021, the price of international crude oil market fluctuated and rose. The Company carried out oil lending and return hedging business in April and November respectively, and bought 3.15 million barrels of Dubai swap; Launched fuel oil hedging business in September, October and November, and sold 25000 tons of LSFO swap. The commodity derivatives business carried out mainly belongs to hedging business. The implementation of the above businesses has no risk exposure, the maximum amount of possible loss is RMB50,000 thousand, and the comprehensive income was RMB166 million. At the same time, for the purpose of stabilizing production and operation, the Company locked in the processing profit of high sulfur crude oil, bought 2.7 million barrels of Dubai swap and sold 2.7 million barrels of dated Brent swap in June, July, September and November; The implementation of the above businesses generated investment income of RMB10.01 million and income from changes in fair value of RMB8.99 million.
For accounting policies related to the hedge accounting of the Company, please refer to Note 3(9) to the financial statements prepared in this annual report in accordance with CAS.
| (IV) | Sales of products |
| 1. | Sales model |
The Company’s sales models are mainly direct sales and agency sales. The products are mostly sold to large trading companies and industrial users, including Sinopec Group and its designated clients. The Company has established long-term relationships with these clients.
81
Report of the Directors (continued)
| 2. | Pricing strategy and change in prices of major products |
Most of the products of the Company are sold at market price. However, sales of the Company’s major petroleum products (gasoline, diesel and jet fuel) are also subject to different extent of government pricing (guided-price).
The prices of products of the Company that are not subject to price control are fixed with reference to the market price in the main chemical products market of Shanghai and other places in China. The Company keeps monitoring major international commodity markets, especially the price trend in Southeast Asian markets. In most cases, the Company revises product prices monthly while more frequent price revisions will be made during periods of intense price fluctuations.
| 3. | Basic information of main businesses of the Company by industry segment |
Please refer to “Comparison and analysis of results of the Company’s operations” in Section II Management Discussion and Analysis of this chapter for basic information of main business of the Group by industry segment.
| 4. | Basic information of main businesses of the Company by sales channel |
| Unit: RMB’000 | ||||||||
| Sales Channel |
Revenue | Year-on-year increase/ decrease in revenue (%) |
||||||
| Direct sales |
54,448,577 | 27.57 | % | |||||
| Agency sales |
23,689,782 | 18.27 | % | |||||
| Trade |
11,060,133 | -4.53 | % | |||||
| 5. | Basic information of joint products, side products, semi-finished products, waste, residual heat utilization products during the production process of the Company |
The Company owns a power plant which provides power and steam resources mainly to the Company while the surplus is sold to external parties. In 2021, the Company sold 770 million kilowatt-hour of power, generating revenue of RMB397 million, and sold 302 thousand giga joules of steam, generating revenue of RMB27.22 million.
82
Report of the Directors (continued)
| (V) | Environmental protection and safety |
| 1. | Major safety production accident of the Company during the Reporting Period |
Nil.
| 2. | Environmental protection investment of the Company during the Reporting Period |
| Unit: RMB100 million | ||||
| Environmental protection investment |
Percentage of invested capital in operating revenue (%) |
|||
| 3.93 |
0.50 | % | ||
Section IV Major Events
| (I) | Plan for profit distribution of ordinary shares or capital reserve capitalization |
| 1. | Cash Dividend Policy and its formulation, implementation or adjustment |
In 2016, the Company made amendments to its cash dividend policy in the Articles of Association of Sinopec Shanghai Petrochemical Company Limited (the “Articles of Association”) and its appendices. The proposed amendments to the Articles of Association were considered and approved at the annual general meeting of 2015 held on 15 June 2016. According to Article 206 of the Articles of Association:
| 1. | The Company should place emphasis on delivering reasonable return on investments to the investors. The Company shall pay due attention to the opinions of minority shareholders through various channels when allocating its profits. The profits distribution policy of the Company shall be consistent and stable, taking into account the long-term interests of the Company, the overall interests of all shareholders and the Company’s sustainable development. |
83
Report of the Directors (continued)
| 2. | The Company may distribute dividends in the following forms: cash, shares or other forms permitted by laws, administrative rules, regulations of competent authorities and regulatory provisions in the place where the Company’s shares are listed. The Company shall give priority to the distribution of dividends in cash. The Company may make interim dividends distribution. |
| 3. | The Company shall distribute cash dividends when the Company’s net profit and retained earnings, are positive and the Company has adequate cash inflows over the requirements of cash flows for its operation and sustainable development. The cash dividends per annum should not be less than thirty (30) percent of the net profit of the Company in the current year. |
| 4. | The Company may adjust its profits distribution policy referred to in sub-paragraphs (2) and (3) of this Article in case of war, natural disasters or other force majeure, or where changes to the external environment of the Company result in material impact on the production and operation of the Company, or where there are significant changes in the Company’s own operations or financial conditions, or where the Company’s board of directors considers it necessary. Independent directors shall issue independent opinions on the adjustment of the profits distribution policy whilst the board of directors shall discuss the rationality of such adjustment in detail and form a resolution which shall be submitted to shareholders’ meeting for approval by way of special resolution. The convening of the shareholders’ meeting shall comply with regulatory provisions in the place where the Company’s shares are listed. |
| 5. | The management of the Company shall formulate the annual profits distribution plan and submit such plan to the board of directors for consideration. Independent directors shall issue independent opinions on such plan and the board of directors shall form a resolution which shall be submitted for approval by shareholders’ meeting. If the conditions for the distribution of cash dividends have been satisfied and the Company does not propose a cash dividends distribution plan or does not propose such plan in compliance with the sub-paragraph (3) of this Article, independent directors shall issue independent opinions whilst the board of directors shall give specific explanation regarding such arrangement and form a resolution which shall be submitted to shareholders’ meeting for approval and make relevant disclosures. The plan for half-yearly dividends distribution of the Company shall comply with Article 214 of the Articles of Association. |
84
Report of the Directors (continued)
| 2. | Plan for profit distribution or capitalisation of capital reserves for the Reporting Period |
In 2021, the net profit attributable to equity shareholders of the Company amounted to RMB2,000,506 thousand under CAS (net profit of RMB2,073,431 thousand under IFRS). In accordance with the 2021 Profit Distribution Plan approved by the Board on 23 March 2022, the Company proposed to distribute a Final Dividend of RMB0.1 per share (including tax) based on the total issued share as at dividend payout date. The 2021 Profit Distribution Plan will be implemented subject to approval at the AGM. The date and time of the AGM and the book closure arrangement will be announced later. The Notice of the AGM will be announced separately in accordance with the Articles of Association of the Company. The Notice of the AGM, the accompanying circular and proxy form will be dispatched to holders of H shares in accordance with the Hong Kong Listing Rules.
Subject to the passing of the resolution by the shareholders of the Company at the AGM, the Final Dividend is expected to be distributed on or around Thursday, 28 July 2022 to shareholders whose names appear on the register of members of the Company’s H shares at the close of business on Tuesday, 5 July 2022. The Final Dividend is denominated and declared in Renminbi. The Final Dividend payable to the holders of the Company’s A shares shall be paid in Renminbi while those payable to the holders of the Company’s H shares shall be paid in Hong Kong dollars. The amount of Hong Kong dollars payable shall be calculated on the basis of the average closing exchange rates for Hong Kong dollars as announced by the Foreign Exchange Trading Centre of the PRC one calendar week prior to the approval of the Final Dividend at the AGM.
The Company is expected to close the register of members of the Company’s H shares from Thursday, 30 June 2022 to Tuesday, 5 July 2022 (both days inclusive), during which period no transfer of H shares will be registered in order to confirm the shareholders’ entitlement to receive the Final Dividend. The holders of the Company’s H shares who wish to receive the Final Dividend should lodge the transfer documents and relevant share certificates with the Company’s H shares share registrar, Hong Kong Registrars Limited, at Shops 1712-1716, 17/F, Hopewell Centre, 183 Queen’s Road East, Wanchai, Hong Kong on or before 4:30 p.m. on Wednesday, 29 June 2022.
The record date for dividend distribution, distribution procedures and time for the distribution of dividends applicable to holders of the Company’s A shares will be announced separately.
85
Report of the Directors (continued)
| 3. | Plan or scheme of dividends distribution of ordinary shares, plan or scheme of capitalization of capital reserves of the Company in the past three years (including the Reporting Period) |
| Unit: ’000 | ||||||||||||||||||||||||
| Year of dividend payment |
Amount of bonus shares for every 10 shares (share) |
Amount of dividend for every 10 shares (RMB) (including tax) |
Amount of capitalization for every 10 shares (share) |
Amount of cash dividend (including tax) |
Net profit attributable to shareholders of ordinary shares of the listed company in the consolidated statement for the year |
Percentage of net profit attributable to shareholders of ordinary shares of the listed company in the consolidated statement (%) |
||||||||||||||||||
| 2021 |
0 | 1.0 | 0 | 1,082,381.35 | 2,000,506 | 54.11 | ||||||||||||||||||
| 2020 |
0 | 1.0 | 0 | 1,082,381.35 | 628,110 | 172.32 | ||||||||||||||||||
| 2019 |
0 | 1.2 | 0 | 1,298,857.62 | 2,213,716 | 58.67 | ||||||||||||||||||
86
Report of the Directors (continued)
| (II) | Fulfilment of undertakings |
| 1. | Undertakings made by the de facto controller, shareholders, connected parties and purchasers of the Company and the Company itself during the Reporting Period or continuing up to the Reporting Period |
Undertakings about share reform
The Company disclosed The Explanatory Memorandum for the Share Reform Scheme of the Company (the Revised Draft) on 20 June 2013, in which the Company’s controlling shareholder, Sinopec Corp., made the following major undertakings that continued up to the Reporting Period:
Sinopec Corp. shall continue to support the development of the Company upon the completion of the share reform scheme, and shall use the Company as a platform for the development of related businesses in the future.
For details, please refer to “The Explanatory Memorandum for the Share Reform Scheme of the Company” (the Revised Draft) (Full Version) published in Shanghai Securities News and China Securities Journal on 20 June 2013, as well as the relevant announcements uploaded to the websites of the Shanghai Stock Exchange, the Hong Kong Stock Exchange and the Company.
The share reform scheme was reviewed and approved at the A shares shareholders’ meeting held on 8 July 2013. After the implementation of the share reform scheme on 20 August 2013, the Company’s A shares resumed trading, and non-circulating shares previously held by non-circulating shares shareholders attained the right of circulation. For details of the implementation of the share reform scheme, please refer to the “Implementation Report of Sinopec Shanghai Petrochemical Company Limited Share Reform Scheme” published in China Securities Journal and Shanghai Securities News on 14 August 2013 and the relevant announcement uploaded to the websites of the Shanghai Stock Exchange and the Hong Kong Stock Exchange on 13 August 2013.
With regard to the aforementioned undertakings, the Company did not notice any violation in fulfilling the above undertakings by Sinopec Corp.
| (III) | Events regarding capital occupation and repay during the Reporting Period |
Nil.
87
Report of the Directors (continued)
| (IV) | Explanation on the reasons and impact for the Company’s changes in accounting policies, accounting estimates, or correction of previous significant accounting errors |
| 1. | New standards adopted by the Company and revision and explanation of the standards |
The Group has applied the following standards and amendments for the first time for their annual Reporting Period commencing 1 January 2021:
| • | CAS Bulletin No.14 (Caikuai [2021] No.1) |
| • | The Accounting Treatment of COVID-19-Related Rent Concessions (Caikuai [2021] No.9) |
| • | Interest rate benchmark reform – Phase 2 – Amendments to IFRS 9, IAS 39, IFRS 7, IFRS 4 and IFRS 16 |
| • | Amendments to IFRS 16, Covid-19-related rent concessions beyond 30 June 2021 |
No other standards or interpretation revisions with major impact on the Group’s combined financial statements was first effective for the financial year started on 1 January 2021.
| (V) | Appointment and dismissal of auditors |
During the Reporting Period, the original accounting firm of the company has served for the audit period. The Company held a general meeting of shareholders on June 16, 2021 and approved the appointment of KPMG Huazhen LLP as the domestic auditor of the Company in 2021 and KPMG as the overseas auditor of the Company in 2021.
88
Report of the Directors (continued)
Details of the auditors appointed by the Company during the Reporting Period and the appointment details are as below:
| Unit: RMB Yuan | ||||
| Current | ||||
| Name of the domestic auditors |
KPMG Huazhen LLP | |||
| Duration of audit of the domestic auditors |
1 Year | |||
| Name of the international auditors |
KPMG | |||
| |
Public Interest Entity Auditor registered in accordance with the Financial Reporting Council Ordinance |
| ||
| Duration of audit of the international auditors |
1 Year | |||
| Remuneration of the domestic and international auditors |
6,837,000 | |||
| (VI) | Material litigation or arbitration |
The Company was not involved in any material litigation or arbitration during the year.
| (VII) | Punishment and reprimand of the listed company and its Directors, Supervisors, senior management, controlling shareholder, de facto controller and purchasers |
During the Reporting Period, the Company and its Directors, Supervisors, senior management, controlling shareholder, de facto controller and purchasers had not been investigated or taken administrative regulatory measures by the CSRC, nor have been subject to any compulsory measures according to law, criminal liability, administrative penalties or disciplinary sanctions by the stock exchange due to reasons attributable to the Company.
89
Report of the Directors (continued)
| (VIII) | Credit status of the Company and its controlling shareholder and de facto controller during the Reporting Period |
During the Reporting Period, the Company and its controlling shareholder and de facto controller of the Company were not involved in any events regarding failure to perform obligations under a judgement of courts, nor have they had any relatively large amount of debts which have become due and outstanding.
| (IX) | The Share Option Incentive Scheme of the Company |
The Share Option Incentive Scheme of the Company took effect from 23 December 2014, with a validity period of 10 years until 22 December 2024. The first grant of A-share share options under the Share Option Incentive Scheme was on 6 January 2015. For details, please refer to the relevant announcements uploaded on the websites of Shanghai Stock Exchange, Hong Kong Stock Exchange and the Company on 6 January 2015. All the exercise periods of the first grant have ended on 28 December 2018. For details, please refer to the relevant announcements uploaded on the websites of Shanghai Stock Exchange, Hong Kong Stock Exchange and the Company on 28 December 2018. At present, the Company has no other granting scheme.
During the Reporting Period, the Company did not grant A-share share options under the Share Option Incentive Scheme, nor did the grantees exercise any A-share share options, and no A-share share options were cancelled or lapsed.
| (X) | Major connected transactions |
| 1. | Connected transactions in relation to daily operations |
Continuing connected transactions under chapter 14A of the Hong Kong Listing Rules
The Company entered into the Mutual Product Supply and Sales Services Framework Agreement and Comprehensive Services Framework Agreement (the “Framework Agreement”) with Sinopec Corp., the controlling shareholder of the Company, and Sinopec Group, the actual controller of the Company on 23 October 2019. Pursuant to the Framework Agreement, the Company conducted a series of continuing connected transactions related to daily operation with Sinopec Group, Sinopec Corp. and their associates. The Framework Agreement is valid for three years and expires on 31 December 2022. The Framework Agreement and the transaction ceiling for 2020-2022 have been deliberated and approved at the first extraordinary general meeting of the Company in 2019. For details, please refer to the announcements of the Company on the websites of the Shanghai Stock Exchange and the Hong Kong Stock Exchange dated 23 October 2019.
90
Report of the Directors (continued)
The Company entered into a storage service agreement with Sinopec Commercial Reserve Co., Ltd., a wholly-owned subsidiary of Sinopec Group, the actual controller of the Company, and its subsidiary Baishawan branch (“Baishawan branch”) on 31 December 2020. Accordingly, Baishawan branch provides storage services to the Company, with the service period from 1 January 2021 to 31 December 2023, and the maximum annual storage service fee is RMB114 million (including value-added tax). For details, please refer to the announcements of the company on the websites of the Shanghai Stock Exchange and the Hong Kong Stock Exchange dated 8 December 2020.
The table below sets out the transaction amounts of the Company’s continuing connected transactions with Sinopec Corp. and Sinopec Group during the Reporting Period:
| Unit: RMB’000 | ||||||||
| Type of connected transaction |
Connected person |
Annual cap |
Transaction |
Percentage | ||||
| Mutual Product Supply and Sales Services Framework Agreement |
||||||||
| Purchases of raw materials |
Sinopec Group, Sinopec Corp. and their associates |
74,111,000 | 51,521,921 | 74.21% | ||||
| Sales of petroleum products and petrochemicals |
Sinopec Group, Sinopec Corp. and their associates |
66,021,000 | 60,926,642 | 68.30% | ||||
| Property leasing |
Sinopec Group, Sinopec Corp. and their associates |
37,000 | 35,403 | 43.21% | ||||
| Agency sales of petrochemical products |
Sinopec Corp. and its associates |
168,000 | 110,552 | 100.00% | ||||
| Comprehensive Services Framework Agreement |
||||||||
| Construction, installation and engineering design services |
Sinopec Group, Sinopec Corp. and their associates |
1,074,000 | 785,216 | 50.89% | ||||
| Petrochemical industry insurance services |
Sinopec Group and its associates |
130,000 | 108,850 | 100.00% | ||||
| Financial services |
Associate of Sinopec Group (Sinopec Finance) |
200,000 | 824 | 0.16% | ||||
| Storage services agreement |
||||||||
| Storage services |
Associate of Sinopec Group (Baishawan Branch) |
114,000 | 114,000 | 83.01% | ||||
91
Report of the Directors (continued)
The prices of continuing connected transactions between the Company and Sinopec Group, Sinopec Corp. and their associates are based on: 1) national pricing; or 2) national guidance price; or 3) the market price is determined by both parties through negotiation, and the conclusion of the related party transaction agreement is based on the needs of the Company’s production and operation. Therefore, the above continuing connected transactions do not have a significant impact on the independence of the Company.
The independent non-executive director of the Company has reviewed the continuing connected transactions of the Group and confirmed that: the above continuing connected transactions 1) are entered into in the daily business of the Company; 2) generally or better; 3) according to the agreement on the transaction, the terms are fair and reasonable and in line with the overall interests of the shareholders of the Company; and 4) the transaction amount in the Reporting Period was within the annual maximum limit.
KPMG, the Company’s overseas auditor, has carried out the test work on the continuous connected transactions of the company during the reporting period in accordance with the Hong Kong assurance business Standards No. 3000 “assurance business other than the audit or review of historical financial information” issued by the Hong Kong Institute of certified public accountants and with reference to the “auditor’s letter on continuous Connected Transactions described in the Hong Kong Listing Rules” No. 740 of the practice notes. The auditor has complied with rule 14A of the Hong Kong listing rules Article 56 and confirmed in a letter to the Board of Directors that, with respect to the aforesaid continuing connected transactions entered into in the year ended 31 December 2021:
| (a) | nothing has come to the auditor’s attention that causes the auditor to believe that the disclosed continuing connected transactions have not been approved by the Company’s board of directors. |
| (b) | for transactions involving the provision of goods or services by the Group, nothing has come to the auditor’s attention that causes the auditor to believe that the disclosed continuing connected transactions were not, in all material respects, in accordance with the pricing policies of the Group. |
| (c) | nothing has come to the auditor’s attention that causes the auditor to believe that the disclosed continuing connected transactions were not entered into, in all material respects, in accordance with the relevant agreements governing such transactions. |
| (d) | with respect to the aggregate amount of each of the continuing connected transactions set out in the attached list of continuing connected transactions, nothing has come to the auditor’s attention that causes the auditor to believe that the disclosed continuing connected transactions have exceeded the annual cap as set by the Company. |
92
Report of the Directors (continued)
Connected transactions under Chapter 14A of the Hong Kong Listing Rules
On 25 August 2021, the Company and Sinopec Baling Petrochemical Limited (“Baling Petrochemical”) was entered into a joint venture agreement to set up a joint venture company, Shanghai Jinshan Baling New Materials Co., Ltd.. The Company subscribed for and contributed RMB400 million of capital in cash, accounting for 50% of the total registered capital, and holds 50% of the equity of the joint venture company. Baling Petrochemical subscribed for and contributed RMB400 million of capital in cash, accounting for 50% of the total registered capital, and holds 50% of the equity of the joint venture company. Baling Petrochemical is a subsidiary of China Petroleum & Chemical Corporation, which is the controlling shareholder of the Company, and so that is a connected person of the Company. Related announcements were published on the official websites of the Shanghai Stock Exchange and Hong Kong Stock Exchange on 25 August 2021, as well as on “Shanghai Securities News” and “China Securities Journal” on 26 August 2021.
The transactions between the Company and Sinopec Group, Sinopec Corp. and their associates as disclosed in Note 28 to the financial statements prepared under IFRS in the 2021 annual report of the Company constituted continuing connected transactions under Chapter 14A of the Hong Kong Listing Rules. The above-mentioned continuing connected transactions have been disclosed in accordance with Chapter 14A of the Hong Kong Listing Rules.
| 2. | Connected parties’ liabilities |
| Unit: RMB’000 | ||||||||||||||||||||||||||
| Funds provided to | Funds provided by connected parties | |||||||||||||||||||||||||
| Connected party | Connected relationship | connected parties | to the listed company | |||||||||||||||||||||||
| Balance as at the beginning of the period |
Transaction amount |
Balance as at the end of the period |
Balance as at the beginning of the period |
Transaction amount |
Balance as at the end of the period |
|||||||||||||||||||||
| Sinopec Corp., its subsidiaries, joint ventures and associates & Sinopec Group and its subsidiaries |
Controlling shareholder, de facto controller and their related parties | 23,198 | 37,933 | 61,131 | 165,060 | 816,609 | 981,669 | |||||||||||||||||||
| Note 1: | The period-end balance of the funds provided by the Group to the connected parties was mainly unsettled receivables arising from the provision of services and pipeline leases to Sinopec Corp., its subsidiaries and associates; |
| Note 2: | The period-end balance of the funds provided by the connected parties to the Group was mainly unsettled payables arising from the provision of construction, installation and engineering design services by Sinopec Group and its subsidiaries as well as the long-term borrowings generated by the Group’s acceptance of loans from Sinopec Corp. and its subsidiaries. |
93
Report of the Directors (continued)
| (XI) | Material contracts and their performance |
| 1. | Entrustments, sub-contracts and lease arrangements |
During the Reporting Period, the Company had no entrustments, sub-contracts or lease arrangements that generated 10% or more (including 10%) of the gross profit of the Company for the period.
| 2. | Guarantees |
There were no guarantees provided by the Company during the Reporting Period.
| 3. | Entrusting others to conduct wealth management |
Please refer to “Investment of the Company” in the section headed “The Principal Operations of the Company during the Reporting Period” in Section II “Management Discussion and Analysis” of this chapter.
| 4. | Other major contracts |
There were no major contracts of the Company during the Reporting Period.
| (XII) | The Company’s disclosure on the fulfillment of its corporate social responsibility |
| 1. | Fulfillment of corporate social responsibility |
For the Company’s performance of corporate social responsibility in 2021 and the Company’s 2021 Environmental, Social and Governance Report, please refer to the “2021 Corporate Social Responsibility Report of Sinopec Shanghai Petrochemical Company Limited” published by the Company on the websites of the Shanghai Stock Exchange, the Hong Kong Stock Exchange and the Company.
| 2. | Environmental protection situation of pollutant-discharging companies and their key subsidiaries as announced by the Ministry of Environmental Protection |
The Company is one of the contaminating enterprises under intensive monitoring and control by the State proclaimed by the Ministry of Environmental Protection. According to Measures for Self-Monitoring and Information Disclosure by the Enterprises subject to Intensive Monitoring and Control of the State (Trial Implementation), the Company has disclosed to the public on the website of the Shanghai Environmental Protection Bureau the sites of the source of pollution, pollutant types and concentration of pollution which are subject to intensive monitoring and control of the State.
94
Report of the Directors (continued)
The Company, as a manufacturing enterprise in the petrochemical industry, consistently places environmental protection as its priority. It continues to receive ISO14001 Environmental Management System Certification. In January 2013, it received certifications from the Shanghai Audit Center of Quality including quality (GB/T19001: 2008), environment (GB/T24001: 2004) and occupational health and safety (GB/T28001: 2011). On 16 September 2019, the continued use of the title “All-China Environmentally Friendly Enterprise” was approved. In 2019, the Company was awarded the title “Sinopec Green Enterprise for 2019”. In 2020, the Company continued to maintain the title of “Green Enterprise”, and successfully completed 27 green base-level establishments. In 2021, the Company further consolidated the original green foundation, and expanded its establishment scale, with a total of 37 green foundations being built successfully.
In 2021, the Company actively put the concept of green development into practice, continued to strengthen pollution prevention and control, consolidated the establishment of green enterprise, continued to promote green base-level construction, and made satisfying efforts in the dual control of total pollutant emission reduction and concentration compliance, as well as environmental risk management and control. The Company also adhered to environmental protection with stricter national, industrial and local standards, increased emission reduction of waste gas and wastewater pollutants, made greater contributions to the improvement of regional ecological environment quality, and strove to create a “domestically-leading and world-class” refining and chemical company with good performance in HSE.
In 2021, the Company clarify assigned tasks, analyzed control indicators, and implemented detailed assessment rules to accelerate the key emission reduction projects, and to strengthen the stable and efficient operation of established environmental protection facilities. In 2021, the emission volume of COD, ammonia nitrogen, sulfur dioxide and nitrogen oxide decreased by 1.92%, 19.32%, 4.96% and 12.78%, respectively compared to the last year.
In 2021, the compliance rate on waste water was 99.95%, and the compliance rate on waste gas emission were 100%, and all hazardous wastes were disposed of properly with a rate of 100%.
The Company continuously implemented LDAR work. In 2021, the Company had inspected a total of 2,994,011 points/times for the sealing points in production equipment, and the number of leaking points detected was 9,561, of which 9,481 points were repaired, achieving a repair rate of 99.20%.
In 2021, the Company paid RMB11.4466 million of environmental tax to the Tax Bureau of Jinshan District.
95
Report of the Directors (continued)
| 3. | Administrative penalties for environmental problems during the reporting period |
In 2021, the Company received 2 administrative penalty decisions issued by the Shanghai Municipal Bureau of Ecology and Environment, involving a fine of RMB0.3798 million. The main reason for the penalty was that the inadequate operation and maintenance of environmental protection online facilities, and thus the COD of outlet water quality caused by the rainstorm the day before yesterday was not found and inspected in time.
| No. |
Event |
Rectification | ||
| 1 | The normal operation of the monitoring equipment is not guaranteed | (1) Strengthened the study of HJ353-2019 and HJ355-2019,carried out daily operation and maintenance according to the new specifications, compiled a complete set of operation and maintenance records and forms, and filled in carefully. | ||
| (2) Collected the sewage water quality online automatic monitoring equipment operation and maintenance personnel qualification and made public announcing. | ||||
| (3) In order to ensure the data accuracy and instrument reliability, a qualified third party was hired to help compare the data. | ||||
| 2 | 2# pump, total sewage outlet COD exceeds the standard | (1) Strictly implemented the “Shanghai Petrochemical Water Quality Management and Control Plan”, implemented the requirements in the plan for production sewage treatment management and control, sewage cleaning and diversion arrangements, rainwater discharge and Suitang River water body management and control, and ensured that the effluent of the sewage treatment plant and the drainage quality outside the Suitang River meet the standards control. | ||
| (2) Through the implementation of the “Shanghai Petrochemical Rainwater and Sewage System Rectification Plan”, the project was transformed and upgraded in terms of sewage removal and diversion, water risk prevention and control, and sewage upgrading so as to improve the discharge level of Shanghai Petrochemical’s rainwater and sewage system, and enhance the ability to prevent and control water risks. | ||||
96
Report of the Directors (continued)
| 4. | Construction and operation of pollution prevention facilities |
| Main pollution facilities |
Pollutant |
Emission limits |
Actual |
Reach (or | ||||
| Thermoelectric boiler |
SO2 | 35 | 6.58 | Reach | ||||
| NOX | 50 | 18 | Reach | |||||
| Particulate matter | 10 | 0.79 | Reach | |||||
| 2#sulfur |
SO2 | 100 | 19.59 | Reach | ||||
| 3#sulfur |
SO2 | 100 | 4.19 | Reach | ||||
| 4#sulfur |
SO2 | 100 | 20.82 | Reach | ||||
| Catalytic cracking |
SO2 | 50 | 7.13 | Reach | ||||
| NOX | 100 | 11.64 | Reach | |||||
| Particulate matter | 30 | 9.62 | Reach | |||||
| Process heating furnace |
SO2 | 50 | 1.52 | Reach | ||||
| NOX | 100 | 86.74 | Reach | |||||
| Particulate matter | 20 | 1.51 | Reach | |||||
| Sewage treatment plant |
COD mg/l | 60 | 33.8 | Reach | ||||
| Ammonia nitrogen mg/l | 8 | 2.12 | Reach |
| 5. | Environmental Impact Assessment and Other Environmental Protection Administrative Licensing of Construction Projects |
According to the requirements of laws and regulations such as the Environmental Impact Assessment Law, the Classified Management Directory of Environmental Impact Assessment of Construction Projects and the Implementation Specifications on Classified Management Directory of Environmental Impact Assessment of Construction Projects in Shanghai (2021), the Company implemented classification management in consideration of the impact of Company’s construction projects on the environment. The Company also strictly verified the implementation of environmental protection measures during different stages such as feasibility study, design, construction and confirmation of trial production conditions etc. In 2021, the Supporting 110KV Power Transformation and Distribution Station Project of the Large Tow Project, 100 level high-performance carbon fiber project, and the upgrading project of sewage biochemical treatment system, were approved by Ecology and Environmental Bureau. The two projects of the Crude Oil Blending and Optimization System Project of the Storage and Transportation Department and the Shanghai Petrochemical Oil Product Cleaning Project of Jinshan District Comprehensive Environmental Improvement have completed the acceptance and information announcement.
97
Report of the Directors (continued)
In June 2021, due to the start of 1,500 ton/year PAN based carbon fiber project (phase II), 3# refining and hydrotreating unit heater waste heat recovery system transformation and other reasons, the Company submitted an application for pollutant discharge permit amendment to Shanghai Municipal Bureau of Ecology and Environment, which has been approved by Municipal Bureau of Ecology and Environment. In November 2021, No. 4 pumping station (emergency discharge) was changed from online monitoring to setting the current signal of the external discharge lift pump, which was approved in December 2021.
| 6. | Emergency environmental incidents response project |
The Company continued to conduct major environmental risks assessments. In accordance with the requirements of “Notice on Printing and Distributing the Sinopec Environmental Risk Assessment Guide” ([2019]29) and key points of Environmental Risk Downgrading in the 2020 Green Enterprise Evaluation Indicators, the Company carried out environmental risks identification and assessment, and re-assessed the environmental risk by following the Sinopec Environmental Risk Assessment Guide (2019). A total of 165 environmental risk sources were assessed, of which none was level I environmental risk source, 52 were level II environmental risk sources. Since R value can not be adjusted, the current level of level II risk cannot be downgraded to level III risk, and 113 were level III environmental risk sources.
The Company carried out regular environmental protection emergency drills. On June 29, 2021, the “emergency drill for T-191 tank fire and explosion accident in workshop 1 of storage and transportation department” was carried out by the Company. Through the drill, the transmission of alarm information and the initial emergency response capability of the first workshop of the storage and transportation department, as well as the information communication between the storage and transportation department and the company’s dispatching about emergencies, environmental monitoring and polluted wastewater collection, transfer and dispatch were verified through the drill. On December 1, 2021, the “Shanghai Petrochemical to SECCO Mutual Supply Pipeline Leakage Accident Drill” was carried out, and the drill further improved the staff from on-site detection, confirmation, alarm, on-site alert, reporting to the activation of emergency plans, to carry out emergency response and emergency response capabilities; on the afternoon of December 30, 2021, the Company and the Jinshan District Ecological Environment Bureau held the “Three Workshop Leakage Accident Environmental Emergency Drill” in the Storage and Transportation Department. Through the drill, Shanghai Petrochemical and government departments have improved the ability of emergency linkage response and the emergency response ability of the storage and transportation department to emergency environmental incidents have verified the practicability and operability of the emergency response plan of the storage and transportation department, ensuring the safe operation of the storage and transportation department and the control of environmental risks.
98
Report of the Directors (continued)
| 7. | Environmental self-monitoring programme |
In accordance with the requirements of pollutant discharge permits, relevant governmental environmental monitoring management, Sinopec Regulations on Environmental Monitoring Management and the need of the Company’s environmental monitoring, the Annual Environmental Monitoring Plan and Emission Implementation Standars of Shanghai Petrochemical were complied and issued in early 2021, the monitoring content includes: clean sewage, air, waste gas, waste water, groundwater, soil, noise, etc. The Company timely organized personnel to update the monitoring plan once the Pollutant Discharge Permit and environmental protection standards were revised and updated, so as to ensure transparency of the environmental monitoring data and government departmental information as well as consistency between environmental protection tax reporting requirements, thereby providing data support for the Company’s various pollution indices to meet the emission standards.
In 2021, a total of 22,724 water quality monitoring data, including 1,824 outsourcing projects, 9,493 air and waste gas monitoring data, including 1,322 outsourcing projects, and 304 noise monitoring data were completed, with the compliance rate of 100%.
| 8. | Measures taken to reduce carbon emissions and its effects during the reporting period |
The Company adopted measures such as optimizing the product structure, stopping or limiting the production of some units with large carbon emission per unit, improving energy efficiency and reducing energy consumption, promoting technical energy conservation and management energy conservation measures, reducing energy waste and improving energy utilization efficiency. In 2021, 13 energy saving technical transformation projects, 3 oil refining energy-saving technical transformation projects, and 1 contract energy management project will be completed. Focusing on carbon recovery and carbon capture, the Company currently sells the CO2 generated by ethylene glycol unit to Sinopec Shanghai Yangu Gas Development Co., Ltd. to produce food grade CO2, with an annual recovery of 91,654 tons, and actively carries out carbon capture CCUS technology exchange and reserve.
| 9. | Consolidate and expand the poverty alleviation and Rural Revitalization |
The Company took multiple measures at the same time, making positive contributions to helping win the battle against poverty, actively carried out the Company’s consumption poverty alleviation work, actively interacted with Jinshan government, and focused on poverty alleviation in the poverty-stricken areas of Yunnan Province and Gansu Province. A total of RMB7,766,000 of consumption poverty alleviation was completed. The Company also took action to help the junior middle school in Bange County, Tibet, and helped the rural revitalization.
The basic unit of Shanghai Petrochemical and 53 villages in Jinshan District, Pinghu City carried out party building pairings and co-construction activities, and reported 48 public welfare projects for village residences and contributed funds of RMB1,821,000.
99
Report of the Directors (continued)
| (XIII) | Inter-bank bond market non-financial enterprise debt financing instruments |
| 1. | Basic information of debt financing instruments of non-financial enterprises |
| Any risk of | ||||||||||||||||||||||||||||||
| Repayment of | terminating | |||||||||||||||||||||||||||||
| Bond | Interest | principal and | Investor suitability | listing and | ||||||||||||||||||||||||||
| Bond name |
Abbreviation |
Code | Issue date |
Value date |
Due date |
balance | rate (%) | interest |
Trading place |
arrangements (if any) |
Trading mechanism |
trading | ||||||||||||||||||
| Phase I ultra short-term financing bonds of Sinopec Shanghai Petrochemical Co., Ltd. in 2020 |
20 Sinopec Shanghai Petrochemical SCP001 | 12002974 | 19-20 August 2020 | 24 August 2020 | 9 February 2021 | 0 | 1.70 | % | One time repayment of principal and interest upon maturity | Interbank market clearing house | The investors who subscribe for the current ultra short-term financing bonds are domestic qualified institutional investors (unless otherwise stipulated by national laws, regulations and departmental rules) | The current ultra short-term financing bonds can be circulated and transferred in the national inter-bank bond market on the working day next to the creditor’s right registration date. It is conducted in accordance with the relevant provisions promulgated by the national interbank lending center. | No | |||||||||||||||||
100
Report of the Directors (continued)
| Any risk of | ||||||||||||||||||||||||||||||
| Repayment of | terminating | |||||||||||||||||||||||||||||
| Bond | Interest | principal and | Investor suitability | listing and | ||||||||||||||||||||||||||
| Bond name |
Abbreviation |
Code | Issue date |
Value date |
Due date |
balance | rate (%) | interest |
Trading place |
arrangements (if any) |
Trading mechanism |
trading | ||||||||||||||||||
| Phase I ultra short-term financing bonds of Sinopec Shanghai Petrochemical Co., Ltd. in 2021 |
21 Sinopec Shanghai Petrochemical SCP001 |
12101769 | 28-29 April 2021 | 29 April | 28 June 2021 | 0 | 2.40 | % | One time repayment of principal and interest upon maturity |
Interbank market clearing house |
The investors who subscribe for the current ultra short-term financing bonds are domestic qualified institutional investors (unless otherwise stipulated by national laws, regulations and departmental rules) |
The current ultra short-term financing bonds can be circulated and transferred in the national inter-bank bond market on the working day next to the creditor’s right registration date. It is conducted in accordance with the relevant provisions promulgated by the national interbank lending center. |
No | |||||||||||||||||
101
Report of the Directors (continued)
| Any risk of | ||||||||||||||||||||||||||||||
| Repayment of | terminating | |||||||||||||||||||||||||||||
| Bond | Interest | principal and | Investor suitability | listing and | ||||||||||||||||||||||||||
| Bond name |
Abbreviation |
Code | Issue date |
Value date |
Due date |
balance | rate (%) | interest |
Trading place |
arrangements (if any) |
Trading mechanism |
trading | ||||||||||||||||||
| Phase II ultra short-term financing bonds of Sinopec Shanghai Petrochemical Co., Ltd. in 2021 |
21 Sinopec Shanghai Petrochemical SCP002 |
12102206 | 16 June 2021 | 17 June | 16 August 2021 | 0 | 2.25 | % | One time repayment of principal and interest upon maturity |
Interbank market clearing house |
The investors who subscribe for the current ultra short-term financing bonds are domestic qualified institutional investors (unless otherwise stipulated by national laws, regulations and departmental rules) |
The current ultra short- term financing bonds can be circulated and transferred in the national inter-bank bond market on the working day next to the creditor’s right registration date. It is conducted in accordance with the relevant provisions promulgated by the national interbank lending center. |
No | |||||||||||||||||
102
Report of the Directors (continued)
| Any risk of | ||||||||||||||||||||||||||||||||||||
| Repayment of | terminating | |||||||||||||||||||||||||||||||||||
| Bond | Interest | principal and | Investor suitability | listing and | ||||||||||||||||||||||||||||||||
| Bond name |
Abbreviation | Code | Issue date | Value date | Due date | balance | rate (%) | interest | Trading place | arrangements (if any) | Trading mechanism | trading | ||||||||||||||||||||||||
| Phase III ultra short-term financing bonds of Sinopec Shanghai Petrochemical Co., Ltd. in 2021 |
21 Sinopec Shanghai Petrochemical SCP003 |
12103167 | |
25-26 August 2021 |
|
|
27 August 2021 |
|
|
26 October 2021 |
|
0 | 2.18 | % | One time repayment of principal and interest upon maturity |
Interbank market clearing house |
The investors who subscribe for the current ultra short- term financing bonds are domestic qualified institutional investors (unless otherwise stipulated by national laws, regulations and departmental rules) |
The current ultra short- term financing bonds can be circulated and transferred in the national inter- bank bond market on the working day next to the creditor’s right registration date. It is conducted in accordance with the relevant provisions promulgated by the national interbank lending center. |
No | |||||||||||||||||
103
Report of the Directors (continued)
| Any risk of | ||||||||||||||||||||||||||||||||||||
| Repayment of | terminating | |||||||||||||||||||||||||||||||||||
| Bond | Interest | principal and | Investor suitability | listing and | ||||||||||||||||||||||||||||||||
| Bond name |
Abbreviation | Code | Issue date | Value date | Due date | balance | rate (%) | interest | Trading place | arrangements (if any) | Trading mechanism | trading | ||||||||||||||||||||||||
| Phase IV ultra short-term financing bonds of Sinopec Shanghai Petrochemical Co., Ltd. in 2021 |
21 Sinopec Shanghai Petrochemical SCP004 |
12103836 | |
20-21 October 2021 |
|
|
22 October 2021 |
|
|
21 December 2021 |
|
0 | 2.30 | % | One time repayment of principal and interest upon maturity |
Interbank market clearing house |
The investors who subscribe for the current ultra short- term financing bonds are domestic qualified institutional investors (unless otherwise stipulated by national laws, regulations and departmental rules) |
The current ultra short- term financing bonds can be circulated and transferred in the national inter- bank bond market on the working day next to the creditor’s right registration date. It is conducted in accordance with the relevant provisions promulgated by the national interbank lending center. |
No | |||||||||||||||||
104
Report of the Directors (continued)
| 2. | Bond interest payment and cashing during the Reporting Period |
| Bond name |
Description of interest payment | |
| Phase I ultra short-term financing bonds of Sinopec Shanghai Petrochemical Co., Ltd. in 2020 | One time repayment of principal and interest upon maturity | |
| Phase I ultra short-term financing bonds of Sinopec Shanghai Petrochemical Co., Ltd. in 2021 | One time repayment of principal and interest upon maturity | |
| Phase II ultra short-term financing bonds of Sinopec Shanghai Petrochemical Co., Ltd. in 2021 | One time repayment of principal and interest upon maturity | |
| Phase III ultra short-term financing bonds of Sinopec Shanghai Petrochemical Co., Ltd. in 2021 | One time repayment of principal and interest upon maturity | |
| Phase IV ultra short-term financing bonds of Sinopec Shanghai Petrochemical Co., Ltd. in 2021 | One time repayment of principal and interest upon maturity | |
| 3. | Intermediaries providing services for bond issuance and duration business |
| Name of signing |
||||||||
| Name of intermediary |
Office address |
accountant |
Contact person |
contact number | ||||
| Industrial Bank Co., Ltd | 15/F, Xingye building, 20 Chaoyangmen North Street, Chaoyang District, Beijing | — | Lin Chen | 010-89926551 | ||||
| Beijing Haiwen law firm | 20th floor, fortune financial center, No. 5, Middle East Third Ring Road, Chaoyang District, Beijing | — | Gao Wei | 010-85606888 | ||||
| Zhongchengxin international credit rating Co., Ltd(special general partnership) |
Building 6, Galaxy SOHO, No. 2, nanzhuxuan interchange, chaoyangmennei street, Dongcheng District, Beijing | — | Wang Mengying | 010-66428877 | ||||
| PricewaterhouseCoopers Zhongtian Certified Public Accountants |
11th floor, PricewaterhouseCoopers center, building 2, enterprise world, No. 202 Hubin Road, Huangpu District, Shanghai | Huang Zhejun, Chen Jiaojiao | Chen Jiaojiao | 021-23235604 | ||||
| Inter-bank market clearing house Co., Ltd |
33rd floor, Oriental International Financial Plaza, 318 south Zhongshan Road, Shanghai | — | Issue post | 021-63326662 | ||||
| Beijing Financial Assets Exchange Co., Ltd |
17 B Financial Street, Xicheng District, Beijing | — | Issue department | 010-57896722 | ||||
105
Report of the Directors (continued)
| 4. | Use of raised funds at the end of the reporting period |
| RMB | ||||||||||||||||||||||||
| Bond name |
Total amount of raised funds |
Used amount | Unused amount | Operation of special account for raised funds (if any) |
Rectification of illegal use of raised funds (if any) |
Whether it is consistent with the purpose, use plan and other agreements promised in the prospectus |
||||||||||||||||||
| Phase I ultra short-term financing bonds of Sinopec Shanghai Petrochemical Co., Ltd. in 2020 |
3,000,000,000.00 | 3,000,000,000.00 | 0 | yes | ||||||||||||||||||||
| Phase I ultra short-term financing bonds of Sinopec Shanghai Petrochemical Co., Ltd. in 2021 |
2,000,000,000.00 | 2,000,000,000.00 | 0 | yes | ||||||||||||||||||||
| Phase II ultra short-term financing bonds of Sinopec Shanghai Petrochemical Co., Ltd. in 2021 |
1,000,000,000.00 | 1,000,000,000.00 | 0 | yes | ||||||||||||||||||||
| Phase III ultra short-term financing bonds of Sinopec Shanghai Petrochemical Co., Ltd. in 2021 |
2,000,000,000.00 | 2,000,000,000.00 | 0 | yes | ||||||||||||||||||||
| Phase IV ultra short-term financing bonds of Sinopec Shanghai Petrochemical Co., Ltd. in 2021 |
1,000,000,000.00 | 1,000,000,000.00 | 0 | yes | ||||||||||||||||||||
106
Report of the Directors (continued)
| 5. | Accounting data and financial indicators of the Company in recent 2 years as of the end of the reporting period (Prepared under CAS) |
| RMB’000 | ||||||||||||
| Main indicators |
2021 | 2020 | Increase/decrease compared to the previous year (%) |
Reason for change | ||||||||
| Net profit after deducting non- recurring profit and loss |
1,908,105 | 493,350 | Increased by 286.76 percentage point |
The market demand for petroleum and petrochemical products has improved significantly during the Reporting Period, the product price has increased, and the Company’s profit has increased significantly. | ||||||||
| Current ratio (%) |
132.52 | 113.61 | Increased by 18.91 percentage point |
Increase in current assets | ||||||||
| Quick ratio (%) |
94.63 | 87.86 | Increased by 6.77 percentage point |
Increase in current assets | ||||||||
| Asset liability ratio (%) |
35.38 | 34.40 | Increased by 0.98 percentage point |
Increase in total liabilities | ||||||||
| EBITDA total debt ratio |
0.28 | 0.16 | Increased by 75 percentage point |
Increase in operating profit | ||||||||
| Interest cover |
29.12 | 7.14 | Increased by 307.84 percentage point |
Increase in operating profit | ||||||||
| Cash interest cover |
45.85 | 18.95 | Increased by 141.95 percentage point |
Increase in operating cash inflow due to increase in operating profit | ||||||||
| EBITDA interest cover |
50.01 | 26.72 | Increased by 87.16 percentage point |
Increase in operating profit | ||||||||
| Loan repayment rate (%) |
100 | % | 100 | % | – | No change | ||||||
| Interest coverage rate (%) |
100 | % | 100 | % | – | No change | ||||||
107
Report of the Directors (continued)
| (XIV) | Equity-linked agreements |
Apart from the Share Option Incentive Scheme disclosed in item (9) under Section IV “Major Events” of Report of Directors, the Company does not have any equity-linked agreements during the year.
| (XV) | Tax rate |
The income tax rate currently applicable to the Group is 25% (2020: 25%).
| (XVI) | Deposits |
The Company did not have any entrusted deposits during the Reporting Period. As at 31 December 2021, the Group did not have any term deposits which could not be collected upon maturity.
| (XVII) | Reserves |
Details of changes in reserves are set out in note 32 to the consolidated financial statements prepared under IFRS.
According to the Company’s Articles of Association, the reserve available for distribution is the lower of the amount determined under China Accounting Standards for Business Enterprises and the amount determined under IFRS. On December 31, 2021, the Company’s reserves available for distribution to shareholders of the Company (including share capital premium and undistributed profits) were RMB11,240,259 thousand (2020: RMB10,535,813 thousand).
| (XVIII) | Financial summary |
A summary of the results, total assets, total liabilities and shareholders’ equity of the Group as at 31 December 2021 are set out on page 7-8 of this annual report.
| (XIV) | Bank loans and other borrowings |
Details of bank loans and other borrowings of the Company and the Group for the year ended 31 December 2021 are set out in note 26 to the consolidated financial statements prepared under IFRS.
| (XX) | Interest capitalized |
Details of interest capitalized during the year are set out in note 9 to the consolidated financial statements prepared under IFRS.
108
Report of the Directors (continued)
| (XXI) | Property, plant and equipment |
Changes in property, plant and equipment during the year are set out in note 16 to the consolidated financial statements prepared under IFRS.
| (XXII) | Purchase, sale and redemption of the Company’s securities |
During the Reporting Period, the Group did not purchase, sell or redeem any of the Company’s listed securities.
| (XXIII) | Pre-emptive rights |
According to the Articles of Association and the laws of the PRC, there is no pre-emptive rights which requires the Company to offer new shares to the existing shareholders of the Company in proportion to their shareholdings.
| (XXIV) | Donations |
During the Reporting Period, the Company and Jinshan Hospital Affiliated to Fudan University jointly built Shanghai Petrochemical occupational disease prevention workstation, and donated RMB600 thousand to carry out research on occupational disease prevention; Donated RMB100 thousand to Shanghai Chemical Industry Zone Development Co., Ltd. to hold the “2021 Shanghai Chemical Industry Zone Green Chemical Innovation and Entrepreneurship Competition (activity).
| (XXV) | Tax relief |
During the Reporting Period, the holders of listed securities of the Company were not entitled to tax relief due to the holding of listed securities of the Company in accordance with the PRC laws.
Section V Business review and outlook
Please refer to Section II “Management Discussion and Analysis” of this chapter for the business review of the Group for the year ended 31 December 2021 and the outlook for 2022.
109
Directors, Supervisors, Senior Management and Employees
| (I) | Changes in shareholdings and remuneration |
| 1. | Changes in shareholdings and remuneration of Directors, Supervisors and senior management who hold the position currently or left the office during the Reporting Period |
| Name |
Used |
Position |
Sex | Age | Date of commencement of service term |
Date of end of service term |
Number of shares held at the beginning of the Reporting Period (ten thousand shares) |
Number of shares held at the end of the Reporting Period |
Change in number of shares during the Reporting Period |
Reason of change |
Total Remuneration received from the Company during the Reporting Period (before taxation) (RMB’ ten thousand) |
Whether received remuneration from connected person(s) of the Company |
||||||||||||||||||||||||||||||||
| Wu Haijun |
None |
Executive Director & Chairman |
M | 60 | June 2020 | June 2023 | 0 | 0 | 0 | — | 114.14 | No | ||||||||||||||||||||||||||||||||
| Guan Zemin |
None |
Executive Director, Vice Chairman & President |
M | 58 | June 2020 | June 2023 | 0 | 0 | 0 | — | 122.30 | No | ||||||||||||||||||||||||||||||||
| Du Jun |
None |
Executive Director, Vice President & Chief Financial Officer |
M | 51 | June 2021 | June 2023 | 0 | 0 | 0 | — | 103.90 | No | ||||||||||||||||||||||||||||||||
| Huang Xiangyu |
None |
Executive Director & Vice President |
M | 54 | June 2020 | June 2023 | 14 | 14 | 0 | — | 100.76 | No | ||||||||||||||||||||||||||||||||
| Xie Zhenglin |
None |
Non-executive Director |
M | 57 | June 2020 | June 2023 | 0 | 0 | 0 | — | 0 | Yes | ||||||||||||||||||||||||||||||||
| Peng Kun |
None |
Non-executive Director |
M | 56 | June 2020 | June 2023 | 0 | 0 | 0 | — | 86.32 | No | ||||||||||||||||||||||||||||||||
| Li Yuanqin |
None |
Independent Non- executive Director |
F | 49 | June 2020 | June 2023 | 0 | 0 | 0 | — | 15.00 | No | ||||||||||||||||||||||||||||||||
| Tang Song |
None |
Independent Non- executive Director |
M | 42 | June 2020 | June 2023 | 0 | 0 | 0 | — | 15.00 | No | ||||||||||||||||||||||||||||||||
| Chen Haifeng |
None |
Independent Non- executive Director |
M | 48 | June 2020 | June 2023 | 0 | 0 | 0 | — | 15.00 | No | ||||||||||||||||||||||||||||||||
| Yang Jun |
None |
Independent Non- executive Director |
M | 65 | June 2020 | June 2023 | 0 | 0 | 0 | — | 15.00 | No | ||||||||||||||||||||||||||||||||
110
Directors, Supervisors, Senior Management and Employees (continued)
| Name |
Used name/ alias |
Position |
Sex | Age | Date of commencement of service term |
Date of end of service term |
Number of shares held at the beginning of the Reporting Period (ten thousand shares) |
Number of shares held at the end of the Reporting Period |
Change in number of shares during the Reporting Period |
Reason of change |
Total Remuneration received from the Company during the Reporting Period (before taxation) (RMB’ ten thousand) |
Whether received remuneration from connected person(s) of the Company |
||||||||||||||||||||||||||||||||
| Gao Song |
None |
Independent Non- executive Director |
M | 52 | June 2020 | June 2023 | 0 | 0 | 0 | — | 15.00 | No | ||||||||||||||||||||||||||||||||
| Ma Yanhui |
None |
Supervisor, Chairman of the Supervisory Committee |
M | 51 | June 2020 | June 2023 | 0 | 0 | 0 | — | 108.13 | No | ||||||||||||||||||||||||||||||||
| Zhang Feng |
None |
Supervisor |
M | 53 | June 2020 | June 2023 | 1 | 1 | 0 | — | 79.53 | No | ||||||||||||||||||||||||||||||||
| Chen Hongjun |
None |
Supervisor |
M | 51 | June 2020 | June 2023 | 3.14 | 3.14 | 0 | — | 82.17 | No | ||||||||||||||||||||||||||||||||
| Zhang Xiao feng |
None |
Supervisor |
M | 52 | June 2020 | June 2023 | 0 | 0 | 0 | — | 0 | yes | ||||||||||||||||||||||||||||||||
| Zheng Yunrui |
None |
Independent Supervisor |
M | 57 | June 2020 | June 2023 | 0 | 0 | 0 | — | 10.00 | No | ||||||||||||||||||||||||||||||||
| Choi Ting Ki |
None |
Independent Supervisor |
M | 68 | June 2020 | June 2023 | 0 | 0 | 0 | — | 10.00 | No | ||||||||||||||||||||||||||||||||
| Jin Qiang* |
None |
Vice President |
M | 57 | June 2020 | June 2023 | 30.1 | 30.1 | 0 | — | 110.96 | No | ||||||||||||||||||||||||||||||||
| Jin Wenmin* |
None |
Vice President |
M | 57 | June 2020 | June 2023 | 17.5 | 17.5 | 0 | — | 99.76 | No | ||||||||||||||||||||||||||||||||
| Huang Fei* |
None |
Vice President |
M | 45 | June 2020 | June 2023 | 0 | 0 | 0 | — | 97.96 | No | ||||||||||||||||||||||||||||||||
| Liu Gang |
None |
Board Secretary |
M | 50 | April 2021 | June 2023 | 0 | 0 | 0 | — | 40.75 | No | ||||||||||||||||||||||||||||||||
|
|
|
|
|
|
|
|
|
|
|
|
|
|
|
|
|
|
|
|
|
|
|
|||||||||||||||||||||||
| Total |
/ |
/ |
/ | / | / | / | 65.74 | 65.74 | 0 | / | 1,241.68 | / | ||||||||||||||||||||||||||||||||
|
|
|
|
|
|
|
|
|
|
|
|
|
|
|
|
|
|
|
|
|
|
|
|||||||||||||||||||||||
| * | On February 15, 2022, Mr. Jin Qiang, Mr. Jin Wenmin and Mr. Huang Fei proposed request to the board of directors that they would no longer serve as executive directors and directors due to job change. Mr. Jin Qiang, Mr. Jin Wenmin and Mr. Huang Fei’s resignation took effect when the resignation report were delivered to the board of directors of the Company on February 15, 2022. |
111
Directors, Supervisors, Senior Management and Employees (continued)
| (II) | Profiles of Directors, Supervisors and senior management |
Directors:
Wu Haijun, born in August 1962, is the Executive Director, Chairman, Chairman of the Strategy Committee and member of the Nomination Committee, Director of Shanghai SECCO and Chairman of Shanghai Chemical Industry Park Development Co., Ltd. Mr. Wu joined the Shanghai Petrochemical Complex (the “Complex”) in 1984 and has held various positions, including Deputy Director and Director of the Company’s No.2 Chemical Plant, as well as manager of the Chemical Division. He was Vice President of the Company from May 1999 to March 2006 and Director of the Company from June 2004 to June 2006. Mr. Wu was manager and Secretary of the Communist Party Committee of the Chemical Sales Branch of Sinopec Corp from December 2005 to March 2008. From December 2005 to April 2010, he was Director of the Chemical Business Department of Sinopec Corp. From April 2010, he was appointed as a Director of Shanghai SECCO. From April 2010 to February 2011, Mr. Wu was President of Shanghai SECCO. From April 2010 to August 2018, he was appointed Secretary of the Communist Party Committee of Shanghai SECCO and in June 2010 he was appointed Director of the Company. From June 2010 to December 2017, he served as Vice Chairman of the Company. From February 2011 to March 2015, he acted as Vice President of Shanghai SECCO, and was President of Shanghai SECCO from March 2015 to December 2017. From December 2017 to January 2019, Mr. Wu was appointed Chairman of Shanghai SECCO. From December 2017 to August 2018, he was the Company’s Deputy Party Secretary. He has served as President of the Company from December 2017 to September 2018. In December 2017, he was appointed as Chairman of the Company. In January 2018, he was appointed as Chairman of Shanghai Chemical Industry Park Development Co, Ltd. and was appointed as Secretary to the Communist Party Committee of the Company in August 2018. Mr. Wu graduated from the East China Institute of Chemical Technology in 1984, majoring in chemical engineering, and obtained a Bachelor’s degree in engineering. In 1997, he obtained a Master’s degree in business administration from the China Europe International Business School. He is a Professorate senior engineer by title.
Guan Zemin, born in December 1964, is serving as Vice Chairman, Executive Director, Vice Chairman of the Strategy Committee and President of the Company. Mr. Guan started to work in 1990, and he has successively served as Section Manager of Technology Development Section, Technology Development Department, and Deputy Chief Engineer of Wuhan Petrochemical Works, and Director of Catalyzing Workshop, Deputy Director and Director of Production Scheduling Department, and Deputy Chief Engineer of the Wuhan branch of Sinopec Corp. (“Wuhan Branch”). From December 2012 to December 2018, he served as Deputy General Manager of Wuhan Branch. From May 2016 to December 2019, he served as General Manager and Director of Sinopec-SK (Wuhan) Petrochemical Company Limited. From December 2018 to December 2019, he served as the Director and Deputy Party Secretary and General Manager of Wuhan Branch. He was appointed Deputy Secretary of the Company in December 2019. From February 2020, he served as the President of the Company. From June 2020, he served as the executive director, vice chairman and vice chairman of the strategy committee of the company. Mr. Guan graduated from the Fine Chemical Major of School of Chemical Engineering, East China University of Science and Technology with a Master’s degree in Engineering in July 1990. He is a senior engineer by professional title.
112
Directors, Supervisors, Senior Management and Employees (continued)
Du Jun, born in March 1970, is currently the Executive Director, member of the Strategy Committee, Vice President and Chief Financial Officer of the Company, chairman of Jinshan Lianmao, and director of Shanghai Chemical Industry Zone Development Co., Ltd. Du Xiansheng joined the work in 1990 and successively served as the chief of the second section of the Secretary of the general manager’s office of Yangzi Petrochemical Co., Ltd., the deputy director of the finance department and the deputy director of the Finance Department of Yangzi Petrochemical Co., Ltd. From August 2004 to July 2007, he served as the director of the Finance Department of Yangzi Petrochemical Co., Ltd. From July 2007 to August 2012, he served as the director of the Finance Department of Yangzi Petrochemical Co., Ltd. From August 2012 to August 2016, he served as the chief accountant of Yangzi Petrochemical Co., Ltd. From December 2015 to September 2020, he served as the supervisor of Yangzi Petrochemical BASF Co., Ltd. From June 2016 to September 2020, he served as a director of Yangzi Petrochemical Co., Ltd. From August 2016 to September 2020, he served as the chief accountant of Yangzi Petrochemical Co., Ltd. Deputy general manager and chief financial officer of the company since September 2020. He has been the chairman of Jinshan Lianmao since December 2020. He has been a director of Shanghai Chemical Industry Zone Development Co., Ltd. since December 2020. He served as the executive director of the company in June 2021. He served as a member of the company’s Strategy Committee in March 2022. Mr. Du graduated from Southeast University in 1990, majoring in industrial enterprise management, and obtained a master’s degree in Business Administration from Southeast University in 2004. He has the title of senior accountant.
Huang Xiangyu, born in March 1968, is serving as the Executive Director and Vice President of the Company. Mr. Huang started his career in 1990 and joined the Complex in 1992. He served as the Deputy Director of the chemical workshop of Shanghai Jinyang Acrylic Plant, Deputy Director of Jinyang Equipment, Director and Deputy Director of Jinyang Acrylic Equipment of Acrylic Business Unit and Chief Engineer of Acrylic Business Unit. From July 2011 to January 2020, he served as the Director of the Acrylic Fiber Research Institute. From November 2011 to January 2020, he served as the Chief Engineer of the Acrylic Fiber Department. From February 2019 to January 2020, he served as Deputy Chief Engineer of the Company. From February 2020, he served as the Vice President of the Company. From June 2020, he was an Executive Director of the Company. Mr. Huang graduated from the Organic Chemical Major of School of Chemical Engineering, East China University of Science and Technology with a Bachelor’s degree in Engineering in July 1990. He obtained a Master’s degree in Engineering from Donghua University in May 2004. He graduated from Polymeric Chemistry and Physics Major of Fudan University with a doctor’s degree in Science in June 2013. He is a professorate senior engineer by title.
113
Directors, Supervisors, Senior Management and Employees (continued)
| (II) | Profiles of Directors, Supervisors and senior management (Continued) |
Xie Zhenglin, born in February 1965, is currently serving as an Non-Executive Director, member of the Strategy Committee, Vice President of Chemical Service Department of the Sinopec Corp., and General Manager of Sinopec Group Assets Management Co., Ltd. Mr. Xie started his work in 1989, served as Principal Staff Member of State Price Control Bureau and State Development Planning Commission, and started to work in Sinopec Group in September 1995, successively served as Deputy Director and Director of the Comprehensive Division of the Finance Department, Deputy Director of Capital Management Department, Deputy Director of General Accounting Department of Sinopec Assets Management (presided over the work), Deputy Director of Assets Management Department of Sinopec Corp., Deputy General Manager of Sinopec Assets Management, Acting Director of Assets Management Department of Sinopec Corp., and Deputy Executive Director and Deputy General Manager of Sinopec Assets Management. From April 2014 to October 2020, he served as the Vice Chairman and director of the China Merchants Energy Shipping Co., Ltd. (listed on the Shanghai Stock Exchange, Stock Code: 601872). Mr. Xie served as Director of Assets Management Department of Sinopec Corp., and Executive Director and General Manager of Sinopec Assets Management from April 2014 to December 2019. He has been the Deputy President of Chemical Service Department of Sinopec Corp. and General Manager of Sinopec Assets Management since December 2019. From June 2020, he served as the executive director and member of the strategy committee of the company. Mr. Xie obtained a Master’s degree in Economics from Graduate School of Chinese Academy of Social Science in August 1989. He obtained a Master’s degree in Business Administration from University of Houston in May 2007. He is a Senior Accountant by professional title.
Peng Kun, born in December 1966, is currently serving as a Non-Executive Director, the General Manager of Human Resource Department, Minister of Party Committee Organization Department, and Director of Office of Veteran Cadres of the Company. Mr. Peng joined the Complex in 1986 and served as Deputy Director of General Affairs Office, Department of Chemical Engineering, General Research Institute, assistant manager of the life logistics subsidiary of Easy-Art Design, section manager of Coordination Section of Chemical Engineering Institute, section manager of Administration Department, Secretary of Party General Branch and Deputy Director of Quality Center, Deputy party Secretary and Secretary of Commission for Discipline Inspection of Quality Management Center, Director of Labor Union, and Chairman, Secretary of the Communist Party Committee and Deputy Manager of Labor Union. He served as Director of Human Resources Department of the Company from February 2016 to April 2018, the Head of Human Resources Division of the Company from April 2018 to May 2019, and the Head of Organization and Personnel Division of the Company from May 2019 to March 2020. He was appointed as Director of CPC United Front Work Department and Director of Retired Cadres Office in May 2019, and General Manager of Human Resources Department and Director of CPC Organization Department of the Company from March 2020. From June 2020, he served as the Non-Executive Director of the Company. Mr. Peng graduated from East China University of Science and Technology with a degree in Engineering Management in July 2004 and obtained senior professional and technical title.
114
Directors, Supervisors, Senior Management and Employees (continued)
| (II) | Profiles of Directors, Supervisors and senior management (Continued) |
Li Yuanqin, born in July 1973, is an Independent Non-Executive Director, Chairman of the Audit Committee of the Company, Professor of the School of Management and the associate head of the Department of Accountancy at Shanghai University. Ms. Li has been appointed as an Independent Non-Executive Director of the Company since August 2017. She is currently the independent Director of Yunsai Zhilian Co., Ltd. (listed on Shanghai Stock Exchange, stock code: 600602, 900901) and Hengtian Kaima Co., Ltd. (listed on Shanghai Stock Exchange, stock code: 900953). Ms. Li served as an independent director of Shanghai New World Co., Ltd. (listed on Shanghai Stock Exchange, stock code: 600628) from June 2014 to December 2021. From April 2000 to March 2003, Ms. Li served at the Settlement Department at the headquarters of ICBC. From June 2006 to September 2009, she was the lecturer at the School of Management at Shanghai University. From September 2009 to March 2020, she was the associate professor at the School of Management at Shanghai University. She has been the professor at the School of Management and the associate head of the Department of Accountancy of Shanghai University since March 2019 and May 2011. During that period, she was also a visiting scholar at Foster School of Business, University of Washington in the United States between February 2012 and February 2013. She also serves as a member of the ninth session of the Shanghai Baoshan Committee of the Chinese People’s Political Consultative Conference and a non-practicing member of the Chinese Institute of Certified Public Accountants. She received a PhD in Management from Antai College of Economics and Management (ACEM) at Shanghai Jiao Tong University.
Tang Song, born in December 1980, is serving as the Independent Non-executive Director and a member of the Audit Committee and Remuneration and Appraisal Committee of the Company, Dean Assistant of School of Accountancy, Shanghai University of Finance and Economics, Professor and PH. D graduate student supervisor. Mr. Tang finished his undergraduate study in June 2003 at the School of Accountancy of the Shanghai University of Finance and Economics and obtained a doctor’s degree from a successive postgraduate and doctoral program in Management (Accountancy) in June 2008. Mr. Tang worked in the School of Accounting and Finance, Hong Kong Polytechnic University for collaborative research from August 2008 to August 2009. He worked in China Europe International Business School for collaborative research from August 2009 to June 2010. Mr. Tang served as Lecturer in School of Accountancy, Shanghai University of Finance and Economics from June 2010 to July 2012. He served as associate professor at the School of Accountancy, Shanghai University of Finance and Economics from August 2012 to June 2019. Mr. Tang served as Dean Assistant of Shanghai University of Finance and Economics from January 2019, and as a Professor of the School of Accountancy of the University since August 2019. Mr. Tang served as an Independent Director of the Shanghai Qifan Cable Co. Ltd. (listed on the Shanghai Stock Exchange, stock code: 605222) since July 2019, served as an independent director of Tibet Dongcai Fund Management Co., Ltd since August 2019, and as an Independent Director for the Shanghai Universal Biotech Co., Ltd (listed on Shenzhen Stock Exchange, stock code: 301166) since April 2020. He served as the independent non-executive director, member of the audit committee and the strategy committee of the Company since June 2020. Mr. Tang served as an Independent Director for the Wuxi Commercial Mansion Grand Orient Co., Ltd. (listed on Shanghai Stock Exchange, stock code: 600327) since November 2020.
115
Directors, Supervisors, Senior Management and Employees (continued)
| (II) | Profiles of Directors, Supervisors and senior management (Continued) |
Chen Haifeng, born in January 1974, is serving as an Independent Non-Executive Director, member of the Audit Committee and the Nomination committee of the Company, and a Senior Director of the Shanghai MindMotion Microelectronics Co., Ltd. Mr. Chen graduated from Fudan University with a Bachelor’s degree in applied physics in July 1997. He served as clerk, project supervisor, and project manager of Investment Banking Department of CITIC Securities from July 1997 to August 2001. Mr. Chen served as Senior Manager of Strategic Investment Department of SVT Group from September 2002 to February 2006. He served as Senior Manager of Investment Banking Department of Orient Securities from August 2006 to March 2008. Mr. Chen served as senior vice president and sponsor Deputy of Investment Banking Department of China Jianyin Investment Securities from April 2008 to May 2012. He served as CEO and sponsor Deputy of Investment Banking Department of Caida Securities from June 2012 to June 2015. Mr. Chen served as independent Director of Cnnc Hua Yuan Titanium Dioxide Company Limited (listed on Shenzhen Stock Exchange, stock code: 002145) from February 2015 to October 2018. He served as CEO and Sponsor Deputy of Investment Banking Department in Dongxing Securities from July 2015 to September 2017. Mr. Chen has been a non independent Director of Zhejiang Yueling Wheels Corporation from October 2017 to December 2020 (listed on the Shenzhen Stock Exchange, Stock Code: 002725). He served as an independent non-executive director, member of the audit committee and member of the nomination committee of the company since June 2020. He served as a Senior Director of the Shanghai MindMotion Microelectronics Co., Ltd. Since January 2021.
Yang Jun, born in August 1957, is serving as an Independent Non-executive Director, Chairman of the Nomination Committee and the Remuneration and Appraisal Committee, and Director (vice president level) of Gansu Gangtai Holding (Group) Co., Ltd. Mr. Yang graduated from East China University of Political Science and Law with a degree in Law in September 1979 and from Peking University with a Master’s degree in Civil Law in July 1991. He worked in Shanghai Intermediate Court and Supreme Court from July 1983 to July 2005. He served as an assistant to the president and general legal officer of Shanghai United Assets and Equity Exchange, General Manager of Beijing Headquarter of Central Enterprise Equity Exchange, operation Director of Equity Exchange and General Manager of Financial Equity Exchange from July 2005 to September 2017. He has served as an arbitrator of China International Economic and Trade Arbitration Commission from March 2007 to March 2015 and served as an arbitrator of Shanghai International Economic and Trade Arbitration Commission and Shanghai Arbitration Commission since March 2007. He served as independent non executive Director of China Merchants Securities Co., Ltd. (listed on the Hong Kong stock exchange, stock code: 06099) from June 2011 to January 2018. He has served as independent Director of Shanghai Zhenhua Heavy Industries Co., Ltd. (listed on Shanghai Stock Exchange, stock code: 600320) from April 2015 to March 2021 and Director (Vice President level) of Gansu Gangtai Holding (Group) Co., Ltd. since September 2017. He served as the independent non-executive director, chairman of the nomination committee and chairman of the remuneration and assessment committee of the company since June 2020.
116
Directors, Supervisors, Senior Management and Employees (continued)
| (II) | Profiles of Directors, Supervisors and senior management (Continued) |
Gao Song, born in June 1970, is serving as an Independent Director, member of Remuneration and Appraisal committee and Strategy Committee, Professor of Business School of East China University of Science and Technology and Director of China’s Institute for action learning. Mr. Gao graduated from Shandong University with a degree in Computer Software in 1992, from the School of Management of Fudan University with a Master’s degree in Corporate Management in 1998 and from the Antai College of Economics & Management of Shanghai Jiao Tong University with a doctorate in Corporate Management in 2006. He served as Director of Marketing Department of Shanghai Guanshengyuan Group Co., Ltd. From March 1998 to May 2002 and General Manager of Shanghai Aichu Food Co., Ltd. From May 2002 to March 2007. He has served as Professor of Business School of East China University of Science and Technology and Director of China’s Institute for action learning since May 2009. He was a visiting scholar at the University of Illinois at Urbana-Champaign from 2014 to 2015. From June 2020, he served as the independent non-executive director, chairman of the remuneration and appraisal committee and member of the strategy committee of the company.
Supervisors:
Ma Yanhui, born in February 1971, is a Supervisor, the Chairman of Supervisory Committee,, the Deputy Secretary of the Communist Party Committee, Secretary of the Communist Party Discipline Supervisory Committee and Chairman of the Labour Union of the Company. Mr. Ma started his career in 1996. He served as Secretary of Office of Yanhua Refinery, Secretary and Deputy Director of Yanhua Office of Great Wall Lubricant Oil, Supervisor and Acting Director and Deputy Director of Integrated Corporate Reform Department of China Petrochemical Corporation, and Deputy Director and Director of Structure Reform Sector, Corporate Reform Department of Sinopec Assets Management Co., Ltd., etc. From June 2008 to August 2017, Mr. Ma was Director of Integrated Corporate Reform Department of China Petrochemical Corporation (Sinopec Group). From August 2017, Mr. Ma was the Deputy Secretary of the Communist Party Committee and Secretary of the Communist Party Discipline Supervisory Committee of the Company. He was appointed as Supervisor, Chairman of Supervisory Committee and Chairman of the Labour Union of the Company in October 2017. Mr. Ma graduated from East China University of Science and Technology in July 1996, majoring in petroleum processing, and obtained a Bachelor’s degree in engineering. In June 2006, he obtained a Master’s degree in corporate management from Renmin University of China. Mr. Ma is a senior economist by professional title.
Zhang Feng, born in June 1969, is currently a Supervisor and the Auditing Director of the Company. Mr. Zhang started his career in the Complex in 1991. He served as Assistant of Chief and Deputy Chief of Finance Section of Polyester II Factory, Deputy Chief of Finance Section of Polyester Department, Deputy Chief and Chief of Cost Section of Finance Division of Polyester Department, Deputy Chief and Chief of Finance Division, Director Assistant, Deputy Director, Deputy Director (Hosting Work), Director of Finance Department and Chief of Finance Division, etc. He worked as Auditing Director of the Company from December 2018 to March 2020, and as Supervisor in October 2019. From March 2020, he worked as the Auditing Director of the Company. Mr. Zhang graduated from Shanghai University of Finance and Economics in 1991, majoring in Accounting, and obtained a Bachelor’s degree in Economics. Mr. Zhang is a senior accountant by professional title.
117
Directors, Supervisors, Senior Management and Employees (continued)
| (II) | Profiles of Directors, Supervisors and senior management (Continued) |
Chen Hongjun, born in January 1971, is currently a Supervisor, Vice-President of Labour Union, Director of the Public Affairs Department and Vice-President of the Association of Science and Technology of the Company. Mr. Chen started his career in the Complex in 1996. He served as Vice Party Branch Secretary of Fibre Polymer Office, Deputy Director of Spinning Office, Director of Simulation Office, Section Manager of Scientific Research Management Department, Deputy Secretary and Secretary of Youth League Committee of the Company, Party Secretary and Deputy Director of the Chemical Engineering Department, Party Secretary and Assistant Manager of Fine Chemicals Department and Director of Public Affairs Department. Mr. Chen was appointed as Vice-President of Labour Union of the Company in November 2013. He was appointed as Vice President of the Association of Science and Technology in December 2017. He served as Director of the Public Affairs Department of the Company from April 2018 to March 2020, and he was elected as Supervisor of the Company in October 2019. He was the Director of Public Affairs of the Company since March 2020. In November 2021, he served as executive director, general manager and Secretary of the general Party branch of Sinopec Shanghai training center, general manager of Shanghai Petrochemical training center, executive vice president of the Party school, general manager of Shanghai Convention Center and President of Jinshan community college. In 1993, Mr. Chen graduated from Chengdu University of Science and Technology, majoring in Dyeing and Finishing Engineering, and obtained a Bachelor’s degree in Engineering. In 1996, he obtained a Master’s degree in Chemical Fibre from Sichuan Unite University. Mr. Chen is a senior engineer by professional title.
Zhang Xiaofeng, born in March 1970, is currently serving as an External Supervisor, Deputy General Manager of the Enterprise Reform and Legal Department of Sinopec Group. Mr. Zhang currently holds the position of supervisor of Sinopec Insurance Limited, Sinopec Oilfield Equipment Corporation, Sinopec Petroleum Reserve Company Limited and director of Sinopec International Energy Investment Co., Ltd. Starting his career in 1995, Mr. Zhang has served as Deputy chief of the Office Management Division of the Legal Department of Sinopec Group, Deputy chief and chief of the Contract Project Division, chief of the Dispute Management Division and chief of the General Management Division of Legal Department of Sinopec Group. He has served as the supervisor of Sinopec Insurance Limited from June 2019 to May 2021. He has served as the Deputy Director of Sinopec Group’s Commission Office for Public Sector Reform from December 2019 to June 2021. He has served as Deputy Director of the Legal Department of Sinopec Group from January 2018 to December 2019. He served as the supervisor of Sinopec Insurance Limited from June 2019 to May 2021. He served as Deputy Director of the Company’s Commission Office for Public Sector Reform from December 2019 to June 2021. He has also served as Deputy General Manager of the Enterprise Reform and Legal Department of Sinopec Group since December 2019. In June 2021, he served as a director of Sinopec International Energy Investment Co., Ltd. Mr. Zhang, majoring in International Economic Law, graduated from China University of Political Science and Law with a Bachelor’s degree in Law in July 1995. Mr. Zhang is a senior economist by professional title and the lawyer of the Company.
118
Directors, Supervisors, Senior Management and Employees (continued)
| (II) | Profiles of Directors, Supervisors and senior management (Continued) |
Zheng Yunrui, born in December 1965, is an Independent Supervisor of the Company, a professor in civil and commercial law at the Faculty of Law of the East China University of Political Science. He has served as the Company’s Independent Supervisor since December 2014. He is currently an independent Director of Fuxin Dare Automotive Parts Co, Ltd. (listed on the Shenzhen Stock Exchange, stock code: 300473) and Wuxi New Hongtai Electrical Technology Co., Ltd. (listed on Shanghai Stock Exchange, stock code: 603016). Mr. Zheng graduated from the Shangrao Normal University in Jiangxi Province, majoring in English Language. Mr. Zheng obtained a Master’s degree in law and a doctorate’s degree in law from the Faculty of Law of Peking University in July 1993 and July 1998, respectively. Mr. Zheng previously worked at the Education Bureau of Shangrao County, Jiangxi Province, Hainan Airport Limited, China Township Enterprise Investment and Development Company Limited and the Legal Affairs Office of the Shanghai Municipal People’s Government. He has been teaching at East China University of Political Science and Law since August 2001. He was a visiting scholar at the Faculty of Law of National University of Singapore between July 2002 and December 2002. From April 2013 to May 2019, he served as independent director of Hangzhou Xianfeng Electronic Technology Co., Ltd. (listed on Shenzhen Stock Exchange, stock code: 002767). From 2019 to February 2021, he served as the external supervisor of Zhejiang Weihai Construction Group Co., Ltd. (listed on Shenzhen Stock Exchange, stock code: 002586). From April 2019 to March 2022, he served as an independent director of Dalian electric porcelain Group Co., Ltd. (listed on Shenzhen Stock Exchange, stock code: 002606). In November 2019, he served as a member of the second shareholding exercise Expert Committee of China Securities small and Medium Investors Service Center. In September 2020, he was appointed as a legal consultant of Wuxi intermediate people’s court. Mr. Zheng has been engaged in trials, teaching and research relating to civil law, property law, contract law, company law, insurance law, social insurance law and government procurement law. He is experienced in the legal affairs on corporate governance and has great academic achievements. He is also an arbitrator at the Arbitration Commission of Xuzhou and Wuxi. Mr. Zheng was appointed as an advisory expert on Civil and administrative cases of the Supreme People’s Procuratorate, a member of the second shareholding exercise Committee of CSI small and medium-sized investment service center, a news, public opinion and legal advisory expert of Wuxi intermediate people’s court, a member of the expert advisory committee of Shanghai Yangpu District people’s Procuratorate and a mediator of Shanghai Second Intermediate People’s court.
Choi Ting Ki, born September 1954, is an Independent Supervisor of the Company and a Fellow of the Hong Kong Institute of Certified Public Accountants. He joined the Company in June 2011. Mr. Choi served as Independent Non-Executive Director of the Company from June 2011 to June 2017 and has been Independent Supervisor since June 2017. Mr. Choi has been an independent non-Executive Director of Yangtzekiang Garment Limited (listed on the Main Board of the Hong Kong Stock Exchange, stock code: 00294) and YGM Trading Limited (listed on the Main Board of the Hong Kong Stock Exchange, stock code: 00375) since December 2012. Mr. Choi graduated from the Department of Accounting, Hong Kong Polytechnic in 1978. He joined KPMG in the same year and has held various positions, including Partner of the audit department of KPMG Hong Kong Office, Executive Partner of KPMG Shanghai Office, Senior Partner of KPMG Huazhen Shanghai Office as well as Senior Partner of KPMG Huazhen in Eastern and Western China. Mr. Choi retired from KPMG Huazhen in April 2010.
119
Directors, Supervisors, Senior Management and Employees (continued)
| (II) | Profiles of Directors, Supervisors and senior management (Continued) |
Senior Management:
Jin Qiang, born in May 1965, is serving as Vice President of the Company. Mr. Jin joined Zhenhai General Petrochemical Works in 1986 and has held various positions, including Deputy Chief of the Utilities Department, Deputy Director and Director of the Machinery and Power Division of SINOPEC Zhenhai Refining & Chemical Co., Ltd., and Director of the Machinery and Power Division of SINOPEC Zhenhai Refining & Chemical Company. Mr. Jin was Deputy Chief Engineer of SINOPEC Zhenhai Refining & Chemical Company from March 2007 to October 2011, and was appointed Vice President of the Company in October 2011. From June 2014 to February 2022, Mr. Jin served as Executive Director of the Company. Mr. Jin graduated from the East China Institute of Chemical Technology in 1986 majoring in chemical machinery and graduated from the Graduate School of Central Party School in 2007 majoring in economic management. He is a professorate senior engineer by title.
Jin Wenmin, born in February 1965, is serving as Vice President of the Company. Mr. Jin joined the Complex in 1985 and served as the Secretary of the Communist Party Committee of the Company’s No. 1 Oil Refining Device of Refining Unit, Head of Butadiene Device, Manager of the storage and transportation, branch company, manager and Deputy Secretary of the Communist Party Committee of Storage and Transportation Department, manager and Deputy Secretary of the Communist Party Committee of Oil Refining Department etc. From April 2013 to February 2017, Mr. Jin was appointed as Head of Production Department of the Company. From May 2013 to August 2016, Mr. Jin was appointed as Assistant to the General Manager of the Company and was appointed Vice President of the Company in September 2016. He was appointed Executive Director of the Company in June 2018. Mr. Jin graduated from the Shanghai Second Polytechnic University in July 2003. He is a senior engineer by professional title.
Huang Fei, born in January 1977, is serving as Deputy President of the Company. Mr. Huang joined Sinopec Shanghai Petrochemical Company Limited in 2000, and he has successively served as Polyolefin Plant Deputy Director of Plastic Business Unit and Manager Assistant and Polyolefin Plant Director of Plastic Department. From August 2012 to June 2014, he served as Deputy Manager of the Plastic Department. From June 2014 to February 2017, he served as Director of Statistical Center and Vice Party Secretary. From February 2017 to December 2018, he served as Manager of Olefin Department and Deputy Party Secretary. From December 2018 to January 2019, he served as President’s Assistant and the Director of Production Department. From January 2019 to December 2019, Mr. Huang served as President’s Assistant and Manager of Production Department of Shanghai SECCO. From February 2020, he served as the Vice President of the Company. From June 2020 to April 2021, he served as the Secretary to the Board and Joint Company Secretary. From June 2020 to February 2022, he served as the Executive Director and member of the Strategy Committee of the Company. Mr. Huang graduated from the Polymer Materials and Engineering Major of East China University of Science and Technology with a Bachelor’s degree of Engineering in July 2000. He graduated from Chemical Engineering Major of East China University of Science and Technology with a Master’s degree in April 2008. He is a senior engineer by professional title.
120
Directors, Supervisors, Senior Management and Employees (continued)
| (II) | Profiles of Directors, Supervisors and senior management (Continued) |
Liu Gang, born in September 1972, is currently the Secretary to the board of directors, the joint company secretary, the assistant to the general manager, the general counsel, and the general manager of the capital operation Department and Shanghai Petrochemical Investment Development Co., Ltd. Mr. Liu Gang joined the work in 1995 and successively served as the deputy director and director of the supply management department of the company’s material supply company and the business operation manager of the commercial department of Shanghai Secco. From November 2015 to August 2018, he served as the deputy director of the company’s material procurement center. From August 2018 to April 2019, he served as the deputy director (presiding over the work) of the company’s material procurement center. From April 2019 to January 2021, he served as the general manager of the material procurement center of the company. He has been the assistant to the general manager of the company since December 2019. He has been the general counsel of the company since March 2021. He has been the Secretary of the board of directors and joint company secretary of the company since April 2021. He has been the general manager of the company’s capital operation Department and Shanghai Petrochemical Investment Development Co., Ltd. since August 2021. Mr. Liu Gang graduated from China Textile University in 1995, majoring in mechatronics, and obtained a master’s degree in power engineering from East China University of technology in 2007, with the title of senior economist.
| (III) | Share options held by the Directors, Supervisors and senior management during the Reporting Period |
There were no share options held by the Directors, Supervisors and senior management during the Reporting Period.
121
Directors, Supervisors, Senior Management and Employees (continued)
| (IV) | Positions held in the Company’s shareholders during the Reporting Period |
| Name |
Name of shareholder |
Position held |
Commencement of term of service |
End of term of service | ||||
| Xie Zhenglin |
Sinopec Corp. |
Deputy general manager of chemical business department |
December 2019 | May 2024 | ||||
| Xie Zhenglin |
Sinopec Asset Management Co., Ltd |
general manager |
December 2019 | May 2024 | ||||
| Zhang Xiaofeng |
Sinopec Group |
Deputy general manager of enterprise reform and law department |
December 2019 | May 2024 |
| (V) | Positions held in other companies during the Reporting Period |
| Name |
Name of other company |
Position held |
Commencement of term of service |
End of term of service | ||||
| Wu Haijun |
Shanghai SECCO |
Director |
August 2019 | August 2022 | ||||
| Wu Haijun |
Shanghai chemical industrial zone development co. LTD |
Chairman |
January 2018 | September 2021* | ||||
| Du Jun |
Jinshan Associated Trading |
Chairman |
December 2020 | July 2023 | ||||
| Du Jun |
Shanghai chemical industrial zone development co. LTD |
Director |
December 2020 | September 2021* |
| * | The board of directors of Shanghai chemical industrial zone development co. LTD has not been convened for a new term after the expiration of the seventh term of directors. In accordance with the relevant provisions of the company law, the directors of the company continue to hold corresponding positions. |
Apart from the information set out in the tables above and in section (2) “Profile of Directors, Supervisors and Senior Management”, no Director, Supervisor or senior management of the Company holds any other position at any other company.
122
Directors, Supervisors, Senior Management and Employees (continued)
| (VI) | Remuneration of Directors, Supervisors and senior management during the Reporting Period |
| Procedures for determining the remuneration of Directors, Supervisors and senior management |
Remuneration for Independent Non-executive Directors are determined in accordance with the Remuneration System for Independent Directors approved at the 2007 Annual General Meeting. Remuneration for Independent Supervisors are determined in accordance with the Remuneration Payment Method for Independent Supervisors approved at the 2016 Annual General Meeting. Remuneration of the other Directors, Employee Representative Supervisors and External Supervisors and senior management are determined in accordance with the Remuneration System for Directors, Supervisors and Senior Management approved at the 2002 Annual General Meeting.·For details of the remuneration of the Directors and Supervisors of the Company, please refer to Note 38 to the consolidated financial statements prepared under IFRS. | |
| Basis for determining the remuneration of Directors, Supervisors and senior management |
The remuneration of Directors, Supervisors and senior management of the Company is determined on the principles of “efficiency, motivation and fairness” and in accordance with the Remuneration System for Directors, Supervisors and Senior Management. | |
| Remuneration paid to Directors, Supervisors and senior management |
Please refer to item (1) “Changes in shareholdings and remuneration” of this chapter. | |
| Total remuneration received by all Directors, Supervisors and senior management for the Reporting Period |
RMB12.4168 million | |
| The five highest paid individuals |
Please refer to note 34(i) to the consolidated financial statements prepared under IFRS. The five individuals are the Directors and Supervisors of the Company. | |
| Pension scheme |
Please refer to Notes 2.24 and 33(e) to the consolidated financial statements prepared under IFRS. | |
123
Directors, Supervisors, Senior Management and Employees (continued)
(VII) Changes in Directors, Supervisors and senior management during the Reporting Period
| Name |
Position held |
Change |
Reason | |||
| Du Jun | Executive Director, Vice President and Chief Finance Officer | Elected | — | |||
| Liu Gang | Secretary to the Board | Appointment | — |
| (VIII) | Interests and short positions of Directors, chief executives and Supervisors in the shares, underlying shares and debentures of the Company or associated corporations |
As at 31 December 2021, the interests and short positions of the Directors, chief executive and Supervisors of the Company in the shares, underlying shares and debentures of the Company or its associated corporations (within the meaning of Part XV of the SFO) which were required to be notified to the Company and the Hong Kong Stock Exchange pursuant to Divisions 7 and 8 of Part XV of the SFO (including interests and short positions which they were taken or deemed to have under such provisions of the SFO); or to be recorded in the register of interests required to be kept under section 352 of the SFO; or as otherwise notified to the Company and the Hong Kong Stock Exchange pursuant to the Model Code for Securities Transactions set out in Appendix 10 to the Hong Kong Listing Rules were as follows:
Interests in the shares and underlying shares of the Company:
| Name |
Position held |
Number of shares held (Shares) |
Number of A shares |
Percentage of the total of the |
Percentage of the total issued A shares | |||||
| Jin Qiang1 |
Executive Director and Vice President |
301,000 A Share (L) | 0.002781 |
0.00411 |
Beneficial owner | |||||
| Jin Wenmin1 |
Executive Director and Vice President |
175,000 A Share (L) | 0.001617 |
0.00239 |
Beneficial owner | |||||
| Huang Xiangyu |
Executive Director and Vice President |
140,000 A Share (L) | 0.001293 |
0.001910 |
Beneficial owner | |||||
| Zhang Feng |
Supervisors |
10,000 A Share (L) | 0.000092 |
0.00014 |
Beneficial owner | |||||
| Chen Hongjun |
Supervisors |
31,400 A Share (L) | 0.000290 |
0.00043 |
Beneficial owner |
(L): Long position
| 1. | Jin Qiang and Jin Wenmin resigned as executive directors on February 15, 2022. |
124
Directors, Supervisors, Senior Management and Employees (continued)
Save as disclosed above, as at 31 December 2021, so far as was known to the Directors, chief executive and Supervisors of the Company, none of the Directors, chief executive or Supervisors of the Company had any interests or short positions in the shares, underlying shares or debentures of the Company or its associated corporations which were required to be disclosed or recorded pursuant to the SFO and the Hong Kong Listing Rules as mentioned above.
| (IX) | Changes in Directors’ and Supervisors’ information |
Save as disclosed in the 2021 interim report, disclosure of changes in Directors’ and Supervisors’ information pursuant to Rule 13.51B(1) of the Hong Kong Listing Rules during the Reporting Period are set out as below:
| (1) | Ms. Li Yuanqin, an independent non-executive director, has ceased to serve as an independent director of Shanghai New World Co., Ltd. (a company listed on Shanghai Stock Exchange, stock code: 600628) since December 10, 2021. |
| (2) | Chen Hongjun, the supervisor, has served as executive director, general manager and Secretary of the general Party branch of Sinopec Shanghai training center (due to the merger of Sinopec Shanghai Convention Center and Sinopec Shanghai training center in November 2021), general manager of Shanghai Petrochemical training center, executive vice president of the Party school, general manager of Shanghai Convention Center and President of Jinshan community college since November 2021. |
| (3) | Zheng Yunrui, the supervisor, has ceased to serve as an independent director of Dalian electric porcelain Group Co., Ltd. (listed on Shenzhen Stock Exchange, stock code: 002606) since March 2022. |
125
Directors, Supervisors, Senior Management and Employees (continued)
| (X) | Transactions, arrangements or interests of Directors and Supervisors |
None of the Directors or Supervisors of the Company had any material interests, either directly or indirectly, in any material contract which was entered into by the Company or any of its subsidiaries and subsisted during the year or at the end of the year.
None of the Directors or Supervisors had any interests in any businesses (other than the Group’s businesses) that competed directly or indirectly with the Group’s business.
None of the Directors or Supervisors of the Company has entered into any service contracts with the Company which are not terminable by the Company within one year without payment of compensation other than statutory compensation.
| (XI) | Directors’ rights to acquire shares or debentures |
During the Reporting Period, the Company did not grant the Directors the rights to acquire shares or debentures.
| (XII) | Compliance of Model Code for Securities Transactions |
The Company has adopted the Model Code for Securities Transactions to regulate securities transactions of the Directors and Supervisors. After making specific enquiries with all the Directors and Supervisors, the Company obtained written confirmations from each Director and Supervisor that they have fully complied with the Model Code for Securities Transactions during the Reporting Period.
The Model Code for Securities Transactions is also applicable to the senior management of the Company who are in possession of unpublished price sensitive information of the Company. No incident of non-compliance of the Model Code for Securities Transaction by the senior management was noted by the Company.
126
Directors, Supervisors, Senior Management and Employees (continued)
| (XIII) | Management contracts |
During the Reporting Period, the Company did not enter into any management and administration contract regarding the whole or any substantial part of its businesses (other than the service contracts with the Directors or any full-time employee of the Company).
| (XIV) | Permitted indemnity provision |
Appropriate Directors’ liability insurance has been arranged to indemnify the Directors for liabilities arising out of corporate activities. Such liability insurance is currently in force and was in force throughout the Reporting Period.
| (XV) | Punishment by securities regulatory authorities in the recent three years |
Nil.
| (XVI) | Employees |
| 1. | Employees of the Group |
| Number (Person) | ||||
| Number of employees of the Company |
8,156 | |||
| Number of employees of the subsidiaries |
74 | |||
| Total number of employees of the Group |
8,230 | |||
| Number of retired workers whose retirement costs are borne by the Group |
19,274 | |||
| Professionals Category of professionals |
||||
| Production personnel |
5,070 | |||
| Sales staff |
75 | |||
| Technical staff |
1,962 | |||
| Financial staff |
79 | |||
| Administrative staff |
1,044 | |||
|
|
|
|||
| Total |
8,230 | |||
|
|
|
|||
| Education level Educational attainment |
||||
| Specialist college graduate and below |
5,582 | |||
| Bachelor’s degree |
2,349 | |||
| Master’s degree and above |
299 | |||
|
|
|
|||
| Total |
8,230 | |||
|
|
|
|||
127
Directors, Supervisors, Senior Management and Employees (continued)
| 2. | Remuneration policy |
Remuneration packages of the Company’s staff include salary, share options and allowances. Employees of the Company are also eligible for medical insurance, retirement and other benefits. In accordance with the relevant regulations of the PRC, the Company also participates in the social security scheme implemented by the relevant government authorities, and makes contribution for the employees in proportion to their monthly salary. Employees of the Company can also enjoy supplementary medical insurance, enterprise annuity, retirement and other benefits.
During the Reporting Period, the staff remuneration of the Company amounted to RMB3,451,723.82 thousand.
| 3. | Training programs |
In consideration of the 2021 annual training plan implementation and the missions of being targeted, systematic and forward-looking, the Company took the “detailed customization from the bigger picture” as the main goal, the “effective training on a case-by-case basis” as the main principle, the “goal-oriented and problem-oriented” as the main requirements. The Company therefore organized staff training at three levels, in all units of the Company and dispatched personnel to participate in the headquarters and external institutions, so as to improve the quality of staff, to enhance their professional quality and to ensure high-quality development.
128
Directors, Supervisors, Senior Management and Employees (continued)
| 4. | Professional structure chart |
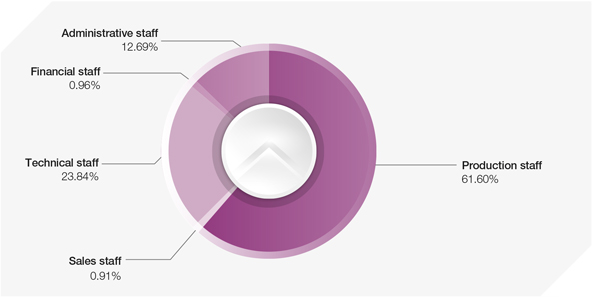
| 5. | Statistics on the education level |
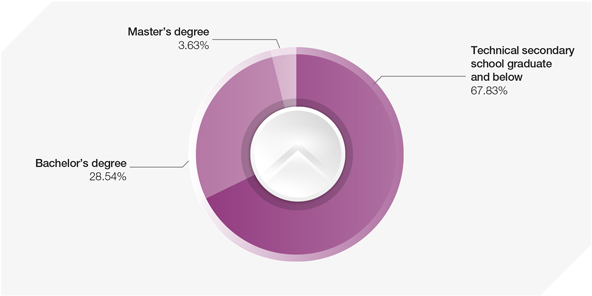
| 6. | Outsourcing services |
The total remuneration paid for outsourcing services of the Company during the Reporting Period was RMB125,063.4 thousand.
129
| (I) | Notes for corporate governance and insider registration management |
| 1. | Corporate governance |
In 2021, the Company strictly complied with the regulatory legislation such as Company Law, Securities Law and the Corporate Governance Principles for Listed Companies issued by the CSRC, as well as the relevant provisions and requirements of the Shanghai Stock Exchange, the Hong Kong Stock Exchange and the New York Stock Exchange. It continued to improve its corporate governance structure, developed its corporate system, standardized the corporate operations and enhanced its overall corporate image.
Accomplishing appropriately specific corporate governance activities for listed companies: During the Reporting Period, the Company was committed to ensuring the compliance of relevant regulatory rules regarding corporate governance and continued to consolidate its achievements in specific areas of corporate governance. None of the Company, its Directors, Supervisors, senior management, shareholders and de facto controllers of the Company has been investigated by the CSRC, or punished or publicly criticized by the CSRC, the Securities and Futures Commission of Hong Kong or the U.S. Securities and Exchange Commission, or publicly censured by the Shanghai Stock Exchange, the Hong Kong Stock Exchange or the New York Stock Exchange.
Through continuous conduction of specific corporate governance activities and improvements of its governance system, the Company further enhanced its corporate governance level. The Company’s internal system also became more robust and standardized. Under the guidance of the relevant regulatory authorities, the Company will operate in strict compliance with the relevant laws and regulations and will further strengthen the establishment of standardized and institutionalized corporate governance so as to ensure the lawful, robust and sustainable development of the Company.
| 2. | Registration and management of persons with access to inside information |
In order to administer the registration and management of persons with access to the Company’s inside information, strengthen confidentiality of inside information and safeguard fairness of information disclosure, during the Reporting Period, the Company enhanced the confidentiality of inside information and the registration, management and reporting of the persons with access to the Company’s inside information according to “System for the Registration and Management of Inside Information”, so as to prevent the Company from suffering unusual stock price fluctuations due to leakage of inside information and the resulting legal risks, and further standardize the Company’s operation.
130
Corporate Governance (continued)
| (II) | Brief introduction of board meeting |
| Session of
the |
Convening date |
Title of the motions |
Status of the resolutions |
Designated websites for |
Date of publication of resolutions |
|||||||||
| The 5th meeting of the 10th board of directors |
24 March 2021 | 1. the 2020 Work Report of the president of the Company 2. the 2020 Work Report of the board of directors (the “Board”) of the Company 3. Proposal on provision for asset impairment and disposal of fixed assets in 2020 4. the 2020 Audited Financial Statements of the Company 5. the 2020 Profit Distribution Plan of the Company 6. the 2021 Financial Budget Report of the Company 7. Full text and summary of the Company’s 2020 Annual Report 8. 2020 Internal control evaluation report of the Company 9. 2020 Corporate social responsibility report of the Company 10. 2021 financial derivatives plan of the Company 11. the appointment of KPMG Huazhen LLP and KPMG as the domestic and international auditors, respectively, of the Company for the year 2021 and the authorization of the Board to fix their remuneration 12. Internal control manual of the Company (2021 Edition) |
Passed | Websites of the Shanghai Stock Exchange, the Hong Kong Stock Exchange and the Company | 25 March 2021 | |||||||||
| The 6th meeting of the 10th board of directors |
28 April 2021 | 1. Approve the form 20-F to be submitted to the U.S. Securities and Exchange Commission and submit the relevant materials of the board meeting to the New York Stock Exchange 2. First quarter report of the Company in 2021 3. Proposal on Amending the articles of association and its annexes 4. Amendment to the rules of procedure of the audit committee of the company 5. Liu Gang was appointed secretary of the board of directors and Joint Secretary of the company 6. Proposal on Authorizing the board of directors to decide to issue debt financing instruments |
Passed | Websites of the Shanghai Stock Exchange, the Hong Kong Stock Exchange and the Company | 29 April 2021 | |||||||||
131
Corporate Governance (continued)
| Session of
the |
Convening date |
Title of the motions |
Status of the resolutions |
Designated websites for |
Date of | |||||||
| The 7th meeting of the 10th board of directors |
16 June 2021 | 1. Elected Mr. Du Jun as the executive director of the 10th board of directors of the company 2. Elected Mr. Du Jun as a member of the strategy committee of the 10th board of directors of the company |
Passed | Websites of the Shanghai Stock Exchange, the Hong Kong Stock Exchange and the Company | 17 June 2021 | |||||||
| The 8th meeting of the 10th board of directors |
9 July 2021 | 1. Proposal on jointly reducing the capital of the joint venture with related parties |
Passed | Websites of the Shanghai Stock Exchange, the Hong Kong Stock Exchange and the Company | 10 July 2021 | |||||||
| The 9th meeting of the 10th board of directors |
25 August 2021 | 1. Full text and summary of the company’s 2021 semi annual report 2. Proposal on joint investment and establishment of joint venture with related parties |
Passed | Websites of the Shanghai Stock Exchange, the Hong Kong Stock Exchange and the Company | 26 August 2021 | |||||||
| The 10th meeting of the 10th board of directors |
30 September 2021 | 1. Measures for business performance assessment of management members of Sinopec Shanghai Petrochemical 2. Measures for the management of remuneration of management members of Sinopec Shanghai Petrochemical |
Passed | Websites of the Shanghai Stock Exchange, the Hong Kong Stock Exchange and the Company | 8 October 2021 | |||||||
| The 11th meeting of the 10th board of directors |
27 October 2021 | 1. Third quarter financial report of the Company in 2021 2. Sinopec Shanghai Petrochemical information disclosure management system |
Passed | Websites of the Shanghai Stock Exchange, the Hong Kong Stock Exchange and the Company | 28 October 2021 | |||||||
| The 12th meeting of the 10th board of directors |
30 November 2021 | 1. Outline of the 14th five year plan of Sinopec Shanghai Petrochemical |
Passed | Websites of the Shanghai Stock Exchange, the Hong Kong Stock Exchange and the Company | 1 December 2021 | |||||||
132
Corporate Governance (continued)
| (III) | Brief introduction of general meeting |
| Session of the meeting |
Convening date |
Title of the motions |
Status of the resolutions |
Designated websites for |
Date of publication of resolutions |
|||||||||
| The Company’s 2020 annual general meeting |
16 June 2021 | 1. the 2020 Work Report of the board of directors (the “Board”) of the Company; 2. the 2020 Work Report of the supervisory committee of the Company; 3. the 2020 Audited Financial Statements of the Company; 4. the 2020 Profit Distribution Plan of the Company; 5. the 2021 Financial Budget Report of the Company; 6. the appointment of KPMG Huazhen LLP and KPMG as the domestic and international auditors, respectively, of the Company for the year 2021 and the authorization of the Board to fix their remuneration; 7. the election of Mr. Du Jun as a non-independent director of the Tenth Session of the Board; 8. the authorization to the Board to decide on the issuance of debt financing instruments; 9. the proposed amendments to the Articles of Association of the Company and its Appendices. |
Passed | Websites of the Shanghai Stock Exchange, the Hong Kong Stock Exchange and the Company | 17 June 2021 | |||||||||
133
Corporate Governance (continued)
| (IV) | Performance of duties by the directors |
| 1. | Directors’ attendance at the Board meetings and general meetings |
| Information on participating in the Board Meeting | Information on participating in General Meetings |
|||||||||||||||||||||||||||||||
| Name of Director |
Independent Director or not |
Attendance at the Board meetings during the year (number of times) |
Attendance in person (number of times) |
Attendance by correspondence (number of times) |
Attendance by proxy (number of times) |
Absence (number of times) |
Failure to attend the meeting in person for two consecutive times or not |
Attendance at general meetings (number of times) |
||||||||||||||||||||||||
| Wu Haijun |
No | 8 | 8 | 6 | 0 | 0 | No | 1 | ||||||||||||||||||||||||
| Guan Zemin |
No | 8 | 7 | 7 | 1 | 0 | No | 0 | ||||||||||||||||||||||||
| Jin Qiang |
No | 8 | 8 | 6 | 0 | 0 | No | 1 | ||||||||||||||||||||||||
| Du Jun |
No | 6 | 6 | 5 | 0 | 0 | No | 1 | ||||||||||||||||||||||||
| Jin Wenmin |
No | 8 | 8 | 6 | 0 | 0 | No | 1 | ||||||||||||||||||||||||
| Huang Xiangyu |
No | 8 | 8 | 6 | 0 | 0 | No | 0 | ||||||||||||||||||||||||
| Huang Fei |
No | 8 | 8 | 6 | 0 | 0 | No | 0 | ||||||||||||||||||||||||
| Xie Zhenglin |
No | 8 | 7 | 7 | 1 | 0 | No | 0 | ||||||||||||||||||||||||
| Peng Kun |
No | 8 | 7 | 7 | 1 | 0 | No | 0 | ||||||||||||||||||||||||
| Li Yuanqin |
Yes | 8 | 8 | 7 | 0 | 0 | No | 1 | ||||||||||||||||||||||||
| Tang Song |
Yes | 8 | 8 | 7 | 0 | 0 | No | 1 | ||||||||||||||||||||||||
| Chen Haifeng |
Yes | 8 | 8 | 7 | 0 | 0 | No | 1 | ||||||||||||||||||||||||
| Yang Jun |
Yes | 8 | 8 | 7 | 0 | 0 | No | 1 | ||||||||||||||||||||||||
| Gao Song |
Yes | 8 | 7 | 6 | 1 | 0 | No | 0 | ||||||||||||||||||||||||
| Number of Board meetings held during the year |
8 | |||||
| including: |
number of meetings held on site |
2 | ||||
| number of meetings held by correspondence |
4 | |||||
| number of meetings held on site and by correspondence concurrently |
2 | |||||
134
Corporate Governance (continued)
| 2. | Disagreements of the Independent Non-executive Directors on relevant issues of the Company |
During the Reporting Period, none of the Independent Non-executive Directors of the Company raised any disagreements on any Board resolutions or other issues of the Company.
| (V) | Major comments and recommendations put forward by the specific Board committees under the Board while discharging their duties during the Reporting Period |
On 23 March 2021, the Board’s Audit Committee reviewed together with the management the accounting principles and standards adopted by the Company and discussed matters regarding audit, risk management, internal control and financial reporting, including the review of the financial statements for the year ended 31 December 2020.
On 23 March 2021, the Board’s Remuneration and Appraisal Committee reviewed the remuneration of Directors, Supervisors and senior management set out in the Company’s annual report for the year ended 31 December 2020.
| (VI) | Information on Supervisory Committee’s identification of risks in the Company |
The Company’s Supervisory Committee had no disagreements to the matters under their supervision during the Reporting Period.
| (VII) | Information on whether the Company fails to guarantee independence from its controlling shareholder or maintain autonomous operational ability in respect of business, personnel, assets, organization and finances, etc. |
The Company is independent of the controlling shareholder with regard to its business, personnel, assets, organizations and finances. The Company has full ability to conduct its business independently and has the ability to operate autonomously.
135
Corporate Governance (continued)
| (VIII) | The Company’s controlling shareholders, actual controllers and other units under their control are engaged in the same or similar business as the Company, as well as the impact of horizontal competition or major changes in horizontal competition on the Company, the solution measures taken, the solution progress and the subsequent solution plan |
The company’s main business is to process petroleum into a variety of petroleum products, intermediate petrochemical products, resins, plastics and synthetic fibers. This kind of business is the same or similar to some businesses engaged in by the Company’s controlling shareholders, actual controllers and other units under their control. The Company adheres to legal and compliant operation. At present, the company is actively committed to transformation and upgrading, focusing on the development of high-end chemicals, new materials and new energy, and striving to achieve differentiated development. The foregoing situation will not have a significant adverse impact on the production and operation of the Company, or damage the independence of the listed company.
| (IX) | Evaluation mechanism for senior management as well as the establishment and implementation of incentive mechanism during the Reporting Period |
On September 30, 2021, the board of directors of the Company deliberated and adopted and implemented the measures for business performance assessment of management members of Shanghai Petrochemical and the measures for salary management of management members of Shanghai Petrochemical, according to which the performance evaluation and incentive of senior managers of the company were carried out.
| (X) | Rectification of problems in self inspection of special actions for governance of listed companies |
The problems existing in the Company’s self inspection of the special action on corporate governance of listed companies are as follows:
Question 1: independent directors do not attend the board of directors of Listed Companies in person: in some cases, independent directors do not attend the board of directors in person for official reasons.
Question 2: the on-site working hours of independent directors are less than 10 working days: so far, there are occasional cases where the on-site working hours of independent directors are less than 10 working days.
Rectification: problem 1 has been rectified. In the future, the company will continue to strengthen communication and service, create better conditions and try to ensure that the on-site working time of independent directors is not less than 10 working days.
136
| (I) | Statement of responsibility for internal control and the establishment of the internal control system |
| 1. | Statement of responsibility for internal control |
The Board of the Company is responsible for establishing and maintaining a comprehensive internal control system pertinent to financial reporting.
The objectives of internal control pertinent to financial reporting are to ensure that the financial information reported is true, complete and reliable and to prevent the risk of material misstatements. However, due to inherent limitations of the internal control, the Company can only provide reasonable level of assurance for the achievement of the objectives mentioned above.
The Board has evaluated the internal controls pertinent to financial reporting in accordance with the requirements under the Basic Standards for Enterprise Internal Control, and is of the view that such internal control was effective in the year 2021.
| 2. | Establishment of internal control system |
| Overall plan of internal control establishment | Since 2004, the Company has established and implemented a comprehensive internal control system which covers aspects such as production, operations, finance, investment, human resources and information disclosure, and amends the Internal Control Manual annually in accordance with domestic and overseas regulatory requirements, risk prevention needs and recommendations by external auditors on internal control review. | |
| The Company’s internal control system has been established primarily for the following basic objectives: (a) to standardize the enterprise’s business operation, prevent operational and managerial risks, ensure that financial statements and relevant information are truthful and complete, improve operational efficiency and effectiveness, and facilitate the achievement of the Company’s development strategy; (b) to plug loopholes and eliminate potential hazards so as to prevent, detect and correct mistakes and fraudulent acts in a timely manner, thereby ensuring that the Company’s assets are secure and integral; and (c) to ensure that the relevant state laws and regulations, the Articles of Association and internal rules and regulations are thoroughly enforced so as to fulfill the regulatory requirements for listed companies in both domestic and overseas capital markets. | ||
137
Internal Control (continued)
| (I) | Statement of responsibility for internal control and the establishment of the internal control system (Continued) |
| Work plan on establishing and improving the internal control system and implementation thereof | The Company’s internal control manual (2021 Edition) consists of 22 categories and 58 business processes. The monitoring scope mainly involves the main aspects of the company’s production and operation development and important links of related businesses, such as financial management, accounting, material procurement, product sales, capital expenditure, human resources, information management, etc. In 2021, the company conscientiously implemented the internal control manual approved by the board of directors, and conducted comprehensive self-examination, process walk through test and annual evaluation of internal control in accordance with the regulations. KPMG Huazhen LLP an external auditor, audited the company’s internal control. The management of the company believes that the internal control of the company is effective during the reporting period. | |
| Establishment of the department inspecting and supervising internal control |
The Company has established an internal control task force, with the Chairman, the President and the Chief Financial Officer as its chief and deputy chief, respectively. As the leading organ of the Company’s overall internal control system, the guidance group’s main duty include organize the formulation and revision of the company’s internal control manual, organize the self inspection of the internal control of the company’s own level and the inspection of its subordinate enterprises, and guide and coordinate the company’s internal control management. | |
| The internal control office under the internal control task force is the centralized management department of the comprehensive supervision of the company’s internal control risk management, which is responsible for the daily supervision and special supervision of the company’s internal control risk management, and the daily work is in the charge of the enterprise management department. The Company established an internal control supervisor working network which was in charge of each department (unit) in the company. These internal control supervisors, representing their respective departments, and administrative heads of second-tier units, conduct internal control work and activities within their respective supervisory scope and functionally report to the internal control office of the Company. | ||
138
Internal Control (continued)
| (I) | Statement of responsibility for internal control and the establishment of the internal control system (Continued) |
| The Board’s work arrangements for internal control | Control reports on the establishment of the internal control system of the Company and the findings of the implementation and inspection of the internal control on a regular basis. The Board also considers and publishes a self-assessment report on the internal control of the Company on an annual basis, and considers and approves the revised Internal Control Manual of the Company annually. | |
| KPMG Huazhen LLP the Company’s external auditor, issued an auditor’s report on internal control over financial reporting according to the “Sarbanes-Oxley Act”. KPMG Huazhen LLP the Company’s external auditor, issued an auditor’s report on internal control over financial reporting according to “Audit Guidelines for Enterprise Internal Control” in 2021. | ||
| Improvements in the internal control system in relation to financial audit |
The Company took the lead for the assessment of the rules and regulations and fully assessed the compliance and effectiveness of each system. A total of 133 amendments were made, 27 systems were added. | |
| Deficiencies in internal control and the relevant rectification | The Company conducted a self-assessment on its internal control work in 2021. The results of the assessment are: no material deficiencies were detected in the design or implementation of the internal control of the Company from 1 January 2021 to 31 December 2021. | |
| (II) | Disclosure of the self-assessment report on internal control |
The Company has disclosed the self-assessment report of the Board on the Company’s internal control.
| (III) | Auditor’s report on internal control |
The Auditor’s report on internal control is disclosed or not: Disclosed
The Company has engaged KPMG Huazhen LLP to conduct an audit on the effectiveness of the internal control over financial reporting of the Company for the year ended 31 December 2021 pursuant to the requirements of the Audit Guidelines for Enterprise Internal Control and an auditor’s report on internal control has been issued.
| (IV) | The Company’s establishment of an accountability system for major errors in the disclosure of information in annual reports |
The Company’s Information Disclosure Management System (2021 Revised Version) sets out specific regulations for the accountability of major errors in the disclosure of information in its annual reports. During the Reporting Period, there were no major errors in the disclosure of information in the Company’s annual report, which required amendments to major accounting errors, supplements to material omission of information or amendments to results forecasts.
139
(under the Hong Kong listing rules)
The Company is committed to operating in compliance with corporate governance standards by implementing stringent corporate governance measures and enhancing accountability and transparency to deliver higher returns to shareholders. It is the Board’s belief that maintaining a good corporate governance system and a world-class governance model are essential in providing a framework for the Company to safeguard the interests of shareholders, enhance corporate value, formulate its business strategies and policies and to develop the Company into a competitive international petrochemical enterprise.
| (1) | Corporate Governance Practices |
The Company has applied the principles set out in the Corporate Governance Code (the Corporate Governance Code before the amendment takes effect on 1 January 2022). On 1 January 2022, the amendment to the Corporate Governance Code (the “New CG Code”) came into effect and the requirements under the New CG code will apply to corporate governance reports for financial year commencing on or after 1 January 2022. The Board will continue to review and enhance its corporate governance practice of the Company to ensure compliance with the New CG Code and align with the latest developments.
In the opinion of the Directors, throughout the Reporting Period, the Company has complied with all applicable code provisions set out in the Corporate Governance Code.
In the opinion of the Directors, throughout the Reporting Period, the Company has complied with all applicable principles and code provisions set out in the Environmental, Social and Governance Reporting Guide, details of which are set out in the Company’s “2021 Corporate Social Responsibility Report”.
| (2) | Securities Transactions by Directors and Supervisors |
The Company has adopted the Model Code for Securities Transactions as set out in Appendix 10 to the Hong Kong Listing Rules.
Specific enquiry has been made with all the Directors and Supervisors and the Directors and Supervisors have confirmed that they have fully complied with the Model Code for Securities Transactions throughout the Reporting Period.
The Model Code for Securities Transactions is also applicable to the senior management of the Company who are in possession of unpublished price sensitive information of the Company. No incident of non-compliance of the Model Code for Securities Transactions by the senior management was noted by the Company.
140
Corporate Governance Report (continued)
(under the Hong Kong listing rules)
| (3) | Board of Directors |
| 1. | Composition of the Board |
The Board currently consists of 11 Directors, including 4 Executive Directors, 2 Non-executive Directors and 5 Independent Non-executive Directors, among whom there is 1 Chairman and 2 Vice Presidents. Details of the current Board composition are as follows:
Executive Directors:
Wu Haijun, Chairman, Chairman of the Strategy Committee and member of the Nomination Committee
Guan Zemin, Vice Chairman and President, Vice Chairman of the Strategy Committee
Du Jun, Vice President, Chief Financial Officer and member of the Strategy Committee
Huang Xiang Yu, Vice President and member of the Strategy Committee
Non-executive Directors:
Xie Zhenglin, member of the Strategy Committee
Peng Kun
Independent Non-executive Directors:
Li Yuanqin, Chairman of the Audit Committee
Tang Song, member of the Audit Committee and the Remuneration and Appraisal Committee
Chen Haifeng, member of the Audit Committee and the Nomination Committee
Yang Jun, Chairmen of the Remuneration and Appraisal Committee and the Nomination Committee
Gao Song, member of the Remuneration and Appraisal Committee and the Strategy Committee
During the Reporting Period and as at the date of this report, Mr. Jin Qiang, Mr. Jin Wenmin and Mr. Huang Fei resigned as Executive Directors on 15 February 2022. Mr. Du Jun was appointed as an Executive Director on 16 June 2021.
The biographical information of the Directors is set out in the section headed “Directors, Supervisors, Senior Management and Employees” on pages 110 to 129 of this annual report. The Directors (including the Chairman and the President (equivalent to the chief executive officer) have no financial, business, family or other material relationship with each other.
141
Corporate Governance Report (continued)
(under the Hong Kong listing rules)
| 2. | Attendance Records of the Directors |
The Board meets at least once per quarter. In 2021, the Board held 8 meetings. Most of the Directors entitled to attend the meetings had actively attended the 8 meetings held during the year in person or by alternates. Before each Board meeting, the joint company secretary would consult each Director on matters to be tabled at the Board meeting. Any matters raised by the Directors would be included in the agenda of the Board meeting. During the Reporting Period, notices and draft agenda of Board meetings were sent to all Directors at least 14 days before the date of the meeting.
To facilitate the Directors in performing their duties effectively and obtaining relevant information to make informed decisions, the agenda of all meetings of the Board or Board committees, together with all relevant documents, are sent to each Board member at least five days before the date of the relevant meetings. The Directors may hold formal or informal meetings with the senior management before any Board meeting. The Directors and members of the Board committees have access to the papers and minutes of meetings of the Board or the Board committees.
The attendance records of each director at the Board meetings and the general meetings of the Company held during the Reporting Period are set out in the table below:
| Board Meeting | Annual General Meeting |
|||||||||||||||||||
| Name of Director |
Number of Meetings |
Attendance in Person |
Attendance by Communication Method |
Attendance by Alternate |
Attendance/ Number of Meetings |
|||||||||||||||
| Executive Directors: |
||||||||||||||||||||
| Wu Haijun |
8 | 8 | 6 | 0 | 1/1 | |||||||||||||||
| Guan Zemin |
8 | 7 | 7 | 1 | 0/1 | |||||||||||||||
| Du Jun(1) |
6 | 8 | 5 | 0 | 1/1 | |||||||||||||||
| Huang Xiangyu |
8 | 8 | 6 | 0 | 0/1 | |||||||||||||||
| Jin Qiang(2) |
8 | 8 | 6 | 0 | 1/1 | |||||||||||||||
| Jin Wenmin(2) |
8 | 8 | 8 | 0 | 1/1 | |||||||||||||||
| Huang Fei(2) |
8 | 8 | 7 | 0 | 0/1 | |||||||||||||||
| Non-executive Directors: |
||||||||||||||||||||
| Xie Zhenglin |
8 | 7 | 7 | 1 | 0/1 | |||||||||||||||
| Peng Kun |
8 | 7 | 7 | 1 | 0/1 | |||||||||||||||
| Independent Non-executive Directors: |
||||||||||||||||||||
| Li Yuanqin |
8 | 8 | 7 | 0 | 1/1 | |||||||||||||||
| Tang Song |
8 | 8 | 7 | 0 | 1/1 | |||||||||||||||
| Chen Haifeng |
8 | 8 | 7 | 0 | 1/1 | |||||||||||||||
| Yang Jun |
8 | 8 | 7 | 0 | 1/1 | |||||||||||||||
| Gao Song |
8 | 7 | 6 | 1 | 0/1 | |||||||||||||||
Notes:
| (1) | Mr. Du Jun was appointed as an Executive Director on 16 June 2021. |
| (2) | Mr. Jin Qiang, Mr. Jin Wenmin and Mr. Huang Fei resigned as Executive Directors on 15 February 2022. |
142
Corporate Governance Report (continued)
(under the Hong Kong listing rules)
The Company did not hold extraordinary general meeting of the shareholders during the Reporting Period.
Apart from the abovementioned Board meetings, the Chairman also held 1 meeting with the Non-executive Directors (including independent Non-executive Directors) without the presence of the Executive Directors during the Reporting Period to discuss the Board’s annual work plan and the implementation of such plans and to review the state of the Company’s productions and operations and its development prospects
| 3. | Chairman and President (equivalent to Chief Executive Officer) |
The duties and responsibilities of the Chairman and the President are separated and the scope of their respective duties and responsibilities is set out in the Articles of Association.
The Chairman of the Company is responsible for providing to all Directors all information concerning the performance of Board duties. He is also committed to improving the quality of the information and timeliness of the delivery of information to the Directors. The Chairman of the Company plays an important role in promoting good corporate governance within the Company. He is to lead the Board, encourage the Directors to carry out their duties in good faith with mutual support and close cooperation, and make an active contribution to the production, operations, reform and development of the Company. The President is accountable to the Board. With the authorization of the Board, the President shall have the power to fully manage the Company’s business, deal with all internal and external affairs of the Company including presiding over the management of the Company’s production and operations, developing basic rules and regulations of the Company, organizing and implementing the annual business plan and investment proposals of the Company, etc.
Code provision C.2.1 of the new CG Code (Equivalent to code provision A.2.1 of the previous Corporate Governance Code) stipulates that the roles of chairman and chief executive should be separate and should not be performed by the same individual.
During the Reporting Period, the positions of the Chairman and the President are held by Mr. Wu Haijun and Mr. Guan Zemin respectively.
143
Corporate Governance Report (continued)
(under the Hong Kong listing rules)
| 4. | Independent Non-executive Directors |
During the Reporting Period, the Board at all times has five Independent Non-executive Directors representing one-third of the Board, meeting the requirements of the Hong Kong Listing Rules relating to the appointment of at least three Independent Non-executive Directors representing at least one-third of the Board with one of whom possessing appropriate professional qualifications, or accounting or related financial management expertise.
The Independent Non-executive Directors possess extensive experience as well as academic and professional qualifications in various areas that include management, accounting and finance thereby ensuring the Board’s ability to protect the interests of the Company’s shareholders as a whole. During the Reporting Period, the Independent Non-executive Directors contributed significantly in improving the Company’s corporate governance structure and protecting the interests of the Company’s minority shareholders.
The Company has received written annual confirmation from each of the Independent Non-executive Directors in respect of his independence in accordance with the independence guidelines set out in Rule 3.13 of the Hong Kong Listing Rules. The Company considers all Independent Non-executive Directors independent.
| 5. | Appointment and Re-election of Directors |
All Directors (including Non-executive Directors and Independent Non-executive Directors) are appointed for a specific term. According to the Articles of Association, Directors shall be elected by shareholders at a general meeting for a term of three years, and shall be eligible for re-election upon expiry of their term of office. However, the term of an Independent Non-executive Director may not exceed a total of six years.
| 6. | Responsibilities of the Directors |
The Board is primarily responsible for formulating and supervising the strategic development of the Company, setting the objectives, strategies, policies and business plans of the Company, reviewing and monitoring the Company’s operations and financial performance directly and indirectly through its committees, as well as devising the appropriate risk management and internal control policies and systems, thereby ensuring the achievement of the Company’s strategic objectives.
144
Corporate Governance Report (continued)
(under the Hong Kong listing rules)
All Directors, including Non-executive Directors and Independent Non-executive Directors, have brought a wide spectrum of valuable business experience, knowledge and professionalism to the Board for its efficient and effective functioning. The functions of the Non-executive Directors include participating in Board meetings to provide independent opinions, taking a lead at Board meetings where potential conflict of interests arises, serving as members of the Board committees when invited, scrutinizing the Company’s performance and providing a balance in the Board for bringing effective independent judgement on corporate actions and operations.
All Directors have full and timely access to all the information of the Company and may, upon request, seek independent professional advice in appropriate circumstances, at the Company’s expenses for discharging their duties to the Company. When the Directors are required to give opinions on matters such as external guarantees, financing and connected transactions, the Company will appoint relevant independent professionals such as auditors, financial advisers and lawyers to provide independent opinions to help the Directors discharging their duties.
The Board reserves the power to make decisions relating to all major matters including policy matters, strategies and budgets, internal control and risk management, material transactions (in particular those that may involve conflict of interests), financial information, appointment of directors and other significant operational matters of the Company. Responsibilities relating to implementing decisions of the Board, directing and co-ordinating the daily operation and management of the Company are delegated to the management.
The Rules of Procedures for the Board, an appendix to the Articles of Association, contains detailed provisions on the terms of reference, authorization, meeting policies and rules of discussion of the Board. The Company has also developed the Work Rules for the President which contains detailed provisions on the duties and responsibilities as well as the rules of procedure for the management.
The Directors shall disclose to the Company details of other offices held by them and the Board regularly reviews the contribution required from each Director to perform his responsibilities to the Company.
The Company has purchased Directors’ and officers’ liabilities insurance in respect of any possible legal action against its Directors and officers arising out of corporate activities.
| 7. | Continuous Professional Development of Directors & Company Secretary |
Directors shall keep abreast of regulatory developments and changes in order to effectively perform their responsibilities and to ensure that their contribution to the Board remains informed and relevant.
145
Corporate Governance Report (continued)
(under the Hong Kong listing rules)
To ensure that the Directors adequately understand the operations and businesses of the Company, every newly-appointed Director will receive a comprehensive set of introductory materials after his/her appointment which includes an introduction to the Group’s business, the duties and responsibilities of a Director and other legal requirements. Relevant on-going professional training sessions will also be organized for newly-appointed Directors to help them fully understand the duties that a Director should fulfill as stipulated in the relevant requirements of the laws and regulations, including the Hong Kong Listing Rules, and to enable them to have a timely and comprehensive understanding of the operations of the Company.
In addition, all Non-executive Directors will receive updated information from the management regularly, including strategic plans, business reports and analyses on economic activities etc. with a view to assist them to perform their duties effectively.
All Directors should participate in continuous professional development to upgrade their expertise and skills and to refresh their knowledge to ensure that they perform their duties better in contributing to the Board. Each of the Directors has provided to the Company records of their participation in the relevant training in 2021. The Company has also committed to organizing training programs for its Directors. Internally-facilitated briefings for Directors would be arranged and reading material on relevant topics would be provided to Directors where appropriate.
During the reporting period, directors: Mr. Du Jun, Mr. Peng Kun, Mr. Tang Song, Mr. Chen Haifeng and Ms. Li Yuanqin, former director Mr. Huang Fei, supervisor Mr. Ma Yanhui and Mr. Chen Hongjun, who participated in the online training of directors and supervisors of Listed Companies in Shanghai in 2021; Ms. Li Yuanqin had the fourth follow-up training for independent directors of Listed Companies in 2021, and Mr. Tang Song and Mr. Gao Song had read relevant books and articles.
During the Reporting Period, Mr. Liu Gang and Ms. Chan Sze Ting, joint company secretaries of the Company, has received no less than 15 hours of relevant professional training respectively.
| (4) | Board Committees |
The Board has established four committees, namely, the Audit Committee, the Remuneration and Appraisal Committee, the Nomination Committee and the Strategy Committee, for overseeing particular aspects of the Company’s affairs. All Board committees stipulate their terms of reference. The Rules of Procedures of the Board committees are posted on the websites of the Hong Kong Stock Exchange, the Shanghai Stock Exchange and the Company and are available to shareholders upon request. The Board committees submit minutes, resolutions and reports to the Board subsequent to their meetings in respect of the progress of work and results of discussion.
146
Corporate Governance Report (continued)
(under the Hong Kong listing rules)
| 1. | The Remuneration and Appraisal Committee |
| (i) | Role and Functions of the Remuneration and Appraisal Committee |
The principal duties of the Remuneration and Appraisal Committee are to formulate and review the remuneration policies and proposals for the Directors and senior management of the Company, to set performance appraisal standards and conduct performance appraisals of the Directors and senior management of the Company, and to establish transparent procedures for developing such remuneration policy and structure to ensure that no Director or any of his directly interested parties is involved in deciding his own remuneration.
The committee may seek advice from independent professionals if required in accordance with the applicable procedures at the expense of the Company.
| (ii) | Members of the Remuneration and Appraisal Committee |
The Remuneration and Appraisal Committee of the Board comprises three Independent Non-executive Directors.
Members of the Remuneration and Appraisal Committee during the Reporting Period are as follows:
| Chairman: | Yang Jun, Independent Non-executive Director | |
| Members: | Tang Song, Independent Non-executive Director | |
| Gao Song, Independent Non-executive Director | ||
147
Corporate Governance Report (continued)
(under the Hong Kong listing rules)
| (iii) | Meetings of the Remuneration and Appraisal Committee |
The Remuneration and Appraisal Committee convenes at least one meeting each year. In 2021, the Remuneration and Appraisal Committee held 2 meetings with a record of attendance as follows:
| Name of Director |
Attendance in Person/Number of Meetings |
Attendance by Alternate/Number of Meetings |
||||||
| Yang Jun |
2/2 | 0 | ||||||
| Tang Song |
2/2 | 0 | ||||||
| Gao Song |
2/2 | 0 | ||||||
| (iv) | Procedures and Basis for the Determination of Remuneration of Directors, Supervisors and Senior Management |
The remuneration of Independent Non-executive Directors is determined in accordance with the “Remuneration System for Independent Directors” amended at the 2007 annual general meeting held in June 2008. The remuneration of other Directors, Staff Supervisors, External Supervisors and senior management is determined according to the “Remuneration System for Directors, Supervisors and Senior Management” passed at the 2002 annual general meeting held in June 2003. The remuneration of Independent Supervisors is determined in accordance with the “Remuneration Payment Method for Independent Supervisors” approved at the 2016 annual general meeting held in June 2017.
The Remuneration and Appraisal Committee reviews the implementation of the remuneration evaluation every year. It also appraises the annual performance of the Directors and senior management of the Company, and makes recommendations to the Board on their remuneration according to the results of the appraisal.
148
Corporate Governance Report (continued)
(under the Hong Kong listing rules)
| (v) | The Work of the Remuneration and Appraisal Committee during the Reporting Period |
During the Reporting Period, the Remuneration and Appraisal Committee reviewed the remuneration policy of the Directors and conducted annual appraisals with the Directors and the senior management. The committee also reviewed the remuneration structure of the Directors, Supervisors and senior management. The Remuneration and Appraisal Committee also considered and adopted “Measures for Evaluation the Business Performance of the Management of Sinopec Shanghai”, “Measures for Manage the Remuneration of Management of Sinopec Shanghai”, “Appointment Agreement for Management Posts of Sinopec Shanghai” and “Responsibility Letter for the Management on the Assessment of Business Performance of Sinopec Shanghai” during the Reporting Period.
| 2. | The Audit Committee |
| (i) | Role and Functions of the Audit Committee |
The Audit Committee is principally responsible for advising the Board on the appointment, dismissal, remuneration and terms of engagement of external auditors, reviewing the effectiveness of the Company’s internal audit function, supervising the internal audit system and its implementation, reviewing the financial information of the Company and its disclosure including verifying the completeness of financial statements, annual reports and interim reports of the Company, reviewing the major opinions stated in the financial statements and reports of the Company, reviewing the financial control, internal control and risk management systems of the Company, reviewing arrangements to enable employees of the Company to raise concerns about possible improprieties in financial reporting, internal control or other matters of the Company and examining connected transactions of the Company.
The establishment of the Audit Committee reflects the Company’s determination to improve the transparency of its financial reporting system and its financial arrangements. The Company pays close attention to the minutes and reports prepared by the Audit Committee. The committee may seek advice from independent professionals in accordance with the applicable procedures at the expense of the Company.
149
Corporate Governance Report (continued)
(under the Hong Kong listing rules)
| (ii) | Members of the Audit Committee |
The Audit Committee of the Board comprises three Independent Non-executive Directors.
Members of the Audit Committee during the Reporting Period are as follows:
| Chairman: | Li Yuanqin, Independent Non-executive Director | |
| Members: | Tang Song, Independent Non-executive Director | |
| Chen Haifeng, Independent Non-executive Director | ||
| (iii) | Meetings of the Audit Committee |
The Audit Committee should convene at least two meetings each year. In 2021, the Audit Committee held 4 meetings without the presence of the Executive Directors with a record of attendance as follows:
| Attendance in | Attendance by | |||||||
| Name of Director |
Person/Number of Meetings | Alternate/Number of Meetings | ||||||
| Liu Yuanqin |
4/4 | 0 | ||||||
| Tang Song |
4/4 | 0 | ||||||
| Chen Haifeng |
4/4 | 0 | ||||||
150
Corporate Governance Report (continued)
(under the Hong Kong listing rules)
| (iv) | The Work of the Audit Committee during the Reporting Period |
During the Reporting Period, the Audit Committee reviewed the accounting principles and standards adopted by the Company, the interim and annual financial results and reports and significant issues on the financial reporting, operational and compliance controls, the effectiveness of the risk management and internal control systems, appointment of external auditors and relevant scope of works, and continuing connected transactions of the Company. The Audit Committee also considered and approved the amendment to “The Rules of Procedure of the Audit Committee” and “The Proposal on Reduction of Capital on the Joint Venture with Related Parties” during the Reporting Period.
| 3. | The Nomination Committee |
| (i) | Role and Functions of the Nomination Committee |
The Nomination Committee is accountable to the Board, and is mainly responsible for reviewing the Board composition, making recommendations to the Board on the procedures and criteria for the selection and appointment of Directors and senior management of the Company and on their qualifications to hold office, and assessing the independence of Independent Non-executive Directors.
In assessing the Board composition, the Nomination Committee would take into account various aspects as well as factors concerning Board diversity as set out in the Company’s Board Diversity Policy, including but not limited to gender, age, cultural and educational background, professional qualifications, experience, skills, knowledge, length of service, etc. The Nomination Committee would discuss and agree on measurable objectives for achieving diversity on the Board, where necessary, and recommend them to the Board for adoption.
In identifying and selecting suitable candidates for directorships, the Nomination Committee would consider the candidate’s relevant criteria as set out in the Director Nomination Policy such as character, qualifications, experience, independence and other relevant criteria necessary to complement the corporate strategy and achieve Board diversity, where appropriate, before making recommendation to the Board.
The Company provides adequate resources to the Nomination Committee for the performance of its duties. The committee may seek independent professional advice during the performance of its duties at the Company’s expense.
151
Corporate Governance Report (continued)
(under the Hong Kong listing rules)
| (ii) | Members of the Nomination Committee |
The Nomination Committee of the Board comprised one Executive Director and two Independent Non-executive Directors.
Members of the Nomination Committee during the Reporting Period are as follows:
| Chairman: | Yang Jun, Independent Non-executive Director | |
| Members: | Chen Haifeng, Independent Non-executive Director | |
| Wu Haijun, Executive Director | ||
| (iii) | Meetings of the Nomination Committee |
The Nomination Committee should convene at least one meeting each year. In 2021, the Nomination Committee held 2 meetings during the Reporting Period. The attendance record of the meetings of the Nomination Committee is set out in the table below:
| Attendance in | Attendance by | |||||||
| Name of Director |
Person/Number of Meetings | Alternate/Number of Meetings | ||||||
| Yang Jun |
2/2 | 0 | ||||||
| Chen Haifeng |
2/2 | 0 | ||||||
| Wu Haijun |
2/2 | 0 | ||||||
152
Corporate Governance Report (continued)
(under the Hong Kong listing rules)
| (iv) | The Work of the Nomination Committee during the Reporting Period |
During the Reporting Period, the Nomination Committee reviewed the structure, number and composition of the Board, and assessed the independence of the Independent Non-executive Directors.
The Nomination Committee also reviewed the composition of the Board from a diversity level. At present, the Board has a total of 11 Directors, including 4 Executive Directors, 2 Non-Executive Directors, and 5 Independent Non-executive Directors. The four Executive Directors are from state-owned enterprises and hold important positions such as chairman, general manager, deputy general manager or chief financial officer. They have rich experience in enterprise management. The two Non-executive Directors have senior professional and technical titles of comprehensive management and senior accountants, rich experience in enterprise management, finance and investment development management, and have a deep understanding of the chemical industry. The five Independent Non-executive Directors are professors of accounting, researchers of law, financial professionals and scholars of business administration with rich professional experience. The Board has one female Director who provides professional advice for the Company in different areas. The diversified portfolio of the Board provides a wide range of professional advice to the Board, so as to ensure that the Board can effectively performs its duties, promotes the Company’s corporate performance and sustainable development. The Nomination Committee considers that the Board is sufficiently diversified in terms of age, cultural and educational background, professional experience, skills, and knowledge. In selecting directors, the Nomination Committee will pay special attention to other aspects such as gender and race, so as to achieve the goal of diversification of the Board. For the gender, age and term of service of Board members, please refer to Chapter V “Directors, Supervisors, Senior Management and Employees”.
153
Corporate Governance Report (continued)
(under the Hong Kong listing rules)
| (v) | Board Diversity Policy |
The Company has adopted a Board Diversity Policy which sets out the approach to achieve diversity of the Board. The Company recognizes and embraces the benefits of having a diverse Board and sees increasing diversity at the Board level as an essential element in maintaining the Company’s competitive advantage.
According to the Diversity Policy of the Board and in order to achieve sustainable and balanced development, the Company regards the increasing diversity of the Board as the key element to support its strategic objectives and maintain sustainable development. When setting the composition of the Board members, the Board consider the diversity of Board members from many aspects, including but not limited to gender, age, cultural and educational background, professional experience, skills, knowledge and service tenure. All appointments of the Board are based on the principle of “talents are the only people to be appointed”. According to specific needs and business model of the Company, the benefits of diversity of Board members are fully considered under objective conditions. The selection of directors will be based on a wide range of criteria, including but not limited to gender, age, cultural and educational background, race, professional experience, skills, knowledge and tenure of service. The final decision will be based on strengths of the candidates and the contribution they can make to the Board. The composition of the Board (including gender, age and term of service) will be disclosed in the Corporate Governance Report every year.
The Nomination Committee will report on the composition of the Board at the diversified level in the Corporate Governance Report every year and monitor the implementation of this policy.
| (vi) | Director Nomination Policy |
The Board has delegated its responsibilities and authority for selection and appointment of Directors to the Nomination Committee of the Company.
The Company has adopted a Director Nomination Policy which sets out the selection criteria and process and the Board succession planning considerations in relation to nomination and appointment of Directors of the Company and aims to ensure that the Board has a balance of skills, experience and diversity of perspectives appropriate to the Company and the continuity of the Board and appropriate leadership at Board level.
154
Corporate Governance Report (continued)
(under the Hong Kong listing rules)
The Director Nomination Policy sets out the factors for assessing the suitability and the potential contribution to the Board of a proposed candidate, including the following:
| • | Character and integrity; |
| • | Qualifications including professional qualifications, skills, knowledge, experience and diversity aspects under the Board Diversity Policy that are relevant to the Company’s business and corporate strategy; |
| • | Any measurable objectives adopted for achieving diversity on the Board; |
| • | Requirement for the Board to have independent non-executive directors in accordance with the Hong Kong Listing Rules and whether the candidate would be considered independent with reference to the independence guidelines set out in the Hong Kong Listing Rules; |
| • | Any potential contributions the candidate can bring to the Board in terms of qualifications, skills, experience, independence and gender diversity; |
| • | Willingness and ability to devote adequate time to discharge duties as a member of the Board and/or Board committee(s) of the Company; |
| • | Such other perspectives that are appropriate to the Company’s business and succession plan and where applicable, may be adopted and/or amended by the Board and/or the Nomination Committee from time to time for nomination of directors and succession planning; |
| • | Other conditions asset out in the Company’s articles of association (if any). |
The Director Nomination Policy also sets out the procedures for the selection and appointment of new Directors and re-election of Directors at general meetings. During the Reporting Period and up to the date of this Annual Report, there were changes in the composition of the Board and details of the changes are set out in the section headed “Composition of the Board” of this Corporate Governance Report.
The Nomination Committee will review the Director Nomination Policy, as appropriate, to ensure its effectiveness.
155
Corporate Governance Report (continued)
(under the Hong Kong listing rules)
| 4. | The Strategy Committee |
| (i) | Role and Functions of the Strategy Committee |
The major duties of the Strategy Committee are to conduct researches and give recommendations to the Board on major investment decisions, projects and major issues that affect the Company’s development, and to monitor the Company’s long-term development strategic plan.
| (ii) | Members of the Strategy Committee |
The Strategy Committee comprises four Executive Directors, one Non-executive Director and one Independent Non-executive Director.
| Chairman: | Wu Haijun, Executive Director | |
| Vic-chairman: | Guan Zemin, Executive Director | |
| Members: | Du Jun, Executive Director (appointed on 16 June 2021) | |
| Xie Zhenglin, Non-executive Director | ||
| Gao Song, Independent Non-executive Director | ||
| Huang Fei, Executive Director | ||
| (resigned on 15 February 2022) | ||
| Huang Xiangyu Executive Director (appointed as a member of Strategy Committee on 7 March 2022) | ||
156
Corporate Governance Report (continued)
(under the Hong Kong listing rules)
| (iii) | Meetings of the Strategy Committee |
In 2021, the Strategy Committee held 1 meeting during the Reporting Period. The attendance record of the meetings of the Strategy Committee is set out in the table below:
| Name of Director |
Attendance in Person/Number of Meetings |
Attendance by Alternate/Number of Meetings |
||||||
| Wu Haijun |
1/1 | 0 | ||||||
| Guan Zemin |
1/1 | 0 | ||||||
| Du Jun |
1/1 | 0 | ||||||
| Xie Zhenglin |
1/1 | 0 | ||||||
| Gao Song |
1/1 | 0 | ||||||
| Huang Fei(1) |
1/1 | 0 | ||||||
| (1) | Mr. Huang Fei left the post as member of the Strategy Committee on 15 February 2022. |
| (iv) | The Work of the Strategy Committee during the Reporting Period |
During the Reporting Period, the Strategic Committee, aiming at building a “leading domestic and world-class” refining and chemical enterprise and relying on the internal and external forces of the enterprise, carried out strategic research on cracking the bottleneck of development, carried out research on the Company’s phased strategic direction and implementation plan, the promotion of new material industry, the development of fine chemical business and other topics, and put forward suggestions for the company’s “14th five year plan” development plan and specified the medium and long-term development ideas and objectives of the Company, striving to gradually build Shanghai Petrochemical into an internationally competitive energy chemical and new material enterprise around 2035. The Strategic Committee also considered and adopted of “The 14th Five Year Plan Outline of Sinopec Shanghai” during the Reporting Period.
157
Corporate Governance Report (continued)
(under the Hong Kong listing rules)
| 5. | Corporate Governance Functions |
The Board is responsible for performing the functions set out in code provision A.2.1 (Equivalent to code provision D.3.1 of the previous Corporate Governance Code) of the Corporate Governance Code.
The Board reviewed the Company’s corporate governance policies and practices, training and continuous professional development of Directors and senior management, the Company’s policies and practices on compliance with legal and regulatory requirements, the compliance of the Model Code for Securities Transactions, and the Company’s compliance with the Corporate Governance Code and disclosure in this Corporate Governance Report.
| 6. | Supervisory Committee |
The Company’s tenth Session of the Supervisory Committee comprises six members, including three Employee Representative Supervisors (one of whom had served as Chairperson of the committee), one External Supervisor and two Independent Supervisors.
The Supervisors are appointed for a fixed term of office and the term of office of each Supervisor during the Reporting Period are set out in the section headed “Directors, Supervisors, Senior Management and Employees” on pages 110 to 129 of this annual report.
158
Corporate Governance Report (continued)
(under the Hong Kong listing rules)
In 2021, the Supervisory Committee convened 4 meetings with a record of attendance as follows:
| Name of Supervisor |
Position | Attendance in Person/ Number of Meetings |
Attendance by Alternate/Number of Meetings |
|||||||
| Ma Yanhui |
Employee Representative Supervisor and Chairperson |
4/4 | 0 | |||||||
| Zhang Feng |
Employee Representative Supervisor |
3/4 | 1 | |||||||
| Chen Hongjun |
Employee Representative Supervisor |
4/4 | 0 | |||||||
| Zhang Xiaofeng |
External Supervisor |
4/4 | 0 | |||||||
| Zheng Yunrui |
Independent Supervisor |
3/4 | 1 | |||||||
| Choi Ting Ki |
Independent Supervisor |
4/4 | 0 | |||||||
The Company’s Supervisory Committee established and refined the check-and-balance system of the Company and promoted and regulated the corporate governance structure in accordance with the relevant laws and regulations, including the Company Law of the PRC and the Code of Corporate Governance for Listed Companies of the PRC. The Supervisory Committee diligently discharges its supervisory duties and exercises supervision over the management’s compliance with the relevant laws and regulations, including the Company Law and the Code of Corporate Governance for Listed Companies of the PRC. It also supervises the enforcement of the resolutions passed at general meetings and Board meetings, compliance with decision-making procedures and the implementation of the internal control system. The Supervisory Committee also examines the financial system and the financial situation of the Company in a conscientious manner, thereby ensuring the orderly operations of the Company and safeguarding shareholders’ interests.
159
Corporate Governance Report (continued)
(under the Hong Kong listing rules)
| (5) | Risk Management and Internal Controls |
The Board acknowledges its responsibility for the risk management and internal control systems and the review of their effectiveness. Such systems are designed to manage rather than eliminate the risk of failure to achieve business objectives, and can only provide reasonable and not absolute assurance against material misstatement or loss.
The Board ensures that risk management and internal control systems of the Company are sound and effective to safeguard the shareholders’ interests and its assets. The Board has the overall responsibility for evaluating and determining the nature and extent of the risks it is willing to take in achieving the Company’s strategic objectives, and establishing and maintaining appropriate and effective risk management and internal control systems.
The Audit Committee assists the Board in leading the management and overseeing their design, implementation and monitoring of the risk management and internal control systems.
The Company has developed and adopted various internal control and risk management procedures and guidelines including the Internal Control Manual, the SINOPEC Comprehensive Risk Management Procedures and SINOPEC Comprehensive Risk Management Implementation Programme with defined authority for implementation by key business processes and office functions, including project management, sales, financial reporting, human resources and information technology management etc.
All divisions conducted internal control assessment regularly to identify risks that potentially impact the business of the Group and various aspects including key operational and financial processes, regulatory compliance and information security etc.
The management, in coordination with division heads, assessed the likelihood of risk occurrence, provided treatment plans, monitored the risk management progress, and reported to the Audit Committee and the Board on all findings and the effectiveness of the systems.
The Internal Audit Department is responsible for performing independent review of the adequacy and effectiveness of the risk management and internal control systems at least once annually. The Internal Audit Department examined key issues in relation to the accounting practices and all material controls and provided its findings and recommendations for improvement to the Audit Committee. The Company has engaged KPMG Huazhen LLP to conduct an audit on the effectiveness of the internal control over financial reporting of the Company according to the guidelines set out in the Audit Guidelines for Enterprise Internal Control (the “Guidelines”) and the Report on Internal Control over Financial Reporting was issued pursuant to the Guidelines.
160
Corporate Governance Report (continued)
(under the Hong Kong listing rules)
The Company has developed its disclosure policy which provides a general guide to the Directors, officers, senior management and relevant employees in handling confidential information, monitoring information disclosure and responding to enquiries. The Company has in place a “System for the Registration and Management of Inside Information” and an “Information Disclosure Management System” which were regularly reviewed by the Board to administer the registration and management of persons with access to the Company’s insider information including but not limited to the Directors, Supervisors and senior management, strengthen the confidentially of the flow of inside information, monitoring information disclosure to safeguard the leakage of inside information and responding to enquiries. Control procedures have been implemented to ensure that unauthorized access and use of inside information are strictly prohibited.
| 1. | Implementation of internal control |
Internal control task force is the leading unit of the internal control work of the Company with the President and the Chief Financial Officer as chief and deputy chief, respectively, and an internal control office was established under the task force. It is responsible for organizing and coordinating the establishment, implementation and daily operation of internal control, as well as the submission of work reports on the inspection and supervision of internal control to the Audit Committee on a regular basis. A supervisory working network consisting of special personnel of each department (unit) responsible for internal control function was established within the Company. The internal control supervisors, on behalf of their own departments, and administrative heads each carry out internal control work within their own scope.
Since the implementation of the internal control system of the Company in 2004, the Company has strictly complied with the requirements of internal control regulations of the CSRC. Combined with corporate management and internal controls, the Internal Control Manual was reviewed annually so as to improve the internal control business process, to specify responsibilities of different departments and positions in charge of the respective control processes, and to urge staff to perform internal control responsibility. The 2021 version of the Internal Control Manual specifies 22 categories, 58 processes and a total of 1,599 control points.
In 2011, the Company launched an internal control management information system and built a dynamic validation and correction system of system data to continuously improve the internal control management information system annually. At the same time, the internal control office actively guides the respective departments responsible for different processes and the secondary units for the online management of internal control and gradually enforces online enquiry and online quarterly testing under the Internal Control Manual.
161
Corporate Governance Report (continued)
(under the Hong Kong listing rules)
| 2. | Implementation of comprehensive risk management |
In 2011, the Company set up a comprehensive risk management task force with key heads of the Company as leaders. The task force has set up an office in the Corporate Management Department of the Company and functions as the daily risk managing organ of the Company.
In 2013, based on the then “Integrated Management System” and other professional management systems, the Company extensively carried out risk management status research, arranged and analysed existing issues and learnt from the successful experience and typical practices of domestic and overseas advanced enterprises and prepared the SINOPEC Comprehensive Risk Management Procedures, which are included in the Integrated Management System. The risk management procedures specify five basic processes of comprehensive risk management, namely risk information collection, risk evaluation, risk response, monitoring and warning, and supervisory assessment and improvement. Through risk identification and assessment, the Company conducts analysis of the effectiveness of the existing internal control system and professional management and creates foundation system of the Company for the establishment of the risk warning system and risk response strategy and measures.
In 2016, the Company developed the SINOPEC Comprehensive Risk Management Implementation Programme according to control capability, management strength and company management conditions, and standardized assessment methods and standards. The Company launched resources management, interest rate and Forex rate special risk identification, and evaluation work to enhance the comprehensive risk management of the Company.
Pursuant to the planning and requirements of State-Owned Assets Supervision and Administration Commission of the State Council, the Company is focusing on its goal of establishing a refining and petrochemical enterprise which is “leading domestically, first-class globally”. The Company vigorously implements annual risk assessment work, organizes some of the Company’s leaders, key department heads to participate in the material and significant online risk identification evaluation to start and perform comprehensive risk management of the Company to provide foundation for the establishment of the risk warning system and risk response strategy and measures. On the basis of the revised Internal Control Manual, the Company organized the persons in charge of the business process to comprehensively identify, analyse and assess material and significant tier 3 risks and attend to tier 4 risks. The Company has preliminary set up the “SINOPEC Risk Database” and improved the key information maintenance of “Risk Level Rating” and “Risk Response Measures” in the system.
The Company set up a comprehensive risk management office which is responsible for collecting and organizing risk information regarding the Company as well as domestic and foreign industry. It sorts out, analyzes and summarizes, forms a risk list, and regularly completes and updates the risk list. The Company set up an internal control office to establish risk assessment work standards, procedures and management rules, formulate company risk assessment plans, and organize risk assessment task.
162
Corporate Governance Report (continued)
(under the Hong Kong listing rules)
Through the implementation of effective supervision and evaluation and improved supervision, the Company effectively promotes the Company’s overall risk management, and forms a closed-loop management mechanism for self-improvement and continuous optimization. Internal supervision of the Company is divided into daily supervision and special supervision. Daily supervision refers to the routine and continuous supervision and inspection of the Company’s establishment and implementation of internal control; special supervision refers to the situation where the Company undergoes major adjustments or changes in its development strategy, organizational structure, business activities, business processes, and key positions, there will be a targeted supervision and inspection of one or more aspects of internal control. The scope and frequency of special supervision depends on the impact of the risk and the effectiveness of the control.
The Company has established a comprehensive internal inspection and evaluation mechanism, designating internal audit as the Company’s responsible division to supervise and improve risk management, and the audit department is responsible for the independent supervision and evaluation of the setting up of the risk management system and the effectiveness of implementation, reporting according to prescribed procedures and monitoring the progress. The Board is responsible for the supervision of the Company’s internal control evaluation work, identifies the Company’s major internal control deficiencies, reviews the relevant rectification measures and oversees the management in the implementation of the measures, reviews and approves the internal control evaluation report. The Supervisory Committee supervises the Board’s establishment and implementation of internal control.
The management has reported to the Board and the Audit Committee on the effectiveness of the risk management and internal control systems for the Reporting Period. The Board, as supported by the Audit Committee as well as the management report on the internal audit findings, reviewed the risk management and internal control systems, including the financial, operational and compliance controls, for the Reporting Period, and considered that such systems are effective and adequate. The annual review also covered the financial reporting and internal audit function and staff qualifications, experiences and relevant resources.
For further details of the risk management and internal controls of the Company, please refer to the section headed “Internal Control” on pages 137 to 139 of this annual report.
163
Corporate Governance Report (continued)
(under the Hong Kong listing rules)
| (6) | Directors’ Responsibilities in relation to the Financial Statements |
The Directors acknowledge their responsibilities for preparing the financial statements of the Company for the year ended 31 December 2021.
The Directors are not aware of any material uncertainties relating to events or conditions that may cast significant doubt upon the Company’s ability to continue as a going concern.
All Directors regularly receive comprehensive reports from the management covering strategic proposals, operations updates, financial objectives, plans and initiatives. The Board presents a balanced, clear and understandable assessment of the affairs and prospects of the Group in the Company’s annual and interim reports, announcements relating to inside information and other financial disclosures as required under the Hong Kong Listing Rules.
During the Reporting Period, the management provided to members of the Board with monthly information on the Company’s production and financial analysis, as well as Xinjinshan Post (《新金山報》), a newspaper published by the Company that covers recent developments in the Company’s production and operations. In addition, Directors including Independent Non-executive Directors were also able to learn about the latest updates on the Company’s business and information disclosure on the Company’s website in a timely manner.
The statements of the independent auditor of the Company (both international and domestic) about their reporting responsibilities on the financial statements are set out in the respective Report of the Independent Auditor and Report of the PRC Auditor on pages 169 to 174 and pages 305 to 310, respectively of this annual report.
164
Corporate Governance Report (continued)
(under the Hong Kong listing rules)
| (7) | Auditors’ Remuneration |
At the 2020 Annual General Meeting of the Company held on 16 June 2021, it was approved that the international and domestic auditors of the Company for the year of 2021 be changed to KPMG and KPMG Huazhen LLP, respectively, and the authorization of the Board to fix their remuneration. In respect of audit services and non-audit services for the Reporting Period is set out in the table below:
| Auditor |
Service Category |
Fees Paid/Payable | ||||
| KPMG and KPMG Huazhen LLP |
– Audit services | RMB | 6,837,000 | |||
| – Non-audit services | RMB | 0 | ||||
According to the relevant regulations of the Ministry of Finance and the State-owned Assets Supervision and Administration Commission of the State Council of the People’s Republic of China, an accounting firm is subject to a prescribed restriction on the term of continuous financial audit of a state-owned enterprise and its subsidiaries. Due to the above restriction, PricewaterhouseCoopers and PricewaterhouseCoopers Zhong Tian LLP retired as the international and domestic auditors of the Company with effect from the conclusion of the 2020 annual general meeting of the Company and would not be re-appointed. On the recommendation of the audit committee, KPMG and KPMG Huazhen LLP were appointed as the international and domestic auditors for the financial year 2021 of the Company at the 2020 Annual General Meeting.
| (8) | Company Secretary |
Mr. Huang Fei resigned as secretary to the Board and joint company secretary on 28 April 2021. Mr. Liu Gang was appointed as secretary to the Board and joint company secretary on 28 April 2021. Ms. Chan Sze Ting of Tricor Services Limited, the external service provider is another joint company secretary of the Company. Ms. Chan’s primary contact person in the Company is Mr. Liu Gang.
All Directors have access to the advice and services of the company secretary on corporate governance and board practices and matters.
165
Corporate Governance Report (continued)
(under the Hong Kong listing rules)
| (9) | Shareholders’ Rights |
The Company engages shareholders through various communication channels and the “Work System of Investor Relations” is in place to ensure that shareholders’ views and concerns are appropriately addressed.
To safeguard shareholder interests and rights, separate resolution should be proposed for each substantially separate issue at general meetings, including the election of individual Director. All resolutions put forward at general meetings will be voted on by poll and poll results will be posted on the websites of the Hong Kong Stock Exchange, the Shanghai Stock Exchange and the Company after each general meeting.
The rights of shareholders holding ordinary shares of the Company are also set out in the Articles of Association. Upon written requests of the shareholders and verification of their identities and shareholding by the Company, they will be allowed to access to relevant information as permitted by law, administrative regulations and the Articles of Association.
| 1. | Convening an Extraordinary General Meeting |
Pursuant to Article 63(3) of the Articles of Association, the Board shall convene an extraordinary general meeting within two months upon written requisition by the shareholders individually or jointly holding 10% or more of the issued and outstanding voting shares of the Company.
| 2. | Putting Forward Proposals at General Meeting |
Pursuant to Article 65 of the Articles of Association, when the Company convenes a shareholders’ general meeting, the Board, the Supervisory Committee and shareholders who individually or jointly hold shares with 3% or more of the total voting rights of the Company shall have the right to move motions in writing for shareholders’ meetings. Shareholders who individually or jointly hold 3% or more of the shares of the Company may propose and submit in writing an extraordinary motion to the convener ten (10) days prior to the convening of the shareholders’ general meeting. The convener shall issue a supplementary notice of the shareholders’ general meeting within two (2) days upon receipt of such motion and shall make an announcement on the content of the extraordinary motion.
| 3. | Putting Forward Enquiries to the Board |
For putting forward any enquiries to the Board of the Company, shareholders may send written enquiries to the Company. The Company will not normally deal with verbal or anonymous enquiries.
166
Corporate Governance Report (continued)
(under the Hong Kong listing rules)
| 4. | Contact Details |
Shareholders may send their enquiries or requests as mentioned above to the Company’s registered address as follows:
48 Jinyi Road
Jinshan District
Shanghai
The People’s Republic of China
For the attention of Mr. Liu Gang, Secretary of the Board
For the avoidance of doubt, shareholder(s) must deposit and send the original duly signed written requisition, notice or statement, or enquiry (as the case may be) to the above address and provide their full name, contact details and identification in order to give effect thereto. Shareholders’ information may be disclosed as required by law.
| (10) | Investor Relations |
The Company considers that effective communication with shareholders is essential for enhancing investor relations and investors’ understanding of the Group’s business performance and strategies. The Company maintains communications with its shareholders. The Company’s major communication channels include annual general meeting, other general meetings, the Company’s website, email, fax and telephone numbers of the Secretary Office of the Board. Through the above communication channels, shareholders may adequately express their opinions or exercise their rights.
The Company is committed to enhancing its relationship with investors. The Chairman presides over and participates in major investor relations activities (including general meetings, results presentations, press conferences, significant events and roadshows, important domestic and overseas capital market conferences, major financial media interviews, etc.) and maintains contact with shareholders to ensure that the views of the shareholders can be conveyed to the entire Board.
During the Reporting Period, the Company continued to strengthen the management of investor relations, implement in good faith the “Work System of Investor Relations”, engage in active interaction and communications with investors and submit investors’ opinions and suggestions to the Company’s management in a timely manner.
167
Corporate Governance Report (continued)
(under the Hong Kong listing rules)
In principle, the Company convenes results briefings every six months after the release of its annual and interim results. In 2021, affected by the Covid-19, conference, the Company held two large scale results briefings and press conferences via telephone conference. The Company has also actively replied to telephone queries and letters from investors, intermediaries and fund managers. In addition, the Directors and senior management also actively attended online capital market meetings organized by securities research companies and investment banks.
The information on the Company’s website is updated regularly to keep the investors and the public informed of the Company’s latest developments.
Amendments to the Articles of Association
In view of the amendments to “The Company Law of the People’s Republic of China” and “The Securities Law of the People’s Republic of China”, and to further improve corporate governance and meeting the operational needs of the Company, the Company has resolved to amend the relevant provisions of the “Articles of Association of Sinopec Shanghai Petrochemical Co., Ltd.” (the “Articles of Association”) and its Appendices. On 28 April 2021, the Company convened its sixth meeting of the Tenth Session of the Board to consider and approve the proposed amendments to the Articles of Association and its Appendices.
On 16 June 2021, the proposal in relation to the amendments to the Articles of Association and its Appendices was approved by the Shareholders at the 2020 annual general meeting of the Company. For the details about the amendment to the Articles of Association and its Appendices, please refer to the announcement of the Company dated 28 April 2021, circular of the Company dated 30 April 2021 and the announcement regarding the resolutions passed at the 2020 annual general meeting of the Company dated 16 June 2021.
| (11) | Relevant policies relating to Shareholders |
The Company has formulated a shareholders’ communication policy to ensure that the opinions and concerns of shareholders are properly addressed, and policy is regularly reviewed to ensure its effectiveness.
The Company has formulated a dividend policy. According to the Articles of Association, the Company’s net profit attributable to the parent company was positive and the accumulated undistributed profit was positive. While the Company’s cash flow can meet its normal operation and sustainable development, the Company shall carry out cash dividend distribution and shall not be less than 30% of the net profit attributable to the parent company realized in that year. For details, please refer to the formulation, implementation or adjustment of cash dividend policy in Section IV of Report of Directors.
168

Independent auditor’s report to the shareholders of Sinopec Shanghai Petrochemical Company Limited
(incorporated in People’s Republic of China with limited liability)
| Opinion | |
We have audited the consolidated financial statements of Sinopec Shanghai Petrochemical Company Limited (“the Company”) and its subsidiaries (“the Group”) set out on pages 175 to 304, which comprise the consolidated statement of financial position as at 31 December 2021, the consolidated statement of profit or loss, the consolidated statement of profit or loss and other comprehensive income, the consolidated statement of changes in equity and the consolidated statement of cash flows for the year then ended and notes to the consolidated financial statements, including a summary of significant accounting policies.
In our opinion, the consolidated financial statements give a true and fair view of the consolidated financial position of the Group as at 31 December 2021 and of its consolidated financial performance and its consolidated cash flows for the year then ended in accordance with International Financial Reporting Standards (“IFRSs”) issued by the International Accounting Standards Board (“IASB”) and have been properly prepared in compliance with the disclosure requirements of the Hong Kong Companies Ordinance.
Basis for opinion
We conducted our audit in accordance with Hong Kong Standards on Auditing (“HKSAs”) issued by the Hong Kong Institute of Certified Public Accountants (“HKICPA”). Our responsibilities under those standards are further described in the Auditor’s responsibilities for the audit of the consolidated financial statements section of our report. We are independent of the Group in accordance with the HKICPA’s Code of Ethics for Professional Accountants (“the Code”) together with any ethical requirements that are relevant to our audit of the consolidated financial statements in the People’s Republic of China, and we have fulfilled our other ethical responsibilities in accordance with these requirements and the Code. We believe that the audit evidence we have obtained is sufficient and appropriate to provide a basis for our opinion.
| Key | audit matters |
Key audit matters are those matters that, in our professional judgement, were of most significance in our audit of the consolidated financial statements of the current period. These matters were addressed in the context of our audit of the consolidated financial statements as a whole, and in forming our opinion thereon, and we do not provide a separate opinion on these matters.
169
Independent Auditor’s Report (continued)
Key audit matters (continued)
Assessment of net realizable value of raw materials, work in progress and finished goods
Refer to notes 2.14, 4.2(a) and 21 to the consolidated financial statements and the accounting policies.
| The Key Audit Matter |
How the matter was addressed in our audit | |
| The Group is principally engaged in processing of crude oil into petroleum products and other chemical products. The crude oil can be processed into various finished goods by different processing procedures. Inventories are valued at the lower of cost and net realizable value.
The gross carrying amount of raw materials, work in progress and finished goods, and provision for diminution in value were RMB5,897,336 thousand and RMB164,806 thousand, respectively, as at 31 December 2021.
The net realizable value is determined based on the estimated selling prices in the ordinary course of business less the estimated costs to completion, and other costs necessary to make the sale.
We identified the assessment of net realizable value of raw materials, work in progress and finished goods as a key audit matter because evaluation of estimated selling prices of inventories, estimated costs to completion, and other costs necessary to make the sale involved a high degree of auditor judgements. |
Our audit procedures to assess net realizable value of raw materials, work in progress and finished goods included the following:
• Evaluating the design, implementation and operating effectiveness of key internal controls over the process of determination of net realizable value of raw materials, work in progress and finished goods, including controls related to the determination of estimated selling prices, estimated costs to completion, other costs necessary to make the sale;
• Evaluating the estimated selling price at the reporting date for a sample of inventory items by comparison of the estimated selling price to the price from publicly available market data and the actual prices of sales transactions subsequent to the reporting date if available; and
• Evaluating the estimated costs to completion and other costs necessary to make the sale by comparing with the historical costs to completion and other costs necessary to make the sale for the same type of inventories on a sample basis. |
170
Independent Auditor’s Report (continued)
Key audit matters (continued)
Assessment of value in use of certain production facilities
Refer to notes 2.12(b), 4.2(b) and 16 to the consolidated financial statements and the accounting policies.
| The Key Audit Matter |
How the matter was addressed in our audit | |
| The carrying amount of property, plant and equipment was RMB11,310,032 thousand as of 31 December 2021. During the year ended 31 December 2021, the Group recognized impairment loss on property, plant and equipment in relation to certain production facilities of RMB259,850 thousand. At the end of each reporting period, if any indication of impairment exists, the Group estimates the recoverable amount of an asset, or a cash-generating unit, at the higher of its fair value less costs of disposal and its value in use, to determine the impairment losses. The Group’s estimated value in use includes assumptions on product sales growth rates, related costs growth rates (“forecasted growth rates”) and discount rate.
We identified the assessment of value in use of certain production facilities as a key audit matter because high degree of subjectivity and auditor judgment was involved to evaluate the forecasted growth rates and the discount rate used to estimate value in use of these assets. The forecasted growth rates and the discount rate were challenging to test as minor changes to those assumptions would have a significant effect on the Group’s assessment of value in use of these assets. In addition, specialized skills and knowledge were required to assess the discount rate used to estimate value in use of these assets. |
Our audit procedures to assess value in use of certain production facilities included the following:
• Evaluating the design, implementation and operating effectiveness of key internal controls related to the process in assessing the value in use of certain production facilities, including controls related to the determination of the forecasted growth rates and the discount rate;
• Assessing the forecasted growth rates adopted in the Group’s value in use assessment by comparing them with historical results, future operation plans and external market data;
• Involving valuation professionals with specialized skills and knowledge assisted in evaluating the discount rate used by comparing it against discount rate that was independently developed using publicly available industry data; and
• Performing sensitivity analysis over the forecasted growth rates and the discount rate assumptions to assess their impact on the Group’s impairment assessment. |
171
Independent Auditor’s Report (continued)
Information other than the consolidated financial statements and auditor’s report thereon
The directors are responsible for the other information. The other information comprises all the information included in the annual report, other than the consolidated financial statements and our auditor’s report thereon.
Our opinion on the consolidated financial statements does not cover the other information and we do not express any form of assurance conclusion thereon.
In connection with our audit of the consolidated financial statements, our responsibility is to read the other information and, in doing so, consider whether the other information is materially inconsistent with the consolidated financial statements or our knowledge obtained in the audit or otherwise appears to be materially misstated.
If, based on the work we have performed, we conclude that there is a material misstatement of this other information, we are required to report that fact. We have nothing to report in this regard.
Responsibilities of the directors for the consolidated financial statements
The directors are responsible for the preparation of the consolidated financial statements that give a true and fair view in accordance with IFRSs issued by the IASB and the disclosure requirements of the Hong Kong Companies Ordinance and for such internal control as the directors determine is necessary to enable the preparation of consolidated financial statements that are free from material misstatement, whether due to fraud or error.
In preparing the consolidated financial statements, the directors are responsible for assessing the Group’s ability to continue as a going concern, disclosing, as applicable, matters related to going concern and using the going concern basis of accounting unless the directors either intend to liquidate the Group or to cease operations, or have no realistic alternative but to do so.
The directors are assisted by the Audit Committee in discharging their responsibilities for overseeing the Group’s financial reporting process.
172
Independent Auditor’s Report (continued)
Auditor’s responsibilities for the audit of the consolidated financial statements
Our objectives are to obtain reasonable assurance about whether the consolidated financial statements as a whole are free from material misstatement, whether due to fraud or error, and to issue an auditor’s report that includes our opinion. This report is made solely to you, as a body, and for no other purpose. We do not assume responsibility towards or accept liability to any other person for the contents of this report.
Reasonable assurance is a high level of assurance but is not a guarantee that an audit conducted in accordance with HKSAs will always detect a material misstatement when it exists. Misstatements can arise from fraud or error and are considered material if, individually or in the aggregate, they could reasonably be expected to influence the economic decisions of users taken on the basis of these consolidated financial statements.
As part of an audit in accordance with HKSAs, we exercise professional judgement and maintain professional scepticism throughout the audit. We also:
| • | Identify and assess the risks of material misstatement of the consolidated financial statements, whether due to fraud or error, design and perform audit procedures responsive to those risks, and obtain audit evidence that is sufficient and appropriate to provide a basis for our opinion. The risk of not detecting a material misstatement resulting from fraud is higher than for one resulting from error, as fraud may involve collusion, forgery, intentional omissions, misrepresentations, or the override of internal control. |
| • | Obtain an understanding of internal control relevant to the audit in order to design audit procedures that are appropriate in the circumstances but not for the purpose of expressing an opinion on the effectiveness of the Group’s internal control. |
| • | Evaluate the appropriateness of accounting policies used and the reasonableness of accounting estimates and related disclosures made by the directors. |
| • | Conclude on the appropriateness of the directors’ use of the going concern basis of accounting and, based on the audit evidence obtained, whether a material uncertainty exists related to events or conditions that may cast significant doubt on the Group’s ability to continue as a going concern. If we conclude that a material uncertainty exists, we are required to draw attention in our auditor’s report to the related disclosures in the consolidated financial statements or, if such disclosures are inadequate, to modify our opinion. Our conclusions are based on the audit evidence obtained up to the date of our auditor’s report. However, future events or conditions may cause the Group to cease to continue as a going concern. |
| • | Evaluate the overall presentation, structure and content of the consolidated financial statements, including the disclosures, and whether the consolidated financial statements represent the underlying transactions and events in a manner that achieves fair presentation. |
| • | Obtain sufficient appropriate audit evidence regarding the financial information of the entities or business activities within the Group to express an opinion on the consolidated financial statements. We are responsible for the direction, supervision and performance of the group audit. We remain solely responsible for our audit opinion. |
173
Independent Auditor’s Report (continued)
Auditor’s responsibilities for the audit of the consolidated financial statements (continued)
We communicate with the Audit Committee regarding, among other matters, the planned scope and timing of the audit and significant audit findings, including any significant deficiencies in internal control that we identify during our audit.
We also provide the Audit Committee with a statement that we have complied with relevant ethical requirements regarding independence and communicate with them all relationships and other matters that may reasonably be thought to bear on our independence and, where applicable, actions taken to eliminate threats or safeguards applied.
From the matters communicated with the Audit Committee, we determine the matter that was of most significance in the audit of the consolidated financial statements of the current period and is therefore the key audit matter. We describe the matter in our auditor’s report unless law or regulation precludes public disclosure about the matter or when, in extremely rare circumstances, we determine that a matter should not be communicated in our report because the adverse consequences of doing so would reasonably be expected to outweigh the public interest benefits of such communication.
The engagement partner on the audit resulting in this independent auditor’s report is Au Yat Fo.
Certified Public Accountants
8th Floor, Prince’s Building
10 Chater Road
Central, Hong Kong
23 March 2022
174
| A. | Financial Statements Prepared Under International Financial Reporting Standards |
For the year ended 31 December 2021
| Year ended 31 December | ||||||||||
| Note | 2021 RMB’000 |
2020 RMB’000 |
||||||||
| Revenue |
5 | 89,198,492 | 74,623,575 | |||||||
| Taxes and surcharges |
(13,309,688 | ) | (13,062,710 | ) | ||||||
|
|
|
|
|
|||||||
| Net sales |
75,888,804 | 61,560,865 | ||||||||
| Cost of sales |
10 | (74,298,048 | ) | (61,901,114 | ) | |||||
|
|
|
|
|
|||||||
| Gross profit/(loss) |
1,590,756 | (340,249 | ) | |||||||
| Selling and administrative expenses |
10 | (368,243 | ) | (486,323 | ) | |||||
| (Provision)/reversal of impairment losses on financial assets |
3.1(c) | (1,355 | ) | 120,916 | ||||||
| Other operating income |
6 | 125,305 | 148,676 | |||||||
| Other operating expenses |
7 | (44,712 | ) | (24,686 | ) | |||||
| Other gains – net |
8 | 130,481 | 115,430 | |||||||
|
|
|
|
|
|||||||
| Profit/(loss) from operations |
1,432,232 | (466,236 | ) | |||||||
|
|
|
|
|
|||||||
| Finance income |
9 | 508,755 | 431,228 | |||||||
| Finance expenses |
9 | (94,186 | ) | (98,954 | ) | |||||
|
|
|
|
|
|||||||
| Finance income – net |
414,569 | 332,274 | ||||||||
|
|
|
|
|
|||||||
| Share of net profits of associates and joint ventures accounted for using the equity method |
20 | 874,285 | 724,740 | |||||||
|
|
|
|
|
|||||||
| Profit before taxation |
2,721,086 | 590,778 | ||||||||
| Income tax (expenses)/benefits |
12 | (644,480 | ) | 65,620 | ||||||
|
|
|
|
|
|||||||
| Profit for the year |
2,076,606 | 656,398 | ||||||||
|
|
|
|
|
|||||||
175
Consolidated lncome Statement (continued)
For the year ended 31 December 2021
| Year ended 31 December | ||||||||||
| Note | 2021 RMB’000 |
2020 RMB’000 |
||||||||
| Profit attributable to: |
||||||||||
| – Equity shareholders of the Company |
2,073,431 | 645,072 | ||||||||
| – Non-controlling interests |
3,175 | 11,326 | ||||||||
|
|
|
|
|
|||||||
| Profit for the year |
2,076,606 | 656,398 | ||||||||
|
|
|
|
|
|||||||
| Earnings per share attributable to equity shareholders of the Company for the year (expressed in RMB per share) |
||||||||||
| Basic earnings per share |
13(a) | RMB 0.192 | RMB 0.060 | |||||||
|
|
|
|
|
|||||||
| Diluted earnings per share |
13(b) | RMB 0.192 | RMB 0.060 | |||||||
|
|
|
|
|
|||||||
The notes on pages 185 to 304 form part of these financial statements.
176
Consolidated Statement of Comprehensive Income
For the year ended 31 December 2021
| Year ended 31 December | ||||||||||||
| Note | 2021 RMB’000 |
2020 RMB’000 |
||||||||||
| Profit for the year |
2,076,606 | 656,398 | ||||||||||
|
|
|
|
|
|||||||||
| Other comprehensive income |
||||||||||||
| Items that are or may be reclassified subsequently to profit or loss: |
||||||||||||
| Share of other comprehensive income of associates accounted for using the equity method |
32 | 16,639 | (11,512 | ) | ||||||||
| Cash flow hedges: net movement in hedging reserve |
32 | 125,159 | — | |||||||||
|
|
|
|
|
|||||||||
| Other comprehensive income for the year, net of tax |
141,798 | (11,512 | ) | |||||||||
|
|
|
|
|
|||||||||
| Total comprehensive income for the year |
2,218,404 | 644,886 | ||||||||||
|
|
|
|
|
|||||||||
| Attributable to: |
||||||||||||
| – Equity shareholders of the Company |
2,215,229 | 633,560 | ||||||||||
| – Non-controlling interests |
3,175 | 11,326 | ||||||||||
|
|
|
|
|
|||||||||
| Total comprehensive income for the year |
2,218,404 | 644,886 | ||||||||||
|
|
|
|
|
|||||||||
The notes on pages 185 to 304 form part of these financial statements.
177
As at 31 December 2021
| As at 31 December | ||||||||||||
| Note | 2021 RMB’000 |
2020 RMB’000 |
||||||||||
| Non-current assets |
||||||||||||
| Property, plant and equipment |
16 | 11,310,032 | 11,713,022 | |||||||||
| Right-of-use assets |
15 | 385,643 | 410,801 | |||||||||
| Investment properties |
17 | 352,188 | 367,586 | |||||||||
| Construction in progress |
18 | 3,293,177 | 1,710,124 | |||||||||
| Investments accounted for using the equity method |
20 | 4,088,888 | 5,387,834 | |||||||||
| Financial assets at fair value through other comprehensive income |
25 | 5,000 | 5,000 | |||||||||
| Time deposits with banks |
24 | 5,581,435 | 7,042,840 | |||||||||
| Deferred tax assets |
12 | 184,143 | 252,121 | |||||||||
| Other non-current assets |
14 | 787,807 | 424,959 | |||||||||
|
|
|
|
|
|||||||||
| 25,988,313 | 27,314,287 | |||||||||||
|
|
|
|
|
|||||||||
| Current assets |
||||||||||||
| Inventories |
21 | 5,923,525 | 3,888,746 | |||||||||
| Financial assets at fair value through other comprehensive income |
25 | 1,047,690 | 1,207,114 | |||||||||
| Derivative financial instruments |
3.1(a) | 81,405 | — | |||||||||
| Trade receivables |
22 | 77,425 | 113,163 | |||||||||
| Other receivables |
22 | 47,597 | 18,101 | |||||||||
| Prepayments |
43,686 | 19,552 | ||||||||||
| Amounts due from related parties |
22 | 1,212,331 | 1,092,316 | |||||||||
| Cash and cash equivalents |
23 | 5,112,010 | 6,916,408 | |||||||||
| Time deposits with banks |
24 | 7,386,607 | 4,049,443 | |||||||||
|
|
|
|
|
|||||||||
| 20,932,276 | 17,304,843 | |||||||||||
|
|
|
|
|
|||||||||
| Total assets |
46,920,589 | 44,619,130 | ||||||||||
|
|
|
|
|
|||||||||
178
Consolidated Balance Sheet (continued)
As at 31 December 2021
| As at 31 December | ||||||||||
| Note | 2021 RMB’000 |
2020 RMB’000 |
||||||||
| Equity and liabilities |
||||||||||
| Equity attributable to equity shareholders of the Company |
||||||||||
| Share capital |
31 | 10,823,814 | 10,823,814 | |||||||
| Reserves |
32 | 19,418,325 | 18,374,176 | |||||||
|
|
|
|
|
|||||||
| 30,242,139 | 29,197,990 | |||||||||
| Non-controlling interests |
135,259 | 136,985 | ||||||||
|
|
|
|
|
|||||||
| Total equity |
30,377,398 | 29,334,975 | ||||||||
|
|
|
|
|
|||||||
| Liabilities |
||||||||||
| Non-current liabilities |
||||||||||
| Borrowings |
26 | 700,000 | — | |||||||
| Lease liabilities |
15 | 1,384 | 3,119 | |||||||
| Deferred tax liabilities |
12 | 33,344 | 35,357 | |||||||
| Deferred income |
30 | 12,720 | 13,433 | |||||||
|
|
|
|
|
|||||||
| 747,448 | 51,909 | |||||||||
|
|
|
|
|
|||||||
179
Consolidated Balance Sheet (continued)
As at 31 December 2021
| As at 31 December | ||||||||||
| Note | 2021 RMB’000 |
2020 RMB’000 |
||||||||
| Current liabilities |
||||||||||
| Borrowings |
26 | 1,559,800 | 1,548,000 | |||||||
| Short-term bonds |
27 | — | 3,017,811 | |||||||
| Lease liabilities |
15 | 3,229 | 9,352 | |||||||
| Derivative financial instruments |
3.1(a) | 23,804 | — | |||||||
| Contract liabilities |
29 | 424,607 | 495,404 | |||||||
| Trade and other payables |
28 | 3,095,694 | 2,820,083 | |||||||
| Amounts due to related parties |
28 | 6,304,816 | 3,656,841 | |||||||
| Current tax liabilities |
3,865,231 | 3,420,824 | ||||||||
| Staff salaries and welfares payable |
260,096 | 244,506 | ||||||||
| Income tax payable |
12 | 258,466 | 19,425 | |||||||
|
|
|
|
|
|||||||
| 15,795,743 | 15,232,246 | |||||||||
|
|
|
|
|
|||||||
| Total liabilities |
16,543,191 | 15,284,155 | ||||||||
|
|
|
|
|
|||||||
| Total equity and liabilities |
46,920,589 | 44,619,130 | ||||||||
|
|
|
|
|
|||||||
Approved and authorized for issue by the Board of Directors on 23 March 2022.
| Wu Haijun | Du Jun | |
| Directors | Directors |
The notes on pages 185 to 304 form part of these financial statements.
180
Consolidated Statement of Changes in Equity
For the year ended 31 December 2021
| Attributable to equity shareholders of the Company | ||||||||||||||||||||||||||
| Note | Share capital RMB’000 |
Other reserves RMB’000 |
Retained earnings RMB’000 |
Total RMB’000 |
Non- controlling interests RMB’000 |
Total equity RMB’000 |
||||||||||||||||||||
| (note 31) | (note 32) | (note 32) | ||||||||||||||||||||||||
| Balance at 1 January 2020 |
10,823,814 | 4,369,391 | 14,670,083 | 29,863,288 | 130,560 | 29,993,848 | ||||||||||||||||||||
|
|
|
|
|
|
|
|
|
|
|
|
|
|||||||||||||||
| Changes in equity for 2020: |
||||||||||||||||||||||||||
| Profit for the year |
— | — | 645,072 | 645,072 | 11,326 | 656,398 | ||||||||||||||||||||
| Other comprehensive income |
32 | — | (11,512 | ) | — | (11,512 | ) | — | (11,512 | ) | ||||||||||||||||
|
|
|
|
|
|
|
|
|
|
|
|
|
|||||||||||||||
| Total comprehensive income for the year |
— | (11,512 | ) | 645,072 | 633,560 | 11,326 | 644,886 | |||||||||||||||||||
|
|
|
|
|
|
|
|
|
|
|
|
|
|||||||||||||||
| Dividends proposed and approved |
34 | — | — | (1,298,858 | ) | (1,298,858 | ) | — | (1,298,858 | ) | ||||||||||||||||
| Dividend paid by subsidiaries to non-controlling interests |
— | — | — | — | (4,901 | ) | (4,901 | ) | ||||||||||||||||||
| Appropriation of safety production fund |
32 | — | 88,460 | (88,460 | ) | — | — | — | ||||||||||||||||||
|
|
|
|
|
|
|
|
|
|
|
|
|
|||||||||||||||
| Balance at 31 December 2020 |
10,823,814 | 4,446,339 | 13,927,837 | 29,197,990 | 136,985 | 29,334,975 | ||||||||||||||||||||
|
|
|
|
|
|
|
|
|
|
|
|
|
|||||||||||||||
The notes on pages 185 to 304 form part of these financial statements.
181
Consolidated Statement of Changes in Equity (continued)
For the year ended 31 December 2021
| Attributable to equity shareholders of the Company | ||||||||||||||||||||||||||
| Note | Share capital RMB’000 |
Other reserves RMB’000 |
Retained earnings RMB’000 |
Total RMB’000 |
Non- controlling interests RMB’000 |
Total equity RMB’000 |
||||||||||||||||||||
| (note 31) | (note 32) | (note 32) | ||||||||||||||||||||||||
| Balance at 31 December 2020 and 1 January 2021 |
10,823,814 | 4,446,339 | 13,927,837 | 29,197,990 | 136,985 | 29,334,975 | ||||||||||||||||||||
|
|
|
|
|
|
|
|
|
|
|
|
|
|||||||||||||||
| Changes in equity for 2021 |
||||||||||||||||||||||||||
| Profit for the year |
— | — | 2,073,431 | 2,073,431 | 3,175 | 2,076,606 | ||||||||||||||||||||
| Other comprehensive income |
32 | — | 141,798 | — | 141,798 | — | 141,798 | |||||||||||||||||||
|
|
|
|
|
|
|
|
|
|
|
|
|
|||||||||||||||
| Total comprehensive income for the year |
— | 141,798 | 2,073,431 | 2,215,229 | 3,175 | 2,218,404 | ||||||||||||||||||||
|
|
|
|
|
|
|
|
|
|
|
|
|
|||||||||||||||
| Transfer to other reserves |
32 | — | 2,498,808 | (2,498,808 | ) | — | — | — | ||||||||||||||||||
| Amounts transferred from hedging reserve to initial carrying amount of hedged items |
3.1a(iii) | — | (88,699 | ) | — | (88,699 | ) | — | (88,699 | ) | ||||||||||||||||
| Dividends proposed and approved |
34 | — | — | (1,082,381 | ) | (1,082,381 | ) | — | (1,082,381 | ) | ||||||||||||||||
| Dividends paid by subsidiaries to non-controlling interests |
— | — | — | — | (4,901 | ) | (4,901 | ) | ||||||||||||||||||
| Appropriation of safety production fund |
32 | — | 40,729 | (40,729 | ) | — | — | — | ||||||||||||||||||
|
|
|
|
|
|
|
|
|
|
|
|
|
|||||||||||||||
| Balance at 31 December 2021 |
10,823,814 | 7,038,975 | 12,379,350 | 30,242,139 | 135,259 | 30,377,398 | ||||||||||||||||||||
|
|
|
|
|
|
|
|
|
|
|
|
|
|||||||||||||||
The notes on pages 185 to 304 form part of these financial statements.
182
Consolidated Statement of Cash Flows
For the year ended 31 December 2021
| Year ended 31 December | ||||||||||
| 2021 | 2020 | |||||||||
| Note | RMB’000 | RMB’000 | ||||||||
| Operating activities |
||||||||||
| Cash generated from operations |
23(b) | 4,411,653 | 1,995,087 | |||||||
| Interest paid |
(110,070 | ) | (71,369 | ) | ||||||
| Income tax paid |
(351,627 | ) | (243,870 | ) | ||||||
|
|
|
|
|
|||||||
| Net cash generated from operating activities |
3,949,956 | 1,679,848 | ||||||||
|
|
|
|
|
|||||||
| Cash flows from investing activities |
||||||||||
| Dividends received from joint ventures and associates |
777,220 | 561,755 | ||||||||
| Interest received from structured deposits |
97,921 | 132,690 | ||||||||
| Interest received from time deposits with maturity more than three months |
398,937 | 277,714 | ||||||||
| Proceeds/(payments) from settlement of derivative financial instruments |
5,674 | (912 | ) | |||||||
| Payment for the purchase of property, plant and equipment and other long-term assets |
(3,224,000 | ) | (1,840,986 | ) | ||||||
| Net proceeds from disposal of property, plant and equipment |
55,254 | 59,642 | ||||||||
| Cash received from time deposits with maturity less than one year |
3,800,000 | 500,000 | ||||||||
| Cash received from maturity of structured deposits |
8,150,000 | 10,900,000 | ||||||||
| Cash payment for investment in structured deposits |
(8,150,000 | ) | (7,600,000 | ) | ||||||
| Cash payment for investment in time deposits with maturity less than one year |
(3,650,000 | ) | (3,000,000 | ) | ||||||
| Cash payment for investment in time deposits with maturity more than one year |
(2,000,000 | ) | (3,500,000 | ) | ||||||
| Acquisition of a subsidiary, net of cash acquired |
— | (340,315 | ) | |||||||
| Payment for set up of an associate |
20 | (26,000 | ) | (27,603 | ) | |||||
| Payment for set up of a joint venture |
20 | (50,000 | ) | — | ||||||
| Proceeds from capital reduction of an associate |
1,460,258 | — | ||||||||
| Payment for sales of financial assets at fair value through other comprehensive income |
(4,685 | ) | (9,513 | ) | ||||||
|
|
|
|
|
|||||||
| Net cash used in investing activities |
(2,359,421 | ) | (3,887,528 | ) | ||||||
|
|
|
|
|
|||||||
183
Consolidated Statement of Cash Flows (continued)
For the year ended 31 December 2021
| Year ended 31 December | ||||||||||||
| 2021 | 2020 | |||||||||||
| Note | RMB’000 | RMB’000 | ||||||||||
| Financing activities |
||||||||||||
| Proceeds from borrowings |
14,163,132 | 3,458,100 | ||||||||||
| Proceeds from short-term bonds |
5,998,899 | 2,998,469 | ||||||||||
| Repayments of borrowings |
(13,451,332 | ) | (3,460,556 | ) | ||||||||
| Repayments of short-term bonds |
(9,000,000 | ) | — | |||||||||
| Principal elements of lease payments |
(17,544 | ) | (15,586 | ) | ||||||||
| Dividends paid by subsidiaries to non-controlling interests |
(4,901 | ) | (4,901 | ) | ||||||||
| Dividends paid to the Company’s shareholders |
(1,081,326 | ) | (1,293,736 | ) | ||||||||
|
|
|
|
|
|||||||||
| Net cash (used in)/generated from financing activities |
(3,393,072 | ) | 1,681,790 | |||||||||
|
|
|
|
|
|||||||||
| Net decrease in cash and cash equivalents |
(1,802,537 | ) | (525,890 | ) | ||||||||
| Cash and cash equivalents at the beginning of the year |
23 | 6,916,408 | 7,449,699 | |||||||||
| Exchange losses on cash and cash equivalents |
(1,861 | ) | (7,401 | ) | ||||||||
|
|
|
|
|
|||||||||
| Cash and cash equivalents at the end of the year |
23 | 5,112,010 | 6,916,408 | |||||||||
|
|
|
|
|
|||||||||
The notes on pages 185 to 304 form part of these financial statements.
184
Notes to the Consolidated Financial Statements
(Expressed in Renminbi Yuan unless otherwise indicated)
| 1 | General Information |
Sinopec Shanghai Petrochemical Company Limited (“the Company”), formerly Shanghai Petrochemical Company Limited, was established in the People’s Republic of China (“the PRC”) on 29 June 1993 with registered capital of RMB4,000,000 thousand, invested by its holding company-China National Petrochemical Corporation (“Sinopec Group”); these shares were converted from assets of former Shanghai Petrochemical Complex.
H shares were listed on the Hong Kong Stock Exchange on 26 July 1993, and listed on the New York Stock Exchange in the form of American Depositary Shares at the same time; the A shares were listed on the Shanghai Stock Exchange on 8 November 1993.
Sinopec Group completed its reorganization on 25 February 2000. After the reorganization, China Petroleum & Chemical Corporation (“Sinopec Corp.”) was established. As part of the reorganization, Sinopec Group transferred its 4,000,000,000 of the Company’s state-owned legal shares, which represented 55.56 percent of the issued share capital of the Company, to Sinopec Corp.. Sinopec Corp. became the largest shareholder of the Company.
The Company changed its name to Sinopec Shanghai Petrochemical Company Limited on 12 October 2000.
Ordinary A shares of RMB14,177 thousand and RMB9,637 thousand were registered on 27 September 2017 and 12 January 2018.
As at 31 December 2021, total share capital of the Company were RMB10,823,814 thousand, 1 Yuan per share. Detailed changes to share capital refers to note 31. The Company and its subsidiaries (“the Group”) is a highly integrated entity which processes crude oil into synthetic fibres, resins and plastics, intermediate petrochemicals and petroleum products.
Details of the Company’s principal subsidiaries are set out in note 19.
185
Notes to the Consolidated Financial Statements (continued)
(Expressed in Renminbi Yuan unless otherwise indicated)
| 2 | Significant accounting policies |
The principal accounting policies applied in the preparation of these consolidated financial statements are set out below. These policies have been consistently applied to all the years presented, unless otherwise stated.
| 2.1 | Statement of compliance and basis of preparation |
| (a) | Statement of compliance |
These financial statements have been prepared in accordance with all applicable International Financial Reporting Standards (IFRSs), which collective term includes all applicable individual International Financial Reporting Standards, International Accounting Standards (IASs) and related Interpretations, promulgated by the International Accounting Standards Board (IASB), and the disclosure requirements of the Hong Kong Companies Ordinance. These financial statements also comply with the applicable disclosure provisions of the Rules Governing the Listing of Securities on The Stock Exchange of Hong Kong Limited. Significant accounting policies adopted by the Group are disclosed below.
The IASB has issued certain amendments to IFRSs that are first effective or available for early adoption for the current accounting period of the Group. Note 2.1 (c) provides information on any changes in accounting policies resulting from initial application of these developments to the extent that they are relevant to the Group for the current accounting period reflected in these financial statements.
| (b) | Basis of preparation |
The consolidated financial statements for the year ended 31 December 2021 comprise the Company and its subsidiaries (together referred to as the “Group”) and the Group’s interest in associates and a joint venture.
The measurement basis used in the preparation of the financial statements is the historical cost basis except for certain financial assets and liabilities measured at fair value, including:
| • | derivative financial instruments (see note 2.13); and |
| • | investment in debt and equity securities (see note 2.11). |
186
Notes to the Consolidated Financial Statements (continued)
(Expressed in Renminbi Yuan unless otherwise indicated)
| 2 | Significant accounting policies (continued) |
| 2.1 | Statement of compliance and basis of preparation (continued) |
| (b) | Basis of preparation (continued) |
The preparation of financial statements in conformity with IFRSs requires management to make judgements, estimates and assumptions that affect the application of policies and reported amounts of assets, liabilities, income and expenses. The estimates and associated assumptions are based on historical experience and various other factors that are believed to be reasonable under the circumstances, the results of which form the basis of making the judgements about carrying values of assets and liabilities that are not readily apparent from other sources. Actual results may differ from these estimates.
The estimates and underlying assumptions are reviewed on an ongoing basis. Revisions to accounting estimates are recognized in the period in which the estimate is revised if the revision affects only that period, or in the period of the revision and future periods if the revision affects both current and future periods.
Judgements made by management in the application of IFRSs that have significant effect on the financial statements and major sources of estimation uncertainty are discussed in note 4.
| (c) | Changes in accounting policies |
New and amended standards adopted by the Group
The Group has applied the following amendments to IFRSs issued by the IASB to these financial statements for the current accounting period:
| • | Amendments to IFRS 9, IAS 39, IFRS 7, IFRS 4 and IFRS 16, Interest rate benchmark reform – phase 2 |
| • | Amendments to IFRS 16, Covid-19-related rent concessions beyond 30 June 2021 |
None of these developments have had a material effect on how the Group’s results and financial position for the current or prior periods have been prepared or presented. The Group has not applied any new standard or interpretation that is not yet effective for the current accounting period.
187
Notes to the Consolidated Financial Statements (continued)
(Expressed in Renminbi Yuan unless otherwise indicated)
| 2 | Significant accounting policies (continued) |
| 2.2 | Subsidiaries |
| 2.2.1 | Consolidation |
Subsidiaries are all entities over which the Group has control. The Group controls an entity when the Group is exposed to, or has rights to, variable returns from its involvement with the entity and has the ability to affect those returns through its power to direct the activities of the entity. Subsidiaries are fully consolidated from the date on which control is transferred to the Group. They are deconsolidated from the date that control ceases.
| (a) | Business combinations |
The acquisition method of accounting is used to account for all business combinations by the Group, regardless of whether equity instruments or other assets are acquired. The consideration transferred for the acquisition of a subsidiary comprises the:
| • | fair values of the assets transferred; |
| • | liabilities incurred to the former owners of the acquired business; |
| • | equity interests issued by the Group; |
| • | fair value of any asset or liability resulting from a contingent consideration arrangement, and |
| • | fair value of any pre-existing equity interest in the subsidiary. |
Identifiable assets acquired and liabilities and contingent liabilities assumed in a business combination are, with limited exceptions, measured initially at their fair values at the acquisition date. The Group recognizes any non-controlling interest in the acquired entity on an acquisition-by-acquisition basis either at fair value or at the non-controlling interest’s proportionate share of the acquired entity’s net identifiable assets.
188
Notes to the Consolidated Financial Statements (continued)
(Expressed in Renminbi Yuan unless otherwise indicated)
| 2 | Significant accounting policies (continued) |
| 2.2 | Subsidiaries (continued) |
| 2.2.1 | Consolidation (continued) |
| (a) | Business combinations (continued) |
Acquisition-related costs are expensed as incurred.
The excess of the:
| • | consideration transferred |
| • | amount of any non-controlling interest in the acquired entity, and |
| • | acquisition-date fair value of any previous equity interest in the acquired entity |
Over the fair value of the net identifiable assets acquired is recorded as goodwill. If those amounts are less than the fair value of the net identifiable assets of the business acquired, the difference is recognized directly in the statement of profit or loss as a bargain purchase.
Where settlement of any part of cash consideration is deferred, the amounts payable in the future are discounted to their present value as at the date of exchange. The discount rate used is the entity’s incremental borrowing rate, being the rate at which a similar borrowing could be obtained from an independent financier under comparable terms and conditions.
If the business combination is achieved in stages, the acquirer’s previously held equity interest in the acquiree is remeasured to fair value at the acquisition date. Any gains or losses arising from such remeasurement are recognized in the statement of profit or loss.
Inter-company transactions, balances and unrealized gains on transactions between group companies are eliminated. Unrealized losses are also eliminated unless the transaction provides evidence of an impairment of the transferred asset. Accounting policies of subsidiaries have been changed where necessary to ensure consistency with the policies adopted by the Group.
Non-controlling interests in the results and equity of subsidiaries are shown separately in the consolidated statement of financial position, consolidated statement of profit or loss, statement of comprehensive income and changes in equity respectively.
189
Notes to the Consolidated Financial Statements (continued)
(Expressed in Renminbi Yuan unless otherwise indicated)
| 2 | Significant accounting policies (continued) |
| 2.2 | Subsidiaries (continued) |
| 2.2.1 | Consolidation (continued) |
| (b) | Changes in ownership interests |
The Group treats transactions with non-controlling interests that do not result in loss of control as transactions with equity owners of the Group. A change in ownership interest results in an adjustment between the carrying amounts of the controlling and non-controlling interests to reflect their relative interests in the subsidiary. Any difference between the amount of the adjustment to non-controlling interests and any consideration paid or received is recognized in a separate reserve within equity attributable to owners of the Group.
When the Group ceases to consolidate or equity account for an investment because of a loss of control, joint control or significant influence, any retained interest in the entity is remeasured to its fair value, with the change in carrying amount recognized in the statement of profit or loss. This fair value becomes the initial carrying amount for the purposes of subsequently accounting for the retained interest as an associate, joint venture or financial asset. In addition, any amounts previously recognized in other comprehensive income in respect of that entity are accounted for as if the Group had directly disposed of the related assets or liabilities. This means that amounts previously recognized in other comprehensive income are reclassified to profit or loss.
| 2.2.2 | Separate financial statements |
Investments in subsidiaries are accounted for at cost less impairment. Cost includes direct attributable costs of investment. The results of subsidiaries are accounted for by the Company on the basis of dividend received and receivable.
Investments in joint ventures and associates are accounted for using the equity method of accounting.
190
Notes to the Consolidated Financial Statements (continued)
(Expressed in Renminbi Yuan unless otherwise indicated)
| 2 | Significant accounting policies (continued) |
| 2.3 | Associates |
Associates are all entities over which the Group has significant influence but not control or joint control. Investments in associates are accounted for using the equity method of accounting. Under the equity method, the investment is initially recognized at cost, and the carrying amount is increased or decreased to recognize the investor’s share of the profit or loss of the investee after the date of acquisition. The Group’s investments in associates include goodwill identified on acquisition. Upon the acquisition of the ownership interest in an associate, any difference between the cost of the associate and the Group’s share of the net fair value of the associate’s identifiable assets and liabilities is accounted for as goodwill.
The Group’s share of post-acquisition profit or loss is recognized in the statement of profit or loss, and its share of post-acquisition movements in other comprehensive income is recognized in other comprehensive income with a corresponding adjustment to the carrying amount of the investment. When the Group’s share of losses in an associate equals or exceeds its interest in the associate, including any other unsecured receivables, the Group does not recognize further losses, unless it has incurred legal or constructive obligations or made payments on behalf of the associate.
The Group determines at each reporting date whether there is any objective evidence that the investment in the associate is impaired. If this is the case, the Group calculates the amount of impairment as the difference between the recoverable amount of the associate and its carrying value and recognizes the amount in the statement of profit or loss.
Profits and losses resulting from upstream and downstream transactions between the Group and its associates are recognized in the Group’s financial statements only to the extent of unrelated investor’s interests in the associates. Unrealized losses are eliminated unless the transaction provides evidence of an impairment of the asset transferred. Accounting policies of associates have been changed where necessary to ensure consistency with the policies adopted by the Group.
Gain or loss on dilution of equity interest in associates are recognized in the statement of profit or loss.
191
Notes to the Consolidated Financial Statements (continued)
(Expressed in Renminbi Yuan unless otherwise indicated)
| 2 | Significant accounting policies (continued) |
| 2.4 | Joint arrangements |
Under IFRS 11 ‘Joint Arrangements’ investments in joint arrangements are classified as either joint operations or joint ventures. The classification depends on the contractual rights and obligations of each investor, rather than the legal structure of the joint arrangement. The Group has assessed the nature of its joint arrangements and determined them to be joint ventures. Joint ventures are accounted for using the equity method.
Under the equity method of accounting, interests in joint ventures are initially recognized at cost and adjusted thereafter to recognize the Group’s share of the post-acquisition profits or losses and movements in other comprehensive income. The Group’s investments in joint ventures include goodwill identified on acquisition. Upon the acquisition of the ownership interest in a joint venture, any difference between the cost of the joint venture and the Group’s share of the net fair value of the joint venture’s identifiable assets and liabilities is accounted for as goodwill. When the Group’s share of losses in a joint venture equals or exceeds its interests in the joint ventures, including any other unsecured receivables, the Group does not recognize further losses, unless it has incurred obligations or made payments on behalf of the joint ventures.
Unrealized gains on transactions between the Group and its joint ventures are eliminated to the extent of the Group’s interest in the joint ventures. Unrealized losses are also eliminated unless the transaction provides evidence of an impairment of the asset transferred. Accounting policies of the joint ventures have been changed where necessary to ensure consistency with the policies adopted by the Group.
The carrying amount of equity-accounted investments is tested for impairment in accordance with the policy described in note 2.12.
| 2.5 | Segment reporting |
Operating segments are reported in a manner consistent with the internal reporting provided to the chief operating decision-maker. The chief operating decision-maker, who is responsible for allocating resources and assessing performance of the operating segments, has been identified as the Board of Directors that makes strategic decisions.
192
Notes to the Consolidated Financial Statements (continued)
(Expressed in Renminbi Yuan unless otherwise indicated)
| 2 | Significant accounting policies (continued) |
| 2.6 | Foreign currency translation |
| (a) | Functional and presentation currency |
Items included in the financial statements of each of the Group’s entities are measured using the currency of the primary economic environment in which the entity operates (“the functional currency”).
The consolidated financial statements are presented in RMB, which is the Company’s functional and the Group’s presentation currency.
| (b) | Transactions and balances |
Foreign currency transactions are translated into the functional currency using the exchange rates at the dates of the transactions. Foreign exchange gains and losses resulting from the settlement of such transactions, and from the translation of monetary assets and liabilities denominated in foreign currencies at year end exchange rates, are generally recognized in the statement of profit or loss. They are deferred in equity if they relate to qualifying cash flow hedges and qualifying net investment hedges.
| 2.7 | Property, plant and equipment |
Property, plant and equipment is stated at historical cost less depreciation and impairment losses. Historical cost includes expenditure that is directly attributable to the acquisition of the items.
Subsequent costs are included in the asset’s carrying amount or recognized as a separate asset, as appropriate, only when it is probable that future economic benefits associated with the item will flow to the Group and the cost of the item can be measured reliably. The carrying amount of the replaced part is derecognized. All other repairs and maintenance are charged to the statement of profit or loss during the financial period in which they are incurred.
Depreciation on property, plant and equipment is calculated using the straight-line method to allocate their cost to their residual values over their estimated useful lives, as follows:
| – Buildings |
12 to 40 years | |||
| – Plant and machinery |
5 to 20 years | |||
| – Vehicles and other equipment |
4 to 20 years | |||
The assets’ residual values and useful lives are reviewed, and adjusted if appropriate, at the end of each reporting period.
An asset’s carrying amount is written down immediately to its recoverable amount if the asset’s carrying amount is greater than its estimated recoverable amount (note 2.12 (b)).
Gains and losses on disposals are determined by comparing the proceeds with the carrying amount and are recognized within Other gains – net in the statement of profit or loss.
193
Notes to the Consolidated Financial Statements (continued)
(Expressed in Renminbi Yuan unless otherwise indicated)
| 2 | Significant accounting policies (continued) |
| 2.8 | Construction in progress |
Construction in progress represents buildings, various plant and equipment under construction and pending installation, and is stated at cost less government grants that compensate the Company for the cost of construction, and impairment losses. Cost comprises direct costs of construction as well as interest charges, and foreign exchange differences on related borrowed funds to the extent that they are regarded as an adjustment to interest charges, during the period of construction. Construction in progress is transferred to property, plant and equipment when the asset is substantially ready for its intended use. No depreciation is provided in respect of construction in progress.
| 2.9 | Investment properties |
Investment properties are properties which are owned either to earn rental income and/or for capital appreciation.
Investment properties are stated in the statement of financial position at cost less accumulated depreciation and impairment losses (note 2.12(b)). Depreciation is provided over their estimated useful lives on a straight-line basis, after taking into account their estimated residual values. Estimated useful lives of the Group’s investment properties are 30-40 years.
| 2.10 | Other non-current assets |
Other non-current assets mainly represent patents and catalysts used in production. These assets are carried at cost less accumulated amortization and impairment losses. Other non-current assets are amortized on a straight-line basis over the respective periods of the rights and the estimated useful lives of the catalysts, as follows:
| Intangible assets |
10 to 28 years | |||
| Long-term prepaid expense |
1.5 to 10 years | |||
| 2.11 | Other investments in debt and equity securities |
The Group’s policies for investments in debt and equity securities, other than investments in subsidiaries, associates and joint ventures, are set out below.
Investments in debt and equity securities are recognized/derecognized on the date the Group commits to purchase/ sell the investment. The investments are initially stated at fair value plus directly attributable transaction costs, except for those investments measured at fair value through profit or loss (FVPL) for which transaction costs are recognized directly in profit or loss. For an explanation of how the Group determines fair value of financial instruments, see note 3.3. These investments are subsequently accounted for as follows, depending on their classification.
194
Notes to the Consolidated Financial Statements (continued)
(Expressed in Renminbi Yuan unless otherwise indicated)
| 2 | Significant accounting policies (continued) |
| 2.11 | Other investments in debt and equity securities (continued) |
| (a) | Investments other than equity investments |
Non-equity investments held by the Group are classified into one of the following measurement categories:
| • | amortized cost, if the investment is held for the collection of contractual cash flows which represent solely payments of principal and interest. Interest income from the investment is calculated using the effective interest method (see note 2.27). |
| • | fair value through other comprehensive income (FVOCI) – recycling, if the contractual cash flows of the investment comprise solely payments of principal and interest and the investment is held within a business model whose objective is achieved by both the collection of contractual cash flows and sale. Changes in fair value are recognized in other comprehensive income, except for the recognition in profit or loss of expected credit losses, interest income (calculated using the effective interest method) and foreign exchange gains and losses. When the investment is derecognized, the amount accumulated in other comprehensive income is recycled from equity to profit or loss. |
| • | fair value through profit or loss (FVPL) if the investment does not meet the criteria for being measured at amortized cost or FVOCI (recycling). Changes in the fair value of the investment (including interest) are recognized in profit or loss. |
| (b) | Equity investments |
An investment in equity securities is classified as FVPL unless the equity investment is not held for trading purposes and on initial recognition of the investment the Group makes an irrevocable election to designate the investment at FVOCI (non-recycling) such that subsequent changes in fair value are recognized in other comprehensive income. Such elections are made on an instrument-by-instrument basis, but may only be made if the investment meets the definition of equity from the issuer’s perspective. Where such an election is made, the amount accumulated in other comprehensive income remains in the fair value reserve (non-recycling) until the investment is disposed of. At the time of disposal, the amount accumulated in the fair value reserve (non-recycling) is transferred to retained earnings. It is not recycled through profit or loss. Dividends from an investment in equity securities, irrespective of whether classified as at FVPL or FVOCI, are recognized in profit or loss as other income in accordance with the policy set out in note 2.28.
195
Notes to the Consolidated Financial Statements (continued)
(Expressed in Renminbi Yuan unless otherwise indicated)
| 2 | Significant accounting policies (continued) |
| 2.12 | Credit losses and impairment of assets |
| (a) | Credit losses from financial instruments |
The Group recognizes a loss allowance for expected credit losses (ECLs) on the following items:
| • | financial assets measured at amortized cost (including cash and cash equivalents, time deposits with banks, trade receivables and other receivables); and |
| • | debt securities measured at FVOCI (recycling); |
Other financial assets measured at fair value, including equity securities designated at FVOCI (non-recycling) and derivative financial assets, are not subject to the ECL assessment.
Measurement of ECLs
ECLs are a probability-weighted estimate of credit losses. Credit losses are measured as the present value of all expected cash shortfalls (i.e. the difference between the cash flows due to the Group in accordance with the contract and the cash flows that the Group expects to receive).
The expected cash shortfalls are discounted using the following discount rates where the effect of discounting is material:
| • | fixed-rate financial assets, trade and other receivables: effective interest rate determined at initial recognition or an approximation thereof; |
| • | variable-rate financial assets: current effective interest rate. |
The maximum period considered when estimating ECLs is the maximum contractual period over which the Group is exposed to credit risk.
In measuring ECLs, the Group takes into account reasonable and supportable information that is available without undue cost or effort. This includes information about past events, current conditions and forecasts of future economic conditions.
196
Notes to the Consolidated Financial Statements (continued)
(Expressed in Renminbi Yuan unless otherwise indicated)
| 2 | Significant accounting policies (continued) |
| 2.12 | Credit losses and impairment of assets (continued) |
| (a) | Credit losses from financial instruments (continued) |
Measurement of ECLs (continued)
ECLs are measured on either of the following bases:
| • | 12-month ECLs: these are losses that are expected to result from possible default events within the 12 months after the reporting date; and |
| • | lifetime ECLs: these are losses that are expected to result from all possible default events over the expected lives of the items to which the ECL model applies. |
Loss allowances for trade receivables are always measured at an amount equal to lifetime ECLs. ECLs on these financial assets are estimated using a provision matrix based on the Group’s historical credit loss experience, adjusted for factors that are specific to the debtors and an assessment of both the current and forecast general economic conditions at the reporting date.
For all other financial instruments, the Group recognizes a loss allowance equal to 12-month ECLs unless there has been a significant increase in credit risk of the financial instrument since initial recognition, in which case the loss allowance is measured at an amount equal to lifetime ECLs.
Significant increases in credit risk
In assessing whether the credit risk of a financial instrument has increased significantly since initial recognition, the Group compares the risk of default occurring on the financial instrument assessed at the reporting date with that assessed at the date of initial recognition.
197
Notes to the Consolidated Financial Statements (continued)
(Expressed in Renminbi Yuan unless otherwise indicated)
| 2 | Significant accounting policies (continued) |
| 2.12 | Credit losses and impairment of assets (continued) |
| (a) | Credit losses from financial instruments (continued) |
Significant increases in credit risk (continued)
In making this reassessment, the Group considers that a default event occurs when
| • | the borrower is unlikely to pay its credit obligations to the Group in full, without recourse by the Group to actions such as realizing security (if any is held); |
| • | the financial asset is 90 days past due. |
The Group considers both quantitative and qualitative information that is reasonable and supportable, including historical experience and forward-looking information that is available without undue cost or effort.
In particular, the following information is taken into account when assessing whether credit risk has increased significantly since initial recognition:
| • | failure to make payments of principal or interest on their contractually due dates; |
| • | an actual or expected significant deterioration in a financial instrument’s external or internal credit rating (if available); |
| • | an actual or expected significant deterioration in the operating results of the debtor; and |
| • | existing or forecast changes in the technological, market, economic or legal environment that have a significant adverse effect on the debtor’s ability to meet its obligation to the Group. |
Depending on the nature of the financial instruments, the assessment of a significant increase in credit risk is performed on either an individual basis or a collective basis. When the assessment is performed on a collective basis, the financial instruments are grouped based on shared credit risk characteristics, such as past due status and credit risk ratings.
ECLs are remeasured at each reporting date to reflect changes in the financial instrument’s credit risk since initial recognition. Any change in the ECL amount is recognized as an impairment gain or loss in profit or loss. The Group recognizes an impairment gain or loss for all financial instruments with a corresponding adjustment to their carrying amount through a loss allowance account, except for investments in debt securities that are measured at FVOCI (recycling), for which the loss allowance is recognized in other comprehensive income and accumulated in the fair value reserve (recycling).
198
Notes to the Consolidated Financial Statements (continued)
(Expressed in Renminbi Yuan unless otherwise indicated)
| 2 | Significant accounting policies (continued) |
| 2.12 | Credit losses and impairment of assets (continued) |
| (a) | Credit losses from financial instruments (continued) |
Basis of calculation of interest income
Interest income recognized in accordance with note 2.27 is calculated based on the gross carrying amount of the financial asset unless the financial asset is credit-impaired, in which case interest income is calculated based on the amortized cost (i.e. the gross carrying amount less loss allowance) of the financial asset.
At each reporting date, the Group assesses whether a financial asset is credit-impaired. A financial asset is credit-impaired when one or more events that have a detrimental impact on the estimated future cash flows of the financial asset have occurred.
Evidence that a financial asset is credit-impaired includes the following observable events:
| • | significant financial difficulties of the debtor; |
| • | a breach of contract, such as a default or past due event; |
| • | it is becoming probable that the borrower will enter into bankruptcy or other financial reorganization; |
| • | significant changes in the technological, market, economic or legal environment that have an adverse effect on the debtor; or |
| • | the disappearance of an active market for a security because of financial difficulties of the issuer. |
Write-off policy
The gross carrying amount of a financial asset is written off (either partially or in full) to the extent that there is no realistic prospect of recovery. This is generally the case when the Group determines that the debtor does not have assets or sources of income that could generate sufficient cash flows to repay the amounts subject to the write-off.
Subsequent recoveries of an asset that was previously written off are recognized as a reversal of impairment in profit or loss in the period in which the recovery occurs.
199
Notes to the Consolidated Financial Statements (continued)
(Expressed in Renminbi Yuan unless otherwise indicated)
| 2 | Significant accounting policies (continued) |
| 2.12 | Credit losses and impairment of assets (continued) |
| (b) | Impairment of other non-current assets |
Internal and external sources of information are reviewed at the end of each reporting period to identify indications that the following assets may be impaired or, except in the case of goodwill, an impairment loss previously recognized no longer exists or may have decreased:
| • | property, plant and equipment; |
| • | right-of-use assets; |
| • | investment properties; |
| • | construction in progress |
| • | other non-current assets; and |
| • | investments in subsidiaries, associates and joint ventures in the Company’s statement of financial position. |
At the end of each reporting period, if any indication of impairment exists, the Company estimates the recoverable amount of an asset, or a cash-generating unit, at the higher of its fair value less costs of disposal and its value in use, to determine the impairment losses.
| • | Calculation of recoverable amount |
The recoverable amount of an asset is the greater of its fair value less costs of disposal and value in use. In assessing value in use, the estimated future cash flows are discounted to their present value using a pre-tax discount rate that reflects current market assessments of the time value of money and the risks specific to the asset. Where an asset does not generate cash inflows largely independent of those from other assets, the recoverable amount is determined for the smallest group of assets that generates cash inflows independently (i.e. a cash-generating unit). A portion of the carrying amount of a corporate asset (for example, head office building) is allocated to an individual cash-generating unit if the allocation can be done on a reasonable and consistent basis, or to the smallest group of cash-generating units if otherwise.
200
Notes to the Consolidated Financial Statements (continued)
(Expressed in Renminbi Yuan unless otherwise indicated)
| 2 | Significant accounting policies (continued) |
| 2.12 | Credit losses and impairment of assets (continued) |
| (b) | Impairment of other non-current assets (continued) |
| • | Recognition of impairment losses |
An impairment loss is recognized in profit or loss if the carrying amount of an asset, or the cash-generating unit to which it belongs, exceeds its recoverable amount. Impairment losses recognized in respect of cash-generating units are allocated first to reduce the carrying amount of any goodwill allocated to the cash-generating unit (or group of units) and then, to reduce the carrying amount of the other assets in the unit (or group of units) on a pro rata basis, except that the carrying value of an asset will not be reduced below its individual fair value less costs of disposal (if measurable) or value in use (if determinable).
| • | Reversals of impairment losses |
An impairment loss is reversed if there has been a favourable change in the estimates used to determine the recoverable amount.
A reversal of an impairment loss is limited to the asset’s carrying amount that would have been determined had no impairment loss been recognized in prior years.
Reversals of impairment losses are credited to profit or loss in the year in which the reversals are recognized.
| (c) | Interim financial reporting and impairment |
Under the Rules Governing the Listing of Securities on the Stock Exchange of Hong Kong Limited, the Group is required to prepare an interim financial report in compliance with IAS 34, Interim financial reporting, in respect of the first six months of the financial year. At the end of the interim period, the Group applies the same impairment testing, recognition, and reversal criteria as it would at the end of the financial year (see notes 2.12(a) and (b)).
| 2.13 | Derivative and hedging activities |
Derivatives are initially recognized at fair value on the date a derivative contract is entered into, and they are subsequently remeasured to their fair value at the end of each reporting period. The accounting for subsequent changes in fair value depends on whether the derivative is designated as a hedging instrument and, if so, the nature of the item being hedged. The Group designates certain derivatives as hedges of a particular risk associated with the cash flows of recognized assets and liabilities and highly probable forecast transactions (cash flow hedges).
201
Notes to the Consolidated Financial Statements (continued)
(Expressed in Renminbi Yuan unless otherwise indicated)
| 2 | Significant accounting policies (continued) |
| 2.13 | Derivative and hedging activities (continued) |
At inception of the hedge relationship, the Group documents the economic relationship between hedging instruments and hedged items, including whether changes in the cash flows of the hedging instruments are expected to offset changes in the cash flows of hedged items. The Group documents its risk management objective and strategy for undertaking its hedge transactions.
The fair values of derivative financial instruments designated in hedge relationships are disclosed in note 3.1(a). Movements in the hedging reserve in shareholders’ equity are shown in note 32. The full fair value of a hedging derivative is classified as a non-current asset or liability when the remaining maturity of the hedged item is more than 12 months; it is classified as a current asset or liability when the remaining maturity of the hedged item is less than 12 months. Trading derivatives are classified as a current asset or liability.
Cash flow hedges that qualify for hedge accounting
The effective portion of changes in the fair value of derivatives that are designated and qualify as cash flow hedges is recognized in the cash flow hedge reserve within equity. The gain or loss relating to the ineffective portion is recognized immediately in the statement of profit or loss, within Other gains – net.
When swap contracts are used to hedge forecast transactions the Group may designate the full change in fair value of the swap contract as the hedging instrument. The gains or losses relating to the effective portion of the change in fair value of the entire swap contract are recognized in the cash flow hedge reserve within equity.
Amounts accumulated in equity are reclassified in the periods when the hedged item affects the statement of profit or loss as follows:
Where the hedged item subsequently results in the recognition of a non-financial asset (such as inventory), the deferred hedging gains and losses are included within the initial cost of the asset. The deferred amounts are ultimately recognized in the statement of profit or loss as the hedged item affects profit or loss (for example through cost of sales).
When a hedging instrument expires, or is sold or terminated, or when a hedge no longer meets the criteria for hedge accounting, any cumulative deferred gain or loss and deferred costs of hedging in equity at that time remains in equity until the forecast transaction occurs, resulting in the recognition of a non-financial asset such as inventory. When the forecast transaction is no longer expected to occur, the cumulative gain or loss and deferred costs of hedging that were reported in equity are immediately reclassified to Other gains – net.
Derivatives that do not qualify for hedge accounting
Certain derivative instruments do not qualify for hedge accounting. Changes in the fair value of any derivative instrument that does not qualify for hedge accounting are recognized immediately in the statement of profit or loss and are included in Other gains – net.
202
Notes to the Consolidated Financial Statements (continued)
(Expressed in Renminbi Yuan unless otherwise indicated)
| 2 | Significant accounting policies (continued) |
| 2.14 | Inventories |
Inventories are valued at the lower of cost and net realizable value. Cost is determined using the weighted average cost method. The cost of finished goods and work in progress comprises raw materials, direct labor, other direct costs and related production overheads (based on normal operating capacity). It excludes borrowing costs. The net realizable value is determined based on the estimated selling price in the ordinary course of business less the estimated costs to completion, and other costs necessary to make the sale.
| 2.15 | Contract liabilities |
A contract liability is recognized when the customer pays non-refundable consideration before the Group recognizes the related revenue (see note 2.26). A contract liability would also be recognized if the Group has an unconditional right to receive non-refundable consideration before the Group recognizes the related revenue. In such cases, a corresponding receivable would also be recognized (see note 2.16).
When the contract includes a significant financing component, the contract balance includes interest accrued under the effective interest method (see note 2.27).
| 2.16 | Trade and other receivables |
A receivable is recognized when the Group has an unconditional right to receive consideration. A right to receive consideration is unconditional if only the passage of time is required before payment of that consideration is due. If revenue has been recognized before the Group has an unconditional right to receive consideration, the amount is presented as a contract asset.
Trade receivables that do not contain a significant financing component are initially measured at their transaction price.
Receivables are subsequently stated at amortized cost using the effective interest method less allowance for credit losses (see note 2.12(a)).
203
Notes to the Consolidated Financial Statements (continued)
(Expressed in Renminbi Yuan unless otherwise indicated)
| 2 | Significant accounting policies (continued) |
| 2.17 | Cash and cash equivalents |
In the consolidated statement of cash flows, cash and cash equivalents include cash in hand, deposits held at call with banks, other short-term, highly liquid investments with original maturities of three months or less that are readily convertible to known amounts of cash and which are subject to an insignificant risk of changes in value, and bank overdrafts. Bank overdrafts are presented within borrowings in current liabilities in the statement of financial position. Cash and cash equivalents are assessed for expected credit losses (ECL) in accordance with the policy set out in note 2.12(a).
| 2.18 | Share capital |
Ordinary shares are classified as equity.
Incremental costs directly attributable to the issue of new shares are shown in equity as a deduction, net of tax, from the proceeds.
| 2.19 | Safety production fund |
Under China’s law and regulation, the Group is required to accrue safety production fund at a certain percentage of the sales of dangerous goods. The fund is earmarked for improving the safety of production. The fund is accrued from retained earnings to other reserves and converted back to retained earnings when used.
| 2.20 | Trade and other payables |
Trade and other payables are obligations to pay for goods or services that have been acquired in the ordinary course of business from suppliers. Trade and other payables are classified as current liabilities if payment is due within one year or less (or in the normal operating cycle of the business if longer). If not, they are presented as non-current liabilities.
Trade and other payables generally are financial liabilities and are recognized initially at fair value plus transaction costs and subsequently measured at amortized cost unless the effect of discounting would be immaterial, in which case they are stated at invoice amounts.
204
Notes to the Consolidated Financial Statements (continued)
(Expressed in Renminbi Yuan unless otherwise indicated)
| 2 | Significant accounting policies (continued) |
| 2.21 | Borrowings |
Borrowings are initially recognized at fair value, net of transaction costs incurred. Borrowings are subsequently measured at amortized cost; any difference between the proceeds (net of transaction costs) and the redemption value is recognized in the statement of profit or loss over the period of the borrowings using the effective interest method.
Fees paid on the establishment of loan facilities are recognized as transaction costs of the loan to the extent that it is probable that some or all of the facility will be drawn down. In this case, the fee is deferred until the draw-down occurs. To the extent there is no evidence that it is probable that some or all of the facility will be drawn down, the fee is capitalized as a pre-payment for liquidity services and amortized over the period of the facility to which it relates.
Borrowings are classified as current liabilities unless the Group has an unconditional right to defer settlement of the liability for at least 12 months after the end of the reporting period.
| 2.22 | Borrowings costs |
General and specific borrowing costs directly attributable to the acquisition, construction or production of qualifying assets, which are assets that necessarily take a substantial period of time to get ready for their intended use or sale, are added to the cost of those assets, until such time as the assets are substantially ready for their intended use or sale.
Investment income earned on the temporary investment of specific borrowings pending their expenditure on qualifying assets is deducted from the borrowing costs eligible for capitalization.
Other borrowing costs are expensed in the period in which they are incurred.
| 2.23 | Current and deferred income tax |
The tax expense for the period comprises current and deferred tax. Tax is recognized in the statement of profit or loss, except to the extent that it relates to items recognized in other comprehensive income or directly in equity. In this case, the tax is also recognized in other comprehensive income or directly in equity, respectively.
| (a) | Current income tax |
The current income tax charge is calculated on the basis of the tax laws enacted or substantively enacted at the statement of financial position date in the countries where the Company’s subsidiaries, associates and joint ventures operate and generate taxable income. Management periodically evaluates positions taken in tax returns with respect to situations in which applicable tax regulation is subject to interpretation. It establishes provisions where appropriate on the basis of amounts expected to be paid to the tax authorities.
205
Notes to the Consolidated Financial Statements (continued)
(Expressed in Renminbi Yuan unless otherwise indicated)
| 2 | Significant accounting policies (continued) |
| 2.23 | Current and deferred income tax (continued) |
| (b) | Deferred income tax |
Inside basis differences
Deferred income tax is recognized, using the liability method, on temporary differences arising between the tax bases of assets and liabilities and their carrying amounts in the consolidated financial statements. However, deferred tax liabilities are not recognized if they arise from the initial recognition of goodwill, the deferred income tax is not accounted for if it arises from initial recognition of an asset or liability in a transaction other than a business combination that at the time of the transaction affects neither accounting nor taxable profit or loss. Deferred income tax is determined using tax rates (and laws) that have been enacted or substantively enacted by the statement of financial position date and are expected to apply when the related deferred income tax asset is realized or the deferred income tax liability is settled.
Deferred income tax assets are recognized only to the extent that it is probable that future taxable profit will be available against which the temporary differences can be utilized.
Outside basis differences
Deferred income tax liabilities are provided on taxable temporary differences arising from investments in subsidiaries, associates and joint arrangements, except for deferred income tax liability where the timing of the reversal of the temporary difference is controlled by the Group and it is probable that the temporary difference will not reverse in the foreseeable future. Generally the Group is unable to control the reversal of the temporary difference for associates. Only when there is an agreement in place that gives the Group the ability to control the reversal of the temporary difference in the foreseeable future, deferred tax liability in relation to taxable temporary differences arising from the associate’s undistributed profits is not recognized.
Deferred income tax assets are recognized on deductible temporary differences arising from investments in subsidiaries, associates and joint arrangements only to the extent that it is probable the temporary difference will reverse in the future and there is sufficient taxable profit available against which the temporary difference can be utilized.
206
Notes to the Consolidated Financial Statements (continued)
(Expressed in Renminbi Yuan unless otherwise indicated)
| 2 | Significant accounting policies (continued) |
| 2.23 | Current and deferred income tax (continued) |
| (c) | Offsetting |
Deferred income tax assets and liabilities are offset when there is a legally enforceable right to offset current tax assets against current tax liabilities and when the deferred income tax assets and liabilities relate to income taxes levied by the same taxation authority on either the taxable entity or different taxable entities where there is an intention to settle the balances on a net basis.
| 2.24 | Employee benefits |
| (a) | Short-term employee benefits |
Salaries, annual bonuses, paid annual leave and the cost of non-monetary benefits are accrued in the year in which the associated services are rendered by employees. Where payment or settlement is deferred and the effect would be material, these amounts are stated at their present values.
| (b) | Pension obligations |
The PRC employees of the Group are covered by various PRC government-sponsored defined-contribution pension plans under which the employees are entitled to a monthly pension based on certain formulas. The relevant government agencies are responsible for the pension liability to these employees when they retire. The Group contributes on a monthly basis to these pension plans for the employees which are determined at a certain percentage of their salaries. Under these plans, the Group has no obligation for post-retirement benefits beyond the contribution made. Contributions to these plans are expensed as incurred and contributions paid to the defined contribution pension plans for a staff are not available to reduce the Group’s future obligations to such defined-contribution pension plans even if the staff leaves the Group.
| (c) | Termination benefits |
Termination benefits are payable when employment is terminated by the Group before the normal retirement date, or whenever an employee accepts voluntary redundancy in exchange for these benefits. The Group recognizes termination benefits at the earlier of the following dates: (a) when the Group can no longer withdraw the offer of those benefits; and (b) when the entity recognizes costs for a restructuring that is within the scope of IAS 37 and involves the payment of terminations benefits. In the case of an offer made to encourage voluntary redundancy, the termination benefits are measured based on the number of employees expected to accept the offer. Benefits falling due more than 12 months after the end of the reporting period are discounted to present value.
207
Notes to the Consolidated Financial Statements (continued)
(Expressed in Renminbi Yuan unless otherwise indicated)
| 2 | Significant accounting policies (continued) |
| 2.25 | Provisions and contingent liabilities |
Provisions for environmental restoration, restructuring costs and legal claims are recognized when: the Group has a present legal or constructive obligation as a result of past events; it is probable that an outflow of resources will be required to settle the obligation; and the amount has been reliably estimated. Restructuring provisions comprise lease termination penalties and employee termination payments. Provisions are not recognized for future operating losses.
Where there are a number of similar obligations, the likelihood that an outflow will be required in settlement is determined by considering the class of obligations as a whole. A provision is recognized even if the likelihood of an outflow with respect to any one item included in the same class of obligations may be small.
Provisions are measured at the present value of the expenditures expected to be required to settle the obligation using a pre-tax rate that reflects current market assessments of the time value of money and the risks specific to the obligation. The increase in the provision due to passage of time is recognized as interest expense.
Where it is not probable that an outflow of economic benefits will be required, or the amount cannot be estimated reliably, the obligation is disclosed as a contingent liability, unless the probability of outflow of economic benefits is remote. Possible obligations, whose existence will only be confirmed by the occurrence or non-occurrence of one or more future events are also disclosed as contingent liabilities unless the probability of outflow of economic benefits is remote.
| 2.26 | Revenue recognition |
| (a) | Sales of petroleum and chemical products |
The Group manufactures and sells petroleum and chemical products. Sales are recognized when control of the products has transferred, being when the products are delivered to or accepted by the customer. Delivery occurs when the products have been shipped to the specific location, the risks of obsolescence and loss have been transferred to the customer, and either the customer has accepted the products in accordance with the sales contract, or the Group has objective evidence that all criteria for acceptance have been satisfied. Advance from customers but goods not yet delivered is recorded as contract liabilities and is recognized as revenue when a customer obtains control over the relevant goods.
Revenue excludes value added tax and is after deduction of any estimated trade discounts.
The Group has elected to apply the practical expedient that contract costs incurred related to contracts with an amortization period of less than one year have been expensed as incurred. The Group also applies the practical expedient in paragraph 121 of IFRS 15 and does not disclose information about remaining performance obligations that have original expected durations of one year or less.
208
Notes to the Consolidated Financial Statements (continued)
(Expressed in Renminbi Yuan unless otherwise indicated)
| 2 | Significant accounting policies (continued) |
| 2.26 | Revenue recognition (continued) |
| (b) | Overseas shipping services |
The Group arranges overseas shipping services for the customer and revenue is recognized over time and based on the actual shipping service provided to the end of the reporting period as a proportion of the total services to be provided, because the customer receives and uses the benefits simultaneously. This is determined based on the actual passages of time (days) relative to the total expected shipping days.
| 2.27 | Interest income |
Interest income from financial assets at FVPL is included in Other gains – net, see note 8 below. Interest income on financial assets at amortized cost and financial assets at FVOCI calculated using the effective interest method is recognized in the consolidated statement of profit or loss as part of other income.
Interest income is calculated by applying the effective interest rate to the gross carrying amount of a financial asset except for financial assets that subsequently become credit-impaired. For credit-impaired financial assets the effective interest rate is applied to the net carrying amount of the financial asset (after deduction of the loss allowance).
Interest income is presented as Finance income where it is earned from financial assets that are held for cash management purposes, see note 9 below.
| 2.28 | Dividend income |
Dividend income is recognized when the right to receive payment is established.
| 2.29 | Government grants |
Grants from the government are recognized at their fair value where there is a reasonable assurance that the grant will be received and the Group will comply with all attached conditions.
Government grants relating to costs are deferred and recognized in the statement of profit or loss over the period necessary to match them with the costs that they are intended to compensate.
Grants that compensate the Group for the cost of an asset are deducted from the carrying amount of the asset and consequently are effectively recognized in the statement of profit or loss over the useful life of the asset by way of reduced depreciation expense.
209
Notes to the Consolidated Financial Statements (continued)
(Expressed in Renminbi Yuan unless otherwise indicated)
| 2 | Significant accounting policies (continued) |
| 2.30 | Leases |
The Group leases various land, buildings, equipment, vehicles and others. Rental contracts of buildings, equipment, vehicles and others are typically made for fixed periods of 1 to 30 years. Rental contracts of land use rights are typically made for fixed periods of 30 to 50 years. Lease terms are negotiated on an individual basis and contain a wide range of different terms and conditions.
Leases are recognized as a right-of-use asset and a corresponding liability at the date at which the leased asset is available for use by the Group.
Assets and liabilities arising from a lease are initially measured on a present value basis. Lease liabilities include the net present value of the following lease payments:
| • | fixed payments (including in-substance fixed payments), less any lease incentives receivable, |
| • | variable lease payment that are based on an index or a rate, initially measured using the index or rate as at the commencement date, |
| • | amounts expected to be payable by the Group under residual value guarantees, |
| • | the exercise price of a purchase option if the Group is reasonably certain to exercise that option, and |
| • | payments of penalties for terminating the lease, if the lease term reflects the Group exercising that option. |
The lease payments are discounted using the interest rate implicit in the lease. If that rate cannot be readily determined, which is generally the case for leases in the Group, the lessee’s incremental borrowing rate is used, being the rate that the individual lessee would have to pay to borrow the funds necessary to obtain an asset of similar value to the right-of-use asset in a similar economic environment with similar terms, security and conditions.
210
Notes to the Consolidated Financial Statements (continued)
(Expressed in Renminbi Yuan unless otherwise indicated)
| 2 | Significant accounting policies (continued) |
| 2.30 | Leases (continued) |
To determine the incremental borrowing rate, the Group:
| • | where possible, uses recent third-party financing received by the individual lessee as a starting point, adjusted to reflect changes in financing conditions since third party financing was received |
| • | uses a build-up approach that starts with a risk-free interest rate adjusted for credit risk for leases held by the Group, which does not have recent third party financing, and |
| • | makes adjustments specific to the lease, e.g., term, country, currency and security. |
Lease payments are allocated between principal and finance cost. The finance cost is charged to profit or loss over the lease period so as to produce a constant periodic rate of interest on the remaining balance of the liability for each period.
Right-of-use assets are measured at cost comprising the following:
| • | the amount of the initial measurement of lease liability, |
| • | any lease payments made at or before the commencement date less any lease incentives received, |
| • | any initial direct costs, and |
| • | restoration costs. |
Right-of-use assets are generally depreciated over the shorter of the asset’s useful life and the lease term on a straight – line basis, as follows:
| Land use rights |
30-50 years | |||
| Buildings |
2-8 years | |||
| Equipment |
2-3 years | |||
| Others |
2-4 years | |||
Payments associated with short-term leases of equipment and vehicles are recognized on a straight-line basis as an expense in the statement of profit or loss. Short-term leases are leases with a lease term of 12 months or less. A single discount rate was applied to the portfolio of the leases with reasonably similar characteristics.
Lease income from operating leases where the Group is a lessor is recognized as income on a straight-line basis over the lease term. Initial direct costs incurred in obtaining an operating lease are added to the carrying amount of the underlying asset and recognized as expense over the lease term on the same basis as lease income. The respective leased assets are included in the statement of financial position based on their nature.
211
Notes to the Consolidated Financial Statements (continued)
(Expressed in Renminbi Yuan unless otherwise indicated)
| 2 | Significant accounting policies (continued) |
| 2.31 | Dividend distribution |
Dividend distribution to the Company’s shareholders is recognized as a liability in the Group’s financial statements in the period in which the dividends are approved by the Company’s shareholders.
| 2.32 | Research and development costs |
Research and development costs comprise all costs that are directly attributable to research and development activities or that can be allocated on a reasonable basis to such activities. Research and development costs are recognized as intangible assets when the following criteria are met:
| • | it is technically feasible to complete the research and development project so that it will be available for use or sale; |
| • | management intends to complete the research and development project, and use or sell it; |
| • | it can be demonstrated how the research and development project will generate economic benefits; |
| • | there are adequate technical, financial and other resources to complete the development and the ability to use or sell the research and development project; and |
| • | the expenditure attributable to the research and development project during its development phase can be reliably measured. |
Other research and development expenditures that do not meet these criteria are recognized as an expense as incurred. Research and development costs previously recognized as an expense are not recognized as an asset in a subsequent period.
| 2.33 | Related parties |
| (a) | A person, or a close member of that person’s family, is related to the Group if that person: |
| (i) | has control or joint control over the Group; |
| (ii) | has significant influence over the Group; or |
| (iii) | is a member of the key management personnel of the Group or the Group’s parent. |
212
Notes to the Consolidated Financial Statements (continued)
(Expressed in Renminbi Yuan unless otherwise indicated)
| 2 | Significant accounting policies (continued) |
| 2.33 | Related parties (continued) |
| (b) | An entity is related to the Group if any of the following conditions applies: |
| (iv) | The entity and the Group are members of the same group (which means that each parent, subsidiary and fellow subsidiary is related to the others). |
| (v) | One entity is an associate or joint venture of the other entity (or an associate or joint venture of a member of a group of which the other entity is a member). |
| (vi) | Both entities are joint ventures of the same third party. |
| (vii) | One entity is a joint venture of a third entity and the other entity is an associate of the third entity. |
| (viii) | The entity is a post-employment benefit plan for the benefit of employees of either the Group or an entity related to the Group. |
| (ix) | The entity is controlled or jointly controlled by a person identified in (i). |
| (x) | A person identified in (a)(i) has significant influence over the entity or is a member of the key management personnel of the entity (or of a parent of the entity). |
| (xi) | The entity, or any member of a Group of which it is a part, provides key management personnel services to the Group or to the Group’s parent. |
Close members of the family of a person are those family members who may be expected to influence, or be influenced by, that person in their dealings with the entity.
| 2.34 | Rounding of amounts |
All amounts disclosed in the consolidated financial statements and notes have been rounded off to the nearest thousand currency units unless otherwise stated.
213
Notes to the Consolidated Financial Statements (continued)
(Expressed in Renminbi Yuan unless otherwise indicated)
| 3 | Financial risk management |
| 3.1 | Financial risk factors |
The Group’s activities exposed it to a variety of financial risks: market risk (including foreign exchange risk, cash flow and fair value interest rate risk and commodity price risk), credit risk and liquidity risk. The Group’s overall risk management programmer focuses on the unpredictability of financial markets and seeks to minimize potential adverse effects on the Group’s financial performance.
Where all relevant criteria are met, hedge accounting is applied to remove the accounting mismatch between the hedging instrument and the hedged item.
| (a) | Derivatives |
The Group has the following derivative financial instruments in the following line items in the statement of financial position:
| As at 31 December | ||||||||
| 2021 RMB’000 |
2020 RMB’000 |
|||||||
| Current derivative financial instrument assets |
||||||||
| Commodity swaps contracts applied hedge accounting |
48,614 | — | ||||||
| Commodity swaps contracts at fair value through profit or loss |
32,791 | — | ||||||
|
|
|
|
|
|||||
| Total derivative financial assets |
81,405 | — | ||||||
|
|
|
|
|
|||||
| Current derivative financial instrument liabilities |
||||||||
| Commodity swaps contracts at fair value through profit or loss |
(23,804 | ) | — | |||||
|
|
|
|
|
|||||
| Total derivative financial liabilities |
(23,804 | ) | — | |||||
|
|
|
|
|
|||||
214
Notes to the Consolidated Financial Statements (continued)
(Expressed in Renminbi Yuan unless otherwise indicated)
| 3 | Financial risk management (continued) |
| 3.1 | Financial risk factors (continued) |
| (a) | Derivatives (continued) |
| (i) | Classification of derivatives |
Derivatives are only used for economic hedging purposes and not as speculative investments. However, where derivatives do not meet the hedge accounting criteria, they are classified as ‘held for trading’ for accounting purposes and are accounted for at fair value through profit or loss. They are presented as current assets or liabilities to the extent they are expected to be settled within 12 months after the end of the reporting period.
The Group’s accounting policy for its cash flow hedges is set out in note 2.13.
| (ii) | Fair value measurement |
For information about the methods and assumptions used in determining the fair value of derivatives refer to note 3.3.
| (iii) | Hedging reserves |
The following table provides a reconciliation of the hedging reserve in respect of commodity price risk and shows the effectiveness of the hedging relationships:
| RMB’000 | ||||
| Balance at 1 January 2021 |
— | |||
| Effective portion of the cash flow hedge recognized in other comprehensive income |
165,576 | |||
| Amounts reclassified to profit or loss |
1,303 | |||
| Reclassified to the cost of inventory |
(88,699 | ) | ||
| Related tax |
(41,720 | ) | ||
|
|
|
|||
| Balance at 31 December 2021 |
36,460 | |||
|
|
|
|||
215
Notes to the Consolidated Financial Statements (continued)
(Expressed in Renminbi Yuan unless otherwise indicated)
| 3 | Financial risk management (continued) |
| 3.1 | Financial risk factors (continued) |
| (a) | Derivatives (continued) |
| (iv) | Amounts recognized in the statement of profit or loss |
In addition to the amounts disclosed in the reconciliation of hedging reserves above, the following amounts were recognized in the statement of profit or loss in relation to derivatives:
| 2021 | 2020 | |||||||
| RMB’000 | RMB’000 | |||||||
| Net gains on commodity swaps contracts not qualifying as hedges included in other gains – net |
18,997 | — | ||||||
| Net losses on foreign exchange option contracts not qualifying as hedges included in other gains – net |
(151 | ) | (376 | ) | ||||
|
|
|
|
|
|||||
| Total |
18,846 | (376 | ) | |||||
|
|
|
|
|
|||||
Hedge effectiveness
Hedge effectiveness is determined at the inception of the hedge relationship, and through periodic prospective effectiveness assessments, to ensure that an economic relationship exists between the hedged item and hedging instrument.
The Group enters into commodity swaps contracts that have similar critical terms as the hedged item, such as reference rate, payment dates, transaction price, crude oil variety and crude oil quantity.
Hedge ineffectiveness for commodity swaps contracts may occur due to the changes in the timing of the hedged transactions. There was no recognized ineffectiveness during the year ended 31 December 2021 in relation to the commodity swaps.
As at 31 December 2021, the Group had certain commodity contracts of crude oil designed as qualified cash flow hedges, which will be matured over the next 10 months. The fair value of such cash flow hedges is RMB48,614 thousand recognized as derivative financial assets in the consolidated statement of financial position.
216
Notes to the Consolidated Financial Statements (continued)
(Expressed in Renminbi Yuan unless otherwise indicated)
| 3 | Financial risk management (continued) |
| 3.1 | Financial risk factors (continued) |
| (b) | Market risk |
| (i) | Foreign exchange risk |
The Group’s major operational activities are carried out in Mainland China and a majority of the transactions are denominated in RMB. Nevertheless, the Group is exposed to foreign exchange risk arising from the recognized assets and liabilities, and future transactions denominated in foreign currencies, primarily with respect to US dollar. The Group’s finance department at its headquarter is responsible for monitoring the amount of assets and liabilities, and transactions denominated in foreign currencies to minimize the foreign exchange risk. For the year ended 31 December 2021 and 31 December 2020, the Group used foreign exchange option contracts to mitigate its exposure to foreign exchange risk respect to US dollar.
As at 31 December 2021, there were no foreign exchange options that had not been matured (31 December 2020: Nil).
As at 31 December 2021, if US dollar had weakened/strengthened by 5% against RMB with all other variables held constant, the Group’s net profit for the year ended 31 December 2021 would have been RMB2,292 thousand decreased/increased (31 December 2020: RMB2,401 thousand decreased/ increased in net profit) before considering the impact of forward and option contracts as a result of foreign exchange gains/losses which is mainly resulted from the translation of US dollar denominated trade receivables and payables.
The aggregate net foreign exchange (losses)/gains recognized in the statement of profit or loss were:
| 2021 RMB’000 |
2020 RMB’000 |
|||||||
| Net foreign exchange (losses)/gains included in other gains – net (note 8) |
(1,861 | ) | 12,248 | |||||
| Net foreign exchange (losses) included in finance income (note 9) |
— | (5,514 | ) | |||||
|
|
|
|
|
|||||
| Total net foreign exchange recognized in profit before taxation |
(1,861 | ) | 6,734 | |||||
|
|
|
|
|
|||||
217
Notes to the Consolidated Financial Statements (continued)
(Expressed in Renminbi Yuan unless otherwise indicated)
| 3 | Financial risk management (continued) |
| 3.1 | Financial risk factors (continued) |
| (b) | Market risk (continued) |
| (ii) | Cash flow and fair value interest rate risk |
The Group’s interest rate risk arises from interest-bearing borrowings and short-term bonds. Borrowings obtained at variable rates expose the Group to cash flow interest rate risk. Borrowings obtained at fixed rates expose the Group to fair value interest rate risk. The Group determines the relative proportions of its fixed rate and floating rate contracts depending on the prevailing market conditions.
The Group’s finance department at its headquarter continuously monitors the interest rate position of the Group. Increases in interest rates will increase the cost of new borrowing and the interest expenses with respect to the Group’s outstanding floating rate borrowings, and therefore could have a material adverse effect on the Group’s financial position. The Group makes adjustments timely with reference to the latest market conditions and may enter into interest rate swap agreements to mitigate its exposure to interest rate risk. For the years ended 31 December 2021 and 31 December 2020, the Group did not enter into any interest rate swap agreements.
218
Notes to the Consolidated Financial Statements (continued)
(Expressed in Renminbi Yuan unless otherwise indicated)
| 3 | Financial risk management (continued) |
| 3.1 | Financial risk factors (continued) |
| (b) | Market risk (continued) |
| (ii) | Cash flow and fair value interest rate risk (continued) |
At the reporting date, the interest rate profile of the Group’s interest-bearing financial instruments was as follows.
| 2021 RMB’000 |
2020 RMB’000 |
|||||||
| Fixed rate: |
||||||||
| Cash and cash equivalents |
— | 1,501,330 | ||||||
| Time deposits with maturity less than one year |
7,350,000 | 4,000,000 | ||||||
| Time deposits with maturity more than one year |
5,500,000 | 7,000,000 | ||||||
| Borrowings |
(1,500,000 | ) | (1,548,000 | ) | ||||
| Short-term bonds |
— | (3,000,000 | ) | |||||
| Lease liabilities |
(4,613 | ) | (12,473 | ) | ||||
|
|
|
|
|
|||||
| 11,345,387 | 7,940,857 | |||||||
|
|
|
|
|
|||||
| Variable rate: |
||||||||
| Cash and cash equivalents |
5,112,010 | 5,415,078 | ||||||
| Borrowings |
(759,800 | ) | — | |||||
|
|
|
|
|
|||||
| 4,352,210 | 5,415,078 | |||||||
|
|
|
|
|
|||||
As at 31 December 2021, if interest rates on the floating rate financial instruments had risen/fallen by 50 basis points while all other variables had been held constant, the Group’s net profit would have increased/decreased by approximately RMB16,252 thousand (2020: RMB20,365 thousand), mainly as a result of higher/lower interest on floating rate cash and cash equivalents.
219
Notes to the Consolidated Financial Statements (continued)
(Expressed in Renminbi Yuan unless otherwise indicated)
| 3 | Financial risk management (continued) |
| 3.1 | Financial risk factors (continued) |
| (b) | Market risk (continued) |
| (iii) | Commodity price risk |
The Group principally engages in processing crude oil into synthetic fibers, resins and plastics, intermediate petrochemicals and petroleum products. The selling price of petroleum products is periodically adjusted by the government department based on the market price adjustment mechanism, and generally in connection with the crude oil price. The fluctuations in prices of crude oil, refined oil products and intermediate petrochemicals and petroleum products could have significant impact on the Group. The Group uses commodity swaps contracts to manage a portion of this risk.
As at 31 December 2021, the Group had certain unexpired commodity contracts of crude oil and refined oil designated as qualified cash flow hedges, balances of which have been disclosed in note 3.1 (a) (31 December 2020: Nil).
| (c) | Credit risk |
| (i) | Risk management |
Credit risk refers to the risk that a counterparty will default on its contractual obligations resulting in a financial loss to the Group. Credit risk is managed on group basis. It mainly arises from cash and cash equivalents, time deposits with banks, bills receivable, derivative financial assets, trade receivables measured at amortized cost and FVOCI, other receivables etc.
The Group expects that there is no significant credit risk associated with cash at bank (including time deposits and structured deposits), bills receivable and derivative financial assets because the counterparties are banks and financial institutions with a relatively higher credit rating, which the Group considers to represent low credit risk. Management does not expect that there will be any significant losses from non-performance by these counterparties.
In addition, the Group has policies to limit the credit exposure on trade receivables, other receivables. The Group assesses the credit quality of and sets credit limits on its customers by taking into account their financial position, the availability of guarantee from third parties, their credit history and other factors such as current market conditions. The credit history of the customers is regularly monitored by the Group. In respect of customers with a poor credit history, the Group will use written payment reminders, or shorten or cancel credit periods, to ensure the overall credit risk of the Group is limited to a controllable extent.
220
Notes to the Consolidated Financial Statements (continued)
(Expressed in Renminbi Yuan unless otherwise indicated)
| 3 | Financial risk management (continued) |
| 3.1 | Financial risk factors (continued) |
| (c) | Credit risk (continued) |
| (i) | Risk management (continued) |
The Group considers the probability of default upon initial recognition of a financial asset and whether there has been a significant increase in credit risk on an ongoing basis throughout each reporting period. To assess whether there is a significant increase in credit risk, the Group compares the risk of a default occurring on the asset as at the reporting date with the risk of default as at the date of initial recognition. It considers available reasonable and supportive forward-looking information. Especially the following indicators are incorporated:
| • | internal credit rating; |
| • | external credit rating (as far as available); |
| • | actual or expected significant adverse changes in business, financial or economic conditions that are expected to cause a significant change to the debtors’ ability to meet its obligations; |
| • | actual or expected significant changes in the operating results of the debtors; |
| • | significant increases in credit risk on other financial instruments of the same debtors; |
| • | significant changes in the value of the collateral supporting the obligation or in the quality of third-party guarantees or credit enhancements; |
| • | significant changes in the expected performance and behaviour of the debtors, including changes in the payment status of debtors, etc. |
Regardless of the analysis above, a significant increase in credit risk is presumed if a debtor is more than 30 days past due in making a contractual payment.
221
Notes to the Consolidated Financial Statements (continued)
(Expressed in Renminbi Yuan unless otherwise indicated)
| 3 | Financial risk management (continued) |
| 3.1 | Financial risk factors (continued) |
| (c) | Credit risk (continued) |
| (i) | Risk management (continued) |
It has other monitoring procedures to ensure that follow-up action is taken to recover overdue debts. In addition, the Group reviews regularly the recoverable amount of each individual trade receivables to ensure that adequate impairment losses are made for irrecoverable amounts. Significant concentrations of credit risk primarily arise when the Group has significant exposure to individual customers. As at 31 December 2021, 69.50% and 81.80% of the total trade receivables were due from the Group’s largest customer and the five largest customers respectively within the Group (31 December 2020, 49.79% and 85.28%).
For other receivables, management makes periodic collective assessment as well as individual assessment on the recoverability of other receivables based on historical settlement records and forward-looking information. The management believes that there is no material credit risk inherent in the Group’s outstanding balance of other receivable.
| (ii) | Impairment of financial assets |
The Group has three types of financial assets that are subject to the expected credit loss model:
| • | Trade receivables for sales of goods and from the providing services, |
| • | Other financial assets carried at amortized cost, and |
| • | Debt instruments carried at FVOCI. |
While cash and cash equivalents, time deposits with banks and bills receivable are also subject to the impairment requirements of IFRS 9, the identified impairment loss was immaterial.
222
Notes to the Consolidated Financial Statements (continued)
(Expressed in Renminbi Yuan unless otherwise indicated)
| 3 | Financial risk management (continued) |
| 3.1 | Financial risk factors (continued) |
| (c) | Credit risk (continued) |
| (ii) | Impairment of financial assets (continued) |
Trade receivables
The Group applies the IFRS 9 simplified approach to measuring expected credit losses which uses a lifetime expected loss allowance for all trade receivables (including trade receivables with related parties) and financial assets at fair value through other comprehensive income.
To measure the expected credit losses, trade receivables have been grouped based on shared credit risk characteristics and the days past due.
The expected credit loss rates are based on the payment profiles of sales over a period of 36 months before 31 December 2021 and 31 December 2020 respectively and the corresponding historical credit losses experienced within this period. The historical loss rates are adjusted to reflect current and forward-looking information on macroeconomic factors affecting the ability of the customers to settle the receivables.
Impairment losses on trade receivables are presented as (provision)/reversal of impairment losses on financial assets within operating profit. Subsequent recoveries of amounts previously written off are credited against the same line item.
Other financial assets at amortized cost
Other financial assets at amortized cost include other receivables.
As at 31 December 2021 and 31 December 2020, the internal credit rating of other receivables was all performing. The Group has assessed that the expected credit losses for these receivables are not material under the 12 months expected losses method.
Management considered that there was no significant increase in credit risk for other receivables including receivables from related parties by taking into account of their past history of making payments when due and current ability to pay, and thus the impairment provision recognized during the period was limited to 12 months expected losses.
223
Notes to the Consolidated Financial Statements (continued)
(Expressed in Renminbi Yuan unless otherwise indicated)
| 3 | Financial risk management (continued) |
| 3.1 | Financial risk factors (continued) |
| (c) | Credit risk (continued) |
| (ii) | Impairment of financial assets (continued) |
Other financial assets at amortized cost (continued)
The provision/(reversal) for loss allowance was recognized in the statement of profit or loss in (provision)/ reversal of impairment losses on financial assets.
Trade and other receivables are written off where there is no reasonable expectation of recovery. Indicators that there is no reasonable expectation of recovery include, amongst others, the failure of a debtor to engage in a repayment plan with the Group, and a failure to make contractual payments for a period of greater than 120 days past due.
Impairment losses on trade and other receivables are presented as (provision)/reversal of impairment losses within operating profit. Subsequent recoveries of amounts previously written off are credited against the same line item.
Debt instruments carried at FVOCI
Debt instruments carried at FVOCI include trade receivables and bills receivable with a business model which is achieved both by collecting contractual cash flows and selling of these assets. The loss allowance for debt instruments is recognized in the statement of profit or loss and reduces the fair value loss otherwise recognized in OCI.
As at 31 December 2021 and 31 December 2020, no loss allowance was provided for financial assets at FVOCI.
224
Notes to the Consolidated Financial Statements (continued)
(Expressed in Renminbi Yuan unless otherwise indicated)
| 3 | Financial risk management (continued) |
| 3.1 | Financial risk factors (continued) |
| (c) | Credit risk (continued) |
| (iii) | (Provision)/reversal of impairment losses on financial assets recognized in the statement of profit or loss |
During the year, the following (losses)/recoveries were recognized in (provision)/reversal of impairment losses on financial assets in relation to impaired financial assets:
| 2021 RMB’000 |
2020 RMB’000 |
|||||||
| Impairment losses |
||||||||
| – provision in loss allowance for trade receivables |
(1,354 | ) | (634 | ) | ||||
| – provision in loss allowance for other receivables |
(1 | ) | – | |||||
| Recoveries on previously written off receivables (note) |
– | 121,550 | ||||||
|
|
|
|
|
|||||
| (Provision)/reversal of impairment losses on financial assets |
(1,355 | ) | 120,916 | |||||
|
|
|
|
|
|||||
| Note: | For the year ended 31 December 2020, the Group recovered previously written off receivables amounted to RMB121,550 thousand due to the liquidation of Zhejiang Jin Yong Acrylic Fiber Company Limited, a former subsidiary of the Group. |
| (iv) | Financial assets at fair value through profit or loss |
The Group is also exposed to credit risk in relation to investments such as derivative financial instruments, which are measured at fair value through profit or loss. The maximum exposure at the end of the reporting period is the carrying amount of these investments.
225
Notes to the Consolidated Financial Statements (continued)
(Expressed in Renminbi Yuan unless otherwise indicated)
| 3 | Financial risk management (continued) |
| 3.1 | Financial risk factors (continued) |
| (d) | Liquidity risk |
Cash flow forecast is performed by the operating entities of the Group and aggregated by Group finance. Group finance monitors rolling forecasts of the Group’s liquidity requirements to ensure it has sufficient cash to meet operational needs while maintaining sufficient headroom on its undrawn committed borrowing facilities from major financial institutions so that the Group does not breach borrowing limits or covenants on any of its borrowing facilities to meet the short-term and long-term liquidity requirements.
The liquidity of the Group is primarily dependent on its ability to maintain adequate cash inflow from operations, the renewal of its short-term bank loans and its ability to obtain adequate external financing to support its working capital and meet its debt obligation when they become due.
Surplus cash held by the operating entities over and above balance required for working capital management is transferred to the Group treasury. As at 31 December 2021, the Group held cash and cash equivalents of RMB5,112,010 thousand (31 December 2020: RMB6,916,408 thousand) (note 23), time deposits with banks – current of RMB7,386,607 thousand (31 December 2020: RMB4,049,443 thousand) (note 24) and trade receivables (including trade receivables with related parties and those carried at fair value through other comprehensive income (“FVOCI”) of RMB1,568,800 thousand (31 December 2020: RMB1,469,431 thousand), that are expected to readily generate cash inflows for managing liquidity risk.
The table below analyzes the Group’s financial liabilities into relevant maturity groupings based on the remaining period at the statement of financial position date to the contractual maturity date. The amounts disclosed in the table are the contractual undiscounted cash flows.
226
Notes to the Consolidated Financial Statements (continued)
(Expressed in Renminbi Yuan unless otherwise indicated)
| 3 | Financial risk management (continued) |
| 3.1 | Financial risk factors (continued) |
| (d) | Liquidity risk (continued) |
| As at 31 December 2021 | ||||||||||||||||||||
| Contractual maturities of financial liabilities | ||||||||||||||||||||
| Less than 1 year RMB’000 |
Between 1 and 2 years RMB’000 |
Between 2 and 5 years RMB’000 |
Over 5 years RMB’000 |
Total RMB’000 |
||||||||||||||||
| Non-derivatives |
||||||||||||||||||||
| Borrowings |
1,578,817 | 7,665 | 704,914 | — | 2,291,396 | |||||||||||||||
| Lease liabilities |
3,814 | 730 | 814 | — | 5,358 | |||||||||||||||
| Bills payables |
562,593 | — | — | — | 562,593 | |||||||||||||||
| Trade payables |
1,527,706 | — | — | — | 1,527,706 | |||||||||||||||
| Other payables |
1,003,860 | — | — | — | 1,003,860 | |||||||||||||||
| Amounts due to related parties excluded non-financial liabilities |
4,910,255 | — | — | — | 4,910,255 | |||||||||||||||
|
|
|
|
|
|
|
|
|
|
|
|||||||||||
| 9,587,045 | 8,395 | 705,728 | — | 10,301,168 | ||||||||||||||||
|
|
|
|
|
|
|
|
|
|
|
|||||||||||
| Derivatives |
||||||||||||||||||||
| Derivative financial liabilities |
23,804 | — | — | — | 23,804 | |||||||||||||||
|
|
|
|
|
|
|
|
|
|
|
|||||||||||
227
Notes to the Consolidated Financial Statements (continued)
(Expressed in Renminbi Yuan unless otherwise indicated)
| 3 | Financial risk management (continued) |
| 3.1 | Financial risk factors (continued) |
| (d) | Liquidity risk (continued) |
| As at 31 December 2020 | ||||||||||||||||||||
| Contractual maturities of financial liabilities | ||||||||||||||||||||
| Less than 1 year RMB’000 |
Between 1 and 2 years RMB’000 |
Between 2 and 5 years RMB’000 |
Over 5 years RMB’000 |
Total RMB’000 |
||||||||||||||||
| Non-derivatives |
||||||||||||||||||||
| Borrowings |
1,558,702 | — | — | — | 1,558,702 | |||||||||||||||
| Short-term bonds |
3,023,614 | — | — | — | 3,023,614 | |||||||||||||||
| Lease liabilities |
9,373 | 2,136 | 1,090 | 103 | 12,702 | |||||||||||||||
| Bills payables |
26,196 | — | — | — | 26,196 | |||||||||||||||
| Trade payables |
1,294,138 | — | — | — | 1,294,138 | |||||||||||||||
| Other payables |
1,498,503 | — | — | — | 1,498,503 | |||||||||||||||
| Amounts due to related parties |
3,655,724 | — | — | — | 3,655,724 | |||||||||||||||
|
|
|
|
|
|
|
|
|
|
|
|||||||||||
| 11,066,250 | 2,136 | 1,090 | 103 | 11,069,579 | ||||||||||||||||
|
|
|
|
|
|
|
|
|
|
|
|||||||||||
| Derivatives |
||||||||||||||||||||
| Derivative financial liabilities |
— | — | — | — | — | |||||||||||||||
|
|
|
|
|
|
|
|
|
|
|
|||||||||||
228
Notes to the Consolidated Financial Statements (continued)
(Expressed in Renminbi Yuan unless otherwise indicated)
| 3 | Financial risk management (continued) |
| 3.2 | Capital management |
The Group’s objectives when managing capital are to safeguard the Group’s ability to continue as a going concern in order to provide returns for shareholders and benefits for other stakeholders and to maintain an optimal capital structure to reduce the cost of capital.
In order to maintain or adjust the capital structure, the Group may adjust the amount of dividends paid to shareholders, return capital to shareholders, issue new shares or sell assets to reduce debt.
Consistent with others in the industry, the Group monitors capital on the basis of the gearing ratio. This ratio is calculated as net debt divided by total capital. Net debt is calculated as total borrowings and short-term bonds less cash and cash equivalents. Total capital is calculated as equity as shown in the consolidated statement of financial position plus net debt.
As cash and cash equivalents exceed total borrowings and short-term bonds, which was resulted primarily from profitability, there was no net debt as at 31 December 2021 and 31 December 2020.
| 3.3 | Fair value estimation |
The table below analyzes the Group’s financial instruments carried at fair value as at 31 December 2021 and 2020 by the level of the inputs to valuation techniques used to measure fair value. Such inputs are categorized into three levels within a fair value hierarchy as follows:
| • | The fair value of financial instruments traded in active markets (such as publicly traded derivatives and equity securities) is based on quoted market prices at the end of the reporting period. The quoted market price used for financial assets held by the Group is the current bid price. These instruments are included in level 1. |
| • | The fair value of financial instruments that are not traded in an active market (for example, over–the–counter derivatives) is determined using valuation techniques that maximize the use of observable market data and rely as little as possible on entity-specific estimates. If all significant inputs required to fair value an instrument are observable, the instrument is included in level 2. |
| • | If one or more of the significant inputs is not based on observable market data, the instrument is included in level 3. This is the case for unlisted equity securities. |
229
Notes to the Consolidated Financial Statements (continued)
(Expressed in Renminbi Yuan unless otherwise indicated)
| 3 | Financial risk management (continued) |
| 3.3 | Fair value estimation (continued) |
| As at 31 December 2021 | ||||||||||||||||||||
| Note | Level 1 RMB’000 |
Level 2 RMB’000 |
Level 3 RMB’000 |
Total RMB’000 |
||||||||||||||||
| Recurring fair value measurements |
||||||||||||||||||||
| Financial assets |
||||||||||||||||||||
| Financial assets measured at fair value through profit or loss |
||||||||||||||||||||
| – Commodity swaps contracts |
3.1 | (a) | — | 32,791 | — | 32,791 | ||||||||||||||
| Financial assets measured at fair value through other comprehensive income |
||||||||||||||||||||
| – Trade and bills receivable |
25 | — | 1,072,690 | — | 1,072,690 | |||||||||||||||
| – Equity investments |
25 | — | — | 5,000 | 5,000 | |||||||||||||||
| – Commodity swaps contracts |
3.1 | (a) | — | 48,614 | — | 48,614 | ||||||||||||||
|
|
|
|
|
|
|
|
|
|||||||||||||
| — | 1,154,095 | 5,000 | 1,159,095 | |||||||||||||||||
|
|
|
|
|
|
|
|
|
|||||||||||||
| Financial liabilities |
||||||||||||||||||||
| Financial liabilities measured at fair value through profit or loss |
||||||||||||||||||||
| – Commodity swaps contracts |
3.1 | (a) | — | 23,804 | — | 23,804 | ||||||||||||||
|
|
|
|
|
|
|
|
|
|||||||||||||
| — | 23,804 | — | 23,804 | |||||||||||||||||
|
|
|
|
|
|
|
|
|
|||||||||||||
| Amounts due to related parties – measured at fair value through profit or loss (FVPL) |
28 | — | 1,388,286 | — | 1,388,286 | |||||||||||||||
|
|
|
|
|
|
|
|
|
|||||||||||||
230
Notes to the Consolidated Financial Statements (continued)
(Expressed in Renminbi Yuan unless otherwise indicated)
| 3 | Financial risk management (continued) |
| 3.3 | Fair value estimation (continued) |
| As at 31 December 2020 | ||||||||||||||||||||
| Note | Level 1 RMB’000 |
Level 2 RMB’000 |
Level 3 RMB’000 |
Total RMB’000 |
||||||||||||||||
| Recurring fair value measurements |
||||||||||||||||||||
| Financial assets |
||||||||||||||||||||
| Financial assets at fair value through other comprehensive income |
||||||||||||||||||||
| – Trade and bills receivable |
25 | — | 1,217,114 | — | 1,217,114 | |||||||||||||||
| – Equity investments |
25 | — | — | 5,000 | 5,000 | |||||||||||||||
|
|
|
|
|
|
|
|
|
|||||||||||||
| — | 1,217,114 | 5,000 | 1,222,114 | |||||||||||||||||
|
|
|
|
|
|
|
|
|
|||||||||||||
Valuation techniques and inputs used in Level 2 fair value measurements
The fair value of commodity swaps contract is the estimated amount that the Group would receive or pay to terminate the swap at the end of the reporting period, taking into account the current interest rates and the current creditworthiness of the swap counterparties.
The fair value of trade and bills receivable is estimated as the present value of the future cash flows, discounted at the market interest rates at the balance sheet date.
The fair value of amounts due to related parties is the estimated amount that the Group would settle the liability by returning certain quantity of crude oil at the end of the reporting period, referring to market price of the related crude oil. As at 31 December 2021, if market price of crude oil had risen/fallen by 10% while all other variables had been held constant, the Group’s net profit would have decreased/increased by approximately RMB89,787 thousand (2020: Nil).
During the year ended 31 December 2021, there were no transfers between Level 1 and Level 2, or transfers into or out of Level 3. The Group’s policy is to recognize transfers between levels of fair value hierarchy as at the end of the reporting period in which they occur.
Financial assets and financial liabilities not measured at fair value mainly represent trade receivables, other receivables, amounts due from related parties excluded prepayments, trade payables, amounts due to related parties, other payables (except for the staff salaries and welfare payables and taxes payables), borrowings and short-term bonds. The carrying amounts of these financial assets and liabilities not measured at fair value are a reasonable approximation of their fair value.
231
Notes to the Consolidated Financial Statements (continued)
(Expressed in Renminbi Yuan unless otherwise indicated)
| 4 | Critical accounting judgement and estimates |
| 4.1 | Critical accounting judgements in applying the Group’s accounting policies |
In the process of applying the Group’s accounting policies, management has made the following accounting judgement:
| (a) | Classification of financial assets |
The classification depends on the Group’s business model for managing the financial assets and the contractual terms of the cash flows. The Group determines the business model for managing financial assets at the level of the financial asset portfolio. The factors considered include the way to evaluate and report the performance of financial assets to key management personnel, the risks affecting the performance of financial assets and their management methods, and the way for relevant business management personnel to obtain remuneration, etc.
When evaluating whether the contractual cash flow of financial assets is consistent with the basic lending arrangements, the Group has the following main judgments: whether the time distribution or amount of the principal may change in the duration due to prepayment and other reasons; whether the interest only includes the time value of money, credit risk, other basic lending risks and the consideration of cost and profit. For example, does the amount of prepayment only reflect the outstanding principal and the interest based on the outstanding principal, as well as the reasonable compensation paid for the early termination of the contract.
| 4.2 | Sources of estimation uncertainty |
Significant sources of estimation uncertainty are as follows:
| (a) | Net realizable value (“NRV”) of inventories |
As described in note 2.14, inventories are valued at the lower of cost and net realizable value. The net realizable value is determined based on the estimated selling prices in the ordinary course of business less the estimated costs to completion, and other costs necessary to make the sale. These estimates are based on the current market condition and historical experience of selling products of similar nature. It could change significantly as a result of competitor actions in response to changes in market conditions.
Management reassesses these estimations at the end of each reporting period to ensure inventory is shown at the lower of cost and net realizable value.
232
Notes to the Consolidated Financial Statements (continued)
(Expressed in Renminbi Yuan unless otherwise indicated)
| 4 | Critical accounting judgement and estimates (continued) |
| 4.2 | Sources of estimation uncertainty (continued) |
| (b) | Impairments for non-current assets |
As discussed in note 2.12, at the end of each reporting period, the Group estimates the recoverable amount of an asset or a cash-generating unit (“CGU”) (a portion of which related to certain production facilities), at the higher of its fair value less costs of disposal and its value in use, to determine the impairment losses. If circumstances indicate that the carrying amount of the asset or CGU may not be recoverable, the asset or CGU may be considered “impaired”, and an impairment loss may be recognized.
The recoverable amount of assets or CGUs is the higher of the fair value less costs of disposal and value in use. As the fair value of certain assets or CGUs may not be publicly available, the Group uses all readily available information in determining an amount that is a reasonable approximation of recoverable amount, including estimates based on reasonable and supportable assumptions for projections of product sales and operating costs and discount rate. In particular, in determining the value in use of the Group’s specific CGUs, significant judgements are required on the accounting estimates which are based on the assumptions relating to product sales growth rates, related costs growth rates and discount rate applied.
| (c) | Useful life and residual value of property, plant and equipment |
Property, plant and equipment, are depreciated on a straight-line basis over the estimated useful lives of the assets, after taking into account the estimated residual value. Management reviews the estimated useful lives and estimated residual value of the assets annually in order to determine the amount of depreciation expense to be recorded during any reporting period. The useful lives are based on the Group’s historical experience with similar assets, taking into account anticipated technological changes. The depreciation expense for future periods is adjusted if there are significant changes from previous estimates.
| 5 | Segment information and revenue |
| 5.1 | Segment information |
The Group manages its business by divisions, which are organized by business lines. In view of the fact that the Company and its subsidiaries operate substantially all in the PRC, no geographical segment information is presented.
In a manner consistent with the way in which information is reported internally to the Group’s chief operating decision maker, Board of Directors, for the purposes of resource allocation and performance assessment, the Group has identified the following five reportable segments. No operating segments have been aggregated to form the following reportable segments.
233
Notes to the Consolidated Financial Statements (continued)
(Expressed in Renminbi Yuan unless otherwise indicated)
| 5 | Segment information and revenue (continued) |
| 5.1 | Segment information (continued) |
Segment results, assets and liabilities include items directly attributable to a segment as well as those that can be allocated on a reasonable basis. Unallocated items mainly comprise interests in associates and joint ventures, deferred tax assets, cash and cash equivalents, time deposits, and incomes relating to these assets (such as share of net profits of associates and joint ventures accounted for using the equity method and interest income), derivative financial assets, borrowings, short-term bonds and interest expenses, derivative financial liabilities, and deferred tax liabilities.
The Group principally operates in five operating segments: synthetic fibres, resins and plastics, intermediate petrochemicals, petroleum products and trading of petrochemical products. Synthetic fibres, resins and plastics, intermediate petrochemicals and petroleum products are produced through intermediate steps from the principal raw material of crude oil. The specific products of each segment are as follows:
| (i) | The petroleum products segment is equipped with crude oil refinery facilities used to produce qualified refined gasoline, fuel, diesel oil, heavy oil and liquefied petroleum gas, and provide raw materials for the Group’s downstream petrochemical processing facilities. |
| (ii) | The intermediate petrochemicals segment primarily produces p-xylene, benzene and ethylene oxide. The intermediate petrochemicals produced by the Group are both served as raw materials in the production of other petrochemicals, resins, plastics and synthetic fibres, and sold to external customers. |
| (iii) | The resins and plastics segment produces primarily polyester chips, polyethylene resins, polypropylene resins and PVA granules. The polyester chips are used to produce polyester fibres, coating and containers. Polyethylene resins and plastics are used to produce insulated cable, mulching films and moulded products such as housewares and toys. Polypropylene resins are used for films, sheets and moulded products such as housewares, toys, consumer electronics and automobile parts. |
| (iv) | The synthetic fibres segment produces primarily polyester, acrylic fibres and carbon fibres, which are mainly used in the textile and apparel industries. |
| (v) | The trading of petrochemical products segment is primarily engaged in importing and exporting of petrochemical products. The products are sourced from international and domestic suppliers. |
| (vi) | Other operating segments represent the operating segments that do not meet the quantitative threshold for determining reportable segments. These include investment property leasing, service provision and a variety of other commercial activities. |
234
Notes to the Consolidated Financial Statements (continued)
(Expressed in Renminbi Yuan unless otherwise indicated)
| 5 | Segment information and revenue (continued) |
| 5.1 | Segment information (continued) |
| 2021 |
Petroleum products RMB’000 |
Intermediate petrochemicals RMB’000 |
Resins and plastics RMB’000 |
Synthetic fibres RMB’000 |
Trading of petrochemical products RMB’000 |
Others RMB’000 |
Total RMB’000 |
|||||||||||||||||||||
| Total segment revenue |
65,528,687 | 26,454,844 | 10,176,285 | 1,381,443 | 12,972,922 | 1,625,705 | 118,139,886 | |||||||||||||||||||||
| Inter segment revenue |
(10,454,529 | ) | (15,619,770 | ) | (170,255 | ) | (445 | ) | (1,912,789 | ) | (783,606 | ) | (28,941,394 | ) | ||||||||||||||
|
|
|
|
|
|
|
|
|
|
|
|
|
|
|
|||||||||||||||
| Revenue from external customers |
55,074,158 | 10,835,074 | 10,006,030 | 1,380,998 | 11,060,133 | 842,099 | 89,198,492 | |||||||||||||||||||||
|
|
|
|
|
|
|
|
|
|
|
|
|
|
|
|||||||||||||||
| Timing of revenue recognition |
||||||||||||||||||||||||||||
| – At a point in time |
55,074,158 | 10,835,074 | 10,006,030 | 1,380,998 | 11,020,323 | 842,099 | 89,158,682 | |||||||||||||||||||||
| – Over time |
— | — | — | — | 39,810 | — | 39,810 | |||||||||||||||||||||
|
|
|
|
|
|
|
|
|
|
|
|
|
|
|
|||||||||||||||
| 55,074,158 | 10,835,074 | 10,006,030 | 1,380,998 | 11,060,133 | 842,099 | 89,198,492 | ||||||||||||||||||||||
|
|
|
|
|
|
|
|
|
|
|
|
|
|
|
|||||||||||||||
| Segment result – profit/(loss) from operations |
2,967,030 | (635,155 | ) | 52,215 | (854,077 | ) | 43,729 | (141,510 | ) | 1,432,232 | ||||||||||||||||||
|
|
|
|
|
|
|
|
|
|
|
|
|
|
|
|||||||||||||||
| 2020 |
Petroleum products RMB’000 |
Intermediate petrochemicals RMB’000 |
Resins and plastics RMB’000 |
Synthetic fibres RMB’000 |
Trading of petrochemical products RMB’000 |
Others RMB’000 |
Total RMB’000 |
|||||||||||||||||||||
| Total segment revenue |
49,711,547 | 19,777,574 | 9,576,944 | 1,480,576 | 12,023,744 | 1,583,236 | 94,153,621 | |||||||||||||||||||||
| Inter segment revenue |
(6,631,343 | ) | (11,526,322 | ) | (101,057 | ) | — | (438,634 | ) | (832,690 | ) | (19,530,046 | ) | |||||||||||||||
|
|
|
|
|
|
|
|
|
|
|
|
|
|
|
|||||||||||||||
| Revenue from external customers |
43,080,204 | 8,251,252 | 9,475,887 | 1,480,576 | 11,585,110 | 750,546 | 74,623,575 | |||||||||||||||||||||
|
|
|
|
|
|
|
|
|
|
|
|
|
|
|
|||||||||||||||
| Timing of revenue recognition |
||||||||||||||||||||||||||||
| – At a point in time |
43,080,204 | 8,251,252 | 9,475,887 | 1,480,576 | 11,583,709 | 750,546 | 74,622,174 | |||||||||||||||||||||
| – Over time |
— | — | — | — | 1,401 | — | 1,401 | |||||||||||||||||||||
|
|
|
|
|
|
|
|
|
|
|
|
|
|
|
|||||||||||||||
| 43,080,204 | 8,251,252 | 9,475,887 | 1,480,576 | 11,585,110 | 750,546 | 74,623,575 | ||||||||||||||||||||||
|
|
|
|
|
|
|
|
|
|
|
|
|
|
|
|||||||||||||||
| Segment result – profit/(loss) from operations |
(2,198,705 | ) | 581,597 | 1,262,029 | (364,211 | ) | 42,039 | 211,015 | (466,236 | ) | ||||||||||||||||||
|
|
|
|
|
|
|
|
|
|
|
|
|
|
|
|||||||||||||||
235
Notes to the Consolidated Financial Statements (continued)
(Expressed in Renminbi Yuan unless otherwise indicated)
| 5 | Segment information and revenue (continued) |
| 5.1 | Segment information (continued) |
| 2021 RMB’000 |
2020 RMB’000 |
|||||||
| Segment result – profit/(loss) from operations |
||||||||
| Petroleum products |
2,967,030 | (2,198,705 | ) | |||||
| Intermediate petrochemicals |
(635,155 | ) | 581,597 | |||||
| Resins and plastics |
52,215 | 1,262,029 | ||||||
| Synthetic fibres |
(854,077 | ) | (364,211 | ) | ||||
| Trading of petrochemical products |
43,729 | 42,039 | ||||||
| Others |
(141,510 | ) | 211,015 | |||||
|
|
|
|
|
|||||
| Profit/(loss) from operations |
1,432,232 | (466,236 | ) | |||||
| Finance income – net |
414,569 | 332,274 | ||||||
| Share of profit of investments accounted for using the equity method |
874,285 | 724,740 | ||||||
|
|
|
|
|
|||||
| Profit before taxation |
2,721,086 | 590,778 | ||||||
|
|
|
|
|
|||||
Other profit and loss disclosures
| 2021 | 2020 | |||||||||||||||||||||||
| Depreciation and amortization RMB’000 |
Impairment loss and credit loss RMB’000 |
Inventory write-down RMB’000 |
Depreciation and amortization RMB’000 |
Impairment loss and credit loss RMB’000 |
Inventory write-down RMB’000 |
|||||||||||||||||||
| Petroleum products |
(975,492 | ) | (94,420 | ) | (782 | ) | (917,637 | ) | — | (138,537 | ) | |||||||||||||
| Intermediate petrochemicals |
(523,484 | ) | (297,632 | ) | (136,694 | ) | (465,425 | ) | (55,204 | ) | (15,418 | ) | ||||||||||||
| Resins and plastics |
(86,183 | ) | (61,242 | ) | (168 | ) | (138,204 | ) | — | (26,382 | ) | |||||||||||||
| Synthetic fibres |
(132,091 | ) | (135,683 | ) | (13,239 | ) | (78,030 | ) | 88,550 | (39,657 | ) | |||||||||||||
| Trading of petrochemical products |
(39,125 | ) | — | — | (19,938 | ) | — | (788 | ) | |||||||||||||||
| Others |
(209,333 | ) | (28,392 | ) | — | (207,905 | ) | — | (106 | ) | ||||||||||||||
|
|
|
|
|
|
|
|
|
|
|
|
|
|||||||||||||
| (1,965,708 | ) | (617,369 | ) | (150,883 | ) | (1,827,139 | ) | 33,346 | (220,888 | ) | ||||||||||||||
|
|
|
|
|
|
|
|
|
|
|
|
|
|||||||||||||
236
Notes to the Consolidated Financial Statements (continued)
(Expressed in Renminbi Yuan unless otherwise indicated)
| 5 | Segment information and revenue (continued) |
| 5.1 | Segment information (continued) |
| As at 31 December | ||||||||
| 2021 Total assets RMB’000 |
2020 Total assets RMB’000 |
|||||||
| Allocated assets |
||||||||
| Petroleum products |
13,317,338 | 11,344,760 | ||||||
| Intermediate petrochemicals |
3,781,785 | 3,176,092 | ||||||
| Resins and plastics |
1,395,867 | 1,654,920 | ||||||
| Synthetic fibres |
1,919,194 | 986,391 | ||||||
| Trading of petrochemical products |
1,348,751 | 1,357,884 | ||||||
| Others |
2,700,327 | 2,432,339 | ||||||
|
|
|
|
|
|||||
| Allocated assets |
24,463,262 | 20,952,386 | ||||||
|
|
|
|
|
|||||
| Unallocated assets |
||||||||
| Investments accounted for using the equity method |
4,088,888 | 5,387,834 | ||||||
| Cash and cash equivalents |
5,112,010 | 6,916,408 | ||||||
| Time deposits with banks |
12,968,042 | 11,092,283 | ||||||
| Deferred tax assets |
184,143 | 252,121 | ||||||
| Derivative financial assets |
81,405 | — | ||||||
| Others |
22,839 | 18,098 | ||||||
|
|
|
|
|
|||||
| Unallocated assets |
22,457,327 | 23,666,744 | ||||||
|
|
|
|
|
|||||
| Total assets |
46,920,589 | 44,619,130 | ||||||
|
|
|
|
|
|||||
237
Notes to the Consolidated Financial Statements (continued)
(Expressed in Renminbi Yuan unless otherwise indicated)
| 5 | Segment information and revenue (continued) |
| 5.1 | Segment information (continued) |
| As at 31 December | ||||||||
| 2021 Total liabilities RMB’000 |
2020 Total liabilities RMB’000 |
|||||||
| Allocated liabilities |
||||||||
| Petroleum products |
9,749,806 | 6,669,419 | ||||||
| Intermediate petrochemicals |
1,257,436 | 1,267,313 | ||||||
| Resins and plastics |
1,327,587 | 1,233,286 | ||||||
| Synthetic fibres |
490,211 | 209,621 | ||||||
| Trading of petrochemical products |
1,257,750 | 1,224,420 | ||||||
| Others |
112,876 | 78,928 | ||||||
|
|
|
|
|
|||||
| Allocated liabilities |
14,195,666 | 10,682,987 | ||||||
|
|
|
|
|
|||||
| Unallocated liabilities |
||||||||
| Borrowings |
2,259,800 | 1,548,000 | ||||||
| Short-term bonds |
— | 3,017,811 | ||||||
| Deferred tax liabilities |
33,344 | 35,357 | ||||||
| Derivative financial liabilities |
23,804 | — | ||||||
| Others |
30,577 | — | ||||||
|
|
|
|
|
|||||
| Unallocated liabilities |
2,347,525 | 4,601,168 | ||||||
|
|
|
|
|
|||||
| Total liabilities |
16,543,191 | 15,284,155 | ||||||
|
|
|
|
|
|||||
238
Notes to the Consolidated Financial Statements (continued)
(Expressed in Renminbi Yuan unless otherwise indicated)
| 5 | Segment information and revenue (continued) |
| 5.1 | Segment information (continued) |
| 2021 RMB’000 |
2020 RMB’000 |
|||||||
| Additions to property, plant and equipment, construction in progress, right-of-use assets, other non-current assets |
||||||||
| Petroleum products |
708,342 | 779,392 | ||||||
| Intermediate petrochemicals |
1,306,813 | 278,788 | ||||||
| Resins and plastics |
44,495 | 139,212 | ||||||
| Synthetic fibres |
1,748,868 | 496,125 | ||||||
| Trading of petrochemical products |
71,917 | 378,292 | ||||||
| Others |
234,023 | 222,080 | ||||||
|
|
|
|
|
|||||
| 4,114,458 | 2,293,889 | |||||||
|
|
|
|
|
|||||
| 5.2 | Revenue |
The Group’s revenue from external customers are substantially all within Mainland China in 2021 and 2020. As at 31 December 2021 and 31 December 2020, assets are also substantially all within Mainland China.
Revenue of approximate RMB59,766,489 thousand (2020: RMB38,651,385 thousand) are derived from a single customer. These revenues are attributable to the petroleum products and others segments.
Details of concentrations of credit risk arising from these customers are set out in note 3.1(c).
| 6 | Other operating income |
| 2021 RMB’000 |
2020 RMB’000 |
|||||||
| Government grants (a) |
35,944 | 61,296 | ||||||
| Rental income from investment property (note 17) |
81,923 | 81,608 | ||||||
| Others |
7,438 | 5,772 | ||||||
|
|
|
|
|
|||||
| 125,305 | 148,676 | |||||||
|
|
|
|
|
|||||
| (a) | Government grants |
Grants related to R&D, other tax refund and subsidies are included in the government grants line item. There are no unfulfilled conditions or other contingencies attaching to these grants.
239
Notes to the Consolidated Financial Statements (continued)
(Expressed in Renminbi Yuan unless otherwise indicated)
| 7 | Other operating expenses |
| 2021 RMB’000 |
2020 RMB’000 |
|||||||
| Cost related to lease of investment properties |
(13,439 | ) | (15,625 | ) | ||||
| Others |
(31,273 | ) | (9,061 | ) | ||||
|
|
|
|
|
|||||
| (44,712 | ) | (24,686 | ) | |||||
|
|
|
|
|
|||||
| 8 | Other gains – net |
| 2021 RMB’000 |
2020 RMB’000 |
|||||||
| Net gains/(losses) on disposal of property, plant and equipment and other long-term assets |
48,671 | (1,212 | ) | |||||
| Gains from structured deposits (note a) |
97,921 | 114,283 | ||||||
| Net losses on foreign exchange option contracts |
(151 | ) | (376 | ) | ||||
| Net gains on commodity swaps contracts not qualified for hedging accounting |
18,997 | — | ||||||
| Impairment losses for investment in an associate |
(28,392 | ) | — | |||||
| Net foreign exchange (losses)/gains |
(1,861 | ) | 12,248 | |||||
| Losses on sale of FVOCI |
(4,685 | ) | (9,513 | ) | ||||
| Net losses on disposal of inventory |
(19 | ) | — | |||||
|
|
|
|
|
|||||
| 130,481 | 115,430 | |||||||
|
|
|
|
|
|||||
| (a) | Gains from structured deposits |
Structured deposits are financial products issued by banks, return of which are linked to the performance of the embedded index, like foreign exchange rate, interest rate and etc..
240
Notes to the Consolidated Financial Statements (continued)
(Expressed in Renminbi Yuan unless otherwise indicated)
| 9 | Finance income and expenses |
| 2021 RMB’000 |
2020 RMB’000 |
|||||||
| Interest income from time deposits with maturity more than 3 months |
424,696 | 339,595 | ||||||
| Interest income from time deposits with maturity less than 3 months |
71,402 | 83,812 | ||||||
| Others |
12,657 | 7,821 | ||||||
|
|
|
|
|
|||||
| Finance income |
508,755 | 431,228 | ||||||
|
|
|
|
|
|||||
| Interest and finance charges paid/payable for lease liabilities and financial liabilities not at fair value through profit or loss |
(106,827 | ) | (101,732 | ) | ||||
| Less: interest expense capitalized into construction in progress |
12,641 | 8,292 | ||||||
|
|
|
|
|
|||||
| Net interest expenses |
(94,186 | ) | (93,440 | ) | ||||
| Net foreign exchange losses |
— | (5,514 | ) | |||||
|
|
|
|
|
|||||
| Finance expenses |
(94,186 | ) | (98,954 | ) | ||||
|
|
|
|
|
|||||
| Finance income – net |
414,569 | 332,274 | ||||||
|
|
|
|
|
|||||
241
Notes to the Consolidated Financial Statements (continued)
(Expressed in Renminbi Yuan unless otherwise indicated)
| 10 | Expense by nature |
| 2021 RMB’000 |
2020 RMB’000 |
|||||||
| Cost of raw materials |
54,457,558 | 42,082,307 | ||||||
| Cost of trading products |
10,929,127 | 11,467,420 | ||||||
| Employee benefit expenses (note 11) |
3,456,765 | 3,143,219 | ||||||
| Depreciation and amortization: |
||||||||
| Property, plant and equipment (note 16) |
1,621,459 | 1,553,039 | ||||||
| Investment properties (note 17) |
15,325 | 15,184 | ||||||
| Other non-current assets (note 14) |
294,617 | 226,263 | ||||||
| Right-of-use assets (note 15) |
34,307 | 32,653 | ||||||
| Repairs and maintenance expenses |
1,587,955 | 1,060,624 | ||||||
| Changes of work in progress and finished goods |
(235,402 | ) | 862,652 | |||||
| Transportation costs |
238,405 | 274,002 | ||||||
| Inventory write-down (note 21) |
150,883 | 220,888 | ||||||
| External processing fee |
213,691 | 215,467 | ||||||
| Commission expense (note 33) |
110,552 | 104,598 | ||||||
| Impairment loss of property, plant and equipment (note 16) |
587,622 | 87,570 | ||||||
| Impairment loss of investments accounted for using equity method (note 20) |
28,392 | — | ||||||
| Auditors’ remuneration – audit services |
6,837 | 7,800 | ||||||
| Expenses relating to short-term leases |
6,938 | 3,731 | ||||||
| 11 | Employee benefit expenses |
| 2021 RMB’000 |
2020 RMB’000 |
|||||||
| Wages and salaries |
2,142,959 | 2,009,645 | ||||||
| Social welfare costs |
861,375 | 714,484 | ||||||
| Others |
452,431 | 419,090 | ||||||
|
|
|
|
|
|||||
| Total employee benefit expense |
3,456,765 | 3,143,219 | ||||||
|
|
|
|
|
|||||
242
Notes to the Consolidated Financial Statements (continued)
(Expressed in Renminbi Yuan unless otherwise indicated)
| 11 | Employee benefit expenses (continued) |
| (a) | Five highest paid individuals |
For the years ended 31 December 2021 and 31 December 2020, all 5 individuals with the highest emoluments are directors and supervisors whose emoluments are disclosed in note 38.
| (b) | Employees of the Group’s subsidiaries in the PRC are required to participate in a defined contribution retirement scheme administered and operated by the local municipal government. The Group’s subsidiaries in the PRC contribute funds which are calculated on certain percentages of the average employee salary as stipulated by the local municipal government to the scheme to fund the retirement benefits of the employees. |
In addition, the Group provides a supplementary retirement plan for its staff at rates not exceeding 8% of the salaries. The Group has no other material obligation for the payment of pension benefits associated with these plans beyond the annual contributions described above.
For the year ended 31 December 2021, the Group’s total contributions to defined contribution retirement plans was RMB431,818 thousand. (2020: RMB342,073 thousand)
| (c) | As at 31 December 2021 and 31 December 2020, there was no material outstanding contribution to the above defined contribution retirement plans. |
| 12 | Income tax (expenses)/benefits |
| 2021 RMB’000 |
2020 RMB’000 |
|||||||
| Current income tax |
(590,668 | ) | (37,027 | ) | ||||
| Deferred taxation |
(53,812 | ) | 102,647 | |||||
|
|
|
|
|
|||||
| Income tax (expenses)/benefits |
(644,480 | ) | 65,620 | |||||
|
|
|
|
|
|||||
243
Notes to the Consolidated Financial Statements (continued)
(Expressed in Renminbi Yuan unless otherwise indicated)
| 12 | Income tax (expenses)/benefits (continued) |
A reconciliation of the expected income tax calculated at the applicable tax rate and profit before taxation, with the actual income tax is as follows:
| Year ended 31 December | ||||||||
| 2021 RMB’000 |
2020 RMB’000 |
|||||||
| Profit before income tax |
2,721,086 | 590,778 | ||||||
|
|
|
|
|
|||||
| Expected PRC income tax at the statutory tax rate of 25% |
(680,272 | ) | (147,695 | ) | ||||
| Tax effect of share of profit of investments accounted for using the equity method |
214,750 | 178,685 | ||||||
| Tax effect of other non-taxable income |
10,782 | 54,379 | ||||||
| Tax effect of additional deductions for R&D expenses |
12,168 | 11,863 | ||||||
| Tax effect of non-deductible loss, expenses and costs |
(185,945 | ) | (51,543 | ) | ||||
| True up for final settlement of enterprise income taxes in respect of previous years |
— | 9,188 | ||||||
| Tax losses for which no deferred income tax asset was recognized |
(21,225 | ) | (2,821 | ) | ||||
| Utilization of previously unrecognized tax losses |
157 | 13,564 | ||||||
| Tax effect of additional deduction for purchasing environmental protection equipment |
12,446 | — | ||||||
| Derecognition of previously recognized tax losses |
(7,341 | ) | — | |||||
|
|
|
|
|
|||||
| Actual income tax (expenses)/benefits |
(644,480 | ) | 65,620 | |||||
|
|
|
|
|
|||||
The provision for PRC income tax is calculated at the rate of 25% (2020: 25%) on the estimated taxable income of the year ended 31 December 2021 determined in accordance with relevant income tax rules and regulations. The Group did not carry out business overseas and therefore does not incur overseas income taxes.
| (a) | Current taxation in the consolidated statement of financial position represents: |
| 2021 RMB’000 |
2020 RMB’000 |
|||||||
| Income tax payable balance at 1 January |
19,425 | 226,269 | ||||||
| Provision for current income tax for the year |
590,668 | 37,027 | ||||||
| Payment during the year |
(351,627 | ) | (243,871 | ) | ||||
|
|
|
|
|
|||||
| Income tax payable balance at 31 December |
258,466 | 19,425 | ||||||
|
|
|
|
|
|||||
244
Notes to the Consolidated Financial Statements (continued)
(Expressed in Renminbi Yuan unless otherwise indicated)
| 12 | Income tax (expenses)/benefits (continued) |
| (b) | Movements in deferred tax assets and liabilities are as follows: |
| Balance as at 1 January 2021 RMB’000 |
Deducted/ (Charged) to profit or loss RMB’000 |
Deducted/ (Charged) to reserves RMB’000 |
Balance as at 31 December 2021 RMB’000 |
|||||||||||||
| Deferred tax assets: |
||||||||||||||||
| Impairment for bad and doubtful debts and provision for inventories |
57,326 | (977 | ) | — | 56,349 | |||||||||||
| Provision for impairment losses in property, plant and equipment and construction in progress |
226,435 | 131,776 | — | 358,211 | ||||||||||||
| Tax losses |
87,799 | (87,799 | ) | — | — | |||||||||||
| Accruals and others |
130,986 | (48,808 | ) | — | 82,178 | |||||||||||
|
|
|
|
|
|
|
|
|
|||||||||
| 502,546 | (5,808 | ) | — | 496,738 | ||||||||||||
|
|
|
|
|
|
|
|
|
|||||||||
| Deferred tax liabilities: |
||||||||||||||||
| Difference in depreciation |
(283,739 | ) | (46,332 | ) | — | (330,071 | ) | |||||||||
| Capitalization of borrowing costs |
(2,043 | ) | 575 | — | (1,468 | ) | ||||||||||
| Derivative financial instruments |
— | (2,247 | ) | (12,153 | ) | (14,400 | ) | |||||||||
|
|
|
|
|
|
|
|
|
|||||||||
| (285,782 | ) | (48,004 | ) | (12,153 | ) | (345,939 | ) | |||||||||
|
|
|
|
|
|
|
|
|
|||||||||
| Deferred tax assets – net |
252,121 | (55,825 | ) | (12,153 | ) | 184,143 | ||||||||||
| Deferred tax liabilities – net |
(35,357 | ) | 2,013 | — | (33,344 | ) | ||||||||||
|
|
|
|
|
|
|
|
|
|||||||||
245
Notes to the Consolidated Financial Statements (continued)
(Expressed in Renminbi Yuan unless otherwise indicated)
| 12 | Income tax (expenses)/benefits (continued) |
| (b) | Movements in deferred tax assets and liabilities are as follows (continued): |
| Balance as at 1 January 2020 RMB’000 |
Deducted/ (charged) to profit or loss RMB’000 |
Balance as at 31 December 2020 RMB’000 |
||||||||||
| Deferred tax assets: |
||||||||||||
| Impairment for bad and doubtful debts and provision for inventories |
38,901 | 18,425 | 57,326 | |||||||||
| Provision for impairment losses in property, plant and equipment and construction in progress |
207,632 | 18,803 | 226,435 | |||||||||
| Tax losses |
1,986 | 85,813 | 87,799 | |||||||||
| Others |
88,663 | 42,323 | 130,986 | |||||||||
|
|
|
|
|
|
|
|||||||
| 337,182 | 165,364 | 502,546 | ||||||||||
|
|
|
|
|
|
|
|||||||
| Deferred tax liabilities: |
||||||||||||
| Gains of financial assets at fair value |
(4,604 | ) | 4,604 | — | ||||||||
| Difference in depreciation |
(178,800 | ) | (104,939 | ) | (283,739 | ) | ||||||
| Capitalization of borrowing costs |
(2,946 | ) | 903 | (2,043 | ) | |||||||
|
|
|
|
|
|
|
|||||||
| (186,350 | ) | (99,432 | ) | (285,782 | ) | |||||||
|
|
|
|
|
|
|
|||||||
| Deferred tax assets – net |
150,832 | 101,289 | 252,121 | |||||||||
| Deferred tax liabilities – net |
— | (35,357 | ) | (35,357 | ) | |||||||
|
|
|
|
|
|
|
|||||||
The Group recognizes deferred tax assets only to the extent that it is probable that future taxable income will be available against which the assets can be utilized. Based on the level of historical taxable income and projections for future taxable income over the periods which the deferred tax assets will be utilized, management believes that it is probable the Group will realize the benefits of these temporary differences for which deferred tax assets have been recognized.
246
Notes to the Consolidated Financial Statements (continued)
(Expressed in Renminbi Yuan unless otherwise indicated)
| 12 | Income tax (expenses)/benefits (continued) |
| (c) | Deferred tax assets not recognized: |
As at 31 December 2021, certain subsidiaries of the Company did not recognize the deferred tax assets in respect of the impairment losses on property, plant and equipment amounting to RMB29,969 thousand (31 December 2020: RMB29,969 thousand), because it was not probable that the related tax benefit would be realized.
As at 31 December 2021, certain subsidiaries of the Company did not recognize the deferred tax assets in respect of tax losses of RMB350,574 thousand (31 December 2020: RMB72,699 thousand) carried forward for PRC income tax purpose because it was not probable that the related tax benefit would be realized.
Tax losses carried forward that are not recognized as deferred tax assets will expire in the following years:
| 2021 RMB’000 |
2020 RMB’000 |
|||||||
| 2022 |
65,331 | 12,687 | ||||||
| 2023 |
66,965 | 10,415 | ||||||
| 2024 |
91,901 | 38,312 | ||||||
| 2025 |
41,475 | 11,285 | ||||||
| 2026 |
84,902 | — | ||||||
|
|
|
|
|
|||||
| 350,574 | 72,699 | |||||||
|
|
|
|
|
|||||
247
Notes to the Consolidated Financial Statements (continued)
(Expressed in Renminbi Yuan unless otherwise indicated)
| 13 | Earnings per share |
| (a) | Basic earnings per share |
Basic earnings per share is calculated by dividing the profit attributable to equity shareholders of the Company by the weighted average number of ordinary shares in issue during the year.
| 2021 RMB’000 |
2020 RMB’000 |
|||||||
| Net profit attributable to equity shareholders of the Company |
2,073,431 | 645,072 | ||||||
| Weighted average number of ordinary shares in issue (thousand of shares) |
10,823,814 | 10,823,814 | ||||||
| Basic earnings per share (RMB per share) |
RMB0.192 | RMB0.060 | ||||||
| (b) | Diluted earnings per share |
There were no dilutive potential ordinary shares for the years ended 31 December 2021 and 2020, therefore diluted earnings per share is the same as basic earnings per share.
248
Notes to the Consolidated Financial Statements (continued)
(Expressed in Renminbi Yuan unless otherwise indicated)
| 14 | Other non-current assets |
| Long-term | ||||||||||||
| Intangible | prepaid | |||||||||||
| assets | expense | Total | ||||||||||
| RMB’000 | RMB’000 | RMB’000 | ||||||||||
| As at 1 January 2020 |
||||||||||||
| Cost |
85,855 | 463,779 | 549,634 | |||||||||
| Accumulated amortization |
(68,220 | ) | — | (68,220 | ) | |||||||
|
|
|
|
|
|
|
|||||||
| Net book amount |
17,635 | 463,779 | 481,414 | |||||||||
|
|
|
|
|
|
|
|||||||
| Year ended 31 December 2020 |
||||||||||||
| Opening net book amount |
17,635 | 463,779 | 481,414 | |||||||||
| Additions |
53 | 169,755 | 169,808 | |||||||||
| Charge for the year |
(2,919 | ) | (223,344 | ) | (226,263 | ) | ||||||
|
|
|
|
|
|
|
|||||||
| Closing net book amount |
14,769 | 410,190 | 424,959 | |||||||||
| As at 31 December 2020 |
||||||||||||
| Cost |
85,908 | 410,190 | 496,098 | |||||||||
| Accumulated amortization |
(71,139 | ) | — | (71,139 | ) | |||||||
|
|
|
|
|
|
|
|||||||
| Net book amount |
14,769 | 410,190 | 424,959 | |||||||||
|
|
|
|
|
|
|
|||||||
| Year ended 31 December 2021 |
||||||||||||
| Opening net book amount |
14,769 | 410,190 | 424,959 | |||||||||
| Additions |
— | 657,465 | 657,465 | |||||||||
| Charge for the year |
(2,925 | ) | (291,692 | ) | (294,617 | ) | ||||||
|
|
|
|
|
|
|
|||||||
| Closing net book amount |
11,844 | 775,963 | 787,807 | |||||||||
| As at 31 December 2021 |
||||||||||||
| Cost |
85,908 | 775,963 | 861,871 | |||||||||
| Accumulated amortization |
(74,064 | ) | — | (74,064 | ) | |||||||
|
|
|
|
|
|
|
|||||||
| Net book amount |
11,844 | 775,963 | 787,807 | |||||||||
|
|
|
|
|
|
|
|||||||
For the year ended 31 December 2021, the amortization of RMB294,617 thousand (2020: RMB226,263 thousand) has been charged in Cost of sales.
249
Notes to the Consolidated Financial Statements (continued)
(Expressed in Renminbi Yuan unless otherwise indicated)
| 15 | Leases |
| (a) | Amounts recognized in the statement of financial position |
The statement of financial position shows the following amounts relating to leases:
| As at 31 December | ||||||||
| 2021 RMB’000 |
2020 RMB’000 |
|||||||
| Right-of-use assets |
||||||||
| Land use rights |
380,764 | 397,808 | ||||||
| Buildings |
3,288 | 11,221 | ||||||
| Equipment |
625 | 879 | ||||||
| Others |
966 | 893 | ||||||
|
|
|
|
|
|||||
| 385,643 | 410,801 | |||||||
|
|
|
|
|
|||||
| Lease liabilities |
||||||||
| Current |
3,229 | 9,352 | ||||||
| Non-current |
1,384 | 3,119 | ||||||
|
|
|
|
|
|||||
| 4,613 | 12,471 | |||||||
|
|
|
|
|
|||||
For the year ended 31 December 2021, additions to the right-of-use assets were RMB9,534 thousand (2020: RMB109,238 thousand, including 102,283 thousand generated by the acquisition of a subsidiary).
At 31 December 2021, the lease liabilities were repayable as follows:
| 2021 RMB’000 |
||||
| Within 1 year |
3,229 | |||
| After 1 year but within 2 years |
672 | |||
| After 2 years but within 5 years |
712 | |||
|
|
|
|||
| 4,613 | ||||
|
|
|
|||
250
Notes to the Consolidated Financial Statements (continued)
(Expressed in Renminbi Yuan unless otherwise indicated)
| 15 | Leases (continued) |
| (b) | Amounts recognized in the statement of profit or loss |
The statement of profit or loss shows the following amounts relating to leases:
| 2021 | 2020 | |||||||
| RMB’000 | RMB’000 | |||||||
| Depreciation charge of right-of-use assets |
||||||||
| Land use rights |
(17,044 | ) | (15,965 | ) | ||||
| Buildings |
(15,677 | ) | (15,481 | ) | ||||
| Equipment |
(399 | ) | (449 | ) | ||||
| Others |
(1,187 | ) | (758 | ) | ||||
|
|
|
|
|
|||||
| (34,307 | ) | (32,653 | ) | |||||
|
|
|
|
|
|||||
| Interest expense (included in Finance expenses) |
(537 | ) | (887 | ) | ||||
| Expense relating to short-term leases (included in Cost of sales) |
(6,938 | ) | (3,731 | ) | ||||
|
|
|
|
|
|||||
The total cash outflow for leases in 2021 was RMB24,482 thousand (2020: RMB20,204 thousand).
251
Notes to the Consolidated Financial Statements (continued)
(Expressed in Renminbi Yuan unless otherwise indicated)
| 16 | Property, plant and equipment |
| Buildings | Plant and machinery |
Vehicles and other equipment |
Total | |||||||||||||
| RMB’000 | RMB’000 | RMB’000 | RMB’000 | |||||||||||||
| Cost: |
||||||||||||||||
| At 1 January 2020 |
3,336,375 | 41,455,159 | 1,871,684 | 46,663,218 | ||||||||||||
| Additions |
707 | 228,153 | 65,380 | 294,240 | ||||||||||||
| Transferred from construction in progress (note 18) |
24,199 | 1,440,695 | 85,419 | 1,550,313 | ||||||||||||
| Acquisition of subsidiary |
124,849 | 146,172 | 4,694 | 275,715 | ||||||||||||
| Reclassification |
52,599 | (55,206 | ) | 2,607 | — | |||||||||||
| Disposals |
(32,690 | ) | (472,643 | ) | (71,564 | ) | (576,897 | ) | ||||||||
| Transferred to investment properties (note 17) |
(24,829 | ) | — | — | (24,829 | ) | ||||||||||
|
|
|
|
|
|
|
|
|
|||||||||
| At 31 December 2020 and 1 January 2021 |
3,481,210 | 42,742,330 | 1,958,220 | 48,181,760 | ||||||||||||
| Additions |
— | 161,118 | 15,646 | 176,764 | ||||||||||||
| Transferred from construction in progress (note 18) |
130,947 | 1,476,065 | 92,962 | 1,699,974 | ||||||||||||
| Reclassification |
267,662 | (275,880 | ) | 8,218 | — | |||||||||||
| Disposals |
(4,717 | ) | (737,634 | ) | (62,782 | ) | (805,133 | ) | ||||||||
| Transferred from investment properties (note 17) |
1,164 | — | — | 1,164 | ||||||||||||
| Transferred to construction in progress (note 18) |
(2,091 | ) | (1,260 | ) | (15,404 | ) | (18,755 | ) | ||||||||
| Transferred to investment properties (note 17) |
(83 | ) | (7 | ) | — | (90 | ) | |||||||||
|
|
|
|
|
|
|
|
|
|||||||||
| At 31 December 2021 |
3,874,092 | 43,364,732 | 1,996,860 | 49,235,684 | ||||||||||||
|
|
|
|
|
|
|
|
|
|||||||||
| Accumulated depreciation: |
||||||||||||||||
| At 1 January 2020 |
(2,310,970 | ) | (30,793,083 | ) | (1,432,530 | ) | (34,536,583 | ) | ||||||||
| Charge for the year |
(91,070 | ) | (1,367,861 | ) | (94,108 | ) | (1,553,039 | ) | ||||||||
| Reclassification |
(29,721 | ) | 29,635 | 86 | — | |||||||||||
| Written back on disposals |
25,670 | 430,397 | 68,698 | 524,765 | ||||||||||||
| Transferred to investment properties (note 17) |
9,527 | — | — | 9,527 | ||||||||||||
|
|
|
|
|
|
|
|
|
|||||||||
252
Notes to the Consolidated Financial Statements (continued)
(Expressed in Renminbi Yuan unless otherwise indicated)
| 16 | Property, plant and equipment (continued) |
| Buildings | Plant and machinery |
Vehicles and other equipment |
Total | |||||||||||||
| RMB’000 | RMB’000 | RMB’000 | RMB’000 | |||||||||||||
| At 31 December 2020 and 1 January 2021 |
(2,396,564 | ) | (31,700,912 | ) | (1,457,854 | ) | (35,555,330 | ) | ||||||||
| Charge for the year |
(88,234 | ) | (1,419,669 | ) | (113,556 | ) | (1,621,459 | ) | ||||||||
| Reclassification |
(214,041 | ) | 216,706 | (2,665 | ) | — | ||||||||||
| Written back on disposals |
3,652 | 626,865 | 55,709 | 686,226 | ||||||||||||
| Transferred from investment properties (note 17) |
(1,088 | ) | — | — | (1,088 | ) | ||||||||||
| Transfer to construction in progress (note 18) |
46 | 735 | 5,642 | 6,423 | ||||||||||||
| Transferred to investment properties (note 17) |
80 | 7 | — | 87 | ||||||||||||
|
|
|
|
|
|
|
|
|
|||||||||
| At 31 December 2021 |
(2,696,149 | ) | (32,276,268 | ) | (1,512,724 | ) | (36,485,141 | ) | ||||||||
|
|
|
|
|
|
|
|
|
|||||||||
| Impairment losses: |
||||||||||||||||
| At 1 January 2020 |
(50,785 | ) | (766,932 | ) | (8,121 | ) | (825,838 | ) | ||||||||
| Charge for the year |
(3,007 | ) | (84,035 | ) | (528 | ) | (87,570 | ) | ||||||||
|
|
|
|
|
|
|
|
|
|||||||||
| At 31 December 2020 and 1 January 2021 |
(53,792 | ) | (850,967 | ) | (8,649 | ) | (913,408 | ) | ||||||||
| Charge for the year |
(793 | ) | (586,147 | ) | (682 | ) | (587,622 | ) | ||||||||
| Written back on disposals |
— | 60,018 | 501 | 60,519 | ||||||||||||
| Reclassification |
(26,133 | ) | 26,270 | (137 | ) | — | ||||||||||
|
|
|
|
|
|
|
|
|
|||||||||
| At 31 December 2021 |
(80,718 | ) | (1,350,826 | ) | (8,967 | ) | (1,440,511 | ) | ||||||||
|
|
|
|
|
|
|
|
|
|||||||||
| Net book value: |
||||||||||||||||
| At 31 December 2021 |
1,097,225 | 9,737,638 | 475,169 | 11,310,032 | ||||||||||||
|
|
|
|
|
|
|
|
|
|||||||||
| At 31 December 2020 |
1,030,854 | 10,190,451 | 491,717 | 11,713,022 | ||||||||||||
|
|
|
|
|
|
|
|
|
|||||||||
253
Notes to the Consolidated Financial Statements (continued)
(Expressed in Renminbi Yuan unless otherwise indicated)
| 16 | Property, plant and equipment (continued) |
| (i) | The Group recognized impairment loss on property, plant and equipment in relation to certain production facilities of RMB259,850 thousand for the year ended 31 December 2021. Due to deteriorating market conditions, the increasing production cost is not expected to be covered by the estimated selling price of the products, the Group identified an impairment indicator for property, plant and equipment in relation to certain production facilities, including 4# aromatic joint unit and 3# aromatic joint unit under intermediate petrochemicals segment, and performed an impairment assessment of these assets based on their estimated recoverable amounts, as a result the carrying amount of these assets were written down to their recoverable amount of RMB519,877 thousand. |
The recoverable amounts of above production facilities are estimated using the present value of future cash flows based on the financial budgets approved by management covering a five-year period. Forecasted cash flows are developed using several key assumptions, including the product sales growth rates, related costs growth rates (“forecasted growth rates”) and discount rate. The forecasted growth rates are based on past business performance and market participants’ expectations for market development, which are consistent with the forecasts included in industry reports. The discount rate used is a pre-tax ratio of 10% and reflects specific risks relating to the Group.
| (ii) | During the year ended 31 December 2021, a number of production facilities were idle or backward production technology. The Group does not expect to have future economic benefits recoverable from the use of those production facilities. |
There is no alternative use of those production facilities which is specifically designed. The recoverable amounts of property, plant and equipment related to those production facilities are estimated to be their residual value. As a result, impairment loss of RMB327,772 thousand was made against the carrying amounts of those assets.
As a result of these assessments, an impairment loss of RMB587,622 thousand on property, plant and equipment was recognized in “cost of sales” for the year ended 31 December 2021.
254
Notes to the Consolidated Financial Statements (continued)
(Expressed in Renminbi Yuan unless otherwise indicated)
| 17 | Investment properties |
| RMB’000 | ||||
| Cost: |
||||
| As at 1 January 2020 |
602,659 | |||
| Transferred from property plant and equipment (note 16) |
24,829 | |||
|
|
|
|||
| At 31 December 2020 and 1 January 2021 |
627,488 | |||
|
|
|
|||
| Transferred from property plant and equipment (note 16) |
90 | |||
| Transferred to property plant and equipment (note 16) |
(1,164 | ) | ||
|
|
|
|||
| At 31 December 2021 |
626,414 | |||
|
|
|
|||
| Accumulated depreciation: |
||||
| At 1 January 2020 |
(235,191 | ) | ||
| Charge for the year |
(15,184 | ) | ||
| Transferred from property plant and equipment (note 16) |
(9,527 | ) | ||
|
|
|
|||
| At 31 December 2020 and 1 January 2021 |
(259,902 | ) | ||
|
|
|
|||
| Charge for the year |
(15,325 | ) | ||
| Transferred from property plant and equipment (note 16) |
(87 | ) | ||
| Transferred to property plant and equipment (note 16) |
1,088 | |||
|
|
|
|||
| At 31 December 2021 |
(274,226 | ) | ||
|
|
|
|||
| Net book value: |
||||
| At 31 December 2021 |
352,188 | |||
|
|
|
|||
| At 31 December 2020 |
367,586 | |||
|
|
|
|||
As at 31 December 2021, the Group has no contractual obligations for future repairs and maintenance (31 December 2020: Nil).
Investment properties represent certain floors of an office building leased to other entities including related parties.
255
Notes to the Consolidated Financial Statements (continued)
(Expressed in Renminbi Yuan unless otherwise indicated)
| 17 | Investment properties (continued) |
| a. | The fair value of the investment properties of the Group as at 31 December 2021 was estimated by the directors to be approximately RMB1,217,987 thousand by reference to market values of similar properties in the nearby area (31 December 2020: RMB1,202,626 thousand). This fair value estimation was at level 3 of fair value hierarchy by using market observable inputs. The investment properties have not been valued by external independent appraisers. |
| b. | Rental income of RMB81,923 thousand was recognized in other operating income by the Group for the year ended 31 December 2021 (2020: RMB81,608 thousand). |
| c. | Leasing arrangements |
The investment properties are leased out under operating leases. The leases typically run for an initial period of 1 to 3 years, with an option to renew the lease after that date at which time all terms are renegotiated. Lease payments are usually renegotiated every year to reflect market rentals.
Undiscounted lease payments under non-cancellable operating leases in place at the reporting date will be receivable by the Group in future periods as follows:
| 2021 | 2020 | |||||||
| RMB’000 | RMB’000 | |||||||
| Within 1 year |
49,420 | 51,396 | ||||||
| Between 1 and 2 years |
39,137 | 4,343 | ||||||
| Above 2 years |
— | 629 | ||||||
|
|
|
|
|
|||||
| 88,557 | 56,368 | |||||||
|
|
|
|
|
|||||
256
Notes to the Consolidated Financial Statements (continued)
(Expressed in Renminbi Yuan unless otherwise indicated)
| 18 | Construction in progress |
| 2021 | 2020 | |||||||
| RMB’000 | RMB’000 | |||||||
| As at 1 January |
1,710,124 | 1,815,549 | ||||||
| Additions |
3,270,695 | 1,444,888 | ||||||
| Transferred to property plant and equipment (note 16) |
(1,699,974 | ) | (1,550,313 | ) | ||||
| Transferred from property plant and equipment (note 16) |
12,332 | — | ||||||
|
|
|
|
|
|||||
| As at 31 December |
3,293,177 | 1,710,124 | ||||||
|
|
|
|
|
|||||
As at 31 December 2021, the impairment loss in construction in progress was RMB24,486 thousand (31 December 2020: RMB24,486 thousand).
For the year ended 31 December 2021, the Group capitalized borrowing costs amounting to RMB12,641 thousand (2020: RMB8,292 thousand) on qualifying assets. Borrowing costs were capitalized at the weighted average rate of its general borrowings of 2.85% (2020: 2.79%).
257
Notes to the Consolidated Financial Statements (continued)
(Expressed in Renminbi Yuan unless otherwise indicated)
| 19 | Subsidiaries |
The following list contains only the particulars of subsidiaries which principally affected the results, assets or liabilities of the Group. The class of shares held is ordinary unless otherwise stated.
| Proportion of ownership interest | ||||||||||||||||||||||
| Name of company |
Place of incorporation and business |
Particulars of paid-up capital ’000 |
Group’s effective interest |
Held by the Company |
Held by a subsidiary |
Principal activity | ||||||||||||||||
| Shanghai Petrochemical Investment Development Company Limited (“Toufa”) |
Mainland China | RMB1,000,000 | 100.00 | 100.00 | — | Investment management | ||||||||||||||||
| China Jinshan Associated Trading Corporation (“Jinmao”) |
Mainland China | RMB25,000 | 67.33 | 67.33 | — | Import and export of petrochemical products and equipment | ||||||||||||||||
| Shanghai Jinchang Engineering Plastics Company Limited (“Jinchang”) |
Mainland China | USD9,154 | 74.25 | — | 74.25 | Production of polypropylene compound products | ||||||||||||||||
| Shanghai Golden Phillips Petrochemical Company Limited (“Jinfei”) |
Mainland China | RMB415,623 | 100.00 | — | 100.00 | Production of polyethylene products | ||||||||||||||||
| Shanghai Jinshan Trading Corporation (“JMGJ”) |
Mainland China | RMB100,000 | 67.33 | — | 67.33 | Import and export of petrochemical products | ||||||||||||||||
| Zhejiang Jinlian Petrochemical Storage and Transportation Co., Ltd. (“Jinlian”) |
Mainland China | RMB400,000 | 100.00 | — | 100.00 | Trading of petrochemical products | ||||||||||||||||
| a. | The total comprehensive income attributable to non-controlling interests for the year ended 31 December 2021 is RMB3,175 thousand (2020: RMB11,326 thousand). |
| b. | On 30 June 2020, one of the Company’s subsidiaries, Toufa acquired 100% share of Zhejiang Zhonghang Oil Petrochemical Storage and Transportation Co., Ltd., renamed as Jinlian, from China Aviation Oil Group Logistics Co., Ltd., with the total purchase consideration of RMB340,369 thousand. |
258
Notes to the Consolidated Financial Statements (continued)
(Expressed in Renminbi Yuan unless otherwise indicated)
| 20 | Investments accounted for using the equity method |
The amounts recognized in the statement of financial position are as follows:
| As at 31 December | ||||||||
| 2021 RMB’000 |
2020 RMB’000 |
|||||||
| Associates |
||||||||
| – Share of net assets |
3,812,845 | 5,146,160 | ||||||
| Joint ventures |
||||||||
| – Share of net assets |
276,043 | 241,674 | ||||||
|
|
|
|
|
|||||
| As at 31 December |
4,088,888 | 5,387,834 | ||||||
|
|
|
|
|
|||||
The amounts recognized in the share of net profits of associates and joint ventures accounted for using the equity method are as follows:
| 2021 RMB’000 |
2020 RMB’000 |
|||||||
| Associates |
825,132 | 678,077 | ||||||
| Joint ventures |
49,153 | 46,663 | ||||||
|
|
|
|
|
|||||
| 874,285 | 724,740 | |||||||
|
|
|
|
|
|||||
259
Notes to the Consolidated Financial Statements (continued)
(Expressed in Renminbi Yuan unless otherwise indicated)
| 20 | Investments accounted for using the equity method (continued) |
| (a) | Investment in associates |
| 2021 RMB’000 |
2020 RMB’000 |
|||||||
| As at 1 January |
5,146,160 | 4,973,464 | ||||||
| Additions (note i) |
26,000 | 27,603 | ||||||
| Decrease caused by associate’s capital reduction (note ii) |
(1,460,258 | ) | — | |||||
| Share of profit |
825,132 | 678,077 | ||||||
| Other comprehensive income |
16,639 | (11,512 | ) | |||||
| Cash dividends distribution |
(712,436 | ) | (521,472 | ) | ||||
| Impairment (note iii) |
(28,392 | ) | — | |||||
|
|
|
|
|
|||||
| As at 31 December |
3,812,845 | 5,146,160 | ||||||
|
|
|
|
|
|||||
Set out below are the material associates of the Group as at 31 December 2021. The associates as listed below have share capital consisting solely of ordinary shares, which are held directly by the Group; the country of incorporation or registration is also their principal place of business.
260
Notes to the Consolidated Financial Statements (continued)
(Expressed in Renminbi Yuan unless otherwise indicated)
| 20 | Investments accounted for using the equity method (continued) |
| (a) | Investment in associates (continued) |
The following list contains only the particulars of material associates, all of which are unlisted corporate entities whose quoted market price is not available:
| Proportion of ownership interest | ||||||||||||||||||||||||
| Name of company |
Form of business structure |
Place of incorporation and business |
Particulars of paid-up capital ‘000 |
Group’s effective interest |
Held by the Company |
Held by a subsidiary |
Principal activity | |||||||||||||||||
| Shanghai Secco Petrochemical Company Limited (“Shanghai Secco”) (note ii) |
Incorporated | Mainland China | RMB500,000 | 20.00 | % | 20.00 | % | — | Manufacturing and distribution of chemical products | |||||||||||||||
| Shanghai Chemical Industry Park Development Company Limited (“Chemical Industry”) |
Incorporated | Mainland China | RMB2,372,439 | 38.26 | % | 38.26 | % | — | Planning, development and operation of the Chemical Industry Park in Shanghai, PRC | |||||||||||||||
| Shanghai Jinsen Hydrocarbon Resins Company Limited (“Jinsen”) |
Incorporated | Mainland China | RMB193,695 | 40.00 | % | — | 40.00 | % | Production of resins products | |||||||||||||||
| Shanghai Azbil Automation Company Limited (“Azbil”) |
Incorporated | Mainland China | RMB24,440 | 40.00 | % | — | 40.00 | % | Service and maintenance of building automation systems and products | |||||||||||||||
| Shanghai Shidian Energy Company Limited (“Shidian Energy”) |
Incorporated | Mainland China | RMB800,000 | 40.00 | % | — | 40.00 | % | Electric power supply | |||||||||||||||
261
Notes to the Consolidated Financial Statements (continued)
(Expressed in Renminbi Yuan unless otherwise indicated)
| 20 | Investments accounted for using the equity method (continued) |
| (a) | Investment in associates (continued) |
There are no contingent liabilities relating to the Group’s interest in the associates.
| i. | In 2021, Toufa invested RMB26,000 thousand to acquire 13% shares of CRRC Materials Qin Dao Company Limited. |
In 2020, Toufa invested RMB27,603 thousand to acquire 29% share of Pinghu China Aviation Oil Port Co., Ltd.
| ii. | According to the resolution of the Board of Directors on 9 July 2021, the Company, Sinopec Corp., and Sinopec Shanghai Gaoqiao Petrochemical Company Limited (“Gaoqiao Company”) approved to reduce their paid-in capital in Shanghai Secco, an associate of the Company, by a total amount of RMB7,300,811,000 in proportion to their shareholding ratios of 20%, 30% and 50% respectively. Among them, the Company reduced its investment cost in Shanghai Secco by approximately RMB1,460,258 thousand and the Company has received the amount of the capital reduction in December 2021. |
During the year ended 31 December 2021, the directors of the Company reviewed the carrying value of the Group’s associate and joint ventures. The entire carrying amount of the interests in an associate is tested for impairment in accordance with IAS 36 Impairment of Assets as a single asset by comparing its recoverable amount with its carrying amount. Since the recoverable amount of investment in an associate Jinsen is lower when compared with its carrying amount, impairment loss amounting to RMB28,392 thousand (2020: nil) is recognized during the year ended 31 December 2021.The recoverable amount of the investment in an associate was based on its fair value less costs to sell. The fair value was estimated with reference to the transaction price of a recent share transaction of the associate.
All of the above associates are accounted for using the equity method in the consolidated financial statements.
Summarized financial information of the material associates, adjusted for any differences in accounting policies, and reconciled to the carrying amounts in the consolidated financial statements, are disclosed below:
262
Notes to the Consolidated Financial Statements (continued)
(Expressed in Renminbi Yuan unless otherwise indicated)
| 20 | Investments accounted for using the equity method (continued) |
| (a) | Investment in associates (continued) |
Summarized financial information for material associates
Set out below are the summarized financial information for the above associates.
Summarized statement of financial position for material associates
| Shanghai Secco |
Chemical Industry |
Jinsen | Azbil | Shidian Energy |
||||||||||||||||
| As at 31 December 2021 |
RMB’000 | RMB’000 | RMB’000 | RMB’000 | RMB’000 | |||||||||||||||
| Current |
||||||||||||||||||||
| – Current assets |
6,066,119 | 4,133,397 | 63,192 | 274,697 | 804,470 | |||||||||||||||
| – Current liabilities |
(5,433,872 | ) | (1,789,223 | ) | (10,476 | ) | (111,472 | ) | (34,565 | ) | ||||||||||
| Non-current |
||||||||||||||||||||
| – Non-current assets |
5,735,360 | 4,431,463 | 58,737 | 15,698 | 121,051 | |||||||||||||||
| – Non-current liabilities |
(66 | ) | (619,306 | ) | — | (7,506 | ) | (15,827 | ) | |||||||||||
|
|
|
|
|
|
|
|
|
|
|
|||||||||||
| Net assets |
6,367,541 | 6,156,331 | 111,453 | 171,417 | 875,129 | |||||||||||||||
|
|
|
|
|
|
|
|
|
|
|
|||||||||||
| Group’s effective interest |
20.00 | % | 38.26 | % | 40.00 | % | 40.00 | % | 40.00 | % | ||||||||||
| Group’s share of net assets |
1,273,508 | 2,355,412 | 44,581 | 68,567 | 350,052 | |||||||||||||||
| Unrealized upstream and downstream transaction |
(3,157 | ) | — | — | — | (15,979 | ) | |||||||||||||
| Unentitled portion (note i) |
— | (331,826 | ) | — | — | — | ||||||||||||||
| Impairment loss |
— | — | (28,392 | ) | — | — | ||||||||||||||
|
|
|
|
|
|
|
|
|
|
|
|||||||||||
| Carrying value |
1,270,351 | 2,023,586 | 16,189 | 68,567 | 334,073 | |||||||||||||||
|
|
|
|
|
|
|
|
|
|
|
|||||||||||
263
Notes to the Consolidated Financial Statements (continued)
(Expressed in Renminbi Yuan unless otherwise indicated)
| 20 | Investments accounted for using the equity method (continued) |
| (a) | Investment in associates (continued) |
| Summarized | statement of financial position for material associates (continued) |
| Shanghai Secco |
Chemical Industry |
Jinsen | Azbil | Shidian Energy |
||||||||||||||||
| As at 31 December 2020 |
RMB’000 | RMB’000 | RMB’000 | RMB’000 | RMB’000 | |||||||||||||||
| Current |
||||||||||||||||||||
| – Current assets |
10,430,726 | 4,618,722 | 74,170 | 227,172 | 790,069 | |||||||||||||||
| – Current liabilities |
(2,783,216 | ) | (1,761,431 | ) | (10,481 | ) | (73,450 | ) | (20,650 | ) | ||||||||||
| Non-current |
||||||||||||||||||||
| – Non-current assets |
6,099,126 | 3,523,528 | 64,421 | 3,984 | 72,441 | |||||||||||||||
| – Non-current liabilities |
(32,482 | ) | (528,237 | ) | — | — | — | |||||||||||||
|
|
|
|
|
|
|
|
|
|
|
|||||||||||
| Net assets |
13,714,154 | 5,852,582 | 128,110 | 157,706 | 841,860 | |||||||||||||||
|
|
|
|
|
|
|
|
|
|
|
|||||||||||
| Group’s effective interest |
20.00 | % | 38.26 | % | 40.00 | % | 40.00 | % | 40.00 | % | ||||||||||
| Group’s share of net assets |
2,742,832 | 2,239,198 | 51,244 | 63,083 | 336,744 | |||||||||||||||
| Unrealized upstream and downstream transaction |
(11,285 | ) | — | — | — | (19,343 | ) | |||||||||||||
| Unentitled portion (note i) |
— | (331,407 | ) | — | — | — | ||||||||||||||
|
|
|
|
|
|
|
|
|
|
|
|||||||||||
| Carrying value |
2,731,547 | 1,907,791 | 51,244 | 63,083 | 317,401 | |||||||||||||||
|
|
|
|
|
|
|
|
|
|
|
|||||||||||
Note i: Unentitled portion represented the earnings from sales of the lands injected by Government in Chemical Industry that cannot be shared by other shareholders.
264
Notes to the Consolidated Financial Statements (continued)
(Expressed in Renminbi Yuan unless otherwise indicated)
| 20 | Investments accounted for using the equity method (continued) |
| (a) | Investment in associates (continued) |
Summarized statement of comprehensive income for material associates
| 2021 |
Shanghai Secco RMB’000 |
Chemical Industry RMB’000 |
Jinsen RMB’000 |
Azbil RMB’000 |
Shidian Energy RMB’000 |
|||||||||||||||
| Revenue |
29,723,223 | 1,709,110 | 165,499 | 427,378 | 489,490 | |||||||||||||||
| Post-tax profit/(loss) from continuing operations |
3,125,904 | 396,761 | (16,657 | ) | 61,711 | 33,269 | ||||||||||||||
| Other comprehensive income |
— | 43,488 | — | — | — | |||||||||||||||
|
|
|
|
|
|
|
|
|
|
|
|||||||||||
| Total comprehensive income |
3,125,904 | 440,249 | (16,657 | ) | 61,711 | 33,269 | ||||||||||||||
|
|
|
|
|
|
|
|
|
|
|
|||||||||||
| Dividend received from the associate |
634,341 | 52,225 | — | 19,200 | — | |||||||||||||||
|
|
|
|
|
|
|
|
|
|
|
|||||||||||
| 2020 |
Shanghai Secco RMB’000 |
Chemical Industry RMB’000 |
Jinsen RMB’000 |
Azbil RMB’000 |
Shidian Energy RMB’000 |
|||||||||||||||
| Revenue |
21,626,059 | 1,683,096 | 187,580 | 340,905 | 472,640 | |||||||||||||||
| Post-tax profit/(loss) from continuing operations |
2,412,802 | 404,117 | (8,232 | ) | 48,264 | 36,696 | ||||||||||||||
| Other comprehensive income |
— | (30,089 | ) | — | — | — | ||||||||||||||
|
|
|
|
|
|
|
|
|
|
|
|||||||||||
| Total comprehensive income |
2,412,802 | 374,028 | (8,232 | ) | 48,264 | 36,696 | ||||||||||||||
|
|
|
|
|
|
|
|
|
|
|
|||||||||||
| Dividend received from the associate |
473,600 | 32,522 | — | 9,200 | — | |||||||||||||||
|
|
|
|
|
|
|
|
|
|
|
|||||||||||
265
Notes to the Consolidated Financial Statements (continued)
(Expressed in Renminbi Yuan unless otherwise indicated)
| 20 | Investments accounted for using the equity method (continued) |
| (a) | Investment in associates (continued) |
| Aggregate information of associates that are not individually material: |
| 2021 RMB’000 |
2020 RMB’000 |
|||||||
| Aggregate carrying value of investments at 31 December |
100,079 | 75,094 | ||||||
|
|
|
|
|
|||||
| Aggregate amounts of the Group’s share of those associates: |
||||||||
| Profit for the year |
5,655 | 8,619 | ||||||
|
|
|
|
|
|||||
| Total comprehensive income |
5,655 | 8,619 | ||||||
|
|
|
|
|
|||||
| Dividend received from the associate |
6,670 | – | ||||||
|
|
|
|
|
|||||
| (b) | Investment in joint ventures |
| 2021 RMB’000 |
2020 RMB’000 |
|||||||
| As at 1 January |
241,674 | 235,294 | ||||||
| Addition (note i) |
50,000 | – | ||||||
| Share of profit |
49,153 | 46,663 | ||||||
| Cash dividends distribution |
(64,784 | ) | (40,283 | ) | ||||
|
|
|
|
|
|||||
| As at 31 December |
276,043 | 241,674 | ||||||
|
|
|
|
|
|||||
266
Notes to the Consolidated Financial Statements (continued)
(Expressed in Renminbi Yuan unless otherwise indicated)
| 20 | Investments accounted for using the equity method (continued) |
| (b) | Investment in joint ventures (continued) |
Details of the Group’s interest in the joint venture, which is accounted for using the equity method in the consolidated financial statements, are as follows:
The following list contains only the particulars of material joint ventures, all of the Group’s joint ventures are unlisted corporate entities whose quoted market price is not available:
| Proportion of ownership interest | ||||||||||||||||||||||
| Name of joint venture |
Form of business structure |
Place of incorporation and business |
Particulars of paid-up capital ’000 |
Group’s effective interest |
Held by the Company |
Held by a subsidiary |
Principal activity | |||||||||||||||
| Linde-SPC Gases Company Limited (“Linde”), formerly known as “BOC-SPC Gases Company Limited”) |
Incorporated | Mainland China | USD 32,000 | 50.00 | % | — | 50.00 | % | Production and sales of industrial gases | |||||||||||||
| Shanghai Petrochemical Pressure Vessel Testing Center (“JYJC”) |
Incorporated | Mainland China | RMB10,000 | 50.00 | % | — | 50.00 | % | Providing inspection and testing service | |||||||||||||
| Shanghai Petrochemical Yangu Gas Development Company Limited (“Yangu Gas”) |
Incorporated | Mainland China | USD10,560 | 50.00 | % | — | 50.00 | % | Production and sales of industrial gases | |||||||||||||
| Shanghai Jinshan Baling New Materials Co., Ltd. (“Baling Materials”) (Note i) |
Incorporated | Mainland China | RMB100,000 | 50.00 | % | — | 50.00 | % | Production and sales of new styrene thermoplastic elastomer materials | |||||||||||||
| i. | In September 2021, Sinopec Baling Petrochemical Co., Ltd and the Company jointly established Baling Materials, the Company agreed to make cash contribution of RMB400,000 thousand to acquire 50% share of Baling Materials. |
267
Notes to the Consolidated Financial Statements (continued)
(Expressed in Renminbi Yuan unless otherwise indicated)
| 20 | Investments accounted for using the equity method (continued) |
| (b) | Investment in joint ventures (continued) |
Summarized financial information for joint ventures
Set out below are the summarized financial information for joint ventures which are accounted for using the equity method.
Summarized statement of financial position for joint ventures
| As at 31 December 2021 |
Linde RMB’000 |
JYJC RMB’000 |
Yangu Gas RMB’000 |
Baling Materials RMB’000 |
||||||||||||
| Current |
||||||||||||||||
| Cash and cash equivalents |
226,860 | 16,914 | 72,916 | 6,062 | ||||||||||||
| Other current assets (excluding cash) |
74,652 | 5,065 | 11,149 | 28,418 | ||||||||||||
|
|
|
|
|
|
|
|
|
|||||||||
| Total current assets |
301,512 | 21,979 | 84,065 | 34,480 | ||||||||||||
|
|
|
|
|
|
|
|
|
|||||||||
| Total current liabilities |
(62,356 | ) | (3,356 | ) | (3,262 | ) | — | |||||||||
|
|
|
|
|
|
|
|
|
|||||||||
| Non-current |
||||||||||||||||
| Total non-current assets |
109,366 | 1,577 | 19,034 | 65,520 | ||||||||||||
| Total non-current liabilities |
(16,303 | ) | — | — | — | |||||||||||
|
|
|
|
|
|
|
|
|
|||||||||
| Net assets |
332,219 | 20,200 | 99,837 | 100,000 | ||||||||||||
|
|
|
|
|
|
|
|
|
|||||||||
| Group’s effective interest |
50 | % | 50 | % | 50 | % | 50 | % | ||||||||
| Interest in joint ventures |
166,110 | 10,100 | 49,919 | 50,000 | ||||||||||||
| Unrealized downstream transactions |
(86 | ) | — | — | — | |||||||||||
|
|
|
|
|
|
|
|
|
|||||||||
| Carrying value |
166,024 | 10,100 | 49,919 | 50,000 | ||||||||||||
|
|
|
|
|
|
|
|
|
|||||||||
268
Notes to the Consolidated Financial Statements (continued)
(Expressed in Renminbi Yuan unless otherwise indicated)
| 20 | Investments accounted for using the equity method (continued) |
| (b) | Investment in joint ventures (continued) |
| Summarized | statement of financial position for joint ventures (continued) |
| As at 31 December 2020 |
Linde RMB’000 |
JYJC RMB’000 |
Yangu Gas RMB’000 |
|||||||||
| Current |
||||||||||||
| Cash and cash equivalents |
233,898 | 13,281 | 62,878 | |||||||||
| Other current assets (excluding cash) |
67,809 | 6,077 | 11,812 | |||||||||
|
|
|
|
|
|
|
|||||||
| Total current assets |
301,707 | 19,358 | 74,690 | |||||||||
|
|
|
|
|
|
|
|||||||
| Total current liabilities |
(57,153 | ) | (2,453 | ) | (3,463 | ) | ||||||
|
|
|
|
|
|
|
|||||||
| Non-current |
||||||||||||
| Total non-current assets |
147,717 | 1,800 | 26,066 | |||||||||
| Total non-current liabilities |
(21,417 | ) | — | — | ||||||||
|
|
|
|
|
|
|
|||||||
| Net assets |
370,854 | 18,705 | 97,293 | |||||||||
|
|
|
|
|
|
|
|||||||
| Group’s effective interest |
50.00 | % | 50.00 | % | 50.00 | % | ||||||
| Interest in joint ventures |
185,427 | 9,352 | 48,648 | |||||||||
| Unrealized downstream transactions |
(1,753 | ) | — | — | ||||||||
|
|
|
|
|
|
|
|||||||
| Carrying value |
183,674 | 9,352 | 48,648 | |||||||||
|
|
|
|
|
|
|
|||||||
269
Notes to the Consolidated Financial Statements (continued)
(Expressed in Renminbi Yuan unless otherwise indicated)
| 20 | Investments accounted for using the equity method (continued) |
| (b) | Investment in joint ventures (continued) |
Summarized statement of comprehensive income for joint ventures
The information above reflects the amounts presented in the financial statements of the joint ventures (and not the Group’s share of those amounts) adjusted for differences in accounting policies between the Group and the joint ventures.
| 2021 |
Linde RMB’000 |
JYJC RMB’000 |
Yangu Gas RMB’000 |
Baling Materials RMB’000 |
||||||||||||
| Revenue |
428,971 | 27,190 | 60,222 | — | ||||||||||||
| Depreciation and amortization |
(44,307 | ) | (386 | ) | (5,162 | ) | — | |||||||||
| Interest income |
3,489 | 304 | 1,516 | — | ||||||||||||
| Profit from continuing operations |
116,768 | 2,250 | 4,144 | — | ||||||||||||
| Income tax benefits/(expenses) |
29,316 | (1,125 | ) | — | — | |||||||||||
| Post-tax profit from continuing operations |
87,452 | 3,375 | 4,144 | — | ||||||||||||
| Other comprehensive income |
— | — | — | — | ||||||||||||
|
|
|
|
|
|
|
|
|
|||||||||
| Total comprehensive income |
87,452 | 3,375 | 4,144 | — | ||||||||||||
|
|
|
|
|
|
|
|
|
|||||||||
| Dividend received from joint venture |
63,044 | 940 | 800 | — | ||||||||||||
|
|
|
|
|
|
|
|
|
|||||||||
| 2020 |
Linde RMB’000 |
JYJC RMB’000 |
Yangu Gas RMB’000 |
|||||||||||||
| Revenue |
420,160 | 21,674 | 58,463 | |||||||||||||
| Depreciation and amortization |
(45,756 | ) | (350 | ) | (8,313 | ) | ||||||||||
| Interest income |
2,246 | 304 | 1,483 | |||||||||||||
| Interest expense |
— | — | — | |||||||||||||
| Profit from continuing operations |
108,677 | 2,279 | 1,830 | |||||||||||||
| Income tax (expenses)/benefits |
(26,290 | ) | (177 | ) | — | |||||||||||
| Post-tax profit from continuing operations |
82,387 | 2,102 | 1,830 | |||||||||||||
| Other comprehensive income |
— | — | — | |||||||||||||
|
|
|
|
|
|
|
|||||||||||
| Total comprehensive income |
82,387 | 2,102 | 1,830 | |||||||||||||
|
|
|
|
|
|
|
|||||||||||
| Dividend received from joint venture |
38,234 | 1,049 | 1,000 | |||||||||||||
|
|
|
|
|
|
|
|||||||||||
270
Notes to the Consolidated Financial Statements (continued)
(Expressed in Renminbi Yuan unless otherwise indicated)
| 21 | Inventories |
| (a) | Inventories in the consolidated statements of financial position comprise: |
| As at 31 December 2021 | As at 31 December 2020 | |||||||||||||||||||||||
| Gross carrying amount RMB’000 |
Provision for diminution in value of inventories RMB’000 |
Carrying amount RMB’000 |
Gross carrying amount RMB’000 |
Provision for diminution in value of inventories RMB’000 |
Carrying amount RMB’000 |
|||||||||||||||||||
| Raw materials |
4,391,555 | (13,406 | ) | 4,378,149 | 2,569,136 | — | 2,569,136 | |||||||||||||||||
| Work in progress |
795,791 | (105,450 | ) | 690,341 | 696,227 | (122,081 | ) | 574,146 | ||||||||||||||||
| Finished goods |
709,990 | (45,950 | ) | 664,040 | 591,485 | (46,652 | ) | 544,833 | ||||||||||||||||
| Spare parts and consumables |
249,456 | (58,461 | ) | 190,995 | 260,431 | (59,800 | ) | 200,631 | ||||||||||||||||
|
|
|
|
|
|
|
|
|
|
|
|
|
|||||||||||||
| 6,146,792 | (223,267 | ) | 5,923,525 | 4,117,279 | (228,533 | ) | 3,888,746 | |||||||||||||||||
|
|
|
|
|
|
|
|
|
|
|
|
|
|||||||||||||
| (b) | The analysis of the amount of inventories recognized as expenses and included in profit or loss is as follows: |
The cost of inventories recognized in Cost of sales amounted to RMB70,704,868 thousand for the year ended 31 December 2021 (2020: RMB53,622,798 thousand) which excluded an inventory provision of RMB150,883 thousand (2020: RMB220,888 thousand).
For the year ended 31 December 2021, the Group sold certain finished goods and utilized certain spare parts and consumables which were previously provided for. The related provision of RMB156,149 thousand was reversed and included in cost of sales in the consolidated statement of profit or loss (2020: RMB147,817 thousand).
271
Notes to the Consolidated Financial Statements (continued)
(Expressed in Renminbi Yuan unless otherwise indicated)
| 22 | Trade and other receivables |
| As at 31 December | As at 31 December | |||||||
| 2021 RMB’000 |
2020 RMB’000 |
|||||||
| Trade receivables |
79,413 | 113,797 | ||||||
| Less: loss allowance |
(1,988 | ) | (634 | ) | ||||
| 77,425 | 113,163 | |||||||
| Amounts due from related parties excluded prepayments and bills receivable |
1,153,111 | 1,055,539 | ||||||
| Total trade receivables |
1,230,536 | 1,168,702 | ||||||
| Other receivables |
47,737 | 18,240 | ||||||
| Less: loss allowance |
(140 | ) | (139 | ) | ||||
| 47,597 | 18,101 | |||||||
| Financial assets measured at amortized cost |
1,278,133 | 1,186,803 | ||||||
| Amounts due from related parties – prepayments |
34,220 | 26,777 | ||||||
| Amounts due from related parties – bills receivables (note 25) |
25,000 | 10,000 | ||||||
|
|
|
|
|
|||||
| 1,337,353 | 1,223,580 | |||||||
|
|
|
|
|
|||||
All of the trade and other receivables are expected to be recovered or recognized as expense within one year.
Amounts due from related parties mainly represent trade-related balances, unsecured in nature and bear no interest.
272
Notes to the Consolidated Financial Statements (continued)
(Expressed in Renminbi Yuan unless otherwise indicated)
| 22 | Trade and other receivables (continued) |
The aging analysis based on invoice date of trade receivables and amounts due from related parties excluded prepayments and bills receivable (net of allowance for doubtful debts) is as follows:
| As at 31 December | As at 31 December | |||||||
| 2021 RMB’000 | 2020 RMB’000 | |||||||
| Within one year |
1,230,360 | 1,167,222 | ||||||
| Over one year within two years |
27 | 1,480 | ||||||
| Over two years |
149 | — | ||||||
|
|
|
|
|
|||||
| 1,230,536 | 1,168,702 | |||||||
|
|
|
|
|
|||||
Movements in the loss allowance account in respect of trade and other receivables during the period is as follows:
| Year ended 31 December | ||||||||
| 2021 RMB’000 |
2020 RMB’000 |
|||||||
| Balance at 1 January |
773 | 139 | ||||||
| Impairment losses recognized during the year |
1,355 | 634 | ||||||
|
|
|
|
|
|||||
| Balance at 31 December |
2,128 | 773 | ||||||
|
|
|
|
|
|||||
As at 31 December 2021 and 31 December 2020, no trade receivable was pledged as collateral.
Sale to third parties is generally on cash basis or on letter of credit. Subject to negotiation, credit is generally only available for major customers with well-established trading records.
273
Notes to the Consolidated Financial Statements (continued)
(Expressed in Renminbi Yuan unless otherwise indicated)
| 23 | Cash and cash equivalents |
| (a) | Cash and cash equivalents comprise: |
| As at 31 December |
As at 31 December |
|||||||
| 2021 RMB’000 |
2020 RMB’000 |
|||||||
| Cash deposits with a related party (note i) |
3,243 | 5,667 | ||||||
| Cash at bank and on hand |
5,108,767 | 6,910,741 | ||||||
|
|
|
|
|
|||||
| Cash and cash equivalents in the consolidated statement of financial position |
5,112,010 | 6,916,408 | ||||||
|
|
|
|
|
|||||
| i. | Cash deposits with a related party were cash deposits at Sinopec Finance Company Limited (“Sinopec Finance”). |
274
Notes to the Consolidated Financial Statements (continued)
(Expressed in Renminbi Yuan unless otherwise indicated)
| 23 | Cash and cash equivalents (continued) |
| (b) | Cash generated from operations |
Reconciliation of profit before taxation to cash generated from operations
| 2021 | 2020 | |||||||
| RMB’000 | RMB’000 | |||||||
| Profit before taxation |
2,721,086 | 590,778 | ||||||
| Adjustments items: |
||||||||
| Interest income from time deposits with maturity more than 3 months |
(424,696 | ) | (339,505 | ) | ||||
| Share of profit of investments accounted for using the equity method |
(874,285 | ) | (724,740 | ) | ||||
| Net (gains)/losses on foreign exchange option contracts and commodity swaps contracts not qualifying as hedges |
(18,846 | ) | 376 | |||||
| Gains from structured deposits |
(97,921 | ) | (114,283 | ) | ||||
| Losses on sale of FVOCI |
4,685 | 9,513 | ||||||
| Interest expense |
94,186 | 64,169 | ||||||
| Foreign exchange losses |
1,861 | 5,514 | ||||||
| Depreciation of property, plant and equipment |
1,621,459 | 1,553,039 | ||||||
| Depreciation of investment property |
15,325 | 15,184 | ||||||
| Depreciation of right-of-use assets |
34,307 | 32,653 | ||||||
| Amortization of other non-current assets |
294,617 | 226,263 | ||||||
| Impairment loss on property, plant and equipment |
587,622 | 87,570 | ||||||
| Impairment loss on investment accounted for using the equity method |
28,392 | — | ||||||
| (Gains)/losses on disposal of property, plant and equipment and other long-term assets-net |
(48,671 | ) | 1,212 | |||||
|
|
|
|
|
|||||
| Profit on operation before change of working capital |
3,939,121 | 1,407,743 | ||||||
| (Increase)/decrease in inventories |
(2,034,779 | ) | 2,865,687 | |||||
| Decrease in operation receivables |
49,586 | 308,333 | ||||||
| Decrease in operation payables |
(70,235 | ) | (1,008,800 | ) | ||||
| Increase/(decrease) in balances to related parties – net |
2,527,960 | (1,577,876 | ) | |||||
|
|
|
|
|
|||||
| Cash generated from operations |
4,411,653 | 1,995,087 | ||||||
|
|
|
|
|
|||||
275
Notes to the Consolidated Financial Statements (continued)
(Expressed in Renminbi Yuan unless otherwise indicated)
| 23 | Cash and cash equivalents (continued) |
| (c) | Reconciliation of liabilities arising from financing activities |
| Borrowings | Lease liabilities |
Short-term bonds |
Total | |||||||||||||
| RMB’000 | RMB’000 | RMB’000 | RMB’000 | |||||||||||||
| As at 1 January 2020 |
1,547,600 | 22,043 | — | 1,569,643 | ||||||||||||
| Changes from financing cash flows: |
||||||||||||||||
| Proceeds from borrowings |
3,458,100 | — | — | 3,458,100 | ||||||||||||
| Proceeds from short-term bonds |
— | — | 2,998,469 | 2,998,469 | ||||||||||||
| Repayments of borrowings |
(3,460,556 | ) | — | — | (3,460,556 | ) | ||||||||||
| Principal elements of lease payments |
— | (15,586 | ) | — | (15,586 | ) | ||||||||||
|
|
|
|
|
|
|
|
|
|||||||||
| Total changes from financing cash flows |
(2,456 | ) | (15,586 | ) | 2,998,469 | 2,980,427 | ||||||||||
| Other changes: |
||||||||||||||||
| Addition of lease liabilities |
— | 6,014 | — | 6,014 | ||||||||||||
| Foreign exchange movements |
2,856 | — | — | 2,856 | ||||||||||||
| Issuance costs on short-term bonds |
— | — | 1,531 | 1,531 | ||||||||||||
| Interest expense |
— | — | 17,811 | 17,811 | ||||||||||||
|
|
|
|
|
|
|
|
|
|||||||||
| Total other changes |
2,856 | 6,014 | 19,342 | 28,212 | ||||||||||||
|
|
|
|
|
|
|
|
|
|||||||||
276
Notes to the Consolidated Financial Statements (continued)
(Expressed in Renminbi Yuan unless otherwise indicated)
| 23 | Cash and cash equivalents (continued) |
| (c) | Reconciliation of liabilities arising from financing activities (continued) |
| Borrowings | Lease liabilities |
Short-term bonds |
Total | |||||||||||||
| RMB’000 | RMB’000 | RMB’000 | RMB’000 | |||||||||||||
| As at 31 December 2020 and 1 January 2021 |
1,548,000 | 12,471 | 3,017,811 | 4,578,282 | ||||||||||||
|
|
|
|
|
|
|
|
|
|||||||||
| Changes from financing cash flows: |
||||||||||||||||
| Proceeds from new bank loans |
14,163,132 | — | — | 14,163,132 | ||||||||||||
| Repayment of bank loans |
(13,451,332 | ) | — | — | (13,451,332 | ) | ||||||||||
| Proceeds from short-term bonds |
— | — | 5,998,899 | 5,998,899 | ||||||||||||
| Repayments of short-term bonds |
— | — | (9,000,000 | ) | (9,000,000 | ) | ||||||||||
| Principal elements of lease payments |
— | (17,544 | ) | — | (17,544 | ) | ||||||||||
|
|
|
|
|
|
|
|
|
|||||||||
| Total changes from financing cash flows |
711,800 | (17,544 | ) | (3,001,101 | ) | (2,306,845 | ) | |||||||||
|
|
|
|
|
|
|
|
|
|||||||||
| Other changes: |
||||||||||||||||
| Addition of lease liabilities |
— | 9,686 | — | 9,686 | ||||||||||||
| Issuance costs on short-term bonds |
— | — | 1,101 | 1,101 | ||||||||||||
| Interest expense |
— | — | 28,340 | 28,340 | ||||||||||||
| Others |
— | — | (46,151 | ) | (46,151 | ) | ||||||||||
|
|
|
|
|
|
|
|
|
|||||||||
| Total other changes |
— | 9,686 | (16,710 | ) | (7,024 | ) | ||||||||||
|
|
|
|
|
|
|
|
|
|||||||||
| As at 31 December 2021 |
2,259,800 | 4,613 | — | 2,264,413 | ||||||||||||
|
|
|
|
|
|
|
|
|
|||||||||
277
Notes to the Consolidated Financial Statements (continued)
(Expressed in Renminbi Yuan unless otherwise indicated)
| 23 | Cash and cash equivalents (continued) |
| (d) | Total cash outflow for leases |
Amounts included in the cash flow statement for leases comprise the following:
| 2021 | 2020 | |||||||
| RMB’000 | RMB’000 | |||||||
| Within operating cash flows |
(6,938 | ) | (4,618 | ) | ||||
| Within financing cash flows |
(17,544 | ) | (15,586 | ) | ||||
|
|
|
|
|
|||||
| (24,482 | ) | (20,204 | ) | |||||
|
|
|
|
|
|||||
These amounts relate to the following:
| 2021 | 2020 | |||||||
| RMB’000 | RMB’000 | |||||||
| Lease rentals paid |
(24,482 | ) | (20,204 | ) | ||||
|
|
|
|
|
|||||
| 24 | Time deposits with banks |
| As at 31 December | ||||||||
| 2021 | 2020 | |||||||
| RMB’000 | RMB’000 | |||||||
| Time deposits with maturity less than one year |
7,386,607 | 4,049,443 | ||||||
| Time deposits with maturity more than one year |
5,581,435 | 7,042,840 | ||||||
|
|
|
|
|
|||||
| 12,968,042 | 11,092,283 | |||||||
|
|
|
|
|
|||||
As at 31 December 2021, interest rates of time deposits with maturity less than one year ranged from 3.40% to 3.50% per annum (31 December 2020: 3.15% to 4.10% per annum), which were presented as current assets. Time deposits with maturity of more than one year were time deposits of three or five years with the interest rates from 3.45% to 4.20% per annum, which were presented as non-current assets in the statement of financial position (31 December 2020: 3.85% to 4.20% per annum).
278
Notes to the Consolidated Financial Statements (continued)
(Expressed in Renminbi Yuan unless otherwise indicated)
| 25 | Financial assets at fair value through other comprehensive income |
| As at 31 December | ||||||||
| 2021 | 2020 | |||||||
| RMB’000 | RMB’000 | |||||||
| Trade and bills receivable (i) |
||||||||
| – Amounts due from related parties (note 22) |
25,000 | 10,000 | ||||||
| – Others |
1,047,690 | 1,207,114 | ||||||
|
|
|
|
|
|||||
| 1,072,690 | 1,217,114 | |||||||
| Equity investments |
5,000 | 5,000 | ||||||
|
|
|
|
|
|||||
| 1,077,690 | 1,222,114 | |||||||
|
|
|
|
|
|||||
| (i) | As at 31 December 2021 and 2020, certain trade receivables and bills receivable were classified as financial assets at FVOCI, as the Group’s business model is achieved both by collecting contractual cash flows and selling of these assets. |
| (ii) | As at 31 December 2021, the Group discounted certain bank acceptance bills to banks for cash proceeds and endorsed certain bank acceptance bills to suppliers for settling trade payables of the same amount on a full recourse basis. The Group has derecognized these bills receivable and the payables to suppliers in their entirety. These derecognized bank acceptance bills had a maturity date less than twelve months from the end of the reporting period. In the opinion of the directors, the Group has transferred substantially all the risks and rewards of ownership of these bills to its suppliers, and the Group has limited exposure in respect of the settlement obligation of these bills receivable under the relevant PRC rules and regulations should the issuing banks fail to settle the bills on maturity date. The Group considered the issuing banks of the bills are of good credit rating and the non-settlement of these bills by the issuing banks on maturity is not probable. |
As at 31 December 2021, the Group’s maximum exposure to loss and undiscounted cash outflow, which is the same as the amounts payable by the Group to banks or suppliers in respect of the discounted bills and endorsed bills, should the issuing banks fail to settle the bills on maturity date, amounted to RMB156,737 thousand and RMB307,275 thousand respectively.
279
Notes to the Consolidated Financial Statements (continued)
(Expressed in Renminbi Yuan unless otherwise indicated)
| 26 | Borrowings |
| As at 31 December |
As at 31 December |
|||||||
| 2021 RMB’000 |
2020 RMB’000 |
|||||||
| Credit loans due within one year |
||||||||
| – Short-term bank loan |
1,559,800 | 1,548,000 | ||||||
|
|
|
|
|
|||||
| Credit loans due over one year but within three years |
||||||||
| – Long-term borrowing from a related party (note 33(c)) |
700,000 | — | ||||||
|
|
|
|
|
|||||
| 2,259,800 | 1,548,000 | |||||||
|
|
|
|
|
|||||
| (a) | The analysis of the repayment schedule of borrowings are as follows: |
| 2021 RMB’000 |
2020 RMB’000 |
|||||||
| Within 1 year or on demand |
1,559,800 | 1,548,000 | ||||||
| Over one year but within two years |
— | — | ||||||
| Over two years but within three years |
700,000 | — | ||||||
|
|
|
|
|
|||||
| 2,259,800 | 1,548,000 | |||||||
|
|
|
|
|
|||||
The weighted average interest rate for the Group’s short-term bank loan was 2.74% as at 31 December 2021 (31 December 2020: 2.79%). The interest rate of the Group’s long-term borrowings was 1.08% as at 31 December 2021 (31 December 2020: Nil).
As at 31 December 2021 and 31 December 2020, no borrowings were secured by property, plant and equipment.
280
Notes to the Consolidated Financial Statements (continued)
(Expressed in Renminbi Yuan unless otherwise indicated)
| 27 | Short-term bonds |
| As at 31 December | ||||||||
| 2021 RMB’000 |
2020 RMB’000 |
|||||||
| Short-term bonds |
— | 3,017,811 | ||||||
| In August 2020, the Company issued 169-day short-term bonds of face value RMB3,000,000 thousand to institutional investors in inter-bank bond market. The effective yield of the short-term bonds is 1.70% per annum. The short-term bonds have been settled after their maturity in 2021. |
| 28 | Trade and other payables |
| As at 31 December | ||||||||
| 2021 RMB’000 |
2020 RMB’000 |
|||||||
| Trade payables |
1,527,706 | 1,294,138 | ||||||
| Bills payable |
562,593 | 26,196 | ||||||
| Amounts due to related parties exclude advances received |
4,910,255 | 3,655,724 | ||||||
|
|
|
|
|
|||||
| 7,000,554 | 4,976,058 | |||||||
|
|
|
|
|
|||||
| Dividends payable |
30,577 | 29,522 | ||||||
| Construction payable |
487,283 | 299,205 | ||||||
| Oil price risk reserve |
— | 546,055 | ||||||
| Accrued expenses |
400,391 | 518,333 | ||||||
| Other liabilities |
87,144 | 106,634 | ||||||
|
|
|
|
|
|||||
| 1,005,395 | 1,499,749 | |||||||
|
|
|
|
|
|||||
| Financial liabilities measured at amortized cost |
8,005,949 | 6,475,807 | ||||||
| Amounts due to related parties – advances received |
6,275 | 1,117 | ||||||
| Amounts due to related parties – measured at fair value through profit or loss (FVPL) (i) |
1,388,286 | — | ||||||
|
|
|
|
|
|||||
| 9,400,510 | 6,476,924 | |||||||
|
|
|
|
|
|||||
| Total amount due to related parties |
6,304,816 | 3,656,841 | ||||||
|
|
|
|
|
|||||
281
Notes to the Consolidated Financial Statements (continued)
(Expressed in Renminbi Yuan unless otherwise indicated)
| 28 | Trade and other payables (continued) |
All trade and other payables (including amounts due to related parties) are expected to be settled or recognized as income within one year or are repayable on demand.
| (i) | Amounts due to related parties – measured at FVPL represents the obligation that the Company needs to return the crude oil to its related party with maturity of less than 1 year, which is measured at fair value through profit or loss. |
As at 31 December 2021 and 31 December 2020, all trade and other payables of the Group were non-interest bearing, and their fair value, approximated their carrying amounts due to their short maturities.
Majority of amount due to related parties were trade payable for purchasing crude oil from related parties.
As at 31 December 2021 and 31 December 2020, the ageing analysis of the trade payables (including amounts due to related parties of trading in nature) and bills payable based on invoice date were as follows:
| As at 31 December | ||||||||
| 2021 RMB’000 |
2020 RMB’000 |
|||||||
| Within one year |
6,990,653 | 4,973,711 | ||||||
| Over one year within two years |
9,527 | 1,973 | ||||||
| Over two years |
374 | 374 | ||||||
|
|
|
|
|
|||||
| 7,000,554 | 4,976,058 | |||||||
|
|
|
|
|
|||||
| 29 | Contract liabilities |
| As at 31 December | ||||||||
| 2021 RMB’000 |
2020 RMB’000 |
|||||||
| Contract liabilities |
424,607 | 495,404 | ||||||
|
|
|
|
|
|||||
The contract liabilities of the Group are advance for goods from customers. Related performance obligations are expected to be satisfied and revenue is recognized within one year. Revenue amounted to RMB495,404 thousand has been recognized in the current year relates to carried-forward contract liabilities (2020: RMB579,750 thousand).
282
Notes to the Consolidated Financial Statements (continued)
(Expressed in Renminbi Yuan unless otherwise indicated)
| 30 | Deferred income |
| 2021 RMB’000 |
2020 RMB’000 |
|||||||
| As at 1 January |
13,433 | 10,005 | ||||||
| Additions |
— | 3,865 | ||||||
| Amortization |
(713 | ) | (437 | ) | ||||
|
|
|
|
|
|||||
| As at 31 December |
12,720 | 13,433 | ||||||
|
|
|
|
|
|||||
| 31 | Share capital |
| Number of shares ’000 |
Amount RMB’000 |
|||||||
| As at 31 December 2020, 1 January 2021 and 31 December 2021 |
||||||||
| Registered, issued and fully paid: |
||||||||
| Ordinary A shares listed in PRC |
7,328,814 | 7,328,814 | ||||||
| Foreign invested H shares listed overseas |
3,495,000 | 3,495,000 | ||||||
|
|
|
|
|
|||||
| Total |
10,823,814 | 10,823,814 | ||||||
|
|
|
|
|
|||||
283
Notes to the Consolidated Financial Statements (continued)
(Expressed in Renminbi Yuan unless otherwise indicated)
| 32 | Reserves |
| Legal surplus (note(a)) RMB’000 |
Capital surplus (note(b)) RMB’000 |
Surplus reserve (note(c)) RMB’000 |
Other reserve (note(d)) RMB’000 |
Hedging (note 3.1(a)) RMB’000 |
Share premium (note(e)) RMB’000 |
Safety production fund (note(f)) RMB’000 |
Retained earnings (note(g)) RMB’000 |
Total RMB’000 |
||||||||||||||||||||||||||||
| Balance at 1 January 2020 |
4,072,476 | 13,739 | 101,355 | 17,838 | — | 106,846 | 57,137 | 14,670,083 | 19,039,474 | |||||||||||||||||||||||||||
| Total comprehensive income for the year attributable to shareholders of the Company |
— | — | — | (11,512 | ) | — | — | — | 645,072 | 633,560 | ||||||||||||||||||||||||||
| Change in fair value of hedging instruments |
— | — | — | — | (63,840 | ) | — | — | — | (63,840 | ) | |||||||||||||||||||||||||
| Reclassified to cost of inventory |
— | — | — | — | 63,840 | — | — | — | 63,840 | |||||||||||||||||||||||||||
| Dividends declared and approved in respect of previous year |
— | — | — | — | — | — | — | (1,298,858 | ) | (1,298,858 | ) | |||||||||||||||||||||||||
| Appropriation of safety production fund |
— | — | — | — | — | — | 88,460 | (88,460 | ) | — | ||||||||||||||||||||||||||
|
|
|
|
|
|
|
|
|
|
|
|
|
|
|
|
|
|
|
|||||||||||||||||||
| Balance at 31 December 2020 and 1 January 2021 |
4,072,476 | 13,739 | 101,355 | 6,326 | — | 106,846 | 145,597 | 13,927,837 | 18,374,176 | |||||||||||||||||||||||||||
|
|
|
|
|
|
|
|
|
|
|
|
|
|
|
|
|
|
|
|||||||||||||||||||
| Total comprehensive income for the year attributable to shareholders of the Company |
— | — | — | 16,639 | 125,159 | — | — | 2,073,431 | 2,215,229 | |||||||||||||||||||||||||||
| Amounts transferred from hedging reserve to initial carrying amount of hedged items |
— | — | — | — | (88,699 | ) | — | — | — | (88,699 | ) | |||||||||||||||||||||||||
| Dividends declared and approved in respect of previous year |
— | — | — | — | — | — | — | (1,082,381 | ) | (1,082,381 | ) | |||||||||||||||||||||||||
| Transfer to legal surplus |
2,498,808 | — | — | — | — | — | — | (2,498,808 | ) | — | ||||||||||||||||||||||||||
| Appropriation of safety production fund |
— | — | — | — | — | — | 40,729 | (40,729 | ) | — | ||||||||||||||||||||||||||
|
|
|
|
|
|
|
|
|
|
|
|
|
|
|
|
|
|
|
|||||||||||||||||||
| Balance at 31 December 2021 |
6,571,284 | 13,739 | 101,355 | 22,965 | 36,460 | 106,846 | 186,326 | 12,379,350 | 19,418,325 | |||||||||||||||||||||||||||
|
|
|
|
|
|
|
|
|
|
|
|
|
|
|
|
|
|
|
|||||||||||||||||||
284
Notes to the Consolidated Financial Statements (continued)
(Expressed in Renminbi Yuan unless otherwise indicated)
| 32 | Reserves (continued) |
Notes:
| (a) | Under PRC rules and regulations, the Company and its PRC subsidiaries are required to set aside 10% of the net income determined in accordance with the PRC accounting rules and regulations to a legal surplus reserve. The transfer to this reserve must be made before distribution of any dividend to shareholders. |
The legal surplus reserve is non-distributable other than in liquidation and can be used to make good of previous years’ losses, if any, and may be utilized for business expansion or converted into ordinary shares by the issuance of new shares to shareholders in proportion to their existing shareholdings or by increasing the par value of the shares currently held by the shareholders, provided that the balance after such issuance is not less than 25% of the registered capital.
In accordance with PRC rules and regulations, the Company has set aside RMB6,571,284 thousand of legal surplus as of 31 December 2021.
| (b) | This reserve represents gifts or grants received from China Petrochemical Corporation, the ultimate parent company and which are required to be included in this reserve fund by PRC regulations. |
| (c) | The transfer to this reserve from the retained profits is subject to the approval by shareholders at general meetings. Its usage is similar to that of the legal surplus reserve. |
| (d) | Other reserve comprises share of post-acquisition movements in other comprehensive income from associates and joint ventures using the equity methods of accounting with a corresponding adjustment to the carrying amount of the investment. |
| (e) | The application of the share premium account is governed by Sections 167 and 168 of the PRC Company Law. |
| (f) | According to the relevant PRC regulations, the Group is required to transfer an amount to specific reserve for the safety production fund based on the turnover of certain refining and chemicals products. This reserve represents unutilized safety production fund. |
| (g) | According to the Company’s Articles of Association, the reserve available for distribution is the lower of the amount determined under China Accounting Standards for Business Enterprises and the amount determined under IFRS. |
285
Notes to the Consolidated Financial Statements (continued)
(Expressed in Renminbi Yuan unless otherwise indicated)
| 33 | Related-party transactions |
The following is a list of the Group’s major related parties:
| Names of related parties |
Relationship with the Company | |
| China International United Petroleum & Chemicals Co., Ltd. |
Subsidiary of the ultimate parent company | |
| Sinopec Chemical Sales Company Limited |
Subsidiary of the ultimate parent company | |
| Sinopec Chemical Commercial Holding Company Limited |
Subsidiary of the ultimate parent company | |
| Petro-cyberworks Information Technology Co., Ltd. |
Subsidiary of the ultimate parent company | |
| Lianhua (Ningbo) International Logistics Co., Ltd. |
Subsidiary of the ultimate parent company | |
| Zhongke (Guangdong) Refining & Chemical Co., Ltd. |
Subsidiary of the ultimate parent company | |
| Sinopec Marketing Co., Ltd. |
Subsidiary of the ultimate parent company | |
| Sinopec Fuel Oil Sales Co., Ltd. |
Subsidiary of the ultimate parent company | |
| Sinopec Lubricant Co., Ltd. |
Subsidiary of the ultimate parent company | |
| Sinopec Yangzi Petrochemical Co., Ltd. |
Subsidiary of the ultimate parent company | |
| China Petrochemical International (Beijing) Company Limited |
Subsidiary of the ultimate parent company | |
| Sinopec Catalysts Co., Ltd. |
Subsidiary of the ultimate parent company | |
| China Petrochemical International (Shanghai) Co., Ltd. |
Subsidiary of the ultimate parent company | |
| Sinopec Beijing Research Institute of Chemical Industry |
Subsidiary of the ultimate parent company | |
| China Petrochemical International (Ningbo) Co., Ltd. |
Subsidiary of the ultimate parent company | |
| Zhoushan Shihua Crude Oil Terminal Co., Ltd. |
Subsidiary of the ultimate parent company | |
| Dalian Sinopec Material Equip Company |
Subsidiary of the ultimate parent company | |
| Sinopec Material & Equipment (East China) Co., Ltd. |
Subsidiary of the ultimate parent company | |
| China Petrochemical International (Nanjing) Co., Ltd. |
Subsidiary of the ultimate parent company | |
| Sinopec Honeywell (Tianjin) Company Limited |
Subsidiary of the ultimate parent company | |
| China Petrochemical International (Wuhan) Co., Ltd. |
Subsidiary of the ultimate parent company | |
| China Petrochemical International Co., Ltd. |
Subsidiary of the ultimate parent company | |
| China Petrochemical Refinery Sales Co., Ltd. |
Subsidiary of the ultimate parent company | |
| Sinopec Shanghai Gaoqiao Petrochemical Co., Ltd. |
Subsidiary of the ultimate parent company | |
| China Petrochemical International (Tianjin) Co., Ltd. |
Subsidiary of the ultimate parent company | |
| Ningbo East sea Line fan Technology Company Limited |
Subsidiary of the ultimate parent company | |
| Sinopec Petroleum & Chemical Scientific Research Institute Dadi Company |
Subsidiary of the ultimate parent company | |
| Sinopec Shanghai Research Institute of Petrochemical Technology |
Subsidiary of the ultimate parent company | |
| Sinopec Lubricating Oil Shanghai Research Institute Company Limited |
Subsidiary of the ultimate parent company | |
| Dalian Furuipu Technology Co., Ltd. |
Subsidiary of the ultimate parent company | |
| Nantong Donghai Petrochemical Co., Ltd. |
Subsidiary of the ultimate parent company |
286
Notes to the Consolidated Financial Statements (continued)
(Expressed in Renminbi Yuan unless otherwise indicated)
| 33 | Related-party transactions (continued) |
| Names of related parties |
Relationship with the Company | |
| China Petroleum and Chemical Corporation Qingdao Security Engineering Research Institute |
Subsidiary of the ultimate parent company | |
| Sinopec (Shanghai) Energy Trade Co., Ltd. |
Subsidiary of the ultimate parent company | |
| Storage and Transportation Installation Company of Ningbo Engineering Company Limited |
Subsidiary of the ultimate parent company | |
| Sinopec Chemical Commercial Holding (Hong Kong) Company Limited |
Subsidiary of the ultimate parent company | |
| Sinopec Yizheng Chemical Fibre Limited Liability Company |
Subsidiary of the ultimate parent company | |
| Fujian Gulei Petrochemical Company Limited |
Subsidiary of the ultimate parent company | |
| Sinopec China East Chemical Sales Co., Ltd |
Subsidiary of the ultimate parent company | |
| Unipec Singapore |
Subsidiary of the ultimate parent company | |
| China Yanshan United Foreign Trade Co., Ltd. |
Subsidiary of the ultimate parent company | |
| Sinopec Chemical Commercial Holding (Wuhan) Company Limited |
Subsidiary of the ultimate parent company | |
| Nanjing Yangzi Petrol-chemical Industry Co., Ltd. |
Subsidiary of the ultimate parent company | |
| Sinopec Baling Petrochemical Co., Ltd. |
Subsidiary of the ultimate parent company | |
| Shengli Oil Field Exploration and Development Research Institute |
Subsidiary of the ultimate parent company | |
| Shanghai Lide Catalyst Co., Ltd. |
Subsidiary of the ultimate parent company | |
| Ypc-gpro (Nanjing) Rubber Co., Ltd. |
Subsidiary of the ultimate parent company | |
| Fujian Refining & Petrochemical Company Limited |
Subsidiary of the ultimate parent company | |
| Sinopec Dalian (Fushun) Research Institute of Petroleum and Petrochemicals |
Subsidiary of the ultimate parent company | |
| Sinopec Jianghan Salt Chemical Hubei Co., Ltd. |
Subsidiary of the ultimate parent company | |
| Yipaike Business Factoring Co., Ltd. |
Subsidiary of the ultimate parent company | |
| Sinopec Great Wall Energy and Chemical Co., Ltd. |
Subsidiary of the ultimate parent company | |
| Sinopec (Shenzhen) E-Commerce Company Limited |
Subsidiary of the ultimate parent company | |
| Sinopec Research Institute of Safety Engineering |
Subsidiary of the ultimate parent company | |
| Ningbo Minggang Gas Company Limited |
Subsidiary of the ultimate parent company | |
| Sinopec Zhongyuan Petrol-Chemical Industry Co., Ltd. |
Subsidiary of the ultimate parent company | |
| Epec E-commerce Co., Ltd. |
Subsidiary of the ultimate parent company | |
| Sinopec Oil Refining and Marketing (Shanghai) Co., Ltd |
Subsidiary of the ultimate parent company | |
| Sinopec Chemical Sales (Guangdong) Co., Ltd. |
Subsidiary of the ultimate parent company | |
| Sinopec Nanguang (Shanghai) Industrial Co., Ltd. |
Subsidiary of the ultimate parent company | |
| Unipec (Qingdao) International Logistics Company Limited |
Subsidiary of the ultimate parent company | |
| Qingdao Zhonghua Sunshine Management System Certification Center |
Subsidiary of the ultimate parent company | |
| Zhejiang Baling Hengyi Caprolactam Limited Company |
Joint venture of the ultimate parent company |
287
Notes to the Consolidated Financial Statements (continued)
(Expressed in Renminbi Yuan unless otherwise indicated)
| 33 | Related-party transactions (continued) |
| Names of related parties |
Relationship with the Company | |
| Shanghai Sinopec Mitsui Chemicals, Co., Ltd |
Joint venture of the ultimate parent company | |
| Basf-ypc Company Limited |
Joint venture of the ultimate parent company | |
| Shanghai Changshi Shipping Co., Ltd. |
Associate of the ultimate parent company | |
| Shanghai KSD Bulk Solids Engineering Co., Ltd. |
Associate of the ultimate parent company | |
| Basf Gao-Qiao Performance Chemicals (Shanghai) Company Limited |
Associate of the ultimate parent company | |
| Sinopec Chemical Commercial Holding (Singapore) Pte. Ltd |
Subsidiary of the immediate parent company | |
| Sinopec Finance Co., Ltd. |
Subsidiary of the immediate parent company | |
| Sinopec Chemical Commercial Holding Company Limited |
Subsidiary of the immediate parent company | |
| Zhongshi Huananjing Chemical Research Institute Co., Ltd. |
Subsidiary of the immediate parent company | |
| China Economy Phulishing House Co., Ltd. |
Subsidiary of the immediate parent company | |
| Sinopec Publishing House Co., Ltd. |
Subsidiary of the immediate parent company | |
| Sinopec Group International Travel Agency Agricultural Bank of China |
Subsidiary of the immediate parent company | |
| Sinopec Assets Management Co., Ltd. |
Subsidiary of the immediate parent company | |
| Ningbo Engineering Company of Sinopec |
Subsidiary of the immediate parent company | |
| Sinopec Shared Service Co., Ltd. |
Subsidiary of the immediate parent company | |
| Sinopec Petroleum Engineering Geophysics Ltd. |
Subsidiary of the immediate parent company | |
| Sinopec Baichuan Economic and Trade Company |
Subsidiary of the immediate parent company | |
| Sinopec Group Jiangsu Petroleum Exploration Bureau Co., Ltd. |
Subsidiary of the immediate parent company | |
| Sinopec Newspaper Office |
Subsidiary of the immediate parent company | |
| Sinopec Energy Saving Technology Service Co., Ltd. |
Subsidiary of the immediate parent company | |
| Sinopec Group Economic and Technology Research Institute Co., Ltd. |
Subsidiary of the immediate parent company | |
| Beijing Petro-Chemical Construction Consulting Co., Ltd. |
Subsidiary of the immediate parent company | |
| China Economicbooks Co., Ltd. |
Subsidiary of the immediate parent company | |
| Petrol-Chemical Industry Management Cadre College |
Subsidiary of the immediate parent company | |
| Sinopec Engineering Quality Supervision Terminal |
Subsidiary of the immediate parent company | |
| Sinopec Group Shanghai Training Center Ltd. |
Subsidiary of the immediate parent company | |
| Sinopec Beijing Yanshan Petrochemical Co., Ltd. |
Subsidiary of the immediate parent company | |
| Sinopec Zhongyuan Petroleum Exploration Bureau Co., Ltd. |
Subsidiary of the immediate parent company | |
| Sinopec Shengli Petroleum Administration Co., Ltd. |
Subsidiary of the immediate parent company | |
| The Fourth Construction Company of Sinopec |
Subsidiary of the immediate parent company | |
| Sinopec Tending Co., Ltd. |
Subsidiary of the immediate parent company |
288
Notes to the Consolidated Financial Statements (continued)
(Expressed in Renminbi Yuan unless otherwise indicated)
| 33 | Related-party transactions (continued) |
| Names of related parties |
Relationship with the Company | |
| Sinopec Shanghai Engineering Co., Ltd. |
Subsidiary of the immediate parent company | |
| Sinopec Engineering Incorporation |
Subsidiary of the immediate parent company | |
| Sinopec Engineering Quality Monitoring Co., Ltd. |
Subsidiary of the immediate parent company | |
| National Petrochemical Project Risk Assessment Technology Center |
Subsidiary of the immediate parent company | |
| The Tenth Construction Company of Sinopec |
Subsidiary of the immediate parent company | |
| The Fifth Construction Company of Sinopec |
Subsidiary of the immediate parent company | |
| Shanghai Petrochemical Machinery Manufacturing Co., Ltd. |
Subsidiary of the immediate parent company | |
| Sinopec Nanjing Engineering Company Limited |
Subsidiary of the immediate parent company | |
| Sinopec Luoyang Engineering Company Limited |
Subsidiary of the immediate parent company | |
| Jiangsu Jinling Opta Polymer Company Limited |
Subsidiary of the immediate parent company | |
| Shanghai Petro-Chemical Haidi Administration Co., Ltd. |
Subsidiary of the immediate parent company | |
| Sinopec Sichuan Uinylon Works |
Subsidiary of the immediate parent company | |
| China Petrochemical Corp. Nanjing Chemistry Industrial Co., Ltd. |
Subsidiary of the immediate parent company | |
| Sinopec Group International Petroleum Exploration And Production Limited |
Subsidiary of the immediate parent company | |
| Sinopec Consulting Company Limited |
Subsidiary of the immediate parent company | |
| Sinopec Guangzhou Engineering Co., Ltd. |
Subsidiary of the immediate parent company | |
| Beijing Yanshan Petrochemical Special Equipment Inspection Co., Ltd. |
Subsidiary of the immediate parent company | |
| China Petrochemical Corp. Engineering Ration Management Station |
Subsidiary of the immediate parent company | |
| Beijing Victory Hotel Company Limited |
Subsidiary of the immediate parent company | |
| Maoming Shihua Dongcheng Chemical Co., Ltd. |
Subsidiary of the immediate parent company | |
| Yihua Tory Polyester Film Company Limited |
Joint venture of the immediate parent company | |
| China Sinopec Pipeline Storage and Transportation Co., Ltd. |
Associate of the immediate parent | |
| Yihua Bonar Yarns and Fabrics Co., Ltd. |
Associate of the immediate parent | |
| Unipec Singapore |
Subsidiary of the immediate parent company | |
| Unipec America, Inc |
Subsidiary of the immediate parent company | |
| Sinopec Japan Company Limited |
Subsidiary of the immediate parent company | |
| Rizhao Shihua Crude Oil Terminal Co., Ltd. |
Joint venture of the ultimate parent company | |
| Sinopec Europe Company Limited |
Subsidiary of the immediate parent company | |
| Sinopec Chemical Commercial Holding (North America), Inc. |
Subsidiary of the immediate parent company | |
| Sinopec International (Australia) Pty. Ltd. |
Subsidiary of the immediate parent company |
289
Notes to the Consolidated Financial Statements (continued)
(Expressed in Renminbi Yuan unless otherwise indicated)
| 33 | Related-party transactions (continued) |
| The following is a summary of significant balances and transactions between the Group and its related parties except for the dividends payable as disclosed in note 34. |
| (a) | Most of the transactions undertaken by the Group during the year ended 31 December 2021 have been affected on such terms as determined by Sinopec Corp. and relevant PRC authorities. |
Sinopec Corp. negotiates and agrees with the terms of crude oil supply with suppliers on a group basis, which is then allocated among its subsidiaries, including the Group, on a discretionary basis. Sinopec Corp. also owns a widespread petroleum products sales network and possesses a fairly high market share in the domestic petroleum products market, which is subject to extensive regulation by the PRC government.
The Group has entered into a mutual product supply and sales services framework agreement with Sinopec Corp. Pursuant to the agreement, Sinopec Corp. provides the Company with crude oil, other petrochemical raw materials and agent services. On the other hand, the Group provides Sinopec Corp. with petroleum products, petrochemical products and property leasing services.
The pricing policy for these services and products provided under the agreement is as follows:
| • | if there are applicable State (central and local government) tariffs, the pricing shall follow the State tariffs; |
| • | if there are no State tariffs, but there are applicable State guidance prices, the pricing shall follow the State’s guidance prices; or |
| • | if there are no State tariffs or State’s guidance prices, the pricing shall be determined in accordance with the prevailing market prices (including any bidding prices). |
Transactions between the Group and Sinopec Corp, its subsidiaries and joint ventures during the year ended 31 December 2021 and the year ended 31 December 2020 were as follows:
| 2021 | 2020 | |||||||
| RMB’000 | RMB’000 | |||||||
| Sales of petroleum products |
47,201,755 | 39,879,549 | ||||||
| Sales other than petroleum products |
9,439,546 | 6,790,568 | ||||||
| Purchases of crude oil |
35,371,820 | 27,934,926 | ||||||
| Purchases other than crude oil |
9,008,147 | 9,937,862 | ||||||
| Commission expense |
110,552 | 104,598 | ||||||
| Rental income |
34,475 | 32,829 | ||||||
|
|
|
|
|
|||||
290
Notes to the Consolidated Financial Statements (continued)
(Expressed in Renminbi Yuan unless otherwise indicated)
| 33 | Related-party transactions (continued) |
| (b) | Other transactions between the Group and Sinopec Group and its subsidiaries, associates and joint ventures of the Group during the year ended 31 December 2021 and the year ended 31 December 2020 were as follows: |
| 2021 | 2020 | |||||||
| RMB’000 | RMB’000 | |||||||
| Sales of goods and service fee income |
||||||||
| – Sinopec Group and its subsidiaries |
36,683 | 14,870 | ||||||
| – Associates and joint ventures of the Group |
4,248,658 | 2,019,997 | ||||||
|
|
|
|
|
|||||
| 4,285,341 | 2,034,867 | |||||||
|
|
|
|
|
|||||
| Purchases |
||||||||
| – Sinopec Group and its subsidiaries |
2,830,256 | 832,617 | ||||||
| – Associates and joint ventures of the Group |
4,425,698 | 3,648,664 | ||||||
|
|
|
|
|
|||||
| 7,255,954 | 4,481,281 | |||||||
|
|
|
|
|
|||||
| Insurance premium expenses |
||||||||
| – Sinopec Group and its subsidiaries |
108,850 | 107,495 | ||||||
|
|
|
|
|
|||||
| Addition to right-of-use assets |
||||||||
| – Sinopec Group and its subsidiaries |
1,388 | 2,267 | ||||||
|
|
|
|
|
|||||
291
Notes to the Consolidated Financial Statements (continued)
(Expressed in Renminbi Yuan unless otherwise indicated)
| 33 | Related-party transactions (continued) |
| (b) | Other transactions between the Group and Sinopec Group and its subsidiaries, associates and joint ventures of the Group during the year ended 31 December 2021 and the year ended 31 December 2020 were as follows: |
| 2021 | 2020 | |||||||
| RMB’000 | RMB’000 | |||||||
| Interest expense of lease liabilities |
||||||||
| – Sinopec Group and its subsidiaries |
247 | 205 | ||||||
| – Joint ventures of the Group |
24 | 8 | ||||||
|
|
|
|
|
|||||
| 271 | 213 | |||||||
|
|
|
|
|
|||||
| Interest income |
||||||||
| – Sinopec Finance |
824 | 2,088 | ||||||
|
|
|
|
|
|||||
| Construction and installation cost |
||||||||
| – Sinopec Group and its subsidiaries |
785,216 | 233,591 | ||||||
|
|
|
|
|
|||||
| Rental income |
||||||||
| – Associates and joint ventures of the Group |
14,930 | 15,577 | ||||||
| – Sinopec Group and its subsidiaries |
464 | 464 | ||||||
|
|
|
|
|
|||||
| Long-term borrowings |
||||||||
| – Sinopec Finance |
700,000 | – | ||||||
|
|
|
|
|
|||||
The directors of the Company are of the opinion that the transactions with Sinopec Corp., its subsidiaries and joint ventures, Sinopec Group and its subsidiaries, associates and joint ventures of the Group as disclosed in notes 33(a) and 33(b) were conducted in the ordinary course of business, on normal commercial terms and in accordance with the agreements governing such transactions.
292
Notes to the Consolidated Financial Statements (continued)
(Expressed in Renminbi Yuan unless otherwise indicated)
| 33 | Related-party transactions (continued) |
| (c) | The relevant amounts due from/to Sinopec Corp., its subsidiaries and joint ventures, Sinopec Group and its subsidiaries, associates and joint ventures of the Group, arising from purchases, sales and other transactions as disclosed in notes 33(a) and 33(b), are summarized as follows: |
| As at 31 December |
As at 31 December |
|||||||
| 2021 RMB’000 |
2020 RMB’000 |
|||||||
| Amounts due from related parties |
||||||||
| – Sinopec Corp., its subsidiaries and joint ventures |
1,184,117 | 1,054,127 | ||||||
| – Associates and joint ventures of the Group |
28,214 | 38,189 | ||||||
|
|
|
|
|
|||||
| 1,212,331 | 1,092,316 | |||||||
|
|
|
|
|
|||||
| Amounts due to related parties |
||||||||
| – Sinopec Corp., its subsidiaries and joint ventures |
4,475,992 | 2,505,532 | ||||||
| – Sinopec Group and its subsidiaries |
1,672,439 | 889,035 | ||||||
| – Associates and joint ventures of the Group |
156,385 | 262,274 | ||||||
|
|
|
|
|
|||||
| 6,304,816 | 3,656,841 | |||||||
|
|
|
|
|
|||||
| Lease liabilities |
||||||||
| – Sinopec Group and its subsidiaries |
992 | 8,453 | ||||||
| – Joint ventures of the Group |
435 | 574 | ||||||
|
|
|
|
|
|||||
| 1,427 | 9,027 | |||||||
|
|
|
|
|
|||||
| Cash deposits, maturing within three months |
||||||||
| – Sinopec Finance (note d) |
3,243 | 5,667 | ||||||
|
|
|
|
|
|||||
| Long-term borrowings |
||||||||
| – Sinopec Finance |
700,000 | – | ||||||
|
|
|
|
|
|||||
293
Notes to the Consolidated Financial Statements (continued)
(Expressed in Renminbi Yuan unless otherwise indicated)
| 33 | Related-party transactions (continued) |
| (d) | As at 31 December 2021 and 31 December 2020, cash deposits at Sinopec Finance were charged at an interest rate of 0.35% per annum. |
Except for cash deposits at Sinopec Finance and long-term borrowings from Sinopec Finance, the balances with related parties as above are unsecured, interest-free and repayable on demand.
| (e) | Key management personnel compensation, post-employment benefit plans and share options |
Key management personnel are those persons having authority and responsibility for planning, directing and controlling the activities of the Group, directly or indirectly, including directors and supervisors of the Group. The key personnel compensations are as follows:
| Year ended 31 December | ||||||||
| 2021 | 2020 | |||||||
| RMB’000 | RMB’000 | |||||||
| Short-term employee benefits |
11,866 | 9,859 | ||||||
| Post-employment benefits |
551 | 441 | ||||||
|
|
|
|
|
|||||
| 12,417 | 10,300 | |||||||
|
|
|
|
|
|||||
| (f) | Transactions with other state-owned entities in the PRC |
The Group is a state-controlled enterprise and operates in an economic regime currently dominated by entities directly or indirectly controlled by the PRC government (collectively referred to as “state-controlled entities”) through its government authorities, agencies, affiliations and other organizations.
Apart from transactions with related parties, the Group has transactions with other state-controlled entities which include, but are not limited to, the following:
| • | sales and purchases of goods and ancillary materials; |
| • | rendering and receiving services; |
| • | lease of assets, purchase of property, plant and equipment; |
294
Notes to the Consolidated Financial Statements (continued)
(Expressed in Renminbi Yuan unless otherwise indicated)
| 33 | Related-party transactions (continued) |
| (f) | Transactions with other state-owned entities in the PRC (continued) |
| • | placing deposits and obtaining finance; and |
| • | use of public utilities |
These transactions are conducted in the ordinary course of the Group’s business on terms comparable to those with other entities that are not state controlled. The Group has established its procurement policies, pricing strategy and approval process for purchases and sales of products and services which do not depend on whether the counterparties are state-controlled entities or not.
| (g) | Commitments with related parties |
| (i) | Construction and installation cost |
| As at 31 December |
As at 31 December |
|||||||
| 2021 RMB’000 |
2020 RMB’000 |
|||||||
| Sinopec Group and its subsidiaries |
775,007 | 145,959 | ||||||
|
|
|
|
|
|||||
| (h) | Investment commitments with related parties |
| As at 31 December |
As at 31 December |
|||||||
| 2021 RMB’000 |
2020 RMB’000 |
|||||||
| Capital contribution to Shanghai Secco (i) |
111,263 | 111,263 | ||||||
| Capital contribution to Shanghai Shidian Energy Company Limited (“Shidian Energy”) (ii) |
80,000 | 80,000 | ||||||
| Capital contribution to Baling Materials (iii) |
350,000 | — | ||||||
|
|
|
|
|
|||||
| 541,263 | 191,263 | |||||||
|
|
|
|
|
|||||
295
Notes to the Consolidated Financial Statements (continued)
(Expressed in Renminbi Yuan unless otherwise indicated)
| 33 | Related-party transactions (continued) |
| (h) | Investment commitments with related parties (continued) |
| (i) | Pursuant to the resolution of the 18th meeting of the 7th term of Board of Directors on 5 December 2013, the Group was approved to make a capital contribution of USD30,017,000 (RMB182,804 thousand equivalent) to Shanghai Secco, an associate of the Group. As at 31 December 2021, the Company has contributed RMB71,541 thousand to Shanghai Secco. |
According to the approval by Shanghai Municipal Commission of Commerce as issued on 19 October 2015, the rest of the capital contribution to Shanghai Secco should be within 50 years starting from its registration date.
| (ii) | Pursuant to the articles of association of Shidian Energy in August 2019, Toufa agreed to make a capital contribution of RMB400,000 thousand to acquire 40% share of Shidian Energy. As at 31 December 2021, Toufa has contributed RMB320,000 thousand to Shidian Energy, and the rest of the capital contribution to Shidian Energy should be paid before January 2022 in accordance with the agreement. |
| (iii) | Sinopec Baling Petrochemical Co., Ltd and the Company jointly established Baling Materials on 7 September 2021, each with a cash contribution of RMB400,000 thousand. As at 31 December 2021, the Company has made a paid-up capital contribution of RMB50,000 thousand. |
Except for the above disclosed in notes 33 (g) and 33 (h), the Group had no other material commitments with related parties as at 31 December 2021, which are contracted, but not included in the financial statements.
| 34 | Dividend |
| (a) | Dividends payable to equity shareholders of the Company attributable to the year: |
| 2021 | 2020 | |||||||
| RMB’000 | RMB’000 | |||||||
| Final dividend proposed after the end of the reporting period of RMB0.10 per ordinary share (2020: RMB0.10 per ordinary share) |
1,082,381 | 1,082,381 | ||||||
|
|
|
|
|
|||||
The final dividend proposed after the end of the reporting period has not been recognized as a liability at the end of the reporting period.
296
Notes to the Consolidated Financial Statements (continued)
(Expressed in Renminbi Yuan unless otherwise indicated)
| 34 | Dividend (continued) |
| (b) | Dividends payable to equity shareholders of the Company attributable to the previous financial year, approved and paid during the year |
| 2021 | 2020 | |||||||
| RMB’000 | RMB’000 | |||||||
| Final dividend in respect of the previous financial year, approved and paid during the year, of RMB0.10 per share (2020: RMB0.12) |
1,082,381 | 1,298,858 | ||||||
|
|
|
|
|
|||||
| 35 | Commitments |
Capital commitments outstanding at 31 December 2021 not provided for in the financial statements were as follows:
| As at 31 December 2021 |
As at 31 December 2020 |
|||||||
| RMB’000 | RMB’000 | |||||||
| Property, plant and equipment contracted for |
1,176,168 | 585,870 | ||||||
|
|
|
|
|
|||||
| 36 | Subsequent event |
| (a) | A dividend in respect of the year ended 31 December 2021 of RMB0.1 per share, amounting to a total dividend of RMB1,082,381 thousands, was proposed by the Board of Directors on 23 March 2022. |
| (b) | Pursuant to [2020] Scp471 approved by China interbank market dealers association, the Company issued a super short-term bonds of RMB1.50 billion to Chinese institutional investors with interest rate of 2.35% per year in January 2022, and will repay the principal and interest upon maturity on 18 May 2022. |
| (c) | Pursuant to [2020] Scp471 approved by China interbank market dealers association, the Company issued another super short-term bonds of RMB1.50 billion to Chinese institutional investors with interest rate of 2.01% per year in March 2022, and will repay the principal and interest upon maturity on 5 July 2022. |
297
Notes to the Consolidated Financial Statements (continued)
(Expressed in Renminbi Yuan unless otherwise indicated)
| 37 | Statement of financial position and equity movement of the Company |
| As at 2021 |
As at 2020 |
|||||||
| RMB’000 | RMB’000 | |||||||
| Non-current assets |
||||||||
| Property, plant and equipment |
10,914,990 | 11,279,484 | ||||||
| Investment properties |
381,540 | 396,676 | ||||||
| Right-of-use assets |
275,924 | 296,371 | ||||||
| Construction in progress |
3,201,111 | 1,694,937 | ||||||
| Investments in subsidiaries |
2,048,328 | 2,048,328 | ||||||
| Investments accounted for using the equity method |
3,299,050 | 4,594,451 | ||||||
| Time deposits with banks |
5,381,149 | 7,042,840 | ||||||
| Deferred tax assets |
178,084 | 238,040 | ||||||
| Other non-current assets |
769,492 | 402,304 | ||||||
|
|
|
|
|
|||||
| 26,449,668 | 27,993,431 | |||||||
|
|
|
|
|
|||||
| Current assets |
||||||||
| Derivative financial instruments |
81,405 | — | ||||||
| Inventories |
5,726,264 | 3,685,456 | ||||||
| Trade receivables |
149 | 1,484 | ||||||
| Other receivables |
8,276 | 6,447 | ||||||
| Amounts due from related parties |
1,116,553 | 975,952 | ||||||
| Prepayments |
13,790 | 6,559 | ||||||
| Financial assets at fair value through other comprehensive income (FVOCI) |
615,689 | 735,262 | ||||||
| Time deposits with banks |
7,386,605 | 4,049,441 | ||||||
| Cash and cash equivalents |
4,927,519 | 5,460,067 | ||||||
|
|
|
|
|
|||||
| 19,876,250 | 14,920,668 | |||||||
|
|
|
|
|
|||||
298
Notes to the Consolidated Financial Statements (continued)
(Expressed in Renminbi Yuan unless otherwise indicated)
| 37 | Statement of financial position and equity movement of the Company (continued) |
| As at 31 December 2021 |
As at 31 December 2020 |
|||||||
| RMB’000 | RMB’000 | |||||||
| Current liabilities |
||||||||
| Trade and other payables |
2,389,508 | 2,287,762 | ||||||
| Contract liabilities |
376,834 | 423,838 | ||||||
| Amounts due to related parties |
7,423,883 | 3,507,497 | ||||||
| Staff salaries and welfares payable |
253,800 | 239,537 | ||||||
| Borrowings |
1,500,000 | 1,500,000 | ||||||
| Short-term bonds |
— | 3,017,811 | ||||||
| Lease liabilities |
1,604 | 7,897 | ||||||
| Derivative financial instruments |
23,804 | — | ||||||
| Income tax payable |
249,332 | — | ||||||
| Current tax liabilities |
3,843,541 | 3,392,922 | ||||||
|
|
|
|
|
|||||
| 16,062,306 | 14,377,264 | |||||||
|
|
|
|
|
|||||
| Net current assets |
3,813,944 | 543,404 | ||||||
|
|
|
|
|
|||||
| Total assets less current liabilities |
30,263,612 | 28,536,835 | ||||||
|
|
|
|
|
|||||
299
Notes to the Consolidated Financial Statements (continued)
(Expressed in Renminbi Yuan unless otherwise indicated)
| 37 | Statement of financial position and equity movement of the Company (continued) |
| As at 31 December 2021 RMB’000 |
As at 31 December 2020 RMB’000 |
|||||||
| Non-current liabilities |
||||||||
| Interest-bearing borrowings |
700,000 | — | ||||||
| Lease liabilities |
399 | 1,911 | ||||||
| Deferred income |
12,720 | 13,433 | ||||||
|
|
|
|
|
|||||
| 713,119 | 15,344 | |||||||
|
|
|
|
|
|||||
| NET ASSETS |
29,550,493 | 28,521,491 | ||||||
| CAPITAL AND RESERVES |
||||||||
| Share capital |
10,823,814 | 10,823,814 | ||||||
| Reserves |
18,726,679 | 17,697,677 | ||||||
|
|
|
|
|
|||||
| TOTAL EQUITY |
29,550,493 | 28,521,491 | ||||||
|
|
|
|
|
|||||
Approved and authorized for issue by the Board of Directors on 23 March 2022.
| Wu Haijun | Du Jun | |
| Directors | Directors | |
300
Notes to the Consolidated Financial Statements (continued)
(Expressed in Renminbi Yuan unless otherwise indicated)
| 37 | Statement of financial position and equity movement of the Company (continued) |
| (a) | Movements in components of equity of the Company |
| Share capital RMB’000 |
Legal surplus RMB’000 |
Capital surplus RMB’000 |
Surplus reserve RMB’000 |
Other reserve RMB’000 |
Hedging RMB’000 |
Share premium RMB’000 |
Safety production fund RMB’000 |
Retained earnings RMB’000 |
Total RMB’000 |
|||||||||||||||||||||||||||||||
| Balance at 1 January 2020 |
10,823,814 | 4,072,476 | 4,180 | 101,355 | 17,838 | — | 106,846 | 57,135 | 14,260,322 | 29,443,966 | ||||||||||||||||||||||||||||||
| Net profit attributable to shareholders of the Company |
— | — | — | — | — | — | — | — | 387,895 | 387,895 | ||||||||||||||||||||||||||||||
| Dividends proposed and approved |
— | — | — | — | — | — | — | — | (1,298,858 | ) | (1,298,858 | ) | ||||||||||||||||||||||||||||
| Appropriation of safety production fund |
— | — | — | — | — | — | — | 88,462 | (88,462 | ) | — | |||||||||||||||||||||||||||||
| Change in fair value of hedging instruments |
— | — | — | — | — | 63,840 | — | — | — | 63,840 | ||||||||||||||||||||||||||||||
| Reclassified to cost of inventory |
— | — | — | — | — | (63,840 | ) | — | — | — | (63,840 | ) | ||||||||||||||||||||||||||||
| Share of other comprehensive income of investments accounted for using the equity method |
— | — | — | — | (11,512 | ) | — | — | — | — | (11,512 | ) | ||||||||||||||||||||||||||||
|
|
|
|
|
|
|
|
|
|
|
|
|
|
|
|
|
|
|
|
|
|||||||||||||||||||||
| Balance at 31 December 2020 and 1 January 2021 |
10,823,814 | 4,072,476 | 4,180 | 101,355 | 6,326 | — | 106,846 | 145,597 | 13,260,897 | 28,521,491 | ||||||||||||||||||||||||||||||
|
|
|
|
|
|
|
|
|
|
|
|
|
|
|
|
|
|
|
|
|
|||||||||||||||||||||
| Total comprehensive income for the year |
— | — | — | — | 16,639 | 125,159 | — | — | 2,058,284 | 2,200,082 | ||||||||||||||||||||||||||||||
| Amounts transferred from hedging reserve to initial carrying amount of hedged items |
— | — | — | — | — | (88,699 | ) | — | — | — | (88,699 | ) | ||||||||||||||||||||||||||||
| Dividends declared and approved in respect of previous year |
— | — | — | — | — | — | — | — | (1,082,381 | ) | (1,082,381 | ) | ||||||||||||||||||||||||||||
| Transfer to legal surplus |
— | 2,498,808 | — | — | — | — | — | — | (2,498,808 | ) | — | |||||||||||||||||||||||||||||
| Appropriation of safety production fund |
— | — | — | — | — | — | — | 32,310 | (32,310 | ) | — | |||||||||||||||||||||||||||||
|
|
|
|
|
|
|
|
|
|
|
|
|
|
|
|
|
|
|
|
|
|||||||||||||||||||||
| Balance at 31 December 2021 |
10,823,814 | 6,571,284 | 4,180 | 101,355 | 22,965 | 36,460 | 106,846 | 177,907 | 11,705,682 | 29,550,493 | ||||||||||||||||||||||||||||||
|
|
|
|
|
|
|
|
|
|
|
|
|
|
|
|
|
|
|
|
|
|||||||||||||||||||||
301
Notes to the Consolidated Financial Statements (continued)
(Expressed in Renminbi Yuan unless otherwise indicated)
| 38 | Benefits and interests of directors and supervisors |
| (a) | Directors’ and supervisors’ emoluments: |
| 2021 | ||||||||||||||||||||
| Salaries and other benefits |
Retirement scheme contributions |
Discretionary bonuses |
Directors’ fees |
Total | ||||||||||||||||
| RMB’000 | RMB’000 | RMB’000 | RMB’000 | RMB’000 | ||||||||||||||||
| Executive directors |
||||||||||||||||||||
| Wu Haijun |
324 | 49 | 768 | – | 1,141 | |||||||||||||||
| Guan Zemin |
407 | 49 | 767 | – | 1,223 | |||||||||||||||
| Jin Qiang (resigned in February 2022) |
378 | 49 | 682 | – | 1,109 | |||||||||||||||
| Du Jun (appointed in June 2021) |
373 | 49 | 617 | – | 1,039 | |||||||||||||||
| Jin Wenmin (resigned in February 2022) |
265 | 49 | 684 | – | 998 | |||||||||||||||
| Huang Xiangyu |
276 | 48 | 684 | – | 1,008 | |||||||||||||||
| Huang Fei (resigned in February 2022) |
251 | 46 | 683 | – | 980 | |||||||||||||||
| Non-executive directors |
||||||||||||||||||||
| Xie Zhenglin |
– | – | – | – | – | |||||||||||||||
| Peng Kun |
186 | 46 | 631 | – | 863 | |||||||||||||||
| Independent non-executive directors |
||||||||||||||||||||
| Li Yuanqin |
– | – | – | 150 | 150 | |||||||||||||||
| Tang Song |
– | – | – | 150 | 150 | |||||||||||||||
| Chen Haifeng |
– | – | – | 150 | 150 | |||||||||||||||
| Yang Jun |
– | – | – | 150 | 150 | |||||||||||||||
| Gao Song |
– | – | – | 150 | 150 | |||||||||||||||
| Supervisors |
||||||||||||||||||||
| Ma Yanhui |
350 | 49 | 682 | – | 1,081 | |||||||||||||||
| Zhang Feng |
169 | 42 | 584 | – | 795 | |||||||||||||||
| Chen Hongjun |
178 | 41 | 603 | – | 822 | |||||||||||||||
| Zheng Yunrui |
100 | – | – | – | 100 | |||||||||||||||
| Cai Tingji |
100 | – | – | – | 100 | |||||||||||||||
|
|
|
|
|
|
|
|
|
|
|
|||||||||||
| 3,357 | 517 | 7,385 | 750 | 12,009 | ||||||||||||||||
|
|
|
|
|
|
|
|
|
|
|
|||||||||||
302
Notes to the Consolidated Financial Statements (continued)
(Expressed in Renminbi Yuan unless otherwise indicated)
| 38 | Benefits and interests of directors and supervisors (continued) |
| (a) | Directors’ and supervisors’ emoluments (continued): |
| 2020 | ||||||||||||||||||||
| Salaries and other benefits |
Retirement scheme contributions |
Discretionary bonuses |
Directors’ fees |
Total | ||||||||||||||||
| RMB’000 | RMB’000 | RMB’000 | RMB’000 | RMB’000 | ||||||||||||||||
| Executive directors |
||||||||||||||||||||
| Wu Haijun |
359 | 44 | 799 | – | 1,202 | |||||||||||||||
| Guan Zemin (appointed in February 2020) |
367 | 41 | 397 | – | 805 | |||||||||||||||
| Jin Qiang |
354 | 44 | 716 | – | 1,114 | |||||||||||||||
| Jin Wenmin |
250 | 44 | 721 | – | 1,015 | |||||||||||||||
| Huang Xiangyu (appointed in June 2020) |
275 | 39 | 440 | – | 754 | |||||||||||||||
| Huang Fei (appointed in June 2020) |
217 | 39 | 426 | – | 682 | |||||||||||||||
| Zhou Meiyun (resigned in September 2020) |
181 | 33 | 668 | – | 882 | |||||||||||||||
| Non-executive directors |
||||||||||||||||||||
| Xie Zhenglin (appointed in June 2020) |
– | – | – | – | – | |||||||||||||||
| Peng Kun (appointed in June 2020) |
96 | 25 | 246 | – | 367 | |||||||||||||||
| Independent non-executive directors |
||||||||||||||||||||
| Li Yuanqin |
– | – | – | 150 | 150 | |||||||||||||||
| Tang Song (appointed in June 2020) |
– | – | – | 75 | 75 | |||||||||||||||
| Chen Haifeng (appointed in June 2020) |
– | – | – | 75 | 75 | |||||||||||||||
| Yang Jun (appointed in June 2020) |
– | – | – | 75 | 75 | |||||||||||||||
| Gao Song (appointed in June 2020) |
– | – | – | 75 | 75 | |||||||||||||||
| Zhang Yimin (resigned in June 2020) |
– | – | – | 75 | 75 | |||||||||||||||
| Liu Yunhong (resigned in June 2020) |
– | – | – | 75 | 75 | |||||||||||||||
| Du Weifeng (resigned in June 2020) |
– | – | – | 75 | 75 | |||||||||||||||
| Supervisors |
||||||||||||||||||||
| Ma Yanhui |
332 | 42 | 720 | – | 1,094 | |||||||||||||||
| Zhang Feng |
148 | 40 | 485 | – | 673 | |||||||||||||||
| Chen Hongjun |
159 | 38 | 485 | – | 682 | |||||||||||||||
| Zheng Yunrui |
100 | – | – | – | 100 | |||||||||||||||
| Cai Tingji |
100 | – | – | – | 100 | |||||||||||||||
|
|
|
|
|
|
|
|
|
|
|
|||||||||||
| 2,938 | 429 | 6,103 | 675 | 10,145 | ||||||||||||||||
|
|
|
|
|
|
|
|
|
|
|
|||||||||||
| (b) | Directors’ retirement benefits |
No specific retirement benefits were paid to directors in respect of services in connection with the management of the affairs of the company or its subsidiary undertaking (2020: Nil).
303
Notes to the Consolidated Financial Statements (continued)
(Expressed in Renminbi Yuan unless otherwise indicated)
| 39 | Possible impact of amendments, new standards and interpretations issued but not yet effective for the year ended 31 December 2021 |
Up to the date of issue of these financial statements, the IASB has issued a number of a number of amendments, new standards and interpretations, which are not yet effective for the year ended 31 December 2021 and which have not been adopted in these financial statements. These developments include the following which may be relevant to the Group.
| Effective for accounting periods beginning on or after | ||
| Annual Improvements to IFRS Standards 2018-2020 |
1 January 2022 | |
| Amendments to IFRS 3, Reference to the Conceptual Framework |
1 January 2022 | |
| Amendments to IAS 16, Property, Plant and Equipment: Proceeds before Intended Use |
1 January 2022 | |
| Amendments to IAS 37, Onerous Contracts – Cost of Fulfilling a Contract |
1 January 2022 | |
| Amendments to IAS 1, Classification of Liabilities as Current or Non-current |
1 January 2023 | |
| IFRS 17, Insurance contracts |
1 January 2023 | |
| Basis for conclusions on IFRS 17 |
1 January 2023 | |
| Illustrative examples on IFRS 17 |
1 January 2023 | |
| Amendments to IFRS 17 |
1 January 2023 | |
| Amendments to IFRS 17, Initial Application of IFRS 17 and IFRS 9 – Comparative Information |
1 January 2023 | |
| Amendments to IAS 1 and IFRS Practice Statement 2, Disclosure of Accounting Policies |
1 January 2023 | |
| Amendments to IAS 8, Definition of Accounting Estimates |
1 January 2023 | |
| Amendments to IAS 12, Deferred Tax related to Assets and Liabilities arising from a Single Transaction |
1 January 2023 |
The Group is in the process of making an assessment of what the impact of these amendments, new standards and interpretations are expected to be in the period of initial application. So far, the Group has concluded that the adoption of them is unlikely to have a significant impact on the consolidated financial statements.
304

The Shareholders of Sinopec Shanghai Petrochemical Company Limited:
Opinion
We have audited the accompanying financial statements of Sinopec Shanghai Petrochemical Company Limited (“Sinopec Shanghai”), which comprise the consolidated and company balance sheets as at 31 December 2021, the consolidated and company income statements, the consolidated and company cash flow statements, the consolidated and company statements of changes in shareholders’ equity for the year then ended, and notes to the financial statements.
In our opinion, the accompanying financial statements present fairly, in all material respects, the consolidated and company financial position of Sinopec Shanghai as at 31 December 2021, and the consolidated and company financial performance and cash flows of Sinopec Shanghai for the year then ended in accordance with Accounting Standards for Business Enterprises issued by the Ministry of Finance of the People’s Republic of China.
Basis for Opinion
We conducted our audit in accordance with China Standards on Auditing for Certified Public Accountants (“CSAs”). Our responsibilities under those standards are further described in the Auditor’s Responsibilities for the Audit of the Financial Statements section of our report. We are independent of Sinopec Shanghai in accordance with the China Code of Ethics for Certified Public Accountants (“the Code”), and we have fulfilled our other ethical responsibilities in accordance with the Code. We believe that the audit evidence we have obtained is sufficient and appropriate to provide a basis for our opinion.
305
Auditor’s Report (continued)
Key Audit Matters
Key audit matters are those matters that, in our professional judgement, were of most significance in our audit of the financial statements of the current period. These matters were addressed in the context of our audit of the financial statements as a whole, and in forming our opinion thereon, and we do not provide a separate opinion on these matters.
| Assessment of net realizable value of raw materials, work in progress and finished goods | ||
| Refer to Note III.10 and Note III.32(1)(a) of the accounting policies to the consolidated financial statements and Note V.7 to the consolidated financial statements. | ||
| The Key Audit Matter |
How the matter was addressed in our audit | |
| The Group is principally engaged in processing of crude oil into petroleum products and other chemical products. The crude oil can be processed into various finished goods by different processing procedures. Inventories are valued at the lower of cost and net realizable value.
The gross carrying amount of raw materials, work in progress and finished goods, and provision for diminution in value were RMB5,897,336 thousand and RMB164,806 thousand, respectively, as at 31 December 2021.
The net realizable value is determined based on the estimated selling prices in the ordinary course of business less the estimated costs to completion, estimated selling expenses and relevant taxes necessary to make the sale.
We identified the assessment of net realizable value of raw materials, work in progress and finished goods as a key audit matter because evaluation of estimated selling prices of inventories, estimated costs to completion, estimated selling expenses and relevant taxes necessary to make the sale involved a high degree of auditor judgements. |
Our audit procedures to assess net realizable value of raw materials, work in progress and finished goods included the following:
• Evaluating the design, implementation and operating effectiveness of key internal controls over the process of determination of net realizable value of raw materials, work in progress and finished goods, including controls related to the determination of estimated selling prices, estimated costs to completion, estimated selling expenses and relevant taxes necessary to make the sale;
• Evaluating the estimated selling price at the reporting date for a sample of inventory items by comparison of the estimated selling price to the price from publicly available market data and the actual prices of sales transactions subsequent to the reporting date if available; and
• Evaluating the estimated costs to completion, estimated selling expenses and relevant taxes necessary to make the sale by comparing with the historical costs to completion and other costs necessary to make the sale for the same type of inventories on a sample basis. | |
306
Auditor’s Report (continued)
Key audit matters (continued)
| Assessment of value in use of certain production facilities | ||
| Refer to notes III.13, III.32(1)(b) of the accounting policies to the consolidated financial statements and Note V.11 to the consolidated financial statements. | ||
| The Key Audit Matter |
How the matter was addressed in our audit | |
| The consolidated carrying amount of property, plant and equipment was RMB11,328,065 thousand as of 31 December 2021. During the year ended 31 December 2021, the Group recognized impairment loss on property, plant and equipment in relation to certain production facilities of RMB259,850 thousand. At the end of each reporting period, if any indication of impairment exists, the Group estimates the recoverable amount of an asset, or a cash- generating unit, at the higher of its fair value less costs of disposal and its value in use, to determine the impairment losses. The Group’s estimated value in use includes assumptions on product sales growth rates, related costs growth rates (“forecasted growth rates”) and discount rate.
We identified the assessment of value in use of certain production facilities as a key audit matter because high degree of subjectivity and auditor judgment was involved to evaluate the forecasted growth rates and the discount rate used to estimate value in use of these assets. The forecasted growth rates and the discount rate were challenging to test as minor changes to those assumptions would have a significant effect on the Group’s assessment of value in use of these assets. In addition, specialized skills and knowledge were required to assess the discount rate used to estimate value in use of these assets. |
Our audit procedures to assess value in use of certain production facilities included the following:
• Evaluating the design, implementation and operating effectiveness of key internal controls related to the process in assessing the value in use of certain production facilities, including controls related to the determination of the forecasted growth rates and the discount rate;
• Assessing the forecasted growth rates adopted in the Group’s value in use assessment by comparing them with historical results, future operation plans and external market data;
• Involving valuation professionals with specialized skills and knowledge assisted in evaluating the discount rate used by comparing it against discount rate that was independently developed using publicly available industry data; and
• Performing sensitivity analysis over the forecasted growth rates and the discount rate assumptions to assess their impact on the Group’s impairment assessment. | |
307
Auditor’s Report (continued)
Information other than the consolidated financial statements and auditor’s report thereon
The directors are responsible for the other information. The other information comprises all the information included in the annual report, other than the consolidated financial statements and our auditor’s report thereon.
Our opinion on the consolidated financial statements does not cover the other information and we do not express any form of assurance conclusion thereon.
In connection with our audit of the consolidated financial statements, our responsibility is to read the other information and, in doing so, consider whether the other information is materially inconsistent with the consolidated financial statements or our knowledge obtained in the audit or otherwise appears to be materially misstated.
If, based on the work we have performed, we conclude that there is a material misstatement of this other information, we are required to report that fact. We have nothing to report in this regard.
Responsibilities of Management and Those Charged with Governance for the consolidated financial statements
Management is responsible for the preparation and fair presentation of the financial statements in accordance with the Accounting Standards for Business Enterprises, and for the design, implementation and maintenance of such internal control necessary to enable that the financial statements are free from material misstatement, whether due to fraud or error.
In preparing the financial statements, management is responsible for assessing Sinopec Shanghai’s ability to continue as a going concern, disclosing, as applicable, matters related to going concern and using the going concern basis of accounting unless management either intends to liquidate Sinopec Shanghai or to cease operations, or has no realistic alternative but to do so.
Those charged with governance are responsible for overseeing Sinopec Shanghai’s financial reporting process.
308
Auditor’s Report (continued)
Auditor’s Responsibilities for the Audit of the Financial Statements
Our objectives are to obtain reasonable assurance about whether the financial statements as a whole are free from material misstatement, whether due to fraud or error, and to issue an auditor’s report that includes our opinion. Reasonable assurance is a high level of assurance, but is not a guarantee that an audit conducted in accordance with CSAs will always detect a material misstatement when it exists. Misstatements can arise from fraud or error and are considered material if, individually or in the aggregate, they could reasonably be expected to influence the economic decisions of users taken on the basis of these financial statements.
As part of an audit in accordance with CSAs, we exercise professional judgement and maintain professional scepticism throughout the audit. We also:
| (1) | Identify and assess the risks of material misstatement of the financial statements, whether due to fraud or error, design and perform audit procedures responsive to those risks, and obtain audit evidence that is sufficient and appropriate to provide a basis for our opinion. The risk of not detecting a material misstatement resulting from fraud is higher than for one resulting from error, as fraud may involve collusion, forgery, intentional omissions, misrepresentations, or the override of internal control. |
| (2) | Obtain an understanding of internal control relevant to the audit in order to design audit procedures that are appropriate in the circumstances. |
| (3) | Evaluate the appropriateness of accounting policies used and the reasonableness of accounting estimates and related disclosures made by management. |
| (4) | Conclude on the appropriateness of management’s use of the going concern basis of accounting and, based on the audit evidence obtained, whether a material uncertainty exists related to events or conditions that may cast significant doubt on Sinopec Shanghai’s ability to continue as a going concern. If we conclude that a material uncertainty exists, we are required to draw attention in our auditor’s report to the related disclosures in the financial statements or, if such disclosures are inadequate, to modify our opinion. Our conclusions are based on the audit evidence obtained up to the date of our auditor’s report. However, future events or conditions may cause Sinopec Shanghai to cease to continue as a going concern. |
| (5) | Evaluate the overall presentation, structure and content of the financial statements, including the disclosures, and whether the financial statements represent the underlying transactions and events in a manner that achieves fair presentation. |
309
Auditor’s Report (continued)
Auditor’s Responsibilities for the Audit of the Financial Statements (continued)
| (6) | Obtain sufficient appropriate audit evidence regarding the financial information of the entities or business activities within Sinopec Shanghai to express an opinion on the financial statements. We are responsible for the direction, supervision and performance of the group audit. We remain solely responsible for our audit opinion. |
We communicate with those charged with governance regarding, among other matters, the planned scope and timing of the audit and significant audit findings, including any significant deficiencies in internal control that we identify during our audit.
We also provide those charged with governance with a statement that we have complied with relevant ethical requirements regarding independence, and communicate with them all relationships and other matters that may reasonably be thought to bear on our independence and, where applicable, related safeguards.
From the matters communicated with those charged with governance, we determine those matters that were of most significance in the audit of the financial statements of the current period and are therefore the key audit matters. We describe these matters in our auditor’s report unless law or regulation precludes public disclosure about the matter or when, in extremely rare circumstances, we determine that a matter should not be communicated in our report because the adverse consequences of doing so would reasonably be expected to outweigh the public interest benefits of such communication.
| KPMG Huazhen LLP | Certified Public Accountants | |
| Registered in the People’s | ||
| Republic of China | ||
| Wang Wenli (Engagement Partner) | ||
| Fang Haijie | ||
| China Beijing | ||
| 23 March 2022 | ||
310
| B. | Financial statements prepared under China Accounting Standards for Business Enterprises |
Consolidated and Company Balance Sheets
As at 31 December 2021
(All amounts in thousands of Renminbi Yuan unless otherwise stated)
| 31 December 2021 |
31 December 2020 |
31 December 2021 |
31 December 2020 |
|||||||||||||||
| Assets |
Note | Consolidated | Consolidated | Company | Company | |||||||||||||
| Current Assets |
||||||||||||||||||
| Cash at bank and on hand |
V.1 | 12,498,617 | 7,920,852 | 12,314,124 | 6,464,509 | |||||||||||||
| Derivative financial assets |
V.2 | 81,405 | – | 81,405 | – | |||||||||||||
| Accounts receivable |
V.3, XIV.1 | 1,169,405 | 1,145,504 | 1,014,787 | 919,061 | |||||||||||||
| Receivables under financing |
V.4, XIV.2 | 1,072,690 | 1,217,114 | 624,584 | 745,262 | |||||||||||||
| Prepayments |
V.5 | 60,577 | 33,741 | 42,024 | 30,972 | |||||||||||||
| Other receivables |
V.6, XIV.3 | 108,728 | 41,299 | 69,053 | 26,932 | |||||||||||||
| Inventories |
V.7 | 5,923,525 | 3,888,746 | 5,726,264 | 3,685,456 | |||||||||||||
| Other current assets |
V.8 | 17,329 | 3,057,587 | 4,009 | 3,048,476 | |||||||||||||
|
|
|
|
|
|
|
|
|
|||||||||||
| Total Current Assets |
20,932,276 | 17,304,843 | 19,876,250 | 14,920,668 | ||||||||||||||
|
|
|
|
|
|
|
|
|
|||||||||||
| Non-Current Assets |
||||||||||||||||||
| Long-term equity investments |
V.9, XIV.4 | 4,188,888 | 5,497,834 | 5,492,265 | 6,797,666 | |||||||||||||
| Investments in other equity instruments |
5,000 | 5,000 | – | – | ||||||||||||||
| Investment properties |
V.10 | 352,188 | 367,586 | 381,540 | 396,676 | |||||||||||||
| Fixed assets |
V.11, XIV.5 | 11,328,065 | 11,733,065 | 10,933,023 | 11,299,527 | |||||||||||||
| Construction in progress |
V.12 | 3,293,177 | 1,710,124 | 3,201,111 | 1,694,937 | |||||||||||||
| Right-of-use assets |
V.13 | 4,879 | 12,993 | 2,205 | 10,366 | |||||||||||||
| Intangible assets |
V.14 | 392,608 | 412,576 | 273,719 | 286,005 | |||||||||||||
| Long-term deferred expenses |
V.15 | 775,963 | 410,191 | 769,492 | 402,304 | |||||||||||||
| Deferred tax assets |
V.16 | 184,143 | 252,121 | 178,084 | 238,040 | |||||||||||||
| Other non-current assets |
V.17 | 5,581,435 | 7,042,840 | 5,381,149 | 7,042,840 | |||||||||||||
|
|
|
|
|
|
|
|
|
|||||||||||
| Total Non-current Assets |
26,106,346 | 27,444,330 | 26,612,588 | 28,168,361 | ||||||||||||||
|
|
|
|
|
|
|
|
|
|||||||||||
| Total Assets |
47,038,622 | 44,749,173 | 46,488,838 | 43,089,029 | ||||||||||||||
|
|
|
|
|
|
|
|
|
|||||||||||
The notes on pages 321 to 470 form part of these financial statements.
311
Consolidated and Company Balance Sheets (continued)
As at 31 December 2021
(All amounts in thousands of Renminbi Yuan unless otherwise stated)
| 31 December 2021 |
31 December 2020 |
31 December 2021 |
31 December 2020 |
|||||||||||||||||
| Liabilities and shareholders’ equity |
Note | Consolidated | Consolidated | Company | Company | |||||||||||||||
| Current Liabilities |
||||||||||||||||||||
| Short-term loans |
V.19 | 1,540,000 | 1,548,000 | 1,500,000 | 1,500,000 | |||||||||||||||
| Derivative financial liabilities |
V. 2 | 23,804 | – | 23,804 | – | |||||||||||||||
| Bills payable |
V.20 | 830,006 | 139,360 | 720,513 | 96,196 | |||||||||||||||
| Accounts payable |
V.21 | 5,888,879 | 4,671,635 | 5,198,489 | 3,892,330 | |||||||||||||||
| Contract liabilities |
V.22 | 430,882 | 496,521 | 383,624 | 425,385 | |||||||||||||||
| Employee benefits payable |
V.23 | 260,096 | 244,506 | 253,800 | 239,537 | |||||||||||||||
| Taxes payable |
V.24 | 4,070,663 | 3,385,910 | 4,043,002 | 3,346,544 | |||||||||||||||
| Other payables |
V.25 | 1,287,064 | 1,664,812 | 2,499,313 | 1,805,186 | |||||||||||||||
| Non-current liabilities due within one year |
V.26 | 23,029 | 9,352 | 1,604 | 7,897 | |||||||||||||||
| Other current liabilities |
V.27 | 1,441,320 | 3,072,150 | 1,438,157 | 3,064,189 | |||||||||||||||
|
|
|
|
|
|
|
|
|
|||||||||||||
| Total Current Liabilities |
15,795,743 | 15,232,246 | 16,062,306 | 14,377,264 | ||||||||||||||||
|
|
|
|
|
|
|
|
|
|||||||||||||
| Non-Current Liabilities |
||||||||||||||||||||
| Long-term loans |
V.28 | 700,000 | – | 700,000 | – | |||||||||||||||
| Lease liabilities |
V.29 | 1,384 | 3,119 | 399 | 1,911 | |||||||||||||||
| Deferred income |
V.30 | 112,720 | 123,433 | 112,720 | 123,433 | |||||||||||||||
| Deferred tax liabilities |
V.16 | 33,344 | 35,357 | – | – | |||||||||||||||
|
|
|
|
|
|
|
|
|
|||||||||||||
| Total Non-Current Liabilities |
847,448 | 161,909 | 813,119 | 125,344 | ||||||||||||||||
|
|
|
|
|
|
|
|
|
|||||||||||||
| Total Liabilities |
16,643,191 | 15,394,155 | 16,875,425 | 14,502,608 | ||||||||||||||||
|
|
|
|
|
|
|
|
|
|||||||||||||
| Shareholders’ equity |
||||||||||||||||||||
| Share capital |
I, V.31 | 10,823,814 | 10,823,814 | 10,823,814 | 10,823,814 | |||||||||||||||
| Capital reserve |
V.32 | 610,327 | 610,327 | 600,768 | 600,768 | |||||||||||||||
| Other comprehensive income |
V.33 | 59,425 | 6,326 | 59,425 | 6,326 | |||||||||||||||
| Specific reserve |
V.34 | 216,512 | 145,597 | 216,508 | 145,597 | |||||||||||||||
| Surplus reserve |
V.35 | 6,672,639 | 6,474,103 | 6,672,639 | 6,474,103 | |||||||||||||||
| Retained earnings |
V.36 | 11,877,455 | 11,157,866 | 11,240,259 | 10,535,813 | |||||||||||||||
|
|
|
|
|
|
|
|
|
|||||||||||||
| Total equity attributable to shareholders of the Company |
30,260,172 | 29,218,033 | 29,613,413 | 28,586,421 | ||||||||||||||||
|
|
|
|
|
|
|
|
|
|||||||||||||
| Non-controlling interests |
V.37 | 135,259 | 136,985 | – | – | |||||||||||||||
|
|
|
|
|
|
|
|
|
|||||||||||||
| Total Shareholders’ Equity |
30,395,431 | 29,355,018 | 29,613,413 | 28,586,421 | ||||||||||||||||
|
|
|
|
|
|
|
|
|
|||||||||||||
| Total Liabilities and Shareholders’ Equity |
47,038,622 | 44,749,173 | 46,488,838 | 43,089,029 | ||||||||||||||||
|
|
|
|
|
|
|
|
|
|||||||||||||
These financial statements were approved by the Board of Directors of the Company on 23 March 2022.
| Wu Haijun | Du Jun | Yang Yating | (Company stamp) | |||
| Chairman | Director and Chief Financial Officer | Accounting Chief | ||||
| (Signature and stamp) |
(Signature and stamp) |
(Signature and stamp) |
The notes on pages 321 to 470 form part of these financial statements.
312
Consolidated and Company Income Statements
For the year ended 31 December 2021
(All amounts in thousands of Renminbi Yuan unless otherwise stated)
| 2021 | 2020 | 2021 | 2020 | |||||||||||||||
| Note | Consolidated | Consolidated | Company | Company | ||||||||||||||
| I. Operating income |
V.38, XIV.6 | 89,280,415 | 74,705,183 | 78,170,627 | 62,484,867 | |||||||||||||
| Less: Operating costs |
V.38, XIV.6 | 71,675,646 | 59,089,119 | 60,772,128 | 47,199,995 | |||||||||||||
| Taxes and surcharges |
V.39 | 13,309,688 | 13,062,710 | 13,294,428 | 13,047,369 | |||||||||||||
| Selling and distribution expenses |
V.40 | 362,334 | 479,260 | 271,713 | 387,719 | |||||||||||||
| General and administrative expenses |
V.41 | 1,842,087 | 2,459,328 | 1,722,893 | 2,341,604 | |||||||||||||
| Research and development expenses |
V.42 | 94,295 | 110,625 | 82,866 | 100,231 | |||||||||||||
| Financial expenses (“-” for income) |
V.43 | (406,799 | ) | (337,459 | ) | (396,207 | ) | (307,334 | ) | |||||||||
| Including: interest expense |
94,186 | 93,440 | 91,886 | 91,745 | ||||||||||||||
| interest income |
508,755 | 431,228 | 491,271 | 399,403 | ||||||||||||||
| Add: Other income |
V.44 | 35,231 | 60,859 | 33,472 | 56,470 | |||||||||||||
| Investment income (“-” for losses) |
V.45, XIV.7 | 967,380 | 837,005 | 875,555 | 762,335 | |||||||||||||
| Including: Income from investment in associates and joint ventures |
864,285 | 714,740 | 774,784 | 625,402 | ||||||||||||||
| Gains from changes in fair value (“-” for losses) |
V.46 | 8,987 | (17,871 | ) | 8,987 | (18,407 | ) | |||||||||||
| Credit losses (“-” for losses) |
V.47 | (1,355 | ) | 120,916 | (1,331 | ) | 100,811 | |||||||||||
| Impairment losses of assets (“-” for losses) |
V.48 | (766,897 | ) | (308,458 | ) | (738,339 | ) | (304,348 | ) | |||||||||
| Gains from asset disposals (“-” for losses) |
V.49 | 79,085 | 102,609 | 79,085 | 15,284 | |||||||||||||
|
|
|
|
|
|
|
|
|
|||||||||||
| II. Operating profit (“-” for loss) |
2,725,595 | 636,660 | 2,680,235 | 327,428 | ||||||||||||||
|
|
|
|
|
|
|
|
|
|||||||||||
| Add: Non-operating income |
V.50 | 27,783 | 16,209 | 27,477 | 14,125 | |||||||||||||
| Less: Non-operating expenses |
V.51 | 105,217 | 79,053 | 104,528 | 79,009 | |||||||||||||
|
|
|
|
|
|
|
|
|
|||||||||||
| III.Profit before income tax (“-” for loss) |
2,648,161 | 573,816 | 2,603,184 | 262,544 | ||||||||||||||
|
|
|
|
|
|
|
|
|
|||||||||||
| Less: Income tax expenses/ (benefits) |
V.52 | 644,480 | (65,620 | ) | 617,821 | (108,387 | ) | |||||||||||
|
|
|
|
|
|
|
|
|
|||||||||||
The notes on pages 321 to 470 form part of these financial statements.
313
Consolidated and Company Income Statements (continued)
For the year ended 31 December 2021
(All amounts in thousands of Renminbi Yuan unless otherwise stated)
| 2021 | 2020 | 2021 | 2020 | |||||||||||||||||
| Note | Consolidated | Consolidated | Company | Company | ||||||||||||||||
| IV. Net profit (“-” for net loss) |
2,003,681 | 639,436 | 1,985,363 | 370,931 | ||||||||||||||||
|
|
|
|
|
|
|
|
|
|||||||||||||
| (1) Net profit classified by continuity of operations (“-” for net loss): |
||||||||||||||||||||
| 1. Net profit from continuing operations (“-” for net loss) |
2,003,681 | 639,436 | 1,985,363 | 370,931 | ||||||||||||||||
| 2. Net profit from discontinued operations (“-” for net loss) |
— | — | — | — | ||||||||||||||||
| (2) Net profit classified by ownership: |
||||||||||||||||||||
| 1. Shareholders of the Company (“-” for net loss) |
2,000,506 | 628,110 | — | — | ||||||||||||||||
| 2. Non-controlling interests (“-” for net loss) |
3,175 | 11,326 | — | — | ||||||||||||||||
|
|
|
|
|
|
|
|
|
|||||||||||||
| V. Other comprehensive income, net of tax |
141,798 | (11,512 | ) | 141,798 | (11,512 | ) | ||||||||||||||
| (1) Other comprehensive income (net of tax) attributable to shareholders of the Company |
141,798 | (11,512 | ) | 141,798 | (11,512 | ) | ||||||||||||||
| Items that may be reclassified to profit or loss |
141,798 | (11,512 | ) | 141,798 | (11,512 | ) | ||||||||||||||
| a. Other comprehensive income recognized under equity method |
16,639 | (11,512 | ) | 16,639 | (11,512 | ) | ||||||||||||||
| b. Cash flow hedge reserve |
125,159 | — | 125,159 | — | ||||||||||||||||
| (2) Other comprehensive income (net of tax) attributable to non-controlling interests |
— | — | — | — | ||||||||||||||||
|
|
|
|
|
|
|
|
|
|||||||||||||
| VI. Total comprehensive income |
2,145,479 | 627,924 | 2,127,161 | 359,419 | ||||||||||||||||
|
|
|
|
|
|
|
|
|
|||||||||||||
| (1) Attributable to shareholders of the Company |
2,142,304 | 616,598 | — | — | ||||||||||||||||
| (2) Attributable to non-controlling interests |
3,175 | 11,326 | — | — | ||||||||||||||||
|
|
|
|
|
|
|
|
|
|||||||||||||
| VII. Earnings per share |
||||||||||||||||||||
| (1) Basic earnings per share (RMB Yuan) |
V.53 | 0.185 | 0.058 | — | — | |||||||||||||||
| (2) Diluted earnings per share (RMB Yuan) |
V.53 | 0.185 | 0.058 | — | — | |||||||||||||||
|
|
|
|
|
|
|
|
|
|||||||||||||
These financial statements were approved by the Board of Directors of the Company on 23 March 2022.
| Wu Haijun | Du Jun | Yang Yating | (Company stamp) | |||
| Chairman | Director and Chief Financial Officer | Accounting Chief | ||||
| (Signature and stamp) |
(Signature and stamp) |
(Signature and stamp) |
The notes on pages 321 to 470 form part of these financial statements.
314
Consolidated and Company Cash Flow Statements
For the year ended 31 December 2021
(All amounts in thousands of Renminbi Yuan unless otherwise stated)
| 2021 | 2020 | 2021 | 2020 | |||||||||||||||||
| Note | Consolidated | Consolidated | Company | Company | ||||||||||||||||
| I. Cash flows from operating activities |
||||||||||||||||||||
| Proceeds from sale of goods and rendering of services |
95,338,044 | 82,393,263 | 83,594,831 | 69,043,869 | ||||||||||||||||
| Refund of taxes |
113,542 | 32,653 | — | 30,094 | ||||||||||||||||
| Proceeds from other operating activities |
V.55 | 219,055 | 245,595 | 1,257,788 | 191,701 | |||||||||||||||
|
|
|
|
|
|
|
|
|
|||||||||||||
| Sub-total of cash inflows |
95,670,641 | 82,671,511 | 84,852,619 | 69,265,664 | ||||||||||||||||
| Payment for goods and services |
(73,364,969 | ) | (62,496,107 | ) | (61,844,330 | ) | (49,357,778 | ) | ||||||||||||
| Payment to and for employees |
(3,431,643 | ) | (3,078,075 | ) | (3,229,404 | ) | (2,899,936 | ) | ||||||||||||
| Payment of various taxes |
(14,321,443 | ) | (14,960,574 | ) | (14,245,703 | ) | (14,877,946 | ) | ||||||||||||
| Payment for other operating activities |
V.55 | (492,560 | ) | (385,538 | ) | (430,268 | ) | (192,855 | ) | |||||||||||
|
|
|
|
|
|
|
|
|
|||||||||||||
| Sub-total of cash outflows |
(91,610,615 | ) | (80,920,294 | ) | (79,749,705 | ) | (67,328,515 | ) | ||||||||||||
|
|
|
|
|
|
|
|
|
|||||||||||||
| Net cash flows generated in operating activities |
V.56, XIV.8 | 4,060,026 | 1,751,217 | 5,102,914 | 1,937,149 | |||||||||||||||
|
|
|
|
|
|
|
|
|
|||||||||||||
| II. Cash flows from investing activities |
||||||||||||||||||||
| Cash received from structured deposits |
8,150,000 | 10,900,000 | 7,000,000 | 10,500,000 | ||||||||||||||||
| Proceeds from capital reduction of an associate |
1,460,258 | — | 1,460,258 | — | ||||||||||||||||
| Cash received from returns on investments |
880,815 | 561,755 | 784,757 | 516,221 | ||||||||||||||||
| Net cash received from disposal of fixed assets and other long-term assets |
55,254 | 59,642 | 54,970 | (38,176 | ) | |||||||||||||||
| Proceeds from other investing activities |
V.55 | 4,198,937 | 910,404 | 4,191,891 | 904,807 | |||||||||||||||
|
|
|
|
|
|
|
|
|
|||||||||||||
| Sub-total of cash inflows |
14,745,264 | 12,431,801 | 13,491,876 | 11,882,852 | ||||||||||||||||
|
|
|
|
|
|
|
|
|
|||||||||||||
| Payment for acquisition of fixed assets, intangible assets and other long-term assets |
(3,224,000 | ) | (1,840,986 | ) | (3,120,461 | ) | (1,832,005 | ) | ||||||||||||
| Payment of structured deposits |
(8,150,000 | ) | (7,600,000 | ) | (7,000,000 | ) | (7,200,000 | ) | ||||||||||||
| Payment for establishing of a subsidiary and an associate |
(76,000 | ) | (367,918 | ) | (50,000 | ) | (200,000 | ) | ||||||||||||
| Payment for other investing activities |
V.55 | (5,654,685 | ) | (6,510,425 | ) | (5,451,605 | ) | (6,502,099 | ) | |||||||||||
|
|
|
|
|
|
|
|
|
|||||||||||||
| Sub-total of cash outflows |
(17,104,685 | ) | (16,319,329 | ) | (15,622,066 | ) | (15,734,104 | ) | ||||||||||||
|
|
|
|
|
|
|
|
|
|||||||||||||
| Net cash flows used in investing activities |
(2,359,421 | ) | (3,887,528 | ) | (2,130,190 | ) | (3,851,252 | ) | ||||||||||||
|
|
|
|
|
|
|
|
|
|||||||||||||
The notes on pages 321 to 470 form part of these financial statements.
315
Consolidated and Company Cash Flow Statements (continued)
For the year ended 31 December 2021
(All amounts in thousands of Renminbi Yuan unless otherwise stated)
| 2021 | 2020 | 2021 | 2020 | |||||||||||||||||
| Note | Consolidated | Consolidated | Company | Company | ||||||||||||||||
| III. Cash flows (used in)/generated from financing activities |
||||||||||||||||||||
| Proceeds from borrowings |
14,163,132 | 3,458,100 | 14,123,132 | 3,398,107 | ||||||||||||||||
| Proceeds from short-term bonds |
5,998,899 | 2,998,469 | 5,998,899 | 2,998,469 | ||||||||||||||||
|
|
|
|
|
|
|
|
|
|||||||||||||
| Sub-total of cash inflows |
20,162,031 | 6,456,569 | 20,122,031 | 6,396,576 | ||||||||||||||||
|
|
|
|
|
|
|
|
|
|||||||||||||
| Repayments of borrowings |
(13,451,332 | ) | (3,460,556 | ) | (13,423,132 | ) | (3,400,969 | ) | ||||||||||||
| Repayments of short-term bonds |
(9,000,000 | ) | — | (9,000,000 | ) | — | ||||||||||||||
| Payment for dividends, profit distributions or interest |
(1,196,297 | ) | (1,370,006 | ) | (1,189,267 | ) | (1,363,200 | ) | ||||||||||||
|
|
|
|
|
|
|
|
|
|||||||||||||
| Including: Dividends paid by subsidiaries to non-controlling interests |
(4,901 | ) | (4,901 | ) | — | — | ||||||||||||||
|
|
|
|
|
|
|
|
|
|||||||||||||
| Payment for other financing activities |
V.55 | (17,544 | ) | (15,586 | ) | (12,862 | ) | (12,677 | ) | |||||||||||
|
|
|
|
|
|
|
|
|
|||||||||||||
| Sub-total of cash outflows |
(23,665,173 | ) | (4,846,148 | ) | (23,625,261 | ) | (4,776,846 | ) | ||||||||||||
|
|
|
|
|
|
|
|
|
|||||||||||||
| Net cash flows (used in)/ generated from financing activities |
(3,503,142 | ) | 1,610,421 | (3,503,230 | ) | 1,619,730 | ||||||||||||||
|
|
|
|
|
|
|
|
|
|||||||||||||
| IV. Effect of foreign exchange rate changes on cash and cash equivalents |
(1,861 | ) | (7,401 | ) | (2,042 | ) | — | |||||||||||||
|
|
|
|
|
|
|
|
|
|||||||||||||
| V. Net increase in cash and cash equivalents (“-” for decrease) |
(1,804,398 | ) | (533,291 | ) | (532,548 | ) | (294,373 | ) | ||||||||||||
| Add: Cash and cash equivalents at beginning of the year |
V.56, XIV.8 | 6,916,408 | 7,449,699 | 5,460,067 | 5,754,440 | |||||||||||||||
|
|
|
|
|
|
|
|
|
|||||||||||||
| VI. Cash and cash equivalents at the end of the year |
V.56, XIV.8 | 5,112,010 | 6,916,408 | 4,927,519 | 5,460,067 | |||||||||||||||
|
|
|
|
|
|
|
|
|
|||||||||||||
These financial statements were approved by the Board of Directors of the Company on 23 March 2022.
| Wu Haijun | Du Jun | Yang Yating | (Company stamp) | |||
| Chairman | Director and Chief Financial Officer | Accounting Chief | ||||
| (Signature and stamp) |
(Signature and stamp) |
(Signature and stamp) |
The notes on pages 321 to 470 form part of these financial statements.
316
Consolidated Statement of Changes in Shareholders’ Equity
For the year ended 31 December 2021
(All amounts in thousands of Renminbi Yuan unless otherwise stated)
| Attributable to equity shareholders of the Company | ||||||||||||||||||||||||||||||||||||||||
| Note | Share capital |
Capital reserve |
Other comprehensive income |
Specific reserve |
Surplus reserve |
Retained earnings |
Sub-total | Non- controlling interests |
Total | |||||||||||||||||||||||||||||||
| I. Balance at 1 January 2021 |
10,823,814 | 610,327 | 6,326 | 145,597 | 6,474,103 | 11,157,866 | 29,218,033 | 136,985 | 29,355,018 | |||||||||||||||||||||||||||||||
|
|
|
|
|
|
|
|
|
|
|
|
|
|
|
|
|
|
|
|||||||||||||||||||||||
| II. Changes in equity for year ended 31 December 2021 (“-” for decreases) 1. Total comprehensive income |
||||||||||||||||||||||||||||||||||||||||
| (1) Net profit |
— | — | — | — | — | 2,000,506 | 2,000,506 | 3,175 | 2,003,681 | |||||||||||||||||||||||||||||||
| (2) Other comprehensive income |
V.33 | — | — | 141,798 | — | — | — | 141,798 | — | 141,798 | ||||||||||||||||||||||||||||||
| 2. Amounts transferred from hedging reserve to initial carrying amount of hedged items |
— | — | (88,699 | ) | — | — | — | (88,699 | ) | — | (88,699 | ) | ||||||||||||||||||||||||||||
| 3. Appropriation of profits |
||||||||||||||||||||||||||||||||||||||||
| (1) Distributions to shareholders |
V.36 | — | — | — | — | — | (1,082,381 | ) | (1,082,381 | ) | (4,901 | ) | (1,087,282 | ) | ||||||||||||||||||||||||||
| (2) Appropriation to surplus reserves |
— | — | — | — | 198,536 | (198,536 | ) | — | — | — | ||||||||||||||||||||||||||||||
| 4. Specific reserve |
||||||||||||||||||||||||||||||||||||||||
| (1) Accrued |
V.34 | — | — | — | 111,644 | — | — | 111,644 | — | 111,644 | ||||||||||||||||||||||||||||||
| (2) Utilized |
V.34 | — | — | — | (40,729 | ) | — | — | (40,729 | ) | — | (40,729 | ) | |||||||||||||||||||||||||||
|
|
|
|
|
|
|
|
|
|
|
|
|
|
|
|
|
|
|
|||||||||||||||||||||||
| III.Balance at 31 December 2021 |
|
10,823,814 | 610,327 | 59,425 | 216,512 | 6,672,639 | 11,877,455 | 30,260,172 | 135,259 | 30,395,431 | ||||||||||||||||||||||||||||||
|
|
|
|
|
|
|
|
|
|
|
|
|
|
|
|
|
|
|
|||||||||||||||||||||||
These financial statements were approved by the Board of Directors of the Company on 23 March 2022.
| Wu Haijun | Du Jun | Yang Yating | (Company stamp) | |||
| Chairman | Director and Chief Financial Officer | Accounting Chief | ||||
| (Signature and stamp) |
(Signature and stamp) |
(Signature and stamp) |
The notes on pages 321 to 470 form part of these financial statements.
317
Consolidated Statement of Changes in Shareholders’ Equity (continued)
For the year ended 31 December 2021
(All amounts in thousands of Renminbi Yuan unless otherwise stated)
| Attributable to equity shareholders of the Company | ||||||||||||||||||||||||||||||||||||||
| Note |
Share capital |
Capital reserve |
Other comprehensive income |
Specific reserve |
Surplus reserve |
Retained earnings |
Sub-total | Non- controlling interests |
Total | |||||||||||||||||||||||||||||
| I. Balance at 1 January 2020 |
10,823,814 | 610,327 | 17,838 | 57,137 | 6,437,010 | 11,939,215 | 29,885,341 | 130,560 | 30,015,901 | |||||||||||||||||||||||||||||
|
|
|
|
|
|
|
|
|
|
|
|
|
|
|
|
|
|
|
|||||||||||||||||||||
| II. Changes in equity for the year ended 31 December 2020 (“-” for decreases) |
||||||||||||||||||||||||||||||||||||||
| 1. Total comprehensive income |
||||||||||||||||||||||||||||||||||||||
| (1) Net profit |
— | — | — | — | — | 628,110 | 628,110 | 11,326 | 639,436 | |||||||||||||||||||||||||||||
| (2) Other comprehensive income |
V.33 | — | — | (11,512 | ) | — | — | — | (11,512 | ) | — | (11,512 | ) | |||||||||||||||||||||||||
| 2. Appropriation of profits |
||||||||||||||||||||||||||||||||||||||
| (1) Appropriation to surplus reserves |
— | — | — | — | 37,093 | (37,093 | ) | — | — | — | ||||||||||||||||||||||||||||
| (2) Distributions to shareholders |
V.36 | — | — | — | — | — | (1,298,858 | ) | (1,298,858 | ) | (4,901 | ) | (1,303,759 | ) | ||||||||||||||||||||||||
| 3. Specific reserve |
||||||||||||||||||||||||||||||||||||||
| (1) Accrued |
V.34 | — | — | — | 139,173 | — | — | 139,173 | — | 139,173 | ||||||||||||||||||||||||||||
| (2) Utilized |
V.34 | — | — | — | (50,713 | ) | — | — | (50,713 | ) | — | (50,713 | ) | |||||||||||||||||||||||||
| (3) Others |
— | — | — | — | — | (73,508 | ) | (73,508 | ) | — | (73,508 | ) | ||||||||||||||||||||||||||
|
|
|
|
|
|
|
|
|
|
|
|
|
|
|
|
|
|
|
|||||||||||||||||||||
| III. Balance at 31 December 2020 |
10,823,814 | 610,327 | 6,326 | 145,597 | 6,474,103 | 11,157,866 | 29,218,033 | 136,985 | 29,355,018 | |||||||||||||||||||||||||||||
|
|
|
|
|
|
|
|
|
|
|
|
|
|
|
|
|
|
|
|||||||||||||||||||||
These financial statements were approved by the Board of Directors of the Company on 23 March 2022.
| Wu Haijun | Du Jun | Yang Yating | (Company stamp) | |||
| Chairman | Director and Chief Financial Officer | Accounting Chief | ||||
| (Signature and stamp) |
(Signature and stamp) |
(Signature and stamp) |
The notes on pages 321 to 470 form part of these financial statements.
318
Statement of Changes in Shareholders’ Equity
For the year ended 31 December 2021
(All amounts in thousands of Renminbi Yuan unless otherwise stated)
| Share capital |
Capital reserve |
Other comprehensive income |
Specific reserve |
Surplus reserve |
Retained earnings |
Total | ||||||||||||||||||||||
| I. Balance at 1 January 2021 |
10,823,814 | 600,768 | 6,326 | 145,597 | 6,474,103 | 10,535,813 | 28,586,421 | |||||||||||||||||||||
|
|
|
|
|
|
|
|
|
|
|
|
|
|
|
|||||||||||||||
| II. Changes in equity for year ended 31 December 2021 (“-” for decreases) |
||||||||||||||||||||||||||||
| 1. Total comprehensive income |
||||||||||||||||||||||||||||
| (1) Net profit |
— | — | — | — | — | 1,985,363 | 1,985,363 | |||||||||||||||||||||
| (2) Other comprehensive income |
— | — | 141,798 | — | — | — | 141,798 | |||||||||||||||||||||
| 2. Amounts transferred from hedging reserve to initial carrying amount of hedged items |
— | — | (88,699 | ) | — | — | — | (88,699 | ) | |||||||||||||||||||
| 3. Appropriation of profits |
||||||||||||||||||||||||||||
| (1) Distributions to shareholders |
— | — | — | — | — | (1,082,381 | ) | (1,082,381 | ) | |||||||||||||||||||
| (2) Appropriation to surplus reserves |
— | — | — | — | 198,536 | (198,536 | ) | — | ||||||||||||||||||||
| 4. Specific reserve |
||||||||||||||||||||||||||||
| (1) Accrued |
— | — | — | 103,221 | — | — | 103,221 | |||||||||||||||||||||
| (2) Utilized |
— | — | — | (32,310 | ) | — | — | (32,310 | ) | |||||||||||||||||||
|
|
|
|
|
|
|
|
|
|
|
|
|
|
|
|||||||||||||||
| III. Balance at 31 December 2021 |
10,823,814 | 600,768 | 59,425 | 216,508 | 6,672,639 | 11,240,259 | 29,613,413 | |||||||||||||||||||||
|
|
|
|
|
|
|
|
|
|
|
|
|
|
|
|||||||||||||||
These financial statements were approved by the Board of Directors of the Company on 23 March 2022.
| Wu Haijun | Du Jun | Yang Yating | (Company stamp) | |||
| Chairman | Director and Chief Financial Officer | Accounting Chief | ||||
| (Signature and stamp) |
(Signature and stamp) |
(Signature and stamp) |
The notes on pages 321 to 470 form part of these financial statements.
319
Statement of Changes in Shareholders’ Equity (continued)
For the year ended 31 December 2021
(All amounts in thousands of Renminbi Yuan unless otherwise stated)
| Share capital |
Capital reserve |
Other comprehensive income |
Specific reserve |
Surplus reserve |
Retained earnings |
Total equity |
||||||||||||||||||||||
| I. Balance at 1 January 2020 |
10,823,814 | 600,768 | 17,838 | 57,135 | 6,437,010 | 11,574,341 | 29,510,906 | |||||||||||||||||||||
|
|
|
|
|
|
|
|
|
|
|
|
|
|
|
|||||||||||||||
| II. Changes in equity for the year ended 31 December 2020 (“-” for decreases) |
||||||||||||||||||||||||||||
| 1. Total comprehensive income |
||||||||||||||||||||||||||||
| (1) Net profit |
— | — | — | — | — | 370,931 | 370,931 | |||||||||||||||||||||
| (2) Other comprehensive income |
— | — | (11,512 | ) | — | — | — | (11,512 | ) | |||||||||||||||||||
| 2. Appropriation of profits |
||||||||||||||||||||||||||||
| (1) Appropriation to surplus reserves |
— | — | — | — | 37,093 | (37,093 | ) | — | ||||||||||||||||||||
| (2) Distributions to shareholders |
— | — | — | — | — | (1,298,858 | ) | (1,298,858 | ) | |||||||||||||||||||
| 3. Specific reserve |
||||||||||||||||||||||||||||
| (1) Accrued |
— | — | — | 132,482 | — | — | 132,482 | |||||||||||||||||||||
| (2) Utilized |
— | — | — | (44,020 | ) | — | — | (44,020 | ) | |||||||||||||||||||
| (3) Others |
— | — | — | — | — | (73,508 | ) | (73,508 | ) | |||||||||||||||||||
|
|
|
|
|
|
|
|
|
|
|
|
|
|
|
|||||||||||||||
| III. Balance at 31 December 2020 |
10,823,814 | 600,768 | 6,326 | 145,597 | 6,474,103 | 10,535,813 | 28,586,421 | |||||||||||||||||||||
|
|
|
|
|
|
|
|
|
|
|
|
|
|
|
|||||||||||||||
These financial statements were approved by the Board of Directors of the Company on 23 March 2022.
| Wu Haijun | Du Jun | Yang Yating | (Company stamp) | |||
| Chairman | Director and Chief Financial Officer | Accounting Chief | ||||
| (Signature and stamp) |
(Signature and stamp) |
(Signature and stamp) |
The notes on pages 321 to 470 form part of these financial statements.
320
Notes to the Financial Statements
For the year ended 31 December 2021
(All amounts in thousands of Renminbi Yuan unless otherwise stated)
| I. | General information |
Sinopec Shanghai Petrochemical Company Limited (“the Company”), formerly Shanghai Petrochemical Company Limited, was established in the People’s Republic of China (“the PRC”) on 29 June 1993 with registered capital of RMB4,000,000,000, invested by its holding company-China National Petrochemical Corporation (“Sinopec Group”); these shares were converted from assets of former Shanghai Petrochemical Complex.
H shares were listed on the Hong Kong Stock Exchange on 26 July 1993 and listed on the New York Stock Exchange in the form of American Depositary Shares at the same time; the A shares were listed on the Shanghai Stock Exchange on 8 November 1993.
Sinopec Group completed its reorganization on 25 February 2000. After the reorganisation, China Petroleum & Chemical Corporation (“Sinopec Corp.”) was established. As part of the reorganisation, Sinopec Group transferred its 4,000,000,000 of the Company’s state-owned legal shares, which represented 55.56 percent of the issued share capital of the Company, to Sinopec Corp. Sinopec Corp. became the largest shareholder of the Company. The Company changed its name to Sinopec Shanghai Petrochemical Company Limited on 12 October 2000.
Ordinary A shares of RMB14,176,600 and RMB9,636,900 were registered on 27 September 2017 and 12 January 2018.
As at 31 December 2021, total share capital of the Company were RMB10,823,813,500, 1 Yuan per share. Detailed changes to share capital refers to Note V.31.
The Company and its subsidiaries (“the Group”) is a highly integrated entity which processes crude oil into synthetic fibres, resins and plastics, intermediate petrochemicals and petroleum products.
Details of the Company’s principal subsidiaries are set out in Note VI.
| II. | Basis of preparation |
The financial statements have been prepared on the going concern basis.
321
Notes to the Financial Statements (continued)
For the year ended 31 December 2021
(All amounts in thousands of Renminbi Yuan unless otherwise stated)
| III. | Summary of significant accounting policies and accounting estimates |
Accounting policies for the provision for impairment of inventories, depreciation of fixed assets, impairment of long-term assets of the Group are adopted according to the specific characteristics of the Company’s operations. Please refer to the relevant notes on accounting policies.
| 1. | Statement of compliance |
The financial statements have been prepared in accordance with the requirements of Accounting Standards for Business Enterprises or referred to as China Accounting Standards (“CAS”) issued by the MOF. These financial statements present truly and completely the consolidated financial position and financial position of the Company as at 31 December 2021, and the consolidated financial performance and financial performance and the consolidated cash flows and cash flows of the Company for the year from 1 January 2021 to 31 December 2021.
These financial statements also comply with the disclosure requirements of “Regulation on the Preparation of Information Disclosures by Companies Issuing Securities, No.15: General Requirements for Financial Reports” as revised by the China Securities Regulatory Commission (“CSRC”) in 2014.
| 2. | Accounting period |
The Company’s accounting year starts on 1 January and ends on 31 December.
| 3. | Operating cycle |
The Company takes the period from the acquisition of assets for processing to until the ultimate realization of cash or cash equivalents as a normal operating cycle. The operating cycle of the Company is usually less than 12 months.
| 4. | Functional currency |
The Company’s functional currency is Renminbi and these financial statements are presented in Renminbi. Functional currency is determined by the Company and its subsidiaries on the primary economic environment in which they operate.
322
Notes to the Financial Statements (continued)
For the year ended 31 December 2021
(All amounts in thousands of Renminbi Yuan unless otherwise stated)
| III. | Summary of significant accounting policies and accounting estimates (continued) |
| 5. | Accounting treatments for business combinations involving entities under common control and not under common control |
A transaction constitutes a business combination when the Group obtains control of one or more entities (or a group of assets or net assets). Business combination is classified as either business combinations involving enterprises under common control or business combinations not involving enterprises under common control
For a transaction not involving enterprises under common control, the acquirer determines whether acquired set of assets constitute a business. The Group may elect to apply the simplified assessment method, the concentration test, to determine whether an acquired set of assets is not a business. If the concentration test is met and the set of assets is determined not to be a business, no further assessment is needed. If the concentration test is not met, the Group shall perform the assessment according to the guidance on the determination of a business.
When the set of assets the group acquired does not constitute a business, acquisition costs should be allocated to each identifiable assets and liabilities at their acquisition-date fair values. It is not required to apply the accounting of business combination described as below.
| (1) | Business combinations involving entities under common control |
A business combination involving entities under common control is a business combination in which all of the combining entities are ultimately controlled by the same party or parties both before and after the business combination, and that control is not transitory. The assets acquired and liabilities assumed are measured based on their carrying amounts in the consolidated financial statements of the ultimate controlling party at the combination date. The difference between the carrying amount of the net assets acquired and the consideration paid for the combination (or the total par value of shares issued) is adjusted against share premium in the capital reserve, with any excess adjusted against retained earnings. Any costs directly attributable to the combination are recognized in profit or loss when incurred. The combination date is the date on which one combining entity obtains control of other combining entities. Transaction costs associated with the issue of equity or debt securities for the business combination are included in the initially recognized amounts of the equity or debt securities.
323
Notes to the Financial Statements (continued)
For the year ended 31 December 2021
(All amounts in thousands of Renminbi Yuan unless otherwise stated)
| III. | Summary of significant accounting policies and accounting estimates (continued) |
| 5. | Accounting treatments for business combinations involving entities under common control and not under common control (continued) |
| (2) | Business combinations involving entities not under common control |
A business combination involving entities not under common control is a business combination in which all of the combining entities are not ultimately controlled by the same party or parties both before and after the business combination. Where (1) the aggregate of the acquisition-date fair value of assets transferred (including the acquirer’s previously held equity interest in the acquiree), liabilities incurred or assumed, and equity securities issued by the acquirer, in exchange for control of the acquiree, exceeds (2) the acquirer’s interest in the acquisition-date fair value of the acquiree’s identifiable net assets, the difference is recognized as goodwill. If (1) is less than (2), the difference is recognized in profit or loss for the current period. The costs of issuing equity or debt securities as a part of the consideration for the acquisition are included in the carrying amounts of these equity or debt securities upon initial recognition. Acquisition-related costs are expensed when incurred. Any difference between the fair value and the carrying amount of the assets transferred as consideration is recognized in profit or loss. The acquiree’s identifiable asset, liabilities and contingent liabilities, if the recognition criteria are met, are recognized by the Group at their acquisition-date fair value. The acquisition date is the date on which the acquirer obtains control of the acquiree.
For a business combination involving entities not under common control and achieved in stages, the Group remeasures its previously-held equity interest in the acquiree to its acquisition-date fair value and recognizes any resulting difference between the fair value and the carrying amount as investment income or other comprehensive income for the current period. In addition, any amount recognized in other comprehensive income and other changes in the owners’ equity under equity accounting in prior reporting periods relating to the previously-held equity interest that may be reclassified to profit or loss are transferred to investment income at the date of acquisition; Any previously-held equity interest that is designated as equity investment at fair value through other comprehensive income, the other comprehensive income recognized in prior reporting periods is transferred to retained earnings and surplus reserve at the date of acquisition.
| 6. | Consolidated financial statements |
| (1) | General principles |
The scope of consolidated financial statements is based on control and the consolidated financial statements comprise the Company and its subsidiaries. Control exists when the investor has all of following: power over the investee; exposure, or rights, to variable returns from its involvement with the investee and has the ability to affect those returns through its power over the investee. When assessing whether the Group has power, only substantive rights (held by the Group and other parties) are considered. The financial position, financial performance and cash flows of subsidiaries are included in the consolidated financial statements from the date that control commences until the date that control ceases.
324
Notes to the Financial Statements (continued)
For the year ended 31 December 2021
(All amounts in thousands of Renminbi Yuan unless otherwise stated)
| XIII. | Summary of significant accounting policies and accounting estimates (continued) |
| 6. | Consolidated financial statements (continued) |
| (1) | General principles (continued) |
Non-controlling interests are presented separately in the consolidated balance sheet within shareholders’ equity. Net profit or loss attributable to non-controlling shareholders is presented separately in the consolidated income statement below the net profit line item. Total comprehensive income attributable to non-controlling shareholders is presented separately in the consolidated income statement below the total comprehensive income line item.
When the amount of loss for the current period attributable to the non-controlling shareholders of a subsidiary exceeds the non-controlling shareholders’ share of the opening owners’ equity of the subsidiary, the excess is still allocated against the non-controlling interests.
When the accounting period or accounting policies of a subsidiary are different from those of the Company, the Company makes necessary adjustments to the financial statements of the subsidiary based on the Company’s own accounting period or accounting policies. Intra-group balances and transactions, and any unrealized profit or loss arising from intra-group transactions, are eliminated when preparing the consolidated financial statements. Unrealized losses resulting from intra-group transactions are eliminated in the same way as unrealized gains, unless they represent impairment losses that are recognized in the financial statements. Unrealized profits and losses resulting from the sale of assets by a subsidiary to the Company are eliminated and allocated between net profit attributable to owners of the parent and non-controlling interests in accordance with the allocation proportion of the parent in the subsidiary. Unrealized profits and losses resulting from the sale of assets by one subsidiary to another are eliminated and allocated between net profit attributable to owners of the parent and non-controlling interests in accordance with the allocation proportion of the parent in the subsidiary. If the accounting treatment of a transaction which considers the Group as an accounting entity is different from that considers the Company or its subsidiaries as an accounting entity, it is adjusted from the perspective of the Group.
| (2) | Subsidiaries acquired through a business combination |
Where a subsidiary was acquired during the reporting period, through a business combination involving entities under common control, the financial statements of the subsidiary are included in the consolidated financial statements based on the carrying amounts of the assets and liabilities of the subsidiary in the financial statements of the ultimate controlling party as if the combination had occurred at the date that the ultimate controlling party first obtained control. The opening balances and the comparative figures of the consolidated financial statements are also restated.
Where a subsidiary was acquired during the reporting period, through a business combination involving entities not under common control, the identifiable assets and liabilities of the acquired subsidiaries are included in the scope of consolidation from the date that control commences, based on the fair value of those identifiable assets and liabilities at the acquisition date.
325
Notes to the Financial Statements (continued)
For the year ended 31 December 2021
(All amounts in thousands of Renminbi Yuan unless otherwise stated)
| III. | Summary of significant accounting policies and accounting estimates (continued) |
| 6. | Consolidated financial statements (continued) |
| (3) | Disposal of subsidiaries |
When the Group loses control over a subsidiary, any resulting disposal gains or losses are recognized as investment income for the current period. The remaining equity interests is re-measured at its fair value at the date when control is lost, any resulting gains or losses are also recognized as investment income for the current period.
When the Group loses control of a subsidiary in multiple transactions in which it disposes of its long-term equity investment in the subsidiary in stages, the following are considered to determine whether the Group should account for the multiple transactions as a bundled transaction:
| • | arrangements are entered into at the same time or in contemplation of each other; |
| • | arrangements work together to achieve an overall commercial effect; |
| • | the occurrence of one arrangement is dependent on the occurrence of at least one other arrangement; |
| • | one arrangement considered on its own is not economically justified, but it is economically justified when considered together with other arrangements. |
If each of the multiple transactions does not form part of a bundled transaction, the transactions conducted before the loss of control of the subsidiary are accounted for in accordance with the accounting policy for partial disposal of equity investment in subsidiaries where control is retained (see Note III.6(4)).
If each of the multiple transactions forms part of a bundled transaction which eventually results in the loss of control in the subsidiary, these multiple transactions are accounted for as a single transaction. In the consolidated financial statements, the difference between the consideration received and the corresponding proportion of the subsidiary’s net assets (calculated continuously from the acquisition date) in each transaction prior to the loss of control shall be recognized in other comprehensive income and transferred to profit or loss when the parent eventually loses control of the subsidiary.
| (4) | Changes in non-controlling interests |
Where the Company acquires a non-controlling interest from a subsidiary’s non-controlling shareholders or disposes of a portion of an interest in a subsidiary without a change in control, the difference between the proportion interests of the subsidiary’s net assets being acquired or disposed and the amount of the consideration paid or received is adjusted to the capital reserve (share premium) in the consolidated balance sheet, with any excess adjusted to retained earnings.
326
Notes to the Financial Statements (continued)
For the year ended 31 December 2021
(All amounts in thousands of Renminbi Yuan unless otherwise stated)
| III. | Summary of significant accounting policies and accounting estimates (continued) |
| 7. | Cash and cash equivalents |
Cash and cash equivalents comprise cash on hand, deposits that can be readily withdraw on demand, and short-term, highly liquid investments that are readily convertible into known amounts of cash and are subject to an insignificant risk of change in value.
| 8. | Foreign currency transactions |
When the Group receives capital in foreign currencies from investors, the capital is translated to Renminbi at the spot exchange rate at the date of the receipt. Other foreign currency transactions are, on initial recognition, translated to Renminbi at the spot exchange rates on the dates of the transactions.
Monetary items denominated in foreign currencies are translated to Renminbi at the spot exchange rate at the balance sheet date. The resulting exchange differences are generally recognized in profit or loss, unless they arise from the retranslation of the principal and interest of specific borrowings for the acquisition of qualifying assets (see Note III.15). Non-monetary items that are measured at historical cost in foreign currencies are translated to Renminbi using the exchange rate at the transaction date. Effect of foreign exchange rate changes on cash is presented separately in the cash flow statement.
| 9. | Financial instruments |
Financial instruments include cash at bank and on hand, account receivables, account payables, loans and borrowings, and share capital.
| (1) | Recognition and initial measurement of financial assets and financial liabilities |
A financial asset or financial liability is recognized in the balance sheet when the Group becomes a party to the contractual provisions of a financial instrument.
A financial asset or financial liability is measured initially at fair value. For financial assets and financial liabilities at fair value through profit or loss, any related directly attributable transaction costs are charged to profit or loss; for other categories of financial assets and financial liabilities, any related directly attributable transaction costs are included in their initial costs. A trade receivable, without significant financing component or practical expedient applied for one year or less contracts, is initially measured at the transaction price in accordance with Note III.21.
327
Notes to the Financial Statements (continued)
For the year ended 31 December 2021
(All amounts in thousands of Renminbi Yuan unless otherwise stated)
| III. | Summary of significant accounting policies and accounting estimates (continued) |
| 9. | Financial instruments (continued) |
| (2) | Classification and subsequent measurement of financial assets |
| (a) | Classification of financial assets |
The classification of financial assets is generally based on the business model in which a financial asset is managed and its contractual cash flow characteristics. On initial recognition, a financial asset is classified as measured at amortized cost, at fair value through other comprehensive income (“FVOCI”), or at fair value through profit or loss (“FVTPL”).
Financial assets are not reclassified subsequent to their initial recognition unless the Group changes its business model for managing financial assets in which case all affected financial assets are reclassified on the first day of the first reporting period following the change in the business model.
A financial asset is measured at amortized cost if it meets both of the following conditions and is not designated as at FVTPL:
| – | it is held within a business model whose objective is to hold assets to collect contractual cash flows; and |
| – | its contractual terms give rise on specified dates to cash flows that are solely payments of principal and interest on the principal amount outstanding. |
A debt investment is measured at FVOCI if it meets both of the following conditions and is not designated as at FVTPL:
| – | it is held within a business model whose objective is achieved by both collecting contractual cash flows and selling financial assets; and |
| – | its contractual terms give rise on specified dates to cash flows that are solely payments of principal and interest on the principal amount outstanding. |
328
Notes to the Financial Statements (continued)
For the year ended 31 December 2021
(All amounts in thousands of Renminbi Yuan unless otherwise stated)
| III. | Summary of significant accounting policies and accounting estimates (continued) |
| 9. | Financial instruments (continued) |
| (2) | Classification and subsequent measurement of financial assets (continued) |
| (a) | Classification of financial assets |
On initial recognition of an equity investment that is not held for trading, the Group may irrevocably elect to present subsequent changes in the investment’s fair value in other comprehensive income, and listed them as other equity instrument investments. This election is made on an investment-by-investment basis. The instrument meets the definition of equity from the perspective of the issuer. The relevant dividend income of such financial assets is included in the current profit and loss.
All financial assets not classified as measured at amortized cost or FVOCI as described above are measured at FVTPL. On initial recognition, the Group may irrevocably designate a financial asset that otherwise meets the requirements to be measured at amortized cost or at FVOCI as at FVTPL if doing so eliminates or significantly reduces an accounting mismatch that would otherwise arise.
The business model refers to how the Group manages its financial assets in order to generate cash flows. That is, the Group’s business model determines whether cash flows will result from collecting contractual cash flows, selling financial assets or both. The Group determines the business model for managing the financial assets according to the facts and based on the specific business objective for managing the financial assets determined by the Group’s key management personnel.
In assessing whether the contractual cash flows are solely payments of principal and interest, the Group considers the contractual terms of the instrument. For the purposes of this assessment, ‘principal’ is defined as the fair value of the financial asset on initial recognition. ‘Interest’ is defined as consideration for the time value of money and for the credit risk associated with the principal amount outstanding during a particular period of time and for other basic lending risks and costs, as well as a profit margin. The Group also assesses whether the financial asset contains a contractual term that could change the timing or amount of contractual cash flows such that it would not meet this condition.
| (b) | Subsequent measurement of financial assets |
| – | Financial assets at FVTPL |
These financial assets are subsequently measured at fair value. Net gains and losses, including any interest or dividend income, are recognized in profit or loss unless the financial assets are part of a hedging relationship. Those maturing more than one year from the balance sheet date and expected to be held for more than one year shall be listed as other non-current financial assets, while the rest shall be listed as trading financial assets.
329
Notes to the Financial Statements (continued)
For the year ended 31 December 2021
(All amounts in thousands of Renminbi Yuan unless otherwise stated)
| III. | Summary of significant accounting policies and accounting estimates (continued) |
| 9. | Financial instruments (continued) |
| (2) | Classification and subsequent measurement of financial assets (continued) |
| (b) | Subsequent measurement of financial assets |
| – | Financial assets at amortized cost |
These assets are subsequently measured at amortized cost using the effective interest method. A gain or loss on a financial asset that is measured at amortized cost and is not part of a hedging relationship shall be recognized in profit or loss when the financial asset is derecognized, reclassified, through the amortization process or in order to recognize impairment gains or losses. Such financial assets mainly include cash at bank and on hand, accounts receivable, other receivables and investments in debt securities, etc. The Group shall list the investments in debt securities that is due within one year (including one year) from the date of balance sheet as non-current assets that are due within one year; The investments in debt securities that is due within one year (including one year) at the time of acquisition is listed as other current assets. The investments in debt securities that is due more than one year from the date of balance sheet is listed as other non-current assets.
| – | Debt investments at FVOCI |
These assets are subsequently measured at fair value. Interest income calculated using the effective interest method, impairment and foreign exchange gains and losses are recognized in profit or loss. Other net gains and losses are recognized in other comprehensive income. On derecognition, gains and losses accumulated in other comprehensive income are reclassified to profit or loss. Such financial assets are listed as Receivables under financing, other investments in debt securities, and other investments in debt securities that are due within one year (including one year) from the date of balance sheet are listed as non-current assets that are due within one year; Other investments in debt securities with a maturity of one year (including one year) at the time of acquisition are listed as other current assets.
| – | Equity investments at FVOCI |
These assets are subsequently measured at fair value. Dividends are recognized as income in profit or loss. Other net gains and losses are recognized in other comprehensive income. On derecognition, gains and losses accumulated in other comprehensive income are reclassified to retained earnings.
330
Notes to the Financial Statements (continued)
For the year ended 31 December 2021
(All amounts in thousands of Renminbi Yuan unless otherwise stated)
| III. | Summary of significant accounting policies and accounting estimates (continued) |
| 9. | Financial instruments (continued) |
| (3) | Classification and subsequent measurement of financial liabilities |
Financial liabilities are classified as measured at FVTPL or amortized cost.
| – | Financial liabilities at FVTPL |
A financial liability is classified as at FVTPL if it is classified as held-for-trading (including derivative financial liability) or it is designated as such on initial recognition.
Financial liabilities at FVTPL are subsequently measured at fair value and net gains and losses, including any interest expense, are recognized in profit or loss, unless the financial liabilities are part of a hedging relationship.
| – | Financial liabilities at amortized cost |
These financial liabilities are subsequently measured at amortized cost using the effective interest method.
The financial liabilities of the Group are mainly financial liabilities measured by amortized cost, including bills payable and accounts payable, other payables, loans, etc. Such financial liabilities are initially measured according to their fair value after deducting transaction costs and are subsequently measured by the effective interest rate method. Where the term is less than one year (including one year), it shall be listed as current liabilities; If the term is more than one year, but the term is due within one year (including one year) from the balance sheet date, it shall be listed as non-current liabilities that are due within one year; The rest are shown as non-current liabilities.
| (4) | Offsetting |
Financial assets and financial liabilities are generally presented separately in the balance sheet and are not offset. However, a financial asset and a financial liability are offset and the net amount is presented in the balance sheet when both of the following conditions are satisfied:
| – | The Group currently has a legally enforceable right to set off the recognized amounts; |
| – | The Group intends either to settle on a net basis, or to realize the financial asset and settle the financial liability simultaneously. |
331
Notes to the Financial Statements (continued)
For the year ended 31 December 2021
(All amounts in thousands of Renminbi Yuan unless otherwise stated)
| III. | Summary of significant accounting policies and accounting estimates (continued) |
| 9. | Financial instruments (continued) |
| (5) | Derecognition of financial assets and financial liabilities |
Financial asset is derecognized when one of the following conditions is met:
| – | the Group’s contractual rights to the cash flows from the financial asset expire; |
| – | the financial asset has been transferred and the Group transfers substantially all of the risks and rewards of ownership of the financial asset; or; |
| – | the financial asset has been transferred, although the Group neither transfers nor retains substantially all of the risks and rewards of ownership of the financial asset, it does not retain control over the transferred asset. |
Where a transfer of a financial asset in its entirety meets the criteria for derecognition, the difference between the two amounts below is recognized in profit or loss:
| – | the carrying amount of the financial asset transferred measured at the date of derecognition; |
| – | the sum of the consideration received from the transfer and, when the transferred financial asset is a debt investment at FVOCI, any cumulative gain or loss that has been recognized directly in other comprehensive income for the part derecognized. |
The Group derecognizes a financial liability (or part of it) only when its contractual obligation (or part of it) is extinguished. The difference between the carrying amount of the part to be recognized and the consideration paid shall be recorded into the profit and loss of the current period.
| (6) | Impairment |
The Group recognizes loss allowances for expected credit loss (ECL) on:
| – | financial assets measured at amortized cost; |
| – | debt investments measured at FVOCI. |
332
Notes to the Financial Statements (continued)
For the year ended 31 December 2021
(All amounts in thousands of Renminbi Yuan unless otherwise stated)
| III. | Summary of significant accounting policies and accounting estimates (continued) |
| 9. | Financial instruments (continued) |
| (6) | Impairment (continued) |
Financial assets measured at fair value, including debt investments or equity securities at FVTPL, equity securities designated at FVOCI and derivative financial assets, are not subject to the ECL assessment.
Measurement of ECLs
ECLs are a probability-weighted estimate of credit losses. Credit losses are measured as the present value of all cash shortfalls (i.e. the difference between the cash flows due to the entity in accordance with the contract and the cash flows that the Group expects to receive).
The maximum period considered when estimating ECLs is the maximum contractual period (including extension options) over which the Group is exposed to credit risk.
Lifetime ECLs are the ECLs that result from all possible default events over the expected life of a financial instrument.
12-month ECLs are the portion of ECLs that result from default events that are possible within the 12 months after the balance sheet date (or a shorter period if the expected life of the instrument is less than 12 months).
Loss allowances for trade receivables and contract assets are always measured at an amount equal to lifetime ECL. ECLs on these financial assets are estimated using a provision matrix based on the Group’s historical credit loss experience, adjusted for factors that are specific to the debtors and an assessment of both the current and forecast general economic conditions at the balance sheet date.
Except for trade receivables and contract assets, the Group measures loss allowance at an amount equal to 12-month ECL for the following financial instruments, and at an amount equal to lifetime ECL for all other financial instruments.
| – | If the financial instrument is determined to have low credit risk at the balance sheet date; |
| – | If the credit risk on a financial instrument has not increased significantly since initial recognition. |
333
Notes to the Financial Statements (continued)
For the year ended 31 December 2021
(All amounts in thousands of Renminbi Yuan unless otherwise stated)
| III. | Summary of significant accounting policies and accounting estimates (continued) |
| 9. | Financial instruments (continued) |
| (6) | Impairment (continued) |
Financial instruments that have low credit risk
The credit risk on a financial instrument is considered low if the financial instrument has a low risk of default, the borrower has a strong capacity to meet its contractual cash flow obligations in the near term and adverse changes in economic and business conditions in the longer term may, but will not necessarily, reduce the ability of the borrower to fulfil its contractual cash flow obligations.
Significant increases in credit risk
In assessing whether the credit risk of a financial instrument has increased significantly since initial recognition, the Group compares the risk of default occurring on the financial instrument assessed at the balance sheet date with that assessed at the date of initial recognition.
When determining whether the credit risk of a financial asset has increased significantly since initial recognition and when estimating ECL, the Group considers reasonable and supportable information that is relevant and available without undue cost or effort, including forward-looking information. In particular, the following information is taken into account:
| – | failure to make payments of principal or interest on their contractually due dates; |
| – | an actual or expected significant deterioration in a financial instrument’s external or internal credit rating (if available); |
| – | an actual or expected significant deterioration in the operating results of the debtor; and |
| – | existing or forecast changes in the technological, market, economic or legal environment that have a significant adverse effect on the debtor’s ability to meet its obligation to the Group. |
Depending on the nature of the financial instruments, the assessment of a significant increase in credit risk is performed on either an individual basis or a collective basis. When the assessment is performed on a collective basis, the financial instruments are grouped based on shared credit risk characteristics, such as past due status and credit risk ratings.
334
Notes to the Financial Statements (continued)
For the year ended 31 December 2021
(All amounts in thousands of Renminbi Yuan unless otherwise stated)
| III. | Summary of significant accounting policies and accounting estimates (continued) |
| 9. | Financial instruments (continued) |
| (6) | Impairment (continued) |
Significant increases in credit risk (continued)
The Group assumes that the credit risk on a financial asset has increased significantly if it is more than 30 days past due.
Credit-impaired financial assets
At each balance sheet date, the Group assesses whether financial assets carried at amortized cost and debt investments at FVOCI are credit impaired. A financial asset is ‘credit-impaired’ when one or more events that have a detrimental impact on the estimated future cash flows of the financial asset have occurred. Evidence that a financial asset is credit-impaired includes the following observable data:
| – | significant financial difficulty of the borrower or issuer; |
| – | a breach of contract, such as a default or delinquency in interest or principal payments; |
| – | for economic or contractual reasons relating to the borrower’s financial difficulty, the Group having granted to the borrower a concession that would not otherwise consider; |
| – | it is probable that the borrower will enter bankruptcy or other financial reorganization; or |
| – | the disappearance of an active market for that financial asset because of financial difficulties. |
Presentation of allowance for ECL
ECLs are remeasured at each balance sheet date to reflect changes in the financial instrument’s credit risk since initial recognition. Any change in the ECL amount is recognized as an impairment gain or loss in profit or loss. The Group recognizes an impairment gain or loss for all financial instruments with a corresponding adjustment to their carrying amount through a loss allowance account, except for debt investments that are measured at FVOCI, for which the loss allowance is recognized in other comprehensive income.
335
Notes to the Financial Statements (continued)
For the year ended 31 December 2021
(All amounts in thousands of Renminbi Yuan unless otherwise stated)
| III. | Summary of significant accounting policies and accounting estimates (continued) |
| 9. | Financial instruments (continued) |
| (6) | Impairment (continued) |
Write-off
The gross carrying amount of a financial asset is written off (either partially or in full) to the extent that there is no realistic prospect of recovery. A write-off constitutes a derecognition event. This is generally the case when the Group determines that the debtor does not have assets or sources of income that could generate sufficient cash flows to repay the amounts subject to the write-off. However, financial assets that are written off could still be subject to enforcement activities in order to comply with the Group’s procedures for recovery of amounts due.
Subsequent recoveries of an asset that was previously written off are recognized as a reversal of impairment in profit or loss in the period in which the recovery occurs.
| (7) | Equity instrument |
The consideration received from the issuance of equity instruments net of transaction costs is recognized in shareholders’ equity. Consideration and transaction costs paid by the Company for repurchasing self-issued equity instruments are deducted from shareholders’ equity.
When the Company repurchases its own shares, those shares are treated as treasury shares. All expenditure relating to the repurchase is recorded in the cost of the treasury shares, with the transaction recording in the share register. Treasury shares are excluded from profit distributions and are presented as a deduction under shareholders’ equity in the balance sheet.
When treasury shares are cancelled, the share capital should be reduced to the extent of the total par value of the treasury shares cancelled. Where the cost of the treasury shares cancelled exceeds the total par value, the excess is deducted from capital reserve (share premium), surplus reserve and retained earnings sequentially. If the cost of treasury shares cancelled is less than the total par value, the difference is credited to the capital reserve (share premium).
When treasury shares are disposed of, any excess of proceeds above cost is recognized in capital reserve (share premium); otherwise, the shortfall is deducted against capital reserve (share premium), surplus reserve and retained earnings sequentially.
336
Notes to the Financial Statements (continued)
For the year ended 31 December 2021
(All amounts in thousands of Renminbi Yuan unless otherwise stated)
| III. | Summary of significant accounting policies and accounting estimates (continued) |
| 10. | Inventories |
| (1) | Classification and cost |
Inventories include raw materials, work in progress, semi-finished goods, finished goods and reusable materials. Reusable materials include low-value consumables, packaging materials and other materials, which can be used repeatedly but do not meet the definition of fixed assets.
Inventories are initially measured at cost. Cost of inventories comprises all costs of purchase, costs of conversion and other expenditure incurred in bringing the inventories to their present location and condition. In addition to the purchase cost of raw materials, work in progress and finished goods include direct labor costs and an appropriate allocation of production overheads.
| (2) | Measurement method of cost of inventories |
Cost of inventories recognized is calculated using the weighted average method.
Consumables including low-value consumables and packaging materials are charged to profit or loss upon receipt. The amortization charge is included in the cost of the related assets or recognized in profit or loss for the current period.
| (3) | Basis for determining the net realizable value and method for provision for obsolete inventories |
At the balance sheet date, inventories are carried at the lower of cost and net realizable value.
Net realizable value is the estimated selling price in the ordinary course of business less the estimated costs of completion and the estimated costs necessary to make the sale and relevant taxes. The net realizable value of materials held for use in the production is measured based on the net realizable value of the finished goods in which they will be incorporated. The net realizable value of the inventory held to satisfy sales or service contracts is measured based on the contract price, to the extent of the quantities specified in sales contracts, and the excess portion of inventories is measured based on general selling prices.
Any excess of the cost over the net realizable value of each item of inventories is recognized as a provision for obsolete inventories, and is recognized in profit or loss.
337
Notes to the Financial Statements (continued)
For the year ended 31 December 2021
(All amounts in thousands of Renminbi Yuan unless otherwise stated)
| III. | Summary of significant accounting policies and accounting estimates (continued) |
| 10. | Inventories (continued) |
| (4) | Inventory count system |
The Group maintains a perpetual inventory system.
| 11. | Long-term equity investments |
| (1) | Investment cost of long-term equity investments |
| (a) | Long-term equity investments acquired through a business combination |
| – | The initial cost of a long-term equity investment acquired through a business combination involving entities under common control is the Company’s share of the carrying amount of the subsidiary’s equity in the consolidated financial statements of the ultimate controlling party at the combination date. The difference between the initial investment cost and the carrying amount of the consideration given is adjusted to the share premium in the capital reserve, with any excess adjusted to retained earnings. For a long-term equity investment in a subsidiary acquired through a business combination achieved in stages which do not form a bundled transaction and involving entities under common control, the Company determines the initial cost of the investment in accordance with the above policies. The difference between this initial cost and the sum of the carrying amount of previously-held investment and the consideration paid for the shares newly acquired is adjusted to capital premium in the capital reserve, with any excess adjusted to retained earnings. |
| – | For a long-term equity investment obtained through a business combination not involving entities under common control, the initial cost comprises the aggregate of the fair value of assets transferred, liabilities incurred or assumed, and equity securities issued by the Company, in exchange for control of the acquiree. For a long-term equity investment obtained through a business combination not involving entities under common control and achieved through multiple transactions in stages which do not form a bundled transaction, the initial cost comprises the carrying amount of the previously-held equity investment in the acquiree immediately before the acquisition date, and the additional investment cost at the acquisition date. |
| (b) | Long-term equity investments acquired other than through a business combination |
| – | A long-term equity investment acquired other than through a business combination is initially recognized at the amount of cash paid if the Group acquires the investment by cash, or at the fair value of the equity securities issued if an investment is acquired by issuing equity securities. |
338
Notes to the Financial Statements (continued)
For the year ended 31 December 2021
(All amounts in thousands of Renminbi Yuan unless otherwise stated)
| III. | Summary of significant accounting policies and accounting estimates (continued) |
| 11. | Long-term equity investments (continued) |
| (2) | Subsequent measurement of long-term equity investment |
| (a) | Investments in subsidiaries |
In the Company’s separate financial statements, long-term equity investments in subsidiaries are accounted for using the cost method for subsequent measurement. Except for cash dividends or profit distributions declared but not yet distributed that have been included in the price or consideration paid in obtaining the investments, the Company recognizes its share of the cash dividends or profit distributions declared by the investee as investment income for the current period.
The investments in subsidiaries are stated in the balance sheet at cost less accumulated impairment losses.
For the impairment of the investments in subsidiaries, refer to Note III.18.
In the Group’s consolidated financial statements, subsidiaries are accounted for in accordance with the policies described in Note III.6.
| (b) | Investment in joint ventures and associates |
A joint venture is an arrangement whereby the Group and other parties have joint control (see Note III.11(3)) and rights to the net assets of the arrangement.
An associate is an entity over which the Group has significant influence (see Note III.11(3)).
An investment in a joint venture or an associate is accounted for using the equity method for subsequent measurement.
The accounting treatments under the equity method adopted by the Group are as follows:
| – | Where the initial cost of a long-term equity investment exceeds the Group’s interest in the fair value of the investee’s identifiable net assets at the date of acquisition, the investment is initially recognized at cost. Where the initial investment cost is less than the Group’s interest in the fair value of the investee’s identifiable net assets at the date of acquisition, the investment is initially recognized at the investor’s share of the fair value of the investee’s identifiable net assets, and the difference is recognized in profit or loss. |
339
Notes to the Financial Statements (continued)
For the year ended 31 December 2021
(All amounts in thousands of Renminbi Yuan unless otherwise stated)
| III. | Summary of significant accounting policies and accounting estimates (continued) |
| 11. | Long-term equity investments (continued) |
| (2) | Subsequent measurement of long-term equity investment (continued) |
| (b) | Investment in joint ventures and associates (continued) |
| – | After the acquisition of the investment, the Group recognizes its share of the investee’s profit or loss and other comprehensive income as investment income or losses and other comprehensive income respectively, and adjusts the carrying amount of the investment accordingly. Once the investee declares any cash dividends or profit distributions, the carrying amount of the investment is reduced by the amount attributable to the Group. Changes in the Group’s share of the investee’s owners’ equity, other than those arising from the investee’s net profit or loss, other comprehensive income or profit distribution (referred to as “other changes in owners’ equity”), is recognized directly in the Group’s equity, and the carrying amount of the investment is adjusted accordingly. |
| – | In calculating its share of the investee’s net profits or losses, other comprehensive income and other changes in owners’ equity, the Group recognizes investment income and other comprehensive income after making appropriate adjustments to align the accounting policies or accounting periods with those of the Group based on the fair value of the investee’s identifiable net assets at the date of acquisition. Unrealized profits and losses resulting from transactions between the Group and its associates or joint ventures are eliminated to the extent of the Group’s interest in the associates or joint ventures. Unrealized losses resulting from transactions between the Group and its associates or joint ventures are eliminated in the same way as unrealized gains but only to the extent that there is no impairment. |
| – | The Group discontinues recognizing its share of further losses of the investee after the carrying amount of the long-term equity investment and any long-term interest that in substance forms part of the Group’s net investment in the joint venture or associate is reduced to zero, except to the extent that the Group has an obligation to assume additional losses. However, if the Group has obligations for additional losses and the criteria with respect to recognition of provisions under the accounting standards on contingencies are satisfied, the Group continues recognizing the investment losses and the provisions. If the joint venture or associate subsequently reports net profits, the Group resumes recognizing its share of those profits only after its share of the profits has fully covered the share of losses not recognized. |
For the impairment of the investments in joint ventures and associates, refer to Note III.18.
| (3) | Criteria for determining the existence of joint control or significant influence over an investee |
Joint control is the contractually agreed sharing of control of an arrangement, which exists only when decisions about the relevant activities (activities with significant impact on the returns of the arrangement) require the unanimous consent of the parties sharing control.
340
Notes to the Financial Statements (continued)
For the year ended 31 December 2021
(All amounts in thousands of Renminbi Yuan unless otherwise stated)
| III. | Summary of significant accounting policies and accounting estimates (continued) |
| 11. | Long-term equity investments (continued) |
| (3) | Criteria for determining the existence of joint control or significant influence over an investee (continued) |
The following factors are usually considered when assessing whether the Group can exercise joint control over an investee:
| – | Whether no single participant party is in a position to control the investee’s related activities unilaterally; |
| – | Whether strategic decisions relating to the investee’s related activities require the unanimous consent of all participant parties that sharing of control. |
Significant influence is the power to participate in the financial and operating policy decisions of an investee but does not have control or joint control over those policies.
| 12. | Investment properties |
Investment properties are properties held either to earn rental income or for capital appreciation or for both. Investment properties are accounted for using the cost model and stated in the balance sheet at cost less accumulated depreciation, amortization and impairment losses. The cost of investment property, less its estimated residual value and accumulated impairment losses, is depreciated or amortized using the straight-line method over its estimated useful life, unless the investment property is classified as held for sale. For the impairment of the investment properties, refer to Note III.18.
| Class |
Estimated useful life (years) |
Residual value rate (%) |
Depreciation rate (%) |
|||||||||
| Plant and buildings |
30-40 years | 3 | % | 2.4%-3.2% | ||||||||
When an investment property is transferred to owner-occupied properties, it is reclassified as fixed asset or intangible asset at the date of the transfer. When an owner-occupied property is transferred out for earning rentals or for capital appreciation, the fixed asset or intangible asset is reclassified as investment properties at its carrying amount at the date of the transfer.
The investment property’s estimated useful life, net residual value and depreciation method applied are reviewed and adjusted as appropriate at each year-end.
An investment property is derecognized on disposal or when the investment property is permanently withdrawn from use and no future economic benefits are expected from its disposal. The net amount of proceeds from sale, transfer, retirement or damage of an investment property after its carrying amount and related taxes and expenses is recognized in profit or loss for the current period.
341
Notes to the Financial Statements (continued)
For the year ended 31 December 2021
(All amounts in thousands of Renminbi Yuan unless otherwise stated)
| III. | Summary of significant accounting policies and accounting estimates (continued) |
| 13. | Fixed assets |
| (1) | Recognition of fixed assets |
Fixed assets represent the tangible assets held by the Group for use in production of goods or for administrative purposes with useful lives over one accounting year.
The cost of a purchased fixed asset comprises the purchase price, related taxes, and any directly attributable expenditure for bringing the asset to working condition for its intended use. The cost of self-constructed assets is measured in accordance with the policy set out in Note III.14. The fixed assets injected by the state-owned shareholder during the restructuring were initially recorded at the valuated amount approved by the relevant authorities managing state-owned assets.
Where the parts of an item of fixed assets have different useful lives or provide benefits to the Group in a different pattern, thus necessitating use of different depreciation rates or methods, each part is recognized as a separate fixed asset.
Any subsequent costs including the cost of replacing part of an item of fixed assets are recognized as assets when it is probable that the economic benefits associated with the costs will flow to the Group, and the carrying amount of the replaced part is derecognized. The costs of the day-to-day maintenance of fixed assets are recognized in profit or loss as incurred.
Fixed assets are stated in the balance sheet at cost less accumulated depreciation and impairment losses.
| (2) | Depreciation of fixed assets |
The cost of a fixed asset, less its estimated residual value and accumulated impairment losses, is depreciated using the straight-line method over its estimated useful life.
The estimated useful lives, residual value rates and depreciation rates of each class of fixed assets are as follows:
| Class |
Estimated useful life (years) |
Residual value rate (%) |
Depreciation rate (%) |
|||||||||
| Buildings |
12~40 years | 0%~5% | 2.4%~8.3% | |||||||||
| Plant and machinery |
5~20 years | 0%~5% | 4.8%~20.0% | |||||||||
| Vehicles and other equipment |
4~20 years | 0%~5% | 4.8%~25.0% | |||||||||
Useful lives, estimated residual values and depreciation methods are reviewed at least at each year-end.
342
Notes to the Financial Statements (continued)
For the year ended 31 December 2021
(All amounts in thousands of Renminbi Yuan unless otherwise stated)
| III. | Summary of significant accounting policies and accounting estimates (continued) |
| 13. | Fixed assets (continued) |
| (3) | For the impairment of the fixed assets, refer to Note III.18. |
| (4) | Disposal of fixed assets |
The carrying amount of a fixed asset is derecognized:
| – | when the fixed asset is holding for disposal; or |
| – | when no future economic benefit is expected to be generated from its use or disposal. |
Gains or losses arising from the retirement or disposal of an item of fixed asset are determined as the difference between the net disposal proceeds and the carrying amount of the item, and are recognized in profit or loss on the date of retirement or disposal.
| 14. | Construction in progress |
The cost of self-constructed assets includes the cost of materials, direct labour, capitalized borrowing costs (see Note III.15), and any other costs directly attributable to bringing the asset to working condition for its intended use.
A self-constructed asset is classified as construction in progress and transferred to fixed asset when it is ready for its intended use, and depreciation begins from the following month. No depreciation is provided against construction in progress.
Construction in progress is stated in the balance sheet at cost less accumulated impairment losses (see Note III.18).
343
Notes to the Financial Statements (continued)
For the year ended 31 December 2021
(All amounts in thousands of Renminbi Yuan unless otherwise stated)
| III. | Summary of significant accounting policies and accounting estimates (continued) |
| 15. | Borrowing costs |
Borrowing costs incurred directly attributable to the acquisition and construction of a qualifying asset are capitalized as part of the cost of the asset. Other borrowing costs are recognized as financial expenses when incurred.
During the capitalization period, the amount of interest (including amortization of any discount or premium on borrowing) to be capitalized in each accounting period is determined as follows:
| – | Where funds are borrowed specifically for the acquisition, and construction or production of a qualifying asset, the amount of interest to be capitalized is the interest expense calculated using effective interest rates during the period less any interest income earned from depositing the borrowed funds or any investment income on the temporary investment of those funds before being used on the asset. |
| – | To the extent that the Group borrows funds generally and uses them for the acquisition, and construction or production of a qualifying asset, the amount of borrowing costs eligible for capitalization is determined by applying a capitalization rate to the weighted average of the excess amounts of cumulative expenditure on the asset over the above amounts of specific borrowings. The capitalization rate is the weighted average of the interest rates applicable to the general-purpose borrowings. |
The effective interest rate is determined as the rate that exactly discounts estimated future cash flow through the expected life of the borrowing or, when appropriate, a shorter period to the initially recognized amount of the borrowings.
During the capitalization period, exchange differences related to the principal and interest on a specific-purpose borrowing denominated in foreign currency are capitalized as part of the cost of the qualifying asset. The exchange differences related to the principal and interest on foreign currency borrowings other than a specific-purpose borrowing are recognized as a financial expense when incurred.
The capitalization period is the period from the date of commencement of capitalization of borrowing costs to the date of cessation of capitalization, excluding any period over which capitalization is suspended. Capitalization of borrowing costs commences when expenditure for the asset is being incurred, borrowing costs are being incurred and activities of acquisition and construction that are necessary to prepare the asset for its intended use are in progress, and ceases when the assets become ready for their intended use. Capitalization of borrowing costs is suspended when the acquisition and construction activities are interrupted abnormally for a period of more than three months.
344
Notes to the Financial Statements (continued)
For the year ended 31 December 2021
(All amounts in thousands of Renminbi Yuan unless otherwise stated)
| III. | Summary of significant accounting policies and accounting estimates (continued) |
| 16. | Intangible assets |
Intangible assets are stated in the balance sheet at cost less accumulated amortization (where the estimated useful life is finite) and impairment losses (see Note III.18). For an intangible asset with finite useful life, its cost less estimated residual value and accumulated impairment losses is amortized using the straight-line method over its estimated useful life, unless the intangible asset is classified as held for sale. The intangible assets injected by the state-owned shareholder during the restructuring were initially recorded at the valuated amount approved by the relevant authorities managing state-owned assets.
The respective amortization periods for intangible assets are as follows:
| Item |
Amortization period (years) |
|||
| Land-use right |
20-50 years | |||
| Other intangible assets |
2-28 years | |||
Useful lives and amortization methods of intangible asset with finite useful life are reviewed at least at each year-end.
An intangible asset is regarded as having an indefinite useful life and is not amortized when there is no foreseeable limit to the period over which the asset is expected to generate economic benefits for the Group. At the balance sheet date, the Group does not have any intangible assets with indefinite useful lives.
Expenditure on an internal research and development project is classified into expenditure incurred during the research phase and expenditure incurred during the development phase.
Expenditure during the research phase is expensed when incurred. Expenditure during the development phase is capitalized if development costs can be measured reliably, the product or process is technically and commercially feasible, and the Group intends to and has sufficient resources to complete the development. Capitalized development costs are stated in the balance sheet at cost less impairment losses (see Note III.18). Other development expenditure is recognized as an expense in the period in which it is incurred.
345
Notes to the Financial Statements (continued)
For the year ended 31 December 2021
(All amounts in thousands of Renminbi Yuan unless otherwise stated)
| III. | Summary of significant accounting policies and accounting estimates (continued) |
| 17. | Long-term deferred expenses |
Long-term prepaid expenses mainly include the catalyst expenditures, leasehold improvements and other expenditures that have been incurred but should be recognized as expenses over more than one year in the current and subsequent periods.
Long-term deferred expenses are amortized using a straight-line method within the benefit period. The respective amortization periods for such expenses are as follows:
| Item |
Amortization period | |||
| Catalysts |
1.5-10 years | |||
| Leasehold improvements |
15-27 years | |||
| 18. | Impairment of assets other than inventories and financial assets |
The carrying amounts of the following assets are reviewed at each balance sheet date based on internal and external sources of information to determine whether there is any indication of impairment:
| – | fixed assets |
| – | construction in progress |
| – | right-of-use assets |
| – | intangible assets |
| – | investment properties measured using a cost model |
| – | long-term equity investments |
| – | long-term deferred expenses, etc. |
346
Notes to the Financial Statements (continued)
For the year ended 31 December 2021
(All amounts in thousands of Renminbi Yuan unless otherwise stated)
| III. | Summary of significant accounting policies and accounting estimates (continued) |
| 18. | Impairment of assets other than inventories and financial assets (continued) |
If any indication exists, the recoverable amount of the asset is estimated. In addition, the Group estimates the recoverable amounts of intangible assets not ready for use at least annually at each year-end, irrespective of whether there is any indication of impairment.
The recoverable amount of an asset (or asset group, set of asset groups) is the higher of its fair value (see Note III.19) less costs to sell and its present value of expected future cash flows.
An asset group is composed of assets directly related to cash generation and is the smallest identifiable group of assets that generates cash inflows that are largely independent of the cash inflows from other assets or asset groups.
The present value of expected future cash flows of an asset is determined by discounting the future cash flows, estimated to be derived from continuing use of the asset and from its ultimate disposal, to their present value using an appropriate pre-tax discount rate.
An impairment loss is recognized in profit or loss when the recoverable amount of an asset is less than its carrying amount. A provision for impairment of the asset is recognized accordingly. Impairment losses related to an asset group or a set of asset groups are allocated first to reduce the carrying amount of any goodwill allocated to the asset group or set of asset groups, and then to reduce the carrying amount of the other assets in the asset group or set of asset groups on a pro rata basis. However, such allocation would not reduce the carrying amount of an asset below the highest of its fair value less costs to sell (if measurable), its present value of expected future cash flows (if determinable) and zero.
Once an impairment loss is recognized, it is not reversed in a subsequent period.
| 19. | Fair value measurement |
Unless otherwise specified, the Group measures fair value as follows:
Fair value is the price that would be received to sell an asset or paid to transfer a liability in an orderly transaction between market participants at the measurement date.
When measuring fair value, the Group takes into account the characteristics of the particular asset or liability (including the condition and location of the asset and restrictions, if any, on the sale or use of the asset) that market participants would consider when pricing the asset or liability at the measurement date, and uses valuation techniques that are appropriate in the circumstances and for which sufficient data and other information are available to measure fair value. Valuation techniques mainly include the market approach, the income approach and the cost approach.
347
Notes to the Financial Statements (continued)
For the year ended 31 December 2021
(All amounts in thousands of Renminbi Yuan unless otherwise stated)
| III. | Summary of significant accounting policies and accounting estimates (continued) |
| 20. | Provisions |
A provision is recognized for an obligation related to a contingency if the Group has a present obligation that can be estimated reliably, and it is probable that an outflow of economic benefits will be required to settle the obligation.
A provision is initially measured at the best estimate of the expenditure required to settle the related present obligation. Where the effect of the time value of money is material, provisions are determined by discounting the expected future cash flows. The increase in the discounted amount of the provision arising from passage of time is recognized as interest expense. Factors pertaining to a contingency such as the risks, uncertainties and time value of money are taken into account as a whole in reaching the best estimate. Where there is a continuous range of possible outcomes for the expenditure required, and each possible outcome in that range is as likely as any other, the best estimate is the mid-point of that range. In other cases, the best estimate is determined according to the following circumstances:
| – | Where the contingency involves a single item, the best estimate is the most likely outcome. |
| – | Where the contingency involves a large population of items, the best estimate is determined by weighting all possible outcomes by their associated probabilities. |
The Group reviews the carrying amount of a provision at the balance sheet date and adjusts the carrying amount to the current best estimate. The estimated liabilities expected to be paid within one year from the balance sheet date are listed as current liabilities.
| 21. | Revenue recognition |
Revenue is the gross inflow of economic benefits arising in the course of the Group’s ordinary activities when the inflows result in increase in shareholders’ equity, other than increase relating to contributions from shareholders.
Revenue is recognized when the Group satisfies the performance obligation in the contract by transferring the control over relevant goods or services to the customers.
Where a contract has two or more performance obligations, the Group determines the stand-alone selling price at contract inception of the distinct good or service underlying each performance obligation in the contract and allocates the transaction price in proportion to those stand-alone selling prices. The Group recognizes as revenue the amount of the transaction price that is allocated to each performance obligation. The stand-alone selling price is the price at which the Group would sell a promised good or service separately to a customer. If a stand-alone selling price is not directly observable, the Group considers all information that is reasonably available to the entity, maximizes the use of observable inputs to estimate the stand-alone selling price.
348
Notes to the Financial Statements (continued)
For the year ended 31 December 2021
(All amounts in thousands of Renminbi Yuan unless otherwise stated)
| III. | Summary of significant accounting policies and accounting estimates (continued) |
| 21. | Revenue recognition (continued) |
For the contract with a warranty, the Group analyses the nature of the warranty provided, if the warranty provides the customer with a distinct service in addition to the assurance that the product complies with agreed-upon specifications, the Group recognizes for the promised warranty as a performance obligation. Otherwise, the Group accounts for the warranty in accordance with the requirements of CAS No.13 – Contingencies.
The transaction price is the amount of consideration to which the Group expects to be entitled in exchange for transferring promised goods or services to a customer, excluding amounts collected on behalf of third parties. The Group recognizes the transaction price only to the extent that it is highly probable that a significant reversal in the amount of cumulative revenue recognized will not occur when the uncertainty associated with the variable consideration is subsequently resolved. Where the contract contains a significant financing component, the Group recognizes the transaction price at an amount that reflects the price that a customer would have paid for the promised goods or services if the customer had paid cash for those goods or services when (or as) they transfer to the customer. The difference between the amount of promised consideration and the cash selling price is amortized using an effective interest method over the contract term. The Group does not adjust the consideration for any effects of a significant financing component if it expects, at contract inception, that the period between when the Group transfers a promised good or service to a customer and when the customer pays for that good or service will be one year or less.
The Group satisfies a performance obligation over time if one of the following criteria is met; or otherwise, a performance obligation is satisfied at a point in time:
| – | the customer simultaneously receives and consumes the benefits provided by the Group’s performance as the Group performs; |
| – | the customer can control the asset created or enhanced during the Group’s performance; or |
| – | the Group’s performance does not create an asset with an alternative use to it and the Group has an enforceable right to payment for performance completed to date. |
For performance obligation satisfied over time, the Group recognizes revenue over time by measuring the progress towards complete satisfaction of that performance obligation. When the outcome of that performance obligation cannot be measured reasonably, but the Group expects to recover the costs incurred in satisfying the performance obligation, the Group recognizes revenue only to the extent of the costs incurred until such time that it can reasonably measure the outcome of the performance obligation.
349
Notes to the Financial Statements (continued)
For the year ended 31 December 2021
(All amounts in thousands of Renminbi Yuan unless otherwise stated)
| III. | Summary of significant accounting policies and accounting estimates (continued) |
| 21. | Revenue recognition (continued) |
For performance obligation satisfied at a point in time, the Group recognizes revenue at the point in time at which the customer obtains control of relevant goods or services. To determine whether a customer has obtained control of goods or services, the Group considers the following indicators:
| – | the Group has a present right to payment for the goods or services; |
| – | the Group has transferred physical possession of the goods to the customer; |
| – | the Group has transferred the legal title of the goods or the significant risks and rewards of ownership of the goods to the customer; and |
| – | the customer has accepted the goods or services, etc. |
The Group determines whether it is a principal or an agent, depending on whether it obtains control of the specified good or service before that good or service is transferred to a customer. The Group is a principal if it controls the specified good or service before that good or service is transferred to a customer, and recognizes revenue in the gross amount of consideration to which it has received (or receivable). Otherwise, the Group is an agent, and recognizes revenue in the amount of any fee or commission to which it expects to be entitled. The fee or commission is the net amount of consideration that the Group retains after paying the other party the consideration, or is the established amount or proportion.
A contract asset is the Group’s right to consideration in exchange for goods or services that it has transferred to a customer when that right is conditional on something other than the passage of time. The Group recognizes loss allowances for expected credit loss on contract assets (see Note III 9(6)). Accounts receivable is the Group’s right to consideration that is unconditional (only the passage of time is required). A contract liability is the Group’s obligation to transfer goods or services to a customer for which the Group has received consideration (or an amount of consideration is due) from the customer.
The following is the description of accounting policies regarding revenue from the Group’s principal activities:
| (1) | Sale of goods |
Revenue from sale is recognized when all of the general conditions stated above and the following conditions are satisfied: the significant risks and rewards of ownership of goods have been transferred to the buyer, as well as the Group retains neither continuing managerial involvement to the degree usually associated with ownership nor effective control over the goods sold. The Group recognizes revenue when goods are sent to designated place or customer take delivery of the goods from Group’s designated warehouse, and confirmed receipt by customers according to the terms of contract.
The Group provides discounts based on the sales amount, and recognizes revenue based on the contract value exclude expected discounts.
350
Notes to the Financial Statements (continued)
For the year ended 31 December 2021
(All amounts in thousands of Renminbi Yuan unless otherwise stated)
| III. | Summary of significant accounting policies and accounting estimates (continued) |
| 21. | Revenue recognition (continued) |
| (2) | Rendering of overseas shipping services |
Revenue from the rendering of overseas shipping services is recognized using the percentage of completion method, with the stage of completion being determined based on proportion of shipping time incurred to date to the estimated total shipping time.
| (3) | Interest income |
Interest income is calculated by the time of lending money and the actual interest rate.
| 22. | Contract costs |
Contract costs are either the incremental costs of obtaining a contract with a customer or the costs to fulfil a contract with a customer.
Incremental costs of obtaining a contract are those costs that the Group incurs to obtain a contract with a customer that it would not have incurred if the contract had not been obtained (e.g. an incremental sales commission). The Group recognizes as an asset the incremental costs of obtaining a contract with a customer if it expects to recover those costs. Other costs of obtaining a contract are expensed when incurred.
If the costs to fulfil a contract with a customer are not within the scope of inventories or other accounting standards, the Group recognizes an asset from the costs incurred to fulfil a contract only if those costs meet all of the following criteria:
| – | the costs relate directly to an existing contract or to a specifically identifiable anticipated contract, including direct labor, direct materials, allocations of overheads (or similar costs), costs that are explicitly chargeable to the customer and other costs that are incurred only because the Group entered into the contract; |
| – | the costs generate or enhance resources of the Group that will be used in satisfying (or in continuing to satisfy) performance obligations in the future; |
| – | the costs are expected to be recovered. |
351
Notes to the Financial Statements (continued)
For the year ended 31 December 2021
(All amounts in thousands of Renminbi Yuan unless otherwise stated)
| III. | Summary of significant accounting policies and accounting estimates (continued) |
| 22. | Contract costs (continued) |
Assets recognized for the incremental costs of obtaining a contract and assets recognized for the costs to fulfil a contract (the “assets related to contract costs”) are amortized on a systematic basis that is consistent with the transfer to the customer of the goods or services to which the assets relate and recognized in profit or loss for the current period. The Group recognizes the incremental costs of obtaining a contract as an expense when incurred if the amortization period of the asset that the entity otherwise would have recognized is one year or less.
The Group recognizes an impairment loss in profit or loss to the extent that the carrying amount of an asset related to contract costs exceeds:
| – | remaining amount of consideration that the Group expects to receive in exchange for the goods or services to which the asset relates; less |
| – | the costs that relate directly to providing those goods or services that have not yet been recognized as expenses. |
| 23. | Employee benefits |
| (1) | Short-term employee benefits |
Employee wages or salaries, bonuses, social security contributions such as medical insurance, work injury insurance, maternity insurance and housing fund, measured at the amount incurred or accrued at the applicable benchmarks and rates, are recognized as a liability as the employee provides services, with a corresponding charge to profit or loss or included in the cost of assets where appropriate. Employee benefits which are non-monetary benefits are measured at fair value.
| (2) | Post employment benefits defined contribution plans |
Pursuant to the relevant laws and regulations of the People’s Republic of China, the Group participated in a defined contribution basic pension insurance plan in the social insurance system established and managed by government organisations. The Group makes contributions to basic pension insurance plans based on the applicable benchmarks and rates stipulated by the government. When employees retire, the relevant local authorities are obliged to pay the basic pensions to them. Basic pension insurance contributions payable are recognized as a liability as the employee provides services, with a corresponding charge to profit or loss or included in the cost of assets where appropriate.
352
Notes to the Financial Statements (continued)
For the year ended 31 December 2021
(All amounts in thousands of Renminbi Yuan unless otherwise stated)
| III. | Summary of significant accounting policies and accounting estimates (continued) |
| 23. | Employee benefits (continued) |
| (3) | Termination benefits |
When the Group terminates the employment with employees before the employment contracts expire, or provides compensation under an offer to encourage employees to accept voluntary redundancy, a provision is recognized with a corresponding expense in profit or loss at the earlier of the following dates:
| – | When the Group cannot unilaterally withdraw the offer of termination benefits because of an employee termination plan or a curtailment proposal; |
| – | When the Group has a formal detailed restructuring plan involving the payment of termination benefits and has raised a valid expectation in those affected that it will carry out the restructuring by starting to implement that plan or announcing its main features to those affected by it. |
Termination benefits expected to be paid in one year are listed as current liabilities.
| 24. | Government grants |
Government grants are non reciprocal transfers of monetary or non monetary assets from the government to the Group except for capital contributions from the government in the capacity as an investor in the Group. Special funds such as investment grants allocated by the government, if clearly defined in official documents as part of “capital reserve” are dealt with as capital contributions, are not regarded as government grants.
A government grant is recognized when there is reasonable assurance that the grant will be received and that the Group will comply with the conditions attaching to the grant.
If a government grant is in the form of a transfer of a monetary asset, it is measured at the amount received or receivable. If a government grant is in the form of a transfer of a non monetary asset, it is measured at fair value.
Government grants related to assets are grants whose primary condition is that the Group qualifying for them should purchase, construct or otherwise acquire long-term assets. Government grants related to income are grants other than those related to assets. A government grant related to an asset is offset against the carrying amount of the related asset or recognized as deferred income and amortized over the useful life of the related asset on a reasonable and systematic manner as other income or non-operating income. A grant that compensates the Group for expenses or losses to be incurred in the future is recognized as deferred income, and included in other income or non operating income offset against related expense in the periods in which the expenses or losses are recognized. Or included in other income or non-operating income offset against the related expenses directly. The Group uses the same reporting method for similar government subsidies.
Government subsidies related to daily activities are included in operating profit, while government subsidies unrelated to daily activities are included in non-operating income and expenditure.
353
Notes to the Financial Statements (continued)
For the year ended 31 December 2021
(All amounts in thousands of Renminbi Yuan unless otherwise stated)
| III. | Summary of significant accounting policies and accounting estimates (continued) |
| 25. | Specific reserve |
According to the decision of the State Council on Further Strengthening the work of production safety (Guofa No.2 2004), Shanghai Municipal Government to implement the State Council on Further Strengthening corporate safety work notice (Hufufa No.35 2010) and Safe production costs extraction and use of management practices (Caiqi No.16 2012) issued by the Ministry of Finance and the national production safety supervision administration on 2 February 2012, The Group extracted safety production costs in a certain percentage of sales revenue from the dangerous goods in previous year, which is used for safety costs.
The Group recognizes a safety fund in the specific reserve pursuant to relevant government regulations, with a corresponding increase in the costs of the related products or expenses.
When the safety fund is subsequently used for revenue expenditure, the specific reserve is reduced accordingly. On utilization of the safety fund for fixed assets, the specific reserve is reduced as the fixed assets are recognized, which is the time when the related assets are ready for their intended use; in such cases, an amount that corresponds to the reduction in the specific reserve is recognized in accumulated depreciation with respect to the related fixed assets. As a consequence, such fixed assets are not depreciated in subsequent periods.
| 26. | Income tax |
Current tax and deferred tax are recognized in profit or loss except to the extent that they relate to a business combination or items recognized directly in equity (including other comprehensive income).
Current tax is the expected tax payable calculated at the applicable tax rate on taxable income for the year, plus any adjustment to tax payable in respect of previous years.
At the balance sheet date, current tax assets and liabilities are offset only if the Group has a legally enforceable right to set them off and also intends either to settle on a net basis or to realize the asset and settle the liability simultaneously.
Deferred tax assets and deferred tax liabilities arise from deductible and taxable temporary differences respectively, being the differences between the carrying amounts of assets and liabilities for financial reporting purposes and their tax bases, which include the deductible losses and tax credits carried forward to subsequent periods. Deferred tax assets are recognized to the extent that it is probable that future taxable profits will be available against which deductible temporary differences can be utilized.
Deferred tax is not recognized for the temporary differences arising from the initial recognition of assets or liabilities in a transaction that is not a business combination and that affects neither accounting profit nor taxable profit (or deductible loss). Deferred tax is not recognized for taxable temporary differences arising from the initial recognition of goodwill.
354
Notes to the Financial Statements (continued)
For the year ended 31 December 2021
(All amounts in thousands of Renminbi Yuan unless otherwise stated)
| III. | Summary of significant accounting policies and accounting estimates (continued) |
| 26. | Income tax (continued) |
At the balance sheet date, deferred tax is measured based on the tax consequences that would follow from the expected manner of recovery or settlement of the carrying amounts of the assets and liabilities, using tax rates enacted at the balance sheet date that are expected to be applied in the period when the asset is recovered, or the liability is settled.
The carrying amount of a deferred tax asset is reviewed at each balance sheet date and is reduced to the extent that it is no longer probable that the related tax benefits will be utilized. Such reduction is reversed to the extent that it becomes probable that sufficient taxable profits will be available.
Deferred tax liabilities are recognized for temporary differences arising from investments in subsidiaries, associates and joint ventures, except where the Group is able to control the timing of reversal of the temporary difference, and it is probable that the temporary difference will not reverse in the foreseeable future. When it is probable that the temporary differences arising from investments in subsidiaries, associates and joint ventures will be reversed in the foreseeable future and that the taxable profit will be available in the future against which the temporary differences can be utilized, the corresponding deferred tax assets are recognized.
At the balance sheet date, deferred tax assets and deferred tax liabilities are offset if all of the following conditions are met:
| – | the taxable entity has a legally enforceable right to offset current tax liabilities and current tax assets; |
| – | they relate to income taxes levied by the same tax authority on either: |
| – | the same taxable entity; or |
| – | different taxable entities which intend either to settle the current tax liabilities and current tax assets on a net basis, or to realize the assets and settle the liabilities simultaneously, in each future period in which significant amounts of deferred tax liabilities or deferred tax assets are expected to be settled or recovered. |
| 27. | Leases |
A contract is lease if the lessor conveys the right to control the use of an identified asset to lessee for a period of time in exchange for consideration.
At inception of a contract, the Group assesses whether a contract is, or contains, a lease. A contract is, or contains, a lease if the contract conveys the right to control the use of an identified asset for a period of time in exchange for consideration.
355
Notes to the Financial Statements (continued)
For the year ended 31 December 2021
(All amounts in thousands of Renminbi Yuan unless otherwise stated)
| III. | Summary of significant accounting policies and accounting estimates (continued) |
| 27. | Leases (continued) |
To assess whether a contract conveys the right to control the use of an identified asset, the Group assesses whether:
| – | the contract involves the use of an identified asset. An identified asset may be specified explicitly or implicitly specified in a contract and should be physically distinct, or capacity portion or other portion of an asset that is not physically distinct, but it represents substantially all of the capacity of the asset and thereby provides the customer with the right to obtain substantially all of the economic benefits from the use of the asset. If the supplier has a substantive substitution right throughout the period of use, then the asset is not identified; |
| – | the lessee has the right to obtain substantially all of the economic benefits from use of the asset throughout the period of use; |
| – | the lessee has the right to direct the use of the asset. |
For a contract that contains more separate lease components, the lessee and the lessor separate lease components and account for each lease component as a lease separately. For a contract that contains lease and non-lease components, the lessee and the lessor separate lease components from non-lease components. However, for the leases of land and buildings in which it is a lessee, the Group has elected not to separate lease components from non-lease components and account for the lease and non-lease components as a single lease component. For a contract that contains lease and non-lease components, the lessee allocates the consideration in the contract to each lease component on the basis of the relative stand-alone price of the lease component and the aggregate stand-alone price of the non-lease components. The lessor allocates the consideration in the contract in accordance with the accounting policy in Note III.21.
| (1) | As a lessee |
The Group recognizes a right-of-use asset and a lease liability at the lease commencement date. The right-of-use asset is initially measured at cost, which comprises the initial amount of the lease liability, any lease payments made at or before the commencement date (less any lease incentives received), any initial direct costs incurred and an estimate of costs to dismantle and remove the underlying asset or to restore the site on which it is located or restore the underlying asset to the condition required by the terms and conditions of the lease.
The right-of-use asset is depreciated using the straight-line method. If the lessee is reasonably certain to exercise a purchase option by the end of the lease term, the right-of-use asset is depreciated over the remaining useful lives of the underlying asset. Otherwise, the right-of-use asset is depreciated from the commencement date to the earlier of the end of the useful life of the right-of-use asset or the end of the lease term. Impairment losses of right-of-use assets are accounted for in accordance with the accounting policy described in Note III.18.
356
Notes to the Financial Statements (continued)
For the year ended 31 December 2021
(All amounts in thousands of Renminbi Yuan unless otherwise stated)
| III. | Summary of significant accounting policies and accounting estimates (continued) |
| 27. | Leases (continued) |
| (1) | As a lessee (continued) |
The lease liability is initially measured at the present value of the lease payments that are not paid at the commencement date. Lease payments include fixed payments and payments to be made if it is reasonably determined that the option to buy or to terminate the lease option will be exercised. The variable rent, which is determined by a certain percentage of sales, is not included in the lease payment and is recorded into the current profit and loss when it actually occurs. The Group will be paid from the balance sheet date within one year (including one year) of the lease liabilities, as a non-current liability due within one year. Discounted using the interest rate implicit in the lease or, if that rate cannot be readily determined, the Group’s incremental borrowing rate.
A constant periodic rate is used to calculate the interest on the lease liability in each period during the lease term with a corresponding charge to profit or loss or included in the cost of assets where appropriate. Variable lease payments not included in the measurement of the lease liability is charged to profit or loss or included in the cost of assets where appropriate as incurred.
Under the following circumstances after the commencement date, the Group remeasures lease liabilities based on the present value of revised lease payments:
| – | there is a change in the amounts expected to be payable under a residual value guarantee; |
| – | there is a change in future lease payments resulting from a change in an index or a rate used to determine those payments; |
| – | there is a change in the assessment of whether the Group will exercise a purchase, extension or termination option, or there is a change in the exercise of the extension or termination option. |
When the lease liability is remeasured, a corresponding adjustment is made to the carrying amount of the right-of-use asset, or is recorded in profit or loss if the carrying amount of the right-of-use asset has been reduced to zero.
The Group has elected not to recognize right-of-use assets and lease liabilities for short-term leases that have a lease term of 12 months or less and leases of low-value assets. The Group recognizes the lease payments associated with these leases in profit or loss or as the cost of the assets where appropriate using the straight-line method over the lease term.
357
Notes to the Financial Statements (continued)
For the year ended 31 December 2021
(All amounts in thousands of Renminbi Yuan unless otherwise stated)
| III. | Summary of significant accounting policies and accounting estimates (continued) |
| 27. | Leases (continued) |
| (2) | As a lessor |
All lease contracts where the Group is a lessor are operating leases.
Lease receipts from operating leases is recognized as income using the straight-line method over the lease term. The initial direct costs incurred in respect of the operating lease are initially capitalized and subsequently amortized in profit or loss over the lease term on the same basis as the lease income. Variable lease payments not included in lease receipts are recognized as income as they are earned.
| 28. | Hedge accounting |
Hedge accounting is a method which recognizes in profit or loss (or other comprehensive income) the gain or loss on the hedging instrument and the hedged item in the same accounting period(s) to represent the effect of risk management.
Hedged items are items that expose the Group to risks of changes in fair value or cash flows and that are designated as being hedged and can be reliably measured. The Group’s hedged items include a forecast transaction that is settled with an undetermined future market price and exposes the Group to risk of variability in cash flows, etc.
A hedging instrument is a designated financial instrument whose changes in fair value or cash flows are expected to offset changes in the fair value or cash flows of the hedged item.
The Group assesses at the inception of a hedging relationship, and on an ongoing basis, whether the hedging relationship meets the hedge effectiveness requirements. A hedging relationship is regarded as having met the hedge effectiveness requirements if all of the following conditions are satisfied:
| – | There is an economic relationship between the hedged item and the hedging instrument. The economic relationship causes the value of the hedging instrument and the hedged item to move in opposite directions due to the same exposure to the hedged risk; |
| – | The effect of credit risk does not dominate the value changes that result from the economic relationship; |
| – | The hedge ratio of the hedging relationship is the same as that resulting from the quantity of the hedged item that the entity actually hedges and the quantity of the hedging instrument that the entity actually uses to hedge that quantity of the hedged item. |
358
Notes to the Financial Statements (continued)
For the year ended 31 December 2021
(All amounts in thousands of Renminbi Yuan unless otherwise stated)
| III. | Summary of significant accounting policies and accounting estimates (continued) |
| 28. | Hedge accounting (continued) |
When a hedging relationship no longer meets the hedge effectiveness requirements due to the hedge ratio, but the risk management objective of the designated hedging relationship remains unchanged, the Group rebalances the hedging relationship. Rebalancing refers to the adjustments made to the designated quantities of the hedged item or the hedging instrument of an already existing hedging relationship for the purpose of maintaining a hedge ratio that complies with the hedge effectiveness requirements.
The Group discontinues applying hedge accounting in any of the following circumstances:
| – | The hedging relationship no longer meets the risk management objective on the basis of which it qualified for hedge accounting; |
| – | The hedging instrument expires or is sold, terminated or exercised; |
| – | There is no longer an economic relationship between the hedged item and the hedging instrument or the effect of credit risk starts to dominate the value changes that result from that economic relationship; |
| – | The hedging relationship no longer meets other criteria for applying hedge accounting. |
| (1) | Cash flow hedges |
A cash flow hedge is a hedge of the exposure to variability in cash flows. The portion of the gain or loss on a hedging instrument that is determined to be an effective hedge is recognized in other comprehensive income as a cash flow hedge reserve. The amount of the cash flow hedge reserve is adjusted to the lower of the following (in absolute amounts):
| – | the cumulative gain or loss on the hedging instrument from inception of the hedge; |
| – | the cumulative change in present value of the expected future cash flows on the hedged item from inception of the hedge. |
The change in the amount of the cash flow hedge reserve is recognized in other comprehensive income in each period.
The portion of the gain or loss on the hedging instrument that is determined to be ineffectiveness is recognized in profit or loss.
359
Notes to the Financial Statements (continued)
For the year ended 31 December 2021
(All amounts in thousands of Renminbi Yuan unless otherwise stated)
| III. | Summary of significant accounting policies and accounting estimates (continued) |
| 28. | Hedge accounting (continued) |
| (1) | Cash flow hedges (continued) |
If a hedged forecast transaction subsequently results in the recognition of a non-financial asset or non-financial liability, or a hedged forecast transaction for a non-financial asset or non-financial liability becomes a firm commitment for which fair value hedge accounting is applied, the Group removes that amount from the cash flow hedge reserve and includes it in the initial cost or other carrying amount of the asset or liability. This is not a reclassification adjustment and will not affect other comprehensive income.
For cash flow hedges other than those covered above, that amount is reclassified from the cash flow hedge reserve to profit or loss as a reclassification adjustment in the same period or periods during which the hedged expected future cash flows affect profit or loss.
When the Group discontinues hedge accounting for a cash flow hedge, the amount of the accumulated cash flow hedge reserve recognized in other comprehensive income is accounted for as follows:
| – | If the hedged future cash flows are still expected to occur, that amount will remain in the cash flow hedge reserve and be accounted for in accordance with the above policy; |
| – | If the hedged future cash flows are no longer expected to occur, that amount is immediately reclassified from the cash flow hedge reserve to profit or loss as a reclassification adjustment. |
| 29. | Profit distributions |
Dividends or profit distributions proposed in the profit appropriation plan, which will be approved after the balance sheet date, are not recognized as a liability at the balance sheet date but are disclosed in the notes separately.
| 30. | Related parties |
If a party has the power to control, jointly control or exercise significant influence over another party, or vice versa, or where two or more parties are subject to common control or joint control from another party, they are considered to be related parties. Related parties may be individuals or enterprises. Enterprises with which the Company is under common control only from the State and that have no other related party relationships are not regarded as related parties.
In addition to the related parties stated above, the Company determines related parties based on the disclosure requirements of Administrative Procedures on the Information Disclosures of Listed Companies issued by the CSRC.
360
Notes to the Financial Statements (continued)
For the year ended 31 December 2021
(All amounts in thousands of Renminbi Yuan unless otherwise stated)
| III. | Summary of significant accounting policies and accounting estimates (continued) |
| 31. | Segment reporting |
Reportable segments are identified based on operating segments which are determined based on the structure of the Group’s internal organization, management requirements and internal reporting system after taking the materiality principle into account. An operating segment is a component of the Group that satisfies all of the following conditions:
| – | the component is able to earn revenues and incur expenses from its ordinary activities; |
| – | whose operating results are regularly reviewed by the Group’s management to make decisions about resources to be allocated to the segment and to assess its performance, and |
| – | for which the information on financial position, operating results and cash flows is available to the Group. Two or more operating segments may be aggregated into a single operating segment if the segments have the similar economic characteristics and are same or similar in respect of the nature of each segment’s products and services, the nature of production processes, the types or classes of customers for the products and services, the methods used to distribute the products or provide the services, and the nature of the regulatory environment. |
Inter-segment revenues are measured on the basis of the actual transaction prices for such transactions for segment reporting. Segment accounting policies are consistent with those for the consolidated financial statements.
| 32. | Significant accounting estimates and judgements |
The preparation of the financial statements requires management to make estimates and assumptions that affect the application of accounting policies and the reported amounts of assets, liabilities, income and expenses. Actual results may differ from these estimates. Estimates as well as underlying assumptions and uncertainties involved are reviewed on an ongoing basis. Revisions to accounting estimates are recognized in the period in which the estimate is revised and in any future periods affected.
361
Notes to the Financial Statements (continued)
For the year ended 31 December 2021
(All amounts in thousands of Renminbi Yuan unless otherwise stated)
| III. | Summary of significant accounting policies and accounting estimates (continued) |
| 32. | Significant accounting estimates and judgements (continued) |
| (1) | Significant accounting estimates |
| (a) | Accounting estimate of Inventory provision |
Any excess of the cost over the net realizable value of each item of inventories is recognized as a provision for diminution in the value of inventories. Net realizable value represents the estimated selling price in the ordinary course of business, less the estimated costs of completion and the estimated costs necessary to make the sale. Management bases the estimates on all available information, including the current market prices of the finished goods and raw materials, and historical cost of sales. If the actual selling prices were to be lower or the costs of completion were to be higher than estimated, the actual allowance for diminution in value of inventories could be higher than estimated.
| (b) | Impairment of assets other than inventories and financial assets |
As described in Note III.18, at the end of each reporting period, the Group estimates the recoverable amount of an asset or a cash-generating unit (“CGU”) (a portion of which related to certain production facilities), at the higher of its fair value less costs of disposal and its value in use, to determine the impairment losses. If circumstances indicate that the carrying amount of the asset or CGU may not be recoverable, the asset or CGU may be considered “impaired”, and an impairment loss may be recognized.
The recoverable amount of assets or CGUs is the higher of the fair value less costs of disposal and value in use. As the fair value of certain assets or CGUs may not be publicly available, the Group uses all readily available information in determining an amount that is a reasonable approximation of recoverable amount, including estimates based on reasonable and supportable assumptions for projections of product sales and operating costs and discount rate. In particular, in determining the value in use of the Group’s specific CGUs, significant judgements are required on the accounting estimates which are based on the assumptions relating to product sales growth rates, related costs growth rates and discount rate applied.
362
Notes to the Financial Statements (continued)
For the year ended 31 December 2021
(All amounts in thousands of Renminbi Yuan unless otherwise stated)
| III. | Summary of significant accounting policies and accounting estimates (continued) |
| 32. | Significant accounting estimates and judgements (continued) |
| (1) | Significant accounting estimates (continued) |
| (c) | Estimated useful life and residual value of fixed assets |
The Group assessed the reasonableness of estimated useful life of fixed assets in line with the historical experience on the basis of similar function or characteristic for the assets. If there are significant changes in estimated useful lives and residual value from previous years, the depreciation expenses for future periods are adjusted.
The Group reviews and adjusts the useful lives and estimated residual value of the assets regularly at the end of each year end.
| (2) | Significant accounting judgements |
| (a) | Classification of financial assets |
The classification depends on the Group’s business model for managing the financial assets and the contractual terms of the cash flows. The Group determines the business model of managing financial assets at the level of financial asset portfolio, taking into account such factors as the way of evaluating and reporting the performance of financial assets to key managers, the risk and management methods that affect the performance of financial assets, and the ways in which relevant business managers are paid, etc
When the Group evaluates whether the contract cash flow of financial assets is consistent with the basic lending arrangement, there are the following main judgments: whether the time distribution or amount of principal may change within the duration due to prepayment or other reasons; Does interest include only the time value of money, credit risk, other basic lending risks, and consideration of costs and profits? For example, does the prepayment amount reflect only the principal outstanding and the interest based on the principal outstanding, as well as the reasonable compensation paid for the early termination of the contract.
| 33. | Changes in significant accounting policies and accounting estimates |
| (1) | Description and reasons of changes in accounting policies |
The following accounting standards take effect for annual periods beginning on or after 1 January 2021 and are relevant to the Group:
| – | CAS Bulletin No.14 (Caikuai [2021] No.1) |
| – | The Accounting Treatment of COVID-19-Related Rent Concessions (Caikuai [2021] No.9) |
363
Notes to the Financial Statements (continued)
For the year ended 31 December 2021
(All amounts in thousands of Renminbi Yuan unless otherwise stated)
| III. | Summary of significant accounting policies and accounting estimates (continued) |
| 33. | Changes in significant accounting policies and accounting estimates (continued) |
| (1) | Description and reasons of changes in accounting policies (continued) |
| (a) | CAS Bulletin No.14 |
CAS Bulletin No.14 takes effect on 26 January 2021.
| (i) | Benchmark interest rate reform |
Bulletin No.14 introduces the accounting and disclosure requirements for the modification of financial instruments and lease liabilities resulting from the benchmark interest rate reform. Transactions related to the benchmark interest rate reform that occurred before 31 December 2020 and during 1 January 2021 to the implementation date are subject to retrospective adjustments. Cumulative effects are adjusted to the opening retained earnings or other comprehensive income for the year 2021. Comparative information is not restated.
The adoption of above standard does not have any significant effect on the financial position or financial performance of the Group.
| (b) | Caikuai [2021] No.9 |
Caikuai [2020] No.10 has provided a practical expedient under certain conditions for rent concessions occurring as a direct consequence of the Covid-19 pandemic. In accordance with the stipulation of Caikuai [2021] No.9, the rent concession period is for the lease payments before 30 June 2022. The Group adjusted the accumulated impact of Caikuai [2021] No.9 to the retained earnings at the beginning of 2021 and other related financial statement items, and did not adjust the data in the previous comparative financial statements.
The adoption of Caikuai [2021] No.9 does not have any significant effect on the financial position or financial performance of the Group.
364
Notes to the Financial Statements (continued)
For the year ended 31 December 2021
(All amounts in thousands of Renminbi Yuan unless otherwise stated)
| IV. | Taxation |
Main types of taxes and corresponding tax rates:
| Tax type |
Tax basis |
Tax rate | ||||
| Corporate income tax (a) |
Based on taxable profits | 25% | ||||
| Value-added tax (VAT) |
Output VAT is calculated on product sales and taxable services revenue. The basis for VAT payable is to deduct input VAT from the output VAT for the period | 5%, 6%, 9% and 13% | ||||
| Consumption tax |
Based on taxable revenue | |
Gasoline: RMB2,109.76 per ton; Diesel oil: RMB1,411.20 per ton; Naphtha: RMB2,105.20 per ton; Fuel oil: RMB1,218.00 per ton |
| ||
| Urban maintenance and construction tax |
Based on VAT and consumption tax paid | 1% and 7% | ||||
| (a) | Pursuant to the ‘Circular on Enterprise Income Tax Policy concerning Deductions for Equipment and Appliances’ (Cai Shui [2018] 54) issued by the State Administration of Taxation, during the period from 1 January 2018 to 31 December 2020, the cost of newly purchased equipment with the original cost less than RMB5 million can be fully deducted against taxable profit in the next month after the asset is put into use, instead of being depreciated annually for tax filing. Pursuant to the ‘Announcement on the extension of the implementation period of some tax incentives’ (Cai Shui [2021] 6) issued by the State Administration of Taxation, the implementation period of Cai Shui [2018] 54 is extended to 31 December 2023. |
365
Notes to the Financial Statements (continued)
For the year ended 31 December 2021
(All amounts in thousands of Renminbi Yuan unless otherwise stated)
| V. | Notes to the consolidated financial statements |
| 1. | Cash at bank and on hand |
| Item |
31 December 2021 | 31 December 2020 | ||||||
| Deposits with banks |
12,498,614 | 7,920,850 | ||||||
| Other monetary funds |
3 | 2 | ||||||
|
|
|
|
|
|||||
| Total |
12,498,617 | 7,920,852 | ||||||
|
|
|
|
|
|||||
Cash and cash equivalents shown in the cash flow statement:
| Item |
31 December 2021 | 31 December 2020 | ||||||
| Deposits with banks |
12,498,614 | 7,920,850 | ||||||
| Less: time deposits (a) |
(7,386,604 | ) | (1,004,442 | ) | ||||
|
|
|
|
|
|||||
| Ending balance of cash and cash equivalents |
5,112,010 | 6,916,408 | ||||||
|
|
|
|
|
|||||
| (a) | As at 31 December 2021, the time deposit is a time deposit of six months to three years deposited in bank, with annual interest rate of 3.2%-4.2%. |
As at 31 December 2020, the time deposit of RMB1,000,000 thousand is a time deposit of three months deposited by the Group with China CITIC Bank Shanghai Branch, with annual interest rate of 4.10%.
366
Notes to the Financial Statements (continued)
For the year ended 31 December 2021
(All amounts in thousands of Renminbi Yuan unless otherwise stated)
| V. | Notes to the consolidated financial statements (continued) |
| 2. | Derivative financial assets and derivative financial liabilities |
| Category |
31 December 2021 | 31 December 2020 | ||||||
| Derivative financial assets |
||||||||
| – Commodity swap contracts |
81,405 | — | ||||||
| Derivative financial Liabilities |
||||||||
| – Commodity swap contracts |
23,804 | — | ||||||
|
|
|
|
|
|||||
As at 31 December 2021, the Group’s derivative financial assets and derivative financial liabilities are mainly commodity swap contracts. (31 December 2020: Nil)
| 3. | Accounts receivable |
| (1) | Accounts receivable by customer type are as follows: |
| Category |
31 December 2021 | 31 December 2020 | ||||||
| Amounts due from related parties (NoteVIII.6) |
1,091,980 | 1,032,341 | ||||||
| Amounts due from third parties |
79,413 | 113,797 | ||||||
|
|
|
|
|
|||||
| Sub-total |
1,171,393 | 1,146,138 | ||||||
| Less: Provision for bad and doubtful debts |
(1,988 | ) | (634 | ) | ||||
|
|
|
|
|
|||||
| Total |
1,169,405 | 1,145,504 | ||||||
|
|
|
|
|
|||||
| (2) | The ageing analysis of accounts receivable is as follows: |
| Aging |
31 December 2021 | 31 December 2020 | ||||||
| Within 1 year (inclusive) |
1,169,279 | 1,144,024 | ||||||
| Over 1 year but within 2 years (inclusive) |
— | 2,114 | ||||||
| Over 2 year but within 3 years (inclusive) |
2,114 | — | ||||||
|
|
|
|
|
|||||
| Total |
1,171,393 | 1,146,138 | ||||||
|
|
|
|
|
|||||
The ageing is counted starting from the date when accounts receivables are recognized.
367
Notes to the Financial Statements (continued)
For the year ended 31 December 2021
(All amounts in thousands of Renminbi Yuan unless otherwise stated)
| V. | Notes to the consolidated financial statements (continued) |
| 3. | Accounts receivable (continued) |
| (3) | Accounts receivable by provisioning method |
| 31 December 2021 | 31 December 2020 | |||||||||||||||||||||||||||||||||||||||
| Book value | Provision for bad and doubtful debts |
Carrying amount |
Book value | Provision for bad and doubtful debts |
Carrying amount |
|||||||||||||||||||||||||||||||||||
| Category |
Amount | Percentage (%) | Amount | Percentage (%) | Amount | Percentage (%) | Amount | Percentage (%) | ||||||||||||||||||||||||||||||||
| Individual assessment |
— | — | — | — | — | — | — | — | — | — | ||||||||||||||||||||||||||||||
| Collective assessment |
1,171,393 | 100 | 1,988 | 0.17 | 1,169,405 | 1,146,138 | 100 | 634 | 0.06 | 1,145,504 | ||||||||||||||||||||||||||||||
|
|
|
|
|
|
|
|
|
|
|
|
|
|
|
|
|
|
|
|
|
|||||||||||||||||||||
| Total |
1,171,393 | 100 | 1,988 | 0.17 | 1,169,405 | 1,146,138 | 100 | 634 | 0.06 | 1,145,504 | ||||||||||||||||||||||||||||||
|
|
|
|
|
|
|
|
|
|
|
|
|
|
|
|
|
|
|
|
|
|||||||||||||||||||||
| (i) | As at 31 December 2021, the Group has no balance of individually impaired accounts receivable (as at 31 December 2020: Nil). |
| (ii) | Criteria for collective assessment for the year ended 31 December 2021 and details: |
According to the historical experience of the Group, there are no significant differences in the losses of different customer groups. Therefore, different customer groups are not further distinguished when calculating impairment loss based on the overdue information.
| (iii) | Assessment of ECLs on accounts receivable: |
At all times the Group measures the impairment loss for accounts receivable at an amount equal to lifetime ECLs, and the ECLs are based on the number of overdue days and the expected loss rate.
The loss given default is measured based on the actual credit loss experience in the past years, and is adjusted taking into consideration the differences among the economic conditions during the historical data collection period, the current economic conditions and the economic conditions during the expected lifetime.
368
Notes to the Financial Statements (continued)
For the year ended 31 December 2021
(All amounts in thousands of Renminbi Yuan unless otherwise stated)
| V. | Notes to the consolidated financial statements (continued) |
| 3. | Accounts receivable (continued) |
| (4) | Movements of provisions for bad and doubtful debts: |
| Provisions for bad and doubtful debts |
2021 | 2020 | ||||||
| Balance at the beginning of the year |
634 | — | ||||||
| Additions during the year |
1,354 | 634 | ||||||
| Recoveries or reversals during the year |
— | — | ||||||
|
|
|
|
|
|||||
| Balance at the end of the year |
1,988 | 634 | ||||||
|
|
|
|
|
|||||
| (5) | As at 31 December 2021, Five largest accounts receivable by debtor at the end of the year: |
| Amount | Provision | Percent of total amount |
||||||||||
| Total amount of five largest accounts receivable by debtor of the Group |
1,109,299 | — | 94.70 | % | ||||||||
|
|
|
|
|
|
|
|||||||
| (6) | Derecognition of accounts receivable due to transfer of financial assets |
| (i) | For the year ended 31 December 2021, the Group has no accounts receivable derecognized due to transfer of financial assets. |
| (ii) | For the year ended 31 December 2021, the Group has no accounts receivable that have fully accrued or accrued a large proportion of bad and doubtful debts in previous years, but fully recovered or reversed, or have a large proportion of recovered or reversed in the current year. (For the year ended 31 December 2020: Nil). |
| (iii) | For the year ended 31 December 2021, the Group has not written off significant accounts receivable. (For the year ended 31 December 2020: Nil) |
| (iv) | At 31 December 2021, the Group has no pledged accounts receivable. (31 December 2020: Nil) |
369
Notes to the Financial Statements (continued)
For the year ended 31 December 2021
(All amounts in thousands of Renminbi Yuan unless otherwise stated)
| V. | Notes to the consolidated financial statements (continued) |
| 4. | Receivables under financing |
| Item |
Note | 31 December 2021 | 31 December 2020 | |||||||||
| Bills receivable |
(1 | ) | 673,295 | 893,187 | ||||||||
| Accounts receivable |
(2 | ) | 399,395 | 323,927 | ||||||||
|
|
|
|
|
|||||||||
| Total |
1,072,690 | 1,217,114 | ||||||||||
|
|
|
|
|
|||||||||
| (1) | Bills receivable |
| (i) | Due to the requirement of cash management, the Group discounted and endorsed part of the bank acceptance notes. The business model of bank acceptance notes management is for the purpose of collecting cash flow of contracts and sales. Therefore, as at 31 December 2021, the Group classified RMB673,295 thousand bills receivable to financial assets measured at fair value and whose changes are included in other comprehensive income and disclosed in bills receivable and accounts receivable (31 December 2020: RMB893,187 thousand). |
| (ii) | The Group has no individually impaired bank acceptance notes, with all provision was accrued by their expected credit loss. As at 31 December 2021 and 31 December 2020, the Group considers no significant credit risk of the bank acceptance notes and the Group has limited exposure to losses arising from banks’ breach of contract. |
| (iii) | As at 31 December 2021, the Group had no pledged bank acceptance notes (31 December 2020: Nil). |
| (iv) | As at 31 December 2021, unmatured bills receivable that have been endorsed or discounted by the Group is as follows: |
| Item |
Derecognized | Not derecognized | ||||||
| Bank acceptance notes |
464,012 | — | ||||||
As at 31 December 2021, the Group endorsed and discounted the undue bills receivable of RMB464,012 thousand (31 December 2020: RMB625,343 thousand). The Group derecognized such bills receivable, accounts payable to suppliers and short-term loans as a whole by considering that the risks and rewards of ownership of such unmatured bills had been substantially transferred. The Group’s continued involvement in the unexpired bills receivable whose overall derecognition is limited to the extent that the issuing bank is unable to settle the amount to the bill holder. The maximum exposure to loss caused by the Group’s continued involvement is the amount of outstanding bills receivable endorsed to the supplier of RMB464,012 thousand (31 December 2020: RMB625,343 thousand). The term of the outstanding bills receivable is within one year.
370
Notes to the Financial Statements (continued)
For the year ended 31 December 2021
(All amounts in thousands of Renminbi Yuan unless otherwise stated)
| V. | Notes to the consolidated financial statements (continued) |
| 4. | Receivables under financing (continued) |
| (2) | Accounts receivable |
| (i) | The Group’s subsidiaries Shanghai Jinshan Trading Corporation Limited(“JMGJ”) and Shanghai Jinmao International Trading Corporation Limited (“Jinmao International”) derecognized part of the accounts receivable for the non-recourse forfaiting business based on the requirement of daily cash management. The business model of accounts receivable management is for the purpose of collecting cash flow of contracts and sales. Therefore, as at 31 December 2021, the Group classified RMB399,395 thousand third party accounts receivable of subsidiaries to financial assets measured at fair value and whose changes are included in other comprehensive income and disclosed in bills receivable and accounts receivable (31 December 2020, RMB323,927 thousand). |
| (ii) | The analysis of accounts receivable derecognized due to the transfer of financial assets is as follows: |
As at 31 December 2021, the Group’s subsidiaries JMGJ derecognized RMB254,915 thousand accounts receivable due to the non-recourse forfaiting. (31 December 2020: RMB263,242 thousand).
| 5. | Prepayments |
| (1) | Prepayments by category: |
| Item |
2021 | 2020 | ||||||
| Amounts advance to related parties (Note VIII.6) |
34,220 | 26,777 | ||||||
| Amounts advance to third parties |
26,357 | 6,964 | ||||||
|
|
|
|
|
|||||
| Total |
60,577 | 33,741 | ||||||
|
|
|
|
|
|||||
| (2) | The ageing analysis of prepayments is as follows: |
| 2021 | 2020 | |||||||||||||||
| Aging |
Amount | Percentage | Amount | Percentage | ||||||||||||
| Within 1 year (inclusive) |
60,577 | 100 | % | 33,741 | 100 | % | ||||||||||
The ageing is counted starting from the date when prepayments are recognized.
371
Notes to the Financial Statements (continued)
For the year ended 31 December 2021
(All amounts in thousands of Renminbi Yuan unless otherwise stated)
| V. | Notes to the consolidated financial statements (continued) |
| 5. | Prepayments (continued) |
| (3) | As at 31 December 2021, the total amount of the top five prepayments to suppliers are summarised as follows: |
| Amount | Percentage of total advances to suppliers |
|||||||
| Total amount of the top five prepayments to suppliers |
54,037 | 89.20 | % | |||||
| 6. | Other receivables |
| Note | 2021 | 2020 | ||||||||||
| Amounts due from related parties |
Note VIII.6 | 61,131 | 23,198 | |||||||||
| Amounts due from third parties |
47,737 | 18,240 | ||||||||||
|
|
|
|
|
|||||||||
| Sub-total |
108,868 | 41,438 | ||||||||||
| Less: Provision for bad and doubtful debts |
(140 | ) | (139 | ) | ||||||||
|
|
|
|
|
|||||||||
| Total |
108,728 | 41,299 | ||||||||||
|
|
|
|
|
|||||||||
| (a) | The ageing analysis is as follows: |
| Aging |
2021 | 2020 | ||||||
| Within 1 year (inclusive) |
108,701 | 41,299 | ||||||
| Over 1 year but within 2 years (inclusive) |
28 | — | ||||||
| Over 2 years but within 3 years (inclusive) |
— | — | ||||||
| Over 3 years |
139 | 139 | ||||||
|
|
|
|
|
|||||
| Total |
108,868 | 41,438 | ||||||
|
|
|
|
|
|||||
The ageing is counted starting from the date when other receivables are recognized.
372
Notes to the Financial Statements (continued)
For the year ended 31 December 2021
(All amounts in thousands of Renminbi Yuan unless otherwise stated)
| V. | Notes to the consolidated financial statements (continued) |
| 6. | Other receivables (continued) |
| (b) | Others by provisioning method: |
| 2021 | 2020 | |||||||||||||||||||||||||||||||||||||||
| Book value | Provision for bad and doubtful debts |
Carrying amount |
Book value | Provision for bad and doubtful debts |
Carrying amount |
|||||||||||||||||||||||||||||||||||
| Category |
Amount | Percentage (%) |
Amount | Percentage (%) |
|
Amount | Percentage (%) |
Amount | Percentage (%) |
|
||||||||||||||||||||||||||||||
| Individual assessment |
— | — | — | — | — | — | — | — | — | — | ||||||||||||||||||||||||||||||
| Collective assessment |
108,868 | 100 | (140 | ) | 0.13 | 108,728 | 41,438 | 100 | (139 | ) | 0.3 | 41,299 | ||||||||||||||||||||||||||||
|
|
|
|
|
|
|
|
|
|
|
|
|
|
|
|
|
|
|
|
|
|||||||||||||||||||||
| Total |
108,868 | 100 | (140 | ) | 0.13 | 108,728 | 41,438 | 100 | (139 | ) | 0.3 | 41,299 | ||||||||||||||||||||||||||||
|
|
|
|
|
|
|
|
|
|
|
|
|
|
|
|
|
|
|
|
|
|||||||||||||||||||||
| (c) | Movements of provisions for bad and doubtful debts |
| Stage 1 | Stage 3 | |||||||||||||||||||||||||||||||
| 12-month ECL (collective) | 12-month ECL (individual) | Sub-total | Lifetime ECL- Credit impaired |
Total | ||||||||||||||||||||||||||||
| Book value |
Provision for bad and doubtful debts |
Book value |
Provision for bad and doubtful debts |
Provision for bad and doubtful debts |
Book value |
Provision for bad and doubtful debts |
Provision for bad and doubtful debts |
|||||||||||||||||||||||||
| Balance at 31 December 2020 |
41,299 | — | — | — | — | 139 | (139 | ) | (139 | ) | ||||||||||||||||||||||
| Additions during the year |
108,701 | (1 | ) | — | — | (1 | ) | — | — | (1 | ) | |||||||||||||||||||||
| Recoveries or reversals during the year |
(41,272 | ) | — | — | — | — | — | — | — | |||||||||||||||||||||||
| Balance at 31 December 2021 |
108,728 | (1 | ) | — | — | (1 | ) | 139 | (139 | ) | (140 | ) | ||||||||||||||||||||
As at 31 December 2021 and 31 December 2020, the Group has no other receivables under Stage 2.
| (i) | For the year ended 31 December 2021, the Group has no other receivables that have fully accrued or accrued a large proportion of bad and doubtful debts in previous years, but fully recovered or reversed, or have a large proportion of recovered or reversed in the current year. (For the year ended 31 December 2020: Nil) |
| (ii) | For the year ended 31 December 2021, the Group has not written off significant other receivables. (For the year ended 31 December 2020: Nil). |
373
Notes to the Financial Statements (continued)
For the year ended 31 December 2021
(All amounts in thousands of Renminbi Yuan unless otherwise stated)
| V. | Notes to the consolidated financial statements (continued) |
| 6. | Other receivables (continued) |
| (d) | Others categorised by nature |
| Nature of other receivables |
2021 | 2020 | ||||||
| Export tax rebate |
35,665 | 10,348 | ||||||
| Amounts due from related parties |
61,131 | 23,198 | ||||||
| Rent receivable |
17 | 1,330 | ||||||
| Water, electricity and gas charges receivable |
86 | 1,437 | ||||||
| Others |
11,969 | 5,125 | ||||||
|
|
|
|
|
|||||
| Sub-total |
108,868 | 41,438 | ||||||
| Less: Provision for bad and doubtful debts |
(140 | ) | (139 | ) | ||||
|
|
|
|
|
|||||
| Total |
108,728 | 41,299 | ||||||
|
|
|
|
|
|||||
| (e) | Five largest others-by debtors as at 31 December 2021 |
| Name |
Nature of the receivable |
Balance at the end of the year |
Ageing | Percentage of ending balance of others (%) |
Ending balance of provision for bad and doubtful debts |
|||||||||||||||
| China International United Petroleum and Chemicals Co., Ltd. |
|
Business transaction |
|
58,186 | |
Within 1 year (inclusive |
) |
53.45 | % | — | ||||||||||
| State Administration of Taxation, Shanghai Jinshan |
|
Export tax rebate |
|
35,665 | |
Within 1 year (inclusive |
) |
32.76 | % | — | ||||||||||
| Shanghai Yufan logistics Co., Ltd. |
|
Business transaction |
|
3,015 | |
Within 1 year (inclusive |
) |
2.77 | % | — | ||||||||||
| Linde-SPC Gases Company Limited (“Linde Gases Company”), formerly known as “BOC-SPC Gases Company Limited”) |
|
Business transaction |
|
2,412 | |
Within 1 year (inclusive |
) |
2.22 | % | — | ||||||||||
| Shanghai Yumao Shipping Agency Co., Ltd. |
|
Business transaction |
|
572 | |
Within 1 year (inclusive |
) |
0.52 | % | — | ||||||||||
|
|
|
|
|
|
|
|||||||||||||||
| Total |
99,850 | 91.72 | % | — | ||||||||||||||||
|
|
|
|
|
|
|
|||||||||||||||
374
Notes to the Financial Statements (continued)
For the year ended 31 December 2021
(All amounts in thousands of Renminbi Yuan unless otherwise stated)
| V. | Notes to the consolidated financial statements (continued) |
| 7. | Inventories |
| (1) | Inventories by categories are as follows: |
| 2021 | 2020 | |||||||||||||||||||||||
| Inventories by categories |
Book value | Provision for impairment of inventories |
Carrying amount |
Book value | Provision for impairment of inventories |
Carrying amount |
||||||||||||||||||
| Raw materials |
4,391,555 | (13,406 | ) | 4,378,149 | 2,569,136 | — | 2,569,136 | |||||||||||||||||
| Work in progress |
795,791 | (105,450 | ) | 690,341 | 696,227 | (122,081 | ) | 574,146 | ||||||||||||||||
| Finished goods |
709,990 | (45,950 | ) | 664,040 | 591,485 | (46,652 | ) | 544,833 | ||||||||||||||||
| Spare parts and consumables |
249,456 | (58,461 | ) | 190,995 | 260,431 | (59,800 | ) | 200,631 | ||||||||||||||||
|
|
|
|
|
|
|
|
|
|
|
|
|
|||||||||||||
| Total |
6,146,792 | (223,267 | ) | 5,923,525 | 4,117,279 | (228,533 | ) | 3,888,746 | ||||||||||||||||
|
|
|
|
|
|
|
|
|
|
|
|
|
|||||||||||||
The balance of inventories of the Group does not include the capitalized interest at 31 December 2021 (31 December 2020: Nil).
The Group has no inventory for guarantee as at 31 December 2021 (31 December 2020: Nil).
| (2) | Provision for impairment of inventories is analysed as follows: |
| Inventories by categories |
31 December 2020 |
Increases during the year |
Decreases during the year |
31 December 2021 |
||||||||||||
| Raw materials |
— | 13,406 | — | 13,406 | ||||||||||||
| Work in progress |
122,081 | 102,355 | (118,986 | ) | 105,450 | |||||||||||
| Finished goods |
46,652 | 35,122 | (35,824 | ) | 45,950 | |||||||||||
| Spare parts and consumables |
59,800 | — | (1,339 | ) | 58,461 | |||||||||||
|
|
|
|
|
|
|
|
|
|||||||||
| Total |
228,533 | 150,883 | (156,149 | ) | 223,267 | |||||||||||
|
|
|
|
|
|
|
|
|
|||||||||
375
Notes to the Financial Statements (continued)
For the year ended 31 December 2021
(All amounts in thousands of Renminbi Yuan unless otherwise stated)
| V. | Notes to the consolidated financial statements (continued) |
| 7. | Inventories (continued) |
| (3) | Provision for impairment of inventories are analysed as follows: |
| Inventories by categories |
Basis for determining net realizable value |
Main reasons for reversal/write-off | ||
| Raw materials | The estimated selling price in the ordinary course of business, less the estimated costs to completion and estimated costs to make the sale and related taxes. | Not applicable | ||
| Work in progress | The estimated selling price in the ordinary course of business, less the estimated costs to completion and estimated costs to make the sale and related taxes. | Sold in current year | ||
| Finished goods | The estimated selling price in the ordinary course of business, less the estimated costs to make the sale and related taxes. | Sold in current year | ||
| Spare parts and consumables | The estimated selling price in the ordinary course of business, less the estimated costs to make the sale and related taxes. | Used for repair and sold in current year | ||
| 8. | Other current assets |
| Item |
2021 | 2020 | ||||||
| Time deposits (a) |
— | 3,044,999 | ||||||
| VAT deductible |
13,322 | 9,084 | ||||||
| Others |
4,007 | 3,504 | ||||||
|
|
|
|
|
|||||
| Total |
17,329 | 3,057,587 | ||||||
|
|
|
|
|
|||||
| (a) | As at 31 December 2020, the Group’s six-month fixed deposit and one-year fixed deposit at Shanghai Jinshan Branch of China Minsheng Bank are RMB500,000 thousand and 1,000,000 thousand respectively, and the one-year fixed deposit at Shanghai Jinshan Branch of China Guangfa bank is RMB1,500,000 thousands, with an annual interest rate range of 3.15% to 3.60%. Time deposits have been settled before 31 December 2021. |
376
Notes to the Financial Statements (continued)
For the year ended 31 December 2021
(All amounts in thousands of Renminbi Yuan unless otherwise stated)
| V. | Notes to the consolidated financial statements (continued) |
| 9. | Long-term equity investments |
| Note | 2021 | 2020 | ||||||||||
| Joint ventures |
(1 | ) | 276,043 | 241,674 | ||||||||
| Associates |
(2 | ) | 3,941,237 | 5,256,160 | ||||||||
| Sub-total |
4,217,280 | 5,497,834 | ||||||||||
| Less: provision for impairment |
||||||||||||
| – Joint ventures |
— | — | ||||||||||
| – Associates |
(28,392 | ) | — | |||||||||
|
|
|
|
|
|||||||||
| Total |
4,188,888 | 5,497,834 | ||||||||||
|
|
|
|
|
|||||||||
| (1) | Joint ventures |
| Current year movement | ||||||||||||||||||||||||||||
| Investee |
31 December 2020 |
Additional/ (negative) investment |
Investment income recognized under equity method |
Cash dividends declared in current year |
Impairment provision |
31 December 2021 |
impairment provision at the end of the year |
|||||||||||||||||||||
| Joint venture of the Company Shanghai Jinshan Baling New Material Co., Ltd. (“Baling Materials”) |
— | 50,000 | — | — | — | 50,000 | — | |||||||||||||||||||||
| Joint ventures of subsidiaries Shanghai Petrochemical Equipment Inspection and Testing Co., Ltd. (“Inspection and Testing company”) |
9,352 | — | 1,688 | (940 | ) | — | 10,100 | — | ||||||||||||||||||||
| Shanghai Petrochemical Yangu Gas Development Company Limited (“Yangu Gas”) |
48,648 | — | 2,071 | (800 | ) | — | 49,919 | — | ||||||||||||||||||||
| Linde Gases Company |
183,674 | — | 45,394 | (63,044 | ) | — | 166,024 | — | ||||||||||||||||||||
|
|
|
|
|
|
|
|
|
|
|
|
|
|
|
|||||||||||||||
| Total |
241,674 | 50,000 | 49,153 | (64,784 | ) | — | 276,043 | — | ||||||||||||||||||||
|
|
|
|
|
|
|
|
|
|
|
|
|
|
|
|||||||||||||||
Interests in joint ventures, refer to Note VI.2.
377
Notes to the Financial Statements (continued)
For the year ended 31 December 2021
(All amounts in thousands of Renminbi Yuan unless otherwise stated)
| V. | Notes to the consolidated financial statements (continued) |
| 9. | Long-term equity investments (continued) |
| (2) | Associates |
| Current year movement | ||||||||||||||||||||||||||||||||||||
| Investee |
31 December 2020 |
Additional/ (negative) investment |
Investment income/(loss) recognized under equity method |
Cash dividends declared in current year |
Impairment provision |
Change in other equity |
Others | 31 December 2021 |
impairment provision at the end of the year |
|||||||||||||||||||||||||||
| Associates of the Company |
||||||||||||||||||||||||||||||||||||
| Shanghai Secco(Note 1) |
2,731,547 | (1,460,258 | ) | 633,403 | (634,341 | ) | — | — | — | 1,270,351 | — | |||||||||||||||||||||||||
| Shanghai Chemical Industry Park Development Company Limited (“Chemical Industry”) |
2,017,791 | — | 141,381 | (52,225 | ) | — | 16,639 | — | 2,123,586 | — | ||||||||||||||||||||||||||
| Associates of subsidiaries |
||||||||||||||||||||||||||||||||||||
| Shanghai Jinsen Hydrocarbon Resins Company Limited (“Jinsen”)(Note 2) |
51,244 | — | (6,663 | ) | — | (28,392 | ) | — | — | 16,189 | (28,392 | ) | ||||||||||||||||||||||||
| Shanghai Azbil Automation Company Limited (“Azbil”) |
63,083 | — | 24,684 | (19,200 | ) | — | — | — | 68,567 | — | ||||||||||||||||||||||||||
| Shanghai Shidian Energy Company Limited (“Shidian Energy”) |
317,401 | — | 16,672 | — | — | — | — | 334,073 | — | |||||||||||||||||||||||||||
| CRRC Forming Technology (Qingdao) Co., Ltd. (“CRRC forming”) |
— | 26,000 | — | — | — | — | — | 26,000 | — | |||||||||||||||||||||||||||
| Others |
75,094 | — | 5,655 | (6,670 | ) | — | — | — | 74,079 | — | ||||||||||||||||||||||||||
|
|
|
|
|
|
|
|
|
|
|
|
|
|
|
|
|
|
|
|||||||||||||||||||
| Total |
5,256,160 | (1,434,258 | ) | 815,132 | (712,436 | ) | (28,392 | ) | 16,639 | — | 3,912,845 | (28,392 | ) | |||||||||||||||||||||||
|
|
|
|
|
|
|
|
|
|
|
|
|
|
|
|
|
|
|
|||||||||||||||||||
Interests in associates, refer to Note VI.2.
| Note | 1: The decrease in investment in Shanghai Secco is shown in Note IX 2(i). |
| Note | 2: During the year ended 31 December 2021, the Group reviewed the carrying value of the Group’s associate and joint ventures. The entire carrying amount of the interests in an associate is tested for impairment in accordance with CAS 8 Impairment of Assets as a single asset by comparing its recoverable amount with its carrying amount. Since the recoverable amount of investment in an associate Jinsen is lower when compared with its carrying amount, impairment loss amounting to RMB28,392 thousand (2020: nil) is recognized during the year ended 31 December 2021. |
The recoverable amount of the investment in an associate was based on its fair value less costs to sell. The fair value was determined by reference to the actual price at which another shareholder of Jinsen sold its equity interest in 2021.
378
Notes to the Financial Statements (continued)
For the year ended 31 December 2021
(All amounts in thousands of Renminbi Yuan unless otherwise stated)
| V. | Notes to the consolidated financial statements (continued) |
| 10. | Investment properties |
| Buildings | ||||
| Cost |
||||
| 31 December 2020 |
627,488 | |||
| Additions during the year |
||||
| – Transfer from fixed assets (Note V.11) |
90 | |||
| Decrease during the year |
||||
| – Transfer out to fixed assets (Note V.11) |
(1,164 | ) | ||
| 31 December 2021 |
626,414 | |||
|
|
|
|||
| Accumulated depreciation |
||||
| 31 December 2020 |
259,902 | |||
| Additions during the year |
||||
| – Charge for current year |
15,325 | |||
| – Transfer from fixed assets (Note V.11) |
87 | |||
| Decrease during the year |
||||
| – Transfer out to fixed assets (Note V.11) |
(1,088 | ) | ||
| 31 December 2021 |
274,226 | |||
|
|
|
|||
| Carrying amount |
||||
| 31 December 2021 |
352,188 | |||
|
|
|
|||
| 31 December 2020 |
367,586 | |||
|
|
|
|||
For the year ended 31 December 2021, the depreciation amount of investment properties is RMB15,325 thousand without provision for impairment (For the year ended 31 December 2020, depreciation amount is RMB15,184 thousand without provision for impairment).
As at 31 December 2021 and 31 December 2020 the Group had no investment properties pending certificates of ownership.
379
Notes to the Financial Statements (continued)
For the year ended 31 December 2021
(All amounts in thousands of Renminbi Yuan unless otherwise stated)
| V. | Notes to the consolidated financial statements (continued) |
| 11. | Fixed assets |
| (1) | Fixed assets |
| Buildings | Plant and machinery |
Vehicles and other equipment |
Total | |||||||||||||
| Cost |
||||||||||||||||
| 31 December 2020 |
3,483,188 | 43,150,536 | 1,958,290 | 48,592,014 | ||||||||||||
| Reclassification in current year |
267,662 | (275,880 | ) | 8,218 | — | |||||||||||
| Increase in current year |
||||||||||||||||
| – Purchase |
— | 161,118 | 15,646 | 176,764 | ||||||||||||
| – Transfer from CIP (Note V.12) |
130,947 | 1,476,065 | 92,962 | 1,699,974 | ||||||||||||
| – Transfer from investment properties |
1,164 | — | — | 1,164 | ||||||||||||
| Decrease in current year |
||||||||||||||||
| – Disposal |
(4,717 | ) | (737,634 | ) | (62,782 | ) | (805,133 | ) | ||||||||
| – Transfer to CIP |
(2,091 | ) | (1,260 | ) | (15,404 | ) | (18,755 | ) | ||||||||
| – Transfer to investment properties |
(83 | ) | (7 | ) | — | (90 | ) | |||||||||
| 31 December 2021 |
3,876,070 | 43,772,938 | 1,996,930 | 49,645,938 | ||||||||||||
|
|
|
|
|
|
|
|
|
|||||||||
| Accumulated depreciation |
||||||||||||||||
| 31 December 2020 |
2,397,124 | 32,092,695 | 1,457,908 | 35,947,727 | ||||||||||||
| Reclassification in current year |
214,041 | (216,706 | ) | 2,665 | — | |||||||||||
| Increase in current year |
||||||||||||||||
| – Charge for current year |
88,298 | 1,421,611 | 113,560 | 1,623,469 | ||||||||||||
| – Transfer from investment properties |
1,088 | — | — | 1,088 | ||||||||||||
| Decrease in current year |
||||||||||||||||
| – Disposal |
(3,652 | ) | (626,865 | ) | (55,709 | ) | (686,226 | ) | ||||||||
| – Transfer to CIP |
(46 | ) | (735 | ) | (5,642 | ) | (6,423 | ) | ||||||||
| – Transfer to investment properties |
(80 | ) | (7 | ) | — | (87 | ) | |||||||||
| 31 December 2021 |
2,696,773 | 32,669,993 | 1,512,782 | 36,879,548 | ||||||||||||
|
|
|
|
|
|
|
|
|
|||||||||
| Provision for impairment |
||||||||||||||||
| 31 December 2020 |
53,792 | 848,781 | 8,649 | 911,222 | ||||||||||||
| Reclassification in current year |
26,133 | (26,270 | ) | 137 | — | |||||||||||
| Increase in current year |
||||||||||||||||
| – Charge for current year |
793 | 586,147 | 682 | 587,622 | ||||||||||||
| Decrease in current year |
||||||||||||||||
| – Disposals during current year |
— | (60,018 | ) | (501 | ) | (60,519 | ) | |||||||||
| 31 December 2021 |
80,718 | 1,348,640 | 8,967 | 1,438,325 | ||||||||||||
|
|
|
|
|
|
|
|
|
|||||||||
| Carrying amount |
||||||||||||||||
| 31 December 2021 |
1,098,579 | 9,754,305 | 475,181 | 11,328,065 | ||||||||||||
|
|
|
|
|
|
|
|
|
|||||||||
| 31 December 2020 |
1,032,272 | 10,209,060 | 491,733 | 11,733,065 | ||||||||||||
|
|
|
|
|
|
|
|
|
|||||||||
380
Notes to the Financial Statements (continued)
For the year ended 31 December 2021
(All amounts in thousands of Renminbi Yuan unless otherwise stated)
| V. | Notes to the consolidated financial statements (continued) |
| 11. | Fixed assets (continued) |
| (2) | During 2021, due to deteriorating market conditions, the increasing production cost is not expected to be covered by the anticipated selling price of the products, the Group identified an impairment indicator assets in relation to certain production facilities, including 4# aromatic joint unit and 3# aromatic joint unit under intermediate petrochemicals segment. |
The Group recognized impairment loss on property, plant and equipment and assets in relation to certain production facilities of RMB519,877 thousand and RMB259,850 thousand, respectively, for the year ended 31 December 2021, in accordance with the accounting policies set out in Note III, 18 to the financial statements.
The recoverable amounts of above production facilities are estimated using the present value of future cash flows based on the financial budgets approved by management covering a five-year period. Forecasted cash flows are developed using several key assumptions, including the product sales growth rates, related costs growth rates (“forecasted growth rates”) and discount rate. The forecasted growth rates are based on past business performance and market participants’ expectations for market development, which are consistent with the forecasts included in industry reports. The discount rate used is a pre-tax ratio of 10.00% and reflects specific risks relating to the Group.
During the year ended 31 December 2021, a number of production facilities were idle or backward production technology. The Group does not expect to have future economic benefits recoverable from the use of those production facilities. There is no alternative use of those production facilities which is specifically designed. The recoverable amounts of property, plant and equipment related to those production facilities are estimated to be their residual value. As a result, impairment loss of RMB327,772 thousand was made against the carrying amounts of those assets.
As a result of these assessments, an impairment loss of RMB587,622 thousand on property, plant and equipment were recognized for the year ended 31 December 2021.
381
Notes to the Financial Statements (continued)
For the year ended 31 December 2021
(All amounts in thousands of Renminbi Yuan unless otherwise stated)
| V. | Notes to the consolidated financial statements (continued) |
| 11. | Fixed assets (continued) |
| (3) | As at 31 December 2021, the cost of temporarily idle fixed assets was RMB3,553,001 thousand, the accumulated depreciation was RMB2,867,318 thousand, related impairment provision was RMB552,580 thousand and the carrying amount of these assets was RMB133,103 thousand (31 December 2020: the cost of temporarily idle fixed assets was RMB491,591 thousand, accumulated depreciation was RMB420,468 thousand, related impairment provision was RMB54,962 thousand, and the carrying amount of these assets was RMB16,161 thousand, respectively). |
As at 31 December 2021 and 31 December 2020, the Group had no pledged fixed assets.
For the year ended 31 December 2021, amount of RMB1,699,974 thousand was transferred from construction in progress to fixed assets. (for the year ended 31 December 2020: RMB1,550,313 thousand).
| (4) | As at 31 December 2021, the carrying amount of fixed assets leased out under operating leases was RMB54,366 thousand (31 December 2020: RMB57,218 thousand). |
| (5) | As at 31 December 2021 and 31 December 2020, the Group had no fixed assets pending certificates of ownership. |
| 12. | Construction in progress |
| (1) | Construction in progress |
| 2021 | 2020 | |||||||||||||||||||||||
| Original cost |
Provision for impairment |
Carrying amount |
Original cost |
Provision for impairment |
Carrying amount |
|||||||||||||||||||
| Construction in progress |
3,317,663 | (24,486 | ) | 3,293,177 | 1,734,610 | (24,486 | ) | 1,710,124 | ||||||||||||||||
382
Notes to the Financial Statements (continued)
For the year ended 31 December 2021
(All amounts in thousands of Renminbi Yuan unless otherwise stated)
| V. | Notes to the consolidated financial statements (continued) |
| 12. | Construction in progress (continued) |
| (2) | The movement of the Group’s major construction in progress is listed as follows: |
| Project |
Budget | 31 December 2020 |
Increase during the year |
Transfer to fixed assets (Note V.11) |
Disposal during the year |
31 December 2021 |
Percentage of actual cost to budget |
Project progress |
Accumulative capitalized interest |
Capitalized interest in current year |
Interest rate for capitalization in current year |
Sources of funding |
||||||||||||||||||||||||||||||||||||
| 24000 T/A precursor fiber and 12000 T/a 48K large tow carbon fiber project |
3,489,638 | 280,000 | 999,999 | — | — | 1,279,999 | 36.68 | % | 36.68 | % | 11,783 | 11,554 | 2.85 | % | |
own funds and borrowings |
| |||||||||||||||||||||||||||||||
| 100,000 tons/year EVA production equipment |
1,131,520 | 257,853 | — | — | — | 257,853 | 22.79 | % | 22.79 | % | 1,081 | — | — | |
own funds and borrowings |
| ||||||||||||||||||||||||||||||||
| PAN carbon fiber project |
847,794 | 145,256 | 8,400 | (153,656 | ) | — | — | 96.04 | % | 96.04 | % | 5,475 | — | — | |
own funds and borrowings |
| |||||||||||||||||||||||||||||||
| Shanghai Petrochemical third circuit 220KV power supply line project |
507,120 | 124,487 | 250,000 | — | — | 374,487 | 75.00 | % | 75.00 | % | — | — | — | own funds | ||||||||||||||||||||||||||||||||||
| Emergency cut-off function renovation project of tank area of storage department |
76,766 | 63,351 | — | (63,351 | ) | — | — | 82.52 | % | 82.52 | % | — | — | — | own funds | |||||||||||||||||||||||||||||||||
| Rectification project of hidden |
99,944 | 49,997 | 32,500 | (82,497 | ) | — | — | 82.54 | % | 82.54 | % | — | — | — | own funds | |||||||||||||||||||||||||||||||||
| danger in central control room of olefin Department 2# 3# aromatics joint unit energy |
954,240 | 29,940 | — | — | — | 29,940 | 3.14 | % | 3.14 | % | — | — | — | own funds | ||||||||||||||||||||||||||||||||||
| saving renovation |
||||||||||||||||||||||||||||||||||||||||||||||||
| Spinning process optimization project of Jinyang plant |
54,184 | 25,268 | 3,914 | (28,869 | ) | — | 313 | 100.00 | % | 100.00 | % | — | — | — | own funds | |||||||||||||||||||||||||||||||||
| Management project of hidden danger of seawall safety |
256,118 | 22,000 | 150,057 | — | — | 172,057 | 67.18 | % | 67.18 | % | 1,104 | 1,087 | 2.85 | % | |
own funds and borrowings |
| |||||||||||||||||||||||||||||||
| 2# delayed coking device is safe and environment friendly sealed coke removal transportation and waste gas treatment |
85,474 | 20,000 | 52,500 | (72,500 | ) | — | — | 84.82 | % | 84.82 | % | — | — | — | own funds | |||||||||||||||||||||||||||||||||
| Optimization and reconstruction project of domestic water pipe network |
35,320 | 17,998 | 12,999 | (30,997 | ) | — | — | 87.76 | % | 87.76 | % | — | — | — | own funds | |||||||||||||||||||||||||||||||||
383
Notes to the Financial Statements (continued)
For the year ended 31 December 2021
(All amounts in thousands of Renminbi Yuan unless otherwise stated)
| V. | Notes to the consolidated financial statements (continued) |
| (2) | The movement of the Group’s major construction in progress is listed as follows: (continued) |
| Project |
Budget | 31 December 2020 |
Increase during the year |
Transfer to fixed assets (Note V.11) |
Disposal during the year |
31 December 2021 |
Percentage of actual cost to budget |
Project progress |
Accumulative capitalized interest |
Capitalized interest in current year |
Interest rate for capitalization in current year |
Sources of funding |
||||||||||||||||||||||||||||||||||||
| Centralized control relocation and reconstruction project of No.5 and No.6 units of thermal power department |
37,930 | 12,971 | 20,000 | (31,144 | ) | — | 1,827 | 86.93 | % | 86.93 | % | — | — | — | own funds | |||||||||||||||||||||||||||||||||
| Energy saving transformation of three GK-VI cracking furnaces in the old area of 2# olefin unit |
92,255 | — | 70,936 | (70,936 | ) | — | — | 76.89 | % | 76.89 | % | — | — | — | own funds | |||||||||||||||||||||||||||||||||
| Optimization project of turbine control system of olefin Department |
76,320 | 4,000 | 42,000 | — | — | 46,000 | 60.27 | % | 60.27 | % | — | — | — | own funds | ||||||||||||||||||||||||||||||||||
| Oil cleaning project |
781,657 | 5,348 | 39,999 | (43,924 | ) | — | 1,423 | 99.53 | % | 99.53 | % | — | — | — | |
own funds and borrowings |
| |||||||||||||||||||||||||||||||
| T-121~1 of Shanghai petrochemical storage and transportation department, Jinshan Area environmental comprehensive improvement |
156,259 | — | 70,000 | — | — | 70,000 | 44.80 | % | 44.80 | % | — | — | — | own funds | ||||||||||||||||||||||||||||||||||
| Olefin department self-control instrumentation hidden trouble rectification project |
95,310 | 7,997 | 61,997 | (69,994 | ) | — | — | 73.44 | % | 73.44 | % | — | — | — | own funds | |||||||||||||||||||||||||||||||||
| Energy saving and reliability of No.5 and No.6 boilers of coal power unit energy consumption compliance of cogeneration department |
80,150 | 1,000 | 52,000 | — | — | 53,000 | 66.13 | % | 66.13 | % | — | — | — | own funds | ||||||||||||||||||||||||||||||||||
| Energy-saving optimization and improvement project of cracked gasoline hydrogenation unit |
63,681 | — | 46,868 | (45,512 | ) | — | 1,356 | 73.60 | % | 73.60 | % | — | — | — | own funds | |||||||||||||||||||||||||||||||||
384
Notes to the Financial Statements (continued)
For the year ended 31 December 2021
(All amounts in thousands of Renminbi Yuan unless otherwise stated)
| V. | Notes to the consolidated financial statements (continued) |
| 12. | Construction in progress (continued) |
| (2) | The movement of the Group’s major construction in progress is listed as follows: (continued) |
| Project |
Budget | 31 December 2020 |
Increase during the year |
Transfer to fixed assets (Note V.11) |
Disposal during the year |
31 December 2021 |
Percentage of actual cost to budget |
Project progress |
Accumulative capitalized interest |
Capitalized interest in current year |
Interest rate for capitalization in current year |
Sources of funding |
||||||||||||||||||||||||||||||||||||
| Shanghai petrochemical ethylene |
70,333 | — | 41,465 | — | — | 41,465 | 58.96 | % | 58.96 | % | — | — | — | own funds | ||||||||||||||||||||||||||||||||||
| glycol product structure optimization and hazardous waste reduction project 100-ton high performance |
566,183 | — | 166,668 | — | — | 166,668 | 29.44 | % | 29.44 | % | — | — | — | own funds | ||||||||||||||||||||||||||||||||||
| carbon fiber plant 2×CC100 Turbine (No.5, No.6) for Coal Power Unit Energy Consumption Compliance |
93,260 | 1,000 | 30,000 | — | — | 31,000 | 33.24 | % | 33.24 | % | — | — | — | own funds | ||||||||||||||||||||||||||||||||||
| Heat and power department equipment renewal |
— | 26,835 | 16,926 | — | — | 43,761 | — | — | — | — | — | own funds | ||||||||||||||||||||||||||||||||||||
| Oil refining department equipment renewal |
— | 34,127 | 18,168 | — | — | 52,295 | — | — | — | — | — | own funds | ||||||||||||||||||||||||||||||||||||
| Utility department equipment renewal (Oil refining segment) |
— | — | 34,471 | — | — | 34,471 | — | — | — | — | — | own funds | ||||||||||||||||||||||||||||||||||||
| Other projects |
— | 605,182 | 1,061,160 | (1,006,594 | ) | — | 659,748 | — | — | — | — | — | own funds | |||||||||||||||||||||||||||||||||||
|
|
|
|
|
|
|
|
|
|
|
|||||||||||||||||||||||||||||||||||||||
| Sub-total |
1,734,610 | 3,283,027 | (1,699,974 | ) | — | 3,317,663 | ||||||||||||||||||||||||||||||||||||||||||
|
|
|
|
|
|
|
|
|
|
|
|||||||||||||||||||||||||||||||||||||||
| Less: Provision for impairment |
(24,486 | ) | — | — | — | (24,486 | ) | |||||||||||||||||||||||||||||||||||||||||
|
|
|
|
|
|
|
|
|
|
|
|
|
|
|
|
|
|
|
|
|
|||||||||||||||||||||||||||||
| Total |
1,710,124 | 3,283,027 | (1,699,974 | ) | — | 3,293,177 | — | — | 19,443 | 12,641 | 2.85 | % | ||||||||||||||||||||||||||||||||||||
|
|
|
|
|
|
|
|
|
|
|
|
|
|
|
|
|
|
|
|
|
|||||||||||||||||||||||||||||
For the year ended 31 December 2021, the capitalized interest of the Group is RMB12,641 thousand (for the year ended 31 December 2020: RMB8,292 thousand).
As at 31 December 2021, the balance of the impairment provision for the Group’s construction in progress was for the long-term suspended energy saving transformation of No. 2 and No. 3 aromatics combined plant with the amount of RMB24,486 thousand (As at 31 December 2020: RMB24,486 thousand).
385
Notes to the Financial Statements (continued)
For the year ended 31 December 2021
(All amounts in thousands of Renminbi Yuan unless otherwise stated)
| V. | Notes to the consolidated financial statements (continued) |
| 13. | Right-of-use assets |
| Item |
Buildings | Plant and machinery |
Vehicles and other equipment |
Total | ||||||||||||
| Cost |
||||||||||||||||
| 31 December 2020 |
36,126 | 1,267 | 1,886 | 39,279 | ||||||||||||
| Increase in current year |
7,746 | 145 | 1,643 | 9,534 | ||||||||||||
| Decrease in current year |
(6,814 | ) | (105 | ) | (793 | ) | (7,712 | ) | ||||||||
| 31 December 2021 |
37,058 | 1,307 | 2,736 | 41,101 | ||||||||||||
|
|
|
|
|
|
|
|
|
|||||||||
| Accumulated depreciation |
||||||||||||||||
| 31 December 2020 |
24,905 | 388 | 993 | 26,286 | ||||||||||||
| Increase in current year |
15,677 | 399 | 1,187 | 17,263 | ||||||||||||
| Decrease in current year |
(6,812 | ) | (105 | ) | (410 | ) | (7,327 | ) | ||||||||
| 31 December 2021 |
33,770 | 682 | 1,770 | 36,222 | ||||||||||||
|
|
|
|
|
|
|
|
|
|||||||||
| Carrying amount |
||||||||||||||||
| 31 December 2021 |
3,288 | 625 | 966 | 4,879 | ||||||||||||
| 31 December 2020 |
11,221 | 879 | 893 | 12,993 | ||||||||||||
|
|
|
|
|
|
|
|
|
|||||||||
| 14. | Intangible assets |
Intangible assets situation
| Land use rights |
Other intangible assets |
Total | ||||||||||
| Cost |
||||||||||||
| 31 December 2020 |
785,567 | 100,193 | 885,760 | |||||||||
| Increase in current year |
||||||||||||
| – Purchase |
— | — | — | |||||||||
| Disposal in current year |
— | — | — | |||||||||
| 31 December 2021 |
785,567 | 100,193 | 885,760 | |||||||||
|
|
|
|
|
|
|
|||||||
| Accumulated amortization |
||||||||||||
| 31 December 2020 |
387,759 | 85,425 | 473,184 | |||||||||
| Charge for current year |
17,044 | 2,924 | 19,968 | |||||||||
| Disposal in current year |
— | — | — | |||||||||
| 31 December 2021 |
404,803 | 88,349 | 493,152 | |||||||||
|
|
|
|
|
|
|
|||||||
| Carrying amount |
||||||||||||
| 31 December 2021 |
380,764 | 11,844 | 392,608 | |||||||||
| 31 December 2020 |
397,808 | 14,768 | 412,576 | |||||||||
|
|
|
|
|
|
|
|||||||
386
Notes to the Financial Statements (continued)
For the year ended 31 December 2021
(All amounts in thousands of Renminbi Yuan unless otherwise stated)
| V. | Notes to the consolidated financial statements (continued) |
| 14. | Intangible assets (continued) |
As at 31 December 2021 and at 31 December 2020, the Group had no land-use right without property right certificate.
As at 31 December 2021 and at 31 December 2020, the Group has no intangible assets formed through internal research and development.
| 15. | Long-term deferred expenses |
| Item |
31 December 2020 |
Increase during the year |
Amortization during the year |
31 December 2021 |
||||||||||||
| Catalysts |
402,304 | 657,465 | (290,278 | ) | 769,491 | |||||||||||
| Lease holding improvements |
6,769 | — | (1,109 | ) | 5,660 | |||||||||||
| Others |
1,118 | — | (306 | ) | 812 | |||||||||||
| Less: Provision for impairment |
— | — | — | — | ||||||||||||
|
|
|
|
|
|
|
|
|
|||||||||
| Total |
410,191 | 657,465 | (291,693 | ) | 775,963 | |||||||||||
|
|
|
|
|
|
|
|
|
|||||||||
| 16. | Deferred tax assets and deferred tax liabilities |
| (1) | Deferred tax assets before offsetting |
| 2021 | 2020 | |||||||||||||||
| Item |
Deductible temporary differences and deductible losses |
Deferred tax assets |
Deductible temporary differences and deductible losses |
Deferred tax assets |
||||||||||||
| Provision for bad debts |
2,127 | 532 | 773 | 193 | ||||||||||||
| Provision for inventory |
223,267 | 55,817 | 228,533 | 57,133 | ||||||||||||
| Provision for impairment of fixed assets |
1,408,357 | 352,089 | 881,253 | 220,313 | ||||||||||||
| Provision for impairment of construction in progress |
24,486 | 6,122 | 24,486 | 6,122 | ||||||||||||
| Accrued expenses |
300,013 | 75,003 | 488,452 | 122,113 | ||||||||||||
| Deductible loss |
— | — | 351,197 | 87,799 | ||||||||||||
| Other deferred tax assets |
28,700 | 7,175 | 35,494 | 8,873 | ||||||||||||
|
|
|
|
|
|
|
|
|
|||||||||
| Total |
1,986,950 | 496,738 | 2,010,188 | 502,546 | ||||||||||||
|
|
|
|
|
|
|
|
|
|||||||||
387
Notes to the Financial Statements (continued)
For the year ended 31 December 2021
(All amounts in thousands of Renminbi Yuan unless otherwise stated)
| V. | Notes to the consolidated financial statements (continued) |
| 16. | Deferred tax assets and deferred tax liabilities (continued) |
| (2) | Deferred tax liabilities before offsetting |
| 2021 | 2020 | |||||||||||||||
| Item |
Taxable temporary differences |
Deferred tax liabilities |
Taxable temporary differences |
Deferred tax liabilities |
||||||||||||
| Capitalized interest |
(5,873 | ) | (1,468 | ) | (8,174 | ) | (2,043 | ) | ||||||||
| Difference in fixed assets depreciation and intangible assets amortization |
(1,320,280 | ) | (330,071 | ) | (1,134,957 | ) | (283,739 | ) | ||||||||
| Cash flow hedges |
(57,600 | ) | (14,400 | ) | — | — | ||||||||||
|
|
|
|
|
|
|
|
|
|||||||||
| Total | (1,383,753 | ) | (345,939 | ) | (1,143,131 | ) | (285,782 | ) | ||||||||
|
|
|
|
|
|
|
|
|
|||||||||
| (3) | Deductible temporary differences and deductible losses that are not recognized as deferred tax assets are analysed as follows: |
| Item |
2021 | 2020 | ||||||
| Deductible temporary differences |
29,969 | 29,969 | ||||||
| Deductible losses |
350,574 | 72,699 | ||||||
|
|
|
|
|
|||||
| Total |
380,543 | 102,668 | ||||||
|
|
|
|
|
|||||
In accordance with the accounting policy set out in note III.26, it is unlikely that some of the Group’s subsidiaries will obtain sufficient future taxable profits to be used to offset the deductible temporary differences and deductible losses. Therefore, the Group has not recognized deferred income tax assets for the deductible temporary differences and deductible losses of the following subsidiaries. Under current tax law, these deductible losses expire between 2022 and 2026.
388
Notes to the Financial Statements (continued)
For the year ended 31 December 2021
(All amounts in thousands of Renminbi Yuan unless otherwise stated)
| V. | Notes to the consolidated financial statements (continued) |
| 16. | Deferred tax assets and deferred tax liabilities (continued) |
| (3) | Deductible temporary differences and deductible losses that are not recognized as deferred tax assets are analysed as follows: (continued) |
The breakdown of deductible losses by subsidiaries is as follows:
| Name of subsidiaries |
2021 | 2020 | ||||||
| Shanghai Petrochemical Investment Development Company Limited (“Toufa”) |
71,113 | 39,656 | ||||||
| Shanghai Jinchang Engineering Plastics Company Limited (“Jinchang”) |
67,585 | — | ||||||
| Shanghai Jinshan Hotel Company Limited (“Jinshan Hotel”) |
21,717 | 21,758 | ||||||
| Zhejiang Jinlian Petrochemical Storage and Transportation Co. LTD (“Jinlian”) |
190,159 | 11,285 | ||||||
|
|
|
|
|
|||||
| Total |
350,574 | 72,699 | ||||||
|
|
|
|
|
|||||
| (4) | Deductible losses that are not recognized as deferred tax assets will expire in the following years: |
| Year |
2021 | 2020 | ||||||
| 2022 |
65,331 | 12,687 | ||||||
| 2023 |
66,965 | 10,415 | ||||||
| 2024 |
91,901 | 38,312 | ||||||
| 2025 |
41,475 | 11,285 | ||||||
| 2026 |
84,902 | — | ||||||
|
|
|
|
|
|||||
| Total |
350,574 | 72,699 | ||||||
|
|
|
|
|
|||||
389
Notes to the Financial Statements (continued)
For the year ended 31 December 2021
(All amounts in thousands of Renminbi Yuan unless otherwise stated)
| V. | Notes to the consolidated financial statements (continued) |
| 16. | Deferred tax assets and deferred tax liabilities (continued) |
| (5) | The net balance of deferred tax assets and liabilities after offsetting is as follows: |
| 2021 | 2020 | |||||||||||||||
| Item |
Offsetting amount of deferred tax assets and deferred tax liabilities |
Deferred tax assets - net |
Offsetting amount of deferred tax assets and deferred tax liabilities |
Deferred tax assets - net |
||||||||||||
| Deferred tax assets |
(312,595 | ) | 184,143 | (250,425 | ) | 252,121 | ||||||||||
| Deferred tax liabilities |
312,595 | (33,344 | ) | 250,425 | (35,357 | ) | ||||||||||
|
|
|
|
|
|
|
|
|
|||||||||
| 17. | Other non-current assets |
| Item |
2021 | 2020 | ||||||
| Time deposit |
5,581,435 | 7,042,840 | ||||||
|
|
|
|
|
|||||
As at 31 December 2021, other non-current assets of the Group is three-year or five-year time deposit with interest rate range from 3.45% to 4.20% per annum (31 December 2020: from 3.85% to 4.20% per annum).
390
Notes to the Financial Statements (continued)
For the year ended 31 December 2021
(All amounts in thousands of Renminbi Yuan unless otherwise stated)
| V. | Notes to the consolidated financial statements (continued) |
| 18. | Provision for assets impairment |
| Decrease | ||||||||||||||||||||||||
| 31 December 2020 |
Increase | Reverse | Sold | Written off | 31 December 2021 |
|||||||||||||||||||
| Provision for accounts receivable (Note V.3) |
634 | 1,354 | — | — | — | 1,988 | ||||||||||||||||||
| Provision for other receivable (Note V.6) |
139 | 1 | — | — | — | 140 | ||||||||||||||||||
|
|
|
|
|
|
|
|
|
|
|
|
|
|||||||||||||
| Sub-total |
773 | 1,355 | — | — | — | 2,128 | ||||||||||||||||||
|
|
|
|
|
|
|
|
|
|
|
|
|
|||||||||||||
| Provision for inventory (Note V.7) |
228,533 | 150,883 | — | (156,149 | ) | — | 223,267 | |||||||||||||||||
| Provision for fixed assets (Note V.11) |
911,222 | 587,622 | — | — | (60,519 | ) | 1,438,325 | |||||||||||||||||
| Provision for CIP (Note V.12) |
24,486 | — | — | — | — | 24,486 | ||||||||||||||||||
| Impairment loss of investments accounted for using equity method (note V.9) |
— | 28,392 | — | — | — | 28,392 | ||||||||||||||||||
|
|
|
|
|
|
|
|
|
|
|
|
|
|||||||||||||
| Sub-total |
1,164,241 | 766,897 | — | (156,149 | ) | (60,519 | ) | 1,714,470 | ||||||||||||||||
|
|
|
|
|
|
|
|
|
|
|
|
|
|||||||||||||
| Total |
1,165,014 | 768,252 | — | (156,149 | ) | (60,519 | ) | 1,716,598 | ||||||||||||||||
|
|
|
|
|
|
|
|
|
|
|
|
|
|||||||||||||
| 19. | Short-term loans |
| Item |
Currency | 2021 | 2020 | |||||||||
| Credit loans |
||||||||||||
| – bank loans |
RMB | 1,540,000 | 1,548,000 | |||||||||
|
|
|
|
|
|
|
|||||||
As at 31 December 2021, the interest rate of short-term loans ranged from 2.70% to 3.70% per annum (31 December 2020: from 2.76% to 3.70% per annum).
As at 31 December 2021 and 31 December 2020, there was no short-term loans which are due but have not been repaid.
391
Notes to the Financial Statements (continued)
For the year ended 31 December 2021
(All amounts in thousands of Renminbi Yuan unless otherwise stated)
| V. | Notes to the consolidated financial statements (continued) |
| 20. | Bills payable |
| Item |
2021 | 2020 | ||||||
| Bank acceptance notes |
830,006 | 139,360 | ||||||
|
|
|
|
|
|||||
The bills above are all due within one year.
| 21. | Accounts payable |
| Item |
2021 | 2020 | ||||||
| Amount due to related parties (Note VIII.6) |
4,361,173 | 3,377,497 | ||||||
| Amount due to third parties |
1,527,706 | 1,294,138 | ||||||
|
|
|
|
|
|||||
| Total |
5,888,879 | 4,671,635 | ||||||
|
|
|
|
|
|||||
As at 31 December 2021 and 31 December 2020, there was no individually significant accounts payable aged over one year.
| 22. | Contract liabilities |
| Item |
2021 | 2020 | ||||||
| Advance from related parties (Note VIII.6) |
6,275 | 1,117 | ||||||
| Advance from third parties |
424,607 | 495,404 | ||||||
|
|
|
|
|
|||||
| Total |
430,882 | 496,521 | ||||||
|
|
|
|
|
|||||
As at 31 December 2021 and 31 December 2020, there was no individually significant contract liabilities aged over one year.
Contract liabilities primarily relate to the Group’s advances from product sales contracts. The Group receives 100% of the contract consideration as advances when entering into the contract with customers. The revenue related to the contracts will be recognized until the Group satisfies its performance obligation.
392
Notes to the Financial Statements (continued)
For the year ended 31 December 2021
(All amounts in thousands of Renminbi Yuan unless otherwise stated)
| V. | Notes to the consolidated financial statements (continued) |
| 22. | Contract liabilities (continued) |
| Changes | in the contract liabilities of the Group are as follows: |
| 2021 | 2020 | |||||||
| Balance at the beginning of the year |
496,521 | 660,783 | ||||||
| Revenue recognized that was included in the contract liability balance at the beginning of the year |
(496,521 | ) | (660,783 | ) | ||||
| Net increase due to cash received during the year |
430,882 | 496,521 | ||||||
|
|
|
|
|
|||||
| Balance at the end of the year |
430,882 | 496,521 | ||||||
|
|
|
|
|
|||||
| 23. | Employee benefits payable |
| (1) | Employee benefits payable: |
| Note | 31 December 2021 | 31 December 2020 | ||||||||||
| Short-term employee benefits |
(2 | ) | 235,593 | 222,831 | ||||||||
| Post-employment benefits |
||||||||||||
| – defined contribution plans |
(3 | ) | 24,503 | 21,675 | ||||||||
|
|
|
|
|
|||||||||
| Total |
260,096 | 244,506 | ||||||||||
|
|
|
|
|
|||||||||
393
Notes to the Financial Statements (continued)
For the year ended 31 December 2021
(All amounts in thousands of Renminbi Yuan unless otherwise stated)
| V. | Notes to the consolidated financial statements (continued) |
| 23. | Employee benefits payable (continued) |
| (2) | Short-term employee benefits |
| 31 December 2020 |
Increase in current year |
Decrease in current year |
31 December 2021 |
|||||||||||||
| Salaries, bonuses, allowances |
203,390 | 2,142,959 | (2,132,099 | ) | 214,250 | |||||||||||
| Staff welfare |
3,569 | 218,075 | (218,075 | ) | 3,569 | |||||||||||
| Social insurances |
15,125 | 212,644 | (210,709 | ) | 17,060 | |||||||||||
| Including: Medical insurance |
12,395 | 165,340 | (163,644 | ) | 14,091 | |||||||||||
| Work injury insurance |
1,347 | 17,359 | (17,218 | ) | 1,488 | |||||||||||
| Maternity insurance |
1,383 | 17,550 | (17,452 | ) | 1,481 | |||||||||||
| Supplementary medical insurance |
— | 12,395 | (12,395 | ) | — | |||||||||||
| Housing funds |
— | 208,205 | (208,197 | ) | 8 | |||||||||||
| Termination benefits |
— | 12,232 | (12,232 | ) | — | |||||||||||
| Labour union fee, staff and workers’ education fee |
747 | 69,540 | (69,581 | ) | 706 | |||||||||||
| Non-monetary benefits |
— | 104,856 | (104,856 | ) | — | |||||||||||
| Others |
— | 47,728 | (47,728 | ) | — | |||||||||||
|
|
|
|
|
|
|
|
|
|||||||||
| Total |
222,831 | 3,016,239 | (3,003,477 | ) | 235,593 | |||||||||||
|
|
|
|
|
|
|
|
|
|||||||||
| (3) | Post-employment benefits - defined contribution plans |
| 31 December 2020 |
Increase in current year |
Decrease in current year |
31 December 2021 |
|||||||||||||
| Basic pensions |
21,017 | 278,930 | (276,187 | ) | 23,760 | |||||||||||
| Unemployment insurance |
658 | 8,708 | (8,623 | ) | 743 | |||||||||||
| Supplemental basic pensions |
— | 152,888 | (152,888 | ) | — | |||||||||||
|
|
|
|
|
|
|
|
|
|||||||||
| Total |
21,675 | 440,526 | (437,698 | ) | 24,503 | |||||||||||
|
|
|
|
|
|
|
|
|
|||||||||
As stipulated by the regulations of the PRC, the Group participates in a defined contribution retirement plan organised by the Shanghai Municipal Government for its staff.
394
Notes to the Financial Statements (continued)
For the year ended 31 December 2021
(All amounts in thousands of Renminbi Yuan unless otherwise stated)
| V. | Notes to the consolidated financial statements (continued) |
| 23. | Employee benefits payable (continued) |
| (3) | Post-employment benefits- defined contribution plans (continued) |
In addition, pursuant to the document “Order of the Ministry of Labour and Social Security No.20” dated 6 January 2004 issued by the Ministry of Labour of the PRC, the Group has set up a supplementary defined contribution retirement plan for the benefit of employees. Employees who have served the Group for more than one year may participate in this plan. The Group and participating employees make defined contributions to their pension saving accounts according to the plan.
The Group has no other material obligation for the payment of pension benefits associated with these plans beyond the annual contributions described above. For the year ended 31 December 2021, the Group’s contribution to the above two plans amounted to RMB278,930 thousand and RMB152,888 thousand respectively (For the year ended 31 December 2020: RMB199,196 thousand and RMB142,877 thousand respectively).
| 24. | Taxes payable |
| 2021 | 2020 | |||||||
| Consumption tax payable |
3,195,865 | 2,784,600 | ||||||
| Value-added tax payable |
325,986 | 356,104 | ||||||
| Educational surcharge payable |
59,865 | 66,870 | ||||||
| Urban maintenance and construction tax payable |
156,261 | 93,471 | ||||||
| Corporate income tax payable |
258,466 | 19,425 | ||||||
| Land use tax payable |
12,149 | 10,967 | ||||||
| Individual income tax payable |
43,303 | 33,771 | ||||||
| Others |
18,768 | 20,702 | ||||||
|
|
|
|
|
|||||
| Total |
4,070,663 | 3,385,910 | ||||||
|
|
|
|
|
|||||
| 25. | Other payables |
| 2021 | 2020 | |||||||
| Dividends payable on ordinary shares |
30,577 | 29,522 | ||||||
| Amounts due to related parties (Note VIII.6) |
281,669 | 165,063 | ||||||
| Amounts due to third parties |
974,818 | 1,470,227 | ||||||
|
|
|
|
|
|||||
| Total |
1,287,064 | 1,664,812 | ||||||
|
|
|
|
|
|||||
395
Notes to the Financial Statements (continued)
For the year ended 31 December 2021
(All amounts in thousands of Renminbi Yuan unless otherwise stated)
| V. | Notes to the consolidated financial statements (continued) |
| 25. | Other payables (continued) |
| (1) | As at 31 December 2021, there are no other payables that are individually significant aged over 1 year except unpaid project guaranty deposit. |
| (2) | Other payables by categories are analysed as follows: |
| Item |
2021 | 2020 | ||||||
| Oil price risk reserve |
— | 546,055 | ||||||
| Accrued expenses |
400,391 | 518,333 | ||||||
| Equipment project payables |
487,283 | 299,205 | ||||||
| Amounts due to related parties |
281,669 | 165,063 | ||||||
| Dividends payable on ordinary shares |
30,577 | 29,522 | ||||||
| Withholding social insurance |
16,630 | 22,559 | ||||||
| Sales discount |
22,017 | 17,190 | ||||||
| Warranty payable |
2,075 | 15,357 | ||||||
| Deposits |
9,120 | 9,585 | ||||||
| Others |
37,302 | 41,943 | ||||||
|
|
|
|
|
|||||
| Total |
1,287,064 | 1,664,812 | ||||||
|
|
|
|
|
|||||
| 26. | Non-current liabilities due within one year |
| 2021 | 2020 | |||||||
| Lease liabilities due within one year (Note V.29) |
3,229 | 9,352 | ||||||
| Long-term loans due within 1 year |
19,800 | — | ||||||
|
|
|
|
|
|||||
| Total |
23,029 | 9,352 | ||||||
|
|
|
|
|
|||||
396
Notes to the Financial Statements (continued)
For the year ended 31 December 2021
(All amounts in thousands of Renminbi Yuan unless otherwise stated)
| V. | Notes to the consolidated financial statements (continued) |
| 27. | Other current liabilities |
| Item |
2021 | 2020 | ||||||
| Short-term bonds |
— | 3,017,811 | ||||||
| Amounts due to related parties – measured at fair value through profit or loss (FVPL) |
1,388,286 | — | ||||||
| Output VAT to be transferred |
53,034 | 54,339 | ||||||
|
|
|
|
|
|||||
| Total |
1,441,320 | 3,072,150 | ||||||
|
|
|
|
|
|||||
| (1) | Short-term bonds: |
| Debenture |
Face value |
Issuance date | Maturity period |
Issuance amount |
Issuance rate |
Balance at the beginning of the year |
Issuance during the year |
Interest at face value |
Amortization of discounts or premium |
Repayment during the year |
Balance at the end of the year |
|||||||||||||||||||||||||||||||||
| 20 Shanghai Petrochemical SCP001 |
RMB100 | 20 August 2020 | 169 days | 3,000,000 | 1.70 | % | 3,017,811 | — | 5,803 | — | 3,023,614 | — | ||||||||||||||||||||||||||||||||
| 21 Shanghai Petrochemical SCP001 |
RMB100 | 28 April 2021 | 60 days | 2,000,000 | 2.40 | % | — | 2,000,000 | 7,924 | — | 2,007,924 | — | ||||||||||||||||||||||||||||||||
| 21 Shanghai Petrochemical SCP002 |
RMB100 | 16 June 2021 | 60 days | 1,000,000 | 2.25 | % | — | 1,000,000 | 3,715 | — | 1,003,715 | — | ||||||||||||||||||||||||||||||||
| 21 Shanghai Petrochemical SCP003 |
RMB100 | 25 August 2021 | 60 days | 2,000,000 | 2.18 | % | — | 2,000,000 | 7,201 | — | 2,007,201 | — | ||||||||||||||||||||||||||||||||
| 21 Shanghai Petrochemical SCP004 |
RMB100 | 20 October 2021 | 60 days | 1,000,000 | 2.30 | % | — | 1,000,000 | 4,798 | — | 1,004,798 | — | ||||||||||||||||||||||||||||||||
|
|
|
|
|
|
|
|
|
|
|
|
|
|
|
|||||||||||||||||||||||||||||||
| Total |
9,000,000 | 3,017,811 | 6,000,000 | 29,441 | — | 9,047,252 | — | |||||||||||||||||||||||||||||||||||||
|
|
|
|
|
|
|
|
|
|
|
|
|
|
|
|||||||||||||||||||||||||||||||
| (2) | Amounts due to related parties – measured at fair value through profit or loss (FVPL) |
Amounts due to related parties – measured at FVPL represents the obligation that the Group needs to return the crude oil to its related party with maturity of less than 1 year, which is measured at fair value through profit or loss.
397
Notes to the Financial Statements (continued)
For the year ended 31 December 2021
(All amounts in thousands of Renminbi Yuan unless otherwise stated)
| V. | Notes to the consolidated financial statements (continued) |
| 28. | Long-term loans |
| Currency | 31 December 2021 | 31 December 2020 | ||||||||||
| Credit loans |
||||||||||||
| – Long-term borrowing from a related party (Note VIII.6) |
RMB | 700,000 | — | |||||||||
|
|
|
|
|
|||||||||
The interest rate of the Group’s long-term borrowings was 1.08% as at 31 December 2021 (31 December 2020: Nil).
| 29. | Lease liabilities |
| 2021 | 2020 | |||||||
| Lease liabilities |
4,613 | 12,471 | ||||||
| Less: Non-current liabilities due within one year (Note V.26) |
(3,229 | ) | (9,352 | ) | ||||
|
|
|
|
|
|||||
| Total |
1,384 | 3,119 | ||||||
|
|
|
|
|
|||||
| 30. | Deferred income |
| Item |
31 December 2020 | Increase in current year | Decrease in current year |
31 December 2021 |
Cause | |||||||||||||
| Government grants |
123,433 | — | (10,713 | ) | 112,720 | related to assets | ||||||||||||
|
|
|
|
|
|
|
|
|
| ||||||||||
| Liability Items |
31 December 2020 |
Increase | Deduct from Property plant and Equipment |
Include in other income |
Deduct from general and administrative expenses |
Deduct from financial expenses |
Include in non- operating income |
Deduct from non- operating expense |
31 December 2021 |
Related to assets/ income |
||||||||||||||||||||||||||||||
| Investment subsidy for |
||||||||||||||||||||||||||||||||||||||||
| Chemical Industry |
110,000 | — | — | — | — | — | (10,000 | ) | — | 100,000 | related to assets | |||||||||||||||||||||||||||||
| Others |
13,433 | — | — | — | — | — | (713 | ) | — | 12,720 | related to assets | |||||||||||||||||||||||||||||
|
|
|
|
|
|
|
|
|
|
|
|
|
|
|
|
|
|
|
|||||||||||||||||||||||
| Total |
123,433 | — | — | — | — | — | (10,713 | ) | — | 112,720 | ||||||||||||||||||||||||||||||
|
|
|
|
|
|
|
|
|
|
|
|
|
|
|
|
|
|
|
|||||||||||||||||||||||
398
Notes to the Financial Statements (continued)
For the year ended 31 December 2021
(All amounts in thousands of Renminbi Yuan unless otherwise stated)
| V. | Notes to the consolidated financial statements (continued) |
| 31. | Share capital |
| Increase or decrease in current year | ||||||||||||||||||||||||||||
| 31 December 2020 |
Issue new share |
Stock dividend |
Transfer from capital surplus to paid-in capital |
Other | Sub-total | 31 December 2021 |
||||||||||||||||||||||
| Non-restricted Shares – |
||||||||||||||||||||||||||||
| Ordinary A shares listed in PRC |
7,328,814 | — | — | — | — | — | 7,328,814 | |||||||||||||||||||||
| Foreign investment H shared listed overseas |
3,495,000 | — | — | — | — | — | 3,495,000 | |||||||||||||||||||||
|
|
|
|
|
|
|
|
|
|
|
|
|
|
|
|||||||||||||||
| Total |
10,823,814 | — | — | — | — | — | 10,823,814 | |||||||||||||||||||||
|
|
|
|
|
|
|
|
|
|
|
|
|
|
|
|||||||||||||||
The Company was founded in Shanghai, PRC on 29 June 1993 with registered capital of RMB4,000,000,000 invested by its holding company-China National Petrochemical Corporation; these shares were converted from assets of former Shanghai Petrochemical Complex.
Approved by Zheng Wei Fa No. [1993]30 issued by the State Council Securities Committee, the Company launched its Initial Public Offering (“IPO”) in July 1993 and September 1993 in Hong Kong, New York and Shanghai to issue 2.23 billion shares, including 1.68 billion H shares and 550 million A shares. The 550 million A shares included 400 million individual shares (including 150 million shares issued to SPC employees) and 150 million legal person shares. H shares were listed on the Hong Kong Stock Exchange on 26 July 1993 and listed on the New York Stock Exchange in the form of American Depositary Shares at the same time; the A shares were listed on the Shanghai Stock Exchange on 8 November 1993.
After the IPO, the total quantity of shares issued by the Company was 6.23 billion, including 4 billion state owned shares, 150 million legal person shares, 400 million individual shares, and 1.68 billion H shares.
399
Notes to the Financial Statements (continued)
For the year ended 31 December 2021
(All amounts in thousands of Renminbi Yuan unless otherwise stated)
| V. | Notes to the consolidated financial statements (continued) |
| 31. | Share capital (continued) |
According to the plan stated in the prospectus issued in July 1993, and approved by the China Securities Regulatory Commission, the Company issued 320 million ordinary A shares with a par value of RMB1 each at an issuing price of RMB2.4 each during the period from 5 April to 10 June 1994. These shares were listed on the Shanghai Stock Exchange on 4 July 1994. By then, the total quantity of shares issued was expanded from 6.23 billion to 6.55 billion.
On 22 August 1996, the Company issued 500 million H shares to overseas investors; on 6 January 1997, another 150 million H shares were issued to overseas investors. By then, the total quantity of shares issued was expanded to 7.2 billion, including 2.33 billion H shares.
In 1998, China National Petrochemical Corporation was restructured to Sinopec Group.
Sinopec Corp. was founded on 28 February 2000 based on the approved assets restructuring of Sinopec Group. As part of the restructuring, the shares of the Company held by the Sinopec Group were injected in Sinopec Corp.; after the restructuring, the ownership of 4 billion state-owned shares of the Company held by the Sinopec Group were transferred to Sinopec Corp., and the shares were changed to state owned legal person shares in nature.
All the A and H shares rank pari passu in all respects.
Pursuant to the ‘Approval on matters relating to the Share Segregation Reform of Sinopec Shanghai Petrochemical Company Limited’ issued by the State-owned Assets Supervision and Administration Commission of the State Council (State Owned Property [2013] No.443), a General Meeting of A share shareholders was held on 8 July 2013 and passed the resolution of ‘Share Segregation Reform of Sinopec Shanghai Petrochemical Company Limited (Amendment)’ (“the share segregation reform resolution”) which was published by the Company on Shanghai Stock Exchange (“SSE”) website on 20 June 2013. According to the Share Segregation Reform Resolution, the controlling shareholder of the Company, Sinopec Corp., offered shareholders of circulating A shares 5 shares for every 10 circulating A shares they held on 16 August 2013, aggregating 360,000,000 A shares, for the purpose of obtaining the listing rights of its noncirculating shares in the A Shares market. From 20 August 2013 (“the circulation date”), all the Company’s non-circulating A shares have been granted circulating rights on Shanghai Stock Exchange(“SSE”). As part of the restricted conditions, Sinopec Corp. committed that all the 3,640,000,000 A shares held were not allowed to be traded on SSE or transferred within 12 months from the circulation date (“the restriction period”). After the restriction period, Sinopec Corp. can only sell no more than 5 and 10 percent of its total shares within 12 and 24 months, respectively. The former 150,000,000 non-circulating A shares held by social legal persons were also prohibited to be traded on SSE or transferred within 12 months from the circulation date. Meanwhile, Sinopec Corp. also committed in the Share Segregation Reform Resolution that a scheme of converting surplus to share capital (no less than 4 shares for every 10 shares) will be proposed on the board of directors and shareholders meetings within 6 months after the circulation date.
On 22 October 2013, Sinopec Corp. passed the Share Reform Commitment Scheme added up to 3,600,000 shares, after deliberation of temporary shareholders’ meeting, A share class shareholders’ meeting and H share class shareholders’ meeting.
400
Notes to the Financial Statements (continued)
For the year ended 31 December 2021
(All amounts in thousands of Renminbi Yuan unless otherwise stated)
| V. | Notes to the consolidated financial statements (continued) |
| 31. | Share capital (continued) |
Since the Company share reform, which was executed after 20 August 2013, the Company’s non-circulating A shares have been granted circulating rights on Shanghai Stock Exchange (“SSE”). As part of the restricted conditions, all the 5,460,000,000 A shares held by Sinopec Corp. and 225,000,000 A shares held by social legal persons had been realized circulation as at 31 December 2016.
On 23 August 2017, the first Share Option Incentive Scheme of A shares was passed according to board resolution. On 27 September 2017, the Company increased newly registered capital of RMB14,177 thousand, which was paid in cash amount to RMB54,580 thousand by 199 grantees. The difference between actual capital contribution and registered capital amount to RMB40,403 thousand was included in share premium, and the confirmed capital reserve — employee equity option plan in the waiting period is RMB21,916 thousand, which is transferred to the capital reserve — equity premium. As to 31 December 2017, total equity capital was 10,814,176,600 shares.
On 8 January 2018, according to the resolution of the board of directors of the Company, the second exercise period exercise plan of the Company’s common a-share stock option incentive plan was adopted. On 12 January 2018, the new registered capital of the Company is RMB9,637 thousand, which is fully paid in cash of RMB37,102 thousand by 185 equity incentive objects who meet the conditions for exercise. The difference between the actual capital contribution and the subscribed registered capital is RMB27,465 thousand, which is included in the Company’s capital reserve — equity premium, and the confirmed capital reserve — employee equity option plan in the waiting period is RMB17,062 thousand, which is transferred to the capital reserve — equity premium.
According to the board resolution of the Company on 28 December 2018, the third exercise period of the stock option incentive plan for A shares of the common stock of the Company will not be exercised because the non-market exercise conditions are not met. As at 31 December 2021 and 31 December 2020, the total share capital of the Company was 10,823,813,500 shares.
| 32. | Capital reserve |
| Item | 31 December 2020 |
Increase in current year |
Decrease in current year |
31 December 2021 |
||||||||||||
| Government grants |
412,370 | — | — | 412,370 | ||||||||||||
| Refund of harbour construction charge |
32,485 | — | — | 32,485 | ||||||||||||
| Share premium (Note V.31) |
106,846 | — | — | 106,846 | ||||||||||||
| Others |
58,626 | — | — | 58,626 | ||||||||||||
|
|
|
|
|
|
|
|
|
|||||||||
| Total |
610,327 | — | — | 610,327 | ||||||||||||
|
|
|
|
|
|
|
|
|
|||||||||
401
Notes to the Financial Statements (continued)
For the year ended 31 December 2021
(All amounts in thousands of Renminbi Yuan unless otherwise stated)
| V. | Notes to the consolidated financial statements (continued) |
| 32. | Capital reserve (continued) |
| Item |
31 December 2019 |
Increase in current year |
Decrease in current year |
31 December 2020 |
||||||||||||
| Government grants |
412,370 | — | — | 412,370 | ||||||||||||
| Refund of harbour construction charge |
32,485 | — | — | 32,485 | ||||||||||||
| Share premium (Note V.31) |
106,846 | — | — | 106,846 | ||||||||||||
| Others |
58,626 | — | — | 58,626 | ||||||||||||
|
|
|
|
|
|
|
|
|
|||||||||
| Total |
610,327 | — | — | 610,327 | ||||||||||||
|
|
|
|
|
|
|
|
|
|||||||||
As at 31 December 2021 and 31 December 2020, there were no outstanding share options.
| 33. | Other comprehensive income |
| Other comprehensive income in Balance Sheet |
Other comprehensive income in 2021 Income Statement |
|||||||||||||||||||||||||||||||
| 31 December 2020 |
Net-of-tax amount attributable to shareholders of the Company |
31 December 2021 |
Before-tax amount |
Less: Previously recognized amount transferred to profit or loss |
Less: income tax expense |
Net-of-tax amount attributable to shareholders of the Company |
Net-of-tax amount attributable to non- controlling interests |
|||||||||||||||||||||||||
| Items that may be reclassified to profit or loss |
— | — | — | — | — | — | — | — | ||||||||||||||||||||||||
| Cash flow hedge reserves |
— | 36,460 | 36,460 | 165,576 | 1,303 | (41,720 | ) | 125,159 | — | |||||||||||||||||||||||
| Other comprehensive income recognized under equity method |
6,326 | 16,639 | 22,965 | 16,639 | — | — | 16,639 | — | ||||||||||||||||||||||||
|
|
|
|
|
|
|
|
|
|
|
|
|
|
|
|
|
|||||||||||||||||
| Total |
6,326 | 53,099 | 59,425 | 182,215 | 1,303 | (41,720 | ) | 141,798 | — | |||||||||||||||||||||||
|
|
|
|
|
|
|
|
|
|
|
|
|
|
|
|
|
|||||||||||||||||
402
Notes to the Financial Statements (continued)
For the year ended 31 December 2021
(All amounts in thousands of Renminbi Yuan unless otherwise stated)
| V. | Notes to the consolidated financial statements (continued) |
| 33. | Other comprehensive income (continued) |
| Other comprehensive income in Balance Sheet |
Other comprehensive income in 2020 Income Statement |
|||||||||||||||||||||||||||||||
| 31 December 2019 |
Net-of-tax amount attributable to shareholders of the Company |
31 December 2020 |
Before-tax amount |
Less: Previously recognized amount transferred to profit or loss |
Less: income tax expense |
Net-of-tax amount attributable to shareholders of the Company |
Net-of-tax amount attributable to non- controlling interests |
|||||||||||||||||||||||||
| Items that may be reclassified to profit or loss |
— | — | — | — | — | — | — | — | ||||||||||||||||||||||||
| Cash flow hedge reserves |
— | — | — | (63,840 | ) | 63,840 | — | — | — | |||||||||||||||||||||||
| Other comprehensive income recognized under equity method |
17,838 | (11,512 | ) | 6,326 | (11,512 | ) | — | — | (11,512 | ) | — | |||||||||||||||||||||
|
|
|
|
|
|
|
|
|
|
|
|
|
|
|
|
|
|||||||||||||||||
| Total |
17,838 | (11,512 | ) | 6,326 | (75,352 | ) | 63,840 | — | (11,512 | ) | — | |||||||||||||||||||||
|
|
|
|
|
|
|
|
|
|
|
|
|
|
|
|
|
|||||||||||||||||
| 34. | Specific reserve |
| Item |
31 December 2020 |
Accrued in current year |
Utilized in current year |
31 December 2021 |
||||||||||||
| Safety fund |
145,597 | 111,644 | (40,729 | ) | 216,512 | |||||||||||
|
|
|
|
|
|
|
|
|
|||||||||
| Item |
31 December 2019 |
Accrued in current year |
Utilized in current year |
31 December 2020 |
||||||||||||
| Safety fund |
57,137 | 139,173 | (50,713 | ) | 145,597 | |||||||||||
|
|
|
|
|
|
|
|
|
|||||||||
Specific reserve represents unutilized safety fund accrued in accordance with state regulations (Note III.25).
403
Notes to the Financial Statements (continued)
For the year ended 31 December 2021
(All amounts in thousands of Renminbi Yuan unless otherwise stated)
| V. | Notes to the consolidated financial statements (continued) |
| 35. | Surplus reserve |
| Item |
31 December 2020 |
Increase in current year |
Decrease in current year |
31 December 2021 |
||||||||||||
| Statutory surplus reserve |
6,372,748 | 198,536 | — | 6,571,284 | ||||||||||||
| Discretionary surplus reserve |
101,355 | — | — | 101,355 | ||||||||||||
|
|
|
|
|
|
|
|
|
|||||||||
| Total |
6,474,103 | 198,536 | — | 6,672,639 | ||||||||||||
|
|
|
|
|
|
|
|
|
|||||||||
| Item |
31 December 2019 |
Increase in current year |
Decrease in current year |
31 December 2020 |
||||||||||||
| Statutory surplus reserve |
6,335,655 | 37,093 | — | 6,372,748 | ||||||||||||
| Discretionary surplus reserve |
101,355 | — | — | 101,355 | ||||||||||||
|
|
|
|
|
|
|
|
|
|||||||||
| Total |
6,437,010 | 37,093 | — | 6,474,103 | ||||||||||||
|
|
|
|
|
|
|
|
|
|||||||||
In accordance with the Company Law and the Company’s Articles of Association, the Company should appropriate 10% of net profit for the year to the statutory surplus reserve. The statutory surplus reserve can be used to make up for the loss or increase the share capital after approval from the appropriate authorities. Statutory surplus reserve amounted to RMB198,536 thousand was provided in current year (2020: RMB37,093 thousand).
The Company appropriates for the discretionary surplus reserve should be proposed by the board of directors and approved by the shareholders’ meeting. The discretionary surplus reserve can be used to make up for the loss or increase the share capital after approval from the appropriate authorities. No discretionary surplus reserve was appropriated in current year (for the year ended 31 December 2020: Nil).
404
Notes to the Financial Statements (continued)
For the year ended 31 December 2021
(All amounts in thousands of Renminbi Yuan unless otherwise stated)
| V. | Notes to the consolidated financial statements (continued) |
| 36. | Retained earnings |
| 2021 | 2020 | |||||||
| Retained earnings at the beginning of the year |
11,157,866 | 11,939,215 | ||||||
| Add: Net profit attributable to shareholders of the Company |
2,000,506 | 628,110 | ||||||
| Less: Appropriation to statutory reserve (Note V. 35) |
(198,536 | ) | (37,093 | ) | ||||
| Dividend to ordinary shares (1) |
(1,082,381 | ) | (1,298,858 | ) | ||||
| Others |
— | (73,508 | ) | |||||
|
|
|
|
|
|||||
| Retained earnings at the end of the year |
11,877,455 | 11,157,866 | ||||||
|
|
|
|
|
|||||
| (1) | Pursuant to the resolution of the shareholders’ meeting on 16 June 2021, a dividend in respect of the year ended 31 December 2020 of RMB0.1 per share (including tax), amounting to a total dividend of RMB1,082,381 thousand was declared, which was paid in July 2021. |
Pursuant to the resolution of the shareholders’ meeting on 18 June 2020, a dividend in respect of the year ended 31 December 2019 of RMB0.12 per share (including tax), amounting to a total dividend of RMB1,298,858 thousand was declared, which was paid in July 2020.
Pursuant to the resolution of the Board of Directors on 23 March, 2022, the Board of Directors proposed that the Company shall pay a cash dividend of RMB0.1 per share (including tax) to all shareholders. Based on 10,823,813,500 shares in issue, a total cash dividend of RMB1,082,381 thousand is proposed, and the above proposal is subject to the approval of the shareholders’ meeting.
| (2) | Retained earnings at the end of the year |
As at 31 December 2021, the consolidated retained earnings attributable to the Group included appropriation to surplus reserves made by the Company’s subsidiaries amounting to RMB293,373 thousand (31 December 2020: RMB276,887 thousand).
405
Notes to the Financial Statements (continued)
For the year ended 31 December 2021
(All amounts in thousands of Renminbi Yuan unless otherwise stated)
| V. | Notes to the consolidated financial statements (continued) |
| 37. | Non-controlling interests |
Attributable to the non-controlling interests of the Group:
| Name of subsidiaries |
2021 | 2020 | ||||||
| China Jinshan Associated Trading Corporation (“Jinmao”) |
101,868 | 95,194 | ||||||
| Shanghai Jinchang Engineering Plastics Company Limited (“Jinchang”) |
33,391 | 41,791 | ||||||
|
|
|
|
|
|||||
| Total |
135,259 | 136,985 | ||||||
|
|
|
|
|
|||||
| 38. | Operating income and operating costs |
| Item |
Note | 2021 | 2020 | |||||||
| Income from principal activities |
(1) | 88,791,702 | 74,295,495 | |||||||
| Income from other operating activities |
488,713 | 409,688 | ||||||||
|
|
|
|
|
|||||||
| Total |
89,280,415 | 74,705,183 | ||||||||
|
|
|
|
|
|||||||
| Item |
Note | 2021 | 2020 | |||||||
| Cost of principal activities |
(1) | 71,282,353 | 58,820,331 | |||||||
| Cost of other operating activities |
393,293 | 268,788 | ||||||||
|
|
|
|
|
|||||||
| Total |
71,675,646 | 59,089,119 | ||||||||
|
|
|
|
|
|||||||
406
Notes to the Financial Statements (continued)
For the year ended 31 December 2021
(All amounts in thousands of Renminbi Yuan unless otherwise stated)
| V. | Notes to the consolidated financial statements (continued) |
| 38. | Operating income and operating costs (continued) |
| (1) | Income and cost from principal activities |
The principal business of the Group mainly belongs to the petrochemical industry.
Analysis by product is as follows:
| 2021 | 2020 | |||||||||||||||
| Income from principal activities |
Cost of principal activities |
Income from principal activities |
Cost of principal activities |
|||||||||||||
| Petroleum products |
55,074,158 | 38,276,985 | 43,080,204 | 30,970,671 | ||||||||||||
| Intermediate petrochemicals |
10,835,074 | 10,359,666 | 8,251,252 | 6,867,874 | ||||||||||||
| Trading of petrochemical products |
11,060,133 | 10,929,127 | 11,585,110 | 11,467,420 | ||||||||||||
| Resins and plastics |
10,006,030 | 9,227,408 | 9,475,887 | 7,334,646 | ||||||||||||
| Synthetic fibres |
1,380,998 | 1,911,682 | 1,480,576 | 1,764,492 | ||||||||||||
| Others |
435,309 | 577,485 | 422,466 | 415,228 | ||||||||||||
|
|
|
|
|
|
|
|
|
|||||||||
| Total |
88,791,702 | 71,282,353 | 74,295,495 | 58,820,331 | ||||||||||||
|
|
|
|
|
|
|
|
|
|||||||||
| (2) | For the year ended 31 December 2021, analysis of revenue are as followings: |
| 2021 | ||||||||||||||||||||||||||||
| Petroleum products |
Intermediate petrochemicals |
Trading of petrochemical products |
Resins and plastics |
Synthetic fibres | Others | Total | ||||||||||||||||||||||
| Income from principal activities |
55,074,158 | 10,835,074 | 11,060,133 | 10,006,030 | 1,380,998 | 435,309 | 88,791,702 | |||||||||||||||||||||
| Including: Recognized at a point in time |
55,074,158 | 10,835,074 | 11,020,323 | 10,006,030 | 1,380,998 | 435,309 | 88,751,892 | |||||||||||||||||||||
| Recognized over time |
— | — | 39,810 | — | — | — | 39,810 | |||||||||||||||||||||
| Income from other operating activities |
— | — | — | — | — | 488,713 | 488,713 | |||||||||||||||||||||
|
|
|
|
|
|
|
|
|
|
|
|
|
|
|
|||||||||||||||
| Total |
55,074,158 | 10,835,074 | 11,060,133 | 10,006,030 | 1,380,998 | 924,022 | 89,280,415 | |||||||||||||||||||||
|
|
|
|
|
|
|
|
|
|
|
|
|
|
|
|||||||||||||||
407
Notes to the Financial Statements (continued)
For the year ended 31 December 2021
(All amounts in thousands of Renminbi Yuan unless otherwise stated)
| V. | Notes to the consolidated financial statements (continued) |
| 38. | Operating income and operating costs (continued) |
| (2) | For the year ended 31 December 2021, analysis of revenue are as followings: (continued) |
For the year ended 31 December 2020, analysis of revenue are as followings:
| 2020 | ||||||||||||||||||||||||||||
| Petroleum products |
Intermediate petrochemicals |
Trading of petrochemical products |
Resins and plastics |
Synthetic fibres |
Others | Total | ||||||||||||||||||||||
| Income from principal activities |
43,080,204 | 8,251,252 | 11,585,110 | 9,475,887 | 1,480,576 | 422,466 | 74,295,495 | |||||||||||||||||||||
| Including: Recognized at a point in time |
43,080,204 | 8,251,252 | 11,583,709 | 9,475,887 | 1,480,576 | 422,466 | 74,294,094 | |||||||||||||||||||||
| Recognized over time |
— | — | 1,401 | — | — | — | 1,401 | |||||||||||||||||||||
| Income from other operating activities |
— | — | — | — | — | 409,688 | 409,688 | |||||||||||||||||||||
|
|
|
|
|
|
|
|
|
|
|
|
|
|
|
|||||||||||||||
| Total |
43,080,204 | 8,251,252 | 11,585,110 | 9,475,887 | 1,480,576 | 832,154 | 74,705,183 | |||||||||||||||||||||
|
|
|
|
|
|
|
|
|
|
|
|
|
|
|
|||||||||||||||
| 39. | Taxes and surcharges |
| Item |
2021 | 2020 | Tax base and rate | |||||||
| Consumption tax |
11,634,040 | 11,399,147 | According to relevant PRC tax regulations, since 1 January 2009, the Group required to pay consumption tax based on the Group’s sales of gasoline, diesel, naphtha and fuel oil rate according to the applicable tax rate (Note IV) | |||||||
| Urban maintenance and construction tax |
916,833 | 899,503 | 1% or 7% of actual payments of consumption tax and VAT during the year | |||||||
| Education surcharges |
672,083 | 665,664 | 3% of actual payments of consumption tax and VAT during the year | |||||||
| Stamp tax |
22,392 | 33,427 | Applicable tax rate | |||||||
| Property tax |
26,277 | 25,860 | 1.2% of taxable property value or 12% of rental expense | |||||||
| Land use tax |
26,192 | 23,615 | Applicable tax rate | |||||||
| Others |
11,871 | 15,494 | ||||||||
|
|
|
|
|
|||||||
| Total |
13,309,688 | 13,062,710 | ||||||||
|
|
|
|
|
|||||||
408
Notes to the Financial Statements (continued)
For the year ended 31 December 2021
(All amounts in thousands of Renminbi Yuan unless otherwise stated)
| V. | Notes to the consolidated financial statements (continued) |
| 40. | Selling and distribution expenses |
| Item |
2021 | 2020 | ||||||
| Transportation fee |
83,279 | 227,000 | ||||||
| Sales commission |
110,552 | 104,598 | ||||||
| Staff costs |
83,588 | 71,866 | ||||||
| Storage and logistics expenses |
51,906 | 47,002 | ||||||
| Others |
33,009 | 28,794 | ||||||
|
|
|
|
|
|||||
| Total |
362,334 | 479,260 | ||||||
|
|
|
|
|
|||||
| 41. | General and administrative expenses |
| Item |
2021 | 2020 | ||||||
| Staff costs |
991,258 | 961,442 | ||||||
| Repair and maintenance expense |
386,298 | 1,060,624 | ||||||
| Depreciation and amortization |
161,309 | 130,044 | ||||||
| Security and fire fighting expenses |
47,516 | 54,596 | ||||||
| Information system operation maintenance |
43,933 | 53,233 | ||||||
| Depreciation of right-of-use assets |
13,591 | 12,991 | ||||||
| Others |
198,182 | 186,398 | ||||||
|
|
|
|
|
|||||
| Total |
1,842,087 | 2,459,328 | ||||||
|
|
|
|
|
|||||
409
Notes to the Financial Statements (continued)
For the year ended 31 December 2021
(All amounts in thousands of Renminbi Yuan unless otherwise stated)
| V. | Notes to the consolidated financial statements (continued) |
| 42. | Research and development expenses |
| Item |
2021 | 2020 | ||||||
| R&D material cost |
14,401 | 44,241 | ||||||
| Technical cooperation fee |
47,696 | 30,101 | ||||||
| Payroll |
24,427 | 25,896 | ||||||
| Depreciation and amortization |
3,738 | 4,271 | ||||||
| Others |
4,033 | 6,116 | ||||||
|
|
|
|
|
|||||
| Total |
94,295 | 110,625 | ||||||
|
|
|
|
|
|||||
| 43. | Finance expenses |
| Item |
2021 | 2020 | ||||||
| Interest expenses from loans and payables |
106,290 | 100,845 | ||||||
| Less: Capitalized borrowing costs |
(12,641 | ) | (8,292 | ) | ||||
| Add: Interest expenses from lease liabilities |
537 | 887 | ||||||
| Interest income from deposits and receivables |
(508,755 | ) | (431,228 | ) | ||||
| Net exchange losses/(gains) |
1,861 | (6,734 | ) | |||||
| Others |
5,909 | 7,063 | ||||||
|
|
|
|
|
|||||
| Total |
(406,799 | ) | (337,459 | ) | ||||
|
|
|
|
|
|||||
The interest rate per annum, at which the borrowing costs were capitalized by the Group, was 2.85% for the year (for the year ended 31 December 2020: 2.88%).
410
Notes to the Financial Statements (continued)
For the year ended 31 December 2021
(All amounts in thousands of Renminbi Yuan unless otherwise stated)
| V. | Notes to the consolidated financial statements (continued) |
| 44. | Other income |
| Item |
2021 | 2020 | Related to asset/ related to income |
|||||||||
| Local education surcharge special fund subsidy |
20,841 | 57 | related to income | |||||||||
| Refund of harbour construction charge |
7,018 | 8,925 | related to income | |||||||||
| Tax refunds |
1,295 | 32,653 | related to income | |||||||||
| Scientific research expenditures subsidy |
4,598 | 8,543 | related to income | |||||||||
| Others |
1,479 | 10,681 | related to income | |||||||||
|
|
|
|
|
|||||||||
| Total |
35,231 | 60,859 | ||||||||||
|
|
|
|
|
|||||||||
| 45. | Investment income |
| Item |
2021 | 2020 | ||||||
| Income from investment in associates and joint ventures |
864,285 | 714,740 | ||||||
| Structured deposits income |
97,921 | 132,690 | ||||||
| Net gains/(losses) from disposal of derivative financial instruments |
9,859 | (912 | ) | |||||
| Discount loss of receivables |
(4,685 | ) | (9,513 | ) | ||||
|
|
|
|
|
|||||
| Total |
967,380 | 837,005 | ||||||
|
|
|
|
|
|||||
There was no significant restriction on the repatriation of investment income.
411
Notes to the Financial Statements (continued)
For the year ended 31 December 2021
(All amounts in thousands of Renminbi Yuan unless otherwise stated)
| V. | Notes to the consolidated financial statements (continued) |
| 46. | Gains from changes in fair value |
| Item |
2021 | 2020 | ||||||
| Financial assets measured at fair value through profit or loss |
||||||||
| Structured deposits |
— | (18,407 | ) | |||||
| Derivative financial assets and derivative financial liabilities |
||||||||
| Foreign exchange option contracts |
— | 536 | ||||||
| commodity swaps contracts |
8,987 | — | ||||||
|
|
|
|
|
|||||
| Total |
8,987 | (17,871 | ) | |||||
|
|
|
|
|
|||||
| 47. | Credit losses |
| Item |
2021 | 2020 | ||||||
| Accounts receivable provision (loss) |
(1,354 | ) | (634 | ) | ||||
| Other receivable provision (loss)/reverse (a) |
(1 | ) | 121,550 | |||||
|
|
|
|
|
|||||
| Total |
(1,355 | ) | 120,916 | |||||
|
|
|
|
|
|||||
| (a) | Zhejiang Jinyong Acrylic Fiber Co., Ltd. (Jinyong company), a former subsidiary of the Group within the scope of merger, went into bankruptcy on 23 August 2019. According to the distribution plan of Jinyong company’s bankruptcy property, the Group recovered RMB121,550 thousand of debt repayment paid by Jinyong company’s bankruptcy administrator in 2020. |
| 48. | Impairment losses |
| Item |
2021 | 2020 | ||||||
| Impairment loss on inventories (Note V. 7) |
(150,883 | ) | (220,888 | ) | ||||
| Impairment loss on fixed assets (Note V. 11) |
(587,622 | ) | (87,570 | ) | ||||
| Impairment loss on long-term equity investment (Note V. 9) |
(28,392 | ) | — | |||||
|
|
|
|
|
|||||
| Total |
(766,897 | ) | (308,458 | ) | ||||
|
|
|
|
|
|||||
412
Notes to the Financial Statements (continued)
For the year ended 31 December 2021
(All amounts in thousands of Renminbi Yuan unless otherwise stated)
| V. | Notes to the consolidated financial statements (continued) |
| 49. | Gains from asset disposals |
| Item |
2021 | 2020 | Amount recognized in extraordinary gain and loss for the year ended 31 December 2021 |
|||||||||
| Gains from disposal of fixed assets |
79,085 | 102,808 | 79,085 | |||||||||
| Losses from disposal of fixed assets |
— | (199 | ) | — | ||||||||
|
|
|
|
|
|
|
|||||||
| Total |
79,085 | 102,609 | 79,085 | |||||||||
|
|
|
|
|
|
|
|||||||
| 50. | Non-operating income |
| Item |
Note | 2021 | 2020 | Amount recognized in extraordinary gain and loss for the year ended 31 December 2021 |
||||||||||||
| Government grants |
(1 | ) | 10,713 | 10,437 | 10,713 | |||||||||||
| Others |
17,070 | 5,772 | 17,070 | |||||||||||||
|
|
|
|
|
|
|
|||||||||||
| Total |
27,783 | 16,209 | 27,783 | |||||||||||||
|
|
|
|
|
|
|
|||||||||||
| (1) | Government grants mainly include: |
| Item |
2021 | 2020 | ||||||
| Amortization of deferred income (Note V.30) |
10,713 | 10,437 | ||||||
413
Notes to the Financial Statements (continued)
For the year ended 31 December 2021
(All amounts in thousands of Renminbi Yuan unless otherwise stated)
| V. | Notes to the consolidated financial statements (continued) |
| 51. | Non-operating expenses |
| 2021 | 2020 | Amount recognized in extraordinary gain and loss for the year ended 31 December 2021 |
||||||||||
| Losses from scrapping of fixed assets |
40,046 | 30,313 | 40,046 | |||||||||
| Allowances |
40,550 | 39,679 | 40,550 | |||||||||
| Others |
24,621 | 9,061 | 24,621 | |||||||||
|
|
|
|
|
|
|
|||||||
| Total |
105,217 | 79,053 | 105,217 | |||||||||
|
|
|
|
|
|
|
|||||||
| 52. | Income tax expenses |
| Item |
2021 | 2020 | ||||||
| Current tax expense for the year based on tax law and regulations |
590,668 | 46,215 | ||||||
| Changes in deferred tax assets/liabilities |
53,812 | (102,647 | ) | |||||
| Tax filing differences |
— | (9,188 | ) | |||||
|
|
|
|
|
|||||
| Total |
644,480 | (65,620 | ) | |||||
|
|
|
|
|
|||||
414
Notes to the Financial Statements (continued)
For the year ended 31 December 2021
(All amounts in thousands of Renminbi Yuan unless otherwise stated)
| V. | Notes to the consolidated financial statements (continued) |
| 52. | Income tax expenses (continued) |
Reconciliation between income tax expenses and accounting profit/(loss):
| Item |
2021 | 2020 | ||||||
| Profit before income tax |
2,648,161 | 573,816 | ||||||
| Expected income tax expense at applicable tax rates |
662,040 | 143,454 | ||||||
| Tax effect of investment income accounted for using the equity method |
(214,750 | ) | (178,685 | ) | ||||
| Other non-taxable profit |
(10,279 | ) | (53,876 | ) | ||||
| Tax deductions for R&D expenses |
(12,168 | ) | (11,863 | ) | ||||
| Additional deduction for purchasing environmental protection equipment not used in the previous year |
(12,446 | ) | — | |||||
| Costs, expenses and losses not deductible |
203,674 | 55,281 | ||||||
| Difference in settlement of income tax in previous years and the supplementary income tax |
— | (9,188 | ) | |||||
| Deductible loss of unrecognized deferred income tax assets in the previous years |
(157 | ) | (13,564 | ) | ||||
| Derecognition of previously recognized tax losses |
7,341 | — | ||||||
| Tax losses for which no deferred income tax asset was recognized in the year |
21,225 | 2,821 | ||||||
| Income tax expenses |
644,480 | (65,620 | ) | |||||
| 53. | Earnings per share |
| (1) | Basic earnings per share |
Basic earnings per share is calculated by dividing the consolidated net profit/(loss) attributable to ordinary shareholders of the Company by the weighted average number of ordinary shares outstanding:
| 2021 | 2020 | |||||||
| Consolidated net profit attributable to ordinary shareholders of the Company |
2,000,506 | 628,110 | ||||||
| Weighted average number of the Company’s ordinary shares outstanding (thousand) |
10,823,814 | 10,823,814 | ||||||
| Basic earnings per share (RMB per share) |
0.185 | 0.058 | ||||||
| (2) | Diluted earnings per share |
For the year ended 31 December 2021, there are no diluted ordinary shares outstanding, the diluted earnings per share equals the basic earnings per share.
415
Notes to the Financial Statements (continued)
For the year ended 31 December 2021
(All amounts in thousands of Renminbi Yuan unless otherwise stated)
| 54. | Supplementary information on income statement |
Expenses on income statement are analysed by their nature:
| 2021 | 2020 | |||||||
| Operating income |
89,280,415 | 74,705,183 | ||||||
| Less: Changes in inventories of finished goods and work in progress |
(235,402 | ) | 862,652 | |||||
| Consumed raw materials and low value consumables, etc. |
54,457,558 | 42,082,307 | ||||||
| Cost of trading products |
10,929,127 | 11,467,420 | ||||||
| Employee benefits |
3,456,765 | 3,143,219 | ||||||
| Depreciation and amortization expenses |
1,950,455 | 1,812,461 | ||||||
| Depreciation of right-of-use assets |
17,263 | 16,688 | ||||||
| Taxes and surcharges |
13,309,688 | 13,062,710 | ||||||
| Repair and maintenance expenses |
1,587,955 | 1,060,624 | ||||||
| Others |
1,810,641 | 1,692,961 | ||||||
| Finance expenses (“-” for income) |
(406,799 | ) | (337,459 | ) | ||||
| Add: Gains from changes in fair value |
8,987 | (17,871 | ) | |||||
| Gains from asset disposals |
79,085 | 102,609 | ||||||
| Other income |
35,231 | 60,859 | ||||||
| Investment income |
967,380 | 837,005 | ||||||
| Impairment losses (“-” for loss) |
(766,897 | ) | (308,458 | ) | ||||
| Credit losses (“-” for loss) |
(1,355 | ) | 120,916 | |||||
|
|
|
|
|
|||||
| Operating profit |
2,725,595 | 636,660 | ||||||
|
|
|
|
|
|||||
416
Notes to the Financial Statements (continued)
For the year ended 31 December 2021
(All amounts in thousands of Renminbi Yuan unless otherwise stated)
| V. | Notes to the consolidated financial statements (continued) |
| 55. | Notes to cash flow statement |
| (1) | Proceeds from other operating activities: |
| Item |
2021 | 2020 | ||||||
| Received bankruptcy repayment of Jinyong company |
— | 121,550 | ||||||
| Subsidy income |
33,936 | 28,206 | ||||||
| Others |
185,119 | 95,839 | ||||||
|
|
|
|
|
|||||
| Total |
219,055 | 245,595 | ||||||
|
|
|
|
|
|||||
| (2) | Payments for other operating activities: |
| Item |
2021 | 2020 | ||||||
| Agency fee |
(110,552 | ) | (104,598 | ) | ||||
| Research and development expenses |
(51,729 | ) | (106,354 | ) | ||||
| Information system operation maintenance |
(43,933 | ) | (53,233 | ) | ||||
| Commodity storage and logistics fee |
(51,906 | ) | (47,002 | ) | ||||
| Security and fire fighting expenses |
(47,516 | ) | (54,596 | ) | ||||
| Others |
(186,924 | ) | (19,755 | ) | ||||
|
|
|
|
|
|||||
| Total |
(492,560 | ) | (385,538 | ) | ||||
|
|
|
|
|
|||||
| (3) | Proceeds from other investing activities: |
| Item |
2021 | 2020 | ||||||
| Time deposits due within one-year receipts |
3,800,000 | 500,000 | ||||||
| Interest income |
398,937 | 410,404 | ||||||
|
|
|
|
|
|||||
| Total |
4,198,937 | 910,404 | ||||||
|
|
|
|
|
|||||
417
Notes to the Financial Statements (continued)
For the year ended 31 December 2021
(All amounts in thousands of Renminbi Yuan unless otherwise stated)
| V. | Notes to the consolidated financial statements (continued) |
| 55. | Notes to cash flow statement (continued) |
| (4) | Payments for other investing activities: |
| Item |
2021 | 2020 | ||||||
| Payments for time deposits due over one year |
(2,000,000 | ) | (3,500,000 | ) | ||||
| Payments for time deposits due within one year |
(3,650,000 | ) | (3,000,000 | ) | ||||
| Discount loss of receivables |
(4,685 | ) | (9,513 | ) | ||||
| Investment losses of derivative financial instruments |
— | (912 | ) | |||||
|
|
|
|
|
|||||
| Total |
(5,654,685 | ) | (6,510,425 | ) | ||||
|
|
|
|
|
|||||
| (5) | Payments for other financing activities: |
| Item |
2021 | 2020 | ||||||
| Lease liabilities payment |
(17,544 | ) | (15,586 | ) | ||||
|
|
|
|
|
|||||
For the year ended 31 December 2021, cash payment of the Group related to lease activities is RMB24,482 thousand (for the year ended 31 December 2020: RMB20,204 thousand), except for the above amount included in financing activities, the rest are included in operating activities.
418
Notes to the Financial Statements (continued)
For the year ended 31 December 2021
(All amounts in thousands of Renminbi Yuan unless otherwise stated)
| V. | Notes to the consolidated financial statements (continued) |
| 56. | Supplementary information on cash flow statement |
| (1) | Supplement to cash flow statement |
| a. | Reconciliation of net profit/(loss) to cash flows from operating activities: |
| Item |
2021 | 2020 | ||||||
| Net profit |
2,003,681 | 639,436 | ||||||
| Add: Provisions for impairment of assets |
766,897 | 308,458 | ||||||
| Provision/(Reversal) of credit losses |
1,355 | (120,916 | ) | |||||
| Depreciation of investment properties |
15,325 | 15,184 | ||||||
| Depreciation of fixed assets |
1,623,469 | 1,555,049 | ||||||
| Depreciation of right-of-use assets |
17,263 | 16,688 | ||||||
| Amortization of intangible assets |
19,968 | 18,884 | ||||||
| Amortization of long-term deferred expenses |
291,693 | 223,344 | ||||||
| Gains on disposal of fixed assets |
(48,671 | ) | (72,296 | ) | ||||
| Gains from changes in fair value |
(8,987 | ) | 17,871 | |||||
| Finance expenses (“-” for income) |
(328,648 | ) | (269,823 | ) | ||||
| Investment income |
(967,380 | ) | (837,005 | ) | ||||
| Decrease in deferred tax assets (“-” for increase) |
55,825 | (101,289 | ) | |||||
| Increase in deferred tax liabilities (“-” for decrease) |
(2,013 | ) | (1,358 | ) | ||||
| Decrease in deferred income |
(10,713 | ) | (10,437 | ) | ||||
| Decrease in inventories (“-” for increase) |
(2,185,662 | ) | 2,644,799 | |||||
| Decrease in operating receivables (“-” for increase) |
(71,784 | ) | 696,083 | |||||
| Increase in operating payables (“-” for decrease) |
2,817,493 | (3,059,915 | ) | |||||
| Increase in specific reserve |
70,915 | 88,460 | ||||||
|
|
|
|
|
|||||
| Net cash flows generated in operating activities |
4,060,026 | 1,751,217 | ||||||
|
|
|
|
|
|||||
419
Notes to the Financial Statements (continued)
For the year ended 31 December 2021
(All amounts in thousands of Renminbi Yuan unless otherwise stated)
| V. | Notes to the consolidated financial statements (continued) |
| 56. | Supplementary information on cash flow statement (continued) |
| (1) | Supplement to cash flow statement (continued) |
| b. | Change in cash and cash equivalents: |
| Item |
2021 | 2020 | ||||||
| Cash and cash equivalents at end of the year |
5,112,010 | 6,916,408 | ||||||
| Less: Cash and cash equivalents at beginning of the year |
(6,916,408 | ) | (7,449,699 | ) | ||||
| Net decrease in cash and cash equivalents |
(1,804,398 | ) | (533,291 | ) | ||||
|
|
|
|
|
|||||
| (2) | Details of cash and cash equivalents |
| Item |
2021 | 2020 | ||||||
| Cash at bank and on hand |
— | — | ||||||
| Including: Bank deposits available on demand |
5,112,010 | 6,916,408 | ||||||
| Cash and cash equivalents at the end of the period/year |
5,112,010 | 6,916,408 | ||||||
|
|
|
|
|
|||||
| 57. | Foreign monetary items |
| 31 December 2021 | ||||||||||||
| Foreign currency | Exchange rate | RMB currency | ||||||||||
| Cash at bank and on hand—USD |
26,015 | 6.3757 | 165,864 | |||||||||
| Derivative financial assets—USD |
12,768 | 6.3757 | 81,405 | |||||||||
| Accounts receivable—USD |
408 | 6.3757 | 2,601 | |||||||||
| Other receivable—USD |
40 | 6.3757 | 255 | |||||||||
| Receivables under financing—USD |
56,242 | 6.3757 | 358,582 | |||||||||
| Derivative financial liabilities—USD |
(3,734 | ) | 6.3757 | (23,804 | ) | |||||||
| Accounts payable—USD |
(79,633 | ) | 6.3757 | (507,716 | ) | |||||||
| Other payables—USD |
(2,521 | ) | 6.3757 | (16,073 | ) | |||||||
| Gross balance sheet exposure—USD |
9,585 | 61,114 | ||||||||||
|
|
|
|
|
|
|
|||||||
420
Notes to the Financial Statements (continued)
For the year ended 31 December 2021
(All amounts in thousands of Renminbi Yuan unless otherwise stated)
| V. | Notes to the consolidated financial statements (continued) |
| 57. | Foreign monetary items (continued) |
| 31 December 2020 | ||||||||||||
| Foreign currency | Exchange rate | RMB currency | ||||||||||
| Cash at bank and on hand—USD |
31,836 | 6.5249 | 207,727 | |||||||||
| Accounts receivable—USD |
18,214 | 6.5249 | 118,845 | |||||||||
| Other receivable—USD |
40 | 6.5249 | 261 | |||||||||
| Receivables under financing—USD |
49,645 | 6.5249 | 323,929 | |||||||||
| Accounts payable—USD |
(88,604 | ) | 6.5249 | (578,132 | ) | |||||||
| Other payables—USD |
(1,319 | ) | 6.5249 | (8,606 | ) | |||||||
| Gross balance sheet exposure—USD |
9,812 | 64,024 | ||||||||||
|
|
|
|
|
|
|
|||||||
| 58. | Leases |
| (1) | As a lessor |
| (a) | Operating lease |
| Item |
2021 | 2020 | ||||||
| Lease income |
81,923 | 81,608 | ||||||
|
|
|
|
|
|||||
The Group leases out some buildings and machinery. The lessee guarantees the residual value of the leased assets at the end of the lease term. The Group has classified these leases as operating leases, because they do not transfer substantially all of the risks and rewards incidental to the ownership of the assets.
| (2) | As a lessee |
| Item |
2021 | 2020 | ||||||
| Short-term lease expenses applied the practical expedient |
6,938 | 3,731 | ||||||
| Total cash outflow for leases |
24,482 | 20,204 | ||||||
|
|
|
|
|
|||||
421
Notes to the Financial Statements (continued)
For the year ended 31 December 2021
(All amounts in thousands of Renminbi Yuan unless otherwise stated)
| V. | Notes to the consolidated financial statements (continued) |
| 59. | Government grants |
| (1) | Details of government grants |
| Category |
Amount | Presentation item |
Amount recognized in profit or loss for the current year |
|||||||
| Investment subsidy for Chemical Industry |
100,000 | Deferred income/Non-operating income | 10,000 | |||||||
| Power units energy saving reconstruction subsidies |
5,200 | Deferred income | — | |||||||
| Huang Gu Tang pipeline relocation subsidy |
3,931 | Deferred income/Non-operating income | 437 | |||||||
| Others subsidy relating to assets |
3,589 | Deferred income/Non-operating income |
276 | |||||||
| Local education surcharge special fund subsidy |
20,841 | Other income | 20,841 | |||||||
| Refund of harbor construction charge |
7,018 | Other income | 7,018 | |||||||
| Financial subsidies for scientific research expenditures |
4,598 | Other income | 4,598 | |||||||
| Commission for withholding tax refund |
1,295 | Other income | 1,295 | |||||||
| Others |
1,479 | Other income |
1,479 | |||||||
|
|
|
|
|
|||||||
| (2) | For the year ended 31 December 2021, there is no repayment of government grants. |
422
Notes to the Financial Statements (continued)
For the year ended 31 December 2021
(All amounts in thousands of Renminbi Yuan unless otherwise stated)
| VI. | Interests in other entities |
| 1. | Interests in subsidiaries |
| (1) | Main components of the Group’s subsidiaries as at 31 December 2021: |
| Percentage of equity | ||||||||||||||||||||
| Name of enterprise |
Main business area |
Place of registration |
Principal activities |
Registered capital (thousands) |
Directly held | Indirectly | Way of acquisition | |||||||||||||
| Toufa |
Shanghai | Shanghai | Investment | RMB1,000,000 | 100.00 | % | — | Establish | ||||||||||||
| Jinmao |
Shanghai | Shanghai | Trading | RMB25,000 | 67.33 | % | — | Establish | ||||||||||||
| Jinchang |
Shanghai | Shanghai | Manufacturing | USD9,154 | — | 74.25 | % | Establish | ||||||||||||
| Shanghai Golden Phillips Petrochemical Company Limited (“Jinfei”) |
Shanghai | Shanghai | Manufacturing | RMB415,623 | — | 100.00 | % | Establish | ||||||||||||
| Jinmao International |
Shanghai | Shanghai | Trading | RMB100,000 | — | 67.33 | % | Establish | ||||||||||||
| Jinlian |
Zhejiang Jiaxing |
Zhejiang Jiaxing |
Trading | RMB400,000 | — | 100.00 | % | Business combinations involving entities not under common control | ||||||||||||
|
|
|
|
|
|
|
|
|
|
| |||||||||||
| (2) | As at 31 December 2021 and 31 December 2020, non-controlling interests of subsidiaries’ non-controlling shareholders were not significant (Note V.37). |
| (3) | In June 2020, upon the approval of the Board of directors of the Group and Toufa, Toufa acquired 100% equity of Jinlian at the consideration of RMB340,369 thousand. As at the acquisition date of 30 June 2020, fair value of fixed assets, intangible assets and identifiable net assets of Jinlian is RMB275,715 thousand, RMB102,283 thousand and RMB340,475 thousand, respectively |
423
Notes to the Financial Statements (continued)
For the year ended 31 December 2021
(All amounts in thousands of Renminbi Yuan unless otherwise stated)
| VI. | Interests in other entities (continued) |
| 2. | Interests in joint ventures or associates |
| (1) | Nature of interest in major joint ventures or associates at 31 December 2021 |
| Name of | Place of main |
Place of | Whether it |
% of ownership interest | Registered capital |
|||||||||||||||
| enterprise |
business |
registry |
Principal activities |
activities |
Directly | Indirectly | (thousands) | |||||||||||||
| Joint ventures Linde Gases Company |
Shanghai | Shanghai | Production and sales of industrial gases |
Yes | — | 50.00 | % | USD32,000 | ||||||||||||
| Inspection and Testing Company |
Shanghai | Shanghai | Inspect and test chemical equipment |
Yes | — | 50.00 | % | RMB10,000 | ||||||||||||
| Yangu Gas |
Shanghai | Shanghai | Production and sales of industrial gases |
Yes | — | 50.00 | % | USD10,560 | ||||||||||||
| Baling Materials |
Shanghai | Shanghai | Production and sales of new styrene thermoplastic elastomer materials |
Yes | 50.00 | % | — | RMB800,000 | ||||||||||||
| Associates – Shanghai Secco |
Shanghai | Shanghai | Manufacturing and distribution of chemical products |
Yes | 20.00 | % | — | RMB500,000 | ||||||||||||
| Chemical Industry |
Shanghai | Shanghai | Planning, development and operation of the Chemical Industry Park in Shanghai, PRC |
Yes | 38.26 | % | — | RMB2,372,439 | ||||||||||||
| Jinsen |
Shanghai | Shanghai | Production of resins products |
Yes | — | 40.00 | % | RMB193,695 | ||||||||||||
| Azbil |
Shanghai | Shanghai | Service and maintenance of building automation systems and products |
— | 40.00 | % | RMB24,440 | |||||||||||||
| Shidian Energy |
Shanghai | Shanghai | Electricity supply |
— | 40.00 | % | RMB800,000 | |||||||||||||
|
|
|
|
|
|
|
|||||||||||||||
The Group applies the equity method to measure these equity investments.
| (i) | Sinopec Baling Petrochemical Co., Ltd. and the Company jointly established Baling Materials on 7 September 2021, each with a cash contribution of RMB400,000 thousand. As at 31 December 2021, the Company has made a paid-up capital contribution of RMB50,000 thousand. The main business scope of Baling Materials is the production and sales of new styrene thermoplastic elastomer materials SBS, SIS, SEBS, SEPS and SSBR (collectively referred to as SBC) and their raw materials, intermediate products and by-products. |
424
Notes to the Financial Statements (continued)
For the year ended 31 December 2021
(All amounts in thousands of Renminbi Yuan unless otherwise stated)
| VI. | Interests in other entities (continued) |
| 2. | Interests in joint ventures or associates (continued) |
| (2) | Key financial information of material joint ventures |
| 2021 | 2020 | |||||||||||||||||||||||||||
| Linde Gases Company |
Inspection and Testing Company |
Yangu Gas | Baling Materials |
Linde Gases Company |
Inspection and Testing Company |
Yangu Gas | ||||||||||||||||||||||
| Current assets |
301,512 | 21,979 | 84,065 | 34,480 | 301,707 | 19,358 | 74,690 | |||||||||||||||||||||
| Including: Cash and cash equivalents |
226,860 | 16,914 | 72,916 | 6,062 | 233,898 | 13,281 | 62,878 | |||||||||||||||||||||
| Non-current assets |
109,366 | 1,577 | 19,034 | 65,520 | 147,717 | 1,800 | 26,066 | |||||||||||||||||||||
|
|
|
|
|
|
|
|
|
|
|
|
|
|
|
|||||||||||||||
| Total assets |
410,878 | 23,556 | 103,099 | 100,000 | 449,424 | 21,158 | 100,756 | |||||||||||||||||||||
| Current liabilities |
(62,356 | ) | (3,356 | ) | (3,262 | ) | — | (57,153 | ) | (2,453 | ) | (3,463 | ) | |||||||||||||||
| Non-current liabilities |
(16,303 | ) | — | — | — | (21,417 | ) | — | — | |||||||||||||||||||
|
|
|
|
|
|
|
|
|
|
|
|
|
|
|
|||||||||||||||
| Total liabilities |
(78,659 | ) | (3,356 | ) | (3,262 | ) | — | (78,570 | ) | (2,453 | ) | (3,463 | ) | |||||||||||||||
| Net assets |
332,219 | 20,200 | 99,837 | 100,000 | 370,854 | 18,705 | 97,293 | |||||||||||||||||||||
| Group’s share of net assets (i) |
166,110 | 10,100 | 49,919 | 50,000 | 185,427 | 9,352 | 48,648 | |||||||||||||||||||||
| Elimination of unrealized profit or loss on intra-group transactions |
(86 | ) | — | — | — | (1,753 | ) | — | — | |||||||||||||||||||
| Carrying amount of interests |
166,024 | 10,100 | 49,919 | 50,000 | 183,674 | 9,352 | 48,648 | |||||||||||||||||||||
|
|
|
|
|
|
|
|
|
|
|
|
|
|
|
|||||||||||||||
425
Notes to the Financial Statements (continued)
For the year ended 31 December 2021
(All amounts in thousands of Renminbi Yuan unless otherwise stated)
| VI. | Interests in other entities (continued) |
| 2. | Interests in joint ventures or associates (continued) |
| (2) | Key financial information of material joint ventures (continued) |
| 2021 | 2020 | |||||||||||||||||||||||||||
| Linde Gases Company |
Inspection and Testing Company |
Yangu Gas | Baling Materials |
Linde Gases Company |
Inspection and Testing Company |
Yangu Gas | ||||||||||||||||||||||
| Operating income |
428,971 | 27,190 | 60,222 | — | 420,160 | 21,674 | 58,463 | |||||||||||||||||||||
| Financial income/(expense) |
3,489 | 304 | 1,516 | — | 2,246 | 304 | 1,483 | |||||||||||||||||||||
| Income tax expenses |
29,316 | (1,125 | ) | — | — | (26,290 | ) | (177 | ) | — | ||||||||||||||||||
| Net profit |
87,452 | 3,375 | 4,144 | — | 82,387 | 2,102 | 1,830 | |||||||||||||||||||||
| Other comprehensive income |
— | — | — | — | — | — | — | |||||||||||||||||||||
| Total comprehensive income |
87,452 | 3,375 | 4,144 | — | 82,387 | 2,102 | 1,830 | |||||||||||||||||||||
| Dividends declared by joint venture |
63,044 | 940 | 800 | — | 38,234 | 1,049 | 1,000 | |||||||||||||||||||||
| (i) | The Group calculated shares of assets by its shareholding ratio, based on the amount from financial statements in joint ventures. The amount in financial statements of joint ventures based on the impacts of identifiable assets when obtained investment, fair value of liabilities, and consistency of accounting policies. |
426
Notes to the Financial Statements (continued)
For the year ended 31 December 2021
(All amounts in thousands of Renminbi Yuan unless otherwise stated)
| VI. | Interests in other entities (continued) |
| 2. | Interests in joint ventures or associates (continued) |
| (3) | Key financial information of material associates |
| 2021 | 2020 | |||||||||||||||||||||||||||||||||||||||
| Shanghai Secco |
Chemical Industry |
Jinsen | Azbil | Shidian Energy |
Shanghai Secco |
Chemical Industry |
Jinsen | Azbil | Shidian Energy |
|||||||||||||||||||||||||||||||
| Current assets |
6,066,119 | 4,133,397 | 63,192 | 274,697 | 804,470 | 10,430,726 | 4,618,722 | 74,170 | 227,172 | 790,069 | ||||||||||||||||||||||||||||||
| Including: Cash and cash equivalents |
2,332,751 | 2,650,246 | 16,163 | 171,399 | 772,235 | 5,220,637 | 2,920,133 | 44,333 | 144,645 | 768,979 | ||||||||||||||||||||||||||||||
| Non-current assets |
5,735,360 | 6,201,415 | 58,737 | 15,698 | 121,051 | 6,099,126 | 3,811,036 | 64,421 | 3,984 | 72,441 | ||||||||||||||||||||||||||||||
|
|
|
|
|
|
|
|
|
|
|
|
|
|
|
|
|
|
|
|
|
|||||||||||||||||||||
| Total assets |
11,801,479 | 10,334,812 | 121,929 | 290,395 | 925,521 | 16,529,852 | 8,429,758 | 138,591 | 231,156 | 862,510 | ||||||||||||||||||||||||||||||
| Current liabilities |
(5,433,872 | ) | (1,789,223 | ) | (10,476 | ) | (111,472 | ) | (34,565 | ) | (2,783,216 | ) | (1,761,431 | ) | (10,481 | ) | (73,450 | ) | (20,650 | ) | ||||||||||||||||||||
| Non-current liabilities |
(66 | ) | (619,306 | ) | — | (7,506 | ) | (15,827 | ) | (32,482 | ) | (528,237 | ) | — | — | — | ||||||||||||||||||||||||
|
|
|
|
|
|
|
|
|
|
|
|
|
|
|
|
|
|
|
|
|
|||||||||||||||||||||
| Total liabilities |
(5,433,938 | ) | (2,408,529 | ) | (10,476 | ) | (118,978 | ) | (50,392 | ) | (2,815,698 | ) | (2,289,668 | ) | (10,481 | ) | (73,450 | ) | (20,650 | ) | ||||||||||||||||||||
| Net assets |
6,367,541 | 7,926,283 | 111,453 | 171,417 | 875,129 | 13,714,154 | 6,140,090 | 128,110 | 157,706 | 841,860 | ||||||||||||||||||||||||||||||
| Non-controlling interests |
— | 1,508,583 | — | — | — | — | — | — | — | — | ||||||||||||||||||||||||||||||
| Net assets attributable to Equity shareholders of the Company |
6,367,541 | 6,417,700 | 111,453 | 171,417 | 875,129 | 13,714,154 | 6,140,090 | 128,110 | 157,706 | 841,860 | ||||||||||||||||||||||||||||||
| Group’s share of net assets (i) |
1,273,508 | 2,455,412 | 44,581 | 68,567 | 350,052 | 2,742,832 | 2,349,198 | 51,244 | 63,083 | 336,744 | ||||||||||||||||||||||||||||||
| Adjustment- elimination of unrealized profit or loss on intra-group transactions |
(3,157 | ) | — | — | — | (15,979 | ) | (11,285 | ) | — | — | — | (19,343 | ) | ||||||||||||||||||||||||||
| Adjustment (ii) |
— | (331,826 | ) | — | — | — | — | (331,407 | ) | — | — | — | ||||||||||||||||||||||||||||
| impairment loss |
— | — | (28,392 | ) | — | — | — | — | — | — | — | |||||||||||||||||||||||||||||
| Carrying amount of interests in associates |
1,270,351 | 2,123,586 | 16,189 | 68,567 | 334,073 | 2,731,547 | 2,017,791 | 51,244 | 63,083 | 317,401 | ||||||||||||||||||||||||||||||
427
Notes to the Financial Statements (continued)
For the year ended 31 December 2021
(All amounts in thousands of Renminbi Yuan unless otherwise stated)
| VI. | Interests in other entities (continued) |
| 2. | Interests in joint ventures or associates (continued) |
| (3) | Key financial information of material associates (continued) |
| 2021 | 2020 | |||||||||||||||||||||||||||||||||||||||
| Shanghai Secco |
Chemical Industry |
Jinsen | Azbil | Shidian Energy |
Chemical Industry |
Chemical Industry |
Jinsen | Azbil | Shidian Energy |
|||||||||||||||||||||||||||||||
| Operating income |
29,723,223 | 1,709,110 | 165,499 | 427,378 | 489,490 | 21,626,059 | 1,683,096 | 187,580 | 340,905 | 472,640 | ||||||||||||||||||||||||||||||
| Net profit/(loss) |
3,125,904 | 370,624 | (16,657 | ) | 61,711 | 33,269 | 2,412,802 | 377,980 | (8,232 | ) | 48,264 | 36,696 | ||||||||||||||||||||||||||||
| Other comprehensive income |
— | 43,488 | — | — | — | — | (30,089 | ) | — | — | — | |||||||||||||||||||||||||||||
| Total comprehensive income |
3,125,904 | 414,112 | (16,657 | ) | 61,711 | 33,269 | 2,412,802 | 347,891 | (8,232 | ) | 48,264 | 36,696 | ||||||||||||||||||||||||||||
| Dividends received from associates |
634,341 | 52,225 | — | 19,200 | — | 473,600 | 32,522 | — | 9,200 | — | ||||||||||||||||||||||||||||||
| (i) | The Group calculates its share of assets based on the amount attributable to the parent company in the consolidated financial statements of associates in proportion to its shareholding. The key financial information of associates is adjusted for fair value adjustments at the time of acquisition and any differences in accounting policies of the Group. |
| (ii) | Unentitled portion represented some piece of lands injected by Government in Chemical Industry as capital reserve and the earnings from this land cannot be shared by other shareholders. |
| (4) | Summarised financial information of immaterial associates |
| 2021 | 2020 | |||||||
| Aggregate carrying amount of long-term investments as at 31 December |
100,079 | 75,094 | ||||||
| Aggregate amount of share of |
||||||||
| Net profit (i) |
5,655 | 8,619 | ||||||
| Other comprehensive income (i) |
— | — | ||||||
| Total comprehensive income |
5,655 | 8,619 | ||||||
| Dividends received from immaterial associates |
6,670 | — | ||||||
| (i) | Net profit and other comprehensive income had been adjusted for fair value adjustments at the time of acquisition and any differences in accounting policies of the Group. |
| (ii) | Unrecognized commitments related to investments in associates refer to Note IX. |
428
Notes to the Financial Statements (continued)
For the year ended 31 December 2021
(All amounts in thousands of Renminbi Yuan unless otherwise stated)
| VII. | Segment information |
Segment information is presented in respect of the Group’s business segments, the format of which is determined based on the structure of the Group’s internal organization, management requirement, and internal reporting system.
In a manner consistent with the way in which information is reported internally to the Group’s chief operating decision maker for the purposes of resource allocation and performance assessment, the Group identified the following five reportable segments. No operating segments have been aggregated to form the following reportable segments.
The Group evaluates the performance and allocates resources to its operating segments on an operating income basis, without considering the effects of finance expenses, investment income, non-operating income and non-operating expenses. The accounting policies adopted by the operating segments are the same with the policies in summary of significant accounting policies. The transfer price of intersegment is recognized with cost plus profit method.
The Group principally operates in five operating segments: petroleum products, intermediate petrochemicals, synthetic fibers, resins and plastics and trading of petrochemical products. Petroleum products, intermediate petrochemicals, synthetic fibers and resins and plastics are produced through intermediate steps from crude oil, the principal raw material. The specific products of each segment are as follows:
| (i) | The Group’s petroleum products segment is equipped with crude oil distillation facilities to produce qualified refined gasoline, kerosene, diesel, heavy oil and liquefied petroleum, in addition to producing feedstocks of the Group’s downstream processing facilities. |
| (ii) | The intermediate petrochemicals segment primarily produces p-xylene, benzene and ethylene oxide. Most of the intermediate petrochemicals produced by the Group are used by the Group as raw materials in the production of other petrochemicals, resins, plastics and synthetic fibres. A portion of the intermediate petrochemicals as well as certain by-products of the production process are sold to outside customers. |
| (iii) | The synthetic fibres segment produces primarily polyester and acrylic fibres, which are mainly used in the textile and apparel industries. |
| (iv) | The resins and plastics segment produces primarily polyester chips, low-density polyethylene resins and films, polypropylene resins and PVA granules. The polyester chips are used to produce polyester fibres, coating and containers. Polyethylene resins and plastics are used to produce insulated cable, mulching films and moulded products such as housewares and toys. Polypropylene resins are used for films, sheets and moulded products such as housewares, toys, consumer electronics and automobile parts. |
429
Notes to the Financial Statements (continued)
For the year ended 31 December 2021
(All amounts in thousands of Renminbi Yuan unless otherwise stated)
| VII. | Segment information (continued) |
| (v) | Group’s trading of petrochemical products segment primarily engages in importing and exporting of petrochemical products. |
| (vi) | All other operating segments represent the operating segments which do not meet the quantitative threshold for determining reportable segments. These include rental, providing services and a variety of other commercial activities, which are not allocated to the above five operating segments. |
Segment results, assets and liabilities include items directly attributable to a segment as well as those that can be allocated on a reasonable basis. Unallocated items mainly comprise long-term equity investments, deferred tax assets and income tax expenses, cash and cash equivalents and its related interest income, interest-bearing borrowings, and interest expenses, invest income, deferred income, other income, gains from asset disposals, non-operating income and expenses and related expenses.
| (1) | Segment information as at 31 December 2021 and for the year ended 31 December 2021 is as follows: |
| Petroleum products |
Intermediate petrochemicals |
Resins and plastics |
Synthetic fibres |
Trading of petrochemical products |
Others | Unallocated | Elimination | Total | ||||||||||||||||||||||||||||
| Revenue from external customers |
55,074,158 | 10,835,074 | 10,006,030 | 1,380,998 | 11,060,133 | 924,022 | — | — | 89,280,415 | |||||||||||||||||||||||||||
| Inter-segment revenue |
10,454,529 | 15,619,770 | 170,255 | 445 | 1,912,789 | 783,606 | — | (28,941,394 | ) | — | ||||||||||||||||||||||||||
| Operating costs |
(38,276,985 | ) | (10,359,666 | ) | (9,227,408 | ) | (1,911,682 | ) | (10,929,127 | ) | (970,778 | ) | — | — | (71,675,646 | ) | ||||||||||||||||||||
| Interest income |
— | — | — | — | — | — | 508,755 | — | 508,755 | |||||||||||||||||||||||||||
| Interest expenses |
— | — | — | — | — | — | (94,186 | ) | — | (94,186 | ) | |||||||||||||||||||||||||
| Investment income |
— | — | — | — | — | 103,095 | 864,285 | — | 967,380 | |||||||||||||||||||||||||||
| Impairment losses |
(95,202 | ) | (432,994 | ) | (61,387 | ) | (148,922 | ) | — | — | (28,392 | ) | — | (766,897 | ) | |||||||||||||||||||||
| Impairment and expected credit losses |
— | (1,332 | ) | (23 | ) | — | — | — | — | — | (1,355 | ) | ||||||||||||||||||||||||
| Gains from changes in fair value |
— | — | — | — | — | 8,987 | — | — | 8,987 | |||||||||||||||||||||||||||
| Depreciation and amortization |
(970,161 | ) | (522,314 | ) | (81,678 | ) | (133,967 | ) | (38,656 | ) | (203,679 | ) | — | — | (1,950,455 | ) | ||||||||||||||||||||
| Depreciation of right-of-use assets |
(5,331 | ) | (1,170 | ) | (4,505 | ) | (134 | ) | (469 | ) | (5,654 | ) | — | — | (17,263 | ) | ||||||||||||||||||||
| Profit/(loss)before income tax |
2,947,974 | (682,740 | ) | 47,941 | (856,101 | ) | 43,729 | (113,104 | ) | 1,260,462 | — | 2,648,161 | ||||||||||||||||||||||||
| Income tax expenses |
— | — | — | — | — | — | (644,480 | ) | — | (644,480 | ) | |||||||||||||||||||||||||
| Net profit/(loss) |
2,947,974 | (682,740 | ) | 47,941 | (856,101 | ) | 43,729 | (113,104 | ) | 615,982 | — | 2,003,681 | ||||||||||||||||||||||||
| Total assets |
13,317,338 | 3,781,785 | 1,395,867 | 1,925,456 | 1,348,751 | 2,712,098 | 22,557,327 | — | 47,038,622 | |||||||||||||||||||||||||||
| Total liabilities |
9,749,806 | 1,257,436 | 1,327,587 | 490,211 | 1,257,750 | 100,157 | 2,460,244 | — | 16,643,191 | |||||||||||||||||||||||||||
| Investment in associates and joint ventures |
— | — | — | — | — | — | 4,188,888 | — | 4,188,888 | |||||||||||||||||||||||||||
| Non-current assets increase (i) |
708,342 | 1,306,813 | 44,495 | 1,748,868 | 71,917 | 234,023 | — | — | 4,114,458 | |||||||||||||||||||||||||||
| (i) | Non-current assets do not include financial assets, long-term equity investments or deferred tax assets. |
430
Notes to the Financial Statements (continued)
For the year ended 31 December 2021
(All amounts in thousands of Renminbi Yuan unless otherwise stated)
| VII. | Segment information (continued) |
| (2) | Segment information as at 31 December 2020 and for the year ended 31 December 2020 is as follows: |
| Petroleum products |
Intermediate petrochemicals |
Resins and plastics |
Synthetic fibres | Trading of petrochemical products |
Others | Unallocated | Elimination | Total | ||||||||||||||||||||||||||||
| Revenue from external customers |
43,080,204 | 8,251,252 | 9,475,887 | 1,480,576 | 11,585,110 | 832,154 | — | — | 74,705,183 | |||||||||||||||||||||||||||
| Inter-segment revenue |
6,631,343 | 11,526,322 | 101,057 | — | 438,634 | 832,690 | — | (19,530,046 | ) | — | ||||||||||||||||||||||||||
| Operating costs |
(30,970,671 | ) | (6,867,874 | ) | (7,334,646 | ) | (1,764,492 | ) | (11,467,420 | ) | (684,016 | ) | — | — | (59,089,119 | ) | ||||||||||||||||||||
| Interest income |
— | — | — | — | — | — | 431,228 | — | 431,228 | |||||||||||||||||||||||||||
| Interest expenses |
— | — | — | — | — | — | (93,440 | ) | — | (93,440 | ) | |||||||||||||||||||||||||
| Investment income |
— | — | — | — | — | — | 837,005 | — | 837,005 | |||||||||||||||||||||||||||
| Impairment losses |
(138,537 | ) | (69,988 | ) | (26,382 | ) | (72,657 | ) | (788 | ) | (106 | ) | — | — | (308,458 | ) | ||||||||||||||||||||
| Impairment and expected credit losses |
— | (634 | ) | — | 121,550 | — | — | — | — | 120,916 | ||||||||||||||||||||||||||
| Gains from changes in fair value |
— | — | — | — | — | — | (17,871 | ) | — | (17,871 | ) | |||||||||||||||||||||||||
| Depreciation and amortization |
(912,430 | ) | (464,012 | ) | (133,943 | ) | (79,868 | ) | (19,906 | ) | (202,302 | ) | — | — | (1,812,461 | ) | ||||||||||||||||||||
| Depreciation of right-of-use assets |
(5,211 | ) | (1,413 | ) | (4,261 | ) | (168 | ) | (32 | ) | (5,603 | ) | — | — | (16,688 | ) | ||||||||||||||||||||
| (Loss)/Profit before income tax |
(2,259,188 | ) | 570,009 | 1,248,497 | (368,296 | ) | 42,128 | 83,120 | 1,257,546 | — | 573,816 | |||||||||||||||||||||||||
| Income tax expenses |
— | — | — | — | — | — | 65,620 | — | 65,620 | |||||||||||||||||||||||||||
| Net (loss)/profit |
(2,259,188 | ) | 570,009 | 1,248,497 | (368,296 | ) | 42,128 | 83,120 | 1,323,166 | — | 639,436 | |||||||||||||||||||||||||
| Total assets |
11,344,778 | 3,187,683 | 1,654,920 | 994,825 | 1,357,884 | 2,432,339 | 23,776,744 | — | 44,749,173 | |||||||||||||||||||||||||||
| Total liabilities |
6,665,051 | 1,267,313 | 1,233,286 | 209,621 | 1,224,420 | 69,864 | 4,724,600 | — | 15,394,155 | |||||||||||||||||||||||||||
| Investment in associates and joint ventures |
— | — | — | — | — | — | 5,497,834 | — | 5,497,834 | |||||||||||||||||||||||||||
| Non-current assets increase (i) |
779,392 | 278,788 | 139,212 | 496,125 | 378,292 | 222,080 | — | — | 2,293,889 | |||||||||||||||||||||||||||
| (i) | Non-current assets do not include financial assets, long-term equity investments, and deferred income assets. |
As the Group operates mainly in the PRC, no geographical segment information is presented.
For the year ended 31 December 2021, revenue from the same customer accounted for 68% of total Group revenue (for the year ended 31 December 2020: 54%). The revenue from the customer derived from the following segments: petroleum products and other segment.
431
Notes to the Financial Statements (continued)
For the year ended 31 December 2021
(All amounts in thousands of Renminbi Yuan unless otherwise stated)
| VIII. | Related parties and related party transactions |
| 1. | Information about the parent of the Company |
| (1) | General information of the parent company |
| Name of parent company |
Place of registration |
Business nature | ||
| China Petroleum & Chemical Corporation | No. 22 Chaoyangmen North Street, Chaoyang District, Beijing | Exploring for, extracting and selling crude oil and natural gas; oil refining; production, sale and transport of petrochemical, chemical fibres and other chemical products; pipe transport of crude oil and natural gas; research and development and application of new technologies and information. |
The Company’s ultimate controlling party is China Petrochemical Corporation.
| (2) | Registered capital and changes in registered capital of the parent company |
| 31 December 2020 | Increase in current year |
Decrease in current year |
31 December 2021 | |||||||||||||
| China Petroleum & Chemical Corporation |
121.1 billion | — | — | 121.1 billion | ||||||||||||
| (3) | The percentages of shareholding and voting rights in the Company held by the parent company |
| 2021 | 2020 | |||||||||||||||
| Share holding | Voting rights | Share holding | Voting rights | |||||||||||||
| China Petroleum & Chemical Corporation |
50.44 | % | 50.44 | % | 50.44 | % | 50.44 | % | ||||||||
432
Notes to the Financial Statements (continued)
For the year ended 31 December 2021
(All amounts in thousands of Renminbi Yuan unless otherwise stated)
| VIII. | Related parties and related party transactions (continued) |
| 2. | Information about the subsidiaries of the Company |
For basic information about the subsidiaries of the Company, refer to Note VI.
| 3. | Basic information about joint ventures and associates of the Company |
In addition to the major joint ventures and associates disclosed in Note VI.2, related party transactions between the Group and other associates are as follows:
| Place of business |
Place of registration |
Whether it is strategic for group activities |
% of ownership interest | |||||||||||||||||||
| Business nature |
Directly | Indirectly | ||||||||||||||||||||
| Shanghai Nanguang Petrochemical Co., Ltd. |
Shanghai | Shanghai | Petrochemical products import and export | Yes | — | 35.00 | % | |||||||||||||||
| Shanghai Jinhuan Petroleum Naphthalene Development Company Limited |
Shanghai | Shanghai | Production of petrochemical products | Yes | — | 25.00 | % | |||||||||||||||
| Shanghai Chemical Industry Park Logistics Company Limited |
Shanghai | Shanghai | Products freight | Yes | — | 33.33 | % | |||||||||||||||
| Pinghu China Aviation Oil Port Co., Ltd (“Pinghu Port”)(i) |
|
Zhejiang jiaxing |
|
|
Zhejiang jiaxing |
|
Products freight | Yes | — | 29.00 | % | |||||||||||
| (i) | In July 2020, with the approval of the board of directors of the Company and Toufa, Toufa increased the capital of Pinghu Port by RMB27,603 thousand in cash, and obtained 29% equity of Pinghu Port. |
| 4. | Information on other related parties |
| Names of other related parties |
Relationship with the Company | |
| China International United Petroleum and Chemicals Co., Ltd. |
Subsidiary of the ultimate parent company | |
| Sinopec Chemical Commercial Holding Company Limited |
Subsidiary of the ultimate parent company | |
| Sinopec Petroleum Sales Co., Ltd. |
Subsidiary of the ultimate parent company | |
| Petro-cyberworks Information Technology Co., Ltd. |
Subsidiary of the ultimate parent company | |
| Unipec (Ningbo) International Logistics Company Limited |
Subsidiary of the ultimate parent company | |
| Zhongke (Guangdong) Refinery and Petrochemical Co., Ltd. |
Subsidiary of the ultimate parent company | |
| Sinopec Marketing Co., Ltd |
Subsidiary of the ultimate parent company | |
| Sinopec Fuel Oil Sales Co., Ltd. |
Subsidiary of the ultimate parent company | |
| Sinopec Lubricant Co., Ltd. |
Subsidiary of the ultimate parent company | |
| Sinopec Yangzi Petrochemical Co., Ltd. |
Subsidiary of the ultimate parent company |
433
Notes to the Financial Statements (continued)
For the year ended 31 December 2021
(All amounts in thousands of Renminbi Yuan unless otherwise stated)
| VIII. | Related parties and related party transactions (continued) |
| 4. | Information on other related parties (continued) |
| Names of other related parties |
Relationship with the Company | |
| China Petrochemical International (Beijing) Co., Ltd. |
Subsidiary of the ultimate parent company | |
| Sinopec Catalysts Co., Ltd. |
Subsidiary of the ultimate parent company | |
| China Petrochemical International (Shanghai) Co.,Ltd. |
Subsidiary of the ultimate parent company | |
| Sinopec Beijing Research Institute of Chemical Industry |
Subsidiary of the ultimate parent company | |
| China Petrochemical International (Ningbo) Co.,Ltd. |
Subsidiary of the ultimate parent company | |
| Zhoushan Shihua Crude Oil Terminal Co., Ltd. |
Subsidiary of the ultimate parent company | |
| Sinopec Materials & Equipment (Dalian) Co., Ltd. |
Subsidiary of the ultimate parent company | |
| Sinopec Materials & Equipment (East China) Co., Ltd. |
Subsidiary of the ultimate parent company | |
| China Petrochemical International (Nanjing) Co., Ltd. |
Subsidiary of the ultimate parent company | |
| Sinopec Honeywell (Tianjin) Company Limited |
Subsidiary of the ultimate parent company | |
| China Petrochemical International (Wuhan) Co., Ltd. |
Subsidiary of the ultimate parent company | |
| China Petrochemical International Co., Ltd. |
Subsidiary of the ultimate parent company | |
| Sinopec Refinery Product Sales Company Limited |
Subsidiary of the ultimate parent company | |
| Sinopec Shanghai Gaoqiao Petrochemical Co., Ltd. |
Subsidiary of the ultimate parent company | |
| China Petrochemical International (Tianjin) Co., Ltd. |
Subsidiary of the ultimate parent company | |
| Ningbo Eastsea Linefan Technology Co., Ltd. |
Subsidiary of the ultimate parent company | |
| Sinopec Research Institute of Petroleum Processing |
Subsidiary of the ultimate parent company | |
| Sinopec Shanghai Research Institute of Petrochemical Technology |
Subsidiary of the ultimate parent company | |
| Sinopec Lubricant Co., Ltd. Shanghai Research Institute |
Subsidiary of the ultimate parent company | |
| Dalian Frip Science and Technology Company Limited |
Subsidiary of the ultimate parent company | |
| Nantong Donghai Petrochemical Co., Ltd. |
Subsidiary of the ultimate parent company | |
| Sinopec Qingdao Research Institute of Safety Engineering |
Subsidiary of the ultimate parent company | |
| Unipec Shanghai Company Limited |
Subsidiary of the ultimate parent company | |
| Storage And Transportation Installation Company of Ningbo Engineering Company Limited |
Subsidiary of the ultimate parent company | |
| Sinopec Chemical Commercial Holding (Hong Kong) Company Limited |
Subsidiary of the ultimate parent company | |
| Sinopec Yizheng Chemical Fibre Limited Liability Company |
Subsidiary of the ultimate parent company | |
| Fujian Gulei Petrochemical Company Limited |
Subsidiary of the ultimate parent company | |
| Sinopec East China Chemical Sales Co., Ltd |
Subsidiary of the ultimate parent company | |
| Unipec Singapore |
Subsidiary of the ultimate parent company | |
| China Yanshan United Foreign Trade Co., Ltd. |
Subsidiary of the ultimate parent company | |
| Sinopec Chemical Commercial Holding (Wuhan) Company Limited |
Subsidiary of the ultimate parent company | |
| Nanjing Yangzi Petrol-chemical Industry Co., Ltd. |
Subsidiary of the ultimate parent company | |
| Sinopec Baling Petrochemical Co., Ltd. |
Subsidiary of the ultimate parent company | |
| Shengli Oil Field Exploration And Development Research Institute |
Subsidiary of the ultimate parent company | |
| Shanghai Leader Catalyst Co., Ltd |
Subsidiary of the ultimate parent company | |
| Nanjing Yangzi Petrochemical Rubber Company Limited |
Subsidiary of the ultimate parent company |
334
Notes to the Financial Statements (continued)
For the year ended 31 December 2021
(All amounts in thousands of Renminbi Yuan unless otherwise stated)
| VIII. | Related parties and related party transactions (continued) |
| 4. | Information on other related parties (continued) |
| Names of other related parties |
Relationship with the Company | |
| Fujian Refining & Petrochemical Company Limited |
Subsidiary of the ultimate parent company | |
| Sinopec Dalian (Fushun) Research Institute of Petroleum and Petrochemicals |
Subsidiary of the ultimate parent company | |
| Sinopec Jianghan Salt Chemical Hubei Co., Ltd. |
Subsidiary of the ultimate parent company | |
| Yipaike Business Factoring Co., Ltd. |
Subsidiary of the ultimate parent company | |
| Sinopec Great Wall Energy and Chemical Co.,Ltd. |
Subsidiary of the ultimate parent company | |
| Sinopec (Shenzhen) E-Commerce Company Limited |
Subsidiary of the ultimate parent company | |
| SINOPEC Research Institute of Safety Engineering |
Subsidiary of the ultimate parent company | |
| Ningbo Minggang Gas Company Limited |
Subsidiary of the ultimate parent company | |
| Sinopec Zhongyuan Petrol-Chemical Industry Co., Ltd. |
Subsidiary of the ultimate parent company | |
| Epec E-commerce Co., Ltd. |
Subsidiary of the ultimate parent company | |
| Sinopec Oil Refinery Product Sales (Shanghai) Co., Ltd |
Subsidiary of the ultimate parent company | |
| Sinopec Chemical Commercial Holding (Guangdong) Company Limited |
Subsidiary of the ultimate parent company | |
| Sinopec-Nam Kwong (Shanghai) Industrial Co., Ltd. |
Subsidiary of the ultimate parent company | |
| Unipec (Qingdao) International Logistics Company Limited |
Subsidiary of the ultimate parent company | |
| Qingdao Zhonghua Sunshine Management System Certification Center |
Subsidiary of the ultimate parent company | |
| Zhejiang Baling Hengyi Caprolactam Co., Ltd. |
Joint venture of the ultimate parent company | |
| Shanghai Sinopec Mitsui Chemicals,Co., Ltd |
Joint venture of the ultimate parent company | |
| BASF-YPC Company Limited |
Joint venture of the ultimate parent company | |
| Shanghai Changshi Shipping Co., Ltd. |
Associate of the ultimate parent company | |
| Shanghai KSD Bulk Solids Engineering Co., Ltd. |
Associate of the ultimate parent company | |
| BASF Gao-Qiao Performance Chemicals (Shanghai) Company Limited |
Associate of the ultimate parent company | |
| Sinopec Chemical Commercial Holding (Singapore) Pte. Ltd |
Subsidiary of the immediate parent company | |
| Sinopec Finance Co., Ltd. |
Subsidiary of the immediate parent company | |
| Sinopec Petroleum Reserve Co., Ltd. |
Subsidiary of the immediate parent company | |
| Sinopec Nanjing Research Institute of Chemical Industry Co., Ltd. |
Subsidiary of the immediate parent company | |
| China Economy Phulishing House Co., Ltd. |
Subsidiary of the immediate parent company | |
| China Petrochemical Press Company Limited |
Subsidiary of the immediate parent company | |
| Sinopec International Travel Service Company Limited |
Subsidiary of the immediate parent company | |
| Sinopec Assets Management Co., Ltd. |
Subsidiary of the immediate parent company |
435
Notes to the Financial Statements (continued)
For the year ended 31 December 2021
(All amounts in thousands of Renminbi Yuan unless otherwise stated)
| VIII. | Related parties and related party transactions (continued) |
| 4. | Information on other related parties (continued) |
| Names of other related parties |
Relationship with the Company | |
| Sinopec Ningbo Engineering Company Limited |
Subsidiary of the immediate parent company | |
| Sinopec Shared Service Co., Ltd. |
Subsidiary of the immediate parent company | |
| Sinopec Geophysical Corporation |
Subsidiary of the immediate parent company | |
| Sinopec Group Baichuan Economic and Trade Co., Ltd. |
Subsidiary of the immediate parent company | |
| Sinopec Group Jiangsu Petroleum Exploration Bureau Co.,Ltd. |
Subsidiary of the immediate parent company | |
| Sinopec News |
Subsidiary of the immediate parent company | |
| Sinopec Energy Saving Technology Service Co., Ltd. |
Subsidiary of the immediate parent company | |
| Sinopec Group Economic and Technology Research Institute Co., Ltd. |
Subsidiary of the immediate parent company | |
| Beijing Petrochemical Engineering Consulting Company Limited |
Subsidiary of the immediate parent company | |
| China Economicbooks Co., Ltd. |
Subsidiary of the immediate parent company | |
| Petrol-Chemical Industry Management Cadre College |
Subsidiary of the immediate parent company | |
| Petrochemical Engineering Quality Supervision Centre |
Subsidiary of the immediate parent company | |
| Sinopec Group Shanghai Training Center Ltd. |
Subsidiary of the immediate parent company | |
| Sinopec Beijing Yanshan Petrochemical Co., Ltd. |
Subsidiary of the immediate parent company | |
| Sinopec Zhongyuan Petroleum Exploration Bureau Co.,Ltd. |
Subsidiary of the immediate parent company | |
| Sinopec Shengli Petroleum Administrative Bureau Co., Ltd. |
Subsidiary of the immediate parent company | |
| Sinopec The Fourth Construction Company Limited |
Subsidiary of the immediate parent company | |
| Sinopec Tendering Company Limited |
Subsidiary of the immediate parent company | |
| Sinopec Shanghai Engineering Co., Ltd. |
Subsidiary of the immediate parent company | |
| Sinopec Engineering Incorporation |
Subsidiary of the immediate parent company | |
| Sinopec Engineering Quality Monitoring Co., Ltd. |
Subsidiary of the immediate parent company | |
| Sinopec engineering (Group) Co., Ltd |
Subsidiary of the immediate parent company | |
| National Petrochemical Project Risk Assessment Technology Center |
Subsidiary of the immediate parent company | |
| Sinopec Tenth Construction Co., Ltd. |
Subsidiary of the immediate parent company | |
| The Fifth Construction Company of Sinopec |
Subsidiary of the immediate parent company | |
| Sinopec Shanghai Petrochemical Machinery Manufacturing Co., Ltd. |
Subsidiary of the immediate parent company | |
| Sinopec Nanjing Engineering & Construction Incorporation |
Subsidiary of the immediate parent company | |
| Sinopec Luoyang Engineering Company Limited |
Subsidiary of the immediate parent company | |
| Jiangsu Jinling Opta Polymer Company Limited |
Subsidiary of the immediate parent company |
436
Notes to the Financial Statements (continued)
For the year ended 31 December 2021
(All amounts in thousands of Renminbi Yuan unless otherwise stated)
| VIII. | Related parties and related party transactions (continued) |
| 4. | Information on other related parties (continued) |
| Names of other related parties |
Relationship with the Company | |
| Shanghai Petrochemical Seawall Management Office |
Subsidiary of the immediate parent company | |
| Sinopec Chongqing SVW Chemical Co., Ltd. |
Subsidiary of the immediate parent company | |
| Sinopec Nanjing Chemical Industries Corporation |
Subsidiary of the immediate parent company | |
| Sinopec International Petroleum Exploration and Production Corporation |
Subsidiary of the immediate parent company | |
| Sinopec Consulting Company Limited |
Subsidiary of the immediate parent company | |
| Sinopec Guangzhou Engineering Co., Ltd. |
Subsidiary of the immediate parent company | |
| Beijing Yanshan Petrochemical Special Equipment Inspection Co., Ltd. |
Subsidiary of the immediate parent company | |
| China Petrochemical Corp. Engineering Ration Management Station |
Subsidiary of the immediate parent company | |
| Beijing Victory Hotel Company Limited |
Subsidiary of the immediate parent company | |
| Maoming Shihua Dongcheng Chemical Industry Co., Ltd. |
Subsidiary of the immediate parent company | |
| Yihua Tory Polyester Film Company Limited |
Joint venture of the immediate parent company | |
| China Sinopec Pipeline Storage and Transportation Co., Ltd. |
Associate of the immediate parent | |
| Yihua Bonar Yarns and Fabrics Co., Ltd. |
Associate of the immediate parent | |
| Sinopec International (Singapore) Pte. Limited |
Subsidiary of the immediate parent company | |
| Unipec America, Inc |
Subsidiary of the immediate parent company | |
| Sinopec Japan Company Limited |
Subsidiary of the immediate parent company | |
| Rizhao Shihua Crude Oil Terminal Co., Ltd. |
Joint venture of the ultimate parent company | |
| Sinopec Europe Company Limited |
Subsidiary of the immediate parent company | |
| Sinopec Chemical Commercial Holding (North america), Inc. |
Subsidiary of the immediate parent company | |
| Sinopec International (Australia) Pty. Ltd. |
Subsidiary of the immediate parent company |
437
Notes to the Financial Statements (continued)
For the year ended 31 December 2021
(All amounts in thousands of Renminbi Yuan unless otherwise stated)
| VIII. | Related parties and related party transactions (continued) |
| 5. | Material related party transactions |
Most of the transactions undertaken by the Group affected on such terms as determined by Sinopec Corp. and relevant PRC authorities.
Sinopec Corp. negotiates and agrees the terms of crude oil supply with suppliers on a group basis, which is then allocated among its subsidiaries, including the Group, on a discretionary basis. Sinopec Corp. also owns a widespread petroleum products sales network and possesses a fairly high market share in domestic petroleum products market, which is subject to extensive regulation by the PRC government.
The Group has entered into a mutual product supply and sales services framework agreement with Sinopec Corp. Pursuant to the agreement, Sinopec Corp. provides the Group with crude oil, other petrochemical raw materials and agent services. On the other hand, the Group provides Sinopec Corp. with petroleum products, petrochemical products and property leasing services.
The pricing policy for these services and products provided under the agreement is as follows:
| • | If there are applicable State (central and local government) tariffs, the pricing shall follow the State tariffs; |
| • | If there are no State tariffs, but there are applicable State’s guidance prices, the pricing shall follow the State’s guidance prices; or |
| • | If there are no State tariffs or State’s guidance prices, the pricing shall be determined in accordance with the prevailing market prices (including any bidding prices). |
In addition to the related transaction disclosed in Note V.9, Note V.37 and Note V.45, other material related party transactions of the Group are as follows:
438
Notes to the Financial Statements (continued)
For the year ended 31 December 2021
(All amounts in thousands of Renminbi Yuan unless otherwise stated)
| VIII. | Related parties and related party transactions (continued) |
| 5. | Material related party transactions (continued) |
| (1) | Purchases and sales of goods, rendering and receiving services |
| Purchases of goods and receiving services: |
| 2021 | 2020 | |||||||||||||||||||
| Name of Related Parties |
Category | Transaction type | Amount | Percentage of the same category (%) |
Amount | Percentage of the same category (%) |
||||||||||||||
| Sinopec Corp., its subsidiaries and joint ventures |
Purchases | Trade | 44,379,967 | 63.79 | % | 37,872,788 | 66.89 | % | ||||||||||||
| Sinopec Group and its subsidiaries |
Purchases | Trade | 2,830,256 | 4.07 | % | 832,617 | 1.47 | % | ||||||||||||
| Associates of the Group |
Purchases | Trade | 4,035,834 | 5.80 | % | 3,237,111 | 5.72 | % | ||||||||||||
| Joint ventures of the Group |
Purchases | Trade | 389,864 | 0.56 | % | 411,556 | 0.73 | % | ||||||||||||
| Key management personnel |
Short-term employee benefits |
Compensation for services |
11,866 | 0.36 | % | 9,859 | 0.02 | % | ||||||||||||
| Key management personnel |
Retirement scheme contributions |
Compensation for services |
551 | 0.36 | % | 441 | 0.00 | % | ||||||||||||
439
Notes to the Financial Statements (continued)
For the year ended 31 December 2021
(All amounts in thousands of Renminbi Yuan unless otherwise stated)
| VIII. | Related parties and related party transactions (continued) |
| 5. | Material related party transactions (continued) |
| (1) | Purchases and sales of goods, rendering and receiving services (continued) |
| Sales of goods, rendering services: |
| 2021 | 2020 | |||||||||||||||||||
| Name of Related Parties |
Category | Transaction type |
Amount | Percentage of the same category (%) |
Amount | Percentage of the same category (%) |
||||||||||||||
| Sinopec Corp., its subsidiaries and joint ventures |
Sales/Service income |
Trade | 56,641,301 | 63.50 | % | 46,670,117 | 62.47 | % | ||||||||||||
| Sinopec Group and its subsidiaries |
Sales/Service income |
Trade | 36,683 | 0.04 | % | 14,870 | 0.02 | % | ||||||||||||
| Associates of the Group |
Sales/Service income |
Trade | 4,208,937 | 4.72 | % | 1,982,310 | 2.65 | % | ||||||||||||
| Joint ventures of the Group |
Sales/Service income |
Trade | 39,721 | 0.04 | % | 37,687 | 0.05 | % | ||||||||||||
| (2) | Lease |
| The Group as the lessor: |
| Name of lessee |
Type of leasing | Rental income recognized in 2021 |
Rental income recognized in 2020 |
|||||||
| Sinopec Corp., its subsidiaries and joint ventures |
Properties and equipment | 34,475 | 32,829 | |||||||
| Associates of the Group |
Equipment | 6,012 | 6,233 | |||||||
| Joint ventures of the Group |
Equipment | 8,918 | 9,344 | |||||||
| Sinopec Group and its subsidiaries |
Properties | 464 | 464 | |||||||
|
|
|
|
|
|||||||
| Total |
49,869 | 48,870 | ||||||||
|
|
|
|
|
|||||||
440
Notes to the Financial Statements (continued)
For the year ended 31 December 2021
(All amounts in thousands of Renminbi Yuan unless otherwise stated)
| VIII. | Related parties and related party transactions (continued) |
| 5. | Material related party transactions (continued) |
| (2) | Lease (continued) |
| Increase in right-of-use assets of the Group as lessee: |
| Related Parties as lessor |
Type of leasing | 2021 | 2020 | |||||||
| Sinopec Group and its subsidiaries |
Properties, lands and equipment |
1,388 | 2,267 | |||||||
| Lease liabilities interest expense of the Group as lessor: | ||||||||||
| 2021 | 2020 | |||||||||
| Sinopec Group and its subsidiaries |
247 | 205 | ||||||||
| Associates of the Group |
24 | 8 | ||||||||
|
|
|
|
|
|||||||
| Total |
271 | 213 | ||||||||
|
|
|
|
|
|||||||
| (3) | Funds Borrowing and Lending |
| As at 31 December 2021, the Group borrowed long-term loans of RMB700,000 thousand from Sinopec Finance, as detailed in Note V.28 (31 December 2020: Nil). |
| (4) | Other related transactions |
| Type of transaction | 2021 | 2020 | ||||||||
| Sinopec Group and its subsidiaries |
Insurance premiums | 108,850 | 107,495 | |||||||
| Sinopec Finance |
Interests received and receivable | 824 | 2,088 | |||||||
| Sinopec Group and its subsidiaries |
Construction, installation and inspection cost |
785,216 | 233,591 | |||||||
| Sinopec Finance |
Long-term loans | 700,000 | — | |||||||
| Sinopec Corp., its subsidiaries and joint ventures |
Sales commission | 110,552 | 104,598 | |||||||
441
Notes to the Financial Statements (continued)
For the year ended 31 December 2021
(All amounts in thousands of Renminbi Yuan unless otherwise stated)
| VIII. | Related parties and related party transactions (continued) |
| 6. | Receivables from and payables to related parties |
Receivables from related parties:
| 2021 | 2020 | |||||||||
| Cash at bank and on hand |
Sinopec Finance | 3,243 | 5,667 | |||||||
| Accounts receivable |
Sinopec Corp., its subsidiaries and joint ventures |
1,067,912 | 996,224 | |||||||
| Associates of the Group | 23,768 | 35,766 | ||||||||
| Joint ventures of the Group | 300 | 351 | ||||||||
|
|
|
|
|
|||||||
| Sub-total |
1,091,980 | 1,032,341 | ||||||||
|
|
|
|
|
|||||||
| Receivables under financing |
Sinopec Corp., its subsidiaries and joint ventures |
25,000 | 10,000 | |||||||
| Other receivables |
Sinopec Corp., its subsidiaries and joint ventures |
58,539 | 21,132 | |||||||
| Joint ventures of the Group | 2,412 | 1,887 | ||||||||
| Associates of the Group | 180 | 179 | ||||||||
|
|
|
|
|
|||||||
| Sub-total |
61,131 | 23,198 | ||||||||
|
|
|
|
|
|||||||
| Prepayments |
Sinopec Corp. and its subsidiaries | 32,666 | 26,771 | |||||||
| Associates of the Group | 1,554 | 6 | ||||||||
|
|
|
|
|
|||||||
| Sub-total |
34,220 | 26,777 | ||||||||
|
|
|
|
|
|||||||
442
Notes to the Financial Statements (continued)
For the year ended 31 December 2021
(All amounts in thousands of Renminbi Yuan unless otherwise stated)
| VIII. | Related parties and related party transactions (continued) |
| 6. | Receivables from and payables to related parties (continued) |
Payables to related parties:
| 2021 | 2020 | |||||||||
| Accounts payable |
Sinopec Corp., its subsidiaries and joint ventures |
4,205,745 | 2,434,461 | |||||||
| Sinopec Group and its subsidiaries | 24,791 | 751,402 | ||||||||
| Associates of the Group | 87,332 | 150,472 | ||||||||
| Joint ventures of the Group | 43,305 | 41,162 | ||||||||
|
|
|
|
|
|||||||
| Sub-total |
4,361,173 | 3,377,497 | ||||||||
|
|
|
|
|
|||||||
| Bills payable |
Associates of the Group | 25,480 | 70,000 | |||||||
| Sinopec Corp., its subsidiaries and joint ventures |
241,933 | 43,164 | ||||||||
|
|
|
|
|
|||||||
| Sub-total |
267,413 | 113,164 | ||||||||
|
|
|
|
|
|||||||
| Other payables |
Sinopec Group and its subsidiaries | 259,248 | 137,549 | |||||||
| Sinopec Corp., its subsidiaries and joint ventures |
22,409 | 27,485 | ||||||||
| Joint ventures of the Group | — | 16 | ||||||||
| Associates of the Group | 12 | 13 | ||||||||
|
|
|
|
|
|||||||
| Sub-total |
281,669 | 165,063 | ||||||||
|
|
|
|
|
|||||||
| Other current liabilities |
Sinopec Group and its subsidiaries | 1,388,286 | — | |||||||
| Contract liabilities |
Associates of the Group | 256 | 611 | |||||||
| Sinopec Corp., its subsidiaries and joint ventures |
5,905 | 422 | ||||||||
| Sinopec Group and its subsidiaries | 114 | 84 | ||||||||
|
|
|
|
|
|||||||
| Sub-total |
6,275 | 1,117 | ||||||||
|
|
|
|
|
|||||||
| Lease liabilities |
Sinopec Group and its subsidiaries | 992 | 8,453 | |||||||
| Joint ventures of the Group | 435 | 574 | ||||||||
|
|
|
|
|
|||||||
| Sub-total |
1,427 | 9,027 | ||||||||
|
|
|
|
|
|||||||
| Long-term loans |
Sinopec Finance | 700,000 | — | |||||||
|
|
|
|
|
|||||||
443
Notes to the Financial Statements (continued)
For the year ended 31 December 2021
(All amounts in thousands of Renminbi Yuan unless otherwise stated)
| VIII. | Related parties and related party transactions (continued) |
| 7. | Commitments with related parties |
Commitments with related parties contracted for by the Group at the balance sheet date but are not yet necessary to be recognized on the balance sheet are as follows:
| (1) | Construction and installation cost: |
| 2021 | 2020 | |||||||
| Sinopec Group and its subsidiaries |
775,007 | 145,959 | ||||||
| (2) | Investment commitments with related parties |
| 2021 | 2020 | |||||||
| Capital contribution to Shanghai Secco (Note IX.2(i)) |
111,263 | 111,263 | ||||||
| Capital contribution to Shidian Energy (Note IX.2(ii)) |
80,000 | 80,000 | ||||||
| Capital contribution to Baling Materials (Note IX.2(iii)) |
350,000 | — | ||||||
|
|
|
|
|
|||||
| Total |
541,263 | 191,263 | ||||||
|
|
|
|
|
|||||
As at 31 December 2021 and 31 December 2020, except for the information disclosed above, the Group and the Company had no other material commitments with related parties, which are contracted, but not included in the financial statements.
444
Notes to the Financial Statements (continued)
For the year ended 31 December 2021
(All amounts in thousands of Renminbi Yuan unless otherwise stated)
| IX. | Commitments |
| 1. | Capital commitments |
Capital expenditures contracted for by the Group at the balance sheet date but are not yet necessary to be recognized on the balance sheet are as follows:
| 2021 | 2020 | |||||||
| Signed purchase contract of fixed assets |
1,176,168 | 585,870 | ||||||
| 2. | Investment commitments |
| (i) | The Company held the 18th meeting of the seventh board of directors on 5 December 2013, and reviewed and approved the capital increase of USD30,017,124 (about RMB182,804 thousand) for Shanghai Secco based on the equity ratio of the affiliated company held by the Company. The Company will make capital contribution to Shanghai Secco in equal amounts in stages. |
As at 31 December 2021 and 31 December 2020, the Company has completed the first phase of its investment in Shanghai Secco with totally RMB71,541 thousand. In accordance with the approval of Shanghai municipal commission of commerce received by Shanghai secco on 19 October 2015, the remaining capital contribution of the Company and other shareholders of Shanghai Secco can be paid within the term of the joint venture of Shanghai Secco. As at 31 December 2021, the Company has not made a resolution to revoke this investment.
According to the resolution of the board of directors on 9 July 2021, the Company, Sinopec Corp. and Sinopec Shanghai Gaoqiao Petrochemical Co., Ltd. (“Gaoqiao Company”) reduced the capital of Shanghai Secco, an associate of the Company, by RMB7,300,811,272 in equal proportions according to the shareholding ratio of 20%, 30% and 50%, respectively. Among which, the Company plans to reduce its capital by about RMB1.46 billion. The above capital reduction was approved by the resolution of the board of directors on 9 July 2021.
| (ii) | According to the resolution of board of directors on 9 July 2019, Toufa agreed to make capital contribution of RMB400,000 thousand to acquire 40% share of Shidian Energy. The payment is to be made in installments. |
As at 31 December 2021 and 31 December 2020, Toufa has contributed RMB320,000 thousand to Shidian Energy, and the rest of the capital contribution of RMB80,000 thousand to Shidian Energy has been paid before January 2022 in accordance with the agreement.
| (iii) | Sinopec Baling Petrochemical Co., Ltd. and the Company jointly established Baling Materials on 7 September 2021, each with a cash contribution of RMB400,000 thousand. As at 31 December 2021, the Company has made a paid-up capital contribution of RMB50,000 thousand. |
445
Notes to the Financial Statements (continued)
For the year ended 31 December 2021
(All amounts in thousands of Renminbi Yuan unless otherwise stated)
| X. | Risk related to financial instruments |
The Group’s normal course of operations expose it to a variety of financial risks: market risk (primarily foreign currency risk, interest rate risk and commodity price risk), credit risk and liquidity risk. The Group’s overall risk management program focuses on the unpredictability of financial markets and seeks to minimize potential adverse effects on the Group’s financial performance.
| 1. | Market risk |
| (1) | Foreign currency risk |
The Group’s major operational activities are carried out in Mainland China and a majority of the transactions are denominated in RMB. Nevertheless, the Group is exposed to foreign currency risk arising from the recognized assets and liabilities, and future transactions denominated in foreign currencies, primarily with respect to US dollars. The Group’s finance department at its headquarters is responsible for monitoring the amount of assets and liabilities, and transactions denominated in foreign currencies to minimize the foreign currency risk.
Therefore, the Group would sign forward exchange contracts or foreign exchange option contracts to avoid foreign exchange risks. As at 31 December 2021 and 31 December 2020, the Group has not signed any currency swaps. As at 31 December 2021 and 31 December 2020, the Group has no unexpired foreign exchange contract and foreign exchange option contract.
As at 31 December 2021 and 31 December 2020, the Group’s exposure to currency risk arising from recognized financial assets or financial liabilities denominated in foreign currencies is presented in the following tables:
| 31 December 2021 | 31 December 2020 | |||||||||||||||
| USD | RMB equivalent | USD | RMB equivalent | |||||||||||||
| Financial assets in foreign currencies– |
||||||||||||||||
| Cash at bank and on hand |
26,015 | 165,864 | 31,836 | 207,727 | ||||||||||||
| Derivative financial assets |
12,768 | 81,405 | — | — | ||||||||||||
| Receivables under financing |
56,242 | 358,582 | 49,645 | 323,929 | ||||||||||||
| Accounts receivable |
408 | 2,601 | 18,214 | 118,845 | ||||||||||||
| Other receivables |
40 | 255 | 40 | 261 | ||||||||||||
| Financial liabilities in foreign currencies– |
||||||||||||||||
| – Accounts payable |
(79,633 | ) | (507,716 | ) | (88,604 | ) | (578,132 | ) | ||||||||
| – Other payables |
(2,521 | ) | (16,073 | ) | (1,319 | ) | (8,606 | ) | ||||||||
| – Derivative financial liabilities |
(3,734 | ) | (23,804 | ) | — | — | ||||||||||
|
|
|
|
|
|
|
|
|
|||||||||
| Total |
9,585 | 61,114 | 9,812 | 64,024 | ||||||||||||
|
|
|
|
|
|
|
|
|
|||||||||
446
Notes to the Financial Statements (continued)
For the year ended 31 December 2021
(All amounts in thousands of Renminbi Yuan unless otherwise stated)
| X. | Risk related to financial instruments (continued) |
| 1. | Market risk (continued) |
| (1) | Foreign currency risk (continued) |
The following are the exchange rates for Renminbi against foreign currencies applied by the Group:
| Average rate | Balance sheet date mid-spot rate | |||||||||||||||
| 2021 | 2020 | 2021 | 2020 | |||||||||||||
| USD |
6.4503 | 6.7506 | 6.3757 | 6.5249 | ||||||||||||
Assuming all other risk variables remained constant, a 5% strengthening or weaken of the Renminbi against the US dollar at 31 December 2021 would have decreased or increased the Group’s net profit by the amount of RMB2,292 thousand (31 December 2020: decreased or increased net profit by RMB2,401 thousand).
| (2) | Interest rate risk |
The interest rate risk of the Group is mainly generated by interest bearing short-term loan and short-term bonds. Financial liabilities with floating interest rate expose the Group to cash flow interest rate risk, while financial liabilities with fixed interest rate expose the Group to cash fair value interest risk. The Group determines the appropriate weightings of fixed and floating rate contracts based on the current market conditions.
The financial department of the Group headquarters continuously monitor the interest rate level of the Group. The increase of interest rate will increase the cost of new interest-bearing debt and the interest expense of the Group’s outstanding interest-bearing debt with floating interest rate and have a significant adverse impact on the financial performance of the Group. The management makes timely adjustments according to the latest market conditions, which may be reducing interest rate risk by entering into interest rate swaps. The Group does not enter any interest rate swap arrangement for the year ended 31 December 2021 and 2020.
447
Notes to the Financial Statements (continued)
For the year ended 31 December 2021
(All amounts in thousands of Renminbi Yuan unless otherwise stated)
| X. | Risk related to financial instruments (continued) |
| 1. | Market risk (continued) |
| (2) | Interest rate risk (continued) |
As at 31 December 2021 and 31 December 2020, the Group held the following interest-bearing financial instruments:
Fixed rate instruments:
| 2021 |
2020 | |||||||||||||
| Item |
Effective |
Amounts | Effective interest rate |
Amounts | ||||||||||
| Financial assets |
||||||||||||||
| – Cash at bank and on hand |
3.40%-4.18% | 7,350,000 | 2.40%-4.18% | 2,501,330 | ||||||||||
| – Other current assets |
— | — | 3.15%-3.60% | 3,000,000 | ||||||||||
| – Other non-current assets |
3.45%-4.20% | 5,500,000 | 3.85%-4.18% | 7,000,000 | ||||||||||
| Financial liabilities |
||||||||||||||
| – Short-term loans |
2.70% | (1,500,000 | ) | 2.60%-3.70% | (1,548,000 | ) | ||||||||
| – Other current liabilities |
— | — | 1.70% | (3,000,000 | ) | |||||||||
| – Lease liabilities |
4.35%-4.90% | (4,613 | ) | 4.35%-4.90% | (12,473 | ) | ||||||||
|
|
|
|
|
|
|
|
||||||||
| Total |
11,345,387 | 7,940,857 | ||||||||||||
Variable rate instruments:
| 2021 |
2020 | |||||||||||||
| Item |
Effective interest rate |
Amounts | Effective interest rate |
Amounts | ||||||||||
| Financial assets |
||||||||||||||
| – Cash at bank and on hand |
0.30%-2.00% | 5,112,013 | 0.30%-3.05 | % | 5,415,080 | |||||||||
| Financial liabilities |
||||||||||||||
| – Short-term loans |
1-year LPR- 0.15% | (40,000 | ) | — | — | |||||||||
| – Non-current liabilities due within one year |
1-year LPR- 0.15% | (19,800 | ) | — | — | |||||||||
| – Long-term loans |
1.08% in the first year, with regular annual adjustments thereafter | (700,000 | ) | — | — | |||||||||
|
|
|
|
|
|
|
|
||||||||
| Total |
4,352,213 | 5,415,080 | ||||||||||||
448
Notes to the Financial Statements (continued)
For the year ended 31 December 2021
(All amounts in thousands of Renminbi Yuan unless otherwise stated)
| X. | Risk related to financial instruments (continued) |
| 1. | Market risk (continued) |
| (2) | Interest rate risk (continued) |
As at 31 December 2021, if interest rates on the floating rate borrowings had risen or fallen by 100 basis points while all other variables had been held constant, the Group’s net loss would increase or decrease by approximately RMB32,504 thousand (31 December 2020: RMB40,730 thousand).
| (3) | Commodity price risk |
The Group principally engages in processing crude oil into synthetic fibers, resins and plastics, intermediate petrochemicals and petroleum products. The Group is exposed to commodity price risks related to the price of crude oil, refined oil and other chemical products. The fluctuation of the price of crude oil, refined oil and other chemical products may have a significant impact on the group. The Group uses derivative financial instruments such as commodity swap contracts to avoid some of these risks.
As at 31 December 2021, the Group had certain commodity contracts of crude oil designed as qualified cash flow hedges. As at 31 December 2021, the fair value of such derivative hedging financial instruments is derivative financial assets of RMB81,405 thousand (31 December 2020: Nil) and derivative financial liabilities of RMB23,804 thousand (31 December 2020: Nil).
As at 31 December 2021, it was estimated that a general increase/decrease of 10% per barrel in basic price of commodity swap contract, with all other variables held constant, would impact the fair value of derivative financial instruments, which would decrease or increase the Group’s profit for the year by approximately RMB1,111 thousand and other comprehensive income by approximately RMB73,938 thousand (31 December 2020: Nil). This sensitivity analysis above is made assuming that the changes in prices had occurred at the balance sheet date and had been applied to the Group’s derivative financial instruments at that date with exposure to commodity price risk.
| 2. | Credit risk |
Credit risk is the risk that one party to a financial instrument will cause a financial loss for the other party by failing to discharge an obligation. The Group’s credit risk is primarily attributable to cash at bank, derivative financial assets, accounts receivable, other receivables and receivables under financing, etc. As at balance sheet date, the maximum exposure to credit risk is represented by the carrying amount of financial assets in the balance sheet.
449
Notes to the Financial Statements (continued)
For the year ended 31 December 2021
(All amounts in thousands of Renminbi Yuan unless otherwise stated)
| X. | Risk related to financial instruments (continued) |
| 2. | Credit risk (continued) |
The cash at bank, derivative financial assets, and receivables under financing of the Group is mainly held with state-owned banks and other large and medium-sized listed banks with good reputation and high credit rating. Management does not foresee any significant credit risks from these deposits and does not expect that these financial institutions may default and cause losses to the Group.
The Group’s exposure to credit is influenced mainly by the individual characteristics of each customer rather than the industry or country/region in which the customers operate. Therefore, significant concentrations of credit risk primarily arise when the Group has significant exposure to individual customers. As at the balance sheet date, 69.50% (31 December 2020: 49.79%) and 81.80% (31 December 2020: 85.28%) of total accounts receivable were due from the Group’s largest and five largest customers respectively.
In respect of receivables, the Group establishes relevant policies to control credit risk exposure. The Group assesses customers’ credit qualifications and sets corresponding credit periods based on their financial status, the possibility of obtaining guarantees from third parties, credit records and other factors such as current market conditions. The Group will regularly monitor customers’ credit records. For customers with poor credit records, the Group will use written reminders, shorten the credit period or cancel the credit period to ensure that the Group’s overall credit risk is within a controllable range.
As at 31 December 2021 and 31 December 2020, the Group has no material collateral mortgaged by the debtor or credit enhancement.
| 3. | Liquidity risk |
Liquidity risk is the risk that an enterprise will encounter difficulty in meeting obligations that are settled by delivering cash or another financial asset. Cash flow forecast is performed by the operating entities of the Group and aggregated by Group finance. Group finance monitors rolling forecasts of the Group’s liquidity requirements to ensure it has sufficient cash to meet operational needs while maintaining sufficient headroom on its undrawn committed borrowing facilities from major financial institution so that the Group does not breach borrowing limits or covenants on any of its borrowing facilities to meet the short-term and long-term liquidity requirements.
450
Notes to the Financial Statements (continued)
For the year ended 31 December 2021
(All amounts in thousands of Renminbi Yuan unless otherwise stated)
| X. | Risk related to financial instruments (continued) |
| 3. | Liquidity risk (continued) |
The following tables set out the remaining contractual maturities at the balance sheet date of the Group’s financial liabilities, which are based on contractual undiscounted cash flows:
| 31 December 2021 | ||||||||||||||||||||||||
| Within 1 year or demand |
More than 1 year but less than 2 years |
More than 2 years but less than 5 years |
More than 5 years |
Total | Carrying amount at balance sheet date |
|||||||||||||||||||
| Short-term loans |
1,550,908 | — | — | — | 1,550,908 | 1,540,000 | ||||||||||||||||||
| Non-current liabilities due within one year |
20,244 | — | — | — | 20,244 | 19,800 | ||||||||||||||||||
| Long-term loans |
7,665 | 7,665 | 704,914 | — | 720,244 | 700,000 | ||||||||||||||||||
| Lease liabilities |
3,814 | 730 | 814 | 5,358 | 4,613 | |||||||||||||||||||
| Accounts payable |
5,888,879 | — | — | — | 5,888,879 | 5,888,879 | ||||||||||||||||||
| Bills payable |
830,006 | — | — | — | 830,006 | 830,006 | ||||||||||||||||||
| Other payables |
1,285,529 | — | — | — | 1,285,529 | 1,285,529 | ||||||||||||||||||
| Derivative financial liabilities |
23,804 | — | — | — | 23,804 | 23,804 | ||||||||||||||||||
|
|
|
|
|
|
|
|
|
|
|
|
|
|||||||||||||
| Total |
9,610,849 | 8,395 | 705,728 | — | 10,324,972 | 10,292,631 | ||||||||||||||||||
|
|
|
|
|
|
|
|
|
|
|
|
|
|||||||||||||
451
Notes to the Financial Statements (continued)
For the year ended 31 December 2021
(All amounts in thousands of Renminbi Yuan unless otherwise stated)
| X. | Risk related to financial instruments (continued) |
| 3. | Liquidity risk (continued) |
| 31 December 2020 | ||||||||||||||||||||||||
| Within 1 year or demand |
More than 1 year but less than 2 years |
More than 2 years but less than 5 years |
More than 5 years |
Total | Carrying amount at balance sheet date |
|||||||||||||||||||
| Short-term loans |
1,558,702 | — | — | — | 1,558,702 | 1,548,000 | ||||||||||||||||||
| Other current liabilities |
3,023,614 | — | — | — | 3,023,614 | 3,017,811 | ||||||||||||||||||
| Lease liabilities |
9,373 | 2,136 | 1,090 | 103 | 12,702 | 12,471 | ||||||||||||||||||
| Accounts payable |
4,671,635 | — | — | — | 4,671,635 | 4,671,635 | ||||||||||||||||||
| Bills payable |
139,360 | — | — | — | 139,360 | 139,360 | ||||||||||||||||||
| Other payables |
1,663,566 | — | — | — | 1,663,566 | 1,663,566 | ||||||||||||||||||
|
|
|
|
|
|
|
|
|
|
|
|
|
|||||||||||||
| Total |
11,066,250 | 2,136 | 1,090 | 103 | 11,069,579 | 11,052,843 | ||||||||||||||||||
|
|
|
|
|
|
|
|
|
|
|
|
|
|||||||||||||
| XI. | Fair value disclosure |
The following table presents the fair value information and the fair value hierarchy, at the end of the current reporting period, of the Group’s assets and liabilities which are measured at fair value at each balance sheet date on a recurring or non-recurring basis. The level in which fair value measurement is categorised is determined by the level of the fair value hierarchy of the lowest level input that is significant to the entire fair value measurement. The levels are defined as follows:
Level 1 inputs: unadjusted quoted prices in active markets that are observable at the measurement date for identical assets or liabilities;
Level 2 inputs: inputs other than Level 1 inputs that are either directly or indirectly observable for underlying assets or liabilities;
Level 3 inputs: inputs that are unobservable for underlying assets or liabilities.
452
Notes to the Financial Statements (continued)
For the year ended 31 December 2021
(All amounts in thousands of Renminbi Yuan unless otherwise stated)
| XI. | Fair value disclosure (continued) |
| 1. | Assets recurring measured at fair value |
As at 31 December 2021, assets recurring measured at fair value are presented in the above three levels as follows:
| Level 1 | Level 2 | Level 3 | Total | |||||||||||||
| Financial assets |
||||||||||||||||
| FVOCI |
||||||||||||||||
| – Receivables under financing |
— | 1,072,690 | — | 1,072,690 | ||||||||||||
| – Investments in other equity instruments |
— | — | 5,000 | 5,000 | ||||||||||||
| Derivative financial assets |
||||||||||||||||
| – Commodity swap contracts |
— | 81,405 | — | 81,405 | ||||||||||||
|
|
|
|
|
|
|
|
|
|||||||||
| Total |
— | 1,154,095 | 5,000 | 1,159,095 | ||||||||||||
| Financial liabilities |
||||||||||||||||
| Derivative financial liabilities |
||||||||||||||||
| – Commodity swap contracts |
— | 23,804 | — | 23,804 | ||||||||||||
|
|
|
|
|
|
|
|
|
|||||||||
| Total |
— | 23,804 | — | 23,804 | ||||||||||||
| Other current liabilities |
||||||||||||||||
| – Amounts due to related parties – measured at fair value through profit or loss |
— | 1,388,286 | — | 1,388,286 | ||||||||||||
453
Notes to the Financial Statements (continued)
For the year ended 31 December 2021
(All amounts in thousands of Renminbi Yuan unless otherwise stated)
| XI. | Fair value disclosure (continued) |
| 1. | Assets recurring measured at fair value (continued) |
As at 31 December 2020, the assets recurring measured at fair value are listed as follows according to the above three levels:
| Level 1 | Level 2 | Level 3 | Total | |||||||||||||
| Financial assets |
||||||||||||||||
| FVOCI |
||||||||||||||||
| – Receivables under financing |
— | 1,217,114 | — | 1,217,114 | ||||||||||||
| – Investments in other equity instruments |
— | — | 5,000 | 5,000 | ||||||||||||
|
|
|
|
|
|
|
|
|
|||||||||
| Total |
— | 1,217,114 | 5,000 | 1,222,114 | ||||||||||||
|
|
|
|
|
|
|
|
|
|||||||||
For the year ended 31 December 2021, there were no transfers between different levels. (For the year ended 31 December 2020: Nil).
The Group uses discounted cash flow model to evaluate the fair value of the structured deposits classified as Level 2 financial assets.
The primary input to the receivables financing valuation is the discount rate for counterparty credit risk.
The main inputs to the valuation of commodity swap contracts are the price of the underlying commodity and the discount rate for counterparty credit risk.
The main input to value of payables due to related parties measured at fair value is the market price of the underlying commodity. As at 31 December 2021, if market price of crude oil had risen/fallen by 10% while all other variables had been held constant, the Group’s net profit would have decreased/increased by approximately RMB89,787 thousand (2020: Nil).
The Group uses discounted cash flow model to evaluate the fair value of the structured deposits classified as Level 3 financial assets.
454
Notes to the Financial Statements (continued)
For the year ended 31 December 2021
(All amounts in thousands of Renminbi Yuan unless otherwise stated)
| XI. | Fair value disclosure (continued) |
| 2. | Fair values of financial assets and liabilities not measured at fair value |
Financial assets and liabilities measured at amortized cost mainly include trade receivables, other receivables, other current assets, short-term loans, trade payables, lease liabilities and other current liabilities.
As at 31 December 2021 and 31 December 2020, the carrying amount of these financial assets and financial liabilities not measured at fair value are a reasonable approximation of their fair value.
| XII. | Capital management |
The Group’s objectives when managing capital are to safeguard the Group’s ability to continue as a going concern, so that it can continue to provide returns for shareholders and benefits for other stakeholders and to maintain an optimal capital structure to reduce the cost of capital.
In order to maintain or adjust the capital structure, the Group may adjust the amount of dividends paid to shareholders, return capital to shareholders, issue new shares or sell assets to reduce debt.
The Group’s total capital is calculated as ‘shareholder’s equity’ and ‘total liabilities’ as shown in the consolidated balance sheet. The Group is not subject to external mandatory capital requirements, and monitors capital on the basis of gearing ratio.
During 2021, the Group’s strategy, which was unchanged from 2020, was to maintain a reasonable range of net debt-to-capital ratio by the management.
| XIII. | Subsequent events |
| 1. | Material non-adjusting post balance sheet date events |
Approved by the China National Association of Financial Market Institutional Investors (Zhongshi Xiezhu [2020] SCP471), the Company will issue short-term bonds of RMB1.5 billion to institutional investors in China in January 2022, using simple interest on an annual basis Interest, with a fixed annual interest rate of 2.35%, will expire on May 18, 2022, and the principal and interest will be repaid once at maturity. In March 2022, it will issue short-term bonds of RMB1.5 billion to institutional investors in China. The interest is calculated on an annual basis with simple interest, and the fixed annual interest rate is 2.01%. It will expire on July 5, 2022 with one-time principal and interest repaid.
455
Notes to the Financial Statements (continued)
For the year ended 31 December 2021
(All amounts in thousands of Renminbi Yuan unless otherwise stated)
| XIII. | Subsequent events (continued) |
| 2. | Explanation of profit distribution after the balance sheet date |
| (1) | Material non-adjusting post balance sheet date events |
On March 23, 2022, the Board of Directors proposed that the Company distribute a cash dividend of RMB0.1 per share (2020: RMB0.1 per share) to ordinary shareholders, totaling RMB1,082,381 thousand (2020: RMB1,082,381 thousand). The proposal is subject to approval by the general meeting of shareholders. Cash dividends proposed for distribution after the balance sheet date are not recognized as a liability at the balance sheet date.
| XIV. | Notes to the Company’s financial statements |
| 1. | Accounts receivable |
| (1) | Accounts receivable by customer type are as follows: |
| Type of customers |
2021 | 2020 | ||||||
| Amounts due from related parties |
1,014,638 | 917,577 | ||||||
| Amounts due from third parties |
2,114 | 2,118 | ||||||
|
|
|
|
|
|||||
| Sub-total |
1,016,752 | 919,695 | ||||||
| Less: provision for bad and doubtful debts |
(1,965 | ) | (634 | ) | ||||
|
|
|
|
|
|||||
| Total |
1,014,787 | 919,061 | ||||||
|
|
|
|
|
|||||
| (2) | The ageing analysis of accounts receivable is as follows: |
| Aging |
2021 | 2020 | ||||||
| Within 1 year (inclusive) |
1,014,638 | 917,581 | ||||||
| Over 1 year but within 2 years (inclusive) |
— | 2,114 | ||||||
| Over 2 year but within 3 years (inclusive) |
2,114 | — | ||||||
|
|
|
|
|
|||||
| Total |
1,016,752 | 919,695 | ||||||
|
|
|
|
|
|||||
The ageing is counted starting from the date when accounts receivable are recognized.
456
Notes to the Financial Statements (continued)
For the year ended 31 December 2021
(All amounts in thousands of Renminbi Yuan unless otherwise stated)
| XIV. | Notes to the Company’s financial statements (continued) |
| 1. | Accounts receivable (continued) |
| (3) | Accounts receivable by provisioning method |
| 2021 | 2020 | |||||||||||||||||||||||||||||||||||||||
| Provision for bad and | Carrying | Provision for bad and | Carrying | |||||||||||||||||||||||||||||||||||||
| Book value | doubtful debts | amount | Book value | doubtful debts | amount | |||||||||||||||||||||||||||||||||||
| Percentage | Percentage | Percentage | Percentage | |||||||||||||||||||||||||||||||||||||
| Category |
Amount | (%) | Amount | (%) | Amount | (%) | Amount | (%) | ||||||||||||||||||||||||||||||||
| Individual assessment |
— | — | — | — | — | — | — | — | — | — | ||||||||||||||||||||||||||||||
| Collective assessment |
1,016,752 | 100 | 1,965 | 0.19 | 1,014,787 | 919,695 | 100 | 634 | 0.07 | 919,061 | ||||||||||||||||||||||||||||||
|
|
|
|
|
|
|
|
|
|
|
|
|
|
|
|
|
|
|
|
|
|||||||||||||||||||||
| Total |
1,016,752 | 100 | 1,965 | 0.19 | 1,014,787 | 919,695 | 100 | 634 | 0.07 | 919,061 | ||||||||||||||||||||||||||||||
|
|
|
|
|
|
|
|
|
|
|
|
|
|
|
|
|
|
|
|
|
|||||||||||||||||||||
| (i) | As at 31 December 2021, the Company has no individually impaired accounts receivable (as at 31 December 2020: Nil). |
| (ii) | Criteria for collective assessment for the year ended 31 December 2021 and details: |
According to the historical experience of the Company, there are no significant differences in the losses of different customer groups. Therefore, different customer groups are not further distinguished when calculating impairment loss based on the overdue information.
| (iii) | Assessment of ECLs on accounts receivable: |
At all times the Company measures the impairment loss for accounts receivable at an amount equal to lifetime ECLs, and the ECLs are based on the number of overdue days and the expected loss rate.
The loss given default is measured based on the actual credit loss experience in the past years, and is adjusted taking into consideration the differences among the economic conditions during the historical data collection period, the current economic conditions and the economic conditions during the expected lifetime.
457
Notes to the Financial Statements (continued)
For the year ended 31 December 2021
(All amounts in thousands of Renminbi Yuan unless otherwise stated)
| XIV. | Notes to the Company’s financial statements (continued) |
| 1. | Accounts receivable (continued) |
| (4) | Movements of provisions for bad and doubtful debts: |
| 2021 | 2020 | |||||||
| Balance at the beginning of the year |
634 | — | ||||||
| Additions during the year |
1,331 | 634 | ||||||
| Recoveries or reversals during the year |
— | — | ||||||
|
|
|
|
|
|||||
| Balance at the end of the year |
1,965 | 634 | ||||||
|
|
|
|
|
|||||
| (i) | For the year ended 31 December 2021, the Company has no accounts receivable that have fully accrued or accrued a large proportion of bad and doubtful debts in previous years, but fully recovered or reversed, or have a large proportion of recovered or reversed in the current year (For the year ended 31 December 2020: Nil). |
| (ii) | For the year ended 31 December 2021, the Company has not written off significant accounts receivable (For the year ended 31 December 2020: Nil). |
| (5) | Five largest accounts receivable by debtor as at 31 December 2021 |
| Percent of total |
||||||||||||
| Item |
Amount | Provision | amount | |||||||||
| Total amount of five largest accounts receivable by debtor of the Company |
1,016,752 | — | 100.00 | % | ||||||||
|
|
|
|
|
|
|
|||||||
| (6) | For the year ended 31 December 2021, the Company has no accounts receivable derecognized due to transfer of financial assets. |
| (7) | As at 31 December 2021, the Company has no pledged accounts receivable. (31 December 2020: Nil) 458 Sinopec Shanghai Petrochemical Company Limited |
458
Notes to the Financial Statements (continued)
For the year ended 31 December 2021
(All amounts in thousands of Renminbi Yuan unless otherwise stated)
| XIV. | Notes to the Company’s financial statements (continued) |
| 2. | Receivables under financing |
| Item |
Note | 2021 | 2020 | |||||||||
| Bills receivable |
(1 | ) | 624,584 | 745,262 | ||||||||
|
|
|
|
|
|
|
|||||||
| (1) | Bills receivable |
| (i) | Due to the requirement of cash management, the Company discounted and endorsed part of the bank acceptance notes. The business model of bank acceptance notes management is for the purpose of collecting cash flow of contracts and sales. Therefore, as at 31 December 2021, the Company classified RMB624,584 thousand bills receivable to financial assets measured at fair value and whose changes are included in other comprehensive income and disclosed in bills receivable and accounts receivable (31 December 2020: RMB745,262 thousand). |
| (ii) | The Company has no single provision for impairment of the bank acceptance notes, with all provision was accrued by their expected credit loss. As at 31 December 2021 and 31 December 2020, the Company considers that no bank acceptance notes has significant credit risk and will not suffer significant loss due to the violation of banks. |
| (iii) | As at 31 December 2021, the Company had no pledged bank acceptance notes (31 December 2020: Nil). |
| (iv) | As at 31 December 2021, unmatured notes receivable that have been endorsed or discounted by the Company is as follows: |
| Item |
Derecognized | Not derecognized | ||||||
| Bank acceptance notes |
324,074 | — | ||||||
|
|
|
|
|
|||||
As at 31 December 2021, the Company endorsed and discounted the undue bills receivable of RMB324,074 thousand (31 December 2020: RMB135,400 thousand). The Company derecognized such bills receivable, accounts payable to suppliers and short-term loans as a whole by considering that the risks and rewards of ownership of such unmatured bills had been substantially transferred. The Company’s continued involvement in the unexpired bills receivable whose overall derecognition is limited to the extent that the issuing bank is unable to settle the amount to the bill holder. The maximum exposure to loss caused by the Company’s continued involvement is the amount of outstanding bills receivable endorsed to the supplier of RMB324,074 thousand (31 December 2020: RMB135,400 thousand). The term of the outstanding bills receivable is within one year.
459
Notes to the Financial Statements (continued)
For the year ended 31 December 2021
(All amounts in thousands of Renminbi Yuan unless otherwise stated)
| XIV. | Notes to the Company’s financial statements (continued) |
| 3. | Other receivables |
| (1) | Analysis by customer type: |
| Customer type |
2021 | 2020 | ||||||
| Amounts due from related parties |
60,777 | 22,939 | ||||||
| Amounts due from third parties |
764,762 | 760,479 | ||||||
|
|
|
|
|
|||||
| Sub-total |
825,539 | 783,418 | ||||||
| Less: Provision for bad and doubtful debts |
(756,486 | ) | (756,486 | ) | ||||
|
|
|
|
|
|||||
| Total |
69,053 | 26,932 | ||||||
|
|
|
|
|
|||||
| (2) | The ageing analysis is as follows: |
| Aging |
2021 | 2020 | ||||||
| Within 1 year (inclusive) |
69,030 | 26,932 | ||||||
| Over 1 year but within 2 years (inclusive) |
23 | — | ||||||
| Over 2 years but within 3 years (inclusive) |
— | — | ||||||
| Over 3 years |
756,486 | 756,486 | ||||||
|
|
|
|
|
|||||
| Total |
825,539 | 783,418 | ||||||
|
|
|
|
|
|||||
The ageing is counted starting from the date when other receivables are recognized.
460
Notes to the Financial Statements (continued)
For the year ended 31 December 2021
(All amounts in thousands of Renminbi Yuan unless otherwise stated)
| XIV. | Notes to the Company’s financial statements (continued) |
| 3. | Other receivables (continued) |
| (3) | Others by provisioning method: |
| 2021 | 2020 | |||||||||||||||||||||||||||||||||||||||
| Provision for bad and | Carrying | Provision for bad and | Carrying | |||||||||||||||||||||||||||||||||||||
| Book value | doubtful debts | amount | Book value | doubtful debts | amount | |||||||||||||||||||||||||||||||||||
| Percentage | Percentage | Percentage | Percentage | |||||||||||||||||||||||||||||||||||||
| Category |
Amount | (%) | Amount | (%) | Amount | (%) | Amount | (%) | ||||||||||||||||||||||||||||||||
| Individual assessment |
756,347 | 92 | 756,347 | 100 | – | 756,347 | 97 | 756,347 | 100 | – | ||||||||||||||||||||||||||||||
| Collective assessment |
69,192 | 8 | 139 | 0.2 | 69,053 | 27,071 | 3 | 139 | 0.5 | 26,932 | ||||||||||||||||||||||||||||||
|
|
|
|
|
|
|
|
|
|
|
|
|
|
|
|
|
|
|
|
|
|||||||||||||||||||||
| Total |
825,539 | 100 | 756,486 | 91.3 | 69,053 | 783,418 | 100 | 756,486 | 96.6 | 26,932 | ||||||||||||||||||||||||||||||
|
|
|
|
|
|
|
|
|
|
|
|
|
|
|
|
|
|
|
|
|
|||||||||||||||||||||
| (4) | Movements of provisions for bad and doubtful debts |
| Stage 1 | Stage 3 | |||||||||||||||||||||||||||||||
| 12-month ECL (collective) |
12-month ECL (individual) |
Sub-total | Lifetime ECL-Credit impaired |
Total | ||||||||||||||||||||||||||||
| Provision | Provision | Provision | ||||||||||||||||||||||||||||||
| for bad and | for bad and | for bad and | ||||||||||||||||||||||||||||||
| doubtful | doubtful | doubtful | ||||||||||||||||||||||||||||||
| Book value | debts | Book value | debts | Book value | debts | |||||||||||||||||||||||||||
| Balance at 31 December 2020 |
26,932 | – | – | – | – | 756,486 | (756,486 | ) | (756,486 | ) | ||||||||||||||||||||||
| Additions during the year |
– | – | – | – | – | – | – | – | ||||||||||||||||||||||||
| Recoveries or reversals during the year |
– | – | – | – | – | – | – | – | ||||||||||||||||||||||||
|
|
|
|
|
|
|
|
|
|
|
|
|
|
|
|
|
|||||||||||||||||
| Balance at 31 December 2021 |
26,932 | – | – | – | – | 756,486 | (756,486 | ) | (756,486 | ) | ||||||||||||||||||||||
|
|
|
|
|
|
|
|
|
|
|
|
|
|
|
|
|
|||||||||||||||||
As at 31 December 2021 and 31 December 2020, the Company has no other receivables under Stage 2.
461
Notes to the Financial Statements (continued)
For the year ended 31 December 2021
(All amounts in thousands of Renminbi Yuan unless otherwise stated)
| XIV. | Notes to the Company’s financial statements (continued) |
| 3. | Other receivables (continued) |
| (4) | Movements of provisions for bad and doubtful debts (continued) |
As at 31 December 2021, the amount receivable from Jinyong company, a subsidiary within the original scope of merger, was RMB756,347 thousand (31 December 2020: RMB756,347 thousand). Jinyong company started to stop production in August 2008 and entered bankruptcy liquidation procedure in August 2019. The Company believes that the other receivables are difficult to recover, so the bad debt provision are fully accrued. As at December 2021, the bankruptcy liquidation procedure has not been completed.
For the year ended 31 December 2021, the Company has no other receivables that have fully accrued or accrued a large proportion of bad and doubtful debts in previous years, but fully recovered or reversed, or have a large proportion of recovered or reversed in the current year.
In 2020, according to the bankruptcy property distribution plan of Jinyong company, the Company will recover the debt repayment of RMB101,445 paid by the bankruptcy administrator of Jinyong company.
For the year ended 31 December 2021, the Company has not written off significant other receivables (For the year ended 31 December 2020: Nil).
| (5) | Others categorised by nature |
| Nature of other receivables |
2021 | 2020 | ||||||
| Receivable from Jinyong company |
756,347 | 756,347 | ||||||
| Accounts due from related parties |
60,777 | 22,939 | ||||||
| Rent receivable |
17 | 1,330 | ||||||
| Water, electricity and gas charges receivable |
86 | 1,437 | ||||||
| Others |
8,312 | 1,365 | ||||||
|
|
|
|
|
|||||
| Sub-total |
825,539 | 783,418 | ||||||
| Less: provisions for bad and doubtful debts |
(756,486 | ) | (756,486 | ) | ||||
|
|
|
|
|
|||||
| Total |
69,053 | 26,932 | ||||||
|
|
|
|
|
|||||
462
Notes to the Financial Statements (continued)
For the year ended 31 December 2021
(All amounts in thousands of Renminbi Yuan unless otherwise stated)
| XIV. | Notes to the Company’s financial statements (continued) |
| 3. | Other receivables (continued) |
| (6) | Five largest others by debtor as at 31 December 2021 |
| Ending balance | ||||||||||||||||
| Percentage of | of provision for | |||||||||||||||
| Nature of the | Balance at the | ending balance | bad and doubtful | |||||||||||||
| Debtor |
receivable |
end of the year | Ageing |
of others (%) | debts | |||||||||||
| Zhejiang Jinyong Acrylic Fiber Co., Ltd |
reimbursed expenses | 756,347 | Over 3 years | 91.62 | % | (756,347 | ) | |||||||||
| China International United Petroleum and Chemicals Co., Ltd. |
Business transaction | 58,186 | Within 1 year (inclusive) | 7.05 | % | — | ||||||||||
| Linde-SPC Gases Company Limited (“Linde”), formerly known as “BOC- SPC Gases Company Limited”) |
Business transaction | 2,412 | Within 1 year (inclusive) | 0.29 | % | — | ||||||||||
| Shanghai Yumao Shipping Agency Co., Ltd. |
Business transaction | 572 | Within 1 year (inclusive) | 0.07 | % | — | ||||||||||
| Shanghai Municipal Market Supervision Administration |
Business transaction | 507 | Within 1 year (inclusive) | 0.06 | % | — | ||||||||||
|
|
|
|
|
|
|
|||||||||||
| Total |
818,024 | 99.09 | % | (756,347 | ) | |||||||||||
|
|
|
|
|
|
|
|||||||||||
| 4. | Long-term equity investment |
| Item |
Note | 2021 | 2020 | |||||||||
| Subsidiaries |
(1) | 2,048,328 | 2,048,328 | |||||||||
| Associates |
(2) | 3,393,937 | 4,749,338 | |||||||||
| Joint ventures |
(3) | 50,000 | — | |||||||||
|
|
|
|
|
|||||||||
| Sub-total |
5,492,265 | 6,797,666 | ||||||||||
| Less: Impairment provision for long-term equity investment |
— | — | ||||||||||
|
|
|
|
|
|||||||||
| Total |
5,492,265 | 6,797,666 | ||||||||||
|
|
|
|
|
|||||||||
463
Notes to the Financial Statements (continued)
For the year ended 31 December 2021
(All amounts in thousands of Renminbi Yuan unless otherwise stated)
| XIV. | Notes to the Company’s financial statements (continued) |
| 4. | Long-term equity investment (continued) |
| (1) | Subsidiaries |
| Name of subsidiaries |
31 December 2020 |
Additional/ negative investment |
31 December 2021 |
Impairment provision |
Cash dividends declared in current year |
|||||||||||||||
| Toufa |
2,031,496 | — | 2,031,496 | — | — | |||||||||||||||
| Jinmao |
16,832 | — | 16,832 | — | 15,000 | |||||||||||||||
|
|
|
|
|
|
|
|
|
|
|
|||||||||||
| Total |
2,048,328 | — | 2,048,328 | — | 15,000 | |||||||||||||||
|
|
|
|
|
|
|
|
|
|
|
|||||||||||
| (2) | Associates |
The information relating to the associates of the Company is disclosed in Note VI.2.
| (3) | Joint venture |
The information relating to the joint venture of the Company, Shanghai Jinshan Baling New Materials Co., Ltd., is disclosed in Note VI.2.
464
Notes to the Financial Statements (continued)
For the year ended 31 December 2021
(All amounts in thousands of Renminbi Yuan unless otherwise stated)
| XIV. | Notes to the Company’s financial statements (continued) |
| 5. | Fixed assets |
| (1) | Fixed assets |
| Buildings | Plant and machinery |
Vehicles and other equipment |
Total | |||||||||||||
| Cost |
||||||||||||||||
| 31 December 2020 |
3,153,383 | 41,819,934 | 1,887,210 | 46,860,527 | ||||||||||||
| Reclassification in current year |
41,280 | (43,418 | ) | 2,138 | — | |||||||||||
| Increase |
||||||||||||||||
| – Purchase |
— | 156,205 | 15,132 | 171,337 | ||||||||||||
| – Transfer from construction in progress |
130,947 | 1,461,502 | 85,872 | 1,678,321 | ||||||||||||
| – Transfer from investment properties |
1,164 | — | — | 1,164 | ||||||||||||
| Decrease |
||||||||||||||||
| – Disposal |
(4,529 | ) | (735,846 | ) | (61,291 | ) | (801,666 | ) | ||||||||
| – Transfer to investment properties |
(2,264 | ) | (7 | ) | — | (2,271 | ) | |||||||||
| 31 December 2021 |
3,319,981 | 42,658,370 | 1,929,061 | 47,907,412 | ||||||||||||
|
|
|
|
|
|
|
|
|
|||||||||
| Accumulated depreciation |
||||||||||||||||
| 31 December 2020 |
2,261,673 | 31,008,856 | 1,400,255 | 34,670,784 | ||||||||||||
| Reclassification in current year |
33,152 | (34,517 | ) | 1,365 | — | |||||||||||
| Increase |
||||||||||||||||
| – Charge for current year |
77,220 | 1,384,106 | 109,004 | 1,570,330 | ||||||||||||
| – Transfer from investment properties |
1,088 | — | — | 1,088 | ||||||||||||
| Decrease |
||||||||||||||||
| – Disposal |
(3,470 | ) | (625,132 | ) | (54,287 | ) | (682,889 | ) | ||||||||
| – Transfer to investment properties |
(2,236 | ) | (7 | ) | — | (2,243 | ) | |||||||||
| 31 December 2021 |
2,367,427 | 31,733,306 | 1,456,337 | 35,557,070 | ||||||||||||
|
|
|
|
|
|
|
|
|
|||||||||
| Provision for impairment |
||||||||||||||||
| 31 December 2020 |
53,792 | 827,822 | 8,602 | 890,216 | ||||||||||||
| Reclassification in current year |
5,127 | (5,311 | ) | 184 | — | |||||||||||
| Increase |
||||||||||||||||
| – Charge for current year |
793 | 586,147 | 682 | 587,622 | ||||||||||||
| Decrease |
||||||||||||||||
| – Disposal |
— | (60,018 | ) | (501 | ) | (60,519 | ) | |||||||||
| 31 December 2021 |
59,712 | 1,348,640 | 8,967 | 1,417,319 | ||||||||||||
|
|
|
|
|
|
|
|
|
|||||||||
| Carrying amount |
||||||||||||||||
| 31 December 2021 |
892,842 | 9,576,424 | 463,757 | 10,933,023 | ||||||||||||
|
|
|
|
|
|
|
|
|
|||||||||
| 31 December 2020 |
837,918 | 9,983,256 | 478,353 | 11,299,527 | ||||||||||||
|
|
|
|
|
|
|
|
|
|||||||||
465
Notes to the Financial Statements (continued)
For the year ended 31 December 2021
(All amounts in thousands of Renminbi Yuan unless otherwise stated)
| XIV. | Notes to the Company’s financial statements (continued) |
| 5. | Fixed assets (continued) |
| (1) | Fixed assets (continued) |
| (i) | 2021, due to deteriorating market conditions, the increasing production cost is not expected to be covered by the anticipated selling price of the products, the Company identified an impairment indicator assets in relation to certain production facilities, including 4# aromatic joint unit and 3# aromatic joint unit under intermediate petrochemicals segment. |
| The Company recognized impairment loss on assets in relation to certain production facilities of RMB519,877 thousand and RMB259,850 thousand, respectively, for the year ended 31 December 2021, in accordance with the accounting policies set out in Note III, 18 to the financial statements. |
| The recoverable amounts of above production facilities are estimated using the present value of future cash flows based on the financial budgets approved by management covering a five-year period. Forecasted cash flows are developed using several key assumptions, including the product sales growth rates, related costs growth rates (“forecasted growth rates”) and discount rate. The forecasted growth rates are based on past business performance and market participants’ expectations for market development, which are consistent with the forecasts included in industry reports. The discount rate used is a pre-tax ratio of 10% and reflects specific risks relating to the Company. |
| During the year ended 31 December 2021, a number of production facilities were idle or backward production technology. The Company does not expect to have future economic benefits recoverable from the use of those production facilities. There is no alternative use of those production facilities which is specifically designed. The recoverable amounts of property, plant and equipment related to those production facilities are estimated to be their residual value. As a result, impairment loss of RMB327,772 thousand was made against the carrying amounts of those assets. |
| According to the above impairment test, in 2021, the Company recognized the impairment loss of fixed assets of RMB587,622 thousand. |
| As at 31 December 2021 and 31 December 2020 the Company had no pledged fixed assets. |
466
Notes to the Financial Statements (continued)
For the year ended 31 December 2021
(All amounts in thousands of Renminbi Yuan unless otherwise stated)
| XIV. | Notes to the Company’s financial statements (continued) |
| 5. | Fixed assets (continued) |
| (1) | Fixed assets (continued) |
| For the year ended 31 December 2021, the amount of fixed assets transferred from construction in progress was RMB1,678,321 thousand (for the year ended 31 December 2020, RMB1,550,175 thousand). |
| (ii) | As at 31 December 2021, the cost of temporarily idle fixed assets was RMB3,551,001 thousand, the accumulated depreciation was RMB2,867,318 thousand, the provision for impairment was RMB552,580 thousand and the carrying amount was RMB133,103 thousand (31 December 2020: the cost of temporarily idle fixed assets was RMB491,591 thousand, accumulated depreciation was RMB420,468 thousand, related impairment provision was RMB54,962 thousand, and the carrying amount of these assets was RMB16,161 thousand, respectively). |
| (iii) | As at 31 December 2021, the carrying amount of fixed assets leased out under operating leases was RMB50,733 thousand (31 December 2020: RMB53,231 thousand). |
| (iv) | As at 31 December 2021 and 31 December 2020, the Company had no fixed assets pending certificates of ownership. |
| 6. | Operating income and operating costs |
| Note | 2021 | 2020 | ||||||||
| Income from principal activities |
(1) | 77,711,400 | 62,089,266 | |||||||
| Income from other operating activities |
459,227 | 395,601 | ||||||||
|
|
|
|
|
|||||||
| Total |
78,170,627 | 62,484,867 | ||||||||
|
|
|
|
|
|||||||
| Note | 2021 | 2020 | ||||||||
| Cost of principal activities |
(1) | 60,426,129 | 46,953,906 | |||||||
| Cost of other operating activities |
345,999 | 246,089 | ||||||||
|
|
|
|
|
|||||||
| Total |
60,772,128 | 47,199,995 | ||||||||
|
|
|
|
|
|||||||
467
Notes to the Financial Statements (continued)
For the year ended 31 December 2021
(All amounts in thousands of Renminbi Yuan unless otherwise stated)
| XIV. | Notes to the Company’s financial statements (continued) |
| 6. | Operating income and operating costs (continued) |
| (1) | Income and cost from principal activities |
| The principal business of the Group mainly belongs to the petrochemical industry. |
| Analysis by product is as follows: |
| 2021 | 2020 | |||||||||||||||
| Income from | Cost from | Income from | Cost from | |||||||||||||
| principal | principal | principal | principal | |||||||||||||
| activities | activities | activities | activities | |||||||||||||
| Petroleum products |
55,074,158 | 38,276,985 | 43,080,204 | 30,963,719 | ||||||||||||
| Intermediate petrochemicals |
12,086,644 | 11,655,393 | 8,947,130 | 7,435,622 | ||||||||||||
| Resins and plastics |
8,726,645 | 7,996,938 | 8,151,469 | 6,367,421 | ||||||||||||
| Synthetic fibres |
1,381,442 | 1,912,126 | 1,480,576 | 1,764,492 | ||||||||||||
| Others |
442,511 | 584,687 | 429,887 | 422,652 | ||||||||||||
|
|
|
|
|
|
|
|
|
|||||||||
| Total |
77,711,400 | 60,426,129 | 62,089,266 | 46,953,906 | ||||||||||||
|
|
|
|
|
|
|
|
|
|||||||||
| The revenue of the Company is recognized at a point in time. |
468
Notes to the Financial Statements (continued)
For the year ended 31 December 2021
(All amounts in thousands of Renminbi Yuan unless otherwise stated)
| XIV. | Notes to the Company’s financial statements (continued) |
| 7. | Investment Income |
| Note | 2021 | 2020 | ||||||||
| Investment accounted for using the cost method |
10,100 | 10,100 | ||||||||
| Investment accounted for using the equity method |
(1) | 774,784 | 625,402 | |||||||
| Structured deposits income |
82,266 | 128,932 | ||||||||
| Investment losses of derivative financial instruments |
10,010 | — | ||||||||
| Discount loss of receivables |
(1,605 | ) | (2,099 | ) | ||||||
|
|
|
|
|
|||||||
| Total |
875,555 | 762,335 | ||||||||
|
|
|
|
|
|||||||
| There are no severe restrictions on the investee’s ability to transfer investment income to the Company. |
| (1) | Income from investment in associates accounted for using the equity method is as follow: |
| 2021 | 2020 | |||||||
| Shanghai Secco |
633,403 | 480,787 | ||||||
| Chemical Industry |
141,381 | 144,615 | ||||||
|
|
|
|
|
|||||
| Total |
774,784 | 625,402 | ||||||
|
|
|
|
|
|||||
469
Notes to the Financial Statements (continued)
For the year ended 31 December 2021
(All amounts in thousands of Renminbi Yuan unless otherwise stated)
| XIV. | Notes to the Company’s financial statements (continued) |
| 8. | Supplementary information on cash flow statements |
| (2) | Reconciliation from net profit/(loss) to cash flow from operating activities |
| 2021 | 2020 | |||||||
| Net profit |
1,985,363 | 370,931 | ||||||
| Add: Provisions for impairment of assets |
738,339 | 304,348 | ||||||
| Impairment credit losses/(reversal) |
1,331 | (100,811 | ) | |||||
| Depreciation of investment properties |
15,088 | 16,199 | ||||||
| Depreciation of fixed assets |
1,570,330 | 1,517,294 | ||||||
| Depreciation of right-of-use assets |
12,841 | 13,021 | ||||||
| Amortization of intangible assets |
12,286 | 12,309 | ||||||
| Amortization of long-term deferred expense |
290,277 | 222,024 | ||||||
| (Gains)/losses on disposal of long-term assets |
(48,517 | ) | 15,029 | |||||
| (Gains)/losses from changes in fair value |
(8,987 | ) | 18,407 | |||||
| Financial expenses (“-” for income) |
(323,437 | ) | (276,792 | ) | ||||
| Investment income |
(875,555 | ) | (762,335 | ) | ||||
| Decrease in deferred tax assets (“-” for increase) |
47,803 | (99,392 | ) | |||||
| Amortization of deferred income |
(10,713 | ) | (10,437 | ) | ||||
| Decrease in inventories (“-” for increase) |
(2,191,525 | ) | 2,466,155 | |||||
| Decrease in operating receivables (“-” for increase) |
(122,029 | ) | 169,918 | |||||
| Increase in operating payables (“-” for decrease) |
3,939,108 | (2,027,181 | ) | |||||
| Increase of reserve |
70,911 | 88,462 | ||||||
|
|
|
|
|
|||||
| Net cash inflow generated in operating activities |
5,102,914 | 1,937,149 | ||||||
|
|
|
|
|
|||||
| (3) | Movement of cash and cash equivalent |
| 2021 | 2020 | |||||||
| Cash and cash equivalents at the end of the year |
4,927,519 | 5,460,067 | ||||||
| Less: Cash and cash equivalents at the beginning of the year |
(5,460,067 | ) | (5,754,440 | ) | ||||
|
|
|
|
|
|||||
| Net decrease in cash and cash equivalents |
(532,548 | ) | (294,373 | ) | ||||
|
|
|
|
|
|||||
470
SUPPLEMENTARY INFORMATION TO THE FINANCIAL STATEMENTS
For the year ended 31 December 2021
(All amounts in thousands of Renminbi Yuan unless otherwise stated)
| I. | Non-recurring items |
| 2021 | 2020 | |||||||
| Gains on disposal of non-current assets |
48,671 | 72,296 | ||||||
| Government grants recorded in profit or loss |
45,944 | 71,296 | ||||||
| Employee reduction expenses |
(12,232 | ) | (20,060 | ) | ||||
| Gains/(losses) from changes in fair value of financial assets and liabilities |
8,987 | (17,871 | ) | |||||
| Gains from structured deposits income |
97,921 | 132,690 | ||||||
| Gains/(losses) from disposal of derivative financial instruments |
9,859 | (912 | ) | |||||
| Loss on selling of financial assets at fair value through other comprehensive income |
(4,685 | ) | (9,513 | ) | ||||
| Other non-operating income and expenses other than those mentioned above |
(57,733 | ) | (42,968 | ) | ||||
| Income tax effect for the above items |
(44,887 | ) | (51,339 | ) | ||||
| Effect on non-controlling interests after tax |
556 | 1,141 | ||||||
|
|
|
|
|
|||||
| Total |
92,401 | 134,760 | ||||||
|
|
|
|
|
|||||
Basis of preparation for extraordinary profit and loss
Pursuant to Announcement [2008] Explanatory Announcement No.1 on Information Disclosure for Companies Offering Their Securities to the Public issued by China Securities regulatory commission (CSRC), extraordinary profit and loss arises in various trading and issues that have no direct relation with the normal operations of a company, or that are related with normal operations but affect the users of the statement to make reasonable judgment of the Company’s operation performance and profitability due to the special and occasional nature of such trading and issues.
| II. | Reconciliation between financial statements prepared under CAS and IFRS |
The Company is listed on the Stoke Exchange of Hong Kong. The Group prepared financial statements under International Financial Reporting Standards (“IFRS”) which has been audited. There are reconciliation items in the consolidated financial report prepared under CAS and IFRS, the reconciliation items and the amount are listed as follows:
| Net profit | Net assets | |||||||||||||||
| 2021 | 2020 | 2021 | 2020 | |||||||||||||
| Under CAS |
2,003,681 | 639,436 | 30,395,431 | 29,355,018 | ||||||||||||
| Adjustments under IFRS – |
||||||||||||||||
| Government grants (1) |
2,010 | 2,010 | (18,033 | ) | (20,043 | ) | ||||||||||
| Safety production costs (2) |
70,915 | 88,460 | — | — | ||||||||||||
| Others |
— | (73,508 | ) | — | — | |||||||||||
|
|
|
|
|
|
|
|
|
|||||||||
| Under IFRS |
2,076,606 | 656,398 | 30,377,398 | 29,334,975 | ||||||||||||
|
|
|
|
|
|
|
|
|
|||||||||
471
Supplementary Information to the Financial Statements (continued)
For the year ended 31 December 2021
(All amounts in thousands of Renminbi Yuan unless otherwise stated)
| II. | Reconciliation between financial statements prepared under CAS and IFRS (continued) |
Notes:
| (1) | Government grants |
Under CAS, government subsidies defined as capital contributions according to the relevant government requirements are not considered a government grant, but instead should be recorded as an increase in capital reserves.
Under IFRS, such grants are offset against the cost of asset to which the grants are related. Upon transfer to property, plant and equipment, the grant is recognized as income over the useful life of the property, plant and equipment by way of a reduced depreciation charge.
| (2) | Safety production costs |
Under CAS, safety production costs should be recognized in profit or loss with a corresponding increase in reserve according to PRC regulations. Such reserve is reduced for expenses incurred for safety production purposes or, when safety production related fixed assets are purchased, is reduced by the purchased cost with a corresponding increase in the accumulated depreciation. Such fixed assets are not depreciated thereafter. Under IFRS, expenses are recognized in profit or loss when incurred, and property, plant and equipment are depreciated with applicable methods.
| III. | Return on net assets and earnings per share |
| Earnings per share (RMB per share) | ||||||||||||||||||||||||
| Weighted average return on net assets (%) |
Basic | Diluted | ||||||||||||||||||||||
| 2021 | 2020 | 2021 | 2020 | 2021 | 2020 | |||||||||||||||||||
| Net profit attributable to shareholders of the Company |
6.727 | 2.127 | 0.185 | 0.059 | 0.185 | 0.059 | ||||||||||||||||||
| Net profit attributable to shareholders of the Company excluding non-recurring items |
6.416 | 1.709 | 0.176 | 0.047 | 0.176 | 0.047 | ||||||||||||||||||
472
Written Confirmation Issued by Directors, Supervisors and Senior Management
Pursuant to the relevant requirements of Article 82 of the Securities Law, Standards for the Contents and Formats of Information Disclosure by Companies Offering to the Public No.2--Contents and Formats of Annual Reports (2021Revision), and Shanghai Stock Exchange Stock Listing Rules (2022 Revision), as the Company’s directors, supervisors and senior management, we fully understood and reviewed the Company’s 2021 Annual Report and issued the written opinions as follows:
| 1. | Confirmation opinions by directors and senior management |
The Company operated in strict accordance with the financial system of listed companies, and the 2021 Annual Report fully, truly and fairly reflected the Company’s financial performance and operating results.
| 2. | Review opinions by supervisors |
| (1) | The formulation and review procedures of the Company’s 2021 Annual Report were in compliance with laws and regulations, articles of association and relevant internal control systems. |
| (2) | The contents and formats of the Company’s 2021 Annual Report met the relevant regulations of China Securities Regulatory Commission and Shanghai Stock Exchange. |
| (3) | No violation of information confidentiality was found in the Company’s personnel involved in the formulation, review and information disclosure of the Company’s 2021 Annual Report. |
| (4) | The Company’s 2021 Annual Report fully, truly and fairly reflected the Company’s financial performance and operating results. |
| 3. | All directors, supervisors and senior management guarantee that the information disclosed in the Company’s 2021 Annual Report and summary is true, accurate and complete, promise that there are no false records, misleading statements or major omissions, and bear the separate and joint legal liabilities for the authenticity, exactness and completeness of the contents. |
Signature:
Directors:
|
Wu Haijun |
Guan Zemin |
Du Jun |
Huang Xiangyu |
Xie Zhenglin |
Peng Kun |
Li Yuanqin | ||||||
|
Tang Song |
Chen Haifeng |
Yang Jun |
Gao Song |
|||||||||
| Supervisors: | ||||||||||||
|
Ma Yanhui |
Zhang Feng |
Chen Hongjun |
Zhang Xiaofeng |
Zheng Yunrui |
Choi Ting Ki |
|||||||
| Senior Management: | ||||||||||||
|
Jin Qiang |
Jin Wenmin |
Huang Fei |
Liu Gang |
|||||||||
473
| (I) | Corporate Information |
| Chinese Name of the Company | 中國石化上海石油化工股份有限公司 | |||
| Chinese Short Name of the Company | 上海石化 | |||
| English Name of the Company | Sinopec Shanghai Petrochemical Company Limited | |||
| Abbreviation of the English Name of the Company | SPC | |||
| Legal Representative of the Company | Wu Haijun |
| (II) | Contact Persons and Contact Details |
| Secretary to the Board | Securities Affairs Representative | |||||
| Name | Liu Gang | Yu Guangxian | ||||
| Address | 48 Jinyi Road, Jinshan District, | |||||
| Shanghai, PRC, Postal Code: 200540 | ||||||
| Tel | 8621-57943143 | 8621-57933728 | ||||
| Fax | 8621-57940050 | 8621-57940050 | ||||
| liugang@spc.com.cn | yuguangxian@spc.com.cn |
| (III) | Basic Information |
| Registered Address | 48 Jinyi Road, Jinshan District, Shanghai, PRC | |
| Postal Code of Registered Address | 200540 | |
| Business Address | 48 Jinyi Road, Jinshan District, Shanghai, PRC | |
| Postal Code of Business Address | 200540 | |
| Principal Place of Business in Hong Kong | Room 605, Island Place Tower, 510 King’s Road, Hong Kong | |
| Website of the Company | www.spc.com.cn | |
| E-mail address | spc@spc.com.cn |
| (IV) | Information Disclosure and Access |
| Designated newspapers for the publication of the Company’s announcements |
“Shanghai Securities News”, “China Securities Journal” and “Securities Times” | |
| Websites for the publication of the Company’s annual reports |
Shanghai Stock Exchange website, Hong Kong Stock Exchange website and the website of the Company | |
| Place for access to the Company’s annual reports |
Secretariat Office to the Board, 48 Jinyi Road, Jinshan District, Shanghai, PRC |
| (V) | Shares Profile of the Company |
| Share Type | Place of Listing | Stock Short Name | Stock Code | |||||
| A Shares | Shanghai Stock Exchange | 上海石化 | 600688 | |||||
| H Shares | Hong Kong Stock Exchange | SHANGHAI PECHEM | 00338 | |||||
| American Depository | New York Stock Exchange | SHI | – | |||||
| Receipts (“ADR”) |
474
Corporate Information (continued)
| (VI) | Other Relevant Information |
| Auditors Engaged by the Company | Name | KPMG Huazhen LLP | ||||
| (Domestic) | Address | 8th floor, KPMG building, Oriental Plaza, | ||||
| Signing Auditors | Wang Wenli, Fang Haijie | |||||
| Auditors Engaged by the Company | Name | KPMG | ||||
| (International) | Address | 8th floor, Prince building, 10 Chater Road, | ||||
| Signing Auditors | Au Yat Fo |
| Legal Advisors: | ||||
| PRC Law: | Haiwen& Partners | |||
| 20th Floor, Fortune & Finance Center | ||||
| No.5 Dong San Huan Central Road | ||||
| Chaoyang District, Beijing, PRC | ||||
| Postal Code: 100020 | ||||
| Hong Kong Law: | Zhong Lun | |||
| 4th floor, Jardine house, 1 Connaught Plaza, central, | ||||
| Hong Kong | ||||
| United States Law | Morrison &Foerster | |||
| 425 Market Street | ||||
| San Francisco, California 94105-2482 | ||||
| U.S.A. | ||||
Joint Company Secretaries:
Liu Gang, Chan Sze Ting
Authorised Representatives for Hong Kong Stock Exchange:
Wu Haijun, Chan Sze Ting
H Shares Share Registrar:
Hong Kong Registrars Limited
Shops 1712-1716, 17th Floor, Hopewell Centre, 183 Queen’s Road East, Wanchai, Hong Kong
ADR Depositary:
The Bank of New York Mellon
Computershare
P.O. Box 30170
College Station, TX 77842-3170
U.S.A.
Number for International Calls: 1-201-680-6921
Email: shrrelations@cpushareownerservices.com
Website: www.mybnymdr.com
475
| 1. | Financial statements signed and sealed by the Chairman, the Chief Financial Officer and the Deputy Director of the Finance Department. |
| 2. | Original signed auditor’s report of the Certified Public Accountant. |
| 3. | Originals of all documents and announcements of the Company which were disclosed in the newspapers designated by CSRC during the Reporting Period. |
| 4. | Written confirmation of the annual report signed by the Directors, Supervisors and senior management. |
Chairman: Wu Haijun
Date of approval by the Board: 23 March 2022
476