SECURITIES AND EXCHANGE COMMISSION
Washington, D.C. 20549
FORM 6-K
Report of Foreign Private Issuer
Pursuant to Rule 13a-16 or 15d-16 of the
Securities Exchange Act of 1934
For the month of August, 2025
Commission File Number 1-34129
CENTRAIS ELÉTRICAS BRASILEIRAS S.A. - ELETROBRÁS
(Exact name of registrant as specified in its charter)
BRAZILIAN ELECTRIC POWER COMPANY
(Translation of Registrant's name into English)
Rua da Quitanda, 196 – 24th floor,
Centro, CEP 20091-005,
Rio de Janeiro, RJ, Brazil
(Address of principal executive office)
Indicate by check mark whether the registrant files or will file annual reports under cover Form 20-F or Form 40-F.
Form 20-F ___X___ Form 40-F _______
Indicate by check mark whether the registrant by furnishing the information contained in this Form is also thereby furnishing the information to the Commission pursuant to Rule 12g3-2(b) under the Securities Exchange Act of 1934.
Yes _______ No___X____

 |
| TABLE OF CONTENTS | |
| 1. CONSOLIDATED RESULT | IFRS AND REGULATORY | 8 |
| 2. ADJUSTED REGULATORY INCOME STATEMENT | 11 |
| 3. ADJUSTED EBITDA | 13 |
| 4. ENERGY TRADING | 16 |
| 5. INVESTMENTS AND EXPANSION PROJECTS | 17 |
| 6. INDEBTEDNESS | 22 |
| 7. COMPULSORY LOAN | 24 |
| 8. CASH FLOW | 25 |
| 9. FINANCIAL PERFORMANCE | 26 |
| 9.1. Operating Revenue | 26 |
| 9.2. Operating Costs and Expenses | 31 |
| 9.3. Generation Contribution Margin | 38 |
| 9.4. Equity Holdings | 40 |
| 9.5. Financial Results | 41 |
| 9.6. Current and Deferred Taxes | 43 |
| 10. OPERATING PERFORMANCE | 44 |
| 10.1. Generation Segment | 44 |
| 10.2. Transmission Segment | 47 |
| 10.3. ESG | 48 |
| 11. APPENDIX | 49 |
| 11.1. Appendix 1 - Accounting Statements | 49 |
| 11.2. Appendix 2 - Statement on Thermal Power Plants Sale | 57 |
| 11.3. Appendix 3 - Statement on Furnas Merger | 57 |
| 11.4. Appendix 4 - Regulatory vs. IFRS Income Statement | 58 |
| 11.5. Appendix 5 - IFRS EBITDA | 61 |
| 11.6. Appendix 6 - IFRS Generation Revenue | 62 |
| 11.7. Appendix 7 - IFRS Transmission Revenue | 62 |
| 11.8. Appendix 8 - Regulatory Transmission Revenue - Adjustment Portion (PA) | 63 |
| 11.9. Appendix 9 - RBSE Financial Component (PRT 120/2016) | 65 |
| 11.10. Appendix 10 - RAP's Periodic Tariff Review of Tendered Contracts | 66 |
| 11.11. Appendix 11 - RAP Annual Readjustment - 2025/2026 cycle | 67 |
| 11.12. Appendix 12 - Financing and Loans Granted (Receivables) | 68 |
| 11.13. Appendix 13 - Reconciliation Regulatory vs. IFRS Results | 69 |
Earnings Release 2Q25 | 3 |
| |
ELETROBRAS RELEASES 2ND QUARTER 2025 RESULTS
Eletrobras’ 2Q25 financial results reflected the positive impacts of energy sales and lower Personnel, Material, Services, and Other (PMSO) expenses, in line with the strategy of optimizing energy trading and the ongoing pursuit of operational efficiency.
2Q25 Main events:
Shareholder's remuneration: R$ 4,000 million in dividends, in line with Eletrobras’ capital allocation methodology. Since the release of the 4Q24 results, Management has delivered consistent performance and accelerated the Company’s risk mitigation efforts. These actions, combined with a more constructive outlook on energy prices, enabled the proposed dividend distribution, reinforcing the Company’s commitment to financial discipline and value creation for its shareholders.
Generation Contribution Margin: the contribution of generation to the results increased from R$ 2,892 million in 2Q24 to R$ 3,345 million in 2Q25. This variation is explained by the increase in gross revenue, driven by the Company's energy trading strategy, which more than offset higher expenses with energy purchased for resale. Lower network usage charges also contributed positively to the generation segment’s results in the period.
Compulsory Loan: the inventory of provisions was reduced by R$ 1.2 billion compared to 1Q25 and by R$ 3.3 billion compared to 2Q24, totaling R$ 12 billion in 2Q25. A net reversal of R$ 279 million was recorded in the quarter, related to favorable decisions and agreements signed.
Investments: R$ 1,966 million in 2Q25, in line with 2Q24 and up 116% when compared to 1Q25. Worth noting the investments in reinforcements and improvements in the transmission segment, which totaled R$ 1,108 million in 2Q25.
The Company is also currently executing 249 large-scale projects in the transmission segment with additional RAP of R$ 1.8 billion between 2025 and 2030 and total estimated CAPEX of R$13.3 billion.
In July, the company delivered the Caladinho project—its first post-privatization auction win—14 months ahead of ANEEL’s original deadline of September 2026.
Eletrobras also made capital contributions to Transnorte Energia S.A. (TNE), of R$ 225 million in April/2025 and R$ 282 million in July/2025, increasing its stake to 64.61%. The project, whose construction was resumed by Eletrobras in 2022, entails the development of a transmission line to connect the state of Roraima to the National Interconnected System (SIN).
Portfolio management: In April, Eletrobras completed the acquisition of a 51% stake in Eletronet, resulting in its control and consolidation. In May, the sale of the Amazonas thermal plants was finalized, generating R$2.9 billion in proceeds, and the asset uncrossing with Copel was also completed, adding 300 MW of hydro capacity to the Company's portfolio through full consolidation of Colíder HPP.
Financial management: Net debt totaled R$ 40.13 billion in 2Q25, up R$ 0.85 billion from 1Q25 and down R$ 2.84 billion from 2Q24. The Company's average debt maturity was extended by 2.6 months YoY, while the total average cost increased to CDI + 0.57% p.a. in 2Q25 from CDI + 0.48% p.a. in 2Q24.
In July 2025, Eletronorte raised R$ 2 billion through a debenture issuance, with final cost equivalent to CDI minus 0.56% p.a. after a swap operation.
Progress in energy trading: 781 clients in 2Q25, up 24% from 2Q24. Of this total, 688 are in the free trading environment (ACL), compared to 551 in the same period last year.
Earnings Release 2Q25 | 4 |
| |
2Q25 Financial Highlights
| ▪ | Regulatory Net Operating Revenue: remained stable from 2Q24, reaching R$ 9,593 million: |
(+) growth in generation revenue, reflecting a 9.9% increase in average price and a 1.0% increase in volume. Growth in sales was registered in both the free contracting environment (ACL) and the regulated contracting environment (ACR).
(-) R$ 483 million YoY reduction in the Annual Permitted Revenue (RAP) related to the 2024 Periodic Tariff Review (2024 RTP), of which R$ 328 million related to Postponement Adjustment Portion (PA Postergação).
| ▪ | Adjusted PMSO: R$ 1,403 million (down -3.8% YoY), reflecting savings linked to efficiency gains. In 2Q25, adjusted PMSO was impacted by the following effects: |
(a) R$ 213 million related to Voluntary Dismissal Plans (VDPs) and severance costs;
(b) R$ 15 million in legal consulting expenses related to the contingency reduction strategy.
| ▪ | Energy Purchased for Resale (IFRS): R$ 1,356 million (up 70.1% vs. 2Q24), mainly driven by energy purchases to cover regulatory ballast requirements at Eletrobras. It is worth noting that these transactions have no impact on the P&L. |
| ▪ | Adjusted Regulatory Provisions: net provision of R$ 98 million, as a result of the lower default on energy sold to Amazonas Energia, from R$482 million in 2Q24 to a reversal of R$15 million in 2Q25. |
| ▪ | Adjusted Regulatory EBITDA: R$ 5,501 million (down 8.6% YoY). |
Excluding equity income, EBITDA reached R$ 5,706 million in 2Q25, up R$318 million YoY, reflecting:
(a) higher generation revenue;
(b) lower costs and expenses with personnel, materials, services and others;
(c) lower provisions recognized in the quarter;
These effects were partially offset by lower transmission revenue and higher costs with energy purchased for resale.
| ▪ | Adjusted IFRS Net Income: R$ 1,469 million, positively impacted by |
(a) an increase in generation revenue that outpaced the growth in energy production and purchase costs,
(b) higher recognition of transmission revenue, and
(c) reductions in PMSO and financial expenses. This combination more than offset the lower contribution from equity income.
Earnings Release 2Q25 | 5 |
| |
Table 1 - Adjustments on Regulatory EBITDA (R$ mm)
| 2Q25 | 2Q24 | % | 1Q25 | % | 6M25 | 6M24 | |
| Regulatory EBITDA (a) | 5,820 | 6,125 | -5.0 | 5,485 | 6.1 | 11,305 | 11,821 |
| Total Adjustments on Regulatory EBITDA (b) | -319 | -108 | 196.3 | -108 | 194.7 | -427 | -198 |
| Gross Revenue: M&A Price Adjustment 2Q25 | 109 | 0 | 0.0 | 0 | 0.0 | 109 | 0 |
| PMSO | 228 | 171 | 33.6 | 191 | 19.1 | 419 | 203 |
| Voluntary Dismissal Plan (PDV) - Provision | 98 | 11 | 795.5 | 96 | 1.1 | 194 | 44 |
| Severance costs from 2025 | 109 | 0 | 0.0 | 31 | 249.7 | 140 | 0 |
| Severance costs from 2024 | 7 | 0 | 0.0 | 22 | -69.6 | 29 | 0 |
| Legal consulting related to the contingency reduction strategy | 15 | 42 | -64.0 | 42 | -63.5 | 57 | 42 |
| Judicial sentences | 0 | 118 | n.m. | 0 | 0.0 | 0 | 118 |
| Provisions | -95 | -396 | -76.0 | -166 | -42.9 | -261 | -514 |
| Provision for litigation | -74 | -89 | -17.3 | -99 | -25.7 | -173 | -228 |
| ECL - Loans and financing | 10 | 0 | 0.0 | 0 | 0.0 | 10 | 4 |
| Onerous contracts | -30 | -45 | -34.1 | -29 | 1.5 | -59 | -83 |
| Estimated losses on investments | -21 | 14 | -250.5 | -12 | 71.3 | -34 | 29 |
| Impairment | 0 | 0 | -56.0 | 0 | -1.3 | 0 | 6 |
| Provision for the Implementation of Lawsuits - Compulsory Loan | 20 | 17 | 19.9 | -26 | -178.0 | -6 | 50 |
| Fair value assessment of assets for sale | 0 | -293 | n.m. | 0 | 0.0 | 0 | -293 |
| Results from asset sale | -504 | 115 | -537.7 | 0 | 0.0 | -504 | 115 |
| Other income and expenses | -57 | 2 | n.m. | -133 | -57.4 | -190 | -3 |
| Regulatory Adjusted EBITDA (c) = (a) + (b) | 5,501 | 6,017 | -8.6 | 5,377 | 2.3 | 10,878 | 11,623 |
Earnings Release 2Q25 | 6 |
| |
MAIN FINANCIAL AND OPERATING INDICATORS
Table 2 - Operating Highlights
| 2Q25 | 2Q24 | ∆% | 1Q25 | ∆% | |
| Generation and Trading | |||||
| Installed Generation Capacity (MW) | 44,368 | 44,279 | 0.2 | 44,359 | 0.0 |
| Assured Capacity (aMW) (1) | 21,655 | 22,012 | -1.6 | 21,915 | -1.2 |
| Net Generation (TWh) | 38.7 | 41.7 | -7.2 | 45.5 | -15.1 |
| Energy Sold ACR (TWh) (2) | 8.7 | 8.8 | -0.4 | 10.0 | -12.8 |
| Energy Sold ACL (TWh) (3) | 17.9 | 15.8 | 13.2 | 23.2 | -22.8 |
| Energy Sold Quotas (TWh) (4) | 4.9 | 8.6 | -43.0 | 5.4 | -9.8 |
| Average ACR Price (R$/MWh) (5) | 220.97 | 213.30 | 3.6 | 212.54 | 4.0 |
| Average ACL Price (R$/MWh) | 152.45 | 147.30 | 3.5 | 143.36 | 6.3 |
| Transmission | |||||
| Transmission lines (km) | 73,774 | 73,803 | 0.0 | 74,097 | -0.4 |
| RAP (R$ mm) (6) | 17,209 | 17,856 | -3.6 | 17,164 | 0.3 |
(1) Assured Capacity (AC) reflects: (a) Ordinance GM/MME 544/21, which established the revision of AC values for plants that had their concessions renewed due to the capitalization (Quota regime plants: Tucuruí, Itumbiara, Sobradinho, Mascarenhas de Moraes, and Curuá-Una), leading to a significant AC reduction, effective from 2023; (b) Ordinance GM/MME 709/22, which introduced an Ordinary Review of the AC for hydroelectric power plants effective from 2023, impacting several Eletrobras plants; (c) the AC increase at Santa Cruz TPP due to the completion of the Combined Cycle, following ANEEL Order 481 of Feb 23, 2023 that authorized the start of commercial operations for a new generating unit at the plant.
(2) Does not include quotas.
(3) Includes contracts under Law 13.182/2015.
(4) The figures presented refer to the Assured Capacity of quotas in GWh.
(5) Excludes thermoelectric power plants.
(6) Approved RAP for the current regulatory cycle, considering the modules in operation at the end of each period—including those in operation at the start of the cycle, as well as new modules that entered commercial operation. Includes transmission contracts from Eletrobras Holding, Chesf, CGT Eletrosul, Eletronorte, TMT, and VSB.
Table 3 - Financial Highlights
| 2Q25 | 2Q24 | ∆% | 1Q25 | ∆% | |
| Financial Indicators | |||||
| Gross Revenue | 12,082 | 10,280 | 17.5 | 12,222 | -1.1 |
| Adjusted Gross Revenue | 12,191 | 10,280 | 18.6 | 12,222 | -0.3 |
| Net Operating Revenue | 10,199 | 8,395 | 21.5 | 10,414 | -2.1 |
| Adjusted Net Operating Revenue | 10,308 | 8,395 | 22.8 | 10,414 | -1.0 |
| Regulatory Net Operating Revenue | 9,593 | 9,620 | -0.3 | 9,708 | -1.2 |
| EBITDA | 1,259 | 4,430 | -71.6 | 4,318 | -70.8 |
| Adjusted EBITDA | 5,151 | 4,322 | 19.2 | 4,416 | 16.6 |
| Regulatory EBITDA | 5,820 | 6,125 | -5.0 | 5,485 | 6.1 |
| Adjusted Regulatory EBITDA | 5,501 | 6,017 | -8.6 | 5,377 | 2.3 |
| EBITDA Margin (%) | 12.3 | 52.8 | -40.4pp | 41.5 | -29.1pp |
| Adjusted EBITDA Margin (%) | 50.0 | 51.5 | -1.5pp | 42.4 | 7.6pp |
| Return on Equity (ROE %) | 5.6 | 3.9 | 1.7pp | 8.0 | -2.4pp |
| Adjusted Gross Debt | 71,042 | 70,375 | 0.9 | 71,192 | -0.2 |
| Adjusted Net Debt (Adj Net Debt) | 40,125 | 42,961 | -6.6 | 39,272 | 2.2 |
| Adj Net Debt/Adjusted LTM EBITDA | 1.5 | 2.5 | -38.7 | 1.5 | -1.1 |
| Net Income | -1,325 | 1,743 | -176.0 | -354 | 274.7 |
| Adjusted Net Income | 1,469 | 1,025 | 43.3 | -80 | n.m. |
| Investments | 1,966 | 2,000 | -1.7 | 912 | 115.5 |
Earnings Release 2Q25 | 7 |
| |
HIGHLIGHTS OF CONSOLIDATED RESULTS
1. CONSOLIDATED RESULT | IFRS AND REGULATORY
Table 4 - Income Statement IFRS (R$ mm)
| 2Q25 | 2Q24 | 1Q25 | 6M25 | 6M24 | ||||||
| IFRS | Adjustment | Adjusted | Adjusted | % Y/Y | Adjusted | % Q/Q | Adjusted | Adjusted | % Y/Y | |
| Generation | 6,851 | 108.93 | 6,960 | 5,828 | 19.4 | 6,967 | -0.1 | 13,928 | 11,761 | 18.4 |
| Transmission | 5,079 | 0 | 5,079 | 4,395 | 15.6 | 5,186 | -2.1 | 10,264 | 8,954 | 14.6 |
| Others | 152 | 0 | 152 | 57 | 168.5 | 69 | 121.1 | 221 | 136 | 62.3 |
| Gross Revenue | 12,082 | 109 | 12,191 | 10,280 | 18.6 | 12,222 | -0.3 | 24,413 | 20,851 | 17.1 |
| (-) Deductions from Revenue | -1,883 | 0 | -1,883 | -1,884 | -0.1 | -1,807 | 4.2 | -3,691 | -3,737 | -1.3 |
| Net Revenue | 10,199 | 109 | 10,308 | 8,395 | 22.8 | 10,414 | -1.0 | 20,722 | 17,114 | 21.1 |
| Energy resale, grid, fuel and construction | -3,568 | 0 | -3,568 | -3,046 | 17.1 | -3,862 | -7.6 | -7,430 | -5,903 | 25.9 |
| Personnel, Material, Services and Others | -1,631 | 228 | -1,403 | -1,458 | -3.8 | -1,467 | -4.3 | -2,870 | -3,052 | -6.0 |
| Operating provisions | -133 | -43 | -177 | -269 | -34.3 | -86 | 106.3 | -262 | -583 | -55.0 |
| Results from asset sale | -105 | 105 | 0 | 0 | 0.0 | 0 | 0.0 | 0 | 0 | 0 |
| Regulatory remeasurements - Transmission contracts | -3,433 | 3,433 | 0 | 0 | 0.0 | -952 | n.m. | -952 | 0 | 0 |
| Other income and expenses | 57 | -57 | 0 | 0 | 0.0 | 0 | 0.0 | 0 | 0 | 0.0 |
| EBITDA, before Equity holdings | 1,385 | 3,775 | 5,160 | 3,622 | 42.5 | 4,049 | 27.5 | 9,209 | 7,575 | 21.6 |
| Equity holdings | -126 | 116 | -10 | 700 | -101.4 | 368 | -102.7 | 358 | 1,276 | -71.9 |
| EBITDA | 1,259 | 3892 | 5,151 | 4,322 | 19.2 | 4,416 | 16.6 | 9,567 | 8,852 | 8.1 |
| D&A | -1,131 | 0 | -1,131 | -968 | 16.9 | -1,112 | 1.7 | -2,244 | -1,965 | 14.2 |
| EBIT | 127 | 3,892 | 4,019 | 3,354 | 19.8 | 3,304 | 21.6 | 7,323 | 6,887 | 6.3 |
| Financial Result | -2,555 | 178 | -2,377 | -2,750 | -13.6 | -3,319 | -28.4 | -5,696 | -5,531 | 3.0 |
| EBT | -2,427 | 4,069 | 1,642 | 604 | 171.9 | -15 | n.m. | 1,627 | 1,356 | 20.0 |
| Income Tax and Social Contribution | 1,102 | -1,275 | -173 | 421 | -141.1 | -65 | 166.5 | -238 | 116 | -304.9 |
| Net Income | -1,325 | 2,794 | 1,469 | 1,025 | 43.3 | -80 | n.m. | 1,389 | 1,472 | -5.6 |
Earnings Release 2Q25 | 8 |
| |
Table 5 - Regulatory IS (R$ mm)
| 2Q25 | 2Q24 | 1Q25 | 6M25 | 6M24 | ||||||
| Regulatory | Adjustment | Adjusted | Adjusted | % Y/Y | Adjusted | % Q/Q | Adjusted | Adjusted | % Y/Y | |
| Generation | 6,836 | 109 | 6,945 | 6,310 | 10.1 | 7,023 | -1.1 | 13,968 | 12,675 | 10.2 |
| Transmission | 4,488 | 0 | 4,488 | 5,138 | -12.7 | 4,423 | 1.5 | 8,911 | 10,129 | -12.0 |
| Others | 152 | 0 | 152 | 56 | 172.8 | 69 | 121.1 | 221 | 134 | 64.5 |
| Gross Revenue | 11,476 | 109 | 11,585 | 11,504 | 0.7 | 11,515 | 0.6 | 23,100 | 22,939 | 0.7 |
| (-) Deductions from Revenue | -1,883 | 0 | -1,883 | -1,884 | -0.1 | -1,807 | 4.2 | -3,691 | -3,737 | -1.3 |
| Net Revenue | 9,593 | 109 | 9,701 | 9,620 | 0.8 | 9,708 | -0.1 | 19,409 | 19,201 | 1.1 |
| Energy resale, grid, fuel and construction | -2,478 | 0 | -2,478 | -2,320 | 6.8 | -3,152 | -21.4 | -5,630 | -4,591 | 22.6 |
| Personnel, Material, Services and Others | -1,647 | 228 | -1,419 | -1,476 | -3.8 | -1,473 | -3.6 | -2,892 | -3,082 | -6.2 |
| Operating provisions | -3 | -95 | -98 | -437 | -77.5 | -77 | 27.1 | -175 | -981 | -82.1 |
| Results from asset sale | 504 | -504 | 0 | 0 | 0.0 | 0 | 0.0 | 0 | 0 | 0.0 |
| Regulatory remeasurements - Transmission contracts | 0 | 0 | 0 | 0 | 0.0 | 0 | 0.0 | 0 | 0 | 0.0 |
| Other income and expenses | 57 | -57 | 0 | 0 | 0.0 | 0 | 0.0 | 0 | 0 | 0.0 |
| EBITDA, before Equity holdings | 6,025 | -319 | 5,706 | 5,388 | 5.9 | 5,006 | 14.0 | 10,711 | 10,547 | 1.6 |
| Equity holdings | -205 | 0 | -205 | 629 | -132.5 | 371 | -155.1 | 166 | 1,076 | -84.5 |
| EBITDA | 5,820 | -319 | 5,501 | 6,017 | -8.6 | 5,377 | 2.3 | 10,878 | 11,623 | -6.4 |
| D&A | -1,615 | 0 | -1,615 | -1,450 | 11.3 | -1,592 | 1.4 | -3,206 | -2,929 | 9.5 |
| EBIT | 4,206 | -319 | 3,886 | 4,567 | -14.9 | 3,785 | 2.7 | 7,672 | 8,694 | -11.8 |
| Financial Result | -2,627 | 229 | -2,398 | -2,945 | -18.6 | -3,275 | -26.8 | -5,673 | -5,815 | -2.4 |
| EBT | 1,578 | -90 | 1,488 | 1,622 | -8.2 | 511 | 191.5 | 1,999 | 2,879 | -30.6 |
| Income Tax and Social Contribution | -330 | 86 | -244 | 84 | -389.2 | -101 | 140.6 | -345 | -286 | 20.7 |
| Net Income | 1,248 | -4 | 1,244 | 1,706 | -27.0 | 409 | 204.1 | 1,654 | 2,593 | -36.2 |
Earnings Release 2Q25 | 9 |
| |
2Q24 Results: reclassifications
It is worth noting that the results presented in this report for 2Q24 differ from those originally disclosed on August 7, 2024. In both the IFRS and regulatory results, two expenses were reclassified as recurring under Other PMSO and Deferred Tax—an adjustment that had already been applied retroactively in the 4Q24 disclosure.
In the regulatory results, additional differences arise from the reclassification between income statement lines: (a) transmission revenue and charges for use of the electricity grid; and (b) other operating expenses (PMSO), operating provisions, and financial result.
The table below presents the originally disclosed amounts, the reclassified figures, and the resulting differences for both IFRS and regulatory results.
Table 6 - Adjusted Income Statement Reclassifications, 2Q24 (R$ mm)
| IFRS, Adjusted | Regulatory, Adjusted | |||||
|
Published in 2Q24 |
Reclassified | Difference |
Published in 2Q24 |
Reclassified | Difference | |
| Generation | 5,828 | 5,828 | 0 | 6,310 | 6,310 | 0 |
| Transmission | 4,395 | 4,395 | 0 | 5,254 | 5,138 | -115 |
| Others | 57 | 57 | 0 | 56 | 56 | 0 |
| Gross Revenue | 10,280 | 10,280 | 0 | 11,620 | 11,504 | -115 |
| (-) Deductions from Revenue | -1,884 | -1,884 | 0 | -1,884 | -1,884 | 0 |
| Net Revenue | 8,395 | 8,395 | 0 | 9,735 | 9,620 | -115 |
| Energy resale, grid, fuel and construction | -3,046 | -3,046 | 0 | -2,435 | -2,320 | 115 |
| Personnel, Material, Services and Others | -1,576 | -1,458 | 118 | -1,500 | -1,476 | 25 |
| Operating provisions | -269 | -269 | 0 | -419 | -437 | -17 |
| Results from asset sale | 0 | 0 | 0 | 0 | 0 | 0 |
| Regulatory remeasurements - Transmission contracts | 0 | 0 | 0 | 0 | 0 | 0 |
| Other income and expenses | 0 | 0 | 0 | 0 | 0 | 0 |
| EBITDA, before Equity Income | 3,504 | 3,622 | 118 | 5,380 | 5,388 | 7 |
| Equity Income | 700 | 700 | 0 | 629 | 629 | 0 |
| EBITDA | 4,204 | 4,322 | 118 | 6,010 | 6,017 | 7 |
| D&A | -968 | -968 | 0 | -1,450 | -1,450 | 0 |
| EBIT | 3,236 | 3,354 | 118 | 4,559 | 4,567 | 7 |
| Financial Result | -2,750 | -2,750 | 0 | -3,055 | -2,945 | 110 |
| EBT | 487 | 604 | 117 | 1,504 | 1,622 | 117 |
| Income Tax and Social Contribution | 129 | 421 | 292 | -208 | 84 | 292 |
| Net Income | 615 | 1,025 | 410 | 1,296 | 1,706 | 410 |
Earnings Release 2Q25 | 10 |
| |
2. ADJUSTED REGULATORY INCOME STATEMENT
This section presents the reconciliation between Regulatory and IFRS Income Statements, along with the adjustments related to non-recurring events in the Regulatory Income Statement.
Additional explanations are provided in Appendix 4 of this report to support a better understanding of the topics.
A detailed reconciliation is also available in the “Regulatory and IFRS Income Statement Reconciliation” spreadsheet, accessible on the Company’s Investor Relations website, under Market Information > Historical Financial Information.
Table 7 - Regulatory IS x IFRS IS(R$ mm)
| 2Q25 IFRS | Difference | 2Q25 Regulatory | Non-recurring Adjustment | 2Q25 Regulatory Adjusted | |
| Generation | 6,851 | -15 | 6,836 | 109 | 6,945 |
| Transmission | 5,079 | -591 | 4,488 | 0 | 4,488 |
| Others | 152 | 0 | 152 | 0 | 152 |
| Gross Revenue | 12,082 | -606 | 11,476 | 109 | 11,585 |
| (-) Deductions from Revenue | -1,883 | 0 | -1,883 | 0 | -1,883 |
| Net Revenue | 10,199 | -606 | 9,593 | 109 | 9,701 |
| Construction | -1,036 | 1,036 | 0 | 0 | 0 |
| Energy resale | -1,356 | -92 | -1,447 | 0 | -1,447 |
| Grid | -955 | 146 | -809 | 0 | -809 |
| Fuel | -222 | 0 | -222 | 0 | -222 |
| Energy resale, grid, fuel and construction | -3,568 | 1,090 | -2,478 | 0 | -2,478 |
| Personnel | -997 | -3 | -1,000 | 213 | -787 |
| Material | -42 | 0 | -42 | 0 | -42 |
| Services | -456 | 0 | -456 | 15 | -441 |
| Others | -136 | -13 | -149 | 0 | -149 |
| Personnel, Material, Services and Others | -1,631 | -16 | -1,647 | 228 | -1,419 |
| Operating provisions | -133 | 130 | -3 | -95 | -98 |
| Results from asset sale | -105 | 610 | 504 | -504 | 0 |
| Regulatory remeasurements - Transmission contracts | -3,433 | 3,433 | 0 | 0 | 0 |
| Other income and expenses | 57 | 0 | 57 | -57 | 0 |
| EBITDA, before Equity holdings | 1,385 | 4,640 | 6,025 | -319 | 5,706 |
| Equity holdings | -126 | -78 | -205 | 0 | -205 |
| EBITDA | 1,259 | 4,561 | 5,820 | -319 | 5,501 |
| D&A | -1,131 | -483 | -1,615 | 0 | -1,615 |
| EBIT | 127 | 4,078 | 4,206 | -319 | 3,886 |
| Financial Result | -2,555 | -73 | -2,627 | 229 | -2,398 |
| EBT | -2,427 | 4,006 | 1,578 | -90 | 1,488 |
| Income Tax and Social Contribution | 1,102 | -1,432 | -330 | 86 | -244 |
| Net Income, continued | -1,325 | 2,573 | 1,248 | -4 | 1,244 |
Earnings Release 2Q25 | 11 |
| |
Adjustments from non-recurring events
The following adjustments are based on events deemed non-recurring:
| ▪ | Generation Revenue: R$ 109 million, referring to adjustments in the valuation of sales transactions involving the Amazonas thermal plants at Eletronorte, as well as the asset uncrossing agreement with Copel at CGT Eletrosul. |
| ▪ | PMSO, Personnel: R$ 213 million, of which R$ 98 million was VDPs and R$ 115 million was severance. |
| ▪ | PMSO, Services: R$ 15 million, for legal consulting related to the contingency reduction strategy. |
| ▪ | Operating Provisions: -R$ 95 million, including provisions for litigation, adjustments related to the implementation of lawsuits linked to compulsory loans, estimated losses on investments and asset impairment, monetary update of onerous contracts, and estimated losses on loans and financing. |
| ▪ | Asset Disposal: -R$ 504 million, referring to non-cash impacts recognized in the income statement resulting from the completion of asset purchase and sale transactions during the quarter, including the sale of thermal plants in Amazonas, the asset uncrossing with Copel, and the acquisition of Eletronet's control. |
| ▪ | Other Income and Expenses: -R$ 57 million, with the entire line excluded. |
| ▪ | Financial Result: R$ 229 million, linked to the monetary update of compulsory loan and litigation. |
| ▪ | Income Tax and Social Contribution: R$ 86 million, due to the change in Eletronorte’s effective tax rate. |
Earnings Release 2Q25 | 12 |
| |
3. ADJUSTED EBITDA
Adjusted Regulatory EBITDA
In 2Q25, adjusted regulatory EBITDA totaled R$ 5,501 million, down R$ 516 million YoY, reflecting lower transmission revenue and a negative contribution from equity income. These results were partially offset by higher generation revenue, lower PMSO costs and expenses, and a reduced volume of provisions recognized in the quarter, positive events that were also observed in 1Q25.
Excluding equity income, EBITDA reached R$ 5,706 million in 2Q25, up R$318 million YoY. Notably, equity income in the quarter reflected (i) the maintenance shutdown of Eletronuclear's Angra 1 Plant which included equipment modernization aimed at extending its useful life, and (ii) the negative impact on ISA Energia's net income due to a reduction in the receivables flow related to the RBSE financial component.
Table 8 - Adjusted Regulatory EBITDA (R$ mm)
| 2Q25 | 2Q24 | % | 1Q25 | % | 6M25 | 6M24 | % | |
| Net Revenue (1) | 9,701 | 9,620 | 0.8 | 9,708 | -0.1 | 19,409 | 19,201 | 1.1 |
| Energy resale, grid charges, fuel | -2,478 | -2,320 | 6.8 | -3,152 | -21.4 | -5,630 | -4,591 | 22.6 |
| - Personnel, Material, Services and Others | -1,419 | -1,476 | -3.8 | -1,473 | -3.6 | -2,892 | -3,082 | -6.2 |
| - Operating provisions (1) | -98 | -437 | -77.5 | -77 | 27.1 | -175 | -981 | -82.1 |
| - Results from asset sale | 0 | 0 | 0.0 | 0 | 0.0 | 0 | 0 | 0.0 |
| - Other income and expenses | 0 | 0 | 0.0 | 0 | 0.0 | 0 | 0 | 0.0 |
| + Equity Holdings | -205 | 629 | -132.5 | 371 | -155.1 | 166 | 1,076 | -84.5 |
| Adjusted Regulatory EBITDA | 5,501 | 6,017 | -8.6 | 5,377 | 2.3 | 10,878 | 11,623 | -6.4 |
(1) Recognizes the amount of R$ 432 million in 1Q24 related to revenue from Amazonas Energia. Due to default, these balances are also fully recognized in operating provisions. In 4Q24 and 1Q25, the revenue from thermal plants was recognized without any corresponding provision. As part of HPP Balbina's revenue remained—and continues to remain—in default, the amounts of R$ 32 million in 4Q24 and R$ 56 million in 1Q25 were provisioned.
Generation revenue was R$ 6,836 million in 2Q25, up R$ 526 million compared to 2Q24. The highlight was the R$ 1,000 million increase in revenue from energy settled in the short-term market, driven by higher volumes and prices. This was partially offset by a R$ 486 million decline in revenue from thermal plants, following the sale of the Amazonas thermal assets to Âmbar in May 2025.
The increase in revenue was accompanied by slightly higher costs associated with generation, of R$ 159 million, reaching R$ 2,478 million in 2Q25. Of note were expenses with energy purchased for resale, which went up by R$ 475 million, partially offset by: (i) lower spending on fuel for electricity production of R$ 242 million, reflecting the sale of Amazonas thermal plants, and (ii) a R$ 74 million reduction in spending on network usage charges.
It is also worth noting the progress in receivables related to energy sold by Eletrobras thermal plants and by Balbina HPP to Amazonas Energia (AmE) following the resumption of its recognition in 3Q24. In 2Q25 the regulatory gross revenue from energy sold by thermal plants and Balbina HPP totaled R$ 769 million, a lower amount compared to previous quarters, reflecting the completion of the sale of the Amazonas thermal plants. Approximately 52% of this revenue was billed under the Reserve Energy Contract (CER) and received through the Reserve Energy Charge, 27% under Availability Contract, and 21% billed to AmE. This latter portion was distributed across two categories:
(a) Sales contracts from thermal plants classified as Independent Power Producers, which were paid by AmE (5% of the total); and
(b) Energy sold by Balbina HPP (16% of the total).
Earnings Release 2Q25 | 13 |
| |
The difference between revenues under the Regulatory and IFRS accounting environments is primarily due to the energy sold to, but not paid for by, Amazonas Energia. This amount is not recognized as revenue in the IFRS result, but is included in the Regulatory result, where it is fully provisioned.
Table 9 - Amazonas Energia (R$ mm)
| Regulatory | IFRS | |
| Gross Revenue | 119 | 134 |
| Paid | 134 | 134 |
| Outstanding | -15 | 0 |
| Provision/Reversal | 15 | 0 |
Transmission revenue was R$ 4,488 million in 2Q25, down R$ 651 million from 2Q24, mainly driven by reductions in Annual Permitted Revenue (RAP) and the Adjustment Portion (PA), revised as part of the Periodic Tariff Adjustment and Annual Adjustment processes for the 2024-2025 regulatory cycle, which started in July 2024.
Personnel, Material, Services and Others (PMSO) went down by R$ 56 million YoY, totaling R$ 1,419 million in 2Q25. As in the previous quarter, this decrease is primarily driven by the gains from various initiatives implemented by the Company to improve staff efficiency, as well as adjustments to processes and the organizational structure.
Provisions in the regulatory view decreased by R$ 338 million, reaching R$ 98 million in 2Q25 from R$ 437 million in 2Q24. This reduction essentially reflects the sharp decline in defaults on energy sales to Amazonas Energia, from R$ 482 million in 2Q24 to a reversal of R$ 15 million in 2Q25.
The second quarter of 2025 was characterized by favorable effects from energy sales, reduced PMSO expenses, and lower provisioning levels, driven by the ongoing strategy to optimize the energy trading portfolio, enhance operational efficiency, and mitigate contingencies.
Earnings Release 2Q25 | 14 |
| |
Adjusted IFRS EBITDA
Adjusted IFRS EBITDA reached R$ 5,151 million in 2Q25, up 19.2% from 2Q24.
The increase in transmission and generation revenues, along with reductions in PMSO expenses, more than offset the increase in costs related to energy purchased for resale, higher provisions, and the lower contribution from equity income.
Table 10 - Adjusted IFRS EBITDA (R$ mm)
| 2Q25 | 2Q24 | % | 1Q25 | % | 6M25 | 6M24 | % | |
| Net Revenue | 10,308 | 8,395 | 22.8 | 10,414 | -1.0 | 20,722 | 17,114 | 21.1 |
| Energy resale, grid charges, fuel | -3,568 | -3,046 | 17.1 | -3,862 | -7.6 | -7,430 | -5,903 | 25.9 |
| Regulatory remeasurement – Transmission Contracts | 0 | 0 | 0.0 | -952 | n.m. | -952 | 0 | 0 |
| - Personnel, Material, Services and Others | -1,403 | -1,458 | -3.8 | -1,467 | -4.3 | -2,870 | -3,052 | -6.0 |
| - Operating provisions | -177 | -269 | -34.3 | -86 | 106.3 | -262 | -583 | -55.0 |
| - Results from asset sale | 0 | 0 | 0.0 | 0 | 0.0 | 0 | 0 | 0.0 |
| - Other income and expenses | 0 | 0 | 0.0 | 0 | 0.0 | 0 | 0 | 0.0 |
| + Equity Holdings | -10 | 700 | -101.4 | 368 | -102.7 | 358 | 1276 | -71.9 |
| Adjusted IFRS EBITDA | 5,151 | 4,322 | 19.2 | 4,416 | 16.6 | 9,567 | 8,852 | 8.1 |
The table detailing the EBITDA calculation, in accordance with CVM Resolution 156/2022, is presented in Appendix 5 of this document.
Earnings Release 2Q25 | 15 |
| |
4. ENERGY TRADING
Eletrobras companies sold 31.5 TWh of energy in 2Q25, down 5.0% compared to the 33.2 TWh traded in 2Q24.
The volumes sold include energy from plants under the quota regime, renewed under Law 12,783/2013, as well as from plants operating under the ACL and ACR exploration regimes and Special Purpose Entities - SPEs, consolidated: HPPs Teles Pires (starting Oct/23), Baguari (starting Oct/23), Retiro Baixo (starting Nov/23), and Santo Antônio (starting Nov/23).
Table 11 - Energy Balance 2Q25 (aMW)
| 2025 | 2026 | 2027 | ||||
| Resources (A) | 16,635 | 17,017 | 17,872 | |||
| Own resources (1) (2) (3) (4) (5) | 14,247 | 15,600 | 16,759 | |||
| Hydraulic | 13,949 | 15,280 | 16,439 | |||
| Wind | 298 | 320 | 320 | |||
| Energy Purchase | 2,388 | 1,417 | 1,113 | |||
| Limit => | Lower | Higher | Lower | Higher | Lower | Higher |
| Sales (B) (6) | 11,998 | 14,096 | 9,347 | 11,847 | 7,148 | 9,148 |
| ACR - Except quotas | 3,498 | 3,597 | 3,148 | |||
| ACL - Bilateral Contracts + STM implemented (range) (6) | 8,500 | 10,598 | 5,750 | 8,250 | 4,000 | 6,000 |
| Average prices Contracts signed | ||||||
| Limit => | Lower | Higher | Lower | Higher | Lower | Higher |
| Average Price of Sales Contracts (ACR and ACL - R$/MWh) | 170 | 180 | 185 | 205 | 195 | 225 |
| Balance (A - B) | 4,637 | 2,539 | 7,670 | 5,170 | 10,724 | 8,724 |
| Balance considering estimated hedge (9) | 2,098 | 0 | 4,889 | 2,389 | 7,732 | 5,732 |
| Uncontracted energy considering estimated hedge (9) | 13% | 0% | 29% | 14% | 43% | 32% |
Contracts signed until 6/30/2025.
The energy balance reflects the SPEs consolidated into Eletrobras, including Santo Antônio HPP (since 3Q22) and HPPs Baguari and Retiro Baixo (since 4Q23) in terms of resources, sales, and average prices. Similarly, Teles Pires HPP, the SPE consolidated into Eletronorte (since 4Q23), is also included.
| 1. | The energy balance does not include Independent Power Producers (IPPs) contracts resulting from the Amazonas Distribuidora de-verticalization process, thermal plant availability contracts, or Assured Capacity Quotas, whether in terms of resources, requirements (sales), or average prices. |
| 2. | Own Resources include the decotization plants (new IPPs) and the New Grants—Sobradinho, Itumbiara, Tucuruí, Curuá-Una, and Mascarenhas de Moraes. For hydroelectric projects, the estimate of GFIS2 was used, representing Assured Capacity adjusted for Internal Losses, Losses in the Basic Grid, Availability, and portfolio-specific factors. |
| 3. | The revised Assured Capacity values, as outlined in Ordinance No. 709/GM/MME, of November 30, 2022, have been taken into account. |
| 4. | With the gradual phasing out of legacy contracts (decotization), plants currently operating under the quota regime are gradually granted new concessions under the IPP regime over a five-year period beginning in 2023. The Assured Capacity values were established in Ordinance GM/MME No. 544/21. |
| 5. | Considering the new concession grants from 2023 onward for the Sobradinho, Itumbiara, Tucuruí, Curuá-Una, and Mascarenhas de Moraes plants, whose Assured Capacity values were established in Ordinance GM/MME No. 544/21. |
| 6. | The balances include intercompany transactions, impacting both energy purchase and sales lines in the ACL, in the following amounts: approximately 800 aMW in 2025 and 200 aMW in 2026 and 2027. |
Table 12 - Assured Capacity Quotas of Hydroelectric Power Plants (aMW)
| 2025 | 2026 | 2027 | |
| Assured Capacity Quotas | 2,626 | 1,313 | 0 |
| 7. | This excludes the Assured Capacity of Jaguari HPP (12.7 aMW), whose concession remains under Eletrobras’ provisional management. |
| 8. | Decotization occurs gradually over a five-year period beginning in 2023. The Assured Capacity values applied from 2023 onward are those established in Ordinance GM/MME No. 544/21. |
| 9. | The figures represent an estimate of uncontracted energy. The projected values for 2025, 2026 and 2027 is 81.8%. Worth noting that the average historical GSF from 2019 to 2024 is 82.7%. Source: CCEE, obtained from the CCEE website at the following link: CCEE Data and Analysis (in Portuguese only, select the MRE option in the panel). It is important to note that this is only an estimate, based on past events. |
Earnings Release 2Q25 | 16 |
| |
5. INVESTMENTS AND EXPANSION PROJECTS
Investments in 2Q25 totaled R$ 1,966 million, with R$ 1,199 million allocated to transmission, R$ 357 million to generation, R$ 117 million to infrastructure, R$ 68 million to the environmental area and R$ 225 million to SPEs.
The amount invested in infrastructure was allocated as follows: 37% to socio-environmental initiatives, 28% to IT, 25% to real estate, and 10% to equipment and vehicles.
In the socio-environmental area, key highlights included investments related to the maintenance of operating licenses for power plants and substations, as well as land compensation.
In 2Q25, Eletrobras contributed R$ 225 million to Transnorte Energia SA (TNE), increasing its stake in the venture to 59.11%. Including the additional contribution made in July 2025, the total stake now stands at 64.61%.
Table 13 - Investments (R$ mm)
| 2Q25 | 2Q24 | % | 1Q25 | % | 6M25 | 6M24 | % | |
| Generation Corporate | 357 | 732 | -51.2 | 167 | 114.7 | 524 | 1,234 | -57.5 |
| Implementation / Expansion | 45 | 412 | -89.0 | 37 | 23.7 | 82 | 710 | -88.4 |
| Maintenance | 312 | 320 | -2.4 | 130 | 140.4 | 442 | 524 | -15.6 |
| Transmission Corporate | 1,199 | 673 | 78.3 | 655 | 82.9 | 1,854 | 1,299 | 42.7 |
| Expansion | 85 | 22 | 288.2 | 54 | 57.4 | 139 | 25 | 446.2 |
| Reinforcements and improvements | 1,108 | 610 | 81.8 | 596 | 85.9 | 1,705 | 1,208 | 41.1 |
| Maintenance | 5 | 41 | -87.0 | 5 | 3.8 | 10 | 65 | -84.0 |
| Infrastructure | 117 | 49 | 136.7 | 43 | 169.9 | 161 | 69 | 134.2 |
| Environmental | 68 | 64 | 5.4 | 47 | 44.1 | 115 | 133 | -13.7 |
| SPEs | 225 | 481 | -53.2 | 0 | 0.0 | 225 | 486 | -53.7 |
| Generation - Contributions | 0 | 478 | n.m. | 0 | 0.0 | 0 | 478 | n.m. |
| Generation - Acquisition | 0 | 0 | 0.0 | 0 | 0.0 | 0 | 0 | 0.0 |
| Transmission - Contributions | 225 | 3 | n.m. | 0 | 0.0 | 225 | 8 | n.m. |
| Transmission - Acquisition | 0 | 0 | 0.0 | 0 | 0.0 | 0 | 0 | 0.0 |
| Total | 1,966 | 2,000 | -1.7 | 912 | 115.5 | 2,879 | 3,221 | -10.6 |
Earnings Release 2Q25 | 17 |
| |
Generation
Investments in generation totaled R$ 357 million in 2Q25, compared to R$ 732 million in 2Q24.
The reduction is mainly explained by decreased expenses associated with the expansion of CGT Eletrosul, as the Coxilha Negra Wind Farm project nears completion.
In 2Q25, main expenditures were allocated to:
Table 14 - Investments in Generation[1]
| Generation (R$ mm) | 2Q25 | 2Q24 | % |
| Maintenance | 312 | 320 | -2.4 |
| Eletrobras Holding | 63 | 77 | -18.5 |
| Eletronorte | 45 | 80 | -43.5 |
| Chesf | 199 | 160 | 24.4 |
| CGT Eletrosul | 5 | 3 | 63.5 |
| Expansion | 45 | 412 | -89.0 |
| Eletrobras Holding | 2 | 5 | -54.0 |
| Eletronorte | 1 | 0 | 886.9 |
| Chesf | 1 | 4 | -65.5 |
| CGT Eletrosul | 40 | 403 | -90.0 |
| Total | 357 | 732 | -51.2 |
| ▪ | Maintenance: |
| ▪ | R$ 199 million by Chesf to replace equipment at the Paulo Afonso IV, Sobradinho and Luiz Gonzaga plants; |
| ▪ | R$ 45 million by Eletronorte, primarily involving Tucuruí, Curuá-Una and Samuel HPPs, and |
| ▪ | R$ 63 million by Eletrobras, with emphasis on Porto Colômbia, Simplício, Marimbondo, Corumbá, Manso, Mascarenhas de Moraes and Itumbiara HPPs. |
| ▪ | Expansion: |
| ▪ | R$ 40 million by CGT Eletrosul for the expansion of the Coxilha Negra Wind Farm, with the start of commercial operation of wind turbines in 3Q24; and |
| ▪ | R$ 1 million by Chesf for the Casa Nova B wind farm. |
[1] For more information on Eletrobras Holding's Corporate Structure, refer to Appendix 3 of this report.
Earnings Release 2Q25 | 18 |
| |
Transmission
Investments in transmission totaled R$ 1,199 million in 2Q25, mainly in reinforcements and improvements (R&I) that reached R$ 1,108 million, up 82% YoY.
Investments in expansions reached R$ 85 million, reflecting the progress of activities in transmission lines and substations related to lots won in auctions in recent years.
In 2Q25, expenditures were distributed as follows:
Table 15 - Investments in Transmission[2]
| Transmission (R$ mm) | 2Q25 | 2Q24 | % |
| Reinforcements and Improvements | 1,108 | 610 | 81.8 |
| Eletrobras Holding | 573 | 145 | 295.7 |
| Eletronorte | 145 | 170 | -15.1 |
| Chesf | 283 | 220 | 28.8 |
| CGT Eletrosul | 107 | 74 | 44.1 |
| Maintenance | 5 | 41 | -87.0 |
| Eletrobras Holding | 0 | 21 | -98.1 |
| Eletronorte | 0 | 13 | -96.4 |
| Chesf | 0 | 0 | 0.0 |
| CGT Eletrosul | 4 | 7 | -33.8 |
| Expansion | 85 | 22 | 288.2 |
| Eletrobras Holding | 29 | 15 | 97.4 |
| Eletronorte | 56 | 6 | 912.5 |
| Chesf | 0 | 2 | -96.8 |
| CGT Eletrosul | 0 | 0 | 0.0 |
| Total | 1,199 | 673 | 78.3 |
| ▪ | Eletrobras Holding: R$ 573 million, of which R$ 422 million is large-scale and R$ 51 million is small-scale, primarily involving Substations Ivaiporã, Itaberá, Grajaú, Cachoeira Paulista, Campinas, Ibiuna, Brasília, Adrianópolis, Itumbiara and Vitória. |
| ▪ | Eletronorte: R$ 145 million, of which R$ 87 million was large-scale and R$ 58 million was small-scale, primarily involving Imperatriz, Marabá, São Luis, Pres. Dutra, Porto Velho, Colinas, Vila do Conde and Guamá substations. |
| ▪ | Chesf: R$ 283 million, of which R$ 183 million were large-scale and R$ 100 million were small-scale, primarily involving Delmiro Gouveia, Messias, Jardim e Teresina, Bongi, Poções and Piauí substations. |
| ▪ | CGT Eletrosul: R$ 107 million, of which R$ 70 million was large-scale and R$ 37 million was small-scale, primarily involving Gravataí, Itajai, Areia, Campos Novos, Blumenau and Curitiba substations. |
[2] For more information on Eletrobras Holding's Corporate Structure, refer to Appendix 3 of this report.
Earnings Release 2Q25 | 19 |
| |
Expansion Projects - Transmission
Large Scale Projects
| ▪ | Sampling: 249 projects[3], including the Itaipu HVDC System Revitalization project. Throughout 2Q25, the sample was increased to 249 from 240, due to 9 projects that were energized and the inclusion of 18 new authorizations issued by the regulator. |
| ▪ | Estimated investment: R$ 6.95 billion, excluding the Itaipu HVDC System Revitalization project, as Eletrobras is responsible solely for the execution, and therefore does not benefit from associated revenue while being fully reimbursed for the amount disbursed. |
| ▪ | Additional associated RAP: R$ 1.8 billion between 2025-2030. |
| ▪ | Auctions: Investments of R$ 6.35 billion, in which the following SPEs stand out: Nova Era Janapu, which was part of the sample since 2Q24, while Nova Era Catarina, Nova Era Ceará, Nova Era Integração and Nova Era Teresina were added in 3Q24[4]. In addition, the sample also includes a lot awarded at Auction 01/2022, won by Eletronorte. |
Small Scale Projects
| ▪ | Sampling: database of the Improvement and Reinforcement Plan Management System (SGPMR). |
| ▪ | Projects: 9,194 small-scale events under implementation or to be implemented, of which 8,668 were improvements and 526 were reinforcements. |
[3] Referring to reinforcements, improvements and auction projects. Considers projects registered in ANEEL's Transmission Management System (SIGET). Projects are included when added to the system and excluded when they are either canceled or enter commercial operation. The 249 projects will add 2,313 km of transmission lines and 13,350 MVA in substations.
[4] Each of the 5 SPEs created holds the contracts signed in last years' transmission auctions. SPE Nova Era Janapu holds contract no. 09/2023-ANEEL for the 4th lot of Auction 01-2023; SPE Nova Era Teresina holds contract no. 04/2024-ANEEL for the 1st lot of Auction 01-2024; SPE Nova Era Ceará holds contract no. 06/2024-ANEEL for the 3rd lot of Auction 01-2024; SPE Nova Era Integração holds contract no. 08/2024-ANEEL for the 5th lot of Auction 01-2024; and SPE Nova Era Catarina holds contract no. 12/2024-ANEEL for the 9th lot of Auction 01-2024.
Earnings Release 2Q25 | 20 |
| |
Expansion Projects - Generation
Two projects are currently under implementation and, once completed, will add approximately 330 MW to Eletrobras’ installed capacity.
Coxilha Negra Wind Farm (302.4 MW capacity, located in Rio Grande do Sul state)
| ▪ | The complex has a total of 72 wind turbines, distributed across 3 wind farms: Coxilha Negra 2, Coxilha Negra 3 and Coxilha Negra 4. |
| ▪ | Investment: R$2.4 billion |
| ▪ | Completion of assembly for 72 wind turbines. |
| ▪ | On April 4, 2025, the commissioning of the last wind turbine was completed and test operations began. |
| ▪ | On June 5, 2025, of the 72 wind turbines, 64 were in commercial operation and 8 had current rulings for test operation. |
| ▪ | Implementation concluded in April 2025 |
| ▪ | Testing began in February 2024, with commercial operations starting gradually in July 2024. At the end of 2Q25, the 72 wind turbines were operating. |
| ▪ | The project is currently in its final stages, which include resolving outstanding documentation, completing operations of the wind farm and the exclusive-use transmission system, demobilizing the construction site, and restoring degraded areas. These activities do not impact the project’s operation and are accounted for in the contract. |
Casa Nova B Wind Farm (27 MW capacity, located in Bahia state)
| ▪ | Estimated Investment: R$ 151 million |
| ▪ | Physical implementation progress: 86% |
| ▪ | Considering both phases of the project: Casa Nova A, which accounts for 60% of the project, is 100% complete, while Casa Nova B, representing the remaining 40%, is 66% complete. |
| ▪ | Physical Works: 2Q25 was a key period for reaching an efficient technical definition for certain equipment. A decision was made to recondition the blades, and the contracting process is already underway—marking an important step toward the project’s continuity. |
| ▪ | Expected start of full operations: 3Q27, with the possibility of an earlier start depending on transmission system access. This access is exclusively subject to technical conditions beyond the Company’s control, as these are projects managed by other agents. |
Earnings Release 2Q25 | 21 |
| |
6. INDEBTEDNESS
Net debt totaled R$ 40.13 billion in 2Q25, up R$ 0.85 billion from 1Q25 and down R$ 2.84 billion from 2Q24.
The Net Debt/Adjusted Regulatory EBITDA LTM ratio reached 1.8x in 2Q25, 1.7x in 1Q25 and 1.8x in 2Q24.
As a result of liability management and a 450 bps increase in the Brazilian basic interest rate (Selic), the Company's average debt maturity was extended by 2.6 months in 2Q25 when compared to 2Q24, while the total average cost increased to CDI + 0.57% p.a. in 2Q25 from CDI + 0.48% p.a. in 2Q24.
Table 16 - Net Debt (R$ mm)
| 06/30/2025 | 03/31/2025 | 06/30/2024 | |
| (+) Gross Debt | 70,290 | 70,890 | 70,814 |
| (+) Derivatives (currency hedge) Net | 752 | 302 | -439 |
| (-) Cash and Cash Equivalents + Current Securities | 29,387 | 30,281 | 26,167 |
| (-) Restricted Cash for Loans and Financing | 899 | 994 | 623 |
| (-) Loans receivable | 632 | 644 | 624 |
| Net Debt | 40,125 | 39,272 | 42,961 |
Chart 1 - Loans and Financing Payable (R$ billion)
Earnings Release 2Q25 | 22 |
| |
Table 17 - Gross Debt Breakdown
| Creditor | Index |
Average cost (per year) |
Total Balance (R$ million) |
Share of Total (%) |
| Debentures & Commercial papers | CDI | CDI + 0.09% to 2.20% | 24,353 | 34.6 |
| Debentures & Commercial papers | IPCA | IPCA + 3.75% to 7.029% | 15,631 | 22.2 |
| BNDES | TJLP, IPCA; Fixed Rate |
IPCA + 5.38% to 6.41%; TJLP to TJLP + 3.28% |
6,046 | 8.6 |
| Banco do Brasil | CDI, IPCA, TJLP |
TJLP + 1.89% to 2.13%; CDI + 2% to 2.25%; IPCA + 6.56% |
2,028 | 2.9 |
| Caixa Econômica Federal | IPCA | IPCA + 6.56% | 1,514 | 2.2 |
| Bradesco | IPCA, CDI |
IPCA + 6.56%; CDI + 2.09% to 2.17% |
1,333 | 1.9 |
| Banco do Nordeste do Brasil | IPCA, TFC |
IPCA + 2.33% to 6.56%; 2.94% to 9.5% |
1,468 | 2.1 |
| Itaú | IPCA, CDI |
IPCA + 6.56%; CDI + 0.30% to 2.28% |
508 | 0.7 |
| Other Creditors | CDI, IPCA, TJLP, Fixed Rate |
CDI + 0.19% to 2.20%; IPCA + 6.56%; 2.94% to 10%; TJLP + 5% |
5,540 | 7.9 |
| Foreign Currency - Bonds and other debts | USD | 1.40% to 4.63% | 11,153 | 15.9 |
| Foreign currency - other debts | EUR | 2.00% to 4.4212% | 716 | 1.0 |
| TOTAL | 70,290 | 100.0 |
*It is important to note that the Company has carried out exchange rate hedge operations for certain foreign currency debts. The data below presents these debts along with their respective equivalent rates (post-hedge) linked to the CDI:
Bonds 2025 - 97.41% of CDI
Bonds 2030 - CDI + 1.70% p.a.
Bonds 2035 - 122.59% of CDI
Citibank - CDI + 0.19% to 1.70% p.a.
Itaú - CDI + 0.30% p.a.
** Exposure to BNDES only considers contracts under the BNDES direct line.
Earnings Release 2Q25 | 23 |
| |
7. COMPULSORY LOAN
Eletrobras has implemented measures to mitigate risks associated with legal proceedings related to compulsory loans on electricity, which involve the monetary update of book-entry credits.To address this, the Company has strengthened its legal defense strategy and pursued settlements with discounts and full resolution of lawsuits. As a result of the negotiations:
| ▪ | The inventory of provisions was reduced by R$ 1.2 billion compared to 1Q25 and R$ 3.3 billion compared to 2Q24, totaling R$ 11.97 billion in 2Q25, mainly due to the agreements signed; |
| ▪ | Net reversal of R$ 279 million[5] due to agreements signed and favorable decisions in 2Q25; |
| ▪ | The amount recorded in 2Q25 under financial expenses related to monetary updates was R$ 176 million; |
| ▪ | In 2Q25, with the signing of new agreements, R$ 116 million in guarantees previously deposited in court were released. These amounts will be received by the Company following the corresponding judicial approvals, bringing the total guarantees released in favor of Eletrobras since 3Q22 to R$ 2.4 billion. |
Thus, as from 3Q22, when negotiations began, the provision inventory related to this set of lawsuits fell by R$ 13.8 billion, from R$25.8 billion to the current R$ 12.0 billion, even considering the accumulated monetary update of R$ 2.7 billion in the period. It is worth noting that this reduction included R$ 4 billion that had a direct impact on the P&L, as it was recorded as a provision reversal resulting from discounts obtained through executed agreements and favorable rulings.
In addition, the agreements signed also allowed for the elimination of R$ 9.6 billion in legal risks considered "off balance", of which R$ 913 million classified as possible and R$ 8.7 billion as remote. These reductions are in line with the Company's strategy of reducing its legacy legal liabilities.
Chart 2 - Total inventory of compulsory loan provisions (R$ bn)
[5] The amount presented considers only book-entry credits. The total result, which includes other lawsuits related to the compulsory loan, showed a net reversal of R$ 246 million, detailed in the provisions for litigation section.
Earnings Release 2Q25 | 24 |
| |
8. CASH FLOW
It is worth highlighting for 2Q25 the net inflow of R$ 2.0 billion related to the completion of asset purchase and sale transactions, as well as capital contributions—including the sale of thermal plants in Amazonas, the acquisition of control of Eletronet, and the contribution to TNE.
Table 18 - Cash Flow (R$ bn)
| 2Q25 | 2Q24 | ∆% | |
| Ajusted Regulatory EBITDA, before Equity Holdings | 5.71 | 5.39 | 5.9 |
| EBITDA Adjustment | 0.32 | 0.11 | 196.3 |
| Income Tax and Social Contribution | -0.04 | -0.59 | -93.5 |
| Working Capital | -0.31 | -0.71 | -56.2 |
| Privatization Charges | -1.80 | -1.13 | 59.9 |
| Dividends Received | 0.25 | 0.80 | -68.8 |
| Operating Cash Flow | 4.12 | 3.87 | 6.6 |
| Investments * | -1.57 | -1.65 | -4.9 |
| Free Cash Flow | 2.55 | 2.21 | 15.2 |
| Debt Service | -1.22 | -2.16 | -43.2 |
| Litigation | -1.35 | -1.16 | 15.9 |
| Guarantees, Restricted Deposits and Others | 0.55 | -0.20 | -374.3 |
| Supplementary social security | -0.15 | -0.10 | 44.9 |
| Net Funding ** | -1.38 | 10.81 | -112.7 |
| Receipt of Loans and Financial Charges | 0.00 | 0.03 | -96.2 |
| Disposal of equity holdings | 2.02 | -0.01 | n.m. |
| Dividends | -1.80 | -1.29 | 39.8 |
| Free Net Cash | -0.78 | 8.13 | -109.6 |
| Change in Restricted Cash (short and long term) | 0.36 | 0.42 | -14.1 |
| Change in Financial Investments (long-term) | 0.00 | 0.02 | -102.3 |
| Net Cash | -0.42 | 8.57 | -104.9 |
*Excludes generation contributions.
**Net funding: debt raised, net of issuance costs.
Earnings Release 2Q25 | 25 |
| |
FINANCIAL AND OPERATING RESULTS ANALYSIS
9. FINANCIAL PERFORMANCE
9.1. Operating Revenue
Regulatory Generation Revenue
Recurring regulatory revenue was R$ 6,945 million in 2Q25, R$ 15 million lower than adjusted IFRS generation revenue, reflecting the different treatment of the billing portion with Amazonas Energia, involving paid and unpaid amounts for the sale of energy to this customer.
Generation Revenue by Contracting Environment
In 2Q25, a negative amount of R$ 109 million was recognized, related to adjustments to the valuation of the sale of Amazonas thermal power plants and the asset uncrossing with Copel in CGT Eletrosul. These effects involve obligations and rights with terms longer than the completion of the transactions and are treated as non-recurring amounts adjusted in gross revenue for the period.
Thus, adjusted regulatory revenue from energy sales in all contracting environments totaled R$ 6,946 million in 2Q25, representing an increase of R$ 636 million compared to 2Q24.
The positive highlights were:
| ▪ | R$ 1,000 million increase in revenue in the short-term market, resulting from a 12.7% higher volume of energy settled in this environment combined with a higher average settlement price; |
| ▪ | R$ 229 million increase in revenue at the free market; |
| ▪ | R$198 million increase in revenue at the regulated market, excluding thermal plants and M&As. |
Such effects more than offset the reductions of:
| ▪ | R$ 486 million in revenue from thermal plants, reflecting the sale of the Amazonas thermal plants to Âmbar in May 2025, resulting in a lower contribution in 2Q25; |
| ▪ | R$ 288 million in revenue from the sale of O&M energy from the quota system plants, in line with the phasing out of legacy contracts (decotization). |
Considering all contracting environments, revenue went up 10.1% in 2Q25 compared to 2Q24, due to the 15.5% increase in the average price, more than offsetting the 4.7% drop in volume.
The 879 aMW reduction in total volume was mainly explained by the drop in GSF, to 95.3% in 2Q25 from 99.2% in 2Q24. Considering the energy sold and settled in different contracting environments, there was a reduction of 1,694 aMW in energy traded under the quota regime, partially offset by increases of 381 aMW in the free market and 450 aMW in the short-term market.
Earnings Release 2Q25 | 26 |
| |
Table 19 - Generation Revenue by Contracting Environment (R$ mm)
| Revenue Generation |
Volume (aMW) (a) |
Price (R$/MWh) (b) |
Regulatory Revenue (c) = (a) x (b) | ||||||
| 2Q25 | % Y/Y | % Q/Q | 2Q25 | % Y/Y | % Q/Q | 2Q25 | % Y/Y | % Q/Q | |
| (+) Regulated Market | 3,999 | -0.4 | -13.8 | 271 | -11.1 | -8.8 | 2,365 | -11.4 | -20.5 |
| Existing | 3,308 | 9.9 | -7.3 | 219 | 4.0 | 4.4 | 1,584 | 14.3 | -2.1 |
| M&As (4) | 61 | -33.7 | -39.5 | 312 | 6.1 | 3.1 | 41 | -29.7 | -36.9 |
| Thermal | 631 | -30.9 | -35.0 | 537 | -12.6 | -12.8 | 740 | -39.6 | -42.7 |
| (+) Free Market | 7,619 | 5.3 | -15.6 | 154 | 4.3 | 2.0 | 2,557 | 9.8 | -12.9 |
| Existing | 7,619 | 5.3 | -15.6 | 154 | 4.3 | 2.0 | 2,557 | 9.8 | -12.9 |
| M&As (4) | 0 | 0.0 | 0.0 | 0 | 0.0 | 0.0 | 0 | 0.0 | 0.0 |
| (+) O&M (Quotas) | 2,248 | -43.0 | -10.8 | 104 | 12.0 | 8.8 | 510 | -36.1 | -1.9 |
| (+) ST Market (CCEE)(1) | 4,001 | 12.7 | -7.2 | 173 | 161.4 | 173.9 | 1,514 | 194.5 | 156.9 |
| (=) Revenue with energy sold | 17,867 | -4.7 | -12.8 | 178 | 15.5 | 12.2 | 6,946 | 10.1 | -1.1 |
| (+) Other (2) | — | — | — | — | — | — | -111 | n.m. | n.m. |
| (=) Total Revenue | — | — | — | — | — | — | 6,836 | 8.3 | -2.7 |
| Recurring | — | — | — | — | — | — | 6,945 | 10.1 | -1.1 |
| Non-recurring | — | — | — | — | — | — | -109 | 0.0 | 0.0 |
| Revenue Generation |
Regulatory Revenue (c) |
Accounting Adjustment (d) (3) |
Accounting Revenue (e) = (c) + (d) | ||||||||
| 2Q25 | 2Q24 | 1Q25 | 2Q25 | 2Q24 | 1Q25 | 2Q25 | 2Q24 | 2Q25x2Q24 | 1Q25 | 2Q25x1Q25 | |
| Regulated Market | 2,365 | 2,670 | 2,975 | 15 | -482 | -56 | 2,381 | 2,188 | 8.8 | 2,919 | -18.4 |
| Free Market | 2,557 | 2,328 | 2,937 | 0 | 0 | 0 | 2,557 | 2,328 | 9.8 | 2,937 | -12.9 |
| O&M (Quotas) | 510 | 798 | 520 | 0 | 0 | 0 | 510 | 798 | -36.1 | 520 | -1.9 |
| Short-term market (1) | 1,514 | 514 | 590 | 0 | 0 | 0 | 1,514 | 514 | 194.5 | 590 | 156.9 |
| Energy Sales | 6,946 | 6,311 | 7,021 | 15 | -482 | -56 | 6,962 | 5,829 | 19.4 | 6,965 | 0.0 |
| Others (2) | -111 | -1 | 2 | 0 | 0 | 0 | -111 | -1 | n.m. | 2 | n.m. |
| Total Revenue | 6,836 | 6,310 | 7,023 | 15 | -482 | -56 | 6,851 | 5,828 | 17.6 | 6,967 | -1.7 |
| Recurring | 6,945 | 6,310 | 7,023 | 15 | -482 | -56 | 6,960 | 5,828 | 19.4 | 6,967 | -0.1 |
| Non-recurring | -109 | 0 | 0 | 0 | 0 | 0 | -109 | 0 | 0.0 | 0 | 0.0 |
(1) Short-term market: Electricity Trading Chamber (CCEE)
(2) Main effect: recognition of a negative impact of R$ XX million related to adjustments in the valuation of the sale of the Amazonas thermal plants and the asset uncrossing with Copel at CGT Eletrosul, due to obligations and rights with maturities extending beyond the transaction closing dates.
(3) The differences between IFRS and regulatory revenues in 2Q24, 1Q25, and 2Q25 are related to energy sold but not paid for by Amazonas Energia. This amount is not recognized as revenue under IFRS, but is included in the regulatory result, where it is fully provisioned.
(4) M&A: includes revenue from assets in which Eletrobras' stake has changed over the last 12 months.
| ▪ | Regulated Contracting Environment (ACR): regulatory generation revenue in ACR totaled R$ 2,365 million in 2Q25, down R$ 305 million from R$ 2,670 million in 2Q24, mainly reflecting an 11.1% drop in average prices due to the thermal energy sales performance. Excluding thermal plants and M&A, revenue in 2Q25 totaled R$ 1,584 million, mainly impacted by the A-1 auction in December 2024 (+351 aMW; R$159/MWh), in addition to the inflation adjustment of existing contracts. Thermal plants, in turn, contributed R$ 740 million to revenues, while Mauá HPP contributed R$ 41 million referring to the portion of the quarter in which it remained in the portfolio, prior to its transfer to Copel following the completion of the asset uncrossing. |
Earnings Release 2Q25 | 27 |
| |
| ▪ | Free Contracting Environment (ACL): regulatory generation revenue in ACL totaled R$ 2,557 million in 2Q25, up by R$ 229 million from 2Q24, mainly due to the 5.3% increase in volume sold, reflecting the strategy of expanding share in the free market, combined with a 4.3% increase in the average price. |
| ▪ | O&M: Operation and maintenance revenues totaled R$ 510 million in 2Q25, down R$ 288 million from 2Q24, mainly reflecting the gradual phasing out of legacy contracts (decotization), mitigated by the effects of the annual readjustment of the Annual Generation Revenue (RAG[6]). |
| ▪ | Short-Term Market (CCEE): revenue of R$ 1,514 million in 2Q25, up R$ 1,000 million from 2Q24, explained by the increases of 161% in price and of 13% in volume. |
Regulatory Transmission Revenue
Regulatory transmission revenue was R$ 4,488 million, down 12.7% from 2Q24. The decrease reflected the approval, in July 2024, of the 2023 periodic tariff review (RTP), which were postponed to 2024, with a particular focus on the revenue review for concession contracts extended under Law No. 12,783/2013.
It is worth noting that the eliminations, both in regulatory and IFRS revenue, refer to the portion of transmission system usage charges paid by Eletrobras’ generation companies to the Group’s own transmission companies, which receive them as RAP. For consolidation purposes, these amounts are eliminated from transmission revenue and from the cost of transmission system charges in generation. The IFRS accounting considers the portion of revenue related to operation and maintenance (O&M), whereas under regulatory accounting, the elimination considers the RAP.
Table 20 - Quarterly IFRS vs. Regulatory Revenue (R$ mm)[7]
| 2Q25 | 2Q24 | Regulatory | |||||
| IFRS | Adjustments | Regulatory | IFRS | Adjustments | Regulatory | ∆% | |
| Eletrobras Holding | 1,994 | -131 | 1,863 | 1,727 | 469 | 2,196 | -15 |
| Chesf | 1,550 | -57 | 1,493 | 1,255 | 330 | 1,585 | -6 |
| CGT Eletrosul | 589 | -95 | 494 | 531 | 8 | 539 | -8 |
| Eletronorte | 1,064 | -177 | 886 | 966 | 51 | 1,017 | -13 |
| Eliminations | -118 | -131 | -249 | -83 | -115 | -199 | 25 |
| TOTAL | 5,079 | -591 | 4,488 | 4,395 | 744 | 5,138 | -13 |
Chart 3 - Reconciliation RAP and Transmission Revenue 2Q25 (R$ mm)
[6] According to ANEEL Resolutions No. 3,225/2023 (2023-2024 cycle) and No. 3,353/2024 (2024-2025 cycle), impacting Eletronorte, Chesf and Furnas.
[7] For more information on Eletrobras Holding's Corporate Structure, refer to Appendix 3 of this report.
Earnings Release 2Q25 | 28 |
| |
Definitions Approved RAP x Gross Revenue
Below is a simplified analysis of the regulatory gross revenue for the transmission segment. Additional details and explanations can be found in the “Modeling Support - Transmission” spreadsheet, available in the Results Center on the Company’s Investor Relations website.
| ▪ | Annual Permitted Revenue
(RAP) and Approved Adjustment Portion (PA) – 2Q25: Corresponds
to one-fourth of the RAP and PA amounts—R$ 16,983 million and R$ 1,529 million, respectively—approved for the 2024/2025 cycle
under ANEEL Resolution No. 3,348/2024, applicable to the transmission concession contracts of Eletrobras (post-Furnas incorporation),
Chesf, CGT Eletrosul, Eletronorte, TMT, and VSB. More details about PA in Appendix 8. |
| ▪ | Sector Taxes and Charges (pass-through): Includes PIS/COFINS taxes related to revenue from the Basic Network, Basic Border Network, and Shared DIT, as indicated in Credit Notices (AVCs) issued by ONS. It also includes the collection of contributions from consumers directly connected to Eletrobras transmission facilities, destined for the Energy Development Account (CDE) and the Incentive Program for Alternative Sources of Electric Energy (PROINFA). |
| ▪ | New Investments: Refers to additional RAP from new installations—primarily large-scale reinforcements and improvements—in the basic network, authorized with predefined revenues and placed into commercial operation during the quarter. |
| ▪ | Discount for Unavailability: Refers to the discounts applied under the Variable Portion (PV) and Suspension of Base Payment (PB) mechanisms, due to asset unavailability and pending Release Terms (Termos de Liberação – TL). In 2Q25, the total revenue reduction from unavailability amounted to approximately -R$63.5 million, of which -R$49.1 million was related to the Variable Portion. |
| ▪ | Items for which transmission companies only act as collectors and which will be deducted through the Adjustment Portion (PA) in the subsequent tariff cycle (pass-through): These are pass-through items recognized as revenue in the current cycle but offset in the next. They include differences in the Annual Permitted Revenue (RAP) calculation approved for billing by ONS, related to advance apportionment, as well as reimbursements from the CDE Fund—via CCEE—for amounts not collected due to tariff discounts. |
| ▪ | Others: Includes two groups of effects. (i) “Eliminations”, which represent transactions between companies within the same corporate group (i.e. Eletrobras companies). In 2Q25, total eliminations amounted to approximately R$ -249 million, and (ii) mismatches related to the RAP approved for the current tariff cycle, such as differences between the Annual Transmission and Distribution Adjustments, additional Credit Notices (AVCs) linked to the termination of Transmission System Use Agreements (CUST) by generators, among others. |
Earnings Release 2Q25 | 29 |
| |
Main Events in the Transmission Segment in 2Q25
| ▪ | Change in RAP Receivables Flow Linked to the RBSE Financial Component |
More details on the changes, including breakdown by contract, are available in Appendix 9.
The effect on the regulatory result will only be reflected as from 3Q25, which marks the first quarter of the next tariff cycle (2025-26).
The effect on IFRS result is already reflected in 2Q25, through the recognition of a R$ 3,433 million expense accounted for as regulatory remeasurement. This expense, as well as the positive amount of R$ 882 million recognized as deferred tax associated with it, were considered as non-recurring items in 2Q25 and, therefore, adjusted in both EBITDA and Net Income.
| ▪ | Periodic Tariff Review (RTP) for tendered contracts with review in 2025-26 |
More details on the changes, including breakdown by contract, are in Appendix 10.
| ▪ | Annual Adjustment (RA) for the 2025-26 Tariff Cycle: RAP and PA approval |
More details on the changes, including breakdown by contract, are in Appendix 11.
Earnings Release 2Q25 | 30 |
| |
9.2. Operating Costs and Expenses
Table 21 - Operating Costs and Expenses (R$ mm)
| 2Q25 | 2Q24 | % | 1Q25 | % | 6M25 | 6M24 | % | |
| Energy purchased for resale | 1,356 | 797 | 70.1 | 1,560 | -13.1 | 2,916 | 1,534 | 90.0 |
| Charges on use of the electricity grid | 955 | 999 | -4.4 | 996 | -4.2 | 1,951 | 1,970 | -1.0 |
| Fuel for electricity production | 222 | 464 | -52.1 | 560 | -60.3 | 782 | 970 | -19.4 |
| Construction | 1,036 | 787 | 31.7 | 745 | 38.9 | 1,781 | 1,428 | 24.7 |
| Personnel, Material, Services and Others | 1,631 | 1,629 | 0.1 | 1,658 | -1.6 | 3,289 | 3,256 | 1.0 |
| Depreciation and Amortization | 1,131 | 968 | 16.9 | 1,112 | 1.7 | 2,244 | 1,965 | 14.2 |
| Operating provisions | 133 | -127 | -205.1 | 126 | 5.4 | 260 | 69 | 276.5 |
| Result from asset sale | 105 | 115 | -8.5 | 0 | 0.0 | 105 | 115 | -8.5 |
| Regulatory remeasurements | 3,433 | 0 | 0.0 | 952 | 260.7 | 4,385 | 0 | 0.0 |
| Costs and expenses | 10,002 | 5,632 | 77.6 | 7,710 | 29.7 | 17,712 | 11,307 | 56.6 |
| Non-recurring events | ||||||||
| (-) Non-recurring PMSO events | -228 | -171 | 33.6 | -191 | 19.1 | -419 | -203 | 106.2 |
| (-) Non-recurring provisions | 43 | 396 | -89.0 | -41 | -206.6 | 3 | 514 | -99.5 |
| (-) Result from asset sale | -105 | -115 | -8.5 | 0 | 0.0 | -105 | -115 | -8.5 |
| (-) Regulatory remeasurements | -3,433 | 0 | 0.0 | 0 | 0.0 | -3,433 | 0 | 0.0 |
| Adjusted Costs and Expenses | 6,279 | 5,742 | 9.4 | 7,478 | -16.0 | 13,757 | 11,503 | 19.6 |
| ▪ | Energy purchased for resale: Totaled R$ 1,356 million in 2Q25, up R$ 559 million from 2Q24. This increase was driven by energy purchases made to meet Eletrobras’ ballast requirements, aiming to rebalance available resources with the Company’s contracted sales commitments. It is worth noting that these transactions do not impact the P&L. |
| ▪ | Charges on use of the electricity grid: Totaled R$ 955 million in 2Q25, down R$ 44 million from 2Q24, mainly reflecting the lower value of the transmission system usage charges (EUST) in force after the definition of Resolution ANEEL No. 3,349/2024, replacing the values previously established by ANEEL Resolution No. 3,216/2023. |
| ▪ | Fuel for electricity production: Costs associated with the use of fuel for electricity production reached R$ 222 million in 2Q25, down R$ 242 million from 2Q24 due to the sale of the Amazonas thermal plants in May 2025. |
| ▪ | Construction-related costs: Totaled R$ 1,036 million in 2Q25, up by R$ 249 million compared to 2Q24. Highlights include increases of R$ 199 million from reinforcement and improvement works and R$ 72 million in civil construction tied to concession contracts secured through transmission auctions in recent years, partially offset by R$ 22 million in write-offs of Fixed Assets in Service. |
| ▪ | Regulatory Remeasurement - transmission contracts: R$ 3,433 million expense in 2Q25, reflecting changes in the payment flow of the RBSE financial component for contracts extended by Law No. 12,783/2013, applicable to the 2025-26, 2026-27 and 2027-28 tariff cycles, in view of the decision of ANEEL's board of directors at the 20th Ordinary Public Meeting held on June 10, 2025. |
| ▪ | Result from asset sale: R$ 105 million expense in 2Q25, reflecting non-cash adjustments due to negotiations concluded during the period, notably: |
| ▪ | - R$ 286 million: completion of the sale of the Amazonas thermal plants to Âmbar Energia; |
| ▪ | + R$ 257 million: Eletronet remeasurement; |
| ▪ | - R$ 76 million: asset uncrossing with Copel, with the acquisition of the Colíder HPP in exchange for a stake in the Jayme Canet Junior HPP (Mauá) and the Mata de Santa Genebra transmission plant. |
Earnings Release 2Q25 | 31 |
| |
PMSO - Personnel, Material, Services and Others
Personnel: adjusted balance of R$ 784 million in 2Q25, down 15% from R$ 923 million in 2Q24, with the main effects being:
| ▪ | R$ 142 million in savings, of which R$ 95 million in compensation expenses and R$ 47 million in labor charges, reflecting the reduction in the number of employees resulting from the Voluntary Dismissal Plans (VDPs), partially offset by new hires, which increased expenses by R$ 30 million. |
| ▪ | R$ 38 million in savings resulting from efficiency gains achieved through team restructuring, driven by VDPs, new hiring models, and increased resource sharing among the group’s companies. |
Non-recurring effects: R$ 213 million, of which: (a) R$ 98 million with VDPs, (b) R$ 72 million with severance costs, and (c) R$ 44 million with severance indemnity fund (FGTS) fines linked to terminations.
Material: adjusted balance of R$ 42 million in 2Q25, up R$ 5 million when compared to R$ 37 million recorded in 2Q24. The variation reflects higher operational maintenance expenses.
There were no non-recurring effects in the quarter.
Services: adjusted balance of R$ 441 million in 2Q25, representing a 6% increase compared to R$ 415 million in 2Q24. The main highlights for the R$ 26 million increase were:
| ▪ | R$ 34 million increase related to the centralization and adjustment of cleaning and maintenance service contracts; |
| ▪ | R$ 8 million reduction due to the rescheduling of machine maintenance to the second half of 2025. |
Non-recurring effects: R$ 15 million related to success fee paid to legal consulting firms as part of the contingency reduction strategy.
Others: adjusted balance of R$ 136 million in 2Q25, up R$ 53 million compared to 2Q24, mainly reflecting the R$ 28 million increase in expenses related to the generation segment, including payments for hydrological risk renegotiation insurance and association contributions.
There were no non-recurring effects in the quarter.
Earnings Release 2Q25 | 32 |
| |
Table 22 - PMSO 2Q25 (R$ mm)[8]
| PMSO | 2Q25 | ||||||
| (R$ million) | Eletrobras Holding | Chesf | Eletronorte | CGT Eletrosul | Total | Elimination | Consolidated IFRS |
| Personnel | 403 | 220 | 192 | 85 | 899 | 0 | 899 |
| Voluntary Dismissal Plan (PDV) - Provision | 76 | 4 | 15 | 3 | 98 | 0 | 98 |
| Material | 17 | 8 | 16 | 2 | 42 | 0 | 42 |
| Services | 225 | 95 | 101 | 35 | 456 | 0 | 456 |
| Other | 47 | 27 | 63 | 6 | 143 | -7 | 136 |
| PMSO | 768 | 353 | 386 | 131 | 1,638 | -7 | 1,631 |
| Non-recurring events | |||||||
| Personnel: PDV, PDC | -76 | -4 | -15 | -3 | -98 | 0 | -98 |
| Personnel: Termination Costs | -63 | -21 | -23 | -9 | -115 | 0 | -115 |
| Services: Success fee related to legal consulting | -11 | -2 | -2 | 0 | -15 | 0 | -15 |
| Other: Judicial convictions | 0 | 0 | 0 | 0 | 0 | 0 | 0 |
| Other: Write-off of court deposits | 0 | 0 | 0 | 0 | 0 | 0 | 0 |
| Adjusted PMSO | 618 | 326 | 346 | 119 | 1,410 | -7 | 1,403 |
Table 23 - PMSO 2Q24 (R$ mm)
| PMSO | 2Q24 | ||||||
| (R$ million) | Eletrobras + Furnas and Others | Chesf | Eletronorte | CGT Eletrosul | Total | Elimination | Consolidated IFRS |
| Personnel | 378 | 244 | 218 | 83 | 923 | 0 | 923 |
| Voluntary Dismissal Plan (PDV) - Provision | 15 | 6 | -10 | 0 | 11 | 0 | 11 |
| Material | 10 | 6 | 22 | -1 | 37 | 0 | 37 |
| Services | 251 | 87 | 84 | 36 | 457 | 0 | 457 |
| Other | 98 | 76 | 37 | 12 | 223 | -22 | 200 |
| PMSO | 752 | 419 | 350 | 130 | 1,651 | -22 | 1,629 |
| Non-recurring events | |||||||
| Personnel: PDV, PDC | -15 | -6 | 10 | 0 | -11 | 0 | -11 |
| Personnel: Retroactive profit Sharing (PLR) | 0 | 0 | 0 | 0 | 0 | 0 | 0 |
| Personnel: allocation to investment activities | 0 | 0 | 0 | 0 | 0 | 0 | 0 |
| Services: Consultancies related to the transformation Plan | -42 | 0 | 0 | 0 | -42 | 0 | -42 |
| Other: Business Combination (1) | -118 | 0 | 0 | 0 | -118 | -118 | |
| Adjusted PMSO | 577 | 413 | 360 | 130 | 1,480 | -22 | 1,458 |
[8] For more information on Eletrobras Holding's Corporate Structure, refer to Appendix 3 of this report.
Earnings Release 2Q25 | 33 |
| |
Table 24 - PMSO IFRS (R$ mm)
| 2Q25 | 2Q24 | 1Q25 | |||||
|
Total (a) |
Nonrecurring (b) |
Adjusted (c) = (a) + (b) |
Adjusted | ∆% | Adjusted | ∆% | |
| Personnel | 899 | -115 | 784 | 923 | -15.1 | 802 | -2.3 |
| VDP | 98 | -98 | 0 | 0 | 0.0 | 0 | 0.0 |
| Material | 42 | 0 | 42 | 37 | 13.0 | 52 | -19.1 |
| Services | 456 | -15 | 441 | 415 | 6.2 | 396 | 11.3 |
| Others | 136 | 0 | 136 | 83 | 64.6 | 217 | -37.1 |
| Total | 1,631 | -228 | 1,403 | 1,458 | -3.8 | 1,467 | -4.3 |
Table 25 - Detailed PMSO IFRS (R$ mm)
| 2Q25 | 2Q24 | % | 1Q25 | % | 6M25 | 6M24 | % | |
| Personnel | 899 | 923 | -2.6 | 855 | 5.1 | 1,755 | 1,868 | -6.1 |
| VDP | 98 | 11 | 795.5 | 96 | 1.1 | 194 | 44 | 344.5 |
| Material | 42 | 37 | 13.0 | 52 | -19.1 | 94 | 83 | 12.9 |
| Services | 456 | 457 | -0.3 | 438 | 4.2 | 894 | 896 | -0.2 |
| Others | 136 | 200 | -32.0 | 217 | -37.1 | 353 | 365 | -3.3 |
| PMSO (a) | 1,631 | 1,629 | 0.1 | 1,658 | -1.6 | 3,289 | 3,256 | 1.0 |
| Personnel | -115 | 0 | 0.0 | -53 | 116.5 | -169 | 0 | 0.0 |
| VDP | -98 | -11 | 795.5 | -96 | 1.1 | -194 | -44 | 344.5 |
| Material | 0 | 0 | 0.0 | 0 | 0.0 | 0 | 0 | 0.0 |
| Services | -15 | -42 | -64.0 | -42 | -63.5 | -57 | -42 | 34.8 |
| Others | 0 | -118 | n.m. | 0 | 0.0 | 0 | -118 | n.m. |
| Non recurring (b) | -228 | -171 | 33.6 | -191 | 19.1 | -419 | -203 | 106.2 |
| Personnel | 784 | 923 | -15.1 | 802 | -2.3 | 1,586 | 1,868 | -15.1 |
| VDP | 0 | 0 | 0.0 | 0 | 0.0 | 0 | 0 | 0.0 |
| Material | 42 | 37 | 13.0 | 52 | -19.1 | 94 | 83 | 12.9 |
| Services | 441 | 415 | 6.2 | 396 | 11.3 | 837 | 854 | -2.0 |
| Others | 136 | 83 | 64.6 | 217 | -37.1 | 353 | 247 | 42.7 |
| PMSO adjusted (c) = (a) + (b) | 1,403 | 1,458 | -3.8 | 1,467 | -4.3 | 2,870 | 3,052 | -6.0 |
| PMSO excluding TPP * (c.1) | 1,374 | 1,422 | -3.4 | 1,430 | -4.0 | 2,804 | 2,984 | -6.0 |
| expenses | 1,336 | 1,412 | -5.4 | 1,394 | -4.2 | 2,729 | 2,951 | -7.5 |
| costs: generation segment ** | 38 | 10 | 287.2 | 37 | 3.3 | 75 | 33 | 123.7 |
| Thermal Power Plants (c.2) | 29 | 36 | -18.7 | 36 | -19.4 | 66 | 68 | -3.6 |
* TPP: Thermal Power Plants. PMSO of thermal plants sold to Âmbar.
For 2Q25, considers amounts for the Santa Cruz Hydropower Plant for the full quarter.
For the other plants, whose sale was completed on May 15, 2025, amounts are considered up to that date.
** Other operating costs, related to generation operations: GSF insurance, association contributions, and other items.
Earnings Release 2Q25 | 34 |
| |
Table 26 - Other Costs and Expenses (R$ mm)
| 2Q25 | 2Q24 | % | 1Q25 | % | 6M25 | 6M24 | % | |
| Convictions, losses and legal costs | 5 | 128 | -95.9 | 71 | -92.6 | 76 | 161 | -52.9 |
| GSF | 17 | 5 | 244.0 | 17 | 1.4 | 33 | 24 | 38.9 |
| Insurance | 24 | 27 | -12.0 | 23 | 5.7 | 47 | 47 | -0.1 |
| Equity Holding | 18 | 16 | 10.3 | 10 | 77.2 | 28 | 33 | -15.1 |
| Donations and contributions | 29 | 10 | 179.3 | 21 | 36.1 | 50 | 64 | -22.1 |
| Rent | 19 | 8 | 134.9 | 23 | -19.2 | 41 | 22 | 91.0 |
| Recovery of expenses | -12 | -6 | 93.6 | -12 | 0.0 | -24 | -46 | -47.2 |
| Taxes | 6 | 11 | -42.7 | 31 | -80.3 | 37 | 37 | -0.6 |
| Water Resources Inspection Fee - TFRH | 11 | 0 | 0.0 | 14 | -17.6 | 25 | 0 | 0.0 |
| Others | 20 | 2 | n.m. | 20 | -2.5 | 40 | 23 | 71.8 |
| Total | 136 | 200 | -32.0 | 217 | -37.1 | 353 | 365 | -3.3 |
Earnings Release 2Q25 | 35 |
| |
Operating Provisions
Table 27 - Operating Provisions - IFRS (R$ mm)
| 2Q25 | 2Q24 | % | 1Q25 | % | 6M25 | 6M24 | % | |
| Operating Provisions / Reversals | ||||||||
| Provision/Reversal for Litigation | 22 | 89 | -75.1 | -108 | -120.5 | -86 | 228 | -137.7 |
| Estimated losses on investments | 21 | -14 | -250.5 | 12 | 71.3 | 34 | -29 | -214.9 |
| Measurement at fair value of assets held for sale | 0 | 167 | n.m. | 0 | 0.0 | 0 | 167 | n.m. |
| Provision for the Implementation of Lawsuits - Compulsory Loan | -20 | -17 | 19.9 | 26 | -178.0 | 6 | -50 | -111.2 |
| ECL - Loans and financing | -10 | 0 | 0.0 | 0 | 0.0 | -10 | -4 | 123.2 |
| ECL - Consumers and resellers | -79 | -43 | 84.1 | -19 | 324.0 | -98 | -175 | -44.2 |
| ECL - Other credits | -26 | -25 | 3.9 | -7 | 248.0 | -33 | -115 | -71.3 |
| Onerous contracts | 30 | 45 | -34.1 | 29 | 1.5 | 59 | 83 | -29.7 |
| Results of actuarial reports | -92 | -128 | -28.4 | -93 | -1.6 | -185 | -256 | -27.8 |
| Other * | 20 | 52 | -62.5 | 33 | -41.3 | 53 | 83 | -35.9 |
| Operating Provisions / Reversals | -133 | 127 | -205.1 | -126 | 5.4 | -260 | -69 | 276.5 |
| Non-recurring items / Adjustments | -43 | -396 | -89.0 | 41 | -206.6 | -3 | -514 | -99.5 |
| Provision for Litigation | -22 | -89 | -75.1 | 108 | -120.5 | 86 | -228 | -137.7 |
| Measurement at fair value of assets held for sale | 0 | -293 | n.m. | 0 | 0.0 | 0 | -293 | n.m. |
| Estimated losses on investments | -21 | 14 | -250.5 | -12 | 71.3 | -34 | 29 | -214.9 |
| Provision for the Implementation of Lawsuits - Compulsory Loan | 20 | 17 | 19.9 | -26 | -178.0 | -6 | 50 | -111.2 |
| ECL - Loans and financing | 10 | 0 | 0.0 | 0 | 0.0 | 10 | 4 | 123.2 |
| Onerous contracts | -30 | -45 | -34.1 | -29 | 1.5 | -59 | -83 | -29.7 |
| Impairment | 0 | 0 | n.m. | 0 | 0.0 | 0 | 6 | n.m. |
| Restitution RGR | 0 | 0 | 0.0 | 0 | 0.0 | 0 | 0 | 0.0 |
| Adjusted Provisions/Reversals | -177 | -269 | -34.3 | -86 | 106.3 | -262 | -583 | -55.0 |
Positive values in the table above indicate reversal of provision.
* Primarily Includes impairment and RGR refunds.
| ▪ | Provision for litigation: reversal of R$ 22 million in 2Q25 compared to a reversal of R$ 89 million in 2Q24. The R$ 67 million variation can be analyzed by separately considering the impact of compulsory loan-related items and other events, including civil, tax, labor, regulatory, environmental, land-related, and other matters. |
| ▪ | Compulsory Loan: In 2Q25, it contributed a net reversal of R$ 246 million, compared to the net reversal of R$ 327 million in 2Q24, representing a reduction of R$ 81 million. In both periods, the result reflects agreements signed and favorable decisions. The variation between the periods is primarily due to a change in the profile of the lawsuits portfolio, with individual risks reduced over the course of its management. It is also worth noting that, unlike other provisions, the monetary update related to the compulsory loan provision was recognized under financial results. |
| ▪ | Other events: In 2Q25, these contributed a provision of R$ 165 million, compared to a provision of R$ 89 million in 2Q24, up by R$ 75 million. Monetary update resulted in an expense of R$ 59 million in 2Q25, compared to R$ 148 million in 2Q24, reflecting the rise in applicable indexes—mainly the IPCA and Selic. Regarding the increase in provisions, it is worth noting the recognition of a provision related to the execution of a Settlement and Commitment Term. |
Earnings Release 2Q25 | 36 |
| |
| ▪ | Fair value measurement of assets available for sale: Reversal of R$ 167 million related to Santa Cruz, with no effect in 2025. |
| ▪ | Share conversion process – Compulsory Loan: R$ 20 million provision in 2Q25, compared to R$ 17 million in 2Q24. This result reflects the mark-to-market effect on the average price of the Company’s preferred class B shares over the past 12 months, impacting balance sheet amounts linked to those shares. These amounts are tied to the commitment to deliver already-converted shares resulting from compulsory loan collections made via electricity bills by taxpayers who have not yet formally requested the share issuance. |
| ▪ | Results of actuarial reports: provision of R$ 92 million in 2Q25 compared to a provision of R$ 128 million associated with interest expenses and current service costs, as outlined in the 2024 reports, due to a reduction in the underlying liability base. |
| ▪ | Estimated losses on investments: reversal of R$ 21 million in 2Q25 related to the review of the remaining useful life of intangible assets in subsidiary Madeira Energia S.A. (MESA), compared to the provision of R$ 14 million in 2Q24 related to the adjustment in the value of receivables, with no counterpart in 2Q25. |
| ▪ | Expected Credit Losses (ECL) – Consumers and Resellers: provisions increased to R$ 79 million in 2Q25 from R$ 43 million million in 2Q24, with the variation not attributable to any specific counterparty in a concentrated manner. |
| ▪ | Expected Credit Losses (ECL) – Other Credits: provisions were mainly stable, R$ 26 million in 2Q25 compared to R$ 25 million in 2Q24. |
| ▪ | Onerous Contracts: R$ 30 million reversal in 2Q25 compared to a R$ 45 million reversal in 2Q24, reflecting changes in the value of contracts. |
Earnings Release 2Q25 | 37 |
| |
9.3. Generation Contribution Margin
The generation contribution margin captures the segment’s aggregate result, focusing on energy trading and directly related costs, while excluding personnel, materials, services, and other operating expenses.
The contribution of the generation business to the Company's result increased from R$ 2,892 million in 2Q24 to R$ 3,345 million in 2Q25. In unit terms, that is, measuring the margin by the volume of available energy (energy resource), the improvement went up from R$79/MWh in 2Q24 to R$98/MWh in 2Q25. The increase was driven by higher prices in the quarter, as part of the portfolio management strategy.
Table 28 - Generation - Adjusted Contribution Margin, Regulatory (R$ mm)
| 2Q25 | 2Q24 | % | 1Q25 | % | 6M25 | 6M24 | % | |
| Gross Revenue | 6,945 | 6,310 | 10.1 | 7,023 | -1.1 | 13,968 | 12,675 | 10.2 |
| Taxes | -704 | -760 | -7.4 | -748 | -5.9 | -1,452 | -1,496 | -2.9 |
| Sector charges | -380 | -328 | 15.8 | -314 | 21.2 | -694 | -664 | 4.5 |
| Net Revenue | 5,861 | 5,222 | 12.2 | 5,962 | -1.7 | 11,823 | 10,515 | 12.4 |
| Energy purchased for resale | -1,447 | -972 | 48.8 | -1,743 | -17.0 | -3,191 | -1,885 | 69.2 |
| Charges on use of the electricity grid | -809 | -883 | -8.4 | -849 | -4.7 | -1,658 | -1,736 | -4.5 |
| Fuel for electricity production (net of CCC(1)) | -222 | -464 | -52.1 | -560 | -60.3 | -782 | -970 | -19.4 |
| GSF Insurance (2) | -17 | -5 | 244.0 | -17 | 1.4 | -33 | -21 | 57.8 |
| Other operating costs (3) | -21 | -5 | 330.1 | -20 | 4.9 | -41 | -12 | 237.1 |
| Contribution Margin | 3,345 | 2,892 | 15.6 | 2,773 | 20.6 | 6,118 | 5,890 | 3.9 |
| Resources (MWm) (4) | 15,625 | 16,763 | -6.8 | 18,740 | -16.6 | 17,174 | 8,382 | 104.9 |
| Unit Margin (R$/MWh) | 98 | 79 | 24.1 | 69 | 43.1 | 82 | 161 | -49.0 |
(1) CCC: Conta de Consumo de Combustíveis, or Fuel Consumption Account, is responsible for management of payments
made by distribution and transmission companies to subsidize the costs of generators serving Isolated Systems.
(2) RRH: Repactuação do Risco Hidrológico, or Renegotiation of the Hydrological Risk
(3) Other Operating Expenses: association contributions (CCEE and ONS) and other costs.
(4) Includes own resources and structural purchases, considering contracts with a supply term longer than 12 months.
Below is a managerial breakdown of the energy segment into four areas of activity, aimed at providing greater clarity on performance:
(i) The result from thermal power plants, whose contribution tend to decline progressively as the divestment strategy advances.
(ii) The contribution of energy billed under the quota system adds no market risk to operations, as its remuneration—limited to the availability attribute—is predictably set by the regulator. This contribution will also tend to zero over time, as the divestment of these plants, renewed at the time of privatization, continues.
(iii) Energy sold in the ACR, while subject to some market risk, provides a relatively stable and predictable cash flow, with price and volume defined over the life of the contracts.
(iv) Finally, the remaining energy resource—after deducting volumes allocated to quotas and the ACR, and adding purchased energy volume—is available for sale in the free market (ACL) or for settlement in the Short-Term Market (MCP). Notably, this is the portion most exposed to market dynamics and, therefore, the focus of active portfolio management.
The contribution margin for energy traded in the ACL and settled in the MCP increased to R$79/MWh in 2Q25 from R$56/MWh in 2Q24, considering the resources available for allocation in both environments.
This volume remained virtually stable, with the amount released by the gradual phasing out of legacy contracts (decotization) also offset by a lower GSF in the period: 95.3% in 2Q25 compared to 99.2% in 2Q24.
Earnings Release 2Q25 | 38 |
| |
The contribution in financial volume rose to R$ 1,615 million in 2Q25 from R$ 1,124 million in 2Q24, as the increase in revenue more than offset higher energy purchase expenses, driven by the strategy of greater exposure to the short-term market in 2Q25.
Table 29 - Generation - Ajusted Contribution Margin, Regulatory - by Contracting Environment (R$ mm)
| 2Q25 | 2Q24 | 1Q25 | |||||||
|
Total (a)=(b)+(c) +(d)+(e) |
Thermal (b) |
Quota (c) |
ACR (d) |
ACL + MCP (e) |
ACL + MCP |
% Y/Y | ACL + MCP |
% Q/Q | |
| Gross Revenue | 6,836 | 650 | 509 | 1,626 | 4,051 | 2,842 | 42.5 | 3,529 | 14.8 |
| (-) Adjustment | 109 | 89 | 0 | 19 | 0 | 0 | 0.0 | 0 | 0.0 |
| Adjusted Gross Revenue | 6,945 | 740 | 509 | 1,645 | 4,051 | 2,842 | 42.5 | 3,529 | 14.8 |
| (-) Taxes | -704 | -56 | -53 | -170 | -424 | -318 | 33.3 | -418 | 1.6 |
| (-) Sector Charges | -380 | 0 | -31 | -100 | -249 | -176 | 41.1 | -193 | 28.9 |
| (-) Energy purchased for resale | -1,447 | -144 | 0 | 0 | -1,303 | -746 | 74.7 | -1,427 | -8.7 |
| (-) Charges on use of the electricity grid | -809 | -65 | -117 | -183 | -445 | -474 | -6.1 | -467 | -4.7 |
| (-) Fuel for electricity production (1) | -222 | -222 | 0 | 0 | 0 | 0 | 0.0 | 0 | -175.0 |
| (-) GSF Insurance (2) | -17 | 0 | 0 | -17 | 0 | 0 | 0.0 | 0 | 0.0 |
| (-) Other operating costs (3) | -21 | 0 | -2 | -6 | -14 | -3 | 403.9 | -12 | 11.6 |
| Contribution Margin (f) | 3,345 | 253 | 306 | 1,170 | 1,615 | 1,124 | 43.7 | 1,012 | 59.6 |
| Own Resources (MWm) | 14,800 | 15,953 | -7.2 | 17,905 | -17.3 | ||||
| (-) Quotas | -2,248 | -3,464 | -35.1 | -2,520 | -10.8 | ||||
| (-) ACR (includes thermal plants) | -3,995 | -4,064 | -1.7 | -4,680 | -14.6 | ||||
| (+) Structural Purchases | 825 | 810 | 1.8 | 835 | -1.2 | ||||
| Resources (MWm) (4) | 9,382 | 9,234 | 1.6 | 11,540 | -18.7 | ||||
| Resources (MWh thousand) (4) (g) | 20,489 | 20,168 | 1.6 | 24,927 | -17.8 | ||||
| R$/MWh (f)/(g) | 79 | 56 | 41.4 | 41 | 94.2 | ||||
(1) Net of CCC: Conta de Consumo de Combustíveis, or Fuel Consumption Account, is responsible for management of payments
made by distribution and transmission companies to subsidize the costs of generators serving Isolated Systems.
(2) RRH: Repactuação do Risco Hidrológico, or Renegotiation of the Hydrological Risk
(3) Other Operating Expenses: association contributions (CCEE and ONS) and other costs.
(4) Includes own resources and structural purchases, considering contracts with a supply term longer than 12 months.
Earnings Release 2Q25 | 39 |
| |
9.4. Equity Holdings
Equity income presented the following highlights:
| ▪ | Eletronuclear: Two factors explained the -R$ 147 million result: |
(i) a reduction in revenue due to the scheduled maintenance shutdown of the Angra 1 plant; and (ii) a provision related to excess reimbursements from the Decommissioning Fund.
The shutdown lasted from April 4 to July 11, 2025, and Angra 1 has since resumed operations. In addition to scheduled maintenance, the shutdown included fuel replacement and equipment modernization as part of the Long-Term Operation (LTO) Program. This program, which includes several interventions through 2028 in exchange for a 20-year extension of useful life—until December 2044—was authorized by the National Nuclear Energy Commission (CNEN) in November 2024.
| ▪ | ISA Energia: The R$ 25 million decrease in results reflects the impact of regulatory remeasurement from the reduced flow of receipts associated with the RBSE financial component of the contract extended pursuant to Law No. 12,783/2013. |
| ▪ | Transnorte Energia: Decline in results due to the CAPEX review for return on contractual assets. |
| ▪ | Norte Energia: The negative variation was mainly due to the increase in interest expense, deferred tax expense and depreciation. |
Non-recurring effects: R$ 116 million adjustment, proportional to Eletrobras’ stake in ISA Energia, referring to the net effect of PIS/COFINS and income tax, reflecting changes in the payment flow of the financial component of the RBSE.
Table 30 - Equity Holdings (R$ mm)
| 2Q25 | 2Q24 | % | 1Q25 | % | 6M25 | 6M24 | % | |
| Highlights Affiliates (a) | -45 | 529 | -108.6 | 277 | -116.3 | 231 | 922 | -74.9 |
| Eletronuclear | -147 | 200 | -173.7 | 64 | -331.8 | -84 | 303 | -127.7 |
| ISA Energia | 25 | 188 | -86.9 | 135 | -81.7 | 159 | 418 | -61.9 |
| Other Affiliates | 78 | 141 | -45.0 | 78 | -1.1 | 156 | 201 | -22.4 |
| Highlights SPEs ** (b) | -148 | 100 | -248.4 | 47 | -415.2 | -101 | 167 | -160.3 |
| IE Madeira | 31 | 52 | -40.0 | 84 | -62.9 | 115 | 117 | -1.4 |
| Belo Monte Transmissora de Energia S.A. - BMTE | 27 | 52 | -48.2 | 56 | -51.6 | 83 | 107 | -22.6 |
| Transnorte Energia | -128 | 19 | -788.0 | 50 | -353.5 | -77 | 35 | -321.0 |
| Chapecoense | 55 | 32 | 72.5 | 43 | 29.0 | 98 | 82 | 20.0 |
| ESBR Jirau | 22 | 5 | 338.1 | 39 | -44.3 | 61 | 41 | 49.3 |
| IE Garanhuns | 23 | 20 | 17.3 | 15 | 59.4 | 38 | 40 | -4.6 |
| Norte Energia | -179 | -80 | 123.6 | -240 | -25.4 | -419 | -254 | 64.9 |
| Other Holdings * (c) | 67 | 71 | -6.5 | 44 | 51.1 | 111 | 187 | -40.7 |
| Total Equity Holdings (a) + (b) + (c) | -126 | 700 | -118.0 | 368 | -134.3 | 242 | 1,276 | -81.1 |
| Non-recurring events | ||||||||
| (-) Regulatory remeasurements, ISA Energia | 116 | 0 | 0.0 | 0 | 0.0 | 116 | 0 | 0.0 |
| Adjusted Equity Holding | -10 | 700 | -101.4 | 368 | -102.7 | 358 | 1,276 | -71.9 |
| * Includes movements from amounts recognized in the balance sheet of associates measured at fair value/cost. | ||||||||
| ** SPE: special purpose entities | ||||||||
Earnings Release 2Q25 | 40 |
| |
9.5. Financial Results
Table 31 - Financial Result (R$ mm)
| 2Q25 | 2Q24 | % | 1Q25 | % | 6M25 | 6M24 | % | |
| Financial Income | 1,069 | 691 | 54.6 | 1,073 | -0.4 | 2,142 | 1,366 | 56.8 |
| Interest income, fines, commissions and fees | -13 | 39 | -133.9 | 37 | -136.3 | 23 | 72 | -67.3 |
| Income from financial investments | 1,101 | 546 | 101.5 | 1,057 | 4.2 | 2,159 | 1,120 | 92.7 |
| Late payment surcharge on electricity | 36 | 32 | 13.3 | 32 | 11.1 | 68 | 79 | -13.1 |
| Other financial income | 24 | 128 | -81.2 | 29 | -17.4 | 53 | 202 | -73.6 |
| (-) Taxes on financial income | -79 | -55 | 45.3 | -82 | -3.6 | -162 | -106 | 52.3 |
| Financial Expenses | -2,380 | -2,498 | -4.7 | -2,464 | -3.4 | -4,844 | -4,968 | -2.5 |
| Debt Charges | -1,528 | -1,500 | 1.9 | -1,640 | -6.8 | -3,168 | -3,125 | 1.4 |
| CDE obligation charges | -661 | -613 | 7.9 | -662 | -0.1 | -1,323 | -1,223 | 8.2 |
| River basin revitalization charges | -79 | -83 | -5.3 | -79 | -0.2 | -157 | -168 | -6.4 |
| Financial discount for early payment - ENBpar | 0 | 0 | 0.0 | 0 | 0.0 | 0 | 0 | 0.0 |
| Other financial expenses | -111 | -302 | -63.2 | -84 | 32.3 | -195 | -453 | -56.9 |
| Net Financial Items | -1,244 | -1,115 | 11.5 | -2,103 | -40.8 | -3,347 | -2,308 | 45.0 |
| Monetary changes | -264 | -190 | 38.8 | -285 | -7.4 | -548 | -537 | 2.2 |
| Exchange rate variations | -12 | 5 | -344.7 | 5 | -344.7 | -7 | 2 | -393.5 |
| Change in fair value of hedged debt net of derivative | -587 | -372 | 57.9 | -966 | -39.2 | -1,554 | -563 | 176.0 |
| Monetary updates - CDE | -316 | -367 | -14.1 | -733 | -56.9 | -1,048 | -861 | 21.8 |
| Monetary updates - river basins | -52 | -67 | -22.4 | -113 | -54.2 | -165 | -154 | 7.6 |
| Change in derivative financial instrument not linked to debt protection | -14 | -124 | -88.9 | -10 | 32.8 | -24 | -196 | -87.7 |
| Financial Results | -2,555 | -2,922 | -12.6 | -3,494 | -26.9 | -6,049 | -5,910 | 2.4 |
| Adjustments | ||||||||
| Monetary restatement - Compulsory Loan | 178 | 172 | 3.4 | 175 | 1.6 | 353 | 379 | -6.9 |
| Adjusted Financial Result | -2,377 | -2,750 | -13.6 | -3,319 | -28.4 | -5,696 | -5,531 | 3.0 |
(1) These obligations were established by Law 14,182/21 (Eletrobras Privatization) as a condition for obtaining new concession grants for electricity generation for an additional 30 years. The charges were calculated based on data published in CNPE Resolution 015/2021, considering (a) the present value of the obligation; (b) the future payment flow; and (c) the payment term. See Table 28 for more details.
Adjusted financial result was negative by R$ 2,377 million in 2Q25, compared to negative R$ 2,750 million in 2Q24. The main variations this quarter were:
| ▪ | Financial Income: increase in financial revenue to R$ 1,069 million in 2Q25 from R$ 691 million in 2Q24 , mainly explained by the increase in average cash and the CDI rate in the period. |
| ▪ | Debt charges: expense increased to R$ 1,528 million in 2Q25 from R$ 1,500 million in 2Q24. Interest expenses on loans and financing rose to R$ 1,455 million in 2Q25, up from R$ 1,366 million in 2Q24, mainly due to the higher Selic rate and increased debt balance during the period, driven by funding raised in 2024—including debenture issuances and financing from financial institutions. Eletrobras' average gross debt balance rose to approximately R$ 71 billion in 2Q25 from R$ 65 billion in 2Q24, while the average Selic rate increased 4.5 p.p., from 10.4% p.a. in 2Q24 to 14.9% p.a. in 2Q25. Part of this increase was offset by a reduction in leasing charges, which declined from R$ 133 million in 2Q24 to R$ 70 million in 2Q25, due to the termination of power purchase agreements—treated as leases—for thermal plants located in the state of Amazonas, following the sale of these assets in May 2025. |
Earnings Release 2Q25 | 41 |
| |
| ▪ | Selic-based monetary update variation: increase in expense to R$ 264 million in 2Q25 from R$ 74 million in 2Q24, which was mainly due to the lower recognition of income tax updates, contributing R$ 79 million to the increase in expenses. In turn, the expense related to the update of Eletrobras' compulsory loan remained stable, reaching R$ 178 million in 2Q25, as the reduction in the inventory from R$ 15 billion in June 2024 to R$ 12 billion in June 2025 was offset by the Selic rate hike in the period, as previously noted. |
| ▪ | Energy Sector Development Fund (CDE) obligation charges and monetary updates (IPCA financial expenses + charges on the outstanding balance of CDE obligations, a 7.6% p.a. charge): expenses totaled R$ 977 million in 2Q25, in line with 2Q24. |
| ▪ | Charges for revitalization of river basins (5.67% charge), with a R$ 79 million expense in 2Q25, and monetary updates - river basins, with a R$ 52 million expense. |
Table 32 - CDE Charges and Projects - Law 14.182/2021 (R$ mm)
| 2Q25 | ||||
| Holding | Chesf | Eletronorte | Total | |
| Debt charges - CDE obligations | -190 | -276 | -195 | -661 |
| Debt charges - Revitalization of river basins | -21 | -31 | -26 | -79 |
| Passive monetary restatement - CDE obligations | -91 | -132 | -93 | -316 |
| Passive monetary updating - Revitalization of river basins | -13 | -20 | -18 | -52 |
| Total CDE charges and Projects - Law 14.182/2021 | -315 | -460 | -332 | -1,107 |
| ▪ | Change in fair value of hedged debt, net of derivatives: R$ 587 million expense in 2Q25, higher than the R$ 372 million expense in 2Q24, mainly explained by the inclusion of new transactions signed at the end of 2024 pegged to the dollar x CDI, such as Bond 2035 (US$750 million in Oct/24) and the SACE financing (R$1.6 billion, or US$400 million, Dec/24). This effect was partially offset by the settlement of the Bond 2025 in Feb/25 and by new credit and swap transactions at CGT Eletrosul, linked to the dollar x CDI and euro x CDI. |
| ▪ | Change in derivative financial instrument not linked to debt protection: negative effect of R$ 14 million in 2Q25 related to the variation of a derivative financial instrument not linked to debt protection, compared to the expense of R$ 124 million in 2Q24. This was essentially due to the termination of the contract between Eletronorte and Albras in December 2024 that contained an embedded derivative linked to the dollar, the Selic rate, and aluminum prices on the LME. |
| ▪ | Other financial expenses: totaled R$ 111 million in 2Q25, compared to R$ 302 million in 2Q24, a R$ 191 million reduction, mainly explained by a R$ 163 million expense recorded in 2Q24 related to PIS/COFINS taxes on interest on equity (IOE) paid by Furnas, with no corresponding expense in 2Q25. |
| ▪ | Other financial income: dropped by R$ 104 million, to R$ 24 million in 2Q25 from R$ 128 million in 2Q24, primarily driven by R$ 106 million recognized in 2Q24, with no corresponding amount in 2Q25, related to interest on dividends due. |
Earnings Release 2Q25 | 42 |
| |
9.6. Current and Deferred Taxes
Adjusted income tax and social contributions amounted to -R$ 173 million in 2Q25, compared to +R$ 421 million in 2Q24.
It is worth noting that Eletrobras recognized two deferred income tax effects in 2Q25: (i) R$ 882 million related to the regulatory remeasurement, and (ii) R$ 393 million related to the change in Eletronorte's effective tax rate.
The first effect reflects the application of each subsidiary’s effective tax rate to the remeasured value of its respective contracts. The second effect stems from the revision of Eletronorte’s deferred tax assets and liabilities, following the adoption of a new effective corporate income tax rate of 6.25%. This lower rate applies as a result of the sale of its thermal power plants in May 2025, after which Eletronorte began operating exclusively with incentivized assets.
Table 33 - Income Tax and Social Contribution (R$ mm)
| 2Q25 | 2Q24 | % | 1Q25 | % | 6M25 | 6M24 | % | |
| Current income tax and social contribution | -254 | 20 | n.m. | -79 | 219.5 | -333 | -494 | -32.6 |
| Deferred income tax and social contribution | 1356 | 1183 | 15 | 14 | n.m. | 1,370 | 1,392 | -1.6 |
| Income tax and social contribution total | 1,102 | 1,203 | -8.4 | -65 | n.m. | 1,037 | 898 | 15.5 |
| Adjustments | ||||||||
| Constitution/Reversal of Deferred Tax on Tax Loss ¹ | 0 | -782 | n.m. | 0 | 0 | 0 | -782 | n.m. |
| Deferred Tax Adjustment on Regulatory Remeasurement ² | -882 | 0 | n.m. | 0 | 0 | -882 | 0 | 0.0 |
| Deferred Tax Adjustment on Eletronorte's tax rate | -393 | 0 | n.m. | 0 | 0.00 | -393 | 0 | 0.0 |
| Adjusted income tax and social contribution | -173 | 421 | -141.1 | -65 | 166.5 | -238 | 116 | -304.9 |
¹ Holding and CGT Eletrosul in 2T24. At the Holding level, R$1,074 million in tax credits were recognized, stemming from tax loss carryforwards accumulated by Eletrobras, following a reassessment of taxable income due to the merger with Furnas. At CGT Eletrosul, R$292.4 million were reversed, based on a revised expectation regarding the completion of the operations required to utilize the tax credit generated by the sale of the Candiota thermal power plant (UTE Candiota).
² Deferred Tax recognized in 2Q25 relative to the Regulatory Remeasurement, due to changes in the payment schedule of the RBSE financial component for contracts extended under Law 12,783/2013, as approved by ANEEL’s Board at its 20th Ordinary Public Meeting held on June 10, 2025, affecting the 2025–26 to 2027–28 cycles.
Earnings Release 2Q25 | 43 |
| |
10. OPERATING PERFORMANCE
10.1. Generation Segment
Generation Assets
The Company had 82 plants, including 47 hydroelectric, 1 thermal, 33 wind and 1 solar in 2Q25, considering corporate ventures, shared ownership and stakes via SPEs. Compared to 1Q25, the decrease of six assets was primarily due to the transfer of ownership of thermal power plants held by Eletronorte. Additionally, the period reflected the acquisition of the Colíder HPP and the transfer of the Gov. Jayme Canet HPP from CGT Eletrosul.
Portfolio installed capacity reached 44,368.08 MW in 2Q25, with 99% generated from clean sources with low greenhouse gas emissions, representing 17% of Brazil's total installed capacity.
Table 34 - Generation Assets
| Source | Installed Capacity (MW) | Assured Capacity (aMW) | Accumulated Generated Energy (GWh) |
| Hydro (47 plants) | 43,072.68 | 21,027.70 | 82,428.31 |
| Thermal (1 plants) | 500.00 | 401.20 | 1,336.02 |
| Wind Power (33 plants) | 794.47 | 226.39 | 811.29 |
| Solar (1 plant) | 0.93 | 0.00 | 0.51 |
| Total (82 plants) | 44,368.08 | 21,655.29 | 84,576.13 |
In 2Q25, Total energy generation by Eletrobras fell by 7.5% compared to the same period last year.
Chart 4 - Eletrobras - Net Energy Generation (GWh)
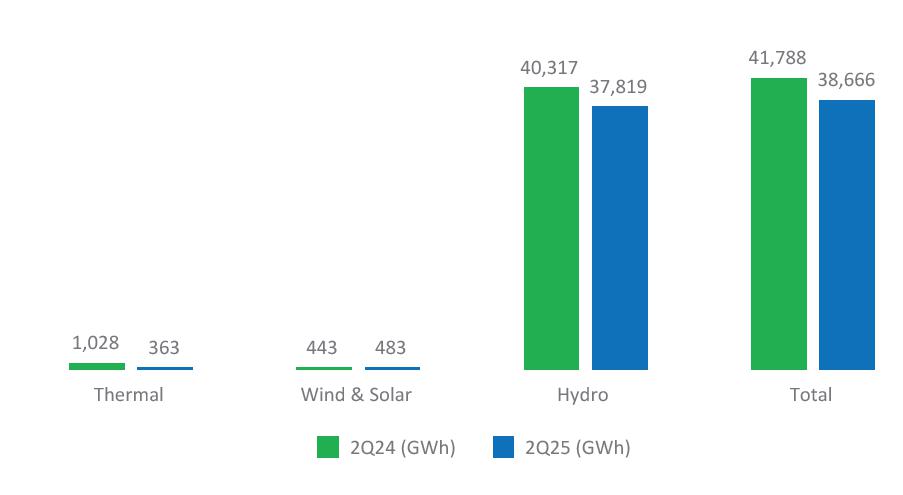
Earnings Release 2Q25 | 44 |
| |
System Data - Installed Capacity and Generation
In 2Q25, Brazil's installed capacity was 254,044.30 MW.
Chart 5 - Brazil’s Installed capacity - by source
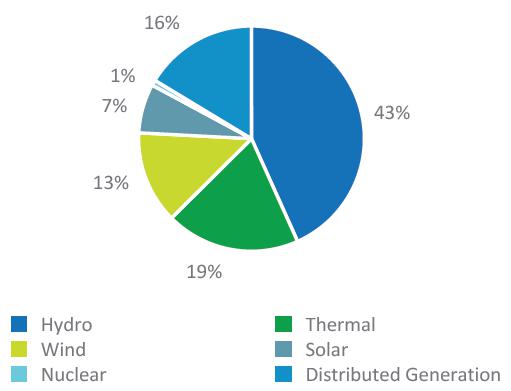
Source: ANEEL's Generation Information System (SIGA)
Chart 6 - Generated Energy SIN - National Interconnected System (GWh)
Source: Operating Results 01/01 to 3/31/2025 from the National Operator of the Electric System (ONS)
Earnings Release 2Q25 | 45 |
| |
System Data - Energy Market
Table 35 - PLD
| 2Q25 | 2Q24 | ∆% | 1Q25 | ∆% | ||
| Market | GSF (%) | 95.34 | 99.22 | -3.9 | 107.56 | -11.4 |
| PLD SE (R$/MWh) | 226.68 | 62.83 | 260.8 | 162.06 | 39.9 | |
| PLD S (R$/MWh) | 235.91 | 62.83 | 275.5 | 164.08 | 43.8 | |
| PLD NE (R$/MWh) | 161.75 | 62.83 | 157.5 | 58.92 | 174.5 | |
| PLD N (R$/MWh) | 163.42 | 62.83 | 160.1 | 58.92 | 177.3 |
Chart 7 - GSF (%)
Chart 8 - Historical Average of Affluent Natural Energy (ENA) - SIN (%)
2Q25 was marked by an increase in ENA in June, with rainfall concentrated in the South region.
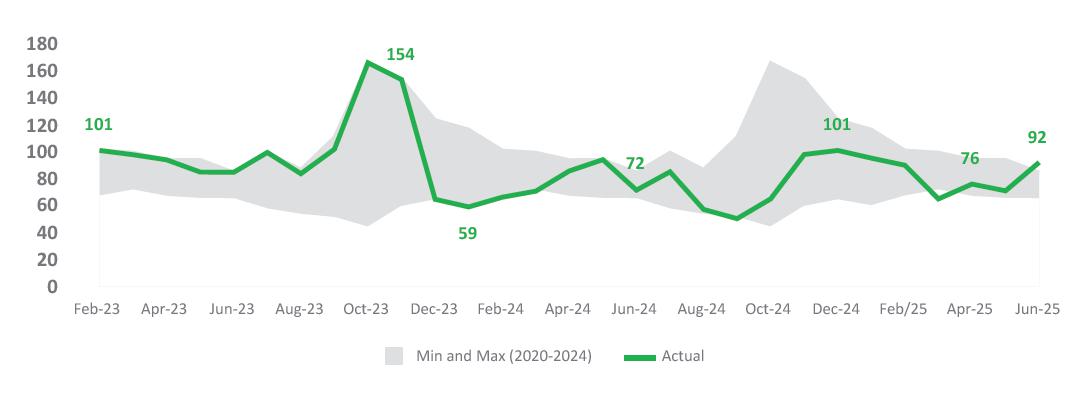
Earnings Release 2Q25 | 46 |
| |
Chart 9 - Energy Stored in Reservoirs - SIN (%)
The level of Energy Stored in Reservoirs was at 70% in 2Q25, around 1% lower from 2Q24.
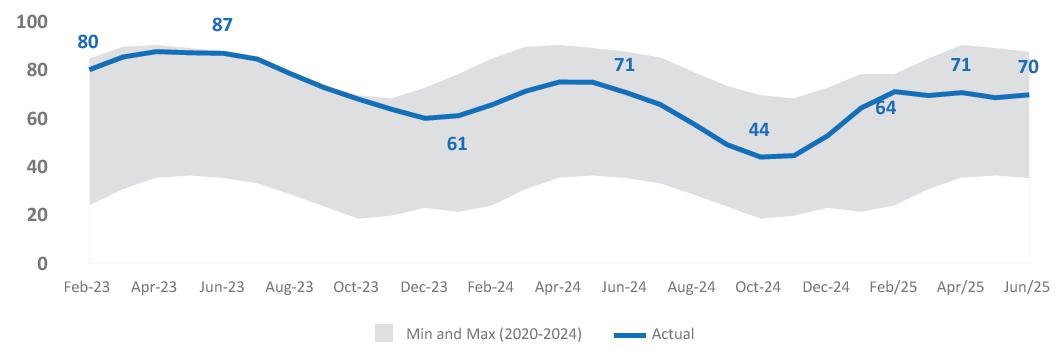
10.2. Transmission Segment
The Company ended 2Q25 with 73.8 thousand km of transmission lines, of which 67.4 thousand km were owned and 6.3 thousand km operated through partnerships, compared to 73.8 thousand km in 1Q24 (66.5 thousand km owned and 7.3 thousand km in partnership).
There were also 411 substations, including 295 owned and 116 operated by third parties.
Table 36 - Transmission Lines (Km)[9]
| Company | Own(1) | In Partnership (2) | Total |
| Chesf | 22,191 | 1,832 | 24,023 |
| Eletronorte | 10,982 | 1,073 | 12,055 |
| CGT Eletrosul | 12,134 | 5 | 12,139 |
| Furnas | 22,129 | 3,429 | 25,558 |
| Total | 67,436 | 6,338 | 73,774 |
(1) Includes TMT (100%) and VSB (100%).
(2) Partnerships consider extensions proportional to the capital invested by Eletrobras Companies in the venture.
[9] For more information on Eletrobras Holding's Corporate Structure, refer to Appendix 3 in this report.
Earnings Release 2Q25 | 47 |
| |
10.3. ESG
Table 37 - ESG KPIs 2Q25
| Pillar | KPI | 2Q24 | 2Q25 | Change | |
| Planet | Accumulated GHG Emissions for the year | 1,873,121 | 885,107 | -53% | |
| (Scopes 1, 2 and 3) (tCO2e) | |||||
| People | Accident Frequency Rate - own Employees (with time off) | 0.48 | 0.48 | —% | |
| Women in the Workforce (%) | 20% | 20% | 0.0 p.p. | ||
| Leadership positions held by women (%) | 26% | 25% | -1.0 p.p. | ||
| Governance | Complaints answered on time (%) | 98.0% | 100.0% | 2.0 p.p. | |
The values presented are preliminary and not assured, and may be adjusted based on data collection, verification and updating processes.
1 The reduction in emissions is primarily due to the removal of coal-fired thermoelectric generation from the Company’s energy matrix.
2 Reduction was due to departures connected to the VDPs.
Earnings Release 2Q25 | 48 |
| |
11. APPENDIX
11.1. Appendix 1 - Accounting Statements
Table 37 - Balance Sheet (R$ Thousand)
| PARENT COMPANY | CONSOLIDATED | |||
| 06/30/2025 | 12/31/2024 | 06/30/2025 | 12/31/2024 | |
| ASSETS | ||||
| CURRENT | ||||
| Cash and cash equivalents | 11,616,284 | 16,387,945 | 22,529,651 | 26,572,522 |
| Restricted cash | 282,037 | 449,865 | 450,603 | 508,734 |
| Securities | 2,687,356 | 6,421,621 | 6,856,889 | 8,951,838 |
| Clients | 1,602,279 | 1,686,293 | 5,234,155 | 5,911,477 |
| Transmission contract assets | 3,814,397 | 4,634,940 | 8,242,777 | 10,539,570 |
| Financing, loans and debentures | 706,240 | 971,555 | 463,157 | 475,458 |
| Remuneration for equity holdings | 1,378,237 | 2,286,078 | 441,456 | 721,683 |
| Taxes and Contributions | 1,531,480 | 1,734,020 | 2,291,209 | 2,831,413 |
| Income tax and social contribution | 0 | 0 | 0 | 0 |
| Right to compensation | 725,813 | 865,299 | 754,685 | 893,254 |
| Warehouse | 63,379 | 50,576 | 393,237 | 441,471 |
| Derivative financial instruments | 0 | 500,998 | 37,418 | 692,660 |
| Others | 854,350 | 729,718 | 1,576,159 | 1,408,919 |
| 25,261,852 | 36,718,908 | 49,271,396 | 59,948,999 | |
| Assets held for sale | 713,777 | 1,353,723 | 713,777 | 4,502,102 |
| 25,975,629 | 38,072,631 | 49,985,173 | 64,451,101 | |
| NON-CURRENT | ||||
| LONG-TERM ASSETS | ||||
| Restricted cash | 1,516,383 | 1,430,650 | 3,132,170 | 3,170,749 |
| Equity Holdings Income | 181,049 | 181,049 | 0 | 0 |
| Right to compensation | 352,803 | 692,126 | 367,239 | 720,081 |
| Financing, loans and debentures | 1,293,095 | 1,894,322 | 168,444 | 163,140 |
| Clients | 153,516 | 171,017 | 545,512 | 602,411 |
| Securities | 429,397 | 421,933 | 439,322 | 433,341 |
| Taxes and Contributions | 2,357,241 | 2,356,369 | 2,748,143 | 2,715,445 |
| Deferred income tax and social contribution | 0 | 0 | 5,722,119 | 5,673,011 |
| Bonds and deposits linked | 4,090,617 | 3,693,298 | 5,739,815 | 5,190,344 |
| Transmission contractual assets | 20,580,061 | 21,223,812 | 55,827,309 | 56,848,086 |
| Derivative financial instruments | 381,029 | 1,269,677 | 757,277 | 1,544,095 |
| Others | 1,868,139 | 2,000,734 | 1,163,786 | 1,645,570 |
| 33,203,330 | 35,334,987 | 76,611,136 | 78,706,273 | |
| INVESTMENTS | ||||
| Equity Income | 112,588,827 | 112,300,525 | 30,926,638 | 30,727,405 |
Earnings Release 2Q25 | 49 |
| |
| PARENT COMPANY | CONSOLIDATED | |||
| 06/30/2025 | 12/31/2024 | 06/30/2025 | 12/31/2024 | |
| Held at fair value | 976,987 | 839,546 | 976,987 | 861,234 |
| Other Investments | 19,387 | 19,387 | 97,987 | 97,987 |
| 113,585,201 | 113,159,458 | 32,001,612 | 31,686,626 | |
| FIXED ASSETS | 7,387,064 | 6,137,175 | 39,106,244 | 36,854,055 |
| INTANGIBLE | 20,538,860 | 20,779,526 | 77,255,959 | 78,173,273 |
| 174,714,455 | 175,411,146 | 224,974,951 | 225,420,227 | |
| TOTAL ASSETS | 200,690,084 | 213,483,777 | 274,960,124 | 289,871,328 |
| PARENT COMPANY | CONSOLIDATED | |||
| LIABILITIES AND SHAREHOLDERS' EQUITY | 6/30/2025 | 12/31/2024 | 6/30/2025 | 12/31/2024 |
| CURRENT LIABILITIES | ||||
| Loans, financing and debentures | 7,128,604 | 8,329,966 | 10,944,211 | 12,809,872 |
| Compulsory loans - Agreements | 1,511,547 | 1,105,534 | 1,511,547 | 1,105,534 |
| Compulsory loans | 1,222,900 | 1,326,925 | 1,222,900 | 1,326,925 |
| Suppliers | 962,898 | 1,145,660 | 2,184,699 | 2,756,328 |
| Taxes and Contributions | 259,791 | 378,569 | 899,111 | 1,146,169 |
| Income tax and social contribution | 0 | 0 | 0 | 0 |
| Onerous contracts | 0 | 0 | 120,720 | 62,711 |
| Shareholder remuneration | 32,793 | 2,486,778 | 35,707 | 2,490,668 |
| Personnel obligations | 376,481 | 483,779 | 779,165 | 1,065,114 |
| Reimbursement Obligations | 0 | 0 | 47,959 | 55,517 |
| Post-employment benefits | 941 | 993 | 300,365 | 289,840 |
| Provision for litigation | 719,478 | 1,719,453 | 811,458 | 1,791,088 |
| Sector charges | 90,107 | 105,352 | 891,955 | 820,067 |
| Obligations under Law 14,182/2021 | 996,590 | 814,819 | 3,578,059 | 2,916,199 |
| RGR Returns | 595,147 | 492,276 | 595,147 | 492,276 |
| Leasing | 19,994 | 8,429 | 49,776 | 26,861 |
| Derivative financial instruments | 967,944 | 824,125 | 1,411,580 | 1,175,652 |
| Others | 245,224 | 458,746 | 1,428,033 | 1,105,093 |
| 15,130,439 | 19,681,404 | 26,812,392 | 31,435,914 | |
| Liabilities associated with assets held for sale | 0 | 0 | 0 | 194,454 |
| 15,130,439 | 19,681,404 | 26,812,392 | 31,630,368 | |
| NON-CURRENT | ||||
| Loans, financing and debentures | 37,688,776 | 40,926,187 | 59,345,657 | 62,810,702 |
| Shareholder remuneration | 0 | 0 | 585 | 0 |
| Suppliers | 0 | 0 | 123,651 | 7,959 |
Earnings Release 2Q25 | 50 |
| |
| PARENT COMPANY | CONSOLIDATED | |||
| 06/30/2025 | 12/31/2024 | 06/30/2025 | 12/31/2024 | |
| Provision for litigation | 14,882,449 | 15,658,437 | 20,610,023 | 21,583,395 |
| Post-employment benefits | 412,648 | 418,586 | 3,397,715 | 3,416,381 |
| Obligations under Law 14,182/2021 | 10,854,810 | 11,111,765 | 38,128,295 | 39,105,924 |
| RGR Returns | 219,987 | 439,974 | 219,987 | 439,974 |
| Onerous contracts | 0 | 0 | 505,083 | 621,725 |
| Reimbursement Obligations | 0 | 0 | 15,286 | 15,286 |
| Leasing | 87,336 | 79,994 | 395,965 | 155,722 |
| Concessions payable - Use of public assets | 38,268 | 38,175 | 561,504 | 543,867 |
| Advances for future capital increases | 115,932 | 108,938 | 115,932 | 108,938 |
| Derivative financial instruments | 114,645 | 2,283 | 114,645 | 2,283 |
| Sector charges | 766,877 | 744,833 | 993,434 | 942,348 |
| Taxes and Contributions | 96,537 | 103,682 | 294,073 | 372,488 |
| Deferred income tax and social contribution | 946,469 | 1,566,835 | 3,112,418 | 4,287,021 |
| Others | 627,994 | 739,459 | 1,458,657 | 1,827,171 |
| 66,852,728 | 71,939,148 | 129,392,910 | 136,241,184 | |
| SHAREHOLDERS' EQUITY | ||||
| Share capital | 70,135,202 | 70,099,826 | 70,135,202 | 70,099,826 |
| Share issue costs | -108,186 | -108,186 | -108,186 | -108,186 |
| Capital Reserves and Granted Equity Instruments | 13,912,770 | 13,910,768 | 13,912,770 | 13,910,768 |
| Treasury shares | -2,222,635 | -2,223,011 | -2,222,635 | -2,223,011 |
| Profit reserves | 43,905,041 | 43,905,041 | 43,905,041 | 43,905,041 |
| Proposed additional dividend | 0 | 1,535,196 | 0 | 1,535,196 |
| Accumulated profit | -1,677,488 | 0 | -1,677,488 | 0 |
| Accumulated other comprehensive income | -5,237,787 | -5,256,409 | -5,237,787 | -5,256,409 |
| Amounts recognized in other comprehensive income classified as held for sale | 0 | 0 | 0 | 0 |
| Controlling shareholders | 118,706,917 | 121,863,225 | 118,706,917 | 121,863,225 |
| Non-controlling shareholders | 0 | 0 | 47,905 | 136,551 |
| TOTAL SHAREHOLDERS' EQUITY | 118,706,917 | 121,863,225 | 118,754,822 | 121,999,776 |
| TOTAL LIABILITIES AND SHAREHOLDERS' EQUITY | 200,690,084 | 213,483,777 | 274,960,124 | 289,871,328 |
Earnings Release 2Q25 | 51 |
| |
Table 38 - Income Statement (R$ Thousand)
| PARENT COMPANY | CONSOLIDATED | |||
| 06/30/2025 | 06/30/2024 | 06/30/2025 | 06/30/2024 | |
| CONTINUING OPERATIONS | ||||
| Net operating revenue | 7,191,028 | 29,553 | 20,613,133 | 17,113,553 |
| Operating costs | -4,162,849 | -67 | -10,923,292 | -9,149,743 |
| GROSS PROFIT | 3,028,179 | 29,486 | 9,689,841 | 7,963,810 |
| Operating expenses | -788,941 | -219,590 | -2,403,980 | -2,157,670 |
| Regulatory Remeasurements - Transmission Contracts | -1,681,819 | 0 | -4,385,033 | 0 |
| OPERATING RESULT BEFORE FINANCIAL RESULT | 557,419 | -190,104 | 2,900,828 | 5,806,140 |
| FINANCIAL RESULT | -3,012,628 | -1,703,591 | -6,048,785 | -5,909,589 |
| Income from interest, fines, commissions and fees | 138,344 | 491,206 | 23,432 | 71,699 |
| Income from financial investments | 1,193,925 | 379,511 | 2,158,536 | 1,120,166 |
| Late payment surcharge on electricity | 2,318 | 0 | 68,224 | 78,502 |
| Other financial income | 45,507 | 156,519 | 53,298 | 201,860 |
| (–) Taxes on financial income | -89,143 | -67,431 | -161,536 | -106,030 |
| Financial Income | 1,290,951 | 959,805 | 2,141,954 | 1,366,197 |
| Debt charges | -1,884,688 | -1,486,043 | -3,168,301 | -3,124,510 |
| CDE obligation charges | -380,441 | 0 | -1,322,857 | -1,222,589 |
| River basin revitalization charges | -41,802 | 0 | -157,249 | -168,008 |
| Other financial expenses | -132,642 | -257,049 | -195,448 | -452,965 |
| Financial expenses | -2,439,573 | -1,743,092 | -4,843,855 | -4,968,072 |
| Monetary updates – CDE | -301,498 | 0 | -1,048,360 | -860,650 |
| Monetary updates – river basins | -42,670 | 0 | -165,447 | -153,765 |
| Monetary reliefs | -369,535 | -514,453 | -548,448 | -536,765 |
| Exchange rate variations | -9,485 | 28,478 | -6,976 | 2,377 |
| Change in fair value of hedged debt net of derivative | -1,140,819 | -434,329 | -1,553,607 | -562,974 |
| Change in derivative financial instrument not linked to debt protection | 0 | 0 | -24,046 | -195,937 |
| Financial items, net | -1,864,007 | -920,304 | -3,346,884 | -2,307,714 |
Earnings Release 2Q25 | 52 |
| |
| PARENT COMPANY | CONSOLIDATED | |||
| 06/30/2025 | 06/30/2024 | 06/30/2025 | 06/30/2024 | |
| PROFIT BEFORE EQUITY HOLDINGS | -2,455,210 | -1,893,695 | -3,147,957 | -103,449 |
| Equity income | 32,631 | 2,884,708 | 241,625 | 1,276,208 |
| Other income and expenses | 85,933 | 3,139 | 190,179 | 2,573 |
| OPERATING PROFIT BEFORE TAX | -2,336,646 | 994,152 | -2,716,153 | 1,175,332 |
| Current income tax and social contribution | 0 | 0 | -332,852 | -494,202 |
| Deferred income tax and social contribution | 659,157 | 1,074,204 | 1,370,283 | 1,392,081 |
| NET INCOME FOR CONTINUING OPERATIONS | -1,677,488 | 2,068,356 | -1,678,722 | 2,073,211 |
| Portion attributable to controlling | -1,677,488 | 2,068,356 | -1,677,488 | 2,068,356 |
| Portion attributable to non-controlling | 0 | 0 | -1,234 | 4,855 |
| NET INCOME (LOSS) FOR DISCONTINUED OPERATIONS | 0 | 0 | 0 | 0 |
| Portion attributable to controlling | 0 | 0 | 0 | 0 |
| Portion attributable to non-controlling | 0 | 0 | 0 | 0 |
| NET INCOME FOR THE YEAR | -1,677,489 | 2,068,356 | -1,678,722 | 2,073,211 |
| Portion attributable to controlling | -1,677,488 | 2,068,355 | -1,677,488 | 2,068,356 |
| Portion attributable to non-controlling | 0 | 0 | -1,234 | 4,855 |
| EARNINGS PER SHARE | ||||
| Earnings per share - basic (ON) | -0.74 | 0.89 | -0.74 | 0.89 |
| Earnings per share - basic (PN) | -0.81 | 0.97 | -0.81 | 0.97 |
| Earnings per share - diluted (ON) | -0.73 | 0.87 | -0.73 | 0.87 |
| Earnings per share - diluted (PN) | -0.80 | 0.96 | -0.80 | 0.96 |
Earnings Release 2Q25 | 53 |
| |
Table 39 - Cash Flow Statement (R$ Thousand)
| PARENT COMPANY | CONSOLIDATED | |||
| 06/30/2025 | 06/30/2024 | 06/30/2025 | 06/30/2024 | |
| OPERATING ACTIVITIES | ||||
| Profit for the year before income tax and social contribution | -2,336,645 | 994,152 | -2,716,153 | 1,175,332 |
| Adjustments to reconcile profit with cash generated by operations: | ||||
| Depreciation and amortization | 447,787 | 8,358 | 2,243,600 | 1,964,812 |
| Net exchange and monetary variations | 723,188 | 485,975 | 1,769,231 | 1,548,803 |
| Financial income | 0 | 0 | 0 | 0 |
| Financial charges | 974,662 | 615,326 | 2,466,439 | 3,323,242 |
| Equity income | -32,631 | -2,884,708 | -241,625 | -1,276,208 |
| Other income and expenses | -183,318 | -13,745 | -84,719 | -13,179 |
| Transmission revenues | -3,872,041 | 0 | -10,264,270 | -8,953,525 |
| Construction cost - transmission | 756,978 | 0 | 1,780,935 | 1,428,308 |
| Regulatory Remeasurements - Transmission Contracts | 1,681,819 | 0 | 4,385,033 | 0 |
| Operating provisions (reversals) | -50,303 | -332,024 | 259,625 | 194,785 |
| Write-offs of PP&E and Intangible Assets | 436 | 0 | -152,745 | 180,772 |
| Result of hedged debt and derivatives | 1,140,819 | 434,329 | 1,577,653 | 758,911 |
| Other | 173,960 | 156,250 | 107,968 | 183,874 |
| 1,761,356 | -1,530,239 | 3,847,125 | -659,405 | |
| (Additions)/decreases in operating assets | ||||
| Clients | 54,672 | 0 | 662,011 | 164,463 |
| Right to compensation | 549,691 | 505,224 | 555,702 | 529,940 |
| Others | 1,268,465 | -162,706 | 2,049,160 | 29,509 |
| 1,872,828 | 342,518 | 3,266,873 | 723,912 | |
| Additions/(decreases) in operating liabilities | ||||
| Suppliers | -183,189 | -70,930 | -523,399 | -1,299,361 |
| Advances | 0 | 0 | 0 | 0 |
| Personnel obligations | -107,298 | -45,912 | -285,949 | -648,136 |
| Sector charges | -2,465 | 0 | 117,841 | 33,044 |
| Others | -34,416 | -81,152 | -1,035,375 | -847,157 |
| -327,368 | -197,994 | -1,726,882 | -2,761,610 | |
| Payment of financial charges | -2,181,963 | -1,945,272 | -3,137,666 | -3,690,811 |
| Payment of financial charges - leases | 0 | 0 | 0 | 0 |
| Receipt of RAP revenue | 3,654,516 | 0 | 9,196,807 | 10,361,815 |
| Receipt of Financial Charges from Subsidiaries | 0 | 0 | 0 | 0 |
| Receipt of remuneration from investments in equity holdings | 1,242,572 | 2,781,535 | 527,296 | 944,197 |
| Payment of litigation | -1,750,604 | -1,098,135 | -1,874,922 | -1,404,087 |
Earnings Release 2Q25 | 54 |
| |
| PARENT COMPANY | CONSOLIDATED | |||
| 06/30/2025 | 06/30/2024 | 06/30/2025 | 06/30/2024 | |
| Bonds and linked deposits | -430,710 | -71,056 | 38,763 | -405,044 |
| Payment of income tax and social contribution | -14,280 | -31,217 | -173,967 | -914,106 |
| Supplementary pension payments | -12,354 | -10,756 | -166,504 | -227,846 |
| Net cash provided by operating activities of discontinued operations | 0 | 0 | 0 | 0 |
| Net cash provided by (used in) operating activities | 1,477,348 | -766,464 | 7,080,770 | 3,142,347 |
| FINANCING ACTIVITIES | ||||
| Loans and financing obtained and debentures obtained | 0 | 9,008,795 | 500,000 | 16,923,438 |
| Payment of loans and financing and debentures - principal | -4,350,801 | -4,625,409 | -6,332,830 | -6,744,199 |
| Payment of remuneration to shareholders | -3,989,181 | -1,287,130 | -3,996,565 | -1,291,679 |
| Payment to dissenting shareholders - incorporation of shares | 0 | 0 | 0 | 0 |
| Share buybacks | 0 | 0 | 0 | 0 |
| Payment of CDE obligations and revitalization of basins - principal | -841,594 | 0 | -2,691,384 | -1,974,965 |
| Lease payments - principal | -17,223 | -8,413 | -25,868 | -30,891 |
| Restricted Cash | 0 | 0 | 0 | 0 |
| Others | -136,635 | 0 | -136,635 | 0 |
| Net cash (used in) financing activities | -9,335,434 | 3,087,843 | -12,683,282 | 6,881,704 |
| INVESTMENT ACTIVITIES | ||||
| Grant of advance for future capital increase | 0 | -8,051 | 0 | -8,051 |
| Receipt of loans and financing | 274,435 | 678,486 | 2,210 | 5,882 |
| Receipt of financial charges | 110,311 | 497,343 | 263 | 27,560 |
| Acquisition of fixed assets | -60,946 | -4,281 | -727,574 | -1,514,290 |
| Acquisition of intangible assets | -19,894 | -26,462 | -105,746 | -136,253 |
| Restricted cash | 82,095 | 0 | 96,710 | -216,121 |
| Financial (withdrawals)/contributions (securities) | 3,497,483 | -180,189 | 1,801,323 | -2,106,401 |
| Receipt of charges (securities) | 229,318 | 107,222 | 280,876 | 281,420 |
| Debentures Acquisition | 0 | 0 | 0 | 0 |
| Transmission infrastructure - contractual asset | -756,978 | 0 | -1,780,935 | -1,450,565 |
| Capital acquisition/contribution of equity holdings | -459,213 | -8,821 | -591,559 | -8,819 |
| Disposal of equity holdings | 189,814 | 0 | 2,584,072 | 0 |
| Net cash in the incorporation of subsidiaries | 0 | 0 | 0 | 0 |
| Net cash in the acquisition of control of investees | 0 | 0 | 0 | 0 |
| Others | 0 | 0 | 0 | -1,006 |
Earnings Release 2Q25 | 55 |
| |
| PARENT COMPANY | CONSOLIDATED | |||
| 06/30/2025 | 06/30/2024 | 06/30/2025 | 06/30/2024 | |
| Net cash provided by investment activities of discontinued operations | 0 | 0 | 0 | 0 |
| Net cash provided by (used in) investing activities | 3,086,425 | 1,055,247 | 1,559,641 | -5,126,644 |
| Increase (decrease) in cash and cash equivalents | -4,771,661 | 3,376,626 | -4,042,871 | 4,897,407 |
| Cash and cash equivalents at the beginning of the period | 16,387,945 | 5,698,457 | 26,572,522 | 13,046,371 |
| Cash and cash equivalents at the end of the period | 11,616,284 | 9,075,083 | 22,529,651 | 17,943,778 |
| -4,771,661 | 3,376,626 | -4,042,871 | 4,897,407 | |
Earnings Release 2Q25 | 56 |
| |
11.2. Appendix 2 - Statement on Thermal Power Plants Sale
On June 10, 2024, Eletrobras signed an agreement with Âmbar Energia/J&F Group to sell its thermoelectric portfolio for R$ 4.7 billion, including R$ 1.2 billion in earn-out. J&F also immediately and fully assumed the credit risk of the energy contracts in this portfolio.
On June 12, 2024, Provisional Measure No. 1,232 was published, introducing changes to the rules for isolated systems. The measure allows for a corporate transfer plan to be approved as an alternative to concession extinction, provided that ANEEL recognizes the loss of service conditions. It also modifies the rules for energy purchase and sale contracts (CCVEEs) reimbursable by the Fuel Consumption Account (CCC).
As a result, Eletronorte entered into Reserve Energy Contracts (CERs) with the Electric Energy Commercialization Chamber (CCEE), linked to specific Company power plants[10]. In addition, the terminations of CCVEEs for these plants, along with the Term of Withdrawal and Waiver of Rights against the Federal Government regarding energy purchases, were signed with Amazonas Distribuidora de Energia S/A before exchanging contracts for CERs.
The documents were approved sub judice in accordance with ANEEL Ruling No. 3,025, dated October 7, 2024. Eletrobras is already receiving the new CER-related payments directly from CCEE, including retroactive amounts up to June 13, 2024, the date on which the energy supply provided for in the CERs began.
Furthermore, on May 14, 2025, the sale of the Amazonas thermal plants to the J&F Group was completed, including the thermoelectric assets previously held by Eletronorte, which serve as counterparties to the new Reserve Energy Contracts (CERs). Following the transfer of ownership, the CERs were subsequently amended to reflect the new holder, the J&F Group.
The closing of the sale of Santa Cruz TPP (500 MW), the last remaining asset in the divested portfolio, is still pending the completion of regulatory approvals.
[10]Aparecida, Jaraqui, Tambaqui, Cristiano Rocha, Manauara and Ponta Negra.
Earnings Release 2Q25 | 57 |
| |
11.3. Appendix 3 - Statement on Furnas Merger
In the tables detailing the main operating subsidiaries of the Eletrobras Group, the comments on results for “Eletrobras Holding” as of 3Q24 take into account the following considerations:
| a) | Assets resulting from the recent incorporation of Furnas; |
| b) | The generation entities: Baguari Energia, Retiro Baixo Energética, Brasil Ventos, and Madeira Energia (MESA); and |
| c) | The transmission entities: Triângulo Mineiro Transmissora, Vale do São Bartolomeu Transmissora, and Nova Era Janapú. |
These seven entities were previously consolidated under Furnas.
In addition, effective April 29, 2025, Eletrobras began consolidating Eletronet after acquiring a 51% stake, bringing its total ownership to 100%. Subsequently, on June 26, 2025, Eletrobras incorporated Eletropar, which was then dissolved. As of this date, comments on the results related to “Eletrobras Holding” also include Eletronet’s performance.
For simplicity in comparisons between 2Q25 and 2Q24, the sum of Eletrobras Holding, Eletropar and consolidated Furnas, including the seven SPEs, was considered for 2Q24. This approach was adopted as the eliminations have an immaterial impact on both the operating result (revenue and EBITDA) and the financial result.
Earnings Release 2Q25 | 58 |
| |
11.4. Appendix 4 - Regulatory vs. IFRS Income Statement
Considering the regulatory income statement versus the IFRS one, the differences in accounting treatment in both frameworks generated a positive effect of R$ 4,640 million on EBITDA before equity income and R$ 2,573 million on net income.
Chart 10 - EBITDA Regulatory x IFRS (R$ mm)
Chart 11 - Net Income Regulatory x IFRS (R$ mm)
The difference between regulatory and IFRS net income can also be analyzed by reorganizing the Income Statement lines. It is possible to group them according to the operational nature of the events to which they are related. This exercise consists of segmenting them into (a) transmission, (b) generation, (c) equity holdings, and (d) others—including provisions, financial result and taxes.
As a result, most of the difference between regulatory vs. IFRS net income is essentially explained by the specific accounting treatment applied to the transmission segment under each accounting framework, resulting in a positive effect of R$ 3,538 million on regulatory net income, considering the transmission-related transactions of consolidated companies.
Chart 12 - Net Income Regulatory x IFRS by Segment (R$ mm)
Earnings Release 2Q25 | 59 |
| |
Transmission: R$ 3,538 million positive effect
Chart 13 - Transmission Effects (R$ mm)
| • | -R$ 591 million in gross revenue, including two effects: |
(a) In the regulatory framework, revenue is recognized on a cash basis, based on the billing of transmission concessionaires. Under IFRS, revenue reflects the value of the contractual asset, which is a non-cash item.
(b) The difference in the way the network usage charge paid by Eletrobras’ generation companies to its own transmission companies is eliminated from transmission revenue, following the cash regime in the regulatory framework. In the IFRS framework, only one of the non-cash portions of transmission revenue is considered: operation and maintenance revenue.
| • | R$ 1,036 million relating to construction costs, recognized only under IFRS accounting; |
| • | R$ 146 million as a counterpart to the elimination in transmission revenue mentioned in item (b) above, recorded in the cost with charges for use of the generation grid, in the same amount, but with the sign inverted; |
| • | R$ 3,433 million in regulatory remeasurement, reflecting changes in the payment flow of the RBSE financial component for contracts extended under Law No. 12,783/2013, applicable to the 2025–2026, 2026–2027, and 2027–2028 tariff cycles, pursuant to the decision of ANEEL’s Board of Directors at its 20th Ordinary Public Meeting held on June 10, 2025. |
| • | -R$ 483 million referring to higher depreciation under the regulatory framework, reflecting the depreciation of transmission lines and substations—an effect that does not occur on the contractual asset under the IFRS framework. |
Earnings Release 2Q25 | 60 |
| |
Generation: R$ 561 million negative effect
Chart 14 - Generation Effects (R$ mm)
| • | In 2Q25, the R$ 15 million negative difference in revenue is explained by the default on part of the energy sold to Amazonas Energia, which was offset by a provision of the same amount under the regulatory framework. In this framework, the revenue is recognized and fully provisioned, whereas under IFRS, it is not recognized. |
| • | Energy Purchased from Independent Power Producers (IPPs): under the regulatory framework, an expense of R$ 92 million is recognized for energy purchased for resale. Under the IFRS framework, the purchase agreement is treated as a lease; therefore, only the depreciation of the right-of-use asset and the interest expense on the lease liability are recognized in the financial result, in the amounts of R$ 4 million and R$ 67 million, respectively. The total net effect is a negative R$ 21 million under the regulatory framework. |
| • | Asset disposal result: the R$ 610 million million difference is explained by the absence, under the regulatory framework, of the write-off of the accounting balance related to lease agreements recognized for energy purchased from IPPs in the North region and resold to Amazonas Energia. Under IFRS accounting, such commitments generate a right-of-use asset, which has no counterpart in the regulatory balance sheet and was written off following the sale of the Amazonas thermal plants. |
| • | Management of Generation Assets (GAG) for investment in improvements: under IFRS, this liability in the amount of R$ 28 million is reversed under provisions, following the decotization curve as legacy contracts of the plants are gradually phased out. Under the regulatory framework, this effect is not recognized. |
Equity Income: R$ 78 million negative effect
| • | Mainly reflecting the equity income from the transmission segment. |
Other Lines: R$ 1,447 million negative effect
| • | Differences in recognition in various lines of provision, financial results and taxes. |
| • | The tax line is the most significant contributor, with a R$ 1,432 million impact that explains virtually the entire difference, reflecting the divergence between the regulatory and IFRS tax bases. |
Earnings Release 2Q25 | 61 |
| |
11.5. Appendix 5 - IFRS EBITDA
Table 41 - Adjusted IFRS EBITDA (R$ Thousand)
| 2Q25 | 2Q24 | % | 1Q25 | % | 6M25 | 6M24 | % | |
| Results for the year | -1,325 | 1,743 | -176.0 | -354 | 274.7 | -1,679 | 2,073 | -181.0 |
| + Results for the year, discontinued operations | 0 | 0 | 0.0 | 0 | 0.0 | 0 | 0 | 0.0 |
| Results for the year, continued operations | -1,325 | 1,743 | -176.0 | -354 | 274.7 | -1,679 | 2,073 | -181.0 |
| + Provision for Income Tax and Social Contribution | -1,102 | -1,203 | -8.4 | 65 | n.m. | -1,037 | -898 | 15.5 |
| + Financial Result | 2,555 | 2,922 | -12.6 | 3,494 | -26.9 | 6,049 | 5,910 | 2.4 |
| + Amortization and Depreciation | 1,131 | 968 | 16.9 | 1,112 | 1.7 | 2,244 | 1,965 | 14.2 |
| EBITDA | 1,259 | 4,430 | -71.6 | 4,318 | -70.8 | 5,576 | 9,050 | -38.4 |
| Revenue Adjustments | 109 | 0 | 0.0 | 0 | 0.0 | 109 | 0 | 0.0 |
| Cost and Expense Adjustments | 3,661 | 171 | n.m. | 191 | n.m. | 3,853 | 203 | n.m. |
| Adjustments Provisions | -43 | -396 | -89.0 | 41 | -206.6 | -3 | -514 | -99.5 |
| Adjustments Results from asset sale | 105 | 115 | -8.5 | 0 | 0.0 | 105 | 115 | -8.5 |
| Adjustments Other Income and Expenses | -57 | 2 | n.m. | -133 | -57.4 | -190 | -3 | n.m. |
| Adjustments Equity Income | 116 | 0 | 0.0 | 0 | 0.0 | 116 | 0 | 0.0 |
| Adjusted EBITDA | 5,151 | 4,322 | 19.2 | 4,416 | 16.6 | 9,567 | 8,852 | 8.1 |
Earnings Release 2Q25 | 62 |
| |
11.6. Appendix 6 - IFRS Generation Revenue
The following table presents the breakdown of the IFRS Generation Revenue, aligned with the accounting statements. The power supply for distribution companies is revenue derived from customers who are not end consumers, such as distributors, traders, and generators, covering contracts in both the free contracting (ACL) and regulated market (ACR) environments, while the power supply for end consumers is revenue that comes directly from end consumers, including industries and commercial entities, and consists exclusively of contracts in the free contracting environment (ACL).
Table 42 - Gross Revenue 2Q25 (R$ mm)
| 2Q25 | |||||||
| Eletrobras Holding | Chesf | Eletronorte | CGT Eletrosul | Total | Elimination | Consolidated IFRS | |
| Power supply for distribution companies | 2,573 | 255 | 1,411 | 200 | 4,439 | -64 | 4,374 |
| Power supply for end consumers | 245 | 55 | 78 | 55 | 433 | 0 | 433 |
| CCEE | 283 | 406 | 819 | 26 | 1,534 | 0 | 1,534 |
| O&M revenue | 176 | 330 | 4 | 0 | 509 | 0 | 509 |
| Generation Revenues | 3,277 | 1,045 | 2,313 | 281 | 6,915 | -64 | 6,851 |
| Non-recurring items - Adjustments | 0 | 0 | 0 | 0 | 0 | 0 | 0 |
| Adjusted Generation Revenue | 3,277 | 1,045 | 2,313 | 281 | 6,915 | -64 | 6,851 |
Table 43 - Gross Revenue 2Q24 (R$ mm)
| 2Q24 | |||||||
| Eletrobras + Furnas and Others | Chesf | Eletronorte | CGT Eletrosul | Total | Elimination | Consolidated IFRS | |
| Power supply for distribution companies | 2,031 | 116 | 1,386 | 193 | 3,726 | -2 | 3,724 |
| Power supply for end consumers | 307 | 77 | 398 | 9 | 792 | 0 | 792 |
| CCEE | 48 | 207 | 258 | 1 | 514 | 0 | 514 |
| O&M revenue | 264 | 528 | 7 | 0 | 798 | 0 | 798 |
| Generation Revenues | 2,650 | 927 | 2,049 | 204 | 5,830 | -2 | 5,828 |
| Non-recurring items - Adjustments | 0 | 0 | 0 | 0 | 0 | 0 | 0 |
| Adjusted Generation Revenue | 2,650 | 927 | 2,049 | 204 | 5,830 | -2 | 5,828 |
11.7. Appendix 7 - IFRS Transmission Revenue
IFRS transmission revenue was R$ 5,079 million in 2Q25, up 16% from 2Q24, recording increases of R$ 342 million in Construction revenue, R$ 334 million in Contractual revenue and R$ 7 million in O&M revenue. O&M revenue refers to the operation and maintenance of assets in service; construction revenue reflects capital expenditures recognized in ongoing projects; and contractual (financial) revenue corresponds to inflation adjustments applied to the contract asset balances under each concession.
Table 44 - Transmission Operating Revenue (R$ mm)
| 2Q25 | 2Q24 | % | 1Q25 | % | 6M25 | 6M24 | % | |
| Transmission Revenues | 5,079 | 4,395 | 15.6 | 5,186 | -2.1 | 10,264 | 8,954 | 14.6 |
| Revenue from Operation & Maintenance | 2,065 | 2,058 | 0.3 | 2,016 | 2.4 | 4,081 | 3,957 | 3.1 |
| Construction Revenue | 1,063 | 721 | 47.5 | 746 | 42.5 | 1,809 | 1,306 | 38.5 |
| Contractual Revenue - Transmission | 1,951 | 1,616 | 20.7 | 2,424 | -19.5 | 4,374 | 3,690 | 18.5 |
| Non-recurring items - Adjustments | 0 | 0 | 0.0 | 0 | 0.0 | 0 | 0 | 0.0 |
| Adjusted Transmission Operating Revenue | 5,079 | 4,395 | 15.6 | 5,186 | -2.1 | 10,264 | 8,954 | 14.6 |
Earnings Release 2Q25 | 63 |
| |
11.8. Appendix 8 - Regulatory Transmission Revenue - Adjustment Portion (PA)
The Adjustment Portion (PA) of the current tariff cycle is a regulatory mechanism, as outlined in the contract, designed to compensate for revenue deficits or surpluses from the previous tariff cycle. In other words, it adjusts the difference between the amounts received and those allowed in the prior cycle, which is then offset in 12 equal monthly installments during the current cycle. The Adjustment Portion can be positive or negative, depending on each agent’s balance.
The table below presents the PA breakdown defined by ANEEL for the 2024/2025 and 2025/2026 cycles, as established in ANEEL Resolutions 3,348/2024 and 3,481/2025, within the scope of the Annual RAP Readjustments. Additionally, the PA Reviews for the upcoming tariff cycles (2026/2027 and 2027/2028) established by ANEEL under the RAP periodic review processes for renewed and tendered concession contracts—already approved by ANEEL up to the 2025/2026 cycle—are also included.
Table 45 - Adjustment Portion (PA) 3,348/2024 (R$ mm)
|
Concession Contracts Extended by Law 12,783/2012 As of Jun/24 |
PA Cycle 24/25 |
PA Cycle 25/26 |
PA Cycle 26/27 |
PA Cycle 27/28 |
TOTAL |
| PA Periodic Review of RAP - 2023 (I) (1) | -811 | 509 | 509 | 509 | 718 |
| PA Postponement RTP (Periodic Tariff Review) (2) | -1,316 | -1,316 | |||
| RBSE - Economic Component | -1,655 | -1,655 | |||
| RBSE - O&M - Ordinance 579/2012 | 18 | 18 | |||
| Reinforcements and Improvements with Previous RAP | -176 | -176 | |||
| Reinforcements and Improvements without Previous RAP (3) | 496 | 496 | |||
| PA Retroactive of the revised revenue for Reinforcements and Improvements (4) | 349 | 373 | 373 | 373 | 1,468 |
| Reinforcements and Improvements with Previous RAP | 50 | 57 | 57 | 57 | 222 |
| Reinforcements and Improvements without Previous RAP | 299 | 316 | 316 | 316 | 1,246 |
| PA Other Adjustments - RTP 2023 (5) | 26 | 26 | |||
| PA Annual Improvements (6) | 131 | 136 | 136 | 136 | 540 |
| PA Annual Readjustment of RAP cycle 2024/2025 (II) | -627 | -887 | -1,487 | ||
| PA Measurement (7) | -623 | -871 | -1,494 | ||
| PA Authorizations for Small-Scale Reinforcements without RAP (8) | 5 | 4 | 10 | ||
| PA Quality DIT (9) | 0 | -1 | -1 | ||
| PA Other Adjustments | 0 | -1 | -1 | ||
| TOTAL PA - Concession Contracts Extended (I + II) | -1,438 | -377 | 509 | 509 | -796 |
| Concession Contracts Tendered | |||||
| PA Periodic Tariff Review of RAP (III) (9) | 19 | 17 | 12 | 8 | 56 |
| PA Annual Readjustment of RAP cycle 2024/2025 (IV) | -110 | -107 | -217 | ||
| PA Measurement (7) | -112 | -108 | -220 | ||
| PA Authorizations for Small-Scale Reinforcements without RAP (8) | 2 | 1 | 3 | ||
| PA Quality DIT (9) | 0 | -0 | 0 | ||
| PA Other Adjustments | 0 | -0 | 0 | ||
| PA TOTAL - Concession Contracts Tendered (III + IV) | -91 | -90 | 12 | 8 | -160 |
| TOTAL PA - Annual Readjustment (Extended + Tendered) | -1,529 | -467 | 522 | 517 | -956 |
Earnings Release 2Q25 | 64 |
| |
(1) PA cycle 24/25 (before Administrative Appeals) - Adjustment Portion (PA) established in ANEEL Resolution No. 3,344/2024, defining the RAP Periodic Review results for Concession Contracts 057/2001, 058/2001, 061/2001, and 062/2001, extended under Law 12,783/2013, following Public Consultation (CP) ANEEL 12/2024. PA cycles 25/26, 26/27 and 27/28 - Adjustment Portion (PA) established in Ruling 1,228/2025, published on 04/24/2025, in which the Agency decides to partially grant the Administrative Appeals filed against ANEEL Resolution no. 3,344/2024,defining the RAP Periodic Review results for Concession Contracts 057/2001, 058/2001, 061/2001, and 062/2001, extended under Law 12,783/2013, following Public Consultation (CP) ANEEL 12/2024. It should be noted that the effects of Ruling 1,228/2025 will be fully reflected in the 2025–2026 RAP cycle.
(2) PA Postponement: Financial differences from postponing the RAP Periodic Review for extended concession contracts from 07/01/2023 to 07/01/2024, per Ruling No. 402/2023. PA to be offset in a single installment. Amounts defined by ANEEL Resolution 3,344/2024.
(3) Includes annual fees (prepayments) for the execution of small-scale improvements related to the 2023-2024 cycle. Amounts for the 2024/2025 cycle were defined in ANEEL Resolution No. 3,344/2024.
(4) PA Retroactive: Retroactive RAP additional installments for reinforcements and improvements undergoing their first Periodic Review (incremental basis), covering the period from commercial operation start until June 30, 2023, as per Submodule 9.7 of PRORET. Already deducted from the annual fees to advance part of the revenue amounts associated with the execution of small-scale improvements that do not have prior revenue authorization. PA to be offset in equal installments until the subsequent review in July 2028. Amounts for the 2024/2025 cycle were defined in ANEEL Resolution No. 3,344/2024 (prior to administrative appeals), while the amounts for the 2025/2026, 2026/2027, and 2027/2028 cycles were established in Ruling No. 1,228/2025 (post-appeals).
(5) PA Other Adjustments - RTP 2023: Adjustments based on Technical Notes No. 58/2024 and No. 103/2024-STR/ANEEL, supporting Public Consultation 12/2024. To be offset in a single installment. Amounts for the 2024/2025 cycle were defined in ANEEL Resolution No. 3,344/2024 (prior to administrative appeals).
(6) PA Annual Improvements: Annual financial contribution for the execution of small-scale improvements to be considered as from the 2024-2025 cycle until the 2027-2028 cycle. Amounts for the 2024/2025 cycle were defined in ANEEL Resolution No. 3,344/2024, while the amounts for the 2025/2026, 2026/2027, and 2027/2028 cycles were established in Ruling No. 1,228/2025 (post-appeals).
(7) PA Measurement: Offsets differences arising from revenue deficits or surpluses in the ONS accounting process. Amounts for cycles 24/25 and 25/26 according to ANEEL Resolutions No. 3.348/2024 and No. 3.481/2025, respectively.
(8) PA Authorizations for Small-scale Reinforcements without RAP: Covers the RAP portion from the commercial operation start date (per ONS Release Term) until June 30 of year i (June of cycle i-1), for cases where small-scale reinforcements were authorized with RAP established within the Annual RAP Adjustment. Amounts for cycles 24/25 and 25/26 according to ANEEL Resolutions No. 3.348/2024 and No. 3.481/2025, respectively.
(9) PA Quality DIT (Other Transmission Facilities): Refers to the amount to be deducted from transmission companies due to violations of continuity limits at connection points within the DIT, as established in PRODIST (Electric Power Distribution Procedures in the National Electric System). Amounts for the 24/25 and 25/26 cycles were defined in ANEEL Resolutions No. 3,348/2024 and No. 3,481/2025, respectively.
(10) Considers only the PA of the Review approved by ANEEL for tendered concession contracts reviewed until 2025. Amounts for the 24/25 and 25/26 cycles were defined in ANEEL Resolutions No. 3,348/2024 and No. 3,481/2025, respectively.
Earnings Release 2Q25 | 65 |
| |
11.9. Appendix 9 - RBSE Financial Component (PRT 120/2016)
Through the publication of Resolutions No. 3,462/2025, 3,463/2025, 3,465/2025, and 3,468/2025, ANEEL approved a new revenue stream related to the financial component of the RBSE, or the Existing Basic Network.
This outcome stems from the issuance of ANEEL Ruling No. 1,746/2025, which ruled on administrative appeals filed by the Brazilian Association of Investors in Self-Generated Energy (ABIAPE), Energia Sustentável do Brasil S.A. (ESBR), and the Brazilian Association of Large Industrial Energy Consumers and Free Consumers (ABRACE). As this was a ruling on appeals, the decision marks, within the administrative sphere, the conclusion of discussions on the matter.
According to the content of Ruling No. 1,746/2025, the decision largely upheld the methodology for calculating the amounts receivable by transmission companies, with adjustments mainly related to the timing of the payment flows. Going forward, the RBSE financial component will be paid through two separate flows, in accordance with the 8-year payment term established by MME Ordinance No. 120/2016. This approach accounts for the different effective start dates of installment payments: July 2017 for the undisputed portion, and July 2020 for the disputed portion.
“(i) not to acknowledge the requests for reconsideration... regarding the capitalization of interest in the cash flow with monthly discretization; (ii) not to acknowledge the requests for reconsideration... seeking to modify the application of the cash flow calculation methodology, applied in advance during the capitalization phase and deferred during the amortization phase, due to administrative preclusion and the absence of material error; (iii) to acknowledge and, on the merits, grant the requests for reconsideration... aimed at modifying the basis for applying the cost of equity (ke) for transmission companies, so that the ke is incorporated as of 2017, the start of effective payment, in order to maintain the payment flow of the undisputed revenue through 2025, and to establish a second flow for the disputed revenue beginning in 2020, with updates based on the ke through this date, the effective payment date, ending in 2028; and (iv) to correct, ex officio, the use of the Weighted Average Cost of Capital (WACC), ensuring it is updated on the dates of the tariff reviews for the financial component of the Existing Basic Network (RBSE)"
As a result, the approved portion of annual revenue from this component for Eletrobras companies now totals R$ 5,504,404 thousand (June 2025 prices), representing a reduction of approximately 20% compared to the previously approved amounts. This amount will be received between July 2025 and June 2028, as shown in the table below:
Table 46 - RBSE Financial Component Review (R$ mm)
| Concessionaire | Contract | 2025/26 | 2026/27 | 2027/28 |
| Chesf | 061/2001 | 1,676 | 1,676 | 1,676 |
| Eletronorte | 058/2001 | 782 | 782 | 782 |
| CGT Eletrosul | 057/2001 | 366 | 366 | 366 |
| Eletrobras Holding | 062/2001 | 2,680 | 2,680 | 2,680 |
| Total | 5,504 | 5,504 | 5,504 |
Source: ANEEL
Price reference: June/2025
Earnings Release 2Q25 | 66 |
| |
11.10. Appendix 10 - RAP's Periodic Tariff Review of Tendered Contracts
The result of the Periodic Tariff Review (RTP) of the Annual Permitted Revenue (RAP) for the 2025 tendered transmission concession contracts was established by ANEEL Resolution No. 3,475/2025, published on June 24, 2025, following Public Consultation No. 17/2025. The review set a repositioning index (IRR) of +3.62%, resulting in a RAP increase of approximately R$ 8.5 million. In addition, an Annual Retroactivity Adjustment Portion (PA) of +R$1.9 million (June 2025 prices) was defined, to be paid over the next five tariff cycles.
Below is a breakdown of the 2025 Periodic Review results for Eletrobras companies, by concessionaire, contract, and RAP component.
Table 47 - RAP before and after RTP for tendered contracts, Total RAP (Auction + New Investments) (R$)
| Concessionaire | Contract | RAP ReH 3.344/2024 (R$) | RAP After-Appeals (R$) | Difference (R$) | Chg (%) |
| Chesf | 017/2009 | 44,506,119 | 49,317,946 | 4,811,826 | -10.8 |
| Chesf | 018/2009 | 11,082,066 | 11,250,262 | 168,196 | -1.5 |
| Eletronorte | 021/2009 | 103,046,656 | 105,227,111 | 2,180,456 | -2.1 |
| Eletronorte | 022/2009 | 57,159,138 | 58,167,068 | 1,007,930 | -1.8 |
| Eletrobras Holding | 028/2009 | 17,248,809 | 17,511,092 | 262,283 | -1.5 |
| Total | 233,042,788 | 241,473,479 | 8,430,690 | -3.6 |
Table 48 - RAP before and after RTP for tendered contracts, Auction's RAP (R$)
| Concessionaire | Contract | RAP ReH 3.344/2024 (R$) | RAP After-Appeals (R$) | Difference (R$) | Chg (%) |
| Chesf | 017/2009 | 36,139,620 | 36,660,971 | 521,352 | -1.4 |
| Chesf | 018/2009 | 11,082,066 | 11,250,262 | 168,196 | -1.5 |
| Eletronorte | 021/2009 | 97,090,991 | 98,526,921 | 1,435,930 | -1.5 |
| Eletronorte | 022/2009 | 55,456,669 | 56,254,960 | 798,290 | -1.4 |
| Eletrobras Holding | 028/2009 | 17,248,809 | 17,511,092 | 262,283 | -1.5 |
| Total | 217,018,155 | 220,204,206 | 3,186,051 | -1.5 |
Table 49 - RAP before and after RTP for tendered contracts, New Investiment's RAP (R$)
| Concessionaire | Contract | RAP ReH 3.344/2024 (R$) | RAP After-Appeals (R$) | Difference (R$) | Chg (%) |
| Chesf | 017/2009 | 8,366,500 | 12,656,974 | 4,290,474 | -51.3 |
| Chesf | 018/2009 | 0 | 0 | 0 | n.m. |
| Eletronorte | 021/2009 | 5,955,665 | 6,700,190 | 744,526 | -12.5 |
| Eletronorte | 022/2009 | 1,702,469 | 1,912,108 | 209,639 | -12.3 |
| Eletrobras Holding | 028/2009 | 0 | 0 | 0 | n.m. |
| Total | 16,024,633 | 21,269,273 | 5,244,639 | -32.7 |
Table 50 - PA Retroactive, based on the RTP outcome for tendered contracts (R$)
| Concessionaire | Contract | Total Annual PA Jun/2025 |
| Chesf | 017/2009 | 1,912,361 |
| Chesf | 018/2009 | 0 |
| Eletronorte | 021/2009 | -16,971 |
| Eletronorte | 022/2009 | -3,556 |
| Eletrobras Holding | 028/2009 | 0 |
| Total | 1,891,834 |
Earnings Release 2Q25 | 67 |
| |
11.11. Appendix 11 - RAP Annual Readjustment - 2025/2026 cycle
In addition, an Annual Retroactivity Adjustment Portion (PA) in the amount of +R$1.9 million was defined (at June 2025 prices), to be paid over the next five tariff cycles.
The result of the Annual Readjustment of the Permitted Annual Revenue (RAP) for the 2025/2026 transmission concession cycle was established through ANEEL Resolution No. 3,481/2025, published on July 17, 2025.
The adjustment resulted in a 2.6% reduction in RAP compared to the amount approved for the 2024/2025 cycle, mainly due to the repositioning of the RBSE financial component (as detailed in Annex 9) and the ex officio adjustments applied by ANEEL during its analysis of the 2023 Periodic Tariff Review appeals (as detailed in Annex 10 of the 1Q25 Earnings Release).
Chart 15 - Annual Readjustment of Transmission Revenue
| ▪ | IPCA/IGPM: Monetary update for the 2025-2026 cycle, based on the IPCA index of 5.32% (applicable to extended contracts and most tendered contracts ) or the IGP-M index of 7.02% (applicable to certain tendered contracts). |
| ▪ | Reinforcements & Improvements: Additional RAP related to reinforcements and improvements that entered commercial operation during the 2024–2025 cycle. |
| ▪ | O&M Transferred Facilities: Additional RAP for the O&M of transmission facilities transferred during the 2024-2025 cycle. |
| ▪ | RTP 2025 Tendered: Result of the RTP 2025 for tendered concession contracts (as detailed in Annex 10). |
| ▪ | RBSE Financial Component: Result[11] of ANEEL Board’s decision on the partial acceptance of reconsideration requests filed by large energy consumers and self-producers regarding the Financial Component of the RBSE RAP (PRT No. 120/2016), providing for the separation of disputed and undisputed balances in the receipt of capital remuneration. |
| ▪ | Appeals 2024/2025 Cycle: Result of the administrative appeals related to the Annual RAP Readjustment for the 2024/2025 cycle, which also incorporates the outcomes of appeals concerning the 2024 Periodic RAP Review for tendered contracts and the 2023 Periodic RAP Review for extended contracts, as detailed in Appendices 9 and 10 of the 1Q25 Earnings Release, respectively). |
| ▪ | AO&M Trajectory: Reduction in the AO&M RAP (PRT 579/2012) due to the Efficient Operating Costs Trajectory, defined within the scope of the RTP 2023 for the extended concession contracts, which will remain in effect through the 2027–2028 cycle. |
[11] RAP result – RBSE Financial Component: Reflects the effect of ANEEL Resolutions No. 3,462/2025, 3,463/2025, 3,465/2025, and 3,468/2025, which amend Resolutions No. 3,011/2022, 2,935/2021, 2,848/2021, and 2,849/2021, respectively. These changes result from ANEEL’s analysis of the requests for reconsideration submitted by ABIAPE, ESBR, and ABRACE against the aforementioned resolutions.
Earnings Release 2Q25 | 68 |
| |
| ▪ | "Step-down Profile" of Tendered Contracts: Reduction in RAP due to the “step-down profile” of tendered contracts, which establishes a decrease in RAP beginning in the 16th year of commercial operation. |
| ▪ | Deactivated RAP: Reduction in RAP related to the deactivation of transmission facilities during the 2024-2025 cycle. |
| ▪ | Adjustment Portion (PA): Includes: |
(i) PA Measurement 5 (-R$ 979 million), with non-recurring effects;
(ii) PA Revision – Retroactivity of revised revenue from Reinforcements and Improvements under the 2023 RTP for extended concession contracts (+R$ 373 million), with recurring effects through the 2027/2028 cycle;
(iii) PA Revision associated with tendered concession contracts (+R$ 17 million);
(iv) PA Annual Improvements (+R$ 136 million);
(v) PA Other Adjustments (-R$ 18 million);
(vi) PA related to the RAP retroactivity for small-scale reinforcements under the Annual Readjustment (+R$ 5 million); and
(vii) PA Quality DIT (-R$ 1 million).
It is worth noting that PA Assessment 5 was mainly composed of the effects of the 2023 RTP appeals and the pass-through installments of the prepayment apportionment and CDE Fund amounts received monthly.
11.12. Appendix 12 - Financing and Loans Granted (Receivables)
Chart 16 - Receivables (R$ billion)
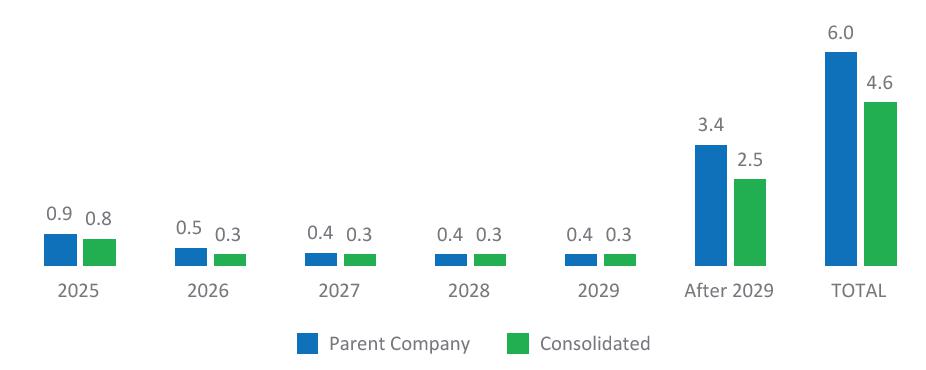
Does not include ECL of R$ 3,989 million and current charges.
Earnings Release 2Q25 | 69 |
| |
11.13. Appendix 13 - Reconciliation Regulatory vs. IFRS Results
Table 50 - Reconciliation IFRS vs. Regulatory (R$ Thousand)
| CVM Result IFRS | Regulatory Result | Differences | CVM Result IFRS | Regulatory Result | Differences | |
| 06/30/2025 | 06/30/2024 | |||||
| OPERATING REVENUES | ||||||
| Generation | ||||||
| Power supply for distribution companies | 9,716,506 | 9,757,199 | -40,693 | 7,407,769 | 8,321,429 | -913,660 |
| Power supply for end consumers | 927,549 | 927,549 | 0 | 1,552,924 | 1,552,924 | 0 |
| CCEE revenue (short term market) | 2,146,052 | 2,146,052 | 0 | 1,215,327 | 1,215,327 | 0 |
| Operation and maintenance (O&M) revenue | 1,028,535 | 1,028,535 | 0 | 1,585,362 | 1,585,362 | 0 |
| Transmission | ||||||
| Operation and maintenance revenue | 4,080,926 | 3,787,716 | 293,210 | 3,956,675 | 3,722,513 | 234,162 |
| Construction revenue | 1,808,870 | 0 | 1,808,870 | 1,306,404 | 0 | 1,306,404 |
| Contract revenue – Transmission | 4,374,474 | 0 | 4,374,474 | 3,690,446 | 0 | 3,690,446 |
| Transmission System Availability (Rap) | 0 | 5,122,962 | -5,122,962 | 0 | 6,406,959 | -6,406,959 |
| Other income | 220,746 | 220,746 | 0 | 135,985 | 134,162 | 1,823 |
| Deductions | ||||||
| (-) Sector charges | -1,364,726 | -1,364,726 | 0 | -1,290,915 | -1,290,915 | 0 |
| (-) ICMS | -152,694 | -152,694 | 0 | -469,065 | -469,065 | 0 |
| (-) PASEP e COFINS | -2,170,644 | -2,170,644 | 0 | -1,975,502 | -1,975,502 | 0 |
| (-) Other Deductions | -2,461 | -2,461 | 0 | -1,857 | -1,857 | 0 |
| Net Operating Revenue | 20,613,133 | 19,300,234 | 1,312,899 | 17,113,553 | 19,201,337 | -2,087,784 |
| OPERATING COSTS | ||||||
| Personnel, Material and Services | -1,320,172 | -1,320,172 | 0 | -1,378,676 | -1,378,219 | -457 |
| Energy purchased for resale | -2,915,546 | -3,190,541 | 274,995 | -1,534,189 | -1,885,260 | 351,071 |
| Charges for use of the electricity grid | -1,951,072 | -1,657,862 | -293,210 | -1,970,405 | -1,736,243 | -234,162 |
| Fuel for electricity production | -781,976 | -781,976 | 0 | -969,786 | -969,786 | 0 |
| Construction | -1,780,935 | 0 | -1,780,935 | -1,428,308 | 0 | -1,428,308 |
| Depreciation | -947,842 | -1,906,946 | 959,104 | -857,205 | -1,812,498 | 955,293 |
| Amortization | -1,126,315 | -1,129,694 | 3,379 | -980,936 | -993,169 | 12,233 |
| Operating provisions/reversals | 0 | 0 | 0 | 0 | 0 | 0 |
| Other costs | -99,434 | -99,435 | 1 | -30,238 | -30,369 | 131 |
| Operating costs | -10,923,292 | -10,086,626 | -836,666 | -9,149,743 | -8,805,544 | -344,199 |
Earnings Release 2Q25 | 70 |
| |
| CVM Result IFRS | Regulatory Result | Differences | CVM Result IFRS | Regulatory Result | Differences | |
| 06/30/2025 | 06/30/2024 | |||||
| GROSS PROFIT | 9,689,841 | 9,213,608 | 476,233 | 7,963,810 | 10,395,793 | -2,431,983 |
| OPERATING EXPENSES | ||||||
| Personnel, Material and Services | -1,422,149 | -1,429,216 | 7,067 | -1,468,621 | -1,493,523 | 24,902 |
| Voluntary Dismissal Program | -193,908 | -193,908 | 0 | -43,625 | -43,625 | 0 |
| Remuneration and compensation | 0 | 0 | 0 | 0 | 0 | 0 |
| Depreciation | -106,627 | -106,627 | 0 | -104,613 | -101,025 | -3,588 |
| Amortization | -62,816 | -62,816 | 0 | -22,058 | -22,058 | 0 |
| Donations and contributions | -40,086 | -40,086 | 0 | -60,042 | -60,042 | 0 |
| Operating provisions/reversals | -259,625 | 86,091 | -345,716 | -68,963 | -466,303 | 397,340 |
| Result from asset sales | -105,460 | 504,251 | -609,711 | -115,215 | -115,215 | 0 |
| Other expenses | -213,309 | -228,952 | 15,643 | -274,533 | -279,880 | 5,347 |
| OPERATING EXPENSES | -2,403,980 | -1,471,263 | -932,718 | -2,157,670 | -2,581,671 | 424,001 |
| Regulatory Remeasurements - Transmission Contracts | -4,385,033 | 0 | -4,385,033 | 0 | 0 | 0 |
| OPERATING RESULT BEFORE FINANCIAL RESULT | 2,900,828 | 7,742,346 | -4,841,518 | 5,806,140 | 7,814,122 | -2,007,982 |
| FINANCIAL RESULT | -6,048,785 | -6,283,908 | 235,123 | -5,909,589 | -6,193,939 | 284,350 |
| PROFIT BEFORE EQUITY HOLDINGS | -3,147,957 | 1,458,438 | -4,606,395 | -103,449 | 1,620,183 | -1,723,632 |
| Equity income | 241,625 | 166,439 | 75,186 | 1,276,208 | 1,075,502 | 200,706 |
| Other income and expenses | 190,179 | 190,179 | 0 | 2,573 | 2,573 | 0 |
| OPERATING PROFIT BEFORE TAX | -2,716,153 | 1,815,056 | -4,531,209 | 1,175,332 | 2,698,258 | -1,522,926 |
| Current income tax and social contribution | -332,852 | -332,852 | 0 | -494,202 | -494,202 | 0 |
| Deferred income tax and social contribution | 1,370,283 | -98,423 | 1,468,706 | 1,392,081 | 990,016 | 402,065 |
| NET INCOME FOR CONTINUING OPERATIONS | -1,678,722 | 1,383,780 | -3,062,502 | 2,073,211 | 3,194,072 | -1,120,861 |
| 0 | 0 | |||||
Earnings Release 2Q25 | 71 |
| |
| CVM Result IFRS | Regulatory Result | Differences | CVM Result IFRS | Regulatory Result | Differences | |
| 06/30/2025 | 06/30/2024 | |||||
| Portion attributable to controlling | -1,677,488 | 1,385,014 | -3,062,502 | 2,068,356 | 3,189,997 | -1,121,641 |
| Portion attributable to controlling | -1,234 | -1,234 | 0 | 4,855 | 4,075 | 780 |
| NET INCOME (LOSS) FOR DISCONTINUED OPERATIONS | 0 | 0 | 0 | 0 | 0 | 0 |
| Portion attributable to controlling | 0 | 0 | 0 | 0 | 0 | 0 |
| Portion attributable to controlling | 0 | 0 | 0 | 0 | 0 | 0 |
| NET INCOME FOR THE YEAR | -1,678,722 | 1,383,780 | -3,062,502 | 2,073,211 | 3,194,072 | -1,120,861 |
| Portion attributable to controlling | -1,677,488 | 1,385,014 | -3,062,502 | 2,068,356 | 3,189,997 | -1,121,641 |
| Portion attributable to controlling | -1,234 | -1,234 | 0 | 4,855 | 4,075 | 780 |
Earnings Release 2Q25 | 72 |

SIGNATURE
Pursuant to the requirements of the Securities Exchange Act of 1934, the registrant has duly caused this report to be signed on its behalf by the undersigned, thereunto duly authorized.
Date: August 7, 2025
| CENTRAIS ELÉTRICAS BRASILEIRAS S.A. - ELETROBRÁS | ||
| By: |
/S/ Eduardo Haiama |
|
|
Eduardo Haiama Vice-President of Finance and Investor Relations |
||
FORWARD-LOOKING STATEMENTS
This document may contain estimates and projections that are not statements of past events but reflect our management’s beliefs and expectations and may constitute forward-looking statements under Section 27A of the Securities Act of 1933, as amended, and Section 21E of the Securities and Exchange Act of 1934, as amended. The words “believes”, “may”, “can”, “estimates”, “continues”, “anticipates”, “intends”, “expects”, and similar expressions are intended to identify estimates that necessarily involve known and unknown risks and uncertainties. Known risks and uncertainties include, but are not limited to: general economic, regulatory, political, and business conditions in Brazil and abroad; fluctuations in interest rates, inflation, and the value of the Brazilian Real; changes in consumer electricity usage patterns and volumes; competitive conditions; our level of indebtedness; the possibility of receiving payments related to our receivables; changes in rainfall and water levels in reservoirs used to operate our hydroelectric plants; our financing and capital investment plans; existing and future government regulations; and other risks described in our annual report and other documents filed with the CVM and SEC. Estimates and projections refer only to the date they were expressed, and we do not assume any obligation to update any of these estimates or projections due to new information or future events. Future results of the Company’s operations and initiatives may differ from current expectations, and investors should not rely solely on the information contained herein. This material contains calculations that may not reflect precise results due to rounding.