P A R N A S S U S F U N D S ®
QUARTERLY REPORT SEPTEMBER 30, 2010
PARNASSUS FUNDS
Parnassus FundSM PARNX
Parnassus Equity Income FundSM– Investor Shares PRBLX
Parnassus Equity Income Fund – Institutional Shares PRILX
Parnassus Mid-Cap FundSM PARMX
Parnassus Small-Cap FundSM PARSX
Parnassus Workplace Fund® PARWX
Parnassus Fixed-Income FundSM PRFIX
| 4 | ||||
| Fund Performance and Commentary |
||||
| 6 | ||||
| 9 | ||||
| 12 | ||||
| 15 | ||||
| 17 | ||||
| 19 | ||||
| 22 | ||||
| Portfolios of Investments |
||||
| 24 | ||||
| 26 | ||||
| 28 | ||||
| 29 | ||||
| 30 | ||||
| 31 | ||||
PARNASSUS FUNDS | Quarterly Report — Q3 2010
November 8, 2010
Dear Shareholder:
Enclosed you will find the quarterly reports for all six Parnassus Funds. The market made a strong comeback in the third quarter, with the S&P 500 Index (“S&P 500”) gaining 11.30% for the period and 8.92% of that gain coming in September. September is usually a weak month for the stock market, but not this September. Three of our five equity funds beat the market for the quarter and the other two were not far behind, and those two have excellent long-term records. Read the reports for more details.
As of June 30, the S&P 500 was down 6.64% for the year-to-date, but the strong third quarter reversed that decline. The S&P 500 is now up 3.91% for the year as of September 30. Uncertainty about the economy continues but the stock market seems to be forecasting an improved situation for next year.
Regarding our Parnassus Funds Reports, I’ve learned that many of our investors who hold their accounts in a fund supermarket or with another third party may not be receiving their reports on a timely basis. For example, the June 30 report did not reach some shareholders until late September. Unfortunately, we have no control over this, since the mailing is done by an outside entity. There are two things you can do to receive more timely reports. First, you can go to our website (www.parnassus.com) and read the current report. They’re normally posted to the website about six weeks after the end of the quarter. If you would like a hard copy mailed directly to you, you can call our Shareholder Services department at (800) 999-3505 and ask to be placed on our quarterly report mailing list.
New Team Members
Joining our shareholder service staff is Jessica Nguyen. She is a 2005 graduate of California State University, East Bay, and her previous experience includes operations work with Thomson Prometric and three years spent managing Julihanh Restaurant in Carmel, California.
Alastair Pyne from New Zealand joins us as a research intern. He is a graduate of the University of Auckland where he studied both politics and business, and he also studied at the Patana School in Bangkok, Thailand. His previous experience includes an internship with the Booz Allen Hamilton consulting firm.
Joining us as a sales and marketing intern is Alexis Crusey, a graduate of Yale University, where she played on the varsity women’s volleyball team. Her previous experience includes working as a research assistant with the Pacific Research Network and coaching a volleyball team. She has also done volunteer work for OrphanACT, a non-profit organization dedicated to aiding orphans in Russia.
| 4 |
Quarterly Report — Q3 2010 | PARNASSUS FUNDS
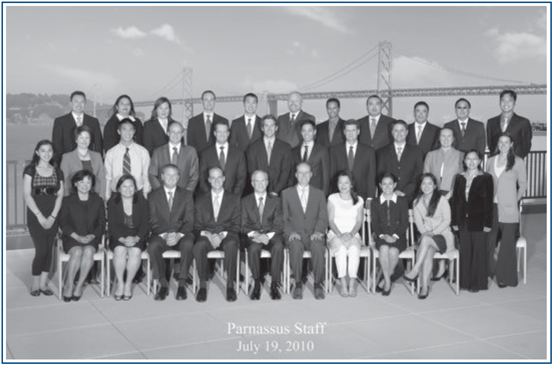
Many of you might want to know who the people are at Parnassus Investments. Below is a photograph of the Parnassus Investments staff. From left to right in the first row are Sheila Alfaro, Minnie Chen, Marc Mahon, Ben Allen, Jerome Dodson, Todd Ahlsten, Marie Lee, Nancy Reyes, and Pearle Lee. Second Row (L-R): Elena Faddoul, Wendy Walker, Ryan Louie, Matt Gershuny, Grant Cleghorn, Rob Burmeister, Minh Bui, John Skidmore, Bill Fraser, Stephanie Mahon, Valerie Tan and Hallie Marshall. Back Row (L-R): Keith Bang, Georgina Salazar, Maria Kamin, Ryan Wilsey, Mark Lee, Jim Gatteau, Iyassu Essayas, Anh Cornell, Thomas Tran, Tony Lee and George Lai.
Finally, all of us would like to thank you for investing with Parnassus Investments. Our team will work hard to take good care of your money.
| Yours truly, |

|
| Jerome L. Dodson, President Parnassus Investments |
| 5 |
PARNASSUS FUNDS | Quarterly Report — Q3 2010
Ticker: PARNX
As of September 30, 2010, the net asset value per share (“NAV”) of the Parnassus Fund was $36.40, so the total return for the quarter was 12.59%. This compares to 11.30% for the S&P 500 Index (“S&P 500”), and 11.18% for the Lipper Multi-Cap Core Average, which represents the average multi-cap core fund followed by Lipper (“Lipper average”). For the quarter, we beat both the S&P 500 and the Lipper average.
At the end of the second quarter (June 30), we were down 7.15% for the year and trailed the S&P 500, but our strong performance this quarter not only gave us a positive return for the year but moved us ahead of the S&P 500. For the year-to-date, we’re up 4.54% compared to a gain of 3.91% for the S&P 500. The Lipper average was up 4.42% for the year-to-date.
Below is a table comparing the performance of the Parnassus Fund with that of the S&P 500 and the Lipper average over the past one-, three-, five- and ten-year periods. You’ll see from the table that we’re ahead of the Lipper average for the one-year period, but behind the S&P 500. For the ten-year period, we actually have a positive return of 0.92% per year, compared to a loss of 0.43% per year for the S&P 500. For that period, we’re slightly behind the Lipper average. For the three- and five-year periods, we’re substantially ahead of all the indices.
| Parnassus Fund Average Annual Total Returns (%) for periods ended 9/30/2010 |
One Year |
Three Years |
Five Years |
Ten Years |
Gross Expense Ratio |
Net Expense Ratio |
||||||||||||||||||
| Parnassus Fund |
10.02 | -1.63 | 5.40 | 0.92 | 1.00 | 0.99 | ||||||||||||||||||
| S&P 500 Index |
10.18 | -7.15 | 0.64 | -0.43 | NA | NA | ||||||||||||||||||
| Lipper Multi-Cap Core Average |
9.95 | -6.44 | 0.94 | 1.54 | NA | NA | ||||||||||||||||||
Performance data quoted represent past performance and are no guarantee of future returns. Current performance may be lower or higher than the performance data quoted. Current performance information to the most recent month-end is available on the Parnassus website (www.parnassus.com). Investment return and principal value will fluctuate so that an investor’s shares, when redeemed, may be worth more or less than their original principal cost. Returns shown in the table do not reflect the deduction of taxes a shareholder may pay on fund distributions or redemption of shares. The S&P 500 Composite Stock Index (also known as the S&P 500) is an unmanaged index of common stocks, and it is not possible to invest directly in an index. Index figures do not take any expenses, fees or taxes into account, but mutual fund returns do. Prior to May 1, 2004, the Parnassus Fund charged a sales load (maximum of 3.5%), which is not reflected in the total return calculations. Before investing, an investor should carefully consider the investment objectives, risks, charges and expenses of the Fund and should carefully read the prospectus, which contains this and other information. The prospectus is available on the Parnassus website, or one can be obtained by calling (800) 999-3505. As described in the Fund’s current prospectus dated May 1, 2010, Parnassus Investments has contractually agreed to limit the total operating expenses to 0.99% of net assets, exclusive of acquired fund fees, until May 1, 2011. This limitation may be continued indefinitely by the Adviser on a year-to-year basis.
Company Analysis
For the quarter, we had no significant losers, as no company accounted for a decline of 5¢ or more per fund share. On the other hand, five companies contributed 24¢ or more to the NAV. The biggest winner was Qualcomm, a San Diego-based provider of software and semiconductors used in cellular telephone handsets. The stock soared 37.4% during the quarter from $32.84 to $45.12 for a gain of 55¢ for each Parnassus Fund share. On July 22, Qualcomm reported strong quarterly results, which dispelled investor concerns about pricing pressure from declining handset prices. We expect the stock to move higher because of strong demand from existing handset owners upgrading to smartphones and new handset customers in emerging markets.
Genzyme, a Cambridge, Massachusetts-based biotechnology company focused on treatments for rare inherited disorders like Gaucher and Fabrys diseases, added 48¢ to the value of each fund share, as its stock rocketed up 39.4% from $50.77 to $70.79. The company received an acquisition offer from French pharmaceutical company Sanofi-Aventis for $69 per share, but the Genzyme board rejected the offer as being much too low. I’m hanging onto the stock because I think the French company will make a higher offer, since it needs Genzyme’s products to fill its drug pipeline.
Maryland-based Ciena Corporation makes optical network equipment used in telecommunications. The company contributed 28¢ to the NAV, as its
| 6 |
Quarterly Report — Q3 2010 | PARNASSUS FUNDS
stock climbed 22.8% from $12.68 to $15.57. Sales increased because of higher demand from telephone companies building out their networks. Revenue growth was especially strong in Europe and Canada following the company’s purchase of the optical equipment assets of Nortel Networks earlier this year.
Autodesk, the leading provider of design software for engineering and construction, added 28¢ to each Parnassus Fund share, as its stock climbed 31.2% from $24.36 to $31.97. Sales moved higher with anticipated increases in construction. Improved pricing and good cost control boosted profits.
Verisign manages the “.com” Domain Name Server that allows people surfing the internet to reach the right website. The stock jumped 19.6% during the quarter and added 24¢ to the NAV. On August 3, the company announced third quarter revenue grew 9% despite the challenging economic environment, and management also announced a $1.1 billion share repurchase program. One week later, the company also completed the sale of its slower-growing, less profitable security business.
Outlook and Strategy
This section represents my thoughts and applies to the three funds that I manage: the Parnassus Fund, the Parnassus Small-Cap Fund and the Parnassus Workplace Fund. The other portfolio managers will discuss their thoughts in their respective reports.
At the end of June, things looked pretty bleak with the S&P 500 having fallen 6.64% for the year-to-date. In the semiannual report, I wrote “My view is that the economy will get stronger as the year progresses and the stock market will follow.” The market made a strong comeback in the third quarter with the S&P 500 climbing 11.30%, most of that gain coming in September when the index rose 8.92%. This strength continued on October 5, when the Institute for Supply Management (ISM) released its index of non-manufacturing businesses (the service sector) for August and it rose from 51.5 to 53.2. (A reading higher than 50 means the economy is growing and, for comparative purposes, the gauge averaged 55.3 during the six-year expansion that ended in December of 2007.) Since the service sector accounts for 90% of the economy, the positive reading had a strong effect on the stock market, which rose over 2% in one day.
Given what happened in September and early October, what does that mean for the rest of the year? I still think November and December will be strong, but not as much as would have been the case, had September and early October been weaker.
The ISM figures mean that the economy is still growing at a reasonable rate, but for sustained growth and a move back to prosperity, we need more jobs. Right now, corporate earnings look pretty good, the economy is growing, so orders are increasing, productivity is at a high level and companies have a lot of cash. The difficulty is that companies are holding onto the cash and not using it to hire workers or expand operations. Management is concerned that the economy will not continue growing and they don’t want to be caught hiring people, and then not having any work for them to do.
Right now, orders are increasing, but companies are trying to fill them with their existing staff. They are postponing hiring. At some point, though, they won’t be able to expand their businesses unless they hire more people. At that point, the number of jobs will start growing and the economy will be able to return to steady, sustainable growth. That hasn’t happened yet, but I expect that it will sometime in the next six months. In my view,
Top 10 Holdings
| QUALCOMM Inc. |
4.3 | % | ||
| Ciena Corp. |
4.3 | % | ||
| MasterCard Inc. |
3.9 | % | ||
| DR Horton Inc. |
3.7 | % | ||
| VeriSign Inc. |
3.7 | % | ||
| PulteGroup Inc. |
3.7 | % | ||
| Teleflex Inc. |
3.7 | % | ||
| Lowe’s Cos., Inc. |
3.6 | % | ||
| Genzyme Corp. |
3.4 | % | ||
| JPMorgan Chase & Co. |
3.3 | % |
Portfolio characteristics and holdings are subject to change periodically.
| 7 |
PARNASSUS FUNDS | Quarterly Report — Q3 2010
the economy has to start producing at least 400,000 new jobs a month to get things back on track. Right now, it’s producing less than 100,000 new jobs per month.
With more jobs, the housing market will pick up as well and people will be able to start buying homes again. Shareholders of the Parnassus Fund and the Parnassus Small-Cap Fund know that both of those funds have a substantial position in homebuilding stocks. Once we get more job-creation and the housing market picks up, those stocks should drive those funds higher.
Right now, I’m very happy with our portfolios in all three funds. We’ll continue to hold those stocks, since we think they’re undervalued and they’re good businesses. However, we’ll keep watching for opportunities when good companies fall into undervalued territory.
A good example is Adobe Systems, the provider of graphic-design software. On September 22, the company announced that revenue for the quarter ending in November would fall in the range of $950 million to $1 billion. Analysts had been expecting revenue in the range of $1.03 billion, so the company did not meet analysts’ estimates, but they weren’t that far off. The stock dropped an amazing 19.0%, falling from $32.94 to $26.67. I know the company well and I know it has great products and it’s a great place to work. There was no justification for the drop in share price, as Adobe is a very good business. We took advantage of this situation to buy shares for both the Parnassus Fund and the Parnassus Workplace Fund. The only reasons we didn’t buy shares for the Parnassus Small-Cap Fund is that the market capitalization of the company is much higher than the $3 billion limit for that fund. I’m confident that we will do well with our Adobe shares.
To recap then, we’re sticking with our current strategy and our current portfolio, which is positioned to take advantage of an upturn in the economy. From time to time, however, a company like Adobe may have a big drop in market value because of an overreaction to corporate news. In these situations, we’ll take the opportunity to buy more shares.
Thank you for the confidence you’ve placed in the Parnassus Investments team. We’ll do our best to be good stewards of your economic resources.
| Yours truly, |

|
| Jerome L.Dodson Portfolio Manager |
| 8 |
Quarterly Report — Q3 2010 | PARNASSUS FUNDS
Ticker: Investor Shares - PRBLX
Ticker: Institutional Shares - PRILX
As of September 30, 2010, the NAV of the Parnassus Equity Income Fund-Investor Shares was $24.45 per share. After taking dividends into account, the total return for the third quarter was a 9.10% gain. This compares to a rise of 11.30% for the S&P 500 Index (“S&P 500”) and an increase of 11.58% for the Lipper Equity Income Fund Average, which represents the average equity income fund followed by Lipper (“Lipper average”).
For the first nine months of 2010, the Fund rose 0.81% versus 3.91% for the S&P 500 and 5.11% for the Lipper average. While the Fund has underperformed so far this year, our long-term record remains outstanding relative to the index. Our one-, three-, five- and ten-year trailing returns beat the S&P 500 for every period. In addition, we are pleased that the Fund reported a positive gain for all trailing periods, while the S&P 500 has a negative return for the trailing three- and ten-year periods.
Below is a table that compares the performance of the Fund with that of the S&P 500 and the Lipper average. Average annual total returns are for the one-, three-, five- and ten-year periods.
Parnassus Equity Income Fund
| Average Annual Total Returns (%) for periods ended 9/30/2010 |
One Year |
Three Years |
Five Years |
Ten Years |
Gross Expense Ratio |
Net Expense Ratio |
||||||||||||||||||
| Parnassus Equity Income Fund Investor Shares |
10.38 | 0.67 | 5.86 | 5.85 | 1.00 | 1.00 | ||||||||||||||||||
| Parnassus Equity Income Fund Institutional Shares |
10.64 | 0.90 | 6.07 | 5.95 | 0.78 | 0.78 | ||||||||||||||||||
| S&P 500 Index |
10.18 | -7.15 | 0.64 | -0.43 | NA | NA | ||||||||||||||||||
| Lipper Equity Income Fund Average |
11.40 | -6.06 | 1.48 | 2.89 | NA | NA | ||||||||||||||||||
The total return for the Parnassus Equity Income Fund-Institutional Shares from commencement (April 28, 2006) was 4.92%. Performance shown prior to the inception of the Institutional Shares reflects the performance of the Parnassus Equity Income Fund-Investor Shares and includes expenses that are not applicable to and are higher than those of the Institutional Shares. The performance of Institutional Shares differs from that shown for the Investor Shares to the extent that the classes do not have the same expenses. Performance data quoted represent past performance and are no guarantee of future returns. Current performance may be lower or higher than the performance data quoted, and current performance information to the most recent month-end is on the Parnassus website (www.parnassus.com). Investment return and principal value will fluctuate so that an investor’s shares, when redeemed, may be worth more or less than their original principal cost. Returns shown in the table do not reflect the deduction of taxes a shareholder may pay on fund distributions or redemption of shares. The S&P 500 is an unmanaged index of common stocks, and it is not possible to invest directly in an index. Index figures do not take any expenses, fees or taxes into account, but mutual fund returns do. On March 31, 1998, the Fund changed its investment objective from a balanced portfolio to an equity income portfolio. Before investing, an investor should carefully consider the investment objectives, risk, charges and expenses of the Fund and should carefully read the prospectus, which contains this and other information. The prospectus is available on the Parnassus website, or one can be obtained by calling (800) 999-3505. As described in the Fund’s current prospectus dated May 1, 2010, Parnassus Investments has contractually agreed to limit the total operating expenses to 0.99% and 0.78% of net assets, exclusive of acquired fund fees, through May 1, 2011 for the Investor Shares and Institutional Shares, respectively. These limitations may be continued indefinitely by the Adviser on a year-to-year basis.
Third Quarter Review
After a steep stock market correction spanning late April to early July, the S&P 500 jumped to end the third quarter up 11.30%. The most important factor driving stocks up was that most public companies’ earnings came in better than expected.
The Fund had a solid absolute return of 9.10% for the quarter, but lagged the S&P 500 by 2.20%. Healthcare was the biggest drag on performance, trimming our return relative to the S&P 500 by 1.16%. Our healthcare stocks rose only 0.15%, compared to 8.86% for the S&P 500 peer group. Within healthcare, it was our medical device investments that lagged the most. Long-term, our portfolio companies in this sector should do well, because they are focused on critical care and improving chronic health conditions.
Our energy-utilities sector exposure reduced the Fund’s return by 0.79% versus the index. While our stocks in the sector rose 7.50% on average, the S&P 500 peer group jumped 12.75%. The Fund’s energy exposure is overweighted relative to the index in natural gas, which underperformed oil-centric companies during the quarter. There continues to be an over-supply of natural gas given new discoveries and weak demand. That said, I am bullish long-term on the prospects for natural gas, because it is a more environmentally-
| 9 |
PARNASSUS FUNDS | Quarterly Report — Q3 2010
friendly energy source than coal. Furthermore, natural gas-fired plants will play an increasingly important role in backing up wind and solar power plants.
In spite of our underperformance for the quarter, I’m confident that our process is sound. We look to invest in companies with sustainable competitive advantages and great long-term prospects for growth. In addition, our portfolio companies must have strong management teams, conservative balance sheets and attractive valuations.
Company Analysis
The Fund had only one stock with a meaningful negative return. Medtronic, the large medical device company, trimmed the NAV by 12¢, as the stock declined 7.4% from $36.27 to $33.58 per share. The stock went down after sales came in below expectations for June and July. Unfortunately, several million unemployed people lost their health insurance during the summer when their COBRA benefits expired. This forced many people to delay procedures. At the same time, several HMOs increased scrutiny of patient requests for operations involving medical devices. Making matters worse, Medtronic also lost sales to competitors in its spinal therapies business.
In late August, I flew to Minneapolis to review our Medtronic investment with CFO Gary Ellis. I learned that Medtronic is successfully introducing new products and expanding overseas. In the emerging markets alone, the company has enormous opportunities. On the other hand, I was disappointed that management was blindsided by the impact of expiring COBRA benefits. They should have seen this coming and incorporated it into their financial projections.
We have a large investment in Medtronic, because most of its products are for procedures that can’t be postponed for long. In addition, as the population ages, the demand for the company’s products, especially its cardiovascular devices, should steadily increase. Medtronic also sells critical care diabetes products for a growing patient base and is investing in next generation neuromodulation and spine therapies. If sales fall below plan again, the company should be able to cushion the blow by cutting non-essential R&D projects or marketing expenses. Finally, the stock is cheap, trading at just nine times estimated 2011 earnings, and sports an attractive 2.7% dividend yield.
The Fund had five stocks that added 10¢ or more to the NAV. Qualcomm, a company that sells wireless communication technology, was our biggest winner, adding 34¢ to the Fund’s NAV. While the stock soared 37.4% to $45.12 from $32.84 per share, the majority of our gain reversed prior unrealized losses.
The stock took a hit in early 2010, as handset and smartphone prices fell more than expected. Qualcomm collects a royalty based on mobile device prices, so lower prices reduce profits. Fortunately, recent data indicates that smartphone demand and prices are stronger than expected. I’d like to thank Parnassus analyst Ryan Wilsey for recommending that we increase our Qualcomm investment when the stock was in the low $30s. He stayed focused on Qualcomm’s long-term value and growth opportunities, while many investors couldn’t see past the company’s negative short-term prospects.
Waste Management is our largest investment, due to the company’s large recurring revenue base, attractive 3.5% dividend yield and growth potential. My Research Director, Ben Allen, also sees exciting growth opportunities
Top 10 Holdings
| Waste Management Inc. |
5.4 | % | ||
| Occidental Petroleum Corp. |
5.1 | % | ||
| Google Inc. |
5.0 | % | ||
| Medtronic Inc. |
4.7 | % | ||
| Microsoft Corp. |
4.7 | % | ||
| Teleflex Inc. |
4.4 | % | ||
| Hewlett-Packard Company |
4.4 | % | ||
| Energen Corp. |
4.1 | % | ||
| QUALCOMM Inc. |
3.9 | % | ||
| MasterCard Inc. |
3.5 | % |
Portfolio characteristics and holdings are subject to change periodically.
| 10 |
Quarterly Report — Q3 2010 | PARNASSUS FUNDS
for the company’s recycling and waste-to-energy businesses. The stock had a solid quarter, as it rose 14.2% to $35.74 per share from $31.29, boosting the Fund’s NAV by 18¢. Waste Management expects collection volumes to grow during the second half of 2010, which should boost revenue and operating cash flow for the company.
Google added 15¢ to the NAV, as its share price rose 18.1% from $444.95 to $525.79. The stock recovered after having a tough mid-summer on concerns about the company’s China business and competition from Facebook. Despite the slow economic recovery, Google continues to grow profits at a double-digit rate, based on its dominant search engine. The company is also introducing new mobile capabilities to extend its lead in this important market segment.
Nike rose 18.6% to $80.14 per share from $67.55, increasing the NAV by 10¢ per share. In late September, the company announced strong order growth of 10%, driven by robust demand for its footwear and apparel. We like the global nature of the brand, as almost all regions showed strong growth with the exception of Western Europe and Japan.
Praxair, a global supplier of industrial gasses, rose 18.8% from $75.99 to $90.26 and increased the NAV by 10¢. The company’s gasses are used by industrial companies to increase production and improve environmental emissions and efficiency. Praxair increased prices for many of its gasses and signed several new supply contracts during the quarter. The company’s gasses are becoming increasingly important, as its customers adjust to stronger environmental standards.
Outlook and Strategy
The de-leveraging process triggered by the financial crisis may take several more years to complete, which should lead to sub-par economic growth. Last quarter, the economy grew at a rate of 1.7%, a surprisingly low number given the high level of deficit spending and record low interest rates. If growth doesn’t accelerate soon, I worry that we won’t see much improvement in unemployment, an important indicator of economic health. I’ve positioned the Fund to perform well even if this dour outlook proves correct.
From a policy standpoint, I’m closely watching what the Federal Reserve will do to stimulate growth. Since short-term rates are as low as they can go, the most powerful tool still available is “quantitative easing,” which is a process by which the Fed buys up financial assets to increase the supply of money in the economy. As for fiscal policy, I don’t anticipate another major stimulus package from Congress, given the prevailing sentiment in Washington.
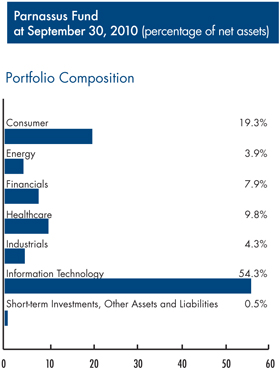
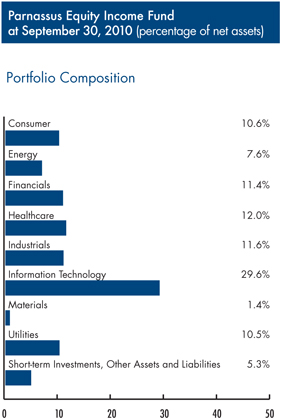
Despite my uninspiring view, our portfolio of stocks should perform well, because we are invested in companies whose prospects aren’t overly dependent on a vigorous recovery. The Fund’s largest overweight position is in the technology sector, which comprises 29.6% of our net assets, versus 18.7% for the S&P 500. We see tremendous long-term demand for technology as mobile devices proliferate, web traffic continues to grow and companies invest for productivity gains. We remain over-weighted relative to the index in energy-utilities, healthcare and industrial sectors. The Fund is still underweighted in comparison to the S&P 500 in consumer discretionary and financial stocks, because most companies in these sectors are highly sensitive to economic growth.
The economic landscape seems to be getting more complex and uncertain. Against this backdrop, my team and I remain committed to our clear and time-tested investment approach: invest in undervalued companies that sell increasingly relevant products or services and have sustainable competitive advantages and top-notch management teams.
Thank you for your trust and investment in the Parnassus Equity Income Fund.
Highest regards,

Todd C. Ahlsten
Portfolio Manager
| 11 |
PARNASSUS FUNDS | Quarterly Report — Q3 2010
Ticker: PARMX
As of September 30, 2010, the NAV of the Parnassus Mid-Cap Fund was $17.42, so the total return for the third quarter was a gain of 10.11%. This compares to a gain of 11.18% for the Lipper Multi-Cap Core Average, which represents the average multi-cap core fund followed by Lipper (the “Lipper average”) and a gain of 13.31% for the Russell Midcap Index (the “Russell”). Despite the Fund’s double digit return this quarter, we trailed our peers and the surging Russell.
For the first nine months of 2010, the Fund is up 7.00% versus a gain of 4.42% for the Lipper average and a gain of 10.97% for the Russell. We are pleased that the Fund has outperformed its peers year-to-date, but disappointed that we’ve fallen short of the Russell.
Longer-term, our strategy of buying high quality businesses at attractive prices has enabled the Fund to beat both its Lipper average and the Russell. During our two year tenure managing the Fund (since October 1, 2008), its average annual return is 6.62%, well ahead of the Lipper average’s 3.02% return and slightly ahead of the Russell’s 6.48% return. The Fund’s three-year and five-year average annual returns also handily beat the Russell and Lipper average.
Below is a table comparing the Parnassus Mid-Cap Fund with the Russell and the Lipper average for the one-, three- and five-year periods and for the period since inception on April 29, 2005.
Third Quarter Review
The Russell surged 13.31% in the third quarter, continuing its year-to-date out-performance relative to the broader market averages. Investor support for the rally was based on stronger than expected corporate earnings.
Parnassus Mid-Cap Fund
| Average Annual Total Returns (%) for periods ended 9/30/2010 |
One Year |
Three Years |
Five Years |
Since Inception 4/29/05 |
Gross Expense Ratio |
Net Expense Ratio |
||||||||||||||||||
| Parnassus Mid-Cap Fund |
16.41 | -1.17 | 4.76 | 4.25 | 1.73 | 1.20 | ||||||||||||||||||
| Russell Midcap Index |
17.54 | -4.16 | 2.60 | 4.90 | NA | NA | ||||||||||||||||||
| Lipper Multi-Cap Core Average |
9.95 | -6.44 | 0.94 | 2.70 | NA | NA | ||||||||||||||||||
Performance data quoted represent past performance and are no guarantee of future returns. Current performance may be lower or higher than the performance data quoted. Current performance information to the most recent month-end is on the Parnassus website (www.parnassus.com). Investment return and principal value will fluctuate so that an investor’s shares, when redeemed, may be worth more or less than their original principal cost. Returns shown in the table do not reflect the deduction of taxes a shareholder may pay on fund distributions or redemption of shares. The Russell Midcap Index is an unmanaged index of common stocks, and it is not possible to invest directly in an index. Index figures do not take any expenses, fees or taxes into account, but mutual fund returns do. Mid-cap companies can be more sensitive to changing economic conditions and have fewer financial resources than large-cap companies. Before investing, an investor should carefully consider the investment objectives, risks, charges and expenses of the Fund and should carefully read the prospectus, which contains this and other information. The prospectus is available on the Parnassus website, or one can be obtained by calling (800) 999-3505. As described in the Fund’s current prospectus dated May 1, 2010, Parnassus Investments has contractually agreed to limit the total operating expenses to 1.20% of net assets, exclusive of acquired fund fees, until May 1, 2011. This limitation may be continued indefinitely by the Adviser on a year-to-year basis.
The Fund participated in the third quarter’s rally, gaining 10.11%, but trailed both the Lipper Average and the Russell, which gained 11.18% and 13.31%, respectively. A key reason the Fund underperformed this quarter was its disproportionate investment in larger stocks, which went up less than smaller stocks within the mid-cap universe. We like the stability of larger companies, which offer downside protection in challenging markets. Unfortunately, this bias hurt us in the quarter.
On a sector basis, we lost ground in the quarter due to the Fund’s being underweighted relative to the Russell in the consumer discretionary sector, the index’s best performing group. The Fund’s overweight position in the healthcare sector, the index’s worst performing group, was the most negative sector allocation decision for the quarter.
Company Analysis
As usual, the Fund’s performance was mostly impacted by stock selection, as opposed to sector allocation. Poor stock selection in the energy, information technology and financial sectors hurt the most, while good stock picking in the industrial sector helped make up some of the difference. The following were the Fund’s three biggest winners and losers in the quarter.
| 12 |
Quarterly Report — Q3 2010 | PARNASSUS FUNDS
Our biggest winner was security software provider McAfee, which added 14¢ to the Fund’s NAV. The stock surged 53.8%, from $30.72 to $46.98 where we sold it, after Intel agreed to acquire the company for $48 per share in cash. Given the substantial premium that Intel offered for McAfee’s shares, we did not expect another bidder to emerge, so we sold the stock.
Deere, the farm equipment manufacturer, rose 25.3% in the quarter, contributing 12¢ to the Fund’s NAV. The company posted excellent financial results in the quarter, due to better pricing and profitability, and the outlook for demand is rosy, given positive farming trends in the U.S. and Brazil.
Shares of Valeant Pharmaceuticals, a developer of dermatology and neurology drugs, boosted the NAV by 12¢, as its stock rose 30.2%, from $19.24 to $25.05. The stock moved up when CEO Michael Pearson provided impressive revenue and earnings growth projections following the company’s merger with Biovail, a Canadian specialty pharmaceutical company. We’re confident that management will create further shareholder value, so we’re holding on to the shares.
The Fund’s biggest loser was the natural gas producer Southwestern Energy, which took 5¢ from the NAV. The stock dropped 13.5% in the quarter, from $38.64 to $33.44, as natural gas prices weakened. We are holding on to the stock, because we like the company’s low production cost, especially in the Fayetteville Shale. Also, natural gas prices are at depressed levels, and when they recover, the stock should move higher.
Applied Materials, the world’s largest supplier of semiconductor manufacturing systems, cost the Fund 2¢, as its stock slipped 2.8%, from $12.02 to $11.68. Despite better than expected financial results, investors are concerned that the sector’s growth cycle is slowing, due to weakening consumer sentiment and solar-purchasing trends. We reduced our position in the company during the quarter.
Natural gas producer Ultra Petroleum took 2¢ from the Fund’s NAV, as its stock dropped 5.1%, from $44.25 to $41.98. Similar to Southwestern, weak natural gas prices reduced the company’s profitability. We are bullish on Ultra’s long-term prospects, due to its long reserve life, low production costs, significant economies of scale and solid returns on deployed capital.
Outlook and Strategy
Since the beginning of the year, we’ve been concerned that economic growth could come in below expectations. This prediction played out in the third quarter, as weak economic data caused many economists to lower their domestic growth expectations. While we don’t anticipate a double-dip recession, we are increasingly concerned about the pace of the economic recovery.
We have positioned the portfolio accordingly by initiating and increasing positions in high quality financial, industrial and utility companies that should be able to grow even in a tepid recovery. To fund these purchases, we’ve sold some of our technology stocks, which ran up during the recent market rally.
As a result of these changes, we are less underweighted in financials relative to the Russell than in previous periods. Our key overweight sectors in comparison to the index are industrials and healthcare, where we’ve identified companies with strong international growth opportunities and resilient business models. We are still significantly underweighted relative to the index in the consumer discretionary sector, an industry that would be hit hard if the economy continues growing at a sub-par rate.
Top 10 Holdings
| Waste Management Inc. |
4.7 | % | ||
| Cooper Industries PLC |
4.4 | % | ||
| Valeant Pharmaceuticals Int’l. |
4.1 | % | ||
| Teleflex Inc. |
4.1 | % | ||
| SEI Investments Co. |
3.7 | % | ||
| Sysco Corp. |
3.6 | % | ||
| Fiserv Inc. |
3.5 | % | ||
| Gen-Probe Inc. |
3.3 | % | ||
| Patterson Companies Inc. |
3.2 | % | ||
| Hudson City Bancorp Inc. |
3.2 | % |
Portfolio characteristics and holdings are subject to change periodically.
| 13 |
PARNASSUS FUNDS | Quarterly Report — Q3 2010
Our commitment to investing in attractively valued companies with secular growth opportunities, competitive advantages and quality leadership remains steadfast. This process is at the core of our long-term strategy for out-performance, which we aim to achieve through solid participation in rising markets and downside protection in declining markets.
Thank you for your investment with us.
Yours truly,

|

|

| ||
| Benjamin E. Allen |
Matthew D. Gershuny | Lori A. Keith | ||
| Portfolio Manager |
Portfolio Manager | Portfolio Manager | ||
| 14 |
Quarterly Report — Q3 2010 | PARNASSUS FUNDS
Ticker: PARSX
As of September 30, 2010, the NAV of the Parnassus Small-Cap Fund was $21.03, so the total return for the quarter was 12.52%. By comparison, the Russell 2000 Index (“Russell 2000”) of smaller companies gained 11.29% and the Lipper Small-Cap Core Average, which represents the average small-cap core fund followed by Lipper (“Lipper average”) gained 10.60%, so we beat both benchmarks. For the year-to-date, the Parnassus Small-Cap Fund is up 17.35% compared to 9.12% for the Russell 2000 and 8.31% for the Lipper average.
Below is a table comparing the performance of the Parnassus Small-Cap Fund with that of the Russell 2000 and the Lipper average for the one-, three- and five-year periods and for the period since inception. As you can see from the table, the Fund beat all its benchmarks by substantial amounts for all time periods.
With more than five years of history in the books, the Parnassus Small-Cap Fund has compiled a remarkable record of performance. A lot of people have asked me how we have been able to do this. I discussed this issue somewhat in the last report, but I would like to address the issue again in this report. In my view, there are four important elements that help us achieve good performance.
First, we try to find companies that have unique characteristics or a “moat” that defends a company’s castle from invasion by competitors. Of course, all companies face competition, but some are better equipped than others to handle that competition and we try to invest in those firms.
Parnassus Small-Cap Fund
| Average Annual Total Returns (%) for periods ended 9/30/2010 |
One Year |
Three Years |
Five Years |
Since Inception 4/29/05 |
Gross Expense Ratio |
Net Expense Ratio |
||||||||||||||||||
| Parnassus Small-Cap Fund |
18.06 | 4.64 | 8.55 | 8.28 | 1.47 | 1.20 | ||||||||||||||||||
| Russell 2000 Index |
13.35 | -4.29 | 1.60 | 4.27 | NA | NA | ||||||||||||||||||
| Lipper Small-Cap Core Average |
13.19 | -4.58 | 1.33 | 3.96 | NA | NA | ||||||||||||||||||
Performance data quoted represent past performance and are no guarantee of future returns. Current performance may be lower or higher than the performance data quoted. Current performance information to the most recent month-end is available on the Parnassus website (www.parnassus.com). Investment return and principal value will fluctuate so that an investor’s shares, when redeemed, may be worth more or less than their original principal cost. Returns shown in the table do not reflect the deduction of taxes a shareholder may pay on fund distributions or redemption of shares. The Russell 2000 Index is an unmanaged index of common stocks, and it is not possible to invest directly in an index. Index figures do not take any expenses, fees or taxes into account, but mutual fund returns do. Small-cap companies can be particularly sensitive to changing economic conditions and have fewer financial resources than large-cap companies. Before investing, an investor should carefully consider the investment objectives, risks, charges and expenses of the Fund and should carefully read the prospectus, which contains this and other information. The prospectus is available on the Parnassus website, or one can be obtained by calling (800) 999-3505. As described in the Fund’s current prospectus dated May 1, 2010, Parnassus Investments has contractually agreed to limit the total operating expenses to 1.20% of net assets, exclusive of acquired fund fees, until May 1, 2011. This limitation may be continued indefinitely by the Adviser on a year-to year basis.
Second, we try to determine a company’s intrinsic value and if the market price is far below the value of the company, we will probably invest in that stock. Valuation is very important, as it gives us a margin of safety and provides some downside protection in falling markets.
Third, size and financial strength are important. At the time we buy them, almost all of our companies have market valuations below $3 billion, so we’re investing in smaller companies. However, we try to invest in companies that are in the higher end of that range and in firms that have strong balance sheets. We think size and financial strength give us an investing edge.
A fourth element is environmental, social and governance issues (ESG). Investing in companies with good ESG characteristics protects us from many negative forces such as labor problems, fines and lawsuits over environmental problems and faulty accounting. On a more positive note, companies that treat their employees well will have greater internal harmony and their workers should be more productive.
Since smaller companies are not as well covered by financial analysts as are larger companies, there is more opportunity with these firms to find undiscovered bargains. Finally, I would like to point out that we’re not perfect, we’ve made mistakes in the past and we’ll definitely make more mistakes in the future. Also, don’t forget that past performance is no guarantee of future returns.
| 15 |
PARNASSUS FUNDS | Quarterly Report — Q3 2010
Company Analysis
Only one company in the portfolio had a substantial negative impact during the quarter. LHC Group, a home healthcare company, sliced 11¢ off the NAV, as its stock dropped 16.4% from $27.75 to $23.19. During the quarter, the Securities and Exchange Commission ordered LHC Group not to destroy any documents, so the agency can determine if the company and its competitors violated Medicare reimbursement rules. As I discussed in the last quarterly report, the U.S. Senate Finance Committee is also probing the same issues relating to home therapy visits, and LHG has responded, saying that its home therapy visits are all authorized by a doctor and that it has not abused the system by making unnecessary visits. We’re holding onto the shares, as there is no evidence that the company has done anything wrong.
Top 10 Holdings
| Teleflex Inc. |
4.5 | % | ||
| Ceragon Networks Ltd. |
4.4 | % | ||
| Administaff Inc. |
4.4 | % | ||
| Brocade Communications Systems Inc. |
4.4 | % | ||
| LHC Group Inc. |
4.3 | % | ||
| Cyberonics Inc. |
4.0 | % | ||
| Electronics for Imaging Inc. |
4.0 | % | ||
| Tellabs Inc. |
3.9 | % | ||
| Toll Brothers Inc. |
3.6 | % | ||
| Ciena Corp. |
3.5 | % |
Portfolio characteristics and holdings are subject to change periodically.
Four companies each accounted for a gain of 14¢ or more on the NAV. The big winner was Ceragon Networks which added 24¢ to each fund share, as its stock rose 33.7% from $7.40 to $9.89. The company provides microwave equipment for wireless backhaul, which means connecting cellular telephone towers to the main telecommunications network. Ceragon’s stock had been trading at depressed levels because it had not been able to book orders in India, its largest market, due to recently enacted government security measures. On August 30, investors drove the stock higher, when the company announced that it was again booking Indian orders after five months without any business.
Electronics for Imaging, a provider of controllers for color copiers and printers, saw a 24.3% increase in its stock price from $9.75 to $12.12 for a gain 16¢ on the NAV. Demand increased from customers such as Xerox and Canon, as they upgraded their printing hardware. The company has also been gaining market share with its ultraviolet printing technology, by replacing both analog and solvent ink-based printers with digital solutions.
Finisar Corporation provides optical subsystems and network performance test systems for use in telecommunications. Sales of all its optical products have been strong, especially its higher-speed products such as the ROADM, a device that allows telecommunications firms to reconfigure optical networks remotely to allow for changes in wavelengths and power needs. The stock added 14¢ to the value of each fund share, as it surged 26.1% from $14.90 to $18.79.
Maryland-based Ciena Corporation makes optical network equipment used in telecommunications. The company added 14¢ to the NAV, as its rose 22.8% from $12.68 to $15.57. Sales increased because of higher demand from telephone companies that need to build out their networks. Revenue growth was especially strong in Europe and Canada following the company’s purchase of the optical equipment assets of Nortel Networks earlier this year.
Yours truly,

Jerome L.Dodson
Portfolio Manager
| 16 |
Quarterly Report — Q3 2010 | PARNASSUS FUNDS
Ticker: PARWX
As of September 30, 2010, the NAV of the Parnassus Workplace Fund was $19.90, so the total return for the quarter was 13.00%. This compares with a gain of 11.30% for the S&P 500 and a gain of 11.18% for the Lipper Multi-Cap Core Average, which represents the average multi-cap core fund followed by Lipper (“Lipper average”), so we beat both benchmarks for the quarter.
You may recall that the Parnassus Workplace Fund was down 9.46% at the end of the second quarter (June 30), but this quarter’s strong performance means that the Fund is actually up 2.31% for the year. We’re making a strong comeback, but we still trail our benchmarks for the year-to-date. For that period, the S&P 500 is up 3.91%, while the Lipper average is up 4.42%.
Below is a table that compares the Parnassus Workplace Fund with the S&P 500 and the Lipper average for the one-, three- and five-year periods as well as the period since inception. You’ll notice that the Fund is ahead of all its benchmarks for all time periods, and the lead is quite substantial for the three- and five-year periods and for the period since inception. Given the Parnassus Workplace Fund’s track record of more than five years, we can say that companies that treat their employees well can also be great investments.
Company Analysis
In line with the Parnassus Workplace Fund’s strong quarterly performance, no companies had a significant negative impact on the value of the Fund’s shares. On the other hand, five companies contributed 14¢ or more to the NAV.
The biggest winner was Qualcomm, a San Diego-based provider of software and semiconductors used in cellular telephone handsets. The stock soared 37.4% during the quarter from $32.84 to $45.12 for a gain of 45¢ for each fund share. On July 22, Qualcomm reported strong quarterly results, which dispelled investor concerns about pricing pressure from declining handset prices. We think that the stock could go a lot higher, because of strong demand from existing handset owners upgrading to smartphones and new handset customers in emerging markets.
Parnassus Workplace Fund
| Average Annual Total Returns (%) for periods ended 9/30/2010 |
One Year |
Three Years |
Five Years |
Since Inception 4/29/05 |
Gross Expense Ratio |
Net Expense Ratio |
||||||||||||||||||
| Parnassus Workplace Fund |
10.89 | 3.63 | 7.67 | 7.24 | 1.36 | 1.20 | ||||||||||||||||||
| S&P 500 Index |
10.18 | -7.15 | 0.64 | 1.86 | NA | NA | ||||||||||||||||||
| Lipper Multi-Cap Core Average |
9.95 | -6.44 | 0.94 | 2.70 | NA | NA | ||||||||||||||||||
Performance data quoted represent past performance and are no guarantee of future returns. Current performance may be lower or higher than the performance data quoted. Current performance information to the most recent month-end is available on the Parnassus website (www.parnassus.com). Investment return and principal value will fluctuate so that an investor’s shares, when redeemed, may be worth more or less than their original principal cost. Returns shown in the table do not reflect the deduction of taxes a shareholder may pay on fund distributions or redemption of shares. The S&P 500 Index is an unmanaged index of common stocks, and it is not possible to invest directly in an index. Index figures do not take any expenses, fees or taxes into account, but mutual fund returns do. Before investing, an investor should carefully consider the investment objectives, risks, charges and expenses of the Fund and should carefully read the prospectus, which contains this and other information. The prospectus is available on the Parnassus website, or one can be obtained by calling (800) 999-3505. As described in the Fund’s current prospectus dated May 1, 2010, Parnassus Investments has contractually agreed to limit the total operating expenses to 1.20% of net assets, exclusive of acquired fund fees, until May 1, 2011. This limitation may be continued indefinitely by the Adviser on a year-to-year basis.
Genzyme, a Cambridge, Massachusetts-based biotechnology company focused on treatments for rare inherited disorders like Gaucher disease and Fabrys disease, added 34¢ to the value of each fund share, as its stock rocketed up 39.4% from $50.77 to $70.79. The company received an acquisition offer from French pharmaceutical company Sanofi-Aventis for $69 per share, but the Genzyme board rejected the offer as being much too low. I’m hanging onto the stock for now, since I think the French company will make a higher offer, since it needs Genzyme’s products to fill its drug pipeline.
eBay’s stock gained 24.4% during the quarter, climbing from $19.61 to $24.40 for an increase of 21¢ on the NAV. PayPal, the company’s online payment business continues to benefit from strong growth, as more consumers buy goods over the Internet.
| 17 |
PARNASSUS FUNDS | Quarterly Report — Q3 2010
Top 10 Holdings
| QUALCOMM Inc. |
6.8 | % | ||
| eBay Inc. |
5.4 | % | ||
| Google Inc. |
4.8 | % | ||
| MasterCard Inc. |
4.7 | % | ||
| International Business Machines Corp. |
4.5 | % | ||
| Intel Corp. |
4.3 | % | ||
| Corning Inc. |
4.2 | % | ||
| Brocade Communications Systems Inc. |
4.0 | % | ||
| Applied Materials Inc. |
4.0 | % | ||
| Genzyme Corp. |
3.8 | % |
Portfolio characteristics and holdings are subject to change periodically.
The stock of Deere & Co. rose 25.3% from $55.68 to $69.78 for a gain of 14¢ for each fund share. Rising farm incomes around the world means higher sales of tractors and other agricultural equipment, so Deere’s revenue has increased substantially. The company has also done a good job of managing costs, as illustrated by a gain in margins of three full percentage points, resulting in strong earnings.
Google, the internet search giant, added 14¢ to the Fund’s NAV, as its share price rose 18.2% from $444.95 to $525.79. In September, the stock moved higher after the company unveiled Google Instant, which predicts and delivers results before a user finishes typing. This should help Google gain share in the mobile market, because typing complete search requests is inconvenient on a handheld device.
Yours truly,

Jerome L.Dodson
Portfolio Manager
| 18 |
Quarterly Report — Q3 2010 | PARNASSUS FUNDS
Ticker: PRFIX
As of September 30, 2010, the NAV of the Parnassus Fixed-Income Fund was $17.85, producing a total return for the quarter of 3.34% (including dividends). This compares to a gain of 3.26% for the Lipper A-Rated Bond Fund Average, which represents the average return of all A-rated bond funds followed by Lipper (“Lipper average”) and a gain of 3.28% for the Barclays Capital U.S. Government/Credit Bond Index (“Barclays Capital Index”). Since the beginning of the year, the total return for the Fund was 8.85% compared to a gain of 8.74% for the Lipper average and a gain of 8.95% for the Barclays Capital Index.
Below is a table comparing the performance of the Fund with that of the Barclays Capital Index and the Lipper average. Average annual total returns are for the one-, three-, five- and ten-year periods. The 30-day SEC yield for the Fund for September 2010 was 1.32%. I’m pleased to report that our long-term returns are better than the Lipper average and Barclays Capital Index for the five- and ten-year periods as of the end of September.
Third Quarter Review
During the third quarter, concerns about the strength of the economic recovery prompted investors to buy Treasuries, driving yields lower. These concerns arose due to weaker than expected economic data, which are pointing to a deceleration in the pace of the recovery. For example, real GDP growth slowed to 1.7% in the second quarter from 3.7% in the first quarter and 5.0% in the fourth quarter of last year. According to the latest Bloomberg economist survey, the economic growth will probably not accelerate during the second half of this year.
Because of this slower growth, the unemployment rate is unlikely to show meaningful improvements over the next several quarters. This outlook seemed to have particularly affected households’ sentiment. Indeed, the latest Conference Board Consumer Confidence Index fell to 48.5 in September, its weakest level since February. Much of the drop in the index was in the expectations component, while the present situation component also fell and has remained near decades’ lows for almost two years.
Parnassus Fixed-Income Fund
| Average Annual Total Returns (%) for periods ended 9/30/2010 |
One Year |
Three Years |
Five Years |
Ten Years |
Gross Expense Ratio |
Net Expense Ratio |
||||||||||||||||||
| Parnassus Fixed-Income Fund |
9.10 | 7.20 | 6.42 | 6.59 | 0.88 | 0.76 | ||||||||||||||||||
| Barclays Capital U.S. Government/Credit Bond Index |
8.73 | 7.46 | 6.15 | 6.52 | NA | NA | ||||||||||||||||||
| Lipper A-Rated Bond Fund Average |
9.93 | 6.19 | 5.09 | 5.73 | NA | NA | ||||||||||||||||||
Performance data quoted represent past performance and are no guarantee of future returns. Current performance may be lower or higher than the performance data quoted. Current performance information to the most recent month-end is available on the Parnassus website (www.parnassus.com). Investment return and principal value will fluctuate so that an investor’s shares, when redeemed, may be worth more or less than their original cost. Returns shown in the table do not reflect the deduction of taxes a shareholder would pay in fund distributions or redemption of shares. The Barclays Capital U.S. Government/ Credit Bond Index is an unmanaged index of bonds, and it is not possible to invest directly in an index. Index figures do not take any expenses, fees, or taxes into account, but mutual fund returns do. Before investing, an investor should carefully consider the investment objectives, risks, charges and expenses of the Fund and should carefully read the prospectus, which contains this and other information. The prospectus is available on the Parnassus website, or one can be obtained by calling (800) 999-3505. As described in the Fund’s current prospectus dated May 1, 2010, Parnassus Investments has contractually agreed to limit the total operating expenses to 0.87% of net assets, exclusive of acquired fund fees, until May 1, 2011. This limitation may be continued indefinitely by the Adviser on a year-to-year basis.
Amid this bleak backdrop, yields moved lower, especially in the middle of the yield curve, with the 5-year and 7-year Treasury bond yields dropping the most. The yield on the 5-year bond decreased 51 basis points to 1.26%, while the yield on the 7-year bond fell 50 basis points to 1.91%. Consequently, our corporate and Treasury bonds performed well during the quarter, since bond prices increase as yields drop. Our corporate bond holdings increased the NAV by 23¢ and our Treasury holdings added 31¢.
Stocks moved higher, as they rose in spite of the uninspiring economic data and gained on stronger than expected corporate earnings. The S&P 500 surged an astonishing 11.3% during the third quarter. As a result, our convertible bonds benefited from this rising equity market, contributing 7¢ to the NAV.
| 19 |
PARNASSUS FUNDS | Quarterly Report — Q3 2010
During the third quarter, the Fund performed better than the Barclays Capital Index by six basis points. The small lead was mainly due to our lack of exposure to government agency bonds. As of the end of the third quarter, the latter made up 11.5% of the Barclays Capital Index. They returned only 1.62% compared to 2.73% for U.S. Treasuries.
We outperformed the Lipper average by eight basis points, because of the higher returns of Treasury and corporate bonds during the quarter. Most of our peers have larger holdings in securitized products, such as commercial mortgage-backed, residential mortgage-backed and asset-backed securities. These securities returned only 1.11% during the quarter compared to 2.73% for U.S. Treasuries and 4.71% for corporate bonds. The Fund doesn’t have exposure to these securitized products, because I think that there is too much risk in owning them at this time. There are more attractive, less risky investment opportunities in corporate and convertible bonds.
Outlook and Strategy
The risks of further economic slowdown and lower inflation have increased over the last six months. This has put pressure on policymakers to find ways to boost economic growth and spur employment. At its September meeting, the Federal Reserve committee explicitly mentioned, for the first time, that inflation has fallen to undesirably low levels. More importantly, it stands ready to “provide additional accommodation if needed to support the economic recovery and to return inflation, over time, to levels consistent with its mandate.”
For bond investors, this means that if economic growth were to further weaken, the Federal Reserve committee would likely embark on another round of monetary stimulus through the purchases of government securities. Its goal would be to increase the quantity of money available in the financial system to make borrowing easier for corporations and households. In turn, this increased liquidity would likely lead to lower interest rates.
| Parnassus Fixed-Income Fund at September 30, 2010 (percentage of net assets) |
||||
| Portfolio Composition |
||||
| U.S. Government Treasury Bonds |
53.7 | % | ||
| Corporate Bonds |
34.2 | % | ||
| Convertible Bonds |
9.3 | % | ||
| Short-term Investments, Other Assets and Liabilities |
2.8 | % | ||
| 100.0 | % | |||
Portfolio characteristics and holdings are subject to change periodically.
The portfolio is positioned to benefit from continued low interest rates. Treasury bonds represent 53.7% of the total net assets, corporate bonds totaled 34.2%, and 9.3% is invested in convertible bonds. While this composition has not significantly changed from the previous quarter, the duration of the portfolio has decreased from 6.10 years to 5.62 years. The portfolio’s duration is a measure of the sensitivity of the portfolio’s NAV to interest rates movements.
Since interest rates are already quite low, regardless of future economic conditions, there is more room for them to go up than to go down. Therefore, the potential gain from lower interest rates diminishes relative to the risk of capital losses due to rising interest rates. This is the reason why I lowered the duration of the portfolio to limit the potential losses.
As always, I am carefully monitoring changes in the economic and financial outlook and will position the portfolio accordingly.
Thank you for your confidence and investments in the Parnassus Fixed-Income Fund.
Yours truly,

Minh T. Bui
Portfolio Manager
| 20 |
Quarterly Report — Q3 2010 | PARNASSUS FUNDS
THIS PAGE LEFT INTENTIONALLY BLANK
| 21 |
PARNASSUS FUNDS | Quarterly Report — Q3 2010
By Milton Moskowitz and Jerome Dodson
We sometimes forget, in the rush of day-to-day activities, how much things have changed over the years, making lives better for many people. Along comes Gail Collins to remind us of the astounding progress made by American women over the past 50 years. Her new book, When Everything Changed, traces this journey in her straight-forward, easy-to-read style. A columnist on the op-ed page of the New York Times, Collins never preaches. She tackles serious subjects but makes you laugh. Did you know that in 1960 most women had to get their husband’s permission to apply for a credit card, that it was difficult then for a woman to bring rape charges against a man unless she had an eyewitness, that women accounted for only 6% of doctors, 3% of lawyers and less than 1% of engineers? As for boards of directors of major corporations, forget it — there was zero representation of women. Gail Collins tells this story not through dry statistics but with portrait after portrait of real women who were interviewed for this engaging book.
The struggle continues today, hence the lists published by magazines to salute companies where women are doing well. First, there is Fortune magazine’s “50 Most Powerful Women in Business.” Ten are female executives at Parnassus portfolio companies, to wit: No. 8, Ginnie Rometty, senior vice president for sales, marketing and strategy at IBM; in 10th place, Carol Bartz, CEO of Yahoo; Melanie Healey (No. 13), Group President, North America, Procter & Gamble; in 14th position, Ann Livermore, Executive Vice President, Enterprise Business, Hewlett-Packard; Anne Sweeney (No. 15), Co-Chair, Disney Media Networks, Walt Disney; in 28th place, Cathie Lesjak, longtime Chief Financial Officer and then interim CEO of Hewlett-Packard; Gina Drosos (No. 39), Group President-Global Beauty, Procter & Gamble; Marissa Mayer (No. 42), Vice President-Search and User Experience, Google; in 43rd spot, Susan Wojcicki, Vice President-Product Management, Google; Lorrie Norrington (No. 44), President-eBay Marketplaces, eBay.
The annual Working Mother magazine list, “The 100 Best Companies for Working Mothers,” is celebrating its 25th anniversary this year. In its first year, 1986, only 30 companies could be found; it took six years to reach the 100 mark. Eight Parnassus portfolio companies grace the current list: Accenture, Cisco Systems, Hewlett-Packard, IBM, Intel, MasterCard, Procter & Gamble and Texas Instruments. Some programs that helped them earn this recognition: Employees at Intel get eight-week paid sabbaticals every five years; MasterCard parents now get coverage for therapy sessions, up to 60 a year, for their autistic children; and at IBM children with developmental issues now have access to medical testing and therapies not reimbursed by insurance; Cisco launched an Off/On ramp program enabling employees to take leaves up to two years; last year Hewlett-Packard allowed one-fifth of all employees to switch to part-time schedules.
| 22 |
Quarterly Report — Q3 2010 | PARNASSUS FUNDS
Walt Disney Company is going into the education business in China, enrolling children in English-language schools adorned with Disney icons. Tuition is $1,800 a year but there are already waiting lists. Ten schools have been opened in Shanghai, five in Beijing. The number is expected to double next year…Waste Management is partnering with local affiliates of Keep America Beautiful to improve community environments. The affiliates come up with programs which Waste Management funds to the tune of about $12,000 per project. The grants are going this year to a dozen groups in Texas, Florida, Georgia, Arkansas, Indiana, Tennessee, Arizona and Puerto Rico…Clean drinking water for children is a worldwide crusade by Procter & Gamble, which has committed to deliver by 2020 more than two billion liters of clean drinking water every year to developing countries. The program utilizes PUR packets, a technology developed by P&G and the U.S. Centers for Disease Control and Prevention. A new plant in Singapore does the manufacturing…Target created 2,400 new jobs by opening 10 new stores on October 10, 2010. Locations are: Sacramento, Simi Valley, Bakersfield, San Jose and Azusa in California, Salt Lake City, Little Rock, Christiana (Delaware), Flushing (New York) and Braintree (Massachusetts)…Nordstrom finally made it into New York City, opening one of its Rack stores in Union Square. It carries 25,000 pairs of shoes…A hallmark in reversing sweatshop conditions in developing countries was reached in Honduras where Nike agreed to contribute $1.54 million to a relief fund for workers thrown out of work by the closure of two plants. The action was applauded by the University of Wisconsin, which earlier in the year had stripped Nike of its contract to supply athletic wear after the workers were dismissed without any severance pay. Nike also agreed to pay health insurance for the workers for one year. Although it was not an owner of the plants, Nike stepped up to assume responsibility for the welfare of workers who had been turning out Nike-branded apparel.
| 23 |
PARNASSUS FUNDS | Quarterly Report — Q3 2010
Portfolio of Investments as of September 30, 2010 (unaudited)
| Shares |
Equities |
Market Value ($) | Per Share | Percent of Net Assets |
||||||||||
| 380,000 | QUALCOMM Inc. | 17,145,600 | 45.12 | 4.3 | % | |||||||||
| 1,100,000 | Ciena Corp. | 17,127,000 | 15.57 | 4.3 | % | |||||||||
| 70,000 | MasterCard Inc. | 15,680,000 | 224.00 | 3.9 | % | |||||||||
| 1,350,000 | DR Horton Inc. | 15,012,000 | 11.12 | 3.7 | % | |||||||||
| 470,000 | VeriSign Inc. | 14,917,800 | 31.74 | 3.7 | % | |||||||||
| 1,700,000 | PulteGroup Inc. | 14,892,000 | 8.76 | 3.7 | % | |||||||||
| 260,000 | Teleflex Inc. | 14,762,800 | 56.78 | 3.7 | % | |||||||||
| 650,000 | Lowe’s Cos., Inc. | 14,488,500 | 22.29 | 3.6 | % | |||||||||
| 190,000 | Genzyme Corp. | 13,450,100 | 70.79 | 3.4 | % | |||||||||
| 350,000 | JPMorgan Chase & Co. | 13,324,500 | 38.07 | 3.3 | % | |||||||||
| 700,000 | Toll Brothers Inc. | 13,314,000 | 19.02 | 3.3 | % | |||||||||
| 25,000 | Google Inc. | 13,144,750 | 525.79 | 3.3 | % | |||||||||
| 660,000 | Intel Corp. | 12,691,800 | 19.23 | 3.2 | % | |||||||||
| 2,100,000 | Brocade Communications Systems Inc. | 12,264,000 | 5.84 | 3.1 | % | |||||||||
| 470,000 | Wells Fargo & Co. | 11,811,100 | 25.13 | 2.9 | % | |||||||||
| 1,000,000 | Applied Materials Inc. | 11,680,000 | 11.68 | 2.9 | % | |||||||||
| 270,000 | Hewlett-Packard Company | 11,358,900 | 42.07 | 2.8 | % | |||||||||
| 470,000 | Cisco Systems Inc. | 10,293,000 | 21.90 | 2.6 | % | |||||||||
| 400,000 | eBay Inc. | 9,760,000 | 24.40 | 2.4 | % | |||||||||
| 360,000 | Administaff Inc. | 9,694,800 | 26.93 | 2.4 | % | |||||||||
| 300,000 | Autodesk Inc. | 9,591,000 | 31.97 | 2.4 | % | |||||||||
| 900,000 | W&T Offshore Inc. | 9,540,000 | 10.60 | 2.4 | % | |||||||||
| 280,000 | Medtronic Inc. | 9,402,400 | 33.58 | 2.3 | % | |||||||||
| 505,000 | Corning Inc. | 9,231,400 | 18.28 | 2.3 | % | |||||||||
| 325,000 | Adobe Systems Inc. | 8,498,750 | 26.15 | 2.1 | % | |||||||||
| 300,000 | Texas Instruments Inc. | 8,142,000 | 27.14 | 2.0 | % | |||||||||
| 715,000 | KB Home | 8,100,950 | 11.33 | 2.0 | % | |||||||||
| 110,000 | Deere & Co. | 7,675,800 | 69.78 | 1.9 | % | |||||||||
| 180,000 | Lam Research Corp. | 7,533,000 | 41.85 | 1.9 | % | |||||||||
| 280,000 | Tower Group Inc. | 6,538,000 | 23.35 | 1.6 | % | |||||||||
| 45,000 | International Business Machines Corp. | 6,036,300 | 134.14 | 1.5 | % | |||||||||
| 475,000 | Quicksilver Resources Inc. | 5,985,000 | 12.60 | 1.5 | % | |||||||||
| 100,000 | Target Corp. | 5,344,000 | 53.44 | 1.4 | % | |||||||||
| 300,000 | Symantec Corp. | 4,551,000 | 15.17 | 1.1 | % | |||||||||
| 350,000 | Seagate Technology | 4,123,000 | 11.78 | 1.0 | % | |||||||||
| 280,000 | Yahoo! Inc. | 3,967,600 | 14.17 | 1.0 | % | |||||||||
| 500,000 | Tellabs Inc. | 3,725,000 | 7.45 | 0.9 | % | |||||||||
| 100,000 | Walgreen Co. | 3,350,000 | 33.50 | 0.8 | % | |||||||||
| 100,000 | The Walt Disney Co. | 3,311,000 | 33.11 | 0.8 | % | |||||||||
| 170,000 | Finisar Corp. | 3,194,300 | 18.79 | 0.8 | % | |||||||||
| 105,000 | Altera Corp. | 3,166,800 | 30.16 | 0.8 | % | |||||||||
| 20,000 | Bio-Rad Laboratories Inc. | 1,810,200 | 90.51 | 0.5 | % | |||||||||
| Total investment in equities | 399,630,150 | 99.5 | % | |||||||||||
| 24 |
Quarterly Report — Q3 2010 | PARNASSUS FUNDS
| Market Value ($) | Percent of Net Assets |
|||||||||
| Total short-term securities |
1,800,885 | 0.4 | % | |||||||
| Other assets and liabilities |
57,728 | 0.1 | % | |||||||
| Total net assets |
401,488,763 | 100.0 | % | |||||||
| Net asset value as of September 30, 2010 |
$ | 36.40 | ||||||||
| 25 |
PARNASSUS FUNDS | Quarterly Report — Q3 2010
Portfolio of Investments as of September 30, 2010 (unaudited)
| Shares |
Equities |
Market Value ($) | Per Share | Percent of Net Assets |
||||||||||
| 4,775,000 | Waste Management Inc. | 170,658,500 | 35.74 | 5.4 | % | |||||||||
| 2,050,000 | Occidental Petroleum Corp. | 160,515,000 | 78.30 | 5.1 | % | |||||||||
| 301,000 | Google Inc. | 158,262,790 | 525.79 | 5.0 | % | |||||||||
| 4,425,000 | Medtronic Inc. | 148,591,500 | 33.58 | 4.7 | % | |||||||||
| 6,000,000 | Microsoft Corp. | 146,940,000 | 24.49 | 4.7 | % | |||||||||
| 2,448,589 | Teleflex Inc. | 139,030,883 | 56.78 | 4.4 | % | |||||||||
| 3,300,000 | Hewlett-Packard Company | 138,831,000 | 42.07 | 4.4 | % | |||||||||
| 2,850,000 | Energen Corp. | 130,302,000 | 45.72 | 4.1 | % | |||||||||
| 2,750,000 | QUALCOMM Inc. | 124,080,000 | 45.12 | 3.9 | % | |||||||||
| 490,000 | MasterCard Inc. | 109,760,000 | 224.00 | 3.5 | % | |||||||||
| 2,750,000 | JPMorgan Chase & Co. | 104,692,500 | 38.07 | 3.3 | % | |||||||||
| 4,000,000 | Bank of New York Mellon Corp. | 104,520,000 | 26.13 | 3.3 | % | |||||||||
| 5,000,000 | MDU Resources Group Inc. | 99,750,000 | 19.95 | 3.2 | % | |||||||||
| 2,015,000 | Accenture PLC | 85,617,350 | 42.49 | 2.7 | % | |||||||||
| 1,650,000 | Cooper Industries PLC | 80,734,500 | 48.93 | 2.6 | % | |||||||||
| 1,000,000 | Nike Inc. | 80,140,000 | 80.14 | 2.5 | % | |||||||||
| 2,691,596 | Sysco Corp. | 76,764,318 | 28.52 | 2.4 | % | |||||||||
| 1,750,000 | McCormick & Co. | 73,570,000 | 42.04 | 2.3 | % | |||||||||
| 1,500,000 | Gen-Probe Inc. | 72,690,000 | 48.46 | 2.3 | % | |||||||||
| 1,100,000 | Procter & Gamble Co. | 65,967,000 | 59.97 | 2.1 | % | |||||||||
| 2,925,000 | Cisco Systems Inc. | 64,057,500 | 21.90 | 2.0 | % | |||||||||
| 2,065,000 | Paychex Inc. | 56,766,850 | 27.49 | 1.8 | % | |||||||||
| 1,090,000 | Aflac Inc. | 56,363,900 | 51.71 | 1.8 | % | |||||||||
| 1,000,000 | Royal Bank of Canada | 52,130,000 | 52.13 | 1.7 | % | |||||||||
| 1,540,309 | VeriSign Inc. | 48,889,408 | 31.74 | 1.5 | % | |||||||||
| 500,000 | Praxair Inc. | 45,130,000 | 90.26 | 1.5 | % | |||||||||
| 3,500,000 | Hudson City Bancorp Inc. | 42,910,000 | 12.26 | 1.4 | % | |||||||||
| 600,000 | Deere & Co. | 41,868,000 | 69.78 | 1.3 | % | |||||||||
| 1,225,000 | Pentair Inc. | 41,196,750 | 33.63 | 1.3 | % | |||||||||
| 1,750,000 | Spectra Energy Corp. | 39,462,500 | 22.55 | 1.3 | % | |||||||||
| 1,001,341 | WD-40 Co. | 38,070,985 | 38.02 | 1.2 | % | |||||||||
| 3,448,000 | W&T Offshore Inc. | 36,548,800 | 10.60 | 1.2 | % | |||||||||
| 750,000 | Northwest Natural Gas Co. | 35,587,500 | 47.45 | 1.1 | % | |||||||||
| 900,000 | AGL Resources Inc. | 34,524,000 | 38.36 | 1.1 | % | |||||||||
| 915,473 | IDEX Corp. | 32,508,446 | 35.51 | 1.0 | % | |||||||||
| 1,000,000 | Black Hills Corp. | 31,200,000 | 31.20 | 1.0 | % | |||||||||
| 500,000 | Gilead Sciences Inc. | 17,805,000 | 35.61 | 0.6 | % | |||||||||
| Total investment in equities | 2,986,436,980 | 94.7 | % | |||||||||||
| 26 |
Quarterly Report — Q3 2010 | PARNASSUS FUNDS
| Principal Amount $ |
Community Loans |
Market Value ($) | Per Share | Percent of Net Assets |
||||||||||
| 1,000,000 | MicroVest I, LP Note | |||||||||||||
| Loan, 5.88%, due 12/15/2010 | 987,669 | 0.0 | % | |||||||||||
| Total investment in community loans | 987,669 | 0.0 | % | |||||||||||
| Total long-term investments | 2,987,424,649 | 94.7 | % | |||||||||||
| Total short-term securities | 201,493,609 | 6.4 | % | |||||||||||
| Other assets and liabilities | (34,507,981 | ) | -1.1 | % | ||||||||||
| Total net assets | 3,154,410,277 | 100.0 | % | |||||||||||
| Net asset value as of September 30, 2010 | ||||||||||||||
| Investor shares | $ | 24.45 | ||||||||||||
| Institutional shares | $ | 24.51 | ||||||||||||
| 27 |
PARNASSUS FUNDS | Quarterly Report — Q3 2010
Portfolio of Investments as of September 30, 2010 (unaudited)
| Shares |
Equities |
Market Value ($) | Per Share | Percent of Net Assets |
||||||||||
| 40,000 | Waste Management Inc. | 1,429,600 | 35.74 | 4.7 | % | |||||||||
| 27,500 | Cooper Industries PLC | 1,345,575 | 48.93 | 4.4 | % | |||||||||
| 50,000 | Valeant Pharmaceuticals International | 1,252,500 | 25.05 | 4.1 | % | |||||||||
| 22,000 | Teleflex Inc. | 1,249,160 | 56.78 | 4.1 | % | |||||||||
| 55,000 | SEI Investments Co. | 1,118,700 | 20.34 | 3.7 | % | |||||||||
| 38,000 | Sysco Corp. | 1,083,760 | 28.52 | 3.6 | % | |||||||||
| 20,000 | Fiserv Inc. | 1,076,400 | 53.82 | 3.5 | % | |||||||||
| 20,500 | Gen-Probe Inc. | 993,430 | 48.46 | 3.3 | % | |||||||||
| 34,250 | Patterson Companies Inc. | 981,263 | 28.65 | 3.2 | % | |||||||||
| 80,000 | Hudson City Bancorp Inc. | 980,800 | 12.26 | 3.2 | % | |||||||||
| 70,000 | Charles Schwab Corp. | 973,000 | 13.90 | 3.2 | % | |||||||||
| 23,000 | McCormick & Co. | 966,920 | 42.04 | 3.2 | % | |||||||||
| 30,000 | Equifax Inc. | 936,000 | 31.20 | 3.1 | % | |||||||||
| 26,000 | IDEX Corp. | 923,260 | 35.51 | 3.0 | % | |||||||||
| 35,000 | Adobe Systems Inc. | 915,250 | 26.15 | 3.0 | % | |||||||||
| 80,000 | DR Horton Inc. | 889,600 | 11.12 | 2.9 | % | |||||||||
| 17,500 | Ecolab Inc. | 887,950 | 50.74 | 2.9 | % | |||||||||
| 25,000 | Pentair Inc. | 840,750 | 33.63 | 2.8 | % | |||||||||
| 30,000 | Paychex Inc. | 824,700 | 27.49 | 2.7 | % | |||||||||
| 40,000 | MDU Resources Group Inc. | 798,000 | 19.95 | 2.6 | % | |||||||||
| 15,000 | Energen Corp. | 685,800 | 45.72 | 2.3 | % | |||||||||
| 24,000 | Administaff Inc. | 646,320 | 26.93 | 2.1 | % | |||||||||
| 12,000 | Aflac Inc. | 620,520 | 51.71 | 2.0 | % | |||||||||
| 27,500 | Spectra Energy Corp. | 620,125 | 22.55 | 2.0 | % | |||||||||
| 7,500 | C. R. Bard Inc. | 610,725 | 81.43 | 2.0 | % | |||||||||
| 40,000 | Symantec Corp. | 606,800 | 15.17 | 2.0 | % | |||||||||
| 18,000 | Southwestern Energy Co. | 601,920 | 33.44 | 2.0 | % | |||||||||
| 40,000 | Glacier Bancorp Inc. | 584,000 | 14.60 | 1.9 | % | |||||||||
| 22,000 | Synopsys Inc. | 544,940 | 24.77 | 1.8 | % | |||||||||
| 10,000 | Quest Diagnostics Inc. | 504,700 | 50.47 | 1.7 | % | |||||||||
| 11,500 | Ultra Petroleum Corp. | 482,770 | 41.98 | 1.6 | % | |||||||||
| 6,500 | Deere & Co. | 453,570 | 69.78 | 1.5 | % | |||||||||
| 14,000 | DENTSPLY International Inc. | 447,580 | 31.97 | 1.5 | % | |||||||||
| 11,000 | Nordstrom Inc. | 409,200 | 37.20 | 1.3 | % | |||||||||
| 9,000 | Coach Inc. | 386,640 | 42.96 | 1.3 | % | |||||||||
| 9,500 | Check Point Software Technologies Ltd. | 350,835 | 36.93 | 1.2 | % | |||||||||
| 10,000 | Noble Corp. | 337,900 | 33.79 | 1.1 | % | |||||||||
| 4,500 | Pioneer Natural Resources Co. | 292,635 | 65.03 | 1.0 | % | |||||||||
| 25,000 | Applied Materials Inc. | 292,000 | 11.68 | 1.0 | % | |||||||||
| Total investment in equities | 29,945,598 | 98.5 | % | |||||||||||
| Total short-term securities | 1,540,565 | 5.1 | % | |||||||||||
| Other assets and liabilities | (1,072,998 | ) | -3.6 | % | ||||||||||
| Total net assets | 30,413,165 | 100.0 | % | |||||||||||
| Net asset value as of September 30, 2010 | $ | 17.42 | ||||||||||||
| 28 |
Quarterly Report — Q3 2010 | PARNASSUS FUNDS
Portfolio of Investments as of September 30, 2010 (unaudited)
| Shares |
Equities |
Market Value ($) | Per Share | Percent of Net Assets |
||||||||||
| 210,000 |
Teleflex Inc. | 11,923,800 | 56.78 | 4.5 | % | |||||||||
| 1,200,000 |
Ceragon Networks Ltd. | 11,868,000 | 9.89 | 4.4 | % | |||||||||
| 440,000 |
Administaff Inc. | 11,849,200 | 26.93 | 4.4 | % | |||||||||
| 2,000,000 |
Brocade Communications Systems Inc. | 11,680,000 | 5.84 | 4.4 | % | |||||||||
| 500,000 |
LHC Group Inc. | 11,595,000 | 23.19 | 4.3 | % | |||||||||
| 400,000 |
Cyberonics Inc. | 10,672,000 | 26.68 | 4.0 | % | |||||||||
| 876,365 |
Electronics for Imaging Inc. | 10,621,544 | 12.12 | 4.0 | % | |||||||||
| 1,400,000 |
Tellabs Inc. | 10,430,000 | 7.45 | 3.9 | % | |||||||||
| 510,000 |
Toll Brothers Inc. | 9,700,200 | 19.02 | 3.6 | % | |||||||||
| 600,000 |
Ciena Corp. | 9,342,000 | 15.57 | 3.5 | % | |||||||||
| 880,000 |
W&T Offshore Inc. | 9,328,000 | 10.60 | 3.5 | % | |||||||||
| 740,000 |
Quicksilver Resources Inc. | 9,324,000 | 12.60 | 3.5 | % | |||||||||
| 370,000 |
Tower Group Inc. | 8,639,500 | 23.35 | 3.2 | % | |||||||||
| 780,000 |
Mentor Graphics Corp. | 8,244,600 | 10.57 | 3.1 | % | |||||||||
| 700,000 |
KB Home | 7,931,000 | 11.33 | 3.0 | % | |||||||||
| 425,000 |
Websense Inc. | 7,539,500 | 17.74 | 2.8 | % | |||||||||
| 1,150,000 |
ClickSoftware Technologies Ltd. | 7,532,500 | 6.55 | 2.8 | % | |||||||||
| 400,000 |
Finisar Corp. | 7,516,000 | 18.79 | 2.8 | % | |||||||||
| 200,000 |
Cymer Inc. | 7,416,000 | 37.08 | 2.8 | % | |||||||||
| 250,000 |
Arbitron Inc. | 6,992,500 | 27.97 | 2.6 | % | |||||||||
| 325,000 |
SEI Investments Co. | 6,610,500 | 20.34 | 2.5 | % | |||||||||
| 200,000 |
VeriSign Inc. | 6,348,000 | 31.74 | 2.4 | % | |||||||||
| 230,000 |
Jack Henry & Associates Inc. | 5,865,000 | 25.50 | 2.2 | % | |||||||||
| 140,000 |
SM Energy Co. | 5,244,400 | 37.46 | 2.0 | % | |||||||||
| 55,000 |
Bio-Rad Laboratories Inc. | 4,978,050 | 90.51 | 1.9 | % | |||||||||
| 100,000 |
Gen-Probe Inc. | 4,846,000 | 48.46 | 1.9 | % | |||||||||
| 151,376 |
Valeant Pharmaceuticals International | 3,791,969 | 25.05 | 1.4 | % | |||||||||
| 140,000 |
Cognex Corp. | 3,754,800 | 26.82 | 1.4 | % | |||||||||
| 110,000 |
Graco Inc. | 3,490,300 | 31.73 | 1.3 | % | |||||||||
| 40,000 |
Compass Minerals International Inc. | 3,064,800 | 76.62 | 1.2 | % | |||||||||
| 420,000 |
Harmonic Inc. | 2,889,600 | 6.88 | 1.1 | % | |||||||||
| 325,000 |
PulteGroup Inc. | 2,847,000 | 8.76 | 1.1 | % | |||||||||
| 60,000 |
Nash Finch Co. | 2,552,400 | 42.54 | 1.0 | % | |||||||||
| 55,000 |
Analogic Corp. | 2,468,400 | 44.88 | 0.9 | % | |||||||||
| 140,000 |
DR Horton Inc. | 1,556,800 | 11.12 | 0.6 | % | |||||||||
| 45,000 |
Simpson Manufacturing Co., Inc. | 1,160,100 | 25.78 | 0.4 | % | |||||||||
| 40,000 |
Glacier Bancorp Inc. | 584,000 | 14.60 | 0.2 | % | |||||||||
| Total investment in equities | 252,197,463 | 94.6 | % | |||||||||||
| Total short-term securities | 15,198,435 | 5.7 | % | |||||||||||
| Other assets and liabilities | (680,825 | ) | -0.3 | % | ||||||||||
| Total net assets | 266,715,073 | 100.0 | % | |||||||||||
| Net asset value as of September 30, 2010 | $ | 21.03 | ||||||||||||
| 29 |
PARNASSUS FUNDS | Quarterly Report — Q3 2010
Portfolio of Investments as of September 30, 2010 (unaudited)
| Shares |
Equities |
Market Value ($) | Per Share | Percent of Net Assets |
||||||||||
| 180,000 |
QUALCOMM Inc. | 8,121,600 | 45.12 | 6.8 | % | |||||||||
| 265,000 |
eBay Inc. | 6,466,000 | 24.40 | 5.4 | % | |||||||||
| 11,000 |
Google Inc. | 5,783,690 | 525.79 | 4.8 | % | |||||||||
| 25,000 |
MasterCard Inc. | 5,600,000 | 224.00 | 4.7 | % | |||||||||
| 40,000 |
International Business Machines Corp. | 5,365,600 | 134.14 | 4.5 | % | |||||||||
| 270,000 |
Intel Corp. | 5,192,100 | 19.23 | 4.3 | % | |||||||||
| 275,000 |
Corning Inc. | 5,027,000 | 18.28 | 4.2 | % | |||||||||
| 820,000 |
Brocade Communications Systems Inc. | 4,788,800 | 5.84 | 4.0 | % | |||||||||
| 410,000 |
Applied Materials Inc. | 4,788,800 | 11.68 | 4.0 | % | |||||||||
| 65,000 |
Genzyme Corp. | 4,601,350 | 70.79 | 3.8 | % | |||||||||
| 190,000 |
Lowe’s Cos., Inc. | 4,235,100 | 22.29 | 3.5 | % | |||||||||
| 210,000 |
MDU Resources Group Inc. | 4,189,500 | 19.95 | 3.5 | % | |||||||||
| 60,000 |
Deere & Co. | 4,186,800 | 69.78 | 3.5 | % | |||||||||
| 200,000 |
SEI Investments Co. | 4,068,000 | 20.34 | 3.4 | % | |||||||||
| 180,000 |
Cisco Systems Inc. | 3,942,000 | 21.90 | 3.3 | % | |||||||||
| 115,000 |
Medtronic Inc. | 3,861,700 | 33.58 | 3.2 | % | |||||||||
| 90,000 |
Hewlett-Packard Company | 3,786,300 | 42.07 | 3.1 | % | |||||||||
| 55,000 |
Devon Energy Corp. | 3,560,700 | 64.74 | 3.0 | % | |||||||||
| 250,000 |
Yahoo! Inc. | 3,542,500 | 14.17 | 2.9 | % | |||||||||
| 100,000 |
Walgreen Co. | 3,350,000 | 33.50 | 2.8 | % | |||||||||
| 120,000 |
Adobe Systems Inc. | 3,138,000 | 26.15 | 2.6 | % | |||||||||
| 180,000 |
Symantec Corp. | 2,730,600 | 15.17 | 2.3 | % | |||||||||
| 30,000 |
Bio-Rad Laboratories Inc. | 2,715,300 | 90.51 | 2.3 | % | |||||||||
| 90,000 |
Paychex Inc. | 2,474,100 | 27.49 | 2.1 | % | |||||||||
| 90,000 |
Texas Instruments Inc. | 2,442,600 | 27.14 | 2.0 | % | |||||||||
| 70,000 |
Autodesk Inc. | 2,237,900 | 31.97 | 1.9 | % | |||||||||
| 60,000 |
Altera Corp. | 1,809,600 | 30.16 | 1.5 | % | |||||||||
| 40,000 |
Accenture PLC | 1,699,600 | 42.49 | 1.4 | % | |||||||||
| 50,000 |
Administaff Inc. | 1,346,500 | 26.93 | 1.1 | % | |||||||||
| 40,000 |
Graco Inc. | 1,269,200 | 31.73 | 1.0 | % | |||||||||
| 15,000 |
Nike Inc. | 1,202,100 | 80.14 | 1.0 | % | |||||||||
| 35,000 |
The Walt Disney Co. | 1,158,850 | 33.11 | 0.9 | % | |||||||||
| 15,000 |
Wells Fargo & Co. | 376,950 | 25.13 | 0.3 | % | |||||||||
| 20,000 |
Seagate Technology | 235,600 | 11.78 | 0.2 | % | |||||||||
| Total investment in equities | 119,294,440 | 99.3 | % | |||||||||||
| Total short-term securities | 730,967 | 0.6 | % | |||||||||||
| Other assets and liabilities | 66,009 | 0.1 | % | |||||||||||
| Total net assets | 120,091,416 | 100.0 | % | |||||||||||
| Net asset value as of September 30, 2010 | $ | 19.90 | ||||||||||||
| 30 |
Quarterly Report — Q3 2010 | PARNASSUS FUNDS
Portfolio of Investments as of September 30, 2010 (unaudited)
| Principal Amount $ |
Convertible Bonds |
Market Value ($) | Per Share | Percent of Net Assets |
||||||||||
| 3,500,000 |
Medtronic Inc. | |||||||||||||
| Notes, 1.50%, due 04/15/2011 | 3,504,375 | 100.13 | 1.9 | % | ||||||||||
| 2,500,000 |
Prologis | |||||||||||||
| Notes, 1.88%, due 11/15/2037 | 2,343,750 | 93.75 | 1.3 | % | ||||||||||
| 2,500,000 |
Hologic Inc. | |||||||||||||
| Notes, 2.00%, due 12/15/2037 | 2,312,500 | 92.50 | 1.3 | % | ||||||||||
| 2,000,000 |
Microsoft Corp. | |||||||||||||
| Notes, 0.00%, due 05/15/2013 | 2,050,000 | 102.50 | 1.1 | % | ||||||||||
| 2,000,000 |
NASDAQ OMX Group Inc. | |||||||||||||
| Notes, 2.50%, due 08/15/2013 | 1,972,500 | 98.63 | 1.1 | % | ||||||||||
| 2,000,000 |
NII Holdings Inc. | |||||||||||||
| Notes, 3.13%, due 06/15/2012 | 1,940,000 | 97.00 | 1.1 | % | ||||||||||
| 2,000,000 |
SanDisk Corp. | |||||||||||||
| Notes, 1.00%, due 05/15/2013 | 1,835,000 | 91.75 | 1.0 | % | ||||||||||
| 1,000,000 |
Intel Corp. | |||||||||||||
| Notes, 2.95%, due 12/15/2035 | 988,750 | 98.88 | 0.5 | % | ||||||||||
| Total investment in convertible bonds | 16,946,875 | 9.3 | % | |||||||||||
| Principal Amount $ |
Corporate Bonds |
Market Value ($) | Per Share | Percent of Net Assets |
||||||||||
| 3,500,000 |
TJX Cos., Inc. | |||||||||||||
| Notes, 4.20%, due 08/15/2015 | 3,876,124 | 110.75 | 2.1 | % | ||||||||||
| 3,000,000 |
Waste Management Inc. | |||||||||||||
| Notes, 6.38%, due 03/11/2015 | 3,517,932 | 117.26 | 1.9 | % | ||||||||||
| 3,000,000 |
Genentech Inc. | |||||||||||||
| Notes, 4.75%, due 07/15/2015 | 3,394,527 | 113.15 | 1.9 | % | ||||||||||
| 3,000,000 |
Praxair Inc. | |||||||||||||
| Notes, 4.50%, due 08/15/2019 | 3,306,966 | 110.23 | 1.8 | % | ||||||||||
| 2,800,000 |
Cisco Systems Inc. | |||||||||||||
| Notes, 5.50%, due 02/22/2016 | 3,303,014 | 117.96 | 1.8 | % | ||||||||||
| 3,000,000 |
Genzyme Corp. | |||||||||||||
| Notes, 3.63%, due 06/15/2015 | 3,181,350 | 106.05 | 1.7 | % | ||||||||||
| 2,500,000 |
Praxair Inc. | |||||||||||||
| Notes, 4.38%, due 03/31/2014 | 2,748,608 | 109.94 | 1.5 | % | ||||||||||
| 2,000,000 |
Valero Energy Corp. | |||||||||||||
| Notes, 9.38%, due 03/15/2019 | 2,554,114 | 127.71 | 1.4 | % | ||||||||||
| 2,000,000 |
Aflac Inc. | |||||||||||||
| Notes, 8.50%, due 05/15/2019 | 2,544,874 | 127.24 | 1.4 | % | ||||||||||
| 2,000,000 |
Waste Management Inc. | |||||||||||||
| Notes, 7.13%, due 12/15/2017 | 2,448,740 | 122.44 | 1.3 | % | ||||||||||
| 2,000,000 |
International Business Machines Corp. | |||||||||||||
| Notes, 6.50%, due 10/15/2013 | 2,324,858 | 116.24 | 1.3 | % | ||||||||||
| 31 |
PARNASSUS FUNDS | Quarterly Report — Q3 2010
PARNASSUS FIXED-INCOME FUND
Portfolio of Investments as of September 30, 2010 (unaudited)
| Principal Amount $ |
Corporate Bonds |
Market Value ($) | Per Share | Percent of Net Assets |
||||||||||
| 2,000,000 |
Burlington Northern Santa Fe Corp. | |||||||||||||
| Notes, 5.65%, due 05/01/2017 | 2,307,578 | 115.38 | 1.3 | % | ||||||||||
| 2,000,000 |
Procter & Gamble Co. | |||||||||||||
| Notes, 4.95%, due 08/15/2014 | 2,270,440 | 113.52 | 1.3 | % | ||||||||||
| 2,000,000 |
Intuit Inc. | |||||||||||||
| Notes, 5.75%, due 03/15/2017 | 2,265,926 | 113.30 | 1.3 | % | ||||||||||
| 2,000,000 |
Charles Schwab Corp. | |||||||||||||
| Notes, 4.95%, due 06/01/2014 | 2,221,980 | 111.10 | 1.2 | % | ||||||||||
| 2,000,000 |
Burlington Northern Santa Fe Corp. | |||||||||||||
| Notes, 4.70%, due 10/01/2019 | 2,196,666 | 109.83 | 1.2 | % | ||||||||||
| 2,000,000 |
JPMorgan Chase & Co. | |||||||||||||
| Notes, 5.15%, due 10/01/2015 | 2,192,942 | 109.65 | 1.2 | % | ||||||||||
| 2,000,000 |
AGL Capital Corp. | |||||||||||||
| Notes, 5.25%, due 08/15/2019 | 2,130,140 | 106.51 | 1.2 | % | ||||||||||
| 2,000,000 |
Adobe Systems Inc. | |||||||||||||
| Notes, 3.25%, due 02/01/2015 | 2,092,832 | 104.64 | 1.2 | % | ||||||||||
| 2,000,000 |
Wells Fargo & Co. | |||||||||||||
| Notes, 3.00%, due 12/09/2011 | 2,060,026 | 103.00 | 1.2 | % | ||||||||||
| 2,000,000 |
Fiserv Inc. | |||||||||||||
| Notes, 3.13%, due 10/01/2015 | 2,029,976 | 101.50 | 1.1 | % | ||||||||||
| 2,000,000 |
JPMorgan Chase & Co. | |||||||||||||
| Notes, 2.63%, due 12/01/2010 | 2,008,132 | 100.41 | 1.1 | % | ||||||||||
| 1,769,879 |
Southwest Air 07-1 Trust | |||||||||||||
| Notes, 6.15%, due 08/01/2022 | 1,893,771 | 107.00 | 1.0 | % | ||||||||||
| 1,493,000 |
Target Corp. | |||||||||||||
| Notes, 5.13%, due 01/15/2013 | 1,630,223 | 109.19 | 0.9 | % | ||||||||||
| 1,000,000 |
Verizon Communications Inc. | |||||||||||||
| Notes, 5.55%, due 02/15/2016 | 1,157,163 | 115.72 | 0.6 | % | ||||||||||
| 500,000 |
Procter & Gamble Co. | |||||||||||||
| Notes, 3.50%, due 02/15/2015 | 545,952 | 109.19 | 0.3 | % | ||||||||||
| Total investment in corporate bonds | 62,204,854 | 34.2 | % | |||||||||||
| 32 |
Quarterly Report — Q3 2010 | PARNASSUS FUNDS
| Principal Amount $ |
U.S. Government Treasury Bonds |
Market Value ($) | Per Share | Percent of Net Assets |
||||||||||
| 6,000,000 | U.S. Treasury | |||||||||||||
| 2.50%, due 04/30/2015 | 6,360,936 | 106.02 | 3.5 | % | ||||||||||
| 5,000,000 | U.S. Treasury | |||||||||||||
| 3.63%, due 08/15/2019 | 5,498,440 | 109.97 | 3.0 | % | ||||||||||
| 5,000,000 | U.S. Treasury | |||||||||||||
| 3.63%, due 02/15/2020 | 5,483,985 | 109.68 | 3.0 | % | ||||||||||
| 5,000,000 | U.S. Treasury | |||||||||||||
| 3.13%, due 10/31/2016 | 5,426,955 | 108.54 | 3.0 | % | ||||||||||
| 5,000,000 | U.S. Treasury | |||||||||||||
| 3.13%, due 04/30/2017 | 5,410,545 | 108.21 | 3.0 | % | ||||||||||
| 5,000,000 | U.S. Treasury | |||||||||||||
| 3.00%, due 09/30/2016 | 5,392,190 | 107.84 | 3.0 | % | ||||||||||
| 5,000,000 | U.S. Treasury | |||||||||||||
| 3.38%, due 11/15/2019 | 5,386,330 | 107.73 | 3.0 | % | ||||||||||
| 5,000,000 | U.S. Treasury | |||||||||||||
| 2.63%, due 06/30/2014 | 5,323,045 | 106.46 | 2.9 | % | ||||||||||
| 5,000,000 | U.S. Treasury | |||||||||||||
| 2.38%, due 09/30/2014 | 5,277,345 | 105.55 | 2.9 | % | ||||||||||
| 5,000,000 | U.S. Treasury | |||||||||||||
| 2.00%, due 11/30/2013 | 5,204,690 | 104.09 | 2.9 | % | ||||||||||
| 5,000,000 | U.S. Treasury | |||||||||||||
| 1.88%, due 06/30/2015 | 5,152,345 | 106.02 | 2.8 | % | ||||||||||
| 4,000,000 | U.S. Treasury | |||||||||||||
| 4.38%, due 05/15/2040 | 4,492,520 | 112.31 | 2.5 | % | ||||||||||
| 4,000,000 | U.S. Treasury | |||||||||||||
| 3.75%, due 11/15/2018 | 4,468,752 | 111.72 | 2.5 | % | ||||||||||
| 4,000,000 | U.S. Treasury | |||||||||||||
| 2.75%, due 05/31/2017 | 4,231,564 | 105.79 | 2.3 | % | ||||||||||
| 4,000,000 | U.S. Treasury | |||||||||||||
| 4.50%, due 02/28/2011 | 4,071,408 | 101.79 | 2.2 | % | ||||||||||
| 3,500,000 | U.S. Treasury | |||||||||||||
| 2.50%, due 06/30/2017 | 3,646,563 | 106.02 | 2.0 | % | ||||||||||
| 3,000,000 | U.S. Treasury | |||||||||||||
| 3.50%, due 05/15/2020 | 3,256,410 | 108.55 | 1.8 | % | ||||||||||
| 2,500,000 | U.S. Treasury | |||||||||||||
| 1.13%, due 06/15/2013 | 2,535,550 | 106.02 | 1.4 | % | ||||||||||
| 2,374,000 | U.S. Treasury (TIPS) | |||||||||||||
| 1.88%, due 07/15/2013 | 2,523,116 | 106.28 | 1.4 | % | ||||||||||
| 2,081,280 | U.S. Treasury (TIPS) | |||||||||||||
| 1.75%, due 01/15/2028 | 2,205,994 | 105.99 | 1.2 | % | ||||||||||
| 2,000,000 | U.S. Treasury | |||||||||||||
| 3.13%, due 09/30/2013 | 2,146,876 | 107.34 | 1.2 | % | ||||||||||
| 2,000,000 | U.S. Treasury | |||||||||||||
| 1.75%, due 04/15/2013 | 2,060,460 | 103.02 | 1.0 | % | ||||||||||
| 1,040,640 | U.S. Treasury (TIPS) | |||||||||||||
| 1.63%, due 01/15/2018 | 1,129,013 | 108.49 | 0.6 | % | ||||||||||
| 1,000,000 | U.S. Treasury | |||||||||||||
| 3.13%, due 09/30/2013 | 1,020,234 | 102.02 | 0.6 | % | ||||||||||
| Total investment in | ||||||||||||||
| U.S. government treasury bonds | 97,705,266 | 53.7 | % | |||||||||||
| Total long-term investments | 176,856,995 | 97.2 | % | |||||||||||
| Total short-term securities | 4,151,923 | 2.3 | % | |||||||||||
| Other assets and liabilities | 1,010,795 | 0.5 | % | |||||||||||
| Total net assets | 182,019,713 | 100.0 | % | |||||||||||
| Net asset value as of September 30, 2010 | $ | 17.85 | ||||||||||||
| 33 |
PARNASSUS FUNDS | Quarterly Report — Q3 2010
THIS PAGE LEFT INTENTIONALLY BLANK
| 34 |
Quarterly Report — Q3 2010 | PARNASSUS FUNDS
THIS PAGE LEFT INTENTIONALLY BLANK
| 35 |
P A R N A S S U S F U N D S
1 Market Street, Suite 1600 San Francisco, CA 94105 (800) 999-3505 www.parnassus.com
This report must be preceded or accompanied by a current prospectus.
Investment Adviser
Independent Registered Public Accounting Firm
Parnassus Investments
Deloitte and Touche, LLP
1 Market Street, Suite 1600
50 Fremont Street
San Francisco, CA 94105
San Francisco, CA 94105
Legal Counsel
Distributor
Foley and Lardner LLP
Parnasssus Funds Distributor
777 E. Wisconsin Ave.
1 Market Street, Suite 1600
Milwaukee, WI 53202
San Francisco, CA 94105