
UNITED STATES
SECURITIES AND EXCHANGE COMMISSION
Washington, D.C. 20549
FORM N-CSR
CERTIFIED SHAREHOLDER REPORT OF REGISTERED
MANAGEMENT INVESTMENT COMPANIES
Investment Company Act file number 811-00215
Fidelity Hastings Street Trust
(Exact name of registrant as specified in charter)
245 Summer St., Boston, Massachusetts 02210
(Address of principal executive offices) (Zip code)
Margaret Carey, Secretary
245 Summer St.
Boston, Massachusetts 02210
(Name and address of agent for service)
Registrant's telephone number, including area code:
617-563-7000
Date of fiscal year end: | December 31 |
Date of reporting period: | December 31, 2023 |
Item 1.
Reports to Stockholders

Contents
Average Annual Total Returns
|
|||
Periods ended December 31, 2023
|
Past 1
year
|
Past 5
years
|
Past 10
years
|
Fidelity® Series Emerging Markets Debt Fund
|
12.47%
|
2.05%
|
3.40%
|
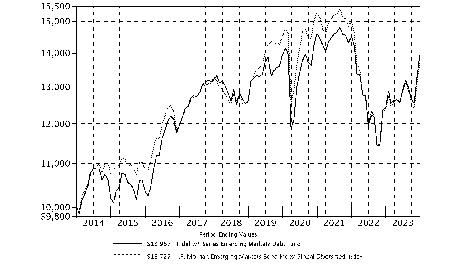
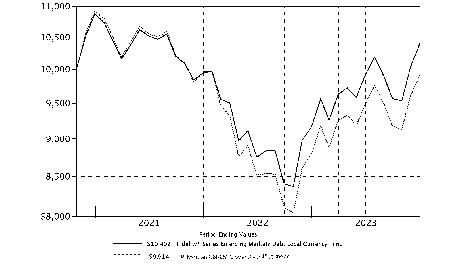
$10,000 Over 10 Years
|
Let's say hypothetically that $10,000 was invested in Fidelity® Series Emerging Markets Debt Fund on December 31, 2013.
The chart shows how the value of your investment would have changed, and also shows how the J.P. Morgan Emerging Markets Bond Index Global Diversified Index performed over the same period.
|
|
Top Bond Issuers (% of Fund's net assets)
|
||
(with maturities greater than one year)
|
||
U.S. Treasury Obligations
|
5.3
|
|
Petroleos Mexicanos
|
3.8
|
|
Dominican Republic
|
3.4
|
|
Turkish Republic
|
3.1
|
|
Colombian Republic
|
2.8
|
|
Indonesian Republic
|
2.6
|
|
Sultanate of Oman
|
2.5
|
|
State of Qatar
|
2.3
|
|
Arab Republic of Egypt
|
2.1
|
|
Republic of Nigeria
|
2.1
|
|
30.0
|
||
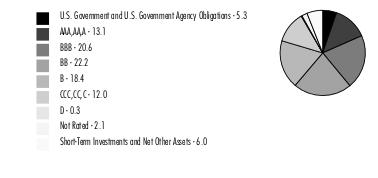
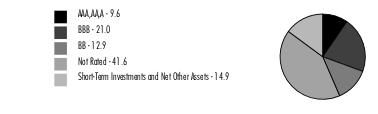
Quality Diversification (% of Fund's net assets)
|
|
We have used ratings from Moody's Investors Service, Inc. Where Moody's® ratings are not available, we have used S&P® ratings. All ratings are as of the date indicated and do not reflect subsequent changes.
|
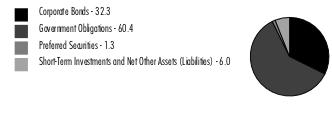
Asset Allocation (% of Fund's net assets)
|
|
Futures - 0.3%
|
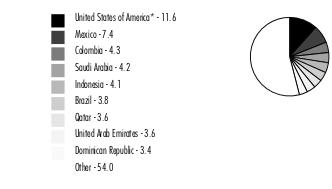
Geographic Diversification (% of Fund's net assets)
|
|
* Includes Short-Term investments and Net Other Assets (Liabilities).
Percentages are adjusted for the effect of derivatives, if applicable.
|
Nonconvertible Bonds - 32.3%
|
|||
Principal
Amount (a)
|
Value ($)
|
||
Azerbaijan - 0.9%
|
|||
Southern Gas Corridor CJSC 6.875% 3/24/26 (b)
|
9,951,000
|
10,090,936
|
|
State Oil Co. of Azerbaijan Republic 6.95% 3/18/30 (Reg. S)
|
2,010,000
|
2,111,128
|
|
TOTAL AZERBAIJAN
|
12,202,064
|
||
Bahrain - 0.7%
|
|||
The Oil and Gas Holding Co.:
|
|||
7.5% 10/25/27 (b)
|
6,889,000
|
7,250,673
|
|
8.375% 11/7/28 (b)
|
1,065,000
|
1,165,509
|
|
TOTAL BAHRAIN
|
8,416,182
|
||
Brazil - 2.2%
|
|||
Adecoagro SA 6% 9/21/27 (b)
|
3,125,000
|
3,009,625
|
|
Aegea Finance SARL 9% 1/20/31 (b)
|
1,045,000
|
1,111,462
|
|
Azul Secured Finance LLP:
|
|||
11.5% 5/28/29 (b)
|
3,722,238
|
3,166,806
|
|
11.93% 8/28/28 (b)
|
1,710,000
|
1,765,575
|
|
Braskem Netherlands BV:
|
|||
5.875% 1/31/50 (b)
|
920,000
|
637,445
|
|
7.25% 2/13/33 (b)
|
1,470,000
|
1,223,775
|
|
CSN Islands XI Corp. 6.75% 1/28/28 (b)
|
1,250,000
|
1,210,950
|
|
CSN Resources SA:
|
|||
5.875% 4/8/32 (b)
|
2,115,000
|
1,824,843
|
|
8.875% 12/5/30 (b)
|
955,000
|
991,195
|
|
Embraer Netherlands Finance BV:
|
|||
5.4% 2/1/27
|
660,000
|
651,961
|
|
6.95% 1/17/28 (b)
|
1,620,000
|
1,663,643
|
|
7% 7/28/30 (b)
|
2,190,000
|
2,288,309
|
|
MARB BondCo PLC 3.95% 1/29/31 (b)
|
1,295,000
|
1,045,842
|
|
MC Brazil Downstream Trading SARL 7.25% 6/30/31 (b)
|
3,635,426
|
2,817,455
|
|
NBM U.S. Holdings, Inc. 6.625% 8/6/29 (b)
|
2,270,000
|
2,194,886
|
|
Nexa Resources SA 6.5% 1/18/28 (b)
|
1,580,000
|
1,580,316
|
|
Samarco Mineracao SA 9.0494% 6/30/31 pay-in-kind (b)(c)
|
710,000
|
592,673
|
|
TOTAL BRAZIL
|
27,776,761
|
||
Burkina Faso - 0.2%
|
|||
Endeavour Mining PLC 5% 10/14/26 (b)
|
3,310,000
|
3,044,166
|
|
Cambodia - 0.2%
|
|||
NagaCorp Ltd. 7.95% 7/6/24 (Reg. S)
|
3,200,000
|
3,093,888
|
|
Chile - 1.7%
|
|||
Antofagasta PLC:
|
|||
2.375% 10/14/30 (b)
|
3,865,000
|
3,158,430
|
|
5.625% 5/13/32 (b)
|
1,390,000
|
1,380,444
|
|
Chile Electricity LUX MPC SARL 6.01% 1/20/33 (b)
|
1,040,000
|
1,069,250
|
|
Corporacion Nacional del Cobre de Chile (Codelco):
|
|||
3% 9/30/29 (b)
|
2,000,000
|
1,778,750
|
|
3.15% 1/14/30 (b)
|
1,645,000
|
1,465,078
|
|
3.15% 1/15/51 (b)
|
1,865,000
|
1,215,747
|
|
3.7% 1/30/50 (b)
|
3,765,000
|
2,707,270
|
|
4.5% 8/1/47 (b)
|
1,970,000
|
1,611,460
|
|
5.125% 2/2/33 (b)
|
1,575,000
|
1,520,348
|
|
5.95% 1/8/34 (b)
|
955,000
|
965,983
|
|
Empresa Nacional de Petroleo 6.15% 5/10/33 (b)
|
585,000
|
585,357
|
|
Sable International Finance Ltd. 5.75% 9/7/27 (b)
|
2,287,000
|
2,164,760
|
|
VTR Comunicaciones SpA:
|
|||
4.375% 4/15/29 (b)
|
933,000
|
442,009
|
|
5.125% 1/15/28 (b)
|
3,749,000
|
1,781,947
|
|
TOTAL CHILE
|
21,846,833
|
||
China - 1.6%
|
|||
ENN Clean Energy International Investment Ltd. 3.375% 5/12/26 (b)
|
3,775,000
|
3,528,757
|
|
ENN Energy Holdings Ltd. 4.625% 5/17/27 (b)
|
3,430,000
|
3,379,408
|
|
Lenovo Group Ltd. 3.421% 11/2/30 (b)
|
2,915,000
|
2,568,873
|
|
Meituan:
|
|||
2.125% 10/28/25 (b)
|
4,740,000
|
4,464,369
|
|
3.05% 10/28/30 (b)
|
1,995,000
|
1,681,346
|
|
Prosus NV:
|
|||
3.061% 7/13/31 (b)
|
815,000
|
655,056
|
|
3.832% 2/8/51 (b)
|
1,590,000
|
999,713
|
|
4.027% 8/3/50 (b)
|
650,000
|
423,719
|
|
4.193% 1/19/32 (b)
|
3,505,000
|
3,009,919
|
|
TOTAL CHINA
|
20,711,160
|
||
Colombia - 1.5%
|
|||
Ecopetrol SA 8.875% 1/13/33
|
2,900,000
|
3,143,781
|
|
Empresas Publicas de Medellin 4.375% 2/15/31 (b)
|
1,910,000
|
1,557,432
|
|
EnfraGen Energia Sur SA 5.375% 12/30/30 (b)
|
5,545,000
|
4,267,987
|
|
Gcm Mining Corp. 6.875% 8/9/26 (b)
|
3,895,000
|
3,378,913
|
|
GeoPark Ltd. 5.5% 1/17/27 (b)
|
2,685,000
|
2,365,190
|
|
Oleoducto Central SA 4% 7/14/27 (b)
|
2,483,000
|
2,296,502
|
|
Termocandelaria Power Ltd. 7.875% 1/30/29 (b)
|
3,041,875
|
2,963,927
|
|
TOTAL COLOMBIA
|
19,973,732
|
||
Costa Rica - 0.2%
|
|||
Liberty Costa Rica SR SF 10.875% 1/15/31 (b)
|
2,280,000
|
2,338,072
|
|
Czech Republic - 0.1%
|
|||
Energo-Pro A/S 11% 11/2/28 (b)
|
1,700,000
|
1,751,000
|
|
Georgia - 0.3%
|
|||
JSC Georgian Railway 4% 6/17/28 (b)
|
3,580,000
|
3,279,056
|
|
Ghana - 1.1%
|
|||
Kosmos Energy Ltd. 7.125% 4/4/26 (b)
|
9,060,000
|
8,623,988
|
|
Tullow Oil PLC:
|
|||
7% 3/1/25 (b)
|
1,060,000
|
979,838
|
|
10.25% 5/15/26 (b)
|
5,670,000
|
5,035,669
|
|
TOTAL GHANA
|
14,639,495
|
||
Guatemala - 0.6%
|
|||
CT Trust 5.125% 2/3/32 (b)
|
3,975,000
|
3,452,009
|
|
Investment Energy Resources Ltd. 6.25% 4/26/29 (b)
|
2,970,000
|
2,783,840
|
|
Millicom International Cellular SA 4.5% 4/27/31 (b)
|
2,050,000
|
1,701,357
|
|
TOTAL GUATEMALA
|
7,937,206
|
||
Hungary - 0.1%
|
|||
Magyar Export-Import Bank 6.125% 12/4/27 (b)
|
1,070,000
|
1,088,565
|
|
India - 0.3%
|
|||
CA Magnum Holdings 5.375% 10/31/26 (b)
|
3,545,000
|
3,296,850
|
|
Indonesia - 1.5%
|
|||
Medco Bell Pte Ltd. 6.375% 1/30/27 (b)
|
3,120,000
|
2,991,300
|
|
Medco Laurel Tree PTE Ltd. 6.95% 11/12/28 (b)
|
3,730,000
|
3,533,653
|
|
PT Adaro Indonesia 4.25% 10/31/24 (b)
|
3,515,000
|
3,418,338
|
|
PT Freeport Indonesia:
|
|||
4.763% 4/14/27 (b)
|
1,225,000
|
1,206,760
|
|
5.315% 4/14/32 (b)
|
2,085,000
|
2,039,391
|
|
6.2% 4/14/52 (b)
|
1,420,000
|
1,407,131
|
|
PT Indonesia Asahan Aluminium 5.45% 5/15/30 (b)
|
2,955,000
|
2,968,852
|
|
PT Pertamina Geothermal Energy 5.15% 4/27/28 (b)
|
1,140,000
|
1,142,138
|
|
TOTAL INDONESIA
|
18,707,563
|
||
Israel - 0.7%
|
|||
Energean Israel Finance Ltd.:
|
|||
4.875% 3/30/26 (Reg. S) (b)
|
3,470,000
|
3,192,400
|
|
8.5% 9/30/33 (Reg. S) (b)
|
1,300,000
|
1,239,875
|
|
Leviathan Bond Ltd.:
|
|||
6.125% 6/30/25 (Reg. S) (b)
|
3,640,000
|
3,521,700
|
|
6.5% 6/30/27 (Reg. S) (b)
|
645,000
|
605,245
|
|
TOTAL ISRAEL
|
8,559,220
|
||
Kazakhstan - 0.6%
|
|||
KazMunaiGaz National Co.:
|
|||
3.5% 4/14/33 (b)
|
2,010,000
|
1,668,928
|
|
5.75% 4/19/47 (b)
|
1,010,000
|
884,697
|
|
Nostrum Oil & Gas Finance BV:
|
|||
5% 6/30/26 (b)
|
3,543,000
|
1,596,299
|
|
14% 6/30/26 pay-in-kind (b)(c)
|
1,109,603
|
233,017
|
|
Tengizchevroil Finance Co. International Ltd. 3.25% 8/15/30 (b)
|
3,800,000
|
3,116,000
|
|
TOTAL KAZAKHSTAN
|
7,498,941
|
||
Kuwait - 0.3%
|
|||
Meglobal BV 4.25% 11/3/26 (b)
|
1,930,000
|
1,862,450
|
|
MEGlobal Canada, Inc. 5% 5/18/25 (b)
|
1,635,000
|
1,615,380
|
|
TOTAL KUWAIT
|
3,477,830
|
||
Luxembourg - 0.1%
|
|||
TMS Issuer SARL 5.78% 8/23/32 (b)
|
1,670,000
|
1,740,975
|
|
Malaysia - 1.0%
|
|||
GENM Capital Labuan Ltd. 3.882% 4/19/31 (b)
|
3,610,000
|
3,074,141
|
|
MISC Capital Two (Labuan) Ltd.:
|
|||
3.625% 4/6/25 (b)
|
945,000
|
923,756
|
|
3.75% 4/6/27 (b)
|
3,090,000
|
2,971,869
|
|
Petronas Capital Ltd.:
|
|||
3.404% 4/28/61 (b)
|
5,315,000
|
3,777,902
|
|
3.5% 4/21/30 (b)
|
1,730,000
|
1,617,758
|
|
TOTAL MALAYSIA
|
12,365,426
|
||
Mauritius - 0.2%
|
|||
AXIAN Telecom 7.375% 2/16/27 (b)
|
2,870,000
|
2,668,203
|
|
Mexico - 4.7%
|
|||
Bimbo Bakeries U.S.A., Inc. 6.4% 1/15/34 (b)
|
2,285,000
|
2,529,198
|
|
Braskem Idesa SAPI:
|
|||
6.99% 2/20/32 (b)
|
450,000
|
254,304
|
|
7.45% 11/15/29 (b)
|
2,825,000
|
1,736,528
|
|
Comision Federal de Electricidad:
|
|||
3.348% 2/9/31 (b)
|
735,000
|
608,213
|
|
4.688% 5/15/29 (b)
|
3,085,000
|
2,900,864
|
|
Petroleos Mexicanos:
|
|||
6.5% 3/13/27
|
1,725,000
|
1,603,172
|
|
6.5% 6/2/41
|
2,587,000
|
1,752,693
|
|
6.625% 6/15/35
|
15,841,000
|
12,049,061
|
|
6.7% 2/16/32
|
4,827,000
|
3,994,343
|
|
6.75% 9/21/47
|
10,407,000
|
6,808,780
|
|
6.875% 10/16/25
|
2,295,000
|
2,256,834
|
|
6.875% 8/4/26
|
2,485,000
|
2,401,504
|
|
6.95% 1/28/60
|
9,575,000
|
6,295,563
|
|
7.69% 1/23/50
|
16,573,000
|
11,787,546
|
|
TV Azteca SA de CV 8.25% (Reg. S) (d)
|
10,535,000
|
4,079,784
|
|
TOTAL MEXICO
|
61,058,387
|
||
Morocco - 0.4%
|
|||
OCP SA:
|
|||
3.75% 6/23/31 (b)
|
3,150,000
|
2,705,063
|
|
6.875% 4/25/44 (b)
|
2,320,000
|
2,199,650
|
|
TOTAL MOROCCO
|
4,904,713
|
||
Nigeria - 0.6%
|
|||
Access Bank PLC 6.125% 9/21/26 (b)
|
3,295,000
|
2,954,173
|
|
IHS Holding Ltd. 5.625% 11/29/26 (b)
|
2,420,000
|
2,090,275
|
|
IHS Netherlands Holdco BV 8% 9/18/27 (b)
|
3,490,000
|
3,094,103
|
|
TOTAL NIGERIA
|
8,138,551
|
||
Oman - 0.1%
|
|||
Lamar Funding Ltd. 3.958% 5/7/25 (b)
|
1,015,000
|
986,773
|
|
Panama - 0.5%
|
|||
Aeropuerto Internacional de Tocumen SA 5.125% 8/11/61 (b)
|
1,230,000
|
922,586
|
|
C&W Senior Financing Designated Activity Co. 6.875% 9/15/27 (b)
|
2,060,000
|
1,915,924
|
|
Cable Onda SA 4.5% 1/30/30 (b)
|
4,955,000
|
4,286,075
|
|
TOTAL PANAMA
|
7,124,585
|
||
Paraguay - 0.3%
|
|||
Telefonica Celular del Paraguay SA 5.875% 4/15/27 (b)
|
3,800,000
|
3,706,596
|
|
Peru - 0.3%
|
|||
Camposol SA 6% 2/3/27 (b)
|
1,235,000
|
820,299
|
|
Compania de Minas Buenaventura SAA 5.5% 7/23/26 (b)
|
2,100,000
|
2,003,337
|
|
Volcan Compania Minera SAA 4.375% 2/11/26 (b)
|
1,345,000
|
813,725
|
|
TOTAL PERU
|
3,637,361
|
||
Qatar - 1.3%
|
|||
Qatar Petroleum:
|
|||
2.25% 7/12/31 (b)
|
7,425,000
|
6,310,879
|
|
3.125% 7/12/41 (b)
|
4,005,000
|
3,074,238
|
|
3.3% 7/12/51 (b)
|
9,800,000
|
7,140,280
|
|
TOTAL QATAR
|
16,525,397
|
||
Saudi Arabia - 2.8%
|
|||
EIG Pearl Holdings SARL 3.545% 8/31/36 (b)
|
6,860,000
|
5,961,769
|
|
Greensaif Pipelines Bidco SARL:
|
|||
6.129% 2/23/38 (b)
|
2,260,000
|
2,358,169
|
|
6.51% 2/23/42 (b)
|
1,685,000
|
1,772,936
|
|
SA Global Sukuk Ltd. 1.602% 6/17/26 (b)
|
2,530,000
|
2,343,413
|
|
Saudi Arabian Oil Co.:
|
|||
2.25% 11/24/30 (b)
|
4,120,000
|
3,523,888
|
|
3.25% 11/24/50 (b)
|
4,170,000
|
2,939,433
|
|
3.5% 4/16/29 (b)
|
11,299,000
|
10,674,024
|
|
4.25% 4/16/39 (b)
|
3,505,000
|
3,104,116
|
|
4.375% 4/16/49 (b)
|
3,671,000
|
3,129,528
|
|
TOTAL SAUDI ARABIA
|
35,807,276
|
||
South Africa - 1.9%
|
|||
Eskom Holdings SOC Ltd.:
|
|||
6.35% 8/10/28 (b)
|
3,515,000
|
3,412,845
|
|
7.125% 2/11/25 (b)
|
8,380,000
|
8,372,144
|
|
8.45% 8/10/28 (b)
|
1,310,000
|
1,323,919
|
|
Liquid Telecommunications Financing PLC 5.5% 9/4/26 (b)
|
4,940,000
|
2,840,500
|
|
Sasol Financing U.S.A. LLC:
|
|||
4.375% 9/18/26
|
5,555,000
|
5,166,150
|
|
8.75% 5/3/29 (b)
|
820,000
|
836,094
|
|
Stillwater Mining Co. 4% 11/16/26 (b)
|
2,210,000
|
1,955,850
|
|
TOTAL SOUTH AFRICA
|
23,907,502
|
||
Tanzania - 0.1%
|
|||
HTA Group Ltd. 7% 12/18/25 (b)
|
1,915,000
|
1,880,913
|
|
Ukraine - 0.3%
|
|||
Biz Finance PLC 9.75% 1/22/25 (b)
|
880,500
|
810,060
|
|
NAK Naftogaz Ukraine:
|
|||
7.625% 11/8/28 (b)
|
1,235,000
|
568,100
|
|
7.65% (Reg. S) (d)
|
3,502,650
|
2,399,315
|
|
TOTAL UKRAINE
|
3,777,475
|
||
United Arab Emirates - 1.9%
|
|||
Abu Dhabi National Energy Co. PJSC:
|
|||
4% 10/3/49 (b)
|
2,460,000
|
2,067,015
|
|
4.696% 4/24/33 (b)
|
1,945,000
|
1,963,808
|
|
4.875% 4/23/30 (b)
|
545,000
|
558,391
|
|
DP World Crescent Ltd.:
|
|||
3.7495% 1/30/30 (b)
|
1,075,000
|
1,009,103
|
|
3.875% 7/18/29 (Reg. S)
|
3,260,000
|
3,084,351
|
|
Galaxy Pipeline Assets BidCo Ltd. 2.625% 3/31/36 (b)
|
5,915,000
|
4,872,481
|
|
GEMS MENASA Cayman Ltd. 7.125% 7/31/26 (b)
|
2,095,000
|
2,053,100
|
|
MDGH GMTN RSC Ltd.:
|
|||
2.875% 11/7/29 (b)
|
1,515,000
|
1,378,256
|
|
3.375% 3/28/32 (Reg. S)
|
570,000
|
520,741
|
|
4.375% 11/22/33 (b)
|
1,715,000
|
1,668,455
|
|
5.084% 5/22/53 (b)
|
3,040,000
|
2,976,312
|
|
5.5% 4/28/33 (b)
|
1,620,000
|
1,714,316
|
|
TOTAL UNITED ARAB EMIRATES
|
23,866,329
|
||
United States of America - 0.3%
|
|||
LCPR Senior Secured Financing DAC 5.125% 7/15/29 (b)
|
3,810,000
|
3,319,026
|
|
Uzbekistan - 0.1%
|
|||
National Bank of Uzbekistan 4.85% 10/21/25 (Reg. S)
|
1,725,000
|
1,597,781
|
|
Venezuela - 0.4%
|
|||
Petroleos de Venezuela SA:
|
|||
5.375% (d)
|
6,115,000
|
651,248
|
|
5.5% (d)
|
3,475,000
|
373,563
|
|
6% (b)(d)
|
15,840,000
|
1,782,000
|
|
6% (b)(d)
|
8,980,000
|
987,601
|
|
9.75% (b)(d)
|
12,585,000
|
1,573,125
|
|
12.75% (b)(d)
|
3,065,000
|
398,450
|
|
TOTAL VENEZUELA
|
5,765,987
|
||
Vietnam - 0.2%
|
|||
Mong Duong Finance Holdings BV 5.125% 5/7/29 (b)
|
2,596,247
|
2,408,019
|
|
|
TOTAL NONCONVERTIBLE BONDS
(Cost $477,894,367)
|
414,825,859
|
||
Government Obligations - 60.4%
|
|||
Principal
Amount (a)
|
Value ($)
|
||
Angola - 1.6%
|
|||
Angola Republic:
|
|||
8% 11/26/29 (b)
|
2,290,000
|
2,032,375
|
|
8.25% 5/9/28 (b)
|
5,065,000
|
4,659,800
|
|
8.75% 4/14/32 (b)
|
2,575,000
|
2,269,219
|
|
9.125% 11/26/49 (b)
|
3,555,000
|
2,901,769
|
|
9.375% 5/8/48 (b)
|
3,125,000
|
2,601,563
|
|
9.5% 11/12/25 (b)
|
5,565,000
|
5,474,569
|
|
TOTAL ANGOLA
|
19,939,295
|
||
Argentina - 1.7%
|
|||
Argentine Republic:
|
|||
0.75% 7/9/30 (e)
|
19,209,632
|
7,670,406
|
|
1% 7/9/29
|
4,963,783
|
1,966,055
|
|
3.625% 7/9/35 (e)
|
17,033,027
|
5,765,339
|
|
4.25% 1/9/38 (e)
|
10,211,997
|
4,029,858
|
|
Buenos Aires Province 6.375% 9/1/37 (b)(e)
|
2,255,000
|
867,048
|
|
Provincia de Cordoba 6.875% 12/10/25 (b)
|
1,223,630
|
1,119,621
|
|
TOTAL ARGENTINA
|
21,418,327
|
||
Armenia - 0.2%
|
|||
Republic of Armenia 3.6% 2/2/31 (b)
|
3,805,000
|
3,101,075
|
|
Bahrain - 0.2%
|
|||
Bahrain Kingdom 5.625% 5/18/34 (b)
|
3,055,000
|
2,760,956
|
|
Barbados - 0.2%
|
|||
Barbados Government 6.5% 10/1/29 (b)
|
3,170,000
|
2,978,437
|
|
Benin - 0.1%
|
|||
Republic of Benin 4.875% 1/19/32 (b)
|
EUR
|
1,920,000
|
1,725,474
|
Bermuda - 0.4%
|
|||
Bermuda Government:
|
|||
2.375% 8/20/30 (b)
|
525,000
|
449,138
|
|
3.375% 8/20/50 (b)
|
965,000
|
672,663
|
|
3.717% 1/25/27 (b)
|
620,000
|
598,881
|
|
4.75% 2/15/29 (b)
|
2,270,000
|
2,243,713
|
|
5% 7/15/32 (b)
|
1,005,000
|
989,925
|
|
TOTAL BERMUDA
|
4,954,320
|
||
Brazil - 1.6%
|
|||
Brazilian Federative Republic:
|
|||
3.875% 6/12/30
|
5,500,000
|
5,025,625
|
|
4.75% 1/14/50
|
4,150,000
|
3,185,125
|
|
5.625% 2/21/47
|
2,183,000
|
1,912,308
|
|
6% 10/20/33
|
1,880,000
|
1,876,898
|
|
7.125% 1/20/37
|
2,080,000
|
2,268,947
|
|
8.25% 1/20/34
|
5,204,000
|
6,109,964
|
|
TOTAL BRAZIL
|
20,378,867
|
||
Chile - 1.4%
|
|||
Chilean Republic:
|
|||
2.45% 1/31/31
|
7,745,000
|
6,728,469
|
|
3.1% 1/22/61
|
7,500,000
|
5,001,563
|
|
3.5% 1/31/34
|
1,775,000
|
1,580,305
|
|
4% 1/31/52
|
985,000
|
808,623
|
|
4.34% 3/7/42
|
1,410,000
|
1,256,222
|
|
5.33% 1/5/54
|
2,835,000
|
2,818,167
|
|
TOTAL CHILE
|
18,193,349
|
||
Colombia - 2.8%
|
|||
Colombian Republic:
|
|||
3% 1/30/30
|
10,600,000
|
8,913,938
|
|
3.125% 4/15/31
|
4,300,000
|
3,495,094
|
|
3.875% 2/15/61
|
1,490,000
|
925,197
|
|
4.125% 5/15/51
|
3,120,000
|
2,067,975
|
|
5% 6/15/45
|
8,500,000
|
6,560,938
|
|
5.2% 5/15/49
|
5,390,000
|
4,204,200
|
|
6.125% 1/18/41
|
1,475,000
|
1,338,102
|
|
7.375% 9/18/37
|
845,000
|
875,367
|
|
7.5% 2/2/34
|
1,110,000
|
1,169,316
|
|
8% 4/20/33
|
1,720,000
|
1,877,488
|
|
8% 11/14/35
|
1,785,000
|
1,950,670
|
|
8.75% 11/14/53
|
1,690,000
|
1,940,859
|
|
TOTAL COLOMBIA
|
35,319,144
|
||
Costa Rica - 1.2%
|
|||
Costa Rican Republic:
|
|||
5.625% 4/30/43 (b)
|
3,955,000
|
3,604,983
|
|
6.125% 2/19/31 (b)
|
3,720,000
|
3,802,538
|
|
6.55% 4/3/34 (b)
|
2,750,000
|
2,847,625
|
|
7% 4/4/44 (b)
|
1,965,000
|
2,048,513
|
|
7.3% 11/13/54 (b)
|
3,295,000
|
3,571,451
|
|
TOTAL COSTA RICA
|
15,875,110
|
||
Dominican Republic - 3.4%
|
|||
Dominican Republic:
|
|||
4.5% 1/30/30 (b)
|
7,180,000
|
6,596,625
|
|
4.875% 9/23/32 (b)
|
6,360,000
|
5,782,130
|
|
5.3% 1/21/41 (b)
|
2,450,000
|
2,119,250
|
|
5.875% 1/30/60 (b)
|
6,775,000
|
5,853,600
|
|
5.95% 1/25/27 (b)
|
4,186,000
|
4,194,707
|
|
6% 7/19/28 (b)
|
2,999,000
|
2,999,000
|
|
6.4% 6/5/49 (b)
|
1,662,000
|
1,562,280
|
|
6.5% 2/15/48 (b)
|
3,345,000
|
3,184,440
|
|
6.85% 1/27/45 (b)
|
4,046,000
|
4,023,747
|
|
7.05% 2/3/31 (b)
|
1,215,000
|
1,274,474
|
|
7.45% 4/30/44 (b)
|
6,031,000
|
6,383,814
|
|
TOTAL DOMINICAN REPUBLIC
|
43,974,067
|
||
Ecuador - 0.9%
|
|||
Ecuador Republic:
|
|||
2.5% 7/31/40 (b)(e)
|
2,800,000
|
882,000
|
|
3.5% 7/31/35 (b)(e)
|
14,640,000
|
5,189,880
|
|
6% 7/31/30 (b)(e)
|
11,715,000
|
5,424,045
|
|
TOTAL ECUADOR
|
11,495,925
|
||
Egypt - 2.1%
|
|||
Arab Republic of Egypt:
|
|||
5.875% 2/16/31 (b)
|
2,625,000
|
1,712,813
|
|
7.0529% 1/15/32 (b)
|
830,000
|
566,734
|
|
7.5% 1/31/27 (b)
|
5,596,000
|
4,700,640
|
|
7.5% 2/16/61 (b)
|
6,070,000
|
3,530,084
|
|
7.6003% 3/1/29 (b)
|
8,726,000
|
6,637,214
|
|
7.903% 2/21/48 (b)
|
3,265,000
|
1,960,020
|
|
8.5% 1/31/47 (b)
|
7,939,000
|
4,927,142
|
|
8.7002% 3/1/49 (b)
|
3,665,000
|
2,284,898
|
|
8.875% 5/29/50 (b)
|
1,945,000
|
1,234,467
|
|
TOTAL EGYPT
|
27,554,012
|
||
El Salvador - 0.3%
|
|||
El Salvador Republic:
|
|||
6.375% 1/18/27 (b)
|
435,000
|
381,984
|
|
7.1246% 1/20/50 (b)
|
3,292,000
|
2,323,946
|
|
7.625% 2/1/41 (b)
|
1,035,000
|
772,369
|
|
7.65% 6/15/35 (b)
|
1,185,000
|
919,486
|
|
TOTAL EL SALVADOR
|
4,397,785
|
||
Gabon - 0.4%
|
|||
Gabonese Republic:
|
|||
6.95% 6/16/25 (b)
|
2,410,000
|
2,287,241
|
|
7% 11/24/31 (b)
|
3,620,000
|
3,002,338
|
|
TOTAL GABON
|
5,289,579
|
||
Georgia - 0.2%
|
|||
Georgia Republic 2.75% 4/22/26 (b)
|
2,915,000
|
2,725,525
|
|
Ghana - 0.7%
|
|||
Ghana Republic:
|
|||
7.75% (b)(d)
|
3,695,000
|
1,588,850
|
|
8.125% (b)(d)
|
1,603,076
|
731,904
|
|
8.125% (b)(d)
|
5,475,000
|
2,381,625
|
|
8.627% (b)(d)
|
2,845,000
|
1,202,013
|
|
10.75% 10/14/30 (b)
|
4,845,000
|
3,040,238
|
|
TOTAL GHANA
|
8,944,630
|
||
Guatemala - 0.7%
|
|||
Guatemalan Republic:
|
|||
4.9% 6/1/30 (b)
|
485,000
|
466,328
|
|
5.25% 8/10/29 (b)
|
1,200,000
|
1,174,800
|
|
5.375% 4/24/32 (b)
|
2,015,000
|
1,951,528
|
|
6.125% 6/1/50 (b)
|
1,355,000
|
1,281,830
|
|
6.6% 6/13/36 (b)
|
4,410,000
|
4,531,275
|
|
TOTAL GUATEMALA
|
9,405,761
|
||
Honduras - 0.1%
|
|||
Republic of Honduras 6.25% 1/19/27 (b)
|
615,000
|
588,863
|
|
Hungary - 1.4%
|
|||
Hungarian Republic:
|
|||
2.125% 9/22/31 (b)
|
2,950,000
|
2,377,907
|
|
3.125% 9/21/51 (b)
|
5,810,000
|
3,925,410
|
|
5.25% 6/16/29 (b)
|
1,585,000
|
1,593,765
|
|
5.5% 6/16/34 (b)
|
2,890,000
|
2,927,859
|
|
6.25% 9/22/32 (b)
|
1,125,000
|
1,200,510
|
|
6.75% 9/25/52 (b)
|
3,800,000
|
4,253,074
|
|
7.625% 3/29/41
|
1,655,000
|
1,978,801
|
|
TOTAL HUNGARY
|
18,257,326
|
||
Indonesia - 2.6%
|
|||
Indonesian Republic:
|
|||
3.85% 10/15/30
|
2,650,000
|
2,522,469
|
|
5.125% 1/15/45 (b)
|
3,353,000
|
3,465,116
|
|
5.25% 1/17/42 (b)
|
3,000,000
|
3,121,125
|
|
5.45% 9/20/52
|
2,955,000
|
3,158,156
|
|
5.95% 1/8/46 (b)
|
2,100,000
|
2,357,250
|
|
6.625% 2/17/37 (b)
|
3,549,000
|
4,150,112
|
|
6.75% 1/15/44 (b)
|
3,035,000
|
3,716,927
|
|
7.75% 1/17/38 (b)
|
4,298,000
|
5,508,156
|
|
8.5% 10/12/35 (b)
|
4,169,000
|
5,534,348
|
|
TOTAL INDONESIA
|
33,533,659
|
||
Ivory Coast - 0.8%
|
|||
Ivory Coast:
|
|||
5.875% 10/17/31 (b)
|
EUR
|
5,335,000
|
5,267,487
|
6.375% 3/3/28 (b)
|
5,580,000
|
5,470,144
|
|
TOTAL IVORY COAST
|
10,737,631
|
||
Jamaica - 0.2%
|
|||
Jamaican Government 7.875% 7/28/45
|
1,685,000
|
2,058,228
|
|
Jordan - 0.6%
|
|||
Jordanian Kingdom:
|
|||
5.85% 7/7/30 (b)
|
2,325,000
|
2,155,711
|
|
6.125% 1/29/26 (b)
|
985,000
|
980,383
|
|
7.375% 10/10/47 (b)
|
2,005,000
|
1,776,430
|
|
7.5% 1/13/29 (b)
|
1,410,000
|
1,425,863
|
|
7.75% 1/15/28 (b)
|
1,725,000
|
1,778,906
|
|
TOTAL JORDAN
|
8,117,293
|
||
Kenya - 0.9%
|
|||
Republic of Kenya:
|
|||
6.3% 1/23/34 (b)
|
4,105,000
|
3,294,263
|
|
6.875% 6/24/24 (b)
|
3,235,000
|
3,135,928
|
|
7% 5/22/27 (b)
|
3,745,000
|
3,510,938
|
|
7.25% 2/28/28 (b)
|
570,000
|
521,550
|
|
8% 5/22/32 (b)
|
685,000
|
618,213
|
|
TOTAL KENYA
|
11,080,892
|
||
Lebanon - 0.1%
|
|||
Lebanese Republic:
|
|||
5.8% (d)
|
5,875,000
|
339,035
|
|
6% (d)
|
1,587,000
|
92,740
|
|
6.1% (d)
|
685,000
|
39,530
|
|
6.375% (d)
|
7,072,000
|
416,894
|
|
TOTAL LEBANON
|
888,199
|
||
Mexico - 1.9%
|
|||
United Mexican States:
|
|||
3.25% 4/16/30
|
3,700,000
|
3,343,875
|
|
4.5% 4/22/29
|
2,040,000
|
2,006,850
|
|
4.75% 4/27/32
|
970,000
|
932,413
|
|
5.75% 10/12/2110
|
3,295,000
|
2,939,758
|
|
6.05% 1/11/40
|
10,222,000
|
10,308,248
|
|
6.338% 5/4/53
|
1,695,000
|
1,725,722
|
|
6.35% 2/9/35
|
2,485,000
|
2,599,155
|
|
TOTAL MEXICO
|
23,856,021
|
||
Mongolia - 0.1%
|
|||
Mongolia Government:
|
|||
5.125% 4/7/26 (b)
|
1,240,000
|
1,203,963
|
|
7.875% 6/5/29 (b)
|
490,000
|
501,079
|
|
TOTAL MONGOLIA
|
1,705,042
|
||
Morocco - 0.2%
|
|||
Moroccan Kingdom 6.5% 9/8/33 (b)
|
2,740,000
|
2,888,131
|
|
Nigeria - 2.1%
|
|||
Republic of Nigeria:
|
|||
6.125% 9/28/28 (b)
|
4,880,000
|
4,318,800
|
|
6.5% 11/28/27 (b)
|
5,087,000
|
4,638,708
|
|
7.143% 2/23/30 (b)
|
4,110,000
|
3,695,147
|
|
7.625% 11/21/25 (b)
|
5,383,000
|
5,307,638
|
|
7.625% 11/28/47 (b)
|
5,315,000
|
4,203,155
|
|
7.696% 2/23/38 (b)
|
980,000
|
802,375
|
|
7.875% 2/16/32 (b)
|
1,635,000
|
1,465,880
|
|
8.375% 3/24/29 (b)
|
3,095,000
|
2,964,430
|
|
TOTAL NIGERIA
|
27,396,133
|
||
Oman - 2.5%
|
|||
Sultanate of Oman:
|
|||
5.625% 1/17/28 (b)
|
6,505,000
|
6,618,838
|
|
6% 8/1/29 (b)
|
3,625,000
|
3,751,875
|
|
6.25% 1/25/31 (b)
|
4,805,000
|
5,046,752
|
|
6.5% 3/8/47 (b)
|
8,100,000
|
8,251,875
|
|
6.75% 1/17/48 (b)
|
7,720,000
|
8,060,163
|
|
7% 1/25/51 (b)
|
490,000
|
527,669
|
|
TOTAL OMAN
|
32,257,172
|
||
Pakistan - 0.8%
|
|||
Islamic Republic of Pakistan:
|
|||
6% 4/8/26 (b)
|
6,130,000
|
4,312,072
|
|
6.875% 12/5/27 (b)
|
5,905,000
|
4,004,328
|
|
7.875% 3/31/36 (b)
|
2,025,000
|
1,268,379
|
|
TOTAL PAKISTAN
|
9,584,779
|
||
Panama - 1.7%
|
|||
Panamanian Republic:
|
|||
2.252% 9/29/32
|
5,065,000
|
3,695,867
|
|
3.16% 1/23/30
|
3,670,000
|
3,122,941
|
|
3.298% 1/19/33
|
5,355,000
|
4,233,797
|
|
3.87% 7/23/60
|
3,880,000
|
2,317,088
|
|
4.3% 4/29/53
|
1,795,000
|
1,198,723
|
|
4.5% 5/15/47
|
2,005,000
|
1,420,417
|
|
4.5% 4/16/50
|
2,680,000
|
1,855,900
|
|
6.4% 2/14/35
|
2,700,000
|
2,632,500
|
|
6.853% 3/28/54
|
1,030,000
|
961,763
|
|
TOTAL PANAMA
|
21,438,996
|
||
Paraguay - 0.8%
|
|||
Republic of Paraguay:
|
|||
2.739% 1/29/33 (b)
|
1,305,000
|
1,070,100
|
|
4.95% 4/28/31 (b)
|
3,865,000
|
3,772,240
|
|
5.4% 3/30/50 (b)
|
3,925,000
|
3,499,138
|
|
5.6% 3/13/48 (b)
|
1,925,000
|
1,759,450
|
|
TOTAL PARAGUAY
|
10,100,928
|
||
Peru - 1.0%
|
|||
Peruvian Republic:
|
|||
2.783% 1/23/31
|
3,585,000
|
3,115,589
|
|
3% 1/15/34
|
5,225,000
|
4,398,797
|
|
3.3% 3/11/41
|
7,075,000
|
5,487,547
|
|
TOTAL PERU
|
13,001,933
|
||
Philippines - 0.7%
|
|||
Philippine Republic:
|
|||
2.65% 12/10/45
|
2,130,000
|
1,505,644
|
|
2.95% 5/5/45
|
865,000
|
646,588
|
|
5% 7/17/33
|
1,135,000
|
1,164,794
|
|
5.5% 1/17/48
|
1,005,000
|
1,055,878
|
|
5.609% 4/13/33
|
1,670,000
|
1,781,159
|
|
5.95% 10/13/47
|
2,670,000
|
2,967,872
|
|
TOTAL PHILIPPINES
|
9,121,935
|
||
Poland - 0.4%
|
|||
Bank Gospodarstwa Krajowego:
|
|||
5.375% 5/22/33 (b)
|
2,000,000
|
2,025,300
|
|
6.25% 10/31/28 (b)
|
985,000
|
1,038,978
|
|
Polish Government 5.5% 4/4/53
|
1,945,000
|
2,023,597
|
|
TOTAL POLAND
|
5,087,875
|
||
Qatar - 2.3%
|
|||
State of Qatar:
|
|||
3.75% 4/16/30 (b)
|
10,275,000
|
10,025,420
|
|
4.4% 4/16/50 (b)
|
9,660,000
|
8,912,026
|
|
4.817% 3/14/49 (b)
|
8,149,000
|
7,917,487
|
|
5.103% 4/23/48 (b)
|
2,960,000
|
2,991,672
|
|
TOTAL QATAR
|
29,846,605
|
||
Romania - 1.4%
|
|||
Romanian Republic:
|
|||
2% 4/14/33 (Reg. S)
|
EUR
|
2,030,000
|
1,666,309
|
3% 2/14/31 (b)
|
5,296,000
|
4,502,500
|
|
3.375% 1/28/50 (Reg. S)
|
EUR
|
3,875,000
|
2,904,802
|
3.624% 5/26/30 (b)
|
EUR
|
1,665,000
|
1,687,685
|
3.625% 3/27/32 (b)
|
2,618,000
|
2,260,067
|
|
4% 2/14/51 (b)
|
3,100,000
|
2,233,364
|
|
7.125% 1/17/33 (b)
|
1,615,000
|
1,742,424
|
|
7.625% 1/17/53 (b)
|
1,138,000
|
1,271,510
|
|
TOTAL ROMANIA
|
18,268,661
|
||
Rwanda - 0.2%
|
|||
Rwanda Republic 5.5% 8/9/31 (b)
|
3,195,000
|
2,549,011
|
|
Saudi Arabia - 1.4%
|
|||
Kingdom of Saudi Arabia:
|
|||
2.25% 2/2/33 (b)
|
4,030,000
|
3,331,047
|
|
3.45% 2/2/61 (b)
|
2,775,000
|
1,946,836
|
|
3.625% 3/4/28 (b)
|
1,770,000
|
1,709,709
|
|
3.75% 1/21/55 (b)
|
3,755,000
|
2,849,106
|
|
4.5% 10/26/46 (b)
|
3,471,000
|
3,063,158
|
|
4.5% 4/22/60 (b)
|
2,055,000
|
1,774,364
|
|
4.625% 10/4/47 (b)
|
3,040,000
|
2,717,699
|
|
TOTAL SAUDI ARABIA
|
17,391,919
|
||
Senegal - 0.3%
|
|||
Republic of Senegal:
|
|||
6.25% 5/23/33 (b)
|
2,700,000
|
2,404,688
|
|
6.75% 3/13/48 (b)
|
1,385,000
|
1,086,792
|
|
TOTAL SENEGAL
|
3,491,480
|
||
Serbia - 0.6%
|
|||
Republic of Serbia:
|
|||
2.125% 12/1/30 (b)
|
5,110,000
|
4,085,854
|
|
6.25% 5/26/28 (b)
|
865,000
|
884,212
|
|
6.5% 9/26/33 (b)
|
2,300,000
|
2,352,647
|
|
TOTAL SERBIA
|
7,322,713
|
||
South Africa - 1.1%
|
|||
South African Republic:
|
|||
5% 10/12/46
|
880,000
|
647,900
|
|
5.65% 9/27/47
|
6,075,000
|
4,844,813
|
|
5.75% 9/30/49
|
7,030,000
|
5,606,284
|
|
7.3% 4/20/52
|
3,545,000
|
3,350,025
|
|
TOTAL SOUTH AFRICA
|
14,449,022
|
||
Sri Lanka - 0.9%
|
|||
Democratic Socialist Republic of Sri Lanka:
|
|||
6.2% (b)(d)
|
4,350,000
|
2,180,438
|
|
6.825% (b)(d)
|
3,085,000
|
1,567,631
|
|
6.85% (b)(d)
|
5,000,000
|
2,548,438
|
|
7.55% (b)(d)
|
3,405,000
|
1,703,564
|
|
7.85% (b)(d)
|
6,363,000
|
3,181,500
|
|
TOTAL SRI LANKA
|
11,181,571
|
||
Turkey - 3.2%
|
|||
Export Credit Bank of Turkey 9% 1/28/27 (b)
|
1,735,000
|
1,804,942
|
|
Turkish Republic:
|
|||
4.75% 1/26/26
|
2,030,000
|
1,969,100
|
|
4.875% 4/16/43
|
5,290,000
|
3,862,229
|
|
5.125% 2/17/28
|
3,070,000
|
2,920,338
|
|
5.75% 5/11/47
|
4,040,000
|
3,151,200
|
|
5.95% 1/15/31
|
2,685,000
|
2,524,437
|
|
6% 1/14/41
|
4,622,000
|
3,912,754
|
|
6.125% 10/24/28
|
2,140,000
|
2,099,875
|
|
6.375% 10/14/25
|
4,480,000
|
4,485,600
|
|
6.625% 2/17/45
|
150,000
|
131,438
|
|
6.75% 5/30/40
|
2,112,000
|
1,932,480
|
|
9.125% 7/13/30
|
3,825,000
|
4,212,281
|
|
9.375% 3/14/29
|
5,270,000
|
5,816,763
|
|
9.375% 1/19/33
|
515,000
|
580,663
|
|
26.2% 10/5/33
|
TRY
|
33,410,000
|
1,172,291
|
TOTAL TURKEY
|
40,576,391
|
||
Ukraine - 0.9%
|
|||
Ukraine Government:
|
|||
6.876% 5/21/31 (b)
|
3,585,000
|
812,227
|
|
7.253% 3/15/35 (b)
|
3,445,000
|
799,240
|
|
7.375% 9/25/34 (b)
|
2,130,000
|
495,225
|
|
7.75% 9/1/24 (b)
|
9,099,000
|
2,747,898
|
|
7.75% 9/1/25 (b)
|
9,100,000
|
2,675,400
|
|
7.75% 9/1/26 (b)
|
5,364,000
|
1,469,736
|
|
7.75% 9/1/27 (b)
|
1,750,000
|
467,250
|
|
7.75% 9/1/28 (b)
|
1,895,000
|
520,178
|
|
7.75% 9/1/29 (b)
|
2,594,000
|
703,623
|
|
7.75% 8/1/41 (b)(c)
|
2,230,000
|
991,904
|
|
9.75% 11/1/30 (b)
|
425,000
|
120,594
|
|
TOTAL UKRAINE
|
11,803,275
|
||
United Arab Emirates - 1.3%
|
|||
Abu Dhabi National Energy Co. PJSC 4.375% 1/24/29 (b)
|
1,740,000
|
1,728,760
|
|
Emirate of Abu Dhabi:
|
|||
3.125% 9/30/49 (b)
|
13,102,000
|
9,601,932
|
|
3.875% 4/16/50 (b)
|
2,990,000
|
2,501,584
|
|
Emirate of Dubai 3.9% 9/9/50 (Reg. S)
|
4,165,000
|
3,117,242
|
|
TOTAL UNITED ARAB EMIRATES
|
16,949,518
|
||
United States of America - 5.3%
|
|||
U.S. Treasury Bonds:
|
|||
2.875% 5/15/52
|
40,530,000
|
32,268,807
|
|
3.25% 5/15/42 (f)
|
9,912,000
|
8,696,231
|
|
3.625% 2/15/53
|
8,841,000
|
8,164,111
|
|
U.S. Treasury Notes:
|
|||
3.625% 3/31/30
|
4,389,000
|
4,320,936
|
|
3.75% 5/31/30
|
3,633,000
|
3,600,786
|
|
4% 2/28/30
|
2,772,000
|
2,785,102
|
|
4.625% 9/30/28
|
4,578,000
|
4,725,354
|
|
4.625% 9/30/30
|
2,898,000
|
3,020,939
|
|
TOTAL UNITED STATES OF AMERICA
|
67,582,266
|
||
Uruguay - 0.6%
|
|||
Uruguay Republic:
|
|||
5.1% 6/18/50
|
6,360,000
|
6,373,913
|
|
5.75% 10/28/34
|
1,745,000
|
1,888,963
|
|
TOTAL URUGUAY
|
8,262,876
|
||
Uzbekistan - 0.4%
|
|||
Republic of Uzbekistan:
|
|||
3.7% 11/25/30 (b)
|
1,595,000
|
1,338,803
|
|
3.9% 10/19/31 (b)
|
2,880,000
|
2,412,000
|
|
5.375% 2/20/29 (b)
|
1,145,000
|
1,084,888
|
|
TOTAL UZBEKISTAN
|
4,835,691
|
||
Venezuela - 0.7%
|
|||
Venezuelan Republic:
|
|||
9.25% (d)
|
27,915,000
|
5,202,239
|
|
11.95% (Reg. S) (d)
|
17,015,000
|
3,186,067
|
|
12.75% (d)
|
3,625,000
|
582,666
|
|
TOTAL VENEZUELA
|
8,970,972
|
||
Vietnam - 0.6%
|
|||
Vietnamese Socialist Republic 5.5% 3/12/28
|
7,812,167
|
7,469,603
|
|
Zambia - 0.2%
|
|||
Republic of Zambia:
|
|||
8.5% (b)(d)
|
585,000
|
362,700
|
|
8.97% (b)(d)
|
4,490,000
|
2,766,963
|
|
TOTAL ZAMBIA
|
3,129,663
|
||
|
TOTAL GOVERNMENT OBLIGATIONS
(Cost $870,904,254)
|
776,213,911
|
||
Common Stocks - 0.0%
|
|||
Shares
|
Value ($)
|
||
Kazakhstan - 0.0%
|
|||
Nostrum Oil & Gas LP warrants (g)(h)
(Cost $0)
|
266,460
|
3
|
|
Preferred Securities - 1.3%
|
|||
Principal
Amount (a)
|
Value ($)
|
||
Kuwait - 0.1%
|
|||
NBK Tier 1 Financing 2 Ltd. 4.5% (b)(c)(i)
|
1,890,000
|
1,816,081
|
|
Mexico - 0.8%
|
|||
Banco Mercantil del Norte SA:
|
|||
6.75% (b)(c)(i)
|
1,970,000
|
1,943,222
|
|
7.625% (b)(c)(i)
|
3,300,000
|
3,232,466
|
|
CEMEX S.A.B. de CV:
|
|||
5.125% (b)(c)(i)
|
3,625,000
|
3,484,030
|
|
9.125% (b)(c)(i)
|
1,175,000
|
1,251,948
|
|
TOTAL MEXICO
|
9,911,666
|
||
Russia - 0.0%
|
|||
Tinkoff Credit Systems 6% (b)(c)(d)(h)(i)
|
1,625,000
|
81,250
|
|
United Arab Emirates - 0.4%
|
|||
DP World Salaam 6% (Reg. S) (c)(i)
|
4,625,000
|
4,742,153
|
|
|
TOTAL PREFERRED SECURITIES
(Cost $18,842,280)
|
16,551,150
|
||
Money Market Funds - 4.2%
|
|||
Shares
|
Value ($)
|
||
Fidelity Cash Central Fund 5.40% (j)
(Cost $54,493,561)
|
54,482,664
|
54,493,561
|
|
|
TOTAL INVESTMENT IN SECURITIES - 98.2%
(Cost $1,422,134,462)
|
1,262,084,484
|
NET OTHER ASSETS (LIABILITIES) - 1.8%
|
23,566,352
|
NET ASSETS - 100.0%
|
1,285,650,836
|
Futures Contracts
|
|||||
Number
of contracts
|
Expiration
Date
|
Notional
Amount ($)
|
Value ($)
|
Unrealized
Appreciation/
(Depreciation) ($)
|
|
Purchased
|
|||||
Treasury Contracts
|
|||||
CBOT 10-Year U.S. Treasury Note Contracts (United States)
|
29
|
Mar 2024
|
3,273,828
|
73,808
|
73,808
|
The notional amount of futures purchased as a percentage of Net Assets is 0.3%
|
|||||
EUR
|
-
|
European Monetary Unit
|
TRY
|
-
|
Turkish Lira
|
(a)
|
Amount is stated in United States dollars unless otherwise noted.
|
(b)
|
Security exempt from registration under Rule 144A of the Securities Act of 1933. These securities may be resold in transactions exempt from registration, normally to qualified institutional buyers. At the end of the period, the value of these securities amounted to $800,459,686 or 62.3% of net assets.
|
(c)
|
Coupon rates for floating and adjustable rate securities reflect the rates in effect at period end.
|
(d)
|
Non-income producing - Security is in default.
|
(e)
|
Security initially issued at one coupon which converts to a higher coupon at a specified date. The rate shown is the rate at period end.
|
(f)
|
Security or a portion of the security was pledged to cover margin requirements for futures contracts. At period end, the value of securities pledged amounted to $74,908.
|
(g)
|
Non-income producing
|
(h)
|
Level 3 security
|
(i)
|
Security is perpetual in nature with no stated maturity date.
|
(j)
|
Affiliated fund that is generally available only to investment companies and other accounts managed by Fidelity Investments. The rate quoted is the annualized seven-day yield of the fund at period end. A complete unaudited listing of the fund's holdings as of its most recent quarter end is available upon request. In addition, each Fidelity Central Fund's financial statements, which are not covered by the Fund's Report of Independent Registered Public Accounting Firm, are available on the SEC's website or upon request.
|
Affiliate
|
Value,
beginning
of period ($)
|
Purchases ($)
|
Sales
Proceeds ($)
|
Dividend
Income ($)
|
Realized
Gain (loss) ($)
|
Change in
Unrealized
appreciation
(depreciation) ($)
|
Value,
end
of period ($)
|
% ownership,
end
of period
|
Fidelity Cash Central Fund 5.40%
|
14,215,744
|
366,272,604
|
325,994,787
|
1,410,730
|
-
|
-
|
54,493,561
|
0.1%
|
Total
|
14,215,744
|
366,272,604
|
325,994,787
|
1,410,730
|
-
|
-
|
54,493,561
|
|
Valuation Inputs at Reporting Date:
|
||||
Description
|
Total ($)
|
Level 1 ($)
|
Level 2 ($)
|
Level 3 ($)
|
Investments in Securities:
|
||||
Equities:
|
||||
Energy
|
3
|
-
|
-
|
3
|
Corporate Bonds
|
414,825,859
|
-
|
414,825,859
|
-
|
Government Obligations
|
776,213,911
|
-
|
776,213,911
|
-
|
Preferred Securities
|
16,551,150
|
-
|
16,469,900
|
81,250
|
Money Market Funds
|
54,493,561
|
54,493,561
|
-
|
-
|
Total Investments in Securities:
|
1,262,084,484
|
54,493,561
|
1,207,509,670
|
81,253
|
Derivative Instruments:
Assets
|
||||
Futures Contracts
|
73,808
|
73,808
|
-
|
-
|
Total Assets
|
73,808
|
73,808
|
-
|
-
|
Total Derivative Instruments:
|
73,808
|
73,808
|
-
|
-
|
Primary Risk Exposure / Derivative Type
|
Value
|
|
Asset ($)
|
Liability ($)
|
|
Interest Rate Risk
|
||
Futures Contracts (a)
|
73,808
|
0
|
Total Interest Rate Risk
|
73,808
|
0
|
Total Value of Derivatives
|
73,808
|
0
|
Statement of Assets and Liabilities
|
||||
December 31, 2023
|
||||
Assets
|
||||
Investment in securities, at value - See accompanying schedule:
|
||||
Unaffiliated issuers (cost $1,367,640,901)
|
$
|
1,207,590,923
|
||
Fidelity Central Funds (cost $54,493,561)
|
54,493,561
|
|||
Total Investment in Securities (cost $1,422,134,462)
|
$
|
1,262,084,484
|
||
Foreign currency held at value (cost $21)
|
21
|
|||
Receivable for investments sold
|
31,498
|
|||
Receivable for fund shares sold
|
306,462
|
|||
Interest receivable
|
26,578,438
|
|||
Distributions receivable from Fidelity Central Funds
|
229,184
|
|||
Receivable from investment adviser for expense reductions
|
188,692
|
|||
Other receivables
|
83
|
|||
Total assets
|
1,289,418,862
|
|||
Liabilities
|
||||
Payable for fund shares redeemed
|
$
|
3,766,380
|
||
Other payables and accrued expenses
|
1,646
|
|||
Total Liabilities
|
3,768,026
|
|||
Net Assets
|
$
|
1,285,650,836
|
||
Net Assets consist of:
|
||||
Paid in capital
|
$
|
1,642,116,115
|
||
Total accumulated earnings (loss)
|
(356,465,279)
|
|||
Net Assets
|
$
|
1,285,650,836
|
||
Net Asset Value, offering price and redemption price per share ($1,285,650,836 ÷ 165,945,135 shares)
|
$
|
7.75
|
||
Statement of Operations
|
||||
Year ended
December 31, 2023
|
||||
Investment Income
|
||||
Dividends
|
$
|
1,071,902
|
||
Interest
|
81,858,383
|
|||
Income from Fidelity Central Funds
|
1,410,730
|
|||
Income before foreign taxes withheld
|
$
|
84,341,015
|
||
Less foreign taxes withheld
|
(4,688)
|
|||
Total Income
|
84,336,327
|
|||
Expenses
|
||||
Custodian fees and expenses
|
$
|
4,541
|
||
Independent trustees' fees and expenses
|
7,281
|
|||
Legal
|
271,460
|
|||
Total expenses before reductions
|
283,282
|
|||
Expense reductions
|
(245,118)
|
|||
Total expenses after reductions
|
38,164
|
|||
Net Investment income (loss)
|
84,298,163
|
|||
Realized and Unrealized Gain (Loss)
|
||||
Net realized gain (loss) on:
|
||||
Investment Securities:
|
||||
Unaffiliated issuers
|
(44,889,013)
|
|||
Foreign currency transactions
|
8,078
|
|||
Total net realized gain (loss)
|
(44,880,935)
|
|||
Change in net unrealized appreciation (depreciation) on:
|
||||
Investment Securities:
|
||||
Unaffiliated issuers
|
103,605,522
|
|||
Assets and liabilities in foreign currencies
|
(3,243)
|
|||
Futures contracts
|
73,808
|
|||
Total change in net unrealized appreciation (depreciation)
|
103,676,087
|
|||
Net gain (loss)
|
58,795,152
|
|||
Net increase (decrease) in net assets resulting from operations
|
$
|
143,093,315
|
||
Statement of Changes in Net Assets
|
||||
Year ended
December 31, 2023
|
Year ended
December 31, 2022
|
|||
Increase (Decrease) in Net Assets
|
||||
Operations
|
||||
Net investment income (loss)
|
$
|
84,298,163
|
$
|
74,504,061
|
Net realized gain (loss)
|
(44,880,935)
|
(93,556,949)
|
||
Change in net unrealized appreciation (depreciation)
|
103,676,087
|
(187,642,052)
|
||
Net increase (decrease) in net assets resulting from operations
|
143,093,315
|
(206,694,940)
|
||
Distributions to shareholders
|
(75,296,697)
|
(66,732,572)
|
||
Share transactions
|
||||
Proceeds from sales of shares
|
124,923,949
|
118,610,757
|
||
Reinvestment of distributions
|
75,296,578
|
66,626,169
|
||
Cost of shares redeemed
|
(143,233,600)
|
(193,506,975)
|
||
Net increase (decrease) in net assets resulting from share transactions
|
56,986,927
|
(8,270,049)
|
||
Total increase (decrease) in net assets
|
124,783,545
|
(281,697,561)
|
||
Net Assets
|
||||
Beginning of period
|
1,160,867,291
|
1,442,564,852
|
||
End of period
|
$
|
1,285,650,836
|
$
|
1,160,867,291
|
Other Information
|
||||
Shares
|
||||
Sold
|
16,964,106
|
15,614,535
|
||
Issued in reinvestment of distributions
|
10,202,779
|
8,801,859
|
||
Redeemed
|
(19,447,972)
|
(25,220,427)
|
||
Net increase (decrease)
|
7,718,913
|
(804,033)
|
||
Fidelity® Series Emerging Markets Debt Fund
|
Years ended December 31,
|
2023
|
2022
|
2021
|
2020
|
2019
|
|||||
Selected Per-Share Data
|
||||||||||
Net asset value, beginning of period
|
$
|
7.34
|
$
|
9.07
|
$
|
9.54
|
$
|
9.60
|
$
|
9.22
|
Income from Investment Operations
|
||||||||||
Net investment income (loss) A,B
|
.524
|
.470
|
.456
|
.519
|
.604
|
|||||
Net realized and unrealized gain (loss)
|
.353 C
|
(1.779)
|
(.515)
|
(.103)
|
.341
|
|||||
Total from investment operations
|
.877
|
(1.309)
|
(.059)
|
.416
|
.945
|
|||||
Distributions from net investment income
|
(.467)
|
(.421)
|
(.411)
|
(.476)
|
(.565)
|
|||||
Total distributions
|
(.467)
|
(.421)
|
(.411)
|
(.476)
|
(.565)
|
|||||
Net asset value, end of period
|
$
|
7.75
|
$
|
7.34
|
$
|
9.07
|
$
|
9.54
|
$
|
9.60
|
Total Return D
|
12.47%
|
(14.45)%
|
(.60)%
|
4.75%
|
10.46%
|
|||||
Ratios to Average Net Assets B,E,F
|
||||||||||
Expenses before reductions
|
.02%
|
-% G
|
-% G
|
-% G
|
-% G
|
|||||
Expenses net of fee waivers, if any G
|
-%
|
-%
|
-%
|
-%
|
-%
|
|||||
Expenses net of all reductions G
|
-%
|
-%
|
-%
|
-%
|
-%
|
|||||
Net investment income (loss)
|
7.12%
|
6.12%
|
4.93%
|
5.73%
|
6.35%
|
|||||
Supplemental Data
|
||||||||||
Net assets, end of period (000 omitted)
|
$
|
1,285,651
|
$
|
1,160,867
|
$
|
1,442,565
|
$
|
1,456,242
|
$
|
1,463,941
|
Portfolio turnover rate H
|
22%
|
27%
|
29%
|
84%
|
61% I
|
Average Annual Total Returns
|
|||
Periods ended December 31, 2023
|
Past 1
year
|
Life of
Fund A
|
Fidelity® Series Emerging Markets Debt Local Currency Fund
|
13.53%
|
1.25%
|
$10,000 Over Life of Fund
|
Let's say hypothetically that $10,000 was invested in Fidelity® Series Emerging Markets Debt Local Currency Fund, on October 30, 2020, when the fund started.
The chart shows how the value of your investment would have changed, and also shows how the J.P. Morgan GBI-EM Global Diversified Index performed over the same period.
|
|
Top Bond Issuers (% of Fund's net assets)
|
||
(with maturities greater than one year)
|
||
United Mexican States
|
10.3
|
|
Malaysian Government
|
8.8
|
|
South African Republic
|
8.2
|
|
Indonesian Republic
|
8.1
|
|
Brazilian Federative Republic
|
5.8
|
|
Kingdom of Thailand
|
4.9
|
|
Czech Republic
|
4.9
|
|
Romanian Republic
|
4.8
|
|
Colombian Republic
|
4.7
|
|
Polish Government
|
4.7
|
|
65.2
|
||
Quality Diversification (% of Fund's net assets)
|
|
We have used ratings from Moody's Investors Service, Inc. Where Moody's® ratings are not available, we have used S&P® ratings. All ratings are as of the date indicated and do not reflect subsequent changes.
|
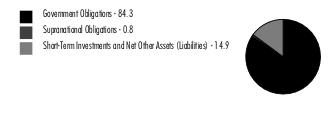
Asset Allocation (% of Fund's net assets)
|
|
Forward foreign currency contracts - (28.1)%
|
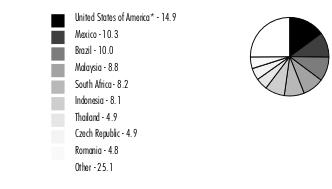
Geographic Diversification (% of Fund's net assets)
|
|
* Includes Short-Term investments and Net Other Assets (Liabilities).
Percentages are adjusted for the effect of derivatives, if applicable.
|
U.S. Government and Government Agency Obligations - 0.5%
|
|||
Principal
Amount (a)
|
Value ($)
|
||
U.S. Treasury Obligations - 0.5%
|
|||
U.S. Treasury Bills, yield at date of purchase 5.32% 5/16/24
(Cost $1,960,862)
|
2,000,000
|
1,961,653
|
|
Foreign Government and Government Agency Obligations - 84.3%
|
|||
Principal
Amount (a)
|
Value ($)
|
||
Brazil - 10.0%
|
|||
Brazil Letras Do Tesouro Nacio, yield at date of purchase 9.9654% to 13.1648% 7/1/24 to 7/1/26
|
BRL
|
102,270,000
|
17,750,309
|
Brazilian Federative Republic:
|
|||
10% 1/1/25
|
BRL
|
28,750,000
|
5,921,913
|
10% 1/1/27
|
BRL
|
38,000,000
|
7,856,169
|
10% 1/1/29
|
BRL
|
22,250,000
|
4,564,239
|
10% 1/1/31
|
BRL
|
12,000,000
|
2,439,673
|
10% 1/1/33
|
BRL
|
18,050,000
|
3,643,842
|
TOTAL BRAZIL
|
42,176,145
|
||
Chile - 2.1%
|
|||
Chilean Republic:
|
|||
4.5% 3/1/26
|
CLP
|
1,025,000,000
|
1,141,714
|
4.7% 9/1/30 (Reg. S) (b)
|
CLP
|
1,950,000,000
|
2,128,468
|
5% 3/1/35
|
CLP
|
1,800,000,000
|
2,001,318
|
6% 4/1/33(Reg. S) (b)
|
CLP
|
1,500,000,000
|
1,779,548
|
6% 1/1/43
|
CLP
|
1,275,000,000
|
1,566,977
|
TOTAL CHILE
|
8,618,025
|
||
China - 4.5%
|
|||
Peoples Republic of China:
|
|||
2.68% 5/21/30
|
CNY
|
48,750,000
|
6,914,758
|
2.88% 2/25/33
|
CNY
|
28,000,000
|
4,035,384
|
2.91% 10/14/28
|
CNY
|
13,000,000
|
1,872,386
|
3.12% 10/25/52
|
CNY
|
15,000,000
|
2,195,641
|
3.81% 9/14/50
|
CNY
|
23,250,000
|
3,813,017
|
TOTAL CHINA
|
18,831,186
|
||
Colombia - 4.7%
|
|||
Colombian Republic:
|
|||
5.75% 11/3/27
|
COP
|
31,100,000,000
|
7,100,330
|
6% 4/28/28
|
COP
|
1,850,000,000
|
420,315
|
7% 6/30/32
|
COP
|
26,300,000,000
|
5,676,569
|
7.25% 10/18/34
|
COP
|
11,500,000,000
|
2,438,024
|
7.25% 10/26/50
|
COP
|
8,500,000,000
|
1,592,157
|
7.5% 8/26/26
|
COP
|
5,075,000,000
|
1,251,038
|
9.25% 5/28/42
|
COP
|
5,400,000,000
|
1,269,328
|
TOTAL COLOMBIA
|
19,747,761
|
||
Czech Republic - 4.9%
|
|||
Czech Republic:
|
|||
0.95% 5/15/30 (Reg. S)
|
CZK
|
175,750,000
|
6,630,228
|
1.2% 3/13/31
|
CZK
|
89,370,000
|
3,358,246
|
1.5% 4/24/40
|
CZK
|
40,000,000
|
1,274,312
|
1.95% 7/30/37
|
CZK
|
38,500,000
|
1,377,263
|
2% 10/13/33
|
CZK
|
181,000,000
|
6,925,003
|
5.7% 5/25/24
|
CZK
|
17,750,000
|
796,148
|
TOTAL CZECH REPUBLIC
|
20,361,200
|
||
Dominican Republic - 0.3%
|
|||
Dominican Republic:
|
|||
9.75% 6/5/26 (Reg. S)
|
DOP
|
26,500,000
|
454,580
|
13.625% 2/3/33 (b)
|
DOP
|
38,500,000
|
799,775
|
TOTAL DOMINICAN REPUBLIC
|
1,254,355
|
||
Egypt - 0.3%
|
|||
Arab Republic of Egypt:
|
|||
14.556% 10/13/27
|
EGP
|
36,000,000
|
899,144
|
16.1% 5/7/29
|
EGP
|
12,000,000
|
293,244
|
TOTAL EGYPT
|
1,192,388
|
||
Hungary - 3.5%
|
|||
Hungarian Republic:
|
|||
2.25% 4/20/33
|
HUF
|
505,000,000
|
1,100,301
|
2.25% 6/22/34
|
HUF
|
470,000,000
|
984,984
|
2.75% 12/22/26
|
HUF
|
1,144,000,000
|
2,998,094
|
3% 6/26/24
|
HUF
|
750,000,000
|
2,121,970
|
3.25% 10/22/31
|
HUF
|
617,000,000
|
1,509,448
|
5.5% 6/24/25
|
HUF
|
400,000,000
|
1,138,924
|
6.75% 10/22/28
|
HUF
|
1,653,000,000
|
4,941,559
|
TOTAL HUNGARY
|
14,795,280
|
||
Indonesia - 8.1%
|
|||
Indonesian Republic:
|
|||
5.125% 4/15/27
|
IDR
|
15,000,000,000
|
940,605
|
6.375% 4/15/32
|
IDR
|
66,000,000,000
|
4,241,541
|
6.5% 2/15/31
|
IDR
|
48,500,000,000
|
3,143,349
|
7.125% 6/15/38
|
IDR
|
18,000,000,000
|
1,222,836
|
7.125% 6/15/42
|
IDR
|
31,500,000,000
|
2,127,306
|
7.125% 6/15/43
|
IDR
|
20,000,000,000
|
1,348,964
|
7.5% 4/15/40
|
IDR
|
41,750,000,000
|
2,898,789
|
8.25% 5/15/29
|
IDR
|
123,500,000,000
|
8,662,727
|
8.25% 5/15/36
|
IDR
|
44,750,000,000
|
3,291,510
|
8.375% 9/15/26
|
IDR
|
66,750,000,000
|
4,547,688
|
8.375% 3/15/34
|
IDR
|
19,788,000,000
|
1,451,617
|
TOTAL INDONESIA
|
33,876,932
|
||
Kazakhstan - 0.2%
|
|||
Kazakhstan Republic 10.5% 8/4/26
|
KZT
|
440,000,000
|
896,043
|
Malaysia - 8.8%
|
|||
Malaysian Government:
|
|||
3.519% 4/20/28
|
MYR
|
40,750,000
|
8,835,877
|
3.582% 7/15/32
|
MYR
|
15,750,000
|
3,372,351
|
3.757% 5/22/40
|
MYR
|
5,000,000
|
1,041,763
|
3.828% 7/5/34
|
MYR
|
14,300,000
|
3,097,358
|
3.882% 3/14/25
|
MYR
|
19,000,000
|
4,157,961
|
3.885% 8/15/29
|
MYR
|
13,000,000
|
2,858,727
|
3.906% 7/15/26
|
MYR
|
23,500,000
|
5,170,358
|
4.065% 6/15/50
|
MYR
|
9,750,000
|
2,033,665
|
4.457% 3/31/53
|
MYR
|
4,500,000
|
1,014,072
|
4.642% 11/7/33
|
MYR
|
4,250,000
|
990,643
|
4.696% 10/15/42
|
MYR
|
6,450,000
|
1,512,009
|
4.762% 4/7/37
|
MYR
|
13,000,000
|
3,047,687
|
TOTAL MALAYSIA
|
37,132,471
|
||
Mexico - 10.3%
|
|||
United Mexican States:
|
|||
5.75% 3/5/26
|
MXN
|
275,000,000
|
14,932,081
|
7.75% 11/23/34
|
MXN
|
91,000,000
|
4,902,350
|
7.75% 11/13/42
|
MXN
|
111,000,000
|
5,764,110
|
8% 9/5/24
|
MXN
|
49,500,000
|
2,860,658
|
8% 7/31/53
|
MXN
|
55,250,000
|
2,896,192
|
8.5% 5/31/29
|
MXN
|
205,250,000
|
11,843,847
|
TOTAL MEXICO
|
43,199,238
|
||
Peru - 2.3%
|
|||
Peruvian Republic:
|
|||
5.35% 8/12/40
|
PEN
|
2,250,000
|
518,990
|
5.4% 8/12/34(Reg. S)
|
PEN
|
4,850,000
|
1,181,416
|
5.94% 2/12/29
|
PEN
|
5,250,000
|
1,416,411
|
6.35% 8/12/28
|
PEN
|
9,900,000
|
2,734,001
|
6.9% 8/12/37
|
PEN
|
2,500,000
|
678,074
|
6.95% 8/12/31
|
PEN
|
11,500,000
|
3,206,953
|
TOTAL PERU
|
9,735,845
|
||
Philippines - 0.1%
|
|||
Philippine Republic 6.25% 1/14/36
|
PHP
|
30,000,000
|
506,964
|
Poland - 4.7%
|
|||
Polish Government:
|
|||
1.25% 10/25/30
|
PLN
|
10,700,000
|
2,152,971
|
1.75% 4/25/32
|
PLN
|
20,750,000
|
4,102,116
|
2.5% 7/25/26
|
PLN
|
4,250,000
|
1,017,365
|
2.5% 7/25/27
|
PLN
|
17,500,000
|
4,107,002
|
2.75% 4/25/28
|
PLN
|
14,000,000
|
3,261,834
|
2.75% 10/25/29
|
PLN
|
7,000,000
|
1,589,092
|
6% 10/25/33
|
PLN
|
12,500,000
|
3,366,764
|
TOTAL POLAND
|
19,597,144
|
||
Romania - 4.8%
|
|||
Romanian Republic:
|
|||
3.65% 9/24/31
|
RON
|
24,250,000
|
4,526,659
|
4.25% 4/28/36
|
RON
|
2,500,000
|
459,836
|
4.75% 2/24/25
|
RON
|
21,050,000
|
4,607,090
|
4.75% 10/11/34
|
RON
|
7,750,000
|
1,516,753
|
5% 2/12/29
|
RON
|
30,950,000
|
6,506,238
|
5.8% 7/26/27
|
RON
|
7,500,000
|
1,644,877
|
6.7% 2/25/32
|
RON
|
3,750,000
|
852,482
|
TOTAL ROMANIA
|
20,113,935
|
||
South Africa - 8.2%
|
|||
South African Republic:
|
|||
6.25% 3/31/36
|
ZAR
|
93,000,000
|
3,337,940
|
7% 2/28/31
|
ZAR
|
94,750,000
|
4,337,712
|
8% 1/31/30
|
ZAR
|
259,000,000
|
13,025,795
|
8.25% 3/31/32
|
ZAR
|
17,750,000
|
847,302
|
8.75% 2/28/48
|
ZAR
|
145,250,000
|
5,845,013
|
8.875% 2/28/35
|
ZAR
|
155,500,000
|
7,172,149
|
TOTAL SOUTH AFRICA
|
34,565,911
|
||
Thailand - 4.9%
|
|||
Kingdom of Thailand:
|
|||
1.585% 12/17/35
|
THB
|
122,750,000
|
3,170,129
|
1.6% 6/17/35
|
THB
|
180,750,000
|
4,698,442
|
2% 12/17/31
|
THB
|
31,250,000
|
870,922
|
2% 6/17/42
|
THB
|
85,000,000
|
2,093,201
|
2.875% 6/17/46
|
THB
|
44,400,000
|
1,185,178
|
3.3% 6/17/38
|
THB
|
217,750,000
|
6,568,882
|
3.775% 6/25/32
|
THB
|
64,000,000
|
2,031,838
|
TOTAL THAILAND
|
20,618,592
|
||
Turkey - 0.9%
|
|||
Turkish Republic:
|
|||
10.5% 8/11/27
|
TRY
|
27,000,000
|
617,994
|
10.6% 2/11/26
|
TRY
|
26,000,000
|
606,575
|
12.6% 10/1/25
|
TRY
|
19,500,000
|
468,496
|
17.3% 7/19/28
|
TRY
|
35,500,000
|
970,358
|
17.8% 7/13/33
|
TRY
|
25,000,000
|
661,718
|
26.2% 10/5/33
|
TRY
|
17,500,000
|
614,040
|
TOTAL TURKEY
|
3,939,181
|
||
Uruguay - 0.7%
|
|||
Uruguay Republic:
|
|||
8.25% 5/21/31
|
UYU
|
31,500,000
|
750,458
|
8.5% 3/15/28 (Reg. S)
|
UYU
|
49,025,000
|
1,206,757
|
9.75% 7/20/33
|
UYU
|
34,298,120
|
889,309
|
TOTAL URUGUAY
|
2,846,524
|
||
|
TOTAL FOREIGN GOVERNMENT AND GOVERNMENT AGENCY OBLIGATIONS
(Cost $350,064,591)
|
354,005,120
|
||
Supranational Obligations - 0.8%
|
|||
Principal
Amount (a)
|
Value ($)
|
||
Asian Infrastructure Investment Bank 2.375% 2/10/25 (Reg. S)
|
PHP
|
57,900,000
|
1,006,326
|
Inter-American Development Bank:
|
|||
5.1% 11/17/26
|
IDR
|
15,000,000,000
|
958,074
|
5.7% 11/12/24
|
INR
|
105,000,000
|
1,245,842
|
|
TOTAL SUPRANATIONAL OBLIGATIONS
(Cost $3,654,451)
|
3,210,242
|
||
Money Market Funds - 12.2%
|
|||
Shares
|
Value ($)
|
||
Fidelity Cash Central Fund 5.40% (c)
(Cost $51,362,343)
|
51,352,073
|
51,362,343
|
|
|
TOTAL INVESTMENT IN SECURITIES - 97.8%
(Cost $407,042,247)
|
410,539,358
|
NET OTHER ASSETS (LIABILITIES) - 2.2%
|
9,318,758
|
NET ASSETS - 100.0%
|
419,858,116
|
Forward Foreign Currency Contracts
|
||||||
Currency
Purchased
|
Currency
Sold
|
Counterparty
|
Settlement
Date
|
Unrealized
Appreciation/
(Depreciation) ($)
|
||
USD
|
91,179
|
HUF
|
31,460,000
|
State Street Bank and Trust Co
|
1/02/24
|
493
|
BRL
|
5,832,000
|
USD
|
1,171,527
|
BNP Paribas S.A.
|
2/29/24
|
22,346
|
BRL
|
3,597,000
|
USD
|
738,604
|
State Street Bank and Trust Co
|
2/29/24
|
(2,259)
|
BRL
|
5,391,000
|
USD
|
1,102,003
|
State Street Bank and Trust Co
|
2/29/24
|
1,592
|
CLP
|
1,244,886,000
|
USD
|
1,425,905
|
State Street Bank and Trust Co
|
2/29/24
|
(17,646)
|
CNY
|
5,419,000
|
USD
|
766,424
|
Bank of America, N.A.
|
2/29/24
|
1,192
|
CNY
|
136,425,000
|
USD
|
19,305,880
|
Goldman Sachs Bank USA
|
2/29/24
|
19,086
|
CZK
|
9,171,000
|
USD
|
405,443
|
Bank of America, N.A.
|
2/29/24
|
3,962
|
CZK
|
19,652,000
|
USD
|
870,764
|
Goldman Sachs Bank USA
|
2/29/24
|
6,527
|
EGP
|
25,000,000
|
USD
|
647,668
|
Citibank, N. A.
|
2/29/24
|
(58,900)
|
EUR
|
960,000
|
USD
|
1,035,194
|
Canadian Imperial Bk. of Comm.
|
2/29/24
|
27,030
|
EUR
|
955,000
|
USD
|
1,053,623
|
Canadian Imperial Bk. of Comm.
|
2/29/24
|
3,069
|
EUR
|
3,792,000
|
USD
|
4,106,016
|
Goldman Sachs Bank USA
|
2/29/24
|
89,770
|
HUF
|
806,169,000
|
USD
|
2,272,850
|
BNP Paribas S.A.
|
2/29/24
|
34,792
|
HUF
|
272,797,000
|
USD
|
774,088
|
JPMorgan Chase Bank, N.A.
|
2/29/24
|
6,787
|
IDR
|
18,213,800,000
|
USD
|
1,179,650
|
Bank of America, N.A.
|
2/29/24
|
2,516
|
IDR
|
81,709,200,000
|
USD
|
5,266,804
|
State Street Bank and Trust Co
|
2/29/24
|
36,531
|
INR
|
414,774,000
|
USD
|
4,963,787
|
BNP Paribas S.A.
|
2/29/24
|
10,642
|
KRW
|
1,334,300,000
|
USD
|
1,018,705
|
BNP Paribas S.A.
|
2/29/24
|
15,248
|
KRW
|
2,676,900,000
|
USD
|
2,046,247
|
Bank of America, N.A.
|
2/29/24
|
28,091
|
KRW
|
1,355,700,000
|
USD
|
1,035,123
|
Goldman Sachs Bank USA
|
2/29/24
|
15,413
|
MXN
|
17,515,000
|
USD
|
998,241
|
Canadian Imperial Bk. of Comm.
|
2/29/24
|
23,557
|
MXN
|
14,716,000
|
USD
|
840,207
|
JPMorgan Chase Bank, N.A.
|
2/29/24
|
18,302
|
MYR
|
9,184,000
|
USD
|
1,983,328
|
Goldman Sachs Bank USA
|
2/29/24
|
23,080
|
PEN
|
3,183,000
|
USD
|
848,415
|
State Street Bank and Trust Co
|
2/29/24
|
10,463
|
PHP
|
72,086,000
|
USD
|
1,304,252
|
Bank of America, N.A.
|
2/29/24
|
(2,720)
|
PLN
|
30,896,000
|
USD
|
7,684,978
|
Goldman Sachs Bank USA
|
2/29/24
|
161,291
|
PLN
|
2,418,000
|
USD
|
615,667
|
Goldman Sachs Bank USA
|
2/29/24
|
(1,598)
|
PLN
|
4,905,000
|
USD
|
1,223,961
|
HSBC Bank
|
2/29/24
|
21,700
|
RON
|
9,202,000
|
USD
|
2,002,500
|
BNP Paribas S.A.
|
2/29/24
|
37,962
|
RON
|
2,857,000
|
USD
|
620,109
|
JPMorgan Chase Bank, N.A.
|
2/29/24
|
13,405
|
THB
|
536,884,000
|
USD
|
15,330,782
|
JPMorgan Chase Bank, N.A.
|
2/29/24
|
461,213
|
THB
|
42,811,000
|
USD
|
1,224,921
|
JPMorgan Chase Bank, N.A.
|
2/29/24
|
34,329
|
TRY
|
33,303,000
|
USD
|
1,077,854
|
Bank of America, N.A.
|
2/29/24
|
(7,029)
|
TRY
|
152,749,000
|
USD
|
4,936,945
|
JPMorgan Chase Bank, N.A.
|
2/29/24
|
(25,451)
|
USD
|
2,260,560
|
BRL
|
11,223,000
|
State Street Bank and Trust Co
|
2/29/24
|
(36,909)
|
USD
|
1,089,746
|
CLP
|
942,194,000
|
State Street Bank and Trust Co
|
2/29/24
|
23,903
|
USD
|
1,000,299
|
COP
|
4,008,200,000
|
Citibank, N. A.
|
2/29/24
|
(22,140)
|
USD
|
1,261,480
|
COP
|
4,945,000,000
|
State Street Bank and Trust Co
|
2/29/24
|
74
|
USD
|
330,982
|
COP
|
1,346,800,000
|
State Street Bank and Trust Co
|
2/29/24
|
(12,569)
|
USD
|
1,058,175
|
CZK
|
24,102,000
|
Citibank, N. A.
|
2/29/24
|
(17,770)
|
USD
|
6,199,297
|
EUR
|
5,707,000
|
State Street Bank and Trust Co
|
2/29/24
|
(115,404)
|
USD
|
1,982,272
|
HUF
|
707,255,000
|
Goldman Sachs Bank USA
|
2/29/24
|
(42,230)
|
USD
|
1,034,231
|
HUF
|
371,711,000
|
Goldman Sachs Bank USA
|
2/29/24
|
(29,784)
|
USD
|
2,053,782
|
KRW
|
2,676,900,000
|
State Street Bank and Trust Co
|
2/29/24
|
(20,555)
|
USD
|
2,074,977
|
KRW
|
2,690,000,000
|
State Street Bank and Trust Co
|
2/29/24
|
(9,512)
|
USD
|
1,157,197
|
MXN
|
20,249,000
|
JPMorgan Chase Bank, N.A.
|
2/29/24
|
(24,098)
|
USD
|
835,191
|
MXN
|
14,716,000
|
Royal Bank of Canada
|
2/29/24
|
(23,318)
|
USD
|
840,507
|
PEN
|
3,183,000
|
Bank of America, N.A.
|
2/29/24
|
(18,372)
|
USD
|
1,302,320
|
PHP
|
72,086,000
|
BNP Paribas S.A.
|
2/29/24
|
788
|
USD
|
1,190,962
|
THB
|
40,850,000
|
JPMorgan Chase Bank, N.A.
|
2/29/24
|
(10,607)
|
USD
|
1,125,950
|
TRY
|
35,101,000
|
Goldman Sachs Bank USA
|
2/29/24
|
(2,688)
|
USD
|
1,379,108
|
ZAR
|
25,403,000
|
State Street Bank and Trust Co
|
2/29/24
|
(2,701)
|
ZAR
|
25,403,000
|
USD
|
1,338,615
|
Goldman Sachs Bank USA
|
2/29/24
|
43,194
|
TOTAL FORWARD FOREIGN CURRENCY CONTRACTS
|
694,088
|
|||||
Unrealized Appreciation
|
1,198,348
|
|||||
Unrealized Depreciation
|
(504,260)
|
|||||
BRL
|
-
|
Brazilian real
|
CLP
|
-
|
Chilean peso
|
CNY
|
-
|
Chinese yuan
|
COP
|
-
|
Colombian peso
|
CZK
|
-
|
Czech koruna
|
DOP
|
-
|
Dominican Republic peso
|
EGP
|
-
|
Egyptian pound
|
EUR
|
-
|
European Monetary Unit
|
HUF
|
-
|
Hungarian forint
|
IDR
|
-
|
Indonesian rupiah
|
INR
|
-
|
Indian rupee
|
KRW
|
-
|
Korean won
|
KZT
|
-
|
Kazakhstan tenge
|
MXN
|
-
|
Mexican peso
|
MYR
|
-
|
Malaysian ringgit
|
PEN
|
-
|
Peruvian new sol
|
PHP
|
-
|
Philippine peso
|
PLN
|
-
|
Polish zloty
|
RON
|
-
|
Romanian leu (new)
|
THB
|
-
|
Thai baht
|
TRY
|
-
|
Turkish Lira
|
USD
|
-
|
U.S. dollar
|
UYU
|
-
|
Uruguay peso
|
ZAR
|
-
|
South African rand
|
(a)
|
Amount is stated in United States dollars unless otherwise noted.
|
(b)
|
Security exempt from registration under Rule 144A of the Securities Act of 1933. These securities may be resold in transactions exempt from registration, normally to qualified institutional buyers. At the end of the period, the value of these securities amounted to $4,707,791 or 1.1% of net assets.
|
(c)
|
Affiliated fund that is generally available only to investment companies and other accounts managed by Fidelity Investments. The rate quoted is the annualized seven-day yield of the fund at period end. A complete unaudited listing of the fund's holdings as of its most recent quarter end is available upon request. In addition, each Fidelity Central Fund's financial statements, which are not covered by the Fund's Report of Independent Registered Public Accounting Firm, are available on the SEC's website or upon request.
|
Affiliate
|
Value,
beginning
of period ($)
|
Purchases ($)
|
Sales
Proceeds ($)
|
Dividend
Income ($)
|
Realized
Gain (loss) ($)
|
Change in
Unrealized
appreciation
(depreciation) ($)
|
Value,
end
of period ($)
|
% ownership,
end
of period
|
Fidelity Cash Central Fund 5.40%
|
52,392,505
|
223,193,175
|
224,223,337
|
2,349,680
|
-
|
-
|
51,362,343
|
0.1%
|
Total
|
52,392,505
|
223,193,175
|
224,223,337
|
2,349,680
|
-
|
-
|
51,362,343
|
|
Valuation Inputs at Reporting Date:
|
||||
Description
|
Total ($)
|
Level 1 ($)
|
Level 2 ($)
|
Level 3 ($)
|
Investments in Securities:
|
||||
U.S. Government and Government Agency Obligations
|
1,961,653
|
-
|
1,961,653
|
-
|
Foreign Government and Government Agency Obligations
|
354,005,120
|
-
|
354,005,120
|
-
|
Supranational Obligations
|
3,210,242
|
-
|
3,210,242
|
-
|
Money Market Funds
|
51,362,343
|
51,362,343
|
-
|
-
|
Total Investments in Securities:
|
410,539,358
|
51,362,343
|
359,177,015
|
-
|
Derivative Instruments:
Assets
|
||||
Forward Foreign Currency Contracts
|
1,198,348
|
-
|
1,198,348
|
-
|
Total Assets
|
1,198,348
|
-
|
1,198,348
|
-
|
Liabilities
|
||||
Forward Foreign Currency Contracts
|
(504,260)
|
-
|
(504,260)
|
-
|
Total Liabilities
|
(504,260)
|
-
|
(504,260)
|
-
|
Total Derivative Instruments:
|
694,088
|
-
|
694,088
|
-
|
Primary Risk Exposure / Derivative Type
|
Value
|
|
Asset ($)
|
Liability ($)
|
|
Foreign Exchange Risk
|
||
Forward Foreign Currency Contracts (a)
|
1,198,348
|
(504,260)
|
Total Foreign Exchange Risk
|
1,198,348
|
(504,260)
|
Total Value of Derivatives
|
1,198,348
|
(504,260)
|
Statement of Assets and Liabilities
|
||||
December 31, 2023
|
||||
Assets
|
||||
Investment in securities, at value - See accompanying schedule:
|
||||
Unaffiliated issuers (cost $355,679,904)
|
$
|
359,177,015
|
||
Fidelity Central Funds (cost $51,362,343)
|
51,362,343
|
|||
Total Investment in Securities (cost $407,042,247)
|
$
|
410,539,358
|
||
Foreign currency held at value (cost $1,845,984)
|
1,787,362
|
|||
Unrealized appreciation on forward foreign currency contracts
|
1,198,348
|
|||
Receivable for fund shares sold
|
331,916
|
|||
Dividends receivable
|
752
|
|||
Reclaims receivable
|
355,372
|
|||
Interest receivable
|
6,722,170
|
|||
Distributions receivable from Fidelity Central Funds
|
226,371
|
|||
Receivable from investment adviser for expense reductions
|
3,943
|
|||
Total assets
|
421,165,592
|
|||
Liabilities
|
||||
Unrealized depreciation on forward foreign currency contracts
|
$
|
504,260
|
||
Payable for fund shares redeemed
|
775,163
|
|||
Other payables and accrued expenses
|
28,053
|
|||
Total Liabilities
|
1,307,476
|
|||
Net Assets
|
$
|
419,858,116
|
||
Net Assets consist of:
|
||||
Paid in capital
|
$
|
459,018,910
|
||
Total accumulated earnings (loss)
|
(39,160,794)
|
|||
Net Assets
|
$
|
419,858,116
|
||
Net Asset Value, offering price and redemption price per share ($419,858,116 ÷ 44,812,897 shares)
|
$
|
9.37
|
||
Statement of Operations
|
||||
Year ended
December 31, 2023
|
||||
Investment Income
|
||||
Foreign Tax Reclaims
|
$
|
328,186
|
||
Interest
|
23,482,942
|
|||
Income from Fidelity Central Funds
|
2,349,680
|
|||
Income before foreign taxes withheld
|
$
|
26,160,808
|
||
Less foreign taxes withheld
|
(248,435)
|
|||
Total Income
|
25,912,373
|
|||
Expenses
|
||||
Custodian fees and expenses
|
$
|
69,029
|
||
Independent trustees' fees and expenses
|
2,447
|
|||
Total expenses before reductions
|
71,476
|
|||
Expense reductions
|
(65,358)
|
|||
Total expenses after reductions
|
6,118
|
|||
Net Investment income (loss)
|
25,906,255
|
|||
Realized and Unrealized Gain (Loss)
|
||||
Net realized gain (loss) on:
|
||||
Investment Securities:
|
||||
Unaffiliated issuers (net of foreign taxes of $42,080)
|
(13,873,910)
|
|||
Forward foreign currency contracts
|
2,405,711
|
|||
Foreign currency transactions
|
208,696
|
|||
Total net realized gain (loss)
|
(11,259,503)
|
|||
Change in net unrealized appreciation (depreciation) on:
|
||||
Investment Securities:
|
||||
Unaffiliated issuers
|
38,899,576
|
|||
Forward foreign currency contracts
|
(2,623,163)
|
|||
Assets and liabilities in foreign currencies
|
71,955
|
|||
Total change in net unrealized appreciation (depreciation)
|
36,348,368
|
|||
Net gain (loss)
|
25,088,865
|
|||
Net increase (decrease) in net assets resulting from operations
|
$
|
50,995,120
|
||
Statement of Changes in Net Assets
|
||||
Year ended
December 31, 2023
|
Year ended
December 31, 2022
|
|||
Increase (Decrease) in Net Assets
|
||||
Operations
|
||||
Net investment income (loss)
|
$
|
25,906,255
|
$
|
20,925,997
|
Net realized gain (loss)
|
(11,259,503)
|
(52,168,810)
|
||
Change in net unrealized appreciation (depreciation)
|
36,348,368
|
(6,006,477)
|
||
Net increase (decrease) in net assets resulting from operations
|
50,995,120
|
(37,249,290)
|
||
Distributions to shareholders
|
(20,583,115)
|
-
|
||
Share transactions
|
||||
Proceeds from sales of shares
|
37,776,245
|
38,013,375
|
||
Reinvestment of distributions
|
20,583,115
|
-
|
||
Cost of shares redeemed
|
(52,206,073)
|
(100,779,866)
|
||
Net increase (decrease) in net assets resulting from share transactions
|
6,153,287
|
(62,766,491)
|
||
Total increase (decrease) in net assets
|
36,565,292
|
(100,015,781)
|
||
Net Assets
|
||||
Beginning of period
|
383,292,824
|
483,308,605
|
||
End of period
|
$
|
419,858,116
|
$
|
383,292,824
|
Other Information
|
||||
Shares
|
||||
Sold
|
4,107,915
|
4,444,382
|
||
Issued in reinvestment of distributions
|
2,259,402
|
-
|
||
Redeemed
|
(5,684,286)
|
(11,553,598)
|
||
Net increase (decrease)
|
683,031
|
(7,109,216)
|
||
Fidelity® Series Emerging Markets Debt Local Currency Fund
|
Years ended December 31,
|
2023
|
2022
|
2021
|
2020 A
|
||||
Selected Per-Share Data
|
||||||||
Net asset value, beginning of period
|
$
|
8.69
|
$
|
9.43
|
$
|
10.81
|
$
|
10.00
|
Income from Investment Operations
|
||||||||
Net investment income (loss) B,C
|
.598
|
.445
|
.439
|
.067
|
||||
Net realized and unrealized gain (loss)
|
.564
|
(1.185)
|
(1.358)
|
.806
|
||||
Total from investment operations
|
1.162
|
(.740)
|
(.919)
|
.873
|
||||
Distributions from net investment income
|
(.482)
|
-
|
(.456)
|
(.063)
|
||||
Distributions from net realized gain
|
-
|
-
|
(.005)
|
-
|
||||
Total distributions
|
(.482)
|
-
|
(.461)
|
(.063)
|
||||
Net asset value, end of period
|
$
|
9.37
|
$
|
8.69
|
$
|
9.43
|
$
|
10.81
|
Total Return D,E
|
13.53%
|
(7.85)%
|
(8.56)%
|
8.74%
|
||||
Ratios to Average Net Assets C,F,G
|
||||||||
Expenses before reductions
|
.02%
|
.02%
|
.03%
|
.04% H
|
||||
Expenses net of fee waivers, if any I
|
-%
|
-%
|
-%
|
-% H
|
||||
Expenses net of all reductions I
|
-%
|
-%
|
-%
|
-% H
|
||||
Net investment income (loss)
|
6.51%
|
5.17%
|
4.31%
|
3.69% H
|
||||
Supplemental Data
|
||||||||
Net assets, end of period (000 omitted)
|
$
|
419,858
|
$
|
383,293
|
$
|
483,309
|
$
|
492,748
|
Portfolio turnover rate J
|
71%
|
53%
|
65%
|
17% K
|
Fidelity Central Fund
|
Investment Manager
|
Investment Objective
|
Investment Practices
|
Expense RatioA
|
Fidelity Money Market Central Funds
|
Fidelity Management & Research Company LLC (FMR)
|
Each fund seeks to obtain a high level of current income consistent with the preservation of capital and liquidity.
|
Short-term Investments
|
Less than .005%
|
Tax cost
|
Gross unrealized appreciation
|
Gross unrealized depreciation
|
Net unrealized appreciation (depreciation)
|
|
Fidelity Series Emerging Markets Debt Fund
|
$1,399,994,161
|
$40,971,692
|
$(178,881,369)
|
$(137,909,677)
|
Fidelity Series Emerging Markets Debt Local Currency Fund
|
408,574,302
|
12,179,973
|
(22,751,199)
|
(10,571,226)
|
Undistributed ordinary income
|
Capital loss carryforward
|
Net unrealized appreciation (depreciation) on securities and other investments
|
|
Fidelity Series Emerging Markets Debt Fund
|
$-
|
$(218,272,965)
|
$(137,902,915)
|
Fidelity Series Emerging Markets Debt Local Currency Fund
|
8,418,546
|
(37,087,243)
|
(10,492,096)
|
Short-term
|
Long-term
|
Total capital loss carryforward
|
||
Fidelity Series Emerging Markets Debt Fund
|
$(27,514,418)
|
$(190,758,547)
|
$(218,272,965)
|
|
Fidelity Series Emerging Markets Debt Local Currency Fund
|
(12,250,181)
|
(24,837,062)
|
(37,087,243)
|
|
December 31, 2023
|
|
Ordinary Income
|
|
Fidelity Series Emerging Markets Debt Fund
|
$75,296,697
|
Fidelity Series Emerging Markets Debt Local Currency Fund
|
20,583,115
|
December 31, 2022
|
|
Ordinary Income
|
|
Fidelity Series Emerging Markets Debt Fund
|
$66,732,572
|
Foreign Exchange Risk
|
Foreign exchange rate risk relates to fluctuations in the value of an asset or liability due to changes in currency exchange rates.
|
Interest Rate Risk
|
Interest rate risk relates to the fluctuations in the value of interest-bearing securities due to changes in the prevailing levels of market interest rates.
|
Purchases ($)
|
Sales ($)
|
|
Fidelity Series Emerging Markets Debt Fund
|
234,997,215
|
249,379,937
|
Fidelity Series Emerging Markets Debt Local Currency Fund
|
241,329,669
|
243,783,202
|
Amount ($)
|
|
Fidelity Series Emerging Markets Debt Local Currency Fund
|
3,255
|
Expense Limitations
|
Reimbursement
|
|
Fidelity Series Emerging Markets Debt Fund
|
.003%
|
$ 240,490
|
Fidelity Series Emerging Markets Debt Local Currency Fund
|
.003%
|
$ 57,094
|
Custodian credits
|
|
Fidelity Series Emerging Markets Debt Fund
|
$ 4,628
|
Fidelity Series Emerging Markets Debt Local Currency Fund
|
8,264
|
The Example is based on an investment of $1,000 invested at the beginning of the period and held for the entire period (July 1, 2023 to December 31, 2023).
|
Annualized Expense Ratio- A
|
Beginning Account Value July 1, 2023
|
Ending Account Value December 31, 2023
|
Expenses Paid During Period- C July 1, 2023 to December 31, 2023
|
|||||||
Fidelity® Series Emerging Markets Debt Fund
|
.01%
|
|||||||||
Actual
|
$ 1,000
|
$ 1,083.00
|
$ .05
|
|||||||
Hypothetical-B
|
$ 1,000
|
$ 1,025.16
|
$ .05
|
|||||||
Fidelity® Series Emerging Markets Debt Local Currency Fund
|
-%-D
|
|||||||||
Actual
|
$ 1,000
|
$ 1,049.50
|
$-E
|
|||||||
Hypothetical-B
|
$ 1,000
|
$ 1,025.21
|
$-E
|
|||||||
Fidelity Series Emerging Markets Debt Fund
|
2.55%
|
Fidelity Series Emerging Markets Debt Local Currency Fund
|
0.61%
|
Fidelity Series Emerging Markets Debt Fund
|
$75,052,906
|
Fidelity Series Emerging Markets Debt Local Currency Fund
|
$20,583,150
|
 |
Item 2.
Code of Ethics
As of the end of the period, December 31, 2023, Fidelity Hastings Street Trust (the trust) has adopted a code of ethics, as defined in Item 2 of Form N-CSR, that applies to its President and Treasurer and its Chief Financial Officer. A copy of the code of ethics is filed as an exhibit to this Form N-CSR.
Item 3.
Audit Committee Financial Expert
The Board of Trustees of the trust has determined that Donald F. Donahue is an audit committee financial expert, as defined in Item 3 of Form N-CSR. Mr. Donahue is independent for purposes of Item 3 of Form N-CSR.
Item 4.
Principal Accountant Fees and Services
Fees and Services
The following table presents fees billed by PricewaterhouseCoopers LLP (“PwC”) in each of the last two fiscal years for services rendered to Fidelity Series Emerging Markets Debt Fund and Fidelity Series Emerging Markets Debt Local Currency Fund (the “Funds”):
Services Billed by PwC
December 31, 2023 FeesA
| | Audit Fees | Audit-Related Fees | Tax Fees | All Other Fees |
| Fidelity Series Emerging Markets Debt Fund | $53,400 | $4,400 | $10,300 | $1,500 |
| Fidelity Series Emerging Markets Debt Local Currency Fund | $52,500 | $4,400 | $9,800 | $1,500 |
December 31, 2022 FeesA
| | Audit Fees | Audit-Related Fees | Tax Fees | All Other Fees |
| Fidelity Series Emerging Markets Debt Fund | $50,300 | $4,400 | $9,300 | $1,500 |
| Fidelity Series Emerging Markets Debt Local Currency Fund | $49,900 | $4,400 | $9,300 | $1,500 |
A Amounts may reflect rounding.
The following table(s) present(s) fees billed by PwC that were required to be approved by the Audit Committee for services that relate directly to the operations and financial reporting of the Fund(s) and that are rendered on behalf of Fidelity Management & Research Company LLC ("FMR") and entities controlling, controlled by, or under common control with FMR (not including any sub-adviser whose role is primarily portfolio management and is subcontracted with or overseen by another investment adviser) that provide ongoing services to the Fund(s) (“Fund Service Providers”):
Services Billed by PwC
| | December 31, 2023A | December 31, 2022A |
| Audit-Related Fees | $8,284,200 | $7,914,600 |
| Tax Fees | $1,000 | $1,000 |
| All Other Fees | $- | $- |
A Amounts may reflect rounding.
“Audit-Related Fees” represent fees billed for assurance and related services that are reasonably related to the performance of the fund audit or the review of the fund's financial statements and that are not reported under Audit Fees.
“Tax Fees” represent fees billed for tax compliance, tax advice or tax planning that relate directly to the operations and financial reporting of the fund.
“All Other Fees” represent fees billed for services provided to the fund or Fund Service Provider, a significant portion of which are assurance related, that relate directly to the operations and financial reporting of the fund, excluding those services that are reported under Audit Fees, Audit-Related Fees or Tax Fees.
Assurance services must be performed by an independent public accountant.
* * *
The aggregate non-audit fees billed by PwC for services rendered to the Fund(s), FMR (not including any sub-adviser whose role is primarily portfolio management and is subcontracted with or overseen by another investment adviser), and any Fund Service Provider for each of the last two fiscal years of the Fund(s) are as follows:
| Billed By | December 31, 2023A | December 31, 2022A |
| PwC | $13,619,700 | $12,913,400 |
A Amounts may reflect rounding.
The trust's Audit Committee has considered non-audit services that were not pre-approved that were provided by PwC to Fund Service Providers to be compatible with maintaining the independence of PwC in its(their) audit of the Fund(s), taking into account representations from PwC, in accordance with Public Company Accounting Oversight Board rules, regarding its independence from the Fund(s) and its(their) related entities and FMR’s review of the appropriateness and permissibility under applicable law of such non-audit services prior to their provision to the Fund(s) Service Providers.
Audit Committee Pre-Approval Policies and Procedures
The trust’s Audit Committee must pre-approve all audit and non-audit services provided by a fund’s independent registered public accounting firm relating to the operations or financial reporting of the fund. Prior to the commencement of any audit or non-audit services to a fund, the Audit Committee reviews the services to determine whether they are appropriate and permissible under applicable law.
The Audit Committee has adopted policies and procedures to, among other purposes, provide a framework for the Committee’s consideration of non-audit services by the audit firms that audit the Fidelity funds. The policies and procedures require that any non-audit service provided by a fund audit firm to a Fidelity fund and any non-audit service provided by a fund auditor to a Fund Service Provider that relates directly to the operations and financial reporting of a Fidelity fund (“Covered Service”) are subject to approval by the Audit Committee before such service is provided.
All Covered Services must be approved in advance of provision of the service either: (i) by formal resolution of the Audit Committee, or (ii) by oral or written approval of the service by the Chair of the Audit Committee (or if the Chair is unavailable, such other member of the Audit Committee as may be designated by the Chair to act in the Chair’s absence). The approval contemplated by (ii) above is permitted where the Treasurer determines that action on such an engagement is necessary before the next meeting of the Audit Committee.
Non-audit services provided by a fund audit firm to a Fund Service Provider that do not relate directly to the operations and financial reporting of a Fidelity fund are reported to the Audit Committee periodically.
Non-Audit Services Approved Pursuant to Rule 2-01(c)(7)(i)(C) and (ii) of Regulation S-X (“De Minimis Exception”)
There were no non-audit services approved or required to be approved by the Audit Committee pursuant to the De Minimis Exception during the Fund’s(s’) last two fiscal
years relating to services provided to (i) the Fund(s) or (ii) any Fund Service Provider that relate directly to the operations and financial reporting of the Fund(s).
The Registrant has not retained, for the preparation of the audit report on the financial statements included in the Form N-CSR, a registered public accounting firm that has a branch or office that is located in a foreign jurisdiction and that the Public Company Accounting Oversight Board (the “PCAOB”) has determined that the PCAOB is unable to inspect or investigate completely because of a position taken by an authority in the foreign jurisdiction.
The Registrant is not a “foreign issuer,” as defined in 17 CFR 240.3b-4.
Item 5.
Audit Committee of Listed Registrants
Not applicable.
Item 6.
Investments
(a)
Not applicable.
(b)
Not applicable.
Item 7.
Disclosure of Proxy Voting Policies and Procedures for Closed-End Management Investment Companies
Not applicable.
Item 8.
Portfolio Managers of Closed-End Management Investment Companies
Not applicable.
Item 9.
Purchase of Equity Securities by Closed-End Management Investment Company and Affiliated Purchasers
Not applicable.
Item 10.
Submission of Matters to a Vote of Security Holders
There were no material changes to the procedures by which shareholders may recommend nominees to the trust’s Board of Trustees.
Item 11.
Controls and Procedures
(a)(i) The President and Treasurer and the Chief Financial Officer have concluded that the trust’s disclosure controls and procedures (as defined in Rule 30a-3(c) under the Investment Company Act) provide reasonable assurances that material information
relating to the trust is made known to them by the appropriate persons, based on their evaluation of these controls and procedures as of a date within 90 days of the filing date of this report.
(a)(ii) There was no change in the trust’s internal control over financial reporting (as defined in Rule 30a-3(d) under the Investment Company Act) that occurred during the period covered by this report that has materially affected, or is reasonably likely to materially affect, the trust’s internal control over financial reporting.
Item 12.
Disclosure of Securities Lending Activities for Closed-End Management
Investment Companies
Not applicable.
Item 18.
Recovery of Erroneously Awarded Compensation
(a)
Not applicable.
(b)
Not applicable.
Item 19.
Exhibits
| (a) | (1) | Code of Ethics pursuant to Item 2 of Form N-CSR is filed and attached hereto as EX-99.CODE ETH. |
| (a) | (2) | |
| (a) | (3) | Not applicable. |
| (b) | |
SIGNATURES
Pursuant to the requirements of the Securities Exchange Act of 1934 and the Investment Company Act of 1940, the registrant has duly caused this report to be signed on its behalf by the undersigned, thereunto duly authorized.
Fidelity Hastings Street Trust
| By: | /s/Stacie M. Smith |
| | Stacie M. Smith |
| | President and Treasurer |
| | |
| Date: | February 22, 2024 |
Pursuant to the requirements of the Securities Exchange Act of 1934 and the Investment Company Act of 1940, this report has been signed below by the following persons on behalf of the registrant and in the capacities and on the dates indicated.
| By: | /s/Stacie M. Smith |
| | Stacie M. Smith |
| | President and Treasurer |
| | |
| Date: | February 22, 2024 |
| By: | /s/John J. Burke III |
| | John J. Burke III |
| | Chief Financial Officer |
| | |
| Date: | February 22, 2024 |
Exhibit EX-99.CERT
I, Stacie M. Smith, certify that:
1.
I have reviewed this report on Form N-CSR of Fidelity Hastings Street Trust;
2.
Based on my knowledge, this report does not contain any untrue statement of a material fact or omit to state a material fact necessary to make the statements made, in light of the circumstances under which such statements were made, not misleading with respect to the period covered by this report;
3.
Based on my knowledge, the financial statements, and other financial information included in this report, fairly present in all material respects the financial condition, results of operations, changes in net assets, and cash flows (if the financial statements are required to include a statement of cash flows) of the registrant as of, and for, the periods presented in this report;
4.
The registrant's other certifying officer(s) and I are responsible for establishing and maintaining disclosure controls and procedures (as defined in Rule 30a-3(c) under the Investment Company Act of 1940) and internal control over financial reporting (as defined in Rule 30a-3(d) under the Investment Company Act of 1940) for the registrant and have:
a.
Designed such disclosure controls and procedures, or caused such disclosure controls and procedures to be designed under our supervision, to ensure that material information relating to the registrant, including its consolidated subsidiaries, is made known to us by others within those entities, particularly during the period in which this report is being prepared;
b.
Designed such internal control over financial reporting, or caused such internal control over financial reporting to be designed under our supervision, to provide reasonable assurance regarding the reliability of financial reporting and the preparation of financial statements for external purposes in accordance with generally accepted accounting principles;
c.
Evaluated the effectiveness of the registrant's disclosure controls and procedures and presented in this report our conclusions about the effectiveness of the disclosure controls and procedures, as of a date within 90 days prior to the filing date of this report based upon such evaluation; and
d.
Disclosed in this report any change in the registrant’s internal control over financial reporting that occurred during the period covered by this report that has materially affected, or is reasonably likely to materially affect, the registrant’s internal control over financial reporting; and
5.
The registrant's other certifying officer(s) and I have disclosed to the registrant's auditors and the audit committee of the registrant's board of directors (or persons performing the equivalent functions):
a.
All significant deficiencies and material weaknesses in the design or operation of internal control over financial reporting which are reasonably likely to adversely affect the registrant's ability to record, process, summarize, and report financial information; and
b.
Any fraud, whether or not material, that involves management or other employees who have a significant role in the registrant's internal control over financial reporting.
Date:
February 22, 2024
/s/Stacie M. Smith |
Stacie M. Smith |
President and Treasurer |
I, John J. Burke III, certify that:
1.
I have reviewed this report on Form N-CSR of Fidelity Hastings Street Trust;
2.
Based on my knowledge, this report does not contain any untrue statement of a material fact or omit to state a material fact necessary to make the statements made, in light of the circumstances under which such statements were made, not misleading with respect to the period covered by this report;
3.
Based on my knowledge, the financial statements, and other financial information included in this report, fairly present in all material respects the financial condition, results of operations, changes in net assets, and cash flows (if the financial statements are required to include a statement of cash flows) of the registrant as of, and for, the periods presented in this report;
4.
The registrant's other certifying officer(s) and I are responsible for establishing and maintaining disclosure controls and procedures (as defined in Rule 30a-3(c) under the Investment Company Act of 1940) and internal control over financial reporting (as defined in Rule 30a-3(d) under the Investment Company Act of 1940) for the registrant and have:
a.
Designed such disclosure controls and procedures, or caused such disclosure controls and procedures to be designed under our supervision, to ensure that material information relating to the registrant, including its consolidated subsidiaries, is made known to us by others within those entities, particularly during the period in which this report is being prepared;
b.
Designed such internal control over financial reporting, or caused such internal control over financial reporting to be designed under our supervision, to provide reasonable assurance regarding the reliability of financial reporting and the preparation of financial statements for external purposes in accordance with generally accepted accounting principles;
c.
Evaluated the effectiveness of the registrant's disclosure controls and procedures and presented in this report our conclusions about the effectiveness of the disclosure controls and procedures, as of a date within 90 days prior to the filing date of this report based upon such evaluation; and
d.
Disclosed in this report any change in the registrant’s internal control over financial reporting that occurred during the period covered by this report that has materially affected, or is reasonably likely to materially affect, the registrant’s internal control over financial reporting; and
5.
The registrant's other certifying officer(s) and I have disclosed to the registrant's auditors and the audit committee of the registrant's board of directors (or persons performing the equivalent functions):
a.
All significant deficiencies and material weaknesses in the design or operation of internal control over financial reporting which are reasonably likely to adversely affect the registrant's ability to record, process, summarize, and report financial information; and
b.
Any fraud, whether or not material, that involves management or other employees who have a significant role in the registrant's internal control over financial reporting.
Date:
February 22, 2024
/s/John J. Burke III |
John J. Burke III |
Chief Financial Officer |
Exhibit EX-99.906CERT
Certification Pursuant to Section 906 of the Sarbanes-Oxley Act of 2002 (subsections (a) and (b) of section 1350, chapter 63 of title 18, United States Code)
In connection with the attached Report of Fidelity Hastings Street Trust (the “Trust”) on Form N-CSR to be filed with the Securities and Exchange Commission (the “Report”), each of the undersigned officers of the Trust does hereby certify that, to the best of such officer’s knowledge:
1.
The Report fully complies with the requirements of 13(a) or 15(d) of the Securities Exchange Act of 1934; and
2.
The information contained in the Report fairly presents, in all material respects, the financial condition and results of operations of the Trust as of, and for, the periods presented in the Report.
Dated: February 22, 2024
/s/Stacie M. Smith |
Stacie M. Smith |
President and Treasurer |
Dated: February 22, 2024
/s/John J. Burke III |
John J. Burke III |
Chief Financial Officer |
A signed original of this written statement required by Section 906, or other document authenticating, acknowledging, or otherwise adopting the signature that appears in typed form within the electronic version of this written statement required by Section 906, has been provided to the Trust and will be retained by the Trust and furnished to the Securities and Exchange Commission or its staff upon request.
Fidelity Investments
FIDELITY FUNDS’
CODE OF ETHICS
FOR PRESIDENT, TREASURER
AND PRINCIPAL ACCOUNTING OFFICER
2023
FIDELITY FUNDS’ CODE OF ETHICS FOR
PRESIDENT, TREASURER AND PRINCIPAL ACCOUNTING OFFICER
I. Purposes of the Code/Covered Officers
This document constitutes the Code of Ethics (Code) adopted by the Fidelity Funds (Funds) pursuant to Section 406 of the Sarbanes-Oxley Act of 2002. The Code applies to the Fidelity Funds’ President and Treasurer, and Chief Financial Officer (Covered Officers). Fidelity’s Ethics Office, within Enterprise Compliance, administers the Code.
The purposes of the Code are to deter wrongdoing and to promote, on the part of the Covered Officers:
·
honest and ethical conduct, including the ethical handling of actual or apparent conflicts of interest between personal and professional relationships;
·
full, fair, accurate, timely and understandable disclosure in reports and documents that the Fidelity Funds submit to the Securities and Exchange Commission (SEC), and in other public communications by a Fidelity Fund;
·
compliance with applicable laws and governmental rules and regulations;
·
the prompt internal reporting to an appropriate person or persons identified in the Code of violations of the Code; and
·
accountability for adherence to the Code.
Each Covered Officer should adhere to a high standard of business ethics and should be sensitive to situations that may give rise to actual as well as apparent conflicts of interest.
II.
Covered Officers Should Handle Ethically
Actual and Apparent Conflicts of Interest
Overview. A “conflict of interest” occurs when a Covered Officer’s private interest interferes with the interests of, or their service to, the Fidelity Funds. For example, a conflict of interest would arise if a Covered Officer, or a member of their family, receives improper personal benefits as a result of their position with the Fidelity Funds.
Certain conflicts of interest arise out of the relationships between Covered Officers and the Fidelity Funds and already are subject to conflict of interest provisions in the Investment Company Act of 1940 (Investment Company Act) and the Investment Advisers Act of 1940 (Investment Advisers Act). For example, Covered Officers may not individually engage in certain transactions (such as the purchase or sale of securities or other property) with a Fidelity Fund because of their status as “affiliated persons” of the Fund. Separate compliance programs and procedures of the Fidelity Funds, Fidelity Management & Research Company (FMR) and the other Fidelity companies are designed to prevent, or identify and correct, violations of these provisions. This Code does not, and is not intended to, repeat or replace these programs and procedures, and such conflicts fall outside of the parameters of this Code.
Although typically not presenting an opportunity for improper personal benefit, conflicts arise from, or as a result of, the contractual relationship between the Fidelity Funds and FMR (or another Fidelity company) of which the Covered Officers are also officers or employees. As a result, this Code recognizes that the Covered Officers will, in the normal course of their duties (whether formally for the Fidelity Funds, FMR or another Fidelity company), be involved in establishing policies and implementing decisions that have different effects on the Fidelity Funds, FMR and other Fidelity companies. The participation of the Covered Officers in such activities is inherent in the contractual relationship between the Fidelity Funds and FMR (or another Fidelity company) and is consistent with the performance by the Covered Officers of their duties as officers of the Fidelity Funds. Thus, if performed in conformity with the provisions of the Investment Company Act and the Investment Advisers Act, such activities will be deemed to have been handled ethically. In addition, it is recognized by the Funds’ Board of Trustees (Board) that the Covered Officers also may be officers or employees of one or more other Fidelity Funds covered by this Code.
Other conflicts of interest are covered by the Code, even if such conflicts of interest are not subject to provisions in the Investment Company Act and the Investment Advisers Act. The following list provides examples of conflicts of interest under the Code, but Covered Officers should keep in mind that these examples are not exhaustive. The overarching principle is that the personal interest of a Covered Officer should not be placed improperly before the interest of a Fidelity Fund.
* * *
Each Covered Officer must:
·
not use their personal influence or personal relationships improperly to influence investment decisions or financial reporting by any Fidelity Fund whereby the Covered Officer would benefit personally to the detriment of any Fidelity Fund;
·
not cause a Fidelity Fund to take action, or fail to take action, for the individual personal benefit of the Covered Officer rather than the benefit of the Fidelity Fund;
·
not engage in any outside business activity, including serving as a director or trustee, that prevents the Covered Officer from devoting appropriate time and attention to the Covered Officer’s responsibilities with the Fidelity Funds;
·
not have a consulting or employment relationship with any of the Fidelity Funds’ service providers that are not affiliated with Fidelity; and
·
not retaliate against any employee or Covered Officer for reports of actual or potential misconduct, which are made in good faith.
With respect to other fact patterns, if a Covered Officer is in doubt, other potential conflict of interest situations should be described immediately to the Fidelity Ethics Office for resolution. Similarly, any questions a Covered Officer has generally regarding the application or interpretation of the Code should be directed to the Fidelity Ethics Office immediately.
III. Disclosure and Compliance
·
Each Covered Officer should familiarize themself with the disclosure requirements generally applicable to the Fidelity Funds.
·
Each Covered Officer should not knowingly misrepresent, or cause others to misrepresent, facts about any Fidelity Fund to others, whether within or outside Fidelity, including to the Board and auditors, and to governmental regulators and self-regulatory organizations;
·
Each Covered Officer should, to the extent appropriate within their area of responsibility, consult with other officers and employees of the Fidelity Funds, FMR and the Fidelity service providers, and with the Board’s Compliance Committee, with the goal of promoting full, fair, accurate, timely and understandable disclosure in the reports and documents the Fidelity Funds file with, or submit to, the SEC and in other public communications made by the Fidelity Funds; and
·
It is the responsibility of each Covered Officer to promote compliance with the standards and restrictions imposed by applicable laws, rules and regulations.
IV. Reporting and Accountability
Each Covered Officer must:
·
upon receipt of the Code, and annually thereafter, submit to the Fidelity Ethics Office an acknowledgement stating that they have received, read, and understand the Code; and
·
notify the Fidelity Ethics Office promptly if they know of any violation of the Code. Failure to do so is itself a violation of this Code.
The Fidelity Ethics Office shall take all action it considers appropriate to investigate any actual or potential violations reported to it. Upon completion of the investigation, if necessary, the matter will be reviewed with senior management or other appropriate parties, and a determination will be made as to whether any action should be taken as detailed below. The Covered Officer will be informed of any action determined to be appropriate. The Fidelity Ethics Office will inform the Personal Trading Committee of all Code violations and actions taken in response. Without implied limitation, appropriate remedial, disciplinary or preventive action may include a written warning, a letter of censure, suspension, dismissal or, in the event of criminal or other serious violations of law, notification of the SEC or other appropriate law enforcement authorities. Additionally, other legal remedies may be pursued.
The policies and procedures described in the Code do not create any obligations to any person or entity other than the Fidelity Funds. The Code is intended solely for the internal use by the Fidelity Funds and does not constitute a promise, contract or an admission by or on behalf of any Fidelity Fund as to any fact, circumstance, or legal conclusion. The Fidelity Funds, the Fidelity companies and the Fidelity Head of Ethics retain the discretion to decide whether the Code applies to a specific situation, and how it should be interpreted.
V. Oversight
Material violations of this Code will be reported promptly by FMR (or another Fidelity company) to the Board’s Compliance Committee. In addition, at least once each year, FMR (or another Fidelity company) will provide a written report to the Board, which describes any issues arising under the Code since the last report to the Board, including, but not limited to, information about material violations of the Code and action taken in response to the material violations.
VI. Other Policies and Procedures
This Code shall be the sole code of ethics adopted by the Fidelity Funds for purposes of Section 406 of the Sarbanes-Oxley Act. Other Fidelity policies or procedures that cover the behavior or activities of Covered Officers are separate requirements applying to the Covered Officers (and others) and are not part of this Code.
VII. Amendments
Any material amendments or changes to this Code must be approved or ratified by a majority vote of the Board, including a majority of the Trustees who are not interested persons of the Fidelity Funds.
VIII. Records and Confidentiality
Records of any violation of the Code and of the actions taken as a result of such violations will be kept by the Fidelity Ethics Office. All reports and records prepared or maintained pursuant to this Code will be considered confidential and shall be maintained and protected accordingly. Except as otherwise required by law or this Code, such matters shall not be disclosed to anyone other than the Fidelity Ethics Office, the Personal Trading Committee, the Board, appropriate personnel at the relevant Fidelity company or companies and the legal counsel of any or all of the foregoing.
2023