
UNITED STATES
SECURITIES AND EXCHANGE COMMISSION
Washington, D.C. 20549
FORM N-CSR
CERTIFIED SHAREHOLDER REPORT OF REGISTERED
MANAGEMENT INVESTMENT COMPANIES
Investment Company Act file number 811-21864
WisdomTree Trust
(Exact name of registrant as specified in charter)
245 Park Avenue, 35th Floor
New York, NY 10167
(Address of principal executive offices) (Zip code)
The Corporation Trust Company
1209 Orange Street
Wilmington, DE 19801
(Name and address of agent for service)
Registrant’s telephone number, including area code: (866) 909-9473
Date of fiscal year end: March 31
Date of reporting period: March 31, 2019
Form N-CSR is to be used by management investment companies to file reports with the Commission not later than 10 days after the transmission to stockholders of any report that is required to be transmitted to stockholders under Rule 30e-1 under the Investment Company Act of 1940 (17 CFR 270.30e-1). The Commission may use the information provided on Form N-CSR in its regulatory, disclosure review, inspection, and policymaking roles.
A registrant is required to disclose the information specified by Form N-CSR, and the Commission will make this information public. A registrant is not required to respond to the collection of information contained in Form N-CSR unless the Form displays a currently valid Office of Management and Budget (“OMB”) control number. Please direct comments concerning the accuracy of the information collection burden estimate and any suggestions for reducing the burden to Secretary, Securities and Exchange Commission, 100 F Street, NE, Washington, DC 20549. The OMB has reviewed this collection of information under the clearance requirements of 44 U.S.C. § 3507.
Item 1. Reports to Stockholders.
The Reports to Shareholders are attached hereto.

WisdomTree Trust
Annual Report
March 31, 2019
WisdomTree Europe Quality Dividend Growth Fund (EUDG)
WisdomTree Europe SmallCap Dividend Fund (DFE)
WisdomTree International Dividend ex-Financials Fund (DOO)
WisdomTree International Equity Fund (DWM)
WisdomTree International High Dividend Fund (DTH)
WisdomTree International LargeCap Dividend Fund (DOL)
WisdomTree International MidCap Dividend Fund (DIM)
WisdomTree International Multifactor Fund (DWMF)
WisdomTree International Quality Dividend Growth Fund (IQDG)
WisdomTree International SmallCap Dividend Fund (DLS)
WisdomTree Japan SmallCap Dividend Fund (DFJ)
IMPORTANT NOTE: Beginning on January 1, 2021, as permitted by regulations adopted by the SEC, paper copies of the WisdomTree Funds’ annual and semi-annual shareholder reports will no longer be sent by mail, unless you specifically request paper copies of the reports. Instead, annual and semi-annual shareholder reports will be available on the WisdomTree Funds’ website (www.wisdomtree.com), and you will be notified by mail each time a report is posted and provided with a website link to access the report.
If you already elected to receive shareholder reports electronically, you will not be affected by this change and you need not take any action. You may elect to receive shareholder reports and other communications from a Fund electronically anytime by contacting your financial intermediary (such as a broker dealer or bank).
You may elect to receive all future reports in paper free of charge. Please contact your financial intermediary to request to continue receiving paper copies of your shareholder reports. Your election to receive reports in paper will apply to all funds held in your account.
| 1 | ||||
| Information about Performance and Shareholder Expense Examples (unaudited) |
2 | |||
| 3 | ||||
| 14 | ||||
| Schedules of Investments | ||||
| 16 | ||||
| 19 | ||||
| 24 | ||||
| 26 | ||||
| 35 | ||||
| 41 | ||||
| 45 | ||||
| 52 | ||||
| 56 | ||||
| 60 | ||||
| 70 | ||||
| 80 | ||||
| 83 | ||||
| 86 | ||||
| 90 | ||||
| 96 | ||||
| 112 | ||||
| 114 | ||||
| 116 | ||||
| 117 | ||||
“WisdomTree” is a registered mark of WisdomTree Investments, Inc. and is licensed for use by the WisdomTree Trust.
(unaudited)
International equity markets, as measure by the MSCI EAFE Index, a broad measure of equity performance for the developed world outside the U.S. and Canada, returned -3.71% in the 12-month period ended March 31, 2019, which underperformed the S&P 500 Index by 13.21%. Measured in local currency, the MSCI EAFE Index returned +2.83% over the period, lagging the return of the S&P 500 Index by 6.67%. It is important to note that when foreign currencies weaken or strengthen relative to the U.S. dollar, there is also an impact on the returns experienced by U.S. investors who invest overseas. Over the period, the U.S. dollar experienced significant appreciation (i.e. strengthened) against most major currencies. In particular, the British pound, Japanese yen, and the Euro (which account for about 75% of the MSCI EAFE Index’s currency exposure) all experienced negative spot returns over the period against the U.S. dollar.
International equity markets experienced a market correction (in both local and U.S. dollar terms) in the fourth quarter of 2018, followed by a relief rally in the first quarter of 2019. Weak equity performance through the fourth quarter of 2018 in mainland Europe (“Eurozone”) was primarily driven by softening economic data, declining economic sentiment, and mounting fears of recession. The Eurozone saw three consecutive quarters of declining gross domestic product (“GDP”) growth in the last nine months of 2018. Importantly, major Eurozone economies, including Germany and France, were a significant drag on Eurozone growth during this time period. German and French GDP both grew 1.5% in 2018. This marked the slowest annual GDP growth rate for Germany since 2013. Meanwhile, export-oriented economies, including Germany, were negatively impacted by the U.S.-China trade dispute. German manufacturing activity exhibited signs of a slowdown, particularly in the automobile manufacturing sector, which led the nation’s Purchasing Managers’ Index to slip into contractionary territory in January 2019.
Political fragmentation and uncertainty also negatively impacted the Eurozone during this time period. The new populist governing body in Italy failed to defuse fears about the country’s budget deficit and slowing economic growth. Meanwhile, protests and demand for political reform in France provided evidence of political and economic divide. Most notably, a lack of resolution on the ultimate outcome and timing of the United Kingdom’s departure from the European Union (known as “BREXIT”) was a hindrance for the Eurozone during this time period. Following several months of negotiations with European Union counterparts, the draft BREXIT deal released by British Prime Minister Theresa May was met with substantial criticism from British Parliament and from within her own party. May’s exit deal was met with such resistance that she narrowly won a no confidence vote in her leadership from within her Conservative party. Multiple variations of a BREXIT resolution were ultimately rejected, including an exit plan negotiated with the European Union, a referendum to revoke BREXIT entirely, and an election to break away from the European Union without a deal altogether. During this time period of political uncertainty, the United Kingdom economy expanded 1.4%, marking the weakest economic growth for the nation in six years.
European equities rebounded alongside global equities, despite reductions in Eurozone economic growth forecasts and ongoing concerns about the political and financial strength of the European Union. During this time period the European Central Bank announced the end of its quantitative easing program. Measures taken by the European Central Bank to stimulate private sector bank lending and more positive news flow on the U.S.-China trade and economic growth helped fuel the rebound in European equities in the first quarter of 2019.
Japan experienced moderating economic growth during this time period, including a sharp decline in Q3 2018 GDP driven by natural disasters followed by a recovery in Q4 2018. Japanese export growth also declined over the period due to weak demand from China as well as the U.S.-China trade dispute. The ultra-accommodative monetary policy maintained by the Bank of Japan, including a near zero 10-year yield, did not spur price inflation during the period. Japanese equities recovered in Q1 2019 alongside global equities, driven by more constructive sentiment around global trade. Despite the equity rally in Q1 2019, Japan’s economic data continued to be negatively impacted by subdued global demand, as evidenced by a contraction in the nation’s manufacturing data and a steep decline in exports.
| WisdomTree Trust | 1 |
Information about Performance and Shareholder Expense Examples (unaudited)
Performance
The performance tables on the following pages are provided for comparative purposes and represent the period noted. Each Fund’s per share NAV is the value of one share of the Fund and is calculated by dividing the value of total assets less total liabilities by the number of shares outstanding. The NAV return is based on the NAV of the Fund and the market price return is based on the market price per share of the Fund. The price used to calculate market price returns is the midpoint of the bid and ask price for Fund shares as of the close of trading on the exchange where Fund shares are listed. NAV and market price returns assume that dividends and capital gain distributions have been reinvested in the Fund at NAV and market price, respectively. As with other ETFs, NAV returns and market price returns may differ because of factors such as the supply and demand for Fund shares and investors’ assessments of the underlying value of a Fund’s portfolio securities.
Fund shares are bought and sold at market price (not NAV) and are not individually redeemed from a Fund. Fund NAV returns are calculated using a Fund’s daily 4:00 p.m. eastern time NAV. Market price returns reflect the midpoint of the bid and ask price as of the close of trading on the exchange where Fund shares are listed. Market price returns do not represent the returns you would receive if you traded shares at other times. The returns do not reflect the deduction of taxes that a shareholder would pay on Fund distributions or on the redemption of Fund shares. Total returns for a period of less than one year are cumulative.
Performance is historical and does not guarantee future results. Current performance may be lower or higher than quoted. Investment returns and the principal value of an investment will fluctuate so that an investor’s shares, when redeemed, may be worth more or less than their original cost.
An index is a statistical measure of a specified financial market or sector. An index does not actually hold a portfolio of securities, incur expenses or pay any transaction costs. Therefore, index returns do not reflect deductions for fees or expenses and an index is not available for direct investment. In comparison, the Funds’ performance is negatively impacted by these deductions. Fund returns do not reflect brokerage commissions or taxes on transactions in Fund shares or taxes that a shareholder would pay on Fund distributions. Past performance is no guarantee of future results. For the most recent month-end performance information visit www.wisdomtree.com.
Shareholder Expense Examples
Each Fund’s performance table is accompanied by a shareholder expense example. As a shareholder of a WisdomTree Fund, you incur two types of cost: (1) transaction costs, including brokerage commissions on purchases and sales of your Fund shares and (2) ongoing costs, including management fees and other Fund expenses. The examples are intended to help you understand your ongoing costs (in dollars and cents) of investing in a Fund and to compare these costs with the ongoing costs of investing in other funds.
The examples are based on an investment of $1,000 invested at the beginning of the period and held for the entire period from October 1, 2018 to March 31, 2019. Except where noted, expenses are calculated using each Fund’s annualized expense ratio (after the effect of contractual or voluntary fee waivers, if any), multiplied by the average account value for the period, multiplied by 182/365 (to reflect the one-half year period). The annualized expense ratio does not include acquired fund fees and expenses (“AFFEs”), which are fees and expenses incurred indirectly by a Fund through its investments in certain underlying investment companies.
Actual expenses
The first line in the shareholder expense example table shown on the following pages provides information about actual account values and actual expenses. You may use the information in this line, together with the amount you invested, to estimate the expenses that you paid over the period. Simply divide your account value by $1,000 (for example, an $8,600 account value divided by $1,000 = 8.6), then multiply the result by the number in the first line for your Fund under the heading entitled “Expenses Paid During the Period” to estimate the expenses you paid on your account during the period.
Hypothetical example for comparison purposes
The second line in the shareholder expense example table shown on the following pages provides information about hypothetical account values and hypothetical expenses based on the Fund’s actual expense ratio and an assumed rate of return of 5% per year before expenses, which is not the Fund’s actual return. The hypothetical account values and expenses may not be used to estimate the actual ending account balance or expenses you paid for the period. You may use this information to compare the ongoing costs of investing in your Fund and other funds. To do so, compare this 5% hypothetical example with the 5% hypothetical examples that appear in the shareholder reports of the other funds.
Please note that the expenses shown in the table are meant to highlight your ongoing costs only and do not reflect any transactional costs, such as brokerage commissions paid on purchases and sales of Fund shares. Therefore, the second line in the table is useful in comparing ongoing Fund costs only and will not help you determine the relative total costs of owning different funds. In addition, if these transactional costs were included, your costs would have been higher.
| 2 | WisdomTree Trust |
Management’s Discussion of Funds’ Performance
as of March 31, 2019 (unaudited)
WisdomTree Europe Quality Dividend Growth Fund (EUDG)
Sector Breakdown†
| Sector | % of Net Assets | |||
| Consumer Staples |
20.9% | |||
| Industrials |
19.8% | |||
| Health Care |
18.4% | |||
| Consumer Discretionary |
17.1% | |||
| Materials |
6.8% | |||
| Information Technology |
4.5% | |||
| Communication Services |
4.2% | |||
| Utilities |
3.0% | |||
| Financials |
2.7% | |||
| Energy |
1.1% | |||
| Real Estate |
0.9% | |||
| Other Assets less Liabilities‡ |
0.6% | |||
| Total |
100.0% | |||
| † | The Fund’s sector breakdown is expressed as a percentage of net assets and may change over time. In addition, a sector may be comprised of several industries. It does not include derivatives (if any). |
| ‡ | Other assets includes investment of cash collateral for securities on loan (if any). |
Top Ten Holdings*
| Description | % of Net Assets | |||
| Roche Holding AG, Genusschein |
7.7% | |||
| Unilever N.V., CVA |
4.8% | |||
| Novo Nordisk A/S, Class B |
4.6% | |||
| British American Tobacco PLC |
4.2% | |||
| LVMH Moet Hennessy Louis Vuitton SE |
3.8% | |||
| Diageo PLC |
3.4% | |||
| Unilever PLC |
3.1% | |||
| Industria de Diseno Textil S.A. |
2.6% | |||
| Airbus SE |
2.2% | |||
| Reckitt Benckiser Group PLC |
2.2% | |||
| * | The ten largest holdings are subject to change, and there are no guarantees the Fund will remain invested in any particular company. Excludes derivatives and investment of cash collateral for securities on loan (if any). |
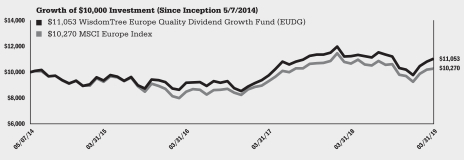
The WisdomTree Europe Quality Dividend Growth Fund (the “Fund”) seeks to track the price and yield performance, before fees and expenses, of the WisdomTree Europe Quality Dividend Growth Index (the “Index”). In seeking to track the Index, the Fund invests in dividend-paying companies with growth characteristics in the European equity market. The Fund generally uses a representative sampling strategy to achieve its investment objective, meaning it generally will invest in a sample of securities in the Index.
The Fund returned -1.62% at net asset value (“NAV”) for the fiscal year ending March 31, 2019 (for more complete performance information please see the table below). The Fund’s sector position in Financials contributed most positively to performance, while its position in Materials contributed least positively to performance. The Fund’s country position in France contributed most positively to performance, while its position in the United Kingdom contributed least positively to performance. The U.S. dollar rallied by 8.73% against the euro during the fiscal year which served as a headwind for European equities. However, the Fund’s significant overweight to higher quality companies proved to be a source of outperformance when compared to companies with low quality (based on return on equity). Much of this quality outperformance came from the broad market correction in the fourth quarter of 2018 which was catalyzed by trade war apprehensions, ongoing BREXIT negotiations, and economic slowdown in the region. However, during the first quarter of 2019, there has been a strong rebound as markets began to stabilize.
Shareholder Expense Example
| Beginning Account Value |
Ending Account Value |
Annualized Expense Ratio |
Expenses Paid During the Period |
|||||||||||||
| Actual |
$ | 1,000.00 | $ | 984.50 | 0.58 | % | $ | 2.87 | ||||||||
| Hypothetical (5% return before expenses) |
$ | 1,000.00 | $ | 1,022.04 | 0.58 | % | $ | 2.92 | ||||||||
Performance
| Average Annual Total Return | ||||||||||||
| 1 Year | 3 Year | Since Inception1 | ||||||||||
| Fund NAV Returns |
-1.62 | % | 6.33 | % | 2.06 | % | ||||||
| Fund Market Price Returns |
-2.32 | % | 6.46 | % | 1.94 | % | ||||||
| WisdomTree Europe Quality Dividend Growth Index |
-1.00 | % | 6.85 | % | 2.58 | % | ||||||
| MSCI Europe Index |
-3.72 | % | 6.56 | % | 0.54 | % | ||||||
| 1 | Total returns are calculated based on the commencement of Fund trading on the NYSE Arca, Inc. on May 7, 2014. |
Performance is historical and does not guarantee future results. The returns do not reflect the deduction of taxes that a shareholder would pay on Fund distributions or on the redemption of Fund shares.
| WisdomTree Trust | 3 |
Management’s Discussion of Funds’ Performance
as of March 31, 2019 (unaudited)
WisdomTree Europe SmallCap Dividend Fund (DFE)
Sector Breakdown†
| Sector | % of Net Assets | |||
| Industrials |
24.9% | |||
| Consumer Discretionary |
17.6% | |||
| Financials |
13.9% | |||
| Consumer Staples |
8.3% | |||
| Real Estate |
7.4% | |||
| Information Technology |
6.5% | |||
| Materials |
5.5% | |||
| Communication Services |
5.1% | |||
| Energy |
4.2% | |||
| Utilities |
2.9% | |||
| Health Care |
2.6% | |||
| Investment Company |
0.5% | |||
| Other Assets less Liabilities‡ |
0.6% | |||
| Total |
100.0% | |||
| † | The Fund’s sector breakdown is expressed as a percentage of net assets and may change over time. In addition, a sector may be comprised of several industries. It does not include derivatives (if any). |
| ‡ | Other assets includes investment of cash collateral for securities on loan (if any). |
Top Ten Holdings*
| Description | % of Net Assets | |||
| Gaztransport Et Technigaz S.A. |
1.3% | |||
| BE Semiconductor Industries N.V. |
1.3% | |||
| REN — Redes Energeticas Nacionais, SGPS, S.A. |
1.0% | |||
| Enav SpA |
1.0% | |||
| Peab AB |
1.0% | |||
| AURELIUS Equity Opportunities SE & Co. KGaA |
0.9% | |||
| alstria office REIT-AG |
0.9% | |||
| Saras SpA |
0.8% | |||
| Tieto Oyj |
0.8% | |||
| Inmarsat PLC |
0.8% | |||
| * | The ten largest holdings are subject to change, and there are no guarantees the Fund will remain invested in any particular company. Excludes derivatives and investment of cash collateral for securities on loan (if any). |
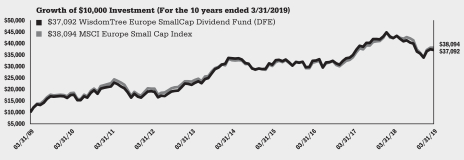
The WisdomTree Europe SmallCap Dividend Fund (the “Fund”) seeks to track the price and yield performance, before fees and expenses, of the WisdomTree Europe SmallCap Dividend Index (the “Index”). In seeking to track the Index, the Fund invests in dividend-paying small-cap companies in the European equity market. The Fund generally uses a representative sampling strategy to achieve its investment objective, meaning it generally will invest in a sample of securities in the Index.
The Fund returned -12.19% at net asset value (“NAV”) for the fiscal year ending March 31, 2019 (for more complete performance information please see the table below). The Fund’s sector position in Materials contributed most positively to performance, while its position in Consumer Staples contributed least positively to performance. The U.S. dollar rallied by 8.73% against the euro during the fiscal year which served as a headwind for European equities. The Fund’s country position in Norway contributed most positively to performance, while its position in Switzerland contributed least positively to performance. Additionally, small-cap companies faced additional pressures during the fiscal period when compared to their larger peers, particularly as the broad market correction was catalyzed by trade war apprehensions, ongoing BREXIT negotiations, and economic slowdown in the region. However, during the first quarter of 2019, there has been a strong rebound as markets began to stabilize.
Shareholder Expense Example
| Beginning Account Value |
Ending Account Value |
Annualized Net Expense Ratio |
Expenses Paid During the Period |
|||||||||||||
| Actual |
$ | 1,000.00 | $ | 929.00 | 0.58 | % | $ | 2.79 | ||||||||
| Hypothetical (5% return before expenses) |
$ | 1,000.00 | $ | 1,022.04 | 0.58 | % | $ | 2.92 | ||||||||
Performance
| Average Annual Total Return | ||||||||||||||||
| 1 Year | 3 Year | 5 Year | 10 Year | |||||||||||||
| Fund NAV Returns |
-12.19 | % | 4.66 | % | 2.05 | % | 14.01 | % | ||||||||
| Fund Market Price Returns |
-12.76 | % | 4.74 | % | 2.00 | % | 14.00 | % | ||||||||
| WisdomTree Europe SmallCap Dividend Index |
-12.08 | % | 5.00 | % | 2.73 | % | 14.74 | % | ||||||||
| MSCI Europe Small Cap Index |
-9.85 | % | 6.43 | % | 3.09 | % | 14.31 | % | ||||||||
Performance is historical and does not guarantee future results. The returns do not reflect the deduction of taxes that a shareholder would pay on Fund distributions or on the redemption of Fund shares.
| 4 | WisdomTree Trust |
Management’s Discussion of Funds’ Performance
as of March 31, 2019 (unaudited)
WisdomTree International Dividend ex-Financials Fund (DOO)
Sector Breakdown†
| Sector | % of Net Assets | |||
| Communication Services |
16.9% | |||
| Utilities |
14.6% | |||
| Energy |
12.1% | |||
| Materials |
11.1% | |||
| Consumer Discretionary |
10.9% | |||
| Health Care |
10.2% | |||
| Consumer Staples |
9.8% | |||
| Industrials |
8.6% | |||
| Information Technology |
4.9% | |||
| Other Assets less Liabilities‡ |
0.9% | |||
| Total |
100.0% | |||
| † | The Fund’s sector breakdown is expressed as a percentage of net assets and may change over time. In addition, a sector may be comprised of several industries. It does not include derivatives (if any). |
| ‡ | Other assets includes investment of cash collateral for securities on loan (if any). |
Top Ten Holdings*
| Description | % of Net Assets | |||
| Telstra Corp., Ltd. |
2.4% | |||
| Hennes & Mauritz AB, Class B |
2.2% | |||
| Endesa S.A. |
2.1% | |||
| BT Group PLC |
2.1% | |||
| Snam SpA |
2.0% | |||
| Imperial Brands PLC |
1.7% | |||
| Iberdrola S.A. |
1.6% | |||
| SSE PLC |
1.5% | |||
| National Grid PLC |
1.5% | |||
| Swisscom AG, Registered Shares |
1.5% | |||
| * | The ten largest holdings are subject to change, and there are no guarantees the Fund will remain invested in any particular company. Excludes derivatives and investment of cash collateral for securities on loan (if any). |
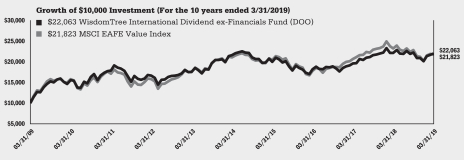
The WisdomTree International Dividend ex-Financials Fund (the “Fund”) seeks to track the price and yield performance, before fees and expenses, of the WisdomTree International Dividend ex-Financials Index (the “Index”). In seeking to track the Index, the Fund invests in high-dividend-yielding companies in the developed world excluding the U.S. and Canada and excluding the financial sector. The Fund generally uses a representative sampling strategy to achieve its investment objective, meaning it generally will invest in a sample of securities in the Index.
The Fund returned -0.49% at net asset value (“NAV”) for the fiscal year ending March 31, 2019 (for more complete performance information please see the table below). The Fund’s sector position in Industrials contributed most positively to performance, while its position in Communication Services contributed least positively to performance. In addition, by the nature of the Fund’s methodology of excluding Financial sector stocks from its portfolio, the Fund avoided the worst performing sector in the market over the fiscal year (-13.22%). The Fund’s country position in Spain contributed most positively to performance, while its position in France contributed least positively to performance. The U.S. dollar rallied over the fiscal year which served as a headwind for international equities. The Fund’s overweight to large-cap equities provided more downside protection than mid- or small-cap peers during the fourth quarter of 2018, where a broad market correction catalyzed by trade war apprehension with China and fears of a U.S. Federal Reserve policy misstep sent global markets sharply downward.
Shareholder Expense Example
| Beginning Account Value |
Ending Account Value |
Annualized Net Expense Ratio |
Expenses Paid During the Period |
|||||||||||||
| Actual |
$ | 1,000.00 | $ | 992.40 | 0.58 | % | $ | 2.88 | ||||||||
| Hypothetical (5% return before expenses) |
$ | 1,000.00 | $ | 1,022.04 | 0.58 | % | $ | 2.92 | ||||||||
Performance
| Average Annual Total Return | ||||||||||||||||
| 1 Year | 3 Year | 5 Year | 10 Year | |||||||||||||
| Fund NAV Returns |
-0.49 | % | 6.49 | % | 0.39 | % | 8.23 | % | ||||||||
| Fund Market Price Returns |
-0.82 | % | 6.66 | % | 0.42 | % | 8.25 | % | ||||||||
| WisdomTree International Dividend Top 100/International Dividend ex-Financials Spliced Index1 |
-0.12 | % | 6.82 | % | 0.71 | % | 8.40 | % | ||||||||
| MSCI EAFE Value Index |
-6.13 | % | 6.90 | % | 0.67 | % | 8.12 | % | ||||||||
| 1 | WisdomTree International Dividend Top 100 Index prior to May 7, 2009; WisdomTree International Dividend ex-Financials Index thereafter. |
Performance is historical and does not guarantee future results. The returns do not reflect the deduction of taxes that a shareholder would pay on Fund distributions or on the redemption of Fund shares.
| WisdomTree Trust | 5 |
Management’s Discussion of Funds’ Performance
as of March 31, 2019 (unaudited)
WisdomTree International Equity Fund (DWM)
Sector Breakdown†
| Sector | % of Net Assets | |||
| Financials |
21.2% | |||
| Industrials |
11.8% | |||
| Consumer Staples |
10.6% | |||
| Consumer Discretionary |
10.2% | |||
| Communication Services |
9.1% | |||
| Health Care |
9.1% | |||
| Energy |
8.1% | |||
| Materials |
7.0% | |||
| Utilities |
5.8% | |||
| Information Technology |
3.3% | |||
| Real Estate |
3.0% | |||
| Investment Company |
0.0% | * | ||
| Other Assets less Liabilities‡ |
0.8% | |||
| Total |
100.0% | |||
| † | The Fund’s sector breakdown is expressed as a percentage of net assets and may change over time. In addition, a sector may be comprised of several industries. It does not include derivatives (if any). |
| ‡ | Other assets includes investment of cash collateral for securities on loan (if any). |
| * | Represents less than 0.1%. |
Top Ten Holdings*
| Description | % of Net Assets | |||
| Novartis AG, Registered Shares |
1.6% | |||
| China Mobile Ltd. |
1.6% | |||
| Nestle S.A., Registered Shares |
1.6% | |||
| Roche Holding AG, Genusschein |
1.4% | |||
| BP PLC |
1.4% | |||
| HSBC Holdings PLC |
1.3% | |||
| Royal Dutch Shell PLC, Class A |
1.3% | |||
| Royal Dutch Shell PLC, Class B |
1.2% | |||
| TOTAL S.A. |
1.1% | |||
| Anheuser-Busch InBev S.A./N.V. |
1.0% | |||
| * | The ten largest holdings are subject to change, and there are no guarantees the Fund will remain invested in any particular company. Excludes derivatives and investment of cash collateral for securities on loan (if any). |
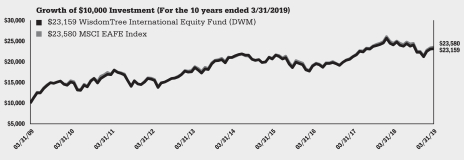
The WisdomTree International Equity Fund (the “Fund”) seeks to track the price and yield performance, before fees and expenses, of the WisdomTree International Equity Index (the “Index”). In seeking to track the Index, the Fund invests in dividend-paying companies in the developed world excluding the U.S. and Canada. The Fund generally uses a representative sampling strategy to achieve its investment objective, meaning it generally will invest in a sample of securities in the Index.
The Fund returned -3.89% at net asset value (“NAV”) for the fiscal year ending March 31, 2019 (for more complete performance information please see the table below). The Fund’s sector position in Energy contributed most positively to performance, while its position in Industrials contributed least positively to performance. The Fund’s country position in Hong Kong contributed most positively to performance, while its position in Japan contributed least positively to performance. The U.S. dollar rallied over the fiscal year which served as a headwind for international equities. The Fund’s overweight to large-cap equities, combined with underweights to both mid-cap and small-cap equities, provided a bit of downside protection during the fourth quarter of 2018, where a broad market correction catalyzed by trade war apprehension with China and fears of a U.S. Federal Reserve policy misstep sent global markets sharply downward.
Shareholder Expense Example
| Beginning Account Value |
Ending Account Value |
Annualized Net Expense Ratio |
Expenses Paid During the Period |
|||||||||||||
| Actual |
$ | 1,000.00 | $ | 961.20 | 0.48 | % | $ | 2.35 | ||||||||
| Hypothetical (5% return before expenses) |
$ | 1,000.00 | $ | 1,022.54 | 0.48 | % | $ | 2.42 | ||||||||
Performance
| Average Annual Total Return | ||||||||||||||||
| 1 Year | 3 Year | 5 Year | 10 Year | |||||||||||||
| Fund NAV Returns |
-3.89 | % | 6.86 | % | 1.93 | % | 8.76 | % | ||||||||
| Fund Market Price Returns |
-4.15 | % | 7.01 | % | 1.89 | % | 8.77 | % | ||||||||
| WisdomTree International Equity Index |
-3.83 | % | 7.18 | % | 2.15 | % | 8.99 | % | ||||||||
| MSCI EAFE Index |
-3.71 | % | 7.27 | % | 2.33 | % | 8.96 | % | ||||||||
Performance is historical and does not guarantee future results. The returns do not reflect the deduction of taxes that a shareholder would pay on Fund distributions or on the redemption of Fund shares.
| 6 | WisdomTree Trust |
Management’s Discussion of Funds’ Performance
as of March 31, 2019 (unaudited)
WisdomTree International High Dividend Fund (DTH)
Sector Breakdown†
| Sector | % of Net Assets | |||
| Financials |
21.3% | |||
| Communication Services |
12.0% | |||
| Energy |
10.6% | |||
| Health Care |
9.7% | |||
| Consumer Staples |
9.5% | |||
| Consumer Discretionary |
8.4% | |||
| Utilities |
8.2% | |||
| Industrials |
8.1% | |||
| Materials |
7.3% | |||
| Real Estate |
2.5% | |||
| Information Technology |
1.5% | |||
| Investment Company |
0.0% | * | ||
| Other Assets less Liabilities‡ |
0.9% | |||
| Total |
100.0% | |||
| † | The Fund’s sector breakdown is expressed as a percentage of net assets and may change over time. In addition, a sector may be comprised of several industries. It does not include derivatives (if any). |
| ‡ | Other assets includes investment of cash collateral for securities on loan (if any). |
| * | Represents less than 0.1%. |
Top Ten Holdings*
| Description | % of Net Assets | |||
| Novartis AG, Registered Shares |
2.7% | |||
| China Mobile Ltd. |
2.7% | |||
| Nestle S.A., Registered Shares |
2.7% | |||
| BP PLC |
2.3% | |||
| Royal Dutch Shell PLC, Class A |
2.2% | |||
| Roche Holding AG, Genusschein |
2.2% | |||
| TOTAL S.A. |
1.9% | |||
| Anheuser-Busch InBev S.A./N.V. |
1.7% | |||
| GlaxoSmithKline PLC |
1.6% | |||
| HSBC Holdings PLC |
1.6% | |||
| * | The ten largest holdings are subject to change, and there are no guarantees the Fund will remain invested in any particular company. Excludes derivatives and investment of cash collateral for securities on loan (if any). |
The WisdomTree International High Dividend Fund (the “Fund”) seeks to track the price and yield performance, before fees and expenses, of the WisdomTree International High Dividend Index (the “Index”). In seeking to track the Index, the Fund invests in high-dividend-yielding companies in the developed world excluding the U.S. and Canada. The Fund generally uses a representative sampling strategy to achieve its investment objective, meaning it generally will invest in a sample of securities in the Index.
The Fund returned -2.53% at net asset value (“NAV”) for the fiscal year ending March 31, 2019 (for more complete performance information please see the table below). The Fund’s sector position in Energy contributed most positively to performance, while its position in Consumer Staples contributed least positively to performance. The Fund’s country position in Hong Kong contributed most positively to performance, while its position in France contributed least positively to performance. The U.S. dollar rallied over the fiscal year which served as a headwind for international equities. However, being overweight to the higher dividend yielding companies provided significant outperformance over the lower/non dividend paying companies. The Fund’s significant weights to large-cap and mid-cap equities proved to provide outperformance relative to small-cap equities. The market and the Fund both underperformed during the fourth quarter of 2018, where a broad market correction catalyzed by trade war apprehension with China and fears of a U.S. Federal Reserve policy misstep sent global markets sharply downward.
Shareholder Expense Example
| Beginning Account Value |
Ending Account Value |
Annualized Net Expense Ratio |
Expenses Paid During the Period |
|||||||||||||
| Actual |
$ | 1,000.00 | $ | 976.40 | 0.58 | % | $ | 2.86 | ||||||||
| Hypothetical (5% return before expenses) |
$ | 1,000.00 | $ | 1,022.04 | 0.58 | % | $ | 2.92 | ||||||||
Performance
| Average Annual Total Return | ||||||||||||||||
| 1 Year | 3 Year | 5 Year | 10 Year | |||||||||||||
| Fund NAV Returns |
-2.53 | % | 6.68 | % | 0.75 | % | 8.26 | % | ||||||||
| Fund Market Price Returns |
-3.19 | % | 6.95 | % | 0.75 | % | 8.26 | % | ||||||||
| WisdomTree International High Dividend Index |
-2.39 | % | 6.90 | % | 1.04 | % | 8.55 | % | ||||||||
| MSCI EAFE Value Index |
-6.13 | % | 6.90 | % | 0.67 | % | 8.12 | % | ||||||||

Performance is historical and does not guarantee future results. The returns do not reflect the deduction of taxes that a shareholder would pay on Fund distributions or on the redemption of Fund shares.
| WisdomTree Trust | 7 |
Management’s Discussion of Funds’ Performance
as of March 31, 2019 (unaudited)
WisdomTree International LargeCap Dividend Fund (DOL)
Sector Breakdown†
| Sector | % of Net Assets | |||
| Financials |
22.0% | |||
| Consumer Staples |
12.0% | |||
| Health Care |
11.4% | |||
| Communication Services |
10.4% | |||
| Energy |
10.3% | |||
| Consumer Discretionary |
9.4% | |||
| Industrials |
8.3% | |||
| Materials |
5.8% | |||
| Utilities |
5.4% | |||
| Information Technology |
2.5% | |||
| Real Estate |
1.6% | |||
| Investment Company |
0.0% | * | ||
| Other Assets less Liabilities‡ |
0.9% | |||
| Total |
100.0% | |||
| † | The Fund’s sector breakdown is expressed as a percentage of net assets and may change over time. In addition, a sector may be comprised of several industries. It does not include derivatives (if any). |
| ‡ | Other assets includes investment of cash collateral for securities on loan (if any). |
| * | Represents less than 0.1%. |
Top Ten Holdings*
| Description | % of Net Assets | |||
| China Mobile Ltd. |
2.4% | |||
| Novartis AG, Registered Shares |
2.4% | |||
| Nestle S.A., Registered Shares |
2.4% | |||
| BP PLC |
2.0% | |||
| Royal Dutch Shell PLC, Class A |
2.0% | |||
| Roche Holding AG, Genusschein |
1.9% | |||
| HSBC Holdings PLC |
1.8% | |||
| TOTAL S.A. |
1.7% | |||
| Royal Dutch Shell PLC, Class B |
1.6% | |||
| Anheuser-Busch InBev S.A./N.V. |
1.5% | |||
| * | The ten largest holdings are subject to change, and there are no guarantees the Fund will remain invested in any particular company. Excludes derivatives and investment of cash collateral for securities on loan (if any). |
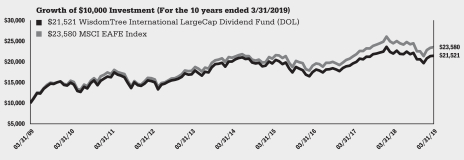
The WisdomTree International LargeCap Dividend Fund (the “Fund”) seeks to track the price and yield performance, before fees and expenses, of the WisdomTree International LargeCap Dividend Index (the “Index”). In seeking to track the Index, the Fund invests in dividend-paying large-cap companies in the developed world excluding the U.S. and Canada. The Fund generally uses a representative sampling strategy to achieve its investment objective, meaning it generally will invest in a sample of securities in the Index.
The Fund returned -2.55% at net asset value (“NAV”) for the fiscal year ending March 31, 2019 (for more complete performance information please see the table below). The Fund’s sector position in Energy contributed most positively to performance, while its position in Consumer Staples contributed least positively to performance. The Fund’s country position in Hong Kong contributed most positively to performance, while its position in France contributed least positively to performance. The U.S. dollar rallied over the fiscal year which served as a headwind for international equities. The Fund’s overweight to large-cap equities provided more protection than mid- or small-cap peers during the fourth quarter of 2018, where a broad market correction catalyzed by trade war apprehension with China and fears of a U.S. Federal Reserve policy misstep sent global markets sharply downward.
Shareholder Expense Example
| Beginning Account Value |
Ending Account Value |
Annualized Net Expense Ratio |
Expenses Paid During the Period |
|||||||||||||
| Actual |
$ | 1,000.00 | $ | 970.50 | 0.48 | % | $ | 2.36 | ||||||||
| Hypothetical (5% return before expenses) |
$ | 1,000.00 | $ | 1,022.54 | 0.48 | % | $ | 2.42 | ||||||||
Performance
| Average Annual Total Return | ||||||||||||||||
| 1 Year | 3 Year | 5 Year | 10 Year | |||||||||||||
| Fund NAV Returns |
-2.55 | % | 6.99 | % | 1.34 | % | 7.97 | % | ||||||||
| Fund Market Price Returns |
-3.17 | % | 7.25 | % | 1.31 | % | 7.89 | % | ||||||||
| WisdomTree International LargeCap Dividend Index |
-2.32 | % | 7.22 | % | 1.57 | % | 8.24 | % | ||||||||
| MSCI EAFE Index |
-3.71 | % | 7.27 | % | 2.33 | % | 8.96 | % | ||||||||
Performance is historical and does not guarantee future results. The returns do not reflect the deduction of taxes that a shareholder would pay on Fund distributions or on the redemption of Fund shares.
| 8 | WisdomTree Trust |
Management’s Discussion of Funds’ Performance
as of March 31, 2019 (unaudited)
WisdomTree International MidCap Dividend Fund (DIM)
Sector Breakdown†
| Sector | % of Net Assets | |||
| Industrials |
19.2% | |||
| Financials |
18.0% | |||
| Consumer Discretionary |
11.3% | |||
| Materials |
10.9% | |||
| Utilities |
9.0% | |||
| Consumer Staples |
7.5% | |||
| Real Estate |
6.4% | |||
| Communication Services |
6.1% | |||
| Information Technology |
4.5% | |||
| Health Care |
3.6% | |||
| Energy |
2.9% | |||
| Other Assets less Liabilities‡ |
0.6% | |||
| Total |
100.0% | |||
| † | The Fund’s sector breakdown is expressed as a percentage of net assets and may change over time. In addition, a sector may be comprised of several industries. It does not include derivatives (if any). |
| ‡ | Other assets includes investment of cash collateral for securities on loan (if any). |
Top Ten Holdings*
| Description | % of Net Assets | |||
| Fortescue Metals Group Ltd. |
0.9% | |||
| Snam SpA |
0.8% | |||
| Mowi ASA |
0.6% | |||
| Hannover Rueck SE |
0.6% | |||
| Persimmon PLC |
0.6% | |||
| Power Assets Holdings Ltd. |
0.6% | |||
| Evraz PLC |
0.6% | |||
| Ferrovial S.A. |
0.5% | |||
| Telefonica Deutschland Holding AG |
0.5% | |||
| Carrefour S.A. |
0.5% | |||
| * | The ten largest holdings are subject to change, and there are no guarantees the Fund will remain invested in any particular company. Excludes derivatives and investment of cash collateral for securities on loan (if any). |
The WisdomTree International MidCap Dividend Fund (the “Fund”) seeks to track the price and yield performance, before fees and expenses, of the WisdomTree International MidCap Dividend Index (the “Index”). In seeking to track the Index, the Fund invests in dividend-paying mid-cap companies in the developed world excluding the U.S. and Canada. The Fund generally uses a representative sampling strategy to achieve its investment objective, meaning it generally will invest in a sample of securities in the Index.
The Fund returned -6.16% at net asset value (“NAV”) for the fiscal year ending March 31, 2019 (for more complete performance information please see the table below). The Fund’s sector position in Utilities contributed most positively to performance, while its position in Real Estate contributed least positively to performance. The Fund’s country position in Hong Kong contributed most positively to performance, while its position in Switzerland contributed least positively to performance. The U.S. dollar rallied over the fiscal year which served as a headwind for international equities. The Fund’s exposure to mid-cap equities outperformed its small-cap peers but underperformed large-cap equities during the fiscal year. Fund returns were brought down particularly during the fourth quarter of 2018, where a broad market correction catalyzed by trade war apprehension with China and fears of a U.S. Federal Reserve policy misstep sent global markets sharply downward.
Shareholder Expense Example
| Beginning Account Value |
Ending Account Value |
Annualized Net Expense Ratio |
Expenses Paid During the Period |
|||||||||||||
| Actual |
$ | 1,000.00 | $ | 951.80 | 0.58 | % | $ | 2.82 | ||||||||
| Hypothetical (5% return before expenses) |
$ | 1,000.00 | $ | 1,022.04 | 0.58 | % | $ | 2.92 | ||||||||
Performance
| Average Annual Total Return | ||||||||||||||||
| 1 Year | 3 Year | 5 Year | 10 Year | |||||||||||||
| Fund NAV Returns |
-6.16 | % | 6.56 | % | 3.56 | % | 10.44 | % | ||||||||
| Fund Market Price Returns |
-6.62 | % | 6.78 | % | 3.56 | % | 10.43 | % | ||||||||
| WisdomTree International MidCap Dividend Index |
-5.78 | % | 7.03 | % | 3.90 | % | 10.80 | % | ||||||||
| MSCI EAFE Mid Cap Index |
-6.23 | % | 6.57 | % | 3.73 | % | 10.47 | % | ||||||||

Performance is historical and does not guarantee future results. The returns do not reflect the deduction of taxes that a shareholder would pay on Fund distributions or on the redemption of Fund shares.
| WisdomTree Trust | 9 |
Management’s Discussion of Funds’ Performance
as of March 31, 2019 (unaudited)
WisdomTree International Multifactor Fund (DWMF)
Sector Breakdown†
| Sector | % of Net Assets | |||
| Financials |
19.3% | |||
| Industrials |
14.3% | |||
| Consumer Discretionary |
11.4% | |||
| Consumer Staples |
10.7% | |||
| Health Care |
8.8% | |||
| Materials |
8.3% | |||
| Information Technology |
6.6% | |||
| Utilities |
5.3% | |||
| Energy |
5.2% | |||
| Communication Services |
5.2% | |||
| Real Estate |
4.4% | |||
| Other Assets less Liabilities‡ |
0.5% | |||
| Total |
100.0% | |||
| † | The Fund’s sector breakdown is expressed as a percentage of net assets and may change over time. In addition, a sector may be comprised of several industries. It does not include derivatives (if any). |
| ‡ | Other assets includes investment of cash collateral for securities on loan (if any). |
Top Ten Holdings*
| Description | % of Net Assets | |||
| Novartis AG, Registered Shares |
1.2% | |||
| Roche Holding AG, Genusschein |
1.2% | |||
| Nestle S.A., Registered Shares |
1.1% | |||
| E.ON SE |
1.0% | |||
| Deutsche Wohnen SE, Bearer Shares |
1.0% | |||
| Allianz SE, Registered Shares |
1.0% | |||
| Zurich Insurance Group AG |
1.0% | |||
| Compass Group PLC |
1.0% | |||
| Hannover Rueck SE |
0.9% | |||
| Muenchener Rueckversicherungs — Gesellschaft AG, Registered Shares |
0.9% | |||
| * | The ten largest holdings are subject to change, and there are no guarantees the Fund will remain invested in any particular company. Excludes derivatives and investment of cash collateral for securities on loan (if any). |
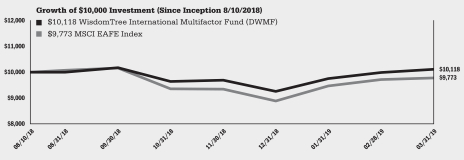
The WisdomTree International Multifactor Fund (the “Fund”) seeks capital appreciation by investing primarily in equity securities of developed countries, excluding the United States and Canada, with the highest composite scores based on two fundamental factors, value and quality measures, and two technical factors, momentum and correlation.
The Fund returned 1.18% at net asset value (“NAV”) for the fiscal period ending March 31, 2019 (for more complete performance information please see the table below). The Fund’s sector position in Health Care contributed most positively to performance, while its position in Energy contributed least positively to performance. The Fund’s country position in Japan contributed most positively to performance, while its position in the France contributed least positively to performance. During the fiscal period, the Fund utilized forward foreign currency contracts to offset applicable international currency exposure from positions in international equities. The Fund’s use of foreign currency contracts contributed positively to Fund performance as the U.S. dollar rallied against various international currencies, which served as tailwind to the strategy’s dynamic currency hedges. Additionally, exposure and tilts to value, quality, momentum, and correlation factors provided outperformance over the fiscal period. Much of this quality outperformance came from the broad market correction in the fourth quarter of 2018 which was catalyzed by trade war apprehensions, ongoing BREXIT negotiations, and global economic slowdown. However, during the first quarter of 2019, there has been a strong rebound as markets began to stabilize.
Shareholder Expense Example
| Beginning Account Value |
Ending Account Value |
Annualized Expense Ratio |
Expenses Paid During the Period |
|||||||||||||
| Actual |
$ | 1,000.00 | $ | 994.90 | 0.38 | % | $ | 1.89 | ||||||||
| Hypothetical (5% return before expenses) |
$ | 1,000.00 | $ | 1,023.04 | 0.38 | % | $ | 1.92 | ||||||||
Performance
| Cumulative Total Return | ||||
| Since Inception1 | ||||
| Fund NAV Returns |
1.18 | % | ||
| Fund Market Price Returns |
1.87 | % | ||
| MSCI EAFE Index |
-2.27 | % | ||
| 1 | Total returns are calculated based on the commencement of Fund trading on the NYSE Arca, Inc. on August 10, 2018. |
Performance is historical and does not guarantee future results. The returns do not reflect the deduction of taxes that a shareholder would pay on Fund distributions or on the redemption of Fund shares.
| 10 | WisdomTree Trust |
Management’s Discussion of Funds’ Performance
as of March 31, 2019 (unaudited)
WisdomTree International Quality Dividend Growth Fund (IQDG)
Sector Breakdown†
| Sector | % of Net Assets | |||
| Industrials |
20.2% | |||
| Consumer Discretionary |
18.4% | |||
| Health Care |
18.2% | |||
| Consumer Staples |
14.1% | |||
| Information Technology |
10.4% | |||
| Real Estate |
4.3% | |||
| Materials |
4.2% | |||
| Communication Services |
4.0% | |||
| Financials |
3.9% | |||
| Energy |
1.8% | |||
| Other Assets less Liabilities‡ |
0.5% | |||
| Total |
100.0% | |||
| † | The Fund’s sector breakdown is expressed as a percentage of net assets and may change over time. In addition, a sector may be comprised of several industries. It does not include derivatives (if any). |
| ‡ | Other assets includes investment of cash collateral for securities on loan (if any). |
Top Ten Holdings*
| Description | % of Net Assets | |||
| Novo Nordisk A/S, Class B |
7.5% | |||
| Diageo PLC |
6.3% | |||
| British American Tobacco PLC |
4.9% | |||
| Industria de Diseno Textil S.A. |
3.5% | |||
| China Overseas Land & Investment Ltd. |
3.2% | |||
| Airbus SE |
3.1% | |||
| Tokyo Electron Ltd. |
2.2% | |||
| Safran S.A. |
1.9% | |||
| CSL Ltd. |
1.9% | |||
| Astellas Pharma, Inc. |
1.7% | |||
| * | The ten largest holdings are subject to change, and there are no guarantees the Fund will remain invested in any particular company. Excludes derivatives and investment of cash collateral for securities on loan (if any). |
The WisdomTree International Quality Dividend Growth Fund (the “Fund”) seeks to track the price and yield performance, before fees and expenses, of the WisdomTree International Quality Dividend Growth Index (the “Index”). In seeking to track the Index, the Fund invests in dividend-paying companies with growth characteristics in the developed world excluding the U.S. and Canada. The Fund generally uses a representative sampling strategy to achieve its investment objective, meaning it generally will invest in a sample of securities in the Index.
The Fund returned -4.43% at net asset value (“NAV”) for the fiscal year ending March 31, 2019 (for more complete performance information please see the table below). The Fund’s sector position in Financials contributed most positively to performance, while its position in Communication Services contributed least positively to performance. The Fund’s country position in Denmark contributed most positively to performance, while its position in the Switzerland contributed least positively to performance. The U.S. dollar rallied over the fiscal year which served as a headwind for international equities. However, the Fund’s significant overweight to higher quality companies proved to be a source of outperformance when compared to companies with low quality (based on return on equity). Much of this quality outperformance came from the broad market correction in the fourth quarter of 2018 which was catalyzed by trade war apprehensions, ongoing BREXIT negotiations, and global economic slowdown. However, during the first quarter of 2019, there has been a strong rebound as markets began to stabilize.
Shareholder Expense Example
| Beginning Account Value |
Ending Account Value |
Annualized Net Expense Ratio |
Expenses Paid Period |
|||||||||||||
| Actual |
$ | 1,000.00 | $ | 977.30 | 0.38 | %1 | $ | 1.87 | ||||||||
| Hypothetical (5% return before expenses) |
$ | 1,000.00 | $ | 1,023.04 | 0.38 | %1 | $ | 1.92 | ||||||||
| 1 | WisdomTree Asset Management, Inc. has contractually agreed to limit the management fee to 0.38% through July 31, 2019, unless earlier terminated by the Board of Trustees of the WisdomTree Trust for any reason. |
Performance
| Average Annual Total Return | ||||||||
| 1 Year | Since Inception1 | |||||||
| Fund NAV Returns |
-4.43 | % | 6.64 | % | ||||
| Fund Market Price Returns |
-4.80 | % | 6.92 | % | ||||
| WisdomTree International Quality Dividend Growth Index |
-4.03 | % | 7.01 | % | ||||
| MSCI EAFE Index |
-3.71 | % | 8.27 | % | ||||
| 1 | Total returns are calculated based on the commencement of Fund trading on the Cboe BZX Exchange, Inc. on April 7, 2016. |

Performance is historical and does not guarantee future results. The returns do not reflect the deduction of taxes that a shareholder would pay on Fund distributions or on the redemption of Fund shares.
| WisdomTree Trust | 11 |
Management’s Discussion of Funds’ Performance
as of March 31, 2019 (unaudited)
WisdomTree International SmallCap Dividend Fund (DLS)
Sector Breakdown†
| Sector | % of Net Assets | |||
| Industrials |
22.5% | |||
| Consumer Discretionary |
16.1% | |||
| Financials |
14.0% | |||
| Materials |
7.8% | |||
| Real Estate |
7.5% | |||
| Consumer Staples |
6.7% | |||
| Information Technology |
6.5% | |||
| Communication Services |
6.5% | |||
| Health Care |
4.1% | |||
| Energy |
3.6% | |||
| Utilities |
3.3% | |||
| Investment Company |
0.8% | |||
| Other Assets less Liabilities‡ |
0.6% | |||
| Total |
100.0% | |||
| † | The Fund’s sector breakdown is expressed as a percentage of net assets and may change over time. In addition, a sector may be comprised of several industries. It does not include derivatives (if any). |
| ‡ | Other assets includes investment of cash collateral for securities on loan (if any). |
Top Ten Holdings*
| Description | % of Net Assets | |||
| StarHub Ltd. |
0.7% | |||
| NOS, SGPS, S.A. |
0.6% | |||
| Delek Group Ltd. |
0.6% | |||
| Austevoll Seafood ASA |
0.6% | |||
| Cembra Money Bank AG |
0.6% | |||
| Azimut Holding SpA |
0.6% | |||
| Gaztransport Et Technigaz S.A. |
0.6% | |||
| Genesis Energy Ltd. |
0.6% | |||
| Warehouses De Pauw, CVA |
0.5% | |||
| Hutchison Port Holdings Trust |
0.5% | |||
| * | The ten largest holdings are subject to change, and there are no guarantees the Fund will remain invested in any particular company. Excludes derivatives and investment of cash collateral for securities on loan (if any). |
The WisdomTree International SmallCap Dividend Fund (the “Fund”) seeks to track the price and yield performance, before fees and expenses, of the WisdomTree International SmallCap Dividend Index (the “Index”). In seeking to track the Index, the Fund invests in dividend-paying small-cap companies in the developed world excluding the U.S. and Canada. The Fund generally uses a representative sampling strategy to achieve its investment objective, meaning it generally will invest in a sample of securities in the Index.
The Fund returned -10.41% at net asset value (“NAV”) for the fiscal year ending March 31, 2019 (for more complete performance information please see the table below). The Fund’s sector position in Materials contributed most positively to performance, while its position in Real Estate contributed least positively to performance. The Fund’s country position in Hong Kong contributed most positively to performance, while its position in Japan contributed least positively to performance. The U.S. dollar rallied over the fiscal year which served as a headwind for international equities. The Fund’s exposure to small-cap equities underperformed its large- and mid-cap peers, as returns were brought down particularly during the fourth quarter of 2018 as a broad market correction catalyzed by trade war apprehension with China and fears of a U.S. Federal Reserve policy misstep sent global markets sharply downward.
Shareholder Expense Example
| Beginning Account Value |
Ending Account Value |
Annualized Net Expense Ratio |
Expenses Paid During the Period |
|||||||||||||
| Actual |
$ | 1,000.00 | $ | 932.30 | 0.58 | % | $ | 2.79 | ||||||||
| Hypothetical (5% return before expenses) |
$ | 1,000.00 | $ | 1,022.04 | 0.58 | % | $ | 2.92 | ||||||||
Performance
| Average Annual Total Return | ||||||||||||||||
| 1 Year | 3 Year | 5 Year | 10 Year | |||||||||||||
| Fund NAV Returns |
-10.41 | % | 7.06 | % | 3.39 | % | 12.21 | % | ||||||||
| Fund Market Price Returns |
-11.08 | % | 7.13 | % | 3.35 | % | 12.14 | % | ||||||||
| WisdomTree International SmallCap Dividend Index |
-9.63 | % | 7.49 | % | 3.98 | % | 12.85 | % | ||||||||
| MSCI EAFE Small Cap Index |
-9.36 | % | 7.50 | % | 4.47 | % | 12.76 | % | ||||||||

Performance is historical and does not guarantee future results. The returns do not reflect the deduction of taxes that a shareholder would pay on Fund distributions or on the redemption of Fund shares.
| 12 | WisdomTree Trust |
Management’s Discussion of Funds’ Performance
as of March 31, 2019 (unaudited)
WisdomTree Japan SmallCap Dividend Fund (DFJ)
Sector Breakdown†
| Sector | % of Net Assets | |||
| Industrials |
25.4% | |||
| Consumer Discretionary |
20.9% | |||
| Materials |
12.9% | |||
| Information Technology |
10.0% | |||
| Financials |
8.6% | |||
| Consumer Staples |
7.2% | |||
| Health Care |
5.2% | |||
| Communication Services |
3.9% | |||
| Real Estate |
2.0% | |||
| Utilities |
1.4% | |||
| Energy |
1.2% | |||
| Investment Company |
0.0% | * | ||
| Other Assets less Liabilities‡ |
1.3% | |||
| Total |
100.0% | |||
| † | The Fund’s sector breakdown is expressed as a percentage of net assets and may change over time. In addition, a sector may be comprised of several industries. It does not include derivatives (if any). |
| ‡ | Other assets includes investment of cash collateral for securities on loan (if any). |
| * | Represents less than 0.1%. |
Top Ten Holdings*
| Description | % of Net Assets | |||
| Sankyo Co., Ltd. |
0.8% | |||
| Matsui Securities Co., Ltd. |
0.7% | |||
| DIC Corp. |
0.6% | |||
| Mitsubishi Materials Corp. |
0.6% | |||
| Nippon Paper Industries Co., Ltd. |
0.6% | |||
| Skylark Holdings Co., Ltd. |
0.5% | |||
| Yokohama Rubber Co., Ltd. (The) |
0.5% | |||
| Nippon Electric Glass Co., Ltd. |
0.5% | |||
| Canon Marketing Japan, Inc. |
0.5% | |||
| Toyota Boshoku Corp. |
0.5% | |||
| * | The ten largest holdings are subject to change, and there are no guarantees the Fund will remain invested in any particular company. Excludes derivatives and investment of cash collateral for securities on loan (if any). |
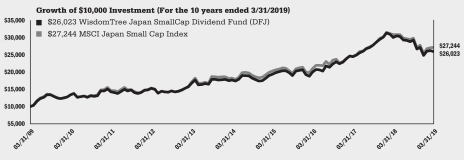
The WisdomTree Japan SmallCap Dividend Fund (the “Fund”) seeks to track the price and yield performance, before fees and expenses, of the WisdomTree Japan SmallCap Dividend Index (the “Index”). In seeking to track the Index, the Fund invests in dividend-paying small-cap companies in the Japanese equity market. The Fund generally uses a representative sampling strategy to achieve its investment objective, meaning it generally will invest in a sample of securities in the Index.
The Fund returned -14.38% at net asset value (“NAV”) for the fiscal year ending March 31, 2019 (for more complete performance information please see the table below). The Fund’s sector position in Communication Services contributed most positively to performance, while its position in Real Estate contributed least positively to performance. The U.S. dollar rallied by 4.01% against the Japanese yen during the fiscal year which served as a headwind for Japanese equities. Additionally, small-cap companies faced additional pressures during the fiscal period when compared to their larger peers, particularly during the fourth quarter of 2018 as the broad market correction was catalyzed by trade war apprehension with China and a global economic slowdown. During the fiscal year, natural disasters in Japan also had an adverse effect on the Japanese equity market and overall economy.
Shareholder Expense Example
| Beginning Account Value |
Ending Account Value |
Annualized Net Expense Ratio |
Expenses Paid During the Period |
|||||||||||||
| Actual |
$ | 1,000.00 | $ | 887.80 | 0.58 | % | $ | 2.73 | ||||||||
| Hypothetical (5% return before expenses) |
$ | 1,000.00 | $ | 1,022.04 | 0.58 | % | $ | 2.92 | ||||||||
Performance
| Average Annual Total Return | ||||||||||||||||
| 1 Year | 3 Year | 5 Year | 10 Year | |||||||||||||
| Fund NAV Returns |
-14.38 | % | 9.09 | % | 7.98 | % | 10.04 | % | ||||||||
| Fund Market Price Returns |
-14.64 | % | 9.31 | % | 8.12 | % | 9.90 | % | ||||||||
| WisdomTree Japan SmallCap Dividend Index |
-13.54 | % | 10.17 | % | 8.61 | % | 11.00 | % | ||||||||
| MSCI Japan Small Cap Index |
-11.87 | % | 8.87 | % | 8.33 | % | 10.54 | % | ||||||||
Performance is historical and does not guarantee future results. The returns do not reflect the deduction of taxes that a shareholder would pay on Fund distributions or on the redemption of Fund shares.
| WisdomTree Trust | 13 |
Description of Indexes (unaudited)
Below are descriptions of each Index referenced in this report:
The MSCI EAFE Index is a market cap-weighted index composed of companies representative of the developed market structure of developed countries in Europe,
Australasia and Japan.
The MSCI EAFE Mid Cap Index is a free float-adjusted market capitalization index that is designed to measure the performance of mid-capitalization equities in the developed markets excluding the U.S. & Canada.
The MSCI EAFE Small Cap Index is comprised of small-capitalization stocks in the MSCI EAFE Index.
The MSCI EAFE Value Index is comprised of value stocks in the MSCI EAFE Index.
The MSCI Europe Index is a free float-adjusted market capitalization index that is designed to measure the performance of large- and mid-cap stocks within developed market European countries.
The MSCI Europe Small Cap Index is comprised of small-capitalization stocks in the MSCI Europe Index.
The MSCI Japan Small Cap Index is comprised of small cap stocks in the MSCI Japan Index.
The S&P 500® Index is a capitalization-weighted index of 500 stocks selected by Standard & Poor’s Index Committee, designed to represent the performance of the leading industries in the United States economy.
The WisdomTree Europe Quality Dividend Growth Index is a fundamentally weighted index that measures the performance of dividend-paying common stocks with growth characteristics selected from the WisdomTree International Equity Index.
The WisdomTree Europe SmallCap Dividend Index is comprised of the small-capitalization segment of the European dividend-paying market.
The WisdomTree International Dividend ex-Financials Index is comprised of high dividend-yielding international stocks outside the financial sector.
The WisdomTree International Dividend Top 100 Index is comprised of the 100 highest dividend-yielding companies in the WisdomTree International LargeCap Dividend Index.
The WisdomTree International Equity Index is comprised of dividend-paying companies in the industrialized world, excluding Canada and the United States.
The WisdomTree International High Dividend Index is comprised of companies with high dividend yields selected from the WisdomTree International Equity Index.
The WisdomTree International LargeCap Dividend Index is comprised of the large-capitalization segment of the dividend-paying market in the industrialized world outside the U.S. and Canada.
The WisdomTree International MidCap Dividend Index is comprised of the mid-capitalization segment of the dividend-paying market in the industrialized world outside the U.S. and Canada.
The WisdomTree International Quality Dividend Growth Index is a fundamentally weighted index designed to provide exposure to dividend paying developed market companies.
The WisdomTree International SmallCap Dividend Index is comprised of the small-capitalization segment of the dividend-paying market in the industrialized world outside the U.S. and Canada.
The WisdomTree Japan SmallCap Dividend Index is comprised of dividend-paying small-capitalization companies in Japan.
The Global Industry Classification Standard (“GICS”) was developed by and is the exclusive property and a service mark of MSCI Inc. (“MSCI”) and Standard & Poor’s (“S&P”), a division of The
| 14 | WisdomTree Trust |
Description of Indexes (unaudited) (concluded)
McGraw-Hill Companies, Inc. and is licensed for use by WisdomTree Investments, Inc. Neither MSCI, S&P nor any other party involved in making or compiling the GICS or any GICS classifications makes any express or implied warranties or representations with respect to such standard or classification (or the results to be obtained by the use thereof), and all such parties hereby expressly disclaim all warranties of originality, accuracy, completeness, merchantability and fitness for a particular purpose with respect to any such standard or classification. Without limiting any of the foregoing, in no event shall MSCI, S&P, any of their affiliates or any third party involved in making or compiling the GICS or any GICS classifications have any liability for any direct, indirect, special, punitive, consequential or any other damages (including lost profits) even if notified of the possibility of such damages.
Neither MSCI nor any other party involved in or related to compiling, computing or creating the MSCI data makes any express or implied warranties or representations with respect to such data (or the results to be obtained by the use thereof), and all such parties hereby expressly disclaim all warranties of originality, accuracy, completeness, merchantability or fitness for a particular purpose with respect to any such data. Without limiting any of the foregoing, in no event shall MSCI, any of its affiliates or any third party involved in or related to compiling, computing or creating the data have any liability for any direct, indirect, special, punitive, consequential or any other damages (including lost profits) even if notified of the possibility of such damages. No further distribution or dissemination of the MSCI data is permitted without MSCI’s express written consent.
WisdomTree Investments, Inc. and WisdomTree Asset Management, Inc. (together, “WisdomTree”) and the Funds make no representation or warranty, express or implied, to the owners of shares of the Funds or any member of the public regarding the advisability of investing in securities generally or in the Funds particularly or the ability of the underlying Indexes to track the performance of their underlying securities. WisdomTree Investments is the licensor of certain trademarks, service marks and trade names of the Funds. WisdomTree Investments has no obligation to take the needs of the Funds or the owners of shares of the Funds into consideration in determining, composing, or calculating the underlying WisdomTree Indexes of the applicable Funds. WisdomTree Investments is not responsible for, and has not participated in, the determination of the timing of, prices of, or quantities of shares of the Funds to be issued or in the determination or calculation of the equation by which the shares of the Funds are redeemable. WisdomTree and the Funds do not guarantee the accuracy, completeness, or performance of the underlying Indexes or the data included therein and shall have no liability in connection with the underlying Indexes or their calculation.
Index performance information assumes the reinvestment of dividends and excludes management fees, transaction costs and expenses. You cannot directly invest in an index.
| WisdomTree Trust | 15 |
WisdomTree Europe Quality Dividend Growth Fund (EUDG)
March 31, 2019
| Investments | Shares | Value | ||||||
| COMMON STOCKS – 99.4% |
| |||||||
| Austria – 0.7% |
| |||||||
| Lenzing AG |
879 | $ | 94,257 | |||||
| Porr AG(a) |
2,170 | 48,537 | ||||||
| Telekom Austria AG* |
14,125 | 102,774 | ||||||
| Voestalpine AG |
1,615 | 49,089 | ||||||
|
|
|
|||||||
| Total Austria |
|
294,657 | ||||||
| Belgium – 0.5% |
| |||||||
| Melexis N.V.(a) |
647 | 39,194 | ||||||
| Umicore S.A. |
2,189 | 97,309 | ||||||
| Warehouses De Pauw CVA |
509 | 81,729 | ||||||
|
|
|
|||||||
| Total Belgium |
|
218,232 | ||||||
| Denmark – 8.1% |
| |||||||
| Chr Hansen Holding A/S |
1,252 | 127,033 | ||||||
| Coloplast A/S Class B |
3,652 | 401,088 | ||||||
| DFDS A/S |
312 | 12,924 | ||||||
| Novo Nordisk A/S Class B |
36,059 | 1,889,550 | ||||||
| Orsted A/S(b) |
6,740 | 511,330 | ||||||
| Pandora A/S |
2,223 | 104,185 | ||||||
| Royal Unibrew A/S |
1,141 | 84,262 | ||||||
| Vestas Wind Systems A/S |
2,787 | 234,742 | ||||||
|
|
|
|||||||
| Total Denmark |
|
3,365,114 | ||||||
| Finland – 3.4% |
| |||||||
| DNA Oyj |
3,331 | 69,119 | ||||||
| Huhtamaki Oyj(a) |
1,990 | 74,117 | ||||||
| Kone Oyj Class B |
10,246 | 517,252 | ||||||
| Neste Oyj(a) |
2,255 | 240,543 | ||||||
| Nokian Renkaat Oyj |
3,013 | 100,953 | ||||||
| Orion Oyj Class B(a) |
4,166 | 156,332 | ||||||
| Stora Enso Oyj Class R |
7,117 | 87,066 | ||||||
| Wartsila Oyj Abp |
9,350 | 151,023 | ||||||
|
|
|
|||||||
| Total Finland |
|
1,396,405 | ||||||
| France – 10.2% |
| |||||||
| Airbus SE |
7,004 | 927,217 | ||||||
| Altran Technologies S.A. |
2,436 | 26,751 | ||||||
| BioMerieux |
611 | 50,563 | ||||||
| Cie Plastic Omnium S.A. |
1,998 | 53,237 | ||||||
| Eurazeo SE |
839 | 63,119 | ||||||
| Faurecia S.A. |
1,037 | 43,642 | ||||||
| Hermes International |
431 | 284,658 | ||||||
| Iliad S.A. |
216 | 21,707 | ||||||
| Ipsen S.A. |
653 | 89,600 | ||||||
| LVMH Moet Hennessy Louis Vuitton SE |
4,299 | 1,582,816 | ||||||
| Rothschild & Co. |
567 | 18,049 | ||||||
| Rubis SCA |
1,462 | 79,815 | ||||||
| Safran S.A. |
3,659 | 502,265 | ||||||
| SEB S.A. |
323 | 54,402 | ||||||
| Teleperformance |
411 | 73,931 | ||||||
| Thales S.A. |
2,128 | 255,071 | ||||||
| Valeo S.A. |
2,505 | 72,709 | ||||||
|
|
|
|||||||
| Total France |
|
4,199,552 | ||||||
| Germany – 5.7% |
| |||||||
| 1&1 Drillisch AG |
1,991 | 70,958 | ||||||
| adidas AG |
1,367 | 332,467 | ||||||
| AURELIUS Equity Opportunities SE & Co. KGaA |
2,112 | 96,234 | ||||||
| Beiersdorf AG |
1,223 | 127,355 | ||||||
| Continental AG |
2,041 | 307,551 | ||||||
| CTS Eventim AG & Co. KGaA |
1,301 | 61,705 | ||||||
| Fielmann AG |
1,372 | 94,744 | ||||||
| Fuchs Petrolub SE |
1,171 | 46,151 | ||||||
| Hamburger Hafen und Logistik AG |
1,633 | 37,369 | ||||||
| Hella GmbH & Co. KGaA |
1,497 | 65,891 | ||||||
| Henkel AG & Co. KGaA |
3,014 | 286,817 | ||||||
| Hugo Boss AG |
1,219 | 83,330 | ||||||
| Infineon Technologies AG |
7,763 | 154,154 | ||||||
| KION Group AG |
1,212 | 63,404 | ||||||
| Koenig & Bauer AG |
940 | 39,412 | ||||||
| NORMA Group SE |
699 | 33,954 | ||||||
| ProSiebenSat.1 Media SE |
7,554 | 107,891 | ||||||
| Sixt SE |
398 | 41,583 | ||||||
| Symrise AG |
1,417 | 127,795 | ||||||
| TUI AG |
5,781 | 55,500 | ||||||
| United Internet AG Registered Shares |
900 | 32,874 | ||||||
| Wacker Chemie AG |
890 | 76,749 | ||||||
|
|
|
|||||||
| Total Germany |
|
2,343,888 | ||||||
| Ireland – 0.8% |
| |||||||
| Glanbia PLC |
3,013 | 59,002 | ||||||
| Kerry Group PLC Class A |
863 | 96,418 | ||||||
| Kingspan Group PLC |
986 | 45,680 | ||||||
| Smurfit Kappa Group PLC |
4,613 | 128,871 | ||||||
|
|
|
|||||||
| Total Ireland |
|
329,971 | ||||||
| Italy – 2.1% |
| |||||||
| Anima Holding SpA(b) |
10,911 | 44,644 | ||||||
| Banca IFIS SpA |
1,843 | 30,441 | ||||||
| Brembo SpA |
3,149 | 35,747 | ||||||
| De’ Longhi SpA |
3,226 | 87,153 | ||||||
| DiaSorin SpA |
677 | 68,187 | ||||||
| Ferrari N.V. |
735 | 98,623 | ||||||
| FinecoBank Banca Fineco SpA |
12,262 | 161,434 | ||||||
| Maire Tecnimont SpA |
12,497 | 47,654 | ||||||
| RAI Way SpA(b) |
7,662 | 39,661 | ||||||
| Recordati SpA |
3,636 | 141,710 | ||||||
| Salvatore Ferragamo SpA |
1,663 | 35,703 | ||||||
| Saras SpA |
45,740 | 84,794 | ||||||
|
|
|
|||||||
| Total Italy |
|
875,751 | ||||||
| Netherlands – 3.2% |
| |||||||
| ASM International N.V. |
577 | 31,293 | ||||||
| ASML Holding N.V. |
2,335 | 438,374 | ||||||
| BE Semiconductor Industries N.V. |
4,578 | 121,931 | ||||||
| Corbion N.V. |
866 | 26,060 | ||||||
| GrandVision N.V.(b) |
2,488 | 53,917 | ||||||
| Koninklijke DSM N.V. |
2,189 | 238,811 | ||||||
| Koninklijke Vopak N.V. |
2,419 | 115,872 | ||||||
See Notes to Financial Statements.
| 16 | WisdomTree Trust |
Schedule of Investments (continued)
WisdomTree Europe Quality Dividend Growth Fund (EUDG)
March 31, 2019
| Investments | Shares | Value | ||||||
| TKH Group N.V. CVA |
754 | $ | 35,592 | |||||
| Wolters Kluwer N.V. |
3,739 | 254,839 | ||||||
|
|
|
|||||||
| Total Netherlands |
|
1,316,689 | ||||||
| Norway – 4.1% |
| |||||||
| Borregaard ASA |
2,677 | 26,579 | ||||||
| Entra ASA(b) |
4,559 | 68,928 | ||||||
| Grieg Seafood ASA |
3,437 | 41,747 | ||||||
| Leroy Seafood Group ASA |
13,034 | 94,687 | ||||||
| Norsk Hydro ASA |
34,662 | 140,675 | ||||||
| Salmar ASA |
4,034 | 193,840 | ||||||
| Schibsted ASA Class A |
860 | 33,814 | ||||||
| Telenor ASA |
44,540 | 893,221 | ||||||
| Veidekke ASA |
4,996 | 52,503 | ||||||
| Yara International ASA |
3,547 | 145,313 | ||||||
|
|
|
|||||||
| Total Norway |
|
1,691,307 | ||||||
| Portugal – 0.7% |
| |||||||
| Altri, SGPS, S.A. |
4,330 | 33,936 | ||||||
| Jeronimo Martins, SGPS, S.A. |
16,662 | 246,023 | ||||||
|
|
|
|||||||
| Total Portugal |
|
279,959 | ||||||
| Spain – 4.5% |
| |||||||
| Amadeus IT Group S.A. |
4,666 | 374,080 | ||||||
| Atresmedia Corp. de Medios de Comunicacion S.A. |
12,062 | 56,586 | ||||||
| Ence Energia y Celulosa S.A. |
6,678 | 37,192 | ||||||
| Grifols S.A. |
4,401 | 123,344 | ||||||
| Industria de Diseno Textil S.A. |
36,588 | 1,076,370 | ||||||
| Prosegur Cash S.A.(b) |
20,257 | 44,763 | ||||||
| Prosegur Cia de Seguridad S.A. |
7,799 | 42,297 | ||||||
| Zardoya Otis S.A.(a) |
13,535 | 112,160 | ||||||
|
|
|
|||||||
| Total Spain |
|
1,866,792 | ||||||
| Sweden – 7.2% |
| |||||||
| AAK AB |
2,725 | 40,743 | ||||||
| AF Poyry AB Class B(a) |
1,487 | 24,849 | ||||||
| Assa Abloy AB Class B |
11,300 | 244,511 | ||||||
| Atlas Copco AB Class A |
12,706 | 341,989 | ||||||
| Atlas Copco AB Class B |
6,243 | 154,875 | ||||||
| Bonava AB Class B |
2,672 | 33,676 | ||||||
| Electrolux AB Series B |
4,410 | 113,587 | ||||||
| Evolution Gaming Group AB(b) |
244 | 19,270 | ||||||
| Hexagon AB Class B |
2,358 | 123,298 | ||||||
| Hexpol AB |
4,664 | 39,297 | ||||||
| Husqvarna AB Class B |
6,735 | 55,142 | ||||||
| Indutrade AB |
1,821 | 51,948 | ||||||
| Intrum AB(a) |
3,557 | 102,392 | ||||||
| Investment AB Latour Class B(a) |
9,120 | 122,416 | ||||||
| JM AB(a) |
3,004 | 53,957 | ||||||
| Lifco AB Class B |
808 | 33,016 | ||||||
| Loomis AB Class B |
1,284 | 44,298 | ||||||
| NetEnt AB* |
7,236 | 26,330 | ||||||
| Nibe Industrier AB Class B |
5,136 | 65,921 | ||||||
| Nobia AB |
5,718 | 33,598 | ||||||
| Peab AB |
9,195 | 79,654 | ||||||
| Sandvik AB |
16,565 | 269,675 | ||||||
| Securitas AB Class B |
6,646 | 107,658 | ||||||
| SKF AB Class B(a) |
7,994 | 133,071 | ||||||
| Sweco AB Class B |
1,860 | 44,919 | ||||||
| Thule Group AB(b) |
1,685 | 38,150 | ||||||
| Volvo AB Class A |
7,512 | 116,544 | ||||||
| Volvo AB Class B |
29,192 | 453,209 | ||||||
|
|
|
|||||||
| Total Sweden |
|
2,967,993 | ||||||
| Switzerland – 16.8% |
| |||||||
| Bucher Industries AG Registered Shares |
144 | 48,150 | ||||||
| Cie Financiere Richemont S.A. Registered Shares |
5,033 | 366,597 | ||||||
| EMS-Chemie Holding AG Registered Shares |
407 | 220,685 | ||||||
| Galenica AG*(b) |
1,134 | 56,136 | ||||||
| Givaudan S.A. Registered Shares* |
157 | 401,052 | ||||||
| Kuehne + Nagel International AG Registered Shares |
2,818 | 386,524 | ||||||
| Logitech International S.A. Registered Shares |
2,234 | 87,552 | ||||||
| Lonza Group AG Registered Shares* |
482 | 149,454 | ||||||
| Oriflame Holding AG |
1,423 | 27,385 | ||||||
| Partners Group Holding AG |
444 | 322,779 | ||||||
| Roche Holding AG Bearer Shares |
2,948 | 803,381 | ||||||
| Roche Holding AG Genusschein |
11,496 | 3,166,912 | ||||||
| SGS S.A. Registered Shares |
139 | 345,860 | ||||||
| Sonova Holding AG Registered Shares |
776 | 153,501 | ||||||
| Straumann Holding AG Registered Shares |
118 | 96,270 | ||||||
| Sunrise Communications Group AG*(a)(b) |
1,731 | 127,405 | ||||||
| Swatch Group AG (The) Bearer Shares |
376 | 107,601 | ||||||
| Swatch Group AG (The) Registered Shares |
334 | 18,479 | ||||||
| Vifor Pharma AG |
595 | 80,447 | ||||||
|
|
|
|||||||
| Total Switzerland |
|
6,966,170 | ||||||
| United Kingdom – 31.4% |
| |||||||
| Ashmore Group PLC |
20,914 | 116,421 | ||||||
| Ashtead Group PLC |
4,593 | 110,870 | ||||||
| Barratt Developments PLC |
36,442 | 284,535 | ||||||
| Beazley PLC |
5,292 | 35,513 | ||||||
| Bellway PLC |
2,265 | 89,870 | ||||||
| Bovis Homes Group PLC |
2,681 | 37,153 | ||||||
| British American Tobacco PLC |
41,436 | 1,724,543 | ||||||
| Carnival PLC |
2,572 | 126,182 | ||||||
| Cineworld Group PLC |
11,265 | 42,950 | ||||||
| Compass Group PLC |
14,523 | 341,487 | ||||||
| Computacenter PLC |
3,458 | 49,836 | ||||||
| Croda International PLC |
1,929 | 126,634 | ||||||
| Diageo PLC |
34,400 | 1,406,606 | ||||||
| Dunelm Group PLC |
4,498 | 50,962 | ||||||
| easyJet PLC |
5,612 | 81,720 | ||||||
| Electrocomponents PLC |
7,620 | 55,782 | ||||||
| FDM Group Holdings PLC |
2,425 | 28,407 | ||||||
| Ferrexpo PLC |
14,549 | 46,940 | ||||||
| Fevertree Drinks PLC |
685 | 26,947 | ||||||
| Fresnillo PLC |
11,165 | 126,689 | ||||||
| Halma PLC |
4,124 | 89,850 | ||||||
| Hargreaves Lansdown PLC |
5,644 | 137,050 | ||||||
| Hays PLC |
14,557 | 28,453 | ||||||
| Howden Joinery Group PLC |
7,555 | 47,776 | ||||||
See Notes to Financial Statements.
| WisdomTree Trust | 17 |
Schedule of Investments (concluded)
WisdomTree Europe Quality Dividend Growth Fund (EUDG)
March 31, 2019
| Investments | Shares | Value | ||||||
| IMI PLC |
4,899 | $ | 61,155 | |||||
| International Consolidated Airlines Group S.A. |
37,636 | 250,684 | ||||||
| Jardine Lloyd Thompson Group PLC |
3,997 | 99,687 | ||||||
| Johnson Matthey PLC |
3,215 | 131,628 | ||||||
| Mondi PLC |
5,559 | 122,997 | ||||||
| Moneysupermarket.com Group PLC |
14,453 | 70,078 | ||||||
| Next PLC |
1,598 | 116,191 | ||||||
| Pagegroup PLC |
9,230 | 56,528 | ||||||
| Persimmon PLC |
11,502 | 325,233 | ||||||
| Reckitt Benckiser Group PLC |
10,873 | 904,206 | ||||||
| Redrow PLC |
6,851 | 53,652 | ||||||
| RELX PLC |
29,913 | 639,826 | ||||||
| Renishaw PLC |
825 | 39,840 | ||||||
| Rentokil Initial PLC |
8,853 | 40,756 | ||||||
| Rightmove PLC |
10,499 | 69,772 | ||||||
| Rotork PLC |
6,706 | 24,712 | ||||||
| Sage Group PLC (The) |
15,794 | 144,310 | ||||||
| Savills PLC |
2,761 | 32,541 | ||||||
| Segro PLC |
18,905 | 165,886 | ||||||
| Smith & Nephew PLC |
8,512 | 168,925 | ||||||
| Softcat PLC |
4,767 | 51,557 | ||||||
| Spirax-Sarco Engineering PLC |
946 | 88,630 | ||||||
| SSE PLC |
39,840 | 616,214 | ||||||
| SSP Group PLC |
2,362 | 21,308 | ||||||
| Superdry PLC |
2,746 | 19,608 | ||||||
| Synthomer PLC |
11,403 | 56,374 | ||||||
| Telecom Plus PLC |
2,651 | 52,507 | ||||||
| Unilever N.V. CVA |
33,907 | 1,971,393 | ||||||
| Unilever PLC |
22,614 | 1,295,083 | ||||||
| Unite Group PLC (The) |
1,903 | 22,751 | ||||||
| WH Smith PLC |
1,929 | 53,338 | ||||||
|
|
|
|||||||
| Total United Kingdom |
|
12,980,546 | ||||||
| TOTAL COMMON STOCKS (Cost: $42,360,798) |
|
41,093,026 | ||||||
| RIGHTS – 0.0% |
| |||||||
| Sweden – 0.0% |
| |||||||
| AF Poyry AB, expiring 4/12/19* (Cost: $0) |
1,487 | 3,046 | ||||||
| INVESTMENT OF CASH COLLATERAL FOR SECURITIES LOANED – 2.4% |
| |||||||
| United States – 2.4% |
| |||||||
| State Street Navigator Securities Lending |
||||||||
| (Cost: $969,973)(d) | 969,973 | 969,973 | ||||||
| TOTAL INVESTMENTS IN SECURITIES – 101.8% (Cost: $43,330,771) |
|
42,066,045 | ||||||
| Other Assets less Liabilities – (1.8)% |
|
(724,404 | ) | |||||
|
|
|
|||||||
| NET ASSETS – 100.0% |
|
$ | 41,341,641 | |||||
| * | Non-income producing security. |
| (a) | Security, or portion thereof, was on loan at March 31, 2019 (See Note 2). |
| (b) | This security is exempt from registration under rule 144A of the Securities Act of 1933. This security may be sold in transactions that are exempt from registration, normally to qualified institutional buyers. |
| (c) | Rate shown represents annualized 7-day yield as of March 31, 2019. |
| (d) | At March 31, 2019, the total market value of the Fund’s securities on loan identified in the Schedule of Investments was $1,039,858 and the total market value of the collateral held by the Fund was $1,096,572. The total market value of the collateral includes non-cash U.S. Government securities collateral having a value of $126,599. |
CVA – Certificaten Van Aandelen (Certificate of Stock)
See Notes to Financial Statements.
| 18 | WisdomTree Trust |
Schedule of Investments
WisdomTree Europe SmallCap Dividend Fund (DFE)
March 31, 2019
| Investments | Shares | Value | ||||||
| COMMON STOCKS – 98.9% |
| |||||||
| Austria – 0.7% |
| |||||||
| Palfinger AG |
23,540 | $ | 660,797 | |||||
| POLYTEC Holding AG(a) |
52,604 | 500,292 | ||||||
| Porr AG(a) |
50,378 | 1,126,813 | ||||||
| S IMMO AG |
81,215 | 1,661,523 | ||||||
| S&T AG* |
18,580 | 465,235 | ||||||
| Schoeller-Bleckmann Oilfield Equipment AG |
5,466 | 454,175 | ||||||
|
|
|
|||||||
| Total Austria |
|
4,868,835 | ||||||
| Belgium – 2.3% |
| |||||||
| Bekaert S.A. |
113,540 | 2,669,607 | ||||||
| D’ieteren S.A./N.V. |
72,144 | 2,859,543 | ||||||
| Econocom Group S.A./N.V.(a) |
261,473 | 1,066,924 | ||||||
| Euronav N.V.(a) |
130,626 | 1,064,115 | ||||||
| Fagron |
31,309 | 562,837 | ||||||
| Greenyard N.V.(a) |
36,583 | 137,198 | ||||||
| Kinepolis Group N.V. |
20,653 | 1,168,787 | ||||||
| Ontex Group N.V. |
117,244 | 2,640,847 | ||||||
| Orange Belgium S.A. |
102,285 | 2,205,133 | ||||||
| Recticel S.A. |
94,149 | 707,235 | ||||||
|
|
|
|||||||
| Total Belgium |
|
15,082,226 | ||||||
| Denmark – 2.9% |
| |||||||
| Alm Brand A/S |
398,569 | 3,440,979 | ||||||
| Matas A/S |
209,645 | 2,074,803 | ||||||
| Per Aarsleff Holding A/S |
23,794 | 789,119 | ||||||
| Ringkjoebing Landbobank A/S(a) |
27,586 | 1,696,987 | ||||||
| Scandinavian Tobacco Group A/S Class A(b) |
272,510 | 3,401,943 | ||||||
| Schouw & Co. A/S |
27,709 | 2,062,135 | ||||||
| Spar Nord Bank A/S |
208,740 | 1,830,378 | ||||||
| Sydbank A/S(a) |
194,046 | 4,027,637 | ||||||
|
|
|
|||||||
| Total Denmark |
|
19,323,981 | ||||||
| Finland – 4.9% |
| |||||||
| Aktia Bank Oyj |
112,639 | 1,185,087 | ||||||
| Citycon Oyj(a) |
476,448 | 4,881,154 | ||||||
| Cramo Oyj |
92,833 | 1,827,284 | ||||||
| Finnair Oyj |
216,207 | 1,946,999 | ||||||
| Kemira Oyj |
355,647 | 4,400,707 | ||||||
| Lehto Group Oyj(a) |
102,412 | 488,722 | ||||||
| Oriola Oyj Class B |
219,902 | 579,020 | ||||||
| Raisio Oyj Class V |
233,222 | 653,374 | ||||||
| Ramirent Oyj |
248,346 | 1,529,521 | ||||||
| Rovio Entertainment Oyj(b) |
61,103 | 406,580 | ||||||
| Sanoma Oyj |
191,537 | 1,878,613 | ||||||
| Terveystalo Oyj*(b) |
46,582 | 493,755 | ||||||
| Tieto Oyj |
179,633 | 5,486,264 | ||||||
| Tikkurila Oyj |
58,242 | 956,104 | ||||||
| Tokmanni Group Corp. |
168,423 | 1,571,535 | ||||||
| Uponor Oyj |
63,871 | 730,802 | ||||||
| YIT Oyj(a) |
579,840 | 3,362,794 | ||||||
|
|
|
|||||||
| Total Finland |
|
32,378,315 | ||||||
| France – 6.1% |
| |||||||
| Akka Technologies |
8,899 | 605,530 | ||||||
| Albioma S.A. |
49,280 | 1,156,481 | ||||||
| Beneteau S.A. |
54,136 | 634,612 | ||||||
| Bonduelle SCA |
23,975 | 703,967 | ||||||
| Chargeurs S.A. |
33,007 | 697,505 | ||||||
| Coface S.A. |
303,233 | 2,683,023 | ||||||
| Derichebourg S.A. |
257,075 | 1,045,514 | ||||||
| Europcar Mobility Group(b) |
152,693 | 1,239,593 | ||||||
| Gaztransport Et Technigaz S.A. |
96,999 | 8,833,032 | ||||||
| Interparfums S.A. |
29,276 | 1,592,675 | ||||||
| IPSOS |
61,648 | 1,545,023 | ||||||
| Jacquet Metal Service S.A. |
23,212 | 387,305 | ||||||
| Kaufman & Broad S.A. |
51,032 | 2,086,912 | ||||||
| Lectra |
32,615 | 789,199 | ||||||
| LISI |
35,432 | 1,090,104 | ||||||
| Maisons du Monde S.A.(b) |
19,503 | 377,100 | ||||||
| Mersen S.A. |
17,909 | 579,143 | ||||||
| Neopost S.A. |
123,489 | 2,958,996 | ||||||
| Nexans S.A.(a) |
44,916 | 1,338,012 | ||||||
| Oeneo S.A. |
63,150 | 667,244 | ||||||
| Rallye S.A.(a) |
236,849 | 2,805,729 | ||||||
| Tarkett S.A.(a) |
74,603 | 1,603,319 | ||||||
| Television Francaise 1 |
413,554 | 3,812,388 | ||||||
| Vilmorin & Cie S.A.(a) |
32,049 | 1,698,549 | ||||||
|
|
|
|||||||
| Total France |
|
40,930,955 | ||||||
| Georgia – 0.2% |
| |||||||
| Bank of Georgia Group PLC |
66,052 | 1,422,722 | ||||||
| Germany – 7.3% |
| |||||||
| alstria office REIT-AG |
355,087 | 5,781,286 | ||||||
| AURELIUS Equity Opportunities SE & Co. KGaA |
139,118 | 6,338,946 | ||||||
| BayWa AG |
41,217 | 1,173,211 | ||||||
| bet-at-home.com AG |
42,252 | 2,751,674 | ||||||
| Bilfinger SE |
47,301 | 1,646,470 | ||||||
| Borussia Dortmund GmbH & Co. KGaA |
74,237 | 682,694 | ||||||
| CANCOM SE |
21,288 | 960,432 | ||||||
| CompuGroup Medical SE |
20,385 | 1,201,688 | ||||||
| CropEnergies AG |
189,383 | 1,105,773 | ||||||
| Deutz AG |
163,335 | 1,368,169 | ||||||
| Elmos Semiconductor AG |
20,368 | 445,512 | ||||||
| Encavis AG |
229,001 | 1,622,514 | ||||||
| GFT Technologies SE |
25,785 | 219,606 | ||||||
| H&R GmbH & Co. KGaA |
26,156 | 217,920 | ||||||
| Hamburger Hafen und Logistik AG |
111,469 | 2,550,821 | ||||||
| Indus Holding AG |
29,522 | 1,423,740 | ||||||
| Jenoptik AG |
27,207 | 1,014,239 | ||||||
| Kloeckner & Co. SE |
187,775 | 1,382,077 | ||||||
| Koenig & Bauer AG |
12,244 | 513,357 | ||||||
| MLP SE |
233,243 | 1,165,441 | ||||||
| NORMA Group SE |
24,273 | 1,179,048 | ||||||
| OHB SE |
15,390 | 622,104 | ||||||
| Pfeiffer Vacuum Technology AG |
6,796 | 1,040,853 | ||||||
| RHOEN-KLINIKUM AG |
28,502 | 821,849 | ||||||
| RIB Software SE |
32,267 | 532,596 | ||||||
| Sixt Leasing SE |
28,668 | 338,637 | ||||||
See Notes to Financial Statements.
| WisdomTree Trust | 19 |
Schedule of Investments (continued)
WisdomTree Europe SmallCap Dividend Fund (DFE)
March 31, 2019
| Investments | Shares | Value | ||||||
| SMA Solar Technology AG |
15,345 | $ | 314,450 | |||||
| Takkt AG |
103,257 | 1,699,711 | ||||||
| VERBIO Vereinigte BioEnergie AG |
143,523 | 1,115,997 | ||||||
| Vossloh AG |
21,545 | 985,816 | ||||||
| Wacker Neuson SE |
84,763 | 2,017,734 | ||||||
| Washtec AG |
22,090 | 1,686,655 | ||||||
| Wuestenrot & Wuerttembergische AG |
143,359 | 2,755,817 | ||||||
|
|
|
|||||||
| Total Germany |
|
48,676,837 | ||||||
| Ireland – 2.0% |
| |||||||
| C&C Group PLC |
737,474 | 2,649,832 | ||||||
| FBD Holdings PLC |
33,147 | 335,716 | ||||||
| Grafton Group PLC |
221,507 | 2,336,499 | ||||||
| Greencore Group PLC |
1,126,313 | 2,964,638 | ||||||
| Hibernia REIT PLC |
908,911 | 1,363,482 | ||||||
| Hostelworld Group PLC(b) |
187,711 | 452,504 | ||||||
| Irish Continental Group PLC |
213,030 | 1,162,516 | ||||||
| Origin Enterprises PLC |
258,233 | 1,528,073 | ||||||
| Total Produce PLC(a) |
321,936 | 614,526 | ||||||
|
|
|
|||||||
| Total Ireland |
|
13,407,786 | ||||||
| Italy – 11.0% |
| |||||||
| Anima Holding SpA(b) |
656,904 | 2,687,831 | ||||||
| Aquafil SpA |
54,436 | 611,235 | ||||||
| Ascopiave SpA |
402,932 | 1,590,299 | ||||||
| ASTM SpA |
118,756 | 3,233,620 | ||||||
| Banca Farmafactoring SpA(b) |
763,976 | 4,653,730 | ||||||
| Banca IFIS SpA |
103,723 | 1,713,205 | ||||||
| Banca Popolare di Sondrio SCPA |
531,819 | 1,455,859 | ||||||
| Biesse SpA |
16,202 | 352,569 | ||||||
| BPER Banca(a) |
706,083 | 2,886,677 | ||||||
| Brunello Cucinelli SpA |
27,188 | 935,685 | ||||||
| Cairo Communication SpA |
305,726 | 1,294,182 | ||||||
| Cementir Holding SpA |
134,174 | 947,634 | ||||||
| Cerved Group SpA |
292,742 | 2,912,329 | ||||||
| CIR-Compagnie Industriali Riunite SpA |
944,272 | 1,157,821 | ||||||
| Credito Emiliano SpA |
307,646 | 1,730,656 | ||||||
| Datalogic SpA |
44,675 | 1,043,397 | ||||||
| doBank SpA(a)(b) |
134,363 | 1,802,890 | ||||||
| El.En. SpA(a) |
16,832 | 355,127 | ||||||
| Emak SpA(a) |
57,395 | 83,522 | ||||||
| Enav SpA(b) |
1,207,644 | 6,587,462 | ||||||
| Esprinet SpA |
73,706 | 266,490 | ||||||
| Falck Renewables SpA |
428,487 | 1,556,444 | ||||||
| Gamenet Group SpA(b) |
132,058 | 1,337,497 | ||||||
| Geox SpA(a) |
345,521 | 640,924 | ||||||
| Gima TT SpA(a)(b) |
119,268 | 954,047 | ||||||
| Gruppo MutuiOnline SpA |
52,585 | 1,089,972 | ||||||
| Immobiliare Grande Distribuzione SIIQ SpA |
391,292 | 2,829,492 | ||||||
| La Doria SpA |
10,610 | 95,903 | ||||||
| Maire Tecnimont SpA |
566,226 | 2,159,132 | ||||||
| MARR SpA |
101,219 | 2,304,898 | ||||||
| OVS SpA*(a)(b) |
758,601 | 1,392,685 | ||||||
| Piaggio & C. SpA |
599,889 | 1,464,374 | ||||||
| RAI Way SpA(b) |
221,319 | 1,145,622 | ||||||
| Reply SpA |
12,029 | 775,288 | ||||||
| SAES Getters SpA |
29,077 | 718,280 | ||||||
| Salini Impregilo SpA(a) |
645,523 | 1,503,288 | ||||||
| Saras SpA |
3,047,350 | 5,649,254 | ||||||
| Societa Cattolica di Assicurazioni SC |
435,503 | 4,163,873 | ||||||
| Technogym SpA(b) |
92,019 | 1,133,459 | ||||||
| Tod’s SpA(a) |
39,534 | 1,833,338 | ||||||
| Unieuro SpA*(b) |
89,327 | 1,322,968 | ||||||
| Zignago Vetro SpA |
98,950 | 1,107,727 | ||||||
|
|
|
|||||||
| Total Italy |
|
73,480,685 | ||||||
| Netherlands – 5.0% |
| |||||||
| Accell Group N.V. |
44,060 | 1,224,451 | ||||||
| AMG Advanced Metallurgical Group N.V. |
8,231 | 256,378 | ||||||
| Amsterdam Commodities N.V. |
35,585 | 781,551 | ||||||
| Arcadis N.V. |
119,500 | 1,862,426 | ||||||
| BE Semiconductor Industries N.V. |
330,934 | 8,814,096 | ||||||
| Beter Bed Holding N.V. |
10,048 | 49,530 | ||||||
| BinckBank N.V. |
247,860 | 1,753,350 | ||||||
| Brunel International N.V.(a) |
33,211 | 503,801 | ||||||
| Corbion N.V. |
60,904 | 1,832,746 | ||||||
| ForFarmers N.V. |
136,141 | 1,120,507 | ||||||
| Intertrust N.V.(b) |
178,206 | 3,361,656 | ||||||
| Kendrion N.V. |
21,285 | 470,349 | ||||||
| Koninklijke BAM Groep N.V.(a) |
422,588 | 1,823,989 | ||||||
| Koninklijke Volkerwessels N.V. |
111,866 | 2,308,689 | ||||||
| PostNL N.V. |
1,706,264 | 4,366,287 | ||||||
| SIF Holding N.V.(a) |
17,042 | 191,739 | ||||||
| Sligro Food Group N.V. |
66,340 | 2,379,951 | ||||||
| Wessanen |
37,493 | 457,195 | ||||||
|
|
|
|||||||
| Total Netherlands |
|
33,558,691 | ||||||
| Norway – 7.0% |
| |||||||
| ABG Sundal Collier Holding ASA |
1,722,183 | 819,935 | ||||||
| American Shipping Co. ASA* |
216,737 | 804,119 | ||||||
| Atea ASA* |
241,208 | 3,506,810 | ||||||
| Austevoll Seafood ASA |
314,037 | 3,719,608 | ||||||
| Borregaard ASA |
115,418 | 1,145,924 | ||||||
| Entra ASA(b) |
297,974 | 4,505,111 | ||||||
| Europris ASA*(b) |
650,274 | 2,080,339 | ||||||
| Grieg Seafood ASA |
215,086 | 2,612,522 | ||||||
| Hexagon Composites ASA |
53,698 | 205,149 | ||||||
| Kongsberg Gruppen ASA |
128,659 | 1,960,154 | ||||||
| Norway Royal Salmon ASA |
69,016 | 1,602,861 | ||||||
| Ocean Yield ASA(a) |
623,818 | 4,628,869 | ||||||
| Sbanken ASA(b) |
57,042 | 518,648 | ||||||
| Scatec Solar ASA(b) |
98,437 | 1,013,907 | ||||||
| Selvaag Bolig ASA |
288,283 | 1,439,473 | ||||||
| SpareBank 1 Nord Norge |
357,884 | 2,647,268 | ||||||
| SpareBank 1 SMN(a) |
364,720 | 3,701,580 | ||||||
| SpareBank 1 SR-Bank ASA |
435,515 | 5,026,963 | ||||||
| Sparebanken Vest |
161,568 | 960,597 | ||||||
| Veidekke ASA |
290,771 | 3,055,736 | ||||||
| XXL ASA(a)(b) |
263,267 | 871,279 | ||||||
|
|
|
|||||||
| Total Norway |
|
46,826,852 | ||||||
See Notes to Financial Statements.
| 20 | WisdomTree Trust |
Schedule of Investments (continued)
WisdomTree Europe SmallCap Dividend Fund (DFE)
March 31, 2019
| Investments | Shares | Value | ||||||
| Portugal – 3.2% |
| |||||||
| Altri, SGPS, S.A. |
377,955 | $ | 2,962,219 | |||||
| Corticeira Amorim, SGPS, S.A.(a) |
111,260 | 1,329,237 | ||||||
| CTT-Correios de Portugal S.A. |
843,982 | 2,444,976 | ||||||
| Mota-Engil, SGPS, S.A.*(a) |
580,417 | 1,329,511 | ||||||
| REN – Redes Energeticas Nacionais, SGPS, S.A. |
2,334,102 | 6,662,191 | ||||||
| Semapa-Sociedade de Investimento e Gestao |
73,322 | 1,195,426 | ||||||
| Sonae Capital, SGPS, S.A. |
875,095 | 859,775 | ||||||
| Sonae, SGPS, S.A. |
4,595,595 | 4,757,671 | ||||||
|
|
|
|||||||
| Total Portugal |
|
21,541,006 | ||||||
| Spain – 4.2% |
| |||||||
| Almirall S.A. |
148,817 | 2,539,907 | ||||||
| Applus Services S.A. |
87,583 | 1,046,365 | ||||||
| Atresmedia Corp. de Medios de Comunicacion S.A.(a) |
701,996 | 3,293,250 | ||||||
| Construcciones y Auxiliar de Ferrocarriles S.A. |
26,504 | 1,275,217 | ||||||
| Ence Energia y Celulosa S.A. |
312,786 | 1,742,010 | ||||||
| Ercros S.A. |
39,427 | 138,833 | ||||||
| Euskaltel S.A.(b) |
351,405 | 3,276,946 | ||||||
| Faes Farma S.A. |
516,999 | 2,188,531 | ||||||
| Fluidra S.A.* |
59,178 | 680,428 | ||||||
| Lar Espana Real Estate Socimi S.A. |
276,678 | 2,311,369 | ||||||
| Obrascon Huarte Lain S.A.(a) |
1,853,187 | 2,335,755 | ||||||
| Sacyr S.A.(a) |
684,304 | 1,732,676 | ||||||
| Talgo S.A.*(b) |
149,093 | 964,276 | ||||||
| Tecnicas Reunidas S.A.(a) |
157,429 | 4,431,602 | ||||||
|
|
|
|||||||
| Total Spain |
|
27,957,165 | ||||||
| Sweden – 14.2% |
| |||||||
| Acando AB |
262,521 | 1,168,924 | ||||||
| AddTech AB Class B |
53,451 | 1,112,206 | ||||||
| AF Poyry AB Class B(a) |
91,034 | 1,521,274 | ||||||
| Alimak Group AB(a)(b) |
47,846 | 682,976 | ||||||
| Ambea AB(a)(b) |
85,459 | 732,482 | ||||||
| Arjo AB Class B |
276,568 | 1,019,765 | ||||||
| Atrium Ljungberg AB Class B |
155,378 | 2,660,186 | ||||||
| Attendo AB(b) |
120,618 | 608,597 | ||||||
| Avanza Bank Holding AB |
33,746 | 1,451,668 | ||||||
| Beijer Ref AB |
69,497 | 1,120,158 | ||||||
| Bergman & Beving AB |
85,364 | 981,079 | ||||||
| Betsson AB* |
337,708 | 2,567,954 | ||||||
| Bilia AB Class A |
326,042 | 2,789,283 | ||||||
| BioGaia AB Class B |
19,549 | 960,030 | ||||||
| Biotage AB |
48,341 | 617,077 | ||||||
| Bonava AB Class B |
200,790 | 2,530,630 | ||||||
| Bravida Holding AB(b) |
223,858 | 1,977,851 | ||||||
| Bufab AB |
47,191 | 497,079 | ||||||
| Bulten AB |
65,149 | 558,402 | ||||||
| Byggmax Group AB(a) |
207,030 | 681,893 | ||||||
| Catena AB |
48,363 | 1,342,649 | ||||||
| Clas Ohlson AB Class B(a) |
283,746 | 2,187,297 | ||||||
| Cloetta AB Class B |
564,559 | 1,460,806 | ||||||
| Coor Service Management Holding AB(b) |
209,669 | 1,871,702 | ||||||
| Duni AB |
95,505 | 1,033,789 | ||||||
| Dustin Group AB(b) |
151,936 | 1,428,398 | ||||||
| Evolution Gaming Group AB(b) |
30,640 | 2,419,738 | ||||||
| Fagerhult AB(a) |
100,347 | 772,458 | ||||||
| Global Gaming 555 AB(a) |
109,877 | 195,107 | ||||||
| Granges AB |
110,427 | 1,139,355 | ||||||
| Hemfosa Fastigheter AB |
335,199 | 2,947,126 | ||||||
| HIQ International AB* |
168,976 | 1,093,071 | ||||||
| Instalco Intressenter AB |
17,163 | 146,181 | ||||||
| Inwido AB |
197,361 | 1,174,553 | ||||||
| ITAB Shop Concept AB Class B(a) |
196,996 | 430,085 | ||||||
| JM AB(a) |
247,420 | 4,444,080 | ||||||
| KappAhl AB |
345,337 | 629,294 | ||||||
| KNOW IT AB |
34,469 | 739,527 | ||||||
| Kungsleden AB |
384,426 | 3,067,019 | ||||||
| Lagercrantz Group AB Class B |
84,359 | 909,502 | ||||||
| LeoVegas AB(a)(b) |
120,412 | 376,219 | ||||||
| Lindab International AB |
107,714 | 982,459 | ||||||
| Mycronic AB(a) |
143,841 | 2,054,805 | ||||||
| NCC AB Class B(a) |
275,106 | 4,239,906 | ||||||
| NetEnt AB* |
550,140 | 2,001,792 | ||||||
| New Wave Group AB Class B |
28,368 | 185,954 | ||||||
| Nobia AB |
428,299 | 2,516,608 | ||||||
| Nobina AB(b) |
262,280 | 1,692,394 | ||||||
| Nolato AB Class B |
21,061 | 877,608 | ||||||
| Nordic Waterproofing Holding A/S(b) |
18,159 | 162,692 | ||||||
| Paradox Interactive AB(a) |
27,523 | 427,297 | ||||||
| Peab AB |
750,924 | 6,505,099 | ||||||
| Platzer Fastigheter Holding AB Class B |
149,392 | 1,232,142 | ||||||
| Pricer AB Class B |
218,676 | 269,240 | ||||||
| Ratos AB Class B(a) |
861,454 | 1,748,858 | ||||||
| Resurs Holding AB(b) |
590,933 | 3,669,719 | ||||||
| Rottneros AB |
524,141 | 619,342 | ||||||
| Scandi Standard AB |
143,868 | 949,265 | ||||||
| Scandic Hotels Group AB(b) |
109,947 | 983,860 | ||||||
| SkiStar AB |
103,683 | 1,143,997 | ||||||
| Thule Group AB(b) |
109,330 | 2,475,316 | ||||||
| Vitrolife AB |
22,499 | 513,397 | ||||||
| Wihlborgs Fastigheter AB |
236,994 | 3,237,834 | ||||||
|
|
|
|||||||
| Total Sweden |
|
94,537,054 | ||||||
| Switzerland – 2.0% |
| |||||||
| Ascom Holding AG Registered Shares |
55,462 | 742,909 | ||||||
| Autoneum Holding AG(a) |
7,399 | 852,902 | ||||||
| Bobst Group S.A. Registered Shares |
19,127 | 1,157,146 | ||||||
| Comet Holding AG Registered Shares*(a) |
6,798 | 580,209 | ||||||
| EFG International AG* |
452,476 | 2,862,334 | ||||||
| Huber + Suhner AG Registered Shares |
17,943 | 1,295,413 | ||||||
| Implenia AG Registered Shares |
27,234 | 811,086 | ||||||
| Kudelski S.A. Bearer Shares*(a) |
34,101 | 204,763 | ||||||
| Mobilezone Holding AG Registered Shares |
143,225 | 1,436,708 | ||||||
| Oriflame Holding AG |
98,815 | 1,901,661 | ||||||
| Swissquote Group Holding S.A. Registered Shares |
13,485 | 491,521 | ||||||
| u-blox Holding AG* |
4,147 | 314,804 | ||||||
| Ypsomed Holding AG Registered Shares* |
5,730 | 733,583 | ||||||
|
|
|
|||||||
| Total Switzerland |
|
13,385,039 | ||||||
See Notes to Financial Statements.
| WisdomTree Trust | 21 |
Schedule of Investments (continued)
WisdomTree Europe SmallCap Dividend Fund (DFE)
March 31, 2019
| Investments | Shares | Value | ||||||
| United Kingdom – 25.9% |
| |||||||
| A.G. Barr PLC |
125,251 | $ | 1,317,092 | |||||
| AA PLC |
729,178 | 864,642 | ||||||
| Aggreko PLC |
343,814 | 3,526,711 | ||||||
| Ascential PLC |
188,258 | 874,774 | ||||||
| BCA Marketplace PLC |
832,180 | 2,142,720 | ||||||
| Biffa PLC(b) |
158,106 | 457,365 | ||||||
| Big Yellow Group PLC |
176,965 | 2,286,343 | ||||||
| Bodycote PLC |
110,841 | 1,188,671 | ||||||
| Bovis Homes Group PLC |
173,364 | 2,402,468 | ||||||
| Brewin Dolphin Holdings PLC |
406,347 | 1,653,070 | ||||||
| Card Factory PLC |
1,371,134 | 3,221,342 | ||||||
| Central Asia Metals PLC |
386,315 | 1,193,029 | ||||||
| Chesnara PLC |
235,703 | 1,160,962 | ||||||
| Civitas Social Housing PLC |
982,068 | 1,228,497 | ||||||
| Clipper Logistics PLC(a) |
47,188 | 163,559 | ||||||
| CMC Markets PLC(b) |
493,036 | 533,877 | ||||||
| Coats Group PLC |
752,430 | 775,539 | ||||||
| Computacenter PLC |
85,245 | 1,228,529 | ||||||
| Concentric AB |
53,845 | 853,365 | ||||||
| ContourGlobal PLC(b) |
193,817 | 435,907 | ||||||
| Costain Group PLC |
174,896 | 763,459 | ||||||
| Countryside Properties PLC(b) |
401,631 | 1,699,826 | ||||||
| Cranswick PLC |
25,242 | 895,309 | ||||||
| Crest Nicholson Holdings PLC |
689,501 | 3,324,282 | ||||||
| Dairy Crest Group PLC |
252,549 | 2,043,612 | ||||||
| Dart Group PLC |
27,609 | 285,469 | ||||||
| De La Rue PLC |
187,732 | 943,027 | ||||||
| DFS Furniture PLC |
336,259 | 1,097,597 | ||||||
| Dignity PLC |
45,722 | 407,812 | ||||||
| Diploma PLC |
73,935 | 1,404,652 | ||||||
| Domino’s Pizza Group PLC |
439,214 | 1,385,010 | ||||||
| Drax Group PLC |
539,769 | 2,661,462 | ||||||
| Dunelm Group PLC |
334,201 | 3,786,505 | ||||||
| Eco Animal Health Group PLC |
28,540 | 163,632 | ||||||
| Elementis PLC |
348,289 | 737,487 | ||||||
| EMIS Group PLC |
77,153 | 1,055,610 | ||||||
| Equiniti Group PLC(b) |
333,184 | 903,044 | ||||||
| Essentra PLC |
378,128 | 2,034,933 | ||||||
| Euromoney Institutional Investor PLC |
59,922 | 982,264 | ||||||
| FDM Group Holdings PLC |
88,180 | 1,032,978 | ||||||
| Ferrexpo PLC |
487,882 | 1,574,079 | ||||||
| Forterra PLC(b) |
273,886 | 1,051,033 | ||||||
| Galliford Try PLC |
261,036 | 2,267,054 | ||||||
| Games Workshop Group PLC |
44,880 | 1,839,224 | ||||||
| Gamma Communications PLC |
29,704 | 378,543 | ||||||
| Genus PLC |
21,117 | 610,867 | ||||||
| Go-Ahead Group PLC (The) |
96,873 | 2,475,378 | ||||||
| Greene King PLC |
566,286 | 4,909,981 | ||||||
| Greggs PLC |
113,190 | 2,712,383 | ||||||
| Halfords Group PLC |
356,970 | 1,079,148 | ||||||
| Hastings Group Holdings PLC(b) |
1,120,822 | 3,163,416 | ||||||
| Headlam Group PLC |
169,889 | 987,328 | ||||||
| Helical PLC |
180,805 | 778,652 | ||||||
| Hill & Smith Holdings PLC |
54,771 | 887,121 | ||||||
| Hilton Food Group PLC |
73,722 | 912,603 | ||||||
| Hochschild Mining PLC |
285,380 | 768,272 | ||||||
| Huntsworth PLC |
179,396 | 201,035 | ||||||
| Ibstock PLC(b) |
424,265 | 1,325,707 | ||||||
| Inland Homes PLC(a) |
334,325 | 261,385 | ||||||
| Inmarsat PLC |
758,108 | 5,482,584 | ||||||
| ITE Group PLC |
649,017 | 591,991 | ||||||
| J D Wetherspoon PLC |
41,234 | 703,863 | ||||||
| James Fisher & Sons PLC |
31,972 | 823,224 | ||||||
| James Halstead PLC(a) |
141,390 | 819,860 | ||||||
| John Laing Group PLC(b) |
345,630 | 1,711,419 | ||||||
| John Menzies PLC |
134,161 | 853,115 | ||||||
| Johnson Service Group PLC |
465,724 | 843,538 | ||||||
| Kcom Group PLC |
880,613 | 806,681 | ||||||
| Keller Group PLC |
76,286 | 613,326 | ||||||
| Kier Group PLC(a) |
238,556 | 1,129,009 | ||||||
| Lookers PLC |
627,124 | 825,346 | ||||||
| M&C Saatchi PLC(a) |
71,262 | 348,217 | ||||||
| Marshalls PLC |
259,258 | 2,089,455 | ||||||
| Marston’s PLC |
1,988,901 | 2,661,613 | ||||||
| McCarthy & Stone PLC(b) |
880,088 | 1,472,490 | ||||||
| McColl’s Retail Group PLC(a) |
254,274 | 240,547 | ||||||
| Mears Group PLC |
237,429 | 788,924 | ||||||
| Millennium & Copthorne Hotels PLC |
144,439 | 858,244 | ||||||
| MJ Gleeson PLC |
80,502 | 843,381 | ||||||
| Moneysupermarket.com Group PLC |
666,246 | 3,230,394 | ||||||
| Morgan Advanced Materials PLC |
274,719 | 869,874 | ||||||
| Morgan Sindall Group PLC |
48,574 | 793,711 | ||||||
| N Brown Group PLC |
778,117 | 998,210 | ||||||
| NCC Group PLC |
335,773 | 612,541 | ||||||
| Norcros PLC |
18,732 | 46,743 | ||||||
| Northgate PLC |
236,577 | 1,152,936 | ||||||
| Numis Corp. PLC |
196,159 | 639,013 | ||||||
| OneSavings Bank PLC |
287,180 | 1,435,470 | ||||||
| Pagegroup PLC |
482,158 | 2,952,898 | ||||||
| PayPoint PLC |
124,914 | 1,394,932 | ||||||
| Pendragon PLC |
3,052,931 | 1,113,874 | ||||||
| Pets at Home Group PLC |
1,087,878 | 2,248,250 | ||||||
| Photo-Me International PLC |
1,042,374 | 1,083,896 | ||||||
| Polar Capital Holdings PLC |
154,051 | 1,047,843 | ||||||
| Polypipe Group PLC |
215,914 | 1,133,828 | ||||||
| Premier Asset Management Group PLC |
63,522 | 185,410 | ||||||
| PZ Cussons PLC |
653,929 | 1,671,825 | ||||||
| QinetiQ Group PLC |
429,402 | 1,685,312 | ||||||
| Rank Group PLC |
587,832 | 1,205,644 | ||||||
| Redde PLC |
666,350 | 1,033,262 | ||||||
| Renewi PLC |
1,161,613 | 355,705 | ||||||
| Restaurant Group PLC (The) |
694,091 | 1,067,234 | ||||||
| RPS Group PLC |
338,857 | 826,577 | ||||||
| RWS Holdings PLC |
160,447 | 1,007,720 | ||||||
| Safestore Holdings PLC |
211,129 | 1,641,042 | ||||||
| Saga PLC |
2,828,316 | 4,098,208 | ||||||
| Savills PLC |
158,993 | 1,873,906 | ||||||
See Notes to Financial Statements.
| 22 | WisdomTree Trust |
Schedule of Investments (concluded)
WisdomTree Europe SmallCap Dividend Fund (DFE)
March 31, 2019
| Investments | Shares | Value | ||||||
| Senior PLC |
303,864 | $ | 863,963 | |||||
| SIG PLC |
533,897 | 987,886 | ||||||
| Soco International PLC |
633,390 | 567,833 | ||||||
| Softcat PLC |
105,223 | 1,138,020 | ||||||
| Spire Healthcare Group PLC(b) |
351,482 | 593,566 | ||||||
| Spirent Communications PLC |
634,503 | 1,188,923 | ||||||
| St. Modwen Properties PLC |
160,934 | 832,110 | ||||||
| Staffline Group PLC |
21,914 | 248,429 | ||||||
| Stagecoach Group PLC |
1,674,793 | 3,352,074 | ||||||
| SThree PLC |
191,626 | 671,689 | ||||||
| Stock Spirits Group PLC |
286,311 | 858,079 | ||||||
| Superdry PLC |
71,496 | 510,533 | ||||||
| Synthomer PLC |
256,902 | 1,270,065 | ||||||
| TalkTalk Telecom Group PLC(a) |
2,099,979 | 3,018,226 | ||||||
| TBC Bank Group PLC |
55,970 | 1,126,066 | ||||||
| Ted Baker PLC |
39,109 | 793,972 | ||||||
| Telecom Plus PLC |
128,055 | 2,536,304 | ||||||
| Topps Tiles PLC |
136,480 | 135,159 | ||||||
| Trifast PLC |
33,073 | 82,097 | ||||||
| TT Electronics PLC |
219,159 | 621,126 | ||||||
| Tyman PLC |
261,410 | 824,326 | ||||||
| U & I Group PLC |
46,700 | 113,916 | ||||||
| Ultra Electronics Holdings PLC |
76,443 | 1,589,761 | ||||||
| Vesuvius PLC |
263,539 | 2,038,106 | ||||||
| Watkin Jones PLC |
372,794 | 1,068,693 | ||||||
| Wincanton PLC |
248,646 | 766,256 | ||||||
| Xaar PLC |
37,319 | 51,449 | ||||||
| XPS Pensions Group PLC |
31,115 | 55,951 | ||||||
|
|
|
|||||||
| Total United Kingdom |
|
173,117,304 | ||||||
| TOTAL COMMON STOCKS (Cost: $759,090,722) |
|
660,495,453 | ||||||
| RIGHTS – 0.0% |
| |||||||
| Sweden – 0.0% |
| |||||||
| AF Poyry AB, expiring 4/12/19*(a) |
||||||||
| (Cost: $0) | 91,034 | $ | 186,479 | |||||
| EXCHANGE-TRADED FUND – 0.5% |
| |||||||
| United States – 0.5% |
| |||||||
| WisdomTree International MidCap Dividend Fund(c) |
||||||||
| (Cost: $3,109,614) | 50,468 | 3,133,558 | ||||||
| INVESTMENT OF CASH COLLATERAL FOR SECURITIES LOANED – 7.4% |
| |||||||
| United States – 7.4% |
| |||||||
| State Street Navigator Securities Lending Government Money Market Portfolio, 2.46%(d) |
||||||||
| (Cost: $49,222,738)(e) | 49,222,738 | 49,222,738 | ||||||
| TOTAL INVESTMENTS IN SECURITIES – 106.8% (Cost: $811,423,074) |
|
713,038,228 | ||||||
| Other Assets less Liabilities – (6.8)% |
|
(45,636,140 | ) | |||||
|
|
|
|||||||
| NET ASSETS – 100.0% |
|
$ | 667,402,088 | |||||
| * | Non-income producing security. |
| (a) | Security, or portion thereof, was on loan at March 31, 2019 (See Note 2). |
| (b) | This security is exempt from registration under rule 144A of the Securities Act of 1933. This security may be sold in transactions that are exempt from registration, normally to qualified institutional buyers. |
| (c) | Affiliated company (See Note 3). |
| (d) | Rate shown represents annualized 7-day yield as of March 31, 2019. |
| (e) | At March 31, 2019, the total market value of the Fund’s securities on loan identified in the Schedule of Investments was $59,533,467. The Fund also had securities on loan having a total market value of $711,056 that were sold and pending settlement. The total market value of the collateral held by the Fund was $63,742,201. The total market value of the collateral includes non-cash U.S. Government securities collateral having a value of $14,519,463. |
| FINANCIAL DERIVATIVE INSTRUMENTS | ||||||||||||||||||||||||||||
| FOREIGN CURRENCY CONTRACTS (OTC – OVER THE COUNTER) | ||||||||||||||||||||||||||||
| Counterparty | Settlement Date |
Amount and Description of Currency to be Purchased |
Amount and Description of Currency to be Sold |
Unrealized Appreciation |
Unrealized Depreciation |
|||||||||||||||||||||||
| Bank of Montreal |
4/1/2019 | 497,000 | GBP | 648,838 | USD | $ | — | $ | (1,222 | ) | ||||||||||||||||||
| Barclays Bank PLC |
4/1/2019 | 902,000 | EUR | 1,012,531 | USD | 280 | — | |||||||||||||||||||||
| Citibank N.A. |
4/2/2019 | 478,000 | DKK | 71,815 | USD | 80 | — | |||||||||||||||||||||
| Citibank N.A. |
4/2/2019 | 30,000 | GBP | 39,066 | USD | 25 | — | |||||||||||||||||||||
| Goldman Sachs |
4/1/2019 | 5,699,000 | NOK | 659,778 | USD | 2,004 | — | |||||||||||||||||||||
| Goldman Sachs |
4/1/2019 | 2,262,000 | SEK | 243,460 | USD | 413 | — | |||||||||||||||||||||
| Goldman Sachs |
4/2/2019 | 69,000 | CHF | 69,304 | USD | — | (20 | ) | ||||||||||||||||||||
| Royal Bank of Canada |
4/2/2019 | 5,150,000 | NOK | 597,143 | USD | 888 | — | |||||||||||||||||||||
| Societe Generale |
4/1/2019 | 179,000 | CHF | 179,732 | USD | 5 | — | |||||||||||||||||||||
| State Street Bank and Trust |
4/1/2019 | 2,820,000 | DKK | 424,055 | USD | 91 | — | |||||||||||||||||||||
| $ | 3,786 | $ | (1,242 | ) | ||||||||||||||||||||||||
| CURRENCY LEGEND | ||
| CHF | Swiss franc | |
| DKK | Danish krone | |
| EUR | Euro | |
| GBP | British pound | |
| NOK | Norwegian krone | |
| SEK | Swedish krona | |
| USD | U.S. dollar |
See Notes to Financial Statements.
| WisdomTree Trust | 23 |
Schedule of Investments
WisdomTree International Dividend ex-Financials Fund (DOO)
March 31, 2019
| Investments | Shares | Value | ||||||
| COMMON STOCKS – 99.1% | ||||||||
| Australia – 10.9% | ||||||||
| Amcor Ltd. |
192,176 | $ | 2,100,923 | |||||
| BHP Group Ltd. |
76,005 | 2,078,081 | ||||||
| BHP Group PLC |
92,677 | 2,232,421 | ||||||
| Rio Tinto Ltd. |
33,562 | 2,334,249 | ||||||
| South32 Ltd. |
633,514 | 1,678,562 | ||||||
| Telstra Corp., Ltd. |
1,797,002 | 4,237,980 | ||||||
| Wesfarmers Ltd. |
65,628 | 1,615,343 | ||||||
| Woodside Petroleum Ltd. |
71,536 | 1,759,236 | ||||||
| Woolworths Group Ltd. |
70,940 | 1,531,923 | ||||||
|
|
|
|||||||
| Total Australia |
|
19,568,718 | ||||||
| Belgium – 1.0% |
| |||||||
| Anheuser-Busch InBev S.A./N.V. |
21,869 | 1,835,777 | ||||||
| China – 2.6% |
| |||||||
| China Mobile Ltd. |
245,500 | 2,501,927 | ||||||
| CNOOC Ltd. |
1,106,000 | 2,071,121 | ||||||
|
|
|
|||||||
| Total China |
|
4,573,048 | ||||||
| Denmark – 1.6% |
| |||||||
| Coloplast A/S Class B |
12,373 | 1,358,887 | ||||||
| Novo Nordisk A/S Class B |
28,142 | 1,474,686 | ||||||
|
|
|
|||||||
| Total Denmark |
|
2,833,573 | ||||||
| Finland – 3.2% |
| |||||||
| Fortum Oyj(a) |
110,414 | 2,260,125 | ||||||
| Kone Oyj Class B |
36,006 | 1,817,703 | ||||||
| Nokia Oyj |
303,636 | 1,729,918 | ||||||
|
|
|
|||||||
| Total Finland |
|
5,807,746 | ||||||
| France – 8.4% |
| |||||||
| Bouygues S.A. |
46,235 | 1,653,492 | ||||||
| Carrefour S.A. |
117,306 | 2,193,089 | ||||||
| Engie S.A. |
153,521 | 2,289,220 | ||||||
| Publicis Groupe S.A. |
23,455 | 1,257,039 | ||||||
| Renault S.A. |
18,853 | 1,247,071 | ||||||
| Sanofi |
27,740 | 2,452,582 | ||||||
| Sodexo S.A. |
15,741 | 1,734,956 | ||||||
| TOTAL S.A. |
38,413 | 2,135,898 | ||||||
|
|
|
|||||||
| Total France |
|
14,963,347 | ||||||
| Germany – 9.4% |
| |||||||
| BASF SE |
17,455 | 1,284,345 | ||||||
| Bayer AG Registered Shares |
11,287 | 730,000 | ||||||
| Bayerische Motoren Werke AG |
22,493 | 1,736,368 | ||||||
| Daimler AG Registered Shares |
39,176 | 2,298,413 | ||||||
| Deutsche Post AG Registered Shares |
48,005 | 1,563,170 | ||||||
| Deutsche Telekom AG Registered Shares |
146,986 | 2,441,814 | ||||||
| Evonik Industries AG |
52,173 | 1,422,382 | ||||||
| Innogy SE |
52,870 | 2,264,778 | ||||||
| Telefonica Deutschland Holding AG |
831,582 | 2,613,543 | ||||||
| United Internet AG Registered Shares |
10,895 | 397,954 | ||||||
|
|
|
|||||||
| Total Germany |
|
16,752,767 | ||||||
| Hong Kong – 1.3% |
| |||||||
| Power Assets Holdings Ltd. |
348,500 | 2,417,318 | ||||||
| Italy – 3.4% |
| |||||||
| Eni SpA |
138,042 | 2,441,877 | ||||||
| Snam SpA |
703,664 | 3,617,909 | ||||||
|
|
|
|||||||
| Total Italy |
|
6,059,786 | ||||||
| Japan – 12.3% |
| |||||||
| Bridgestone Corp. |
43,900 | 1,691,986 | ||||||
| Canon, Inc. |
60,700 | 1,762,019 | ||||||
| FUJIFILM Holdings Corp. |
22,300 | 1,014,213 | ||||||
| Fujitsu Ltd. |
12,200 | 880,239 | ||||||
| Hitachi Ltd. |
25,200 | 816,208 | ||||||
| Japan Tobacco, Inc. |
79,700 | 1,976,569 | ||||||
| Marubeni Corp. |
220,700 | 1,525,369 | ||||||
| Mitsubishi Corp. |
60,300 | 1,674,682 | ||||||
| Murata Manufacturing Co., Ltd. |
14,400 | 717,105 | ||||||
| Nissan Motor Co., Ltd.(a) |
238,400 | 1,956,136 | ||||||
| Nomura Research Institute Ltd. |
15,500 | 704,386 | ||||||
| Sekisui House Ltd. |
108,900 | 1,802,456 | ||||||
| Subaru Corp.(a) |
67,500 | 1,538,318 | ||||||
| Takeda Pharmaceutical Co., Ltd. |
49,100 | 2,005,521 | ||||||
| Tokyo Electron Ltd.(a) |
8,500 | 1,228,712 | ||||||
| Yahoo Japan Corp. |
309,900 | 758,756 | ||||||
|
|
|
|||||||
| Total Japan |
|
22,052,675 | ||||||
| Netherlands – 1.5% |
| |||||||
| Koninklijke Ahold Delhaize N.V. |
64,705 | 1,723,716 | ||||||
| Koninklijke Philips N.V. |
25,793 | 1,051,743 | ||||||
|
|
|
|||||||
| Total Netherlands |
|
2,775,459 | ||||||
| Norway – 0.7% |
| |||||||
| Equinor ASA |
61,080 | 1,339,467 | ||||||
| Portugal – 2.1% |
| |||||||
| EDP – Energias de Portugal S.A. |
586,214 | 2,307,097 | ||||||
| Galp Energia, SGPS, S.A. |
90,337 | 1,448,490 | ||||||
|
|
|
|||||||
| Total Portugal |
|
3,755,587 | ||||||
| Singapore – 1.3% |
| |||||||
| Singapore Telecommunications Ltd. |
1,082,300 | 2,413,102 | ||||||
| Spain – 10.0% |
| |||||||
| Aena SME S.A.(b) |
10,326 | 1,860,925 | ||||||
| Endesa S.A. |
149,887 | 3,827,156 | ||||||
| Ferrovial S.A. |
94,567 | 2,217,133 | ||||||
| Iberdrola S.A. |
329,561 | 2,895,992 | ||||||
| Naturgy Energy Group S.A. |
90,057 | 2,520,934 | ||||||
| Repsol S.A. |
124,165 | 2,127,529 | ||||||
| Telefonica S.A. |
289,352 | 2,426,669 | ||||||
|
|
|
|||||||
| Total Spain |
|
17,876,338 | ||||||
| Sweden – 3.5% |
| |||||||
| Hennes & Mauritz AB Class B |
231,325 | 3,865,684 | ||||||
| Telia Co. AB |
517,799 | 2,341,883 | ||||||
|
|
|
|||||||
| Total Sweden |
|
6,207,567 | ||||||
| Switzerland – 7.9% |
| |||||||
| ABB Ltd. Registered Shares |
72,762 | 1,366,982 | ||||||
| Kuehne + Nagel International AG Registered Shares |
12,083 | 1,657,333 | ||||||
See Notes to Financial Statements.
| 24 | WisdomTree Trust |
Schedule of Investments (concluded)
WisdomTree International Dividend ex-Financials Fund (DOO)
March 31, 2019
| Investments | Shares | Value | ||||||
| LafargeHolcim Ltd. Registered Shares* |
36,876 | $ | 1,821,398 | |||||
| Nestle S.A. Registered Shares |
20,167 | 1,921,727 | ||||||
| Novartis AG Registered Shares |
24,210 | 2,328,380 | ||||||
| Roche Holding AG Genusschein |
8,854 | 2,439,095 | ||||||
| Swisscom AG Registered Shares(a) |
5,388 | 2,634,759 | ||||||
|
|
|
|||||||
| Total Switzerland |
|
14,169,674 | ||||||
| United Kingdom – 18.0% |
| |||||||
| Anglo American PLC |
87,296 | 2,335,879 | ||||||
| AstraZeneca PLC |
24,894 | 1,990,080 | ||||||
| BP PLC |
327,085 | 2,380,373 | ||||||
| British American Tobacco PLC |
45,315 | 1,885,984 | ||||||
| BT Group PLC |
1,290,248 | 3,748,365 | ||||||
| GlaxoSmithKline PLC |
121,716 | 2,532,558 | ||||||
| Imperial Brands PLC |
87,880 | 3,005,369 | ||||||
| National Grid PLC |
241,091 | 2,672,820 | ||||||
| Rio Tinto PLC |
43,887 | 2,551,111 | ||||||
| Royal Dutch Shell PLC Class A |
74,796 | 2,352,269 | ||||||
| SSE PLC |
178,573 | 2,762,026 | ||||||
| Unilever PLC |
27,380 | 1,568,027 | ||||||
| Vodafone Group PLC |
1,344,868 | 2,449,898 | ||||||
|
|
|
|||||||
| Total United Kingdom |
|
32,234,759 | ||||||
| TOTAL COMMON STOCKS (Cost: $191,658,497) |
177,636,708 | |||||||
| INVESTMENT OF CASH COLLATERAL FOR SECURITIES LOANED – 3.5% |
| |||||||
| United States – 3.5% |
| |||||||
| State Street Navigator Securities Lending Government Money Market Portfolio, 2.46%(c) |
||||||||
| (Cost: $6,169,610)(d) | 6,169,610 | 6,169,610 | ||||||
| TOTAL INVESTMENTS IN SECURITIES – 102.6% (Cost: $197,828,107) |
183,806,318 | |||||||
| Other Assets less Liabilities – (2.6)% |
(4,617,365 | ) | ||||||
|
|
|
|||||||
| NET ASSETS – 100.0% | $ | 179,188,953 | ||||||
| * | Non-income producing security. |
| (a) | Security, or portion thereof, was on loan at March 31, 2019 (See Note 2). |
| (b) | This security is exempt from registration under rule 144A of the Securities Act of 1933. This security may be sold in transactions that are exempt from registration, normally to qualified institutional buyers. |
| (c) | Rate shown represents annualized 7-day yield as of March 31, 2019. |
| (d) | At March 31, 2019, the total market value of the Fund’s securities on loan identified in the Schedule of Investments was $9,092,582. The total market value of the collateral held by the Fund was $10,105,638. The total market value of the collateral includes non-cash U.S. Government securities collateral having a value of $3,936,028. |
| FINANCIAL DERIVATIVE INSTRUMENTS | ||||||||||||||||||||||||||||
| FOREIGN CURRENCY CONTRACTS (OTC – OVER THE COUNTER) | ||||||||||||||||||||||||||||
| Counterparty | Settlement Date |
Amount and be Purchased |
Amount and Description of be Sold |
Unrealized Appreciation |
Unrealized Depreciation |
|||||||||||||||||||||||
| Deutsche Bank AG |
4/2/2019 | 85,266 | USD | 75,982 | EUR | $ | — | $ | (51 | ) | ||||||||||||||||||
| HSBC Holdings PLC |
4/1/2019 | 34,819 | USD | 49,213 | AUD | — | (139 | ) | ||||||||||||||||||||
| $ | — | $ | (190 | ) | ||||||||||||||||||||||||
| CURRENCY LEGEND | ||
| AUD | Australian dollar | |
| EUR | Euro | |
| USD | U.S. dollar | |
See Notes to Financial Statements.
| WisdomTree Trust | 25 |
Schedule of Investments
WisdomTree International Equity Fund (DWM)
March 31, 2019
| Investments | Shares | Value | ||||||
| COMMON STOCKS – 99.2% | ||||||||
| Australia – 7.7% | ||||||||
| Adelaide Brighton Ltd. |
88,414 | $ | 282,622 | |||||
| AGL Energy Ltd. |
54,515 | 843,037 | ||||||
| Alumina Ltd. |
341,830 | 587,622 | ||||||
| Amcor Ltd. |
70,999 | 776,181 | ||||||
| AMP Ltd. |
334,400 | 498,836 | ||||||
| Aristocrat Leisure Ltd. |
22,009 | 383,192 | ||||||
| ASX Ltd. |
15,198 | 753,985 | ||||||
| Aurizon Holdings Ltd. |
186,026 | 601,253 | ||||||
| AusNet Services |
491,558 | 619,791 | ||||||
| Australia & New Zealand Banking Group Ltd. |
211,823 | 3,916,694 | ||||||
| Bank of Queensland Ltd. |
68,094 | 440,172 | ||||||
| Bendigo & Adelaide Bank Ltd. |
59,451 | 408,796 | ||||||
| BHP Group Ltd. |
179,512 | 4,908,103 | ||||||
| BHP Group PLC |
134,908 | 3,249,690 | ||||||
| Boral Ltd. |
86,392 | 281,682 | ||||||
| Brambles Ltd. |
93,067 | 777,455 | ||||||
| Caltex Australia Ltd. |
23,470 | 436,971 | ||||||
| carsales.com Ltd. |
35,190 | 316,215 | ||||||
| CIMIC Group Ltd. |
17,978 | 616,313 | ||||||
| Cleanaway Waste Management Ltd. |
205,209 | 323,610 | ||||||
| Coca-Cola Amatil Ltd. |
84,353 | 518,309 | ||||||
| Cochlear Ltd. |
3,266 | 402,010 | ||||||
| Commonwealth Bank of Australia |
134,702 | 6,759,227 | ||||||
| Crown Resorts Ltd. |
71,302 | 582,974 | ||||||
| CSL Ltd. |
10,158 | 1,406,635 | ||||||
| Flight Centre Travel Group Ltd. |
8,122 | 242,606 | ||||||
| Fortescue Metals Group Ltd. |
366,945 | 1,853,288 | ||||||
| Harvey Norman Holdings Ltd.(a) |
181,656 | 518,738 | ||||||
| Iluka Resources Ltd. |
38,359 | 245,235 | ||||||
| Insurance Australia Group Ltd. |
155,029 | 845,759 | ||||||
| IOOF Holdings Ltd.(a) |
49,274 | 214,211 | ||||||
| JB Hi-Fi Ltd.(a) |
25,098 | 444,818 | ||||||
| Macquarie Group Ltd. |
23,073 | 2,121,181 | ||||||
| Magellan Financial Group Ltd. |
19,831 | 513,188 | ||||||
| Medibank Pvt Ltd. |
251,102 | 492,302 | ||||||
| National Australia Bank Ltd. |
251,113 | 4,507,614 | ||||||
| New Hope Corp., Ltd. |
78,459 | 167,757 | ||||||
| Orica Ltd. |
21,339 | 267,238 | ||||||
| Perpetual Ltd. |
9,853 | 270,724 | ||||||
| Premier Investments Ltd. |
33,074 | 382,014 | ||||||
| Qantas Airways Ltd. |
78,927 | 317,332 | ||||||
| QBE Insurance Group Ltd. |
86,907 | 759,950 | ||||||
| Ramsay Health Care Ltd. |
8,692 | 397,320 | ||||||
| REA Group Ltd. |
6,690 | 354,992 | ||||||
| Rio Tinto Ltd. |
27,373 | 1,903,802 | ||||||
| Sonic Healthcare Ltd. |
29,282 | 510,859 | ||||||
| South32 Ltd. |
311,416 | 825,129 | ||||||
| Star Entertainment Group Ltd. (The) |
109,552 | 325,289 | ||||||
| Suncorp Group Ltd. |
86,785 | 849,506 | ||||||
| Tabcorp Holdings Ltd. |
144,053 | 472,756 | ||||||
| Telstra Corp., Ltd. |
1,357,742 | 3,202,047 | ||||||
| Treasury Wine Estates Ltd. |
39,745 | 421,517 | ||||||
| Wesfarmers Ltd. |
83,410 | 2,053,022 | ||||||
| Westpac Banking Corp. |
285,754 | 5,261,379 | ||||||
| Woodside Petroleum Ltd. |
56,852 | 1,398,122 | ||||||
| Woolworths Group Ltd. |
70,768 | 1,528,209 | ||||||
|
|
|
|||||||
| Total Australia |
|
64,359,279 | ||||||
| Austria – 0.4% |
| |||||||
| Andritz AG |
8,651 | 371,455 | ||||||
| Erste Group Bank AG* |
20,968 | 771,299 | ||||||
| Lenzing AG |
2,656 | 284,808 | ||||||
| Oesterreichische Post AG |
10,890 | 460,989 | ||||||
| OMV AG |
15,391 | 835,920 | ||||||
| Telekom Austria AG* |
28,337 | 206,182 | ||||||
| Vienna Insurance Group AG Wiener Versicherung Gruppe |
11,635 | 299,174 | ||||||
| Voestalpine AG |
10,215 | 310,490 | ||||||
|
|
|
|||||||
| Total Austria |
|
3,540,317 | ||||||
| Belgium – 1.8% |
| |||||||
| Ageas |
15,267 | 737,130 | ||||||
| Anheuser-Busch InBev S.A./N.V. |
104,037 | 8,733,309 | ||||||
| Bekaert S.A. |
5,991 | 140,863 | ||||||
| bpost S.A.(a) |
30,394 | 328,140 | ||||||
| Euronav N.V. |
42,715 | 347,968 | ||||||
| KBC Group N.V. |
24,013 | 1,679,255 | ||||||
| Proximus SADP |
36,081 | 1,041,603 | ||||||
| Solvay S.A. |
5,321 | 575,840 | ||||||
| UCB S.A. |
6,519 | 560,409 | ||||||
| Umicore S.A. |
13,999 | 622,306 | ||||||
|
|
|
|||||||
| Total Belgium |
|
14,766,823 | ||||||
| China – 3.4% |
| |||||||
| Beijing Enterprises Holdings Ltd. |
78,000 | 442,168 | ||||||
| China Aerospace International Holdings Ltd.(a) |
1,346,000 | 97,736 | ||||||
| China Jinmao Holdings Group Ltd. |
728,000 | 474,826 | ||||||
| China Mobile Ltd. |
1,319,481 | 13,447,026 | ||||||
| China Overseas Land & Investment Ltd. |
425,175 | 1,614,050 | ||||||
| China Power International Development Ltd. |
1,789,866 | 458,300 | ||||||
| China Resources Power Holdings Co., Ltd. |
476,000 | 715,520 | ||||||
| China South City Holdings Ltd. |
3,090,000 | 495,978 | ||||||
| China Unicom Hong Kong Ltd. |
314,000 | 398,003 | ||||||
| CITIC Ltd. |
1,259,000 | 1,879,691 | ||||||
| CNOOC Ltd. |
2,360,700 | 4,420,702 | ||||||
| Fosun International Ltd. |
304,487 | 515,886 | ||||||
| Guangdong Investment Ltd. |
406,000 | 784,076 | ||||||
| Lenovo Group Ltd. |
1,081,003 | 972,220 | ||||||
| Shanghai Industrial Holdings Ltd. |
214,000 | 503,789 | ||||||
| Shenzhen Investment Ltd. |
1,218,000 | 465,481 | ||||||
| Sino-Ocean Group Holding Ltd. |
1,410,000 | 617,889 | ||||||
| Sun Art Retail Group Ltd. |
331,500 | 323,056 | ||||||
|
|
|
|||||||
| Total China |
|
28,626,397 | ||||||
| Denmark – 1.4% |
| |||||||
| AP Moller – Maersk A/S Class B |
282 | 358,064 | ||||||
| Carlsberg A/S Class B |
3,591 | 448,939 | ||||||
| Chr Hansen Holding A/S |
7,117 | 722,121 | ||||||
See Notes to Financial Statements.
| 26 | WisdomTree Trust |
Schedule of Investments (continued)
WisdomTree International Equity Fund (DWM)
March 31, 2019
| Investments | Shares | Value | ||||||
| Coloplast A/S Class B |
8,094 | $ | 888,938 | |||||
| Danske Bank A/S |
57,540 | 1,010,833 | ||||||
| H. Lundbeck A/S(a) |
5,426 | 235,038 | ||||||
| ISS A/S |
8,493 | 258,674 | ||||||
| Novo Nordisk A/S Class B |
76,154 | 3,990,593 | ||||||
| Novozymes A/S Class B |
7,485 | 344,492 | ||||||
| Orsted A/S(b) |
13,983 | 1,060,821 | ||||||
| Pandora A/S |
6,467 | 303,087 | ||||||
| SimCorp A/S |
4,425 | 427,615 | ||||||
| Sydbank A/S |
8,577 | 178,025 | ||||||
| Tryg A/S |
24,495 | 672,736 | ||||||
| Vestas Wind Systems A/S |
6,840 | 576,117 | ||||||
|
|
|
|||||||
| Total Denmark |
|
11,476,093 | ||||||
| Finland – 1.8% |
| |||||||
| Elisa Oyj |
16,441 | 742,492 | ||||||
| Fortum Oyj(a) |
69,665 | 1,426,011 | ||||||
| Kesko Oyj Class B |
8,758 | 533,392 | ||||||
| Kone Oyj Class B |
19,878 | 1,003,508 | ||||||
| Metsa Board Oyj(a) |
22,389 | 137,387 | ||||||
| Metso Oyj |
11,319 | 389,674 | ||||||
| Neste Oyj(a) |
10,182 | 1,086,121 | ||||||
| Nokia Oyj |
303,215 | 1,727,519 | ||||||
| Nokian Renkaat Oyj(a) |
11,329 | 379,588 | ||||||
| Nordea Bank Abp(a) |
420,700 | 3,209,009 | ||||||
| Orion Oyj Class B(a) |
11,459 | 430,006 | ||||||
| Outokumpu Oyj(a) |
35,257 | 128,187 | ||||||
| Sampo Oyj Class A |
31,097 | 1,411,007 | ||||||
| Stora Enso Oyj Class R |
33,617 | 411,252 | ||||||
| UPM-Kymmene Oyj |
35,305 | 1,030,698 | ||||||
| Valmet Oyj(a) |
13,596 | 344,407 | ||||||
| Wartsila Oyj Abp |
18,566 | 299,882 | ||||||
|
|
|
|||||||
| Total Finland |
|
14,690,140 | ||||||
| France – 11.0% |
| |||||||
| Accor S.A. |
11,547 | 468,186 | ||||||
| Aeroports de Paris |
4,291 | 830,649 | ||||||
| Air Liquide S.A. |
12,998 | 1,654,321 | ||||||
| Airbus SE |
19,224 | 2,544,950 | ||||||
| ALD S.A.(b) |
19,295 | 269,734 | ||||||
| Amundi S.A.(b) |
9,350 | 588,974 | ||||||
| Atos SE |
2,894 | 279,459 | ||||||
| AXA S.A. |
172,363 | 4,341,052 | ||||||
| BNP Paribas S.A. |
89,692 | 4,291,281 | ||||||
| Bouygues S.A. |
23,511 | 840,818 | ||||||
| Bureau Veritas S.A. |
12,204 | 286,398 | ||||||
| Capgemini SE |
6,667 | 809,241 | ||||||
| Carrefour S.A. |
52,812 | 987,344 | ||||||
| Casino Guichard Perrachon S.A.(a) |
17,497 | 759,337 | ||||||
| Christian Dior SE |
4,128 | 1,968,537 | ||||||
| Cie de Saint-Gobain |
26,998 | 979,468 | ||||||
| Cie Generale des Etablissements Michelin SCA |
8,281 | 980,043 | ||||||
| Cie Plastic Omnium S.A. |
8,090 | 215,560 | ||||||
| CNP Assurances |
34,409 | 758,041 | ||||||
| Coface S.A. |
22,665 | 200,541 | ||||||
| Covivio |
3,608 | 383,248 | ||||||
| Credit Agricole S.A. |
201,642 | 2,438,476 | ||||||
| Danone S.A. |
26,231 | 2,023,159 | ||||||
| Edenred |
14,171 | 645,546 | ||||||
| Eiffage S.A. |
4,137 | 397,910 | ||||||
| Electricite de France S.A. |
176,303 | 2,413,154 | ||||||
| Elis S.A. |
10,320 | 166,053 | ||||||
| Engie S.A. |
185,985 | 2,773,305 | ||||||
| EssilorLuxottica S.A. |
10,072 | 1,101,304 | ||||||
| Eurazeo SE |
3,895 | 293,025 | ||||||
| Eutelsat Communications S.A. |
26,448 | 463,127 | ||||||
| Getlink SE |
19,246 | 292,064 | ||||||
| Hermes International |
1,335 | 881,715 | ||||||
| ICADE |
4,282 | 362,526 | ||||||
| Imerys S.A. |
4,013 | 200,247 | ||||||
| JCDecaux S.A. |
11,026 | 335,760 | ||||||
| Kering S.A. |
2,943 | 1,689,285 | ||||||
| Klepierre S.A. |
21,788 | 762,808 | ||||||
| Korian S.A. |
104 | 4,213 | ||||||
| L’Oreal S.A. |
14,554 | 3,918,801 | ||||||
| Lagardere SCA |
14,929 | 384,209 | ||||||
| Legrand S.A. |
6,985 | 467,920 | ||||||
| LVMH Moet Hennessy Louis Vuitton SE |
13,063 | 4,809,568 | ||||||
| Metropole Television S.A. |
20,917 | 386,121 | ||||||
| Natixis S.A. |
206,327 | 1,105,318 | ||||||
| Nexity S.A. |
6,084 | 297,167 | ||||||
| Orange S.A. |
152,648 | 2,485,311 | ||||||
| Pernod Ricard S.A. |
6,927 | 1,244,477 | ||||||
| Peugeot S.A. |
32,670 | 797,499 | ||||||
| Publicis Groupe S.A. |
12,736 | 682,568 | ||||||
| Remy Cointreau S.A. |
3,270 | 436,567 | ||||||
| Renault S.A. |
16,055 | 1,061,991 | ||||||
| Rexel S.A. |
19,576 | 221,018 | ||||||
| Rubis SCA |
5,068 | 276,677 | ||||||
| Safran S.A. |
11,607 | 1,593,274 | ||||||
| Sanofi |
77,265 | 6,831,246 | ||||||
| Schneider Electric SE |
24,097 | 1,892,389 | ||||||
| SCOR SE |
16,004 | 682,145 | ||||||
| SEB S.A. |
1,548 | 260,726 | ||||||
| Societe BIC S.A. |
3,193 | 284,849 | ||||||
| Societe Generale S.A. |
62,747 | 1,815,990 | ||||||
| Sodexo S.A. |
6,585 | 725,792 | ||||||
| SPIE S.A. |
10,516 | 186,092 | ||||||
| Suez |
49,482 | 656,174 | ||||||
| Thales S.A. |
6,964 | 834,734 | ||||||
| TOTAL S.A. |
172,233 | 9,576,762 | ||||||
| Unibail-Rodamco-Westfield(a) |
6,150 | 1,009,174 | ||||||
| Valeo S.A. |
10,326 | 299,719 | ||||||
| Veolia Environnement S.A. |
34,601 | 774,315 | ||||||
| Vinci S.A. |
25,728 | 2,505,227 | ||||||
| Vivendi S.A. |
42,998 | 1,247,080 | ||||||
| Wendel S.A. |
2,177 | 274,511 | ||||||
|
|
|
|||||||
| Total France |
|
91,706,270 | ||||||
See Notes to Financial Statements.
| WisdomTree Trust | 27 |
Schedule of Investments (continued)
WisdomTree International Equity Fund (DWM)
March 31, 2019
| Investments | Shares | Value | ||||||
| Germany – 7.3% |
| |||||||
| 1&1 Drillisch AG |
8,000 | $ | 285,114 | |||||
| Aareal Bank AG |
10,836 | 334,355 | ||||||
| adidas AG |
4,422 | 1,075,471 | ||||||
| Allianz SE Registered Shares |
23,945 | 5,331,083 | ||||||
| AURELIUS Equity Opportunities SE & Co. KGaA |
5,283 | 240,721 | ||||||
| Aurubis AG |
3,433 | 184,141 | ||||||
| Axel Springer SE |
8,661 | 447,739 | ||||||
| BASF SE |
43,991 | 3,236,873 | ||||||
| Bayer AG Registered Shares |
32,868 | 2,125,776 | ||||||
| Bayerische Motoren Werke AG |
38,759 | 2,992,037 | ||||||
| Beiersdorf AG |
4,616 | 480,678 | ||||||
| Brenntag AG |
6,966 | 359,019 | ||||||
| Continental AG |
5,732 | 863,735 | ||||||
| Covestro AG(b) |
8,592 | 472,922 | ||||||
| Daimler AG Registered Shares |
90,045 | 5,282,842 | ||||||
| Deutsche Bank AG Registered Shares |
37,066 | 302,158 | ||||||
| Deutsche Boerse AG |
6,673 | 856,424 | ||||||
| Deutsche Lufthansa AG Registered Shares |
25,128 | 552,026 | ||||||
| Deutsche Post AG Registered Shares |
65,762 | 2,141,385 | ||||||
| Deutsche Telekom AG Registered Shares |
298,546 | 4,959,615 | ||||||
| Deutsche Wohnen SE Bearer Shares |
11,488 | 557,637 | ||||||
| Duerr AG |
2,913 | 114,349 | ||||||
| E.ON SE |
101,066 | 1,124,833 | ||||||
| Evonik Industries AG |
22,527 | 614,149 | ||||||
| Fielmann AG |
6,271 | 433,046 | ||||||
| Fraport AG Frankfurt Airport Services Worldwide |
4,110 | 314,922 | ||||||
| Freenet AG |
20,126 | 432,874 | ||||||
| Fresenius Medical Care AG & Co. KGaA |
5,978 | 482,621 | ||||||
| Fresenius SE & Co. KGaA |
8,813 | 492,409 | ||||||
| GEA Group AG |
10,078 | 264,231 | ||||||
| Hannover Rueck SE |
7,331 | 1,053,646 | ||||||
| HeidelbergCement AG |
5,334 | 384,272 | ||||||
| Hella GmbH & Co. KGaA |
6,042 | 265,943 | ||||||
| Henkel AG & Co. KGaA |
5,820 | 553,840 | ||||||
| Hochtief AG |
1,926 | 278,977 | ||||||
| Hugo Boss AG |
4,405 | 301,122 | ||||||
| Indus Holding AG |
5,296 | 255,407 | ||||||
| Infineon Technologies AG |
26,846 | 533,097 | ||||||
| Innogy SE |
34,260 | 1,467,586 | ||||||
| KION Group AG |
3,411 | 178,442 | ||||||
| LANXESS AG |
2,633 | 140,550 | ||||||
| LEG Immobilien AG |
3,432 | 421,779 | ||||||
| MAN SE |
3,953 | 324,907 | ||||||
| Merck KGaA |
5,017 | 572,629 | ||||||
| METRO AG |
34,988 | 581,044 | ||||||
| MTU Aero Engines AG |
2,847 | 645,105 | ||||||
| Muenchener Rueckversicherungs – Gesellschaft AG Registered Shares |
9,669 | 2,290,792 | ||||||
| OSRAM Licht AG |
4,953 | 170,626 | ||||||
| ProSiebenSat.1 Media SE |
29,791 | 425,494 | ||||||
| Rheinmetall AG |
2,554 | 266,357 | ||||||
| RWE AG |
21,455 | 575,769 | ||||||
| SAP SE |
26,497 | 3,064,472 | ||||||
| Siemens AG Registered Shares |
36,812 | 3,965,618 | ||||||
| Symrise AG |
7,015 | 632,664 | ||||||
| Talanx AG |
12,007 | 463,244 | ||||||
| Telefonica Deutschland Holding AG |
340,299 | 1,069,511 | ||||||
| ThyssenKrupp AG |
9,497 | 130,577 | ||||||
| TUI AG |
39,723 | 381,355 | ||||||
| Uniper SE |
18,326 | 553,325 | ||||||
| Volkswagen AG |
9,124 | 1,486,532 | ||||||
| Wacker Neuson SE |
10,251 | 244,019 | ||||||
|
|
|
|||||||
| Total Germany |
|
61,033,886 | ||||||
| Hong Kong – 2.9% |
| |||||||
| AIA Group Ltd. |
230,165 | 2,291,403 | ||||||
| Bank of East Asia Ltd. (The) |
157,858 | 512,790 | ||||||
| BOC Hong Kong Holdings Ltd. |
462,444 | 1,914,589 | ||||||
| CLP Holdings Ltd. |
123,500 | 1,431,665 | ||||||
| Dah Sing Financial Holdings Ltd. |
49,200 | 257,910 | ||||||
| Galaxy Entertainment Group Ltd. |
88,000 | 599,189 | ||||||
| Hang Lung Group Ltd. |
161,000 | 516,844 | ||||||
| Hang Lung Properties Ltd. |
230,000 | 561,379 | ||||||
| Hang Seng Bank Ltd. |
97,900 | 2,415,714 | ||||||
| Henderson Land Development Co., Ltd. |
186,509 | 1,185,587 | ||||||
| Hong Kong & China Gas Co., Ltd. |
543,517 | 1,303,064 | ||||||
| Hong Kong Exchanges & Clearing Ltd. |
30,135 | 1,050,317 | ||||||
| Hopewell Holdings Ltd. |
63,500 | 312,244 | ||||||
| Hysan Development Co., Ltd. |
49,000 | 262,479 | ||||||
| MTR Corp., Ltd. |
213,335 | 1,320,783 | ||||||
| New World Development Co., Ltd. |
568,772 | 943,371 | ||||||
| PCCW Ltd. |
1,565,000 | 972,898 | ||||||
| Power Assets Holdings Ltd. |
151,000 | 1,047,389 | ||||||
| Sino Land Co., Ltd. |
356,400 | 689,196 | ||||||
| Sun Hung Kai Properties Ltd. |
115,000 | 1,973,325 | ||||||
| Swire Pacific Ltd. Class A |
50,500 | 649,749 | ||||||
| Swire Properties Ltd. |
214,200 | 920,929 | ||||||
| Wharf Holdings Ltd. (The) |
236,000 | 712,514 | ||||||
| Wheelock & Co., Ltd. |
57,000 | 417,519 | ||||||
|
|
|
|||||||
| Total Hong Kong |
|
24,262,847 | ||||||
| Ireland – 0.4% |
| |||||||
| AIB Group PLC |
168,034 | 755,085 | ||||||
| CRH PLC |
22,573 | 700,820 | ||||||
| DCC PLC |
5,291 | 457,446 | ||||||
| Kerry Group PLC Class A |
5,528 | 617,608 | ||||||
| Kingspan Group PLC |
7,530 | 348,856 | ||||||
| Paddy Power Betfair PLC |
3,232 | 249,497 | ||||||
| Smurfit Kappa Group PLC |
8,311 | 232,180 | ||||||
|
|
|
|||||||
| Total Ireland |
|
3,361,492 | ||||||
| Israel – 0.4% |
| |||||||
| Bank Hapoalim BM |
86,022 | 569,554 | ||||||
| Bezeq Israeli Telecommunication Corp., Ltd. |
498,682 | 357,934 | ||||||
| Delek Automotive Systems Ltd. |
46,554 | 179,579 | ||||||
| Harel Insurance Investments & Financial Services Ltd. |
56,658 | 373,104 | ||||||
| Israel Chemicals Ltd. |
92,437 | 480,860 | ||||||
| Mediterranean Towers Ltd. |
262,079 | 471,538 | ||||||
See Notes to Financial Statements.
| 28 | WisdomTree Trust |
Schedule of Investments (continued)
WisdomTree International Equity Fund (DWM)
March 31, 2019
| Investments | Shares | Value | ||||||
| Naphtha Israel Petroleum Corp., Ltd. |
36,979 | $ | 234,752 | |||||
| Paz Oil Co., Ltd. |
3,994 | 596,676 | ||||||
| Strauss Group Ltd. |
20,760 | 497,414 | ||||||
|
|
|
|||||||
| Total Israel |
|
3,761,411 | ||||||
| Italy – 3.4% |
| |||||||
| A2A SpA |
236,010 | 431,029 | ||||||
| ACEA SpA |
21,000 | 355,348 | ||||||
| Ascopiave SpA |
121,344 | 478,923 | ||||||
| Assicurazioni Generali SpA |
118,081 | 2,187,689 | ||||||
| Azimut Holding SpA(a) |
18,644 | 317,156 | ||||||
| Banca Generali SpA |
11,834 | 294,724 | ||||||
| Banca Mediolanum SpA |
72,525 | 514,260 | ||||||
| Brembo SpA |
18,153 | 206,073 | ||||||
| Cementir Holding SpA |
29,395 | 207,609 | ||||||
| Datalogic SpA |
8,681 | 202,747 | ||||||
| Davide Campari-Milano SpA |
39,230 | 385,432 | ||||||
| De’ Longhi SpA |
12,779 | 345,234 | ||||||
| Enel SpA |
524,592 | 3,359,873 | ||||||
| Eni SpA |
275,124 | 4,866,772 | ||||||
| ERG SpA |
22,801 | 431,907 | ||||||
| Ferrari N.V. |
1,751 | 234,950 | ||||||
| FinecoBank Banca Fineco SpA |
45,279 | 596,117 | ||||||
| Hera SpA |
91,150 | 329,969 | ||||||
| Infrastrutture Wireless Italiane SpA(b) |
38,330 | 343,020 | ||||||
| Intesa Sanpaolo SpA |
1,607,167 | 3,917,802 | ||||||
| Iren SpA |
99,636 | 254,407 | ||||||
| Italgas SpA |
70,486 | 435,615 | ||||||
| MARR SpA |
13,525 | 307,983 | ||||||
| Mediobanca Banca di Credito Finanziario SpA |
56,342 | 585,948 | ||||||
| Piaggio & C. SpA |
129,061 | 315,048 | ||||||
| Poste Italiane SpA(b) |
112,501 | 1,095,462 | ||||||
| Prysmian SpA |
10,458 | 198,042 | ||||||
| Recordati SpA |
9,935 | 387,208 | ||||||
| Snam SpA |
292,733 | 1,505,095 | ||||||
| Societa Cattolica di Assicurazioni SC |
29,647 | 283,457 | ||||||
| Telecom Italia SpA RSP |
1,124,510 | 639,409 | ||||||
| Terna Rete Elettrica Nazionale SpA |
144,709 | 917,724 | ||||||
| UniCredit SpA |
62,267 | 799,006 | ||||||
| Unione di Banche Italiane SpA(a) |
71,270 | 188,700 | ||||||
| UnipolSai Assicurazioni SpA(a) |
339,411 | 916,183 | ||||||
|
|
|
|||||||
| Total Italy |
|
28,835,921 | ||||||
| Japan – 16.9% |
| |||||||
| Aeon Co., Ltd. |
35,200 | 736,692 | ||||||
| AGC, Inc. |
12,400 | 434,675 | ||||||
| Aisin Seiki Co., Ltd. |
16,300 | 582,432 | ||||||
| AIT Corp. |
36,800 | 370,045 | ||||||
| Amada Holdings Co., Ltd. |
53,700 | 531,251 | ||||||
| ANA Holdings, Inc. |
9,100 | 333,712 | ||||||
| Aozora Bank Ltd. |
12,400 | 306,513 | ||||||
| Asahi Group Holdings Ltd. |
14,700 | 654,750 | ||||||
| Asahi Kasei Corp. |
61,600 | 635,562 | ||||||
| Astellas Pharma, Inc. |
77,800 | 1,165,752 | ||||||
| Azbil Corp. |
20,900 | 488,866 | ||||||
| Bandai Namco Holdings, Inc. |
12,700 | 595,501 | ||||||
| Bridgestone Corp. |
42,500 | 1,638,027 | ||||||
| Brother Industries Ltd. |
21,000 | 388,562 | ||||||
| Canon, Inc. |
80,000 | 2,322,266 | ||||||
| Chiba Bank Ltd. (The) |
62,800 | 340,993 | ||||||
| Chubu Electric Power Co., Inc. |
34,400 | 537,204 | ||||||
| Chugai Pharmaceutical Co., Ltd. |
16,700 | 1,148,186 | ||||||
| Concordia Financial Group Ltd. |
88,000 | 339,486 | ||||||
| Cosmo Energy Holdings Co., Ltd.(a) |
9,900 | 198,921 | ||||||
| Dai-ichi Life Holdings, Inc. |
45,333 | 629,915 | ||||||
| Daiichi Sankyo Co., Ltd. |
29,300 | 1,350,047 | ||||||
| Daiken Medical Co., Ltd. |
105,400 | 529,452 | ||||||
| Daikin Industries Ltd. |
6,400 | 749,948 | ||||||
| Daito Trust Construction Co., Ltd. |
3,800 | 529,738 | ||||||
| Daiwa House Industry Co., Ltd. |
26,200 | 832,975 | ||||||
| Daiwa Securities Group, Inc. |
100,800 | 490,863 | ||||||
| Denka Co., Ltd. |
10,600 | 305,498 | ||||||
| Denso Corp. |
29,900 | 1,166,177 | ||||||
| Dentsu, Inc. |
10,900 | 460,383 | ||||||
| Disco Corp.(a) |
1,500 | 213,715 | ||||||
| East Japan Railway Co. |
7,300 | 704,377 | ||||||
| Eisai Co., Ltd. |
10,700 | 600,615 | ||||||
| FamilyMart UNY Holdings Co., Ltd. |
16,900 | 430,726 | ||||||
| FANUC Corp. |
6,800 | 1,159,904 | ||||||
| Fast Retailing Co., Ltd. |
1,700 | 799,124 | ||||||
| FCC Co., Ltd. |
12,900 | 272,836 | ||||||
| France Bed Holdings Co., Ltd.(a) |
76,700 | 625,048 | ||||||
| Fuji Electric Co., Ltd. |
7,600 | 215,603 | ||||||
| FUJIFILM Holdings Corp. |
17,900 | 814,099 | ||||||
| Fujitsu Ltd. |
7,600 | 548,345 | ||||||
| Gurunavi, Inc.(a) |
20,800 | 130,605 | ||||||
| Hamamatsu Photonics K.K. |
11,600 | 448,552 | ||||||
| Hirose Electric Co., Ltd.(a) |
4,805 | 504,876 | ||||||
| Hitachi Ltd. |
29,300 | 949,004 | ||||||
| Hitachi Metals Ltd. |
50,600 | 587,899 | ||||||
| Honda Motor Co., Ltd. |
73,400 | 1,986,114 | ||||||
| Hoya Corp. |
9,900 | 653,739 | ||||||
| Hulic Co., Ltd. |
29,400 | 288,462 | ||||||
| I-Net Corp.(a) |
25,700 | 305,795 | ||||||
| Ichigo, Inc. |
59,400 | 203,393 | ||||||
| Iida Group Holdings Co., Ltd. |
21,300 | 385,838 | ||||||
| Isuzu Motors Ltd. |
46,400 | 609,528 | ||||||
| ITOCHU Corp. |
89,400 | 1,617,414 | ||||||
| Japan Airlines Co., Ltd. |
16,100 | 567,140 | ||||||
| Japan Exchange Group, Inc. |
29,500 | 525,848 | ||||||
| Japan Post Holdings Co., Ltd. |
232,000 | 2,716,466 | ||||||
| Japan Post Insurance Co., Ltd.(a) |
25,500 | 551,768 | ||||||
| Japan Tobacco, Inc. |
137,744 | 3,416,066 | ||||||
| JFE Holdings, Inc. |
33,500 | 568,548 | ||||||
| JXTG Holdings, Inc. |
162,200 | 742,235 | ||||||
| Kajima Corp. |
32,500 | 479,785 | ||||||
| Kaneka Corp. |
7,200 | 269,630 | ||||||
| Kansai Electric Power Co., Inc. (The) |
30,800 | 454,132 | ||||||
| Kao Corp. |
11,900 | 937,292 | ||||||
See Notes to Financial Statements.
| WisdomTree Trust | 29 |
Schedule of Investments (continued)
WisdomTree International Equity Fund (DWM)
March 31, 2019
| Investments | Shares | Value | ||||||
| KDDI Corp. |
109,200 | $ | 2,353,002 | |||||
| Kirin Holdings Co., Ltd. |
34,400 | 821,268 | ||||||
| Komatsu Ltd. |
40,900 | 949,844 | ||||||
| Kubota Corp. |
44,400 | 641,621 | ||||||
| Kyoei Steel Ltd.(a) |
16,500 | 235,235 | ||||||
| Kyoritsu Maintenance Co., Ltd.(a) |
8,200 | 406,722 | ||||||
| Kyoritsu Printing Co., Ltd. |
67,500 | 135,994 | ||||||
| Kyowa Hakko Kirin Co., Ltd. |
19,000 | 413,696 | ||||||
| Kyushu Financial Group, Inc.(a) |
83,800 | 340,697 | ||||||
| Lawson, Inc. |
9,100 | 504,802 | ||||||
| LIXIL Group Corp. |
22,300 | 297,777 | ||||||
| Makita Corp. |
10,000 | 348,286 | ||||||
| Marubeni Corp. |
107,100 | 740,222 | ||||||
| Marui Group Co., Ltd.(a) |
20,500 | 413,945 | ||||||
| Mazda Motor Corp. |
34,600 | 387,154 | ||||||
| Medipal Holdings Corp. |
21,200 | 503,736 | ||||||
| Michinoku Bank Ltd. (The)(a) |
46,800 | 679,897 | ||||||
| Mitsubishi Chemical Holdings Corp. |
82,400 | 580,228 | ||||||
| Mitsubishi Corp. |
81,600 | 2,266,237 | ||||||
| Mitsubishi Electric Corp. |
89,100 | 1,145,094 | ||||||
| Mitsubishi Estate Co., Ltd. |
29,700 | 538,134 | ||||||
| Mitsubishi Gas Chemical Co., Inc. |
12,400 | 176,895 | ||||||
| Mitsubishi Heavy Industries Ltd. |
18,500 | 768,514 | ||||||
| Mitsubishi Materials Corp. |
9,200 | 242,873 | ||||||
| Mitsubishi Motors Corp. |
56,600 | 300,680 | ||||||
| Mitsubishi Tanabe Pharma Corp. |
38,500 | 514,446 | ||||||
| Mitsubishi UFJ Financial Group, Inc. |
507,600 | 2,522,293 | ||||||
| Mitsui Fudosan Co., Ltd. |
21,100 | 530,431 | ||||||
| Mizuho Financial Group, Inc. |
1,276,800 | 1,976,021 | ||||||
| Monex Group, Inc.(a) |
33,100 | 114,535 | ||||||
| MS&AD Insurance Group Holdings, Inc. |
29,930 | 911,272 | ||||||
| Murata Manufacturing Co., Ltd. |
16,200 | 806,743 | ||||||
| Nabtesco Corp. |
10,800 | 314,677 | ||||||
| NEC Corp. |
13,900 | 470,303 | ||||||
| Nichiha Corp. |
8,400 | 231,468 | ||||||
| Nidec Corp. |
4,000 | 506,844 | ||||||
| Nintendo Co., Ltd. |
3,000 | 855,400 | ||||||
| Nippon Express Co., Ltd. |
6,800 | 378,443 | ||||||
| Nippon Kayaku Co., Ltd.(a) |
34,000 | 401,789 | ||||||
| Nippon Light Metal Holdings Co., Ltd. |
146,900 | 322,507 | ||||||
| Nippon Steel & Sumikin Bussan Corp. |
6,700 | 272,395 | ||||||
| Nippon Steel & Sumitomo Metal Corp. |
50,500 | 891,512 | ||||||
| Nippon Telegraph & Telephone Corp. |
87,300 | 3,709,372 | ||||||
| Nissan Motor Co., Ltd.(a) |
308,200 | 2,528,863 | ||||||
| Nisshinbo Holdings, Inc.(a) |
32,800 | 286,557 | ||||||
| Nitto Denko Corp. |
6,600 | 346,741 | ||||||
| NOK Corp.(a) |
21,600 | 336,241 | ||||||
| Nomura Holdings, Inc. |
163,100 | 589,715 | ||||||
| Nomura Real Estate Holdings, Inc. |
13,800 | 264,941 | ||||||
| Nomura Research Institute Ltd. |
9,200 | 418,087 | ||||||
| NSK Ltd. |
38,500 | 360,704 | ||||||
| NTT Data Corp. |
48,300 | 532,812 | ||||||
| NTT DOCOMO, Inc. |
198,955 | 4,406,543 | ||||||
| Obayashi Corp. |
43,100 | 433,784 | ||||||
| Oji Holdings Corp. |
73,000 | 453,097 | ||||||
| Omron Corp. |
11,600 | 542,874 | ||||||
| Ono Pharmaceutical Co., Ltd. |
17,400 | 340,973 | ||||||
| Oracle Corp. |
5,300 | 355,775 | ||||||
| Oriental Land Co., Ltd. |
3,900 | 442,906 | ||||||
| Otsuka Holdings Co., Ltd. |
18,500 | 726,896 | ||||||
| Outsourcing, Inc.(a) |
13,000 | 160,437 | ||||||
| Panasonic Corp. |
75,400 | 650,013 | ||||||
| Park24 Co., Ltd. |
13,400 | 290,917 | ||||||
| Pigeon Corp. |
8,300 | 339,319 | ||||||
| Qol Holdings Co., Ltd. |
17,700 | 241,149 | ||||||
| Recruit Holdings Co., Ltd. |
29,900 | 853,900 | ||||||
| Resona Holdings, Inc. |
110,200 | 477,598 | ||||||
| Ricoh Co., Ltd.(a) |
24,600 | 257,146 | ||||||
| San-In Godo Bank Ltd. (The)(a) |
44,600 | 319,939 | ||||||
| Sanwa Holdings Corp. |
33,700 | 400,984 | ||||||
| SBI Holdings, Inc. |
20,500 | 456,729 | ||||||
| Secom Co., Ltd. |
9,500 | 813,832 | ||||||
| Seiko Epson Corp.(a) |
28,200 | 431,847 | ||||||
| Seino Holdings Co., Ltd. |
28,600 | 381,127 | ||||||
| Sekisui House Ltd. |
52,000 | 860,677 | ||||||
| Seven & I Holdings Co., Ltd. |
29,300 | 1,105,451 | ||||||
| Seven Bank Ltd. |
135,400 | 400,016 | ||||||
| Shikoku Electric Power Co., Inc.(a) |
28,800 | 350,747 | ||||||
| Shimizu Corp. |
43,200 | 375,465 | ||||||
| Shin-Etsu Chemical Co., Ltd. |
10,200 | 855,184 | ||||||
| Shionogi & Co., Ltd. |
11,900 | 736,674 | ||||||
| Shizuoka Bank Ltd. (The) |
60,800 | 463,065 | ||||||
| Showa Shell Sekiyu K.K. |
41,100 | 564,060 | ||||||
| SMC Corp. |
1,500 | 562,813 | ||||||
| SoftBank Group Corp. |
9,600 | 931,942 | ||||||
| Sojitz Corp. |
157,500 | 554,953 | ||||||
| Sompo Holdings, Inc. |
15,400 | 570,169 | ||||||
| Sony Corp. |
12,100 | 507,788 | ||||||
| Sony Financial Holdings, Inc. |
29,400 | 554,612 | ||||||
| Subaru Corp.(a) |
49,300 | 1,123,542 | ||||||
| Sumitomo Chemical Co., Ltd. |
100,500 | 467,611 | ||||||
| Sumitomo Corp. |
67,300 | 930,897 | ||||||
| Sumitomo Electric Industries Ltd. |
46,600 | 618,260 | ||||||
| Sumitomo Heavy Industries Ltd. |
13,000 | 421,060 | ||||||
| Sumitomo Metal Mining Co., Ltd. |
12,800 | 378,154 | ||||||
| Sumitomo Mitsui Financial Group, Inc. |
68,300 | 2,391,750 | ||||||
| Sumitomo Mitsui Trust Holdings, Inc. |
20,207 | 725,871 | ||||||
| Sumitomo Realty & Development Co., Ltd. |
10,000 | 414,329 | ||||||
| Sumitomo Rubber Industries Ltd. |
24,100 | 289,152 | ||||||
| Suntory Beverage & Food Ltd. |
10,900 | 512,084 | ||||||
| Suzuken Co., Ltd. |
8,800 | 509,626 | ||||||
| Suzuki Motor Corp. |
11,900 | 526,595 | ||||||
| Sysmex Corp. |
3,600 | 217,590 | ||||||
| T&D Holdings, Inc. |
30,200 | 317,593 | ||||||
| Taisei Corp. |
10,800 | 501,531 | ||||||
| Takeda Pharmaceutical Co., Ltd. |
49,200 | 2,009,606 | ||||||
| Teijin Ltd. |
19,800 | 326,646 | ||||||
| Terumo Corp. |
18,000 | 549,668 | ||||||
See Notes to Financial Statements.
| 30 | WisdomTree Trust |
Schedule of Investments (continued)
WisdomTree International Equity Fund (DWM)
March 31, 2019
| Investments | Shares | Value | ||||||
| Toda Corp. |
51,200 | $ | 314,550 | |||||
| Toho Co., Ltd. |
11,200 | 449,781 | ||||||
| Tokai Tokyo Financial Holdings, Inc.(a) |
58,700 | 212,664 | ||||||
| Tokio Marine Holdings, Inc. |
29,300 | 1,419,403 | ||||||
| Tokyo Electron Device Ltd. |
26,000 | 418,123 | ||||||
| Tokyo Electron Ltd.(a) |
8,200 | 1,185,346 | ||||||
| Tokyo Gas Co., Ltd. |
18,500 | 500,337 | ||||||
| Toray Industries, Inc. |
47,300 | 302,086 | ||||||
| TOTO Ltd. |
7,200 | 305,407 | ||||||
| Toyo Ink SC Holdings Co., Ltd. |
14,400 | 323,296 | ||||||
| Toyo Kanetsu K.K. |
12,100 | 219,076 | ||||||
| Toyoda Gosei Co., Ltd. |
12,600 | 266,833 | ||||||
| Toyota Boshoku Corp. |
18,800 | 284,501 | ||||||
| Toyota Motor Corp. |
143,610 | 8,416,660 | ||||||
| Toyota Tsusho Corp. |
20,900 | 680,711 | ||||||
| Trend Micro, Inc. |
9,100 | 443,140 | ||||||
| Ube Industries Ltd. |
14,500 | 298,030 | ||||||
| Unicharm Corp. |
14,200 | 469,934 | ||||||
| USS Co., Ltd. |
26,260 | 487,311 | ||||||
| Wacoal Holdings Corp. |
16,300 | 405,273 | ||||||
| West Japan Railway Co. |
8,820 | 664,498 | ||||||
| Yahoo Japan Corp. |
195,310 | 478,195 | ||||||
| Yakult Honsha Co., Ltd. |
4,000 | 279,713 | ||||||
| Yamaha Corp. |
6,900 | 344,735 | ||||||
| Yamaha Motor Co., Ltd. |
20,500 | 402,091 | ||||||
| Yamato Holdings Co., Ltd. |
12,600 | 325,459 | ||||||
| Yuasa Trading Co., Ltd. |
15,500 | 436,916 | ||||||
|
|
|
|||||||
| Total Japan |
|
141,403,613 | ||||||
| Netherlands – 2.3% |
| |||||||
| Aalberts Industries N.V. |
8,675 | 300,307 | ||||||
| ABN AMRO Group N.V. CVA(b) |
74,909 | 1,690,642 | ||||||
| Aegon N.V. |
164,458 | 791,091 | ||||||
| Akzo Nobel N.V. |
9,686 | 859,089 | ||||||
| ASML Holding N.V. |
5,445 | 1,022,247 | ||||||
| ASR Nederland N.V. |
11,387 | 474,357 | ||||||
| BE Semiconductor Industries N.V. |
11,580 | 308,422 | ||||||
| Boskalis Westminster(a) |
12,389 | 320,648 | ||||||
| Corbion N.V. |
9,206 | 277,030 | ||||||
| Euronext N.V.(b) |
4,886 | 309,973 | ||||||
| Heineken Holding N.V. |
4,428 | 443,998 | ||||||
| Heineken N.V. |
13,521 | 1,428,328 | ||||||
| ING Groep N.V. |
249,137 | 3,016,753 | ||||||
| Koninklijke Ahold Delhaize N.V. |
63,029 | 1,679,068 | ||||||
| Koninklijke DSM N.V. |
8,017 | 874,623 | ||||||
| Koninklijke KPN N.V. |
262,779 | 833,843 | ||||||
| Koninklijke Philips N.V. |
36,927 | 1,505,746 | ||||||
| NN Group N.V. |
19,231 | 799,608 | ||||||
| PostNL N.V. |
81,675 | 209,004 | ||||||
| Randstad N.V.(a) |
10,911 | 532,569 | ||||||
| Signify N.V.(b) |
12,246 | 327,948 | ||||||
| Wolters Kluwer N.V. |
16,088 | 1,096,510 | ||||||
|
|
|
|||||||
| Total Netherlands |
|
19,101,804 | ||||||
| New Zealand – 0.5% |
| |||||||
| Abano Healthcare Group Ltd. |
81,084 | 215,667 | ||||||
| Air New Zealand Ltd. |
99,872 | 172,666 | ||||||
| Arvida Group Ltd. |
539,776 | 478,565 | ||||||
| Auckland International Airport Ltd. |
75,430 | 418,748 | ||||||
| Contact Energy Ltd. |
87,459 | 413,951 | ||||||
| Fisher & Paykel Healthcare Corp., Ltd. |
39,097 | 418,627 | ||||||
| Mercury NZ Ltd. |
156,510 | 416,285 | ||||||
| Meridian Energy Ltd. |
166,432 | 475,025 | ||||||
| PGG Wrightson Ltd. |
220,080 | 73,546 | ||||||
| Spark New Zealand Ltd. |
209,661 | 543,357 | ||||||
| Tourism Holdings Ltd. |
66,562 | 215,174 | ||||||
| Vector Ltd. |
72,832 | 177,824 | ||||||
| Z Energy Ltd. |
73,671 | 314,525 | ||||||
|
|
|
|||||||
| Total New Zealand |
|
4,333,960 | ||||||
| Norway – 1.6% |
| |||||||
| Aker ASA Class A |
8,051 | 615,165 | ||||||
| Aker BP ASA |
22,079 | 787,107 | ||||||
| DNB ASA |
85,003 | 1,567,476 | ||||||
| Equinor ASA |
162,252 | 3,558,141 | ||||||
| Gjensidige Forsikring ASA(a) |
33,720 | 583,432 | ||||||
| Leroy Seafood Group ASA |
47,509 | 345,135 | ||||||
| Mowi ASA |
55,500 | 1,240,623 | ||||||
| Norsk Hydro ASA |
97,382 | 395,223 | ||||||
| Ocean Yield ASA |
46,096 | 342,043 | ||||||
| Orkla ASA |
58,683 | 451,114 | ||||||
| Salmar ASA |
13,315 | 639,805 | ||||||
| SpareBank 1 SR-Bank ASA |
25,605 | 295,548 | ||||||
| Storebrand ASA |
39,324 | 306,588 | ||||||
| Telenor ASA |
100,974 | 2,024,968 | ||||||
| Yara International ASA |
7,360 | 301,524 | ||||||
|
|
|
|||||||
| Total Norway |
|
13,453,892 | ||||||
| Portugal – 0.4% |
| |||||||
| Altri, SGPS, S.A. |
44,125 | 345,829 | ||||||
| EDP – Energias de Portugal S.A. |
237,512 | 934,750 | ||||||
| Galp Energia, SGPS, S.A. |
40,001 | 641,388 | ||||||
| Jeronimo Martins, SGPS, S.A. |
49,000 | 723,508 | ||||||
| Navigator Co. S.A. (The) |
74,173 | 339,804 | ||||||
| REN – Redes Energeticas Nacionais, SGPS, S.A. |
138,557 | 395,481 | ||||||
| Semapa-Sociedade de Investimento e Gestao |
5,863 | 95,589 | ||||||
|
|
|
|||||||
| Total Portugal |
|
3,476,349 | ||||||
| Singapore – 1.7% |
| |||||||
| CapitaLand Ltd. |
164,800 | 444,090 | ||||||
| City Developments Ltd. |
37,600 | 251,222 | ||||||
| ComfortDelGro Corp., Ltd. |
230,400 | 437,156 | ||||||
| DBS Group Holdings Ltd. |
111,200 | 2,071,300 | ||||||
| Hutchison Port Holdings Trust |
1,855,936 | 436,145 | ||||||
| Jardine Cycle & Carriage Ltd. |
22,655 | 543,419 | ||||||
| Keppel Corp., Ltd. |
98,900 | 454,159 | ||||||
| Keppel Infrastructure Trust(a) |
881,700 | 302,688 | ||||||
| Olam International Ltd. |
304,700 | 445,409 | ||||||
| Oversea-Chinese Banking Corp., Ltd. |
182,061 | 1,485,252 | ||||||
See Notes to Financial Statements.
| WisdomTree Trust | 31 |
Schedule of Investments (continued)
WisdomTree International Equity Fund (DWM)
March 31, 2019
| Investments | Shares | Value | ||||||
| QAF Ltd. |
531,274 | $ | 329,472 | |||||
| SATS Ltd. |
121,900 | 459,881 | ||||||
| Sheng Siong Group Ltd. |
971,800 | 746,159 | ||||||
| Singapore Airlines Ltd. |
25,500 | 181,860 | ||||||
| Singapore Technologies Engineering Ltd. |
260,000 | 717,903 | ||||||
| Singapore Telecommunications Ltd. |
1,204,500 | 2,685,559 | ||||||
| StarHub Ltd. |
358,900 | 394,803 | ||||||
| United Overseas Bank Ltd. |
64,001 | 1,190,244 | ||||||
| UOL Group Ltd. |
67,800 | 347,885 | ||||||
| Wilmar International Ltd. |
267,000 | 652,470 | ||||||
|
|
|
|||||||
| Total Singapore |
|
14,577,076 | ||||||
| Spain – 4.2% |
| |||||||
| Acciona S.A.(a) |
5,162 | 575,558 | ||||||
| Acerinox S.A. |
27,522 | 272,998 | ||||||
| ACS Actividades de Construccion y Servicios S.A. |
19,543 | 859,321 | ||||||
| Aena SME S.A.(b) |
8,092 | 1,458,319 | ||||||
| Amadeus IT Group S.A. |
15,512 | 1,243,620 | ||||||
| Applus Services S.A. |
26,592 | 317,698 | ||||||
| Atresmedia Corp. de Medios de Comunicacion S.A.(a) |
40,443 | 189,729 | ||||||
| Banco Bilbao Vizcaya Argentaria S.A. |
343,113 | 1,962,152 | ||||||
| Banco de Sabadell S.A. |
373,998 | 372,826 | ||||||
| Banco Santander S.A. |
931,299 | 4,333,941 | ||||||
| Bankia S.A. |
158,201 | 410,339 | ||||||
| Bankinter S.A. |
51,130 | 389,823 | ||||||
| Bolsas y Mercados Espanoles SHMSF S.A. |
8,576 | 239,969 | ||||||
| CaixaBank S.A. |
318,492 | 995,610 | ||||||
| Cellnex Telecom S.A.*(a)(b) |
17,492 | 513,806 | ||||||
| Cia de Distribucion Integral Logista Holdings S.A. |
12,324 | 290,598 | ||||||
| Cie Automotive S.A. |
9,095 | 244,891 | ||||||
| Enagas S.A. |
23,446 | 682,905 | ||||||
| Ence Energia y Celulosa S.A. |
42,852 | 238,657 | ||||||
| Endesa S.A. |
92,255 | 2,355,603 | ||||||
| Ferrovial S.A. |
43,671 | 1,023,871 | ||||||
| Iberdrola S.A. |
425,296 | 3,737,256 | ||||||
| Industria de Diseno Textil S.A. |
107,170 | 3,152,799 | ||||||
| Mapfre S.A. |
218,484 | 602,518 | ||||||
| Mediaset Espana Comunicacion S.A. |
90,240 | 674,426 | ||||||
| Naturgy Energy Group S.A. |
63,050 | 1,764,936 | ||||||
| Obrascon Huarte Lain S.A.(a) |
74,514 | 93,917 | ||||||
| Red Electrica Corp. S.A. |
38,221 | 815,412 | ||||||
| Repsol S.A. |
108,884 | 1,865,693 | ||||||
| Telefonica S.A. |
402,363 | 3,374,444 | ||||||
| Zardoya Otis S.A. |
41,457 | 343,539 | ||||||
|
|
|
|||||||
| Total Spain |
|
35,397,174 | ||||||
| Sweden – 2.9% |
| |||||||
| Alfa Laval AB |
16,811 | 386,776 | ||||||
| Assa Abloy AB Class B |
25,885 | 560,103 | ||||||
| Atlas Copco AB Class A |
20,079 | 540,438 | ||||||
| Atlas Copco AB Class B |
27,735 | 688,045 | ||||||
| Axfood AB(a) |
25,345 | 472,727 | ||||||
| Boliden AB |
16,637 | 474,610 | ||||||
| Castellum AB |
16,755 | 325,786 | ||||||
| Dometic Group AB(a)(b) |
29,727 | 234,123 | ||||||
| Electrolux AB Series B |
19,585 | 504,443 | ||||||
| Essity AB Class B |
26,120 | 754,991 | ||||||
| Evolution Gaming Group AB(b) |
3,413 | 269,535 | ||||||
| Fabege AB |
62,110 | 903,998 | ||||||
| Hemfosa Fastigheter AB |
18,071 | 158,883 | ||||||
| Hennes & Mauritz AB Class B |
156,758 | 2,619,591 | ||||||
| ICA Gruppen AB(a) |
17,249 | 693,657 | ||||||
| Intrum AB(a) |
9,489 | 273,152 | ||||||
| Investment AB Latour Class B(a) |
31,901 | 428,199 | ||||||
| NCC AB Class B(a) |
18,589 | 286,492 | ||||||
| Nobia AB |
40,758 | 239,487 | ||||||
| Peab AB |
37,839 | 327,791 | ||||||
| Saab AB Class B(a) |
5,542 | 177,995 | ||||||
| Sandvik AB |
52,137 | 848,780 | ||||||
| Securitas AB Class B |
24,295 | 393,553 | ||||||
| Skandinaviska Enskilda Banken AB Class A(a) |
181,183 | 1,572,090 | ||||||
| Skanska AB Class B(a) |
41,694 | 759,233 | ||||||
| SKF AB Class B(a) |
25,563 | 425,531 | ||||||
| SSAB AB Class A(a) |
69,044 | 248,848 | ||||||
| Svenska Cellulosa AB SCA Class B |
22,778 | 197,935 | ||||||
| Svenska Handelsbanken AB Class A(a) |
127,904 | 1,352,774 | ||||||
| Swedbank AB Class A(a) |
97,403 | 1,379,350 | ||||||
| Swedish Match AB |
12,733 | 650,563 | ||||||
| Tele2 AB Class B |
61,208 | 817,290 | ||||||
| Telefonaktiebolaget LM Ericsson Class B |
87,924 | 809,728 | ||||||
| Telia Co. AB |
351,127 | 1,588,065 | ||||||
| Trelleborg AB Class B |
15,722 | 244,001 | ||||||
| Volvo AB Class A |
8,196 | 127,155 | ||||||
| Volvo AB Class B |
81,154 | 1,259,924 | ||||||
|
|
|
|||||||
| Total Sweden |
|
23,995,642 | ||||||
| Switzerland – 8.3% |
| |||||||
| ABB Ltd. Registered Shares |
106,699 | 2,004,557 | ||||||
| Adecco Group AG Registered Shares |
10,701 | 570,777 | ||||||
| Baloise Holding AG Registered Shares |
4,635 | 765,596 | ||||||
| Cembra Money Bank AG |
3,048 | 288,151 | ||||||
| Cie Financiere Richemont S.A. Registered Shares |
17,852 | 1,300,315 | ||||||
| Clariant AG Registered Shares* |
23,351 | 490,749 | ||||||
| Coca-Cola HBC AG* |
12,644 | 430,841 | ||||||
| Credit Suisse Group AG Registered Shares* |
75,654 | 881,579 | ||||||
| Dufry AG* |
3,423 | 359,520 | ||||||
| EMS-Chemie Holding AG Registered Shares |
1,010 | 547,645 | ||||||
| Flughafen Zurich AG Registered Shares |
2,028 | 370,005 | ||||||
| Geberit AG Registered Shares |
1,578 | 644,890 | ||||||
| Givaudan S.A. Registered Shares* |
442 | 1,129,077 | ||||||
| Helvetia Holding AG Registered Shares |
633 | 386,448 | ||||||
| Julius Baer Group Ltd.* |
8,013 | 323,690 | ||||||
| Kuehne + Nagel International AG Registered Shares |
7,175 | 984,140 | ||||||
| LafargeHolcim Ltd. Registered Shares* |
32,978 | 1,628,866 | ||||||
| Logitech International S.A. Registered Shares |
14,590 | 571,792 | ||||||
| Lonza Group AG Registered Shares* |
2,120 | 657,351 | ||||||
| Nestle S.A. Registered Shares |
137,574 | 13,109,522 | ||||||
See Notes to Financial Statements.
| 32 | WisdomTree Trust |
Schedule of Investments (continued)
WisdomTree International Equity Fund (DWM)
March 31, 2019
| Investments | Shares | Value | ||||||
| Novartis AG Registered Shares |
139,963 | $ | 13,460,846 | |||||
| Partners Group Holding AG |
886 | 644,105 | ||||||
| Roche Holding AG Bearer Shares |
5,477 | 1,492,577 | ||||||
| Roche Holding AG Genusschein |
42,759 | 11,779,227 | ||||||
| Schindler Holding AG Participation Certificate |
3,647 | 755,840 | ||||||
| SGS S.A. Registered Shares |
358 | 890,776 | ||||||
| STMicroelectronics N.V. |
17,349 | 256,751 | ||||||
| Sunrise Communications Group AG*(a)(b) |
5,578 | 410,551 | ||||||
| Swatch Group AG (The) Bearer Shares |
1,766 | 505,382 | ||||||
| Swiss Life Holding AG Registered Shares* |
1,936 | 852,431 | ||||||
| Swiss Re AG |
24,774 | 2,419,937 | ||||||
| Swisscom AG Registered Shares(a) |
3,641 | 1,780,467 | ||||||
| UBS Group AG Registered Shares* |
197,977 | 2,399,420 | ||||||
| Vontobel Holding AG Registered Shares |
8,925 | 479,901 | ||||||
| Zurich Insurance Group AG |
11,178 | 3,699,437 | ||||||
|
|
|
|||||||
| Total Switzerland |
|
69,273,159 | ||||||
| United Kingdom – 18.5% |
| |||||||
| Admiral Group PLC |
25,826 | 730,261 | ||||||
| Aggreko PLC |
27,593 | 283,038 | ||||||
| Anglo American PLC |
92,024 | 2,462,391 | ||||||
| Antofagasta PLC |
59,398 | 747,670 | ||||||
| Ashmore Group PLC |
51,709 | 287,845 | ||||||
| Associated British Foods PLC |
17,562 | 558,145 | ||||||
| AstraZeneca PLC |
66,390 | 5,307,359 | ||||||
| Aviva PLC |
234,471 | 1,259,996 | ||||||
| Babcock International Group PLC |
30,270 | 194,653 | ||||||
| BAE Systems PLC |
160,037 | 1,005,979 | ||||||
| Barclays PLC |
331,186 | 667,525 | ||||||
| Barratt Developments PLC |
128,859 | 1,006,115 | ||||||
| Bellway PLC |
12,162 | 482,563 | ||||||
| Berkeley Group Holdings PLC |
12,555 | 603,513 | ||||||
| Bodycote PLC |
28,262 | 303,085 | ||||||
| BP PLC |
1,587,702 | 11,554,560 | ||||||
| Brewin Dolphin Holdings PLC |
61,955 | 252,041 | ||||||
| British American Tobacco PLC |
174,935 | 7,280,695 | ||||||
| British Land Co. PLC (The) |
73,022 | 560,442 | ||||||
| BT Group PLC |
1,029,513 | 2,990,891 | ||||||
| Bunzl PLC |
8,921 | 294,333 | ||||||
| Burberry Group PLC |
15,061 | 383,575 | ||||||
| Carnival PLC |
9,312 | 456,845 | ||||||
| Centrica PLC |
624,009 | 928,578 | ||||||
| Close Brothers Group PLC |
12,438 | 235,817 | ||||||
| CNH Industrial N.V. |
31,267 | 318,220 | ||||||
| Coca-Cola European Partners PLC |
15,383 | 792,822 | ||||||
| Compass Group PLC |
51,054 | 1,200,461 | ||||||
| Costain Group PLC |
62,574 | 273,149 | ||||||
| Countryside Properties PLC(b) |
53,591 | 226,814 | ||||||
| Derwent London PLC |
7,285 | 305,950 | ||||||
| Diageo PLC |
90,384 | 3,695,777 | ||||||
| Direct Line Insurance Group PLC |
121,085 | 556,963 | ||||||
| Dixons Carphone PLC |
127,553 | 243,910 | ||||||
| easyJet PLC |
18,421 | 268,239 | ||||||
| Electrocomponents PLC |
48,132 | 352,352 | ||||||
| Equiniti Group PLC(b) |
88,301 | 239,326 | ||||||
| Evraz PLC |
136,642 | 1,104,631 | ||||||
| Fresnillo PLC |
40,896 | 464,045 | ||||||
| G4S PLC |
100,492 | 240,286 | ||||||
| GlaxoSmithKline PLC |
381,345 | 7,934,687 | ||||||
| Greene King PLC |
28,421 | 246,424 | ||||||
| Halma PLC |
18,436 | 401,665 | ||||||
| Hammerson PLC |
56,805 | 248,558 | ||||||
| Hastings Group Holdings PLC(b) |
100,679 | 284,157 | ||||||
| Howden Joinery Group PLC |
48,986 | 309,773 | ||||||
| HSBC Holdings PLC |
1,335,554 | 10,847,254 | ||||||
| Ibstock PLC(b) |
56,388 | 176,196 | ||||||
| IMI PLC |
24,415 | 304,778 | ||||||
| Imperial Brands PLC |
96,379 | 3,296,023 | ||||||
| Inchcape PLC |
44,139 | 328,413 | ||||||
| Informa PLC |
49,059 | 475,740 | ||||||
| Inmarsat PLC |
40,280 | 291,302 | ||||||
| InterContinental Hotels Group PLC |
7,492 | 450,537 | ||||||
| International Consolidated Airlines Group S.A. |
92,570 | 616,585 | ||||||
| Intertek Group PLC |
6,140 | 388,595 | ||||||
| Investec PLC |
36,375 | 209,643 | ||||||
| ITV PLC |
352,452 | 583,723 | ||||||
| J Sainsbury PLC |
156,465 | 480,549 | ||||||
| Jardine Lloyd Thompson Group PLC |
12,562 | 313,301 | ||||||
| Johnson Matthey PLC |
6,546 | 268,005 | ||||||
| Jupiter Fund Management PLC |
61,969 | 292,149 | ||||||
| Kingfisher PLC |
143,716 | 439,708 | ||||||
| Land Securities Group PLC |
38,953 | 463,621 | ||||||
| Legal & General Group PLC |
433,523 | 1,555,176 | ||||||
| Lloyds Banking Group PLC |
4,193,050 | 3,395,178 | ||||||
| London Stock Exchange Group PLC |
8,574 | 530,799 | ||||||
| Lookers PLC |
241,720 | 318,123 | ||||||
| Man Group PLC |
134,829 | 238,586 | ||||||
| Marks & Spencer Group PLC |
183,736 | 667,735 | ||||||
| McCarthy & Stone PLC(b) |
132,753 | 222,111 | ||||||
| Micro Focus International PLC |
26,103 | 679,080 | ||||||
| Mondi PLC |
18,529 | 409,969 | ||||||
| Morgan Advanced Materials PLC |
100,079 | 316,891 | ||||||
| National Grid PLC |
261,013 | 2,893,682 | ||||||
| Next PLC |
7,013 | 509,917 | ||||||
| PayPoint PLC |
29,863 | 333,484 | ||||||
| Pearson PLC |
36,679 | 399,658 | ||||||
| Pennon Group PLC |
39,763 | 385,283 | ||||||
| Persimmon PLC |
41,489 | 1,173,151 | ||||||
| Polar Capital Holdings PLC |
40,437 | 275,049 | ||||||
| PRS REIT PLC (The)(a) |
394,644 | 507,042 | ||||||
| Prudential PLC |
74,865 | 1,499,875 | ||||||
| PZ Cussons PLC |
139,558 | 356,792 | ||||||
| Reckitt Benckiser Group PLC |
27,499 | 2,286,836 | ||||||
| Redde PLC |
151,584 | 235,051 | ||||||
| Redrow PLC |
37,531 | 293,918 | ||||||
| RELX PLC |
88,952 | 1,902,645 | ||||||
| Rentokil Initial PLC |
95,315 | 438,800 | ||||||
| Rio Tinto PLC |
98,346 | 5,716,763 | ||||||
See Notes to Financial Statements.
| WisdomTree Trust | 33 |
Schedule of Investments (concluded)
WisdomTree International Equity Fund (DWM)
March 31, 2019
| Investments | Shares | Value | ||||||
| Rolls-Royce Holdings PLC* |
41,169 | $ | 484,524 | |||||
| Rotork PLC |
95,357 | 351,393 | ||||||
| Royal Dutch Shell PLC Class A |
338,091 | 10,632,665 | ||||||
| Royal Dutch Shell PLC Class B |
311,469 | 9,854,276 | ||||||
| Royal Mail PLC |
74,867 | 232,475 | ||||||
| RPC Group PLC |
31,230 | 321,485 | ||||||
| RSA Insurance Group PLC |
53,431 | 353,547 | ||||||
| Saga PLC |
182,581 | 264,558 | ||||||
| Sage Group PLC (The) |
61,697 | 563,725 | ||||||
| Schroders PLC |
9,957 | 350,570 | ||||||
| Segro PLC |
81,223 | 712,711 | ||||||
| Severn Trent PLC |
20,102 | 517,592 | ||||||
| Smith & Nephew PLC |
21,006 | 416,874 | ||||||
| Smiths Group PLC |
22,559 | 421,826 | ||||||
| Soco International PLC |
128,971 | 115,622 | ||||||
| Spectris PLC |
8,574 | 280,426 | ||||||
| Spirax-Sarco Engineering PLC |
3,741 | 350,492 | ||||||
| SSE PLC |
107,468 | 1,662,230 | ||||||
| St. James’s Place PLC |
26,629 | 356,705 | ||||||
| Stagecoach Group PLC |
176,401 | 353,064 | ||||||
| Standard Chartered PLC |
60,005 | 462,335 | ||||||
| Standard Life Aberdeen PLC |
210,173 | 722,869 | ||||||
| TalkTalk Telecom Group PLC(a) |
257,654 | 370,317 | ||||||
| Tate & Lyle PLC |
44,060 | 416,699 | ||||||
| Tesco PLC |
170,705 | 516,277 | ||||||
| TP ICAP PLC |
37,572 | 144,035 | ||||||
| Travis Perkins PLC |
17,139 | 306,185 | ||||||
| Unilever N.V. CVA |
72,653 | 4,224,130 | ||||||
| Unilever PLC |
56,847 | 3,255,575 | ||||||
| United Utilities Group PLC |
58,101 | 616,570 | ||||||
| Vodafone Group PLC |
3,010,550 | 5,484,212 | ||||||
| WH Smith PLC |
22,771 | 629,635 | ||||||
| Whitbread PLC |
8,044 | 532,263 | ||||||
| William Hill PLC |
85,365 | 178,588 | ||||||
| WM Morrison Supermarkets PLC |
145,254 | 430,691 | ||||||
|
|
|
|||||||
| Total United Kingdom |
|
155,200,981 | ||||||
| TOTAL COMMON STOCKS (Cost: $790,570,091) |
830,634,526 | |||||||
| RIGHTS – 0.0% |
| |||||||
| Singapore – 0.0% |
| |||||||
| Keppel Infrastructure Trust, expiring 4/4/19* (Cost: $0) |
104,041 | 1,843 | ||||||
| EXCHANGE-TRADED FUND – 0.0% |
| |||||||
| United States – 0.0% |
| |||||||
| WisdomTree International Dividend Ex-Financials Fund(c) |
||||||||
| (Cost: $19,711) | 482 | 19,842 | ||||||
| INVESTMENT OF CASH COLLATERAL FOR SECURITIES LOANED – 3.0% |
| |||||||
| United States – 3.0% |
| |||||||
| State Street Navigator Securities Lending Government Money Market Portfolio, 2.46%(d) |
||||||||
| (Cost: $24,868,219)(e) | 24,868,219 | $ | 24,868,219 | |||||
| TOTAL INVESTMENTS IN SECURITIES – 102.2% (Cost: $815,458,021) |
|
855,524,430 | ||||||
| Other Assets less Liabilities – (2.2)% |
(18,264,280 | ) | ||||||
|
|
|
|||||||
| NET ASSETS – 100.0% | $ | 837,260,150 | ||||||
| * | Non-income producing security. |
| (a) | Security, or portion thereof, was on loan at March 31, 2019 (See Note 2). |
| (b) | This security is exempt from registration under rule 144A of the Securities Act of 1933. This security may be sold in transactions that are exempt from registration, normally to qualified institutional buyers. |
| (c) | Affiliated company (See Note 3). |
| (d) | Rate shown represents annualized 7-day yield as of March 31, 2019. |
| (e) | At March 31, 2019, the total market value of the Fund’s securities on loan identified in the Schedule of Investments was $34,526,658. The total market value of the collateral held by the Fund was $36,452,056. The total market value of the collateral includes non-cash U.S. Government securities collateral having a value of $11,583,837. |
CVA – Certificaten Van Aandelen (Certificate of Stock)
RSP – Risparmio Italian Savings Shares
See Notes to Financial Statements.
| 34 | WisdomTree Trust |
Schedule of Investments
WisdomTree International High Dividend Fund (DTH)
March 31, 2019
| Investments | Shares | Value | ||||||
| COMMON STOCKS – 99.1% | ||||||||
| Australia – 9.8% | ||||||||
| Adelaide Brighton Ltd. |
24,592 | $ | 78,610 | |||||
| AGL Energy Ltd. |
21,674 | 335,174 | ||||||
| Alumina Ltd. |
137,073 | 235,635 | ||||||
| Amcor Ltd. |
31,857 | 348,270 | ||||||
| AMP Ltd. |
104,024 | 155,176 | ||||||
| ASX Ltd. |
4,592 | 227,813 | ||||||
| Aurizon Holdings Ltd. |
88,319 | 285,455 | ||||||
| AusNet Services |
136,807 | 172,496 | ||||||
| Australia & New Zealand Banking Group Ltd. |
81,139 | 1,500,293 | ||||||
| Bank of Queensland Ltd. |
18,147 | 117,306 | ||||||
| Bendigo & Adelaide Bank Ltd. |
19,308 | 132,765 | ||||||
| BHP Group Ltd. |
86,664 | 2,369,512 | ||||||
| BHP Group PLC |
66,716 | 1,607,068 | ||||||
| Boral Ltd. |
30,121 | 98,210 | ||||||
| Brambles Ltd. |
38,214 | 319,229 | ||||||
| Caltex Australia Ltd. |
9,562 | 178,028 | ||||||
| CIMIC Group Ltd. |
8,096 | 277,543 | ||||||
| Coca-Cola Amatil Ltd. |
32,232 | 198,050 | ||||||
| Commonwealth Bank of Australia |
50,143 | 2,516,131 | ||||||
| Crown Resorts Ltd. |
25,462 | 208,181 | ||||||
| CSR Ltd. |
47,824 | 112,786 | ||||||
| Downer EDI Ltd. |
18,627 | 101,619 | ||||||
| DuluxGroup Ltd. |
11,148 | 58,600 | ||||||
| Event Hospitality and Entertainment Ltd. |
9,668 | 93,538 | ||||||
| Fortescue Metals Group Ltd. |
185,336 | 936,056 | ||||||
| Harvey Norman Holdings Ltd.(a) |
65,834 | 187,996 | ||||||
| Insurance Australia Group Ltd. |
57,027 | 311,110 | ||||||
| JB Hi-Fi Ltd.(a) |
5,892 | 104,425 | ||||||
| Macquarie Group Ltd. |
8,469 | 778,585 | ||||||
| Magellan Financial Group Ltd. |
3,569 | 92,359 | ||||||
| Medibank Pvt Ltd. |
46,990 | 92,127 | ||||||
| Metcash Ltd. |
30,225 | 56,896 | ||||||
| Mineral Resources Ltd. |
7,145 | 80,192 | ||||||
| National Australia Bank Ltd. |
95,347 | 1,711,530 | ||||||
| New Hope Corp., Ltd. |
44,169 | 94,440 | ||||||
| Nine Entertainment Co. Holdings Ltd. |
69,819 | 84,809 | ||||||
| Orora Ltd. |
28,207 | 59,910 | ||||||
| Platinum Asset Management Ltd.(a) |
15,779 | 51,447 | ||||||
| Premier Investments Ltd. |
6,334 | 73,160 | ||||||
| Rio Tinto Ltd. |
13,461 | 936,217 | ||||||
| Sonic Healthcare Ltd. |
10,591 | 184,773 | ||||||
| South32 Ltd. |
140,005 | 370,958 | ||||||
| Suncorp Group Ltd. |
33,554 | 328,447 | ||||||
| Super Retail Group Ltd. |
11,823 | 67,440 | ||||||
| Tabcorp Holdings Ltd. |
57,100 | 187,392 | ||||||
| Telstra Corp., Ltd. |
691,046 | 1,629,736 | ||||||
| Wesfarmers Ltd. |
41,538 | 1,022,401 | ||||||
| Westpac Banking Corp. |
109,086 | 2,008,521 | ||||||
| Whitehaven Coal Ltd. |
26,023 | 74,866 | ||||||
| Woodside Petroleum Ltd. |
26,645 | 655,262 | ||||||
| Woolworths Group Ltd. |
34,214 | 738,839 | ||||||
|
|
|
|||||||
| Total Australia | 24,647,382 | |||||||
| Investments | Shares | Value | ||||||
| Austria – 0.4% | ||||||||
| Andritz AG |
3,485 | $ | 149,638 | |||||
| Erste Group Bank AG* |
7,239 | 266,284 | ||||||
| Lenzing AG |
1,018 | 109,162 | ||||||
| Oesterreichische Post AG |
4,066 | 172,120 | ||||||
| UNIQA Insurance Group AG |
9,474 | 94,464 | ||||||
| Vienna Insurance Group AG Wiener Versicherung Gruppe |
3,194 | 82,128 | ||||||
|
|
|
|||||||
| Total Austria |
|
873,796 | ||||||
| Belgium – 2.5% |
| |||||||
| Ageas |
4,540 | 219,203 | ||||||
| Anheuser-Busch InBev S.A./N.V. |
51,849 | 4,352,426 | ||||||
| bpost S.A.(a) |
13,141 | 141,873 | ||||||
| Cofinimmo S.A. |
1,025 | 136,269 | ||||||
| KBC Group N.V. |
8,828 | 617,352 | ||||||
| Proximus SADP |
17,537 | 506,266 | ||||||
| Solvay S.A. |
2,172 | 235,054 | ||||||
| Warehouses De Pauw CVA |
741 | 118,980 | ||||||
|
|
|
|||||||
| Total Belgium |
|
6,327,423 | ||||||
| China – 4.6% |
| |||||||
| China Aerospace International Holdings Ltd. |
1,540,000 | 111,822 | ||||||
| China Jinmao Holdings Group Ltd. |
212,000 | 138,273 | ||||||
| China Mobile Ltd. |
662,500 | 6,751,635 | ||||||
| China Overseas Land & Investment Ltd. |
126,000 | 478,321 | ||||||
| China Power International Development Ltd. |
647,000 | 165,666 | ||||||
| China Resources Power Holdings Co., Ltd. |
190,000 | 285,607 | ||||||
| CITIC Telecom International Holdings Ltd. |
311,000 | 139,852 | ||||||
| CNOOC Ltd. |
1,265,000 | 2,368,869 | ||||||
| Guangdong Investment Ltd. |
126,000 | 243,334 | ||||||
| Lenovo Group Ltd. |
496,000 | 446,087 | ||||||
| Shanghai Industrial Holdings Ltd. |
57,000 | 134,187 | ||||||
| Shenzhen Investment Ltd. |
374,000 | 142,931 | ||||||
| Sino-Ocean Group Holding Ltd. |
218,500 | 95,751 | ||||||
| Yuexiu Property Co., Ltd. |
684,000 | 164,684 | ||||||
|
|
|
|||||||
| Total China |
|
11,667,019 | ||||||
| Denmark – 0.5% |
| |||||||
| Danske Bank A/S |
19,844 | 348,609 | ||||||
| ISS A/S |
4,122 | 125,545 | ||||||
| Pandora A/S |
2,854 | 133,758 | ||||||
| Scandinavian Tobacco Group A/S Class A(b) |
11,265 | 140,629 | ||||||
| Topdanmark A/S |
5,152 | 257,575 | ||||||
| Tryg A/S |
8,141 | 223,586 | ||||||
|
|
|
|||||||
| Total Denmark |
|
1,229,702 | ||||||
| Finland – 2.3% |
| |||||||
| DNA Oyj |
4,743 | 98,418 | ||||||
| Elisa Oyj |
4,774 | 215,599 | ||||||
| Fortum Oyj(a) |
34,086 | 697,725 | ||||||
| Kesko Oyj Class B |
2,448 | 149,091 | ||||||
| Kone Oyj Class B |
11,706 | 590,958 | ||||||
| Konecranes Oyj(a) |
1,781 | 63,374 | ||||||
| Metso Oyj |
4,503 | 155,023 | ||||||
| Nokia Oyj |
150,041 | 854,835 | ||||||
See Notes to Financial Statements.
| WisdomTree Trust | 35 |
Schedule of Investments (continued)
WisdomTree International High Dividend Fund (DTH)
March 31, 2019
| Investments | Shares | Value | ||||||
| Nokian Renkaat Oyj(a) |
4,147 | $ | 138,949 | |||||
| Nordea Bank Abp(a) |
160,126 | 1,221,407 | ||||||
| Orion Oyj Class B(a) |
4,894 | 183,650 | ||||||
| Outokumpu Oyj(a) |
13,800 | 50,174 | ||||||
| Sampo Oyj Class A |
16,911 | 767,326 | ||||||
| Tieto Oyj |
4,278 | 130,657 | ||||||
| UPM-Kymmene Oyj |
15,164 | 442,699 | ||||||
| Valmet Oyj(a) |
2,918 | 73,917 | ||||||
|
|
|
|||||||
| Total Finland |
|
5,833,802 | ||||||
| France – 10.0% |
| |||||||
| ALD S.A.(b) |
10,518 | 147,036 | ||||||
| Amundi S.A.(b) |
4,031 | 253,920 | ||||||
| AXA S.A. |
66,433 | 1,673,150 | ||||||
| BNP Paribas S.A. |
31,822 | 1,522,512 | ||||||
| Bouygues S.A. |
12,342 | 441,384 | ||||||
| Carrefour S.A. |
23,202 | 433,772 | ||||||
| Casino Guichard Perrachon S.A.(a) |
7,186 | 311,859 | ||||||
| Cie Generale des Etablissements Michelin SCA |
4,032 | 477,181 | ||||||
| CNP Assurances |
12,665 | 279,014 | ||||||
| Covivio |
1,886 | 200,334 | ||||||
| Credit Agricole S.A. |
70,540 | 853,047 | ||||||
| Electricite de France S.A. |
84,677 | 1,159,020 | ||||||
| Engie S.A. |
88,600 | 1,321,154 | ||||||
| Eutelsat Communications S.A. |
12,445 | 217,922 | ||||||
| Gaztransport Et Technigaz S.A. |
1,622 | 147,704 | ||||||
| ICADE |
2,517 | 213,096 | ||||||
| Kaufman & Broad S.A. |
1,562 | 63,877 | ||||||
| Klepierre S.A. |
9,374 | 328,188 | ||||||
| Lagardere SCA |
5,895 | 151,712 | ||||||
| Metropole Television S.A. |
6,341 | 117,053 | ||||||
| Natixis S.A. |
90,733 | 486,067 | ||||||
| Nexity S.A. |
1,450 | 70,824 | ||||||
| Orange S.A. |
84,297 | 1,372,467 | ||||||
| Publicis Groupe S.A. |
5,710 | 306,020 | ||||||
| Renault S.A. |
7,823 | 517,469 | ||||||
| Rexel S.A. |
11,669 | 131,746 | ||||||
| Sanofi |
40,047 | 3,540,683 | ||||||
| Schneider Electric SE |
13,595 | 1,067,644 | ||||||
| SCOR SE |
3,506 | 149,437 | ||||||
| Societe BIC S.A. |
1,314 | 117,222 | ||||||
| Societe Generale S.A. |
21,579 | 624,528 | ||||||
| Sodexo S.A. |
3,159 | 348,182 | ||||||
| Suez |
24,189 | 320,767 | ||||||
| TOTAL S.A. |
87,807 | 4,882,379 | ||||||
| Unibail-Rodamco-Westfield(a) |
2,671 | 438,293 | ||||||
| Veolia Environnement S.A. |
15,443 | 345,590 | ||||||
|
|
|
|||||||
| Total France |
|
25,032,253 | ||||||
| Germany – 7.7% |
| |||||||
| Aareal Bank AG |
3,597 | 110,989 | ||||||
| Allianz SE Registered Shares |
8,940 | 1,990,390 | ||||||
| AURELIUS Equity Opportunities SE & Co. KGaA |
1,543 | 70,307 | ||||||
| Axel Springer SE |
2,841 | 146,868 | ||||||
| BASF SE |
23,777 | 1,749,520 | ||||||
| Investments | Shares | Value | ||||||
| Bayerische Motoren Werke AG |
20,839 | $ | 1,608,686 | |||||
| Daimler AG Registered Shares |
45,796 | 2,686,801 | ||||||
| Deutsche Lufthansa AG Registered Shares |
12,438 | 273,245 | ||||||
| Deutsche Post AG Registered Shares |
33,030 | 1,075,544 | ||||||
| Deutsche Telekom AG Registered Shares |
158,534 | 2,633,656 | ||||||
| E.ON SE |
47,593 | 529,695 | ||||||
| Evonik Industries AG |
12,593 | 343,320 | ||||||
| Freenet AG |
6,972 | 149,955 | ||||||
| Hannover Rueck SE |
2,477 | 356,006 | ||||||
| Hugo Boss AG |
1,970 | 134,668 | ||||||
| Innogy SE |
20,481 | 877,339 | ||||||
| LEG Immobilien AG |
737 | 90,574 | ||||||
| MAN SE |
3,172 | 260,715 | ||||||
| METRO AG |
17,565 | 291,701 | ||||||
| Muenchener Rueckversicherungs – Gesellschaft AG Registered Shares |
3,564 | 844,388 | ||||||
| ProSiebenSat.1 Media SE |
12,931 | 184,689 | ||||||
| Siemens AG Registered Shares |
18,863 | 2,032,040 | ||||||
| Talanx AG |
3,498 | 134,957 | ||||||
| Telefonica Deutschland Holding AG |
158,805 | 499,101 | ||||||
| TLG Immobilien AG |
4,112 | 123,925 | ||||||
| TUI AG |
15,640 | 150,150 | ||||||
|
|
|
|||||||
| Total Germany |
|
19,349,229 | ||||||
| Hong Kong – 2.3% |
| |||||||
| Bank of East Asia Ltd. (The) |
44,400 | 144,230 | ||||||
| BOC Hong Kong Holdings Ltd. |
154,047 | 637,778 | ||||||
| CLP Holdings Ltd. |
61,000 | 707,138 | ||||||
| Hang Lung Properties Ltd. |
104,000 | 253,841 | ||||||
| Hang Seng Bank Ltd. |
31,018 | 765,379 | ||||||
| Henderson Land Development Co., Ltd. |
71,200 | 452,599 | ||||||
| Hopewell Holdings Ltd. |
35,500 | 174,562 | ||||||
| Hysan Development Co., Ltd. |
22,000 | 117,848 | ||||||
| New World Development Co., Ltd. |
217,489 | 360,729 | ||||||
| PCCW Ltd. |
348,380 | 216,574 | ||||||
| Power Assets Holdings Ltd. |
72,018 | 499,542 | ||||||
| Sino Land Co., Ltd. |
124,000 | 239,788 | ||||||
| Sun Hung Kai Properties Ltd. |
46,000 | 789,330 | ||||||
| Swire Pacific Ltd. Class B |
87,500 | 175,001 | ||||||
| Wharf Holdings Ltd. (The) |
77,000 | 232,473 | ||||||
|
|
|
|||||||
| Total Hong Kong |
|
5,766,812 | ||||||
| Israel – 0.5% |
| |||||||
| Bank Leumi Le-Israel BM |
31,339 | 204,733 | ||||||
| Bezeq Israeli Telecommunication Corp., Ltd. |
183,895 | 131,992 | ||||||
| Carasso Motors Ltd. |
18,150 | 82,815 | ||||||
| Delek Automotive Systems Ltd. |
16,824 | 64,898 | ||||||
| Delek Group Ltd. |
1,010 | 174,597 | ||||||
| First International Bank of Israel Ltd. |
6,159 | 145,043 | ||||||
| Harel Insurance Investments & Financial Services Ltd. |
19,057 | 125,494 | ||||||
| Israel Chemicals Ltd. |
41,015 | 213,361 | ||||||
| Mediterranean Towers Ltd. |
64,816 | 116,618 | ||||||
|
|
|
|||||||
| Total Israel |
|
1,259,551 | ||||||
See Notes to Financial Statements.
| 36 | WisdomTree Trust |
Schedule of Investments (continued)
WisdomTree International High Dividend Fund (DTH)
March 31, 2019
| Investments | Shares | Value | ||||||
| Italy – 3.6% |
| |||||||
| A2A SpA |
67,828 | $ | 123,875 | |||||
| ACEA SpA |
5,625 | 95,183 | ||||||
| Ascopiave SpA |
27,301 | 107,752 | ||||||
| Assicurazioni Generali SpA |
42,627 | 789,751 | ||||||
| Azimut Holding SpA(a) |
10,962 | 186,476 | ||||||
| Banca Mediolanum SpA |
22,980 | 162,947 | ||||||
| De’ Longhi SpA |
5,390 | 145,615 | ||||||
| Enav SpA(b) |
18,944 | 103,336 | ||||||
| Enel SpA |
279,055 | 1,787,274 | ||||||
| Eni SpA |
135,631 | 2,399,228 | ||||||
| ERG SpA |
5,809 | 110,037 | ||||||
| FinecoBank Banca Fineco SpA |
9,129 | 120,187 | ||||||
| Hera SpA |
34,041 | 123,231 | ||||||
| Intesa Sanpaolo SpA |
45,959 | 112,035 | ||||||
| Italgas SpA |
24,834 | 153,478 | ||||||
| MARR SpA |
3,800 | 86,531 | ||||||
| Mediobanca Banca di Credito Finanziario SpA |
18,585 | 193,281 | ||||||
| Poste Italiane SpA(b) |
38,806 | 377,868 | ||||||
| Saras SpA |
40,842 | 75,714 | ||||||
| Snam SpA |
146,083 | 751,090 | ||||||
| Telecom Italia SpA RSP |
209,247 | 118,980 | ||||||
| Terna Rete Elettrica Nazionale SpA |
65,255 | 413,838 | ||||||
| Unipol Gruppo SpA |
21,820 | 108,783 | ||||||
| UnipolSai Assicurazioni SpA(a) |
109,039 | 294,332 | ||||||
| Zignago Vetro SpA |
10,433 | 116,795 | ||||||
|
|
|
|||||||
| Total Italy |
|
9,057,617 | ||||||
| Japan – 8.9% |
| |||||||
| Amada Holdings Co., Ltd. |
13,900 | 137,512 | ||||||
| Autobacs Seven Co., Ltd.(a) |
3,400 | 56,521 | ||||||
| Bridgestone Corp. |
20,700 | 797,815 | ||||||
| Canon, Inc. |
43,700 | 1,268,538 | ||||||
| Chugoku Electric Power Co., Inc. (The)(a) |
10,400 | 129,759 | ||||||
| Daito Trust Construction Co., Ltd. |
1,500 | 209,107 | ||||||
| Daiwa Securities Group, Inc. |
37,000 | 180,178 | ||||||
| FIDEA Holdings Co., Ltd.(a) |
86,016 | 101,803 | ||||||
| Heiwa Corp.(a) |
2,200 | 43,966 | ||||||
| Hirose Electric Co., Ltd.(a) |
800 | 84,058 | ||||||
| ITOCHU Corp. |
43,500 | 786,997 | ||||||
| IwaiCosmo Holdings, Inc. |
8,600 | 96,035 | ||||||
| Japan Exchange Group, Inc. |
7,800 | 139,038 | ||||||
| Japan Post Holdings Co., Ltd. |
87,400 | 1,023,358 | ||||||
| Japan Tobacco, Inc. |
63,000 | 1,562,407 | ||||||
| JFE Holdings, Inc. |
18,100 | 307,186 | ||||||
| Konica Minolta, Inc.(a) |
11,100 | 109,210 | ||||||
| Lawson, Inc. |
3,300 | 183,060 | ||||||
| Marubeni Corp. |
55,900 | 386,353 | ||||||
| Marusan Securities Co., Ltd.(a) |
11,700 | 69,131 | ||||||
| Matsui Securities Co., Ltd.(a) |
8,100 | 76,254 | ||||||
| Mitsubishi Chemical Holdings Corp. |
34,900 | 245,752 | ||||||
| Mitsubishi Corp. |
40,776 | 1,132,452 | ||||||
| Mitsubishi Tanabe Pharma Corp. |
15,600 | 208,451 | ||||||
| Mizuho Financial Group, Inc. |
514,600 | 796,413 | ||||||
| MS&AD Insurance Group Holdings, Inc. |
10,400 | 316,646 | ||||||
| Investments | Shares | Value | ||||||
| Nissan Motor Co., Ltd.(a) |
155,105 | $ | 1,272,678 | |||||
| Nomura Holdings, Inc. |
66,800 | 241,526 | ||||||
| NSK Ltd. |
17,100 | 160,209 | ||||||
| NTT DOCOMO, Inc. |
98,857 | 2,189,528 | ||||||
| Okumura Corp.(a) |
2,900 | 92,095 | ||||||
| Resona Holdings, Inc. |
31,000 | 134,352 | ||||||
| Sankyo Co., Ltd. |
3,000 | 114,379 | ||||||
| Seiko Epson Corp.(a) |
8,000 | 122,510 | ||||||
| Sekisui House Ltd. |
24,100 | 398,891 | ||||||
| Sony Financial Holdings, Inc.(a) |
6,300 | 118,845 | ||||||
| Subaru Corp.(a) |
25,200 | 574,305 | ||||||
| Sumitomo Chemical Co., Ltd.(a) |
42,100 | 195,885 | ||||||
| Sumitomo Corp. |
33,200 | 459,224 | ||||||
| Sumitomo Mitsui Financial Group, Inc. |
25,700 | 899,970 | ||||||
| Sumitomo Rubber Industries Ltd. |
6,200 | 74,388 | ||||||
| Takeda Pharmaceutical Co., Ltd. |
23,900 | 976,211 | ||||||
| Tokai Tokyo Financial Holdings, Inc.(a) |
16,400 | 59,415 | ||||||
| Toyota Motor Corp. |
67,792 | 3,973,137 | ||||||
|
|
|
|||||||
| Total Japan |
|
22,505,548 | ||||||
| Netherlands – 2.0% |
| |||||||
| ABN AMRO Group N.V. CVA(b) |
27,882 | 629,277 | ||||||
| Aegon N.V. |
51,967 | 249,976 | ||||||
| Akzo Nobel N.V. |
5,185 | 459,878 | ||||||
| ASR Nederland N.V. |
3,259 | 135,763 | ||||||
| BE Semiconductor Industries N.V. |
7,996 | 212,966 | ||||||
| Boskalis Westminster(a) |
5,644 | 146,076 | ||||||
| ING Groep N.V. |
96,325 | 1,166,381 | ||||||
| Koninklijke Ahold Delhaize N.V. |
27,634 | 736,159 | ||||||
| Koninklijke KPN N.V. |
134,900 | 428,061 | ||||||
| Koninklijke Volkerwessels N.V. |
2,294 | 47,344 | ||||||
| NN Group N.V. |
6,911 | 287,353 | ||||||
| PostNL N.V. |
24,273 | 62,114 | ||||||
| Randstad N.V.(a) |
5,271 | 257,279 | ||||||
| Signify N.V.(b) |
5,211 | 139,550 | ||||||
| Sligro Food Group N.V. |
1,812 | 65,006 | ||||||
|
|
|
|||||||
| Total Netherlands |
|
5,023,183 | ||||||
| New Zealand – 0.8% |
| |||||||
| Air New Zealand Ltd. |
76,622 | 132,470 | ||||||
| Auckland International Airport Ltd. |
31,318 | 173,861 | ||||||
| Chorus Ltd. |
31,903 | 128,371 | ||||||
| Contact Energy Ltd. |
41,509 | 196,466 | ||||||
| Genesis Energy Ltd. |
77,071 | 169,251 | ||||||
| Infratil Ltd. |
21,894 | 62,265 | ||||||
| Mercury NZ Ltd. |
53,052 | 141,108 | ||||||
| Meridian Energy Ltd. |
119,262 | 340,394 | ||||||
| Skellerup Holdings Ltd. |
75,769 | 109,033 | ||||||
| SKYCITY Entertainment Group Ltd. |
36,669 | 96,782 | ||||||
| Spark New Zealand Ltd. |
95,430 | 247,316 | ||||||
| Trade Me Group Ltd. |
27,635 | 120,998 | ||||||
| Vector Ltd. |
43,147 | 105,346 | ||||||
|
|
|
|||||||
| Total New Zealand |
|
2,023,661 | ||||||
See Notes to Financial Statements.
| WisdomTree Trust | 37 |
Schedule of Investments (continued)
WisdomTree International High Dividend Fund (DTH)
March 31, 2019
| Investments | Shares | Value | ||||||
| Norway – 2.1% |
| |||||||
| Aker ASA Class A |
1,852 | $ | 141,509 | |||||
| Atea ASA* |
8,094 | 117,675 | ||||||
| DNB ASA |
34,587 | 637,793 | ||||||
| Entra ASA(b) |
2,850 | 43,090 | ||||||
| Equinor ASA |
77,060 | 1,689,904 | ||||||
| Gjensidige Forsikring ASA(a) |
11,707 | 202,557 | ||||||
| Mowi ASA |
25,954 | 580,164 | ||||||
| Norsk Hydro ASA |
52,277 | 212,165 | ||||||
| Ocean Yield ASA |
13,335 | 98,949 | ||||||
| Orkla ASA |
22,030 | 169,351 | ||||||
| Salmar ASA |
4,794 | 230,359 | ||||||
| SpareBank 1 SR-Bank ASA |
9,452 | 109,100 | ||||||
| Storebrand ASA |
5,040 | 39,294 | ||||||
| Telenor ASA |
48,006 | 962,729 | ||||||
| Veidekke ASA |
5,902 | 62,025 | ||||||
|
|
|
|||||||
| Total Norway |
|
5,296,664 | ||||||
| Portugal – 0.6% |
| |||||||
| Altri, SGPS, S.A. |
8,139 | 63,789 | ||||||
| CTT-Correios de Portugal S.A. |
17,491 | 50,671 | ||||||
| EDP – Energias de Portugal S.A. |
135,501 | 533,276 | ||||||
| Galp Energia, SGPS, S.A. |
20,037 | 321,279 | ||||||
| Jeronimo Martins, SGPS, S.A. |
18,945 | 279,732 | ||||||
| NOS, SGPS, S.A. |
28,065 | 179,623 | ||||||
| REN – Redes Energeticas Nacionais, SGPS, S.A. |
20,790 | 59,341 | ||||||
| Sonae, SGPS, S.A. |
56,026 | 58,002 | ||||||
|
|
|
|||||||
| Total Portugal |
|
1,545,713 | ||||||
| Singapore – 1.8% |
| |||||||
| CapitaLand Ltd. |
81,600 | 219,889 | ||||||
| ComfortDelGro Corp., Ltd. |
77,300 | 146,667 | ||||||
| DBS Group Holdings Ltd. |
38,045 | 708,657 | ||||||
| Frasers Property Ltd. |
74,200 | 99,152 | ||||||
| Hutchison Port Holdings Trust |
346,623 | 81,456 | ||||||
| Jardine Cycle & Carriage Ltd. |
9,300 | 223,076 | ||||||
| Keppel Infrastructure Trust(a) |
379,000 | 130,111 | ||||||
| NetLink NBN Trust |
130,600 | 80,028 | ||||||
| Olam International Ltd. |
88,200 | 128,930 | ||||||
| Oversea-Chinese Banking Corp., Ltd. |
58,895 | 480,465 | ||||||
| SATS Ltd. |
29,700 | 112,047 | ||||||
| Sheng Siong Group Ltd. |
93,200 | 71,560 | ||||||
| Singapore Exchange Ltd. |
17,800 | 96,064 | ||||||
| Singapore Technologies Engineering Ltd. |
117,000 | 323,057 | ||||||
| Singapore Telecommunications Ltd. |
648,300 | 1,445,453 | ||||||
| StarHub Ltd. |
110,800 | 121,884 | ||||||
|
|
|
|||||||
| Total Singapore |
|
4,468,496 | ||||||
| Spain – 5.3% |
| |||||||
| Acciona S.A.(a) |
1,340 | 149,409 | ||||||
| Acerinox S.A. |
12,506 | 124,050 | ||||||
| ACS Actividades de Construccion y Servicios S.A. |
8,251 | 362,803 | ||||||
| Aena SME S.A.(b) |
4,600 | 829,000 | ||||||
| Atresmedia Corp. de Medios de Comunicacion S.A.(a) |
7,572 | 35,522 | ||||||
| Banco Bilbao Vizcaya Argentaria S.A. |
117,541 | 672,179 | ||||||
| Investments | Shares | Value | ||||||
| Banco de Sabadell S.A. |
127,702 | $ | 127,302 | |||||
| Banco Santander S.A. |
347,633 | 1,617,763 | ||||||
| Bankia S.A. |
42,928 | 111,346 | ||||||
| Bankinter S.A. |
9,271 | 70,684 | ||||||
| Bolsas y Mercados Espanoles SHMSF S.A. |
2,996 | 83,832 | ||||||
| CaixaBank S.A. |
110,474 | 345,343 | ||||||
| Cia de Distribucion Integral Logista Holdings S.A. |
4,595 | 108,350 | ||||||
| Enagas S.A. |
8,404 | 244,781 | ||||||
| Endesa S.A. |
54,416 | 1,389,437 | ||||||
| Faes Farma S.A. |
13,701 | 57,998 | ||||||
| Ferrovial S.A. |
22,682 | 531,782 | ||||||
| Iberdrola S.A. |
225,184 | 1,978,787 | ||||||
| Mapfre S.A. |
75,263 | 207,554 | ||||||
| Mediaset Espana Comunicacion S.A. |
21,143 | 158,016 | ||||||
| Naturgy Energy Group S.A. |
33,695 | 943,212 | ||||||
| Obrascon Huarte Lain S.A.(a) |
33,572 | 42,314 | ||||||
| Red Electrica Corp. S.A. |
17,176 | 366,435 | ||||||
| Repsol S.A. |
53,804 | 921,915 | ||||||
| Tecnicas Reunidas S.A.(a) |
4,036 | 113,613 | ||||||
| Telefonica S.A. |
191,901 | 1,609,390 | ||||||
| Zardoya Otis S.A.(a) |
12,859 | 106,558 | ||||||
|
|
|
|||||||
| Total Spain |
|
13,309,375 | ||||||
| Sweden – 2.4% |
| |||||||
| Axfood AB(a) |
7,550 | 140,820 | ||||||
| BillerudKorsnas AB(a) |
7,481 | 99,488 | ||||||
| Castellum AB |
4,407 | 85,690 | ||||||
| Electrolux AB Series B |
6,635 | 170,895 | ||||||
| Hemfosa Fastigheter AB |
4,172 | 36,681 | ||||||
| Hennes & Mauritz AB Class B |
75,572 | 1,262,888 | ||||||
| Holmen AB Class B |
2,716 | 59,003 | ||||||
| ICA Gruppen AB(a) |
6,211 | 249,771 | ||||||
| Intrum AB(a) |
5,129 | 147,644 | ||||||
| JM AB(a) |
8,646 | 155,297 | ||||||
| NCC AB Class B(a) |
6,700 | 103,260 | ||||||
| Nobia AB |
13,665 | 80,293 | ||||||
| Peab AB |
14,400 | 124,744 | ||||||
| Skandinaviska Enskilda Banken AB Class A(a) |
70,162 | 608,782 | ||||||
| Skanska AB Class B(a) |
16,938 | 308,435 | ||||||
| SKF AB Class B(a) |
9,815 | 163,384 | ||||||
| Svenska Handelsbanken AB Class A(a) |
47,372 | 501,029 | ||||||
| Swedbank AB Class A(a) |
37,259 | 527,635 | ||||||
| Swedish Match AB |
5,709 | 291,688 | ||||||
| Tele2 AB Class B |
18,179 | 242,738 | ||||||
| Telia Co. AB |
170,872 | 772,814 | ||||||
|
|
|
|||||||
| Total Sweden |
|
6,132,979 | ||||||
| Switzerland – 10.7% |
| |||||||
| ABB Ltd. Registered Shares |
56,471 | 1,060,922 | ||||||
| Adecco Group AG Registered Shares |
5,837 | 311,338 | ||||||
| Baloise Holding AG Registered Shares |
689 | 113,807 | ||||||
| Helvetia Holding AG Registered Shares |
169 | 103,175 | ||||||
| Kuehne + Nagel International AG Registered Shares |
3,141 | 430,827 | ||||||
| LafargeHolcim Ltd. Registered Shares* |
17,022 | 840,759 | ||||||
See Notes to Financial Statements.
| 38 | WisdomTree Trust |
Schedule of Investments (continued)
WisdomTree International High Dividend Fund (DTH)
March 31, 2019
| Investments | Shares | Value | ||||||
| Nestle S.A. Registered Shares |
70,233 | $ | 6,692,551 | |||||
| Novartis AG Registered Shares |
71,215 | 6,849,054 | ||||||
| Oriflame Holding AG |
1,879 | 36,161 | ||||||
| Roche Holding AG Genusschein |
19,814 | 5,458,350 | ||||||
| SGS S.A. Registered Shares |
177 | 440,412 | ||||||
| Sulzer AG Registered Shares |
778 | 75,855 | ||||||
| Sunrise Communications Group AG*(a)(b) |
1,985 | 146,100 | ||||||
| Swiss Life Holding AG Registered Shares* |
434 | 191,092 | ||||||
| Swiss Re AG |
9,465 | 924,546 | ||||||
| Swisscom AG Registered Shares(a) |
1,801 | 880,698 | ||||||
| UBS Group AG Registered Shares* |
78,239 | 948,232 | ||||||
| Zurich Insurance Group AG |
4,471 | 1,479,708 | ||||||
|
|
|
|||||||
| Total Switzerland |
|
26,983,587 | ||||||
| United Kingdom – 20.3% |
| |||||||
| Admiral Group PLC |
7,118 | 201,270 | ||||||
| Aggreko PLC |
5,397 | 55,360 | ||||||
| Anglo American PLC |
45,022 | 1,204,705 | ||||||
| Antofagasta PLC |
26,122 | 328,810 | ||||||
| Ashmore Group PLC |
16,932 | 94,254 | ||||||
| AstraZeneca PLC |
34,422 | 2,751,769 | ||||||
| Aviva PLC |
108,477 | 582,932 | ||||||
| Babcock International Group PLC |
11,680 | 75,109 | ||||||
| BAE Systems PLC |
91,313 | 573,986 | ||||||
| Barratt Developments PLC |
61,681 | 481,598 | ||||||
| BBA Aviation PLC |
13,194 | 42,809 | ||||||
| BCA Marketplace PLC |
35,870 | 92,359 | ||||||
| Bellway PLC |
3,615 | 143,436 | ||||||
| Bovis Homes Group PLC |
8,247 | 114,286 | ||||||
| BP PLC |
793,015 | 5,771,196 | ||||||
| Brewin Dolphin Holdings PLC |
7,987 | 32,492 | ||||||
| British American Tobacco PLC |
86,187 | 3,587,054 | ||||||
| British Land Co. PLC (The) |
22,319 | 171,298 | ||||||
| Britvic PLC |
6,341 | 78,702 | ||||||
| BT Group PLC |
528,631 | 1,535,753 | ||||||
| Card Factory PLC |
33,609 | 78,961 | ||||||
| Carnival PLC |
3,783 | 185,593 | ||||||
| Centrica PLC |
275,000 | 409,223 | ||||||
| Crest Nicholson Holdings PLC |
30,030 | 144,783 | ||||||
| Daily Mail & General Trust PLC Class A Non-Voting Shares |
12,110 | 101,860 | ||||||
| Direct Line Insurance Group PLC |
50,491 | 232,247 | ||||||
| Dixons Carphone PLC |
57,004 | 109,005 | ||||||
| Drax Group PLC |
18,203 | 89,754 | ||||||
| Dunelm Group PLC |
13,720 | 155,448 | ||||||
| Evraz PLC |
71,010 | 574,054 | ||||||
| G4S PLC |
42,329 | 101,213 | ||||||
| Galliford Try PLC |
8,166 | 70,920 | ||||||
| Games Workshop Group PLC |
1,704 | 69,832 | ||||||
| GlaxoSmithKline PLC |
198,235 | 4,124,697 | ||||||
| Go-Ahead Group PLC (The) |
2,661 | 67,996 | ||||||
| Greene King PLC |
18,093 | 156,875 | ||||||
| Halfords Group PLC |
26,079 | 78,839 | ||||||
| Hammerson PLC |
13,282 | 58,117 | ||||||
| HSBC Holdings PLC |
494,483 | 4,016,148 | ||||||
| Investments | Shares | Value | ||||||
| Ibstock PLC(b) |
24,191 | $ | 75,590 | |||||
| IMI PLC |
6,997 | 87,345 | ||||||
| Imperial Brands PLC |
49,070 | 1,678,123 | ||||||
| Inchcape PLC |
17,443 | 129,783 | ||||||
| Inmarsat PLC |
14,795 | 106,996 | ||||||
| International Consolidated Airlines Group S.A. |
45,143 | 300,686 | ||||||
| Investec PLC |
12,173 | 70,158 | ||||||
| ITV PLC |
151,883 | 251,545 | ||||||
| J Sainsbury PLC |
75,849 | 232,954 | ||||||
| John Wood Group PLC |
16,355 | 108,134 | ||||||
| Jupiter Fund Management PLC |
27,577 | 130,010 | ||||||
| Kingfisher PLC |
54,198 | 165,822 | ||||||
| Land Securities Group PLC |
11,652 | 138,683 | ||||||
| Legal & General Group PLC |
185,044 | 663,808 | ||||||
| Lloyds Banking Group PLC |
1,573,926 | 1,274,432 | ||||||
| Man Group PLC |
40,057 | 70,883 | ||||||
| Marks & Spencer Group PLC |
77,180 | 280,488 | ||||||
| Meggitt PLC |
17,084 | 111,930 | ||||||
| Micro Focus International PLC |
12,023 | 312,783 | ||||||
| Morgan Advanced Materials PLC |
10,999 | 34,827 | ||||||
| National Express Group PLC |
17,434 | 92,233 | ||||||
| National Grid PLC |
141,704 | 1,570,981 | ||||||
| Pagegroup PLC |
13,171 | 80,664 | ||||||
| Pennon Group PLC |
17,698 | 171,484 | ||||||
| Persimmon PLC |
22,353 | 632,058 | ||||||
| Redrow PLC |
8,150 | 63,825 | ||||||
| Rio Tinto PLC |
49,497 | 2,877,215 | ||||||
| Royal Dutch Shell PLC Class A |
177,854 | 5,593,352 | ||||||
| Royal Mail PLC |
33,229 | 103,182 | ||||||
| RPC Group PLC |
8,301 | 85,451 | ||||||
| Saga PLC |
53,395 | 77,369 | ||||||
| Schroders PLC Non-Voting Shares |
2,329 | 65,097 | ||||||
| Severn Trent PLC |
7,354 | 189,353 | ||||||
| SSE PLC |
50,077 | 774,551 | ||||||
| St. James’s Place PLC |
10,197 | 136,592 | ||||||
| Standard Life Aberdeen PLC |
78,318 | 269,367 | ||||||
| TalkTalk Telecom Group PLC(a) |
78,831 | 113,301 | ||||||
| Tate & Lyle PLC |
13,945 | 131,885 | ||||||
| Telford Homes PLC(a) |
27,300 | 100,672 | ||||||
| Travis Perkins PLC |
4,662 | 83,286 | ||||||
| United Utilities Group PLC |
27,332 | 290,048 | ||||||
| Vodafone Group PLC |
1,467,791 | 2,673,823 | ||||||
| William Hill PLC |
32,685 | 68,379 | ||||||
|
|
|
|||||||
| Total United Kingdom |
|
51,213,891 | ||||||
| TOTAL COMMON STOCKS (Cost: $261,622,555) |
249,547,683 | |||||||
| RIGHTS – 0.0% | ||||||||
| Singapore – 0.0% | ||||||||
| Keppel Infrastructure Trust, expiring 4/4/19* |
||||||||
| (Cost: $0) | 44,722 | 792 | ||||||
See Notes to Financial Statements.
| WisdomTree Trust | 39 |
Schedule of Investments (concluded)
WisdomTree International High Dividend Fund (DTH)
March 31, 2019
| Investments | Shares | Value | ||||||
| EXCHANGE-TRADED FUND – 0.0% | ||||||||
| United States – 0.0% | ||||||||
| WisdomTree International LargeCap Dividend Fund(a)(c) |
||||||||
| (Cost: $35,934) | 822 | $ | 38,107 | |||||
| INVESTMENT OF CASH COLLATERAL FOR SECURITIES LOANED – 3.6% |
| |||||||
| United States – 3.6% | ||||||||
| State Street Navigator Securities Lending Government Money Market Portfolio, 2.46%(d) |
||||||||
| (Cost: $9,191,247)(e) | 9,191,247 | 9,191,247 | ||||||
| TOTAL INVESTMENTS IN SECURITIES – 102.7% (Cost: $270,849,736) |
258,777,829 | |||||||
| Other Assets less Liabilities – (2.7)% |
(6,925,654 | ) | ||||||
|
|
|
|||||||
| NET ASSETS – 100.0% | $ | 251,852,175 | ||||||
| * | Non-income producing security. |
| (a) | Security, or portion thereof, was on loan at March 31, 2019 (See Note 2). |
| (b) | This security is exempt from registration under rule 144A of the Securities Act of 1933. This security may be sold in transactions that are exempt from registration, normally to qualified institutional buyers. |
| (c) | Affiliated company (See Note 3). |
| (d) | Rate shown represents annualized 7-day yield as of March 31, 2019. |
| (e) | At March 31, 2019, the total market value of the Fund’s securities on loan identified in the Schedule of Investments was $11,106,908 and the total market value of the collateral held by the Fund was $11,824,394. The total market value of the collateral includes non-cash U.S. Government securities collateral having a value of $2,633,147. |
CVA – Certificaten Van Aandelen (Certificate of Stock)
RSP – Risparmio Italian Savings Shares
| FINANCIAL DERIVATIVE INSTRUMENTS | ||||||||||||||||||||||||||||
| FOREIGN CURRENCY CONTRACTS (OTC – OVER THE COUNTER) | ||||||||||||||||||||||||||||
| Counterparty | Settlement Date |
Amount and Description of Currency to be Purchased |
Amount and Description of Currency to be Sold |
Unrealized Appreciation |
Unrealized Depreciation |
|||||||||||||||||||||||
| Citibank N.A. |
4/2/2019 | 41,849 | USD | 387,350 | SEK | $ | 87 | $ | — | |||||||||||||||||||
| Credit Suisse International |
4/1/2019 | 71,644 | USD | 63,847 | EUR | — | (46 | ) | ||||||||||||||||||||
| Royal Bank of Canada |
4/2/2019 | 110,995 | USD | 98,800 | EUR | 57 | — | |||||||||||||||||||||
| $ | 144 | $ | (46 | ) | ||||||||||||||||||||||||
| CURRENCY LEGEND | ||
| EUR | Euro | |
| SEK | Swedish krona | |
| USD | U.S. dollar | |
See Notes to Financial Statements.
| 40 | WisdomTree Trust |
Schedule of Investments
WisdomTree International LargeCap Dividend Fund (DOL)
March 31, 2019
| Investments | Shares | Value | ||||||
| COMMON STOCKS – 99.1% |
| |||||||
| Australia – 7.0% |
| |||||||
| Australia & New Zealand Banking Group Ltd. |
139,867 | $ | 2,586,198 | |||||
| BHP Group Ltd. |
122,264 | 3,342,865 | ||||||
| BHP Group PLC |
92,244 | 2,221,991 | ||||||
| Commonwealth Bank of Australia |
86,544 | 4,342,701 | ||||||
| CSL Ltd. |
5,345 | 740,152 | ||||||
| Macquarie Group Ltd. |
12,830 | 1,179,507 | ||||||
| National Australia Bank Ltd. |
162,931 | 2,924,700 | ||||||
| Rio Tinto Ltd. |
17,596 | 1,223,808 | ||||||
| Telstra Corp., Ltd. |
919,274 | 2,167,980 | ||||||
| Wesfarmers Ltd. |
53,002 | 1,304,571 | ||||||
| Westpac Banking Corp. |
182,586 | 3,361,823 | ||||||
| Woodside Petroleum Ltd. |
32,789 | 806,357 | ||||||
| Woolworths Group Ltd. |
42,288 | 913,194 | ||||||
|
|
|
|||||||
| Total Australia |
|
27,115,847 | ||||||
| Austria – 0.2% |
| |||||||
| Erste Group Bank AG* |
11,426 | 420,300 | ||||||
| OMV AG |
9,952 | 540,516 | ||||||
|
|
|
|||||||
| Total Austria |
|
960,816 | ||||||
| Belgium – 1.8% |
| |||||||
| Anheuser-Busch InBev S.A./N.V. |
71,186 | 5,975,656 | ||||||
| KBC Group N.V. |
15,270 | 1,067,848 | ||||||
|
|
|
|||||||
| Total Belgium |
|
7,043,504 | ||||||
| China – 3.9% |
| |||||||
| China Mobile Ltd. |
914,986 | 9,324,758 | ||||||
| China Overseas Land & Investment Ltd. |
248,000 | 941,458 | ||||||
| CITIC Ltd. |
873,273 | 1,303,799 | ||||||
| CNOOC Ltd. |
1,710,529 | 3,203,177 | ||||||
| Fosun International Ltd. |
201,000 | 340,550 | ||||||
|
|
|
|||||||
| Total China |
|
15,113,742 | ||||||
| Denmark – 1.2% |
| |||||||
| Coloplast A/S Class B |
5,272 | 579,007 | ||||||
| Danske Bank A/S |
33,888 | 595,327 | ||||||
| Novo Nordisk A/S Class B |
54,018 | 2,830,630 | ||||||
| Orsted A/S(a) |
10,779 | 817,749 | ||||||
|
|
|
|||||||
| Total Denmark |
|
4,822,713 | ||||||
| Finland – 1.8% |
| |||||||
| Fortum Oyj(b) |
48,846 | 999,856 | ||||||
| Kone Oyj Class B |
16,604 | 838,225 | ||||||
| Nokia Oyj |
206,374 | 1,175,783 | ||||||
| Nordea Bank Abp(b) |
261,660 | 1,995,886 | ||||||
| Sampo Oyj Class A |
27,292 | 1,238,357 | ||||||
| UPM-Kymmene Oyj |
20,494 | 598,304 | ||||||
|
|
|
|||||||
| Total Finland |
|
6,846,411 | ||||||
| France – 12.9% |
| |||||||
| Accor S.A. |
7,752 | 314,313 | ||||||
| Aeroports de Paris |
1,879 | 363,736 | ||||||
| Air Liquide S.A. |
10,040 | 1,277,841 | ||||||
| Airbus SE |
11,197 | 1,482,304 | ||||||
| AXA S.A. |
109,153 | 2,749,075 | ||||||
| Investments | Shares | Value | ||||||
| BNP Paribas S.A. |
54,161 | $ | 2,591,313 | |||||
| Bouygues S.A. |
16,139 | 577,175 | ||||||
| Capgemini SE |
3,012 | 365,597 | ||||||
| Christian Dior SE |
2,347 | 1,119,224 | ||||||
| Cie de Saint-Gobain |
17,095 | 620,194 | ||||||
| Cie Generale des Etablissements Michelin SCA |
5,540 | 655,650 | ||||||
| CNP Assurances |
22,934 | 505,243 | ||||||
| Credit Agricole S.A. |
118,579 | 1,433,987 | ||||||
| Danone S.A. |
19,189 | 1,480,020 | ||||||
| Electricite de France S.A. |
116,355 | 1,592,614 | ||||||
| Engie S.A. |
121,625 | 1,813,605 | ||||||
| EssilorLuxottica S.A. |
7,194 | 786,614 | ||||||
| Hermes International |
827 | 546,201 | ||||||
| Kering S.A. |
1,441 | 827,135 | ||||||
| L’Oreal S.A. |
9,373 | 2,523,768 | ||||||
| Legrand S.A. |
5,467 | 366,230 | ||||||
| LVMH Moet Hennessy Louis Vuitton SE |
8,342 | 3,071,378 | ||||||
| Natixis S.A. |
150,465 | 806,059 | ||||||
| Orange S.A. |
115,647 | 1,882,886 | ||||||
| Pernod Ricard S.A. |
3,782 | 679,459 | ||||||
| Peugeot S.A. |
22,965 | 560,593 | ||||||
| Publicis Groupe S.A. |
7,834 | 419,852 | ||||||
| Renault S.A. |
10,664 | 705,393 | ||||||
| Safran S.A. |
6,675 | 916,267 | ||||||
| Sanofi |
54,476 | 4,816,398 | ||||||
| Schneider Electric SE |
17,243 | 1,354,129 | ||||||
| Societe Generale S.A. |
37,301 | 1,079,545 | ||||||
| Thales S.A. |
3,379 | 405,021 | ||||||
| TOTAL S.A. |
119,000 | 6,616,820 | ||||||
| Unibail-Rodamco-Westfield(b) |
4,324 | 709,539 | ||||||
| Vinci S.A. |
16,822 | 1,638,018 | ||||||
| Vivendi S.A. |
27,321 | 792,397 | ||||||
|
|
|
|||||||
| Total France |
|
50,445,593 | ||||||
| Germany – 8.4% |
| |||||||
| adidas AG |
2,871 | 698,254 | ||||||
| Allianz SE Registered Shares |
15,938 | 3,548,415 | ||||||
| BASF SE |
31,853 | 2,343,755 | ||||||
| Bayer AG Registered Shares |
23,634 | 1,528,556 | ||||||
| Bayerische Motoren Werke AG |
27,641 | 2,133,773 | ||||||
| Continental AG |
4,103 | 618,267 | ||||||
| Covestro AG(a) |
5,791 | 318,749 | ||||||
| Daimler AG Registered Shares |
60,736 | 3,563,315 | ||||||
| Deutsche Boerse AG |
3,995 | 512,725 | ||||||
| Deutsche Post AG Registered Shares |
47,014 | 1,530,900 | ||||||
| Deutsche Telekom AG Registered Shares |
231,906 | 3,852,553 | ||||||
| E.ON SE |
80,826 | 899,568 | ||||||
| Evonik Industries AG |
17,454 | 475,845 | ||||||
| Fresenius Medical Care AG & Co. KGaA |
4,971 | 401,323 | ||||||
| Fresenius SE & Co. KGaA |
5,438 | 303,837 | ||||||
| HeidelbergCement AG |
5,085 | 366,334 | ||||||
| Henkel AG & Co. KGaA |
6,059 | 576,584 | ||||||
| Infineon Technologies AG |
14,311 | 284,182 | ||||||
| Innogy SE |
25,358 | 1,086,254 | ||||||
See Notes to Financial Statements.
| WisdomTree Trust | 41 |
Schedule of Investments (continued)
WisdomTree International LargeCap Dividend Fund (DOL)
March 31, 2019
| Investments | Shares | Value | ||||||
| Muenchener Rueckversicherungs – Gesellschaft AG Registered Shares |
6,210 | $ | 1,471,281 | |||||
| SAP SE |
17,583 | 2,033,536 | ||||||
| Siemens AG Registered Shares |
26,105 | 2,812,193 | ||||||
| Volkswagen AG |
7,310 | 1,190,986 | ||||||
|
|
|
|||||||
| Total Germany |
|
32,551,185 | ||||||
| Hong Kong – 2.9% |
| |||||||
| AIA Group Ltd. |
141,000 | 1,403,722 | ||||||
| BOC Hong Kong Holdings Ltd. |
247,215 | 1,023,508 | ||||||
| CLP Holdings Ltd. |
87,000 | 1,008,541 | ||||||
| Galaxy Entertainment Group Ltd. |
56,000 | 381,302 | ||||||
| Hang Seng Bank Ltd. |
52,195 | 1,287,928 | ||||||
| Henderson Land Development Co., Ltd. |
125,566 | 798,189 | ||||||
| Hong Kong & China Gas Co., Ltd. |
333,780 | 800,227 | ||||||
| Hong Kong Exchanges & Clearing Ltd. |
22,670 | 790,134 | ||||||
| MTR Corp., Ltd. |
150,443 | 931,411 | ||||||
| New World Development Co., Ltd. |
330,000 | 547,341 | ||||||
| Sun Hung Kai Properties Ltd. |
77,942 | 1,337,434 | ||||||
| Swire Properties Ltd. |
116,600 | 501,309 | ||||||
| Wheelock & Co., Ltd. |
44,000 | 322,295 | ||||||
|
|
|
|||||||
| Total Hong Kong |
|
11,133,341 | ||||||
| Ireland – 0.1% |
| |||||||
| CRH PLC |
17,626 | 547,231 | ||||||
| Italy – 2.7% |
| |||||||
| Assicurazioni Generali SpA |
75,487 | 1,398,549 | ||||||
| Enel SpA |
418,014 | 2,677,269 | ||||||
| Eni SpA |
188,886 | 3,341,276 | ||||||
| Intesa Sanpaolo SpA |
1,010,481 | 2,463,257 | ||||||
| UniCredit SpA |
40,893 | 524,736 | ||||||
|
|
|
|||||||
| Total Italy |
|
10,405,087 | ||||||
| Japan – 13.7% |
| |||||||
| Asahi Group Holdings Ltd. |
7,900 | 351,872 | ||||||
| Asahi Kasei Corp. |
36,300 | 374,528 | ||||||
| Astellas Pharma, Inc. |
46,000 | 689,262 | ||||||
| Bridgestone Corp. |
26,900 | 1,036,775 | ||||||
| Canon, Inc. |
58,300 | 1,692,351 | ||||||
| Chugai Pharmaceutical Co., Ltd. |
7,800 | 536,279 | ||||||
| Dai-ichi Life Holdings, Inc. |
25,100 | 348,772 | ||||||
| Daiichi Sankyo Co., Ltd. |
13,200 | 608,213 | ||||||
| Daikin Industries Ltd. |
3,900 | 457,000 | ||||||
| Daiwa House Industry Co., Ltd. |
15,900 | 505,508 | ||||||
| Denso Corp. |
19,300 | 752,750 | ||||||
| East Japan Railway Co. |
5,900 | 569,291 | ||||||
| Eisai Co., Ltd. |
6,500 | 364,860 | ||||||
| FANUC Corp. |
5,500 | 938,158 | ||||||
| Fast Retailing Co., Ltd. |
900 | 423,065 | ||||||
| FUJIFILM Holdings Corp. |
9,800 | 445,708 | ||||||
| Hitachi Ltd. |
18,100 | 586,245 | ||||||
| Honda Motor Co., Ltd. |
51,800 | 1,401,644 | ||||||
| ITOCHU Corp. |
55,700 | 1,007,718 | ||||||
| Japan Post Holdings Co., Ltd. |
144,600 | 1,693,108 | ||||||
| Japan Tobacco, Inc. |
89,309 | 2,214,873 | ||||||
| Investments | Shares | Value | ||||||
| JXTG Holdings, Inc. |
91,200 | $ | 417,336 | |||||
| Kao Corp. |
7,600 | 598,607 | ||||||
| KDDI Corp. |
76,300 | 1,644,085 | ||||||
| Kirin Holdings Co., Ltd. |
15,300 | 365,273 | ||||||
| Komatsu Ltd.(b) |
25,000 | 580,589 | ||||||
| Kubota Corp. |
24,400 | 352,602 | ||||||
| Mitsubishi Corp. |
55,100 | 1,530,265 | ||||||
| Mitsubishi Electric Corp. |
58,300 | 749,259 | ||||||
| Mitsubishi Estate Co., Ltd. |
19,100 | 346,073 | ||||||
| Mitsubishi UFJ Financial Group, Inc. |
326,100 | 1,620,409 | ||||||
| Mitsui Fudosan Co., Ltd. |
14,400 | 362,000 | ||||||
| Mizuho Financial Group, Inc. |
792,698 | 1,226,807 | ||||||
| MS&AD Insurance Group Holdings, Inc. |
17,500 | 532,818 | ||||||
| Murata Manufacturing Co., Ltd. |
10,700 | 532,849 | ||||||
| Nidec Corp. |
2,200 | 278,764 | ||||||
| Nintendo Co., Ltd. |
2,500 | 712,834 | ||||||
| Nippon Steel & Sumitomo Metal Corp. |
30,000 | 529,611 | ||||||
| Nippon Telegraph & Telephone Corp. |
59,500 | 2,528,152 | ||||||
| Nissan Motor Co., Ltd.(b) |
197,700 | 1,622,181 | ||||||
| Nomura Holdings, Inc. |
110,600 | 399,893 | ||||||
| NTT DOCOMO, Inc. |
135,800 | 3,007,758 | ||||||
| Otsuka Holdings Co., Ltd. |
11,100 | 436,138 | ||||||
| Panasonic Corp. |
49,000 | 422,422 | ||||||
| Recruit Holdings Co., Ltd. |
13,900 | 396,963 | ||||||
| Secom Co., Ltd. |
5,700 | 488,299 | ||||||
| Seven & I Holdings Co., Ltd. |
17,500 | 660,252 | ||||||
| Shin-Etsu Chemical Co., Ltd. |
6,700 | 561,738 | ||||||
| SoftBank Group Corp. |
6,500 | 631,002 | ||||||
| Sompo Holdings, Inc. |
8,600 | 318,406 | ||||||
| Sony Corp. |
7,400 | 310,548 | ||||||
| Subaru Corp.(b) |
32,300 | 736,114 | ||||||
| Sumitomo Corp. |
41,700 | 576,796 | ||||||
| Sumitomo Mitsui Financial Group, Inc. |
42,400 | 1,484,776 | ||||||
| Sumitomo Mitsui Trust Holdings, Inc. |
9,700 | 348,441 | ||||||
| Suzuki Motor Corp. |
6,800 | 300,912 | ||||||
| Takeda Pharmaceutical Co., Ltd. |
33,000 | 1,347,906 | ||||||
| Tokio Marine Holdings, Inc. |
18,100 | 876,832 | ||||||
| Tokyo Electron Ltd.(b) |
5,900 | 852,871 | ||||||
| Toyota Motor Corp. |
94,100 | 5,514,990 | ||||||
| Yahoo Japan Corp. |
141,100 | 345,468 | ||||||
|
|
|
|||||||
| Total Japan |
|
53,547,019 | ||||||
| Netherlands – 2.2% |
| |||||||
| ABN AMRO Group N.V. CVA(a) |
47,646 | 1,075,336 | ||||||
| Akzo Nobel N.V. |
7,144 | 633,629 | ||||||
| ASML Holding N.V. |
3,648 | 684,877 | ||||||
| Heineken Holding N.V. |
5,040 | 505,363 | ||||||
| Heineken N.V. |
9,331 | 985,706 | ||||||
| ING Groep N.V. |
159,687 | 1,933,620 | ||||||
| Koninklijke Ahold Delhaize N.V. |
37,072 | 987,584 | ||||||
| Koninklijke DSM N.V. |
4,007 | 437,148 | ||||||
| Koninklijke Philips N.V. |
21,460 | 875,059 | ||||||
| Wolters Kluwer N.V. |
5,809 | 395,924 | ||||||
|
|
|
|||||||
| Total Netherlands |
|
8,514,246 | ||||||
See Notes to Financial Statements.
| 42 | WisdomTree Trust |
Schedule of Investments (continued)
WisdomTree International LargeCap Dividend Fund (DOL)
March 31, 2019
| Investments | Shares | Value | ||||||
| Norway – 1.2% |
| |||||||
| DNB ASA |
56,674 | $ | 1,045,082 | |||||
| Equinor ASA |
108,764 | 2,385,165 | ||||||
| Telenor ASA |
65,216 | 1,307,864 | ||||||
|
|
|
|||||||
| Total Norway |
|
4,738,111 | ||||||
| Singapore – 1.2% |
| |||||||
| DBS Group Holdings Ltd. |
69,000 | 1,285,249 | ||||||
| Oversea-Chinese Banking Corp., Ltd. |
103,783 | 846,661 | ||||||
| Singapore Telecommunications Ltd. |
883,800 | 1,970,525 | ||||||
| United Overseas Bank Ltd. |
39,686 | 738,051 | ||||||
|
|
|
|||||||
| Total Singapore |
|
4,840,486 | ||||||
| Spain – 4.6% |
| |||||||
| Aena SME S.A.(a) |
6,126 | 1,104,012 | ||||||
| Amadeus IT Group S.A. |
7,047 | 564,968 | ||||||
| Banco Bilbao Vizcaya Argentaria S.A. |
210,174 | 1,201,917 | ||||||
| Banco Santander S.A. |
601,097 | 2,797,296 | ||||||
| CaixaBank S.A. |
195,703 | 611,770 | ||||||
| Endesa S.A. |
72,650 | 1,855,017 | ||||||
| Iberdrola S.A. |
306,777 | 2,695,779 | ||||||
| Industria de Diseno Textil S.A. |
73,102 | 2,150,563 | ||||||
| Naturgy Energy Group S.A. |
46,456 | 1,300,427 | ||||||
| Repsol S.A. |
74,065 | 1,269,081 | ||||||
| Telefonica S.A. |
269,859 | 2,263,190 | ||||||
|
|
|
|||||||
| Total Spain |
|
17,814,020 | ||||||
| Sweden – 2.2% |
| |||||||
| Assa Abloy AB Class B |
19,396 | 419,693 | ||||||
| Atlas Copco AB Class A |
22,159 | 596,422 | ||||||
| Essity AB Class B |
18,149 | 524,592 | ||||||
| Hennes & Mauritz AB Class B |
103,440 | 1,728,591 | ||||||
| Sandvik AB |
29,945 | 487,499 | ||||||
| Skandinaviska Enskilda Banken AB Class A(b) |
118,182 | 1,025,443 | ||||||
| Svenska Handelsbanken AB Class A(b) |
84,831 | 897,213 | ||||||
| Swedbank AB Class A(b) |
61,323 | 868,411 | ||||||
| Telefonaktiebolaget LM Ericsson Class B |
49,408 | 455,018 | ||||||
| Telia Co. AB |
218,238 | 987,039 | ||||||
| Volvo AB Class B |
47,073 | 730,813 | ||||||
|
|
|
|||||||
| Total Sweden |
|
8,720,734 | ||||||
| Switzerland – 10.5% |
| |||||||
| ABB Ltd. Registered Shares |
74,051 | 1,391,198 | ||||||
| Cie Financiere Richemont S.A. Registered Shares |
10,396 | 757,231 | ||||||
| Credit Suisse Group AG Registered Shares* |
38,317 | 446,499 | ||||||
| Geberit AG Registered Shares |
904 | 369,443 | ||||||
| Givaudan S.A. Registered Shares |
250 | 638,618 | ||||||
| Kuehne + Nagel International AG Registered Shares |
4,472 | 613,390 | ||||||
| LafargeHolcim Ltd. Registered Shares* |
22,781 | 1,125,211 | ||||||
| Nestle S.A. Registered Shares |
96,965 | 9,239,862 | ||||||
| Novartis AG Registered Shares |
96,532 | 9,283,899 | ||||||
| Partners Group Holding AG |
654 | 475,445 | ||||||
| Roche Holding AG Bearer Shares |
6,203 | 1,690,425 | ||||||
| Roche Holding AG Genusschein |
27,323 | 7,526,926 | ||||||
| SGS S.A. Registered Shares |
245 | 609,609 | ||||||
| Investments | Shares | Value | ||||||
| Swiss Re AG |
15,436 | $ | 1,507,796 | |||||
| Swisscom AG Registered Shares(b) |
2,520 | 1,232,292 | ||||||
| UBS Group AG Registered Shares* |
132,726 | 1,608,598 | ||||||
| Zurich Insurance Group AG |
7,162 | 2,370,314 | ||||||
|
|
|
|||||||
| Total Switzerland |
|
40,886,756 | ||||||
| United Kingdom – 20.6% |
| |||||||
| Anglo American PLC |
60,552 | 1,620,259 | ||||||
| Associated British Foods PLC |
12,825 | 407,596 | ||||||
| AstraZeneca PLC |
47,103 | 3,765,515 | ||||||
| Aviva PLC |
172,956 | 929,427 | ||||||
| BAE Systems PLC |
117,374 | 737,803 | ||||||
| Barclays PLC |
179,525 | 361,843 | ||||||
| BP PLC |
1,085,444 | 7,899,359 | ||||||
| British American Tobacco PLC |
117,972 | 4,909,927 | ||||||
| BT Group PLC |
709,017 | 2,059,801 | ||||||
| Coca-Cola European Partners PLC |
12,518 | 645,163 | ||||||
| Compass Group PLC |
35,096 | 825,231 | ||||||
| Diageo PLC |
62,291 | 2,547,062 | ||||||
| GlaxoSmithKline PLC |
272,767 | 5,675,493 | ||||||
| HSBC Holdings PLC |
851,669 | 6,917,182 | ||||||
| Imperial Brands PLC |
66,684 | 2,280,497 | ||||||
| International Consolidated Airlines Group S.A. |
64,515 | 429,718 | ||||||
| Legal & General Group PLC |
265,265 | 951,585 | ||||||
| Lloyds Banking Group PLC |
2,762,888 | 2,237,153 | ||||||
| National Grid PLC |
204,776 | 2,270,219 | ||||||
| Prudential PLC |
52,556 | 1,052,928 | ||||||
| Reckitt Benckiser Group PLC |
19,617 | 1,631,363 | ||||||
| RELX PLC |
54,534 | 1,166,459 | ||||||
| Rio Tinto PLC |
67,400 | 3,917,900 | ||||||
| Royal Dutch Shell PLC Class A |
242,008 | 7,610,939 | ||||||
| Royal Dutch Shell PLC Class B |
196,713 | 6,223,619 | ||||||
| Smith & Nephew PLC |
20,204 | 400,958 | ||||||
| SSE PLC |
69,786 | 1,079,395 | ||||||
| Standard Chartered PLC |
33,408 | 257,407 | ||||||
| Tesco PLC |
116,706 | 352,963 | ||||||
| Unilever N.V. CVA |
52,498 | 3,052,295 | ||||||
| Unilever PLC |
41,081 | 2,352,670 | ||||||
| Vodafone Group PLC |
1,947,732 | 3,548,114 | ||||||
|
|
|
|||||||
| Total United Kingdom |
|
80,117,843 | ||||||
| TOTAL COMMON STOCKS (Cost: $381,450,984) |
|
386,164,685 | ||||||
| EXCHANGE-TRADED FUND – 0.0% |
| |||||||
| United States – 0.0% |
| |||||||
| WisdomTree International MidCap Dividend Fund(c) |
||||||||
| (Cost: $3,574) | 62 | 3,850 | ||||||
See Notes to Financial Statements.
| WisdomTree Trust | 43 |
Schedule of Investments (concluded)
WisdomTree International LargeCap Dividend Fund (DOL)
March 31, 2019
| Investments | Shares | Value | ||||||
| INVESTMENT OF CASH COLLATERAL FOR SECURITIES LOANED – 2.3% |
| |||||||
| United States – 2.3% |
| |||||||
| State Street Navigator Securities Lending Government Money Market Portfolio, 2.46%(d) |
||||||||
| (Cost: $8,974,430)(e) | 8,974,430 | $ | 8,974,430 | |||||
| TOTAL INVESTMENTS IN SECURITIES – 101.4% (Cost: $390,428,988) |
|
395,142,965 | ||||||
| Other Assets less Liabilities – (1.4)% |
|
(5,632,929 | ) | |||||
|
|
|
|||||||
| NET ASSETS – 100.0% |
|
$ | 389,510,036 | |||||
| * | Non-income producing security. |
| (a) | This security is exempt from registration under rule 144A of the Securities Act of 1933. This security may be sold in transactions that are exempt from registration, normally to qualified institutional buyers. |
| (b) | Security, or portion thereof, was on loan at March 31, 2019 (See Note 2). |
| (c) | Affiliated company (See Note 3). |
| (d) | Rate shown represents annualized 7-day yield as of March 31, 2019. |
| (e) | At March 31, 2019, the total market value of the Fund’s securities on loan identified in the Schedule of Investments was $10,472,949. The total market value of the collateral held by the Fund was $11,094,813. The total market value of the collateral includes non-cash U.S. Government securities collateral having a value of $2,120,383. |
CVA – Certificaten Van Aandelen (Certificate of Stock)
| FINANCIAL DERIVATIVE INSTRUMENTS | ||||||||||||||||||||||||||||
| FOREIGN CURRENCY CONTRACTS (OTC – OVER THE COUNTER) | ||||||||||||||||||||||||||||
| Counterparty | Settlement Date |
Amount and Description of Purchased |
Amount and Description of be Sold |
Unrealized Appreciation |
Unrealized Depreciation |
|||||||||||||||||||||||
| Royal Bank of Canada | 4/2/2019 | 64,535 | USD | 600,000 | SEK | $ | — | $ | (153 | ) | ||||||||||||||||||
| CURRENCY LEGEND | ||
| SEK | Swedish krona | |
| USD | U.S. dollar | |
See Notes to Financial Statements.
| 44 | WisdomTree Trust |
Schedule of Investments
WisdomTree International MidCap Dividend Fund (DIM)
March 31, 2019
| Investments | Shares | Value | ||||||
| COMMON STOCKS – 99.4% |
| |||||||
| Australia – 9.3% |
| |||||||
| Adelaide Brighton Ltd. |
45,831 | $ | 146,502 | |||||
| AGL Energy Ltd. |
67,648 | 1,046,130 | ||||||
| Alumina Ltd. |
404,935 | 696,102 | ||||||
| Amcor Ltd. |
103,261 | 1,128,879 | ||||||
| AMP Ltd. |
476,172 | 710,322 | ||||||
| Aristocrat Leisure Ltd. |
20,936 | 364,510 | ||||||
| ASX Ltd. |
16,660 | 826,517 | ||||||
| Aurizon Holdings Ltd. |
197,927 | 639,718 | ||||||
| AusNet Services |
434,215 | 547,489 | ||||||
| Bank of Queensland Ltd. |
63,660 | 411,510 | ||||||
| Bendigo & Adelaide Bank Ltd. |
62,766 | 431,591 | ||||||
| Boral Ltd. |
99,788 | 325,359 | ||||||
| Brambles Ltd. |
119,198 | 995,746 | ||||||
| Caltex Australia Ltd. |
22,989 | 428,015 | ||||||
| Challenger Ltd. |
42,125 | 247,766 | ||||||
| CIMIC Group Ltd. |
24,734 | 847,918 | ||||||
| Coca-Cola Amatil Ltd. |
79,893 | 490,905 | ||||||
| Cochlear Ltd. |
2,335 | 287,414 | ||||||
| Computershare Ltd. |
29,066 | 352,651 | ||||||
| Crown Resorts Ltd. |
64,850 | 530,222 | ||||||
| Domino’s Pizza Enterprises Ltd.(a) |
4,199 | 129,511 | ||||||
| Downer EDI Ltd. |
56,783 | 309,779 | ||||||
| Evolution Mining Ltd. |
68,442 | 177,941 | ||||||
| Flight Centre Travel Group Ltd. |
5,870 | 175,338 | ||||||
| Fortescue Metals Group Ltd. |
522,811 | 2,640,503 | ||||||
| Harvey Norman Holdings Ltd.(a) |
177,994 | 508,281 | ||||||
| Healthscope Ltd. |
119,967 | 207,081 | ||||||
| Iluka Resources Ltd. |
18,585 | 118,817 | ||||||
| Incitec Pivot Ltd. |
108,657 | 240,816 | ||||||
| Insurance Australia Group Ltd. |
218,119 | 1,189,945 | ||||||
| Magellan Financial Group Ltd. |
18,329 | 474,319 | ||||||
| Medibank Pvt Ltd. |
261,434 | 512,559 | ||||||
| Newcrest Mining Ltd. |
15,271 | 276,726 | ||||||
| Orica Ltd. |
20,219 | 253,212 | ||||||
| Orora Ltd. |
101,132 | 214,799 | ||||||
| Qantas Airways Ltd. |
89,940 | 361,611 | ||||||
| QBE Insurance Group Ltd. |
90,491 | 791,290 | ||||||
| Ramsay Health Care Ltd. |
9,191 | 420,130 | ||||||
| REA Group Ltd. |
4,573 | 242,658 | ||||||
| Reece Ltd. |
25,126 | 175,984 | ||||||
| Seek Ltd. |
21,018 | 261,875 | ||||||
| Seven Group Holdings Ltd.(a) |
14,860 | 185,782 | ||||||
| Sonic Healthcare Ltd. |
29,636 | 517,035 | ||||||
| South32 Ltd. |
419,514 | 1,111,546 | ||||||
| Star Entertainment Group Ltd. (The) |
71,060 | 210,996 | ||||||
| Suncorp Group Ltd. |
142,373 | 1,393,635 | ||||||
| Tabcorp Holdings Ltd. |
150,732 | 494,675 | ||||||
| Treasury Wine Estates Ltd. |
29,879 | 316,882 | ||||||
| Washington H Soul Pattinson & Co., Ltd. |
16,957 | 316,915 | ||||||
| Whitehaven Coal Ltd. |
78,050 | 224,543 | ||||||
|
|
|
|||||||
| Total Australia |
|
25,910,450 | ||||||
| Investments | Shares | Value | ||||||
| Austria – 0.9% |
| |||||||
| Andritz AG |
8,923 | $ | 383,134 | |||||
| BAWAG Group AG(b) |
4,916 | 217,154 | ||||||
| EVN AG |
11,850 | 172,709 | ||||||
| Oesterreichische Post AG |
7,118 | 301,315 | ||||||
| Telekom Austria AG* |
45,573 | 331,592 | ||||||
| UNIQA Insurance Group AG |
33,742 | 336,438 | ||||||
| Verbund AG |
6,321 | 303,633 | ||||||
| Vienna Insurance Group AG Wiener Versicherung Gruppe |
9,425 | 242,347 | ||||||
| Voestalpine AG |
10,451 | 317,664 | ||||||
|
|
|
|||||||
| Total Austria |
|
2,605,986 | ||||||
| Belgium – 2.2% |
| |||||||
| Ackermans & van Haaren N.V. |
2,099 | 316,998 | ||||||
| Ageas |
22,049 | 1,064,582 | ||||||
| bpost S.A.(a) |
40,188 | 433,878 | ||||||
| Colruyt S.A. |
10,790 | 798,415 | ||||||
| Elia System Operator S.A./N.V. |
4,687 | 328,925 | ||||||
| Melexis N.V.(a) |
2,980 | 180,521 | ||||||
| Proximus SADP |
46,681 | 1,347,609 | ||||||
| Solvay S.A. |
7,368 | 797,367 | ||||||
| UCB S.A. |
7,842 | 674,140 | ||||||
| Umicore S.A. |
7,938 | 352,873 | ||||||
|
|
|
|||||||
| Total Belgium |
|
6,295,308 | ||||||
| China – 2.2% |
| |||||||
| Beijing Enterprises Holdings Ltd. |
90,200 | 511,328 | ||||||
| China Everbright International Ltd. |
267,407 | 271,837 | ||||||
| China Jinmao Holdings Group Ltd. |
1,101,242 | 718,267 | ||||||
| China Resources Pharmaceutical Group Ltd.(b) |
167,000 | 236,142 | ||||||
| China Resources Power Holdings Co., Ltd. |
568,000 | 853,814 | ||||||
| Guangdong Investment Ltd. |
510,208 | 985,325 | ||||||
| Lenovo Group Ltd. |
1,548,000 | 1,392,223 | ||||||
| Shenzhen Investment Ltd. |
930,000 | 355,416 | ||||||
| Sino-Ocean Group Holding Ltd. |
1,217,464 | 533,516 | ||||||
| Sun Art Retail Group Ltd. |
347,500 | 338,649 | ||||||
|
|
|
|||||||
| Total China |
|
6,196,517 | ||||||
| Denmark – 2.1% |
| |||||||
| AP Moller–Maersk A/S Class B |
413 | 524,399 | ||||||
| Carlsberg A/S Class B |
5,613 | 701,725 | ||||||
| Chr Hansen Holding A/S |
3,477 | 352,791 | ||||||
| DFDS A/S |
4,369 | 180,973 | ||||||
| H. Lundbeck A/S(a) |
7,298 | 316,128 | ||||||
| ISS A/S |
14,598 | 444,616 | ||||||
| Jyske Bank A/S Registered Shares |
3,801 | 146,983 | ||||||
| Novozymes A/S Class B |
8,086 | 372,153 | ||||||
| Pandora A/S |
8,240 | 386,181 | ||||||
| Topdanmark A/S |
12,479 | 623,889 | ||||||
| Tryg A/S |
29,516 | 810,634 | ||||||
| Vestas Wind Systems A/S |
10,745 | 905,026 | ||||||
|
|
|
|||||||
| Total Denmark | 5,765,498 | |||||||
See Notes to Financial Statements.
| WisdomTree Trust | 45 |
Schedule of Investments (continued)
WisdomTree International MidCap Dividend Fund (DIM)
March 31, 2019
| Investments | Shares | Value | ||||||
| Finland – 1.5% |
| |||||||
| DNA Oyj |
11,057 | $ | 229,436 | |||||
| Elisa Oyj |
16,285 | 735,447 | ||||||
| Huhtamaki Oyj(a) |
6,567 | 244,587 | ||||||
| Kesko Oyj Class B |
6,959 | 423,827 | ||||||
| Konecranes Oyj(a) |
4,993 | 177,666 | ||||||
| Metsa Board Oyj(a) |
12,704 | 77,957 | ||||||
| Metso Oyj |
12,215 | 420,521 | ||||||
| Nokian Renkaat Oyj(a) |
12,971 | 434,604 | ||||||
| Orion Oyj Class B(a) |
13,778 | 517,028 | ||||||
| Stora Enso Oyj Class R |
32,208 | 394,015 | ||||||
| Wartsila Oyj Abp |
35,301 | 570,189 | ||||||
|
|
|
|||||||
| Total Finland |
|
4,225,277 | ||||||
| France – 7.4% |
| |||||||
| ALD S.A.(b) |
30,549 | 427,059 | ||||||
| Alstom S.A. |
4,667 | 202,382 | ||||||
| Amundi S.A.(b) |
17,639 | 1,111,114 | ||||||
| Arkema S.A. |
3,721 | 354,556 | ||||||
| Atos SE |
3,542 | 342,033 | ||||||
| Bollore S.A.(a) |
90,822 | 410,773 | ||||||
| Bureau Veritas S.A. |
26,013 | 610,462 | ||||||
| Carrefour S.A. |
78,611 | 1,469,668 | ||||||
| Casino Guichard Perrachon S.A.(a) |
20,848 | 904,765 | ||||||
| Cie Plastic Omnium S.A. |
5,556 | 148,041 | ||||||
| Covivio |
7,551 | 802,079 | ||||||
| Edenred |
17,952 | 817,786 | ||||||
| Eiffage S.A. |
4,871 | 468,509 | ||||||
| Elis S.A. |
10,689 | 171,991 | ||||||
| Eramet |
1,358 | 75,571 | ||||||
| Eurazeo SE |
4,422 | 332,671 | ||||||
| Eutelsat Communications S.A. |
36,761 | 643,716 | ||||||
| Faurecia S.A. |
5,898 | 248,214 | ||||||
| Getlink SE |
30,944 | 469,585 | ||||||
| ICADE |
7,545 | 638,781 | ||||||
| Imerys S.A. |
5,092 | 254,088 | ||||||
| Ingenico Group S.A. |
2,508 | 179,161 | ||||||
| Ipsen S.A. |
1,563 | 214,463 | ||||||
| JCDecaux S.A. |
10,878 | 331,253 | ||||||
| Klepierre S.A. |
40,910 | 1,432,278 | ||||||
| Lagardere SCA |
16,240 | 417,948 | ||||||
| Nexity S.A. |
6,323 | 308,840 | ||||||
| Orpea |
1,515 | 182,020 | ||||||
| Remy Cointreau S.A. |
2,059 | 274,891 | ||||||
| Rexel S.A. |
11,831 | 133,575 | ||||||
| Rubis SCA |
5,847 | 319,205 | ||||||
| SCOR SE |
19,507 | 831,454 | ||||||
| SEB S.A. |
1,566 | 263,757 | ||||||
| Societe BIC S.A. |
3,512 | 313,307 | ||||||
| Sodexo S.A. |
10,581 | 1,166,227 | ||||||
| Suez |
66,170 | 877,471 | ||||||
| Teleperformance |
2,169 | 390,161 | ||||||
| Valeo S.A. |
13,351 | 387,522 | ||||||
| Veolia Environnement S.A. |
50,746 | 1,135,614 | ||||||
| Investments | Shares | Value | ||||||
| Vicat S.A. |
3,036 | $ | 146,177 | |||||
| Wendel S.A. |
2,682 | 338,189 | ||||||
|
|
|
|||||||
| Total France |
|
20,547,357 | ||||||
| Germany – 6.2% |
| |||||||
| 1&1 Drillisch AG |
9,102 | 324,388 | ||||||
| Aurubis AG |
2,205 | 118,273 | ||||||
| Axel Springer SE |
8,076 | 417,497 | ||||||
| Brenntag AG |
7,712 | 397,467 | ||||||
| Carl Zeiss Meditec AG Bearer Shares |
2,461 | 205,730 | ||||||
| CTS Eventim AG & Co. KGaA |
4,111 | 194,981 | ||||||
| Deutsche Lufthansa AG Registered Shares |
37,673 | 827,621 | ||||||
| DMG MORI AG |
5,108 | 247,488 | ||||||
| Duerr AG |
4,260 | 167,226 | ||||||
| Fielmann AG |
4,811 | 332,225 | ||||||
| Fraport AG Frankfurt Airport Services Worldwide |
3,855 | 295,383 | ||||||
| Freenet AG |
21,459 | 461,544 | ||||||
| Fuchs Petrolub SE |
3,303 | 130,178 | ||||||
| GEA Group AG |
11,200 | 293,648 | ||||||
| Hannover Rueck SE |
11,280 | 1,621,216 | ||||||
| Hella GmbH & Co. KGaA |
5,089 | 223,996 | ||||||
| Hochtief AG |
3,245 | 470,031 | ||||||
| Hugo Boss AG |
5,317 | 363,465 | ||||||
| K+S AG Registered Shares |
6,886 | 126,340 | ||||||
| KION Group AG |
3,909 | 204,494 | ||||||
| LANXESS AG |
2,762 | 147,436 | ||||||
| LEG Immobilien AG |
4,705 | 578,225 | ||||||
| MAN SE |
9,356 | 768,994 | ||||||
| Merck KGaA |
4,491 | 512,592 | ||||||
| METRO AG |
52,913 | 878,724 | ||||||
| MTU Aero Engines AG |
2,145 | 486,038 | ||||||
| OSRAM Licht AG |
4,727 | 162,841 | ||||||
| ProSiebenSat.1 Media SE |
34,918 | 498,722 | ||||||
| Rheinmetall AG |
1,967 | 205,139 | ||||||
| RWE AG |
31,287 | 839,621 | ||||||
| Stroeer SE & Co. KGaA |
3,447 | 202,038 | ||||||
| Suedzucker AG |
13,735 | 175,352 | ||||||
| Symrise AG |
4,215 | 380,139 | ||||||
| Talanx AG |
22,610 | 872,319 | ||||||
| Telefonica Deutschland Holding AG |
470,817 | 1,479,710 | ||||||
| TUI AG |
49,743 | 476,799 | ||||||
| Uniper SE |
23,896 | 721,502 | ||||||
| United Internet AG Registered Shares |
7,611 | 278,002 | ||||||
| Wacker Chemie AG |
2,655 | 228,954 | ||||||
|
|
|
|||||||
| Total Germany |
|
17,316,338 | ||||||
| Hong Kong – 3.4% |
| |||||||
| Bank of East Asia Ltd. (The) |
233,722 | 759,229 | ||||||
| Dah Sing Banking Group Ltd. |
96,400 | 181,012 | ||||||
| Hang Lung Group Ltd. |
86,000 | 276,078 | ||||||
| Hang Lung Properties Ltd. |
486,000 | 1,186,219 | ||||||
| Hopewell Holdings Ltd. |
91,662 | 450,723 | ||||||
| Hysan Development Co., Ltd. |
77,000 | 412,468 | ||||||
| PCCW Ltd. |
1,015,543 | 631,323 | ||||||
| Power Assets Holdings Ltd. |
229,000 | 1,588,424 | ||||||
See Notes to Financial Statements.
| 46 | WisdomTree Trust |
Schedule of Investments (continued)
WisdomTree International MidCap Dividend Fund (DIM)
March 31, 2019
| Investments | Shares | Value | ||||||
| Sino Land Co., Ltd. |
575,046 | $ | 1,112,007 | |||||
| SJM Holdings Ltd. |
261,000 | 297,908 | ||||||
| Swire Pacific Ltd. Class A |
56,500 | 726,947 | ||||||
| Swire Pacific Ltd. Class B |
155,000 | 310,002 | ||||||
| Techtronic Industries Co., Ltd. |
62,500 | 419,987 | ||||||
| Wharf Holdings Ltd. (The) |
411,000 | 1,240,861 | ||||||
|
|
|
|||||||
| Total Hong Kong |
|
9,593,188 | ||||||
| Ireland – 0.8% |
| |||||||
| AIB Group PLC |
145,821 | 655,268 | ||||||
| Bank of Ireland Group PLC |
39,822 | 237,432 | ||||||
| DCC PLC |
4,167 | 360,268 | ||||||
| Kingspan Group PLC |
4,551 | 210,842 | ||||||
| Paddy Power Betfair PLC |
4,439 | 342,673 | ||||||
| Smurfit Kappa Group PLC |
13,270 | 370,717 | ||||||
|
|
|
|||||||
| Total Ireland |
|
2,177,200 | ||||||
| Israel – 1.1% |
| |||||||
| Azrieli Group Ltd. |
7,319 | 433,774 | ||||||
| Bank Hapoalim BM |
84,189 | 557,417 | ||||||
| Bank Leumi Le-Israel BM |
106,954 | 698,714 | ||||||
| Bezeq Israeli Telecommunication Corp., Ltd. |
528,578 | 379,392 | ||||||
| Elbit Systems Ltd. |
1,719 | 221,900 | ||||||
| Israel Chemicals Ltd. |
69,263 | 360,308 | ||||||
| Mizrahi Tefahot Bank Ltd. |
14,688 | 301,907 | ||||||
|
|
|
|||||||
| Total Israel |
|
2,953,412 | ||||||
| Italy – 5.3% |
| |||||||
| A2A SpA |
257,158 | 469,652 | ||||||
| ACEA SpA |
21,569 | 364,977 | ||||||
| Banca Mediolanum SpA |
116,314 | 824,759 | ||||||
| Brembo SpA |
14,992 | 170,189 | ||||||
| Davide Campari-Milano SpA |
28,350 | 278,537 | ||||||
| De’ Longhi SpA |
13,322 | 359,904 | ||||||
| DiaSorin SpA |
1,511 | 152,187 | ||||||
| ERG SpA |
13,434 | 254,473 | ||||||
| FinecoBank Banca Fineco SpA |
45,653 | 601,041 | ||||||
| Hera SpA |
118,082 | 427,465 | ||||||
| IMA Industria Macchine Automatiche SpA |
2,499 | 186,739 | ||||||
| Infrastrutture Wireless Italiane SpA(b) |
45,290 | 405,305 | ||||||
| Iren SpA |
74,047 | 189,069 | ||||||
| Italgas SpA |
77,177 | 476,967 | ||||||
| Leonardo SpA |
11,555 | 134,416 | ||||||
| Mediobanca Banca di Credito Finanziario SpA |
93,125 | 968,485 | ||||||
| Moncler SpA |
5,148 | 207,633 | ||||||
| Poste Italiane SpA(b) |
148,542 | 1,446,406 | ||||||
| Prysmian SpA |
11,397 | 215,823 | ||||||
| Recordati SpA |
12,462 | 485,695 | ||||||
| Salvatore Ferragamo SpA |
5,662 | 121,557 | ||||||
| Snam SpA |
454,088 | 2,334,707 | ||||||
| Societa Iniziative Autostradali e Servizi SpA |
14,950 | 259,185 | ||||||
| Telecom Italia SpA RSP |
600,377 | 341,381 | ||||||
| Terna Rete Elettrica Nazionale SpA |
187,418 | 1,188,578 | ||||||
| Unione di Banche Italiane SpA(a) |
95,701 | 253,386 | ||||||
| Unipol Gruppo SpA |
98,534 | 491,237 | ||||||
| Investments | Shares | Value | ||||||
| UnipolSai Assicurazioni SpA(a) |
413,594 | $ | 1,116,427 | |||||
|
|
|
|||||||
| Total Italy |
|
14,726,180 | ||||||
| Japan – 22.4% |
| |||||||
| ABC-Mart, Inc. |
3,878 | 230,890 | ||||||
| AGC, Inc. |
11,628 | 407,613 | ||||||
| Air Water, Inc. |
10,800 | 156,509 | ||||||
| Aisin Seiki Co., Ltd. |
18,000 | 643,177 | ||||||
| Ajinomoto Co., Inc. |
17,900 | 286,083 | ||||||
| Alfresa Holdings Corp. |
9,500 | 270,362 | ||||||
| Amada Holdings Co., Ltd. |
39,300 | 388,793 | ||||||
| ANA Holdings, Inc. |
11,800 | 432,725 | ||||||
| Aozora Bank Ltd. |
9,400 | 232,357 | ||||||
| Asics Corp. |
12,300 | 165,022 | ||||||
| Azbil Corp. |
10,000 | 233,907 | ||||||
| Bandai Namco Holdings, Inc. |
14,100 | 661,146 | ||||||
| Benesse Holdings, Inc. |
6,500 | 168,835 | ||||||
| Brother Industries Ltd. |
15,500 | 286,796 | ||||||
| Canon Marketing Japan, Inc. |
14,100 | 277,325 | ||||||
| Casio Computer Co., Ltd.(a) |
17,800 | 232,380 | ||||||
| Chiba Bank Ltd. (The) |
42,800 | 232,396 | ||||||
| Chubu Electric Power Co., Inc. |
37,100 | 579,368 | ||||||
| Chugoku Electric Power Co., Inc. (The)(a) |
25,500 | 318,160 | ||||||
| Coca-Cola Bottlers Japan Holdings, Inc. |
3,400 | 86,348 | ||||||
| Concordia Financial Group Ltd. |
72,400 | 279,304 | ||||||
| Dai Nippon Printing Co., Ltd. |
19,679 | 470,618 | ||||||
| Daicel Corp.(a) |
21,200 | 230,224 | ||||||
| Daifuku Co., Ltd.(a) |
5,100 | 265,402 | ||||||
| Daito Trust Construction Co., Ltd. |
5,620 | 783,454 | ||||||
| Daiwa Securities Group, Inc. |
150,100 | 730,938 | ||||||
| Denka Co., Ltd. |
8,400 | 242,092 | ||||||
| Dentsu, Inc. |
11,600 | 489,949 | ||||||
| DIC Corp. |
6,100 | 178,285 | ||||||
| Disco Corp.(a) |
2,100 | 299,200 | ||||||
| Electric Power Development Co., Ltd. |
10,000 | 243,574 | ||||||
| FamilyMart UNY Holdings Co., Ltd. |
14,000 | 356,814 | ||||||
| Fuji Electric Co., Ltd. |
6,375 | 180,851 | ||||||
| Fujitsu Ltd. |
7,600 | 548,345 | ||||||
| Fukuoka Financial Group, Inc. |
10,400 | 230,767 | ||||||
| Hakuhodo DY Holdings, Inc. |
17,600 | 282,719 | ||||||
| Hamamatsu Photonics K.K. |
5,300 | 204,942 | ||||||
| Hankyu Hanshin Holdings, Inc. |
7,700 | 288,702 | ||||||
| Haseko Corp. |
25,800 | 324,467 | ||||||
| Hikari Tsushin, Inc. |
2,100 | 397,859 | ||||||
| Hino Motors Ltd. |
29,600 | 249,241 | ||||||
| Hirose Electric Co., Ltd.(a) |
3,075 | 323,099 | ||||||
| Hisamitsu Pharmaceutical Co., Inc.(a) |
2,800 | 128,762 | ||||||
| Hitachi Chemical Co., Ltd.(a) |
12,100 | 268,051 | ||||||
| Hitachi Construction Machinery Co., Ltd.(a) |
12,300 | 326,378 | ||||||
| Hitachi High-Technologies Corp. |
6,400 | 262,222 | ||||||
| Hitachi Metals Ltd. |
19,900 | 231,209 | ||||||
| Hulic Co., Ltd. |
26,900 | 263,933 | ||||||
| Idemitsu Kosan Co., Ltd. |
10,100 | 338,081 | ||||||
| IHI Corp. |
6,600 | 158,553 | ||||||
See Notes to Financial Statements.
| WisdomTree Trust | 47 |
Schedule of Investments (continued)
WisdomTree International MidCap Dividend Fund (DIM)
March 31, 2019
| Investments | Shares | Value | ||||||
| Iida Group Holdings Co., Ltd. |
17,400 | $ | 315,192 | |||||
| Isuzu Motors Ltd. |
41,000 | 538,591 | ||||||
| Itochu Techno-Solutions Corp. |
12,900 | 301,041 | ||||||
| J. Front Retailing Co., Ltd. |
15,200 | 180,859 | ||||||
| Japan Airlines Co., Ltd. |
20,500 | 722,135 | ||||||
| Japan Exchange Group, Inc. |
39,800 | 709,449 | ||||||
| Japan Post Insurance Co., Ltd.(a) |
39,400 | 852,536 | ||||||
| JFE Holdings, Inc. |
47,100 | 799,362 | ||||||
| JGC Corp.(a) |
10,500 | 139,545 | ||||||
| JSR Corp. |
14,100 | 218,599 | ||||||
| JTEKT Corp. |
25,800 | 317,474 | ||||||
| Kajima Corp. |
35,276 | 520,766 | ||||||
| Kaneka Corp. |
5,000 | 187,243 | ||||||
| Kansai Electric Power Co., Inc. (The) |
47,500 | 700,366 | ||||||
| Kansai Paint Co., Ltd.(a) |
11,400 | 217,422 | ||||||
| Kawasaki Heavy Industries Ltd.(a) |
8,256 | 203,631 | ||||||
| Kikkoman Corp.(a) |
6,200 | 304,160 | ||||||
| Kintetsu Group Holdings Co., Ltd. |
3,800 | 177,151 | ||||||
| Kobe Steel Ltd. |
21,800 | 163,670 | ||||||
| Koito Manufacturing Co., Ltd. |
3,800 | 215,260 | ||||||
| Konami Holdings Corp. |
3,100 | 134,576 | ||||||
| Konica Minolta, Inc.(a) |
30,700 | 302,049 | ||||||
| Kose Corp. |
1,200 | 220,409 | ||||||
| Kuraray Co., Ltd. |
26,000 | 330,740 | ||||||
| Kyowa Hakko Kirin Co., Ltd. |
16,100 | 350,553 | ||||||
| Kyushu Railway Co.(a) |
8,800 | 289,398 | ||||||
| Lawson, Inc. |
8,400 | 465,971 | ||||||
| LIXIL Group Corp. |
17,100 | 228,340 | ||||||
| Mabuchi Motor Co., Ltd. |
5,700 | 198,265 | ||||||
| Makita Corp. |
8,958 | 311,994 | ||||||
| Marubeni Corp. |
124,400 | 859,791 | ||||||
| Marui Group Co., Ltd.(a) |
12,900 | 260,482 | ||||||
| Maruichi Steel Tube Ltd. |
6,800 | 198,130 | ||||||
| Mazda Motor Corp.(a) |
27,400 | 306,590 | ||||||
| Mebuki Financial Group, Inc. |
88,500 | 226,277 | ||||||
| Medipal Holdings Corp. |
10,300 | 244,740 | ||||||
| MEIJI Holdings Co., Ltd. |
5,600 | 454,840 | ||||||
| MINEBEA MITSUMI, Inc. |
16,100 | 241,896 | ||||||
| Mitsubishi Chemical Holdings Corp. |
106,900 | 752,748 | ||||||
| Mitsubishi Gas Chemical Co., Inc. |
11,300 | 161,202 | ||||||
| Mitsubishi Heavy Industries Ltd. |
21,500 | 893,138 | ||||||
| Mitsubishi Materials Corp. |
9,100 | 240,233 | ||||||
| Mitsubishi Motors Corp. |
57,700 | 306,524 | ||||||
| Mitsubishi Tanabe Pharma Corp. |
41,800 | 558,542 | ||||||
| Mitsui Chemicals, Inc. |
14,100 | 340,255 | ||||||
| Nabtesco Corp. |
7,300 | 212,698 | ||||||
| NEC Corp. |
11,960 | 404,664 | ||||||
| NGK Insulators Ltd. |
16,100 | 233,896 | ||||||
| NGK Spark Plug Co., Ltd. |
10,400 | 192,995 | ||||||
| NH Foods Ltd. |
6,000 | 216,018 | ||||||
| Nifco, Inc.(a) |
7,800 | 198,726 | ||||||
| Nikon Corp.(a) |
21,700 | 306,037 | ||||||
| Nippon Express Co., Ltd. |
5,100 | 283,832 | ||||||
| Nippon Paint Holdings Co., Ltd. |
7,300 | 286,895 | ||||||
| Investments | Shares | Value | ||||||
| Nissan Chemical Corp. |
6,100 | $ | 279,415 | |||||
| Nisshin Seifun Group, Inc. |
14,300 | 328,156 | ||||||
| Nissin Foods Holdings Co., Ltd. |
3,800 | 260,921 | ||||||
| Nitto Denko Corp. |
7,300 | 383,516 | ||||||
| NOK Corp.(a) |
13,500 | 210,150 | ||||||
| Nomura Real Estate Holdings, Inc. |
12,568 | 241,288 | ||||||
| Nomura Research Institute Ltd. |
10,110 | 459,442 | ||||||
| NSK Ltd. |
48,700 | 456,267 | ||||||
| Obayashi Corp. |
43,000 | 432,778 | ||||||
| Obic Co., Ltd. |
5,100 | 514,216 | ||||||
| Odakyu Electric Railway Co., Ltd. |
14,800 | 358,751 | ||||||
| Oji Holdings Corp. |
44,862 | 278,450 | ||||||
| Olympus Corp. |
26,400 | 286,695 | ||||||
| Omron Corp. |
7,800 | 365,036 | ||||||
| Ono Pharmaceutical Co., Ltd. |
23,000 | 450,711 | ||||||
| Oracle Corp. |
3,868 | 259,649 | ||||||
| Osaka Gas Co., Ltd. |
23,000 | 453,828 | ||||||
| Otsuka Corp. |
8,500 | 317,545 | ||||||
| Park24 Co., Ltd. |
10,800 | 234,471 | ||||||
| Pigeon Corp. |
5,300 | 216,673 | ||||||
| Pola Orbis Holdings, Inc. |
8,500 | 271,085 | ||||||
| Resona Holdings, Inc. |
150,100 | 650,521 | ||||||
| Ricoh Co., Ltd.(a) |
28,960 | 302,721 | ||||||
| Ryohin Keikaku Co., Ltd. |
700 | 177,332 | ||||||
| Sankyo Co., Ltd. |
7,200 | 274,509 | ||||||
| Santen Pharmaceutical Co., Ltd. |
12,800 | 190,696 | ||||||
| SBI Holdings, Inc. |
15,600 | 347,559 | ||||||
| SCSK Corp. |
5,200 | 231,847 | ||||||
| Sega Sammy Holdings, Inc. |
15,573 | 183,750 | ||||||
| Seibu Holdings, Inc. |
12,800 | 224,001 | ||||||
| Seiko Epson Corp.(a) |
27,300 | 418,065 | ||||||
| Sekisui Chemical Co., Ltd. |
25,200 | 405,030 | ||||||
| Sekisui House Ltd. |
55,700 | 921,917 | ||||||
| Seven Bank Ltd.(a) |
63,700 | 188,191 | ||||||
| SG Holdings Co., Ltd. |
10,800 | 314,677 | ||||||
| Shimadzu Corp. |
8,200 | 237,069 | ||||||
| Shimamura Co., Ltd. |
1,700 | 143,913 | ||||||
| Shimano, Inc. |
2,900 | 471,609 | ||||||
| Shimizu Corp. |
45,800 | 398,063 | ||||||
| Shizuoka Bank Ltd. (The) |
30,900 | 235,341 | ||||||
| Showa Shell Sekiyu K.K. |
24,309 | 333,619 | ||||||
| Skylark Holdings Co., Ltd. |
5,900 | 97,814 | ||||||
| Sojitz Corp. |
84,200 | 296,680 | ||||||
| Sony Financial Holdings, Inc. |
29,709 | 560,441 | ||||||
| Square Enix Holdings Co., Ltd.(a) |
3,500 | 122,691 | ||||||
| Stanley Electric Co., Ltd. |
7,800 | 209,649 | ||||||
| Sumitomo Chemical Co., Ltd. |
127,800 | 594,633 | ||||||
| Sumitomo Dainippon Pharma Co., Ltd. |
12,390 | 306,378 | ||||||
| Sumitomo Electric Industries Ltd. |
45,512 | 603,825 | ||||||
| Sumitomo Heavy Industries Ltd. |
6,900 | 223,486 | ||||||
| Sumitomo Metal Mining Co., Ltd. |
15,300 | 452,012 | ||||||
| Sumitomo Rubber Industries Ltd. |
18,200 | 218,364 | ||||||
| Sundrug Co., Ltd. |
3,800 | 104,712 | ||||||
| Suntory Beverage & Food Ltd. |
12,100 | 568,460 | ||||||
See Notes to Financial Statements.
| 48 | WisdomTree Trust |
Schedule of Investments (continued)
WisdomTree International MidCap Dividend Fund (DIM)
March 31, 2019
| Investments | Shares | Value | ||||||
| T&D Holdings, Inc. |
34,951 | $ | 367,556 | |||||
| Taiheiyo Cement Corp. |
7,000 | 233,365 | ||||||
| Taisei Corp. |
10,675 | 495,727 | ||||||
| Taiyo Nippon Sanso Corp.(a) |
16,700 | 254,381 | ||||||
| TDK Corp. |
3,900 | 305,489 | ||||||
| Teijin Ltd. |
10,900 | 179,820 | ||||||
| TIS, Inc. |
3,100 | 146,759 | ||||||
| Tobu Railway Co., Ltd. |
8,600 | 248,245 | ||||||
| Toho Co., Ltd. |
8,200 | 329,304 | ||||||
| Tohoku Electric Power Co., Inc. |
37,400 | 477,109 | ||||||
| Tokyo Gas Co., Ltd. |
21,400 | 578,768 | ||||||
| Tokyu Corp. |
19,800 | 345,787 | ||||||
| Tokyu Fudosan Holdings Corp. |
34,900 | 208,735 | ||||||
| Toray Industries, Inc. |
60,000 | 383,196 | ||||||
| Tosoh Corp. |
21,800 | 338,960 | ||||||
| TOTO Ltd. |
6,400 | 271,473 | ||||||
| Toyota Boshoku Corp. |
14,400 | 217,916 | ||||||
| Toyota Tsusho Corp. |
17,900 | 583,001 | ||||||
| Trend Micro, Inc. |
7,730 | 376,426 | ||||||
| Tsuruha Holdings, Inc. |
1,400 | 113,837 | ||||||
| Ube Industries Ltd. |
9,200 | 189,095 | ||||||
| USS Co., Ltd. |
16,600 | 308,049 | ||||||
| West Japan Railway Co. |
8,776 | 661,183 | ||||||
| Yamada Denki Co., Ltd.(a) |
56,400 | 278,217 | ||||||
| Yamaha Corp. |
5,800 | 289,777 | ||||||
| Yamaha Motor Co., Ltd. |
23,960 | 469,957 | ||||||
| Yamato Holdings Co., Ltd. |
10,100 | 260,884 | ||||||
| Yaskawa Electric Corp. |
7,000 | 219,768 | ||||||
| Yokogawa Electric Corp. |
11,400 | 235,961 | ||||||
| Yokohama Rubber Co., Ltd. (The) |
12,000 | 222,903 | ||||||
| ZOZO, Inc.(a) |
5,900 | 111,193 | ||||||
|
|
|
|||||||
| Total Japan |
|
62,637,582 | ||||||
| Netherlands – 2.7% |
| |||||||
| Aalberts Industries N.V. |
5,356 | 185,411 | ||||||
| Aegon N.V. |
241,092 | 1,159,722 | ||||||
| ASR Nederland N.V. |
14,487 | 603,496 | ||||||
| Boskalis Westminster |
10,351 | 267,901 | ||||||
| Euronext N.V.(b) |
5,679 | 360,282 | ||||||
| GrandVision N.V.(b) |
11,202 | 242,759 | ||||||
| Koninklijke KPN N.V. |
429,793 | 1,363,808 | ||||||
| Koninklijke Vopak N.V. |
8,128 | 389,337 | ||||||
| NN Group N.V. |
33,658 | 1,399,470 | ||||||
| Randstad N.V.(a) |
15,275 | 745,577 | ||||||
| SBM Offshore N.V. |
15,682 | 298,553 | ||||||
| Signify N.V.(b) |
16,451 | 440,557 | ||||||
|
|
|
|||||||
| Total Netherlands | 7,456,873 | |||||||
| New Zealand – 1.0% |
| |||||||
| Auckland International Airport Ltd. |
94,804 | 526,303 | ||||||
| Fisher & Paykel Healthcare Corp., Ltd. |
25,057 | 268,295 | ||||||
| Mercury NZ Ltd. |
160,735 | 427,523 | ||||||
| Meridian Energy Ltd. |
267,948 | 764,769 | ||||||
| Ryman Healthcare Ltd. |
23,744 | 198,369 | ||||||
| Spark New Zealand Ltd. |
260,104 | 674,085 | ||||||
|
|
|
|||||||
| Total New Zealand | 2,859,344 | |||||||
| Investments | Shares | Value | ||||||
| Norway – 2.5% |
| |||||||
| Aker ASA Class A |
6,233 | $ | 476,255 | |||||
| Aker BP ASA |
22,820 | 813,524 | ||||||
| Gjensidige Forsikring ASA(a) |
59,652 | 1,032,114 | ||||||
| Leroy Seafood Group ASA |
42,916 | 311,768 | ||||||
| Mowi ASA |
73,404 | 1,640,841 | ||||||
| Norsk Hydro ASA |
146,845 | 595,967 | ||||||
| Orkla ASA |
78,693 | 604,937 | ||||||
| Salmar ASA |
13,739 | 660,179 | ||||||
| Storebrand ASA |
48,022 | 374,402 | ||||||
| Yara International ASA |
12,663 | 518,778 | ||||||
|
|
|
|||||||
| Total Norway | 7,028,765 | |||||||
| Portugal – 1.3% |
| |||||||
| EDP–Energias de Portugal S.A. |
370,324 | 1,457,443 | ||||||
| Galp Energia, SGPS, S.A. |
60,070 | 963,180 | ||||||
| Jeronimo Martins, SGPS, S.A. |
64,996 | 959,697 | ||||||
| Navigator Co. S.A. (The) |
39,388 | 180,445 | ||||||
|
|
|
|||||||
| Total Portugal |
|
3,560,765 | ||||||
| Singapore – 2.6% |
| |||||||
| CapitaLand Ltd. |
344,400 | 928,062 | ||||||
| City Developments Ltd. |
28,200 | 188,416 | ||||||
| ComfortDelGro Corp., Ltd. |
242,300 | 459,735 | ||||||
| Frasers Property Ltd. |
302,400 | 404,093 | ||||||
| Jardine Cycle & Carriage Ltd. |
21,611 | 518,377 | ||||||
| Keppel Corp., Ltd. |
128,900 | 591,922 | ||||||
| Olam International Ltd. |
230,400 | 336,797 | ||||||
| SATS Ltd. |
92,200 | 347,835 | ||||||
| Sembcorp Industries Ltd. |
117,100 | 220,454 | ||||||
| Singapore Airlines Ltd. |
48,461 | 345,613 | ||||||
| Singapore Exchange Ltd. |
100,700 | 543,460 | ||||||
| Singapore Technologies Engineering Ltd. |
300,400 | 829,455 | ||||||
| UOL Group Ltd. |
50,000 | 256,552 | ||||||
| Venture Corp., Ltd. |
23,000 | 304,629 | ||||||
| Wilmar International Ltd. |
427,300 | 1,044,196 | ||||||
|
|
|
|||||||
| Total Singapore |
|
7,319,596 | ||||||
| Spain – 4.0% |
| |||||||
| Acciona S.A.(a) |
4,870 | 543,000 | ||||||
| Acerinox S.A. |
23,497 | 233,073 | ||||||
| ACS Actividades de Construccion y Servicios S.A. |
23,259 | 1,022,717 | ||||||
| Banco de Sabadell S.A. |
650,275 | 648,237 | ||||||
| Bankia S.A. |
246,174 | 638,522 | ||||||
| Bankinter S.A. |
66,257 | 505,153 | ||||||
| Cia de Distribucion Integral Logista Holdings S.A. |
14,214 | 335,164 | ||||||
| Ebro Foods S.A.(a) |
11,558 | 247,359 | ||||||
| EDP Renovaveis S.A. |
18,506 | 176,625 | ||||||
| Enagas S.A. |
30,420 | 886,035 | ||||||
| Ferrovial S.A. |
64,723 | 1,517,438 | ||||||
| Grifols S.A. |
13,768 | 385,867 | ||||||
| Grupo Catalana Occidente S.A. |
7,636 | 272,656 | ||||||
| Mapfre S.A. |
374,292 | 1,032,192 | ||||||
| Mediaset Espana Comunicacion S.A. |
60,162 | 449,632 | ||||||
| Prosegur Cash S.A.(b) |
78,452 | 173,361 | ||||||
See Notes to Financial Statements.
| WisdomTree Trust | 49 |
Schedule of Investments (continued)
WisdomTree International MidCap Dividend Fund (DIM)
March 31, 2019
| Investments | Shares | Value | ||||||
| Prosegur Cia de Seguridad S.A. |
29,554 | $ | 160,282 | |||||
| Red Electrica Corp. S.A. |
54,634 | 1,165,570 | ||||||
| Siemens Gamesa Renewable Energy S.A.* |
14,829 | 236,357 | ||||||
| Viscofan S.A. |
3,586 | 224,480 | ||||||
| Zardoya Otis S.A. |
29,743 | 246,469 | ||||||
|
|
|
|||||||
| Total Spain |
|
11,100,189 | ||||||
| Sweden – 3.5% |
| |||||||
| Alfa Laval AB |
21,384 | 491,989 | ||||||
| Axfood AB(a) |
22,716 | 423,692 | ||||||
| BillerudKorsnas AB(a) |
14,184 | 188,630 | ||||||
| Boliden AB |
15,706 | 448,051 | ||||||
| Castellum AB |
19,458 | 378,344 | ||||||
| Dometic Group AB(b) |
16,848 | 132,691 | ||||||
| Electrolux AB Series B |
22,719 | 585,164 | ||||||
| Fabege AB |
22,953 | 334,076 | ||||||
| Hexpol AB |
17,573 | 148,063 | ||||||
| Husqvarna AB Class B |
23,002 | 188,325 | ||||||
| ICA Gruppen AB(a) |
16,431 | 660,762 | ||||||
| Indutrade AB |
6,566 | 187,311 | ||||||
| Intrum AB(a) |
13,943 | 401,365 | ||||||
| Investment AB Latour Class B(a) |
30,366 | 407,595 | ||||||
| Kinnevik AB Class B |
15,228 | 395,340 | ||||||
| Lundin Petroleum AB |
12,028 | 408,225 | ||||||
| Saab AB Class B(a) |
4,676 | 150,182 | ||||||
| Securitas AB Class B |
25,549 | 413,867 | ||||||
| Skanska AB Class B(a) |
41,103 | 748,471 | ||||||
| SKF AB Class B(a) |
28,843 | 480,131 | ||||||
| SSAB AB Class B |
56,569 | 172,537 | ||||||
| Svenska Cellulosa AB SCA Class B |
23,795 | 206,772 | ||||||
| Swedish Match AB |
15,981 | 816,512 | ||||||
| Tele2 AB Class B |
57,595 | 769,047 | ||||||
| Trelleborg AB Class B |
12,703 | 197,147 | ||||||
|
|
|
|||||||
| Total Sweden |
|
9,734,289 | ||||||
| Switzerland – 3.2% |
| |||||||
| Adecco Group AG Registered Shares |
14,257 | 760,450 | ||||||
| Baloise Holding AG Registered Shares |
3,409 | 563,089 | ||||||
| BKW AG |
3,341 | 227,788 | ||||||
| Clariant AG Registered Shares* |
16,085 | 338,045 | ||||||
| Coca-Cola HBC AG* |
12,736 | 433,976 | ||||||
| DKSH Holding AG(a) |
3,887 | 224,032 | ||||||
| Dufry AG* |
3,692 | 387,773 | ||||||
| EMS-Chemie Holding AG Registered Shares |
1,326 | 718,988 | ||||||
| Flughafen Zurich AG Registered Shares |
1,927 | 351,577 | ||||||
| Helvetia Holding AG Registered Shares |
769 | 469,477 | ||||||
| Julius Baer Group Ltd.* |
12,795 | 516,862 | ||||||
| Logitech International S.A. Registered Shares |
7,251 | 284,172 | ||||||
| OC Oerlikon Corp. AG Registered Shares* |
17,574 | 224,815 | ||||||
| SFS Group AG* |
1,857 | 161,292 | ||||||
| Sonova Holding AG Registered Shares |
2,414 | 477,516 | ||||||
| Straumann Holding AG Registered Shares |
334 | 272,492 | ||||||
| Sulzer AG Registered Shares |
2,208 | 215,279 | ||||||
| Sunrise Communications Group AG*(a)(b) |
4,339 | 319,358 | ||||||
| Swiss Life Holding AG Registered Shares* |
2,578 | 1,135,107 | ||||||
| Investments | Shares | Value | ||||||
| VAT Group AG*(b) |
1,910 | $ | 200,800 | |||||
| Vifor Pharma AG |
2,133 | 288,391 | ||||||
| Vontobel Holding AG Registered Shares |
4,510 | 242,505 | ||||||
|
|
|
|||||||
| Total Switzerland |
|
8,813,784 | ||||||
| United Kingdom – 13.8% |
| |||||||
| Admiral Group PLC |
37,502 | 1,060,414 | ||||||
| Antofagasta PLC |
73,091 | 920,031 | ||||||
| Ashmore Group PLC |
68,986 | 384,020 | ||||||
| Babcock International Group PLC |
31,354 | 201,624 | ||||||
| Barratt Developments PLC |
171,850 | 1,341,784 | ||||||
| BBA Aviation PLC |
66,351 | 215,282 | ||||||
| Beazley PLC |
38,785 | 260,275 | ||||||
| Bellway PLC |
11,488 | 455,820 | ||||||
| Berkeley Group Holdings PLC |
9,327 | 448,345 | ||||||
| British Land Co. PLC (The) |
93,765 | 719,643 | ||||||
| Bunzl PLC |
16,625 | 548,513 | ||||||
| Burberry Group PLC |
19,602 | 499,226 | ||||||
| Carnival PLC |
13,279 | 651,466 | ||||||
| Centrica PLC |
967,935 | 1,440,368 | ||||||
| Cineworld Group PLC |
55,079 | 210,001 | ||||||
| ConvaTec Group PLC(b) |
86,970 | 160,413 | ||||||
| Croda International PLC |
5,832 | 382,857 | ||||||
| Daily Mail & General Trust PLC Class A Non-Voting Shares |
28,085 | 236,228 | ||||||
| Derwent London PLC |
5,227 | 219,520 | ||||||
| Direct Line Insurance Group PLC |
156,804 | 721,262 | ||||||
| DS Smith PLC |
68,535 | 299,974 | ||||||
| easyJet PLC |
20,884 | 304,104 | ||||||
| Electrocomponents PLC |
23,477 | 171,864 | ||||||
| Evraz PLC |
196,223 | 1,586,291 | ||||||
| Fresnillo PLC |
42,473 | 481,940 | ||||||
| G4S PLC |
116,424 | 278,381 | ||||||
| Halma PLC |
13,696 | 298,395 | ||||||
| Hammerson PLC |
75,726 | 331,350 | ||||||
| Hargreaves Lansdown PLC |
20,323 | 493,490 | ||||||
| Hays PLC |
69,295 | 135,442 | ||||||
| Hikma Pharmaceuticals PLC |
10,608 | 247,635 | ||||||
| HomeServe PLC |
16,343 | 218,281 | ||||||
| Howden Joinery Group PLC |
34,909 | 220,754 | ||||||
| IMI PLC |
22,851 | 285,254 | ||||||
| Inchcape PLC |
31,963 | 237,818 | ||||||
| Informa PLC |
49,936 | 484,244 | ||||||
| InterContinental Hotels Group PLC |
6,902 | 415,057 | ||||||
| Intertek Group PLC |
5,735 | 362,963 | ||||||
| Investec PLC |
62,948 | 362,794 | ||||||
| ITV PLC |
407,905 | 675,563 | ||||||
| J Sainsbury PLC |
147,770 | 453,844 | ||||||
| Jardine Lloyd Thompson Group PLC |
15,420 | 384,581 | ||||||
| John Wood Group PLC |
47,266 | 312,508 | ||||||
| Johnson Matthey PLC |
8,803 | 360,411 | ||||||
| Kingfisher PLC |
118,423 | 362,323 | ||||||
| Land Securities Group PLC |
69,787 | 830,609 | ||||||
| Man Group PLC |
162,098 | 286,839 | ||||||
See Notes to Financial Statements.
| 50 | WisdomTree Trust |
Schedule of Investments (concluded)
WisdomTree International MidCap Dividend Fund (DIM)
March 31, 2019
| Investments | Shares | Value | ||||||
| Marks & Spencer Group PLC |
202,394 | $ | 735,542 | |||||
| Mediclinic International PLC |
9,418 | 37,405 | ||||||
| Meggitt PLC |
55,906 | 366,281 | ||||||
| Melrose Industries PLC |
84,804 | 202,388 | ||||||
| Merlin Entertainments PLC(b) |
37,075 | 165,850 | ||||||
| Micro Focus International PLC |
28,828 | 749,972 | ||||||
| Mondi PLC |
21,682 | 479,732 | ||||||
| Next PLC |
8,458 | 614,983 | ||||||
| Pearson PLC |
36,657 | 399,419 | ||||||
| Pennon Group PLC |
44,844 | 434,515 | ||||||
| Persimmon PLC |
56,484 | 1,597,153 | ||||||
| Redrow PLC |
30,937 | 242,278 | ||||||
| Rentokil Initial PLC |
66,577 | 306,499 | ||||||
| Rightmove PLC |
40,688 | 270,394 | ||||||
| Royal Mail PLC |
96,767 | 300,478 | ||||||
| RPC Group PLC |
34,798 | 358,214 | ||||||
| RSA Insurance Group PLC |
72,549 | 480,049 | ||||||
| Sage Group PLC (The) |
62,560 | 571,610 | ||||||
| Schroders PLC |
18,303 | 644,420 | ||||||
| Segro PLC |
59,533 | 522,387 | ||||||
| Severn Trent PLC |
22,833 | 587,910 | ||||||
| Smiths Group PLC |
22,262 | 416,272 | ||||||
| Spectris PLC |
6,411 | 209,682 | ||||||
| Spirax-Sarco Engineering PLC |
3,165 | 296,527 | ||||||
| St. James’s Place PLC |
44,273 | 593,053 | ||||||
| Standard Life Aberdeen PLC |
322,841 | 1,110,380 | ||||||
| Tate & Lyle PLC |
50,516 | 477,757 | ||||||
| Taylor Wimpey PLC |
105,898 | 242,104 | ||||||
| TP ICAP PLC |
48,828 | 187,186 | ||||||
| Travis Perkins PLC |
14,086 | 251,644 | ||||||
| Unite Group PLC (The) |
16,730 | 200,015 | ||||||
| United Utilities Group PLC |
75,231 | 798,355 | ||||||
| Victrex PLC |
4,548 | 127,770 | ||||||
| Weir Group PLC (The) |
9,932 | 201,635 | ||||||
| Whitbread PLC |
10,676 | 706,419 | ||||||
| William Hill PLC |
94,041 | 196,738 | ||||||
| WM Morrison Supermarkets PLC |
130,341 | 386,473 | ||||||
|
|
|
|||||||
| Total United Kingdom |
|
38,429,290 | ||||||
| TOTAL COMMON STOCKS (Cost: $264,430,969) |
277,253,188 | |||||||
| INVESTMENT OF CASH COLLATERAL FOR SECURITIES LOANED – 3.6% |
| |||||||
| United States – 3.6% |
| |||||||
| State Street Navigator Securities Lending Government Money Market Portfolio, 2.46%(c) |
||||||||
| (Cost: $9,936,957)(d) | 9,936,957 | 9,936,957 | ||||||
| TOTAL INVESTMENTS IN SECURITIES – 103.0% (Cost: $274,367,926) |
|
287,190,145 | ||||||
| Other Assets less Liabilities – (3.0)% |
|
(8,266,518 | ) | |||||
|
|
|
|||||||
| NET ASSETS – 100.0% | $ | 278,923,627 | ||||||
| * | Non-income producing security. |
| (a) | Security, or portion thereof, was on loan at March 31, 2019 (See Note 2). |
| (b) | This security is exempt from registration under rule 144A of the Securities Act of 1933. This security may be sold in transactions that are exempt from registration, normally to qualified institutional buyers. |
| (c) | Rate shown represents annualized 7-day yield as of March 31, 2019. |
| (d) | At March 31, 2019, the total market value of the Fund’s securities on loan identified in the Schedule of Investments was $17,241,120. The Fund also had securities on loan having a total market value of $380,435 that were sold and pending settlement. The total market value of the collateral held by the Fund was $18,538,893. The total market value of the collateral includes non-cash U.S. Government securities collateral having a value of $8,601,936. |
RSP – Risparmio Italian Savings Shares
See Notes to Financial Statements.
| WisdomTree Trust | 51 |
WisdomTree International Multifactor Fund (DWMF)
March 31, 2019
| Investments | Shares | Value | ||||||
| COMMON STOCKS – 99.5% |
| |||||||
| Australia – 7.0% |
| |||||||
| AGL Energy Ltd. |
7,109 | $ | 109,936 | |||||
| ASX Ltd. |
2,444 | 121,249 | ||||||
| Aurizon Holdings Ltd. |
33,686 | 108,876 | ||||||
| BHP Group Ltd. |
644 | 17,608 | ||||||
| BHP Group PLC |
4,275 | 102,977 | ||||||
| BlueScope Steel Ltd. |
9,183 | 90,998 | ||||||
| Brambles Ltd. |
15,560 | 129,984 | ||||||
| CIMIC Group Ltd. |
504 | 17,278 | ||||||
| Macquarie Group Ltd. |
1,177 | 108,206 | ||||||
| National Australia Bank Ltd. |
5,928 | 106,411 | ||||||
| Rio Tinto Ltd. |
1,355 | 94,241 | ||||||
| Santos Ltd. |
3,961 | 19,217 | ||||||
| Wesfarmers Ltd. |
4,735 | 116,545 | ||||||
| Westpac Banking Corp. |
5,561 | 102,390 | ||||||
| Woodside Petroleum Ltd. |
1,067 | 26,240 | ||||||
| Woolworths Group Ltd. |
5,015 | 108,297 | ||||||
|
|
|
|||||||
| Total Australia |
|
1,380,453 | ||||||
| Belgium – 1.4% |
| |||||||
| Colruyt S.A. |
1,820 | 134,672 | ||||||
| Proximus SADP |
1,499 | 43,274 | ||||||
| UCB S.A. |
1,140 | 98,001 | ||||||
|
|
|
|||||||
| Total Belgium |
|
275,947 | ||||||
| China – 0.3% |
| |||||||
| WH Group Ltd.(a) |
63,000 | 67,414 | ||||||
| Denmark – 1.4% |
| |||||||
| Carlsberg A/S Class B |
1,150 | 143,770 | ||||||
| Coloplast A/S Class B |
951 | 104,445 | ||||||
| H. Lundbeck A/S |
866 | 37,513 | ||||||
|
|
|
|||||||
| Total Denmark |
|
285,728 | ||||||
| Finland – 0.4% |
| |||||||
| Stora Enso Oyj Class R |
6,294 | 76,997 | ||||||
| France – 6.0% |
| |||||||
| Alstom S.A. |
1,924 | 83,433 | ||||||
| Cie de Saint-Gobain |
2,117 | 76,803 | ||||||
| CNP Assurances |
5,219 | 114,976 | ||||||
| Credit Agricole S.A. |
8,586 | 103,831 | ||||||
| Eurazeo SE |
1,554 | 116,909 | ||||||
| Hermes International |
253 | 167,097 | ||||||
| Orange S.A. |
4,692 | 76,392 | ||||||
| Publicis Groupe S.A. |
1,703 | 91,270 | ||||||
| Sanofi |
1,573 | 139,074 | ||||||
| Societe BIC S.A. |
569 | 50,761 | ||||||
| TOTAL S.A. |
2,959 | 164,531 | ||||||
|
|
|
|||||||
| Total France |
|
1,185,077 | ||||||
| Germany – 8.1% |
| |||||||
| Allianz SE Registered Shares |
887 | 197,480 | ||||||
| Covestro AG(a) |
2,791 | 153,623 | ||||||
| Deutsche Lufthansa AG Registered Shares |
4,313 | 94,750 | ||||||
| Deutsche Telekom AG Registered Shares |
7,309 | 121,421 | ||||||
| Investments | Shares | Value | ||||||
| Deutsche Wohnen SE Bearer Shares |
4,088 | $ | 198,435 | |||||
| E.ON SE |
18,418 | 204,987 | ||||||
| Evonik Industries AG |
3,422 | 93,293 | ||||||
| Hannover Rueck SE |
1,295 | 186,124 | ||||||
| Hochtief AG |
934 | 135,288 | ||||||
| Muenchener Rueckversicherungs – Gesellschaft AG Registered Shares |
783 | 185,509 | ||||||
| ProSiebenSat.1 Media SE |
2,284 | 32,622 | ||||||
|
|
|
|||||||
| Total Germany |
|
1,603,532 | ||||||
| Hong Kong – 4.4% |
| |||||||
| CK Asset Holdings Ltd. |
12,000 | 106,701 | ||||||
| CK Hutchison Holdings Ltd. |
8,000 | 84,026 | ||||||
| CK Infrastructure Holdings Ltd. |
17,000 | 139,574 | ||||||
| CLP Holdings Ltd. |
8,500 | 98,536 | ||||||
| Henderson Land Development Co., Ltd. |
9,000 | 57,211 | ||||||
| Hong Kong Exchanges & Clearing Ltd. |
2,600 | 90,620 | ||||||
| Hysan Development Co., Ltd. |
20,000 | 107,134 | ||||||
| Kerry Properties Ltd. |
20,500 | 91,532 | ||||||
| Swire Pacific Ltd. Class A |
8,000 | 102,931 | ||||||
|
|
|
|||||||
| Total Hong Kong |
|
878,265 | ||||||
| Israel – 0.6% |
| |||||||
| Israel Chemicals Ltd. |
22,200 | 115,485 | ||||||
| Italy – 2.6% |
| |||||||
| Assicurazioni Generali SpA |
6,157 | 114,071 | ||||||
| Enel SpA |
22,044 | 141,186 | ||||||
| Eni SpA |
9,257 | 163,751 | ||||||
| Recordati SpA |
2,318 | 90,342 | ||||||
|
|
|
|||||||
| Total Italy |
|
509,350 | ||||||
| Japan – 24.4% |
| |||||||
| Aeon Mall Co., Ltd. |
3,900 | 64,128 | ||||||
| AGC, Inc. |
800 | 28,044 | ||||||
| Alfresa Holdings Corp. |
2,800 | 79,686 | ||||||
| ANA Holdings, Inc. |
2,000 | 73,343 | ||||||
| Asahi Group Holdings Ltd. |
1,400 | 62,357 | ||||||
| Astellas Pharma, Inc. |
3,700 | 55,441 | ||||||
| Brother Industries Ltd. |
6,800 | 125,820 | ||||||
| Canon, Inc. |
6,300 | 182,878 | ||||||
| Casio Computer Co., Ltd. |
8,100 | 105,746 | ||||||
| Central Japan Railway Co. |
400 | 92,912 | ||||||
| Dai Nippon Printing Co., Ltd. |
2,200 | 52,612 | ||||||
| Dai-ichi Life Holdings, Inc. |
2,400 | 33,349 | ||||||
| Daicel Corp. |
6,000 | 65,158 | ||||||
| Daiwa House Industry Co., Ltd. |
1,700 | 54,048 | ||||||
| East Japan Railway Co. |
1,000 | 96,490 | ||||||
| Electric Power Development Co., Ltd. |
1,400 | 34,100 | ||||||
| FUJIFILM Holdings Corp. |
3,400 | 154,633 | ||||||
| Fujitsu Ltd. |
2,100 | 151,516 | ||||||
| Hitachi Ltd. |
4,500 | 145,751 | ||||||
| Hoya Corp. |
1,100 | 72,638 | ||||||
| ITOCHU Corp. |
4,900 | 88,650 | ||||||
| Japan Airlines Co., Ltd. |
1,800 | 63,407 | ||||||
| Japan Tobacco, Inc. |
2,000 | 49,600 | ||||||
See Notes to Financial Statements.
| 52 | WisdomTree Trust |
Schedule of Investments (continued)
WisdomTree International Multifactor Fund (DWMF)
March 31, 2019
| Investments | Shares | Value | ||||||
| Kajima Corp. |
1,800 | $ | 26,573 | |||||
| Kamigumi Co., Ltd. |
1,000 | 23,165 | ||||||
| KDDI Corp. |
1,600 | 34,476 | ||||||
| Kintetsu Group Holdings Co., Ltd. |
1,100 | 51,281 | ||||||
| Kirin Holdings Co., Ltd. |
2,100 | 50,136 | ||||||
| Kobe Steel Ltd. |
7,000 | 52,555 | ||||||
| Konica Minolta, Inc. |
15,400 | 151,516 | ||||||
| Kyushu Electric Power Co., Inc. |
4,500 | 53,137 | ||||||
| Kyushu Railway Co. |
3,100 | 101,947 | ||||||
| Marubeni Corp. |
6,200 | 42,851 | ||||||
| McDonald’s Holdings Co., Japan Ltd. |
2,900 | 134,146 | ||||||
| Medipal Holdings Corp. |
2,500 | 59,403 | ||||||
| MEIJI Holdings Co., Ltd. |
700 | 56,855 | ||||||
| Mitsubishi Corp. |
1,700 | 47,213 | ||||||
| Mitsubishi Estate Co., Ltd. |
2,700 | 48,921 | ||||||
| Mitsubishi Heavy Industries Ltd. |
1,500 | 62,312 | ||||||
| Mitsui Chemicals, Inc. |
2,900 | 69,981 | ||||||
| MS&AD Insurance Group Holdings, Inc. |
2,500 | 76,117 | ||||||
| Nippon Steel & Sumitomo Metal Corp. |
5,100 | 90,034 | ||||||
| Nippon Telegraph & Telephone Corp. |
1,200 | 50,988 | ||||||
| Nomura Research Institute Ltd. |
2,900 | 131,788 | ||||||
| NSK Ltd. |
3,200 | 29,981 | ||||||
| Seiko Epson Corp. |
10,600 | 162,326 | ||||||
| Sekisui House Ltd. |
9,200 | 152,274 | ||||||
| Seven & I Holdings Co., Ltd. |
1,700 | 64,139 | ||||||
| SG Holdings Co., Ltd. |
700 | 20,396 | ||||||
| Shionogi & Co., Ltd. |
600 | 37,143 | ||||||
| Showa Denko K.K. |
1,000 | 35,145 | ||||||
| Sony Corp. |
2,000 | 83,932 | ||||||
| Sony Financial Holdings, Inc. |
1,600 | 30,183 | ||||||
| SUMCO Corp. |
8,900 | 98,983 | ||||||
| Sumitomo Chemical Co., Ltd. |
14,800 | 68,862 | ||||||
| Sumitomo Corp. |
2,400 | 33,197 | ||||||
| Sumitomo Heavy Industries Ltd. |
800 | 25,911 | ||||||
| Sumitomo Mitsui Financial Group, Inc. |
1,200 | 42,022 | ||||||
| Suntory Beverage & Food Ltd. |
1,100 | 51,678 | ||||||
| Suzuken Co., Ltd. |
1,000 | 57,912 | ||||||
| T&D Holdings, Inc. |
2,500 | 26,291 | ||||||
| Taiheiyo Cement Corp. |
2,000 | 66,676 | ||||||
| Taisei Corp. |
500 | 23,219 | ||||||
| Teijin Ltd. |
6,300 | 103,933 | ||||||
| Tokio Marine Holdings, Inc. |
1,500 | 72,666 | ||||||
| Tokyo Electric Power Co. Holdings, Inc.* |
500 | 3,162 | ||||||
| Toshiba Corp. |
700 | 22,293 | ||||||
| Tosoh Corp. |
3,800 | 59,085 | ||||||
| West Japan Railway Co. |
1,300 | 97,942 | ||||||
|
|
|
|||||||
| Total Japan |
|
4,817,053 | ||||||
| Luxembourg – 0.4% |
| |||||||
| ArcelorMittal |
3,659 | 74,191 | ||||||
| Netherlands – 3.0% |
| |||||||
| Aegon N.V. |
18,750 | 90,193 | ||||||
| EXOR N.V. |
1,170 | 76,065 | ||||||
| Heineken Holding N.V. |
1,175 | 117,818 | ||||||
| Investments | Shares | Value | ||||||
| Koninklijke Ahold Delhaize N.V. |
5,523 | $ | 147,130 | |||||
| NN Group N.V. |
2,678 | 111,349 | ||||||
| Randstad N.V. |
1,097 | 53,545 | ||||||
|
|
|
|||||||
| Total Netherlands |
|
596,100 | ||||||
| Norway – 1.0% |
| |||||||
| Mowi ASA |
3,883 | 86,799 | ||||||
| Telenor ASA |
5,112 | 102,518 | ||||||
|
|
|
|||||||
| Total Norway |
|
189,317 | ||||||
| Singapore – 1.7% |
| |||||||
| ComfortDelGro Corp., Ltd. |
39,100 | 74,188 | ||||||
| SATS Ltd. |
11,200 | 42,253 | ||||||
| Singapore Exchange Ltd. |
21,100 | 113,873 | ||||||
| Wilmar International Ltd. |
44,800 | 109,478 | ||||||
|
|
|
|||||||
| Total Singapore |
|
339,792 | ||||||
| Spain – 3.7% |
| |||||||
| Aena SME S.A.(a) |
425 | 76,592 | ||||||
| Enagas S.A. |
5,769 | 168,032 | ||||||
| Endesa S.A. |
5,322 | 135,890 | ||||||
| Red Electrica Corp. S.A. |
6,369 | 135,877 | ||||||
| Repsol S.A. |
9,704 | 166,275 | ||||||
| Telefonica S.A. |
6,337 | 53,146 | ||||||
|
|
|
|||||||
| Total Spain |
|
735,812 | ||||||
| Sweden – 2.0% |
| |||||||
| Sandvik AB |
3,438 | 55,970 | ||||||
| Securitas AB Class B |
4,153 | 67,274 | ||||||
| SKF AB Class B |
3,543 | 58,978 | ||||||
| Svenska Handelsbanken AB Class A |
10,184 | 107,711 | ||||||
| Telia Co. AB |
10,111 | 45,730 | ||||||
| Volvo AB Class B |
4,414 | 68,528 | ||||||
|
|
|
|||||||
| Total Sweden |
|
404,191 | ||||||
| Switzerland – 9.1% |
| |||||||
| Adecco Group AG Registered Shares |
2,807 | 149,722 | ||||||
| Julius Baer Group Ltd.* |
3,383 | 136,658 | ||||||
| Nestle S.A. Registered Shares |
2,187 | 208,401 | ||||||
| Novartis AG Registered Shares |
2,512 | 241,590 | ||||||
| Roche Holding AG Genusschein |
857 | 236,086 | ||||||
| SGS S.A. Registered Shares |
62 | 154,269 | ||||||
| Sonova Holding AG Registered Shares |
909 | 179,810 | ||||||
| Swiss Life Holding AG Registered Shares* |
377 | 165,995 | ||||||
| Swisscom AG Registered Shares |
271 | 132,520 | ||||||
| Zurich Insurance Group AG |
586 | 193,941 | ||||||
|
|
|
|||||||
| Total Switzerland |
|
1,798,992 | ||||||
| United Kingdom – 22.0% |
| |||||||
| Admiral Group PLC |
3,876 | 109,598 | ||||||
| Anglo American PLC |
3,298 | 88,248 | ||||||
| Auto Trader Group PLC(a) |
13,561 | 92,170 | ||||||
| Aviva PLC |
22,847 | 122,775 | ||||||
| Barratt Developments PLC |
19,489 | 152,168 | ||||||
| Berkeley Group Holdings PLC |
3,133 | 150,602 | ||||||
| BP PLC |
21,833 | 158,890 | ||||||
| BT Group PLC |
15,074 | 43,792 | ||||||
See Notes to Financial Statements.
| WisdomTree Trust | 53 |
Schedule of Investments (continued)
WisdomTree International Multifactor Fund (DWMF)
March 31, 2019
| Investments | Shares | Value | ||||||
| Carnival PLC |
2,707 | $ | 132,805 | |||||
| Coca-Cola European Partners PLC |
2,679 | 138,611 | ||||||
| Compass Group PLC |
8,078 | 189,942 | ||||||
| Diageo PLC |
3,440 | 140,661 | ||||||
| Direct Line Insurance Group PLC |
26,518 | 121,977 | ||||||
| Fiat Chrysler Automobiles N.V.* |
8,027 | 119,622 | ||||||
| GlaxoSmithKline PLC |
7,085 | 147,418 | ||||||
| HSBC Holdings PLC |
14,089 | 114,430 | ||||||
| InterContinental Hotels Group PLC |
2,962 | 178,122 | ||||||
| International Consolidated Airlines Group S.A. |
9,206 | 61,319 | ||||||
| Investec PLC |
10,688 | 61,599 | ||||||
| ITV PLC |
22,591 | 37,415 | ||||||
| Legal & General Group PLC |
40,095 | 143,833 | ||||||
| Lloyds Banking Group PLC |
165,281 | 133,831 | ||||||
| London Stock Exchange Group PLC |
1,379 | 85,371 | ||||||
| Marks & Spencer Group PLC |
43,074 | 156,540 | ||||||
| Merlin Entertainments PLC(a) |
30,449 | 136,210 | ||||||
| Pearson PLC |
6,351 | 69,201 | ||||||
| Persimmon PLC |
5,066 | 143,247 | ||||||
| Investments | Shares | Value | ||||||
| RELX PLC |
4,019 | $ | 85,965 | |||||
| Rio Tinto PLC |
2,030 | 118,002 | ||||||
| Royal Dutch Shell PLC Class A |
5,329 | 167,592 | ||||||
| Schroders PLC |
2,783 | 97,985 | ||||||
| Segro PLC |
4,894 | 42,944 | ||||||
| Smith & Nephew PLC |
4,717 | 93,611 | ||||||
| Taylor Wimpey PLC |
56,671 | 129,561 | ||||||
| Tesco PLC |
28,964 | 87,598 | ||||||
| Unilever N.V. CVA |
2,485 | 144,481 | ||||||
| Unilever PLC |
2,616 | 149,816 | ||||||
|
|
|
|||||||
| Total United Kingdom |
|
4,347,952 | ||||||
| TOTAL INVESTMENTS IN SECURITIES – 99.5% (Cost: $18,931,952) |
|
19,681,648 | ||||||
| Other Assets less Liabilities – 0.5% |
|
96,479 | ||||||
|
|
|
|||||||
| NET ASSETS – 100.0% |
|
$ | 19,778,127 | |||||
| * | Non-income producing security. |
| (a) | This security is exempt from registration under rule 144A of the Securities Act of 1933. This security may be sold in transactions that are exempt from registration, normally to qualified institutional buyers. |
CVA – Certificaten Van Aandelen (Certificate of Stock)
| FINANCIAL DERIVATIVE INSTRUMENTS | ||||||||||||||||||||||||||||
| FOREIGN CURRENCY CONTRACTS (OTC – OVER THE COUNTER) | ||||||||||||||||||||||||||||
| Counterparty | Settlement Date |
Amount and Description of Currency to be Purchased |
Amount and be Sold |
Unrealized Appreciation |
Unrealized Depreciation |
|||||||||||||||||||||||
| Bank of America N.A. |
4/10/2019 | 90,995 | USD | 10,132,338 | JPY | $ | – | $ | (606 | ) | ||||||||||||||||||
| Barclays Bank PLC |
4/10/2019 | 56,389 | DKK | 8,555 | USD | – | (68 | ) | ||||||||||||||||||||
| Barclays Bank PLC |
4/10/2019 | 45,249 | SGD | 33,382 | USD | 30 | – | |||||||||||||||||||||
| Barclays Bank PLC |
4/10/2019 | 64,693 | USD | 234,124 | ILS | 148 | – | |||||||||||||||||||||
| Citibank N.A. |
4/10/2019 | 218,040 | AUD | 153,997 | USD | 914 | – | |||||||||||||||||||||
| Citibank N.A. |
4/10/2019 | 220,894 | CHF | 220,402 | USD | 1,571 | – | |||||||||||||||||||||
| Citibank N.A. |
4/10/2019 | 168,917 | DKK | 25,642 | USD | – | (218 | ) | ||||||||||||||||||||
| Citibank N.A. |
4/10/2019 | 435,360 | EUR | 493,131 | USD | – | (3,954 | ) | ||||||||||||||||||||
| Citibank N.A. |
4/10/2019 | 223,384 | GBP | 297,075 | USD | – | (5,875 | ) | ||||||||||||||||||||
| Citibank N.A. |
4/10/2019 | 27,380 | ILS | 7,604 | USD | – | (56 | ) | ||||||||||||||||||||
| Citibank N.A. |
4/10/2019 | 15,680 | ILS | 4,358 | USD | – | (35 | ) | ||||||||||||||||||||
| Citibank N.A. |
4/10/2019 | 62,866,012 | JPY | 563,799 | USD | 4,536 | – | |||||||||||||||||||||
| Citibank N.A. |
4/10/2019 | 199,036 | NOK | 23,217 | USD | – | (97 | ) | ||||||||||||||||||||
| Citibank N.A. |
4/10/2019 | 396,334 | SEK | 42,626 | USD | 129 | – | |||||||||||||||||||||
| Citibank N.A. |
4/10/2019 | 621,116 | SEK | 66,736 | USD | 268 | – | |||||||||||||||||||||
| Citibank N.A. |
4/10/2019 | 29,853 | SGD | 22,026 | USD | 17 | – | |||||||||||||||||||||
| Citibank N.A. |
4/10/2019 | 2,253,457 | USD | 3,199,047 | AUD | – | (19,381 | ) | ||||||||||||||||||||
| Citibank N.A. |
4/10/2019 | 3,713,351 | USD | 3,297,954 | EUR | 7,724 | – | |||||||||||||||||||||
| Citibank N.A. |
4/10/2019 | 4,428,694 | USD | 490,213,467 | JPY | – | (3,040 | ) | ||||||||||||||||||||
| Goldman Sachs |
4/10/2019 | 1,630,528 | AUD | 1,149,638 | USD | 8,809 | – | |||||||||||||||||||||
| Goldman Sachs |
4/10/2019 | 137,637 | NOK | 16,042 | USD | – | (54 | ) | ||||||||||||||||||||
| Goldman Sachs |
4/10/2019 | 977,766 | USD | 980,391 | CHF | – | (7,417 | ) | ||||||||||||||||||||
| Goldman Sachs |
4/10/2019 | 2,148,968 | USD | 1,642,691 | GBP | 7,580 | – | |||||||||||||||||||||
| Goldman Sachs |
4/10/2019 | 199,959 | USD | 1,756,374 | NOK | – | (4,063 | ) | ||||||||||||||||||||
| Goldman Sachs |
4/10/2019 | 400,243 | USD | 3,780,805 | SEK | – | (7,619 | ) | ||||||||||||||||||||
| Goldman Sachs |
4/10/2019 | 205,840 | USD | 279,468 | SGD | – | (516 | ) | ||||||||||||||||||||
| HSBC Holdings PLC |
4/10/2019 | 893,933 | USD | 898,568 | CHF | – | (9,027 | ) | ||||||||||||||||||||
| Morgan Stanley & Co. International |
4/10/2019 | 259,890 | USD | 229,585 | EUR | 1,925 | – | |||||||||||||||||||||
| UBS AG |
4/10/2019 | 282,158 | USD | 397,975 | AUD | – | (593 | ) | ||||||||||||||||||||
| UBS AG |
4/10/2019 | 111,931 | USD | 112,184 | CHF | – | (802 | ) | ||||||||||||||||||||
See Notes to Financial Statements.
| 54 | WisdomTree Trust |
Schedule of Investments (concluded)
WisdomTree International Multifactor Fund (DWMF)
March 31, 2019
| Counterparty | Settlement Date |
Amount and Description of Currency to be Purchased |
Amount and be Sold |
Unrealized Appreciation |
Unrealized Depreciation |
|||||||||||||||||||||||
| UBS AG |
4/10/2019 | 212,701 | USD | 1,409,129 | DKK | $ | 606 | $ | – | |||||||||||||||||||
| UBS AG |
4/10/2019 | 26,633 | USD | 175,303 | DKK | 247 | – | |||||||||||||||||||||
| UBS AG |
4/10/2019 | 464,954 | USD | 410,208 | EUR | 4,038 | – | |||||||||||||||||||||
| UBS AG |
4/10/2019 | 269,075 | USD | 203,159 | GBP | 4,240 | – | |||||||||||||||||||||
| UBS AG |
4/10/2019 | 255,646 | USD | 193,066 | GBP | 3,968 | – | |||||||||||||||||||||
| UBS AG |
4/10/2019 | 8,100 | USD | 29,117 | ILS | 73 | – | |||||||||||||||||||||
| UBS AG |
4/10/2019 | 554,523 | USD | 61,548,614 | JPY | – | (1,902 | ) | ||||||||||||||||||||
| UBS AG |
4/10/2019 | 25,037 | USD | 214,603 | NOK | 109 | – | |||||||||||||||||||||
| UBS AG |
4/10/2019 | 50,115 | USD | 465,263 | SEK | – | (76 | ) | ||||||||||||||||||||
| UBS AG |
4/10/2019 | 25,773 | USD | 34,871 | SGD | 25 | – | |||||||||||||||||||||
| $ | 46,957 | $ | (65,399 | ) | ||||||||||||||||||||||||
| CURRENCY LEGEND | ||
| AUD | Australian dollar | |
| CHF | Swiss franc | |
| DKK | Danish krone | |
| EUR | Euro | |
| GBP | British pound | |
| ILS | Israeli new shekel | |
| JPY | Japanese yen | |
| NOK | Norwegian krone | |
| SEK | Swedish krona | |
| SGD | Singapore dollar | |
| USD | U.S. dollar | |
See Notes to Financial Statements.
| WisdomTree Trust | 55 |
Schedule of Investments
WisdomTree International Quality Dividend Growth Fund (IQDG)
March 31, 2019
| Investments | Shares | Value | ||||||
| COMMON STOCKS – 99.5% | ||||||||
| Australia – 6.5% | ||||||||
| Altium Ltd. |
2,592 | $ | 59,508 | |||||
| ARB Corp., Ltd.(a) |
2,590 | 31,645 | ||||||
| Aristocrat Leisure Ltd. |
10,276 | 178,912 | ||||||
| Blackmores Ltd.(a) |
508 | 33,607 | ||||||
| Caltex Australia Ltd. |
20,630 | 384,095 | ||||||
| carsales.com Ltd. |
13,239 | 118,965 | ||||||
| Cochlear Ltd. |
1,659 | 204,205 | ||||||
| Computershare Ltd. |
23,396 | 283,858 | ||||||
| Corporate Travel Management Ltd.(a) |
1,862 | 33,675 | ||||||
| Costa Group Holdings Ltd. |
1,812 | 6,616 | ||||||
| Crown Resorts Ltd. |
41,972 | 343,168 | ||||||
| CSL Ltd. |
9,637 | 1,334,489 | ||||||
| Domino’s Pizza Enterprises Ltd.(a) |
2,009 | 61,964 | ||||||
| Flight Centre Travel Group Ltd. |
2,264 | 67,626 | ||||||
| Inghams Group Ltd.(a) |
40,834 | 126,758 | ||||||
| Magellan Financial Group Ltd. |
13,727 | 355,228 | ||||||
| McMillan Shakespeare Ltd. |
6,623 | 56,456 | ||||||
| Mineral Resources Ltd. |
14,167 | 159,004 | ||||||
| Northern Star Resources Ltd. |
19,990 | 127,089 | ||||||
| Pendal Group Ltd. |
31,259 | 205,395 | ||||||
| Platinum Asset Management Ltd.(a) |
54,114 | 176,439 | ||||||
| Reece Ltd. |
12,264 | 85,898 | ||||||
| Seek Ltd. |
10,813 | 134,725 | ||||||
| Technology One Ltd. |
13,373 | 75,996 | ||||||
| Webjet Ltd. |
2,875 | 29,715 | ||||||
|
|
|
|||||||
| Total Australia |
|
4,675,036 | ||||||
| Austria – 0.4% | ||||||||
| Lenzing AG |
2,772 | 297,248 | ||||||
| Belgium – 0.6% | ||||||||
| Kinepolis Group N.V. |
869 | 49,178 | ||||||
| Melexis N.V.(a) |
1,973 | 119,520 | ||||||
| Warehouses De Pauw CVA |
1,656 | 265,900 | ||||||
|
|
|
|||||||
| Total Belgium |
|
434,598 | ||||||
| China – 3.7% | ||||||||
| Beijing Tong Ren Tang Chinese Medicine Co., Ltd. |
18,000 | 32,973 | ||||||
| China Everbright International Ltd. |
146,074 | 148,494 | ||||||
| China Overseas Land & Investment Ltd. |
594,000 | 2,254,944 | ||||||
| China South City Holdings Ltd. |
650,000 | 104,332 | ||||||
| CSPC Pharmaceutical Group Ltd. |
70,000 | 130,192 | ||||||
|
|
|
|||||||
| Total China |
|
2,670,935 | ||||||
| Denmark – 10.4% | ||||||||
| Ambu A/S Class B |
745 | 19,733 | ||||||
| Chr Hansen Holding A/S |
2,541 | 257,821 | ||||||
| Coloplast A/S Class B |
9,435 | 1,036,216 | ||||||
| DFDS A/S |
2,669 | 110,555 | ||||||
| DSV A/S |
1,119 | 92,635 | ||||||
| GN Store Nord A/S |
1,430 | 66,460 | ||||||
| Novo Nordisk A/S Class B |
102,422 | 5,367,078 | ||||||
| Pandora A/S |
4,936 | 231,334 | ||||||
| Rockwool International A/S Class B |
42 | 9,848 | ||||||
| Royal Unibrew A/S |
2,012 | 148,585 | ||||||
| SimCorp A/S |
894 | 86,393 | ||||||
|
|
|
|||||||
| Total Denmark |
|
7,426,658 | ||||||
| Finland – 2.1% | ||||||||
| DNA Oyj |
8,023 | 166,480 | ||||||
| Neste Oyj |
6,444 | 687,386 | ||||||
| Nokian Renkaat Oyj |
8,259 | 276,725 | ||||||
| Wartsila Oyj Abp |
21,881 | 353,426 | ||||||
|
|
|
|||||||
| Total Finland |
|
1,484,017 | ||||||
| France – 7.0% | ||||||||
| Airbus SE |
16,970 | 2,246,556 | ||||||
| Alten S.A. |
714 | 76,484 | ||||||
| Eurazeo SE |
2,864 | 215,461 | ||||||
| Hermes International |
1,025 | 676,972 | ||||||
| Ipsen S.A. |
1,291 | 177,141 | ||||||
| Safran S.A. |
9,723 | 1,334,661 | ||||||
| SEB S.A. |
917 | 154,448 | ||||||
| Trigano S.A. |
50 | 3,902 | ||||||
| Valeo S.A. |
4,524 | 131,312 | ||||||
|
|
|
|||||||
| Total France |
|
5,016,937 | ||||||
| Germany – 4.7% | ||||||||
| 1&1 Drillisch AG |
8,613 | 306,961 | ||||||
| adidas AG |
3,471 | 844,179 | ||||||
| AURELIUS Equity Opportunities SE & Co. KGaA |
5,733 | 261,226 | ||||||
| Bechtle AG |
1,089 | 100,941 | ||||||
| CompuGroup Medical SE |
1,124 | 66,259 | ||||||
| Continental AG |
4,464 | 672,664 | ||||||
| CTS Eventim AG & Co. KGaA |
1,906 | 90,400 | ||||||
| Fielmann AG |
2,564 | 177,058 | ||||||
| Fuchs Petrolub SE |
3,013 | 118,748 | ||||||
| Hugo Boss AG |
3,233 | 221,005 | ||||||
| Nemetschek SE |
560 | 95,577 | ||||||
| Pfeiffer Vacuum Technology AG |
306 | 46,866 | ||||||
| Siltronic AG |
1,110 | 98,014 | ||||||
| United Internet AG Registered Shares |
6,756 | 246,772 | ||||||
| Wirecard AG |
203 | 25,461 | ||||||
|
|
|
|||||||
| Total Germany |
|
3,372,131 | ||||||
| Hong Kong – 1.1% | ||||||||
| Galaxy Entertainment Group Ltd. |
64,000 | 435,773 | ||||||
| Techtronic Industries Co., Ltd. |
34,500 | 231,833 | ||||||
| Vitasoy International Holdings Ltd. |
26,000 | 125,861 | ||||||
|
|
|
|||||||
| Total Hong Kong |
|
793,467 | ||||||
| Ireland – 0.5% | ||||||||
| Glanbia PLC |
9,066 | 177,535 | ||||||
| Hibernia REIT PLC |
12,808 | 19,214 | ||||||
| Irish Continental Group PLC |
7,270 | 39,673 | ||||||
| Kingspan Group PLC |
2,511 | 116,331 | ||||||
|
|
|
|||||||
| Total Ireland |
|
352,753 | ||||||
| Israel – 0.5% | ||||||||
| Bezeq Israeli Telecommunication Corp., Ltd. |
511,906 | 367,425 | ||||||
See Notes to Financial Statements.
| 56 | WisdomTree Trust |
Schedule of Investments (continued)
WisdomTree International Quality Dividend Growth Fund (IQDG)
March 31, 2019
| Investments | Shares | Value | ||||||
| Italy – 2.0% | ||||||||
| Brembo SpA |
9,161 | $ | 103,996 | |||||
| Datalogic SpA |
845 | 19,735 | ||||||
| De’ Longhi SpA |
7,828 | 211,479 | ||||||
| DiaSorin SpA |
986 | 99,310 | ||||||
| Ferrari N.V. |
1,428 | 191,610 | ||||||
| Gima TT SpA(b) |
324 | 2,592 | ||||||
| IMA Industria Macchine Automatiche SpA |
1,225 | 91,539 | ||||||
| Interpump Group SpA |
1,849 | 60,374 | ||||||
| Moncler SpA |
2,261 | 91,192 | ||||||
| Recordati SpA |
10,611 | 413,554 | ||||||
| Reply SpA |
512 | 32,999 | ||||||
| Salvatore Ferragamo SpA |
3,482 | 74,755 | ||||||
| Technogym SpA(b) |
3,088 | 38,037 | ||||||
|
|
|
|||||||
| Total Italy |
|
1,431,172 | ||||||
| Japan – 16.2% | ||||||||
| Ai Holdings Corp. |
1,600 | 26,439 | ||||||
| Asahi Intecc Co., Ltd. |
900 | 42,282 | ||||||
| Astellas Pharma, Inc. |
83,100 | 1,245,167 | ||||||
| Benefit One, Inc. |
2,900 | 56,907 | ||||||
| Calbee, Inc. |
3,000 | 80,824 | ||||||
| Chugai Pharmaceutical Co., Ltd. |
11,400 | 783,792 | ||||||
| Create SD Holdings Co., Ltd. |
1,700 | 39,979 | ||||||
| CyberAgent, Inc. |
800 | 32,633 | ||||||
| Daikin Industries Ltd. |
4,800 | 562,461 | ||||||
| Dip Corp.(a) |
1,100 | 19,002 | ||||||
| Disco Corp. |
1,500 | 213,715 | ||||||
| Elecom Co., Ltd. |
1,800 | 55,536 | ||||||
| Financial Products Group Co., Ltd. |
4,400 | 36,056 | ||||||
| Funai Soken Holdings, Inc. |
1,000 | 24,059 | ||||||
| GMO Payment Gateway, Inc. |
700 | 49,709 | ||||||
| Harmonic Drive Systems, Inc.(a) |
1,100 | 37,665 | ||||||
| Haseko Corp. |
14,100 | 177,325 | ||||||
| Hazama Ando Corp. |
8,900 | 59,583 | ||||||
| Hikari Tsushin, Inc. |
900 | 170,511 | ||||||
| Hoya Corp. |
9,000 | 594,308 | ||||||
| Japan Lifeline Co., Ltd.(a) |
2,400 | 39,637 | ||||||
| Japan Material Co., Ltd. |
700 | 8,576 | ||||||
| Kakaku.com, Inc. |
5,300 | 101,849 | ||||||
| Kaken Pharmaceutical Co., Ltd. |
3,100 | 140,877 | ||||||
| Keyence Corp. |
300 | 186,936 | ||||||
| Koito Manufacturing Co., Ltd. |
2,400 | 135,953 | ||||||
| Kotobuki Spirits Co., Ltd. |
100 | 3,831 | ||||||
| Kyudenko Corp. |
2,100 | 65,836 | ||||||
| Lasertec Corp. |
1,300 | 54,321 | ||||||
| M3, Inc. |
3,100 | 52,010 | ||||||
| Meitec Corp. |
1,900 | 86,344 | ||||||
| Mixi, Inc. |
7,000 | 161,774 | ||||||
| Modec, Inc. |
1,900 | 54,072 | ||||||
| MonotaRO Co., Ltd.(a) |
2,100 | 46,692 | ||||||
| Murata Manufacturing Co., Ltd. |
19,200 | 956,140 | ||||||
| Nidec Corp. |
2,600 | 329,448 | ||||||
| Nihon M&A Center, Inc. |
1,700 | 46,538 | ||||||
| Nissan Chemical Corp. |
3,800 | 174,062 | ||||||
| Nitto Denko Corp. |
6,800 | 357,248 | ||||||
| Obara Group, Inc. |
300 | 9,934 | ||||||
| Open House Co., Ltd.(a) |
1,100 | 37,715 | ||||||
| Oracle Corp. |
3,400 | 228,233 | ||||||
| Oriental Land Co., Ltd. |
1,500 | 170,348 | ||||||
| Park24 Co., Ltd. |
5,100 | 110,722 | ||||||
| Pigeon Corp. |
3,100 | 126,734 | ||||||
| Pilot Corp. |
100 | 4,052 | ||||||
| Relo Group, Inc. |
3,100 | 87,103 | ||||||
| Ryohin Keikaku Co., Ltd. |
200 | 50,666 | ||||||
| Seria Co., Ltd.(a) |
500 | 17,234 | ||||||
| Shimano, Inc. |
1,100 | 178,886 | ||||||
| Sundrug Co., Ltd. |
3,100 | 85,423 | ||||||
| Sysmex Corp. |
2,300 | 139,016 | ||||||
| Systena Corp. |
2,000 | 21,719 | ||||||
| T-Gaia Corp. |
2,400 | 39,810 | ||||||
| TechnoPro Holdings, Inc. |
1,000 | 59,629 | ||||||
| Toei Animation Co., Ltd. |
900 | 44,396 | ||||||
| Tokyo Electron Ltd. |
10,800 | 1,561,187 | ||||||
| Trend Micro, Inc. |
6,400 | 311,659 | ||||||
| United Arrows Ltd. |
1,100 | 38,311 | ||||||
| USS Co., Ltd. |
9,400 | 174,437 | ||||||
| Yahoo Japan Corp. |
245,000 | 599,855 | ||||||
| Yaskawa Electric Corp.(a) |
5,500 | 172,675 | ||||||
| ZOZO, Inc.(a) |
1,900 | 35,808 | ||||||
|
|
|
|||||||
| Total Japan |
|
11,615,649 | ||||||
| Netherlands – 2.4% | ||||||||
| ASM International N.V. |
1,960 | 106,298 | ||||||
| ASML Holding N.V. |
6,423 | 1,205,857 | ||||||
| BE Semiconductor Industries N.V. |
12,537 | 333,911 | ||||||
| Corbion N.V. |
2,332 | 70,175 | ||||||
|
|
|
|||||||
| Total Netherlands |
|
1,716,241 | ||||||
| New Zealand – 0.9% | ||||||||
| Fisher & Paykel Healthcare Corp., Ltd. |
18,933 | 202,723 | ||||||
| Mainfreight Ltd. |
3,181 | 77,775 | ||||||
| Ryman Healthcare Ltd. |
17,980 | 150,214 | ||||||
| Z Energy Ltd. |
41,079 | 175,379 | ||||||
|
|
|
|||||||
| Total New Zealand |
|
606,091 | ||||||
| Norway – 1.9% | ||||||||
| Borregaard ASA |
4,879 | 48,441 | ||||||
| Entra ASA(b) |
9,740 | 147,261 | ||||||
| Grieg Seafood ASA |
8,157 | 99,078 | ||||||
| Leroy Seafood Group ASA |
32,225 | 234,102 | ||||||
| Salmar ASA |
11,791 | 566,575 | ||||||
| Tomra Systems ASA |
3,007 | 89,739 | ||||||
| Veidekke ASA |
11,720 | 123,167 | ||||||
| XXL ASA(a)(b) |
2,353 | 7,787 | ||||||
|
|
|
|||||||
| Total Norway |
|
1,316,150 | ||||||
| Portugal – 0.1% | ||||||||
| Altri, SGPS, S.A. |
8,815 | 69,087 | ||||||
See Notes to Financial Statements.
| WisdomTree Trust | 57 |
Schedule of Investments (continued)
WisdomTree International Quality Dividend Growth Fund (IQDG)
March 31, 2019
| Investments | Shares | Value | ||||||
| Singapore – 0.7% | ||||||||
| First Resources Ltd. |
81,900 | $ | 99,163 | |||||
| Sheng Siong Group Ltd. |
101,400 | 77,856 | ||||||
| SIA Engineering Co., Ltd. |
60,200 | 109,333 | ||||||
| Venture Corp., Ltd. |
17,200 | 227,810 | ||||||
|
|
|
|||||||
| Total Singapore |
|
514,162 | ||||||
| Spain – 4.3% | ||||||||
| Cie Automotive S.A. |
3,590 | 96,664 | ||||||
| Industria de Diseno Textil S.A. |
85,673 | 2,520,386 | ||||||
| Prosegur Cash S.A.(b) |
47,377 | 104,692 | ||||||
| Prosegur Cia de Seguridad S.A. |
17,917 | 97,170 | ||||||
| Zardoya Otis S.A. |
28,959 | 239,973 | ||||||
|
|
|
|||||||
| Total Spain |
|
3,058,885 | ||||||
| Sweden – 5.8% | ||||||||
| AddTech AB Class B |
2,282 | 47,484 | ||||||
| Atlas Copco AB Class A |
33,911 | 912,734 | ||||||
| Atlas Copco AB Class B |
13,693 | 339,693 | ||||||
| Beijer Ref AB |
2,334 | 37,620 | ||||||
| Bonava AB Class B |
5,728 | 72,192 | ||||||
| Electrolux AB Series B |
14,612 | 376,355 | ||||||
| Evolution Gaming Group AB(b) |
877 | 69,259 | ||||||
| Fagerhult AB(a) |
2,774 | 21,354 | ||||||
| Hexpol AB |
11,496 | 96,861 | ||||||
| Indutrade AB |
3,897 | 111,171 | ||||||
| Intrum AB(a) |
8,734 | 251,418 | ||||||
| Investment AB Latour Class B(a) |
20,004 | 268,509 | ||||||
| JM AB |
6,368 | 114,380 | ||||||
| Lifco AB Class B |
1,761 | 71,956 | ||||||
| Loomis AB Class B |
2,894 | 99,844 | ||||||
| Mycronic AB |
5,104 | 72,912 | ||||||
| NetEnt AB* |
17,241 | 62,735 | ||||||
| Nobia AB |
8,260 | 48,534 | ||||||
| Nolato AB Class B |
50 | 2,083 | ||||||
| Paradox Interactive AB |
982 | 15,246 | ||||||
| Peab AB |
23,333 | 202,129 | ||||||
| Sandvik AB |
43,092 | 701,529 | ||||||
| Sweco AB Class B |
4,055 | 97,929 | ||||||
| Thule Group AB(b) |
2,233 | 50,557 | ||||||
| Vitrolife AB |
1,454 | 33,178 | ||||||
|
|
|
|||||||
| Total Sweden |
|
4,177,662 | ||||||
| Switzerland – 6.6% | ||||||||
| Bucher Industries AG Registered Shares |
367 | 122,714 | ||||||
| EMS-Chemie Holding AG Registered Shares |
1,181 | 640,366 | ||||||
| Kuehne + Nagel International AG Registered Shares |
6,864 | 941,482 | ||||||
| Logitech International S.A. Registered Shares |
4,429 | 173,576 | ||||||
| Oriflame Holding AG |
2,136 | 41,107 | ||||||
| Partners Group Holding AG |
1,347 | 979,243 | ||||||
| SGS S.A. Registered Shares |
321 | 798,713 | ||||||
| Sonova Holding AG Registered Shares |
1,936 | 382,962 | ||||||
| Straumann Holding AG Registered Shares |
211 | 172,143 | ||||||
| Sunrise Communications Group AG*(b) |
4,474 | 329,294 | ||||||
| Temenos AG Registered Shares* |
635 | 93,602 | ||||||
| Ypsomed Holding AG Registered Shares* |
259 | 33,158 | ||||||
|
|
|
|||||||
| Total Switzerland |
|
4,708,360 | ||||||
| United Kingdom – 21.1% | ||||||||
| Abcam PLC |
2,391 | 35,362 | ||||||
| Ashtead Group PLC |
9,041 | 218,241 | ||||||
| Barratt Developments PLC |
88,378 | 690,045 | ||||||
| Bellway PLC |
5,974 | 237,036 | ||||||
| Bovis Homes Group PLC |
6,238 | 86,446 | ||||||
| British American Tobacco PLC |
83,778 | 3,486,793 | ||||||
| Cineworld Group PLC |
28,179 | 107,439 | ||||||
| Compass Group PLC |
39,910 | 938,426 | ||||||
| Computacenter PLC |
3,946 | 56,869 | ||||||
| Cranswick PLC |
1,360 | 48,238 | ||||||
| Croda International PLC |
4,238 | 278,215 | ||||||
| Diageo PLC |
109,461 | 4,475,830 | ||||||
| Diploma PLC |
3,185 | 60,510 | ||||||
| Domino’s Pizza Group PLC |
5,344 | 16,852 | ||||||
| Dunelm Group PLC |
13,055 | 147,913 | ||||||
| easyJet PLC |
10,385 | 151,222 | ||||||
| Electrocomponents PLC |
13,821 | 101,177 | ||||||
| FDM Group Holdings PLC |
4,458 | 52,223 | ||||||
| Fevertree Drinks PLC |
559 | 21,990 | ||||||
| Games Workshop Group PLC |
1,567 | 64,217 | ||||||
| Greggs PLC |
3,305 | 79,198 | ||||||
| Hargreaves Lansdown PLC |
12,671 | 307,682 | ||||||
| Hill & Smith Holdings PLC |
2,813 | 45,562 | ||||||
| HomeServe PLC |
7,433 | 99,277 | ||||||
| Howden Joinery Group PLC |
17,701 | 111,936 | ||||||
| IMI PLC |
14,119 | 176,251 | ||||||
| Jardine Lloyd Thompson Group PLC |
10,320 | 257,385 | ||||||
| JD Sports Fashion PLC |
6,185 | 40,506 | ||||||
| Marshalls PLC |
13,834 | 111,493 | ||||||
| Moneysupermarket.com Group PLC |
31,918 | 154,759 | ||||||
| Next PLC |
4,338 | 315,417 | ||||||
| NMC Health PLC |
740 | 22,024 | ||||||
| Pagegroup PLC |
22,406 | 137,222 | ||||||
| Redrow PLC |
15,091 | 118,183 | ||||||
| RELX PLC |
37,986 | 812,504 | ||||||
| Renishaw PLC |
752 | 36,315 | ||||||
| Rentokil Initial PLC |
29,152 | 134,206 | ||||||
| Rightmove PLC |
17,093 | 113,592 | ||||||
| Rotork PLC |
21,899 | 80,698 | ||||||
| RWS Holdings PLC |
6,183 | 38,834 | ||||||
| Softcat PLC |
4,204 | 45,468 | ||||||
| Spirax-Sarco Engineering PLC |
1,666 | 156,086 | ||||||
| Synthomer PLC |
14,932 | 73,820 | ||||||
| Ted Baker PLC |
1,714 | 34,797 | ||||||
| Unite Group PLC (The) |
12,193 | 145,773 | ||||||
| Victrex PLC |
3,223 | 90,546 | ||||||
| WH Smith PLC |
3,687 | 101,948 | ||||||
|
|
|
|||||||
| Total United Kingdom |
|
15,116,526 | ||||||
| TOTAL COMMON STOCKS (Cost: $72,876,006) |
71,221,190 | |||||||
See Notes to Financial Statements.
| 58 | WisdomTree Trust |
Schedule of Investments (concluded)
WisdomTree International Quality Dividend Growth Fund (IQDG)
March 31, 2019
| Investments | Shares | Value | ||||||
| INVESTMENT OF CASH COLLATERAL FOR SECURITIES LOANED – 1.2% | ||||||||
| United States – 1.2% | ||||||||
| State Street Navigator Securities Lending Government Money Market Portfolio, 2.46%(c) |
||||||||
| (Cost: $851,521)(d) | 851,521 | $ | 851,521 | |||||
| TOTAL INVESTMENTS IN SECURITIES – 100.7% (Cost: $73,727,527) |
72,072,711 | |||||||
| Other Assets less Liabilities – (0.7)% |
|
(531,621 | ) | |||||
|
|
|
|||||||
| NET ASSETS – 100.0% |
|
$ | 71,541,090 | |||||
| * | Non-income producing security. |
| (a) | Security, or portion thereof, was on loan at March 31, 2019 (See Note 2). |
| (b) | This security is exempt from registration under rule 144A of the Securities Act of 1933. This security may be sold in transactions that are exempt from registration, normally to qualified institutional buyers. |
| (c) | Rate shown represents annualized 7-day yield as of March 31, 2019. |
| (d) | At March 31, 2019, the total market value of the Fund’s securities on loan identified in the Schedule of Investments was $1,132,980. The total market value of the collateral held by the Fund was $1,199,530. The total market value of the collateral includes non-cash U.S. Government securities collateral having a value of $348,009. |
CVA – Certificaten Van Aandelen (Certificate of Stock)
| FINANCIAL DERIVATIVE INSTRUMENTS | ||||||||||||||||||||||||||||
| FOREIGN CURRENCY CONTRACTS (OTC — OVER THE COUNTER) | ||||||||||||||||||||||||||||
| Counterparty | Settlement Date |
Amount and Description of Currency to be Purchased |
Amount and Description of Currency to be Sold |
Unrealized Appreciation |
Unrealized Depreciation |
|||||||||||||||||||||||
| Citibank N.A. |
4/2/2019 | 56,474 | DKK | 8,486 | USD | $ | 8 | $ | — | |||||||||||||||||||
| Citibank N.A. |
4/2/2019 | 11,789 | GBP | 15,325 | USD | 36 | — | |||||||||||||||||||||
| Goldman Sachs |
4/2/2019 | 3,064,467 | JPY | 27,656 | USD | 30 | — | |||||||||||||||||||||
| Societe Generale |
4/2/2019 | 8,024 | EUR | 9,001 | USD | 9 | — | |||||||||||||||||||||
| $ | 83 | $ | — | |||||||||||||||||||||||||
| CURRENCY LEGEND | ||
| DKK | Danish krone | |
| EUR | Euro | |
| GBP | British pound | |
| JPY | Japanese yen | |
| USD | U.S. dollar | |
See Notes to Financial Statements.
| WisdomTree Trust | 59 |
Schedule of Investments
WisdomTree International SmallCap Dividend Fund (DLS)
March 31, 2019
| Investments | Shares | Value | ||||||
| COMMON STOCKS – 98.6% | ||||||||
| Australia – 10.3% | ||||||||
| A2B Australia Ltd.(a) |
161,969 | $ | 241,615 | |||||
| Accent Group Ltd. |
2,552,138 | 2,610,592 | ||||||
| ALS Ltd. |
482,169 | 2,599,641 | ||||||
| Altium Ltd. |
284,020 | 6,520,675 | ||||||
| AMA Group Ltd.(a) |
1,043,750 | 808,156 | ||||||
| Ansell Ltd. |
221,530 | 4,000,188 | ||||||
| AP Eagers Ltd. |
237,999 | 1,242,610 | ||||||
| ARB Corp., Ltd.(a) |
75,955 | 928,020 | ||||||
| ARQ Group Ltd. |
125,682 | 176,771 | ||||||
| AUB Group Ltd. |
91,452 | 850,365 | ||||||
| Austal Ltd. |
555,200 | 887,369 | ||||||
| Australian Pharmaceutical Industries Ltd. |
1,403,534 | 1,510,455 | ||||||
| Bapcor Ltd. |
264,106 | 1,035,594 | ||||||
| Beach Energy Ltd. |
3,344,197 | 4,893,633 | ||||||
| Bega Cheese Ltd.(a) |
193,909 | 629,487 | ||||||
| Blackmores Ltd.(a) |
21,416 | 1,416,773 | ||||||
| Breville Group Ltd. |
183,140 | 2,117,922 | ||||||
| Brickworks Ltd. |
181,208 | 2,229,449 | ||||||
| carsales.com Ltd. |
329,787 | 2,963,442 | ||||||
| Cedar Woods Properties Ltd. |
230,007 | 865,943 | ||||||
| Cleanaway Waste Management Ltd. |
2,710,619 | 4,274,583 | ||||||
| Collins Foods Ltd. |
261,103 | 1,346,545 | ||||||
| Corporate Travel Management Ltd.(a) |
124,013 | 2,242,838 | ||||||
| Costa Group Holdings Ltd. |
80,586 | 294,235 | ||||||
| CSR Ltd. |
1,399,344 | 3,300,159 | ||||||
| Dicker Data Ltd.(a) |
345,108 | 1,005,104 | ||||||
| DuluxGroup Ltd. |
573,660 | 3,015,495 | ||||||
| ERM Power Ltd. |
286,956 | 386,275 | ||||||
| Estia Health Ltd. |
609,368 | 1,164,405 | ||||||
| Event Hospitality and Entertainment Ltd. |
237,380 | 2,296,643 | ||||||
| G8 Education Ltd. |
1,959,934 | 4,218,484 | ||||||
| Genworth Mortgage Insurance Australia Ltd.(a) |
2,196,586 | 3,729,224 | ||||||
| GrainCorp Ltd. Class A |
363,229 | 2,368,621 | ||||||
| GUD Holdings Ltd. |
180,265 | 1,527,651 | ||||||
| GWA Group Ltd. |
588,039 | 1,328,329 | ||||||
| Healius Ltd. |
793,766 | 1,482,930 | ||||||
| HT&E Ltd.(a) |
60,824 | 73,883 | ||||||
| IDP Education Ltd. |
316,201 | 3,272,616 | ||||||
| Infomedia Ltd. |
904,143 | 979,443 | ||||||
| Inghams Group Ltd.(a) |
481,388 | 1,494,339 | ||||||
| Integrated Research Ltd.(a) |
97,260 | 179,630 | ||||||
| Invocare Ltd.(a) |
172,217 | 1,738,371 | ||||||
| IOOF Holdings Ltd.(a) |
505,420 | 2,197,233 | ||||||
| IPH Ltd. |
20,717 | 103,603 | ||||||
| IRESS Ltd. |
271,606 | 2,521,664 | ||||||
| IVE Group Ltd. |
482,565 | 747,282 | ||||||
| Japara Healthcare Ltd.(a) |
811,956 | 807,482 | ||||||
| JB Hi-Fi Ltd.(a) |
287,813 | 5,100,976 | ||||||
| Link Administration Holdings Ltd. |
487,582 | 2,556,091 | ||||||
| MACA Ltd. |
1,445,695 | 1,006,410 | ||||||
| McMillan Shakespeare Ltd.(a) |
178,373 | 1,520,487 | ||||||
| Metcash Ltd. |
1,277,976 | 2,405,697 | ||||||
| Mineral Resources Ltd. |
294,797 | 3,308,662 | ||||||
| Monadelphous Group Ltd.(a) |
192,599 | 2,373,700 | ||||||
| Monash IVF Group Ltd. |
964,430 | 729,613 | ||||||
| MYOB Group Ltd. |
1,192,732 | 2,821,366 | ||||||
| MyState Ltd. |
227,953 | 702,761 | ||||||
| Navigator Global Investments Ltd. |
838,515 | 1,852,437 | ||||||
| Navitas Ltd.(a) |
688,767 | 2,827,955 | ||||||
| New Hope Corp., Ltd. |
831,098 | 1,777,015 | ||||||
| NIB Holdings Ltd. |
697,735 | 2,597,132 | ||||||
| Nick Scali Ltd.(a) |
204,361 | 823,101 | ||||||
| Nine Entertainment Co. Holdings Ltd. |
2,754,252 | 3,345,585 | ||||||
| Northern Star Resources Ltd. |
607,710 | 3,863,596 | ||||||
| Nufarm Ltd. |
199,015 | 665,854 | ||||||
| OFX Group Ltd. |
435,042 | 516,083 | ||||||
| oOh!media Ltd. |
337,585 | 932,835 | ||||||
| OZ Minerals Ltd. |
461,701 | 3,476,474 | ||||||
| Peet Ltd. |
690,171 | 500,068 | ||||||
| Pendal Group Ltd. |
655,314 | 4,305,895 | ||||||
| Perpetual Ltd.(a) |
165,916 | 4,558,763 | ||||||
| Platinum Asset Management Ltd.(a) |
1,602,901 | 5,226,268 | ||||||
| Premier Investments Ltd. |
368,053 | 4,251,118 | ||||||
| Qube Holdings Ltd. |
1,155,906 | 2,299,073 | ||||||
| Regis Healthcare Ltd.(a) |
800,608 | 1,956,369 | ||||||
| Regis Resources Ltd. |
803,952 | 3,026,762 | ||||||
| Reject Shop Ltd. (The)(a) |
70,400 | 132,523 | ||||||
| Ruralco Holdings Ltd. |
455,408 | 1,413,691 | ||||||
| Sandfire Resources NL |
137,993 | 677,341 | ||||||
| SeaLink Travel Group Ltd. |
216,534 | 618,336 | ||||||
| Servcorp Ltd.(a) |
355,300 | 671,350 | ||||||
| SG Fleet Group Ltd. |
622,472 | 972,780 | ||||||
| Sigma Healthcare Ltd. |
3,465,895 | 1,292,549 | ||||||
| Sims Metal Management Ltd. |
214,746 | 1,633,755 | ||||||
| Southern Cross Media Group Ltd. |
1,717,711 | 1,427,606 | ||||||
| St Barbara Ltd. |
263,040 | 629,686 | ||||||
| Steadfast Group Ltd. |
833,372 | 1,876,595 | ||||||
| Super Retail Group Ltd. |
171,248 | 976,817 | ||||||
| Tassal Group Ltd. |
219,917 | 759,220 | ||||||
| Virtus Health Ltd. |
165,110 | 467,971 | ||||||
| WPP AUNZ Ltd. |
2,304,936 | 1,031,506 | ||||||
|
|
|
|||||||
| Total Australia | 172,535,639 | |||||||
| Austria – 0.7% | ||||||||
| Lenzing AG |
61,180 | 6,560,464 | ||||||
| Palfinger AG |
28,324 | 795,090 | ||||||
| Porr AG(a) |
40,067 | 896,185 | ||||||
| S IMMO AG |
134,514 | 2,751,931 | ||||||
|
|
|
|||||||
| Total Austria | 11,003,670 | |||||||
| Belgium – 1.5% | ||||||||
| Cofinimmo S.A. |
54,415 | 7,234,225 | ||||||
| D’ieteren S.A./N.V. |
80,154 | 3,177,032 | ||||||
| Econocom Group S.A./N.V.(a) |
321,586 | 1,312,211 | ||||||
| Fagron |
10,774 | 193,682 | ||||||
| Greenyard N.V.(a) |
77,460 | 290,500 | ||||||
| Kinepolis Group N.V. |
14,710 | 832,463 | ||||||
See Notes to Financial Statements.
| 60 | WisdomTree Trust |
Schedule of Investments (continued)
WisdomTree International SmallCap Dividend Fund (DLS)
March 31, 2019
| Investments | Shares | Value | ||||||
| Ontex Group N.V. |
117,642 | $ | 2,649,812 | |||||
| Orange Belgium S.A. |
12,092 | 260,688 | ||||||
| Recticel S.A. |
84,370 | 633,776 | ||||||
| Warehouses De Pauw CVA |
54,768 | 8,793,963 | ||||||
|
|
|
|||||||
| Total Belgium | 25,378,352 | |||||||
| China – 2.9% | ||||||||
| Beijing Tong Ren Tang Chinese Medicine Co., Ltd. |
980,000 | 1,795,222 | ||||||
| China Overseas Grand Oceans Group Ltd.(a) |
2,784,000 | 1,514,364 | ||||||
| China Power Clean Energy Development Co., Ltd. |
3,992,000 | 2,624,057 | ||||||
| China Power International Development Ltd. |
22,709,000 | 5,814,698 | ||||||
| China South City Holdings Ltd. |
11,424,000 | 1,833,673 | ||||||
| China Travel International Investment Hong Kong Ltd. |
7,060,000 | 1,798,738 | ||||||
| CITIC Telecom International Holdings Ltd. |
13,980,822 | 6,286,957 | ||||||
| CPMC Holdings Ltd.(a) |
1,945,109 | 780,526 | ||||||
| Dah Chong Hong Holdings Ltd. |
3,213,000 | 1,158,325 | ||||||
| Guotai Junan International Holdings Ltd.(a) |
16,636,000 | 3,369,606 | ||||||
| Poly Property Group Co., Ltd. |
5,774,000 | 2,250,771 | ||||||
| Shanghai Industrial Holdings Ltd. |
2,331,000 | 5,487,536 | ||||||
| Shenwan Hongyuan HK Ltd. |
4,075,000 | 1,105,708 | ||||||
| Shougang Fushan Resources Group Ltd. |
12,580,000 | 2,884,604 | ||||||
| Xiwang Special Steel Co., Ltd. |
9,104,000 | 1,774,421 | ||||||
| Yuexiu Property Co., Ltd. |
30,954,000 | 7,452,667 | ||||||
|
|
|
|||||||
| Total China | 47,931,873 | |||||||
| Denmark – 1.0% | ||||||||
| Alm Brand A/S |
348,839 | 3,011,643 | ||||||
| Matas A/S |
319,951 | 3,166,474 | ||||||
| Per Aarsleff Holding A/S |
38,338 | 1,271,465 | ||||||
| Schouw & Co. A/S |
22,579 | 1,680,355 | ||||||
| Spar Nord Bank A/S |
378,357 | 3,317,698 | ||||||
| Sydbank A/S |
186,750 | 3,876,200 | ||||||
|
|
|
|||||||
| Total Denmark | 16,323,835 | |||||||
| Finland – 2.4% | ||||||||
| Aktia Bank Oyj |
155,866 | 1,639,882 | ||||||
| Citycon Oyj(a) |
207,027 | 2,120,971 | ||||||
| Cramo Oyj |
136,936 | 2,695,388 | ||||||
| Finnair Oyj |
202,157 | 1,820,475 | ||||||
| Kemira Oyj |
434,404 | 5,375,231 | ||||||
| Lassila & Tikanoja Oyj |
78,209 | 1,255,783 | ||||||
| Oriola Oyj Class B |
683,490 | 1,799,686 | ||||||
| Ramirent Oyj |
290,728 | 1,790,545 | ||||||
| Sanoma Oyj |
320,978 | 3,148,182 | ||||||
| Tieto Oyj(a) |
205,403 | 6,273,319 | ||||||
| Tikkurila Oyj |
90,279 | 1,482,026 | ||||||
| Tokmanni Group Corp. |
255,516 | 2,384,190 | ||||||
| Uponor Oyj |
193,307 | 2,211,788 | ||||||
| Valmet Oyj(a) |
96,983 | 2,456,724 | ||||||
| YIT Oyj(a) |
697,609 | 4,045,797 | ||||||
|
|
|
|||||||
| Total Finland | 40,499,987 | |||||||
| France – 3.0% | ||||||||
| Albioma S.A. |
80,161 | 1,881,183 | ||||||
| Beneteau S.A. |
58,445 | 685,125 | ||||||
| Coface S.A. |
388,360 | 3,436,231 | ||||||
| Elior Group S.A.(b) |
266,574 | 3,570,918 | ||||||
| Gaztransport Et Technigaz S.A. |
104,309 | 9,498,704 | ||||||
| IPSOS |
86,575 | 2,169,743 | ||||||
| Jacquet Metal Service S.A. |
45,153 | 753,403 | ||||||
| Kaufman & Broad S.A. |
60,646 | 2,480,069 | ||||||
| Korian S.A. |
93,732 | 3,797,310 | ||||||
| Lectra |
39,020 | 944,183 | ||||||
| LISI |
41,785 | 1,285,561 | ||||||
| Maisons du Monde S.A.(b) |
48,212 | 932,202 | ||||||
| Metropole Television S.A. |
347,358 | 6,412,108 | ||||||
| Neopost S.A. |
137,279 | 3,289,427 | ||||||
| Rothschild & Co. |
97,156 | 3,092,747 | ||||||
| SPIE S.A. |
266,926 | 4,723,553 | ||||||
| Vilmorin & Cie S.A. |
37,841 | 2,005,517 | ||||||
|
|
|
|||||||
| Total France | 50,957,984 | |||||||
| Georgia – 0.1% | ||||||||
| Bank of Georgia Group PLC |
103,527 | 2,229,912 | ||||||
| Germany – 3.4% | ||||||||
| Aareal Bank AG |
175,080 | 5,402,254 | ||||||
| alstria office REIT-AG |
289,500 | 4,713,443 | ||||||
| AURELIUS Equity Opportunities SE & Co. KGaA |
119,717 | 5,454,935 | ||||||
| BayWa AG |
77,106 | 2,194,764 | ||||||
| bet-at-home.com AG |
37,010 | 2,410,287 | ||||||
| Bilfinger SE |
60,222 | 2,096,228 | ||||||
| Borussia Dortmund GmbH & Co. KGaA |
179,399 | 1,649,778 | ||||||
| Comdirect Bank AG |
82,381 | 934,265 | ||||||
| CompuGroup Medical SE |
21,080 | 1,242,658 | ||||||
| CropEnergies AG |
271,397 | 1,584,638 | ||||||
| Deutz AG |
106,287 | 890,309 | ||||||
| Elmos Semiconductor AG |
50,707 | 1,109,120 | ||||||
| Encavis AG |
212,992 | 1,509,087 | ||||||
| Gerresheimer AG |
25,437 | 1,913,649 | ||||||
| Hamburger Hafen und Logistik AG |
104,628 | 2,394,274 | ||||||
| Indus Holding AG |
26,333 | 1,269,946 | ||||||
| Jenoptik AG |
58,020 | 2,162,905 | ||||||
| Kloeckner & Co. SE |
132,924 | 978,358 | ||||||
| MLP SE |
166,446 | 831,678 | ||||||
| NORMA Group SE |
29,496 | 1,432,753 | ||||||
| Pfeiffer Vacuum Technology AG |
16,016 | 2,452,958 | ||||||
| RHOEN-KLINIKUM AG |
23,678 | 682,750 | ||||||
| Takkt AG |
120,389 | 1,981,721 | ||||||
| TLG Immobilien AG |
166,688 | 5,023,525 | ||||||
| Wacker Neuson SE |
87,065 | 2,072,532 | ||||||
| Washtec AG |
11,548 | 881,734 | ||||||
| Wuestenrot & Wuerttembergische AG |
114,354 | 2,198,249 | ||||||
| Zeal Network SE |
5,512 | 124,711 | ||||||
|
|
|
|||||||
| Total Germany | 57,593,509 | |||||||
See Notes to Financial Statements.
| WisdomTree Trust | 61 |
Schedule of Investments (continued)
WisdomTree International SmallCap Dividend Fund (DLS)
March 31, 2019
| Investments | Shares | Value | ||||||
| Hong Kong – 0.4% | ||||||||
| Dah Sing Financial Holdings Ltd. |
340,629 | $ | 1,785,602 | |||||
| Hongkong & Shanghai Hotels Ltd. (The) |
1,306,870 | 1,881,239 | ||||||
| Kowloon Development Co., Ltd. |
1,009,000 | 1,259,651 | ||||||
| Lai Sun Development Co., Ltd. |
760,434 | 1,280,637 | ||||||
| Television Broadcasts Ltd. |
51,700 | 100,239 | ||||||
|
|
|
|||||||
| Total Hong Kong |
|
6,307,368 | ||||||
| Ireland – 0.6% | ||||||||
| C&C Group PLC |
795,085 | 2,856,836 | ||||||
| FBD Holdings PLC |
57,797 | 585,374 | ||||||
| Grafton Group PLC |
230,654 | 2,432,983 | ||||||
| Greencore Group PLC |
876,705 | 2,307,629 | ||||||
| Hostelworld Group PLC(b) |
24,752 | 59,668 | ||||||
| Irish Continental Group PLC |
342,988 | 1,871,703 | ||||||
|
|
|
|||||||
| Total Ireland |
|
10,114,193 | ||||||
| Israel – 3.9% | ||||||||
| Amot Investments Ltd. |
872,314 | 4,855,068 | ||||||
| Ashtrom Properties Ltd. |
365,237 | 1,758,081 | ||||||
| Avgol Industries 1953 Ltd. |
140,940 | 149,159 | ||||||
| Delek Group Ltd. |
59,910 | 10,356,547 | ||||||
| Direct Insurance Financial Investments Ltd. |
97,942 | 1,106,430 | ||||||
| Discount Investment Corp., Ltd. Registered Shares |
1,035,729 | 2,393,733 | ||||||
| Elco Ltd. |
19,677 | 371,111 | ||||||
| Electra Consumer Products 1970 Ltd. |
156,376 | 1,820,405 | ||||||
| First International Bank of Israel Ltd. |
220,495 | 5,192,585 | ||||||
| Fox Wizel Ltd. |
38,426 | 1,175,220 | ||||||
| Gazit-Globe Ltd. |
401,995 | 3,228,720 | ||||||
| Harel Insurance Investments & Financial Services Ltd. |
631,747 | 4,160,181 | ||||||
| Inrom Construction Industries Ltd. |
387,071 | 1,334,194 | ||||||
| Magic Software Enterprises Ltd. |
85,332 | 727,215 | ||||||
| Matrix IT Ltd. |
204,074 | 2,566,283 | ||||||
| Maytronics Ltd. |
259,644 | 1,675,472 | ||||||
| Melisron Ltd. |
76,282 | 3,869,430 | ||||||
| Menora Mivtachim Holdings Ltd. |
109,706 | 1,339,681 | ||||||
| Paz Oil Co., Ltd. |
39,710 | 5,932,402 | ||||||
| Phoenix Holdings Ltd. (The) |
145,886 | 756,492 | ||||||
| Rami Levy Chain Stores Hashikma Marketing 2006 Ltd. |
22,475 | 1,135,717 | ||||||
| Sella Capital Real Estate Ltd. |
823,362 | 1,471,881 | ||||||
| Shapir Engineering and Industry Ltd. |
394,706 | 1,344,198 | ||||||
| Shikun & Binui Ltd.* |
356,776 | 852,779 | ||||||
| Shufersal Ltd. |
330,155 | 2,128,653 | ||||||
| Strauss Group Ltd. |
108,443 | 2,598,317 | ||||||
| ZUR Shamir Holdings Ltd. |
241,931 | 846,577 | ||||||
|
|
|
|||||||
| Total Israel |
|
65,146,531 | ||||||
| Italy – 5.0% | ||||||||
| Anima Holding SpA(b) |
670,213 | 2,742,287 | ||||||
| Aquafil SpA |
45,590 | 511,907 | ||||||
| Ascopiave SpA |
1,018,639 | 4,020,382 | ||||||
| ASTM SpA |
92,722 | 2,524,738 | ||||||
| Azimut Holding SpA(a) |
570,708 | 9,708,414 | ||||||
| Banca Generali SpA |
159,619 | 3,975,281 | ||||||
| Banca IFIS SpA |
115,501 | 1,907,744 | ||||||
| Banca Popolare di Sondrio SCPA |
409,240 | 1,120,298 | ||||||
| Biesse SpA |
50,798 | 1,105,407 | ||||||
| BPER Banca(a) |
631,485 | 2,581,698 | ||||||
| Cairo Communication SpA |
508,160 | 2,151,115 | ||||||
| Cerved Group SpA |
342,593 | 3,408,269 | ||||||
| CIR-Compagnie Industriali Riunite SpA |
1,185,826 | 1,454,003 | ||||||
| Cofide SpA(a) |
912,470 | 533,799 | ||||||
| Credito Emiliano SpA |
667,861 | 3,757,037 | ||||||
| Datalogic SpA |
58,462 | 1,365,396 | ||||||
| doBank SpA(a)(b) |
171,862 | 2,306,054 | ||||||
| El.En. SpA(a) |
15,690 | 331,033 | ||||||
| Enav SpA(b) |
950,142 | 5,182,839 | ||||||
| Fincantieri SpA |
541,131 | 665,939 | ||||||
| Gamenet Group SpA(b) |
160,986 | 1,630,483 | ||||||
| Gima TT SpA(a)(b) |
427,597 | 3,420,427 | ||||||
| Immobiliare Grande Distribuzione SIIQ SpA |
440,682 | 3,186,639 | ||||||
| Maire Tecnimont SpA |
518,690 | 1,977,868 | ||||||
| MARR SpA |
135,104 | 3,076,507 | ||||||
| Massimo Zanetti Beverage Group SpA(b) |
190,392 | 1,278,414 | ||||||
| RAI Way SpA(b) |
700,175 | 3,624,343 | ||||||
| Saras SpA |
3,228,025 | 5,984,194 | ||||||
| Societa Cattolica di Assicurazioni SC |
450,711 | 4,309,278 | ||||||
| Tod’s SpA(a) |
46,929 | 2,176,271 | ||||||
| Zignago Vetro SpA |
137,794 | 1,542,578 | ||||||
|
|
|
|||||||
| Total Italy |
|
83,560,642 | ||||||
| Japan – 24.4% | ||||||||
| 77 Bank Ltd. (The) |
54,000 | 754,736 | ||||||
| ADEKA Corp.(a) |
83,301 | 1,221,462 | ||||||
| Aeon Delight Co., Ltd. |
45,700 | 1,777,463 | ||||||
| Ai Holdings Corp. |
33,200 | 548,609 | ||||||
| Aica Kogyo Co., Ltd.(a) |
44,400 | 1,480,201 | ||||||
| Aichi Corp. |
129,400 | 818,358 | ||||||
| Aichi Steel Corp. |
29,000 | 899,986 | ||||||
| Aida Engineering Ltd. |
74,100 | 534,235 | ||||||
| Aisan Industry Co., Ltd. |
121,300 | 745,214 | ||||||
| Akita Bank Ltd. (The)(a) |
31,400 | 637,447 | ||||||
| Albis Co., Ltd.(a) |
20,000 | 418,124 | ||||||
| Alinco, Inc. |
124,800 | 1,109,484 | ||||||
| Alpen Co., Ltd. |
49,700 | 767,828 | ||||||
| Amano Corp. |
84,600 | 1,992,611 | ||||||
| Aoyama Trading Co., Ltd.(a) |
78,001 | 1,773,054 | ||||||
| Arcs Co., Ltd. |
65,500 | 1,440,367 | ||||||
| Ariake Japan Co., Ltd. |
38,000 | 2,032,434 | ||||||
| Asahi Broadcasting Group Holdings Corp. |
31,000 | 216,777 | ||||||
| Asahi Holdings, Inc.(a) |
61,400 | 1,110,564 | ||||||
| Asante, Inc. |
3,000 | 59,059 | ||||||
| Asanuma Corp.(a) |
24,200 | 537,851 | ||||||
| ASKUL Corp.(a) |
30,688 | 765,779 | ||||||
| Autobacs Seven Co., Ltd.(a) |
89,403 | 1,486,213 | ||||||
| Avex, Inc.(a) |
52,000 | 693,427 | ||||||
| Awa Bank Ltd. (The) |
15,200 | 386,437 | ||||||
See Notes to Financial Statements.
| 62 | WisdomTree Trust |
Schedule of Investments (continued)
WisdomTree International SmallCap Dividend Fund (DLS)
March 31, 2019
| Investments | Shares | Value | ||||||
| Bando Chemical Industries Ltd. |
32,800 | $ | 314,413 | |||||
| Bank of Saga Ltd. (The) |
48,900 | 842,060 | ||||||
| Baroque Japan Ltd.(a) |
88,000 | 686,127 | ||||||
| Bell System24 Holdings, Inc. |
89,700 | 1,108,638 | ||||||
| Belluna Co., Ltd. |
200,800 | 1,556,547 | ||||||
| Bic Camera, Inc. |
48,600 | 510,655 | ||||||
| BML, Inc. |
39,200 | 1,136,848 | ||||||
| C.I. Takiron Corp. |
119,100 | 645,616 | ||||||
| Central Glass Co., Ltd. |
49,700 | 1,091,123 | ||||||
| Chiyoda Co., Ltd. |
50,900 | 818,097 | ||||||
| Chiyoda Integre Co., Ltd. |
65,000 | 1,205,629 | ||||||
| Chugoku Bank Ltd. (The) |
151,000 | 1,417,437 | ||||||
| Citizen Watch Co., Ltd. |
297,607 | 1,658,974 | ||||||
| CKD Corp.(a) |
118,200 | 1,065,760 | ||||||
| CONEXIO Corp.(a) |
78,100 | 984,320 | ||||||
| Cosel Co., Ltd.(a) |
42,000 | 442,065 | ||||||
| Cosmo Energy Holdings Co., Ltd.(a) |
73,600 | 1,478,849 | ||||||
| Daido Metal Co., Ltd.(a) |
82,800 | 529,633 | ||||||
| Daido Steel Co., Ltd.(a) |
49,591 | 1,955,682 | ||||||
| Daiho Corp. |
29,400 | 859,276 | ||||||
| Daio Paper Corp.(a) |
62,200 | 762,573 | ||||||
| Daishi Hokuetsu Financial Group, Inc. |
47,540 | 1,342,210 | ||||||
| Daiwabo Holdings Co., Ltd. |
59,300 | 3,412,757 | ||||||
| DCM Holdings Co., Ltd.(a) |
149,900 | 1,397,631 | ||||||
| DeNA Co., Ltd. |
81,000 | 1,219,921 | ||||||
| Denyo Co., Ltd.(a) |
15,600 | 192,948 | ||||||
| Dexerials Corp.(a) |
117,900 | 781,846 | ||||||
| DMG Mori Co., Ltd. |
138,700 | 1,715,502 | ||||||
| Doshisha Co., Ltd. |
43,300 | 675,603 | ||||||
| Doutor Nichires Holdings Co., Ltd. |
36,800 | 699,195 | ||||||
| Dowa Holdings Co., Ltd.(a) |
64,900 | 2,134,309 | ||||||
| Eagle Industry Co., Ltd.(a) |
62,400 | 681,588 | ||||||
| Earth Corp.(a) |
34,800 | 1,616,046 | ||||||
| EDION Corp.(a) |
132,700 | 1,158,135 | ||||||
| Ehime Bank Ltd. (The)(a) |
108,000 | 1,110,394 | ||||||
| Elematec Corp. |
16,900 | 258,497 | ||||||
| eRex Co., Ltd. |
25,600 | 238,688 | ||||||
| ES-Con Japan Ltd.(a) |
70,000 | 461,671 | ||||||
| ESPEC Corp. |
21,700 | 404,455 | ||||||
| Excel Co., Ltd.(a) |
18,700 | 395,338 | ||||||
| Exedy Corp.(a) |
36,470 | 790,126 | ||||||
| F@N Communications, Inc. |
126,000 | 640,900 | ||||||
| FIDEA Holdings Co., Ltd.(a) |
828,800 | 980,917 | ||||||
| Financial Products Group Co., Ltd. |
91,600 | 750,609 | ||||||
| Foster Electric Co., Ltd. |
63,385 | 951,763 | ||||||
| France Bed Holdings Co., Ltd.(a) |
123,000 | 1,002,358 | ||||||
| Fudo Tetra Corp.(a) |
44,420 | 578,702 | ||||||
| Fuji Corp., Ltd.(a) |
258,400 | 1,914,333 | ||||||
| Fuji Oil Co., Ltd.(a) |
185,500 | 422,334 | ||||||
| Fujikura Ltd.(a) |
225,000 | 847,676 | ||||||
| Fujimi, Inc. |
61,441 | 1,342,782 | ||||||
| Fujimori Kogyo Co., Ltd. |
38,400 | 1,054,669 | ||||||
| Fujitec Co., Ltd.(a) |
60,600 | 670,687 | ||||||
| Fujitsu General Ltd.(a) |
81,900 | 1,158,742 | ||||||
| Fukui Bank Ltd. (The) |
57,000 | 872,368 | ||||||
| Fukui Computer Holdings, Inc. |
31,000 | 578,073 | ||||||
| Fukuyama Transporting Co., Ltd. |
18,000 | 692,777 | ||||||
| Funai Soken Holdings, Inc. |
187,350 | 4,507,504 | ||||||
| Furukawa Electric Co., Ltd. |
49,000 | 1,235,569 | ||||||
| Gakkyusha Co., Ltd. |
3,000 | 35,208 | ||||||
| Gecoss Corp. |
91,000 | 850,928 | ||||||
| Geo Holdings Corp.(a) |
94,100 | 1,307,547 | ||||||
| Glory Ltd.(a) |
76,577 | 1,837,544 | ||||||
| GMO Financial Holdings, Inc. |
245,100 | 1,428,283 | ||||||
| Godo Steel Ltd. |
40,900 | 611,551 | ||||||
| GS Yuasa Corp.(a) |
46,400 | 910,100 | ||||||
| Gunma Bank Ltd. (The) |
424,900 | 1,608,466 | ||||||
| Gunze Ltd.(a) |
35,600 | 1,439,310 | ||||||
| H2O Retailing Corp.(a) |
96,000 | 1,337,417 | ||||||
| Hachijuni Bank Ltd. (The) |
726,400 | 3,012,311 | ||||||
| Hakuto Co., Ltd. |
52,200 | 553,197 | ||||||
| Hanwa Co., Ltd.(a) |
64,300 | 1,792,162 | ||||||
| Happinet Corp. |
112,000 | 1,445,977 | ||||||
| Hazama Ando Corp. |
152,000 | 1,017,590 | ||||||
| Heiwa Corp.(a) |
124,819 | 2,494,463 | ||||||
| Heiwado Co., Ltd. |
67,000 | 1,426,743 | ||||||
| Hiroshima Bank Ltd. (The)(a) |
330,700 | 1,685,096 | ||||||
| Hokkaido Gas Co., Ltd.(a) |
25,000 | 325,247 | ||||||
| Hokkoku Bank Ltd. (The) |
14,000 | 438,903 | ||||||
| Hokuetsu Corp. |
157,000 | 917,731 | ||||||
| Hokuetsu Industries Co., Ltd.(a) |
162,600 | 1,693,796 | ||||||
| Hokuhoku Financial Group, Inc.(a) |
150,200 | 1,564,626 | ||||||
| Hosokawa Micron Corp. |
31,900 | 1,425,175 | ||||||
| Hyakugo Bank Ltd. (The) |
179,800 | 571,799 | ||||||
| Hyakujushi Bank Ltd. (The) |
27,600 | 571,525 | ||||||
| Ibiden Co., Ltd.(a) |
92,100 | 1,399,577 | ||||||
| Ichibanya Co., Ltd.(a) |
1,000 | 43,728 | ||||||
| Ichigo, Inc. |
334,800 | 1,146,399 | ||||||
| Ichinen Holdings Co., Ltd. |
33,000 | 343,163 | ||||||
| Ichiyoshi Securities Co., Ltd. |
146,000 | 1,023,589 | ||||||
| Idec Corp.(a) |
79,200 | 1,365,258 | ||||||
| Iino Kaiun Kaisha Ltd.(a) |
203,900 | 687,127 | ||||||
| Imasen Electric Industrial |
94,200 | 851,915 | ||||||
| Inaba Denki Sangyo Co., Ltd. |
39,300 | 1,521,439 | ||||||
| Inabata & Co., Ltd. |
59,400 | 807,670 | ||||||
| Internet Initiative Japan, Inc. |
90,400 | 1,828,663 | ||||||
| Iseki & Co., Ltd. |
49,000 | 721,155 | ||||||
| Itochu Enex Co., Ltd. |
187,101 | 1,507,829 | ||||||
| Itoki Corp. |
122,000 | 595,203 | ||||||
| Iwatani Corp.(a) |
19,000 | 610,245 | ||||||
| Iyo Bank Ltd. (The)(a) |
240,500 | 1,273,280 | ||||||
| Japan Aviation Electronics Industry Ltd. |
47,000 | 654,352 | ||||||
| Japan Wool Textile Co., Ltd. (The) |
99,000 | 843,448 | ||||||
| JINS, Inc. |
8,800 | 475,439 | ||||||
| Juroku Bank Ltd. (The) |
55,000 | 1,117,044 | ||||||
| K’s Holdings Corp. |
180,802 | 1,604,080 | ||||||
| kabu.com Securities Co., Ltd. |
576,701 | 2,896,922 | ||||||
| Kadokawa Dwango(a) |
69,000 | 727,497 | ||||||
See Notes to Financial Statements.
| WisdomTree Trust | 63 |
Schedule of Investments (continued)
WisdomTree International SmallCap Dividend Fund (DLS)
March 31, 2019
| Investments | Shares | Value | ||||||
| Kaga Electronics Co., Ltd.(a) |
55,500 | $ | 1,018,891 | |||||
| Kanamoto Co., Ltd. |
15,000 | 371,324 | ||||||
| Kandenko Co., Ltd. |
151,900 | 1,298,255 | ||||||
| Kasai Kogyo Co., Ltd.(a) |
45,400 | 335,522 | ||||||
| Kato Sangyo Co., Ltd.(a) |
47,100 | 1,553,191 | ||||||
| Kato Works Co., Ltd.(a) |
42,600 | 1,005,681 | ||||||
| Keihin Corp. |
32,000 | 523,865 | ||||||
| Keiyo Bank Ltd. (The) |
92,500 | 539,865 | ||||||
| Kintetsu World Express, Inc. |
64,500 | 982,491 | ||||||
| Kitano Construction Corp. |
5,600 | 157,347 | ||||||
| Kito Corp. |
82,300 | 1,242,475 | ||||||
| Kiyo Bank Ltd. (The)(a) |
52,150 | 726,995 | ||||||
| Koa Corp. |
98,600 | 1,326,425 | ||||||
| Kobe Bussan Co., Ltd. |
29,200 | 1,108,009 | ||||||
| Koei Tecmo Holdings Co., Ltd.(a) |
104,800 | 2,020,538 | ||||||
| Kohnan Shoji Co., Ltd. |
82,200 | 2,040,054 | ||||||
| Kokuyo Co., Ltd. |
124,900 | 1,832,566 | ||||||
| Konoike Transport Co., Ltd. |
47,700 | 789,074 | ||||||
| Kurabo Industries Ltd. |
38,395 | 704,524 | ||||||
| Kurimoto Ltd. |
72,000 | 947,120 | ||||||
| KYB Corp.(a) |
30,079 | 738,625 | ||||||
| Kyoei Steel Ltd.(a) |
42,200 | 601,632 | ||||||
| KYORIN Holdings, Inc.(a) |
146,390 | 2,858,100 | ||||||
| Kyosan Electric Manufacturing Co., Ltd.(a) |
356,900 | 1,170,481 | ||||||
| Kyushu Financial Group, Inc.(a) |
565,000 | 2,297,059 | ||||||
| Lintec Corp. |
54,530 | 1,179,426 | ||||||
| Macnica Fuji Electronics Holdings, Inc.(a) |
53,700 | 732,592 | ||||||
| Maeda Road Construction Co., Ltd. |
71,300 | 1,384,322 | ||||||
| Mandom Corp. |
60,760 | 1,562,298 | ||||||
| Marubun Corp. |
120,200 | 691,760 | ||||||
| Maruha Nichiro Corp. |
51,000 | 1,824,637 | ||||||
| Matsui Construction Co., Ltd.(a) |
74,400 | 477,246 | ||||||
| Matsui Securities Co., Ltd.(a) |
349,040 | 3,285,899 | ||||||
| Max Co., Ltd. |
44,247 | 650,803 | ||||||
| Maxell Holdings Ltd.(a) |
62,000 | 879,433 | ||||||
| MegaChips Corp.(a) |
36,400 | 558,735 | ||||||
| Megmilk Snow Brand Co., Ltd. |
36,500 | 888,386 | ||||||
| Meitec Corp.(a) |
41,300 | 1,876,849 | ||||||
| Mimasu Semiconductor Industry Co., Ltd. |
17,000 | 226,390 | ||||||
| Ministop Co., Ltd. |
42,100 | 651,935 | ||||||
| Mito Securities Co., Ltd. |
181,000 | 336,866 | ||||||
| Mitsubishi Logistics Corp.(a) |
53,000 | 1,479,604 | ||||||
| Mitsubishi Shokuhin Co., Ltd.(a) |
33,300 | 871,273 | ||||||
| Mitsuboshi Belting Ltd.(a) |
28,800 | 512,330 | ||||||
| Mitsui Mining & Smelting Co., Ltd.(a) |
43,864 | 1,125,084 | ||||||
| Mixi, Inc. |
139,100 | 3,214,689 | ||||||
| Miyazaki Bank Ltd. (The) |
26,964 | 674,557 | ||||||
| Modec, Inc. |
9,000 | 256,132 | ||||||
| Morinaga Milk Industry Co., Ltd.(a) |
49,900 | 1,692,863 | ||||||
| MOS Food Services, Inc.(a) |
2,000 | 48,606 | ||||||
| MrMax Holdings Ltd. |
83,000 | 331,445 | ||||||
| Musashino Bank Ltd. (The) |
15,945 | 318,223 | ||||||
| Nachi-Fujikoshi Corp. |
22,200 | 892,533 | ||||||
| Nagaileben Co., Ltd. |
41,600 | 902,019 | ||||||
| Nagase & Co., Ltd. |
98,900 | 1,419,814 | ||||||
| Nanto Bank Ltd. (The) |
48,000 | 898,984 | ||||||
| NEC Networks & System Integration Corp. |
58,701 | 1,418,667 | ||||||
| NHK Spring Co., Ltd.(a) |
166,000 | 1,490,753 | ||||||
| Nichias Corp. |
64,500 | 1,277,355 | ||||||
| Nichiha Corp. |
63,701 | 1,755,324 | ||||||
| Nichirin Co., Ltd. |
40,000 | 641,821 | ||||||
| Nihon Kohden Corp. |
60,600 | 1,801,274 | ||||||
| Nihon Nohyaku Co., Ltd.(a) |
140,100 | 564,526 | ||||||
| Nihon Parkerizing Co., Ltd. |
71,101 | 887,759 | ||||||
| Nihon Tokushu Toryo Co., Ltd. |
21,000 | 218,756 | ||||||
| Nihon Unisys Ltd. |
92,200 | 2,442,340 | ||||||
| Nihon Yamamura Glass Co., Ltd.(a) |
18,300 | 238,908 | ||||||
| Nikkon Holdings Co., Ltd. |
62,500 | 1,478,859 | ||||||
| Nippo Corp. |
90,900 | 1,695,059 | ||||||
| Nippon Flour Mills Co., Ltd. |
152,797 | 2,622,887 | ||||||
| Nippon Kayaku Co., Ltd.(a) |
209,299 | 2,473,353 | ||||||
| Nippon Koei Co., Ltd. |
36,500 | 772,968 | ||||||
| Nippon Light Metal Holdings Co., Ltd. |
976,800 | 2,144,486 | ||||||
| Nippon Paper Industries Co., Ltd.(a) |
23,638 | 488,200 | ||||||
| Nippon Piston Ring Co., Ltd. |
34,000 | 483,191 | ||||||
| Nippon Signal Co., Ltd.(a) |
63,000 | 564,060 | ||||||
| Nippon Soda Co., Ltd. |
24,000 | 634,015 | ||||||
| Nippon Steel & Sumikin Bussan Corp. |
34,173 | 1,389,335 | ||||||
| Nippon Thompson Co., Ltd.(a) |
151,700 | 697,613 | ||||||
| Nipro Corp.(a) |
178,591 | 2,305,701 | ||||||
| Nishi-Nippon Financial Holdings, Inc. |
97,000 | 823,779 | ||||||
| Nishi-Nippon Railroad Co., Ltd.(a) |
61,900 | 1,497,657 | ||||||
| Nishimatsu Construction Co., Ltd. |
59,400 | 1,316,422 | ||||||
| Nishimatsuya Chain Co., Ltd. |
92,200 | 774,685 | ||||||
| Nishio Rent All Co., Ltd. |
21,600 | 622,523 | ||||||
| Nissei ASB Machine Co., Ltd.(a) |
8,000 | 273,569 | ||||||
| Nisshinbo Holdings, Inc.(a) |
168,692 | 1,473,778 | ||||||
| Nissin Electric Co., Ltd. |
145,500 | 1,334,259 | ||||||
| Nissin Kogyo Co., Ltd. |
33,000 | 413,525 | ||||||
| Nitta Corp. |
30,400 | 988,752 | ||||||
| Noevir Holdings Co., Ltd. |
44,400 | 2,154,113 | ||||||
| NOF Corp. |
52,200 | 1,777,965 | ||||||
| Nojima Corp. |
39,600 | 718,764 | ||||||
| Noritake Co., Ltd. |
33,500 | 1,604,102 | ||||||
| North Pacific Bank Ltd. |
420,000 | 1,051,091 | ||||||
| NS Solutions Corp. |
91,600 | 2,472,790 | ||||||
| NS United Kaiun Kaisha Ltd.(a) |
46,800 | 1,001,664 | ||||||
| NSD Co., Ltd. |
102,000 | 2,374,793 | ||||||
| NTN Corp.(a) |
528,000 | 1,564,656 | ||||||
| NuFlare Technology, Inc. |
11,900 | 660,126 | ||||||
| Obara Group, Inc. |
12,500 | 413,900 | ||||||
| Ogaki Kyoritsu Bank Ltd. (The) |
38,700 | 804,174 | ||||||
| Ohsho Food Service Corp. |
45,100 | 2,856,313 | ||||||
| Oita Bank Ltd. (The) |
26,300 | 822,135 | ||||||
| Okamura Corp. |
70,400 | 737,169 | ||||||
| Okasan Securities Group, Inc.(a) |
485,000 | 1,800,922 | ||||||
| Okinawa Electric Power Co., Inc. (The) |
31,200 | 531,346 | ||||||
| OKUMA Corp.(a) |
17,200 | 930,822 | ||||||
See Notes to Financial Statements.
| 64 | WisdomTree Trust |
Schedule of Investments (continued)
WisdomTree International SmallCap Dividend Fund (DLS)
March 31, 2019
| Investments | Shares | Value | ||||||
| Okumura Corp.(a) |
77,900 | $ | 2,473,854 | |||||
| Okura Industrial Co., Ltd. |
17,900 | 288,185 | ||||||
| Okuwa Co., Ltd. |
42,000 | 421,575 | ||||||
| Onoken Co., Ltd.(a) |
23,800 | 333,718 | ||||||
| Onward Holdings Co., Ltd. |
166,400 | 879,469 | ||||||
| Organo Corp. |
5,000 | 141,618 | ||||||
| OSG Corp. |
51,000 | 983,738 | ||||||
| Paramount Bed Holdings Co., Ltd. |
28,600 | 1,268,699 | ||||||
| PC Depot Corp. |
110,000 | 440,258 | ||||||
| Penta-Ocean Construction Co., Ltd. |
170,800 | 791,619 | ||||||
| Piolax, Inc.(a) |
20,000 | 384,695 | ||||||
| Plenus Co., Ltd.(a) |
64,700 | 1,032,301 | ||||||
| Press Kogyo Co., Ltd. |
136,900 | 726,027 | ||||||
| Prospect Co., Ltd.(a) |
2,659,000 | 432,416 | ||||||
| Raito Kogyo Co., Ltd. |
124,400 | 1,676,874 | ||||||
| Raysum Co., Ltd.(a) |
84,700 | 779,009 | ||||||
| Rengo Co., Ltd. |
297,900 | 2,793,696 | ||||||
| Resorttrust, Inc.(a) |
96,400 | 1,306,410 | ||||||
| Riso Kagaku Corp. |
46,800 | 739,938 | ||||||
| Roland DG Corp. |
32,800 | 690,464 | ||||||
| Round One Corp. |
134,800 | 1,706,237 | ||||||
| Ryobi Ltd. |
55,500 | 1,245,535 | ||||||
| Ryoden Corp. |
35,400 | 469,505 | ||||||
| Ryosan Co., Ltd.(a) |
31,986 | 857,699 | ||||||
| Saibu Gas Co., Ltd.(a) |
26,800 | 578,929 | ||||||
| Saizeriya Co., Ltd. |
39,101 | 753,158 | ||||||
| San-Ai Oil Co., Ltd. |
96,200 | 790,042 | ||||||
| San-In Godo Bank Ltd. (The)(a) |
96,787 | 694,303 | ||||||
| Sangetsu Corp. |
77,800 | 1,412,117 | ||||||
| Sanoh Industrial Co., Ltd.(a) |
54,200 | 247,287 | ||||||
| Sanrio Co., Ltd.(a) |
77,173 | 1,841,387 | ||||||
| Sanshin Electronics Co., Ltd.(a) |
59,800 | 1,023,275 | ||||||
| Sanwa Holdings Corp. |
205,000 | 2,439,219 | ||||||
| Sanyo Chemical Industries Ltd. |
18,000 | 832,633 | ||||||
| Sanyo Denki Co., Ltd. |
26,500 | 950,490 | ||||||
| Sanyo Special Steel Co., Ltd. |
40,000 | 819,985 | ||||||
| Sapporo Holdings Ltd. |
48,900 | 1,067,817 | ||||||
| Sato Holdings Corp. |
28,300 | 663,747 | ||||||
| Sato Shoji Corp. |
40,000 | 327,054 | ||||||
| Satori Electric Co., Ltd. |
67,500 | 573,248 | ||||||
| Sawai Pharmaceutical Co., Ltd. |
66,000 | 3,822,198 | ||||||
| Seiko Holdings Corp.(a) |
25,500 | 607,061 | ||||||
| Senko Group Holdings Co., Ltd.(a) |
215,000 | 1,785,111 | ||||||
| SFP Holdings Co., Ltd.(a) |
3,000 | 51,552 | ||||||
| Shibuya Corp. |
16,000 | 472,693 | ||||||
| Shiga Bank Ltd. (The)(a) |
25,600 | 610,135 | ||||||
| Shikoku Bank Ltd. (The) |
57,000 | 535,574 | ||||||
| Shima Seiki Manufacturing Ltd.(a) |
10,000 | 307,178 | ||||||
| Shimachu Co., Ltd. |
62,900 | 1,638,918 | ||||||
| Shinko Electric Industries Co., Ltd.(a) |
91,000 | 697,186 | ||||||
| Shinko Plantech Co., Ltd. |
127,500 | 1,359,263 | ||||||
| Shinmaywa Industries Ltd. |
113,400 | 1,409,752 | ||||||
| Shinsho Corp. |
13,000 | 303,257 | ||||||
| Ship Healthcare Holdings, Inc. |
57,100 | 2,344,667 | ||||||
| SHO-BOND Holdings Co., Ltd. |
13,800 | 921,371 | ||||||
| Shoei Co., Ltd.(a) |
37,300 | 1,592,289 | ||||||
| Siix Corp.(a) |
31,000 | 469,404 | ||||||
| Sinko Industries Ltd. |
21,000 | 284,022 | ||||||
| SMK Corp.(a) |
10,800 | 255,449 | ||||||
| Sotetsu Holdings, Inc. |
78,900 | 2,427,199 | ||||||
| St. Marc Holdings Co., Ltd. |
15,100 | 339,557 | ||||||
| Star Micronics Co., Ltd.(a) |
59,800 | 910,358 | ||||||
| Starts Corp., Inc. |
44,800 | 956,430 | ||||||
| Sumitomo Bakelite Co., Ltd. |
79,600 | 2,851,461 | ||||||
| Sumitomo Forestry Co., Ltd.(a) |
142,000 | 1,971,848 | ||||||
| Sumitomo Osaka Cement Co., Ltd. |
39,500 | 1,555,947 | ||||||
| Sumitomo Riko Co., Ltd. |
78,550 | 658,575 | ||||||
| Sumitomo Seika Chemicals Co., Ltd. |
12,200 | 448,606 | ||||||
| Suruga Bank Ltd.*(a) |
319,100 | 1,478,957 | ||||||
| T-Gaia Corp. |
88,500 | 1,468,004 | ||||||
| T. RAD Co., Ltd. |
16,000 | 306,744 | ||||||
| Tadano Ltd.(a) |
64,800 | 615,303 | ||||||
| Taiho Kogyo Co., Ltd. |
57,200 | 467,688 | ||||||
| Taikisha Ltd. |
33,200 | 1,009,333 | ||||||
| Taiyo Holdings Co., Ltd.(a) |
29,959 | 986,589 | ||||||
| Taiyo Yuden Co., Ltd.(a) |
58,900 | 1,158,470 | ||||||
| Takaoka Toko Co., Ltd. |
28,000 | 333,162 | ||||||
| Takasago Thermal Engineering Co., Ltd. |
128,501 | 2,068,833 | ||||||
| Takuma Co., Ltd. |
29,700 | 354,463 | ||||||
| Tamron Co., Ltd. |
62,100 | 1,132,763 | ||||||
| Tanseisha Co., Ltd. |
33,000 | 389,972 | ||||||
| Tatsuta Electric Wire and Cable Co., Ltd. |
296,900 | 1,223,168 | ||||||
| TechnoPro Holdings, Inc. |
46,300 | 2,760,808 | ||||||
| Tekken Corp. |
39,000 | 960,510 | ||||||
| Toa Corp. |
54,000 | 544,464 | ||||||
| Toagosei Co., Ltd. |
114,500 | 1,210,327 | ||||||
| Tobishima Corp. |
43,400 | 527,772 | ||||||
| Tocalo Co., Ltd. |
191,800 | 1,511,041 | ||||||
| Toda Corp. |
176,000 | 1,081,267 | ||||||
| Toei Co., Ltd. |
6,700 | 891,638 | ||||||
| Toho Bank Ltd. (The) |
160,372 | 428,876 | ||||||
| Toho Holdings Co., Ltd.(a) |
51,800 | 1,293,070 | ||||||
| TOKAI Holdings Corp. |
209,600 | 1,740,276 | ||||||
| Tokai Rika Co., Ltd. |
108,422 | 1,848,420 | ||||||
| Tokai Tokyo Financial Holdings, Inc.(a) |
490,500 | 1,777,029 | ||||||
| Tokyo Ohka Kogyo Co., Ltd. |
15,300 | 417,455 | ||||||
| Tokyo Rope Manufacturing Co., Ltd. |
23,000 | 202,810 | ||||||
| Tokyo Seimitsu Co., Ltd.(a) |
40,500 | 1,030,384 | ||||||
| Tokyo Steel Manufacturing Co., Ltd. |
70,000 | 608,393 | ||||||
| Tokyu Construction Co., Ltd. |
126,200 | 946,343 | ||||||
| Toli Corp. |
335,000 | 805,077 | ||||||
| TOMONY Holdings, Inc. |
190,590 | 724,926 | ||||||
| Tomy Co., Ltd. |
91,000 | 938,899 | ||||||
| Topcon Corp. |
51,300 | 605,302 | ||||||
| Toppan Forms Co., Ltd. |
84,900 | 724,854 | ||||||
| Topy Industries Ltd. |
29,500 | 590,080 | ||||||
| Toshiba Plant Systems & Services Corp. |
74,900 | 1,328,353 | ||||||
| Towa Bank Ltd. (The)(a) |
88,000 | 566,075 | ||||||
See Notes to Financial Statements.
| WisdomTree Trust | 65 |
Schedule of Investments (continued)
WisdomTree International SmallCap Dividend Fund (DLS)
March 31, 2019
| Investments | Shares | Value | ||||||
| Toyo Ink SC Holdings Co., Ltd. |
67,600 | $ | 1,517,694 | |||||
| Toyo Kanetsu K.K. |
9,000 | 162,949 | ||||||
| Toyo Tire Corp. |
143,800 | 1,630,474 | ||||||
| Toyobo Co., Ltd.(a) |
76,469 | 977,582 | ||||||
| TPR Co., Ltd. |
45,600 | 867,218 | ||||||
| Trusco Nakayama Corp. |
43,300 | 1,199,029 | ||||||
| Tsubaki Nakashima Co., Ltd.(a) |
41,000 | 736,026 | ||||||
| Tsubakimoto Chain Co. |
40,000 | 1,427,474 | ||||||
| Tsumura & Co. |
142,801 | 4,341,377 | ||||||
| Tsuzuki Denki Co., Ltd. |
25,600 | 196,825 | ||||||
| UKC Holdings Corp.(a) |
32,700 | 604,751 | ||||||
| Union Tool Co. |
15,100 | 398,765 | ||||||
| Unipres Corp. |
62,000 | 968,496 | ||||||
| Unizo Holdings Co., Ltd.(a) |
95,100 | 1,813,761 | ||||||
| Valor Holdings Co., Ltd. |
52,700 | 1,276,970 | ||||||
| Vital KSK Holdings, Inc.(a) |
179,500 | 1,770,917 | ||||||
| VT Holdings Co., Ltd.(a) |
187,000 | 704,513 | ||||||
| Wacoal Holdings Corp. |
47,468 | 1,180,214 | ||||||
| Wacom Co., Ltd.(a) |
22,000 | 92,623 | ||||||
| World Holdings Co., Ltd. |
10,000 | 170,665 | ||||||
| Wowow, Inc. |
26,700 | 714,991 | ||||||
| Xebio Holdings Co., Ltd. |
63,900 | 703,746 | ||||||
| Yahagi Construction Co., Ltd. |
101,000 | 699,887 | ||||||
| YAMABIKO Corp. |
80,800 | 775,990 | ||||||
| Yamanashi Chuo Bank Ltd. (The) |
32,800 | 406,277 | ||||||
| Yamatane Corp. |
81,000 | 1,144,545 | ||||||
| Yamazen Corp. |
103,400 | 1,090,191 | ||||||
| Yokohama Reito Co., Ltd.(a) |
60,000 | 484,619 | ||||||
| Yorozu Corp.(a) |
51,000 | 666,269 | ||||||
| Yuasa Trading Co., Ltd. |
25,648 | 722,968 | ||||||
| Yumeshin Holdings Co., Ltd.(a) |
154,800 | 1,081,090 | ||||||
| Yurtec Corp. |
60,000 | 439,084 | ||||||
| Zenrin Co., Ltd.(a) |
82,500 | 1,826,874 | ||||||
| Zojirushi Corp.(a) |
57,900 | 601,572 | ||||||
|
|
|
|||||||
| Total Japan |
|
408,753,843 | ||||||
| Netherlands – 2.0% | ||||||||
| Accell Group N.V. |
64,367 | 1,788,793 | ||||||
| Arcadis N.V. |
107,245 | 1,671,430 | ||||||
| BE Semiconductor Industries N.V. |
271,099 | 7,220,451 | ||||||
| Beter Bed Holding N.V.(a) |
114,890 | 566,328 | ||||||
| BinckBank N.V. |
336,096 | 2,377,528 | ||||||
| Brunel International N.V.(a) |
12,260 | 185,981 | ||||||
| Corbion N.V. |
97,412 | 2,931,359 | ||||||
| Intertrust N.V.(b) |
158,338 | 2,986,869 | ||||||
| Kendrion N.V. |
17,940 | 396,432 | ||||||
| Koninklijke Volkerwessels N.V. |
181,190 | 3,739,396 | ||||||
| PostNL N.V. |
1,549,012 | 3,963,883 | ||||||
| SIF Holding N.V.(a) |
18,730 | 210,730 | ||||||
| Sligro Food Group N.V. |
56,380 | 2,022,635 | ||||||
| TKH Group N.V. CVA |
56,895 | 2,685,706 | ||||||
|
|
|
|||||||
| Total Netherlands |
|
32,747,521 | ||||||
| New Zealand – 4.3% | ||||||||
| Air New Zealand Ltd. |
3,571,782 | 6,175,145 | ||||||
| Chorus Ltd. |
1,552,345 | 6,246,324 | ||||||
| Contact Energy Ltd. |
1,591,192 | 7,531,237 | ||||||
| EBOS Group Ltd.(a) |
276,043 | 4,141,748 | ||||||
| Freightways Ltd. |
297,260 | 1,674,560 | ||||||
| Genesis Energy Ltd. |
4,251,193 | 9,335,788 | ||||||
| Heartland Group Holdings Ltd.(a) |
1,415,074 | 1,447,621 | ||||||
| Infratil Ltd. |
1,373,115 | 3,905,056 | ||||||
| Kathmandu Holdings Ltd. |
923,024 | 1,410,085 | ||||||
| Kiwi Property Group Ltd. |
2,295,827 | 2,325,144 | ||||||
| Mainfreight Ltd. |
112,542 | 2,751,618 | ||||||
| New Zealand Refining Co., Ltd. (The) |
1,184,536 | 1,696,492 | ||||||
| Port of Tauranga Ltd.(a) |
438,780 | 1,624,916 | ||||||
| Restaurant Brands New Zealand Ltd. |
388,654 | 2,319,292 | ||||||
| Scales Corp., Ltd. |
379,641 | 1,279,041 | ||||||
| Skellerup Holdings Ltd. |
532,488 | 766,261 | ||||||
| SKY Network Television Ltd. |
1,899,695 | 1,671,313 | ||||||
| SKYCITY Entertainment Group Ltd. |
1,692,765 | 4,467,781 | ||||||
| Trade Me Group Ltd. |
1,023,829 | 4,482,773 | ||||||
| Trustpower Ltd.(a) |
698,634 | 3,149,455 | ||||||
| Z Energy Ltd. |
849,052 | 3,624,874 | ||||||
|
|
|
|||||||
| Total New Zealand |
|
72,026,524 | ||||||
| Norway – 3.0% | ||||||||
| American Shipping Co. ASA* |
491,708 | 1,824,292 | ||||||
| Atea ASA* |
267,635 | 3,891,019 | ||||||
| Austevoll Seafood ASA |
851,843 | 10,089,645 | ||||||
| Borregaard ASA |
142,904 | 1,418,818 | ||||||
| Entra ASA(b) |
308,660 | 4,666,674 | ||||||
| Evry A/S(b) |
472,062 | 1,743,180 | ||||||
| Grieg Seafood ASA |
324,647 | 3,943,295 | ||||||
| Norway Royal Salmon ASA(a) |
129,403 | 3,005,318 | ||||||
| Ocean Yield ASA |
517,978 | 3,843,513 | ||||||
| Selvaag Bolig ASA |
276,266 | 1,379,469 | ||||||
| SpareBank 1 Nord Norge |
312,384 | 2,310,704 | ||||||
| SpareBank 1 SMN(a) |
178,758 | 1,814,233 | ||||||
| SpareBank 1 SR-Bank ASA |
491,075 | 5,668,268 | ||||||
| Sparebanken Vest |
99,449 | 591,271 | ||||||
| Veidekke ASA |
285,164 | 2,996,812 | ||||||
| XXL ASA(a)(b) |
186,476 | 617,140 | ||||||
|
|
|
|||||||
| Total Norway |
|
49,803,651 | ||||||
| Portugal – 1.7% | ||||||||
| Altri, SGPS, S.A. |
786,486 | 6,164,078 | ||||||
| Mota-Engil, SGPS, S.A.*(a) |
471,744 | 1,080,583 | ||||||
| NOS, SGPS, S.A. |
1,642,196 | 10,510,456 | ||||||
| REN – Redes Energeticas Nacionais, SGPS, S.A. |
1,368,292 | 3,905,495 | ||||||
| Semapa-Sociedade de Investimento e Gestao |
66,672 | 1,087,006 | ||||||
| Sonae Capital, SGPS, S.A. |
1,089,478 | 1,070,405 | ||||||
| Sonae, SGPS, S.A. |
3,839,709 | 3,975,126 | ||||||
|
|
|
|||||||
| Total Portugal |
|
27,793,149 | ||||||
| Singapore – 3.8% | ||||||||
| Accordia Golf Trust |
6,141,671 | 2,697,892 | ||||||
| Asian Pay Television Trust |
11,183,617 | 1,040,336 | ||||||
See Notes to Financial Statements.
| 66 | WisdomTree Trust |
Schedule of Investments (continued)
WisdomTree International SmallCap Dividend Fund (DLS)
March 31, 2019
| Investments | Shares | Value | ||||||
| Banyan Tree Holdings Ltd. |
1,033,442 | $ | 434,893 | |||||
| Best World International Ltd.(a) |
786,000 | 1,259,225 | ||||||
| Boustead Singapore Ltd. |
1,378,100 | 803,764 | ||||||
| China Aviation Oil Singapore Corp., Ltd.(a) |
751,500 | 743,455 | ||||||
| Chip Eng Seng Corp., Ltd.(a) |
1,195,860 | 675,403 | ||||||
| CITIC Envirotech Ltd. |
3,071,200 | 1,088,354 | ||||||
| CSE Global Ltd. |
2,303,600 | 918,379 | ||||||
| First Resources Ltd. |
1,618,000 | 1,959,040 | ||||||
| Geo Energy Resources Ltd.(a) |
5,207,400 | 684,324 | ||||||
| GuocoLand Ltd.(a) |
1,560,000 | 2,234,330 | ||||||
| HRnetgroup Ltd. |
407,000 | 232,872 | ||||||
| Hutchison Port Holdings Trust |
35,691,800 | 8,387,573 | ||||||
| Japfa Ltd. |
2,459,100 | 1,180,078 | ||||||
| Keppel Infrastructure Trust(a) |
11,510,088 | 3,951,414 | ||||||
| KSH Holdings Ltd. |
2,132,125 | 794,923 | ||||||
| Lian Beng Group Ltd. |
2,803,500 | 1,034,884 | ||||||
| OUE Ltd.(a) |
722,500 | 906,792 | ||||||
| Oxley Holdings Ltd. |
5,379,500 | 1,231,189 | ||||||
| QAF Ltd. |
1,814,363 | 1,125,186 | ||||||
| Raffles Medical Group Ltd. |
2,233,500 | 1,764,374 | ||||||
| Sheng Siong Group Ltd. |
3,727,000 | 2,861,632 | ||||||
| SIA Engineering Co., Ltd. |
1,452,000 | 2,637,076 | ||||||
| Singapore Post Ltd. |
4,751,100 | 3,507,641 | ||||||
| StarHub Ltd. |
10,168,400 | 11,185,615 | ||||||
| Tuan Sing Holdings Ltd. |
2,301,000 | 688,007 | ||||||
| UMS Holdings Ltd.(a) |
3,141,859 | 1,681,689 | ||||||
| United Engineers Ltd. |
1,172,589 | 2,181,561 | ||||||
| Wing Tai Holdings Ltd. |
8,000 | 11,990 | ||||||
| Yanlord Land Group Ltd. |
3,489,100 | 3,503,268 | ||||||
|
|
|
|||||||
| Total Singapore |
|
63,407,159 | ||||||
| Spain – 1.7% | ||||||||
| Almirall S.A. |
107,054 | 1,827,125 | ||||||
| Applus Services S.A. |
92,750 | 1,108,096 | ||||||
| Atresmedia Corp. de Medios de Comunicacion S.A.(a) |
630,502 | 2,957,853 | ||||||
| Bolsas y Mercados Espanoles SHMSF S.A. |
211,086 | 5,906,486 | ||||||
| Construcciones y Auxiliar de Ferrocarriles S.A. |
19,162 | 921,963 | ||||||
| Ence Energia y Celulosa S.A. |
800,432 | 4,457,874 | ||||||
| Euskaltel S.A.(b) |
324,546 | 3,026,478 | ||||||
| Faes Farma S.A. |
498,129 | 2,108,652 | ||||||
| Lar Espana Real Estate Socimi S.A. |
207,756 | 1,735,594 | ||||||
| Obrascon Huarte Lain S.A.(a) |
1,669,665 | 2,104,444 | ||||||
| Tecnicas Reunidas S.A.(a) |
99,145 | 2,790,917 | ||||||
|
|
|
|||||||
| Total Spain |
|
28,945,482 | ||||||
| Sweden – 5.8% | ||||||||
| Acando AB |
665,796 | 2,964,581 | ||||||
| AddTech AB Class B |
107,649 | 2,239,955 | ||||||
| AF Poyry AB Class B(a) |
111,761 | 1,867,644 | ||||||
| Ahlstrom-Munksjo Oyj(a) |
151,714 | 2,327,009 | ||||||
| Alimak Group AB(a)(b) |
94,782 | 1,352,963 | ||||||
| Arjo AB Class B |
284,537 | 1,049,148 | ||||||
| Atrium Ljungberg AB Class B |
235,739 | 4,036,026 | ||||||
| Attendo AB(b) |
228,322 | 1,152,035 | ||||||
| Avanza Bank Holding AB |
43,226 | 1,859,473 | ||||||
| Betsson AB* |
426,166 | 3,240,595 | ||||||
| Bilia AB Class A |
386,276 | 3,304,583 | ||||||
| BioGaia AB Class B |
18,060 | 886,907 | ||||||
| Bonava AB Class B |
295,792 | 3,727,975 | ||||||
| Bravida Holding AB(b) |
216,377 | 1,911,754 | ||||||
| Bulten AB(a) |
142,786 | 1,223,840 | ||||||
| Cloetta AB Class B |
415,208 | 1,074,358 | ||||||
| Coor Service Management Holding AB(b) |
344,040 | 3,071,223 | ||||||
| Duni AB |
140,940 | 1,525,598 | ||||||
| Dustin Group AB(b) |
249,668 | 2,347,207 | ||||||
| Evolution Gaming Group AB(b) |
29,074 | 2,296,066 | ||||||
| Granges AB |
93,138 | 960,972 | ||||||
| Hemfosa Fastigheter AB |
332,478 | 2,923,203 | ||||||
| HIQ International AB* |
247,033 | 1,598,005 | ||||||
| Holmen AB Class B |
135,786 | 2,949,865 | ||||||
| KNOW IT AB |
74,231 | 1,592,614 | ||||||
| Kungsleden AB |
466,802 | 3,724,230 | ||||||
| Loomis AB Class B |
91,150 | 3,144,696 | ||||||
| Mycronic AB(a) |
233,264 | 3,332,235 | ||||||
| NetEnt AB* |
523,947 | 1,906,484 | ||||||
| New Wave Group AB Class B |
261,182 | 1,712,060 | ||||||
| Nobia AB |
465,342 | 2,734,266 | ||||||
| Nobina AB(b) |
240,066 | 1,549,055 | ||||||
| Nolato AB Class B |
57,396 | 2,391,681 | ||||||
| NP3 Fastigheter AB |
200,756 | 1,623,311 | ||||||
| Peab AB |
362,565 | 3,140,825 | ||||||
| Platzer Fastigheter Holding AB Class B |
156,394 | 1,289,893 | ||||||
| Resurs Holding AB(b) |
756,450 | 4,697,586 | ||||||
| Rottneros AB |
748,500 | 884,452 | ||||||
| Scandi Standard AB |
211,528 | 1,395,698 | ||||||
| SkiStar AB |
98,440 | 1,086,148 | ||||||
| Thule Group AB(b) |
65,481 | 1,482,541 | ||||||
| Wallenstam AB Class B |
402,272 | 4,070,297 | ||||||
| Wihlborgs Fastigheter AB |
235,416 | 3,216,275 | ||||||
|
|
|
|||||||
| Total Sweden |
|
96,865,332 | ||||||
| Switzerland – 1.5% | ||||||||
| Ascom Holding AG Registered Shares |
128,756 | 1,724,676 | ||||||
| Cembra Money Bank AG |
103,676 | 9,801,281 | ||||||
| EFG International AG* |
501,690 | 3,173,659 | ||||||
| Implenia AG Registered Shares |
32,583 | 970,391 | ||||||
| Oriflame Holding AG |
88,576 | 1,704,615 | ||||||
| Panalpina Welttransport Holding AG Registered Shares |
37,310 | 6,211,465 | ||||||
| Ypsomed Holding AG Registered Shares* |
11,620 | 1,487,649 | ||||||
|
|
|
|||||||
| Total Switzerland |
|
25,073,736 | ||||||
| United Kingdom – 15.2% | ||||||||
| A.G. Barr PLC |
97,202 | 1,022,139 | ||||||
| AA PLC |
269,572 | 319,652 | ||||||
| Aggreko PLC |
469,918 | 4,820,237 | ||||||
| Ascential PLC |
191,523 | 889,946 | ||||||
| Balfour Beatty PLC |
377,856 | 1,290,490 | ||||||
| BCA Marketplace PLC |
1,285,059 | 3,308,805 | ||||||
See Notes to Financial Statements.
| WisdomTree Trust | 67 |
Schedule of Investments (continued)
WisdomTree International SmallCap Dividend Fund (DLS)
March 31, 2019
| Investments | Shares | Value | ||||||
| Big Yellow Group PLC |
262,619 | $ | 3,392,971 | |||||
| Bodycote PLC |
120,613 | 1,293,467 | ||||||
| Bovis Homes Group PLC |
174,460 | 2,417,656 | ||||||
| Brewin Dolphin Holdings PLC |
526,775 | 2,142,986 | ||||||
| Britvic PLC |
477,541 | 5,927,027 | ||||||
| Card Factory PLC |
1,888,262 | 4,436,283 | ||||||
| CareTech Holdings PLC |
210,310 | 918,049 | ||||||
| Central Asia Metals PLC |
495,086 | 1,528,939 | ||||||
| Chesnara PLC |
311,098 | 1,532,323 | ||||||
| Civitas Social Housing PLC |
1,604,072 | 2,006,579 | ||||||
| Clinigen Group PLC |
82,220 | 992,623 | ||||||
| Close Brothers Group PLC |
26,042 | 493,740 | ||||||
| CMC Markets PLC(b) |
974,172 | 1,054,867 | ||||||
| Coats Group PLC |
1,064,934 | 1,097,641 | ||||||
| Computacenter PLC |
156,206 | 2,251,200 | ||||||
| Concentric AB |
83,100 | 1,317,014 | ||||||
| ContourGlobal PLC(b) |
314,036 | 706,287 | ||||||
| Costain Group PLC |
212,789 | 928,871 | ||||||
| Countryside Properties PLC(b) |
408,909 | 1,730,629 | ||||||
| Cranswick PLC |
69,081 | 2,450,236 | ||||||
| Crest Nicholson Holdings PLC |
995,381 | 4,799,017 | ||||||
| Dairy Crest Group PLC |
112,248 | 908,304 | ||||||
| Dart Group PLC |
36,770 | 380,191 | ||||||
| De La Rue PLC |
289,679 | 1,455,133 | ||||||
| Devro PLC |
483,810 | 1,241,945 | ||||||
| DFS Furniture PLC |
331,626 | 1,082,474 | ||||||
| Diploma PLC |
131,655 | 2,501,244 | ||||||
| Dixons Carphone PLC |
2,967,236 | 5,674,027 | ||||||
| Domino’s Pizza Group PLC |
716,883 | 2,260,606 | ||||||
| Drax Group PLC |
614,501 | 3,029,946 | ||||||
| Dunelm Group PLC |
331,219 | 3,752,719 | ||||||
| Elementis PLC |
855,104 | 1,810,646 | ||||||
| EMIS Group PLC |
50,459 | 690,382 | ||||||
| Epwin Group PLC |
889,500 | 846,116 | ||||||
| Equiniti Group PLC(b) |
336,516 | 912,074 | ||||||
| Essentra PLC |
500,674 | 2,694,426 | ||||||
| Eurocell PLC |
186,862 | 579,508 | ||||||
| Euromoney Institutional Investor PLC |
104,282 | 1,709,430 | ||||||
| FDM Group Holdings PLC |
105,097 | 1,231,151 | ||||||
| Ferrexpo PLC |
745,404 | 2,404,936 | ||||||
| Galliford Try PLC |
366,002 | 3,178,666 | ||||||
| Games Workshop Group PLC |
104,088 | 4,265,624 | ||||||
| Gamma Communications PLC |
84,096 | 1,071,705 | ||||||
| Genus PLC |
52,156 | 1,508,754 | ||||||
| Go-Ahead Group PLC (The) |
122,602 | 3,132,827 | ||||||
| Greene King PLC |
762,858 | 6,614,359 | ||||||
| Greggs PLC |
89,738 | 2,150,400 | ||||||
| Halfords Group PLC |
560,186 | 1,693,485 | ||||||
| Hastings Group Holdings PLC(b) |
1,340,369 | 3,783,067 | ||||||
| Headlam Group PLC |
303,056 | 1,761,242 | ||||||
| Helical PLC |
142,207 | 612,426 | ||||||
| Hill & Smith Holdings PLC |
168,228 | 2,724,775 | ||||||
| Hilton Food Group PLC |
76,258 | 943,996 | ||||||
| Huntsworth PLC |
877,616 | 983,477 | ||||||
| Ibstock PLC(b) |
523,778 | 1,636,657 | ||||||
| Inmarsat PLC |
1,014,040 | 7,333,466 | ||||||
| ITE Group PLC |
2,115,268 | 1,929,411 | ||||||
| J D Wetherspoon PLC |
71,516 | 1,220,775 | ||||||
| James Fisher & Sons PLC |
63,729 | 1,640,912 | ||||||
| James Halstead PLC |
254,119 | 1,473,528 | ||||||
| John Laing Group PLC(b) |
388,831 | 1,925,332 | ||||||
| John Menzies PLC |
243,498 | 1,548,376 | ||||||
| Johnson Service Group PLC |
542,595 | 982,770 | ||||||
| Jupiter Fund Management PLC |
1,558,382 | 7,346,893 | ||||||
| Kcom Group PLC |
1,675,691 | 1,535,007 | ||||||
| Keller Group PLC |
109,584 | 881,036 | ||||||
| Kier Group PLC |
353,964 | 1,675,198 | ||||||
| Lookers PLC |
1,240,496 | 1,632,593 | ||||||
| M&C Saatchi PLC |
117,864 | 575,935 | ||||||
| Marshalls PLC |
248,000 | 1,998,723 | ||||||
| Marston’s PLC |
3,035,172 | 4,061,767 | ||||||
| McBride PLC* |
518,684 | 675,871 | ||||||
| McColl’s Retail Group PLC(a) |
218,113 | 206,338 | ||||||
| Microgen PLC |
20,100 | 96,908 | ||||||
| Millennium & Copthorne Hotels PLC |
167,711 | 996,524 | ||||||
| MJ Gleeson PLC |
107,850 | 1,129,893 | ||||||
| Moneysupermarket.com Group PLC |
211,037 | 1,023,245 | ||||||
| Morgan Advanced Materials PLC |
349,295 | 1,106,012 | ||||||
| Morgan Sindall Group PLC |
44,594 | 728,677 | ||||||
| N Brown Group PLC |
1,143,301 | 1,466,687 | ||||||
| National Express Group PLC |
983,163 | 5,201,311 | ||||||
| NCC Group PLC |
225,360 | 411,118 | ||||||
| Northgate PLC |
294,259 | 1,434,044 | ||||||
| Numis Corp. PLC |
291,446 | 949,422 | ||||||
| OneSavings Bank PLC |
292,919 | 1,464,156 | ||||||
| Oxford Instruments PLC |
54,532 | 694,236 | ||||||
| Pagegroup PLC |
1,093,889 | 6,699,345 | ||||||
| PayPoint PLC |
144,598 | 1,614,746 | ||||||
| Photo-Me International PLC |
1,626,193 | 1,690,971 | ||||||
| Polar Capital Holdings PLC |
147,838 | 1,005,583 | ||||||
| Polypipe Group PLC |
271,315 | 1,424,755 | ||||||
| PZ Cussons PLC |
844,440 | 2,158,883 | ||||||
| QinetiQ Group PLC |
580,876 | 2,279,815 | ||||||
| Rank Group PLC |
940,245 | 1,928,444 | ||||||
| Redde PLC |
992,824 | 1,539,503 | ||||||
| Renewi PLC |
2,136,967 | 654,375 | ||||||
| Restaurant Group PLC (The) |
1,337,903 | 2,057,159 | ||||||
| RPS Group PLC |
447,133 | 1,090,696 | ||||||
| RWS Holdings PLC |
390,785 | 2,454,405 | ||||||
| Safestore Holdings PLC |
242,290 | 1,883,247 | ||||||
| Saga PLC |
3,765,692 | 5,456,458 | ||||||
| Savills PLC |
172,732 | 2,035,835 | ||||||
| Senior PLC |
257,357 | 731,732 | ||||||
| SIG PLC |
992,578 | 1,836,598 | ||||||
| Smart Metering Systems PLC |
16,470 | 116,964 | ||||||
| Spirent Communications PLC |
840,635 | 1,575,171 | ||||||
| St. Modwen Properties PLC |
199,269 | 1,030,321 | ||||||
| Stagecoach Group PLC |
2,407,316 | 4,818,208 | ||||||
See Notes to Financial Statements.
| 68 | WisdomTree Trust |
Schedule of Investments (concluded)
WisdomTree International SmallCap Dividend Fund (DLS)
March 31, 2019
| Investments | Shares | Value | ||||||
| SThree PLC |
231,459 | $ | 811,311 | |||||
| Stock Spirits Group PLC |
445,069 | 1,333,879 | ||||||
| Synthomer PLC |
395,584 | 1,955,678 | ||||||
| TalkTalk Telecom Group PLC(a) |
1,901,064 | 2,732,332 | ||||||
| TBC Bank Group PLC |
80,609 | 1,621,780 | ||||||
| Ted Baker PLC |
58,859 | 1,194,928 | ||||||
| Telecom Plus PLC |
124,163 | 2,459,218 | ||||||
| TT Electronics PLC |
229,346 | 649,997 | ||||||
| Tyman PLC |
381,707 | 1,203,668 | ||||||
| U & I Group PLC |
295,659 | 721,204 | ||||||
| Ultra Electronics Holdings PLC |
101,370 | 2,108,160 | ||||||
| Vertu Motors PLC |
1,300,648 | 596,997 | ||||||
| Vesuvius PLC |
566,801 | 4,383,415 | ||||||
| Volution Group PLC |
172,269 | 380,485 | ||||||
| WH Smith PLC |
149,018 | 4,120,457 | ||||||
| Wincanton PLC |
32,228 | 99,318 | ||||||
| XPS Pensions Group PLC |
116,480 | 209,455 | ||||||
|
|
|
|||||||
| Total United Kingdom |
|
254,308,052 | ||||||
| TOTAL COMMON STOCKS (Cost: $1,564,000,682) |
1,649,307,944 | |||||||
| RIGHTS – 0.0% |
| |||||||
| Singapore – 0.0% | ||||||||
| Keppel Infrastructure Trust, expiring 4/4/19* |
1,363,595 | 24,161 | ||||||
| Sweden – 0.0% | ||||||||
| AF Poyry AB, expiring 4/12/19*(a) |
111,761 | 228,937 | ||||||
| TOTAL RIGHTS (Cost: $0) |
253,098 | |||||||
| EXCHANGE-TRADED FUNDS – 0.8% |
| |||||||
| United States – 0.8% | ||||||||
| WisdomTree Europe SmallCap Dividend Fund(c) |
124,546 | 7,277,796 | ||||||
| WisdomTree Japan SmallCap Dividend Fund(c) |
86,816 | 5,920,851 | ||||||
| TOTAL EXCHANGE-TRADED FUNDS (Cost: $13,715,012) |
13,198,647 | |||||||
| Principal Amount† |
||||||||
| FOREIGN CORPORATE BOND – 0.0% | ||||||||
| Israel – 0.0% | ||||||||
| IDB Development Corp. Ltd. 4.95%, 12/18/25, Series B9 |
||||||||
| (Cost: $161,512) | 734,891 | ILS | 112,540 | |||||
| Investments | Shares | Value | ||||||
| INVESTMENT OF CASH COLLATERAL FOR SECURITIES LOANED – 4.8% |
| |||||||
| United States – 4.8% |
| |||||||
| State Street Navigator Securities Lending Government Money Market Portfolio, 2.46%(d) |
||||||||
| (Cost: $80,551,752)(e) | 80,551,752 | 80,551,752 | ||||||
| TOTAL INVESTMENTS IN SECURITIES – 104.2% (Cost: $1,658,428,958) |
|
1,743,423,981 | ||||||
| Other Assets less Liabilities – (4.2)% |
|
(70,329,046 | ) | |||||
|
|
|
|||||||
| NET ASSETS – 100.0% | $ | 1,673,094,935 | ||||||
| † | Principal amount is reported in U.S. dollars unless otherwise noted. |
| * | Non-income producing security. |
| (a) | Security, or portion thereof, was on loan at March 31, 2019 (See Note 2). |
| (b) | This security is exempt from registration under rule 144A of the Securities Act of 1933. This security may be sold in transactions that are exempt from registration, normally to qualified institutional buyers. |
| (c) | Affiliated company (See Note 3). |
| (d) | Rate shown represents annualized 7-day yield as of March 31, 2019. |
| (e) | At March 31, 2019, the total market value of the Fund’s securities on loan identified in the Schedule of Investments was $197,556,350. The total market value of the collateral held by the Fund was $208,852,281. The total market value of the collateral includes non-cash U.S. Government securities collateral having a value of $128,300,529. |
CVA – Certificaten Van Aandelen (Certificate of Stock)
| CURRENCY LEGEND | ||
| ILS | Israeli new shekel | |
See Notes to Financial Statements.
| WisdomTree Trust | 69 |
Schedule of Investments
WisdomTree Japan SmallCap Dividend Fund (DFJ)
March 31, 2019
| Investments | Shares | Value | ||||||
| COMMON STOCKS – 98.7% |
| |||||||
| Japan – 98.7% |
| |||||||
| Air Freight & Logistics – 0.3% |
| |||||||
| AIT Corp. |
20,300 | $ | 204,128 | |||||
| Kintetsu World Express, Inc. |
29,000 | 441,740 | ||||||
| Konoike Transport Co., Ltd. |
32,600 | 539,283 | ||||||
| Maruwa Unyu Kikan Co., Ltd.(a) |
10,500 | 359,534 | ||||||
| SBS Holdings, Inc. |
15,800 | 265,653 | ||||||
|
|
|
|||||||
| Total Air Freight & Logistics |
|
1,810,338 | ||||||
| Auto Components – 5.9% |
| |||||||
| Ahresty Corp.(a) |
36,900 | 211,029 | ||||||
| Aisan Industry Co., Ltd. |
75,400 | 463,224 | ||||||
| Daido Metal Co., Ltd.(a) |
52,700 | 337,097 | ||||||
| Daikyonishikawa Corp. |
60,600 | 556,260 | ||||||
| Eagle Industry Co., Ltd. |
55,300 | 604,036 | ||||||
| Exedy Corp.(a) |
45,625 | 988,470 | ||||||
| FCC Co., Ltd. |
31,400 | 664,113 | ||||||
| Futaba Industrial Co., Ltd. |
78,300 | 385,540 | ||||||
| G-Tekt Corp. |
43,900 | 606,830 | ||||||
| H-One Co., Ltd. |
27,400 | 221,804 | ||||||
| IJT Technology Holdings Co., Ltd.(a) |
68,600 | 360,090 | ||||||
| Imasen Electric Industrial |
44,700 | 404,253 | ||||||
| Kasai Kogyo Co., Ltd.(a) |
49,000 | 362,127 | ||||||
| Keihin Corp. |
68,421 | 1,120,105 | ||||||
| KYB Corp.(a) |
27,240 | 668,910 | ||||||
| Musashi Seimitsu Industry Co., Ltd. |
44,400 | 601,708 | ||||||
| NHK Spring Co., Ltd.(a) |
189,900 | 1,705,386 | ||||||
| Nichirin Co., Ltd. |
19,900 | 319,306 | ||||||
| Nifco, Inc.(a) |
63,672 | 1,622,217 | ||||||
| Nihon Tokushu Toryo Co., Ltd. |
6,400 | 66,668 | ||||||
| Nissin Kogyo Co., Ltd. |
61,900 | 775,672 | ||||||
| NOK Corp.(a) |
185,500 | 2,887,623 | ||||||
| Pacific Industrial Co., Ltd.(a) |
50,000 | 702,896 | ||||||
| Piolax, Inc.(a) |
31,800 | 611,666 | ||||||
| Press Kogyo Co., Ltd. |
70,500 | 373,885 | ||||||
| Riken Corp. |
13,900 | 631,675 | ||||||
| Sanoh Industrial Co., Ltd.(a) |
77,300 | 352,681 | ||||||
| Shoei Co., Ltd.(a) |
12,800 | 546,416 | ||||||
| Showa Corp. |
35,200 | 449,044 | ||||||
| Sumitomo Riko Co., Ltd. |
60,200 | 504,726 | ||||||
| T. RAD Co., Ltd. |
8,000 | 153,372 | ||||||
| Tachi-S Co., Ltd. |
14,000 | 200,352 | ||||||
| Taiho Kogyo Co., Ltd. |
44,600 | 364,666 | ||||||
| Tokai Rika Co., Ltd. |
126,858 | 2,162,723 | ||||||
| Topre Corp.(a) |
38,700 | 722,708 | ||||||
| Toyo Tire Corp. |
138,800 | 1,573,781 | ||||||
| Toyoda Gosei Co., Ltd. |
98,300 | 2,081,720 | ||||||
| Toyota Boshoku Corp. |
205,600 | 3,111,352 | ||||||
| TPR Co., Ltd. |
26,300 | 500,172 | ||||||
| TS Tech Co., Ltd. |
49,400 | 1,421,502 | ||||||
| Unipres Corp. |
45,703 | 713,922 | ||||||
| Yokohama Rubber Co., Ltd. (The) |
170,300 | 3,163,363 | ||||||
| Yorozu Corp.(a) |
29,500 | 385,391 | ||||||
|
|
|
|||||||
| Total Auto Components |
|
36,660,481 | ||||||
| Banks – 5.8% |
| |||||||
| 77 Bank Ltd. (The) |
45,700 | 638,731 | ||||||
| Akita Bank Ltd. (The) |
23,700 | 481,130 | ||||||
| Aomori Bank Ltd. (The) |
12,562 | 332,989 | ||||||
| Awa Bank Ltd. (The) |
19,975 | 507,834 | ||||||
| Bank of Nagoya Ltd. (The)(a) |
9,369 | 302,185 | ||||||
| Bank of Okinawa Ltd. (The) |
14,080 | 438,231 | ||||||
| Bank of Saga Ltd. (The) |
26,444 | 455,367 | ||||||
| Bank of the Ryukyus Ltd.(a) |
45,708 | 465,814 | ||||||
| Chugoku Bank Ltd. (The) |
121,000 | 1,135,827 | ||||||
| Chukyo Bank Ltd. (The) |
26,500 | 543,719 | ||||||
| Daishi Hokuetsu Financial Group, Inc. |
37,455 | 1,057,477 | ||||||
| Ehime Bank Ltd. (The)(a) |
62,999 | 647,720 | ||||||
| FIDEA Holdings Co., Ltd. |
360,800 | 427,021 | ||||||
| Fukui Bank Ltd. (The) |
25,048 | 383,352 | ||||||
| Gunma Bank Ltd. (The) |
362,200 | 1,371,114 | ||||||
| Hachijuni Bank Ltd. (The) |
517,600 | 2,146,437 | ||||||
| Hiroshima Bank Ltd. (The) |
292,100 | 1,488,408 | ||||||
| Hokkoku Bank Ltd. (The) |
26,462 | 829,590 | ||||||
| Hokuhoku Financial Group, Inc. |
136,400 | 1,420,872 | ||||||
| Hyakugo Bank Ltd. (The) |
165,600 | 526,640 | ||||||
| Hyakujushi Bank Ltd. (The) |
27,600 | 571,525 | ||||||
| Iyo Bank Ltd. (The) |
235,600 | 1,247,338 | ||||||
| Jimoto Holdings, Inc. |
300,200 | 314,615 | ||||||
| Juroku Bank Ltd. (The) |
41,400 | 840,829 | ||||||
| Keiyo Bank Ltd. (The) |
133,842 | 781,153 | ||||||
| Kiyo Bank Ltd. (The)(a) |
57,590 | 802,831 | ||||||
| Kyushu Financial Group, Inc.(a) |
424,600 | 1,726,250 | ||||||
| Miyazaki Bank Ltd. (The) |
24,300 | 607,912 | ||||||
| Musashino Bank Ltd. (The) |
27,100 | 540,849 | ||||||
| Nanto Bank Ltd. (The) |
40,700 | 762,263 | ||||||
| Nishi-Nippon Financial Holdings, Inc. |
171,700 | 1,458,174 | ||||||
| North Pacific Bank Ltd. |
521,515 | 1,305,142 | ||||||
| Ogaki Kyoritsu Bank Ltd. (The) |
46,142 | 958,816 | ||||||
| Oita Bank Ltd. (The) |
11,700 | 365,741 | ||||||
| San-In Godo Bank Ltd. (The) |
175,700 | 1,260,386 | ||||||
| Senshu Ikeda Holdings, Inc. |
421,440 | 1,081,348 | ||||||
| Shiga Bank Ltd. (The) |
26,584 | 633,587 | ||||||
| Shikoku Bank Ltd. (The) |
40,300 | 378,660 | ||||||
| Suruga Bank Ltd.*(a) |
174,300 | 807,841 | ||||||
| Tochigi Bank Ltd. (The) |
66,143 | 140,431 | ||||||
| Toho Bank Ltd. (The) |
269,900 | 721,782 | ||||||
| Tokyo Kiraboshi Financial Group, Inc.(a) |
22,100 | 312,477 | ||||||
| TOMONY Holdings, Inc. |
107,177 | 407,657 | ||||||
| Towa Bank Ltd. (The) |
29,400 | 189,120 | ||||||
| Yamagata Bank Ltd. (The) |
19,100 | 339,947 | ||||||
| Yamaguchi Financial Group, Inc. |
135,800 | 1,150,837 | ||||||
| Yamanashi Chuo Bank Ltd. (The) |
17,200 | 213,048 | ||||||
|
|
|
|||||||
| Total Banks |
|
35,521,017 | ||||||
| Beverages – 0.6% |
| |||||||
| Ito En Ltd. |
27,000 | 1,402,629 | ||||||
| Sapporo Holdings Ltd. |
41,498 | 906,181 | ||||||
| Takara Holdings, Inc. |
98,511 | 1,165,026 | ||||||
|
|
|
|||||||
| Total Beverages |
|
3,473,836 | ||||||
See Notes to Financial Statements.
| 70 | WisdomTree Trust |
Schedule of Investments (continued)
WisdomTree Japan SmallCap Dividend Fund (DFJ)
March 31, 2019
| Investments | Shares | Value | ||||||
| Building Products – 1.9% |
| |||||||
| Aica Kogyo Co., Ltd. |
50,115 | $ | 1,670,726 | |||||
| Bunka Shutter Co., Ltd. |
44,400 | 321,713 | ||||||
| Central Glass Co., Ltd. |
30,886 | 678,077 | ||||||
| Nichias Corp. |
55,113 | 1,091,455 | ||||||
| Nichiha Corp. |
18,400 | 507,025 | ||||||
| Nihon Flush Co., Ltd.(a) |
9,700 | 182,108 | ||||||
| Nitto Boseki Co., Ltd. |
20,799 | 372,065 | ||||||
| Noritz Corp. |
27,100 | 423,082 | ||||||
| Okabe Co., Ltd. |
91,100 | 787,665 | ||||||
| Sankyo Tateyama, Inc. |
24,200 | 325,334 | ||||||
| Sanwa Holdings Corp. |
202,866 | 2,413,828 | ||||||
| Shin Nippon Air Technologies Co., Ltd. |
31,000 | 541,663 | ||||||
| Sinko Industries Ltd. |
21,700 | 293,490 | ||||||
| Takara Standard Co., Ltd. |
62,431 | 956,051 | ||||||
| Takasago Thermal Engineering Co., Ltd. |
86,572 | 1,393,787 | ||||||
|
|
|
|||||||
| Total Building Products |
|
11,958,069 | ||||||
| Capital Markets – 2.5% |
| |||||||
| GCA Corp. |
61,200 | 435,701 | ||||||
| GMO Financial Holdings, Inc. |
152,100 | 886,340 | ||||||
| Ichiyoshi Securities Co., Ltd. |
99,088 | 694,695 | ||||||
| IwaiCosmo Holdings, Inc. |
51,300 | 572,858 | ||||||
| kabu.com Securities Co., Ltd. |
402,600 | 2,022,366 | ||||||
| Kyokuto Securities Co., Ltd.(a) |
80,400 | 746,725 | ||||||
| Marusan Securities Co., Ltd.(a) |
197,300 | 1,165,779 | ||||||
| Matsui Securities Co., Ltd.(a) |
439,400 | 4,136,557 | ||||||
| Mito Securities Co., Ltd. |
157,700 | 293,501 | ||||||
| Monex Group, Inc.(a) |
187,494 | 648,780 | ||||||
| Okasan Securities Group, Inc.(a) |
361,000 | 1,340,480 | ||||||
| Sparx Group Co., Ltd.(a) |
227,500 | 480,959 | ||||||
| Tokai Tokyo Financial Holdings, Inc.(a) |
533,500 | 1,932,814 | ||||||
| Toyo Securities Co., Ltd. |
241,600 | 309,953 | ||||||
|
|
|
|||||||
| Total Capital Markets |
|
15,667,508 | ||||||
| Chemicals – 7.2% |
| |||||||
| Achilles Corp.(a) |
27,600 | 476,021 | ||||||
| ADEKA Corp. |
74,425 | 1,091,311 | ||||||
| Arakawa Chemical Industries Ltd.(a) |
26,300 | 323,389 | ||||||
| Asahi Yukizai Corp. |
20,100 | 295,639 | ||||||
| C.I. Takiron Corp. |
96,300 | 522,022 | ||||||
| Chugoku Marine Paints Ltd.(a) |
70,400 | 630,315 | ||||||
| Dainichiseika Color & Chemicals Manufacturing Co., Ltd. |
17,242 | 470,442 | ||||||
| Denka Co., Ltd. |
98,000 | 2,824,412 | ||||||
| DIC Corp. |
133,800 | 3,910,584 | ||||||
| Fujimi, Inc. |
27,300 | 596,636 | ||||||
| Fujimori Kogyo Co., Ltd. |
19,100 | 524,588 | ||||||
| Fuso Chemical Co., Ltd.(a) |
19,400 | 326,357 | ||||||
| JCU Corp. |
20,100 | 314,343 | ||||||
| JSP Corp.(a) |
14,123 | 311,718 | ||||||
| Kaneka Corp. |
44,500 | 1,666,463 | ||||||
| Kanto Denka Kogyo Co., Ltd. |
32,700 | 220,393 | ||||||
| KH Neochem Co., Ltd. |
26,400 | 636,834 | ||||||
| Koatsu Gas Kogyo Co., Ltd. |
64,700 | 499,199 | ||||||
| Konishi Co., Ltd. |
14,200 | 205,780 | ||||||
| Kumiai Chemical Industry Co., Ltd. |
62,424 | 440,467 | ||||||
| Kureha Corp.(a) |
10,664 | 598,305 | ||||||
| Lintec Corp. |
72,265 | 1,563,016 | ||||||
| Moriroku Holdings Co., Ltd. |
27,200 | 640,405 | ||||||
| Nihon Nohyaku Co., Ltd.(a) |
98,100 | 395,289 | ||||||
| Nihon Parkerizing Co., Ltd. |
64,500 | 805,339 | ||||||
| Nippon Kayaku Co., Ltd. |
187,800 | 2,219,293 | ||||||
| Nippon Shokubai Co., Ltd. |
28,100 | 1,832,967 | ||||||
| Nippon Soda Co., Ltd. |
25,618 | 676,759 | ||||||
| NOF Corp. |
68,000 | 2,316,122 | ||||||
| Okamoto Industries, Inc. |
13,487 | 681,143 | ||||||
| Okura Industrial Co., Ltd. |
19,390 | 312,174 | ||||||
| Osaka Organic Chemical Industry Ltd. |
27,500 | 270,317 | ||||||
| Osaka Soda Co., Ltd. |
23,500 | 576,221 | ||||||
| Riken Technos Corp. |
98,900 | 404,768 | ||||||
| Sakai Chemical Industry Co., Ltd. |
11,100 | 243,792 | ||||||
| Sakata INX Corp. |
44,700 | 412,330 | ||||||
| Sanyo Chemical Industries Ltd. |
17,435 | 806,498 | ||||||
| Sekisui Plastics Co., Ltd. |
44,300 | 355,809 | ||||||
| Shikoku Chemicals Corp.(a) |
41,100 | 449,302 | ||||||
| Sumitomo Bakelite Co., Ltd. |
26,618 | 953,520 | ||||||
| Sumitomo Seika Chemicals Co., Ltd. |
8,100 | 297,845 | ||||||
| T Hasegawa Co., Ltd. |
26,000 | 419,298 | ||||||
| Taiyo Holdings Co., Ltd. |
41,991 | 1,382,818 | ||||||
| Takasago International Corp. |
21,100 | 637,661 | ||||||
| Tayca Corp.(a) |
13,900 | 320,359 | ||||||
| Toagosei Co., Ltd. |
86,000 | 909,066 | ||||||
| Tokuyama Corp. |
24,000 | 566,364 | ||||||
| Tokyo Ohka Kogyo Co., Ltd. |
27,000 | 736,685 | ||||||
| Toyo Ink SC Holdings Co., Ltd. |
56,602 | 1,270,777 | ||||||
| Toyobo Co., Ltd.(a) |
87,953 | 1,124,394 | ||||||
| Ube Industries Ltd. |
104,493 | 2,147,731 | ||||||
| Valqua Ltd.(a) |
21,137 | 422,606 | ||||||
| Zeon Corp. |
108,700 | 1,099,914 | ||||||
|
|
|
|||||||
| Total Chemicals |
|
44,135,800 | ||||||
| Commercial Services & Supplies – 1.5% |
| |||||||
| Aeon Delight Co., Ltd. |
27,000 | 1,050,142 | ||||||
| Bell System24 Holdings, Inc. |
62,700 | 774,934 | ||||||
| Daiseki Co., Ltd. |
14,107 | 342,973 | ||||||
| Inui Global Logistics Co., Ltd.(a) |
36,700 | 296,757 | ||||||
| Kokuyo Co., Ltd. |
73,703 | 1,081,390 | ||||||
| Matsuda Sangyo Co., Ltd. |
37,300 | 469,430 | ||||||
| Mitsubishi Pencil Co., Ltd. |
39,600 | 767,421 | ||||||
| Nakamoto Packs Co., Ltd. |
26,400 | 363,496 | ||||||
| Nichiban Co., Ltd. |
9,500 | 201,184 | ||||||
| Nippon Air Conditioning Services Co., Ltd. |
44,500 | 273,791 | ||||||
| Nippon Parking Development Co., Ltd. |
271,700 | 422,211 | ||||||
| Okamura Corp. |
80,876 | 846,865 | ||||||
| Pilot Corp. |
8,600 | 348,475 | ||||||
| Prestige International, Inc. |
18,800 | 236,094 | ||||||
| Relia, Inc. |
48,700 | 424,588 | ||||||
| Sato Holdings Corp. |
27,138 | 636,493 | ||||||
| Toppan Forms Co., Ltd. |
114,600 | 978,425 | ||||||
|
|
|
|||||||
| Total Commercial Services & Supplies |
|
9,514,669 | ||||||
See Notes to Financial Statements.
| WisdomTree Trust | 71 |
Schedule of Investments (continued)
WisdomTree Japan SmallCap Dividend Fund (DFJ)
March 31, 2019
| Investments | Shares | Value | ||||||
| Construction & Engineering – 5.8% |
| |||||||
| Asanuma Corp.(a) |
9,400 | $ | 208,917 | |||||
| Asunaro Aoki Construction Co., Ltd. |
65,000 | 575,507 | ||||||
| COMSYS Holdings Corp.(a) |
81,100 | 2,212,784 | ||||||
| Daiho Corp. |
19,000 | 555,315 | ||||||
| Fudo Tetra Corp. |
17,460 | 227,468 | ||||||
| Hazama Ando Corp. |
175,900 | 1,177,593 | ||||||
| Kandenko Co., Ltd. |
158,538 | 1,354,989 | ||||||
| Kitano Construction Corp. |
9,365 | 263,135 | ||||||
| Kumagai Gumi Co., Ltd. |
45,100 | 1,409,821 | ||||||
| Kyowa Exeo Corp. |
80,166 | 2,212,650 | ||||||
| Kyudenko Corp. |
39,190 | 1,228,615 | ||||||
| Maeda Corp. |
97,487 | 967,075 | ||||||
| Maeda Road Construction Co., Ltd. |
78,694 | 1,527,880 | ||||||
| Matsui Construction Co., Ltd. |
53,200 | 341,257 | ||||||
| Meisei Industrial Co., Ltd. |
62,400 | 421,130 | ||||||
| Mirait Holdings Corp.(a) |
55,800 | 815,184 | ||||||
| Nippo Corp. |
96,558 | 1,800,567 | ||||||
| Nippon Densetsu Kogyo Co., Ltd. |
45,100 | 938,794 | ||||||
| Nippon Koei Co., Ltd. |
10,500 | 222,361 | ||||||
| Nippon Road Co., Ltd. (The) |
8,600 | 505,814 | ||||||
| Nishimatsu Construction Co., Ltd. |
58,907 | 1,305,496 | ||||||
| Nittoc Construction Co., Ltd.(a) |
99,900 | 537,927 | ||||||
| Okumura Corp. |
79,070 | 2,511,009 | ||||||
| OSJB Holdings Corp. |
80,300 | 200,959 | ||||||
| Penta-Ocean Construction Co., Ltd. |
180,593 | 837,008 | ||||||
| PS Mitsubishi Construction Co., Ltd.(a) |
81,100 | 485,054 | ||||||
| Raito Kogyo Co., Ltd. |
61,700 | 831,697 | ||||||
| Shinnihon Corp. |
38,200 | 338,566 | ||||||
| SHO-BOND Holdings Co., Ltd. |
11,300 | 754,456 | ||||||
| Sumitomo Densetsu Co., Ltd. |
28,300 | 480,168 | ||||||
| Sumitomo Mitsui Construction Co., Ltd. |
136,360 | 949,845 | ||||||
| Taihei Dengyo Kaisha Ltd. |
16,400 | 348,344 | ||||||
| Taikisha Ltd. |
27,165 | 825,859 | ||||||
| Tekken Corp. |
19,700 | 485,180 | ||||||
| Toda Corp. |
227,649 | 1,398,575 | ||||||
| Tokyo Energy & Systems, Inc. |
44,400 | 395,121 | ||||||
| Tokyu Construction Co., Ltd. |
98,400 | 737,878 | ||||||
| Toshiba Plant Systems & Services Corp. |
62,400 | 1,106,665 | ||||||
| Totetsu Kogyo Co., Ltd. |
26,479 | 729,647 | ||||||
| Toyo Construction Co., Ltd. |
97,900 | 377,678 | ||||||
| Yahagi Construction Co., Ltd. |
77,800 | 539,121 | ||||||
| Yokogawa Bridge Holdings Corp.(a) |
12,200 | 209,754 | ||||||
| Yurtec Corp. |
93,900 | 687,166 | ||||||
|
|
|
|||||||
| Total Construction & Engineering |
|
36,040,029 | ||||||
| Construction Materials – 0.3% |
| |||||||
| Geostr Corp. |
106,500 | 414,704 | ||||||
| Krosaki Harima Corp. |
9,700 | 485,504 | ||||||
| Sumitomo Osaka Cement Co., Ltd. |
30,340 | 1,195,125 | ||||||
|
|
|
|||||||
| Total Construction Materials |
|
2,095,333 | ||||||
| Consumer Finance – 0.0% |
| |||||||
| J Trust Co., Ltd.(a) |
62,600 | 213,785 | ||||||
| Containers & Packaging – 1.0% |
| |||||||
| FP Corp. |
20,200 | 1,193,549 | ||||||
| Fuji Seal International, Inc. |
21,210 | 766,500 | ||||||
| Hokkan Holdings Ltd.(a) |
11,400 | 197,853 | ||||||
| Nihon Yamamura Glass Co., Ltd. |
27,200 | 355,098 | ||||||
| Pack Corp. (The) |
16,500 | 506,098 | ||||||
| Rengo Co., Ltd. |
143,500 | 1,345,738 | ||||||
| Toyo Seikan Group Holdings Ltd. |
76,900 | 1,575,031 | ||||||
|
|
|
|||||||
| Total Containers & Packaging |
|
5,939,867 | ||||||
| Distributors – 0.7% |
| |||||||
| Arata Corp. |
8,300 | 286,078 | ||||||
| Canon Marketing Japan, Inc. |
158,200 | 3,111,546 | ||||||
| Doshisha Co., Ltd. |
32,200 | 502,411 | ||||||
| Happinet Corp. |
29,800 | 384,733 | ||||||
|
|
|
|||||||
| Total Distributors |
|
4,284,768 | ||||||
| Diversified Consumer Services – 0.8% |
| |||||||
| Benesse Holdings, Inc. |
97,700 | 2,537,720 | ||||||
| Meiko Network Japan Co., Ltd.(a) |
27,286 | 237,398 | ||||||
| Riso Kyoiku Co., Ltd. |
196,700 | 906,329 | ||||||
| Studio Alice Co., Ltd. |
25,360 | 522,849 | ||||||
| Tokyo Individualized Educational Institute, Inc. |
56,000 | 563,617 | ||||||
|
|
|
|||||||
| Total Diversified Consumer Services |
|
4,767,913 | ||||||
| Diversified Financial Services – 0.2% |
| |||||||
| Financial Products Group Co., Ltd. |
104,300 | 854,679 | ||||||
| Ricoh Leasing Co., Ltd. |
21,300 | 642,743 | ||||||
|
|
|
|||||||
| Total Diversified Financial Services |
|
1,497,422 | ||||||
| Diversified Telecommunication Services – 0.1% |
| |||||||
| Internet Initiative Japan, Inc. |
17,900 | 362,092 | ||||||
| Electric Utilities – 0.5% |
| |||||||
| Hokkaido Electric Power Co., Inc.(a) |
35,800 | 205,708 | ||||||
| Okinawa Electric Power Co., Inc. (The) |
45,425 | 773,602 | ||||||
| Shikoku Electric Power Co., Inc.(a) |
166,000 | 2,021,665 | ||||||
|
|
|
|||||||
| Total Electric Utilities |
|
3,000,975 | ||||||
| Electrical Equipment – 1.8% |
| |||||||
| Chiyoda Integre Co., Ltd. |
26,381 | 489,318 | ||||||
| Cosel Co., Ltd.(a) |
43,200 | 454,696 | ||||||
| Daihen Corp.(a) |
18,900 | 485,798 | ||||||
| Denyo Co., Ltd. |
20,900 | 258,500 | ||||||
| Fujikura Ltd.(a) |
200,015 | 753,546 | ||||||
| Furukawa Electric Co., Ltd. |
46,400 | 1,170,009 | ||||||
| GS Yuasa Corp.(a) |
52,300 | 1,025,824 | ||||||
| Helios Techno Holding Co., Ltd.(a) |
49,000 | 294,394 | ||||||
| Idec Corp.(a) |
26,936 | 464,326 | ||||||
| Mabuchi Motor Co., Ltd. |
62,000 | 2,156,570 | ||||||
| Nippon Carbon Co., Ltd.(a) |
8,400 | 372,625 | ||||||
| Nissin Electric Co., Ltd. |
116,165 | 1,065,253 | ||||||
| Nitto Kogyo Corp.(a) |
45,200 | 904,122 | ||||||
| Sanyo Denki Co., Ltd. |
8,200 | 294,114 | ||||||
| Sinfonia Technology Co., Ltd. |
24,000 | 293,156 | ||||||
| Takaoka Toko Co., Ltd. |
26,500 | 315,314 | ||||||
| Tatsuta Electric Wire and Cable Co., Ltd. |
67,800 | 279,322 | ||||||
| Toyo Tanso Co., Ltd. |
5,500 | 102,213 | ||||||
|
|
|
|||||||
| Total Electrical Equipment |
|
11,179,100 | ||||||
See Notes to Financial Statements.
| 72 | WisdomTree Trust |
Schedule of Investments (continued)
WisdomTree Japan SmallCap Dividend Fund (DFJ)
March 31, 2019
| Investments | Shares | Value | ||||||
| Electronic Equipment, Instruments & Components – 5.5% |
| |||||||
| Ai Holdings Corp. |
23,500 | $ | 388,323 | |||||
| Amano Corp. |
59,035 | 1,390,471 | ||||||
| Anritsu Corp.(a) |
62,000 | 1,148,304 | ||||||
| Azbil Corp. |
105,308 | 2,463,228 | ||||||
| Canon Electronics, Inc. |
42,500 | 673,488 | ||||||
| Citizen Watch Co., Ltd. |
395,600 | 2,205,224 | ||||||
| CMK Corp. |
47,200 | 275,477 | ||||||
| CONEXIO Corp. |
53,800 | 678,059 | ||||||
| Daiwabo Holdings Co., Ltd. |
19,539 | 1,124,483 | ||||||
| Dexerials Corp. |
98,000 | 649,880 | ||||||
| Elematec Corp. |
20,577 | 314,739 | ||||||
| ESPEC Corp. |
23,000 | 428,685 | ||||||
| Excel Co., Ltd.(a) |
13,300 | 281,176 | ||||||
| FTGroup Co., Ltd. |
44,600 | 553,647 | ||||||
| Hagiwara Electric Holdings Co., Ltd. |
18,700 | 520,359 | ||||||
| Hakuto Co., Ltd. |
26,534 | 281,198 | ||||||
| Hioki EE Corp. |
8,500 | 364,006 | ||||||
| Hochiki Corp. |
3,500 | 35,194 | ||||||
| Horiba Ltd. |
24,000 | 1,333,514 | ||||||
| Ibiden Co., Ltd.(a) |
102,300 | 1,554,579 | ||||||
| Innotech Corp. |
21,800 | 190,062 | ||||||
| Iriso Electronics Co., Ltd.(a) |
9,000 | 411,438 | ||||||
| Japan Aviation Electronics Industry Ltd. |
61,800 | 860,404 | ||||||
| Kaga Electronics Co., Ltd. |
27,500 | 504,856 | ||||||
| Koa Corp. |
20,747 | 279,101 | ||||||
| Kyosan Electric Manufacturing Co., Ltd.(a) |
44,700 | 146,597 | ||||||
| Macnica Fuji Electronics Holdings, Inc.(a) |
62,600 | 854,009 | ||||||
| Marubun Corp. |
41,800 | 240,562 | ||||||
| Maruwa Co., Ltd. |
3,400 | 160,347 | ||||||
| Nippon Electric Glass Co., Ltd. |
118,600 | 3,144,880 | ||||||
| Nippon Signal Co., Ltd.(a) |
44,900 | 402,005 | ||||||
| Nissha Co., Ltd. |
24,300 | 256,644 | ||||||
| Nohmi Bosai Ltd. |
34,091 | 557,172 | ||||||
| Oki Electric Industry Co., Ltd.(a) |
146,300 | 1,728,874 | ||||||
| Optex Group Co., Ltd. |
8,300 | 132,353 | ||||||
| Osaki Electric Co., Ltd. |
44,500 | 277,007 | ||||||
| Ryoden Corp. |
21,461 | 284,634 | ||||||
| Ryosan Co., Ltd.(a) |
44,400 | 1,190,579 | ||||||
| Sanshin Electronics Co., Ltd.(a) |
26,400 | 451,747 | ||||||
| Satori Electric Co., Ltd. |
26,700 | 226,751 | ||||||
| Shibaura Electronics Co., Ltd.(a) |
8,500 | 289,515 | ||||||
| Siix Corp.(a) |
20,400 | 308,898 | ||||||
| SMK Corp.(a) |
7,500 | 177,395 | ||||||
| Sumida Corp.(a) |
45,100 | 636,457 | ||||||
| Tachibana Eletech Co., Ltd.(a) |
34,400 | 516,847 | ||||||
| Taiyo Yuden Co., Ltd.(a) |
40,300 | 792,638 | ||||||
| Tamura Corp.(a) |
28,200 | 155,669 | ||||||
| Topcon Corp. |
41,800 | 493,209 | ||||||
| Tsuzuki Denki Co., Ltd. |
35,810 | 275,325 | ||||||
| UKC Holdings Corp.(a) |
13,700 | 253,367 | ||||||
| V Technology Co., Ltd. |
3,200 | 405,619 | ||||||
| Vitec Holdings Co., Ltd. |
21,100 | 390,222 | ||||||
|
|
|
|||||||
| Total Electronic Equipment, Instruments & Components |
|
33,659,217 | ||||||
| Energy Equipment & Services – 0.3% |
| |||||||
| Modec, Inc. |
31,104 | 885,193 | ||||||
| Shinko Plantech Co., Ltd. |
84,100 | 896,580 | ||||||
| Toyo Kanetsu K.K. |
5,600 | 101,391 | ||||||
|
|
|
|||||||
| Total Energy Equipment & Services |
|
1,883,164 | ||||||
| Entertainment – 2.3% |
| |||||||
| Avex, Inc.(a) |
52,799 | 704,082 | ||||||
| Capcom Co., Ltd. |
69,426 | 1,555,554 | ||||||
| COLOPL, Inc.(a) |
124,100 | 770,264 | ||||||
| Daiichikosho Co., Ltd. |
45,100 | 2,306,239 | ||||||
| DeNA Co., Ltd. |
96,000 | 1,445,833 | ||||||
| GungHo Online Entertainment, Inc.(a) |
373,100 | 1,358,443 | ||||||
| Koei Tecmo Holdings Co., Ltd. |
151,800 | 2,926,695 | ||||||
| Marvelous, Inc.(a) |
54,000 | 419,081 | ||||||
| Shochiku Co., Ltd.(a) |
2,700 | 302,480 | ||||||
| Toei Animation Co., Ltd. |
26,600 | 1,312,156 | ||||||
| Toei Co., Ltd. |
7,331 | 975,612 | ||||||
|
|
|
|||||||
| Total Entertainment |
|
14,076,439 | ||||||
| Food & Staples Retailing – 2.3% |
| |||||||
| Ain Holdings, Inc. |
8,600 | 646,447 | ||||||
| Albis Co., Ltd.(a) |
8,900 | 186,065 | ||||||
| Arcs Co., Ltd. |
32,694 | 718,952 | ||||||
| Axial Retailing, Inc. |
26,000 | 801,012 | ||||||
| Belc Co., Ltd. |
10,600 | 479,794 | ||||||
| Cawachi Ltd. |
17,900 | 286,083 | ||||||
| Cocokara fine, Inc. |
8,800 | 349,424 | ||||||
| Create SD Holdings Co., Ltd. |
27,900 | 656,130 | ||||||
| Heiwado Co., Ltd. |
32,963 | 701,936 | ||||||
| Inageya Co., Ltd.(a) |
26,600 | 305,929 | ||||||
| Kato Sangyo Co., Ltd.(a) |
26,416 | 871,106 | ||||||
| Kobe Bussan Co., Ltd. |
32,400 | 1,229,435 | ||||||
| Life Corp. |
16,100 | 345,899 | ||||||
| Ministop Co., Ltd. |
25,800 | 399,523 | ||||||
| Mitsubishi Shokuhin Co., Ltd. |
47,800 | 1,250,655 | ||||||
| Nihon Chouzai Co., Ltd. |
13,900 | 470,931 | ||||||
| Nishimoto Co., Ltd. |
8,200 | 321,525 | ||||||
| Okuwa Co., Ltd. |
38,900 | 390,459 | ||||||
| Qol Holdings Co., Ltd. |
13,500 | 183,927 | ||||||
| San-A Co., Ltd. |
9,600 | 384,226 | ||||||
| Shoei Foods Corp.(a) |
8,900 | 253,286 | ||||||
| Sogo Medical Holdings Co., Ltd. |
19,800 | 303,212 | ||||||
| United Super Markets Holdings, Inc. |
69,300 | 685,581 | ||||||
| Valor Holdings Co., Ltd. |
33,291 | 806,672 | ||||||
| Yaoko Co., Ltd. |
19,500 | 958,395 | ||||||
| Yokohama Reito Co., Ltd.(a) |
33,000 | 266,540 | ||||||
|
|
|
|||||||
| Total Food & Staples Retailing |
|
14,253,144 | ||||||
| Food Products – 3.5% |
| |||||||
| Ariake Japan Co., Ltd. |
9,228 | 493,561 | ||||||
| Chubu Shiryo Co., Ltd. |
700 | 7,387 | ||||||
| DyDo Group Holdings, Inc. |
8,500 | 383,204 | ||||||
| Ezaki Glico Co., Ltd. |
26,500 | 1,393,414 | ||||||
| Feed One Co., Ltd. |
185,700 | 295,281 | ||||||
See Notes to Financial Statements.
| WisdomTree Trust | 73 |
Schedule of Investments (continued)
WisdomTree Japan SmallCap Dividend Fund (DFJ)
March 31, 2019
| Investments | Shares | Value | ||||||
| Fuji Oil Holdings, Inc. |
48,400 | $ | 1,657,280 | |||||
| Fujicco Co., Ltd. |
22,600 | 439,198 | ||||||
| Hokuto Corp. |
31,591 | 547,423 | ||||||
| Itoham Yonekyu Holdings, Inc.(a) |
169,100 | 1,052,626 | ||||||
| J-Oil Mills, Inc. |
24,200 | 900,790 | ||||||
| Kagome Co., Ltd. |
26,900 | 755,830 | ||||||
| Kameda Seika Co., Ltd. |
9,000 | 431,766 | ||||||
| Kenko Mayonnaise Co., Ltd.(a) |
8,900 | 176,416 | ||||||
| Kewpie Corp. |
83,800 | 2,010,110 | ||||||
| Kotobuki Spirits Co., Ltd. |
5,600 | 214,519 | ||||||
| Marudai Food Co., Ltd.(a) |
24,600 | 418,057 | ||||||
| Maruha Nichiro Corp. |
27,432 | 981,440 | ||||||
| Megmilk Snow Brand Co., Ltd. |
35,800 | 871,348 | ||||||
| Mitsui Sugar Co., Ltd.(a) |
34,698 | 854,558 | ||||||
| Morinaga & Co., Ltd. |
22,987 | 997,900 | ||||||
| Morinaga Milk Industry Co., Ltd.(a) |
24,182 | 820,377 | ||||||
| Nippon Flour Mills Co., Ltd. |
66,683 | 1,144,669 | ||||||
| Nippon Suisan Kaisha Ltd. |
190,000 | 1,450,513 | ||||||
| Nisshin Oillio Group Ltd. (The) |
24,300 | 717,902 | ||||||
| Prima Meat Packers Ltd. |
33,800 | 627,232 | ||||||
| Rock Field Co., Ltd. |
19,400 | 286,570 | ||||||
| S Foods, Inc. |
10,700 | 391,516 | ||||||
| Sakata Seed Corp. |
12,200 | 414,988 | ||||||
| Showa Sangyo Co., Ltd.(a) |
26,600 | 720,484 | ||||||
| Starzen Co., Ltd.(a) |
9,400 | 321,444 | ||||||
|
|
|
|||||||
| Total Food Products |
|
21,777,803 | ||||||
| Gas Utilities – 0.8% |
| |||||||
| Hokkaido Gas Co., Ltd. |
38,600 | 502,182 | ||||||
| Nippon Gas Co., Ltd. |
13,000 | 359,398 | ||||||
| Saibu Gas Co., Ltd. |
36,800 | 794,948 | ||||||
| Shizuoka Gas Co., Ltd. |
45,092 | 342,615 | ||||||
| Toho Gas Co., Ltd.(a) |
63,000 | 2,828,839 | ||||||
|
|
|
|||||||
| Total Gas Utilities |
|
4,827,982 | ||||||
| Health Care Equipment & Supplies – 1.4% |
| |||||||
| Daiken Medical Co., Ltd. |
73,700 | 370,215 | ||||||
| Eiken Chemical Co., Ltd. |
21,970 | 517,268 | ||||||
| Hogy Medical Co., Ltd. |
21,300 | 751,470 | ||||||
| Jeol Ltd. |
26,600 | 478,721 | ||||||
| Mani, Inc. |
14,100 | 689,172 | ||||||
| Menicon Co., Ltd. |
8,800 | 254,018 | ||||||
| Nagaileben Co., Ltd. |
27,226 | 590,346 | ||||||
| Nakanishi, Inc. |
44,300 | 865,708 | ||||||
| Nihon Kohden Corp. |
44,300 | 1,316,773 | ||||||
| Nikkiso Co., Ltd. |
42,800 | 499,594 | ||||||
| Nipro Corp.(a) |
136,900 | 1,767,449 | ||||||
| Paramount Bed Holdings Co., Ltd. |
19,121 | 848,210 | ||||||
|
|
|
|||||||
| Total Health Care Equipment & Supplies |
|
8,948,944 | ||||||
| Health Care Providers & Services – 1.7% |
| |||||||
| As One Corp. |
14,400 | 1,144,871 | ||||||
| BML, Inc. |
27,300 | 791,733 | ||||||
| Japan Lifeline Co., Ltd.(a) |
40,500 | 668,871 | ||||||
| Miraca Holdings, Inc. |
89,000 | 2,208,014 | ||||||
| NichiiGakkan Co., Ltd. |
59,900 | 705,151 | ||||||
| Ship Healthcare Holdings, Inc. |
31,307 | 1,285,543 | ||||||
| Solasto Corp.(a) |
61,900 | 696,819 | ||||||
| Toho Holdings Co., Ltd.(a) |
45,100 | 1,125,819 | ||||||
| Tokai Corp. |
25,700 | 626,450 | ||||||
| Vital KSK Holdings, Inc.(a) |
68,300 | 673,837 | ||||||
| WIN-Partners Co., Ltd.(a) |
29,900 | 340,371 | ||||||
|
|
|
|||||||
| Total Health Care Providers & Services |
|
10,267,479 | ||||||
| Health Care Technology – 0.1% |
| |||||||
| EM Systems Co., Ltd.(a) |
26,400 | 317,225 | ||||||
| Hotels, Restaurants & Leisure – 2.9% |
| |||||||
| Aeon Fantasy Co., Ltd. |
5,000 | 128,970 | ||||||
| Create Restaurants Holdings, Inc.(a) |
39,100 | 483,252 | ||||||
| Doutor Nichires Holdings Co., Ltd. |
24,953 | 474,104 | ||||||
| Fuji Kyuko Co., Ltd.(a) |
15,401 | 578,833 | ||||||
| Hiday Hidaka Corp. |
26,698 | 516,183 | ||||||
| HIS Co., Ltd. |
17,700 | 650,847 | ||||||
| Ichibanya Co., Ltd.(a) |
27,636 | 1,208,459 | ||||||
| KOMEDA Holdings Co., Ltd. |
52,800 | 1,003,670 | ||||||
| Koshidaka Holdings Co., Ltd. |
14,100 | 211,592 | ||||||
| Kyoritsu Maintenance Co., Ltd.(a) |
8,500 | 421,602 | ||||||
| MOS Food Services, Inc.(a) |
9,500 | 230,880 | ||||||
| Ohsho Food Service Corp. |
20,800 | 1,317,324 | ||||||
| Plenus Co., Ltd.(a) |
67,168 | 1,071,678 | ||||||
| Resorttrust, Inc.(a) |
82,408 | 1,116,791 | ||||||
| Round One Corp. |
44,237 | 559,932 | ||||||
| Royal Holdings Co., Ltd. |
27,400 | 685,217 | ||||||
| Saizeriya Co., Ltd. |
10,300 | 198,397 | ||||||
| SFP Holdings Co., Ltd.(a) |
9,000 | 154,655 | ||||||
| Shidax Corp.(a) |
116,800 | 339,789 | ||||||
| Skylark Holdings Co., Ltd. |
197,800 | 3,279,243 | ||||||
| St. Marc Holdings Co., Ltd. |
17,200 | 386,780 | ||||||
| Tokyo Dome Corp. |
62,500 | 596,851 | ||||||
| Tokyotokeiba Co., Ltd. |
9,642 | 292,697 | ||||||
| Toridoll Holdings Corp.(a) |
16,900 | 341,100 | ||||||
| Yoshinoya Holdings Co., Ltd.(a) |
31,600 | 510,465 | ||||||
| Zensho Holdings Co., Ltd.(a) |
45,300 | 1,049,367 | ||||||
|
|
|
|||||||
| Total Hotels, Restaurants & Leisure |
|
17,808,678 | ||||||
| Household Durables – 2.0% |
| |||||||
| Cleanup Corp. |
15,000 | 80,092 | ||||||
| ES-Con Japan Ltd.(a) |
73,400 | 484,094 | ||||||
| FJ Next Co., Ltd. |
28,400 | 218,866 | ||||||
| Foster Electric Co., Ltd. |
41,700 | 626,150 | ||||||
| France Bed Holdings Co., Ltd. |
11,100 | 90,457 | ||||||
| Fuji Corp., Ltd.(a) |
63,000 | 466,730 | ||||||
| Fujitsu General Ltd. |
60,900 | 861,629 | ||||||
| Hoosiers Holdings(a) |
44,500 | 259,317 | ||||||
| JVC Kenwood Corp.(a) |
118,000 | 285,712 | ||||||
| Ki-Star Real Estate Co., Ltd. |
18,400 | 277,118 | ||||||
| LEC, Inc.(a) |
9,000 | 114,894 | ||||||
| Misawa Homes Co., Ltd. |
44,000 | 314,839 | ||||||
| Nihon House Holdings Co., Ltd.(a) |
80,900 | 344,255 | ||||||
| Pressance Corp.(a) |
45,100 | 561,076 | ||||||
See Notes to Financial Statements.
| 74 | WisdomTree Trust |
Schedule of Investments (continued)
WisdomTree Japan SmallCap Dividend Fund (DFJ)
March 31, 2019
| Investments | Shares | Value | ||||||
| Sanei Architecture Planning Co., Ltd.(a) |
19,000 | $ | 268,645 | |||||
| Sangetsu Corp. |
80,900 | 1,468,384 | ||||||
| Space Value Holdings Co., Ltd.(a) |
52,400 | 242,389 | ||||||
| Starts Corp., Inc. |
44,500 | 950,025 | ||||||
| Sumitomo Forestry Co., Ltd. |
175,400 | 2,435,649 | ||||||
| Tama Home Co., Ltd. |
44,300 | 427,451 | ||||||
| Tamron Co., Ltd. |
27,066 | 493,710 | ||||||
| Toa Corp. |
42,152 | 425,004 | ||||||
| Zojirushi Corp.(a) |
44,500 | 462,348 | ||||||
|
|
|
|||||||
| Total Household Durables |
|
12,158,834 | ||||||
| Household Products – 0.1% |
| |||||||
| Earth Corp. |
14,100 | 654,777 | ||||||
| ST Corp.(a) |
9,400 | 160,679 | ||||||
|
|
|
|||||||
| Total Household Products |
|
815,456 | ||||||
| Independent Power & Renewable Electricity Producers – 0.1% |
| |||||||
| eRex Co., Ltd.(a) |
22,900 | 213,514 | ||||||
| West Holdings Corp.(a) |
41,500 | 415,431 | ||||||
|
|
|
|||||||
| Total Independent Power & Renewable Electricity Producers |
|
628,945 | ||||||
| Industrial Conglomerates – 0.4% |
| |||||||
| Mie Kotsu Group Holdings, Inc.(a) |
112,800 | 572,739 | ||||||
| Nisshinbo Holdings, Inc.(a) |
136,500 | 1,192,533 | ||||||
| TOKAI Holdings Corp. |
114,900 | 953,996 | ||||||
|
|
|
|||||||
| Total Industrial Conglomerates |
|
2,719,268 | ||||||
| Interactive Media & Services – 0.7% |
| |||||||
| Dip Corp.(a) |
34,300 | 592,507 | ||||||
| Gurunavi, Inc. |
86,000 | 540,001 | ||||||
| Mixi, Inc. |
134,000 | 3,096,824 | ||||||
| MTI Ltd. |
24,000 | 137,254 | ||||||
|
|
|
|||||||
| Total Interactive Media & Services |
|
4,366,586 | ||||||
| Internet & Direct Marketing Retail – 0.1% |
| |||||||
| ASKUL Corp.(a) |
25,265 | 630,455 | ||||||
| Belluna Co., Ltd. |
28,384 | 220,025 | ||||||
|
|
|
|||||||
| Total Internet & Direct Marketing Retail |
|
850,480 | ||||||
| IT Services – 2.2% |
| |||||||
| Digital Garage, Inc.(a) |
9,900 | 290,243 | ||||||
| DTS Corp. |
19,891 | 735,006 | ||||||
| Future Corp. |
44,700 | 766,505 | ||||||
| GMO Internet, Inc. |
41,872 | 682,451 | ||||||
| Infocom Corp.(a) |
36,600 | 608,760 | ||||||
| Information Services International-Dentsu Ltd. |
21,300 | 734,151 | ||||||
| Kanematsu Electronics Ltd. |
34,100 | 1,030,533 | ||||||
| LAC Co., Ltd.(a) |
24,000 | 329,584 | ||||||
| NEC Networks & System Integration Corp. |
51,579 | 1,246,545 | ||||||
| NET One Systems Co., Ltd. |
62,158 | 1,565,111 | ||||||
| Nihon Unisys Ltd. |
73,200 | 1,939,038 | ||||||
| NS Solutions Corp. |
71,480 | 1,929,640 | ||||||
| NSD Co., Ltd. |
49,800 | 1,159,458 | ||||||
| Transcosmos, Inc. |
25,300 | 493,497 | ||||||
|
|
|
|||||||
| Total IT Services |
|
13,510,522 | ||||||
| Leisure Products – 1.6% |
| |||||||
| Daikoku Denki Co., Ltd.(a) |
25,000 | 348,286 | ||||||
| Fields Corp. |
44,600 | 291,732 | ||||||
| Furyu Corp. |
26,600 | 237,678 | ||||||
| GLOBERIDE, Inc. |
8,400 | 199,290 | ||||||
| Heiwa Corp. |
122,900 | 2,456,112 | ||||||
| Mizuno Corp.(a) |
19,623 | 454,741 | ||||||
| Sankyo Co., Ltd. |
132,300 | 5,044,098 | ||||||
| Tomy Co., Ltd. |
56,100 | 578,816 | ||||||
|
|
|
|||||||
| Total Leisure Products |
|
9,610,753 | ||||||
| Life Sciences Tools & Services – 0.1% |
| |||||||
| EPS Holdings, Inc. |
26,100 | 435,295 | ||||||
| Machinery – 6.1% |
| |||||||
| Aichi Corp. |
123,200 | 779,148 | ||||||
| Aida Engineering Ltd. |
73,300 | 528,467 | ||||||
| Alinco, Inc. |
11,900 | 105,792 | ||||||
| Anest Iwata Corp. |
47,100 | 413,617 | ||||||
| Bando Chemical Industries Ltd. |
28,693 | 275,044 | ||||||
| CKD Corp.(a) |
44,741 | 403,411 | ||||||
| DMG Mori Co., Ltd. |
108,100 | 1,337,028 | ||||||
| Ebara Corp. |
45,300 | 1,276,921 | ||||||
| Fujitec Co., Ltd.(a) |
93,161 | 1,031,054 | ||||||
| Fukushima Industries Corp. |
8,500 | 273,005 | ||||||
| Furukawa Co., Ltd. |
46,900 | 590,249 | ||||||
| Giken Ltd. |
26,300 | 804,314 | ||||||
| Glory Ltd. |
59,100 | 1,418,165 | ||||||
| Hirata Corp.(a) |
8,800 | 607,417 | ||||||
| Hitachi Zosen Corp. |
94,600 | 290,590 | ||||||
| Hokuetsu Industries Co., Ltd. |
26,918 | 280,403 | ||||||
| Hosokawa Micron Corp. |
5,800 | 259,123 | ||||||
| Japan Steel Works Ltd. (The)(a) |
28,304 | 521,406 | ||||||
| Juki Corp. |
28,900 | 287,212 | ||||||
| Kato Works Co., Ltd. |
19,000 | 448,543 | ||||||
| Kito Corp. |
15,800 | 238,531 | ||||||
| Kitz Corp.(a) |
71,189 | 521,609 | ||||||
| Kurita Water Industries Ltd. |
78,500 | 2,004,965 | ||||||
| Kyokuto Kaihatsu Kogyo Co., Ltd. |
27,480 | 367,691 | ||||||
| Makino Milling Machine Co., Ltd.(a) |
21,715 | 894,615 | ||||||
| Max Co., Ltd. |
43,800 | 644,228 | ||||||
| Meidensha Corp. |
43,600 | 597,562 | ||||||
| METAWATER Co., Ltd. |
10,600 | 298,794 | ||||||
| Mitsubishi Logisnext Co., Ltd.(a) |
43,100 | 469,219 | ||||||
| Mitsuboshi Belting Ltd. |
38,546 | 685,703 | ||||||
| Miura Co., Ltd. |
47,000 | 1,083,227 | ||||||
| Morita Holdings Corp. |
31,605 | 519,683 | ||||||
| Nachi-Fujikoshi Corp. |
16,200 | 651,308 | ||||||
| Nippon Thompson Co., Ltd.(a) |
31,900 | 146,697 | ||||||
| Nissei ASB Machine Co., Ltd.(a) |
9,600 | 328,283 | ||||||
| Nitta Corp. |
10,500 | 341,510 | ||||||
| Nitto Kohki Co., Ltd. |
30,200 | 595,897 | ||||||
| Noritake Co., Ltd. |
9,000 | 430,953 | ||||||
| NS Tool Co., Ltd.(a) |
10,100 | 231,592 | ||||||
| NTN Corp.(a) |
595,400 | 1,764,387 | ||||||
See Notes to Financial Statements.
| WisdomTree Trust | 75 |
Schedule of Investments (continued)
WisdomTree Japan SmallCap Dividend Fund (DFJ)
March 31, 2019
| Investments | Shares | Value | ||||||
| Obara Group, Inc. |
14,379 | $ | 476,117 | |||||
| Oiles Corp.(a) |
25,800 | 411,644 | ||||||
| OKUMA Corp.(a) |
21,070 | 1,140,257 | ||||||
| Organo Corp. |
13,100 | 371,039 | ||||||
| OSG Corp. |
60,500 | 1,166,983 | ||||||
| Rheon Automatic Machinery Co., Ltd.(a) |
17,700 | 253,143 | ||||||
| Ryobi Ltd. |
26,200 | 587,982 | ||||||
| Shibuya Corp. |
8,600 | 254,072 | ||||||
| Shima Seiki Manufacturing Ltd.(a) |
12,700 | 390,116 | ||||||
| Shinmaywa Industries Ltd. |
65,285 | 811,602 | ||||||
| Sodick Co., Ltd.(a) |
61,900 | 516,183 | ||||||
| Star Micronics Co., Ltd.(a) |
49,834 | 758,642 | ||||||
| Tadano Ltd.(a) |
80,000 | 759,633 | ||||||
| Takeuchi Manufacturing Co., Ltd. |
25,500 | 448,557 | ||||||
| Takuma Co., Ltd. |
26,500 | 316,271 | ||||||
| Tocalo Co., Ltd. |
44,300 | 349,005 | ||||||
| Toshiba Machine Co., Ltd.(a) |
29,961 | 602,820 | ||||||
| Tsubaki Nakashima Co., Ltd.(a) |
34,900 | 626,519 | ||||||
| Tsubakimoto Chain Co. |
45,145 | 1,611,083 | ||||||
| Tsugami Corp. |
58,700 | 451,844 | ||||||
| Union Tool Co. |
8,600 | 227,111 | ||||||
| YAMABIKO Corp. |
40,200 | 386,074 | ||||||
| Yushin Precision Equipment Co., Ltd.(a) |
13,700 | 124,394 | ||||||
|
|
|
|||||||
| Total Machinery |
|
37,788,454 | ||||||
| Marine – 0.6% |
| |||||||
| Iino Kaiun Kaisha Ltd.(a) |
80,300 | 270,605 | ||||||
| Japan Transcity Corp. |
86,700 | 348,570 | ||||||
| Mitsui OSK Lines Ltd. |
36,400 | 783,018 | ||||||
| Nippon Yusen K.K.(a) |
81,200 | 1,189,921 | ||||||
| NS United Kaiun Kaisha Ltd.(a) |
44,000 | 941,736 | ||||||
|
|
|
|||||||
| Total Marine |
|
3,533,850 | ||||||
| Media – 0.9% |
| |||||||
| AOI TYO Holdings, Inc. |
17,500 | 124,113 | ||||||
| Asahi Broadcasting Group Holdings Corp. |
41,400 | 289,503 | ||||||
| F@N Communications, Inc. |
68,200 | 346,900 | ||||||
| Intage Holdings, Inc. |
35,800 | 277,835 | ||||||
| Kadokawa Dwango(a) |
45,300 | 477,618 | ||||||
| SKY Perfect JSAT Holdings, Inc.(a) |
455,400 | 1,892,614 | ||||||
| Tv Tokyo Holdings Corp. |
26,200 | 550,819 | ||||||
| Wowow, Inc. |
26,000 | 696,246 | ||||||
| Zenrin Co., Ltd. |
27,580 | 610,729 | ||||||
|
|
|
|||||||
| Total Media |
|
5,266,377 | ||||||
| Metals & Mining – 3.6% |
| |||||||
| Aichi Steel Corp. |
26,500 | 822,401 | ||||||
| Asahi Holdings, Inc.(a) |
44,400 | 803,079 | ||||||
| Daido Steel Co., Ltd.(a) |
39,500 | 1,557,731 | ||||||
| Dowa Holdings Co., Ltd.(a) |
61,400 | 2,019,208 | ||||||
| Godo Steel Ltd. |
27,400 | 409,694 | ||||||
| Hakudo Co., Ltd.(a) |
17,598 | 247,073 | ||||||
| Kobe Steel Ltd. |
387,400 | 2,908,519 | ||||||
| Kurimoto Ltd. |
24,500 | 322,284 | ||||||
| Kyoei Steel Ltd. |
30,614 | 436,454 | ||||||
| Maruichi Steel Tube Ltd. |
90,300 | 2,631,048 | ||||||
| Mitsubishi Materials Corp. |
144,200 | 3,806,771 | ||||||
| Mitsui Mining & Smelting Co., Ltd.(a) |
29,400 | 754,091 | ||||||
| Nippon Light Metal Holdings Co., Ltd. |
752,900 | 1,652,931 | ||||||
| Nippon Yakin Kogyo Co., Ltd.(a) |
70,900 | 160,780 | ||||||
| OSAKA Titanium Technologies Co., Ltd.(a) |
22,500 | 342,526 | ||||||
| Sanyo Special Steel Co., Ltd. |
27,300 | 559,639 | ||||||
| Toho Titanium Co., Ltd.(a) |
38,300 | 328,380 | ||||||
| Toho Zinc Co., Ltd.(a) |
11,796 | 333,573 | ||||||
| Tokyo Rope Manufacturing Co., Ltd. |
8,100 | 71,424 | ||||||
| Tokyo Steel Manufacturing Co., Ltd. |
45,400 | 394,586 | ||||||
| Topy Industries Ltd. |
26,400 | 528,072 | ||||||
| UACJ Corp.(a) |
47,963 | 898,724 | ||||||
|
|
|
|||||||
| Total Metals & Mining |
|
21,988,988 | ||||||
| Multiline Retail – 0.7% |
| |||||||
| Fuji Co., Ltd. |
10,200 | 175,921 | ||||||
| H2O Retailing Corp.(a) |
104,700 | 1,458,620 | ||||||
| MrMax Holdings Ltd. |
63,000 | 251,579 | ||||||
| Parco Co., Ltd.(a) |
63,000 | 574,875 | ||||||
| Seria Co., Ltd.(a) |
15,000 | 517,008 | ||||||
| Takashimaya Co., Ltd. |
82,800 | 1,102,653 | ||||||
|
|
|
|||||||
| Total Multiline Retail |
|
4,080,656 | ||||||
| Oil, Gas & Consumable Fuels – 0.9% |
| |||||||
| BP Castrol K.K.(a) |
40,600 | 506,927 | ||||||
| Cosmo Energy Holdings Co., Ltd.(a) |
48,300 | 970,495 | ||||||
| Fuji Oil Co., Ltd.(a) |
98,600 | 224,486 | ||||||
| Itochu Enex Co., Ltd. |
146,681 | 1,182,088 | ||||||
| Iwatani Corp.(a) |
18,933 | 608,093 | ||||||
| Nippon Coke & Engineering Co., Ltd. |
437,300 | 395,085 | ||||||
| Sala Corp. |
98,800 | 549,856 | ||||||
| San-Ai Oil Co., Ltd. |
53,116 | 436,215 | ||||||
| Sinanen Holdings Co., Ltd. |
26,400 | 502,073 | ||||||
|
|
|
|||||||
| Total Oil, Gas & Consumable Fuels |
|
5,375,318 | ||||||
| Paper & Forest Products – 0.9% |
| |||||||
| Daiken Corp. |
16,500 | 321,100 | ||||||
| Daio Paper Corp.(a) |
44,278 | 542,849 | ||||||
| Hokuetsu Corp. |
187,932 | 1,098,541 | ||||||
| Nippon Paper Industries Co., Ltd.(a) |
167,800 | 3,465,608 | ||||||
|
|
|
|||||||
| Total Paper & Forest Products |
|
5,428,098 | ||||||
| Personal Products – 0.7% |
| |||||||
| Fancl Corp. |
53,600 | 1,384,975 | ||||||
| Mandom Corp. |
29,006 | 745,820 | ||||||
| Milbon Co., Ltd. |
17,400 | 809,595 | ||||||
| Noevir Holdings Co., Ltd. |
27,100 | 1,314,785 | ||||||
|
|
|
|||||||
| Total Personal Products |
|
4,255,175 | ||||||
| Pharmaceuticals – 2.0% |
| |||||||
| Fuji Pharma Co., Ltd.(a) |
20,300 | 320,773 | ||||||
| JCR Pharmaceuticals Co., Ltd. |
8,500 | 500,700 | ||||||
| Kaken Pharmaceutical Co., Ltd. |
45,300 | 2,058,626 | ||||||
| KYORIN Holdings, Inc. |
70,485 | 1,376,140 | ||||||
| Mochida Pharmaceutical Co., Ltd. |
29,222 | 1,499,580 | ||||||
| Nichi-iko Pharmaceutical Co., Ltd.(a) |
45,100 | 598,155 | ||||||
See Notes to Financial Statements.
| 76 | WisdomTree Trust |
Schedule of Investments (continued)
WisdomTree Japan SmallCap Dividend Fund (DFJ)
March 31, 2019
| Investments | Shares | Value | ||||||
| Sawai Pharmaceutical Co., Ltd. |
44,424 | $ | 2,572,687 | |||||
| Seikagaku Corp. |
37,400 | 405,137 | ||||||
| Torii Pharmaceutical Co., Ltd. |
17,700 | 356,127 | ||||||
| Towa Pharmaceutical Co., Ltd. |
25,500 | 671,107 | ||||||
| Tsumura & Co. |
44,200 | 1,343,750 | ||||||
| ZERIA Pharmaceutical Co., Ltd.(a) |
40,200 | 694,788 | ||||||
|
|
|
|||||||
| Total Pharmaceuticals |
|
12,397,570 | ||||||
| Professional Services – 1.8% |
| |||||||
| Altech Corp. |
26,500 | 442,205 | ||||||
| BayCurrent Consulting, Inc.(a) |
5,600 | 175,814 | ||||||
| Benefit One, Inc.(a) |
59,200 | 1,161,697 | ||||||
| en-japan, Inc.(a) |
13,200 | 384,009 | ||||||
| FULLCAST Holdings Co., Ltd. |
21,900 | 466,947 | ||||||
| Funai Soken Holdings, Inc. |
26,110 | 628,187 | ||||||
| IR Japan Holdings Ltd.(a) |
11,100 | 182,016 | ||||||
| JAC Recruitment Co., Ltd. |
39,700 | 876,603 | ||||||
| Link And Motivation, Inc.(a) |
4,600 | 33,289 | ||||||
| Meitec Corp. |
36,400 | 1,654,172 | ||||||
| Nomura Co., Ltd. |
35,900 | 1,011,953 | ||||||
| Outsourcing, Inc.(a) |
30,300 | 373,942 | ||||||
| Quick Co., Ltd. |
24,600 | 398,721 | ||||||
| Tanseisha Co., Ltd. |
45,100 | 532,961 | ||||||
| TechnoPro Holdings, Inc. |
22,200 | 1,323,756 | ||||||
| Trust Tech, Inc. |
8,500 | 281,452 | ||||||
| Weathernews, Inc. |
9,200 | 268,058 | ||||||
| World Holdings Co., Ltd. |
14,100 | 240,637 | ||||||
| YAMADA Consulting Group Co., Ltd.(a) |
3,600 | 74,937 | ||||||
| Yumeshin Holdings Co., Ltd.(a) |
80,000 | 558,703 | ||||||
|
|
|
|||||||
| Total Professional Services |
|
11,070,059 | ||||||
| Real Estate Management & Development – 2.0% |
| |||||||
| Airport Facilities Co., Ltd.(a) |
44,519 | 222,424 | ||||||
| Daibiru Corp. |
92,500 | 877,490 | ||||||
| Goldcrest Co., Ltd. |
37,900 | 511,565 | ||||||
| Heiwa Real Estate Co., Ltd. |
21,268 | 409,469 | ||||||
| Ichigo, Inc. |
262,500 | 898,835 | ||||||
| Japan Property Management Center Co., Ltd. |
2,700 | 19,344 | ||||||
| Katitas Co., Ltd.(a) |
9,000 | 308,578 | ||||||
| Keihanshin Building Co., Ltd. |
70,900 | 692,442 | ||||||
| Kenedix, Inc. |
80,400 | 402,418 | ||||||
| Nippon Commercial Development Co., Ltd.(a) |
23,000 | 309,617 | ||||||
| Nisshin Fudosan Co. |
56,600 | 236,760 | ||||||
| Open House Co., Ltd.(a) |
26,600 | 912,021 | ||||||
| Prospect Co., Ltd. |
1,513,800 | 246,180 | ||||||
| Raysum Co., Ltd. |
43,000 | 395,483 | ||||||
| SAMTY Co., Ltd. |
25,600 | 346,930 | ||||||
| Shinoken Group Co., Ltd.(a) |
27,300 | 184,244 | ||||||
| Star Mica Co., Ltd.(a) |
3,800 | 48,579 | ||||||
| Sun Frontier Fudousan Co., Ltd.(a) |
45,500 | 486,715 | ||||||
| Takara Leben Co., Ltd.(a) |
198,500 | 616,922 | ||||||
| Tateru, Inc.(a) |
17,300 | 41,732 | ||||||
| TOC Co., Ltd. |
62,000 | 428,513 | ||||||
| Tokyo Tatemono Co., Ltd. |
169,900 | 2,082,977 | ||||||
| Tosei Corp. |
61,700 | 557,995 | ||||||
| Unizo Holdings Co., Ltd.(a) |
45,100 | 860,154 | ||||||
|
|
|
|||||||
| Total Real Estate Management & Development |
|
12,097,387 | ||||||
| Road & Rail – 2.1% |
| |||||||
| Fukuyama Transporting Co., Ltd. |
24,211 | 931,823 | ||||||
| Hitachi Transport System Ltd. |
56,900 | 1,688,725 | ||||||
| Ichinen Holdings Co., Ltd. |
23,500 | 244,374 | ||||||
| Maruzen Showa Unyu Co., Ltd. |
26,400 | 715,544 | ||||||
| Nankai Electric Railway Co., Ltd. |
45,100 | 1,244,798 | ||||||
| Nikkon Holdings Co., Ltd. |
62,060 | 1,468,448 | ||||||
| Nishi-Nippon Railroad Co., Ltd.(a) |
44,600 | 1,079,087 | ||||||
| Sakai Moving Service Co., Ltd.(a) |
9,000 | 570,809 | ||||||
| Sankyu, Inc. |
32,706 | 1,595,631 | ||||||
| Senko Group Holdings Co., Ltd. |
170,156 | 1,412,778 | ||||||
| Sotetsu Holdings, Inc. |
62,700 | 1,928,839 | ||||||
|
|
|
|||||||
| Total Road & Rail |
|
12,880,856 | ||||||
| Semiconductors & Semiconductor Equipment – 1.0% |
| |||||||
| Ferrotec Holdings Corp.(a) |
21,600 | 215,834 | ||||||
| Japan Material Co., Ltd. |
21,100 | 258,496 | ||||||
| Lasertec Corp. |
26,300 | 1,098,952 | ||||||
| MegaChips Corp.(a) |
8,500 | 130,474 | ||||||
| Mimasu Semiconductor Industry Co., Ltd. |
18,927 | 252,052 | ||||||
| Mitsui High-Tec, Inc.(a) |
20,100 | 183,594 | ||||||
| NuFlare Technology, Inc. |
8,700 | 482,613 | ||||||
| Optorun Co., Ltd. |
13,400 | 258,956 | ||||||
| Sanken Electric Co., Ltd. |
17,100 | 317,327 | ||||||
| Shindengen Electric Manufacturing Co., Ltd. |
8,500 | 313,706 | ||||||
| Shinko Electric Industries Co., Ltd.(a) |
134,453 | 1,030,096 | ||||||
| Tokyo Seimitsu Co., Ltd. |
35,900 | 913,352 | ||||||
| Ulvac, Inc. |
19,600 | 566,653 | ||||||
| Yamaichi Electronics Co., Ltd. |
26,500 | 260,487 | ||||||
|
|
|
|||||||
| Total Semiconductors & Semiconductor Equipment |
|
6,282,592 | ||||||
| Software – 0.6% |
| |||||||
| Broadleaf Co., Ltd. |
92,300 | 485,329 | ||||||
| Computer Engineering & Consulting Ltd. |
20,200 | 377,410 | ||||||
| Cresco Ltd.(a) |
11,700 | 351,470 | ||||||
| Fuji Soft, Inc. |
14,400 | 569,833 | ||||||
| Fukui Computer Holdings, Inc. |
21,900 | 408,381 | ||||||
| Infomart Corp.(a) |
33,600 | 409,204 | ||||||
| Miroku Jyoho Service Co., Ltd. |
8,600 | 220,740 | ||||||
| SRA Holdings |
21,700 | 483,268 | ||||||
| Systena Corp. |
51,300 | 557,100 | ||||||
|
|
|
|||||||
| Total Software |
|
3,862,735 | ||||||
| Specialty Retail – 4.3% |
| |||||||
| Adastria Co., Ltd. |
69,100 | 1,532,642 | ||||||
| Alpen Co., Ltd. |
22,700 | 350,698 | ||||||
| AOKI Holdings, Inc. |
105,854 | 1,108,414 | ||||||
| Aoyama Trading Co., Ltd.(a) |
92,100 | 2,093,541 | ||||||
| Arcland Sakamoto Co., Ltd. |
21,716 | 294,098 | ||||||
| Autobacs Seven Co., Ltd.(a) |
95,400 | 1,585,906 | ||||||
| Bic Camera, Inc. |
59,000 | 619,930 | ||||||
| Chiyoda Co., Ltd. |
39,491 | 634,724 | ||||||
| DCM Holdings Co., Ltd.(a) |
169,545 | 1,580,796 | ||||||
See Notes to Financial Statements.
| WisdomTree Trust | 77 |
Schedule of Investments (continued)
WisdomTree Japan SmallCap Dividend Fund (DFJ)
March 31, 2019
| Investments | Shares | Value | ||||||
| EDION Corp.(a) |
106,639 | $ | 930,689 | |||||
| Geo Holdings Corp.(a) |
44,400 | 616,951 | ||||||
| Gfoot Co., Ltd.(a) |
45,039 | 267,341 | ||||||
| IDOM, Inc.(a) |
42,260 | 122,941 | ||||||
| JINS, Inc. |
5,300 | 286,344 | ||||||
| Joshin Denki Co., Ltd.(a) |
9,700 | 223,560 | ||||||
| K’s Holdings Corp. |
229,996 | 2,040,530 | ||||||
| Keiyo Co., Ltd. |
100,100 | 447,662 | ||||||
| Kohnan Shoji Co., Ltd. |
34,600 | 858,709 | ||||||
| Komeri Co., Ltd. |
42,237 | 1,034,508 | ||||||
| LIXIL VIVA Corp. |
59,400 | 753,468 | ||||||
| Nishimatsuya Chain Co., Ltd. |
49,600 | 416,750 | ||||||
| Nojima Corp. |
27,600 | 500,957 | ||||||
| PAL GROUP Holdings Co., Ltd. |
26,600 | 722,166 | ||||||
| Right On Co., Ltd.(a) |
26,500 | 176,451 | ||||||
| Sac’s Bar Holdings, Inc. |
52,300 | 542,444 | ||||||
| Sanrio Co., Ltd.(a) |
90,442 | 2,157,992 | ||||||
| Shimachu Co., Ltd. |
56,464 | 1,471,222 | ||||||
| T-Gaia Corp. |
56,200 | 932,224 | ||||||
| United Arrows Ltd. |
24,029 | 836,896 | ||||||
| VT Holdings Co., Ltd.(a) |
176,900 | 666,462 | ||||||
| Xebio Holdings Co., Ltd. |
41,600 | 458,151 | ||||||
| Yellow Hat Ltd. |
33,400 | 439,358 | ||||||
|
|
|
|||||||
| Total Specialty Retail |
|
26,704,525 | ||||||
| Technology Hardware, Storage & Peripherals – 0.7% |
| |||||||
| Elecom Co., Ltd. |
27,100 | 836,125 | ||||||
| Maxell Holdings Ltd.(a) |
62,200 | 882,269 | ||||||
| MCJ Co., Ltd. |
79,900 | 583,992 | ||||||
| Riso Kagaku Corp. |
51,700 | 817,410 | ||||||
| Roland DG Corp. |
8,900 | 187,351 | ||||||
| Toshiba TEC Corp. |
33,200 | 922,347 | ||||||
| Wacom Co., Ltd.(a) |
56,211 | 236,657 | ||||||
|
|
|
|||||||
| Total Technology Hardware, Storage & Peripherals |
|
4,466,151 | ||||||
| Textiles, Apparel & Luxury Goods – 1.9% |
| |||||||
| Asics Corp. |
169,900 | 2,279,455 | ||||||
| Baroque Japan Ltd.(a) |
79,800 | 622,193 | ||||||
| Descente Ltd.(a) |
45,553 | 1,193,510 | ||||||
| Fujibo Holdings, Inc. |
12,800 | 304,721 | ||||||
| Goldwin, Inc.(a) |
8,200 | 1,194,236 | ||||||
| Gunze Ltd.(a) |
10,783 | 435,957 | ||||||
| Japan Wool Textile Co., Ltd. (The) |
73,825 | 628,965 | ||||||
| Kurabo Industries Ltd. |
19,976 | 366,547 | ||||||
| Onward Holdings Co., Ltd. |
177,833 | 939,895 | ||||||
| Seiko Holdings Corp.(a) |
48,500 | 1,154,605 | ||||||
| Seiren Co., Ltd.(a) |
43,311 | 639,775 | ||||||
| Wacoal Holdings Corp. |
55,100 | 1,369,971 | ||||||
| Yondoshi Holdings, Inc. |
27,500 | 517,776 | ||||||
|
|
|
|||||||
| Total Textiles, Apparel & Luxury Goods |
|
11,647,606 | ||||||
| Thrifts & Mortgage Finance – 0.0% |
| |||||||
| Aruhi Corp.(a) |
11,300 | 224,908 | ||||||
| Trading Companies & Distributors – 2.4% |
| |||||||
| Advan Co., Ltd. |
80,900 | 744,790 | ||||||
| Alconix Corp.(a) |
22,100 | 228,218 | ||||||
| Daiichi Jitsugyo Co., Ltd. |
8,600 | 248,245 | ||||||
| Gecoss Corp. |
78,800 | 736,848 | ||||||
| Hanwa Co., Ltd.(a) |
43,222 | 1,204,679 | ||||||
| Inaba Denki Sangyo Co., Ltd. |
26,994 | 1,045,031 | ||||||
| Inabata & Co., Ltd. |
48,541 | 660,019 | ||||||
| Japan Pulp & Paper Co., Ltd. |
15,257 | 572,043 | ||||||
| Kamei Corp. |
27,800 | 295,870 | ||||||
| Kanamoto Co., Ltd. |
18,028 | 446,282 | ||||||
| Kanematsu Corp. |
97,700 | 1,116,597 | ||||||
| Nagase & Co., Ltd. |
85,904 | 1,233,243 | ||||||
| Nippon Steel & Sumikin Bussan Corp. |
38,700 | 1,573,384 | ||||||
| Nishio Rent All Co., Ltd. |
11,800 | 340,082 | ||||||
| Onoken Co., Ltd. |
27,300 | 382,794 | ||||||
| Sanyo Trading Co., Ltd.(a) |
15,900 | 268,771 | ||||||
| Sato Shoji Corp. |
43,000 | 351,583 | ||||||
| Seika Corp. |
9,700 | 118,834 | ||||||
| Shinsho Corp. |
14,200 | 331,250 | ||||||
| Trusco Nakayama Corp. |
26,800 | 742,124 | ||||||
| Wakita & Co., Ltd. |
36,800 | 367,385 | ||||||
| Yamazen Corp. |
79,906 | 842,484 | ||||||
| Yuasa Trading Co., Ltd. |
32,200 | 907,657 | ||||||
|
|
|
|||||||
| Total Trading Companies & Distributors |
|
14,758,213 | ||||||
| Transportation Infrastructure – 0.5% |
| |||||||
| Kamigumi Co., Ltd. |
80,500 | 1,864,770 | ||||||
| Mitsubishi Logistics Corp.(a) |
27,500 | 767,719 | ||||||
| Nissin Corp. |
22,700 | 380,025 | ||||||
|
|
|
|||||||
| Total Transportation Infrastructure | 3,012,514 | |||||||
| TOTAL COMMON STOCKS (Cost: $677,242,439) |
608,161,248 | |||||||
| EXCHANGE-TRADED FUND – 0.0% | ||||||||
| United States – 0.0% | ||||||||
| WisdomTree Japan Hedged Equity Fund(b) |
||||||||
| (Cost: $34,221) | 678 | 34,314 | ||||||
| INVESTMENT OF CASH COLLATERAL FOR SECURITIES LOANED – 4.5% |
| |||||||
| United States – 4.5% | ||||||||
| State Street Navigator Securities Lending |
|
|||||||
| (Cost: $28,042,256)(d) | 28,042,256 | 28,042,256 | ||||||
| TOTAL INVESTMENTS IN SECURITIES – 103.2% (Cost: $705,318,916) |
|
636,237,818 | ||||||
| Other Assets less Liabilities – (3.2)% |
(19,944,286 | ) | ||||||
|
|
|
|||||||
| NET ASSETS – 100.0% | $ | 616,293,532 | ||||||
| * | Non-income producing security. |
| (a) | Security, or portion thereof, was on loan at March 31, 2019 (See Note 2). |
| (b) | Affiliated company (See Note 3). |
| (c) | Rate shown represents annualized 7-day yield as of March 31, 2019. |
| (d) | At March 31, 2019, the total market value of the Fund’s securities on loan identified in the Schedule of Investments was $114,242,751. The total market value of the collateral held by the Fund was $120,790,180. The total market value of the collateral includes non-cash U.S. Government securities collateral having a value of $92,747,924. |
See Notes to Financial Statements.
| 78 | WisdomTree Trust |
Schedule of Investments (concluded)
WisdomTree Japan SmallCap Dividend Fund (DFJ)
March 31, 2019
| FINANCIAL DERIVATIVE INSTRUMENTS | ||||||||||||||||||||||||||||
| FOREIGN CURRENCY CONTRACTS (OTC – OVER THE COUNTER) | ||||||||||||||||||||||||||||
| Counterparty | Settlement Date |
Amount and Description of Currency to be Purchased |
Amount and be Sold |
Unrealized Appreciation |
Unrealized Depreciation |
|||||||||||||||||||||||
| State Street Bank and Trust |
4/2/2019 | 369,986 | USD | 41,000,000 | JPY | $ | — | $ | (435 | ) | ||||||||||||||||||
| CURRENCY LEGEND | ||
| JPY | Japanese yen | |
| USD | U.S. dollar | |
See Notes to Financial Statements.
| WisdomTree Trust | 79 |
Statements of Assets and Liabilities
WisdomTree Trust
March 31, 2019
| WisdomTree Europe Quality Dividend Growth Fund |
WisdomTree Europe SmallCap Dividend Fund |
WisdomTree International Dividend ex-Financials Fund |
WisdomTree International Equity Fund |
WisdomTree International High Dividend Fund |
||||||||||||||||
| ASSETS: |
||||||||||||||||||||
| Investments, at cost |
$ | 43,330,771 | $ | 808,313,460 | $ | 197,828,107 | $ | 815,438,310 | $ | 270,813,802 | ||||||||||
| Investment in affiliates, at cost (Note 3) |
— | 3,109,614 | — | 19,711 | 35,934 | |||||||||||||||
| Foreign currency, at cost |
— | 10,415 | 7,500 | 463,098 | 26,137 | |||||||||||||||
| Investments in securities, at value1,2 (Note 2) |
42,066,045 | 709,904,670 | 183,806,318 | 855,504,588 | 258,739,722 | |||||||||||||||
| Investment in affiliates, at value (Note 3) |
— | 3,133,558 | — | 19,842 | 38,107 | |||||||||||||||
| Cash |
8,787 | 17,813 | 16,272 | 57,783 | 20,409 | |||||||||||||||
| Foreign currency, at value |
— | 9,658 | 7,490 | 462,960 | 26,160 | |||||||||||||||
| Unrealized appreciation on foreign currency contracts |
— | 3,786 | — | — | 144 | |||||||||||||||
| Receivables: |
||||||||||||||||||||
| Investment securities sold3 |
21,486 | 8,768,025 | — | — | 71,690 | |||||||||||||||
| Dividends |
65,168 | 2,296,320 | 1,202,850 | 4,769,109 | 1,597,796 | |||||||||||||||
| Securities lending income |
3,580 | 178,109 | 8,030 | 28,710 | 12,906 | |||||||||||||||
| Foreign tax reclaims |
179,770 | 1,226,936 | 407,076 | 1,630,897 | 662,587 | |||||||||||||||
| Total Assets |
42,344,836 | 725,538,875 | 185,448,036 | 862,473,889 | 261,169,521 | |||||||||||||||
| LIABILITIES: |
||||||||||||||||||||
| Foreign currency due to custodian, at value |
12,293 | — | — | — | — | |||||||||||||||
| Unrealized depreciation on foreign currency contracts |
— | 1,242 | 190 | — | 46 | |||||||||||||||
| Payables: |
||||||||||||||||||||
| Cash collateral received for securities loaned (Note 2) |
969,973 | 49,222,738 | 6,169,610 | 24,868,219 | 9,191,247 | |||||||||||||||
| Investment securities purchased |
— | 8,578,229 | — | — | — | |||||||||||||||
| Advisory fees (Note 3) |
20,771 | 332,042 | 88,608 | 342,375 | 125,103 | |||||||||||||||
| Service fees (Note 2) |
158 | 2,536 | 675 | 3,145 | 950 | |||||||||||||||
| Total Liabilities |
1,003,195 | 58,136,787 | 6,259,083 | 25,213,739 | 9,317,346 | |||||||||||||||
| NET ASSETS |
$ | 41,341,641 | $ | 667,402,088 | $ | 179,188,953 | $ | 837,260,150 | $ | 251,852,175 | ||||||||||
| NET ASSETS: |
||||||||||||||||||||
| Paid-in capital |
$ | 48,313,743 | $ | 911,776,864 | $ | 217,751,649 | $ | 851,197,363 | $ | 298,966,627 | ||||||||||
| Total distributable earnings (loss) |
(6,972,102 | ) | (244,374,776 | ) | (38,562,696 | ) | (13,937,213 | ) | (47,114,452 | ) | ||||||||||
| NET ASSETS |
$ | 41,341,641 | $ | 667,402,088 | $ | 179,188,953 | $ | 837,260,150 | $ | 251,852,175 | ||||||||||
| Outstanding beneficial interest shares of $0.001 par value (unlimited number of shares authorized) |
1,650,000 | 11,400,000 | 4,350,000 | 16,550,000 | 6,250,000 | |||||||||||||||
| Net asset value per share |
$ | 25.06 | $ | 58.54 | $ | 41.19 | $ | 50.59 | $ | 40.30 | ||||||||||
| 1 Includes market value of securities out on loan of: |
$ | 1,039,858 | $ | 59,533,467 | $ | 9,092,582 | $ | 34,526,658 | $ | 11,106,908 | ||||||||||
| 2 Investments in securities include investment of cash collateral for securities loaned (see Schedule of Investments for additional information). |
| |||||||||||||||||||
| 3 Includes market value of securities out on loan, which were sold and pending settlement, of: |
— | $ | 711,056 | — | — | — | ||||||||||||||
See Notes to Financial Statements.
| 80 | WisdomTree Trust |
Statements of Assets and Liabilities (continued)
WisdomTree Trust
March 31, 2019
| WisdomTree International LargeCap Dividend Fund |
WisdomTree International MidCap Dividend Fund |
WisdomTree International Multifactor Fund |
WisdomTree International Quality Dividend Growth Fund |
WisdomTree International SmallCap Dividend Fund |
||||||||||||||||
| ASSETS: |
||||||||||||||||||||
| Investments, at cost |
$ | 390,425,414 | $ | 274,367,926 | $ | 18,931,952 | $ | 73,727,527 | $ | 1,644,713,946 | ||||||||||
| Investment in affiliates, at cost (Note 3) |
3,574 | — | — | — | 13,715,012 | |||||||||||||||
| Foreign currency, at cost |
47,118 | 517,706 | 11,427 | 20,609 | 633,271 | |||||||||||||||
| Investments in securities, at value1,2 (Note 2) |
395,139,115 | 287,190,145 | 19,681,648 | 72,072,711 | 1,730,225,334 | |||||||||||||||
| Investment in affiliates, at value (Note 3) |
3,850 | — | — | — | 13,198,647 | |||||||||||||||
| Cash |
152,747 | 114,654 | 2,102 | 67,122 | — | |||||||||||||||
| Deposits at broker |
— | — | — | — | 432 | |||||||||||||||
| Foreign currency, at value |
47,012 | 517,854 | 11,413 | 20,614 | 632,497 | |||||||||||||||
| Unrealized appreciation on foreign currency contracts |
— | — | 46,957 | 83 | — | |||||||||||||||
| Receivables: |
||||||||||||||||||||
| Investment securities sold3 |
2,264,190 | 423,323 | — | — | 53,327 | |||||||||||||||
| Dividends |
2,332,874 | 1,284,835 | 102,657 | 273,247 | 10,163,970 | |||||||||||||||
| Securities lending income |
7,739 | 16,887 | — | 3,257 | 200,170 | |||||||||||||||
| Interest |
— | — | — | — | 2,856 | |||||||||||||||
| Foreign tax reclaims |
1,017,000 | 194,372 | 4,238 | 56,467 | 1,088,402 | |||||||||||||||
| Total Assets |
400,964,527 | 289,742,070 | 19,849,015 | 72,493,501 | 1,755,565,635 | |||||||||||||||
| LIABILITIES: |
||||||||||||||||||||
| Due to custodian |
— | — | — | — | 1,089,125 | |||||||||||||||
| Unrealized depreciation on foreign currency contracts |
153 | — | 65,399 | — | — | |||||||||||||||
| Payables: |
||||||||||||||||||||
| Cash collateral received for securities loaned (Note 2) |
8,974,430 | 9,936,957 | — | 851,521 | 80,551,752 | |||||||||||||||
| Investment securities purchased |
— | 747,362 | — | 77,885 | — | |||||||||||||||
| Capital shares redeemed |
2,318,502 | — | — | — | — | |||||||||||||||
| Advisory fees (Note 3) |
159,939 | 133,112 | 5,416 | 22,742 | 823,525 | |||||||||||||||
| Service fees (Note 2) |
1,467 | 1,012 | 73 | 263 | 6,298 | |||||||||||||||
| Total Liabilities |
11,454,491 | 10,818,443 | 70,888 | 952,411 | 82,470,700 | |||||||||||||||
| NET ASSETS |
$ | 389,510,036 | $ | 278,923,627 | $ | 19,778,127 | $ | 71,541,090 | $ | 1,673,094,935 | ||||||||||
| NET ASSETS: |
||||||||||||||||||||
| Paid-in capital |
$ | 425,495,699 | $ | 276,368,781 | $ | 19,077,225 | $ | 75,329,449 | $ | 1,644,361,186 | ||||||||||
| Total distributable earnings (loss) |
(35,985,663 | ) | 2,554,846 | 700,902 | (3,788,359 | ) | 28,733,749 | |||||||||||||
| NET ASSETS |
$ | 389,510,036 | $ | 278,923,627 | $ | 19,778,127 | $ | 71,541,090 | $ | 1,673,094,935 | ||||||||||
| Outstanding beneficial interest shares of $0.001 par value (unlimited number of shares authorized) |
8,400,000 | 4,500,000 | 800,004 | 2,500,000 | 25,450,000 | |||||||||||||||
| Net asset value per share |
$ | 46.37 | $ | 61.98 | $ | 24.72 | $ | 28.62 | $ | 65.74 | ||||||||||
| 1 Includes market value of securities out on loan of: |
$ | 10,472,949 | $ | 17,241,120 | — | $ | 1,132,980 | $ | 197,556,350 | |||||||||||
| 2 Investments in securities include investment of cash collateral for securities loaned (see Schedule of Investments for additional information). |
| |||||||||||||||||||
| 3 Includes market value of securities out on loan, which were sold and pending settlement, of: |
— | $ | 380,435 | — | — | — | ||||||||||||||
See Notes to Financial Statements.
| WisdomTree Trust | 81 |
Statements of Assets and Liabilities (concluded)
WisdomTree Trust
March 31, 2019
| WisdomTree Japan SmallCap Dividend Fund |
||||
| ASSETS: |
||||
| Investments, at cost |
$ | 705,284,695 | ||
| Investment in affiliates, at cost (Note 3) |
34,221 | |||
| Foreign currency, at cost |
1,010,245 | |||
| Investments in securities, at value1,2 (Note 2) |
636,203,504 | |||
| Investment in affiliates, at value (Note 3) |
34,314 | |||
| Cash |
936 | |||
| Foreign currency, at value |
1,009,520 | |||
| Receivables: |
||||
| Dividends |
7,268,510 | |||
| Securities lending income |
56,404 | |||
| Foreign tax reclaims |
108,501 | |||
| Total Assets |
644,681,689 | |||
| LIABILITIES: |
||||
| Unrealized depreciation on foreign currency contracts |
435 | |||
| Payables: |
||||
| Cash collateral received for securities loaned (Note 2) |
28,042,256 | |||
| Advisory fees (Note 3) |
342,864 | |||
| Service fees (Note 2) |
2,602 | |||
| Total Liabilities |
28,388,157 | |||
| NET ASSETS |
$ | 616,293,532 | ||
| NET ASSETS: |
| |||
| Paid-in capital |
$ | 749,187,649 | ||
| Total distributable earnings (loss) |
(132,894,117 | ) | ||
| NET ASSETS |
$ | 616,293,532 | ||
| Outstanding beneficial interest shares of $0.001 par value (unlimited number of shares authorized) |
9,050,000 | |||
| Net asset value per share |
$ | 68.10 | ||
| 1 Includes market value of securities out on loan of: |
$ | 114,242,751 | ||
| 2 Investments in securities include investment of cash collateral for securities loaned (see Schedule of Investments for additional information). |
| |||
See Notes to Financial Statements.
| 82 | WisdomTree Trust |
WisdomTree Trust
For the Year Ended March 31, 2019
| WisdomTree Europe Quality Dividend Growth Fund |
WisdomTree Europe SmallCap Dividend Fund |
WisdomTree International Dividend ex-Financials Fund |
WisdomTree International Equity Fund |
WisdomTree International High Dividend Fund |
||||||||||||||||
| INVESTMENT INCOME: |
||||||||||||||||||||
| Dividends1 |
$ | 1,800,701 | $ | 39,095,176 | $ | 8,090,266 | $ | 33,752,662 | $ | 13,817,629 | ||||||||||
| Dividends from affiliates (Note 3) |
— | 170,603 | 59,420 | 123,854 | 36,864 | |||||||||||||||
| Non-cash dividends |
8,379 | 1,713,232 | 497,985 | 1,144,746 | 435,916 | |||||||||||||||
| Securities lending income (Note 2) |
29,515 | 2,318,370 | 115,593 | 443,596 | 197,970 | |||||||||||||||
| Total investment income |
1,838,595 | 43,297,381 | 8,763,264 | 35,464,858 | 14,488,379 | |||||||||||||||
| EXPENSES: |
||||||||||||||||||||
| Advisory fees (Note 3) |
355,616 | 5,403,106 | 1,068,282 | 4,177,781 | 1,713,782 | |||||||||||||||
| Service fees (Note 2) |
2,698 | 40,989 | 8,104 | 38,295 | 13,001 | |||||||||||||||
| Total expenses |
358,314 | 5,444,095 | 1,076,386 | 4,216,076 | 1,726,783 | |||||||||||||||
| Expense waivers (Note 3) |
— | (13,255 | ) | (1,662 | ) | (2,618 | ) | (891 | ) | |||||||||||
| Net expenses |
358,314 | 5,430,840 | 1,074,724 | 4,213,458 | 1,725,892 | |||||||||||||||
| Net investment income |
1,480,281 | 37,866,541 | 7,688,540 | 31,251,400 | 12,762,487 | |||||||||||||||
| NET REALIZED AND UNREALIZED GAIN (LOSS) ON INVESTMENTS: |
||||||||||||||||||||
| Net realized gain (loss) from: |
||||||||||||||||||||
| Investment transactions2 |
(3,748,837 | ) | (25,026,478 | ) | (1,125,648 | ) | (19,688,951 | ) | (4,068,518 | ) | ||||||||||
| Investment transactions in affiliates (Note 3) |
— | (583,640 | ) | (170,993 | ) | (391,101 | ) | (55,716 | ) | |||||||||||
| In-kind redemptions |
2,189,093 | 59,773,255 | 1,064,128 | 23,880,385 | 6,864,207 | |||||||||||||||
| Foreign currency contracts |
1,884 | (11,038 | ) | 8,527 | 63,145 | 43,669 | ||||||||||||||
| Foreign currency related transactions |
(22,485 | ) | (370,685 | ) | (112,838 | ) | (313,861 | ) | (115,255 | ) | ||||||||||
| Net realized gain (loss) |
(1,580,345 | ) | 33,781,414 | (336,824 | ) | 3,549,617 | 2,668,387 | |||||||||||||
| Net increase (decrease) in unrealized appreciation/depreciation: |
||||||||||||||||||||
| Investment transactions |
(3,637,173 | ) | (207,691,904 | ) | (8,107,679 | ) | (68,911,847 | ) | (25,465,847 | ) | ||||||||||
| Investment transactions in affiliates (Note 3) |
— | 57,716 | (12,253 | ) | 128 | 4,634 | ||||||||||||||
| Foreign currency contracts |
— | (5,182 | ) | 341 | — | 98 | ||||||||||||||
| Translation of assets and liabilities denominated in foreign currencies |
(6,221 | ) | (82,700 | ) | (22,428 | ) | (74,276 | ) | (34,286 | ) | ||||||||||
| Net decrease in unrealized appreciation/depreciation |
(3,643,394 | ) | (207,722,070 | ) | (8,142,019 | ) | (68,985,995 | ) | (25,495,401 | ) | ||||||||||
| Net realized and unrealized loss on investments |
(5,223,739 | ) | (173,940,656 | ) | (8,478,843 | ) | (65,436,378 | ) | (22,827,014 | ) | ||||||||||
| NET DECREASE IN NET ASSETS RESULTING FROM OPERATIONS |
$ | (3,743,458 | ) | $ | (136,074,115 | ) | $ | (790,303 | ) | $ | (34,184,978 | ) | $ | (10,064,527 | ) | |||||
| 1 Net of foreign withholding tax of: |
$ | 219,783 | $ | 4,853,033 | $ | 738,236 | $ | 3,207,951 | $ | 1,290,566 | ||||||||||
| 2 Net of foreign capital gains tax withholding of: |
— | — | — | $ | 1,452 | $ | 645 | |||||||||||||
See Notes to Financial Statements.
| WisdomTree Trust | 83 |
Statements of Operations (continued)
WisdomTree Trust
For the Year or Period Ended March 31, 2019
| WisdomTree International LargeCap Dividend Fund |
WisdomTree International MidCap Dividend Fund |
WisdomTree International Multifactor Fund1 |
WisdomTree International Quality Dividend Growth Fund |
WisdomTree International SmallCap Dividend Fund |
||||||||||||||||
| INVESTMENT INCOME: |
||||||||||||||||||||
| Dividends2 |
$ | 16,809,772 | $ | 9,625,144 | $ | 182,835 | $ | 1,399,960 | $ | 62,606,848 | ||||||||||
| Dividends from affiliates (Note 3) |
111,388 | 31,998 | — | — | 668,971 | |||||||||||||||
| Interest |
— | — | — | — | 3,830 | |||||||||||||||
| Non-cash dividends |
622,822 | 282,919 | 860 | 4,566 | 974,172 | |||||||||||||||
| Securities lending income (Note 2) |
165,708 | 179,901 | — | 36,420 | 2,424,343 | |||||||||||||||
| Total investment income |
17,709,690 | 10,119,962 | 183,695 | 1,440,946 | 66,678,164 | |||||||||||||||
| EXPENSES: |
||||||||||||||||||||
| Advisory fees (Note 3) |
1,972,934 | 1,583,525 | 17,495 | 283,897 | 10,350,505 | |||||||||||||||
| Service fees (Note 2) |
18,085 | 12,013 | 203 | 2,602 | 78,521 | |||||||||||||||
| Total expenses |
1,991,019 | 1,595,538 | 17,698 | 286,499 | 10,429,026 | |||||||||||||||
| Expense waivers (Note 3) |
(3,848 | ) | (897 | ) | — | (59,145 | ) | (46,259 | ) | |||||||||||
| Net expenses |
1,987,171 | 1,594,641 | 17,698 | 227,354 | 10,382,767 | |||||||||||||||
| Net investment income |
15,722,519 | 8,525,321 | 165,997 | 1,213,592 | 56,295,397 | |||||||||||||||
| NET REALIZED AND UNREALIZED GAIN (LOSS) ON INVESTMENTS: |
||||||||||||||||||||
| Net realized gain (loss) from: |
||||||||||||||||||||
| Investment transactions3 |
(4,151,878 | ) | (9,790,676 | ) | (253,538 | ) | (2,059,006 | ) | (21,788,571 | ) | ||||||||||
| Investment transactions in affiliates (Note 3) |
(464,811 | ) | (163,934 | ) | — | — | (2,307,513 | ) | ||||||||||||
| In-kind redemptions |
11,301,585 | 12,102,804 | 284,469 | 1,012,216 | 68,045,751 | |||||||||||||||
| Futures contracts |
— | — | — | — | 342,345 | |||||||||||||||
| Foreign currency contracts |
42,200 | 58,369 | 113,565 | (20,081 | ) | 225,498 | ||||||||||||||
| Foreign currency related transactions |
(122,610 | ) | (169,061 | ) | 2,162 | 13,899 | (984,829 | ) | ||||||||||||
| Net realized gain (loss) |
6,604,486 | 2,037,502 | 146,658 | (1,052,972 | ) | 43,532,681 | ||||||||||||||
| Net increase (decrease) in unrealized appreciation/depreciation: |
||||||||||||||||||||
| Investment transactions |
(32,779,493 | ) | (29,408,642 | ) | 749,696 | (3,673,522 | ) | (299,302,776 | ) | |||||||||||
| Investment transactions in affiliates (Note 3) |
(17,568 | ) | 2,727 | — | — | (686,979 | ) | |||||||||||||
| Foreign currency contracts |
(560 | ) | 1 | (18,442 | ) | 61 | — | |||||||||||||
| Translation of assets and liabilities denominated in foreign currencies |
(50,832 | ) | (11,252 | ) | (143 | ) | (2,480 | ) | (69,994 | ) | ||||||||||
| Net increase (decrease) in unrealized appreciation/depreciation |
(32,848,453 | ) | (29,417,166 | ) | 731,111 | (3,675,941 | ) | (300,059,749 | ) | |||||||||||
| Net realized and unrealized gain (loss) on investments |
(26,243,967 | ) | (27,379,664 | ) | 877,769 | (4,728,913 | ) | (256,527,068 | ) | |||||||||||
| NET INCREASE (DECREASE) IN NET ASSETS RESULTING FROM OPERATIONS |
$ | (10,521,448 | ) | $ | (18,854,343 | ) | $ | 1,043,766 | $ | (3,515,321 | ) | $ | (200,231,671 | ) | ||||||
| 1 For the period August 10, 2018 (commencement of operations) through March 31, 2019. |
|
|
|
|
|
|||||||||||||||
| 2 Net of foreign withholding tax of: |
$ | 1,604,802 | $ | 919,044 | $ | 15,376 | $ | 114,709 | $ | 6,258,905 | ||||||||||
| 3 Net of foreign capital gains tax withholding of: |
— | — | — | — | $ | 4,845 | ||||||||||||||
See Notes to Financial Statements.
| 84 | WisdomTree Trust |
Statements of Operations (concluded)
WisdomTree Trust
For the Year Ended March 31, 2019
| WisdomTree Japan SmallCap Dividend Fund |
||||
| INVESTMENT INCOME: |
||||
| Dividends1 |
$ | 18,055,749 | ||
| Dividends from affiliates (Note 3) |
121,427 | |||
| Securities lending income (Note 2) |
562,347 | |||
| Total investment income |
18,739,523 | |||
| EXPENSES: |
||||
| Advisory fees (Note 3) |
5,632,155 | |||
| Service fees (Note 2) |
42,727 | |||
| Total expenses |
5,674,882 | |||
| Expense waivers (Note 3) |
(11,906 | ) | ||
| Net expenses |
5,662,976 | |||
| Net investment income |
13,076,547 | |||
| NET REALIZED AND UNREALIZED GAIN (LOSS) ON INVESTMENTS: |
||||
| Net realized gain (loss) from: |
||||
| Investment transactions |
(47,365,746 | ) | ||
| Investment transactions in affiliates (Note 3) |
(648,086 | ) | ||
| In-kind redemptions |
86,952,463 | |||
| Foreign currency contracts |
(365,539 | ) | ||
| Foreign currency related transactions |
(59,366 | ) | ||
| Net realized gain |
38,513,726 | |||
| Net increase (decrease) in unrealized appreciation/depreciation: |
||||
| Investment transactions |
(220,464,139 | ) | ||
| Investment transactions in affiliates (Note 3) |
(21,209 | ) | ||
| Foreign currency contracts |
(435 | ) | ||
| Translation of assets and liabilities denominated in foreign currencies |
(10,324 | ) | ||
| Net decrease in unrealized appreciation/depreciation |
(220,496,107 | ) | ||
| Net realized and unrealized loss on investments |
(181,982,381 | ) | ||
| NET DECREASE IN NET ASSETS RESULTING FROM OPERATIONS |
$ | (168,905,834 | ) | |
| 1 Net of foreign withholding tax of: |
$ | 2,029,271 | ||
See Notes to Financial Statements.
| WisdomTree Trust | 85 |
Statements of Changes in Net Assets
WisdomTree Trust
| WisdomTree Europe Quality Dividend Growth Fund |
WisdomTree Europe SmallCap Dividend Fund |
WisdomTree International Dividend ex-Financials Fund |
||||||||||||||||||||||
| For the Year Ended March 31, 2019 |
For the Year Ended March 31, 2018 |
For the Year Ended March 31, 2019 |
For the Year Ended March 31, 2018 |
For the Year Ended March 31, 2019 |
For the Year Ended March 31, 2018 |
|||||||||||||||||||
| INCREASE (DECREASE) IN NET ASSETS RESULTING FROM OPERATIONS: |
|
|||||||||||||||||||||||
| Net investment income |
$ | 1,480,281 | $ | 846,281 | $ | 37,866,541 | $ | 29,429,572 | $ | 7,688,540 | $ | 7,666,413 | ||||||||||||
| Net realized gain (loss) on investments, foreign currency contracts and foreign currency related transactions |
(1,580,345 | ) | 316,357 | 33,781,414 | 25,703,372 | (336,824 | ) | (4,272,491 | ) | |||||||||||||||
| Net increase (decrease) in unrealized appreciation/depreciation on investments, foreign currency contracts and translation of assets and liabilities denominated in foreign currencies |
(3,643,394 | ) | 1,717,072 | (207,722,070 | ) | 118,883,460 | (8,142,019 | ) | 21,490,838 | |||||||||||||||
| Net increase (decrease) in net assets resulting from operations |
(3,743,458 | ) | 2,879,710 | (136,074,115 | ) | 174,016,404 | (790,303 | ) | 24,884,760 | |||||||||||||||
| DISTRIBUTIONS TO SHAREHOLDERS1: |
||||||||||||||||||||||||
| Distributable earnings |
(1,768,215 | ) | (538,884 | ) | (42,589,672 | ) | (28,824,886 | ) | (7,765,680 | ) | (7,674,532 | ) | ||||||||||||
| CAPITAL SHARE TRANSACTIONS: |
||||||||||||||||||||||||
| Net proceeds from sale of shares |
14,416,259 | 56,267,441 | 81,706,516 | 379,132,162 | 7,858,668 | 2,282,900 | ||||||||||||||||||
| Cost of shares redeemed |
(39,726,421 | ) | (3,821,291 | ) | (459,722,935 | ) | (75,240,524 | ) | (18,759,740 | ) | (21,414,941 | ) | ||||||||||||
| Net increase (decrease) in net assets resulting from capital share transactions |
(25,310,162 | ) | 52,446,150 | (378,016,419 | ) | 303,891,638 | (10,901,072 | ) | (19,132,041 | ) | ||||||||||||||
| Net Increase (Decrease) in Net Assets |
(30,821,835 | ) | 54,786,976 | (556,680,206 | ) | 449,083,156 | (19,457,055 | ) | (1,921,813 | ) | ||||||||||||||
| NET ASSETS: |
||||||||||||||||||||||||
| Beginning of year |
$ | 72,163,476 | $ | 17,376,500 | $ | 1,224,082,294 | $ | 774,999,138 | $ | 198,646,008 | $ | 200,567,821 | ||||||||||||
| End of year2 |
$ | 41,341,641 | $ | 72,163,476 | $ | 667,402,088 | $ | 1,224,082,294 | $ | 179,188,953 | $ | 198,646,008 | ||||||||||||
| SHARES CREATED AND REDEEMED: |
||||||||||||||||||||||||
| Shares outstanding, beginning of year |
2,750,000 | 750,000 | 17,600,000 | 13,100,000 | 4,600,000 | 5,050,000 | ||||||||||||||||||
| Shares created |
550,000 | 2,150,000 | 1,200,000 | 5,650,000 | 200,000 | 50,000 | ||||||||||||||||||
| Shares redeemed |
(1,650,000 | ) | (150,000 | ) | (7,400,000 | ) | (1,150,000 | ) | (450,000 | ) | (500,000 | ) | ||||||||||||
| Shares outstanding, end of year |
1,650,000 | 2,750,000 | 11,400,000 | 17,600,000 | 4,350,000 | 4,600,000 | ||||||||||||||||||
| 1 Amounts for the fiscal year ended March 31, 2018 have been reclassified to match the current year presentation which conforms to the "Disclosure Update and Simplification" amendments adopted by the SEC and which became effective November 5, 2018. The amounts shown for the fiscal year ended March 31, 2018 represents a distribution entirely from net investment income. See Note 7 in the Notes to Financial Statements for more information. |
| |||||||||||||||||||||||
| 2 The "Disclosure Update and Simplification" amendments adopted by the SEC removed the requirement to disclose the amounts pertaining to undistributed net investment income included in net assets for the current fiscal year ended March 31, 2019. The undistributed net investment income included in the net assets for the fiscal year ended March 31, 2018 were as follows: |
| |||||||||||||||||||||||
| Undistributednet investment income included in the net assets |
$ | 334,887 | $ | 3,856,593 | $ | 703,745 | ||||||||||||||||||
See Notes to Financial Statements.
| 86 | WisdomTree Trust |
Statements of Changes in Net Assets (continued)
WisdomTree Trust
| WisdomTree International Equity Fund |
WisdomTree International High Dividend Fund |
WisdomTree International LargeCap Dividend Fund |
||||||||||||||||||||||
| For the Year Ended March 31, 2019 |
For the Year Ended March 31, 2018 |
For the Year Ended March 31, 2019 |
For the Year Ended March 31, 2018 |
For the Year Ended March 31, 2019 |
For the Year Ended March 31, 2018 |
|||||||||||||||||||
| INCREASE (DECREASE) IN NET ASSETS RESULTING FROM OPERATIONS: |
|
|||||||||||||||||||||||
| Net investment income |
$ | 31,251,400 | $ | 26,119,630 | $ | 12,762,487 | $ | 12,094,014 | $ | 15,722,519 | $ | 13,384,433 | ||||||||||||
| Net realized gain (loss) on investments, foreign currency contracts and foreign currency related transactions |
3,549,617 | (2,257,820 | ) | 2,668,387 | (4,437,300 | ) | 6,604,486 | (6,510,413 | ) | |||||||||||||||
| Net increase (decrease) in unrealized appreciation/depreciation on investments, foreign currency contracts and translation of assets and liabilities denominated in foreign currencies |
(68,985,995 | ) | 73,280,262 | (25,495,401 | ) | 23,164,345 | (32,848,453 | ) | 37,272,146 | |||||||||||||||
| Net increase (decrease) in net assets resulting from operations |
(34,184,978 | ) | 97,142,072 | (10,064,527 | ) | 30,821,059 | (10,521,448 | ) | 44,146,166 | |||||||||||||||
| DISTRIBUTIONS TO SHAREHOLDERS1: |
||||||||||||||||||||||||
| Distributable earnings |
(32,159,951 | ) | (24,687,701 | ) | (13,212,551 | ) | (11,744,233 | ) | (16,024,315 | ) | (12,934,443 | ) | ||||||||||||
| CAPITAL SHARE TRANSACTIONS: |
||||||||||||||||||||||||
| Net proceeds from sale of shares |
69,968,919 | 147,167,975 | — | 65,710,900 | 18,707,671 | 52,574,727 | ||||||||||||||||||
| Cost of shares redeemed |
(81,357,277 | ) | (8,577,112 | ) | (60,050,662 | ) | — | (45,511,991 | ) | — | ||||||||||||||
| Net increase (decrease) in net assets resulting from capital share transactions |
(11,388,358 | ) | 138,590,863 | (60,050,662 | ) | 65,710,900 | (26,804,320 | ) | 52,574,727 | |||||||||||||||
| Net Increase (Decrease) in Net Assets |
(77,733,287 | ) | 211,045,234 | (83,327,740 | ) | 84,787,726 | (53,350,083 | ) | 83,786,450 | |||||||||||||||
| NET ASSETS: |
||||||||||||||||||||||||
| Beginning of year |
$ | 914,993,437 | $ | 703,948,203 | $ | 335,179,915 | $ | 250,392,189 | $ | 442,860,119 | $ | 359,073,669 | ||||||||||||
| End of year2 |
$ | 837,260,150 | $ | 914,993,437 | $ | 251,852,175 | $ | 335,179,915 | $ | 389,510,036 | $ | 442,860,119 | ||||||||||||
| SHARES CREATED AND REDEEMED: |
||||||||||||||||||||||||
| Shares outstanding, beginning of year |
16,750,000 | 14,200,000 | 7,750,000 | 6,200,000 | 8,950,000 | 7,900,000 | ||||||||||||||||||
| Shares created |
1,350,000 | 2,700,000 | — | 1,550,000 | 400,000 | 1,050,000 | ||||||||||||||||||
| Shares redeemed |
(1,550,000 | ) | (150,000 | ) | (1,500,000 | ) | — | (950,000 | ) | — | ||||||||||||||
| Shares outstanding, end of year |
16,550,000 | 16,750,000 | 6,250,000 | 7,750,000 | 8,400,000 | 8,950,000 | ||||||||||||||||||
| 1 Amounts for the fiscal year ended March 31, 2018 have been reclassified to match the current year presentation which conforms to the "Disclosure Update and Simplification" amendments adopted by the SEC and which became effective November 5, 2018. The amounts shown for the fiscal year ended March 31, 2018 represents a distribution entirely from net investment income. See Note 7 in the Notes to Financial Statements for more information. |
| |||||||||||||||||||||||
| 2 The "Disclosure Update and Simplification" amendments adopted by the SEC removed the requirement to disclose the amounts pertaining to undistributed net investment income included in net assets for the current fiscal year ended March 31, 2019. The undistributed net investment income included in the net assets for the fiscal year ended March 31, 2018 were as follows: |
| |||||||||||||||||||||||
| Undistributednet investment income included in the net assets |
$ | 4,021,252 | $ | 1,255,785 | $ | 1,771,819 | ||||||||||||||||||
See Notes to Financial Statements.
| WisdomTree Trust | 87 |
Statements of Changes in Net Assets (continued)
WisdomTree Trust
| WisdomTree International MidCap Dividend Fund |
WisdomTree International Multifactor Fund |
WisdomTree International Quality Dividend Growth Fund |
||||||||||||||||||
| For the Year Ended March 31, 2019 |
For the Year Ended March 31, 2018 |
For the Period August 10, 2018* through March 31, 2019 |
For the Year Ended March 31, 2019 |
For the Year Ended March 31, 2018 |
||||||||||||||||
| INCREASE (DECREASE) IN NET ASSETS RESULTING FROM OPERATIONS: |
|
|||||||||||||||||||
| Net investment income |
$ | 8,525,321 | $ | 6,564,915 | $ | 165,997 | $ | 1,213,592 | $ | 330,599 | ||||||||||
| Net realized gain (loss) on investments, foreign currency contracts and foreign currency related transactions |
2,037,502 | 4,524,073 | 146,658 | (1,052,972 | ) | 68,065 | ||||||||||||||
| Net increase (decrease) in unrealized appreciation/depreciation on investments, foreign currency contracts and translation of assets and liabilities denominated in foreign currencies |
(29,417,166 | ) | 21,086,588 | 731,111 | (3,675,941 | ) | 1,583,152 | |||||||||||||
| Net increase (decrease) in net assets resulting from operations |
(18,854,343 | ) | 32,175,576 | 1,043,766 | (3,515,321 | ) | 1,981,816 | |||||||||||||
| DISTRIBUTIONS TO SHAREHOLDERS1: |
||||||||||||||||||||
| Distributable earnings |
(8,622,448 | ) | (6,153,904 | ) | (62,055 | ) | (1,130,824 | ) | (213,547 | ) | ||||||||||
| CAPITAL SHARE TRANSACTIONS: |
||||||||||||||||||||
| Net proceeds from sale of shares |
64,964,241 | 80,441,494 | 21,263,942 | 61,114,211 | 16,337,920 | |||||||||||||||
| Cost of shares redeemed |
(44,652,606 | ) | — | (2,467,626 | ) | (9,323,029 | ) | (2,859,234 | ) | |||||||||||
| Net increase in net assets resulting from capital share transactions |
20,311,635 | 80,441,494 | 18,796,316 | 51,791,182 | 13,478,686 | |||||||||||||||
| Net Increase (Decrease) in Net Assets |
(7,165,156 | ) | 106,463,166 | 19,778,027 | 47,145,037 | 15,246,955 | ||||||||||||||
| NET ASSETS: |
||||||||||||||||||||
| Beginning of period |
$ | 286,088,783 | $ | 179,625,617 | $ | 100 | $ | 24,396,053 | $ | 9,149,098 | ||||||||||
| End of period2 |
$ | 278,923,627 | $ | 286,088,783 | $ | 19,778,127 | $ | 71,541,090 | $ | 24,396,053 | ||||||||||
| SHARES CREATED AND REDEEMED: |
||||||||||||||||||||
| Shares outstanding, beginning of period |
4,200,000 | 3,000,000 | 4 | 800,000 | 350,004 | |||||||||||||||
| Shares created |
1,000,000 | 1,200,000 | 900,000 | 2,050,000 | 550,000 | |||||||||||||||
| Shares redeemed |
(700,000 | ) | — | (100,000 | ) | (350,000 | ) | (100,004 | ) | |||||||||||
| Shares outstanding, end of period |
4,500,000 | 4,200,000 | 800,004 | 2,500,000 | 800,000 | |||||||||||||||
| * Commencement of operations. |
| |||||||||||||||||||
| 1 Amounts for the fiscal year or period ended March 31, 2018 have been reclassified to match the current year presentation which conforms to the “Disclosure Update and Simplification” amendments adopted by the SEC and which became effective November 5, 2018. The amounts shown for the fiscal year or period ended March 31, 2018 represents a distribution entirely from net investment income. See Note 7 in the Notes to Financial Statements for more information. |
| |||||||||||||||||||
| 2 The “Disclosure Update and Simplification” amendments adopted by the SEC removed the requirement to disclose the amounts pertaining to undistributed net investment income included in net assets for the current fiscal year or period ended March 31, 2019. The undistributed net investment income included in the net assets for the fiscal year or period ended March 31, 2018 were as follows: |
| |||||||||||||||||||
| Undistributednet investment income included in the net assets |
$ | 1,131,599 | $ | 136,501 | ||||||||||||||||
See Notes to Financial Statements.
| 88 | WisdomTree Trust |
Statements of Changes in Net Assets (concluded)
WisdomTree Trust
| WisdomTree International SmallCap Dividend Fund |
WisdomTree Japan SmallCap Dividend Fund |
|||||||||||||||
| For the Year Ended March 31, 2019 |
For the Year Ended March 31, 2018 |
For the Year Ended March 31, 2019 |
For the Year Ended March 31, 2018 |
|||||||||||||
| INCREASE (DECREASE) IN NET ASSETS RESULTING FROM OPERATIONS: |
|
|||||||||||||||
| Net investment income |
$ | 56,295,397 | $ | 47,040,477 | $ | 13,076,547 | $ | 12,946,612 | ||||||||
| Net realized gain on investments, futures contracts, foreign currency contracts and foreign currency related transactions |
43,532,681 | 22,288,125 | 38,513,726 | 15,099,962 | ||||||||||||
| Net increase (decrease) in unrealized appreciation/depreciation on investments, foreign currency contracts and translation of assets and liabilities denominated in foreign currencies |
(300,059,749 | ) | 204,548,417 | (220,496,107 | ) | 95,939,141 | ||||||||||
| Net increase (decrease) in net assets resulting from operations |
(200,231,671 | ) | 273,877,019 | (168,905,834 | ) | 123,985,715 | ||||||||||
| DISTRIBUTIONS TO SHAREHOLDERS1: |
||||||||||||||||
| Distributable earnings |
(57,938,955 | ) | (49,435,198 | ) | (16,060,084 | ) | (11,126,041 | ) | ||||||||
| CAPITAL SHARE TRANSACTIONS: |
||||||||||||||||
| Net proceeds from sale of shares |
163,769,847 | 431,989,018 | 302,236,796 | 586,894,213 | ||||||||||||
| Cost of shares redeemed |
(172,971,405 | ) | — | (601,568,699 | ) | (74,466,035 | ) | |||||||||
| Net increase (decrease) in net assets resulting from capital share transactions |
(9,201,558 | ) | 431,989,018 | (299,331,903 | ) | 512,428,178 | ||||||||||
| Net Increase (Decrease) in Net Assets |
(267,372,184 | ) | 656,430,839 | (484,297,821 | ) | 625,287,852 | ||||||||||
| NET ASSETS: |
||||||||||||||||
| Beginning of year |
$ | 1,940,467,119 | $ | 1,284,036,280 | $ | 1,100,591,353 | $ | 475,303,501 | ||||||||
| End of year2 |
$ | 1,673,094,935 | $ | 1,940,467,119 | $ | 616,293,532 | $ | 1,100,591,353 | ||||||||
| SHARES CREATED AND REDEEMED: |
||||||||||||||||
| Shares outstanding, beginning of year |
25,600,000 | 19,700,000 | 13,600,000 | 7,150,000 | ||||||||||||
| Shares created |
2,300,000 | 5,900,000 | 3,950,000 | 7,500,000 | ||||||||||||
| Shares redeemed |
(2,450,000 | ) | — | (8,500,000 | ) | (1,050,000 | ) | |||||||||
| Shares outstanding, end of year |
25,450,000 | 25,600,000 | 9,050,000 | 13,600,000 | ||||||||||||
| 1 Amounts for the fiscal year ended March 31, 2018 have been reclassified to match the current year presentation which conforms to the “Disclosure Update and Simplification” amendments adopted by the SEC and which became effective November 5, 2018. The amounts shown for the fiscal year ended March 31, 2018 represents a distribution entirely from net investment income. See Note 7 in the Notes to Financial Statements for more information. |
| |||||||||||||||
| 2 The “Disclosure Update and Simplification” amendments adopted by the SEC removed the requirement to disclose the amounts pertaining to undistributed net investment income included in net assets for the current fiscal year ended March 31, 2019. The undistributed net investment income included in the net assets for the fiscal year ended March 31, 2018 were as follows: |
| |||||||||||||||
| Undistributednet investment income included in the net assets |
$ | 5,684,304 | $ | 7,982,378 | ||||||||||||
See Notes to Financial Statements.
| WisdomTree Trust | 89 |
WisdomTree Trust
Selected data for a share of beneficial interest outstanding throughout the period is presented below:
| WisdomTree Europe Quality Dividend Growth Fund |
For the Period Ended March 31, 2019 |
For the Period Ended March 31, 2018 |
For the Year Ended March 31, 2017 |
For the Year Ended March 31, 2016 |
For the Period May 7, 2014* through March 31, 2015 |
|||||||||||||||
| Net asset value, beginning of period |
$ | 26.24 | $ | 23.17 | $ | 22.32 | $ | 23.18 | $ | 25.10 | ||||||||||
| Investment operations: |
||||||||||||||||||||
| Net investment income1 |
0.61 | 0.53 | 0.48 | 0.48 | 0.37 | |||||||||||||||
| Net realized and unrealized gain (loss) |
(1.05 | ) | 2.94 | 0.88 | (0.89 | ) | (1.96 | ) | ||||||||||||
| Total from investment operations |
(0.44 | ) | 3.47 | 1.36 | (0.41 | ) | (1.59 | ) | ||||||||||||
| Dividends to shareholders: |
||||||||||||||||||||
| Net investment income |
(0.74 | ) | (0.40 | ) | (0.51 | ) | (0.45 | ) | (0.33 | ) | ||||||||||
| Net asset value, end of period |
$ | 25.06 | $ | 26.24 | $ | 23.17 | $ | 22.32 | $ | 23.18 | ||||||||||
| TOTAL RETURN2 |
(1.62 | )% | 15.03 | % | 6.24 | % | (1.83 | )% | (6.35 | )% | ||||||||||
| RATIOS/SUPPLEMENTAL DATA: |
||||||||||||||||||||
| Net assets, end of period (000’s omitted) |
$ | 41,342 | $ | 72,163 | $ | 17,377 | $ | 17,854 | $ | 11,591 | ||||||||||
| Ratios to average net assets of: |
||||||||||||||||||||
| Expenses |
0.58 | % | 0.58 | % | 0.58 | % | 0.58 | %3 | 0.58 | %4 | ||||||||||
| Net investment income |
2.41 | % | 2.02 | % | 2.19 | % | 2.13 | % | 1.75 | %4 | ||||||||||
| Portfolio turnover rate5 |
42 | % | 18 | % | 35 | % | 54 | % | 21 | % | ||||||||||
| WisdomTree Europe SmallCap Dividend Fund |
For the Year Ended March 31, 2019 |
For the Year Ended March 31, 2018 |
For the Year Ended March 31, 2017 |
For the Year Ended March 31, 2016 |
For the Year Ended March 31, 2015 |
|||||||||||||||
| Net asset value, beginning of year |
$ | 69.55 | $ | 59.16 | $ | 57.01 | $ | 55.63 | $ | 62.23 | ||||||||||
| Investment operations: |
||||||||||||||||||||
| Net investment income1 |
2.57 | 1.88 | 2.04 | 1.45 | 1.94 | |||||||||||||||
| Net realized and unrealized gain (loss) |
(10.87 | ) | 10.39 | 2.32 | 1.49 | (7.03 | ) | |||||||||||||
| Total from investment operations |
(8.30 | ) | 12.27 | 4.36 | 2.94 | (5.09 | ) | |||||||||||||
| Dividends to shareholders: |
||||||||||||||||||||
| Net investment income |
(2.71 | ) | (1.88 | ) | (2.21 | ) | (1.56 | ) | (1.51 | ) | ||||||||||
| Net asset value, end of year |
$ | 58.54 | $ | 69.55 | $ | 59.16 | $ | 57.01 | $ | 55.63 | ||||||||||
| TOTAL RETURN2 |
(12.19 | )% | 20.94 | % | 7.97 | % | 5.25 | % | (8.26 | )% | ||||||||||
| RATIOS/SUPPLEMENTAL DATA: |
||||||||||||||||||||
| Net assets, end of year (000’s omitted) |
$ | 667,402 | $ | 1,224,082 | $ | 774,999 | $ | 1,125,935 | $ | 853,874 | ||||||||||
| Ratios to average net assets6 of: |
||||||||||||||||||||
| Expenses, net of expense waivers |
0.58 | % | 0.58 | % | 0.58 | % | 0.58 | %7 | 0.59 | %8 | ||||||||||
| Expenses, prior to expense waivers |
0.58 | % | 0.58 | % | 0.58 | % | 0.59 | %7 | 0.59 | %8 | ||||||||||
| Net investment income |
4.06 | % | 2.76 | % | 3.68 | % | 2.59 | % | 3.40 | % | ||||||||||
| Portfolio turnover rate5 |
52 | % | 33 | % | 45 | % | 50 | % | 42 | % | ||||||||||
| * | Commencement of operations. |
| 1 | Based on average shares outstanding. |
| 2 | Total return is calculated assuming an initial investment made at the net asset value at the beginning of the period, reinvestment of all dividends and distributions at net asset value during the period and redemption on the last day of the period. Total return calculated for a period of less than one year is not annualized. For the periods in which the investment advisor waived advisory fees for the WisdomTree Europe SmallCap Dividend Fund, the total return would have been lower if certain expenses had not been waived (Notes 2 and 3). |
| 3 | Included in the expense ratio are non-recurring professional expenses. Without these expenses, the expense ratio would have been unchanged. |
| 4 | Annualized. |
| 5 | Portfolio turnover rate is not annualized and excludes the value of the portfolio securities received or delivered as a result of in-kind creations or redemptions of the Fund’s capital shares. Short-term securities with maturities less than or equal to 365 days are excluded from the portfolio turnover calculation. |
| 6 | The ratios to average net assets do not include net investment income (loss) or expenses of other funds in which the Fund invests. |
| 7 | Included in the expense ratio are non-recurring professional expenses. Without these expenses, the expense ratio (net of expense waivers) would have been 0.58% and the expense ratio (prior to expense waivers) would have been 0.58%. |
| 8 | Included in the expense ratio are proxy expenses. Without these proxy expenses, the expense ratio would have been 0.58%. |
See Notes to Financial Statements.
| 90 | WisdomTree Trust |
Financial Highlights (continued)
WisdomTree Trust
Selected data for a share of beneficial interest outstanding throughout the period is presented below:
| WisdomTree International Dividend ex-Financials Fund |
For the Year Ended March 31, 2019 |
For the Year Ended March 31, 2018 |
For the Year Ended March 31, 2017 |
For the Year Ended March 31, 2016 |
For the Year Ended March 31, 2015 |
|||||||||||||||
| Net asset value, beginning of year |
$ | 43.18 | $ | 39.72 | $ | 38.41 | $ | 43.79 | $ | 49.23 | ||||||||||
| Investment operations: |
||||||||||||||||||||
| Net investment income1 |
1.74 | 1.58 | 1.48 | 1.64 | 2.00 | |||||||||||||||
| Net realized and unrealized gain (loss) |
(1.98 | ) | 3.45 | 1.34 | (5.41 | ) | (5.53 | ) | ||||||||||||
| Total from investment operations |
(0.24 | ) | 5.03 | 2.82 | (3.77 | ) | (3.53 | ) | ||||||||||||
| Dividends to shareholders: |
||||||||||||||||||||
| Net investment income |
(1.75 | ) | (1.57 | ) | (1.51 | ) | (1.61 | ) | (1.91 | ) | ||||||||||
| Net asset value, end of year |
$ | 41.19 | $ | 43.18 | $ | 39.72 | $ | 38.41 | $ | 43.79 | ||||||||||
| TOTAL RETURN2 |
(0.49 | )% | 12.84 | % | 7.56 | % | (8.83 | )% | (7.41 | )% | ||||||||||
| RATIOS/SUPPLEMENTAL DATA: |
||||||||||||||||||||
| Net assets, end of year (000’s omitted) |
$ | 179,189 | $ | 198,646 | $ | 200,568 | $ | 230,483 | $ | 324,083 | ||||||||||
| Ratios to average net assets3 of: |
||||||||||||||||||||
| Expenses4 |
0.58 | % | 0.58 | % | 0.58 | % | 0.58 | %5 | 0.59 | %6 | ||||||||||
| Net investment income |
4.17 | % | 3.73 | % | 3.86 | % | 3.99 | % | 4.23 | % | ||||||||||
| Portfolio turnover rate7 |
41 | % | 35 | % | 30 | % | 40 | % | 44 | % | ||||||||||
| WisdomTree International Equity Fund |
For the Year Ended March 31, 2019 |
For the Year Ended March 31, 2018 |
For the Year Ended March 31, 2017 |
For the Year Ended March 31, 2016 |
For the Year Ended March 31, 2015 |
|||||||||||||||
| Net asset value, beginning of year |
$ | 54.63 | $ | 49.57 | $ | 45.90 | $ | 51.67 | $ | 54.47 | ||||||||||
| Investment operations: |
||||||||||||||||||||
| Net investment income1 |
1.86 | 1.70 | 1.59 | 1.68 | 1.92 | |||||||||||||||
| Net realized and unrealized gain (loss) |
(3.98 | ) | 4.98 | 3.68 | (5.79 | ) | (2.86 | ) | ||||||||||||
| Total from investment operations |
(2.12 | ) | 6.68 | 5.27 | (4.11 | ) | (0.94 | ) | ||||||||||||
| Dividends to shareholders: |
||||||||||||||||||||
| Net investment income |
(1.92 | ) | (1.62 | ) | (1.60 | ) | (1.66 | ) | (1.86 | ) | ||||||||||
| Net asset value, end of year |
$ | 50.59 | $ | 54.63 | $ | 49.57 | $ | 45.90 | $ | 51.67 | ||||||||||
| TOTAL RETURN2 |
(3.89 | )% | 13.61 | % | 11.75 | % | (8.15 | )% | (1.83 | )% | ||||||||||
| RATIOS/SUPPLEMENTAL DATA: |
||||||||||||||||||||
| Net assets, end of year (000’s omitted) |
$ | 837,260 | $ | 914,993 | $ | 703,948 | $ | 621,932 | $ | 645,832 | ||||||||||
| Ratios to average net assets3 of: |
||||||||||||||||||||
| Expenses4 |
0.48 | % | 0.48 | % | 0.48 | % | 0.48 | %5 | 0.49 | %6 | ||||||||||
| Net investment income |
3.59 | % | 3.15 | % | 3.41 | % | 3.47 | % | 3.63 | % | ||||||||||
| Portfolio turnover rate7 |
15 | % | 19 | % | 14 | % | 13 | % | 19 | % | ||||||||||
| 1 | Based on average shares outstanding. |
| 2 | Total return is calculated assuming an initial investment made at the net asset value at the beginning of the period, reinvestment of all dividends and distributions at net asset value during the period and redemption on the last day of the period. For the periods in which the investment advisor waived advisory fees, the total return would have been lower if certain expenses had not been waived (Notes 2 and 3). |
| 3 | The ratios to average net assets do not include net investment income (loss) or expenses of other funds in which the Fund invests. |
| 4 | The expense ratio includes investment advisory fee waivers. Without these investment advisory fee waivers, the expense ratio would have been unchanged. |
| 5 | Included in the expense ratio are non-recurring professional expenses. Without these expenses, the expense ratio would have been unchanged. |
| 6 | Included in the expense ratio are proxy expenses. Without these proxy expenses, the expense ratio would have been 0.58% and 0.48%, for WisdomTree International Dividend ex-Financials Fund and WisdomTree International Equity Fund, respectively. |
| 7 | Portfolio turnover rate is not annualized and excludes the value of the portfolio securities received or delivered as a result of in-kind creations or redemptions of the Fund’s capital shares. Short-term securities with maturities less than or equal to 365 days are excluded from the portfolio turnover calculation. |
See Notes to Financial Statements.
| WisdomTree Trust | 91 |
Financial Highlights (continued)
WisdomTree Trust
Selected data for a share of beneficial interest outstanding throughout the period is presented below:
| WisdomTree International High Dividend Fund |
For the Year Ended March 31, 2019 |
For the Year Ended March 31, 2018 |
For the Year Ended March 31, 2017 |
For the Year Ended March 31, 2016 |
For the Year Ended March 31, 2015 |
|||||||||||||||
| Net asset value, beginning of year |
$ | 43.25 | $ | 40.39 | $ | 37.59 | $ | 43.28 | $ | 47.62 | ||||||||||
| Investment operations: |
||||||||||||||||||||
| Net investment income1 |
1.78 | 1.66 | 1.63 | 1.65 | 1.94 | |||||||||||||||
| Net realized and unrealized gain (loss) |
(2.89 | ) | 2.79 | 2.79 | (5.70 | ) | (4.41 | ) | ||||||||||||
| Total from investment operations |
(1.11 | ) | 4.45 | 4.42 | (4.05 | ) | (2.47 | ) | ||||||||||||
| Dividends to shareholders: |
||||||||||||||||||||
| Net investment income |
(1.84 | ) | (1.59 | ) | (1.62 | ) | (1.64 | ) | (1.87 | ) | ||||||||||
| Net asset value, end of year |
$ | 40.30 | $ | 43.25 | $ | 40.39 | $ | 37.59 | $ | 43.28 | ||||||||||
| TOTAL RETURN2 |
(2.53 | )% | 11.12 | % | 12.09 | % | (9.60 | )% | (5.41 | )% | ||||||||||
| RATIOS/SUPPLEMENTAL DATA: |
||||||||||||||||||||
| Net assets, end of year (000’s omitted) |
$ | 251,852 | $ | 335,180 | $ | 250,392 | $ | 257,467 | $ | 337,620 | ||||||||||
| Ratios to average net assets3 of: |
||||||||||||||||||||
| Expenses4 |
0.58 | % | 0.58 | % | 0.58 | % | 0.58 | %5 | 0.59 | %6 | ||||||||||
| Net investment income |
4.32 | % | 3.83 | % | 4.28 | % | 4.09 | % | 4.24 | % | ||||||||||
| Portfolio turnover rate7 |
24 | % | 26 | % | 29 | % | 21 | % | 20 | % | ||||||||||
| WisdomTree International LargeCap Dividend Fund |
For the Year Ended March 31, 2019 |
For the Year Ended March 31, 2018 |
For the Year Ended March 31, 2017 |
For the Year Ended March 31, 2016 |
For the Year Ended March 31, 2015 |
|||||||||||||||
| Net asset value, beginning of year |
$ | 49.48 | $ | 45.45 | $ | 42.14 | $ | 48.67 | $ | 51.68 | ||||||||||
| Investment operations: |
||||||||||||||||||||
| Net investment income1 |
1.81 | 1.62 | 1.54 | 1.59 | 1.88 | |||||||||||||||
| Net realized and unrealized gain (loss) |
(3.09 | ) | 3.97 | 3.32 | (6.58 | ) | (3.09 | ) | ||||||||||||
| Total from investment operations |
(1.28 | ) | 5.59 | 4.86 | (4.99 | ) | (1.21 | ) | ||||||||||||
| Dividends to shareholders: |
||||||||||||||||||||
| Net investment income |
(1.83 | ) | (1.56 | ) | (1.55 | ) | (1.54 | ) | (1.80 | ) | ||||||||||
| Net asset value, end of year |
$ | 46.37 | $ | 49.48 | $ | 45.45 | $ | 42.14 | $ | 48.67 | ||||||||||
| TOTAL RETURN2 |
(2.55 | )% | 12.41 | % | 11.79 | % | (10.49 | )% | (2.47 | )% | ||||||||||
| RATIOS/SUPPLEMENTAL DATA: |
||||||||||||||||||||
| Net assets, end of year (000’s omitted) |
$ | 389,510 | $ | 442,860 | $ | 359,074 | $ | 366,613 | $ | 355,273 | ||||||||||
| Ratios to average net assets3 of: |
||||||||||||||||||||
| Expenses4 |
0.48 | % | 0.48 | % | 0.48 | % | 0.48 | %5 | 0.49 | %6 | ||||||||||
| Net investment income |
3.83 | % | 3.30 | % | 3.59 | % | 3.51 | % | 3.72 | % | ||||||||||
| Portfolio turnover rate7 |
14 | % | 16 | % | 15 | % | 19 | % | 12 | % | ||||||||||
| 1 | Based on average shares outstanding. |
| 2 | Total return is calculated assuming an initial investment made at the net asset value at the beginning of the period, reinvestment of all dividends and distributions at net asset value during the period and redemption on the last day of the period. For the periods in which the investment advisor waived advisory fees, the total return would have been lower if certain expenses had not been waived (Notes 2 and 3). |
| 3 | The ratios to average net assets do not include net investment income (loss) or expenses of other funds in which the Fund invests. |
| 4 | The expense ratio includes investment advisory fee waivers. Without these investment advisory fee waivers, the expense ratio would have been unchanged. |
| 5 | Included in the expense ratio are non-recurring professional expenses. Without these expenses, the expense ratio would have been unchanged. |
| 6 | Included in the expense ratio are proxy expenses. Without these proxy expenses, the expense ratio would have been 0.58% and 0.48%, for WisdomTree International High Dividend Fund and WisdomTree International LargeCap Dividend Fund, respectively. |
| 7 | Portfolio turnover rate is not annualized and excludes the value of the portfolio securities received or delivered as a result of in-kind creations or redemptions of the Fund’s capital shares. Short-term securities with maturities less than or equal to 365 days are excluded from the portfolio turnover calculation. |
See Notes to Financial Statements.
| 92 | WisdomTree Trust |
Financial Highlights (continued)
WisdomTree Trust
Selected data for a share of beneficial interest outstanding throughout the period is presented below:
| WisdomTree International MidCap Dividend Fund |
For the Year Ended March 31, 2019 |
For the Year Ended March 31, 2018 |
For the Year Ended March 31, 2017 |
For the Year Ended March 31, 2016 |
For the Year Ended March 31, 2015 |
|||||||||||||||
| Net asset value, beginning of year |
$ | 68.12 | $ | 59.88 | $ | 55.82 | $ | 58.65 | $ | 60.03 | ||||||||||
| Investment operations: |
||||||||||||||||||||
| Net investment income1 |
2.00 | 1.84 | 1.60 | 1.64 | 1.81 | |||||||||||||||
| Net realized and unrealized gain (loss) |
(6.17 | ) | 8.17 | 4.03 | (2.85 | ) | (1.45 | ) | ||||||||||||
| Total from investment operations |
(4.17 | ) | 10.01 | 5.63 | (1.21 | ) | 0.36 | |||||||||||||
| Dividends to shareholders: |
||||||||||||||||||||
| Net investment income |
(1.97 | ) | (1.77 | ) | (1.57 | ) | (1.62 | ) | (1.74 | ) | ||||||||||
| Net asset value, end of year |
$ | 61.98 | $ | 68.12 | $ | 59.88 | $ | 55.82 | $ | 58.65 | ||||||||||
| TOTAL RETURN2 |
(6.16 | )% | 16.87 | % | 10.34 | % | (2.12 | )% | 0.57 | % | ||||||||||
| RATIOS/SUPPLEMENTAL DATA: |
||||||||||||||||||||
| Net assets, end of year (000’s omitted) |
$ | 278,924 | $ | 286,089 | $ | 179,626 | $ | 153,512 | $ | 155,414 | ||||||||||
| Ratios to average net assets3 of: |
||||||||||||||||||||
| Expenses4 |
0.58 | % | 0.58 | % | 0.58 | % | 0.58 | %5 | 0.59 | %6 | ||||||||||
| Net investment income |
3.12 | % | 2.76 | % | 2.87 | % | 2.91 | % | 3.09 | % | ||||||||||
| Portfolio turnover rate7 |
28 | % | 23 | % | 31 | % | 24 | % | 29 | % | ||||||||||
| WisdomTree International Multifactor Fund | For the Period August 10, 2018* through March 31, 2019 |
|||
| Net asset value, beginning of period |
$ | 24.75 | ||
| Investment operations: |
||||
| Net investment income1 |
0.55 | |||
| Net realized and unrealized loss |
(0.27 | ) | ||
| Total from investment operations |
0.28 | |||
| Dividends to shareholders: |
||||
| Net investment income |
(0.31 | ) | ||
| Net asset value, end of period |
$ | 24.72 | ||
| TOTAL RETURN2 |
1.18 | % | ||
| RATIOS/SUPPLEMENTAL DATA: |
||||
| Net assets, end of period (000’s omitted) |
$ | 19,778 | ||
| Ratios to average net assets of: |
||||
| Expenses |
0.38 | %8 | ||
| Net investment income |
3.61 | %8 | ||
| Portfolio turnover rate7 |
114 | % | ||
| * | Commencement of operations. |
| 1 | Based on average shares outstanding. |
| 2 | Total return is calculated assuming an initial investment made at the net asset value at the beginning of the period, reinvestment of all dividends and distributions at net asset value during the period and redemption on the last day of the period. Total return calculated for a period of less than one year is not annualized. For the periods in which the investment advisor waived advisory fees for the WisdomTree International MidCap Dividend Fund, the total return would have been lower if certain expenses had not been waived (Notes 2 and 3). |
| 3 | The ratios to average net assets do not include net investment income (loss) or expenses of other funds in which the Fund invests. |
| 4 | The expense ratio includes investment advisory fee waivers. Without these investment advisory fee waivers, the expense ratio would have been unchanged. |
| 5 | Included in the expense ratio are non-recurring professional expenses. Without these expenses, the expense ratio would have been unchanged. |
| 6 | Included in the expense ratio are proxy expenses. Without these proxy expenses, the expense ratio would have been 0.58%. |
| 7 | Portfolio turnover rate is not annualized and excludes the value of the portfolio securities received or delivered as a result of in-kind creations or redemptions of the Fund’s capital shares. Short-term securities with maturities less than or equal to 365 days are excluded from the portfolio turnover calculation. |
| 8 | Annualized. |
See Notes to Financial Statements.
| WisdomTree Trust | 93 |
Financial Highlights (continued)
WisdomTree Trust
Selected data for a share of beneficial interest outstanding throughout the period is presented below:
| WisdomTree International Quality Dividend Growth Fund | For the Period Ended March 31, 2019 |
For the Period Ended March 31, 2018 |
For the Period April 7, 2016* through March 31, 2017 |
|||||||||
| Net asset value, beginning of period |
$ | 30.50 | $ | 26.14 | $ | 24.86 | ||||||
| Investment operations: |
||||||||||||
| Net investment income1 |
0.58 | 0.65 | 0.73 | |||||||||
| Net realized and unrealized gain (loss) |
(1.95 | ) | 4.12 | 1.02 | ||||||||
| Total from investment operations |
(1.37 | ) | 4.77 | 1.75 | ||||||||
| Dividends to shareholders: |
||||||||||||
| Net investment income |
(0.51 | ) | (0.41 | ) | (0.47 | ) | ||||||
| Net asset value, end of period |
$ | 28.62 | $ | 30.50 | $ | 26.14 | ||||||
| TOTAL RETURN2 |
(4.43 | )% | 18.33 | % | 7.12 | % | ||||||
| RATIOS/SUPPLEMENTAL DATA: |
||||||||||||
| Net assets, end of period (000’s omitted) |
$ | 71,541 | $ | 24,396 | $ | 9,149 | ||||||
| Ratios to average net assets of: |
||||||||||||
| Expenses, net of expense waivers |
0.38 | % | 0.38 | % | 0.38 | %3 | ||||||
| Expenses, prior to expense waivers |
0.48 | % | 0.48 | % | 0.48 | %3 | ||||||
| Net investment income |
2.05 | % | 2.18 | % | 2.97 | %3 | ||||||
| Portfolio turnover rate4 |
55 | % | 39 | % | 38 | % | ||||||
| WisdomTree International SmallCap Dividend Fund |
For the Year Ended March 31, 2019 |
For the Year Ended March 31, 2018 |
For the Year Ended March 31, 2017 |
For the Year Ended March 31, 2016 |
For the Year Ended March 31, 2015 |
|||||||||||||||
| Net asset value, beginning of year |
$ | 75.80 | $ | 65.18 | $ | 58.98 | $ | 59.21 | $ | 64.84 | ||||||||||
| Investment operations: |
||||||||||||||||||||
| Net investment income1 |
2.19 | 2.07 | 1.97 | 1.64 | 1.91 | |||||||||||||||
| Net realized and unrealized gain (loss) |
(10.01 | ) | 10.76 | 6.22 | (0.31 | ) | (5.67 | ) | ||||||||||||
| Total from investment operations |
(7.82 | ) | 12.83 | 8.19 | 1.33 | (3.76 | ) | |||||||||||||
| Dividends to shareholders: |
||||||||||||||||||||
| Net investment income |
(2.24 | ) | (2.21 | ) | (1.99 | ) | (1.56 | ) | (1.87 | ) | ||||||||||
| Net asset value, end of year |
$ | 65.74 | $ | 75.80 | $ | 65.18 | $ | 58.98 | $ | 59.21 | ||||||||||
| TOTAL RETURN2 |
(10.41 | )% | 19.91 | % | 14.24 | % | 2.26 | % | (5.87 | )% | ||||||||||
| RATIOS/SUPPLEMENTAL DATA: |
||||||||||||||||||||
| Net assets, end of year (000’s omitted) |
$ | 1,673,095 | $ | 1,940,467 | $ | 1,284,036 | $ | 1,099,977 | $ | 917,778 | ||||||||||
| Ratios to average net assets5 of: |
||||||||||||||||||||
| Expenses6 |
0.58 | % | 0.58 | % | 0.58 | % | 0.58 | %7 | 0.59 | %8 | ||||||||||
| Net investment income |
3.15 | % | 2.83 | % | 3.27 | % | 2.82 | % | 3.16 | % | ||||||||||
| Portfolio turnover rate4 |
35 | % | 28 | % | 38 | % | 48 | % | 25 | % | ||||||||||
| * | Commencement of operations. |
| 1 | Based on average shares outstanding. |
| 2 | Total return is calculated assuming an initial investment made at the net asset value at the beginning of the period, reinvestment of all dividends and distributions at net asset value during the period and redemption on the last day of the period. Total return calculated for a period of less than one year is not annualized. For the periods in which the investment advisor waived advisory fees, the total return would have been lower if certain expenses had not been waived (Notes 2 and 3). |
| 3 | Annualized. |
| 4 | Portfolio turnover rate is not annualized and excludes the value of the portfolio securities received or delivered as a result of in-kind creations or redemptions of the Fund’s capital shares. Short-term securities with maturities less than or equal to 365 days are excluded from the portfolio turnover calculation. |
| 5 | The ratios to average net assets do not include net investment income (loss) or expenses of other funds in which the Fund invests. |
| 6 | The expense ratio includes investment advisory fee waivers. Without these investment advisory fee waivers, the expense ratio would have been unchanged. |
| 7 | Included in the expense ratio are non-recurring professional expenses. Without these expenses, the expense ratio would have been unchanged. |
| 8 | Included in the expense ratio are proxy expenses. Without these proxy expenses, the expense ratio would have been 0.58%. |
See Notes to Financial Statements.
| 94 | WisdomTree Trust |
Financial Highlights (concluded)
WisdomTree Trust
Selected data for a share of beneficial interest outstanding throughout the period is presented below:
| WisdomTree Japan SmallCap Dividend Fund |
For the Year Ended March 31, 2019 |
For the Year Ended March 31, 2018 |
For the Year Ended March 31, 2017 |
For the Year Ended March 31, 2016 |
For the Year Ended March 31, 2015 |
|||||||||||||||
| Net asset value, beginning of year |
$ | 80.93 | $ | 66.48 | $ | 55.30 | $ | 54.09 | $ | 50.28 | ||||||||||
| Investment operations: |
||||||||||||||||||||
| Net investment income1 |
1.00 | 1.47 | 1.11 | 0.91 | 0.71 | |||||||||||||||
| Net realized and unrealized gain (loss) |
(12.61 | ) | 14.27 | 11.16 | 1.00 | 3.89 | ||||||||||||||
| Total from investment operations |
(11.61 | ) | 15.74 | 12.27 | 1.91 | 4.60 | ||||||||||||||
| Dividends to shareholders: |
||||||||||||||||||||
| Net investment income |
(1.22 | ) | (1.29 | ) | (1.09 | ) | (0.70 | ) | (0.79 | ) | ||||||||||
| Net asset value, end of year |
$ | 68.10 | $ | 80.93 | $ | 66.48 | $ | 55.30 | $ | 54.09 | ||||||||||
| TOTAL RETURN2 |
(14.38 | )% | 23.84 | % | 22.43 | % | 3.51 | % | 9.26 | % | ||||||||||
| RATIOS/SUPPLEMENTAL DATA: |
||||||||||||||||||||
| Net assets, end of year (000’s omitted) |
$ | 616,294 | $ | 1,100,591 | $ | 475,304 | $ | 423,031 | $ | 286,651 | ||||||||||
| Ratios to average net assets3 of: |
||||||||||||||||||||
| Expenses4 |
0.58 | % | 0.58 | % | 0.58 | % | 0.58 | % | 0.59 | %5 | ||||||||||
| Net investment income |
1.35 | % | 1.94 | % | 1.84 | % | 1.65 | % | 1.40 | % | ||||||||||
| Portfolio turnover rate6 |
42 | % | 18 | % | 33 | % | 29 | % | 36 | % | ||||||||||
| 1 | Based on average shares outstanding. |
| 2 | Total return is calculated assuming an initial investment made at the net asset value at the beginning of the period, reinvestment of all dividends and distributions at net asset value during the period and redemption on the last day of the period. For the periods in which the investment advisor waived advisory fees, the total return would have been lower if certain expenses had not been waived (Notes 2 and 3). |
| 3 | The ratios to average net assets do not include net investment income (loss) or expenses of other funds in which the Fund invests. |
| 4 | The expense ratio includes investment advisory fee waivers. Without these investment advisory fee waivers, the expense ratio would have been unchanged. |
| 5 | Included in the expense ratio are proxy expenses. Without these proxy expenses, the expense ratio would have been 0.58%. |
| 6 | Portfolio turnover rate is not annualized and excludes the value of the portfolio securities received or delivered as a result of in-kind creations or redemptions of the Fund’s capital shares. Short-term securities with maturities less than or equal to 365 days are excluded from the portfolio turnover calculation. |
See Notes to Financial Statements.
| WisdomTree Trust | 95 |
1. ORGANIZATION
WisdomTree Trust (the “Trust”) is registered under the Investment Company Act of 1940, as amended (the “1940 Act”), as an open-end management investment company. The Trust was established as a Delaware statutory trust on December 15, 2005. As of March 31, 2019, the Trust consisted of 76 operational investment funds (each a “Fund”, collectively, the “Funds”). In accordance with Accounting Standards Update (“ASU”) 2013-08, Financial Services-Investment Companies, each Fund listed below qualifies as an investment company and is applying the accounting and reporting guidance for investment companies. These notes relate only to the Funds listed in the table below:
| Fund | Commencement of Operations |
|||
| WisdomTree Europe Quality Dividend Growth Fund (“Europe Quality Dividend Growth Fund’’) |
May 7, 2014 | |||
| WisdomTree Europe SmallCap Dividend Fund (“Europe SmallCap Dividend Fund’’) |
June 16, 2006 | |||
| WisdomTree International Dividend ex-Financials Fund (“International Dividend ex-Financials Fund’’) |
June 16, 2006 | |||
| WisdomTree International Equity Fund (“International Equity Fund’’) |
June 16, 2006 | |||
| WisdomTree International High Dividend Fund (“International High Dividend Fund’’) |
June 16, 2006 | |||
| WisdomTree International LargeCap Dividend Fund (“International LargeCap Dividend Fund’’) |
June 16, 2006 | |||
| WisdomTree International MidCap Dividend Fund (“International MidCap Dividend Fund’’) |
June 16, 2006 | |||
| WisdomTree International Multifactor Fund (“International Multifactor Fund’’) |
August 10, 2018 | |||
| WisdomTree International Quality Dividend Growth Fund (“International Quality Dividend Growth Fund’’) |
April 7, 2016 | |||
| WisdomTree International SmallCap Dividend Fund (“International SmallCap Dividend Fund’’) |
June 16, 2006 | |||
| WisdomTree Japan SmallCap Dividend Fund (“Japan SmallCap Dividend Fund’’) |
June 16, 2006 | |||
Each Fund, except for the International Multifactor Fund, seeks to track the price and yield performance, before fees and expenses, of a particular index (“Index”) developed by WisdomTree Investments, Inc. (“WisdomTree Investments’’). The International Multifactor Fund is actively managed using a model-based approach seeking capital appreciation. WisdomTree Investments is the parent company of WisdomTree Asset Management, Inc. (‘‘WTAM’’), the investment adviser to each Fund and the Trust. “WisdomTree” is a registered trademark of WisdomTree Investments and has been licensed for use by the Trust. Each Fund described herein is considered to be non-diversified as defined under the 1940 Act.
In the normal course of business, the Funds may enter into contracts that contain a variety of representations or that provide indemnification for certain liabilities. The Funds’ maximum exposure under these arrangements is unknown, as this would involve future claims that may be made against the Funds that have not yet occurred. However, the Funds have not had prior claims or losses pursuant to these contracts and believes such exposure to be remote.
2. SIGNIFICANT ACCOUNTING POLICIES
The Financial Accounting Standards Board (“FASB”) Accounting Standards Codification (the “Codification”) is the exclusive reference of authoritative U.S. generally accepted accounting principles (“GAAP”) recognized by the FASB to be applied by nongovernmental entities. Rules and interpretive releases of the Securities and Exchange Commission (“SEC”) under authority of federal laws are also sources of authoritative GAAP for SEC registrants.
The following is a summary of significant accounting policies followed by the Funds:
Use of Estimates — The preparation of financial statements in conformity with GAAP, requires management to make certain estimates and assumptions that affect the reported amounts of assets and liabilities and disclosure of contingent assets and liabilities at the date of the financial statements and the reported amounts of increases and decreases in the net assets from operations during the reporting period. Actual results could differ from those estimates.
Investment Valuation — The net asset value (“NAV”) of each Fund’s shares is calculated each day a Fund is open for business as of the regularly scheduled close of regular trading on the New York Stock Exchange, normally 4:00 p.m. Eastern time (the “NAV Calculation Time”). NAV per share is calculated by dividing a Fund’s net assets by the number of Fund shares outstanding. Each Fund issues and redeems shares at NAV only in large blocks of shares known as creation units, which only certain institutions (e.g. broker-dealers) may purchase or redeem. Shares of each Fund are listed on a national securities exchange and trade at market prices. Most investors will buy and sell shares in the secondary market through brokers. Because Fund shares trade at market prices rather than NAV, shares may trade at a price greater than NAV or less than NAV. In calculating each Fund’s NAV, investments are valued under policies approved by the Board of Trustees of the Trust (the “Board of Trustees”). Equity securities (including preferred stock) traded on any recognized U.S. or non-U.S. exchange are valued at the last sale price or official closing price on the exchange or system on which they are principally traded. Unlisted equity securities (including preferred stock) are valued at the last quoted sale price or, if no sale price is available, at the mean between the highest bid and lowest ask price. Each Fund may invest in
| 96 | WisdomTree Trust |
Notes to Financial Statements (continued)
money market funds which are valued at their NAV per share and exchange-traded funds (“ETFs” or “ETF”) or exchange-traded notes (“ETNs” or “ETN”) which are valued at their last sale or official closing price on the exchange on which they are principally traded or at their NAV per share in instances where the ETF or ETN has not traded on its principal exchange. Fixed income securities (including short-term debt securities with remaining maturities of 60 days or less), if any, generally are valued at current market quotations or mean prices obtained from broker-dealers or independent pricing service providers. Broker-dealers or independent pricing service providers, in determining the value of securities, may consider such factors as recent transactions, indications from broker-dealers yields and quoted prices on similar securities, and market sentiment for the type of security. Foreign currency contracts are valued daily using WM/Reuters closing spot and forward rates as of 4:00 p.m. London time. Futures contracts generally are valued at the settlement price, the price at which a futures contract settles once a given trading day has ended, on the primary exchange on which they trade.
In certain instances, such as when reliable market valuations are not readily available or are not deemed to reflect current market values, a Fund’s investments, which include derivatives, will be fair valued in accordance with the Fund’s pricing policy. The Board of Trustees has established a pricing committee (the “Pricing Committee”) which is comprised of senior representatives of WTAM and which reports to the Board of Trustees on a quarterly basis. In the event that a financial instrument cannot be valued based upon a price from a national securities exchange, independent pricing service provider or broker-dealer quotation, or such prices are deemed to not reflect current market value, the Pricing Committee may value the financial instrument in good faith under the policies and procedures approved by the Board of Trustees based on current facts and circumstances. Securities that may be valued using “fair value” pricing may include, but are not limited to, securities for which there are no current market quotations, securities whose issuer is in default or bankruptcy, securities subject to corporate actions (such as mergers or reorganizations), securities subject to non-U.S. investment limits or currency controls, and securities affected by “significant events.” An example of a significant event is an event occurring after the close of the market in which a security trades but before a Fund’s next NAV Calculation Time that may materially affect the value of a Fund’s investment (e.g., government action, natural disaster, or significant market fluctuation). When fair value pricing is employed, the prices of securities used by a Fund to calculate its NAV may differ from quoted or published prices for the same securities.
Fair Value Measurement — In accordance with Codification Topic 820 (“ASC 820”), Fair Value Measurements and Disclosures, fair value is defined as the price that each Fund would receive upon selling an investment in an orderly transaction to an independent buyer in the principal or most advantageous market of the investment. ASC 820 established a three-tier hierarchy of inputs to be used when determining fair value measurements for disclosure purposes. Inputs refer broadly to the assumptions that market participants would use in pricing the asset or liability, including assumptions about risk — for example, the risk inherent in a particular valuation technique used to measure fair value (such as a pricing model) and/or the risk inherent in the inputs to the valuation technique. Inputs may be observable or unobservable. Observable inputs reflect the assumptions market participants would use in pricing the asset or liability. Observable inputs are based on market data obtained from sources independent of the reporting entity. Unobservable inputs reflect the reporting entity’s own assumptions about the assumptions market participants would use in pricing the asset or liability. Unobservable inputs are based on the best information available in the circumstances. The three-tier hierarchy of inputs is summarized in the three broad levels listed below:
Level 1 – quoted prices in active markets for identical securities
Level 2 – other significant observable inputs (including quoted prices for similar securities, interest rates, prepayment speeds, credit risk, etc.)
Level 3 – significant unobservable inputs (including each Fund’s assumptions in determining the fair value of investments)
The inputs or methodology used for valuation are not necessarily an indication of the risk associated with investing in those investments.
Investments that use Level 2 or Level 3 inputs may include, but are not limited to: (i) an unlisted security related to corporate actions; (ii) a restricted security (e.g., one that may not be publicly sold without registration under the Securities Act of 1933, as amended); (iii) a security whose trading has been suspended or which has been de-listed from its primary trading exchange; (iv) a security that is thinly traded; (v) a security in default or bankruptcy proceedings for which there is no current market quotation or market activity; (vi) a security affected by currency controls or restrictions; and (vii) a security affected by a significant event (e.g., an event that occurs after the close of the markets on which the security is traded but before the time as of which a Fund’s NAV is computed and that may materially affect the value of the Fund’s investments).
The valuation techniques and significant inputs used in determining the fair market value measurements for Level 2 and Level 3 positions are as follows:
Financial instruments are generally valued by independent pricing service providers that use broker-dealer quotations, reported trades or valuation estimates from their internal pricing models. Depending on the type of financial instrument, the independent pricing service providers’ internal pricing models may use inputs that are observable such as issuer details, interest rates, yield curves,
| WisdomTree Trust | 97 |
Notes to Financial Statements (continued)
prepayment speeds, credit risks/spreads, default rates and quoted prices for similar assets. Financial instruments that use similar valuation techniques and observable inputs as described above and have an appropriate level of market activity are categorized as Level 2 of the fair value hierarchy, otherwise a Level 3 fair value classification is appropriate. Over-the-counter financial derivative instruments derive their value from underlying asset prices, indices, reference rates, and other inputs or a combination of these factors. These instruments are normally valued on the basis of broker-dealer quotations or prices obtained from independent pricing service providers. Depending on the product and the terms of the transaction, the value of the financial derivative instruments can be estimated by an independent pricing service provider using a series of techniques including simulation pricing models. The pricing models use inputs that are observed from actively quoted markets such as issuer details, indices, credit risks/spreads, interest rates, yield curves, default and exchange rates. Derivative contracts that use valuation techniques and observable inputs as described above and have an appropriate level of market activity are categorized as Level 2 of the fair value hierarchy, otherwise a Level 3 fair value classification is appropriate.
Determination of a fair value by the Pricing Committee may include significant unobservable inputs and therefore would be reflected as a Level 3 of the fair value hierarchy. The Pricing Committee may employ a market-based valuation approach which may use, among other potential considerations, related or comparable securities, recent transactions, market multiples, and other relevant information to determine fair value. The Pricing Committee may also use an income-based valuation approach in which anticipated future cash flows of the financial instrument are discounted to calculate fair value.
The following is a summary of the fair valuations according to the inputs used as of March 31, 2019 in valuing each Fund’s assets:
| Europe Quality Dividend Growth Fund | Level 1 | Level 2 | Level 3 | |||||||||
| Common Stocks* |
$ | 41,093,026 | $ | — | $ | — | ||||||
| Rights |
3,046 | — | — | |||||||||
| Investment of Cash Collateral for Securities Loaned |
— | 969,973 | — | |||||||||
| Total |
$ | 41,096,072 | $ | 969,973 | $ | — | ||||||
| Europe SmallCap Dividend Fund | Level 1 | Level 2 | Level 3 | |||||||||
| Common Stocks* |
$ | 660,495,453 | $ | — | $ | — | ||||||
| Rights |
186,479 | — | — | |||||||||
| Exchange-Traded Fund |
3,133,558 | — | — | |||||||||
| Investment of Cash Collateral for Securities Loaned |
— | 49,222,738 | — | |||||||||
| Total |
$ | 663,815,490 | $ | 49,222,738 | $ | — | ||||||
| Unrealized Appreciation on Foreign Currency Contracts |
— | 3,786 | — | |||||||||
| Unrealized Depreciation on Foreign Currency Contracts |
— | (1,242 | ) | — | ||||||||
| Total - Net |
$ | 663,815,490 | $ | 49,225,282 | $ | — | ||||||
| International Dividend ex-Financials Fund | Level 1 | Level 2 | Level 3 | |||||||||
| Common Stocks* |
$ | 177,636,708 | $ | — | $ | — | ||||||
| Investment of Cash Collateral for Securities Loaned |
— | 6,169,610 | — | |||||||||
| Total |
$ | 177,636,708 | $ | 6,169,610 | $ | — | ||||||
| Unrealized Depreciation on Foreign Currency Contracts |
— | (190 | ) | — | ||||||||
| Total - Net |
$ | 177,636,708 | $ | 6,169,420 | $ | — | ||||||
| International Equity Fund | Level 1 | Level 2 | Level 3 | |||||||||
| Common Stocks |
||||||||||||
| Japan |
$ | 140,839,553 | $ | 564,060 | $ | — | ||||||
| Other* |
689,230,913 | — | — | |||||||||
| Rights |
— | 1,843 | — | |||||||||
| Exchange-Traded Fund |
19,842 | — | — | |||||||||
| Investment of Cash Collateral for Securities Loaned |
— | 24,868,219 | — | |||||||||
| Total |
$ | 830,090,308 | $ | 25,434,122 | $ | — | ||||||
| 98 | WisdomTree Trust |
Notes to Financial Statements (continued)
| International High Dividend Fund | Level 1 | Level 2 | Level 3 | |||||||||
| Common Stocks* |
$ | 249,547,683 | $ | — | $ | — | ||||||
| Rights |
— | 792 | — | |||||||||
| Exchange-Traded Fund |
38,107 | — | — | |||||||||
| Investment of Cash Collateral for Securities Loaned |
— | 9,191,247 | — | |||||||||
| Total |
$ | 249,585,790 | $ | 9,192,039 | $ | — | ||||||
| Unrealized Appreciation on Foreign Currency Contracts |
— | 144 | — | |||||||||
| Unrealized Depreciation on Foreign Currency Contracts |
— | (46 | ) | — | ||||||||
| Total - Net |
$ | 249,585,790 | $ | 9,192,137 | $ | — | ||||||
| International LargeCap Dividend Fund | Level 1 | Level 2 | Level 3 | |||||||||
| Common Stocks* |
$ | 386,164,685 | $ | — | $ | — | ||||||
| Exchange-Traded Fund |
3,850 | — | — | |||||||||
| Investment of Cash Collateral for Securities Loaned |
— | 8,974,430 | — | |||||||||
| Total |
$ | 386,168,535 | $ | 8,974,430 | $ | — | ||||||
| Unrealized Depreciation on Foreign Currency Contracts |
— | (153 | ) | — | ||||||||
| Total - Net |
$ | 386,168,535 | $ | 8,974,277 | $ | — | ||||||
| International MidCap Dividend Fund | Level 1 | Level 2 | Level 3 | |||||||||
| Common Stocks |
||||||||||||
| Japan |
$ | 62,303,963 | $ | 333,619 | $ | — | ||||||
| Other* |
214,615,606 | — | — | |||||||||
| Investment of Cash Collateral for Securities Loaned |
— | 9,936,957 | — | |||||||||
| Total |
$ | 276,919,569 | $ | 10,270,576 | $ | — | ||||||
| International Multifactor Fund | Level 1 | Level 2 | Level 3 | |||||||||
| Common Stocks* |
$ | 19,681,648 | $ | — | $ | — | ||||||
| Total |
$ | 19,681,648 | $ | — | $ | — | ||||||
| Unrealized Appreciation on Foreign Currency Contracts |
— | 46,957 | — | |||||||||
| Unrealized Depreciation on Foreign Currency Contracts |
— | (65,399 | ) | — | ||||||||
| Total - Net |
$ | 19,681,648 | $ | (18,442 | ) | $ | — | |||||
| International Quality Dividend Growth Fund | Level 1 | Level 2 | Level 3 | |||||||||
| Common Stocks* |
$ | 71,221,190 | $ | — | $ | — | ||||||
| Investment of Cash Collateral for Securities Loaned |
— | 851,521 | — | |||||||||
| Total |
$ | 71,221,190 | $ | 851,521 | $ | — | ||||||
| Unrealized Appreciation on Foreign Currency Contracts |
— | 83 | — | |||||||||
| Total - Net |
$ | 71,221,190 | $ | 851,604 | $ | — | ||||||
| International SmallCap Dividend Fund | Level 1 | Level 2 | Level 3 | |||||||||
| Common Stocks* |
$ | 1,649,307,944 | $ | — | $ | — | ||||||
| Rights |
||||||||||||
| Singapore |
— | 24,161 | — | |||||||||
| Sweden |
228,937 | — | — | |||||||||
| Exchange-Traded Funds |
13,198,647 | — | — | |||||||||
| Foreign Corporate Bond |
— | 112,540 | — | |||||||||
| Investment of Cash Collateral for Securities Loaned |
— | 80,551,752 | — | |||||||||
| Total |
$ | 1,662,735,528 | $ | 80,688,453 | $ | — | ||||||
| WisdomTree Trust | 99 |
Notes to Financial Statements (continued)
| Japan SmallCap Dividend Fund | Level 1 | Level 2 | Level 3 | |||||||||
| Common Stocks |
||||||||||||
| Electronic Equipment, Instruments & Components |
$ | 33,268,995 | $ | 390,222 | $ | — | ||||||
| Other* |
574,502,031 | — | — | |||||||||
| Exchange-Traded Fund |
34,314 | — | — | |||||||||
| Investment of Cash Collateral for Securities Loaned |
— | 28,042,256 | — | |||||||||
| Total |
$ | 607,805,340 | $ | 28,432,478 | $ | — | ||||||
| Unrealized Depreciation on Foreign Currency Contracts |
— | (435 | ) | — | ||||||||
| Total - Net |
$ | 607,805,340 | $ | 28,432,043 | $ | — | ||||||
| * | Please refer to the Schedule of Investments for a breakdown of the valuation by industry type and/or country. |
During the fiscal year or period ended March 31, 2019, there were no significant transfers into or out of Level 3 of the fair value hierarchy.
Derivatives and Hedging Disclosure — Codification Topic 815 (“ASC 815”), Derivatives and Hedging, requires qualitative disclosures about objectives and strategies for using derivatives, quantitative disclosures about fair value amounts of gains and losses on derivative instruments, and disclosures about credit-risk-related contingent features in derivative agreements. The Funds have invested in derivatives, specifically foreign currency contracts during the year or period ended March 31, 2019 and open positions in such derivatives as of March 31, 2019 are detailed in each Fund’s Schedule of Investments. All of the derivative instruments disclosed and described herein are subject to risk. Risks may arise upon entering into foreign currency contracts from potential inability of a counterparty to meet the terms of their contracts and from unanticipated movements in the value of the foreign currencies relative to the U.S. dollar or each other. The Funds’ derivative agreements also contain credit-risk related contingent features which include, but are not limited to, a percentage decline in the Funds’ NAV over a specified time period. If an event occurred at March 31, 2019 that triggered a contingent feature, the counterparty to the agreement may require the Funds to post additional collateral or terminate the derivative positions and demand payment. Any collateral posted with respect to the derivative positions would be used to offset or reduce the payment. The maximum exposure to derivatives agreements with credit-risk related contingent features would be the total value of derivatives in net liability positions for each Fund, as disclosed on page 105. At March 31, 2019, the Funds did not receive or post collateral with any counterparty for derivatives and no event occurred that triggered a credit-risk-related contingent feature. Information with respect to the amounts and types of collateral received and/or posted for derivative instruments as of March 31, 2019, if any, is reflected as a footnote below the respective derivatives tables on each Fund’s Schedule of Investments.
As of March 31, 2019, the effects of such derivative instruments on each Fund’s financial position as reflected in the Statements of Assets and Liabilities are presented in the summary below:
| Asset Derivatives | Liability Derivatives | |||||||||||
| Fund | Balance Sheet Location | Value | Balance Sheet Location | Value | ||||||||
| Europe SmallCap Dividend Fund |
||||||||||||
| Foreign exchange contracts |
Unrealized appreciation on foreign currency contracts | $ | 3,786 | Unrealized depreciation on foreign currency contracts | $ | 1,242 | ||||||
| International Dividend ex-Financials Fund |
||||||||||||
| Foreign exchange contracts |
Unrealized appreciation on foreign currency contracts |
— | Unrealized depreciation on foreign currency contracts |
190 | ||||||||
| International High Dividend Fund |
||||||||||||
| Foreign exchange contracts |
Unrealized appreciation on foreign currency contracts |
144 | Unrealized depreciation on foreign currency contracts |
46 | ||||||||
| International LargeCap Dividend Fund |
||||||||||||
| Foreign exchange contracts |
Unrealized appreciation on foreign currency contracts |
— | Unrealized depreciation on foreign currency contracts |
153 | ||||||||
| International Multifactor Fund |
||||||||||||
| Foreign exchange contracts |
Unrealized appreciation on foreign currency contracts |
46,957 | Unrealized depreciation on foreign currency contracts |
65,399 | ||||||||
| International Quality Dividend Growth Fund |
||||||||||||
| Foreign exchange contracts |
Unrealized appreciation on foreign currency contracts |
83 | Unrealized depreciation on foreign currency contracts |
— | ||||||||
| Japan SmallCap Dividend Fund |
||||||||||||
| Foreign exchange contracts |
Unrealized appreciation on foreign currency contracts |
— | Unrealized depreciation on foreign currency contracts |
435 | ||||||||
| 100 | WisdomTree Trust |
Notes to Financial Statements (continued)
For the fiscal year or period ended March 31, 2019, the effects of derivative instruments on each Fund’s financial performance as reflected in the Statements of Operations are presented in the summary below:
| Fund | Amount of Realized Gain or (Loss) on Derivatives Recognized1 |
Change in Unrealized Appreciation or (Depreciation) on Derivatives Recognized2 |
||||||
| Europe Quality Dividend Growth Fund |
||||||||
| Foreign exchange contracts |
$ | 1,884 | $ | — | ||||
| Europe SmallCap Dividend Fund |
||||||||
| Foreign exchange contracts |
(11,038 | ) | (5,182 | ) | ||||
| International Dividend ex-Financials Fund |
||||||||
| Foreign exchange contracts |
8,527 | 341 | ||||||
| International Equity Fund |
||||||||
| Foreign exchange contracts |
63,145 | — | ||||||
| International High Dividend Fund |
||||||||
| Foreign exchange contracts |
43,669 | 98 | ||||||
| International LargeCap Dividend Fund |
||||||||
| Foreign exchange contracts |
42,200 | (560 | ) | |||||
| International MidCap Dividend Fund |
||||||||
| Foreign exchange contracts |
58,369 | 1 | ||||||
| International Multifactor Fund3 |
||||||||
| Foreign exchange contracts |
113,565 | (18,442 | ) | |||||
| International Quality Dividend Growth Fund |
||||||||
| Foreign exchange contracts |
(20,081 | ) | 61 | |||||
| International SmallCap Dividend Fund |
| |||||||
| Foreign exchange contracts |
225,498 | — | ||||||
| Equity contracts |
342,345 | — | ||||||
| Japan SmallCap Dividend Fund |
||||||||
| Foreign exchange contracts |
(365,539 | ) | (435 | ) | ||||
| 1 | Realized gains (losses) on derivatives are located on the Statements of Operations as follows: |
| Foreign exchange contracts |
Net realized gain (loss) from foreign currency contracts | |
| Equity contracts |
Net realized gain (loss) from futures contracts |
| 2 | Change in unrealized appreciation (depreciation) is located on the Statements of Operations as follows: |
| Foreign exchange contracts |
Net increase (decrease) in unrealized appreciation/depreciation from foreign currency contracts |
| 3 | For the period August 10, 2018 (commencement of operations) through March 31, 2019. |
During the fiscal year or period ended March 31, 2019, the volume of derivative activity (based on the average of month-end balances, except where footnoted) for each Fund was as follows:
| Average Notional | ||||||||||||
| Fund | Foreign currency contracts (to deliver USD) |
Foreign currency contracts (to receive USD) |
Futures contracts (long) |
|||||||||
| Europe Quality Dividend Growth Fund |
| |||||||||||
| Foreign exchange contracts |
$ | 14,464 | $ | 10,222 | $ | — | ||||||
| Europe SmallCap Dividend Fund |
||||||||||||
| Foreign exchange contracts |
372,098 | 482,360 | — | |||||||||
| International Dividend ex-Financials Fund |
||||||||||||
| Foreign exchange contracts |
5,961 | 76,783 | — | |||||||||
| International Equity Fund |
||||||||||||
| Foreign exchange contracts |
11,449 | 106,607 | — | |||||||||
| International High Dividend Fund |
||||||||||||
| Foreign exchange contracts |
61,108 | 83,322 | — | |||||||||
| International LargeCap Dividend Fund |
||||||||||||
| Foreign exchange contracts |
— | 144,932 | — | |||||||||
| WisdomTree Trust | 101 |
Notes to Financial Statements (continued)
| Average Notional | ||||||||||||
| Fund | Foreign currency contracts (to deliver USD) |
Foreign currency contracts (to receive USD) |
Futures contracts (long) |
|||||||||
| International MidCap Dividend Fund |
||||||||||||
| Foreign exchange contracts |
$ | — | $ | 76,380 | $ | — | ||||||
| International Multifactor Fund1 |
||||||||||||
| Foreign exchange contracts |
639,788 | 7,314,640 | — | |||||||||
| International Quality Dividend Growth Fund |
||||||||||||
| Foreign exchange contracts |
49,500 | 53,581 | — | |||||||||
| International SmallCap Dividend Fund |
||||||||||||
| Equity contracts2 |
— | — | 6,878,609 | |||||||||
| Foreign exchange contracts |
341,516 | 161,538 | — | |||||||||
| Japan SmallCap Dividend Fund |
||||||||||||
| Foreign exchange contracts |
— | 305,279 | — | |||||||||
| 1 | For the period August 10, 2018 (commencement of operations) through March 31, 2019. |
| 2 | The volume of derivative activity for the period is based on intra-month balances. |
Investment Transactions and Investment Income — Investment transactions are recorded as of the date that the securities are purchased or sold (trade date). Realized gains and losses on sales of portfolio securities are calculated using the identified-cost method. Dividend income (net of foreign taxes withheld, if any) is recognized on the ex-dividend date or as soon as practicable after the existence of a dividend declaration has been determined. Non-cash dividend income is recognized at the fair value of securities received on the ex-dividend date or as soon as practicable after the existence of a dividend declaration has been determined. Interest income (including amortization of premiums and accretion of discounts), net of any foreign taxes withheld, is accrued daily. Generally, amortization of premiums and accretion of discounts are recognized daily using the effective interest method (also known as the scientific amortization method). Income earned from securities lending activities (i.e. Securities lending income), net of fees payable to the securities borrower and/or securities lending agent, is accrued daily.
Foreign Currency Translation — The accounting records of the Funds are maintained in U.S. dollars. Foreign currencies, as well as investment securities and other assets and liabilities denominated in foreign currencies, are translated into U.S. dollars using exchange rates prevailing on the respective dates of such transactions that are deemed appropriate by WTAM. Realized and unrealized foreign exchange gains and losses on investments are included as a component of net realized gain (loss) from investment transactions and net increase (decrease) in unrealized appreciation (depreciation) from investment transactions, respectively, on the Statements of Operations. Realized and unrealized foreign exchange gains or losses from foreign currency contracts are included in net realized gain (loss) from foreign currency contracts and net increase (decrease) in unrealized appreciation/depreciation from foreign currency contracts, respectively, on the Statements of Operations. Realized and unrealized foreign exchange gains or losses arising from sales of foreign currencies, currency gains or losses recognized between the trade and settlement dates on investment transactions, and the difference between the amounts of dividends and foreign withholding taxes recorded on the Funds’ books and the U.S. dollar equivalent of the amounts actually received or paid are included in net realized gain (loss) from foreign currency related transactions and/or increase (decrease) in unrealized appreciation (depreciation) from translation of assets and liabilities denominated in foreign currencies in the Statements of Operations. Certain foreign exchange gains and losses included in realized and unrealized gains or losses are included in, or are a reduction of, ordinary income in accordance with U.S. Federal income tax regulations.
Expenses/Reimbursements — Under the investment advisory agreement for each Fund, except for Funds that commenced operations on or after March 26, 2013, WTAM has agreed to pay all expenses of the Trust, except for: (i) brokerage expenses and other expenses (such as stamp taxes) connected with the execution of portfolio transactions or in connection with creation and redemption transactions; (ii) legal fees or expenses in connection with any arbitration, litigation or pending or threatened arbitration or litigation, including any settlements in connection therewith; (iii) compensation and expenses of trustees who are not interested persons of the Funds (“Independent Trustees”); (iv) compensation and expenses of counsel to the Independent Trustees; (v) compensation and expenses of the Trust’s Chief Compliance Officer (‘‘CCO’’); (vi) extraordinary expenses; (vii) distribution fees and expenses paid by the Trust under any distribution plan adopted pursuant to Rule 12b-1 under the 1940 Act; and (viii) the advisory fee payable to WTAM.
Under the investment advisory agreement for Funds that commenced operations on or after March 26, 2013, WTAM has agreed to pay all expenses of the Trust, except for: (i) brokerage expenses and other fees, charges, taxes, levies or expenses (such as stamp taxes) incurred in connection with the execution of portfolio transactions or in connection with creation and redemption transactions (including without limitation any fees, charges, taxes, levies or expenses related to the purchase or sale of an amount of any currency, or the partition or repatriation of any security or other asset, related to the execution of portfolio transactions or any creation or redemption transactions); (ii) legal fees or expenses in connection with any arbitration, litigation or pending or
| 102 | WisdomTree Trust |
Notes to Financial Statements (continued)
threatened arbitration or litigation, including any settlements in connection therewith; (iii) compensation and expenses of each Independent Trustee; (iv) compensation and expenses of counsel to the Independent Trustees; (v) compensation and expenses of the Trust’s CCO; (vi) extraordinary expenses (in each case as determined by a majority of the Independent Trustees); (vii) distribution fees and expenses paid by the Trust under any distribution plan adopted pursuant to Rule 12b-1 under the 1940 Act; (viii) interest and taxes of any kind or nature (including, but not limited to, income, excise, transfer and withholding taxes); (ix) fees and expenses related to the provision of securities lending services; and (x) the advisory fee payable to WTAM.
Acquired fund fees and expenses (“AFFEs”) (which are fees and expenses incurred indirectly by a Fund through its investments in certain underlying investment companies) are not operating expenses of the Funds and are not paid by WTAM.
Pursuant to a separate contractual arrangement, WTAM arranges for the provision of CCO services with respect to each Fund, and is liable and responsible for, and administers, payments to the CCO, the Independent Trustees and counsel to the Independent Trustees. WTAM receives a fee, as shown on the Statements of Operations under “Service fees”, of up to 0.0044% per annum of each Fund’s average daily net assets for providing such services and paying such expenses. WTAM provides CCO services to the Trust.
Currency Transactions — The Funds may enter into foreign currency forward and foreign currency futures contracts to facilitate local securities settlements or to protect against currency exposure. The Funds, other than the International Multifactor Fund, do not expect to engage in currency transactions for the purpose of hedging against declines in the value of the Fund’s assets that are denominated in one or more foreign currencies. The Funds may not enter into such contracts for speculative purposes.
Forward Foreign Currency Contracts — The Funds, except for the International Multifactor Fund, utilized forward foreign currency contracts (‘‘Forward Contracts’’) primarily to facilitate foreign security settlements. The International Multifactor Fund utilized Forward Contracts to dynamically offset applicable international currency exposure from positions in international equities. A Forward Contract involves an obligation to purchase or sell a specific currency at a future date, which may be any fixed number of days from the date of the contract agreed upon by the parties, at a price set at the time of the contract. These contracts are principally traded in the inter-bank market conducted directly between currency traders (usually large, commercial banks) and their customers. A Forward Contract generally does not require an initial margin deposit and no commissions are charged at any stage for trades. However, if a Fund is in an unrealized loss position on a Forward Contract, it may be required to pledge collateral (or additional collateral) to the counterparty. If a Fund is in an unrealized gain position on a Forward Contract, it may receive collateral from the counterparty.
Risks may arise upon entering into Forward Contracts from the potential inability of counterparties to meet the terms of their contracts and from unanticipated movements in the value of foreign currencies relative to the U.S. dollar or each other.
Fluctuations in the value of open Forward Contracts are recorded for book purposes as unrealized gains or losses on Forward Contracts by the Funds and included in net increase (decrease) in unrealized appreciation (depreciation) from foreign currency contracts on the Statements of Operations. Realized gains and losses on Forward Contracts include net gains or losses recognized by the Funds on contracts which have settled are included in net realized gain (loss) from foreign currency contracts on the Statements of Operations.
Futures Contracts — The International SmallCap Dividend Fund utilized equity futures contracts on a temporary basis during the period to obtain market exposure consistent with its investment objective during the Fund’s annual portfolio rebalance. When a Fund purchases a listed futures contract, it agrees to purchase a specified reference asset (e.g., commodity, currency or Treasury security) at a specified future date. When a Fund sells a listed futures contract, it agrees to sell a specified reference asset (e.g., commodity, currency or Treasury security) at a specified future date. The price at which the purchase and sale will take place is fixed when the Fund enters into the contract. The exchange clearing corporation is the ultimate counterparty for all exchange-listed contracts, so credit risk is limited to the creditworthiness of the exchange’s clearing corporation.
Upon entering into a futures contract, a Fund is required to deliver to a broker an amount of cash and/or government securities equal to a certain percentage of the contract amount. This amount is known as the “initial margin”. Subsequent payments, known as “variation margin”, generally are made or received by the Fund each day or at other agreed-upon time periods depending on the fluctuations in the value of the underlying futures contracts, except that in the case of certain futures contracts payments may be made or received at settlement. Such variation margin is recorded for financial statement purposes on a daily basis as an unrealized gain or loss on futures until the financial futures contract is closed, at which time the net gain or loss is reclassified to realized gain or loss on futures. When a Fund purchases or sells a futures contract, the Fund is required to “cover” its position in order to limit the risk associated with the use of leverage and other related risks. To cover its position, a Fund will segregate assets consisting of, or take other measures with respect to, cash or liquid securities that, when added to any amounts deposited with a futures commission merchant as margin, will “cover” its position in a manner consistent with the 1940 Act or the rules and SEC interpretations thereunder. This will function as a practical limit on the amount of leverage which a Fund may undertake and on the potential increase in the speculative character of a Fund’s outstanding portfolio securities.
As of March 31, 2019, there were no open futures contracts in the Funds.
| WisdomTree Trust | 103 |
Notes to Financial Statements (continued)
Securities Lending — Each Fund may lend portfolio securities to certain creditworthy borrowers, including the Funds’ securities lending agent. It is the Funds’ policy that, at origination, all loans are secured by collateral of at least 102% of the value of U.S. securities loaned and 105% of the value of foreign securities loaned. Collateral in the form of cash and/or high-grade debt obligations, equivalent to at least 100% of the market value of securities, is maintained at all times. The cash collateral can be invested in certain money market mutual funds which also have exposure to the fluctuations of the market. The values of the investments of cash collateral for securities on loan along with the obligations to return such collateral are included on the Statements of Assets and Liabilities. The total value of securities received as collateral for securities on loan is included in a footnote following each Schedule of Investments, but is not included within the Statements of Assets and Liabilities because the receiving Fund does not have the right to sell or repledge the securities received as collateral. Each Fund receives compensation for lending its securities from interest or dividends earned on the cash or U.S. government securities held as collateral, net of fee rebates paid to the borrower plus reasonable administrative and custody fees, all of which are included in the securities lending income earned by the Funds and disclosed on the Statements of Operations. The dividend and interest income earned on the securities loaned is accounted for in the same manner as other dividend and interest income. The borrower pays to the Funds an amount equal to any dividends or interest received on loaned securities. Dividends received while a security is out on loan are not considered Qualified Dividend Income (“QDI”) under the specific criteria issued by the Internal Revenue Service and are subject to taxation at the shareholder’s ordinary income tax rate instead of the lower long-term capital gains tax rate. Lending portfolio securities could result in a loss or delay in recovering each Fund’s securities if the borrower defaults. In the event of a borrower default with respect to the failure to return to each Fund some or all of the securities loaned, the securities lending agent shall indemnify each Fund against the failure of the borrower.
Master Netting Arrangements — ASU No. 2011-11 “Disclosures about Offsetting Assets and Liabilities” (“ASU 2011-11”) is generally intended to (i) help investors and other financial statement users to better assess the effect or potential effect of offsetting arrangements on a company’s financial position, (ii) improve transparency in the reporting of how companies mitigate credit risk, and (iii) facilitate comparisons between those entities that prepare their financial statements on the basis of GAAP and those entities that prepare their financial statements on the basis of international financial reporting standards. ASU 2011-11 requires entities to disclose (i) gross and net information about both instruments and transactions eligible for offset in the financial statements, and (ii) instruments and transactions subject to an agreement similar to a master netting agreement. ASU 2011-11 is limited in scope to the following financial instruments, to the extent they are offset in the financial statements or subject to an enforceable master netting arrangement or similar agreement: (i) recognized derivative instruments accounted for under ASC 815 (Derivatives and Hedging); (ii) repurchase agreements and reverse repurchase agreements; and (iii) securities borrowing and securities lending transactions.
In order to better define its contractual rights and to secure rights that will help a Fund mitigate its counterparty risk, a Fund may enter into an International Swaps and Derivatives Association, Inc. Master Agreement (“ISDA Master Agreement”) or similar agreement with its counterparties. An ISDA Master Agreement is a bilateral agreement between a Fund and a counterparty that governs over-the-counter derivatives (“OTC”), such as total return swap contracts and Forward Contracts, and typically contains, among other things, collateral posting terms, netting and rights of set-off provisions in the event of a default and/or termination event. Under an ISDA Master Agreement, a Fund may, under certain circumstances, offset with the counterparty certain derivative financial instruments’ payables and receivables to create a single net payment. The provisions of the ISDA Master Agreement typically permit a single net payment in the event of a default (close-out netting) or similar event, including the bankruptcy or insolvency of the counterparty.
Collateral requirements generally differ by type of derivative. Collateral terms are contract-specific for OTC derivatives (e.g. foreign exchange contracts, options and certain swaps). Generally, for transactions traded under an ISDA Master Agreement, the collateral requirements are calculated by netting the marked to market amount for each transaction under such agreement and comparing that amount to the value of any collateral currently pledged by a Fund and the counterparty. Generally, the amount of collateral due from or to a counterparty must exceed a minimum transfer amount threshold before a transfer is required to be made. To the extent amounts due to a Fund from its derivatives counterparties are not fully collateralized, contractually or otherwise, the Fund bears the risk of loss from a counterparty’s non-performance.
The Funds’ security lending activities are governed by a Securities Lending Authorization Agreement (“Lending Agreement”) between the Funds and the lending agent. The Lending Agreement authorizes the lending agent to lend qualifying U.S. and foreign securities held by a Fund to approved borrowers (each a “Borrower”). To mitigate borrower risk, a Fund typically receives from a Borrower collateral in the form of U.S. dollar cash and/or securities issued or guaranteed by the U.S. government or its agencies in excess of the market value of the securities loaned. Under the provisions of the Lending Agreement, a Fund shall have, as to the collateral, all of the rights and remedies of a secured party under applicable law. A Fund is exposed to risk of loss if a Borrower defaults on its obligation to return borrowed securities and the value of the collateral a Fund received is insufficient to cover the market value of the securities loaned. Also, the lending agent is permitted to invest the cash collateral it receives from a Borrower into a money market fund which is subject to market fluctuation. Therefore, a Fund is exposed to risk of loss if the value of invested cash collateral is insufficient to satisfy the Fund’s obligation to return the full amount owed to such Borrower.
| 104 | WisdomTree Trust |
Notes to Financial Statements (continued)
For financial reporting purposes, the Funds elect to not offset assets and liabilities subject to an ISDA Master Agreement or Lending Agreement, if any, in the Statements of Assets and Liabilities. Therefore, all qualifying transactions are presented on a gross basis in the Statements of Assets and Liabilities. As of March 31, 2019, the impact of netting of assets and liabilities and the offsetting of collateral pledged or received based on contractual netting/set-off provisions in the ISDA Master Agreement and the Lending Agreement are detailed in the following table:
| 1 | The amount of collateral presented has been limited such that the net amount by counterparty cannot be less than zero. |
Short-Term Investments — Each Fund may invest a portion of its assets in high-quality money market instruments on an ongoing basis to provide liquidity or for other reasons. The instruments include short-term obligations issued by the U.S. government, its agencies, non-U.S. government agencies, negotiable certificates of deposit (“CDs”), fixed time deposits and bankers’ acceptances of U.S. and foreign banks and similar institutions, commercial papers, repurchase agreements and money market funds. CDs are short-term negotiable obligations of commercial banks. Time deposits are non-negotiable deposits maintained in banking institutions for specified periods of time at stated interest rates. Banker’s acceptances are time drafts drawn on commercial banks by borrowers, usually in connection with international transactions.
Tax Information and Dividends and Distributions to Shareholders — It is each Fund’s policy to comply with all requirements of the Internal Revenue Code of 1986, as amended (the “Code”). Each Fund intends to qualify for and to elect treatment as a separate Regulated Investment Company (“RIC”) under Subchapter M of the Code. In order to qualify for the special tax treatment accorded RICs and their shareholders, each Fund must, among other things, distribute with respect to each taxable year an amount equal to or greater than the sum of 90% of its investment company taxable income and 90% of its net tax-exempt interest income. There can be no guarantee that a Fund will pay dividends. Taxable net realized gains from investment transactions, reduced by capital loss carryforwards, if any, are declared and distributed to shareholders at least annually. The capital loss carryforward amount, if any, is available to offset future net capital gains. The Funds may occasionally be required to make supplemental distributions at some other
| WisdomTree Trust | 105 |
Notes to Financial Statements (continued)
time during the year. The Trust reserves the right to declare special distributions if, in its reasonable discretion, such action is necessary or advisable to preserve the status of each Fund as a RIC or to avoid imposition of income or excise taxes on undistributed income. Dividends and distributions to shareholders are recorded on the ex-dividend date. The amount of dividends and distributions from net investment income and net realized capital gains are determined in accordance with the requirements of the Code and the U.S. Treasury regulations. These book/tax differences are either considered temporary or permanent in nature. To the extent these differences are permanent in nature, such amounts are reclassified within the components of net assets based on their Federal tax basis treatment; temporary differences do not require reclassification. Dividends and distributions that exceed earnings and profit for tax purposes are reported for tax purposes as a return of capital.
3. ADVISORY FEES AND OTHER TRANSACTIONS WITH AFFILIATES
WTAM has overall responsibility for the general management and administration of the Trust. WTAM provides an investment program for each Fund. WTAM has arranged for Mellon Investments Corporation (“Mellon”) to provide sub-advisory services to the Funds. Mellon is compensated by WTAM at no additional cost to the Funds. WTAM also arranges for transfer agency, custody, fund accounting, fund administration, securities lending and all other non-distribution related services necessary for the Funds to operate, which are generally under separate agreements entered into between the Trust on behalf of the Funds and the applicable service provider. Under the investment advisory agreement for each Fund, WTAM agrees to pay all expenses of the Funds, except for certain expenses described in Note 2.
Pursuant to a separate contractual arrangement, as also described in Note 2, WTAM arranges for the provision of CCO services with respect to each Fund, and is liable and responsible for, and administers, payments to the CCO, the Independent Trustees and counsel to the Independent Trustees in exchange for a fee, accrued daily and paid monthly in arrears, of up to 0.0044% per annum of each Fund’s average daily net assets. WTAM expects to receive advisory fees from each Fund, based on a percentage of the Fund’s average daily net assets, as shown in the following table:
| Fund | Advisory (before fee waiver) |
Advisory Fee Waiver1 |
Advisory Fee Expiration Date |
|||||||||
| Europe Quality Dividend Growth Fund |
0.58 | % | — | — | ||||||||
| Europe SmallCap Dividend Fund |
0.58 | % | — | — | ||||||||
| International Dividend ex-Financials Fund |
0.58 | % | — | — | ||||||||
| International Equity Fund |
0.48 | % | — | — | ||||||||
| International High Dividend Fund |
0.58 | % | — | — | ||||||||
| International LargeCap Dividend Fund |
0.48 | % | — | — | ||||||||
| International MidCap Dividend Fund |
0.58 | % | — | — | ||||||||
| International Multifactor Fund |
0.38 | % | — | — | ||||||||
| International Quality Dividend Growth Fund |
0.48 | % | (0.10 | )% | July 31, 2019 | |||||||
| International SmallCap Dividend Fund |
0.58 | % | — | — | ||||||||
| Japan SmallCap Dividend Fund |
0.58 | % | — | — | ||||||||
| 1 | WTAM has contractually agreed to waive a portion of its advisory fee by the waiver amount listed per annum based on the average daily net assets through the expiration date listed, unless earlier terminated by the Board of Trustees of the Trust for any reason. The dollar amount of contractual fee waivers are included in “Expense waivers” on the Statements of Operations. |
Each Fund may purchase shares of affiliated ETFs in secondary market transactions to reduce cash balances. For these transactions, WTAM waives its advisory fees for each Fund’s investment in affiliated funds. The waivers may be reduced to offset the incremental costs related to these investments (fund accounting, safekeeping, transaction fees, etc.) that are paid by WTAM out of its advisory fee. The dollar amount of advisory fees waived during the period for the Funds, if any, are shown in the Statements of Operations in “Expense waivers”.
Affiliated holdings are funds which are managed by, or an affiliate of, WTAM. Transactions with affiliated funds during the fiscal year ended March 31, 2019 are as follows:
| Fund | Value at 3/31/2018 |
Purchases/ Additions |
Sales/ Reductions |
Realized Gain/ (Loss) |
Change in Unrealized Appreciation/ Depreciation |
Value at 3/31/2019 |
Dividend Income |
|||||||||||||||||||||
| Europe SmallCap Dividend Fund |
||||||||||||||||||||||||||||
| International MidCap Dividend Fund |
$ | 5,240,125 | $ | 25,978,128 | $ | 27,558,771 | $ | (583,640 | ) | $ | 57,716 | $ | 3,133,558 | $ | 170,603 | |||||||||||||
| International Dividend ex-Financials Fund |
||||||||||||||||||||||||||||
| International LargeCap Dividend Fund |
$ | 130,035 | $ | 4,896,635 | $ | 4,843,424 | $ | (170,993 | ) | $ | (12,253 | ) | $ | — | $ | 59,420 | ||||||||||||
| 106 | WisdomTree Trust |
Notes to Financial Statements (continued)
| Fund | Value at 3/31/2018 |
Purchases/ Additions |
Sales/ Reductions |
Realized Gain/(Loss) |
Change in Unrealized Appreciation/ Depreciation |
Value at 3/31/2019 |
Dividend Income |
|||||||||||||||||||||
| International Equity Fund |
||||||||||||||||||||||||||||
| International Dividend ex-Financials Fund |
$ | 174 | $ | 11,022,019 | $ | 10,611,378 | $ | (391,101 | ) | $ | 128 | $ | 19,842 | $ | 123,854 | |||||||||||||
| International High Dividend Fund |
||||||||||||||||||||||||||||
| International LargeCap Dividend Fund |
$ | 267,690 | $ | 5,488,279 | $ | 5,666,780 | $ | (55,716 | ) | $ | 4,634 | $ | 38,107 | $ | 36,864 | |||||||||||||
| International LargeCap Dividend Fund |
||||||||||||||||||||||||||||
| International MidCap Dividend Fund |
$ | 759,963 | $ | 9,859,270 | $ | 10,133,004 | $ | (464,811 | ) | $ | (17,568 | ) | $ | 3,850 | $ | 111,388 | ||||||||||||
| International MidCap Dividend Fund |
||||||||||||||||||||||||||||
| Australia Dividend Fund |
$ | 42,653 | $ | 1,472,903 | $ | 1,467,044 | $ | (50,773 | ) | $ | 2,261 | $ | — | $ | 8,250 | |||||||||||||
| Japan Hedged Equity Fund |
43,912 | 1,899,267 | 1,830,484 | (113,161 | ) | 466 | — | 23,748 | ||||||||||||||||||||
| Total |
$ | 86,565 | $ | 3,372,170 | $ | 3,297,528 | $ | (163,934 | ) | $ | 2,727 | $ | — | $ | 31,998 | |||||||||||||
| International SmallCap Dividend Fund |
||||||||||||||||||||||||||||
| Europe SmallCap Dividend Fund |
$ | 3,899,580 | $ | 28,219,661 | $ | 23,151,555 | $ | (1,447,466 | ) | $ | (242,424 | ) | $ | 7,277,796 | $ | 511,193 | ||||||||||||
| Japan SmallCap Dividend Fund |
3,220,099 | 23,208,578 | 19,203,224 | (860,047 | ) | (444,555 | ) | 5,920,851 | 157,778 | |||||||||||||||||||
| Total |
$ | 7,119,679 | $ | 51,428,239 | $ | 42,354,779 | $ | (2,307,513 | ) | $ | (686,979 | ) | $ | 13,198,647 | $ | 668,971 | ||||||||||||
| Japan SmallCap Dividend Fund |
||||||||||||||||||||||||||||
| Japan Hedged Equity Fund |
$ | 244,988 | $ | 57,656,296 | $ | 57,197,675 | $ | (648,086 | ) | $ | (21,209 | ) | $ | 34,314 | $ | 121,427 | ||||||||||||
During the fiscal year ended March 31, 2019, certain Funds engaged in purchase and sale transactions with funds that have a common investment adviser, WTAM. These interfund purchase and sale transactions were effected in accordance with Rule 17a-7 under the 1940 Act. For the fiscal year ended March 31, 2019, the cost of purchases, proceeds from sales and the net realized gain or loss recognized upon the disposal of securities resulting from interfund transactions are shown in the following table:
| Fund | Purchases | Sales | Net Realized Gain/(Loss) |
|||||||||
| Europe Quality Dividend Growth Fund |
$ | 9,625,343 | $ | 6,026,315 | $ | (793,885 | ) | |||||
| Europe SmallCap Dividend Fund |
31,510,689 | 36,626,881 | (6,152,539 | ) | ||||||||
| International Dividend ex-Financials Fund |
13,877,676 | 5,771,492 | (818,512 | ) | ||||||||
| International Equity Fund |
19,610,096 | 14,525,642 | (1,539,871 | ) | ||||||||
| International High Dividend Fund |
8,417,668 | 10,417,272 | 446,180 | |||||||||
| International LargeCap Dividend Fund |
8,293,269 | 8,297,266 | (271,091 | ) | ||||||||
| International MidCap Dividend Fund |
17,691,021 | 17,363,998 | (2,828,445 | ) | ||||||||
| International Quality Dividend Growth Fund |
8,339,962 | 6,172,083 | (81,982 | ) | ||||||||
| International SmallCap Dividend Fund |
63,918,420 | 69,647,996 | (9,894,775 | ) | ||||||||
| Japan SmallCap Dividend Fund |
31,403,928 | 32,485,611 | (4,111,933 | ) | ||||||||
Related Party Transactions — WTAM or its affiliates may from time to time own shares of a Fund. As of March 31, 2019, WTAM held shares of the following Funds which were purchased through an unaffiliated broker in ordinary brokerage transactions in the secondary market in which the Funds’ shares trade:
| Fund | Fund Shares held by WTAM |
Market Value of Fund Shares held by WTAM |
Dividends and Distributions paid to WTAM on Fund Shares held by WTAM |
|||||||||
| International Equity Fund |
125 | $ | 6,329 | $ | 247 | |||||||
| International High Dividend Fund* |
— | — | 94 | |||||||||
| International Multifactor Fund |
428 | 10,634 | 88 | |||||||||
| International Quality Dividend Growth Fund |
169 | 4,857 | 165 | |||||||||
| International SmallCap Dividend Fund |
307 | 20,204 | 631 | |||||||||
| Japan SmallCap Dividend Fund |
78 | 5,320 | 63 | |||||||||
| * | No shares were held in this Fund by WTAM at the end of the period. |
At March 31, 2019, approximately 26% of the International Quality Dividend Growth Fund’s outstanding shares were held by an affiliated fund.
| WisdomTree Trust | 107 |
Notes to Financial Statements (continued)
4. CAPITAL SHARE TRANSACTIONS
As of March 31, 2019, there were an unlimited number of $0.001 par value shares of beneficial interest authorized by the Trust. Shares are issued and redeemed by each Fund only in creation units or multiples thereof. Except when aggregated in creation units, shares of each Fund are not redeemable. Transactions in shares for each Fund are disclosed in detail in the Statements of Changes in Net Assets. The consideration for the purchase of creation units of a Fund generally consists of the in-kind contribution of a portfolio of equity securities and an amount of cash. Investors purchasing and redeeming creation units may be charged a purchase transaction fee and a redemption transaction fee to offset transfer and other transaction costs associated with the issuance and redemption of creation units.
5. INVESTMENT PORTFOLIO TRANSACTIONS
Purchases and sales of investments (excluding purchases and sales resulting from in-kind capital share transactions and short-term investments) and the cost of purchases and the proceeds from sales resulting from in-kind capital share transactions (excluding short-term investments) for the fiscal year or period ended March 31, 2019 are shown in the following table. Realized gains and losses on sales resulting from in-kind capital share redemptions, as shown on the Statements of Operations, are not recognized by the Funds for tax purposes.
| In-kind Capital Share Transactions | ||||||||||||||||
| Fund | Purchases | Sales | Purchases | Sales | ||||||||||||
| Europe Quality Dividend Growth Fund |
$ | 25,554,748 | $ | 25,775,588 | $ | 14,219,969 | $ | 39,496,745 | ||||||||
| Europe SmallCap Dividend Fund |
560,322,214 | 481,892,715 | 6,928,689 | 457,231,294 | ||||||||||||
| International Dividend ex-Financials Fund |
74,217,467 | 75,054,524 | 7,870,567 | 18,755,090 | ||||||||||||
| International Equity Fund |
134,087,232 | 133,535,859 | 65,930,459 | 80,166,387 | ||||||||||||
| International High Dividend Fund |
69,231,312 | 70,573,318 | — | 59,812,303 | ||||||||||||
| International LargeCap Dividend Fund |
57,093,933 | 59,087,913 | 18,245,757 | 44,285,617 | ||||||||||||
| International MidCap Dividend Fund |
76,660,607 | 76,229,088 | 64,069,837 | 44,035,230 | ||||||||||||
| International Multifactor Fund1 |
10,467,831 | 10,335,284 | 21,236,754 | 2,468,587 | ||||||||||||
| International Quality Dividend Growth Fund |
33,319,374 | 31,968,409 | 59,671,014 | 9,172,200 | ||||||||||||
| International SmallCap Dividend Fund |
719,598,852 | 620,606,138 | 74,377,168 | 171,546,169 | ||||||||||||
| Japan SmallCap Dividend Fund |
475,266,637 | 401,918,849 | 227,381,485 | 599,655,006 | ||||||||||||
| 1 | For the period August 10, 2018 (commencement of operations) through March 31, 2019. |
6. FEDERAL INCOME TAXES
At March 31, 2019, the cost of investments (including securities on loan and derivatives) for Federal income tax purposes was as follows:
| Investments in Long Securities | Investments in Financial Derivatives1 | |||||||||||||||||||||||||||||||||||
| Fund | Tax Cost | Gross Unrealized Appreciation |
Gross Unrealized Depreciation |
Net Unrealized Appreciation/ (Depreciation) |
Gross Unrealized Appreciation |
Gross Unrealized Depreciation |
Net Unrealized Appreciation/ (Depreciation) |
Total Net Unrealized Appreciation/ (Depreciation) |
||||||||||||||||||||||||||||
| Europe Quality Dividend Growth Fund |
$ | 43,480,767 | $ | 2,693,159 | $ | (4,107,881 | ) | $ | (1,414,722 | ) | $ | — | $ | — | $ | — | $ | (1,414,722 | ) | |||||||||||||||||
| Europe SmallCap Dividend Fund |
812,370,997 | 50,969,352 | (150,302,122 | ) | (99,332,770 | ) | 3,786 | (1,242 | ) | 2,544 | (99,330,226 | ) | ||||||||||||||||||||||||
| International Dividend ex-Financials Fund |
198,033,960 | 10,584,053 | (24,811,695 | ) | (14,227,642 | ) | — | (190 | ) | (190 | ) | (14,227,832 | ) | |||||||||||||||||||||||
| International Equity Fund |
819,937,267 | 104,605,111 | (69,017,948 | ) | 35,587,163 | — | — | — | 35,587,163 | |||||||||||||||||||||||||||
| International High Dividend Fund |
271,482,099 | 20,756,797 | (33,461,067 | ) | (12,704,270 | ) | 144 | (46 | ) | 98 | (12,704,172 | ) | ||||||||||||||||||||||||
| International LargeCap Dividend Fund |
391,359,336 | 41,707,182 | (37,923,553 | ) | 3,783,629 | — | (153 | ) | (153 | ) | 3,783,476 | |||||||||||||||||||||||||
| International MidCap Dividend Fund |
275,696,534 | 30,769,288 | (19,275,677 | ) | 11,493,611 | — | — | — | 11,493,611 | |||||||||||||||||||||||||||
| International Multifactor Fund |
18,954,685 | 915,819 | (188,856 | ) | 726,963 | 925 | (802 | ) | 123 | 727,086 | ||||||||||||||||||||||||||
| International Quality Dividend Growth Fund |
73,921,907 | 4,168,155 | (6,017,351 | ) | (1,849,196 | ) | 83 | — | 83 | (1,849,113 | ) | |||||||||||||||||||||||||
| International SmallCap Dividend Fund |
1,661,916,965 | 240,363,348 | (158,856,332 | ) | 81,507,016 | — | — | — | 81,507,016 | |||||||||||||||||||||||||||
| Japan SmallCap Dividend Fund |
705,390,506 | 26,443,663 | (95,596,351 | ) | (69,152,688 | ) | — | (435 | ) | (435 | ) | (69,153,123 | ) | |||||||||||||||||||||||
| 1 | Certain financial derivatives may be considered section 1256 contracts under the Code. Each section 1256 contract held at the close of a taxable year shall be treated as sold for its fair market value on the last business day of such taxable year (and any realized gain or loss shall be taken into account for the taxable year). As such, the unrealized appreciation/(deprecation) for financial derivatives on a tax basis may not correspond to the unrealized appreciation/(depreciation) on a GAAP basis. The unrealized appreciation/(depreciation) for financial derivatives on a GAAP basis is located in the respective financial derivatives tables in each Fund’s Schedule of Investments. |
| 108 | WisdomTree Trust |
Notes to Financial Statements (continued)
At March 31, 2019, the components of accumulated earnings/(loss) on a tax-basis were as follows:
| Fund | Undistributed Ordinary Income |
Undistributed Capital and Other Losses |
Net Unrealized (Depreciation) |
Currency and Other Unrealized Depreciation |
Total Accumulated (Losses) |
|||||||||||||||
| Europe Quality Dividend Growth Fund |
$ | 54,999 | $ | (5,606,912 | ) | $ | (1,414,722 | ) | $ | (5,467 | ) | $ | (6,972,102 | ) | ||||||
| Europe SmallCap Dividend Fund |
1,579,232 | (146,576,535 | ) | (99,330,226 | ) | (47,247 | ) | (244,374,776 | ) | |||||||||||
| International Dividend ex-Financials Fund |
543,298 | (24,868,169 | ) | (14,227,832 | ) | (9,993 | ) | (38,562,696 | ) | |||||||||||
| International Equity Fund |
3,237,922 | (52,713,962 | ) | 35,587,163 | (48,336 | ) | (13,937,213 | ) | ||||||||||||
| International High Dividend Fund |
903,037 | (35,293,052 | ) | (12,704,172 | ) | (20,265 | ) | (47,114,452 | ) | |||||||||||
| International LargeCap Dividend Fund |
1,481,388 | (41,221,833 | ) | 3,783,476 | (28,694 | ) | (35,985,663 | ) | ||||||||||||
| International MidCap Dividend Fund |
995,843 | (9,926,138 | ) | 11,493,611 | (8,470 | ) | 2,554,846 | |||||||||||||
| International Multifactor Fund |
78,710 | (104,751 | ) | 727,086 | (143 | ) | 700,902 | |||||||||||||
| International Quality Dividend Growth Fund |
229,262 | (2,165,868 | ) | (1,849,113 | ) | (2,640 | ) | (3,788,359 | ) | |||||||||||
| International SmallCap Dividend Fund |
9,229,282 | (61,931,486 | ) | 81,507,016 | (71,063 | ) | 28,733,749 | |||||||||||||
| Japan SmallCap Dividend Fund |
6,556,480 | (70,268,784 | ) | (69,153,123 | ) | (28,690 | ) | (132,894,117 | ) | |||||||||||
The tax character of distributions paid during the fiscal years or period ended March 31, 2019 and March 31, 2018 was as follows:
| Year Ended March 31, 2019 | Year Ended March 31, 2018 | |||||||
| Fund | Distributions Paid from Ordinary Income* |
Distributions Paid from Ordinary Income* |
||||||
| Europe Quality Dividend Growth Fund |
$ | 1,768,215 | $ | 538,884 | ||||
| Europe SmallCap Dividend Fund |
42,589,672 | 28,824,886 | ||||||
| International Dividend ex-Financials Fund |
7,765,680 | 7,674,532 | ||||||
| International Equity Fund |
32,159,951 | 24,687,701 | ||||||
| International High Dividend Fund |
13,212,551 | 11,744,233 | ||||||
| International LargeCap Dividend Fund |
16,024,315 | 12,934,443 | ||||||
| International MidCap Dividend Fund |
8,622,448 | 6,153,904 | ||||||
| International Multifactor Fund |
62,055 | 1 | — | |||||
| International Quality Dividend Growth Fund |
1,130,824 | 213,547 | ||||||
| International SmallCap Dividend Fund |
57,938,955 | 49,435,198 | ||||||
| Japan SmallCap Dividend Fund |
16,060,084 | 11,126,041 | ||||||
| * | Includes short-term capital gains if any. |
| 1 | For the period August 10, 2018 (commencement of operations) through March 31, 2019. |
At March 31, 2019, for Federal tax purposes, the Funds have capital loss carryforwards available to offset future capital gains as indicated in the below table. To the extent that these loss carryforwards are utilized, capital gains so offset will not be distributed to shareholders.
| Fund | Short-Term Post-Effective No Expiration |
Long-Term Post-Effective No Expiration |
Capital Loss Available Total |
|||||||||
| Europe Quality Dividend Growth Fund |
$ | 3,614,839 | $ | 1,992,073 | $ | 5,606,912 | ||||||
| Europe SmallCap Dividend Fund |
91,947,759 | 54,628,776 | 146,576,535 | |||||||||
| International Dividend ex-Financials Fund |
13,669,123 | 11,199,046 | 24,868,169 | |||||||||
| International Equity Fund |
10,612,373 | 42,101,589 | 52,713,962 | |||||||||
| International High Dividend Fund |
6,375,651 | 28,917,401 | 35,293,052 | |||||||||
| International LargeCap Dividend Fund |
10,684,421 | 30,537,412 | 41,221,833 | |||||||||
| International MidCap Dividend Fund |
4,192,032 | 5,734,106 | 9,926,138 | |||||||||
| International Multifactor Fund |
— | — | — | |||||||||
| International Quality Dividend Growth Fund |
1,947,644 | 218,224 | 2,165,868 | |||||||||
| International SmallCap Dividend Fund |
61,931,486 | — | 61,931,486 | |||||||||
| Japan SmallCap Dividend Fund |
58,574,381 | 11,694,403 | 70,268,784 | |||||||||
Capital losses incurred after October 31 (“post-October capital losses”) and late year ordinary losses incurred after December 31 within the taxable year are deemed to arise on the first business day of each Fund’s next taxable year.
| WisdomTree Trust | 109 |
Notes to Financial Statements (continued)
During the fiscal year or period ended March 31, 2019, the following Funds incurred and will elect to defer post-October capital losses and late year ordinary losses as follows:
| Fund | Short-Term Post-October Capital Losses |
Long-Term Post-October Capital Losses |
||||||
| Europe Quality Dividend Growth Fund |
$ | — | $ | — | ||||
| Europe SmallCap Dividend Fund |
— | — | ||||||
| International Dividend ex-Financials Fund |
— | — | ||||||
| International Equity Fund |
— | — | ||||||
| International High Dividend Fund |
— | — | ||||||
| International LargeCap Dividend Fund |
— | — | ||||||
| International MidCap Dividend Fund |
— | — | ||||||
| International Multifactor Fund1 |
148,507 | (43,756 | ) | |||||
| International Quality Dividend Growth Fund |
— | — | ||||||
| International SmallCap Dividend Fund |
— | — | ||||||
| Japan SmallCap Dividend Fund |
— | — | ||||||
| 1 | For the period August 10, 2018 (commencement of operations) through March 31, 2019. |
During the fiscal year or period ended March 31, 2019, the amount of capital loss carryforwards that expired unused are shown in the following table:
| Fund | Expired Capital Loss Carryforward |
|||
| Europe Quality Dividend Growth Fund |
$ | — | ||
| Europe SmallCap Dividend Fund |
2,102,724 | |||
| International Dividend ex-Financials Fund |
— | |||
| International Equity Fund |
8,855,174 | |||
| International High Dividend Fund |
7,637,372 | |||
| International LargeCap Dividend Fund |
8,092,071 | |||
| International MidCap Dividend Fund |
11,183,904 | |||
| International Multifactor Fund1 |
— | |||
| International Quality Dividend Growth Fund |
— | |||
| International SmallCap Dividend Fund |
6,365,431 | |||
| Japan SmallCap Dividend Fund |
3,661,232 | |||
| 1 | For the period August 10, 2018 (commencement of operations) through March 31, 2019. |
At March 31, 2019, the effect of permanent “book/tax” reclassifications resulted in increases (decreases) to the components of net assets as follows:
| Fund | Total Distributable Earnings (Loss) |
Paid-in Capital | ||||||
| Europe Quality Dividend Growth Fund |
$ | (1,661,500 | ) | $ | 1,661,500 | |||
| Europe SmallCap Dividend Fund |
(56,460,921 | ) | 56,460,921 | |||||
| International Dividend ex-Financials Fund |
(974,783 | ) | 974,783 | |||||
| International Equity Fund |
(14,277,146 | ) | 14,277,146 | |||||
| International High Dividend Fund |
923,185 | (923,185 | ) | |||||
| International LargeCap Dividend Fund |
(3,115,538 | ) | 3,115,538 | |||||
| International MidCap Dividend Fund |
(652,358 | ) | 652,358 | |||||
| International Multifactor Fund |
(280,809 | ) | 280,809 | |||||
| International Quality Dividend Growth Fund |
(994,678 | ) | 994,678 | |||||
| International SmallCap Dividend Fund |
(61,389,238 | ) | 61,389,238 | |||||
| Japan SmallCap Dividend Fund |
(82,480,581 | ) | 82,480,581 | |||||
The differences are primarily due to redemptions-in-kind, foreign currency transactions, investments in passive foreign investment companies, expiration of capital loss carryforwards and foreign capital gains taxes.
| 110 | WisdomTree Trust |
Notes to Financial Statements (concluded)
GAAP provides guidance on tax provisions that prescribe a minimum threshold for financial statement recognition of the benefit of a tax position taken or expected to be taken in a tax return. Foreign taxes are provided for based on each Fund’s understanding of the tax rules and rates that exist in the foreign markets in which it invests. Taxes are accrued and applied to net investment income, net realized capital gains and net unrealized appreciation, as applicable, as the income is earned or capital gains are recorded. As of and during the fiscal year or period ended March 31, 2019, the Funds did not have any liabilities for unrecognized tax benefits relating to uncertain income tax positions they have taken or expect to take in the future. If applicable, the Funds will recognize interest accrued related to unrecognized tax benefits in interest expense and penalties in “Other” expenses on the Statements of Operations. The Funds file tax returns with the Internal Revenue Service, the State of New York, and various other states. Generally, each of the tax years in the four-year period ended March 31, 2019, remains subject to examination by taxing authorities.
7. RECENT ACCOUNTING PRONOUNCEMENTS
On August 17, 2018, the SEC voted to adopt “Disclosure Update and Simplification” amendments to certain of its disclosure requirements that have become redundant, duplicative, overlapping, outdated, or superseded, in light of other SEC disclosure requirements, GAAP, or changes in the information environment. The SEC will also be referring certain SEC disclosure requirements that overlap with, but require information incremental to, GAAP to the FASB for potential incorporation into GAAP. The amendments are intended to facilitate the disclosure of information to investors and simplify compliance without significantly altering the total mix of information provided to investors. These amendments became effective on November 5, 2018 (30 days after their publication in the Federal Register). WTAM has evaluated these amendments and determined that there is no significant impact on the Trust’s financial statements. All applicable amendments have been incorporated into the Trust’s financial statements and related disclosures. The specific amendments incorporated into the Trust’s financial statements pertain to (i) the amendment requiring the presentation of the distributable earnings in total on the Statements of Assets and Liabilities, rather than showing the 3 components of distributable earnings (i.e., (1) undistributed (distributions in excess of) net investment income, (2) accumulated net realized gain (loss) on investments and (3) net unrealized appreciation (depreciation) on investments, and (ii) the amendment requiring the presentation of distributions to shareholders in total on the Statements of Changes in Net Assets, except for tax return of capital distributions, which shall continue to be disclosed separately.
On August 28, 2018, the FASB issued ASU 2018-13, Fair Value Measurement (Topic 820): Disclosure Framework — Changes to the Disclosure Requirements for Fair Value Measurement. ASU 2018-13 includes removals, additions and modifications to the disclosure requirements for fair value measurements that are intended to improve the effectiveness of disclosures in the notes to financial statements. The amendments in ASU 2018-13 are effective for all entities for fiscal years, and interim periods within those fiscal years, beginning after December 15, 2019. An entity is permitted to early adopt any removed or modified disclosures upon issuance of this ASU and delay adoption of the additional disclosures until their effective date. WTAM has evaluated ASU 2018-13 and has adopted the disclosure framework for the Trust’s financial statements.
8. ADDITIONAL INFORMATION
The Board of Trustees, after careful consideration, approved the liquidation of the WisdomTree Australia Dividend Fund.
The last day of secondary market trading of shares of the Fund on its respective exchange was March 14, 2019. Shareholders were able to sell Fund shares through a broker in the standard manner through this date. Customary brokerage charges may have applied to such transactions. The Fund was closed to new investors after the close of business on March 14, 2019.
Beginning on or about this date, the Fund was in the process of liquidating its portfolio assets. This caused the Fund to increase its cash holdings and deviate from the investment objective and strategies stated in its prospectus.
Shareholders that remained in the Fund had their shares automatically redeemed and received cash in an amount equal to the net asset value of their shares as of the close of business on March 22, 2019 and were not charged any transaction fees by the Fund. This amount included any accrued capital gains and dividends.
Whether an investor sold their shares or were automatically redeemed, an investor generally would have recognized a capital gain (or loss) equal to the amount received above (or below) their adjusted cost basis in such shares.
| WisdomTree Trust | 111 |
Report of Independent Registered Public Accounting Firm
To the Shareholders of WisdomTree Europe SmallCap Dividend Fund, WisdomTree International Dividend ex-Financials Fund, WisdomTree International Equity Fund, WisdomTree International High Dividend Fund, WisdomTree International LargeCap Dividend Fund, WisdomTree International MidCap Dividend Fund, WisdomTree International SmallCap Dividend Fund, WisdomTree Japan SmallCap Dividend Fund, WisdomTree Europe Quality Dividend Growth Fund, WisdomTree International Multifactor Fund and WisdomTree International Quality Dividend Growth Fund and the Board of Trustees of WisdomTree Trust
Opinion on the Financial Statements
We have audited the accompanying statements of assets and liabilities of WisdomTree Europe SmallCap Dividend Fund, WisdomTree International Dividend ex-Financials Fund, WisdomTree International Equity Fund, WisdomTree International High Dividend Fund, WisdomTree International LargeCap Dividend Fund, WisdomTree International MidCap Dividend Fund, WisdomTree International SmallCap Dividend Fund, WisdomTree Japan SmallCap Dividend Fund, WisdomTree Europe Quality Dividend Growth Fund, WisdomTree International Multifactor Fund and WisdomTree International Quality Dividend Growth Fund (collectively referred to as the “Funds”), (eleven of the funds constituting WisdomTree Trust (the “Trust”)) including the schedules of investments, as of March 31, 2019, and the related statements of operations, and changes in net assets, and the financial highlights for each of the periods indicated in the table below and the related notes (collectively referred to as the “financial statements”). In our opinion, the financial statements present fairly, in all material respects, the financial position of each of the Funds (eleven of the funds constituting WisdomTree Trust) at March 31, 2019, and the results of their operations, changes in net assets and financial highlights for each of the periods indicated in the table below, in conformity with U.S. generally accepted accounting principles.
| Individual fund constituting the WisdomTree Trust | Statement of operations |
Statements of changes in net assets |
Financial highlights | |||
| WisdomTree Europe SmallCap Dividend Fund WisdomTree International Dividend ex-Financials Fund WisdomTree International Equity Fund WisdomTree International High Dividend Fund WisdomTree International LargeCap Dividend Fund WisdomTree International MidCap Dividend Fund WisdomTree International SmallCap Dividend Fund WisdomTree Japan SmallCap Dividend Fund |
For the year ended March 31, 2019 | For each of the two years in the period ended March 31, 2019 | For each of the five years in the period ended March 31, 2019 | |||
| WisdomTree Europe Quality Dividend Growth Fund |
For the year ended March 31, 2019 | For each of the two years in the period ended March 31, 2019 | For each of the four years in the period ended March 31, 2019 and the period from May 7, 2014 (commencement of operations) through March 31, 2015 | |||
| WisdomTree International Multifactor Fund |
For the year ended March 31, 2019 | For the period from August 10, 2018 (commencement of operations) through March 31, 2019 | ||||
| WisdomTree International Quality Dividend Growth Fund |
For the year ended March 31, 2019 | For each of the two years in the period ended March 31, 2019 | For each of the two years in the period ended March 31, 2019 and the period from April 7, 2016 (commencement of operations) through March 31, 2017 | |||
Basis for Opinion
These financial statements are the responsibility of the Trust’s management. Our responsibility is to express an opinion on each of the Funds’ financial statements based on our audits. We are a public accounting firm registered with the Public Company Accounting Oversight Board (United States) (“PCAOB”) and are required to be independent with respect to the Trust in accordance with the U.S. federal securities laws and the applicable rules and regulations of the Securities and Exchange Commission and the PCAOB.
We conducted our audits in accordance with the standards of the PCAOB. Those standards require that we plan and perform the audit to obtain reasonable assurance about whether the financial statements are free of material misstatement, whether due to error or fraud. The Trust is not required to have, nor were we engaged to perform, an audit of the Trust’s internal control over financial reporting. As part of our audits, we are required to obtain an understanding of internal control over financial reporting, but not for the purpose of expressing an opinion on the effectiveness of the Trust’s internal control over financial reporting. Accordingly, we express no such opinion.
Our audits included performing procedures to assess the risks of material misstatement of the financial statements, whether due to error or fraud, and performing procedures that respond to those risks. Such procedures included examining, on a test basis, evidence regarding the amounts and disclosures in the financial statements. Our procedures included confirmation of securities
| 112 | WisdomTree Trust |
Report of Independent Registered Public Accounting Firm (concluded)
owned as of March 31, 2019, by correspondence with the custodian and brokers or by other appropriate auditing procedures where replies from brokers were not received. Our audits also included evaluating the accounting principles used and significant estimates made by management, as well as evaluating the overall presentation of the financial statements. We believe that our audits provide a reasonable basis for our opinion.

We have served as the auditor of one or more WisdomTree investment companies since 2006.
New York, NY
May 23, 2019
| WisdomTree Trust | 113 |
Trustees and Officers Information (unaudited)
The Board of Trustees is responsible for overseeing the management and affairs of the Funds and the Trust. The Board of Trustees elects the officers of the Trust who are responsible for administering the Trust’s day-to-day operations. Each Trustee serves until his or her successor is duly elected or appointed and qualified.
The address of each Trustee and Officer is c/o WisdomTree Asset Management, Inc., 245 Park Avenue, 35th Floor, New York, NY 10167.
Independent Trustees
| Name |
Position(s) Held with |
Principal Occupation(s) |
Number of Portfolios in Fund Complex Overseen by Trustee/ Officer* |
Other | ||||||
| David G. Chrencik^ (1948) |
Trustee, 2014-present | Chief Financial Officer of Sarus Indochina Select LP (hedge fund) since 2012; Chief Financial Officer of GeoGreen BioFuels, Inc. (biodiesel fuel producer) from 2010 to 2014; Audit Partner at PricewaterhouseCoopers LLP (public accounting firm) from 1972 to 2009 (includes positions prior to becoming Audit Partner and predecessor firms). | 76 | Trustee, Vericimetry Funds (2011 to 2014). | ||||||
| Joel Goldberg#† (1945) |
Trustee, 2012-present | Attorney, Partner, Stroock & Stroock & Lavan LLP from 2010 to 2018; Attorney, Partner at Willkie Farr & Gallagher LLP from 2006 to 2010. | 76 | Director, Better Business Bureau (Metropolitan New York, Long Island and the Mid-Hudson Region). | ||||||
| Toni Massaro† (1955) |
Trustee, 2006-present | Dean Emerita at the University of Arizona James E. Rogers College of Law (“Rogers College of Law”) since 2009 (distinguished Emerita in July 2009); Dean at the Rogers College of Law from 1999 to 2009; Regents’ Professor since 2006; Milton O. Riepe Chair in Constitutional Law since 1997; Professor at the Rogers College of Law since 1990. | 76 | None | ||||||
| Melinda A. Raso Kirstein‡ (1955) |
Trustee, 2014-present | Retired since 2004, Merrill Lynch Investment Management, Vice President; Senior Portfolio Manager, Fixed Income Management; Director, Tax Exempt Fund Management. | 76 | Associate Alumnae of Douglass College, Chair of Investment Committee. | ||||||
| Victor Ugolyn (1947) |
Trustee, 2006-present; Chairman of the Board of Trustees, 2006-present | Private Investor, 2005 to present; President and Chief Executive Officer of William D. Witter, Inc. from 2005 to 2006; Consultant to AXA Enterprise in 2004; Chairman, President and Chief Executive Officer of Enterprise Capital Management (subsidiary of The MONY Group, Inc.) and Enterprise Group of Funds, Chairman of MONY Securities Corporation, and Chairman of the Fund Board of Enterprise Group of Funds from 1991 to 2004. | 76 | Member of the Board of Governors of Naismith Memorial Basketball Hall of Fame (2001-2016). | ||||||
| * | As of March 31, 2019. |
| ^ | Chair of the Audit Committee. |
| # | Chair of the Contracts Review Committee. |
| † | Co-Chair of the Governance, Nominating and Compliance Committee. |
| ‡ | Chair of the Investment Committee. |
| 114 | WisdomTree Trust |
Trustees and Officers Information (unaudited) (concluded)
Interested Trustee and Officers
| Name |
Position(s) Held with |
Principal Occupation(s) |
Number of Portfolios in Fund Complex Overseen by Trustee/ Officer* |
Other | ||||||
| Jonathan Steinberg** (1964) |
Trustee, 2005-present; President, 2005-present | President, WisdomTree Investments, Inc. and WisdomTree Asset Management, Inc. since 2012; Chief Executive Officer, WisdomTree Investments, Inc. and WisdomTree Asset Management, Inc. since 2005. | 76 | Director, WisdomTree Investments, Inc. and WisdomTree Asset Management, Inc. | ||||||
| David Castano** (1971) |
Treasurer, 2013-present | Director of Fund Accounting & Administration, WisdomTree Asset Management, Inc., since 2011. | 76 | None | ||||||
| Terry Jane Feld** (1960) |
Chief Compliance Officer, 2012-present | Chief Compliance Officer, WisdomTree Asset Management, Inc. since 2012; Senior Compliance Officer, WisdomTree Asset Management since 2011. | 76 | None | ||||||
| Ryan Louvar** (1972) |
Secretary and Chief Legal Officer, 2013-present | General Counsel, WisdomTree Asset Management, Inc. since 2013; Vice President and Senior Managing Counsel, State Street, 2005 to 2013. | 76 | None | ||||||
| Joanne Antico** (1975) |
Assistant Secretary, 2018-present | Assistant General Counsel, WisdomTree Asset Management, Inc. since 2016; Executive Director and Assistant Secretary, Morgan Stanley Investment Management Inc., 2005 to 2016. | 76 | None | ||||||
| Clint Martin** (1977) |
Assistant Treasurer, 2015-present | Fund Manager, Fund Accounting & Administration, WisdomTree Asset Management, Inc., since 2012. | 76 | None | ||||||
| * | As of March 31, 2019. |
| ** | Elected by and serves at the pleasure of the Board. |
| WisdomTree Trust | 115 |
Supplemental Information (unaudited)
Federal Income Tax Information
The following Federal tax information related to the Funds’ fiscal year ended March 31, 2019, is provided for information purposes only and should not be used for reporting to federal or state revenue agencies. Federal tax information for the calendar year will be reported to you on Form 1099-DIV in January 2020.
Certain dividends paid by the Funds may be subject to a maximum tax rate of 15%, as provided by the Jobs and Growth Tax Relief Reconciliation Act of 2003. Of the distributions paid during the fiscal year or period ended March 31, 2019, the following represents the maximum amount of ordinary income distributions that may be considered qualified dividend income:
| Fund | Qualified Dividend Income |
|||
| Europe Quality Dividend Growth Fund |
$ | 1,631,726 | ||
| Europe SmallCap Dividend Fund |
36,376,930 | |||
| International Dividend ex-Financials Fund |
6,891,264 | |||
| International Equity Fund |
27,222,880 | |||
| International High Dividend Fund |
10,854,636 | |||
| International LargeCap Dividend Fund |
13,548,771 | |||
| International MidCap Dividend Fund |
7,799,872 | |||
| International Multifactor Fund1 |
62,055 | |||
| International Quality Dividend Growth Fund |
1,130,824 | |||
| International SmallCap Dividend Fund |
55,330,867 | |||
| Japan SmallCap Dividend Fund |
16,060,084 | |||
| 1 | For the period August 10, 2018 (commencement of operations) through March 31, 2019. |
The Funds intend to elect to pass through to shareholders the credit for taxes paid to foreign countries during the fiscal year or period ended March 31, 2019. The gross foreign source income and foreign taxes paid are as follows:
| Fund | Gross Foreign Income |
Foreign Taxes Paid |
||||||
| Europe Quality Dividend Growth Fund |
$ | 1,652,229 | $ | 156,756 | ||||
| Europe SmallCap Dividend Fund |
37,406,365 | 3,519,984 | ||||||
| International Dividend ex-Financials Fund |
7,109,502 | 462,607 | ||||||
| International Equity Fund |
29,376,122 | 2,046,689 | ||||||
| International High Dividend Fund |
11,656,398 | 792,960 | ||||||
| International LargeCap Dividend Fund |
14,485,036 | 1,016,160 | ||||||
| International MidCap Dividend Fund |
8,699,991 | 579,950 | ||||||
| International Multifactor Fund1 |
198,933 | 14,780 | ||||||
| International Quality Dividend Growth Fund |
1,366,933 | 92,682 | ||||||
| International SmallCap Dividend Fund |
62,119,782 | 5,325,636 | ||||||
| Japan SmallCap Dividend Fund |
18,708,923 | 1,860,153 | ||||||
| 1 | For the period August 10, 2018 (commencement of operations) through March 31, 2019. |
| 116 | WisdomTree Trust |
General Information (unaudited)
Proxy Voting Policies, Procedures and Record
A complete copy of the Proxy Voting Policy may be obtained upon request, at no charge, by calling 1-866-909-WISE (9473) or writing to: WisdomTree Trust, c/o Foreside Fund Services, LLC, Three Canal Plaza Suite 100, Portland, ME, 04101.
The Trust is required to disclose annually the Funds’ complete proxy voting record on Form N-PX covering the most recent 12-month period ended June 30 and to file Form N-PX with the SEC no later than August 31 of each year. The current Form N-PX for the Funds is available at no charge upon request by calling 1-866-909-WISE (9473) or through the Trust’s website at www.wisdomtree.com. The Funds’ Form N-PX is also available on the SEC’s website at www.sec.gov.
Shareholder Reports and Quarterly Portfolio Disclosure
The Funds are required to file their complete schedule of portfolio holdings with the SEC for their first and third fiscal quarters on Form N-Q. Beginning in April 2019, the Funds will cease filing Form N-Q and will commence filing Form N-PORT. Part F of each Fund’s Form N-PORT filings for the first and third fiscal quarters will contain the complete schedule of portfolio holdings in the same manner as previously filed on Form N-Q. Copies of the filings are available, without charge, on the SEC’s website at www.sec.gov and are also available by calling the Trust at 1-866-909-WISE (9473). Copies of the filings may also be obtained, after paying a duplicating fee, by electronic request at the following E-mail address: publicinfo@sec.gov.
Information about each Fund’s portfolio holdings is available daily, without charge, at www.wisdomtree.com.
The Statement of Additional Information (“SAI”) has additional information about the Funds’ Trustees and Officers and is available without charge upon request. Contact your financial representative for a free prospectus or SAI.
Frequency Distribution of Discounts & Premiums
Information about differences between the per share net asset value of each Fund and the market trading price of shares of each Fund are available, without charge, at www.wisdomtree.com.
| WisdomTree Trust | 117 |
The WisdomTree Funds are exchange traded funds (“ETFs”) registered with the United States Securities and Exchange Commission as separate series (“Funds”) of WisdomTree Trust (“Trust”). WisdomTree Asset Management, Inc., a wholly owned subsidiary of WisdomTree Investments, Inc., serves as the investment adviser to the Trust. None of the WisdomTree entities are affiliated with Foreside Fund Services, LLC, the Funds’ distributor. WisdomTree Investments, its affiliates and their independent providers are not liable for any informational errors, incompleteness, delays, or for any actions taken in reliance on information contained herein.
Investors should consider the investment objectives, risks, charges and expenses of the Funds carefully before investing. A prospectus, containing this and other information, is available at www.wisdomtree.com, or by calling 1-866-909-WISE (9473). Investors should read the prospectus carefully before investing. There are risks associated with investing, including possible loss of principal. Past performance does not guarantee future results. Indexes are unmanaged and you cannot invest directly in an index.
There are risks associated with investing including possible loss of principal. Foreign investing involves special risks, such as risk of loss from currency fluctuation or political or economic uncertainty. Investments in real estate involve additional special risks, such as credit risk, interest rate fluctuations and the effect of varied economic conditions. Funds that focus their investments in one country or region may be significantly impacted by events and developments associated with the region which can adversely affect performance. Funds focusing on a single sector and/or smaller companies generally experience greater price volatility. Investments in emerging, offshore or frontier markets are generally less liquid and less efficient than investments in developed markets and are subject to additional risks, such as risks of adverse governmental regulation and intervention or political developments. Inflation protected securities do not eliminate risks associated with inflation or deflation. Investments in currency involve additional special risks, such as credit risk and interest rate fluctuations. Derivative investments can be volatile and these investments may be less liquid than other securities, and more sensitive to the effect of varied economic conditions. As these Funds can have a high concentration in some issuers the Funds can be adversely impacted by changes affecting such issuers. Due to the investment strategy of certain Funds they may make higher capital gain distributions than other ETFs. Please read the Fund’s prospectus for specific details regarding the Fund’s risk profile.
Transactions in Fund shares will result in brokerage commissions and will generate tax consequences. Shares may be sold through brokerage accounts, but may be redeemed from the Funds only by Authorized Participants in large creation unit size aggregations of shares.
WisdomTree Trust
245 Park Avenue, 35th Floor
New York, NY 10167
WisdomTree Fund shares are distributed by Foreside Fund Services, LLC, in the U.S. only.
WTGM-2276


WisdomTree Trust
Annual Report
March 31, 2019
WisdomTree Asia Pacific ex-Japan Fund (AXJL)
WisdomTree China ex-State-Owned Enterprises Fund (CXSE)
WisdomTree Emerging Markets Consumer Growth Fund (EMCG)
WisdomTree Emerging Markets ex-State-Owned Enterprises Fund (XSOE)
WisdomTree Emerging Markets High Dividend Fund (DEM)
WisdomTree Emerging Markets Multifactor Fund (EMMF)
WisdomTree Emerging Markets Quality Dividend Growth Fund (DGRE)
WisdomTree Emerging Markets SmallCap Dividend Fund (DGS)
WisdomTree Global ex-U.S. Quality Dividend Growth Fund (DNL)
WisdomTree Global ex-U.S. Real Estate Fund (DRW)
WisdomTree Global High Dividend Fund (DEW)
WisdomTree India Earnings Fund (EPI)
WisdomTree Middle East Dividend Fund (GULF)
IMPORTANT NOTE: Beginning on January 1, 2021, as permitted by regulations adopted by the SEC, paper copies of the WisdomTree Funds’ annual and semi-annual shareholder reports will no longer be sent by mail, unless you specifically request paper copies of the reports. Instead, annual and semi-annual shareholder reports will be available on the WisdomTree Funds’ website (www.wisdomtree.com), and you will be notified by mail each time a report is posted and provided with a website link to access the report.
If you already elected to receive shareholder reports electronically, you will not be affected by this change and you need not take any action. You may elect to receive shareholder reports and other communications from a Fund electronically anytime by contacting your financial intermediary (such as a broker dealer or bank).
You may elect to receive all future reports in paper free of charge. Please contact your financial intermediary to request to continue receiving paper copies of your shareholder reports. Your election to receive reports in paper will apply to all funds held in your account.
| 1 | ||||
| Information about Performance and Shareholder Expense Examples (unaudited) |
3 | |||
| 4 | ||||
| 17 | ||||
| Schedules of Investments | ||||
| 20 | ||||
| 23 | ||||
| 26 | ||||
| 29 | ||||
| 35 | ||||
| 41 | ||||
| 44 | ||||
| 48 | ||||
| 58 | ||||
| 62 | ||||
| 65 | ||||
| 74 | ||||
| 79 | ||||
| 81 | ||||
| 84 | ||||
| 87 | ||||
| 92 | ||||
| 99 | ||||
| 116 | ||||
| 118 | ||||
| 120 | ||||
| 122 | ||||
“WisdomTree” is a registered mark of WisdomTree Investments, Inc. and is licensed for use by the WisdomTree Trust.
Market Environment Overview (unaudited)
Emerging markets (“EM”) assets experienced substantial volatility over the fiscal year ended March 31, 2019 (the “period”). EM equities, as measured by the MSCI Emerging Markets Index, returned -1.80% in local currency terms and -7.28% in U.S. dollar terms over the period. For much of the period, broad strength in the U.S. dollar hurt foreign EM currencies. Argentina and Turkey experienced even greater negative performance due to political and economic shocks. The Argentine peso weakened 53.51% versus the U.S. dollar during the period. A sharp contraction in Argentinian economic activity in the fourth quarter of 2018 combined with rampant inflation, high unemployment, and a large fiscal deficit sunk the Argentine peso, despite a sizeable financial support program from the International Monetary Fund. The Turkish lira declined 29.25% versus the U.S. dollar as the Turkish economy entered a recession in late 2018 and foreign investors weighed concerns over the country’s political and economic instability. Rising debt burdens and subsequent bankruptcies led the Turkish lira lower over the period, alongside a meaningful increase in borrowing costs and persistently high inflation.
Moderating global economic growth and trade also weighed on EM equity and currency performance in the period. Signals of a slowdown in China were a meaningful headwind on EM equity returns at the end of 2018 as China’s gross domestic product (“GDP”) growth slowed to a level last experienced in 2009. The country’s manufacturing activity contracted while trade activity also provided evidence of the negative impact from the U.S.-China trade dispute. Economic stimulus implemented by the Chinese government and easing trade tensions drove a rebound in Chinese equities in the first quarter of 2019; although, uncertainty around the ultimate resolution between the U.S. and China continues to loom over EM equities.
Additionally, many EM countries have economies heavily reliant on the performance of the energy market. One of the biggest drivers of negative performance and heightened volatility of EM currencies was the drop in oil prices in late 2018, followed by a recovery in the first quarter of 2019. The price of crude oil futures dropped 40% in the fourth quarter of 2018 due to oversupply and later recovered 32% in early 2019 on a cut in global production.
In contrast, lower oil prices benefit net importing economies, like India, which boasted a +7.0% GDP growth rate in 2018. Lower oil import prices helped to moderate inflationary pressures in India in 2018, leading the Reserve Bank of India to cut its lending rate in the first quarter of 2019 for the first time since August 2017.
The developed international equity market, as measured by the MSCI EAFE Index, returned +3.01% in local currency terms and -3.55% in U.S. dollar terms for the fiscal year ended March 31, 2019. Positive returns in local currency terms and negative performance in U.S. dollar terms was driven by broad strengthening of the U.S. dollar during the period. During the fiscal year, the U.S. dollar strengthened +8.73% vs. the Euro, +7.00% vs. British pound, and +4.01% vs. the Japanese yen.
Developed international equities experienced a market correction (in both local and U.S. dollar terms) in the fourth quarter of 2018, followed by a relief rally in the first quarter of 2019. Key drivers of negative returns through 2018 included: uncertainty surrounding the withdrawal of the United Kingdom from the European Union, a marked slowdown in economic growth in the Eurozone, natural disasters in Japan, and global trade disputes. Importantly, major Eurozone economies, including Germany and France, were a significant drag on Eurozone growth during this time period. German and French GDP both grew 1.5% in 2018. This marked the slowest annual GDP growth rate for Germany since 2013, while purchasing managers’ index survey data slipped into contractionary territory, and the yield on the nation’s 10-year government bond turned negative.
During the fiscal year, the European Central Bank announced the end of its quantitative easing program while the Japanese monetary policy remained ultra-accommodative with a near zero 10-year yield. Measures taken by the European Central Bank to stimulate private sector bank lending and more positive news flow on the U.S.-China trade and economic growth helped fuel the rebound in European equities in the first quarter of
| WisdomTree Trust | 1 |
Market Environment Overview (unaudited) (concluded)
2019. Japan equities also recovered in early 2019 despite weakening export and production levels, resulting from dwindling demand from China, as well as the absence of price inflation. Although developed world equities have rallied, the global macroeconomic backdrop remains a key risk to equity performance in many of these nations.
| 2 | WisdomTree Trust |
Information about Performance and Shareholder Expense Examples (unaudited)
Performance
The performance tables on the following pages are provided for comparative purposes and represent the period noted. Each Fund’s per share NAV is the value of one share of the Fund and is calculated by dividing the value of total assets less total liabilities by the number of shares outstanding. The NAV return is based on the NAV of the Fund and the market price return is based on the market price per share of the Fund. The price used to calculate market price returns is the midpoint of the bid and ask price for Fund shares as of the close of trading on the exchange where Fund shares are listed. NAV and market price returns assume that dividends and capital gain distributions have been reinvested in the Fund at NAV and market price, respectively. As with other ETFs, NAV returns and market price returns may differ because of factors such as the supply and demand for Fund shares and investors’ assessments of the underlying value of a Fund’s portfolio securities.
Fund shares are bought and sold at market price (not NAV) and are not individually redeemed from a Fund. Fund NAV returns are calculated using a Fund’s daily 4:00 p.m. eastern time NAV. Market price returns reflect the midpoint of the bid and ask price as of the close of trading on the exchange where Fund shares are listed. Market price returns do not represent the returns you would receive if you traded shares at other times. The returns do not reflect the deduction of taxes that a shareholder would pay on Fund distributions or on the redemption of Fund shares. Total returns for a period of less than one year are cumulative.
Performance is historical and does not guarantee future results. Current performance may be lower or higher than quoted. Investment returns and the principal value of an investment will fluctuate so that an investor’s shares, when redeemed, may be worth more or less than their original cost.
An index is a statistical measure of a specified financial market or sector. An index does not actually hold a portfolio of securities, incur expenses or pay any transaction costs. Therefore, index returns do not reflect deductions for fees or expenses and an index is not available for direct investment. In comparison, the Funds’ performance is negatively impacted by these deductions. Fund returns do not reflect brokerage commissions or taxes on transactions in Fund shares or taxes that a shareholder would pay on Fund distributions. Past performance is no guarantee of future results. For the most recent month-end performance information visit www.wisdomtree.com.
Shareholder Expense Examples
Each Fund’s performance table is accompanied by a shareholder expense example. As a shareholder of a WisdomTree Fund, you incur two types of cost: (1) transaction costs, including brokerage commissions on purchases and sales of your Fund shares and (2) ongoing costs, including management fees and other Fund expenses. The examples are intended to help you understand your ongoing costs (in dollars and cents) of investing in a Fund and to compare these costs with the ongoing costs of investing in other funds.
The examples are based on an investment of $1,000 invested at the beginning of the period and held for the entire period from October 1, 2018 to March 31, 2019. Except where noted, expenses are calculated using each Fund’s annualized expense ratio (after the effect of contractual or voluntary fee waivers, if any), multiplied by the average account value for the period, multiplied by 182/365 (to reflect the one-half year period). The annualized expense ratio does not include acquired fund fees and expenses (“AFFEs”), which are fees and expenses incurred indirectly by a Fund through its investments in certain underlying investment companies.
Actual expenses
The first line in the shareholder expense example table shown on the following pages provides information about actual account values and actual expenses. You may use the information in this line, together with the amount you invested, to estimate the expenses that you paid over the period. Simply divide your account value by $1,000 (for example, an $8,600 account value divided by $1,000 = 8.6), then multiply the result by the number in the first line for your Fund under the heading entitled “Expenses Paid During the Period” to estimate the expenses you paid on your account during the period.
Hypothetical example for comparison purposes
The second line in the shareholder expense example table shown on the following pages provides information about hypothetical account values and hypothetical expenses based on the Fund’s actual expense ratio and an assumed rate of return of 5% per year before expenses, which is not the Fund’s actual return. The hypothetical account values and expenses may not be used to estimate the actual ending account balance or expenses you paid for the period. You may use this information to compare the ongoing costs of investing in your Fund and other funds. To do so, compare this 5% hypothetical example with the 5% hypothetical examples that appear in the shareholder reports of the other funds.
Please note that the expenses shown in the table are meant to highlight your ongoing costs only and do not reflect any transactional costs, such as brokerage commissions paid on purchases and sales of Fund shares. Therefore, the second line in the table is useful in comparing ongoing Fund costs only and will not help you determine the relative total costs of owning different funds. In addition, if these transactional costs were included, your costs would have been higher.
| WisdomTree Trust | 3 |
Management’s Discussion of Funds’ Performance
as of March 31, 2019 (unaudited)
WisdomTree Asia Pacific ex-Japan Fund (AXJL)
Sector Breakdown†
| Sector | % of Net Assets | |||
| Financials |
21.3% | |||
| Information Technology |
19.2% | |||
| Materials |
12.9% | |||
| Communication Services |
10.1% | |||
| Energy |
7.9% | |||
| Industrials |
6.0% | |||
| Consumer Discretionary |
5.8% | |||
| Consumer Staples |
5.8% | |||
| Utilities |
5.0% | |||
| Real Estate |
4.2% | |||
| Health Care |
1.4% | |||
| Investment Company |
0.0% | * | ||
| Other Assets less Liabilities‡ |
0.4% | |||
| Total |
100.0% | |||
| † | The Fund’s sector breakdown is expressed as a percentage of net assets and may change over time. In addition, a sector may be comprised of several industries. It does not include derivatives (if any). |
| ‡ | Other assets includes investment of cash collateral for securities on loan (if any). |
| * | Represents less than 0.1%. |
Top Ten Holdings*
| Description | % of Net Assets | |||
| Samsung Electronics Co., Ltd. |
7.4% | |||
| Taiwan Semiconductor Manufacturing Co., Ltd. |
5.1% | |||
| BHP Group Ltd. |
3.6% | |||
| China Mobile Ltd. |
2.5% | |||
| Singapore Telecommunications Ltd. |
2.1% | |||
| China Construction Bank Corp., Class H |
2.0% | |||
| China Petroleum & Chemical Corp., Class H |
1.9% | |||
| Commonwealth Bank of Australia |
1.9% | |||
| Westpac Banking Corp. |
1.5% | |||
| CNOOC Ltd. |
1.3% | |||
| * | The ten largest holdings are subject to change, and there are no guarantees the Fund will remain invested in any particular company. Excludes derivatives and investment of cash collateral for securities on loan (if any). |
The WisdomTree Asia Pacific ex-Japan Fund (the ‘‘Fund’’) seeks to track the price and yield performance, before fees and expenses, of the WisdomTree Asia Pacific ex-Japan Index (the ‘‘Index’’). In seeking to track the Index, the Fund invests in dividend-paying large-cap companies in the Asia Pacific ex-Japan region. The Fund generally uses a representative sampling strategy to achieve its investment objective, meaning it generally will invest in a sample of securities in the Index.
The Fund returned 1.55% at net asset value (“NAV”) for the fiscal year ending March 31, 2019 (for more complete performance information please see the table below). The Fund’s position in Hong Kong contributed most positively to performance, while its position in South Korea contributed most negatively to performance. Additionally, the Fund’s positions in Real Estate contributed the most to performance, while its positions in Information Technology contributed negatively. In 2018, due to the heightened risks of a U.S.- China trade war, Asian large-cap equities suffered a considerable loss. However, the first quarter of 2019 saw significant positive returns due to Chinese market’s rebound. The Fund’s combined weight in Hong Kong and China, of approximately 29%, contributed to the Fund’s 10.01% gain (based on NAV) in the first quarter of 2019. The strengthening of the U.S. dollar in 2018 also made Asian currencies vulnerable, which lowered Asian equity performance further.
Shareholder Expense Example
| Beginning Account Value |
Ending Account Value |
Annualized Net Expense Ratio |
Expenses Paid During the Period |
|||||||||||||
| Actual |
$ | 1,000.00 | $ | 1,005.00 | 0.48 | % | $ | 2.40 | ||||||||
| Hypothetical (5% return before expenses) |
$ | 1,000.00 | $ | 1,022.54 | 0.48 | % | $ | 2.42 | ||||||||
Performance
| Average Annual Total Return | ||||||||||||||||
| 1 Year | 3 Year | 5 Year | 10 Year | |||||||||||||
| Fund NAV Returns |
1.55 | % | 9.58 | % | 4.11 | % | 10.01 | % | ||||||||
| Fund Market Price Returns |
0.56 | % | 9.75 | % | 4.09 | % | 9.95 | % | ||||||||
| WisdomTree Pacific ex-Japan Dividend/Asia Pacific ex-Japan Spliced Index1 |
2.28 | % | 10.28 | % | 4.66 | % | 10.80 | % | ||||||||
| MSCI Pacific ex-Japan/MSCI AC Asia Pacific ex-Japan Spliced Index2 |
-3.50 | % | 11.25 | % | 5.30 | % | 11.24 | % | ||||||||
| 1 | WisdomTree Pacific ex-Japan Dividend Index through June 17, 2011; WisdomTree Asia Pacific ex-Japan Index thereafter. |
| 2 | MSCI Pacific ex-Japan Index through June 17, 2011; MSCI AC Asia Pacific ex-Japan Index thereafter. |
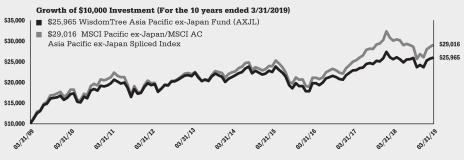
Performance is historical and does not guarantee future results. The returns do not reflect the deduction of taxes that a shareholder would pay on Fund distributions or on the redemption of Fund shares.
| 4 | WisdomTree Trust |
Management’s Discussion of Funds’ Performance
as of March 31, 2019 (unaudited)
WisdomTree China ex-State-Owned Enterprises Fund (CXSE)
Sector Breakdown†
| Sector | % of Net Assets | |||
| Consumer Discretionary |
29.3% | |||
| Communication Services |
22.2% | |||
| Financials |
13.8% | |||
| Health Care |
7.7% | |||
| Real Estate |
7.1% | |||
| Information Technology |
6.8% | |||
| Consumer Staples |
5.4% | |||
| Industrials |
4.9% | |||
| Materials |
1.7% | |||
| Utilities |
0.8% | |||
| Energy |
0.2% | |||
| Other Assets less Liabilities‡ |
0.1% | |||
| Total |
100.0% | |||
| † | The Fund’s sector breakdown is expressed as a percentage of net assets and may change over time. In addition, a sector may be comprised of several industries. It does not include derivatives (if any). |
| ‡ | Other assets includes investment of cash collateral for securities on loan (if any). |
Top Ten Holdings*
| Description | % of Net Assets | |||
| Tencent Holdings Ltd. |
11.8% | |||
| Alibaba Group Holding Ltd., ADR |
11.8% | |||
| Baidu, Inc., ADR |
5.0% | |||
| Ping An Insurance Group Co. of China Ltd., Class A |
4.9% | |||
| Ping An Insurance Group Co. of China Ltd., Class H |
3.9% | |||
| JD.com, Inc., ADR |
2.5% | |||
| China Minsheng Banking Corp., Ltd., Class A |
1.9% | |||
| NetEase, Inc., ADR |
1.8% | |||
| Yum China Holdings, Inc. |
1.7% | |||
| Ctrip.com International Ltd., ADR |
1.5% | |||
| * | The ten largest holdings are subject to change, and there are no guarantees the Fund will remain invested in any particular company. Excludes derivatives and investment of cash collateral for securities on loan (if any). |
The WisdomTree China ex-State-Owned Enterprises Fund (the ‘‘Fund’’) seeks to track the price and yield performance, before fees and expenses, of the WisdomTree China ex-State-Owned Enterprises Index (the ‘‘Index’’). In seeking to track the Index, the Fund invests in Chinese companies that are not state-owned enterprises, which is defined as government ownership of greater than 20%. The Fund generally uses a representative sampling strategy to achieve its investment objective, meaning it generally will invest in a sample of securities in the Index.
The Fund returned -9.91% at net asset value (“NAV”) for the fiscal year ending March 31, 2019 (for more complete performance information please see the table below). The Fund’s positions in Utilities contributed the most to performance, while its positions in Information Technology contributed most negatively. In 2018, due to the heightened risks of a U.S.- China trade war and global economy slowdown, Chinese equities suffered a considerable loss. The strengthening of the U.S. dollar in 2018 also made Chinese yuan vulnerable, which further elevated Chinese equity losses. The overall risky economic condition in the latter half of 2018 resulted in a -26.36% Chinese market loss, as measured by the Index. While the Chinese market rebounded 26.60% in the first quarter of 2019, as measured by the Index, as the U.S.-China trade deal started to make progress. However, the decline trend in 2018 led to an overall negative return for the fiscal year.
Shareholder Expense Example
| Beginning Account Value |
Ending Account Value |
Annualized Net Expense Ratio |
Expenses Paid During the Period |
|||||||||||||
| Actual |
$ | 1,000.00 | $ | 1,084.20 | 0.32 | %1 | $ | 1.66 | ||||||||
| Hypothetical (5% return before expenses) |
$ | 1,000.00 | $ | 1,023.34 | 0.32 | %1 | $ | 1.61 | ||||||||
| 1 | WisdomTree Asset Management, Inc. has contractually agreed to limit the management fee to 0.32% through July 31, 2019, unless earlier terminated by the Board of Trustees of the WisdomTree Trust for any reason. |
Performance
| Average Annual Total Return | ||||||||||||||||
| 1 Year | 3 Year | 5 Year | Since Inception1 | |||||||||||||
| Fund NAV Returns |
-9.91 | % | 19.79 | % | 11.13 | % | 8.81 | % | ||||||||
| Fund Market Price Returns |
-10.60 | % | 20.18 | % | 11.18 | % | 8.69 | % | ||||||||
| WisdomTree China Dividend ex-Financials/China ex-State-Owned Enterprises Spliced Index2 |
-11.88 | % | 19.17 | % | 11.54 | % | 9.14 | % | ||||||||
| MSCI China Index |
-6.23 | % | 15.95 | % | 9.43 | % | 8.76 | % | ||||||||
| FTSE China 50 Index |
-2.24 | % | 12.82 | % | 7.79 | % | 6.98 | % | ||||||||
| 1 | Total returns are calculated based on the commencement of Fund trading on the NASDAQ on September 19, 2012. |
| 2 | WisdomTree China Dividend ex-Financials Index through June 30, 2015; WisdomTree China ex-State-Owned Enterprises Index thereafter. |
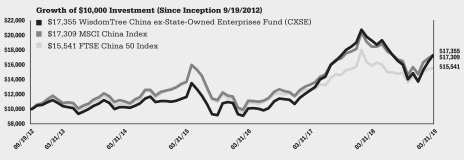
Performance is historical and does not guarantee future results. The returns do not reflect the deduction of taxes that a shareholder would pay on Fund distributions or on the redemption of Fund shares.
| WisdomTree Trust | 5 |
Management’s Discussion of Funds’ Performance
as of March 31, 2019 (unaudited)
WisdomTree Emerging Markets Consumer Growth Fund (EMCG)
Sector Breakdown†
| Sector | % of Net Assets | |||
| Consumer Discretionary |
25.4% | |||
| Consumer Staples |
22.9% | |||
| Information Technology |
16.3% | |||
| Communication Services |
14.0% | |||
| Financials |
8.1% | |||
| Real Estate |
5.8% | |||
| Health Care |
3.4% | |||
| Utilities |
2.1% | |||
| Materials |
1.0% | |||
| Energy |
0.7% | |||
| Other Assets less Liabilities‡ |
0.3% | |||
| Total |
100.0% | |||
| † | The Fund’s sector breakdown is expressed as a percentage of net assets and may change over time. In addition, a sector may be comprised of several industries. It does not include derivatives (if any). |
| ‡ | Other assets includes investment of cash collateral for securities on loan (if any). |
Top Ten Holdings*
| Description | % of Net Assets | |||
| Tencent Holdings Ltd. |
2.5% | |||
| Naspers Ltd., Class N |
2.3% | |||
| Samsung Electronics Co., Ltd. |
2.3% | |||
| Alibaba Group Holding Ltd., ADR |
2.1% | |||
| Taiwan Semiconductor Manufacturing Co., Ltd. |
2.0% | |||
| MercadoLibre, Inc. |
1.6% | |||
| Titan Co., Ltd. |
0.8% | |||
| Cia Cervecerias Unidas S.A. |
0.8% | |||
| Fomento Economico Mexicano S.A.B. de C.V. |
0.8% | |||
| CP ALL PCL, NVDR |
0.8% | |||
| * | The ten largest holdings are subject to change, and there are no guarantees the Fund will remain invested in any particular company. Excludes derivatives and investment of cash collateral for securities on loan (if any). |
The WisdomTree Emerging Markets Consumer Growth Fund (the ‘‘Fund’’) seeks income and capital appreciation. Prior to October 26, 2018, the Fund sought to track the price and yield performance, before fees and expenses, of the WisdomTree Emerging Markets Consumer Growth Index. In seeking to track the Index, the Fund invests in companies in the consumer and non-consumer sectors that exemplify growth trends in emerging market consumers and their local economies. The Fund generally uses a representative sampling strategy to achieve its investment objective, meaning it generally will invest in a sample of securities in the Index.
The Fund returned -12.66% at net asset value (“NAV”) for the fiscal year ending March 31, 2019 (for more complete performance information please see the table below). The Fund’s position in Argentina contributed most positively to performance, while its position in South Africa contributed most negatively to performance. In 2018, due to the heightened risks of a U.S.- China trade war and global economy slowdown, emerging market equities suffered a considerable loss. The strengthening of the U.S. dollar in 2018 also made emerging market currencies vulnerable, which further elevated emerging market equity losses. In addition, South Africa experienced recession in 2018 with a drop in GDP by 0.7%, which also negatively impacted the Fund’s return.
Shareholder Expense Example
| Beginning Account Value |
Ending Account Value |
Annualized Net Expense Ratio |
Expenses Paid During the Period |
|||||||||||||
| Actual |
$ | 1,000.00 | $ | 1,044.90 | 0.32 | %1 | $ | 1.63 | ||||||||
| Hypothetical (5% return before expenses) |
$ | 1,000.00 | $ | 1,023.34 | 0.32 | %1 | $ | 1.61 | ||||||||
| 1 | WisdomTree Asset Management, Inc. has contractually agreed to limit the management fee to 0.32% through July 31, 2019, unless earlier terminated by the Board of Trustees of the WisdomTree Trust for any reason. |
Performance
| Average Annual Total Return | ||||||||||||||||
| 1 Year | 3 Year | 5 Year | Since Inception1 | |||||||||||||
| Fund NAV Returns |
-12.66 | % | 5.28 | % | 0.42 | % | 0.26 | % | ||||||||
| Fund Market Price Returns |
-13.48 | % | 5.79 | % | 0.55 | % | 0.29 | % | ||||||||
| MSCI Emerging Markets Index |
-7.41 | % | 10.68 | % | 3.68 | % | 3.36 | % | ||||||||
| 1 | Total returns are calculated based on the commencement of Fund trading on the NASDAQ on September 27, 2013. |
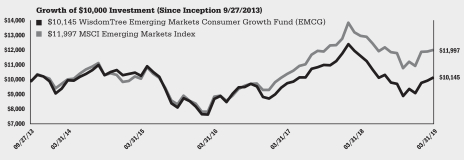
Performance is historical and does not guarantee future results. The returns do not reflect the deduction of taxes that a shareholder would pay on Fund distributions or on the redemption of Fund shares.
| 6 | WisdomTree Trust |
Management’s Discussion of Funds’ Performance
as of March 31, 2019 (unaudited)
WisdomTree Emerging Markets ex-State-Owned Enterprises Fund (XSOE)
Sector Breakdown†
| Sector | % of Net Assets | |||
| Consumer Discretionary |
18.9% | |||
| Information Technology |
16.2% | |||
| Financials |
16.1% | |||
| Communication Services |
14.7% | |||
| Consumer Staples |
7.7% | |||
| Materials |
6.7% | |||
| Energy |
6.4% | |||
| Industrials |
5.0% | |||
| Health Care |
4.1% | |||
| Real Estate |
2.8% | |||
| Utilities |
1.2% | |||
| Other Assets less Liabilities‡ |
0.2% | |||
| Total |
100.0% | |||
| † | The Fund’s sector breakdown is expressed as a percentage of net assets and may change over time. In addition, a sector may be comprised of several industries. It does not include derivatives (if any). |
| ‡ | Other assets includes investment of cash collateral for securities on loan (if any). |
Top Ten Holdings*
| Description | % of Net Assets | |||
| Tencent Holdings Ltd. |
8.1% | |||
| Alibaba Group Holding Ltd., ADR |
7.3% | |||
| Samsung Electronics Co., Ltd. |
4.3% | |||
| Taiwan Semiconductor Manufacturing Co., Ltd. |
3.3% | |||
| Naspers Ltd., Class N |
2.1% | |||
| Reliance Industries Ltd., GDR |
2.1% | |||
| Lukoil PJSC, ADR |
2.0% | |||
| Ping An Insurance Group Co. of China Ltd., Class H |
1.9% | |||
| Ping An Insurance Group Co. of China Ltd., Class A |
1.6% | |||
| Baidu, Inc., ADR |
1.4% | |||
| * | The ten largest holdings are subject to change, and there are no guarantees the Fund will remain invested in any particular company. Excludes derivatives and investment of cash collateral for securities on loan (if any). |
The WisdomTree Emerging Markets ex-State-Owned Enterprises Fund (the ‘‘Fund’’) seeks to track the price and yield performance, before fees and expenses, of the WisdomTree Emerging Markets ex-State-Owned Enterprises Index (the ‘‘Index’’). In seeking to track the Index, the Fund invests in emerging market companies that are not state-owned enterprises, which is defined as government ownership of more than 20%. The Fund generally uses a representative sampling strategy to achieve its investment objective, meaning it generally will invest in a sample of securities in the Index.
The Fund returned -8.64% at net asset value (“NAV”) for the fiscal year ending March 31, 2019 (for more complete performance information please see the table below). The Fund’s position in Russia contributed most positively to performance, while its position in Hong Kong contributed most negatively to performance. Additionally, the Fund’s positions in Energy contributed the most to performance, while its positions in Health Care contributed most negatively. In 2018, due to the heightened risks of a U.S.- China trade war and global economy slowdown, emerging market equities suffered a considerable loss. The strengthening of the U.S. dollar in 2018 also made emerging market currencies vulnerable, which further elevated emerging market equity losses. Ex-State-Owned enterprises were especially impacted by the slowdown without governments’ support.
Shareholder Expense Example
| Beginning Account Value |
Ending Account Value |
Annualized Net Expense Ratio |
Expenses Paid During the Period |
|||||||||||||
| Actual |
$ | 1,000.00 | $ | 1,023.70 | 0.32 | %1 | $ | 1.61 | ||||||||
| Hypothetical (5% return before expenses) |
$ | 1,000.00 | $ | 1,023.34 | 0.32 | %1 | $ | 1.61 | ||||||||
| 1 | WisdomTree Asset Management, Inc. has contractually agreed to limit the management fee to 0.32% through July 31, 2019, unless earlier terminated by the Board of Trustees of the WisdomTree Trust for any reason. |
Performance
| Average Annual Total Return | ||||||||||||
| 1 Year | 3 Year | Since Inception1 | ||||||||||
| Fund NAV Returns |
-8.64 | % | 11.57 | % | 5.48 | % | ||||||
| Fund Market Price Returns |
-9.48 | % | 11.81 | % | 5.70 | % | ||||||
| WisdomTree Emerging Markets ex-State-Owned Enterprises Index |
-8.39 | % | 12.26 | % | 6.67 | % | ||||||
| MSCI Emerging Markets Index |
-7.41 | % | 10.68 | % | 4.70 | % | ||||||
| 1 | Total returns are calculated based on the commencement of Fund trading on the NYSE Arca, Inc. on December 10, 2014. |
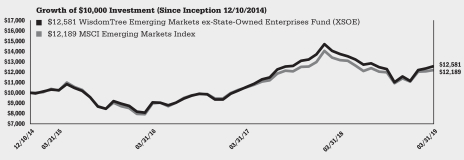
Performance is historical and does not guarantee future results. The returns do not reflect the deduction of taxes that a shareholder would pay on Fund distributions or on the redemption of Fund shares.
| WisdomTree Trust | 7 |
Management’s Discussion of Funds’ Performance
as of March 31, 2019 (unaudited)
WisdomTree Emerging Markets High Dividend Fund (DEM)
Sector Breakdown†
| Sector | % of Net Assets | |||
| Financials |
21.3% | |||
| Energy |
18.0% | |||
| Materials |
15.1% | |||
| Communication Services |
10.4% | |||
| Information Technology |
10.4% | |||
| Consumer Discretionary |
5.9% | |||
| Utilities |
4.7% | |||
| Consumer Staples |
4.6% | |||
| Real Estate |
4.3% | |||
| Industrials |
4.2% | |||
| Health Care |
0.8% | |||
| Investment Company |
0.1% | |||
| Other Assets less Liabilities‡ |
0.2% | |||
| Total |
100.0% | |||
| † | The Fund’s sector breakdown is expressed as a percentage of net assets and may change over time. In addition, a sector may be comprised of several industries. It does not include derivatives (if any). |
| ‡ | Other assets includes investment of cash collateral for securities on loan (if any). |
Top Ten Holdings*
| Description | % of Net Assets | |||
| China Mobile Ltd. |
2.9% | |||
| China Construction Bank Corp., Class H |
2.8% | |||
| Lukoil PJSC, ADR |
2.8% | |||
| Tatneft PJSC, ADR |
2.8% | |||
| MMC Norilsk Nickel PJSC, ADR |
2.7% | |||
| Gazprom PJSC, ADR |
2.3% | |||
| China Petroleum & Chemical Corp., Class H |
2.2% | |||
| Sberbank of Russia PJSC, ADR |
2.1% | |||
| Industrial & Commercial Bank of China Ltd., Class H |
2.0% | |||
| Nan Ya Plastics Corp. |
1.7% | |||
| * | The ten largest holdings are subject to change, and there are no guarantees the Fund will remain invested in any particular company. Excludes derivatives and investment of cash collateral for securities on loan (if any). |
The WisdomTree Emerging Markets High Dividend Fund (the ‘‘Fund’’) seeks to track the price and yield performance, before fees and expenses, of the WisdomTree Emerging Markets High Dividend Index (the ‘‘Index’’). In seeking to track the Index, the Fund invests in high-dividend-yielding companies in the emerging markets region. The Fund generally uses a representative sampling strategy to achieve its investment objective, meaning it generally will invest in a sample of securities in the Index.
The Fund returned -3.51% at net asset value (“NAV”) for the fiscal year ending March 31, 2019 (for more complete performance information please see the table below). The Fund’s position in Hong Kong contributed most positively to performance, while its position in South Africa contributed most negatively to performance. Additionally, the Fund’s positions in Energy contributed the most to performance, while its positions in Health Care contributed most negatively. In 2018, due to the heightened risks of a U.S.-China trade war and global economy slowdown, emerging market equities suffered a considerable loss. The strengthening of the U.S. dollar in 2018 also made emerging market currencies vulnerable, which further elevated emerging market equity losses. While the Chinese market rebounded in the first quarter of 2019, South Africa, India, and Brazil did not generate large positive returns. The augmented risks in emerging markets contributed to the negative return during the fiscal year.
Shareholder Expense Example
| Beginning Account Value |
Ending Account Value |
Annualized Net Expense Ratio |
Expenses Paid During the Period |
|||||||||||||
| Actual |
$ | 1,000.00 | $ | 1,004.00 | 0.63 | % | $ | 3.15 | ||||||||
| Hypothetical (5% return before expenses) |
$ | 1,000.00 | $ | 1,021.79 | 0.63 | % | $ | 3.18 | ||||||||
Performance
| Average Annual Total Return | ||||||||||||||||
| 1 Year | 3 Year | 5 Year | 10 Year | |||||||||||||
| Fund NAV Returns |
-3.51 | % | 12.03 | % | 1.82 | % | 7.72 | % | ||||||||
| Fund Market Price Returns |
-4.25 | % | 12.31 | % | 1.94 | % | 7.62 | % | ||||||||
| WisdomTree Emerging Markets High Dividend Index |
-2.84 | % | 12.79 | % | 2.71 | % | 8.85 | % | ||||||||
| MSCI Emerging Markets Index |
-7.41 | % | 10.68 | % | 3.68 | % | 8.94 | % | ||||||||
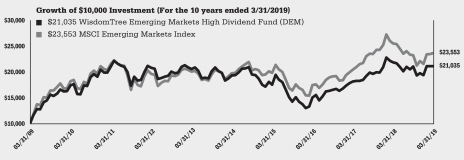
Performance is historical and does not guarantee future results. The returns do not reflect the deduction of taxes that a shareholder would pay on Fund distributions or on the redemption of Fund shares.
| 8 | WisdomTree Trust |
Management’s Discussion of Funds’ Performance
as of March 31, 2019 (unaudited)
WisdomTree Emerging Markets Multifactor Fund (EMMF)
Sector Breakdown†
| Sector | % of Net Assets | |||
| Financials |
22.6% | |||
| Information Technology |
15.0% | |||
| Communication Services |
9.8% | |||
| Industrials |
9.4% | |||
| Materials |
9.3% | |||
| Energy |
9.0% | |||
| Consumer Discretionary |
7.8% | |||
| Consumer Staples |
6.3% | |||
| Health Care |
3.7% | |||
| Utilities |
3.7% | |||
| Real Estate |
2.9% | |||
| Other Assets less Liabilities‡ |
0.5% | |||
| Total |
100.0% | |||
| † | The Fund’s sector breakdown is expressed as a percentage of net assets and may change over time. In addition, a sector may be comprised of several industries. It does not include derivatives (if any). |
| ‡ | Other assets includes investment of cash collateral for securities on loan (if any). |
Top Ten Holdings*
| Description | % of Net Assets | |||
| IRB Brasil Resseguros S.A. |
1.5% | |||
| Samsung Electronics Co., Ltd. |
1.4% | |||
| SK Hynix, Inc. |
1.4% | |||
| Sul America S.A. |
1.3% | |||
| Samsung SDS Co., Ltd. |
1.3% | |||
| Bank of Communications Co., Ltd., Class H |
1.2% | |||
| China CITIC Bank Corp., Ltd., Class H |
1.1% | |||
| SK Telecom Co., Ltd. |
1.1% | |||
| HCL Technologies Ltd. |
1.1% | |||
| China Cinda Asset Management Co., Ltd., Class H |
1.1% | |||
| * | The ten largest holdings are subject to change, and there are no guarantees the Fund will remain invested in any particular company. Excludes derivatives and investment of cash collateral for securities on loan (if any). |
The WisdomTree Emerging Markets Multifactor Fund (the ‘‘Fund’’) seeks capital appreciation, by investing in equity securities of emerging markets countries with the highest composite scores based on two fundamental factors, value and quality measures, and two technical factors, momentum and correlation.
The Fund returned -3.52% at net asset value (“NAV”) for the fiscal period ending March 31, 2019 (for more complete performance information please see the table below). The Fund’s position in Brazil contributed most positively to performance, while its position in Taiwan contributed most negatively to performance. In 2018, due to the heightened risks of a U.S.- China trade war and global economy slowdown, emerging market equities suffered a considerable loss. The strengthening of the U.S. dollar in 2018 also made emerging market currencies vulnerable, which further elevated emerging market equity losses. While the Fund’s tilt towards high value and high quality, low volatility and low correlation equities provided a buffer for the loss, the Fund nevertheless had negative returns in the past fiscal period.
Shareholder Expense Example
| Beginning Account Value |
Ending Account Value |
Annualized Net Expense Ratio |
Expenses Paid During the Period |
|||||||||||||
| Actual |
$ | 1,000.00 | $ | 963.60 | 0.48 | % | $ | 2.35 | ||||||||
| Hypothetical (5% return before expenses) |
$ | 1,000.00 | $ | 1,022.54 | 0.48 | % | $ | 2.42 | ||||||||
Performance
| Cumulative Total Return | ||||
| Since Inception1 | ||||
| Fund NAV Returns |
-3.52 | % | ||
| Fund Market Price Returns |
-2.36 | % | ||
| MSCI Emerging Markets Index |
0.67 | % | ||
| 1 | Total returns are calculated based on the commencement of Fund trading on the NYSE Arca, Inc. on August 10, 2018. |
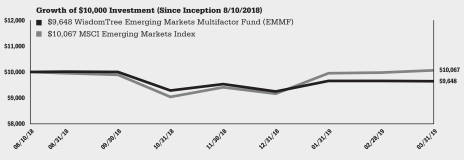
Performance is historical and does not guarantee future results. The returns do not reflect the deduction of taxes that a shareholder would pay on Fund distributions or on the redemption of Fund shares.
| WisdomTree Trust | 9 |
Management’s Discussion of Funds’ Performance
as of March 31, 2019 (unaudited)
WisdomTree Emerging Markets Quality Dividend Growth Fund (DGRE)
Sector Breakdown†
| Sector | % of Net Assets | |||
| Information Technology |
17.0% | |||
| Financials |
13.1% | |||
| Consumer Discretionary |
13.0% | |||
| Consumer Staples |
11.6% | |||
| Materials |
9.4% | |||
| Industrials |
8.0% | |||
| Energy |
7.5% | |||
| Communication Services |
7.2% | |||
| Real Estate |
5.9% | |||
| Health Care |
4.0% | |||
| Utilities |
3.2% | |||
| Other Assets less Liabilities‡ |
0.1% | |||
| Total |
100.0% | |||
| † | The Fund’s sector breakdown is expressed as a percentage of net assets and may change over time. In addition, a sector may be comprised of several industries. It does not include derivatives (if any). |
| ‡ | Other assets includes investment of cash collateral for securities on loan (if any). |
Top Ten Holdings*
| Description | % of Net Assets | |||
| Tencent Holdings Ltd. |
3.9 | % | ||
| Taiwan Semiconductor Manufacturing Co., Ltd. |
2.8 | % | ||
| Samsung Electronics Co., Ltd. |
2.7 | % | ||
| Ping An Insurance Group Co. of China Ltd., Class H |
1.1 | % | ||
| Reliance Industries Ltd. |
1.0 | % | ||
| China Mobile Ltd. |
1.0 | % | ||
| Infosys Ltd. |
0.8 | % | ||
| Sberbank of Russia PJSC, ADR |
0.8 | % | ||
| Lukoil PJSC, ADR |
0.8 | % | ||
| SK Hynix, Inc. |
0.7 | % | ||
| * | The ten largest holdings are subject to change, and there are no guarantees the Fund will remain invested in any particular company. Excludes derivatives and investment of cash collateral for securities on loan (if any). |
The WisdomTree Emerging Markets Quality Dividend Growth Fund (the ‘‘Fund’’) seeks income and capital appreciation by investing in dividend-paying companies with growth characteristics in the emerging markets region. Prior to October 26, 2018, the Fund sought to track the price and yield performance, before fees and expenses, of the WisdomTree Emerging Markets Quality Dividend Growth Index.
The Fund returned -5.79% at net asset value (“NAV”) for the fiscal year ending March 31, 2019 (for more complete performance information please see the table below). The Fund’s position in China contributed most positively to performance, while its position in South Africa contributed most negatively to performance. In 2018, due to the heightened risks of a U.S.- China trade war and global economy slowdown, emerging market equities suffered a considerable loss. The strengthening of the U.S. dollar in 2018 also made emerging market currencies vulnerable, which further elevated emerging market equity losses. While the Chinese market rebounded in the first quarter of 2019, South Africa, India, and Brazil did not generate large positive returns. The augmented global equity risks overshadowed by the U.S.-China trade war contributed to the overall negative return of the Fund during the year.
Shareholder Expense Example
| Beginning Account Value |
Ending Account Value |
Annualized Net Expense Ratio |
Expenses Paid During the Period |
|||||||||||||
| Actual |
$ | 1,000.00 | $ | 1,036.90 | 0.32 | %1 | $ | 1.63 | ||||||||
| Hypothetical (5% return before expenses) |
$ | 1,000.00 | $ | 1,023.34 | 0.32 | %1 | $ | 1.61 | ||||||||
| 1 | WisdomTree Asset Management, Inc. has contractually agreed to limit the management fee to 0.32% through July 31, 2019, unless earlier terminated by the Board of Trustees of the WisdomTree Trust for any reason. |
Performance
| Average Annual Total Return | ||||||||||||||||
| 1 Year | 3 Year | 5 Year | Since Inception1 | |||||||||||||
| Fund NAV Returns |
-5.79 | % | 8.16 | % | 2.41 | % | 2.07 | % | ||||||||
| Fund Market Price Returns |
-5.62 | % | 8.49 | % | 2.63 | % | 1.84 | % | ||||||||
| MSCI Emerging Markets Index |
-7.41 | % | 10.68 | % | 3.68 | % | 4.20 | % | ||||||||
| 1 | Total returns are calculated based on the commencement of Fund trading on the NASDAQ on August 1, 2013. |
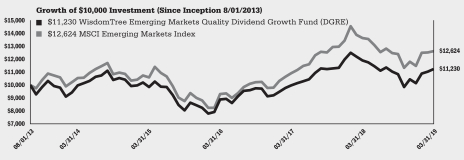
Performance is historical and does not guarantee future results. The returns do not reflect the deduction of taxes that a shareholder would pay on Fund distributions or on the redemption of Fund shares.
| 10 | WisdomTree Trust |
Management’s Discussion of Funds’ Performance
as of March 31, 2019 (unaudited)
WisdomTree Emerging Markets SmallCap Dividend Fund (DGS)
Sector Breakdown†
| Sector | % of Net Assets | |||
| Information Technology |
18.3% | |||
| Real Estate |
14.2% | |||
| Consumer Discretionary |
13.2% | |||
| Industrials |
12.7% | |||
| Financials |
10.3% | |||
| Materials |
9.4% | |||
| Consumer Staples |
6.1% | |||
| Utilities |
6.0% | |||
| Communication Services |
4.5% | |||
| Health Care |
2.6% | |||
| Energy |
2.3% | |||
| Other Assets less Liabilities‡ |
0.4% | |||
| Total |
100.0% | |||
| † | The Fund’s sector breakdown is expressed as a percentage of net assets and may change over time. In addition, a sector may be comprised of several industries. It does not include derivatives (if any). |
| ‡ | Other assets includes investment of cash collateral for securities on loan (if any). |
Top Ten Holdings*
| Description | % of Net Assets | |||
| Guangzhou R&F Properties Co., Ltd., Class H |
1.4% | |||
| Transmissora Alianca de Energia Eletrica S.A. |
1.1% | |||
| Moneta Money Bank AS |
0.7% | |||
| Yuzhou Properties Co., Ltd. |
0.7% | |||
| Foschini Group Ltd. (The) |
0.7% | |||
| Yuexiu Property Co., Ltd. |
0.6% | |||
| Wistron Corp. |
0.6% | |||
| Truworths International Ltd. |
0.6% | |||
| SPAR Group Ltd. (The) |
0.6% | |||
| Telkom S.A. SOC Ltd. |
0.6% | |||
| * | The ten largest holdings are subject to change, and there are no guarantees the Fund will remain invested in any particular company. Excludes derivatives and investment of cash collateral for securities on loan (if any). |
The WisdomTree Emerging Markets SmallCap Dividend Fund (the ‘‘Fund’’) seeks to track the price and yield performance, before fees and expenses, of the WisdomTree Emerging Markets SmallCap Dividend Index (the ‘‘Index’’). In seeking to track the Index, the Fund invests in dividend-paying small-cap companies in the emerging markets
region. The Fund generally uses a representative sampling strategy to achieve its investment objective, meaning it generally will invest in a sample of securities in the Index.
The Fund returned -8.40% at net asset value (“NAV”) for the fiscal year ending March 31, 2019 (for more complete performance information please see the table below). The Fund’s position in Mexico contributed most positively to performance, while its position in South Africa contributed most negatively to performance. Additionally, the Fund’s positions in Communication Services contributed the most to performance, while its positions in Consumer Discretionary contributed most negatively. In 2018, due to the heightened risks of a U.S.- China trade war and global economy slowdown, emerging market equities suffered a considerable loss. The strengthening of the U.S. dollar in 2018 also made emerging market currencies vulnerable, which further increased emerging market equity losses. The relative high volatility of small-cap equities subjected them to more negative returns as the global markets fluctuated.
Shareholder Expense Example
| Beginning Account Value |
Ending Account Value |
Annualized Net Expense Ratio |
Expenses Paid During the Period |
|||||||||||||
| Actual |
$ | 1,000.00 | $ | 1,033.50 | 0.63 | % | $ | 3.19 | ||||||||
| Hypothetical (5% return before expenses) |
$ | 1,000.00 | $ | 1,021.79 | 0.63 | % | $ | 3.18 | ||||||||
Performance
| Average Annual Total Return | ||||||||||||||||
| 1 Year | 3 Year | 5 Year | 10 Year | |||||||||||||
| Fund NAV Returns |
-8.40 | % | 11.28 | % | 3.57 | % | 10.23 | % | ||||||||
| Fund Market Price Returns |
-9.26 | % | 11.47 | % | 3.54 | % | 10.27 | % | ||||||||
| WisdomTree Emerging Markets SmallCap Dividend Index |
-7.49 | % | 12.17 | % | 4.59 | % | 11.59 | % | ||||||||
| MSCI Emerging Markets Small Cap Index |
-12.42 | % | 5.95 | % | 1.76 | % | 10.37 | % | ||||||||
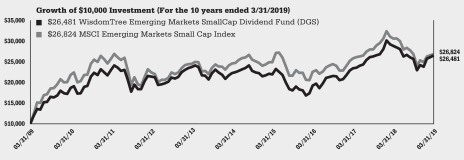
Performance is historical and does not guarantee future results. The returns do not reflect the deduction of taxes that a shareholder would pay on Fund distributions or on the redemption of Fund shares.
| WisdomTree Trust | 11 |
Management’s Discussion of Funds’ Performance
as of March 31, 2019 (unaudited)
WisdomTree Global ex-U.S. Quality Dividend Growth Fund (DNL)
Sector Breakdown†
| Sector | % of Net Assets | |||
| Information Technology |
18.3% | |||
| Industrials |
16.5% | |||
| Consumer Discretionary |
13.2% | |||
| Consumer Staples |
12.1% | |||
| Health Care |
11.1% | |||
| Communication Services |
10.8% | |||
| Materials |
6.3% | |||
| Financials |
4.9% | |||
| Real Estate |
4.8% | |||
| Energy |
1.0% | |||
| Utilities |
0.5% | |||
| Investment Company |
0.0% | * | ||
| Other Assets less Liabilities‡ |
0.5% | |||
| Total |
100.0% | |||
| † | The Fund’s sector breakdown is expressed as a percentage of net assets and may change over time. In addition, a sector may be comprised of several industries. It does not include derivatives (if any). |
| ‡ | Other assets includes investment of cash collateral for securities on loan (if any). |
| * | Represents less than 0.1%. |
Top Ten Holdings*
| Description | % of Net Assets | |||
| British American Tobacco PLC |
6.0% | |||
| Telenor ASA |
5.0% | |||
| Tokyo Electron Ltd. |
3.9% | |||
| Atlas Copco AB, Class A |
3.3% | |||
| Safran S.A. |
2.8% | |||
| Taiwan Semiconductor Manufacturing Co., Ltd. |
2.7% | |||
| CSL Ltd. |
2.6% | |||
| ASML Holding N.V. |
2.5% | |||
| adidas AG |
2.3% | |||
| Galaxy Entertainment Group Ltd. |
1.9% | |||
| * | The ten largest holdings are subject to change, and there are no guarantees the Fund will remain invested in any particular company. Excludes derivatives and investment of cash collateral for securities on loan (if any). |
The WisdomTree Global ex-U.S. Quality Dividend Growth Fund (the ‘‘Fund’’) seeks to track the price and yield performance, before fees and expenses, of the WisdomTree Global ex-U.S. Quality Dividend Growth Index (the ‘‘Index’’). In seeking to track the Index, the Fund invests in dividend-paying companies with growth characteristics in developed and emerging equity markets, ex-U.S. The Fund generally uses a representative sampling strategy to achieve its investment objective, meaning it generally will invest in a sample of securities in the Index.
The Fund returned -3.65% at net asset value (“NAV”) for the fiscal year ending March 31, 2019 (for more complete performance information please see the table below). The Fund’s position in Norway contributed most positively to performance, while its position in United Kingdom contributed most negatively to performance. In 2018, due to the global economy slowdown, global equities suffered a considerable loss. The Fund’s position in United Kingdom generated negative returns because of the uncertainty surrounding the withdrawal of the United Kingdom from the European Union. However, the Fund’s tilt towards high quality and high dividend yield growth companies provided a buffer to the loss.
Shareholder Expense Example
| Beginning Account Value |
Ending Account Value |
Annualized Net Expense Ratio |
Expenses Paid During the Period |
|||||||||||||
| Actual |
$ | 1,000.00 | $ | 978.70 | 0.58 | % | $ | 2.86 | ||||||||
| Hypothetical (5% return before expenses) |
$ | 1,000.00 | $ | 1,022.04 | 0.58 | % | $ | 2.92 | ||||||||
Performance
| Average Annual Total Return | ||||||||||||||||
| 1 Year | 3 Year | 5 Year | 10 Year | |||||||||||||
| Fund NAV Returns |
-3.65 | % | 8.00 | % | 3.62 | % | 7.30 | % | ||||||||
| Fund Market Price Returns |
-3.83 | % | 8.41 | % | 3.78 | % | 7.13 | % | ||||||||
| WisdomTree Japan Equity Income/Global ex-U.S. Quality Dividend Growth Spliced Index1 |
-2.94 | % | 8.84 | % | 4.32 | % | 8.07 | % | ||||||||
| MSCI Japan Value/MSCI AC World ex-USA Growth Spliced Index2 |
-3.05 | % | 8.42 | % | 4.01 | % | 9.63 | % | ||||||||
| 1 | WisdomTree Japan Equity Income Index through June 19, 2009; WisdomTree Global ex-U.S. Quality Dividend Growth Index thereafter. |
| 2 | MSCI Japan Value Index through June 19, 2009; MSCI AC World ex-USA Growth Index thereafter. |
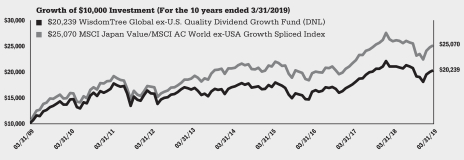
Performance is historical and does not guarantee future results. The returns do not reflect the deduction of taxes that a shareholder would pay on Fund distributions or on the redemption of Fund shares.
| 12 | WisdomTree Trust |
Management’s Discussion of Funds’ Performance
as of March 31, 2019 (unaudited)
WisdomTree Global ex-U.S. Real Estate Fund (DRW)
Sector Breakdown†
| Sector | % of Net Assets | |||
| Real Estate Management & Development |
53.7% | |||
| Equity Real Estate Investment Trusts (REITs) |
46.0% | |||
| Other Assets less Liabilities‡ |
0.3% | |||
| Total |
100.0% | |||
| † | The Fund’s industry breakdown is expressed as a percentage of net assets and may change over time. It does not include derivatives (if any). |
| ‡ | Other assets includes investment of cash collateral for securities on loan (if any). |
Top Ten Holdings*
| Description | % of Net Assets | |||
| Sun Hung Kai Properties Ltd. |
4.6% | |||
| Henderson Land Development Co., Ltd. |
2.8% | |||
| Unibail-Rodamco-Westfield |
2.3% | |||
| Scentre Group |
2.1% | |||
| Link REIT |
2.0% | |||
| Vonovia SE |
2.0% | |||
| New World Development Co., Ltd. |
1.8% | |||
| Klepierre S.A. |
1.8% | |||
| Swire Properties Ltd. |
1.7% | |||
| Daiwa House Industry Co., Ltd. |
1.6% | |||
| * | The ten largest holdings are subject to change, and there are no guarantees the Fund will remain invested in any particular company. Excludes derivatives and investment of cash collateral for securities on loan (if any). |
The WisdomTree Global ex-U.S. Real Estate Fund (the ‘‘Fund’’) seeks to track the price and yield performance, before fees and expenses, of the WisdomTree Global ex-U.S. Real Estate Index (the ‘‘Index’’). In seeking to track the Index, the Fund invests in dividend-paying companies in the Real Estate sector in developed and emerging equity markets, ex-U.S. The Fund generally uses a representative sampling strategy to achieve its investment objective, meaning it generally will invest in a sample of securities in the Index.
The Fund returned 4.51% at net asset value (“NAV”) for the fiscal year ending March 31, 2019 (for more complete performance information please see the table below). The Fund’s position in Hong Kong contributed most positively to performance, while its position in Netherlands contributed most negatively to performance. Additionally, the Fund’s positions in Real Estate contributed the most to performance, while its positions in Industrials contributed most negatively. The first quarter of 2019 saw significant positive returns due to the Chinese market’s rebound. In 2018 however, due to the heightened risks of a U.S.- China trade war, global equities suffered a considerable loss. The Fund’s focus on investing in value companies in the Real Estate sector mitigated some losses as the global market experienced a large decline. The exposure to global dividend yielding Real Estate companies contributed to the positive gains.
Shareholder Expense Example
| Beginning Account Value |
Ending Account Value |
Annualized Expense Ratio |
Expenses Paid During the Period |
|||||||||||||
| Actual |
$ | 1,000.00 | $ | 1,097.80 | 0.58 | % | $ | 3.03 | ||||||||
| Hypothetical (5% return before expenses) |
$ | 1,000.00 | $ | 1,022.04 | 0.58 | % | $ | 2.92 | ||||||||
Performance
| Average Annual Total Return | ||||||||||||||||
| 1 Year | 3 Year | 5 Year | 10 Year | |||||||||||||
| Fund NAV Returns |
4.51 | % | 11.68 | % | 8.45 | % | 13.53 | % | ||||||||
| Fund Market Price Returns |
4.19 | % | 11.66 | % | 8.53 | % | 13.40 | % | ||||||||
| WisdomTree International Real Estate/Global ex-U.S. Real Estate Spliced Index1 |
4.86 | % | 11.99 | % | 8.71 | % | 13.84 | % | ||||||||
| Dow Jones Global ex-U.S. Select Real Estate Securities Index |
3.75 | % | 3.98 | % | 3.87 | % | 12.01 | % | ||||||||
| 1 | WisdomTree International Real Estate Index through June 17, 2011; WisdomTree Global ex-U.S. Real Estate Index thereafter. |
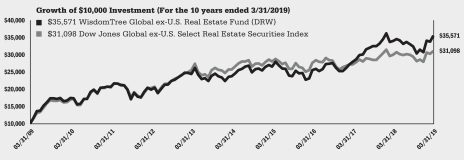
Performance is historical and does not guarantee future results. The returns do not reflect the deduction of taxes that a shareholder would pay on Fund distributions or on the redemption of Fund shares.
| WisdomTree Trust | 13 |
Management’s Discussion of Funds’ Performance
as of March 31, 2019 (unaudited)
WisdomTree Global High Dividend Fund (DEW)
Sector Breakdown†
| Sector | % of Net Assets | |||
| Financials |
16.9 | % | ||
| Energy |
12.8 | % | ||
| Consumer Staples |
12.3 | % | ||
| Communication Services |
10.0 | % | ||
| Utilities |
9.0 | % | ||
| Real Estate |
8.0 | % | ||
| Health Care |
7.8 | % | ||
| Information Technology |
7.6 | % | ||
| Consumer Discretionary |
5.8 | % | ||
| Industrials |
5.0 | % | ||
| Materials |
4.3 | % | ||
| Investment Company |
0.1 | % | ||
| Other Assets less Liabilities‡ |
0.4 | % | ||
| Total |
100.0 | % | ||
| † | The Fund’s sector breakdown is expressed as a percentage of net assets and may change over time. In addition, a sector may be comprised of several industries. It does not include derivatives (if any). |
| ‡ | Other assets includes investment of cash collateral for securities on loan (if any). |
Top Ten Holdings*
| Description | % of Net Assets | |||
| Exxon Mobil Corp. |
3.0 | % | ||
| AT&T, Inc. |
2.8 | % | ||
| Verizon Communications, Inc. |
2.4 | % | ||
| Procter & Gamble Co. (The) |
2.1 | % | ||
| Chevron Corp. |
2.0 | % | ||
| Pfizer, Inc. |
1.7 | % | ||
| Philip Morris International, Inc. |
1.6 | % | ||
| Cisco Systems, Inc. |
1.6 | % | ||
| Coca-Cola Co. (The) |
1.5 | % | ||
| Intel Corp. |
1.5 | % | ||
| * | The ten largest holdings are subject to change, and there are no guarantees the Fund will remain invested in any particular company. Excludes derivatives and investment of cash collateral for securities on loan (if any). |
The WisdomTree Global High Dividend Fund (the ‘‘Fund’’) seeks to track the price and yield performance, before fees and expenses, of the WisdomTree Global High Dividend Index (the ‘‘Index’’). In seeking to track the Index, the Fund invests in high-dividend- yielding companies in the U.S. and in developed and emerging equity markets. The Fund generally uses a representative sampling strategy to achieve its investment objective, meaning it generally will invest in a sample of securities in the Index.
The Fund returned 3.59% at net asset value (“NAV”) for the fiscal year ending March 31, 2019 (for more complete performance information please see the table below). The Fund’s position in Hong Kong contributed most positively to performance, while its position in Germany contributed most negatively to performance. Additionally, the Fund’s positions in Health Care contributed the most to performance, while its positions in Financials contributed most negatively. The first quarter of 2019 saw significant positive returns due to the Chinese market’s rebound. In 2018 however, due to the heightened risks of a U.S.- China trade war, global equities suffered a considerable loss. The Fund’s focus on investing in value companies mitigated some losses as the global market experienced a large decline. The exposure to global high dividend yielding companies contributed to the positive gains.
Shareholder Expense Example
| Beginning Account Value |
Ending Account Value |
Annualized Net Expense Ratio |
Expenses Paid During the Period |
|||||||||||||
| Actual |
$ | 1,000.00 | $ | 1,002.40 | 0.58 | % | $ | 2.90 | ||||||||
| Hypothetical (5% return before expenses) |
$ | 1,000.00 | $ | 1,022.04 | 0.58 | % | $ | 2.92 | ||||||||
Performance
| Average Annual Total Return | ||||||||||||||||
| 1 Year | 3 Year | 5 Year | 10 Year | |||||||||||||
| Fund NAV Returns |
3.59 | % | 7.97 | % | 3.23 | % | 10.09 | % | ||||||||
| Fund Market Price Returns |
3.33 | % | 8.05 | % | 3.29 | % | 10.02 | % | ||||||||
| WisdomTree Europe Equity Income/Global High Dividend Spliced Index1 |
3.27 | % | 7.84 | % | 3.10 | % | 10.12 | % | ||||||||
| MSCI Europe Value/MSCI AC World Spliced Index2 |
2.60 | % | 10.67 | % | 6.45 | % | 12.85 | % | ||||||||
| 1 | WisdomTree Europe Equity Income Index through June 19, 2009; WisdomTree Global High Dividend Index thereafter. |
| 2 | MSCI Europe Value Index through June 19, 2009; MSCI AC World Index thereafter. |
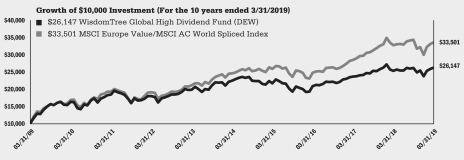
Performance is historical and does not guarantee future results. The returns do not reflect the deduction of taxes that a shareholder would pay on Fund distributions or on the redemption of Fund shares.
| 14 | WisdomTree Trust |
Management’s Discussion of Funds’ Performance
as of March 31, 2019 (unaudited)
WisdomTree India Earnings Fund (EPI) (consolidated)
Sector Breakdown†
| Sector | % of Net Assets | |||
| Financials |
24.2% | |||
| Energy |
19.8% | |||
| Information Technology |
15.6% | |||
| Materials |
11.3% | |||
| Consumer Discretionary |
7.8% | |||
| Industrials |
5.3% | |||
| Utilities |
5.2% | |||
| Consumer Staples |
4.3% | |||
| Health Care |
4.1% | |||
| Communication Services |
1.6% | |||
| Real Estate |
1.3% | |||
| Other Assets less Liabilities‡ |
-0.5% | |||
| Total |
100.0% | |||
| † | The Fund’s sector breakdown is expressed as a percentage of net assets and may change over time. In addition, a sector may be comprised of several industries. It does not include derivatives (if any). |
| ‡ | Other assets includes investment of cash collateral for securities on loan (if any). |
Top Ten Holdings*
| Description | % of Net Assets | |||
| Reliance Industries Ltd. |
9.9% | |||
| Housing Development Finance Corp., Ltd. |
8.4% | |||
| Infosys Ltd. |
7.3% | |||
| Tata Consultancy Services Ltd. |
3.1% | |||
| Indian Oil Corp., Ltd. |
2.5% | |||
| ICICI Bank Ltd. |
2.4% | |||
| Oil & Natural Gas Corp., Ltd. |
2.3% | |||
| Vedanta Ltd. |
1.9% | |||
| HCL Technologies Ltd. |
1.8% | |||
| Bharat Petroleum Corp., Ltd. |
1.8% | |||
| * | The ten largest holdings are subject to change, and there are no guarantees the Fund will remain invested in any particular company. Excludes derivatives and investment of cash collateral for securities on loan (if any). |
The WisdomTree India Earnings Fund (the ‘‘Fund’’) seeks to track the price and yield performance, before fees and expenses, of the WisdomTree India Earnings Index (the ‘‘Index’’). In seeking to track the Index, the Fund invests in profitable companies in the Indian equity market. The Fund generally uses a representative sampling strategy to achieve its investment objective, meaning it generally will invest in a sample of securities in the Index.
The Fund returned 2.89% at net asset value (“NAV”) for the fiscal year ending March 31, 2019 (for more complete performance information please see the table below). The Fund’s positions in Information Technology contributed the most to performance, while its positions in Consumer Discretionary contributed most negatively. In the fourth quarter of 2018, India’s economy suffered a slowdown when its GDP decreased from 8.2% to 7.2%. The Indian rupee also depreciated in the fourth quarter of 2018. Against this general economic backdrop, the Fund had a return of -3.44% (based on NAV) through the fourth quarter of 2018. However, in the first quarter of 2019, as the global environment became “risk on”, the Fund generated a 6.55% return (based on NAV).
Shareholder Expense Example
| Beginning Account Value |
Ending Account Value |
Annualized Expense Ratio |
Expenses Paid During the Period |
|||||||||||||
| Actual |
$ | 1,000.00 | $ | 1,097.60 | 0.85 | % | $ | 4.45 | ||||||||
| Hypothetical (5% return before expenses) |
$ | 1,000.00 | $ | 1,020.69 | 0.85 | % | $ | 4.28 | ||||||||
Performance
| Average Annual Total Return | ||||||||||||||||
| 1 Year | 3 Year | 5 Year | 10 Year | |||||||||||||
| Fund NAV Returns |
2.89 | % | 11.90 | % | 7.90 | % | 10.12 | % | ||||||||
| Fund Market Price Returns |
1.72 | % | 11.78 | % | 7.92 | % | 10.11 | % | ||||||||
| WisdomTree India Earnings Index |
3.31 | % | 13.22 | % | 9.17 | % | 11.47 | % | ||||||||
| MSCI India Index |
6.75 | % | 11.69 | % | 7.87 | % | 11.59 | % | ||||||||
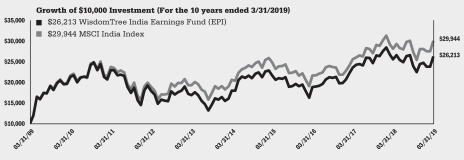
Performance is historical and does not guarantee future results. The returns do not reflect the deduction of taxes that a shareholder would pay on Fund distributions or on the redemption of Fund shares.
| WisdomTree Trust | 15 |
Management’s Discussion of Funds’ Performance
as of March 31, 2019 (unaudited)
WisdomTree Middle East Dividend Fund (GULF)
Sector Breakdown†
| Sector | % of Net Assets | |||
| Financials |
57.5% | |||
| Communication Services |
12.0% | |||
| Materials |
7.8% | |||
| Real Estate |
7.1% | |||
| Industrials |
6.6% | |||
| Energy |
2.7% | |||
| Utilities |
1.6% | |||
| Consumer Staples |
1.6% | |||
| Consumer Discretionary |
1.4% | |||
| Health Care |
0.2% | |||
| Other Assets less Liabilities‡ |
1.5% | |||
| Total |
100.0% | |||
| † | The Fund’s sector breakdown is expressed as a percentage of net assets and may change over time. In addition, a sector may be comprised of several industries. It does not include derivatives (if any). |
| ‡ | Other assets includes investment of cash collateral for securities on loan (if any). |
Top Ten Holdings*
| Description | % of Net Assets | |||
| Qatar National Bank QPSC |
7.5 | % | ||
| Al Rajhi Bank |
5.9 | % | ||
| Emirates Telecommunications Group Co. PJSC |
4.5 | % | ||
| First Abu Dhabi Bank PJSC |
4.5 | % | ||
| Saudi Basic Industries Corp. |
4.3 | % | ||
| National Bank of Kuwait SAKP |
3.9 | % | ||
| Ahli United Bank BSC |
3.2 | % | ||
| Abu Dhabi Commercial Bank PJSC |
3.1 | % | ||
| Mobile Telecommunications Co. KSC |
3.1 | % | ||
| Arab Bank PLC |
3.0 | % | ||
| * | The ten largest holdings are subject to change, and there are no guarantees the Fund will remain invested in any particular company. Excludes derivatives and investment of cash collateral for securities on loan (if any). |
The WisdomTree Middle East Dividend Fund (the ‘‘Fund’’) seeks to track the price and yield performance, before fees and expenses, of the WisdomTree Middle East Dividend Index (the ‘‘Index’’). In seeking to track the Index, the Fund invests in dividend-paying companies in the Middle East. The Fund generally uses a representative sampling strategy to achieve its investment objective, meaning it generally will invest in a sample of securities in the Index.
The Fund returned 13.41% at net asset value (“NAV”) for the fiscal year ending March 31, 2019 (for more complete performance information please see the table below). The Fund’s position in Saudi Arabia contributed most positively to performance, while its position in Egypt contributed most negatively to performance. Saudi Arabia had a strong performance in the first quarter of 2019 due to a steady rise in increased oil prices. Continued demand combined with OPEC’s decision to curtail production aided to oil prices rising. On the backs of rising oil prices and stronger domestic demand, the general economy within the Middle East grew in 2018. Aiding in some of this growth were a few large-scale public service projects to modernize both the infrastructure and economies within a few countries. In particular, Qatar’s new infrastructure spending went into building for the upcoming FIFA 2022 World Cup tournament. Additionally, Kuwait has begun a large-scale, long-term, revitalization plan that will include infrastructure building, legislative changes, and private sector engagement initiatives, all with the eventual goal of creating a top, knowledge-based economy by 2035, with lower unemployment rates. By and large, the macroeconomics within the whole region, combined with improving economic conditions domestically in a couple of key countries, led to the Fund’s positive return during the fiscal year.
Shareholder Expense Example
| Beginning Account Value |
Ending Account Value |
Annualized Expense Ratio |
Expenses Paid During the Period |
|||||||||||||
| Actual |
$ | 1,000.00 | $ | 1,081.40 | 0.88 | % | $ | 4.57 | ||||||||
| Hypothetical (5% return before expenses) |
$ | 1,000.00 | $ | 1,020.54 | 0.88 | % | $ | 4.43 | ||||||||
Performance
| Average Annual Total Return | ||||||||||||||||
| 1 Year | 3 Year | 5 Year | 10 Year | |||||||||||||
| Fund NAV Returns |
13.41 | % | 9.80 | % | 1.87 | % | 9.76 | % | ||||||||
| Fund Market Price Returns |
12.90 | % | 10.02 | % | 1.52 | % | 9.51 | % | ||||||||
| WisdomTree Middle East Dividend Index |
13.87 | % | 11.35 | % | 3.14 | % | 11.16 | % | ||||||||
| MSCI Arabian Markets ex-Saudi Arabia Index |
8.94 | % | 6.11 | % | -0.56 | % | 6.20 | % | ||||||||
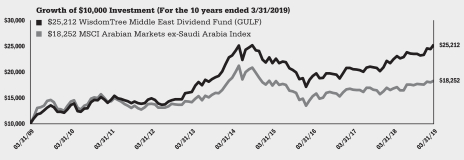
Performance is historical and does not guarantee future results. The returns do not reflect the deduction of taxes that a shareholder would pay on Fund distributions or on the redemption of Fund shares.
| 16 | WisdomTree Trust |
Description of Indexes (unaudited)
Below are descriptions of each Index referenced in this report:
The Dow Jones Global ex-U.S. Select Real Estate Securities Index is a float-adjusted market capitalization weighted index that defines and measures the investable universe of publicly traded real estate securities in countries outside the U.S.
The FTSE China 50 Index is a capitalization weighted index that is comprised of the 50 largest and most liquid Chinese securities.
The MSCI AC Asia Pacific ex-Japan Index is comprised of large- and mid-capitalization segments of emerging market and developed market countries in the Asia Pacific region, excluding Japan.
The MSCI AC World ex-USA Growth Index is comprised of growth stocks in the developed and emerging markets covered by MSCI, excluding the U.S.
The MSCI AC World Index is comprised of the world stock market indexes covered by MSCI.
The MSCI ACWI ex-USA Index is comprised of large- and mid-capitalization segments of the developed and emerging markets covered by MSCI, excluding the U.S.
The MSCI Arabian Markets ex-Saudi Arabia Index is a free float-adjusted market capitalization index that aims to represent the universe of companies in the Gulf Cooperation Council (GCC) countries, excluding Saudi Arabia, plus Jordan, Egypt, Morocco, Tunisia and Lebanon.
The MSCI China Index is a free float-adjusted market capitalization weighted index designed to measure the performance of the Chinese equity market.
The MSCI Emerging Markets Index is a free float-adjusted market capitalization index that is designed to measure emerging markets equity performance.
The MSCI Emerging Markets Small Cap Index is a free float-adjusted market capitalization index that is designed to measure the performance of small capitalization equities in the emerging markets.
The MSCI Europe Value Index is comprised of value stocks in the MSCI Europe Index.
The MSCI India Index is a free float-adjusted market capitalization index that is designed to measure the performance of the Indian equity market.
The MSCI Japan Value Index is comprised of value stocks in the MSCI Japan Index.
The MSCI Pacific ex-Japan Index is a subset of the MSCI EAFE Index that is comprised of stocks in Australia, Hong Kong, Singapore and New Zealand.
The WisdomTree Asia Pacific ex-Japan Index is comprised of dividend-paying companies incorporated in emerging market and developed countries in the Pacific region, excluding Japan.
The WisdomTree China Dividend ex-Financials Index is comprised of Chinese dividend paying stocks outside the Financials sector.
The WisdomTree China ex-State-Owned Enterprises Index measures the performance of Chinese stocks that are not state-owned enterprises. WisdomTree Investments, Inc., as index provider, defines state-owned enterprises as companies with over 20% government ownership.
The WisdomTree Emerging Markets Consumer Growth Index consists of stocks that best exemplify growth trends in emerging market consumers and their local economies.
The WisdomTree Emerging Markets ex-State-Owned Enterprises Index is a modified market capitalization weighted index that consists of common stocks in emerging markets, excluding common stocks of “state-owned enterprises.” WisdomTree Investments, Inc., as index provider, defines state-owned enterprises as companies with over 20% government ownership.
The WisdomTree Emerging Markets High Dividend Index is comprised of the highest dividend-yielding stocks selected from the WisdomTree Emerging Markets Dividend Index.
| WisdomTree Trust | 17 |
Description of Indexes (unaudited) (continued)
The WisdomTree Emerging Markets Quality Dividend Growth Index consists of dividend paying stocks with growth characteristics selected from the WisdomTree Emerging Markets Dividend Index.
The WisdomTree Emerging Markets SmallCap Dividend Index is comprised of primarily small-capitalization stocks selected from the WisdomTree Emerging Markets Dividend Index.
The WisdomTree Europe Equity Income Index is comprised of companies with high dividend yields selected from the WisdomTree Europe Dividend Index.
The WisdomTree Global ex-U.S. Quality Dividend Growth Index is comprised of growth companies selected from developed and emerging markets outside the U.S.
The WisdomTree Global ex-U.S. Real Estate Index is comprised of companies in developed and emerging markets outside of Canada and the U.S., which WisdomTree classifies as being Global Real Estate securities.
The WisdomTree Global High Dividend Index is comprised of high dividend-paying companies selected from the WisdomTree Global Dividend Index.
The WisdomTree India Earnings Index is a fundamentally weighted index that is comprised of companies incorporated and traded in India that are profitable and that are eligible to be purchased by foreign investors as of the index measurement date.
The WisdomTree International Real Estate Index is comprised of companies in developed markets outside of the U.S. and Canada that pay regular cash dividends and that WisdomTree Investments classifies as being part of the International Real Estate sector.
The WisdomTree Japan Equity Income Index is comprised of companies with high dividend yields selected from the WisdomTree Japan Dividend Index.
The WisdomTree Middle East Dividend Index is comprised of companies in the Middle East region that pay regular cash dividends on shares of common stock and that meet specified requirements as of the index measurement date.
The WisdomTree Pacific ex-Japan Dividend Index is comprised of dividend-paying companies incorporated in the Pacific region, excluding Japan.
The Dow Jones Global ex-U.S. Select Real Estate Securities Index is calculated, distributed and marketed by Dow Jones Indexes, a licensed trademark of CME Group Index Services LLC, and has been licensed for use.
The Global Industry Classification Standard (“GICS”) was developed by and is the exclusive property and a service mark of MSCI Inc. (“MSCI”) and Standard & Poor’s (“S&P”), a division of The McGraw-Hill Companies, Inc. and is licensed for use by WisdomTree Investments, Inc. Neither MSCI, S&P nor any other party involved in making or compiling the GICS or any GICS classifications makes any express or implied warranties or representations with respect to such standard or classification (or the results to be obtained by the use thereof), and all such parties hereby expressly disclaim all warranties of originality, accuracy, completeness, merchantability and fitness for a particular purpose with respect to any such standard or classification. Without limiting any of the foregoing, in no event shall MSCI, S&P, any of their affiliates or any third party involved in making or compiling the GICS or any GICS classifications have any liability for any direct, indirect, special, punitive, consequential or any other damages (including lost profits) even if notified of the possibility of such damages.
Neither MSCI nor any other party involved in or related to compiling, computing or creating the MSCI data makes any express or implied warranties or representations with respect to such data (or the results to be obtained by the use thereof), and all such parties hereby expressly disclaim all warranties of originality, accuracy, completeness, merchantability or fitness for a particular purpose with respect to any such data. Without limiting any of the foregoing, in no event shall MSCI, any of its affiliates or any third party involved in or related to compiling, computing or creating the data have any liability for any direct, indirect, special, punitive, consequential or any other damages (including lost profits) even if notified of the possibility of such damages. No further distribution or dissemination of the MSCI data is permitted without MSCI’s express written consent.
| 18 | WisdomTree Trust |
Description of Indexes (unaudited) (concluded)
WisdomTree Investments, Inc. and WisdomTree Asset Management, Inc. (together, “WisdomTree”) and the Funds make no representation or warranty, express or implied, to the owners of shares of the Funds or any member of the public regarding the advisability of investing in securities generally or in the Funds particularly or the ability of the underlying Indexes to track the performance of their underlying securities. WisdomTree Investments is the licensor of certain trademarks, service marks and trade names of the Funds. WisdomTree Investments has no obligation to take the needs of the Funds or the owners of shares of the Funds into consideration in determining, composing, or calculating the underlying WisdomTree Indexes of the applicable Funds. WisdomTree Investments is not responsible for, and has not participated in, the determination of the timing of, prices of, or quantities of shares of the Funds to be issued or in the determination or calculation of the equation by which the shares of the Funds are redeemable. WisdomTree and the Funds do not guarantee the accuracy, completeness, or performance of the underlying Indexes or the data included therein and shall have no liability in connection with the underlying Indexes or their calculation.
Index performance information assumes the reinvestment of dividends and excludes management fees, transaction costs and expenses. You cannot directly invest in an index.
| WisdomTree Trust | 19 |
WisdomTree Asia Pacific ex-Japan Fund (AXJL)
March 31, 2019
| Investments | Shares | Value | ||||||
| COMMON STOCKS – 99.6% | ||||||||
| Australia – 23.2% | ||||||||
| AGL Energy Ltd. |
11,400 | $ | 176,293 | |||||
| Amcor Ltd. |
16,004 | 174,960 | ||||||
| AMP Ltd. |
27,365 | 40,821 | ||||||
| APA Group |
15,149 | 107,396 | ||||||
| Aristocrat Leisure Ltd. |
2,765 | 48,141 | ||||||
| Australia & New Zealand Banking Group Ltd. |
20,406 | 377,315 | ||||||
| BHP Group Ltd. |
44,807 | 1,225,085 | ||||||
| Brambles Ltd. |
13,898 | 116,100 | ||||||
| CIMIC Group Ltd. |
2,897 | 99,313 | ||||||
| Cochlear Ltd. |
289 | 35,573 | ||||||
| Commonwealth Bank of Australia |
12,579 | 631,203 | ||||||
| Computershare Ltd. |
2,964 | 35,962 | ||||||
| Crown Resorts Ltd. |
9,028 | 73,814 | ||||||
| CSL Ltd. |
1,760 | 243,717 | ||||||
| Fortescue Metals Group Ltd. |
62,714 | 316,743 | ||||||
| Insurance Australia Group Ltd. |
12,131 | 66,180 | ||||||
| Macquarie Group Ltd. |
1,936 | 177,983 | ||||||
| National Australia Bank Ltd. |
22,985 | 412,593 | ||||||
| Newcrest Mining Ltd. |
3,044 | 55,160 | ||||||
| Qantas Airways Ltd. |
16,322 | 65,624 | ||||||
| QBE Insurance Group Ltd. |
5,149 | 45,025 | ||||||
| Ramsay Health Care Ltd. |
1,623 | 74,189 | ||||||
| REA Group Ltd. |
762 | 40,434 | ||||||
| Rio Tinto Ltd. |
6,096 | 423,979 | ||||||
| Sonic Healthcare Ltd. |
4,721 | 82,363 | ||||||
| South32 Ltd. |
58,862 | 155,961 | ||||||
| Suncorp Group Ltd. |
7,730 | 75,666 | ||||||
| Sydney Airport |
36,226 | 191,197 | ||||||
| Tabcorp Holdings Ltd. |
26,173 | 85,895 | ||||||
| Telstra Corp., Ltd. |
168,990 | 398,540 | ||||||
| Transurban Group |
33,128 | 310,629 | ||||||
| Treasury Wine Estates Ltd. |
4,734 | 50,207 | ||||||
| Wesfarmers Ltd. |
15,912 | 391,652 | ||||||
| Westpac Banking Corp. |
27,200 | 500,814 | ||||||
| Woodside Petroleum Ltd. |
10,565 | 259,818 | ||||||
| Woolworths Group Ltd. |
12,721 | 274,705 | ||||||
|
|
|
|||||||
| Total Australia | 7,841,050 | |||||||
| China – 19.2% |
| |||||||
| AAC Technologies Holdings, Inc. |
7,400 | 43,788 | ||||||
| Agricultural Bank of China Ltd. Class H |
213,900 | 98,640 | ||||||
| Anhui Conch Cement Co., Ltd. Class H |
13,500 | 82,462 | ||||||
| ANTA Sports Products Ltd. |
13,000 | 88,434 | ||||||
| Bank of China Ltd. Class H |
615,055 | 278,931 | ||||||
| Bank of Communications Co., Ltd. Class H |
186,955 | 153,137 | ||||||
| Beijing Enterprises Holdings Ltd. |
6,900 | 39,115 | ||||||
| China CITIC Bank Corp., Ltd. Class H |
99,800 | 63,567 | ||||||
| China Construction Bank Corp. Class H |
791,400 | 678,491 | ||||||
| China Evergrande Group(a) |
26,000 | 86,446 | ||||||
| China Gas Holdings Ltd. |
13,100 | 46,059 | ||||||
| China Life Insurance Co., Ltd. Class H |
27,396 | 73,638 | ||||||
| China Merchants Bank Co., Ltd. Class H |
22,204 | 107,909 | ||||||
| China Mobile Ltd. |
82,134 | 837,040 | ||||||
| China Overseas Land & Investment Ltd. |
23,565 | 89,457 | ||||||
| China Pacific Insurance Group Co., Ltd. Class H |
15,400 | 60,423 | ||||||
| China Petroleum & Chemical Corp. Class H |
833,161 | 656,981 | ||||||
| China Resources Beer Holdings Co., Ltd. |
4,300 | 18,104 | ||||||
| China Resources Cement Holdings Ltd. |
42,000 | 43,338 | ||||||
| China Resources Land Ltd. |
18,300 | 82,059 | ||||||
| China Resources Power Holdings Co., Ltd. |
46,418 | 69,775 | ||||||
| China Shenhua Energy Co., Ltd. Class H |
67,036 | 152,860 | ||||||
| China Telecom Corp., Ltd. Class H |
139,038 | 77,224 | ||||||
| CITIC Ltd. |
76,400 | 114,065 | ||||||
| CNOOC Ltd. |
230,061 | 430,818 | ||||||
| Country Garden Holdings Co., Ltd. |
60,000 | 93,708 | ||||||
| CSPC Pharmaceutical Group Ltd. |
21,300 | 39,616 | ||||||
| ENN Energy Holdings Ltd. |
4,600 | 44,477 | ||||||
| Fosun International Ltd. |
27,500 | 46,593 | ||||||
| Geely Automobile Holdings Ltd. |
44,800 | 85,606 | ||||||
| Guangdong Investment Ltd. |
43,500 | 84,008 | ||||||
| Hengan International Group Co., Ltd. |
10,600 | 92,902 | ||||||
| Industrial & Commercial Bank of China Ltd. Class H |
547,270 | 400,869 | ||||||
| Kunlun Energy Co., Ltd. |
32,000 | 33,427 | ||||||
| Lenovo Group Ltd. |
124,000 | 111,522 | ||||||
| PetroChina Co., Ltd. Class H |
201,419 | 130,602 | ||||||
| PICC Property & Casualty Co., Ltd. Class H |
30,500 | 34,658 | ||||||
| Ping An Insurance Group Co. of China Ltd. Class H |
17,146 | 191,993 | ||||||
| Shenzhou International Group Holdings Ltd. |
6,400 | 85,769 | ||||||
| Tencent Holdings Ltd. |
6,100 | 280,524 | ||||||
| Want Want China Holdings Ltd. |
74,800 | 62,127 | ||||||
| WH Group Ltd.(b) |
157,500 | 168,536 | ||||||
|
|
|
|||||||
| Total China | 6,459,698 | |||||||
| Hong Kong – 10.3% |
| |||||||
| AIA Group Ltd. |
26,325 | 262,078 | ||||||
| Bank of East Asia Ltd. (The) |
15,200 | 49,376 | ||||||
| BOC Hong Kong Holdings Ltd. |
52,389 | 216,898 | ||||||
| Chow Tai Fook Jewellery Group Ltd. |
30,600 | 30,951 | ||||||
| CLP Holdings Ltd. |
30,604 | 354,775 | ||||||
| Galaxy Entertainment Group Ltd. |
31,000 | 211,078 | ||||||
| Hang Lung Properties Ltd. |
32,000 | 78,105 | ||||||
| Hang Seng Bank Ltd. |
9,003 | 222,152 | ||||||
| Henderson Land Development Co., Ltd. |
24,523 | 155,886 | ||||||
| Hong Kong & China Gas Co., Ltd. |
110,345 | 264,548 | ||||||
| Hong Kong Exchanges & Clearing Ltd. |
5,300 | 184,725 | ||||||
| MTR Corp., Ltd. |
57,152 | 353,835 | ||||||
| New World Development Co., Ltd. |
62,857 | 104,255 | ||||||
| Power Assets Holdings Ltd. |
36,579 | 253,725 | ||||||
| Sino Land Co., Ltd. |
34,924 | 67,535 | ||||||
| Sun Hung Kai Properties Ltd. |
14,534 | 249,394 | ||||||
| Swire Pacific Ltd. Class A |
5,500 | 70,765 | ||||||
| Swire Properties Ltd. |
26,800 | 115,223 | ||||||
| Techtronic Industries Co., Ltd. |
11,000 | 73,918 | ||||||
| Wharf Holdings Ltd. (The) |
25,350 | 76,535 | ||||||
| Wheelock & Co., Ltd. |
9,000 | 65,924 | ||||||
|
|
|
|||||||
| Total Hong Kong | 3,461,681 | |||||||
See Notes to Financial Statements.
| 20 | WisdomTree Trust |
Schedule of Investments (continued)
WisdomTree Asia Pacific ex-Japan Fund (AXJL)
March 31, 2019
| Investments | Shares | Value | ||||||
| India – 5.7% |
| |||||||
| Asian Paints Ltd. |
1,571 | $ | 33,851 | |||||
| Bharat Petroleum Corp., Ltd. |
22,575 | 129,552 | ||||||
| Bharti Airtel Ltd. |
10,036 | 48,257 | ||||||
| Bharti Infratel Ltd. |
16,946 | 76,664 | ||||||
| Coal India Ltd. |
31,730 | 108,645 | ||||||
| HCL Technologies Ltd. |
2,315 | 36,340 | ||||||
| Hero MotoCorp Ltd. |
1,355 | 49,939 | ||||||
| Hindustan Unilever Ltd. |
4,461 | 109,910 | ||||||
| Indian Oil Corp., Ltd. |
66,815 | 157,067 | ||||||
| Infosys Ltd. |
676 | 7,259 | ||||||
| Infosys Ltd. ADR |
31,781 | 347,366 | ||||||
| ITC Ltd. |
23,743 | 101,878 | ||||||
| Larsen & Toubro Ltd. GDR Reg S |
2,427 | 48,346 | ||||||
| Mahindra & Mahindra Ltd. |
3,080 | 29,962 | ||||||
| Maruti Suzuki India Ltd. |
595 | 57,310 | ||||||
| NTPC Ltd. |
27,487 | 53,447 | ||||||
| Power Grid Corp. of India Ltd. |
17,244 | 49,261 | ||||||
| Reliance Industries Ltd. GDR(b) |
3,259 | 130,686 | ||||||
| Tata Consultancy Services Ltd. |
4,531 | 130,920 | ||||||
| Tech Mahindra Ltd. |
4,344 | 48,654 | ||||||
| Vedanta Ltd. |
32,682 | 87,018 | ||||||
| Vedanta Ltd. ADR |
7,681 | 81,111 | ||||||
|
|
|
|||||||
| Total India | 1,923,443 | |||||||
| Indonesia – 1.9% |
| |||||||
| Astra International Tbk PT |
192,461 | 99,001 | ||||||
| Bank Central Asia Tbk PT |
26,675 | 51,983 | ||||||
| Bank Mandiri Persero Tbk PT* |
83,448 | 43,658 | ||||||
| Bank Rakyat Indonesia Persero Tbk PT |
283,800 | 82,111 | ||||||
| Gudang Garam Tbk PT |
8,500 | 49,663 | ||||||
| Hanjaya Mandala Sampoerna Tbk PT |
124,900 | 32,891 | ||||||
| Telekomunikasi Indonesia Persero Tbk PT |
813,800 | 225,738 | ||||||
| Unilever Indonesia Tbk PT |
7,835 | 27,084 | ||||||
| United Tractors Tbk PT |
14,500 | 27,544 | ||||||
|
|
|
|||||||
| Total Indonesia | 639,673 | |||||||
| Malaysia – 1.7% |
| |||||||
| CIMB Group Holdings Bhd |
28,400 | 35,826 | ||||||
| DiGi.Com Bhd |
48,200 | 53,720 | ||||||
| Genting Malaysia Bhd |
28,140 | 22,057 | ||||||
| Malayan Banking Bhd |
47,394 | 107,616 | ||||||
| MISC Bhd |
28,500 | 46,703 | ||||||
| Petronas Chemicals Group Bhd |
32,308 | 72,490 | ||||||
| Petronas Gas Bhd |
11,300 | 48,771 | ||||||
| Public Bank Bhd |
13,190 | 74,827 | ||||||
| Tenaga Nasional Bhd |
33,900 | 105,125 | ||||||
|
|
|
|||||||
| Total Malaysia | 567,135 | |||||||
| Philippines – 0.2% |
| |||||||
| SM Investments Corp. |
3,754 | 66,773 | ||||||
| Singapore – 6.5% |
| |||||||
| CapitaLand Ltd. |
32,100 | 86,501 | ||||||
| DBS Group Holdings Ltd. |
16,417 | 305,796 | ||||||
| Genting Singapore Ltd. |
147,300 | 113,099 | ||||||
| Jardine Cycle & Carriage Ltd. |
5,578 | 133,798 | ||||||
| Keppel Corp., Ltd. |
21,284 | 97,738 | ||||||
| Oversea-Chinese Banking Corp., Ltd. |
22,774 | 185,790 | ||||||
| Singapore Airlines Ltd. |
16,857 | 120,221 | ||||||
| Singapore Technologies Engineering Ltd. |
41,125 | 113,553 | ||||||
| Singapore Telecommunications Ltd. |
312,077 | 695,808 | ||||||
| United Overseas Bank Ltd. |
8,698 | 161,759 | ||||||
| Wilmar International Ltd. |
77,000 | 188,165 | ||||||
|
|
|
|||||||
| Total Singapore | 2,202,228 | |||||||
| South Korea – 13.3% |
| |||||||
| Hana Financial Group, Inc. |
1,647 | 52,815 | ||||||
| Hyundai Motor Co. |
1,830 | 192,657 | ||||||
| KB Financial Group, Inc. |
2,122 | 78,236 | ||||||
| Kia Motors Corp. |
2,752 | 85,705 | ||||||
| Korea Zinc Co., Ltd. |
130 | 53,255 | ||||||
| KT&G Corp. |
1,852 | 168,868 | ||||||
| LG Chem Ltd. |
327 | 105,437 | ||||||
| LG Corp. |
1,041 | 71,075 | ||||||
| LG Household & Health Care Ltd. |
41 | 51,182 | ||||||
| LG Uplus Corp. |
1,955 | 26,610 | ||||||
| Lotte Chemical Corp. |
228 | 58,351 | ||||||
| NCSoft Corp. |
111 | 48,503 | ||||||
| POSCO |
919 | 204,834 | ||||||
| S-Oil Corp. |
647 | 51,071 | ||||||
| Samsung C&T Corp. |
566 | 53,354 | ||||||
| Samsung Electronics Co., Ltd. |
63,482 | 2,497,112 | ||||||
| Samsung Fire & Marine Insurance Co., Ltd. |
159 | 42,163 | ||||||
| Samsung Life Insurance Co., Ltd. |
342 | 25,339 | ||||||
| Samsung SDS Co., Ltd. |
138 | 28,570 | ||||||
| Shinhan Financial Group Co., Ltd. |
2,170 | 80,293 | ||||||
| SK Holdings Co., Ltd. |
233 | 55,525 | ||||||
| SK Hynix, Inc. |
2,952 | 192,968 | ||||||
| SK Innovation Co., Ltd. |
816 | 129,039 | ||||||
| SK Telecom Co., Ltd. |
341 | 75,554 | ||||||
| SK Telecom Co., Ltd. ADR |
1,777 | 43,519 | ||||||
|
|
|
|||||||
| Total South Korea | 4,472,035 | |||||||
| Taiwan – 15.8% |
| |||||||
| ASE Technology Holding Co., Ltd.* |
40,526 | 88,756 | ||||||
| Asustek Computer, Inc. |
15,000 | 108,532 | ||||||
| Catcher Technology Co., Ltd. |
11,000 | 84,587 | ||||||
| Cathay Financial Holding Co., Ltd. |
58,614 | 85,485 | ||||||
| China Steel Corp. |
151,078 | 124,017 | ||||||
| Chunghwa Telecom Co., Ltd. |
62,436 | 221,825 | ||||||
| CTBC Financial Holding Co., Ltd. |
117,389 | 77,890 | ||||||
| Delta Electronics, Inc. |
29,415 | 151,749 | ||||||
| Far EasTone Telecommunications Co., Ltd. |
29,000 | 69,911 | ||||||
| First Financial Holding Co., Ltd. |
74,595 | 51,068 | ||||||
| Formosa Chemicals & Fibre Corp. |
78,685 | 285,937 | ||||||
| Formosa Petrochemical Corp. |
29,511 | 110,593 | ||||||
| Formosa Plastics Corp. |
80,444 | 285,804 | ||||||
| Fubon Financial Holding Co., Ltd. |
50,803 | 75,824 | ||||||
| Hon Hai Precision Industry Co., Ltd. |
119,625 | 285,279 | ||||||
| Hua Nan Financial Holdings Co., Ltd. |
7,000 | 4,406 | ||||||
See Notes to Financial Statements.
| WisdomTree Trust | 21 |
Schedule of Investments (concluded)
WisdomTree Asia Pacific ex-Japan Fund (AXJL)
March 31, 2019
| Investments | Shares | Value | ||||||
| Largan Precision Co., Ltd. |
1,000 | $ | 149,251 | |||||
| MediaTek, Inc. |
18,000 | 164,988 | ||||||
| Mega Financial Holding Co., Ltd. |
104,827 | 95,404 | ||||||
| Nan Ya Plastics Corp. |
117,537 | 300,893 | ||||||
| President Chain Store Corp. |
14,000 | 137,863 | ||||||
| Quanta Computer, Inc. |
61,000 | 114,398 | ||||||
| Taiwan Mobile Co., Ltd. |
30,100 | 108,893 | ||||||
| Taiwan Semiconductor Manufacturing Co., Ltd. |
215,241 | 1,714,497 | ||||||
| Uni-President Enterprises Corp. |
129,346 | 313,917 | ||||||
| United Microelectronics Corp. |
210,000 | 79,379 | ||||||
| Yageo Corp. |
3,000 | 31,440 | ||||||
|
|
|
|||||||
| Total Taiwan | 5,322,586 | |||||||
| Thailand – 1.8% |
| |||||||
| Advanced Info Service PCL NVDR |
11,900 | 68,996 | ||||||
| Airports of Thailand PCL NVDR |
23,340 | 50,011 | ||||||
| Charoen Pokphand Foods PCL NVDR |
53,000 | 42,587 | ||||||
| CP ALL PCL |
28,800 | 67,837 | ||||||
| Indorama Ventures PCL NVDR |
18,000 | 28,218 | ||||||
| PTT Exploration & Production PCL |
16,813 | 66,489 | ||||||
| PTT Global Chemical PCL |
34,194 | 72,461 | ||||||
| PTT PCL NVDR |
52,200 | 78,954 | ||||||
| Siam Cement PCL (The) NVDR |
4,871 | 73,982 | ||||||
| Siam Commercial Bank PCL (The) |
11,400 | 47,418 | ||||||
|
|
|
|||||||
| Total Thailand | 596,953 | |||||||
| TOTAL COMMON STOCKS (Cost: $30,027,799) |
|
33,553,255 | ||||||
| EXCHANGE-TRADED FUND – 0.0% | ||||||||
| United States – 0.0% | ||||||||
| WisdomTree Global ex-U.S. Real Estate Fund(c) (Cost: $1,758) |
64 | 2,056 | ||||||
| TOTAL INVESTMENTS IN SECURITIES – 99.6% (Cost: $30,029,557) |
|
33,555,311 | ||||||
| Other Assets less Liabilities – 0.4% |
|
147,605 | ||||||
|
|
|
|||||||
| NET ASSETS – 100.0% |
|
$ | 33,702,916 | |||||
| * | Non-income producing security. |
| (a) | Security, or portion thereof, was on loan at March 31, 2019 (See Note 2). At March 31, 2019, the total market value of the Fund’s securities on loan identified in the Schedule of Investments was $82,124. The total market value of the collateral held by the Fund was $86,398. The total market value of the collateral includes non-cash U.S. Government securities collateral having a value of $86,398. |
| (b) | This security is exempt from registration under rule 144A of the Securities Act of 1933. This security may be sold in transactions that are exempt from registration, normally to qualified institutional buyers. |
| (c) | Affiliated company (See Note 3). |
ADR – American Depositary Receipt
GDR – Global Depositary Receipt
NVDR – Non-Voting Depositary Receipt
Reg S – Regulation S provides an exclusion from the registration requirements of the Securities Act of 1933. These securities may be resold in transactions exempt from registration, normally to qualified institutional buyers.
See Notes to Financial Statements.
| 22 | WisdomTree Trust |
Schedule of Investments
WisdomTree China ex-State-Owned Enterprises Fund (CXSE)
March 31, 2019
| Investments | Shares | Value | ||||||
| COMMON STOCKS – 99.9% | ||||||||
| China – 99.5% | ||||||||
| Air Freight & Logistics – 0.9% | ||||||||
| SF Holding Co., Ltd. Class A |
60,800 | $ | 331,102 | |||||
| ZTO Express Cayman, Inc. ADR |
54,629 | 998,618 | ||||||
|
|
|
|||||||
| Total Air Freight & Logistics |
|
1,329,720 | ||||||
| Auto Components – 1.2% | ||||||||
| China First Capital Group Ltd.* |
488,000 | 257,992 | ||||||
| Fuyao Glass Industry Group Co., Ltd. Class A |
115,867 | 419,220 | ||||||
| Fuyao Glass Industry Group Co., Ltd. Class H(a) |
70,800 | 237,658 | ||||||
| Minth Group Ltd. |
112,000 | 352,414 | ||||||
| Xinyi Glass Holdings Ltd. |
362,000 | 415,040 | ||||||
|
|
|
|||||||
| Total Auto Components |
|
1,682,324 | ||||||
| Automobiles – 2.2% | ||||||||
| BYD Co., Ltd. Class A |
70,797 | 563,154 | ||||||
| BYD Co., Ltd. Class H(b) |
103,500 | 623,649 | ||||||
| Geely Automobile Holdings Ltd. |
855,000 | 1,633,789 | ||||||
| Great Wall Motor Co., Ltd. Class H(b) |
444,000 | 333,148 | ||||||
|
|
|
|||||||
| Total Automobiles |
|
3,153,740 | ||||||
| Banks – 3.4% | ||||||||
| China Minsheng Banking Corp., Ltd. Class A |
2,909,336 | 2,742,983 | ||||||
| China Minsheng Banking Corp., Ltd. Class H |
1,038,100 | 753,794 | ||||||
| Ping An Bank Co., Ltd. Class A |
745,200 | 1,420,695 | ||||||
|
|
|
|||||||
| Total Banks |
|
4,917,472 | ||||||
| Biotechnology – 0.7% | ||||||||
| 3SBio, Inc.(a) |
95,000 | 186,857 | ||||||
| China Biologic Products Holdings, Inc.* |
3,897 | 355,601 | ||||||
| Walvax Biotechnology Co., Ltd. Class A* |
107,800 | 408,789 | ||||||
|
|
|
|||||||
| Total Biotechnology |
|
951,247 | ||||||
| Capital Markets – 1.4% | ||||||||
| Changjiang Securities Co., Ltd. Class A |
775,906 | 868,849 | ||||||
| East Money Information Co., Ltd. Class A |
403,960 | 1,164,212 | ||||||
|
|
|
|||||||
| Total Capital Markets |
|
2,033,061 | ||||||
| Chemicals – 0.8% | ||||||||
| Tianqi Lithium Corp. Class A |
78,220 | 408,984 | ||||||
| Zhejiang Longsheng Group Co., Ltd. Class A |
283,500 | 725,140 | ||||||
|
|
|
|||||||
| Total Chemicals |
|
1,134,124 | ||||||
| Communications Equipment – 0.3% | ||||||||
| Hengtong Optic-electric Co., Ltd. Class A |
124,580 | 393,128 | ||||||
| Diversified Consumer Services – 2.6% | ||||||||
| New Oriental Education & Technology Group, Inc. ADR* |
19,206 | 1,730,268 | ||||||
| TAL Education Group ADR* |
55,824 | 2,014,130 | ||||||
|
|
|
|||||||
| Total Diversified Consumer Services |
|
3,744,398 | ||||||
| Electrical Equipment – 1.5% | ||||||||
| Fangda Carbon New Material Co., Ltd. Class A |
119,300 | 400,771 | ||||||
| Fullshare Holdings Ltd.*(b) |
1,375,000 | 183,921 | ||||||
| Jiangsu Zhongtian Technology Co., Ltd. Class A |
268,782 | 397,707 | ||||||
| Luxshare Precision Industry Co., Ltd. Class A |
215,695 | 795,485 | ||||||
| TBEA Co., Ltd. Class A |
241,375 | 297,209 | ||||||
|
|
|
|||||||
| Total Electrical Equipment |
|
2,075,093 | ||||||
| Electronic Equipment, Instruments & Components – 2.8% |
| |||||||
| AAC Technologies Holdings, Inc. |
116,500 | 689,367 | ||||||
| Chaozhou Three-Circle Group Co., Ltd. Class A |
102,338 | 315,635 | ||||||
| Hollysys Automation Technologies Ltd. |
9,482 | 198,553 | ||||||
| Kingboard Holdings Ltd. |
102,500 | 363,653 | ||||||
| OFILM Group Co., Ltd. Class A |
191,900 | 405,232 | ||||||
| Sunny Optical Technology Group Co., Ltd. |
107,900 | 1,288,639 | ||||||
| Tunghsu Optoelectronic Technology Co., Ltd. Class A |
414,800 | 372,577 | ||||||
| Zhejiang Dahua Technology Co., Ltd. Class A |
150,500 | 367,494 | ||||||
|
|
|
|||||||
| Total Electronic Equipment, Instruments & Components |
|
4,001,150 | ||||||
| Entertainment – 2.3% | ||||||||
| Alibaba Pictures Group Ltd.*(b) |
1,750,000 | 309,879 | ||||||
| iQIYI, Inc. ADR*(b) |
17,940 | 429,125 | ||||||
| NetEase, Inc. ADR |
10,636 | 2,568,062 | ||||||
|
|
|
|||||||
| Total Entertainment |
|
3,307,066 | ||||||
| Food & Staples Retailing – 0.5% | ||||||||
| Sun Art Retail Group Ltd. |
283,500 | 276,282 | ||||||
| Yonghui Superstores Co., Ltd. Class A |
338,446 | 434,854 | ||||||
|
|
|
|||||||
| Total Food & Staples Retailing |
|
711,136 | ||||||
| Food Products – 4.2% | ||||||||
| Dali Foods Group Co., Ltd.(a) |
354,500 | 265,090 | ||||||
| Foshan Haitian Flavouring & Food Co., Ltd. Class A |
48,863 | 629,998 | ||||||
| Health & Happiness H&H International Holdings Ltd.*(b) |
30,500 | 190,969 | ||||||
| Henan Shuanghui Investment & Development Co., Ltd. Class A |
91,900 | 353,277 | ||||||
| Tingyi Cayman Islands Holding Corp. |
278,000 | 458,266 | ||||||
| Uni-President China Holdings Ltd. |
223,000 | 218,743 | ||||||
| Want Want China Holdings Ltd. |
986,000 | 818,961 | ||||||
| Wens Foodstuffs Group Co., Ltd. Class A |
304,800 | 1,840,268 | ||||||
| WH Group Ltd.(a) |
1,195,500 | 1,279,285 | ||||||
|
|
|
|||||||
| Total Food Products |
|
6,054,857 | ||||||
| Gas Utilities – 0.8% | ||||||||
| ENN Energy Holdings Ltd. |
118,500 | 1,145,773 | ||||||
| Health Care Equipment & Supplies – 0.5% |
|
|||||||
| Lepu Medical Technology Beijing Co., Ltd. Class A |
103,400 | 407,480 | ||||||
| Shandong Weigao Group Medical Polymer Co., Ltd. Class H |
372,000 | 355,421 | ||||||
|
|
|
|||||||
| Total Health Care Equipment & Supplies |
|
762,901 | ||||||
| Health Care Providers & Services – 0.9% | ||||||||
| Aier Eye Hospital Group Co., Ltd. Class A |
113,800 | 575,389 | ||||||
| Huadong Medicine Co., Ltd. Class A |
64,800 | 314,436 | ||||||
| Meinian Onehealth Healthcare Holdings Co., Ltd. Class A |
141,100 | 390,073 | ||||||
|
|
|
|||||||
| Total Health Care Providers & Services |
|
1,279,898 | ||||||
| Hotels, Restaurants & Leisure – 2.4% | ||||||||
| Huazhu Group Ltd. ADR |
16,213 | 683,216 | ||||||
| MGM China Holdings Ltd.(b) |
104,800 | 219,217 | ||||||
See Notes to Financial Statements.
| WisdomTree Trust | 23 |
Schedule of Investments (continued)
WisdomTree China ex-State-Owned Enterprises Fund (CXSE)
March 31, 2019
| Investments | Shares | Value | ||||||
| Yum China Holdings, Inc. |
55,919 | $ | 2,511,322 | |||||
|
|
|
|||||||
| Total Hotels, Restaurants & Leisure |
|
3,413,755 | ||||||
| Household Durables – 1.6% | ||||||||
| Haier Electronics Group Co., Ltd.* |
230,000 | 668,038 | ||||||
| Qingdao Haier Co., Ltd. Class A |
362,000 | 921,082 | ||||||
| TCL Corp. Class A |
1,224,400 | 739,247 | ||||||
|
|
|
|||||||
| Total Household Durables |
|
2,328,367 | ||||||
| Industrial Conglomerates – 0.4% | ||||||||
| Fosun International Ltd. |
346,500 | 587,075 | ||||||
| Insurance – 9.0% | ||||||||
| Fanhua, Inc. ADR(b) |
8,576 | 225,206 | ||||||
| Ping An Insurance Group Co. of China Ltd. Class A |
619,794 | 7,106,271 | ||||||
| Ping An Insurance Group Co. of China Ltd. Class H |
501,500 | 5,615,629 | ||||||
|
|
|
|||||||
| Total Insurance |
|
12,947,106 | ||||||
| Interactive Media & Services – 19.6% | ||||||||
| 58.com, Inc. ADR* |
13,892 | 912,427 | ||||||
| Autohome, Inc. ADR*(b) |
9,095 | 956,066 | ||||||
| Baidu, Inc. ADR* |
43,488 | 7,168,997 | ||||||
| Momo, Inc. ADR* |
23,213 | 887,665 | ||||||
| Tencent Holdings Ltd. |
369,600 | 16,997,216 | ||||||
| Weibo Corp. ADR* |
10,718 | 664,409 | ||||||
| YY, Inc. ADR* |
7,065 | 593,531 | ||||||
|
|
|
|||||||
| Total Interactive Media & Services |
|
28,180,311 | ||||||
| Internet & Direct Marketing Retail – 16.4% | ||||||||
| Alibaba Group Holding Ltd. ADR* |
92,944 | 16,957,633 | ||||||
| Baozun, Inc. ADR*(b) |
5,530 | 229,716 | ||||||
| Ctrip.com International Ltd. ADR* |
50,930 | 2,225,132 | ||||||
| JD.com, Inc. ADR* |
121,187 | 3,653,788 | ||||||
| Vipshop Holdings Ltd. ADR* |
67,082 | 538,668 | ||||||
|
|
|
|||||||
| Total Internet & Direct Marketing Retail |
|
23,604,937 | ||||||
| IT Services – 0.4% | ||||||||
| Chinasoft International Ltd.*(b) |
362,000 | 223,660 | ||||||
| GDS Holdings Ltd. ADR*(b) |
10,366 | 369,963 | ||||||
|
|
|
|||||||
| Total IT Services |
|
593,623 | ||||||
| Life Sciences Tools & Services – 0.7% | ||||||||
| Genscript Biotech Corp.* |
152,000 | 286,966 | ||||||
| Wuxi Biologics Cayman, Inc.*(a) |
79,000 | 768,378 | ||||||
|
|
|
|||||||
| Total Life Sciences Tools & Services |
|
1,055,344 | ||||||
| Machinery – 1.8% | ||||||||
| China Conch Venture Holdings Ltd. |
273,363 | 978,554 | ||||||
| Haitian International Holdings Ltd. |
118,000 | 268,173 | ||||||
| Sany Heavy Industry Co., Ltd. Class A |
482,400 | 916,808 | ||||||
| Shenzhen Inovance Technology Co., Ltd. Class A† |
101,800 | 397,087 | ||||||
|
|
|
|||||||
| Total Machinery |
|
2,560,622 | ||||||
| Marine – 0.1% | ||||||||
| SITC International Holdings Co., Ltd. |
149,000 | 152,989 | ||||||
| Media – 0.2% |
| |||||||
| China Literature Ltd.*(a)(b) |
46,600 | 218,163 | ||||||
| Metals & Mining – 0.6% |
| |||||||
| China Hongqiao Group Ltd.(b) |
272,500 | 205,160 | ||||||
| Ganfeng Lithium Co., Ltd. Class A |
85,650 | 351,414 | ||||||
| Zhejiang Huayou Cobalt Co., Ltd. Class A |
56,000 | 312,208 | ||||||
|
|
|
|||||||
| Total Metals & Mining |
|
868,782 | ||||||
| Paper & Forest Products – 0.3% | ||||||||
| Lee & Man Paper Manufacturing Ltd. |
222,000 | 189,199 | ||||||
| Nine Dragons Paper Holdings Ltd. |
250,000 | 238,221 | ||||||
|
|
|
|||||||
| Total Paper & Forest Products |
|
427,420 | ||||||
| Personal Products – 0.7% | ||||||||
| Hengan International Group Co., Ltd. |
116,000 | 1,016,682 | ||||||
| Pharmaceuticals – 4.9% |
| |||||||
| China Medical System Holdings Ltd. |
221,000 | 214,247 | ||||||
| CSPC Pharmaceutical Group Ltd. |
694,000 | 1,290,776 | ||||||
| Jiangsu Hengrui Medicine Co., Ltd. Class A |
200,311 | 1,948,747 | ||||||
| Kangmei Pharmaceutical Co., Ltd. Class A |
244,451 | 379,881 | ||||||
| Luye Pharma Group Ltd.(a)(b) |
261,107 | 228,182 | ||||||
| Shanghai Fosun Pharmaceutical Group Co., Ltd. Class A |
100,500 | 445,073 | ||||||
| Shanghai Fosun Pharmaceutical Group Co., Ltd. Class H |
81,500 | 294,340 | ||||||
| Sichuan Kelun Pharmaceutical Co., Ltd. Class A |
84,360 | 363,183 | ||||||
| Sino Biopharmaceutical Ltd. |
974,500 | 888,860 | ||||||
| SSY Group Ltd. |
298,000 | 277,126 | ||||||
| Tasly Pharmaceutical Group Co., Ltd. Class A |
90,300 | 302,410 | ||||||
| Tonghua Dongbao Pharmaceutical Co., Ltd. Class A |
128,047 | 330,567 | ||||||
|
|
|
|||||||
| Total Pharmaceuticals |
|
6,963,392 | ||||||
| Professional Services – 0.2% | ||||||||
| 51job, Inc. ADR* |
4,311 | 335,741 | ||||||
| Real Estate Management & Development – 7.1% |
| |||||||
| Agile Group Holdings Ltd. |
212,000 | 342,987 | ||||||
| China Evergrande Group(b) |
443,000 | 1,472,933 | ||||||
| China Fortune Land Development Co., Ltd. Class A |
105,100 | 484,824 | ||||||
| CIFI Holdings Group Co., Ltd. |
554,000 | 419,919 | ||||||
| Country Garden Holdings Co., Ltd. |
1,137,000 | 1,775,782 | ||||||
| Future Land Development Holdings Ltd. |
300,000 | 371,472 | ||||||
| Gemdale Corp. Class A |
262,600 | 536,954 | ||||||
| Guangzhou R&F Properties Co., Ltd. Class H |
157,600 | 340,904 | ||||||
| Jiayuan International Group Ltd. |
150,000 | 79,301 | ||||||
| KWG Group Holdings Ltd. |
233,500 | 281,693 | ||||||
| Logan Property Holdings Co., Ltd. |
204,000 | 337,841 | ||||||
| Longfor Group Holdings Ltd. |
243,500 | 857,695 | ||||||
| Shimao Property Holdings Ltd. |
189,500 | 592,652 | ||||||
| Sunac China Holdings Ltd. |
348,000 | 1,733,383 | ||||||
| Yuexiu Property Co., Ltd. |
1,462,000 | 352,004 | ||||||
| Zall Smart Commerce Group Ltd.*(b) |
580,000 | 226,832 | ||||||
|
|
|
|||||||
| Total Real Estate Management & Development |
|
10,207,176 | ||||||
| Semiconductors & Semiconductor Equipment – 0.8% |
|
|||||||
| Hanergy Thin Film Power Group Ltd.*† |
502,000 | 0 | ||||||
| LONGi Green Energy Technology Co., Ltd. Class A |
178,271 | 691,929 | ||||||
See Notes to Financial Statements.
| 24 | WisdomTree Trust |
Schedule of Investments (concluded)
WisdomTree China ex-State-Owned Enterprises Fund (CXSE)
March 31, 2019
| Investments | Shares | Value | ||||||
| Sanan Optoelectronics Co., Ltd. Class A |
220,240 | $ | 480,470 | |||||
|
|
|
|||||||
| Total Semiconductors & Semiconductor Equipment |
|
1,172,399 | ||||||
| Software – 2.0% | ||||||||
| Hundsun Technologies, Inc. Class A |
47,300 | 615,895 | ||||||
| Iflytek Co., Ltd. Class A |
165,300 | 892,072 | ||||||
| Kingdee International Software Group Co., Ltd. |
311,000 | 359,737 | ||||||
| Kingsoft Corp., Ltd. |
170,000 | 432,263 | ||||||
| Yonyou Network Technology Co., Ltd. Class A |
113,000 | 569,663 | ||||||
|
|
|
|||||||
| Total Software |
|
2,869,630 | ||||||
| Specialty Retail – 0.8% | ||||||||
| China Yongda Automobiles Services Holdings Ltd.(b) |
221,000 | 175,114 | ||||||
| GOME Retail Holdings Ltd.*(b) |
1,426,000 | 132,611 | ||||||
| Suning.com Co., Ltd. Class A |
312,400 | 583,035 | ||||||
| Zhongsheng Group Holdings Ltd. |
88,500 | 219,620 | ||||||
|
|
|
|||||||
| Total Specialty Retail |
|
1,110,380 | ||||||
| Technology Hardware, Storage & Peripherals – 0.5% |
|
|||||||
| Focus Media Information Technology Co., Ltd. Class A |
701,024 | 653,643 | ||||||
| Meitu, Inc.*(a) |
254,500 | 119,633 | ||||||
|
|
|
|||||||
| Total Technology Hardware, Storage & Peripherals |
|
773,276 | ||||||
| Textiles, Apparel & Luxury Goods – 2.0% | ||||||||
| ANTA Sports Products Ltd. |
138,000 | 938,770 | ||||||
| Li Ning Co., Ltd.* |
273,500 | 429,246 | ||||||
| Shenzhou International Group Holdings Ltd. |
112,000 | 1,500,971 | ||||||
|
|
|
|||||||
| Total Textiles, Apparel & Luxury Goods |
|
2,868,987 | ||||||
| Total China |
|
142,933,245 | ||||||
| Hong Kong – 0.3% |
| |||||||
| Oil, Gas & Consumable Fuels – 0.2% |
| |||||||
| United Energy Group Ltd.(b) |
1,172,000 | 226,939 | ||||||
| Specialty Retail – 0.1% |
| |||||||
| Chow Tai Fook Jewellery Group Ltd. |
218,000 | 220,504 | ||||||
| Total Hong Kong |
|
447,443 | ||||||
| Singapore – 0.1% | ||||||||
| Entertainment – 0.1% |
| |||||||
| IGG, Inc. |
131,000 | 181,568 | ||||||
| TOTAL COMMON STOCKS (Cost: $142,633,937) |
|
143,562,256 | ||||||
| INVESTMENT OF CASH COLLATERAL FOR SECURITIES LOANED – 0.7% |
| |||||||
| United States – 0.7% | ||||||||
| State Street Navigator Securities Lending Government Money Market Portfolio, 2.46%(c) |
||||||||
| (Cost: $1,057,470)(d) | 1,057,470 | 1,057,470 | ||||||
| TOTAL INVESTMENTS IN SECURITIES – 100.6% (Cost: $143,691,407) |
|
144,619,726 | ||||||
| Other Assets less Liabilities – (0.6)% |
|
(921,019 | ) | |||||
|
|
|
|||||||
| NET ASSETS – 100.0% |
|
$ | 143,698,707 | |||||
| * | Non-income producing security. |
| † | Security is being fair valued using significant unobservable inputs by a pricing committee under the direction of the Board of Trustees. The aggregate value of fair valued securities is $397,087, which represents 0.3% of net assets. |
| (a) | This security is exempt from registration under rule 144A of the Securities Act of 1933. This security may be sold in transactions that are exempt from registration, normally to qualified institutional buyers. |
| (b) | Security, or portion thereof, was on loan at March 31, 2019 (See Note 2). |
| (c) | Rate shown represents annualized 7-day yield as of March 31, 2019. |
| (d) | At March 31, 2019, the total market value of the Fund’s securities on loan identified in the Schedule of Investments was $6,079,058 and the total market value of the collateral held by the Fund was $6,250,510. The total market value of the collateral includes non-cash U.S. Government securities collateral having a value of $5,193,040. |
ADR – American Depositary Receipt
See Notes to Financial Statements.
| WisdomTree Trust | 25 |
Schedule of Investments
WisdomTree Emerging Markets Consumer Growth Fund (EMCG)
March 31, 2019
| Investments | Shares | Value | ||||||
| COMMON STOCKS – 99.7% | ||||||||
| Argentina – 1.6% | ||||||||
| MercadoLibre, Inc.* |
1,073 | $ | 544,794 | |||||
| Brazil – 4.4% |
| |||||||
| Cia Brasileira de Distribuicao (Preference Shares) |
8,244 | 193,745 | ||||||
| Hypera S.A. |
17,845 | 118,762 | ||||||
| Lojas Renner S.A. |
20,368 | 229,236 | ||||||
| Magazine Luiza S.A. |
4,075 | 180,991 | ||||||
| Porto Seguro S.A. |
9,505 | 131,473 | ||||||
| Raia Drogasil S.A. |
8,825 | 148,077 | ||||||
| Sul America S.A. |
20,178 | 154,509 | ||||||
| Telefonica Brasil S.A. (Preference Shares) |
14,648 | 178,786 | ||||||
| TIM Participacoes S.A. |
53,446 | 161,916 | ||||||
|
|
|
|||||||
| Total Brazil |
|
1,497,495 | ||||||
| Chile – 1.3% | ||||||||
| Cia Cervecerias Unidas S.A. |
19,412 | 277,914 | ||||||
| Embotelladora Andina S.A. Class B, (Preference Shares) |
42,375 | 154,748 | ||||||
|
|
|
|||||||
| Total Chile |
|
432,662 | ||||||
| China – 31.8% | ||||||||
| 3SBio, Inc.(a) |
51,000 | 100,311 | ||||||
| 58.com, Inc. ADR* |
1,409 | 92,543 | ||||||
| Alibaba Group Holding Ltd. ADR* |
3,911 | 713,562 | ||||||
| Alibaba Health Information Technology Ltd.*(b) |
86,000 | 99,366 | ||||||
| Anhui Conch Cement Co., Ltd. Class H |
16,000 | 97,733 | ||||||
| ANTA Sports Products Ltd. |
27,289 | 185,636 | ||||||
| Autohome, Inc. ADR*(b) |
1,850 | 194,472 | ||||||
| BAIC Motor Corp., Ltd. Class H(a) |
141,787 | 92,659 | ||||||
| Baidu, Inc. ADR* |
1,154 | 190,237 | ||||||
| Baozun, Inc. ADR*(b) |
2,007 | 83,371 | ||||||
| Brilliance China Automotive Holdings Ltd. |
100,000 | 99,109 | ||||||
| BYD Electronic International Co., Ltd.(b) |
67,000 | 86,375 | ||||||
| China Communications Services Corp., Ltd. Class H |
86,000 | 76,688 | ||||||
| China Evergrande Group(b) |
33,000 | 109,720 | ||||||
| China International Travel Service Corp., Ltd. Class A |
9,000 | 93,854 | ||||||
| China Jinmao Holdings Group Ltd. |
188,000 | 122,620 | ||||||
| China Longyuan Power Group Corp., Ltd. Class H |
117,000 | 81,379 | ||||||
| China Medical System Holdings Ltd. |
66,000 | 63,983 | ||||||
| China Mengniu Dairy Co., Ltd.* |
38,000 | 141,351 | ||||||
| China Merchants Bank Co., Ltd. Class H |
28,000 | 136,077 | ||||||
| China Mobile Ltd. |
25,000 | 254,779 | ||||||
| China Resources Beer Holdings Co., Ltd. |
22,000 | 92,625 | ||||||
| China Resources Gas Group Ltd. |
18,000 | 84,841 | ||||||
| China Resources Land Ltd. |
24,000 | 107,618 | ||||||
| China Taiping Insurance Holdings Co., Ltd. |
25,600 | 76,311 | ||||||
| China Telecom Corp., Ltd. Class H |
182,000 | 101,086 | ||||||
| China Traditional Chinese Medicine Holdings Co., Ltd. |
112,000 | 66,630 | ||||||
| China Unicom Hong Kong Ltd. |
86,000 | 109,007 | ||||||
| Chong Sing Holdings FinTech Group*(b) |
1,488,000 | 12,321 | ||||||
| Country Garden Holdings Co., Ltd. |
88,000 | 137,438 | ||||||
| CSPC Pharmaceutical Group Ltd. |
54,000 | 100,434 | ||||||
| Ctrip.com International Ltd. ADR* |
3,636 | 158,857 | ||||||
| Dali Foods Group Co., Ltd.(a) |
103,500 | 77,395 | ||||||
| Dongfeng Motor Group Co., Ltd. Class H |
78,000 | 78,100 | ||||||
| ENN Energy Holdings Ltd. |
10,000 | 96,688 | ||||||
| Focus Media Information Technology Co., Ltd. Class A |
49,100 | 45,811 | ||||||
| Foshan Haitian Flavouring & Food Co., Ltd. Class A |
7,100 | 91,600 | ||||||
| Fuyao Glass Industry Group Co., Ltd. Class A |
18,800 | 68,064 | ||||||
| Fuyao Glass Industry Group Co., Ltd. Class H(a) |
37,200 | 124,870 | ||||||
| Geely Automobile Holdings Ltd. |
64,876 | 123,968 | ||||||
| Gree Electric Appliances, Inc. of Zhuhai Class A |
11,100 | 77,978 | ||||||
| Greentown China Holdings Ltd. |
97,500 | 97,376 | ||||||
| Guangzhou Automobile Group Co., Ltd. Class H |
84,000 | 99,196 | ||||||
| Guangzhou R&F Properties Co., Ltd. Class H |
48,400 | 104,693 | ||||||
| Haier Electronics Group Co., Ltd.* |
42,000 | 121,988 | ||||||
| Hangzhou Hikvision Digital Technology Co., Ltd. Class A |
19,100 | 99,675 | ||||||
| Henan Shuanghui Investment & Development Co., Ltd. Class A |
15,100 | 58,084 | ||||||
| Hengan International Group Co., Ltd. |
11,500 | 100,790 | ||||||
| HengTen Networks Group Ltd.*(b) |
1,928,000 | 58,454 | ||||||
| Huaneng Renewables Corp., Ltd. Class H |
298,000 | 82,757 | ||||||
| Huayu Automotive Systems Co., Ltd. Class A |
16,600 | 50,342 | ||||||
| Huazhu Group Ltd. ADR |
2,811 | 118,456 | ||||||
| Jiangsu Yanghe Brewery Joint-Stock Co., Ltd. Class A |
4,300 | 83,451 | ||||||
| Kingboard Holdings Ltd. |
30,000 | 106,434 | ||||||
| Kingboard Laminates Holdings Ltd. |
82,500 | 86,704 | ||||||
| Kingdee International Software Group Co., Ltd. |
111,000 | 128,393 | ||||||
| Kweichow Moutai Co., Ltd. Class A |
1,700 | 216,033 | ||||||
| Legend Holdings Corp. Class H(a) |
26,700 | 70,917 | ||||||
| Logan Property Holdings Co., Ltd. |
78,126 | 129,381 | ||||||
| Longfor Group Holdings Ltd. |
34,410 | 121,203 | ||||||
| LONGi Green Energy Technology Co., Ltd. Class A |
26,600 | 103,309 | ||||||
| Luzhou Laojiao Co., Ltd. Class A |
8,300 | 82,232 | ||||||
| Momo, Inc. ADR* |
3,364 | 128,639 | ||||||
| NetEase, Inc. ADR |
473 | 114,206 | ||||||
| Nexteer Automotive Group Ltd. |
61,000 | 75,376 | ||||||
| Ninestar Corp. Class A |
15,551 | 72,916 | ||||||
| Ping An Insurance Group Co. of China Ltd. Class A |
10,000 | 114,729 | ||||||
| Ping An Insurance Group Co. of China Ltd. Class H |
21,129 | 236,592 | ||||||
| Qingdao Haier Co., Ltd. Class A |
24,900 | 63,397 | ||||||
| RiseSun Real Estate Development Co., Ltd. Class A |
44,500 | 74,496 | ||||||
| Sanan Optoelectronics Co., Ltd. Class A |
25,500 | 55,666 | ||||||
| Shanghai 2345 Network Holding Group Co., Ltd. Class A |
88,400 | 79,715 | ||||||
| Shanxi Xinghuacun Fen Wine Factory Co., Ltd. Class A |
9,900 | 89,083 | ||||||
| Shenzhou International Group Holdings Ltd. |
13,000 | 174,218 | ||||||
| SSY Group Ltd. |
108,000 | 100,434 | ||||||
| Sun Art Retail Group Ltd. |
86,500 | 84,297 | ||||||
See Notes to Financial Statements.
| 26 | WisdomTree Trust |
Schedule of Investments (continued)
WisdomTree Emerging Markets Consumer Growth Fund (EMCG)
March 31, 2019
| Investments | Shares | Value | ||||||
| Sunac China Holdings Ltd. |
35,000 | $ | 174,332 | |||||
| Suning.com Co., Ltd. Class A |
40,900 | 76,381 | ||||||
| Sunny Optical Technology Group Co., Ltd. |
9,000 | 107,485 | ||||||
| TAL Education Group ADR* |
4,113 | 148,397 | ||||||
| Tencent Holdings Ltd. |
19,000 | 873,764 | ||||||
| Tianma Microelectronics Co., Ltd. Class A |
28,000 | 64,498 | ||||||
| Tingyi Cayman Islands Holding Corp. |
66,000 | 108,796 | ||||||
| TravelSky Technology Ltd. Class H |
35,000 | 92,516 | ||||||
| Uni-President China Holdings Ltd. |
83,000 | 81,415 | ||||||
| Weibo Corp. ADR* |
1,727 | 107,057 | ||||||
| Weifu High-Technology Group Co., Ltd. Class A |
17,900 | 61,503 | ||||||
| Wuhu Shunrong Sanqi Interactive Entertainment Network Technology Co., Ltd. Class A |
30,800 | 63,706 | ||||||
| Wuliangye Yibin Co., Ltd. Class A |
9,100 | 128,642 | ||||||
| Yonyou Network Technology Co., Ltd. Class A |
16,600 | 83,739 | ||||||
| Yuzhou Properties Co., Ltd. |
204,000 | 123,180 | ||||||
| Zhongsheng Group Holdings Ltd. |
46,500 | 115,392 | ||||||
|
|
|
|||||||
| Total China |
|
10,941,902 | ||||||
| Hungary – 0.4% | ||||||||
| Richter Gedeon Nyrt |
7,826 | 147,536 | ||||||
| India – 11.5% |
| |||||||
| Axis Bank Ltd.* |
20,204 | 226,684 | ||||||
| Bajaj Auto Ltd. |
4,765 | 200,237 | ||||||
| Britannia Industries Ltd. |
4,052 | 180,476 | ||||||
| Cadila Healthcare Ltd. |
25,925 | 129,878 | ||||||
| Cipla Ltd. |
16,650 | 127,119 | ||||||
| Dabur India Ltd. |
30,177 | 178,078 | ||||||
| Eicher Motors Ltd. |
637 | 188,941 | ||||||
| GAIL India Ltd. |
34,527 | 173,271 | ||||||
| Godrej Consumer Products Ltd. |
20,598 | 203,973 | ||||||
| Hindustan Unilever Ltd. |
10,192 | 251,111 | ||||||
| ICICI Bank Ltd. |
34,015 | 196,651 | ||||||
| ITC Ltd. |
45,228 | 194,067 | ||||||
| JSW Steel Ltd. |
32,159 | 136,040 | ||||||
| Mahindra & Mahindra Ltd. |
23,585 | 229,432 | ||||||
| Marico Ltd. |
36,761 | 183,951 | ||||||
| Maruti Suzuki India Ltd. |
2,025 | 195,048 | ||||||
| Nestle India Ltd. |
1,610 | 254,740 | ||||||
| Page Industries Ltd. |
576 | 207,636 | ||||||
| Tech Mahindra Ltd. |
19,172 | 214,732 | ||||||
| Titan Co., Ltd. |
17,442 | 287,494 | ||||||
|
|
|
|||||||
| Total India |
|
3,959,559 | ||||||
| Indonesia – 1.8% | ||||||||
| Charoen Pokphand Indonesia Tbk PT |
562,400 | 252,764 | ||||||
| Gudang Garam Tbk PT |
31,853 | 186,107 | ||||||
| Indofood CBP Sukses Makmur Tbk PT |
265,800 | 174,058 | ||||||
| Tiga Pilar Sejahtera Food Tbk PT*† |
538,700 | 3,178 | ||||||
|
|
|
|||||||
| Total Indonesia |
|
616,107 | ||||||
| Malaysia – 4.1% | ||||||||
| Astro Malaysia Holdings Bhd |
434,400 | 162,800 | ||||||
| CIMB Group Holdings Bhd |
129,100 | 162,857 | ||||||
| DiGi.Com Bhd |
159,800 | 178,099 | ||||||
| FGV Holdings Bhd* |
454,000 | 131,224 | ||||||
| Genting Malaysia Bhd |
145,300 | 113,891 | ||||||
| Hong Leong Financial Group Bhd |
32,700 | 153,628 | ||||||
| IOI Corp. Bhd |
142,400 | 155,567 | ||||||
| Maxis Bhd |
123,400 | 162,015 | ||||||
| My EG Services Bhd |
577,900 | 199,593 | ||||||
|
|
|
|||||||
| Total Malaysia |
|
1,419,674 | ||||||
| Mexico – 4.1% | ||||||||
| Alsea S.A.B. de C.V. |
69,258 | 145,210 | ||||||
| Arca Continental S.A.B. de C.V. |
26,481 | 147,616 | ||||||
| El Puerto de Liverpool S.A.B. de C.V. Class C1 |
22,118 | 140,365 | ||||||
| Fomento Economico Mexicano S.A.B. de C.V. |
29,001 | 267,845 | ||||||
| Gruma S.A.B. de C.V. Class B |
13,285 | 135,744 | ||||||
| Grupo Bimbo S.A.B. de C.V. Series A |
83,806 | 175,324 | ||||||
| Grupo Financiero Banorte S.A.B. de C.V. Class O |
34,794 | 189,311 | ||||||
| Wal-Mart de Mexico S.A.B. de C.V. |
83,553 | 223,641 | ||||||
|
|
|
|||||||
| Total Mexico |
|
1,425,056 | ||||||
| Philippines – 2.9% | ||||||||
| Ayala Land, Inc. |
266,500 | 227,877 | ||||||
| Globe Telecom, Inc. |
4,490 | 165,714 | ||||||
| Jollibee Foods Corp. |
39,270 | 237,071 | ||||||
| Megaworld Corp. |
1,748,300 | 193,109 | ||||||
| Universal Robina Corp. |
57,410 | 166,184 | ||||||
|
|
|
|||||||
| Total Philippines |
|
989,955 | ||||||
| Poland – 1.0% | ||||||||
| Alior Bank S.A.* |
9,283 | 144,674 | ||||||
| LPP S.A. |
87 | 188,916 | ||||||
|
|
|
|||||||
| Total Poland |
|
333,590 | ||||||
| Russia – 1.7% | ||||||||
| Mobile TeleSystems PJSC ADR |
20,352 | 153,861 | ||||||
| Tatneft PJSC ADR |
3,323 | 229,952 | ||||||
| X5 Retail Group N.V. GDR Reg S |
7,588 | 189,093 | ||||||
|
|
|
|||||||
| Total Russia |
|
572,906 | ||||||
| South Africa – 5.9% | ||||||||
| Capitec Bank Holdings Ltd. |
2,344 | 219,425 | ||||||
| Clicks Group Ltd. |
13,621 | 173,988 | ||||||
| Foschini Group Ltd. (The) |
14,012 | 158,374 | ||||||
| MultiChoice Group Ltd.* |
3,416 | 28,591 | ||||||
| Naspers Ltd. Class N |
3,416 | 789,293 | ||||||
| Pick n Pay Stores Ltd. |
38,761 | 178,495 | ||||||
| SPAR Group Ltd. (The) |
13,788 | 183,454 | ||||||
| Tiger Brands Ltd. |
9,438 | 173,429 | ||||||
| Truworths International Ltd. |
29,009 | 139,581 | ||||||
|
|
|
|||||||
| Total South Africa |
|
2,044,630 | ||||||
| South Korea – 10.4% | ||||||||
| Celltrion, Inc.* |
680 | 108,431 | ||||||
| Cheil Worldwide, Inc. |
5,899 | 125,765 | ||||||
| CJ CheilJedang Corp. |
432 | 122,928 | ||||||
| CJ ENM Co., Ltd. |
486 | 99,760 | ||||||
| Coway Co., Ltd. |
1,461 | 121,632 | ||||||
| E-Mart, Inc. |
590 | 89,402 | ||||||
See Notes to Financial Statements.
| WisdomTree Trust | 27 |
Schedule of Investments (concluded)
WisdomTree Emerging Markets Consumer Growth Fund (EMCG)
March 31, 2019
| Investments | Shares | Value | ||||||
| Hotel Shilla Co., Ltd. |
2,087 | $ | 175,403 | |||||
| Industrial Bank of Korea |
8,012 | 99,171 | ||||||
| Kakao Corp. |
1,224 | 111,606 | ||||||
| KB Financial Group, Inc. |
3,183 | 117,354 | ||||||
| KT Corp. ADR |
6,361 | 79,131 | ||||||
| LG Electronics, Inc. |
1,757 | 116,246 | ||||||
| LG Household & Health Care Ltd. |
135 | 168,527 | ||||||
| LG Household & Health Care Ltd. (Preference Shares) |
156 | 114,894 | ||||||
| LG Uplus Corp. |
6,533 | 88,922 | ||||||
| NAVER Corp. |
1,294 | 141,358 | ||||||
| NCSoft Corp. |
440 | 192,265 | ||||||
| Samsung Electro-Mechanics Co., Ltd. |
979 | 90,129 | ||||||
| Samsung Electronics Co., Ltd. |
19,847 | 780,696 | ||||||
| Samsung SDS Co., Ltd. |
711 | 147,199 | ||||||
| Shinsegae, Inc. |
413 | 122,798 | ||||||
| SK Hynix, Inc. |
3,974 | 259,775 | ||||||
| SK Telecom Co., Ltd. |
488 | 108,124 | ||||||
|
|
|
|||||||
| Total South Korea |
|
3,581,516 | ||||||
| Taiwan – 11.6% | ||||||||
| Acer, Inc.* |
124,000 | 79,460 | ||||||
| Advantech Co., Ltd. |
12,000 | 99,674 | ||||||
| Chailease Holding Co., Ltd. |
33,000 | 134,910 | ||||||
| Chicony Electronics Co., Ltd. |
50,000 | 116,319 | ||||||
| China Development Financial Holding Corp. |
269,000 | 89,898 | ||||||
| China Life Insurance Co., Ltd. |
87,000 | 73,816 | ||||||
| Giant Manufacturing Co., Ltd. |
21,000 | 149,900 | ||||||
| Globalwafers Co., Ltd. |
12,000 | 117,973 | ||||||
| Macronix International |
143,000 | 96,971 | ||||||
| Micro-Star International Co., Ltd. |
50,000 | 140,329 | ||||||
| Nanya Technology Corp. |
62,000 | 123,515 | ||||||
| Novatek Microelectronics Corp. |
20,000 | 128,486 | ||||||
| Pou Chen Corp. |
88,000 | 107,214 | ||||||
| President Chain Store Corp. |
11,000 | 108,321 | ||||||
| Realtek Semiconductor Corp. |
28,000 | 165,345 | ||||||
| Ruentex Development Co., Ltd. |
65,680 | 99,307 | ||||||
| Ruentex Industries Ltd. |
39,000 | 102,370 | ||||||
| Standard Foods Corp. |
43,000 | 72,270 | ||||||
| Synnex Technology International Corp. |
82,000 | 98,441 | ||||||
| Taiwan Cement Corp. |
71,000 | 95,026 | ||||||
| Taiwan Mobile Co., Ltd. |
26,000 | 94,061 | ||||||
| Taiwan Semiconductor Manufacturing Co., Ltd. |
88,000 | 700,962 | ||||||
| Uni-President Enterprises Corp. |
55,000 | 133,483 | ||||||
| United Microelectronics Corp. |
220,000 | 83,159 | ||||||
| Vanguard International Semiconductor Corp. |
43,000 | 92,779 | ||||||
| Walsin Technology Corp.(b) |
26,000 | 168,719 | ||||||
| Winbond Electronics Corp. |
236,000 | 112,944 | ||||||
| Wistron Corp. |
133,000 | 102,273 | ||||||
| WPG Holdings Ltd. |
72,000 | 93,912 | ||||||
| Yageo Corp. |
9,000 | 94,320 | ||||||
| Yuanta Financial Holding Co., Ltd. |
178,000 | 101,358 | ||||||
|
|
|
|||||||
| Total Taiwan |
|
3,977,515 | ||||||
| Thailand – 4.5% | ||||||||
| Advanced Info Service PCL NVDR |
32,000 | 185,537 | ||||||
| Berli Jucker PCL NVDR |
91,700 | 143,033 | ||||||
| Central Pattana PCL NVDR |
81,000 | 186,962 | ||||||
| CP ALL PCL NVDR |
111,900 | 263,574 | ||||||
| Electricity Generating PCL NVDR |
23,800 | 218,989 | ||||||
| Home Product Center PCL NVDR |
443,100 | 213,626 | ||||||
| Robinson PCL NVDR |
81,000 | 149,953 | ||||||
| True Corp. PCL NVDR |
1,348,600 | 202,279 | ||||||
|
|
|
|||||||
| Total Thailand |
|
1,563,953 | ||||||
| Turkey – 0.7% |
| |||||||
| BIM Birlesik Magazalar AS |
6,746 | 90,988 | ||||||
| Ford Otomotiv Sanayi AS |
8,945 | 77,233 | ||||||
| Tofas Turk Otomobil Fabrikasi AS |
26,904 | 81,480 | ||||||
|
|
|
|||||||
| Total Turkey |
|
249,701 | ||||||
| TOTAL COMMON STOCKS (Cost: $30,848,448) |
|
34,298,551 | ||||||
| INVESTMENT OF CASH COLLATERAL FOR SECURITIES LOANED – 0.9% |
| |||||||
| United States – 0.9% |
| |||||||
| State Street Navigator Securities Lending Government Money Market Portfolio, 2.46%(c) |
||||||||
| (Cost: $307,985)(d) | 307,985 | 307,985 | ||||||
| TOTAL INVESTMENTS IN SECURITIES – 100.6% (Cost: $31,156,433) |
|
34,606,536 | ||||||
| Other Assets less Liabilities – (0.6)% |
|
(192,190 | ) | |||||
|
|
|
|||||||
| NET ASSETS – 100.0% |
|
$ | 34,414,346 | |||||
| * | Non-income producing security. |
| † | Security is being fair valued using significant unobservable inputs by a pricing committee under the direction of the Board of Trustees. The aggregate value of fair valued securities is $3,178, which represents 0.01% of net assets. |
| (a) | This security is exempt from registration under rule 144A of the Securities Act of 1933. This security may be sold in transactions that are exempt from registration, normally to qualified institutional buyers. |
| (b) | Security, or portion thereof, was on loan at March 31, 2019 (See Note 2). |
| (c) | Rate shown represents annualized 7-day yield as of March 31, 2019. |
| (d) | At March 31, 2019, the total market value of the Fund’s securities on loan identified in the Schedule of Investments was $655,926 and the total market value of the collateral held by the Fund was $758,405. The total market value of the collateral includes non-cash U.S. Government securities collateral having a value of $450,420. |
ADR – American Depositary Receipt
GDR – Global Depositary Receipt
NVDR – Non-Voting Depositary Receipt
Reg S – Regulation S provides an exclusion from the registration requirements of the Securities Act of 1933. These securities may be resold in transactions exempt from registration, normally to qualified institutional buyers.
See Notes to Financial Statements.
| 28 | WisdomTree Trust |
Schedule of Investments
WisdomTree Emerging Markets ex-State-Owned Enterprises Fund (XSOE)
March 31, 2019
| Investments | Shares | Value | ||||||
| COMMON STOCKS – 99.8% |
| |||||||
| Brazil – 4.7% |
| |||||||
| Ambev S.A. |
405,522 | $ | 1,753,716 | |||||
| B2W Cia Digital* |
12,826 | 139,146 | ||||||
| B3 S.A. – Brasil Bolsa Balcao |
185,684 | 1,532,536 | ||||||
| Banco Bradesco S.A. |
77,923 | 757,866 | ||||||
| Banco Santander Brasil S.A. |
31,263 | 353,222 | ||||||
| BR Malls Participacoes S.A. |
79,510 | 256,813 | ||||||
| BRF S.A.* |
75,143 | 437,338 | ||||||
| CCR S.A. |
85,461 | 257,808 | ||||||
| Cia Siderurgica Nacional S.A.* |
59,243 | 247,372 | ||||||
| Cosan S.A. |
19,903 | 218,121 | ||||||
| CVC Brasil Operadora e Agencia de Viagens S.A. |
12,400 | 174,448 | ||||||
| Embraer S.A. |
70,585 | 334,634 | ||||||
| Energisa S.A. |
18,000 | 187,553 | ||||||
| Engie Brasil Energia S.A. |
24,960 | 273,927 | ||||||
| Equatorial Energia S.A. |
13,444 | 276,363 | ||||||
| Estacio Participacoes S.A. |
29,360 | 200,677 | ||||||
| Hypera S.A. |
32,023 | 213,119 | ||||||
| Itau Unibanco Holding S.A. |
23,529 | 180,472 | ||||||
| Itausa – Investimentos Itau S.A. |
46,559 | 175,387 | ||||||
| Klabin S.A. |
76,071 | 332,885 | ||||||
| Kroton Educacional S.A. |
144,677 | 394,063 | ||||||
| Localiza Rent a Car S.A. |
45,567 | 387,092 | ||||||
| Lojas Renner S.A. |
54,533 | 613,754 | ||||||
| M. Dias Branco S.A. |
10,740 | 119,910 | ||||||
| Magazine Luiza S.A. |
5,150 | 228,738 | ||||||
| Multiplan Empreendimentos Imobiliarios S.A. |
24,180 | 145,327 | ||||||
| Natura Cosmeticos S.A. |
15,573 | 181,632 | ||||||
| Oi S.A.* |
285,339 | 111,446 | ||||||
| Pagseguro Digital Ltd. Class A* |
16,050 | 479,093 | ||||||
| Porto Seguro S.A. |
9,650 | 133,479 | ||||||
| Raia Drogasil S.A. |
25,894 | 434,483 | ||||||
| Rumo S.A.* |
97,964 | 482,054 | ||||||
| Sul America S.A. |
30,559 | 234,000 | ||||||
| Suzano Papel e Celulose S.A. |
60,847 | 727,813 | ||||||
| TIM Participacoes S.A. |
68,802 | 208,437 | ||||||
| Transmissora Alianca de Energia Eletrica S.A. |
33,699 | 214,748 | ||||||
| Ultrapar Participacoes S.A. |
50,703 | 612,339 | ||||||
| WEG S.A. |
68,808 | 318,253 | ||||||
|
|
|
|||||||
| Total Brazil |
|
14,330,064 | ||||||
| Chile – 1.1% | ||||||||
| Aguas Andinas S.A. Class A |
237,660 | 135,127 | ||||||
| AntarChile S.A. |
7,873 | 105,905 | ||||||
| Banco de Chile |
2,124,554 | 312,809 | ||||||
| Banco de Credito e Inversiones S.A. |
3,597 | 229,963 | ||||||
| Banco Santander Chile |
4,081,558 | 307,043 | ||||||
| Cencosud S.A. |
112,387 | 194,575 | ||||||
| Colbun S.A. |
587,442 | 132,773 | ||||||
| Empresas CMPC S.A. |
72,400 | 255,351 | ||||||
| Empresas COPEC S.A. |
27,556 | 349,875 | ||||||
| Enel Americas S.A. |
1,535,431 | 272,981 | ||||||
| Enel Chile S.A. |
2,025,238 | 212,204 | ||||||
| Itau CorpBanca |
13,490,360 | 118,949 | ||||||
| Latam Airlines Group S.A. |
18,924 | 201,205 | ||||||
| S.A.C.I. Falabella |
36,927 | 274,588 | ||||||
| Sociedad Matriz del Banco de Chile S.A. Class B |
263,866 | 128,584 | ||||||
|
|
|
|||||||
| Total Chile |
|
3,231,932 | ||||||
| China – 36.1% | ||||||||
| 51job, Inc. ADR*(a) |
2,994 | 233,173 | ||||||
| 58.com, Inc. ADR* |
8,957 | 588,296 | ||||||
| AAC Technologies Holdings, Inc. |
75,000 | 443,793 | ||||||
| Agile Group Holdings Ltd. |
176,000 | 284,741 | ||||||
| Aier Eye Hospital Group Co., Ltd. Class A |
55,500 | 280,795 | ||||||
| Alibaba Group Holding Ltd. ADR* |
121,340 | 22,138,483 | ||||||
| Alibaba Pictures Group Ltd.*(a) |
1,300,000 | 230,193 | ||||||
| ANTA Sports Products Ltd. |
96,000 | 653,049 | ||||||
| Autohome, Inc. ADR* |
5,712 | 600,445 | ||||||
| Baidu, Inc. ADR* |
26,785 | 4,415,507 | ||||||
| Baozun, Inc. ADR*(a) |
4,150 | 172,391 | ||||||
| BYD Co., Ltd. Class A |
30,300 | 241,175 | ||||||
| BYD Co., Ltd. Class H(a) |
60,000 | 361,531 | ||||||
| Chaozhou Three-Circle Group Co., Ltd. Class A |
43,200 | 133,325 | ||||||
| China Biologic Products Holdings, Inc.* |
2,661 | 242,816 | ||||||
| China Conch Venture Holdings Ltd. |
192,900 | 690,513 | ||||||
| China Evergrande Group(a) |
300,000 | 997,459 | ||||||
| China First Capital Group Ltd.* |
334,000 | 176,574 | ||||||
| China Fortune Land Development Co., Ltd. Class A |
51,864 | 239,401 | ||||||
| China Hongqiao Group Ltd. |
206,000 | 155,091 | ||||||
| China Literature Ltd.*(a)(b) |
39,000 | 182,581 | ||||||
| China Medical System Holdings Ltd. |
129,000 | 125,057 | ||||||
| China Minsheng Banking Corp., Ltd. Class A |
1,322,093 | 1,247,295 | ||||||
| China Minsheng Banking Corp., Ltd. Class H |
645,500 | 468,710 | ||||||
| China Yongda Automobiles Services Holdings Ltd. |
160,500 | 127,174 | ||||||
| CIFI Holdings Group Co., Ltd. |
416,000 | 315,314 | ||||||
| Country Garden Holdings Co., Ltd. |
753,000 | 1,176,030 | ||||||
| CSPC Pharmaceutical Group Ltd. |
442,000 | 822,069 | ||||||
| Ctrip.com International Ltd. ADR* |
30,931 | 1,351,375 | ||||||
| Dali Foods Group Co., Ltd.(b) |
198,500 | 148,433 | ||||||
| East Money Information Co., Ltd. Class A |
153,960 | 443,996 | ||||||
| ENN Energy Holdings Ltd. |
72,800 | 703,892 | ||||||
| Fangda Carbon New Material Co., Ltd. Class A |
44,900 | 150,932 | ||||||
| Focus Media Information Technology Co., Ltd. Class A |
305,800 | 285,314 | ||||||
| Foshan Haitian Flavouring & Food Co., Ltd. Class A |
20,500 | 264,479 | ||||||
| Fosun International Ltd. |
244,500 | 414,251 | ||||||
| Fullshare Holdings Ltd.*(a) |
112,500 | 15,048 | ||||||
| Fuyao Glass Industry Group Co., Ltd. Class A |
43,400 | 157,127 | ||||||
| Fuyao Glass Industry Group Co., Ltd. Class H(b) |
42,400 | 142,324 | ||||||
| GDS Holdings Ltd. ADR*(a) |
6,950 | 248,045 | ||||||
| Geely Automobile Holdings Ltd. |
517,000 | 987,904 | ||||||
| Gemdale Corp. Class A |
126,700 | 259,237 | ||||||
| Genscript Biotech Corp.* |
98,000 | 185,015 | ||||||
See Notes to Financial Statements.
| WisdomTree Trust | 29 |
Schedule of Investments (continued)
WisdomTree Emerging Markets ex-State-Owned Enterprises Fund (XSOE)
March 31, 2019
| Investments | Shares | Value | ||||||
| GOME Retail Holdings Ltd.*(a) |
1,279,000 | $ | 118,940 | |||||
| Great Wall Motor Co., Ltd. Class H(a) |
256,500 | 192,458 | ||||||
| Guangzhou R&F Properties Co., Ltd. Class H |
122,800 | 265,625 | ||||||
| Haier Electronics Group Co., Ltd.* |
126,000 | 365,964 | ||||||
| Haitian International Holdings Ltd. |
75,000 | 170,447 | ||||||
| Hanergy Thin Film Power Group Ltd.*† |
102,000 | 0 | ||||||
| Henan Shuanghui Investment & Development Co., Ltd. Class A |
36,500 | 140,401 | ||||||
| Hengan International Group Co., Ltd. |
71,000 | 622,271 | ||||||
| Hengtong Optic-electric Co., Ltd. Class A |
66,560 | 210,173 | ||||||
| Hollysys Automation Technologies Ltd. |
6,450 | 135,063 | ||||||
| Huadong Medicine Co., Ltd. Class A |
31,600 | 153,434 | ||||||
| Huazhu Group Ltd. ADR |
10,476 | 441,459 | ||||||
| Hundsun Technologies, Inc. Class A |
19,800 | 257,982 | ||||||
| Iflytek Co., Ltd. Class A |
73,250 | 395,560 | ||||||
| iQIYI, Inc. ADR*(a) |
12,200 | 291,824 | ||||||
| JD.com, Inc. ADR* |
72,820 | 2,195,523 | ||||||
| Jiangsu Hengrui Medicine Co., Ltd. Class A |
85,966 | 836,864 | ||||||
| Jiayuan International Group Ltd. |
46,000 | 24,319 | ||||||
| Kangmei Pharmaceutical Co., Ltd. Class A |
107,700 | 167,475 | ||||||
| Kingboard Holdings Ltd. |
66,000 | 234,154 | ||||||
| Kingdee International Software Group Co., Ltd. |
198,000 | 229,026 | ||||||
| Kingsoft Corp., Ltd. |
112,000 | 284,781 | ||||||
| KWG Group Holdings Ltd. |
142,500 | 171,909 | ||||||
| Lee & Man Paper Manufacturing Ltd. |
131,000 | 111,643 | ||||||
| Lepu Medical Technology Beijing Co., Ltd. Class A |
41,900 | 165,226 | ||||||
| Li Ning Co., Ltd.* |
159,000 | 249,540 | ||||||
| Logan Property Holdings Co., Ltd. |
184,000 | 304,715 | ||||||
| Longfor Group Holdings Ltd. |
169,500 | 597,032 | ||||||
| LONGi Green Energy Technology Co., Ltd. Class A |
71,993 | 279,607 | ||||||
| Luxshare Precision Industry Co., Ltd. Class A |
83,930 | 309,732 | ||||||
| Luye Pharma Group Ltd.(a)(b) |
168,000 | 146,814 | ||||||
| Meinian Onehealth Healthcare Holdings Co., Ltd. Class A |
61,300 | 169,573 | ||||||
| Minth Group Ltd. |
80,000 | 251,721 | ||||||
| Momo, Inc. ADR* |
14,434 | 551,956 | ||||||
| NetEase, Inc. ADR |
6,590 | 1,591,155 | ||||||
| New Oriental Education & Technology Group, Inc. ADR* |
11,970 | 1,078,377 | ||||||
| Nine Dragons Paper Holdings Ltd. |
151,000 | 143,884 | ||||||
| OFILM Group Co., Ltd. Class A |
86,700 | 183,200 | ||||||
| Ping An Bank Co., Ltd. Class A |
336,800 | 642,507 | ||||||
| Ping An Insurance Group Co. of China Ltd. Class A |
417,800 | 4,793,366 | ||||||
| Ping An Insurance Group Co. of China Ltd. Class H |
506,500 | 5,671,546 | ||||||
| Qingdao Haier Co., Ltd. Class A |
147,500 | 375,543 | ||||||
| Sanan Optoelectronics Co., Ltd. Class A |
97,700 | 213,276 | ||||||
| Sany Heavy Industry Co., Ltd. Class A |
210,300 | 399,934 | ||||||
| SF Holding Co., Ltd. Class A |
22,900 | 124,788 | ||||||
| Shandong Weigao Group Medical Polymer Co., Ltd. Class H |
280,000 | 267,518 | ||||||
| Shanghai Fosun Pharmaceutical Group Co., Ltd. Class A |
66,100 | 292,917 | ||||||
| Shenzhen Inovance Technology Co., Ltd. Class A† |
42,400 | 165,494 | ||||||
| Shenzhou International Group Holdings Ltd. |
75,600 | 1,013,143 | ||||||
| Shimao Property Holdings Ltd. |
118,000 | 369,034 | ||||||
| Sichuan Kelun Pharmaceutical Co., Ltd. Class A |
40,200 | 173,178 | ||||||
| Sino Biopharmaceutical Ltd. |
631,000 | 575,540 | ||||||
| SSY Group Ltd. |
196,000 | 182,269 | ||||||
| Sun Art Retail Group Ltd. |
204,500 | 199,291 | ||||||
| Sunac China Holdings Ltd. |
232,000 | 1,155,574 | ||||||
| Suning.com Co., Ltd. Class A |
129,100 | 241,095 | ||||||
| Sunny Optical Technology Group Co., Ltd. |
66,400 | 792,999 | ||||||
| TAL Education Group ADR* |
34,190 | 1,233,575 | ||||||
| Tasly Pharmaceutical Group Co., Ltd. Class A |
33,509 | 112,292 | ||||||
| TBEA Co., Ltd. Class A |
174,651 | 215,189 | ||||||
| TCL Corp. Class A |
613,400 | 370,585 | ||||||
| Tencent Holdings Ltd. |
535,600 | 24,630,934 | ||||||
| Tianqi Lithium Corp. Class A |
36,665 | 191,831 | ||||||
| Tingyi Cayman Islands Holding Corp. |
174,000 | 286,825 | ||||||
| Tonghua Dongbao Pharmaceutical Co., Ltd. Class A |
51,730 | 133,632 | ||||||
| Tunghsu Optoelectronic Technology Co., Ltd. Class A |
171,500 | 154,141 | ||||||
| Uni-President China Holdings Ltd. |
140,000 | 137,326 | ||||||
| Vipshop Holdings Ltd. ADR* |
36,031 | 289,329 | ||||||
| Walvax Biotechnology Co., Ltd. Class A* |
42,000 | 159,370 | ||||||
| Want Want China Holdings Ltd. |
633,000 | 525,756 | ||||||
| Weibo Corp. ADR*(a) |
7,218 | 447,444 | ||||||
| Wens Foodstuffs Group Co., Ltd. Class A |
125,400 | 757,602 | ||||||
| WH Group Ltd.(b) |
804,000 | 860,337 | ||||||
| Wuxi Biologics Cayman, Inc.*(b) |
50,500 | 491,172 | ||||||
| Xinyi Glass Holdings Ltd. |
234,000 | 268,282 | ||||||
| Yonghui Superstores Co., Ltd. Class A |
140,100 | 180,123 | ||||||
| Yonyou Network Technology Co., Ltd. Class A |
50,000 | 252,225 | ||||||
| Yuexiu Property Co., Ltd. |
1,296,000 | 312,033 | ||||||
| Yum China Holdings, Inc. |
33,887 | 1,521,865 | ||||||
| YY, Inc. ADR* |
4,176 | 350,826 | ||||||
| Zall Smart Commerce Group Ltd.*(a) |
240,000 | 93,860 | ||||||
| Zhejiang Dahua Technology Co., Ltd. Class A |
49,700 | 121,436 | ||||||
| Zhejiang Longsheng Group Co., Ltd. Class A |
109,700 | 280,771 | ||||||
| Zhongsheng Group Holdings Ltd. |
57,500 | 142,689 | ||||||
| ZTO Express Cayman, Inc. ADR |
32,367 | 591,669 | ||||||
|
|
|
|||||||
| Total China |
|
110,302,311 | ||||||
| Czech Republic – 0.1% | ||||||||
| Komercni Banka AS |
9,916 | 405,177 | ||||||
| Hong Kong – 0.1% | ||||||||
| Chow Tai Fook Jewellery Group Ltd. |
169,800 | 171,748 | ||||||
| United Energy Group Ltd.(a) |
880,000 | 170,396 | ||||||
|
|
|
|||||||
| Total Hong Kong |
|
342,144 | ||||||
| Hungary – 0.4% | ||||||||
| OTP Bank Nyrt |
25,354 | 1,115,275 | ||||||
| India – 9.9% | ||||||||
| Adani Ports & Special Economic Zone Ltd. |
68,698 | 375,000 | ||||||
| Ambuja Cements Ltd. |
82,659 | 280,760 | ||||||
| Apollo Hospitals Enterprise Ltd. |
7,080 | 125,462 | ||||||
See Notes to Financial Statements.
| 30 | WisdomTree Trust |
Schedule of Investments (continued)
WisdomTree Emerging Markets ex-State-Owned Enterprises Fund (XSOE)
March 31, 2019
| Investments | Shares | Value | ||||||
| Ashok Leyland Ltd. |
121,898 | $ | 160,654 | |||||
| Asian Paints Ltd. |
25,436 | 548,081 | ||||||
| Aurobindo Pharma Ltd. |
22,166 | 250,937 | ||||||
| Avenue Supermarts Ltd.*(b) |
8,257 | 175,343 | ||||||
| Bajaj Auto Ltd. |
6,012 | 252,639 | ||||||
| Bajaj Finserv Ltd. |
3,234 | 328,514 | ||||||
| Bharti Airtel Ltd. |
110,746 | 532,508 | ||||||
| Bharti Infratel Ltd. |
66,901 | 302,660 | ||||||
| Biocon Ltd. |
13,183 | 116,187 | ||||||
| Bosch Ltd. |
731 | 191,889 | ||||||
| Britannia Industries Ltd. |
4,998 | 222,610 | ||||||
| Cadila Healthcare Ltd. |
20,856 | 104,483 | ||||||
| Cipla Ltd. |
28,952 | 221,042 | ||||||
| Dabur India Ltd. |
44,945 | 265,226 | ||||||
| Divi’s Laboratories Ltd. |
6,266 | 154,047 | ||||||
| Dr. Reddy’s Laboratories Ltd. |
6,568 | 263,597 | ||||||
| Eicher Motors Ltd. |
1,032 | 306,102 | ||||||
| Glenmark Pharmaceuticals Ltd. |
15,243 | 142,407 | ||||||
| Godrej Consumer Products Ltd. |
33,909 | 335,786 | ||||||
| Havells India Ltd. |
22,694 | 253,066 | ||||||
| HCL Technologies Ltd. |
46,525 | 730,330 | ||||||
| HDFC Life Insurance Co., Ltd.(b) |
32,888 | 179,691 | ||||||
| Hero MotoCorp Ltd. |
7,080 | 260,935 | ||||||
| Hindalco Industries Ltd. |
83,133 | 246,609 | ||||||
| Hindustan Unilever Ltd. |
50,378 | 1,241,215 | ||||||
| ICICI Bank Ltd. ADR |
104,822 | 1,201,260 | ||||||
| ICICI Prudential Life Insurance Co., Ltd.(b) |
32,299 | 163,302 | ||||||
| Indiabulls Ventures Ltd. |
24,197 | 113,921 | ||||||
| Infosys Ltd. ADR |
236,826 | 2,588,508 | ||||||
| JSW Steel Ltd. |
87,734 | 371,136 | ||||||
| Kotak Mahindra Bank Ltd. |
58,147 | 1,120,132 | ||||||
| Lupin Ltd. |
18,575 | 198,312 | ||||||
| Mahindra & Mahindra Ltd. |
48,555 | 472,338 | ||||||
| Marico Ltd. |
56,075 | 280,598 | ||||||
| Maruti Suzuki India Ltd. |
8,135 | 783,561 | ||||||
| Mindtree Ltd. |
11,424 | 155,756 | ||||||
| Motherson Sumi Systems Ltd. |
80,855 | 174,724 | ||||||
| Mphasis Ltd. |
9,625 | 137,703 | ||||||
| Nestle India Ltd. |
1,917 | 303,315 | ||||||
| Oracle Financial Services Software Ltd. |
2,519 | 123,188 | ||||||
| Page Industries Ltd. |
522 | 188,171 | ||||||
| Pidilite Industries Ltd. |
12,533 | 225,467 | ||||||
| Piramal Enterprises Ltd. |
7,076 | 282,248 | ||||||
| Reliance Industries Ltd. GDR(b) |
162,275 | 6,507,228 | ||||||
| Shree Cement Ltd. |
845 | 227,704 | ||||||
| Sun Pharmaceutical Industries Ltd. |
82,733 | 571,876 | ||||||
| Tata Consultancy Services Ltd. |
71,427 | 2,063,831 | ||||||
| Tata Steel Ltd. |
23,985 | 180,385 | ||||||
| Tech Mahindra Ltd. |
39,521 | 442,647 | ||||||
| Titan Co., Ltd. |
21,957 | 361,914 | ||||||
| UltraTech Cement Ltd. |
8,463 | 488,460 | ||||||
| United Spirits Ltd.* |
23,977 | 191,712 | ||||||
| UPL Ltd. |
28,215 | 390,530 | ||||||
| Vedanta Ltd. |
133,007 | 354,141 | ||||||
| Wipro Ltd. |
112,708 | 414,551 | ||||||
| Yes Bank Ltd. |
96,405 | 382,837 | ||||||
| Zee Entertainment Enterprises Ltd. |
40,206 | 258,560 | ||||||
|
|
|
|||||||
| Total India |
|
30,287,796 | ||||||
| Indonesia – 2.1% | ||||||||
| Adaro Energy Tbk PT |
2,339,600 | 220,981 | ||||||
| Astra International Tbk PT |
1,963,600 | 1,010,068 | ||||||
| Bank Central Asia Tbk PT |
1,143,000 | 2,227,405 | ||||||
| Charoen Pokphand Indonesia Tbk PT |
724,100 | 325,438 | ||||||
| Gudang Garam Tbk PT |
40,400 | 236,045 | ||||||
| Hanjaya Mandala Sampoerna Tbk PT |
898,500 | 236,613 | ||||||
| Indah Kiat Pulp & Paper Corp. Tbk PT |
305,600 | 184,562 | ||||||
| Indocement Tunggal Prakarsa Tbk PT |
201,800 | 310,353 | ||||||
| Indofood CBP Sukses Makmur Tbk PT |
241,700 | 158,276 | ||||||
| Indofood Sukses Makmur Tbk PT |
556,200 | 249,001 | ||||||
| Kalbe Farma Tbk PT |
2,165,700 | 231,170 | ||||||
| Matahari Department Store Tbk PT |
190,900 | 54,830 | ||||||
| Pabrik Kertas Tjiwi Kimia Tbk PT |
138,300 | 107,076 | ||||||
| Unilever Indonesia Tbk PT |
118,400 | 409,287 | ||||||
| United Tractors Tbk PT |
224,500 | 426,455 | ||||||
|
|
|
|||||||
| Total Indonesia |
|
6,387,560 | ||||||
| Malaysia – 2.0% | ||||||||
| AirAsia Group Bhd |
337,100 | 219,641 | ||||||
| Genting Malaysia Bhd |
539,700 | 423,035 | ||||||
| HAP Seng Consolidated Bhd |
105,100 | 254,866 | ||||||
| Hartalega Holdings Bhd |
271,800 | 308,251 | ||||||
| Hong Leong Bank Bhd |
105,208 | 523,141 | ||||||
| Hong Leong Financial Group Bhd |
51,900 | 243,832 | ||||||
| Nestle Malaysia Bhd |
8,300 | 298,454 | ||||||
| Press Metal Aluminium Holdings Bhd |
405,000 | 447,410 | ||||||
| Public Bank Bhd |
444,800 | 2,523,348 | ||||||
| QL Resources Bhd |
131,700 | 221,946 | ||||||
| Top Glove Corp. Bhd |
248,800 | 281,557 | ||||||
| YTL Corp. Bhd |
897,958 | 233,150 | ||||||
|
|
|
|||||||
| Total Malaysia |
|
5,978,631 | ||||||
| Mexico – 2.5% | ||||||||
| Alfa S.A.B. de C.V. Class A |
217,477 | 231,295 | ||||||
| America Movil S.A.B. de C.V. Series L |
1,311,587 | 938,514 | ||||||
| Arca Continental S.A.B. de C.V. |
27,002 | 150,521 | ||||||
| Banco Santander Mexico S.A. Institucion de Banca Multiple Grupo Financiero Santander Class B |
135,238 | 184,965 | ||||||
| Cemex S.A.B. de C.V. Series CPO* |
939,860 | 439,466 | ||||||
| Coca-Cola Femsa S.A.B. de C.V. Series L |
34,120 | 225,696 | ||||||
| El Puerto de Liverpool S.A.B. de C.V. Class C1 |
17,466 | 110,842 | ||||||
| Fomento Economico Mexicano S.A.B. de C.V. |
107,155 | 989,654 | ||||||
| Gruma S.A.B. de C.V. Class B |
13,350 | 136,408 | ||||||
| Grupo Aeroportuario del Centro Norte S.A.B. de C.V. |
25,970 | 146,843 | ||||||
| Grupo Aeroportuario del Pacifico S.A.B. de C.V. Class B |
25,769 | 228,922 | ||||||
| Grupo Aeroportuario del Sureste S.A.B. de C.V. Class B |
12,390 | 200,335 | ||||||
See Notes to Financial Statements.
| WisdomTree Trust | 31 |
Schedule of Investments (continued)
WisdomTree Emerging Markets ex-State-Owned Enterprises Fund (XSOE)
March 31, 2019
| Investments | Shares | Value | ||||||
| Grupo Bimbo S.A.B. de C.V. Series A |
105,668 | $ | 221,060 | |||||
| Grupo Carso S.A.B. de C.V. Series A1 |
35,704 | 140,423 | ||||||
| Grupo Financiero Banorte S.A.B. de C.V. Class O |
179,169 | 974,842 | ||||||
| Grupo Financiero Inbursa S.A.B. de C.V. Class O |
145,258 | 201,366 | ||||||
| Grupo Mexico S.A.B. de C.V. Series B |
217,925 | 599,483 | ||||||
| Grupo Televisa S.A.B. Series CPO |
129,052 | 286,014 | ||||||
| Industrias Penoles S.A.B. de C.V. |
9,590 | 119,930 | ||||||
| Infraestructura Energetica Nova S.A.B. de C.V. |
32,040 | 128,854 | ||||||
| Kimberly-Clark de Mexico S.A.B. de C.V. Class A* |
98,964 | 168,056 | ||||||
| Mexichem S.A.B. de C.V. |
71,019 | 169,918 | ||||||
| Wal-Mart de Mexico S.A.B. de C.V. |
284,129 | 760,509 | ||||||
|
|
|
|||||||
| Total Mexico |
|
7,753,916 | ||||||
| Philippines – 1.2% | ||||||||
| Aboitiz Equity Ventures, Inc. |
155,100 | 174,122 | ||||||
| Ayala Corp. |
15,945 | 285,437 | ||||||
| Ayala Land, Inc. |
391,200 | 334,505 | ||||||
| Bank of the Philippine Islands |
150,260 | 240,943 | ||||||
| BDO Unibank, Inc. |
126,273 | 321,754 | ||||||
| JG Summit Holdings, Inc. |
217,980 | 263,602 | ||||||
| Jollibee Foods Corp. |
25,610 | 154,606 | ||||||
| Manila Electric Co. |
23,390 | 169,267 | ||||||
| Metropolitan Bank & Trust Co. |
126,309 | 192,194 | ||||||
| PLDT, Inc. |
5,995 | 131,294 | ||||||
| SM Investments Corp. |
30,545 | 543,307 | ||||||
| SM Prime Holdings, Inc. |
688,700 | 523,312 | ||||||
| Universal Robina Corp. |
64,910 | 187,894 | ||||||
|
|
|
|||||||
| Total Philippines |
|
3,522,237 | ||||||
| Poland – 1.1% | ||||||||
| Alior Bank S.A.* |
13,671 | 213,061 | ||||||
| Bank Millennium S.A.* |
88,978 | 207,484 | ||||||
| Bank Polska Kasa Opieki S.A. |
22,441 | 643,872 | ||||||
| CCC S.A. |
4,183 | 234,798 | ||||||
| CD Projekt S.A.* |
10,877 | 567,419 | ||||||
| Cyfrowy Polsat S.A.* |
36,872 | 246,977 | ||||||
| Dino Polska S.A.*(b) |
8,345 | 263,376 | ||||||
| LPP S.A. |
204 | 442,975 | ||||||
| mBank S.A. |
1,919 | 212,830 | ||||||
| Santander Bank Polska S.A. |
4,854 | 482,381 | ||||||
|
|
|
|||||||
| Total Poland |
|
3,515,173 | ||||||
| Russia – 4.5% | ||||||||
| Globaltrans Investment PLC GDR Reg S |
16,458 | 175,113 | ||||||
| Lukoil PJSC ADR |
68,182 | 6,109,107 | ||||||
| Magnitogorsk Iron & Steel Works PJSC GDR Reg S |
11,641 | 104,303 | ||||||
| MMC Norilsk Nickel PJSC ADR |
75,978 | 1,604,655 | ||||||
| Mobile TeleSystems PJSC ADR |
61,492 | 464,880 | ||||||
| Novatek PJSC GDR Reg S |
14,979 | 2,567,401 | ||||||
| Novolipetsk Steel PJSC GDR Reg S |
12,224 | 313,790 | ||||||
| PhosAgro PJSC GDR Reg S |
9,956 | 124,749 | ||||||
| Polymetal International PLC |
26,228 | 295,421 | ||||||
| Polyus PJSC GDR Reg S |
5,277 | 216,885 | ||||||
| Severstal PJSC GDR Reg S |
24,782 | 386,599 | ||||||
| X5 Retail Group N.V. GDR Reg S |
15,271 | 380,553 | ||||||
| Yandex N.V. Class A* |
29,153 | 1,001,114 | ||||||
|
|
|
|||||||
| Total Russia |
|
13,744,570 | ||||||
| South Africa – 6.0% | ||||||||
| Absa Group Ltd. |
49,883 | 526,113 | ||||||
| Anglo American Platinum Ltd. |
3,588 | 183,154 | ||||||
| AngloGold Ashanti Ltd. |
24,615 | 327,017 | ||||||
| Aspen Pharmacare Holdings Ltd. |
5,851 | 37,724 | ||||||
| AVI Ltd. |
25,155 | 157,493 | ||||||
| Barloworld Ltd. |
16,144 | 142,171 | ||||||
| Bid Corp., Ltd. |
23,014 | 475,560 | ||||||
| Bidvest Group Ltd. (The) |
22,050 | 295,860 | ||||||
| Capitec Bank Holdings Ltd. |
4,450 | 416,570 | ||||||
| Clicks Group Ltd. |
20,050 | 256,109 | ||||||
| Discovery Ltd. |
33,937 | 321,926 | ||||||
| Exxaro Resources Ltd. |
23,084 | 263,074 | ||||||
| FirstRand Ltd. |
248,365 | 1,084,307 | ||||||
| Foschini Group Ltd. (The) |
18,305 | 206,897 | ||||||
| Gold Fields Ltd. |
50,140 | 185,245 | ||||||
| Impala Platinum Holdings Ltd.* |
51,580 | 218,177 | ||||||
| Imperial Logistics Ltd. |
23,933 | 99,358 | ||||||
| Investec Ltd. |
30,917 | 180,812 | ||||||
| Kumba Iron Ore Ltd. |
5,305 | 158,290 | ||||||
| Life Healthcare Group Holdings Ltd. |
106,295 | 197,830 | ||||||
| Mondi Ltd. |
10,044 | 222,021 | ||||||
| Motus Holdings Ltd. |
2,055 | 11,659 | ||||||
| Mr. Price Group Ltd. |
14,984 | 196,916 | ||||||
| MTN Group Ltd.(a) |
99,763 | 613,053 | ||||||
| MultiChoice Group Ltd.* |
32,474 | 271,794 | ||||||
| Naspers Ltd. Class N |
28,317 | 6,542,859 | ||||||
| Nedbank Group Ltd. |
17,005 | 296,253 | ||||||
| Netcare Ltd. |
98,385 | 159,299 | ||||||
| PSG Group Ltd. |
13,912 | 252,266 | ||||||
| Remgro Ltd. |
35,598 | 457,303 | ||||||
| Sanlam Ltd. |
131,405 | 672,094 | ||||||
| Sappi Ltd. |
44,175 | 204,162 | ||||||
| Shoprite Holdings Ltd. |
31,007 | 341,026 | ||||||
| SPAR Group Ltd. (The) |
16,092 | 214,110 | ||||||
| Standard Bank Group Ltd. |
87,589 | 1,125,014 | ||||||
| Tiger Brands Ltd. |
13,336 | 245,058 | ||||||
| Truworths International Ltd. |
32,933 | 158,462 | ||||||
| Vodacom Group Ltd. |
42,393 | 327,562 | ||||||
| Woolworths Holdings Ltd. |
59,967 | 193,275 | ||||||
|
|
|
|||||||
| Total South Africa |
|
18,237,873 | ||||||
| South Korea – 13.9% | ||||||||
| Amorepacific Corp. |
2,441 | 405,364 | ||||||
| Amorepacific Group |
2,205 | 135,202 | ||||||
| BNK Financial Group, Inc. |
30,346 | 178,585 | ||||||
| Celltrion Healthcare Co., Ltd.*(a) |
3,814 | 224,452 | ||||||
| Celltrion, Inc.* |
6,418 | 1,023,397 | ||||||
| CJ CheilJedang Corp. |
658 | 187,238 | ||||||
| CJ Corp. |
1,376 | 150,922 | ||||||
| CJ Corp. (Preference Shares)*† |
167 | 5,395 | ||||||
| CJ ENM Co., Ltd. |
768 | 157,646 | ||||||
See Notes to Financial Statements.
| 32 | WisdomTree Trust |
Schedule of Investments (continued)
WisdomTree Emerging Markets ex-State-Owned Enterprises Fund (XSOE)
March 31, 2019
| Investments | Shares | Value | ||||||
| Coway Co., Ltd. |
3,818 | $ | 317,858 | |||||
| DB Insurance Co., Ltd. |
3,508 | 212,316 | ||||||
| DGB Financial Group, Inc. |
20,474 | 147,364 | ||||||
| Doosan Corp. |
984 | 80,273 | ||||||
| E-Mart, Inc. |
1,394 | 211,231 | ||||||
| Fila Korea Ltd. |
3,315 | 227,795 | ||||||
| GS Engineering & Construction Corp. |
5,279 | 198,119 | ||||||
| GS Holdings Corp. |
5,070 | 235,835 | ||||||
| Hana Financial Group, Inc. |
19,591 | 628,238 | ||||||
| Hankook Tire Co., Ltd. |
5,679 | 187,365 | ||||||
| Hanmi Science Co., Ltd. |
1,967 | 134,125 | ||||||
| Hanon Systems |
10,578 | 105,771 | ||||||
| Hanwha Chemical Corp. |
9,374 | 172,599 | ||||||
| HLB, Inc.* |
2,418 | 170,417 | ||||||
| Hotel Shilla Co., Ltd. |
2,686 | 225,746 | ||||||
| Hyundai Department Store Co., Ltd. |
1,499 | 133,379 | ||||||
| Hyundai Engineering & Construction Co., Ltd. |
5,666 | 266,553 | ||||||
| Hyundai Glovis Co., Ltd. |
1,572 | 177,960 | ||||||
| Hyundai Heavy Industries Co., Ltd.* |
3,061 | 320,905 | ||||||
| Hyundai Heavy Industries Holdings Co., Ltd. |
648 | 190,101 | ||||||
| Hyundai Marine & Fire Insurance Co., Ltd. |
5,219 | 174,258 | ||||||
| Hyundai Merchant Marine Co., Ltd.* |
34,058 | 109,216 | ||||||
| Hyundai Motor Co. |
9,470 | 996,974 | ||||||
| Hyundai Steel Co. |
6,592 | 260,753 | ||||||
| Kakao Corp. |
3,621 | 330,168 | ||||||
| KB Financial Group, Inc. |
24,936 | 919,365 | ||||||
| Kia Motors Corp. |
17,114 | 532,975 | ||||||
| Korea Investment Holdings Co., Ltd. |
4,212 | 230,434 | ||||||
| Korea Zinc Co., Ltd. |
917 | 375,654 | ||||||
| Korean Air Lines Co., Ltd. |
4,751 | 133,309 | ||||||
| KT&G Corp. |
8,337 | 760,179 | ||||||
| LG Chem Ltd. |
3,266 | 1,053,084 | ||||||
| LG Corp. |
9,103 | 621,516 | ||||||
| LG Display Co., Ltd. |
12,302 | 211,337 | ||||||
| LG Electronics, Inc. |
6,897 | 456,316 | ||||||
| LG Household & Health Care Ltd. |
622 | 776,473 | ||||||
| LG Innotek Co., Ltd. |
1,184 | 122,562 | ||||||
| LG Uplus Corp. |
16,877 | 229,715 | ||||||
| Lotte Chemical Corp. |
993 | 254,133 | ||||||
| Lotte Corp. |
3,557 | 154,802 | ||||||
| Lotte Shopping Co., Ltd. |
769 | 120,590 | ||||||
| LS Corp. |
2,860 | 131,775 | ||||||
| Medy-Tox, Inc. |
368 | 189,268 | ||||||
| Mirae Asset Daewoo Co., Ltd. |
32,539 | 210,123 | ||||||
| NAVER Corp. |
8,887 | 970,829 | ||||||
| NCSoft Corp. |
1,153 | 503,822 | ||||||
| Netmarble Corp.(b) |
2,344 | 258,127 | ||||||
| NH Investment & Securities Co., Ltd. |
14,766 | 174,965 | ||||||
| OCI Co., Ltd. |
1,624 | 132,913 | ||||||
| Orion Corp. |
1,845 | 162,541 | ||||||
| POSCO |
5,140 | 1,145,644 | ||||||
| S-1 Corp. |
1,885 | 166,895 | ||||||
| Samsung Biologics Co., Ltd.*(b) |
1,096 | 308,494 | ||||||
| Samsung C&T Corp. |
6,268 | 590,852 | ||||||
| Samsung Electro-Mechanics Co., Ltd. |
3,846 | 354,072 | ||||||
| Samsung Electronics Co., Ltd. |
332,787 | 13,090,423 | ||||||
| Samsung Engineering Co., Ltd.* |
11,382 | 161,440 | ||||||
| Samsung Fire & Marine Insurance Co., Ltd. |
2,300 | 609,902 | ||||||
| Samsung Heavy Industries Co., Ltd.* |
32,244 | 234,636 | ||||||
| Samsung Life Insurance Co., Ltd. |
5,708 | 422,908 | ||||||
| Samsung SDS Co., Ltd. |
2,657 | 550,079 | ||||||
| Samsung Securities Co., Ltd. |
6,932 | 203,361 | ||||||
| Shinhan Financial Group Co., Ltd. |
31,273 | 1,157,137 | ||||||
| Shinsegae, Inc. |
744 | 221,214 | ||||||
| SillaJen, Inc.*(a) |
4,366 | 247,321 | ||||||
| SK Holdings Co., Ltd. |
2,287 | 545,004 | ||||||
| SK Hynix, Inc. |
34,556 | 2,258,880 | ||||||
| SK Innovation Co., Ltd. |
5,304 | 838,753 | ||||||
| SK Telecom Co., Ltd. |
2,518 | 557,904 | ||||||
| ViroMed Co., Ltd.* |
977 | 240,829 | ||||||
| Yuhan Corp. |
675 | 142,719 | ||||||
|
|
|
|||||||
| Total South Korea |
|
42,418,794 | ||||||
| Taiwan – 11.1% | ||||||||
| Acer, Inc.* |
253,000 | 162,124 | ||||||
| Advantech Co., Ltd. |
27,000 | 224,266 | ||||||
| ASE Technology Holding Co., Ltd.* |
222,062 | 486,338 | ||||||
| Asia Cement Corp. |
166,000 | 215,980 | ||||||
| Asustek Computer, Inc. |
46,000 | 332,830 | ||||||
| AU Optronics Corp. |
638,000 | 234,951 | ||||||
| Catcher Technology Co., Ltd. |
57,000 | 438,312 | ||||||
| Cathay Financial Holding Co., Ltd. |
549,000 | 800,686 | ||||||
| Chang Hwa Commercial Bank Ltd. |
399,857 | 239,365 | ||||||
| Cheng Shin Rubber Industry Co., Ltd. |
135,000 | 183,749 | ||||||
| Chicony Electronics Co., Ltd. |
65,240 | 151,773 | ||||||
| China Development Financial Holding Corp. |
1,139,000 | 380,646 | ||||||
| China Life Insurance Co., Ltd. |
228,569 | 193,932 | ||||||
| Chroma ATE, Inc. |
34,000 | 161,613 | ||||||
| Compal Electronics, Inc. |
343,000 | 213,119 | ||||||
| CTBC Financial Holding Co., Ltd. |
1,381,672 | 916,766 | ||||||
| Delta Electronics, Inc. |
130,000 | 670,658 | ||||||
| E.Sun Financial Holding Co., Ltd. |
701,496 | 540,566 | ||||||
| Eclat Textile Co., Ltd. |
15,000 | 201,976 | ||||||
| Far Eastern New Century Corp. |
315,080 | 311,292 | ||||||
| Far EasTone Telecommunications Co., Ltd. |
112,000 | 270,002 | ||||||
| Feng TAY Enterprise Co., Ltd. |
28,000 | 198,050 | ||||||
| Formosa Chemicals & Fibre Corp. |
272,000 | 988,433 | ||||||
| Formosa Petrochemical Corp. |
176,000 | 659,561 | ||||||
| Formosa Plastics Corp. |
311,000 | 1,104,930 | ||||||
| Fubon Financial Holding Co., Ltd. |
448,000 | 668,646 | ||||||
| Highwealth Construction Corp. |
105,000 | 173,067 | ||||||
| Hiwin Technologies Corp. |
23,064 | 194,567 | ||||||
| Hon Hai Precision Industry Co., Ltd. |
838,068 | 1,998,605 | ||||||
| Hotai Motor Co., Ltd. |
24,000 | 293,960 | ||||||
| Innolux Corp. |
669,000 | 217,063 | ||||||
| Inventec Corp. |
239,000 | 181,845 | ||||||
| Largan Precision Co., Ltd. |
6,000 | 895,508 | ||||||
| Lite-On Technology Corp. |
202,015 | 293,972 | ||||||
See Notes to Financial Statements.
| WisdomTree Trust | 33 |
Schedule of Investments (concluded)
WisdomTree Emerging Markets ex-State-Owned Enterprises Fund (XSOE)
March 31, 2019
| Investments | Shares | Value | ||||||
| Macronix International |
138,742 | $ | 94,084 | |||||
| MediaTek, Inc. |
111,000 | 1,017,423 | ||||||
| Nan Ya Plastics Corp. |
352,000 | 901,115 | ||||||
| Nanya Technology Corp. |
99,000 | 197,226 | ||||||
| Novatek Microelectronics Corp. |
46,000 | 295,518 | ||||||
| Pegatron Corp. |
141,000 | 243,841 | ||||||
| Pou Chen Corp. |
216,000 | 263,162 | ||||||
| Powertech Technology, Inc. |
76,000 | 179,517 | ||||||
| President Chain Store Corp. |
41,000 | 403,741 | ||||||
| Quanta Computer, Inc. |
186,000 | 348,820 | ||||||
| Realtek Semiconductor Corp. |
41,000 | 242,112 | ||||||
| Shin Kong Financial Holding Co., Ltd. |
847,454 | 249,668 | ||||||
| SinoPac Financial Holdings Co., Ltd. |
762,452 | 282,019 | ||||||
| Synnex Technology International Corp. |
121,000 | 145,260 | ||||||
| Taishin Financial Holding Co., Ltd. |
686,771 | 313,075 | ||||||
| Taiwan Cement Corp. |
268,600 | 359,493 | ||||||
| Taiwan Mobile Co., Ltd. |
112,000 | 405,185 | ||||||
| Taiwan Semiconductor Manufacturing Co., Ltd. |
1,265,000 | 10,076,329 | ||||||
| Tatung Co., Ltd.* |
134,000 | 105,650 | ||||||
| Tripod Technology Corp. |
35,000 | 112,993 | ||||||
| Uni-President Enterprises Corp. |
343,160 | 832,834 | ||||||
| United Microelectronics Corp. |
878,000 | 331,880 | ||||||
| Walsin Technology Corp. |
23,000 | 149,251 | ||||||
| Wistron Corp. |
264,078 | 203,068 | ||||||
| WPG Holdings Ltd. |
123,360 | 160,902 | ||||||
| Yageo Corp. |
21,396 | 224,231 | ||||||
| Yuanta Financial Holding Co., Ltd. |
824,236 | 469,342 | ||||||
|
|
|
|||||||
| Total Taiwan |
|
33,806,890 | ||||||
| Thailand – 2.2% | ||||||||
| Advanced Info Service PCL NVDR |
128,300 | 743,885 | ||||||
| Bangkok Dusit Medical Services PCL NVDR |
434,400 | 339,471 | ||||||
| Bangkok Expressway & Metro PCL NVDR |
872,100 | 277,555 | ||||||
| Banpu PCL NVDR |
363,500 | 185,559 | ||||||
| Berli Jucker PCL NVDR |
166,200 | 259,238 | ||||||
| BTS Group Holdings PCL NVDR |
841,300 | 291,612 | ||||||
| Bumrungrad Hospital PCL NVDR |
34,000 | 192,311 | ||||||
| Central Pattana PCL NVDR |
158,900 | 366,769 | ||||||
| Charoen Pokphand Foods PCL NVDR |
427,400 | 343,428 | ||||||
| CP ALL PCL NVDR |
478,100 | 1,126,138 | ||||||
| Energy Absolute PCL NVDR |
286,300 | 433,036 | ||||||
| Fabrinet* |
4,417 | 231,274 | ||||||
| Glow Energy PCL NVDR |
69,300 | 198,718 | ||||||
| Gulf Energy Development PCL NVDR |
85,000 | 255,790 | ||||||
| Home Product Center PCL NVDR |
479,300 | 231,079 | ||||||
| Indorama Ventures PCL NVDR |
221,400 | 347,082 | ||||||
| Land & Houses PCL NVDR |
598,000 | 201,626 | ||||||
| Minor International PCL NVDR |
263,200 | 323,454 | ||||||
| Robinson PCL NVDR |
61,000 | 112,927 | ||||||
| True Corp. PCL NVDR |
1,279,500 | 191,915 | ||||||
|
|
|
|||||||
| Total Thailand |
|
6,652,867 | ||||||
| Turkey – 0.6% | ||||||||
| Akbank T.A.S.* |
228,885 | 256,045 | ||||||
| BIM Birlesik Magazalar AS |
17,776 | 239,757 | ||||||
| Enka Insaat ve Sanayi AS |
140,847 | 114,431 | ||||||
| Haci Omer Sabanci Holding AS |
95,049 | 131,900 | ||||||
| KOC Holding AS |
84,321 | 240,145 | ||||||
| Tupras Turkiye Petrol Rafinerileri AS |
11,843 | 261,613 | ||||||
| Turkcell Iletisim Hizmetleri AS |
91,194 | 195,153 | ||||||
| Turkiye Garanti Bankasi AS |
172,794 | 255,080 | ||||||
|
|
|
|||||||
| Total Turkey |
|
1,694,124 | ||||||
| United Kingdom – 0.2% | ||||||||
| Antofagasta PLC |
20,788 | 261,668 | ||||||
| Fresnillo PLC |
9,530 | 108,137 | ||||||
| Investec PLC |
52,483 | 302,480 | ||||||
| Mediclinic International PLC |
23,463 | 93,188 | ||||||
|
|
|
|||||||
| Total United Kingdom | 765,473 | |||||||
| TOTAL COMMON STOCKS (Cost: $294,859,379) |
304,492,807 | |||||||
| INVESTMENT OF CASH COLLATERAL FOR SECURITIES LOANED – 0.6% |
| |||||||
| United States – 0.6% |
| |||||||
| State Street Navigator Securities Lending Government Money Market Portfolio, 2.46%(c) |
||||||||
| (Cost: $1,845,375)(d) | 1,845,375 | 1,845,375 | ||||||
| TOTAL INVESTMENTS IN SECURITIES – 100.4% (Cost: $296,704,754) |
|
306,338,182 | ||||||
| Other Assets less Liabilities – (0.4)% |
|
(1,154,202 | ) | |||||
|
|
|
|||||||
| NET ASSETS – 100.0% |
|
$ | 305,183,980 | |||||
| * | Non-income producing security. |
| † | Security is being fair valued using significant unobservable inputs by a pricing committee under the direction of the Board of Trustees. The aggregate value of fair valued securities is $170,889, which represents 0.1% of net assets. |
| (a) | Security, or portion thereof, was on loan at March 31, 2019 (See Note 2). |
| (b) | This security is exempt from registration under rule 144A of the Securities Act of 1933. This security may be sold in transactions that are exempt from registration, normally to qualified institutional buyers. |
| (c) | Rate shown represents annualized 7-day yield as of March 31, 2019. |
| (d) | At March 31, 2019, the total market value of the Fund’s securities on loan identified in the Schedule of Investments was $4,002,585 and the total market value of the collateral held by the Fund was $4,183,721. The total market value of the collateral includes non-cash U.S. Government securities collateral having a value of $2,338,346. |
ADR – American Depositary Receipt
GDR – Global Depositary Receipt
NVDR – Non-Voting Depositary Receipt
Reg S – Regulation S provides an exclusion from the registration requirements of the Securities Act of 1933. These securities may be resold in transactions exempt from registration, normally to qualified institutional buyers.
See Notes to Financial Statements.
| 34 | WisdomTree Trust |
Schedule of Investments
WisdomTree Emerging Markets High Dividend Fund (DEM)
March 31, 2019
| Investments | Shares | Value | ||||||
| COMMON STOCKS – 99.7% |
| |||||||
| Brazil – 4.2% |
| |||||||
| AES Tiete Energia S.A. |
554,589 | $ | 1,578,962 | |||||
| Banco do Brasil S.A. |
753,998 | 9,439,264 | ||||||
| Banco Santander Brasil S.A. |
211,894 | 2,394,064 | ||||||
| BB Seguridade Participacoes S.A. |
941,044 | 6,412,747 | ||||||
| CCR S.A. |
2,382,179 | 7,186,263 | ||||||
| Cia de Saneamento Basico do Estado de Sao Paulo |
420,304 | 4,536,004 | ||||||
| Cia de Saneamento de Minas Gerais-COPASA |
147,757 | 2,318,658 | ||||||
| Cia de Saneamento do Parana |
163,582 | 3,150,415 | ||||||
| Cia Hering |
316,030 | 2,427,252 | ||||||
| Cielo S.A. |
3,737,480 | 9,113,931 | ||||||
| EcoRodovias Infraestrutura e Logistica S.A. |
386,451 | 952,300 | ||||||
| EDP – Energias do Brasil S.A. |
391,382 | 1,707,651 | ||||||
| Engie Brasil Energia S.A. |
886,406 | 9,727,985 | ||||||
| Ez Tec Empreendimentos e Participacoes S.A. |
229,975 | 1,583,712 | ||||||
| Fleury S.A. |
305,974 | 1,603,893 | ||||||
| Hypera S.A. |
596,528 | 3,970,007 | ||||||
| Itau Unibanco Holding S.A. |
494,503 | 3,792,922 | ||||||
| Mahle-Metal Leve S.A. |
42,744 | 266,896 | ||||||
| MRV Engenharia e Participacoes S.A. |
467,611 | 1,680,982 | ||||||
| Multiplus S.A. |
186,545 | 1,286,550 | ||||||
| Petrobras Distribuidora S.A. |
440,967 | 2,623,117 | ||||||
| Qualicorp Consultoria e Corretora de Seguros S.A. |
706,306 | 2,845,769 | ||||||
| Smiles Fidelidade S.A. |
110,890 | 1,359,163 | ||||||
| Transmissora Alianca de Energia Eletrica S.A. |
1,174,074 | 7,481,829 | ||||||
| Tupy S.A. |
274,872 | 1,279,821 | ||||||
| Wiz Solucoes e Corretagem de Seguros S.A. |
99,231 | 216,734 | ||||||
|
|
|
|||||||
| Total Brazil |
|
90,936,891 | ||||||
| Chile – 0.9% | ||||||||
| AES Gener S.A. |
7,362,033 | 1,978,788 | ||||||
| Aguas Andinas S.A. Class A |
5,896,265 | 3,352,460 | ||||||
| Banco Santander Chile |
53,892,371 | 4,054,154 | ||||||
| CAP S.A. |
169,701 | 2,015,040 | ||||||
| Colbun S.A. |
19,528,827 | 4,413,878 | ||||||
| Empresas Lipigas S.A. |
252,583 | 2,053,068 | ||||||
| Enel Generacion Chile S.A. |
1,099,453 | 713,047 | ||||||
|
|
|
|||||||
| Total Chile |
|
18,580,435 | ||||||
| China – 28.3% | ||||||||
| Agile Group Holdings Ltd. |
2,606,000 | 4,216,103 | ||||||
| Agricultural Bank of China Ltd. Class H |
24,358,000 | 11,232,678 | ||||||
| Anhui Expressway Co., Ltd. Class H |
310,000 | 204,167 | ||||||
| Anhui Hengyuan Coal Industry and Electricity Power Co., Ltd. Class A |
594,100 | 686,908 | ||||||
| Anhui Jinhe Industrial Co., Ltd. Class A |
388,800 | 1,027,512 | ||||||
| Anhui Yingjia Distillery Co., Ltd. Class A |
145,600 | 393,888 | ||||||
| Anxin Trust Co., Ltd. Class A |
1,331,000 | 1,431,971 | ||||||
| Bank of Beijing Co., Ltd. Class A |
3,944,000 | 3,638,701 | ||||||
| Bank of China Ltd. Class H |
67,715,084 | 30,709,202 | ||||||
| Bank of Communications Co., Ltd. Class H |
19,683,287 | 16,122,846 | ||||||
| Bank of Nanjing Co., Ltd. Class A |
1,540,500 | 1,813,243 | ||||||
| Baoshan Iron & Steel Co., Ltd. Class A |
6,480,800 | 6,972,439 | ||||||
| Beijing Capital Land Ltd. Class H(a) |
834,000 | 318,728 | ||||||
| Beijing Enterprises Water Group Ltd.* |
8,022,000 | 4,956,299 | ||||||
| Beijing Jingneng Clean Energy Co., Ltd. Class H |
1,410,000 | 301,760 | ||||||
| Central China Securities Co., Ltd. Class H(a) |
985,000 | 301,148 | ||||||
| CGN Power Co., Ltd. Class H(b) |
7,034,000 | 1,962,364 | ||||||
| China Aoyuan Group Ltd. |
1,032,000 | 1,244,981 | ||||||
| China Cinda Asset Management Co., Ltd. Class H |
8,483,000 | 2,355,804 | ||||||
| China CITIC Bank Corp., Ltd. Class H |
11,744,000 | 7,480,302 | ||||||
| China Construction Bank Corp. Class H |
72,176,054 | 61,878,718 | ||||||
| China Evergrande Group(a) |
2,655,000 | 8,827,508 | ||||||
| China Fortune Land Development Co., Ltd. Class A |
301,000 | 1,389,396 | ||||||
| China Gezhouba Group Co., Ltd. Class A |
1,250,500 | 1,350,946 | ||||||
| China Jinmao Holdings Group Ltd. |
5,284,000 | 3,446,402 | ||||||
| China Lesso Group Holdings Ltd. |
1,168,000 | 755,857 | ||||||
| China Lilang Ltd. |
1,303,000 | 1,470,656 | ||||||
| China Mobile Ltd. |
6,080,500 | 61,967,274 | ||||||
| China Oriental Group Co., Ltd.(a) |
2,220,000 | 1,394,225 | ||||||
| China Petroleum & Chemical Corp. Class H |
60,344,000 | 47,583,661 | ||||||
| China Power International Development Ltd. |
9,819,000 | 2,514,180 | ||||||
| China Resources Cement Holdings Ltd. |
2,272,000 | 2,344,372 | ||||||
| China Resources Power Holdings Co., Ltd. |
3,812,000 | 5,730,177 | ||||||
| China Sanjiang Fine Chemicals Co., Ltd. |
2,444,000 | 666,267 | ||||||
| China SCE Group Holdings Ltd. |
1,420,000 | 739,852 | ||||||
| China Shenhua Energy Co., Ltd. Class H |
4,914,500 | 11,206,383 | ||||||
| China South Publishing & Media Group Co., Ltd. Class A |
677,332 | 1,297,173 | ||||||
| China State Construction International Holdings Ltd. |
1,986,000 | 1,859,515 | ||||||
| China Suntien Green Energy Corp., Ltd. Class H |
3,462,000 | 1,054,042 | ||||||
| China Union Holdings Ltd. Class A |
449,500 | 496,308 | ||||||
| China Vanke Co., Ltd. Class H |
891,800 | 3,748,992 | ||||||
| China Yangtze Power Co., Ltd. Class A |
4,201,700 | 10,547,704 | ||||||
| China Yongda Automobiles Services Holdings Ltd.(a) |
1,436,500 | 1,138,228 | ||||||
| China ZhengTong Auto Services Holdings Ltd.(a) |
1,294,000 | 718,710 | ||||||
| China Zhongwang Holdings Ltd.(a) |
4,320,800 | 2,355,814 | ||||||
| Chinese Universe Publishing and Media Group Co., Ltd. Class A |
577,000 | 1,304,222 | ||||||
| Chongqing Changan Automobile Co., Ltd. Class A |
1,340,300 | 1,651,392 | ||||||
| Chongqing Rural Commercial Bank Co., Ltd. Class H |
2,165,991 | 1,249,937 | ||||||
| CIFI Holdings Group Co., Ltd. |
3,702,000 | 2,805,992 | ||||||
| CNHTC Jinan Truck Co., Ltd. Class A |
181,291 | 483,698 | ||||||
| CNOOC Ltd. |
16,072,600 | 30,097,927 | ||||||
| Country Garden Holdings Co., Ltd. |
5,941,000 | 9,278,614 | ||||||
| CPMC Holdings Ltd.(a) |
929,000 | 372,786 | ||||||
| Daqin Railway Co., Ltd. Class A |
4,391,886 | 5,450,482 | ||||||
See Notes to Financial Statements.
| WisdomTree Trust | 35 |
Schedule of Investments (continued)
WisdomTree Emerging Markets High Dividend Fund (DEM)
March 31, 2019
| Investments | Shares | Value | ||||||
| Datang International Power Generation Co., Ltd. Class H |
2,242,000 | $ | 599,775 | |||||
| DeHua TB New Decoration Materials Co., Ltd. Class A |
738,100 | 778,716 | ||||||
| Dongfeng Motor Group Co., Ltd. Class H |
3,642,000 | 3,646,663 | ||||||
| Fangda Carbon New Material Co., Ltd. Class A |
2,059,700 | 6,923,696 | ||||||
| Fangda Special Steel Technology Co., Ltd. Class A |
679,600 | 1,455,231 | ||||||
| Fantasia Holdings Group Co., Ltd.* |
1,236,000 | 245,627 | ||||||
| Financial Street Holdings Co., Ltd. Class A |
825,100 | 1,053,445 | ||||||
| Gemdale Corp. Class A |
1,155,909 | 2,365,071 | ||||||
| GF Securities Co., Ltd. Class H |
416,200 | 598,059 | ||||||
| Great Wall Motor Co., Ltd. Class H(a) |
2,970,000 | 2,228,460 | ||||||
| Gree Real Estate Co., Ltd. Class A |
842,900 | 676,056 | ||||||
| Greenland Holdings Group Co., Ltd. Class A |
816,900 | 916,554 | ||||||
| Guangdong Ellington Electronics Technology Co., Ltd. Class A |
517,157 | 899,611 | ||||||
| Guangdong Tapai Group Co., Ltd. Class A |
426,600 | 785,886 | ||||||
| Guangxi Guiguan Electric Power Co., Ltd. Class A |
1,271,884 | 1,105,295 | ||||||
| Guangzhou Automobile Group Co., Ltd. Class H |
4,406,000 | 5,203,042 | ||||||
| Guangzhou R&F Properties Co., Ltd. Class H |
1,018,800 | 2,203,737 | ||||||
| Guizhou Panjiang Refined Coal Co., Ltd. Class A |
1,339,180 | 1,125,914 | ||||||
| Guotai Junan International Holdings Ltd.(a) |
1,970,000 | 399,022 | ||||||
| Harbin Pharmaceutical Group Co., Ltd. Class A |
2,397,615 | 2,226,291 | ||||||
| Hebei Chengde Lolo Co. Class A |
504,920 | 677,715 | ||||||
| Henan Shuanghui Investment & Development Co., Ltd. Class A |
535,037 | 2,058,080 | ||||||
| Hisense Home Appliances Group Co., Ltd. Class H |
403,000 | 566,770 | ||||||
| HLA Corp., Ltd. Class A |
875,104 | 1,272,249 | ||||||
| Hopson Development Holdings Ltd. |
670,000 | 652,934 | ||||||
| Huabao International Holdings Ltd. |
935,000 | 474,054 | ||||||
| Huafa Industrial Co., Ltd. Zhuhai Class A |
544,000 | 751,216 | ||||||
| Huafu Fashion Co., Ltd. Class A |
366,370 | 423,603 | ||||||
| Huapont Life Sciences Co., Ltd. Class A |
2,489,000 | 2,185,218 | ||||||
| Huayu Automotive Systems Co., Ltd. Class A |
848,000 | 2,571,685 | ||||||
| Industrial & Commercial Bank of China Ltd. Class H |
58,233,823 | 42,655,620 | ||||||
| Industrial Bank Co., Ltd. Class A |
4,572,712 | 12,363,646 | ||||||
| Jiangsu Expressway Co., Ltd. Class H |
1,616,527 | 2,285,804 | ||||||
| Jinke Properties Group Co., Ltd. Class A |
941,300 | 1,022,513 | ||||||
| JNBY Design Ltd. |
238,500 | 479,434 | ||||||
| Joyoung Co., Ltd. Class A |
268,064 | 920,246 | ||||||
| Kaisa Group Holdings Ltd.*(a) |
1,513,000 | 686,155 | ||||||
| Kingboard Holdings Ltd. |
1,056,000 | 3,746,470 | ||||||
| Kingboard Laminates Holdings Ltd. |
2,310,500 | 2,428,248 | ||||||
| KWG Group Holdings Ltd. |
2,206,500 | 2,661,871 | ||||||
| Lee & Man Paper Manufacturing Ltd. |
2,496,000 | 2,127,178 | ||||||
| Lenovo Group Ltd. |
9,852,000 | 8,860,581 | ||||||
| Liuzhou Iron & Steel Co., Ltd. Class A |
491,400 | 574,745 | ||||||
| Livzon Pharmaceutical Group, Inc. Class H |
182,500 | 634,686 | ||||||
| Logan Property Holdings Co., Ltd. |
1,262,000 | 2,089,950 | ||||||
| Lonking Holdings Ltd. |
2,922,000 | 945,468 | ||||||
| Maanshan Iron & Steel Co., Ltd. Class H(a) |
2,268,000 | 1,109,449 | ||||||
| Nine Dragons Paper Holdings Ltd. |
2,459,000 | 2,343,113 | ||||||
| Ningbo Sanxing Medical Electric Co., Ltd. Class A |
873,465 | 928,029 | ||||||
| Poly Property Group Co., Ltd. |
1,051,000 | 409,692 | ||||||
| Powerlong Real Estate Holdings Ltd. |
1,973,000 | 1,033,004 | ||||||
| Red Star Macalline Group Corp., Ltd. Class H(b) |
1,035,000 | 1,000,726 | ||||||
| RiseSun Real Estate Development Co., Ltd. Class A |
690,600 | 1,156,104 | ||||||
| SAIC Motor Corp., Ltd. Class A |
2,715,478 | 10,534,286 | ||||||
| Sansteel Minguang Co., Ltd. Fujian Class A |
674,396 | 1,654,830 | ||||||
| Shaanxi Coal Industry Co., Ltd. Class A |
2,639,600 | 3,499,723 | ||||||
| Shandong Buchang Pharmaceuticals Co., Ltd. Class A |
250,820 | 1,081,256 | ||||||
| Shandong Chenming Paper Holdings Ltd. Class H |
1,327,500 | 854,002 | ||||||
| Shandong Hi-speed Co., Ltd. Class A |
778,100 | 585,873 | ||||||
| Shanghai Industrial Holdings Ltd. |
586,000 | 1,379,535 | ||||||
| Shanghai Zijiang Enterprise Group Co., Ltd. Class A |
2,429,100 | 1,669,957 | ||||||
| Shanxi Lu’an Environmental Energy Development Co., Ltd. Class A |
798,900 | 930,833 | ||||||
| Shanying International Holding Co., Ltd. Class A |
2,407,200 | 1,418,486 | ||||||
| Shenzhen Expressway Co., Ltd. Class H |
984,000 | 1,153,230 | ||||||
| Shenzhen Investment Ltd. |
3,238,000 | 1,237,460 | ||||||
| Shenzhen Jinjia Group Co., Ltd. Class A |
1,177,900 | 2,487,188 | ||||||
| Shenzhen Overseas Chinese Town Co., Ltd. Class A |
1,955,300 | 2,240,381 | ||||||
| Shenzhen Zhongjin Lingnan Nonfemet Co., Ltd. Class A |
2,849,600 | 2,141,377 | ||||||
| Shimao Property Holdings Ltd. |
1,177,000 | 3,680,960 | ||||||
| Shougang Fushan Resources Group Ltd. |
9,600,000 | 2,201,288 | ||||||
| Shui On Land Ltd. |
2,243,000 | 554,325 | ||||||
| Sino-Ocean Group Holding Ltd. |
3,683,500 | 1,614,181 | ||||||
| Sinopec Shanghai Petrochemical Co., Ltd. Class H |
7,886,000 | 3,757,175 | ||||||
| Sinotruk Hong Kong Ltd.(a) |
895,500 | 1,905,089 | ||||||
| SITC International Holdings Co., Ltd. |
1,967,000 | 2,019,633 | ||||||
| Sou Yu Te Group Co., Ltd. Class A |
1,487,300 | 781,252 | ||||||
| TCL Corp. Class A |
4,516,600 | 2,728,698 | ||||||
| TCL Electronics Holdings Ltd. |
1,098,000 | 600,057 | ||||||
| Tianneng Power International Ltd. |
924,000 | 831,017 | ||||||
| Tongling Jingda Special Magnet Wire Co., Ltd. Class A |
1,007,700 | 536,824 | ||||||
| Weichai Power Co., Ltd. Class H |
2,774,000 | 4,431,361 | ||||||
| Weifu High-Technology Group Co., Ltd. Class A |
279,500 | 960,337 | ||||||
| WH Group Ltd.(b) |
10,730,000 | 11,481,857 | ||||||
| Xingda International Holdings Ltd. |
1,477,000 | 464,741 | ||||||
| Xinyi Glass Holdings Ltd. |
4,090,000 | 4,689,202 | ||||||
See Notes to Financial Statements.
| 36 | WisdomTree Trust |
Schedule of Investments (continued)
WisdomTree Emerging Markets High Dividend Fund (DEM)
March 31, 2019
| Investments | Shares | Value | ||||||
| Xinyi Solar Holdings Ltd. |
5,984,000 | $ | 2,881,486 | |||||
| Xiwang Special Steel Co., Ltd. |
2,567,000 | 500,323 | ||||||
| XTEP International Holdings Ltd. |
1,958,400 | 1,399,579 | ||||||
| Yanzhou Coal Mining Co., Ltd. Class H |
2,682,000 | 2,634,185 | ||||||
| Yuexiu Property Co., Ltd. |
3,940,000 | 948,617 | ||||||
| Yuzhou Properties Co., Ltd. |
2,571,000 | 1,552,435 | ||||||
| Zhejiang Chint Electrics Co., Ltd. Class A |
405,500 | 1,617,124 | ||||||
| Zhejiang Wanfeng Auto Wheel Co., Ltd. Class A |
482,600 | 580,970 | ||||||
| Zhuzhou Kibing Group Co., Ltd. Class A |
1,140,600 | 760,377 | ||||||
| Zoomlion Heavy Industry Science and Technology Co., Ltd. Class H |
1,497,400 | 742,028 | ||||||
|
|
|
|||||||
| Total China |
|
615,804,399 | ||||||
| Czech Republic – 0.7% | ||||||||
| CEZ AS |
428,366 | 10,064,479 | ||||||
| Komercni Banka AS |
81,085 | 3,313,210 | ||||||
| Moneta Money Bank AS(b) |
322,573 | 1,113,343 | ||||||
| O2 Czech Republic AS |
24,544 | 266,193 | ||||||
|
|
|
|||||||
| Total Czech Republic |
|
14,757,225 | ||||||
| Hong Kong – 0.2% | ||||||||
| Chow Tai Fook Jewellery Group Ltd. |
2,187,200 | 2,212,290 | ||||||
| Stella International Holdings Ltd. |
1,045,500 | 1,571,590 | ||||||
|
|
|
|||||||
| Total Hong Kong |
|
3,783,880 | ||||||
| Hungary – 0.1% | ||||||||
| Magyar Telekom Telecommunications PLC |
964,297 | 1,555,313 | ||||||
| India – 3.6% |
| |||||||
| Bharat Petroleum Corp., Ltd. |
2,162,427 | 12,409,569 | ||||||
| Bharti Infratel Ltd. |
1,490,727 | 6,744,047 | ||||||
| Chennai Petroleum Corp., Ltd. |
15,947 | 62,913 | ||||||
| Coal India Ltd. |
3,334,312 | 11,416,800 | ||||||
| Greaves Cotton Ltd. |
508,823 | 1,022,420 | ||||||
| Hindustan Petroleum Corp., Ltd. |
1,807,910 | 7,407,799 | ||||||
| Indian Oil Corp., Ltd. |
7,159,675 | 16,830,791 | ||||||
| Mangalore Refinery & Petrochemicals Ltd. |
33,818 | 36,271 | ||||||
| National Aluminium Co., Ltd. |
1,726,552 | 1,381,989 | ||||||
| NHPC Ltd. |
6,858,763 | 2,445,492 | ||||||
| NLC India Ltd. |
143,155 | 143,413 | ||||||
| Oil India Ltd. |
674,561 | 1,805,808 | ||||||
| Vedanta Ltd. |
6,488,312 | 17,275,628 | ||||||
|
|
|
|||||||
| Total India |
|
78,982,940 | ||||||
| Indonesia – 2.1% | ||||||||
| Adaro Energy Tbk PT |
43,538,700 | 4,112,328 | ||||||
| AKR Corporindo Tbk PT |
3,650,300 | 1,209,931 | ||||||
| Bank Pembangunan Daerah Jawa Barat Dan Banten Tbk PT* |
4,178,700 | 589,831 | ||||||
| Bukit Asam Tbk PT |
8,601,400 | 2,536,930 | ||||||
| Indika Energy Tbk PT |
3,554,400 | 455,532 | ||||||
| Indo Tambangraya Megah Tbk PT |
1,451,100 | 2,438,031 | ||||||
| Indocement Tunggal Prakarsa Tbk PT |
3,702,000 | 5,693,385 | ||||||
| Matahari Department Store Tbk PT |
6,813,800 | 1,957,053 | ||||||
| Telekomunikasi Indonesia Persero Tbk PT |
88,861,100 | 24,648,971 | ||||||
| Waskita Beton Precast Tbk PT |
44,332,900 | 1,251,533 | ||||||
|
|
|
|||||||
| Total Indonesia |
|
44,893,525 | ||||||
| Malaysia – 2.6% | ||||||||
| AirAsia Group Bhd |
3,671,800 | 2,392,404 | ||||||
| Astro Malaysia Holdings Bhd |
7,581,500 | 2,841,322 | ||||||
| Berjaya Sports Toto Bhd |
1,187,772 | 704,080 | ||||||
| Bermaz Auto Bhd |
1,772,500 | 981,225 | ||||||
| British American Tobacco Malaysia Bhd |
294,097 | 2,603,470 | ||||||
| CIMB Group Holdings Bhd |
4,070,600 | 5,134,988 | ||||||
| DiGi.Com Bhd |
2,683,747 | 2,991,071 | ||||||
| Lotte Chemical Titan Holding Bhd(b) |
1,498,200 | 1,504,622 | ||||||
| Mah Sing Group Bhd |
1,377,800 | 313,865 | ||||||
| Malayan Banking Bhd |
7,155,865 | 16,248,590 | ||||||
| MISC Bhd |
3,167,200 | 5,190,096 | ||||||
| Sime Darby Bhd |
12,184,400 | 5,909,049 | ||||||
| SP Setia Bhd |
1,845,293 | 1,026,042 | ||||||
| Sunway Bhd |
1,754,900 | 722,163 | ||||||
| Sunway Construction Group Bhd |
908,000 | 424,808 | ||||||
| Telekom Malaysia Bhd |
5,829,600 | 4,569,435 | ||||||
| YTL Corp. Bhd |
8,961,078 | 2,326,698 | ||||||
| YTL Power International Bhd |
7,209,396 | 1,518,697 | ||||||
|
|
|
|||||||
| Total Malaysia |
|
57,402,625 | ||||||
| Mexico – 1.5% | ||||||||
| Concentradora Fibra Danhos S.A. de C.V. |
1,832,766 | 2,617,225 | ||||||
| Grupo Aeroportuario del Pacifico S.A.B. de C.V. Class B |
747,383 | 6,639,466 | ||||||
| Grupo Mexico S.A.B. de C.V. Series B |
6,183,018 | 17,008,678 | ||||||
| Kimberly-Clark de Mexico S.A.B. de C.V. Class A* |
2,278,387 | 3,869,059 | ||||||
| Macquarie Mexico Real Estate Management S.A. de C.V.*(b) |
1,872,860 | 2,030,480 | ||||||
| Nemak S.A.B. de C.V.(a)(b) |
1,828,115 | 1,058,370 | ||||||
|
|
|
|||||||
| Total Mexico |
|
33,223,278 | ||||||
| Philippines – 0.5% | ||||||||
| Aboitiz Power Corp. |
3,609,200 | 2,433,169 | ||||||
| DMCI Holdings, Inc. |
8,306,700 | 1,898,313 | ||||||
| Globe Telecom, Inc. |
7,370 | 272,006 | ||||||
| Manila Electric Co. |
114,780 | 830,630 | ||||||
| PLDT, Inc. |
194,429 | 4,258,110 | ||||||
| Semirara Mining & Power Corp. |
4,567,600 | 1,909,328 | ||||||
|
|
|
|||||||
| Total Philippines |
|
11,601,556 | ||||||
| Poland – 1.0% | ||||||||
| Asseco Poland S.A. |
132,958 | 1,799,893 | ||||||
| Bank Handlowy w Warszawie S.A. |
105,044 | 1,849,439 | ||||||
| Bank Polska Kasa Opieki S.A. |
277,964 | 7,975,283 | ||||||
| Ciech S.A. |
157,435 | 2,203,109 | ||||||
| Powszechny Zaklad Ubezpieczen S.A. |
691,511 | 7,304,979 | ||||||
| Warsaw Stock Exchange |
21,288 | 216,553 | ||||||
|
|
|
|||||||
| Total Poland |
|
21,349,256 | ||||||
| Russia – 16.3% | ||||||||
| Gazprom Neft PJSC ADR |
69,954 | 1,720,868 | ||||||
| Gazprom PJSC ADR |
11,059,465 | 49,922,425 | ||||||
| Lukoil PJSC ADR |
670,094 | 60,040,422 | ||||||
| Magnit PJSC GDR Reg S |
736,954 | 10,391,051 | ||||||
See Notes to Financial Statements.
| WisdomTree Trust | 37 |
Schedule of Investments (continued)
WisdomTree Emerging Markets High Dividend Fund (DEM)
March 31, 2019
| Investments | Shares | Value | ||||||
| Magnitogorsk Iron & Steel Works PJSC GDR Reg S |
494,396 | $ | 4,429,788 | |||||
| MMC Norilsk Nickel PJSC ADR |
2,756,134 | 58,209,550 | ||||||
| Mobile TeleSystems PJSC ADR |
1,817,609 | 13,741,124 | ||||||
| Novolipetsk Steel PJSC GDR Reg S |
334,376 | 8,583,432 | ||||||
| PhosAgro PJSC GDR Reg S |
165,871 | 2,078,364 | ||||||
| Polyus PJSC GDR Reg S |
121,233 | 4,982,676 | ||||||
| Rosneft Oil Co. PJSC GDR Reg S |
2,018,403 | 12,675,571 | ||||||
| Rostelecom PJSC ADR |
378,854 | 2,473,917 | ||||||
| RusHydro PJSC ADR |
2,509,313 | 1,794,159 | ||||||
| Sberbank of Russia PJSC ADR |
3,373,725 | 44,735,593 | ||||||
| Severstal PJSC GDR Reg S |
959,536 | 14,968,762 | ||||||
| Tatneft PJSC ADR |
865,303 | 59,878,968 | ||||||
| VTB Bank PJSC GDR Reg S |
3,602,243 | 4,113,762 | ||||||
|
|
|
|||||||
| Total Russia |
|
354,740,432 | ||||||
| South Africa – 6.9% | ||||||||
| Absa Group Ltd.(a) |
1,015,808 | 10,713,662 | ||||||
| Aeci Ltd. |
291,907 | 1,938,321 | ||||||
| African Rainbow Minerals Ltd. |
40,228 | 473,377 | ||||||
| Alexander Forbes Group Holdings Ltd. |
1,441,577 | 502,809 | ||||||
| Assore Ltd. |
19,021 | 493,290 | ||||||
| Astral Foods Ltd. |
120,790 | 1,404,460 | ||||||
| AVI Ltd. |
616,763 | 3,861,491 | ||||||
| Blue Label Telecoms Ltd.* |
1,131,425 | 294,208 | ||||||
| Coronation Fund Managers Ltd. |
476,903 | 1,519,211 | ||||||
| Exxaro Resources Ltd. |
617,563 | 7,037,981 | ||||||
| FirstRand Ltd.(a) |
2,873,459 | 12,544,889 | ||||||
| Foschini Group Ltd. (The) |
433,672 | 4,901,693 | ||||||
| Hyprop Investments Ltd. |
392,784 | 1,919,627 | ||||||
| Imperial Logistics Ltd.(a) |
251,848 | 1,045,550 | ||||||
| Investec Ltd. |
246,843 | 1,443,615 | ||||||
| Kumba Iron Ore Ltd.(a) |
221,263 | 6,602,026 | ||||||
| Liberty Holdings Ltd. |
272,378 | 1,908,181 | ||||||
| Metair Investments Ltd. |
127,094 | 201,729 | ||||||
| MTN Group Ltd.(a) |
4,502,451 | 27,668,004 | ||||||
| Nedbank Group Ltd. |
306,884 | 5,346,384 | ||||||
| Netcare Ltd. |
2,513,036 | 4,068,953 | ||||||
| Peregrine Holdings Ltd. |
336,319 | 438,436 | ||||||
| Reunert Ltd. |
55,101 | 271,278 | ||||||
| RMB Holdings Ltd. |
1,002,424 | 5,281,385 | ||||||
| SPAR Group Ltd. (The) |
271,469 | 3,611,994 | ||||||
| Standard Bank Group Ltd. |
1,577,828 | 20,266,002 | ||||||
| Telkom S.A. SOC Ltd. |
1,028,323 | 5,199,640 | ||||||
| Truworths International Ltd. |
1,041,433 | 5,011,011 | ||||||
| Tsogo Sun Holdings Ltd. |
1,271,631 | 1,702,709 | ||||||
| Vodacom Group Ltd. |
1,549,076 | 11,969,388 | ||||||
|
|
|
|||||||
| Total South Africa |
|
149,641,304 | ||||||
| South Korea – 1.2% | ||||||||
| Coway Co., Ltd. |
105,440 | 8,778,152 | ||||||
| Daishin Securities Co., Ltd. |
35,060 | 339,759 | ||||||
| Doosan Corp. |
20,247 | 1,651,724 | ||||||
| Huchems Fine Chemical Corp. |
64,934 | 1,275,683 | ||||||
| KEPCO Plant Service & Engineering Co., Ltd. |
32,840 | 1,006,812 | ||||||
| Kumho Industrial Co., Ltd. |
36,669 | 308,832 | ||||||
| Meritz Financial Group, Inc. |
32,334 | 404,495 | ||||||
| Meritz Fire & Marine Insurance Co., Ltd. |
40,052 | 857,425 | ||||||
| Orange Life Insurance Ltd.(b) |
57,384 | 1,819,949 | ||||||
| S-Oil Corp. |
78,149 | 6,168,752 | ||||||
| Seah Besteel Corp. |
71,920 | 1,213,345 | ||||||
| Ssangyong Cement Industrial Co., Ltd. |
316,074 | 1,782,111 | ||||||
|
|
|
|||||||
| Total South Korea |
|
25,607,039 | ||||||
| Taiwan – 25.2% | ||||||||
| Accton Technology Corp.(a) |
969,000 | 3,914,294 | ||||||
| Alpha Networks, Inc.(a) |
993,000 | 637,933 | ||||||
| Asustek Computer, Inc. |
1,808,000 | 13,081,683 | ||||||
| Aten International Co., Ltd. |
329,000 | 1,017,300 | ||||||
| AU Optronics Corp.(a) |
44,039,000 | 16,217,863 | ||||||
| Cathay Financial Holding Co., Ltd. |
8,540,000 | 12,455,119 | ||||||
| Chang Wah Electromaterials, Inc. |
89,000 | 454,811 | ||||||
| Charoen Pokphand Enterprise |
623,000 | 1,047,076 | ||||||
| Cheng Shin Rubber Industry Co., Ltd.(a) |
3,807,000 | 5,181,735 | ||||||
| Chicony Electronics Co., Ltd. |
1,978,386 | 4,602,465 | ||||||
| Chicony Power Technology Co., Ltd.(a) |
636,045 | 1,178,377 | ||||||
| Chin-Poon Industrial Co., Ltd. |
928,000 | 1,147,184 | ||||||
| China Development Financial Holding Corp. |
11,163,000 | 3,730,598 | ||||||
| China General Plastics Corp. |
845,300 | 622,583 | ||||||
| Chong Hong Construction Co., Ltd. |
478,000 | 1,395,824 | ||||||
| Chung-Hsin Electric & Machinery Manufacturing Corp. |
841,000 | 563,477 | ||||||
| Chunghwa Telecom Co., Ltd. |
5,836,000 | 20,734,316 | ||||||
| Cleanaway Co., Ltd. |
388,000 | 2,177,901 | ||||||
| Compal Electronics, Inc. |
8,233,000 | 5,115,490 | ||||||
| Compeq Manufacturing Co., Ltd.(a) |
2,554,000 | 1,963,946 | ||||||
| Continental Holdings Corp. |
1,810,000 | 927,889 | ||||||
| CTBC Financial Holding Co., Ltd. |
20,584,000 | 13,657,884 | ||||||
| CTCI Corp. |
1,872,000 | 2,915,462 | ||||||
| Da-Li Development Co., Ltd. |
488,000 | 524,093 | ||||||
| Elite Advanced Laser Corp. |
159,500 | 352,944 | ||||||
| Elite Material Co., Ltd. |
802,000 | 2,771,305 | ||||||
| Elite Semiconductor Memory Technology, Inc. |
598,000 | 612,154 | ||||||
| Everlight Electronics Co., Ltd. |
1,450,000 | 1,470,207 | ||||||
| Far Eastern Department Stores Ltd. |
2,906,000 | 1,546,321 | ||||||
| Far EasTone Telecommunications Co., Ltd. |
2,645,000 | 6,376,389 | ||||||
| Faraday Technology Corp.(a) |
499,000 | 721,288 | ||||||
| Feng Hsin Steel Co., Ltd. |
98,000 | 192,054 | ||||||
| First Financial Holding Co., Ltd. |
11,884,585 | 8,136,297 | ||||||
| FLEXium Interconnect, Inc.(a) |
670,000 | 2,017,359 | ||||||
| Formosa Chemicals & Fibre Corp. |
8,712,000 | 31,658,928 | ||||||
| Formosa International Hotels Corp. |
40,000 | 205,707 | ||||||
| Formosa Petrochemical Corp.(a) |
2,886,000 | 10,815,301 | ||||||
| Formosa Plastics Corp. |
9,329,000 | 33,144,352 | ||||||
| Foxsemicon Integrated Technology, Inc. |
118,000 | 526,435 | ||||||
| Fubon Financial Holding Co., Ltd. |
7,111,000 | 10,613,261 | ||||||
| Getac Technology Corp.(a) |
1,177,000 | 1,962,908 | ||||||
| Gigabyte Technology Co., Ltd.(a) |
1,929,000 | 3,073,081 | ||||||
| Global PMX Co., Ltd. |
99,000 | 391,882 | ||||||
| Great Wall Enterprise Co., Ltd. |
483,150 | 553,372 | ||||||
See Notes to Financial Statements.
| 38 | WisdomTree Trust |
Schedule of Investments (continued)
WisdomTree Emerging Markets High Dividend Fund (DEM)
March 31, 2019
| Investments | Shares | Value | ||||||
| Greatek Electronics, Inc. |
1,277,000 | $ | 1,760,922 | |||||
| HannStar Display Corp.(a) |
8,008,000 | 1,772,021 | ||||||
| Highwealth Construction Corp. |
2,307,000 | 3,802,521 | ||||||
| Hotai Motor Co., Ltd.(a) |
781,000 | 9,565,954 | ||||||
| Huaku Development Co., Ltd.(a) |
534,000 | 1,282,134 | ||||||
| Hung Sheng Construction Ltd. |
857,800 | 826,614 | ||||||
| Innolux Corp.(a) |
30,310,000 | 9,834,363 | ||||||
| Inventec Corp. |
8,578,000 | 6,526,633 | ||||||
| ITEQ Corp. |
615,000 | 1,771,937 | ||||||
| KEE TAI Properties Co., Ltd. |
868,000 | 336,549 | ||||||
| Kenda Rubber Industrial Co., Ltd. |
1,393,543 | 1,336,098 | ||||||
| King Yuan Electronics Co., Ltd.(a) |
2,786,000 | 2,372,852 | ||||||
| King’s Town Bank Co., Ltd. |
1,454,000 | 1,509,645 | ||||||
| Kinik Co. |
296,000 | 586,804 | ||||||
| Kung Long Batteries Industrial Co., Ltd. |
162,000 | 880,420 | ||||||
| L&K Engineering Co., Ltd. |
375,000 | 351,024 | ||||||
| Lealea Enterprise Co., Ltd. |
1,470,000 | 486,494 | ||||||
| Lelon Electronics Corp. |
145,000 | 190,304 | ||||||
| Lien Hwa Industrial Corp. |
464,908 | 507,589 | ||||||
| Lion Travel Service Co., Ltd. |
168,000 | 479,681 | ||||||
| Lite-On Semiconductor Corp. |
497,000 | 561,978 | ||||||
| Marketech International Corp. |
279,000 | 485,210 | ||||||
| Mega Financial Holding Co., Ltd. |
10,272,302 | 9,348,910 | ||||||
| Merry Electronics Co., Ltd. |
784,275 | 4,300,465 | ||||||
| Micro-Star International Co., Ltd.(a) |
1,570,000 | 4,406,320 | ||||||
| momo.com, Inc. |
73,000 | 602,797 | ||||||
| Namchow Holdings Co., Ltd. |
909,000 | 1,574,945 | ||||||
| Nan Ya Plastics Corp. |
14,513,000 | 37,153,054 | ||||||
| Nanya Technology Corp.(a) |
2,971,000 | 5,918,768 | ||||||
| Nien Made Enterprise Co., Ltd. |
327,000 | 2,880,566 | ||||||
| Novatek Microelectronics Corp. |
1,367,000 | 8,782,012 | ||||||
| Nuvoton Technology Corp. |
189,000 | 317,652 | ||||||
| Oriental Union Chemical Corp. |
1,525,000 | 1,291,429 | ||||||
| Pegatron Corp.(a) |
6,024,000 | 10,417,715 | ||||||
| Pou Chen Corp. |
6,833,000 | 8,324,951 | ||||||
| Powertech Technology, Inc. |
1,864,000 | 4,402,888 | ||||||
| President Chain Store Corp. |
1,695,000 | 16,691,244 | ||||||
| Primax Electronics Ltd.(a) |
1,017,000 | 2,002,949 | ||||||
| Qisda Corp. |
4,163,000 | 2,667,681 | ||||||
| Quanta Computer, Inc. |
7,291,990 | 13,675,217 | ||||||
| Radiant Opto-Electronics Corp.(a) |
1,356,170 | 4,338,618 | ||||||
| Rechi Precision Co., Ltd. |
1,277,000 | 1,048,267 | ||||||
| Ruentex Industries Ltd. |
1,167,600 | 3,064,806 | ||||||
| Sanyang Motor Co., Ltd. |
854,000 | 559,718 | ||||||
| Sercomm Corp.(a) |
675,000 | 1,478,318 | ||||||
| Shinkong Insurance Co., Ltd. |
432,000 | 546,649 | ||||||
| Sigurd Microelectronics Corp. |
668,000 | 652,384 | ||||||
| Sinbon Electronics Co., Ltd. |
384,000 | 1,289,531 | ||||||
| Sinon Corp. |
3,561,000 | 2,102,828 | ||||||
| SinoPac Financial Holdings Co., Ltd. |
10,901,440 | 4,032,265 | ||||||
| Sitronix Technology Corp. |
276,000 | 1,267,144 | ||||||
| Sunonwealth Electric Machine Industry Co., Ltd. |
92,000 | 105,371 | ||||||
| Supreme Electronics Co., Ltd. |
1,507,000 | 1,535,335 | ||||||
| Synnex Technology International Corp. |
3,502,000 | 4,204,150 | ||||||
| Systex Corp. |
278,000 | 612,456 | ||||||
| Taichung Commercial Bank Co., Ltd. |
348,813 | 129,020 | ||||||
| Taiflex Scientific Co., Ltd. |
564,000 | 705,446 | ||||||
| Taiwan Cogeneration Corp. |
772,000 | 662,527 | ||||||
| Taiwan Cooperative Financial Holding Co., Ltd. |
9,008,320 | 5,699,526 | ||||||
| Taiwan Hon Chuan Enterprise Co., Ltd. |
1,402,000 | 2,235,794 | ||||||
| Taiwan Mobile Co., Ltd. |
3,101,253 | 11,219,471 | ||||||
| Taiwan Paiho Ltd. |
534,000 | 1,240,551 | ||||||
| Taiwan PCB Techvest Co., Ltd. |
213,000 | 255,361 | ||||||
| Taiyen Biotech Co., Ltd. |
1,025,000 | 1,062,564 | ||||||
| Thinking Electronic Industrial Co., Ltd. |
81,000 | 222,076 | ||||||
| Tong Hsing Electronic Industries Ltd. |
359,000 | 1,205,577 | ||||||
| Tong Yang Industry Co., Ltd. |
782,000 | 1,003,491 | ||||||
| Topco Scientific Co., Ltd. |
459,435 | 1,189,563 | ||||||
| Transcend Information, Inc. |
783,000 | 1,778,362 | ||||||
| Tripod Technology Corp. |
1,316,000 | 4,248,536 | ||||||
| TXC Corp. |
812,000 | 849,662 | ||||||
| TYC Brother Industrial Co., Ltd. |
186,000 | 161,133 | ||||||
| Uni-President Enterprises Corp. |
14,781,000 | 35,872,838 | ||||||
| United Microelectronics Corp.(a) |
22,497,000 | 8,503,757 | ||||||
| UPC Technology Corp. |
3,963,680 | 1,601,136 | ||||||
| Walsin Lihwa Corp. |
6,072,000 | 3,477,257 | ||||||
| Waterland Financial Holdings Co., Ltd. |
4,501,000 | 1,533,411 | ||||||
| Weikeng Industrial Co., Ltd. |
540,000 | 359,177 | ||||||
| Winbond Electronics Corp.(a) |
8,820,000 | 4,221,054 | ||||||
| Wistron Corp.(a) |
6,989,561 | 5,374,754 | ||||||
| Wistron NeWeb Corp. |
612,840 | 1,610,618 | ||||||
| Wowprime Corp. |
103,000 | 310,800 | ||||||
| WPG Holdings Ltd. |
3,868,280 | 5,045,501 | ||||||
| YFY, Inc. |
5,396,000 | 2,074,678 | ||||||
| Yungtay Engineering Co., Ltd. |
531,000 | 1,102,643 | ||||||
| Zeng Hsing Industrial Co., Ltd. |
100,000 | 486,689 | ||||||
|
|
|
|||||||
| Total Taiwan |
|
546,674,971 | ||||||
| Thailand – 2.6% | ||||||||
| AP Thailand PCL NVDR |
7,011,300 | 1,557,576 | ||||||
| Bangchak Corp. PCL NVDR(a) |
1,773,300 | 1,802,077 | ||||||
| Bangkok Land PCL NVDR |
33,852,800 | 1,674,772 | ||||||
| Big Camera Corp. PCL NVDR(a) |
12,567,941 | 506,916 | ||||||
| BTS Group Holdings PCL NVDR |
7,787,443 | 2,699,287 | ||||||
| Esso Thailand PCL NVDR(a) |
4,033,300 | 1,398,024 | ||||||
| Glow Energy PCL NVDR |
713,900 | 2,047,106 | ||||||
| Hana Microelectronics PCL NVDR(a) |
1,558,100 | 1,522,014 | ||||||
| IRPC PCL NVDR |
10,531,600 | 1,908,199 | ||||||
| Jasmine International PCL NVDR(a) |
11,659,600 | 1,983,987 | ||||||
| KGI Securities Thailand PCL NVDR |
13,571,700 | 2,078,414 | ||||||
| LPN Development PCL NVDR(a) |
5,711,400 | 1,232,806 | ||||||
| Major Cineplex Group PCL NVDR |
2,505,300 | 2,210,443 | ||||||
| Pruksa Holding PCL NVDR(a) |
2,874,000 | 1,630,124 | ||||||
| PTT Global Chemical PCL NVDR |
2,561,034 | 5,427,116 | ||||||
| Quality Houses PCL NVDR |
18,759,400 | 1,749,734 | ||||||
| Ratchaburi Electricity Generating Holding PCL NVDR |
1,174,300 | 2,164,694 | ||||||
See Notes to Financial Statements.
| WisdomTree Trust | 39 |
Schedule of Investments (concluded)
WisdomTree Emerging Markets High Dividend Fund (DEM)
March 31, 2019
| Investments | Shares | Value | ||||||
| Sansiri PCL NVDR(a) |
36,814,200 | $ | 1,519,666 | |||||
| Siam Cement PCL (The) NVDR |
155,600 | 2,363,296 | ||||||
| Siam Commercial Bank PCL (The) NVDR |
610,900 | 2,541,005 | ||||||
| Siamgas & Petrochemicals PCL NVDR(a) |
4,856,400 | 1,407,874 | ||||||
| Somboon Advance Technology PCL NVDR |
1,425,200 | 799,387 | ||||||
| SPCG PCL NVDR |
2,962,100 | 1,717,430 | ||||||
| Star Petroleum Refining PCL NVDR(a) |
4,685,338 | 1,609,270 | ||||||
| Thai Oil PCL NVDR |
1,091,700 | 2,390,835 | ||||||
| Thai Vegetable Oil PCL NVDR |
2,068,797 | 1,743,826 | ||||||
| Thanachart Capital PCL NVDR |
1,158,600 | 1,989,718 | ||||||
| Tisco Financial Group PCL NVDR |
745,500 | 2,073,117 | ||||||
| TPI Polene Power PCL NVDR(a) |
9,425,600 | 1,811,759 | ||||||
| TTW PCL NVDR |
4,827,077 | 1,855,691 | ||||||
|
|
|
|||||||
| Total Thailand |
|
57,416,163 | ||||||
| Turkey – 1.8% | ||||||||
| Akbank T.A.S.* |
3,423,021 | 3,829,208 | ||||||
| Aksa Akrilik Kimya Sanayii AS |
382,673 | 621,803 | ||||||
| Aygaz AS |
323,683 | 551,732 | ||||||
| Borusan Mannesmann Boru Sanayi ve Ticaret AS |
343,772 | 581,107 | ||||||
| Emlak Konut Gayrimenkul Yatirim Ortakligi AS |
3,648,232 | 987,998 | ||||||
| Eregli Demir ve Celik Fabrikalari T.A.S. |
4,657,891 | 7,519,110 | ||||||
| Ford Otomotiv Sanayi AS |
125,222 | 1,081,197 | ||||||
| Iskenderun Demir ve Celik AS(a) |
843,839 | 1,067,943 | ||||||
| Tofas Turk Otomobil Fabrikasi AS |
295,851 | 895,995 | ||||||
| Tupras Turkiye Petrol Rafinerileri AS |
445,758 | 9,846,821 | ||||||
| Turkcell Iletisim Hizmetleri AS |
3,679,270 | 7,873,544 | ||||||
| Turkiye Garanti Bankasi AS |
2,199,589 | 3,247,057 | ||||||
| Vestel Beyaz Esya Sanayi ve Ticaret AS |
88,554 | 264,897 | ||||||
|
|
|
|||||||
| Total Turkey | 38,368,412 | |||||||
| TOTAL COMMON STOCKS (Cost: $2,056,341,795) |
2,165,319,644 | |||||||
| EXCHANGE-TRADED FUND – 0.1% |
| |||||||
| United States – 0.1% |
| |||||||
| WisdomTree Global High Dividend Fund(a)(c) |
||||||||
| (Cost: $2,254,420) | 50,000 | 2,304,355 | ||||||
| INVESTMENT OF CASH COLLATERAL FOR SECURITIES LOANED – 1.3% |
| |||||||
| United States – 1.3% |
| |||||||
| State Street Navigator Securities Lending Government Money Market Portfolio, 2.46%(d) |
||||||||
| (Cost: $28,284,557)(e) | 28,284,557 | 28,284,557 | ||||||
| TOTAL INVESTMENTS IN SECURITIES – 101.1% (Cost: $2,086,880,772) |
|
2,195,908,556 | ||||||
| Other Assets less Liabilities – (1.1)% |
|
(22,902,776 | ) | |||||
|
|
|
|||||||
| NET ASSETS – 100.0% |
|
$ | 2,173,005,780 | |||||
| * | Non-income producing security. |
| (a) | Security, or portion thereof, was on loan at March 31, 2019 (See Note 2). |
| (b) | This security is exempt from registration under rule 144A of the Securities Act of 1933. This security may be sold in transactions that are exempt from registration, normally to qualified institutional buyers. |
| (c) | Affiliated company (See Note 3). |
| (d) | Rate shown represents annualized 7-day yield as of March 31, 2019. |
| (e) | At March 31, 2019, the total market value of the Fund’s securities on loan identified in the Schedule of Investments was $115,479,838 and the total market value of the collateral held by the Fund was $130,887,792. The total market value of the collateral includes non-cash U.S. Government securities collateral having a value of $102,603,235. |
ADR – American Depositary Receipt
GDR – Global Depositary Receipt
NVDR – Non-Voting Depositary Receipt
Reg S – Regulation S provides an exclusion from the registration requirements of the Securities Act of 1933. These securities may be resold in transactions exempt from registration, normally to qualified institutional buyers.
| FINANCIAL DERIVATIVE INSTRUMENTS | ||||||||||||||||||||||||||||
| FOREIGN CURRENCY CONTRACTS (OTC – OVER THE COUNTER) | ||||||||||||||||||||||||||||
| Counterparty | Settlement Date |
Amount and Description of Currency to be Purchased |
Amount and Description of Currency to be Sold |
Unrealized Appreciation |
Unrealized Depreciation |
|||||||||||||||||||||||
| Banco De Investimentos Credit Suisse (Brasil) S.A. |
4/3/2019 | 1,411,804 | BRL | 362,820 | USD | $ | — | $ | (47 | ) | ||||||||||||||||||
| Citibank N.A. |
4/1/2019 | 423,149 | MXN | 21,781 | USD | 33 | — | |||||||||||||||||||||
| Credit Suisse International |
4/1/2019 | 117,538,137 | KRW | 103,512 | USD | 37 | — | |||||||||||||||||||||
| Deutsche Bank AG |
4/1/2019 | 68,186,442 | TWD | 2,212,050 | USD | 323 | — | |||||||||||||||||||||
| Merrill Lynch International |
4/2/2019 | 949,121 | MYR | 232,628 | USD | — | (142 | ) | ||||||||||||||||||||
| Morgan Stanley & Co. International |
4/1/2019 | 3,355,130 | CNY | 499,311 | USD | — | (50 | ) | ||||||||||||||||||||
| Morgan Stanley & Co. International |
4/1/2019 | 1,106,040 | USD | 15,964,653 | ZAR | — | (983 | ) | ||||||||||||||||||||
| Royal Bank of Canada |
4/1/2019 | 1,082,933 | USD | 6,070,163 | TRY | 8,492 | — | |||||||||||||||||||||
| State Street Bank and Trust |
4/2/2019 | 22,357,648 | INR | 323,190 | USD | — | (453 | ) | ||||||||||||||||||||
| $ | 8,885 | $ | (1,675 | ) | ||||||||||||||||||||||||
| CURRENCY LEGEND | ||
| BRL | Brazilian real | |
| CNY | Chinese yuan | |
| INR | Indian rupee | |
| KRW | South Korean won | |
| MXN | Mexican peso | |
| MYR | Malaysian ringgit | |
| TRY | Turkish new lira | |
| TWD | New Taiwan dollar | |
| USD | U.S. dollar | |
| ZAR | South African rand |
See Notes to Financial Statements.
| 40 | WisdomTree Trust |
Schedule of Investments
WisdomTree Emerging Markets Multifactor Fund (EMMF)
March 31, 2019
| Investments | Shares | Value | ||||||
| COMMON STOCKS – 99.5% | ||||||||
| Brazil – 6.2% | ||||||||
| Banco Santander Brasil S.A. |
6,447 | $ | 72,841 | |||||
| Cia Brasileira de Distribuicao (Preference Shares) |
2,000 | 47,003 | ||||||
| Hypera S.A. |
17,933 | 119,347 | ||||||
| IRB Brasil Resseguros S.A. |
11,908 | 279,211 | ||||||
| Itausa – Investimentos Itau S.A. (Preference Shares) |
24,386 | 75,068 | ||||||
| Lojas Renner S.A. |
8,008 | 90,128 | ||||||
| Magazine Luiza S.A. |
1,035 | 45,970 | ||||||
| Sul America S.A. |
31,260 | 239,368 | ||||||
| Telefonica Brasil S.A. (Preference Shares) |
8,544 | 104,283 | ||||||
| TIM Participacoes S.A. |
30,304 | 91,807 | ||||||
|
|
|
|||||||
| Total Brazil |
|
1,165,026 | ||||||
| Chile – 0.4% | ||||||||
| Embotelladora Andina S.A. Class B, (Preference Shares) |
22,222 | 81,152 | ||||||
| China – 37.4% |
| |||||||
| Agricultural Bank of China Ltd. Class H |
152,000 | 70,095 | ||||||
| Angang Steel Co., Ltd. Class H |
84,000 | 61,422 | ||||||
| Anhui Conch Cement Co., Ltd. Class H |
12,500 | 76,354 | ||||||
| ANTA Sports Products Ltd. |
7,000 | 47,618 | ||||||
| Bank of China Ltd. Class H |
149,000 | 67,572 | ||||||
| Bank of Communications Co., Ltd. Class H |
286,000 | 234,266 | ||||||
| Bank of Guiyang Co., Ltd. Class A |
30,200 | 58,646 | ||||||
| Bank of Jiangsu Co., Ltd. Class A |
50,500 | 53,579 | ||||||
| Bank of Nanjing Co., Ltd. Class A |
52,300 | 61,560 | ||||||
| Bank of Ningbo Co., Ltd. Class A |
14,800 | 46,777 | ||||||
| Baoshan Iron & Steel Co., Ltd. Class A |
59,300 | 63,799 | ||||||
| BYD Electronic International Co., Ltd. |
84,500 | 108,936 | ||||||
| China Cinda Asset Management Co., Ltd. Class H |
716,000 | 198,839 | ||||||
| China CITIC Bank Corp., Ltd. Class H |
334,000 | 212,740 | ||||||
| China Coal Energy Co., Ltd. Class H |
201,000 | 83,217 | ||||||
| China Communications Construction Co., Ltd. Class H |
147,000 | 152,057 | ||||||
| China Construction Bank Corp. Class H |
218,000 | 186,898 | ||||||
| China Everbright Bank Co., Ltd. Class H |
404,000 | 190,936 | ||||||
| China International Capital Corp., Ltd. Class H(a) |
10,400 | 24,086 | ||||||
| China Longyuan Power Group Corp., Ltd. Class H |
169,000 | 117,547 | ||||||
| China Medical System Holdings Ltd. |
46,000 | 44,594 | ||||||
| China Mengniu Dairy Co., Ltd.* |
10,000 | 37,198 | ||||||
| China Merchants Bank Co., Ltd. Class H |
13,000 | 63,179 | ||||||
| China Minsheng Banking Corp., Ltd. Class H |
101,500 | 73,701 | ||||||
| China Mobile Ltd. |
16,000 | 163,058 | ||||||
| China Oriental Group Co., Ltd. |
92,000 | 57,779 | ||||||
| China Pacific Insurance Group Co., Ltd. Class H |
17,400 | 68,270 | ||||||
| China Railway Construction Corp., Ltd. Class H |
33,000 | 43,216 | ||||||
| China Railway Group Ltd. Class H |
202,000 | 184,246 | ||||||
| China Resources Sanjiu Medical & Pharmaceutical Co., Ltd. Class A |
16,100 | 69,094 | ||||||
| China Shenhua Energy Co., Ltd. Class H |
31,000 | 70,688 | ||||||
| China Taiping Insurance Holdings Co., Ltd. |
10,400 | 31,001 | ||||||
| China Telecom Corp., Ltd. Class H |
290,000 | 161,071 | ||||||
| China Unicom Hong Kong Ltd. |
110,000 | 139,428 | ||||||
| Chongqing Rural Commercial Bank Co., Ltd. Class H |
69,000 | 39,818 | ||||||
| CITIC Ltd. |
99,000 | 147,807 | ||||||
| CNOOC Ltd. |
86,000 | 161,046 | ||||||
| Dali Foods Group Co., Ltd.(a) |
74,500 | 55,709 | ||||||
| Daqin Railway Co., Ltd. Class A |
70,100 | 86,997 | ||||||
| Dongfeng Motor Group Co., Ltd. Class H |
112,000 | 112,143 | ||||||
| Fuyao Glass Industry Group Co., Ltd. Class H(a) |
17,600 | 59,078 | ||||||
| Gree Electric Appliances, Inc. of Zhuhai Class A |
7,300 | 51,283 | ||||||
| Greenland Holdings Group Co., Ltd. Class A |
73,900 | 82,915 | ||||||
| Guotai Junan Securities Co., Ltd. Class H(a) |
21,400 | 47,707 | ||||||
| Huaneng Renewables Corp., Ltd. Class H |
188,000 | 52,209 | ||||||
| Huatai Securities Co., Ltd. Class H(a) |
22,800 | 45,600 | ||||||
| Industrial & Commercial Bank of China Ltd. Class H |
97,000 | 71,051 | ||||||
| Industrial Bank Co., Ltd. Class A |
21,600 | 58,402 | ||||||
| Inner Mongolia Yitai Coal Co., Ltd. Class B |
114,800 | 141,319 | ||||||
| Jiangsu Expressway Co., Ltd. Class H |
76,000 | 107,466 | ||||||
| Jiangxi Copper Co., Ltd. Class H |
80,000 | 106,192 | ||||||
| Jiayuan International Group Ltd. |
6,000 | 3,172 | ||||||
| Jinke Properties Group Co., Ltd. Class A |
82,700 | 89,835 | ||||||
| Kunlun Energy Co., Ltd. |
112,000 | 116,994 | ||||||
| Lee & Man Paper Manufacturing Ltd. |
94,000 | 80,110 | ||||||
| Lenovo Group Ltd. |
154,000 | 138,503 | ||||||
| Maanshan Iron & Steel Co., Ltd. Class H |
150,000 | 73,376 | ||||||
| Metallurgical Corp. of China Ltd. Class H |
346,000 | 102,258 | ||||||
| New China Life Insurance Co., Ltd. Class H |
6,500 | 33,121 | ||||||
| Noah Holdings Ltd. ADR* |
800 | 38,768 | ||||||
| People’s Insurance Co. Group of China Ltd. (The) Class H |
110,000 | 47,083 | ||||||
| PetroChina Co., Ltd. Class H |
122,000 | 79,106 | ||||||
| Ping An Insurance Group Co. of China Ltd. Class H |
7,000 | 78,383 | ||||||
| Postal Savings Bank of China Co., Ltd. Class H(a) |
111,000 | 63,490 | ||||||
| RiseSun Real Estate Development Co., Ltd. Class A |
28,500 | 47,711 | ||||||
| Shaanxi Coal Industry Co., Ltd. Class A |
46,400 | 61,520 | ||||||
| Shandong Buchang Pharmaceuticals Co., Ltd. Class A |
15,700 | 67,681 | ||||||
| Shanghai Industrial Holdings Ltd. |
62,000 | 145,958 | ||||||
| Shanghai Pharmaceuticals Holding Co., Ltd. Class H |
43,200 | 94,105 | ||||||
| Shui On Land Ltd. |
383,500 | 94,776 | ||||||
| Sinopec Shanghai Petrochemical Co., Ltd. Class H |
264,000 | 125,779 | ||||||
| Sun Art Retail Group Ltd. |
25,500 | 24,850 | ||||||
| Tingyi Cayman Islands Holding Corp. |
16,000 | 26,375 | ||||||
| Tong Ren Tang Technologies Co., Ltd. Class H |
71,000 | 95,331 | ||||||
| Weichai Power Co., Ltd. Class H |
35,000 | 55,911 | ||||||
| Weifu High-Technology Group Co., Ltd. Class A |
22,800 | 78,339 | ||||||
| Yanzhou Coal Mining Co., Ltd. Class H |
38,000 | 37,323 | ||||||
| Yum China Holdings, Inc. |
2,371 | 106,482 | ||||||
| Yuzhou Properties Co., Ltd. |
128,000 | 77,290 | ||||||
| Zhejiang Expressway Co., Ltd. Class H |
96,000 | 110,064 | ||||||
| Zhongsheng Group Holdings Ltd. |
15,000 | 37,223 | ||||||
| Zijin Mining Group Co., Ltd. Class H |
208,000 | 86,115 | ||||||
|
|
|
|||||||
| Total China |
|
7,067,241 | ||||||
| Hungary – 0.6% | ||||||||
| MOL Hungarian Oil & Gas PLC |
9,624 | 110,136 | ||||||
See Notes to Financial Statements.
| WisdomTree Trust | 41 |
Schedule of Investments (continued)
WisdomTree Emerging Markets Multifactor Fund (EMMF)
March 31, 2019
| Investments | Shares | Value | ||||||
| India – 10.5% |
| |||||||
| Bajaj Auto Ltd. |
2,260 | $ | 94,971 | |||||
| Coal India Ltd. |
25,531 | 87,419 | ||||||
| Dr. Reddy’s Laboratories Ltd. |
664 | 26,649 | ||||||
| Dr. Reddy’s Laboratories Ltd. ADR |
1,829 | 74,074 | ||||||
| GAIL India Ltd. |
14,917 | 74,860 | ||||||
| HCL Technologies Ltd. |
12,778 | 200,584 | ||||||
| Infosys Ltd. ADR |
17,339 | 189,515 | ||||||
| JSW Steel Ltd. |
1,915 | 8,101 | ||||||
| Nestle India Ltd. |
493 | 78,004 | ||||||
| Oil & Natural Gas Corp., Ltd. |
45,273 | 104,401 | ||||||
| Petronet LNG Ltd. |
30,329 | 110,130 | ||||||
| Power Grid Corp. of India Ltd. |
38,233 | 109,221 | ||||||
| Tata Consultancy Services Ltd. |
6,359 | 183,739 | ||||||
| Tata Steel Ltd. |
13,761 | 103,493 | ||||||
| Tech Mahindra Ltd. |
15,644 | 175,217 | ||||||
| Titan Co., Ltd. |
6,706 | 110,534 | ||||||
| UPL Ltd. |
2,515 | 34,811 | ||||||
| Wipro Ltd. |
18,591 | 68,379 | ||||||
| Wipro Ltd. ADR |
36,899 | 146,858 | ||||||
|
|
|
|||||||
| Total India |
|
1,980,960 | ||||||
| Indonesia – 2.2% | ||||||||
| Astra International Tbk PT |
157,200 | 80,863 | ||||||
| Bank Tabungan Negara Persero Tbk PT |
141,900 | 24,314 | ||||||
| Bukit Asam Tbk PT |
195,900 | 57,780 | ||||||
| Charoen Pokphand Indonesia Tbk PT |
94,600 | 42,517 | ||||||
| Gudang Garam Tbk PT |
15,400 | 89,978 | ||||||
| Indofood CBP Sukses Makmur Tbk PT |
123,700 | 81,004 | ||||||
| Unilever Indonesia Tbk PT |
14,000 | 48,395 | ||||||
|
|
|
|||||||
| Total Indonesia |
|
424,851 | ||||||
| Malaysia – 3.7% | ||||||||
| CIMB Group Holdings Bhd |
63,300 | 79,852 | ||||||
| Hong Leong Bank Bhd |
15,800 | 78,565 | ||||||
| Malayan Banking Bhd |
36,700 | 83,333 | ||||||
| Malaysia Airports Holdings Bhd |
53,500 | 94,878 | ||||||
| Petronas Chemicals Group Bhd |
35,800 | 80,325 | ||||||
| RHB Bank Bhd |
116,700 | 162,937 | ||||||
| Tenaga Nasional Bhd |
37,600 | 116,599 | ||||||
|
|
|
|||||||
| Total Malaysia |
|
696,489 | ||||||
| Mexico – 3.3% | ||||||||
| Alfa S.A.B. de C.V. Class A |
96,400 | 102,525 | ||||||
| Alsea S.A.B. de C.V. |
19,159 | 40,170 | ||||||
| America Movil S.A.B. de C.V. Series L |
164,200 | 117,494 | ||||||
| Coca-Cola Femsa S.A.B. de C.V. Series L |
14,100 | 93,268 | ||||||
| Gruma S.A.B. de C.V. Class B |
5,783 | 59,090 | ||||||
| Grupo Bimbo S.A.B. de C.V. Series A |
38,600 | 80,752 | ||||||
| Megacable Holdings S.A.B. de C.V. Series CPO |
27,000 | 125,371 | ||||||
| Mexichem S.A.B. de C.V. |
3,265 | 7,812 | ||||||
|
|
|
|||||||
| Total Mexico |
|
626,482 | ||||||
| Philippines – 1.1% | ||||||||
| DMCI Holdings, Inc. |
281,000 | 64,216 | ||||||
| Manila Electric Co. |
13,940 | 100,880 | ||||||
| Metro Pacific Investments Corp. |
514,000 | 47,475 | ||||||
|
|
|
|||||||
| Total Philippines |
|
212,571 | ||||||
| Poland – 0.9% | ||||||||
| Grupa Lotos S.A. |
4,070 | 88,537 | ||||||
| Powszechny Zaklad Ubezpieczen S.A. |
7,809 | 82,493 | ||||||
|
|
|
|||||||
| Total Poland |
|
171,030 | ||||||
| Russia – 4.4% | ||||||||
| Gazprom PJSC ADR |
28,217 | 127,372 | ||||||
| Lukoil PJSC ADR |
1,439 | 128,934 | ||||||
| Magnitogorsk Iron & Steel Works PJSC GDR Reg S |
6,707 | 60,095 | ||||||
| MMC Norilsk Nickel PJSC ADR |
4,653 | 98,271 | ||||||
| Novolipetsk Steel PJSC GDR Reg S |
5,104 | 131,020 | ||||||
| Rosneft Oil Co. PJSC GDR Reg S |
5,117 | 32,135 | ||||||
| Severstal PJSC GDR Reg S |
9,367 | 146,125 | ||||||
| Tatneft PJSC ADR |
1,442 | 99,786 | ||||||
|
|
|
|||||||
| Total Russia |
|
823,738 | ||||||
| South Africa – 2.1% | ||||||||
| Capitec Bank Holdings Ltd. |
437 | 40,908 | ||||||
| Investec Ltd. |
7,153 | 41,833 | ||||||
| Pick n Pay Stores Ltd. |
9,983 | 45,972 | ||||||
| PSG Group Ltd. |
2,159 | 39,149 | ||||||
| Telkom S.A. SOC Ltd. |
30,884 | 156,163 | ||||||
| Woolworths Holdings Ltd. |
19,693 | 63,471 | ||||||
|
|
|
|||||||
| Total South Africa |
|
387,496 | ||||||
| South Korea – 11.1% | ||||||||
| Coway Co., Ltd. |
1,968 | 163,841 | ||||||
| DB Insurance Co., Ltd. |
2,377 | 143,864 | ||||||
| GS Engineering & Construction Corp. |
3,925 | 147,304 | ||||||
| KT Corp. ADR |
15,122 | 188,118 | ||||||
| KT&G Corp. |
1,737 | 158,382 | ||||||
| Kumho Petrochemical Co., Ltd. |
1,810 | 151,803 | ||||||
| LG Uplus Corp. |
13,432 | 182,825 | ||||||
| Samsung Electronics Co., Ltd. |
6,635 | 260,993 | ||||||
| Samsung SDS Co., Ltd. |
1,143 | 236,635 | ||||||
| SK Hynix, Inc. |
3,989 | 260,756 | ||||||
| SK Telecom Co., Ltd. |
913 | 202,290 | ||||||
|
|
|
|||||||
| Total South Korea |
|
2,096,811 | ||||||
| Taiwan – 12.0% | ||||||||
| Advantech Co., Ltd. |
18,000 | 149,511 | ||||||
| Cathay Financial Holding Co., Ltd. |
31,000 | 45,212 | ||||||
| Chailease Holding Co., Ltd. |
6,000 | 24,529 | ||||||
| Chicony Electronics Co., Ltd. |
59,000 | 137,256 | ||||||
| China Airlines Ltd. |
219,000 | 70,062 | ||||||
| China Development Financial Holding Corp. |
341,000 | 113,960 | ||||||
| China Life Insurance Co., Ltd. |
110,000 | 93,331 | ||||||
| China Steel Corp. |
111,000 | 91,118 | ||||||
| Compal Electronics, Inc. |
104,000 | 64,619 | ||||||
| Eva Airways Corp. |
158,000 | 77,410 | ||||||
| Feng TAY Enterprise Co., Ltd. |
5,000 | 35,366 | ||||||
| Formosa Chemicals & Fibre Corp. |
14,000 | 50,875 | ||||||
| Globalwafers Co., Ltd. |
7,000 | 68,818 | ||||||
| Highwealth Construction Corp. |
48,000 | 79,116 | ||||||
See Notes to Financial Statements.
| 42 | WisdomTree Trust |
Schedule of Investments (concluded)
WisdomTree Emerging Markets Multifactor Fund (EMMF)
March 31, 2019
| Investments | Shares | Value | ||||||
| Pou Chen Corp. |
65,000 | $ | 79,192 | |||||
| President Chain Store Corp. |
7,000 | 68,931 | ||||||
| Ruentex Development Co., Ltd. |
44,600 | 67,434 | ||||||
| Ruentex Industries Ltd. |
22,800 | 59,847 | ||||||
| Standard Foods Corp. |
25,000 | 42,018 | ||||||
| Taiwan Business Bank |
113,000 | 43,997 | ||||||
| Taiwan Cement Corp. |
52,000 | 69,597 | ||||||
| Taiwan High Speed Rail Corp. |
55,000 | 64,243 | ||||||
| Taiwan Mobile Co., Ltd. |
15,000 | 54,266 | ||||||
| Uni-President Enterprises Corp. |
16,000 | 38,831 | ||||||
| Walsin Technology Corp. |
13,000 | 84,359 | ||||||
| WPG Holdings Ltd. |
115,960 | 151,250 | ||||||
| Yageo Corp. |
7,000 | 73,360 | ||||||
| Yuanta Financial Holding Co., Ltd. |
227,000 | 129,260 | ||||||
| Zhen Ding Technology Holding Ltd. |
42,000 | 130,413 | ||||||
|
|
|
|||||||
| Total Taiwan |
|
2,258,181 | ||||||
| Thailand – 3.4% | ||||||||
| Advanced Info Service PCL NVDR |
15,800 | 91,609 | ||||||
| Bangkok Bank PCL NVDR |
11,000 | 71,750 | ||||||
| Bangkok Dusit Medical Services PCL NVDR |
135,900 | 106,202 | ||||||
| Electricity Generating PCL NVDR |
13,300 | 122,376 | ||||||
| Home Product Center PCL NVDR |
226,200 | 109,055 | ||||||
| TMB Bank PCL NVDR |
1,091,500 | 70,164 | ||||||
| True Corp. PCL NVDR |
510,300 | 76,541 | ||||||
|
|
|
|||||||
| Total Thailand |
|
647,697 | ||||||
| Turkey – 0.2% | ||||||||
| Turk Hava Yollari AO* |
4,685 | 10,722 | ||||||
| Turkiye Garanti Bankasi AS |
20,351 | 30,043 | ||||||
|
|
|
|||||||
| Total Turkey |
|
40,765 | ||||||
| TOTAL INVESTMENTS IN SECURITIES – 99.5% (Cost: $18,075,814) |
|
18,790,626 | ||||||
| Other Assets less Liabilities – 0.5% |
|
94,992 | ||||||
|
|
|
|||||||
| NET ASSETS – 100.0% |
|
$ | 18,885,618 | |||||
| * | Non-income producing security. |
| (a) | This security is exempt from registration under rule 144A of the Securities Act of 1933. This security may be sold in transactions that are exempt from registration, normally to qualified institutional buyers. |
ADR – American Depositary Receipt
GDR – Global Depositary Receipt
NVDR – Non-Voting Depositary Receipt
Reg S – Regulation S provides an exclusion from the registration requirements of the Securities Act of 1933. These securities may be resold in transactions exempt from registration, normally to qualified institutional buyers.
| FINANCIAL DERIVATIVE INSTRUMENTS | ||||||||||||||||||||||||||||
| FOREIGN CURRENCY CONTRACTS (OTC – OVER THE COUNTER) | ||||||||||||||||||||||||||||
| Counterparty | Settlement Date |
Amount and Description of Currency to be Purchased |
Amount and Description of Currency to be Sold |
Unrealized Appreciation |
Unrealized Depreciation |
|||||||||||||||||||||||
| Bank of America N.A. |
4/1/2019 | 195,833 | HKD | 24,947 | USD | $ | — | $ | (1 | ) | ||||||||||||||||||
| Bank of America N.A. |
4/1/2019 | 525,924 | HUF | 1,843 | USD | — | (7 | ) | ||||||||||||||||||||
| Bank of America N.A. |
4/1/2019 | 76,178 | MXN | 3,933 | USD | — | (6 | ) | ||||||||||||||||||||
| Bank of America N.A. |
4/2/2019 | 27,215 | ZAR | 1,861 | USD | 26 | — | |||||||||||||||||||||
| Citibank N.A. |
4/9/2019 | 47,880 | USD | 265,611 | TRY | 1,475 | — | |||||||||||||||||||||
| Citibank N.A. |
4/10/2019 | 1,193,339 | USD | 4,641,732 | BRL | 1,261 | — | |||||||||||||||||||||
| Citibank N.A. |
4/10/2019 | 396,448 | USD | 5,641,596 | ZAR | 5,632 | — | |||||||||||||||||||||
| HSBC Holdings PLC |
4/2/2019 | 28,512 | MXN | 1,467 | USD | 2 | — | |||||||||||||||||||||
| HSBC Holdings PLC |
4/10/2019 | 2,132,615 | USD | 2,405,269,758 | KRW | 13,129 | — | |||||||||||||||||||||
| Merrill Lynch International |
4/1/2019 | 7,531 | MYR | 1,848 | USD | — | (3 | ) | ||||||||||||||||||||
| Merrill Lynch International |
4/1/2019 | 122,408 | THB | 3,854 | USD | 3 | — | |||||||||||||||||||||
| Merrill Lynch International |
4/2/2019 | 15,539 | BRL | 3,918 | USD | 75 | — | |||||||||||||||||||||
| $ | 21,603 | $ | (17 | ) | ||||||||||||||||||||||||
| CURRENCY LEGEND | ||
| BRL | Brazilian real | |
| HKD | Hong Kong dollar | |
| HUF | Hungary forint | |
| KRW | South Korean won | |
| MXN | Mexican peso | |
| MYR | Malaysian ringgit | |
| THB | Thai baht | |
| TRY | Turkish new lira | |
| USD | U.S. dollar | |
| ZAR | South African rand | |
See Notes to Financial Statements.
| WisdomTree Trust | 43 |
Schedule of Investments
WisdomTree Emerging Markets Quality Dividend Growth Fund (DGRE)
March 31, 2019
| Investments | Shares | Value | ||||||
| COMMON STOCKS – 99.9% |
| |||||||
| Brazil – 4.4% |
| |||||||
| Banco do Brasil S.A. |
18,871 | $ | 236,245 | |||||
| Banco Santander Brasil S.A. |
18,453 | 208,489 | ||||||
| Bradespar S.A. (Preference Shares) |
16,432 | 134,692 | ||||||
| Braskem S.A. Class A, (Preference Shares) |
12,098 | 158,231 | ||||||
| Estacio Participacoes S.A. |
31,686 | 216,576 | ||||||
| Itau Unibanco Holding S.A. (Preference Shares) |
51,870 | 458,896 | ||||||
| Lojas Renner S.A. |
25,418 | 286,073 | ||||||
| Magazine Luiza S.A. |
5,044 | 224,029 | ||||||
| Multiplan Empreendimentos Imobiliarios S.A. |
30,820 | 185,235 | ||||||
| Odontoprev S.A. |
51,665 | 217,721 | ||||||
| Porto Seguro S.A. |
14,175 | 196,069 | ||||||
| Raia Drogasil S.A. |
12,188 | 204,506 | ||||||
| Sao Martinho S.A. |
35,031 | 165,087 | ||||||
| SLC Agricola S.A. |
15,207 | 160,444 | ||||||
|
|
|
|||||||
| Total Brazil |
|
3,052,293 | ||||||
| Chile – 1.7% | ||||||||
| Cia Cervecerias Unidas S.A. |
16,932 | 242,409 | ||||||
| Colbun S.A. |
948,652 | 214,413 | ||||||
| Embotelladora Andina S.A. Class B, (Preference Shares) |
52,040 | 190,043 | ||||||
| Empresas CMPC S.A. |
45,896 | 161,873 | ||||||
| Latam Airlines Group S.A. |
19,877 | 211,338 | ||||||
| SONDA S.A. |
106,919 | 161,052 | ||||||
|
|
|
|||||||
| Total Chile |
|
1,181,128 | ||||||
| China – 33.9% | ||||||||
| AAC Technologies Holdings, Inc. |
29,000 | 171,600 | ||||||
| Agile Group Holdings Ltd. |
186,000 | 300,919 | ||||||
| Agricultural Bank of China Ltd. Class H |
576,000 | 265,622 | ||||||
| Air China Ltd. Class H |
212,000 | 260,883 | ||||||
| Anhui Conch Cement Co., Ltd. Class A |
27,900 | 158,510 | ||||||
| Anhui Conch Cement Co., Ltd. Class H |
32,000 | 195,466 | ||||||
| ANTA Sports Products Ltd. |
59,000 | 401,353 | ||||||
| Anxin Trust Co., Ltd. Class A |
162,100 | 174,397 | ||||||
| BAIC Motor Corp., Ltd. Class H(a) |
340,000 | 222,193 | ||||||
| Bank of China Ltd. Class H |
1,089,000 | 493,868 | ||||||
| Beijing Capital International Airport Co., Ltd. Class H |
194,000 | 184,116 | ||||||
| BYD Electronic International Co., Ltd.(b) |
152,500 | 196,600 | ||||||
| China Cinda Asset Management Co., Ltd. Class H |
825,000 | 229,110 | ||||||
| China CITIC Bank Corp., Ltd. Class H |
346,000 | 220,384 | ||||||
| China Gas Holdings Ltd. |
77,400 | 272,134 | ||||||
| China International Travel Service Corp., Ltd. Class A |
17,800 | 185,623 | ||||||
| China Jinmao Holdings Group Ltd. |
496,000 | 323,508 | ||||||
| China Longyuan Power Group Corp., Ltd. Class H |
259,000 | 180,146 | ||||||
| China Medical System Holdings Ltd. |
183,000 | 177,406 | ||||||
| China Mobile Ltd. |
66,500 | 677,711 | ||||||
| China National Building Material Co., Ltd. Class H |
188,000 | 148,246 | ||||||
| China Petroleum & Chemical Corp. Class H |
466,000 | 367,460 | ||||||
| China Railway Construction Corp., Ltd. Class H |
160,000 | 209,530 | ||||||
| China Resources Beer Holdings Co., Ltd. |
70,000 | 294,715 | ||||||
| China Resources Cement Holdings Ltd. |
154,000 | 158,905 | ||||||
| China Resources Gas Group Ltd. |
56,000 | 263,951 | ||||||
| China Shenhua Energy Co., Ltd. Class H |
117,500 | 267,932 | ||||||
| China Southern Airlines Co., Ltd. Class H |
322,000 | 287,956 | ||||||
| China Yangtze Power Co., Ltd. Class A |
55,000 | 138,069 | ||||||
| China ZhengTong Auto Services Holdings Ltd. |
322,500 | 179,122 | ||||||
| Country Garden Holdings Co., Ltd. |
261,000 | 407,628 | ||||||
| CRRC Corp., Ltd. Class H |
226,000 | 213,046 | ||||||
| CSPC Pharmaceutical Group Ltd. |
156,000 | 290,142 | ||||||
| Dongyue Group Ltd. |
231,000 | 160,377 | ||||||
| Fufeng Group Ltd.*(b) |
299,000 | 156,928 | ||||||
| Future Land Development Holdings Ltd. |
368,000 | 455,667 | ||||||
| Fuyao Glass Industry Group Co., Ltd. Class H(a) |
59,200 | 198,717 | ||||||
| Ganfeng Lithium Co., Ltd. Class A |
30,000 | 123,166 | ||||||
| Geely Automobile Holdings Ltd. |
166,000 | 317,199 | ||||||
| Gree Electric Appliances, Inc. of Zhuhai Class A |
20,400 | 143,312 | ||||||
| Greenland Holdings Group Co., Ltd. Class A |
130,600 | 146,532 | ||||||
| Greentown Service Group Co., Ltd. |
296,000 | 262,442 | ||||||
| Guangzhou Automobile Group Co., Ltd. Class H |
196,400 | 231,929 | ||||||
| Haier Electronics Group Co., Ltd.* |
93,000 | 270,116 | ||||||
| Haitian International Holdings Ltd. |
104,000 | 236,353 | ||||||
| Hangzhou Hikvision Digital Technology Co., Ltd. Class A |
48,200 | 251,536 | ||||||
| Hangzhou Robam Appliances Co., Ltd. Class A |
32,200 | 154,287 | ||||||
| Huadong Medicine Co., Ltd. Class A |
19,200 | 93,226 | ||||||
| Huaneng Renewables Corp., Ltd. Class H |
722,000 | 200,506 | ||||||
| Inner Mongolia Yili Industrial Group Co., Ltd. Class A |
33,900 | 146,845 | ||||||
| Jiangsu Expressway Co., Ltd. Class H |
156,000 | 220,587 | ||||||
| Jiangsu Hengrui Medicine Co., Ltd. Class A |
19,800 | 192,750 | ||||||
| Jiangsu Yanghe Brewery Joint-Stock Co., Ltd. Class A |
7,600 | 147,494 | ||||||
| Jinke Properties Group Co., Ltd. Class A |
135,200 | 146,865 | ||||||
| Kingboard Holdings Ltd. |
73,500 | 260,763 | ||||||
| Kingboard Laminates Holdings Ltd. |
202,000 | 212,294 | ||||||
| Kunlun Energy Co., Ltd. |
196,000 | 204,740 | ||||||
| Kweichow Moutai Co., Ltd. Class A |
3,100 | 393,942 | ||||||
| Lee & Man Paper Manufacturing Ltd. |
181,000 | 154,255 | ||||||
| Logan Property Holdings Co., Ltd. |
252,000 | 417,328 | ||||||
| Longfor Group Holdings Ltd. |
104,500 | 368,082 | ||||||
| LONGi Green Energy Technology Co., Ltd. Class A |
53,000 | 205,842 | ||||||
| New China Life Insurance Co., Ltd. Class H |
39,700 | 202,294 | ||||||
| Nexteer Automotive Group Ltd. |
159,000 | 196,473 | ||||||
| Ping An Insurance Group Co. of China Ltd. Class A |
26,100 | 299,442 | ||||||
| Ping An Insurance Group Co. of China Ltd. Class H |
67,500 | 755,833 | ||||||
| RiseSun Real Estate Development Co., Ltd. Class A |
108,500 | 181,635 | ||||||
| Shanghai 2345 Network Holding Group Co., Ltd. Class A |
163,200 | 147,167 | ||||||
| Shanxi Xinghuacun Fen Wine Factory Co., Ltd. Class A |
18,100 | 162,868 | ||||||
| Shenzhen Zhongjin Lingnan Nonfemet Co., Ltd. Class A |
138,500 | 104,078 | ||||||
| Shenzhou International Group Holdings Ltd. |
27,000 | 361,837 | ||||||
| Sihuan Pharmaceutical Holdings Group Ltd. |
935,000 | 226,307 | ||||||
| Silergy Corp. |
15,000 | 223,877 | ||||||
| Sinopec Shanghai Petrochemical Co., Ltd. Class A |
129,800 | 103,721 | ||||||
See Notes to Financial Statements.
| 44 | WisdomTree Trust |
Schedule of Investments (continued)
WisdomTree Emerging Markets Quality Dividend Growth Fund (DGRE)
March 31, 2019
| Investments | Shares | Value | ||||||
| Sinopec Shanghai Petrochemical Co., Ltd. Class H |
362,000 | $ | 172,470 | |||||
| SSY Group Ltd. |
226,000 | 210,167 | ||||||
| Sunac China Holdings Ltd. |
100,000 | 498,092 | ||||||
| Sunny Optical Technology Group Co., Ltd. |
25,400 | 303,346 | ||||||
| Tencent Holdings Ltd. |
58,400 | 2,685,673 | ||||||
| Uni-President China Holdings Ltd. |
225,000 | 220,702 | ||||||
| Weichai Power Co., Ltd. Class A |
93,500 | 164,872 | ||||||
| Weichai Power Co., Ltd. Class H |
237,000 | 378,599 | ||||||
| Wuhu Shunrong Sanqi Interactive Entertainment Network Technology Co., Ltd. Class A |
73,200 | 151,406 | ||||||
| Xinyi Solar Holdings Ltd. |
614,000 | 295,661 | ||||||
| Zhejiang Dahua Technology Co., Ltd. Class A |
54,800 | 133,897 | ||||||
| Zhongsheng Group Holdings Ltd. |
112,000 | 277,933 | ||||||
|
|
|
|||||||
| Total China |
|
23,450,681 | ||||||
| Hong Kong – 0.3% | ||||||||
| China Water Affairs Group Ltd. |
226,000 | 236,078 | ||||||
| Hungary – 0.3% |
| |||||||
| MOL Hungarian Oil & Gas PLC |
20,354 | 232,929 | ||||||
| India – 12.1% |
| |||||||
| Adani Ports & Special Economic Zone Ltd. |
41,829 | 228,331 | ||||||
| AIA Engineering Ltd. |
8,850 | 229,455 | ||||||
| Asian Paints Ltd. |
9,184 | 197,892 | ||||||
| Aurobindo Pharma Ltd. |
17,999 | 203,763 | ||||||
| Bajaj Auto Ltd. |
6,105 | 256,547 | ||||||
| Balkrishna Industries Ltd. |
14,383 | 206,688 | ||||||
| Bharat Forge Ltd. |
22,885 | 169,271 | ||||||
| Britannia Industries Ltd. |
5,064 | 225,550 | ||||||
| Container Corp. of India Ltd. |
26,242 | 198,988 | ||||||
| Eicher Motors Ltd. |
734 | 217,712 | ||||||
| GAIL India Ltd. |
49,450 | 248,160 | ||||||
| Godrej Consumer Products Ltd. |
27,315 | 270,488 | ||||||
| Hindustan Unilever Ltd. |
13,571 | 334,363 | ||||||
| Info Edge India Ltd. |
11,004 | 292,680 | ||||||
| Infosys Ltd. |
53,332 | 572,660 | ||||||
| InterGlobe Aviation Ltd.(a) |
15,321 | 315,853 | ||||||
| JSW Steel Ltd. |
40,039 | 169,375 | ||||||
| Larsen & Toubro Infotech Ltd.(a) |
8,696 | 213,725 | ||||||
| Marico Ltd. |
50,601 | 253,206 | ||||||
| Maruti Suzuki India Ltd. |
3,172 | 305,526 | ||||||
| Motherson Sumi Systems Ltd. |
78,019 | 168,595 | ||||||
| Mphasis Ltd. |
12,398 | 177,375 | ||||||
| Natco Pharma Ltd. |
19,605 | 162,288 | ||||||
| Nestle India Ltd. |
1,827 | 289,075 | ||||||
| Page Industries Ltd. |
634 | 228,544 | ||||||
| Petronet LNG Ltd. |
78,514 | 285,098 | ||||||
| Pidilite Industries Ltd. |
12,410 | 223,255 | ||||||
| Power Grid Corp. of India Ltd. |
78,263 | 223,576 | ||||||
| Reliance Industries Ltd. |
36,730 | 722,803 | ||||||
| Sun Pharmaceutical Industries Ltd. |
27,052 | 186,992 | ||||||
| Titan Co., Ltd. |
20,995 | 346,058 | ||||||
| UPL Ltd. |
18,680 | 258,554 | ||||||
|
|
|
|||||||
| Total India |
|
8,382,446 | ||||||
| Indonesia – 2.5% | ||||||||
| Adaro Energy Tbk PT |
1,873,700 | 176,975 | ||||||
| Bank Central Asia Tbk PT |
181,100 | 352,916 | ||||||
| Bank Danamon Indonesia Tbk PT |
368,600 | 240,729 | ||||||
| Bank Mandiri Persero Tbk PT* |
566,100 | 296,169 | ||||||
| Gudang Garam Tbk PT |
37,700 | 220,270 | ||||||
| Kalbe Farma Tbk PT |
2,333,331 | 249,063 | ||||||
| United Tractors Tbk PT |
92,700 | 176,091 | ||||||
|
|
|
|||||||
| Total Indonesia |
|
1,712,213 | ||||||
| Malaysia – 2.3% | ||||||||
| CIMB Group Holdings Bhd |
152,300 | 192,124 | ||||||
| Hartalega Holdings Bhd |
141,600 | 160,590 | ||||||
| Inari Amertron Bhd |
414,175 | 159,279 | ||||||
| IOI Corp. Bhd |
160,500 | 175,341 | ||||||
| Malaysia Airports Holdings Bhd |
94,500 | 167,588 | ||||||
| My EG Services Bhd |
753,750 | 260,328 | ||||||
| Petronas Chemicals Group Bhd |
86,600 | 194,306 | ||||||
| Petronas Dagangan Bhd |
29,500 | 180,649 | ||||||
| Press Metal Aluminium Holdings Bhd |
111,400 | 123,065 | ||||||
|
|
|
|||||||
| Total Malaysia |
|
1,613,270 | ||||||
| Mexico – 2.2% | ||||||||
| Bolsa Mexicana de Valores S.A.B. de C.V. |
125,858 | 260,573 | ||||||
| Fomento Economico Mexicano S.A.B. de C.V. |
34,625 | 319,787 | ||||||
| Gruma S.A.B. de C.V. Class B |
18,532 | 189,356 | ||||||
| Grupo Aeroportuario del Pacifico S.A.B. de C.V. Class B |
24,286 | 215,748 | ||||||
| Grupo Financiero Inbursa S.A.B. de C.V. Class O |
151,098 | 209,461 | ||||||
| Grupo Mexico S.A.B. de C.V. Series B |
73,222 | 201,424 | ||||||
| Industrias Penoles S.A.B. de C.V. |
8,773 | 109,713 | ||||||
|
|
|
|||||||
| Total Mexico |
|
1,506,062 | ||||||
| Philippines – 1.1% | ||||||||
| International Container Terminal Services, Inc. |
109,120 | 271,605 | ||||||
| Jollibee Foods Corp. |
42,100 | 254,155 | ||||||
| SM Prime Holdings, Inc. |
320,900 | 243,838 | ||||||
|
|
|
|||||||
| Total Philippines |
|
769,598 | ||||||
| Poland – 0.4% | ||||||||
| Polski Koncern Naftowy Orlen S.A. |
10,201 | 259,798 | ||||||
| Russia – 3.3% |
| |||||||
| Lukoil PJSC ADR |
6,211 | 556,506 | ||||||
| Magnitogorsk Iron & Steel Works PJSC GDR Reg S |
16,235 | 145,466 | ||||||
| Novatek PJSC GDR Reg S |
1,794 | 307,492 | ||||||
| Novolipetsk Steel PJSC GDR Reg S |
7,417 | 190,394 | ||||||
| Sberbank of Russia PJSC ADR |
42,267 | 560,460 | ||||||
| Severstal PJSC GDR Reg S |
11,254 | 175,562 | ||||||
| Tatneft PJSC ADR |
5,313 | 367,660 | ||||||
|
|
|
|||||||
| Total Russia |
|
2,303,540 | ||||||
| Singapore – 0.5% | ||||||||
| IGG, Inc. |
230,000 | 318,779 | ||||||
| South Africa – 4.6% |
| |||||||
| African Rainbow Minerals Ltd. |
17,371 | 204,411 | ||||||
| AVI Ltd. |
28,234 | 176,770 | ||||||
See Notes to Financial Statements.
| WisdomTree Trust | 45 |
Schedule of Investments (continued)
WisdomTree Emerging Markets Quality Dividend Growth Fund (DGRE)
March 31, 2019
| Investments | Shares | Value | ||||||
| Capitec Bank Holdings Ltd. |
3,376 | $ | 316,031 | |||||
| Clicks Group Ltd. |
19,433 | 248,228 | ||||||
| Foschini Group Ltd. (The) |
17,204 | 194,453 | ||||||
| KAP Industrial Holdings Ltd. |
317,116 | 154,586 | ||||||
| Mondi Ltd. |
6,560 | 145,008 | ||||||
| Mr. Price Group Ltd. |
12,722 | 167,189 | ||||||
| Pick n Pay Stores Ltd. |
46,477 | 214,027 | ||||||
| PSG Group Ltd. |
12,628 | 228,983 | ||||||
| Shoprite Holdings Ltd. |
16,892 | 185,784 | ||||||
| SPAR Group Ltd. (The) |
14,521 | 193,207 | ||||||
| Standard Bank Group Ltd. |
27,522 | 353,499 | ||||||
| Tiger Brands Ltd. |
10,947 | 201,159 | ||||||
| Truworths International Ltd. |
35,705 | 171,800 | ||||||
|
|
|
|||||||
| Total South Africa |
|
3,155,135 | ||||||
| South Korea – 11.8% | ||||||||
| CJ ENM Co., Ltd. |
953 | 195,621 | ||||||
| Coway Co., Ltd. |
3,000 | 249,758 | ||||||
| Daelim Industrial Co., Ltd. |
3,160 | 268,368 | ||||||
| Douzone Bizon Co., Ltd. |
5,049 | 207,280 | ||||||
| E-Mart, Inc. |
1,027 | 155,620 | ||||||
| GS Holdings Corp. |
3,815 | 177,457 | ||||||
| Hana Financial Group, Inc. |
7,037 | 225,660 | ||||||
| Hotel Shilla Co., Ltd. |
3,066 | 257,683 | ||||||
| KIWOOM Securities Co., Ltd. |
3,513 | 250,995 | ||||||
| Koh Young Technology, Inc. |
2,010 | 151,401 | ||||||
| Korea Investment Holdings Co., Ltd. |
3,586 | 196,186 | ||||||
| Kumho Petrochemical Co., Ltd. |
1,961 | 164,468 | ||||||
| LG Household & Health Care Ltd. |
297 | 370,759 | ||||||
| LG Household & Health Care Ltd. (Preference Shares) |
309 | 227,578 | ||||||
| LG Uplus Corp. |
13,396 | 182,335 | ||||||
| Lotte Chemical Corp. |
798 | 204,228 | ||||||
| LOTTE Fine Chemical Co., Ltd. |
4,217 | 163,835 | ||||||
| Medy-Tox, Inc. |
484 | 248,929 | ||||||
| Meritz Fire & Marine Insurance Co., Ltd. |
12,913 | 276,439 | ||||||
| NAVER Corp. |
2,926 | 319,641 | ||||||
| NCSoft Corp. |
811 | 354,379 | ||||||
| POSCO Chemical Co., Ltd. |
2,110 | 111,904 | ||||||
| S-1 Corp. |
2,357 | 208,685 | ||||||
| S-Oil Corp. |
2,098 | 165,607 | ||||||
| Samsung Electronics Co., Ltd. |
46,925 | 1,845,830 | ||||||
| Samsung SDS Co., Ltd. |
1,465 | 303,299 | ||||||
| SK Hynix, Inc. |
7,676 | 501,770 | ||||||
| Ssangyong Cement Industrial Co., Ltd. |
30,502 | 171,978 | ||||||
|
|
|
|||||||
| Total South Korea |
|
8,157,693 | ||||||
| Taiwan – 11.8% | ||||||||
| Accton Technology Corp. |
79,000 | 319,122 | ||||||
| AU Optronics Corp. |
552,000 | 203,280 | ||||||
| Chailease Holding Co., Ltd. |
70,000 | 286,173 | ||||||
| China Life Insurance Co., Ltd. |
228,000 | 193,449 | ||||||
| China Steel Corp. |
209,000 | 171,564 | ||||||
| Chroma ATE, Inc. |
52,000 | 247,173 | ||||||
| CTBC Financial Holding Co., Ltd. |
377,000 | 250,147 | ||||||
| Feng TAY Enterprise Co., Ltd. |
39,680 | 280,665 | ||||||
| Formosa Chemicals & Fibre Corp. |
61,000 | 221,671 | ||||||
| Global Unichip Corp. |
27,000 | 180,026 | ||||||
| Gourmet Master Co., Ltd. |
31,000 | 206,194 | ||||||
| Grand Pacific Petrochemical |
182,000 | 141,429 | ||||||
| Hota Industrial Manufacturing Co., Ltd. |
43,383 | 159,763 | ||||||
| Lien Hwa Industrial Corp. |
160,000 | 174,689 | ||||||
| Micro-Star International Co., Ltd. |
85,000 | 238,559 | ||||||
| Nan Ya Plastics Corp. |
91,000 | 232,959 | ||||||
| Nien Made Enterprise Co., Ltd. |
32,000 | 281,890 | ||||||
| Parade Technologies Ltd. |
16,000 | 268,393 | ||||||
| President Chain Store Corp. |
24,000 | 236,336 | ||||||
| Realtek Semiconductor Corp. |
55,000 | 324,784 | ||||||
| Taiwan Semiconductor Manufacturing Co., Ltd. |
244,291 | 1,945,894 | ||||||
| TCI Co., Ltd. |
19,000 | 260,151 | ||||||
| Uni-President Enterprises Corp. |
116,000 | 281,527 | ||||||
| Vanguard International Semiconductor Corp. |
106,000 | 228,711 | ||||||
| Win Semiconductors Corp. |
50,000 | 352,850 | ||||||
| Winbond Electronics Corp. |
574,000 | 274,704 | ||||||
| Yageo Corp.(b) |
20,000 | 209,601 | ||||||
|
|
|
|||||||
| Total Taiwan |
|
8,171,704 | ||||||
| Thailand – 4.7% | ||||||||
| Airports of Thailand PCL NVDR |
133,200 | 285,414 | ||||||
| Bangkok Chain Hospital PCL NVDR |
319,800 | 171,312 | ||||||
| Beauty Community PCL NVDR |
837,200 | 175,433 | ||||||
| Central Pattana PCL NVDR |
100,400 | 231,741 | ||||||
| CP ALL PCL NVDR |
112,017 | 263,850 | ||||||
| Energy Absolute PCL NVDR |
157,800 | 238,677 | ||||||
| Home Product Center PCL NVDR |
513,000 | 247,326 | ||||||
| Indorama Ventures PCL NVDR |
93,000 | 145,793 | ||||||
| IRPC PCL NVDR |
1,276,400 | 231,268 | ||||||
| PTT Global Chemical PCL NVDR |
79,500 | 168,469 | ||||||
| PTT PCL NVDR |
213,200 | 322,471 | ||||||
| Siam Global House PCL NVDR |
314,055 | 171,204 | ||||||
| Thai Oil PCL NVDR |
86,100 | 188,560 | ||||||
| Tisco Financial Group PCL NVDR |
84,300 | 234,425 | ||||||
| WHA Corp. PCL NVDR |
1,414,700 | 188,121 | ||||||
|
|
|
|||||||
| Total Thailand |
|
3,264,064 | ||||||
| Turkey – 2.0% | ||||||||
| BIM Birlesik Magazalar AS |
14,474 | 195,221 | ||||||
| Eregli Demir ve Celik Fabrikalari T.A.S. |
102,784 | 165,921 | ||||||
| Ford Otomotiv Sanayi AS |
20,940 | 180,801 | ||||||
| Haci Omer Sabanci Holding AS |
136,025 | 188,763 | ||||||
| TAV Havalimanlari Holding AS |
37,354 | 154,319 | ||||||
| Tekfen Holding AS |
60,163 | 240,030 | ||||||
| Turkiye Garanti Bankasi AS |
164,569 | 242,939 | ||||||
|
|
|
|||||||
| Total Turkey | 1,367,994 | |||||||
| TOTAL COMMON STOCKS (Cost: $60,273,528) |
69,135,405 | |||||||
See Notes to Financial Statements.
| 46 | WisdomTree Trust |
Schedule of Investments (concluded)
WisdomTree Emerging Markets Quality Dividend Growth Fund (DGRE)
March 31, 2019
| Investments | Shares | Value | ||||||
| INVESTMENT OF CASH COLLATERAL FOR SECURITIES LOANED – 0.3% |
| |||||||
| United States – 0.3% |
| |||||||
| State Street Navigator Securities Lending Government Money Market Portfolio, 2.46%(c) |
||||||||
| (Cost: $202,825)(d) | 202,825 | $ | 202,825 | |||||
| TOTAL INVESTMENTS IN SECURITIES—100.2% (Cost: $60,476,353) |
|
69,338,230 | ||||||
| Other Assets less Liabilities – (0.2)% |
|
(149,247 | ) | |||||
|
|
|
|||||||
| NET ASSETS – 100.0% |
|
$ | 69,188,983 | |||||
| * | Non-income producing security. |
| (a) | This security is exempt from registration under rule 144A of the Securities Act of 1933. This security may be sold in transactions that are exempt from registration, normally to qualified institutional buyers. |
| (b) | Security, or portion thereof, was on loan at March 31, 2019 (See Note 2). |
| (c) | Rate shown represents annualized 7-day yield as of March 31, 2019. |
| (d) | At March 31, 2019, the total market value of the Fund’s securities on loan identified in the Schedule of Investments was $439,964 and the total market value of the collateral held by the Fund was $489,423. The total market value of the collateral includes non-cash U.S. Government securities collateral having a value of $286,598. |
ADR – American Depositary Receipt
GDR – Global Depositary Receipt
NVDR – Non-Voting Depositary Receipt
Reg S – Regulation S provides an exclusion from the registration requirements of the Securities Act of 1933. These securities may be resold in transactions exempt from registration, normally to qualified institutional buyers.
| FINANCIAL DERIVATIVE INSTRUMENTS | ||||||||||||||||||||||||||||
| FOREIGN CURRENCY CONTRACTS (OTC – OVER THE COUNTER) | ||||||||||||||||||||||||||||
| Counterparty | Settlement Date |
Amount and Description of Currency to be Purchased |
Amount and Description of Currency to be Sold |
Unrealized Appreciation |
Unrealized Depreciation |
|||||||||||||||||||||||
| State Street Bank and Trust |
4/2/2019 | 1,459 | USD | 5,600 | PLN | $ | — | $ | (2 | ) | ||||||||||||||||||
| CURRENCY LEGEND | ||
| PLN | Polish zloty | |
| USD | U.S. dollar | |
See Notes to Financial Statements.
| WisdomTree Trust | 47 |
Schedule of Investments
WisdomTree Emerging Markets SmallCap Dividend Fund (DGS)
March 31, 2019
| Investments | Shares | Value | ||||||
| COMMON STOCKS – 99.6% | ||||||||
| Brazil – 6.9% | ||||||||
| AES Tiete Energia S.A. |
886,800 | $ | 2,524,795 | |||||
| Alupar Investimento S.A. |
241,019 | 1,438,051 | ||||||
| Arezzo Industria e Comercio S.A. |
98,504 | 1,265,059 | ||||||
| Camil Alimentos S.A. |
366,616 | 641,533 | ||||||
| Cia de Locacao das Americas |
83,825 | 839,822 | ||||||
| Cia de Saneamento de Minas Gerais-COPASA |
351,112 | 5,509,780 | ||||||
| Cia de Saneamento do Parana |
406,544 | 7,829,605 | ||||||
| Cia Hering |
497,250 | 3,819,103 | ||||||
| Cia Paranaense de Energia |
73,794 | 608,677 | ||||||
| CVC Brasil Operadora e Agencia de Viagens S.A. |
75,512 | 1,062,333 | ||||||
| Duratex S.A. |
235,016 | 662,468 | ||||||
| EcoRodovias Infraestrutura e Logistica S.A. |
944,057 | 2,326,363 | ||||||
| EDP – Energias do Brasil S.A. |
943,839 | 4,118,094 | ||||||
| Estacio Participacoes S.A. |
323,490 | 2,211,073 | ||||||
| Ez Tec Empreendimentos e Participacoes S.A. |
454,286 | 3,128,418 | ||||||
| Fleury S.A. |
582,140 | 3,051,534 | ||||||
| Grendene S.A. |
708,081 | 1,524,711 | ||||||
| Guararapes Confeccoes S.A. |
14,425 | 533,751 | ||||||
| Iguatemi Empresa de Shopping Centers S.A. |
133,835 | 1,338,453 | ||||||
| Instituto Hermes Pardini S.A. |
112,769 | 588,229 | ||||||
| Iochpe Maxion S.A. |
312,079 | 1,720,095 | ||||||
| Linx S.A. |
188,615 | 1,793,241 | ||||||
| Mahle-Metal Leve S.A. |
164,258 | 1,025,636 | ||||||
| MRV Engenharia e Participacoes S.A. |
1,189,186 | 4,274,922 | ||||||
| Multiplus S.A. |
361,900 | 2,495,926 | ||||||
| Odontoprev S.A. |
394,155 | 1,661,007 | ||||||
| Qualicorp Consultoria e Corretora de Seguros S.A. |
1,577,416 | 6,355,547 | ||||||
| Sao Martinho S.A. |
349,071 | 1,645,030 | ||||||
| Ser Educacional S.A.(a) |
133,314 | 697,452 | ||||||
| SLC Agricola S.A. |
146,098 | 1,541,430 | ||||||
| Smiles Fidelidade S.A. |
314,206 | 3,851,177 | ||||||
| Sul America S.A. |
429,853 | 3,291,523 | ||||||
| Tegma Gestao Logistica S.A. |
141,412 | 958,565 | ||||||
| TOTVS S.A. |
159,015 | 1,609,885 | ||||||
| Transmissora Alianca de Energia Eletrica S.A. |
2,550,450 | 16,252,836 | ||||||
| Tupy S.A. |
342,624 | 1,595,279 | ||||||
| Valid Solucoes e Servicos de Seguranca em Meios de Pagamento e Identificacao S.A. |
155,194 | 768,852 | ||||||
| Via Varejo S.A. |
239,970 | 260,214 | ||||||
| Wiz Solucoes e Corretagem de Seguros S.A. |
527,968 | 1,153,154 | ||||||
|
|
|
|||||||
| Total Brazil |
|
97,973,623 | ||||||
| Chile – 1.6% |
| |||||||
| CAP S.A. |
246,496 | 2,926,908 | ||||||
| Empresas Lipigas S.A. |
193,254 | 1,570,825 | ||||||
| Engie Energia Chile S.A. |
479,714 | 923,157 | ||||||
| Grupo Security S.A. |
3,108,490 | 1,263,085 | ||||||
| Inversiones Aguas Metropolitanas S.A. |
2,182,439 | 3,335,518 | ||||||
| Inversiones La Construccion S.A. |
154,924 | 2,693,796 | ||||||
| Parque Arauco S.A. |
1,221,014 | 3,265,727 | ||||||
| Ripley Corp. S.A. |
1,458,238 | 1,189,842 | ||||||
| Salfacorp S.A. |
439,500 | 597,858 | ||||||
| Sociedad Matriz SAAM S.A. |
14,992,042 | 1,497,937 | ||||||
| SONDA S.A. |
1,372,434 | 2,067,298 | ||||||
| Vina Concha y Toro S.A. |
682,723 | 1,422,183 | ||||||
|
|
|
|||||||
| Total Chile |
|
22,754,134 | ||||||
| China – 23.9% |
| |||||||
| 361 Degrees International Ltd.(b) |
3,834,000 | 727,732 | ||||||
| Anhui Anke Biotechnology Group Co., Ltd. Class A |
179,200 | 435,187 | ||||||
| Anhui Expressway Co., Ltd. Class H |
2,305,666 | 1,518,518 | ||||||
| Anhui Yingjia Distillery Co., Ltd. Class A |
349,500 | 945,494 | ||||||
| Anhui Zhongding Sealing Parts Co., Ltd. Class A |
879,100 | 1,619,484 | ||||||
| Asia Cement China Holdings Corp. |
837,000 | 824,210 | ||||||
| Ausnutria Dairy Corp., Ltd. |
669,000 | 893,142 | ||||||
| BAIC Motor Corp., Ltd. Class H(a) |
2,813,000 | 1,838,316 | ||||||
| Bank of Chongqing Co., Ltd. Class H(b) |
2,141,500 | 1,369,478 | ||||||
| Beijing Capital International Airport Co., Ltd. Class H |
3,970,000 | 3,767,731 | ||||||
| Beijing Capital Land Ltd. Class H(b) |
6,670,000 | 2,549,061 | ||||||
| Beijing Dahao Technology Corp. Ltd. Class A |
300,402 | 520,771 | ||||||
| Beijing Jingneng Clean Energy Co., Ltd. Class H |
7,792,000 | 1,667,598 | ||||||
| Beijing Tong Ren Tang Chinese Medicine Co., Ltd. |
287,000 | 525,743 | ||||||
| Beijing Urban Construction Investment & Development Co., Ltd. Class A |
1,618,400 | 2,468,468 | ||||||
| CECEP COSTIN New Materials Group Ltd.*† |
4,614,000 | 1 | ||||||
| Central China Real Estate Ltd. |
3,639,000 | 1,780,108 | ||||||
| Central China Securities Co., Ltd. Class H(b) |
5,063,000 | 1,547,933 | ||||||
| CGN New Energy Holdings Co., Ltd.*(a) |
1,650,000 | 250,129 | ||||||
| Changzhou Xingyu Automotive Lighting Systems Co., Ltd. Class A |
115,660 | 1,034,369 | ||||||
| Chaowei Power Holdings Ltd.(b) |
973,000 | 368,131 | ||||||
| Chengdu Xingrong Environment Co., Ltd. Class A |
1,314,300 | 909,422 | ||||||
| China Agri-Industries Holdings Ltd. |
3,114,000 | 1,067,097 | ||||||
| China Aoyuan Group Ltd. |
6,603,000 | 7,965,708 | ||||||
| China BlueChemical Ltd. Class H |
3,682,000 | 1,196,071 | ||||||
| China Communications Services Corp., Ltd. Class H |
4,066,000 | 3,625,756 | ||||||
| China Datang Corp. Renewable Power Co., Ltd. Class H |
3,239,000 | 383,731 | ||||||
| China Everbright Greentech Ltd.(a)(b) |
1,228,000 | 974,585 | ||||||
| China Harmony New Energy Auto Holding Ltd.(b) |
2,547,000 | 953,914 | ||||||
| China High Speed Transmission Equipment Group Co., Ltd.(b) |
819,000 | 709,457 | ||||||
| China Lesso Group Holdings Ltd. |
5,705,000 | 3,691,922 | ||||||
| China Lilang Ltd. |
2,672,000 | 3,015,805 | ||||||
| China Maple Leaf Educational Systems Ltd.(b) |
2,862,000 | 1,378,144 | ||||||
| China Meidong Auto Holdings Ltd. |
1,188,000 | 576,600 | ||||||
| China New Higher Education Group Ltd.(a)(b) |
575,000 | 281,276 | ||||||
See Notes to Financial Statements.
| 48 | WisdomTree Trust |
Schedule of Investments (continued)
WisdomTree Emerging Markets SmallCap Dividend Fund (DGS)
March 31, 2019
| Investments | Shares | Value | ||||||
| China Overseas Grand Oceans Group Ltd. |
3,600,000 | $ | 1,958,229 | |||||
| China Overseas Property Holdings Ltd. |
2,145,000 | 1,030,153 | ||||||
| China Power Clean Energy Development Co., Ltd. |
1,484,000 | 975,476 | ||||||
| China Power International Development Ltd. |
18,538,000 | 4,746,703 | ||||||
| China Railway Signal & Communication Corp., Ltd. Class H(a) |
3,907,000 | 3,090,780 | ||||||
| China Reinsurance Group Corp. Class H |
19,151,000 | 4,049,791 | ||||||
| China Resources Medical Holdings Co., Ltd. |
985,500 | 708,058 | ||||||
| China Sanjiang Fine Chemicals Co., Ltd. |
4,337,000 | 1,182,323 | ||||||
| China SCE Group Holdings Ltd. |
10,882,000 | 5,669,766 | ||||||
| China Shineway Pharmaceutical Group Ltd. |
836,000 | 837,070 | ||||||
| China South City Holdings Ltd. |
15,562,000 | 2,497,866 | ||||||
| China Suntien Green Energy Corp., Ltd. Class H |
8,152,000 | 2,481,962 | ||||||
| China Tian Lun Gas Holdings Ltd.(b) |
553,000 | 634,721 | ||||||
| China Travel International Investment Hong Kong Ltd. |
6,514,000 | 1,659,628 | ||||||
| China Yongda Automobiles Services Holdings Ltd.(b) |
5,046,500 | 3,998,653 | ||||||
| China Yuhua Education Corp., Ltd.(a) |
2,420,000 | 992,669 | ||||||
| China ZhengTong Auto Services Holdings Ltd.(b) |
4,511,000 | 2,505,489 | ||||||
| Chinasoft International Ltd.*(b) |
638,000 | 394,181 | ||||||
| Chinese Universe Publishing and Media Group Co., Ltd. Class A |
1,243,900 | 2,811,649 | ||||||
| Chongqing Rural Commercial Bank Co., Ltd. Class H |
11,783,000 | 6,799,660 | ||||||
| Chow Tai Seng Jewellery Co., Ltd. Class A |
100,400 | 523,947 | ||||||
| CIMC Enric Holdings Ltd. |
574,000 | 588,628 | ||||||
| CITIC Guoan Information Industry Co., Ltd. Class A |
1,923,200 | 1,699,921 | ||||||
| CITIC Resources Holdings Ltd.(b) |
7,366,000 | 684,995 | ||||||
| CITIC Telecom International Holdings Ltd. |
7,733,000 | 3,477,409 | ||||||
| CMST Development Co., Ltd. Class A |
524,200 | 528,085 | ||||||
| COFCO Tunhe Sugar Co., Ltd. Class A |
1,158,600 | 1,551,650 | ||||||
| Cogobuy Group*(a) |
1,175,000 | 432,582 | ||||||
| Colour Life Services Group Co., Ltd.*(b) |
1,325,000 | 962,108 | ||||||
| Consun Pharmaceutical Group Ltd. |
994,000 | 729,360 | ||||||
| COSCO Shipping Energy Transportation Co., Ltd. Class H |
1,366,000 | 783,062 | ||||||
| CPMC Holdings Ltd.(b) |
2,780,000 | 1,115,549 | ||||||
| CT Environmental Group Ltd.(b) |
6,050,000 | 262,040 | ||||||
| Dah Chong Hong Holdings Ltd. |
3,916,000 | 1,411,764 | ||||||
| Dalian Port PDA Co., Ltd. Class A |
2,351,500 | 871,289 | ||||||
| Dongyue Group Ltd. |
4,169,000 | 2,894,420 | ||||||
| Dr Peng Telecom & Media Group Co., Ltd. Class A |
1,159,200 | 1,826,721 | ||||||
| Elion Clean Energy Co., Ltd. Class A |
695,000 | 749,792 | ||||||
| Eternal Asia Supply Chain Management Ltd. Class A |
920,800 | 781,012 | ||||||
| Fantasia Holdings Group Co., Ltd.*(b) |
10,192,500 | 2,025,529 | ||||||
| Fu Shou Yuan International Group Ltd. |
994,000 | 911,700 | ||||||
| Fufeng Group Ltd.*(b) |
4,232,000 | 2,221,140 | ||||||
| Fujian Funeng Co., Ltd. Class A |
178,400 | 255,911 | ||||||
| Goodbaby International Holdings Ltd.(b) |
1,630,000 | 473,430 | ||||||
| Grand Baoxin Auto Group Ltd.(b) |
2,757,000 | 951,786 | ||||||
| Greatview Aseptic Packaging Co., Ltd. |
2,950,000 | 1,800,075 | ||||||
| Greenland Hong Kong Holdings Ltd. |
4,996,000 | 2,030,235 | ||||||
| Greentown China Holdings Ltd. |
2,203,500 | 2,200,707 | ||||||
| Greentown Service Group Co., Ltd.(b) |
1,174,000 | 1,040,903 | ||||||
| GRG Banking Equipment Co., Ltd. Class A |
1,616,882 | 1,756,382 | ||||||
| Guangdong Provincial Expressway Development Co., Ltd. Class A |
986,400 | 1,332,775 | ||||||
| Guangdong Tapai Group Co., Ltd. Class A |
907,400 | 1,671,619 | ||||||
| Guangzhou R&F Properties Co., Ltd. Class H |
8,944,800 | 19,348,238 | ||||||
| Guorui Properties Ltd. |
2,104,000 | 428,843 | ||||||
| Guotai Junan International Holdings Ltd.(b) |
16,148,000 | 3,270,762 | ||||||
| Guoxuan High-Tech Co., Ltd. Class A |
294,600 | 771,110 | ||||||
| Haisco Pharmaceutical Group Co., Ltd. Class A |
282,600 | 620,272 | ||||||
| Hangzhou Binjiang Real Estate Group Co., Ltd. Class A |
1,502,100 | 1,057,250 | ||||||
| Hefei Meiya Optoelectronic Technology, Inc. Class A |
199,400 | 824,281 | ||||||
| Henan Senyuan Electric Co., Ltd. Class A |
263,600 | 573,470 | ||||||
| Hisense Electric Co., Ltd. Class A |
718,900 | 1,125,387 | ||||||
| Hisense Home Appliances Group Co., Ltd. Class H |
2,436,000 | 3,425,938 | ||||||
| Hopson Development Holdings Ltd. |
2,734,000 | 2,664,361 | ||||||
| Huabao International Holdings Ltd. |
4,706,000 | 2,385,987 | ||||||
| Huadian Fuxin Energy Corp., Ltd. Class H |
7,010,000 | 1,553,819 | ||||||
| Huafa Industrial Co., Ltd. Zhuhai Class A |
3,519,000 | 4,859,427 | ||||||
| Huaneng Renewables Corp., Ltd. Class H |
8,664,000 | 2,406,069 | ||||||
| Huayi Brothers Media Corp. Class A |
556,000 | 450,909 | ||||||
| Huolinhe Opencut Coal Industry Corp. Ltd. of Inner Mongolia Class A |
926,900 | 1,256,519 | ||||||
| Inner Mongolia MengDian HuaNeng Thermal Power Corp. Ltd. Class A |
1,165,700 | 508,244 | ||||||
| Jiangsu Changshu Rural Commercial Bank Co., Ltd. Class A |
1,336,600 | 1,491,697 | ||||||
| Jiangsu Yangnong Chemical Co., Ltd. Class A |
120,373 | 991,256 | ||||||
| Jingrui Holdings Ltd. |
4,191,000 | 1,377,433 | ||||||
| Jiuzhitang Co., Ltd. Class A |
451,400 | 881,950 | ||||||
| Jizhong Energy Resources Co., Ltd. Class A |
1,259,200 | 813,209 | ||||||
| JNBY Design Ltd. |
918,500 | 1,846,372 | ||||||
| Joincare Pharmaceutical Group Industry Co., Ltd. Class A |
779,300 | 1,023,960 | ||||||
| Kaisa Group Holdings Ltd.* |
9,220,000 | 4,181,326 | ||||||
| Lonking Holdings Ltd. |
9,617,000 | 3,111,762 | ||||||
| Luenmei Quantum Co., Ltd. Class A |
730,100 | 1,471,021 | ||||||
| Northeast Securities Co., Ltd. Class A |
1,049,600 | 1,589,972 | ||||||
| ORG Technology Co., Ltd. Class A |
2,465,600 | 2,197,694 | ||||||
| Oriental Energy Co., Ltd. Class A |
384,400 | 565,143 | ||||||
| Pacific Securities Co., Ltd. (The) Class A |
1,760,700 | 1,108,265 | ||||||
| Poly Property Group Co., Ltd. |
8,765,000 | 3,416,697 | ||||||
| Powerlong Real Estate Holdings Ltd. |
9,240,800 | 4,838,208 | ||||||
| Q Technology Group Co., Ltd.(b) |
681,000 | 577,769 | ||||||
| Rainbow Department Store Co., Ltd. Class A |
477,100 | 1,036,526 | ||||||
See Notes to Financial Statements.
| WisdomTree Trust | 49 |
Schedule of Investments (continued)
WisdomTree Emerging Markets SmallCap Dividend Fund (DGS)
March 31, 2019
| Investments | Shares | Value | ||||||
| Realcan Pharmaceutical Group Co., Ltd. Class A |
417,400 | $ | 562,107 | |||||
| Redco Group(a)(b) |
1,392,000 | 656,106 | ||||||
| Saurer Intelligent Technology Co., Ltd. Class A |
397,200 | 491,166 | ||||||
| Sealand Securities Co., Ltd. Class A |
2,979,400 | 2,731,035 | ||||||
| Shandong Chenming Paper Holdings Ltd. Class H |
2,500,500 | 1,608,612 | ||||||
| Shanghai Industrial Urban Development Group Ltd. |
6,410,000 | 1,363,665 | ||||||
| Shanghai Jin Jiang International Hotels Group Co., Ltd. Class H |
4,545,587 | 1,227,606 | ||||||
| Shanghai La Chapelle Fashion Co., Ltd. Class H(a) |
920,600 | 528,909 | ||||||
| Shanghai Mechanical and Electrical Industry Co., Ltd. Class A |
481,098 | 1,259,265 | ||||||
| Shanghai Waigaoqiao Free Trade Zone Group Co., Ltd. Class A |
245,246 | 649,956 | ||||||
| Shenzhen Expressway Co., Ltd. Class H |
2,593,697 | 3,039,766 | ||||||
| Shenzhen Huaqiang Industry Co., Ltd. Class A |
194,401 | 643,066 | ||||||
| Shenzhen Sunlord Electronics Co., Ltd. Class A |
662,100 | 1,863,086 | ||||||
| Shenzhen Suntak Circuit Technology Co., Ltd. Class A |
208,600 | 526,141 | ||||||
| Shijiazhuang Yiling Pharmaceutical Co., Ltd. Class A |
304,300 | 590,017 | ||||||
| Shougang Fushan Resources Group Ltd. |
19,882,000 | 4,558,959 | ||||||
| Shui On Land Ltd. |
17,921,000 | 4,428,912 | ||||||
| Sichuan Hebang Biotechnology Co., Ltd. Class A |
3,448,800 | 1,011,002 | ||||||
| Sichuan Languang Development Co., Ltd. Class A |
1,001,500 | 1,099,829 | ||||||
| Sihuan Pharmaceutical Holdings Group Ltd. |
5,379,000 | 1,301,932 | ||||||
| Sinochem International Corp. Class A |
622,600 | 735,610 | ||||||
| Sinopec Engineering Group Co., Ltd. Class H |
3,313,900 | 3,233,712 | ||||||
| Sinopec Kantons Holdings Ltd. |
3,230,000 | 1,468,939 | ||||||
| SITC International Holdings Co., Ltd. |
5,597,000 | 5,746,765 | ||||||
| Skyworth Digital Holdings Ltd. |
6,272,000 | 2,133,293 | ||||||
| Springland International Holdings Ltd. |
2,818,000 | 577,963 | ||||||
| Sunwoda Electronic Co., Ltd. Class A |
951,800 | 1,686,845 | ||||||
| Taiji Computer Corp. Ltd. Class A |
90,200 | 501,857 | ||||||
| TangShan Port Group Co., Ltd. Class A |
3,443,000 | 1,659,968 | ||||||
| TCL Electronics Holdings Ltd. |
3,516,000 | 1,921,495 | ||||||
| Tian Ge Interactive Holdings Ltd.(a) |
1,045,000 | 415,340 | ||||||
| Tiangong International Co., Ltd.(b) |
2,222,000 | 520,829 | ||||||
| Tianjin Guangyu Development Co., Ltd. Class A |
404,400 | 554,228 | ||||||
| Tianjin Port Co., Ltd. Class A |
644,200 | 845,487 | ||||||
| Tianneng Power International Ltd. |
3,364,000 | 3,025,477 | ||||||
| Times China Holdings Ltd.(b) |
2,997,000 | 6,215,474 | ||||||
| Tong Ren Tang Technologies Co., Ltd. Class H(b) |
991,888 | 1,331,792 | ||||||
| TravelSky Technology Ltd. Class H |
1,307,000 | 3,454,831 | ||||||
| Tsaker Chemical Group Ltd.(a) |
164,500 | 71,668 | ||||||
| Virscend Education Co., Ltd.(a) |
1,282,000 | 594,460 | ||||||
| Wangfujing Group Co., Ltd. Class A |
309,800 | 868,982 | ||||||
| West China Cement Ltd. |
6,886,000 | 912,291 | ||||||
| Western Mining Co., Ltd. Class A |
1,268,300 | 1,219,193 | ||||||
| Wisdom Education International Holdings Co., Ltd. |
720,000 | 349,454 | ||||||
| Wuxi Taiji Industry Co., Ltd. Class A |
753,300 | 853,042 | ||||||
| Xiabuxiabu Catering Management China Holdings Co., Ltd.*(a)(b) |
413,500 | 720,601 | ||||||
| Xiamen ITG Group Corp. Ltd. Class A |
1,675,700 | 2,291,551 | ||||||
| Xingda International Holdings Ltd. |
4,583,000 | 1,442,049 | ||||||
| Xiwang Special Steel Co., Ltd. |
5,965,000 | 1,162,612 | ||||||
| XTEP International Holdings Ltd. |
4,518,800 | 3,229,380 | ||||||
| Yadea Group Holdings Ltd.(a)(b) |
1,316,000 | 466,051 | ||||||
| Yang Quan Coal Industry Group Co., Ltd. Class A |
1,587,300 | 1,438,448 | ||||||
| YiChang HEC ChangJiang Pharmaceutical Co., Ltd. Class H(a)(b) |
218,400 | 945,942 | ||||||
| Yifan Pharmaceutical Co., Ltd. Class A |
999,700 | 1,971,076 | ||||||
| Yuexiu Property Co., Ltd. |
36,820,000 | 8,864,999 | ||||||
| Yuexiu Transport Infrastructure Ltd. |
3,104,000 | 2,526,712 | ||||||
| Yunnan Aluminium Co., Ltd. Class A |
945,800 | 686,811 | ||||||
| Yunnan Hongxiang Yixintang Pharmaceutical Co., Ltd. Class A |
111,103 | 418,277 | ||||||
| Yuzhou Properties Co., Ltd. |
15,594,000 | 9,416,055 | ||||||
| Zhaojin Mining Industry Co., Ltd. Class H |
1,107,000 | 1,108,417 | ||||||
| Zhejiang Jiahua Energy Chemical Industry Co., Ltd. Class A |
1,258,900 | 2,442,793 | ||||||
| Zhejiang Runtu Co., Ltd. Class A |
862,200 | 1,825,705 | ||||||
| Zhejiang Wanfeng Auto Wheel Co., Ltd. Class A |
1,899,968 | 2,287,245 | ||||||
| Zhejiang Wanliyang Co., Ltd. Class A |
368,900 | 422,685 | ||||||
| Zhenro Properties Group Ltd.(b) |
2,598,000 | 1,807,028 | ||||||
| Zhou Hei Ya International Holdings Co., Ltd.(a)(b) |
1,543,500 | 819,928 | ||||||
|
|
|
|||||||
| Total China |
|
340,338,088 | ||||||
| Czech Republic – 0.7% |
| |||||||
| Moneta Money Bank AS(a) |
2,935,372 | 10,131,278 | ||||||
| Hong Kong – 1.2% |
| |||||||
| C&D International Investment Group Ltd.(b) |
855,000 | 984,618 | ||||||
| Canvest Environmental Protection Group Co., Ltd.(b) |
782,000 | 391,501 | ||||||
| China Water Affairs Group Ltd. |
2,042,000 | 2,133,058 | ||||||
| Citychamp Watch & Jewellery Group Ltd. |
5,060,000 | 1,050,682 | ||||||
| CP Pokphand Co., Ltd. |
15,066,000 | 1,362,666 | ||||||
| Crystal International Group Ltd.(a) |
1,632,000 | 856,545 | ||||||
| Hua Han Health Industry Holdings Ltd.*†(b) |
8,880,000 | 299,773 | ||||||
| IMAX China Holding, Inc.(a) |
286,400 | 712,174 | ||||||
| Joy City Property Ltd. |
11,004,000 | 1,527,954 | ||||||
| LVGEM China Real Estate Investment Co., Ltd.(b) |
2,504,000 | 720,901 | ||||||
| NetDragon Websoft Holdings Ltd. |
362,000 | 909,387 | ||||||
| Pou Sheng International Holdings Ltd.(b) |
2,129,000 | 461,060 | ||||||
| Stella International Holdings Ltd. |
2,894,000 | 4,350,244 | ||||||
| Vinda International Holdings Ltd. |
513,000 | 992,024 | ||||||
|
|
|
|||||||
| Total Hong Kong |
|
16,752,587 | ||||||
See Notes to Financial Statements.
| 50 | WisdomTree Trust |
Schedule of Investments (continued)
WisdomTree Emerging Markets SmallCap Dividend Fund (DGS)
March 31, 2019
| Investments | Shares | Value | ||||||
| Hungary – 0.2% |
| |||||||
| Magyar Telekom Telecommunications PLC |
1,592,072 | $ | 2,567,851 | |||||
| India – 3.3% |
| |||||||
| AIA Engineering Ltd. |
19,026 | 493,289 | ||||||
| Amara Raja Batteries Ltd. |
36,090 | 375,070 | ||||||
| Anveshan Heavy Engineering Ltd.* |
4,392 | 35,409 | ||||||
| Apollo Hospitals Enterprise Ltd. |
40,202 | 712,407 | ||||||
| Apollo Tyres Ltd. |
267,875 | 861,338 | ||||||
| Arvind Fashions Ltd.* |
23,720 | 357,195 | ||||||
| Arvind Ltd. |
120,598 | 158,331 | ||||||
| Bajaj Corp., Ltd.* |
174,593 | 778,517 | ||||||
| Bata India Ltd. |
24,931 | 505,656 | ||||||
| Birlasoft Ltd.* |
111,739 | 159,120 | ||||||
| Care Ratings Ltd. |
69,396 | 991,328 | ||||||
| Castrol India Ltd. |
792,314 | 1,903,155 | ||||||
| Ceat Ltd. |
21,182 | 342,428 | ||||||
| CESC Ltd. |
85,550 | 902,304 | ||||||
| Chennai Petroleum Corp., Ltd. |
231,475 | 913,203 | ||||||
| Cochin Shipyard Ltd.(a) |
135,319 | 764,936 | ||||||
| Coromandel International Ltd. |
107,913 | 790,557 | ||||||
| Crompton Greaves Consumer Electricals Ltd. |
319,489 | 1,047,822 | ||||||
| DCM Shriram Ltd. |
75,528 | 451,369 | ||||||
| Engineers India Ltd. |
489,088 | 828,149 | ||||||
| Federal Bank Ltd. |
1,627,570 | 2,266,029 | ||||||
| GHCL Ltd. |
93,028 | 330,550 | ||||||
| Graphite India Ltd. |
99,146 | 639,601 | ||||||
| Greaves Cotton Ltd. |
242,922 | 488,123 | ||||||
| Gujarat Narmada Valley Fertilizers & Chemicals Ltd. |
71,463 | 315,613 | ||||||
| Gujarat Pipavav Port Ltd. |
555,534 | 797,916 | ||||||
| HEG Ltd. |
23,533 | 711,170 | ||||||
| HeidelbergCement India Ltd. |
213,508 | 559,544 | ||||||
| Hexaware Technologies Ltd. |
99,634 | 496,624 | ||||||
| IDFC Bank Ltd. |
2,403,279 | 1,925,399 | ||||||
| Indian Hotels Co., Ltd. (The) |
200,339 | 447,961 | ||||||
| Info Edge India Ltd. |
24,833 | 660,499 | ||||||
| IRB Infrastructure Developers Ltd. |
512,247 | 1,071,079 | ||||||
| Jain Irrigation Systems Ltd. |
462,149 | 392,935 | ||||||
| JM Financial Ltd. |
443,444 | 602,354 | ||||||
| Kajaria Ceramics Ltd. |
55,401 | 471,718 | ||||||
| Karnataka Bank Ltd. (The) |
550,721 | 1,062,488 | ||||||
| Karur Vysya Bank Ltd. (The) |
461,609 | 475,102 | ||||||
| KPIT Technologies Ltd.*† |
108,028 | 127,326 | ||||||
| L&T Technology Services Ltd.(a) |
10,238 | 232,359 | ||||||
| Mahanagar Gas Ltd. |
55,780 | 849,523 | ||||||
| Mangalore Refinery & Petrochemicals Ltd. |
677,893 | 727,065 | ||||||
| Mindtree Ltd. |
75,716 | 1,032,317 | ||||||
| Motilal Oswal Financial Services Ltd. |
47,021 | 408,681 | ||||||
| Multi Commodity Exchange of India Ltd. |
51,454 | 599,102 | ||||||
| Natco Pharma Ltd. |
94,136 | 779,246 | ||||||
| National Aluminium Co., Ltd. |
3,278,116 | 2,623,912 | ||||||
| NBCC India Ltd. |
776,155 | 742,823 | ||||||
| NCC Ltd. |
564,061 | 918,864 | ||||||
| NIIT Technologies Ltd. |
28,699 | 549,268 | ||||||
| NLC India Ltd. |
989,397 | 991,182 | ||||||
| Persistent Systems Ltd. |
41,806 | 379,920 | ||||||
| PI Industries Ltd. |
61,243 | 912,302 | ||||||
| Rallis India Ltd. |
249,005 | 589,129 | ||||||
| Redington India Ltd. |
623,758 | 923,369 | ||||||
| Reliance Infrastructure Ltd. |
384,024 | 759,456 | ||||||
| Sanofi India Ltd. |
6,422 | 542,113 | ||||||
| Sobha Ltd. |
88,038 | 656,520 | ||||||
| Sonata Software Ltd. |
72,716 | 354,474 | ||||||
| South Indian Bank Ltd. (The) |
2,745,085 | 653,828 | ||||||
| SRF Ltd. |
13,571 | 470,749 | ||||||
| Sundram Fasteners Ltd. |
58,017 | 474,395 | ||||||
| Supreme Industries Ltd. |
61,928 | 998,849 | ||||||
| Tata Global Beverages Ltd. |
219,772 | 647,023 | ||||||
| Torrent Power Ltd. |
249,183 | 926,231 | ||||||
|
|
|
|||||||
| Total India |
|
46,956,314 | ||||||
| Indonesia – 2.9% |
| |||||||
| Ace Hardware Indonesia Tbk PT |
8,228,600 | 1,028,575 | ||||||
| Adhi Karya Persero Tbk PT |
5,155,000 | 595,504 | ||||||
| AKR Corporindo Tbk PT |
7,578,145 | 2,511,857 | ||||||
| Astra Agro Lestari Tbk PT |
1,325,666 | 1,044,986 | ||||||
| Bank Pembangunan Daerah Jawa Barat Dan Banten Tbk PT* |
17,918,200 | 2,529,184 | ||||||
| Bank Pembangunan Daerah Jawa Timur Tbk PT |
17,729,800 | 809,296 | ||||||
| Bank Tabungan Negara Persero Tbk PT |
9,336,616 | 1,599,813 | ||||||
| Barito Pacific Tbk PT |
6,536,400 | 1,647,871 | ||||||
| Ciputra Development Tbk PT |
10,081,000 | 707,935 | ||||||
| Indika Energy Tbk PT |
7,141,300 | 915,230 | ||||||
| Indo Tambangraya Megah Tbk PT |
3,971,600 | 6,672,790 | ||||||
| Japfa Comfeed Indonesia Tbk PT |
18,375,800 | 2,264,714 | ||||||
| Jasa Marga Persero Tbk PT |
2,644,500 | 1,109,613 | ||||||
| Link Net Tbk PT |
3,948,300 | 1,244,934 | ||||||
| Matahari Department Store Tbk PT |
14,867,600 | 4,270,259 | ||||||
| Media Nusantara Citra Tbk PT |
16,039,740 | 844,790 | ||||||
| Pakuwon Jati Tbk PT |
15,576,000 | 754,736 | ||||||
| Perusahaan Perkebunan London Sumatra Indonesia Tbk PT |
8,405,000 | 613,848 | ||||||
| PP Persero Tbk PT |
5,988,600 | 874,739 | ||||||
| Ramayana Lestari Sentosa Tbk PT |
5,119,700 | 639,962 | ||||||
| Sawit Sumbermas Sarana Tbk PT |
4,191,100 | 313,450 | ||||||
| Sri Rejeki Isman Tbk PT |
11,081,600 | 263,032 | ||||||
| Surya Citra Media Tbk PT |
19,746,200 | 2,294,941 | ||||||
| Timah Tbk PT |
6,514,700 | 574,154 | ||||||
| Tower Bersama Infrastructure Tbk PT |
3,274,303 | 905,952 | ||||||
| Waskita Beton Precast Tbk PT |
53,528,300 | 1,511,122 | ||||||
| Waskita Karya Persero Tbk PT |
13,417,800 | 1,870,389 | ||||||
| Wijaya Karya Persero Tbk PT |
5,929,300 | 899,388 | ||||||
|
|
|
|||||||
| Total Indonesia |
|
41,313,064 | ||||||
| Malaysia – 5.0% |
| |||||||
| Aeon Co. M Bhd |
924,800 | 332,996 | ||||||
| AirAsia Group Bhd |
5,886,300 | 3,835,287 | ||||||
| Alliance Bank Malaysia Bhd |
2,860,647 | 2,865,902 | ||||||
See Notes to Financial Statements.
| WisdomTree Trust | 51 |
Schedule of Investments (continued)
WisdomTree Emerging Markets SmallCap Dividend Fund (DGS)
March 31, 2019
| Investments | Shares | Value | ||||||
| Astro Malaysia Holdings Bhd |
13,565,100 | $ | 5,083,797 | |||||
| Berjaya Sports Toto Bhd |
2,132,000 | 1,263,794 | ||||||
| Bermaz Auto Bhd |
3,235,580 | 1,791,160 | ||||||
| British American Tobacco Malaysia Bhd |
469,100 | 4,152,670 | ||||||
| Bursa Malaysia Bhd |
1,740,750 | 2,929,321 | ||||||
| Cahya Mata Sarawak Bhd |
1,122,500 | 918,347 | ||||||
| DRB-Hicom Bhd |
738,000 | 343,466 | ||||||
| Econpile Holdings Bhd |
1,264,000 | 156,355 | ||||||
| Ekovest Bhd |
3,780,300 | 458,359 | ||||||
| FGV Holdings Bhd* |
4,186,200 | 1,209,973 | ||||||
| Gamuda Bhd |
8,595,400 | 6,063,626 | ||||||
| Genting Plantations Bhd |
498,000 | 1,293,031 | ||||||
| Globetronics Technology Bhd |
1,738,833 | 741,107 | ||||||
| Heineken Malaysia Bhd |
372,400 | 2,189,247 | ||||||
| IJM Corp. Bhd |
7,533,800 | 4,096,763 | ||||||
| Inari Amertron Bhd |
5,049,975 | 1,942,060 | ||||||
| IOI Properties Group Bhd |
4,252,200 | 1,374,869 | ||||||
| Kossan Rubber Industries Bhd |
612,200 | 527,849 | ||||||
| KPJ Healthcare Bhd |
4,047,300 | 971,550 | ||||||
| Mah Sing Group Bhd |
5,871,577 | 1,337,555 | ||||||
| Malakoff Corp. Bhd |
6,943,363 | 1,547,694 | ||||||
| Malaysian Pacific Industries Bhd |
225,000 | 551,133 | ||||||
| Malaysian Resources Corp. Bhd |
3,860,543 | 836,884 | ||||||
| My EG Services Bhd |
1,899,500 | 656,043 | ||||||
| Padini Holdings Bhd |
565,200 | 497,016 | ||||||
| Pos Malaysia Bhd |
1,074,700 | 481,739 | ||||||
| QL Resources Bhd |
457,300 | 770,661 | ||||||
| Scientex Bhd |
546,100 | 1,143,700 | ||||||
| Serba Dinamik Holdings Bhd |
770,100 | 711,152 | ||||||
| Sime Darby Bhd |
10,665,800 | 2,899,948 | ||||||
| SKP Resources Bhd |
2,032,600 | 667,161 | ||||||
| SP Setia Bhd |
6,716,540 | 3,734,610 | ||||||
| Sunway Bhd |
6,483,361 | 2,667,985 | ||||||
| Sunway Construction Group Bhd |
1,954,500 | 914,414 | ||||||
| Supermax Corp. Bhd |
1,705,800 | 614,213 | ||||||
| TIME dotCom Bhd |
355,000 | 756,522 | ||||||
| Uchi Technologies Bhd |
1,559,700 | 1,020,061 | ||||||
| Unisem M Bhd |
1,315,600 | 853,972 | ||||||
| VS Industry Bhd |
2,930,225 | 767,995 | ||||||
| WCT Holdings Bhd |
2,478,300 | 503,855 | ||||||
| Yinson Holdings Bhd |
669,100 | 753,916 | ||||||
| YTL Power International Bhd |
11,729,000 | 2,470,775 | ||||||
|
|
|
|||||||
| Total Malaysia |
|
71,700,533 | ||||||
| Mexico – 1.7% |
| |||||||
| Bolsa Mexicana de Valores S.A.B. de C.V. |
1,512,378 | 3,131,182 | ||||||
| Corp. Inmobiliaria Vesta S.A.B. de C.V. |
2,245,758 | 3,249,822 | ||||||
| Grupo Aeroportuario del Centro Norte S.A.B. de C.V. |
884,982 | 5,003,986 | ||||||
| Grupo Cementos de Chihuahua S.A.B. de C.V. |
89,520 | 494,408 | ||||||
| Grupo Comercial Chedraui S.A. de C.V. |
185,206 | 359,384 | ||||||
| Grupo Herdez S.A.B. de C.V. |
495,483 | 1,106,040 | ||||||
| Grupo Rotoplas S.A.B. de C.V.*(b) |
386,490 | 404,472 | ||||||
| Macquarie Mexico Real Estate Management S.A. de C.V.*(a) |
3,608,572 | 3,912,271 | ||||||
| Megacable Holdings S.A.B. de C.V. Series CPO |
432,386 | 2,007,733 | ||||||
| Prologis Property Mexico S.A. de C.V. |
1,466,046 | 2,826,659 | ||||||
| Qualitas Controladora S.A.B. de C.V. |
242,821 | 597,242 | ||||||
| Regional S.A.B. de C.V. |
258,499 | 1,304,789 | ||||||
| Unifin Financiera S.A.B. de C.V. SOFOM ENR(b) |
195,679 | 418,948 | ||||||
|
|
|
|||||||
| Total Mexico |
|
24,816,936 | ||||||
| Philippines – 0.8% |
| |||||||
| Cosco Capital, Inc. |
3,510,200 | 511,389 | ||||||
| D&L Industries, Inc. |
6,185,300 | 1,323,991 | ||||||
| Manila Water Co., Inc. |
2,144,845 | 941,510 | ||||||
| Pilipinas Shell Petroleum Corp. |
1,541,710 | 1,450,399 | ||||||
| Robinsons Land Corp. |
3,223,726 | 1,504,119 | ||||||
| Robinsons Retail Holdings, Inc. |
318,990 | 479,913 | ||||||
| Security Bank Corp. |
465,360 | 1,533,180 | ||||||
| Semirara Mining & Power Corp. |
5,058,600 | 2,114,574 | ||||||
| Vista Land & Lifescapes, Inc. |
10,090,900 | 1,389,396 | ||||||
|
|
|
|||||||
| Total Philippines |
|
11,248,471 | ||||||
| Poland – 1.0% |
| |||||||
| Asseco Poland S.A. |
410,995 | 5,563,765 | ||||||
| Ciech S.A. |
264,381 | 3,699,686 | ||||||
| Eurocash S.A.(b) |
281,208 | 1,604,870 | ||||||
| Grupa Azoty S.A. |
219,034 | 2,353,822 | ||||||
| Warsaw Stock Exchange |
149,483 | 1,520,622 | ||||||
|
|
|
|||||||
| Total Poland |
|
14,742,765 | ||||||
| Singapore – 0.3% |
| |||||||
| IGG, Inc. |
2,634,000 | 3,650,714 | ||||||
| South Africa – 8.5% |
| |||||||
| Adcock Ingram Holdings Ltd. |
183,656 | 783,208 | ||||||
| Advtech Ltd. |
1,164,904 | 993,556 | ||||||
| Aeci Ltd. |
423,155 | 2,809,834 | ||||||
| African Rainbow Minerals Ltd. |
522,878 | 6,152,892 | ||||||
| Alexander Forbes Group Holdings Ltd. |
3,961,933 | 1,381,886 | ||||||
| Astral Foods Ltd. |
296,488 | 3,447,351 | ||||||
| Attacq Ltd. |
2,904,602 | 2,890,251 | ||||||
| AVI Ltd. |
1,131,626 | 7,084,997 | ||||||
| Barloworld Ltd. |
578,415 | 5,093,782 | ||||||
| Blue Label Telecoms Ltd.* |
3,219,520 | 837,181 | ||||||
| Cashbuild Ltd.(b) |
60,390 | 1,036,424 | ||||||
| City Lodge Hotels Ltd. |
110,526 | 915,937 | ||||||
| Coronation Fund Managers Ltd. |
1,888,957 | 6,017,418 | ||||||
| Dis-Chem Pharmacies Ltd.(a)(b) |
337,085 | 566,590 | ||||||
| Equites Property Fund Ltd. |
1,965,081 | 2,658,489 | ||||||
| Foschini Group Ltd. (The) |
829,337 | 9,373,801 | ||||||
| Hosken Consolidated Investments Ltd. |
79,032 | 612,637 | ||||||
| Hyprop Investments Ltd. |
1,615,503 | 7,895,339 | ||||||
| Investec Ltd. |
1,066,025 | 6,234,449 | ||||||
| JSE Ltd. |
275,380 | 2,523,079 | ||||||
| KAP Industrial Holdings Ltd. |
4,839,946 | 2,359,353 | ||||||
See Notes to Financial Statements.
| 52 | WisdomTree Trust |
Schedule of Investments (continued)
WisdomTree Emerging Markets SmallCap Dividend Fund (DGS)
March 31, 2019
| Investments | Shares | Value | ||||||
| Massmart Holdings Ltd.(b) |
279,402 | $ | 1,540,259 | |||||
| Metair Investments Ltd. |
694,831 | 1,102,864 | ||||||
| Mpact Ltd. |
437,519 | 741,776 | ||||||
| Murray & Roberts Holdings Ltd. |
780,996 | 773,347 | ||||||
| Omnia Holdings Ltd.(b) |
209,817 | 740,552 | ||||||
| Peregrine Holdings Ltd. |
1,421,532 | 1,853,154 | ||||||
| Pick n Pay Stores Ltd. |
816,024 | 3,757,799 | ||||||
| Pioneer Foods Group Ltd. |
508,327 | 2,824,107 | ||||||
| Raubex Group Ltd. |
598,863 | 835,512 | ||||||
| Reunert Ltd. |
789,357 | 3,886,234 | ||||||
| Santam Ltd.(b) |
120,995 | 2,527,251 | ||||||
| SPAR Group Ltd. (The) |
622,285 | 8,279,729 | ||||||
| Telkom S.A. SOC Ltd. |
1,636,271 | 8,273,685 | ||||||
| Tongaat Hulett Ltd. |
295,167 | 441,279 | ||||||
| Trencor Ltd. |
489,654 | 906,562 | ||||||
| Truworths International Ltd. |
1,769,655 | 8,514,960 | ||||||
| Tsogo Sun Holdings Ltd. |
2,185,760 | 2,926,725 | ||||||
|
|
|
|||||||
| Total South Africa |
|
121,594,249 | ||||||
| South Korea – 7.8% |
| |||||||
| Aekyung Petrochemical Co., Ltd. |
58,217 | 475,440 | ||||||
| Ahnlab, Inc. |
12,271 | 565,389 | ||||||
| Bukwang Pharmaceutical Co., Ltd. |
27,420 | 461,388 | ||||||
| Caregen Co., Ltd.† |
7,384 | 497,644 | ||||||
| Cheil Worldwide, Inc. |
204,345 | 4,356,576 | ||||||
| Chong Kun Dang Pharmaceutical Corp. |
4,709 | 423,150 | ||||||
| Com2uS Corp. |
7,323 | 673,528 | ||||||
| Daesang Corp. |
38,072 | 950,878 | ||||||
| Daewoong Pharmaceutical Co., Ltd. |
417 | 67,596 | ||||||
| Daishin Securities Co., Ltd. |
155,780 | 1,509,629 | ||||||
| DB HiTek Co., Ltd. |
58,829 | 647,839 | ||||||
| DGB Financial Group, Inc. |
427,460 | 3,076,688 | ||||||
| Dongsuh Cos., Inc. |
152,912 | 2,653,833 | ||||||
| DONGSUNG Corp. |
125,630 | 587,697 | ||||||
| Douzone Bizon Co., Ltd. |
11,713 | 480,861 | ||||||
| Eugene Corp. |
128,320 | 751,765 | ||||||
| F&F Co., Ltd. |
7,569 | 537,452 | ||||||
| Grand Korea Leisure Co., Ltd. |
82,873 | 1,653,664 | ||||||
| Green Cross Corp. |
3,700 | 471,016 | ||||||
| Green Cross Holdings Corp. |
36,366 | 772,109 | ||||||
| Halla Holdings Corp. |
24,337 | 872,624 | ||||||
| Hana Tour Service, Inc. |
18,732 | 1,194,782 | ||||||
| Hancom, Inc. |
36,074 | 427,447 | ||||||
| Handsome Co., Ltd. |
11,390 | 447,031 | ||||||
| Hanjin Kal Corp. |
30,518 | 690,963 | ||||||
| Hankook Tire Worldwide Co., Ltd. |
47,625 | 652,426 | ||||||
| Hanmi Semiconductor Co., Ltd. |
85,920 | 606,307 | ||||||
| Hansae Co., Ltd. |
39,386 | 988,901 | ||||||
| Hansol Chemical Co., Ltd. |
11,954 | 867,773 | ||||||
| Hansol Paper Co., Ltd. |
36,258 | 471,153 | ||||||
| Hanssem Co., Ltd. |
21,099 | 1,706,359 | ||||||
| Hanwha Corp. |
88,172 | 2,361,403 | ||||||
| Hanwha General Insurance Co., Ltd. |
57,084 | 259,998 | ||||||
| Harim Holdings Co., Ltd. |
55,831 | 570,557 | ||||||
| Hite Jinro Co., Ltd.(b) |
144,717 | 2,358,616 | ||||||
| Huchems Fine Chemical Corp. |
92,312 | 1,813,547 | ||||||
| Huvis Corp. |
51,865 | 364,622 | ||||||
| Hyundai Corp. |
13,584 | 298,582 | ||||||
| Hyundai Department Store Co., Ltd. |
10,473 | 931,876 | ||||||
| Hyundai Elevator Co., Ltd. |
5,371 | 423,018 | ||||||
| Iljin Materials Co., Ltd. |
22,602 | 738,732 | ||||||
| iMarketKorea, Inc. |
142,177 | 1,203,701 | ||||||
| Innocean Worldwide, Inc. |
15,448 | 951,295 | ||||||
| IS Dongseo Co., Ltd. |
46,716 | 1,292,294 | ||||||
| It’s Hanbul Co., Ltd. |
8,919 | 236,509 | ||||||
| Jahwa Electronics Co., Ltd. |
42,149 | 525,424 | ||||||
| JB Financial Group Co., Ltd. |
163,899 | 804,262 | ||||||
| Jeju Air Co., Ltd. |
21,243 | 740,164 | ||||||
| JW Life Science Corp. |
19,883 | 431,782 | ||||||
| KEPCO Plant Service & Engineering Co., Ltd. |
91,118 | 2,793,504 | ||||||
| Kginicis Co., Ltd. |
18,342 | 213,298 | ||||||
| KIWOOM Securities Co., Ltd. |
16,287 | 1,163,665 | ||||||
| Koh Young Technology, Inc. |
7,323 | 551,596 | ||||||
| Kolon Industries, Inc. |
29,980 | 1,336,436 | ||||||
| Korea Autoglass Corp. |
32,807 | 465,327 | ||||||
| Korea Petrochemical Ind Co., Ltd. |
8,566 | 1,184,796 | ||||||
| Korean Reinsurance Co. |
289,158 | 2,330,892 | ||||||
| KT Skylife Co., Ltd. |
48,618 | 505,411 | ||||||
| Kumho Industrial Co., Ltd.(b) |
62,513 | 526,495 | ||||||
| Kumho Petrochemical Co., Ltd. |
16,319 | 1,368,663 | ||||||
| Kyobo Securities Co., Ltd. |
65,355 | 541,794 | ||||||
| Kyungdong Pharm Co., Ltd. |
65,821 | 608,863 | ||||||
| LEENO Industrial, Inc. |
15,595 | 820,211 | ||||||
| LF Corp. |
28,563 | 629,086 | ||||||
| LG Hausys Ltd. |
14,941 | 798,977 | ||||||
| Lock&Lock Co., Ltd. |
13,884 | 248,911 | ||||||
| LOTTE Fine Chemical Co., Ltd. |
27,107 | 1,053,140 | ||||||
| LOTTE Himart Co., Ltd. |
20,296 | 915,475 | ||||||
| LS Corp. |
47,247 | 2,176,917 | ||||||
| LS Industrial Systems Co., Ltd. |
21,784 | 911,585 | ||||||
| Meritz Financial Group, Inc. |
157,151 | 1,965,945 | ||||||
| Meritz Fire & Marine Insurance Co., Ltd. |
261,666 | 5,601,695 | ||||||
| Meritz Securities Co., Ltd. |
1,200,706 | 5,167,341 | ||||||
| Mirae Asset Life Insurance Co., Ltd. |
144,475 | 654,217 | ||||||
| Modetour Network, Inc. |
32,024 | 651,709 | ||||||
| Moorim P&P Co., Ltd. |
37,409 | 187,193 | ||||||
| Muhak Co., Ltd. |
48,282 | 542,327 | ||||||
| Nexen Tire Corp. |
55,882 | 488,371 | ||||||
| NICE Information Service Co., Ltd. |
64,714 | 724,049 | ||||||
| NongShim Co., Ltd. |
5,616 | 1,528,803 | ||||||
| NS Shopping Co., Ltd. |
51,084 | 533,297 | ||||||
| OCI Co., Ltd. |
31,275 | 2,559,640 | ||||||
| Partron Co., Ltd. |
123,230 | 1,443,890 | ||||||
| Poongsan Corp. |
42,148 | 1,073,101 | ||||||
| Posco International Corp. |
90,156 | 1,409,804 | ||||||
| PSK, Inc. |
34,980 | 505,393 | ||||||
| S&T Motiv Co., Ltd. |
30,769 | 1,046,325 | ||||||
| Samick THK Co., Ltd.(b) |
19,387 | 254,485 | ||||||
See Notes to Financial Statements.
| WisdomTree Trust | 53 |
Schedule of Investments (continued)
WisdomTree Emerging Markets SmallCap Dividend Fund (DGS)
March 31, 2019
| Investments | Shares | Value | ||||||
| Samjin Pharmaceutical Co., Ltd. |
12,746 | $ | 428,385 | |||||
| Seah Besteel Corp. |
50,853 | 857,929 | ||||||
| Seoul Semiconductor Co., Ltd. |
32,091 | 583,807 | ||||||
| SFA Engineering Corp. |
58,109 | 2,216,650 | ||||||
| Silicon Works Co., Ltd. |
18,424 | 685,767 | ||||||
| SK Discovery Co., Ltd. |
20,128 | 469,908 | ||||||
| SK Gas Ltd. |
11,975 | 964,245 | ||||||
| SK Materials Co., Ltd.(b) |
7,805 | 1,166,177 | ||||||
| SK Networks Co., Ltd. |
275,393 | 1,467,825 | ||||||
| SKC Co., Ltd. |
35,464 | 1,129,437 | ||||||
| SKCKOLONPI, Inc.(b) |
19,851 | 531,645 | ||||||
| SL Corp. |
24,786 | 480,391 | ||||||
| Soulbrain Co., Ltd. |
10,729 | 500,012 | ||||||
| ST Pharm Co., Ltd. |
16,609 | 321,908 | ||||||
| Sungwoo Hitech Co., Ltd. |
105,277 | 397,420 | ||||||
| TES Co., Ltd. |
37,911 | 584,479 | ||||||
| Tongyang Life Insurance Co., Ltd. |
182,053 | 736,969 | ||||||
| WiSoL Co., Ltd. |
31,614 | 441,443 | ||||||
| WONIK IPS Co., Ltd. |
28,149 | 580,289 | ||||||
| Youlchon Chemical Co., Ltd. |
43,110 | 491,828 | ||||||
| Youngone Corp. |
18,322 | 526,207 | ||||||
| Yuhan Corp. |
6,283 | 1,328,447 | ||||||
|
|
|
|||||||
| Total South Korea |
|
111,220,085 | ||||||
| Taiwan – 26.3% |
| |||||||
| AcBel Polytech, Inc.(b) |
1,684,303 | 1,139,427 | ||||||
| Accton Technology Corp.(b) |
1,598,633 | 6,457,709 | ||||||
| Acer, Inc.*(b) |
5,901,000 | 3,781,404 | ||||||
| Alpha Networks, Inc. |
1,535,000 | 986,129 | ||||||
| Arcadyan Technology Corp.(b) |
345,000 | 1,043,267 | ||||||
| Asia Vital Components Co., Ltd.(b) |
744,000 | 825,580 | ||||||
| ASMedia Technology, Inc.(b) |
31,000 | 568,291 | ||||||
| Aten International Co., Ltd. |
530,000 | 1,638,812 | ||||||
| BES Engineering Corp. |
1,807,000 | 471,970 | ||||||
| Capital Futures Corp. |
381,000 | 581,627 | ||||||
| Capital Securities Corp.(b) |
3,091,340 | 962,894 | ||||||
| Cathay Real Estate Development Co., Ltd. |
2,241,000 | 1,752,343 | ||||||
| Chang Wah Electromaterials, Inc. |
196,000 | 1,001,606 | ||||||
| Charoen Pokphand Enterprise(b) |
762,000 | 1,280,693 | ||||||
| Chaun-Choung Technology Corp.(b) |
206,000 | 835,483 | ||||||
| Cheng Loong Corp. |
1,969,000 | 1,309,664 | ||||||
| Chicony Electronics Co., Ltd. |
3,018,652 | 7,022,513 | ||||||
| Chicony Power Technology Co., Ltd.(b) |
993,625 | 1,840,852 | ||||||
| Chin-Poon Industrial Co., Ltd.(b) |
1,389,650 | 1,717,872 | ||||||
| China Airlines Ltd. |
3,652,000 | 1,168,337 | ||||||
| China General Plastics Corp. |
1,261,795 | 929,341 | ||||||
| China Metal Products Co., Ltd. |
1,154,000 | 1,400,354 | ||||||
| China Steel Chemical Corp.(b) |
313,726 | 1,369,094 | ||||||
| Chong Hong Construction Co., Ltd. |
1,094,000 | 3,194,627 | ||||||
| Chroma ATE, Inc.(b) |
909,132 | 4,321,404 | ||||||
| Chung-Hsin Electric & Machinery Manufacturing Corp.(b) |
1,535,000 | 1,028,463 | ||||||
| Cleanaway Co., Ltd.(b) |
429,161 | 2,408,944 | ||||||
| Clevo Co.* |
996,000 | 946,863 | ||||||
| Compeq Manufacturing Co., Ltd. |
3,979,000 | 3,059,726 | ||||||
| Continental Holdings Corp. |
765,000 | 392,174 | ||||||
| Coremax Corp.(b) |
187,893 | 552,940 | ||||||
| CTCI Corp.(b) |
2,598,190 | 4,046,434 | ||||||
| Cub Elecparts, Inc.(b) |
134,572 | 1,279,330 | ||||||
| Da-Li Development Co., Ltd. |
1,213,000 | 1,302,714 | ||||||
| Darfon Electronics Corp. |
330,000 | 546,065 | ||||||
| Depo Auto Parts Ind Co., Ltd. |
224,000 | 495,670 | ||||||
| Elan Microelectronics Corp. |
826,409 | 2,373,005 | ||||||
| Elite Advanced Laser Corp.(b) |
363,312 | 803,941 | ||||||
| Elite Material Co., Ltd.(b) |
1,239,163 | 4,281,918 | ||||||
| Elite Semiconductor Memory Technology, Inc. |
1,223,000 | 1,251,948 | ||||||
| Ennoconn Corp.(b) |
130,674 | 1,127,798 | ||||||
| Epistar Corp.(b) |
1,453,000 | 1,169,170 | ||||||
| Eternal Materials Co., Ltd. |
1,277,494 | 1,015,512 | ||||||
| Eva Airways Corp. |
1,383,775 | 677,958 | ||||||
| Evergreen Marine Corp. Taiwan Ltd. |
2,002,015 | 776,239 | ||||||
| Everlight Chemical Industrial Corp.(b) |
1,709,000 | 948,197 | ||||||
| Everlight Electronics Co., Ltd. |
2,398,165 | 2,431,585 | ||||||
| Far Eastern Department Stores Ltd. |
3,845,841 | 2,046,423 | ||||||
| Far Eastern International Bank |
7,604,258 | 2,763,345 | ||||||
| Faraday Technology Corp.(b) |
814,200 | 1,176,899 | ||||||
| Farglory Land Development Co., Ltd. |
1,297,640 | 1,578,868 | ||||||
| Feng Hsin Steel Co., Ltd. |
933,950 | 1,830,294 | ||||||
| FLEXium Interconnect, Inc.(b) |
1,031,028 | 3,104,408 | ||||||
| Formosa International Hotels Corp. |
294,000 | 1,511,948 | ||||||
| Foxsemicon Integrated Technology, Inc.(b) |
268,197 | 1,196,512 | ||||||
| Gemtek Technology Corp.(b) |
1,005,000 | 749,988 | ||||||
| Genius Electronic Optical Co., Ltd. |
68,000 | 795,380 | ||||||
| Getac Technology Corp. |
1,644,292 | 2,742,221 | ||||||
| Giant Manufacturing Co., Ltd. |
597,000 | 4,261,449 | ||||||
| Gigabyte Technology Co., Ltd.(b) |
2,921,000 | 4,653,432 | ||||||
| Global Brands Manufacture Ltd. |
430,000 | 182,768 | ||||||
| Global PMX Co., Ltd. |
200,000 | 791,681 | ||||||
| Global Unichip Corp.(b) |
136,000 | 906,799 | ||||||
| Grand Pacific Petrochemical |
1,760,000 | 1,367,661 | ||||||
| Grape King Bio Ltd. |
257,988 | 1,665,762 | ||||||
| Great Wall Enterprise Co., Ltd. |
2,225,387 | 2,548,828 | ||||||
| Greatek Electronics, Inc. |
1,439,000 | 1,984,312 | ||||||
| Hannstar Board Corp. |
630,000 | 535,553 | ||||||
| HannStar Display Corp.(b) |
10,926,000 | 2,417,719 | ||||||
| Highwealth Construction Corp.(b) |
4,403,613 | 7,258,271 | ||||||
| Hiwin Technologies Corp.(b) |
229,516 | 1,936,184 | ||||||
| Holiday Entertainment Co., Ltd. |
461,000 | 961,772 | ||||||
| Holtek Semiconductor, Inc. |
608,773 | 1,441,911 | ||||||
| Holy Stone Enterprise Co., Ltd.(b) |
398,000 | 1,497,964 | ||||||
| Hota Industrial Manufacturing Co., Ltd.(b) |
386,427 | 1,423,061 | ||||||
| Hsin Kuang Steel Co., Ltd.(b) |
662,000 | 701,296 | ||||||
| Huaku Development Co., Ltd. |
1,234,296 | 2,963,544 | ||||||
| Hung Sheng Construction Ltd.(b) |
1,857,800 | 1,790,258 | ||||||
| IEI Integration Corp. |
601,258 | 661,334 | ||||||
| International CSRC Investment Holdings Co.(b) |
1,482,033 | 2,009,993 | ||||||
| ITEQ Corp. |
998,000 | 2,875,437 | ||||||
See Notes to Financial Statements.
| 54 | WisdomTree Trust |
Schedule of Investments (continued)
WisdomTree Emerging Markets SmallCap Dividend Fund (DGS)
March 31, 2019
| Investments | Shares | Value | ||||||
| Jentech Precision Industrial Co., Ltd. |
144,000 | $ | 537,305 | |||||
| Jih Lin Technology Co., Ltd. |
244,000 | 552,593 | ||||||
| KEE TAI Properties Co., Ltd. |
1,965,000 | 761,887 | ||||||
| Kenda Rubber Industrial Co., Ltd.(b) |
1,600,039 | 1,534,081 | ||||||
| King Slide Works Co., Ltd. |
50,004 | 557,304 | ||||||
| King Yuan Electronics Co., Ltd. |
4,674,000 | 3,980,873 | ||||||
| King’s Town Bank Co., Ltd. |
2,873,000 | 2,982,950 | ||||||
| Kinik Co.(b) |
569,495 | 1,128,994 | ||||||
| Kinpo Electronics |
1,405,000 | 517,407 | ||||||
| Kinsus Interconnect Technology Corp.(b) |
545,368 | 798,043 | ||||||
| Kung Long Batteries Industrial Co., Ltd. |
374,000 | 2,032,576 | ||||||
| L&K Engineering Co., Ltd. |
810,000 | 758,213 | ||||||
| Lealea Enterprise Co., Ltd. |
2,525,000 | 835,645 | ||||||
| Lelon Electronics Corp. |
242,000 | 317,610 | ||||||
| Lien Hwa Industrial Corp. |
2,252,830 | 2,459,653 | ||||||
| Lion Travel Service Co., Ltd. |
255,000 | 728,087 | ||||||
| Lite-On Semiconductor Corp.(b) |
971,000 | 1,097,949 | ||||||
| Long Chen Paper Co., Ltd.(b) |
3,908,732 | 2,162,323 | ||||||
| Lotes Co., Ltd. |
156,977 | 1,265,677 | ||||||
| Macronix International(b) |
5,817,000 | 3,944,625 | ||||||
| Makalot Industrial Co., Ltd. |
389,667 | 2,730,912 | ||||||
| Marketech International Corp. |
245,000 | 426,080 | ||||||
| Mercuries & Associates Holding Ltd.(b) |
992,560 | 578,071 | ||||||
| Merida Industry Co., Ltd. |
178,043 | 993,605 | ||||||
| Merry Electronics Co., Ltd.(b) |
1,160,030 | 6,360,866 | ||||||
| Micro-Star International Co., Ltd.(b) |
2,496,877 | 7,007,669 | ||||||
| Mirle Automation Corp. |
553,560 | 844,156 | ||||||
| momo.com, Inc. |
127,000 | 1,048,701 | ||||||
| Namchow Holdings Co., Ltd. |
484,086 | 838,734 | ||||||
| Nan Kang Rubber Tire Co., Ltd.(b) |
1,176,000 | 1,190,480 | ||||||
| Nantex Industry Co., Ltd. |
676,615 | 725,560 | ||||||
| Nichidenbo Corp. |
352,000 | 669,269 | ||||||
| Nuvoton Technology Corp.(b) |
460,000 | 773,122 | ||||||
| OptoTech Corp. |
1,959,485 | 1,509,962 | ||||||
| Oriental Union Chemical Corp. |
1,816,000 | 1,537,860 | ||||||
| Pan-International Industrial Corp. |
1,304,000 | 992,158 | ||||||
| Powertech Technology, Inc. |
3,003,000 | 7,093,279 | ||||||
| Primax Electronics Ltd. |
1,881,000 | 3,704,570 | ||||||
| Qisda Corp. |
6,557,000 | 4,201,773 | ||||||
| Radiant Opto-Electronics Corp.(b) |
2,173,252 | 6,952,601 | ||||||
| Realtek Semiconductor Corp. |
1,190,770 | 7,031,688 | ||||||
| Rechi Precision Co., Ltd.(b) |
1,497,000 | 1,228,861 | ||||||
| Rexon Industrial Corp. Ltd.(b) |
225,000 | 606,658 | ||||||
| Ruentex Industries Ltd. |
1,671,200 | 4,386,693 | ||||||
| Run Long Construction Co., Ltd.(b) |
289,000 | 653,568 | ||||||
| Sanyang Motor Co., Ltd. |
2,162,000 | 1,416,992 | ||||||
| SDI Corp.(b) |
404,000 | 937,233 | ||||||
| Sercomm Corp.(b) |
1,126,488 | 2,467,122 | ||||||
| Shin Zu Shing Co., Ltd. |
156,000 | 554,241 | ||||||
| Shinkong Insurance Co., Ltd. |
672,000 | 850,343 | ||||||
| Shinkong Synthetic Fibers Corp. |
2,918,000 | 1,320,748 | ||||||
| Shiny Chemical Industrial Co., Ltd. |
251,000 | 744,355 | ||||||
| Sigurd Microelectronics Corp. |
1,085,000 | 1,059,636 | ||||||
| Sinbon Electronics Co., Ltd.(b) |
670,120 | 2,250,366 | ||||||
| Sincere Navigation Corp.(b) |
758,000 | 386,126 | ||||||
| Sinon Corp. |
2,126,000 | 1,255,437 | ||||||
| Sitronix Technology Corp. |
618,000 | 2,837,300 | ||||||
| Standard Foods Corp. |
1,321,896 | 2,221,710 | ||||||
| Sunny Friend Environmental Technology Co., Ltd. |
125,000 | 977,434 | ||||||
| Sunonwealth Electric Machine Industry Co., Ltd. |
818,000 | 936,889 | ||||||
| Supreme Electronics Co., Ltd. |
2,121,000 | 2,160,880 | ||||||
| Syncmold Enterprise Corp. |
730,915 | 1,975,478 | ||||||
| Synnex Technology International Corp. |
5,244,600 | 6,296,141 | ||||||
| Systex Corp.(b) |
456,000 | 1,004,604 | ||||||
| TA Chen Stainless Pipe(b) |
493,809 | 728,204 | ||||||
| Ta Ya Electric Wire & Cable |
830,000 | 298,924 | ||||||
| Taichung Commercial Bank Co., Ltd. |
6,268,254 | 2,318,525 | ||||||
| Taiflex Scientific Co., Ltd.(b) |
893,000 | 1,116,956 | ||||||
| Taimide Tech, Inc. |
205,000 | 406,402 | ||||||
| Tainan Spinning Co., Ltd.(b) |
2,415,000 | 948,119 | ||||||
| Taisun Enterprise Co., Ltd. |
717,000 | 431,542 | ||||||
| Taiwan Business Bank |
5,775,800 | 2,248,815 | ||||||
| Taiwan Cogeneration Corp. |
1,184,970 | 1,016,935 | ||||||
| Taiwan Fertilizer Co., Ltd. |
946,000 | 1,414,987 | ||||||
| Taiwan Glass Industry Corp. |
2,010,000 | 896,725 | ||||||
| Taiwan Hon Chuan Enterprise Co., Ltd.(b) |
944,692 | 1,506,517 | ||||||
| Taiwan Paiho Ltd.(b) |
870,000 | 2,021,122 | ||||||
| Taiwan PCB Techvest Co., Ltd. |
931,302 | 1,116,517 | ||||||
| Taiwan Styrene Monomer |
2,048,000 | 1,618,040 | ||||||
| Taiwan Surface Mounting Technology Corp.(b) |
659,000 | 1,068,025 | ||||||
| Teco Electric and Machinery Co., Ltd.(b) |
4,469,683 | 3,045,484 | ||||||
| Test Research, Inc.(b) |
704,115 | 1,274,788 | ||||||
| Thinking Electronic Industrial Co., Ltd.(b) |
318,000 | 871,855 | ||||||
| Ton Yi Industrial Corp. |
2,092,538 | 889,416 | ||||||
| Tong Hsing Electronic Industries Ltd.(b) |
486,918 | 1,635,146 | ||||||
| Tong Yang Industry Co., Ltd. |
1,261,685 | 1,619,041 | ||||||
| Topco Scientific Co., Ltd. |
676,521 | 1,751,639 | ||||||
| Transcend Information, Inc.(b) |
1,238,479 | 2,812,853 | ||||||
| Tripod Technology Corp. |
1,979,928 | 6,391,942 | ||||||
| TSRC Corp.(b) |
1,217,011 | 1,085,894 | ||||||
| Tung Ho Steel Enterprise Corp.(b) |
2,800,153 | 1,930,639 | ||||||
| TXC Corp.(b) |
1,508,549 | 1,578,518 | ||||||
| TYC Brother Industrial Co., Ltd.(b) |
858,000 | 743,291 | ||||||
| U-Ming Marine Transport Corp.(b) |
888,420 | 895,035 | ||||||
| Unimicron Technology Corp. |
2,359,000 | 2,265,583 | ||||||
| Union Bank of Taiwan |
3,986,000 | 1,383,826 | ||||||
| Unitech Printed Circuit Board Corp.(b) |
658,000 | 444,068 | ||||||
| UPC Technology Corp. |
2,852,920 | 1,152,442 | ||||||
| USI Corp. |
1,246,090 | 487,188 | ||||||
| Visual Photonics Epitaxy Co., Ltd.(b) |
420,750 | 1,247,759 | ||||||
| Voltronic Power Technology Corp. |
121,315 | 2,377,452 | ||||||
| Walsin Lihwa Corp. |
9,344,000 | 5,351,036 | ||||||
| Walton Advanced Engineering, Inc. |
832,000 | 291,546 | ||||||
| Wan Hai Lines Ltd. |
2,061,000 | 1,073,281 | ||||||
| Waterland Financial Holdings Co., Ltd. |
8,576,000 | 2,921,692 | ||||||
| Weikeng Industrial Co., Ltd. |
1,545,000 | 1,027,644 | ||||||
See Notes to Financial Statements.
| WisdomTree Trust | 55 |
Schedule of Investments (continued)
WisdomTree Emerging Markets SmallCap Dividend Fund (DGS)
March 31, 2019
| Investments | Shares | Value | ||||||
| Winbond Electronics Corp.(b) |
13,931,000 | $ | 6,667,064 | |||||
| Wistron Corp.(b) |
11,264,007 | 8,661,669 | ||||||
| Wistron NeWeb Corp. |
946,722 | 2,488,100 | ||||||
| Wowprime Corp. |
321,000 | 968,609 | ||||||
| WPG Holdings Ltd. |
6,134,058 | 8,000,815 | ||||||
| WT Microelectronics Co., Ltd. |
1,967,678 | 2,595,224 | ||||||
| YC Co., Ltd. |
853,000 | 381,934 | ||||||
| YC INOX Co., Ltd.(b) |
1,969,000 | 1,677,009 | ||||||
| YFY, Inc. |
3,125,000 | 1,201,514 | ||||||
| Yieh Phui Enterprise Co., Ltd.(b) |
2,092,400 | 676,862 | ||||||
| Yulon Motor Co., Ltd.(b) |
1,188,000 | 749,715 | ||||||
| Yungtay Engineering Co., Ltd. |
868,790 | 1,804,077 | ||||||
| Zeng Hsing Industrial Co., Ltd. |
308,000 | 1,499,002 | ||||||
| Zig Sheng Industrial Co., Ltd.(b) |
1,311,000 | 387,934 | ||||||
|
|
|
|||||||
| Total Taiwan |
|
375,009,829 | ||||||
| Thailand – 5.9% |
| |||||||
| Amata Corp. PCL NVDR |
1,155,500 | 768,270 | ||||||
| Ananda Development PCL NVDR |
5,937,000 | 669,748 | ||||||
| AP Thailand PCL NVDR |
3,733,000 | 829,294 | ||||||
| Asia Plus Group Holdings PCL NVDR(b) |
13,057,700 | 1,267,298 | ||||||
| Bangchak Corp. PCL NVDR |
1,684,900 | 1,712,243 | ||||||
| Bangkok Chain Hospital PCL NVDR |
1,549,800 | 830,206 | ||||||
| Bangkok Land PCL NVDR |
36,355,014 | 1,798,562 | ||||||
| BCPG PCL NVDR |
1,485,800 | 767,831 | ||||||
| Beauty Community PCL NVDR(b) |
7,973,500 | 1,670,830 | ||||||
| Big Camera Corp. PCL NVDR |
9,070,100 | 365,834 | ||||||
| Carabao Group PCL NVDR(b) |
505,400 | 863,966 | ||||||
| Central Plaza Hotel PCL NVDR |
832,600 | 1,147,826 | ||||||
| CH Karnchang PCL NVDR |
795,525 | 626,694 | ||||||
| Chularat Hospital PCL NVDR |
8,005,600 | 479,302 | ||||||
| Com7 PCL NVDR |
629,000 | 354,785 | ||||||
| Eastern Polymer Group PCL NVDR(b) |
2,397,100 | 487,200 | ||||||
| Eastern Water Resources Development and Management PCL NVDR |
2,711,000 | 948,231 | ||||||
| Erawan Group PCL (The) NVDR(b) |
1,799,100 | 399,674 | ||||||
| Esso Thailand PCL NVDR(b) |
6,570,400 | 2,277,435 | ||||||
| Forth Smart Service PCL NVDR(b) |
2,575,505 | 576,212 | ||||||
| GFPT PCL NVDR |
1,075,900 | 474,637 | ||||||
| Golden Land Property Development PCL NVDR |
1,484,500 | 390,596 | ||||||
| Gunkul Engineering PCL NVDR |
7,056,233 | 689,281 | ||||||
| Hana Microelectronics PCL NVDR(b) |
2,194,000 | 2,143,186 | ||||||
| Inter Far East Energy Corp. NVDR*† |
4,230,700 | 0 | ||||||
| Jasmine International PCL NVDR |
24,025,400 | 4,088,141 | ||||||
| Jay Mart PCL NVDR(b) |
1,539,200 | 390,438 | ||||||
| JMT Network Services PCL NVDR |
1,690,000 | 750,874 | ||||||
| JWD Infologistics PCL NVDR |
2,077,200 | 540,000 | ||||||
| KCE Electronics PCL NVDR(b) |
1,270,700 | 972,995 | ||||||
| KGI Securities Thailand PCL NVDR |
8,519,300 | 1,304,673 | ||||||
| Kiatnakin Bank PCL NVDR |
1,149,806 | 2,518,088 | ||||||
| LPN Development PCL NVDR(b) |
4,498,518 | 971,005 | ||||||
| Major Cineplex Group PCL NVDR |
2,164,800 | 1,910,017 | ||||||
| MBK PCL NVDR |
1,693,000 | 1,109,639 | ||||||
| MC Group PCL NVDR(b) |
1,188,500 | 361,400 | ||||||
| Mega Lifesciences PCL NVDR |
615,400 | 630,235 | ||||||
| MK Restaurants Group PCL NVDR |
948,400 | 2,166,661 | ||||||
| Origin Property PCL NVDR(b) |
3,437,300 | 741,941 | ||||||
| Polyplex Thailand PCL NVDR |
1,243,400 | 611,219 | ||||||
| Pruksa Holding PCL NVDR |
3,451,900 | 1,957,908 | ||||||
| PTG Energy PCL NVDR(b) |
1,074,000 | 338,428 | ||||||
| Quality Houses PCL NVDR |
23,204,844 | 2,164,372 | ||||||
| Ratchaburi Electricity Generating Holding PCL NVDR |
1,551,800 | 2,860,574 | ||||||
| Robinson PCL NVDR(b) |
884,700 | 1,637,817 | ||||||
| Sansiri PCL NVDR |
36,339,400 | 1,500,067 | ||||||
| SC Asset Corp. PCL NVDR |
9,369,000 | 885,678 | ||||||
| Sermsang Power Corp. Co., Ltd. NVDR |
1,629,000 | 400,384 | ||||||
| Siam City Cement PCL NVDR(b) |
328,254 | 2,327,309 | ||||||
| Siam Future Development PCL NVDR |
2,788,300 | 667,751 | ||||||
| Siam Global House PCL NVDR |
1,618,957 | 882,557 | ||||||
| Siamgas & Petrochemicals PCL NVDR |
3,686,200 | 1,068,632 | ||||||
| Somboon Advance Technology PCL NVDR |
755,200 | 423,588 | ||||||
| SPCG PCL NVDR |
2,424,500 | 1,405,729 | ||||||
| Sri Trang Agro-Industry PCL NVDR(b) |
917,000 | 369,863 | ||||||
| Star Petroleum Refining PCL NVDR(b) |
9,192,070 | 3,157,194 | ||||||
| Supalai PCL NVDR |
1,432,000 | 852,838 | ||||||
| Synnex Thailand PCL NVDR |
883,380 | 331,250 | ||||||
| Taokaenoi Food & Marketing PCL NVDR(b) |
1,205,380 | 357,037 | ||||||
| Thai Vegetable Oil PCL NVDR |
2,442,800 | 2,059,080 | ||||||
| Thanachart Capital PCL NVDR |
1,593,400 | 2,736,420 | ||||||
| Thonburi Healthcare Group PCL NVDR |
587,800 | 588,078 | ||||||
| Tisco Financial Group PCL NVDR(b) |
1,300,757 | 3,617,199 | ||||||
| TPI Polene Power PCL NVDR |
10,813,400 | 2,078,517 | ||||||
| TTW PCL NVDR |
6,069,700 | 2,333,397 | ||||||
| Unique Engineering & Construction PCL NVDR(b) |
1,606,400 | 498,599 | ||||||
| Univentures PCL NVDR(b) |
1,910,000 | 367,134 | ||||||
| VGI Global Media PCL NVDR |
2,923,200 | 833,621 | ||||||
| Vinythai PCL NVDR |
611,600 | 476,021 | ||||||
| WHA Corp. PCL NVDR(b) |
19,479,300 | 2,590,283 | ||||||
| WHA Utilities and Power PCL NVDR |
3,389,800 | 635,554 | ||||||
| Workpoint Entertainment PCL NVDR(b) |
487,200 | 343,888 | ||||||
|
|
|
|||||||
| Total Thailand |
|
84,353,234 | ||||||
| Turkey – 1.6% |
| |||||||
| Aksa Akrilik Kimya Sanayii AS |
771,577 | 1,253,731 | ||||||
| Anadolu Cam Sanayii AS |
1 | 1 | ||||||
| Anadolu Efes Biracilik ve Malt Sanayii AS |
372,572 | 1,154,725 | ||||||
| Aselsan Elektronik Sanayi ve Ticaret AS |
1 | 3 | ||||||
| Aslan Cimento AS |
61,311 | 265,447 | ||||||
| Aygaz AS |
788,523 | 1,344,073 | ||||||
| Borusan Mannesmann Boru Sanayi ve Ticaret AS |
258,547 | 437,044 | ||||||
| Coca-Cola Icecek AS |
152,599 | 819,501 | ||||||
| EGE Endustri VE Ticaret AS |
6,028 | 483,555 | ||||||
| Emlak Konut Gayrimenkul Yatirim Ortakligi AS |
14,281,535 | 3,867,663 | ||||||
| Enerjisa Enerji AS(a) |
928,726 | 848,242 | ||||||
| Kordsa Teknik Tekstil AS |
297,925 | 548,959 | ||||||
| Soda Sanayii AS |
649,658 | 862,439 | ||||||
See Notes to Financial Statements.
| 56 | WisdomTree Trust |
Schedule of Investments (concluded)
WisdomTree Emerging Markets SmallCap Dividend Fund (DGS)
March 31, 2019
| Investments | Shares | Value | ||||||
| TAV Havalimanlari Holding AS |
516,366 | $ | 2,133,245 | |||||
| Tekfen Holding AS |
470,211 | 1,875,983 | ||||||
| Tofas Turk Otomobil Fabrikasi AS |
764,604 | 2,315,628 | ||||||
| Torunlar Gayrimenkul Yatirim Ortakligi AS |
780,437 | 317,723 | ||||||
| Trakya Cam Sanayii AS |
1,051,973 | 618,194 | ||||||
| Turkiye Halk Bankasi AS |
1,018,585 | 1,150,271 | ||||||
| Turkiye Sise ve Cam Fabrikalari AS |
1,043,070 | 1,076,377 | ||||||
| Turkiye Vakiflar Bankasi TAO Class D |
1,398,505 | 1,121,359 | ||||||
|
|
|
|||||||
| Total Turkey | 22,494,163 | |||||||
| TOTAL COMMON STOCKS (Cost: $1,325,134,703) |
1,419,617,918 | |||||||
| INVESTMENT OF CASH COLLATERAL FOR SECURITIES LOANED – 0.8% |
| |||||||
| United States – 0.8% |
| |||||||
| State Street Navigator Securities Lending Government Money Market Portfolio, 2.46%(c) |
||||||||
| (Cost: $10,706,585)(d) | 10,706,585 | 10,706,585 | ||||||
| TOTAL INVESTMENTS IN SECURITIES – 100.4% (Cost: $1,335,841,288) |
|
1,430,324,503 | ||||||
| Other Assets less Liabilities – (0.4)% |
|
(5,355,728 | ) | |||||
|
|
|
|||||||
| NET ASSETS – 100.0% |
|
$ | 1,424,968,775 | |||||
| * | Non-income producing security. |
| † | Security is being fair valued using significant unobservable inputs by a pricing committee under the direction of the Board of Trustees. The aggregate value of fair valued securities is $924,744, which represents 0.06% of net assets. |
| (a) | This security is exempt from registration under rule 144A of the Securities Act of 1933. This security may be sold in transactions that are exempt from registration, normally to qualified institutional buyers. |
| (b) | Security, or portion thereof, was on loan at March 31, 2019 (See Note 2). |
| (c) | Rate shown represents annualized 7-day yield as of March 31, 2019. |
| (d) | At March 31, 2019, the total market value of the Fund’s securities on loan identified in the Schedule of Investments was $102,226,525 and the total market value of the collateral held by the Fund was $116,590,463. The total market value of the collateral includes non-cash U.S. Government securities collateral having a value of $105,883,878. |
NVDR – Non-Voting Depositary Receipt
See Notes to Financial Statements.
| WisdomTree Trust | 57 |
Schedule of Investments
WisdomTree Global ex-U.S. Quality Dividend Growth Fund (DNL)
March 31, 2019
| Investments | Shares | Value | ||||||
| COMMON STOCKS – 99.5% | ||||||||
| Australia – 4.9% | ||||||||
| Altium Ltd. |
3,715 | $ | 85,291 | |||||
| Aristocrat Leisure Ltd. |
22,148 | 385,612 | ||||||
| carsales.com Ltd. |
18,703 | 168,064 | ||||||
| Cochlear Ltd. |
2,189 | 269,443 | ||||||
| Corporate Travel Management Ltd.(a) |
3,749 | 67,802 | ||||||
| CSL Ltd. |
13,455 | 1,863,189 | ||||||
| Domino’s Pizza Enterprises Ltd.(a) |
4,368 | 134,724 | ||||||
| Northern Star Resources Ltd. |
19,790 | 125,817 | ||||||
| REA Group Ltd. |
4,510 | 239,315 | ||||||
| Reece Ltd. |
24,961 | 174,828 | ||||||
|
|
|
|||||||
| Total Australia |
|
3,514,085 | ||||||
| Belgium – 0.2% |
| |||||||
| Melexis N.V.(a) |
2,548 | 154,352 | ||||||
| Brazil – 1.8% |
| |||||||
| Ambev S.A. |
120,895 | 522,821 | ||||||
| BB Seguridade Participacoes S.A. |
40,496 | 275,960 | ||||||
| CCR S.A. |
66,351 | 200,160 | ||||||
| IRB Brasil Resseguros S.A. |
3,499 | 82,042 | ||||||
| Localiza Rent a Car S.A. |
7,914 | 67,229 | ||||||
| Lojas Renner S.A. |
8,496 | 95,620 | ||||||
| Magazine Luiza S.A. |
400 | 17,766 | ||||||
| Natura Cosmeticos S.A. |
2,408 | 28,085 | ||||||
| Raia Drogasil S.A. |
2,200 | 36,915 | ||||||
|
|
|
|||||||
| Total Brazil |
|
1,326,598 | ||||||
| Canada – 3.1% |
| |||||||
| Alimentation Couche-Tard, Inc. Class B |
6,336 | 373,345 | ||||||
| Canadian Pacific Railway Ltd. |
3,088 | 636,438 | ||||||
| CCL Industries, Inc. Class B |
3,900 | 157,933 | ||||||
| CI Financial Corp. |
38,296 | 522,863 | ||||||
| Constellation Software, Inc. |
269 | 228,034 | ||||||
| FirstService Corp. |
600 | 53,468 | ||||||
| Toromont Industries Ltd. |
2,719 | 138,906 | ||||||
| West Fraser Timber Co., Ltd. |
2,100 | 102,174 | ||||||
|
|
|
|||||||
| Total Canada |
|
2,213,161 | ||||||
| Chile – 0.1% |
| |||||||
| Aguas Andinas S.A. Class A |
167,969 | 95,503 | ||||||
| China – 6.7% |
| |||||||
| AAC Technologies Holdings, Inc. |
21,000 | 124,262 | ||||||
| Anhui Conch Cement Co., Ltd. Class H |
37,000 | 226,008 | ||||||
| ANTA Sports Products Ltd. |
28,000 | 190,473 | ||||||
| Brilliance China Automotive Holdings Ltd. |
44,000 | 43,608 | ||||||
| China Conch Venture Holdings Ltd. |
39,500 | 141,396 | ||||||
| China Gas Holdings Ltd. |
36,200 | 127,277 | ||||||
| China Medical System Holdings Ltd. |
39,000 | 37,808 | ||||||
| China Overseas Land & Investment Ltd. |
132,000 | 501,099 | ||||||
| China Resources Gas Group Ltd. |
18,000 | 84,841 | ||||||
| CIFI Holdings Group Co., Ltd. |
254,000 | 192,524 | ||||||
| Country Garden Holdings Co., Ltd. |
417,000 | 651,268 | ||||||
| CSPC Pharmaceutical Group Ltd. |
56,400 | 104,897 | ||||||
| Dali Foods Group Co., Ltd.(b) |
70,500 | 52,718 | ||||||
| Fullshare Holdings Ltd.*(a) |
40,000 | 5,350 | ||||||
| Geely Automobile Holdings Ltd. |
113,000 | 215,925 | ||||||
| Haier Electronics Group Co., Ltd.* |
17,000 | 49,376 | ||||||
| Haitian International Holdings Ltd. |
23,000 | 52,270 | ||||||
| Kingboard Laminates Holdings Ltd. |
96,000 | 100,892 | ||||||
| Logan Property Holdings Co., Ltd. |
62,000 | 102,676 | ||||||
| Luye Pharma Group Ltd.(a)(b) |
29,500 | 25,780 | ||||||
| MGM China Holdings Ltd.(a) |
10,400 | 21,754 | ||||||
| Minth Group Ltd. |
22,000 | 69,223 | ||||||
| Shenzhou International Group Holdings Ltd. |
14,300 | 191,639 | ||||||
| Sino Biopharmaceutical Ltd. |
33,250 | 30,328 | ||||||
| SITC International Holdings Co., Ltd. |
67,000 | 68,793 | ||||||
| Sunac China Holdings Ltd. |
60,000 | 298,855 | ||||||
| Sunny Optical Technology Group Co., Ltd. |
6,500 | 77,628 | ||||||
| Tencent Holdings Ltd. |
16,000 | 735,801 | ||||||
| Xinyi Glass Holdings Ltd. |
144,000 | 165,097 | ||||||
| Xinyi Solar Holdings Ltd. |
166,000 | 79,934 | ||||||
| Zhuzhou CRRC Times Electric Co., Ltd. Class H |
8,300 | 49,060 | ||||||
|
|
|
|||||||
| Total China |
|
4,818,560 | ||||||
| Denmark – 3.1% |
| |||||||
| Ambu A/S Class B |
1,545 | 40,922 | ||||||
| Chr Hansen Holding A/S |
3,058 | 310,277 | ||||||
| Coloplast A/S Class B |
11,943 | 1,311,661 | ||||||
| DSV A/S |
1,842 | 152,488 | ||||||
| GN Store Nord A/S |
1,727 | 80,263 | ||||||
| Rockwool International A/S Class B |
264 | 61,904 | ||||||
| Royal Unibrew A/S |
2,420 | 178,716 | ||||||
| SimCorp A/S |
1,281 | 123,791 | ||||||
|
|
|
|||||||
| Total Denmark |
|
2,260,022 | ||||||
| Finland – 0.3% |
| |||||||
| DNA Oyj |
10,924 | 226,676 | ||||||
| France – 3.6% |
| |||||||
| Gaztransport Et Technigaz S.A. |
3,626 | 330,195 | ||||||
| Ipsen S.A. |
1,672 | 229,419 | ||||||
| Safran S.A. |
14,712 | 2,019,493 | ||||||
| Trigano S.A. |
569 | 44,403 | ||||||
|
|
|
|||||||
| Total France |
|
2,623,510 | ||||||
| Germany – 5.0% |
| |||||||
| 1&1 Drillisch AG |
18,069 | 643,966 | ||||||
| adidas AG |
6,716 | 1,633,393 | ||||||
| Bechtle AG |
1,293 | 119,850 | ||||||
| CompuGroup Medical SE |
979 | 57,712 | ||||||
| CTS Eventim AG & Co. KGaA |
4,017 | 190,523 | ||||||
| Fuchs Petrolub SE |
3,562 | 140,386 | ||||||
| Hugo Boss AG |
7,308 | 499,568 | ||||||
| Nemetschek SE |
633 | 108,036 | ||||||
| Siltronic AG |
2,031 | 179,339 | ||||||
| Wirecard AG |
441 | 55,311 | ||||||
|
|
|
|||||||
| Total Germany |
|
3,628,084 | ||||||
| Hong Kong – 2.9% |
| |||||||
| Galaxy Entertainment Group Ltd. |
198,000 | 1,348,174 | ||||||
| Melco International Development Ltd. |
22,000 | 51,567 | ||||||
See Notes to Financial Statements.
| 58 | WisdomTree Trust |
Schedule of Investments (continued)
WisdomTree Global ex-U.S. Quality Dividend Growth Fund (DNL)
March 31, 2019
| Investments | Shares | Value | ||||||
| Techtronic Industries Co., Ltd. |
74,000 | $ | 497,264 | |||||
| Vitasoy International Holdings Ltd. |
40,000 | 193,632 | ||||||
|
|
|
|||||||
| Total Hong Kong |
|
2,090,637 | ||||||
| India – 3.2% |
| |||||||
| Alkem Laboratories Ltd. |
417 | 10,539 | ||||||
| Asian Paints Ltd. |
1,938 | 41,759 | ||||||
| Aurobindo Pharma Ltd. |
3,124 | 35,366 | ||||||
| Bajaj Auto Ltd. |
1,386 | 58,243 | ||||||
| Bajaj Holdings & Investment Ltd. |
634 | 31,268 | ||||||
| Bandhan Bank Ltd.(b) |
3,399 | 25,821 | ||||||
| Bharat Forge Ltd. |
3,396 | 25,119 | ||||||
| Bharti Infratel Ltd. |
45,537 | 206,009 | ||||||
| Biocon Ltd. |
1,384 | 12,198 | ||||||
| Cadila Healthcare Ltd. |
3,993 | 20,004 | ||||||
| Colgate-Palmolive India Ltd. |
1,848 | 33,563 | ||||||
| Dabur India Ltd. |
4,367 | 25,770 | ||||||
| Eicher Motors Ltd. |
116 | 34,407 | ||||||
| Emami Ltd. |
1,269 | 7,327 | ||||||
| Endurance Technologies Ltd.(b) |
116 | 1,944 | ||||||
| Godrej Consumer Products Ltd. |
3,626 | 35,907 | ||||||
| Graphite India Ltd. |
412 | 2,658 | ||||||
| Havells India Ltd. |
2,878 | 32,093 | ||||||
| Hero MotoCorp Ltd. |
2,848 | 104,964 | ||||||
| Hindustan Unilever Ltd. |
8,701 | 214,376 | ||||||
| Indraprastha Gas Ltd. |
5,850 | 25,794 | ||||||
| InterGlobe Aviation Ltd.(b) |
1,385 | 28,553 | ||||||
| ITC Ltd. |
51,014 | 218,894 | ||||||
| JSW Steel Ltd. |
11,715 | 49,557 | ||||||
| Maruti Suzuki India Ltd. |
1,390 | 133,885 | ||||||
| Mindtree Ltd. |
1,765 | 24,064 | ||||||
| Motherson Sumi Systems Ltd. |
12,973 | 28,034 | ||||||
| Mphasis Ltd. |
1,510 | 21,603 | ||||||
| Nestle India Ltd. |
203 | 32,119 | ||||||
| Oracle Financial Services Software Ltd. |
455 | 22,251 | ||||||
| Petronet LNG Ltd. |
12,713 | 46,163 | ||||||
| Pidilite Industries Ltd. |
2,326 | 41,845 | ||||||
| Shree Cement Ltd. |
75 | 20,210 | ||||||
| Siemens Ltd. |
1,368 | 22,291 | ||||||
| Sun Pharmaceutical Industries Ltd. |
4,148 | 28,672 | ||||||
| Tata Consultancy Services Ltd. |
11,835 | 341,964 | ||||||
| Tech Mahindra Ltd. |
9,694 | 108,576 | ||||||
| Titan Co., Ltd. |
2,166 | 35,702 | ||||||
| UPL Ltd. |
6,106 | 84,514 | ||||||
| Whirlpool of India Ltd. |
539 | 11,788 | ||||||
| Zee Entertainment Enterprises Ltd. |
7,934 | 51,023 | ||||||
|
|
|
|||||||
| Total India |
|
2,336,837 | ||||||
| Indonesia – 0.3% |
| |||||||
| Charoen Pokphand Indonesia Tbk PT |
93,600 | 42,068 | ||||||
| Gudang Garam Tbk PT |
15,600 | 91,146 | ||||||
| United Tractors Tbk PT |
40,000 | 75,983 | ||||||
|
|
|
|||||||
| Total Indonesia |
|
209,197 | ||||||
| Israel – 0.4% |
| |||||||
| Bezeq Israeli Telecommunication Corp., Ltd. |
399,960 | 287,075 | ||||||
| Italy – 2.6% |
| |||||||
| De’ Longhi SpA |
13,942 | 376,654 | ||||||
| Ferrari N.V. |
3,098 | 415,691 | ||||||
| IMA Industria Macchine Automatiche SpA |
2,358 | 176,203 | ||||||
| Moncler SpA |
5,440 | 219,410 | ||||||
| Recordati SpA |
14,716 | 573,543 | ||||||
| Reply SpA |
604 | 38,929 | ||||||
| Technogym SpA(b) |
5,397 | 66,479 | ||||||
|
|
|
|||||||
| Total Italy |
|
1,866,909 | ||||||
| Japan – 12.9% |
| |||||||
| Advantest Corp. |
7,300 | 169,697 | ||||||
| Asahi Intecc Co., Ltd. |
1,500 | 70,470 | ||||||
| Benefit One, Inc.(a) |
3,700 | 72,606 | ||||||
| Daito Trust Construction Co., Ltd. |
7,400 | 1,031,594 | ||||||
| en-japan, Inc.(a) |
1,000 | 29,092 | ||||||
| GMO Payment Gateway, Inc.(a) |
800 | 56,810 | ||||||
| Harmonic Drive Systems, Inc.(a) |
2,000 | 68,483 | ||||||
| Haseko Corp. |
25,900 | 325,724 | ||||||
| Hoya Corp. |
10,400 | 686,756 | ||||||
| Kakaku.com, Inc. |
8,200 | 157,577 | ||||||
| Kaken Pharmaceutical Co., Ltd.(a) |
2,900 | 131,788 | ||||||
| M3, Inc. |
3,900 | 65,432 | ||||||
| MonotaRO Co., Ltd. |
3,000 | 66,703 | ||||||
| Murata Manufacturing Co., Ltd. |
25,800 | 1,284,814 | ||||||
| Nidec Corp. |
4,700 | 595,541 | ||||||
| Nihon M&A Center, Inc. |
2,600 | 71,175 | ||||||
| Open House Co., Ltd. |
2,400 | 82,288 | ||||||
| Oracle Corp. |
4,300 | 288,648 | ||||||
| Pigeon Corp. |
3,600 | 147,174 | ||||||
| Pilot Corp. |
700 | 28,364 | ||||||
| Relo Group, Inc. |
2,300 | 64,625 | ||||||
| Seria Co., Ltd.(a) |
1,800 | 62,041 | ||||||
| Sysmex Corp. |
3,900 | 235,723 | ||||||
| T-Gaia Corp. |
4,400 | 72,985 | ||||||
| TechnoPro Holdings, Inc. |
1,500 | 89,443 | ||||||
| Tokai Carbon Co., Ltd.(a) |
4,900 | 61,181 | ||||||
| Tokyo Electron Ltd.(a) |
19,600 | 2,833,266 | ||||||
| Trend Micro, Inc. |
7,000 | 340,877 | ||||||
| ZOZO, Inc. |
6,900 | 130,039 | ||||||
|
|
|
|||||||
| Total Japan |
|
9,320,916 | ||||||
| Malaysia – 0.3% |
| |||||||
| Fraser & Neave Holdings Bhd |
5,500 | 46,937 | ||||||
| Hartalega Holdings Bhd |
20,600 | 23,363 | ||||||
| Nestle Malaysia Bhd |
900 | 32,362 | ||||||
| Press Metal Aluminium Holdings Bhd |
27,800 | 30,711 | ||||||
| Top Glove Corp. Bhd |
23,400 | 26,481 | ||||||
| Westports Holdings Bhd |
26,400 | 24,314 | ||||||
|
|
|
|||||||
| Total Malaysia |
|
184,168 | ||||||
| Mexico – 0.6% |
| |||||||
| Fomento Economico Mexicano S.A.B. de C.V. |
25,156 | 232,334 | ||||||
| Grupo Aeroportuario del Centro Norte S.A.B. de C.V. |
15,298 | 86,500 | ||||||
| Kimberly-Clark de Mexico S.A.B. de C.V. Class A* |
60,999 | 103,586 | ||||||
|
|
|
|||||||
| Total Mexico |
|
422,420 | ||||||
See Notes to Financial Statements.
| WisdomTree Trust | 59 |
Schedule of Investments (continued)
WisdomTree Global ex-U.S. Quality Dividend Growth Fund (DNL)
March 31, 2019
| Investments | Shares | Value | ||||||
| Netherlands – 4.1% |
| |||||||
| ASML Holding N.V. |
9,525 | $ | 1,788,229 | |||||
| Koninklijke DSM N.V. |
10,919 | 1,191,220 | ||||||
|
|
|
|||||||
| Total Netherlands |
|
2,979,449 | ||||||
| New Zealand – 0.6% |
| |||||||
| Fisher & Paykel Healthcare Corp., Ltd. |
23,207 | 248,486 | ||||||
| Ryman Healthcare Ltd. |
18,970 | 158,485 | ||||||
|
|
|
|||||||
| Total New Zealand |
|
406,971 | ||||||
| Norway – 6.3% |
| |||||||
| Austevoll Seafood ASA |
11,651 | 138,000 | ||||||
| Leroy Seafood Group ASA |
32,662 | 237,277 | ||||||
| Salmar ASA |
12,360 | 593,916 | ||||||
| Telenor ASA |
179,388 | 3,597,509 | ||||||
|
|
|
|||||||
| Total Norway |
|
4,566,702 | ||||||
| Philippines – 0.1% |
| |||||||
| DMCI Holdings, Inc. |
207,100 | 47,328 | ||||||
| Jollibee Foods Corp. |
5,670 | 34,230 | ||||||
| Semirara Mining & Power Corp. |
54,170 | 22,644 | ||||||
|
|
|
|||||||
| Total Philippines |
|
104,202 | ||||||
| Poland – 0.0% |
| |||||||
| CCC S.A. |
328 | 18,411 | ||||||
| Russia – 0.9% |
| |||||||
| Mobile TeleSystems PJSC ADR |
46,269 | 349,794 | ||||||
| Novatek PJSC GDR Reg S |
1,340 | 229,676 | ||||||
| PhosAgro PJSC GDR Reg S |
4,915 | 61,585 | ||||||
|
|
|
|||||||
| Total Russia |
|
641,055 | ||||||
| South Africa – 1.3% |
| |||||||
| Assore Ltd. |
2,835 | 73,523 | ||||||
| Capitec Bank Holdings Ltd. |
1,100 | 102,972 | ||||||
| Clicks Group Ltd. |
6,051 | 77,293 | ||||||
| Life Healthcare Group Holdings Ltd. |
54,110 | 100,706 | ||||||
| Mr. Price Group Ltd. |
6,952 | 91,361 | ||||||
| MultiChoice Group Ltd.* |
871 | 7,290 | ||||||
| Naspers Ltd. Class N |
944 | 218,118 | ||||||
| Pick n Pay Stores Ltd. |
12,484 | 57,489 | ||||||
| RMB Holdings Ltd. |
37,525 | 197,705 | ||||||
|
|
|
|||||||
| Total South Africa |
|
926,457 | ||||||
| South Korea – 1.3% |
| |||||||
| Amorepacific Corp. |
226 | 37,531 | ||||||
| Coway Co., Ltd. |
1,883 | 156,764 | ||||||
| NAVER Corp. |
218 | 23,815 | ||||||
| NCSoft Corp. |
321 | 140,266 | ||||||
| SK Hynix, Inc. |
8,616 | 563,217 | ||||||
|
|
|
|||||||
| Total South Korea |
|
921,593 | ||||||
| Spain – 0.4% |
| |||||||
| Prosegur Cash S.A.(b) |
146,862 | 324,531 | ||||||
| Sweden – 7.0% |
| |||||||
| Atlas Copco AB Class A |
89,906 | 2,419,871 | ||||||
| Atlas Copco AB Class B |
45,337 | 1,124,712 | ||||||
| Beijer Ref AB |
3,088 | 49,773 | ||||||
| Evolution Gaming Group AB(b) |
1,580 | 124,778 | ||||||
| Fabege AB |
14,228 | 207,085 | ||||||
| Hexpol AB |
18,162 | 153,026 | ||||||
| Indutrade AB |
5,220 | 148,913 | ||||||
| Investment AB Latour Class B(a) |
28,547 | 383,179 | ||||||
| Lifco AB Class B |
2,307 | 94,267 | ||||||
| Sweco AB Class B |
5,972 | 144,225 | ||||||
| Thule Group AB(b) |
7,822 | 177,096 | ||||||
|
|
|
|||||||
| Total Sweden |
|
5,026,925 | ||||||
| Switzerland – 6.7% |
| |||||||
| EMS-Chemie Holding AG Registered Shares |
1,927 | 1,044,864 | ||||||
| Logitech International S.A. Registered Shares |
7,289 | 285,661 | ||||||
| Partners Group Holding AG |
1,704 | 1,238,775 | ||||||
| Roche Holding AG Bearer Shares |
4,258 | 1,160,379 | ||||||
| Schindler Holding AG Participation Certificate |
1,817 | 376,573 | ||||||
| Straumann Holding AG Registered Shares |
288 | 234,963 | ||||||
| Sunrise Communications Group AG*(a)(b) |
5,197 | 382,508 | ||||||
| Temenos AG Registered Shares* |
787 | 116,007 | ||||||
|
|
|
|||||||
| Total Switzerland |
|
4,839,730 | ||||||
| Taiwan – 5.2% |
| |||||||
| Advantech Co., Ltd. |
11,000 | 91,368 | ||||||
| Catcher Technology Co., Ltd. |
29,000 | 223,001 | ||||||
| Eclat Textile Co., Ltd. |
5,283 | 71,136 | ||||||
| Feng TAY Enterprise Co., Ltd. |
12,440 | 87,991 | ||||||
| Hiwin Technologies Corp. |
4,000 | 33,744 | ||||||
| Largan Precision Co., Ltd. |
2,000 | 298,503 | ||||||
| Micro-Star International Co., Ltd. |
42,000 | 117,876 | ||||||
| Nien Made Enterprise Co., Ltd. |
8,000 | 70,472 | ||||||
| Novatek Microelectronics Corp. |
33,000 | 212,002 | ||||||
| President Chain Store Corp. |
42,000 | 413,588 | ||||||
| Taiwan Semiconductor Manufacturing Co., Ltd. |
249,000 | 1,983,404 | ||||||
| Walsin Technology Corp. |
7,000 | 45,424 | ||||||
| Yageo Corp. |
8,000 | 83,840 | ||||||
|
|
|
|||||||
| Total Taiwan |
|
3,732,349 | ||||||
| Thailand – 1.1% |
| |||||||
| Advanced Info Service PCL NVDR |
24,600 | 142,631 | ||||||
| Airports of Thailand PCL NVDR |
47,400 | 101,566 | ||||||
| Bangkok Dusit Medical Services PCL NVDR |
93,200 | 72,833 | ||||||
| Central Pattana PCL NVDR |
34,250 | 79,055 | ||||||
| CP ALL PCL |
54,056 | 127,326 | ||||||
| Delta Electronics Thailand PCL NVDR |
24,300 | 54,366 | ||||||
| Energy Absolute PCL NVDR |
13,200 | 19,965 | ||||||
| Home Product Center PCL NVDR |
126,100 | 60,795 | ||||||
| Indorama Ventures PCL NVDR |
47,000 | 73,681 | ||||||
| VGI Global Media PCL NVDR |
175,400 | 50,020 | ||||||
|
|
|
|||||||
| Total Thailand |
|
782,238 | ||||||
| Turkey – 0.5% |
| |||||||
| BIM Birlesik Magazalar AS |
4,510 | 60,830 | ||||||
| Eregli Demir ve Celik Fabrikalari T.A.S. |
116,201 | 187,580 | ||||||
| Ford Otomotiv Sanayi AS |
3,729 | 32,197 | ||||||
| Iskenderun Demir ve Celik AS |
18,297 | 23,156 | ||||||
| KOC Holding AS |
23,947 | 68,201 | ||||||
|
|
|
|||||||
| Total Turkey |
|
371,964 | ||||||
See Notes to Financial Statements.
| 60 | WisdomTree Trust |
Schedule of Investments (concluded)
WisdomTree Global ex-U.S. Quality Dividend Growth Fund (DNL)
March 31, 2019
| Investments | Shares | Value | ||||||
| United Kingdom – 12.0% |
| |||||||
| Ashmore Group PLC |
79,713 | $ | 443,733 | |||||
| Ashtead Group PLC |
19,592 | 472,932 | ||||||
| British American Tobacco PLC |
103,381 | 4,302,658 | ||||||
| Countryside Properties PLC(b) |
36,345 | 153,823 | ||||||
| Croda International PLC |
5,648 | 370,778 | ||||||
| Diploma PLC |
5,051 | 95,961 | ||||||
| Electrocomponents PLC |
21,651 | 158,497 | ||||||
| Fevertree Drinks PLC |
1,500 | 59,009 | ||||||
| Halma PLC |
8,785 | 191,399 | ||||||
| Hargreaves Lansdown PLC |
24,415 | 592,853 | ||||||
| Hays PLC |
193,533 | 378,275 | ||||||
| Howden Joinery Group PLC |
41,039 | 259,519 | ||||||
| JD Sports Fashion PLC |
9,808 | 64,234 | ||||||
| NMC Health PLC |
1,990 | 59,226 | ||||||
| Pagegroup PLC |
37,358 | 228,793 | ||||||
| Redrow PLC |
46,255 | 362,238 | ||||||
| Rightmove PLC |
35,094 | 233,219 | ||||||
| Softcat PLC |
6,757 | 73,079 | ||||||
| Unite Group PLC (The) |
17,505 | 209,281 | ||||||
|
|
|
|||||||
| Total United Kingdom |
|
8,709,507 | ||||||
| TOTAL COMMON STOCKS (Cost: $67,498,484) |
71,930,794 | |||||||
| EXCHANGE-TRADED FUNDS – 0.0% | ||||||||
| United States – 0.0% | ||||||||
| WisdomTree Emerging Markets High Dividend Fund(c) |
106 | 4,647 | ||||||
| WisdomTree International Equity Fund(a)(c) |
136 | 6,886 | ||||||
| TOTAL EXCHANGE-TRADED FUNDS (Cost: $11,502) |
11,533 | |||||||
| INVESTMENT OF CASH COLLATERAL FOR SECURITIES LOANED – 1.4% |
| |||||||
| United States – 1.4% | ||||||||
| State Street Navigator Securities Lending Government Money Market Portfolio, 2.46%(d) |
||||||||
| (Cost: $982,785)(e) | 982,785 | 982,785 | ||||||
| TOTAL INVESTMENTS IN SECURITIES – 100.9% (Cost: $68,492,771) |
72,925,112 | |||||||
| Other Assets less Liabilities – (0.9)% |
(645,132 | ) | ||||||
|
|
|
|||||||
| NET ASSETS – 100.0% | $ | 72,279,980 | ||||||
| * | Non-income producing security. |
| (a) | Security, or portion thereof, was on loan at March 31, 2019 (See Note 2). |
| (b) | This security is exempt from registration under rule 144A of the Securities Act of 1933. This security may be sold in transactions that are exempt from registration, normally to qualified institutional buyers. |
| (c) | Affiliated company (See Note 3). |
| (d) | Rate shown represents annualized 7-day yield as of March 31, 2019. |
| (e) | At March 31, 2019, the total market value of the Fund’s securities on loan identified in the Schedule of Investments was $3,869,120 and the total market value of the collateral held by the Fund was $4,126,373. The total market value of the collateral includes non-cash U.S. Government securities collateral having a value of $3,143,588. |
ADR – American Depositary Receipt
GDR – Global Depositary Receipt
NVDR – Non-Voting Depositary Receipt
Reg S – Regulation S provides an exclusion from the registration requirements of the Securities Act of 1933. These securities may be resold in transactions exempt from registration, normally to qualified institutional buyers.
See Notes to Financial Statements.
| WisdomTree Trust | 61 |
Schedule of Investments
WisdomTree Global ex-U.S. Real Estate Fund (DRW)
March 31, 2019
| Investments | Shares | Value | ||||||
| COMMON STOCKS – 99.7% | ||||||||
| Australia – 10.6% | ||||||||
| Abacus Property Group |
78,010 | $ | 206,142 | |||||
| BWP Trust |
105,567 | 280,461 | ||||||
| Charter Hall Group |
61,645 | 449,718 | ||||||
| Charter Hall Retail REIT |
72,130 | 238,255 | ||||||
| Cromwell Property Group |
455,558 | 354,348 | ||||||
| Dexus |
128,609 | 1,163,893 | ||||||
| Goodman Group |
136,436 | 1,293,846 | ||||||
| GPT Group (The) |
241,745 | 1,066,403 | ||||||
| Growthpoint Properties Australia Ltd. |
115,095 | 339,294 | ||||||
| LendLease Group |
61,175 | 537,981 | ||||||
| Mirvac Group |
477,164 | 932,122 | ||||||
| Scentre Group |
814,339 | 2,377,494 | ||||||
| Shopping Centres Australasia Property Group |
103,825 | 194,705 | ||||||
| Stockland |
436,547 | 1,193,889 | ||||||
| Vicinity Centres |
657,470 | 1,214,288 | ||||||
| Viva Energy REIT |
120,262 | 216,987 | ||||||
|
|
|
|||||||
| Total Australia |
|
12,059,826 | ||||||
| Austria – 0.5% |
| |||||||
| CA Immobilien Anlagen AG |
7,126 | 257,646 | ||||||
| IMMOFINANZ AG* |
10,537 | 261,949 | ||||||
| S IMMO AG |
4,495 | 91,960 | ||||||
|
|
|
|||||||
| Total Austria |
|
611,555 | ||||||
| Belgium – 0.9% |
| |||||||
| Befimmo S.A. |
4,182 | 246,527 | ||||||
| Cofinimmo S.A. |
2,843 | 377,964 | ||||||
| Warehouses De Pauw CVA |
2,346 | 376,692 | ||||||
|
|
|
|||||||
| Total Belgium |
|
1,001,183 | ||||||
| Brazil – 0.1% |
| |||||||
| Multiplan Empreendimentos Imobiliarios S.A. |
13,435 | 80,747 | ||||||
| Canada – 5.3% |
| |||||||
| Allied Properties Real Estate Investment Trust |
9,401 | 346,921 | ||||||
| Artis Real Estate Investment Trust |
36,654 | 304,821 | ||||||
| Boardwalk Real Estate Investment Trust |
3,973 | 121,276 | ||||||
| Canadian Apartment Properties REIT |
10,393 | 399,632 | ||||||
| Choice Properties Real Estate Investment Trust |
26,406 | 277,906 | ||||||
| Cominar Real Estate Investment Trust |
38,088 | 336,989 | ||||||
| Dream Global Real Estate Investment Trust |
28,185 | 298,949 | ||||||
| Dream Office Real Estate Investment Trust |
9,602 | 177,744 | ||||||
| First Capital Realty, Inc. |
31,002 | 496,608 | ||||||
| Granite Real Estate Investment Trust |
6,243 | 298,376 | ||||||
| H&R Real Estate Investment Trust |
56,043 | 982,048 | ||||||
| Killam Apartment Real Estate Investment Trust |
8,300 | 120,528 | ||||||
| Northview Apartment Real Estate Investment Trust |
8,506 | 184,771 | ||||||
| RioCan Real Estate Investment Trust |
52,414 | 1,038,511 | ||||||
| SmartCentres Real Estate Investment Trust |
20,504 | 537,329 | ||||||
| Tricon Capital Group, Inc.(a) |
8,494 | 73,181 | ||||||
|
|
|
|||||||
| Total Canada |
|
5,995,590 | ||||||
| Chile – 0.1% |
| |||||||
| Parque Arauco S.A. |
43,950 | 117,549 | ||||||
| China – 13.3% |
| |||||||
| Agile Group Holdings Ltd. |
492,000 | 795,980 | ||||||
| Central China Real Estate Ltd. |
90,000 | 44,026 | ||||||
| China Aoyuan Group Ltd. |
216,000 | 260,577 | ||||||
| China Evergrande Group(a) |
492,000 | 1,635,832 | ||||||
| China Jinmao Holdings Group Ltd. |
1,057,000 | 689,411 | ||||||
| China Overseas Land & Investment Ltd. |
366,049 | 1,389,596 | ||||||
| China Resources Land Ltd. |
278,000 | 1,246,581 | ||||||
| China SCE Group Holdings Ltd. |
330,000 | 171,937 | ||||||
| China South City Holdings Ltd. |
552,800 | 88,730 | ||||||
| China Vanke Co., Ltd. Class H |
161,600 | 679,342 | ||||||
| CIFI Holdings Group Co., Ltd. |
695,900 | 527,469 | ||||||
| Country Garden Holdings Co., Ltd. |
1,106,000 | 1,727,343 | ||||||
| Future Land Development Holdings Ltd. |
190,000 | 235,263 | ||||||
| Greentown China Holdings Ltd. |
71,000 | 70,910 | ||||||
| Guangzhou R&F Properties Co., Ltd. Class H |
292,800 | 633,347 | ||||||
| Hopson Development Holdings Ltd. |
126,000 | 122,791 | ||||||
| Jiayuan International Group Ltd. |
58,000 | 30,663 | ||||||
| Kaisa Group Holdings Ltd.* |
306,000 | 138,773 | ||||||
| KWG Group Holdings Ltd. |
366,500 | 442,137 | ||||||
| Logan Property Holdings Co., Ltd. |
156,000 | 258,346 | ||||||
| Longfor Group Holdings Ltd. |
168,500 | 593,510 | ||||||
| Poly Property Group Co., Ltd. |
287,000 | 111,876 | ||||||
| Powerlong Real Estate Holdings Ltd. |
371,000 | 194,245 | ||||||
| Shenzhen Investment Ltd. |
834,000 | 318,728 | ||||||
| Shimao Property Holdings Ltd. |
197,000 | 616,099 | ||||||
| Shui On Land Ltd. |
659,500 | 162,986 | ||||||
| Sino-Ocean Group Holding Ltd. |
810,700 | 355,264 | ||||||
| Sunac China Holdings Ltd. |
156,900 | 781,507 | ||||||
| Times China Holdings Ltd. |
97,000 | 201,168 | ||||||
| Yuexiu Property Co., Ltd. |
1,304,000 | 313,959 | ||||||
| Yuzhou Properties Co., Ltd. |
508,000 | 306,743 | ||||||
|
|
|
|||||||
| Total China |
|
15,145,139 | ||||||
| Finland – 0.3% |
| |||||||
| Citycon Oyj |
35,059 | 359,175 | ||||||
| France – 8.1% |
| |||||||
| Covivio |
13,102 | 1,391,715 | ||||||
| Gecina S.A. |
8,153 | 1,206,576 | ||||||
| ICADE |
11,627 | 984,375 | ||||||
| Klepierre S.A. |
57,070 | 1,998,047 | ||||||
| Mercialys S.A. |
20,525 | 288,081 | ||||||
| Nexity S.A. |
8,620 | 421,035 | ||||||
| Unibail-Rodamco-Westfield |
45,578 | 374,594 | ||||||
| Unibail-Rodamco-Westfield(a) |
15,744 | 2,583,485 | ||||||
|
|
|
|||||||
| Total France |
|
9,247,908 | ||||||
| Germany – 4.5% |
| |||||||
| alstria office REIT-AG |
19,709 | 320,889 | ||||||
| Deutsche Euroshop AG |
8,396 | 254,730 | ||||||
| Deutsche Wohnen SE Bearer Shares |
19,499 | 946,497 | ||||||
| LEG Immobilien AG |
5,746 | 706,160 | ||||||
| PATRIZIA Immobilien AG |
4,075 | 90,734 | ||||||
| TAG Immobilien AG |
11,715 | 289,392 | ||||||
See Notes to Financial Statements.
| 62 | WisdomTree Trust |
Schedule of Investments (continued)
WisdomTree Global ex-U.S. Real Estate Fund (DRW)
March 31, 2019
| Investments | Shares | Value | ||||||
| TLG Immobilien AG |
10,451 | $ | 314,965 | |||||
| Vonovia SE |
43,671 | 2,266,443 | ||||||
|
|
|
|||||||
| Total Germany |
|
5,189,810 | ||||||
| Hong Kong – 21.9% |
| |||||||
| Champion REIT |
762,000 | 660,081 | ||||||
| Hang Lung Group Ltd. |
148,649 | 477,195 | ||||||
| Hang Lung Properties Ltd. |
612,283 | 1,494,448 | ||||||
| Henderson Land Development Co., Ltd. |
498,287 | 3,167,475 | ||||||
| Hui Xian REIT |
1,192,634 | 583,837 | ||||||
| Hysan Development Co., Ltd. |
99,115 | 530,932 | ||||||
| Joy City Property Ltd. |
506,000 | 70,260 | ||||||
| Kowloon Development Co., Ltd. |
87,000 | 108,612 | ||||||
| Link REIT |
199,115 | 2,328,519 | ||||||
| New World Development Co., Ltd. |
1,222,054 | 2,026,910 | ||||||
| Sino Land Co., Ltd. |
721,735 | 1,395,670 | ||||||
| Sun Hung Kai Properties Ltd. |
305,810 | 5,247,499 | ||||||
| Sunlight Real Estate Investment Trust |
281,000 | 211,557 | ||||||
| Swire Pacific Ltd. Class A |
66,778 | 859,187 | ||||||
| Swire Pacific Ltd. Class B |
267,500 | 535,003 | ||||||
| Swire Properties Ltd. |
460,341 | 1,979,186 | ||||||
| Wharf Holdings Ltd. (The) |
500,872 | 1,512,196 | ||||||
| Wheelock & Co., Ltd. |
183,231 | 1,342,147 | ||||||
| Yuexiu Real Estate Investment Trust |
620,000 | 440,716 | ||||||
|
|
|
|||||||
| Total Hong Kong |
|
24,971,430 | ||||||
| Ireland – 0.2% |
| |||||||
| Green REIT PLC |
64,347 | 108,378 | ||||||
| Hibernia REIT PLC |
44,807 | 67,216 | ||||||
|
|
|
|||||||
| Total Ireland |
|
175,594 | ||||||
| Israel – 1.2% |
| |||||||
| Alony Hetz Properties & Investments Ltd. |
14,809 | 166,641 | ||||||
| Amot Investments Ltd. |
56,797 | 316,117 | ||||||
| Azrieli Group Ltd. |
7,677 | 454,992 | ||||||
| Gazit-Globe Ltd. |
23,842 | 191,493 | ||||||
| Melisron Ltd. |
3,830 | 194,278 | ||||||
|
|
|
|||||||
| Total Israel |
|
1,323,521 | ||||||
| Japan – 6.8% |
| |||||||
| Aeon Mall Co., Ltd. |
10,530 | 173,146 | ||||||
| Daibiru Corp. |
8,800 | 83,480 | ||||||
| Daito Trust Construction Co., Ltd. |
8,300 | 1,157,058 | ||||||
| Daiwa House Industry Co., Ltd. |
58,300 | 1,853,528 | ||||||
| Hulic Co., Ltd. |
40,600 | 398,352 | ||||||
| Ichigo, Inc. |
24,600 | 84,234 | ||||||
| Invesco Office J-REIT, Inc. |
839 | 133,258 | ||||||
| Invincible Investment Corp. |
797 | 390,273 | ||||||
| Katitas Co., Ltd.(a) |
1,800 | 61,716 | ||||||
| Mitsubishi Estate Co., Ltd. |
54,589 | 989,097 | ||||||
| Mitsui Fudosan Co., Ltd. |
43,808 | 1,101,285 | ||||||
| Nomura Real Estate Holdings, Inc. |
17,265 | 331,464 | ||||||
| Open House Co., Ltd.(a) |
3,000 | 102,860 | ||||||
| Relo Group, Inc. |
3,000 | 84,293 | ||||||
| Sumitomo Realty & Development Co., Ltd. |
9,379 | 388,599 | ||||||
| Tokyo Tatemono Co., Ltd. |
15,900 | 194,934 | ||||||
| Tokyu Fudosan Holdings Corp. |
39,568 | 236,654 | ||||||
|
|
|
|||||||
| Total Japan |
|
7,764,231 | ||||||
| Malaysia – 0.5% |
| |||||||
| IGB Real Estate Investment Trust |
244,400 | 110,751 | ||||||
| IOI Properties Group Bhd |
204,575 | 66,146 | ||||||
| Pavilion Real Estate Investment Trust |
90,600 | 40,390 | ||||||
| Sime Darby Bhd |
330,000 | 89,724 | ||||||
| SP Setia Bhd |
216,875 | 120,589 | ||||||
| Sunway Bhd |
206,465 | 84,963 | ||||||
| Sunway Real Estate Investment Trust |
202,096 | 89,105 | ||||||
|
|
|
|||||||
| Total Malaysia |
|
601,668 | ||||||
| Mexico – 1.4% |
| |||||||
| Concentradora Fibra Danhos S.A. de C.V. |
169,498 | 242,046 | ||||||
| Fibra Uno Administracion S.A. de C.V. |
681,198 | 941,860 | ||||||
| PLA Administradora Industrial S de RL de C.V. |
182,866 | 282,630 | ||||||
| Prologis Property Mexico S.A. de C.V. |
54,028 | 104,171 | ||||||
|
|
|
|||||||
| Total Mexico |
|
1,570,707 | ||||||
| Netherlands – 0.5% |
| |||||||
| Eurocommercial Properties N.V. CVA |
8,872 | 256,221 | ||||||
| Wereldhave N.V.(a) |
10,580 | 289,509 | ||||||
|
|
|
|||||||
| Total Netherlands |
|
545,730 | ||||||
| New Zealand – 0.5% |
| |||||||
| Goodman Property Trust |
176,546 | 208,299 | ||||||
| Kiwi Property Group Ltd. |
234,317 | 237,309 | ||||||
| Precinct Properties New Zealand Ltd. |
149,697 | 159,266 | ||||||
|
|
|
|||||||
| Total New Zealand |
|
604,874 | ||||||
| Norway – 0.2% |
| |||||||
| Entra ASA(b) |
18,347 | 277,391 | ||||||
| Philippines – 0.4% |
| |||||||
| Ayala Land, Inc. |
213,100 | 182,217 | ||||||
| Megaworld Corp. |
551,600 | 60,927 | ||||||
| Robinsons Land Corp. |
111,547 | 52,045 | ||||||
| SM Prime Holdings, Inc. |
262,875 | 199,747 | ||||||
|
|
|
|||||||
| Total Philippines |
|
494,936 | ||||||
| Russia – 0.1% |
| |||||||
| LSR Group PJSC GDR Reg S |
73,051 | 146,102 | ||||||
| Singapore – 9.4% |
| |||||||
| Ascendas Real Estate Investment Trust |
458,984 | 986,079 | ||||||
| Ascott Residence Trust |
358,288 | 312,130 | ||||||
| Bukit Sembawang Estates Ltd. |
27,100 | 113,042 | ||||||
| CapitaLand Commercial Trust |
451,775 | 647,060 | ||||||
| CapitaLand Ltd. |
425,989 | 1,147,922 | ||||||
| CapitaLand Mall Trust |
485,586 | 853,226 | ||||||
| CapitaLand Retail China Trust |
162,100 | 187,890 | ||||||
| CDL Hospitality Trusts |
195,000 | 234,662 | ||||||
| City Developments Ltd. |
57,603 | 384,870 | ||||||
| Frasers Centrepoint Trust |
148,000 | 260,052 | ||||||
| Frasers Logistics & Industrial Trust |
294,299 | 252,039 | ||||||
| GuocoLand Ltd. |
103,800 | 148,669 | ||||||
| Ho Bee Land Ltd. |
80,800 | 150,326 | ||||||
| Keppel DC REIT |
157,700 | 174,640 | ||||||
See Notes to Financial Statements.
| WisdomTree Trust | 63 |
Schedule of Investments (concluded)
WisdomTree Global ex-U.S. Real Estate Fund (DRW)
March 31, 2019
| Investments | Shares | Value | ||||||
| Keppel REIT |
490,200 | $ | 466,857 | |||||
| Manulife US Real Estate Investment Trust |
165,700 | 141,673 | ||||||
| Mapletree Commercial Trust |
427,592 | 596,640 | ||||||
| Mapletree Industrial Trust |
306,818 | 475,687 | ||||||
| Mapletree Logistics Trust |
511,975 | 551,852 | ||||||
| Mapletree North Asia Commercial Trust |
602,500 | 587,154 | ||||||
| OUE Ltd. |
93,300 | 117,098 | ||||||
| Parkway Life Real Estate Investment Trust |
74,700 | 161,036 | ||||||
| SPH REIT |
276,200 | 214,108 | ||||||
| Starhill Global REIT |
428,884 | 231,145 | ||||||
| Suntec Real Estate Investment Trust |
405,528 | 583,817 | ||||||
| United Engineers Ltd. |
49,500 | 92,093 | ||||||
| UOL Group Ltd. |
63,000 | 323,256 | ||||||
| Wing Tai Holdings Ltd. |
57,600 | 86,326 | ||||||
| Yanlord Land Group Ltd. |
276,900 | 278,024 | ||||||
|
|
|
|||||||
| Total Singapore |
|
10,759,373 | ||||||
| South Africa – 2.3% |
| |||||||
| Growthpoint Properties Ltd. |
676,255 | 1,145,126 | ||||||
| Hyprop Investments Ltd. |
57,951 | 283,220 | ||||||
| Redefine Properties Ltd. |
1,362,826 | 916,662 | ||||||
| Vukile Property Fund Ltd. |
176,384 | 244,617 | ||||||
|
|
|
|||||||
| Total South Africa |
|
2,589,625 | ||||||
| Spain – 0.5% |
| |||||||
| Inmobiliaria Colonial Socimi S.A. |
26,662 | 274,376 | ||||||
| Merlin Properties Socimi S.A. |
25,232 | 330,490 | ||||||
|
|
|
|||||||
| Total Spain |
|
604,866 | ||||||
| Sweden – 2.0% |
| |||||||
| Atrium Ljungberg AB Class B |
10,800 | 184,904 | ||||||
| Castellum AB |
26,444 | 514,180 | ||||||
| Fabege AB |
18,051 | 262,729 | ||||||
| Hemfosa Fastigheter AB |
18,749 | 164,844 | ||||||
| Hufvudstaden AB Class A |
17,148 | 298,208 | ||||||
| Klovern AB Class B |
82,148 | 112,922 | ||||||
| Kungsleden AB |
26,245 | 209,387 | ||||||
| Sagax AB Class B |
5,553 | 105,129 | ||||||
| Wallenstam AB Class B |
23,772 | 240,532 | ||||||
| Wihlborgs Fastigheter AB |
11,700 | 159,847 | ||||||
|
|
|
|||||||
| Total Sweden |
|
2,252,682 | ||||||
| Switzerland – 1.4% |
| |||||||
| Allreal Holding AG Registered Shares* |
1,565 | 266,359 | ||||||
| PSP Swiss Property AG Registered Shares |
4,976 | 540,620 | ||||||
| Swiss Prime Site AG Registered Shares* |
8,887 | 778,583 | ||||||
|
|
|
|||||||
| Total Switzerland |
|
1,585,562 | ||||||
| Taiwan – 0.2% |
| |||||||
| Highwealth Construction Corp. |
170,110 | 280,385 | ||||||
| Thailand – 0.6% |
| |||||||
| Central Pattana PCL NVDR |
70,374 | 162,436 | ||||||
| Land & Houses PCL NVDR |
672,111 | 226,614 | ||||||
| MBK PCL NVDR |
85,200 | 55,842 | ||||||
| Pruksa Holding PCL NVDR |
113,400 | 64,320 | ||||||
| Quality Houses PCL NVDR |
829,800 | 77,398 | ||||||
| WHA Corp. PCL NVDR |
645,100 | 85,783 | ||||||
|
|
|
|||||||
| Total Thailand |
|
672,393 | ||||||
| Turkey – 0.1% |
| |||||||
| Emlak Konut Gayrimenkul Yatirim Ortakligi AS |
478,917 | 129,698 | ||||||
| United Kingdom – 5.8% |
| |||||||
| Assura PLC |
274,626 | 205,407 | ||||||
| Big Yellow Group PLC |
14,374 | 185,708 | ||||||
| British Land Co. PLC (The) |
144,263 | 1,107,214 | ||||||
| Capital & Counties Properties PLC |
13,933 | 43,682 | ||||||
| CLS Holdings PLC |
35,106 | 112,304 | ||||||
| Derwent London PLC |
7,539 | 316,618 | ||||||
| Great Portland Estates PLC |
14,768 | 143,652 | ||||||
| Hammerson PLC |
127,525 | 558,004 | ||||||
| Land Securities Group PLC |
109,987 | 1,309,072 | ||||||
| Londonmetric Property PLC |
70,459 | 183,348 | ||||||
| NewRiver REIT PLC |
60,687 | 188,601 | ||||||
| Primary Health Properties PLC |
47,760 | 80,779 | ||||||
| Safestore Holdings PLC |
13,802 | 107,279 | ||||||
| Savills PLC |
14,198 | 167,339 | ||||||
| Secure Income REIT PLC |
29,054 | 155,600 | ||||||
| Segro PLC |
76,920 | 674,953 | ||||||
| Shaftesbury PLC |
19,161 | 219,716 | ||||||
| St. Modwen Properties PLC |
9,701 | 50,159 | ||||||
| Tritax Big Box REIT PLC |
194,785 | 364,478 | ||||||
| Unite Group PLC (The) |
21,660 | 258,956 | ||||||
| Workspace Group PLC |
15,083 | 191,822 | ||||||
|
|
|
|||||||
| Total United Kingdom |
|
6,624,691 | ||||||
| TOTAL COMMON STOCKS (Cost: $103,812,223) |
|
113,783,941 | ||||||
| INVESTMENT OF CASH COLLATERAL FOR SECURITIES LOANED – 2.7% |
| |||||||
| United States – 2.7% | ||||||||
| State Street Navigator Securities Lending Government Money Market Portfolio, 2.46%(c) |
||||||||
| (Cost: $3,046,250)(d) | 3,046,250 | 3,046,250 | ||||||
| TOTAL INVESTMENTS IN SECURITIES – 102.4% (Cost: $106,858,473) |
|
116,830,191 | ||||||
| Other Assets less Liabilities – (2.4)% |
|
(2,684,277 | ) | |||||
|
|
|
|||||||
| NET ASSETS – 100.0% |
|
$ | 114,145,914 | |||||
| * | Non-income producing security. |
| (a) | Security, or portion thereof, was on loan at March 31, 2019 (See Note 2). |
| (b) | This security is exempt from registration under rule 144A of the Securities Act of 1933. This security may be sold in transactions that are exempt from registration, normally to qualified institutional buyers. |
| (c) | Rate shown represents annualized 7-day yield as of March 31, 2019. |
| (d) | At March 31, 2019, the total market value of the Fund’s securities on loan identified in the Schedule of Investments was $4,479,976 and the total market value of the collateral held by the Fund was $4,710,875. The total market value of the collateral includes non-cash U.S. Government securities collateral having a value of $1,664,625. |
CVA – Certificaten Van Aandelen (Certificate of Stock)
GDR – Global Depositary Receipt
NVDR – Non-Voting Depositary Receipt
Reg S – Regulation S provides an exclusion from the registration requirements of the Securities Act of 1933. These securities may be resold in transactions exempt from registration, normally to qualified institutional buyers.
See Notes to Financial Statements.
| 64 | WisdomTree Trust |
Schedule of Investments
WisdomTree Global High Dividend Fund (DEW)
March 31, 2019
| Investments | Shares | Value | ||||||
| COMMON STOCKS – 99.5% | ||||||||
| Australia – 3.6% | ||||||||
| AGL Energy Ltd. |
3,515 | $ | 54,357 | |||||
| Alumina Ltd. |
23,542 | 40,470 | ||||||
| Amcor Ltd. |
5,769 | 63,068 | ||||||
| AMP Ltd. |
11,215 | 16,730 | ||||||
| APA Group |
4,409 | 31,257 | ||||||
| ASX Ltd. |
1,194 | 59,235 | ||||||
| Aurizon Holdings Ltd. |
11,675 | 37,735 | ||||||
| Australia & New Zealand Banking Group Ltd. |
11,886 | 219,777 | ||||||
| Bank of Queensland Ltd. |
2,731 | 17,654 | ||||||
| Bendigo & Adelaide Bank Ltd. |
3,718 | 25,566 | ||||||
| BHP Group Ltd. |
13,089 | 357,871 | ||||||
| BHP Group PLC |
10,007 | 241,051 | ||||||
| Boral Ltd. |
4,453 | 14,519 | ||||||
| Coca-Cola Amatil Ltd. |
3,232 | 19,859 | ||||||
| Commonwealth Bank of Australia |
7,507 | 376,695 | ||||||
| Crown Resorts Ltd. |
3,159 | 25,828 | ||||||
| Fortescue Metals Group Ltd. |
16,307 | 82,360 | ||||||
| Harvey Norman Holdings Ltd.(a) |
9,264 | 26,454 | ||||||
| Insurance Australia Group Ltd. |
10,512 | 57,348 | ||||||
| Macquarie Group Ltd. |
1,318 | 121,168 | ||||||
| Mineral Resources Ltd. |
509 | 5,713 | ||||||
| National Australia Bank Ltd. |
12,920 | 231,921 | ||||||
| Rio Tinto Ltd. |
1,808 | 125,747 | ||||||
| Sonic Healthcare Ltd. |
2,136 | 37,265 | ||||||
| South32 Ltd. |
18,652 | 49,421 | ||||||
| Suncorp Group Ltd. |
6,244 | 61,120 | ||||||
| Sydney Airport |
10,883 | 57,439 | ||||||
| Tabcorp Holdings Ltd. |
10,628 | 34,878 | ||||||
| Telstra Corp., Ltd. |
49,051 | 115,680 | ||||||
| Transurban Group |
9,843 | 92,294 | ||||||
| Wesfarmers Ltd. |
4,912 | 120,902 | ||||||
| Westpac Banking Corp. |
15,376 | 283,107 | ||||||
| Whitehaven Coal Ltd. |
4,281 | 12,316 | ||||||
| Woodside Petroleum Ltd. |
2,957 | 72,720 | ||||||
| Woolworths Group Ltd. |
4,120 | 88,970 | ||||||
|
|
|
|||||||
| Total Australia |
|
3,278,495 | ||||||
| Austria – 0.1% |
| |||||||
| Lenzing AG |
149 | 15,978 | ||||||
| Oesterreichische Post AG |
731 | 30,944 | ||||||
| Vienna Insurance Group AG Wiener Versicherung Gruppe |
264 | 6,788 | ||||||
| Voestalpine AG |
623 | 18,937 | ||||||
|
|
|
|||||||
| Total Austria |
|
72,647 | ||||||
| Belgium – 0.9% |
| |||||||
| Ageas |
1,096 | 52,918 | ||||||
| Anheuser-Busch InBev S.A./N.V. |
6,845 | 574,598 | ||||||
| bpost S.A.(a) |
1,772 | 19,131 | ||||||
| Cofinimmo S.A. |
304 | 40,415 | ||||||
| KBC Group N.V. |
1,153 | 80,631 | ||||||
| Proximus SADP |
1,743 | 50,318 | ||||||
|
|
|
|||||||
| Total Belgium |
|
818,011 | ||||||
| Brazil – 0.3% |
| |||||||
| Banco Bradesco S.A. |
2,856 | 27,777 | ||||||
| Banco do Brasil S.A. |
4,000 | 50,076 | ||||||
| Banco Santander Brasil S.A. |
3,400 | 38,414 | ||||||
| BB Seguridade Participacoes S.A. |
3,199 | 21,800 | ||||||
| CCR S.A. |
9,433 | 28,456 | ||||||
| Cielo S.A. |
13,712 | 33,437 | ||||||
| Engie Brasil Energia S.A. |
3,755 | 41,210 | ||||||
| Itau Unibanco Holding S.A. |
3,595 | 27,574 | ||||||
| Ultrapar Participacoes S.A. |
2,000 | 24,154 | ||||||
|
|
|
|||||||
| Total Brazil |
|
292,898 | ||||||
| Canada – 2.8% |
| |||||||
| AltaGas Ltd. |
1,755 | 23,107 | ||||||
| ARC Resources Ltd.(a) |
1,489 | 10,165 | ||||||
| Bank of Montreal |
1,991 | 149,018 | ||||||
| Bank of Nova Scotia (The) |
3,869 | 206,026 | ||||||
| BCE, Inc. |
4,314 | 191,619 | ||||||
| Canadian Imperial Bank of Commerce |
1,606 | 126,946 | ||||||
| CI Financial Corp. |
1,416 | 19,333 | ||||||
| Emera, Inc. |
1,714 | 64,111 | ||||||
| Enbridge, Inc. |
8,606 | 311,786 | ||||||
| Fortis, Inc. |
1,048 | 38,744 | ||||||
| Great-West Lifeco, Inc. |
3,683 | 89,211 | ||||||
| Hydro One Ltd.(b) |
2,000 | 31,079 | ||||||
| IGM Financial, Inc. |
952 | 24,499 | ||||||
| Inter Pipeline Ltd. |
2,190 | 36,245 | ||||||
| Keyera Corp. |
1,210 | 28,539 | ||||||
| Manulife Financial Corp. |
5,218 | 88,272 | ||||||
| National Bank of Canada |
1,173 | 52,954 | ||||||
| Norbord, Inc. |
1,048 | 28,884 | ||||||
| Pembina Pipeline Corp. |
2,470 | 90,761 | ||||||
| Power Corp. of Canada |
2,004 | 46,742 | ||||||
| Power Financial Corp. |
2,701 | 63,120 | ||||||
| Royal Bank of Canada |
3,689 | 278,397 | ||||||
| Shaw Communications, Inc. Class B |
1,876 | 39,052 | ||||||
| Sun Life Financial, Inc. |
1,238 | 47,576 | ||||||
| TELUS Corp. |
2,304 | 85,299 | ||||||
| Toronto-Dominion Bank (The) |
4,710 | 255,675 | ||||||
| TransCanada Corp.(a) |
3,691 | 165,825 | ||||||
| Vermilion Energy, Inc. |
844 | 20,842 | ||||||
|
|
|
|||||||
| Total Canada |
|
2,613,827 | ||||||
| Chile – 0.1% |
| |||||||
| Banco Santander Chile |
754,554 | 56,763 | ||||||
| Enel Americas S.A. |
156,943 | 27,902 | ||||||
| Enel Chile S.A. |
163,113 | 17,091 | ||||||
|
|
|
|||||||
| Total Chile |
|
101,756 | ||||||
| China – 3.4% |
| |||||||
| Agile Group Holdings Ltd. |
22,000 | 35,593 | ||||||
| Agricultural Bank of China Ltd. Class H |
159,074 | 73,357 | ||||||
| Bank of China Ltd. Class H |
486,366 | 220,570 | ||||||
| Bank of Communications Co., Ltd. Class H |
149,125 | 122,150 | ||||||
| Beijing Enterprises Water Group Ltd.* |
50,000 | 30,892 | ||||||
See Notes to Financial Statements.
| WisdomTree Trust | 65 |
Schedule of Investments (continued)
WisdomTree Global High Dividend Fund (DEW)
March 31, 2019
| Investments | Shares | Value | ||||||
| China Cinda Asset Management Co., Ltd. Class H |
164,000 | $ | 45,544 | |||||
| China CITIC Bank Corp., Ltd. Class H |
73,000 | 46,497 | ||||||
| China Construction Bank Corp. Class H |
648,536 | 556,010 | ||||||
| China Everbright Bank Co., Ltd. Class H |
37,000 | 17,487 | ||||||
| China Evergrande Group(a) |
20,000 | 66,497 | ||||||
| China Jinmao Holdings Group Ltd. |
44,000 | 28,698 | ||||||
| China Mobile Ltd. |
33,500 | 341,404 | ||||||
| China Petroleum & Chemical Corp. Class H |
330,000 | 260,218 | ||||||
| China Resources Cement Holdings Ltd. |
20,000 | 20,637 | ||||||
| China Resources Power Holdings Co., Ltd. |
15,575 | 23,412 | ||||||
| China Shenhua Energy Co., Ltd. Class H |
26,000 | 59,287 | ||||||
| China Vanke Co., Ltd. Class H |
7,600 | 31,949 | ||||||
| CIFI Holdings Group Co., Ltd. |
40,000 | 30,319 | ||||||
| CNOOC Ltd. |
97,415 | 182,422 | ||||||
| Country Garden Holdings Co., Ltd. |
47,000 | 73,404 | ||||||
| Dongfeng Motor Group Co., Ltd. Class H |
24,000 | 24,031 | ||||||
| Guangdong Investment Ltd. |
22,000 | 42,487 | ||||||
| Guangzhou Automobile Group Co., Ltd. Class H |
30,000 | 35,427 | ||||||
| Industrial & Commercial Bank of China Ltd. Class H |
443,000 | 324,493 | ||||||
| Kingboard Holdings Ltd. |
11,000 | 39,026 | ||||||
| Kingboard Laminates Holdings Ltd. |
15,000 | 15,764 | ||||||
| KWG Group Holdings Ltd. |
24,500 | 29,556 | ||||||
| Lenovo Group Ltd. |
48,000 | 43,170 | ||||||
| Logan Property Holdings Co., Ltd. |
8,000 | 13,249 | ||||||
| Longfor Group Holdings Ltd. |
8,000 | 28,179 | ||||||
| Shimao Property Holdings Ltd. |
13,000 | 40,656 | ||||||
| Sino-Ocean Group Holding Ltd. |
48,775 | 21,374 | ||||||
| Sinopec Shanghai Petrochemical Co., Ltd. Class H |
40,000 | 19,057 | ||||||
| Weichai Power Co., Ltd. Class H |
18,000 | 28,754 | ||||||
| WH Group Ltd.(b) |
59,500 | 63,669 | ||||||
| Xinyi Glass Holdings Ltd. |
24,000 | 27,516 | ||||||
| Yanzhou Coal Mining Co., Ltd. Class H |
6,000 | 5,893 | ||||||
| Yuexiu Property Co., Ltd. |
186,000 | 44,782 | ||||||
|
|
|
|||||||
| Total China |
|
3,113,430 | ||||||
| Czech Republic – 0.1% |
| |||||||
| CEZ AS |
1,970 | 46,285 | ||||||
| Komercni Banka AS |
685 | 27,990 | ||||||
| O2 Czech Republic AS |
1,688 | 18,307 | ||||||
|
|
|
|||||||
| Total Czech Republic |
|
92,582 | ||||||
| Denmark – 0.2% |
| |||||||
| Danske Bank A/S |
4,167 | 73,203 | ||||||
| ISS A/S |
800 | 24,366 | ||||||
| Pandora A/S |
622 | 29,151 | ||||||
| Tryg A/S |
1,602 | 43,998 | ||||||
|
|
|
|||||||
| Total Denmark |
|
170,718 | ||||||
| Finland – 0.8% |
| |||||||
| Elisa Oyj |
984 | 44,438 | ||||||
| Fortum Oyj(a) |
4,515 | 92,420 | ||||||
| Kesko Oyj Class B |
608 | 37,029 | ||||||
| Kone Oyj Class B |
1,404 | 70,879 | ||||||
| Metso Oyj |
904 | 31,122 | ||||||
| Nokia Oyj |
20,568 | 117,183 | ||||||
| Nokian Renkaat Oyj(a) |
760 | 25,464 | ||||||
| Nordea Bank Abp(a) |
20,313 | 154,943 | ||||||
| Sampo Oyj Class A |
2,195 | 99,597 | ||||||
| UPM-Kymmene Oyj |
2,531 | 73,890 | ||||||
|
|
|
|||||||
| Total Finland |
|
746,965 | ||||||
| France – 3.1% |
| |||||||
| ALD S.A.(b) |
1,291 | 18,047 | ||||||
| Amundi S.A.(b) |
527 | 33,197 | ||||||
| AXA S.A. |
8,092 | 203,801 | ||||||
| BNP Paribas S.A. |
4,663 | 223,100 | ||||||
| Bouygues S.A. |
1,684 | 60,224 | ||||||
| Casino Guichard Perrachon S.A.(a) |
715 | 31,030 | ||||||
| Cie de Saint-Gobain |
1,760 | 63,852 | ||||||
| Cie Generale des Etablissements Michelin SCA |
537 | 63,553 | ||||||
| CNP Assurances |
2,682 | 59,085 | ||||||
| Credit Agricole S.A. |
8,968 | 108,451 | ||||||
| Engie S.A. |
11,656 | 173,808 | ||||||
| Eutelsat Communications S.A. |
1,103 | 19,314 | ||||||
| ICADE |
528 | 44,702 | ||||||
| Klepierre S.A. |
1,254 | 43,903 | ||||||
| Lagardere SCA |
1,092 | 28,103 | ||||||
| Metropole Television S.A. |
1,116 | 20,601 | ||||||
| Natixis S.A. |
12,491 | 66,916 | ||||||
| Orange S.A. |
11,957 | 194,676 | ||||||
| Publicis Groupe S.A. |
720 | 38,587 | ||||||
| Renault S.A. |
1,351 | 89,365 | ||||||
| Sanofi |
4,418 | 390,609 | ||||||
| SCOR SE |
988 | 42,112 | ||||||
| Societe Generale S.A. |
3,022 | 87,461 | ||||||
| Suez |
2,391 | 31,707 | ||||||
| TOTAL S.A. |
10,523 | 585,116 | ||||||
| Unibail-Rodamco-Westfield(a) |
428 | 70,232 | ||||||
| Veolia Environnement S.A. |
2,217 | 49,613 | ||||||
|
|
|
|||||||
| Total France |
|
2,841,165 | ||||||
| Germany – 2.7% |
| |||||||
| 1&1 Drillisch AG |
658 | 23,451 | ||||||
| Allianz SE Registered Shares |
1,336 | 297,445 | ||||||
| Axel Springer SE |
349 | 18,042 | ||||||
| BASF SE |
3,338 | 245,611 | ||||||
| Bayerische Motoren Werke AG |
2,559 | 197,544 | ||||||
| Daimler AG Registered Shares |
6,429 | 377,182 | ||||||
| Deutsche Lufthansa AG Registered Shares |
1,574 | 34,579 | ||||||
| Deutsche Post AG Registered Shares |
4,074 | 132,660 | ||||||
| Deutsche Telekom AG Registered Shares |
17,382 | 288,760 | ||||||
| E.ON SE |
8,011 | 89,160 | ||||||
| Evonik Industries AG |
1,818 | 49,564 | ||||||
| Freenet AG |
1,250 | 26,885 | ||||||
| Hannover Rueck SE |
280 | 40,243 | ||||||
| Hugo Boss AG |
438 | 29,941 | ||||||
| Innogy SE |
1,753 | 75,093 | ||||||
| MAN SE |
376 | 30,904 | ||||||
| METRO AG |
1,523 | 25,292 | ||||||
See Notes to Financial Statements.
| 66 | WisdomTree Trust |
Schedule of Investments (continued)
WisdomTree Global High Dividend Fund (DEW)
March 31, 2019
| Investments | Shares | Value | ||||||
| Muenchener Rueckversicherungs – Gesellschaft AG Registered Shares |
538 | $ | 127,464 | |||||
| ProSiebenSat.1 Media SE |
1,674 | 23,909 | ||||||
| Siemens AG Registered Shares |
2,661 | 286,660 | ||||||
| Talanx AG |
614 | 23,689 | ||||||
| Telefonica Deutschland Holding AG |
19,043 | 59,850 | ||||||
| TUI AG |
1,859 | 17,847 | ||||||
|
|
|
|||||||
| Total Germany |
|
2,521,775 | ||||||
| Hong Kong – 1.0% |
| |||||||
| Bank of East Asia Ltd. (The) |
4,600 | 14,943 | ||||||
| BOC Hong Kong Holdings Ltd. |
27,000 | 111,784 | ||||||
| CLP Holdings Ltd. |
8,500 | 98,536 | ||||||
| Hang Lung Properties Ltd. |
13,472 | 32,882 | ||||||
| Hang Seng Bank Ltd. |
4,700 | 115,974 | ||||||
| Henderson Land Development Co., Ltd. |
11,000 | 69,924 | ||||||
| Hopewell Holdings Ltd. |
8,500 | 41,796 | ||||||
| Hysan Development Co., Ltd. |
6,000 | 32,140 | ||||||
| New World Development Co., Ltd. |
44,472 | 73,762 | ||||||
| PCCW Ltd. |
40,000 | 24,866 | ||||||
| Power Assets Holdings Ltd. |
7,500 | 52,023 | ||||||
| Sino Land Co., Ltd. |
26,000 | 50,278 | ||||||
| SJM Holdings Ltd. |
19,000 | 21,687 | ||||||
| Sun Hung Kai Properties Ltd. |
7,500 | 128,695 | ||||||
| Wharf Holdings Ltd. (The) |
12,519 | 37,797 | ||||||
|
|
|
|||||||
| Total Hong Kong |
|
907,087 | ||||||
| India – 0.3% |
| |||||||
| Bharat Petroleum Corp., Ltd. |
8,005 | 45,938 | ||||||
| Bharti Infratel Ltd. |
6,484 | 29,334 | ||||||
| Coal India Ltd. |
11,110 | 38,041 | ||||||
| Hindustan Petroleum Corp., Ltd. |
6,874 | 28,166 | ||||||
| Indian Oil Corp., Ltd. |
25,536 | 60,029 | ||||||
| Vedanta Ltd. |
24,364 | 64,871 | ||||||
|
|
|
|||||||
| Total India |
|
266,379 | ||||||
| Indonesia – 0.1% |
| |||||||
| Adaro Energy Tbk PT |
149,000 | 14,074 | ||||||
| Gudang Garam Tbk PT |
4,500 | 26,292 | ||||||
| Telekomunikasi Indonesia Persero Tbk PT |
320,300 | 88,847 | ||||||
|
|
|
|||||||
| Total Indonesia |
|
129,213 | ||||||
| Israel – 0.0% |
| |||||||
| Bank Leumi Le-Israel BM |
2,719 | 17,763 | ||||||
| Bezeq Israeli Telecommunication Corp., Ltd. |
12,470 | 8,950 | ||||||
|
|
|
|||||||
| Total Israel |
|
26,713 | ||||||
| Italy – 1.5% |
| |||||||
| ACEA SpA |
1,434 | 24,265 | ||||||
| Assicurazioni Generali SpA |
5,937 | 109,995 | ||||||
| Azimut Holding SpA(a) |
1,614 | 27,456 | ||||||
| Banca Mediolanum SpA |
3,764 | 26,690 | ||||||
| De’ Longhi SpA |
543 | 14,670 | ||||||
| Enel SpA |
44,062 | 282,205 | ||||||
| Eni SpA |
16,098 | 284,764 | ||||||
| Hera SpA |
10,634 | 38,496 | ||||||
| Intesa Sanpaolo SpA |
109,368 | 266,607 | ||||||
| Mediobanca Banca di Credito Finanziario SpA |
2,778 | 28,891 | ||||||
| Poste Italiane SpA(b) |
5,483 | 53,390 | ||||||
| Snam SpA |
21,077 | 108,368 | ||||||
| Telecom Italia SpA RSP |
28,639 | 16,284 | ||||||
| Terna Rete Elettrica Nazionale SpA |
10,736 | 68,086 | ||||||
| UnipolSai Assicurazioni SpA(a) |
14,338 | 38,703 | ||||||
|
|
|
|||||||
| Total Italy |
|
1,388,870 | ||||||
| Japan – 2.4% |
| |||||||
| Amada Holdings Co., Ltd. |
2,400 | 23,743 | ||||||
| Aozora Bank Ltd. |
833 | 20,591 | ||||||
| Bridgestone Corp. |
2,200 | 84,792 | ||||||
| Canon, Inc. |
5,400 | 156,753 | ||||||
| Chugoku Electric Power Co., Inc. (The)(a) |
2,500 | 31,192 | ||||||
| Daito Trust Construction Co., Ltd. |
200 | 27,881 | ||||||
| Daiwa Securities Group, Inc. |
5,401 | 26,301 | ||||||
| ITOCHU Corp. |
5,942 | 107,502 | ||||||
| Japan Exchange Group, Inc. |
1,200 | 21,390 | ||||||
| Japan Post Holdings Co., Ltd. |
12,400 | 145,190 | ||||||
| Japan Tobacco, Inc. |
8,000 | 198,401 | ||||||
| JFE Holdings, Inc. |
1,900 | 32,246 | ||||||
| Marubeni Corp. |
6,269 | 43,328 | ||||||
| Mitsubishi Corp. |
4,100 | 113,867 | ||||||
| Mizuho Financial Group, Inc. |
63,800 | 98,739 | ||||||
| MS&AD Insurance Group Holdings, Inc. |
1,400 | 42,626 | ||||||
| Nissan Motor Co., Ltd.(a) |
19,300 | 158,362 | ||||||
| Nomura Holdings, Inc. |
6,500 | 23,502 | ||||||
| NTT DOCOMO, Inc. |
11,200 | 248,063 | ||||||
| Resona Holdings, Inc. |
6,400 | 27,737 | ||||||
| Sankyo Co., Ltd. |
500 | 19,063 | ||||||
| Sekisui House Ltd. |
2,100 | 34,758 | ||||||
| Subaru Corp.(a) |
2,700 | 61,533 | ||||||
| Sumitomo Chemical Co., Ltd.(a) |
4,700 | 21,868 | ||||||
| Sumitomo Corp. |
5,086 | 70,350 | ||||||
| Sumitomo Mitsui Financial Group, Inc. |
3,800 | 133,070 | ||||||
| Takeda Pharmaceutical Co., Ltd. |
2,700 | 110,283 | ||||||
| Tokyo Electron Ltd.(a) |
700 | 101,188 | ||||||
|
|
|
|||||||
| Total Japan |
|
2,184,319 | ||||||
| Malaysia – 0.2% |
| |||||||
| CIMB Group Holdings Bhd |
20,700 | 26,113 | ||||||
| DiGi.Com Bhd |
35,800 | 39,899 | ||||||
| Malayan Banking Bhd |
34,500 | 78,338 | ||||||
| Maxis Bhd |
29,900 | 39,256 | ||||||
| Sime Darby Bhd |
39,900 | 21,795 | ||||||
| YTL Power International Bhd |
34,990 | 7,371 | ||||||
|
|
|
|||||||
| Total Malaysia |
|
212,772 | ||||||
| Mexico – 0.1% |
| |||||||
| Concentradora Fibra Danhos S.A. de C.V. |
17,578 | 25,102 | ||||||
| Grupo Aeroportuario del Pacifico S.A.B. de C.V. Class B |
2,977 | 26,446 | ||||||
| Grupo Mexico S.A.B. de C.V. Series B |
22,472 | 61,818 | ||||||
| Nemak S.A.B. de C.V.(a)(b) |
10,508 | 6,083 | ||||||
|
|
|
|||||||
| Total Mexico |
|
119,449 | ||||||
See Notes to Financial Statements.
| WisdomTree Trust | 67 |
Schedule of Investments (continued)
WisdomTree Global High Dividend Fund (DEW)
March 31, 2019
| Investments | Shares | Value | ||||||
| Netherlands – 0.6% |
| |||||||
| ABN AMRO Group N.V. CVA(b) |
3,545 | $ | 80,008 | |||||
| Aegon N.V. |
8,467 | 40,729 | ||||||
| ASR Nederland N.V. |
480 | 19,996 | ||||||
| Boskalis Westminster |
672 | 17,392 | ||||||
| ING Groep N.V. |
14,465 | 175,154 | ||||||
| Koninklijke Ahold Delhaize N.V. |
3,653 | 97,314 | ||||||
| NN Group N.V. |
1,512 | 62,868 | ||||||
| Randstad N.V.(a) |
791 | 38,609 | ||||||
| Signify N.V.(b) |
1,408 | 37,706 | ||||||
|
|
|
|||||||
| Total Netherlands |
|
569,776 | ||||||
| New Zealand – 0.1% |
| |||||||
| Mercury NZ Ltd. |
12,049 | 32,048 | ||||||
| Meridian Energy Ltd. |
14,462 | 41,277 | ||||||
| Spark New Zealand Ltd. |
17,760 | 46,027 | ||||||
|
|
|
|||||||
| Total New Zealand |
|
119,352 | ||||||
| Norway – 0.7% |
| |||||||
| DNB ASA |
4,198 | 77,412 | ||||||
| Equinor ASA |
9,935 | 217,872 | ||||||
| Gjensidige Forsikring ASA(a) |
2,105 | 36,421 | ||||||
| Mowi ASA |
2,783 | 62,210 | ||||||
| Norsk Hydro ASA |
7,321 | 29,712 | ||||||
| Orkla ASA |
3,030 | 23,293 | ||||||
| Salmar ASA |
466 | 22,392 | ||||||
| Telenor ASA |
7,036 | 141,102 | ||||||
|
|
|
|||||||
| Total Norway |
|
610,414 | ||||||
| Philippines – 0.0% |
| |||||||
| Manila Electric Co. |
3,230 | 23,375 | ||||||
| Poland – 0.1% |
| |||||||
| Bank Polska Kasa Opieki S.A. |
995 | 28,548 | ||||||
| Powszechny Zaklad Ubezpieczen S.A. |
3,616 | 38,199 | ||||||
|
|
|
|||||||
| Total Poland |
|
66,747 | ||||||
| Portugal – 0.2% |
| |||||||
| EDP – Energias de Portugal S.A. |
18,184 | 71,565 | ||||||
| Galp Energia, SGPS, S.A. |
2,959 | 47,445 | ||||||
| Jeronimo Martins, SGPS, S.A. |
2,081 | 30,727 | ||||||
| Navigator Co. S.A. (The) |
6,336 | 29,027 | ||||||
|
|
|
|||||||
| Total Portugal |
|
178,764 | ||||||
| Russia – 1.6% |
| |||||||
| Gazprom PJSC ADR |
43,404 | 195,926 | ||||||
| Lukoil PJSC ADR |
2,809 | 251,686 | ||||||
| Magnit PJSC GDR Reg S |
2,829 | 39,889 | ||||||
| MMC Norilsk Nickel PJSC ADR |
10,297 | 217,473 | ||||||
| Mobile TeleSystems PJSC ADR |
7,107 | 53,729 | ||||||
| Novolipetsk Steel PJSC GDR Reg S |
2,190 | 56,217 | ||||||
| PhosAgro PJSC GDR Reg S |
1,452 | 18,194 | ||||||
| Rosneft Oil Co. PJSC GDR Reg S |
6,709 | 42,132 | ||||||
| Sberbank of Russia PJSC ADR |
17,727 | 235,060 | ||||||
| Severstal PJSC GDR Reg S |
4,789 | 74,708 | ||||||
| Tatneft PJSC ADR |
3,048 | 210,922 | ||||||
| VTB Bank PJSC GDR Reg S |
20,881 | 23,846 | ||||||
| X5 Retail Group N.V. GDR Reg S |
1,400 | 34,888 | ||||||
|
|
|
|||||||
| Total Russia |
|
1,454,670 | ||||||
| Singapore – 0.8% |
| |||||||
| CapitaLand Ltd. |
9,300 | 25,061 | ||||||
| ComfortDelGro Corp., Ltd. |
8,900 | 16,887 | ||||||
| DBS Group Holdings Ltd. |
7,800 | 145,289 | ||||||
| Frasers Property Ltd. |
30,300 | 40,490 | ||||||
| Jardine Cycle & Carriage Ltd. |
1,500 | 35,980 | ||||||
| Keppel Corp., Ltd. |
7,900 | 36,278 | ||||||
| Oversea-Chinese Banking Corp., Ltd. |
11,982 | 97,749 | ||||||
| Singapore Airlines Ltd. |
6,800 | 48,496 | ||||||
| Singapore Technologies Engineering Ltd. |
12,300 | 33,962 | ||||||
| Singapore Telecommunications Ltd. |
77,700 | 173,240 | ||||||
| United Overseas Bank Ltd. |
4,313 | 80,210 | ||||||
| Venture Corp., Ltd. |
2,000 | 26,489 | ||||||
|
|
|
|||||||
| Total Singapore |
|
760,131 | ||||||
| South Africa – 0.7% |
| |||||||
| Absa Group Ltd. |
5,327 | 56,183 | ||||||
| AVI Ltd. |
3,333 | 20,868 | ||||||
| Exxaro Resources Ltd. |
2,209 | 25,175 | ||||||
| FirstRand Ltd. |
18,065 | 78,868 | ||||||
| Foschini Group Ltd. (The) |
1,823 | 20,605 | ||||||
| Imperial Logistics Ltd.(a) |
1,920 | 7,971 | ||||||
| Kumba Iron Ore Ltd.(a) |
873 | 26,048 | ||||||
| MTN Group Ltd.(a) |
17,555 | 107,877 | ||||||
| Nedbank Group Ltd. |
1,981 | 34,512 | ||||||
| Netcare Ltd. |
11,447 | 18,534 | ||||||
| RMB Holdings Ltd. |
5,075 | 26,738 | ||||||
| Sanlam Ltd. |
9,142 | 46,758 | ||||||
| SPAR Group Ltd. (The) |
2,304 | 30,656 | ||||||
| Standard Bank Group Ltd. |
7,834 | 100,622 | ||||||
| Tiger Brands Ltd. |
1,029 | 18,909 | ||||||
| Truworths International Ltd. |
4,624 | 22,249 | ||||||
| Vodacom Group Ltd. |
5,623 | 43,448 | ||||||
|
|
|
|||||||
| Total South Africa |
|
686,021 | ||||||
| South Korea – 0.3% |
| |||||||
| Coway Co., Ltd. |
325 | 27,057 | ||||||
| Doosan Corp. |
108 | 8,810 | ||||||
| KT&G Corp. |
792 | 72,216 | ||||||
| Lotte Chemical Corp. |
177 | 45,299 | ||||||
| S-Oil Corp. |
271 | 21,391 | ||||||
| SK Innovation Co., Ltd. |
316 | 49,971 | ||||||
| SK Telecom Co., Ltd. |
254 | 56,278 | ||||||
|
|
|
|||||||
| Total South Korea |
|
281,022 | ||||||
| Spain – 1.9% |
| |||||||
| Acerinox S.A. |
2,548 | 25,274 | ||||||
| ACS Actividades de Construccion y Servicios S.A. |
1,527 | 67,143 | ||||||
| Aena SME S.A.(b) |
588 | 105,968 | ||||||
| Banco Bilbao Vizcaya Argentaria S.A. |
18,016 | 103,028 | ||||||
| Banco de Sabadell S.A. |
19,384 | 19,323 | ||||||
| Banco Santander S.A. |
53,633 | 249,589 | ||||||
| CaixaBank S.A. |
15,514 | 48,497 | ||||||
| Enagas S.A. |
1,706 | 49,690 | ||||||
| Endesa S.A. |
6,805 | 173,756 | ||||||
See Notes to Financial Statements.
| 68 | WisdomTree Trust |
Schedule of Investments (continued)
WisdomTree Global High Dividend Fund (DEW)
March 31, 2019
| Investments | Shares | Value | ||||||
| Ferrovial S.A. |
2,698 | $ | 63,255 | |||||
| Iberdrola S.A. |
32,056 | 281,690 | ||||||
| Mapfre S.A. |
15,862 | 43,743 | ||||||
| Mediaset Espana Comunicacion S.A. |
2,579 | 19,275 | ||||||
| Naturgy Energy Group S.A. |
4,522 | 126,583 | ||||||
| Red Electrica Corp. S.A. |
3,272 | 69,805 | ||||||
| Repsol S.A. |
7,624 | 130,635 | ||||||
| Telefonica S.A. |
21,349 | 179,045 | ||||||
|
|
|
|||||||
| Total Spain |
|
1,756,299 | ||||||
| Sweden – 0.7% |
| |||||||
| Atlas Copco AB Class A |
3,106 | 83,600 | ||||||
| Axfood AB(a) |
761 | 14,194 | ||||||
| Electrolux AB Series B |
1,140 | 29,362 | ||||||
| Hennes & Mauritz AB Class B |
6,738 | 112,599 | ||||||
| ICA Gruppen AB(a) |
821 | 33,016 | ||||||
| Skandinaviska Enskilda Banken AB Class A |
9,780 | 84,859 | ||||||
| Skanska AB Class B(a) |
2,517 | 45,834 | ||||||
| Svenska Handelsbanken AB Class A(a) |
6,575 | 69,540 | ||||||
| Swedbank AB Class A(a) |
5,291 | 74,927 | ||||||
| Swedish Match AB |
538 | 27,488 | ||||||
| Tele2 AB Class B |
1,454 | 19,415 | ||||||
| Telia Co. AB |
18,631 | 84,264 | ||||||
|
|
|
|||||||
| Total Sweden |
|
679,098 | ||||||
| Switzerland – 2.6% |
| |||||||
| ABB Ltd. Registered Shares |
7,571 | 142,237 | ||||||
| Adecco Group AG Registered Shares |
773 | 41,231 | ||||||
| Baloise Holding AG Registered Shares |
386 | 63,758 | ||||||
| Kuehne + Nagel International AG Registered Shares |
601 | 82,435 | ||||||
| LafargeHolcim Ltd. Registered Shares* |
2,213 | 109,306 | ||||||
| Novartis AG Registered Shares |
7,643 | 735,060 | ||||||
| Roche Holding AG Genusschein |
2,107 | 580,435 | ||||||
| Swiss Re AG |
1,380 | 134,799 | ||||||
| Swisscom AG Registered Shares(a) |
258 | 126,163 | ||||||
| UBS Group AG Registered Shares* |
10,774 | 130,577 | ||||||
| Zurich Insurance Group AG |
635 | 210,158 | ||||||
|
|
|
|||||||
| Total Switzerland |
|
2,356,159 | ||||||
| Taiwan – 2.0% |
| |||||||
| Asustek Computer, Inc. |
7,486 | 54,164 | ||||||
| AU Optronics Corp. |
146,000 | 53,766 | ||||||
| Catcher Technology Co., Ltd. |
5,000 | 38,448 | ||||||
| Cathay Financial Holding Co., Ltd. |
51,000 | 74,381 | ||||||
| Cheng Shin Rubber Industry Co., Ltd. |
17,197 | 23,407 | ||||||
| China Development Financial Holding Corp. |
137,000 | 45,784 | ||||||
| China Steel Corp. |
58,000 | 47,611 | ||||||
| Chunghwa Telecom Co., Ltd. |
24,000 | 85,268 | ||||||
| Compal Electronics, Inc. |
27,000 | 16,776 | ||||||
| CTBC Financial Holding Co., Ltd. |
95,480 | 63,353 | ||||||
| Delta Electronics, Inc. |
12,000 | 61,907 | ||||||
| Far EasTone Telecommunications Co., Ltd. |
10,000 | 24,107 | ||||||
| First Financial Holding Co., Ltd. |
76,374 | 52,286 | ||||||
| Formosa Chemicals & Fibre Corp. |
37,000 | 134,456 | ||||||
| Formosa Petrochemical Corp. |
16,000 | 59,960 | ||||||
| Formosa Plastics Corp. |
36,000 | 127,902 | ||||||
| Fubon Financial Holding Co., Ltd. |
44,195 | 65,962 | ||||||
| Hotai Motor Co., Ltd. |
3,000 | 36,745 | ||||||
| Innolux Corp. |
108,000 | 35,042 | ||||||
| Inventec Corp. |
34,000 | 25,869 | ||||||
| Mega Financial Holding Co., Ltd. |
82,941 | 75,485 | ||||||
| Nan Ya Plastics Corp. |
51,000 | 130,559 | ||||||
| Nanya Technology Corp. |
11,000 | 21,914 | ||||||
| Novatek Microelectronics Corp. |
6,000 | 38,546 | ||||||
| Pegatron Corp. |
22,680 | 39,222 | ||||||
| Pou Chen Corp. |
30,000 | 36,550 | ||||||
| President Chain Store Corp. |
6,000 | 59,084 | ||||||
| Quanta Computer, Inc. |
23,210 | 43,527 | ||||||
| SinoPac Financial Holdings Co., Ltd. |
88,559 | 32,757 | ||||||
| Taiwan Mobile Co., Ltd. |
13,800 | 49,925 | ||||||
| Uni-President Enterprises Corp. |
49,000 | 118,921 | ||||||
| United Microelectronics Corp. |
82,000 | 30,996 | ||||||
| WPG Holdings Ltd. |
13,800 | 18,000 | ||||||
| Yuanta Financial Holding Co., Ltd. |
77,000 | 43,846 | ||||||
|
|
|
|||||||
| Total Taiwan |
|
1,866,526 | ||||||
| Thailand – 0.2% |
| |||||||
| Advanced Info Service PCL NVDR |
7,900 | 45,804 | ||||||
| Glow Energy PCL NVDR |
7,900 | 22,653 | ||||||
| Land & Houses PCL NVDR |
84,600 | 28,524 | ||||||
| PTT Global Chemical PCL NVDR |
17,836 | 37,797 | ||||||
| Siam Commercial Bank PCL (The) NVDR |
9,900 | 41,179 | ||||||
| Thai Oil PCL NVDR |
6,700 | 14,673 | ||||||
|
|
|
|||||||
| Total Thailand |
|
190,630 | ||||||
| Turkey – 0.2% |
| |||||||
| Akbank T.A.S.* |
21,206 | 23,722 | ||||||
| Eregli Demir ve Celik Fabrikalari T.A.S. |
19,306 | 31,165 | ||||||
| Tupras Turkiye Petrol Rafinerileri AS |
1,698 | 37,509 | ||||||
| Turkcell Iletisim Hizmetleri AS |
10,384 | 22,222 | ||||||
| Turkiye Garanti Bankasi AS |
13,441 | 19,842 | ||||||
|
|
|
|||||||
| Total Turkey |
|
134,460 | ||||||
| United Kingdom – 7.4% |
| |||||||
| Admiral Group PLC |
1,212 | 34,271 | ||||||
| Anglo American PLC |
5,300 | 141,818 | ||||||
| Antofagasta PLC |
4,087 | 51,445 | ||||||
| AstraZeneca PLC |
4,072 | 325,524 | ||||||
| Aviva PLC |
16,097 | 86,502 | ||||||
| Babcock International Group PLC |
2,043 | 13,138 | ||||||
| BAE Systems PLC |
13,523 | 85,004 | ||||||
| Barratt Developments PLC |
7,194 | 56,170 | ||||||
| Bellway PLC |
537 | 21,307 | ||||||
| BP PLC |
97,755 | 711,416 | ||||||
| British American Tobacco PLC |
11,725 | 487,988 | ||||||
| British Land Co. PLC (The) |
3,480 | 26,709 | ||||||
| BT Group PLC |
53,617 | 155,765 | ||||||
| Centrica PLC |
25,966 | 38,640 | ||||||
| Direct Line Insurance Group PLC |
4,412 | 20,294 | ||||||
| Dixons Carphone PLC |
8,278 | 15,829 | ||||||
See Notes to Financial Statements.
| WisdomTree Trust | 69 |
Schedule of Investments (continued)
WisdomTree Global High Dividend Fund (DEW)
March 31, 2019
| Investments | Shares | Value | ||||||
| Evraz PLC |
14,907 | $ | 120,510 | |||||
| Fresnillo PLC |
3,919 | 44,469 | ||||||
| G4S PLC |
6,576 | 15,724 | ||||||
| GlaxoSmithKline PLC |
25,243 | 525,234 | ||||||
| Hammerson PLC |
3,291 | 14,400 | ||||||
| Hays PLC |
8,594 | 16,798 | ||||||
| HSBC Holdings PLC |
79,507 | 645,749 | ||||||
| Imperial Brands PLC |
5,900 | 201,771 | ||||||
| International Consolidated Airlines Group S.A. |
6,918 | 46,079 | ||||||
| ITV PLC |
21,294 | 35,267 | ||||||
| J Sainsbury PLC |
10,189 | 31,293 | ||||||
| John Wood Group PLC |
2,009 | 13,283 | ||||||
| Kingfisher PLC |
7,961 | 24,357 | ||||||
| Land Securities Group PLC |
2,718 | 32,350 | ||||||
| Legal & General Group PLC |
31,291 | 112,250 | ||||||
| Lloyds Banking Group PLC |
238,440 | 193,069 | ||||||
| Man Group PLC |
10,189 | 18,030 | ||||||
| Marks & Spencer Group PLC |
7,791 | 28,314 | ||||||
| Micro Focus International PLC |
1,823 | 47,426 | ||||||
| National Grid PLC |
17,532 | 194,366 | ||||||
| Pennon Group PLC |
2,399 | 23,245 | ||||||
| Persimmon PLC |
2,658 | 75,158 | ||||||
| Rio Tinto PLC |
6,882 | 400,044 | ||||||
| Royal Dutch Shell PLC Class A |
21,827 | 686,440 | ||||||
| Royal Mail PLC |
6,650 | 20,649 | ||||||
| Schroders PLC |
665 | 23,414 | ||||||
| Severn Trent PLC |
1,185 | 30,512 | ||||||
| SSE PLC |
7,731 | 119,577 | ||||||
| St. James’s Place PLC |
1,864 | 24,969 | ||||||
| Standard Life Aberdeen PLC |
13,226 | 45,489 | ||||||
| Tate & Lyle PLC |
2,000 | 18,915 | ||||||
| Taylor Wimpey PLC |
26,111 | 59,695 | ||||||
| Unilever PLC |
3,505 | 200,728 | ||||||
| United Utilities Group PLC |
3,218 | 34,150 | ||||||
| Vodafone Group PLC |
209,642 | 381,897 | ||||||
| William Hill PLC |
5,320 | 11,130 | ||||||
|
|
|
|||||||
| Total United Kingdom |
|
6,788,571 | ||||||
| United States – 55.7% |
| |||||||
| AbbVie, Inc. |
12,483 | 1,006,005 | ||||||
| Acadia Realty Trust |
548 | 14,944 | ||||||
| AES Corp. |
5,282 | 95,499 | ||||||
| Alexandria Real Estate Equities, Inc. |
452 | 64,437 | ||||||
| Alliant Energy Corp. |
1,541 | 72,627 | ||||||
| Altria Group, Inc. |
18,701 | 1,073,998 | ||||||
| Ameren Corp. |
1,867 | 137,318 | ||||||
| American Campus Communities, Inc. |
1,040 | 49,483 | ||||||
| American Electric Power Co., Inc. |
3,793 | 317,664 | ||||||
| American Financial Group, Inc. |
361 | 34,732 | ||||||
| Apartment Investment & Management Co. Class A |
805 | 40,483 | ||||||
| Apple Hospitality REIT, Inc. |
3,532 | 57,572 | ||||||
| Archer-Daniels-Midland Co. |
3,468 | 149,575 | ||||||
| AT&T, Inc. |
81,044 | 2,541,540 | ||||||
| AvalonBay Communities, Inc. |
696 | 139,708 | ||||||
| Avangrid, Inc. |
2,560 | 128,896 | ||||||
| BB&T Corp. |
3,644 | 169,555 | ||||||
| Bed Bath & Beyond, Inc. |
1,282 | 21,781 | ||||||
| BGC Partners, Inc. Class A |
2,732 | 14,507 | ||||||
| Boston Properties, Inc. |
669 | 89,566 | ||||||
| Brandywine Realty Trust |
2,331 | 36,970 | ||||||
| Brixmor Property Group, Inc. |
3,578 | 65,728 | ||||||
| Broadcom, Inc. |
2,530 | 760,796 | ||||||
| Camden Property Trust |
500 | 50,750 | ||||||
| Campbell Soup Co. |
2,700 | 102,951 | ||||||
| Cardinal Health, Inc. |
2,261 | 108,867 | ||||||
| CenterPoint Energy, Inc. |
4,124 | 126,607 | ||||||
| CenturyLink, Inc. |
21,194 | 254,116 | ||||||
| Chevron Corp. |
14,612 | 1,799,906 | ||||||
| Cincinnati Financial Corp. |
672 | 57,725 | ||||||
| Cinemark Holdings, Inc. |
831 | 33,232 | ||||||
| Cisco Systems, Inc. |
27,353 | 1,476,788 | ||||||
| CME Group, Inc. |
2,014 | 331,464 | ||||||
| CMS Energy Corp. |
1,531 | 85,032 | ||||||
| CNA Financial Corp. |
3,096 | 134,212 | ||||||
| Coca-Cola Co. (The) |
29,874 | 1,399,896 | ||||||
| Cogent Communications Holdings, Inc. |
378 | 20,507 | ||||||
| Colony Capital, Inc. |
7,517 | 39,990 | ||||||
| Columbia Property Trust, Inc. |
1,340 | 30,163 | ||||||
| Compass Minerals International, Inc. |
385 | 20,932 | ||||||
| Consolidated Edison, Inc. |
2,388 | 202,526 | ||||||
| CoreCivic, Inc. |
1,298 | 25,246 | ||||||
| CoreSite Realty Corp. |
218 | 23,330 | ||||||
| Coty, Inc. Class A |
7,761 | 89,251 | ||||||
| Covanta Holding Corp. |
1,628 | 28,181 | ||||||
| Cracker Barrel Old Country Store, Inc. |
271 | 43,796 | ||||||
| Crown Castle International Corp. |
2,585 | 330,880 | ||||||
| CubeSmart |
1,250 | 40,050 | ||||||
| Cummins, Inc. |
1,006 | 158,817 | ||||||
| CVR Energy, Inc. |
1,228 | 50,594 | ||||||
| Cypress Semiconductor Corp. |
3,893 | 58,084 | ||||||
| CyrusOne, Inc. |
459 | 24,070 | ||||||
| Darden Restaurants, Inc. |
768 | 93,289 | ||||||
| Designer Brands, Inc. |
808 | 17,954 | ||||||
| Digital Realty Trust, Inc. |
1,159 | 137,921 | ||||||
| Dominion Energy, Inc. |
6,860 | 525,888 | ||||||
| Domtar Corp. |
527 | 26,166 | ||||||
| DTE Energy Co. |
1,189 | 148,316 | ||||||
| Duke Energy Corp. |
6,438 | 579,420 | ||||||
| Duke Realty Corp. |
1,574 | 48,133 | ||||||
| Edison International |
2,227 | 137,896 | ||||||
| Emerson Electric Co. |
4,010 | 274,565 | ||||||
| Entergy Corp. |
1,870 | 178,828 | ||||||
| EPR Properties |
823 | 63,289 | ||||||
| Equity Residential |
1,873 | 141,074 | ||||||
| Erie Indemnity Co. Class A |
130 | 23,208 | ||||||
| Essex Property Trust, Inc. |
303 | 87,640 | ||||||
| Eversource Energy |
2,010 | 142,609 | ||||||
| Exelon Corp. |
6,825 | 342,137 | ||||||
See Notes to Financial Statements.
| 70 | WisdomTree Trust |
Schedule of Investments (continued)
WisdomTree Global High Dividend Fund (DEW)
March 31, 2019
| Investments | Shares | Value | ||||||
| Extended Stay America, Inc. |
2,328 | $ | 41,788 | |||||
| Extra Space Storage, Inc. |
754 | 76,840 | ||||||
| Exxon Mobil Corp. |
33,688 | 2,721,990 | ||||||
| Fastenal Co. |
1,578 | 101,481 | ||||||
| Federal Realty Investment Trust |
404 | 55,691 | ||||||
| Federated Investors, Inc. Class B |
751 | 22,012 | ||||||
| Fidelity National Financial, Inc. |
1,390 | 50,804 | ||||||
| First American Financial Corp. |
571 | 29,407 | ||||||
| First Hawaiian, Inc. |
760 | 19,798 | ||||||
| FirstEnergy Corp. |
3,814 | 158,701 | ||||||
| Flowers Foods, Inc. |
1,707 | 36,393 | ||||||
| FNB Corp. |
1,861 | 19,727 | ||||||
| Foot Locker, Inc. |
767 | 46,480 | ||||||
| Ford Motor Co. |
67,789 | 595,187 | ||||||
| Franklin Resources, Inc. |
2,742 | 90,870 | ||||||
| Gaming and Leisure Properties, Inc. |
2,364 | 91,179 | ||||||
| Gap, Inc. (The) |
2,843 | 74,430 | ||||||
| General Electric Co. |
67,422 | 673,546 | ||||||
| General Mills, Inc. |
5,261 | 272,257 | ||||||
| General Motors Co. |
13,761 | 510,533 | ||||||
| Genuine Parts Co. |
824 | 92,313 | ||||||
| GEO Group, Inc. (The) |
1,700 | 32,640 | ||||||
| Gilead Sciences, Inc. |
7,978 | 518,650 | ||||||
| H&R Block, Inc. |
1,641 | 39,286 | ||||||
| Hanesbrands, Inc. |
2,654 | 47,454 | ||||||
| Harley-Davidson, Inc. |
1,295 | 46,180 | ||||||
| Hawaiian Electric Industries, Inc. |
1,320 | 53,816 | ||||||
| HCP, Inc. |
4,460 | 139,598 | ||||||
| Healthcare Realty Trust, Inc. |
977 | 31,371 | ||||||
| Healthcare Trust of America, Inc. Class A |
1,613 | 46,116 | ||||||
| Helmerich & Payne, Inc. |
1,109 | 61,616 | ||||||
| Highwoods Properties, Inc. |
1,004 | 46,967 | ||||||
| Hospitality Properties Trust |
2,101 | 55,277 | ||||||
| Host Hotels & Resorts, Inc. |
5,767 | 108,996 | ||||||
| Hudson Pacific Properties, Inc. |
824 | 28,362 | ||||||
| Huntington Bancshares, Inc. |
5,204 | 65,987 | ||||||
| Intel Corp. |
25,095 | 1,347,601 | ||||||
| International Business Machines Corp. |
8,205 | 1,157,725 | ||||||
| International Paper Co. |
3,986 | 184,432 | ||||||
| Interpublic Group of Cos., Inc. (The) |
2,928 | 61,517 | ||||||
| Iron Mountain, Inc. |
3,162 | 112,125 | ||||||
| J.M. Smucker Co. (The) |
793 | 92,384 | ||||||
| Kellogg Co. |
2,449 | 140,524 | ||||||
| Kennedy-Wilson Holdings, Inc. |
1,105 | 23,636 | ||||||
| Kimberly-Clark Corp. |
2,539 | 314,582 | ||||||
| Kimco Realty Corp. |
5,016 | 92,796 | ||||||
| Kinder Morgan, Inc. |
15,437 | 308,894 | ||||||
| Kohl’s Corp. |
1,257 | 86,444 | ||||||
| Kraft Heinz Co. (The) |
11,208 | 365,941 | ||||||
| L Brands, Inc. |
3,815 | 105,218 | ||||||
| Lamar Advertising Co. Class A |
794 | 62,932 | ||||||
| Las Vegas Sands Corp. |
8,914 | 543,397 | ||||||
| Legg Mason, Inc. |
580 | 15,875 | ||||||
| Leggett & Platt, Inc. |
1,093 | 46,146 | ||||||
| Liberty Property Trust |
1,528 | 73,986 | ||||||
| Life Storage, Inc. |
385 | 37,449 | ||||||
| Macerich Co. (The) |
1,398 | 60,603 | ||||||
| Macquarie Infrastructure Corp. |
2,251 | 92,786 | ||||||
| Macy’s, Inc. |
2,887 | 69,375 | ||||||
| Maxim Integrated Products, Inc. |
1,702 | 90,495 | ||||||
| MDU Resources Group, Inc. |
1,662 | 42,929 | ||||||
| Medical Properties Trust, Inc. |
4,310 | 79,778 | ||||||
| Merck & Co., Inc. |
15,223 | 1,266,097 | ||||||
| Mercury General Corp. |
451 | 22,582 | ||||||
| Meredith Corp.(a) |
256 | 14,147 | ||||||
| MetLife, Inc. |
6,257 | 266,360 | ||||||
| Mid-America Apartment Communities, Inc. |
643 | 70,299 | ||||||
| Molson Coors Brewing Co. Class B |
1,136 | 67,762 | ||||||
| Murphy Oil Corp. |
1,328 | 38,910 | ||||||
| National Fuel Gas Co. |
830 | 50,597 | ||||||
| National Health Investors, Inc. |
457 | 35,897 | ||||||
| National Retail Properties, Inc. |
1,169 | 64,751 | ||||||
| Navient Corp. |
2,552 | 29,527 | ||||||
| New York Community Bancorp, Inc. |
6,760 | 78,213 | ||||||
| Newell Brands, Inc. |
5,186 | 79,553 | ||||||
| NiSource, Inc. |
1,911 | 54,769 | ||||||
| Nordstrom, Inc. |
925 | 41,052 | ||||||
| NorthWestern Corp. |
478 | 33,656 | ||||||
| Occidental Petroleum Corp. |
6,380 | 422,356 | ||||||
| OGE Energy Corp. |
1,411 | 60,842 | ||||||
| Old Republic International Corp. |
2,563 | 53,618 | ||||||
| Olin Corp. |
2,048 | 47,391 | ||||||
| Omega Healthcare Investors, Inc. |
2,401 | 91,598 | ||||||
| Omnicom Group, Inc. |
1,591 | 116,127 | ||||||
| ONEOK, Inc. |
3,714 | 259,386 | ||||||
| Outfront Media, Inc. |
1,940 | 45,396 | ||||||
| PACCAR, Inc. |
2,547 | 173,553 | ||||||
| PacWest Bancorp |
1,144 | 43,026 | ||||||
| Park Hotels & Resorts, Inc. |
1,937 | 60,202 | ||||||
| Patterson Cos., Inc. |
864 | 18,878 | ||||||
| Paychex, Inc. |
2,434 | 195,207 | ||||||
| Pebblebrook Hotel Trust |
1,173 | 36,433 | ||||||
| Penske Automotive Group, Inc. |
522 | 23,307 | ||||||
| People’s United Financial, Inc. |
3,776 | 62,077 | ||||||
| PepsiCo, Inc. |
9,400 | 1,151,970 | ||||||
| Pfizer, Inc. |
37,168 | 1,578,525 | ||||||
| Philip Morris International, Inc. |
17,081 | 1,509,790 | ||||||
| Phillips 66 |
2,871 | 273,233 | ||||||
| Physicians Realty Trust |
1,741 | 32,748 | ||||||
| Piedmont Office Realty Trust, Inc. Class A |
1,797 | 37,467 | ||||||
| Pinnacle West Capital Corp. |
1,042 | 99,594 | ||||||
| PPL Corp. |
8,000 | 253,920 | ||||||
| Principal Financial Group, Inc. |
1,614 | 81,007 | ||||||
| ProAssurance Corp. |
952 | 32,949 | ||||||
| Procter & Gamble Co. (The) |
18,345 | 1,908,797 | ||||||
| Prologis, Inc. |
3,076 | 221,318 | ||||||
| Prudential Financial, Inc. |
2,233 | 205,168 | ||||||
| Public Service Enterprise Group, Inc. |
3,698 | 219,698 | ||||||
See Notes to Financial Statements.
| WisdomTree Trust | 71 |
Schedule of Investments (continued)
WisdomTree Global High Dividend Fund (DEW)
March 31, 2019
| Investments | Shares | Value | ||||||
| Public Storage |
1,096 | $ | 238,687 | |||||
| QTS Realty Trust, Inc. Class A |
359 | 16,151 | ||||||
| QUALCOMM, Inc. |
11,256 | 641,930 | ||||||
| Rayonier, Inc. |
1,438 | 45,326 | ||||||
| Realty Income Corp. |
2,042 | 150,210 | ||||||
| Regency Centers Corp. |
901 | 60,808 | ||||||
| Retail Opportunity Investments Corp. |
756 | 13,109 | ||||||
| Retail Properties of America, Inc. Class A |
2,151 | 26,221 | ||||||
| RLJ Lodging Trust |
1,640 | 28,815 | ||||||
| Ryder System, Inc. |
723 | 44,819 | ||||||
| Ryman Hospitality Properties, Inc. |
386 | 31,745 | ||||||
| Sabra Health Care REIT, Inc. |
2,419 | 47,098 | ||||||
| Scotts Miracle-Gro Co. (The) |
352 | 27,660 | ||||||
| Sempra Energy |
1,545 | 194,454 | ||||||
| Senior Housing Properties Trust |
3,991 | 47,014 | ||||||
| Simon Property Group, Inc. |
2,177 | 396,671 | ||||||
| SITE Centers Corp. |
2,035 | 27,717 | ||||||
| Six Flags Entertainment Corp. |
746 | 36,815 | ||||||
| SL Green Realty Corp. |
484 | 43,521 | ||||||
| Sonoco Products Co. |
590 | 36,303 | ||||||
| South Jersey Industries, Inc. |
874 | 28,029 | ||||||
| Southern Co. (The) |
11,166 | 577,059 | ||||||
| Spirit Realty Capital, Inc. |
1,215 | 48,272 | ||||||
| STAG Industrial, Inc. |
800 | 23,720 | ||||||
| STORE Capital Corp. |
1,494 | 50,049 | ||||||
| Sun Communities, Inc. |
369 | 43,734 | ||||||
| Sunstone Hotel Investors, Inc. |
1,774 | 25,546 | ||||||
| Tanger Factory Outlet Centers, Inc. |
1,221 | 25,617 | ||||||
| Tapestry, Inc. |
1,975 | 64,168 | ||||||
| Targa Resources Corp. |
2,992 | 124,318 | ||||||
| Target Corp. |
3,380 | 271,279 | ||||||
| Taubman Centers, Inc. |
501 | 26,493 | ||||||
| TerraForm Power, Inc. Class A |
1,533 | 21,063 | ||||||
| TFS Financial Corp. |
2,294 | 37,782 | ||||||
| UDR, Inc. |
1,438 | 65,371 | ||||||
| Umpqua Holdings Corp. |
2,300 | 37,950 | ||||||
| United Bankshares, Inc. |
643 | 23,302 | ||||||
| United Parcel Service, Inc. Class B |
4,275 | 477,688 | ||||||
| Uniti Group, Inc.(a) |
2,240 | 25,066 | ||||||
| Valero Energy Corp. |
2,731 | 231,671 | ||||||
| Valley National Bancorp |
1,899 | 18,192 | ||||||
| Ventas, Inc. |
3,304 | 210,828 | ||||||
| VEREIT, Inc. |
12,038 | 100,758 | ||||||
| Verizon Communications, Inc. |
37,229 | 2,201,351 | ||||||
| VICI Properties, Inc. |
1,917 | 41,944 | ||||||
| Virtu Financial, Inc. Class A |
980 | 23,275 | ||||||
| Vornado Realty Trust |
1,056 | 71,217 | ||||||
| W.P. Carey, Inc. |
1,444 | 113,109 | ||||||
| Watsco, Inc. |
215 | 30,790 | ||||||
| WEC Energy Group, Inc. |
1,939 | 153,336 | ||||||
| Weingarten Realty Investors |
1,053 | 30,927 | ||||||
| Wells Fargo & Co. |
24,020 | 1,160,646 | ||||||
| Welltower, Inc. |
3,241 | 251,502 | ||||||
| Western Digital Corp. |
2,195 | 105,492 | ||||||
| Western Union Co. (The) |
3,629 | 67,028 | ||||||
| WestRock Co. |
2,612 | 100,170 | ||||||
| Weyerhaeuser Co. |
5,551 | 146,213 | ||||||
| Whirlpool Corp. |
612 | 81,329 | ||||||
| Williams Cos., Inc. (The) |
8,900 | 255,608 | ||||||
| Williams-Sonoma, Inc. |
580 | 32,637 | ||||||
| Wyndham Destinations, Inc. |
1,666 | 67,456 | ||||||
| Xcel Energy, Inc. |
3,677 | 206,684 | ||||||
| Xenia Hotels & Resorts, Inc. |
866 | 18,974 | ||||||
| Xerox Corp. |
2,008 | 64,216 | ||||||
|
|
|
|||||||
| Total United States |
|
51,379,679 | ||||||
| TOTAL COMMON STOCKS (Cost: $88,026,069) |
|
91,800,765 | ||||||
| EXCHANGE-TRADED FUNDS – 0.1% |
| |||||||
| United States – 0.1% |
| |||||||
| WisdomTree International High Dividend Fund(a)(c) |
943 | 37,976 | ||||||
| WisdomTree U.S. High Dividend Fund(a)(c) |
176 | 12,755 | ||||||
| TOTAL EXCHANGE-TRADED FUNDS (Cost: $49,651) |
50,731 | |||||||
| INVESTMENT OF CASH COLLATERAL FOR SECURITIES LOANED – 1.5% |
| |||||||
| United States – 1.5% |
| |||||||
| State Street Navigator Securities Lending Government Money Market Portfolio, 2.46%(d) |
||||||||
| (Cost: $1,424,615)(e) | 1,424,615 | 1,424,615 | ||||||
| TOTAL INVESTMENTS IN SECURITIES – 101.1% (Cost: $89,500,335) |
|
93,276,111 | ||||||
| Other Assets less Liabilities – (1.1)% |
|
(1,048,782 | ) | |||||
|
|
|
|||||||
| NET ASSETS – 100.0% |
|
$ | 92,227,329 | |||||
| * | Non-income producing security. |
| (a) | Security, or portion thereof, was on loan at March 31, 2019 (See Note 2). |
| (b) | This security is exempt from registration under rule 144A of the Securities Act of 1933. This security may be sold in transactions that are exempt from registration, normally to qualified institutional buyers. |
| (c) | Affiliated company (See Note 3). |
| (d) | Rate shown represents annualized 7-day yield as of March 31, 2019. |
| (e) | At March 31, 2019, the total market value of the Fund’s securities on loan identified in the Schedule of Investments was $1,651,491 and the total market value of the collateral held by the Fund was $1,797,412. The total market value of the collateral includes non-cash U.S. Government securities collateral having a value of $372,797. |
ADR – American Depositary Receipt
GDR – Global Depositary Receipt
NVDR – Non-Voting Depositary Receipt
Reg S – Regulation S provides an exclusion from the registration requirements of the Securities Act of 1933. These securities may be resold in transactions exempt from registration, normally to qualified institutional buyers.
RSP – Risparmio Italian Savings Shares
See Notes to Financial Statements.
| 72 | WisdomTree Trust |
Schedule of Investments (concluded)
WisdomTree Global High Dividend Fund (DEW)
March 31, 2019
| FINANCIAL DERIVATIVE INSTRUMENTS | ||||||||||||||||||||||||||||
| FOREIGN CURRENCY CONTRACTS (OTC – OVER THE COUNTER) | ||||||||||||||||||||||||||||
| Counterparty | Settlement Date |
Amount and Description of Currency to be Purchased |
Amount and Description of Currency to be Sold |
Unrealized Appreciation |
Unrealized Depreciation |
|||||||||||||||||||||||
| Citibank N.A. |
4/2/2019 | 6,283 | USD | 58,150 | SEK | $ | 13 | $ | — | |||||||||||||||||||
| Royal Bank of Canada |
4/2/2019 | 11,908 | USD | 10,600 | EUR | 6 | — | |||||||||||||||||||||
| $ | 19 | $ | — | |||||||||||||||||||||||||
| CURRENCY LEGEND | ||
| EUR | Euro | |
| SEK | Swedish krona | |
| USD | U.S. dollar | |
See Notes to Financial Statements.
| WisdomTree Trust | 73 |
Schedule of Investments
WisdomTree India Earnings Fund (EPI) (consolidated)
March 31, 2019
| Investments | Shares | Value | ||||||
| COMMON STOCKS – 100.5% | ||||||||
| India – 100.5% | ||||||||
| Aerospace & Defense – 0.2% | ||||||||
| Bharat Electronics Ltd. |
1,836,280 | $ | 2,471,788 | |||||
| Airlines – 0.5% |
| |||||||
| InterGlobe Aviation Ltd.(a) |
248,825 | 5,129,692 | ||||||
| SpiceJet Ltd.* |
969,416 | 1,367,888 | ||||||
|
|
|
|||||||
| Total Airlines |
|
6,497,580 | ||||||
| Auto Components – 1.1% |
| |||||||
| Apollo Tyres Ltd. |
762,096 | 2,450,478 | ||||||
| Balkrishna Industries Ltd. |
139,479 | 2,004,350 | ||||||
| Bharat Forge Ltd. |
339,601 | 2,511,895 | ||||||
| Bosch Ltd. |
4,638 | 1,217,486 | ||||||
| Ceat Ltd. |
56,768 | 917,712 | ||||||
| Endurance Technologies Ltd.(a) |
9,686 | 162,310 | ||||||
| Exide Industries Ltd. |
431,591 | 1,362,525 | ||||||
| Jamna Auto Industries Ltd. |
122,166 | 110,747 | ||||||
| Mahindra CIE Automotive Ltd.* |
101,969 | 345,171 | ||||||
| Minda Corp. Ltd. |
141,555 | 277,389 | ||||||
| Minda Industries Ltd. |
69,152 | 325,820 | ||||||
| Motherson Sumi Systems Ltd. |
1,116,878 | 2,413,521 | ||||||
| Sundram Fasteners Ltd. |
66,361 | 542,623 | ||||||
|
|
|
|||||||
| Total Auto Components |
|
14,642,027 | ||||||
| Automobiles – 5.3% |
| |||||||
| Bajaj Auto Ltd. |
161,945 | 6,805,313 | ||||||
| Eicher Motors Ltd. |
14,869 | 4,410,303 | ||||||
| Hero MotoCorp Ltd. |
264,263 | 9,739,489 | ||||||
| Mahindra & Mahindra Ltd. |
1,763,263 | 17,152,839 | ||||||
| Maruti Suzuki India Ltd. |
170,810 | 16,452,375 | ||||||
| Tata Motors Ltd.* |
5,607,058 | 14,103,643 | ||||||
| TVS Motor Co., Ltd. |
145,500 | 989,043 | ||||||
|
|
|
|||||||
| Total Automobiles |
|
69,653,005 | ||||||
| Banks – 6.9% |
| |||||||
| Axis Bank Ltd.* |
261,175 | 2,930,325 | ||||||
| Bandhan Bank Ltd.(a) |
35,729 | 271,417 | ||||||
| City Union Bank Ltd. |
613,313 | 1,813,601 | ||||||
| DCB Bank Ltd. |
408,478 | 1,207,008 | ||||||
| Federal Bank Ltd. |
4,427,220 | 6,163,917 | ||||||
| ICICI Bank Ltd. |
5,468,071 | 31,612,594 | ||||||
| IDFC Bank Ltd. |
5,742,851 | 4,600,913 | ||||||
| Indian Bank* |
383,304 | 1,549,815 | ||||||
| Karnataka Bank Ltd. (The) |
698,469 | 1,347,534 | ||||||
| Karur Vysya Bank Ltd. (The) |
703,032 | 723,583 | ||||||
| Kotak Mahindra Bank Ltd. |
976,564 | 18,812,337 | ||||||
| RBL Bank Ltd.(a) |
73,602 | 722,845 | ||||||
| South Indian Bank Ltd. (The) |
6,146,399 | 1,463,956 | ||||||
| Yes Bank Ltd. |
4,571,375 | 18,153,522 | ||||||
|
|
|
|||||||
| Total Banks |
|
91,373,367 | ||||||
| Beverages – 0.1% |
| |||||||
| Radico Khaitan Ltd. |
23,816 | 135,831 | ||||||
| United Breweries Ltd. |
14,261 | 287,134 | ||||||
| United Spirits Ltd.* |
161,248 | 1,289,286 | ||||||
|
|
|
|||||||
| Total Beverages |
|
1,712,251 | ||||||
| Biotechnology – 0.1% |
| |||||||
| Biocon Ltd. |
173,579 | $ | 1,529,825 | |||||
| Building Products – 0.1% |
| |||||||
| Blue Star Ltd. |
30,000 | 293,569 | ||||||
| Sintex Plastics Technology Ltd.* |
1,801,591 | 518,827 | ||||||
|
|
|
|||||||
| Total Building Products |
|
812,396 | ||||||
| Capital Markets – 0.6% |
| |||||||
| Care Ratings Ltd. |
41,738 | 596,231 | ||||||
| Edelweiss Financial Services Ltd. |
769,562 | 2,196,765 | ||||||
| IIFL Holdings Ltd. |
421,974 | 2,613,163 | ||||||
| Indiabulls Ventures Ltd. |
40,290 | 189,687 | ||||||
| JM Financial Ltd. |
641,909 | 871,940 | ||||||
| Motilal Oswal Financial Services Ltd. |
87,149 | 757,451 | ||||||
| Multi Commodity Exchange of India Ltd. |
25,002 | 291,110 | ||||||
| Reliance Nippon Life Asset Management Ltd.(a) |
125,673 | 380,420 | ||||||
|
|
|
|||||||
| Total Capital Markets |
|
7,896,767 | ||||||
| Chemicals – 3.2% |
| |||||||
| Aarti Industries Ltd. |
19,262 | 438,668 | ||||||
| Advanced Enzyme Technologies Ltd. |
86,889 | 229,028 | ||||||
| Asian Paints Ltd. |
262,656 | 5,659,569 | ||||||
| Balaji Amines Ltd. |
25,195 | 180,284 | ||||||
| Berger Paints India Ltd. |
189,587 | 886,016 | ||||||
| Bhansali Engineering Polymers Ltd. |
71,265 | 75,148 | ||||||
| Bodal Chemicals Ltd. |
184,150 | 336,933 | ||||||
| Castrol India Ltd. |
534,376 | 1,283,582 | ||||||
| Chambal Fertilizers and Chemicals Ltd. |
658,727 | 1,588,457 | ||||||
| Coromandel International Ltd. |
186,267 | 1,364,569 | ||||||
| DCM Shriram Ltd. |
191,658 | 1,145,383 | ||||||
| EID Parry India Ltd. |
265,546 | 784,467 | ||||||
| GHCL Ltd. |
172,430 | 612,683 | ||||||
| Gujarat Alkalies & Chemicals Ltd. |
119,982 | 854,379 | ||||||
| Gujarat Fluorochemicals Ltd. |
45,209 | 720,962 | ||||||
| Gujarat Narmada Valley Fertilizers & Chemicals Ltd. |
219,111 | 967,694 | ||||||
| Gujarat State Fertilizers & Chemicals Ltd. |
530,284 | 798,009 | ||||||
| Himadri Speciality Chemical Ltd. |
235,124 | 394,730 | ||||||
| Kansai Nerolac Paints Ltd. |
134,610 | 890,923 | ||||||
| Kiri Industries Ltd.* |
82,254 | 588,275 | ||||||
| Meghmani Organics Ltd. |
237,581 | 209,545 | ||||||
| National Fertilizers Ltd. |
548,894 | 278,904 | ||||||
| Navin Fluorine International Ltd. |
40,220 | 410,822 | ||||||
| NOCIL Ltd. |
98,518 | 208,271 | ||||||
| Phillips Carbon Black Ltd. |
92,537 | 235,700 | ||||||
| PI Industries Ltd. |
67,211 | 1,001,204 | ||||||
| Pidilite Industries Ltd. |
96,408 | 1,734,370 | ||||||
| Rain Industries Ltd. |
490,607 | 723,782 | ||||||
| Rashtriya Chemicals & Fertilizers Ltd. |
435,467 | 366,792 | ||||||
| Solar Industries India Ltd. |
8,523 | 133,440 | ||||||
| SRF Ltd. |
17,678 | 613,212 | ||||||
| Sudarshan Chemical Industries |
25,186 | 125,030 | ||||||
| Supreme Industries Ltd. |
32,841 | 529,699 | ||||||
| Tata Chemicals Ltd. |
332,784 | 2,828,484 | ||||||
See Notes to Financial Statements.
| 74 | WisdomTree Trust |
Schedule of Investments (continued)
WisdomTree India Earnings Fund (EPI) (consolidated)
March 31, 2019
| Investments | Shares | Value | ||||||
| Thirumalai Chemicals Ltd. |
172,439 | $ | 219,796 | |||||
| UPL Ltd. |
921,444 | 12,753,902 | ||||||
|
|
|
|||||||
| Total Chemicals |
|
42,172,712 | ||||||
| Communications Equipment – 0.0% |
| |||||||
| Sterlite Technologies Ltd. |
148,565 | 468,481 | ||||||
| Construction & Engineering – 1.7% |
| |||||||
| Dilip Buildcon Ltd.(a) |
76,009 | 703,858 | ||||||
| Engineers India Ltd. |
405,246 | 686,184 | ||||||
| IRB Infrastructure Developers Ltd. |
1,137,707 | 2,378,879 | ||||||
| J Kumar Infraprojects Ltd. |
98,243 | 227,827 | ||||||
| Kalpataru Power Transmission Ltd. |
137,338 | 933,264 | ||||||
| KEC International Ltd. |
200,375 | 867,014 | ||||||
| KNR Constructions Ltd. |
169,269 | 638,592 | ||||||
| Larsen & Toubro Ltd. |
581,528 | 11,628,881 | ||||||
| NBCC India Ltd. |
713,497 | 682,856 | ||||||
| NCC Ltd. |
662,741 | 1,079,615 | ||||||
| Praj Industries Ltd. |
128,237 | 287,110 | ||||||
| Voltas Ltd. |
272,507 | 2,476,067 | ||||||
|
|
|
|||||||
| Total Construction & Engineering |
|
22,590,147 | ||||||
| Construction Materials – 1.7% |
| |||||||
| ACC Ltd. |
71,377 | 1,716,860 | ||||||
| Ambuja Cements Ltd. |
1,174,383 | 3,988,918 | ||||||
| Century Textiles & Industries Ltd. |
56,046 | 754,912 | ||||||
| Grasim Industries Ltd. |
582,004 | 7,207,944 | ||||||
| HeidelbergCement India Ltd. |
99,681 | 261,235 | ||||||
| JK Cement Ltd. |
67,358 | 842,716 | ||||||
| JK Lakshmi Cement Ltd. |
74,846 | 375,067 | ||||||
| Prism Johnson Ltd. |
91,584 | 126,453 | ||||||
| Ramco Cements Ltd. (The) |
125,545 | 1,333,650 | ||||||
| Shree Cement Ltd. |
3,398 | 915,665 | ||||||
| UltraTech Cement Ltd. |
88,610 | 5,114,310 | ||||||
|
|
|
|||||||
| Total Construction Materials |
|
22,637,730 | ||||||
| Consumer Finance – 2.3% |
| |||||||
| Bajaj Finance Ltd. |
176,245 | 7,696,011 | ||||||
| Bharat Financial Inclusion Ltd.* |
125,004 | 2,039,401 | ||||||
| Cholamandalam Investment and Finance Co., Ltd. |
75,178 | 1,576,161 | ||||||
| Magma Fincorp Ltd. |
433,909 | 737,849 | ||||||
| Mahindra & Mahindra Financial Services Ltd. |
479,873 | 2,917,683 | ||||||
| Manappuram Finance Ltd. |
1,779,483 | 3,218,610 | ||||||
| Muthoot Finance Ltd. |
456,389 | 4,055,620 | ||||||
| Shriram Transport Finance Co., Ltd. |
379,856 | 7,004,375 | ||||||
| Sundaram Finance Ltd. |
52,422 | 1,179,504 | ||||||
|
|
|
|||||||
| Total Consumer Finance |
|
30,425,214 | ||||||
| Containers & Packaging – 0.0% |
| |||||||
| Nilkamal Ltd. |
6,204 | 128,034 | ||||||
| Uflex Ltd. |
146,514 | 482,000 | ||||||
|
|
|
|||||||
| Total Containers & Packaging |
|
610,034 | ||||||
| Diversified Financial Services – 3.2% |
| |||||||
| Aditya Birla Capital Ltd.* |
795,760 | 1,116,534 | ||||||
| Bajaj Holdings & Investment Ltd. |
99,349 | 4,899,759 | ||||||
| Housing & Urban Development Corp. Ltd. |
1,147,491 | 743,737 | ||||||
| IDFC Ltd. |
2,263,090 | 1,520,705 | ||||||
| L&T Finance Holdings Ltd. |
1,016,183 | 2,237,730 | ||||||
| Power Finance Corp., Ltd. |
7,940,187 | 14,109,520 | ||||||
| REC Ltd. |
6,798,812 | 15,005,967 | ||||||
| Reliance Capital Ltd. |
704,016 | 2,078,257 | ||||||
|
|
|
|||||||
| Total Diversified Financial Services |
|
41,712,209 | ||||||
| Diversified Telecommunication Services – 0.6% |
| |||||||
| Bharti Infratel Ltd. |
1,606,191 | 7,266,406 | ||||||
| Himachal Futuristic Communications Ltd. |
2,423,039 | 788,734 | ||||||
|
|
|
|||||||
| Total Diversified Telecommunication Services |
|
8,055,140 | ||||||
| Electric Utilities – 2.3% |
| |||||||
| Adani Transmission Ltd.* |
872,599 | 2,738,405 | ||||||
| CESC Ltd. |
231,541 | 2,442,085 | ||||||
| Power Grid Corp. of India Ltd. |
5,724,672 | 16,353,845 | ||||||
| Reliance Infrastructure Ltd. |
661,731 | 1,308,656 | ||||||
| Tata Power Co., Ltd. (The) |
5,449,691 | 5,805,662 | ||||||
| Torrent Power Ltd. |
377,636 | 1,403,699 | ||||||
|
|
|
|||||||
| Total Electric Utilities |
|
30,052,352 | ||||||
| Electrical Equipment – 0.6% |
| |||||||
| ABB India Ltd. |
39,010 | 741,063 | ||||||
| Amara Raja Batteries Ltd. |
58,421 | 607,148 | ||||||
| Finolex Cables Ltd. |
79,559 | 546,032 | ||||||
| Graphite India Ltd. |
107,451 | 693,177 | ||||||
| Havells India Ltd. |
276,448 | 3,082,730 | ||||||
| HEG Ltd. |
48,257 | 1,458,333 | ||||||
| KEI Industries Ltd. |
67,685 | 415,685 | ||||||
|
|
|
|||||||
| Total Electrical Equipment |
|
7,544,168 | ||||||
| Electronic Equipment, Instruments & Components – 0.1% |
| |||||||
| Redington India Ltd. |
690,289 | 1,021,857 | ||||||
| Entertainment – 0.1% |
| |||||||
| Inox Leisure Ltd.* |
125,491 | 596,705 | ||||||
| PVR Ltd. |
17,534 | 416,792 | ||||||
|
|
|
|||||||
| Total Entertainment |
|
1,013,497 | ||||||
| Food & Staples Retailing – 0.0% |
| |||||||
| Spencer’s Retail Ltd.* |
151,307 | 349,464 | ||||||
| Food Products – 0.9% |
| |||||||
| Avanti Feeds Ltd. |
126,936 | 749,064 | ||||||
| Balrampur Chini Mills Ltd. |
624,219 | 1,235,372 | ||||||
| Bombay Burmah Trading Co. |
8,924 | 167,376 | ||||||
| Britannia Industries Ltd. |
53,136 | 2,366,671 | ||||||
| GlaxoSmithKline Consumer Healthcare Ltd. |
6,501 | 680,064 | ||||||
| Kaveri Seed Co., Ltd. |
90,878 | 603,252 | ||||||
| KRBL Ltd. |
256,496 | 1,245,732 | ||||||
| LT Foods Ltd. |
250,554 | 141,779 | ||||||
| Manpasand Beverages Ltd. |
180,671 | 304,878 | ||||||
| McLeod Russel India Ltd. |
291,709 | 361,083 | ||||||
| Nestle India Ltd. |
18,932 | 2,995,492 | ||||||
| Tata Global Beverages Ltd. |
283,112 | 833,500 | ||||||
| Venky’s India Ltd. |
9,360 | 306,350 | ||||||
|
|
|
|||||||
| Total Food Products |
|
11,990,613 | ||||||
See Notes to Financial Statements.
| WisdomTree Trust | 75 |
Schedule of Investments (continued)
WisdomTree India Earnings Fund (EPI) (consolidated)
March 31, 2019
| Investments | Shares | Value | ||||||
| Gas Utilities – 1.2% |
| |||||||
| Adani Gas Ltd.* |
1,483,735 | $ | 2,756,502 | |||||
| GAIL India Ltd. |
1,393,395 | 6,992,620 | ||||||
| Gujarat Gas Ltd. |
199,645 | 426,812 | ||||||
| Gujarat State Petronet Ltd. |
695,524 | 1,914,636 | ||||||
| Indraprastha Gas Ltd. |
541,204 | 2,386,298 | ||||||
| Mahanagar Gas Ltd. |
55,967 | 852,371 | ||||||
|
|
|
|||||||
| Total Gas Utilities |
|
15,329,239 | ||||||
| Health Care Providers & Services – 0.0% |
| |||||||
| Apollo Hospitals Enterprise Ltd. |
22,522 | 399,105 | ||||||
| Dr Lal PathLabs Ltd.(a) |
12,649 | 190,680 | ||||||
|
|
|
|||||||
| Total Health Care Providers & Services |
|
589,785 | ||||||
| Health Care Technology – 0.0% |
| |||||||
| TAKE Solutions Ltd. |
129,764 | 279,758 | ||||||
| Hotels, Restaurants & Leisure – 0.1% |
| |||||||
| Coffee Day Enterprises Ltd.*(a) |
78,732 | 328,850 | ||||||
| EIH Ltd. |
143,620 | 426,973 | ||||||
| Indian Hotels Co., Ltd. (The) |
160,280 | 358,389 | ||||||
| Jubilant Foodworks Ltd. |
19,497 | 406,404 | ||||||
|
|
|
|||||||
| Total Hotels, Restaurants & Leisure |
|
1,520,616 | ||||||
| Household Durables – 0.3% |
| |||||||
| Amber Enterprises India Ltd.* |
18,956 | 223,450 | ||||||
| Bajaj Electricals Ltd. |
17,629 | 142,025 | ||||||
| Crompton Greaves Consumer Electricals Ltd. |
430,482 | 1,411,844 | ||||||
| Symphony Ltd. |
25,703 | 511,945 | ||||||
| Whirlpool of India Ltd. |
46,247 | 1,011,459 | ||||||
|
|
|
|||||||
| Total Household Durables |
|
3,300,723 | ||||||
| Household Products – 1.0% |
| |||||||
| Eveready Industries India Ltd. |
40,434 | 112,095 | ||||||
| Hindustan Unilever Ltd. |
549,585 | 13,540,695 | ||||||
| Jyothy Laboratories Ltd. |
80,204 | 211,871 | ||||||
|
|
|
|||||||
| Total Household Products |
|
13,864,661 | ||||||
| Independent Power & Renewable Electricity Producers – 1.7% |
| |||||||
| JSW Energy Ltd.* |
730,281 | 765,332 | ||||||
| NHPC Ltd. |
11,035,715 | 3,934,784 | ||||||
| NLC India Ltd. |
1,065,195 | 1,067,117 | ||||||
| NTPC Ltd. |
7,977,098 | 15,510,865 | ||||||
| PTC India Ltd. |
1,420,165 | 1,505,754 | ||||||
|
|
|
|||||||
| Total Independent Power & Renewable Electricity Producers |
|
22,783,852 | ||||||
| Industrial Conglomerates – 0.3% |
| |||||||
| Godrej Industries Ltd. |
136,287 | 1,055,277 | ||||||
| Nava Bharat Ventures Ltd. |
613,220 | 913,966 | ||||||
| Siemens Ltd. |
110,415 | 1,799,155 | ||||||
|
|
|
|||||||
| Total Industrial Conglomerates |
|
3,768,398 | ||||||
| Insurance – 0.9% |
| |||||||
| Bajaj Finserv Ltd. |
59,158 | 6,009,351 | ||||||
| General Insurance Corp. of India(a) |
314,997 | 1,098,795 | ||||||
| HDFC Life Insurance Co., Ltd.(a) |
127,259 | 695,309 | ||||||
| ICICI Lombard General Insurance Co., Ltd.(a) |
60,084 | 896,208 | ||||||
| ICICI Prudential Life Insurance Co., Ltd.(a) |
235,209 | 1,189,202 | ||||||
| Max Financial Services Ltd.* |
147,453 | 926,330 | ||||||
| SBI Life Insurance Co., Ltd.(a) |
74,853 | 630,375 | ||||||
| TI Financial Holdings Ltd. |
131,202 | 921,208 | ||||||
|
|
|
|||||||
| Total Insurance |
|
12,366,778 | ||||||
| Interactive Media & Services – 0.1% |
| |||||||
| Info Edge India Ltd. |
45,421 | 1,208,090 | ||||||
| IT Services – 15.2% |
| |||||||
| CESC Ventures Ltd.* |
50,436 | 452,810 | ||||||
| eClerx Services Ltd. |
52,738 | 873,688 | ||||||
| HCL Technologies Ltd. |
1,538,875 | 24,156,617 | ||||||
| Hexaware Technologies Ltd. |
253,003 | 1,261,089 | ||||||
| Infosys Ltd. |
8,985,687 | 96,485,071 | ||||||
| Larsen & Toubro Infotech Ltd.(a) |
18,740 | 460,581 | ||||||
| Mindtree Ltd. |
182,748 | 2,491,598 | ||||||
| Mphasis Ltd. |
169,909 | 2,430,845 | ||||||
| NIIT Technologies Ltd. |
84,284 | 1,613,106 | ||||||
| Persistent Systems Ltd. |
95,910 | 871,601 | ||||||
| Sonata Software Ltd. |
47,023 | 229,227 | ||||||
| Tata Consultancy Services Ltd. |
1,423,042 | 41,117,748 | ||||||
| Tech Mahindra Ltd. |
1,134,932 | 12,711,566 | ||||||
| Vakrangee Ltd. |
4,487,868 | 3,258,604 | ||||||
| Wipro Ltd. |
3,686,099 | 13,557,821 | ||||||
|
|
|
|||||||
| Total IT Services |
|
201,971,972 | ||||||
| Life Sciences Tools & Services – 0.2% |
| |||||||
| Dishman Carbogen Amcis Ltd.* |
78,378 | 235,728 | ||||||
| Divi’s Laboratories Ltd. |
106,714 | 2,623,524 | ||||||
| Syngene International Ltd.(a) |
42,798 | 367,775 | ||||||
|
|
|
|||||||
| Total Life Sciences Tools & Services |
|
3,227,027 | ||||||
| Machinery – 0.9% |
| |||||||
| Action Construction Equipment Ltd. |
76,119 | 125,922 | ||||||
| AIA Engineering Ltd. |
76,719 | 1,989,101 | ||||||
| Anveshan Heavy Engineering Ltd.* |
14,477 | 116,713 | ||||||
| Ashok Leyland Ltd. |
2,404,882 | 3,169,480 | ||||||
| BEML Ltd. |
39,481 | 577,070 | ||||||
| Carborundum Universal Ltd. |
61,221 | 362,642 | ||||||
| Cochin Shipyard Ltd.(a) |
178,094 | 1,006,736 | ||||||
| Cummins India Ltd. |
85,762 | 923,543 | ||||||
| Escorts Ltd. |
173,747 | 1,996,554 | ||||||
| Greaves Cotton Ltd. |
89,095 | 179,026 | ||||||
| Jain Irrigation Systems Ltd. |
882,406 | 750,252 | ||||||
| Thermax Ltd. |
27,877 | 390,942 | ||||||
|
|
|
|||||||
| Total Machinery |
|
11,587,981 | ||||||
| Media – 0.5% |
| |||||||
| Sun TV Network Ltd. |
214,308 | 1,943,080 | ||||||
| TV Today Network Ltd. |
61,579 | 282,450 | ||||||
| Zee Entertainment Enterprises Ltd. |
750,888 | 4,828,879 | ||||||
|
|
|
|||||||
| Total Media |
|
7,054,409 | ||||||
| Metals & Mining – 6.4% |
| |||||||
| APL Apollo Tubes Ltd. |
14,917 | 310,474 | ||||||
| Godawari Power and Ispat Ltd.* |
32,620 | 109,008 | ||||||
See Notes to Financial Statements.
| 76 | WisdomTree Trust |
Schedule of Investments (continued)
WisdomTree India Earnings Fund (EPI) (consolidated)
March 31, 2019
| Investments | Shares | Value | ||||||
| Hindalco Industries Ltd. |
4,589,255 | $ | 13,613,741 | |||||
| Hindustan Copper Ltd. |
176,279 | 124,559 | ||||||
| Hindustan Zinc Ltd. |
960,568 | 3,838,805 | ||||||
| Jindal Saw Ltd. |
417,048 | 520,144 | ||||||
| Jindal Stainless Hisar Ltd.* |
496,059 | 671,318 | ||||||
| Jindal Stainless Ltd.* |
645,036 | 378,036 | ||||||
| JSW Steel Ltd. |
2,898,636 | 12,261,931 | ||||||
| Maithan Alloys Ltd. |
70,286 | 512,471 | ||||||
| National Aluminium Co., Ltd. |
1,998,323 | 1,599,524 | ||||||
| NMDC Ltd. |
3,522,523 | 5,311,115 | ||||||
| Prakash Industries Ltd.* |
326,467 | 422,015 | ||||||
| Ramkrishna Forgings Ltd. |
40,482 | 306,676 | ||||||
| Surya Roshni Ltd. |
66,625 | 242,649 | ||||||
| Tata Metaliks Ltd. |
30,210 | 283,283 | ||||||
| Tata Sponge Iron Ltd. |
19,579 | 214,910 | ||||||
| Tata Steel Ltd. |
2,434,912 | 18,312,366 | ||||||
| Tinplate Co. of India Ltd. (The) |
74,352 | 165,877 | ||||||
| Vedanta Ltd. |
9,227,381 | 24,568,609 | ||||||
| Welspun Corp., Ltd. |
174,821 | 343,712 | ||||||
|
|
|
|||||||
| Total Metals & Mining |
|
84,111,223 | ||||||
| Multiline Retail – 0.0% |
| |||||||
| Shoppers Stop Ltd. |
32,949 | 224,329 | ||||||
| V-Mart Retail Ltd. |
3,537 | 137,561 | ||||||
|
|
|
|||||||
| Total Multiline Retail |
|
361,890 | ||||||
| Oil, Gas & Consumable Fuels – 19.8% |
| |||||||
| Aegis Logistics Ltd. |
151,556 | 444,550 | ||||||
| Bharat Petroleum Corp., Ltd. |
4,155,218 | 23,845,643 | ||||||
| Chennai Petroleum Corp., Ltd. |
386,785 | 1,525,923 | ||||||
| Coal India Ltd. |
2,393,176 | 8,194,317 | ||||||
| Hindustan Petroleum Corp., Ltd. |
5,375,830 | 22,027,129 | ||||||
| Indian Oil Corp., Ltd. |
14,025,280 | 32,970,290 | ||||||
| Mangalore Refinery & Petrochemicals Ltd. |
1,650,762 | 1,770,503 | ||||||
| Oil & Natural Gas Corp., Ltd. |
13,173,189 | 30,377,726 | ||||||
| Oil India Ltd. |
1,529,322 | 4,094,013 | ||||||
| Petronet LNG Ltd. |
1,589,082 | 5,770,243 | ||||||
| Reliance Industries Ltd. |
6,674,331 | 131,342,934 | ||||||
|
|
|
|||||||
| Total Oil, Gas & Consumable Fuels |
|
262,363,271 | ||||||
| Paper & Forest Products – 0.1% |
| |||||||
| Century Plyboards India Ltd. |
166,612 | 500,979 | ||||||
| JK Paper Ltd. |
129,550 | 265,271 | ||||||
|
|
|
|||||||
| Total Paper & Forest Products |
|
766,250 | ||||||
| Personal Products – 0.9% |
| |||||||
| Bajaj Corp., Ltd.* |
94,357 | 420,742 | ||||||
| Colgate-Palmolive India Ltd. |
78,576 | 1,427,072 | ||||||
| Dabur India Ltd. |
540,181 | 3,187,672 | ||||||
| Emami Ltd. |
20,475 | 118,224 | ||||||
| Godrej Consumer Products Ltd. |
413,703 | 4,096,720 | ||||||
| Marico Ltd. |
466,024 | 2,331,970 | ||||||
|
|
|
|||||||
| Total Personal Products |
|
11,582,400 | ||||||
| Pharmaceuticals – 3.7% |
| |||||||
| Alembic Pharmaceuticals Ltd. |
69,861 | 542,349 | ||||||
| Alkem Laboratories Ltd. |
40,756 | 1,030,063 | ||||||
| Aurobindo Pharma Ltd. |
666,316 | 7,543,245 | ||||||
| Bliss Gvs Pharma Ltd. |
87,086 | 225,650 | ||||||
| Cadila Healthcare Ltd. |
471,709 | 2,363,141 | ||||||
| Cipla Ltd. |
413,704 | 3,158,543 | ||||||
| Dr. Reddy’s Laboratories Ltd. |
75,604 | 3,034,255 | ||||||
| Eris Lifesciences Ltd.*(a) |
20,542 | 191,231 | ||||||
| Glenmark Pharmaceuticals Ltd. |
220,809 | 2,062,903 | ||||||
| Granules India Ltd. |
213,300 | 352,395 | ||||||
| Indoco Remedies Ltd. |
32,223 | 94,099 | ||||||
| Ipca Laboratories Ltd. |
43,638 | 618,491 | ||||||
| Jubilant Life Sciences Ltd. |
157,586 | 1,512,280 | ||||||
| Lupin Ltd. |
42,728 | 456,177 | ||||||
| Natco Pharma Ltd. |
193,572 | 1,602,365 | ||||||
| Pfizer Ltd. |
4,749 | 228,007 | ||||||
| Piramal Enterprises Ltd. |
368,608 | 14,703,083 | ||||||
| Strides Pharma Science Ltd. |
315,143 | 2,149,023 | ||||||
| Sun Pharmaceutical Industries Ltd. |
677,963 | 4,686,288 | ||||||
| Suven Life Sciences Ltd. |
106,413 | 400,767 | ||||||
| Torrent Pharmaceuticals Ltd. |
60,994 | 1,716,681 | ||||||
|
|
|
|||||||
| Total Pharmaceuticals |
|
48,671,036 | ||||||
| Professional Services – 0.1% |
| |||||||
| L&T Technology Services Ltd.(a) |
9,397 | 213,272 | ||||||
| Quess Corp., Ltd.*(a) |
39,311 | 423,753 | ||||||
| TeamLease Services Ltd.* |
5,792 | 253,005 | ||||||
|
|
|
|||||||
| Total Professional Services |
|
890,030 | ||||||
| Real Estate Management & Development – 1.3% |
| |||||||
| Anant Raj Ltd. |
418,619 | 203,040 | ||||||
| Capacit’e Infraprojects Ltd. |
59,644 | 195,269 | ||||||
| DLF Ltd. |
2,354,235 | 6,880,041 | ||||||
| Godrej Properties Ltd.* |
45,110 | 529,501 | ||||||
| Indiabulls Real Estate Ltd.* |
3,715,970 | 4,945,686 | ||||||
| Kolte-Patil Developers Ltd. |
49,524 | 179,688 | ||||||
| Mahindra Lifespace Developers Ltd. |
59,817 | 311,238 | ||||||
| Oberoi Realty Ltd. |
138,948 | 1,059,635 | ||||||
| Phoenix Mills Ltd. (The) |
61,729 | 586,192 | ||||||
| Prestige Estates Projects Ltd. |
254,300 | 927,998 | ||||||
| Puravankara Ltd. |
209,602 | 223,142 | ||||||
| Sobha Ltd. |
119,977 | 894,697 | ||||||
| Sunteck Realty Ltd. |
40,694 | 270,951 | ||||||
|
|
|
|||||||
| Total Real Estate Management & Development |
|
17,207,078 | ||||||
| Road & Rail – 0.2% |
| |||||||
| Container Corp. of India Ltd. |
321,286 | 2,436,255 | ||||||
| VRL Logistics Ltd. |
59,957 | 245,107 | ||||||
|
|
|
|||||||
| Total Road & Rail |
|
2,681,362 | ||||||
| Software – 0.2% |
| |||||||
| Birlasoft Ltd.* |
414,348 | 590,046 | ||||||
| KPIT Technologies Ltd.*† |
478,863 | 564,405 | ||||||
| Oracle Financial Services Software Ltd. |
32,334 | 1,581,250 | ||||||
| Tata Elxsi Ltd. |
25,094 | 348,871 | ||||||
|
|
|
|||||||
| Total Software |
|
3,084,572 | ||||||
See Notes to Financial Statements.
| WisdomTree Trust | 77 |
Schedule of Investments (concluded)
WisdomTree India Earnings Fund (EPI) (consolidated)
March 31, 2019
| Investments | Shares | Value | ||||||
| Specialty Retail – 0.2% |
| |||||||
| Arvind Fashions Ltd.* |
78,175 | $ | 1,177,224 | |||||
| PC Jeweller Ltd. |
1,036,789 | 1,230,228 | ||||||
| Shankara Building Products Ltd. |
7,438 | 44,037 | ||||||
|
|
|
|||||||
| Total Specialty Retail |
|
2,451,489 | ||||||
| Textiles, Apparel & Luxury Goods – 0.8% |
| |||||||
| Arvind Ltd. |
320,521 | 420,807 | ||||||
| Indo Count Industries Ltd. |
352,308 | 247,671 | ||||||
| Page Industries Ltd. |
1,374 | 495,299 | ||||||
| Rajesh Exports Ltd. |
394,026 | 3,787,826 | ||||||
| Raymond Ltd. |
18,575 | 217,591 | ||||||
| Swan Energy Ltd. |
49,670 | 77,077 | ||||||
| Titan Co., Ltd. |
231,293 | 3,812,370 | ||||||
| Trident Ltd. |
648,826 | 671,538 | ||||||
| Vardhman Textiles Ltd. |
47,319 | 743,272 | ||||||
| Welspun India Ltd. |
812,899 | 699,956 | ||||||
|
|
|
|||||||
| Total Textiles, Apparel & Luxury Goods |
|
11,173,407 | ||||||
| Thrifts & Mortgage Finance – 10.3% |
| |||||||
| Can Fin Homes Ltd. |
157,539 | 793,323 | ||||||
| Dewan Housing Finance Corp., Ltd. |
587,695 | 1,274,647 | ||||||
| GIC Housing Finance Ltd. |
121,535 | 473,070 | ||||||
| GRUH Finance Ltd. |
96,370 | 383,672 | ||||||
| Housing Development Finance Corp., Ltd. |
3,937,341 | 111,868,227 | ||||||
| Indiabulls Housing Finance Ltd. |
1,105,101 | 13,691,129 | ||||||
| LIC Housing Finance Ltd. |
960,276 | 7,377,248 | ||||||
| PNB Housing Finance Ltd.(a) |
52,885 | 660,156 | ||||||
|
|
|
|||||||
| Total Thrifts & Mortgage Finance |
|
136,521,472 | ||||||
| Tobacco – 1.3% |
| |||||||
| ITC Ltd. |
4,033,135 | 17,305,657 | ||||||
| Trading Companies & Distributors – 0.1% |
| |||||||
| Adani Enterprises Ltd. |
767,243 | 1,625,303 | ||||||
| MMTC Ltd. |
406,948 | 164,483 | ||||||
|
|
|
|||||||
| Total Trading Companies & Distributors |
|
1,789,786 | ||||||
| Transportation Infrastructure – 0.8% |
| |||||||
| Adani Ports & Special Economic Zone Ltd. |
1,883,823 | 10,283,185 | ||||||
| Water Utilities – 0.1% |
| |||||||
| VA Tech Wabag Ltd. |
134,175 | 637,416 | ||||||
| Wireless Telecommunication Services – 0.2% |
| |||||||
| Bharti Airtel Ltd. |
407,457 | 1,959,205 | ||||||
| TOTAL INVESTMENTS IN SECURITIES – 100.5% (Cost: $938,528,939) |
|
1,329,926,642 | ||||||
| Other Assets less Liabilities – (0.5)% |
|
(6,502,698 | ) | |||||
|
|
|
|||||||
| NET ASSETS – 100.0% |
|
$ | 1,323,423,944 | |||||
| * | Non-income producing security. |
| † | Security is being fair valued using significant unobservable inputs by a pricing committee under the direction of the Board of Trustees. The aggregate value of fair valued securities is $564,405, which represents 0.04% of net assets. |
| (a) | This security is exempt from registration under rule 144A of the Securities Act of 1933. This security may be sold in transactions that are exempt from registration, normally to qualified institutional buyers. |
See Notes to Financial Statements.
| 78 | WisdomTree Trust |
Schedule of Investments
WisdomTree Middle East Dividend Fund (GULF)
March 31, 2019
| Investments | Shares | Value | ||||||
| COMMON STOCKS – 98.5% | ||||||||
| Bahrain – 3.2% | ||||||||
| Ahli United Bank BSC |
730,761 | $ | 650,377 | |||||
| Egypt – 3.3% |
| |||||||
| Alexandria Mineral Oils Co. |
58,993 | 20,288 | ||||||
| Commercial International Bank Egypt SAE |
44,382 | 174,532 | ||||||
| Eastern Tobacco |
176,018 | 184,854 | ||||||
| ElSewedy Electric Co. |
192,691 | 172,899 | ||||||
| Heliopolis Housing |
7,094 | 9,865 | ||||||
| Juhayna Food Industries |
6,544 | 5,090 | ||||||
| Orascom Development Egypt |
36,095 | 15,829 | ||||||
| Oriental Weavers |
70,847 | 47,872 | ||||||
| Sidi Kerir Petrochemicals Co. |
21,682 | 21,232 | ||||||
| Talaat Moustafa Group |
33,423 | 21,620 | ||||||
| Telecom Egypt Co. |
10,656 | 8,941 | ||||||
|
|
|
|||||||
| Total Egypt |
|
683,022 | ||||||
| Jordan – 3.0% |
| |||||||
| Arab Bank PLC |
66,546 | 610,083 | ||||||
| Kuwait – 11.9% |
| |||||||
| Agility Public Warehousing Co. KSC |
33,409 | 94,371 | ||||||
| Boubyan Bank KSCP |
24,813 | 49,365 | ||||||
| Burgan Bank SAK |
38,623 | 45,342 | ||||||
| Gulf Bank KSCP |
128,178 | 131,086 | ||||||
| Humansoft Holding Co. KSC |
8,631 | 91,447 | ||||||
| Kuwait Finance House KSCP |
171,037 | 392,581 | ||||||
| Kuwait International Bank KSCP |
48,146 | 48,764 | ||||||
| Kuwait Projects Co. Holding KSCP |
40,809 | 29,523 | ||||||
| Mabanee Co. SAK |
15,445 | 29,407 | ||||||
| Mezzan Holding Co. KSCC |
4,952 | 7,865 | ||||||
| Mobile Telecommunications Co. KSC |
404,666 | 644,059 | ||||||
| National Bank of Kuwait SAKP |
269,305 | 797,023 | ||||||
| Qurain Petrochemical Industries Co. |
56,500 | 72,274 | ||||||
|
|
|
|||||||
| Total Kuwait |
|
2,433,107 | ||||||
| Morocco – 2.9% |
| |||||||
| Attijariwafa Bank |
5,538 | 243,538 | ||||||
| Douja Promotion Groupe Addoha S.A. |
24,668 | 29,660 | ||||||
| Maroc Telecom |
16,179 | 240,231 | ||||||
| Societe d’Exploitation des Ports |
4,231 | 78,824 | ||||||
|
|
|
|||||||
| Total Morocco |
|
592,253 | ||||||
| Oman – 1.2% |
| |||||||
| Bank Muscat SAOG |
242,530 | 253,239 | ||||||
| Qatar – 23.1% |
| |||||||
| Barwa Real Estate Co. |
25,960 | 261,329 | ||||||
| Commercial Bank PQSC (The) |
11,373 | 140,415 | ||||||
| Doha Bank QPSC |
36,239 | 212,512 | ||||||
| Industries Qatar QSC |
16,062 | 546,613 | ||||||
| Masraf Al Rayan QSC |
41,603 | 419,944 | ||||||
| Medicare Group |
1,854 | 33,762 | ||||||
| Ooredoo QPSC |
11,076 | 202,004 | ||||||
| Qatar Electricity & Water Co. QSC |
4,238 | 200,553 | ||||||
| Qatar Fuel QSC |
4,940 | 268,659 | ||||||
| Qatar Gas Transport Co., Ltd. |
31,095 | 177,649 | ||||||
| Qatar Insurance Co. SAQ |
11,539 | 115,652 | ||||||
| Qatar International Islamic Bank QSC |
5,729 | 115,249 | ||||||
| Qatar Islamic Bank SAQ |
8,895 | 370,508 | ||||||
| Qatar National Bank QPSC |
30,966 | 1,535,223 | ||||||
| United Development Co. QSC |
30,155 | 115,377 | ||||||
| Widam Food Co. |
607 | 10,704 | ||||||
|
|
|
|||||||
| Total Qatar |
|
4,726,153 | ||||||
| Saudi Arabia – 27.3% |
| |||||||
| Advanced Petrochemical Co. |
5,267 | 78,225 | ||||||
| Al Rajhi Bank |
42,581 | 1,210,323 | ||||||
| Alawwal Bank* |
3,116 | 14,390 | ||||||
| Alinma Bank |
26,979 | 174,232 | ||||||
| Almarai Co. JSC |
3,547 | 52,112 | ||||||
| Arab National Bank |
6,148 | 40,655 | ||||||
| Bank Al-Jazira |
7,125 | 31,727 | ||||||
| Bank AlBilad |
8,814 | 69,330 | ||||||
| Banque Saudi Fransi |
16,920 | 166,703 | ||||||
| Bupa Arabia for Cooperative Insurance Co. |
384 | 8,509 | ||||||
| Dar Al Arkan Real Estate Development Co. |
25,910 | 74,338 | ||||||
| Jarir Marketing Co. |
2,897 | 122,049 | ||||||
| Kingdom Holding Co. |
10,310 | 24,192 | ||||||
| Mouwasat Medical Services Co. |
620 | 13,226 | ||||||
| National Commercial Bank |
34,621 | 506,804 | ||||||
| National Petrochemical Co. |
918 | 6,560 | ||||||
| Rabigh Refining & Petrochemical Co. |
1,156 | 6,171 | ||||||
| Riyad Bank |
50,307 | 323,008 | ||||||
| Sahara Petrochemical Co. |
18,566 | 81,584 | ||||||
| Samba Financial Group |
50,155 | 513,539 | ||||||
| Saudi Arabian Fertilizer Co. |
4,909 | 107,726 | ||||||
| Saudi Basic Industries Corp. |
26,571 | 877,115 | ||||||
| Saudi British Bank (The) |
7,730 | 77,705 | ||||||
| Saudi Electricity Co. |
30,448 | 133,959 | ||||||
| Saudi Industrial Investment Group |
8,624 | 56,568 | ||||||
| Saudi International Petrochemical Co. |
8,091 | 43,882 | ||||||
| Saudi Investment Bank (The) |
10,736 | 53,646 | ||||||
| Saudi Telecom Co. |
15,110 | 431,904 | ||||||
| Savola Group (The) |
8,256 | 69,124 | ||||||
| Yanbu National Petrochemical Co. |
11,190 | 223,182 | ||||||
|
|
|
|||||||
| Total Saudi Arabia |
|
5,592,488 | ||||||
| United Arab Emirates – 22.6% |
| |||||||
| Abu Dhabi Commercial Bank PJSC |
249,677 | 644,398 | ||||||
| Air Arabia PJSC |
617,734 | 158,087 | ||||||
| Aldar Properties PJSC |
653,579 | 322,065 | ||||||
| Arabtec Holding PJSC |
27,672 | 16,047 | ||||||
| Aramex PJSC |
25,302 | 32,789 | ||||||
| DAMAC Properties Dubai Co. PJSC |
322,023 | 118,356 | ||||||
| Dana Gas PJSC |
357,022 | 90,395 | ||||||
| DP World PLC |
8,901 | 142,416 | ||||||
| Dubai Financial Market PJSC |
295,059 | 59,203 | ||||||
| Dubai Investments PJSC |
316,334 | 117,987 | ||||||
| Dubai Islamic Bank PJSC |
271,819 | 362,613 | ||||||
| Emaar Malls PJSC |
263,141 | 124,654 | ||||||
| Emaar Properties PJSC |
242,778 | 309,330 | ||||||
See Notes to Financial Statements.
| WisdomTree Trust | 79 |
Schedule of Investments (concluded)
WisdomTree Middle East Dividend Fund (GULF)
March 31, 2019
| Investments | Shares | Value | ||||||
| Emirates NBD PJSC |
28,148 | $ | 77,782 | |||||
| Emirates Telecommunications Group Co. PJSC |
202,370 | 920,089 | ||||||
| First Abu Dhabi Bank PJSC |
220,865 | 917,590 | ||||||
| RAK Properties PJSC* |
305,275 | 35,405 | ||||||
| Union National Bank PJSC |
113,415 | 166,737 | ||||||
|
|
|
|||||||
| Total United Arab Emirates |
|
4,615,943 | ||||||
| TOTAL INVESTMENTS IN SECURITIES – 98.5% (Cost: $17,121,651) |
20,156,665 | |||||||
| Other Assets less Liabilities – 1.5% |
316,145 | |||||||
|
|
|
|||||||
| NET ASSETS – 100.0% | $ | 20,472,810 | ||||||
| * | Non-income producing security. |
See Notes to Financial Statements.
| 80 | WisdomTree Trust |
Statements of Assets and Liabilities
WisdomTree Trust
March 31, 2019
| WisdomTree Asia Pacific ex-Japan Fund |
WisdomTree China ex-State- Owned Enterprises Fund |
WisdomTree Emerging Markets Consumer Growth Fund |
WisdomTree Emerging Markets ex-State-Owned Enterprises Fund |
WisdomTree Emerging Markets High Dividend Fund |
||||||||||||||||
| ASSETS: |
||||||||||||||||||||
| Investments, at cost |
$ | 30,027,799 | $ | 143,691,407 | $ | 31,156,433 | $ | 296,704,754 | $ | 2,084,626,352 | ||||||||||
| Investment in affiliates, at cost (Note 3) |
1,758 | — | — | — | 2,254,420 | |||||||||||||||
| Foreign currency, at cost |
9,648 | 35,547 | 48,168 | 126,915 | 1,430,186 | |||||||||||||||
| Investments in securities, at value1,2 (Note 2) |
33,553,255 | 144,619,726 | 34,606,536 | 306,338,182 | 2,193,604,201 | |||||||||||||||
| Investment in affiliates, at value (Note 3) |
2,056 | — | — | — | 2,304,355 | |||||||||||||||
| Cash |
17,311 | 105,787 | 16,363 | 99,373 | 534,857 | |||||||||||||||
| Foreign currency, at value |
9,654 | 35,492 | 47,828 | 126,909 | 1,429,801 | |||||||||||||||
| Unrealized appreciation on foreign currency contracts |
— | — | — | — | 8,885 | |||||||||||||||
| Receivables: |
||||||||||||||||||||
| Capital shares sold |
— | — | — | — | 8,744,388 | |||||||||||||||
| Dividends |
148,232 | 18,252 | 62,212 | 563,463 | 4,515,279 | |||||||||||||||
| Securities lending income |
45 | 13,203 | 1,659 | 8,350 | 136,188 | |||||||||||||||
| Total Assets |
33,730,553 | 144,792,460 | 34,734,598 | 307,136,277 | 2,211,277,954 | |||||||||||||||
| LIABILITIES: |
||||||||||||||||||||
| Unrealized depreciation on foreign currency contracts |
— | — | — | — | 1,675 | |||||||||||||||
| Payables: |
||||||||||||||||||||
| Cash collateral received for securities loaned (Note 2) |
— | 1,057,470 | 307,985 | 1,845,375 | 28,284,557 | |||||||||||||||
| Investment securities purchased |
— | — | — | — | 8,741,886 | |||||||||||||||
| Advisory fees (Note 3) |
13,668 | 35,790 | 8,980 | 82,031 | 1,158,110 | |||||||||||||||
| Service fees (Note 2) |
125 | 493 | 123 | 1,128 | 8,097 | |||||||||||||||
| Foreign capital gains tax |
13,844 | — | 3,164 | 23,763 | 77,849 | |||||||||||||||
| Total Liabilities |
27,637 | 1,093,753 | 320,252 | 1,952,297 | 38,272,174 | |||||||||||||||
| NET ASSETS |
$ | 33,702,916 | $ | 143,698,707 | $ | 34,414,346 | $ | 305,183,980 | $ | 2,173,005,780 | ||||||||||
| NET ASSETS: |
||||||||||||||||||||
| Paid-in capital |
$ | 40,226,951 | $ | 167,837,565 | $ | 42,375,656 | $ | 308,382,208 | $ | 3,374,592,117 | ||||||||||
| Total distributable earnings (loss) |
(6,524,035 | ) | (24,138,858 | ) | (7,961,310 | ) | (3,198,228 | ) | (1,201,586,337 | ) | ||||||||||
| NET ASSETS |
$ | 33,702,916 | $ | 143,698,707 | $ | 34,414,346 | $ | 305,183,980 | $ | 2,173,005,780 | ||||||||||
| Outstanding beneficial interest shares of $0.001 par value (unlimited number of shares authorized) |
500,000 | 1,850,000 | 1,550,000 | 10,600,000 | 49,700,000 | |||||||||||||||
| Net asset value per share |
$ | 67.41 | $ | 77.67 | $ | 22.20 | $ | 28.79 | $ | 43.72 | ||||||||||
| 1 Includes market value of securities out on loan of: |
$ | 82,124 | $ | 6,079,058 | $ | 655,926 | $ | 4,002,585 | $ | 115,479,838 | ||||||||||
| 2 Investments in securities include investment of cash collateral for securities loaned (see Schedule of Investments for additional information). |
| |||||||||||||||||||
See Notes to Financial Statements.
| WisdomTree Trust | 81 |
Statements of Assets and Liabilities (continued)
WisdomTree Trust
March 31, 2019
| WisdomTree Emerging Markets Multifactor Fund |
WisdomTree Emerging Markets Quality Dividend Growth Fund |
WisdomTree Markets SmallCap |
WisdomTree Global ex-U.S. Quality Dividend Growth Fund |
WisdomTree Global ex-U.S. Real Estate Fund |
||||||||||||||||
| ASSETS: |
||||||||||||||||||||
| Investments, at cost |
$ | 18,075,814 | $ | 60,476,353 | $ | 1,335,841,288 | $ | 68,481,269 | $ | 106,858,473 | ||||||||||
| Investment in affiliates, at cost (Note 3) |
— | — | — | 11,502 | — | |||||||||||||||
| Foreign currency, at cost |
35,770 | 39,057 | 1,069,413 | 7,217 | 16,810 | |||||||||||||||
| Investments in securities, at value1,2 (Note 2) |
18,790,626 | 69,338,230 | 1,430,324,503 | 72,913,579 | 116,830,191 | |||||||||||||||
| Investment in affiliates, at value (Note 3) |
— | — | — | 11,533 | — | |||||||||||||||
| Cash |
44,722 | 1,142 | 44,212 | 42,997 | 84,533 | |||||||||||||||
| Foreign currency, at value |
35,783 | 38,931 | 1,068,280 | 7,207 | 16,751 | |||||||||||||||
| Unrealized appreciation on foreign currency contracts |
21,603 | — | — | — | — | |||||||||||||||
| Receivables: |
||||||||||||||||||||
| Investment securities sold |
27,037 | — | — | — | — | |||||||||||||||
| Capital shares sold |
— | — | — | 48 | — | |||||||||||||||
| Dividends |
70,576 | 133,639 | 4,758,981 | 263,415 | 261,334 | |||||||||||||||
| Securities lending income |
— | 1,833 | 261,034 | 1,809 | 6,112 | |||||||||||||||
| Foreign tax reclaims |
— | — | 270 | 109,391 | 48,417 | |||||||||||||||
| Total Assets |
18,990,347 | 69,513,775 | 1,436,457,280 | 73,349,979 | 117,247,338 | |||||||||||||||
| LIABILITIES: |
||||||||||||||||||||
| Unrealized depreciation on foreign currency contracts |
17 | 2 | — | — | — | |||||||||||||||
| Payables: |
||||||||||||||||||||
| Cash collateral received for securities loaned (Note 2) |
— | 202,825 | 10,706,585 | 982,785 | 3,046,250 | |||||||||||||||
| Investment securities purchased |
81,400 | — | — | — | — | |||||||||||||||
| Advisory fees (Note 3) |
7,705 | 18,606 | 756,451 | 32,917 | 54,759 | |||||||||||||||
| Service fees (Note 2) |
71 | 256 | 5,284 | 249 | 415 | |||||||||||||||
| Foreign capital gains tax |
15,536 | 103,103 | 20,185 | 54,048 | — | |||||||||||||||
| Total Liabilities |
104,729 | 324,792 | 11,488,505 | 1,069,999 | 3,101,424 | |||||||||||||||
| NET ASSETS |
$ | 18,885,618 | $ | 69,188,983 | $ | 1,424,968,775 | $ | 72,279,980 | $ | 114,145,914 | ||||||||||
| NET ASSETS: |
||||||||||||||||||||
| Paid-in capital |
$ | 18,738,953 | $ | 77,670,921 | $ | 1,725,109,130 | $ | 83,363,508 | $ | 118,023,138 | ||||||||||
| Total distributable earnings (loss) |
146,665 | (8,481,938 | ) | (300,140,355 | ) | (11,083,528 | ) | (3,877,224 | ) | |||||||||||
| NET ASSETS |
$ | 18,885,618 | $ | 69,188,983 | $ | 1,424,968,775 | $ | 72,279,980 | $ | 114,145,914 | ||||||||||
| Outstanding beneficial interest shares of $0.001 par value (unlimited number of shares authorized) |
800,004 | 2,800,000 | 30,300,000 | 1,300,000 | 3,550,000 | |||||||||||||||
| Net asset value per share |
$ | 23.61 | $ | 24.71 | $ | 47.03 | $ | 55.60 | $ | 32.15 | ||||||||||
| 1 Includes market value of securities out on loan of: |
— | $ | 439,964 | $ | 102,226,525 | $ | 3,869,120 | $ | 4,479,976 | |||||||||||
| 2 Investments in securities include investment of cash collateral for securities loaned (see Schedule of Investments for additional information). |
| |||||||||||||||||||
See Notes to Financial Statements.
| 82 | WisdomTree Trust |
Statements of Assets and Liabilities (concluded)
WisdomTree Trust
March 31, 2019
| WisdomTree Global High Dividend Fund |
WisdomTree India Earnings Fund (consolidated) |
WisdomTree Middle East Dividend Fund |
||||||||||
| ASSETS: |
||||||||||||
| Investments, at cost |
$ | 89,450,684 | $ | 938,528,939 | $ | 17,121,651 | ||||||
| Investment in affiliates, at cost (Note 3) |
49,651 | — | — | |||||||||
| Foreign currency, at cost |
20,220 | 2,558,467 | 44,302 | |||||||||
| Investments in securities, at value1,2 (Note 2) |
93,225,380 | 1,329,926,642 | 20,156,665 | |||||||||
| Investment in affiliates, at value (Note 3) |
50,731 | — | — | |||||||||
| Cash |
12,691 | 1,562,980 | 16,656 | |||||||||
| Foreign currency, at value |
20,273 | 2,549,120 | 44,309 | |||||||||
| Unrealized appreciation on foreign currency contracts |
19 | — | — | |||||||||
| Receivables: |
||||||||||||
| Investment securities sold |
— | — | 9,404 | |||||||||
| Dividends |
326,512 | 588,441 | 271,095 | |||||||||
| Securities lending income |
1,601 | — | — | |||||||||
| Foreign tax reclaims |
63,297 | — | — | |||||||||
| Total Assets |
93,700,504 | 1,334,627,183 | 20,498,129 | |||||||||
| LIABILITIES: |
||||||||||||
| Payables: |
||||||||||||
| Cash collateral received for securities loaned (Note 2) |
1,424,615 | — | — | |||||||||
| Investment securities purchased |
— | 1,937,032 | — | |||||||||
| Advisory fees (Note 3) |
45,255 | 904,195 | 14,594 | |||||||||
| Service fees (Note 2) |
344 | 4,793 | 72 | |||||||||
| Closed foreign currency contracts |
— | — | 10,653 | |||||||||
| Foreign capital gains tax |
2,961 | 8,357,219 | — | |||||||||
| Total Liabilities |
1,473,175 | 11,203,239 | 25,319 | |||||||||
| NET ASSETS |
$ | 92,227,329 | $ | 1,323,423,944 | $ | 20,472,810 | ||||||
| NET ASSETS: |
||||||||||||
| Paid-in capital |
$ | 96,590,605 | $ | 1,148,247,637 | $ | 21,843,106 | ||||||
| Total distributable earnings (loss) |
(4,363,276 | ) | 175,176,307 | (1,370,296 | ) | |||||||
| NET ASSETS |
$ | 92,227,329 | $ | 1,323,423,944 | $ | 20,472,810 | ||||||
| Outstanding beneficial interest shares of $0.001 par value (unlimited number of shares authorized) |
2,000,000 | 50,400,000 | 1,000,000 | |||||||||
| Net asset value per share |
$ | 46.11 | $ | 26.26 | $ | 20.47 | ||||||
| 1 Includes market value of securities out on loan of: |
$ | 1,651,491 | — | — | ||||||||
| 2 Investments in securities include investment of cash collateral for securities loaned (see Schedule of Investments for additional information). |
| |||||||||||
See Notes to Financial Statements.
| WisdomTree Trust | 83 |
WisdomTree Trust
For the Year Ended March 31, 2019
| WisdomTree Asia Pacific ex-Japan Fund |
WisdomTree China ex-State- Owned Enterprises Fund |
WisdomTree Emerging Markets Consumer Growth Fund |
WisdomTree Emerging Markets ex-State-Owned Enterprises Fund |
WisdomTree Emerging Markets High Dividend Fund |
||||||||||||||||
| INVESTMENT INCOME: |
||||||||||||||||||||
| Dividends1 |
$ | 1,759,260 | $ | 2,528,025 | $ | 1,235,659 | $ | 3,161,051 | $ | 98,009,233 | ||||||||||
| Dividends from affiliates (Note 3) |
17,111 | — | — | — | 200,404 | |||||||||||||||
| Interest |
10 | — | 13 | 130 | — | |||||||||||||||
| Non-cash dividends |
9,739 | — | — | 1,297 | — | |||||||||||||||
| Securities lending income (Note 2) |
1,775 | 219,842 | 39,065 | 58,588 | 1,219,272 | |||||||||||||||
| Total investment income |
1,787,895 | 2,747,867 | 1,274,737 | 3,221,066 | 99,428,909 | |||||||||||||||
| EXPENSES: |
||||||||||||||||||||
| Advisory fees (Note 3) |
188,660 | 1,057,704 | 230,814 | 1,019,893 | 12,869,261 | |||||||||||||||
| Service fees (Note 2) |
1,729 | 7,387 | 1,612 | 7,737 | 89,881 | |||||||||||||||
| Total expenses |
190,389 | 1,065,091 | 232,426 | 1,027,630 | 12,959,142 | |||||||||||||||
| Expense waivers (Note 3) |
(131 | ) | (520,457 | ) | (113,575 | ) | (457,193 | ) | (8,763 | ) | ||||||||||
| Net expenses |
190,258 | 544,634 | 118,851 | 570,437 | 12,950,379 | |||||||||||||||
| Net investment income |
1,597,637 | 2,203,233 | 1,155,886 | 2,650,629 | 86,478,530 | |||||||||||||||
| NET REALIZED AND UNREALIZED GAIN (LOSS) ON INVESTMENTS: |
||||||||||||||||||||
| Net realized gain (loss) from: |
||||||||||||||||||||
| Investment transactions2 |
(734,175 | ) | (21,042,819 | ) | (9,716,879 | ) | (11,861,498 | ) | (100,754,428 | ) | ||||||||||
| Investment transactions in affiliates (Note 3) |
(39,357 | ) | — | — | — | (1,652,321 | ) | |||||||||||||
| In-kind redemptions |
865,383 | 8,419,226 | 240,093 | 379,691 | 15,154,657 | |||||||||||||||
| Foreign currency contracts |
(18,542 | ) | (42,667 | ) | 9,681 | (113,760 | ) | 481,139 | ||||||||||||
| Foreign currency related transactions |
10,374 | (11,397 | ) | (30,056 | ) | 31,918 | (1,178,493 | ) | ||||||||||||
| Payment by sub-advisor (Note 3) |
— | — | — | 288 | — | |||||||||||||||
| Net realized gain (loss) |
83,683 | (12,677,657 | ) | (9,497,161 | ) | (11,563,361 | ) | (87,949,446 | ) | |||||||||||
| Net increase (decrease) in unrealized appreciation/depreciation: |
||||||||||||||||||||
| Investment transactions3 |
(1,256,642 | ) | (13,941,166 | ) | 839,812 | 9,243,446 | (73,174,785 | ) | ||||||||||||
| Investment transactions in affiliates (Note 3) |
(1,039 | ) | — | — | — | 344,032 | ||||||||||||||
| Foreign currency contracts |
(27 | ) | — | (491 | ) | 4,366 | (9,426 | ) | ||||||||||||
| Translation of assets and liabilities denominated in foreign currencies |
(390 | ) | (1,960 | ) | (915 | ) | (6,037 | ) | (3,740 | ) | ||||||||||
| Net increase (decrease) in unrealized appreciation/depreciation |
(1,258,098 | ) | (13,943,126 | ) | 838,406 | 9,241,775 | (72,843,919 | ) | ||||||||||||
| Net realized and unrealized loss on investments |
(1,174,415 | ) | (26,620,783 | ) | (8,658,755 | ) | (2,321,586 | ) | (160,793,365 | ) | ||||||||||
| NET INCREASE (DECREASE) IN NET ASSETS RESULTING FROM OPERATIONS |
$ | 423,222 | $ | (24,417,550 | ) | $ | (7,502,869 | ) | $ | 329,043 | $ | (74,314,835 | ) | |||||||
| 1 Net of foreign withholding tax of: |
$ | 132,232 | $ | 130,705 | $ | 153,139 | $ | 493,994 | $ | 13,613,730 | ||||||||||
| 2 Net of foreign capital gains tax withholding (credit) of: |
— | — | $ | (68 | ) | — | $ | 19,198 | ||||||||||||
| 3 Includes net increase in accrued foreign capital gain taxes of: |
$ | 13,844 | — | $ | 3,164 | $ | 23,763 | $ | 77,849 | |||||||||||
See Notes to Financial Statements.
| 84 | WisdomTree Trust |
Statements of Operations (continued)
WisdomTree Trust
For the Year or Period Ended March 31, 2019
| WisdomTree Emerging Markets Multifactor Fund1 |
WisdomTree Emerging Markets Quality Dividend Growth Fund |
WisdomTree Emerging Markets SmallCap Dividend Fund |
WisdomTree Global ex-U.S. Quality Dividend Growth Fund |
WisdomTree Global ex-U.S. Real Estate Fund |
||||||||||||||||
| INVESTMENT INCOME: |
||||||||||||||||||||
| Dividends2 |
$ | 168,314 | $ | 2,400,448 | $ | 60,488,457 | $ | 1,767,795 | $ | 4,347,053 | ||||||||||
| Dividends from affiliates (Note 3) |
185 | — | 334,183 | 17,670 | — | |||||||||||||||
| Interest |
4 | — | 9,568 | 6 | — | |||||||||||||||
| Non-cash dividends |
— | — | 6,841 | 33,321 | 49,551 | |||||||||||||||
| Securities lending income (Note 2) |
— | 19,246 | 3,704,267 | 19,479 | 45,559 | |||||||||||||||
| Total investment income |
168,503 | 2,419,694 | 64,543,316 | 1,838,271 | 4,442,163 | |||||||||||||||
| EXPENSES: |
||||||||||||||||||||
| Advisory fees (Note 3) |
33,004 | 468,072 | 9,154,487 | 395,277 | 598,553 | |||||||||||||||
| Service fees (Note 2) |
303 | 3,269 | 63,937 | 2,999 | 4,541 | |||||||||||||||
| Total expenses |
33,307 | 471,341 | 9,218,424 | 398,276 | 603,094 | |||||||||||||||
| Expense waivers (Note 3) |
(30 | ) | (230,321 | ) | (7,237 | ) | (227 | ) | — | |||||||||||
| Net expenses |
33,277 | 241,020 | 9,211,187 | 398,049 | 603,094 | |||||||||||||||
| Net investment income |
135,226 | 2,178,674 | 55,332,129 | 1,440,222 | 3,839,069 | |||||||||||||||
| NET REALIZED AND UNREALIZED GAIN (LOSS) ON INVESTMENTS: |
||||||||||||||||||||
| Net realized gain (loss) from: |
||||||||||||||||||||
| Investment transactions3 |
(317,174 | ) | (10,618,863 | ) | (55,561,741 | ) | (3,832,898 | ) | (3,109,292 | ) | ||||||||||
| Investment transactions in affiliates (Note 3) |
(4,203 | ) | — | (741,359 | ) | (50,013 | ) | — | ||||||||||||
| In-kind redemptions |
— | 2,398,486 | 7,096,317 | 1,620,944 | 1,745,222 | |||||||||||||||
| Foreign currency contracts |
(292,785 | ) | (29,051 | ) | (262,715 | ) | (15,809 | ) | 36,996 | |||||||||||
| Foreign currency related transactions |
17,063 | (73,147 | ) | (281,393 | ) | 5,183 | (45,439 | ) | ||||||||||||
| Net realized loss |
(597,099 | ) | (8,322,575 | ) | (49,750,891 | ) | (2,272,593 | ) | (1,372,513 | ) | ||||||||||
| Net increase (decrease) in unrealized appreciation/depreciation: |
||||||||||||||||||||
| Investment transactions4 |
699,276 | (144,669 | ) | (162,089,125 | ) | (2,207,499 | ) | 3,115,673 | ||||||||||||
| Investment transactions in affiliates (Note 3) |
— | — | (3,025 | ) | 125 | — | ||||||||||||||
| Foreign currency contracts |
21,586 | (2 | ) | (763 | ) | — | (15 | ) | ||||||||||||
| Translation of assets and liabilities denominated in foreign currencies |
(735 | ) | (1,217 | ) | (50,957 | ) | (4,697 | ) | (2,631 | ) | ||||||||||
| Net increase (decrease) in unrealized appreciation/depreciation |
720,127 | (145,888 | ) | (162,143,870 | ) | (2,212,071 | ) | 3,113,027 | ||||||||||||
| Net realized and unrealized gain (loss) on investments |
123,028 | (8,468,463 | ) | (211,894,761 | ) | (4,484,664 | ) | 1,740,514 | ||||||||||||
| NET INCREASE (DECREASE) IN NET ASSETS RESULTING FROM OPERATIONS |
$ | 258,254 | $ | (6,289,789 | ) | $ | (156,562,632 | ) | $ | (3,044,442 | ) | $ | 5,579,583 | |||||||
| 1 For the period August 10, 2018 (commencement of operations) through March 31, 2019. |
| |||||||||||||||||||
| 2 Net of foreign withholding tax of: |
$ | 22,164 | $ | 313,941 | $ | 8,806,134 | $ | 216,071 | $ | 454,658 | ||||||||||
| 3 Net of foreign capital gains tax withholding (credit) of: |
$ | 4,955 | $ | 117,868 | $ | 45,855 | $ | (10 | ) | — | ||||||||||
| 4 Includes net increase (decrease) in accrued foreign capital gain taxes of: |
$ | 15,536 | $ | 89,845 | $ | (432 | ) | $ | 51,875 | — | ||||||||||
See Notes to Financial Statements.
| WisdomTree Trust | 85 |
Statements of Operations (concluded)
WisdomTree Trust
For the Year Ended March 31, 2019
| WisdomTree Global High Dividend Fund |
WisdomTree India Earnings Fund (consolidated) |
WisdomTree Middle East Dividend Fund |
||||||||||
| INVESTMENT INCOME: |
||||||||||||
| Dividends1 |
$ | 4,200,552 | $ | 29,327,920 | $ | 955,311 | ||||||
| Dividends from affiliates (Note 3) |
11,128 | — | — | |||||||||
| Non-cash dividends |
126,401 | — | — | |||||||||
| Securities lending income (Note 2) |
24,194 | — | — | |||||||||
| Total investment income |
4,362,275 | 29,327,920 | 955,311 | |||||||||
| EXPENSES: |
||||||||||||
| Advisory fees (Note 3) |
568,785 | 12,274,486 | 157,471 | |||||||||
| Service fees (Note 2) |
4,315 | 65,069 | 788 | |||||||||
| Interest expense (Note 8) |
— | 185,659 | — | |||||||||
| Total expenses |
573,100 | 12,525,214 | 158,259 | |||||||||
| Expense waivers (Note 3) |
(381 | ) | — | — | ||||||||
| Net expenses |
572,719 | 12,525,214 | 158,259 | |||||||||
| Net investment income |
3,789,556 | 16,802,706 | 797,052 | |||||||||
| NET REALIZED AND UNREALIZED GAIN (LOSS) ON INVESTMENTS: |
||||||||||||
| Net realized gain (loss) from: |
||||||||||||
| Investment transactions2 |
(945,012 | ) | 29,612,630 | (359,045 | ) | |||||||
| Investment transactions in affiliates (Note 3) |
(38,984 | ) | — | — | ||||||||
| In-kind redemptions |
1,429,776 | — | — | |||||||||
| Foreign currency contracts |
2,160 | 1,067,496 | (8,264 | ) | ||||||||
| Foreign currency related transactions |
(13,136 | ) | (1,921,742 | ) | 427 | |||||||
| Payment by sub-advisor (Note 3) |
— | — | 17,117 | |||||||||
| Net realized gain (loss) |
434,804 | 28,758,384 | (349,765 | ) | ||||||||
| Net increase (decrease) in unrealized appreciation/depreciation: |
||||||||||||
| Investment transactions3 |
(1,192,335 | ) | (19,293,545 | ) | 1,897,666 | |||||||
| Investment transactions in affiliates (Note 3) |
1,080 | — | — | |||||||||
| Foreign currency contracts |
19 | — | 1 | |||||||||
| Translation of assets and liabilities denominated in foreign currencies |
(2,905 | ) | (5,416 | ) | (49 | ) | ||||||
| Net increase (decrease) in unrealized appreciation/depreciation |
(1,194,141 | ) | (19,298,961 | ) | 1,897,618 | |||||||
| Net realized and unrealized gain (loss) on investments |
(759,337 | ) | 9,459,423 | 1,547,853 | ||||||||
| NET INCREASE IN NET ASSETS RESULTING FROM OPERATIONS |
$ | 3,030,219 | $ | 26,262,129 | $ | 2,344,905 | ||||||
| 1 Net of foreign withholding tax of: |
$ | 231,798 | — | $ | 17,095 | |||||||
| 2 Net of foreign capital gains tax credit of: |
— | $ | (2 | ) | — | |||||||
| 3 Includes net increase (decrease) in accrued foreign capital gain taxes of: |
$ | 2,961 | $ | (9,509,693 | ) | — | ||||||
See Notes to Financial Statements.
| 86 | WisdomTree Trust |
Statements of Changes in Net Assets
WisdomTree Trust
| WisdomTree Asia Pacific ex-Japan Fund |
WisdomTree China ex-State-Owned Enterprises Fund |
WisdomTree Emerging Markets Consumer Growth Fund |
||||||||||||||||||||||
| For the Year Ended March 31, 2019 |
For the Year Ended March 31, 2018 |
For the Year Ended March 31, 2019 |
For the Year Ended March 31, 2018 |
For the Year Ended March 31, 2019 |
For the Year Ended March 31, 2018 |
|||||||||||||||||||
| INCREASE (DECREASE) IN NET ASSETS RESULTING FROM OPERATIONS: |
|
|||||||||||||||||||||||
| Net investment income |
$ | 1,597,637 | $ | 1,472,256 | $ | 2,203,233 | $ | 114,474 | $ | 1,155,886 | $ | 681,206 | ||||||||||||
| Net realized gain (loss) on investments, foreign currency contracts and foreign currency related transactions |
83,683 | 1,433,260 | (12,677,657 | ) | (1,140,498 | ) | (9,497,161 | ) | 2,745,372 | |||||||||||||||
| Net increase (decrease) in unrealized appreciation/depreciation on investments and translation of assets and liabilities denominated in foreign currencies |
(1,258,098 | ) | 2,463,176 | (13,943,126 | ) | 14,228,163 | 838,406 | 2,070,375 | ||||||||||||||||
| Net increase (decrease) in net assets resulting from operations |
423,222 | 5,368,692 | (24,417,550 | ) | 13,202,139 | (7,502,869 | ) | 5,496,953 | ||||||||||||||||
| DISTRIBUTIONS TO SHAREHOLDERS1: |
||||||||||||||||||||||||
| Distributable earnings |
(1,626,373 | ) | (1,460,015 | ) | (2,142,539 | ) | (175,236 | ) | (1,229,361 | ) | (608,721 | ) | ||||||||||||
| Tax return of capital |
— | — | (19,493 | ) | — | — | — | |||||||||||||||||
| Total distributions to shareholders |
(1,626,373 | ) | (1,460,015 | ) | (2,162,032 | ) | (175,236 | ) | (1,229,361 | ) | (608,721 | ) | ||||||||||||
| CAPITAL SHARE TRANSACTIONS: |
||||||||||||||||||||||||
| Net proceeds from sale of shares |
— | 6,764,109 | 31,032,707 | 194,324,594 | 7,530,704 | 24,219,358 | ||||||||||||||||||
| Cost of shares redeemed |
(10,144,864 | ) | (7,276,813 | ) | (76,681,994 | ) | — | (14,436,242 | ) | (3,837,105 | ) | |||||||||||||
| Net increase (decrease) in net assets resulting from capital share transactions |
(10,144,864 | ) | (512,704 | ) | (45,649,287 | ) | 194,324,594 | (6,905,538 | ) | 20,382,253 | ||||||||||||||
| Net Increase (Decrease) in Net Assets |
(11,348,015 | ) | 3,395,973 | (72,228,869 | ) | 207,351,497 | (15,637,768 | ) | 25,270,485 | |||||||||||||||
| NET ASSETS: |
||||||||||||||||||||||||
| Beginning of year |
$ | 45,050,931 | $ | 41,654,958 | $ | 215,927,576 | $ | 8,576,079 | $ | 50,052,114 | $ | 24,781,629 | ||||||||||||
| End of year2 |
$ | 33,702,916 | $ | 45,050,931 | $ | 143,698,707 | $ | 215,927,576 | $ | 34,414,346 | $ | 50,052,114 | ||||||||||||
| SHARES CREATED AND REDEEMED: |
||||||||||||||||||||||||
| Shares outstanding, beginning of year |
650,000 | 650,000 | 2,475,000 | 150,000 | 1,900,000 | 1,100,000 | ||||||||||||||||||
| Shares created |
— | 100,000 | 450,000 | 2,325,000 | 350,000 | 950,000 | ||||||||||||||||||
| Shares redeemed |
(150,000 | ) | (100,000 | ) | (1,075,000 | ) | — | (700,000 | ) | (150,000 | ) | |||||||||||||
| Shares outstanding, end of year |
500,000 | 650,000 | 1,850,000 | 2,475,000 | 1,550,000 | 1,900,000 | ||||||||||||||||||
| 1 Amounts for the fiscal year or period ended March 31, 2018 have been reclassified to match the current fiscal year presentation which conforms to the “Disclosure Update and Simplification” amendments adopted by the SEC and which became effective November 5, 2018. The amounts shown for the fiscal year or period ended March 31, 2018 represents a distribution entirely from net investment income. See Note 9 in the Notes to Financial Statements for more information. |
| |||||||||||||||||||||||
|
2 The “Disclosure Update and Simplification” amendments adopted by the SEC removed the requirement to disclose the amounts pertaining to undistributed (distributions in excess of) net
investment income included in net assets for the current fiscal year ended March 31, 2019. The undistributed (distributions in excess of) net investment income included in the net assets for the fiscal year ended March 31, 2018 were as
follows: |
| |||||||||||||||||||||||
| Undistributed(Distributions in excess of) net investmentincome included in the net assets |
|
$ | 50,165 | $ | (31,293 | ) | $ | 84,990 | ||||||||||||||||
See Notes to Financial Statements.
| WisdomTree Trust | 87 |
Statements of Changes in Net Assets (continued)
WisdomTree Trust
| WisdomTree Emerging Markets ex-State-Owned Enterprises Fund |
WisdomTree Emerging Markets High Dividend Fund |
WisdomTree Multifactor Fund |
||||||||||||||||||
| For the Year Ended March 31, 2019 |
For the Year Ended March 31, 2018 |
For the Year Ended March 31, 2019 |
For the Year Ended March 31, 2018 |
For the Period through |
||||||||||||||||
| INCREASE (DECREASE) IN NET ASSETS RESULTING FROM OPERATIONS: |
|
|||||||||||||||||||
| Net investment income |
$ | 2,650,629 | $ | 223,513 | $ | 86,478,530 | $ | 75,063,396 | $ | 135,226 | ||||||||||
| Net realized gain (loss) on investments, payments by sub-advisor, foreign currency contracts and foreign currency related transactions |
(11,563,361 | ) | 613,059 | (87,949,446 | ) | 58,603,912 | (597,099 | ) | ||||||||||||
| Net increase (decrease) in unrealized appreciation/depreciation on investments, foreign currency contracts and translation of assets and liabilities denominated in foreign currencies |
9,241,775 | 148,826 | (72,843,919 | ) | 236,034,137 | 720,127 | ||||||||||||||
| Net increase (decrease) in net assets resulting from operations |
329,043 | 985,398 | (74,314,835 | ) | 369,701,445 | 258,254 | ||||||||||||||
| DISTRIBUTIONS TO SHAREHOLDERS1: |
||||||||||||||||||||
| Distributable earnings |
(2,582,368 | ) | (125,650 | ) | (87,028,025 | ) | (74,635,924 | ) | (111,589 | ) | ||||||||||
| CAPITAL SHARE TRANSACTIONS: |
||||||||||||||||||||
| Net proceeds from sale of shares |
227,609,647 | 104,725,354 | 222,013,442 | 283,093,631 | 18,738,853 | |||||||||||||||
| Cost of shares redeemed |
(12,948,803 | ) | (15,280,657 | ) | (169,841,137 | ) | (17,363,657 | ) | — | |||||||||||
| Net increase in net assets resulting from capital share transactions |
214,660,844 | 89,444,697 | 52,172,305 | 265,729,974 | 18,738,853 | |||||||||||||||
| Net Increase (Decrease) in Net Assets |
212,407,519 | 90,304,445 | (109,170,555 | ) | 560,795,495 | 18,885,518 | ||||||||||||||
| NET ASSETS: |
||||||||||||||||||||
| Beginning of period |
$ | 92,776,461 | $ | 2,472,016 | $ | 2,282,176,335 | $ | 1,721,380,840 | $ | 100 | ||||||||||
| End of period2 |
$ | 305,183,980 | $ | 92,776,461 | $ | 2,173,005,780 | $ | 2,282,176,335 | $ | 18,885,618 | ||||||||||
| SHARES CREATED AND REDEEMED: |
||||||||||||||||||||
| Shares outstanding, beginning of period |
2,900,000 | 100,000 | 48,200,000 | 42,300,000 | 4 | |||||||||||||||
| Shares created |
8,200,000 | 3,300,000 | 5,400,000 | 6,300,000 | 800,000 | |||||||||||||||
| Shares redeemed |
(500,000 | ) | (500,000 | ) | (3,900,000 | ) | (400,000 | ) | — | |||||||||||
| Shares outstanding, end of period |
10,600,000 | 2,900,000 | 49,700,000 | 48,200,000 | 800,004 | |||||||||||||||
| * Commencement of operations. |
||||||||||||||||||||
|
1 Amounts for the fiscal year or period ended March 31, 2018 have been reclassified to match the current fiscal year presentation which conforms to the “Disclosure Update and Simplification” amendments adopted by the SEC and which became effective November 5, 2018. The amounts shown for the fiscal year or period ended March 31, 2018 represents a distribution entirely from net investment income. See Note 9 in the Notes to Financial Statements for more information. |
| |||||||||||||||||||
|
2 The “Disclosure Update and Simplification” amendments adopted by the SEC removed the requirement to disclose the amounts pertaining to undistributed net investment income included in net assets for the current fiscal year or period ended March 31, 2019. The undistributed net investment income included in the net assets for the fiscal year ended March 31, 2018 were as follows: |
| |||||||||||||||||||
| Undistributednet investment incomeincluded in the net assets |
$ | 106,787 | $ | 4,535,652 | ||||||||||||||||
See Notes to Financial Statements.
| 88 | WisdomTree Trust |
Statements of Changes in Net Assets (continued)
WisdomTree Trust
| WisdomTree Emerging Markets Quality Dividend Growth Fund |
WisdomTree Emerging Markets SmallCap Dividend Fund |
WisdomTree Global ex-U.S. Quality Dividend Growth Fund |
||||||||||||||||||||||
| For the Year Ended March 31, 2019 |
For the Year Ended March 31, 2018 |
For the Year Ended |
For the Year Ended |
For the Year Ended March 31, 2019 |
For the Year Ended March 31, 2018 |
|||||||||||||||||||
| INCREASE (DECREASE) IN NET ASSETS RESULTING FROM OPERATIONS: |
|
|||||||||||||||||||||||
| Net investment income |
$ | 2,178,674 | $ | 1,361,181 | $ | 55,332,129 | $ | 40,436,205 | $ | 1,440,222 | $ | 1,304,331 | ||||||||||||
| Net realized gain (loss) on investments, foreign currency contracts and foreign currency related transactions |
(8,322,575 | ) | 2,933,521 | (49,750,891 | ) | 86,621,425 | (2,272,593 | ) | 5,766,997 | |||||||||||||||
| Net increase (decrease) in unrealized appreciation/depreciation on investments, foreign currency contracts and translation of assets and liabilities denominated in foreign currencies |
(145,888 | ) | 6,026,385 | (162,143,870 | ) | 158,443,070 | (2,212,071 | ) | 2,773,077 | |||||||||||||||
| Net increase (decrease) in net assets resulting from operations |
(6,289,789 | ) | 10,321,087 | (156,562,632 | ) | 285,500,700 | (3,044,442 | ) | 9,844,405 | |||||||||||||||
| DISTRIBUTIONS TO SHAREHOLDERS1: |
||||||||||||||||||||||||
| Distributable earnings |
(2,036,219 | ) | (1,254,486 | ) | (58,272,794 | ) | (39,444,335 | ) | (1,532,940 | ) | (1,055,807 | ) | ||||||||||||
| CAPITAL SHARE TRANSACTIONS: |
||||||||||||||||||||||||
| Net proceeds from sale of shares |
20,285,323 | 23,204,036 | 56,606,185 | 390,446,108 | 17,216,657 | 12,021,088 | ||||||||||||||||||
| Cost of shares redeemed |
(18,212,318 | ) | (5,194,843 | ) | (159,906,299 | ) | — | (11,200,399 | ) | — | ||||||||||||||
| Net increase (decrease) in net assets resulting from capital share transactions |
2,073,005 | 18,009,193 | (103,300,114 | ) | 390,446,108 | 6,016,258 | 12,021,088 | |||||||||||||||||
| Net Increase (Decrease) in Net Assets |
(6,253,003 | ) | 27,075,794 | (318,135,540 | ) | 636,502,473 | 1,438,876 | 20,809,686 | ||||||||||||||||
| NET ASSETS: |
||||||||||||||||||||||||
| Beginning of year |
$ | 75,441,986 | $ | 48,366,192 | $ | 1,743,104,315 | $ | 1,106,601,842 | $ | 70,841,104 | $ | 50,031,418 | ||||||||||||
| End of year2 |
$ | 69,188,983 | $ | 75,441,986 | $ | 1,424,968,775 | $ | 1,743,104,315 | $ | 72,279,980 | $ | 70,841,104 | ||||||||||||
| SHARES CREATED AND REDEEMED: |
||||||||||||||||||||||||
| Shares outstanding, beginning of year |
2,800,000 | 2,100,000 | 32,600,000 | 24,800,000 | 1,200,000 | 1,000,000 | ||||||||||||||||||
| Shares created |
800,000 | 900,000 | 1,200,000 | 7,800,000 | 300,000 | 200,000 | ||||||||||||||||||
| Shares redeemed |
(800,000 | ) | (200,000 | ) | (3,500,000 | ) | — | (200,000 | ) | — | ||||||||||||||
| Shares outstanding, end of year |
2,800,000 | 2,800,000 | 30,300,000 | 32,600,000 | 1,300,000 | 1,200,000 | ||||||||||||||||||
| 1 Amounts for the fiscal year or period ended March 31, 2018 have been reclassified to match the current fiscal year presentation which conforms to the “Disclosure Update and Simplification” amendments adopted by the SEC and which became effective November 5, 2018. The amounts shown for the fiscal year or period ended March 31, 2018 represents a distribution entirely from net investment income. See Note 9 in the Notes to Financial Statements for more information. |
| |||||||||||||||||||||||
|
2 The “Disclosure Update and Simplification” amendments adopted by the SEC removed the requirement to disclose the amounts pertaining to undistributed net investment income included in net assets for the current fiscal year ended March 31, 2019. The undistributed net investment income included in the net assets for the fiscal year ended March 31, 2018 were as follows: |
| |||||||||||||||||||||||
| Undistributednet investment incomeincluded in the net assets |
$ | 88,866 | $ | 3,677,294 | $ | 253,241 | ||||||||||||||||||
See Notes to Financial Statements.
| WisdomTree Trust | 89 |
Statements of Changes in Net Assets (continued)
WisdomTree Trust
| WisdomTree Global ex-U.S. Real Estate Fund |
WisdomTree Global High Dividend Fund |
WisdomTree India Earnings Fund (consolidated) |
||||||||||||||||||||||
| For the Year Ended March 31, 2019 |
For the Year Ended March 31, 2018 |
For the Year Ended March 31, 2019 |
For the Year Ended March 31, 2018 |
For the Year Ended March 31, 2019 |
For the Year Ended March 31, 2018 |
|||||||||||||||||||
| INCREASE (DECREASE) IN NET ASSETS RESULTING FROM OPERATIONS: |
|
|||||||||||||||||||||||
| Net investment income |
$ | 3,839,069 | $ | 3,192,261 | $ | 3,789,556 | $ | 3,365,276 | $ | 16,802,706 | $ | 15,714,555 | ||||||||||||
| Net realized gain (loss) on investments, foreign currency contracts and foreign currency related transactions |
(1,372,513 | ) | 8,106,097 | 434,804 | 3,241,181 | 28,758,384 | 67,494,908 | |||||||||||||||||
| Net increase (decrease) in unrealized appreciation/depreciation on investments, foreign currency contracts and translation of assets and liabilities denominated in foreign currencies |
3,113,027 | 5,139,781 | (1,194,141 | ) | (555,442 | ) | (19,298,961 | ) | 52,787,776 | |||||||||||||||
| Net increase in net assets resulting from operations |
5,579,583 | 16,438,139 | 3,030,219 | 6,051,015 | 26,262,129 | 135,997,239 | ||||||||||||||||||
| DISTRIBUTIONS TO SHAREHOLDERS1: |
||||||||||||||||||||||||
| Distributable earnings |
(4,157,515 | ) | (6,147,290 | ) | (3,977,862 | ) | (3,155,342 | ) | (18,968,260 | ) | (14,626,040 | ) | ||||||||||||
| Tax return of capital |
— | — | — | — | (609,812 | ) | — | |||||||||||||||||
| Total distributions to shareholders |
(4,157,515 | ) | (6,147,290 | ) | (3,977,862 | ) | (3,155,342 | ) | (19,578,072 | ) | (14,626,040 | ) | ||||||||||||
| CAPITAL SHARE TRANSACTIONS: |
||||||||||||||||||||||||
| Net proceeds from sale of shares |
14,383,629 | 24,385,279 | — | 11,952,469 | 236,716,827 | 123,976,585 | ||||||||||||||||||
| Cost of shares redeemed |
(8,988,290 | ) | (10,408,019 | ) | (11,182,914 | ) | — | (591,544,150 | ) | (138,386,249 | ) | |||||||||||||
| Net increase (decrease) in net assets resulting from capital share transactions |
5,395,339 | 13,977,260 | (11,182,914 | ) | 11,952,469 | (354,827,323 | ) | (14,409,664 | ) | |||||||||||||||
| Net Increase (Decrease) in Net Assets |
6,817,407 | 24,268,109 | (12,130,557 | ) | 14,848,142 | (348,143,266 | ) | 106,961,535 | ||||||||||||||||
| NET ASSETS: |
||||||||||||||||||||||||
| Beginning of year |
$ | 107,328,507 | $ | 83,060,398 | $ | 104,357,886 | $ | 89,509,744 | $ | 1,671,567,210 | $ | 1,564,605,675 | ||||||||||||
| End of year2 |
$ | 114,145,914 | $ | 107,328,507 | $ | 92,227,329 | $ | 104,357,886 | $ | 1,323,423,944 | $ | 1,671,567,210 | ||||||||||||
| SHARES CREATED AND REDEEMED: |
||||||||||||||||||||||||
| Shares outstanding, beginning of year |
3,350,000 | 2,950,000 | 2,250,000 | 2,000,000 | 64,600,000 | 65,000,000 | ||||||||||||||||||
| Shares created |
500,000 | 750,000 | — | 250,000 | 9,400,000 | 4,800,000 | ||||||||||||||||||
| Shares redeemed |
(300,000 | ) | (350,000 | ) | (250,000 | ) | — | (23,600,000 | ) | (5,200,000 | ) | |||||||||||||
| Shares outstanding, end of year |
3,550,000 | 3,350,000 | 2,000,000 | 2,250,000 | 50,400,000 | 64,600,000 | ||||||||||||||||||
| 1 Amounts for the fiscal year or period ended March 31, 2018 have been reclassified to match the current fiscal year presentation which conforms to the “Disclosure Update and Simplification” amendments adopted by the SEC and which became effective November 5, 2018. The amounts shown for the fiscal year or period ended March 31, 2018 represents a distribution entirely from net investment income. See Note 9 in the Notes to Financial Statements for more information. |
| |||||||||||||||||||||||
|
2 The “Disclosure Update and Simplification” amendments adopted by the SEC removed the requirement to disclose the amounts pertaining to undistributed (distributions in excess of) net investment income included in net assets for the current fiscal year ended March 31, 2019. The undistributed (distributions in excess of) net investment income included in the net assets for the fiscal year ended March 31, 2018 were as follows: |
| |||||||||||||||||||||||
| Undistributed(Distributions in excess of) net investmentincome included in the net assets |
|
$ | (3,052,046 | ) | $ | 289,167 | $ | 3,644,786 | ||||||||||||||||
See Notes to Financial Statements.
| 90 | WisdomTree Trust |
Statements of Changes in Net Assets (concluded)
WisdomTree Trust
| WisdomTree Middle East Dividend Fund |
||||||||
| For the Year Ended March 31, 2019 |
For the Year Ended March 31, 2018 |
|||||||
| INCREASE (DECREASE) IN NET ASSETS RESULTING FROM OPERATIONS: |
| |||||||
| Net investment income |
$ | 797,052 | $ | 539,037 | ||||
| Net realized loss on investments, payments by sub-advisor, foreign currency contracts and foreign currency related transactions |
(349,765 | ) | (824,113 | ) | ||||
| Net increase in unrealized appreciation/depreciation on investments and translation of assets and liabilities denominated in foreign currencies |
1,897,618 | 1,725,152 | ||||||
| Net increase in net assets resulting from operations |
2,344,905 | 1,440,076 | ||||||
| DISTRIBUTIONS TO SHAREHOLDERS1: |
| |||||||
| Distributable earnings |
(738,425 | ) | (417,266 | ) | ||||
| CAPITAL SHARE TRANSACTIONS: |
| |||||||
| Net proceeds from sale of shares |
5,736,903 | — | ||||||
| Cost of shares redeemed |
(1,894,772 | ) | (3,600,006 | ) | ||||
| Net increase (decrease) in net assets resulting from capital share transactions |
3,842,131 | (3,600,006 | ) | |||||
| Net Increase (Decrease) in Net Assets |
5,448,611 | (2,577,196 | ) | |||||
| NET ASSETS: |
| |||||||
| Beginning of year |
$ | 15,024,199 | $ | 17,601,395 | ||||
| End of year2 |
$ | 20,472,810 | $ | 15,024,199 | ||||
| SHARES CREATED AND REDEEMED: |
| |||||||
| Shares outstanding, beginning of year |
800,000 | 1,000,000 | ||||||
| Shares created |
300,000 | — | ||||||
| Shares redeemed |
(100,000 | ) | (200,000 | ) | ||||
| Shares outstanding, end of year |
1,000,000 | 800,000 | ||||||
| 1 Amounts for the fiscal year or period ended March 31, 2018 have been reclassified to match the current fiscal year presentation which conforms to the “Disclosure Update and Simplification” amendments adopted by the SEC and which became effective November 5, 2018. The amounts shown for the fiscal year or period ended March 31, 2018 represents a distribution entirely from net investment income. See Note 9 in the Notes to Financial Statements for more information. |
| |||||||
|
2 The “Disclosure Update and Simplification” amendments adopted by the SEC removed the requirement to disclose the amounts pertaining to undistributed net investment income included in net assets for the current fiscal year ended March 31, 2019. The undistributed net investment income included in the net assets for the fiscal year ended March 31, 2018 was $183,670. |
| |||||||
See Notes to Financial Statements.
| WisdomTree Trust | 91 |
WisdomTree Trust
Selected data for a share of beneficial interest outstanding throughout the period is presented below:
| WisdomTree Asia Pacific ex-Japan Fund | For the Year Ended March 31, 2019 |
For the Year Ended March 31, 2018 |
For the Year Ended March 31, 2017 |
For the Year Ended March 31, 2016 |
For the Year Ended March 31, 2015 |
|||||||||||||||
| Net asset value, beginning of year |
$ | 69.31 | $ | 64.08 | $ | 57.08 | $ | 67.20 | $ | 65.72 | ||||||||||
| Investment operations: |
||||||||||||||||||||
| Net investment income1 |
2.71 | 2.21 | 1.90 | 2.14 | 2.29 | |||||||||||||||
| Net realized and unrealized gain (loss) |
(1.73 | ) | 5.23 | 7.03 | (10.20 | ) | 1.46 | |||||||||||||
| Total from investment operations |
0.98 | 7.44 | 8.93 | (8.06 | ) | 3.75 | ||||||||||||||
| Dividends to shareholders: |
||||||||||||||||||||
| Net investment income |
(2.88 | ) | (2.21 | ) | (1.93 | ) | (2.06 | ) | (2.27 | ) | ||||||||||
| Net asset value, end of year |
$ | 67.41 | $ | 69.31 | $ | 64.08 | $ | 57.08 | $ | 67.20 | ||||||||||
| TOTAL RETURN2 |
1.55 | % | 11.75 | % | 15.96 | % | (12.06 | )%3 | 5.71 | % | ||||||||||
| RATIOS/SUPPLEMENTAL DATA: |
||||||||||||||||||||
| Net assets, end of year (000’s omitted) |
$ | 33,703 | $ | 45,051 | $ | 41,655 | $ | 45,665 | $ | 47,037 | ||||||||||
| Ratios to average net assets4 of: |
||||||||||||||||||||
| Expenses |
0.48 | %5 | 0.48 | %5 | 0.48 | % | 0.48 | %5 | 0.49 | %5,6 | ||||||||||
| Net investment income |
4.06 | % | 3.24 | % | 3.19 | % | 3.59 | % | 3.36 | % | ||||||||||
| Portfolio turnover rate7 |
21 | % | 26 | % | 27 | % | 24 | % | 17 | % | ||||||||||
| WisdomTree China ex-State-Owned Enterprises Fund |
For the Year Ended March 31, 2019 |
For the Year Ended March 31, 2018 |
For the Year Ended March 31, 2017 |
For the Year Ended March 31, 20168 |
For the Year Ended March 31, 2015 |
|||||||||||||||
| Net asset value, beginning of year |
$ | 87.24 | $ | 57.17 | $ | 46.75 | $ | 55.28 | $ | 49.70 | ||||||||||
| Investment operations: |
||||||||||||||||||||
| Net investment income1 |
0.98 | 0.12 | 0.64 | 1.25 | 1.33 | |||||||||||||||
| Net realized and unrealized gain (loss) |
(9.64 | ) | 30.56 | 10.45 | (8.59 | ) | 5.48 | |||||||||||||
| Total from investment operations |
(8.66 | ) | 30.68 | 11.09 | (7.34 | ) | 6.81 | |||||||||||||
| Dividends and distributions to shareholders: |
||||||||||||||||||||
| Net investment income |
(0.90 | ) | (0.61 | ) | (0.67 | ) | (1.19 | ) | (1.23 | ) | ||||||||||
| Tax return of capital |
(0.01 | ) | — | — | — | — | ||||||||||||||
| Total dividends and distributions to shareholders |
(0.91 | ) | (0.61 | ) | (0.67 | ) | (1.19 | ) | (1.23 | ) | ||||||||||
| Net asset value, end of year |
$ | 77.67 | $ | 87.24 | $ | 57.17 | $ | 46.75 | $ | 55.28 | ||||||||||
| TOTAL RETURN2 |
(9.91 | )% | 53.95 | % | 23.94 | % | (13.40 | )% | 13.86 | % | ||||||||||
| RATIOS/SUPPLEMENTAL DATA: |
||||||||||||||||||||
| Net assets, end of year (000’s omitted) |
$ | 143,699 | $ | 215,928 | $ | 8,576 | $ | 9,351 | $ | 16,585 | ||||||||||
| Ratios to average net assets of: |
||||||||||||||||||||
| Expenses, net of expense waivers |
0.32 | %9 | 0.33 | %9,10 | 0.53 | %10 | 0.57 | %10 | 0.64 | %11 | ||||||||||
| Expenses, prior to expense waivers |
0.63 | % | 0.63 | % | 0.63 | % | 0.63 | % | 0.64 | %11 | ||||||||||
| Net investment income |
1.31 | % | 0.14 | % | 1.29 | % | 2.42 | % | 2.53 | % | ||||||||||
| Portfolio turnover rate7 |
35 | % | 20 | % | 37 | % | 143 | % | 30 | % | ||||||||||
| 1 | Based on average shares outstanding. |
| 2 | Total return is calculated assuming an initial investment made at the net asset value at the beginning of the period, reinvestment of all dividends and distributions at net asset value during the period and redemption on the last day of the period. For the periods in which the investment advisor waived advisory fees, the total return would have been lower if certain expenses had not been waived (Notes 2 and 3). |
| 3 | Includes a voluntary reimbursement from the sub-advisor for investment losses on certain foreign exchange transactions during the period. Excluding this voluntary reimbursement, total return would have been unchanged. |
| 4 | The ratios to average net assets do not include net investment income (loss) or expenses of other funds in which the Fund invests. |
| 5 | The expense ratio includes investment advisory fee waivers. Without these investment advisory fee waivers, the expense ratio would have been unchanged. |
| 6 | Included in the expense ratio are proxy expenses. Without these proxy expenses, the expense ratio would have been 0.48%. |
| 7 | Portfolio turnover rate is not annualized and excludes the value of the portfolio securities received or delivered as a result of in-kind creations or redemptions of the Fund’s capital shares. Short-term securities with maturities less than or equal to 365 days are excluded from the portfolio turnover calculation. |
| 8 | The information reflects the investment objective and strategy of the WisdomTree China Dividend ex-Financials Fund through June 30, 2015 and the investment objective and strategy of the WisdomTree China ex-State-Owned Enterprises Fund thereafter. |
| 9 | Effective June 30, 2017, the investment advisor contractually agreed to limit the advisory fee to 0.32% through July 31, 2019, unless earlier terminated by the Board of Trustees of the Trust. |
| 10 | Effective July 1, 2015, the investment advisor contractually agreed to limit the advisory fee to 0.53% through July 31, 2017, unless earlier terminated by the Board of Trustees of the Trust. |
| 11 | Included in the expense ratio are proxy expenses. Without these proxy expenses, the expense ratio would have been 0.63%. |
See Notes to Financial Statements.
| 92 | WisdomTree Trust |
Financial Highlights (continued)
WisdomTree Trust
Selected data for a share of beneficial interest outstanding throughout the period is presented below:
| WisdomTree Emerging Markets Consumer Growth Fund |
For the Year Ended March 31, 2019 |
For the Year Ended March 31, 2018 |
For the Year Ended March 31, 2017 |
For the Year Ended March 31, 2016 |
For the Year Ended March 31, 2015 |
|||||||||||||||
| Net asset value, beginning of year |
$ | 26.34 | $ | 22.53 | $ | 20.60 | $ | 24.89 | $ | 24.56 | ||||||||||
| Investment operations: |
||||||||||||||||||||
| Net investment income1 |
0.71 | 0.49 | 0.45 | 0.52 | 0.48 | |||||||||||||||
| Net realized and unrealized gain (loss) |
(4.08 | ) | 3.77 | 2.01 | (4.28 | ) | 0.32 | |||||||||||||
| Total from investment operations |
(3.37 | ) | 4.26 | 2.46 | (3.76 | ) | 0.80 | |||||||||||||
| Dividends to shareholders: |
||||||||||||||||||||
| Net investment income |
(0.77 | ) | (0.45 | ) | (0.53 | ) | (0.53 | ) | (0.47 | ) | ||||||||||
| Net asset value, end of year |
$ | 22.20 | $ | 26.34 | $ | 22.53 | $ | 20.60 | $ | 24.89 | ||||||||||
| TOTAL RETURN2 |
(12.66 | )% | 19.05 | % | 12.17 | % | (15.21 | )% | 3.24 | % | ||||||||||
| RATIOS/SUPPLEMENTAL DATA: |
||||||||||||||||||||
| Net assets, end of year (000’s omitted) |
$ | 34,414 | $ | 50,052 | $ | 24,782 | $ | 12,357 | $ | 19,912 | ||||||||||
| Ratios to average net assets of: |
||||||||||||||||||||
| Expenses, net of expense waivers |
0.32 | %3 | 0.38 | %3 | 0.63 | % | 0.63 | % | 0.64 | %4 | ||||||||||
| Expenses, prior to expense waivers |
0.63 | % | 0.63 | % | 0.63 | % | 0.63 | % | 0.64 | %4 | ||||||||||
| Net investment income |
3.15 | % | 1.93 | % | 2.12 | % | 2.39 | % | 1.88 | % | ||||||||||
| Portfolio turnover rate5 |
88 | % | 63 | % | 72 | % | 49 | % | 41 | % | ||||||||||
| WisdomTree Emerging Markets ex-State-Owned Enterprises Fund |
For the Year Ended March 31, 2019 |
For the Year Ended March 31, 2018 |
For the Year Ended March 31, 2017 |
For the Year Ended March 31, 2016 |
For the Period December 10, 2014* through March 31, 2015 |
|||||||||||||||
| Net asset value, beginning of period |
$ | 31.99 | $ | 24.72 | $ | 21.48 | $ | 25.17 | $ | 24.59 | ||||||||||
| Investment operations: |
||||||||||||||||||||
| Net investment income1 |
0.42 | 0.28 | 0.30 | 0.35 | 0.07 | |||||||||||||||
| Net realized and unrealized gain (loss) |
(3.20 | ) | 7.20 | 3.25 | (3.24 | ) | 0.56 | |||||||||||||
| Total from investment operations |
(2.78 | ) | 7.48 | 3.55 | (2.89 | ) | 0.63 | |||||||||||||
| Dividends to shareholders: |
||||||||||||||||||||
| Net investment income |
(0.42 | ) | (0.21 | ) | (0.31 | ) | (0.80 | ) | (0.05 | ) | ||||||||||
| Net asset value, end of period |
$ | 28.79 | $ | 31.99 | $ | 24.72 | $ | 21.48 | $ | 25.17 | ||||||||||
| TOTAL RETURN2 |
(8.64 | )%6 | 30.30 | % | 16.68 | % | (11.69 | )% | 2.57 | % | ||||||||||
| RATIOS/SUPPLEMENTAL DATA: |
||||||||||||||||||||
| Net assets, end of period (000’s omitted) |
$ | 305,184 | $ | 92,776 | $ | 2,472 | $ | 2,148 | $ | 10,069 | ||||||||||
| Ratios to average net assets of: |
||||||||||||||||||||
| Expenses, net of expense waivers |
0.32 | %3 | 0.33 | %3 | 0.58 | % | 0.58 | % | 0.58 | %7 | ||||||||||
| Expenses, prior to expense waivers |
0.58 | % | 0.58 | % | 0.58 | % | 0.58 | % | 0.58 | %7 | ||||||||||
| Net investment income |
1.51 | % | 0.92 | % | 1.33 | % | 1.48 | % | 0.88 | %7 | ||||||||||
| Portfolio turnover rate5 |
24 | % | 68 | % | 15 | % | 46 | % | 2 | % | ||||||||||
| * | Commencement of operations. |
| 1 | Based on average shares outstanding. |
| 2 | Total return is calculated assuming an initial investment made at the net asset value at the beginning of the period, reinvestment of all dividends and distributions at net asset value during the period and redemption on the last day of the period. Total return calculated for a period of less than one year is not annualized. For the periods in which the investment advisor waived advisory fees, the total return would have been lower if certain expenses had not been waived (Notes 2 and 3). |
| 3 | Effective June 30, 2017, the investment advisor contractually agreed to limit the advisory fee to 0.32% through July 31, 2019, unless earlier terminated by the Board of Trustees of the Trust. |
| 4 | Included in the expense ratio are proxy expenses. Without these proxy expenses, the expense ratio would have been 0.63%. |
| 5 | Portfolio turnover rate is not annualized and excludes the value of the portfolio securities received or delivered as a result of in-kind creations or redemptions of the Fund’s capital shares. Short-term securities with maturities less than or equal to 365 days are excluded from the portfolio turnover calculation. |
| 6 | Includes a reimbursement from the sub-advisor for an operational error. Excluding the reimbursement, total return would have been unchanged (Note 3). |
| 7 | Annualized. |
See Notes to Financial Statements.
| WisdomTree Trust | 93 |
Financial Highlights (continued)
WisdomTree Trust
Selected data for a share of beneficial interest outstanding throughout the period is presented below:
| WisdomTree Emerging Markets High Dividend Fund |
For the Year Ended March 31, 2019 |
For the Year Ended March 31, 2018 |
For the Year Ended March 31, 2017 |
For the Year Ended March 31, 2016 |
For the Year Ended March 31, 2015 |
|||||||||||||||
| Net asset value, beginning of year |
$ | 47.35 | $ | 40.69 | $ | 35.05 | $ | 42.68 | $ | 49.23 | ||||||||||
| Investment operations: |
||||||||||||||||||||
| Net investment income1 |
1.84 | 1.67 | 1.42 | 1.76 | 2.16 | |||||||||||||||
| Net realized and unrealized gain (loss) |
(3.57 | ) | 6.65 | 5.58 | (7.74 | ) | (6.57 | ) | ||||||||||||
| Total from investment operations |
(1.73 | ) | 8.32 | 7.00 | (5.98 | ) | (4.41 | ) | ||||||||||||
| Dividends to shareholders: |
||||||||||||||||||||
| Net investment income |
(1.90 | ) | (1.66 | ) | (1.36 | ) | (1.65 | ) | (2.14 | ) | ||||||||||
| Net asset value, end of year |
$ | 43.72 | $ | 47.35 | $ | 40.69 | $ | 35.05 | $ | 42.68 | ||||||||||
| TOTAL RETURN2 |
(3.51 | )% | 20.98 | % | 20.44 | % | (14.07 | )% | (9.40 | )% | ||||||||||
| RATIOS/SUPPLEMENTAL DATA: |
||||||||||||||||||||
| Net assets, end of year (000’s omitted) |
$ | 2,173,006 | $ | 2,282,176 | $ | 1,721,381 | $ | 1,321,221 | $ | 2,159,557 | ||||||||||
| Ratios to average net assets3 of: |
||||||||||||||||||||
| Expenses4 |
0.63 | % | 0.63 | % | 0.63 | % | 0.63 | % | 0.64 | %5 | ||||||||||
| Net investment income |
4.23 | % | 3.81 | % | 3.81 | % | 4.64 | % | 4.45 | % | ||||||||||
| Portfolio turnover rate6 |
44 | % | 41 | % | 41 | % | 43 | % | 39 | % | ||||||||||
| WisdomTree Emerging Markets Multifactor Fund | For the Period August 10, 2018* through March 31, 2019 |
|||
| Net asset value, beginning of period |
$ | 24.68 | ||
| Investment operations: |
||||
| Net investment income1 |
0.29 | |||
| Net realized and unrealized loss |
(1.16 | ) | ||
| Total from investment operations |
(0.87 | ) | ||
| Dividends to shareholders: |
||||
| Net investment income |
(0.20 | ) | ||
| Net asset value, end of period |
$ | 23.61 | ||
| TOTAL RETURN2 |
(3.52 | )% | ||
| RATIOS/SUPPLEMENTAL DATA: |
||||
| Net assets, end of period (000’s omitted) |
$ | 18,886 | ||
| Ratios to average net assets of: |
||||
| Expenses4 |
0.48 | %7 | ||
| Net investment income |
1.97 | %7 | ||
| Portfolio turnover rate6 |
133 | % | ||
| * | Commencement of operations. |
| 1 | Based on average shares outstanding. |
| 2 | Total return is calculated assuming an initial investment made at the net asset value at the beginning of the period, reinvestment of all dividends and distributions at net asset value during the period and redemption on the last day of the period. Total return calculated for a period of less than one year is not annualized. For the periods in which the investment advisor waived advisory fees, the total return would have been lower if certain expenses had not been waived (Notes 2 and 3). |
| 3 | The ratios to average net assets do not include net investment income (loss) or expenses of other funds in which the Fund invests. |
| 4 | The expense ratio includes investment advisory fee waivers. Without these investment advisory fee waivers, the expense ratio would have been unchanged. |
| 5 | Included in the expense ratio are proxy expenses. Without these proxy expenses, the expense ratio would have been 0.63%. |
| 6 | Portfolio turnover rate is not annualized and excludes the value of the portfolio securities received or delivered as a result of in-kind creations or redemptions of the Fund’s capital shares. Short-term securities with maturities less than or equal to 365 days are excluded from the portfolio turnover calculation. |
| 7 | Annualized. |
See Notes to Financial Statements.
| 94 | WisdomTree Trust |
Financial Highlights (continued)
WisdomTree Trust
Selected data for a share of beneficial interest outstanding throughout the period is presented below:
| WisdomTree Emerging Markets Quality Dividend Growth Fund |
For the Year Ended March 31, 2019 |
For the Year Ended March 31, 2018 |
For the Year Ended March 31, 2017 |
For the Year Ended March 31, 2016 |
For the Year Ended March 31, 2015 |
|||||||||||||||
| Net asset value, beginning of year |
$ | 26.94 | $ | 23.03 | $ | 21.11 | $ | 24.08 | $ | 24.92 | ||||||||||
| Investment operations: |
||||||||||||||||||||
| Net investment income1 |
0.71 | 0.56 | 0.63 | 0.55 | 0.61 | |||||||||||||||
| Net realized and unrealized gain (loss) |
(2.30 | ) | 3.87 | 1.96 | (2.94 | ) | (0.87 | ) | ||||||||||||
| Total from investment operations |
(1.59 | ) | 4.43 | 2.59 | (2.39 | ) | (0.26 | ) | ||||||||||||
| Dividends to shareholders: |
||||||||||||||||||||
| Net investment income |
(0.64 | ) | (0.52 | ) | (0.67 | ) | (0.58 | ) | (0.58 | ) | ||||||||||
| Net asset value, end of year |
$ | 24.71 | $ | 26.94 | $ | 23.03 | $ | 21.11 | $ | 24.08 | ||||||||||
| TOTAL RETURN2 |
(5.79 | )% | 19.44 | % | 12.45 | % | (9.89 | )%3 | (1.19 | )% | ||||||||||
| RATIOS/SUPPLEMENTAL DATA: |
||||||||||||||||||||
| Net assets, end of year (000’s omitted) |
$ | 69,189 | $ | 75,442 | $ | 48,366 | $ | 31,667 | $ | 40,944 | ||||||||||
| Ratios to average net assets of: |
||||||||||||||||||||
| Expenses, net of expense waivers |
0.32 | %4 | 0.39 | %4 | 0.63 | % | 0.63 | % | 0.64 | %5 | ||||||||||
| Expenses, prior to expense waivers |
0.63 | % | 0.63 | % | 0.63 | % | 0.63 | % | 0.64 | %5 | ||||||||||
| Net investment income |
2.93 | % | 2.17 | % | 2.88 | % | 2.59 | % | 2.42 | % | ||||||||||
| Portfolio turnover rate6 |
81 | % | 62 | % | 49 | % | 62 | % | 47 | % | ||||||||||
| WisdomTree Emerging Markets SmallCap Dividend Fund |
For the Year Ended March 31, 2019 |
For the Year Ended March 31, 2018 |
For the Year Ended March 31, 2017 |
For the Year Ended March 31, 2016 |
For the Year Ended March 31, 2015 |
|||||||||||||||
| Net asset value, beginning of year |
$ | 53.47 | $ | 44.62 | $ | 37.90 | $ | 44.46 | $ | 46.40 | ||||||||||
| Investment operations: |
||||||||||||||||||||
| Net investment income1 |
1.79 | 1.42 | 1.35 | 1.24 | 1.32 | |||||||||||||||
| Net realized and unrealized gain (loss) |
(6.35 | ) | 8.89 | 6.71 | (6.65 | ) | (1.97 | ) | ||||||||||||
| Total from investment operations |
(4.56 | ) | 10.31 | 8.06 | (5.41 | ) | (0.65 | ) | ||||||||||||
| Dividends to shareholders: |
||||||||||||||||||||
| Net investment income |
(1.88 | ) | (1.46 | ) | (1.34 | ) | (1.15 | ) | (1.29 | ) | ||||||||||
| Net asset value, end of year |
$ | 47.03 | $ | 53.47 | $ | 44.62 | $ | 37.90 | $ | 44.46 | ||||||||||
| TOTAL RETURN2 |
(8.40 | )% | 23.55 | % | 21.76 | % | (12.20 | )% | (1.51 | )% | ||||||||||
| RATIOS/SUPPLEMENTAL DATA: |
||||||||||||||||||||
| Net assets, end of year (000’s omitted) |
$ | 1,424,969 | $ | 1,743,104 | $ | 1,106,602 | $ | 894,468 | $ | 1,413,669 | ||||||||||
| Ratios to average net assets7 of: |
||||||||||||||||||||
| Expenses8 |
0.63 | % | 0.63 | % | 0.63 | % | 0.63 | % | 0.64 | %5 | ||||||||||
| Net investment income |
3.81 | % | 2.88 | % | 3.36 | % | 3.13 | % | 2.84 | % | ||||||||||
| Portfolio turnover rate6 |
40 | % | 48 | % | 47 | % | 52 | % | 42 | % | ||||||||||
| 1 | Based on average shares outstanding. |
| 2 | Total return is calculated assuming an initial investment made at the net asset value at the beginning of the period, reinvestment of all dividends and distributions at net asset value during the period and redemption on the last day of the period. For the periods in which the investment advisor waived advisory fees, the total return would have been lower if certain expenses had not been waived (Notes 2 and 3). |
| 3 | Includes a voluntary reimbursement from the sub-advisor for investment losses on certain foreign exchange transactions during the period. Excluding this voluntary reimbursement, total return would have been unchanged. |
| 4 | Effective June 30, 2017, the investment advisor contractually agreed to limit the advisory fee to 0.32% through July 31, 2019, unless earlier terminated by the Board of Trustees of the Trust. |
| 5 | Included in the expense ratio are proxy expenses. Without these proxy expenses, the expense ratio would have been 0.63%. |
| 6 | Portfolio turnover rate is not annualized and excludes the value of the portfolio securities received or delivered as a result of in-kind creations or redemptions of the Fund’s capital shares. Short-term securities with maturities less than or equal to 365 days are excluded from the portfolio turnover calculation. |
| 7 | The ratios to average net assets do not include net investment income (loss) or expenses of other funds in which the Fund invests. |
| 8 | The expense ratio includes investment advisory fee waivers. Without these investment advisory fee waivers, the expense ratio would have been unchanged. |
See Notes to Financial Statements.
| WisdomTree Trust | 95 |
Financial Highlights (continued)
WisdomTree Trust
Selected data for a share of beneficial interest outstanding throughout the period is presented below:
| WisdomTree Global ex-U.S. Quality Dividend Growth Fund |
For the Year Ended March 31, 2019 |
For the Year Ended March 31, 2018 |
For the Year Ended March 31, 2017 |
For the Year Ended March 31, 2016 |
For the Year Ended March 31, 2015 |
|||||||||||||||
| Net asset value, beginning of year |
$ | 59.03 | $ | 50.03 | $ | 47.16 | $ | 50.80 | $ | 51.68 | ||||||||||
| Investment operations: |
||||||||||||||||||||
| Net investment income1 |
1.17 | 1.24 | 1.14 | 1.02 | 1.05 | |||||||||||||||
| Net realized and unrealized gain (loss) |
(3.34 | ) | 8.79 | 2.94 | (3.75 | ) | (0.91 | ) | ||||||||||||
| Total from investment operations |
(2.17 | ) | 10.03 | 4.08 | (2.73 | ) | 0.14 | |||||||||||||
| Dividends to shareholders: |
||||||||||||||||||||
| Net investment income |
(1.26 | ) | (1.03 | ) | (1.21 | ) | (0.91 | ) | (1.02 | ) | ||||||||||
| Net asset value, end of year |
$ | 55.60 | $ | 59.03 | $ | 50.03 | $ | 47.16 | $ | 50.80 | ||||||||||
| TOTAL RETURN2 |
(3.65 | )% | 20.18 | % | 8.80 | % | (5.42 | )% | 0.24 | % | ||||||||||
| RATIOS/SUPPLEMENTAL DATA: |
||||||||||||||||||||
| Net assets, end of year (000’s omitted) |
$ | 72,280 | $ | 70,841 | $ | 50,031 | $ | 66,026 | $ | 86,353 | ||||||||||
| Ratios to average net assets3 of: |
||||||||||||||||||||
| Expenses |
0.58 | %4 | 0.58 | %4 | 0.58 | % | 0.58 | %4,5 | 0.59 | %4,6 | ||||||||||
| Net investment income |
2.11 | % | 2.20 | % | 2.39 | % | 2.15 | % | 2.05 | % | ||||||||||
| Portfolio turnover rate7 |
60 | % | 67 | % | 66 | % | 61 | % | 64 | % | ||||||||||
| WisdomTree Global ex-U.S. Real Estate Fund | For the Year Ended March 31, 2019 |
For the Year Ended March 31, 2018 |
For the Year Ended March 31, 2017 |
For the Year Ended March 31, 2016 |
For the Year Ended March 31, 2015 |
|||||||||||||||
| Net asset value, beginning of year |
$ | 32.04 | $ | 28.16 | $ | 27.26 | $ | 29.65 | $ | 27.77 | ||||||||||
| Investment operations: |
||||||||||||||||||||
| Net investment income1 |
1.12 | 1.11 | 1.06 | 0.89 | 1.54 | |||||||||||||||
| Net realized and unrealized gain (loss) |
0.24 | 4.92 | 1.35 | (2.08 | ) | 1.75 | ||||||||||||||
| Total from investment operations |
1.36 | 6.03 | 2.41 | (1.19 | ) | 3.29 | ||||||||||||||
| Dividends to shareholders: |
||||||||||||||||||||
| Net investment income |
(1.25 | ) | (2.15 | ) | (1.51 | ) | (1.20 | ) | (1.41 | ) | ||||||||||
| Net asset value, end of year |
$ | 32.15 | $ | 32.04 | $ | 28.16 | $ | 27.26 | $ | 29.65 | ||||||||||
| TOTAL RETURN2 |
4.51 | % | 21.90 | % | 9.33 | %8 | (3.89 | )% | 12.08 | % | ||||||||||
| RATIOS/SUPPLEMENTAL DATA: |
||||||||||||||||||||
| Net assets, end of year (000’s omitted) |
$ | 114,146 | $ | 107,329 | $ | 83,060 | $ | 94,044 | $ | 121,560 | ||||||||||
| Ratios to average net assets3 of: |
||||||||||||||||||||
| Expenses |
0.58 | % | 0.58 | % | 0.58 | % | 0.58 | %5 | 0.59 | %4,6 | ||||||||||
| Net investment income |
3.72 | % | 3.56 | % | 3.86 | % | 3.22 | % | 5.21 | % | ||||||||||
| Portfolio turnover rate7 |
17 | % | 23 | % | 19 | % | 32 | % | 26 | % | ||||||||||
| 1 | Based on average shares outstanding. |
| 2 | Total return is calculated assuming an initial investment made at the net asset value at the beginning of the period, reinvestment of all dividends and distributions at net asset value during the period and redemption on the last day of the period. For the periods in which the investment advisor waived advisory fees, the total return would have been lower if certain expenses had not been waived (Notes 2 and 3). |
| 3 | The ratios to average net assets do not include net investment income (loss) or expenses of other funds in which the Fund invests. |
| 4 | The expense ratio includes investment advisory fee waivers. Without these investment advisory fee waivers, the expense ratio would have been unchanged. |
| 5 | Included in the expense ratio are non-recurring professional expenses. Without these expenses, the expense ratio would have been unchanged. |
| 6 | Included in the expense ratio are proxy expenses. Without these proxy expenses, the expense ratio would have been 0.58%. |
| 7 | Portfolio turnover rate is not annualized and excludes the value of the portfolio securities received or delivered as a result of in-kind creations or redemptions of the Fund’s capital shares. Short-term securities with maturities less than or equal to 365 days are excluded from the portfolio turnover calculation. |
| 8 | Includes a voluntary reimbursement from the sub-advisor for investment losses on certain foreign exchange transactions during the year. Excluding this voluntary reimbursement, total return would have been unchanged. |
See Notes to Financial Statements.
| 96 | WisdomTree Trust |
Financial Highlights (continued)
WisdomTree Trust
Selected data for a share of beneficial interest outstanding throughout the period is presented below:
| WisdomTree Global High Dividend Fund | For the Year Ended March 31, 2019 |
For the Year Ended March 31, 2018 |
For the Year Ended March 31, 2017 |
For the Year Ended March 31, 2016 |
For the Year Ended March 31, 2015 |
|||||||||||||||
| Net asset value, beginning of year |
$ | 46.38 | $ | 44.75 | $ | 40.84 | $ | 44.23 | $ | 47.51 | ||||||||||
| Investment operations: |
||||||||||||||||||||
| Net investment income1 |
1.77 | 1.59 | 1.46 | 1.76 | 1.83 | |||||||||||||||
| Net realized and unrealized gain (loss) |
(0.18 | ) | 1.54 | 3.97 | (3.43 | ) | (3.28 | ) | ||||||||||||
| Total from investment operations |
1.59 | 3.13 | 5.43 | (1.67 | ) | (1.45 | ) | |||||||||||||
| Dividends to shareholders: |
||||||||||||||||||||
| Net investment income |
(1.86 | ) | (1.50 | ) | (1.52 | ) | (1.72 | ) | (1.83 | ) | ||||||||||
| Net asset value, end of year |
$ | 46.11 | $ | 46.38 | $ | 44.75 | $ | 40.84 | $ | 44.23 | ||||||||||
| TOTAL RETURN2 |
3.59 | % | 7.02 | % | 13.54 | % | (3.77 | )% | (3.23 | )% | ||||||||||
| RATIOS/SUPPLEMENTAL DATA: |
||||||||||||||||||||
| Net assets, end of year (000’s omitted) |
$ | 92,227 | $ | 104,358 | $ | 89,510 | $ | 73,511 | $ | 101,718 | ||||||||||
| Ratios to average net assets3 of: |
||||||||||||||||||||
| Expenses |
0.58 | %4 | 0.58 | %4 | 0.58 | % | 0.58 | %4,5 | 0.59 | %4,6 | ||||||||||
| Net investment income |
3.86 | % | 3.41 | % | 3.42 | % | 4.19 | % | 3.91 | % | ||||||||||
| Portfolio turnover rate7 |
19 | % | 21 | % | 21 | % | 56 | % | 30 | % | ||||||||||
| WisdomTree India Earnings Fund (consolidated) | For the Year Ended March 31, 2019 |
For the Year Ended March 31, 2018 |
For the Year Ended March 31, 2017 |
For the Year Ended March 31, 2016 |
For the Year Ended March 31, 2015 |
|||||||||||||||
| Net asset value, beginning of year |
$ | 25.88 | $ | 24.07 | $ | 19.42 | $ | 22.64 | $ | 18.93 | ||||||||||
| Investment operations: |
||||||||||||||||||||
| Net investment income1 |
0.28 | 0.24 | 0.23 | 0.26 | 0.22 | |||||||||||||||
| Net realized and unrealized gain (loss) |
0.45 | 1.79 | 4.70 | (3.26 | ) | 3.65 | ||||||||||||||
| Total from investment operations |
0.73 | 2.03 | 4.93 | (3.00 | ) | 3.87 | ||||||||||||||
| Dividends and distributions to shareholders: |
||||||||||||||||||||
| Net investment income |
(0.34 | ) | (0.22 | ) | (0.28 | ) | (0.22 | ) | (0.16 | ) | ||||||||||
| Tax return of capital |
(0.01 | ) | — | — | — | — | ||||||||||||||
| Total dividends and distributions to shareholders |
(0.35 | ) | (0.22 | ) | (0.28 | ) | (0.22 | ) | (0.16 | ) | ||||||||||
| Net asset value, end of year |
$ | 26.26 | $ | 25.88 | $ | 24.07 | $ | 19.42 | $ | 22.64 | ||||||||||
| TOTAL RETURN2 |
2.89 | % | 8.46 | % | 25.56 | % | (13.31 | )%8 | 20.44 | % | ||||||||||
| RATIOS/SUPPLEMENTAL DATA: |
||||||||||||||||||||
| Net assets, end of year (000’s omitted) |
$ | 1,323,424 | $ | 1,671,567 | $ | 1,564,606 | $ | 1,475,616 | $ | 2,372,406 | ||||||||||
| Ratios to average net assets of: |
||||||||||||||||||||
| Expenses9 |
0.85 | % | 0.84 | % | 0.84 | % | 0.84 | % | 0.84 | %10 | ||||||||||
| Net investment income |
1.14 | % | 0.91 | % | 1.09 | % | 1.28 | % | 0.99 | % | ||||||||||
| Portfolio turnover rate7 |
37 | % | 22 | % | 30 | % | 38 | % | 26 | % | ||||||||||
| 1 | Based on average shares outstanding. |
| 2 | Total return is calculated assuming an initial investment made at the net asset value at the beginning of the period, reinvestment of all dividends and distributions at net asset value during the period and redemption on the last day of the period. For the periods in which the investment advisor waived advisory fees for the WisdomTree Global High Dividend Fund, the total return would have been lower if certain expenses had not been waived (Notes 2 and 3). |
| 3 | The ratios to average net assets do not include net investment income (loss) or expenses of other funds in which the Fund invests. |
| 4 | The expense ratio includes investment advisory fee waivers. Without these investment advisory fee waivers, the expense ratio would have been unchanged. |
| 5 | Included in the expense ratio are non-recurring professional expenses. Without these expenses, the expense ratio would have been unchanged. |
| 6 | Included in the expense ratio are proxy expenses. Without these proxy expenses, the expense ratio would have been 0.58%. |
| 7 | Portfolio turnover rate is not annualized and excludes the value of the portfolio securities received or delivered as a result of in-kind creations or redemptions of the Fund’s capital shares. Short-term securities with maturities less than or equal to 365 days are excluded from the portfolio turnover calculation. |
| 8 | Includes a reimbursement from the sub-advisor for operating losses on a creation that took place during the period when the NAV was understated. Excluding the reimbursement, total return would have been unchanged. |
| 9 | Includes interest expense of 0.01%, 0.01%, 0.01%, 0.01% and 0.01% for the fiscal years ended 2019, 2018, 2017, 2016 and 2015, respectively. |
| 10 | Included in the expense ratio are proxy expenses. Without these proxy expenses, the expense ratio would have been unchanged. |
See Notes to Financial Statements.
| WisdomTree Trust | 97 |
Financial Highlights (concluded)
WisdomTree Trust
Selected data for a share of beneficial interest outstanding throughout the period is presented below:
| WisdomTree Middle East Dividend Fund | For the Year Ended March 31, 2019 |
For the Year Ended March 31, 2018 |
For the Year Ended March 31, 2017 |
For the Year Ended March 31, 2016 |
For the Year Ended March 31, 2015 |
|||||||||||||||
| Net asset value, beginning of year |
$ | 18.78 | $ | 17.60 | $ | 17.28 | $ | 20.25 | $ | 22.38 | ||||||||||
| Investment operations: |
||||||||||||||||||||
| Net investment income1 |
0.86 | 0.58 | 0.59 | 0.58 | 0.67 | |||||||||||||||
| Net realized and unrealized gain (loss) |
1.59 | 1.06 | 0.50 | (2.85 | ) | (2.06 | ) | |||||||||||||
| Total from investment operations |
2.45 | 1.64 | 1.09 | (2.27 | ) | (1.39 | ) | |||||||||||||
| Dividends to shareholders: |
||||||||||||||||||||
| Net investment income |
(0.76 | ) | (0.46 | ) | (0.77 | ) | (0.70 | ) | (0.74 | ) | ||||||||||
| Net asset value, end of year |
$ | 20.47 | $ | 18.78 | $ | 17.60 | $ | 17.28 | $ | 20.25 | ||||||||||
| TOTAL RETURN2 |
13.41 | %3 | 9.49 | %4 | 6.60 | % | (11.57 | )% | (6.28 | )% | ||||||||||
| RATIOS/SUPPLEMENTAL DATA: |
||||||||||||||||||||
| Net assets, end of year (000’s omitted) |
$ | 20,473 | $ | 15,024 | $ | 17,601 | $ | 20,731 | $ | 34,420 | ||||||||||
| Ratios to average net assets of: |
||||||||||||||||||||
| Expenses |
0.88 | % | 0.88 | % | 0.88 | % | 0.88 | % | 0.89 | %5 | ||||||||||
| Net investment income |
4.45 | % | 3.28 | % | 3.44 | % | 3.13 | % | 2.93 | % | ||||||||||
| Portfolio turnover rate6 |
30 | % | 46 | % | 29 | % | 25 | % | 89 | % | ||||||||||
| 1 | Based on average shares outstanding. |
| 2 | Total return is calculated assuming an initial investment made at the net asset value at the beginning of the period, reinvestment of all dividends and distributions at net asset value during the period and redemption on the last day of the period. |
| 3 | Includes a voluntary reimbursement from the sub-advisor for an operational error. Excluding the reimbursement, total return would have been 0.05% lower (Note 3). |
| 4 | Includes a reimbursement from the sub-advisor for an operational error. Excluding the reimbursement, total return would have been unchanged. |
| 5 | Included in the expense ratio are proxy expenses. Without these proxy expenses, the expense ratio would have been 0.88%. |
| 6 | Portfolio turnover rate is not annualized and excludes the value of the portfolio securities received or delivered as a result of in-kind creations or redemptions of the Fund’s capital shares. Short-term securities with maturities less than or equal to 365 days are excluded from the portfolio turnover calculation. |
See Notes to Financial Statements.
| 98 | WisdomTree Trust |
1. ORGANIZATION
WisdomTree Trust (the “Trust”) is registered under the Investment Company Act of 1940, as amended (the “1940 Act”), as an open-end management investment company. The Trust was established as a Delaware statutory trust on December 15, 2005. As of March 31, 2019, the Trust consisted of 76 operational investment funds (each a “Fund”, collectively, the “Funds”). In accordance with Accounting Standards Update (“ASU”) 2013-08, Financial Services-Investment Companies, each Fund listed below qualifies as an investment company and is applying the accounting and reporting guidance for investment companies. These notes relate only to the Funds listed in the table below:
| Fund | Commencement of Operations |
|||
| WisdomTree Asia Pacific ex-Japan Fund (“Asia Pacific ex-Japan Fund’’) |
June 16, 2006 | |||
| WisdomTree China ex-State-Owned Enterprises Fund (“China ex-State-Owned Enterprises Fund’’) |
September 19, 2012 | |||
| WisdomTree Emerging Markets Consumer Growth Fund (“Emerging Markets Consumer Growth Fund’’) |
September 27, 2013 | |||
| WisdomTree Emerging Markets ex-State-Owned Enterprises Fund (“Emerging Markets ex-State-Owned Enterprises Fund’’) |
December 10, 2014 | |||
| WisdomTree Emerging Markets High Dividend Fund (“Emerging Markets High Dividend Fund’’) |
July 13, 2007 | |||
| WisdomTree Emerging Markets Multifactor Fund (“Emerging Markets Multifactor Fund’’) |
August 10, 2018 | |||
| WisdomTree Emerging Markets Quality Dividend Growth Fund (“Emerging Markets Quality Dividend Growth Fund’’) |
August 1, 2013 | |||
| WisdomTree Emerging Markets SmallCap Dividend Fund (“Emerging Markets SmallCap Dividend Fund’’) |
October 30, 2007 | |||
| WisdomTree Global ex-U.S. Quality Dividend Growth Fund (“Global ex-U.S. Quality Dividend Growth Fund’’) |
June 16, 2006 | |||
| WisdomTree Global ex-U.S. Real Estate Fund (“Global ex-U.S. Real Estate Fund’’) |
June 5, 2007 | |||
| WisdomTree Global High Dividend Fund (“Global High Dividend Fund’’) |
June 16, 2006 | |||
| WisdomTree India Earnings Fund (“India Earnings Fund’’) (consolidated) |
February 22, 2008 | |||
| WisdomTree Middle East Dividend Fund (“Middle East Dividend Fund’’) |
July 16, 2008 | |||
The India Earnings Fund makes its investments through the WisdomTree India Investment Portfolio, Inc. (the “Portfolio”), a wholly owned subsidiary organized in the Republic of Mauritius (“Mauritius”). The Portfolio was incorporated under the provisions of the Mauritius Companies Act, 2001 and holds a Global Business License Category 1 issued by the Financial Services Commission. The Portfolio is advised by WisdomTree Asset Management, Inc. (“WTAM”) and is sub-advised by Mellon Investments Corporation (“Mellon”).
Each Fund, except for the Emerging Markets Consumer Growth Fund, Emerging Markets Multifactor Fund and Emerging Markets Quality Dividend Growth Fund, seeks to track the price and yield performance, before fees and expenses, of a particular index (“Index”) developed by WisdomTree Investments, Inc. (“WisdomTree Investments’’). The Emerging Markets Consumer Growth Fund and Emerging Markets Quality Dividend Growth Fund are actively managed using a model-based approach seeking income and capital appreciation. The Emerging Markets Multifactor Fund is actively managed using a model-based approach seeking capital appreciation. WisdomTree Investments is the parent company of WTAM, the investment adviser to each Fund and the Trust. “WisdomTree” is a registered trademark of WisdomTree Investments and has been licensed for use by the Trust. Each Fund described herein is considered to be non-diversified as defined under the 1940 Act. The securities in each Index are weighted based on earnings or earnings yield.
In the normal course of business, the Funds may enter into contracts that contain a variety of representations or that provide indemnification for certain liabilities. The Funds’ maximum exposure under these arrangements is unknown, as this would involve future claims that may be made against the Funds that have not yet occurred. However, the Funds have not had prior claims or losses pursuant to these contracts and believes such exposure to be remote.
2. SIGNIFICANT ACCOUNTING POLICIES
The Financial Accounting Standards Board (“FASB”) Accounting Standards Codification (the “Codification”) is the exclusive reference of authoritative U.S. generally accepted accounting principles (“GAAP”) recognized by the FASB to be applied by nongovernmental entities. Rules and interpretive releases of the Securities and Exchange Commission (“SEC”) under authority of federal laws are also sources of authoritative GAAP for SEC registrants.
The following is a summary of significant accounting policies followed by the Funds:
Use of Estimates — The preparation of financial statements in conformity with GAAP, requires management to make certain estimates and assumptions that affect the reported amounts of assets and liabilities and disclosure of contingent assets and liabilities at the date of the financial statements and the reported amounts of increases and decreases in the net assets from operations during the reporting period. Actual results could differ from those estimates.
| WisdomTree Trust | 99 |
Notes to Financial Statements (continued)
Basis of Consolidation — The financial statements for the India Earnings Fund include the accounts of a wholly-owned and controlled Mauritius subsidiary (the “Subsidiary”). The Fund’s accompanying financial statements reflect the financial position and the results of operations on a consolidated basis with its Subsidiary. All intercompany accounts and transactions have been eliminated in the consolidation.
Investment Valuation — The net asset value (“NAV”) of each Fund’s shares is calculated each day a Fund is open for business as of the regularly scheduled close of regular trading on the New York Stock Exchange, normally 4:00 p.m. Eastern time (the “NAV Calculation Time”). NAV per share is calculated by dividing a Fund’s net assets by the number of Fund shares outstanding. Each Fund issues and redeems shares at NAV only in large blocks of shares known as creation units, which only certain institutions (e.g. broker-dealers) may purchase or redeem. Shares of each Fund are listed on a national securities exchange and trade at market prices. Most investors will buy and sell shares in the secondary market through brokers. Because Fund shares trade at market prices rather than NAV, shares may trade at a price greater than NAV or less than NAV. In calculating each Fund’s NAV, investments are valued under policies approved by the Board of Trustees of the Trust (the “Board of Trustees”). Equity securities (including preferred stock) traded on any recognized U.S. or non-U.S. exchange are valued at the last sale price or official closing price on the exchange or system on which they are principally traded. Unlisted equity securities (including preferred stock) are valued at the last quoted sale price or, if no sale price is available, at the mean between the highest bid and lowest ask price. Each Fund may invest in money market funds which are valued at their NAV per share and exchange-traded funds (“ETFs” or “ETF”) or exchange-traded notes (“ETNs” or “ETN”) which are valued at their last sale or official closing price on the exchange on which they are principally traded or at their NAV per share in instances where the ETF or ETN has not traded on its principal exchange. Fixed income securities (including short-term debt securities with remaining maturities of 60 days or less), if any, generally are valued at current market quotations or mean prices obtained from broker-dealers or independent pricing service providers. Broker-dealers or independent pricing service providers, in determining the value of securities, may consider such factors as recent transactions, indications from broker-dealers yields and quoted prices on similar securities, and market sentiment for the type of security. Foreign currency contracts are valued daily using WM/Reuters closing spot and forward rates as of 4:00 p.m. London time.
In certain instances, such as when reliable market valuations are not readily available or are not deemed to reflect current market values, a Fund’s investments, which include derivatives, will be fair valued in accordance with the Fund’s pricing policy. The Board of Trustees has established a pricing committee (the “Pricing Committee”) which is comprised of senior representatives of WTAM and which reports to the Board of Trustees on a quarterly basis. In the event that a financial instrument cannot be valued based upon a price from a national securities exchange, independent pricing service provider or broker-dealer quotation, or such prices are deemed to not reflect current market value, the Pricing Committee may value the financial instrument in good faith under the policies and procedures approved by the Board of Trustees based on current facts and circumstances. Securities that may be valued using “fair value” pricing may include, but are not limited to, securities for which there are no current market quotations, securities whose issuer is in default or bankruptcy, securities subject to corporate actions (such as mergers or reorganizations), securities subject to non-U.S. investment limits or currency controls, and securities affected by “significant events.” An example of a significant event is an event occurring after the close of the market in which a security trades but before a Fund’s next NAV Calculation Time that may materially affect the value of a Fund’s investment (e.g., government action, natural disaster, or significant market fluctuation). When fair value pricing is employed, the prices of securities used by a Fund to calculate its NAV may differ from quoted or published prices for the same securities.
Fair Value Measurement — In accordance with Codification Topic 820 (“ASC 820”), Fair Value Measurements and Disclosures, fair value is defined as the price that each Fund would receive upon selling an investment in an orderly transaction to an independent buyer in the principal or most advantageous market of the investment. ASC 820 established a three-tier hierarchy of inputs to be used when determining fair value measurements for disclosure purposes. Inputs refer broadly to the assumptions that market participants would use in pricing the asset or liability, including assumptions about risk — for example, the risk inherent in a particular valuation technique used to measure fair value (such as a pricing model) and/or the risk inherent in the inputs to the valuation technique. Inputs may be observable or unobservable. Observable inputs reflect the assumptions market participants would use in pricing the asset or liability. Observable inputs are based on market data obtained from sources independent of the reporting entity. Unobservable inputs reflect the reporting entity’s own assumptions about the assumptions market participants would use in pricing the asset or liability. Unobservable inputs are based on the best information available in the circumstances. The three-tier hierarchy of inputs is summarized in the three broad levels listed below:
Level 1 – quoted prices in active markets for identical securities
Level 2 – other significant observable inputs (including quoted prices for similar securities, interest rates,
prepayment speeds, credit risk, etc.)
Level 3 – significant unobservable inputs (including each Fund’s assumptions in determining the fair value of investments)
The inputs or methodology used for valuation are not necessarily an indication of the risk associated with investing in those investments.
| 100 | WisdomTree Trust |
Notes to Financial Statements (continued)
Investments that use Level 2 or Level 3 inputs may include, but are not limited to: (i) an unlisted security related to corporate actions; (ii) a restricted security (e.g., one that may not be publicly sold without registration under the Securities Act of 1933, as amended); (iii) a security whose trading has been suspended or which has been de-listed from its primary trading exchange; (iv) a security that is thinly traded; (v) a security in default or bankruptcy proceedings for which there is no current market quotation or market activity; (vi) a security affected by currency controls or restrictions; and (vii) a security affected by a significant event (e.g., an event that occurs after the close of the markets on which the security is traded but before the time as of which a Fund’s NAV is computed and that may materially affect the value of the Fund’s investments).
The valuation techniques and significant inputs used in determining the fair market value measurements for Level 2 and Level 3 positions are as follows:
Financial instruments are generally valued by independent pricing service providers that use broker-dealer quotations, reported trades or valuation estimates from their internal pricing models. Depending on the type of financial instrument, the independent pricing service providers’ internal pricing models may use inputs that are observable such as issuer details, interest rates, yield curves, prepayment speeds, credit risks/spreads, default rates and quoted prices for similar assets. Financial instruments that use similar valuation techniques and observable inputs as described above and have an appropriate level of market activity are categorized as Level 2 of the fair value hierarchy, otherwise a Level 3 fair value classification is appropriate. Over-the-counter financial derivative instruments derive their value from underlying asset prices, indices, reference rates, and other inputs or a combination of these factors. These instruments are normally valued on the basis of broker-dealer quotations or prices obtained from independent pricing service providers. Depending on the product and the terms of the transaction, the value of the financial derivative instruments can be estimated by an independent pricing service provider using a series of techniques including simulation pricing models. The pricing models use inputs that are observed from actively quoted markets such as issuer details, indices, credit risks/spreads, interest rates, yield curves, default and exchange rates. Derivative contracts that use valuation techniques and observable inputs as described above and have an appropriate level of market activity are categorized as Level 2 of the fair value hierarchy, otherwise a Level 3 fair value classification is appropriate.
Determination of a fair value by the Pricing Committee may include significant unobservable inputs and therefore would be reflected as a Level 3 of the fair value hierarchy. The Pricing Committee may employ a market-based valuation approach which may use, among other potential considerations, related or comparable securities, recent transactions, market multiples, and other relevant information to determine fair value. The Pricing Committee may also use an income-based valuation approach in which anticipated future cash flows of the financial instrument are discounted to calculate fair value.
The following is a summary of the fair valuations according to the inputs used as of March 31, 2019 in valuing each Fund’s assets:
| Asia Pacific ex-Japan Fund | Level 1 | Level 2 | Level 3 | |||||||||
| Common Stocks* |
$ | 33,553,255 | $ | — | $ | — | ||||||
| Exchange-Traded Fund |
2,056 | — | — | |||||||||
| Total |
$ | 33,555,311 | $ | — | $ | — | ||||||
| China ex-State-Owned Enterprises Fund | Level 1 | Level 2 | Level 3 | |||||||||
| Common Stocks |
||||||||||||
| Machinery |
$ | 2,163,535 | $ | — | $ | 397,087 | ** | |||||
| Semiconductors & Semiconductor Equipment |
1,172,399 | — | 0 | ** | ||||||||
| Other* |
139,829,235 | — | — | |||||||||
| Investment of Cash Collateral for Securities Loaned |
— | 1,057,470 | — | |||||||||
| Total |
$ | 143,165,169 | $ | 1,057,470 | $ | 397,087 | ||||||
| Emerging Markets Consumer Growth Fund | Level 1 | Level 2 | Level 3 | |||||||||
| Common Stocks |
||||||||||||
| Indonesia |
$ | 612,929 | $ | — | $ | 3,178 | ** | |||||
| Other* |
33,682,444 | — | — | |||||||||
| Investment of Cash Collateral for Securities Loaned |
— | 307,985 | — | |||||||||
| Total |
$ | 34,295,373 | $ | 307,985 | $ | 3,178 | ||||||
| WisdomTree Trust | 101 |
Notes to Financial Statements (continued)
| Emerging Markets ex-State-Owned Enterprises Fund | Level 1 | Level 2 | Level 3 | |||||||||
| Common Stocks |
||||||||||||
| China |
$ | 110,136,817 | $ | — | $ | 165,494 | ** | |||||
| South Korea |
42,413,399 | — | 5,395 | ** | ||||||||
| Other* |
151,771,702 | — | — | |||||||||
| Investment of Cash Collateral for Securities Loaned |
— | 1,845,375 | — | |||||||||
| Total |
$ | 304,321,918 | $ | 1,845,375 | $ | 170,889 | ||||||
| Emerging Markets High Dividend Fund | Level 1 | Level 2 | Level 3 | |||||||||
| Common Stocks* |
$ | 2,165,319,644 | $ | — | $ | — | ||||||
| Exchange-Traded Fund |
2,304,355 | — | — | |||||||||
| Investment of Cash Collateral for Securities Loaned |
— | 28,284,557 | — | |||||||||
| Total |
$ | 2,167,623,999 | $ | 28,284,557 | $ | — | ||||||
| Unrealized Appreciation on Foreign Currency Contracts |
— | 8,885 | — | |||||||||
| Unrealized Depreciation on Foreign Currency Contracts |
— | (1,675 | ) | — | ||||||||
| Total - Net |
$ | 2,167,623,999 | $ | 28,291,767 | $ | — | ||||||
| Emerging Markets Multifactor Fund | Level 1 | Level 2 | Level 3 | |||||||||
| Common Stocks* |
$ | 18,790,626 | $ | — | $ | — | ||||||
| Total |
$ | 18,790,626 | $ | — | $ | — | ||||||
| Unrealized Appreciation on Foreign Currency Contracts |
— | 21,603 | — | |||||||||
| Unrealized Depreciation on Foreign Currency Contracts |
— | (17 | ) | — | ||||||||
| Total - Net |
$ | 18,790,626 | $ | 21,586 | $ | — | ||||||
| Emerging Markets Quality Dividend Growth Fund | Level 1 | Level 2 | Level 3 | |||||||||
| Common Stocks* |
$ | 69,135,405 | $ | — | $ | — | ||||||
| Investment of Cash Collateral for Securities Loaned |
— | 202,825 | — | |||||||||
| Total |
$ | 69,135,405 | $ | 202,825 | $ | — | ||||||
| Unrealized Depreciation on Foreign Currency Contracts |
— | (2 | ) | — | ||||||||
| Total - Net |
$ | 69,135,405 | $ | 202,823 | $ | — | ||||||
| Emerging Markets SmallCap Dividend Fund | Level 1 | Level 2 | Level 3 | |||||||||
| Common Stocks |
||||||||||||
| China |
$ | 340,338,087 | $ | — | $ | 1 | ** | |||||
| Hong Kong |
16,452,814 | — | 299,773 | ** | ||||||||
| India |
46,828,988 | — | 127,326 | ** | ||||||||
| South Korea |
110,217,048 | 505,393 | 497,644 | ** | ||||||||
| Thailand |
84,353,234 | — | 0 | ** | ||||||||
| Other* |
819,997,610 | — | — | |||||||||
| Investment of Cash Collateral for Securities Loaned |
— | 10,706,585 | — | |||||||||
| Total |
$ | 1,418,187,781 | $ | 11,211,978 | $ | 924,744 | ||||||
| Global ex-U.S. Quality Dividend Growth Fund | Level 1 | Level 2 | Level 3 | |||||||||
| Common Stocks* |
$ | 71,930,794 | $ | — | $ | — | ||||||
| Exchange-Traded Funds |
11,533 | — | — | |||||||||
| Investment of Cash Collateral for Securities Loaned |
— | 982,785 | — | |||||||||
| Total |
$ | 71,942,327 | $ | 982,785 | $ | — | ||||||
| 102 | WisdomTree Trust |
Notes to Financial Statements (continued)
| Global ex-U.S. Real Estate Fund | Level 1 | Level 2 | Level 3 | |||||||||
| Common Stocks* |
$ | 113,783,941 | $ | — | $ | — | ||||||
| Investment of Cash Collateral for Securities Loaned |
— | 3,046,250 | — | |||||||||
| Total |
$ | 113,783,941 | $ | 3,046,250 | $ | — | ||||||
| Global High Dividend Fund | Level 1 | Level 2 | Level 3 | |||||||||
| Common Stocks* |
$ | 91,800,765 | $ | — | $ | — | ||||||
| Exchange-Traded Funds |
50,731 | — | — | |||||||||
| Investment of Cash Collateral for Securities Loaned |
— | 1,424,615 | — | |||||||||
| Total |
$ | 91,851,496 | $ | 1,424,615 | $ | — | ||||||
| Unrealized Appreciation on Foreign Currency Contracts |
— | 19 | — | |||||||||
| Total - Net |
$ | 91,851,496 | $ | 1,424,634 | $ | — | ||||||
| India Earnings Fund (consolidated) | Level 1 | Level 2 | Level 3 | |||||||||
| Common Stocks |
||||||||||||
| Software |
$ | 2,520,167 | $ | — | $ | 564,405 | ** | |||||
| Other* |
1,326,842,070 | — | — | |||||||||
| Total |
$ | 1,329,362,237 | $ | — | $ | 564,405 | ||||||
| Middle East Dividend Fund | Level 1 | Level 2 | Level 3 | |||||||||
| Common Stocks |
||||||||||||
| Jordan |
$ | — | $ | 610,083 | $ | — | ||||||
| Other* |
19,546,582 | — | — | |||||||||
| Total |
$ | 19,546,582 | $ | 610,083 | $ | — | ||||||
| * | Please refer to the Schedule of Investments for a breakdown of the valuation by industry type and/or country. |
| ** | Security is being fair valued using significant unobservable inputs by the Pricing Committee. |
The following is a reconciliation of assets in which significant unobservable inputs (Level 3) were used in determining fair value:
| Common Stocks | ||||
| China | ||||
| China ex-State-Owned Enterprises Fund |
||||
| Balance as of March 31, 2018 |
$ | 1,776,923 | ||
| Realized gain (loss) |
(1,387,417 | ) | ||
| Change in unrealized appreciation (depreciation) |
(770 | ) | ||
| Purchases |
417,002 | |||
| Sales |
(1,131,304 | ) | ||
| Transfers into Level 3 |
722,653 | |||
| Transfers out of Level 3 |
— | |||
| Balance as of March 31, 2019 |
$ | 397,087 | ||
| Net change in unrealized appreciation (depreciation) from investments still held as of March 31, 2019 is: |
$ | (185,627 | ) | |
Derivatives and Hedging Disclosure — Codification Topic 815 (“ASC 815”), Derivatives and Hedging, requires qualitative disclosures about objectives and strategies for using derivatives, quantitative disclosures about fair value amounts of gains and losses on derivative instruments, and disclosures about credit-risk-related contingent features in derivative agreements. The Funds have invested in derivatives, specifically foreign currency contracts during the year or period ended March 31, 2019 and open positions in such derivatives as of March 31, 2019 are detailed in each Fund’s Schedule of Investments. All of the derivative instruments disclosed and described herein are subject to risk. Risks may arise upon entering into foreign currency contracts from potential inability of a counterparty to meet the terms of their contracts and from unanticipated movements in the value of the foreign currencies relative to the U.S. dollar or each other. The Funds’ derivative agreements also contain credit-risk related contingent features which include, but are not limited to, a percentage decline in the Funds’ NAV over a specified time period. If an event occurred at March 31, 2019 that triggered a contingent feature, the counterparty to the agreement may require the Funds to post additional collateral or terminate the derivative positions and demand payment. Any collateral posted with respect to the derivative positions would be used
| WisdomTree Trust | 103 |
Notes to Financial Statements (continued)
to offset or reduce the payment. The maximum exposure to derivatives agreements with credit-risk related contingent features would be the total value of derivatives in net liability positions for each Fund, as disclosed on page 108. At March 31, 2019, the Funds did not receive or post collateral with any counterparty for derivatives and no event occurred that triggered a credit-risk-related contingent feature. Information with respect to the amounts and types of collateral received and/or posted for derivative instruments as of March 31, 2019, if any, is reflected as a footnote below the respective derivatives tables on each Fund’s Schedule of Investments.
As of March 31, 2019, the effects of such derivative instruments on each Fund’s financial position as reflected in the Statements of Assets and Liabilities are presented in the summary below:
| Asset Derivatives | Liability Derivatives | |||||||||||
| Fund | Balance Sheet Location | Value | Balance Sheet Location | Value | ||||||||
| Emerging Markets High Dividend Fund |
| |||||||||||
| Foreign exchange contracts |
Unrealized appreciation on foreign currency contracts |
$ | 8,885 | Unrealized depreciation on foreign currency contracts |
$ | 1,675 | ||||||
| Emerging Markets Multifactor Fund |
| |||||||||||
| Foreign exchange contracts |
Unrealized appreciation on foreign currency contracts |
21,603 | Unrealized depreciation on foreign currency contracts |
17 | ||||||||
| Emerging Markets Quality Dividend Growth Fund |
| |||||||||||
| Foreign exchange contracts |
Unrealized appreciation on foreign currency contracts |
— | Unrealized depreciation on foreign currency contracts |
2 | ||||||||
| Global High Dividend Fund |
| |||||||||||
| Foreign exchange contracts |
Unrealized appreciation on foreign currency contracts |
19 | Unrealized depreciation on foreign currency contracts |
— | ||||||||
For the fiscal year or period ended March 31, 2019, the effects of derivative instruments on each Fund’s financial performance as reflected in the Statements of Operations are presented in the summary below:
| Fund | Amount of Realized Gain or (Loss) on Derivatives Recognized1 |
Change in Unrealized Appreciation or (Depreciation) on Derivatives Recognized2 |
||||||
| Asia Pacific ex-Japan Fund |
| |||||||
| Foreign exchange contracts |
$(18,542) | $ | (27) | |||||
| China ex-State-Owned Enterprises Fund |
| |||||||
| Foreign exchange contracts |
(42,667 | ) | — | |||||
| Emerging Markets Consumer Growth Fund |
| |||||||
| Foreign exchange contracts |
9,681 | (491 | ) | |||||
| Emerging Markets ex-State-Owned Enterprises Fund |
| |||||||
| Foreign exchange contracts |
(113,760 | ) | 4,366 | |||||
| Emerging Markets High Dividend Fund |
| |||||||
| Foreign exchange contracts |
481,139 | (9,426 | ) | |||||
| Emerging Markets Multifactor Fund3 |
| |||||||
| Foreign exchange contracts |
(292,785 | ) | 21,586 | |||||
| Emerging Markets Quality Dividend Growth Fund |
| |||||||
| Foreign exchange contracts |
(29,051 | ) | (2 | ) | ||||
| Emerging Markets SmallCap Dividend Fund |
| |||||||
| Foreign exchange contracts |
(262,715 | ) | (763 | ) | ||||
| Global ex-U.S. Quality Dividend Growth Fund |
| |||||||
| Foreign exchange contracts |
(15,809 | ) | — | |||||
| Global ex-U.S. Real Estate Fund |
| |||||||
| Foreign exchange contracts |
36,996 | (15 | ) | |||||
| Global High Dividend Fund |
| |||||||
| Foreign exchange contracts |
2,160 | 19 | ||||||
| India Earnings Fund (consolidated) |
| |||||||
| Foreign exchange contracts |
1,067,496 | — | ||||||
| 104 | WisdomTree Trust |
Notes to Financial Statements (continued)
| Fund | Amount of Realized Gain or (Loss) on Derivatives Recognized1 |
Change in Unrealized Appreciation or (Depreciation) on Derivatives Recognized2 |
||||||
| Middle East Dividend Fund |
| |||||||
| Foreign exchange contracts |
$ | (8,264 | ) | $ | 1 | |||
| 1 | Realized gains (losses) on derivatives are located on the Statements of Operations as follows: |
| Foreign exchange contracts |
Net realized gain (loss) from foreign currency contracts |
| 2 | Change in unrealized appreciation (depreciation) is located on the Statements of Operations as follows: |
| Foreign exchange contracts |
Net increase (decrease) in unrealized appreciation/depreciation from foreign currency contracts |
| 3 | For the period August 10, 2018 (commencement of operations) through March 31, 2019. |
During the fiscal year or period ended March 31, 2019, the volume of derivative activity (based on the average of month-end balances) for each Fund was as follows:
| Average Notional | ||||||||
| Fund | Foreign currency USD) |
Foreign currency contracts (to receive USD) |
||||||
| Asia Pacific ex-Japan Fund |
| |||||||
| Foreign exchange contracts |
$ | — | $ | 54,187 | ||||
| China ex-State-Owned Enterprises Fund |
| |||||||
| Foreign exchange contracts |
421,763 | 588,400 | ||||||
| Emerging Markets Consumer Growth Fund |
| |||||||
| Foreign exchange contracts |
40,465 | 76,017 | ||||||
| Emerging Markets ex-State-Owned Enterprises Fund |
| |||||||
| Foreign exchange contracts |
731,452 | 250,809 | ||||||
| Emerging Markets High Dividend Fund |
| |||||||
| Foreign exchange contracts |
1,382,755 | 1,487,170 | ||||||
| Emerging Markets Multifactor Fund1 |
| |||||||
| Foreign exchange contracts |
3,518,047 | 6,393,408 | ||||||
| Emerging Markets Quality Dividend Growth Fund |
| |||||||
| Foreign exchange contracts |
15,065 | 82,107 | ||||||
| Emerging Markets SmallCap Dividend Fund |
| |||||||
| Foreign exchange contracts |
508,666 | 1,479,833 | ||||||
| Global ex-U.S. Quality Dividend Growth Fund |
| |||||||
| Foreign exchange contracts |
— | 17,269 | ||||||
| Global ex-U.S. Real Estate Fund |
| |||||||
| Foreign exchange contracts |
12,273 | 37,112 | ||||||
| Global High Dividend Fund |
| |||||||
| Foreign exchange contracts |
20,706 | 16,889 | ||||||
| India Earnings Fund (consolidated) |
| |||||||
| Foreign exchange contracts |
6,685,689 | 7,070,489 | ||||||
| Middle East Dividend Fund |
| |||||||
| Foreign exchange contracts |
789 | 8,099 | ||||||
| 1 | For the period August 10, 2018 (commencement of operations) through March 31, 2019. |
Investment Transactions and Investment Income — Investment transactions are recorded as of the date that the securities are purchased or sold (trade date). Realized gains and losses on sales of portfolio securities are calculated using the identified-cost method. Dividend income (net of foreign taxes withheld, if any) is recognized on the ex-dividend date or as soon as practicable after the existence of a dividend declaration has been determined. Non-cash dividend income is recognized at the fair value of securities received on the ex-dividend date or as soon as practicable after the existence of a dividend declaration has been determined. Interest income (including amortization of premiums and accretion of discounts), net of any foreign taxes withheld, is accrued daily. Generally, amortization of premiums and accretion of discounts are recognized daily using the interest method (also known as the scientific amortization method). Income earned from securities lending activities (i.e. Securities lending income), net of fees payable to the securities borrower and/or securities lending agent, is accrued daily.
Foreign Currency Translation — The accounting records of the Funds are maintained in U.S. dollars. Foreign currencies, as well as investment securities and other assets and liabilities denominated in foreign currencies, are translated into U.S. dollars using
| WisdomTree Trust | 105 |
Notes to Financial Statements (continued)
exchange rates prevailing on the respective dates of such transactions that are deemed appropriate by WTAM. Realized and unrealized foreign exchange gains and losses on investments are included as a component of net realized gain (loss) from investment transactions and net increase (decrease) in unrealized appreciation (depreciation) from investment transactions, respectively, on the Statements of Operations. Realized and unrealized foreign exchange gains or losses from foreign currency contracts are included in net realized gain (loss) from foreign currency contracts and net increase (decrease) in unrealized appreciation/depreciation from foreign currency contracts, respectively, on the Statements of Operations. Realized and unrealized foreign exchange gains or losses arising from sales of foreign currencies, currency gains or losses recognized between the trade and settlement dates on investment transactions, and the difference between the amounts of dividends and foreign withholding taxes recorded on the Funds’ books and the U.S. dollar equivalent of the amounts actually received or paid are included in net realized gain (loss) from foreign currency related transactions and/or increase (decrease) in unrealized appreciation (depreciation) from translation of assets and liabilities denominated in foreign currencies in the Statements of Operations. Certain foreign exchange gains and losses included in realized and unrealized gains or losses are included in, or are a reduction of, ordinary income in accordance with U.S. Federal income tax regulations.
Expenses/Reimbursements — Under the investment advisory agreement for each Fund, except for Funds that commenced operations on or after March 26, 2013, WTAM has agreed to pay all expenses of the Trust, except for: (i) brokerage expenses and other expenses (such as stamp taxes) connected with the execution of portfolio transactions or in connection with creation and redemption transactions; (ii) legal fees or expenses in connection with any arbitration, litigation or pending or threatened arbitration or litigation, including any settlements in connection therewith; (iii) compensation and expenses of trustees who are not interested persons of the Funds (“Independent Trustees”); (iv) compensation and expenses of counsel to the Independent Trustees; (v) compensation and expenses of the Trust’s Chief Compliance Officer (‘‘CCO’’); (vi) extraordinary expenses; (vii) distribution fees and expenses paid by the Trust under any distribution plan adopted pursuant to Rule 12b-1 under the 1940 Act; and (viii) the advisory fee payable to WTAM.
Under the investment advisory agreement for Funds that commenced operations on or after March 26, 2013, WTAM has agreed to pay all expenses of the Trust, except for: (i) brokerage expenses and other fees, charges, taxes, levies or expenses (such as stamp taxes) incurred in connection with the execution of portfolio transactions or in connection with creation and redemption transactions (including without limitation any fees, charges, taxes, levies or expenses related to the purchase or sale of an amount of any currency, or the partition or repatriation of any security or other asset, related to the execution of portfolio transactions or any creation or redemption transactions); (ii) legal fees or expenses in connection with any arbitration, litigation or pending or threatened arbitration or litigation, including any settlements in connection therewith; (iii) compensation and expenses of each Independent Trustee; (iv) compensation and expenses of counsel to the Independent Trustees; (v) compensation and expenses of the Trust’s CCO; (vi) extraordinary expenses (in each case as determined by a majority of the Independent Trustees); (vii) distribution fees and expenses paid by the Trust under any distribution plan adopted pursuant to Rule 12b-1 under the 1940 Act; (viii) interest and taxes of any kind or nature (including, but not limited to, income, excise, transfer and withholding taxes); (ix) fees and expenses related to the provision of securities lending services; and (x) the advisory fee payable to WTAM.
Acquired fund fees and expenses (“AFFEs”) (which are fees and expenses incurred indirectly by a Fund through its investments in certain underlying investment companies) are not operating expenses of the Funds and are not paid by WTAM.
Pursuant to a separate contractual arrangement, WTAM arranges for the provision of CCO services with respect to each Fund, and is liable and responsible for, and administers, payments to the CCO, the Independent Trustees and counsel to the Independent Trustees. WTAM receives a fee, as shown on the Statements of Operations under “Service fees”, of up to 0.0044% per annum of each Fund’s average daily net assets for providing such services and paying such expenses. WTAM provides CCO services to the Trust.
Currency Transactions — The Funds may enter into foreign currency contracts to facilitate local securities settlements or to protect against currency exposure. The Funds do not expect to engage in currency transactions for the purpose of hedging against declines in the value of the Fund’s assets that are denominated in one or more foreign currencies. The Funds may not enter into such contracts for speculative purposes.
Forward Foreign Currency Contracts — The Funds utilized forward foreign currency contracts (‘‘Forward Contracts’’) primarily to facilitate foreign security settlements. A Forward Contract involves an obligation to purchase or sell a specific currency at a future date, which may be any fixed number of days from the date of the contract agreed upon by the parties, at a price set at the time of the contract. These contracts are principally traded in the inter-bank market conducted directly between currency traders (usually large, commercial banks) and their customers. A Forward Contract generally does not require an initial margin deposit and no commissions are charged at any stage for trades. However, if a Fund is in an unrealized loss position on a Forward Contract, it may be required to pledge collateral (or additional collateral) to the counterparty. If a Fund is in an unrealized gain position on a Forward Contract, it may receive collateral from the counterparty.
Risks may arise upon entering into Forward Contracts from the potential inability of counterparties to meet the terms of their contracts and from unanticipated movements in the value of foreign currencies relative to the U.S. dollar or each other.
| 106 | WisdomTree Trust |
Notes to Financial Statements (continued)
Fluctuations in the value of open Forward Contracts are recorded for book purposes as unrealized gains or losses on Forward Contracts by the Funds and included in net increase (decrease) in unrealized appreciation (depreciation) from foreign currency contracts on the Statements of Operations. Realized gains and losses on Forward Contracts include net gains or losses recognized by the Funds on contracts which have settled are included in net realized gain (loss) from foreign currency contracts on the Statements of Operations.
Securities Lending — Each Fund may lend portfolio securities to certain creditworthy borrowers, including the Funds’ securities lending agent. It is the Funds’ policy that, at origination, all loans are secured by collateral of at least 102% of the value of U.S. securities loaned and 105% of the value of foreign securities loaned. Collateral in the form of cash and/or high-grade debt obligations, equivalent to at least 100% of the market value of securities, is maintained at all times. The cash collateral can be invested in certain money market mutual funds which also have exposure to the fluctuations of the market. The values of the investments of cash collateral for securities on loan along with the obligations to return such collateral are included on the Statements of Assets and Liabilities. The total value of securities received as collateral for securities on loan is included in a footnote following each Schedule of Investments, but is not included within the Statements of Assets and Liabilities because the receiving Fund does not have the right to sell or repledge the securities received as collateral. Each Fund receives compensation for lending its securities from interest or dividends earned on the cash or U.S. government securities held as collateral, net of fee rebates paid to the borrower plus reasonable administrative and custody fees, all of which are included in the securities lending income earned by the Funds and disclosed on the Statements of Operations. The dividend and interest income earned on the securities loaned is accounted for in the same manner as other dividend and interest income. The borrower pays to the Funds an amount equal to any dividends or interest received on loaned securities. Dividends received while a security is out on loan are not considered Qualified Dividend Income (“QDI”) under the specific criteria issued by the Internal Revenue Service and are subject to taxation at the shareholder’s ordinary income tax rate instead of the lower long-term capital gains tax rate. Lending portfolio securities could result in a loss or delay in recovering each Fund’s securities if the borrower defaults. In the event of a borrower default with respect to the failure to return to each Fund some or all of the securities loaned, the securities lending agent shall indemnify each Fund against the failure of the borrower.
Master Netting Arrangements — ASU No. 2011-11 “Disclosures about Offsetting Assets and Liabilities” (“ASU 2011-11”) is generally intended to (i) help investors and other financial statement users to better assess the effect or potential effect of offsetting arrangements on a company’s financial position, (ii) improve transparency in the reporting of how companies mitigate credit risk, and (iii) facilitate comparisons between those entities that prepare their financial statements on the basis of GAAP and those entities that prepare their financial statements on the basis of international financial reporting standards. ASU 2011-11 requires entities to disclose (i) gross and net information about both instruments and transactions eligible for offset in the financial statements, and (ii) instruments and transactions subject to an agreement similar to a master netting agreement. ASU 2011-11 is limited in scope to the following financial instruments, to the extent they are offset in the financial statements or subject to an enforceable master netting arrangement or similar agreement: (i) recognized derivative instruments accounted for under ASC 815 (Derivatives and Hedging); (ii) repurchase agreements and reverse repurchase agreements; and (iii) securities borrowing and securities lending transactions.
In order to better define its contractual rights and to secure rights that will help a Fund mitigate its counterparty risk, a Fund may enter into an International Swaps and Derivatives Association, Inc. Master Agreement (“ISDA Master Agreement”) or similar agreement with its counterparties. An ISDA Master Agreement is a bilateral agreement between a Fund and a counterparty that governs over-the-counter derivatives (“OTC”), such as total return swap contracts and Forward Contracts, and typically contains, among other things, collateral posting terms, netting and rights of set-off provisions in the event of a default and/or termination event. Under an ISDA Master Agreement, a Fund may, under certain circumstances, offset with the counterparty certain derivative financial instruments’ payables and receivables to create a single net payment. The provisions of the ISDA Master Agreement typically permit a single net payment in the event of a default (close-out netting) or similar event, including the bankruptcy or insolvency of the counterparty.
Collateral requirements generally differ by type of derivative. Collateral terms are contract-specific for OTC derivatives (e.g. foreign exchange contracts, options and certain swaps). Generally, for transactions traded under an ISDA Master Agreement, the collateral requirements are calculated by netting the marked to market amount for each transaction under such agreement and comparing that amount to the value of any collateral currently pledged by a Fund and the counterparty. Generally, the amount of collateral due from or to a counterparty must exceed a minimum transfer amount threshold before a transfer is required to be made. To the extent amounts due to a Fund from its derivatives counterparties are not fully collateralized, contractually or otherwise, the Fund bears the risk of loss from a counterparty’s non-performance.
The Funds’ security lending activities are governed by a Securities Lending Authorization Agreement (“Lending Agreement”) between the Funds and the lending agent. The Lending Agreement authorizes the lending agent to lend qualifying U.S. and foreign securities held by a Fund to approved borrowers (each a “Borrower”). To mitigate borrower risk, a Fund typically receives from a Borrower collateral in the form of U.S. dollar cash and/or securities issued or guaranteed by the U.S. government or its agencies in
| WisdomTree Trust | 107 |
Notes to Financial Statements (continued)
excess of the market value of the securities loaned. Under the provisions of the Lending Agreement, a Fund shall have, as to the collateral, all of the rights and remedies of a secured party under applicable law. A Fund is exposed to risk of loss if a Borrower defaults on its obligation to return borrowed securities and the value of the collateral a Fund received is insufficient to cover the market value of the securities loaned. Also, the lending agent is permitted to invest the cash collateral it receives from a Borrower into a money market fund which is subject to market fluctuation. Therefore, a Fund is exposed to risk of loss if the value of invested cash collateral is insufficient to satisfy the Fund’s obligation to return the full amount owed to such Borrower.
For financial reporting purposes, the Funds elect to not offset assets and liabilities subject to an ISDA Master Agreement or Lending Agreement, if any, in the Statements of Assets and Liabilities. Therefore, all qualifying transactions are presented on a gross basis in the Statements of Assets and Liabilities. As of March 31, 2019, the impact of netting of assets and liabilities and the offsetting of collateral pledged or received based on contractual netting/set-off provisions in the ISDA Master Agreement and the Lending Agreement are detailed in the following table:
| Assets | Liabilities | |||||||||||||||||||||||||||||||
| Gross Amounts Assets and |
Gross Amounts Not Offset in the Statements of Assets and Liabilities |
Net Amount |
Gross Amounts Assets and |
Gross Amounts Not Offset in the Statements of Assets and Liabilities |
Net Amount |
|||||||||||||||||||||||||||
| Fund | Financial Instruments |
Collateral Received |
Financial Instruments |
Collateral Posted |
||||||||||||||||||||||||||||
| Asia Pacific ex-Japan Fund |
||||||||||||||||||||||||||||||||
| Securities Lending |
$ | 82,124 | $ | — | $ | (82,124 | )1 | $ | — | $ | — | $ | — | $ | — | $ | — | |||||||||||||||
| China ex-State-Owned Enterprises Fund |
||||||||||||||||||||||||||||||||
| Securities Lending |
6,079,058 | — | (6,079,058 | )1 | — | — | — | — | — | |||||||||||||||||||||||
| Emerging Markets Consumer Growth Fund |
||||||||||||||||||||||||||||||||
| Securities Lending |
655,926 | — | (655,926 | )1 | — | — | — | — | — | |||||||||||||||||||||||
| Emerging Markets ex-State-Owned Enterprises Fund |
||||||||||||||||||||||||||||||||
| Securities Lending |
4,002,585 | — | (4,002,585 | )1 | — | — | — | — | — | |||||||||||||||||||||||
| Emerging Markets High Dividend Fund |
||||||||||||||||||||||||||||||||
| Securities Lending |
115,479,838 | — | (115,479,838 | )1 | — | — | — | — | — | |||||||||||||||||||||||
| Foreign Currency Contracts |
8,885 | — | — | 8,885 | 1,675 | — | — | 1,675 | ||||||||||||||||||||||||
| Emerging Markets Multifactor Fund |
||||||||||||||||||||||||||||||||
| Foreign Currency Contracts |
21,603 | (17 | ) | — | 21,586 | 17 | (17 | ) | — | — | ||||||||||||||||||||||
| Emerging Markets Quality Dividend Growth Fund |
||||||||||||||||||||||||||||||||
| Securities Lending |
439,964 | — | (439,964 | )1 | — | — | — | — | — | |||||||||||||||||||||||
| Foreign Currency Contracts |
— | — | — | — | 2 | — | — | 2 | ||||||||||||||||||||||||
| Emerging Markets SmallCap Dividend Fund |
||||||||||||||||||||||||||||||||
| Securities Lending |
102,226,525 | — | (102,226,525 | )1 | — | — | — | — | — | |||||||||||||||||||||||
| Global ex-U.S. Quality Dividend Growth Fund |
||||||||||||||||||||||||||||||||
| Securities Lending |
3,869,120 | — | (3,869,120 | )1 | — | — | — | — | — | |||||||||||||||||||||||
| Global ex-U.S. Real Estate Fund |
||||||||||||||||||||||||||||||||
| Securities Lending |
4,479,976 | — | (4,479,976 | )1 | — | — | — | — | — | |||||||||||||||||||||||
| Global High Dividend Fund |
||||||||||||||||||||||||||||||||
| Securities Lending |
1,651,491 | — | (1,651,491 | )1 | — | — | — | — | — | |||||||||||||||||||||||
| Foreign Currency Contracts |
19 | — | — | 19 | — | — | — | — | ||||||||||||||||||||||||
| 1 | The amount of collateral presented has been limited such that the net amount by counterparty cannot be less than zero. |
Short-Term Investments — Each Fund may invest a portion of its assets in high-quality money market instruments on an ongoing basis to provide liquidity or for other reasons. The instruments include short-term obligations issued by the U.S. government, its agencies, non-U.S. government agencies, negotiable certificates of deposit (“CDs”), fixed time deposits and bankers’ acceptances of U.S. and foreign banks and similar institutions, commercial papers, repurchase agreements and money market funds. CDs are short-term negotiable obligations of commercial banks. Time deposits are non-negotiable deposits maintained in banking institutions for specified periods of time at stated interest rates. Banker’s acceptances are time drafts drawn on commercial banks by borrowers, usually in connection with international transactions.
Tax Information and Dividends and Distributions to Shareholders — It is each Fund’s policy to comply with all requirements of the Internal Revenue Code of 1986, as amended (the “Code”). Each Fund intends to qualify for and to elect treatment as a separate Regulated Investment Company (“RIC”) under Subchapter M of the Code. In order to qualify for the special tax treatment accorded
| 108 | WisdomTree Trust |
Notes to Financial Statements (continued)
RICs and their shareholders, each Fund must, among other things, distribute with respect to each taxable year an amount equal to or greater than the sum of 90% of its investment company taxable income and 90% of its net tax-exempt interest income. There can be no guarantee that a Fund will pay dividends. Taxable net realized gains from investment transactions, reduced by capital loss carryforwards, if any, are declared and distributed to shareholders at least annually. The capital loss carryforward amount, if any, is available to offset future net capital gains. The Funds may occasionally be required to make supplemental distributions at some other time during the year. The Trust reserves the right to declare special distributions if, in its reasonable discretion, such action is necessary or advisable to preserve the status of each Fund as a RIC or to avoid imposition of income or excise taxes on undistributed income. Dividends and distributions to shareholders are recorded on the ex-dividend date. The amount of dividends and distributions from net investment income and net realized capital gains are determined in accordance with the requirements of the Code and the U.S. Treasury regulations. These book/tax differences are either considered temporary or permanent in nature. To the extent these differences are permanent in nature, such amounts are reclassified within the components of net assets based on their Federal tax basis treatment; temporary differences do not require reclassification. Dividends and distributions that exceed earnings and profit for tax purposes are reported for tax purposes as a return of capital. The India Earnings Fund has filed an election to treat the Portfolio as a ‘‘pass-through’’ entity for tax purposes.
3. ADVISORY FEES AND OTHER TRANSACTIONS WITH AFFILIATES
WTAM has overall responsibility for the general management and administration of the Trust. WTAM provides an investment program for each Fund. WTAM has arranged for Mellon to provide sub-advisory services to the Funds. Mellon is compensated by WTAM at no additional cost to the Funds. WTAM also arranges for transfer agency, custody, fund accounting, fund administration, securities lending and all other non-distribution related services necessary for the Funds to operate, which are generally under separate agreements entered into between the Trust on behalf of the Funds and the applicable service provider. Under the investment advisory agreement for each Fund, WTAM agrees to pay all expenses of the Funds, except for certain expenses described in Note 2.
Pursuant to a separate contractual arrangement, as also described in Note 2, WTAM arranges for the provision of CCO services with respect to each Fund, and is liable and responsible for, and administers, payments to the CCO, the Independent Trustees and counsel to the Independent Trustees in exchange for a fee, accrued daily and paid monthly in arrears, of up to 0.0044% per annum of each Fund’s average daily net assets. WTAM expects to receive advisory fees from each Fund, based on a percentage of the Fund’s average daily net assets, as shown in the following table:
| Fund | Advisory Fee Rate (before fee waiver) |
Advisory Fee Waiver |
Advisory Fee Expiration Date |
|||||||||
| Asia Pacific ex-Japan Fund |
0.48 | % | — | — | ||||||||
| China ex-State-Owned Enterprises Fund |
0.63 | % | (0.31 | )% | July 31, 2019 | |||||||
| Emerging Markets Consumer Growth Fund |
0.63 | % | (0.31 | )% | July 31, 2019 | |||||||
| Emerging Markets ex-State-Owned Enterprises Fund |
0.58 | % | (0.26 | )% | July 31, 2019 | |||||||
| Emerging Markets High Dividend Fund |
0.63 | % | — | — | ||||||||
| Emerging Markets Multifactor Fund |
0.48 | % | — | |||||||||
| Emerging Markets Quality Dividend Growth Fund |
0.63 | % | (0.31 | )% | July 31, 2019 | |||||||
| Emerging Markets SmallCap Dividend Fund |
0.63 | % | — | — | ||||||||
| Global ex-U.S. Quality Dividend Growth Fund |
0.58 | % | — | — | ||||||||
| Global ex-U.S. Real Estate Fund |
0.58 | % | — | — | ||||||||
| Global High Dividend Fund |
0.58 | % | — | — | ||||||||
| India Earnings Fund (consolidated) |
0.83 | % | — | — | ||||||||
| Middle East Dividend Fund |
0.88 | % | — | — | ||||||||
During the fiscal year ended March 31, 2019, the Emerging Markets ex-State-Owned Enterprises Fund and the Middle East Dividend Fund each received a voluntary reimbursement of $288 and $17,117, respectively, from Mellon for investment losses resulting from an operational error. The dollar amount of the reimbursement is shown in the Statements of Operations in “Net realized gain from payment by sub-advisor”.
Each Fund may purchase shares of affiliated ETFs in secondary market transactions to reduce cash balances. For these transactions, WTAM waives its advisory fees for each Fund’s investment in affiliated funds. The waivers may be reduced to offset the incremental costs related to these investments (fund accounting, safekeeping, transaction fees, etc.) that are paid by WTAM out of its advisory fee. The dollar amount of advisory fees waived during the period for the Funds, if any, are shown in the Statements of Operations in “Expense waivers”.
| WisdomTree Trust | 109 |
Notes to Financial Statements (continued)
Affiliated holdings are funds which are managed by, or an affiliate of, WTAM. Transactions with affiliated funds during the fiscal year or period ended March 31, 2019 are as follows:
| Fund | Value at 3/31/2018 |
Purchases/ Additions |
Sales/ Reductions |
Realized Gain/(Loss) |
Change in Unrealized Appreciation/ Depreciation |
Value at 3/31/2019 |
Dividend Income |
|||||||||||||||||||||
| Asia Pacific ex-Japan Fund |
||||||||||||||||||||||||||||
| Global ex-U.S. Real Estate Fund |
$ | 111,132 | $ | 1,144,115 | $ | 1,212,795 | $ | (39,357 | ) | $ | (1,039 | ) | $ | 2,056 | $ | 17,111 | ||||||||||||
| Emerging Markets High Dividend Fund |
||||||||||||||||||||||||||||
| Global High Dividend Fund |
$ | 2,617,313 | $ | 9,823,739 | $ | 9,919,325 | $ | (270,428 | ) | $ | 53,056 | $ | 2,304,355 | $ | 100,059 | |||||||||||||
| India Earnings Fund |
33,538,657 | — | 32,447,740 | (1,381,893 | ) | 290,976 | — | 100,345 | ||||||||||||||||||||
| Total |
$ | 36,155,970 | $ | 9,823,739 | $ | 42,367,065 | $ | (1,652,321 | ) | $ | 344,032 | $ | 2,304,355 | $ | 200,404 | |||||||||||||
| Emerging Markets Multifactor Fund1 |
||||||||||||||||||||||||||||
| India Earnings Fund |
$ | — | $ | 45,309 | $ | 41,106 | $ | (4,203 | ) | $ | — | $ | — | $ | 185 | |||||||||||||
| Emerging Markets SmallCap Dividend Fund |
||||||||||||||||||||||||||||
| Emerging Markets High Dividend Fund |
$ | 134,566 | $ | 25,629,027 | $ | 25,019,209 | $ | (741,359 | ) | $ | (3,025 | ) | $ | — | $ | 334,183 | ||||||||||||
| Global ex-U.S. Quality Dividend Growth Fund |
||||||||||||||||||||||||||||
| Emerging Markets High Dividend Fund |
$ | 11,429 | $ | 562,495 | $ | 552,950 | $ | (16,228 | ) | $ | (99 | ) | $ | 4,647 | $ | 6,221 | ||||||||||||
| International Equity Fund |
17,116 | 849,646 | 826,315 | (33,785 | ) | 224 | 6,886 | 11,449 | ||||||||||||||||||||
| Total |
$ | 28,545 | $ | 1,412,141 | $ | 1,379,265 | $ | (50,013 | ) | $ | 125 | $ | 11,533 | $ | 17,670 | |||||||||||||
| Global High Dividend Fund |
||||||||||||||||||||||||||||
| International High Dividend Fund |
$ | — | $ | 1,456,817 | $ | 1,390,767 | $ | (28,813 | ) | $ | 739 | $ | 37,976 | $ | 9,186 | |||||||||||||
| U.S. High Dividend Fund |
— | 481,535 | 458,950 | (10,171 | ) | 341 | 12,755 | 1,942 | ||||||||||||||||||||
| Total |
$ | — | $ | 1,938,352 | $ | 1,849,717 | $ | (38,984 | ) | $ | 1,080 | $ | 50,731 | $ | 11,128 | |||||||||||||
| 1 | For the period August 10, 2018 (commencement of operations) through March 31, 2019. |
Related Party Transactions — WTAM or its affiliates may from time to time own shares of a Fund. As of March 31, 2019, WTAM held shares of the following Funds which were purchased through an unaffiliated broker in ordinary brokerage transactions in the secondary market in which the Funds’ shares trade:
| Fund | Fund Shares held by WTAM |
Market Value of Fund Shares held by WTAM |
Dividends and distributions paid to WTAM on Fund Shares held by WTAM |
|||||||||
| Emerging Markets ex-State-Owned Enterprises Fund |
843 | $ | 24,304 | $ | 375 | |||||||
| Emerging Markets High Dividend Fund |
10 | 438 | 31 | |||||||||
| Emerging Markets Multifactor Fund |
594 | 14,119 | 88 | |||||||||
| Emerging Markets SmallCap Dividend Fund |
340 | 16,017 | 594 | |||||||||
| India Earnings Fund (consolidated) |
137 | 3,607 | 24 | |||||||||
4. CAPITAL SHARE TRANSACTIONS
As of March 31, 2019, there were an unlimited number of $0.001 par value shares of beneficial interest authorized by the Trust. Shares are issued and redeemed by each Fund only in creation units or multiples thereof. Except when aggregated in creation units, shares of each Fund are not redeemable. Transactions in shares for each Fund are disclosed in detail in the Statements of Changes in Net Assets. The consideration for the purchase of creation units of a Fund generally consists of the in-kind contribution of a portfolio of equity securities and an amount of cash. The India Earnings Fund and Middle East Dividend Fund issue and redeem shares on a cash basis only as certain securities markets in which these Funds invest do not permit in-kind transfers of securities. Investors purchasing and redeeming creation units may be charged a purchase transaction fee and a redemption transaction fee to offset transfer and other transaction costs associated with the issuance and redemption of creation units.
5. INVESTMENT PORTFOLIO TRANSACTIONS
Purchases and sales of investments (excluding purchases and sales resulting from in-kind capital share transactions and short-term investments) and the cost of purchases and the proceeds from sales resulting from in-kind capital share transactions (excluding short-term investments) for the fiscal year or period ended March 31, 2019 are shown in the following table. Realized gains and losses
| 110 | WisdomTree Trust |
Notes to Financial Statements (continued)
on sales resulting from in-kind capital share redemptions, as shown on the Statements of Operations, are not recognized by the Funds for tax purposes.
| In-kind Capital Share Transactions | ||||||||||||||||
| Fund | Purchases | Sales | Purchases | Sales | ||||||||||||
| Asia Pacific ex-Japan Fund |
$ | 8,031,602 | $ | 11,445,589 | $ | — | $ | 6,749,122 | ||||||||
| China ex-State-Owned Enterprises Fund |
58,397,776 | 68,525,810 | 23,290,105 | 58,565,458 | ||||||||||||
| Emerging Markets Consumer Growth Fund |
32,677,441 | 35,503,154 | 3,871,698 | 7,931,577 | ||||||||||||
| Emerging Markets ex-State-Owned Enterprises Fund |
146,449,529 | 42,576,201 | 117,199,909 | 6,776,191 | ||||||||||||
| Emerging Markets High Dividend Fund |
926,310,342 | 895,648,782 | 126,099,152 | 104,243,543 | ||||||||||||
| Emerging Markets Multifactor Fund1 |
23,602,906 | 14,811,415 | 9,600,727 | — | ||||||||||||
| Emerging Markets Quality Dividend Growth Fund |
64,712,617 | 59,995,417 | 8,714,714 | 11,410,363 | ||||||||||||
| Emerging Markets SmallCap Dividend Fund |
576,717,997 | 631,414,817 | 25,823,112 | 76,441,851 | ||||||||||||
| Global ex-U.S. Quality Dividend Growth Fund |
41,604,867 | 40,996,563 | 15,089,018 | 9,820,069 | ||||||||||||
| Global ex-U.S. Real Estate Fund |
17,975,008 | 17,640,038 | 14,702,624 | 9,142,803 | ||||||||||||
| Global High Dividend Fund |
18,883,240 | 19,324,553 | — | 10,687,415 | ||||||||||||
| India Earnings Fund (consolidated) |
552,242,812 | 909,762,389 | — | — | ||||||||||||
| Middle East Dividend Fund |
9,027,961 | 5,266,141 | — | — | ||||||||||||
| 1 | For the period August 10, 2018 (commencement of operations) through March 31, 2019. |
6. FEDERAL INCOME TAXES
At March 31, 2019, the cost of investments (including securities on loan and derivatives) for Federal income tax purposes was as follows:
| Investments in Long Securities | Investments in Financial Derivatives1 | |||||||||||||||||||||||||||||||||||
| Fund | Tax Cost | Gross Unrealized Appreciation |
Gross Unrealized Depreciation |
Net Unrealized Appreciation/ (Depreciation) |
Gross Unrealized Appreciation |
Gross Unrealized Depreciation |
Net Unrealized Appreciation/ (Depreciation) |
Total Net Unrealized Appreciation/ (Depreciation) |
||||||||||||||||||||||||||||
| Asia Pacific ex-Japan Fund |
$ | 30,345,390 | $ | 5,106,063 | $ | (1,896,142 | ) | $ | 3,209,921 | $ | — | $ | — | $ | — | $ | 3,209,921 | |||||||||||||||||||
| China ex-State-Owned Enterprises Fund |
145,185,164 | 12,147,120 | (12,712,558 | ) | (565,438 | ) | — | — | — | (565,438 | ) | |||||||||||||||||||||||||
| Emerging Markets Consumer Growth Fund |
31,194,706 | 4,365,253 | (953,423 | ) | 3,411,830 | — | — | — | 3,411,830 | |||||||||||||||||||||||||||
| Emerging Markets ex-State-Owned Enterprises Fund |
302,440,041 | 15,316,441 | (11,418,300 | ) | 3,898,141 | — | — | — | 3,898,141 | |||||||||||||||||||||||||||
| Emerging Markets High Dividend Fund |
2,099,088,769 | 242,430,534 | (145,610,747 | ) | 96,819,787 | 8,885 | (1,628 | ) | 7,257 | 96,827,044 | ||||||||||||||||||||||||||
| Emerging Markets Multifactor Fund |
18,118,748 | 894,013 | (222,135 | ) | 671,878 | 6 | (17 | ) | (11 | ) | 671,867 | |||||||||||||||||||||||||
| Emerging Markets Quality Dividend Growth Fund |
60,660,662 | 10,799,128 | (2,121,560 | ) | 8,677,568 | — | (2 | ) | (2 | ) | 8,677,566 | |||||||||||||||||||||||||
| Emerging Markets SmallCap Dividend Fund |
1,346,545,114 | 197,108,323 | (113,328,934 | ) | 83,779,389 | — | — | — | 83,779,389 | |||||||||||||||||||||||||||
| Global ex-U.S. Quality Dividend Growth Fund |
68,635,473 | 7,848,926 | (3,559,287 | ) | 4,289,639 | — | — | — | 4,289,639 | |||||||||||||||||||||||||||
| Global ex-U.S. Real Estate Fund |
113,790,005 | 10,003,394 | (6,963,208 | ) | 3,040,186 | — | — | — | 3,040,186 | |||||||||||||||||||||||||||
| Global High Dividend Fund |
89,614,750 | 10,677,492 | (7,016,131 | ) | 3,661,361 | 19 | — | 19 | 3,661,380 | |||||||||||||||||||||||||||
| WisdomTree Trust | 111 |
Notes to Financial Statements (continued)
| Investments in Long Securities | Investments in Financial Derivatives1 | |||||||||||||||||||||||||||||||||||
| Fund | Tax Cost | Gross Unrealized Appreciation |
Gross Unrealized Depreciation |
Net Unrealized Appreciation/ (Depreciation) |
Gross Unrealized Appreciation |
Gross Unrealized Depreciation |
Net Unrealized Appreciation/ (Depreciation) |
Total Net Unrealized Appreciation/ (Depreciation) |
||||||||||||||||||||||||||||
| India Earnings Fund (consolidated) |
$ | 957,616,915 | $ | 421,661,600 | $ | (49,351,873 | ) | $ | 372,309,727 | $ | — | $ | — | $ | — | $ | 372,309,727 | |||||||||||||||||||
| Middle East Dividend Fund |
17,300,774 | 3,672,290 | (816,399 | ) | 2,855,891 | — | — | — | 2,855,891 | |||||||||||||||||||||||||||
| 1 | Certain financial derivatives may be considered section 1256 contracts under the Code. Each section 1256 contract held at the close of a taxable year shall be treated as sold for its fair market value on the last business day of such taxable year (and any realized gain or loss shall be taken into account for the taxable year). As such, the unrealized appreciation/(deprecation) for financial derivatives on a tax basis may not correspond to the unrealized appreciation/(depreciation) on a GAAP basis. The unrealized appreciation/(depreciation) for financial derivatives on a GAAP basis is located in the respective financial derivatives tables in each Fund’s Schedule of Investments. |
At March 31, 2019, the components of accumulated earnings/(loss) on a tax-basis were as follows:
| Fund | Undistributed Ordinary Income |
Undistributed Capital and Other Losses |
Net Unrealized (Depreciation) |
Currency and Other Unrealized Depreciation |
Total Accumulated (Losses) |
|||||||||||||||
| Asia Pacific ex-Japan Fund |
$ | 12,006 | $ | (9,731,351 | ) | $ | 3,209,921 | $ | (14,611 | ) | $ | (6,524,035 | ) | |||||||
| China ex-State-Owned Enterprises Fund |
— | (23,573,364 | ) | (565,438 | ) | (56 | ) | (24,138,858 | ) | |||||||||||
| Emerging Markets Consumer Growth Fund |
15,671 | (11,384,695 | ) | 3,411,830 | (4,116 | ) | (7,961,310 | ) | ||||||||||||
| Emerging Markets ex-State-Owned Enterprises Fund |
124,917 | (7,191,338 | ) | 3,898,141 | (29,948 | ) | (3,198,228 | ) | ||||||||||||
| Emerging Markets High Dividend Fund |
4,629,179 | (1,302,935,847 | ) | 96,827,044 | (106,713 | ) | (1,201,586,337 | ) | ||||||||||||
| Emerging Markets Multifactor Fund |
16,595 | (525,526 | ) | 671,867 | (16,271 | ) | 146,665 | |||||||||||||
| Emerging Markets Quality Dividend Growth Fund |
16,450 | (17,071,286 | ) | 8,677,566 | (104,668 | ) | (8,481,938 | ) | ||||||||||||
| Emerging Markets SmallCap Dividend Fund |
4,737,604 | (388,595,820 | ) | 83,779,389 | (61,528 | ) | (300,140,355 | ) | ||||||||||||
| Global ex-U.S. Quality Dividend Growth Fund |
158,965 | (15,475,760 | ) | 4,289,639 | (56,372 | ) | (11,083,528 | ) | ||||||||||||
| Global ex-U.S. Real Estate Fund |
3,978,995 | (10,892,834 | ) | 3,040,186 | (3,571 | ) | (3,877,224 | ) | ||||||||||||
| Global High Dividend Fund |
101,770 | (8,121,509 | ) | 3,661,380 | (4,917 | ) | (4,363,276 | ) | ||||||||||||
| India Earnings Fund (consolidated) |
— | (188,764,575 | ) | 372,309,727 | (8,368,845 | ) | 175,176,307 | |||||||||||||
| Middle East Dividend Fund |
310,853 | (4,536,974 | ) | 2,855,891 | (66 | ) | (1,370,296 | ) | ||||||||||||
The tax character of distributions paid during the fiscal years or periods ended March 31, 2019 and March 31, 2018, was as follows:
| Year Ended March 31, 2019 | Year Ended March 31, 2018 | |||||||||||
| Fund | Distributions Paid from Ordinary Income* |
Distributions Paid from Return of Capital |
Distributions Paid from Ordinary Income* |
|||||||||
| Asia Pacific ex-Japan Fund |
$ | 1,626,373 | $ | — | $ | 1,460,015 | ||||||
| China ex-State-Owned Enterprises Fund |
2,142,539 | 19,493 | 175,236 | |||||||||
| Emerging Markets Consumer Growth Fund |
1,229,361 | — | 608,721 | |||||||||
| Emerging Markets ex-State-Owned Enterprises Fund |
2,582,368 | — | 125,650 | |||||||||
| Emerging Markets High Dividend Fund |
87,028,025 | — | 74,635,924 | |||||||||
| Emerging Markets Multifactor Fund |
111,589 | 1 | — | — | ||||||||
| Emerging Markets Quality Dividend Growth Fund |
2,036,219 | — | 1,254,486 | |||||||||
| Emerging Markets SmallCap Dividend Fund |
58,272,794 | — | 39,444,335 | |||||||||
| Global ex-U.S. Quality Dividend Growth Fund |
1,532,940 | — | 1,055,807 | |||||||||
| Global ex-U.S. Real Estate Fund |
4,157,515 | — | 6,147,290 | |||||||||
| Global High Dividend Fund |
3,977,862 | — | 3,155,342 | |||||||||
| India Earnings Fund (consolidated) |
18,968,260 | 609,812 | 14,626,040 | |||||||||
| Middle East Dividend Fund |
738,425 | — | 417,266 | |||||||||
| *Includes | short-term capital gains if any. |
| 1 | For the period August 10, 2018 (commencement of operations) through March 31, 2019. |
| 112 | WisdomTree Trust |
Notes to Financial Statements (continued)
At March 31, 2019, for Federal tax purposes, the Funds have capital loss carryforwards available to offset future capital gains as indicated in the below table. To the extent that these loss carryforwards are utilized, capital gains so offset will not be distributed to shareholders.
| Fund | Short-Term Post-Effective No Expiration |
Long-Term Post-Effective No Expiration |
Capital Loss Available Total |
|||||||||
| Asia Pacific ex-Japan Fund |
$ | 3,219,685 | $ | 6,511,666 | $ | 9,731,351 | ||||||
| China ex-State-Owned Enterprises Fund |
19,069,102 | 4,474,202 | 23,543,304 | |||||||||
| Emerging Markets Consumer Growth Fund |
4,511,523 | 6,873,172 | 11,384,695 | |||||||||
| Emerging Markets ex-State-Owned Enterprises Fund |
6,155,717 | 1,035,621 | 7,191,338 | |||||||||
| Emerging Markets High Dividend Fund |
484,217,233 | 818,718,614 | 1,302,935,847 | |||||||||
| Emerging Markets Multifactor Fund |
387,223 | 138,303 | 525,526 | |||||||||
| Emerging Markets Quality Dividend Growth Fund |
9,274,805 | 7,796,481 | 17,071,286 | |||||||||
| Emerging Markets SmallCap Dividend Fund |
263,674,320 | 124,921,500 | 388,595,820 | |||||||||
| Global ex-U.S. Quality Dividend Growth Fund |
13,339,763 | 2,135,997 | 15,475,760 | |||||||||
| Global ex-U.S. Real Estate Fund |
3,699,298 | 7,193,536 | 10,892,834 | |||||||||
| Global High Dividend Fund |
4,663,371 | 3,458,138 | 8,121,509 | |||||||||
| India Earnings Fund (consolidated) |
184,991,188 | 3,773,387 | 188,764,575 | |||||||||
| Middle East Dividend Fund |
1,987,043 | 2,549,931 | 4,536,974 | |||||||||
Capital losses incurred after October 31 (“post-October capital losses”) and late year ordinary losses incurred after December 31 within the taxable year are deemed to arise on the first business day of each Fund’s next taxable year.
During the fiscal year or period ended March 31, 2019, the following Funds incurred and will elect to defer late year ordinary losses as follows:
| Fund | Late Year Ordinary Loss |
|||
| Asia Pacific ex-Japan Fund |
$ | — | ||
| China ex-State-Owned Enterprises Fund |
30,060 | |||
| Emerging Markets Consumer Growth Fund |
— | |||
| Emerging Markets ex-State-Owned Enterprises Fund |
— | |||
| Emerging Markets High Dividend Fund |
— | |||
| Emerging Markets Multifactor Fund |
— | |||
| Emerging Markets Quality Dividend Growth Fund |
— | |||
| Emerging Markets SmallCap Dividend Fund |
— | |||
| Global ex-U.S. Quality Dividend Growth Fund |
— | |||
| Global ex-U.S. Real Estate Fund |
— | |||
| Global High Dividend Fund |
— | |||
| India Earnings Fund (consolidated) |
— | |||
| Middle East Dividend Fund |
— | |||
During the fiscal year or period ended March 31, 2019, the amount of expired capital loss carryforwards and the amount of capital loss carryforwards used to offset realized gains and the amount of capital loss carryforwards that expired unused are shown in the following table:
| Fund | Expired Capital Loss Carryforward |
Utilized Capital Loss Carryforward |
||||||
| Asia Pacific ex-Japan Fund |
$ | 2,148,087 | $ | — | ||||
| China ex-State-Owned Enterprises Fund |
— | — | ||||||
| Emerging Markets Consumer Growth Fund |
— | — | ||||||
| Emerging Markets ex-State-Owned Enterprises Fund |
— | — | ||||||
| Emerging Markets High Dividend Fund |
561,494 | — | ||||||
| Emerging Markets Multifactor Fund1 |
— | — | ||||||
| Emerging Markets Quality Dividend Growth Fund |
— | — | ||||||
| Emerging Markets SmallCap Dividend Fund |
4,882,951 | — | ||||||
| WisdomTree Trust | 113 |
Notes to Financial Statements (continued)
| Fund | Expired Capital Loss Carryforward |
Utilized Capital Loss Carryforward |
||||||
| Global ex-U.S. Quality Dividend Growth Fund |
$ | — | $ | — | ||||
| Global ex-U.S. Real Estate Fund |
10,538,886 | — | ||||||
| Global High Dividend Fund |
807,956 | — | ||||||
| India Earnings Fund (consolidated) |
6,294,051 | 38,708,025 | ||||||
| Middle East Dividend Fund |
763,315 | — | ||||||
| 1 | For the period August 10, 2018 (commencement of operations) through March 31, 2019. |
At March 31, 2019, the effect of permanent “book/tax” reclassifications resulted in increases (decreases) to the components of net assets as follows:
| Fund | Total Distributable Earnings (Loss) |
Paid-in Capital | ||||||
| Asia Pacific ex-Japan Fund |
$ | 1,362,746 | $ | (1,362,746 | ) | |||
| China ex-State-Owned Enterprises Fund |
(7,716,920 | ) | 7,716,920 | |||||
| Emerging Markets Consumer Growth Fund |
(155,319 | ) | 155,319 | |||||
| Emerging Markets ex-State-Owned Enterprises Fund |
(379,691 | ) | 379,691 | |||||
| Emerging Markets High Dividend Fund |
(14,042,513 | ) | 14,042,513 | |||||
| Emerging Markets Multifactor Fund |
— | — | ||||||
| Emerging Markets Quality Dividend Growth Fund |
(2,391,073 | ) | 2,391,073 | |||||
| Emerging Markets SmallCap Dividend Fund |
(1,765,702 | ) | 1,765,702 | |||||
| Global ex-U.S. Quality Dividend Growth Fund |
(1,611,445 | ) | 1,611,445 | |||||
| Global ex-U.S. Real Estate Fund |
9,595,901 | (9,595,901 | ) | |||||
| Global High Dividend Fund |
(601,916 | ) | 601,916 | |||||
| India Earnings Fund (consolidated) |
6,294,050 | (6,294,050 | ) | |||||
| Middle East Dividend Fund |
763,316 | (763,316 | ) | |||||
The differences are primarily due to redemptions-in-kind, foreign currency transactions, investments in passive foreign investment companies, investments in partnerships, and expiration of capital loss carryforwards.
GAAP provides guidance on tax provisions that prescribe a minimum threshold for financial statement recognition of the benefit of a tax position taken or expected to be taken in a tax return. Foreign taxes are provided for based on each Fund’s understanding of the tax rules and rates that exist in the foreign markets in which it invests. Taxes are accrued and applied to net investment income, net realized capital gains and net unrealized appreciation, as applicable, as the income is earned or capital gains are recorded. As of and during the fiscal year or period ended March 31, 2019, the Funds did not have any liabilities for unrecognized tax benefits relating to uncertain income tax positions they have taken or expect to take in the future. If applicable, the Funds will recognize interest accrued related to unrecognized tax benefits in interest expense and penalties in “Other” expenses on the Statements of Operations. The Funds file tax returns with the Internal Revenue Service, the State of New York, and various other states. Generally, each of the tax years in the four-year period ended March 31, 2019, remains subject to examination by taxing authorities.
7. MAURITIUS AND INDIA TAXATION
The Portfolio holds a tax residency certificate issued by the Mauritian Revenue authorities, other tax residency related documentation prescribed by the Indian Revenue authorities and should be regarded as the beneficial owner of the investments made in Indian securities, which should entitle it to claim the benefits of the double taxation avoidance agreement entered between the Government of India and Mauritius (“tax treaty”). Since the India Earnings Fund makes its investments through the Portfolio, a wholly owned subsidiary organized in the Republic of Mauritius, this structure should permit the India Earnings Fund to indirectly benefit from any tax treaty benefits claimed by the Portfolio. The Supreme Court of India upheld the validity of this tax treaty in response to a lower court challenge contesting the tax treaty’s applicability to entities such as the Portfolio. The eligibility for tax treaty benefits does however continue to be a highly litigated matter in India.
The taxable profits derived from the worldwide income of the wholly owned subsidiary of the India Earnings Fund, i.e. the Portfolio, is subject to income tax at the rate of 15% in the Republic of Mauritius. As with all Mauritian tax residents, the Portfolio is entitled to a foreign tax credit (“FTC”) on its foreign sourced income. The FTC is based on the lower of the Mauritian tax or the foreign taxes incurred. Where documentary evidence is not available to substantiate the foreign taxes suffered, the FTC can be presumed to be 80% of the Mauritius tax on its foreign source income. The presumed FTC effectively reduces the Mauritian income tax rate on the foreign sourced income of the Portfolio to a maximum of 3%. Interest income on call and deposit accounts with Mauritian banks is exempt from tax, and there is no tax on capital gains in Mauritius. Prior to August 8, 2012, the Mauritius income tax was paid by the Portfolio, and thereafter, the Mauritius income tax was paid by WTAM. Effective July 1, 2021, the Portfolio will not be allowed to
| 114 | WisdomTree Trust |
Notes to Financial Statements (concluded)
compute its foreign tax according to a presumed amount of 80% of the Mauritian tax of the relevant foreign sourced income. Furthermore, transactions with the Portfolio will not necessarily be considered to be foreign sourced income. However, the Portfolio may apply for a partial exemption on its foreign dividend income, interest income and profits from foreign permanent establishments. The partial exemption would be computed at 80% of the relevant foreign sourced income.
On May 10, 2016, the Government of India and Mauritius announced the signing of a protocol amending the provisions of the tax treaty (“2016 Protocol”). The 2016 Protocol has become effective on April 1, 2017 in respect of income and gains received from India. The 2016 Protocol, inter alia, provides for capital gains arising on disposal of shares of an Indian company acquired by a company resident in Mauritius on or after April 1, 2017 to be taxed in India. However, investments in shares acquired up to March 31, 2017 are grandfathered, thus exempted from capital gains tax in India irrespective of the date of disposal. In addition, shares acquired from April 1, 2017 and disposed of by March 31, 2019 are taxable at a concessionary rate equivalent to 50% of the domestic tax rate prevailing in India provided the Mauritius company meets the prescribed limitation of benefits (“LOB”) clause. As such, the LOB Article denies the concessional 50% Indian capital gains tax rate benefit in respect of capital gains arising between April 1, 2017 and March 31, 2019, where the detailed LOB conditions prescribed under the tax treaty are not fulfilled.
Any shares acquired by the Portfolio after April 1, 2017 and transferred on or after April 1, 2019 are subject to the full rate of capital gains tax in India. The 2016 Protocol only amends the capital gains article in relation to the taxation of shares. As such, all other “securities” besides shares are subject to similar taxation principles, as they apply currently to the Portfolio.
This amendment will reduce the return to the India Earnings Fund on its investments made on or after April 1, 2017 and the return received by India Earnings Fund shareholders. The Indian tax rates applicable on disposal of securities by the Portfolio would depend on the nature of securities, the holding period and the manner of disposal.
In March 2012, the Indian Finance Minister introduced a new chapter to the Indian Income Tax Act, 1961 (“IT Act”), which included certain General Anti-Avoidance Rules (“GAAR”). GAAR is applicable to financial years beginning on or after April 1, 2017. All investments made into India before April 1, 2017 are grandfathered and are exempt from the applicability of GAAR, irrespective of the date of exit of the investments. With effect from April 1, 2017, the investments made by the Portfolio would be subject to GAAR if any tax benefit is claimed by the Portfolio.
Reference to investments by the India Earnings Fund herein should be understood to refer to investments by the Portfolio.
8. DEMAND NOTE
During the year ended March 31, 2019, the India Earnings Fund had a demand note agreement with Bank of America, N.A. which allowed the Fund to borrow up to $400,000,000 and had a final maturity date of October 9, 2018. During the year ended March 31, 2019, the Fund utilized the demand note and borrowed for a period of 6 days with an average outstanding note balance of $263,885,625 and a weighted average interest rate of 4.28% per annum. Interest expense related to the loan for the year ended March 31, 2019 was $185,659. At March 31, 2019, the Fund did not have any amounts outstanding under the demand note agreement.
9. RECENT ACCOUNTING PRONOUNCEMENTS
On August 17, 2018, the SEC voted to adopt “Disclosure Update and Simplification” amendments to certain of its disclosure requirements that have become redundant, duplicative, overlapping, outdated, or superseded, in light of other SEC disclosure requirements, GAAP, or changes in the information environment. The SEC will also be referring certain SEC disclosure requirements that overlap with, but require information incremental to, GAAP to the FASB for potential incorporation into GAAP. The amendments are intended to facilitate the disclosure of information to investors and simplify compliance without significantly altering the total mix of information provided to investors. These amendments became effective on November 5, 2018 (30 days after their publication in the Federal Register). WTAM has evaluated these amendments and determined that there is no significant impact on the Trust’s financial statements. All applicable amendments have been incorporated into the Trust’s financial statements and related disclosures. The specific amendments incorporated into the Trust’s financial statements pertain to (i) the amendment requiring the presentation of the distributable earnings in total on the Statements of Assets and Liabilities, rather than showing the 3 components of distributable earnings (i.e., (1) undistributed (distributions in excess of) net investment income, (2) accumulated net realized gain (loss) on investments and (3) net unrealized appreciation (depreciation) on investments, and (ii) the amendment requiring the presentation of distributions to shareholders in total on the Statements of Changes in Net Assets, except for tax return of capital distributions, which shall continue to be disclosed separately.
On August 28, 2018, the FASB issued ASU 2018-13, Fair Value Measurement (Topic 820): Disclosure Framework — Changes to the Disclosure Requirements for Fair Value Measurement. ASU 2018-13 includes removals, additions and modifications to the disclosure requirements for fair value measurements that are intended to improve the effectiveness of disclosures in the notes to financial statements. The amendments in ASU 2018-13 are effective for all entities for fiscal years, and interim periods within those fiscal years, beginning after December 15, 2019. An entity is permitted to early adopt any removed or modified disclosures upon issuance of this ASU and delay adoption of the additional disclosures until their effective date. WTAM has evaluated ASU 2018-13 and has adopted the disclosure framework for the Trust’s financial statements.
| WisdomTree Trust | 115 |
Report of Independent Registered Public Accounting Firm
To the Shareholders of WisdomTree Asia Pacific ex-Japan Fund, WisdomTree China ex-State-Owned Enterprises Fund, WisdomTree Emerging Markets Consumer Growth Fund, WisdomTree Emerging Markets ex-State-Owned Enterprises Fund, WisdomTree Emerging Markets High Dividend Fund, WisdomTree Emerging Markets Multifactor Fund, WisdomTree Emerging Markets Quality Dividend Growth Fund, WisdomTree Emerging Markets SmallCap Dividend Fund, WisdomTree Global ex-U.S. Quality Dividend Growth Fund, WisdomTree Global ex-U.S. Real Estate Fund, WisdomTree Global High Dividend Fund, WisdomTree India Earnings Fund (consolidated) and WisdomTree Middle East Dividend Fund and the Board of Trustees of WisdomTree Trust
Opinion on the Financial Statements
We have audited the accompanying statements of assets and liabilities of WisdomTree Asia Pacific ex-Japan Fund, WisdomTree China ex-State-Owned Enterprises Fund, WisdomTree Emerging Markets Consumer Growth Fund, WisdomTree Emerging Markets ex-State-Owned Enterprises Fund, WisdomTree Emerging Markets High Dividend Fund, WisdomTree Emerging Markets Multifactor Fund, WisdomTree Emerging Markets Quality Dividend Growth Fund, WisdomTree Emerging Markets SmallCap Dividend Fund, WisdomTree Global ex-U.S. Quality Dividend Growth Fund, WisdomTree Global ex-U.S. Real Estate Fund, WisdomTree Global High Dividend Fund, WisdomTree India Earnings Fund (consolidated) and WisdomTree Middle East Dividend Fund (collectively referred to as the “Funds”), (thirteen of the funds constituting WisdomTree Trust (the “Trust”)) including the schedules of investments, as of March 31, 2019, and the related statements of operations, and changes in net assets, and the financial highlights for each of the periods indicated in the table below and the related notes (collectively referred to as the “financial statements”). In our opinion, the financial statements present fairly, in all material respects, the financial position of each of the Funds (thirteen of the funds constituting WisdomTree Trust) at March 31, 2019, and the results of their operations, changes in net assets and financial highlights for each of the periods indicated in the table below, in conformity with U.S. generally accepted accounting principles.
| Individual fund constituting the WisdomTree Trust | Statement of operations |
Statements of changes in net assets |
Financial highlights | |||
| WisdomTree Asia Pacific ex-Japan Fund WisdomTree China ex-State-Owned Enterprises Fund WisdomTree Emerging Markets Consumer Growth Fund WisdomTree Emerging Markets High Dividend Fund WisdomTree Emerging Markets Quality Dividend Growth Fund WisdomTree Emerging Markets SmallCap Dividend Fund WisdomTree Global ex-U.S. Quality Dividend Growth Fund WisdomTree Global ex-U.S. Real Estate Fund WisdomTree Global High Dividend Fund WisdomTree India Earnings Fund (consolidated) WisdomTree Middle East Dividend Fund |
For the year ended March 31, 2019 | For each of the two years in the period ended March 31, 2019 | For each of the five years in the period ended March 31, 2019 | |||
| WisdomTree Emerging Markets ex-State-Owned Enterprises Fund |
For the year ended March 31, 2019 | For each of the two years in the period ended March 31, 2019 | For each of the four years in the period ended March 31, 2019 and the period from December 10, 2014 (commencement of operations) through March 31, 2015 | |||
| WisdomTree Emerging Markets Multifactor Fund |
For the period from August 10, 2018 (commencement of operations) through March 31, 2019 | |||||
Basis for Opinion
These financial statements are the responsibility of the Trust’s management. Our responsibility is to express an opinion on each of the Funds’ financial statements based on our audits. We are a public accounting firm registered with the Public Company Accounting Oversight Board (United States) (“PCAOB”) and are required to be independent with respect to the Trust in accordance with the U.S. federal securities laws and the applicable rules and regulations of the Securities and Exchange Commission and the PCAOB.
We conducted our audits in accordance with the standards of the PCAOB. Those standards require that we plan and perform the audit to obtain reasonable assurance about whether the financial statements are free of material misstatement, whether due to error or fraud. The Trust is not required to have, nor were we engaged to perform, an audit of the Trust’s internal control over financial reporting. As part of our audits, we are required to obtain an understanding of internal control over financial reporting, but not for the purpose of expressing an opinion on the effectiveness of the Trust’s internal control over financial reporting. Accordingly, we express no such opinion.
Our audits included performing procedures to assess the risks of material misstatement of the financial statements, whether due to error or fraud, and performing procedures that respond to those risks. Such procedures included examining, on a test basis, evidence regarding the amounts and disclosures in the financial statements. Our procedures included confirmation of securities
| 116 | WisdomTree Trust |
Report of Independent Registered Public Accounting Firm (concluded)
owned as of March 31, 2019, by correspondence with the custodian and brokers or by other appropriate auditing procedures where replies from brokers were not received. Our audits also included evaluating the accounting principles used and significant estimates made by management, as well as evaluating the overall presentation of the financial statements. We believe that our audits provide a reasonable basis for our opinion.

We have served as the auditor of one or more WisdomTree investment companies since 2006.
New York, NY
May 23, 2019
| WisdomTree Trust | 117 |
Trustees and Officers Information (unaudited)
The Board of Trustees is responsible for overseeing the management and affairs of the Funds and the Trust. The Board of Trustees elects the officers of the Trust who are responsible for administering the Trust’s day-to-day operations. Each Trustee serves until his or her successor is duly elected or appointed and qualified.
The address of each Trustee and Officer is c/o WisdomTree Asset Management, Inc., 245 Park Avenue, 35th Floor, New York, NY 10167.
Independent Trustees
| Name and Year of Birth |
Position(s) Held with |
Principal Occupation(s) |
Number of Portfolios in Fund Complex Overseen by Trustee/ Officer* |
Other During the Past | ||||||
| David G. Chrencik^ (1948) |
Trustee, 2014- present | Chief Financial Officer of Sarus Indochina Select LP (hedge fund) since 2012; Chief Financial Officer of GeoGreen BioFuels, Inc. (biodiesel fuel producer) from 2010 to 2014; Audit Partner at PricewaterhouseCoopers LLP (public accounting firm) from 1972 to 2009 (includes positions prior to becoming Audit Partner and predecessor firms). | 76 | Trustee, Vericimetry Funds (2011 to 2014). | ||||||
| Joel Goldberg#† (1945) |
Trustee, 2012- present | Attorney, Partner, Stroock & Stroock & Lavan LLP from 2010 to 2018; Attorney, Partner at Willkie Farr & Gallagher LLP from 2006 to 2010. | 76 | Director, Better Business Bureau (Metropolitan New York, Long Island and the Mid-Hudson Region). | ||||||
| Toni Massaro† (1955) |
Trustee, 2006- present | Dean Emerita at the University of Arizona James E. Rogers College of Law (“Rogers College of Law”) since 2009 (distinguished Emerita in July 2009); Dean at the Rogers College of Law from 1999 to 2009; Regents’ Professor since 2006; Milton O. Riepe Chair in Constitutional Law since 1997; Professor at the Rogers College of Law since 1990. | 76 | None | ||||||
| Melinda A. Raso Kirstein‡ (1955) |
Trustee, 2014- present | Retired since 2004, Merrill Lynch Investment Management, Vice President; Senior Portfolio Manager, Fixed Income Management; Director, Tax Exempt Fund Management. | 76 | Associate Alumnae of Douglass College, Chair of Investment Committee. | ||||||
| Victor Ugolyn (1947) |
Trustee, 2006- present; Chairman of the Board of Trustees, 2006-present | Private Investor, 2005 to present; President and Chief Executive Officer of William D. Witter, Inc. from 2005 to 2006; Consultant to AXA Enterprise in 2004; Chairman, President and Chief Executive Officer of Enterprise Capital Management (subsidiary of The MONY Group, Inc.) and Enterprise Group of Funds, Chairman of MONY Securities Corporation, and Chairman of the Fund Board of Enterprise Group of Funds from 1991 to 2004. | 76 | Member of the Board of Governors of Naismith Memorial Basketball Hall of Fame (2001-2016). | ||||||
| * | As of March 31, 2019. |
| ^ | Chair of the Audit Committee. |
| # | Co-Chair of the Contracts Review Committee. |
| † | Chair of the Governance, Nominating and Compliance Committee. |
| ‡ | Chair of the Investment Committee. |
| 118 | WisdomTree Trust |
Trustees and Officers Information (unaudited) (concluded)
Interested Trustee and Officers
| Name and Year of Birth |
Position(s) Held with the Trust, Term of Office and Length of Time Served |
Principal Occupation(s) |
Number of Portfolios in Fund Complex Overseen by Trustee/ Officer* |
Other During the Past | ||||||
| Jonathan Steinberg** (1964) |
Trustee, 2005- present; President, 2005-present |
President, WisdomTree Investments, Inc. and WisdomTree Asset Management, Inc. since 2012; Chief Executive Officer, WisdomTree Investments, Inc. and WisdomTree Asset Management, Inc. since 2005. | 76 | Director, WisdomTree Investments, Inc. and WisdomTree Asset Management, Inc. | ||||||
| David Castano** (1971) |
Treasurer, 2013- present | Director of Fund Accounting & Administration, WisdomTree Asset Management, Inc., since 2011. | 76 | None | ||||||
| Terry Jane Feld** (1960) |
Chief Compliance Officer, 2012- present | Chief Compliance Officer, WisdomTree Asset Management, Inc. since 2012; Senior Compliance Officer, WisdomTree Asset Management since 2011. | 76 | None | ||||||
| Ryan Louvar** (1972) |
Secretary and Chief Legal Officer, 2013- present |
General Counsel, WisdomTree Asset Management, Inc. since 2013; Vice President and Senior Managing Counsel, State Street, 2005 to 2013. | 76 | None | ||||||
| Joanne Antico** (1975) |
Assistant Secretary, 2018- |
Assistant General Counsel, WisdomTree Asset Management, Inc. since 2016; Executive Director and Assistant Secretary, Morgan Stanley Investment Management Inc., 2005 to 2016. | 76 | None | ||||||
| Clint Martin** (1977) |
Assistant Treasurer, 2015-present | Fund Manager, Fund Accounting & Administration, WisdomTree Asset Management, Inc., since 2012. | 76 | None | ||||||
| * | As of March 31, 2019. |
| ** | Elected by and serves at the pleasure of the Board. |
| WisdomTree Trust | 119 |
Supplemental Information (unaudited)
Federal Income Tax Information
The following Federal tax information related to the Funds’ fiscal year or period ended March 31, 2019, is provided for information purposes only and should not be used for reporting to federal or state revenue agencies. Federal tax information for the calendar year will be reported to you on Form 1099-DIV in January 2020.
Certain dividends paid by the Funds may be subject to a maximum tax rate of 15%, as provided by the Jobs and Growth Tax Relief Reconciliation Act of 2003. Of the distributions paid during the fiscal year or period ended March 31, 2019, the following represents the maximum amount of ordinary income distributions that may be considered qualified dividend income:
| Fund | Qualified Dividend Income |
|||
| Asia Pacific ex-Japan Fund |
$ | 1,190,685 | ||
| China ex-State-Owned Enterprises Fund |
1,339,459 | |||
| Emerging Markets Consumer Growth Fund |
673,763 | |||
| Emerging Markets ex-State-Owned Enterprises Fund |
2,123,778 | |||
| Emerging Markets High Dividend Fund |
63,438,544 | |||
| Emerging Markets Multifactor Fund1 |
110,468 | |||
| Emerging Markets Quality Dividend Growth Fund |
1,716,487 | |||
| Emerging Markets SmallCap Dividend Fund |
28,197,323 | |||
| Global ex-U.S. Quality Dividend Growth Fund |
1,346,730 | |||
| Global ex-U.S. Real Estate Fund |
1,067,223 | |||
| Global High Dividend Fund |
3,515,159 | |||
| India Earnings Fund (consolidated) |
19,578,072 | |||
| Middle East Dividend Fund |
61,776 | |||
| 1 | For the period August 10, 2018 (commencement of operations) through March 31, 2019. |
The Funds intend to elect to pass through to shareholders the credit for taxes paid to foreign countries during the fiscal year or period ended March 31, 2019. The gross foreign source income and foreign taxes paid are as follows:
| Fund | Gross Foreign Income |
Foreign Taxes Paid |
||||||
| Asia Pacific ex-Japan Fund |
$ | 1,896,877 | $ | 132,232 | ||||
| China ex-State-Owned Enterprises Fund |
2,498,254 | 127,641 | ||||||
| Emerging Markets Consumer Growth Fund |
1,226,042 | 120,765 | ||||||
| Emerging Markets ex-State-Owned Enterprises Fund |
3,598,822 | 476,687 | ||||||
| Emerging Markets High Dividend Fund |
96,836,882 | 10,874,277 | ||||||
| Emerging Markets Multifactor Fund1 |
190,086 | 21,968 | ||||||
| Emerging Markets Quality Dividend Growth Fund |
2,628,991 | 415,486 | ||||||
| Emerging Markets SmallCap Dividend Fund |
59,167,690 | 6,881,719 | ||||||
| Global ex-U.S. Quality Dividend Growth Fund |
1,712,617 | 162,547 | ||||||
| Global ex-U.S. Real Estate Fund |
4,333,161 | 263,554 | ||||||
| Global High Dividend Fund |
— | — | ||||||
| India Earnings Fund (consolidated) |
— | — | ||||||
| Middle East Dividend Fund |
959,711 | 15,836 | ||||||
| 1 | For the period August 10, 2018 (commencement of operations) through March 31, 2019. |
| 120 | WisdomTree Trust |
Supplemental Information (unaudited) (concluded)
The following represents the percentage of dividends paid during the fiscal year or period ended March 31, 2019, that qualify for the 70% dividends received deduction for corporate shareholders:
| Fund | Dividends-Received Deduction |
|||
| Asia Pacific ex-Japan Fund |
— | |||
| China ex-State-Owned Enterprises Fund |
1.42 | % | ||
| Emerging Markets Consumer Growth Fund |
— | |||
| Emerging Markets ex-State-Owned Enterprises Fund |
0.30 | % | ||
| Emerging Markets High Dividend Fund |
0.03 | % | ||
| Emerging Markets Multifactor Fund1 |
— | |||
| Emerging Markets Quality Dividend Growth Fund |
— | |||
| Emerging Markets SmallCap Dividend Fund |
— | |||
| Global ex-U.S. Quality Dividend Growth Fund |
— | |||
| Global ex-U.S. Real Estate Fund |
— | |||
| Global High Dividend Fund |
50.51 | % | ||
| India Earnings Fund (consolidated) |
— | |||
| Middle East Dividend Fund |
— | |||
| 1 | For the period August 10, 2018 (commencement of operations) through March 31, 2019. |
| WisdomTree Trust | 121 |
General Information (unaudited)
Proxy Voting Policies, Procedures and Record
A complete copy of the Proxy Voting Policy may be obtained upon request, at no charge, by calling 1-866-909-WISE (9473) or writing to: WisdomTree Trust, c/o Foreside Fund Services, LLC, Three Canal Plaza Suite 100, Portland, ME, 04101.
The Trust is required to disclose annually the Funds’ complete proxy voting record on Form N-PX covering the most recent 12-month period ended June 30 and to file Form N-PX with the SEC no later than August 31 of each year. The current Form N-PX for the Funds is available at no charge upon request by calling 1-866-909-WISE (9473) or through the Trust’s website at www.wisdomtree.com. The Funds’ Form N-PX is also available on the SEC’s website at www.sec.gov.
Shareholder Reports and Quarterly Portfolio Disclosure
The Funds are required to file their complete schedule of portfolio holdings with the SEC for their first and third fiscal quarters on Form N-Q. Beginning in April 2019, the Funds will cease filing Form N-Q and will commence filing Form N-PORT. Part F of each Fund’s Form N-PORT filings for the first and third fiscal quarters will contain the complete schedule of portfolio holdings in the same manner as previously filed on Form N-Q. Copies of the filings are available, without charge, on the SEC’s website at www.sec.gov and are also available by calling the Trust at 1-866-909-WISE (9473). Copies of the filings may also be obtained, after paying a duplicating fee, by electronic request at the following E-mail address: publicinfo@sec.gov.
Information about each Fund’s portfolio holdings is available daily, without charge, at www.wisdomtree.com.
The Statement of Additional Information (“SAI”) has additional information about the Funds’ Trustees and Officers and is available without charge upon request. Contact your financial representative for a free prospectus or SAI.
Frequency Distribution of Discounts & Premiums
Information about differences between the per share net asset value of each Fund and the market trading price of shares of each Fund are available, without charge, at www.wisdomtree.com.
| 122 | WisdomTree Trust |
The WisdomTree Funds are exchange traded funds (“ETFs”) registered with the United States Securities and Exchange Commission as separate series (“Funds”) of WisdomTree Trust (“Trust”). WisdomTree Asset Management, Inc., a wholly owned subsidiary of WisdomTree Investments, Inc., serves as the investment adviser to the Trust. None of the WisdomTree entities are affiliated with Foreside Fund Services, LLC, the Funds’ distributor. WisdomTree Investments, its affiliates and their independent providers are not liable for any informational errors, incompleteness, delays, or for any actions taken in reliance on information contained herein.
Investors should consider the investment objectives, risks, charges and expenses of the Funds carefully before investing. A prospectus, containing this and other information, is available at www.wisdomtree.com, or by calling 1-866-909-WISE (9473). Investors should read the prospectus carefully before investing. There are risks associated with investing, including possible loss of principal. Past performance does not guarantee future results. Indexes are unmanaged and you cannot invest directly in an index.
There are risks associated with investing including possible loss of principal. Foreign investing involves special risks, such as risk of loss from currency fluctuation or political or economic uncertainty. Investments in real estate involve additional special risks, such as credit risk, interest rate fluctuations and the effect of varied economic conditions. Funds that focus their investments in one country or region may be significantly impacted by events and developments associated with the region which can adversely affect performance. Funds focusing on a single sector and/or smaller companies generally experience greater price volatility. Investments in emerging, offshore or frontier markets are generally less liquid and less efficient than investments in developed markets and are subject to additional risks, such as risks of adverse governmental regulation and intervention or political developments. Inflation protected securities do not eliminate risks associated with inflation or deflation. Investments in currency involve additional special risks, such as credit risk and interest rate fluctuations. Derivative investments can be volatile and these investments may be less liquid than other securities, and more sensitive to the effect of varied economic conditions. As these Funds can have a high concentration in some issuers the Funds can be adversely impacted by changes affecting such issuers. Due to the investment strategy of certain Funds they may make higher capital gain distributions than other ETFs. Please read the Fund’s prospectus for specific details regarding the Fund’s risk profile.
The Dow Jones Global ex-U.S. Select Real Estate Securities Index is calculated, distributed and marketed by Dow Jones Indexes, a licensed trademark of CME Group Index Services LLC, and has been licensed for use.
Transactions in Fund shares will result in brokerage commissions and will generate tax consequences. Shares may be sold through brokerage accounts, but may be redeemed from the Funds only by Authorized Participants in large creation unit sizes of shares.
WisdomTree Trust
245 Park Avenue, 35th Floor
New York, NY 10167
WisdomTree Fund shares are distributed by Foreside Fund Services, LLC, in the U.S. only.
WTGM-2275


WisdomTree Trust
Annual Report
March 31, 2019
WisdomTree U.S. Dividend ex-Financials Fund (DTN)
WisdomTree U.S. High Dividend Fund (DHS)
WisdomTree U.S. LargeCap Dividend Fund (DLN)
WisdomTree U.S. LargeCap Fund (EPS)
(formerly, WisdomTree U.S. Earnings 500 Fund)
WisdomTree U.S. MidCap Dividend Fund (DON)
WisdomTree U.S. MidCap Fund (EZM)
(formerly, WisdomTree U.S. MidCap Earnings Fund)
WisdomTree U.S. Multifactor Fund (USMF)
WisdomTree U.S. Quality Dividend Growth Fund (DGRW)
WisdomTree U.S. Quality Shareholder Yield Fund (QSY)
WisdomTree U.S. SmallCap Dividend Fund (DES)
WisdomTree U.S. SmallCap Fund (EES)
(formerly, WisdomTree U.S. SmallCap Earnings Fund)
WisdomTree U.S. SmallCap Quality Dividend Growth Fund (DGRS)
WisdomTree U.S. Total Dividend Fund (DTD)
WisdomTree U.S. Total Market Fund (EXT)
(formerly, WisdomTree U.S. Total Earnings Fund)
IMPORTANT NOTE: Beginning on January 1, 2021, as permitted by regulations adopted by the SEC, paper copies of the WisdomTree Funds’ annual and semi-annual shareholder reports will no longer be sent by mail, unless you specifically request paper copies of the reports. Instead, annual and semi-annual shareholder reports will be available on the WisdomTree Funds’ website (www.wisdomtree.com), and you will be notified by mail each time a report is posted and provided with a website link to access the report.
If you already elected to receive shareholder reports electronically, you will not be affected by this change and you need not take any action. You may elect to receive shareholder reports and other communications from a Fund electronically anytime by contacting your financial intermediary (such as a broker dealer or bank).
You may elect to receive all future reports in paper free of charge. Please contact your financial intermediary to request to continue receiving paper copies of your shareholder reports. Your election to receive reports in paper will apply to all funds held in your account.
| 1 | ||||
| Information about Performance and Shareholder Expense Examples (unaudited) |
2 | |||
| 3 | ||||
| 17 | ||||
| Schedules of Investments | ||||
| 19 | ||||
| 21 | ||||
| 26 | ||||
| 31 | ||||
| 38 | ||||
| 44 | ||||
| 52 | ||||
| 55 | ||||
| 59 | ||||
| 62 | ||||
| 71 | ||||
| 81 | ||||
| 85 | ||||
| 95 | ||||
| 109 | ||||
| 112 | ||||
| 115 | ||||
| 120 | ||||
| 127 | ||||
| 139 | ||||
| 141 | ||||
| 143 | ||||
| 144 | ||||
“WisdomTree” is a registered mark of WisdomTree Investments, Inc. and is licensed for use by the WisdomTree Trust.
(unaudited)
The U.S. equity market, as measured by the S&P 500® Index, returned +9.50% for the 12-month fiscal period that ended March 31, 2019 (the “period”).
U.S. equities experienced positive returns through September 2018, driven by robust corporate profits and economic growth, the benefit of U.S. corporate tax reform, gradual monetary policy normalization, as well as positive consumer and business survey data.
The positive trend in U.S. equities reversed in the fourth quarter of 2018 with the S&P 500® Index experiencing a market correction of -13.52% in the fourth quarter of 2018, resulting in the first calendar year loss for the index since the 2008 financial crisis. Key drivers of negative returns and heightened volatility in the fourth quarter of 2018 were concerns about the sustainability of U.S. corporate earnings growth, U.S. credit quality, as well as fears of slowing global trade and economic growth.
Through the last nine months of 2018, the U.S. Federal Reserve (the “Fed”) raised the benchmark rate three times, equating to a cumulative increase of 0.75%. Meanwhile, the Consumer Price Index decreased from its 2018 peak and U.S. inflation expectations, as measured by the difference between the nominal and real 10-year U.S. Treasury yields, fell below the +2.0% threshold, a signal from the market that additional Fed rate hikes in late 2018 and beyond may not be warranted.
In the first quarter of 2019, the U.S. equity market, as measured by the S&P 500® Index, rebounded sharply to return +13.65%. Indicators of economic growth signaled a mix of moderating growth and continued strength. Purchasing Managers’ Index survey data decreased, although the level remained consistent with the average it had been across periods of economic expansion. Meanwhile, payroll wage, and unemployment data exceeded expectations. The delayed release of fourth-quarter and full-year 2018 gross domestic product (“GDP”) fueled positive equity market returns - 2018 real GDP growth of +2.9% was stronger than anticipated and marked a rate of expansion that had only been reached two other times since 2005. The Fed also paused its multi-year rate hike program for the time being and stressed that further rate actions would be data dependent. Easing monetary policy and more constructive U.S.-China trade negotiations drove positive sentiment in U.S. equity markets.
Over the period, the increase in U.S. short-term interest rates exceeded the decrease in long-term rates (an anomaly that is generally seen as a recession indicator if it persists for a protracted period of time), resulting in inversion at the short-end of the U.S. Treasury yield curve and in flattening at long-end. The Fed funds rate increased 0.75% to 2.50% while the 2-Year U.S. Treasury Note yield was unchanged at 2.27% and the 10-Year U.S. Treasury Note yield fell 0.33% to 2.41%. The closely monitored spread between the 2- and 10-year U.S. Treasury yields decreased from 0.47% to 0.14% over the period. The rise in short-term rates was driven by tightening monetary policy through the final nine months of 2018, while the drop in long-term rates reflected the outlook for slowing global economic growth as well as the Fed’s dovish shift in monetary policy in early 2019.
| WisdomTree Trust | 1 |
Information about Performance and Shareholder Expense Examples (unaudited)
Performance
The performance tables on the following pages are provided for comparative purposes and represent the period noted. Each Fund’s per share NAV is the value of one share of the Fund and is calculated by dividing the value of total assets less total liabilities by the number of shares outstanding. The NAV return is based on the NAV of the Fund and the market price return is based on the market price per share of the Fund. The price used to calculate market price returns is the midpoint of the bid and ask price for Fund shares as of the close of trading on the exchange where Fund shares are listed. NAV and market price returns assume that dividends and capital gain distributions have been reinvested in the Fund at NAV and market price, respectively. As with other ETFs, NAV returns and market price returns may differ because of factors such as the supply and demand for Fund shares and investors’ assessments of the underlying value of a Fund’s portfolio securities.
Fund shares are bought and sold at market price (not NAV) and are not individually redeemed from a Fund. Fund NAV returns are calculated using a Fund’s daily 4:00 p.m. eastern time NAV. Market price returns reflect the midpoint of the bid and ask price as of the close of trading on the exchange where Fund shares are listed. Market price returns do not represent the returns you would receive if you traded shares at other times. The returns do not reflect the deduction of taxes that a shareholder would pay on Fund distributions or on the redemption of Fund shares. Total returns for a period of less than one year are cumulative.
Performance is historical and does not guarantee future results. Current performance may be lower or higher than quoted. Investment returns and the principal value of an investment will fluctuate so that an investor’s shares, when redeemed, may be worth more or less than their original cost.
An index is a statistical measure of a specified financial market or sector. An index does not actually hold a portfolio of securities, incur expenses or pay any transaction costs. Therefore, index returns do not reflect deductions for fees or expenses and an index is not available for direct investment. In comparison, the Funds’ performance is negatively impacted by these deductions. Fund returns do not reflect brokerage commissions or taxes on transactions in Fund shares or taxes that a shareholder would pay on Fund distributions. Past performance is no guarantee of future results. For the most recent month-end performance information visit www.wisdomtree.com.
Shareholder Expense Examples
Each Fund’s performance table is accompanied by a shareholder expense example. As a shareholder of a WisdomTree Fund, you incur two types of cost: (1) transaction costs, including brokerage commissions on purchases and sales of your Fund shares and (2) ongoing costs, including management fees and other Fund expenses. The examples are intended to help you understand your ongoing costs (in dollars and cents) of investing in a Fund and to compare these costs with the ongoing costs of investing in other funds.
The examples are based on an investment of $1,000 invested at the beginning of the period and held for the entire period from October 1, 2018 to March 31, 2019. Except where noted, expenses are calculated using each Fund’s annualized expense ratio (after the effect of contractual or voluntary fee waivers, if any), multiplied by the average account value for the period, multiplied by 182/365 (to reflect the one-half year period). The annualized expense ratio does not include acquired fund fees and expenses (“AFFEs”), which are fees and expenses incurred indirectly by a Fund through its investments in certain underlying investment companies.
Actual expenses
The first line in the shareholder expense example table shown on the following pages provides information about actual account values and actual expenses. You may use the information in this line, together with the amount you invested, to estimate the expenses that you paid over the period. Simply divide your account value by $1,000 (for example, an $8,600 account value divided by $1,000 = 8.6), then multiply the result by the number in the first line for your Fund under the heading entitled “Expenses Paid During the Period” to estimate the expenses you paid on your account during the period.
Hypothetical example for comparison purposes
The second line in the shareholder expense example table shown on the following pages provides information about hypothetical account values and hypothetical expenses based on the Fund’s actual expense ratio and an assumed rate of return of 5% per year before expenses, which is not the Fund’s actual return. The hypothetical account values and expenses may not be used to estimate the actual ending account balance or expenses you paid for the period. You may use this information to compare the ongoing costs of investing in your Fund and other funds. To do so, compare this 5% hypothetical example with the 5% hypothetical examples that appear in the shareholder reports of the other funds.
Please note that the expenses shown in the table are meant to highlight your ongoing costs only and do not reflect any transactional costs, such as brokerage commissions paid on purchases and sales of Fund shares. Therefore, the second line in the table is useful in comparing ongoing Fund costs only and will not help you determine the relative total costs of owning different funds. In addition, if these transactional costs were included, your costs would have been higher.
| 2 | WisdomTree Trust |
Management’s Discussion of Funds’ Performance
as of March 31, 2019 (unaudited)
WisdomTree U.S. Dividend ex-Financials Fund (DTN)
Sector Breakdown†
| Sector | % of Net Assets | |||
| Energy |
14.6% | |||
| Consumer Discretionary |
12.7% | |||
| Utilities |
12.3% | |||
| Consumer Staples |
11.8% | |||
| Information Technology |
11.5% | |||
| Industrials |
10.3% | |||
| Communication Services |
9.1% | |||
| Materials |
8.7% | |||
| Health Care |
8.1% | |||
| Investment Company |
0.7% | |||
| Other Assets less Liabilities‡ |
0.2% | |||
| Total |
100.0% | |||
| † | The Fund’s sector breakdown is expressed as a percentage of net assets and may change over time. In addition, a sector may be comprised of several industries. |
| ‡ | Other assets includes investment of cash collateral for securities on loan (if any). |
Top Ten Holdings*
| Description | % of Net Assets | |||
| General Electric Co. |
2.5% | |||
| CenturyLink, Inc. |
2.3% | |||
| Targa Resources Corp. |
2.2% | |||
| AT&T, Inc. |
1.9% | |||
| Williams Cos., Inc. (The) |
1.8% | |||
| Ford Motor Co. |
1.8% | |||
| L Brands, Inc. |
1.8% | |||
| ONEOK, Inc. |
1.8% | |||
| General Mills, Inc. |
1.8% | |||
| Altria Group, Inc. |
1.8% | |||
| * | The ten largest holdings are subject to change, and there are no guarantees the Fund will remain invested in any particular company. Excludes derivatives and investment of cash collateral for securities on loan (if any). |
The WisdomTree U.S. Dividend ex-Financials Fund (the ‘‘Fund’’) seeks to track the price and yield performance, before fees and expenses, of the WisdomTree U.S. Dividend ex-Financials Index (the ‘‘Index’’). In seeking to track the Index, the Fund invests in high dividend yielding companies in the U.S. equity market excluding the financial sector. The Fund generally uses a representative sampling strategy to achieve its investment objective, meaning it generally will invest in a sample of securities in the Index.
The Fund returned 4.99% at net asset value (“NAV”) for the fiscal year ending March 31, 2019 (for more complete performance information please see the table below). The Fund’s position in Energy, combined with the exclusion of Financials, contributed most positively to performance, while its position in Consumer Discretionary contributed least positively to performance. Despite the Federal Reserve (the “Fed”) raising the federal funds target rate three times throughout the fiscal year, the Fund was able to maintain positive performance in a rising rate environment, which is traditionally a headwind for dividend-oriented strategies. The Fund’s overweight position to mid-cap equities provided much of the observed underperformance during the fourth quarter of 2018, where a broad market correction catalyzed by trade war apprehension with China and fears of a Fed policy misstep sent markets sharply downward. Over the entire fiscal year, the individual positions in large- and mid-cap equities proved to do the most harm, as stock selection was the biggest detractor.
Shareholder Expense Example
| Beginning Account Value |
Ending Account Value |
Annualized Net Expense Ratio |
Expenses Paid During the Period |
|||||||||||||
| Actual |
$ | 1,000.00 | $ | 963.10 | 0.38 | % | $ | 1.86 | ||||||||
| Hypothetical (5% return before expenses) |
$ | 1,000.00 | $ | 1,023.04 | 0.38 | % | $ | 1.92 | ||||||||
Performance
| Average Annual Total Return | ||||||||||||||||
| 1 Year | 3 Year | 5 Year | 10 Year | |||||||||||||
| Fund NAV Returns |
4.99 | % | 7.92 | % | 7.57 | % | 16.37 | % | ||||||||
| Fund Market Price Returns |
4.96 | % | 7.93 | % | 7.57 | % | 16.35 | % | ||||||||
| WisdomTree Dividend Top 100/U.S. Dividend ex-Financials Spliced Index1 |
5.36 | % | 8.35 | % | 7.98 | % | 16.86 | % | ||||||||
| Dow Jones U.S. Select Dividend IndexSM |
7.20 | % | 10.30 | % | 9.98 | % | 16.46 | % | ||||||||
| 1 | WisdomTree Dividend Top 100 Index through May 7, 2009; WisdomTree U.S. Dividend ex-Financials Index thereafter. |
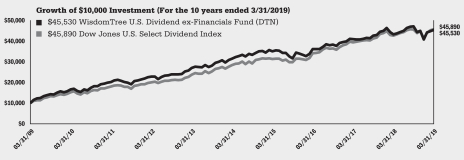
Performance is historical and does not guarantee future results. The returns do not reflect the deduction of taxes that a shareholder would pay on Fund distributions or on the redemption of Fund shares.
| WisdomTree Trust | 3 |
Management’s Discussion of Funds’ Performance
as of March 31, 2019 (unaudited)
WisdomTree U.S. High Dividend Fund (DHS)
Sector Breakdown†
| Sector | % of Net Assets | |||
| Consumer Staples |
15.8% | |||
| Real Estate |
14.5% | |||
| Energy |
14.1% | |||
| Communication Services |
9.9% | |||
| Financials |
9.4% | |||
| Utilities |
9.3% | |||
| Health Care |
7.2% | |||
| Information Technology |
6.8% | |||
| Industrials |
5.6% | |||
| Consumer Discretionary |
5.4% | |||
| Materials |
1.1% | |||
| Investment Company |
0.7% | |||
| Other Assets less Liabilities‡ |
0.2% | |||
| Total |
100.0% | |||
| † | The Fund’s sector breakdown is expressed as a percentage of net assets and may change over time. In addition, a sector may be comprised of several industries. |
| ‡ | Other assets includes investment of cash collateral for securities on loan (if any). |
Top Ten Holdings*
| Description | % of Net Assets | |||
| Exxon Mobil Corp. |
5.0% | |||
| AT&T, Inc. |
4.9% | |||
| Verizon Communications, Inc. |
3.8% | |||
| Chevron Corp. |
3.4% | |||
| Wells Fargo & Co. |
3.1% | |||
| Procter & Gamble Co. (The) |
2.8% | |||
| Philip Morris International, Inc. |
2.8% | |||
| Pfizer, Inc. |
2.8% | |||
| International Business Machines Corp. |
2.5% | |||
| Altria Group, Inc. |
2.4% | |||
| * | The ten largest holdings are subject to change, and there are no guarantees the Fund will remain invested in any particular company. Excludes derivatives and investment of cash collateral for securities on loan (if any). |
The WisdomTree U.S. High Dividend Fund (the ‘‘Fund’’) seeks to track the price and yield performance, before fees and expenses, of the WisdomTree U.S. High Dividend Index (the ‘‘Index’’). In seeking to track the Index, the Fund invests in high dividend yielding companies in the U.S. equity market. The Fund generally uses a representative sampling strategy to achieve its investment objective, meaning it generally will invest in a sample of securities in the Index.
The Fund returned 10.15% at net asset value (“NAV”) for the fiscal year ending March 31, 2019 (for more complete performance information please see the table below). The Fund’s position in Financials contributed most positively to performance, while its position in Information Technology contributed least positively to performance. Despite the Federal Reserve (the “Fed”) raising the federal funds target rate three times throughout the fiscal year, the Fund was able to maintain positive performance in a rising rate environment, which is traditionally a headwind for dividend-oriented strategies. The Fund’s tilt toward mid-cap equities also provided a bit of downside protection in the fourth quarter of 2018, where a broad market correction catalyzed by trade war apprehension with China and fears of a Fed policy misstep sent markets sharply downward. Likewise, underweight exposure to large-cap equities, along with the individual positions held, also provided a downside buffer over the same period. The Fund’s overall objective of allocating toward larger dividend payers also helped provide outsized returns over the entire fiscal year.
Shareholder Expense Example
| Beginning Account Value |
Ending Account Value |
Annualized Net Expense Ratio |
Expenses Paid During the Period |
|||||||||||||
| Actual |
$ | 1,000.00 | $ | 1,021.70 | 0.38 | % | $ | 1.92 | ||||||||
| Hypothetical (5% return before expenses) |
$ | 1,000.00 | $ | 1,023.04 | 0.38 | % | $ | 1.92 | ||||||||
Performance
| Average Annual Total Return | ||||||||||||||||
| 1 Year | 3 Year | 5 Year | 10 Year | |||||||||||||
| Fund NAV Returns |
10.15 | % | 8.21 | % | 8.63 | % | 16.19 | % | ||||||||
| Fund Market Price Returns |
10.17 | % | 8.21 | % | 8.61 | % | 16.19 | % | ||||||||
| WisdomTree U.S. High Dividend Index |
10.53 | % | 8.61 | % | 9.04 | % | 16.67 | % | ||||||||
| Russell 1000® Value Index |
5.67 | % | 10.45 | % | 7.72 | % | 14.52 | % | ||||||||
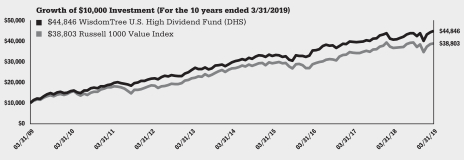
Performance is historical and does not guarantee future results. The returns do not reflect the deduction of taxes that a shareholder would pay on Fund distributions or on the redemption of Fund shares.
| 4 | WisdomTree Trust |
Management’s Discussion of Funds’ Performance
as of March 31, 2019 (unaudited)
WisdomTree U.S. LargeCap Dividend Fund (DLN)
Sector Breakdown†
| Sector | % of Net Assets | |||
| Information Technology |
17.3% | |||
| Financials |
14.8% | |||
| Consumer Staples |
12.3% | |||
| Health Care |
11.7% | |||
| Industrials |
10.0% | |||
| Energy |
8.6% | |||
| Communication Services |
7.3% | |||
| Consumer Discretionary |
6.1% | |||
| Utilities |
5.2% | |||
| Real Estate |
4.2% | |||
| Materials |
2.0% | |||
| Investment Company |
0.4% | |||
| Other Assets less Liabilities‡ |
0.1% | |||
| Total |
100.0% | |||
| † | The Fund’s sector breakdown is expressed as a percentage of net assets and may change over time. In addition, a sector may be comprised of several industries. |
| ‡ | Other assets includes investment of cash collateral for securities on loan (if any). |
Top Ten Holdings*
| Description | % of Net Assets | |||
| Microsoft Corp. |
3.3% | |||
| Apple, Inc. |
3.3% | |||
| AT&T, Inc. |
3.1% | |||
| Exxon Mobil Corp. |
3.1% | |||
| JPMorgan Chase & Co. |
2.3% | |||
| Verizon Communications, Inc. |
2.2% | |||
| Johnson & Johnson |
2.1% | |||
| Chevron Corp. |
1.9% | |||
| Wells Fargo & Co. |
1.7% | |||
| Procter & Gamble Co. (The) |
1.6% | |||
| * | The ten largest holdings are subject to change, and there are no guarantees the Fund will remain invested in any particular company. Excludes derivatives and investment of cash collateral for securities on loan (if any). |
The WisdomTree U.S. LargeCap Dividend Fund (the ‘‘Fund’’) seeks to track the price and yield performance, before fees and expenses, of the WisdomTree U.S. LargeCap Dividend Index (the ‘‘Index’’). In seeking to track the Index, the Fund invests in dividend-paying large-cap companies in the U.S. equity market. The Fund generally uses a representative sampling strategy to achieve its investment objective, meaning it generally will invest in a sample of securities in the Index.
The Fund returned 9.44% at net asset value (“NAV”) for the fiscal year ending March 31, 2019 (for more complete performance information please see the table below). The Fund’s position in Information Technology contributed most positively to performance, while its position in Energy contributed least positively to performance. Despite the Federal Reserve (the “Fed”) raising the federal funds target rate three times throughout the fiscal year, the Fund was able to maintain positive performance in a rising rate environment, which is traditionally a headwind for dividend-oriented strategies. The Fund’s overweight to larger dividend payers helped provide outsized returns over the entire fiscal period. The same positioning helped provide downside protection during the fourth quarter of 2018, where a broad market correction catalyzed by trade war apprehension with China and fears of a Fed policy misstep sent markets sharply downward.
Shareholder Expense Example
| Beginning Account Value |
Ending Account Value |
Annualized Net Expense Ratio |
Expenses Paid During the Period |
|||||||||||||
| Actual |
$ | 1,000.00 | $ | 1,001.90 | 0.28 | % | $ | 1.40 | ||||||||
| Hypothetical (5% return before expenses) |
$ | 1,000.00 | $ | 1,023.54 | 0.28 | % | $ | 1.41 | ||||||||
Performance
| Average Annual Total Return | ||||||||||||||||
| 1 Year | 3 Year | 5 Year | 10 Year | |||||||||||||
| Fund NAV Returns |
9.44 | % | 11.62 | % | 9.75 | % | 15.30 | % | ||||||||
| Fund Market Price Returns |
9.35 | % | 11.63 | % | 9.73 | % | 15.28 | % | ||||||||
| WisdomTree U.S. LargeCap Dividend Index |
9.71 | % | 11.95 | % | 10.06 | % | 15.67 | % | ||||||||
| S&P 500® Index |
9.50 | % | 13.51 | % | 10.91 | % | 15.92 | % | ||||||||
| Russell 1000® Value Index |
5.67 | % | 10.45 | % | 7.72 | % | 14.52 | % | ||||||||
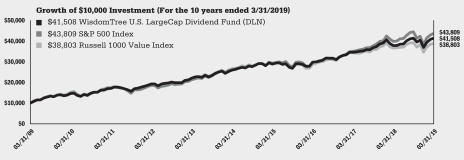
Performance is historical and does not guarantee future results. The returns do not reflect the deduction of taxes that a shareholder would pay on Fund distributions or on the redemption of Fund shares.
| WisdomTree Trust | 5 |
Management’s Discussion of Funds’ Performance
as of March 31, 2019 (unaudited)
WisdomTree U.S. LargeCap Fund (EPS)
(formerly, WisdomTree U.S. Earnings 500 Fund)
Sector Breakdown†
| Sector | % of Net Assets | |||
| Information Technology |
21.5% | |||
| Financials |
20.8% | |||
| Health Care |
10.6% | |||
| Communication Services |
10.2% | |||
| Industrials |
9.7% | |||
| Consumer Discretionary |
8.7% | |||
| Consumer Staples |
7.0% | |||
| Energy |
4.9% | |||
| Utilities |
2.8% | |||
| Materials |
2.0% | |||
| Real Estate |
1.5% | |||
| Investment Company |
0.2% | |||
| Other Assets less Liabilities‡ |
0.1% | |||
| Total |
100.0% | |||
| † | The Fund’s sector breakdown is expressed as a percentage of net assets and may change over time. In addition, a sector may be comprised of several industries. |
| ‡ | Other assets includes investment of cash collateral for securities on loan (if any). |
Top Ten Holdings*
| Description | % of Net Assets | |||
| Apple, Inc. |
5.3% | |||
| Microsoft Corp. |
2.7% | |||
| Berkshire Hathaway, Inc., Class B |
2.6% | |||
| Alphabet, Inc., Class A |
2.4% | |||
| JPMorgan Chase & Co. |
2.3% | |||
| Bank of America Corp. |
2.0% | |||
| Facebook, Inc., Class A |
1.9% | |||
| Intel Corp. |
1.7% | |||
| Exxon Mobil Corp. |
1.4% | |||
| Citigroup, Inc. |
1.4% | |||
| * | The ten largest holdings are subject to change, and there are no guarantees the Fund will remain invested in any particular company. Excludes derivatives and investment of cash collateral for securities on loan (if any). |
The WisdomTree U.S. LargeCap Fund (the ‘‘Fund’’) seeks to track the price and yield performance, before fees and expenses, of the WisdomTree U.S. LargeCap Index (the ‘‘Index’’). In seeking to track the Index, the Fund invests in earnings-generating large-cap companies in the U.S. equity market. The Fund generally uses a representative sampling strategy to achieve its investment objective, meaning it generally will invest in a sample of securities in the Index. Prior to March 28, 2019, the WisdomTree U.S. LargeCap Index was named the WisdomTree U.S. Earnings 500 Index.
The Fund returned 6.93% at net asset value (“NAV”) for the fiscal year ending March 31, 2019 (for more complete performance information please see the table below). The Fund’s position in Energy contributed most positively to performance, while its position in Financials contributed least positively to performance. The Fund was able to maintain positive performance over the fiscal period, despite three federal funds target rate increases from the Federal Reserve (the “Fed”) that provided a headwind to Fund performance. The Fund was modestly underweight large-cap equities during the fourth quarter of 2018, where a broad market correction catalyzed by trade war apprehension with China and fears of a Fed policy misstep sent markets sharply downward, which helped provide a bit of downside protection due to stock allocations. However, over the total fiscal period, an overweight allocation to underperforming companies with low valuation ratios hindered performance considerably. Likewise, stock allocations in companies with greater valuation ratios contributed to underperformance to the same extent.
Shareholder Expense Example
| Beginning Account Value |
Ending Account Value |
Annualized Net Expense Ratio |
Expenses Paid During the Period |
|||||||||||||
| Actual |
$ | 1,000.00 | $ | 983.60 | 0.28 | % | $ | 1.38 | ||||||||
| Hypothetical (5% return before expenses) |
$ | 1,000.00 | $ | 1,023.54 | 0.28 | % | $ | 1.41 | ||||||||
Performance
| Average Annual Total Return | ||||||||||||||||
| 1 Year | 3 Year | 5 Year | 10 Year | |||||||||||||
| Fund NAV Returns |
6.93 | % | 13.13 | % | 9.91 | % | 15.33 | % | ||||||||
| Fund Market Price Returns |
6.75 | % | 13.14 | % | 9.90 | % | 15.33 | % | ||||||||
| WisdomTree U.S. LargeCap Index |
7.22 | % | 13.47 | % | 10.21 | % | 15.67 | % | ||||||||
| S&P 500® Index |
9.50 | % | 13.51 | % | 10.91 | % | 15.92 | % | ||||||||
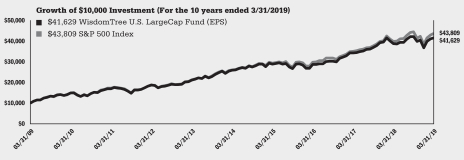
Performance is historical and does not guarantee future results. The returns do not reflect the deduction of taxes that a shareholder would pay on Fund distributions or on the redemption of Fund shares.
| 6 | WisdomTree Trust |
Management’s Discussion of Funds’ Performance
as of March 31, 2019 (unaudited)
WisdomTree U.S. MidCap Dividend Fund (DON)
Sector Breakdown†
| Sector | % of Net Assets | |||
| Consumer Discretionary |
19.1% | |||
| Real Estate |
15.4% | |||
| Industrials |
13.7% | |||
| Financials |
9.6% | |||
| Materials |
9.5% | |||
| Utilities |
8.7% | |||
| Information Technology |
7.7% | |||
| Energy |
7.0% | |||
| Consumer Staples |
4.4% | |||
| Communication Services |
2.5% | |||
| Health Care |
1.7% | |||
| Investment Company |
0.5% | |||
| Other Assets less Liabilities‡ |
0.2% | |||
| Total |
100.0% | |||
| † | The Fund’s sector breakdown is expressed as a percentage of net assets and may change over time. In addition, a sector may be comprised of several industries. |
| ‡ | Other assets includes investment of cash collateral for securities on loan (if any). |
Top Ten Holdings*
| Description | % of Net Assets | |||
| Targa Resources Corp. |
1.7% | |||
| Coty, Inc., Class A |
1.2% | |||
| L Brands, Inc. |
1.2% | |||
| Baker Hughes a GE Co. |
1.0% | |||
| Kohl’s Corp. |
1.0% | |||
| J.M. Smucker Co. (The) |
0.9% | |||
| AES Corp. |
0.9% | |||
| Campbell Soup Co. |
0.9% | |||
| WestRock Co. |
0.9% | |||
| Macy’s, Inc. |
0.8% | |||
| * | The ten largest holdings are subject to change, and there are no guarantees the Fund will remain invested in any particular company. Excludes derivatives and investment of cash collateral for securities on loan (if any). |
The WisdomTree U.S. MidCap Dividend Fund (the ‘‘Fund’’) seeks to track the price and yield performance, before fees and expenses, of the WisdomTree U.S. MidCap Dividend Index (the ‘‘Index’’). In seeking to track the Index, the Fund invests in dividend-paying mid-cap companies in the U.S. equity market. The Fund generally uses a representative sampling strategy to achieve its investment objective, meaning it generally will invest in a sample of securities in the Index.
The Fund returned 7.21% at net asset value (“NAV”) for the fiscal year ending March 31, 2019 (for more complete performance information please see the table below). The Fund’s position in Real Estate contributed most positively to performance, while its position in Information Technology contributed least positively to performance. Despite the Federal Reserve (the “Fed”) raising the federal funds target rate three times throughout the fiscal year, the Fund was able to maintain positive performance in a rising rate environment, which is traditionally a headwind for dividend-oriented strategies. The Fund’s overweight to larger dividend payers provided a bit of downside protection throughout the fourth quarter of 2018, where a broad market correction catalyzed by trade war apprehension with China and fears of a Fed policy misstep sent markets sharply downward. During the fiscal year, portfolio allocations to these same larger dividend payers helped provide outsized returns.
Shareholder Expense Example
| Beginning Account Value |
Ending Account Value |
Annualized Net Expense Ratio |
Expenses Paid During the Period |
|||||||||||||
| Actual |
$ | 1,000.00 | $ | 979.30 | 0.38 | % | $ | 1.88 | ||||||||
| Hypothetical (5% return before expenses) |
$ | 1,000.00 | $ | 1,023.04 | 0.38 | % | $ | 1.92 | ||||||||
Performance
| Average Annual Total Return | ||||||||||||||||
| 1 Year | 3 Year | 5 Year | 10 Year | |||||||||||||
| Fund NAV Returns |
7.21 | % | 10.26 | % | 9.58 | % | 18.05 | % | ||||||||
| Fund Market Price Returns |
7.22 | % | 10.26 | % | 9.58 | % | 18.02 | % | ||||||||
| WisdomTree U.S. MidCap Dividend Index |
7.57 | % | 10.67 | % | 9.97 | % | 18.52 | % | ||||||||
| S&P MidCap 400® Index |
2.59 | % | 11.24 | % | 8.29 | % | 16.28 | % | ||||||||
| Russell MidCap Value Index |
2.89 | % | 9.50 | % | 7.22 | % | 16.39 | % | ||||||||
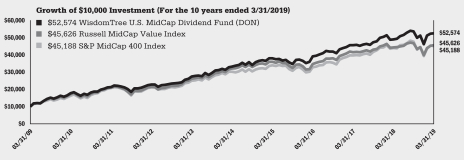
Performance is historical and does not guarantee future results. The returns do not reflect the deduction of taxes that a shareholder would pay on Fund distributions or on the redemption of Fund shares.
| WisdomTree Trust | 7 |
Management’s Discussion of Funds’ Performance
as of March 31, 2019 (unaudited)
WisdomTree U.S. MidCap Fund (EZM)
(formerly, WisdomTree U.S. MidCap Earnings Fund)
Sector Breakdown†
| Sector | % of Net Assets | |||
| Industrials |
19.8% | |||
| Financials |
18.1% | |||
| Consumer Discretionary |
15.7% | |||
| Information Technology |
11.6% | |||
| Materials |
9.3% | |||
| Real Estate |
6.5% | |||
| Health Care |
5.1% | |||
| Energy |
4.1% | |||
| Consumer Staples |
3.4% | |||
| Utilities |
3.2% | |||
| Communication Services |
2.8% | |||
| Investment Company |
0.3% | |||
| Other Assets less Liabilities‡ |
0.1% | |||
| Total |
100.0% | |||
| † | The Fund’s sector breakdown is expressed as a percentage of net assets and may change over time. In addition, a sector may be comprised of several industries. |
| ‡ | Other assets includes investment of cash collateral for securities on loan (if any). |
Top Ten Holdings*
| Description | % of Net Assets | |||
| Chemours Co. (The) |
1.2% | |||
| PulteGroup, Inc. |
0.9% | |||
| Huntsman Corp. |
0.9% | |||
| Reliance Steel & Aluminum Co. |
0.6% | |||
| Nektar Therapeutics |
0.6% | |||
| United States Steel Corp. |
0.6% | |||
| GrafTech International Ltd. |
0.6% | |||
| Arrow Electronics, Inc. |
0.6% | |||
| Chesapeake Energy Corp. |
0.6% | |||
| PBF Energy, Inc., Class A |
0.6% | |||
| * | The ten largest holdings are subject to change, and there are no guarantees the Fund will remain invested in any particular company. Excludes derivatives and investment of cash collateral for securities on loan (if any). |
The WisdomTree U.S. MidCap Fund (the ‘‘Fund’’) seeks to track the price and yield performance, before fees and expenses, of the WisdomTree U.S. MidCap Index (the ‘‘Index’’). In seeking to track the Index, the Fund invests in earnings-generating mid-cap companies in the U.S. equity market. The Fund generally uses a representative sampling strategy to achieve its investment objective, meaning it generally will invest in a sample of securities in the Index. Prior to March 28, 2019, the WisdomTree U.S. MidCap Index was named the WisdomTree U.S. MidCap Earnings Index.
The Fund returned 3.22% at net asset value (“NAV”) for the fiscal year ending March 31, 2019 (for more complete performance information please see the table below). The Fund’s position in Financials contributed most positively to performance, while its position in Health Care contributed least positively to performance. The Fund was able to maintain positive performance over the fiscal period, despite three federal funds target rate increases from the Federal Reserve (the “Fed”) that provided a headwind to Fund performance. Overweight exposures to companies with greater earnings helped provide positive performance as well, while those with lesser earnings hampered performance the most, primarily due to stock allocations. During the fourth quarter of 2018, while a broad market correction catalyzed by trade war apprehension with China and fears of a Fed policy misstep sent markets sharply downward, the Fund received a bit of a downside buffer from companies with greater valuation ratios held by the Fund. During the fiscal year, overweight allocations to companies with lesser valuation ratios helped provide much of the positive performance, while stock allocations to companies with larger valuation ratios tempered it.
Shareholder Expense Example
| Beginning Account Value |
Ending Account Value |
Annualized Net Expense Ratio |
Expenses Paid During the Period |
|||||||||||||
| Actual |
$ | 1,000.00 | $ | 958.60 | 0.38 | % | $ | 1.86 | ||||||||
| Hypothetical (5% return before expenses) |
$ | 1,000.00 | $ | 1,023.04 | 0.38 | % | $ | 1.92 | ||||||||
Performance
| Average Annual Total Return | ||||||||||||||||
| 1 Year | 3 Year | 5 Year | 10 Year | |||||||||||||
| Fund NAV Returns |
3.22 | % | 10.91 | % | 7.28 | % | 17.79 | % | ||||||||
| Fund Market Price Returns |
3.19 | % | 10.94 | % | 7.30 | % | 17.78 | % | ||||||||
| WisdomTree U.S. MidCap Index |
3.56 | % | 11.28 | % | 7.61 | % | 18.20 | % | ||||||||
| S&P MidCap 400® Index |
2.59 | % | 11.24 | % | 8.29 | % | 16.28 | % | ||||||||
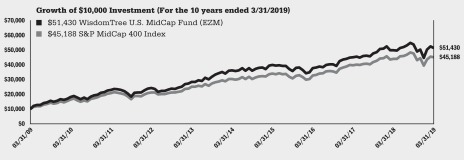
Performance is historical and does not guarantee future results. The returns do not reflect the deduction of taxes that a shareholder would pay on Fund distributions or on the redemption of Fund shares.
| 8 | WisdomTree Trust |
Management’s Discussion of Funds’ Performance
as of March 31, 2019 (unaudited)
WisdomTree U.S. Multifactor Fund (USMF)
Sector Breakdown†
| Sector | % of Net Assets | |||
| Information Technology |
21.7% | |||
| Health Care |
14.5% | |||
| Financials |
12.8% | |||
| Consumer Discretionary |
10.8% | |||
| Industrials |
9.8% | |||
| Communication Services |
9.4% | |||
| Consumer Staples |
7.4% | |||
| Energy |
5.3% | |||
| Utilities |
3.3% | |||
| Real Estate |
3.2% | |||
| Materials |
2.8% | |||
| Other Assets less Liabilities‡ |
-1.0% | |||
| Total |
100.0% | |||
| † | The Fund’s sector breakdown is expressed as a percentage of net assets and may change over time. In addition, a sector may be comprised of several industries. |
| ‡ | Other assets includes investment of cash collateral for securities on loan (if any). |
Top Ten Holdings*
| Description | % of Net Assets | |||
| Western Union Co. (The) |
1.5% | |||
| Booz Allen Hamilton Holding Corp. |
1.5% | |||
| MAXIMUS, Inc. |
1.4% | |||
| Citrix Systems, Inc. |
1.4% | |||
| CDK Global, Inc. |
1.3% | |||
| Merck & Co., Inc. |
1.3% | |||
| Waste Management, Inc. |
1.3% | |||
| Verizon Communications, Inc. |
1.3% | |||
| Republic Services, Inc. |
1.3% | |||
| Chevron Corp. |
1.2% | |||
| * | The ten largest holdings are subject to change, and there are no guarantees the Fund will remain invested in any particular company. Excludes derivatives and investment of cash collateral for securities on loan (if any). |
The WisdomTree U.S. Multifactor Fund (the ‘‘Fund’’) seeks to track the price and yield performance, before fees and expenses, of the WisdomTree U.S. Multifactor Index (the ‘‘Index’’). In seeking to track the Index, the Fund invests in U.S. companies with the highest composite scores based on two fundamental factors, value and quality measures, and two technical factors, momentum and correlation. The Fund generally uses a representative sampling strategy to achieve its investment objective, meaning it generally will invest in a sample of securities in the Index.
The Fund returned 5.25% at net asset value (“NAV”) for the fiscal year ending March 31, 2019 (for more complete performance information please see the table below). The Fund’s position in Financials contributed most positively to performance, while its position in Health Care contributed least positively to performance. A few factors that comprised the Fund’s overall strategy struggled during the fiscal year, with companies having greater valuation ratios universally weighing down Fund performance and almost all dividend-paying companies detracting considerably from Fund performance. An underweight to large-cap equities, in conjunction with an overweight to mid-cap equities, also provided a significant drag on Fund performance. These same group results were just as pronounced during the fourth quarter of 2018, where a broad market correction catalyzed by trade war apprehension with China and fears of a Federal Reserve policy misstep sent markets sharply downward.
Shareholder Expense Example
| Beginning Account Value |
Ending Account Value |
Annualized Net Expense Ratio |
Expenses Paid During the Period |
|||||||||||||
| Actual |
$ | 1,000.00 | $ | 951.30 | 0.28 | % | $ | 1.36 | ||||||||
| Hypothetical (5% return before expenses) |
$ | 1,000.00 | $ | 1,023.54 | 0.28 | % | $ | 1.41 | ||||||||
Performance
| Average Annual Total Return | ||||||||
| 1 Year | Since Inception1 | |||||||
| Fund NAV Returns |
5.25 | % | 10.88 | % | ||||
| Fund Market Price Returns |
5.15 | % | 10.84 | % | ||||
| WisdomTree U.S. Multifactor Index |
5.41 | % | 10.98 | % | ||||
| S&P 500® Index |
9.50 | % | 11.63 | % | ||||
| S&P 500® Equal Weight Index |
7.22 | % | 9.44 | % | ||||
| 1 | Total returns are calculated based on the commencement of Fund trading on the Cboe BZX Exchange, Inc. on June 29, 2017. |
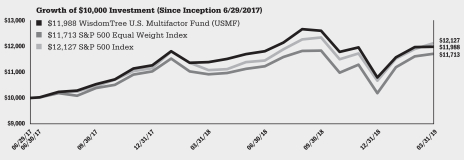
Performance is historical and does not guarantee future results. The returns do not reflect the deduction of taxes that a shareholder would pay on Fund distributions or on the redemption of Fund shares.
| WisdomTree Trust | 9 |
Management’s Discussion of Funds’ Performance
as of March 31, 2019 (unaudited)
WisdomTree U.S. Quality Dividend Growth Fund (DGRW)
Sector Breakdown†
| Sector | % of Net Assets | |||
| Information Technology |
21.0% | |||
| Industrials |
18.6% | |||
| Consumer Staples |
12.7% | |||
| Consumer Discretionary |
10.7% | |||
| Health Care |
10.3% | |||
| Financials |
9.1% | |||
| Communication Services |
7.8% | |||
| Energy |
7.0% | |||
| Materials |
2.5% | |||
| Real Estate |
0.1% | |||
| Other Assets less Liabilities‡ |
0.2% | |||
| Total |
100.0% | |||
| † | The Fund’s sector breakdown is expressed as a percentage of net assets and may change over time. In addition, a sector may be comprised of several industries. |
| ‡ | Other assets includes investment of cash collateral for securities on loan (if any). |
Top Ten Holdings*
| Description | % of Net Assets | |||
| Exxon Mobil Corp. |
5.0% | |||
| Apple, Inc. |
4.7% | |||
| Microsoft Corp. |
4.5% | |||
| Verizon Communications, Inc. |
4.4% | |||
| Wells Fargo & Co. |
3.6% | |||
| Procter & Gamble Co. (The) |
3.3% | |||
| Altria Group, Inc. |
2.8% | |||
| AbbVie, Inc. |
2.6% | |||
| International Business Machines Corp. |
2.5% | |||
| PepsiCo, Inc. |
2.4% | |||
| * | The ten largest holdings are subject to change, and there are no guarantees the Fund will remain invested in any particular company. Excludes derivatives and investment of cash collateral for securities on loan (if any). |
The WisdomTree U.S. Quality Dividend Growth Fund (the ‘‘Fund’’) seeks to track the price and yield performance, before fees and expenses, of the WisdomTree U.S. Quality Dividend Growth Index (the ‘‘Index’’). In seeking to track the Index, the Fund invests in dividend-paying large-cap companies with growth characteristics in the U.S. equity market. The Fund generally uses a representative sampling strategy to achieve its investment objective, meaning it generally will invest in a sample of securities in the Index.
The Fund returned 9.25% at net asset value (“NAV”) for the fiscal year ending March 31, 2019 (for more complete performance information please see the table below). The Fund’s position in Health Care contributed most positively to performance, while its position in Financials contributed least positively to performance. Despite the Federal Reserve (the “Fed”) raising the federal funds target rate three times throughout the fiscal year, the Fund was able to maintain positive performance in a rising rate environment, which is traditionally a headwind for dividend-oriented strategies. During the fiscal year, portfolio allocations to companies that pay greater dividends provided a significant portion of the Fund’s positive performance, while portfolio allocations to those that pay fewer dividends inhibited performance the most. In addition, an overweight allocation to mid-cap equities was the most helpful for performance, while being underweight large-cap equities was almost as large a detractor. However, the large-cap underweight positioning and stock selection actually provided a bit of downside protection during the fourth quarter of 2018, where a broad market correction catalyzed by trade war apprehension with China and fears of a Fed policy misstep sent markets sharply downward. During this same period, the paradigm involving dividend payers was reversed, with companies that pay larger dividends becoming performance detractors and those that pay smaller dividends becoming performance benefactors.
Shareholder Expense Example
| Beginning Account Value |
Ending Account Value |
Annualized Expense Ratio |
Expenses Paid During the Period |
|||||||||||||
| Actual |
$ | 1,000.00 | $ | 983.50 | 0.28 | % | $ | 1.38 | ||||||||
| Hypothetical (5% return before expenses) |
$ | 1,000.00 | $ | 1,023.54 | 0.28 | % | $ | 1.41 | ||||||||
Performance
| Average Annual Total Return | ||||||||||||||||
| 1 Year | 3 Year | 5 Year | Since Inception1 | |||||||||||||
| Fund NAV Returns |
9.25 | % | 13.69 | % | 11.35 | % | 12.12 | % | ||||||||
| Fund Market Price Returns |
9.17 | % | 13.71 | % | 11.35 | % | 12.12 | % | ||||||||
| WisdomTree U.S. Quality Dividend Growth Index |
9.55 | % | 14.04 | % | 11.67 | % | 12.44 | % | ||||||||
| NASDAQ U.S. Dividend AchieversTM Select Index |
10.81 | % | 12.86 | % | 10.19 | % | 10.69 | % | ||||||||
1 Total returns are calculated based on the commencement of Fund trading on the NASDAQ on May 22, 2013.
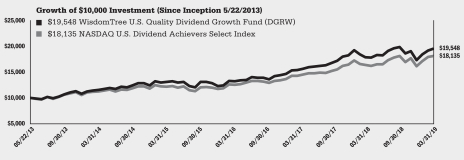
Performance is historical and does not guarantee future results. The returns do not reflect the deduction of taxes that a shareholder would pay on Fund distributions or on the redemption of Fund shares.
| 10 | WisdomTree Trust |
Management’s Discussion of Funds’ Performance
as of March 31, 2019 (unaudited)
WisdomTree U.S. Quality Shareholder Yield Fund (QSY)
Sector Breakdown†
| Sector | % of Net Assets | |||
| Consumer Discretionary |
21.6% | |||
| Information Technology |
19.8% | |||
| Financials |
18.7% | |||
| Industrials |
17.0% | |||
| Health Care |
6.8% | |||
| Energy |
4.5% | |||
| Consumer Staples |
3.3% | |||
| Materials |
3.3% | |||
| Communication Services |
3.1% | |||
| Real Estate |
1.0% | |||
| Utilities |
0.8% | |||
| Other Assets less Liabilities‡ |
0.1% | |||
| Total |
100.0% | |||
| † | The Fund’s sector breakdown is expressed as a percentage of net assets and may change over time. In addition, a sector may be comprised of several industries. |
| ‡ | Other assets includes investment of cash collateral for securities on loan (if any). |
Top Ten Holdings*
| Description | % of Net Assets | |||
| Celgene Corp. |
1.3% | |||
| Lam Research Corp. |
1.3% | |||
| eBay, Inc. |
1.3% | |||
| Synchrony Financial |
1.2% | |||
| Best Buy Co., Inc. |
1.2% | |||
| Voya Financial, Inc. |
1.2% | |||
| Applied Materials, Inc. |
1.1% | |||
| CDK Global, Inc. |
1.1% | |||
| Toll Brothers, Inc. |
1.1% | |||
| Spirit AeroSystems Holdings, Inc., Class A |
1.0% | |||
| * | The ten largest holdings are subject to change, and there are no guarantees the Fund will remain invested in any particular company. Excludes derivatives and investment of cash collateral for securities on loan (if any). |
The WisdomTree U.S. Quality Shareholder Yield Fund (the ‘‘Fund’’) seeks income and capital appreciation by investing primarily in U.S. equity securities that provide a high total shareholder yield with favorable relative quality characteristics.
The Fund returned 6.70% at net asset value (“NAV”) for the fiscal year ending March 31, 2019 (for more complete performance information please see the table below). Despite the Federal Reserve (the “Fed”) raising the federal funds target rate three times throughout the fiscal year, the Fund was able to maintain positive performance in a rising rate environment, which is traditionally a headwind for strategies that place an emphasis on dividends. The Fund’s position in Financials contributed most positively to performance, while its position in Information Technology contributed least positively to performance. In addition, the Fund’s underweight allocation to large-cap equities hindered performance, while its overweight positioning to mid-cap equities was also a detractor. The Fund also struggled during the fourth quarter of 2018, where a broad market correction catalyzed by trade war apprehension with China and fears of a Fed policy misstep sent markets sharply downward. Once again, the underweight and overweight to large- and mid- cap equities, respectively, harmed performance the most during this volatile period for equity markets.
Shareholder Expense Example
| Beginning Account Value |
Ending Account Value |
Annualized Expense Ratio |
Expenses Paid During the Period |
|||||||||||||
| Actual |
$ | 1,000.00 | $ | 980.60 | 0.38 | % | $ | 1.88 | ||||||||
| Hypothetical (5% return before expenses) |
$ | 1,000.00 | $ | 1,023.04 | 0.38 | % | $ | 1.92 | ||||||||
Performance
| Average Annual Total Return | ||||||||||||||||
| 1 Year | 3 Year | 5 Year | 10 Year | |||||||||||||
| Fund NAV Returns |
6.70 | % | 12.28 | % | 9.29 | % | 15.15 | % | ||||||||
| Fund Market Price Returns |
6.64 | % | 12.27 | % | 9.29 | % | 15.14 | % | ||||||||
| Russell 1000® Value Index |
5.67 | % | 10.45 | % | 7.72 | % | 14.52 | % | ||||||||
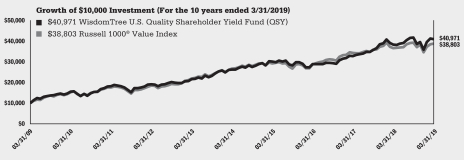
Performance is historical and does not guarantee future results. The returns do not reflect the deduction of taxes that a shareholder would pay on Fund distributions or on the redemption of Fund shares.
| WisdomTree Trust | 11 |
Management’s Discussion of Funds’ Performance
as of March 31, 2019 (unaudited)
WisdomTree U.S. SmallCap Dividend Fund (DES)
Sector Breakdown†
| Sector | % of Net Assets | |||
| Industrials |
17.2% | |||
| Consumer Discretionary |
16.0% | |||
| Real Estate |
13.7% | |||
| Financials |
11.1% | |||
| Materials |
9.5% | |||
| Utilities |
7.2% | |||
| Information Technology |
6.3% | |||
| Communication Services |
6.2% | |||
| Consumer Staples |
6.2% | |||
| Energy |
3.5% | |||
| Health Care |
2.0% | |||
| Investment Company |
0.9% | |||
| Other Assets less Liabilities‡ |
0.2% | |||
| Total |
100.0% | |||
| † | The Fund’s sector breakdown is expressed as a percentage of net assets and may change over time. In addition, a sector may be comprised of several industries. |
| ‡ | Other assets includes investment of cash collateral for securities on loan (if any). |
Top Ten Holdings*
| Description | % of Net Assets | |||
| Vector Group Ltd. |
1.5% | |||
| TerraForm Power, Inc., Class A |
1.3% | |||
| Pattern Energy Group, Inc., Class A |
1.2% | |||
| Pitney Bowes, Inc. |
1.0% | |||
| Covanta Holding Corp. |
1.0% | |||
| Domtar Corp. |
0.9% | |||
| WisdomTree U.S. MidCap Dividend Fund |
0.9% | |||
| SemGroup Corp., Class A |
0.9% | |||
| Bed Bath & Beyond, Inc. |
0.9% | |||
| GameStop Corp., Class A |
0.8% | |||
| * | The ten largest holdings are subject to change, and there are no guarantees the Fund will remain invested in any particular company. Excludes derivatives and investment of cash collateral for securities on loan (if any). |
The WisdomTree U.S. SmallCap Dividend Fund (the ‘‘Fund’’) seeks to track the price and yield performance, before fees and expenses, of the WisdomTree U.S. SmallCap Dividend Index (the ‘‘Index’’). In seeking to track the Index, the Fund invests in dividend-paying small-cap companies in the U.S. equity market. The Fund generally uses a representative sampling strategy to achieve its investment objective, meaning it generally will invest in a sample of securities in the Index.
The Fund returned 3.25% at net asset value (“NAV”) for the fiscal year ending March 31, 2019 (for more complete performance information please see the table below). The Fund’s position in Utilities contributed most positively to performance, while its position in Health Care contributed least positively to performance. Despite the Federal Reserve (the “Fed”) raising the federal funds target rate three times throughout the fiscal year, the Fund was able to maintain positive performance in a rising rate environment, which is traditionally a headwind for dividend-oriented strategies. The Fund’s overweight to companies that pay larger dividends helped the most to provide positive returns during the fiscal year. Likewise, this same positioning provided a bit of downside protection during the fourth quarter of 2018, where a broad market correction catalyzed by trade war apprehension with China and fears of a Fed policy misstep sent markets sharply downward.
Shareholder Expense Example
| Beginning Account Value |
Ending Account Value |
Annualized Net Expense Ratio |
Expenses Paid During the Period |
|||||||||||||
| Actual |
$ | 1,000.00 | $ | 938.80 | 0.38 | % | $ | 1.84 | ||||||||
| Hypothetical (5% return before expenses) |
$ | 1,000.00 | $ | 1,023.04 | 0.38 | % | $ | 1.92 | ||||||||
Performance
| Average Annual Total Return | ||||||||||||||||
| 1 Year | 3 Year | 5 Year | 10 Year | |||||||||||||
| Fund NAV Returns |
3.25 | % | 9.54 | % | 6.96 | % | 16.85 | % | ||||||||
| Fund Market Price Returns |
3.35 | % | 9.58 | % | 6.98 | % | 16.80 | % | ||||||||
| WisdomTree U.S. SmallCap Dividend Index |
3.58 | % | 9.87 | % | 7.20 | % | 17.12 | % | ||||||||
| Russell 2000® Index |
2.05 | % | 12.92 | % | 7.05 | % | 15.36 | % | ||||||||
| Russell 2000® Value Index |
0.17 | % | 10.86 | % | 5.59 | % | 14.12 | % | ||||||||
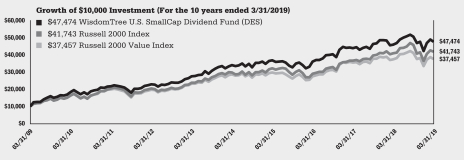
Performance is historical and does not guarantee future results. The returns do not reflect the deduction of taxes that a shareholder would pay on Fund distributions or on the redemption of Fund shares.
| 12 | WisdomTree Trust |
Management’s Discussion of Funds’ Performance
as of March 31, 2019 (unaudited)
WisdomTree U.S. SmallCap Fund (EES)
(formerly, WisdomTree U.S. SmallCap Earnings Fund)
Sector Breakdown†
| Sector | % of Net Assets | |||
| Consumer Discretionary |
23.7% | |||
| Financials |
19.8% | |||
| Industrials |
19.3% | |||
| Energy |
9.2% | |||
| Information Technology |
7.9% | |||
| Materials |
6.7% | |||
| Real Estate |
3.7% | |||
| Health Care |
3.2% | |||
| Consumer Staples |
2.8% | |||
| Communication Services |
2.4% | |||
| Utilities |
1.0% | |||
| Investment Company |
0.2% | |||
| Other Assets less Liabilities‡ |
0.1% | |||
| Total |
100.0% | |||
| † | The Fund’s sector breakdown is expressed as a percentage of net assets and may change over time. In addition, a sector may be comprised of several industries. |
| ‡ | Other assets includes investment of cash collateral for securities on loan (if any). |
Top Ten Holdings*
| Description | % of Net Assets | |||
| Bed Bath & Beyond, Inc. |
1.1% | |||
| American Axle & Manufacturing Holdings, Inc. |
1.0% | |||
| Warrior Met Coal, Inc. |
1.0% | |||
| Dana, Inc. |
1.0% | |||
| Gulfport Energy Corp. |
0.9% | |||
| FTS International, Inc. |
0.9% | |||
| Kronos Worldwide, Inc. |
0.8% | |||
| Lithia Motors, Inc., Class A |
0.7% | |||
| W&T Offshore, Inc. |
0.7% | |||
| KB Home |
0.7% | |||
| * | The ten largest holdings are subject to change, and there are no guarantees the Fund will remain invested in any particular company. Excludes derivatives and investment of cash collateral for securities on loan (if any). |
The WisdomTree U.S. SmallCap Fund (the ‘‘Fund’’) seeks to track the price and yield performance, before fees and expenses, of the WisdomTree U.S. SmallCap Index (the ‘‘Index’’). In seeking to track the Index, the Fund invests in earnings-generating small-cap companies in the U.S. equity market. The Fund generally uses a representative sampling strategy to achieve its investment objective, meaning it generally will invest in a sample of securities in the Index. Prior to March 28, 2019, the WisdomTree U.S. SmallCap Index was named the WisdomTree U.S. SmallCap Earnings Index.
The Fund returned 2.72% at net asset value (“NAV”) for the fiscal year ending March 31, 2019 (for more complete performance information please see the table below). The Fund’s position in Information Technology contributed most positively to performance, while its position in Financials contributed least positively to performance. The Fund was able to maintain positive performance during the fiscal year, despite three federal funds target rate increases from the Federal Reserve (the “Fed”) that provided a headwind to Fund performance. The Fund received positive performance particularly from the companies with greater earnings over the fiscal year, as well as those that had the lowest valuation ratios. In contrast, companies with higher valuation ratios and lower earnings were primary performance detractors. Companies with greater earnings and lower valuation ratios also helped provide a bit of downside protection during the fourth quarter of 2018, where a broad market correction catalyzed by trade war apprehension with China and fears of a Fed policy misstep sent markets sharply downward.
Shareholder Expense Example
| Beginning Account Value |
Ending Account Value |
Annualized Net Expense Ratio |
Expenses Paid During the Period |
|||||||||||||
| Actual |
$ | 1,000.00 | $ | 914.30 | 0.38 | % | $ | 1.81 | ||||||||
| Hypothetical (5% return before expenses) |
$ | 1,000.00 | $ | 1,023.04 | 0.38 | % | $ | 1.92 | ||||||||
Performance
| Average Annual Total Return | ||||||||||||||||
| 1 Year | 3 Year | 5 Year | 10 Year | |||||||||||||
| Fund NAV Returns |
2.72 | % | 13.44 | % | 7.18 | % | 18.07 | % | ||||||||
| Fund Market Price Returns |
2.69 | % | 13.47 | % | 7.14 | % | 18.01 | % | ||||||||
| WisdomTree U.S. SmallCap Index |
2.97 | % | 13.70 | % | 7.38 | % | 18.33 | % | ||||||||
| Russell 2000® Index |
2.05 | % | 12.92 | % | 7.05 | % | 15.36 | % | ||||||||
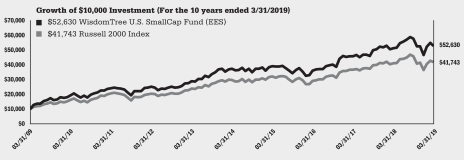
Performance is historical and does not guarantee future results. The returns do not reflect the deduction of taxes that a shareholder would pay on Fund distributions or on the redemption of Fund shares.
| WisdomTree Trust | 13 |
Management’s Discussion of Funds’ Performance
as of March 31, 2019 (unaudited)
WisdomTree U.S. SmallCap Quality Dividend Growth Fund (DGRS)
Sector Breakdown†
| Sector | % of Net Assets | |||
| Industrials |
26.1% | |||
| Consumer Discretionary |
18.7% | |||
| Financials |
16.1% | |||
| Materials |
13.5% | |||
| Information Technology |
5.4% | |||
| Communication Services |
5.3% | |||
| Real Estate |
4.7% | |||
| Consumer Staples |
3.6% | |||
| Utilities |
3.3% | |||
| Health Care |
3.0% | |||
| Energy |
0.2% | |||
| Other Assets less Liabilities‡ |
0.1% | |||
| Total |
100.0% | |||
| † | The Fund’s sector breakdown is expressed as a percentage of net assets and may change over time. In addition, a sector may be comprised of several industries. |
| ‡ | Other assets includes investment of cash collateral for securities on loan (if any). |
Top Ten Holdings*
| Description | % of Net Assets | |||
| Brookfield Property REIT, Inc., Class A |
2.4% | |||
| Artisan Partners Asset Management, Inc., Class A |
2.0% | |||
| PotlatchDeltic Corp. |
1.6% | |||
| Kronos Worldwide, Inc. |
1.4% | |||
| Patterson Cos., Inc. |
1.4% | |||
| Moelis & Co., Class A |
1.4% | |||
| Meredith Corp. |
1.3% | |||
| Schweitzer-Mauduit International, Inc. |
1.1% | |||
| Sinclair Broadcast Group, Inc., Class A |
1.1% | |||
| MDC Holdings, Inc. |
1.1% | |||
| * | The ten largest holdings are subject to change, and there are no guarantees the Fund will remain invested in any particular company. Excludes derivatives and investment of cash collateral for securities on loan (if any). |
The WisdomTree U.S. SmallCap Quality Dividend Growth Fund (the ‘‘Fund’’) seeks to track the price and yield performance, before fees and expenses, of the WisdomTree U.S. SmallCap Quality Dividend Growth Index (the ‘‘Index’’). In seeking to track the Index, the Fund invests in dividend-paying small-cap companies with growth characteristics in the U.S. equity market. The Fund generally uses a representative sampling strategy to achieve its investment objective, meaning it generally will invest in a sample of securities in the Index.
The Fund returned 3.81% at net asset value (“NAV”) for the fiscal year ending March 31, 2019 (for more complete performance information please see the table below). The Fund’s position in Industrials contributed most positively to performance, while its position in Real Estate contributed least positively to performance. Despite the Federal Reserve (the “Fed”) raising the federal funds target rate three times throughout the fiscal year, the Fund was able to maintain positive performance in a rising rate environment, which is traditionally a headwind for dividend-oriented strategies. The Fund received the best performance contributions from companies that pay fewer dividends, while those that pay larger ones weighed on performance a bit more. Companies with greater profits also helped performance much more throughout the fiscal period, while less profitable companies tended to detract from performance. Likewise, portfolio allocations to companies with higher profitability helped provide a considerable downside buffer during the fourth quarter of 2018, where a broad market correction catalyzed by trade war apprehension with China and fears of a Fed policy misstep sent markets sharply downward. Conversely, those companies that were less profitable hindered performance more during this same period.
Shareholder Expense Example
| Beginning Account Value |
Ending Account Value |
Annualized Expense Ratio |
Expenses Paid During the Period |
|||||||||||||
| Actual |
$ | 1,000.00 | $ | 935.00 | 0.38 | % | $ | 1.83 | ||||||||
| Hypothetical (5% return before expenses) |
$ | 1,000.00 | $ | 1,023.04 | 0.38 | % | $ | 1.92 | ||||||||
Performance
| Average Annual Total Return | ||||||||||||||||
| 1 Year | 3 Year | 5 Year | Since Inception1 | |||||||||||||
| Fund NAV Returns |
3.81 | % | 9.74 | % | 6.48 | % | 8.25 | % | ||||||||
| Fund Market Price Returns |
3.79 | % | 9.74 | % | 6.49 | % | 8.22 | % | ||||||||
| WisdomTree U.S. SmallCap Quality Dividend Growth Index |
4.09 | % | 10.03 | % | 6.72 | % | 8.51 | % | ||||||||
| Russell 2000® Index |
2.05 | % | 12.92 | % | 7.05 | % | 8.37 | % | ||||||||
| 1 | Total returns are calculated based on the commencement of Fund trading on the NASDAQ on July 25, 2013. |
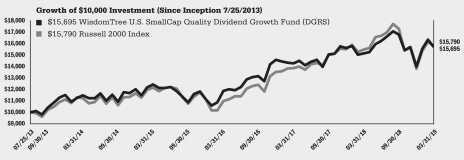
Performance is historical and does not guarantee future results. The returns do not reflect the deduction of taxes that a shareholder would pay on Fund distributions or on the redemption of Fund shares.
| 14 | WisdomTree Trust |
Management’s Discussion of Funds’ Performance
as of March 31, 2019 (unaudited)
WisdomTree U.S. Total Dividend Fund (DTD)
Sector Breakdown†
| Sector | % of Net Assets | |||
| Financials |
15.5% | |||
| Information Technology |
15.5% | |||
| Consumer Staples |
11.0% | |||
| Health Care |
10.0% | |||
| Industrials |
10.0% | |||
| Real Estate |
8.0% | |||
| Energy |
7.9% | |||
| Consumer Discretionary |
7.2% | |||
| Communication Services |
6.6% | |||
| Utilities |
5.3% | |||
| Materials |
2.7% | |||
| Investment Company |
0.2% | |||
| Other Assets less Liabilities‡ |
0.1% | |||
| Total |
100.0% | |||
| † | The Fund’s sector breakdown is expressed as a percentage of net assets and may change over time. In addition, a sector may be comprised of several industries. |
| ‡ | Other assets includes investment of cash collateral for securities on loan (if any). |
Top Ten Holdings*
| Description | % of Net Assets | |||
| Microsoft Corp. |
2.9% | |||
| Apple, Inc. |
2.8% | |||
| AT&T, Inc. |
2.6% | |||
| Exxon Mobil Corp. |
2.6% | |||
| JPMorgan Chase & Co. |
1.8% | |||
| Verizon Communications, Inc. |
1.8% | |||
| Johnson & Johnson |
1.8% | |||
| Chevron Corp. |
1.7% | |||
| Wells Fargo & Co. |
1.5% | |||
| Procter & Gamble Co. (The) |
1.4% | |||
| * | The ten largest holdings are subject to change, and there are no guarantees the Fund will remain invested in any particular company. Excludes derivatives and investment of cash collateral for securities on loan (if any). |
The WisdomTree U.S. Total Dividend Fund (the ‘‘Fund’’) seeks to track the price and yield performance, before fees and expenses, of the WisdomTree U.S. Dividend Index (the ‘‘Index’’). In seeking to track the Index, the Fund invests in U.S. all-cap equities from a broad range of dividend-paying companies. The Fund generally uses a representative sampling strategy to achieve its investment objective, meaning it generally will invest in a sample of securities in the Index.
The Fund returned 9.10% at net asset value (“NAV”) for the fiscal year ending March 31, 2019 (for more complete performance information please see the table below). The Fund’s position in Energy contributed most positively to performance, while its position in Information Technology contributed least positively to performance. Despite the Federal Reserve (the “Fed”) raising the federal funds target rate three times throughout the fiscal year, the Fund was able to maintain positive performance in a rising rate environment, which is traditionally a headwind for dividend-oriented strategies. The Fund’s overweight to large-cap equities, combined with underweights to both mid- and small-cap equities, provided a bit of protection during the fourth quarter of 2018, where a broad market correction catalyzed by trade war apprehension with China and fears of a Fed policy misstep sent markets sharply downward. Likewise, portfolio allocations to companies that pay greater dividends helped provide outsized returns over the entire fiscal year.
Shareholder Expense Example
| Beginning Account Value |
Ending Account Value |
Annualized Net Expense Ratio |
Expenses Paid During the Period |
|||||||||||||
| Actual |
$ | 1,000.00 | $ | 999.10 | 0.28 | % | $ | 1.40 | ||||||||
| Hypothetical (5% return before expenses) |
$ | 1,000.00 | $ | 1,023.54 | 0.28 | % | $ | 1.41 | ||||||||
Performance
| Average Annual Total Return | ||||||||||||||||
| 1 Year | 3 Year | 5 Year | 10 Year | |||||||||||||
| Fund NAV Returns |
9.10 | % | 11.39 | % | 9.64 | % | 15.63 | % | ||||||||
| Fund Market Price Returns |
9.03 | % | 11.40 | % | 9.65 | % | 15.60 | % | ||||||||
| WisdomTree U.S. Dividend Index |
9.36 | % | 11.69 | % | 9.94 | % | 16.09 | % | ||||||||
| Russell 3000® Index |
8.77 | % | 13.48 | % | 10.36 | % | 16.00 | % | ||||||||
| Russell 3000® Value Index |
5.30 | % | 10.50 | % | 7.56 | % | 14.50 | % | ||||||||
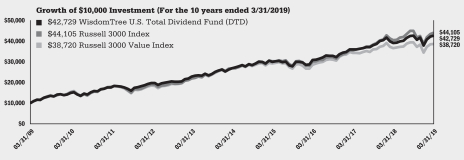
Performance is historical and does not guarantee future results. The returns do not reflect the deduction of taxes that a shareholder would pay on Fund distributions or on the redemption of Fund shares.
| WisdomTree Trust | 15 |
Management’s Discussion of Funds’ Performance
as of March 31, 2019 (unaudited)
WisdomTree U.S. Total Market Fund (EXT)
(formerly, WisdomTree U.S. Total Earnings Fund)
Sector Breakdown†
| Sector | % of Net Assets | |||
| Financials |
21.4% | |||
| Information Technology |
20.0% | |||
| Industrials |
11.2% | |||
| Health Care |
9.6% | |||
| Communication Services |
9.2% | |||
| Consumer Discretionary |
9.1% | |||
| Consumer Staples |
6.5% | |||
| Energy |
4.9% | |||
| Utilities |
2.9% | |||
| Materials |
2.7% | |||
| Real Estate |
2.2% | |||
| Other Assets less Liabilities‡ |
0.3% | |||
| Total |
100.0% | |||
| † | The Fund’s sector breakdown is expressed as a percentage of net assets and may change over time. In addition, a sector may be comprised of several industries. |
| ‡ | Other assets includes investment of cash collateral for securities on loan (if any). |
Top Ten Holdings*
| Description | % of Net Assets | |||
| Apple, Inc. |
4.5% | |||
| Microsoft Corp. |
2.3% | |||
| Berkshire Hathaway, Inc., Class B |
2.3% | |||
| Alphabet, Inc., Class A |
2.1% | |||
| JPMorgan Chase & Co. |
1.9% | |||
| Bank of America Corp. |
1.8% | |||
| Facebook, Inc., Class A |
1.7% | |||
| Intel Corp. |
1.5% | |||
| Exxon Mobil Corp. |
1.3% | |||
| Citigroup, Inc. |
1.3% | |||
| * | The ten largest holdings are subject to change, and there are no guarantees the Fund will remain invested in any particular company. Excludes derivatives and investment of cash collateral for securities on loan (if any). |
The WisdomTree U.S. Total Market Fund (the ‘‘Fund’’) seeks to track the price and yield performance, before fees and expenses, of the WisdomTree U.S. Total Market Index (the ‘‘Index’’). In seeking to track the Index, the Fund invests in U.S. all-cap equities from a broad range of earnings-generating companies. The Fund generally uses a representative sampling strategy to achieve its investment objective, meaning it generally will invest in a sample of securities in the Index. Prior to March 28, 2019, the WisdomTree U.S. Total Market Index was named the WisdomTree U.S. Earnings Index.
The Fund returned 6.34% at net asset value (“NAV”) for the fiscal year ending March 31, 2019 (for more complete performance information please see the table below). The Fund’s position in Energy contributed most positively to performance, while its position in Financials contributed least positively to performance. The Fund was able to maintain positive performance during the fiscal year, despite three federal funds target rate increases from the Federal Reserve (the “Fed”) that provided a headwind to Fund performance. In addition, the Fund’s overweight to large-cap equities and portfolio allocations to companies with low (or negative) earnings hindered Fund performance during the fiscal year. During the fourth quarter of 2018, where a broad market correction catalyzed by trade war apprehension with China and fears of a Fed policy misstep sent markets sharply downward, stock selection in large- and mid-cap equities provided a bit of downside protection.
Shareholder Expense Example
| Beginning Account Value |
Ending Account Value |
Annualized Expense Ratio |
Expenses Paid During the Period |
|||||||||||||
| Actual |
$ | 1,000.00 | $ | 978.30 | 0.28 | % | $ | 1.38 | ||||||||
| Hypothetical (5% return before expenses) |
$ | 1,000.00 | $ | 1,023.54 | 0.28 | % | $ | 1.41 | ||||||||
Performance
| Average Annual Total Return | ||||||||||||||||
| 1 Year | 3 Year | 5 Year | 10 Year | |||||||||||||
| Fund NAV Returns |
6.34 | % | 12.89 | % | 9.54 | % | 15.64 | % | ||||||||
| Fund Market Price Returns |
6.23 | % | 12.94 | % | 9.53 | % | 15.62 | % | ||||||||
| WisdomTree U.S. Total Market Index |
6.74 | % | 13.34 | % | 9.93 | % | 16.02 | % | ||||||||
| Russell 3000® Index |
8.77 | % | 13.48 | % | 10.36 | % | 16.00 | % | ||||||||
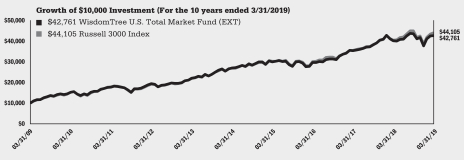
Performance is historical and does not guarantee future results. The returns do not reflect the deduction of taxes that a shareholder would pay on Fund distributions or on the redemption of Fund shares.
| 16 | WisdomTree Trust |
Description of Indexes (unaudited)
Below are descriptions of each Index referenced in this report:
The Dow Jones U.S. Select Dividend IndexSM is comprised of 100 U.S. dividend-paying companies.
The NASDAQ U.S. Dividend AchieversTM Select Index is a capitalization-weighted index that measures the performance of U.S. common stocks that have a history of increasing dividends for at least ten consecutive years.
The Russell 1000® Value Index is a capitalization-weighted index that is comprised of the large-capitalization value segment of the U.S. equity universe, selecting from the Russell 1000 Index.
The Russell 2000® Index is a capitalization-weighted index that is comprised of the smallest 2,000 securities in the Russell 3000 Index, based on total market capitalization.
The Russell 2000® Value Index is a capitalization-weighted index that is comprised of the small-capitalization value segment of the U.S. equity universe, selecting from the Russell 2000 Index.
The Russell 3000® Index is a capitalization-weighted index that is comprised of the 3,000 largest U.S. companies, based on total market capitalization.
The Russell 3000® Value Index is a capitalization-weighted index that measures the performance of the value segment of the broad U.S. equity market, selecting from the Russell 3000 Index.
The Russell Midcap Value Index is a capitalization weighted index that measures the midcap value segment of the U.S. equity universe, selecting from the Russell Midcap Index.
The S&P 500® Equal Weight Index is the equal-weight version of the widely used S&P 500 Index. The index includes the same constituents as the capitalization-weighted S&P 500 Index, but each company is allocated a fixed weight — or 0.2% of the index total at each quarterly rebalance.
The S&P 500® Index is a capitalization-weighted index of 500 stocks selected by the Standard & Poor’s Index Committee, designed to represent the performance of the leading industries in the United States economy.
The S&P MidCap 400® Index is a capitalization-weighted index that is comprised of the mid-capitalization range of the U.S. stock market, with stocks selected by the Standard & Poor’s Index Committee.
The WisdomTree Dividend Top 100 Index is comprised of the 100 highest dividend-yielding companies in the WisdomTree U.S. LargeCap Dividend Index.
The WisdomTree U.S. Dividend ex-Financials Index is comprised of high dividend-yielding stocks outside the Financials sector.
The WisdomTree U.S. Dividend Index defines the dividend-paying portion of the U.S. stock market.
The WisdomTree U.S. High Dividend Index is comprised of companies with high dividend yields, selected from the WisdomTree U.S. Dividend Index.
The WisdomTree U.S. LargeCap Dividend Index is comprised of the large-capitalization segment of the U.S. dividend-paying market, selected from the WisdomTree U.S. Dividend Index.
The WisdomTree U.S. LargeCap Index is a fundamentally weighted index that measures the performance of earnings-generating companies within the large-capitalization segment of the U.S. Stock Market.
The WisdomTree U.S. MidCap Dividend Index is comprised of the mid-capitalization segment of the U.S. dividend-paying market, selected from the WisdomTree U.S. Dividend Index.
The WisdomTree U.S. MidCap Index is a fundamentally weighted index that measures the performance of earnings-generating companies within the mid-capitalization segment of the U.S. Stock Market.
| WisdomTree Trust | 17 |
Description of Indexes (unaudited) (concluded)
The WisdomTree U.S. Multifactor Index is comprised of 200 U.S. companies with the highest composite scores based on two fundamental factors, value and quality measures, and two technical factors, momentum and correlation.
The WisdomTree U.S. Quality Dividend Growth Index is comprised of dividend-paying stocks with growth characteristics.
The WisdomTree U.S. SmallCap Dividend Index is comprised of the small-capitalization segment of the U.S. dividend-paying market, selected from the WisdomTree U.S. Dividend Index.
The WisdomTree U.S. SmallCap Index is a fundamentally weighted index that measures the performance of earnings-generating companies within the small-capitalization segment of the U.S. Stock Market.
The WisdomTree U.S. SmallCap Quality Dividend Growth Index is comprised of the small-capitalization segment of dividend-paying stocks with growth characteristics.
The WisdomTree U.S. Total Market Index is a fundamentally weighted index that measures the performance of earnings-generating companies within the broad U.S. Stock Market.
Index performance information assumes the reinvestment of dividends and excludes management fees, transaction costs and expenses. You cannot directly invest in an index.
The Dow Jones U.S. Select Dividend Index is calculated, distributed and marketed by Dow Jones Indexes, a licensed trademark of CME Group Index Services LLC, and has been licensed for use.
The Global Industry Classification Standard (“GICS”) was developed by and is the exclusive property and a service mark of MSCI Inc. (“MSCI”) and Standard & Poor’s (“S&P”), a division of The McGraw-Hill Companies, Inc., and is licensed for use by WisdomTree Investments, Inc. Neither MSCI, S&P nor any other party involved in making or compiling the GICS or any GICS classifications makes any express or implied warranties or representations with respect to such standard or classification (or the results to be obtained by the use thereof), and all such parties hereby expressly disclaim all warranties of originality, accuracy, completeness, merchantability and fitness for a particular purpose with respect to any such standard or classification. Without limiting any of the foregoing, in no event shall MSCI, S&P, any of their affiliates or any third party involved in making or compiling the GICS or any GICS classifications have any liability for any direct, indirect, special, punitive, consequential or any other damages (including lost profits) even if notified of the possibility of such damages.
Neither MSCI nor any other party involved in or related to compiling, computing or creating the MSCI data makes any express or implied warranties or representations with respect to such data (or the results to be obtained by the use thereof), and all such parties hereby expressly disclaim all warranties of originality, accuracy, completeness, merchantability or fitness for a particular purpose with respect to any such data. Without limiting any of the foregoing, in no event shall MSCI, any of its affiliates or any third party involved in or related to compiling, computing or creating the data have any liability for any direct, indirect, special, punitive, consequential or any other damages (including lost profits) even if notified of the possibility of such damages. No further distribution or dissemination of the MSCI data is permitted without MSCI’s express written consent.
WisdomTree Investments, Inc. and WisdomTree Asset Management, Inc. (together, “WisdomTree”) and the Funds make no representation or warranty, express or implied, to the owners of shares of the Funds or any member of the public regarding the advisability of investing in securities generally or in the Funds particularly or the ability of the underlying Indexes to track the performance of their underlying securities. WisdomTree Investments is the licensor of certain trademarks, service marks and trade names of the Funds. WisdomTree Investments has no obligation to take the needs of the Funds or the owners of shares of the Funds into consideration in determining, composing, or calculating the underlying WisdomTree Indexes of the applicable Funds. WisdomTree Investments is not responsible for, and has not participated in, the determination of the timing of, prices of, or quantities of shares of the Funds to be issued or in the determination or calculation of the equation by which the shares of the Funds are redeemable. WisdomTree and the Funds do not guarantee the accuracy, completeness, or performance of the underlying Indexes or the data included therein and shall have no liability in connection with the underlying Indexes or their calculation.
| 18 | WisdomTree Trust |
Schedule of Investments
WisdomTree U.S. Dividend ex-Financials Fund (DTN)
March 31, 2019
| Investments | Shares | Value | ||||||
| COMMON STOCKS – 99.1% | ||||||||
| United States – 99.1% | ||||||||
| Aerospace & Defense – 1.6% |
| |||||||
| Lockheed Martin Corp. |
22,499 | $ | 6,753,300 | |||||
| United Technologies Corp. |
45,354 | 5,845,677 | ||||||
|
|
|
|||||||
| Total Aerospace & Defense |
|
12,598,977 | ||||||
| Air Freight & Logistics – 1.0% |
| |||||||
| United Parcel Service, Inc. Class B |
70,431 | 7,869,960 | ||||||
| Automobiles – 3.0% |
| |||||||
| Ford Motor Co. |
1,648,434 | 14,473,250 | ||||||
| General Motors Co. |
251,910 | 9,345,861 | ||||||
|
|
|
|||||||
| Total Automobiles |
|
23,819,111 | ||||||
| Beverages – 1.7% |
| |||||||
| Coca-Cola Co. (The) |
138,834 | 6,505,761 | ||||||
| PepsiCo, Inc. |
58,847 | 7,211,700 | ||||||
|
|
|
|||||||
| Total Beverages |
|
13,717,461 | ||||||
| Biotechnology – 2.8% |
| |||||||
| AbbVie, Inc. |
117,044 | 9,432,576 | ||||||
| Amgen, Inc. |
29,451 | 5,595,101 | ||||||
| Gilead Sciences, Inc. |
106,837 | 6,945,473 | ||||||
|
|
|
|||||||
| Total Biotechnology |
|
21,973,150 | ||||||
| Chemicals – 4.0% |
| |||||||
| Air Products & Chemicals, Inc. |
39,049 | 7,456,797 | ||||||
| Celanese Corp. |
54,431 | 5,367,441 | ||||||
| CF Industries Holdings, Inc. |
148,420 | 6,067,410 | ||||||
| DowDuPont, Inc. |
109,740 | 5,850,239 | ||||||
| Eastman Chemical Co. |
87,977 | 6,675,695 | ||||||
|
|
|
|||||||
| Total Chemicals |
|
31,417,582 | ||||||
| Containers & Packaging – 3.9% |
| |||||||
| Avery Dennison Corp. |
52,168 | 5,894,984 | ||||||
| International Paper Co. |
219,968 | 10,177,919 | ||||||
| Packaging Corp. of America |
76,317 | 7,584,383 | ||||||
| WestRock Co. |
192,210 | 7,371,254 | ||||||
|
|
|
|||||||
| Total Containers & Packaging |
|
31,028,540 | ||||||
| Diversified Telecommunication Services – 5.3% |
| |||||||
| AT&T, Inc. |
468,400 | 14,689,024 | ||||||
| CenturyLink, Inc. |
1,493,955 | 17,912,521 | ||||||
| Verizon Communications, Inc. |
154,918 | 9,160,301 | ||||||
|
|
|
|||||||
| Total Diversified Telecommunication Services |
|
41,761,846 | ||||||
| Electric Utilities – 8.9% |
| |||||||
| Avangrid, Inc. |
145,676 | 7,334,787 | ||||||
| Duke Energy Corp. |
102,116 | 9,190,440 | ||||||
| Edison International |
161,603 | 10,006,458 | ||||||
| Entergy Corp. |
102,776 | 9,828,469 | ||||||
| FirstEnergy Corp. |
226,246 | 9,414,096 | ||||||
| PPL Corp. |
387,560 | 12,301,154 | ||||||
| Southern Co. (The) |
236,409 | 12,217,617 | ||||||
|
|
|
|||||||
| Total Electric Utilities |
|
70,293,021 | ||||||
| Electrical Equipment – 0.9% |
| |||||||
| Emerson Electric Co. |
106,989 | 7,325,537 | ||||||
| Energy Equipment & Services – 1.1% |
| |||||||
| Baker Hughes a GE Co. |
324,153 | 8,985,521 | ||||||
| Entertainment – 1.2% |
| |||||||
| Viacom, Inc. Class B |
200,035 | 5,614,982 | ||||||
| Walt Disney Co. (The) |
35,520 | 3,943,786 | ||||||
|
|
|
|||||||
| Total Entertainment |
|
9,558,768 | ||||||
| Food Products – 5.7% |
| |||||||
| Campbell Soup Co. |
201,853 | 7,696,655 | ||||||
| General Mills, Inc. |
273,449 | 14,150,986 | ||||||
| J.M. Smucker Co. (The) |
70,354 | 8,196,241 | ||||||
| Kellogg Co. |
129,053 | 7,405,061 | ||||||
| Kraft Heinz Co. (The) |
227,015 | 7,412,040 | ||||||
|
|
|
|||||||
| Total Food Products |
|
44,860,983 | ||||||
| Health Care Providers & Services – 2.2% |
| |||||||
| Cardinal Health, Inc. |
153,274 | 7,380,143 | ||||||
| CVS Health Corp. |
76,489 | 4,125,052 | ||||||
| Quest Diagnostics, Inc. |
61,734 | 5,551,121 | ||||||
|
|
|
|||||||
| Total Health Care Providers & Services |
|
17,056,316 | ||||||
| Hotels, Restaurants & Leisure – 1.7% |
| |||||||
| Las Vegas Sands Corp. |
219,699 | 13,392,851 | ||||||
| Household Durables – 2.0% |
| |||||||
| Newell Brands, Inc. |
394,258 | 6,047,918 | ||||||
| Whirlpool Corp. |
70,994 | 9,434,392 | ||||||
|
|
|
|||||||
| Total Household Durables |
|
15,482,310 | ||||||
| Household Products – 1.0% |
| |||||||
| Kimberly-Clark Corp. |
65,348 | 8,096,617 | ||||||
| Industrial Conglomerates – 3.3% |
| |||||||
| 3M Co. |
29,412 | 6,111,225 | ||||||
| General Electric Co. |
1,992,490 | 19,904,975 | ||||||
|
|
|
|||||||
| Total Industrial Conglomerates |
|
26,016,200 | ||||||
| IT Services – 3.9% |
| |||||||
| International Business Machines Corp. |
92,998 | 13,122,018 | ||||||
| Paychex, Inc. |
106,295 | 8,524,859 | ||||||
| Western Union Co. (The) |
493,819 | 9,120,837 | ||||||
|
|
|
|||||||
| Total IT Services |
|
30,767,714 | ||||||
| Machinery – 2.6% |
| |||||||
| Caterpillar, Inc. |
44,180 | 5,985,948 | ||||||
| Cummins, Inc. |
49,570 | 7,825,616 | ||||||
| Illinois Tool Works, Inc. |
48,387 | 6,944,986 | ||||||
|
|
|
|||||||
| Total Machinery |
|
20,756,550 | ||||||
| Media – 2.6% |
| |||||||
| Comcast Corp. Class A |
118,235 | 4,727,035 | ||||||
| Fox Corp. Class B* |
10,834 | 388,724 | ||||||
| Interpublic Group of Cos., Inc. (The) |
354,661 | 7,451,428 | ||||||
| Omnicom Group, Inc. |
91,083 | 6,648,148 | ||||||
| Sirius XM Holdings, Inc. |
271,988 | 1,542,172 | ||||||
|
|
|
|||||||
| Total Media |
|
20,757,507 | ||||||
| Metals & Mining – 0.8% |
| |||||||
| Nucor Corp. |
104,748 | 6,112,046 | ||||||
See Notes to Financial Statements.
| WisdomTree Trust | 19 |
Schedule of Investments (concluded)
WisdomTree U.S. Dividend ex-Financials Fund (DTN)
March 31, 2019
| Investments | Shares | Value | ||||||
| Multi-Utilities – 3.4% |
| |||||||
| CenterPoint Energy, Inc. |
299,231 | $ | 9,186,392 | |||||
| Consolidated Edison, Inc. |
93,569 | 7,935,587 | ||||||
| Dominion Energy, Inc. |
128,517 | 9,852,113 | ||||||
|
|
|
|||||||
| Total Multi-Utilities |
|
26,974,092 | ||||||
| Multiline Retail – 3.3% |
| |||||||
| Kohl’s Corp. |
130,695 | 8,987,895 | ||||||
| Macy’s, Inc. |
317,592 | 7,631,736 | ||||||
| Target Corp. |
119,378 | 9,581,278 | ||||||
|
|
|
|||||||
| Total Multiline Retail |
|
26,200,909 | ||||||
| Oil, Gas & Consumable Fuels – 13.5% |
| |||||||
| Chevron Corp. |
73,208 | 9,017,761 | ||||||
| Exxon Mobil Corp. |
120,474 | 9,734,299 | ||||||
| Kinder Morgan, Inc. |
639,521 | 12,796,815 | ||||||
| Occidental Petroleum Corp. |
150,513 | 9,963,961 | ||||||
| ONEOK, Inc. |
204,085 | 14,253,296 | ||||||
| Phillips 66 |
86,765 | 8,257,425 | ||||||
| Targa Resources Corp. |
426,270 | 17,711,519 | ||||||
| Valero Energy Corp. |
120,866 | 10,253,063 | ||||||
| Williams Cos., Inc. (The) |
505,372 | 14,514,284 | ||||||
|
|
|
|||||||
| Total Oil, Gas & Consumable Fuels |
|
106,502,423 | ||||||
| Pharmaceuticals – 3.1% |
| |||||||
| Bristol-Myers Squibb Co. |
126,295 | 6,025,535 | ||||||
| Johnson & Johnson |
41,136 | 5,750,401 | ||||||
| Merck & Co., Inc. |
80,811 | 6,721,051 | ||||||
| Pfizer, Inc. |
149,594 | 6,353,257 | ||||||
|
|
|
|||||||
| Total Pharmaceuticals |
|
24,850,244 | ||||||
| Semiconductors & Semiconductor Equipment – 5.2% |
| |||||||
| Broadcom, Inc. |
25,474 | 7,660,286 | ||||||
| KLA-Tencor Corp. |
74,945 | 8,949,182 | ||||||
| Maxim Integrated Products, Inc. |
138,687 | 7,373,988 | ||||||
| QUALCOMM, Inc. |
162,630 | 9,274,789 | ||||||
| Texas Instruments, Inc. |
72,464 | 7,686,257 | ||||||
|
|
|
|||||||
| Total Semiconductors & Semiconductor Equipment |
|
40,944,502 | ||||||
| Specialty Retail – 2.8% |
| |||||||
| Gap, Inc. (The) |
294,339 | 7,705,795 | ||||||
| L Brands, Inc. |
518,748 | 14,307,070 | ||||||
|
|
|
|||||||
| Total Specialty Retail |
|
22,012,865 | ||||||
| Technology Hardware, Storage & Peripherals – 2.4% |
| |||||||
| Hewlett Packard Enterprise Co. |
465,009 | 7,175,089 | ||||||
| Western Digital Corp. |
250,332 | 12,030,956 | ||||||
|
|
|
|||||||
| Total Technology Hardware, Storage & Peripherals |
|
19,206,045 | ||||||
| Tobacco – 3.3% |
| |||||||
| Altria Group, Inc. |
243,807 | 14,001,836 | ||||||
| Philip Morris International, Inc. |
140,946 | 12,458,217 | ||||||
|
|
|
|||||||
| Total Tobacco |
|
26,460,053 | ||||||
| Trading Companies & Distributors – 0.9% |
| |||||||
| Fastenal Co. | 111,746 | 7,186,385 | ||||||
| TOTAL COMMON STOCKS (Cost: $724,147,126) |
783,986,086 | |||||||
| EXCHANGE-TRADED FUNDS – 0.7% | ||||||||
| United States – 0.7% | ||||||||
| WisdomTree U.S. LargeCap Dividend Fund(a) |
28,953 | 2,727,952 | ||||||
| WisdomTree U.S. MidCap Dividend Fund(a) | 76,272 | 2,729,775 | ||||||
| TOTAL EXCHANGE-TRADED FUNDS (Cost: $5,231,495) |
5,457,727 | |||||||
| TOTAL INVESTMENTS IN SECURITIES – 99.8% (Cost: $729,378,621) |
789,443,813 | |||||||
| Other Assets less Liabilities – 0.2% |
|
1,625,055 | ||||||
|
|
|
|||||||
| NET ASSETS – 100.0% |
|
$ | 791,068,868 | |||||
| * | Non-income producing security. |
| (a) | Affiliated company (See Note 3). |
See Notes to Financial Statements.
| 20 | WisdomTree Trust |
Schedule of Investments
WisdomTree U.S. High Dividend Fund (DHS)
March 31, 2019
| Investments | Shares | Value | ||||||
| COMMON STOCKS – 99.1% | ||||||||
| United States – 99.1% | ||||||||
| Aerospace & Defense – 1.0% |
| |||||||
| Lockheed Martin Corp. |
30,807 | $ | 9,247,029 | |||||
| Air Freight & Logistics – 1.1% |
| |||||||
| United Parcel Service, Inc. Class B |
90,797 | 10,145,657 | ||||||
| Auto Components – 0.0% |
| |||||||
| LCI Industries |
2,703 | 207,644 | ||||||
| Automobiles – 1.8% |
| |||||||
| Ford Motor Co. |
974,642 | 8,557,357 | ||||||
| General Motors Co. |
216,741 | 8,041,091 | ||||||
| Harley-Davidson, Inc. |
26,909 | 959,575 | ||||||
|
|
|
|||||||
| Total Automobiles |
|
17,558,023 | ||||||
| Banks – 5.9% |
| |||||||
| Arrow Financial Corp. |
4,384 | 144,190 | ||||||
| Banc of California, Inc. |
12,812 | 177,318 | ||||||
| Bank of Hawaii Corp. |
6,353 | 501,061 | ||||||
| Bank OZK |
13,977 | 405,053 | ||||||
| BB&T Corp. |
97,762 | 4,548,866 | ||||||
| Boston Private Financial Holdings, Inc. |
7,263 | 79,602 | ||||||
| Bridge Bancorp, Inc. |
3,007 | 88,105 | ||||||
| Cathay General Bancorp |
12,587 | 426,825 | ||||||
| Central Pacific Financial Corp. |
6,841 | 197,294 | ||||||
| Citizens & Northern Corp. |
2,039 | 51,057 | ||||||
| Comerica, Inc. |
20,974 | 1,537,814 | ||||||
| Community Trust Bancorp, Inc. |
2,786 | 114,393 | ||||||
| Financial Institutions, Inc. |
2,398 | 65,178 | ||||||
| First Bancorp, Inc. |
5,021 | 125,123 | ||||||
| First Hawaiian, Inc. |
23,205 | 604,490 | ||||||
| First of Long Island Corp. (The) |
583 | 12,785 | ||||||
| Flushing Financial Corp. |
5,949 | 130,462 | ||||||
| FNB Corp. |
61,733 | 654,370 | ||||||
| Heritage Commerce Corp. |
12,905 | 156,151 | ||||||
| Hope Bancorp, Inc. |
27,290 | 356,953 | ||||||
| Huntington Bancshares, Inc. |
178,548 | 2,263,989 | ||||||
| Investors Bancorp, Inc. |
48,459 | 574,239 | ||||||
| KeyCorp |
168,805 | 2,658,679 | ||||||
| Mercantile Bank Corp. |
160 | 5,235 | ||||||
| Midland States Bancorp, Inc. |
4,207 | 101,220 | ||||||
| PacWest Bancorp |
33,695 | 1,267,269 | ||||||
| Park National Corp. |
2,203 | 208,734 | ||||||
| People’s United Financial, Inc. |
66,487 | 1,093,046 | ||||||
| Peoples Bancorp, Inc. |
1,169 | 36,204 | ||||||
| Premier Financial Bancorp, Inc. |
701 | 11,013 | ||||||
| Regions Financial Corp. |
157,180 | 2,224,097 | ||||||
| Sandy Spring Bancorp, Inc. |
5,677 | 177,577 | ||||||
| Southside Bancshares, Inc. |
7,377 | 245,138 | ||||||
| Stock Yards Bancorp, Inc. |
451 | 15,248 | ||||||
| SunTrust Banks, Inc. |
62,047 | 3,676,285 | ||||||
| Trustmark Corp. |
10,454 | 351,568 | ||||||
| Umpqua Holdings Corp. |
18,227 | 300,745 | ||||||
| United Bankshares, Inc. |
1,755 | 63,601 | ||||||
| Univest Financial Corp. |
7,484 | 183,059 | ||||||
| Valley National Bancorp |
64,350 | 616,473 | ||||||
| Washington Trust Bancorp, Inc. |
2,257 | 108,675 | ||||||
| Wells Fargo & Co. |
611,622 | 29,553,575 | ||||||
| West Bancorporation, Inc. |
3,052 | 63,115 | ||||||
|
|
|
|||||||
| Total Banks |
|
56,175,874 | ||||||
| Beverages – 4.4% |
| |||||||
| Coca-Cola Co. (The) |
473,500 | 22,188,210 | ||||||
| PepsiCo, Inc. |
161,858 | 19,835,698 | ||||||
|
|
|
|||||||
| Total Beverages |
|
42,023,908 | ||||||
| Biotechnology – 3.3% |
| |||||||
| AbbVie, Inc. |
264,608 | 21,324,759 | ||||||
| Gilead Sciences, Inc. |
159,001 | 10,336,655 | ||||||
|
|
|
|||||||
| Total Biotechnology |
|
31,661,414 | ||||||
| Capital Markets – 0.4% |
| |||||||
| Ares Management Corp. Class A |
22,558 | 523,571 | ||||||
| Artisan Partners Asset Management, Inc. Class A |
23,300 | 586,461 | ||||||
| BGC Partners, Inc. Class A |
93,796 | 498,057 | ||||||
| Cohen & Steers, Inc. |
8,562 | 361,916 | ||||||
| Eaton Vance Corp. |
18,873 | 760,771 | ||||||
| Federated Investors, Inc. Class B |
18,953 | 555,512 | ||||||
| GAIN Capital Holdings, Inc.(a) |
16,752 | 105,202 | ||||||
| Moelis & Co. Class A |
10,685 | 444,603 | ||||||
| Virtu Financial, Inc. Class A |
16,587 | 393,941 | ||||||
|
|
|
|||||||
| Total Capital Markets |
|
4,230,034 | ||||||
| Chemicals – 0.3% |
| |||||||
| CF Industries Holdings, Inc. |
13,115 | 536,141 | ||||||
| Chemours Co. (The) |
24,711 | 918,261 | ||||||
| Huntsman Corp. |
34,579 | 777,682 | ||||||
| Kronos Worldwide, Inc. |
15,347 | 215,165 | ||||||
| Olin Corp. |
27,802 | 643,338 | ||||||
| Valhi, Inc. |
1,050 | 2,425 | ||||||
|
|
|
|||||||
| Total Chemicals |
|
3,093,012 | ||||||
| Commercial Services & Supplies – 0.2% |
| |||||||
| Covanta Holding Corp. |
35,450 | 613,639 | ||||||
| Ennis, Inc. |
9,611 | 199,524 | ||||||
| HNI Corp. |
7,611 | 276,203 | ||||||
| Knoll, Inc. |
11,014 | 208,275 | ||||||
| Pitney Bowes, Inc. |
67,963 | 466,906 | ||||||
| Steelcase, Inc. Class A |
17,578 | 255,760 | ||||||
|
|
|
|||||||
| Total Commercial Services & Supplies |
|
2,020,307 | ||||||
| Consumer Finance – 0.5% |
| |||||||
| Navient Corp. |
63,589 | 735,725 | ||||||
| Santander Consumer USA Holdings, Inc. |
61,055 | 1,290,092 | ||||||
| Synchrony Financial |
91,527 | 2,919,711 | ||||||
|
|
|
|||||||
| Total Consumer Finance |
|
4,945,528 | ||||||
| Containers & Packaging – 0.7% |
| |||||||
| Greif, Inc. Class B |
639 | 31,241 | ||||||
| International Paper Co. |
67,473 | 3,121,976 | ||||||
| Packaging Corp. of America |
12,215 | 1,213,927 | ||||||
| Sonoco Products Co. |
11,848 | 729,007 | ||||||
| WestRock Co. |
39,078 | 1,498,641 | ||||||
|
|
|
|||||||
| Total Containers & Packaging |
|
6,594,792 | ||||||
See Notes to Financial Statements.
| WisdomTree Trust | 21 |
Schedule of Investments (continued)
WisdomTree U.S. High Dividend Fund (DHS)
March 31, 2019
| Investments | Shares | Value | ||||||
| Diversified Consumer Services – 0.1% |
| |||||||
| H&R Block, Inc. |
30,037 | $ | 719,086 | |||||
| Diversified Telecommunication Services – 9.4% |
| |||||||
| AT&T, Inc. |
1,482,318 | 46,485,492 | ||||||
| CenturyLink, Inc. |
486,601 | 5,834,346 | ||||||
| Cogent Communications Holdings, Inc. |
9,732 | 527,961 | ||||||
| Consolidated Communications Holdings, Inc. |
42,661 | 465,432 | ||||||
| Verizon Communications, Inc. |
613,024 | 36,248,109 | ||||||
|
|
|
|||||||
| Total Diversified Telecommunication Services |
|
89,561,340 | ||||||
| Electric Utilities – 5.7% |
| |||||||
| Alliant Energy Corp. |
26,429 | 1,245,599 | ||||||
| American Electric Power Co., Inc. |
59,015 | 4,942,506 | ||||||
| Avangrid, Inc. |
37,618 | 1,894,066 | ||||||
| Duke Energy Corp. |
103,162 | 9,284,580 | ||||||
| Edison International |
47,841 | 2,962,315 | ||||||
| Entergy Corp. |
23,272 | 2,225,501 | ||||||
| Evergy, Inc. |
30,469 | 1,768,726 | ||||||
| Eversource Energy |
33,457 | 2,373,774 | ||||||
| Exelon Corp. |
96,941 | 4,859,652 | ||||||
| FirstEnergy Corp. |
71,977 | 2,994,963 | ||||||
| Hawaiian Electric Industries, Inc. |
14,535 | 592,592 | ||||||
| OGE Energy Corp. |
26,750 | 1,153,460 | ||||||
| Pinnacle West Capital Corp. |
13,659 | 1,305,527 | ||||||
| Portland General Electric Co. |
11,103 | 575,580 | ||||||
| PPL Corp. |
138,159 | 4,385,167 | ||||||
| Southern Co. (The) |
182,143 | 9,413,150 | ||||||
| Xcel Energy, Inc. |
43,225 | 2,429,677 | ||||||
|
|
|
|||||||
| Total Electric Utilities |
|
54,406,835 | ||||||
| Electrical Equipment – 0.6% |
| |||||||
| Emerson Electric Co. |
72,651 | 4,974,414 | ||||||
| Hubbell, Inc. |
7,111 | 838,956 | ||||||
|
|
|
|||||||
| Total Electrical Equipment |
|
5,813,370 | ||||||
| Electronic Equipment, Instruments & Components – 0.1% |
| |||||||
| AVX Corp. |
23,172 | 401,803 | ||||||
| Daktronics, Inc. |
16,316 | 121,554 | ||||||
|
|
|
|||||||
| Total Electronic Equipment, Instruments & Components |
|
523,357 | ||||||
| Energy Equipment & Services – 0.4% |
| |||||||
| Archrock, Inc. |
30,261 | 295,953 | ||||||
| Baker Hughes a GE Co. |
64,447 | 1,786,471 | ||||||
| Helmerich & Payne, Inc. |
20,116 | 1,117,645 | ||||||
| RPC, Inc. |
14,845 | 169,381 | ||||||
|
|
|
|||||||
| Total Energy Equipment & Services |
|
3,369,450 | ||||||
| Entertainment – 0.1% |
| |||||||
| AMC Entertainment Holdings, Inc. Class A |
13,170 | 195,574 | ||||||
| Cinemark Holdings, Inc. |
15,226 | 608,888 | ||||||
|
|
|
|||||||
| Total Entertainment |
|
804,462 | ||||||
| Equity Real Estate Investment Trusts (REITs) – 14.4% |
| |||||||
| Acadia Realty Trust |
14,938 | 407,359 | ||||||
| Agree Realty Corp. |
5,868 | 406,887 | ||||||
| Alexander’s, Inc. |
3 | 1,129 | ||||||
| Alexandria Real Estate Equities, Inc. |
12,176 | 1,735,811 | ||||||
| American Campus Communities, Inc. |
22,454 | 1,068,361 | ||||||
| American Finance Trust, Inc. |
22,910 | 247,428 | ||||||
| Apartment Investment & Management Co. Class A |
19,505 | 980,906 | ||||||
| Apple Hospitality REIT, Inc. |
67,072 | 1,093,274 | ||||||
| Armada Hoffler Properties, Inc. |
15,055 | 234,707 | ||||||
| Ashford Hospitality Trust, Inc. |
47,110 | 223,773 | ||||||
| AvalonBay Communities, Inc. |
15,731 | 3,157,684 | ||||||
| Bluerock Residential Growth REIT, Inc. |
14,599 | 157,377 | ||||||
| Braemar Hotels & Resorts, Inc. |
10,529 | 128,559 | ||||||
| Brandywine Realty Trust |
39,782 | 630,943 | ||||||
| Brixmor Property Group, Inc. |
77,217 | 1,418,476 | ||||||
| Brookfield Property REIT, Inc. Class A |
39,757 | 814,621 | ||||||
| Camden Property Trust |
11,978 | 1,215,767 | ||||||
| CareTrust REIT, Inc. |
16,230 | 380,756 | ||||||
| CatchMark Timber Trust, Inc. Class A |
23,316 | 228,963 | ||||||
| Cedar Realty Trust, Inc. |
28,770 | 97,818 | ||||||
| Chatham Lodging Trust |
16,148 | 310,688 | ||||||
| Chesapeake Lodging Trust |
15,363 | 427,245 | ||||||
| Colony Capital, Inc. |
118,819 | 632,117 | ||||||
| Community Healthcare Trust, Inc. |
6,459 | 231,814 | ||||||
| CoreCivic, Inc. |
38,443 | 747,716 | ||||||
| CorEnergy Infrastructure Trust, Inc.(a) |
5,795 | 212,966 | ||||||
| CorePoint Lodging, Inc. |
15,394 | 171,951 | ||||||
| CoreSite Realty Corp. |
6,434 | 688,567 | ||||||
| Corporate Office Properties Trust |
22,768 | 621,566 | ||||||
| Cousins Properties, Inc. |
56,714 | 547,857 | ||||||
| Crown Castle International Corp. |
57,908 | 7,412,224 | ||||||
| CubeSmart |
27,860 | 892,634 | ||||||
| CyrusOne, Inc. |
13,063 | 685,024 | ||||||
| DiamondRock Hospitality Co. |
45,895 | 497,043 | ||||||
| Digital Realty Trust, Inc. |
26,367 | 3,137,673 | ||||||
| Duke Realty Corp. |
41,748 | 1,276,654 | ||||||
| Easterly Government Properties, Inc. |
17,871 | 321,857 | ||||||
| EastGroup Properties, Inc. |
4,546 | 507,515 | ||||||
| EPR Properties |
17,214 | 1,323,757 | ||||||
| Equity Residential |
41,171 | 3,101,000 | ||||||
| Essential Properties Realty Trust, Inc. |
16,450 | 321,104 | ||||||
| Essex Property Trust, Inc. |
6,912 | 1,999,227 | ||||||
| Extra Space Storage, Inc. |
16,608 | 1,692,521 | ||||||
| Federal Realty Investment Trust |
8,755 | 1,206,877 | ||||||
| Four Corners Property Trust, Inc. |
13,268 | 392,733 | ||||||
| Franklin Street Properties Corp. |
32,253 | 231,899 | ||||||
| Gaming and Leisure Properties, Inc. |
61,148 | 2,358,478 | ||||||
| GEO Group, Inc. (The) |
39,731 | 762,835 | ||||||
| Getty Realty Corp. |
9,049 | 289,839 | ||||||
| Gladstone Commercial Corp. |
13,014 | 270,301 | ||||||
| Gladstone Land Corp. |
5,152 | 65,173 | ||||||
| Global Medical REIT, Inc. |
16,565 | 162,668 | ||||||
| Global Net Lease, Inc. |
34,036 | 643,280 | ||||||
| Hannon Armstrong Sustainable Infrastructure Capital, Inc. |
15,481 | 396,933 | ||||||
| HCP, Inc. |
68,575 | 2,146,397 | ||||||
| Healthcare Realty Trust, Inc. |
20,376 | 654,273 | ||||||
| Healthcare Trust of America, Inc. Class A |
36,256 | 1,036,559 | ||||||
See Notes to Financial Statements.
| 22 | WisdomTree Trust |
Schedule of Investments (continued)
WisdomTree U.S. High Dividend Fund (DHS)
March 31, 2019
| Investments | Shares | Value | ||||||
| Highwoods Properties, Inc. |
18,443 | $ | 862,764 | |||||
| Hospitality Properties Trust |
50,420 | 1,326,550 | ||||||
| Host Hotels & Resorts, Inc. |
122,077 | 2,307,255 | ||||||
| Hudson Pacific Properties, Inc. |
3,187 | 109,697 | ||||||
| Independence Realty Trust, Inc. |
30,566 | 329,807 | ||||||
| Industrial Logistics Properties Trust |
35,404 | 714,099 | ||||||
| InfraREIT, Inc. |
11,386 | 238,764 | ||||||
| Iron Mountain, Inc. |
72,630 | 2,575,460 | ||||||
| iStar, Inc. |
17,575 | 147,982 | ||||||
| Jernigan Capital, Inc. |
8,802 | 185,194 | ||||||
| Kimco Realty Corp. |
106,200 | 1,964,700 | ||||||
| Lamar Advertising Co. Class A |
15,819 | 1,253,814 | ||||||
| Lexington Realty Trust |
15,555 | 140,928 | ||||||
| Liberty Property Trust |
19,854 | 961,331 | ||||||
| Life Storage, Inc. |
7,339 | 713,865 | ||||||
| LTC Properties, Inc. |
9,230 | 422,734 | ||||||
| Macerich Co. (The) |
32,998 | 1,430,463 | ||||||
| Medical Properties Trust, Inc. |
81,339 | 1,505,585 | ||||||
| Mid-America Apartment Communities, Inc. |
15,419 | 1,685,759 | ||||||
| Monmouth Real Estate Investment Corp. |
22,307 | 294,006 | ||||||
| National Health Investors, Inc. |
8,605 | 675,923 | ||||||
| National Retail Properties, Inc. |
23,815 | 1,319,113 | ||||||
| National Storage Affiliates Trust |
11,325 | 322,876 | ||||||
| NexPoint Residential Trust, Inc. |
5,175 | 198,410 | ||||||
| NorthStar Realty Europe Corp. |
12,174 | 211,341 | ||||||
| Office Properties Income Trust |
23,924 | 661,259 | ||||||
| Omega Healthcare Investors, Inc. |
53,099 | 2,025,727 | ||||||
| One Liberty Properties, Inc. |
4,987 | 144,623 | ||||||
| Outfront Media, Inc. |
41,180 | 963,612 | ||||||
| Park Hotels & Resorts, Inc. |
40,666 | 1,263,899 | ||||||
| Pebblebrook Hotel Trust |
11,204 | 347,996 | ||||||
| Physicians Realty Trust |
31,658 | 595,487 | ||||||
| PotlatchDeltic Corp. |
227 | 8,578 | ||||||
| Preferred Apartment Communities, Inc. Class A |
16,167 | 239,595 | ||||||
| Prologis, Inc. |
66,786 | 4,805,253 | ||||||
| PS Business Parks, Inc. |
3,525 | 552,826 | ||||||
| Public Storage |
24,460 | 5,326,899 | ||||||
| QTS Realty Trust, Inc. Class A |
1,112 | 50,029 | ||||||
| Rayonier, Inc. |
4,195 | 132,226 | ||||||
| Realty Income Corp. |
42,623 | 3,135,348 | ||||||
| Regency Centers Corp. |
13,929 | 940,068 | ||||||
| Retail Opportunity Investments Corp. |
22,831 | 395,890 | ||||||
| Retail Properties of America, Inc. Class A |
2,612 | 31,840 | ||||||
| RLJ Lodging Trust |
18,925 | 332,512 | ||||||
| Ryman Hospitality Properties, Inc. |
9,864 | 811,215 | ||||||
| Sabra Health Care REIT, Inc. |
64,945 | 1,264,479 | ||||||
| Safehold, Inc. |
2,403 | 52,409 | ||||||
| Saul Centers, Inc. |
487 | 25,017 | ||||||
| Senior Housing Properties Trust |
105,965 | 1,248,268 | ||||||
| Simon Property Group, Inc. |
44,983 | 8,196,352 | ||||||
| SITE Centers Corp. |
37,789 | 514,686 | ||||||
| SL Green Realty Corp. |
12,397 | 1,114,738 | ||||||
| Spirit Realty Capital, Inc. |
7,303 | 290,148 | ||||||
| STAG Industrial, Inc. |
24,366 | 722,452 | ||||||
| STORE Capital Corp. |
34,864 | 1,167,944 | ||||||
| Summit Hotel Properties, Inc. |
33,797 | 385,624 | ||||||
| Taubman Centers, Inc. |
1,897 | 100,313 | ||||||
| Tier REIT, Inc. |
10,337 | 296,258 | ||||||
| UDR, Inc. |
24,008 | 1,091,404 | ||||||
| UMH Properties, Inc. |
14,371 | 202,344 | ||||||
| Uniti Group, Inc.(a) |
84,649 | 947,222 | ||||||
| Universal Health Realty Income Trust |
2,009 | 152,101 | ||||||
| Urstadt Biddle Properties, Inc. Class A |
2,279 | 47,039 | ||||||
| Ventas, Inc. |
64,542 | 4,118,425 | ||||||
| VEREIT, Inc. |
249,488 | 2,088,215 | ||||||
| VICI Properties, Inc. |
83,461 | 1,826,127 | ||||||
| Vornado Realty Trust |
17,937 | 1,209,671 | ||||||
| W.P. Carey, Inc. |
34,067 | 2,668,468 | ||||||
| Washington Prime Group, Inc. |
3,734 | 21,097 | ||||||
| Weingarten Realty Investors |
8,936 | 262,450 | ||||||
| Welltower, Inc. |
62,891 | 4,880,342 | ||||||
| Weyerhaeuser Co. |
152,322 | 4,012,161 | ||||||
| Whitestone REIT |
17,930 | 215,519 | ||||||
| Xenia Hotels & Resorts, Inc. |
26,883 | 589,007 | ||||||
|
|
|
|||||||
| Total Equity Real Estate Investment Trusts (REITs) |
|
137,383,146 | ||||||
| Food & Staples Retailing – 0.0% |
| |||||||
| SpartanNash Co. |
3,304 | 52,434 | ||||||
| Village Super Market, Inc. Class A |
8 | 219 | ||||||
|
|
|
|||||||
| Total Food & Staples Retailing |
|
52,653 | ||||||
| Food Products – 2.3% |
| |||||||
| Archer-Daniels-Midland Co. |
49,007 | 2,113,672 | ||||||
| B&G Foods, Inc.(a) |
17,202 | 420,073 | ||||||
| Campbell Soup Co. |
39,919 | 1,522,111 | ||||||
| Flowers Foods, Inc. |
32,691 | 696,972 | ||||||
| General Mills, Inc. |
111,957 | 5,793,775 | ||||||
| J.M. Smucker Co. (The) |
14,188 | 1,652,902 | ||||||
| Kellogg Co. |
46,616 | 2,674,826 | ||||||
| Kraft Heinz Co. (The) |
227,003 | 7,411,648 | ||||||
|
|
|
|||||||
| Total Food Products |
|
22,285,979 | ||||||
| Gas Utilities – 0.2% |
| |||||||
| National Fuel Gas Co. |
10,766 | 656,295 | ||||||
| Northwest Natural Holding Co. |
4,228 | 277,484 | ||||||
| South Jersey Industries, Inc. |
14,372 | 460,910 | ||||||
| Spire, Inc. |
6,458 | 531,429 | ||||||
|
|
|
|||||||
| Total Gas Utilities |
|
1,926,118 | ||||||
| Health Care Providers & Services – 0.2% |
| |||||||
| Cardinal Health, Inc. |
41,573 | 2,001,740 | ||||||
| Hotels, Restaurants & Leisure – 1.1% |
| |||||||
| Bluegreen Vacations Corp.(a) |
119 | 1,768 | ||||||
| Brinker International, Inc. |
6,060 | 268,943 | ||||||
| Dine Brands Global, Inc. |
1,201 | 109,639 | ||||||
| Las Vegas Sands Corp. |
151,900 | 9,259,824 | ||||||
| Six Flags Entertainment Corp. |
9,036 | 445,927 | ||||||
| Wyndham Destinations, Inc. |
12,265 | 496,610 | ||||||
|
|
|
|||||||
| Total Hotels, Restaurants & Leisure |
|
10,582,711 | ||||||
See Notes to Financial Statements.
| WisdomTree Trust | 23 |
Schedule of Investments (continued)
WisdomTree U.S. High Dividend Fund (DHS)
March 31, 2019
| Investments | Shares | Value | ||||||
| Household Durables – 0.5% |
| |||||||
| Ethan Allen Interiors, Inc. |
8,433 | $ | 161,323 | |||||
| Leggett & Platt, Inc. |
21,627 | 913,092 | ||||||
| MDC Holdings, Inc. |
12,890 | 374,584 | ||||||
| Newell Brands, Inc. |
72,242 | 1,108,192 | ||||||
| Tupperware Brands Corp. |
15,570 | 398,281 | ||||||
| Whirlpool Corp. |
9,872 | 1,311,890 | ||||||
|
|
|
|||||||
| Total Household Durables |
|
4,267,362 | ||||||
| Household Products – 3.4% |
| |||||||
| Kimberly-Clark Corp. |
42,114 | 5,217,925 | ||||||
| Procter & Gamble Co. (The) |
260,166 | 27,070,272 | ||||||
| Spectrum Brands Holdings, Inc. |
8,946 | 490,062 | ||||||
|
|
|
|||||||
| Total Household Products |
|
32,778,259 | ||||||
| Independent Power & Renewable Electricity Producers – 0.3% |
| |||||||
| AES Corp. |
77,494 | 1,401,092 | ||||||
| Clearway Energy, Inc. Class A |
13,995 | 203,487 | ||||||
| Pattern Energy Group, Inc. Class A |
32,321 | 711,062 | ||||||
| TerraForm Power, Inc. Class A |
56,334 | 774,029 | ||||||
|
|
|
|||||||
| Total Independent Power & Renewable Electricity Producers |
|
3,089,670 | ||||||
| Industrial Conglomerates – 2.1% |
| |||||||
| General Electric Co. |
2,040,439 | 20,383,986 | ||||||
| Insurance – 2.2% |
| |||||||
| CNA Financial Corp. |
32,336 | 1,401,766 | ||||||
| EMC Insurance Group, Inc. |
4,914 | 156,658 | ||||||
| Fidelity National Financial, Inc. |
39,537 | 1,445,077 | ||||||
| First American Financial Corp. |
16,743 | 862,265 | ||||||
| Mercury General Corp. |
10,648 | 533,145 | ||||||
| MetLife, Inc. |
151,664 | 6,456,336 | ||||||
| Old Republic International Corp. |
42,876 | 896,966 | ||||||
| Principal Financial Group, Inc. |
51,124 | 2,565,914 | ||||||
| Prudential Financial, Inc. |
64,327 | 5,910,365 | ||||||
| Safety Insurance Group, Inc. |
2,528 | 220,290 | ||||||
| Stewart Information Services Corp. |
4,562 | 194,752 | ||||||
|
|
|
|||||||
| Total Insurance |
|
20,643,534 | ||||||
| Internet & Direct Marketing Retail – 0.0% |
| |||||||
| PetMed Express, Inc.(a) |
7,276 | 165,747 | ||||||
| IT Services – 3.0% |
| |||||||
| International Business Machines Corp. |
167,578 | 23,645,256 | ||||||
| Paychex, Inc. |
44,118 | 3,538,264 | ||||||
| Western Union Co. (The) |
69,784 | 1,288,910 | ||||||
|
|
|
|||||||
| Total IT Services |
|
28,472,430 | ||||||
| Machinery – 0.3% |
| |||||||
| Briggs & Stratton Corp. |
12,783 | 151,223 | ||||||
| Cummins, Inc. |
19,838 | 3,131,825 | ||||||
| NN, Inc. |
3,793 | 28,409 | ||||||
|
|
|
|||||||
| Total Machinery |
|
3,311,457 | ||||||
| Media – 0.4% |
| |||||||
| Entercom Communications Corp. Class A |
34,298 | 180,064 | ||||||
| Gannett Co., Inc. |
34,800 | 366,792 | ||||||
| Interpublic Group of Cos., Inc. (The) |
54,971 | 1,154,941 | ||||||
| Meredith Corp. |
7,415 | 409,753 | ||||||
| Omnicom Group, Inc. |
26,037 | 1,900,441 | ||||||
|
|
|
|||||||
| Total Media |
|
4,011,991 | ||||||
| Metals & Mining – 0.1% |
| |||||||
| Compass Minerals International, Inc. |
9,362 | 509,012 | ||||||
| Mortgage Real Estate Investment Trusts (REITs) – 0.0% |
| |||||||
| Arlington Asset Investment Corp. Class A(a) |
23,951 | 190,650 | ||||||
| Multi-Utilities – 3.1% |
| |||||||
| Avista Corp. |
9,619 | 390,724 | ||||||
| Black Hills Corp. |
7,711 | 571,154 | ||||||
| CenterPoint Energy, Inc. |
69,573 | 2,135,891 | ||||||
| Consolidated Edison, Inc. |
39,957 | 3,388,753 | ||||||
| Dominion Energy, Inc. |
101,094 | 7,749,866 | ||||||
| DTE Energy Co. |
21,155 | 2,638,875 | ||||||
| MDU Resources Group, Inc. |
24,653 | 636,787 | ||||||
| NiSource, Inc. |
40,277 | 1,154,339 | ||||||
| NorthWestern Corp. |
7,478 | 526,526 | ||||||
| Public Service Enterprise Group, Inc. |
58,902 | 3,499,368 | ||||||
| Sempra Energy |
29,735 | 3,742,447 | ||||||
| Unitil Corp. |
3,206 | 173,669 | ||||||
| WEC Energy Group, Inc. |
34,081 | 2,695,125 | ||||||
|
|
|
|||||||
| Total Multi-Utilities |
|
29,303,524 | ||||||
| Multiline Retail – 0.9% |
| |||||||
| Kohl’s Corp. |
24,715 | 1,699,650 | ||||||
| Macy’s, Inc. |
38,672 | 929,288 | ||||||
| Nordstrom, Inc. |
19,863 | 881,520 | ||||||
| Target Corp. |
62,906 | 5,048,836 | ||||||
|
|
|
|||||||
| Total Multiline Retail |
|
8,559,294 | ||||||
| Oil, Gas & Consumable Fuels – 13.7% |
| |||||||
| Berry Petroleum Corp. |
4,273 | 49,310 | ||||||
| Chevron Corp. |
265,131 | 32,658,837 | ||||||
| CVR Energy, Inc. |
32,276 | 1,329,771 | ||||||
| Evolution Petroleum Corp. |
10,870 | 73,373 | ||||||
| Exxon Mobil Corp. |
593,916 | 47,988,413 | ||||||
| Green Plains, Inc. |
7,885 | 131,522 | ||||||
| Kinder Morgan, Inc. |
388,220 | 7,768,282 | ||||||
| Marathon Petroleum Corp. |
75,910 | 4,543,213 | ||||||
| Murphy Oil Corp. |
5,820 | 170,526 | ||||||
| Occidental Petroleum Corp. |
121,351 | 8,033,436 | ||||||
| ONEOK, Inc. |
83,412 | 5,825,494 | ||||||
| PBF Energy, Inc. Class A |
18,407 | 573,194 | ||||||
| Phillips 66 |
60,575 | 5,764,923 | ||||||
| SemGroup Corp. Class A |
4,518 | 66,595 | ||||||
| Targa Resources Corp. |
71,442 | 2,968,415 | ||||||
| Valero Energy Corp. |
66,125 | 5,609,384 | ||||||
| Williams Cos., Inc. (The) |
249,871 | 7,176,295 | ||||||
|
|
|
|||||||
| Total Oil, Gas & Consumable Fuels |
|
130,730,983 | ||||||
| Paper & Forest Products – 0.1% |
| |||||||
| Domtar Corp. |
12,282 | 609,801 | ||||||
| PH Glatfelter Co. |
3,650 | 51,538 | ||||||
|
|
|
|||||||
| Total Paper & Forest Products |
|
661,339 | ||||||
See Notes to Financial Statements.
| 24 | WisdomTree Trust |
Schedule of Investments (concluded)
WisdomTree U.S. High Dividend Fund (DHS)
March 31, 2019
| Investments | Shares | Value | ||||||
| Personal Products – 0.2% |
| |||||||
| Coty, Inc. Class A(a) |
192,423 | $ | 2,212,864 | |||||
| Natural Health Trends Corp.(a) |
2,003 | 25,959 | ||||||
|
|
|
|||||||
| Total Personal Products |
|
2,238,823 | ||||||
| Pharmaceuticals – 3.7% |
| |||||||
| Bristol-Myers Squibb Co. |
177,339 | 8,460,844 | ||||||
| Pfizer, Inc. |
621,077 | 26,377,140 | ||||||
|
|
|
|||||||
| Total Pharmaceuticals |
|
34,837,984 | ||||||
| Professional Services – 0.0% |
| |||||||
| Resources Connection, Inc. |
5,383 | 89,035 | ||||||
| Real Estate Management & Development – 0.1% |
| |||||||
| Kennedy-Wilson Holdings, Inc. |
26,322 | 563,028 | ||||||
| Newmark Group, Inc. Class A |
16,415 | 136,901 | ||||||
|
|
|
|||||||
| Total Real Estate Management & Development |
|
699,929 | ||||||
| Road & Rail – 0.1% |
| |||||||
| Ryder System, Inc. |
9,968 | 617,916 | ||||||
| Semiconductors & Semiconductor Equipment – 2.8% |
| |||||||
| Cypress Semiconductor Corp. |
50,813 | 758,130 | ||||||
| KLA-Tencor Corp. |
15,641 | 1,867,692 | ||||||
| Maxim Integrated Products, Inc. |
35,531 | 1,889,183 | ||||||
| NVE Corp. |
1,650 | 161,519 | ||||||
| QUALCOMM, Inc. |
176,978 | 10,093,055 | ||||||
| Texas Instruments, Inc. |
110,955 | 11,768,997 | ||||||
| Xperi Corp. |
9,488 | 222,019 | ||||||
|
|
|
|||||||
| Total Semiconductors & Semiconductor Equipment |
|
26,760,595 | ||||||
| Specialty Retail – 0.8% |
| |||||||
| Abercrombie & Fitch Co. Class A |
14,634 | 401,118 | ||||||
| Barnes & Noble, Inc. |
25,798 | 140,083 | ||||||
| Bed Bath & Beyond, Inc. |
33,933 | 576,522 | ||||||
| Buckle, Inc. (The) |
10,435 | 195,343 | ||||||
| Cato Corp. (The) Class A |
12,587 | 188,553 | ||||||
| Chico’s FAS, Inc. |
38,931 | 166,236 | ||||||
| Designer Brands, Inc. |
14,676 | 326,101 | ||||||
| GameStop Corp. Class A |
37,195 | 377,901 | ||||||
| Gap, Inc. (The) |
52,167 | 1,365,732 | ||||||
| Guess?, Inc. |
4,614 | 90,435 | ||||||
| Haverty Furniture Cos., Inc. |
4,424 | 96,797 | ||||||
| L Brands, Inc. |
78,014 | 2,151,626 | ||||||
| Office Depot, Inc. |
81,381 | 295,413 | ||||||
| Penske Automotive Group, Inc. |
13,539 | 604,516 | ||||||
| Tile Shop Holdings, Inc. |
11,235 | 63,590 | ||||||
| Williams-Sonoma, Inc.(a) |
2,144 | 120,643 | ||||||
|
|
|
|||||||
| Total Specialty Retail |
|
7,160,609 | ||||||
| Technology Hardware, Storage & Peripherals – 0.9% |
| |||||||
| Hewlett Packard Enterprise Co. |
169,658 | 2,617,823 | ||||||
| HP, Inc. |
165,560 | 3,216,831 | ||||||
| Western Digital Corp. |
54,599 | 2,624,028 | ||||||
| Xerox Corp. |
13,613 | 435,343 | ||||||
|
|
|
|||||||
| Total Technology Hardware, Storage & Peripherals |
|
8,894,025 | ||||||
| Textiles, Apparel & Luxury Goods – 0.3% |
| |||||||
| Hanesbrands, Inc. |
62,644 | 1,120,075 | ||||||
| Tapestry, Inc. |
42,149 | 1,369,421 | ||||||
|
|
|
|||||||
| Total Textiles, Apparel & Luxury Goods |
|
2,489,496 | ||||||
| Thrifts & Mortgage Finance – 0.4% |
| |||||||
| Dime Community Bancshares, Inc. |
9,379 | 175,669 | ||||||
| New York Community Bancorp, Inc. |
76,988 | 890,751 | ||||||
| Northwest Bancshares, Inc. |
19,826 | 336,447 | ||||||
| Oritani Financial Corp. |
16,707 | 277,837 | ||||||
| Provident Financial Services, Inc. |
12,046 | 311,871 | ||||||
| Territorial Bancorp, Inc. |
579 | 15,581 | ||||||
| TFS Financial Corp. |
67,348 | 1,109,222 | ||||||
| TrustCo Bank Corp. |
25,749 | 199,812 | ||||||
| United Financial Bancorp, Inc. |
11,305 | 162,227 | ||||||
|
|
|
|||||||
| Total Thrifts & Mortgage Finance |
|
3,479,417 | ||||||
| Tobacco – 5.3% |
| |||||||
| Altria Group, Inc. |
401,339 | 23,048,899 | ||||||
| Philip Morris International, Inc. |
302,219 | 26,713,138 | ||||||
| Universal Corp. |
5,756 | 331,718 | ||||||
| Vector Group Ltd. |
80,808 | 871,918 | ||||||
|
|
|
|||||||
| Total Tobacco |
|
50,965,673 | ||||||
| Trading Companies & Distributors – 0.1% |
| |||||||
| H&E Equipment Services, Inc. |
8,437 | 211,853 | ||||||
| Watsco, Inc. |
5,492 | 786,509 | ||||||
|
|
|
|||||||
| Total Trading Companies & Distributors |
|
998,362 | ||||||
| Transportation Infrastructure – 0.1% |
| |||||||
| Macquarie Infrastructure Corp. |
18,437 | 759,973 | ||||||
| TOTAL COMMON STOCKS (Cost: $904,423,510) |
|
944,404,544 | ||||||
| EXCHANGE-TRADED FUND – 0.7% | ||||||||
| United States – 0.7% | ||||||||
| WisdomTree U.S. Total Dividend Fund(a)(b) (Cost: $6,382,419) | 73,466 | 6,952,088 | ||||||
| INVESTMENT OF CASH COLLATERAL FOR SECURITIES LOANED – 0.3% |
| |||||||
| United States – 0.3% |
| |||||||
| State Street Navigator Securities Lending Government Money Market
Portfolio, 2.46%(c) (Cost: $2,952,420)(d) |
2,952,420 | 2,952,420 | ||||||
| TOTAL INVESTMENTS IN SECURITIES – 100.1% (Cost: $913,758,349) |
|
954,309,052 | ||||||
| Other Assets less Liabilities – (0.1)% |
|
(1,033,354 | ) | |||||
|
|
|
|||||||
| NET ASSETS – 100.0% |
|
$ | 953,275,698 | |||||
| (a) | Security, or portion thereof, was on loan at March 31, 2019 (See Note 2). |
| (b) | Affiliated company (See Note 3). |
| (c) | Rate shown represents annualized 7-day yield as of March 31, 2019. |
| (d) | At March 31, 2019, the total market value of the Fund’s securities on loan identified in the Schedule of Investments was $3,014,863 and the total market value of the collateral held by the Fund was $3,086,591. The total market value of the collateral includes non-cash U.S. Government securities collateral having a value of $134,171. |
See Notes to Financial Statements.
| WisdomTree Trust | 25 |
Schedule of Investments
WisdomTree U.S. LargeCap Dividend Fund (DLN)
March 31, 2019
| Investments | Shares | Value | ||||||
| COMMON STOCKS – 99.5% | ||||||||
| United States – 99.5% | ||||||||
| Aerospace & Defense – 2.9% | ||||||||
| Boeing Co. (The) |
52,301 | $ | 19,948,647 | |||||
| General Dynamics Corp. |
28,781 | 4,872,048 | ||||||
| Harris Corp. |
9,822 | 1,568,672 | ||||||
| L3 Technologies, Inc. |
6,022 | 1,242,760 | ||||||
| Lockheed Martin Corp. |
37,580 | 11,280,013 | ||||||
| Northrop Grumman Corp. |
14,076 | 3,794,890 | ||||||
| Raytheon Co. |
25,770 | 4,692,201 | ||||||
| Textron, Inc. |
1,767 | 89,516 | ||||||
| United Technologies Corp. |
87,589 | 11,289,346 | ||||||
|
|
|
|||||||
| Total Aerospace & Defense |
|
58,778,093 | ||||||
| Air Freight & Logistics – 0.8% |
| |||||||
| C.H. Robinson Worldwide, Inc. |
12,517 | 1,088,854 | ||||||
| Expeditors International of Washington, Inc. |
4,032 | 306,029 | ||||||
| FedEx Corp. |
13,896 | 2,520,873 | ||||||
| United Parcel Service, Inc. Class B |
109,689 | 12,256,649 | ||||||
|
|
|
|||||||
| Total Air Freight & Logistics |
|
16,172,405 | ||||||
| Airlines – 0.3% |
| |||||||
| American Airlines Group, Inc. |
24,306 | 771,959 | ||||||
| Delta Air Lines, Inc. |
69,239 | 3,576,194 | ||||||
| Southwest Airlines Co. |
34,205 | 1,775,581 | ||||||
|
|
|
|||||||
| Total Airlines |
|
6,123,734 | ||||||
| Automobiles – 1.0% |
| |||||||
| Ford Motor Co. |
1,098,516 | 9,644,971 | ||||||
| General Motors Co. |
264,811 | 9,824,488 | ||||||
|
|
|
|||||||
| Total Automobiles |
|
19,469,459 | ||||||
| Banks – 8.6% |
| |||||||
| Bank of America Corp. |
1,028,143 | 28,366,465 | ||||||
| BB&T Corp. |
120,238 | 5,594,674 | ||||||
| Citigroup, Inc. |
332,760 | 20,704,327 | ||||||
| Citizens Financial Group, Inc. |
77,668 | 2,524,210 | ||||||
| Comerica, Inc. |
26,621 | 1,951,852 | ||||||
| Fifth Third Bancorp |
89,021 | 2,245,110 | ||||||
| First Republic Bank |
1,430 | 143,658 | ||||||
| Huntington Bancshares, Inc. |
185,675 | 2,354,359 | ||||||
| JPMorgan Chase & Co. |
452,584 | 45,815,078 | ||||||
| KeyCorp |
172,676 | 2,719,647 | ||||||
| M&T Bank Corp. |
15,245 | 2,393,770 | ||||||
| PNC Financial Services Group, Inc. (The) |
61,508 | 7,544,571 | ||||||
| Regions Financial Corp. |
154,619 | 2,187,859 | ||||||
| SunTrust Banks, Inc. |
77,305 | 4,580,321 | ||||||
| U.S. Bancorp |
212,740 | 10,251,941 | ||||||
| Wells Fargo & Co. |
735,904 | 35,558,881 | ||||||
|
|
|
|||||||
| Total Banks |
|
174,936,723 | ||||||
| Beverages – 2.9% |
| |||||||
| Brown-Forman Corp. Class B |
10,621 | 560,576 | ||||||
| Coca-Cola Co. (The) |
575,066 | 26,947,593 | ||||||
| Constellation Brands, Inc. Class A |
11,125 | 1,950,546 | ||||||
| Keurig Dr Pepper, Inc. |
121,513 | 3,398,719 | ||||||
| Molson Coors Brewing Co. Class B |
25,004 | 1,491,489 | ||||||
| PepsiCo, Inc. |
196,637 | 24,097,864 | ||||||
|
|
|
|||||||
| Total Beverages |
|
58,446,787 | ||||||
| Biotechnology – 2.6% |
| |||||||
| AbbVie, Inc. |
314,500 | 25,345,555 | ||||||
| Amgen, Inc. |
75,329 | 14,311,003 | ||||||
| Gilead Sciences, Inc. |
193,659 | 12,589,772 | ||||||
|
|
|
|||||||
| Total Biotechnology |
|
52,246,330 | ||||||
| Capital Markets – 3.0% |
| |||||||
| Ameriprise Financial, Inc. |
17,775 | 2,276,978 | ||||||
| Bank of New York Mellon Corp. (The) |
101,054 | 5,096,153 | ||||||
| BlackRock, Inc. |
20,930 | 8,944,854 | ||||||
| Charles Schwab Corp. (The) |
77,625 | 3,319,245 | ||||||
| CME Group, Inc. |
23,667 | 3,895,115 | ||||||
| E*TRADE Financial Corp. |
14,320 | 664,878 | ||||||
| Franklin Resources, Inc. |
70,012 | 2,320,198 | ||||||
| Goldman Sachs Group, Inc. (The) |
30,306 | 5,818,449 | ||||||
| Intercontinental Exchange, Inc. |
31,798 | 2,421,100 | ||||||
| Moody’s Corp. |
9,982 | 1,807,640 | ||||||
| Morgan Stanley |
225,670 | 9,523,274 | ||||||
| MSCI, Inc. |
3,179 | 632,112 | ||||||
| Nasdaq, Inc. |
13,920 | 1,217,861 | ||||||
| Northern Trust Corp. |
21,647 | 1,957,105 | ||||||
| S&P Global, Inc. |
13,882 | 2,922,855 | ||||||
| State Street Corp. |
50,347 | 3,313,336 | ||||||
| T. Rowe Price Group, Inc. |
27,212 | 2,724,465 | ||||||
| TD Ameritrade Holding Corp. |
57,272 | 2,863,027 | ||||||
|
|
|
|||||||
| Total Capital Markets |
|
61,718,645 | ||||||
| Chemicals – 1.5% |
| |||||||
| Air Products & Chemicals, Inc. |
27,573 | 5,265,340 | ||||||
| Celanese Corp. |
14,009 | 1,381,428 | ||||||
| DowDuPont, Inc. |
284,012 | 15,140,680 | ||||||
| Ecolab, Inc. |
14,086 | 2,486,742 | ||||||
| International Flavors & Fragrances, Inc. |
11,129 | 1,433,304 | ||||||
| Mosaic Co. (The) |
184 | 5,025 | ||||||
| PPG Industries, Inc. |
21,408 | 2,416,321 | ||||||
| Sherwin-Williams Co. (The) |
3,571 | 1,538,065 | ||||||
|
|
|
|||||||
| Total Chemicals |
|
29,666,905 | ||||||
| Commercial Services & Supplies – 0.4% |
| |||||||
| Cintas Corp. |
5,542 | 1,120,094 | ||||||
| Republic Services, Inc. |
30,270 | 2,433,102 | ||||||
| Rollins, Inc. |
5,152 | 214,426 | ||||||
| Waste Management, Inc. |
39,011 | 4,053,633 | ||||||
|
|
|
|||||||
| Total Commercial Services & Supplies |
|
7,821,255 | ||||||
| Communications Equipment – 1.6% |
| |||||||
| Cisco Systems, Inc. |
554,170 | 29,919,638 | ||||||
| Motorola Solutions, Inc. |
14,002 | 1,966,161 | ||||||
|
|
|
|||||||
| Total Communications Equipment |
|
31,885,799 | ||||||
| Construction Materials – 0.0% |
| |||||||
| Vulcan Materials Co. |
2,543 | 301,091 | ||||||
| Consumer Finance – 0.8% |
| |||||||
| American Express Co. |
55,446 | 6,060,248 | ||||||
See Notes to Financial Statements.
| 26 | WisdomTree Trust |
Schedule of Investments (continued)
WisdomTree U.S. LargeCap Dividend Fund (DLN)
March 31, 2019
| Investments | Shares | Value | ||||||
| Capital One Financial Corp. |
43,373 | $ | 3,543,140 | |||||
| Discover Financial Services |
30,870 | 2,196,709 | ||||||
| Synchrony Financial |
114,043 | 3,637,972 | ||||||
|
|
|
|||||||
| Total Consumer Finance |
|
15,438,069 | ||||||
| Containers & Packaging – 0.2% |
| |||||||
| Ball Corp. |
13,764 | 796,385 | ||||||
| International Paper Co. |
82,508 | 3,817,645 | ||||||
|
|
|
|||||||
| Total Containers & Packaging |
|
4,614,030 | ||||||
| Distributors – 0.1% |
| |||||||
| Genuine Parts Co. |
14,309 | 1,603,037 | ||||||
| Diversified Telecommunication Services – 5.6% |
| |||||||
| AT&T, Inc. |
2,030,427 | 63,674,191 | ||||||
| CenturyLink, Inc. |
537,740 | 6,447,502 | ||||||
| Verizon Communications, Inc. |
743,929 | 43,988,522 | ||||||
|
|
|
|||||||
| Total Diversified Telecommunication Services |
|
114,110,215 | ||||||
| Electric Utilities – 3.4% |
| |||||||
| American Electric Power Co., Inc. |
72,491 | 6,071,121 | ||||||
| Avangrid, Inc. |
47,087 | 2,370,831 | ||||||
| Duke Energy Corp. |
125,796 | 11,321,640 | ||||||
| Edison International |
51,397 | 3,182,502 | ||||||
| Entergy Corp. |
33,309 | 3,185,340 | ||||||
| Evergy, Inc. |
28,662 | 1,663,829 | ||||||
| Eversource Energy |
41,682 | 2,957,338 | ||||||
| Exelon Corp. |
124,294 | 6,230,858 | ||||||
| FirstEnergy Corp. |
74,550 | 3,102,026 | ||||||
| NextEra Energy, Inc. |
50,742 | 9,809,443 | ||||||
| PPL Corp. |
153,991 | 4,887,674 | ||||||
| Southern Co. (The) |
210,163 | 10,861,224 | ||||||
| Xcel Energy, Inc. |
65,980 | 3,708,736 | ||||||
|
|
|
|||||||
| Total Electric Utilities |
|
69,352,562 | ||||||
| Electrical Equipment – 0.4% |
| |||||||
| AMETEK, Inc. |
7,461 | 619,039 | ||||||
| Emerson Electric Co. |
80,679 | 5,524,091 | ||||||
| Rockwell Automation, Inc. |
13,879 | 2,435,210 | ||||||
|
|
|
|||||||
| Total Electrical Equipment |
|
8,578,340 | ||||||
| Electronic Equipment, Instruments & Components – 0.2% |
| |||||||
| Amphenol Corp. Class A |
15,684 | 1,481,197 | ||||||
| CDW Corp. |
4,186 | 403,405 | ||||||
| Corning, Inc. |
78,243 | 2,589,843 | ||||||
|
|
|
|||||||
| Total Electronic Equipment, Instruments & Components |
|
4,474,445 | ||||||
| Energy Equipment & Services – 0.1% |
| |||||||
| Halliburton Co. |
94,519 | 2,769,407 | ||||||
| Entertainment – 0.7% |
| |||||||
| Activision Blizzard, Inc. |
26,968 | 1,227,853 | ||||||
| Walt Disney Co. (The) |
112,131 | 12,449,905 | ||||||
|
|
|
|||||||
| Total Entertainment |
|
13,677,758 | ||||||
| Equity Real Estate Investment Trusts (REITs) – 4.2% |
| |||||||
| Alexandria Real Estate Equities, Inc. |
12,770 | 1,820,491 | ||||||
| American Tower Corp. |
36,744 | 7,240,773 | ||||||
| AvalonBay Communities, Inc. |
16,404 | 3,292,775 | ||||||
| Boston Properties, Inc. |
21,467 | 2,874,002 | ||||||
| Crown Castle International Corp. |
70,963 | 9,083,264 | ||||||
| Digital Realty Trust, Inc. |
32,572 | 3,876,068 | ||||||
| Equinix, Inc. |
8,533 | 3,866,814 | ||||||
| Equity Residential |
42,986 | 3,237,706 | ||||||
| Essex Property Trust, Inc. |
8,435 | 2,439,739 | ||||||
| HCP, Inc. |
108,442 | 3,394,235 | ||||||
| Host Hotels & Resorts, Inc. |
147,139 | 2,780,927 | ||||||
| Prologis, Inc. |
82,250 | 5,917,888 | ||||||
| Public Storage |
27,248 | 5,934,069 | ||||||
| Realty Income Corp. |
52,984 | 3,897,503 | ||||||
| Simon Property Group, Inc. |
55,520 | 10,116,299 | ||||||
| Ventas, Inc. |
71,000 | 4,530,510 | ||||||
| Vornado Realty Trust |
24,283 | 1,637,646 | ||||||
| Welltower, Inc. |
74,952 | 5,816,275 | ||||||
| Weyerhaeuser Co. |
178,097 | 4,691,075 | ||||||
|
|
|
|||||||
| Total Equity Real Estate Investment Trusts (REITs) |
|
86,448,059 | ||||||
| Food & Staples Retailing – 2.1% |
| |||||||
| Costco Wholesale Corp. |
21,388 | 5,178,890 | ||||||
| Kroger Co. (The) |
51,391 | 1,264,219 | ||||||
| Sysco Corp. |
55,450 | 3,701,842 | ||||||
| Walgreens Boots Alliance, Inc. |
85,871 | 5,433,058 | ||||||
| Walmart, Inc. |
281,391 | 27,444,064 | ||||||
|
|
|
|||||||
| Total Food & Staples Retailing |
|
43,022,073 | ||||||
| Food Products – 1.9% |
| |||||||
| Archer-Daniels-Midland Co. |
62,962 | 2,715,551 | ||||||
| Conagra Brands, Inc. |
64,935 | 1,801,297 | ||||||
| General Mills, Inc. |
122,683 | 6,348,845 | ||||||
| Hershey Co. (The) |
18,697 | 2,146,977 | ||||||
| Hormel Foods Corp. |
46,934 | 2,100,766 | ||||||
| Kellogg Co. |
56,493 | 3,241,568 | ||||||
| Kraft Heinz Co. (The) |
264,464 | 8,634,750 | ||||||
| McCormick & Co., Inc. Non-Voting Shares |
9,018 | 1,358,381 | ||||||
| Mondelez International, Inc. Class A |
151,579 | 7,566,824 | ||||||
| Tyson Foods, Inc. Class A |
33,684 | 2,338,680 | ||||||
|
|
|
|||||||
| Total Food Products |
|
38,253,639 | ||||||
| Health Care Equipment & Supplies – 1.2% |
| |||||||
| Abbott Laboratories |
120,698 | 9,648,598 | ||||||
| Baxter International, Inc. |
26,889 | 2,186,344 | ||||||
| Becton, Dickinson and Co. |
14,115 | 3,524,939 | ||||||
| Danaher Corp. |
20,195 | 2,666,144 | ||||||
| ResMed, Inc. |
9,573 | 995,305 | ||||||
| Stryker Corp. |
19,082 | 3,769,077 | ||||||
| Zimmer Biomet Holdings, Inc. |
8,041 | 1,026,836 | ||||||
|
|
|
|||||||
| Total Health Care Equipment & Supplies |
|
23,817,243 | ||||||
| Health Care Providers & Services – 1.6% |
| |||||||
| AmerisourceBergen Corp. |
18,810 | 1,495,771 | ||||||
| Anthem, Inc. |
12,644 | 3,628,575 | ||||||
| Cardinal Health, Inc. |
40,551 | 1,952,531 | ||||||
| Cigna Corp. |
351 | 56,448 | ||||||
| CVS Health Corp. |
147,579 | 7,958,936 | ||||||
| HCA Healthcare, Inc. |
13,093 | 1,707,065 | ||||||
See Notes to Financial Statements.
| WisdomTree Trust | 27 |
Schedule of Investments (continued)
WisdomTree U.S. LargeCap Dividend Fund (DLN)
March 31, 2019
| Investments | Shares | Value | ||||||
| Humana, Inc. |
4,280 | $ | 1,138,480 | |||||
| McKesson Corp. |
11,923 | 1,395,706 | ||||||
| UnitedHealth Group, Inc. |
56,173 | 13,889,336 | ||||||
|
|
|
|||||||
| Total Health Care Providers & Services |
|
33,222,848 | ||||||
| Hotels, Restaurants & Leisure – 2.2% |
| |||||||
| Darden Restaurants, Inc. |
11,529 | 1,400,428 | ||||||
| Hilton Worldwide Holdings, Inc. |
12,923 | 1,074,030 | ||||||
| Las Vegas Sands Corp. |
177,686 | 10,831,739 | ||||||
| Marriott International, Inc. Class A |
22,140 | 2,769,493 | ||||||
| McDonald’s Corp. |
83,845 | 15,922,165 | ||||||
| MGM Resorts International |
47,814 | 1,226,907 | ||||||
| Starbucks Corp. |
118,934 | 8,841,554 | ||||||
| Yum! Brands, Inc. |
22,877 | 2,283,353 | ||||||
|
|
|
|||||||
| Total Hotels, Restaurants & Leisure |
|
44,349,669 | ||||||
| Household Durables – 0.0% |
| |||||||
| D.R. Horton, Inc. |
23,961 | 991,506 | ||||||
| Lennar Corp. Class A |
150 | 7,364 | ||||||
|
|
|
|||||||
| Total Household Durables |
|
998,870 | ||||||
| Household Products – 2.4% |
| |||||||
| Church & Dwight Co., Inc. |
13,653 | 972,503 | ||||||
| Clorox Co. (The) |
13,824 | 2,218,199 | ||||||
| Colgate-Palmolive Co. |
95,655 | 6,556,194 | ||||||
| Kimberly-Clark Corp. |
46,829 | 5,802,113 | ||||||
| Procter & Gamble Co. (The) |
315,948 | 32,874,389 | ||||||
|
|
|
|||||||
| Total Household Products |
|
48,423,398 | ||||||
| Industrial Conglomerates – 2.5% |
| |||||||
| 3M Co. |
68,724 | 14,279,473 | ||||||
| General Electric Co. |
2,240,098 | 22,378,579 | ||||||
| Honeywell International, Inc. |
76,860 | 12,214,591 | ||||||
| Roper Technologies, Inc. |
3,654 | 1,249,558 | ||||||
|
|
|
|||||||
| Total Industrial Conglomerates |
|
50,122,201 | ||||||
| Insurance – 2.4% |
| |||||||
| Aflac, Inc. |
76,450 | 3,822,500 | ||||||
| Allstate Corp. (The) |
36,311 | 3,419,770 | ||||||
| American International Group, Inc. |
133,709 | 5,757,509 | ||||||
| Arthur J. Gallagher & Co. |
13,847 | 1,081,451 | ||||||
| Cincinnati Financial Corp. |
13,608 | 1,168,927 | ||||||
| CNA Financial Corp. |
33,630 | 1,457,860 | ||||||
| Hartford Financial Services Group, Inc. (The) |
48,648 | 2,418,779 | ||||||
| Lincoln National Corp. |
28,669 | 1,682,870 | ||||||
| Loews Corp. |
148 | 7,094 | ||||||
| Marsh & McLennan Cos., Inc. |
44,759 | 4,202,870 | ||||||
| MetLife, Inc. |
186,287 | 7,930,238 | ||||||
| Principal Financial Group, Inc. |
51,088 | 2,564,107 | ||||||
| Progressive Corp. (The) |
47,887 | 3,452,174 | ||||||
| Prudential Financial, Inc. |
72,133 | 6,627,580 | ||||||
| Travelers Cos., Inc. (The) |
29,580 | 4,057,193 | ||||||
|
|
|
|||||||
| Total Insurance |
|
49,650,922 | ||||||
| Internet & Direct Marketing Retail – 0.0% |
| |||||||
| Expedia Group, Inc. |
6,641 | 790,279 | ||||||
| IT Services – 3.0% |
| |||||||
| Automatic Data Processing, Inc. |
44,927 | 7,176,639 | ||||||
| Cognizant Technology Solutions Corp. Class A |
31,843 | 2,307,025 | ||||||
| DXC Technology Co. |
13,458 | 865,484 | ||||||
| Fidelity National Information Services, Inc. |
18,378 | 2,078,552 | ||||||
| International Business Machines Corp. |
203,649 | 28,734,874 | ||||||
| MasterCard, Inc. Class A |
23,156 | 5,452,080 | ||||||
| Paychex, Inc. |
52,243 | 4,189,889 | ||||||
| Total System Services, Inc. |
6,135 | 582,886 | ||||||
| Visa, Inc. Class A |
56,697 | 8,855,505 | ||||||
|
|
|
|||||||
| Total IT Services |
|
60,242,934 | ||||||
| Life Sciences Tools & Services – 0.1% |
| |||||||
| Agilent Technologies, Inc. |
14,478 | 1,163,742 | ||||||
| Thermo Fisher Scientific, Inc. |
5,724 | 1,566,773 | ||||||
|
|
|
|||||||
| Total Life Sciences Tools & Services |
|
2,730,515 | ||||||
| Machinery – 1.6% |
| |||||||
| Caterpillar, Inc. |
69,408 | 9,404,090 | ||||||
| Cummins, Inc. |
23,746 | 3,748,781 | ||||||
| Deere & Co. |
25,479 | 4,072,563 | ||||||
| Dover Corp. |
17,760 | 1,665,888 | ||||||
| Fortive Corp. |
6,991 | 586,475 | ||||||
| Illinois Tool Works, Inc. |
44,391 | 6,371,440 | ||||||
| PACCAR, Inc. |
36,479 | 2,485,679 | ||||||
| Parker-Hannifin Corp. |
11,918 | 2,045,367 | ||||||
| Stanley Black & Decker, Inc. |
14,544 | 1,980,457 | ||||||
| Xylem, Inc. |
4,024 | 318,057 | ||||||
|
|
|
|||||||
| Total Machinery |
|
32,678,797 | ||||||
| Media – 1.0% |
| |||||||
| CBS Corp. Class B Non-Voting Shares |
22,080 | 1,049,463 | ||||||
| Comcast Corp. Class A |
407,882 | 16,307,122 | ||||||
| Fox Corp. Class A* |
12,496 | 458,728 | ||||||
| Fox Corp. Class B* |
9,809 | 351,947 | ||||||
| Omnicom Group, Inc. |
25,202 | 1,839,494 | ||||||
| Sirius XM Holdings, Inc. |
150,667 | 854,282 | ||||||
|
|
|
|||||||
| Total Media |
|
20,861,036 | ||||||
| Metals & Mining – 0.2% |
| |||||||
| Freeport-McMoRan, Inc. |
81,167 | 1,046,242 | ||||||
| Newmont Mining Corp. |
36,579 | 1,308,431 | ||||||
| Nucor Corp. |
40,151 | 2,342,811 | ||||||
|
|
|
|||||||
| Total Metals & Mining |
|
4,697,484 | ||||||
| Multi-Utilities – 1.7% |
| |||||||
| Ameren Corp. |
30,945 | 2,276,005 | ||||||
| CenterPoint Energy, Inc. |
83,851 | 2,574,226 | ||||||
| CMS Energy Corp. |
33,650 | 1,868,921 | ||||||
| Consolidated Edison, Inc. |
48,061 | 4,076,053 | ||||||
| Dominion Energy, Inc. |
120,717 | 9,254,165 | ||||||
| DTE Energy Co. |
25,232 | 3,147,440 | ||||||
| Public Service Enterprise Group, Inc. |
72,801 | 4,325,107 | ||||||
| Sempra Energy |
36,108 | 4,544,553 | ||||||
| WEC Energy Group, Inc. |
42,366 | 3,350,303 | ||||||
|
|
|
|||||||
| Total Multi-Utilities |
|
35,416,773 | ||||||
See Notes to Financial Statements.
| 28 | WisdomTree Trust |
Schedule of Investments (continued)
WisdomTree U.S. LargeCap Dividend Fund (DLN)
March 31, 2019
| Investments | Shares | Value | ||||||
| Multiline Retail – 0.4% |
| |||||||
| Dollar General Corp. |
13,351 | $ | 1,592,775 | |||||
| Target Corp. |
78,851 | 6,328,581 | ||||||
|
|
|
|||||||
| Total Multiline Retail |
|
7,921,356 | ||||||
| Oil, Gas & Consumable Fuels – 8.4% |
| |||||||
| Anadarko Petroleum Corp. |
43,522 | 1,979,381 | ||||||
| Apache Corp. |
47,079 | 1,631,758 | ||||||
| Chevron Corp. |
316,525 | 38,989,549 | ||||||
| ConocoPhillips |
87,234 | 5,821,997 | ||||||
| Devon Energy Corp. |
31,636 | 998,432 | ||||||
| EOG Resources, Inc. |
23,716 | 2,257,289 | ||||||
| Exxon Mobil Corp. |
782,686 | 63,241,029 | ||||||
| Hess Corp. |
17,904 | 1,078,358 | ||||||
| Kinder Morgan, Inc. |
474,561 | 9,495,966 | ||||||
| Marathon Oil Corp. |
24,805 | 414,491 | ||||||
| Marathon Petroleum Corp. |
93,365 | 5,587,895 | ||||||
| Occidental Petroleum Corp. |
148,431 | 9,826,132 | ||||||
| ONEOK, Inc. |
102,870 | 7,184,441 | ||||||
| Phillips 66 |
74,248 | 7,066,182 | ||||||
| Pioneer Natural Resources Co. |
3,060 | 465,977 | ||||||
| Valero Energy Corp. |
81,255 | 6,892,862 | ||||||
| Williams Cos., Inc. (The) |
287,954 | 8,270,039 | ||||||
|
|
|
|||||||
| Total Oil, Gas & Consumable Fuels |
|
171,201,778 | ||||||
| Personal Products – 0.1% |
| |||||||
| Estee Lauder Cos., Inc. (The) Class A |
12,682 | 2,099,505 | ||||||
| Pharmaceuticals – 6.2% |
| |||||||
| Bristol-Myers Squibb Co. |
216,181 | 10,313,996 | ||||||
| Eli Lilly & Co. |
92,146 | 11,956,865 | ||||||
| Johnson & Johnson |
305,165 | 42,659,015 | ||||||
| Merck & Co., Inc. |
320,147 | 26,626,626 | ||||||
| Pfizer, Inc. |
766,469 | 32,551,938 | ||||||
| Zoetis, Inc. |
12,215 | 1,229,684 | ||||||
|
|
|
|||||||
| Total Pharmaceuticals |
|
125,338,124 | ||||||
| Road & Rail – 1.0% |
| |||||||
| CSX Corp. |
50,934 | 3,810,882 | ||||||
| Norfolk Southern Corp. |
24,894 | 4,652,440 | ||||||
| Union Pacific Corp. |
71,508 | 11,956,137 | ||||||
|
|
|
|||||||
| Total Road & Rail |
|
20,419,459 | ||||||
| Semiconductors & Semiconductor Equipment – 4.4% |
| |||||||
| Analog Devices, Inc. |
36,668 | 3,860,040 | ||||||
| Applied Materials, Inc. |
90,927 | 3,606,165 | ||||||
| Broadcom, Inc. |
46,617 | 14,018,198 | ||||||
| Intel Corp. |
489,640 | 26,293,668 | ||||||
| KLA-Tencor Corp. |
21,253 | 2,537,821 | ||||||
| Lam Research Corp. |
18,643 | 3,337,283 | ||||||
| Maxim Integrated Products, Inc. |
44,510 | 2,366,597 | ||||||
| Microchip Technology, Inc.(a) |
22,529 | 1,869,006 | ||||||
| NVIDIA Corp. |
12,602 | 2,262,815 | ||||||
| QUALCOMM, Inc. |
215,135 | 12,269,149 | ||||||
| Skyworks Solutions, Inc. |
14,560 | 1,200,909 | ||||||
| Texas Instruments, Inc. |
135,161 | 14,336,527 | ||||||
| Xilinx, Inc. |
19,550 | 2,478,745 | ||||||
|
|
|
|||||||
| Total Semiconductors & Semiconductor Equipment |
|
90,436,923 | ||||||
| Software – 4.2% |
| |||||||
| Citrix Systems, Inc. |
9,054 | 902,322 | ||||||
| Intuit, Inc. |
11,242 | 2,938,771 | ||||||
| Microsoft Corp. |
571,273 | 67,375,938 | ||||||
| Oracle Corp. |
257,737 | 13,843,054 | ||||||
| Symantec Corp. |
19,795 | 455,087 | ||||||
|
|
|
|||||||
| Total Software |
|
85,515,172 | ||||||
| Specialty Retail – 2.0% |
| |||||||
| Best Buy Co., Inc. |
40,970 | 2,911,328 | ||||||
| Home Depot, Inc. (The) |
115,685 | 22,198,795 | ||||||
| Lowe’s Cos., Inc. |
72,585 | 7,945,880 | ||||||
| Ross Stores, Inc. |
18,281 | 1,701,961 | ||||||
| TJX Cos., Inc. (The) |
94,773 | 5,042,871 | ||||||
|
|
|
|||||||
| Total Specialty Retail |
|
39,800,835 | ||||||
| Technology Hardware, Storage & Peripherals – 3.9% |
| |||||||
| Apple, Inc. |
354,605 | 67,357,219 | ||||||
| Hewlett Packard Enterprise Co. |
187,432 | 2,892,076 | ||||||
| HP, Inc. |
204,144 | 3,966,518 | ||||||
| NetApp, Inc. |
30,903 | 2,142,814 | ||||||
| Western Digital Corp. |
53,784 | 2,584,859 | ||||||
|
|
|
|||||||
| Total Technology Hardware, Storage & Peripherals |
|
78,943,486 | ||||||
| Textiles, Apparel & Luxury Goods – 0.5% |
| |||||||
| NIKE, Inc. Class B |
68,223 | 5,745,059 | ||||||
| VF Corp. |
47,213 | 4,103,282 | ||||||
|
|
|
|||||||
| Total Textiles, Apparel & Luxury Goods |
|
9,848,341 | ||||||
| Tobacco – 2.9% |
| |||||||
| Altria Group, Inc. |
476,427 | 27,361,203 | ||||||
| Philip Morris International, Inc. |
366,831 | 32,424,192 | ||||||
|
|
|
|||||||
| Total Tobacco |
|
59,785,395 | ||||||
| Trading Companies & Distributors – 0.2% |
| |||||||
| Fastenal Co. |
36,726 | 2,361,849 | ||||||
| W.W. Grainger, Inc. |
3,257 | 980,129 | ||||||
|
|
|
|||||||
| Total Trading Companies & Distributors |
|
3,341,978 | ||||||
| Water Utilities – 0.1% |
| |||||||
| American Water Works Co., Inc. |
16,082 | 1,676,709 | ||||||
| TOTAL COMMON STOCKS (Cost: $1,673,906,444) |
|
2,024,240,890 | ||||||
| EXCHANGE-TRADED FUND – 0.4% |
| |||||||
| United States – 0.4% |
| |||||||
| WisdomTree U.S. Total Dividend Fund(a)(b) (Cost: $6,939,614) | 76,179 | 7,208,819 | ||||||
| INVESTMENT OF CASH COLLATERAL FOR SECURITIES LOANED – 0.0% |
| |||||||
| United States – 0.0% |
| |||||||
| State Street Navigator Securities Lending Government Money Market Portfolio, 2.46%(c) |
||||||||
| (Cost: $561,537)(d) | 561,537 | 561,537 | ||||||
| TOTAL INVESTMENTS IN SECURITIES – 99.9% (Cost: $1,681,407,595) |
|
2,032,011,246 | ||||||
| Other Assets less Liabilities – 0.1% |
|
2,954,103 | ||||||
|
|
|
|||||||
| NET ASSETS – 100.0% |
|
$ | 2,034,965,349 | |||||
See Notes to Financial Statements.
| WisdomTree Trust | 29 |
Schedule of Investments (concluded)
WisdomTree U.S. LargeCap Dividend Fund (DLN)
March 31, 2019
| * | Non-income producing security. |
| (a) | Security, or portion thereof, was on loan at March 31, 2019 (See Note 2). |
| (b) | Affiliated company (See Note 3). |
| (c) | Rate shown represents annualized 7-day yield as of March 31, 2019. |
| (d) | At March 31, 2019, the total market value of the Fund’s securities on loan identified in the Schedule of Investments was $2,231,329 and the total market value of the collateral held by the Fund was $2,247,579. The total market value of the collateral includes non-cash U.S. Government securities collateral having a value of $1,686,042. |
See Notes to Financial Statements.
| 30 | WisdomTree Trust |
Schedule of Investments
WisdomTree U.S. LargeCap Fund (EPS)
March 31, 2019
| Investments | Shares | Value | ||||||
| COMMON STOCKS – 99.7% | ||||||||
| United States – 99.7% | ||||||||
| Aerospace & Defense – 2.8% | ||||||||
| Arconic, Inc. |
5,985 | $ | 114,373 | |||||
| Boeing Co. (The) |
4,933 | 1,881,545 | ||||||
| General Dynamics Corp. |
3,424 | 579,615 | ||||||
| Harris Corp. |
946 | 151,086 | ||||||
| HEICO Corp. |
488 | 46,297 | ||||||
| Huntington Ingalls Industries, Inc. |
665 | 137,788 | ||||||
| L3 Technologies, Inc. |
730 | 150,650 | ||||||
| Lockheed Martin Corp. |
3,152 | 946,104 | ||||||
| Northrop Grumman Corp. |
2,077 | 559,959 | ||||||
| Raytheon Co. |
2,832 | 515,650 | ||||||
| Spirit AeroSystems Holdings, Inc. Class A |
1,415 | 129,515 | ||||||
| Teledyne Technologies, Inc.* |
256 | 60,675 | ||||||
| Textron, Inc. |
4,076 | 206,490 | ||||||
| TransDigm Group, Inc.* |
415 | 188,406 | ||||||
| United Technologies Corp. |
8,723 | 1,124,307 | ||||||
|
|
|
|||||||
| Total Aerospace & Defense | 6,792,460 | |||||||
| Air Freight & Logistics – 0.8% | ||||||||
| C.H. Robinson Worldwide, Inc. |
1,302 | 113,261 | ||||||
| Expeditors International of Washington, Inc. |
1,485 | 112,711 | ||||||
| FedEx Corp. |
3,360 | 609,538 | ||||||
| United Parcel Service, Inc. Class B |
9,487 | 1,060,077 | ||||||
| XPO Logistics, Inc.* |
1,074 | 57,717 | ||||||
|
|
|
|||||||
| Total Air Freight & Logistics | 1,953,304 | |||||||
| Airlines – 0.7% | ||||||||
| Alaska Air Group, Inc. |
1,504 | 84,405 | ||||||
| American Airlines Group, Inc. |
7,920 | 251,539 | ||||||
| Delta Air Lines, Inc. |
12,155 | 627,806 | ||||||
| Southwest Airlines Co. |
8,298 | 430,749 | ||||||
| United Continental Holdings, Inc.* |
4,236 | 337,948 | ||||||
|
|
|
|||||||
| Total Airlines | 1,732,447 | |||||||
| Auto Components – 0.2% | ||||||||
| BorgWarner, Inc. |
4,076 | 156,559 | ||||||
| Lear Corp. |
1,681 | 228,129 | ||||||
|
|
|
|||||||
| Total Auto Components | 384,688 | |||||||
| Automobiles – 1.1% | ||||||||
| Ford Motor Co. |
131,392 | 1,153,622 | ||||||
| General Motors Co. |
42,160 | 1,564,136 | ||||||
|
|
|
|||||||
| Total Automobiles | 2,717,758 | |||||||
| Banks – 9.4% | ||||||||
| Bank of America Corp. |
178,198 | 4,916,483 | ||||||
| BB&T Corp. |
11,408 | 530,814 | ||||||
| Citigroup, Inc. |
53,283 | 3,315,268 | ||||||
| Citizens Financial Group, Inc. |
9,477 | 308,003 | ||||||
| Comerica, Inc. |
2,919 | 214,021 | ||||||
| Fifth Third Bancorp |
14,817 | 373,685 | ||||||
| First Republic Bank |
1,645 | 165,257 | ||||||
| Huntington Bancshares, Inc. |
18,955 | 240,349 | ||||||
| JPMorgan Chase & Co. |
53,645 | 5,430,483 | ||||||
| KeyCorp |
19,972 | 314,559 | ||||||
| M&T Bank Corp. |
1,946 | 305,561 | ||||||
| PNC Financial Services Group, Inc. (The) |
7,050 | 864,753 | ||||||
| Regions Financial Corp. |
20,042 | 283,594 | ||||||
| SunTrust Banks, Inc. |
8,606 | 509,906 | ||||||
| SVB Financial Group* |
822 | 182,780 | ||||||
| U.S. Bancorp |
23,494 | 1,132,176 | ||||||
| Wells Fargo & Co. |
67,538 | 3,263,436 | ||||||
| Zions Bancorp NA |
3,359 | 152,532 | ||||||
|
|
|
|||||||
| Total Banks | 22,503,660 | |||||||
| Beverages – 1.5% | ||||||||
| Brown-Forman Corp. Class B |
2,950 | 155,701 | ||||||
| Coca-Cola Co. (The) |
24,654 | 1,155,286 | ||||||
| Constellation Brands, Inc. Class A |
2,950 | 517,224 | ||||||
| Molson Coors Brewing Co. Class B |
3,503 | 208,954 | ||||||
| Monster Beverage Corp.* |
3,358 | 183,280 | ||||||
| PepsiCo, Inc. |
12,051 | 1,476,850 | ||||||
|
|
|
|||||||
| Total Beverages | 3,697,295 | |||||||
| Biotechnology – 2.6% | ||||||||
| AbbVie, Inc. |
15,870 | 1,278,963 | ||||||
| Alexion Pharmaceuticals, Inc.* |
326 | 44,069 | ||||||
| Amgen, Inc. |
7,833 | 1,488,113 | ||||||
| Biogen, Inc.* |
2,496 | 590,005 | ||||||
| Celgene Corp.* |
11,113 | 1,048,401 | ||||||
| Gilead Sciences, Inc. |
19,540 | 1,270,295 | ||||||
| Regeneron Pharmaceuticals, Inc.* |
1,007 | 413,494 | ||||||
| Vertex Pharmaceuticals, Inc.* |
665 | 122,327 | ||||||
|
|
|
|||||||
| Total Biotechnology | 6,255,667 | |||||||
| Building Products – 0.1% | ||||||||
| A.O. Smith Corp. |
1,782 | 95,016 | ||||||
| Lennox International, Inc. |
320 | 84,608 | ||||||
| Masco Corp. |
3,609 | 141,870 | ||||||
|
|
|
|||||||
| Total Building Products | 321,494 | |||||||
| Capital Markets – 4.4% | ||||||||
| Ameriprise Financial, Inc. |
3,304 | 423,242 | ||||||
| Bank of New York Mellon Corp. (The) |
13,191 | 665,222 | ||||||
| BlackRock, Inc. |
2,089 | 892,776 | ||||||
| CBOE Global Markets, Inc. |
597 | 56,978 | ||||||
| Charles Schwab Corp. (The) |
13,346 | 570,675 | ||||||
| CME Group, Inc. |
1,851 | 304,638 | ||||||
| E*TRADE Financial Corp. |
3,763 | 174,716 | ||||||
| FactSet Research Systems, Inc. |
251 | 62,316 | ||||||
| Franklin Resources, Inc. |
9,737 | 322,684 | ||||||
| Goldman Sachs Group, Inc. (The) |
10,227 | 1,963,482 | ||||||
| Interactive Brokers Group, Inc. Class A |
1,014 | 52,606 | ||||||
| Intercontinental Exchange, Inc. |
4,292 | 326,793 | ||||||
| KKR & Co., Inc. Class A |
15,876 | 372,927 | ||||||
| MarketAxess Holdings, Inc. |
127 | 31,252 | ||||||
| Moody’s Corp. |
1,584 | 286,847 | ||||||
| Morgan Stanley |
38,598 | 1,628,836 | ||||||
| MSCI, Inc. |
579 | 115,128 | ||||||
| Nasdaq, Inc. |
1,494 | 130,710 | ||||||
| Northern Trust Corp. |
2,828 | 255,679 | ||||||
See Notes to Financial Statements.
| WisdomTree Trust | 31 |
Schedule of Investments (continued)
WisdomTree U.S. LargeCap Fund (EPS)
March 31, 2019
| Investments | Shares | Value | ||||||
| Raymond James Financial, Inc. |
2,288 | $ | 183,978 | |||||
| S&P Global, Inc. |
2,083 | 438,576 | ||||||
| SEI Investments Co. |
1,754 | 91,646 | ||||||
| State Street Corp. |
7,402 | 487,126 | ||||||
| T. Rowe Price Group, Inc. |
3,733 | 373,748 | ||||||
| TD Ameritrade Holding Corp. |
5,151 | 257,498 | ||||||
|
|
|
|||||||
| Total Capital Markets | 10,470,079 | |||||||
| Chemicals – 1.0% | ||||||||
| Air Products & Chemicals, Inc. |
1,865 | 356,140 | ||||||
| Albemarle Corp. |
1,511 | 123,872 | ||||||
| Celanese Corp. |
2,737 | 269,896 | ||||||
| CF Industries Holdings, Inc. |
752 | 30,742 | ||||||
| DowDuPont, Inc. |
3,852 | 205,350 | ||||||
| Eastman Chemical Co. |
3,027 | 229,689 | ||||||
| Ecolab, Inc. |
1,734 | 306,120 | ||||||
| FMC Corp. |
1,333 | 102,401 | ||||||
| International Flavors & Fragrances, Inc. |
570 | 73,410 | ||||||
| Livent Corp.* |
1,245 | 15,289 | ||||||
| PPG Industries, Inc. |
2,436 | 274,951 | ||||||
| RPM International, Inc. |
845 | 49,044 | ||||||
| Sherwin-Williams Co. (The) |
623 | 268,332 | ||||||
| Westlake Chemical Corp. |
3,050 | 206,973 | ||||||
|
|
|
|||||||
| Total Chemicals | 2,512,209 | |||||||
| Commercial Services & Supplies – 0.4% | ||||||||
| Cintas Corp. |
713 | 144,104 | ||||||
| Copart, Inc.* |
1,682 | 101,912 | ||||||
| Republic Services, Inc. |
2,295 | 184,472 | ||||||
| Rollins, Inc. |
1,183 | 49,237 | ||||||
| Waste Management, Inc. |
3,548 | 368,673 | ||||||
|
|
|
|||||||
| Total Commercial Services & Supplies | 848,398 | |||||||
| Communications Equipment – 1.2% | ||||||||
| Arista Networks, Inc.* |
519 | 163,205 | ||||||
| Cisco Systems, Inc. |
44,963 | 2,427,552 | ||||||
| F5 Networks, Inc.* |
532 | 83,487 | ||||||
| Juniper Networks, Inc. |
2,830 | 74,910 | ||||||
| Motorola Solutions, Inc. |
1,192 | 167,381 | ||||||
| Ubiquiti Networks, Inc. |
506 | 75,753 | ||||||
|
|
|
|||||||
| Total Communications Equipment | 2,992,288 | |||||||
| Construction & Engineering – 0.0% | ||||||||
| Jacobs Engineering Group, Inc. |
791 | 59,475 | ||||||
| Construction Materials – 0.1% |
| |||||||
| Martin Marietta Materials, Inc. |
486 | 97,773 | ||||||
| Vulcan Materials Co. |
739 | 87,498 | ||||||
|
|
|
|||||||
| Total Construction Materials | 185,271 | |||||||
| Consumer Finance – 1.5% | ||||||||
| Ally Financial, Inc. |
10,126 | 278,364 | ||||||
| American Express Co. |
10,609 | 1,159,564 | ||||||
| Capital One Financial Corp. |
12,575 | 1,027,252 | ||||||
| Discover Financial Services |
7,416 | 527,722 | ||||||
| Synchrony Financial |
19,150 | 610,885 | ||||||
|
|
|
|||||||
| Total Consumer Finance | 3,603,787 | |||||||
| Containers & Packaging – 0.3% | ||||||||
| Avery Dennison Corp. |
929 | 104,977 | ||||||
| Ball Corp. |
2,004 | 115,952 | ||||||
| International Paper Co. |
6,230 | 288,262 | ||||||
| Packaging Corp. of America |
1,256 | 124,821 | ||||||
| WestRock Co. |
3,214 | 123,257 | ||||||
|
|
|
|||||||
| Total Containers & Packaging | 757,269 | |||||||
| Distributors – 0.1% | ||||||||
| Genuine Parts Co. |
1,453 | 162,779 | ||||||
| LKQ Corp.* |
3,847 | 109,178 | ||||||
|
|
|
|||||||
| Total Distributors | 271,957 | |||||||
| Diversified Consumer Services – 0.0% | ||||||||
| Service Corp. International |
1,359 | 54,564 | ||||||
| Diversified Financial Services – 2.6% |
| |||||||
| Berkshire Hathaway, Inc. Class B* |
30,538 | 6,134,779 | ||||||
| Diversified Telecommunication Services – 2.4% |
| |||||||
| AT&T, Inc. |
84,432 | 2,647,788 | ||||||
| CenturyLink, Inc. |
5,854 | 70,189 | ||||||
| Verizon Communications, Inc. |
49,351 | 2,918,125 | ||||||
|
|
|
|||||||
| Total Diversified Telecommunication Services | 5,636,102 | |||||||
| Electric Utilities – 1.9% | ||||||||
| Alliant Energy Corp. |
2,033 | 95,815 | ||||||
| American Electric Power Co., Inc. |
4,337 | 363,224 | ||||||
| Avangrid, Inc. |
313 | 15,760 | ||||||
| Duke Energy Corp. |
6,251 | 562,590 | ||||||
| Edison International |
2,736 | 169,413 | ||||||
| Entergy Corp. |
1,966 | 188,009 | ||||||
| Evergy, Inc. |
1,636 | 94,970 | ||||||
| Eversource Energy |
2,713 | 192,487 | ||||||
| Exelon Corp. |
9,391 | 470,771 | ||||||
| NextEra Energy, Inc. |
6,067 | 1,172,872 | ||||||
| Pinnacle West Capital Corp. |
1,044 | 99,785 | ||||||
| PPL Corp. |
10,601 | 336,476 | ||||||
| Southern Co. (The) |
8,401 | 434,164 | ||||||
| Xcel Energy, Inc. |
4,309 | 242,209 | ||||||
|
|
|
|||||||
| Total Electric Utilities | 4,438,545 | |||||||
| Electrical Equipment – 0.3% | ||||||||
| AMETEK, Inc. |
1,812 | 150,342 | ||||||
| Emerson Electric Co. |
6,040 | 413,559 | ||||||
| Rockwell Automation, Inc. |
1,214 | 213,008 | ||||||
|
|
|
|||||||
| Total Electrical Equipment | 776,909 | |||||||
| Electronic Equipment, Instruments & Components – 0.3% |
|
|||||||
| Amphenol Corp. Class A |
2,560 | 241,766 | ||||||
| CDW Corp. |
1,259 | 121,330 | ||||||
| Corning, Inc. |
7,131 | 236,036 | ||||||
| Keysight Technologies, Inc.* |
202 | 17,614 | ||||||
| Trimble, Inc.* |
1,289 | 52,076 | ||||||
| Zebra Technologies Corp. Class A* |
396 | 82,974 | ||||||
|
|
|
|||||||
| Total Electronic Equipment, Instruments & Components |
|
751,796 | ||||||
| Energy Equipment & Services – 0.1% | ||||||||
| Halliburton Co. |
5,838 | 171,053 | ||||||
See Notes to Financial Statements.
| 32 | WisdomTree Trust |
Schedule of Investments (continued)
WisdomTree U.S. LargeCap Fund (EPS)
March 31, 2019
| Investments | Shares | Value | ||||||
| Entertainment – 1.4% |
| |||||||
| Activision Blizzard, Inc. |
4,939 | $ | 224,873 | |||||
| Electronic Arts, Inc.* |
2,673 | 271,657 | ||||||
| Netflix, Inc.* |
844 | 300,937 | ||||||
| Take-Two Interactive Software, Inc.* |
341 | 32,180 | ||||||
| Viacom, Inc. Class B |
9,743 | 273,486 | ||||||
| Walt Disney Co. (The) |
19,453 | 2,159,866 | ||||||
|
|
|
|||||||
| Total Entertainment | 3,262,999 | |||||||
| Equity Real Estate Investment Trusts (REITs) – 1.4% |
|
|||||||
| Alexandria Real Estate Equities, Inc. |
612 | 87,247 | ||||||
| American Tower Corp. |
1,256 | 247,507 | ||||||
| AvalonBay Communities, Inc. |
799 | 160,383 | ||||||
| Boston Properties, Inc. |
773 | 103,489 | ||||||
| Camden Property Trust |
415 | 42,123 | ||||||
| Crown Castle International Corp. |
742 | 94,976 | ||||||
| Digital Realty Trust, Inc. |
427 | 50,813 | ||||||
| Duke Realty Corp. |
2,354 | 71,985 | ||||||
| Equinix, Inc. |
145 | 65,708 | ||||||
| Equity LifeStyle Properties, Inc. |
368 | 42,062 | ||||||
| Equity Residential |
1,733 | 130,530 | ||||||
| Essex Property Trust, Inc. |
269 | 77,806 | ||||||
| Extra Space Storage, Inc. |
934 | 95,184 | ||||||
| Federal Realty Investment Trust |
333 | 45,904 | ||||||
| HCP, Inc. |
1,293 | 40,471 | ||||||
| Host Hotels & Resorts, Inc. |
8,751 | 165,394 | ||||||
| Iron Mountain, Inc. |
1,324 | 46,949 | ||||||
| Mid-America Apartment Communities, Inc. |
490 | 53,572 | ||||||
| Prologis, Inc. |
3,761 | 270,604 | ||||||
| Public Storage |
1,158 | 252,189 | ||||||
| Realty Income Corp. |
954 | 70,176 | ||||||
| Regency Centers Corp. |
684 | 46,163 | ||||||
| SBA Communications Corp.* |
44 | 8,785 | ||||||
| Simon Property Group, Inc. |
2,271 | 413,799 | ||||||
| SL Green Realty Corp. |
620 | 55,750 | ||||||
| Sun Communities, Inc. |
150 | 17,778 | ||||||
| UDR, Inc. |
857 | 38,959 | ||||||
| Ventas, Inc. |
2,050 | 130,811 | ||||||
| VICI Properties, Inc. |
3,202 | 70,060 | ||||||
| Vornado Realty Trust |
944 | 63,663 | ||||||
| W.P. Carey, Inc. |
715 | 56,006 | ||||||
| Welltower, Inc. |
1,437 | 111,511 | ||||||
| Weyerhaeuser Co. |
8,264 | 217,674 | ||||||
|
|
|
|||||||
| Total Equity Real Estate Investment Trusts (REITs) | 3,446,031 | |||||||
| Food & Staples Retailing – 1.3% | ||||||||
| Costco Wholesale Corp. |
2,747 | 665,158 | ||||||
| Kroger Co. (The) |
17,542 | 431,533 | ||||||
| Sysco Corp. |
4,367 | 291,541 | ||||||
| Walgreens Boots Alliance, Inc. |
11,632 | 735,957 | ||||||
| Walmart, Inc. |
9,083 | 885,865 | ||||||
|
|
|
|||||||
| Total Food & Staples Retailing | 3,010,054 | |||||||
| Food Products – 1.5% | ||||||||
| Archer-Daniels-Midland Co. |
7,567 | 326,365 | ||||||
| Campbell Soup Co. |
909 | 34,660 | ||||||
| Conagra Brands, Inc. |
4,743 | 131,571 | ||||||
| General Mills, Inc. |
7,755 | 401,321 | ||||||
| Hershey Co. (The) |
1,741 | 199,919 | ||||||
| Hormel Foods Corp. |
3,884 | 173,848 | ||||||
| J.M. Smucker Co. (The) |
1,218 | 141,897 | ||||||
| Kellogg Co. |
5,293 | 303,712 | ||||||
| Kraft Heinz Co. (The) |
14,721 | 480,641 | ||||||
| Lamb Weston Holdings, Inc. |
1,008 | 75,539 | ||||||
| McCormick & Co., Inc. Non-Voting Shares |
716 | 107,851 | ||||||
| Mondelez International, Inc. Class A |
14,236 | 710,661 | ||||||
| Tyson Foods, Inc. Class A |
6,623 | 459,835 | ||||||
|
|
|
|||||||
| Total Food Products | 3,547,820 | |||||||
| Gas Utilities – 0.1% | ||||||||
| Atmos Energy Corp. |
841 | 86,564 | ||||||
| UGI Corp. |
1,745 | 96,708 | ||||||
|
|
|
|||||||
| Total Gas Utilities | 183,272 | |||||||
| Health Care Equipment & Supplies – 1.4% | ||||||||
| Abbott Laboratories |
5,917 | 473,005 | ||||||
| ABIOMED, Inc.* |
113 | 32,272 | ||||||
| Align Technology, Inc.* |
320 | 90,986 | ||||||
| Baxter International, Inc. |
3,470 | 282,146 | ||||||
| Becton, Dickinson and Co. |
629 | 157,080 | ||||||
| Boston Scientific Corp.* |
6,632 | 254,536 | ||||||
| Cooper Cos., Inc. (The) |
247 | 73,154 | ||||||
| Danaher Corp. |
4,962 | 655,083 | ||||||
| DexCom, Inc.* |
42 | 5,002 | ||||||
| Edwards Lifesciences Corp.* |
1,155 | 220,986 | ||||||
| IDEXX Laboratories, Inc.* |
368 | 82,285 | ||||||
| Intuitive Surgical, Inc.* |
424 | 241,926 | ||||||
| ResMed, Inc. |
775 | 80,577 | ||||||
| Stryker Corp. |
2,356 | 465,357 | ||||||
| Teleflex, Inc. |
139 | 42,000 | ||||||
| Varian Medical Systems, Inc.* |
564 | 79,930 | ||||||
| West Pharmaceutical Services, Inc. |
319 | 35,154 | ||||||
| Zimmer Biomet Holdings, Inc. |
1,310 | 167,287 | ||||||
|
|
|
|||||||
| Total Health Care Equipment & Supplies | 3,438,766 | |||||||
| Health Care Providers & Services – 2.6% | ||||||||
| AmerisourceBergen Corp. |
2,487 | 197,766 | ||||||
| Anthem, Inc. |
2,256 | 647,427 | ||||||
| Cardinal Health, Inc. |
2,907 | 139,972 | ||||||
| Centene Corp.* |
2,200 | 116,820 | ||||||
| Cigna Corp. |
2,699 | 434,053 | ||||||
| Covetrus, Inc.* |
508 | 16,180 | ||||||
| CVS Health Corp. |
13,902 | 749,735 | ||||||
| DaVita, Inc.* |
1,201 | 65,202 | ||||||
| HCA Healthcare, Inc. |
4,942 | 644,338 | ||||||
| Henry Schein, Inc.* |
1,287 | 77,362 | ||||||
| Humana, Inc. |
966 | 256,956 | ||||||
| Laboratory Corp. of America Holdings* |
1,233 | 188,624 | ||||||
| McKesson Corp. |
2,500 | 292,650 | ||||||
| Molina Healthcare, Inc.* |
391 | 55,506 | ||||||
| Quest Diagnostics, Inc. |
1,536 | 138,117 | ||||||
| UnitedHealth Group, Inc. |
7,744 | 1,914,782 | ||||||
See Notes to Financial Statements.
| WisdomTree Trust | 33 |
Schedule of Investments (continued)
WisdomTree U.S. LargeCap Fund (EPS)
March 31, 2019
| Investments | Shares | Value | ||||||
| Universal Health Services, Inc. Class B |
1,322 | $ | 176,844 | |||||
| WellCare Health Plans, Inc.* |
306 | 82,544 | ||||||
|
|
|
|||||||
| Total Health Care Providers & Services | 6,194,878 | |||||||
| Health Care Technology – 0.1% | ||||||||
| Cerner Corp.* |
2,241 | 128,207 | ||||||
| Veeva Systems, Inc. Class A* |
295 | 37,424 | ||||||
|
|
|
|||||||
| Total Health Care Technology | 165,631 | |||||||
| Hotels, Restaurants & Leisure – 1.7% | ||||||||
| Aramark |
1,939 | 57,297 | ||||||
| Chipotle Mexican Grill, Inc.* |
83 | 58,956 | ||||||
| Darden Restaurants, Inc. |
1,022 | 124,142 | ||||||
| Domino’s Pizza, Inc. |
261 | 67,364 | ||||||
| Hilton Worldwide Holdings, Inc. |
1,798 | 149,432 | ||||||
| Las Vegas Sands Corp. |
8,582 | 523,159 | ||||||
| Marriott International, Inc. Class A |
3,848 | 481,346 | ||||||
| McDonald’s Corp. |
5,944 | 1,128,766 | ||||||
| MGM Resorts International |
2,184 | 56,041 | ||||||
| Starbucks Corp. |
12,974 | 964,487 | ||||||
| Vail Resorts, Inc. |
246 | 53,456 | ||||||
| Wynn Resorts Ltd. |
908 | 108,343 | ||||||
| Yum! Brands, Inc. |
4,031 | 402,334 | ||||||
|
|
|
|||||||
| Total Hotels, Restaurants & Leisure | 4,175,123 | |||||||
| Household Durables – 0.4% | ||||||||
| D.R. Horton, Inc. |
7,959 | 329,343 | ||||||
| Lennar Corp. Class A |
5,606 | 275,199 | ||||||
| Mohawk Industries, Inc.* |
1,393 | 175,727 | ||||||
| NVR, Inc.* |
55 | 152,185 | ||||||
| Whirlpool Corp. |
1,055 | 140,199 | ||||||
|
|
|
|||||||
| Total Household Durables | 1,072,653 | |||||||
| Household Products – 1.3% | ||||||||
| Church & Dwight Co., Inc. |
1,500 | 106,845 | ||||||
| Clorox Co. (The) |
879 | 141,044 | ||||||
| Colgate-Palmolive Co. |
6,811 | 466,826 | ||||||
| Kimberly-Clark Corp. |
2,544 | 315,202 | ||||||
| Procter & Gamble Co. (The) |
19,485 | 2,027,414 | ||||||
|
|
|
|||||||
| Total Household Products | 3,057,331 | |||||||
| Independent Power & Renewable Electricity Producers – 0.1% |
| |||||||
| AES Corp. |
10,524 | 190,274 | ||||||
| Vistra Energy Corp. |
305 | 7,939 | ||||||
|
|
|
|||||||
| Total Independent Power & Renewable Electricity Producers |
|
198,213 | ||||||
| Industrial Conglomerates – 1.2% | ||||||||
| 3M Co. |
5,719 | 1,188,294 | ||||||
| Honeywell International, Inc. |
9,187 | 1,459,998 | ||||||
| Roper Technologies, Inc. |
621 | 212,363 | ||||||
|
|
|
|||||||
| Total Industrial Conglomerates | 2,860,655 | |||||||
| Insurance – 3.0% | ||||||||
| Aflac, Inc. |
12,361 | 618,050 | ||||||
| Alleghany Corp.* |
267 | 163,511 | ||||||
| Allstate Corp. (The) |
7,347 | 691,940 | ||||||
| American Financial Group, Inc. |
1,487 | 143,064 | ||||||
| American International Group, Inc. |
3,192 | 137,448 | ||||||
| Arthur J. Gallagher & Co. |
1,665 | 130,037 | ||||||
| Brown & Brown, Inc. |
2,046 | 60,377 | ||||||
| Cincinnati Financial Corp. |
1,973 | 169,481 | ||||||
| CNA Financial Corp. |
4,870 | 211,115 | ||||||
| Fidelity National Financial, Inc. |
4,131 | 150,988 | ||||||
| Hartford Financial Services Group, Inc. (The) |
7,084 | 352,216 | ||||||
| Lincoln National Corp. |
5,506 | 323,202 | ||||||
| Loews Corp. |
4,237 | 203,079 | ||||||
| Markel Corp.* |
121 | 120,545 | ||||||
| Marsh & McLennan Cos., Inc. |
4,305 | 404,240 | ||||||
| MetLife, Inc. |
17,096 | 727,777 | ||||||
| Principal Financial Group, Inc. |
6,623 | 332,408 | ||||||
| Progressive Corp. (The) |
8,215 | 592,219 | ||||||
| Prudential Financial, Inc. |
8,679 | 797,427 | ||||||
| Reinsurance Group of America, Inc. |
944 | 134,029 | ||||||
| Torchmark Corp. |
1,582 | 129,645 | ||||||
| Travelers Cos., Inc. (The) |
3,846 | 527,517 | ||||||
| W.R. Berkley Corp. |
1,583 | 134,112 | ||||||
|
|
|
|||||||
| Total Insurance | 7,254,427 | |||||||
| Interactive Media & Services – 4.4% | ||||||||
| Alphabet, Inc. Class A* |
4,917 | 5,786,768 | ||||||
| Facebook, Inc. Class A* |
27,295 | 4,549,804 | ||||||
| IAC/InterActiveCorp* |
537 | 112,829 | ||||||
| Match Group, Inc. |
1,807 | 102,294 | ||||||
| TripAdvisor, Inc.* |
248 | 12,760 | ||||||
| Twitter, Inc.* |
1,516 | 49,846 | ||||||
|
|
|
|||||||
| Total Interactive Media & Services | 10,614,301 | |||||||
| Internet & Direct Marketing Retail – 1.3% | ||||||||
| Amazon.com, Inc.* |
923 | 1,643,632 | ||||||
| Booking Holdings, Inc.* |
416 | 725,883 | ||||||
| eBay, Inc. |
14,443 | 536,413 | ||||||
| Expedia Group, Inc. |
662 | 78,778 | ||||||
| Qurate Retail, Inc.* |
7,463 | 119,259 | ||||||
|
|
|
|||||||
| Total Internet & Direct Marketing Retail | 3,103,965 | |||||||
| IT Services – 4.0% | ||||||||
| Akamai Technologies, Inc.* |
733 | 52,563 | ||||||
| Alliance Data Systems Corp. |
904 | 158,182 | ||||||
| Automatic Data Processing, Inc. |
2,315 | 369,798 | ||||||
| Broadridge Financial Solutions, Inc. |
928 | 96,224 | ||||||
| Cognizant Technology Solutions Corp. Class A |
5,463 | 395,794 | ||||||
| DXC Technology Co. |
4,055 | 260,777 | ||||||
| Fidelity National Information Services, Inc. |
1,321 | 149,405 | ||||||
| First Data Corp. Class A* |
10,661 | 280,065 | ||||||
| Fiserv, Inc.* |
2,810 | 248,067 | ||||||
| FleetCor Technologies, Inc.* |
696 | 171,627 | ||||||
| Gartner, Inc.* |
98 | 14,865 | ||||||
| Global Payments, Inc. |
789 | 107,714 | ||||||
| GoDaddy, Inc. Class A* |
96 | 7,218 | ||||||
| International Business Machines Corp. |
17,043 | 2,404,767 | ||||||
| Jack Henry & Associates, Inc. |
434 | 60,213 | ||||||
| Leidos Holdings, Inc. |
1,323 | 84,791 | ||||||
| MasterCard, Inc. Class A |
5,890 | 1,386,801 | ||||||
See Notes to Financial Statements.
| 34 | WisdomTree Trust |
Schedule of Investments (continued)
WisdomTree U.S. LargeCap Fund (EPS)
March 31, 2019
| Investments | Shares | Value | ||||||
| Paychex, Inc. |
2,562 | $ | 205,472 | |||||
| PayPal Holdings, Inc.* |
4,853 | 503,936 | ||||||
| Total System Services, Inc. |
1,192 | 113,252 | ||||||
| VeriSign, Inc.* |
605 | 109,844 | ||||||
| Visa, Inc. Class A |
13,733 | 2,144,957 | ||||||
| Western Union Co. (The) |
8,245 | 152,285 | ||||||
| Worldpay, Inc. Class A* |
493 | 55,956 | ||||||
|
|
|
|||||||
| Total IT Services | 9,534,573 | |||||||
| Leisure Products – 0.0% | ||||||||
| Hasbro, Inc. |
1,213 | 103,129 | ||||||
| Life Sciences Tools & Services – 0.7% |
| |||||||
| Agilent Technologies, Inc. |
2,265 | 182,061 | ||||||
| Bio-Rad Laboratories, Inc. Class A* |
871 | 266,247 | ||||||
| Illumina, Inc.* |
473 | 146,956 | ||||||
| IQVIA Holdings, Inc.* |
422 | 60,705 | ||||||
| Mettler-Toledo International, Inc.* |
151 | 109,173 | ||||||
| PerkinElmer, Inc. |
520 | 50,107 | ||||||
| Thermo Fisher Scientific, Inc. |
2,196 | 601,089 | ||||||
| Waters Corp.* |
600 | 151,026 | ||||||
|
|
|
|||||||
| Total Life Sciences Tools & Services | 1,567,364 | |||||||
| Machinery – 1.8% | ||||||||
| Caterpillar, Inc. |
8,492 | 1,150,581 | ||||||
| Cummins, Inc. |
2,851 | 450,087 | ||||||
| Deere & Co. |
3,777 | 603,716 | ||||||
| Dover Corp. |
1,681 | 157,678 | ||||||
| Fortive Corp. |
2,762 | 231,704 | ||||||
| IDEX Corp. |
556 | 84,367 | ||||||
| Illinois Tool Works, Inc. |
3,560 | 510,967 | ||||||
| PACCAR, Inc. |
6,514 | 443,864 | ||||||
| Parker-Hannifin Corp. |
1,633 | 280,255 | ||||||
| Snap-on, Inc. |
792 | 123,964 | ||||||
| Stanley Black & Decker, Inc. |
1,647 | 224,272 | ||||||
| Wabtec Corp. |
701 | 51,678 | ||||||
| Xylem, Inc. |
1,176 | 92,951 | ||||||
|
|
|
|||||||
| Total Machinery | 4,406,084 | |||||||
| Media – 1.8% | ||||||||
| CBS Corp. Class B Non-Voting Shares |
5,716 | 271,681 | ||||||
| Charter Communications, Inc. Class A* |
681 | 236,246 | ||||||
| Comcast Corp. Class A |
57,362 | 2,293,333 | ||||||
| Discovery, Inc. Class A* |
4,695 | 126,859 | ||||||
| DISH Network Corp. Class A* |
8,264 | 261,886 | ||||||
| Fox Corp. Class A* |
3,870 | 142,068 | ||||||
| Interpublic Group of Cos., Inc. (The) |
4,759 | 99,987 | ||||||
| Liberty Broadband Corp. Class C* |
3,708 | 340,172 | ||||||
| Liberty Media Corp – Liberty SiriusXM Series C* |
1,820 | 69,597 | ||||||
| Omnicom Group, Inc. |
3,156 | 230,356 | ||||||
| Sirius XM Holdings, Inc. |
32,503 | 184,292 | ||||||
|
|
|
|||||||
| Total Media | 4,256,477 | |||||||
| Metals & Mining – 0.5% | ||||||||
| Freeport-McMoRan, Inc. |
47,291 | 609,581 | ||||||
| Newmont Mining Corp. |
2,116 | 75,689 | ||||||
| Nucor Corp. |
6,126 | 357,452 | ||||||
| Steel Dynamics, Inc. |
6,079 | 214,407 | ||||||
|
|
|
|||||||
| Total Metals & Mining | 1,257,129 | |||||||
| Multi-Utilities – 0.8% | ||||||||
| Ameren Corp. |
2,258 | 166,076 | ||||||
| CenterPoint Energy, Inc. |
2,702 | 82,951 | ||||||
| CMS Energy Corp. |
2,406 | 133,629 | ||||||
| Consolidated Edison, Inc. |
2,897 | 245,695 | ||||||
| Dominion Energy, Inc. |
5,437 | 416,801 | ||||||
| DTE Energy Co. |
1,768 | 220,540 | ||||||
| NiSource, Inc. |
504 | 14,445 | ||||||
| Public Service Enterprise Group, Inc. |
4,625 | 274,771 | ||||||
| Sempra Energy |
772 | 97,164 | ||||||
| WEC Energy Group, Inc. |
2,649 | 209,483 | ||||||
|
|
|
|||||||
| Total Multi-Utilities | 1,861,555 | |||||||
| Multiline Retail – 0.7% | ||||||||
| Dollar General Corp. |
2,461 | 293,597 | ||||||
| Dollar Tree, Inc.* |
2,387 | 250,731 | ||||||
| Kohl’s Corp. |
2,511 | 172,682 | ||||||
| Macy’s, Inc. |
6,509 | 156,411 | ||||||
| Nordstrom, Inc. |
1,864 | 82,724 | ||||||
| Target Corp. |
7,741 | 621,293 | ||||||
|
|
|
|||||||
| Total Multiline Retail | 1,577,438 | |||||||
| Oil, Gas & Consumable Fuels – 4.8% | ||||||||
| Anadarko Petroleum Corp. |
1,026 | 46,663 | ||||||
| Apache Corp. |
9,200 | 318,872 | ||||||
| Cheniere Energy, Inc.* |
1,548 | 105,821 | ||||||
| Chevron Corp. |
19,347 | 2,383,163 | ||||||
| Concho Resources, Inc. |
961 | 106,633 | ||||||
| ConocoPhillips |
14,796 | 987,485 | ||||||
| Continental Resources, Inc.* |
3,555 | 159,157 | ||||||
| Diamondback Energy, Inc. |
1,201 | 121,938 | ||||||
| EOG Resources, Inc. |
4,941 | 470,284 | ||||||
| Exxon Mobil Corp. |
41,373 | 3,342,938 | ||||||
| HollyFrontier Corp. |
3,819 | 188,162 | ||||||
| Kinder Morgan, Inc. |
14,869 | 297,529 | ||||||
| Marathon Oil Corp. |
8,814 | 147,282 | ||||||
| Marathon Petroleum Corp. |
7,067 | 422,960 | ||||||
| Noble Energy, Inc. |
6,789 | 167,892 | ||||||
| Occidental Petroleum Corp. |
9,237 | 611,489 | ||||||
| ONEOK, Inc. |
3,131 | 218,669 | ||||||
| Phillips 66 |
7,889 | 750,796 | ||||||
| Pioneer Natural Resources Co. |
884 | 134,616 | ||||||
| Valero Energy Corp. |
6,598 | 559,708 | ||||||
| Williams Cos., Inc. (The) |
2,341 | 67,234 | ||||||
|
|
|
|||||||
| Total Oil, Gas & Consumable Fuels | 11,609,291 | |||||||
| Personal Products – 0.1% | ||||||||
| Estee Lauder Cos., Inc. (The) Class A |
2,152 | 356,264 | ||||||
| Pharmaceuticals – 3.3% |
| |||||||
| Bristol-Myers Squibb Co. |
14,912 | 711,452 | ||||||
| Eli Lilly & Co. |
3,815 | 495,034 | ||||||
| Johnson & Johnson |
21,720 | 3,036,239 | ||||||
| Merck & Co., Inc. |
13,918 | 1,157,560 | ||||||
See Notes to Financial Statements.
| WisdomTree Trust | 35 |
Schedule of Investments (continued)
WisdomTree U.S. LargeCap Fund (EPS)
March 31, 2019
| Investments | Shares | Value | ||||||
| Pfizer, Inc. |
52,277 | $ | 2,220,204 | |||||
| Zoetis, Inc. |
2,708 | 272,614 | ||||||
|
|
|
|||||||
| Total Pharmaceuticals | 7,893,103 | |||||||
| Professional Services – 0.1% | ||||||||
| CoStar Group, Inc.* |
109 | 50,840 | ||||||
| Equifax, Inc. |
734 | 86,979 | ||||||
| TransUnion |
776 | 51,868 | ||||||
| Verisk Analytics, Inc. |
918 | 122,094 | ||||||
|
|
|
|||||||
| Total Professional Services | 311,781 | |||||||
| Real Estate Management & Development – 0.1% | ||||||||
| CBRE Group, Inc. Class A* |
4,264 | 210,855 | ||||||
| Road & Rail – 1.2% |
| |||||||
| CSX Corp. |
8,484 | 634,773 | ||||||
| JB Hunt Transport Services, Inc. |
1,008 | 102,100 | ||||||
| Kansas City Southern |
1,096 | 127,114 | ||||||
| Norfolk Southern Corp. |
3,113 | 581,789 | ||||||
| Old Dominion Freight Line, Inc. |
765 | 110,458 | ||||||
| Union Pacific Corp. |
7,320 | 1,223,904 | ||||||
|
|
|
|||||||
| Total Road & Rail | 2,780,138 | |||||||
| Semiconductors & Semiconductor Equipment – 5.6% |
|
|||||||
| Advanced Micro Devices, Inc.* |
2,969 | 75,769 | ||||||
| Analog Devices, Inc. |
3,202 | 337,075 | ||||||
| Applied Materials, Inc. |
24,175 | 958,780 | ||||||
| Broadcom, Inc. |
3,163 | 951,146 | ||||||
| Intel Corp. |
76,828 | 4,125,664 | ||||||
| KLA-Tencor Corp. |
2,735 | 326,586 | ||||||
| Lam Research Corp. |
3,901 | 698,318 | ||||||
| Maxim Integrated Products, Inc. |
2,538 | 134,945 | ||||||
| Microchip Technology, Inc.(a) |
1,293 | 107,267 | ||||||
| Micron Technology, Inc.* |
73,889 | 3,053,832 | ||||||
| NVIDIA Corp. |
5,640 | 1,012,718 | ||||||
| ON Semiconductor Corp.* |
5,438 | 111,860 | ||||||
| Qorvo, Inc.* |
124 | 8,895 | ||||||
| Skyworks Solutions, Inc. |
3,004 | 247,770 | ||||||
| Texas Instruments, Inc. |
10,382 | 1,101,219 | ||||||
| Xilinx, Inc. |
1,651 | 209,330 | ||||||
|
|
|
|||||||
| Total Semiconductors & Semiconductor Equipment |
|
13,461,174 | ||||||
| Software – 4.5% | ||||||||
| Adobe, Inc.* |
1,972 | 525,518 | ||||||
| ANSYS, Inc.* |
423 | 77,286 | ||||||
| Cadence Design Systems, Inc.* |
1,393 | 88,470 | ||||||
| Citrix Systems, Inc. |
913 | 90,990 | ||||||
| Fortinet, Inc.* |
422 | 35,435 | ||||||
| Intuit, Inc. |
1,180 | 308,464 | ||||||
| Microsoft Corp. |
55,470 | 6,542,132 | ||||||
| Oracle Corp. |
41,409 | 2,224,077 | ||||||
| PTC, Inc.* |
66 | 6,084 | ||||||
| Red Hat, Inc.* |
452 | 82,580 | ||||||
| salesforce.com, Inc.* |
1,040 | 164,705 | ||||||
| SS&C Technologies Holdings, Inc. |
540 | 34,393 | ||||||
| Symantec Corp. |
4,214 | 96,880 | ||||||
| Synopsys, Inc.* |
668 | 76,920 | ||||||
| Ultimate Software Group, Inc. (The)* |
30 | 9,904 | ||||||
| VMware, Inc. Class A |
2,930 | 528,894 | ||||||
|
|
|
|||||||
| Total Software | 10,892,732 | |||||||
| Specialty Retail – 2.4% | ||||||||
| Advance Auto Parts, Inc. |
433 | 73,840 | ||||||
| AutoZone, Inc.* |
267 | 273,440 | ||||||
| Best Buy Co., Inc. |
4,489 | 318,988 | ||||||
| Burlington Stores, Inc.* |
381 | 59,695 | ||||||
| CarMax, Inc.* |
2,259 | 157,678 | ||||||
| Gap, Inc. (The) |
6,435 | 168,468 | ||||||
| Home Depot, Inc. (The) |
11,229 | 2,154,733 | ||||||
| L Brands, Inc. |
4,060 | 111,975 | ||||||
| Lowe’s Cos., Inc. |
7,155 | 783,258 | ||||||
| O’Reilly Automotive, Inc.* |
660 | 256,278 | ||||||
| Ross Stores, Inc. |
3,471 | 323,150 | ||||||
| Tiffany & Co. |
1,255 | 132,465 | ||||||
| TJX Cos., Inc. (The) |
12,259 | 652,302 | ||||||
| Tractor Supply Co. |
1,057 | 103,332 | ||||||
| Ulta Salon Cosmetics & Fragrance, Inc.* |
440 | 153,441 | ||||||
|
|
|
|||||||
| Total Specialty Retail | 5,723,043 | |||||||
| Technology Hardware, Storage & Peripherals – 5.8% |
|
|||||||
| Apple, Inc. |
66,528 | 12,636,993 | ||||||
| HP, Inc. |
30,604 | 594,636 | ||||||
| NetApp, Inc. |
3,218 | 223,136 | ||||||
| Western Digital Corp. |
9,798 | 470,892 | ||||||
|
|
|
|||||||
| Total Technology Hardware, Storage & Peripherals | 13,925,657 | |||||||
| Textiles, Apparel & Luxury Goods – 0.7% | ||||||||
| NIKE, Inc. Class B |
10,212 | 859,953 | ||||||
| PVH Corp. |
1,271 | 154,998 | ||||||
| Ralph Lauren Corp. |
783 | 101,539 | ||||||
| Tapestry, Inc. |
3,648 | 118,524 | ||||||
| VF Corp. |
3,743 | 325,304 | ||||||
|
|
|
|||||||
| Total Textiles, Apparel & Luxury Goods | 1,560,318 | |||||||
| Tobacco – 1.3% | ||||||||
| Altria Group, Inc. |
25,497 | 1,464,293 | ||||||
| Philip Morris International, Inc. |
18,104 | 1,600,212 | ||||||
|
|
|
|||||||
| Total Tobacco | 3,064,505 | |||||||
| Trading Companies & Distributors – 0.2% | ||||||||
| Fastenal Co. |
2,401 | 154,408 | ||||||
| United Rentals, Inc.* |
1,728 | 197,424 | ||||||
| W.W. Grainger, Inc. |
501 | 150,766 | ||||||
|
|
|
|||||||
| Total Trading Companies & Distributors | 502,598 | |||||||
| Water Utilities – 0.1% | ||||||||
| American Water Works Co., Inc. |
1,121 | 116,875 | ||||||
| Wireless Telecommunication Services – 0.2% |
| |||||||
| Sprint Corp.* |
9,045 | 51,104 | ||||||
| T-Mobile U.S., Inc.* |
7,602 | 525,298 | ||||||
|
|
|
|||||||
| Total Wireless Telecommunication Services |
|
576,402 | ||||||
| TOTAL COMMON STOCKS (Cost: $205,564,683) |
239,157,858 | |||||||
See Notes to Financial Statements.
| 36 | WisdomTree Trust |
Schedule of Investments (concluded)
WisdomTree U.S. LargeCap Fund (EPS)
March 31, 2019
| Investments | Shares | Value | ||||||
| EXCHANGE-TRADED FUND – 0.2% |
| |||||||
| United States – 0.2% |
| |||||||
| WisdomTree U.S. High Dividend Fund(a)(b) (Cost: $482,330) |
7,385 | $ | 535,191 | |||||
| INVESTMENT OF CASH COLLATERAL FOR SECURITIES LOANED – 0.1% |
| |||||||
| United States – 0.1% |
| |||||||
| State Street Navigator Securities Lending Government Money Market Portfolio, 2.46%(c) |
||||||||
| (Cost: $56,980)(d) | 56,980 | 56,980 | ||||||
| TOTAL INVESTMENTS IN SECURITIES – 100.0% (Cost: $206,103,993) |
|
239,750,029 | ||||||
| Other Assets less Liabilities – 0.0% |
|
101,125 | ||||||
|
|
|
|||||||
| NET ASSETS – 100.0% |
|
$ | 239,851,154 | |||||
| * | Non-income producing security. |
| (a) | Security, or portion thereof, was on loan at March 31, 2019 (See Note 2). |
| (b) | Affiliated company (See Note 3). |
| (c) | Rate shown represents annualized 7-day yield as of March 31, 2019. |
| (d) | At March 31, 2019, the total market value of the Fund’s securities on loan identified in the Schedule of Investments was $152,284 and the total market value of the collateral held by the Fund was $153,689. The total market value of the collateral includes non-cash U.S. Government securities collateral having a value of $96,709. |
See Notes to Financial Statements.
| WisdomTree Trust | 37 |
Schedule of Investments
WisdomTree U.S. MidCap Dividend Fund (DON)
March 31, 2019
| Investments | Shares | Value | ||||||
| COMMON STOCKS – 99.3% | ||||||||
| United States – 99.3% | ||||||||
| Aerospace & Defense – 1.1% | ||||||||
| Arconic, Inc. |
466,490 | $ | 8,914,624 | |||||
| BWX Technologies, Inc. |
120,474 | 5,973,101 | ||||||
| Curtiss-Wright Corp. |
21,133 | 2,395,214 | ||||||
| HEICO Corp. |
2,249 | 213,363 | ||||||
| HEICO Corp. Class A |
14,254 | 1,198,191 | ||||||
| Hexcel Corp. |
70,467 | 4,873,498 | ||||||
| Huntington Ingalls Industries, Inc. |
57,975 | 12,012,420 | ||||||
| Spirit AeroSystems Holdings, Inc. Class A |
54,387 | 4,978,042 | ||||||
|
|
|
|||||||
| Total Aerospace & Defense | 40,558,453 | |||||||
| Airlines – 0.4% | ||||||||
| Alaska Air Group, Inc. |
200,967 | 11,278,268 | ||||||
| SkyWest, Inc. |
46,575 | 2,528,557 | ||||||
|
|
|
|||||||
| Total Airlines | 13,806,825 | |||||||
| Auto Components – 1.3% | ||||||||
| BorgWarner, Inc. |
326,530 | 12,542,017 | ||||||
| Gentex Corp. |
438,145 | 9,060,839 | ||||||
| Goodyear Tire & Rubber Co. (The) |
567,705 | 10,303,846 | ||||||
| Lear Corp. |
115,072 | 15,616,421 | ||||||
|
|
|
|||||||
| Total Auto Components | 47,523,123 | |||||||
| Automobiles – 0.7% | ||||||||
| Harley-Davidson, Inc. |
543,887 | 19,395,010 | ||||||
| Thor Industries, Inc. |
123,031 | 7,673,444 | ||||||
|
|
|
|||||||
| Total Automobiles | 27,068,454 | |||||||
| Banks – 4.3% | ||||||||
| Associated Banc-Corp. |
180,677 | 3,857,454 | ||||||
| BancorpSouth Bank |
80,861 | 2,281,897 | ||||||
| Bank of Hawaii Corp. |
43,084 | 3,398,035 | ||||||
| Bank OZK |
166,941 | 4,837,950 | ||||||
| BankUnited, Inc. |
94,911 | 3,170,027 | ||||||
| BOK Financial Corp. |
56,433 | 4,602,111 | ||||||
| Cathay General Bancorp |
88,087 | 2,987,030 | ||||||
| Chemical Financial Corp. |
79,710 | 3,280,864 | ||||||
| CIT Group, Inc. |
86,764 | 4,162,069 | ||||||
| Columbia Banking System, Inc. |
67,359 | 2,201,966 | ||||||
| Commerce Bancshares, Inc. |
53,835 | 3,125,660 | ||||||
| Community Bank System, Inc. |
30,843 | 1,843,486 | ||||||
| Cullen/Frost Bankers, Inc. |
57,088 | 5,541,532 | ||||||
| CVB Financial Corp. |
98,767 | 2,079,045 | ||||||
| East West Bancorp, Inc. |
89,519 | 4,294,226 | ||||||
| First Citizens BancShares, Inc. Class A |
881 | 358,743 | ||||||
| First Financial Bankshares, Inc. |
31,208 | 1,803,198 | ||||||
| First Hawaiian, Inc. |
188,031 | 4,898,208 | ||||||
| First Horizon National Corp. |
385,670 | 5,391,667 | ||||||
| FNB Corp. |
517,541 | 5,485,935 | ||||||
| Fulton Financial Corp. |
178,928 | 2,769,805 | ||||||
| Glacier Bancorp, Inc. |
54,854 | 2,198,000 | ||||||
| Hancock Whitney Corp. |
83,865 | 3,388,146 | ||||||
| Home BancShares, Inc. |
172,469 | 3,030,280 | ||||||
| Iberiabank Corp. |
42,575 | 3,053,053 | ||||||
| Investors Bancorp, Inc. |
375,363 | 4,448,052 | ||||||
| PacWest Bancorp |
293,528 | 11,039,588 | ||||||
| People’s United Financial, Inc. |
562,062 | 9,240,299 | ||||||
| Pinnacle Financial Partners, Inc. |
36,239 | 1,982,273 | ||||||
| Popular, Inc. |
51,239 | 2,671,089 | ||||||
| Prosperity Bancshares, Inc. |
59,192 | 4,087,800 | ||||||
| Signature Bank |
34,051 | 4,360,912 | ||||||
| Sterling Bancorp |
138,033 | 2,571,555 | ||||||
| Synovus Financial Corp. |
122,642 | 4,213,979 | ||||||
| TCF Financial Corp. |
146,966 | 3,040,727 | ||||||
| UMB Financial Corp. |
31,341 | 2,007,078 | ||||||
| Umpqua Holdings Corp. |
351,015 | 5,791,747 | ||||||
| United Bankshares, Inc. |
150,544 | 5,455,715 | ||||||
| Valley National Bancorp |
508,005 | 4,866,688 | ||||||
| Webster Financial Corp. |
68,478 | 3,469,780 | ||||||
| Wintrust Financial Corp. |
17,145 | 1,154,373 | ||||||
| Zions Bancorp NA |
169,426 | 7,693,635 | ||||||
|
|
|
|||||||
| Total Banks | 162,135,677 | |||||||
| Building Products – 1.6% | ||||||||
| A.O. Smith Corp. |
245,339 | 13,081,476 | ||||||
| Armstrong World Industries, Inc. |
42,819 | 3,400,685 | ||||||
| Fortune Brands Home & Security, Inc. |
225,943 | 10,757,146 | ||||||
| Lennox International, Inc. |
37,135 | 9,818,494 | ||||||
| Masco Corp. |
391,581 | 15,393,049 | ||||||
| Owens Corning |
171,973 | 8,103,368 | ||||||
|
|
|
|||||||
| Total Building Products | 60,554,218 | |||||||
| Capital Markets – 1.5% | ||||||||
| Affiliated Managers Group, Inc. |
23,601 | 2,527,903 | ||||||
| BGC Partners, Inc. Class A |
1,215,146 | 6,452,425 | ||||||
| CBOE Global Markets, Inc. |
43,415 | 4,143,528 | ||||||
| Eaton Vance Corp. |
151,461 | 6,105,393 | ||||||
| Evercore, Inc. Class A |
35,029 | 3,187,639 | ||||||
| FactSet Research Systems, Inc. |
13,069 | 3,244,641 | ||||||
| Interactive Brokers Group, Inc. Class A |
17,612 | 913,710 | ||||||
| KKR & Co., Inc. Class A |
408,721 | 9,600,856 | ||||||
| LPL Financial Holdings, Inc. |
52,224 | 3,637,402 | ||||||
| MarketAxess Holdings, Inc. |
8,685 | 2,137,205 | ||||||
| Morningstar, Inc. |
13,671 | 1,722,409 | ||||||
| Raymond James Financial, Inc. |
82,451 | 6,629,885 | ||||||
| SEI Investments Co. |
60,583 | 3,165,462 | ||||||
| Stifel Financial Corp. |
28,690 | 1,513,684 | ||||||
|
|
|
|||||||
| Total Capital Markets | 54,982,142 | |||||||
| Chemicals – 4.6% | ||||||||
| Albemarle Corp.(a) |
131,931 | 10,815,703 | ||||||
| Ashland Global Holdings, Inc. |
65,225 | 5,096,029 | ||||||
| CF Industries Holdings, Inc. |
531,622 | 21,732,707 | ||||||
| Chemours Co. (The) |
482,909 | 17,944,899 | ||||||
| Eastman Chemical Co. |
342,634 | 25,999,068 | ||||||
| FMC Corp. |
92,041 | 7,070,590 | ||||||
| Huntsman Corp. |
672,676 | 15,128,483 | ||||||
| NewMarket Corp. |
15,379 | 6,667,719 | ||||||
| Olin Corp. |
531,999 | 12,310,457 | ||||||
| RPM International, Inc. |
251,947 | 14,623,004 | ||||||
See Notes to Financial Statements.
| 38 | WisdomTree Trust |
Schedule of Investments (continued)
WisdomTree U.S. MidCap Dividend Fund (DON)
March 31, 2019
| Investments | Shares | Value | ||||||
| Scotts Miracle-Gro Co. (The) |
151,392 | $ | 11,896,383 | |||||
| Valvoline, Inc. |
327,437 | 6,077,231 | ||||||
| W.R. Grace & Co. |
84,389 | 6,585,718 | ||||||
| Westlake Chemical Corp. |
157,538 | 10,690,529 | ||||||
|
|
|
|||||||
| Total Chemicals | 172,638,520 | |||||||
| Commercial Services & Supplies – 1.0% | ||||||||
| ADT, Inc.(a) |
1,200,608 | 7,671,885 | ||||||
| Brink’s Co. (The) |
37,238 | 2,808,118 | ||||||
| Healthcare Services Group, Inc.(a) |
105,636 | 3,484,932 | ||||||
| KAR Auction Services, Inc. |
295,710 | 15,172,880 | ||||||
| MSA Safety, Inc. |
53,646 | 5,546,996 | ||||||
| Tetra Tech, Inc. |
33,443 | 1,992,868 | ||||||
|
|
|
|||||||
| Total Commercial Services & Supplies | 36,677,679 | |||||||
| Communications Equipment – 0.7% | ||||||||
| Juniper Networks, Inc. |
703,950 | 18,633,556 | ||||||
| Ubiquiti Networks, Inc. |
49,850 | 7,463,044 | ||||||
|
|
|
|||||||
| Total Communications Equipment | 26,096,600 | |||||||
| Construction & Engineering – 0.5% | ||||||||
| EMCOR Group, Inc. |
18,126 | 1,324,648 | ||||||
| Fluor Corp. |
285,733 | 10,514,975 | ||||||
| Jacobs Engineering Group, Inc. |
114,106 | 8,579,630 | ||||||
|
|
|
|||||||
| Total Construction & Engineering | 20,419,253 | |||||||
| Construction Materials – 0.4% | ||||||||
| Eagle Materials, Inc. |
27,682 | 2,333,593 | ||||||
| Martin Marietta Materials, Inc. |
53,718 | 10,806,987 | ||||||
|
|
|
|||||||
| Total Construction Materials | 13,140,580 | |||||||
| Consumer Finance – 0.6% | ||||||||
| Ally Financial, Inc. |
343,127 | 9,432,561 | ||||||
| FirstCash, Inc. |
15,749 | 1,362,289 | ||||||
| Santander Consumer USA Holdings, Inc. |
496,726 | 10,495,820 | ||||||
|
|
|
|||||||
| Total Consumer Finance | 21,290,670 | |||||||
| Containers & Packaging – 3.4% | ||||||||
| AptarGroup, Inc. |
76,335 | 8,121,281 | ||||||
| Avery Dennison Corp. |
154,643 | 17,474,659 | ||||||
| Bemis Co., Inc. |
189,768 | 10,528,329 | ||||||
| Graphic Packaging Holding Co. |
680,575 | 8,595,662 | ||||||
| Packaging Corp. of America |
250,314 | 24,876,205 | ||||||
| Sealed Air Corp. |
237,453 | 10,937,085 | ||||||
| Sonoco Products Co. |
229,793 | 14,139,163 | ||||||
| WestRock Co. |
828,221 | 31,762,276 | ||||||
|
|
|
|||||||
| Total Containers & Packaging | 126,434,660 | |||||||
| Distributors – 0.2% | ||||||||
| Pool Corp. |
38,689 | 6,382,524 | ||||||
| Diversified Consumer Services – 0.6% | ||||||||
| H&R Block, Inc. |
603,778 | 14,454,445 | ||||||
| Service Corp. International |
238,845 | 9,589,627 | ||||||
|
|
|
|||||||
| Total Diversified Consumer Services | 24,044,072 | |||||||
| Diversified Financial Services – 0.4% | ||||||||
| AXA Equitable Holdings, Inc. |
501,921 | 10,108,689 | ||||||
| Jefferies Financial Group, Inc. |
294,603 | 5,535,590 | ||||||
| Voya Financial, Inc. |
3,782 | 188,949 | ||||||
|
|
|
|||||||
| Total Diversified Financial Services | 15,833,228 | |||||||
| Electric Utilities – 3.4% | ||||||||
| ALLETE, Inc. |
111,232 | 9,146,607 | ||||||
| Alliant Energy Corp. |
555,298 | 26,171,195 | ||||||
| Hawaiian Electric Industries, Inc. |
298,100 | 12,153,537 | ||||||
| IDACORP, Inc. |
101,249 | 10,078,326 | ||||||
| OGE Energy Corp. |
614,902 | 26,514,574 | ||||||
| Pinnacle West Capital Corp. |
283,364 | 27,083,931 | ||||||
| PNM Resources, Inc. |
148,927 | 7,050,204 | ||||||
| Portland General Electric Co. |
202,508 | 10,498,015 | ||||||
|
|
|
|||||||
| Total Electric Utilities | 128,696,389 | |||||||
| Electrical Equipment – 0.9% | ||||||||
| Acuity Brands, Inc. |
15,384 | 1,846,234 | ||||||
| EnerSys |
28,983 | 1,888,532 | ||||||
| GrafTech International Ltd. |
642,271 | 8,214,646 | ||||||
| Hubbell, Inc. |
141,784 | 16,727,677 | ||||||
| Regal Beloit Corp. |
47,300 | 3,872,451 | ||||||
|
|
|
|||||||
| Total Electrical Equipment | 32,549,540 | |||||||
| Electronic Equipment, Instruments & Components – 1.3% |
| |||||||
| Avnet, Inc. |
175,418 | 7,607,879 | ||||||
| Cognex Corp. |
72,462 | 3,685,417 | ||||||
| Dolby Laboratories, Inc. Class A |
51,976 | 3,272,929 | ||||||
| FLIR Systems, Inc. |
149,626 | 7,119,205 | ||||||
| Jabil, Inc. |
193,370 | 5,141,708 | ||||||
| Littelfuse, Inc. |
20,226 | 3,690,841 | ||||||
| National Instruments Corp. |
218,220 | 9,680,239 | ||||||
| SYNNEX Corp. |
74,455 | 7,102,262 | ||||||
|
|
|
|||||||
| Total Electronic Equipment, Instruments & Components |
|
47,300,480 | ||||||
| Energy Equipment & Services – 1.9% | ||||||||
| Baker Hughes a GE Co. |
1,366,420 | 37,877,162 | ||||||
| Helmerich & Payne, Inc. |
419,056 | 23,282,751 | ||||||
| National Oilwell Varco, Inc. |
234,622 | 6,250,330 | ||||||
| Patterson-UTI Energy, Inc. |
250,125 | 3,506,753 | ||||||
|
|
|
|||||||
| Total Energy Equipment & Services | 70,916,996 | |||||||
| Entertainment – 0.9% | ||||||||
| Cinemark Holdings, Inc. |
286,879 | 11,472,291 | ||||||
| Viacom, Inc. Class B |
786,478 | 22,076,437 | ||||||
| World Wrestling Entertainment, Inc. Class A |
20,251 | 1,757,382 | ||||||
|
|
|
|||||||
| Total Entertainment | 35,306,110 | |||||||
| Equity Real Estate Investment Trusts (REITs) – 15.4% |
| |||||||
| American Campus Communities, Inc. |
184,817 | 8,793,593 | ||||||
| American Homes 4 Rent Class A |
96,510 | 2,192,707 | ||||||
| Americold Realty Trust |
126,234 | 3,851,399 | ||||||
| Apartment Investment & Management Co. Class A |
161,697 | 8,131,742 | ||||||
| Apple Hospitality REIT, Inc. |
583,548 | 9,511,832 | ||||||
| Brixmor Property Group, Inc. |
666,625 | 12,245,901 | ||||||
| Camden Property Trust |
93,827 | 9,523,441 | ||||||
| Colony Capital, Inc. |
1,190,512 | 6,333,524 | ||||||
| CoreSite Realty Corp. |
48,086 | 5,146,164 | ||||||
See Notes to Financial Statements.
| WisdomTree Trust | 39 |
Schedule of Investments (continued)
WisdomTree U.S. MidCap Dividend Fund (DON)
March 31, 2019
| Investments | Shares | Value | ||||||
| Cousins Properties, Inc. |
445,994 | $ | 4,308,302 | |||||
| CubeSmart |
216,415 | 6,933,937 | ||||||
| CyrusOne, Inc. |
102,689 | 5,385,011 | ||||||
| Douglas Emmett, Inc. |
146,910 | 5,938,102 | ||||||
| Duke Realty Corp. |
349,923 | 10,700,645 | ||||||
| EastGroup Properties, Inc. |
32,191 | 3,593,803 | ||||||
| EPR Properties |
136,056 | 10,462,706 | ||||||
| Equity LifeStyle Properties, Inc. |
62,804 | 7,178,497 | ||||||
| Extra Space Storage, Inc. |
147,445 | 15,026,120 | ||||||
| Federal Realty Investment Trust |
74,562 | 10,278,372 | ||||||
| First Industrial Realty Trust, Inc. |
93,337 | 3,300,396 | ||||||
| Gaming and Leisure Properties, Inc. |
531,230 | 20,489,541 | ||||||
| Healthcare Realty Trust, Inc. |
162,312 | 5,211,838 | ||||||
| Healthcare Trust of America, Inc. Class A |
300,508 | 8,591,524 | ||||||
| Highwoods Properties, Inc. |
148,791 | 6,960,443 | ||||||
| Hospitality Properties Trust |
429,718 | 11,305,881 | ||||||
| Hudson Pacific Properties, Inc. |
171,013 | 5,886,267 | ||||||
| Invitation Homes, Inc. |
334,638 | 8,141,743 | ||||||
| Iron Mountain, Inc. |
630,111 | 22,343,736 | ||||||
| JBG SMITH Properties |
102,664 | 4,245,156 | ||||||
| Kilroy Realty Corp. |
85,375 | 6,485,085 | ||||||
| Kimco Realty Corp. |
934,265 | 17,283,902 | ||||||
| Lamar Advertising Co. Class A |
135,370 | 10,729,426 | ||||||
| Liberty Property Trust |
161,468 | 7,818,281 | ||||||
| Life Storage, Inc. |
66,495 | 6,467,969 | ||||||
| Macerich Co. (The) |
283,518 | 12,290,505 | ||||||
| Medical Properties Trust, Inc. |
778,831 | 14,416,162 | ||||||
| Mid-America Apartment Communities, Inc. |
131,255 | 14,350,109 | ||||||
| National Health Investors, Inc. |
68,166 | 5,354,439 | ||||||
| National Retail Properties, Inc. |
227,014 | 12,574,305 | ||||||
| Omega Healthcare Investors, Inc. |
471,506 | 17,987,954 | ||||||
| Paramount Group, Inc. |
256,110 | 3,634,201 | ||||||
| Park Hotels & Resorts, Inc. |
380,349 | 11,821,247 | ||||||
| Physicians Realty Trust |
307,733 | 5,788,458 | ||||||
| PS Business Parks, Inc. |
25,078 | 3,932,983 | ||||||
| Rayonier, Inc. |
146,131 | 4,606,049 | ||||||
| Regency Centers Corp. |
192,318 | 12,979,542 | ||||||
| Rexford Industrial Realty, Inc. |
52,934 | 1,895,567 | ||||||
| RLJ Lodging Trust |
404,119 | 7,100,371 | ||||||
| Ryman Hospitality Properties, Inc. |
72,877 | 5,993,404 | ||||||
| Sabra Health Care REIT, Inc. |
532,434 | 10,366,490 | ||||||
| Senior Housing Properties Trust |
905,714 | 10,669,311 | ||||||
| SL Green Realty Corp. |
105,945 | 9,526,574 | ||||||
| Spirit Realty Capital, Inc. |
172,853 | 6,867,450 | ||||||
| STORE Capital Corp. |
309,246 | 10,359,741 | ||||||
| Sun Communities, Inc. |
74,438 | 8,822,392 | ||||||
| Sunstone Hotel Investors, Inc. |
104,147 | 1,499,717 | ||||||
| Taubman Centers, Inc. |
100,468 | 5,312,748 | ||||||
| UDR, Inc. |
279,728 | 12,716,435 | ||||||
| Uniti Group, Inc.(a) |
770,365 | 8,620,384 | ||||||
| VEREIT, Inc. |
2,159,718 | 18,076,840 | ||||||
| VICI Properties, Inc. |
696,360 | 15,236,357 | ||||||
| W.P. Carey, Inc. |
293,241 | 22,969,568 | ||||||
| Weingarten Realty Investors |
229,070 | 6,727,786 | ||||||
|
|
|
|||||||
| Total Equity Real Estate Investment Trusts (REITs) |
|
573,294,075 | ||||||
| Food & Staples Retailing – 0.1% | ||||||||
| Casey’s General Stores, Inc. |
24,705 | 3,181,263 | ||||||
| Food Products – 2.9% | ||||||||
| Campbell Soup Co. |
837,957 | 31,951,300 | ||||||
| Flowers Foods, Inc. |
614,353 | 13,098,006 | ||||||
| Ingredion, Inc. |
143,215 | 13,561,028 | ||||||
| J.M. Smucker Co. (The) |
302,026 | 35,186,029 | ||||||
| Lamb Weston Holdings, Inc. |
128,815 | 9,653,396 | ||||||
| Lancaster Colony Corp. |
39,014 | 6,113,104 | ||||||
|
|
|
|||||||
| Total Food Products | 109,562,863 | |||||||
| Gas Utilities – 2.3% | ||||||||
| Atmos Energy Corp. |
200,079 | 20,594,132 | ||||||
| National Fuel Gas Co. |
199,289 | 12,148,658 | ||||||
| New Jersey Resources Corp. |
186,780 | 9,299,776 | ||||||
| ONE Gas, Inc. |
98,181 | 8,741,054 | ||||||
| Southwest Gas Holdings, Inc. |
103,194 | 8,488,738 | ||||||
| Spire, Inc. |
121,383 | 9,988,607 | ||||||
| UGI Corp. |
281,963 | 15,626,390 | ||||||
|
|
|
|||||||
| Total Gas Utilities | 84,887,355 | |||||||
| Health Care Equipment & Supplies – 0.5% |
| |||||||
| Cantel Medical Corp. |
6,428 | 429,969 | ||||||
| Dentsply Sirona, Inc. |
169,306 | 8,395,884 | ||||||
| Hill-Rom Holdings, Inc. |
47,884 | 5,069,000 | ||||||
| West Pharmaceutical Services, Inc. |
32,999 | 3,636,490 | ||||||
|
|
|
|||||||
| Total Health Care Equipment & Supplies | 17,531,343 | |||||||
| Health Care Providers & Services – 1.0% | ||||||||
| Chemed Corp. |
6,005 | 1,922,020 | ||||||
| Encompass Health Corp. |
141,515 | 8,264,476 | ||||||
| Quest Diagnostics, Inc. |
268,479 | 24,141,632 | ||||||
| Universal Health Services, Inc. Class B |
19,335 | 2,586,443 | ||||||
|
|
|
|||||||
| Total Health Care Providers & Services | 36,914,571 | |||||||
| Hotels, Restaurants & Leisure – 4.0% | ||||||||
| Aramark |
259,708 | 7,674,371 | ||||||
| Choice Hotels International, Inc. |
51,262 | 3,985,108 | ||||||
| Churchill Downs, Inc. |
24,594 | 2,219,854 | ||||||
| Cracker Barrel Old Country Store, Inc. |
53,967 | 8,721,607 | ||||||
| Domino’s Pizza, Inc. |
32,676 | 8,433,676 | ||||||
| Dunkin’ Brands Group, Inc. |
142,268 | 10,684,327 | ||||||
| Hyatt Hotels Corp. Class A |
31,852 | 2,311,500 | ||||||
| Marriott Vacations Worldwide Corp. |
83,966 | 7,850,821 | ||||||
| Six Flags Entertainment Corp. |
366,023 | 18,063,235 | ||||||
| Texas Roadhouse, Inc. |
95,510 | 5,939,767 | ||||||
| Vail Resorts, Inc. |
81,390 | 17,686,047 | ||||||
| Wendy’s Co. (The) |
367,704 | 6,578,224 | ||||||
| Wyndham Destinations, Inc. |
332,322 | 13,455,718 | ||||||
| Wyndham Hotels & Resorts, Inc. |
162,500 | 8,123,375 | ||||||
| Wynn Resorts Ltd. |
239,834 | 28,616,993 | ||||||
|
|
|
|||||||
| Total Hotels, Restaurants & Leisure | 150,344,623 | |||||||
| Household Durables – 2.2% | ||||||||
| Leggett & Platt, Inc. |
435,414 | 18,383,179 | ||||||
| Newell Brands, Inc. |
1,528,554 | 23,448,019 | ||||||
See Notes to Financial Statements.
| 40 | WisdomTree Trust |
Schedule of Investments (continued)
WisdomTree U.S. MidCap Dividend Fund (DON)
March 31, 2019
| Investments | Shares | Value | ||||||
| PulteGroup, Inc. |
308,781 | $ | 8,633,517 | |||||
| Toll Brothers, Inc. |
162,626 | 5,887,061 | ||||||
| Whirlpool Corp. |
204,616 | 27,191,420 | ||||||
|
|
|
|||||||
| Total Household Durables | 83,543,196 | |||||||
| Independent Power & Renewable Electricity Producers – 1.0% |
| |||||||
| AES Corp. |
1,812,820 | 32,775,786 | ||||||
| NRG Energy, Inc. |
103,473 | 4,395,533 | ||||||
|
|
|
|||||||
| Total Independent Power & Renewable Electricity Producers |
|
37,171,319 | ||||||
| Industrial Conglomerates – 0.3% | ||||||||
| Carlisle Cos., Inc. |
78,433 | 9,617,454 | ||||||
| Insurance – 2.2% | ||||||||
| American Equity Investment Life Holding Co. |
22,573 | 609,923 | ||||||
| American Financial Group, Inc. |
45,592 | 4,386,406 | ||||||
| American National Insurance Co. |
19,923 | 2,407,097 | ||||||
| Assurant, Inc. |
50,626 | 4,804,914 | ||||||
| Brown & Brown, Inc. |
103,122 | 3,043,130 | ||||||
| CNO Financial Group, Inc. |
142,973 | 2,313,303 | ||||||
| Erie Indemnity Co. Class A |
40,437 | 7,218,813 | ||||||
| Fidelity National Financial, Inc. |
326,513 | 11,934,050 | ||||||
| First American Financial Corp. |
131,091 | 6,751,187 | ||||||
| Hanover Insurance Group, Inc. (The) |
25,290 | 2,887,359 | ||||||
| Kemper Corp. |
26,671 | 2,030,730 | ||||||
| Mercury General Corp. |
78,576 | 3,934,300 | ||||||
| National General Holdings Corp. |
13,649 | 323,891 | ||||||
| Old Republic International Corp. |
340,782 | 7,129,159 | ||||||
| Primerica, Inc. |
10,803 | 1,319,587 | ||||||
| Reinsurance Group of America, Inc. |
30,861 | 4,381,645 | ||||||
| RLI Corp. |
12,015 | 862,076 | ||||||
| Selective Insurance Group, Inc. |
22,160 | 1,402,285 | ||||||
| Torchmark Corp. |
27,283 | 2,235,842 | ||||||
| Unum Group |
246,247 | 8,330,536 | ||||||
| W.R. Berkley Corp. |
30,745 | 2,604,716 | ||||||
|
|
|
|||||||
| Total Insurance | 80,910,949 | |||||||
| IT Services – 3.0% | ||||||||
| Alliance Data Systems Corp. |
56,167 | 9,828,102 | ||||||
| Booz Allen Hamilton Holding Corp. |
194,259 | 11,294,218 | ||||||
| Broadridge Financial Solutions, Inc. |
182,466 | 18,919,900 | ||||||
| Jack Henry & Associates, Inc. |
69,453 | 9,635,909 | ||||||
| Leidos Holdings, Inc. |
259,423 | 16,626,420 | ||||||
| MAXIMUS, Inc. |
71,642 | 5,085,149 | ||||||
| Perspecta, Inc. |
124,866 | 2,524,791 | ||||||
| Sabre Corp. |
524,318 | 11,215,162 | ||||||
| Western Union Co. (The) |
1,470,290 | 27,156,256 | ||||||
|
|
|
|||||||
| Total IT Services | 112,285,907 | |||||||
| Leisure Products – 1.2% | ||||||||
| Brunswick Corp. |
125,067 | 6,294,622 | ||||||
| Hasbro, Inc. |
296,110 | 25,175,272 | ||||||
| Polaris Industries, Inc. |
147,559 | 12,458,407 | ||||||
|
|
|
|||||||
| Total Leisure Products | 43,928,301 | |||||||
| Life Sciences Tools & Services – 0.3% | ||||||||
| Bio-Techne Corp. |
28,340 | 5,626,907 | ||||||
| Bruker Corp. |
58,628 | 2,253,660 | ||||||
| PerkinElmer, Inc. |
35,200 | 3,391,872 | ||||||
|
|
|
|||||||
| Total Life Sciences Tools & Services | 11,272,439 | |||||||
| Machinery – 3.7% | ||||||||
| AGCO Corp. |
68,579 | 4,769,669 | ||||||
| Allison Transmission Holdings, Inc. |
154,163 | 6,925,002 | ||||||
| Barnes Group, Inc. |
49,525 | 2,546,080 | ||||||
| Crane Co. |
86,890 | 7,352,632 | ||||||
| Donaldson Co., Inc. |
156,873 | 7,853,062 | ||||||
| Flowserve Corp. |
189,493 | 8,553,714 | ||||||
| Graco, Inc. |
168,842 | 8,361,056 | ||||||
| IDEX Corp. |
79,250 | 12,025,395 | ||||||
| ITT, Inc. |
66,116 | 3,834,728 | ||||||
| Kennametal, Inc. |
153,475 | 5,640,206 | ||||||
| Lincoln Electric Holdings, Inc. |
120,798 | 10,131,328 | ||||||
| Nordson Corp. |
54,572 | 7,231,881 | ||||||
| Oshkosh Corp. |
96,119 | 7,221,421 | ||||||
| Snap-on, Inc. |
114,503 | 17,922,010 | ||||||
| Timken Co. (The) |
185,387 | 8,086,581 | ||||||
| Toro Co. (The) |
110,700 | 7,620,588 | ||||||
| Trinity Industries, Inc. |
294,504 | 6,399,572 | ||||||
| Wabtec Corp. |
43,229 | 3,186,842 | ||||||
| Woodward, Inc. |
31,465 | 2,985,714 | ||||||
|
|
|
|||||||
| Total Machinery | 138,647,481 | |||||||
| Media – 1.4% | ||||||||
| Cable One, Inc. |
4,927 | 4,835,259 | ||||||
| Interpublic Group of Cos., Inc. (The) |
1,154,679 | 24,259,806 | ||||||
| New York Times Co. (The) Class A |
75,620 | 2,484,117 | ||||||
| News Corp. Class A |
519,277 | 6,459,806 | ||||||
| Nexstar Media Group, Inc. Class A |
60,474 | 6,553,567 | ||||||
| Tribune Media Co. Class A |
174,733 | 8,062,181 | ||||||
|
|
|
|||||||
| Total Media | 52,654,736 | |||||||
| Metals & Mining – 1.0% | ||||||||
| Reliance Steel & Aluminum Co. |
150,521 | 13,586,025 | ||||||
| Royal Gold, Inc. |
69,216 | 6,293,811 | ||||||
| Steel Dynamics, Inc. |
418,624 | 14,764,868 | ||||||
| United States Steel Corp. |
143,650 | 2,799,739 | ||||||
|
|
|
|||||||
| Total Metals & Mining | 37,444,443 | |||||||
| Multi-Utilities – 1.7% | ||||||||
| Avista Corp. |
159,064 | 6,461,180 | ||||||
| Black Hills Corp. |
144,904 | 10,733,039 | ||||||
| MDU Resources Group, Inc. |
455,889 | 11,775,613 | ||||||
| NiSource, Inc. |
831,021 | 23,817,062 | ||||||
| NorthWestern Corp. |
133,484 | 9,398,608 | ||||||
|
|
|
|||||||
| Total Multi-Utilities | 62,185,502 | |||||||
| Multiline Retail – 2.2% | ||||||||
| Kohl’s Corp. |
528,538 | 36,347,558 | ||||||
| Macy’s, Inc. |
1,203,061 | 28,909,556 | ||||||
| Nordstrom, Inc. |
398,270 | 17,675,223 | ||||||
|
|
|
|||||||
| Total Multiline Retail | 82,932,337 | |||||||
See Notes to Financial Statements.
| WisdomTree Trust | 41 |
Schedule of Investments (continued)
WisdomTree U.S. MidCap Dividend Fund (DON)
March 31, 2019
| Investments | Shares | Value | ||||||
| Oil, Gas & Consumable Fuels – 5.1% | ||||||||
| Cabot Oil & Gas Corp. |
412,048 | $ | 10,754,453 | |||||
| Cimarex Energy Co. |
81,534 | 5,699,227 | ||||||
| CVR Energy, Inc. |
665,506 | 27,418,847 | ||||||
| Delek U.S. Holdings, Inc. |
175,879 | 6,405,513 | ||||||
| Diamondback Energy, Inc. |
43,335 | 4,399,803 | ||||||
| EQT Corp. |
141,649 | 2,937,800 | ||||||
| HollyFrontier Corp. |
350,138 | 17,251,299 | ||||||
| Murphy Oil Corp. |
498,475 | 14,605,317 | ||||||
| Noble Energy, Inc. |
771,084 | 19,068,907 | ||||||
| PBF Energy, Inc. Class A |
342,369 | 10,661,371 | ||||||
| Peabody Energy Corp. |
150,191 | 4,254,911 | ||||||
| Range Resources Corp. |
162,133 | 1,822,375 | ||||||
| Targa Resources Corp. |
1,561,642 | 64,886,225 | ||||||
|
|
|
|||||||
| Total Oil, Gas & Consumable Fuels | 190,166,048 | |||||||
| Paper & Forest Products – 0.2% | ||||||||
| Louisiana-Pacific Corp. |
272,395 | 6,640,990 | ||||||
| Personal Products – 1.4% | ||||||||
| Coty, Inc. Class A(a) |
4,046,040 | 46,529,460 | ||||||
| Nu Skin Enterprises, Inc. Class A |
94,065 | 4,501,951 | ||||||
|
|
|
|||||||
| Total Personal Products | 51,031,411 | |||||||
| Professional Services – 1.3% | ||||||||
| Equifax, Inc. |
151,546 | 17,958,201 | ||||||
| Insperity, Inc. |
25,404 | 3,141,458 | ||||||
| ManpowerGroup, Inc. |
146,235 | 12,092,172 | ||||||
| Robert Half International, Inc. |
184,198 | 12,002,342 | ||||||
| TransUnion |
69,814 | 4,666,368 | ||||||
|
|
|
|||||||
| Total Professional Services | 49,860,541 | |||||||
| Real Estate Management & Development – 0.0% |
| |||||||
| Jones Lang LaSalle, Inc. |
8,074 | 1,244,849 | ||||||
| Road & Rail – 1.2% | ||||||||
| JB Hunt Transport Services, Inc. |
88,902 | 9,004,884 | ||||||
| Kansas City Southern |
120,676 | 13,996,003 | ||||||
| Knight-Swift Transportation Holdings, Inc. |
131,412 | 4,294,544 | ||||||
| Landstar System, Inc. |
21,677 | 2,371,247 | ||||||
| Old Dominion Freight Line, Inc. |
26,567 | 3,836,009 | ||||||
| Ryder System, Inc. |
187,352 | 11,613,950 | ||||||
|
|
|
|||||||
| Total Road & Rail | 45,116,637 | |||||||
| Semiconductors & Semiconductor Equipment – 1.2% |
| |||||||
| Cabot Microelectronics Corp. |
36,242 | 4,057,654 | ||||||
| Cypress Semiconductor Corp. |
1,002,217 | 14,953,077 | ||||||
| Entegris, Inc. |
108,575 | 3,875,042 | ||||||
| MKS Instruments, Inc. |
52,810 | 4,913,970 | ||||||
| Monolithic Power Systems, Inc. |
34,485 | 4,672,373 | ||||||
| Teradyne, Inc. |
158,981 | 6,333,803 | ||||||
| Universal Display Corp.(a) |
10,655 | 1,628,617 | ||||||
| Versum Materials, Inc. |
96,386 | 4,849,180 | ||||||
|
|
|
|||||||
| Total Semiconductors & Semiconductor Equipment |
|
45,283,716 | ||||||
| Software – 0.9% | ||||||||
| Blackbaud, Inc. |
31,001 | 2,471,710 | ||||||
| CDK Global, Inc. |
127,876 | 7,521,666 | ||||||
| j2 Global, Inc. |
97,484 | 8,442,114 | ||||||
| LogMeIn, Inc. |
58,066 | 4,651,087 | ||||||
| Pegasystems, Inc. |
15,531 | 1,009,515 | ||||||
| SS&C Technologies Holdings, Inc. |
136,653 | 8,703,430 | ||||||
|
|
|
|||||||
| Total Software | 32,799,522 | |||||||
| Specialty Retail – 4.4% | ||||||||
| Aaron’s, Inc. |
15,814 | 831,816 | ||||||
| American Eagle Outfitters, Inc. |
419,046 | 9,290,250 | ||||||
| Foot Locker, Inc. |
252,082 | 15,276,169 | ||||||
| Gap, Inc. (The) |
1,091,227 | 28,568,323 | ||||||
| L Brands, Inc. |
1,678,118 | 46,282,494 | ||||||
| Penske Automotive Group, Inc. |
251,449 | 11,227,198 | ||||||
| Tiffany & Co. |
254,023 | 26,812,128 | ||||||
| Tractor Supply Co. |
138,052 | 13,495,964 | ||||||
| Williams-Sonoma, Inc.(a) |
210,116 | 11,823,227 | ||||||
|
|
|
|||||||
| Total Specialty Retail | 163,607,569 | |||||||
| Technology Hardware, Storage & Peripherals – 0.7% |
| |||||||
| Xerox Corp. |
771,912 | 24,685,746 | ||||||
| Textiles, Apparel & Luxury Goods – 2.2% | ||||||||
| Carter’s, Inc. |
78,683 | 7,930,459 | ||||||
| Columbia Sportswear Co. |
65,983 | 6,874,109 | ||||||
| Hanesbrands, Inc. |
1,247,645 | 22,307,893 | ||||||
| PVH Corp. |
10,116 | 1,233,646 | ||||||
| Ralph Lauren Corp. |
104,559 | 13,559,211 | ||||||
| Tapestry, Inc. |
884,704 | 28,744,033 | ||||||
| Wolverine World Wide, Inc. |
65,989 | 2,357,787 | ||||||
|
|
|
|||||||
| Total Textiles, Apparel & Luxury Goods | 83,007,138 | |||||||
| Thrifts & Mortgage Finance – 0.6% | ||||||||
| New York Community Bancorp, Inc. |
1,184,103 | 13,700,072 | ||||||
| Radian Group, Inc. |
6,127 | 127,074 | ||||||
| TFS Financial Corp. |
530,507 | 8,737,450 | ||||||
|
|
|
|||||||
| Total Thrifts & Mortgage Finance | 22,564,596 | |||||||
| Trading Companies & Distributors – 0.9% | ||||||||
| Air Lease Corp. |
132,436 | 4,549,176 | ||||||
| GATX Corp. |
67,379 | 5,145,734 | ||||||
| MSC Industrial Direct Co., Inc. Class A |
113,901 | 9,420,752 | ||||||
| Watsco, Inc. |
111,052 | 15,903,757 | ||||||
|
|
|
|||||||
| Total Trading Companies & Distributors | 35,019,419 | |||||||
| Transportation Infrastructure – 0.7% | ||||||||
| Macquarie Infrastructure Corp. |
666,924 | 27,490,607 | ||||||
| Water Utilities – 0.3% | ||||||||
| Aqua America, Inc. |
347,022 | 12,645,482 | ||||||
| Wireless Telecommunication Services – 0.1% |
| |||||||
| Telephone & Data Systems, Inc. |
149,180 | 4,584,301 | ||||||
| TOTAL COMMON STOCKS (Cost: $3,322,257,770) |
3,708,414,922 | |||||||
| EXCHANGE-TRADED FUND – 0.5% | ||||||||
| United States – 0.5% | ||||||||
| WisdomTree U.S. LargeCap Dividend Fund(a)(b) (Cost: $17,242,594) |
199,908 | 18,835,332 | ||||||
See Notes to Financial Statements.
| 42 | WisdomTree Trust |
Schedule of Investments (concluded)
WisdomTree U.S. MidCap Dividend Fund (DON)
March 31, 2019
| Investments | Shares | Value | ||||||
| INVESTMENT OF CASH COLLATERAL FOR SECURITIES LOANED – 1.8% |
| |||||||
| United States – 1.8% | ||||||||
| State Street Navigator Securities Lending |
|
|||||||
| (Cost: $66,221,701)(d) | 66,221,701 | $ | 66,221,701 | |||||
| TOTAL INVESTMENTS IN SECURITIES – 101.6% (Cost: $3,405,722,065) |
|
3,793,471,955 | ||||||
| Other Assets less Liabilities – (1.6)% |
(59,789,268 | ) | ||||||
|
|
|
|||||||
| NET ASSETS – 100.0% | $ | 3,733,682,687 | ||||||
| (a) | Security, or portion thereof, was on loan at March 31, 2019 (See Note 2). |
| (b) | Affiliated company (See Note 3). |
| (c) | Rate shown represents annualized 7-day yield as of March 31, 2019. |
| (d) | At March 31, 2019, the total market value of the Fund’s securities on loan identified in the Schedule of Investments was $69,153,640 and the total market value of the collateral held by the Fund was $70,912,999. The total market value of the collateral includes non-cash U.S. Government securities collateral having a value of $4,691,298. |
See Notes to Financial Statements.
| WisdomTree Trust | 43 |
Schedule of Investments
WisdomTree U.S. MidCap Fund (EZM)
March 31, 2019
| Investments | Shares | Value | ||||||
| COMMON STOCKS – 99.6% | ||||||||
| United States – 99.6% | ||||||||
| Aerospace & Defense – 1.0% | ||||||||
| Aerojet Rocketdyne Holdings, Inc.* |
31,454 | $ | 1,117,561 | |||||
| Axon Enterprise, Inc.* |
6,362 | 346,156 | ||||||
| BWX Technologies, Inc. |
51,742 | 2,565,368 | ||||||
| Curtiss-Wright Corp. |
23,857 | 2,703,952 | ||||||
| Hexcel Corp. |
41,504 | 2,870,417 | ||||||
| Mercury Systems, Inc.* |
5,645 | 361,732 | ||||||
| Moog, Inc. Class A |
15,311 | 1,331,291 | ||||||
|
|
|
|||||||
| Total Aerospace & Defense | 11,296,477 | |||||||
| Airlines – 0.5% | ||||||||
| Allegiant Travel Co. |
9,335 | 1,208,602 | ||||||
| JetBlue Airways Corp.* |
64,089 | 1,048,496 | ||||||
| SkyWest, Inc. |
50,369 | 2,734,533 | ||||||
| Spirit Airlines, Inc.* |
17,111 | 904,488 | ||||||
|
|
|
|||||||
| Total Airlines | 5,896,119 | |||||||
| Auto Components – 1.4% | ||||||||
| Dorman Products, Inc.* |
13,085 | 1,152,657 | ||||||
| Fox Factory Holding Corp.* |
9,837 | 687,508 | ||||||
| Gentex Corp. |
186,251 | 3,851,671 | ||||||
| Goodyear Tire & Rubber Co. (The) |
342,179 | 6,210,549 | ||||||
| Visteon Corp.* |
56,509 | 3,805,881 | ||||||
|
|
|
|||||||
| Total Auto Components | 15,708,266 | |||||||
| Automobiles – 0.9% | ||||||||
| Harley-Davidson, Inc. |
151,478 | 5,401,705 | ||||||
| Thor Industries, Inc. |
76,434 | 4,767,189 | ||||||
|
|
|
|||||||
| Total Automobiles | 10,168,894 | |||||||
| Banks – 9.1% | ||||||||
| Associated Banc-Corp. |
85,765 | 1,831,083 | ||||||
| BancorpSouth Bank |
46,035 | 1,299,108 | ||||||
| Bank of Hawaii Corp. |
18,075 | 1,425,575 | ||||||
| Bank OZK |
108,825 | 3,153,748 | ||||||
| BankUnited, Inc. |
67,002 | 2,237,867 | ||||||
| BOK Financial Corp. |
32,213 | 2,626,970 | ||||||
| Cathay General Bancorp |
44,184 | 1,498,279 | ||||||
| CenterState Bank Corp. |
35,633 | 848,422 | ||||||
| Chemical Financial Corp. |
39,829 | 1,639,362 | ||||||
| CIT Group, Inc. |
70,409 | 3,377,520 | ||||||
| Columbia Banking System, Inc. |
24,958 | 815,877 | ||||||
| Commerce Bancshares, Inc. |
41,125 | 2,387,718 | ||||||
| Community Bank System, Inc. |
15,974 | 954,766 | ||||||
| Cullen/Frost Bankers, Inc. |
27,502 | 2,669,619 | ||||||
| CVB Financial Corp. |
40,139 | 844,926 | ||||||
| East West Bancorp, Inc. |
87,787 | 4,211,142 | ||||||
| First Citizens BancShares, Inc. Class A |
6,171 | 2,512,831 | ||||||
| First Financial Bancorp |
32,346 | 778,245 | ||||||
| First Financial Bankshares, Inc. |
14,131 | 816,489 | ||||||
| First Hawaiian, Inc. |
68,111 | 1,774,292 | ||||||
| First Horizon National Corp. |
217,703 | 3,043,488 | ||||||
| First Interstate BancSystem, Inc. Class A |
25,054 | 997,650 | ||||||
| First Midwest Bancorp, Inc. |
41,743 | 854,062 | ||||||
| FNB Corp. |
201,019 | 2,130,801 | ||||||
| Fulton Financial Corp. |
76,102 | 1,178,059 | ||||||
| Glacier Bancorp, Inc. |
23,511 | 942,086 | ||||||
| Great Western Bancorp, Inc. |
30,754 | 971,519 | ||||||
| Hancock Whitney Corp. |
48,749 | 1,969,460 | ||||||
| Home BancShares, Inc. |
102,853 | 1,807,127 | ||||||
| Iberiabank Corp. |
25,131 | 1,802,144 | ||||||
| Independent Bank Corp. |
9,696 | 785,473 | ||||||
| International Bancshares Corp. |
34,178 | 1,299,789 | ||||||
| Investors Bancorp, Inc. |
114,488 | 1,356,683 | ||||||
| Old National Bancorp |
60,066 | 985,082 | ||||||
| PacWest Bancorp |
77,823 | 2,926,923 | ||||||
| People’s United Financial, Inc. |
165,413 | 2,719,390 | ||||||
| Pinnacle Financial Partners, Inc. |
40,722 | 2,227,493 | ||||||
| Popular, Inc. |
55,437 | 2,889,931 | ||||||
| Prosperity Bancshares, Inc. |
29,469 | 2,035,129 | ||||||
| Renasant Corp. |
25,881 | 876,072 | ||||||
| Signature Bank |
25,181 | 3,224,931 | ||||||
| Simmons First National Corp. Class A |
45,943 | 1,124,685 | ||||||
| South State Corp. |
15,403 | 1,052,641 | ||||||
| Sterling Bancorp |
116,070 | 2,162,384 | ||||||
| Synovus Financial Corp. |
70,987 | 2,439,113 | ||||||
| TCF Financial Corp. |
80,806 | 1,671,876 | ||||||
| Texas Capital Bancshares, Inc.* |
32,504 | 1,774,393 | ||||||
| Trustmark Corp. |
29,932 | 1,006,613 | ||||||
| UMB Financial Corp. |
21,350 | 1,367,254 | ||||||
| Umpqua Holdings Corp. |
102,248 | 1,687,092 | ||||||
| Union Bankshares Corp. |
25,538 | 825,644 | ||||||
| United Bankshares, Inc. |
46,830 | 1,697,119 | ||||||
| Valley National Bancorp |
141,792 | 1,358,367 | ||||||
| Webster Financial Corp. |
37,518 | 1,901,037 | ||||||
| WesBanco, Inc. |
19,966 | 793,649 | ||||||
| Western Alliance Bancorp* |
63,011 | 2,585,971 | ||||||
| Wintrust Financial Corp. |
28,164 | 1,896,282 | ||||||
|
|
|
|||||||
| Total Banks | 100,071,251 | |||||||
| Beverages – 0.2% | ||||||||
| Boston Beer Co., Inc. (The) Class A* |
2,547 | 750,677 | ||||||
| National Beverage Corp.(a) |
17,629 | 1,017,722 | ||||||
|
|
|
|||||||
| Total Beverages | 1,768,399 | |||||||
| Biotechnology – 1.2% | ||||||||
| Emergent BioSolutions, Inc.* |
14,687 | 741,987 | ||||||
| Exelixis, Inc.* |
155,676 | 3,705,089 | ||||||
| Genomic Health, Inc.* |
2,264 | 158,593 | ||||||
| Halozyme Therapeutics, Inc.* |
27,379 | 440,802 | ||||||
| Ligand Pharmaceuticals, Inc.* |
13,728 | 1,725,747 | ||||||
| Myriad Genetics, Inc.* |
5,471 | 181,637 | ||||||
| Repligen Corp.* |
1,949 | 115,147 | ||||||
| United Therapeutics Corp.* |
50,515 | 5,928,946 | ||||||
|
|
|
|||||||
| Total Biotechnology | 12,997,948 | |||||||
| Building Products – 1.4% | ||||||||
| Armstrong World Industries, Inc. |
22,437 | 1,781,946 | ||||||
| Fortune Brands Home & Security, Inc. |
95,160 | 4,530,568 | ||||||
| Owens Corning |
93,273 | 4,395,024 | ||||||
See Notes to Financial Statements.
| 44 | WisdomTree Trust |
Schedule of Investments (continued)
WisdomTree U.S. MidCap Fund (EZM)
March 31, 2019
| Investments | Shares | Value | ||||||
| Simpson Manufacturing Co., Inc. |
21,755 | $ | 1,289,419 | |||||
| Trex Co., Inc.* |
18,848 | 1,159,529 | ||||||
| USG Corp. |
47,595 | 2,060,863 | ||||||
|
|
|
|||||||
| Total Building Products | 15,217,349 | |||||||
| Capital Markets – 2.2% | ||||||||
| Affiliated Managers Group, Inc. |
32,396 | 3,469,936 | ||||||
| BGC Partners, Inc. Class A |
229,435 | 1,218,300 | ||||||
| Eaton Vance Corp. |
69,982 | 2,820,975 | ||||||
| Evercore, Inc. Class A |
27,594 | 2,511,054 | ||||||
| Federated Investors, Inc. Class B |
51,085 | 1,497,301 | ||||||
| Houlihan Lokey, Inc. |
25,032 | 1,147,717 | ||||||
| Legg Mason, Inc. |
49,156 | 1,345,400 | ||||||
| LPL Financial Holdings, Inc. |
38,001 | 2,646,770 | ||||||
| Moelis & Co. Class A |
42,348 | 1,762,100 | ||||||
| Morningstar, Inc. |
8,784 | 1,106,696 | ||||||
| Stifel Financial Corp. |
45,457 | 2,398,311 | ||||||
| Virtu Financial, Inc. Class A |
71,983 | 1,709,596 | ||||||
|
|
|
|||||||
| Total Capital Markets | 23,634,156 | |||||||
| Chemicals – 3.8% | ||||||||
| Ashland Global Holdings, Inc. |
11,015 | 860,602 | ||||||
| Balchem Corp. |
13,843 | 1,284,630 | ||||||
| Cabot Corp. |
27,774 | 1,156,232 | ||||||
| Chemours Co. (The) |
343,571 | 12,767,098 | ||||||
| H.B. Fuller Co. |
18,961 | 922,263 | ||||||
| Huntsman Corp. |
424,602 | 9,549,299 | ||||||
| Ingevity Corp.* |
15,538 | 1,640,968 | ||||||
| NewMarket Corp. |
4,538 | 1,967,495 | ||||||
| Olin Corp. |
116,442 | 2,694,468 | ||||||
| PolyOne Corp. |
49,971 | 1,464,650 | ||||||
| Quaker Chemical Corp. |
2,884 | 577,752 | ||||||
| Scotts Miracle-Gro Co. (The) |
21,805 | 1,713,437 | ||||||
| Sensient Technologies Corp. |
23,054 | 1,562,831 | ||||||
| Valvoline, Inc. |
112,440 | 2,086,886 | ||||||
| W.R. Grace & Co. |
16,850 | 1,314,974 | ||||||
|
|
|
|||||||
| Total Chemicals | 41,563,585 | |||||||
| Commercial Services & Supplies – 1.2% | ||||||||
| Advanced Disposal Services, Inc.* |
3,015 | 84,420 | ||||||
| Brady Corp. Class A |
25,331 | 1,175,612 | ||||||
| Clean Harbors, Inc.* |
6,624 | 473,815 | ||||||
| Covanta Holding Corp. |
39,596 | 685,407 | ||||||
| Deluxe Corp. |
52,784 | 2,307,716 | ||||||
| Healthcare Services Group, Inc. |
16,290 | 537,407 | ||||||
| KAR Auction Services, Inc. |
61,429 | 3,151,922 | ||||||
| MSA Safety, Inc. |
12,859 | 1,329,621 | ||||||
| Stericycle, Inc.* |
18,850 | 1,025,817 | ||||||
| Tetra Tech, Inc. |
20,395 | 1,215,338 | ||||||
| UniFirst Corp. |
9,163 | 1,406,520 | ||||||
|
|
|
|||||||
| Total Commercial Services & Supplies | 13,393,595 | |||||||
| Communications Equipment – 0.6% | ||||||||
| Ciena Corp.* |
26,793 | 1,000,451 | ||||||
| CommScope Holding Co., Inc.* |
102,524 | 2,227,846 | ||||||
| EchoStar Corp. Class A* |
18,560 | 676,512 | ||||||
| InterDigital, Inc. |
17,814 | 1,175,368 | ||||||
| Lumentum Holdings, Inc.* |
33,064 | 1,869,438 | ||||||
|
|
|
|||||||
| Total Communications Equipment | 6,949,615 | |||||||
| Construction & Engineering – 1.6% | ||||||||
| AECOM* |
27,984 | 830,285 | ||||||
| EMCOR Group, Inc. |
38,457 | 2,810,437 | ||||||
| Fluor Corp. |
73,472 | 2,703,770 | ||||||
| Granite Construction, Inc. |
14,398 | 621,274 | ||||||
| KBR, Inc. |
149,719 | 2,858,136 | ||||||
| MasTec, Inc.* |
60,416 | 2,906,010 | ||||||
| Quanta Services, Inc. |
86,106 | 3,249,640 | ||||||
| Valmont Industries, Inc. |
9,535 | 1,240,503 | ||||||
|
|
|
|||||||
| Total Construction & Engineering | 17,220,055 | |||||||
| Construction Materials – 0.3% | ||||||||
| Eagle Materials, Inc. |
35,876 | 3,024,347 | ||||||
| Consumer Finance – 2.0% | ||||||||
| Credit Acceptance Corp.* |
7,855 | 3,549,910 | ||||||
| FirstCash, Inc. |
11,108 | 960,842 | ||||||
| Green Dot Corp. Class A* |
8,148 | 494,176 | ||||||
| Navient Corp. |
279,479 | 3,233,572 | ||||||
| Nelnet, Inc. Class A |
31,837 | 1,753,264 | ||||||
| OneMain Holdings, Inc. |
93,954 | 2,983,040 | ||||||
| Santander Consumer USA Holdings, Inc. |
288,752 | 6,101,330 | ||||||
| SLM Corp. |
264,330 | 2,619,510 | ||||||
|
|
|
|||||||
| Total Consumer Finance | 21,695,644 | |||||||
| Containers & Packaging – 2.4% | ||||||||
| AptarGroup, Inc. |
19,146 | 2,036,943 | ||||||
| Bemis Co., Inc. |
36,185 | 2,007,544 | ||||||
| Berry Global Group, Inc.* |
73,827 | 3,977,061 | ||||||
| Crown Holdings, Inc.* |
91,869 | 5,013,291 | ||||||
| Graphic Packaging Holding Co. |
156,923 | 1,981,937 | ||||||
| Greif, Inc. Class A |
35,790 | 1,476,338 | ||||||
| Owens-Illinois, Inc. |
68,143 | 1,293,354 | ||||||
| Sealed Air Corp. |
79,736 | 3,672,640 | ||||||
| Silgan Holdings, Inc. |
78,336 | 2,321,096 | ||||||
| Sonoco Products Co. |
45,595 | 2,805,460 | ||||||
|
|
|
|||||||
| Total Containers & Packaging | 26,585,664 | |||||||
| Distributors – 0.2% | ||||||||
| Pool Corp. |
14,008 | 2,310,900 | ||||||
| Diversified Consumer Services – 1.8% | ||||||||
| Adtalem Global Education, Inc.* |
24,519 | 1,135,720 | ||||||
| Bright Horizons Family Solutions, Inc.* |
11,174 | 1,420,327 | ||||||
| Graham Holdings Co. Class B |
3,683 | 2,516,152 | ||||||
| Grand Canyon Education, Inc.* |
17,705 | 2,027,400 | ||||||
| H&R Block, Inc. |
248,052 | 5,938,365 | ||||||
| Laureate Education, Inc. Class A* |
187,036 | 2,799,929 | ||||||
| ServiceMaster Global Holdings, Inc.* |
55,797 | 2,605,720 | ||||||
| Weight Watchers International, Inc.* |
36,688 | 739,263 | ||||||
|
|
|
|||||||
| Total Diversified Consumer Services | 19,182,876 | |||||||
| Diversified Financial Services – 0.6% | ||||||||
| Jefferies Financial Group, Inc. |
166,411 | 3,126,863 | ||||||
See Notes to Financial Statements.
| WisdomTree Trust | 45 |
Schedule of Investments (continued)
WisdomTree U.S. MidCap Fund (EZM)
March 31, 2019
| Investments | Shares | Value | ||||||
| Voya Financial, Inc. |
62,202 | $ | 3,107,612 | |||||
|
|
|
|||||||
| Total Diversified Financial Services | 6,234,475 | |||||||
| Diversified Telecommunication Services – 0.2% |
| |||||||
| Cogent Communications Holdings, Inc. |
4,852 | 263,221 | ||||||
| Vonage Holdings Corp.* |
59,424 | 596,617 | ||||||
| Zayo Group Holdings, Inc.* |
33,954 | 964,973 | ||||||
|
|
|
|||||||
| Total Diversified Telecommunication Services |
|
1,824,811 | ||||||
| Electric Utilities – 1.3% | ||||||||
| ALLETE, Inc. |
15,694 | 1,290,518 | ||||||
| El Paso Electric Co. |
16,954 | 997,234 | ||||||
| Hawaiian Electric Industries, Inc. |
44,448 | 1,812,145 | ||||||
| IDACORP, Inc. |
21,302 | 2,120,401 | ||||||
| MGE Energy, Inc. |
10,916 | 741,961 | ||||||
| OGE Energy Corp. |
92,350 | 3,982,132 | ||||||
| PNM Resources, Inc. |
23,680 | 1,121,011 | ||||||
| Portland General Electric Co. |
39,203 | 2,032,283 | ||||||
|
|
|
|||||||
| Total Electric Utilities | 14,097,685 | |||||||
| Electrical Equipment – 1.7% | ||||||||
| Acuity Brands, Inc. |
23,653 | 2,838,596 | ||||||
| EnerSys |
24,007 | 1,564,296 | ||||||
| Generac Holdings, Inc.* |
33,730 | 1,727,988 | ||||||
| GrafTech International Ltd. |
513,133 | 6,562,971 | ||||||
| Hubbell, Inc. |
29,710 | 3,505,186 | ||||||
| Regal Beloit Corp. |
27,480 | 2,249,788 | ||||||
|
|
|
|||||||
| Total Electrical Equipment | 18,448,825 | |||||||
| Electronic Equipment, Instruments & Components – 3.9% |
| |||||||
| Arrow Electronics, Inc.* |
84,383 | 6,502,554 | ||||||
| Avnet, Inc. |
68,759 | 2,982,078 | ||||||
| AVX Corp. |
111,215 | 1,928,468 | ||||||
| Belden, Inc. |
20,708 | 1,112,020 | ||||||
| Cognex Corp. |
51,377 | 2,613,034 | ||||||
| Coherent, Inc.* |
22,177 | 3,142,924 | ||||||
| Dolby Laboratories, Inc. Class A |
32,751 | 2,062,331 | ||||||
| FLIR Systems, Inc. |
47,019 | 2,237,164 | ||||||
| II-VI, Inc.* |
27,781 | 1,034,564 | ||||||
| IPG Photonics Corp.* |
32,155 | 4,880,486 | ||||||
| Jabil, Inc. |
93,477 | 2,485,553 | ||||||
| Littelfuse, Inc. |
9,305 | 1,697,976 | ||||||
| National Instruments Corp. |
27,343 | 1,212,936 | ||||||
| Rogers Corp.* |
7,036 | 1,117,880 | ||||||
| SYNNEX Corp. |
33,488 | 3,194,420 | ||||||
| Tech Data Corp.* |
25,123 | 2,572,846 | ||||||
| Vishay Intertechnology, Inc. |
136,248 | 2,516,501 | ||||||
|
|
|
|||||||
| Total Electronic Equipment, Instruments & Components |
|
43,293,735 | ||||||
| Energy Equipment & Services – 0.3% | ||||||||
| Apergy Corp.* |
24,108 | 989,874 | ||||||
| Cactus, Inc. Class A* |
18,552 | 660,451 | ||||||
| Helmerich & Payne, Inc. |
244 | 13,557 | ||||||
| RPC, Inc. |
148,987 | 1,699,942 | ||||||
|
|
|
|||||||
| Total Energy Equipment & Services | 3,363,824 | |||||||
| Entertainment – 0.3% | ||||||||
| Cinemark Holdings, Inc. |
53,650 | 2,145,463 | ||||||
| Madison Square Garden Co. (The) Class A* |
267 | 78,266 | ||||||
| World Wrestling Entertainment, Inc. Class A |
9,602 | 833,262 | ||||||
| Zynga, Inc. Class A* |
56,815 | 302,824 | ||||||
|
|
|
|||||||
| Total Entertainment | 3,359,815 | |||||||
| Equity Real Estate Investment Trusts (REITs) – 5.9% |
| |||||||
| Acadia Realty Trust |
9,874 | 269,264 | ||||||
| American Campus Communities, Inc. |
14,894 | 708,657 | ||||||
| Americold Realty Trust |
11,276 | 344,031 | ||||||
| Apartment Investment & Management Co. Class A |
3,531 | 177,574 | ||||||
| Apple Hospitality REIT, Inc. |
64,340 | 1,048,742 | ||||||
| Brandywine Realty Trust |
38,635 | 612,751 | ||||||
| Brixmor Property Group, Inc. |
130,614 | 2,399,379 | ||||||
| Columbia Property Trust, Inc. |
1,025 | 23,073 | ||||||
| CoreCivic, Inc. |
46,755 | 909,385 | ||||||
| CoreSite Realty Corp. |
4,542 | 486,085 | ||||||
| Corporate Office Properties Trust |
17,327 | 473,027 | ||||||
| Cousins Properties, Inc. |
63,126 | 609,797 | ||||||
| CubeSmart |
29,492 | 944,924 | ||||||
| CyrusOne, Inc. |
11,214 | 588,062 | ||||||
| DiamondRock Hospitality Co. |
37,873 | 410,165 | ||||||
| Douglas Emmett, Inc. |
20,285 | 819,920 | ||||||
| EastGroup Properties, Inc. |
5,259 | 587,115 | ||||||
| Empire State Realty Trust, Inc. Class A |
23,555 | 372,169 | ||||||
| EPR Properties |
21,425 | 1,647,582 | ||||||
| Equity Commonwealth |
43,862 | 1,433,849 | ||||||
| First Industrial Realty Trust, Inc. |
40,082 | 1,417,300 | ||||||
| Gaming and Leisure Properties, Inc. |
66,633 | 2,570,035 | ||||||
| GEO Group, Inc. (The) |
42,857 | 822,854 | ||||||
| Healthcare Realty Trust, Inc. |
2,915 | 93,601 | ||||||
| Healthcare Trust of America, Inc. Class A |
52,959 | 1,514,098 | ||||||
| Highwoods Properties, Inc. |
24,948 | 1,167,067 | ||||||
| Hospitality Properties Trust |
73,587 | 1,936,074 | ||||||
| Hudson Pacific Properties, Inc. |
22,979 | 790,937 | ||||||
| JBG SMITH Properties |
2,495 | 103,168 | ||||||
| Kilroy Realty Corp. |
11,298 | 858,196 | ||||||
| Kimco Realty Corp. |
153,493 | 2,839,620 | ||||||
| Lamar Advertising Co. Class A |
25,186 | 1,996,242 | ||||||
| Liberty Property Trust |
28,269 | 1,368,785 | ||||||
| Life Storage, Inc. |
8,037 | 781,759 | ||||||
| Macerich Co. (The) |
12,125 | 525,619 | ||||||
| Medical Properties Trust, Inc. |
124,991 | 2,313,583 | ||||||
| National Health Investors, Inc. |
11,649 | 915,029 | ||||||
| National Retail Properties, Inc. |
34,751 | 1,924,858 | ||||||
| Omega Healthcare Investors, Inc. |
46,313 | 1,766,841 | ||||||
| Outfront Media, Inc. |
25,239 | 590,593 | ||||||
| Park Hotels & Resorts, Inc. |
85,516 | 2,657,837 | ||||||
| Pebblebrook Hotel Trust |
16,967 | 526,995 | ||||||
| Physicians Realty Trust |
18,269 | 343,640 | ||||||
| Piedmont Office Realty Trust, Inc. Class A |
17,937 | 373,986 | ||||||
| PotlatchDeltic Corp. |
24,560 | 928,122 | ||||||
| PS Business Parks, Inc. |
6,942 | 1,088,714 | ||||||
See Notes to Financial Statements.
| 46 | WisdomTree Trust |
Schedule of Investments (continued)
WisdomTree U.S. MidCap Fund (EZM)
March 31, 2019
| Investments | Shares | Value | ||||||
| Rayonier, Inc. |
32,841 | $ | 1,035,148 | |||||
| Retail Properties of America, Inc. Class A |
79,889 | 973,847 | ||||||
| Rexford Industrial Realty, Inc. |
6,914 | 247,590 | ||||||
| RLJ Lodging Trust |
55,224 | 970,286 | ||||||
| Ryman Hospitality Properties, Inc. |
10,412 | 856,283 | ||||||
| Sabra Health Care REIT, Inc. |
125,220 | 2,438,033 | ||||||
| Senior Housing Properties Trust |
215,359 | 2,536,929 | ||||||
| Spirit Realty Capital, Inc. |
18,059 | 717,484 | ||||||
| STAG Industrial, Inc. |
10,376 | 307,648 | ||||||
| STORE Capital Corp. |
38,763 | 1,298,561 | ||||||
| Sunstone Hotel Investors, Inc. |
77,037 | 1,109,333 | ||||||
| Tanger Factory Outlet Centers, Inc.(a) |
13,940 | 292,461 | ||||||
| Taubman Centers, Inc. |
8,722 | 461,219 | ||||||
| Terreno Realty Corp. |
7,820 | 328,753 | ||||||
| Urban Edge Properties |
26,495 | 503,405 | ||||||
| Weingarten Realty Investors |
92,881 | 2,727,915 | ||||||
| Xenia Hotels & Resorts, Inc. |
30,826 | 675,398 | ||||||
|
|
|
|||||||
| Total Equity Real Estate Investment Trusts (REITs) |
|
64,561,397 | ||||||
| Food & Staples Retailing – 0.8% | ||||||||
| BJ’s Wholesale Club Holdings, Inc.* |
37,495 | 1,027,363 | ||||||
| Casey’s General Stores, Inc. |
10,567 | 1,360,713 | ||||||
| Performance Food Group Co.* |
35,468 | 1,405,952 | ||||||
| Sprouts Farmers Market, Inc.* |
60,412 | 1,301,274 | ||||||
| U.S. Foods Holding Corp.* |
110,596 | 3,860,906 | ||||||
|
|
|
|||||||
| Total Food & Staples Retailing | 8,956,208 | |||||||
| Food Products – 1.8% | ||||||||
| Cal-Maine Foods, Inc. |
32,419 | 1,446,860 | ||||||
| Darling Ingredients, Inc.* |
32,230 | 697,779 | ||||||
| Flowers Foods, Inc. |
83,261 | 1,775,124 | ||||||
| Hain Celestial Group, Inc. (The)* |
15,646 | 361,736 | ||||||
| Ingredion, Inc. |
43,352 | 4,105,001 | ||||||
| J&J Snack Foods Corp. |
4,905 | 779,110 | ||||||
| Lancaster Colony Corp. |
6,403 | 1,003,286 | ||||||
| Pilgrim’s Pride Corp.* |
182,326 | 4,064,047 | ||||||
| Post Holdings, Inc.* |
17,580 | 1,923,252 | ||||||
| Sanderson Farms, Inc.(a) |
12,494 | 1,647,209 | ||||||
| Seaboard Corp. |
377 | 1,615,332 | ||||||
| Tootsie Roll Industries, Inc.(a) |
15,580 | 580,196 | ||||||
|
|
|
|||||||
| Total Food Products | 19,998,932 | |||||||
| Gas Utilities – 0.8% | ||||||||
| National Fuel Gas Co. |
45,823 | 2,793,370 | ||||||
| New Jersey Resources Corp. |
31,190 | 1,552,950 | ||||||
| ONE Gas, Inc. |
18,027 | 1,604,944 | ||||||
| Southwest Gas Holdings, Inc. |
21,681 | 1,783,479 | ||||||
| Spire, Inc. |
18,037 | 1,484,265 | ||||||
|
|
|
|||||||
| Total Gas Utilities | 9,219,008 | |||||||
| Health Care Equipment & Supplies – 0.9% | ||||||||
| Cantel Medical Corp. |
9,343 | 624,953 | ||||||
| Globus Medical, Inc. Class A* |
31,181 | 1,540,653 | ||||||
| Haemonetics Corp.* |
2,221 | 194,293 | ||||||
| Hill-Rom Holdings, Inc. |
21,074 | 2,230,894 | ||||||
| ICU Medical, Inc.* |
4,122 | 986,518 | ||||||
| Inogen, Inc.* |
3,329 | 317,487 | ||||||
| Integer Holdings Corp.* |
4,643 | 350,175 | ||||||
| Integra LifeSciences Holdings Corp.* |
8,142 | 453,672 | ||||||
| Masimo Corp.* |
15,482 | 2,140,851 | ||||||
| Merit Medical Systems, Inc.* |
6,589 | 407,398 | ||||||
| Neogen Corp.* |
8,661 | 497,055 | ||||||
| NuVasive, Inc.* |
1,650 | 93,704 | ||||||
| Quidel Corp.* |
6,683 | 437,536 | ||||||
|
|
|
|||||||
| Total Health Care Equipment & Supplies | 10,275,189 | |||||||
| Health Care Providers & Services – 1.5% | ||||||||
| Acadia Healthcare Co., Inc.* |
60,255 | 1,766,074 | ||||||
| Amedisys, Inc.* |
7,888 | 972,275 | ||||||
| AMN Healthcare Services, Inc.* |
21,696 | 1,021,665 | ||||||
| BioTelemetry, Inc.* |
3,273 | 204,955 | ||||||
| Chemed Corp. |
6,099 | 1,952,107 | ||||||
| Encompass Health Corp. |
42,690 | 2,493,096 | ||||||
| Ensign Group, Inc. (The) |
16,925 | 866,391 | ||||||
| HealthEquity, Inc.* |
8,815 | 652,134 | ||||||
| LHC Group, Inc.* |
4,387 | 486,343 | ||||||
| MEDNAX, Inc.* |
67,574 | 1,835,985 | ||||||
| Patterson Cos., Inc. |
44,879 | 980,606 | ||||||
| Select Medical Holdings Corp.* |
78,301 | 1,103,261 | ||||||
| Tenet Healthcare Corp.* |
67,187 | 1,937,673 | ||||||
|
|
|
|||||||
| Total Health Care Providers & Services | 16,272,565 | |||||||
| Health Care Technology – 0.1% | ||||||||
| HMS Holdings Corp.* |
8,631 | 255,564 | ||||||
| Medidata Solutions, Inc.* |
6,632 | 485,728 | ||||||
| Omnicell, Inc.* |
4,105 | 331,848 | ||||||
|
|
|
|||||||
| Total Health Care Technology | 1,073,140 | |||||||
| Hotels, Restaurants & Leisure – 3.5% | ||||||||
| Boyd Gaming Corp. |
42,494 | 1,162,636 | ||||||
| Caesars Entertainment Corp.*(a) |
91,428 | 794,509 | ||||||
| Cheesecake Factory, Inc. (The) |
20,134 | 984,955 | ||||||
| Choice Hotels International, Inc. |
26,809 | 2,084,132 | ||||||
| Churchill Downs, Inc. |
15,588 | 1,406,973 | ||||||
| Cracker Barrel Old Country Store, Inc. |
11,565 | 1,869,020 | ||||||
| Dave & Buster’s Entertainment, Inc. |
22,269 | 1,110,555 | ||||||
| Dunkin’ Brands Group, Inc. |
29,313 | 2,201,406 | ||||||
| Eldorado Resorts, Inc.* |
17,873 | 834,490 | ||||||
| Extended Stay America, Inc. |
113,152 | 2,031,078 | ||||||
| Hilton Grand Vacations, Inc.* |
71,720 | 2,212,562 | ||||||
| Hyatt Hotels Corp. Class A |
24,740 | 1,795,382 | ||||||
| Jack in the Box, Inc. |
14,979 | 1,214,198 | ||||||
| Marriott Vacations Worldwide Corp. |
4,434 | 414,579 | ||||||
| Penn National Gaming, Inc.* |
34,738 | 698,234 | ||||||
| Planet Fitness, Inc. Class A* |
64,853 | 4,456,698 | ||||||
| Red Rock Resorts, Inc. Class A |
70,500 | 1,822,425 | ||||||
| SeaWorld Entertainment, Inc.* |
10,137 | 261,129 | ||||||
| Six Flags Entertainment Corp. |
31,574 | 1,558,177 | ||||||
| Texas Roadhouse, Inc. |
21,776 | 1,354,250 | ||||||
| Wendy’s Co. (The) |
245,679 | 4,395,197 | ||||||
| Wyndham Destinations, Inc. |
47,588 | 1,926,838 | ||||||
| Wyndham Hotels & Resorts, Inc. |
25,003 | 1,249,900 | ||||||
|
|
|
|||||||
| Total Hotels, Restaurants & Leisure | 37,839,323 | |||||||
See Notes to Financial Statements.
| WisdomTree Trust | 47 |
Schedule of Investments (continued)
WisdomTree U.S. MidCap Fund (EZM)
March 31, 2019
| Investments | Shares | Value | ||||||
| Household Durables – 1.9% | ||||||||
| iRobot Corp.*(a) |
8,202 | $ | 965,293 | |||||
| Leggett & Platt, Inc. |
82,349 | 3,476,775 | ||||||
| PulteGroup, Inc. |
343,674 | 9,609,125 | ||||||
| Tempur Sealy International, Inc.* |
23,367 | 1,347,575 | ||||||
| Toll Brothers, Inc. |
163,353 | 5,913,379 | ||||||
|
|
|
|||||||
| Total Household Durables | 21,312,147 | |||||||
| Household Products – 0.3% | ||||||||
| Energizer Holdings, Inc. |
22,040 | 990,257 | ||||||
| Spectrum Brands Holdings, Inc. |
28,345 | 1,552,739 | ||||||
| WD-40 Co. |
2,920 | 494,765 | ||||||
|
|
|
|||||||
| Total Household Products | 3,037,761 | |||||||
| Independent Power & Renewable Electricity Producers – 0.2% |
| |||||||
| Clearway Energy, Inc. Class C |
55,835 | 843,667 | ||||||
| Ormat Technologies, Inc. |
23,181 | 1,278,432 | ||||||
|
|
|
|||||||
| Total Independent Power & Renewable Electricity Producers |
|
2,122,099 | ||||||
| Industrial Conglomerates – 0.3% | ||||||||
| Carlisle Cos., Inc. |
30,342 | 3,720,536 | ||||||
| Insurance – 2.9% | ||||||||
| American Equity Investment Life Holding Co. |
97,879 | 2,644,691 | ||||||
| American National Insurance Co. |
20,290 | 2,451,438 | ||||||
| Assurant, Inc. |
23,526 | 2,232,853 | ||||||
| Erie Indemnity Co. Class A |
12,239 | 2,184,906 | ||||||
| First American Financial Corp. |
65,873 | 3,392,459 | ||||||
| Genworth Financial, Inc. Class A* |
476,461 | 1,824,846 | ||||||
| Hanover Insurance Group, Inc. (The) |
17,913 | 2,045,127 | ||||||
| Kemper Corp. |
19,155 | 1,458,462 | ||||||
| Mercury General Corp. |
9,800 | 490,686 | ||||||
| National General Holdings Corp. |
41,367 | 981,639 | ||||||
| Old Republic International Corp. |
199,732 | 4,178,393 | ||||||
| Primerica, Inc. |
18,316 | 2,237,299 | ||||||
| ProAssurance Corp. |
15,053 | 520,984 | ||||||
| RLI Corp. |
9,314 | 668,280 | ||||||
| Selective Insurance Group, Inc. |
17,357 | 1,098,351 | ||||||
| Unum Group |
102,912 | 3,481,513 | ||||||
|
|
|
|||||||
| Total Insurance | 31,891,927 | |||||||
| Interactive Media & Services – 0.2% | ||||||||
| Cargurus, Inc.* |
12,890 | 516,373 | ||||||
| Yelp, Inc.* |
41,797 | 1,441,997 | ||||||
|
|
|
|||||||
| Total Interactive Media & Services | 1,958,370 | |||||||
| Internet & Direct Marketing Retail – 0.3% | ||||||||
| Etsy, Inc.* |
8,304 | 558,195 | ||||||
| GrubHub, Inc.* |
11,643 | 808,839 | ||||||
| Stamps.com, Inc.* |
9,883 | 804,575 | ||||||
| Stitch Fix, Inc. Class A*(a) |
21,780 | 614,850 | ||||||
|
|
|
|||||||
| Total Internet & Direct Marketing Retail | 2,786,459 | |||||||
| IT Services – 2.3% | ||||||||
| Black Knight, Inc.* |
32,385 | 1,764,983 | ||||||
| Booz Allen Hamilton Holding Corp. |
62,053 | 3,607,761 | ||||||
| CACI International, Inc. Class A* |
13,909 | 2,531,716 | ||||||
| CoreLogic, Inc.* |
36,470 | 1,358,872 | ||||||
| EPAM Systems, Inc.* |
14,473 | 2,447,818 | ||||||
| Euronet Worldwide, Inc.* |
18,002 | 2,566,905 | ||||||
| ManTech International Corp. Class A |
12,899 | 696,804 | ||||||
| MAXIMUS, Inc. |
28,887 | 2,050,399 | ||||||
| Perspecta, Inc. |
83,209 | 1,682,486 | ||||||
| Sabre Corp. |
143,438 | 3,068,139 | ||||||
| Science Applications International Corp. |
22,863 | 1,759,308 | ||||||
| WEX, Inc.* |
9,945 | 1,909,341 | ||||||
|
|
|
|||||||
| Total IT Services | 25,444,532 | |||||||
| Leisure Products – 0.5% | ||||||||
| Brunswick Corp. |
40,075 | 2,016,975 | ||||||
| Polaris Industries, Inc. |
37,314 | 3,150,421 | ||||||
|
|
|
|||||||
| Total Leisure Products | 5,167,396 | |||||||
| Life Sciences Tools & Services – 0.6% | ||||||||
| Bio-Techne Corp. |
5,520 | 1,095,996 | ||||||
| Bruker Corp. |
49,244 | 1,892,939 | ||||||
| Charles River Laboratories International, Inc.* |
15,030 | 2,183,108 | ||||||
| Medpace Holdings, Inc.* |
10,765 | 634,812 | ||||||
| PRA Health Sciences, Inc.* |
4,346 | 479,320 | ||||||
| Syneos Health, Inc.* |
831 | 43,013 | ||||||
|
|
|
|||||||
| Total Life Sciences Tools & Services | 6,329,188 | |||||||
| Machinery – 6.1% | ||||||||
| AGCO Corp. |
44,325 | 3,082,804 | ||||||
| Albany International Corp. Class A |
10,031 | 718,119 | ||||||
| Allison Transmission Holdings, Inc. |
113,161 | 5,083,192 | ||||||
| Barnes Group, Inc. |
27,648 | 1,421,384 | ||||||
| Crane Co. |
35,196 | 2,978,286 | ||||||
| Donaldson Co., Inc. |
50,048 | 2,505,403 | ||||||
| Flowserve Corp. |
23,046 | 1,040,296 | ||||||
| Gardner Denver Holdings, Inc.* |
88,706 | 2,466,914 | ||||||
| Graco, Inc. |
70,091 | 3,470,906 | ||||||
| Harsco Corp.* |
39,628 | 798,900 | ||||||
| Hillenbrand, Inc. |
20,387 | 846,672 | ||||||
| ITT, Inc. |
45,360 | 2,630,880 | ||||||
| John Bean Technologies Corp. |
12,120 | 1,113,707 | ||||||
| Kennametal, Inc. |
56,722 | 2,084,533 | ||||||
| Lincoln Electric Holdings, Inc. |
28,577 | 2,396,753 | ||||||
| Middleby Corp. (The)* |
24,176 | 3,143,605 | ||||||
| Navistar International Corp.* |
99,172 | 3,203,256 | ||||||
| Nordson Corp. |
26,214 | 3,473,879 | ||||||
| Oshkosh Corp. |
61,156 | 4,594,650 | ||||||
| Proto Labs, Inc.* |
5,447 | 572,698 | ||||||
| RBC Bearings, Inc.* |
6,714 | 853,819 | ||||||
| Rexnord Corp.* |
6,447 | 162,078 | ||||||
| Terex Corp. |
50,635 | 1,626,903 | ||||||
| Timken Co. (The) |
72,127 | 3,146,180 | ||||||
| Toro Co. (The) |
46,094 | 3,173,111 | ||||||
| Trinity Industries, Inc. |
72,118 | 1,567,124 | ||||||
| WABCO Holdings, Inc.* |
44,492 | 5,865,380 | ||||||
| Watts Water Technologies, Inc. Class A |
15,036 | 1,215,210 | ||||||
| Woodward, Inc. |
22,288 | 2,114,908 | ||||||
|
|
|
|||||||
| Total Machinery | 67,351,550 | |||||||
See Notes to Financial Statements.
| 48 | WisdomTree Trust |
Schedule of Investments (continued)
WisdomTree U.S. MidCap Fund (EZM)
March 31, 2019
| Investments | Shares | Value | ||||||
| Marine – 0.1% | ||||||||
| Kirby Corp.* |
8,041 | $ | 603,959 | |||||
| Media – 1.9% | ||||||||
| AMC Networks, Inc. Class A* |
71,533 | 4,060,213 | ||||||
| Cable One, Inc. |
1,577 | 1,547,636 | ||||||
| John Wiley & Sons, Inc. Class A |
32,996 | 1,459,083 | ||||||
| New York Times Co. (The) Class A |
29,716 | 976,171 | ||||||
| Nexstar Media Group, Inc. Class A |
30,687 | 3,325,550 | ||||||
| Sinclair Broadcast Group, Inc. Class A |
96,025 | 3,695,042 | ||||||
| TEGNA, Inc. |
222,897 | 3,142,848 | ||||||
| Tribune Media Co. Class A |
67,613 | 3,119,664 | ||||||
|
|
|
|||||||
| Total Media | 21,326,207 | |||||||
| Metals & Mining – 2.2% | ||||||||
| Allegheny Technologies, Inc.* |
68,001 | 1,738,785 | ||||||
| Cleveland-Cliffs, Inc.(a) |
553,340 | 5,527,867 | ||||||
| Commercial Metals Co. |
70,662 | 1,206,907 | ||||||
| Reliance Steel & Aluminum Co. |
77,634 | 7,007,245 | ||||||
| United States Steel Corp. |
345,166 | 6,727,285 | ||||||
| Worthington Industries, Inc. |
41,156 | 1,535,942 | ||||||
|
|
|
|||||||
| Total Metals & Mining | 23,744,031 | |||||||
| Multi-Utilities – 0.6% | ||||||||
| Avista Corp. |
25,159 | 1,021,958 | ||||||
| Black Hills Corp. |
25,713 | 1,904,562 | ||||||
| MDU Resources Group, Inc. |
91,147 | 2,354,327 | ||||||
| NorthWestern Corp. |
24,836 | 1,748,703 | ||||||
|
|
|
|||||||
| Total Multi-Utilities | 7,029,550 | |||||||
| Multiline Retail – 0.1% | ||||||||
| Ollie’s Bargain Outlet Holdings, Inc.* |
15,510 | 1,323,468 | ||||||
| Oil, Gas & Consumable Fuels – 3.8% | ||||||||
| Centennial Resource Development, Inc. Class A* |
136,319 | 1,198,244 | ||||||
| Chesapeake Energy Corp.*(a) |
2,061,701 | 6,391,273 | ||||||
| Cimarex Energy Co. |
74,551 | 5,211,115 | ||||||
| CNX Resources Corp.* |
25,973 | 279,729 | ||||||
| CVR Energy, Inc. |
51,546 | 2,123,695 | ||||||
| Delek U.S. Holdings, Inc. |
67,293 | 2,450,811 | ||||||
| Magnolia Oil & Gas Corp.* |
40,625 | 487,500 | ||||||
| Matador Resources Co.* |
86,419 | 1,670,479 | ||||||
| Murphy Oil Corp. |
47,931 | 1,404,379 | ||||||
| Parsley Energy, Inc. Class A* |
197,273 | 3,807,369 | ||||||
| PBF Energy, Inc. Class A |
204,951 | 6,382,174 | ||||||
| Peabody Energy Corp. |
137,508 | 3,895,602 | ||||||
| SM Energy Co. |
58,120 | 1,016,519 | ||||||
| Southwestern Energy Co.* |
1,114,771 | 5,228,276 | ||||||
|
|
|
|||||||
| Total Oil, Gas & Consumable Fuels | 41,547,165 | |||||||
| Paper & Forest Products – 0.7% | ||||||||
| Domtar Corp. |
54,728 | 2,717,245 | ||||||
| Louisiana-Pacific Corp. |
209,390 | 5,104,928 | ||||||
|
|
|
|||||||
| Total Paper & Forest Products | 7,822,173 | |||||||
| Personal Products – 0.3% | ||||||||
| Edgewell Personal Care Co.* |
32,602 | 1,430,902 | ||||||
| Nu Skin Enterprises, Inc. Class A |
28,540 | 1,365,924 | ||||||
| USANA Health Sciences, Inc.* |
8,734 | 732,521 | ||||||
|
|
|
|||||||
| Total Personal Products | 3,529,347 | |||||||
| Pharmaceuticals – 0.8% | ||||||||
| Catalent, Inc.* |
27,516 | 1,116,874 | ||||||
| Nektar Therapeutics* |
205,041 | 6,889,378 | ||||||
| Supernus Pharmaceuticals, Inc.* |
27,057 | 948,077 | ||||||
|
|
|
|||||||
| Total Pharmaceuticals | 8,954,329 | |||||||
| Professional Services – 1.7% | ||||||||
| ASGN, Inc.* |
22,524 | 1,430,049 | ||||||
| Exponent, Inc. |
12,402 | 715,843 | ||||||
| FTI Consulting, Inc.* |
21,666 | 1,664,382 | ||||||
| Insperity, Inc. |
11,772 | 1,455,726 | ||||||
| Korn Ferry |
30,422 | 1,362,297 | ||||||
| ManpowerGroup, Inc. |
70,006 | 5,788,796 | ||||||
| Robert Half International, Inc. |
63,976 | 4,168,676 | ||||||
| TriNet Group, Inc.* |
40,166 | 2,399,517 | ||||||
|
|
|
|||||||
| Total Professional Services | 18,985,286 | |||||||
| Real Estate Management & Development – 0.6% |
| |||||||
| Howard Hughes Corp. (The)* |
3,965 | 436,150 | ||||||
| Jones Lang LaSalle, Inc. |
22,611 | 3,486,164 | ||||||
| Kennedy-Wilson Holdings, Inc. |
52,866 | 1,130,804 | ||||||
| Newmark Group, Inc. Class A |
70,546 | 588,354 | ||||||
| Realogy Holdings Corp.(a) |
79,636 | 907,850 | ||||||
|
|
|
|||||||
| Total Real Estate Management & Development |
|
6,549,322 | ||||||
| Road & Rail – 2.1% | ||||||||
| AMERCO |
12,256 | 4,553,226 | ||||||
| Avis Budget Group, Inc.* |
67,551 | 2,354,828 | ||||||
| Genesee & Wyoming, Inc. Class A* |
28,840 | 2,513,118 | ||||||
| Knight-Swift Transportation Holdings, Inc. |
116,370 | 3,802,972 | ||||||
| Landstar System, Inc. |
22,164 | 2,424,520 | ||||||
| Ryder System, Inc. |
48,053 | 2,978,805 | ||||||
| Schneider National, Inc. Class B |
113,411 | 2,387,301 | ||||||
| Werner Enterprises, Inc. |
44,885 | 1,532,823 | ||||||
|
|
|
|||||||
| Total Road & Rail | 22,547,593 | |||||||
| Semiconductors & Semiconductor Equipment – 2.3% |
| |||||||
| Brooks Automation, Inc. |
20,083 | 589,034 | ||||||
| Cabot Microelectronics Corp. |
11,985 | 1,341,841 | ||||||
| Cirrus Logic, Inc.* |
37,002 | 1,556,674 | ||||||
| Cypress Semiconductor Corp. |
38,663 | 576,852 | ||||||
| Entegris, Inc. |
67,897 | 2,423,244 | ||||||
| First Solar, Inc.* |
13,910 | 735,004 | ||||||
| Integrated Device Technology, Inc.* |
24,339 | 1,192,368 | ||||||
| MKS Instruments, Inc. |
57,041 | 5,307,665 | ||||||
| Monolithic Power Systems, Inc. |
7,690 | 1,041,918 | ||||||
| Semtech Corp.* |
5,571 | 283,620 | ||||||
| Silicon Laboratories, Inc.* |
9,155 | 740,273 | ||||||
| Teradyne, Inc. |
106,486 | 4,242,402 | ||||||
| Universal Display Corp.(a) |
7,794 | 1,191,313 | ||||||
| Versum Materials, Inc. |
77,009 | 3,874,323 | ||||||
|
|
|
|||||||
| Total Semiconductors & Semiconductor Equipment |
|
25,096,531 | ||||||
See Notes to Financial Statements.
| WisdomTree Trust | 49 |
Schedule of Investments (continued)
WisdomTree U.S. MidCap Fund (EZM)
March 31, 2019
| Investments | Shares | Value | ||||||
| Software – 1.8% | ||||||||
| ACI Worldwide, Inc.* |
15,349 | $ | 504,522 | |||||
| Alarm.com Holdings, Inc.* |
3,622 | 235,068 | ||||||
| Altair Engineering, Inc. Class A* |
1,236 | 45,497 | ||||||
| Aspen Technology, Inc.* |
17,004 | 1,772,837 | ||||||
| Blackbaud, Inc. |
6,454 | 514,578 | ||||||
| Bottomline Technologies DE, Inc.* |
831 | 41,625 | ||||||
| CDK Global, Inc. |
70,032 | 4,119,282 | ||||||
| Ellie Mae, Inc.* |
3,525 | 347,882 | ||||||
| Envestnet, Inc.* |
3,454 | 225,857 | ||||||
| Fair Isaac Corp.* |
7,789 | 2,115,726 | ||||||
| Guidewire Software, Inc.* |
1,057 | 102,698 | ||||||
| j2 Global, Inc. |
22,667 | 1,962,962 | ||||||
| LogMeIn, Inc. |
3,534 | 283,073 | ||||||
| Manhattan Associates, Inc.* |
20,388 | 1,123,583 | ||||||
| Paycom Software, Inc.* |
8,023 | 1,517,390 | ||||||
| Paylocity Holding Corp.* |
5,558 | 495,718 | ||||||
| Pegasystems, Inc. |
2,073 | 134,745 | ||||||
| Qualys, Inc.* |
6,248 | 516,960 | ||||||
| RealPage, Inc.* |
6,493 | 394,060 | ||||||
| Teradata Corp.* |
14,236 | 621,401 | ||||||
| Trade Desk, Inc. (The) Class A* |
4,335 | 858,113 | ||||||
| Tyler Technologies, Inc.* |
7,392 | 1,510,925 | ||||||
| Verint Systems, Inc.* |
8,043 | 481,454 | ||||||
|
|
|
|||||||
| Total Software | 19,925,956 | |||||||
| Specialty Retail – 3.4% | ||||||||
| Aaron’s, Inc. |
20,434 | 1,074,828 | ||||||
| American Eagle Outfitters, Inc. |
118,824 | 2,634,328 | ||||||
| AutoNation, Inc.* |
108,781 | 3,885,657 | ||||||
| Designer Brands, Inc. |
5,011 | 111,344 | ||||||
| Dick’s Sporting Goods, Inc. |
86,358 | 3,178,838 | ||||||
| Five Below, Inc.* |
10,895 | 1,353,704 | ||||||
| Floor & Decor Holdings, Inc. Class A* |
42,571 | 1,754,777 | ||||||
| Foot Locker, Inc. |
95,344 | 5,777,846 | ||||||
| Michaels Cos., Inc. (The)* |
216,964 | 2,477,729 | ||||||
| Monro, Inc. |
9,197 | 795,725 | ||||||
| Murphy USA, Inc.* |
15,326 | 1,312,212 | ||||||
| National Vision Holdings, Inc.* |
8,508 | 267,406 | ||||||
| Penske Automotive Group, Inc. |
102,318 | 4,568,499 | ||||||
| RH* |
9,635 | 991,923 | ||||||
| Sally Beauty Holdings, Inc.* |
111,982 | 2,061,589 | ||||||
| Urban Outfitters, Inc.* |
74,671 | 2,213,249 | ||||||
| Williams-Sonoma, Inc. |
54,544 | 3,069,191 | ||||||
|
|
|
|||||||
| Total Specialty Retail | 37,528,845 | |||||||
| Technology Hardware, Storage & Peripherals – 0.6% |
| |||||||
| NCR Corp.* |
33,697 | 919,591 | ||||||
| Xerox Corp. |
174,308 | 5,574,370 | ||||||
|
|
|
|||||||
| Total Technology Hardware, Storage & Peripherals |
|
6,493,961 | ||||||
| Textiles, Apparel & Luxury Goods – 1.7% | ||||||||
| Carter’s, Inc. |
26,494 | 2,670,330 | ||||||
| Columbia Sportswear Co. |
25,578 | 2,664,716 | ||||||
| Deckers Outdoor Corp.* |
11,025 | 1,620,565 | ||||||
| Hanesbrands, Inc. |
305,901 | 5,469,510 | ||||||
| Skechers U.S.A., Inc. Class A* |
107,093 | 3,599,396 | ||||||
| Steven Madden Ltd. |
42,260 | 1,430,078 | ||||||
| Wolverine World Wide, Inc. |
40,870 | 1,460,285 | ||||||
|
|
|
|||||||
| Total Textiles, Apparel & Luxury Goods | 18,914,880 | |||||||
| Thrifts & Mortgage Finance – 1.4% | ||||||||
| LendingTree, Inc.*(a) |
2,893 | 1,017,063 | ||||||
| MGIC Investment Corp.* |
397,567 | 5,243,909 | ||||||
| New York Community Bancorp, Inc. |
240,658 | 2,784,413 | ||||||
| Radian Group, Inc. |
213,894 | 4,436,162 | ||||||
| TFS Financial Corp. |
34,702 | 571,542 | ||||||
| Washington Federal, Inc. |
44,396 | 1,282,600 | ||||||
|
|
|
|||||||
| Total Thrifts & Mortgage Finance | 15,335,689 | |||||||
| Trading Companies & Distributors – 1.9% | ||||||||
| Air Lease Corp. |
130,583 | 4,485,526 | ||||||
| Applied Industrial Technologies, Inc. |
25,561 | 1,520,113 | ||||||
| Beacon Roofing Supply, Inc.* |
8,186 | 263,262 | ||||||
| GATX Corp. |
22,834 | 1,743,833 | ||||||
| HD Supply Holdings, Inc.* |
77,501 | 3,359,668 | ||||||
| MSC Industrial Direct Co., Inc. Class A |
32,044 | 2,650,359 | ||||||
| SiteOne Landscape Supply, Inc.* |
12,720 | 726,948 | ||||||
| Univar, Inc.* |
101,375 | 2,246,470 | ||||||
| Watsco, Inc. |
12,992 | 1,860,584 | ||||||
| WESCO International, Inc.* |
40,011 | 2,120,983 | ||||||
|
|
|
|||||||
| Total Trading Companies & Distributors | 20,977,746 | |||||||
| Transportation Infrastructure – 0.1% | ||||||||
| Macquarie Infrastructure Corp. |
38,169 | 1,573,326 | ||||||
| Water Utilities – 0.3% | ||||||||
| American States Water Co. |
8,198 | 584,517 | ||||||
| Aqua America, Inc. |
62,693 | 2,284,533 | ||||||
| California Water Service Group |
563 | 30,560 | ||||||
|
|
|
|||||||
| Total Water Utilities | 2,899,610 | |||||||
| Wireless Telecommunication Services – 0.2% |
| |||||||
| Shenandoah Telecommunications Co. |
7,171 | 318,105 | ||||||
| Telephone & Data Systems, Inc. |
31,230 | 959,698 | ||||||
| United States Cellular Corp.* |
21,327 | 979,123 | ||||||
|
|
|
|||||||
| Total Wireless Telecommunication Services | 2,256,926 | |||||||
| TOTAL COMMON STOCKS (Cost: $948,319,715) |
1,093,591,937 | |||||||
| EXCHANGE-TRADED FUND – 0.3% | ||||||||
| United States – 0.3% | ||||||||
| WisdomTree U.S. MidCap Dividend Fund(b) (Cost: $3,800,559) |
111,330 | 3,984,501 | ||||||
| INVESTMENT OF CASH COLLATERAL FOR SECURITIES LOANED – 0.2% |
| |||||||
| United States – 0.2% | ||||||||
| State Street Navigator Securities Lending |
||||||||
| (Cost: $1,864,173)(d) | 1,864,173 | 1,864,173 | ||||||
| TOTAL INVESTMENTS IN SECURITIES – 100.1% (Cost: $953,984,447) |
|
1,099,440,611 | ||||||
| Other Assets less Liabilities – (0.1)% |
(1,129,175 | ) | ||||||
|
|
|
|||||||
| NET ASSETS – 100.0% | $ | 1,098,311,436 | ||||||
See Notes to Financial Statements.
| 50 | WisdomTree Trust |
Schedule of Investments (concluded)
WisdomTree U.S. MidCap Fund (EZM)
March 31, 2019
| * | Non-income producing security. |
| (a) | Security, or portion thereof, was on loan at March 31, 2019 (See Note 2). |
| (b) | Affiliated company (See Note 3). |
| (c) | Rate shown represents annualized 7-day yield as of March 31, 2019. |
| (d) | At March 31, 2019, the total market value of the Fund’s securities on loan identified in the Schedule of Investments was $16,770,856 and the total market value of the collateral held by the Fund was $17,209,660. The total market value of the collateral includes non-cash U.S. Government securities collateral having a value of $15,345,487. |
See Notes to Financial Statements.
| WisdomTree Trust | 51 |
Schedule of Investments
WisdomTree U.S. Multifactor Fund (USMF)
March 31, 2019
| Investments | Shares | Value | ||||||
| COMMON STOCKS – 101.0% |
| |||||||
| United States – 101.0% |
| |||||||
| Airlines – 2.4% |
| |||||||
| JetBlue Airways Corp.* |
57,673 | $ | 943,530 | |||||
| Southwest Airlines Co. |
16,995 | 882,211 | ||||||
| United Continental Holdings, Inc.* |
11,218 | 894,972 | ||||||
|
|
|
|||||||
| Total Airlines |
|
2,720,713 | ||||||
| Auto Components – 0.4% |
| |||||||
| Gentex Corp. |
24,001 | 496,341 | ||||||
| Banks – 3.7% |
| |||||||
| Fifth Third Bancorp |
40,922 | 1,032,053 | ||||||
| First Citizens BancShares, Inc. Class A |
2,815 | 1,146,268 | ||||||
| First Horizon National Corp. |
79,441 | 1,110,585 | ||||||
| Signature Bank |
7,255 | 929,148 | ||||||
|
|
|
|||||||
| Total Banks |
|
4,218,054 | ||||||
| Beverages – 0.9% |
| |||||||
| Keurig Dr Pepper, Inc. |
13,461 | 376,504 | ||||||
| Molson Coors Brewing Co. Class B |
3,614 | 215,575 | ||||||
| PepsiCo, Inc. |
3,309 | 405,518 | ||||||
|
|
|
|||||||
| Total Beverages |
|
997,597 | ||||||
| Biotechnology – 2.0% |
| |||||||
| Biogen, Inc.* |
2,501 | 591,186 | ||||||
| Celgene Corp.* |
8,818 | 831,890 | ||||||
| United Therapeutics Corp.* |
7,450 | 874,407 | ||||||
|
|
|
|||||||
| Total Biotechnology |
|
2,297,483 | ||||||
| Building Products – 1.1% |
| |||||||
| USG Corp. |
28,495 | 1,233,834 | ||||||
| Capital Markets – 1.1% |
| |||||||
| MarketAxess Holdings, Inc. |
5,180 | 1,274,694 | ||||||
| Commercial Services & Supplies – 2.5% |
| |||||||
| Republic Services, Inc. |
17,869 | 1,436,310 | ||||||
| Waste Management, Inc. |
13,945 | 1,449,025 | ||||||
|
|
|
|||||||
| Total Commercial Services & Supplies |
|
2,885,335 | ||||||
| Communications Equipment – 4.1% |
| |||||||
| Ciena Corp.* |
20,880 | 779,659 | ||||||
| CommScope Holding Co., Inc.* |
30,111 | 654,312 | ||||||
| Juniper Networks, Inc. |
48,342 | 1,279,613 | ||||||
| Motorola Solutions, Inc. |
8,350 | 1,172,507 | ||||||
| Ubiquiti Networks, Inc. |
5,388 | 806,637 | ||||||
|
|
|
|||||||
| Total Communications Equipment |
|
4,692,728 | ||||||
| Consumer Finance – 1.5% |
| |||||||
| Santander Consumer USA Holdings, Inc. |
40,813 | 862,379 | ||||||
| Synchrony Financial |
26,700 | 851,730 | ||||||
|
|
|
|||||||
| Total Consumer Finance |
|
1,714,109 | ||||||
| Containers & Packaging – 2.8% |
| |||||||
| Bemis Co., Inc. |
20,398 | 1,131,681 | ||||||
| Berry Global Group, Inc.* |
16,904 | 910,618 | ||||||
| Sonoco Products Co. |
18,964 | 1,166,855 | ||||||
|
|
|
|||||||
| Total Containers & Packaging |
|
3,209,154 | ||||||
| Distributors – 0.9% |
| |||||||
| Genuine Parts Co. |
6,083 | 681,479 | ||||||
| LKQ Corp.* |
13,937 | 395,532 | ||||||
|
|
|
|||||||
| Total Distributors |
|
1,077,011 | ||||||
| Diversified Consumer Services – 0.3% |
| |||||||
| H&R Block, Inc. |
15,958 | 382,035 | ||||||
| Diversified Telecommunication Services – 2.3% |
| |||||||
| AT&T, Inc. |
38,944 | 1,221,284 | ||||||
| Verizon Communications, Inc. |
24,354 | 1,440,052 | ||||||
|
|
|
|||||||
| Total Diversified Telecommunication Services |
|
2,661,336 | ||||||
| Electric Utilities – 1.7% |
| |||||||
| Alliant Energy Corp. |
2,451 | 115,516 | ||||||
| American Electric Power Co., Inc. |
1,468 | 122,945 | ||||||
| Duke Energy Corp. |
1,359 | 122,310 | ||||||
| Entergy Corp. |
1,354 | 129,483 | ||||||
| Evergy, Inc. |
2,140 | 124,227 | ||||||
| Eversource Energy |
1,796 | 127,426 | ||||||
| Exelon Corp. |
2,687 | 134,699 | ||||||
| FirstEnergy Corp. |
2,883 | 119,962 | ||||||
| IDACORP, Inc. |
1,102 | 109,693 | ||||||
| NextEra Energy, Inc. |
611 | 118,119 | ||||||
| OGE Energy Corp. |
2,772 | 119,529 | ||||||
| Pinnacle West Capital Corp. |
1,287 | 123,011 | ||||||
| Portland General Electric Co. |
2,345 | 121,565 | ||||||
| PPL Corp. |
3,457 | 109,725 | ||||||
| Southern Co. (The) |
2,356 | 121,758 | ||||||
| Xcel Energy, Inc. |
2,124 | 119,390 | ||||||
|
|
|
|||||||
| Total Electric Utilities |
|
1,939,358 | ||||||
| Electronic Equipment, Instruments & Components – 2.5% |
| |||||||
| CDW Corp. |
11,507 | 1,108,930 | ||||||
| Keysight Technologies, Inc.* |
11,772 | 1,026,518 | ||||||
| Zebra Technologies Corp. Class A* |
3,606 | 755,565 | ||||||
|
|
|
|||||||
| Total Electronic Equipment, Instruments & Components |
|
2,891,013 | ||||||
| Entertainment – 1.6% |
| |||||||
| Cinemark Holdings, Inc. |
24,877 | 994,831 | ||||||
| Viacom, Inc. Class B |
30,726 | 862,479 | ||||||
|
|
|
|||||||
| Total Entertainment |
|
1,857,310 | ||||||
| Equity Real Estate Investment Trusts (REITs) – 3.2% |
| |||||||
| American Campus Communities, Inc. |
2,391 | 113,764 | ||||||
| American Homes 4 Rent Class A |
5,181 | 117,712 | ||||||
| American Tower Corp. |
614 | 120,995 | ||||||
| Brixmor Property Group, Inc. |
5,428 | 99,712 | ||||||
| CubeSmart |
3,492 | 111,884 | ||||||
| EPR Properties |
1,554 | 119,503 | ||||||
| Equity LifeStyle Properties, Inc. |
985 | 112,585 | ||||||
| Extra Space Storage, Inc. |
1,133 | 115,464 | ||||||
| Gaming and Leisure Properties, Inc. |
3,287 | 126,780 | ||||||
| HCP, Inc. |
3,566 | 111,616 | ||||||
| Healthcare Trust of America, Inc. Class A |
3,829 | 109,471 | ||||||
| Highwoods Properties, Inc. |
2,489 | 116,435 | ||||||
| Hospitality Properties Trust |
4,149 | 109,160 | ||||||
See Notes to Financial Statements.
| 52 | WisdomTree Trust |
Schedule of Investments (continued)
WisdomTree U.S. Multifactor Fund (USMF)
March 31, 2019
| Investments | Shares | Value | ||||||
| Host Hotels & Resorts, Inc. |
4,914 | $ | 92,875 | |||||
| Iron Mountain, Inc. |
2,796 | 99,146 | ||||||
| Kimco Realty Corp. |
5,222 | 96,607 | ||||||
| Liberty Property Trust |
2,257 | 109,284 | ||||||
| Life Storage, Inc. |
1,151 | 111,958 | ||||||
| Medical Properties Trust, Inc. |
6,280 | 116,243 | ||||||
| Mid-America Apartment Communities, Inc. |
1,083 | 118,404 | ||||||
| National Retail Properties, Inc. |
2,068 | 114,547 | ||||||
| Omega Healthcare Investors, Inc. |
2,814 | 107,354 | ||||||
| Park Hotels & Resorts, Inc. |
3,152 | 97,964 | ||||||
| Public Storage |
546 | 118,908 | ||||||
| Regency Centers Corp. |
1,694 | 114,328 | ||||||
| Simon Property Group, Inc. |
647 | 117,890 | ||||||
| SL Green Realty Corp. |
1,152 | 103,588 | ||||||
| STORE Capital Corp. |
3,570 | 119,595 | ||||||
| Ventas, Inc. |
1,574 | 100,437 | ||||||
| VICI Properties, Inc. |
5,547 | 121,368 | ||||||
| Vornado Realty Trust |
1,586 | 106,960 | ||||||
| W.P. Carey, Inc. |
1,564 | 122,508 | ||||||
| Welltower, Inc. |
1,357 | 105,303 | ||||||
|
|
|
|||||||
| Total Equity Real Estate Investment Trusts (REITs) |
|
3,680,348 | ||||||
| Food & Staples Retailing – 1.6% |
| |||||||
| Casey’s General Stores, Inc. |
2,584 | 332,742 | ||||||
| Kroger Co. (The) |
8,833 | 217,292 | ||||||
| Sysco Corp. |
5,293 | 353,361 | ||||||
| U.S. Foods Holding Corp.* |
7,240 | 252,748 | ||||||
| Walgreens Boots Alliance, Inc. |
4,356 | 275,604 | ||||||
| Walmart, Inc. |
3,672 | 358,130 | ||||||
|
|
|
|||||||
| Total Food & Staples Retailing |
|
1,789,877 | ||||||
| Food Products – 3.0% |
| |||||||
| General Mills, Inc. |
6,163 | 318,935 | ||||||
| Hershey Co. (The) |
3,390 | 389,274 | ||||||
| Hormel Foods Corp. |
8,232 | 368,464 | ||||||
| Ingredion, Inc. |
3,335 | 315,791 | ||||||
| J.M. Smucker Co. (The) |
2,776 | 323,404 | ||||||
| Kellogg Co. |
5,990 | 343,706 | ||||||
| Lamb Weston Holdings, Inc. |
4,525 | 339,104 | ||||||
| McCormick & Co., Inc. Non-Voting Shares |
2,390 | 360,006 | ||||||
| Post Holdings, Inc.* |
2,798 | 306,101 | ||||||
| Tyson Foods, Inc. Class A |
5,060 | 351,316 | ||||||
|
|
|
|||||||
| Total Food Products |
|
3,416,101 | ||||||
| Gas Utilities – 0.4% |
| |||||||
| National Fuel Gas Co. |
1,820 | 110,947 | ||||||
| ONE Gas, Inc. |
1,244 | 110,753 | ||||||
| Southwest Gas Holdings, Inc. |
1,117 | 91,885 | ||||||
| UGI Corp. |
2,131 | 118,100 | ||||||
|
|
|
|||||||
| Total Gas Utilities |
|
431,685 | ||||||
| Health Care Providers & Services – 7.1% |
| |||||||
| Anthem, Inc. |
3,942 | 1,131,275 | ||||||
| Encompass Health Corp. |
19,646 | 1,147,326 | ||||||
| HCA Healthcare, Inc. |
8,651 | 1,127,917 | ||||||
| Henry Schein, Inc.* |
18,738 | 1,126,341 | ||||||
| McKesson Corp. |
8,974 | 1,050,497 | ||||||
| Quest Diagnostics, Inc. |
14,395 | 1,294,399 | ||||||
| Universal Health Services, Inc. Class B |
9,209 | 1,231,888 | ||||||
|
|
|
|||||||
| Total Health Care Providers & Services |
|
8,109,643 | ||||||
| Hotels, Restaurants & Leisure – 2.0% |
| |||||||
| Darden Restaurants, Inc. |
4,957 | 602,127 | ||||||
| McDonald’s Corp. |
3,431 | 651,547 | ||||||
| Starbucks Corp. |
7,744 | 575,689 | ||||||
| Texas Roadhouse, Inc. |
7,733 | 480,915 | ||||||
|
|
|
|||||||
| Total Hotels, Restaurants & Leisure |
|
2,310,278 | ||||||
| Household Durables – 1.1% |
| |||||||
| NVR, Inc.* |
163 | 451,021 | ||||||
| PulteGroup, Inc. |
15,399 | 430,556 | ||||||
| Toll Brothers, Inc. |
10,182 | 368,588 | ||||||
|
|
|
|||||||
| Total Household Durables |
|
1,250,165 | ||||||
| Household Products – 1.5% |
| |||||||
| Church & Dwight Co., Inc. |
4,293 | 305,791 | ||||||
| Clorox Co. (The) |
1,994 | 319,957 | ||||||
| Colgate-Palmolive Co. |
5,393 | 369,636 | ||||||
| Kimberly-Clark Corp. |
2,712 | 336,017 | ||||||
| Procter & Gamble Co. (The) |
3,647 | 379,470 | ||||||
|
|
|
|||||||
| Total Household Products |
|
1,710,871 | ||||||
| Independent Power & Renewable Electricity Producers – 0.3% |
| |||||||
| AES Corp. |
6,354 | 114,880 | ||||||
| NRG Energy, Inc. |
2,318 | 98,469 | ||||||
| Vistra Energy Corp. |
3,420 | 89,023 | ||||||
|
|
|
|||||||
| Total Independent Power & Renewable Electricity Producers |
|
302,372 | ||||||
| Insurance – 5.2% |
| |||||||
| Assurant, Inc. |
12,044 | 1,143,096 | ||||||
| Erie Indemnity Co. Class A |
7,347 | 1,311,586 | ||||||
| Hanover Insurance Group, Inc. (The) |
11,457 | 1,308,046 | ||||||
| Hartford Financial Services Group, Inc. (The) |
26,786 | 1,331,800 | ||||||
| Kemper Corp. |
10,726 | 816,678 | ||||||
|
|
|
|||||||
| Total Insurance |
|
5,911,206 | ||||||
| IT Services – 9.0% |
| |||||||
| Booz Allen Hamilton Holding Corp. |
28,755 | 1,671,816 | ||||||
| CACI International, Inc. Class A* |
7,347 | 1,337,301 | ||||||
| Euronet Worldwide, Inc.* |
6,715 | 957,492 | ||||||
| First Data Corp. Class A* |
26,358 | 692,425 | ||||||
| Leidos Holdings, Inc. |
20,906 | 1,339,865 | ||||||
| MAXIMUS, Inc. |
23,317 | 1,655,041 | ||||||
| Science Applications International Corp. |
12,873 | 990,577 | ||||||
| Western Union Co. (The) |
91,270 | 1,685,757 | ||||||
|
|
|
|||||||
| Total IT Services |
|
10,330,274 | ||||||
| Machinery – 1.6% |
| |||||||
| Allison Transmission Holdings, Inc. |
19,913 | 894,492 | ||||||
| Snap-on, Inc. |
6,144 | 961,659 | ||||||
|
|
|
|||||||
| Total Machinery |
|
1,856,151 | ||||||
| Media – 4.6% |
| |||||||
| Cable One, Inc. |
1,124 | 1,103,071 | ||||||
See Notes to Financial Statements.
| WisdomTree Trust | 53 |
Schedule of Investments (concluded)
WisdomTree U.S. Multifactor Fund (USMF)
March 31, 2019
| Investments | Shares | Value | ||||||
| CBS Corp. Class B Non-Voting Shares |
17,614 | $ | 837,193 | |||||
| Comcast Corp. Class A |
24,136 | 964,957 | ||||||
| Fox Corp. Class A* |
9,036 | 331,712 | ||||||
| Nexstar Media Group, Inc. Class A |
8,097 | 877,472 | ||||||
| Omnicom Group, Inc. |
15,814 | 1,154,264 | ||||||
|
|
|
|||||||
| Total Media |
|
5,268,669 | ||||||
| Multi-Utilities – 1.0% |
| |||||||
| Ameren Corp. |
1,635 | 120,254 | ||||||
| CenterPoint Energy, Inc. |
3,907 | 119,945 | ||||||
| CMS Energy Corp. |
2,117 | 117,578 | ||||||
| Consolidated Edison, Inc. |
1,393 | 118,141 | ||||||
| Dominion Energy, Inc. |
1,556 | 119,283 | ||||||
| DTE Energy Co. |
968 | 120,748 | ||||||
| MDU Resources Group, Inc. |
4,305 | 111,198 | ||||||
| Public Service Enterprise Group, Inc. |
1,991 | 118,285 | ||||||
| Sempra Energy |
758 | 95,402 | ||||||
| WEC Energy Group, Inc. |
1,489 | 117,750 | ||||||
|
|
|
|||||||
| Total Multi-Utilities |
|
1,158,584 | ||||||
| Multiline Retail – 1.9% |
| |||||||
| Dollar General Corp. |
4,685 | 558,921 | ||||||
| Dollar Tree, Inc.* |
3,842 | 403,564 | ||||||
| Kohl’s Corp. |
5,481 | 376,928 | ||||||
| Macy’s, Inc. |
12,326 | 296,194 | ||||||
| Target Corp. |
6,374 | 511,577 | ||||||
|
|
|
|||||||
| Total Multiline Retail |
|
2,147,184 | ||||||
| Oil, Gas & Consumable Fuels – 5.3% |
| |||||||
| Cabot Oil & Gas Corp. |
38,469 | 1,004,041 | ||||||
| Chevron Corp. |
11,505 | 1,417,186 | ||||||
| ConocoPhillips |
14,478 | 966,262 | ||||||
| HollyFrontier Corp. |
15,131 | 745,504 | ||||||
| Murphy Oil Corp. |
25,548 | 748,556 | ||||||
| Phillips 66 |
12,500 | 1,189,625 | ||||||
|
|
|
|||||||
| Total Oil, Gas & Consumable Fuels |
|
6,071,174 | ||||||
| Pharmaceuticals – 5.4% |
| |||||||
| Eli Lilly & Co. |
10,709 | 1,389,600 | ||||||
| Johnson & Johnson |
9,892 | 1,382,803 | ||||||
| Merck & Co., Inc. |
17,659 | 1,468,699 | ||||||
| Nektar Therapeutics* |
15,246 | 512,265 | ||||||
| Pfizer, Inc. |
33,066 | 1,404,313 | ||||||
|
|
|
|||||||
| Total Pharmaceuticals |
|
6,157,680 | ||||||
| Road & Rail – 1.0% |
| |||||||
| AMERCO |
3,220 | 1,196,262 | ||||||
| Semiconductors & Semiconductor Equipment – 2.5% |
| |||||||
| Broadcom, Inc. |
3,173 | 954,153 | ||||||
| Integrated Device Technology, Inc.* |
24,699 | 1,210,004 | ||||||
| Versum Materials, Inc. |
14,644 | 736,739 | ||||||
|
|
|
|||||||
| Total Semiconductors & Semiconductor Equipment |
|
2,900,896 | ||||||
| Software – 2.7% |
| |||||||
| CDK Global, Inc. |
25,584 | 1,504,851 | ||||||
| Citrix Systems, Inc. |
15,519 | 1,546,623 | ||||||
|
|
|
|||||||
| Total Software |
|
3,051,474 | ||||||
| Specialty Retail – 3.8% |
| |||||||
| Advance Auto Parts, Inc. |
2,563 | 437,068 | ||||||
| AutoZone, Inc.* |
592 | 606,279 | ||||||
| Burlington Stores, Inc.* |
2,458 | 385,120 | ||||||
| Foot Locker, Inc. |
5,158 | 312,575 | ||||||
| Gap, Inc. (The) |
12,664 | 331,544 | ||||||
| O’Reilly Automotive, Inc.* |
1,264 | 490,811 | ||||||
| TJX Cos., Inc. (The) |
11,510 | 612,447 | ||||||
| Tractor Supply Co. |
4,847 | 473,843 | ||||||
| Ulta Salon Cosmetics & Fragrance, Inc.* |
1,221 | 425,799 | ||||||
| Williams-Sonoma, Inc. |
5,675 | 319,332 | ||||||
|
|
|
|||||||
| Total Specialty Retail |
|
4,394,818 | ||||||
| Technology Hardware, Storage & Peripherals – 0.8% |
| |||||||
| Xerox Corp. |
29,487 | 942,994 | ||||||
| Textiles, Apparel & Luxury Goods – 0.3% |
| |||||||
| Hanesbrands, Inc. |
16,022 | 286,473 | ||||||
| Thrifts & Mortgage Finance – 1.4% |
| |||||||
| MGIC Investment Corp.* |
57,605 | 759,810 | ||||||
| Radian Group, Inc. |
38,621 | 800,999 | ||||||
|
|
|
|||||||
| Total Thrifts & Mortgage Finance |
|
1,560,809 | ||||||
| Tobacco – 0.5% |
| |||||||
| Altria Group, Inc. |
5,344 | 306,906 | ||||||
| Philip Morris International, Inc. |
2,760 | 243,956 | ||||||
|
|
|
|||||||
| Total Tobacco |
|
550,862 | ||||||
| Trading Companies & Distributors – 1.1% |
| |||||||
| HD Supply Holdings, Inc.* |
29,231 | 1,267,164 | ||||||
| Wireless Telecommunication Services – 0.9% |
| |||||||
| T-Mobile U.S., Inc.* |
14,297 | 987,923 | ||||||
| TOTAL INVESTMENTS IN SECURITIES – 101.0% (Cost: $113,006,322) |
|
115,590,042 | ||||||
| Other Assets less Liabilities – (1.0)% |
|
(1,109,387 | ) | |||||
|
|
|
|||||||
| NET ASSETS – 100.0% |
|
$ | 114,480,655 | |||||
| * | Non-income producing security. |
See Notes to Financial Statements.
| 54 | WisdomTree Trust |
Schedule of Investments
WisdomTree U.S. Quality Dividend Growth Fund (DGRW)
March 31, 2019
| Investments | Shares | Value | ||||||
| COMMON STOCKS – 99.8% |
| |||||||
| United States – 99.8% |
| |||||||
| Aerospace & Defense – 4.9% |
| |||||||
| Boeing Co. (The) |
145,040 | $ | 55,321,157 | |||||
| BWX Technologies, Inc. |
9,516 | 471,803 | ||||||
| Curtiss-Wright Corp. |
2,516 | 285,163 | ||||||
| General Dynamics Corp. |
75,297 | 12,746,276 | ||||||
| Harris Corp. |
23,321 | 3,724,597 | ||||||
| HEICO Corp. |
3,135 | 297,417 | ||||||
| HEICO Corp. Class A |
3,896 | 327,498 | ||||||
| Hexcel Corp. |
14,393 | 995,420 | ||||||
| Huntington Ingalls Industries, Inc. |
6,975 | 1,445,220 | ||||||
| L3 Technologies, Inc. |
13,734 | 2,834,286 | ||||||
| Northrop Grumman Corp. |
36,413 | 9,816,945 | ||||||
| Raytheon Co. |
66,839 | 12,170,045 | ||||||
| Spirit AeroSystems Holdings, Inc. Class A |
8,300 | 759,699 | ||||||
| Textron, Inc. |
9,514 | 481,979 | ||||||
| United Technologies Corp. |
257,130 | 33,141,486 | ||||||
|
|
|
|||||||
| Total Aerospace & Defense |
|
134,818,991 | ||||||
| Air Freight & Logistics – 1.7% |
| |||||||
| C.H. Robinson Worldwide, Inc. |
33,116 | 2,880,761 | ||||||
| Expeditors International of Washington, Inc. |
29,726 | 2,256,203 | ||||||
| FedEx Corp. |
42,021 | 7,623,030 | ||||||
| United Parcel Service, Inc. Class B |
304,021 | 33,971,306 | ||||||
|
|
|
|||||||
| Total Air Freight & Logistics |
|
46,731,300 | ||||||
| Airlines – 0.7% |
| |||||||
| Alaska Air Group, Inc. |
24,165 | 1,356,140 | ||||||
| American Airlines Group, Inc. |
56,953 | 1,808,827 | ||||||
| Delta Air Lines, Inc. |
216,842 | 11,199,890 | ||||||
| Southwest Airlines Co. |
78,565 | 4,078,309 | ||||||
|
|
|
|||||||
| Total Airlines |
|
18,443,166 | ||||||
| Auto Components – 0.1% |
| |||||||
| Gentex Corp. |
84,022 | 1,737,575 | ||||||
| Automobiles – 1.1% |
| |||||||
| General Motors Co. |
719,619 | 26,697,865 | ||||||
| Harley-Davidson, Inc. |
73,000 | 2,603,180 | ||||||
| Thor Industries, Inc. |
12,163 | 758,606 | ||||||
|
|
|
|||||||
| Total Automobiles |
|
30,059,651 | ||||||
| Banks – 4.4% |
| |||||||
| Bank OZK |
46,434 | 1,345,657 | ||||||
| Comerica, Inc. |
62,152 | 4,556,985 | ||||||
| KeyCorp |
575,360 | 9,061,920 | ||||||
| Pinnacle Financial Partners, Inc. |
7,672 | 419,659 | ||||||
| Regions Financial Corp. |
485,989 | 6,876,744 | ||||||
| Wells Fargo & Co. |
2,073,984 | 100,214,907 | ||||||
|
|
|
|||||||
| Total Banks |
|
122,475,872 | ||||||
| Beverages – 3.1% |
| |||||||
| Brown-Forman Corp. Class A |
21,468 | 1,098,518 | ||||||
| Brown-Forman Corp. Class B |
58,575 | 3,091,588 | ||||||
| Constellation Brands, Inc. Class A |
30,825 | 5,404,547 | ||||||
| Keurig Dr Pepper, Inc. |
377,269 | 10,552,214 | ||||||
| PepsiCo, Inc. |
549,567 | 67,349,436 | ||||||
|
|
|
|||||||
| Total Beverages |
|
87,496,303 | ||||||
| Biotechnology – 2.6% |
| |||||||
| AbbVie, Inc. |
894,729 | 72,106,210 | ||||||
| Building Products – 0.2% |
| |||||||
| A.O. Smith Corp. |
28,313 | 1,509,649 | ||||||
| Armstrong World Industries, Inc. |
10,035 | 796,980 | ||||||
| Fortune Brands Home & Security, Inc. |
24,344 | 1,159,018 | ||||||
| Lennox International, Inc. |
7,432 | 1,965,021 | ||||||
| Owens Corning |
18,320 | 863,238 | ||||||
|
|
|
|||||||
| Total Building Products |
|
6,293,906 | ||||||
| Capital Markets – 2.9% |
| |||||||
| Ameriprise Financial, Inc. |
50,948 | 6,526,439 | ||||||
| CBOE Global Markets, Inc. |
18,223 | 1,739,203 | ||||||
| Charles Schwab Corp. (The) |
199,434 | 8,527,798 | ||||||
| CME Group, Inc. |
62,202 | 10,237,205 | ||||||
| E*TRADE Financial Corp. |
35,401 | 1,643,668 | ||||||
| Eaton Vance Corp. |
51,566 | 2,078,625 | ||||||
| Evercore, Inc. Class A |
8,483 | 771,953 | ||||||
| FactSet Research Systems, Inc. |
6,969 | 1,730,194 | ||||||
| Franklin Resources, Inc. |
166,474 | 5,516,948 | ||||||
| LPL Financial Holdings, Inc. |
22,903 | 1,595,194 | ||||||
| MarketAxess Holdings, Inc. |
4,981 | 1,225,725 | ||||||
| Morningstar, Inc. |
6,413 | 807,974 | ||||||
| MSCI, Inc. |
18,498 | 3,678,142 | ||||||
| Northern Trust Corp. |
62,734 | 5,671,781 | ||||||
| Raymond James Financial, Inc. |
30,036 | 2,415,195 | ||||||
| S&P Global, Inc. |
37,825 | 7,964,054 | ||||||
| SEI Investments Co. |
19,461 | 1,016,837 | ||||||
| T. Rowe Price Group, Inc. |
82,900 | 8,299,948 | ||||||
| TD Ameritrade Holding Corp. |
161,270 | 8,061,887 | ||||||
|
|
|
|||||||
| Total Capital Markets |
|
79,508,770 | ||||||
| Chemicals – 2.0% |
| |||||||
| Air Products & Chemicals, Inc. |
76,191 | 14,549,433 | ||||||
| Celanese Corp. |
37,637 | 3,711,385 | ||||||
| Chemours Co. (The) |
74,866 | 2,782,021 | ||||||
| Eastman Chemical Co. |
47,392 | 3,596,105 | ||||||
| Ecolab, Inc. |
38,905 | 6,868,289 | ||||||
| FMC Corp. |
18,451 | 1,417,406 | ||||||
| International Flavors & Fragrances, Inc. |
28,646 | 3,689,318 | ||||||
| NewMarket Corp. |
1,615 | 700,199 | ||||||
| Olin Corp. |
63,150 | 1,461,291 | ||||||
| PPG Industries, Inc. |
50,991 | 5,755,354 | ||||||
| RPM International, Inc. |
29,636 | 1,720,073 | ||||||
| Scotts Miracle-Gro Co. (The) |
21,025 | 1,652,145 | ||||||
| Sherwin-Williams Co. (The) |
10,423 | 4,489,290 | ||||||
| W.R. Grace & Co. |
16,223 | 1,266,043 | ||||||
| Westlake Chemical Corp. |
20,113 | 1,364,868 | ||||||
|
|
|
|||||||
| Total Chemicals |
|
55,023,220 | ||||||
| Commercial Services & Supplies – 0.9% |
| |||||||
| Cintas Corp. |
17,455 | 3,527,830 | ||||||
| Healthcare Services Group, Inc. |
14,525 | 479,180 | ||||||
See Notes to Financial Statements.
| WisdomTree Trust | 55 |
Schedule of Investments (continued)
WisdomTree U.S. Quality Dividend Growth Fund (DGRW)
March 31, 2019
| Investments | Shares | Value | ||||||
| MSA Safety, Inc. |
9,799 | $ | 1,013,216 | |||||
| Republic Services, Inc. |
80,853 | 6,498,964 | ||||||
| Rollins, Inc. |
50,066 | 2,083,747 | ||||||
| Tetra Tech, Inc. |
5,259 | 313,384 | ||||||
| Waste Management, Inc. |
107,442 | 11,164,298 | ||||||
|
|
|
|||||||
| Total Commercial Services & Supplies |
|
25,080,619 | ||||||
| Communications Equipment – 0.0% |
| |||||||
| Ubiquiti Networks, Inc. |
6,715 | 1,005,303 | ||||||
| Construction & Engineering – 0.1% |
| |||||||
| EMCOR Group, Inc. |
3,125 | 228,375 | ||||||
| Fluor Corp. |
32,086 | 1,180,765 | ||||||
|
|
|
|||||||
| Total Construction & Engineering |
|
1,409,140 | ||||||
| Construction Materials – 0.1% |
| |||||||
| Eagle Materials, Inc. |
3,614 | 304,660 | ||||||
| Martin Marietta Materials, Inc. |
9,255 | 1,861,921 | ||||||
| Vulcan Materials Co. |
13,881 | 1,643,510 | ||||||
|
|
|
|||||||
| Total Construction Materials |
|
3,810,091 | ||||||
| Consumer Finance – 0.9% |
| |||||||
| American Express Co. |
151,706 | 16,581,466 | ||||||
| Discover Financial Services |
104,497 | 7,436,006 | ||||||
|
|
|
|||||||
| Total Consumer Finance |
|
24,017,472 | ||||||
| Containers & Packaging – 0.4% |
| |||||||
| AptarGroup, Inc. |
14,038 | 1,493,503 | ||||||
| Avery Dennison Corp. |
19,600 | 2,214,800 | ||||||
| Graphic Packaging Holding Co. |
131,415 | 1,659,771 | ||||||
| Packaging Corp. of America |
35,671 | 3,544,984 | ||||||
| Sealed Air Corp. |
39,513 | 1,819,969 | ||||||
|
|
|
|||||||
| Total Containers & Packaging |
|
10,733,027 | ||||||
| Distributors – 0.0% |
| |||||||
| Pool Corp. |
7,466 | 1,231,666 | ||||||
| Diversified Consumer Services – 0.1% |
| |||||||
| Service Corp. International |
41,457 | 1,664,499 | ||||||
| Diversified Telecommunication Services – 4.4% |
| |||||||
| Verizon Communications, Inc. |
2,079,847 | 122,981,353 | ||||||
| Electrical Equipment – 1.0% |
| |||||||
| Acuity Brands, Inc. |
2,169 | 260,302 | ||||||
| AMETEK, Inc. |
27,279 | 2,263,339 | ||||||
| Emerson Electric Co. |
247,309 | 16,933,247 | ||||||
| EnerSys |
3,020 | 196,783 | ||||||
| Hubbell, Inc. |
21,872 | 2,580,458 | ||||||
| Rockwell Automation, Inc. |
35,847 | 6,289,715 | ||||||
|
|
|
|||||||
| Total Electrical Equipment |
|
28,523,844 | ||||||
| Electronic Equipment, Instruments & Components – 0.3% |
| |||||||
| Amphenol Corp. Class A |
35,551 | 3,357,437 | ||||||
| CDW Corp. |
21,560 | 2,077,737 | ||||||
| Cognex Corp. |
10,797 | 549,135 | ||||||
| Dolby Laboratories, Inc. Class A |
9,326 | 587,258 | ||||||
| Littelfuse, Inc. |
2,429 | 443,244 | ||||||
| National Instruments Corp. |
18,623 | 826,116 | ||||||
|
|
|
|||||||
| Total Electronic Equipment, Instruments & Components |
|
7,840,927 | ||||||
| Entertainment – 1.4% |
| |||||||
| Activision Blizzard, Inc. |
58,296 | 2,654,217 | ||||||
| Cinemark Holdings, Inc. |
53,629 | 2,144,624 | ||||||
| Walt Disney Co. (The) |
310,754 | 34,503,017 | ||||||
| World Wrestling Entertainment, Inc. Class A |
1,644 | 142,666 | ||||||
|
|
|
|||||||
| Total Entertainment |
|
39,444,524 | ||||||
| Equity Real Estate Investment Trusts (REITs) – 0.1% |
| |||||||
| Ryman Hospitality Properties, Inc. |
24,150 | 1,986,096 | ||||||
| Food & Staples Retailing – 1.0% |
| |||||||
| Casey’s General Stores, Inc. |
4,709 | 606,378 | ||||||
| Costco Wholesale Corp. |
56,559 | 13,695,196 | ||||||
| Kroger Co. (The) |
192,255 | 4,729,473 | ||||||
| Sysco Corp. |
149,311 | 9,968,003 | ||||||
|
|
|
|||||||
| Total Food & Staples Retailing |
|
28,999,050 | ||||||
| Food Products – 1.9% |
| |||||||
| Flowers Foods, Inc. |
99,371 | 2,118,590 | ||||||
| General Mills, Inc. |
373,239 | 19,315,118 | ||||||
| Hershey Co. (The) |
43,801 | 5,029,669 | ||||||
| Hormel Foods Corp. |
128,577 | 5,755,107 | ||||||
| Kellogg Co. |
146,428 | 8,402,039 | ||||||
| Lancaster Colony Corp. |
6,563 | 1,028,356 | ||||||
| McCormick & Co., Inc. Non-Voting Shares |
24,743 | 3,727,038 | ||||||
| Tyson Foods, Inc. Class A |
88,891 | 6,171,702 | ||||||
|
|
|
|||||||
| Total Food Products |
|
51,547,619 | ||||||
| Health Care Equipment & Supplies – 2.4% |
| |||||||
| Abbott Laboratories |
332,131 | 26,550,552 | ||||||
| Baxter International, Inc. |
77,652 | 6,313,884 | ||||||
| Becton, Dickinson and Co. |
40,844 | 10,199,972 | ||||||
| Cantel Medical Corp. |
1,027 | 68,696 | ||||||
| Cooper Cos., Inc. (The) |
833 | 246,710 | ||||||
| Danaher Corp. |
56,720 | 7,488,174 | ||||||
| Hill-Rom Holdings, Inc. |
2,989 | 316,415 | ||||||
| ResMed, Inc. |
23,911 | 2,486,027 | ||||||
| Stryker Corp. |
50,379 | 9,950,860 | ||||||
| Teleflex, Inc. |
4,060 | 1,226,770 | ||||||
| West Pharmaceutical Services, Inc. |
7,653 | 843,361 | ||||||
|
|
|
|||||||
| Total Health Care Equipment & Supplies |
|
65,691,421 | ||||||
| Health Care Providers & Services – 2.9% |
| |||||||
| AmerisourceBergen Corp. |
46,199 | 3,673,745 | ||||||
| Anthem, Inc. |
34,857 | 10,003,262 | ||||||
| Chemed Corp. |
889 | 284,542 | ||||||
| Cigna Corp. |
1,295 | 208,262 | ||||||
| CVS Health Corp. |
432,296 | 23,313,723 | ||||||
| Encompass Health Corp. |
21,916 | 1,279,895 | ||||||
| Humana, Inc. |
10,271 | 2,732,086 | ||||||
| UnitedHealth Group, Inc. |
156,712 | 38,748,609 | ||||||
| Universal Health Services, Inc. Class B |
2,977 | 398,233 | ||||||
|
|
|
|||||||
| Total Health Care Providers & Services |
|
80,642,357 | ||||||
| Hotels, Restaurants & Leisure – 2.5% |
| |||||||
| Aramark |
28,233 | 834,285 | ||||||
| Cracker Barrel Old Country Store, Inc. |
10,590 | 1,711,450 | ||||||
See Notes to Financial Statements.
| 56 | WisdomTree Trust |
Schedule of Investments (continued)
WisdomTree U.S. Quality Dividend Growth Fund (DGRW)
March 31, 2019
| Investments | Shares | Value | ||||||
| Darden Restaurants, Inc. |
46,394 | $ | 5,635,479 | |||||
| Hyatt Hotels Corp. Class A |
10,103 | 733,175 | ||||||
| Las Vegas Sands Corp. |
512,781 | 31,259,130 | ||||||
| Marriott Vacations Worldwide Corp. |
9,047 | 845,895 | ||||||
| Starbucks Corp. |
330,584 | 24,575,615 | ||||||
| Texas Roadhouse, Inc. |
13,832 | 860,212 | ||||||
| Wendy’s Co. (The) |
73,761 | 1,319,584 | ||||||
| Wyndham Destinations, Inc. |
41,454 | 1,678,472 | ||||||
|
|
|
|||||||
| Total Hotels, Restaurants & Leisure |
|
69,453,297 | ||||||
| Household Durables – 0.3% |
| |||||||
| D.R. Horton, Inc. |
80,062 | 3,312,966 | ||||||
| Leggett & Platt, Inc. |
69,573 | 2,937,372 | ||||||
| Lennar Corp. Class A |
22,172 | 1,088,423 | ||||||
| PulteGroup, Inc. |
55,497 | 1,551,696 | ||||||
| Toll Brothers, Inc. |
15,420 | 558,204 | ||||||
|
|
|
|||||||
| Total Household Durables |
|
9,448,661 | ||||||
| Household Products – 3.6% |
| |||||||
| Church & Dwight Co., Inc. |
43,040 | 3,065,739 | ||||||
| Clorox Co. (The) |
32,755 | 5,255,867 | ||||||
| Procter & Gamble Co. (The) |
882,847 | 91,860,231 | ||||||
|
|
|
|||||||
| Total Household Products |
|
100,181,837 | ||||||
| Industrial Conglomerates – 2.7% |
| |||||||
| 3M Co. |
193,880 | 40,284,386 | ||||||
| Carlisle Cos., Inc. |
14,416 | 1,767,690 | ||||||
| Honeywell International, Inc. |
214,150 | 34,032,718 | ||||||
|
|
|
|||||||
| Total Industrial Conglomerates |
|
76,084,794 | ||||||
| Insurance – 1.0% |
| |||||||
| Brown & Brown, Inc. |
47,263 | 1,394,731 | ||||||
| Erie Indemnity Co. Class A |
15,198 | 2,713,147 | ||||||
| Marsh & McLennan Cos., Inc. |
119,856 | 11,254,478 | ||||||
| Selective Insurance Group, Inc. |
4,289 | 271,408 | ||||||
| Torchmark Corp. |
13,245 | 1,085,428 | ||||||
| Travelers Cos., Inc. (The) |
83,466 | 11,448,197 | ||||||
|
|
|
|||||||
| Total Insurance |
|
28,167,389 | ||||||
| Internet & Direct Marketing Retail – 0.1% |
| |||||||
| Expedia Group, Inc. |
20,769 | 2,471,511 | ||||||
| IT Services – 5.3% |
| |||||||
| Alliance Data Systems Corp. |
5,967 | 1,044,106 | ||||||
| Automatic Data Processing, Inc. |
106,052 | 16,940,746 | ||||||
| Booz Allen Hamilton Holding Corp. |
29,499 | 1,715,072 | ||||||
| Broadridge Financial Solutions, Inc. |
23,470 | 2,433,604 | ||||||
| Cognizant Technology Solutions Corp. Class A |
64,750 | 4,691,137 | ||||||
| Global Payments, Inc. |
3,914 | 534,339 | ||||||
| International Business Machines Corp. |
492,796 | 69,533,516 | ||||||
| Jack Henry & Associates, Inc. |
11,816 | 1,639,352 | ||||||
| MasterCard, Inc. Class A |
54,638 | 12,864,517 | ||||||
| MAXIMUS, Inc. |
14,713 | 1,044,329 | ||||||
| Paychex, Inc. |
131,138 | 10,517,268 | ||||||
| Sabre Corp. |
50,798 | 1,086,569 | ||||||
| Total System Services, Inc. |
15,933 | 1,513,794 | ||||||
| Visa, Inc. Class A |
135,624 | 21,183,113 | ||||||
|
|
|
|||||||
| Total IT Services |
|
146,741,462 | ||||||
| Leisure Products – 0.2% |
| |||||||
| Brunswick Corp. |
10,790 | 543,061 | ||||||
| Hasbro, Inc. |
47,959 | 4,077,474 | ||||||
| Polaris Industries, Inc. |
19,644 | 1,658,543 | ||||||
|
|
|
|||||||
| Total Leisure Products |
|
6,279,078 | ||||||
| Life Sciences Tools & Services – 0.1% |
| |||||||
| Bio-Techne Corp. |
5,316 | 1,055,492 | ||||||
| Bruker Corp. |
11,592 | 445,596 | ||||||
| PerkinElmer, Inc. |
5,211 | 502,132 | ||||||
|
|
|
|||||||
| Total Life Sciences Tools & Services |
|
2,003,220 | ||||||
| Machinery – 3.7% |
| |||||||
| AGCO Corp. |
16,290 | 1,132,970 | ||||||
| Allison Transmission Holdings, Inc. |
13,446 | 603,994 | ||||||
| Caterpillar, Inc. |
187,780 | 25,442,312 | ||||||
| Crane Co. |
15,308 | 1,295,363 | ||||||
| Cummins, Inc. |
62,359 | 9,844,615 | ||||||
| Deere & Co. |
68,394 | 10,932,097 | ||||||
| Donaldson Co., Inc. |
26,297 | 1,316,428 | ||||||
| Dover Corp. |
48,178 | 4,519,096 | ||||||
| Fortive Corp. |
21,361 | 1,791,974 | ||||||
| Graco, Inc. |
33,913 | 1,679,372 | ||||||
| IDEX Corp. |
14,570 | 2,210,852 | ||||||
| Illinois Tool Works, Inc. |
117,486 | 16,862,766 | ||||||
| ITT, Inc. |
13,894 | 805,852 | ||||||
| Lincoln Electric Holdings, Inc. |
19,381 | 1,625,484 | ||||||
| Nordson Corp. |
9,062 | 1,200,896 | ||||||
| Oshkosh Corp. |
14,165 | 1,064,216 | ||||||
| Parker-Hannifin Corp. |
29,896 | 5,130,752 | ||||||
| Snap-on, Inc. |
18,342 | 2,870,890 | ||||||
| Stanley Black & Decker, Inc. |
37,430 | 5,096,843 | ||||||
| Toro Co. (The) |
22,288 | 1,534,306 | ||||||
| Trinity Industries, Inc. |
51,794 | 1,125,484 | ||||||
| Wabtec Corp. |
13,083 | 964,479 | ||||||
| Woodward, Inc. |
5,572 | 528,727 | ||||||
| Xylem, Inc. |
31,044 | 2,453,718 | ||||||
|
|
|
|||||||
| Total Machinery |
|
102,033,486 | ||||||
| Media – 2.0% |
| |||||||
| Cable One, Inc. |
284 | 278,712 | ||||||
| CBS Corp. Class B Non-Voting Shares |
52,340 | 2,487,720 | ||||||
| Comcast Corp. Class A |
1,138,779 | 45,528,384 | ||||||
| Fox Corp. Class A* |
33,042 | 1,212,972 | ||||||
| Fox Corp. Class B* |
25,731 | 923,228 | ||||||
| Interpublic Group of Cos., Inc. (The) |
155,849 | 3,274,388 | ||||||
| Nexstar Media Group, Inc. Class A |
6,336 | 686,632 | ||||||
|
|
|
|||||||
| Total Media |
|
54,392,036 | ||||||
| Multiline Retail – 0.9% |
| |||||||
| Dollar General Corp. |
38,218 | 4,559,407 | ||||||
| Nordstrom, Inc. |
56,576 | 2,510,843 | ||||||
| Target Corp. |
239,734 | 19,241,051 | ||||||
|
|
|
|||||||
| Total Multiline Retail |
|
26,311,301 | ||||||
See Notes to Financial Statements.
| WisdomTree Trust | 57 |
Schedule of Investments (concluded)
WisdomTree U.S. Quality Dividend Growth Fund (DGRW)
March 31, 2019
| Investments | Shares | Value | ||||||
| Oil, Gas & Consumable Fuels – 7.0% |
| |||||||
| EQT Corp. |
25,339 | $ | 525,531 | |||||
| Exxon Mobil Corp. |
1,734,999 | 140,187,919 | ||||||
| Marathon Petroleum Corp. |
254,106 | 15,208,244 | ||||||
| PBF Energy, Inc. Class A |
41,904 | 1,304,891 | ||||||
| Phillips 66 |
197,815 | 18,826,053 | ||||||
| Valero Energy Corp. |
218,107 | 18,502,017 | ||||||
|
|
|
|||||||
| Total Oil, Gas & Consumable Fuels |
|
194,554,655 | ||||||
| Personal Products – 0.2% |
| |||||||
| Estee Lauder Cos., Inc. (The) Class A |
36,013 | 5,961,952 | ||||||
| Nu Skin Enterprises, Inc. Class A |
13,249 | 634,097 | ||||||
|
|
|
|||||||
| Total Personal Products |
|
6,596,049 | ||||||
| Pharmaceuticals – 2.3% |
| |||||||
| Bristol-Myers Squibb Co. |
596,728 | 28,469,893 | ||||||
| Eli Lilly & Co. |
255,902 | 33,205,843 | ||||||
| Zoetis, Inc. |
36,034 | 3,627,543 | ||||||
|
|
|
|||||||
| Total Pharmaceuticals |
|
65,303,279 | ||||||
| Professional Services – 0.1% |
| |||||||
| Insperity, Inc. |
2,473 | 305,811 | ||||||
| Robert Half International, Inc. |
32,526 | 2,119,394 | ||||||
|
|
|
|||||||
| Total Professional Services |
|
2,425,205 | ||||||
| Real Estate Management & Development – 0.0% |
| |||||||
| Jones Lang LaSalle, Inc. |
5,189 | 800,040 | ||||||
| Road & Rail – 2.2% |
| |||||||
| CSX Corp. |
138,964 | 10,397,287 | ||||||
| JB Hunt Transport Services, Inc. |
13,624 | 1,379,975 | ||||||
| Knight-Swift Transportation Holdings, Inc. |
7,960 | 260,133 | ||||||
| Landstar System, Inc. |
5,604 | 613,022 | ||||||
| Norfolk Southern Corp. |
70,924 | 13,254,986 | ||||||
| Old Dominion Freight Line, Inc. |
3,940 | 568,897 | ||||||
| Ryder System, Inc. |
24,158 | 1,497,554 | ||||||
| Union Pacific Corp. |
198,602 | 33,206,254 | ||||||
|
|
|
|||||||
| Total Road & Rail |
|
61,178,108 | ||||||
| Semiconductors & Semiconductor Equipment – 5.6% |
| |||||||
| Analog Devices, Inc. |
87,770 | 9,239,548 | ||||||
| Applied Materials, Inc. |
237,867 | 9,433,805 | ||||||
| Cabot Microelectronics Corp. |
2,542 | 284,602 | ||||||
| Intel Corp. |
1,179,641 | 63,346,722 | ||||||
| KLA-Tencor Corp. |
53,287 | 6,363,001 | ||||||
| Lam Research Corp. |
49,603 | 8,879,433 | ||||||
| Maxim Integrated Products, Inc. |
95,050 | 5,053,808 | ||||||
| Microchip Technology, Inc.(a) |
44,860 | 3,721,586 | ||||||
| MKS Instruments, Inc. |
5,431 | 505,355 | ||||||
| Monolithic Power Systems, Inc. |
4,864 | 659,023 | ||||||
| NVIDIA Corp. |
27,567 | 4,949,931 | ||||||
| Skyworks Solutions, Inc. |
40,484 | 3,339,120 | ||||||
| Texas Instruments, Inc. |
324,615 | 34,431,913 | ||||||
| Universal Display Corp.(a) |
2,507 | 383,195 | ||||||
| Xilinx, Inc. |
45,751 | 5,800,769 | ||||||
|
|
|
|||||||
| Total Semiconductors & Semiconductor Equipment |
|
156,391,811 | ||||||
| Software – 5.0% |
| |||||||
| Citrix Systems, Inc. |
15,985 | 1,593,065 | ||||||
| Intuit, Inc. |
26,843 | 7,017,029 | ||||||
| j2 Global, Inc. |
13,175 | 1,140,955 | ||||||
| Microsoft Corp. |
1,071,659 | 126,391,462 | ||||||
| Pegasystems, Inc. |
4,101 | 266,565 | ||||||
| Symantec Corp. |
73,751 | 1,695,536 | ||||||
|
|
|
|||||||
| Total Software |
|
138,104,612 | ||||||
| Specialty Retail – 4.5% |
| |||||||
| Aaron’s, Inc. |
5,208 | 273,941 | ||||||
| Advance Auto Parts, Inc. |
3,010 | 513,295 | ||||||
| American Eagle Outfitters, Inc. |
45,456 | 1,007,760 | ||||||
| Best Buy Co., Inc. |
105,753 | 7,514,808 | ||||||
| Foot Locker, Inc. |
41,380 | 2,507,628 | ||||||
| Gap, Inc. (The) |
150,158 | 3,931,136 | ||||||
| Home Depot, Inc. (The) |
323,062 | 61,992,367 | ||||||
| Lowe’s Cos., Inc. |
201,616 | 22,070,904 | ||||||
| Ross Stores, Inc. |
54,586 | 5,081,957 | ||||||
| Tiffany & Co. |
34,182 | 3,607,910 | ||||||
| TJX Cos., Inc. (The) |
261,495 | 13,914,149 | ||||||
| Tractor Supply Co. |
24,206 | 2,366,379 | ||||||
| Williams-Sonoma, Inc. |
24,272 | 1,365,785 | ||||||
|
|
|
|||||||
| Total Specialty Retail |
|
126,148,019 | ||||||
| Technology Hardware, Storage & Peripherals – 4.8% |
| |||||||
| Apple, Inc. |
686,659 | 130,430,877 | ||||||
| NetApp, Inc. |
61,409 | 4,258,100 | ||||||
|
|
|
|||||||
| Total Technology Hardware, Storage & Peripherals |
|
134,688,977 | ||||||
| Textiles, Apparel & Luxury Goods – 0.8% |
| |||||||
| Carter’s, Inc. |
12,694 | 1,279,428 | ||||||
| Columbia Sportswear Co. |
11,305 | 1,177,755 | ||||||
| NIKE, Inc. Class B |
188,296 | 15,856,406 | ||||||
| PVH Corp. |
4,356 | 531,214 | ||||||
| Tapestry, Inc. |
124,200 | 4,035,258 | ||||||
|
|
|
|||||||
| Total Textiles, Apparel & Luxury Goods |
|
22,880,061 | ||||||
| Tobacco – 2.8% |
| |||||||
| Altria Group, Inc. |
1,356,723 | 77,916,602 | ||||||
| Trading Companies & Distributors – 0.5% |
| |||||||
| Fastenal Co. |
107,710 | 6,926,830 | ||||||
| GATX Corp. |
5,632 | 430,116 | ||||||
| MSC Industrial Direct Co., Inc. Class A |
15,827 | 1,309,051 | ||||||
| W.W. Grainger, Inc. |
14,097 | 4,242,210 | ||||||
|
|
|
|||||||
| Total Trading Companies & Distributors |
|
12,908,207 | ||||||
| TOTAL INVESTMENTS IN SECURITIES – 99.8% (Cost: $2,372,390,940) |
|
2,774,767,669 | ||||||
| Other Assets less Liabilities – 0.2% |
|
5,593,707 | ||||||
|
|
|
|||||||
| NET ASSETS – 100.0% |
|
$ | 2,780,361,376 | |||||
| * | Non-income producing security. |
| (a) | Security, or portion thereof, was on loan at March 31, 2019 (See Note 2). At March 31, 2019, the total market value of the Fund’s securities on loan identified in the Schedule of Investments was $3,679,773. The total market value of the collateral held by the Fund was $3,693,013. The total market value of the collateral includes non-cash U.S. Government securities collateral having a value of $3,693,013. |
See Notes to Financial Statements.
| 58 | WisdomTree Trust |
Schedule of Investments
WisdomTree U.S. Quality Shareholder Yield Fund (QSY)
March 31, 2019
| Investments | Shares | Value | ||||||
| COMMON STOCKS – 99.9% | ||||||||
| United States – 99.3% |
| |||||||
| Aerospace & Defense – 3.6% |
| |||||||
| Boeing Co. (The) |
568 | $ | 216,647 | |||||
| Hexcel Corp. |
3,281 | 226,914 | ||||||
| Huntington Ingalls Industries, Inc. |
1,013 | 209,894 | ||||||
| Spirit AeroSystems Holdings, Inc. Class A |
4,361 | 399,162 | ||||||
| Textron, Inc. |
6,394 | 323,920 | ||||||
|
|
|
|||||||
| Total Aerospace & Defense |
|
1,376,537 | ||||||
| Air Freight & Logistics – 0.4% |
| |||||||
| Expeditors International of Washington, Inc. |
1,808 | 137,227 | ||||||
| Airlines – 2.2% |
| |||||||
| American Airlines Group, Inc. |
5,228 | 166,041 | ||||||
| Delta Air Lines, Inc. |
2,795 | 144,362 | ||||||
| JetBlue Airways Corp.* |
9,445 | 154,520 | ||||||
| Southwest Airlines Co. |
3,767 | 195,545 | ||||||
| United Continental Holdings, Inc.* |
2,082 | 166,102 | ||||||
|
|
|
|||||||
| Total Airlines |
|
826,570 | ||||||
| Auto Components – 1.5% |
| |||||||
| Gentex Corp. |
14,864 | 307,387 | ||||||
| Lear Corp. |
1,946 | 264,092 | ||||||
|
|
|
|||||||
| Total Auto Components |
|
571,479 | ||||||
| Automobiles – 0.3% |
| |||||||
| Harley-Davidson, Inc. |
3,234 | 115,325 | ||||||
| Banks – 5.3% |
| |||||||
| Bank of America Corp. |
9,805 | 270,520 | ||||||
| Comerica, Inc. |
3,409 | 249,948 | ||||||
| Fifth Third Bancorp |
10,410 | 262,540 | ||||||
| JPMorgan Chase & Co. |
1,749 | 177,051 | ||||||
| M&T Bank Corp. |
1,771 | 278,083 | ||||||
| PacWest Bancorp |
9,843 | 370,195 | ||||||
| SunTrust Banks, Inc. |
3,452 | 204,531 | ||||||
| Zions Bancorp NA |
4,572 | 207,615 | ||||||
|
|
|
|||||||
| Total Banks |
|
2,020,483 | ||||||
| Beverages – 0.3% |
| |||||||
| Constellation Brands, Inc. Class A |
761 | 133,426 | ||||||
| Biotechnology – 3.2% |
| |||||||
| AbbVie, Inc. |
3,204 | 258,210 | ||||||
| Amgen, Inc. |
1,917 | 364,192 | ||||||
| Biogen, Inc.* |
435 | 102,825 | ||||||
| Celgene Corp.* |
5,431 | 512,361 | ||||||
|
|
|
|||||||
| Total Biotechnology |
|
1,237,588 | ||||||
| Building Products – 1.9% |
| |||||||
| Fortune Brands Home & Security, Inc. |
7,394 | 352,028 | ||||||
| Lennox International, Inc. |
677 | 178,999 | ||||||
| Masco Corp. |
4,645 | 182,595 | ||||||
|
|
|
|||||||
| Total Building Products |
|
713,622 | ||||||
| Capital Markets – 4.7% |
| |||||||
| Affiliated Managers Group, Inc. |
2,822 | 302,265 | ||||||
| Ameriprise Financial, Inc. |
2,454 | 314,358 | ||||||
| Bank of New York Mellon Corp. (The) |
3,703 | 186,742 | ||||||
| FactSet Research Systems, Inc. |
436 | 108,246 | ||||||
| LPL Financial Holdings, Inc. |
2,999 | 208,880 | ||||||
| Morgan Stanley |
6,567 | 277,127 | ||||||
| Northern Trust Corp. |
1,569 | 141,853 | ||||||
| S&P Global, Inc. |
595 | 125,277 | ||||||
| SEI Investments Co. |
2,343 | 122,422 | ||||||
|
|
|
|||||||
| Total Capital Markets |
|
1,787,170 | ||||||
| Chemicals – 1.5% |
| |||||||
| Eastman Chemical Co. |
2,330 | 176,800 | ||||||
| NewMarket Corp. |
342 | 148,278 | ||||||
| PPG Industries, Inc. |
2,166 | 244,476 | ||||||
|
|
|
|||||||
| Total Chemicals |
|
569,554 | ||||||
| Commercial Services & Supplies – 0.4% |
| |||||||
| Republic Services, Inc. |
1,716 | 137,932 | ||||||
| Communications Equipment – 2.9% |
| |||||||
| Cisco Systems, Inc. |
7,130 | 384,949 | ||||||
| F5 Networks, Inc.* |
981 | 153,948 | ||||||
| Juniper Networks, Inc. |
12,648 | 334,793 | ||||||
| Ubiquiti Networks, Inc. |
1,603 | 239,985 | ||||||
|
|
|
|||||||
| Total Communications Equipment |
|
1,113,675 | ||||||
| Construction & Engineering – 0.5% |
| |||||||
| Quanta Services, Inc. |
5,164 | 194,889 | ||||||
| Consumer Finance – 2.9% |
| |||||||
| Ally Financial, Inc. |
10,509 | 288,892 | ||||||
| Discover Financial Services |
4,678 | 332,887 | ||||||
| Synchrony Financial |
14,909 | 475,597 | ||||||
|
|
|
|||||||
| Total Consumer Finance |
|
1,097,376 | ||||||
| Containers & Packaging – 1.1% |
| |||||||
| International Paper Co. |
3,561 | 164,767 | ||||||
| Sealed Air Corp. |
5,328 | 245,408 | ||||||
|
|
|
|||||||
| Total Containers & Packaging |
|
410,175 | ||||||
| Diversified Consumer Services – 0.3% |
| |||||||
| H&R Block, Inc. |
4,086 | 97,819 | ||||||
| Diversified Financial Services – 2.0% |
| |||||||
| Jefferies Financial Group, Inc. |
16,851 | 316,630 | ||||||
| Voya Financial, Inc. |
8,926 | 445,943 | ||||||
|
|
|
|||||||
| Total Diversified Financial Services |
|
762,573 | ||||||
| Diversified Telecommunication Services – 0.3% |
| |||||||
| CenturyLink, Inc. |
9,208 | 110,404 | ||||||
| Electrical Equipment – 1.5% |
| |||||||
| Acuity Brands, Inc. |
1,570 | 188,416 | ||||||
| Emerson Electric Co. |
1,893 | 129,614 | ||||||
| Rockwell Automation, Inc. |
1,460 | 256,171 | ||||||
|
|
|
|||||||
| Total Electrical Equipment |
|
574,201 | ||||||
| Electronic Equipment, Instruments & Components – 1.9% |
| |||||||
| Avnet, Inc. |
6,569 | 284,898 | ||||||
| Corning, Inc. |
9,036 | 299,092 | ||||||
| TE Connectivity Ltd. |
1,690 | 136,467 | ||||||
|
|
|
|||||||
| Total Electronic Equipment, Instruments & Components |
|
720,457 | ||||||
See Notes to Financial Statements.
| WisdomTree Trust | 59 |
Schedule of Investments (continued)
WisdomTree U.S. Quality Shareholder Yield Fund (QSY)
March 31, 2019
| Investments | Shares | Value | ||||||
| Equity Real Estate Investment Trusts (REITs) – 1.0% |
| |||||||
| SL Green Realty Corp. |
4,101 | $ | 368,762 | |||||
| Food & Staples Retailing – 1.9% |
| |||||||
| Casey’s General Stores, Inc. |
1,056 | 135,981 | ||||||
| Kroger Co. (The) |
12,196 | 300,022 | ||||||
| U.S. Foods Holding Corp.* |
3,414 | 119,183 | ||||||
| Walgreens Boots Alliance, Inc. |
2,730 | 172,727 | ||||||
|
|
|
|||||||
| Total Food & Staples Retailing |
|
727,913 | ||||||
| Food Products – 0.4% |
| |||||||
| Conagra Brands, Inc. |
5,696 | 158,007 | ||||||
| Health Care Providers & Services – 2.7% |
| |||||||
| Amedisys, Inc.* |
983 | 121,165 | ||||||
| Cardinal Health, Inc. |
4,502 | 216,771 | ||||||
| DaVita, Inc.* |
6,429 | 349,030 | ||||||
| HCA Healthcare, Inc. |
909 | 118,515 | ||||||
| McKesson Corp. |
1,978 | 231,545 | ||||||
|
|
|
|||||||
| Total Health Care Providers & Services |
|
1,037,026 | ||||||
| Hotels, Restaurants & Leisure – 6.8% |
| |||||||
| Domino’s Pizza, Inc. |
526 | 135,761 | ||||||
| Dunkin’ Brands Group, Inc. |
4,475 | 336,072 | ||||||
| Hilton Worldwide Holdings, Inc. |
3,592 | 298,531 | ||||||
| Hyatt Hotels Corp. Class A |
4,846 | 351,674 | ||||||
| Las Vegas Sands Corp. |
2,282 | 139,111 | ||||||
| Marriott International, Inc. Class A |
2,559 | 320,105 | ||||||
| McDonald’s Corp. |
723 | 137,298 | ||||||
| MGM Resorts International |
10,536 | 270,354 | ||||||
| Starbucks Corp. |
4,116 | 305,983 | ||||||
| Yum! Brands, Inc. |
2,955 | 294,939 | ||||||
|
|
|
|||||||
| Total Hotels, Restaurants & Leisure |
|
2,589,828 | ||||||
| Household Durables – 3.0% |
| |||||||
| NVR, Inc.* |
107 | 296,069 | ||||||
| PulteGroup, Inc. |
7,577 | 211,853 | ||||||
| Toll Brothers, Inc. |
11,721 | 424,300 | ||||||
| Whirlpool Corp. |
1,552 | 206,245 | ||||||
|
|
|
|||||||
| Total Household Durables |
|
1,138,467 | ||||||
| Household Products – 0.3% |
| |||||||
| Kimberly-Clark Corp. |
952 | 117,953 | ||||||
| Independent Power & Renewable Electricity Producers – 0.8% |
| |||||||
| NRG Energy, Inc. |
6,841 | 290,606 | ||||||
| Industrial Conglomerates – 0.4% |
| |||||||
| 3M Co. |
662 | 137,550 | ||||||
| Insurance – 3.2% |
| |||||||
| Aflac, Inc. |
3,206 | 160,300 | ||||||
| Allstate Corp. (The) |
1,670 | 157,281 | ||||||
| Loews Corp. |
5,092 | 244,059 | ||||||
| MetLife, Inc. |
5,071 | 215,872 | ||||||
| Primerica, Inc. |
1,166 | 142,427 | ||||||
| Prudential Financial, Inc. |
1,960 | 180,085 | ||||||
| Torchmark Corp. |
1,579 | 129,399 | ||||||
|
|
|
|||||||
| Total Insurance |
|
1,229,423 | ||||||
| Internet & Direct Marketing Retail – 1.7% |
| |||||||
| Booking Holdings, Inc.* |
92 | 160,532 | ||||||
| eBay, Inc. |
12,880 | 478,363 | ||||||
|
|
|
|||||||
| Total Internet & Direct Marketing Retail |
|
638,895 | ||||||
| IT Services – 2.5% |
| |||||||
| Akamai Technologies, Inc.* |
2,027 | 145,356 | ||||||
| Black Knight, Inc.* |
2,281 | 124,315 | ||||||
| Booz Allen Hamilton Holding Corp. |
1,920 | 111,629 | ||||||
| DXC Technology Co. |
1,610 | 103,539 | ||||||
| Fiserv, Inc.* |
1,769 | 156,167 | ||||||
| International Business Machines Corp. |
1,328 | 187,381 | ||||||
| VeriSign, Inc.* |
702 | 127,455 | ||||||
|
|
|
|||||||
| Total IT Services |
|
955,842 | ||||||
| Leisure Products – 0.3% |
| |||||||
| Polaris Industries, Inc. |
1,572 | 132,724 | ||||||
| Life Sciences Tools & Services – 0.6% |
| |||||||
| Waters Corp.* |
902 | 227,042 | ||||||
| Machinery – 3.5% |
| |||||||
| Allison Transmission Holdings, Inc. |
6,611 | 296,966 | ||||||
| Cummins, Inc. |
1,234 | 194,812 | ||||||
| Dover Corp. |
3,597 | 337,399 | ||||||
| Illinois Tool Works, Inc. |
1,189 | 170,657 | ||||||
| Lincoln Electric Holdings, Inc. |
1,268 | 106,347 | ||||||
| Snap-on, Inc. |
649 | 101,581 | ||||||
| Toro Co. (The) |
2,039 | 140,365 | ||||||
|
|
|
|||||||
| Total Machinery |
|
1,348,127 | ||||||
| Media – 2.8% |
| |||||||
| Charter Communications, Inc. Class A* |
903 | 313,260 | ||||||
| Comcast Corp. Class A |
3,353 | 134,053 | ||||||
| Liberty Global PLC Class C* |
15,135 | 366,418 | ||||||
| Omnicom Group, Inc. |
1,972 | 143,936 | ||||||
| Sirius XM Holdings, Inc. |
21,104 | 119,660 | ||||||
|
|
|
|||||||
| Total Media |
|
1,077,327 | ||||||
| Metals & Mining – 0.7% |
| |||||||
| Reliance Steel & Aluminum Co. |
1,601 | 144,506 | ||||||
| Steel Dynamics, Inc. |
3,489 | 123,057 | ||||||
|
|
|
|||||||
| Total Metals & Mining |
|
267,563 | ||||||
| Multiline Retail – 1.2% |
| |||||||
| Dollar General Corp. |
917 | 109,398 | ||||||
| Kohl’s Corp. |
1,990 | 136,852 | ||||||
| Target Corp. |
2,800 | 224,728 | ||||||
|
|
|
|||||||
| Total Multiline Retail |
|
470,978 | ||||||
| Oil, Gas & Consumable Fuels – 4.5% |
| |||||||
| Anadarko Petroleum Corp. |
7,304 | 332,186 | ||||||
| Cabot Oil & Gas Corp. |
7,625 | 199,012 | ||||||
| ConocoPhillips |
2,126 | 141,889 | ||||||
| Marathon Petroleum Corp. |
6,103 | 365,265 | ||||||
| Occidental Petroleum Corp. |
1,893 | 125,317 | ||||||
| Phillips 66 |
3,346 | 318,439 | ||||||
| Valero Energy Corp. |
2,669 | 226,411 | ||||||
|
|
|
|||||||
| Total Oil, Gas & Consumable Fuels |
|
1,708,519 | ||||||
See Notes to Financial Statements.
| 60 | WisdomTree Trust |
Schedule of Investments (concluded)
WisdomTree U.S. Quality Shareholder Yield Fund (QSY)
March 31, 2019
| Investments | Shares | Value | ||||||
| Pharmaceuticals – 0.3% |
| |||||||
| Pfizer, Inc. |
2,557 | $ | 108,596 | |||||
| Professional Services – 0.4% |
| |||||||
| Robert Half International, Inc. |
2,421 | 157,752 | ||||||
| Road & Rail – 2.3% |
| |||||||
| CSX Corp. |
2,552 | 190,941 | ||||||
| Genesee & Wyoming, Inc. Class A* |
2,135 | 186,044 | ||||||
| Norfolk Southern Corp. |
1,250 | 233,612 | ||||||
| Union Pacific Corp. |
1,685 | 281,732 | ||||||
|
|
|
|||||||
| Total Road & Rail |
|
892,329 | ||||||
| Semiconductors & Semiconductor Equipment – 4.7% |
| |||||||
| Applied Materials, Inc. |
10,921 | 433,127 | ||||||
| Intel Corp. |
3,002 | 161,207 | ||||||
| KLA-Tencor Corp. |
1,356 | 161,920 | ||||||
| Lam Research Corp. |
2,707 | 484,580 | ||||||
| Maxim Integrated Products, Inc. |
2,480 | 131,862 | ||||||
| Skyworks Solutions, Inc. |
3,081 | 254,121 | ||||||
| Texas Instruments, Inc. |
1,568 | 166,318 | ||||||
|
|
|
|||||||
| Total Semiconductors & Semiconductor Equipment |
|
1,793,135 | ||||||
| Software – 3.7% |
| |||||||
| CDK Global, Inc. |
7,342 | 431,857 | ||||||
| Citrix Systems, Inc. |
3,058 | 304,760 | ||||||
| Fair Isaac Corp.* |
958 | 260,222 | ||||||
| Oracle Corp. |
7,354 | 394,983 | ||||||
|
|
|
|||||||
| Total Software |
|
1,391,822 | ||||||
| Specialty Retail – 5.8% |
| |||||||
| AutoZone, Inc.* |
253 | 259,102 | ||||||
| Best Buy Co., Inc. |
6,426 | 456,632 | ||||||
| Foot Locker, Inc. |
3,418 | 207,131 | ||||||
| Gap, Inc. (The) |
4,198 | 109,904 | ||||||
| Home Depot, Inc. (The) |
858 | 164,642 | ||||||
| Lowe’s Cos., Inc. |
1,501 | 164,314 | ||||||
| O’Reilly Automotive, Inc.* |
474 | 184,054 | ||||||
| Ross Stores, Inc. |
1,508 | 140,395 | ||||||
| Tiffany & Co. |
1,624 | 171,413 | ||||||
| TJX Cos., Inc. (The) |
2,183 | 116,157 | ||||||
| Williams-Sonoma, Inc. |
4,197 | 236,165 | ||||||
|
|
|
|||||||
| Total Specialty Retail |
|
2,209,909 | ||||||
| Technology Hardware, Storage & Peripherals – 4.1% |
| |||||||
| Apple, Inc. |
1,653 | 313,987 | ||||||
| Hewlett Packard Enterprise Co. |
25,834 | 398,619 | ||||||
| HP, Inc. |
11,191 | 217,441 | ||||||
| NetApp, Inc. |
4,072 | 282,352 | ||||||
| Western Digital Corp. |
7,064 | 339,496 | ||||||
|
|
|
|||||||
| Total Technology Hardware, Storage & Peripherals |
|
1,551,895 | ||||||
| Textiles, Apparel & Luxury Goods – 0.7% |
| |||||||
| Hanesbrands, Inc. |
7,617 | 136,192 | ||||||
| NIKE, Inc. Class B |
1,680 | 141,473 | ||||||
|
|
|
|||||||
| Total Textiles, Apparel & Luxury Goods |
|
277,665 | ||||||
| Tobacco – 0.3% |
| |||||||
| Altria Group, Inc. |
2,206 | 126,691 | ||||||
| Total United States |
|
37,840,828 | ||||||
| United Kingdom – 0.6% | ||||||||
| Capital Markets – 0.6% | ||||||||
| Janus Henderson Group PLC |
9,284 | 231,914 | ||||||
| TOTAL INVESTMENTS IN SECURITIES – 99.9% (Cost: $34,983,743) |
38,072,742 | |||||||
| Other Assets less Liabilities – 0.1% |
40,185 | |||||||
|
|
|
|||||||
| NET ASSETS – 100.0% | $ | 38,112,927 | ||||||
| * | Non-income producing security. |
See Notes to Financial Statements.
| WisdomTree Trust | 61 |
Schedule of Investments
WisdomTree U.S. SmallCap Dividend Fund (DES)
March 31, 2019
| Investments | Shares | Value | ||||||
| COMMON STOCKS – 98.9% | ||||||||
| United States – 98.8% |
| |||||||
| Aerospace & Defense – 0.5% |
| |||||||
| AAR Corp. |
32,676 | $ | 1,062,297 | |||||
| Cubic Corp. |
21,032 | 1,182,839 | ||||||
| Moog, Inc. Class A |
54,338 | 4,724,689 | ||||||
| National Presto Industries, Inc. |
10,051 | 1,091,036 | ||||||
| Triumph Group, Inc. |
104,614 | 1,993,943 | ||||||
|
|
|
|||||||
| Total Aerospace & Defense |
|
10,054,804 | ||||||
| Air Freight & Logistics – 0.2% |
| |||||||
| Forward Air Corp. |
52,276 | 3,383,825 | ||||||
| Airlines – 0.5% |
| |||||||
| Allegiant Travel Co. |
53,234 | 6,892,206 | ||||||
| Hawaiian Holdings, Inc. |
106,404 | 2,793,105 | ||||||
|
|
|
|||||||
| Total Airlines |
|
9,685,311 | ||||||
| Auto Components – 1.7% |
| |||||||
| Cooper Tire & Rubber Co. |
85,420 | 2,553,204 | ||||||
| Dana, Inc. |
611,874 | 10,854,645 | ||||||
| LCI Industries |
133,795 | 10,278,132 | ||||||
| Standard Motor Products, Inc. |
54,294 | 2,665,835 | ||||||
| Strattec Security Corp. |
9,410 | 276,466 | ||||||
| Superior Industries International, Inc. |
256,642 | 1,221,616 | ||||||
| Tenneco, Inc. Class A |
292,526 | 6,482,376 | ||||||
| Tower International, Inc. |
54,729 | 1,150,951 | ||||||
|
|
|
|||||||
| Total Auto Components |
|
35,483,225 | ||||||
| Automobiles – 0.1% |
| |||||||
| Winnebago Industries, Inc. |
94,212 | 2,934,704 | ||||||
| Banks – 6.4% |
| |||||||
| 1st Constitution Bancorp |
4,650 | 82,631 | ||||||
| 1st Source Corp. |
24,294 | 1,091,044 | ||||||
| ACNB Corp. |
9,274 | 343,138 | ||||||
| Amalgamated Bank Class A |
14,067 | 220,149 | ||||||
| American National Bankshares, Inc. |
12,733 | 444,636 | ||||||
| Ameris Bancorp |
19,255 | 661,409 | ||||||
| Ames National Corp. |
21,874 | 599,566 | ||||||
| Arrow Financial Corp. |
18,808 | 618,595 | ||||||
| Banc of California, Inc. |
99,516 | 1,377,301 | ||||||
| BancFirst Corp. |
30,462 | 1,588,593 | ||||||
| Bank of Commerce Holdings |
9,051 | 95,488 | ||||||
| Bank of Marin Bancorp |
12,699 | 516,722 | ||||||
| Bank of Princeton (The) |
12,216 | 387,614 | ||||||
| BankFinancial Corp. |
19,792 | 294,307 | ||||||
| Bankwell Financial Group, Inc. |
11,669 | 340,501 | ||||||
| Banner Corp. |
30,750 | 1,665,728 | ||||||
| Bar Harbor Bankshares |
22,509 | 582,308 | ||||||
| BCB Bancorp, Inc. |
53,670 | 719,178 | ||||||
| Berkshire Hills Bancorp, Inc. |
65,117 | 1,773,787 | ||||||
| Blue Hills Bancorp, Inc. |
30,608 | 731,531 | ||||||
| Boston Private Financial Holdings, Inc. |
118,064 | 1,293,981 | ||||||
| Bridge Bancorp, Inc. |
27,380 | 802,234 | ||||||
| Brookline Bancorp, Inc. |
94,487 | 1,360,613 | ||||||
| Bryn Mawr Bank Corp. |
23,140 | 836,048 | ||||||
| Business First Bancshares, Inc.(a) |
7,999 | 196,295 | ||||||
| C&F Financial Corp. |
3,907 | 197,694 | ||||||
| Cadence BanCorp |
218,411 | 4,051,524 | ||||||
| Cambridge Bancorp(a) |
697 | 57,746 | ||||||
| Camden National Corp. |
17,115 | 714,038 | ||||||
| Capital City Bank Group, Inc. |
10,445 | 227,492 | ||||||
| Capstar Financial Holdings, Inc. |
29,104 | 420,262 | ||||||
| CenterState Bank Corp. |
54,011 | 1,286,002 | ||||||
| Central Pacific Financial Corp. |
36,473 | 1,051,881 | ||||||
| Central Valley Community Bancorp |
8,086 | 158,081 | ||||||
| Century Bancorp, Inc. Class A |
1,081 | 78,913 | ||||||
| Chemung Financial Corp. |
4,742 | 222,542 | ||||||
| Citizens & Northern Corp. |
24,693 | 618,313 | ||||||
| City Holding Co. |
21,364 | 1,627,723 | ||||||
| Civista Bancshares, Inc. |
11,143 | 243,252 | ||||||
| CNB Financial Corp. |
18,029 | 455,593 | ||||||
| Codorus Valley Bancorp, Inc. |
8,245 | 176,031 | ||||||
| Columbia Banking System, Inc. |
75,788 | 2,477,510 | ||||||
| Community Financial Corp. (The) |
2,513 | 71,294 | ||||||
| Community Trust Bancorp, Inc. |
25,198 | 1,034,630 | ||||||
| ConnectOne Bancorp, Inc. |
35,667 | 702,640 | ||||||
| County Bancorp, Inc. |
18,793 | 330,757 | ||||||
| DNB Financial Corp.(a) |
1,660 | 62,698 | ||||||
| Enterprise Bancorp, Inc. |
9,098 | 261,386 | ||||||
| Enterprise Financial Services Corp. |
7,672 | 312,787 | ||||||
| Evans Bancorp, Inc. |
4,984 | 177,680 | ||||||
| FB Financial Corp. |
4,967 | 157,752 | ||||||
| Fidelity Southern Corp. |
31,658 | 867,113 | ||||||
| Financial Institutions, Inc. |
21,609 | 587,333 | ||||||
| First Bancorp |
13,034 | 453,062 | ||||||
| First Bancorp, Inc. |
17,092 | 425,933 | ||||||
| First Bancshares, Inc. (The) |
2,512 | 77,621 | ||||||
| First Bank |
4,665 | 53,787 | ||||||
| First Busey Corp. |
59,930 | 1,462,292 | ||||||
| First Business Financial Services, Inc. |
10,908 | 218,378 | ||||||
| First Choice Bancorp(a) |
21,468 | 461,562 | ||||||
| First Commonwealth Financial Corp. |
110,829 | 1,396,445 | ||||||
| First Community Bankshares, Inc. |
21,558 | 714,432 | ||||||
| First Community Corp. |
4,923 | 93,882 | ||||||
| First Financial Bancorp |
120,381 | 2,896,367 | ||||||
| First Financial Corp. |
14,252 | 598,584 | ||||||
| First Financial Northwest, Inc. |
10,273 | 161,800 | ||||||
| First Guaranty Bancshares, Inc. |
8,484 | 173,922 | ||||||
| First Internet Bancorp |
21,747 | 420,370 | ||||||
| First Interstate BancSystem, Inc. Class A |
36,113 | 1,438,020 | ||||||
| First Merchants Corp. |
48,359 | 1,782,029 | ||||||
| First Midwest Bancorp, Inc. |
105,741 | 2,163,461 | ||||||
| First Northwest Bancorp |
23,872 | 371,687 | ||||||
| First of Long Island Corp. (The) |
47,101 | 1,032,925 | ||||||
| Flushing Financial Corp. |
53,695 | 1,177,531 | ||||||
| German American Bancorp, Inc. |
18,149 | 533,581 | ||||||
| Great Southern Bancorp, Inc. |
13,317 | 691,152 | ||||||
| Great Western Bancorp, Inc. |
71,443 | 2,256,884 | ||||||
| Guaranty Bancshares, Inc. |
9,076 | 265,201 | ||||||
See Notes to Financial Statements.
| 62 | WisdomTree Trust |
Schedule of Investments (continued)
WisdomTree U.S. SmallCap Dividend Fund (DES)
March 31, 2019
| Investments | Shares | Value | ||||||
| Hanmi Financial Corp. |
80,789 | $ | 1,718,382 | |||||
| Hawthorn Bancshares, Inc. |
4,062 | 94,401 | ||||||
| Heartland Financial USA, Inc. |
9,664 | 412,170 | ||||||
| Heritage Commerce Corp. |
51,380 | 621,698 | ||||||
| Heritage Financial Corp. |
26,797 | 807,662 | ||||||
| Hilltop Holdings, Inc. |
69,964 | 1,276,843 | ||||||
| Hope Bancorp, Inc. |
283,863 | 3,712,928 | ||||||
| Horizon Bancorp, Inc. |
38,360 | 617,212 | ||||||
| Independent Bank Corp. |
39,917 | 2,275,684 | ||||||
| Independent Bank Group, Inc. |
31,227 | 1,601,633 | ||||||
| International Bancshares Corp. |
62,968 | 2,394,673 | ||||||
| Lakeland Bancorp, Inc. |
66,015 | 985,604 | ||||||
| Lakeland Financial Corp. |
20,000 | 904,400 | ||||||
| LCNB Corp. |
45,170 | 774,666 | ||||||
| LegacyTexas Financial Group, Inc. |
46,738 | 1,747,534 | ||||||
| Level One Bancorp, Inc.(a) |
9,319 | 216,760 | ||||||
| Live Oak Bancshares, Inc.(a) |
22,511 | 328,886 | ||||||
| Macatawa Bank Corp. |
33,436 | 332,354 | ||||||
| MBT Financial Corp. |
28,168 | 282,243 | ||||||
| Mercantile Bank Corp. |
19,788 | 647,463 | ||||||
| Mid Penn Bancorp, Inc.(a) |
12,233 | 299,709 | ||||||
| Middlefield Banc Corp. |
3,598 | 148,274 | ||||||
| Midland States Bancorp, Inc. |
51,332 | 1,235,048 | ||||||
| MidSouth Bancorp, Inc. |
3,062 | 34,937 | ||||||
| MidWestOne Financial Group, Inc. |
31,006 | 844,914 | ||||||
| MutualFirst Financial, Inc. |
7,055 | 211,438 | ||||||
| National Bank Holdings Corp. Class A |
26,018 | 865,359 | ||||||
| NBT Bancorp, Inc. |
49,758 | 1,791,786 | ||||||
| Northrim BanCorp, Inc. |
9,091 | 312,912 | ||||||
| Norwood Financial Corp. |
8,366 | 258,007 | ||||||
| OFG Bancorp |
20,714 | 409,930 | ||||||
| Old National Bancorp |
188,441 | 3,090,432 | ||||||
| Old Point Financial Corp.(a) |
3,676 | 77,931 | ||||||
| Old Second Bancorp, Inc. |
6,008 | 75,641 | ||||||
| Opus Bank |
45,418 | 899,276 | ||||||
| Origin Bancorp, Inc. |
5,629 | 191,667 | ||||||
| Orrstown Financial Services, Inc. |
21,116 | 392,546 | ||||||
| Park National Corp. |
27,992 | 2,652,242 | ||||||
| Parke Bancorp, Inc. |
9,428 | 196,951 | ||||||
| Peapack Gladstone Financial Corp. |
5,226 | 137,026 | ||||||
| Penns Woods Bancorp, Inc. |
9,937 | 408,411 | ||||||
| Peoples Bancorp of North Carolina, Inc. |
3,976 | 105,762 | ||||||
| Peoples Bancorp, Inc. |
26,156 | 810,051 | ||||||
| Peoples Financial Services Corp. |
9,875 | 446,745 | ||||||
| Plumas Bancorp |
2,986 | 68,051 | ||||||
| Preferred Bank |
10,284 | 462,471 | ||||||
| Premier Financial Bancorp, Inc. |
19,452 | 305,591 | ||||||
| QCR Holdings, Inc. |
3,505 | 118,890 | ||||||
| RBB Bancorp |
12,180 | 228,984 | ||||||
| Reliant Bancorp, Inc. |
4,272 | 95,351 | ||||||
| Renasant Corp. |
63,889 | 2,162,643 | ||||||
| Republic Bancorp, Inc. Class A |
21,056 | 941,624 | ||||||
| S&T Bancorp, Inc. |
34,808 | 1,375,960 | ||||||
| Sandy Spring Bancorp, Inc. |
38,213 | 1,195,303 | ||||||
| SB One Bancorp |
2,552 | 55,429 | ||||||
| ServisFirst Bancshares, Inc. |
28,340 | 956,758 | ||||||
| Shore Bancshares, Inc. |
7,929 | 118,221 | ||||||
| Sierra Bancorp |
17,620 | 428,166 | ||||||
| Simmons First National Corp. Class A |
81,401 | 1,992,696 | ||||||
| South State Corp. |
38,432 | 2,626,443 | ||||||
| Southern National Bancorp of Virginia, Inc. |
25,723 | 376,842 | ||||||
| Southside Bancshares, Inc. |
50,476 | 1,677,317 | ||||||
| Stock Yards Bancorp, Inc. |
33,801 | 1,142,812 | ||||||
| Summit Financial Group, Inc. |
10,027 | 265,816 | ||||||
| Tompkins Financial Corp. |
18,298 | 1,391,929 | ||||||
| Towne Bank |
72,959 | 1,805,735 | ||||||
| TriCo Bancshares |
25,767 | 1,012,385 | ||||||
| Trustmark Corp. |
88,532 | 2,977,331 | ||||||
| Two River Bancorp |
4,074 | 64,573 | ||||||
| Union Bankshares Corp. |
91,285 | 2,951,244 | ||||||
| Union Bankshares, Inc.(a) |
5,694 | 257,540 | ||||||
| United Community Banks, Inc. |
94,980 | 2,367,851 | ||||||
| Unity Bancorp, Inc. |
6,124 | 115,621 | ||||||
| Univest Financial Corp. |
39,162 | 957,903 | ||||||
| Washington Trust Bancorp, Inc. |
26,053 | 1,254,452 | ||||||
| WesBanco, Inc. |
59,100 | 2,349,225 | ||||||
| West Bancorporation, Inc. |
43,611 | 901,875 | ||||||
| Westamerica Bancorporation |
30,578 | 1,889,720 | ||||||
|
|
|
|||||||
| Total Banks |
|
133,117,915 | ||||||
| Beverages – 0.1% |
| |||||||
| Coca-Cola Consolidated, Inc. |
5,556 | 1,599,184 | ||||||
| MGP Ingredients, Inc.(a) |
13,469 | 1,039,133 | ||||||
|
|
|
|||||||
| Total Beverages |
|
2,638,317 | ||||||
| Building Products – 1.1% |
| |||||||
| AAON, Inc. |
58,829 | 2,716,723 | ||||||
| Advanced Drainage Systems, Inc. |
92,125 | 2,374,061 | ||||||
| Apogee Enterprises, Inc. |
79,255 | 2,971,270 | ||||||
| Griffon Corp. |
190,114 | 3,513,307 | ||||||
| Insteel Industries, Inc. |
14,993 | 313,654 | ||||||
| Quanex Building Products Corp. |
119,633 | 1,900,968 | ||||||
| Simpson Manufacturing Co., Inc. |
101,296 | 6,003,814 | ||||||
| Universal Forest Products, Inc. |
115,658 | 3,457,018 | ||||||
|
|
|
|||||||
| Total Building Products |
|
23,250,815 | ||||||
| Capital Markets – 2.1% |
| |||||||
| Ares Management Corp. Class A |
209,101 | 4,853,234 | ||||||
| Artisan Partners Asset Management, Inc. Class A |
233,271 | 5,871,431 | ||||||
| Associated Capital Group, Inc. Class A |
907 | 35,881 | ||||||
| B. Riley Financial, Inc. |
24,850 | 414,746 | ||||||
| Cohen & Steers, Inc. |
70,617 | 2,984,981 | ||||||
| Diamond Hill Investment Group, Inc. |
5,589 | 782,460 | ||||||
| Federated Investors, Inc. Class B |
173,248 | 5,077,899 | ||||||
| GAIN Capital Holdings, Inc.(a) |
74,263 | 466,372 | ||||||
| GAMCO Investors, Inc. Class A |
5,197 | 106,539 | ||||||
| Greenhill & Co., Inc. |
16,457 | 353,990 | ||||||
| Hamilton Lane, Inc. Class A |
26,235 | 1,143,321 | ||||||
| Houlihan Lokey, Inc. |
39,725 | 1,821,391 | ||||||
See Notes to Financial Statements.
| WisdomTree Trust | 63 |
Schedule of Investments (continued)
WisdomTree U.S. SmallCap Dividend Fund (DES)
March 31, 2019
| Investments | Shares | Value | ||||||
| Ladenburg Thalmann Financial Services, Inc. |
119,735 | $ | 338,850 | |||||
| Legg Mason, Inc. |
191,388 | 5,238,290 | ||||||
| Moelis & Co. Class A |
94,228 | 3,920,827 | ||||||
| Oppenheimer Holdings, Inc. Class A |
12,392 | 322,440 | ||||||
| Piper Jaffray Cos. |
13,677 | 996,096 | ||||||
| PJT Partners, Inc. Class A |
4,289 | 179,280 | ||||||
| Pzena Investment Management, Inc. Class A |
11,464 | 92,744 | ||||||
| Silvercrest Asset Management Group, Inc. Class A |
15,487 | 220,690 | ||||||
| Virtu Financial, Inc. Class A |
160,792 | 3,818,810 | ||||||
| Virtus Investment Partners, Inc. |
8,935 | 871,609 | ||||||
| Waddell & Reed Financial, Inc. Class A |
166,581 | 2,880,185 | ||||||
| Westwood Holdings Group, Inc. |
14,764 | 520,726 | ||||||
|
|
|
|||||||
| Total Capital Markets |
|
43,312,792 | ||||||
| Chemicals – 3.9% |
| |||||||
| Advanced Emissions Solutions, Inc.(a) |
275,000 | 3,179,000 | ||||||
| American Vanguard Corp. |
15,005 | 258,386 | ||||||
| Balchem Corp. |
20,699 | 1,920,867 | ||||||
| Cabot Corp. |
248,064 | 10,326,904 | ||||||
| Chase Corp. |
7,779 | 719,869 | ||||||
| FutureFuel Corp. |
97,901 | 1,311,873 | ||||||
| H.B. Fuller Co. |
106,792 | 5,194,363 | ||||||
| Hawkins, Inc. |
33,747 | 1,242,902 | ||||||
| Innophos Holdings, Inc. |
220,269 | 6,638,908 | ||||||
| Innospec, Inc. |
41,742 | 3,479,196 | ||||||
| Kronos Worldwide, Inc. |
996,995 | 13,977,870 | ||||||
| Minerals Technologies, Inc. |
17,955 | 1,055,574 | ||||||
| PolyOne Corp. |
299,557 | 8,780,016 | ||||||
| Quaker Chemical Corp. |
17,561 | 3,517,995 | ||||||
| Rayonier Advanced Materials, Inc. |
177,416 | 2,405,761 | ||||||
| Sensient Technologies Corp. |
143,783 | 9,747,050 | ||||||
| Stepan Co. |
38,206 | 3,343,789 | ||||||
| Tredegar Corp. |
131,072 | 2,115,502 | ||||||
| Valhi, Inc. |
993,076 | 2,294,005 | ||||||
|
|
|
|||||||
| Total Chemicals |
|
81,509,830 | ||||||
| Commercial Services & Supplies – 6.3% |
| |||||||
| ABM Industries, Inc. |
244,611 | 8,891,610 | ||||||
| ACCO Brands Corp. |
512,206 | 4,384,483 | ||||||
| Brady Corp. Class A |
142,970 | 6,635,238 | ||||||
| Covanta Holding Corp. |
1,155,812 | 20,007,106 | ||||||
| Deluxe Corp. |
183,517 | 8,023,363 | ||||||
| Ennis, Inc. |
176,232 | 3,658,576 | ||||||
| Herman Miller, Inc. |
205,494 | 7,229,279 | ||||||
| HNI Corp. |
198,587 | 7,206,722 | ||||||
| Interface, Inc. |
153,120 | 2,345,798 | ||||||
| Kimball International, Inc. Class B |
112,073 | 1,584,712 | ||||||
| Knoll, Inc. |
233,943 | 4,423,862 | ||||||
| LSC Communications, Inc. |
646,762 | 4,223,356 | ||||||
| Matthews International Corp. Class A |
87,464 | 3,231,795 | ||||||
| McGrath RentCorp |
85,184 | 4,818,859 | ||||||
| Mobile Mini, Inc. |
187,742 | 6,371,964 | ||||||
| Multi-Color Corp. |
18,738 | 934,839 | ||||||
| Pitney Bowes, Inc. |
2,983,667 | 20,497,792 | ||||||
| Quad/Graphics, Inc. |
491,888 | 5,853,467 | ||||||
| RR Donnelley & Sons Co. |
144,686 | 682,918 | ||||||
| Steelcase, Inc. Class A |
450,081 | 6,548,679 | ||||||
| U.S. Ecology, Inc. |
40,751 | 2,281,241 | ||||||
| UniFirst Corp. |
4,207 | 645,775 | ||||||
| Viad Corp. |
20,836 | 1,172,858 | ||||||
| VSE Corp. |
18,317 | 578,451 | ||||||
|
|
|
|||||||
| Total Commercial Services & Supplies |
|
132,232,743 | ||||||
| Communications Equipment – 0.8% |
| |||||||
| ADTRAN, Inc. |
225,253 | 3,085,966 | ||||||
| Comtech Telecommunications Corp. |
58,504 | 1,358,463 | ||||||
| InterDigital, Inc. |
90,167 | 5,949,219 | ||||||
| Plantronics, Inc. |
89,475 | 4,125,692 | ||||||
| TESSCO Technologies, Inc. |
79,911 | 1,237,022 | ||||||
|
|
|
|||||||
| Total Communications Equipment |
|
15,756,362 | ||||||
| Construction & Engineering – 1.1% |
| |||||||
| Argan, Inc. |
55,751 | 2,784,762 | ||||||
| Comfort Systems USA, Inc. |
36,966 | 1,936,649 | ||||||
| Granite Construction, Inc. |
81,687 | 3,524,794 | ||||||
| KBR, Inc. |
380,651 | 7,266,628 | ||||||
| Primoris Services Corp. |
74,696 | 1,544,713 | ||||||
| Valmont Industries, Inc. |
38,902 | 5,061,150 | ||||||
|
|
|
|||||||
| Total Construction & Engineering |
|
22,118,696 | ||||||
| Construction Materials – 0.0% |
| |||||||
| United States Lime & Minerals, Inc. |
6,472 | 499,121 | ||||||
| Consumer Finance – 0.4% |
| |||||||
| Navient Corp. |
694,412 | 8,034,347 | ||||||
| Nelnet, Inc. Class A |
17,895 | 985,477 | ||||||
|
|
|
|||||||
| Total Consumer Finance |
|
9,019,824 | ||||||
| Containers & Packaging – 1.2% |
| |||||||
| Greif, Inc. Class A |
134,800 | 5,560,500 | ||||||
| Greif, Inc. Class B |
76,386 | 3,734,512 | ||||||
| Myers Industries, Inc. |
174,791 | 2,990,674 | ||||||
| Owens-Illinois, Inc. |
262,530 | 4,982,819 | ||||||
| Silgan Holdings, Inc. |
236,664 | 7,012,354 | ||||||
|
|
|
|||||||
| Total Containers & Packaging |
|
24,280,859 | ||||||
| Distributors – 0.3% |
| |||||||
| Core-Mark Holding Co., Inc. |
112,126 | 4,163,238 | ||||||
| Weyco Group, Inc. |
42,357 | 1,311,373 | ||||||
|
|
|
|||||||
| Total Distributors |
|
5,474,611 | ||||||
| Diversified Consumer Services – 0.5% |
| |||||||
| Carriage Services, Inc. |
24,875 | 478,844 | ||||||
| Collectors Universe, Inc. |
42,476 | 744,179 | ||||||
| Graham Holdings Co. Class B |
5,024 | 3,432,296 | ||||||
| Strategic Education, Inc. |
47,732 | 6,267,689 | ||||||
|
|
|
|||||||
| Total Diversified Consumer Services |
|
10,923,008 | ||||||
| Diversified Financial Services – 0.0% |
| |||||||
| Marlin Business Services Corp. |
15,689 | 337,313 | ||||||
| Diversified Telecommunication Services – 1.6% |
| |||||||
| ATN International, Inc. |
19,730 | 1,112,575 | ||||||
See Notes to Financial Statements.
| 64 | WisdomTree Trust |
Schedule of Investments (continued)
WisdomTree U.S. SmallCap Dividend Fund (DES)
March 31, 2019
| Investments | Shares | Value | ||||||
| Cogent Communications Holdings, Inc. |
304,371 | $ | 16,512,127 | |||||
| Consolidated Communications Holdings, Inc.(a) |
1,326,417 | 14,471,209 | ||||||
| IDT Corp. Class B* |
123,698 | 821,355 | ||||||
|
|
|
|||||||
| Total Diversified Telecommunication Services |
|
32,917,266 | ||||||
| Electric Utilities – 1.2% |
| |||||||
| El Paso Electric Co. |
141,499 | 8,322,971 | ||||||
| Genie Energy Ltd. Class B |
189,132 | 1,607,622 | ||||||
| MGE Energy, Inc. |
102,151 | 6,943,203 | ||||||
| Otter Tail Corp. |
160,184 | 7,980,367 | ||||||
| Spark Energy, Inc. Class A(a) |
108,593 | 967,564 | ||||||
|
|
|
|||||||
| Total Electric Utilities |
|
25,821,727 | ||||||
| Electrical Equipment – 0.2% |
| |||||||
| Allied Motion Technologies, Inc. |
4,762 | 163,717 | ||||||
| AZZ, Inc. |
45,526 | 1,863,379 | ||||||
| Encore Wire Corp. |
5,631 | 322,206 | ||||||
| LSI Industries, Inc. |
223,409 | 587,566 | ||||||
| Powell Industries, Inc. |
46,719 | 1,240,389 | ||||||
| Preformed Line Products Co. |
9,196 | 488,216 | ||||||
|
|
|
|||||||
| Total Electrical Equipment |
|
4,665,473 | ||||||
| Electronic Equipment, Instruments & Components – 1.9% |
| |||||||
| AVX Corp. |
679,498 | 11,782,495 | ||||||
| Badger Meter, Inc. |
49,522 | 2,755,404 | ||||||
| Bel Fuse, Inc. Class B |
17,710 | 447,709 | ||||||
| Belden, Inc. |
28,471 | 1,528,893 | ||||||
| Benchmark Electronics, Inc. |
168,851 | 4,432,339 | ||||||
| CTS Corp. |
26,110 | 766,851 | ||||||
| Daktronics, Inc. |
192,797 | 1,436,338 | ||||||
| KEMET Corp. |
92,039 | 1,561,902 | ||||||
| Mesa Laboratories, Inc. |
3,204 | 738,522 | ||||||
| Methode Electronics, Inc. |
99,328 | 2,858,660 | ||||||
| MTS Systems Corp. |
66,872 | 3,641,849 | ||||||
| Park Electrochemical Corp. |
59,596 | 935,657 | ||||||
| PC Connection, Inc. |
32,411 | 1,188,511 | ||||||
| Vishay Intertechnology, Inc. |
328,095 | 6,059,914 | ||||||
|
|
|
|||||||
| Total Electronic Equipment, Instruments & Components |
|
40,135,044 | ||||||
| Energy Equipment & Services – 1.6% |
| |||||||
| Archrock, Inc. |
1,098,231 | 10,740,699 | ||||||
| DMC Global, Inc. |
9,049 | 449,192 | ||||||
| Liberty Oilfield Services, Inc. Class A(a) |
132,344 | 2,036,774 | ||||||
| Mammoth Energy Services, Inc. |
145,421 | 2,421,260 | ||||||
| RPC, Inc.(a) |
1,094,412 | 12,487,241 | ||||||
| U.S. Silica Holdings, Inc.(a) |
259,782 | 4,509,816 | ||||||
|
|
|
|||||||
| Total Energy Equipment & Services |
|
32,644,982 | ||||||
| Entertainment – 0.4% |
| |||||||
| AMC Entertainment Holdings, Inc. Class A(a) |
395,091 | 5,867,101 | ||||||
| Marcus Corp. (The) |
49,934 | 1,999,857 | ||||||
|
|
|
|||||||
| Total Entertainment |
|
7,866,958 | ||||||
| Equity Real Estate Investment Trusts (REITs) – 13.2% |
| |||||||
| Acadia Realty Trust |
125,546 | 3,423,639 | ||||||
| Agree Realty Corp. |
63,721 | 4,418,414 | ||||||
| Alexander’s, Inc. |
10,967 | 4,125,456 | ||||||
| American Assets Trust, Inc. |
54,552 | 2,501,755 | ||||||
| American Finance Trust, Inc. |
275,049 | 2,970,529 | ||||||
| Armada Hoffler Properties, Inc. |
103,386 | 1,611,788 | ||||||
| Ashford Hospitality Trust, Inc. |
536,840 | 2,549,990 | ||||||
| Bluerock Residential Growth REIT, Inc. |
93,537 | 1,008,329 | ||||||
| Braemar Hotels & Resorts, Inc. |
86,464 | 1,055,725 | ||||||
| Brandywine Realty Trust |
411,455 | 6,525,676 | ||||||
| Brookfield Property REIT, Inc. Class A |
439,109 | 8,997,343 | ||||||
| BRT Apartments Corp. |
49,354 | 685,034 | ||||||
| CareTrust REIT, Inc. |
169,637 | 3,979,684 | ||||||
| CatchMark Timber Trust, Inc. Class A |
197,502 | 1,939,470 | ||||||
| CBL & Associates Properties, Inc.(a) |
824,950 | 1,278,673 | ||||||
| Cedar Realty Trust, Inc. |
84,721 | 288,051 | ||||||
| Chatham Lodging Trust |
125,396 | 2,412,619 | ||||||
| Chesapeake Lodging Trust |
143,058 | 3,978,443 | ||||||
| CIM Commercial Trust Corp. |
27,182 | 497,159 | ||||||
| Clipper Realty, Inc. |
32,609 | 436,635 | ||||||
| Columbia Property Trust, Inc. |
183,321 | 4,126,556 | ||||||
| Community Healthcare Trust, Inc. |
56,534 | 2,029,005 | ||||||
| Condor Hospitality Trust, Inc. |
45,087 | 405,783 | ||||||
| CoreCivic, Inc. |
380,384 | 7,398,469 | ||||||
| CorEnergy Infrastructure Trust, Inc.(a) |
51,864 | 1,906,002 | ||||||
| CorePoint Lodging, Inc. |
181,591 | 2,028,372 | ||||||
| Corporate Office Properties Trust |
223,583 | 6,103,816 | ||||||
| DiamondRock Hospitality Co. |
445,840 | 4,828,447 | ||||||
| Easterly Government Properties, Inc. |
142,472 | 2,565,921 | ||||||
| Empire State Realty Trust, Inc. Class A |
188,525 | 2,978,695 | ||||||
| Essential Properties Realty Trust, Inc. |
116,547 | 2,274,998 | ||||||
| Four Corners Property Trust, Inc. |
131,409 | 3,889,706 | ||||||
| Franklin Street Properties Corp. |
190,561 | 1,370,134 | ||||||
| GEO Group, Inc. (The) |
405,690 | 7,789,248 | ||||||
| Getty Realty Corp. |
96,214 | 3,081,734 | ||||||
| Gladstone Commercial Corp. |
102,336 | 2,125,519 | ||||||
| Gladstone Land Corp.(a) |
26,862 | 339,804 | ||||||
| Global Medical REIT, Inc. |
102,477 | 1,006,324 | ||||||
| Global Net Lease, Inc. |
336,713 | 6,363,876 | ||||||
| Hannon Armstrong Sustainable Infrastructure Capital, Inc. |
120,950 | 3,101,158 | ||||||
| Hersha Hospitality Trust |
94,845 | 1,625,643 | ||||||
| Independence Realty Trust, Inc. |
299,024 | 3,226,469 | ||||||
| Industrial Logistics Properties Trust |
376,629 | 7,596,607 | ||||||
| InfraREIT, Inc. |
103,338 | 2,166,998 | ||||||
| Innovative Industrial Properties, Inc.(a) |
10,776 | 880,291 | ||||||
| Investors Real Estate Trust |
30,319 | 1,816,411 | ||||||
| iStar, Inc. |
127,043 | 1,069,702 | ||||||
| Jernigan Capital, Inc. |
52,274 | 1,099,845 | ||||||
| Kite Realty Group Trust |
258,084 | 4,126,763 | ||||||
| Lexington Realty Trust |
798,738 | 7,236,566 | ||||||
| LTC Properties, Inc. |
75,428 | 3,454,602 | ||||||
| Mack-Cali Realty Corp. |
123,492 | 2,741,522 | ||||||
| MedEquities Realty Trust, Inc. |
221,687 | 2,467,376 | ||||||
| Monmouth Real Estate Investment Corp. |
179,495 | 2,365,744 | ||||||
| National Storage Affiliates Trust |
101,038 | 2,880,593 | ||||||
| New Senior Investment Group, Inc. |
308,474 | 1,681,183 | ||||||
See Notes to Financial Statements.
| WisdomTree Trust | 65 |
Schedule of Investments (continued)
WisdomTree U.S. SmallCap Dividend Fund (DES)
March 31, 2019
| Investments | Shares | Value | ||||||
| NexPoint Residential Trust, Inc. |
40,742 | $ | 1,562,048 | |||||
| NorthStar Realty Europe Corp. |
99,654 | 1,729,993 | ||||||
| Office Properties Income Trust |
241,145 | 6,665,248 | ||||||
| One Liberty Properties, Inc. |
65,985 | 1,913,565 | ||||||
| Outfront Media, Inc. |
416,493 | 9,745,936 | ||||||
| Pebblebrook Hotel Trust |
131,562 | 4,086,316 | ||||||
| Pennsylvania Real Estate Investment Trust(a) |
313,427 | 1,971,456 | ||||||
| Piedmont Office Realty Trust, Inc. Class A |
236,076 | 4,922,185 | ||||||
| PotlatchDeltic Corp. |
116,960 | 4,419,918 | ||||||
| Preferred Apartment Communities, Inc. Class A |
140,468 | 2,081,736 | ||||||
| QTS Realty Trust, Inc. Class A |
86,482 | 3,890,825 | ||||||
| Retail Opportunity Investments Corp. |
199,358 | 3,456,868 | ||||||
| Retail Properties of America, Inc. Class A |
429,412 | 5,234,532 | ||||||
| RPT Realty |
171,810 | 2,063,438 | ||||||
| Safehold, Inc. |
32,694 | 713,056 | ||||||
| Saul Centers, Inc. |
38,564 | 1,981,033 | ||||||
| Seritage Growth Properties Class A(a) |
37,360 | 1,660,278 | ||||||
| SITE Centers Corp. |
449,397 | 6,120,787 | ||||||
| STAG Industrial, Inc. |
236,928 | 7,024,915 | ||||||
| Summit Hotel Properties, Inc. |
319,677 | 3,647,515 | ||||||
| Tanger Factory Outlet Centers, Inc.(a) |
209,403 | 4,393,275 | ||||||
| Terreno Realty Corp. |
68,539 | 2,881,380 | ||||||
| Tier REIT, Inc. |
92,022 | 2,637,351 | ||||||
| UMH Properties, Inc. |
90,915 | 1,280,083 | ||||||
| Universal Health Realty Income Trust |
26,105 | 1,976,410 | ||||||
| Urban Edge Properties |
198,784 | 3,776,896 | ||||||
| Urstadt Biddle Properties, Inc. Class A |
75,367 | 1,555,575 | ||||||
| Washington Prime Group, Inc.(a) |
837,012 | 4,729,118 | ||||||
| Washington Real Estate Investment Trust |
139,338 | 3,954,413 | ||||||
| Whitestone REIT |
146,855 | 1,765,197 | ||||||
| Xenia Hotels & Resorts, Inc. |
260,769 | 5,713,449 | ||||||
|
|
|
|||||||
| Total Equity Real Estate Investment Trusts (REITs) |
|
276,389,089 | ||||||
| Food & Staples Retailing – 0.7% |
| |||||||
| Andersons, Inc. (The) |
77,929 | 2,511,652 | ||||||
| Ingles Markets, Inc. Class A |
35,918 | 992,055 | ||||||
| PriceSmart, Inc. |
48,241 | 2,840,430 | ||||||
| SpartanNash Co. |
206,460 | 3,276,520 | ||||||
| Village Super Market, Inc. Class A |
57,448 | 1,570,054 | ||||||
| Weis Markets, Inc. |
99,721 | 4,069,614 | ||||||
|
|
|
|||||||
| Total Food & Staples Retailing |
|
15,260,325 | ||||||
| Food Products – 1.4% |
| |||||||
| Alico, Inc. |
11,205 | 304,888 | ||||||
| B&G Foods, Inc.(a) |
557,451 | 13,612,953 | ||||||
| Calavo Growers, Inc. |
30,346 | 2,544,512 | ||||||
| J&J Snack Foods Corp. |
30,489 | 4,842,873 | ||||||
| John B. Sanfilippo & Son, Inc. |
11,714 | 841,885 | ||||||
| Limoneira Co. |
30,419 | 715,759 | ||||||
| Sanderson Farms, Inc.(a) |
40,771 | 5,375,249 | ||||||
| Tootsie Roll Industries, Inc.(a) |
52,894 | 1,969,790 | ||||||
|
|
|
|||||||
| Total Food Products |
|
30,207,909 | ||||||
| Gas Utilities – 1.2% |
| |||||||
| Chesapeake Utilities Corp. |
40,704 | 3,712,612 | ||||||
| Northwest Natural Holding Co. |
113,032 | 7,418,290 | ||||||
| RGC Resources, Inc. |
12,736 | 337,632 | ||||||
| South Jersey Industries, Inc. |
438,446 | 14,060,963 | ||||||
|
|
|
|||||||
| Total Gas Utilities |
|
25,529,497 | ||||||
| Health Care Equipment & Supplies – 0.5% |
| |||||||
| Atrion Corp. |
2,416 | 2,122,891 | ||||||
| CONMED Corp. |
55,597 | 4,624,558 | ||||||
| Invacare Corp. |
48,505 | 405,987 | ||||||
| LeMaitre Vascular, Inc. |
22,356 | 693,036 | ||||||
| Meridian Bioscience, Inc. |
160,807 | 2,831,811 | ||||||
| Utah Medical Products, Inc. |
6,167 | 544,238 | ||||||
|
|
|
|||||||
| Total Health Care Equipment & Supplies |
|
11,222,521 | ||||||
| Health Care Providers & Services – 1.2% |
| |||||||
| Ensign Group, Inc. (The) |
36,462 | 1,866,490 | ||||||
| National HealthCare Corp. |
53,292 | 4,043,797 | ||||||
| National Research Corp. |
68,682 | 2,651,125 | ||||||
| Owens & Minor, Inc. |
294,500 | 1,207,450 | ||||||
| Patterson Cos., Inc. |
638,110 | 13,942,703 | ||||||
| U.S. Physical Therapy, Inc. |
18,122 | 1,903,354 | ||||||
|
|
|
|||||||
| Total Health Care Providers & Services |
|
25,614,919 | ||||||
| Health Care Technology – 0.1% |
| |||||||
| Computer Programs & Systems, Inc. |
32,512 | 965,281 | ||||||
| Simulations Plus, Inc. |
27,052 | 571,068 | ||||||
|
|
|
|||||||
| Total Health Care Technology |
|
1,536,349 | ||||||
| Hotels, Restaurants & Leisure – 3.2% |
| |||||||
| BBX Capital Corp. |
54,604 | 323,256 | ||||||
| BJ’s Restaurants, Inc. |
30,661 | 1,449,652 | ||||||
| Bloomin’ Brands, Inc. |
248,299 | 5,077,715 | ||||||
| Bluegreen Vacations Corp.(a) |
454,800 | 6,758,328 | ||||||
| Boyd Gaming Corp. |
155,656 | 4,258,748 | ||||||
| Brinker International, Inc. |
161,505 | 7,167,592 | ||||||
| Cheesecake Factory, Inc. (The) |
180,128 | 8,811,862 | ||||||
| Dave & Buster’s Entertainment, Inc. |
70,619 | 3,521,769 | ||||||
| Dine Brands Global, Inc. |
76,504 | 6,984,050 | ||||||
| International Speedway Corp. Class A |
39,246 | 1,712,303 | ||||||
| Jack in the Box, Inc. |
65,145 | 5,280,654 | ||||||
| Nathan’s Famous, Inc. |
6,351 | 434,408 | ||||||
| Papa John’s International, Inc.(a) |
82,306 | 4,358,103 | ||||||
| RCI Hospitality Holdings, Inc. |
8,800 | 202,136 | ||||||
| Red Rock Resorts, Inc. Class A |
169,011 | 4,368,934 | ||||||
| Ruth’s Hospitality Group, Inc. |
75,534 | 1,932,915 | ||||||
| Speedway Motorsports, Inc. |
135,602 | 1,962,161 | ||||||
| Wingstop, Inc. |
24,994 | 1,900,294 | ||||||
|
|
|
|||||||
| Total Hotels, Restaurants & Leisure |
|
66,504,880 | ||||||
| Household Durables – 1.7% |
| |||||||
| Bassett Furniture Industries, Inc. |
48,575 | 797,116 | ||||||
| Ethan Allen Interiors, Inc. |
160,455 | 3,069,504 | ||||||
| Flexsteel Industries, Inc. |
52,627 | 1,220,420 | ||||||
| Hamilton Beach Brands Holding Co. Class A |
15,404 | 330,570 | ||||||
| Hooker Furniture Corp. |
34,801 | 1,003,313 | ||||||
| KB Home |
68,146 | 1,647,089 | ||||||
| La-Z-Boy, Inc. |
122,143 | 4,029,498 | ||||||
| Lifetime Brands, Inc. |
26,339 | 248,903 | ||||||
See Notes to Financial Statements.
| 66 | WisdomTree Trust |
Schedule of Investments (continued)
WisdomTree U.S. SmallCap Dividend Fund (DES)
March 31, 2019
| Investments | Shares | Value | ||||||
| MDC Holdings, Inc. |
366,072 | $ | 10,638,052 | |||||
| Tupperware Brands Corp. |
517,471 | 13,236,908 | ||||||
|
|
|
|||||||
| Total Household Durables |
|
36,221,373 | ||||||
| Household Products – 1.4% |
| |||||||
| Energizer Holdings, Inc. |
196,929 | 8,848,020 | ||||||
| Oil-Dri Corp. of America |
27,598 | 859,402 | ||||||
| Spectrum Brands Holdings, Inc. |
277,082 | 15,178,552 | ||||||
| WD-40 Co. |
25,385 | 4,301,234 | ||||||
|
|
|
|||||||
| Total Household Products |
|
29,187,208 | ||||||
| Independent Power & Renewable Electricity Producers – 3.3% |
| |||||||
| Clearway Energy, Inc. Class A |
380,307 | 5,529,664 | ||||||
| Clearway Energy, Inc. Class C |
705,307 | 10,657,189 | ||||||
| Ormat Technologies, Inc. |
43,510 | 2,399,576 | ||||||
| Pattern Energy Group, Inc. Class A |
1,099,190 | 24,182,180 | ||||||
| TerraForm Power, Inc. Class A |
1,901,077 | 26,120,798 | ||||||
|
|
|
|||||||
| Total Independent Power & Renewable Electricity Producers |
|
68,889,407 | ||||||
| Industrial Conglomerates – 0.1% |
| |||||||
| Raven Industries, Inc. |
76,740 | 2,944,514 | ||||||
| Insurance – 0.9% |
| |||||||
| AMERISAFE, Inc. |
7,994 | 474,844 | ||||||
| Crawford & Co. Class A |
46,283 | 427,655 | ||||||
| Crawford & Co. Class B |
21,024 | 191,949 | ||||||
| Donegal Group, Inc. Class A |
36,817 | 495,189 | ||||||
| EMC Insurance Group, Inc. |
35,200 | 1,122,176 | ||||||
| Employers Holdings, Inc. |
21,102 | 846,401 | ||||||
| FBL Financial Group, Inc. Class A |
24,007 | 1,505,719 | ||||||
| FedNat Holding Co. |
6,019 | 96,545 | ||||||
| HCI Group, Inc. |
15,440 | 659,751 | ||||||
| Heritage Insurance Holdings, Inc. |
22,838 | 333,435 | ||||||
| Horace Mann Educators Corp. |
45,595 | 1,605,400 | ||||||
| Independence Holding Co. |
3,260 | 114,915 | ||||||
| Investors Title Co. |
875 | 138,163 | ||||||
| Kingstone Cos., Inc. |
8,702 | 128,267 | ||||||
| Kinsale Capital Group, Inc. |
7,111 | 487,601 | ||||||
| National Western Life Group, Inc. Class A |
314 | 82,416 | ||||||
| Navigators Group, Inc. (The) |
952 | 66,516 | ||||||
| ProAssurance Corp. |
70,679 | 2,446,200 | ||||||
| Protective Insurance Corp. Class B |
13,755 | 254,743 | ||||||
| Safety Insurance Group, Inc. |
26,837 | 2,338,576 | ||||||
| State Auto Financial Corp. |
30,921 | 1,017,919 | ||||||
| Stewart Information Services Corp. |
15,390 | 656,999 | ||||||
| Tiptree, Inc. |
27,810 | 176,037 | ||||||
| United Fire Group, Inc. |
23,365 | 1,021,284 | ||||||
| United Insurance Holdings Corp. |
11,582 | 184,154 | ||||||
| Universal Insurance Holdings, Inc. |
28,193 | 873,983 | ||||||
|
|
|
|||||||
| Total Insurance |
|
17,746,837 | ||||||
| Internet & Direct Marketing Retail – 0.2% |
| |||||||
| PetMed Express, Inc.(a) |
137,277 | 3,127,170 | ||||||
| IT Services – 1.5% |
| |||||||
| Cass Information Systems, Inc. |
31,962 | 1,511,803 | ||||||
| CSG Systems International, Inc. |
113,931 | 4,819,281 | ||||||
| Hackett Group, Inc. (The) |
75,834 | 1,198,177 | ||||||
| ManTech International Corp. Class A |
66,595 | 3,597,462 | ||||||
| NIC, Inc. |
220,739 | 3,772,429 | ||||||
| Presidio, Inc. |
132,510 | 1,961,148 | ||||||
| Science Applications International Corp. |
101,527 | 7,812,503 | ||||||
| Switch, Inc. Class A(a) |
100,093 | 1,031,959 | ||||||
| TTEC Holdings, Inc. |
130,590 | 4,731,276 | ||||||
|
|
|
|||||||
| Total IT Services |
|
30,436,038 | ||||||
| Leisure Products – 0.5% |
| |||||||
| Acushnet Holdings Corp. |
237,186 | 5,488,484 | ||||||
| Callaway Golf Co. |
33,538 | 534,261 | ||||||
| Clarus Corp. |
38,241 | 489,867 | ||||||
| Escalade, Inc. |
62,042 | 693,009 | ||||||
| Johnson Outdoors, Inc. Class A |
9,895 | 706,107 | ||||||
| Marine Products Corp. |
107,900 | 1,453,413 | ||||||
| Sturm Ruger & Co., Inc. |
36,206 | 1,919,642 | ||||||
|
|
|
|||||||
| Total Leisure Products |
|
11,284,783 | ||||||
| Life Sciences Tools & Services – 0.1% |
| |||||||
| Luminex Corp. |
59,576 | 1,370,844 | ||||||
| Machinery – 4.3% |
| |||||||
| Actuant Corp. Class A |
15,766 | 384,217 | ||||||
| Alamo Group, Inc. |
9,553 | 954,727 | ||||||
| Albany International Corp. Class A |
47,524 | 3,402,243 | ||||||
| Altra Industrial Motion Corp. |
233,021 | 7,235,302 | ||||||
| Astec Industries, Inc. |
48,589 | 1,834,721 | ||||||
| Briggs & Stratton Corp. |
261,631 | 3,095,095 | ||||||
| Columbus McKinnon Corp. |
21,650 | 743,677 | ||||||
| Douglas Dynamics, Inc. |
89,238 | 3,397,291 | ||||||
| Eastern Co. (The) |
16,805 | 462,474 | ||||||
| EnPro Industries, Inc. |
43,850 | 2,826,132 | ||||||
| ESCO Technologies, Inc. |
22,902 | 1,535,121 | ||||||
| Federal Signal Corp. |
124,109 | 3,225,593 | ||||||
| Franklin Electric Co., Inc. |
71,296 | 3,642,513 | ||||||
| Global Brass & Copper Holdings, Inc. |
34,640 | 1,193,002 | ||||||
| Gorman-Rupp Co. (The) |
60,830 | 2,064,570 | ||||||
| Graham Corp. |
30,400 | 596,752 | ||||||
| Greenbrier Cos., Inc. (The) |
110,333 | 3,556,033 | ||||||
| Hillenbrand, Inc. |
173,191 | 7,192,622 | ||||||
| Hurco Cos., Inc. |
10,161 | 409,793 | ||||||
| Hyster-Yale Materials Handling, Inc. |
35,068 | 2,186,840 | ||||||
| John Bean Technologies Corp. |
23,267 | 2,138,005 | ||||||
| Kadant, Inc. |
15,367 | 1,351,681 | ||||||
| Lindsay Corp. |
21,486 | 2,079,630 | ||||||
| Miller Industries, Inc. |
41,906 | 1,292,800 | ||||||
| Mueller Industries, Inc. |
138,584 | 4,343,222 | ||||||
| Mueller Water Products, Inc. Class A |
434,814 | 4,365,532 | ||||||
| NN, Inc. |
292,628 | 2,191,784 | ||||||
| Omega Flex, Inc. |
18,555 | 1,406,469 | ||||||
| Park-Ohio Holdings Corp. |
24,525 | 794,119 | ||||||
| REV Group, Inc.(a) |
226,733 | 2,482,726 | ||||||
| Spartan Motors, Inc. |
82,614 | 729,482 | ||||||
| Standex International Corp. |
19,419 | 1,425,355 | ||||||
| Sun Hydraulics Corp. |
43,208 | 2,009,604 | ||||||
See Notes to Financial Statements.
| WisdomTree Trust | 67 |
Schedule of Investments (continued)
WisdomTree U.S. SmallCap Dividend Fund (DES)
March 31, 2019
| Investments | Shares | Value | ||||||
| Tennant Co. |
39,910 | $ | 2,478,012 | |||||
| Terex Corp. |
145,189 | 4,664,923 | ||||||
| Titan International, Inc. |
59,890 | 357,543 | ||||||
| Wabash National Corp. |
194,534 | 2,635,936 | ||||||
| Watts Water Technologies, Inc. Class A |
41,606 | 3,362,597 | ||||||
|
|
|
|||||||
| Total Machinery |
|
90,048,138 | ||||||
| Marine – 0.2% |
| |||||||
| Matson, Inc. |
141,807 | 5,117,815 | ||||||
| Media – 4.1% |
| |||||||
| Emerald Expositions Events, Inc. |
258,746 | 3,286,074 | ||||||
| Entercom Communications Corp. Class A |
1,113,613 | 5,846,468 | ||||||
| Entravision Communications Corp. Class A |
693,527 | 2,247,027 | ||||||
| EW Scripps Co. (The) Class A |
110,678 | 2,324,238 | ||||||
| Gannett Co., Inc. |
1,016,085 | 10,709,536 | ||||||
| John Wiley & Sons, Inc. Class A |
172,785 | 7,640,553 | ||||||
| Meredith Corp.(a) |
225,667 | 12,470,358 | ||||||
| National CineMedia, Inc. |
1,042,814 | 7,351,839 | ||||||
| New Media Investment Group, Inc. |
1,043,789 | 10,959,785 | ||||||
| Saga Communications, Inc. Class A |
22,117 | 734,063 | ||||||
| Scholastic Corp. |
62,021 | 2,465,955 | ||||||
| Sinclair Broadcast Group, Inc. Class A |
277,485 | 10,677,623 | ||||||
| TEGNA, Inc. |
649,121 | 9,152,606 | ||||||
|
|
|
|||||||
| Total Media |
|
85,866,125 | ||||||
| Metals & Mining – 2.4% |
| |||||||
| Carpenter Technology Corp. |
142,345 | 6,526,518 | ||||||
| Commercial Metals Co. |
453,074 | 7,738,504 | ||||||
| Compass Minerals International, Inc. |
296,770 | 16,135,385 | ||||||
| Gold Resource Corp. |
56,399 | 221,648 | ||||||
| Haynes International, Inc. |
44,481 | 1,460,311 | ||||||
| Hecla Mining Co. |
408,853 | 940,362 | ||||||
| Kaiser Aluminum Corp. |
54,464 | 5,704,015 | ||||||
| Materion Corp. |
22,559 | 1,287,217 | ||||||
| Olympic Steel, Inc. |
7,800 | 123,786 | ||||||
| Schnitzer Steel Industries, Inc. Class A |
117,118 | 2,810,832 | ||||||
| Synalloy Corp. |
17,239 | 262,033 | ||||||
| Worthington Industries, Inc. |
190,986 | 7,127,597 | ||||||
|
|
|
|||||||
| Total Metals & Mining |
|
50,338,208 | ||||||
| Mortgage Real Estate Investment Trusts (REITs) – 0.1% |
| |||||||
| Arlington Asset Investment Corp. Class A(a) |
218,319 | 1,737,819 | ||||||
| Multi-Utilities – 0.2% |
| |||||||
| Unitil Corp. |
61,103 | 3,309,950 | ||||||
| Multiline Retail – 0.5% |
| |||||||
| Big Lots, Inc. |
229,595 | 8,729,202 | ||||||
| Dillard’s, Inc. Class A(a) |
19,434 | 1,399,637 | ||||||
|
|
|
|||||||
| Total Multiline Retail |
|
10,128,839 | ||||||
| Oil, Gas & Consumable Fuels – 1.9% |
| |||||||
| Adams Resources & Energy, Inc. |
14,890 | 581,603 | ||||||
| Arch Coal, Inc. Class A(a) |
48,179 | 4,397,297 | ||||||
| Berry Petroleum Corp. |
513,820 | 5,929,483 | ||||||
| Evolution Petroleum Corp. |
250,628 | 1,691,739 | ||||||
| Green Plains, Inc. |
167,771 | 2,798,420 | ||||||
| Hallador Energy Co. |
132,459 | 696,734 | ||||||
| NACCO Industries, Inc. Class A |
13,434 | 513,448 | ||||||
| Panhandle Oil and Gas, Inc. Class A |
20,872 | 327,690 | ||||||
| SemGroup Corp. Class A |
1,286,701 | 18,965,973 | ||||||
| SM Energy Co. |
101,536 | 1,775,865 | ||||||
| World Fuel Services Corp. |
89,557 | 2,587,302 | ||||||
|
|
|
|||||||
| Total Oil, Gas & Consumable Fuels |
|
40,265,554 | ||||||
| Paper & Forest Products – 2.0% |
| |||||||
| Boise Cascade Co. |
86,027 | 2,302,083 | ||||||
| Domtar Corp. |
390,000 | 19,363,500 | ||||||
| Neenah, Inc. |
63,295 | 4,073,666 | ||||||
| PH Glatfelter Co. |
298,565 | 4,215,738 | ||||||
| Schweitzer-Mauduit International, Inc. |
287,300 | 11,124,256 | ||||||
|
|
|
|||||||
| Total Paper & Forest Products |
|
41,079,243 | ||||||
| Personal Products – 0.5% |
| |||||||
| Inter Parfums, Inc. |
88,521 | 6,716,088 | ||||||
| Medifast, Inc. |
25,767 | 3,286,581 | ||||||
| Natural Health Trends Corp.(a) |
52,809 | 684,405 | ||||||
|
|
|
|||||||
| Total Personal Products |
|
10,687,074 | ||||||
| Pharmaceuticals – 0.1% |
| |||||||
| Phibro Animal Health Corp. Class A |
40,720 | 1,343,760 | ||||||
| Professional Services – 1.1% |
| |||||||
| Barrett Business Services, Inc. |
15,923 | 1,231,326 | ||||||
| BG Staffing, Inc. |
80,726 | 1,763,056 | ||||||
| CRA International, Inc. |
21,537 | 1,088,480 | ||||||
| Exponent, Inc. |
87,669 | 5,060,255 | ||||||
| Heidrick & Struggles International, Inc. |
44,746 | 1,715,114 | ||||||
| ICF International, Inc. |
14,553 | 1,107,192 | ||||||
| Kelly Services, Inc. Class A |
72,592 | 1,601,379 | ||||||
| Kforce, Inc. |
82,543 | 2,898,910 | ||||||
| Korn Ferry |
72,877 | 3,263,432 | ||||||
| Navigant Consulting, Inc. |
51,294 | 998,694 | ||||||
| Resources Connection, Inc. |
158,477 | 2,621,210 | ||||||
|
|
|
|||||||
| Total Professional Services |
|
23,349,048 | ||||||
| Real Estate Management & Development – 0.5% |
| |||||||
| Consolidated-Tomoka Land Co. |
532 | 31,415 | ||||||
| Griffin Industrial Realty, Inc. |
3,118 | 108,662 | ||||||
| Kennedy-Wilson Holdings, Inc. |
251,389 | 5,377,211 | ||||||
| Newmark Group, Inc. Class A |
239,656 | 1,998,731 | ||||||
| RE/MAX Holdings, Inc. Class A |
25,803 | 994,448 | ||||||
| Realogy Holdings Corp.(a) |
118,149 | 1,346,898 | ||||||
| RMR Group, Inc. (The) Class A |
9,266 | 565,041 | ||||||
|
|
|
|||||||
| Total Real Estate Management & Development |
|
10,422,406 | ||||||
| Road & Rail – 0.6% |
| |||||||
| ArcBest Corp. |
37,131 | 1,143,263 | ||||||
| Heartland Express, Inc. |
49,806 | 960,260 | ||||||
| Marten Transport Ltd. |
45,297 | 807,646 | ||||||
| Schneider National, Inc. Class B |
141,786 | 2,984,595 | ||||||
| Universal Logistics Holdings, Inc. |
83,911 | 1,651,368 | ||||||
| Werner Enterprises, Inc. |
117,358 | 4,007,776 | ||||||
|
|
|
|||||||
| Total Road & Rail |
|
11,554,908 | ||||||
See Notes to Financial Statements.
| 68 | WisdomTree Trust |
Schedule of Investments (continued)
WisdomTree U.S. SmallCap Dividend Fund (DES)
March 31, 2019
| Investments | Shares | Value | ||||||
| Semiconductors & Semiconductor Equipment – 0.9% |
| |||||||
| Brooks Automation, Inc. |
156,997 | $ | 4,604,722 | |||||
| Cohu, Inc. |
70,365 | 1,037,884 | ||||||
| NVE Corp. |
28,960 | 2,834,894 | ||||||
| Power Integrations, Inc. |
42,427 | 2,967,344 | ||||||
| Xperi Corp. |
288,896 | 6,760,167 | ||||||
|
|
|
|||||||
| Total Semiconductors & Semiconductor Equipment |
|
18,205,011 | ||||||
| Software – 1.2% |
| |||||||
| American Software, Inc. Class A |
175,819 | 2,101,037 | ||||||
| Ebix, Inc.(a) |
29,265 | 1,444,813 | ||||||
| Monotype Imaging Holdings, Inc. |
164,078 | 3,263,512 | ||||||
| Progress Software Corp. |
110,552 | 4,905,192 | ||||||
| QAD, Inc. Class A |
20,690 | 891,118 | ||||||
| TiVo Corp. |
1,267,848 | 11,816,343 | ||||||
|
|
|
|||||||
| Total Software |
|
24,422,015 | ||||||
| Specialty Retail – 6.5% |
| |||||||
| Abercrombie & Fitch Co. Class A |
394,250 | 10,806,392 | ||||||
| Barnes & Noble, Inc. |
917,739 | 4,983,323 | ||||||
| Bed Bath & Beyond, Inc.(a) |
1,062,588 | 18,053,370 | ||||||
| Buckle, Inc. (The)(a) |
369,257 | 6,912,491 | ||||||
| Caleres, Inc. |
62,326 | 1,538,829 | ||||||
| Camping World Holdings, Inc. Class A(a) |
130,078 | 1,809,385 | ||||||
| Cato Corp. (The) Class A |
296,720 | 4,444,866 | ||||||
| Chico’s FAS, Inc. |
1,066,166 | 4,552,529 | ||||||
| Children’s Place, Inc. (The) |
46,948 | 4,567,101 | ||||||
| Citi Trends, Inc. |
27,224 | 525,695 | ||||||
| Designer Brands, Inc. |
428,409 | 9,519,248 | ||||||
| Dick’s Sporting Goods, Inc. |
268,777 | 9,893,681 | ||||||
| GameStop Corp. Class A(a) |
1,689,954 | 17,169,933 | ||||||
| Group 1 Automotive, Inc. |
56,795 | 3,674,637 | ||||||
| Guess?, Inc. |
502,460 | 9,848,216 | ||||||
| Haverty Furniture Cos., Inc. |
99,338 | 2,173,515 | ||||||
| Lithia Motors, Inc. Class A |
52,300 | 4,850,825 | ||||||
| Monro, Inc. |
49,257 | 4,261,716 | ||||||
| Office Depot, Inc. |
2,752,328 | 9,990,951 | ||||||
| Shoe Carnival, Inc.(a) |
26,932 | 916,496 | ||||||
| Sonic Automotive, Inc. Class A |
87,451 | 1,295,149 | ||||||
| Tailored Brands, Inc.(a) |
346,169 | 2,713,965 | ||||||
| Tile Shop Holdings, Inc. |
295,199 | 1,670,826 | ||||||
| Winmark Corp. |
2,183 | 411,692 | ||||||
|
|
|
|||||||
| Total Specialty Retail |
|
136,584,831 | ||||||
| Textiles, Apparel & Luxury Goods – 0.7% |
| |||||||
| Culp, Inc. |
36,075 | 693,722 | ||||||
| Movado Group, Inc. |
53,834 | 1,958,481 | ||||||
| Oxford Industries, Inc. |
43,706 | 3,289,313 | ||||||
| Rocky Brands, Inc. |
21,949 | 525,898 | ||||||
| Steven Madden Ltd. |
237,670 | 8,042,753 | ||||||
| Superior Group of Cos., Inc. |
36,601 | 608,309 | ||||||
|
|
|
|||||||
| Total Textiles, Apparel & Luxury Goods |
|
15,118,476 | ||||||
| Thrifts & Mortgage Finance – 1.3% |
| |||||||
| Capitol Federal Financial, Inc. |
147,083 | 1,963,558 | ||||||
| Dime Community Bancshares, Inc. |
63,293 | 1,185,478 | ||||||
| ESSA Bancorp, Inc. |
12,600 | 194,040 | ||||||
| Federal Agricultural Mortgage Corp. Class C |
13,625 | 986,859 | ||||||
| First Defiance Financial Corp. |
19,537 | 561,493 | ||||||
| FS Bancorp, Inc. |
1,364 | 68,855 | ||||||
| Hingham Institution for Savings |
948 | 163,065 | ||||||
| Home Bancorp, Inc. |
6,256 | 208,012 | ||||||
| Kearny Financial Corp. |
58,382 | 751,376 | ||||||
| Luther Burbank Corp. |
70,990 | 716,999 | ||||||
| Meridian Bancorp, Inc. |
25,113 | 394,023 | ||||||
| Meta Financial Group, Inc. |
9,069 | 178,478 | ||||||
| Northfield Bancorp, Inc. |
79,829 | 1,109,623 | ||||||
| Northwest Bancshares, Inc. |
161,673 | 2,743,591 | ||||||
| OceanFirst Financial Corp. |
40,335 | 970,460 | ||||||
| Oritani Financial Corp. |
135,531 | 2,253,881 | ||||||
| Provident Financial Holdings, Inc. |
10,967 | 218,463 | ||||||
| Provident Financial Services, Inc. |
90,026 | 2,330,773 | ||||||
| Prudential Bancorp, Inc. |
2,935 | 50,922 | ||||||
| Riverview Bancorp, Inc. |
13,361 | 97,669 | ||||||
| SI Financial Group, Inc. |
25,747 | 332,394 | ||||||
| Southern Missouri Bancorp, Inc. |
4,688 | 144,390 | ||||||
| Standard AVB Financial Corp. |
1,631 | 43,988 | ||||||
| Sterling Bancorp, Inc. |
47,662 | 483,293 | ||||||
| Territorial Bancorp, Inc. |
19,495 | 524,610 | ||||||
| Timberland Bancorp, Inc. |
6,216 | 173,924 | ||||||
| TrustCo Bank Corp. |
151,790 | 1,177,890 | ||||||
| United Community Financial Corp. |
45,673 | 427,043 | ||||||
| United Financial Bancorp, Inc. |
74,003 | 1,061,943 | ||||||
| Walker & Dunlop, Inc. |
25,164 | 1,281,099 | ||||||
| Washington Federal, Inc. |
89,013 | 2,571,586 | ||||||
| Waterstone Financial, Inc. |
40,540 | 667,288 | ||||||
| Western New England Bancorp, Inc. |
22,127 | 204,232 | ||||||
| WSFS Financial Corp. |
14,780 | 570,508 | ||||||
|
|
|
|||||||
| Total Thrifts & Mortgage Finance |
|
26,811,806 | ||||||
| Tobacco – 2.0% |
| |||||||
| Turning Point Brands, Inc. |
19,674 | 906,775 | ||||||
| Universal Corp. |
165,835 | 9,557,071 | ||||||
| Vector Group Ltd. |
2,856,858 | 30,825,498 | ||||||
|
|
|
|||||||
| Total Tobacco |
|
41,289,344 | ||||||
| Trading Companies & Distributors – 1.0% |
| |||||||
| Applied Industrial Technologies, Inc. |
108,826 | 6,471,882 | ||||||
| H&E Equipment Services, Inc. |
274,966 | 6,904,396 | ||||||
| Kaman Corp. |
53,041 | 3,099,716 | ||||||
| Rush Enterprises, Inc. Class A |
66,693 | 2,788,434 | ||||||
| Rush Enterprises, Inc. Class B |
11,846 | 491,965 | ||||||
| Systemax, Inc. |
77,899 | 1,763,634 | ||||||
|
|
|
|||||||
| Total Trading Companies & Distributors |
|
21,520,027 | ||||||
| Water Utilities – 1.2% |
| |||||||
| American States Water Co. |
91,640 | 6,533,932 | ||||||
| Artesian Resources Corp. Class A |
26,732 | 996,302 | ||||||
| California Water Service Group |
115,214 | 6,253,816 | ||||||
| Connecticut Water Service, Inc. |
35,024 | 2,404,398 | ||||||
| Global Water Resources, Inc. |
94,157 | 923,680 | ||||||
| Middlesex Water Co. |
46,426 | 2,599,392 | ||||||
See Notes to Financial Statements.
| WisdomTree Trust | 69 |
Schedule of Investments (concluded)
WisdomTree U.S. SmallCap Dividend Fund (DES)
March 31, 2019
| Investments | Shares | Value | ||||||
| SJW Group |
75,226 | $ | 4,644,453 | |||||
| York Water Co. (The) |
34,136 | 1,171,547 | ||||||
|
|
|
|||||||
| Total Water Utilities |
|
25,527,520 | ||||||
| Wireless Telecommunication Services – 0.2% |
| |||||||
| Shenandoah Telecommunications Co. |
44,174 | 1,959,558 | ||||||
| Spok Holdings, Inc. |
106,777 | 1,454,303 | ||||||
|
|
|
|||||||
| Total Wireless Telecommunication Services |
|
3,413,861 | ||||||
| Total United States | 2,061,680,966 | |||||||
| Puerto Rico – 0.1% | ||||||||
| IT Services – 0.1% | ||||||||
| EVERTEC, Inc. |
73,696 | 2,049,486 | ||||||
| TOTAL COMMON STOCKS (Cost: $2,036,116,942) |
2,063,730,452 | |||||||
| EXCHANGE-TRADED FUND – 0.9% | ||||||||
| United States – 0.9% | ||||||||
| WisdomTree U.S. MidCap Dividend Fund(a)(b) (Cost: $18,023,392) |
530,617 | 18,990,782 | ||||||
| RIGHTS – 0.0% | ||||||||
| United States – 0.0% | ||||||||
| A. Schulman, Inc. CVR†* (Cost: $46,058) |
106,369 | 46,058 | ||||||
| INVESTMENT OF CASH COLLATERAL FOR SECURITIES LOANED – 2.5% |
| |||||||
| United States – 2.5% | ||||||||
| State Street Navigator Securities Lending Government Money Market Portfolio, 2.46%(c) (Cost: $52,465,765)(d) |
52,465,765 | 52,465,765 | ||||||
| TOTAL INVESTMENTS IN SECURITIES – 102.3% (Cost: $2,106,652,157) |
|
2,135,233,057 | ||||||
| Other Assets less Liabilities – (2.3)% |
(47,528,018 | ) | ||||||
|
|
|
|||||||
| NET ASSETS – 100.0% | $ | 2,087,705,039 | ||||||
| † | Security is being fair valued using significant unobservable inputs by a pricing committee under the direction of the Board of Trustees. The aggregate value of fair valued securities is $46,058, which represent less than 0.0% of net assets. |
| * | Non-income producing security. |
| (a) | Security, or portion thereof, was on loan at March 31, 2019 (See Note 2). |
| (b) | Affiliated company (See Note 3). |
| (c) | Rate shown represents annualized 7-day yield as of March 31, 2019. |
| (d) | At March 31, 2019, the total market value of the Fund’s securities on loan identified in the Schedule of Investments was $99,316,811 and the total market value of the collateral held by the Fund was $102,153,222. The total market value of the collateral includes non-cash U.S. Government securities collateral having a value of $49,687,457. |
CVR – Contingent Value Rights
See Notes to Financial Statements.
| 70 | WisdomTree Trust |
Schedule of Investments
WisdomTree U.S. SmallCap Fund (EES)
March 31, 2019
| Investments | Shares | Value | ||||||
| COMMON STOCKS – 99.7% | ||||||||
| United States – 99.3% |
| |||||||
| Aerospace & Defense – 0.5% |
| |||||||
| AAR Corp. |
25,487 | $ | 828,582 | |||||
| Aerovironment, Inc.* |
8,631 | 590,447 | ||||||
| Astronics Corp.* |
19,984 | 653,876 | ||||||
| Ducommun, Inc.* |
1,786 | 77,727 | ||||||
| National Presto Industries, Inc. |
5,163 | 560,444 | ||||||
| Vectrus, Inc.* |
21,403 | 569,106 | ||||||
| Wesco Aircraft Holdings, Inc.* |
71,814 | 631,245 | ||||||
|
|
|
|||||||
| Total Aerospace & Defense |
|
3,911,427 | ||||||
| Air Freight & Logistics – 1.1% |
| |||||||
| Air Transport Services Group, Inc.* |
90,959 | 2,096,605 | ||||||
| Atlas Air Worldwide Holdings, Inc.* |
46,569 | 2,354,529 | ||||||
| Echo Global Logistics, Inc.* |
18,704 | 463,485 | ||||||
| Forward Air Corp. |
22,625 | 1,464,516 | ||||||
| Hub Group, Inc. Class A* |
31,827 | 1,300,133 | ||||||
| Radiant Logistics, Inc.* |
25,278 | 159,251 | ||||||
|
|
|
|||||||
| Total Air Freight & Logistics |
|
7,838,519 | ||||||
| Airlines – 0.5% |
| |||||||
| Hawaiian Holdings, Inc. |
136,338 | 3,578,873 | ||||||
| Auto Components – 4.2% |
| |||||||
| American Axle & Manufacturing Holdings, Inc.* |
509,001 | 7,283,804 | ||||||
| Cooper Tire & Rubber Co. |
48,025 | 1,435,467 | ||||||
| Cooper-Standard Holdings, Inc.* |
43,336 | 2,035,059 | ||||||
| Dana, Inc. |
401,274 | 7,118,601 | ||||||
| Gentherm, Inc.* |
17,995 | 663,296 | ||||||
| LCI Industries |
38,643 | 2,968,555 | ||||||
| Modine Manufacturing Co.* |
112,060 | 1,554,272 | ||||||
| Motorcar Parts of America, Inc.* |
9,271 | 174,944 | ||||||
| Shiloh Industries, Inc.* |
39,331 | 216,320 | ||||||
| Standard Motor Products, Inc. |
17,876 | 877,712 | ||||||
| Stoneridge, Inc.* |
31,216 | 900,894 | ||||||
| Tenneco, Inc. Class A |
198,207 | 4,392,267 | ||||||
| Tower International, Inc. |
49,678 | 1,044,728 | ||||||
|
|
|
|||||||
| Total Auto Components |
|
30,665,919 | ||||||
| Automobiles – 0.3% |
| |||||||
| Winnebago Industries, Inc. |
75,886 | 2,363,849 | ||||||
| Banks – 11.3% |
| |||||||
| 1st Source Corp. |
20,223 | 908,215 | ||||||
| Allegiance Bancshares, Inc.* |
10,384 | 350,149 | ||||||
| American National Bankshares, Inc. |
7,161 | 250,062 | ||||||
| Ameris Bancorp |
32,477 | 1,115,585 | ||||||
| Arrow Financial Corp. |
12,175 | 400,436 | ||||||
| Atlantic Capital Bancshares, Inc.* |
13,740 | 244,984 | ||||||
| Banc of California, Inc. |
19,029 | 263,361 | ||||||
| BancFirst Corp. |
25,663 | 1,338,326 | ||||||
| Bancorp, Inc. (The)* |
114,715 | 926,897 | ||||||
| Bank of Commerce Holdings |
14,499 | 152,964 | ||||||
| Bank of Marin Bancorp |
7,742 | 315,022 | ||||||
| BankFinancial Corp. |
9,812 | 145,904 | ||||||
| Banner Corp. |
26,135 | 1,415,733 | ||||||
| Bar Harbor Bankshares |
16,510 | 427,114 | ||||||
| Baycom Corp.* |
7,710 | 174,554 | ||||||
| BCB Bancorp, Inc. |
10,625 | 142,375 | ||||||
| Berkshire Hills Bancorp, Inc. |
43,183 | 1,176,305 | ||||||
| Boston Private Financial Holdings, Inc. |
49,643 | 544,087 | ||||||
| Bridge Bancorp, Inc. |
11,700 | 342,810 | ||||||
| Brookline Bancorp, Inc. |
60,415 | 869,976 | ||||||
| Bryn Mawr Bank Corp. |
17,189 | 621,039 | ||||||
| Byline Bancorp, Inc.* |
13,850 | 255,948 | ||||||
| C&F Financial Corp. |
3,737 | 189,092 | ||||||
| Cadence BanCorp |
132,946 | 2,466,148 | ||||||
| Cambridge Bancorp |
3,232 | 267,771 | ||||||
| Camden National Corp. |
15,805 | 659,385 | ||||||
| Capital City Bank Group, Inc. |
8,338 | 181,602 | ||||||
| Capstar Financial Holdings, Inc. |
8,645 | 124,834 | ||||||
| Carolina Financial Corp. |
14,843 | 513,419 | ||||||
| CBTX, Inc. |
12,793 | 415,389 | ||||||
| Central Pacific Financial Corp. |
25,310 | 729,940 | ||||||
| Central Valley Community Bancorp |
11,330 | 221,502 | ||||||
| Century Bancorp, Inc. Class A |
5,351 | 390,623 | ||||||
| Chemung Financial Corp. |
3,719 | 174,533 | ||||||
| Citizens & Northern Corp. |
7,590 | 190,054 | ||||||
| City Holding Co. |
12,142 | 925,099 | ||||||
| Civista Bancshares, Inc. |
5,983 | 130,609 | ||||||
| CNB Financial Corp. |
15,344 | 387,743 | ||||||
| Codorus Valley Bancorp, Inc. |
8,682 | 185,361 | ||||||
| Community Trust Bancorp, Inc. |
15,991 | 656,591 | ||||||
| ConnectOne Bancorp, Inc. |
32,751 | 645,195 | ||||||
| Customers Bancorp, Inc.* |
42,020 | 769,386 | ||||||
| Eagle Bancorp, Inc.* |
31,383 | 1,575,427 | ||||||
| Enterprise Bancorp, Inc. |
10,956 | 314,766 | ||||||
| Enterprise Financial Services Corp. |
24,006 | 978,725 | ||||||
| Equity Bancshares, Inc. Class A* |
9,990 | 287,712 | ||||||
| Esquire Financial Holdings, Inc.* |
4,482 | 102,010 | ||||||
| Farmers & Merchants Bancorp, Inc.(a) |
4,541 | 136,684 | ||||||
| Farmers National Banc Corp. |
26,972 | 371,944 | ||||||
| FB Financial Corp. |
25,843 | 820,774 | ||||||
| Fidelity Southern Corp. |
22,384 | 613,098 | ||||||
| Financial Institutions, Inc. |
15,650 | 425,367 | ||||||
| First Bancorp |
26,189 | 910,330 | ||||||
| First Bancshares, Inc. (The) |
6,944 | 214,570 | ||||||
| First Bank |
14,774 | 170,344 | ||||||
| First Busey Corp. |
40,566 | 989,810 | ||||||
| First Business Financial Services, Inc. |
8,105 | 162,262 | ||||||
| First Commonwealth Financial Corp. |
90,202 | 1,136,545 | ||||||
| First Community Bankshares, Inc. |
10,472 | 347,042 | ||||||
| First Community Corp. |
4,894 | 93,329 | ||||||
| First Financial Corp. |
11,633 | 488,586 | ||||||
| First Financial Northwest, Inc. |
10,847 | 170,840 | ||||||
| First Foundation, Inc. |
30,516 | 414,102 | ||||||
| First Internet Bancorp |
11,410 | 220,555 | ||||||
| First Merchants Corp. |
45,962 | 1,693,700 | ||||||
| First Mid-Illinois Bancshares, Inc. |
11,611 | 386,879 | ||||||
| First of Long Island Corp. (The) |
19,081 | 418,446 | ||||||
See Notes to Financial Statements.
| WisdomTree Trust | 71 |
Schedule of Investments (continued)
WisdomTree U.S. SmallCap Fund (EES)
March 31, 2019
| Investments | Shares | Value | ||||||
| Flushing Financial Corp. |
27,145 | $ | 595,290 | |||||
| Franklin Financial Network, Inc. |
16,628 | 482,378 | ||||||
| German American Bancorp, Inc. |
17,782 | 522,791 | ||||||
| Great Southern Bancorp, Inc. |
14,626 | 759,089 | ||||||
| Guaranty Bancshares, Inc. |
6,103 | 178,330 | ||||||
| Hanmi Financial Corp. |
33,694 | 716,671 | ||||||
| HarborOne Bancorp, Inc.* |
10,779 | 185,399 | ||||||
| Heartland Financial USA, Inc. |
25,489 | 1,087,106 | ||||||
| Heritage Commerce Corp. |
29,837 | 361,028 | ||||||
| Heritage Financial Corp. |
18,637 | 561,719 | ||||||
| Hilltop Holdings, Inc. |
86,688 | 1,582,056 | ||||||
| HomeTrust Bancshares, Inc. |
12,007 | 302,576 | ||||||
| Hope Bancorp, Inc. |
170,651 | 2,232,115 | ||||||
| Horizon Bancorp, Inc. |
34,503 | 555,153 | ||||||
| Independent Bank Corp. |
19,306 | 415,079 | ||||||
| Independent Bank Group, Inc. |
40,409 | 2,072,578 | ||||||
| Investar Holding Corp. |
5,949 | 135,102 | ||||||
| Lakeland Bancorp, Inc. |
44,597 | 665,833 | ||||||
| Lakeland Financial Corp. |
19,854 | 897,798 | ||||||
| LCNB Corp. |
9,785 | 167,813 | ||||||
| LegacyTexas Financial Group, Inc. |
39,958 | 1,494,030 | ||||||
| Live Oak Bancshares, Inc.(a) |
69,663 | 1,017,776 | ||||||
| Macatawa Bank Corp. |
31,119 | 309,323 | ||||||
| Mercantile Bank Corp. |
14,775 | 483,438 | ||||||
| Metropolitan Bank Holding Corp.* |
7,091 | 246,696 | ||||||
| Midland States Bancorp, Inc. |
14,580 | 350,795 | ||||||
| MidWestOne Financial Group, Inc. |
10,874 | 296,317 | ||||||
| National Bank Holdings Corp. Class A |
18,007 | 598,913 | ||||||
| National Bankshares, Inc. |
5,540 | 237,389 | ||||||
| NBT Bancorp, Inc. |
34,143 | 1,229,489 | ||||||
| Nicolet Bankshares, Inc.* |
9,024 | 537,830 | ||||||
| Northeast Bancorp |
10,359 | 214,224 | ||||||
| Northrim BanCorp, Inc. |
7,054 | 242,799 | ||||||
| OFG Bancorp |
43,455 | 859,975 | ||||||
| Old Line Bancshares, Inc. |
9,985 | 248,926 | ||||||
| Old Second Bancorp, Inc. |
24,043 | 302,701 | ||||||
| Opus Bank |
26,118 | 517,136 | ||||||
| Origin Bancorp, Inc. |
12,557 | 427,566 | ||||||
| Orrstown Financial Services, Inc. |
6,792 | 126,263 | ||||||
| Pacific Premier Bancorp, Inc. |
45,658 | 1,211,307 | ||||||
| Park National Corp. |
14,489 | 1,372,833 | ||||||
| Parke Bancorp, Inc. |
13,006 | 271,695 | ||||||
| Peapack Gladstone Financial Corp. |
17,655 | 462,914 | ||||||
| People’s Utah Bancorp |
13,417 | 353,806 | ||||||
| Peoples Bancorp, Inc. |
15,923 | 493,135 | ||||||
| Preferred Bank |
16,503 | 742,140 | ||||||
| QCR Holdings, Inc. |
14,205 | 481,834 | ||||||
| RBB Bancorp |
16,794 | 315,727 | ||||||
| Reliant Bancorp, Inc. |
5,754 | 128,429 | ||||||
| Republic Bancorp, Inc. Class A |
19,810 | 885,903 | ||||||
| Republic First Bancorp, Inc.* |
11,905 | 62,501 | ||||||
| S&T Bancorp, Inc. |
29,305 | 1,158,427 | ||||||
| Sandy Spring Bancorp, Inc. |
29,701 | 929,047 | ||||||
| SB One Bancorp |
4,306 | 93,526 | ||||||
| Seacoast Banking Corp. of Florida* |
31,700 | 835,295 | ||||||
| ServisFirst Bancshares, Inc. |
41,239 | 1,392,229 | ||||||
| Shore Bancshares, Inc. |
14,833 | 221,160 | ||||||
| Sierra Bancorp |
11,234 | 272,986 | ||||||
| SmartFinancial, Inc.* |
8,744 | 165,349 | ||||||
| Southern First Bancshares, Inc.* |
7,159 | 242,475 | ||||||
| Southern National Bancorp of Virginia, Inc. |
24,496 | 358,866 | ||||||
| Southside Bancshares, Inc. |
25,198 | 837,330 | ||||||
| Spirit of Texas Bancshares, Inc.* |
3,811 | 80,793 | ||||||
| Stock Yards Bancorp, Inc. |
18,981 | 641,748 | ||||||
| Tompkins Financial Corp. |
12,061 | 917,480 | ||||||
| Towne Bank |
52,319 | 1,294,895 | ||||||
| TriCo Bancshares |
18,448 | 724,822 | ||||||
| TriState Capital Holdings, Inc.* |
25,949 | 530,138 | ||||||
| Triumph Bancorp, Inc.* |
13,080 | 384,421 | ||||||
| United Community Banks, Inc. |
75,243 | 1,875,808 | ||||||
| Univest Financial Corp. |
21,722 | 531,320 | ||||||
| Veritex Holdings, Inc. |
42,061 | 1,018,717 | ||||||
| Washington Trust Bancorp, Inc. |
15,080 | 726,102 | ||||||
| West Bancorporation, Inc. |
16,408 | 339,317 | ||||||
| Westamerica Bancorporation |
15,148 | 936,146 | ||||||
|
|
|
|||||||
| Total Banks |
|
83,558,080 | ||||||
| Beverages – 0.2% |
| |||||||
| Coca-Cola Consolidated, Inc. |
1,325 | 381,375 | ||||||
| Craft Brew Alliance, Inc.* |
5,544 | 77,505 | ||||||
| MGP Ingredients, Inc. |
9,537 | 735,779 | ||||||
|
|
|
|||||||
| Total Beverages |
|
1,194,659 | ||||||
| Biotechnology – 0.6% |
| |||||||
| Anika Therapeutics, Inc.* |
9,330 | 282,139 | ||||||
| BioSpecifics Technologies Corp.* |
3,095 | 192,911 | ||||||
| ChemoCentryx, Inc.* |
19,131 | 265,730 | ||||||
| Eagle Pharmaceuticals, Inc.* |
11,654 | 588,411 | ||||||
| Enanta Pharmaceuticals, Inc.* |
15,465 | 1,477,217 | ||||||
| Palatin Technologies, Inc.*(a) |
164,183 | 160,932 | ||||||
| REGENXBIO, Inc.* |
26,232 | 1,503,356 | ||||||
| Surface Oncology, Inc.* |
27,879 | 132,983 | ||||||
| Vanda Pharmaceuticals, Inc.* |
7,816 | 143,814 | ||||||
|
|
|
|||||||
| Total Biotechnology |
|
4,747,493 | ||||||
| Building Products – 2.6% |
| |||||||
| AAON, Inc. |
18,659 | 861,673 | ||||||
| Advanced Drainage Systems, Inc. |
40,122 | 1,033,944 | ||||||
| American Woodmark Corp.* |
17,644 | 1,457,924 | ||||||
| Apogee Enterprises, Inc. |
36,535 | 1,369,697 | ||||||
| Builders FirstSource, Inc.* |
189,968 | 2,534,173 | ||||||
| Continental Building Products, Inc.* |
39,442 | 977,767 | ||||||
| CSW Industrials, Inc.* |
12,689 | 726,953 | ||||||
| Gibraltar Industries, Inc.* |
27,977 | 1,136,146 | ||||||
| Griffon Corp. |
13,335 | 246,431 | ||||||
| Insteel Industries, Inc. |
18,641 | 389,970 | ||||||
| JELD-WEN Holding, Inc.* |
117,677 | 2,078,176 | ||||||
| NCI Building Systems, Inc.* |
77,771 | 479,069 | ||||||
| Patrick Industries, Inc.* |
57,280 | 2,595,930 | ||||||
| PGT Innovations, Inc.* |
47,377 | 656,171 | ||||||
See Notes to Financial Statements.
| 72 | WisdomTree Trust |
Schedule of Investments (continued)
WisdomTree U.S. SmallCap Fund (EES)
March 31, 2019
| Investments | Shares | Value | ||||||
| Quanex Building Products Corp. |
25,624 | $ | 407,165 | |||||
| Universal Forest Products, Inc. |
80,995 | 2,420,940 | ||||||
|
|
|
|||||||
| Total Building Products |
|
19,372,129 | ||||||
| Capital Markets – 1.7% |
| |||||||
| Artisan Partners Asset Management, Inc. Class A |
67,717 | 1,704,437 | ||||||
| B. Riley Financial, Inc. |
20,221 | 337,488 | ||||||
| Blucora, Inc.* |
21,392 | 714,065 | ||||||
| Cohen & Steers, Inc. |
38,626 | 1,632,721 | ||||||
| Diamond Hill Investment Group, Inc. |
4,142 | 579,880 | ||||||
| Donnelley Financial Solutions, Inc.* |
52,677 | 783,834 | ||||||
| GAIN Capital Holdings, Inc.(a) |
41,563 | 261,016 | ||||||
| Greenhill & Co., Inc. |
9,349 | 201,097 | ||||||
| Hamilton Lane, Inc. Class A |
15,796 | 688,390 | ||||||
| INTL FCStone, Inc.* |
10,924 | 423,414 | ||||||
| Oppenheimer Holdings, Inc. Class A |
14,526 | 377,966 | ||||||
| Piper Jaffray Cos. |
7,238 | 527,144 | ||||||
| PJT Partners, Inc. Class A |
2,717 | 113,571 | ||||||
| Pzena Investment Management, Inc. Class A |
40,827 | 330,290 | ||||||
| Victory Capital Holdings, Inc. Class A* |
64,538 | 969,361 | ||||||
| Virtus Investment Partners, Inc. |
11,404 | 1,112,460 | ||||||
| Waddell & Reed Financial, Inc. Class A |
104,859 | 1,813,012 | ||||||
| Westwood Holdings Group, Inc. |
7,662 | 270,239 | ||||||
|
|
|
|||||||
| Total Capital Markets |
|
12,840,385 | ||||||
| Chemicals – 2.8% |
| |||||||
| Advanced Emissions Solutions, Inc.(a) |
57,817 | 668,365 | ||||||
| AdvanSix, Inc.* |
37,552 | 1,072,861 | ||||||
| American Vanguard Corp. |
20,519 | 353,337 | ||||||
| Chase Corp. |
6,819 | 631,030 | ||||||
| Ferro Corp.* |
73,052 | 1,382,874 | ||||||
| FutureFuel Corp. |
52,618 | 705,081 | ||||||
| Hawkins, Inc. |
6,776 | 249,560 | ||||||
| Innophos Holdings, Inc. |
20,732 | 624,863 | ||||||
| Innospec, Inc. |
23,120 | 1,927,052 | ||||||
| Koppers Holdings, Inc.* |
32,540 | 845,389 | ||||||
| Kraton Corp.* |
45,794 | 1,473,651 | ||||||
| Kronos Worldwide, Inc. |
417,709 | 5,856,280 | ||||||
| Minerals Technologies, Inc. |
47,581 | 2,797,287 | ||||||
| OMNOVA Solutions, Inc.* |
22,030 | 154,651 | ||||||
| Stepan Co. |
21,139 | 1,850,085 | ||||||
| Trecora Resources* |
11,430 | 103,899 | ||||||
|
|
|
|||||||
| Total Chemicals |
|
20,696,265 | ||||||
| Commercial Services & Supplies – 3.1% |
| |||||||
| ABM Industries, Inc. |
41,616 | 1,512,742 | ||||||
| ACCO Brands Corp. |
256,333 | 2,194,211 | ||||||
| ARC Document Solutions, Inc.* |
45,474 | 101,407 | ||||||
| Casella Waste Systems, Inc. Class A* |
6,397 | 227,477 | ||||||
| Charah Solutions, Inc.* |
31,810 | 203,584 | ||||||
| Ennis, Inc. |
28,408 | 589,750 | ||||||
| Heritage-Crystal Clean, Inc.* |
12,140 | 333,243 | ||||||
| Herman Miller, Inc. |
64,138 | 2,256,375 | ||||||
| HNI Corp. |
27,888 | 1,012,056 | ||||||
| Interface, Inc. |
67,310 | 1,031,189 | ||||||
| Kimball International, Inc. Class B |
39,020 | 551,743 | ||||||
| Knoll, Inc. |
48,697 | 920,860 | ||||||
| LSC Communications, Inc. |
7,599 | 49,621 | ||||||
| Matthews International Corp. Class A |
29,145 | 1,076,908 | ||||||
| McGrath RentCorp |
20,811 | 1,177,278 | ||||||
| Multi-Color Corp. |
20,374 | 1,016,459 | ||||||
| Pitney Bowes, Inc. |
408,134 | 2,803,881 | ||||||
| Quad/Graphics, Inc. |
36,258 | 431,470 | ||||||
| RR Donnelley & Sons Co. |
159,070 | 750,810 | ||||||
| SP Plus Corp.* |
28,450 | 970,714 | ||||||
| Steelcase, Inc. Class A |
125,324 | 1,823,464 | ||||||
| U.S. Ecology, Inc. |
11,280 | 631,454 | ||||||
| Viad Corp. |
13,518 | 760,928 | ||||||
| VSE Corp. |
15,660 | 494,543 | ||||||
|
|
|
|||||||
| Total Commercial Services & Supplies |
|
22,922,167 | ||||||
| Communications Equipment – 0.3% |
| |||||||
| Applied Optoelectronics, Inc.*(a) |
19,154 | 233,679 | ||||||
| CalAmp Corp.* |
7,191 | 90,463 | ||||||
| Casa Systems, Inc.* |
133,359 | 1,106,880 | ||||||
| Clearfield, Inc.* |
6,495 | 95,476 | ||||||
| Comtech Telecommunications Corp. |
10,241 | 237,796 | ||||||
| Digi International, Inc.* |
8,477 | 107,403 | ||||||
| NETGEAR, Inc.* |
7,373 | 244,194 | ||||||
|
|
|
|||||||
| Total Communications Equipment |
|
2,115,891 | ||||||
| Construction & Engineering – 1.3% |
| |||||||
| Ameresco, Inc. Class A* |
36,009 | 582,626 | ||||||
| Argan, Inc. |
17,734 | 885,813 | ||||||
| Comfort Systems USA, Inc. |
33,824 | 1,772,039 | ||||||
| Construction Partners, Inc. Class A* |
77,387 | 988,232 | ||||||
| Dycom Industries, Inc.* |
32,808 | 1,507,200 | ||||||
| MYR Group, Inc.* |
13,822 | 478,656 | ||||||
| Northwest Pipe Co.* |
12,248 | 293,952 | ||||||
| NV5 Global, Inc.* |
6,245 | 370,703 | ||||||
| Orion Group Holdings, Inc.* |
16,602 | 48,478 | ||||||
| Primoris Services Corp. |
40,980 | 847,466 | ||||||
| Sterling Construction Co., Inc.* |
29,450 | 368,714 | ||||||
| Tutor Perini Corp.* |
66,182 | 1,133,036 | ||||||
|
|
|
|||||||
| Total Construction & Engineering |
|
9,276,915 | ||||||
| Construction Materials – 0.4% |
| |||||||
| Forterra, Inc.*(a) |
30,507 | 128,739 | ||||||
| Summit Materials, Inc. Class A* |
114,863 | 1,822,876 | ||||||
| United States Lime & Minerals, Inc. |
4,580 | 353,210 | ||||||
| US Concrete, Inc.* |
12,905 | 534,525 | ||||||
|
|
|
|||||||
| Total Construction Materials |
|
2,839,350 | ||||||
| Consumer Finance – 0.7% |
| |||||||
| Curo Group Holdings Corp.* |
6,419 | 64,383 | ||||||
| Elevate Credit, Inc.* |
20,955 | 90,945 | ||||||
| Encore Capital Group, Inc.*(a) |
41,429 | 1,128,112 | ||||||
| Enova International, Inc.* |
49,808 | 1,136,618 | ||||||
| EZCORP, Inc. Class A* |
58,483 | 545,061 | ||||||
| PRA Group, Inc.* |
28,339 | 759,769 | ||||||
| Regional Management Corp.* |
15,612 | 381,245 | ||||||
| World Acceptance Corp.* |
8,788 | 1,029,338 | ||||||
|
|
|
|||||||
| Total Consumer Finance |
|
5,135,471 | ||||||
See Notes to Financial Statements.
| WisdomTree Trust | 73 |
Schedule of Investments (continued)
WisdomTree U.S. SmallCap Fund (EES)
March 31, 2019
| Investments | Shares | Value | ||||||
| Containers & Packaging – 0.0% |
| |||||||
| UFP Technologies, Inc.* |
5,013 | $ | 187,486 | |||||
| Distributors – 0.2% |
| |||||||
| Core-Mark Holding Co., Inc. |
20,603 | 764,989 | ||||||
| Funko, Inc. Class A*(a) |
15,633 | 339,549 | ||||||
| Weyco Group, Inc. |
9,643 | 298,547 | ||||||
|
|
|
|||||||
| Total Distributors |
|
1,403,085 | ||||||
| Diversified Consumer Services – 0.6% |
| |||||||
| American Public Education, Inc.* |
12,097 | 364,362 | ||||||
| Bridgepoint Education, Inc.* |
31,391 | 191,799 | ||||||
| Career Education Corp.* |
71,559 | 1,182,155 | ||||||
| Carriage Services, Inc. |
18,712 | 360,206 | ||||||
| Collectors Universe, Inc. |
7,806 | 136,761 | ||||||
| K12, Inc.* |
18,240 | 622,531 | ||||||
| Sotheby’s* |
38,767 | 1,463,454 | ||||||
|
|
|
|||||||
| Total Diversified Consumer Services |
|
4,321,268 | ||||||
| Diversified Financial Services – 0.1% |
| |||||||
| Marlin Business Services Corp. |
9,884 | 212,506 | ||||||
| On Deck Capital, Inc.* |
31,786 | 172,280 | ||||||
|
|
|
|||||||
| Total Diversified Financial Services |
|
384,786 | ||||||
| Diversified Telecommunication Services – 0.3% |
| |||||||
| ATN International, Inc. |
9,941 | 560,573 | ||||||
| Bandwidth, Inc. Class A* |
7,625 | 510,570 | ||||||
| Globalstar, Inc.*(a) |
3,323,831 | 1,429,247 | ||||||
|
|
|
|||||||
| Total Diversified Telecommunication Services |
|
2,500,390 | ||||||
| Electric Utilities – 0.2% |
| |||||||
| Genie Energy Ltd. Class B |
22,841 | 194,149 | ||||||
| Otter Tail Corp. |
26,663 | 1,328,351 | ||||||
| Spark Energy, Inc. Class A(a) |
13,018 | 115,990 | ||||||
|
|
|
|||||||
| Total Electric Utilities |
|
1,638,490 | ||||||
| Electrical Equipment – 0.9% |
| |||||||
| Allied Motion Technologies, Inc. |
3,988 | 137,107 | ||||||
| Atkore International Group, Inc.* |
87,026 | 1,873,670 | ||||||
| AZZ, Inc. |
11,519 | 471,473 | ||||||
| Encore Wire Corp. |
22,029 | 1,260,499 | ||||||
| Enphase Energy, Inc.*(a) |
56,094 | 517,748 | ||||||
| LSI Industries, Inc. |
12,946 | 34,048 | ||||||
| Preformed Line Products Co. |
6,213 | 329,848 | ||||||
| Sunrun, Inc.* |
71,746 | 1,008,749 | ||||||
| Thermon Group Holdings, Inc.* |
10,931 | 267,919 | ||||||
| TPI Composites, Inc.* |
13,375 | 382,792 | ||||||
| Vicor Corp.* |
11,709 | 363,213 | ||||||
|
|
|
|||||||
| Total Electrical Equipment |
|
6,647,066 | ||||||
| Electronic Equipment, Instruments & Components – 3.4% |
| |||||||
| Anixter International, Inc.* |
39,650 | 2,224,761 | ||||||
| Arlo Technologies, Inc.* |
14,609 | 60,335 | ||||||
| Badger Meter, Inc. |
6,611 | 367,836 | ||||||
| Bel Fuse, Inc. Class B |
10,895 | 275,426 | ||||||
| Benchmark Electronics, Inc. |
41,234 | 1,082,392 | ||||||
| Control4 Corp.* |
18,724 | 316,997 | ||||||
| CTS Corp. |
20,039 | 588,545 | ||||||
| Daktronics, Inc. |
17,010 | 126,725 | ||||||
| ePlus, Inc.* |
11,941 | 1,057,256 | ||||||
| FARO Technologies, Inc.* |
1,790 | 78,599 | ||||||
| Insight Enterprises, Inc.* |
51,902 | 2,857,724 | ||||||
| KEMET Corp. |
86,595 | 1,469,517 | ||||||
| Kimball Electronics, Inc.* |
30,755 | 476,395 | ||||||
| Knowles Corp.* |
62,174 | 1,096,128 | ||||||
| Mesa Laboratories, Inc. |
691 | 159,276 | ||||||
| Methode Electronics, Inc. |
77,866 | 2,240,983 | ||||||
| MTS Systems Corp. |
10,409 | 566,874 | ||||||
| Napco Security Technologies, Inc.* |
8,212 | 170,317 | ||||||
| nLight, Inc.* |
10,843 | 241,582 | ||||||
| OSI Systems, Inc.* |
9,397 | 823,177 | ||||||
| Park Electrochemical Corp. |
3,675 | 57,698 | ||||||
| PC Connection, Inc. |
29,000 | 1,063,430 | ||||||
| PCM, Inc.* |
5,050 | 184,982 | ||||||
| Plexus Corp.* |
28,038 | 1,708,916 | ||||||
| Sanmina Corp.* |
56,766 | 1,637,699 | ||||||
| ScanSource, Inc.* |
21,636 | 775,002 | ||||||
| TTM Technologies, Inc.* |
256,179 | 3,004,980 | ||||||
| Vishay Precision Group, Inc.* |
12,387 | 423,759 | ||||||
|
|
|
|||||||
| Total Electronic Equipment, Instruments & Components |
|
25,137,311 | ||||||
| Energy Equipment & Services – 3.8% |
| |||||||
| C&J Energy Services, Inc.* |
121,062 | 1,878,882 | ||||||
| Covia Holdings Corp.*(a) |
181,777 | 1,016,133 | ||||||
| DMC Global, Inc. |
6,008 | 298,237 | ||||||
| Era Group, Inc.* |
7,889 | 91,039 | ||||||
| Forum Energy Technologies, Inc.* |
169,255 | 864,893 | ||||||
| FTS International, Inc.* |
626,728 | 6,267,280 | ||||||
| Helix Energy Solutions Group, Inc.* |
93,811 | 742,045 | ||||||
| Keane Group, Inc.* |
161,973 | 1,763,886 | ||||||
| Liberty Oilfield Services, Inc. Class A(a) |
159,035 | 2,447,549 | ||||||
| Mammoth Energy Services, Inc. |
157,111 | 2,615,898 | ||||||
| NCS Multistage Holdings, Inc.* |
24,096 | 124,817 | ||||||
| Newpark Resources, Inc.* |
54,873 | 502,637 | ||||||
| ProPetro Holding Corp.* |
131,192 | 2,957,068 | ||||||
| SEACOR Holdings, Inc.* |
26,106 | 1,103,762 | ||||||
| Select Energy Services, Inc. Class A* |
74,281 | 892,858 | ||||||
| Smart Sand, Inc.*(a) |
105,732 | 470,507 | ||||||
| Solaris Oilfield Infrastructure, Inc. Class A(a) |
66,806 | 1,098,291 | ||||||
| U.S. Silica Holdings, Inc.(a) |
122,453 | 2,125,784 | ||||||
| Unit Corp.* |
34,766 | 495,068 | ||||||
|
|
|
|||||||
| Total Energy Equipment & Services |
|
27,756,634 | ||||||
| Entertainment – 0.1% |
| |||||||
| Marcus Corp. (The) |
21,019 | 841,811 | ||||||
| Reading International, Inc. Class A* |
13,208 | 210,800 | ||||||
|
|
|
|||||||
| Total Entertainment |
|
1,052,611 | ||||||
| Equity Real Estate Investment Trusts (REITs) – 2.9% |
| |||||||
| Agree Realty Corp. |
11,788 | 817,380 | ||||||
| Alexander & Baldwin, Inc. |
32,735 | 832,778 | ||||||
| Alexander’s, Inc. |
2,494 | 938,168 | ||||||
| American Assets Trust, Inc. |
5,416 | 248,378 | ||||||
| Armada Hoffler Properties, Inc. |
10,703 | 166,860 | ||||||
See Notes to Financial Statements.
| 74 | WisdomTree Trust |
Schedule of Investments (continued)
WisdomTree U.S. SmallCap Fund (EES)
March 31, 2019
| Investments | Shares | Value | ||||||
| Braemar Hotels & Resorts, Inc. |
12,713 | $ | 155,226 | |||||
| BRT Apartments Corp. |
28,623 | 397,287 | ||||||
| CareTrust REIT, Inc. |
24,961 | 585,585 | ||||||
| Chatham Lodging Trust |
21,762 | 418,701 | ||||||
| Chesapeake Lodging Trust |
43,203 | 1,201,476 | ||||||
| Community Healthcare Trust, Inc. |
2,699 | 96,867 | ||||||
| CorEnergy Infrastructure Trust, Inc.(a) |
5,556 | 204,183 | ||||||
| Easterly Government Properties, Inc. |
4,543 | 81,820 | ||||||
| Essential Properties Realty Trust, Inc. |
8,034 | 156,824 | ||||||
| Four Corners Property Trust, Inc. |
33,108 | 979,997 | ||||||
| Franklin Street Properties Corp. |
9,619 | 69,161 | ||||||
| Getty Realty Corp. |
15,347 | 491,564 | ||||||
| Gladstone Land Corp.(a) |
5,352 | 67,703 | ||||||
| Global Net Lease, Inc. |
9,238 | 174,598 | ||||||
| Hannon Armstrong Sustainable Infrastructure Capital, Inc. |
17,663 | 452,879 | ||||||
| Independence Realty Trust, Inc. |
19,900 | 214,721 | ||||||
| Industrial Logistics Properties Trust |
62,823 | 1,267,140 | ||||||
| InfraREIT, Inc. |
9,213 | 193,197 | ||||||
| Innovative Industrial Properties, Inc.(a) |
741 | 60,532 | ||||||
| iStar, Inc. |
50,272 | 423,290 | ||||||
| Jernigan Capital, Inc. |
11,755 | 247,325 | ||||||
| Lexington Realty Trust |
290,907 | 2,635,617 | ||||||
| LTC Properties, Inc. |
36,178 | 1,656,952 | ||||||
| Mack-Cali Realty Corp. |
15,649 | 347,408 | ||||||
| MedEquities Realty Trust, Inc. |
18,771 | 208,921 | ||||||
| Monmouth Real Estate Investment Corp. |
30,368 | 400,250 | ||||||
| National Storage Affiliates Trust |
2,393 | 68,224 | ||||||
| NorthStar Realty Europe Corp. |
27,235 | 472,800 | ||||||
| One Liberty Properties, Inc. |
8,622 | 250,038 | ||||||
| Retail Opportunity Investments Corp. |
28,782 | 499,080 | ||||||
| RPT Realty |
30,311 | 364,035 | ||||||
| Safehold, Inc. |
4,161 | 90,751 | ||||||
| Saul Centers, Inc. |
8,008 | 411,371 | ||||||
| Summit Hotel Properties, Inc. |
79,497 | 907,061 | ||||||
| Tier REIT, Inc. |
6,551 | 187,752 | ||||||
| Universal Health Realty Income Trust |
4,111 | 311,244 | ||||||
| Urstadt Biddle Properties, Inc. Class A |
12,374 | 255,399 | ||||||
| Washington Prime Group, Inc. |
141,482 | 799,373 | ||||||
| Washington Real Estate Investment Trust |
8,680 | 246,338 | ||||||
| Whitestone REIT |
10,430 | 125,369 | ||||||
|
|
|
|||||||
| Total Equity Real Estate Investment Trusts (REITs) |
|
21,181,623 | ||||||
| Food & Staples Retailing – 1.0% |
| |||||||
| Andersons, Inc. (The) |
16,018 | 516,260 | ||||||
| Chefs’ Warehouse, Inc. (The)* |
6,180 | 191,889 | ||||||
| Ingles Markets, Inc. Class A |
31,908 | 881,299 | ||||||
| Natural Grocers by Vitamin Cottage, Inc.* |
7,061 | 84,379 | ||||||
| PriceSmart, Inc. |
20,749 | 1,221,701 | ||||||
| Smart & Final Stores, Inc.* |
11,564 | 57,126 | ||||||
| SpartanNash Co. |
45,591 | 723,529 | ||||||
| United Natural Foods, Inc.* |
203,362 | 2,688,446 | ||||||
| Village Super Market, Inc. Class A |
12,713 | 347,446 | ||||||
| Weis Markets, Inc. |
21,577 | 880,558 | ||||||
|
|
|
|||||||
| Total Food & Staples Retailing |
|
7,592,633 | ||||||
| Food Products – 0.7% |
| |||||||
| B&G Foods, Inc.(a) |
39,205 | 957,386 | ||||||
| Calavo Growers, Inc. |
8,058 | 675,663 | ||||||
| Hostess Brands, Inc.* |
152,626 | 1,907,825 | ||||||
| John B. Sanfilippo & Son, Inc. |
7,916 | 568,923 | ||||||
| Landec Corp.* |
13,037 | 160,094 | ||||||
| Limoneira Co. |
8,418 | 198,076 | ||||||
| Simply Good Foods Co. (The)* |
32,704 | 673,376 | ||||||
|
|
|
|||||||
| Total Food Products |
|
5,141,343 | ||||||
| Gas Utilities – 0.1% |
| |||||||
| Chesapeake Utilities Corp. |
8,214 | 749,199 | ||||||
| Health Care Equipment & Supplies – 0.7% |
| |||||||
| AngioDynamics, Inc.* |
4,191 | 95,806 | ||||||
| Atrion Corp. |
650 | 571,142 | ||||||
| CONMED Corp. |
10,113 | 841,199 | ||||||
| FONAR Corp.* |
13,852 | 283,550 | ||||||
| Heska Corp.* |
1,230 | 104,698 | ||||||
| IntriCon Corp.* |
3,167 | 79,428 | ||||||
| iRadimed Corp.*(a) |
2,678 | 75,225 | ||||||
| Lantheus Holdings, Inc.* |
26,484 | 648,328 | ||||||
| LeMaitre Vascular, Inc. |
12,535 | 388,585 | ||||||
| Meridian Bioscience, Inc. |
20,750 | 365,408 | ||||||
| OraSure Technologies, Inc.* |
19,837 | 221,183 | ||||||
| Orthofix Medical, Inc.* |
3,475 | 196,025 | ||||||
| STAAR Surgical Co.* |
1,994 | 68,175 | ||||||
| Tactile Systems Technology, Inc.* |
2,625 | 138,390 | ||||||
| Utah Medical Products, Inc. |
3,143 | 277,370 | ||||||
| Varex Imaging Corp.* |
15,074 | 510,707 | ||||||
|
|
|
|||||||
| Total Health Care Equipment & Supplies |
|
4,865,219 | ||||||
| Health Care Providers & Services – 0.7% |
| |||||||
| Addus HomeCare Corp.* |
3,006 | 191,152 | ||||||
| Apollo Medical Holdings, Inc.*(a) |
4,803 | 87,991 | ||||||
| CorVel Corp.* |
9,429 | 615,148 | ||||||
| Cross Country Healthcare, Inc.* |
19,206 | 135,018 | ||||||
| Magellan Health, Inc.* |
24,870 | 1,639,431 | ||||||
| National HealthCare Corp. |
10,383 | 787,862 | ||||||
| National Research Corp. |
9,597 | 370,444 | ||||||
| Providence Service Corp. (The)* |
2,369 | 157,823 | ||||||
| RadNet, Inc.* |
14,685 | 181,947 | ||||||
| Tivity Health, Inc.* |
52,825 | 927,607 | ||||||
| U.S. Physical Therapy, Inc. |
1,644 | 172,669 | ||||||
|
|
|
|||||||
| Total Health Care Providers & Services |
|
5,267,092 | ||||||
| Health Care Technology – 0.1% |
| |||||||
| Computer Programs & Systems, Inc. |
3,145 | 93,375 | ||||||
| HealthStream, Inc.* |
7,250 | 203,435 | ||||||
| NextGen Healthcare, Inc.* |
15,768 | 265,375 | ||||||
| Simulations Plus, Inc. |
6,407 | 135,252 | ||||||
|
|
|
|||||||
| Total Health Care Technology |
|
697,437 | ||||||
| Hotels, Restaurants & Leisure – 2.5% |
| |||||||
| BBX Capital Corp. |
168,965 | 1,000,273 | ||||||
| BJ’s Restaurants, Inc. |
12,636 | 597,430 | ||||||
| Bloomin’ Brands, Inc. |
93,041 | 1,902,688 | ||||||
See Notes to Financial Statements.
| WisdomTree Trust | 75 |
Schedule of Investments (continued)
WisdomTree U.S. SmallCap Fund (EES)
March 31, 2019
| Investments | Shares | Value | ||||||
| Bluegreen Vacations Corp.(a) |
96,045 | $ | 1,427,229 | |||||
| Brinker International, Inc. |
47,267 | 2,097,709 | ||||||
| Carrols Restaurant Group, Inc.* |
15,386 | 153,398 | ||||||
| Chuy’s Holdings, Inc.* |
6,563 | 149,440 | ||||||
| Del Taco Restaurants, Inc.* |
28,314 | 284,839 | ||||||
| Denny’s Corp.* |
39,609 | 726,825 | ||||||
| Dine Brands Global, Inc. |
11,667 | 1,065,080 | ||||||
| El Pollo Loco Holdings, Inc.* |
6,920 | 90,029 | ||||||
| Fiesta Restaurant Group, Inc.* |
12,263 | 160,768 | ||||||
| Habit Restaurants, Inc. (The) Class A* |
79,029 | 855,094 | ||||||
| International Speedway Corp. Class A |
28,101 | 1,226,047 | ||||||
| J Alexander’s Holdings, Inc.* |
14,698 | 144,334 | ||||||
| Monarch Casino & Resort, Inc.* |
13,141 | 577,153 | ||||||
| Nathan’s Famous, Inc. |
1,000 | 68,400 | ||||||
| Papa John’s International, Inc.(a) |
12,986 | 687,609 | ||||||
| RCI Hospitality Holdings, Inc. |
12,421 | 285,310 | ||||||
| Red Lion Hotels Corp.* |
14,295 | 115,504 | ||||||
| Red Robin Gourmet Burgers, Inc.* |
6,254 | 180,178 | ||||||
| Ruth’s Hospitality Group, Inc. |
26,221 | 670,995 | ||||||
| Shake Shack, Inc. Class A* |
46,572 | 2,754,734 | ||||||
| Speedway Motorsports, Inc. |
41,343 | 598,233 | ||||||
| Town Sports International Holdings, Inc.* |
45,523 | 216,690 | ||||||
| Wingstop, Inc. |
5,828 | 443,103 | ||||||
|
|
|
|||||||
| Total Hotels, Restaurants & Leisure |
|
18,479,092 | ||||||
| Household Durables – 5.8% |
| |||||||
| Bassett Furniture Industries, Inc. |
10,974 | 180,083 | ||||||
| Beazer Homes USA, Inc.* |
57,364 | 660,260 | ||||||
| Cavco Industries, Inc.* |
7,926 | 931,543 | ||||||
| Century Communities, Inc.* |
73,119 | 1,752,662 | ||||||
| Ethan Allen Interiors, Inc. |
28,768 | 550,332 | ||||||
| Flexsteel Industries, Inc. |
9,501 | 220,328 | ||||||
| Green Brick Partners, Inc.* |
93,607 | 819,061 | ||||||
| Hamilton Beach Brands Holding Co. Class A |
18,546 | 397,997 | ||||||
| Hooker Furniture Corp. |
16,896 | 487,112 | ||||||
| Installed Building Products, Inc.* |
20,702 | 1,004,047 | ||||||
| KB Home |
206,821 | 4,998,864 | ||||||
| La-Z-Boy, Inc. |
57,726 | 1,904,381 | ||||||
| LGI Homes, Inc.*(a) |
54,653 | 3,292,297 | ||||||
| M/I Homes, Inc.* |
62,560 | 1,665,347 | ||||||
| MDC Holdings, Inc. |
112,776 | 3,277,271 | ||||||
| Meritage Homes Corp.* |
83,745 | 3,744,239 | ||||||
| New Home Co., Inc. (The)* |
38,449 | 183,017 | ||||||
| Taylor Morrison Home Corp. Class A* |
236,781 | 4,202,863 | ||||||
| TopBuild Corp.* |
41,868 | 2,713,884 | ||||||
| TRI Pointe Group, Inc.* |
359,966 | 4,549,970 | ||||||
| Tupperware Brands Corp. |
81,111 | 2,074,819 | ||||||
| Turtle Beach Corp.*(a) |
34,405 | 390,841 | ||||||
| Universal Electronics, Inc.* |
4,455 | 165,503 | ||||||
| VOXX International Corp.* |
14,358 | 66,334 | ||||||
| William Lyon Homes Class A* |
119,546 | 1,837,422 | ||||||
| ZAGG, Inc.* |
68,993 | 625,766 | ||||||
|
|
|
|||||||
| Total Household Durables |
|
42,696,243 | ||||||
| Household Products – 0.2% |
| |||||||
| Central Garden and Pet Co. Class A* |
50,785 | 1,180,751 | ||||||
| Independent Power & Renewable Electricity Producers – 0.3% |
| |||||||
| Pattern Energy Group, Inc. Class A |
103,595 | 2,279,090 | ||||||
| Industrial Conglomerates – 0.1% |
| |||||||
| Raven Industries, Inc. |
23,522 | 902,539 | ||||||
| Insurance – 2.2% |
| |||||||
| Ambac Financial Group, Inc.* |
130,856 | 2,371,111 | ||||||
| AMERISAFE, Inc. |
12,730 | 756,162 | ||||||
| EMC Insurance Group, Inc. |
10,720 | 341,754 | ||||||
| Employers Holdings, Inc. |
39,802 | 1,596,458 | ||||||
| FBL Financial Group, Inc. Class A |
18,314 | 1,148,654 | ||||||
| FedNat Holding Co. |
16,575 | 265,863 | ||||||
| HCI Group, Inc. |
7,726 | 330,132 | ||||||
| Health Insurance Innovations, Inc. Class A*(a) |
6,800 | 182,376 | ||||||
| Heritage Insurance Holdings, Inc. |
13,418 | 195,903 | ||||||
| Horace Mann Educators Corp. |
20,025 | 705,080 | ||||||
| Independence Holding Co. |
8,716 | 307,239 | ||||||
| Investors Title Co. |
1,739 | 274,588 | ||||||
| Kingstone Cos., Inc. |
4,156 | 61,259 | ||||||
| Kinsale Capital Group, Inc. |
7,245 | 496,790 | ||||||
| National Western Life Group, Inc. Class A |
4,470 | 1,173,241 | ||||||
| Navigators Group, Inc. (The) |
18,221 | 1,273,101 | ||||||
| Safety Insurance Group, Inc. |
10,113 | 881,247 | ||||||
| State Auto Financial Corp. |
21,569 | 710,052 | ||||||
| Stewart Information Services Corp. |
12,854 | 548,737 | ||||||
| United Fire Group, Inc. |
11,493 | 502,359 | ||||||
| United Insurance Holdings Corp. |
20,329 | 323,231 | ||||||
| Universal Insurance Holdings, Inc. |
47,112 | 1,460,472 | ||||||
|
|
|
|||||||
| Total Insurance |
|
15,905,809 | ||||||
| Interactive Media & Services – 0.2% |
| |||||||
| Care.com, Inc.* |
4,530 | 89,513 | ||||||
| Cars.com, Inc.* |
33,220 | 757,416 | ||||||
| QuinStreet, Inc.* |
19,367 | 259,324 | ||||||
| Travelzoo* |
8,720 | 116,848 | ||||||
|
|
|
|||||||
| Total Interactive Media & Services |
|
1,223,101 | ||||||
| Internet & Direct Marketing Retail – 0.4% |
| |||||||
| 1-800-Flowers.com, Inc. Class A* |
32,100 | 585,183 | ||||||
| Duluth Holdings, Inc. Class B*(a) |
13,632 | 324,987 | ||||||
| Leaf Group Ltd.* |
29,880 | 239,637 | ||||||
| PetMed Express, Inc.(a) |
26,665 | 607,429 | ||||||
| Shutterstock, Inc. |
18,949 | 883,592 | ||||||
|
|
|
|||||||
| Total Internet & Direct Marketing Retail |
|
2,640,828 | ||||||
| IT Services – 1.2% |
| |||||||
| Carbonite, Inc.* |
2,928 | 72,644 | ||||||
| Cass Information Systems, Inc. |
7,623 | 360,568 | ||||||
| CSG Systems International, Inc. |
27,034 | 1,143,538 | ||||||
| ExlService Holdings, Inc.* |
19,555 | 1,173,691 | ||||||
| GreenSky, Inc. Class A* |
98,920 | 1,280,025 | ||||||
| Hackett Group, Inc. (The) |
28,230 | 446,034 | ||||||
| Information Services Group, Inc.* |
18,549 | 69,188 | ||||||
| NIC, Inc. |
73,604 | 1,257,892 | ||||||
See Notes to Financial Statements.
| 76 | WisdomTree Trust |
Schedule of Investments (continued)
WisdomTree U.S. SmallCap Fund (EES)
March 31, 2019
| Investments | Shares | Value | ||||||
| Perficient, Inc.* |
12,385 | $ | 339,225 | |||||
| Presidio, Inc. |
36,965 | 547,082 | ||||||
| PRGX Global, Inc.* |
7,039 | 55,749 | ||||||
| Sykes Enterprises, Inc.* |
29,114 | 823,344 | ||||||
| TTEC Holdings, Inc. |
21,176 | 767,206 | ||||||
| Unisys Corp.* |
56,052 | 654,127 | ||||||
| Virtusa Corp.* |
2,409 | 128,761 | ||||||
|
|
|
|||||||
| Total IT Services |
|
9,119,074 | ||||||
| Leisure Products – 1.1% |
| |||||||
| Acushnet Holdings Corp. |
77,384 | 1,790,666 | ||||||
| American Outdoor Brands Corp.* |
27,436 | 256,252 | ||||||
| Callaway Golf Co. |
108,335 | 1,725,777 | ||||||
| Clarus Corp. |
6,771 | 86,737 | ||||||
| Johnson Outdoors, Inc. Class A |
12,779 | 911,909 | ||||||
| Malibu Boats, Inc. Class A* |
30,141 | 1,192,981 | ||||||
| Marine Products Corp. |
26,187 | 352,739 | ||||||
| MasterCraft Boat Holdings, Inc.* |
27,883 | 629,319 | ||||||
| Nautilus, Inc.* |
31,938 | 177,575 | ||||||
| Sturm Ruger & Co., Inc. |
14,274 | 756,807 | ||||||
|
|
|
|||||||
| Total Leisure Products |
|
7,880,762 | ||||||
| Life Sciences Tools & Services – 0.3% |
| |||||||
| Cambrex Corp.* |
43,143 | 1,676,105 | ||||||
| Luminex Corp. |
20,386 | 469,082 | ||||||
| NeoGenomics, Inc.* |
6,874 | 140,642 | ||||||
| Pacific Biosciences of California, Inc.* |
41,916 | 303,053 | ||||||
|
|
|
|||||||
| Total Life Sciences Tools & Services |
|
2,588,882 | ||||||
| Machinery – 5.2% |
| |||||||
| Alamo Group, Inc. |
13,018 | 1,301,019 | ||||||
| Altra Industrial Motion Corp. |
30,269 | 939,852 | ||||||
| Blue Bird Corp.* |
23,618 | 399,853 | ||||||
| Chart Industries, Inc.* |
10,568 | 956,615 | ||||||
| Columbus McKinnon Corp. |
18,705 | 642,517 | ||||||
| Commercial Vehicle Group, Inc.* |
98,554 | 755,909 | ||||||
| Douglas Dynamics, Inc. |
17,587 | 669,537 | ||||||
| Energy Recovery, Inc.*(a) |
59,097 | 515,917 | ||||||
| EnPro Industries, Inc. |
24,895 | 1,604,483 | ||||||
| ESCO Technologies, Inc. |
15,383 | 1,031,122 | ||||||
| Evoqua Water Technologies Corp.* |
24,556 | 308,914 | ||||||
| Federal Signal Corp. |
67,139 | 1,744,943 | ||||||
| Franklin Electric Co., Inc. |
34,584 | 1,766,897 | ||||||
| Global Brass & Copper Holdings, Inc. |
32,062 | 1,104,215 | ||||||
| Gorman-Rupp Co. (The) |
17,887 | 607,085 | ||||||
| Greenbrier Cos., Inc. (The) |
43,152 | 1,390,789 | ||||||
| Hurco Cos., Inc. |
9,933 | 400,598 | ||||||
| Hyster-Yale Materials Handling, Inc. |
16,281 | 1,015,283 | ||||||
| Kadant, Inc. |
8,375 | 736,665 | ||||||
| L.B. Foster Co. Class A* |
7,971 | 150,014 | ||||||
| Lindsay Corp. |
3,180 | 307,792 | ||||||
| Lydall, Inc.* |
30,241 | 709,454 | ||||||
| Meritor, Inc.* |
189,020 | 3,846,557 | ||||||
| Milacron Holdings Corp.* |
35,049 | 396,755 | ||||||
| Miller Industries, Inc. |
18,236 | 562,581 | ||||||
| Mueller Industries, Inc. |
50,248 | 1,574,772 | ||||||
| Mueller Water Products, Inc. Class A |
105,890 | 1,063,136 | ||||||
| Omega Flex, Inc. |
5,460 | 413,868 | ||||||
| Park-Ohio Holdings Corp. |
23,122 | 748,690 | ||||||
| REV Group, Inc. |
71,502 | 782,947 | ||||||
| Spartan Motors, Inc. |
38,786 | 342,480 | ||||||
| SPX Corp.* |
15,096 | 525,190 | ||||||
| SPX FLOW, Inc.* |
36,470 | 1,163,393 | ||||||
| Standex International Corp. |
12,193 | 894,966 | ||||||
| Sun Hydraulics Corp. |
13,558 | 630,583 | ||||||
| Tennant Co. |
6,542 | 406,193 | ||||||
| TriMas Corp.* |
40,475 | 1,223,559 | ||||||
| Twin Disc, Inc.* |
15,528 | 258,541 | ||||||
| Wabash National Corp. |
91,350 | 1,237,793 | ||||||
| Welbilt, Inc.* |
181,245 | 2,968,793 | ||||||
|
|
|
|||||||
| Total Machinery |
|
38,100,270 | ||||||
| Marine – 0.2% |
| |||||||
| Matson, Inc. |
45,676 | 1,648,447 | ||||||
| Media – 1.7% |
| |||||||
| Emerald Expositions Events, Inc. |
65,099 | 826,757 | ||||||
| EW Scripps Co. (The) Class A |
32,347 | 679,287 | ||||||
| Gannett Co., Inc. |
98,425 | 1,037,399 | ||||||
| Gray Television, Inc.* |
127,496 | 2,723,315 | ||||||
| Lee Enterprises, Inc.* |
154,294 | 509,170 | ||||||
| Loral Space & Communications, Inc.* |
47,603 | 1,716,088 | ||||||
| MSG Networks, Inc. Class A* |
117,859 | 2,563,433 | ||||||
| National CineMedia, Inc. |
272,234 | 1,919,250 | ||||||
| New Media Investment Group, Inc. |
31,217 | 327,779 | ||||||
| Scholastic Corp. |
1,545 | 61,429 | ||||||
| TechTarget, Inc.* |
18,604 | 302,687 | ||||||
|
|
|
|||||||
| Total Media |
|
12,666,594 | ||||||
| Metals & Mining – 2.7% |
| |||||||
| AK Steel Holding Corp.*(a) |
391,444 | 1,076,471 | ||||||
| Carpenter Technology Corp. |
51,909 | 2,380,028 | ||||||
| Century Aluminum Co.* |
55,270 | 490,798 | ||||||
| Compass Minerals International, Inc. |
24,255 | 1,318,744 | ||||||
| Gold Resource Corp. |
34,993 | 137,523 | ||||||
| Kaiser Aluminum Corp. |
15,447 | 1,617,764 | ||||||
| Materion Corp. |
14,577 | 831,764 | ||||||
| Olympic Steel, Inc. |
29,280 | 464,674 | ||||||
| Ramaco Resources, Inc.*(a) |
60,920 | 353,336 | ||||||
| Ryerson Holding Corp.* |
213,300 | 1,825,848 | ||||||
| Schnitzer Steel Industries, Inc. Class A |
67,874 | 1,628,976 | ||||||
| Synalloy Corp. |
12,532 | 190,486 | ||||||
| Universal Stainless & Alloy Products, Inc.* |
8,192 | 135,741 | ||||||
| Warrior Met Coal, Inc. |
234,788 | 7,137,555 | ||||||
|
|
|
|||||||
| Total Metals & Mining |
|
19,589,708 | ||||||
| Multi-Utilities – 0.1% |
| |||||||
| Unitil Corp. |
9,723 | 526,695 | ||||||
| Multiline Retail – 0.9% |
| |||||||
| Big Lots, Inc. |
90,606 | 3,444,840 | ||||||
| Dillard’s, Inc. Class A(a) |
40,706 | 2,931,646 | ||||||
|
|
|
|||||||
| Total Multiline Retail |
|
6,376,486 | ||||||
See Notes to Financial Statements.
| WisdomTree Trust | 77 |
Schedule of Investments (continued)
WisdomTree U.S. SmallCap Fund (EES)
March 31, 2019
| Investments | Shares | Value | ||||||
| Oil, Gas & Consumable Fuels – 5.4% |
| |||||||
| Adams Resources & Energy, Inc. |
3,072 | $ | 119,992 | |||||
| Arch Coal, Inc. Class A(a) |
49,513 | 4,519,051 | ||||||
| Bonanza Creek Energy, Inc.* |
83,529 | 1,895,273 | ||||||
| Callon Petroleum Co.* |
340,373 | 2,569,816 | ||||||
| Carrizo Oil & Gas, Inc.*(a) |
116,421 | 1,451,770 | ||||||
| CONSOL Energy, Inc.* |
65,735 | 2,249,452 | ||||||
| Contura Energy, Inc.* |
35,208 | 2,039,247 | ||||||
| Denbury Resources, Inc.* |
1,027,878 | 2,107,150 | ||||||
| Earthstone Energy, Inc. Class A* |
40,563 | 287,186 | ||||||
| Evolution Petroleum Corp. |
35,965 | 242,764 | ||||||
| Gulfport Energy Corp.* |
799,468 | 6,411,733 | ||||||
| Hallador Energy Co. |
19,499 | 102,565 | ||||||
| NACCO Industries, Inc. Class A |
14,227 | 543,756 | ||||||
| Overseas Shipholding Group, Inc. Class A* |
599,401 | 1,372,628 | ||||||
| Panhandle Oil and Gas, Inc. Class A |
3,128 | 49,110 | ||||||
| Par Pacific Holdings, Inc.* |
44,055 | 784,620 | ||||||
| Penn Virginia Corp.* |
2,803 | 123,612 | ||||||
| Renewable Energy Group, Inc.* |
76,531 | 1,680,621 | ||||||
| REX American Resources Corp.* |
8,571 | 690,908 | ||||||
| Ring Energy, Inc.* |
50,195 | 294,645 | ||||||
| SilverBow Resources, Inc.* |
29,517 | 678,891 | ||||||
| SRC Energy, Inc.* |
743,390 | 3,806,157 | ||||||
| W&T Offshore, Inc.* |
732,020 | 5,050,938 | ||||||
| World Fuel Services Corp. |
21,206 | 612,641 | ||||||
|
|
|
|||||||
| Total Oil, Gas & Consumable Fuels |
|
39,684,526 | ||||||
| Paper & Forest Products – 0.8% |
| |||||||
| Boise Cascade Co. |
63,762 | 1,706,271 | ||||||
| Clearwater Paper Corp.* |
28,973 | 564,394 | ||||||
| Neenah, Inc. |
8,960 | 576,666 | ||||||
| PH Glatfelter Co. |
13,858 | 195,675 | ||||||
| Schweitzer-Mauduit International, Inc. |
49,174 | 1,904,017 | ||||||
| Verso Corp. Class A* |
59,489 | 1,274,254 | ||||||
|
|
|
|||||||
| Total Paper & Forest Products |
|
6,221,277 | ||||||
| Personal Products – 0.3% |
| |||||||
| elf Beauty, Inc.* |
23,566 | 249,799 | ||||||
| Inter Parfums, Inc. |
12,524 | 950,196 | ||||||
| Lifevantage Corp.* |
8,676 | 123,980 | ||||||
| Medifast, Inc. |
5,547 | 707,520 | ||||||
| Natural Health Trends Corp.(a) |
27,998 | 362,854 | ||||||
|
|
|
|||||||
| Total Personal Products |
|
2,394,349 | ||||||
| Pharmaceuticals – 0.8% |
| |||||||
| ANI Pharmaceuticals, Inc.* |
4,205 | 296,621 | ||||||
| Corcept Therapeutics, Inc.*(a) |
69,809 | 819,558 | ||||||
| Innoviva, Inc.* |
172,922 | 2,426,095 | ||||||
| Phibro Animal Health Corp. Class A |
31,870 | 1,051,710 | ||||||
| Prestige Consumer Healthcare, Inc.* |
33,351 | 997,528 | ||||||
|
|
|
|||||||
| Total Pharmaceuticals |
|
5,591,512 | ||||||
| Professional Services – 1.3% |
| |||||||
| Barrett Business Services, Inc. |
8,642 | 668,286 | ||||||
| BG Staffing, Inc. |
11,598 | 253,300 | ||||||
| CBIZ, Inc.* |
50,143 | 1,014,894 | ||||||
| CRA International, Inc. |
5,728 | 289,493 | ||||||
| Forrester Research, Inc. |
5,617 | 271,582 | ||||||
| GP Strategies Corp.* |
16,551 | 201,095 | ||||||
| Heidrick & Struggles International, Inc. |
12,258 | 469,849 | ||||||
| ICF International, Inc. |
12,522 | 952,674 | ||||||
| InnerWorkings, Inc.* |
37,961 | 137,419 | ||||||
| Kelly Services, Inc. Class A |
56,521 | 1,246,853 | ||||||
| Kforce, Inc. |
27,686 | 972,332 | ||||||
| Mistras Group, Inc.* |
11,112 | 153,457 | ||||||
| Navigant Consulting, Inc. |
14,499 | 282,296 | ||||||
| Resources Connection, Inc. |
21,150 | 349,821 | ||||||
| TrueBlue, Inc.* |
45,814 | 1,083,043 | ||||||
| WageWorks, Inc.* |
24,003 | 906,353 | ||||||
| Willdan Group, Inc.* |
3,691 | 136,825 | ||||||
|
|
|
|||||||
| Total Professional Services |
|
9,389,572 | ||||||
| Real Estate Management & Development – 0.9% |
| |||||||
| Consolidated-Tomoka Land Co. |
6,062 | 357,961 | ||||||
| Five Point Holdings LLC Class A*(a) |
107,781 | 777,101 | ||||||
| HFF, Inc. Class A |
32,933 | 1,572,551 | ||||||
| Marcus & Millichap, Inc.* |
27,079 | 1,102,928 | ||||||
| RE/MAX Holdings, Inc. Class A |
21,776 | 839,247 | ||||||
| RMR Group, Inc. (The) Class A |
19,854 | 1,210,697 | ||||||
| St. Joe Co. (The)* |
29,135 | 480,436 | ||||||
|
|
|
|||||||
| Total Real Estate Management & Development |
|
6,340,921 | ||||||
| Road & Rail – 0.8% |
| |||||||
| ArcBest Corp. |
24,945 | 768,057 | ||||||
| Covenant Transportation Group, Inc. Class A* |
27,518 | 522,292 | ||||||
| Heartland Express, Inc. |
48,024 | 925,903 | ||||||
| Marten Transport Ltd. |
41,674 | 743,047 | ||||||
| PAM Transportation Services, Inc.* |
7,397 | 362,009 | ||||||
| Saia, Inc.* |
25,781 | 1,575,219 | ||||||
| Universal Logistics Holdings, Inc. |
38,849 | 764,548 | ||||||
| US Xpress Enterprises, Inc. Class A* |
14,543 | 96,129 | ||||||
| USA Truck, Inc.* |
9,513 | 137,368 | ||||||
|
|
|
|||||||
| Total Road & Rail |
|
5,894,572 | ||||||
| Semiconductors & Semiconductor Equipment – 2.0% |
| |||||||
| ACM Research, Inc. Class A*(a) |
11,840 | 182,691 | ||||||
| Advanced Energy Industries, Inc.* |
67,576 | 3,357,176 | ||||||
| Amkor Technology, Inc.* |
379,696 | 3,242,604 | ||||||
| Axcelis Technologies, Inc.* |
38,513 | 774,882 | ||||||
| AXT, Inc.* |
46,598 | 207,361 | ||||||
| Ceva, Inc.* |
6,211 | 167,449 | ||||||
| Cohu, Inc. |
28,515 | 420,596 | ||||||
| CyberOptics Corp.* |
3,073 | 52,548 | ||||||
| Diodes, Inc.* |
39,543 | 1,372,142 | ||||||
| FormFactor, Inc.* |
26,920 | 433,143 | ||||||
| Nanometrics, Inc.* |
32,665 | 1,008,695 | ||||||
| NVE Corp. |
2,442 | 239,047 | ||||||
| Photronics, Inc.* |
45,437 | 429,380 | ||||||
| Power Integrations, Inc. |
16,249 | 1,136,455 | ||||||
| Rudolph Technologies, Inc.* |
34,289 | 781,789 | ||||||
| Ultra Clean Holdings, Inc.* |
115,206 | 1,192,382 | ||||||
|
|
|
|||||||
| Total Semiconductors & Semiconductor Equipment |
|
14,998,340 | ||||||
See Notes to Financial Statements.
| 78 | WisdomTree Trust |
Schedule of Investments (continued)
WisdomTree U.S. SmallCap Fund (EES)
March 31, 2019
| Investments | Shares | Value | ||||||
| Software – 0.6% |
| |||||||
| American Software, Inc. Class A |
17,669 | $ | 211,145 | |||||
| Appfolio, Inc. Class A* |
5,002 | 397,159 | ||||||
| Ebix, Inc.(a) |
38,075 | 1,879,763 | ||||||
| MicroStrategy, Inc. Class A* |
4,242 | 611,908 | ||||||
| Monotype Imaging Holdings, Inc. |
3,915 | 77,869 | ||||||
| Progress Software Corp. |
25,155 | 1,116,127 | ||||||
| QAD, Inc. Class A |
1,610 | 69,343 | ||||||
| SPS Commerce, Inc.* |
3,238 | 343,422 | ||||||
| Zix Corp.* |
11,182 | 76,932 | ||||||
|
|
|
|||||||
| Total Software |
|
4,783,668 | ||||||
| Specialty Retail – 6.9% |
| |||||||
| Abercrombie & Fitch Co. Class A |
58,363 | 1,599,730 | ||||||
| America’s Car-Mart, Inc.* |
8,524 | 778,582 | ||||||
| Asbury Automotive Group, Inc.* |
37,066 | 2,570,898 | ||||||
| At Home Group, Inc.* |
28,461 | 508,313 | ||||||
| Bed Bath & Beyond, Inc. |
460,442 | 7,822,910 | ||||||
| Boot Barn Holdings, Inc.* |
28,109 | 827,529 | ||||||
| Buckle, Inc. (The) |
78,387 | 1,467,405 | ||||||
| Caleres, Inc. |
46,012 | 1,136,036 | ||||||
| Camping World Holdings, Inc. Class A(a) |
199,236 | 2,771,373 | ||||||
| Cato Corp. (The) Class A |
31,029 | 464,814 | ||||||
| Chico’s FAS, Inc. |
207,855 | 887,541 | ||||||
| Children’s Place, Inc. (The) |
20,110 | 1,956,301 | ||||||
| Citi Trends, Inc. |
16,974 | 327,768 | ||||||
| Conn’s, Inc.* |
35,715 | 816,445 | ||||||
| Container Store Group, Inc. (The)* |
27,253 | 239,826 | ||||||
| Express, Inc.* |
93,380 | 399,666 | ||||||
| GameStop Corp. Class A |
319,621 | 3,247,349 | ||||||
| Genesco, Inc.* |
18,395 | 837,892 | ||||||
| Group 1 Automotive, Inc. |
49,733 | 3,217,725 | ||||||
| Guess?, Inc. |
36,282 | 711,127 | ||||||
| Haverty Furniture Cos., Inc. |
23,512 | 514,443 | ||||||
| Hibbett Sports, Inc.* |
37,022 | 844,472 | ||||||
| J. Jill, Inc.(a) |
101,015 | 554,572 | ||||||
| Kirkland’s, Inc.* |
8,386 | 58,954 | ||||||
| Lithia Motors, Inc. Class A |
57,446 | 5,328,117 | ||||||
| Lumber Liquidators Holdings, Inc.*(a) |
6,271 | 63,337 | ||||||
| MarineMax, Inc.* |
30,502 | 584,418 | ||||||
| Office Depot, Inc. |
735,756 | 2,670,794 | ||||||
| Party City Holdco, Inc.*(a) |
197,354 | 1,566,991 | ||||||
| Shoe Carnival, Inc.(a) |
16,770 | 570,683 | ||||||
| Sleep Number Corp.* |
25,350 | 1,191,450 | ||||||
| Sonic Automotive, Inc. Class A |
71,006 | 1,051,599 | ||||||
| Sportsman’s Warehouse Holdings, Inc.* |
69,527 | 333,730 | ||||||
| Tailored Brands, Inc.(a) |
120,700 | 946,288 | ||||||
| Tile Shop Holdings, Inc. |
32,318 | 182,920 | ||||||
| Tilly’s, Inc. Class A |
34,931 | 388,782 | ||||||
| Vitamin Shoppe, Inc.* |
37,504 | 264,028 | ||||||
| Winmark Corp. |
2,813 | 530,504 | ||||||
| Zumiez, Inc.* |
25,882 | 644,203 | ||||||
|
|
|
|||||||
| Total Specialty Retail |
|
50,879,515 | ||||||
| Technology Hardware, Storage & Peripherals – 0.1% |
| |||||||
| Immersion Corp.* |
79,879 | 673,380 | ||||||
| Textiles, Apparel & Luxury Goods – 0.9% |
| |||||||
| Crocs, Inc.* |
8,177 | 210,558 | ||||||
| Culp, Inc. |
12,743 | 245,048 | ||||||
| G-III Apparel Group Ltd.* |
57,678 | 2,304,813 | ||||||
| Movado Group, Inc. |
21,486 | 781,661 | ||||||
| Oxford Industries, Inc. |
13,598 | 1,023,385 | ||||||
| Superior Group of Cos., Inc. |
15,999 | 265,903 | ||||||
| Unifi, Inc.* |
12,265 | 237,328 | ||||||
| Vera Bradley, Inc.* |
32,860 | 435,395 | ||||||
| Vince Holding Corp.*(a) |
87,184 | 1,081,081 | ||||||
|
|
|
|||||||
| Total Textiles, Apparel & Luxury Goods |
|
6,585,172 | ||||||
| Thrifts & Mortgage Finance – 3.6% |
| |||||||
| Axos Financial, Inc.* |
63,605 | 1,842,001 | ||||||
| Capitol Federal Financial, Inc. |
79,522 | 1,061,619 | ||||||
| Dime Community Bancshares, Inc. |
39,050 | 731,406 | ||||||
| Federal Agricultural Mortgage Corp. Class C |
18,309 | 1,326,121 | ||||||
| First Defiance Financial Corp. |
18,141 | 521,372 | ||||||
| Flagstar Bancorp, Inc. |
67,689 | 2,228,322 | ||||||
| FS Bancorp, Inc. |
3,999 | 201,870 | ||||||
| Home Bancorp, Inc. |
9,320 | 309,890 | ||||||
| HomeStreet, Inc.* |
18,617 | 490,558 | ||||||
| Kearny Financial Corp. |
26,488 | 340,901 | ||||||
| Luther Burbank Corp. |
67,050 | 677,205 | ||||||
| Merchants Bancorp |
34,453 | 740,739 | ||||||
| Meridian Bancorp, Inc. |
45,765 | 718,053 | ||||||
| Meta Financial Group, Inc. |
27,301 | 537,284 | ||||||
| NMI Holdings, Inc. Class A* |
53,760 | 1,390,771 | ||||||
| Northfield Bancorp, Inc. |
32,098 | 446,162 | ||||||
| Northwest Bancshares, Inc. |
66,640 | 1,130,881 | ||||||
| OceanFirst Financial Corp. |
29,363 | 706,474 | ||||||
| Ocwen Financial Corp.* |
129,293 | 235,313 | ||||||
| OP Bancorp |
13,923 | 121,826 | ||||||
| Oritani Financial Corp. |
42,481 | 706,459 | ||||||
| PCSB Financial Corp. |
3,367 | 65,892 | ||||||
| PennyMac Financial Services, Inc. |
50,263 | 1,117,849 | ||||||
| Provident Financial Services, Inc. |
51,133 | 1,323,833 | ||||||
| Riverview Bancorp, Inc. |
20,415 | 149,234 | ||||||
| Southern Missouri Bancorp, Inc. |
7,269 | 223,885 | ||||||
| Sterling Bancorp, Inc. |
68,951 | 699,163 | ||||||
| Territorial Bancorp, Inc. |
8,836 | 237,777 | ||||||
| Timberland Bancorp, Inc. |
8,423 | 235,676 | ||||||
| TrustCo Bank Corp. |
90,877 | 705,205 | ||||||
| United Community Financial Corp. |
42,746 | 399,675 | ||||||
| United Financial Bancorp, Inc. |
45,544 | 653,556 | ||||||
| Walker & Dunlop, Inc. |
41,922 | 2,134,249 | ||||||
| Waterstone Financial, Inc. |
23,212 | 382,070 | ||||||
| Western New England Bancorp, Inc. |
18,813 | 173,644 | ||||||
| WSFS Financial Corp. |
40,188 | 1,551,257 | ||||||
|
|
|
|||||||
| Total Thrifts & Mortgage Finance |
|
26,518,192 | ||||||
| Tobacco – 0.4% |
| |||||||
| Turning Point Brands, Inc. |
12,716 | 586,080 | ||||||
See Notes to Financial Statements.
| WisdomTree Trust | 79 |
Schedule of Investments (concluded)
WisdomTree U.S. SmallCap Fund (EES)
March 31, 2019
| Investments | Shares | Value | ||||||
| Universal Corp. |
28,469 | $ | 1,640,669 | |||||
| Vector Group Ltd. |
62,818 | 677,806 | ||||||
|
|
|
|||||||
| Total Tobacco |
|
2,904,555 | ||||||
| Trading Companies & Distributors – 1.7% |
| |||||||
| BlueLinx Holdings, Inc.*(a) |
16,200 | 431,568 | ||||||
| BMC Stock Holdings, Inc.* |
100,784 | 1,780,853 | ||||||
| CAI International, Inc.* |
50,445 | 1,170,324 | ||||||
| DXP Enterprises, Inc.* |
13,600 | 529,312 | ||||||
| EVI Industries, Inc.(a) |
1,963 | 74,849 | ||||||
| GMS, Inc.* |
46,276 | 699,693 | ||||||
| H&E Equipment Services, Inc. |
52,913 | 1,328,645 | ||||||
| Herc Holdings, Inc.* |
21,932 | 854,909 | ||||||
| Kaman Corp. |
15,054 | 879,756 | ||||||
| Lawson Products, Inc.* |
2,064 | 64,727 | ||||||
| MRC Global, Inc.* |
25,992 | 454,340 | ||||||
| NOW, Inc.* |
46,396 | 647,688 | ||||||
| Rush Enterprises, Inc. Class A |
54,739 | 2,288,638 | ||||||
| Systemax, Inc. |
36,976 | 837,137 | ||||||
| Titan Machinery, Inc.* |
5,242 | 81,566 | ||||||
| Transcat, Inc.* |
5,641 | 129,630 | ||||||
| Willis Lease Finance Corp.* |
9,217 | 390,709 | ||||||
|
|
|
|||||||
| Total Trading Companies & Distributors |
|
12,644,344 | ||||||
| Water Utilities – 0.3% |
| |||||||
| Artesian Resources Corp. Class A |
6,494 | 242,032 | ||||||
| Cadiz, Inc.*(a) |
12,282 | 118,890 | ||||||
| Connecticut Water Service, Inc. |
4,005 | 274,943 | ||||||
| Middlesex Water Co. |
7,371 | 412,702 | ||||||
| SJW Group |
12,350 | 762,489 | ||||||
| York Water Co. (The) |
5,456 | 187,250 | ||||||
|
|
|
|||||||
| Total Water Utilities |
|
1,998,306 | ||||||
| Wireless Telecommunication Services – 0.0% |
| |||||||
| Spok Holdings, Inc. |
4,256 | 57,967 | ||||||
| Total United States |
|
730,945,604 | ||||||
| Puerto Rico – 0.4% | ||||||||
| Banks – 0.2% | ||||||||
| First BanCorp |
160,288 | 1,836,900 | ||||||
| IT Services – 0.2% |
| |||||||
| EVERTEC, Inc. |
40,317 | 1,121,216 | ||||||
| Total Puerto Rico |
|
2,958,116 | ||||||
| TOTAL COMMON STOCKS (Cost: $665,385,369) |
|
733,903,720 | ||||||
| EXCHANGE-TRADED FUND – 0.2% | ||||||||
| United States – 0.2% | ||||||||
| WisdomTree U.S. MidCap Fund(a)(b) (Cost: $1,436,142) |
36,450 | 1,433,943 | ||||||
| RIGHTS – 0.0% | ||||||||
| United States – 0.0% | ||||||||
| A. Schulman, Inc.
CVR†* (Cost: $6,075) |
14,030 | 6,075 | ||||||
| INVESTMENT OF CASH COLLATERAL FOR SECURITIES LOANED – 2.7% |
| |||||||
| United States – 2.7% |
| |||||||
| State Street Navigator Securities Lending Government Money Market Portfolio, 2.46%(c) |
||||||||
| (Cost: $19,556,200)(d) | 19,556,200 | 19,556,200 | ||||||
| TOTAL INVESTMENTS IN SECURITIES – 102.6% (Cost: $686,383,786) |
|
754,899,938 | ||||||
| Other Assets less Liabilities – (2.6)% |
(18,802,117 | ) | ||||||
|
|
|
|||||||
| NET ASSETS – 100.0% | $ | 736,097,821 | ||||||
| * | Non-income producing security. |
| † | Security is being fair valued using significant unobservable inputs by a pricing committee under the direction of the Board of Trustees. The aggregate value of fair valued securities is $6,075, which represent less than 0.0% of net assets. |
| (a) | Security, or portion thereof, was on loan at March 31, 2019 (See Note 2). |
| (b) | Affiliated company (See Note 3). |
| (c) | Rate shown represents annualized 7-day yield as of March 31, 2019. |
| (d) | At March 31, 2019, the total market value of the Fund’s securities on loan identified in the Schedule of Investments was $30,079,170. The Fund also had securities on loan having a total market value of $33,493 that were sold and pending settlement. The total market value of the collateral held by the Fund was $31,852,135. The total market value of the collateral includes non-cash U.S. Government securities collateral having a value of $12,295,935. |
CVR – Contingent Value Rights
See Notes to Financial Statements.
| 80 | WisdomTree Trust |
Schedule of Investments
WisdomTree U.S. SmallCap Quality Dividend Growth Fund (DGRS)
March 31, 2019
| Investments | Shares | Value | ||||||
| COMMON STOCKS – 99.9% | ||||||||
| United States – 99.7% |
| |||||||
| Aerospace & Defense – 0.6% |
| |||||||
| Moog, Inc. Class A |
6,717 | $ | 584,043 | |||||
| National Presto Industries, Inc. |
888 | 96,393 | ||||||
|
|
|
|||||||
| Total Aerospace & Defense |
|
680,436 | ||||||
| Airlines – 0.9% |
| |||||||
| Allegiant Travel Co. |
6,112 | 791,321 | ||||||
| Hawaiian Holdings, Inc. |
13,022 | 341,827 | ||||||
|
|
|
|||||||
| Total Airlines |
|
1,133,148 | ||||||
| Auto Components – 3.4% |
| |||||||
| Cooper Tire & Rubber Co. |
11,384 | 340,268 | ||||||
| Dana, Inc. |
72,039 | 1,277,972 | ||||||
| LCI Industries |
16,407 | 1,260,385 | ||||||
| Standard Motor Products, Inc. |
6,529 | 320,574 | ||||||
| Tenneco, Inc. Class A |
34,781 | 770,747 | ||||||
| Tower International, Inc. |
7,366 | 154,907 | ||||||
|
|
|
|||||||
| Total Auto Components |
|
4,124,853 | ||||||
| Automobiles – 0.3% |
| |||||||
| Winnebago Industries, Inc. |
10,380 | 323,337 | ||||||
| Banks – 5.7% |
| |||||||
| 1st Source Corp. |
10,150 | 455,836 | ||||||
| Enterprise Financial Services Corp. |
4,997 | 203,728 | ||||||
| FB Financial Corp. |
4,779 | 151,781 | ||||||
| First Financial Bancorp |
53,086 | 1,277,249 | ||||||
| FNCB Bancorp, Inc. |
2,911 | 22,415 | ||||||
| Great Western Bancorp, Inc. |
29,412 | 929,125 | ||||||
| Hanmi Financial Corp. |
26,103 | 555,211 | ||||||
| Heartland Financial USA, Inc. |
6,875 | 293,219 | ||||||
| LegacyTexas Financial Group, Inc. |
21,341 | 797,940 | ||||||
| Live Oak Bancshares, Inc.(a) |
4,849 | 70,844 | ||||||
| Plumas Bancorp |
1,388 | 31,633 | ||||||
| Preferred Bank |
5,948 | 267,482 | ||||||
| ServisFirst Bancshares, Inc. |
11,804 | 398,503 | ||||||
| South State Corp. |
14,330 | 979,312 | ||||||
| Stock Yards Bancorp, Inc. |
10,614 | 358,859 | ||||||
| West Bancorporation, Inc. |
2,755 | 56,973 | ||||||
|
|
|
|||||||
| Total Banks |
|
6,850,110 | ||||||
| Beverages – 0.2% |
| |||||||
| Coca-Cola Consolidated, Inc. |
573 | 164,927 | ||||||
| MGP Ingredients, Inc. |
1,657 | 127,837 | ||||||
|
|
|
|||||||
| Total Beverages |
|
292,764 | ||||||
| Building Products – 1.9% |
| |||||||
| AAON, Inc. |
7,613 | 351,569 | ||||||
| Apogee Enterprises, Inc. |
8,947 | 335,423 | ||||||
| Griffon Corp. |
19,992 | 369,452 | ||||||
| Insteel Industries, Inc. |
1,622 | 33,932 | ||||||
| Simpson Manufacturing Co., Inc. |
12,196 | 722,857 | ||||||
| Universal Forest Products, Inc. |
13,599 | 406,474 | ||||||
|
|
|
|||||||
| Total Building Products |
|
2,219,707 | ||||||
| Capital Markets – 7.2% |
| |||||||
| Artisan Partners Asset Management, Inc. Class A |
94,167 | 2,370,183 | ||||||
| B. Riley Financial, Inc. |
7,457 | 124,457 | ||||||
| Cohen & Steers, Inc. |
29,289 | 1,238,046 | ||||||
| Diamond Hill Investment Group, Inc. |
3,083 | 431,620 | ||||||
| Houlihan Lokey, Inc. |
16,523 | 757,580 | ||||||
| Moelis & Co. Class A |
39,915 | 1,660,863 | ||||||
| Silvercrest Asset Management Group, Inc. Class A |
4,222 | 60,163 | ||||||
| Virtus Investment Partners, Inc. |
3,272 | 319,184 | ||||||
| Waddell & Reed Financial, Inc. Class A |
72,961 | 1,261,496 | ||||||
| Westwood Holdings Group, Inc. |
11,169 | 393,931 | ||||||
|
|
|
|||||||
| Total Capital Markets |
|
8,617,523 | ||||||
| Chemicals – 7.2% |
| |||||||
| Balchem Corp. |
2,891 | 268,285 | ||||||
| Cabot Corp. |
30,672 | 1,276,875 | ||||||
| Chase Corp. |
1,294 | 119,747 | ||||||
| FutureFuel Corp. |
11,330 | 151,822 | ||||||
| H.B. Fuller Co. |
13,089 | 636,649 | ||||||
| Innophos Holdings, Inc. |
26,479 | 798,077 | ||||||
| Innospec, Inc. |
5,591 | 466,010 | ||||||
| Kronos Worldwide, Inc. |
121,023 | 1,696,743 | ||||||
| Minerals Technologies, Inc. |
2,460 | 144,623 | ||||||
| PolyOne Corp. |
36,742 | 1,076,908 | ||||||
| Quaker Chemical Corp. |
1,747 | 349,977 | ||||||
| Sensient Technologies Corp. |
17,889 | 1,212,695 | ||||||
| Stepan Co. |
4,929 | 431,386 | ||||||
|
|
|
|||||||
| Total Chemicals |
|
8,629,797 | ||||||
| Commercial Services & Supplies – 7.9% |
| |||||||
| ABM Industries, Inc. |
28,677 | 1,042,409 | ||||||
| ACCO Brands Corp. |
58,245 | 498,577 | ||||||
| Brady Corp. Class A |
16,300 | 756,483 | ||||||
| Deluxe Corp. |
21,635 | 945,882 | ||||||
| Ennis, Inc. |
21,340 | 443,018 | ||||||
| Herman Miller, Inc. |
24,348 | 856,563 | ||||||
| HNI Corp. |
23,522 | 853,613 | ||||||
| Interface, Inc. |
17,220 | 263,810 | ||||||
| Kimball International, Inc. Class B |
12,776 | 180,653 | ||||||
| Knoll, Inc. |
27,126 | 512,953 | ||||||
| Matthews International Corp. Class A |
10,070 | 372,087 | ||||||
| McGrath RentCorp |
10,100 | 571,357 | ||||||
| Mobile Mini, Inc. |
22,019 | 747,325 | ||||||
| Multi-Color Corp. |
1,600 | 79,824 | ||||||
| Steelcase, Inc. Class A |
52,469 | 763,424 | ||||||
| U.S. Ecology, Inc. |
3,891 | 217,818 | ||||||
| UniFirst Corp. |
796 | 122,186 | ||||||
| Viad Corp. |
2,811 | 158,231 | ||||||
| VSE Corp. |
1,821 | 57,507 | ||||||
|
|
|
|||||||
| Total Commercial Services & Supplies |
|
9,443,720 | ||||||
| Communications Equipment – 1.1% |
| |||||||
| InterDigital, Inc. |
11,422 | 753,624 | ||||||
| Plantronics, Inc. |
11,092 | 511,452 | ||||||
|
|
|
|||||||
| Total Communications Equipment |
|
1,265,076 | ||||||
See Notes to Financial Statements.
| WisdomTree Trust | 81 |
Schedule of Investments (continued)
WisdomTree U.S. SmallCap Quality Dividend Growth Fund (DGRS)
March 31, 2019
| Investments | Shares | Value | ||||||
| Construction & Engineering – 1.9% |
| |||||||
| Argan, Inc. |
6,338 | $ | 316,583 | |||||
| Comfort Systems USA, Inc. |
4,798 | 251,367 | ||||||
| KBR, Inc. |
45,085 | 860,673 | ||||||
| Primoris Services Corp. |
9,007 | 186,265 | ||||||
| Valmont Industries, Inc. |
4,643 | 604,054 | ||||||
|
|
|
|||||||
| Total Construction & Engineering |
|
2,218,942 | ||||||
| Construction Materials – 0.0% |
| |||||||
| United States Lime & Minerals, Inc. |
705 | 54,370 | ||||||
| Containers & Packaging – 1.8% |
| |||||||
| Greif, Inc. Class A |
17,527 | 722,989 | ||||||
| Owens-Illinois, Inc. |
30,815 | 584,868 | ||||||
| Silgan Holdings, Inc. |
30,068 | 890,915 | ||||||
|
|
|
|||||||
| Total Containers & Packaging |
|
2,198,772 | ||||||
| Distributors – 0.5% |
| |||||||
| Core-Mark Holding Co., Inc. |
13,647 | 506,713 | ||||||
| Weyco Group, Inc. |
4,301 | 133,159 | ||||||
|
|
|
|||||||
| Total Distributors |
|
639,872 | ||||||
| Diversified Consumer Services – 0.1% |
| |||||||
| Carriage Services, Inc. |
6,450 | 124,162 | ||||||
| Electric Utilities – 1.4% |
| |||||||
| MGE Energy, Inc. |
11,913 | 809,726 | ||||||
| Otter Tail Corp. |
17,584 | 876,035 | ||||||
|
|
|
|||||||
| Total Electric Utilities |
|
1,685,761 | ||||||
| Electrical Equipment – 0.3% |
| |||||||
| Allied Motion Technologies, Inc. |
314 | 10,795 | ||||||
| AZZ, Inc. |
6,718 | 274,968 | ||||||
| Encore Wire Corp. |
625 | 35,763 | ||||||
|
|
|
|||||||
| Total Electrical Equipment |
|
321,526 | ||||||
| Electronic Equipment, Instruments & Components – 1.3% |
| |||||||
| Badger Meter, Inc. |
5,405 | 300,734 | ||||||
| CTS Corp. |
3,442 | 101,092 | ||||||
| KEMET Corp. |
11,258 | 191,048 | ||||||
| Methode Electronics, Inc. |
12,217 | 351,605 | ||||||
| MTS Systems Corp. |
8,069 | 439,438 | ||||||
| PC Connection, Inc. |
5,113 | 187,494 | ||||||
|
|
|
|||||||
| Total Electronic Equipment, Instruments & Components |
|
1,571,411 | ||||||
| Entertainment – 0.2% |
| |||||||
| Marcus Corp. (The) |
4,803 | 192,360 | ||||||
| Equity Real Estate Investment Trusts (REITs) – 4.0% |
| |||||||
| Brookfield Property REIT, Inc. Class A |
139,695 | 2,862,350 | ||||||
| PotlatchDeltic Corp. |
50,210 | 1,897,436 | ||||||
|
|
|
|||||||
| Total Equity Real Estate Investment Trusts (REITs) |
|
4,759,786 | ||||||
| Food & Staples Retailing – 0.8% |
| |||||||
| Ingles Markets, Inc. Class A |
5,422 | 149,756 | ||||||
| PriceSmart, Inc. |
5,847 | 344,271 | ||||||
| Weis Markets, Inc. |
12,266 | 500,575 | ||||||
|
|
|
|||||||
| Total Food & Staples Retailing |
|
994,602 | ||||||
| Food Products – 1.1% |
| |||||||
| Calavo Growers, Inc. |
3,458 | 289,953 | ||||||
| J&J Snack Foods Corp. |
3,694 | 586,755 | ||||||
| John B. Sanfilippo & Son, Inc. |
1,352 | 97,168 | ||||||
| Limoneira Co. |
3,630 | 85,414 | ||||||
| Tootsie Roll Industries, Inc.(a) |
6,886 | 256,423 | ||||||
|
|
|
|||||||
| Total Food Products |
|
1,315,713 | ||||||
| Gas Utilities – 0.4% |
| |||||||
| Chesapeake Utilities Corp. |
4,388 | 400,229 | ||||||
| RGC Resources, Inc. |
2,219 | 58,826 | ||||||
|
|
|
|||||||
| Total Gas Utilities |
|
459,055 | ||||||
| Health Care Equipment & Supplies – 1.0% |
| |||||||
| Atrion Corp. |
218 | 191,552 | ||||||
| CONMED Corp. |
5,970 | 496,585 | ||||||
| LeMaitre Vascular, Inc. |
3,715 | 115,165 | ||||||
| Meridian Bioscience, Inc. |
20,460 | 360,301 | ||||||
| Utah Medical Products, Inc. |
849 | 74,924 | ||||||
|
|
|
|||||||
| Total Health Care Equipment & Supplies |
|
1,238,527 | ||||||
| Health Care Providers & Services – 1.7% |
| |||||||
| Ensign Group, Inc. (The) |
3,713 | 190,068 | ||||||
| Patterson Cos., Inc. |
77,356 | 1,690,229 | ||||||
| U.S. Physical Therapy, Inc. |
1,802 | 189,264 | ||||||
|
|
|
|||||||
| Total Health Care Providers & Services |
|
2,069,561 | ||||||
| Health Care Technology – 0.1% |
| |||||||
| Simulations Plus, Inc. |
3,713 | 78,381 | ||||||
| Hotels, Restaurants & Leisure – 2.6% |
| |||||||
| BBX Capital Corp. |
9,575 | 56,684 | ||||||
| BJ’s Restaurants, Inc. |
3,104 | 146,757 | ||||||
| Bloomin’ Brands, Inc. |
30,465 | 623,009 | ||||||
| Boyd Gaming Corp. |
18,918 | 517,596 | ||||||
| Cheesecake Factory, Inc. (The) |
22,665 | 1,108,772 | ||||||
| Dave & Buster’s Entertainment, Inc. |
8,618 | 429,780 | ||||||
| RCI Hospitality Holdings, Inc. |
735 | 16,883 | ||||||
| Ruth’s Hospitality Group, Inc. |
10,174 | 260,353 | ||||||
|
|
|
|||||||
| Total Hotels, Restaurants & Leisure |
|
3,159,834 | ||||||
| Household Durables – 2.3% |
| |||||||
| Bassett Furniture Industries, Inc. |
4,368 | 71,679 | ||||||
| Ethan Allen Interiors, Inc. |
18,308 | 350,232 | ||||||
| Flexsteel Industries, Inc. |
5,028 | 116,599 | ||||||
| Hooker Furniture Corp. |
4,032 | 116,243 | ||||||
| KB Home |
7,110 | 171,849 | ||||||
| La-Z-Boy, Inc. |
15,974 | 526,982 | ||||||
| Lifetime Brands, Inc. |
3,696 | 34,927 | ||||||
| MDC Holdings, Inc. |
45,279 | 1,315,808 | ||||||
|
|
|
|||||||
| Total Household Durables |
|
2,704,319 | ||||||
| Household Products – 0.5% |
| |||||||
| Oil-Dri Corp. of America |
3,108 | 96,783 | ||||||
| WD-40 Co. |
2,799 | 474,263 | ||||||
|
|
|
|||||||
| Total Household Products |
|
571,046 | ||||||
| Independent Power & Renewable Electricity Producers – 0.3% |
| |||||||
| Ormat Technologies, Inc. |
6,215 | 342,757 | ||||||
| Industrial Conglomerates – 0.3% |
| |||||||
| Raven Industries, Inc. |
8,053 | 308,994 | ||||||
See Notes to Financial Statements.
| 82 | WisdomTree Trust |
Schedule of Investments (continued)
WisdomTree U.S. SmallCap Quality Dividend Growth Fund (DGRS)
March 31, 2019
| Investments | Shares | Value | ||||||
| Insurance – 1.4% |
| |||||||
| AMERISAFE, Inc. |
4,767 | $ | 283,160 | |||||
| Employers Holdings, Inc. |
10,376 | 416,181 | ||||||
| HCI Group, Inc. |
4,475 | 191,217 | ||||||
| Independence Holding Co. |
1,881 | 66,305 | ||||||
| Investors Title Co. |
296 | 46,738 | ||||||
| Kingstone Cos., Inc. |
3,822 | 56,336 | ||||||
| Kinsale Capital Group, Inc. |
1,743 | 119,518 | ||||||
| United Insurance Holdings Corp. |
9,956 | 158,301 | ||||||
| Universal Insurance Holdings, Inc. |
9,516 | 294,996 | ||||||
|
|
|
|||||||
| Total Insurance |
|
1,632,752 | ||||||
| Internet & Direct Marketing Retail – 0.3% |
| |||||||
| PetMed Express, Inc.(a) |
16,635 | 378,945 | ||||||
| IT Services – 2.4% |
| |||||||
| CSG Systems International, Inc. |
14,136 | 597,953 | ||||||
| Hackett Group, Inc. (The) |
10,219 | 161,460 | ||||||
| NIC, Inc. |
29,090 | 497,148 | ||||||
| Science Applications International Corp. |
13,060 | 1,004,967 | ||||||
| TTEC Holdings, Inc. |
15,786 | 571,927 | ||||||
|
|
|
|||||||
| Total IT Services |
|
2,833,455 | ||||||
| Leisure Products – 0.5% |
| |||||||
| Callaway Golf Co. |
4,011 | 63,895 | ||||||
| Johnson Outdoors, Inc. Class A |
1,357 | 96,836 | ||||||
| Marine Products Corp. |
12,311 | 165,829 | ||||||
| Sturm Ruger & Co., Inc. |
4,686 | 248,452 | ||||||
|
|
|
|||||||
| Total Leisure Products |
|
575,012 | ||||||
| Machinery – 7.2% |
| |||||||
| Alamo Group, Inc. |
1,119 | 111,833 | ||||||
| Albany International Corp. Class A |
4,679 | 334,970 | ||||||
| Altra Industrial Motion Corp. |
26,980 | 837,729 | ||||||
| Briggs & Stratton Corp. |
28,463 | 336,717 | ||||||
| Douglas Dynamics, Inc. |
10,739 | 408,834 | ||||||
| EnPro Industries, Inc. |
5,102 | 328,824 | ||||||
| ESCO Technologies, Inc. |
1,994 | 133,658 | ||||||
| Federal Signal Corp. |
15,074 | 391,773 | ||||||
| Franklin Electric Co., Inc. |
8,818 | 450,512 | ||||||
| Global Brass & Copper Holdings, Inc. |
4,638 | 159,733 | ||||||
| Gorman-Rupp Co. (The) |
6,840 | 232,150 | ||||||
| Greenbrier Cos., Inc. (The) |
12,790 | 412,222 | ||||||
| Hillenbrand, Inc. |
20,985 | 871,507 | ||||||
| Hyster-Yale Materials Handling, Inc. |
4,085 | 254,741 | ||||||
| John Bean Technologies Corp. |
2,891 | 265,654 | ||||||
| Kadant, Inc. |
1,814 | 159,559 | ||||||
| Lindsay Corp. |
2,208 | 213,712 | ||||||
| Miller Industries, Inc. |
4,858 | 149,869 | ||||||
| Mueller Industries, Inc. |
15,436 | 483,764 | ||||||
| Mueller Water Products, Inc. Class A |
51,548 | 517,542 | ||||||
| Omega Flex, Inc. |
2,943 | 223,079 | ||||||
| Park-Ohio Holdings Corp. |
3,218 | 104,199 | ||||||
| REV Group, Inc. |
21,125 | 231,319 | ||||||
| Standex International Corp. |
2,383 | 174,912 | ||||||
| Sun Hydraulics Corp. |
5,020 | 233,480 | ||||||
| Tennant Co. |
4,727 | 293,499 | ||||||
| Wabash National Corp. |
21,997 | 298,059 | ||||||
|
|
|
|||||||
| Total Machinery |
|
8,613,850 | ||||||
| Marine – 0.5% |
| |||||||
| Matson, Inc. |
16,602 | 599,166 | ||||||
| Media – 5.0% |
| |||||||
| Entercom Communications Corp. Class A |
132,569 | 695,987 | ||||||
| Entravision Communications Corp. Class A |
77,233 | 250,235 | ||||||
| John Wiley & Sons, Inc. Class A |
21,827 | 965,190 | ||||||
| Meredith Corp. |
27,687 | 1,529,984 | ||||||
| Saga Communications, Inc. Class A |
716 | 23,764 | ||||||
| Sinclair Broadcast Group, Inc. Class A |
34,307 | 1,320,133 | ||||||
| TEGNA, Inc. |
81,935 | 1,155,284 | ||||||
|
|
|
|||||||
| Total Media |
|
5,940,577 | ||||||
| Metals & Mining – 2.6% |
| |||||||
| Carpenter Technology Corp. |
17,216 | 789,354 | ||||||
| Commercial Metals Co. |
55,385 | 945,976 | ||||||
| Materion Corp. |
3,129 | 178,541 | ||||||
| Schnitzer Steel Industries, Inc. Class A |
13,618 | 326,832 | ||||||
| Worthington Industries, Inc. |
24,855 | 927,588 | ||||||
|
|
|
|||||||
| Total Metals & Mining |
|
3,168,291 | ||||||
| Multiline Retail – 0.9% |
| |||||||
| Big Lots, Inc. |
28,586 | 1,086,840 | ||||||
| Oil, Gas & Consumable Fuels – 0.2% |
| |||||||
| Evolution Petroleum Corp. |
31,521 | 212,767 | ||||||
| NACCO Industries, Inc. Class A |
1,830 | 69,942 | ||||||
|
|
|
|||||||
| Total Oil, Gas & Consumable Fuels |
|
282,709 | ||||||
| Paper & Forest Products – 1.7% |
| |||||||
| Boise Cascade Co. |
10,204 | 273,059 | ||||||
| Neenah, Inc. |
7,858 | 505,741 | ||||||
| Schweitzer-Mauduit International, Inc. |
34,099 | 1,320,313 | ||||||
|
|
|
|||||||
| Total Paper & Forest Products |
|
2,099,113 | ||||||
| Personal Products – 1.0% |
| |||||||
| Inter Parfums, Inc. |
9,641 | 731,463 | ||||||
| Medifast, Inc. |
2,904 | 370,405 | ||||||
| Natural Health Trends Corp.(a) |
5,187 | 67,223 | ||||||
|
|
|
|||||||
| Total Personal Products |
|
1,169,091 | ||||||
| Pharmaceuticals – 0.1% |
| |||||||
| Phibro Animal Health Corp. Class A |
4,602 | 151,866 | ||||||
| Professional Services – 1.7% |
| |||||||
| Barrett Business Services, Inc. |
2,045 | 158,140 | ||||||
| CRA International, Inc. |
2,337 | 118,112 | ||||||
| Exponent, Inc. |
8,670 | 500,432 | ||||||
| ICF International, Inc. |
2,536 | 192,939 | ||||||
| Kelly Services, Inc. Class A |
8,454 | 186,495 | ||||||
| Kforce, Inc. |
10,108 | 354,993 | ||||||
| Korn Ferry |
8,518 | 381,436 | ||||||
| Navigant Consulting, Inc. |
5,982 | 116,470 | ||||||
|
|
|
|||||||
| Total Professional Services |
|
2,009,017 | ||||||
See Notes to Financial Statements.
| WisdomTree Trust | 83 |
Schedule of Investments (concluded)
WisdomTree U.S. SmallCap Quality Dividend Growth Fund (DGRS)
March 31, 2019
| Investments | Shares | Value | ||||||
| Real Estate Management & Development – 0.7% |
| |||||||
| Consolidated-Tomoka Land Co. |
554 | $ | 32,714 | |||||
| Realogy Holdings Corp. |
41,173 | 469,372 | ||||||
| RMR Group, Inc. (The) Class A |
5,636 | 343,683 | ||||||
|
|
|
|||||||
| Total Real Estate Management & Development |
|
845,769 | ||||||
| Road & Rail – 1.2% |
| |||||||
| ArcBest Corp. |
3,648 | 112,322 | ||||||
| Heartland Express, Inc. |
5,946 | 114,639 | ||||||
| Marten Transport Ltd. |
5,226 | 93,180 | ||||||
| Schneider National, Inc. Class B |
18,835 | 396,477 | ||||||
| Universal Logistics Holdings, Inc. |
10,111 | 198,984 | ||||||
| Werner Enterprises, Inc. |
13,687 | 467,411 | ||||||
|
|
|
|||||||
| Total Road & Rail |
|
1,383,013 | ||||||
| Semiconductors & Semiconductor Equipment – 0.3% |
| |||||||
| Power Integrations, Inc. |
5,179 | 362,219 | ||||||
| Software – 0.1% |
| |||||||
| Ebix, Inc.(a) |
3,696 | 182,471 | ||||||
| Specialty Retail – 6.4% |
| |||||||
| Buckle, Inc. (The) |
43,785 | 819,655 | ||||||
| Caleres, Inc. |
7,275 | 179,620 | ||||||
| Chico’s FAS, Inc. |
127,411 | 544,045 | ||||||
| Children’s Place, Inc. (The) |
6,013 | 584,945 | ||||||
| Designer Brands, Inc. |
52,035 | 1,156,218 | ||||||
| Dick’s Sporting Goods, Inc. |
32,516 | 1,196,914 | ||||||
| Group 1 Automotive, Inc. |
6,663 | 431,096 | ||||||
| Guess?, Inc. |
60,392 | 1,183,683 | ||||||
| Haverty Furniture Cos., Inc. |
11,979 | 262,100 | ||||||
| Lithia Motors, Inc. Class A |
6,361 | 589,983 | ||||||
| Monro, Inc. |
5,912 | 511,506 | ||||||
| Shoe Carnival, Inc. |
2,663 | 90,622 | ||||||
| Sonic Automotive, Inc. Class A |
9,216 | 136,489 | ||||||
|
|
|
|||||||
| Total Specialty Retail |
|
7,686,876 | ||||||
| Technology Hardware, Storage & Peripherals – 0.0% |
| |||||||
| AstroNova, Inc. |
1,490 | 30,381 | ||||||
| Textiles, Apparel & Luxury Goods – 1.4% |
| |||||||
| Culp, Inc. |
4,039 | 77,670 | ||||||
| Oxford Industries, Inc. |
5,595 | 421,080 | ||||||
| Rocky Brands, Inc. |
2,615 | 62,655 | ||||||
| Steven Madden Ltd. |
28,857 | 976,521 | ||||||
| Superior Group of Cos., Inc. |
5,524 | 91,809 | ||||||
|
|
|
|||||||
| Total Textiles, Apparel & Luxury Goods |
|
1,629,735 | ||||||
| Thrifts & Mortgage Finance – 1.8% |
| |||||||
| FS Bancorp, Inc. |
990 | 49,975 | ||||||
| Hingham Institution for Savings |
267 | 45,927 | ||||||
| Timberland Bancorp, Inc. |
3,009 | 84,192 | ||||||
| Walker & Dunlop, Inc. |
12,445 | 633,575 | ||||||
| Washington Federal, Inc. |
37,404 | 1,080,601 | ||||||
| WSFS Financial Corp. |
5,923 | 228,628 | ||||||
|
|
|
|||||||
| Total Thrifts & Mortgage Finance |
|
2,122,898 | ||||||
| Trading Companies & Distributors – 1.9% |
| |||||||
| Applied Industrial Technologies, Inc. |
13,018 | 774,181 | ||||||
| H&E Equipment Services, Inc. |
31,884 | 800,607 | ||||||
| Kaman Corp. |
6,423 | 375,360 | ||||||
| Rush Enterprises, Inc. Class A |
7,322 | 306,133 | ||||||
| Rush Enterprises, Inc. Class B |
1,929 | 80,111 | ||||||
|
|
|
|||||||
| Total Trading Companies & Distributors |
|
2,336,392 | ||||||
| Water Utilities – 1.2% |
| |||||||
| American States Water Co. |
9,916 | 707,011 | ||||||
| SJW Group |
9,068 | 559,858 | ||||||
| York Water Co. (The) |
4,385 | 150,493 | ||||||
|
|
|
|||||||
| Total Water Utilities |
|
1,417,362 | ||||||
| Wireless Telecommunication Services – 0.2% |
| |||||||
| Shenandoah Telecommunications Co. |
4,869 | 215,989 | ||||||
| Total United States | 119,344,011 | |||||||
| Puerto Rico – 0.2% | ||||||||
| IT Services – 0.2% | ||||||||
| EVERTEC, Inc. |
9,009 | 250,540 | ||||||
| TOTAL COMMON STOCKS (Cost: $111,234,725) |
119,594,551 | |||||||
| INVESTMENT OF CASH COLLATERAL FOR SECURITIES LOANED – 0.6% |
| |||||||
| United States – 0.6% |
| |||||||
| State Street Navigator Securities Lending Government Money Market Portfolio, 2.46%(b) |
||||||||
| (Cost: $655,204)(c) | 655,204 | 655,204 | ||||||
| TOTAL INVESTMENTS IN SECURITIES – 100.5% (Cost: $111,889,929) |
|
120,249,755 | ||||||
| Other Assets less Liabilities – (0.5)% |
(550,436 | ) | ||||||
|
|
|
|||||||
| NET ASSETS – 100.0% | $ | 119,699,319 | ||||||
| (a) | Security, or portion thereof, was on loan at March 31, 2019 (See Note 2). |
| (b) | Rate shown represents annualized 7-day yield as of March 31, 2019. |
| (c) | At March 31, 2019, the total market value of the Fund’s securities on loan identified in the Schedule of Investments was $805,812 and the total market value of the collateral held by the Fund was $822,855. The total market value of the collateral includes non-cash U.S. Government securities collateral having a value of $167,651. |
See Notes to Financial Statements.
| 84 | WisdomTree Trust |
Schedule of Investments
WisdomTree U.S. Total Dividend Fund (DTD)
March 31, 2019
| Investments | Shares | Value | ||||||
| COMMON STOCKS – 99.7% | ||||||||
| United States – 99.7% | ||||||||
| Aerospace & Defense – 2.5% | ||||||||
| AAR Corp. |
742 | $ | 24,122 | |||||
| Arconic, Inc. |
4,758 | 90,925 | ||||||
| Boeing Co. (The) |
14,491 | 5,527,157 | ||||||
| BWX Technologies, Inc. |
2,135 | 105,853 | ||||||
| Curtiss-Wright Corp. |
550 | 62,337 | ||||||
| General Dynamics Corp. |
6,901 | 1,168,201 | ||||||
| Harris Corp. |
2,897 | 462,680 | ||||||
| Hexcel Corp. |
520 | 35,963 | ||||||
| Huntington Ingalls Industries, Inc. |
819 | 169,697 | ||||||
| L3 Technologies, Inc. |
1,685 | 347,734 | ||||||
| Lockheed Martin Corp. |
9,536 | 2,862,326 | ||||||
| National Presto Industries, Inc. |
829 | 89,988 | ||||||
| Northrop Grumman Corp. |
3,137 | 845,735 | ||||||
| Raytheon Co. |
6,200 | 1,128,896 | ||||||
| Triumph Group, Inc. |
7,043 | 134,240 | ||||||
| United Technologies Corp. |
24,140 | 3,111,405 | ||||||
|
|
|
|||||||
| Total Aerospace & Defense |
|
16,167,259 | ||||||
| Air Freight & Logistics – 0.7% |
| |||||||
| C.H. Robinson Worldwide, Inc. |
3,575 | 310,989 | ||||||
| Expeditors International of Washington, Inc. |
3,541 | 268,762 | ||||||
| FedEx Corp. |
3,819 | 692,805 | ||||||
| Forward Air Corp. |
543 | 35,148 | ||||||
| United Parcel Service, Inc. Class B |
28,843 | 3,222,917 | ||||||
|
|
|
|||||||
| Total Air Freight & Logistics |
|
4,530,621 | ||||||
| Airlines – 0.3% |
| |||||||
| Alaska Air Group, Inc. |
1,807 | 101,409 | ||||||
| Allegiant Travel Co. |
710 | 91,924 | ||||||
| American Airlines Group, Inc. |
8,327 | 264,466 | ||||||
| Delta Air Lines, Inc. |
21,140 | 1,091,881 | ||||||
| Hawaiian Holdings, Inc. |
818 | 21,472 | ||||||
| Southwest Airlines Co. |
6,266 | 325,268 | ||||||
|
|
|
|||||||
| Total Airlines |
|
1,896,420 | ||||||
| Auto Components – 0.2% |
| |||||||
| BorgWarner, Inc. |
5,299 | 203,535 | ||||||
| Dana, Inc. |
12,278 | 217,812 | ||||||
| Gentex Corp. |
6,612 | 136,736 | ||||||
| Goodyear Tire & Rubber Co. (The) |
10,235 | 185,765 | ||||||
| LCI Industries |
1,442 | 110,774 | ||||||
| Lear Corp. |
1,429 | 193,930 | ||||||
| Tenneco, Inc. Class A |
5,090 | 112,794 | ||||||
|
|
|
|||||||
| Total Auto Components |
|
1,161,346 | ||||||
| Automobiles – 0.9% |
| |||||||
| Ford Motor Co. |
317,965 | 2,791,733 | ||||||
| General Motors Co. |
67,859 | 2,517,569 | ||||||
| Harley-Davidson, Inc. |
9,658 | 344,404 | ||||||
| Thor Industries, Inc. |
3,057 | 190,665 | ||||||
|
|
|
|||||||
| Total Automobiles |
|
5,844,371 | ||||||
| Banks – 8.7% |
| |||||||
| Associated Banc-Corp. |
4,443 | 94,858 | ||||||
| Banc of California, Inc. |
6,776 | 93,780 | ||||||
| BancorpSouth Bank |
3,095 | 87,341 | ||||||
| Bank of America Corp. |
265,403 | 7,322,469 | ||||||
| Bank of Marin Bancorp |
2,290 | 93,180 | ||||||
| Bank OZK |
12,046 | 349,093 | ||||||
| BankUnited, Inc. |
6,426 | 214,628 | ||||||
| BB&T Corp. |
27,703 | 1,289,021 | ||||||
| Berkshire Hills Bancorp, Inc. |
3,595 | 97,928 | ||||||
| BOK Financial Corp. |
2,520 | 205,506 | ||||||
| Boston Private Financial Holdings, Inc. |
7,823 | 85,740 | ||||||
| Cadence BanCorp |
14,266 | 264,634 | ||||||
| Cathay General Bancorp |
4,562 | 154,697 | ||||||
| Chemical Financial Corp. |
4,614 | 189,912 | ||||||
| CIT Group, Inc. |
6,157 | 295,351 | ||||||
| Citigroup, Inc. |
91,174 | 5,672,846 | ||||||
| Citizens & Northern Corp. |
4,337 | 108,598 | ||||||
| Citizens Financial Group, Inc. |
21,106 | 685,945 | ||||||
| Columbia Banking System, Inc. |
2,944 | 96,239 | ||||||
| Comerica, Inc. |
6,229 | 456,710 | ||||||
| Commerce Bancshares, Inc. |
1,719 | 99,805 | ||||||
| Community Bank System, Inc. |
2,024 | 120,974 | ||||||
| ConnectOne Bancorp, Inc. |
3,857 | 75,983 | ||||||
| Cullen/Frost Bankers, Inc. |
2,234 | 216,854 | ||||||
| CVB Financial Corp. |
4,998 | 105,208 | ||||||
| East West Bancorp, Inc. |
3,738 | 179,312 | ||||||
| Fifth Third Bancorp |
26,393 | 665,634 | ||||||
| First Financial Bancorp |
2,134 | 51,344 | ||||||
| First Financial Bankshares, Inc. |
1,429 | 82,568 | ||||||
| First Hawaiian, Inc. |
11,134 | 290,041 | ||||||
| First Horizon National Corp. |
20,631 | 288,421 | ||||||
| First Republic Bank |
1,629 | 163,649 | ||||||
| Flushing Financial Corp. |
1,149 | 25,198 | ||||||
| FNB Corp. |
31,040 | 329,024 | ||||||
| Fulton Financial Corp. |
7,622 | 117,989 | ||||||
| Glacier Bancorp, Inc. |
3,467 | 138,923 | ||||||
| Great Southern Bancorp, Inc. |
2,308 | 119,785 | ||||||
| Great Western Bancorp, Inc. |
2,726 | 86,114 | ||||||
| Guaranty Bancshares, Inc. |
2,212 | 64,635 | ||||||
| Hancock Whitney Corp. |
5,516 | 222,846 | ||||||
| Hanmi Financial Corp. |
6,202 | 131,917 | ||||||
| Hilltop Holdings, Inc. |
5,666 | 103,405 | ||||||
| Home BancShares, Inc. |
12,502 | 219,660 | ||||||
| Hope Bancorp, Inc. |
20,611 | 269,592 | ||||||
| Huntington Bancshares, Inc. |
50,225 | 636,853 | ||||||
| Iberiabank Corp. |
1,994 | 142,990 | ||||||
| Independent Bank Corp. |
452 | 36,617 | ||||||
| International Bancshares Corp. |
2,361 | 89,789 | ||||||
| Investors Bancorp, Inc. |
18,606 | 220,481 | ||||||
| JPMorgan Chase & Co. |
118,301 | 11,975,610 | ||||||
| KeyCorp |
54,155 | 852,941 | ||||||
| Lakeland Bancorp, Inc. |
2,676 | 39,953 | ||||||
| M&T Bank Corp. |
3,226 | 506,547 | ||||||
See Notes to Financial Statements.
| WisdomTree Trust | 85 |
Schedule of Investments (continued)
WisdomTree U.S. Total Dividend Fund (DTD)
March 31, 2019
| Investments | Shares | Value | ||||||
| Midland States Bancorp, Inc. |
4,726 | $ | 113,708 | |||||
| Old National Bancorp |
7,752 | 127,133 | ||||||
| Opus Bank |
3,801 | 75,260 | ||||||
| PacWest Bancorp |
15,638 | 588,145 | ||||||
| Park National Corp. |
1,129 | 106,973 | ||||||
| People’s United Financial, Inc. |
23,927 | 393,360 | ||||||
| Pinnacle Financial Partners, Inc. |
2,330 | 127,451 | ||||||
| PNC Financial Services Group, Inc. (The) |
15,379 | 1,886,388 | ||||||
| Prosperity Bancshares, Inc. |
2,317 | 160,012 | ||||||
| Regions Financial Corp. |
48,634 | 688,171 | ||||||
| Renasant Corp. |
3,118 | 105,544 | ||||||
| Republic Bancorp, Inc. Class A |
1,577 | 70,523 | ||||||
| S&T Bancorp, Inc. |
2,666 | 105,387 | ||||||
| Signature Bank |
1,310 | 167,772 | ||||||
| South State Corp. |
2,556 | 174,677 | ||||||
| Sterling Bancorp |
10,942 | 203,849 | ||||||
| SunTrust Banks, Inc. |
18,152 | 1,075,506 | ||||||
| Synovus Financial Corp. |
8,006 | 275,086 | ||||||
| TCF Financial Corp. |
4,802 | 99,353 | ||||||
| U.S. Bancorp |
50,423 | 2,429,884 | ||||||
| UMB Financial Corp. |
1,592 | 101,952 | ||||||
| Umpqua Holdings Corp. |
14,717 | 242,831 | ||||||
| United Bankshares, Inc. |
6,457 | 234,002 | ||||||
| United Community Banks, Inc. |
3,638 | 90,695 | ||||||
| Unity Bancorp, Inc. |
1,915 | 36,155 | ||||||
| Valley National Bancorp |
21,003 | 201,209 | ||||||
| Webster Financial Corp. |
1,588 | 80,464 | ||||||
| Wells Fargo & Co. |
194,675 | 9,406,696 | ||||||
| Zions Bancorp NA |
5,377 | 244,170 | ||||||
|
|
|
|||||||
| Total Banks |
|
56,141,494 | ||||||
| Beverages – 2.4% |
| |||||||
| Brown-Forman Corp. Class A |
4,275 | 218,752 | ||||||
| Brown-Forman Corp. Class B |
4,201 | 221,729 | ||||||
| Coca-Cola Co. (The) |
155,839 | 7,302,615 | ||||||
| Constellation Brands, Inc. Class A |
2,375 | 416,409 | ||||||
| Keurig Dr Pepper, Inc. |
29,927 | 837,058 | ||||||
| Molson Coors Brewing Co. Class B |
5,979 | 356,647 | ||||||
| PepsiCo, Inc. |
52,285 | 6,407,527 | ||||||
|
|
|
|||||||
| Total Beverages |
|
15,760,737 | ||||||
| Biotechnology – 2.2% |
| |||||||
| AbbVie, Inc. |
85,311 | 6,875,213 | ||||||
| Amgen, Inc. |
20,617 | 3,916,818 | ||||||
| Gilead Sciences, Inc. |
49,494 | 3,217,605 | ||||||
|
|
|
|||||||
| Total Biotechnology |
|
14,009,636 | ||||||
| Building Products – 0.2% |
| |||||||
| A.O. Smith Corp. |
4,367 | 232,849 | ||||||
| Fortune Brands Home & Security, Inc. |
4,947 | 235,527 | ||||||
| Griffon Corp. |
6,678 | 123,409 | ||||||
| Lennox International, Inc. |
683 | 180,585 | ||||||
| Masco Corp. |
6,813 | 267,819 | ||||||
| Owens Corning |
4,275 | 201,438 | ||||||
|
|
|
|||||||
| Total Building Products |
|
1,241,627 | ||||||
| Capital Markets – 3.1% |
| |||||||
| Affiliated Managers Group, Inc. |
2,022 | 216,576 | ||||||
| Ameriprise Financial, Inc. |
5,561 | 712,364 | ||||||
| Ares Management Corp. Class A |
5,125 | 118,951 | ||||||
| Artisan Partners Asset Management, Inc. Class A |
11,687 | 294,162 | ||||||
| Bank of New York Mellon Corp. (The) |
24,039 | 1,212,287 | ||||||
| BGC Partners, Inc. Class A |
56,289 | 298,895 | ||||||
| BlackRock, Inc. |
5,632 | 2,406,948 | ||||||
| CBOE Global Markets, Inc. |
1,631 | 155,663 | ||||||
| Charles Schwab Corp. (The) |
17,781 | 760,316 | ||||||
| CME Group, Inc. |
7,117 | 1,171,316 | ||||||
| Cohen & Steers, Inc. |
3,951 | 167,009 | ||||||
| E*TRADE Financial Corp. |
1,908 | 88,588 | ||||||
| Eaton Vance Corp. |
7,198 | 290,151 | ||||||
| Evercore, Inc. Class A |
1,210 | 110,110 | ||||||
| FactSet Research Systems, Inc. |
696 | 172,796 | ||||||
| Federated Investors, Inc. Class B |
7,105 | 208,248 | ||||||
| Franklin Resources, Inc. |
19,068 | 631,914 | ||||||
| Goldman Sachs Group, Inc. (The) |
8,108 | 1,556,655 | ||||||
| Intercontinental Exchange, Inc. |
7,591 | 577,979 | ||||||
| KKR & Co., Inc. Class A |
14,903 | 350,071 | ||||||
| Legg Mason, Inc. |
9,633 | 263,655 | ||||||
| LPL Financial Holdings, Inc. |
2,848 | 198,363 | ||||||
| MarketAxess Holdings, Inc. |
160 | 39,373 | ||||||
| Moelis & Co. Class A |
3,911 | 162,737 | ||||||
| Moody’s Corp. |
2,772 | 501,981 | ||||||
| Morgan Stanley |
59,605 | 2,515,331 | ||||||
| MSCI, Inc. |
1,532 | 304,623 | ||||||
| Nasdaq, Inc. |
3,739 | 327,125 | ||||||
| Northern Trust Corp. |
4,607 | 416,519 | ||||||
| Raymond James Financial, Inc. |
2,401 | 193,064 | ||||||
| S&P Global, Inc. |
3,257 | 685,761 | ||||||
| SEI Investments Co. |
2,629 | 137,365 | ||||||
| Silvercrest Asset Management Group, Inc. Class A |
2,012 | 28,671 | ||||||
| State Street Corp. |
13,449 | 885,079 | ||||||
| Stifel Financial Corp. |
1,932 | 101,932 | ||||||
| T. Rowe Price Group, Inc. |
7,290 | 729,875 | ||||||
| TD Ameritrade Holding Corp. |
13,678 | 683,763 | ||||||
| Virtu Financial, Inc. Class A |
6,636 | 157,605 | ||||||
| Waddell & Reed Financial, Inc. Class A |
7,879 | 136,228 | ||||||
| Westwood Holdings Group, Inc. |
2,341 | 82,567 | ||||||
|
|
|
|||||||
| Total Capital Markets |
|
20,052,616 | ||||||
| Chemicals – 1.7% |
| |||||||
| Air Products & Chemicals, Inc. |
6,351 | 1,212,787 | ||||||
| Albemarle Corp.(a) |
2,233 | 183,061 | ||||||
| Ashland Global Holdings, Inc. |
1,040 | 81,255 | ||||||
| Cabot Corp. |
2,256 | 93,917 | ||||||
| Celanese Corp. |
2,863 | 282,320 | ||||||
| CF Industries Holdings, Inc. |
6,927 | 283,176 | ||||||
| Chemours Co. (The) |
8,025 | 298,209 | ||||||
| DowDuPont, Inc. |
74,400 | 3,966,264 | ||||||
| Eastman Chemical Co. |
5,262 | 399,281 | ||||||
| Ecolab, Inc. |
3,912 | 690,624 | ||||||
See Notes to Financial Statements.
| 86 | WisdomTree Trust |
Schedule of Investments (continued)
WisdomTree U.S. Total Dividend Fund (DTD)
March 31, 2019
| Investments | Shares | Value | ||||||
| FMC Corp. |
2,011 | $ | 154,485 | |||||
| Hawkins, Inc. |
1,679 | 61,838 | ||||||
| Huntsman Corp. |
12,844 | 288,862 | ||||||
| Innophos Holdings, Inc. |
3,753 | 113,115 | ||||||
| International Flavors & Fragrances, Inc. |
2,174 | 279,989 | ||||||
| Kronos Worldwide, Inc. |
13,089 | 183,508 | ||||||
| Mosaic Co. (The) |
1,737 | 47,437 | ||||||
| Olin Corp. |
10,740 | 248,524 | ||||||
| PolyOne Corp. |
3,918 | 114,837 | ||||||
| PPG Industries, Inc. |
4,619 | 521,346 | ||||||
| Quaker Chemical Corp. |
209 | 41,869 | ||||||
| Rayonier Advanced Materials, Inc. |
2,609 | 35,378 | ||||||
| RPM International, Inc. |
4,067 | 236,049 | ||||||
| Scotts Miracle-Gro Co. (The) |
2,324 | 182,620 | ||||||
| Sensient Technologies Corp. |
1,326 | 89,889 | ||||||
| Sherwin-Williams Co. (The) |
1,108 | 477,227 | ||||||
| Valhi, Inc. |
35,496 | 81,996 | ||||||
| Valvoline, Inc. |
6,598 | 122,459 | ||||||
| W.R. Grace & Co. |
1,542 | 120,338 | ||||||
| Westlake Chemical Corp. |
2,659 | 180,440 | ||||||
|
|
|
|||||||
| Total Chemicals |
|
11,073,100 | ||||||
| Commercial Services & Supplies – 0.6% |
| |||||||
| ABM Industries, Inc. |
3,644 | 132,459 | ||||||
| ACCO Brands Corp. |
11,777 | 100,811 | ||||||
| ADT, Inc.(a) |
25,903 | 165,520 | ||||||
| Cintas Corp. |
1,538 | 310,845 | ||||||
| Covanta Holding Corp. |
7,172 | 124,147 | ||||||
| Deluxe Corp. |
2,200 | 96,184 | ||||||
| Healthcare Services Group, Inc. |
2,737 | 90,294 | ||||||
| HNI Corp. |
2,353 | 85,390 | ||||||
| Interface, Inc. |
5,833 | 89,362 | ||||||
| KAR Auction Services, Inc. |
4,697 | 241,003 | ||||||
| LSC Communications, Inc. |
12,302 | 80,332 | ||||||
| McGrath RentCorp |
1,017 | 57,532 | ||||||
| MSA Safety, Inc. |
1,763 | 182,294 | ||||||
| Quad/Graphics, Inc. |
5,415 | 64,439 | ||||||
| Republic Services, Inc. |
8,682 | 697,859 | ||||||
| Rollins, Inc. |
5,020 | 208,932 | ||||||
| UniFirst Corp. |
191 | 29,319 | ||||||
| Waste Management, Inc. |
11,051 | 1,148,310 | ||||||
|
|
|
|||||||
| Total Commercial Services & Supplies |
|
3,905,032 | ||||||
| Communications Equipment – 1.4% |
| |||||||
| ADTRAN, Inc. |
7,237 | 99,147 | ||||||
| Cisco Systems, Inc. |
155,303 | 8,384,809 | ||||||
| Juniper Networks, Inc. |
9,551 | 252,815 | ||||||
| Motorola Solutions, Inc. |
4,289 | 602,261 | ||||||
|
|
|
|||||||
| Total Communications Equipment |
|
9,339,032 | ||||||
| Construction & Engineering – 0.1% |
| |||||||
| Fluor Corp. |
4,904 | 180,467 | ||||||
| Jacobs Engineering Group, Inc. |
1,172 | 88,123 | ||||||
| KBR, Inc. |
2,939 | 56,105 | ||||||
|
|
|
|||||||
| Total Construction & Engineering |
|
324,695 | ||||||
| Construction Materials – 0.0% |
| |||||||
| Martin Marietta Materials, Inc. |
550 | 110,649 | ||||||
| Vulcan Materials Co. |
697 | 82,525 | ||||||
|
|
|
|||||||
| Total Construction Materials |
|
193,174 | ||||||
| Consumer Finance – 0.7% |
| |||||||
| Ally Financial, Inc. |
10,904 | 299,751 | ||||||
| American Express Co. |
14,804 | 1,618,077 | ||||||
| Capital One Financial Corp. |
9,468 | 773,441 | ||||||
| Discover Financial Services |
7,385 | 525,517 | ||||||
| Navient Corp. |
6,622 | 76,616 | ||||||
| Nelnet, Inc. Class A |
783 | 43,120 | ||||||
| Santander Consumer USA Holdings, Inc. |
16,644 | 351,688 | ||||||
| Synchrony Financial |
28,924 | 922,675 | ||||||
|
|
|
|||||||
| Total Consumer Finance |
|
4,610,885 | ||||||
| Containers & Packaging – 0.6% |
| |||||||
| AptarGroup, Inc. |
1,598 | 170,011 | ||||||
| Avery Dennison Corp. |
2,221 | 250,973 | ||||||
| Ball Corp. |
5,706 | 330,149 | ||||||
| Bemis Co., Inc. |
3,423 | 189,908 | ||||||
| Graphic Packaging Holding Co. |
12,331 | 155,741 | ||||||
| Greif, Inc. Class B |
2,179 | 106,531 | ||||||
| International Paper Co. |
21,841 | 1,010,583 | ||||||
| Myers Industries, Inc. |
1,854 | 31,722 | ||||||
| Owens-Illinois, Inc. |
4,774 | 90,611 | ||||||
| Packaging Corp. of America |
3,610 | 358,762 | ||||||
| Sealed Air Corp. |
4,666 | 214,916 | ||||||
| Sonoco Products Co. |
4,278 | 263,225 | ||||||
| WestRock Co. |
12,977 | 497,668 | ||||||
|
|
|
|||||||
| Total Containers & Packaging |
|
3,670,800 | ||||||
| Distributors – 0.1% |
| |||||||
| Genuine Parts Co. |
4,866 | 545,138 | ||||||
| Pool Corp. |
812 | 133,956 | ||||||
| Weyco Group, Inc. |
2,037 | 63,065 | ||||||
|
|
|
|||||||
| Total Distributors |
|
742,159 | ||||||
| Diversified Consumer Services – 0.1% |
| |||||||
| H&R Block, Inc. |
8,231 | 197,050 | ||||||
| Service Corp. International |
5,405 | 217,011 | ||||||
|
|
|
|||||||
| Total Diversified Consumer Services |
|
414,061 | ||||||
| Diversified Financial Services – 0.1% |
| |||||||
| AXA Equitable Holdings, Inc. |
18,291 | 368,381 | ||||||
| Jefferies Financial Group, Inc. |
14,478 | 272,041 | ||||||
|
|
|
|||||||
| Total Diversified Financial Services |
|
640,422 | ||||||
| Diversified Telecommunication Services – 4.8% |
| |||||||
| AT&T, Inc. |
543,940 | 17,057,958 | ||||||
| CenturyLink, Inc. |
134,342 | 1,610,760 | ||||||
| Cogent Communications Holdings, Inc. |
6,063 | 328,918 | ||||||
| Consolidated Communications Holdings, Inc. |
8,259 | 90,106 | ||||||
| Verizon Communications, Inc. |
201,731 | 11,928,354 | ||||||
|
|
|
|||||||
| Total Diversified Telecommunication Services |
|
31,016,096 | ||||||
See Notes to Financial Statements.
| WisdomTree Trust | 87 |
Schedule of Investments (continued)
WisdomTree U.S. Total Dividend Fund (DTD)
March 31, 2019
| Investments | Shares | Value | ||||||
| Electric Utilities – 3.2% |
| |||||||
| ALLETE, Inc. |
2,399 | $ | 197,270 | |||||
| Alliant Energy Corp. |
8,184 | 385,712 | ||||||
| American Electric Power Co., Inc. |
19,270 | 1,613,862 | ||||||
| Avangrid, Inc. |
13,775 | 693,571 | ||||||
| Duke Energy Corp. |
33,385 | 3,004,650 | ||||||
| Edison International |
11,925 | 738,396 | ||||||
| El Paso Electric Co. |
2,074 | 121,993 | ||||||
| Entergy Corp. |
8,524 | 815,150 | ||||||
| Evergy, Inc. |
9,778 | 567,613 | ||||||
| Eversource Energy |
11,524 | 817,628 | ||||||
| Exelon Corp. |
36,964 | 1,853,005 | ||||||
| FirstEnergy Corp. |
20,131 | 837,651 | ||||||
| Hawaiian Electric Industries, Inc. |
5,066 | 206,541 | ||||||
| IDACORP, Inc. |
1,942 | 193,307 | ||||||
| NextEra Energy, Inc. |
13,526 | 2,614,846 | ||||||
| OGE Energy Corp. |
8,782 | 378,680 | ||||||
| Otter Tail Corp. |
3,106 | 154,741 | ||||||
| Pinnacle West Capital Corp. |
4,177 | 399,237 | ||||||
| PNM Resources, Inc. |
3,958 | 187,372 | ||||||
| Portland General Electric Co. |
3,360 | 174,182 | ||||||
| PPL Corp. |
32,927 | 1,045,103 | ||||||
| Southern Co. (The) |
52,131 | 2,694,130 | ||||||
| Xcel Energy, Inc. |
17,575 | 987,891 | ||||||
|
|
|
|||||||
| Total Electric Utilities |
|
20,682,531 | ||||||
| Electrical Equipment – 0.4% |
| |||||||
| AMETEK, Inc. |
2,284 | 189,503 | ||||||
| Emerson Electric Co. |
22,225 | 1,521,746 | ||||||
| GrafTech International Ltd. |
8,871 | 113,460 | ||||||
| Hubbell, Inc. |
2,388 | 281,736 | ||||||
| Rockwell Automation, Inc. |
3,160 | 554,454 | ||||||
|
|
|
|||||||
| Total Electrical Equipment |
|
2,660,899 | ||||||
| Electronic Equipment, Instruments & Components – 0.4% |
| |||||||
| Amphenol Corp. Class A |
3,441 | 324,968 | ||||||
| Avnet, Inc. |
2,400 | 104,088 | ||||||
| AVX Corp. |
8,003 | 138,772 | ||||||
| CDW Corp. |
2,404 | 231,674 | ||||||
| Corning, Inc. |
23,007 | 761,532 | ||||||
| FLIR Systems, Inc. |
3,185 | 151,542 | ||||||
| Jabil, Inc. |
4,264 | 113,380 | ||||||
| Littelfuse, Inc. |
159 | 29,014 | ||||||
| Methode Electronics, Inc. |
2,926 | 84,210 | ||||||
| National Instruments Corp. |
3,793 | 168,257 | ||||||
| SYNNEX Corp. |
2,658 | 253,547 | ||||||
|
|
|
|||||||
| Total Electronic Equipment, Instruments & Components |
|
2,360,984 | ||||||
| Energy Equipment & Services – 0.3% |
| |||||||
| Archrock, Inc. |
7,686 | 75,169 | ||||||
| Baker Hughes a GE Co. |
21,531 | 596,839 | ||||||
| Halliburton Co. |
25,559 | 748,879 | ||||||
| Helmerich & Payne, Inc. |
4,837 | 268,744 | ||||||
| National Oilwell Varco, Inc. |
3,389 | 90,283 | ||||||
| Patterson-UTI Energy, Inc. |
5,935 | 83,209 | ||||||
| RPC, Inc. |
12,494 | 142,556 | ||||||
| U.S. Silica Holdings, Inc. |
6,734 | 116,902 | ||||||
|
|
|
|||||||
| Total Energy Equipment & Services |
|
2,122,581 | ||||||
| Entertainment – 0.7% |
| |||||||
| Activision Blizzard, Inc. |
4,643 | 211,396 | ||||||
| AMC Entertainment Holdings, Inc. Class A(a) |
6,264 | 93,020 | ||||||
| Cinemark Holdings, Inc. |
4,960 | 198,350 | ||||||
| Marcus Corp. (The) |
1,131 | 45,297 | ||||||
| Viacom, Inc. Class A |
7,582 | 246,036 | ||||||
| Viacom, Inc. Class B |
4,678 | 131,312 | ||||||
| Walt Disney Co. (The) |
29,575 | 3,283,712 | ||||||
|
|
|
|||||||
| Total Entertainment |
|
4,209,123 | ||||||
| Equity Real Estate Investment Trusts (REITs) – 7.9% |
| |||||||
| Acadia Realty Trust |
5,108 | 139,295 | ||||||
| Alexandria Real Estate Equities, Inc. |
2,958 | 421,692 | ||||||
| American Assets Trust, Inc. |
2,969 | 136,158 | ||||||
| American Campus Communities, Inc. |
6,560 | 312,125 | ||||||
| American Finance Trust, Inc. |
10,033 | 108,356 | ||||||
| American Homes 4 Rent Class A |
5,321 | 120,893 | ||||||
| American Tower Corp. |
11,078 | 2,183,031 | ||||||
| Americold Realty Trust |
5,135 | 156,669 | ||||||
| Apartment Investment & Management Co. Class A |
6,006 | 302,042 | ||||||
| Apple Hospitality REIT, Inc. |
10,308 | 168,020 | ||||||
| Ashford Hospitality Trust, Inc. |
23,231 | 110,347 | ||||||
| AvalonBay Communities, Inc. |
5,430 | 1,089,964 | ||||||
| Boston Properties, Inc. |
4,592 | 614,777 | ||||||
| Brandywine Realty Trust |
9,310 | 147,657 | ||||||
| Brixmor Property Group, Inc. |
12,141 | 223,030 | ||||||
| Brookfield Property REIT, Inc. Class A |
21,075 | 431,827 | ||||||
| Camden Property Trust |
3,946 | 400,519 | ||||||
| CatchMark Timber Trust, Inc. Class A |
11,305 | 111,015 | ||||||
| CBL & Associates Properties, Inc.(a) |
67,850 | 105,168 | ||||||
| Cedar Realty Trust, Inc. |
30,987 | 105,356 | ||||||
| Chatham Lodging Trust |
8,011 | 154,132 | ||||||
| Chesapeake Lodging Trust |
4,291 | 119,333 | ||||||
| Columbia Property Trust, Inc. |
6,246 | 140,597 | ||||||
| Community Healthcare Trust, Inc. |
3,818 | 137,028 | ||||||
| CoreCivic, Inc. |
9,493 | 184,639 | ||||||
| CorePoint Lodging, Inc. |
9,406 | 105,065 | ||||||
| CoreSite Realty Corp. |
1,322 | 141,480 | ||||||
| Corporate Office Properties Trust |
3,960 | 108,108 | ||||||
| Cousins Properties, Inc. |
16,252 | 156,994 | ||||||
| Crown Castle International Corp. |
19,766 | 2,530,048 | ||||||
| CubeSmart |
7,532 | 241,325 | ||||||
| CyrusOne, Inc. |
3,714 | 194,762 | ||||||
| DiamondRock Hospitality Co. |
11,928 | 129,180 | ||||||
| Digital Realty Trust, Inc. |
8,878 | 1,056,482 | ||||||
| Douglas Emmett, Inc. |
5,414 | 218,834 | ||||||
| Duke Realty Corp. |
13,447 | 411,209 | ||||||
| Easterly Government Properties, Inc. |
5,687 | 102,423 | ||||||
| EastGroup Properties, Inc. |
2,094 | 233,774 | ||||||
| Empire State Realty Trust, Inc. Class A |
10,268 | 162,234 | ||||||
| EPR Properties |
5,019 | 385,961 | ||||||
See Notes to Financial Statements.
| 88 | WisdomTree Trust |
Schedule of Investments (continued)
WisdomTree U.S. Total Dividend Fund (DTD)
March 31, 2019
| Investments | Shares | Value | ||||||
| Equinix, Inc. |
1,818 | $ | 823,845 | |||||
| Equity LifeStyle Properties, Inc. |
2,839 | 324,498 | ||||||
| Equity Residential |
13,357 | 1,006,049 | ||||||
| Essex Property Trust, Inc. |
2,276 | 658,310 | ||||||
| Extra Space Storage, Inc. |
6,339 | 646,007 | ||||||
| Federal Realty Investment Trust |
2,602 | 358,686 | ||||||
| First Industrial Realty Trust, Inc. |
4,588 | 162,232 | ||||||
| Gaming and Leisure Properties, Inc. |
19,908 | 767,852 | ||||||
| GEO Group, Inc. (The) |
11,935 | 229,152 | ||||||
| Gladstone Commercial Corp. |
4,079 | 84,721 | ||||||
| Global Net Lease, Inc. |
7,305 | 138,064 | ||||||
| Hannon Armstrong Sustainable Infrastructure Capital, Inc. |
4,065 | 104,227 | ||||||
| HCP, Inc. |
25,700 | 804,410 | ||||||
| Healthcare Realty Trust, Inc. |
5,669 | 182,032 | ||||||
| Healthcare Trust of America, Inc. Class A |
9,293 | 265,687 | ||||||
| Hersha Hospitality Trust |
3,794 | 65,029 | ||||||
| Highwoods Properties, Inc. |
3,336 | 156,058 | ||||||
| Hospitality Properties Trust |
14,864 | 391,072 | ||||||
| Host Hotels & Resorts, Inc. |
26,488 | 500,623 | ||||||
| Hudson Pacific Properties, Inc. |
6,125 | 210,822 | ||||||
| Independence Realty Trust, Inc. |
9,137 | 98,588 | ||||||
| Industrial Logistics Properties Trust |
8,772 | 176,931 | ||||||
| Investors Real Estate Trust |
2,449 | 146,720 | ||||||
| Invitation Homes, Inc. |
9,896 | 240,770 | ||||||
| Iron Mountain, Inc. |
24,413 | 865,685 | ||||||
| iStar, Inc. |
10,298 | 86,709 | ||||||
| JBG SMITH Properties |
3,858 | 159,528 | ||||||
| Kilroy Realty Corp. |
2,570 | 195,217 | ||||||
| Kimco Realty Corp. |
21,612 | 399,822 | ||||||
| Kite Realty Group Trust |
8,998 | 143,878 | ||||||
| Lamar Advertising Co. Class A |
4,754 | 376,802 | ||||||
| Lexington Realty Trust |
20,785 | 188,312 | ||||||
| Liberty Property Trust |
9,043 | 437,862 | ||||||
| Life Storage, Inc. |
3,219 | 313,112 | ||||||
| LTC Properties, Inc. |
2,987 | 136,805 | ||||||
| Macerich Co. (The) |
4,464 | 193,514 | ||||||
| Mack-Cali Realty Corp. |
4,263 | 94,639 | ||||||
| MedEquities Realty Trust, Inc. |
20,025 | 222,878 | ||||||
| Medical Properties Trust, Inc. |
33,704 | 623,861 | ||||||
| Mid-America Apartment Communities, Inc. |
4,393 | 480,287 | ||||||
| National Health Investors, Inc. |
2,582 | 202,816 | ||||||
| National Retail Properties, Inc. |
8,905 | 493,248 | ||||||
| New Senior Investment Group, Inc. |
29,996 | 163,478 | ||||||
| Office Properties Income Trust |
3,203 | 88,531 | ||||||
| Omega Healthcare Investors, Inc. |
21,530 | 821,369 | ||||||
| One Liberty Properties, Inc. |
5,158 | 149,582 | ||||||
| Outfront Media, Inc. |
5,046 | 118,076 | ||||||
| Paramount Group, Inc. |
6,803 | 96,535 | ||||||
| Park Hotels & Resorts, Inc. |
15,590 | 484,537 | ||||||
| Pebblebrook Hotel Trust |
8,688 | 269,849 | ||||||
| Physicians Realty Trust |
12,498 | 235,087 | ||||||
| Piedmont Office Realty Trust, Inc. Class A |
9,719 | 202,641 | ||||||
| PotlatchDeltic Corp. |
1,936 | 73,161 | ||||||
| Preferred Apartment Communities, Inc. Class A |
5,789 | 85,793 | ||||||
| Prologis, Inc. |
22,635 | 1,628,588 | ||||||
| PS Business Parks, Inc. |
1,265 | 198,390 | ||||||
| Public Storage |
7,428 | 1,617,670 | ||||||
| QTS Realty Trust, Inc. Class A |
1,973 | 88,765 | ||||||
| Rayonier, Inc. |
5,781 | 182,217 | ||||||
| Realty Income Corp. |
15,985 | 1,175,857 | ||||||
| Regency Centers Corp. |
6,148 | 414,929 | ||||||
| Retail Opportunity Investments Corp. |
7,658 | 132,790 | ||||||
| Retail Properties of America, Inc. Class A |
12,398 | 151,132 | ||||||
| Rexford Industrial Realty, Inc. |
1,016 | 36,383 | ||||||
| RLJ Lodging Trust |
11,383 | 199,999 | ||||||
| RPT Realty |
7,265 | 87,253 | ||||||
| Ryman Hospitality Properties, Inc. |
3,028 | 249,023 | ||||||
| Sabra Health Care REIT, Inc. |
20,540 | 399,914 | ||||||
| Safehold, Inc. |
5,675 | 123,772 | ||||||
| Saul Centers, Inc. |
1,627 | 83,579 | ||||||
| Senior Housing Properties Trust |
42,741 | 503,489 | ||||||
| Simon Property Group, Inc. |
15,970 | 2,909,894 | ||||||
| SL Green Realty Corp. |
1,923 | 172,916 | ||||||
| Spirit Realty Capital, Inc. |
6,161 | 244,777 | ||||||
| STAG Industrial, Inc. |
6,462 | 191,598 | ||||||
| STORE Capital Corp. |
11,439 | 383,206 | ||||||
| Sun Communities, Inc. |
3,259 | 386,257 | ||||||
| Tanger Factory Outlet Centers, Inc. |
5,196 | 109,012 | ||||||
| Taubman Centers, Inc. |
2,427 | 128,340 | ||||||
| UDR, Inc. |
11,247 | 511,289 | ||||||
| Uniti Group, Inc. |
25,457 | 284,864 | ||||||
| Ventas, Inc. |
21,600 | 1,378,296 | ||||||
| VEREIT, Inc. |
86,849 | 726,926 | ||||||
| VICI Properties, Inc. |
25,399 | 555,730 | ||||||
| Vornado Realty Trust |
6,917 | 466,482 | ||||||
| W.P. Carey, Inc. |
10,306 | 807,269 | ||||||
| Washington Prime Group, Inc. |
17,290 | 97,689 | ||||||
| Washington Real Estate Investment Trust |
3,675 | 104,297 | ||||||
| Weingarten Realty Investors |
5,920 | 173,870 | ||||||
| Welltower, Inc. |
22,350 | 1,734,360 | ||||||
| Weyerhaeuser Co. |
34,711 | 914,288 | ||||||
| Whitestone REIT |
5,687 | 68,358 | ||||||
| Xenia Hotels & Resorts, Inc. |
8,361 | 183,190 | ||||||
|
|
|
|||||||
| Total Equity Real Estate Investment Trusts (REITs) |
|
51,054,206 | ||||||
| Food & Staples Retailing – 1.8% |
| |||||||
| Casey’s General Stores, Inc. |
469 | 60,393 | ||||||
| Costco Wholesale Corp. |
5,520 | 1,336,613 | ||||||
| Kroger Co. (The) |
15,756 | 387,598 | ||||||
| Sysco Corp. |
15,186 | 1,013,818 | ||||||
| Walgreens Boots Alliance, Inc. |
24,753 | 1,566,122 | ||||||
| Walmart, Inc. |
76,327 | 7,444,172 | ||||||
| Weis Markets, Inc. |
1,479 | 60,358 | ||||||
|
|
|
|||||||
| Total Food & Staples Retailing |
|
11,869,074 | ||||||
| Food Products – 1.9% |
| |||||||
| Alico, Inc. |
970 | 26,394 | ||||||
| Archer-Daniels-Midland Co. |
19,902 | 858,373 | ||||||
See Notes to Financial Statements.
| WisdomTree Trust | 89 |
Schedule of Investments (continued)
WisdomTree U.S. Total Dividend Fund (DTD)
March 31, 2019
| Investments | Shares | Value | ||||||
| B&G Foods, Inc.(a) |
5,024 | $ | 122,686 | |||||
| Calavo Growers, Inc. |
437 | 36,642 | ||||||
| Campbell Soup Co. |
13,090 | 499,122 | ||||||
| Conagra Brands, Inc. |
18,536 | 514,189 | ||||||
| Flowers Foods, Inc. |
8,900 | 189,748 | ||||||
| General Mills, Inc. |
35,748 | 1,849,959 | ||||||
| Hershey Co. (The) |
4,698 | 539,471 | ||||||
| Hormel Foods Corp. |
13,596 | 608,557 | ||||||
| Ingredion, Inc. |
1,935 | 183,225 | ||||||
| J&J Snack Foods Corp. |
212 | 33,674 | ||||||
| J.M. Smucker Co. (The) |
4,008 | 466,932 | ||||||
| Kellogg Co. |
12,446 | 714,151 | ||||||
| Kraft Heinz Co. (The) |
74,497 | 2,432,327 | ||||||
| Lamb Weston Holdings, Inc. |
1,753 | 131,370 | ||||||
| Lancaster Colony Corp. |
819 | 128,329 | ||||||
| McCormick & Co., Inc. Non-Voting Shares |
3,560 | 536,243 | ||||||
| Mondelez International, Inc. Class A |
40,106 | 2,002,092 | ||||||
| Tyson Foods, Inc. Class A |
8,709 | 604,666 | ||||||
|
|
|
|||||||
| Total Food Products |
|
12,478,150 | ||||||
| Gas Utilities – 0.2% |
| |||||||
| Atmos Energy Corp. |
3,085 | 317,539 | ||||||
| National Fuel Gas Co. |
3,092 | 188,488 | ||||||
| New Jersey Resources Corp. |
2,500 | 124,475 | ||||||
| Northwest Natural Holding Co. |
2,097 | 137,626 | ||||||
| ONE Gas, Inc. |
1,749 | 155,714 | ||||||
| South Jersey Industries, Inc. |
3,081 | 98,808 | ||||||
| Southwest Gas Holdings, Inc. |
1,079 | 88,759 | ||||||
| Spire, Inc. |
2,287 | 188,197 | ||||||
| UGI Corp. |
4,382 | 242,850 | ||||||
|
|
|
|||||||
| Total Gas Utilities |
|
1,542,456 | ||||||
| Health Care Equipment & Supplies – 1.1% |
| |||||||
| Abbott Laboratories |
36,869 | 2,947,308 | ||||||
| Baxter International, Inc. |
6,750 | 548,843 | ||||||
| Becton, Dickinson and Co. |
4,011 | 1,001,667 | ||||||
| Danaher Corp. |
4,920 | 649,538 | ||||||
| Meridian Bioscience, Inc. |
4,589 | 80,812 | ||||||
| ResMed, Inc. |
3,206 | 333,328 | ||||||
| Stryker Corp. |
5,093 | 1,005,969 | ||||||
| Teleflex, Inc. |
425 | 128,418 | ||||||
| Zimmer Biomet Holdings, Inc. |
1,770 | 226,029 | ||||||
|
|
|
|||||||
| Total Health Care Equipment & Supplies |
|
6,921,912 | ||||||
| Health Care Providers & Services – 1.4% |
| |||||||
| AmerisourceBergen Corp. |
5,388 | 428,454 | ||||||
| Anthem, Inc. |
4,106 | 1,178,340 | ||||||
| Cardinal Health, Inc. |
7,128 | 343,213 | ||||||
| Chemed Corp. |
209 | 66,894 | ||||||
| CVS Health Corp. |
39,062 | 2,106,614 | ||||||
| Encompass Health Corp. |
3,112 | 181,741 | ||||||
| HCA Healthcare, Inc. |
2,365 | 308,349 | ||||||
| Humana, Inc. |
1,032 | 274,512 | ||||||
| McKesson Corp. |
1,460 | 170,907 | ||||||
| Quest Diagnostics, Inc. |
3,411 | 306,717 | ||||||
| UnitedHealth Group, Inc. |
15,842 | 3,917,093 | ||||||
|
|
|
|||||||
| Total Health Care Providers & Services |
|
9,282,834 | ||||||
| Hotels, Restaurants & Leisure – 2.3% |
| |||||||
| Aramark |
2,692 | 79,549 | ||||||
| Brinker International, Inc. |
2,049 | 90,935 | ||||||
| Choice Hotels International, Inc. |
1,292 | 100,440 | ||||||
| Churchill Downs, Inc. |
813 | 73,381 | ||||||
| Cracker Barrel Old Country Store, Inc. |
833 | 134,621 | ||||||
| Darden Restaurants, Inc. |
4,124 | 500,942 | ||||||
| Dine Brands Global, Inc. |
2,583 | 235,802 | ||||||
| Domino’s Pizza, Inc. |
629 | 162,345 | ||||||
| Dunkin’ Brands Group, Inc. |
2,601 | 195,335 | ||||||
| Hilton Worldwide Holdings, Inc. |
3,918 | 325,625 | ||||||
| Jack in the Box, Inc. |
359 | 29,100 | ||||||
| Las Vegas Sands Corp. |
49,060 | 2,990,698 | ||||||
| Marriott International, Inc. Class A |
5,340 | 667,981 | ||||||
| Marriott Vacations Worldwide Corp. |
1,914 | 178,959 | ||||||
| McDonald’s Corp. |
22,826 | 4,334,657 | ||||||
| MGM Resorts International |
10,356 | 265,735 | ||||||
| Six Flags Entertainment Corp. |
4,599 | 226,961 | ||||||
| Starbucks Corp. |
31,049 | 2,308,183 | ||||||
| Texas Roadhouse, Inc. |
2,216 | 137,813 | ||||||
| Vail Resorts, Inc. |
985 | 214,040 | ||||||
| Wendy’s Co. (The) |
7,600 | 135,964 | ||||||
| Wyndham Destinations, Inc. |
3,508 | 142,039 | ||||||
| Wyndham Hotels & Resorts, Inc. |
1,801 | 90,032 | ||||||
| Wynn Resorts Ltd. |
3,840 | 458,189 | ||||||
| Yum! Brands, Inc. |
6,340 | 632,795 | ||||||
|
|
|
|||||||
| Total Hotels, Restaurants & Leisure |
|
14,712,121 | ||||||
| Household Durables – 0.3% |
| |||||||
| Bassett Furniture Industries, Inc. |
3,678 | 60,356 | ||||||
| D.R. Horton, Inc. |
7,313 | 302,612 | ||||||
| Ethan Allen Interiors, Inc. |
4,833 | 92,455 | ||||||
| Flexsteel Industries, Inc. |
2,978 | 69,060 | ||||||
| La-Z-Boy, Inc. |
1,800 | 59,382 | ||||||
| Leggett & Platt, Inc. |
7,377 | 311,457 | ||||||
| Lennar Corp. Class A |
2,793 | 137,108 | ||||||
| MDC Holdings, Inc. |
4,178 | 121,413 | ||||||
| Newell Brands, Inc. |
14,265 | 218,825 | ||||||
| PulteGroup, Inc. |
6,488 | 181,405 | ||||||
| Toll Brothers, Inc. |
4,342 | 157,180 | ||||||
| Whirlpool Corp. |
3,572 | 474,683 | ||||||
|
|
|
|||||||
| Total Household Durables |
|
2,185,936 | ||||||
| Household Products – 2.1% |
| |||||||
| Church & Dwight Co., Inc. |
5,302 | 377,661 | ||||||
| Clorox Co. (The) |
4,049 | 649,703 | ||||||
| Colgate-Palmolive Co. |
24,936 | 1,709,113 | ||||||
| Energizer Holdings, Inc. |
1,855 | 83,345 | ||||||
| Kimberly-Clark Corp. |
13,880 | 1,719,732 | ||||||
| Oil-Dri Corp. of America |
680 | 21,175 | ||||||
| Procter & Gamble Co. (The) |
86,324 | 8,982,012 | ||||||
| Spectrum Brands Holdings, Inc. |
3,866 | 211,780 | ||||||
|
|
|
|||||||
| Total Household Products |
|
13,754,521 | ||||||
See Notes to Financial Statements.
| 90 | WisdomTree Trust |
Schedule of Investments (continued)
WisdomTree U.S. Total Dividend Fund (DTD)
March 31, 2019
| Investments | Shares | Value | ||||||
| Independent Power & Renewable Electricity Producers – 0.2% |
| |||||||
| AES Corp. |
34,842 | $ | 629,943 | |||||
| Clearway Energy, Inc. Class C |
5,376 | 81,231 | ||||||
| NRG Energy, Inc. |
2,205 | 93,669 | ||||||
| Ormat Technologies, Inc. |
501 | 27,630 | ||||||
| Pattern Energy Group, Inc. Class A |
7,942 | 174,724 | ||||||
| TerraForm Power, Inc. Class A |
13,921 | 191,275 | ||||||
|
|
|
|||||||
| Total Independent Power & Renewable Electricity Producers |
|
1,198,472 | ||||||
| Industrial Conglomerates – 2.1% |
| |||||||
| 3M Co. |
17,024 | 3,537,247 | ||||||
| Carlisle Cos., Inc. |
1,088 | 133,410 | ||||||
| General Electric Co. |
678,587 | 6,779,084 | ||||||
| Honeywell International, Inc. |
18,986 | 3,017,255 | ||||||
| Raven Industries, Inc. |
929 | 35,646 | ||||||
| Roper Technologies, Inc. |
877 | 299,908 | ||||||
|
|
|
|||||||
| Total Industrial Conglomerates |
|
13,802,550 | ||||||
| Insurance – 2.6% |
| |||||||
| Aflac, Inc. |
21,865 | 1,093,250 | ||||||
| Allstate Corp. (The) |
8,333 | 784,802 | ||||||
| American Financial Group, Inc. |
1,404 | 135,079 | ||||||
| American International Group, Inc. |
37,230 | 1,603,124 | ||||||
| American National Insurance Co. |
495 | 59,806 | ||||||
| AMERISAFE, Inc. |
1,652 | 98,129 | ||||||
| Arthur J. Gallagher & Co. |
5,841 | 456,182 | ||||||
| Assurant, Inc. |
1,764 | 167,421 | ||||||
| Brown & Brown, Inc. |
5,490 | 162,010 | ||||||
| Cincinnati Financial Corp. |
5,669 | 486,967 | ||||||
| CNA Financial Corp. |
9,491 | 411,435 | ||||||
| CNO Financial Group, Inc. |
6,269 | 101,432 | ||||||
| Erie Indemnity Co. Class A |
1,537 | 274,385 | ||||||
| Fidelity National Financial, Inc. |
11,720 | 428,366 | ||||||
| First American Financial Corp. |
5,143 | 264,865 | ||||||
| Hanover Insurance Group, Inc. (The) |
1,419 | 162,007 | ||||||
| Hartford Financial Services Group, Inc. (The) |
13,439 | 668,187 | ||||||
| Horace Mann Educators Corp. |
699 | 24,612 | ||||||
| Lincoln National Corp. |
6,843 | 401,684 | ||||||
| Loews Corp. |
1,227 | 58,810 | ||||||
| Marsh & McLennan Cos., Inc. |
11,130 | 1,045,107 | ||||||
| Mercury General Corp. |
3,399 | 170,188 | ||||||
| MetLife, Inc. |
46,942 | 1,998,321 | ||||||
| Old Republic International Corp. |
13,550 | 283,466 | ||||||
| Principal Financial Group, Inc. |
17,775 | 892,127 | ||||||
| ProAssurance Corp. |
4,590 | 158,860 | ||||||
| Progressive Corp. (The) |
9,926 | 715,565 | ||||||
| Prudential Financial, Inc. |
20,826 | 1,913,493 | ||||||
| Reinsurance Group of America, Inc. |
1,529 | 217,088 | ||||||
| RLI Corp. |
541 | 38,817 | ||||||
| Safety Insurance Group, Inc. |
963 | 83,916 | ||||||
| Torchmark Corp. |
1,323 | 108,420 | ||||||
| Travelers Cos., Inc. (The) |
7,450 | 1,021,842 | ||||||
| Unum Group |
10,687 | 361,541 | ||||||
| W.R. Berkley Corp. |
1,456 | 123,352 | ||||||
|
|
|
|||||||
| Total Insurance |
|
16,974,656 | ||||||
| Internet & Direct Marketing Retail – 0.0% |
| |||||||
| Expedia Group, Inc. |
1,769 | 210,511 | ||||||
| IT Services – 2.8% |
| |||||||
| Alliance Data Systems Corp. |
1,046 | 183,029 | ||||||
| Automatic Data Processing, Inc. |
11,710 | 1,870,555 | ||||||
| Booz Allen Hamilton Holding Corp. |
3,582 | 208,257 | ||||||
| Broadridge Financial Solutions, Inc. |
2,823 | 292,717 | ||||||
| Cass Information Systems, Inc. |
1,107 | 52,361 | ||||||
| Cognizant Technology Solutions Corp. Class A |
6,371 | 461,579 | ||||||
| DXC Technology Co. |
4,283 | 275,440 | ||||||
| Fidelity National Information Services, Inc. |
4,975 | 562,673 | ||||||
| International Business Machines Corp. |
53,813 | 7,593,014 | ||||||
| Jack Henry & Associates, Inc. |
1,635 | 226,840 | ||||||
| Leidos Holdings, Inc. |
4,104 | 263,025 | ||||||
| ManTech International Corp. Class A |
843 | 45,539 | ||||||
| MasterCard, Inc. Class A |
7,617 | 1,793,423 | ||||||
| Paychex, Inc. |
13,095 | 1,050,219 | ||||||
| Sabre Corp. |
5,294 | 113,239 | ||||||
| Science Applications International Corp. |
1,000 | 76,950 | ||||||
| Switch, Inc. Class A(a) |
10,533 | 108,595 | ||||||
| Total System Services, Inc. |
1,882 | 178,809 | ||||||
| Visa, Inc. Class A |
16,329 | 2,550,427 | ||||||
| Western Union Co. (The) |
19,628 | 362,529 | ||||||
|
|
|
|||||||
| Total IT Services |
|
18,269,220 | ||||||
| Leisure Products – 0.1% |
| |||||||
| Brunswick Corp. |
1,721 | 86,618 | ||||||
| Escalade, Inc. |
1,983 | 22,150 | ||||||
| Hasbro, Inc. |
3,586 | 304,881 | ||||||
| Marine Products Corp. |
2,125 | 28,624 | ||||||
| Polaris Industries, Inc. |
2,067 | 174,517 | ||||||
|
|
|
|||||||
| Total Leisure Products |
|
616,790 | ||||||
| Life Sciences Tools & Services – 0.2% |
| |||||||
| Agilent Technologies, Inc. |
4,290 | 344,830 | ||||||
| Bio-Techne Corp. |
812 | 161,223 | ||||||
| Luminex Corp. |
2,222 | 51,128 | ||||||
| Thermo Fisher Scientific, Inc. |
1,699 | 465,050 | ||||||
|
|
|
|||||||
| Total Life Sciences Tools & Services |
|
1,022,231 | ||||||
| Machinery – 1.8% |
| |||||||
| AGCO Corp. |
1,754 | 121,991 | ||||||
| Albany International Corp. Class A |
805 | 57,630 | ||||||
| Allison Transmission Holdings, Inc. |
4,055 | 182,151 | ||||||
| Altra Industrial Motion Corp. |
4,370 | 135,688 | ||||||
| Briggs & Stratton Corp. |
7,244 | 85,697 | ||||||
| Caterpillar, Inc. |
17,867 | 2,420,800 | ||||||
| Crane Co. |
1,791 | 151,554 | ||||||
| Cummins, Inc. |
5,782 | 912,804 | ||||||
| Deere & Co. |
7,163 | 1,144,934 | ||||||
| Donaldson Co., Inc. |
3,387 | 169,553 | ||||||
| Dover Corp. |
4,315 | 404,747 | ||||||
| Flowserve Corp. |
1,882 | 84,953 | ||||||
| Fortive Corp. |
2,059 | 172,730 | ||||||
| Graco, Inc. |
3,809 | 188,622 | ||||||
See Notes to Financial Statements.
| WisdomTree Trust | 91 |
Schedule of Investments (continued)
WisdomTree U.S. Total Dividend Fund (DTD)
March 31, 2019
| Investments | Shares | Value | ||||||
| Graham Corp. |
2,382 | $ | 46,759 | |||||
| Greenbrier Cos., Inc. (The) |
911 | 29,362 | ||||||
| Hurco Cos., Inc. |
756 | 30,489 | ||||||
| IDEX Corp. |
1,718 | 260,689 | ||||||
| Illinois Tool Works, Inc. |
10,804 | 1,550,698 | ||||||
| Kennametal, Inc. |
3,296 | 121,128 | ||||||
| Lincoln Electric Holdings, Inc. |
1,868 | 156,669 | ||||||
| Lindsay Corp. |
346 | 33,489 | ||||||
| Mueller Industries, Inc. |
3,190 | 99,975 | ||||||
| NN, Inc. |
11,958 | 89,565 | ||||||
| Nordson Corp. |
1,169 | 154,916 | ||||||
| Oshkosh Corp. |
1,404 | 105,483 | ||||||
| PACCAR, Inc. |
5,904 | 402,299 | ||||||
| Parker-Hannifin Corp. |
2,842 | 487,744 | ||||||
| REV Group, Inc. |
10,817 | 118,446 | ||||||
| Snap-on, Inc. |
1,304 | 204,102 | ||||||
| Stanley Black & Decker, Inc. |
3,177 | 432,612 | ||||||
| Terex Corp. |
3,257 | 104,647 | ||||||
| Timken Co. (The) |
4,355 | 189,965 | ||||||
| Toro Co. (The) |
2,295 | 157,988 | ||||||
| Trinity Industries, Inc. |
3,377 | 73,382 | ||||||
| Wabtec Corp. |
3,645 | 268,709 | ||||||
| Xylem, Inc. |
2,965 | 234,354 | ||||||
|
|
|
|||||||
| Total Machinery |
|
11,587,324 | ||||||
| Media – 1.1% |
| |||||||
| CBS Corp. Class B Non-Voting Shares |
5,882 | 279,571 | ||||||
| Comcast Corp. Class A |
103,891 | 4,153,562 | ||||||
| Emerald Expositions Events, Inc. |
6,751 | 85,738 | ||||||
| Entercom Communications Corp. Class A |
21,767 | 114,277 | ||||||
| Fox Corp. Class A* |
2,686 | 98,603 | ||||||
| Fox Corp. Class B* |
3,548 | 127,302 | ||||||
| Gannett Co., Inc. |
7,812 | 82,338 | ||||||
| Interpublic Group of Cos., Inc. (The) |
16,103 | 338,324 | ||||||
| John Wiley & Sons, Inc. Class A |
1,714 | 75,793 | ||||||
| Meredith Corp. |
2,196 | 121,351 | ||||||
| National CineMedia, Inc. |
9,711 | 68,463 | ||||||
| New Media Investment Group, Inc. |
11,357 | 119,249 | ||||||
| News Corp. Class A |
11,007 | 136,927 | ||||||
| Nexstar Media Group, Inc. Class A |
903 | 97,858 | ||||||
| Omnicom Group, Inc. |
8,527 | 622,386 | ||||||
| Sinclair Broadcast Group, Inc. Class A |
2,785 | 107,167 | ||||||
| Sirius XM Holdings, Inc. |
48,270 | 273,691 | ||||||
| TEGNA, Inc. |
7,144 | 100,730 | ||||||
| Tribune Media Co. Class A |
3,860 | 178,100 | ||||||
|
|
|
|||||||
| Total Media |
|
7,181,430 | ||||||
| Metals & Mining – 0.3% |
| |||||||
| Commercial Metals Co. |
4,388 | 74,947 | ||||||
| Compass Minerals International, Inc. |
3,635 | 197,635 | ||||||
| Freeport-McMoRan, Inc. |
32,797 | 422,753 | ||||||
| Newmont Mining Corp. |
10,902 | 389,965 | ||||||
| Nucor Corp. |
10,062 | 587,118 | ||||||
| Reliance Steel & Aluminum Co. |
2,319 | 209,313 | ||||||
| Royal Gold, Inc. |
1,107 | 100,659 | ||||||
| Steel Dynamics, Inc. |
5,052 | 178,184 | ||||||
| Worthington Industries, Inc. |
1,809 | 67,512 | ||||||
|
|
|
|||||||
| Total Metals & Mining |
|
2,228,086 | ||||||
| Mortgage Real Estate Investment Trusts (REITs) – 0.0% |
| |||||||
| Arlington Asset Investment Corp. Class A(a) |
14,249 | 113,422 | ||||||
| Multi-Utilities – 1.6% |
| |||||||
| Ameren Corp. |
9,231 | 678,940 | ||||||
| Black Hills Corp. |
2,549 | 188,804 | ||||||
| CenterPoint Energy, Inc. |
21,480 | 659,436 | ||||||
| CMS Energy Corp. |
8,620 | 478,755 | ||||||
| Consolidated Edison, Inc. |
12,220 | 1,036,378 | ||||||
| Dominion Energy, Inc. |
31,962 | 2,450,207 | ||||||
| DTE Energy Co. |
6,472 | 807,317 | ||||||
| MDU Resources Group, Inc. |
7,320 | 189,076 | ||||||
| NiSource, Inc. |
11,046 | 316,578 | ||||||
| NorthWestern Corp. |
2,538 | 178,701 | ||||||
| Public Service Enterprise Group, Inc. |
20,877 | 1,240,303 | ||||||
| Sempra Energy |
8,705 | 1,095,611 | ||||||
| WEC Energy Group, Inc. |
11,684 | 923,971 | ||||||
|
|
|
|||||||
| Total Multi-Utilities |
|
10,244,077 | ||||||
| Multiline Retail – 0.5% |
| |||||||
| Dollar General Corp. |
3,740 | 446,182 | ||||||
| Kohl’s Corp. |
8,494 | 584,133 | ||||||
| Macy’s, Inc. |
15,777 | 379,121 | ||||||
| Nordstrom, Inc. |
5,235 | 232,329 | ||||||
| Target Corp. |
22,575 | 1,811,870 | ||||||
|
|
|
|||||||
| Total Multiline Retail |
|
3,453,635 | ||||||
| Oil, Gas & Consumable Fuels – 7.5% |
| |||||||
| Anadarko Petroleum Corp. |
14,321 | 651,319 | ||||||
| Apache Corp. |
7,025 | 243,487 | ||||||
| Berry Petroleum Corp. |
8,147 | 94,016 | ||||||
| Cabot Oil & Gas Corp. |
3,442 | 89,836 | ||||||
| Chevron Corp. |
87,310 | 10,754,846 | ||||||
| Cimarex Energy Co. |
2,547 | 178,035 | ||||||
| ConocoPhillips |
28,243 | 1,884,938 | ||||||
| CVR Energy, Inc. |
9,685 | 399,022 | ||||||
| Delek U.S. Holdings, Inc. |
2,472 | 90,030 | ||||||
| Devon Energy Corp. |
3,744 | 118,161 | ||||||
| Diamondback Energy, Inc. |
793 | 80,513 | ||||||
| EOG Resources, Inc. |
6,053 | 576,125 | ||||||
| EQT Corp. |
6,552 | 135,888 | ||||||
| Evolution Petroleum Corp. |
4,534 | 30,605 | ||||||
| Exxon Mobil Corp. |
205,268 | 16,585,654 | ||||||
| Hess Corp. |
5,398 | 325,122 | ||||||
| HollyFrontier Corp. |
6,306 | 310,697 | ||||||
| Kinder Morgan, Inc. |
124,470 | 2,490,645 | ||||||
| Marathon Oil Corp. |
8,614 | 143,940 | ||||||
| Marathon Petroleum Corp. |
23,714 | 1,419,283 | ||||||
| Murphy Oil Corp. |
7,680 | 225,024 | ||||||
| Noble Energy, Inc. |
7,788 | 192,597 | ||||||
| Occidental Petroleum Corp. |
38,249 | 2,532,084 | ||||||
| ONEOK, Inc. |
27,035 | 1,888,124 | ||||||
See Notes to Financial Statements.
| 92 | WisdomTree Trust |
Schedule of Investments (continued)
WisdomTree U.S. Total Dividend Fund (DTD)
March 31, 2019
| Investments | Shares | Value | ||||||
| Panhandle Oil and Gas, Inc. Class A |
1,522 | $ | 23,895 | |||||
| PBF Energy, Inc. Class A |
5,427 | 168,997 | ||||||
| Phillips 66 |
19,061 | 1,814,035 | ||||||
| Pioneer Natural Resources Co. |
861 | 131,113 | ||||||
| SemGroup Corp. Class A |
15,337 | 226,067 | ||||||
| Targa Resources Corp. |
22,752 | 945,346 | ||||||
| Valero Energy Corp. |
21,006 | 1,781,939 | ||||||
| Williams Cos., Inc. (The) |
80,461 | 2,310,840 | ||||||
|
|
|
|||||||
| Total Oil, Gas & Consumable Fuels |
|
48,842,223 | ||||||
| Paper & Forest Products – 0.1% |
| |||||||
| Domtar Corp. |
3,199 | 158,830 | ||||||
| Louisiana-Pacific Corp. |
4,518 | 110,149 | ||||||
| Schweitzer-Mauduit International, Inc. |
5,382 | 208,391 | ||||||
|
|
|
|||||||
| Total Paper & Forest Products |
|
477,370 | ||||||
| Personal Products – 0.2% |
| |||||||
| Coty, Inc. Class A(a) |
28,242 | 324,783 | ||||||
| Estee Lauder Cos., Inc. (The) Class A |
3,754 | 621,475 | ||||||
| Inter Parfums, Inc. |
712 | 54,019 | ||||||
| Medifast, Inc. |
431 | 54,974 | ||||||
| Nu Skin Enterprises, Inc. Class A |
1,917 | 91,748 | ||||||
|
|
|
|||||||
| Total Personal Products |
|
1,146,999 | ||||||
| Pharmaceuticals – 5.2% |
| |||||||
| Bristol-Myers Squibb Co. |
53,679 | 2,561,025 | ||||||
| Eli Lilly & Co. |
25,863 | 3,355,983 | ||||||
| Johnson & Johnson |
81,312 | 11,366,604 | ||||||
| Merck & Co., Inc. |
86,613 | 7,203,603 | ||||||
| Pfizer, Inc. |
208,976 | 8,875,211 | ||||||
| Zoetis, Inc. |
3,907 | 393,318 | ||||||
|
|
|
|||||||
| Total Pharmaceuticals |
|
33,755,744 | ||||||
| Professional Services – 0.1% |
| |||||||
| Equifax, Inc. |
1,403 | 166,255 | ||||||
| Kelly Services, Inc. Class A |
1,112 | 24,531 | ||||||
| ManpowerGroup, Inc. |
1,798 | 148,677 | ||||||
| Robert Half International, Inc. |
2,901 | 189,029 | ||||||
|
|
|
|||||||
| Total Professional Services |
|
528,492 | ||||||
| Real Estate Management & Development – 0.1% |
| |||||||
| Jones Lang LaSalle, Inc. |
210 | 32,378 | ||||||
| Kennedy-Wilson Holdings, Inc. |
8,751 | 187,184 | ||||||
| Newmark Group, Inc. Class A |
16,940 | 141,280 | ||||||
| RE/MAX Holdings, Inc. Class A |
2,521 | 97,159 | ||||||
|
|
|
|||||||
| Total Real Estate Management & Development |
|
458,001 | ||||||
| Road & Rail – 1.0% |
| |||||||
| CSX Corp. |
15,987 | 1,196,147 | ||||||
| JB Hunt Transport Services, Inc. |
1,664 | 168,547 | ||||||
| Kansas City Southern |
1,104 | 128,042 | ||||||
| Norfolk Southern Corp. |
6,295 | 1,176,473 | ||||||
| Old Dominion Freight Line, Inc. |
241 | 34,798 | ||||||
| Ryder System, Inc. |
4,695 | 291,043 | ||||||
| Union Pacific Corp. |
19,511 | 3,262,239 | ||||||
|
|
|
|||||||
| Total Road & Rail |
|
6,257,289 | ||||||
| Semiconductors & Semiconductor Equipment – 3.9% |
| |||||||
| Analog Devices, Inc. |
9,243 | 973,011 | ||||||
| Applied Materials, Inc. |
27,835 | 1,103,936 | ||||||
| Broadcom, Inc. |
12,700 | 3,819,017 | ||||||
| Brooks Automation, Inc. |
2,732 | 80,129 | ||||||
| Cabot Microelectronics Corp. |
346 | 38,738 | ||||||
| Cypress Semiconductor Corp. |
14,191 | 211,730 | ||||||
| Intel Corp. |
136,048 | 7,305,778 | ||||||
| KLA-Tencor Corp. |
5,541 | 661,651 | ||||||
| Lam Research Corp. |
5,592 | 1,001,024 | ||||||
| Maxim Integrated Products, Inc. |
9,993 | 531,328 | ||||||
| Microchip Technology, Inc.(a) |
5,312 | 440,683 | ||||||
| NVE Corp. |
403 | 39,450 | ||||||
| NVIDIA Corp. |
2,862 | 513,901 | ||||||
| QUALCOMM, Inc. |
58,707 | 3,348,060 | ||||||
| Skyworks Solutions, Inc. |
4,552 | 375,449 | ||||||
| Teradyne, Inc. |
2,754 | 109,719 | ||||||
| Texas Instruments, Inc. |
33,653 | 3,569,574 | ||||||
| Xilinx, Inc. |
6,322 | 801,566 | ||||||
| Xperi Corp. |
4,265 | 99,801 | ||||||
|
|
|
|||||||
| Total Semiconductors & Semiconductor Equipment |
|
25,024,545 | ||||||
| Software – 3.7% |
| |||||||
| Intuit, Inc. |
3,260 | 852,197 | ||||||
| j2 Global, Inc. |
1,405 | 121,673 | ||||||
| Microsoft Corp. |
159,114 | 18,765,905 | ||||||
| Oracle Corp. |
68,254 | 3,665,922 | ||||||
| SS&C Technologies Holdings, Inc. |
2,350 | 149,672 | ||||||
| Symantec Corp. |
9,611 | 220,957 | ||||||
|
|
|
|||||||
| Total Software |
|
23,776,326 | ||||||
| Specialty Retail – 2.1% |
| |||||||
| Abercrombie & Fitch Co. Class A |
5,414 | 148,398 | ||||||
| American Eagle Outfitters, Inc. |
8,829 | 195,739 | ||||||
| Barnes & Noble, Inc. |
10,005 | 54,327 | ||||||
| Best Buy Co., Inc. |
8,045 | 571,678 | ||||||
| Buckle, Inc. (The) |
4,966 | 92,964 | ||||||
| Camping World Holdings, Inc. Class A(a) |
5,219 | 72,596 | ||||||
| Chico’s FAS, Inc. |
16,751 | 71,527 | ||||||
| Children’s Place, Inc. (The) |
259 | 25,196 | ||||||
| Dick’s Sporting Goods, Inc. |
2,613 | 96,185 | ||||||
| Foot Locker, Inc. |
3,983 | 241,370 | ||||||
| Gap, Inc. (The) |
16,244 | 425,268 | ||||||
| Group 1 Automotive, Inc. |
1,959 | 126,747 | ||||||
| Guess?, Inc. |
4,798 | 94,041 | ||||||
| Home Depot, Inc. (The) |
30,562 | 5,864,542 | ||||||
| L Brands, Inc. |
26,012 | 717,411 | ||||||
| Lithia Motors, Inc. Class A |
1,323 | 122,708 | ||||||
| Lowe’s Cos., Inc. |
19,588 | 2,144,298 | ||||||
| Office Depot, Inc. |
24,790 | 89,988 | ||||||
| Penske Automotive Group, Inc. |
3,194 | 142,612 | ||||||
| Ross Stores, Inc. |
4,015 | 373,796 | ||||||
| Sonic Automotive, Inc. Class A |
6,093 | 90,237 | ||||||
| Tiffany & Co. |
3,247 | 342,721 | ||||||
| TJX Cos., Inc. (The) |
25,700 | 1,367,497 | ||||||
See Notes to Financial Statements.
| WisdomTree Trust | 93 |
Schedule of Investments (concluded)
WisdomTree U.S. Total Dividend Fund (DTD)
March 31, 2019
| Investments | Shares | Value | ||||||
| Tractor Supply Co. |
2,344 | $ | 229,149 | |||||
| Williams-Sonoma, Inc.(a) |
2,811 | 158,175 | ||||||
|
|
|
|||||||
| Total Specialty Retail |
|
13,859,170 | ||||||
| Technology Hardware, Storage & Peripherals – 3.3% |
| |||||||
| Apple, Inc. |
95,585 | 18,156,371 | ||||||
| Hewlett Packard Enterprise Co. |
56,205 | 867,243 | ||||||
| HP, Inc. |
57,046 | 1,108,404 | ||||||
| NetApp, Inc. |
7,853 | 544,527 | ||||||
| Western Digital Corp. |
11,549 | 555,045 | ||||||
| Xerox Corp. |
9,089 | 290,666 | ||||||
|
|
|
|||||||
| Total Technology Hardware, Storage & Peripherals |
|
21,522,256 | ||||||
| Textiles, Apparel & Luxury Goods – 0.6% |
| |||||||
| Carter’s, Inc. |
692 | 69,747 | ||||||
| Columbia Sportswear Co. |
1,634 | 170,230 | ||||||
| Hanesbrands, Inc. |
9,899 | 176,994 | ||||||
| NIKE, Inc. Class B |
20,288 | 1,708,452 | ||||||
| Ralph Lauren Corp. |
944 | 122,418 | ||||||
| Tapestry, Inc. |
7,187 | 233,506 | ||||||
| VF Corp. |
12,351 | 1,073,425 | ||||||
| Wolverine World Wide, Inc. |
1,501 | 53,631 | ||||||
|
|
|
|||||||
| Total Textiles, Apparel & Luxury Goods |
|
3,608,403 | ||||||
| Thrifts & Mortgage Finance – 0.3% |
| |||||||
| Capitol Federal Financial, Inc. |
7,145 | 95,386 | ||||||
| ESSA Bancorp, Inc. |
7,176 | 110,510 | ||||||
| Meta Financial Group, Inc. |
1,035 | 20,369 | ||||||
| New York Community Bancorp, Inc. |
64,534 | 746,658 | ||||||
| Northwest Bancshares, Inc. |
6,944 | 117,840 | ||||||
| Provident Financial Services, Inc. |
4,484 | 116,091 | ||||||
| Southern Missouri Bancorp, Inc. |
807 | 24,856 | ||||||
| Sterling Bancorp, Inc. |
10,132 | 102,739 | ||||||
| TFS Financial Corp. |
13,386 | 220,467 | ||||||
| Washington Federal, Inc. |
7,787 | 224,966 | ||||||
|
|
|
|||||||
| Total Thrifts & Mortgage Finance |
|
1,779,882 | ||||||
| Tobacco – 2.5% |
| |||||||
| Altria Group, Inc. |
128,970 | 7,406,747 | ||||||
| Philip Morris International, Inc. |
97,116 | 8,584,083 | ||||||
| Universal Corp. |
1,508 | 86,906 | ||||||
| Vector Group Ltd. |
32,319 | 348,722 | ||||||
|
|
|
|||||||
| Total Tobacco |
|
16,426,458 | ||||||
| Trading Companies & Distributors – 0.3% |
| |||||||
| Air Lease Corp. |
3,130 | 107,516 | ||||||
| Applied Industrial Technologies, Inc. |
824 | 49,003 | ||||||
| Fastenal Co. |
8,723 | 560,976 | ||||||
| GATX Corp. |
1,617 | 123,490 | ||||||
| H&E Equipment Services, Inc. |
4,314 | 108,325 | ||||||
| Kaman Corp. |
742 | 43,363 | ||||||
| MSC Industrial Direct Co., Inc. Class A |
1,201 | 99,335 | ||||||
| Rush Enterprises, Inc. Class A |
2,772 | 115,897 | ||||||
| W.W. Grainger, Inc. |
1,495 | 449,890 | ||||||
| Watsco, Inc. |
939 | 134,474 | ||||||
|
|
|
|||||||
| Total Trading Companies & Distributors |
|
1,792,269 | ||||||
| Transportation Infrastructure – 0.0% |
| |||||||
| Macquarie Infrastructure Corp. |
7,019 | 289,323 | ||||||
| Water Utilities – 0.1% |
| |||||||
| American Water Works Co., Inc. |
4,195 | 437,371 | ||||||
| Aqua America, Inc. |
6,589 | 240,103 | ||||||
| Middlesex Water Co. |
744 | 41,656 | ||||||
|
|
|
|||||||
| Total Water Utilities |
|
719,130 | ||||||
| Wireless Telecommunication Services – 0.0% |
| |||||||
| Shenandoah Telecommunications Co. |
911 | 40,412 | ||||||
| Telephone & Data Systems, Inc. |
4,233 | 130,080 | ||||||
|
|
|
|||||||
| Total Wireless Telecommunication Services | 170,492 | |||||||
| TOTAL COMMON STOCKS (Cost: $507,819,028) |
645,909,687 | |||||||
| EXCHANGE-TRADED FUND – 0.2% | ||||||||
| United States – 0.2% | ||||||||
| WisdomTree U.S. Total Market Fund(a)(b) (Cost: $1,289,374) |
41,966 | 1,355,082 | ||||||
| INVESTMENT OF CASH COLLATERAL FOR SECURITIES LOANED – 0.3% |
| |||||||
| United States – 0.3% |
| |||||||
| State Street Navigator Securities Lending Government Money Market Portfolio, 2.46%(c) |
||||||||
| (Cost: $1,829,310)(d) | 1,829,310 | 1,829,310 | ||||||
| TOTAL INVESTMENTS IN SECURITIES – 100.2% (Cost: $510,937,712) |
|
649,094,079 | ||||||
| Other Assets less Liabilities – (0.2)% |
(990,970 | ) | ||||||
|
|
|
|||||||
| NET ASSETS – 100.0% | $ | 648,103,109 | ||||||
| * | Non-income producing security. |
| (a) | Security, or portion thereof, was on loan at March 31, 2019 (See Note 2). |
| (b) | Affiliated company (See Note 3). |
| (c) | Rate shown represents annualized 7-day yield as of March 31, 2019. |
| (d) | At March 31, 2019, the total market value of the Fund’s securities on loan identified in the Schedule of Investments was $2,277,248 and the total market value of the collateral held by the Fund was $2,333,741. The total market value of the collateral includes non-cash U.S. Government securities collateral having a value of $504,431. |
See Notes to Financial Statements.
| 94 | WisdomTree Trust |
Schedule of Investments
WisdomTree U.S. Total Market Fund (EXT)
March 31, 2019
| Investments | Shares | Value | ||||||
| COMMON STOCKS – 99.7% | ||||||||
| United States – 99.7% | ||||||||
| Aerospace & Defense – 2.4% |
| |||||||
| Aerojet Rocketdyne Holdings, Inc.* |
493 | $ | 17,516 | |||||
| Aerovironment, Inc.* |
47 | 3,215 | ||||||
| Arconic, Inc. |
3,560 | 68,032 | ||||||
| Astronics Corp.* |
207 | 6,773 | ||||||
| Axon Enterprise, Inc.* |
70 | 3,809 | ||||||
| Boeing Co. (The) |
2,033 | 775,427 | ||||||
| BWX Technologies, Inc. |
113 | 5,603 | ||||||
| Cubic Corp. |
193 | 10,854 | ||||||
| Curtiss-Wright Corp. |
582 | 65,964 | ||||||
| General Dynamics Corp. |
1,105 | 187,054 | ||||||
| Harris Corp. |
357 | 57,016 | ||||||
| HEICO Corp. |
278 | 26,374 | ||||||
| Hexcel Corp. |
182 | 12,587 | ||||||
| Huntington Ingalls Industries, Inc. |
143 | 29,630 | ||||||
| L3 Technologies, Inc. |
565 | 116,599 | ||||||
| Lockheed Martin Corp. |
1,475 | 442,736 | ||||||
| Moog, Inc. Class A |
124 | 10,782 | ||||||
| Northrop Grumman Corp. |
649 | 174,970 | ||||||
| Raytheon Co. |
851 | 154,950 | ||||||
| Spirit AeroSystems Holdings, Inc. Class A |
222 | 20,320 | ||||||
| Teledyne Technologies, Inc.* |
96 | 22,753 | ||||||
| Textron, Inc. |
722 | 36,577 | ||||||
| TransDigm Group, Inc.* |
222 | 100,786 | ||||||
| United Technologies Corp. |
3,162 | 407,550 | ||||||
| Vectrus, Inc.* |
142 | 3,776 | ||||||
| Wesco Aircraft Holdings, Inc.* |
355 | 3,120 | ||||||
|
|
|
|||||||
| Total Aerospace & Defense |
|
2,764,773 | ||||||
| Air Freight & Logistics – 0.8% |
| |||||||
| Air Transport Services Group, Inc.* |
859 | 19,800 | ||||||
| Atlas Air Worldwide Holdings, Inc.* |
564 | 28,516 | ||||||
| C.H. Robinson Worldwide, Inc. |
328 | 28,533 | ||||||
| Echo Global Logistics, Inc.* |
146 | 3,618 | ||||||
| Expeditors International of Washington, Inc. |
888 | 67,399 | ||||||
| FedEx Corp. |
1,103 | 200,095 | ||||||
| Hub Group, Inc. Class A* |
363 | 14,828 | ||||||
| United Parcel Service, Inc. Class B |
4,413 | 493,109 | ||||||
|
|
|
|||||||
| Total Air Freight & Logistics |
|
855,898 | ||||||
| Airlines – 0.7% |
| |||||||
| Alaska Air Group, Inc. |
1,101 | 61,788 | ||||||
| American Airlines Group, Inc. |
3,968 | 126,024 | ||||||
| Delta Air Lines, Inc. |
5,505 | 284,333 | ||||||
| Hawaiian Holdings, Inc. |
677 | 17,771 | ||||||
| SkyWest, Inc. |
304 | 16,504 | ||||||
| Southwest Airlines Co. |
2,361 | 122,560 | ||||||
| Spirit Airlines, Inc.* |
427 | 22,571 | ||||||
| United Continental Holdings, Inc.* |
2,076 | 165,623 | ||||||
|
|
|
|||||||
| Total Airlines |
|
817,174 | ||||||
| Auto Components – 0.3% |
| |||||||
| BorgWarner, Inc. |
470 | 18,053 | ||||||
| Cooper Tire & Rubber Co. |
994 | 29,711 | ||||||
| Dana, Inc. |
763 | 13,536 | ||||||
| Dorman Products, Inc.* |
202 | 17,794 | ||||||
| Fox Factory Holding Corp.* |
187 | 13,069 | ||||||
| Gentex Corp. |
3,694 | 76,392 | ||||||
| Gentherm, Inc.* |
294 | 10,837 | ||||||
| Goodyear Tire & Rubber Co. (The) |
742 | 13,467 | ||||||
| LCI Industries |
19 | 1,460 | ||||||
| Lear Corp. |
392 | 53,198 | ||||||
| Motorcar Parts of America, Inc.* |
192 | 3,623 | ||||||
| Shiloh Industries, Inc.* |
459 | 2,524 | ||||||
| Standard Motor Products, Inc. |
269 | 13,208 | ||||||
| Stoneridge, Inc.* |
441 | 12,727 | ||||||
| Superior Industries International, Inc. |
875 | 4,165 | ||||||
|
|
|
|||||||
| Total Auto Components |
|
283,764 | ||||||
| Automobiles – 1.1% |
| |||||||
| Ford Motor Co. |
60,202 | 528,573 | ||||||
| General Motors Co. |
15,897 | 589,779 | ||||||
| Thor Industries, Inc. |
1,575 | 98,233 | ||||||
| Winnebago Industries, Inc. |
1,668 | 51,958 | ||||||
|
|
|
|||||||
| Total Automobiles |
|
1,268,543 | ||||||
| Banks – 9.7% |
| |||||||
| 1st Source Corp. |
70 | 3,144 | ||||||
| Allegiance Bancshares, Inc.* |
91 | 3,069 | ||||||
| American National Bankshares, Inc. |
91 | 3,178 | ||||||
| Arrow Financial Corp. |
92 | 3,026 | ||||||
| Associated Banc-Corp. |
413 | 8,818 | ||||||
| Banc of California, Inc. |
1,552 | 21,480 | ||||||
| Bancorp, Inc. (The)* |
370 | 2,990 | ||||||
| BancorpSouth Bank |
255 | 7,196 | ||||||
| Bank of America Corp. |
75,334 | 2,078,465 | ||||||
| Bank of Hawaii Corp. |
958 | 75,557 | ||||||
| Bank of Marin Bancorp |
77 | 3,133 | ||||||
| Bar Harbor Bankshares |
136 | 3,518 | ||||||
| BB&T Corp. |
3,552 | 165,275 | ||||||
| Boston Private Financial Holdings, Inc. |
609 | 6,675 | ||||||
| Bridge Bancorp, Inc. |
120 | 3,516 | ||||||
| Brookline Bancorp, Inc. |
710 | 10,224 | ||||||
| Bryn Mawr Bank Corp. |
84 | 3,035 | ||||||
| Cadence BanCorp |
4,677 | 86,758 | ||||||
| Capstar Financial Holdings, Inc. |
204 | 2,946 | ||||||
| CBTX, Inc. |
92 | 2,987 | ||||||
| Citigroup, Inc. |
22,822 | 1,419,985 | ||||||
| Citizens Financial Group, Inc. |
5,586 | 181,545 | ||||||
| City Holding Co. |
193 | 14,705 | ||||||
| CNB Financial Corp. |
129 | 3,260 | ||||||
| Columbia Banking System, Inc. |
1,722 | 56,292 | ||||||
| Comerica, Inc. |
1,970 | 144,440 | ||||||
| Commerce Bancshares, Inc. |
267 | 15,502 | ||||||
| Community Bank System, Inc. |
653 | 39,030 | ||||||
| Community Trust Bancorp, Inc. |
75 | 3,079 | ||||||
| ConnectOne Bancorp, Inc. |
990 | 19,503 | ||||||
| Cullen/Frost Bankers, Inc. |
905 | 87,848 | ||||||
| Customers Bancorp, Inc.* |
1,441 | 26,385 | ||||||
See Notes to Financial Statements.
| WisdomTree Trust | 95 |
Schedule of Investments (continued)
WisdomTree U.S. Total Market Fund (EXT)
March 31, 2019
| Investments | Shares | Value | ||||||
| CVB Financial Corp. |
215 | $ | 4,526 | |||||
| Eagle Bancorp, Inc.* |
816 | 40,963 | ||||||
| East West Bancorp, Inc. |
432 | 20,723 | ||||||
| Enterprise Bancorp, Inc. |
95 | 2,729 | ||||||
| Farmers National Banc Corp. |
256 | 3,530 | ||||||
| Fifth Third Bancorp |
3,892 | 98,156 | ||||||
| Financial Institutions, Inc. |
124 | 3,370 | ||||||
| First Bancorp |
139 | 4,832 | ||||||
| First Citizens BancShares, Inc. Class A |
209 | 85,105 | ||||||
| First Commonwealth Financial Corp. |
2,169 | 27,329 | ||||||
| First Community Bankshares, Inc. |
90 | 2,983 | ||||||
| First Financial Bancorp |
2,482 | 59,717 | ||||||
| First Financial Bankshares, Inc. |
279 | 16,121 | ||||||
| First Financial Corp. |
72 | 3,024 | ||||||
| First Internet Bancorp |
143 | 2,764 | ||||||
| First Interstate BancSystem, Inc. Class A |
711 | 28,312 | ||||||
| First Merchants Corp. |
146 | 5,380 | ||||||
| First Mid-Illinois Bancshares, Inc. |
90 | 2,999 | ||||||
| First Midwest Bancorp, Inc. |
3,041 | 62,219 | ||||||
| First of Long Island Corp. (The) |
153 | 3,355 | ||||||
| First Republic Bank |
1,253 | 125,876 | ||||||
| Franklin Financial Network, Inc. |
119 | 3,452 | ||||||
| Glacier Bancorp, Inc. |
362 | 14,505 | ||||||
| Great Southern Bancorp, Inc. |
57 | 2,958 | ||||||
| HarborOne Bancorp, Inc.* |
195 | 3,354 | ||||||
| HomeTrust Bancshares, Inc. |
127 | 3,200 | ||||||
| Huntington Bancshares, Inc. |
3,653 | 46,320 | ||||||
| Iberiabank Corp. |
1,062 | 76,156 | ||||||
| Independent Bank Group, Inc. |
961 | 49,290 | ||||||
| JPMorgan Chase & Co. |
21,526 | 2,179,077 | ||||||
| KeyCorp |
11,595 | 182,621 | ||||||
| Lakeland Financial Corp. |
124 | 5,607 | ||||||
| LCNB Corp. |
203 | 3,481 | ||||||
| LegacyTexas Financial Group, Inc. |
1,059 | 39,596 | ||||||
| Live Oak Bancshares, Inc. |
1,033 | 15,092 | ||||||
| M&T Bank Corp. |
465 | 73,014 | ||||||
| Mercantile Bank Corp. |
116 | 3,796 | ||||||
| Metropolitan Bank Holding Corp.* |
88 | 3,062 | ||||||
| Midland States Bancorp, Inc. |
459 | 11,044 | ||||||
| MidWestOne Financial Group, Inc. |
127 | 3,461 | ||||||
| NBT Bancorp, Inc. |
652 | 23,478 | ||||||
| Nicolet Bankshares, Inc.* |
64 | 3,814 | ||||||
| Northeast Bancorp |
182 | 3,764 | ||||||
| OFG Bancorp |
190 | 3,760 | ||||||
| Old Line Bancshares, Inc. |
118 | 2,942 | ||||||
| Old Second Bancorp, Inc. |
232 | 2,921 | ||||||
| Opus Bank |
830 | 16,434 | ||||||
| Origin Bancorp, Inc. |
187 | 6,367 | ||||||
| Orrstown Financial Services, Inc. |
154 | 2,863 | ||||||
| Peapack Gladstone Financial Corp. |
144 | 3,776 | ||||||
| People’s United Financial, Inc. |
5,456 | 89,697 | ||||||
| People’s Utah Bancorp |
113 | 2,980 | ||||||
| Peoples Bancorp, Inc. |
93 | 2,880 | ||||||
| PNC Financial Services Group, Inc. (The) |
2,457 | 301,376 | ||||||
| Popular, Inc. |
430 | 22,416 | ||||||
| Preferred Bank |
143 | 6,431 | ||||||
| Prosperity Bancshares, Inc. |
151 | 10,428 | ||||||
| QCR Holdings, Inc. |
89 | 3,019 | ||||||
| RBB Bancorp |
153 | 2,876 | ||||||
| Regions Financial Corp. |
4,329 | 61,255 | ||||||
| Renasant Corp. |
1,996 | 67,565 | ||||||
| Republic Bancorp, Inc. Class A |
194 | 8,676 | ||||||
| Republic First Bancorp, Inc.* |
476 | 2,499 | ||||||
| Sandy Spring Bancorp, Inc. |
722 | 22,584 | ||||||
| Seacoast Banking Corp. of Florida* |
760 | 20,026 | ||||||
| ServisFirst Bancshares, Inc. |
163 | 5,503 | ||||||
| Sierra Bancorp |
126 | 3,062 | ||||||
| Signature Bank |
70 | 8,965 | ||||||
| Simmons First National Corp. Class A |
2,414 | 59,095 | ||||||
| Southside Bancshares, Inc. |
391 | 12,993 | ||||||
| Sterling Bancorp |
4,488 | 83,611 | ||||||
| SunTrust Banks, Inc. |
3,024 | 179,172 | ||||||
| SVB Financial Group* |
83 | 18,456 | ||||||
| TCF Financial Corp. |
634 | 13,117 | ||||||
| Tompkins Financial Corp. |
59 | 4,488 | ||||||
| Towne Bank |
211 | 5,222 | ||||||
| TriCo Bancshares |
189 | 7,426 | ||||||
| Trustmark Corp. |
2,161 | 72,674 | ||||||
| U.S. Bancorp |
8,564 | 412,699 | ||||||
| UMB Financial Corp. |
123 | 7,877 | ||||||
| Union Bankshares Corp. |
97 | 3,136 | ||||||
| Valley National Bancorp |
7,340 | 70,317 | ||||||
| Veritex Holdings, Inc. |
677 | 16,397 | ||||||
| Washington Trust Bancorp, Inc. |
66 | 3,178 | ||||||
| Wells Fargo & Co. |
26,620 | 1,286,278 | ||||||
| Westamerica Bancorporation |
228 | 14,090 | ||||||
| Zions Bancorp NA |
2,660 | 120,791 | ||||||
|
|
|
|||||||
| Total Banks |
|
10,933,037 | ||||||
| Beverages – 1.4% |
| |||||||
| Boston Beer Co., Inc. (The) Class A* |
46 | 13,558 | ||||||
| Brown-Forman Corp. Class B |
1,043 | 55,050 | ||||||
| Coca-Cola Co. (The) |
10,695 | 501,168 | ||||||
| Coca-Cola Consolidated, Inc. |
12 | 3,454 | ||||||
| Constellation Brands, Inc. Class A |
1,401 | 245,637 | ||||||
| Molson Coors Brewing Co. Class B |
965 | 57,562 | ||||||
| Monster Beverage Corp.* |
1,042 | 56,872 | ||||||
| National Beverage Corp. |
181 | 10,449 | ||||||
| PepsiCo, Inc. |
4,869 | 596,696 | ||||||
|
|
|
|||||||
| Total Beverages |
|
1,540,446 | ||||||
| Biotechnology – 2.4% |
| |||||||
| AbbVie, Inc. |
6,271 | 505,380 | ||||||
| Amgen, Inc. |
3,479 | 660,940 | ||||||
| Anika Therapeutics, Inc.* |
96 | 2,903 | ||||||
| Biogen, Inc.* |
994 | 234,962 | ||||||
| Celgene Corp.* |
5,153 | 486,134 | ||||||
| Emergent BioSolutions, Inc.* |
187 | 9,447 | ||||||
| Enanta Pharmaceuticals, Inc.* |
59 | 5,636 | ||||||
See Notes to Financial Statements.
| 96 | WisdomTree Trust |
Schedule of Investments (continued)
WisdomTree U.S. Total Market Fund (EXT)
March 31, 2019
| Investments | Shares | Value | ||||||
| Exelixis, Inc.* |
1,712 | $ | 40,746 | |||||
| Gilead Sciences, Inc. |
7,222 | 469,502 | ||||||
| Halozyme Therapeutics, Inc.* |
777 | 12,510 | ||||||
| Ligand Pharmaceuticals, Inc.* |
146 | 18,354 | ||||||
| Neurocrine Biosciences, Inc.* |
56 | 4,934 | ||||||
| Regeneron Pharmaceuticals, Inc.* |
483 | 198,329 | ||||||
| United Therapeutics Corp.* |
42 | 4,929 | ||||||
| Vertex Pharmaceuticals, Inc.* |
125 | 22,994 | ||||||
|
|
|
|||||||
| Total Biotechnology |
|
2,677,700 | ||||||
| Building Products – 0.4% |
| |||||||
| A.O. Smith Corp. |
210 | 11,197 | ||||||
| AAON, Inc. |
68 | 3,140 | ||||||
| Advanced Drainage Systems, Inc. |
130 | 3,350 | ||||||
| American Woodmark Corp.* |
401 | 33,135 | ||||||
| Armstrong World Industries, Inc. |
484 | 38,439 | ||||||
| Builders FirstSource, Inc.* |
2,172 | 28,975 | ||||||
| Fortune Brands Home & Security, Inc. |
221 | 10,522 | ||||||
| Gibraltar Industries, Inc.* |
87 | 3,533 | ||||||
| Griffon Corp. |
841 | 15,542 | ||||||
| JELD-WEN Holding, Inc.* |
2,652 | 46,834 | ||||||
| Lennox International, Inc. |
229 | 60,548 | ||||||
| Masco Corp. |
966 | 37,973 | ||||||
| NCI Building Systems, Inc.* |
1,883 | 11,599 | ||||||
| Owens Corning |
1,982 | 93,392 | ||||||
| PGT Innovations, Inc.* |
194 | 2,687 | ||||||
| Quanex Building Products Corp. |
228 | 3,623 | ||||||
| Simpson Manufacturing Co., Inc. |
77 | 4,564 | ||||||
| Trex Co., Inc.* |
149 | 9,166 | ||||||
| Universal Forest Products, Inc. |
189 | 5,649 | ||||||
| USG Corp. |
719 | 31,133 | ||||||
|
|
|
|||||||
| Total Building Products |
|
455,001 | ||||||
| Capital Markets – 4.4% |
| |||||||
| Affiliated Managers Group, Inc. |
820 | 87,830 | ||||||
| Ameriprise Financial, Inc. |
1,821 | 233,270 | ||||||
| Artisan Partners Asset Management, Inc. Class A |
2,090 | 52,605 | ||||||
| Bank of New York Mellon Corp. (The) |
5,040 | 254,167 | ||||||
| BlackRock, Inc. |
991 | 423,524 | ||||||
| CBOE Global Markets, Inc. |
18 | 1,718 | ||||||
| Charles Schwab Corp. (The) |
6,744 | 288,373 | ||||||
| CME Group, Inc. |
846 | 139,235 | ||||||
| Cohen & Steers, Inc. |
1,163 | 49,160 | ||||||
| Cowen, Inc.* |
257 | 3,724 | ||||||
| Donnelley Financial Solutions, Inc.* |
808 | 12,023 | ||||||
| E*TRADE Financial Corp. |
672 | 31,201 | ||||||
| Evercore, Inc. Class A |
82 | 7,462 | ||||||
| FactSet Research Systems, Inc. |
144 | 35,751 | ||||||
| Federated Investors, Inc. Class B |
182 | 5,334 | ||||||
| Franklin Resources, Inc. |
2,410 | 79,867 | ||||||
| Goldman Sachs Group, Inc. (The) |
4,509 | 865,683 | ||||||
| Greenhill & Co., Inc. |
225 | 4,840 | ||||||
| Houlihan Lokey, Inc. |
510 | 23,383 | ||||||
| Interactive Brokers Group, Inc. Class A |
721 | 37,405 | ||||||
| Intercontinental Exchange, Inc. |
2,291 | 174,437 | ||||||
| INTL FCStone, Inc.* |
140 | 5,426 | ||||||
| KKR & Co., Inc. Class A |
8,133 | 191,044 | ||||||
| LPL Financial Holdings, Inc. |
883 | 61,501 | ||||||
| MarketAxess Holdings, Inc. |
66 | 16,241 | ||||||
| Moody’s Corp. |
530 | 95,978 | ||||||
| Morgan Stanley |
17,146 | 723,561 | ||||||
| Morningstar, Inc. |
146 | 18,395 | ||||||
| MSCI, Inc. |
290 | 57,664 | ||||||
| Nasdaq, Inc. |
848 | 74,192 | ||||||
| Northern Trust Corp. |
1,787 | 161,563 | ||||||
| Raymond James Financial, Inc. |
477 | 38,356 | ||||||
| S&P Global, Inc. |
635 | 133,699 | ||||||
| SEI Investments Co. |
342 | 17,870 | ||||||
| State Street Corp. |
3,852 | 253,500 | ||||||
| T. Rowe Price Group, Inc. |
965 | 96,616 | ||||||
| TD Ameritrade Holding Corp. |
1,473 | 73,635 | ||||||
| Victory Capital Holdings, Inc. Class A* |
535 | 8,036 | ||||||
| Virtu Financial, Inc. Class A |
770 | 18,288 | ||||||
| Virtus Investment Partners, Inc. |
279 | 27,216 | ||||||
| Waddell & Reed Financial, Inc. Class A |
2,452 | 42,395 | ||||||
| Westwood Holdings Group, Inc. |
81 | 2,857 | ||||||
|
|
|
|||||||
| Total Capital Markets |
|
4,929,025 | ||||||
| Chemicals – 1.4% |
| |||||||
| Air Products & Chemicals, Inc. |
1,103 | 210,629 | ||||||
| Albemarle Corp.(a) |
1,076 | 88,210 | ||||||
| Ashland Global Holdings, Inc. |
441 | 34,455 | ||||||
| Celanese Corp. |
547 | 53,940 | ||||||
| CF Industries Holdings, Inc. |
769 | 31,437 | ||||||
| Chemours Co. (The) |
3,552 | 131,992 | ||||||
| DowDuPont, Inc. |
892 | 47,552 | ||||||
| Eastman Chemical Co. |
543 | 41,203 | ||||||
| Ecolab, Inc. |
846 | 149,353 | ||||||
| Ferro Corp.* |
1,463 | 27,695 | ||||||
| FMC Corp. |
1,114 | 85,577 | ||||||
| FutureFuel Corp. |
201 | 2,693 | ||||||
| Huntsman Corp. |
3,637 | 81,796 | ||||||
| Ingevity Corp.* |
75 | 7,921 | ||||||
| Innophos Holdings, Inc. |
439 | 13,231 | ||||||
| International Flavors & Fragrances, Inc. |
425 | 54,736 | ||||||
| Koppers Holdings, Inc.* |
819 | 21,278 | ||||||
| Kraton Corp.* |
859 | 27,643 | ||||||
| Livent Corp.* |
1,042 | 12,796 | ||||||
| Minerals Technologies, Inc. |
691 | 40,624 | ||||||
| NewMarket Corp. |
50 | 21,678 | ||||||
| Olin Corp. |
2,431 | 56,253 | ||||||
| PPG Industries, Inc. |
480 | 54,178 | ||||||
| Quaker Chemical Corp. |
15 | 3,005 | ||||||
| RPM International, Inc. |
617 | 35,811 | ||||||
| Sensient Technologies Corp. |
505 | 34,234 | ||||||
| Sherwin-Williams Co. (The) |
186 | 80,112 | ||||||
| Stepan Co. |
80 | 7,002 | ||||||
| Valvoline, Inc. |
1,095 | 20,323 | ||||||
| W.R. Grace & Co. |
846 | 66,022 | ||||||
See Notes to Financial Statements.
| WisdomTree Trust | 97 |
Schedule of Investments (continued)
WisdomTree U.S. Total Market Fund (EXT)
March 31, 2019
| Investments | Shares | Value | ||||||
| Westlake Chemical Corp. |
1,261 | $ | 85,571 | |||||
|
|
|
|||||||
| Total Chemicals |
|
1,628,950 | ||||||
| Commercial Services & Supplies – 0.6% |
| |||||||
| ACCO Brands Corp. |
3,695 | 31,629 | ||||||
| Cintas Corp. |
371 | 74,983 | ||||||
| Clean Harbors, Inc.* |
58 | 4,149 | ||||||
| Copart, Inc.* |
846 | 51,259 | ||||||
| Covanta Holding Corp. |
185 | 3,202 | ||||||
| Ennis, Inc. |
120 | 2,491 | ||||||
| Herman Miller, Inc. |
1,238 | 43,553 | ||||||
| HNI Corp. |
444 | 16,113 | ||||||
| Interface, Inc. |
2,498 | 38,269 | ||||||
| KAR Auction Services, Inc. |
976 | 50,078 | ||||||
| Kimball International, Inc. Class B |
212 | 2,998 | ||||||
| LSC Communications, Inc. |
1,007 | 6,576 | ||||||
| McGrath RentCorp |
202 | 11,427 | ||||||
| MSA Safety, Inc. |
147 | 15,200 | ||||||
| Republic Services, Inc. |
1,249 | 100,395 | ||||||
| Rollins, Inc. |
430 | 17,897 | ||||||
| RR Donnelley & Sons Co. |
2,867 | 13,532 | ||||||
| Tetra Tech, Inc. |
129 | 7,687 | ||||||
| U.S. Ecology, Inc. |
52 | 2,911 | ||||||
| UniFirst Corp. |
152 | 23,332 | ||||||
| VSE Corp. |
95 | 3,000 | ||||||
| Waste Management, Inc. |
1,599 | 166,152 | ||||||
|
|
|
|||||||
| Total Commercial Services & Supplies |
|
686,833 | ||||||
| Communications Equipment – 1.3% |
| |||||||
| Arista Networks, Inc.* |
293 | 92,137 | ||||||
| CalAmp Corp.* |
353 | 4,441 | ||||||
| Casa Systems, Inc.* |
991 | 8,225 | ||||||
| Ciena Corp.* |
751 | 28,042 | ||||||
| Cisco Systems, Inc. |
19,108 | 1,031,641 | ||||||
| F5 Networks, Inc.* |
214 | 33,583 | ||||||
| InterDigital, Inc. |
63 | 4,157 | ||||||
| Juniper Networks, Inc. |
2,303 | 60,960 | ||||||
| Lumentum Holdings, Inc.* |
420 | 23,747 | ||||||
| Motorola Solutions, Inc. |
565 | 79,337 | ||||||
| NETGEAR, Inc.* |
56 | 1,855 | ||||||
| Ubiquiti Networks, Inc. |
338 | 50,602 | ||||||
|
|
|
|||||||
| Total Communications Equipment |
|
1,418,727 | ||||||
| Construction & Engineering – 0.3% |
| |||||||
| Comfort Systems USA, Inc. |
69 | 3,615 | ||||||
| EMCOR Group, Inc. |
774 | 56,564 | ||||||
| Fluor Corp. |
1,610 | 59,248 | ||||||
| Jacobs Engineering Group, Inc. |
707 | 53,159 | ||||||
| KBR, Inc. |
2,350 | 44,862 | ||||||
| MasTec, Inc.* |
271 | 13,035 | ||||||
| MYR Group, Inc.* |
117 | 4,052 | ||||||
| Tutor Perini Corp.* |
1,385 | 23,711 | ||||||
| Valmont Industries, Inc. |
392 | 50,999 | ||||||
|
|
|
|||||||
| Total Construction & Engineering |
|
309,245 | ||||||
| Construction Materials – 0.0% |
| |||||||
| Forterra, Inc.*(a) |
818 | 3,452 | ||||||
| Martin Marietta Materials, Inc. |
115 | 23,135 | ||||||
| US Concrete, Inc.* |
397 | 16,444 | ||||||
|
|
|
|||||||
| Total Construction Materials |
|
43,031 | ||||||
| Consumer Finance – 1.6% |
| |||||||
| Ally Financial, Inc. |
1,858 | 51,076 | ||||||
| American Express Co. |
4,839 | 528,903 | ||||||
| Capital One Financial Corp. |
5,837 | 476,825 | ||||||
| Credit Acceptance Corp.* |
71 | 32,087 | ||||||
| Curo Group Holdings Corp.* |
391 | 3,922 | ||||||
| Discover Financial Services |
2,208 | 157,121 | ||||||
| Elevate Credit, Inc.* |
1,129 | 4,900 | ||||||
| Encore Capital Group, Inc.*(a) |
1,127 | 30,688 | ||||||
| Enova International, Inc.* |
419 | 9,562 | ||||||
| EZCORP, Inc. Class A* |
540 | 5,033 | ||||||
| FirstCash, Inc. |
24 | 2,076 | ||||||
| Green Dot Corp. Class A* |
127 | 7,703 | ||||||
| Nelnet, Inc. Class A |
703 | 38,714 | ||||||
| OneMain Holdings, Inc. |
414 | 13,144 | ||||||
| PRA Group, Inc.* |
764 | 20,483 | ||||||
| Santander Consumer USA Holdings, Inc. |
5,232 | 110,552 | ||||||
| Synchrony Financial |
9,503 | 303,146 | ||||||
| World Acceptance Corp.* |
88 | 10,307 | ||||||
|
|
|
|||||||
| Total Consumer Finance |
|
1,806,242 | ||||||
| Containers & Packaging – 0.5% |
| |||||||
| AptarGroup, Inc. |
160 | 17,022 | ||||||
| Avery Dennison Corp. |
784 | 88,592 | ||||||
| Ball Corp. |
1,203 | 69,606 | ||||||
| Bemis Co., Inc. |
998 | 55,369 | ||||||
| Berry Global Group, Inc.* |
263 | 14,168 | ||||||
| Crown Holdings, Inc.* |
561 | 30,614 | ||||||
| International Paper Co. |
1,441 | 66,675 | ||||||
| Owens-Illinois, Inc. |
2,369 | 44,964 | ||||||
| Sealed Air Corp. |
1,806 | 83,184 | ||||||
| Silgan Holdings, Inc. |
269 | 7,970 | ||||||
| Sonoco Products Co. |
1,022 | 62,884 | ||||||
| WestRock Co. |
501 | 19,213 | ||||||
|
|
|
|||||||
| Total Containers & Packaging |
|
560,261 | ||||||
| Distributors – 0.1% |
| |||||||
| Genuine Parts Co. |
1,113 | 124,689 | ||||||
| Pool Corp. |
76 | 12,538 | ||||||
| Weyco Group, Inc. |
95 | 2,941 | ||||||
|
|
|
|||||||
| Total Distributors |
|
140,168 | ||||||
| Diversified Consumer Services – 0.2% |
| |||||||
| Adtalem Global Education, Inc.* |
355 | $ | 16,444 | |||||
| Bridgepoint Education, Inc.* |
401 | 2,450 | ||||||
| Bright Horizons Family Solutions, Inc.* |
88 | 11,186 | ||||||
| Career Education Corp.* |
253 | 4,179 | ||||||
| Collectors Universe, Inc. |
274 | 4,800 | ||||||
| Graham Holdings Co. Class B |
54 | 36,892 | ||||||
| Grand Canyon Education, Inc.* |
121 | 13,856 | ||||||
See Notes to Financial Statements.
| 98 | WisdomTree Trust |
Schedule of Investments (continued)
WisdomTree U.S. Total Market Fund (EXT)
March 31, 2019
| Investments | Shares | Value | ||||||
| H&R Block, Inc. |
2,874 | $ | 68,803 | |||||
| Laureate Education, Inc. Class A* |
1,877 | 28,099 | ||||||
| Service Corp. International |
701 | 28,145 | ||||||
| ServiceMaster Global Holdings, Inc.* |
338 | 15,785 | ||||||
| Weight Watchers International, Inc.* |
459 | 9,249 | ||||||
|
|
|
|||||||
| Total Diversified Consumer Services |
|
239,888 | ||||||
| Diversified Financial Services – 2.3% |
| |||||||
| Berkshire Hathaway, Inc. Class B* |
12,746 | 2,560,544 | ||||||
| Voya Financial, Inc. |
1,833 | 91,577 | ||||||
|
|
|
|||||||
| Total Diversified Financial Services |
|
2,652,121 | ||||||
| Diversified Telecommunication Services – 2.1% |
| |||||||
| AT&T, Inc. |
32,946 | 1,033,186 | ||||||
| ATN International, Inc. |
46 | 2,594 | ||||||
| Cogent Communications Holdings, Inc. |
266 | 14,430 | ||||||
| Globalstar, Inc.*(a) |
25,158 | 10,818 | ||||||
| IDT Corp. Class B* |
437 | 2,902 | ||||||
| Verizon Communications, Inc. |
21,176 | 1,252,137 | ||||||
| Vonage Holdings Corp.* |
342 | 3,434 | ||||||
|
|
|
|||||||
| Total Diversified Telecommunication Services |
|
2,319,501 | ||||||
| Electric Utilities – 1.8% |
| |||||||
| ALLETE, Inc. |
210 | 17,268 | ||||||
| Alliant Energy Corp. |
897 | 42,276 | ||||||
| American Electric Power Co., Inc. |
2,152 | 180,230 | ||||||
| Avangrid, Inc. |
372 | 18,730 | ||||||
| Duke Energy Corp. |
2,930 | 263,700 | ||||||
| Edison International |
1,810 | 112,075 | ||||||
| Entergy Corp. |
253 | 24,194 | ||||||
| Evergy, Inc. |
640 | 37,152 | ||||||
| Eversource Energy |
1,563 | 110,895 | ||||||
| Exelon Corp. |
4,530 | 227,089 | ||||||
| Hawaiian Electric Industries, Inc. |
369 | 15,044 | ||||||
| IDACORP, Inc. |
126 | 12,542 | ||||||
| NextEra Energy, Inc. |
2,288 | 442,316 | ||||||
| OGE Energy Corp. |
1,176 | 50,709 | ||||||
| Otter Tail Corp. |
293 | 14,597 | ||||||
| Pinnacle West Capital Corp. |
618 | 59,069 | ||||||
| PNM Resources, Inc. |
275 | 13,019 | ||||||
| Portland General Electric Co. |
439 | 22,758 | ||||||
| PPL Corp. |
4,226 | 134,133 | ||||||
| Southern Co. (The) |
2,347 | 121,293 | ||||||
| Xcel Energy, Inc. |
2,162 | 121,526 | ||||||
|
|
|
|||||||
| Total Electric Utilities |
|
2,040,615 | ||||||
| Electrical Equipment – 0.4% |
| |||||||
| AMETEK, Inc. |
1,234 | 102,385 | ||||||
| Atkore International Group, Inc.* |
992 | 21,358 | ||||||
| AZZ, Inc. |
134 | 5,485 | ||||||
| Emerson Electric Co. |
1,610 | 110,237 | ||||||
| Encore Wire Corp. |
66 | 3,777 | ||||||
| EnerSys |
221 | 14,400 | ||||||
| Generac Holdings, Inc.* |
561 | 28,740 | ||||||
| GrafTech International Ltd. |
5,512 | 70,498 | ||||||
| Hubbell, Inc. |
90 | 10,618 | ||||||
| LSI Industries, Inc. |
778 | 2,046 | ||||||
| Preformed Line Products Co. |
57 | 3,026 | ||||||
| Regal Beloit Corp. |
583 | 47,730 | ||||||
| Rockwell Automation, Inc. |
287 | 50,357 | ||||||
| Sunrun, Inc.* |
598 | 8,408 | ||||||
|
|
|
|||||||
| Total Electrical Equipment |
|
479,065 | ||||||
| Electronic Equipment, Instruments & Components – 0.8% |
| |||||||
| Amphenol Corp. Class A |
882 | 83,296 | ||||||
| Arlo Technologies, Inc.* |
111 | 458 | ||||||
| Arrow Electronics, Inc.* |
1,410 | 108,655 | ||||||
| AVX Corp. |
1,804 | 31,281 | ||||||
| Belden, Inc. |
880 | 47,256 | ||||||
| CDW Corp. |
712 | 68,616 | ||||||
| Cognex Corp. |
255 | 12,969 | ||||||
| Coherent, Inc.* |
42 | 5,952 | ||||||
| Control4 Corp.* |
164 | 2,777 | ||||||
| Corning, Inc. |
4,441 | 146,997 | ||||||
| CTS Corp. |
121 | 3,554 | ||||||
| Dolby Laboratories, Inc. Class A |
442 | 27,833 | ||||||
| FLIR Systems, Inc. |
273 | 12,989 | ||||||
| II-VI, Inc.* |
116 | 4,320 | ||||||
| Insight Enterprises, Inc.* |
581 | 31,990 | ||||||
| IPG Photonics Corp.* |
112 | 16,999 | ||||||
| KEMET Corp. |
1,235 | 20,958 | ||||||
| Keysight Technologies, Inc.* |
477 | 41,594 | ||||||
| Knowles Corp.* |
839 | 14,792 | ||||||
| MTS Systems Corp. |
69 | 3,758 | ||||||
| National Instruments Corp. |
226 | 10,025 | ||||||
| nLight, Inc.* |
187 | 4,166 | ||||||
| Plexus Corp.* |
120 | 7,314 | ||||||
| Rogers Corp.* |
187 | 29,711 | ||||||
| Sanmina Corp.* |
321 | 9,261 | ||||||
| SYNNEX Corp. |
1 | 95 | ||||||
| Tech Data Corp.* |
485 | 49,669 | ||||||
| Trimble, Inc.* |
224 | 9,050 | ||||||
| TTM Technologies, Inc.* |
3,068 | 35,988 | ||||||
| Zebra Technologies Corp. Class A* |
193 | 40,439 | ||||||
|
|
|
|||||||
| Total Electronic Equipment, Instruments & Components |
|
882,762 | ||||||
| Energy Equipment & Services – 0.3% |
| |||||||
| C&J Energy Services, Inc.* |
987 | 15,318 | ||||||
| Cactus, Inc. Class A* |
151 | 5,376 | ||||||
| Covia Holdings Corp.*(a) |
2,790 | 15,596 | ||||||
| Forum Energy Technologies, Inc.* |
2,027 | 10,358 | ||||||
| FTS International, Inc.* |
3,815 | 38,150 | ||||||
| Halliburton Co. |
3,041 | 89,101 | ||||||
| Helmerich & Payne, Inc. |
57 | 3,167 | ||||||
| Keane Group, Inc.* |
716 | 7,797 | ||||||
| Liberty Oilfield Services, Inc. Class A(a) |
972 | 14,959 | ||||||
| Mammoth Energy Services, Inc. |
293 | 4,878 | ||||||
| NCS Multistage Holdings, Inc.* |
545 | 2,823 | ||||||
| ProPetro Holding Corp.* |
411 | 9,264 | ||||||
| RPC, Inc. |
1,943 | 22,170 | ||||||
| SEACOR Holdings, Inc.* |
132 | 5,581 | ||||||
See Notes to Financial Statements.
| WisdomTree Trust | 99 |
Schedule of Investments (continued)
WisdomTree U.S. Total Market Fund (EXT)
March 31, 2019
| Investments | Shares | Value | ||||||
| Select Energy Services, Inc. Class A* |
1,123 | $ | 13,499 | |||||
| Smart Sand, Inc.*(a) |
4,082 | 18,165 | ||||||
| U.S. Silica Holdings, Inc. |
1,997 | 34,668 | ||||||
|
|
|
|||||||
| Total Energy Equipment & Services |
|
310,870 | ||||||
| Entertainment – 1.2% |
| |||||||
| Activision Blizzard, Inc. |
1,172 | 53,361 | ||||||
| Cinemark Holdings, Inc. |
975 | 38,990 | ||||||
| Electronic Arts, Inc.* |
768 | 78,052 | ||||||
| Madison Square Garden Co. (The) Class A* |
14 | 4,104 | ||||||
| Netflix, Inc.* |
350 | 124,796 | ||||||
| Viacom, Inc. Class B |
2,972 | 83,424 | ||||||
| Walt Disney Co. (The) |
8,241 | 914,998 | ||||||
| World Wrestling Entertainment, Inc. Class A |
94 | 8,157 | ||||||
| Zynga, Inc. Class A* |
3,778 | 20,137 | ||||||
|
|
|
|||||||
| Total Entertainment |
|
1,326,019 | ||||||
| Equity Real Estate Investment Trusts (REITs) – 2.0% |
| |||||||
| Alexander & Baldwin, Inc. |
538 | 13,687 | ||||||
| Alexandria Real Estate Equities, Inc. |
115 | 16,394 | ||||||
| American Tower Corp. |
770 | 151,736 | ||||||
| Americold Realty Trust |
120 | 3,661 | ||||||
| Apartment Investment & Management Co. Class A |
482 | 24,240 | ||||||
| AvalonBay Communities, Inc. |
483 | 96,953 | ||||||
| Boston Properties, Inc. |
161 | 21,555 | ||||||
| Brandywine Realty Trust |
224 | 3,553 | ||||||
| Brixmor Property Group, Inc. |
1,946 | 35,748 | ||||||
| Camden Property Trust |
124 | 12,586 | ||||||
| CoreCivic, Inc. |
1,037 | 20,170 | ||||||
| Corporate Office Properties Trust |
139 | 3,795 | ||||||
| Crown Castle International Corp. |
432 | 55,296 | ||||||
| CubeSmart |
554 | 17,750 | ||||||
| DiamondRock Hospitality Co. |
1,526 | 16,527 | ||||||
| Digital Realty Trust, Inc. |
194 | 23,086 | ||||||
| Douglas Emmett, Inc. |
97 | 3,921 | ||||||
| Duke Realty Corp. |
1,050 | 32,109 | ||||||
| EastGroup Properties, Inc. |
64 | 7,145 | ||||||
| Empire State Realty Trust, Inc. Class A |
204 | 3,223 | ||||||
| EPR Properties |
357 | 27,453 | ||||||
| Equity LifeStyle Properties, Inc. |
214 | 24,460 | ||||||
| Equity Residential |
1,162 | 87,522 | ||||||
| Essex Property Trust, Inc. |
204 | 59,005 | ||||||
| Extra Space Storage, Inc. |
403 | 41,070 | ||||||
| First Industrial Realty Trust, Inc. |
231 | 8,168 | ||||||
| Gaming and Leisure Properties, Inc. |
1,122 | 43,275 | ||||||
| GEO Group, Inc. (The) |
820 | 15,744 | ||||||
| HCP, Inc. |
1,739 | 54,431 | ||||||
| Healthcare Realty Trust, Inc. |
224 | 7,193 | ||||||
| Healthcare Trust of America, Inc. Class A |
119 | 3,402 | ||||||
| Hospitality Properties Trust |
134 | 3,525 | ||||||
| Host Hotels & Resorts, Inc. |
4,421 | 83,557 | ||||||
| Hudson Pacific Properties, Inc. |
97 | 3,339 | ||||||
| Industrial Logistics Properties Trust |
98 | 1,977 | ||||||
| Kilroy Realty Corp. |
25 | 1,899 | ||||||
| Kimco Realty Corp. |
2,413 | 44,640 | ||||||
| Lamar Advertising Co. Class A |
82 | 6,499 | ||||||
| Lexington Realty Trust |
1,543 | 13,980 | ||||||
| Liberty Property Trust |
785 | 38,010 | ||||||
| Life Storage, Inc. |
134 | 13,034 | ||||||
| Medical Properties Trust, Inc. |
2,027 | 37,520 | ||||||
| Mid-America Apartment Communities, Inc. |
255 | 27,879 | ||||||
| National Health Investors, Inc. |
197 | 15,474 | ||||||
| National Retail Properties, Inc. |
488 | 27,030 | ||||||
| Omega Healthcare Investors, Inc. |
840 | 32,046 | ||||||
| Pebblebrook Hotel Trust |
259 | 8,044 | ||||||
| Prologis, Inc. |
1,740 | 125,193 | ||||||
| Public Storage |
558 | 121,521 | ||||||
| Realty Income Corp. |
571 | 42,003 | ||||||
| Regency Centers Corp. |
26 | 1,755 | ||||||
| RPT Realty |
210 | 2,522 | ||||||
| Ryman Hospitality Properties, Inc. |
150 | 12,336 | ||||||
| Sabra Health Care REIT, Inc. |
1,514 | 29,478 | ||||||
| SBA Communications Corp.* |
68 | 13,577 | ||||||
| Senior Housing Properties Trust |
3,725 | 43,880 | ||||||
| Simon Property Group, Inc. |
1,051 | 191,503 | ||||||
| STORE Capital Corp. |
637 | 21,339 | ||||||
| Terreno Realty Corp. |
129 | 5,423 | ||||||
| Tier REIT, Inc. |
547 | 15,677 | ||||||
| UDR, Inc. |
822 | 37,368 | ||||||
| Urstadt Biddle Properties, Inc. Class A |
61 | 1,259 | ||||||
| Ventas, Inc. |
1,049 | 66,937 | ||||||
| VICI Properties, Inc. |
1,316 | 28,794 | ||||||
| Vornado Realty Trust |
55 | 3,709 | ||||||
| W.P. Carey, Inc. |
396 | 31,019 | ||||||
| Weingarten Realty Investors |
88 | 2,584 | ||||||
| Welltower, Inc. |
1,188 | 92,189 | ||||||
| Weyerhaeuser Co. |
4,552 | 119,900 | ||||||
|
|
|
|||||||
| Total Equity Real Estate Investment Trusts (REITs) |
|
2,303,277 | ||||||
| Food & Staples Retailing – 1.2% |
| |||||||
| Andersons, Inc. (The) |
96 | 3,094 | ||||||
| BJ’s Wholesale Club Holdings, Inc.* |
1,137 | 31,154 | ||||||
| Casey’s General Stores, Inc. |
133 | 17,126 | ||||||
| Costco Wholesale Corp. |
949 | 229,791 | ||||||
| Kroger Co. (The) |
7,789 | 191,609 | ||||||
| Performance Food Group Co.* |
491 | 19,463 | ||||||
| Smart & Final Stores, Inc.* |
556 | 2,747 | ||||||
| Sprouts Farmers Market, Inc.* |
768 | 16,543 | ||||||
| Sysco Corp. |
1,397 | 93,264 | ||||||
| U.S. Foods Holding Corp.* |
1,236 | 43,149 | ||||||
| Walgreens Boots Alliance, Inc. |
4,697 | 297,179 | ||||||
| Walmart, Inc. |
4,313 | 420,647 | ||||||
| Weis Markets, Inc. |
200 | 8,162 | ||||||
|
|
|
|||||||
| Total Food & Staples Retailing |
|
1,373,928 | ||||||
| Food Products – 1.4% |
| |||||||
| Archer-Daniels-Midland Co. |
2,762 | 119,125 | ||||||
| B&G Foods, Inc. |
625 | 15,263 | ||||||
| Cal-Maine Foods, Inc. |
192 | 8,569 | ||||||
| Campbell Soup Co. |
475 | 18,112 | ||||||
See Notes to Financial Statements.
| 100 | WisdomTree Trust |
Schedule of Investments (continued)
WisdomTree U.S. Total Market Fund (EXT)
March 31, 2019
| Investments | Shares | Value | ||||||
| Conagra Brands, Inc. |
909 | $ | 25,216 | |||||
| Darling Ingredients, Inc.* |
495 | 10,717 | ||||||
| Flowers Foods, Inc. |
1,312 | 27,972 | ||||||
| General Mills, Inc. |
1,788 | 92,529 | ||||||
| Hershey Co. (The) |
906 | 104,036 | ||||||
| Hormel Foods Corp. |
2,020 | 90,415 | ||||||
| Hostess Brands, Inc.* |
881 | 11,013 | ||||||
| Ingredion, Inc. |
641 | 60,696 | ||||||
| J&J Snack Foods Corp. |
73 | 11,595 | ||||||
| J.M. Smucker Co. (The) |
265 | 30,872 | ||||||
| Kellogg Co. |
2,688 | 154,237 | ||||||
| Kraft Heinz Co. (The) |
6,640 | 216,796 | ||||||
| Lamb Weston Holdings, Inc. |
416 | 31,175 | ||||||
| Lancaster Colony Corp. |
13 | 2,037 | ||||||
| Mondelez International, Inc. Class A |
6,456 | 322,284 | ||||||
| Pilgrim’s Pride Corp.* |
226 | 5,038 | ||||||
| Post Holdings, Inc.* |
122 | 13,347 | ||||||
| Sanderson Farms, Inc. |
16 | 2,109 | ||||||
| Seaboard Corp. |
5 | 21,423 | ||||||
| Tootsie Roll Industries, Inc. |
270 | 10,057 | ||||||
| Tyson Foods, Inc. Class A |
1,866 | 129,556 | ||||||
|
|
|
|||||||
| Total Food Products |
|
1,534,189 | ||||||
| Gas Utilities – 0.2% |
| |||||||
| Atmos Energy Corp. |
367 | 37,775 | ||||||
| Chesapeake Utilities Corp. |
13 | 1,186 | ||||||
| National Fuel Gas Co. |
560 | 34,138 | ||||||
| New Jersey Resources Corp. |
228 | 11,352 | ||||||
| ONE Gas, Inc. |
219 | 19,497 | ||||||
| Southwest Gas Holdings, Inc. |
230 | 18,920 | ||||||
| UGI Corp. |
969 | 53,702 | ||||||
|
|
|
|||||||
| Total Gas Utilities |
|
176,570 | ||||||
| Health Care Equipment & Supplies – 1.3% |
| |||||||
| Abbott Laboratories |
2,643 | 211,281 | ||||||
| ABIOMED, Inc.* |
27 | 7,711 | ||||||
| Align Technology, Inc.* |
69 | 19,619 | ||||||
| Baxter International, Inc. |
1,107 | 90,010 | ||||||
| Becton, Dickinson and Co. |
467 | 116,624 | ||||||
| Boston Scientific Corp.* |
2,844 | 109,153 | ||||||
| Cantel Medical Corp. |
194 | 12,976 | ||||||
| Cooper Cos., Inc. (The) |
117 | 34,652 | ||||||
| Danaher Corp. |
1,893 | 249,914 | ||||||
| Edwards Lifesciences Corp.* |
627 | 119,964 | ||||||
| Globus Medical, Inc. Class A* |
200 | 9,882 | ||||||
| Haemonetics Corp.* |
89 | 7,786 | ||||||
| Hill-Rom Holdings, Inc. |
235 | 24,877 | ||||||
| ICU Medical, Inc.* |
16 | 3,829 | ||||||
| IDEXX Laboratories, Inc.* |
90 | 20,124 | ||||||
| Inogen, Inc.* |
19 | 1,812 | ||||||
| Intuitive Surgical, Inc.* |
152 | 86,728 | ||||||
| Masimo Corp.* |
82 | 11,339 | ||||||
| Neogen Corp.* |
83 | 4,763 | ||||||
| ResMed, Inc. |
393 | 40,860 | ||||||
| Stryker Corp. |
792 | 156,436 | ||||||
| Teleflex, Inc. |
67 | 20,245 | ||||||
| Varex Imaging Corp.* |
286 | 9,690 | ||||||
| Varian Medical Systems, Inc.* |
290 | 41,099 | ||||||
| West Pharmaceutical Services, Inc. |
191 | 21,048 | ||||||
| Zimmer Biomet Holdings, Inc. |
364 | 46,483 | ||||||
|
|
|
|||||||
| Total Health Care Equipment & Supplies |
|
1,478,905 | ||||||
| Health Care Providers & Services – 2.3% |
| |||||||
| Amedisys, Inc.* |
112 | 13,805 | ||||||
| AmerisourceBergen Corp. |
680 | 54,074 | ||||||
| AMN Healthcare Services, Inc.* |
223 | 10,501 | ||||||
| Anthem, Inc. |
964 | 276,649 | ||||||
| Cardinal Health, Inc. |
462 | 22,245 | ||||||
| Centene Corp.* |
1,106 | 58,728 | ||||||
| Cigna Corp. |
1,510 | 242,838 | ||||||
| Covetrus, Inc.* |
222 | 7,071 | ||||||
| CVS Health Corp. |
5,342 | 288,094 | ||||||
| Encompass Health Corp. |
359 | 20,966 | ||||||
| Ensign Group, Inc. (The) |
399 | 20,425 | ||||||
| HCA Healthcare, Inc. |
1,933 | 252,024 | ||||||
| Henry Schein, Inc.* |
561 | 33,722 | ||||||
| Humana, Inc. |
475 | 126,350 | ||||||
| Laboratory Corp. of America Holdings* |
280 | 42,834 | ||||||
| Magellan Health, Inc.* |
301 | 19,842 | ||||||
| McKesson Corp. |
744 | 87,093 | ||||||
| Molina Healthcare, Inc.* |
185 | 26,263 | ||||||
| Quest Diagnostics, Inc. |
399 | 35,878 | ||||||
| Select Medical Holdings Corp.* |
1,041 | 14,668 | ||||||
| Tenet Healthcare Corp.* |
670 | 19,323 | ||||||
| UnitedHealth Group, Inc. |
3,079 | 761,313 | ||||||
| Universal Health Services, Inc. Class B |
686 | 91,766 | ||||||
| WellCare Health Plans, Inc.* |
128 | 34,528 | ||||||
|
|
|
|||||||
| Total Health Care Providers & Services |
|
2,561,000 | ||||||
| Health Care Technology – 0.0% |
| |||||||
| Allscripts Healthcare Solutions, Inc.* |
1,475 | 14,071 | ||||||
| Cerner Corp.* |
70 | 4,005 | ||||||
| Medidata Solutions, Inc.* |
140 | 10,254 | ||||||
| NextGen Healthcare, Inc.* |
191 | 3,215 | ||||||
| Veeva Systems, Inc. Class A* |
125 | 15,857 | ||||||
|
|
|
|||||||
| Total Health Care Technology |
|
47,402 | ||||||
| Hotels, Restaurants & Leisure – 1.9% |
| |||||||
| Aramark |
222 | 6,560 | ||||||
| BBX Capital Corp. |
1,752 | 10,372 | ||||||
| BJ’s Restaurants, Inc. |
185 | 8,747 | ||||||
| Bloomin’ Brands, Inc. |
298 | 6,094 | ||||||
| Bluegreen Vacations Corp.(a) |
1,205 | 17,906 | ||||||
| Brinker International, Inc. |
341 | 15,134 | ||||||
| Caesars Entertainment Corp.*(a) |
3,907 | 33,952 | ||||||
| Choice Hotels International, Inc. |
405 | 31,485 | ||||||
| Churchill Downs, Inc. |
258 | 23,287 | ||||||
| Cracker Barrel Old Country Store, Inc. |
145 | 23,433 | ||||||
| Darden Restaurants, Inc. |
366 | 44,458 | ||||||
| Domino’s Pizza, Inc. |
75 | 19,357 | ||||||
| Dunkin’ Brands Group, Inc. |
217 | 16,297 | ||||||
See Notes to Financial Statements.
| WisdomTree Trust | 101 |
Schedule of Investments (continued)
WisdomTree U.S. Total Market Fund (EXT)
March 31, 2019
| Investments | Shares | Value | ||||||
| Eldorado Resorts, Inc.* |
259 | $ | 12,093 | |||||
| Hilton Grand Vacations, Inc.* |
1 | 31 | ||||||
| Hilton Worldwide Holdings, Inc. |
1,476 | 122,670 | ||||||
| Hyatt Hotels Corp. Class A |
187 | 13,571 | ||||||
| International Speedway Corp. Class A |
343 | 14,965 | ||||||
| Jack in the Box, Inc. |
86 | 6,971 | ||||||
| Las Vegas Sands Corp. |
2,574 | 156,911 | ||||||
| Marriott International, Inc. Class A |
2,033 | 254,308 | ||||||
| McDonald’s Corp. |
2,718 | 516,148 | ||||||
| Monarch Casino & Resort, Inc.* |
78 | 3,426 | ||||||
| Planet Fitness, Inc. Class A* |
512 | 35,185 | ||||||
| Red Robin Gourmet Burgers, Inc.* |
96 | 2,766 | ||||||
| Red Rock Resorts, Inc. Class A |
1,522 | 39,344 | ||||||
| SeaWorld Entertainment, Inc.* |
116 | 2,988 | ||||||
| Shake Shack, Inc. Class A* |
211 | 12,481 | ||||||
| Six Flags Entertainment Corp. |
698 | 34,446 | ||||||
| Speedway Motorsports, Inc. |
226 | 3,270 | ||||||
| Starbucks Corp. |
4,820 | 358,319 | ||||||
| Texas Roadhouse, Inc. |
208 | 12,935 | ||||||
| Vail Resorts, Inc. |
68 | 14,776 | ||||||
| Wendy’s Co. (The) |
2,490 | 44,546 | ||||||
| Wyndham Destinations, Inc. |
352 | 14,252 | ||||||
| Wyndham Hotels & Resorts, Inc. |
324 | 16,197 | ||||||
| Yum! Brands, Inc. |
1,862 | 185,846 | ||||||
|
|
|
|||||||
| Total Hotels, Restaurants & Leisure |
|
2,135,527 | ||||||
| Household Durables – 0.6% |
| |||||||
| Bassett Furniture Industries, Inc. |
155 | 2,544 | ||||||
| Beazer Homes USA, Inc.* |
1,982 | 22,813 | ||||||
| Cavco Industries, Inc.* |
18 | 2,116 | ||||||
| D.R. Horton, Inc. |
4,785 | 198,003 | ||||||
| Ethan Allen Interiors, Inc. |
1,065 | 20,373 | ||||||
| Flexsteel Industries, Inc. |
406 | 9,415 | ||||||
| Green Brick Partners, Inc.* |
400 | 3,500 | ||||||
| Hamilton Beach Brands Holding Co. Class A |
142 | 3,047 | ||||||
| La-Z-Boy, Inc. |
1,241 | 40,941 | ||||||
| Lennar Corp. Class A |
1,134 | 55,668 | ||||||
| M/I Homes, Inc.* |
1,261 | 33,568 | ||||||
| MDC Holdings, Inc. |
439 | 12,757 | ||||||
| Meritage Homes Corp.* |
79 | 3,532 | ||||||
| Mohawk Industries, Inc.* |
427 | 53,866 | ||||||
| New Home Co., Inc. (The)* |
504 | 2,399 | ||||||
| NVR, Inc.* |
12 | 33,204 | ||||||
| PulteGroup, Inc. |
994 | 27,792 | ||||||
| Taylor Morrison Home Corp. Class A* |
119 | 2,112 | ||||||
| Toll Brothers, Inc. |
252 | 9,122 | ||||||
| TopBuild Corp.* |
556 | 36,040 | ||||||
| TRI Pointe Group, Inc.* |
980 | 12,387 | ||||||
| Universal Electronics, Inc.* |
299 | 11,108 | ||||||
| Whirlpool Corp. |
92 | 12,226 | ||||||
| William Lyon Homes Class A* |
2,816 | 43,282 | ||||||
| ZAGG, Inc.* |
708 | 6,422 | ||||||
|
|
|
|||||||
| Total Household Durables |
|
658,237 | ||||||
| Household Products – 1.2% |
| |||||||
| Church & Dwight Co., Inc. |
948 | 67,526 | ||||||
| Clorox Co. (The) |
503 | 80,712 | ||||||
| Colgate-Palmolive Co. |
2,008 | 137,628 | ||||||
| Energizer Holdings, Inc. |
284 | 12,760 | ||||||
| Kimberly-Clark Corp. |
1,481 | 183,496 | ||||||
| Procter & Gamble Co. (The) |
8,560 | 890,668 | ||||||
| Spectrum Brands Holdings, Inc. |
745 | 40,811 | ||||||
|
|
|
|||||||
| Total Household Products |
|
1,413,601 | ||||||
| Independent Power & Renewable Electricity Producers – 0.0% |
| |||||||
| AES Corp. |
1,165 | 21,063 | ||||||
| Clearway Energy, Inc. Class C |
164 | 2,478 | ||||||
| Ormat Technologies, Inc. |
119 | 6,563 | ||||||
|
|
|
|||||||
| Total Independent Power & Renewable Electricity Producers |
|
30,104 | ||||||
| Industrial Conglomerates – 1.1% |
| |||||||
| 3M Co. |
2,106 | 437,585 | ||||||
| Carlisle Cos., Inc. |
606 | 74,308 | ||||||
| Honeywell International, Inc. |
4,167 | 662,219 | ||||||
| Roper Technologies, Inc. |
186 | 63,606 | ||||||
|
|
|
|||||||
| Total Industrial Conglomerates |
|
1,237,718 | ||||||
| Insurance – 3.1% |
| |||||||
| Aflac, Inc. |
6,257 | 312,850 | ||||||
| Alleghany Corp.* |
128 | 78,387 | ||||||
| Allstate Corp. (The) |
2,367 | 222,924 | ||||||
| American Equity Investment Life Holding Co. |
2,141 | 57,850 | ||||||
| American Financial Group, Inc. |
266 | 25,592 | ||||||
| American International Group, Inc. |
2,727 | 117,425 | ||||||
| American National Insurance Co. |
411 | 49,657 | ||||||
| Arthur J. Gallagher & Co. |
1,007 | 78,647 | ||||||
| Assurant, Inc. |
490 | 46,506 | ||||||
| Brown & Brown, Inc. |
1,590 | 46,921 | ||||||
| Cincinnati Financial Corp. |
1,130 | 97,067 | ||||||
| CNA Financial Corp. |
2,972 | 128,836 | ||||||
| Employers Holdings, Inc. |
401 | 16,084 | ||||||
| Erie Indemnity Co. Class A |
210 | 37,489 | ||||||
| FBL Financial Group, Inc. Class A |
112 | 7,025 | ||||||
| Fidelity National Financial, Inc. |
2,574 | 94,080 | ||||||
| First American Financial Corp. |
285 | 14,677 | ||||||
| Genworth Financial, Inc. Class A* |
9,421 | 36,082 | ||||||
| Hanover Insurance Group, Inc. (The) |
274 | 31,282 | ||||||
| Hartford Financial Services Group, Inc. (The) |
4,022 | 199,974 | ||||||
| Horace Mann Educators Corp. |
114 | 4,014 | ||||||
| Lincoln National Corp. |
1,275 | 74,842 | ||||||
| Loews Corp. |
1,161 | 55,647 | ||||||
| Markel Corp.* |
45 | 44,831 | ||||||
| Marsh & McLennan Cos., Inc. |
1,980 | 185,922 | ||||||
| MetLife, Inc. |
8,363 | 356,013 | ||||||
| National Western Life Group, Inc. Class A |
49 | 12,861 | ||||||
| Navigators Group, Inc. (The) |
151 | 10,550 | ||||||
| Old Republic International Corp. |
3,890 | 81,379 | ||||||
| Primerica, Inc. |
125 | 15,269 | ||||||
| Principal Financial Group, Inc. |
1,520 | 76,289 | ||||||
| Progressive Corp. (The) |
3,481 | 250,945 | ||||||
See Notes to Financial Statements.
| 102 | WisdomTree Trust |
Schedule of Investments (continued)
WisdomTree U.S. Total Market Fund (EXT)
March 31, 2019
| Investments | Shares | Value | ||||||
| Prudential Financial, Inc. |
2,935 | $ | 269,668 | |||||
| Reinsurance Group of America, Inc. |
689 | 97,824 | ||||||
| RLI Corp. |
144 | 10,332 | ||||||
| Selective Insurance Group, Inc. |
219 | 13,858 | ||||||
| Torchmark Corp. |
234 | 19,176 | ||||||
| Travelers Cos., Inc. (The) |
1,399 | 191,887 | ||||||
| W.R. Berkley Corp. |
755 | 63,964 | ||||||
|
|
|
|||||||
| Total Insurance |
|
3,534,626 | ||||||
| Interactive Media & Services – 4.0% |
| |||||||
| Alphabet, Inc. Class A* |
2,050 | 2,412,624 | ||||||
| Cargurus, Inc.* |
92 | 3,686 | ||||||
| Facebook, Inc. Class A* |
11,392 | 1,898,932 | ||||||
| IAC/InterActiveCorp* |
223 | 46,855 | ||||||
| Match Group, Inc. |
1,064 | 60,233 | ||||||
| TripAdvisor, Inc.* |
218 | 11,216 | ||||||
| Twitter, Inc.* |
751 | 24,693 | ||||||
| Yelp, Inc.* |
611 | 21,080 | ||||||
|
|
|
|||||||
| Total Interactive Media & Services |
|
4,479,319 | ||||||
| Internet & Direct Marketing Retail – 1.1% |
| |||||||
| Amazon.com, Inc.* |
390 | 694,492 | ||||||
| Booking Holdings, Inc.* |
166 | 289,655 | ||||||
| eBay, Inc. |
5,081 | 188,708 | ||||||
| Expedia Group, Inc. |
414 | 49,266 | ||||||
| GrubHub, Inc.* |
78 | 5,419 | ||||||
| PetMed Express, Inc.(a) |
540 | 12,301 | ||||||
| Qurate Retail, Inc.* |
548 | 8,757 | ||||||
| Shutterstock, Inc. |
219 | 10,212 | ||||||
| Stamps.com, Inc.* |
55 | 4,478 | ||||||
|
|
|
|||||||
| Total Internet & Direct Marketing Retail |
|
1,263,288 | ||||||
| IT Services – 3.5% |
| |||||||
| Alliance Data Systems Corp. |
77 | 13,473 | ||||||
| Automatic Data Processing, Inc. |
994 | 158,782 | ||||||
| Black Knight, Inc.* |
123 | 6,704 | ||||||
| Booz Allen Hamilton Holding Corp. |
567 | 32,965 | ||||||
| Broadridge Financial Solutions, Inc. |
166 | 17,213 | ||||||
| CACI International, Inc. Class A* |
67 | 12,195 | ||||||
| Cognizant Technology Solutions Corp. Class A |
1,855 | 134,395 | ||||||
| CSG Systems International, Inc. |
326 | 13,790 | ||||||
| DXC Technology Co. |
2,150 | 138,267 | ||||||
| EPAM Systems, Inc.* |
163 | 27,568 | ||||||
| Euronet Worldwide, Inc.* |
160 | 22,814 | ||||||
| ExlService Holdings, Inc.* |
115 | 6,902 | ||||||
| Fidelity National Information Services, Inc. |
748 | 84,599 | ||||||
| First Data Corp. Class A* |
3,206 | 84,222 | ||||||
| Fiserv, Inc.* |
1,392 | 122,886 | ||||||
| Gartner, Inc.* |
94 | 14,258 | ||||||
| Global Payments, Inc. |
118 | 16,109 | ||||||
| GoDaddy, Inc. Class A* |
90 | 6,767 | ||||||
| GreenSky, Inc. Class A* |
572 | 7,402 | ||||||
| International Business Machines Corp. |
6,561 | 925,757 | ||||||
| Jack Henry & Associates, Inc. |
147 | 20,395 | ||||||
| Leidos Holdings, Inc. |
126 | 8,075 | ||||||
| ManTech International Corp. Class A |
160 | 8,643 | ||||||
| MasterCard, Inc. Class A |
2,274 | 535,413 | ||||||
| MAXIMUS, Inc. |
481 | 34,141 | ||||||
| NIC, Inc. |
756 | 12,920 | ||||||
| Paychex, Inc. |
1,482 | 118,856 | ||||||
| PayPal Holdings, Inc.* |
2,161 | 224,398 | ||||||
| Perspecta, Inc. |
998 | 20,180 | ||||||
| Presidio, Inc. |
716 | 10,597 | ||||||
| Science Applications International Corp. |
193 | 14,851 | ||||||
| Sykes Enterprises, Inc.* |
181 | 5,119 | ||||||
| Total System Services, Inc. |
687 | 65,272 | ||||||
| TTEC Holdings, Inc. |
263 | 9,529 | ||||||
| Unisys Corp.* |
354 | 4,131 | ||||||
| VeriSign, Inc.* |
327 | 59,370 | ||||||
| Virtusa Corp.* |
76 | 4,062 | ||||||
| Visa, Inc. Class A |
5,268 | 822,809 | ||||||
| Western Union Co. (The) |
6,121 | 113,055 | ||||||
| WEX, Inc.* |
53 | 10,175 | ||||||
| Worldpay, Inc. Class A* |
226 | 25,651 | ||||||
|
|
|
|||||||
| Total IT Services |
|
3,974,710 | ||||||
| Leisure Products – 0.1% |
| |||||||
| Acushnet Holdings Corp. |
410 | 9,487 | ||||||
| Callaway Golf Co. |
1,054 | 16,790 | ||||||
| Clarus Corp. |
304 | 3,894 | ||||||
| Hasbro, Inc. |
331 | 28,142 | ||||||
| Johnson Outdoors, Inc. Class A |
54 | 3,854 | ||||||
| Malibu Boats, Inc. Class A* |
113 | 4,473 | ||||||
| Marine Products Corp. |
186 | 2,505 | ||||||
| MasterCraft Boat Holdings, Inc.* |
147 | 3,318 | ||||||
| Nautilus, Inc.* |
277 | 1,540 | ||||||
|
|
|
|||||||
| Total Leisure Products |
|
74,003 | ||||||
| Life Sciences Tools & Services – 0.7% |
| |||||||
| Agilent Technologies, Inc. |
974 | 78,290 | ||||||
| Bio-Rad Laboratories, Inc. Class A* |
416 | 127,163 | ||||||
| Bruker Corp. |
652 | 25,063 | ||||||
| Cambrex Corp.* |
403 | 15,657 | ||||||
| Charles River Laboratories International, Inc.* |
183 | 26,581 | ||||||
| Illumina, Inc.* |
254 | 78,915 | ||||||
| IQVIA Holdings, Inc.* |
91 | 13,090 | ||||||
| Medpace Holdings, Inc.* |
61 | 3,597 | ||||||
| Mettler-Toledo International, Inc.* |
58 | 41,934 | ||||||
| PerkinElmer, Inc. |
343 | 33,052 | ||||||
| PRA Health Sciences, Inc.* |
124 | 13,676 | ||||||
| Syneos Health, Inc.* |
71 | 3,675 | ||||||
| Thermo Fisher Scientific, Inc. |
953 | 260,855 | ||||||
| Waters Corp.* |
209 | 52,607 | ||||||
|
|
|
|||||||
| Total Life Sciences Tools & Services |
|
774,155 | ||||||
| Machinery – 2.5% |
| |||||||
| AGCO Corp. |
208 | 14,466 | ||||||
| Albany International Corp. Class A |
410 | 29,352 | ||||||
| Allison Transmission Holdings, Inc. |
1,686 | 75,735 | ||||||
| Blue Bird Corp.* |
195 | 3,301 | ||||||
| Caterpillar, Inc. |
3,819 | 517,436 | ||||||
| Chart Industries, Inc.* |
55 | 4,979 | ||||||
See Notes to Financial Statements.
| WisdomTree Trust | 103 |
Schedule of Investments (continued)
WisdomTree U.S. Total Market Fund (EXT)
March 31, 2019
| Investments | Shares | Value | ||||||
| Columbus McKinnon Corp. |
143 | $ | 4,912 | |||||
| Commercial Vehicle Group, Inc.* |
1,267 | 9,718 | ||||||
| Cummins, Inc. |
1,551 | 244,856 | ||||||
| Deere & Co. |
1,315 | 210,190 | ||||||
| Douglas Dynamics, Inc. |
83 | 3,160 | ||||||
| Dover Corp. |
464 | 43,523 | ||||||
| Energy Recovery, Inc.*(a) |
425 | 3,710 | ||||||
| ESCO Technologies, Inc. |
51 | 3,419 | ||||||
| Evoqua Water Technologies Corp.* |
1,226 | 15,423 | ||||||
| Federal Signal Corp. |
354 | 9,200 | ||||||
| Flowserve Corp. |
207 | 9,344 | ||||||
| Fortive Corp. |
694 | 58,220 | ||||||
| Gardner Denver Holdings, Inc.* |
1,762 | 49,001 | ||||||
| Global Brass & Copper Holdings, Inc. |
161 | 5,545 | ||||||
| Gorman-Rupp Co. (The) |
89 | 3,021 | ||||||
| Graco, Inc. |
264 | 13,073 | ||||||
| Harsco Corp.* |
415 | 8,366 | ||||||
| Hillenbrand, Inc. |
190 | 7,891 | ||||||
| Hyster-Yale Materials Handling, Inc. |
205 | 12,784 | ||||||
| IDEX Corp. |
117 | 17,754 | ||||||
| Illinois Tool Works, Inc. |
1,861 | 267,109 | ||||||
| ITT, Inc. |
1,178 | 68,324 | ||||||
| John Bean Technologies Corp. |
276 | 25,362 | ||||||
| Kennametal, Inc. |
1,138 | 41,821 | ||||||
| Lincoln Electric Holdings, Inc. |
739 | 61,980 | ||||||
| Lindsay Corp. |
90 | 8,711 | ||||||
| Lydall, Inc.* |
699 | 16,399 | ||||||
| Manitowoc Co., Inc. (The)* |
878 | 14,408 | ||||||
| Meritor, Inc.* |
3,556 | 72,365 | ||||||
| Middleby Corp. (The)* |
204 | 26,526 | ||||||
| Milacron Holdings Corp.* |
856 | 9,690 | ||||||
| Miller Industries, Inc. |
120 | 3,702 | ||||||
| Mueller Water Products, Inc. Class A |
2,066 | 20,743 | ||||||
| Navistar International Corp.* |
1,527 | 49,322 | ||||||
| Nordson Corp. |
426 | 56,454 | ||||||
| Oshkosh Corp. |
262 | 19,684 | ||||||
| PACCAR, Inc. |
1,750 | 119,245 | ||||||
| Park-Ohio Holdings Corp. |
206 | 6,670 | ||||||
| Parker-Hannifin Corp. |
530 | 90,959 | ||||||
| Proto Labs, Inc.* |
74 | 7,780 | ||||||
| RBC Bearings, Inc.* |
59 | 7,503 | ||||||
| REV Group, Inc. |
3,841 | 42,059 | ||||||
| Rexnord Corp.* |
274 | 6,888 | ||||||
| Spartan Motors, Inc. |
533 | 4,706 | ||||||
| SPX FLOW, Inc.* |
743 | 23,702 | ||||||
| Stanley Black & Decker, Inc. |
488 | 66,451 | ||||||
| Sun Hydraulics Corp. |
364 | 16,930 | ||||||
| Tennant Co. |
60 | 3,725 | ||||||
| Terex Corp. |
1,355 | 43,536 | ||||||
| Timken Co. (The) |
1,682 | 73,369 | ||||||
| Toro Co. (The) |
207 | 14,250 | ||||||
| TriMas Corp.* |
119 | 3,597 | ||||||
| Trinity Industries, Inc. |
410 | 8,909 | ||||||
| Twin Disc, Inc.* |
202 | 3,363 | ||||||
| Wabash National Corp. |
2,242 | 30,379 | ||||||
| WABCO Holdings, Inc.* |
152 | 20,038 | ||||||
| Woodward, Inc. |
275 | 26,095 | ||||||
| Xylem, Inc. |
224 | 17,705 | ||||||
|
|
|
|||||||
| Total Machinery |
|
2,778,838 | ||||||
| Marine – 0.0% |
| |||||||
| Kirby Corp.* |
143 | 10,741 | ||||||
| Matson, Inc. |
287 | 10,358 | ||||||
|
|
|
|||||||
| Total Marine |
|
21,099 | ||||||
| Media – 1.8% |
| |||||||
| AMC Networks, Inc. Class A* |
1,189 | 67,488 | ||||||
| Cable One, Inc. |
14 | 13,739 | ||||||
| CBS Corp. Class B Non-Voting Shares |
1,477 | 70,202 | ||||||
| Charter Communications, Inc. Class A* |
220 | 76,320 | ||||||
| Comcast Corp. Class A |
22,726 | 908,585 | ||||||
| Discovery, Inc. Class A* |
2,310 | 62,416 | ||||||
| DISH Network Corp. Class A* |
1,754 | 55,584 | ||||||
| Emerald Expositions Events, Inc. |
1,538 | 19,533 | ||||||
| EW Scripps Co. (The) Class A |
344 | 7,224 | ||||||
| Fox Corp. Class A* |
1,769 | 64,940 | ||||||
| Gannett Co., Inc. |
2,146 | 22,619 | ||||||
| Gray Television, Inc.* |
778 | 16,618 | ||||||
| Interpublic Group of Cos., Inc. (The) |
2,455 | 51,580 | ||||||
| Lee Enterprises, Inc.* |
1,605 | 5,297 | ||||||
| Liberty Broadband Corp. Class C* |
1,759 | 161,371 | ||||||
| Liberty Media Corp – Liberty SiriusXM Series C* |
1,345 | 51,433 | ||||||
| Loral Space & Communications, Inc.* |
78 | 2,812 | ||||||
| MSG Networks, Inc. Class A* |
678 | 14,746 | ||||||
| National CineMedia, Inc. |
1,324 | 9,334 | ||||||
| New Media Investment Group, Inc. |
907 | 9,523 | ||||||
| New York Times Co. (The) Class A |
463 | 15,210 | ||||||
| Nexstar Media Group, Inc. Class A |
501 | 54,293 | ||||||
| Omnicom Group, Inc. |
1,724 | 125,835 | ||||||
| Sirius XM Holdings, Inc. |
14,541 | 82,447 | ||||||
| TEGNA, Inc. |
917 | 12,930 | ||||||
| Tribune Media Co. Class A |
1,303 | 60,120 | ||||||
|
|
|
|||||||
| Total Media |
|
2,042,199 | ||||||
| Metals & Mining – 0.6% |
| |||||||
| AK Steel Holding Corp.*(a) |
5,949 | 16,360 | ||||||
| Allegheny Technologies, Inc.* |
1,052 | 26,900 | ||||||
| Century Aluminum Co.* |
915 | 8,125 | ||||||
| Cleveland-Cliffs, Inc.(a) |
5,569 | 55,634 | ||||||
| Commercial Metals Co. |
1,739 | 29,702 | ||||||
| Freeport-McMoRan, Inc. |
21,100 | 271,979 | ||||||
| Newmont Mining Corp. |
1,036 | 37,058 | ||||||
| Nucor Corp. |
1,587 | 92,601 | ||||||
| Reliance Steel & Aluminum Co. |
1,191 | 107,500 | ||||||
| Schnitzer Steel Industries, Inc. Class A |
551 | 13,224 | ||||||
| Steel Dynamics, Inc. |
927 | 32,695 | ||||||
| United States Steel Corp. |
412 | 8,030 | ||||||
| Warrior Met Coal, Inc. |
998 | 30,339 | ||||||
|
|
|
|||||||
| Total Metals & Mining |
|
730,147 | ||||||
See Notes to Financial Statements.
| 104 | WisdomTree Trust |
Schedule of Investments (continued)
WisdomTree U.S. Total Market Fund (EXT)
March 31, 2019
| Investments | Shares | Value | ||||||
| Multi-Utilities – 0.8% |
| |||||||
| Ameren Corp. |
1,024 | $ | 75,315 | |||||
| Black Hills Corp. |
291 | 21,554 | ||||||
| CenterPoint Energy, Inc. |
2,133 | 65,483 | ||||||
| CMS Energy Corp. |
1,123 | 62,372 | ||||||
| Consolidated Edison, Inc. |
1,411 | 119,667 | ||||||
| Dominion Energy, Inc. |
2,259 | 173,175 | ||||||
| DTE Energy Co. |
880 | 109,771 | ||||||
| MDU Resources Group, Inc. |
627 | 16,195 | ||||||
| NiSource, Inc. |
1,253 | 35,911 | ||||||
| NorthWestern Corp. |
350 | 24,644 | ||||||
| Public Service Enterprise Group, Inc. |
1,054 | 62,618 | ||||||
| Sempra Energy |
641 | 80,676 | ||||||
| WEC Energy Group, Inc. |
1,410 | 111,503 | ||||||
|
|
|
|||||||
| Total Multi-Utilities |
|
958,884 | ||||||
| Multiline Retail – 0.5% |
| |||||||
| Dillard’s, Inc. Class A(a) |
160 | 11,523 | ||||||
| Dollar General Corp. |
992 | 118,346 | ||||||
| Dollar Tree, Inc.* |
847 | 88,969 | ||||||
| Kohl’s Corp. |
825 | 56,735 | ||||||
| Macy’s, Inc. |
3,794 | 91,170 | ||||||
| Nordstrom, Inc. |
414 | 18,373 | ||||||
| Ollie’s Bargain Outlet Holdings, Inc.* |
140 | 11,946 | ||||||
| Target Corp. |
2,771 | 222,401 | ||||||
|
|
|
|||||||
| Total Multiline Retail |
|
619,463 | ||||||
| Oil, Gas & Consumable Fuels – 4.6% |
| |||||||
| Anadarko Petroleum Corp. |
547 | 24,878 | ||||||
| Apache Corp. |
3,908 | 135,451 | ||||||
| Arch Coal, Inc. Class A |
271 | 24,734 | ||||||
| Callon Petroleum Co.* |
1,973 | 14,896 | ||||||
| Carrizo Oil & Gas, Inc.* |
1,115 | 13,904 | ||||||
| Centennial Resource Development, Inc. Class A* |
1,475 | 12,965 | ||||||
| Cheniere Energy, Inc.* |
608 | 41,563 | ||||||
| Chesapeake Energy Corp.*(a) |
22,728 | 70,457 | ||||||
| Chevron Corp. |
8,311 | 1,023,749 | ||||||
| Cimarex Energy Co. |
830 | 58,017 | ||||||
| CNX Resources Corp.* |
694 | 7,474 | ||||||
| Concho Resources, Inc. |
25 | 2,774 | ||||||
| ConocoPhillips |
6,094 | 406,714 | ||||||
| Continental Resources, Inc.* |
1,659 | 74,273 | ||||||
| CVR Energy, Inc. |
766 | 31,559 | ||||||
| Delek U.S. Holdings, Inc. |
899 | 32,742 | ||||||
| Denbury Resources, Inc.* |
6,323 | 12,962 | ||||||
| EOG Resources, Inc. |
2,061 | 196,166 | ||||||
| Exxon Mobil Corp. |
17,680 | 1,428,544 | ||||||
| Gulfport Energy Corp.* |
5,691 | 45,642 | ||||||
| HollyFrontier Corp. |
636 | 31,336 | ||||||
| Kinder Morgan, Inc. |
6,410 | 128,264 | ||||||
| Magnolia Oil & Gas Corp.* |
540 | 6,480 | ||||||
| Marathon Oil Corp. |
4,364 | 72,922 | ||||||
| Marathon Petroleum Corp. |
2,035 | 121,795 | ||||||
| Matador Resources Co.* |
955 | 18,460 | ||||||
| Murphy Oil Corp. |
613 | 17,961 | ||||||
| Noble Energy, Inc. |
3,414 | 84,428 | ||||||
| Occidental Petroleum Corp. |
4,087 | 270,559 | ||||||
| ONEOK, Inc. |
442 | 30,869 | ||||||
| Overseas Shipholding Group, Inc. Class A* |
4,257 | 9,749 | ||||||
| Parsley Energy, Inc. Class A* |
2,135 | 41,206 | ||||||
| PBF Energy, Inc. Class A |
2,250 | 70,065 | ||||||
| Peabody Energy Corp. |
1,676 | 47,481 | ||||||
| Phillips 66 |
3,613 | 343,849 | ||||||
| SM Energy Co. |
900 | 15,741 | ||||||
| Targa Resources Corp. |
424 | 17,617 | ||||||
| Valero Energy Corp. |
2,003 | 169,915 | ||||||
| W&T Offshore, Inc.* |
2,142 | 14,780 | ||||||
| Williams Cos., Inc. (The) |
2,066 | 59,336 | ||||||
| World Fuel Services Corp. |
534 | 15,427 | ||||||
|
|
|
|||||||
| Total Oil, Gas & Consumable Fuels |
|
5,247,704 | ||||||
| Paper & Forest Products – 0.0% |
| |||||||
| Boise Cascade Co. |
1,084 | 29,008 | ||||||
| Clearwater Paper Corp.* |
467 | 9,097 | ||||||
| PH Glatfelter Co. |
768 | 10,844 | ||||||
| Verso Corp. Class A* |
195 | 4,177 | ||||||
|
|
|
|||||||
| Total Paper & Forest Products |
|
53,126 | ||||||
| Personal Products – 0.2% |
| |||||||
| elf Beauty, Inc.* |
1,198 | 12,699 | ||||||
| Estee Lauder Cos., Inc. (The) Class A |
918 | 151,975 | ||||||
| Nu Skin Enterprises, Inc. Class A |
134 | 6,413 | ||||||
| USANA Health Sciences, Inc.* |
125 | 10,484 | ||||||
|
|
|
|||||||
| Total Personal Products |
|
181,571 | ||||||
| Pharmaceuticals – 3.0% |
| |||||||
| ANI Pharmaceuticals, Inc.* |
61 | 4,303 | ||||||
| Bristol-Myers Squibb Co. |
5,140 | 245,230 | ||||||
| Catalent, Inc.* |
156 | 6,332 | ||||||
| Corcept Therapeutics, Inc.* |
465 | 5,459 | ||||||
| Eli Lilly & Co. |
1,715 | 222,538 | ||||||
| Innoviva, Inc.* |
1,128 | 15,826 | ||||||
| Johnson & Johnson |
8,920 | 1,246,927 | ||||||
| Merck & Co., Inc. |
6,006 | 499,519 | ||||||
| Nektar Therapeutics* |
1,855 | 62,328 | ||||||
| Pfizer, Inc. |
22,436 | 952,857 | ||||||
| Zoetis, Inc. |
908 | 91,408 | ||||||
|
|
|
|||||||
| Total Pharmaceuticals |
|
3,352,727 | ||||||
| Professional Services – 0.2% |
| |||||||
| ASGN, Inc.* |
434 | 27,555 | ||||||
| CoStar Group, Inc.* |
20 | 9,328 | ||||||
| Exponent, Inc. |
218 | 12,583 | ||||||
| FTI Consulting, Inc.* |
77 | 5,915 | ||||||
| GP Strategies Corp.* |
259 | 3,147 | ||||||
| InnerWorkings, Inc.* |
882 | 3,193 | ||||||
| Insperity, Inc. |
54 | 6,678 | ||||||
| Kforce, Inc. |
97 | 3,407 | ||||||
| ManpowerGroup, Inc. |
897 | 74,173 | ||||||
| Mistras Group, Inc.* |
212 | 2,928 | ||||||
| Robert Half International, Inc. |
927 | 60,403 | ||||||
See Notes to Financial Statements.
| WisdomTree Trust | 105 |
Schedule of Investments (continued)
WisdomTree U.S. Total Market Fund (EXT)
March 31, 2019
| Investments | Shares | Value | ||||||
| TransUnion |
346 | $ | 23,126 | |||||
| TriNet Group, Inc.* |
229 | 13,680 | ||||||
|
|
|
|||||||
| Total Professional Services |
|
246,116 | ||||||
| Real Estate Management & Development – 0.2% |
| |||||||
| CBRE Group, Inc. Class A* |
1,595 | 78,873 | ||||||
| Five Point Holdings LLC Class A*(a) |
2,783 | 20,065 | ||||||
| HFF, Inc. Class A |
62 | 2,960 | ||||||
| Jones Lang LaSalle, Inc. |
355 | 54,734 | ||||||
| Kennedy-Wilson Holdings, Inc. |
155 | 3,315 | ||||||
| Marcus & Millichap, Inc.* |
419 | 17,066 | ||||||
| Newmark Group, Inc. Class A |
2,237 | 18,657 | ||||||
| RE/MAX Holdings, Inc. Class A |
112 | 4,316 | ||||||
| Realogy Holdings Corp. |
2,994 | 34,132 | ||||||
| St. Joe Co. (The)* |
465 | 7,668 | ||||||
|
|
|
|||||||
| Total Real Estate Management & Development |
|
241,786 | ||||||
| Road & Rail – 1.3% |
| |||||||
| AMERCO |
189 | 70,215 | ||||||
| ArcBest Corp. |
304 | 9,360 | ||||||
| Covenant Transportation Group, Inc. Class A* |
161 | 3,056 | ||||||
| CSX Corp. |
2,702 | 202,164 | ||||||
| Genesee & Wyoming, Inc. Class A* |
916 | 79,820 | ||||||
| JB Hunt Transport Services, Inc. |
814 | 82,450 | ||||||
| Kansas City Southern |
980 | 113,660 | ||||||
| Knight-Swift Transportation Holdings, Inc. |
2,083 | 68,072 | ||||||
| Landstar System, Inc. |
361 | 39,490 | ||||||
| Marten Transport Ltd. |
190 | 3,388 | ||||||
| Norfolk Southern Corp. |
929 | 173,621 | ||||||
| Old Dominion Freight Line, Inc. |
503 | 72,628 | ||||||
| Saia, Inc.* |
23 | 1,405 | ||||||
| Union Pacific Corp. |
2,779 | 464,649 | ||||||
| Universal Logistics Holdings, Inc. |
160 | 3,149 | ||||||
| Werner Enterprises, Inc. |
1,306 | 44,600 | ||||||
|
|
|
|||||||
| Total Road & Rail |
|
1,431,727 | ||||||
| Semiconductors & Semiconductor Equipment – 5.1% |
| |||||||
| Advanced Micro Devices, Inc.* |
1,244 | 31,747 | ||||||
| Analog Devices, Inc. |
1,548 | 162,958 | ||||||
| Applied Materials, Inc. |
10,869 | 431,065 | ||||||
| Axcelis Technologies, Inc.* |
255 | 5,131 | ||||||
| Broadcom, Inc. |
1,346 | 404,756 | ||||||
| Brooks Automation, Inc. |
220 | 6,453 | ||||||
| Cabot Microelectronics Corp. |
83 | 9,293 | ||||||
| Ceva, Inc.* |
139 | 3,747 | ||||||
| Cirrus Logic, Inc.* |
736 | 30,963 | ||||||
| Cohu, Inc. |
192 | 2,832 | ||||||
| Cypress Semiconductor Corp. |
1,390 | 20,739 | ||||||
| Diodes, Inc.* |
91 | 3,158 | ||||||
| Entegris, Inc. |
880 | 31,407 | ||||||
| First Solar, Inc.* |
573 | 30,277 | ||||||
| Integrated Device Technology, Inc.* |
326 | 15,971 | ||||||
| Intel Corp. |
30,675 | 1,647,247 | ||||||
| KLA-Tencor Corp. |
818 | 97,677 | ||||||
| Lam Research Corp. |
1,807 | 323,471 | ||||||
| Maxim Integrated Products, Inc. |
1,407 | 74,810 | ||||||
| Microchip Technology, Inc.(a) |
545 | 45,213 | ||||||
| Micron Technology, Inc.* |
31,600 | 1,306,028 | ||||||
| MKS Instruments, Inc. |
140 | 13,027 | ||||||
| Monolithic Power Systems, Inc. |
85 | 11,517 | ||||||
| Nanometrics, Inc.* |
116 | 3,582 | ||||||
| NVIDIA Corp. |
2,382 | 427,712 | ||||||
| ON Semiconductor Corp.* |
1,434 | 29,497 | ||||||
| Power Integrations, Inc. |
26 | 1,818 | ||||||
| Qorvo, Inc.* |
153 | 10,975 | ||||||
| Rudolph Technologies, Inc.* |
156 | 3,557 | ||||||
| Silicon Laboratories, Inc.* |
25 | 2,021 | ||||||
| Skyworks Solutions, Inc. |
704 | 58,066 | ||||||
| Teradyne, Inc. |
740 | 29,482 | ||||||
| Texas Instruments, Inc. |
3,724 | 395,005 | ||||||
| Universal Display Corp.(a) |
15 | 2,293 | ||||||
| Xilinx, Inc. |
788 | 99,910 | ||||||
|
|
|
|||||||
| Total Semiconductors & Semiconductor Equipment |
|
5,773,405 | ||||||
| Software – 4.2% |
| |||||||
| ACI Worldwide, Inc.* |
415 | 13,641 | ||||||
| Adobe, Inc.* |
647 | 172,419 | ||||||
| ANSYS, Inc.* |
284 | 51,890 | ||||||
| Aspen Technology, Inc.* |
193 | 20,122 | ||||||
| Cadence Design Systems, Inc.* |
962 | 61,097 | ||||||
| Citrix Systems, Inc. |
580 | 57,803 | ||||||
| Envestnet, Inc.* |
143 | 9,351 | ||||||
| Fortinet, Inc.* |
144 | 12,092 | ||||||
| Guidewire Software, Inc.* |
134 | 13,019 | ||||||
| Intuit, Inc. |
393 | 102,734 | ||||||
| j2 Global, Inc. |
160 | 13,856 | ||||||
| LogMeIn, Inc. |
144 | 11,534 | ||||||
| Microsoft Corp. |
22,348 | 2,635,723 | ||||||
| Monotype Imaging Holdings, Inc. |
353 | 7,021 | ||||||
| Oracle Corp. |
16,825 | 903,671 | ||||||
| Paycom Software, Inc.* |
68 | 12,861 | ||||||
| Paylocity Holding Corp.* |
53 | 4,727 | ||||||
| Pegasystems, Inc. |
97 | 6,305 | ||||||
| Progress Software Corp. |
352 | 15,618 | ||||||
| PTC, Inc.* |
89 | 8,204 | ||||||
| Qualys, Inc.* |
143 | 11,832 | ||||||
| RealPage, Inc.* |
183 | 11,106 | ||||||
| Red Hat, Inc.* |
219 | 40,011 | ||||||
| salesforce.com, Inc.* |
553 | 87,579 | ||||||
| SPS Commerce, Inc.* |
87 | 9,227 | ||||||
| SS&C Technologies Holdings, Inc. |
333 | 21,209 | ||||||
| Symantec Corp. |
3,060 | 70,349 | ||||||
| Synopsys, Inc.* |
555 | 63,908 | ||||||
| Teradata Corp.* |
606 | 26,452 | ||||||
| Ultimate Software Group, Inc. (The)* |
50 | 16,507 | ||||||
| Verint Systems, Inc.* |
340 | 20,352 | ||||||
| VMware, Inc. Class A |
1,295 | 233,761 | ||||||
|
|
|
|||||||
| Total Software |
|
4,745,981 | ||||||
| Specialty Retail – 2.6% |
| |||||||
| Aaron’s, Inc. |
233 | 12,256 | ||||||
See Notes to Financial Statements.
| 106 | WisdomTree Trust |
Schedule of Investments (continued)
WisdomTree U.S. Total Market Fund (EXT)
March 31, 2019
| Investments | Shares | Value | ||||||
| Abercrombie & Fitch Co. Class A |
1,264 | $ | 34,646 | |||||
| Advance Auto Parts, Inc. |
261 | 44,508 | ||||||
| American Eagle Outfitters, Inc. |
759 | 16,827 | ||||||
| At Home Group, Inc.* |
609 | 10,877 | ||||||
| AutoZone, Inc.* |
162 | 165,907 | ||||||
| Bed Bath & Beyond, Inc. |
3,988 | 67,756 | ||||||
| Best Buy Co., Inc. |
1,129 | 80,227 | ||||||
| Boot Barn Holdings, Inc.* |
408 | 12,012 | ||||||
| Burlington Stores, Inc.* |
296 | 46,377 | ||||||
| Camping World Holdings, Inc. Class A(a) |
2,152 | 29,934 | ||||||
| CarMax, Inc.* |
1,529 | 106,724 | ||||||
| Children’s Place, Inc. (The) |
48 | 4,669 | ||||||
| Citi Trends, Inc. |
262 | 5,059 | ||||||
| Conn’s, Inc.* |
415 | 9,487 | ||||||
| Container Store Group, Inc. (The)* |
676 | 5,949 | ||||||
| Designer Brands, Inc. |
373 | 8,288 | ||||||
| Express, Inc.* |
3,546 | 15,177 | ||||||
| Five Below, Inc.* |
186 | 23,111 | ||||||
| Foot Locker, Inc. |
893 | 54,116 | ||||||
| Gap, Inc. (The) |
1,208 | 31,625 | ||||||
| Guess?, Inc. |
1,063 | 20,835 | ||||||
| Haverty Furniture Cos., Inc. |
157 | 3,435 | ||||||
| Hibbett Sports, Inc.* |
750 | 17,108 | ||||||
| Home Depot, Inc. (The) |
4,909 | 941,988 | ||||||
| J. Jill, Inc. |
1,824 | 10,014 | ||||||
| Kirkland’s, Inc.* |
299 | 2,102 | ||||||
| L Brands, Inc. |
406 | 11,197 | ||||||
| Lowe’s Cos., Inc. |
2,944 | 322,280 | ||||||
| Lumber Liquidators Holdings, Inc.*(a) |
1,047 | 10,575 | ||||||
| MarineMax, Inc.* |
463 | 8,871 | ||||||
| Monro, Inc. |
208 | 17,996 | ||||||
| Murphy USA, Inc.* |
133 | 11,387 | ||||||
| National Vision Holdings, Inc.* |
361 | 11,346 | ||||||
| O’Reilly Automotive, Inc.* |
419 | 162,698 | ||||||
| Office Depot, Inc. |
1,320 | 4,792 | ||||||
| RH* |
154 | 15,854 | ||||||
| Ross Stores, Inc. |
1,068 | 99,431 | ||||||
| Sally Beauty Holdings, Inc.* |
879 | 16,182 | ||||||
| Shoe Carnival, Inc.(a) |
225 | 7,657 | ||||||
| Sonic Automotive, Inc. Class A |
1,458 | 21,593 | ||||||
| Sportsman’s Warehouse Holdings, Inc.* |
697 | 3,346 | ||||||
| Tailored Brands, Inc. |
1,510 | 11,838 | ||||||
| Tiffany & Co. |
164 | 17,310 | ||||||
| Tile Shop Holdings, Inc. |
858 | 4,856 | ||||||
| Tilly’s, Inc. Class A |
545 | 6,066 | ||||||
| TJX Cos., Inc. (The) |
4,369 | 232,474 | ||||||
| Tractor Supply Co. |
693 | 67,748 | ||||||
| Ulta Salon Cosmetics & Fragrance, Inc.* |
141 | 49,171 | ||||||
| Williams-Sonoma, Inc. |
270 | 15,193 | ||||||
| Winmark Corp. |
62 | 11,693 | ||||||
| Zumiez, Inc.* |
743 | 18,493 | ||||||
|
|
|
|||||||
| Total Specialty Retail |
|
2,941,061 | ||||||
| Technology Hardware, Storage & Peripherals – 5.1% |
| |||||||
| Apple, Inc. |
27,030 | 5,134,348 | ||||||
| Electronics For Imaging, Inc.* |
535 | 14,392 | ||||||
| HP, Inc. |
14,361 | 279,034 | ||||||
| NetApp, Inc. |
752 | 52,144 | ||||||
| Western Digital Corp. |
4,874 | 234,244 | ||||||
| Xerox Corp. |
345 | 11,033 | ||||||
|
|
|
|||||||
| Total Technology Hardware, Storage & Peripherals |
|
5,725,195 | ||||||
| Textiles, Apparel & Luxury Goods – 0.6% |
| |||||||
| Columbia Sportswear Co. |
545 | 56,778 | ||||||
| Crocs, Inc.* |
126 | 3,245 | ||||||
| Culp, Inc. |
153 | 2,942 | ||||||
| Deckers Outdoor Corp.* |
274 | 40,275 | ||||||
| G-III Apparel Group Ltd.* |
883 | 35,285 | ||||||
| Movado Group, Inc. |
93 | 3,383 | ||||||
| NIKE, Inc. Class B |
4,477 | 377,008 | ||||||
| PVH Corp. |
205 | 25,000 | ||||||
| Ralph Lauren Corp. |
56 | 7,262 | ||||||
| Tapestry, Inc. |
969 | 31,483 | ||||||
| Unifi, Inc.* |
562 | 10,875 | ||||||
| Vera Bradley, Inc.* |
510 | 6,757 | ||||||
| VF Corp. |
837 | 72,744 | ||||||
| Vince Holding Corp.* |
292 | 3,621 | ||||||
| Wolverine World Wide, Inc. |
195 | 6,967 | ||||||
|
|
|
|||||||
| Total Textiles, Apparel & Luxury Goods |
|
683,625 | ||||||
| Thrifts & Mortgage Finance – 0.3% |
| |||||||
| Axos Financial, Inc.* |
900 | 26,064 | ||||||
| Capitol Federal Financial, Inc. |
2,134 | 28,489 | ||||||
| First Defiance Financial Corp. |
127 | 3,650 | ||||||
| LendingTree, Inc.*(a) |
63 | 22,148 | ||||||
| Luther Burbank Corp. |
506 | 5,111 | ||||||
| MGIC Investment Corp.* |
8,175 | 107,828 | ||||||
| NMI Holdings, Inc. Class A* |
533 | 13,789 | ||||||
| OP Bancorp |
354 | 3,097 | ||||||
| PennyMac Financial Services, Inc. |
644 | 14,323 | ||||||
| Provident Financial Services, Inc. |
1,368 | 35,418 | ||||||
| Radian Group, Inc. |
982 | 20,367 | ||||||
| Sterling Bancorp, Inc. |
2,365 | 23,981 | ||||||
| TFS Financial Corp. |
952 | 15,679 | ||||||
| TrustCo Bank Corp. |
1,519 | 11,787 | ||||||
| United Financial Bancorp, Inc. |
335 | 4,807 | ||||||
| Walker & Dunlop, Inc. |
205 | 10,437 | ||||||
| WSFS Financial Corp. |
119 | 4,593 | ||||||
|
|
|
|||||||
| Total Thrifts & Mortgage Finance |
|
351,568 | ||||||
| Tobacco – 1.1% |
| |||||||
| Altria Group, Inc. |
9,494 | 545,240 | ||||||
| Philip Morris International, Inc. |
8,055 | 711,982 | ||||||
| Universal Corp. |
115 | 6,628 | ||||||
| Vector Group Ltd. |
1,784 | 19,249 | ||||||
|
|
|
|||||||
| Total Tobacco |
|
1,283,099 | ||||||
| Trading Companies & Distributors – 0.5% |
| |||||||
| Applied Industrial Technologies, Inc. |
156 | 9,277 | ||||||
| Beacon Roofing Supply, Inc.* |
903 | 29,041 | ||||||
| BMC Stock Holdings, Inc.* |
1,687 | 29,809 | ||||||
See Notes to Financial Statements.
| WisdomTree Trust | 107 |
Schedule of Investments (concluded)
WisdomTree U.S. Total Market Fund (EXT)
March 31, 2019
| Investments | Shares | Value | ||||||
| CAI International, Inc.* |
652 | $ | 15,126 | |||||
| DXP Enterprises, Inc.* |
91 | 3,542 | ||||||
| Fastenal Co. |
1,403 | 90,227 | ||||||
| GATX Corp. |
220 | 16,801 | ||||||
| H&E Equipment Services, Inc. |
890 | 22,348 | ||||||
| HD Supply Holdings, Inc.* |
1,172 | 50,806 | ||||||
| Herc Holdings, Inc.* |
651 | 25,376 | ||||||
| Kaman Corp. |
64 | 3,740 | ||||||
| MRC Global, Inc.* |
722 | 12,621 | ||||||
| NOW, Inc.* |
495 | 6,910 | ||||||
| SiteOne Landscape Supply, Inc.* |
218 | 12,459 | ||||||
| Systemax, Inc. |
96 | 2,173 | ||||||
| Titan Machinery, Inc.* |
205 | 3,190 | ||||||
| United Rentals, Inc.* |
265 | 30,276 | ||||||
| Univar, Inc.* |
2,031 | 45,011 | ||||||
| Veritiv Corp.* |
121 | 3,185 | ||||||
| W.W. Grainger, Inc. |
290 | 87,270 | ||||||
| Watsco, Inc. |
17 | 2,435 | ||||||
| WESCO International, Inc.* |
1,162 | 61,598 | ||||||
|
|
|
|||||||
| Total Trading Companies & Distributors |
|
563,221 | ||||||
| Water Utilities – 0.1% |
| |||||||
| American Water Works Co., Inc. |
598 | 62,348 | ||||||
| Aqua America, Inc. |
505 | 18,402 | ||||||
|
|
|
|||||||
| Total Water Utilities |
|
80,750 | ||||||
| Wireless Telecommunication Services – 0.2% |
| |||||||
| Spok Holdings, Inc. |
227 | 3,092 | ||||||
| Sprint Corp.* |
5,460 | 30,849 | ||||||
| T-Mobile U.S., Inc.* |
2,719 | 187,883 | ||||||
| Telephone & Data Systems, Inc. |
418 | 12,845 | ||||||
| United States Cellular Corp.* |
258 | 11,845 | ||||||
|
|
|
|||||||
| Total Wireless Telecommunication Services |
|
246,514 | ||||||
| Total United States |
|
112,720,024 | ||||||
| Puerto Rico – 0.0% | ||||||||
| Banks – 0.0% | ||||||||
| First BanCorp |
1,486 | 17,030 | ||||||
| IT Services – 0.0% | ||||||||
| EVERTEC, Inc. |
645 | 17,937 | ||||||
| Total Puerto Rico | 34,967 | |||||||
| TOTAL COMMON STOCKS (Cost: $95,927,066) |
112,754,991 | |||||||
| INVESTMENT OF CASH COLLATERAL FOR SECURITIES LOANED – 0.2% |
| |||||||
| United States – 0.2% | ||||||||
| State Street Navigator Securities Lending Government Money Market Portfolio, 2.46%(b) |
||||||||
| (Cost: $203,221)(c) | 203,221 | 203,221 | ||||||
| TOTAL INVESTMENTS IN SECURITIES – 99.9% (Cost: $96,130,287) |
112,958,212 | |||||||
| Other Assets less Liabilities – 0.1% |
66,864 | |||||||
|
|
|
|||||||
| NET ASSETS – 100.0% |
|
$ | 113,025,076 | |||||
| * | Non-income producing security. |
| (a) | Security, or portion thereof, was on loan at March 31, 2019 (See Note 2). |
| (b) | Rate shown represents annualized 7-day yield as of March 31, 2019. |
| (c) | At March 31, 2019, the total market value of the Fund’s securities on loan identified in the Schedule of Investments was $416,084 and the total market value of the collateral held by the Fund was $437,813. The total market value of the collateral includes non-cash U.S. Government securities collateral having a value of $234,592. |
See Notes to Financial Statements.
| 108 | WisdomTree Trust |
Statements of Assets and Liabilities
WisdomTree Trust
March 31, 2019
| WisdomTree U.S. Dividend ex-Financials Fund |
WisdomTree U.S. High Dividend Fund |
WisdomTree U.S. LargeCap Dividend Fund |
WisdomTree U.S. LargeCap Fund |
WisdomTree U.S. MidCap Dividend Fund |
||||||||||||||||
| ASSETS: |
||||||||||||||||||||
| Investments, at cost |
$ | 724,147,126 | $ | 907,375,930 | $ | 1,674,467,981 | $ | 205,621,663 | $ | 3,388,479,471 | ||||||||||
| Investment in affiliates, at cost (Note 3) |
5,231,495 | 6,382,419 | 6,939,614 | 482,330 | 17,242,594 | |||||||||||||||
| Investments in securities, at value1,2 (Note 2) |
783,986,086 | 947,356,964 | 2,024,802,427 | 239,214,838 | 3,774,636,623 | |||||||||||||||
| Investment in affiliates, at value (Note 3) |
5,457,727 | 6,952,088 | 7,208,819 | 535,191 | 18,835,332 | |||||||||||||||
| Cash |
90,852 | 20,357 | 1,322,642 | 10,708 | 41,466 | |||||||||||||||
| Receivables: |
||||||||||||||||||||
| Investment securities sold |
— | 118,301 | — | — | — | |||||||||||||||
| Capital shares sold |
— | 3,613,403 | — | — | — | |||||||||||||||
| Dividends |
1,788,407 | 2,069,126 | 2,678,069 | 199,991 | 7,566,877 | |||||||||||||||
| Securities lending income |
— | 2,154 | 4,842 | 261 | 9,881 | |||||||||||||||
| Total Assets |
791,323,072 | 960,132,393 | 2,036,016,799 | 239,960,989 | 3,801,090,179 | |||||||||||||||
| LIABILITIES: |
||||||||||||||||||||
| Payables: |
||||||||||||||||||||
| Cash collateral received for securities loaned (Note 2) |
— | 2,952,420 | 561,537 | 56,980 | 66,221,701 | |||||||||||||||
| Investment securities purchased |
— | 3,607,612 | — | — | — | |||||||||||||||
| Advisory fees (Note 3) |
251,275 | 293,241 | 482,310 | 51,972 | 1,172,151 | |||||||||||||||
| Service fees (Note 2) |
2,929 | 3,422 | 7,603 | 883 | 13,640 | |||||||||||||||
| Total Liabilities |
254,204 | 6,856,695 | 1,051,450 | 109,835 | 67,407,492 | |||||||||||||||
| NET ASSETS |
$ | 791,068,868 | $ | 953,275,698 | $ | 2,034,965,349 | $ | 239,851,154 | $ | 3,733,682,687 | ||||||||||
| NET ASSETS: |
||||||||||||||||||||
| Paid-in capital |
$ | 772,034,748 | $ | 946,244,272 | $ | 1,721,988,007 | $ | 211,232,490 | $ | 3,468,305,602 | ||||||||||
| Total distributable earnings (loss) |
19,034,120 | 7,031,426 | 312,977,342 | 28,618,664 | 265,377,085 | |||||||||||||||
| NET ASSETS |
$ | 791,068,868 | $ | 953,275,698 | $ | 2,034,965,349 | $ | 239,851,154 | $ | 3,733,682,687 | ||||||||||
| Outstanding beneficial interest shares of $0.001 par value (unlimited number of shares authorized) |
9,250,000 | 13,150,000 | 21,600,000 | 7,550,000 | 104,400,000 | |||||||||||||||
| Net asset value per share |
$ | 85.52 | $ | 72.49 | $ | 94.21 | $ | 31.77 | $ | 35.76 | ||||||||||
| 1 Includes market value of securities out on loan of: |
— | $ | 3,014,863 | $ | 2,231,329 | $ | 152,284 | $ | 69,153,640 | |||||||||||
| 2 Investments in securities include investment of cash collateral for securities loaned (see Schedule of Investments for additional information). |
| |||||||||||||||||||
See Notes to Financial Statements.
| WisdomTree Trust | 109 |
Statements of Assets and Liabilities (continued)
WisdomTree Trust
March 31, 2019
| WisdomTree U.S. MidCap Fund |
WisdomTree U.S. Multifactor Fund |
WisdomTree U.S. Quality Dividend Growth Fund |
WisdomTree U.S. Quality Shareholder Yield Fund |
WisdomTree U.S. SmallCap Dividend Fund |
||||||||||||||||
| ASSETS: |
||||||||||||||||||||
| Investments, at cost |
$ | 950,183,888 | $ | 113,006,322 | $ | 2,372,390,940 | $ | 34,983,743 | $ | 2,088,628,765 | ||||||||||
| Investment in affiliates, at cost (Note 3) |
3,800,559 | — | — | — | 18,023,392 | |||||||||||||||
| Investments in securities, at value1,2 (Note 2) |
1,095,456,110 | 115,590,042 | 2,774,767,669 | 38,072,742 | 2,116,242,275 | |||||||||||||||
| Investment in affiliates, at value (Note 3) |
3,984,501 | — | — | — | 18,990,782 | |||||||||||||||
| Cash |
8,939 | 9,498 | 4,030,648 | 8,301 | 834,985 | |||||||||||||||
| Receivables: |
||||||||||||||||||||
| Dividends |
1,078,730 | 120,253 | 2,218,680 | 44,287 | 4,689,271 | |||||||||||||||
| Securities lending income |
4,614 | 385 | 1,241 | 14 | 89,458 | |||||||||||||||
| Total Assets |
1,100,532,894 | 115,720,178 | 2,781,018,238 | 38,125,344 | 2,140,846,771 | |||||||||||||||
| LIABILITIES: |
||||||||||||||||||||
| Payables: |
||||||||||||||||||||
| Cash collateral received for securities loaned (Note 2) |
1,864,173 | — | — | — | 52,465,765 | |||||||||||||||
| Investment securities purchased |
— | 1,215,899 | — | — | — | |||||||||||||||
| Advisory fees (Note 3) |
353,184 | 23,258 | 646,700 | 12,274 | 668,165 | |||||||||||||||
| Service fees (Note 2) |
4,101 | 366 | 10,162 | 143 | 7,802 | |||||||||||||||
| Total Liabilities |
2,221,458 | 1,239,523 | 656,862 | 12,417 | 53,141,732 | |||||||||||||||
| NET ASSETS |
$ | 1,098,311,436 | $ | 114,480,655 | $ | 2,780,361,376 | $ | 38,112,927 | $ | 2,087,705,039 | ||||||||||
| NET ASSETS: |
||||||||||||||||||||
| Paid-in capital |
$ | 1,066,333,842 | $ | 123,529,665 | $ | 2,469,476,042 | $ | 37,603,181 | $ | 2,173,795,294 | ||||||||||
| Total distributable earnings (loss) |
31,977,594 | (9,049,010 | ) | 310,885,334 | 509,746 | (86,090,255 | ) | |||||||||||||
| NET ASSETS |
$ | 1,098,311,436 | $ | 114,480,655 | $ | 2,780,361,376 | $ | 38,112,927 | $ | 2,087,705,039 | ||||||||||
| Outstanding beneficial interest shares of $0.001 par value (unlimited number of shares authorized) |
27,950,000 | 3,950,000 | 64,600,000 | 450,000 | 75,800,000 | |||||||||||||||
| Net asset value per share |
$ | 39.30 | $ | 28.98 | $ | 43.04 | $ | 84.70 | $ | 27.54 | ||||||||||
| 1 Includes market value of securities out on loan of: |
$ | 16,770,856 | — | $ | 3,679,773 | — | $ | 99,316,811 | ||||||||||||
| 2 Investments in securities include investment of cash collateral for securities loaned (see Schedule of Investments for additional information). |
| |||||||||||||||||||
See Notes to Financial Statements.
| 110 | WisdomTree Trust |
Statements of Assets and Liabilities (concluded)
WisdomTree Trust
March 31, 2019
| WisdomTree U.S. SmallCap Fund |
WisdomTree U.S. SmallCap Quality Dividend Growth Fund |
WisdomTree U.S. Total Dividend Fund |
WisdomTree U.S. Total Market Fund |
|||||||||||||
| ASSETS: |
||||||||||||||||
| Investments, at cost |
$ | 684,947,644 | $ | 111,889,929 | $ | 509,648,338 | $ | 96,130,287 | ||||||||
| Investment in affiliates, at cost (Note 3) |
1,436,142 | — | 1,289,374 | — | ||||||||||||
| Investments in securities, at value1,2 (Note 2) |
753,465,995 | 120,249,755 | 647,738,997 | 112,958,212 | ||||||||||||
| Investment in affiliates, at value (Note 3) |
1,433,943 | — | 1,355,082 | — | ||||||||||||
| Cash |
24,121 | 22,091 | 24,677 | 222,808 | ||||||||||||
| Receivables: |
||||||||||||||||
| Investment securities sold3 |
1,619,737 | — | — | — | ||||||||||||
| Capital shares sold |
— | — | — | 11,302,505 | ||||||||||||
| Dividends |
681,622 | 121,662 | 966,056 | 88,375 | ||||||||||||
| Securities lending income |
40,924 | 554 | 1,239 | 283 | ||||||||||||
| Total Assets |
757,266,342 | 120,394,062 | 650,086,051 | 124,572,183 | ||||||||||||
| LIABILITIES: |
||||||||||||||||
| Payables: |
||||||||||||||||
| Cash collateral received for securities loaned (Note 2) |
19,556,200 | 655,204 | 1,829,310 | 203,221 | ||||||||||||
| Investment securities purchased |
1,373,400 | — | — | 11,319,539 | ||||||||||||
| Advisory fees (Note 3) |
236,181 | 39,087 | 151,248 | 23,970 | ||||||||||||
| Service fees (Note 2) |
2,740 | 452 | 2,384 | 377 | ||||||||||||
| Total Liabilities |
21,168,521 | 694,743 | 1,982,942 | 11,547,107 | ||||||||||||
| NET ASSETS |
$ | 736,097,821 | $ | 119,699,319 | $ | 648,103,109 | $ | 113,025,076 | ||||||||
| NET ASSETS: |
||||||||||||||||
| Paid-in capital |
$ | 741,380,409 | $ | 131,279,865 | $ | 523,925,494 | $ | 100,787,673 | ||||||||
| Total distributable earnings (loss) |
(5,282,588 | ) | (11,580,546 | ) | 124,177,615 | 12,237,403 | ||||||||||
| NET ASSETS |
$ | 736,097,821 | $ | 119,699,319 | $ | 648,103,109 | $ | 113,025,076 | ||||||||
| Outstanding beneficial interest shares of $0.001 par value (unlimited number of shares authorized) |
20,400,000 | 3,450,000 | 6,850,000 | 3,500,000 | ||||||||||||
| Net asset value per share |
$ | 36.08 | $ | 34.70 | $ | 94.61 | $ | 32.29 | ||||||||
| 1 Includes market value of securities out on loan of: |
$ | 30,079,170 | $ | 805,812 | $ | 2,277,248 | $ | 416,084 | ||||||||
| 2 Investments in securities include investment of cash collateral for securities loaned (see Schedule of Investments for additional information). |
| |||||||||||||||
| 3 Includes market value of securities out on loan, which were sold and pending settlement, of: |
$ | 33,493 | — | — | — | |||||||||||
See Notes to Financial Statements.
| WisdomTree Trust | 111 |
WisdomTree Trust
For the Year Ended March 31, 2019
| WisdomTree U.S. Dividend ex-Financials Fund |
WisdomTree U.S. High Dividend Fund |
WisdomTree U.S. LargeCap Dividend Fund |
WisdomTree U.S. LargeCap Fund |
WisdomTree U.S. MidCap Dividend Fund |
||||||||||||||||
| INVESTMENT INCOME: |
||||||||||||||||||||
| Dividends1 |
$ | 30,596,071 | $ | 35,562,874 | $ | 59,260,238 | $ | 4,663,550 | $ | 88,067,270 | ||||||||||
| Dividends from affiliates (Note 3) |
83,326 | 121,537 | 156,080 | 33,947 | 300,036 | |||||||||||||||
| Non-cash dividends |
820,606 | 1,599,684 | 1,024,956 | — | 1,373,312 | |||||||||||||||
| Securities lending income (Note 2) |
21,494 | 58,237 | 50,239 | 4,677 | 608,016 | |||||||||||||||
| Total investment income |
31,521,497 | 37,342,332 | 60,491,513 | 4,702,174 | 90,348,634 | |||||||||||||||
| EXPENSES: |
||||||||||||||||||||
| Advisory fees (Note 3) |
3,032,755 | 3,608,729 | 5,514,528 | 588,799 | 12,602,713 | |||||||||||||||
| Service fees (Note 2) |
35,116 | 41,785 | 86,657 | 9,314 | 145,927 | |||||||||||||||
| Total expenses |
3,067,871 | 3,650,514 | 5,601,185 | 598,113 | 12,748,640 | |||||||||||||||
| Expense waivers (Note 3) |
(5,915 | ) | (10,351 | ) | (6,895 | ) | (1,118 | ) | (27,393 | ) | ||||||||||
| Net expenses |
3,061,956 | 3,640,163 | 5,594,290 | 596,995 | 12,721,247 | |||||||||||||||
| Net investment income |
28,459,541 | 33,702,169 | 54,897,223 | 4,105,179 | 77,627,387 | |||||||||||||||
| NET REALIZED AND UNREALIZED GAIN (LOSS) ON INVESTMENTS: |
||||||||||||||||||||
| Net realized gain (loss) from: |
||||||||||||||||||||
| Investment transactions |
(37,968,205 | ) | (32,105,853 | ) | (34,231,732 | ) | (5,074,624 | ) | (93,515,427 | ) | ||||||||||
| Investment transactions in affiliates (Note 3) |
(30,518 | ) | 10,817 | (574,350 | ) | (9,351 | ) | 1,019,836 | ||||||||||||
| In-kind redemptions |
28,735,083 | 50,156,892 | 86,947,042 | 12,909,935 | 92,191,616 | |||||||||||||||
| Net realized gain (loss) |
(9,263,640 | ) | 18,061,856 | 52,140,960 | 7,825,960 | (303,975 | ) | |||||||||||||
| Net increase (decrease) in unrealized appreciation/depreciation: |
||||||||||||||||||||
| Investment transactions |
17,425,122 | 40,169,006 | 77,790,304 | 1,098,654 | 147,285,061 | |||||||||||||||
| Investment transactions in affiliates (Note 3) |
208,868 | 490,903 | 269,205 | 53,394 | 1,676,878 | |||||||||||||||
| Net increase in unrealized appreciation/depreciation |
17,633,990 | 40,659,909 | 78,059,509 | 1,152,048 | 148,961,939 | |||||||||||||||
| Net realized and unrealized gain on investments |
8,370,350 | 58,721,765 | 130,200,469 | 8,978,008 | 148,657,964 | |||||||||||||||
| NET INCREASE IN NET ASSETS RESULTING FROM OPERATIONS |
$ | 36,829,891 | $ | 92,423,934 | $ | 185,097,692 | $ | 13,083,187 | $ | 226,285,351 | ||||||||||
| 1 Net of foreign withholding tax of: |
— | — | — | — | $ | 1,506 | ||||||||||||||
See Notes to Financial Statements.
| 112 | WisdomTree Trust |
Statements of Operations (continued)
WisdomTree Trust
For the Year Ended March 31, 2019
| WisdomTree U.S. MidCap Fund |
WisdomTree U.S. Multifactor Fund |
WisdomTree U.S. Quality Dividend Growth Fund |
WisdomTree U.S. Quality Shareholder Yield Fund |
WisdomTree U.S. SmallCap Dividend Fund |
||||||||||||||||
| INVESTMENT INCOME: |
||||||||||||||||||||
| Dividends1 |
$ | 18,144,628 | $ | 1,115,950 | $ | 61,338,713 | $ | 813,820 | $ | 58,937,855 | ||||||||||
| Dividends from affiliates (Note 3) |
79,588 | 1,325 | — | — | 281,329 | |||||||||||||||
| Non-cash dividends |
223,336 | — | — | — | 6,936,558 | |||||||||||||||
| Securities lending income (Note 2) |
466,686 | 7,150 | 53,997 | 2,616 | 1,970,767 | |||||||||||||||
| Total investment income |
18,914,238 | 1,124,425 | 61,392,710 | 816,436 | 68,126,509 | |||||||||||||||
| EXPENSES: |
||||||||||||||||||||
| Advisory fees (Note 3) |
4,179,065 | 162,383 | 6,579,577 | 146,999 | 7,869,001 | |||||||||||||||
| Service fees (Note 2) |
48,389 | 2,552 | 103,393 | 1,702 | 91,115 | |||||||||||||||
| Total expenses |
4,227,454 | 164,935 | 6,682,970 | 148,701 | 7,960,116 | |||||||||||||||
| Expense waivers (Note 3) |
(6,643 | ) | (72 | ) | — | — | (31,345 | ) | ||||||||||||
| Net expenses |
4,220,811 | 164,863 | 6,682,970 | 148,701 | 7,928,771 | |||||||||||||||
| Net investment income |
14,693,427 | 959,562 | 54,709,740 | 667,735 | 60,197,738 | |||||||||||||||
| NET REALIZED AND UNREALIZED GAIN (LOSS) ON INVESTMENTS: |
||||||||||||||||||||
| Net realized gain (loss) from: |
||||||||||||||||||||
| Investment transactions |
(88,817,242 | ) | (11,643,534 | ) | (87,803,790 | ) | (2,594,268 | ) | (46,132,123 | ) | ||||||||||
| Investment transactions in affiliates (Note 3) |
43,326 | 1,052 | — | — | (149,116 | ) | ||||||||||||||
| In-kind redemptions |
43,346,512 | 216,054 | 34,935,782 | 2,133,252 | 20,481,857 | |||||||||||||||
| Net realized loss |
(45,427,404 | ) | (11,426,428 | ) | (52,868,008 | ) | (461,016 | ) | (25,799,382 | ) | ||||||||||
| Net increase (decrease) in unrealized appreciation/depreciation: |
||||||||||||||||||||
| Investment transactions |
55,323,211 | 2,506,832 | 211,580,499 | 2,272,056 | 19,107,219 | |||||||||||||||
| Investment transactions in affiliates (Note 3) |
147,030 | — | — | — | 885,374 | |||||||||||||||
| Net increase in unrealized appreciation/depreciation |
55,470,241 | 2,506,832 | 211,580,499 | 2,272,056 | 19,992,593 | |||||||||||||||
| Net realized and unrealized gain (loss) on investments |
10,042,837 | (8,919,596 | ) | 158,712,491 | 1,811,040 | (5,806,789 | ) | |||||||||||||
| NET INCREASE (DECREASE) IN NET ASSETS RESULTING FROM OPERATIONS |
$ | 24,736,264 | $ | (7,960,034 | ) | $ | 213,422,231 | $ | 2,478,775 | $ | 54,390,949 | |||||||||
| 1 Net of foreign withholding tax of: |
$ | 5,523 | — | — | — | $ | 284 | |||||||||||||
See Notes to Financial Statements.
| WisdomTree Trust | 113 |
Statements of Operations (concluded)
WisdomTree Trust
For the Year Ended March 31, 2019
| WisdomTree U.S. SmallCap Fund |
WisdomTree U.S. SmallCap Quality Dividend Growth Fund |
WisdomTree U.S. Total Dividend Fund |
WisdomTree U.S. Total Market Fund |
|||||||||||||
| INVESTMENT INCOME: |
||||||||||||||||
| Dividends1 |
$ | 11,986,811 | $ | 3,065,769 | $ | 18,011,094 | $ | 1,705,157 | ||||||||
| Dividends from affiliates (Note 3) |
22,164 | — | 34,694 | — | ||||||||||||
| Non-cash dividends |
978,410 | 61,639 | 485,567 | 6,587 | ||||||||||||
| Securities lending income (Note 2) |
617,286 | 55,779 | 29,374 | 5,510 | ||||||||||||
| Total investment income |
13,604,671 | 3,183,187 | 18,560,729 | 1,717,254 | ||||||||||||
| EXPENSES: |
||||||||||||||||
| Advisory fees (Note 3) |
2,658,288 | 423,622 | 1,694,647 | 220,942 | ||||||||||||
| Service fees (Note 2) |
30,780 | 4,905 | 26,630 | 3,472 | ||||||||||||
| Total expenses |
2,689,068 | 428,527 | 1,721,277 | 224,414 | ||||||||||||
| Expense waivers (Note 3) |
(1,520 | ) | — | (1,979 | ) | — | ||||||||||
| Net expenses |
2,687,548 | 428,527 | 1,719,298 | 224,414 | ||||||||||||
| Net investment income |
10,917,123 | 2,754,660 | 16,841,431 | 1,492,840 | ||||||||||||
| NET REALIZED AND UNREALIZED GAIN (LOSS) ON INVESTMENTS: |
||||||||||||||||
| Net realized gain (loss) from: |
||||||||||||||||
| Investment transactions |
(48,830,073 | ) | (11,507,384 | ) | (12,203,522 | ) | (4,548,850 | ) | ||||||||
| Investment transactions in affiliates (Note 3) |
(146,831 | ) | — | (114,228 | ) | — | ||||||||||
| In-kind redemptions |
28,071,418 | 4,514,280 | 18,710,771 | 3,516,148 | ||||||||||||
| Net realized gain (loss) |
(20,905,486 | ) | (6,993,104 | ) | 6,393,021 | (1,032,702 | ) | |||||||||
| Net increase (decrease) in unrealized appreciation/depreciation: |
||||||||||||||||
| Investment transactions |
17,707,810 | 7,710,228 | 29,177,598 | 4,233,368 | ||||||||||||
| Investment transactions in affiliates (Note 3) |
(75,744 | ) | — | 64,955 | — | |||||||||||
| Net increase in unrealized appreciation/depreciation |
17,632,066 | 7,710,228 | 29,242,553 | 4,233,368 | ||||||||||||
| Net realized and unrealized gain (loss) on investments |
(3,273,420 | ) | 717,124 | 35,635,574 | 3,200,666 | |||||||||||
| NET INCREASE IN NET ASSETS RESULTING FROM OPERATIONS |
$ | 7,643,703 | $ | 3,471,784 | $ | 52,477,005 | $ | 4,693,506 | ||||||||
| 1 Net of foreign withholding tax of: |
$ | 2,323 | — | — | $ | 43 | ||||||||||
See Notes to Financial Statements.
| 114 | WisdomTree Trust |
Statements of Changes in Net Assets
WisdomTree Trust
| WisdomTree U.S. Dividend ex-Financials Fund |
WisdomTree U.S. High Dividend Fund |
WisdomTree U.S. LargeCap Dividend Fund |
||||||||||||||||||||||
| For the Year Ended March 31, 2019 |
For the Year Ended March 31, 2018 |
For the Year Ended March 31, 2019 |
For the Year Ended March 31, 2018 |
For the Year Ended March 31, 2019 |
For the Year Ended March 31, 2018 |
|||||||||||||||||||
| INCREASE (DECREASE) IN NET ASSETS RESULTING FROM OPERATIONS: |
| |||||||||||||||||||||||
| Net investment income |
$ | 28,459,541 | $ | 28,114,605 | $ | 33,702,169 | $ | 38,363,082 | $ | 54,897,223 | $ | 50,203,846 | ||||||||||||
| Net realized gain (loss) on investments |
(9,263,640 | ) | 68,089,943 | 18,061,856 | 97,944,451 | 52,140,960 | 106,057,521 | |||||||||||||||||
| Net increase (decrease) in unrealized appreciation/depreciation on investments |
17,633,990 | (45,889,978 | ) | 40,659,909 | (97,797,886 | ) | 78,059,509 | 22,735,417 | ||||||||||||||||
| Net increase in net assets resulting from operations |
36,829,891 | 50,314,570 | 92,423,934 | 38,509,647 | 185,097,692 | 178,996,784 | ||||||||||||||||||
| DISTRIBUTIONS TO SHAREHOLDERS1: |
||||||||||||||||||||||||
| Distributable earnings |
(27,973,156 | ) | (28,141,027 | ) | (32,229,868 | ) | (38,366,808 | ) | (53,410,696 | ) | (49,979,017 | ) | ||||||||||||
| CAPITAL SHARE TRANSACTIONS: |
||||||||||||||||||||||||
| Net proceeds from sale of shares |
97,756,088 | — | 166,962,552 | 107,537,497 | 234,835,743 | 65,734,319 | ||||||||||||||||||
| Cost of shares redeemed |
(126,053,661 | ) | (115,015,958 | ) | (309,176,101 | ) | (335,753,622 | ) | (265,109,065 | ) | (201,532,333 | ) | ||||||||||||
| Net decrease in net assets resulting from capital share transactions |
(28,297,573 | ) | (115,015,958 | ) | (142,213,549 | ) | (228,216,125 | ) | (30,273,322 | ) | (135,798,014 | ) | ||||||||||||
| Net Increase (Decrease) in Net Assets |
(19,440,838 | ) | (92,842,415 | ) | (82,019,483 | ) | (228,073,286 | ) | 101,413,674 | (6,780,247 | ) | |||||||||||||
| NET ASSETS: |
||||||||||||||||||||||||
| Beginning of year |
$ | 810,509,706 | $ | 903,352,121 | $ | 1,035,295,181 | $ | 1,263,368,467 | $ | 1,933,551,675 | $ | 1,940,331,922 | ||||||||||||
| End of year2 |
$ | 791,068,868 | $ | 810,509,706 | $ | 953,275,698 | $ | 1,035,295,181 | $ | 2,034,965,349 | $ | 1,933,551,675 | ||||||||||||
| SHARES CREATED AND REDEEMED: |
||||||||||||||||||||||||
| Shares outstanding, beginning of year |
9,600,000 | 10,950,000 | 15,200,000 | 18,450,000 | 21,850,000 | 23,400,000 | ||||||||||||||||||
| Shares created |
1,250,000 | — | 2,500,000 | 1,500,000 | 2,750,000 | 750,000 | ||||||||||||||||||
| Shares redeemed |
(1,600,000 | ) | (1,350,000 | ) | (4,550,000 | ) | (4,750,000 | ) | (3,000,000 | ) | (2,300,000 | ) | ||||||||||||
| Shares outstanding, end of year |
9,250,000 | 9,600,000 | 13,150,000 | 15,200,000 | 21,600,000 | 21,850,000 | ||||||||||||||||||
| 1 Amounts for the fiscal year ended March 31, 2018 have been reclassified to match the current fiscal year presentation which conforms to the “Disclosure Update and Simplification” amendments adopted by the SEC and which became effective November 5, 2018. The amounts shown for the fiscal year ended March 31, 2018 represents a distribution entirely from net investment income. See Note 7 in the Notes to Financial Statements for more information. |
| |||||||||||||||||||||||
| 2 The “Disclosure Update and Simplification” amendments adopted by the SEC removed the requirement to disclose the amounts pertaining to undistributed (distributions in excess of) net investment income included in net assets for the current fiscal year ended March 31, 2019. The undistributed (distributions in excess of) net investment income included in the net assets for the fiscal year ended March 31, 2018 were as follows: |
| |||||||||||||||||||||||
| Undistributed(Distributions in excess of) net investment income included in the net assets |
$ | — | $ | (1,168 | ) | $ | 224,829 | |||||||||||||||||
See Notes to Financial Statements.
| WisdomTree Trust | 115 |
Statements of Changes in Net Assets (continued)
WisdomTree Trust
| WisdomTree U.S. LargeCap Fund |
WisdomTree U.S. MidCap Dividend Fund |
WisdomTree U.S. MidCap Fund |
||||||||||||||||||||||
| For the Year Ended March 31, 2019 |
For the Year Ended March 31, 2018 |
For the Year Ended March 31, 2019 |
For the Year Ended March 31, 2018 |
For the Year Ended March 31, 2019 |
For the Year Ended March 31, 2018 |
|||||||||||||||||||
| INCREASE (DECREASE) IN NET ASSETS RESULTING FROM OPERATIONS: |
| |||||||||||||||||||||||
| Net investment income |
$ | 4,105,179 | $ | 2,760,132 | $ | 77,627,387 | $ | 67,562,271 | $ | 14,693,427 | $ | 11,328,673 | ||||||||||||
| Net realized gain (loss) on investments |
7,825,960 | 5,573,933 | (303,975 | ) | 151,602,232 | (45,427,404 | ) | 79,550,348 | ||||||||||||||||
| Net increase (decrease) in unrealized appreciation/depreciation on investments |
1,152,048 | 8,714,316 | 148,961,939 | (11,367,758 | ) | 55,470,241 | (2,203,034 | ) | ||||||||||||||||
| Net increase in net assets resulting from operations |
13,083,187 | 17,048,381 | 226,285,351 | 207,796,745 | 24,736,264 | 88,675,987 | ||||||||||||||||||
| DISTRIBUTIONS TO SHAREHOLDERS2: |
||||||||||||||||||||||||
| Distributable earnings |
(4,134,218 | ) | (2,586,608 | ) | (73,682,291 | ) | (66,312,628 | ) | (15,362,214 | ) | (10,100,147 | ) | ||||||||||||
| CAPITAL SHARE TRANSACTIONS: |
||||||||||||||||||||||||
| Net proceeds from sale of shares |
84,643,974 | 41,622,216 | 840,413,736 | 517,345,920 | 223,804,927 | 265,962,766 | ||||||||||||||||||
| Cost of shares redeemed |
(38,554,537 | ) | (1,525,680 | ) | (323,811,148 | ) | (416,912,058 | ) | (170,031,971 | ) | (104,207,220 | ) | ||||||||||||
| Payment by sub-advisor |
— | — | — | — | — | 621 | ||||||||||||||||||
| Net increase in net assets resulting from capital share transactions |
46,089,437 | 40,096,536 | 516,602,588 | 100,433,862 | 53,772,956 | 161,756,167 | ||||||||||||||||||
| Net Increase in Net Assets |
55,038,406 | 54,558,309 | 669,205,648 | 241,917,979 | 63,147,006 | 240,332,007 | ||||||||||||||||||
| NET ASSETS: |
||||||||||||||||||||||||
| Beginning of year |
$ | 184,812,748 | $ | 130,254,439 | $ | 3,064,477,039 | $ | 2,822,559,060 | $ | 1,035,164,430 | $ | 794,832,423 | ||||||||||||
| End of year3 |
$ | 239,851,154 | $ | 184,812,748 | $ | 3,733,682,687 | $ | 3,064,477,039 | $ | 1,098,311,436 | $ | 1,035,164,430 | ||||||||||||
| SHARES CREATED AND REDEEMED: |
||||||||||||||||||||||||
| Shares outstanding, beginning of year |
6,100,000 | 4,800,000 | 1 | 89,850,000 | 86,850,000 | 1 | 26,800,000 | 22,550,000 | ||||||||||||||||
| Shares created |
2,800,000 | 1,350,000 | 1 | 24,500,000 | 15,200,000 | 1 | 6,000,000 | 6,900,000 | ||||||||||||||||
| Shares redeemed |
(1,350,000 | ) | (50,000 | )1 | (9,950,000 | ) | (12,200,000 | )1 | (4,850,000 | ) | (2,650,000 | ) | ||||||||||||
| Shares outstanding, end of year |
7,550,000 | 6,100,000 | 1 | 104,400,000 | 89,850,000 | 1 | 27,950,000 | 26,800,000 | ||||||||||||||||
| 1 Shares were adjusted to reflect a 3:1 stock split effective November 10, 2017. |
| |||||||||||||||||||||||
| 2 Amounts for the fiscal year ended March 31, 2018 have been reclassified to match the current fiscal year presentation which conforms to the “Disclosure Update and Simplification” amendments adopted by the SEC and which became effective November 5, 2018. The amounts shown for the fiscal year ended March 31, 2018 represents a distribution entirely from net investment income. See Note 7 in the Notes to Financial Statements for more information. |
| |||||||||||||||||||||||
| 3 The “Disclosure Update and Simplification” amendments adopted by the SEC removed the requirement to disclose the amounts pertaining to undistributed (distributions in excess of) net investment income included in net assets for the current fiscal year ended March 31, 2019. The undistributed net investment income included in the net assets for the fiscal year ended March 31, 2018 were as follows: |
| |||||||||||||||||||||||
| Undistributednet investment income included in the net assets |
$ | 171,084 | $ | 1,247,018 | $ | 1,228,287 | ||||||||||||||||||
See Notes to Financial Statements.
| 116 | WisdomTree Trust |
Statements of Changes in Net Assets (continued)
WisdomTree Trust
| WisdomTree U.S. Multifactor Fund |
WisdomTree U.S. Quality Dividend Growth Fund |
WisdomTree U.S. Quality Shareholder Yield Fund |
||||||||||||||||||||||
| For the Year Ended March 31, 2019 |
For the Period June 29, 2017* through March 31, 2018 |
For the Year Ended March 31, 2019 |
For the Year Ended March 31, 2018 |
For the Year Ended March 31, 2019 |
For the Year Ended March 31, 2018 |
|||||||||||||||||||
| INCREASE (DECREASE) IN NET ASSETS RESULTING FROM OPERATIONS: |
|
|||||||||||||||||||||||
| Net investment income |
$ | 959,562 | $ | 41,000 | $ | 54,709,740 | $ | 34,389,062 | $ | 667,735 | $ | 669,721 | ||||||||||||
| Net realized gain (loss) on investments |
(11,426,428 | ) | 211,928 | (52,868,008 | ) | 135,463,606 | (461,016 | ) | 8,337,573 | |||||||||||||||
| Net increase (decrease) in unrealized appreciation/depreciation on investments |
2,506,832 | 76,888 | 211,580,499 | 59,521,255 | 2,272,056 | (2,235,918 | ) | |||||||||||||||||
| Net increase (decrease) in net assets resulting from operations |
(7,960,034 | ) | 329,816 | 213,422,231 | 229,373,923 | 2,478,775 | 6,771,376 | |||||||||||||||||
| DISTRIBUTIONS TO SHAREHOLDERS1: |
||||||||||||||||||||||||
| Distributable earnings |
(905,199 | ) | (35,735 | ) | (54,505,786 | ) | (34,344,320 | ) | (676,737 | ) | (642,537 | ) | ||||||||||||
| CAPITAL SHARE TRANSACTIONS: |
||||||||||||||||||||||||
| Net proceeds from sale of shares |
204,488,667 | 8,103,820 | 813,059,228 | 1,022,866,864 | 7,819,793 | — | ||||||||||||||||||
| Cost of shares redeemed |
(86,725,156 | ) | (2,815,624 | ) | (255,919,617 | ) | (444,009,619 | ) | (15,975,374 | ) | (21,380,227 | ) | ||||||||||||
| Payment by sub-advisor |
— | — | — | 1,034 | — | — | ||||||||||||||||||
| Net increase (decrease) in net assets resulting from capital share transactions |
117,763,511 | 5,288,196 | 557,139,611 | 578,858,279 | (8,155,581 | ) | (21,380,227 | ) | ||||||||||||||||
| Net Increase (Decrease) in Net Assets |
108,898,278 | 5,582,277 | 716,056,056 | 773,887,882 | (6,353,543 | ) | (15,251,388 | ) | ||||||||||||||||
| NET ASSETS: |
||||||||||||||||||||||||
| Beginning of period |
$ | 5,582,377 | $ | 100 | $ | 2,064,305,320 | $ | 1,290,417,438 | $ | 44,466,470 | $ | 59,717,858 | ||||||||||||
| End of period2 |
$ | 114,480,655 | $ | 5,582,377 | $ | 2,780,361,376 | $ | 2,064,305,320 | $ | 38,112,927 | $ | 44,466,470 | ||||||||||||
| SHARES CREATED AND REDEEMED: |
||||||||||||||||||||||||
| Shares outstanding, beginning of period |
200,000 | 4 | 51,200,000 | 36,400,000 | 550,000 | 850,000 | ||||||||||||||||||
| Shares created |
6,900,000 | 300,000 | 20,200,000 | 25,950,000 | 100,000 | — | ||||||||||||||||||
| Shares redeemed |
(3,150,000 | ) | (100,004 | ) | (6,800,000 | ) | (11,150,000 | ) | (200,000 | ) | (300,000 | ) | ||||||||||||
| Shares outstanding, end of period |
3,950,000 | 200,000 | 64,600,000 | 51,200,000 | 450,000 | 550,000 | ||||||||||||||||||
| * Commencement of operations. |
||||||||||||||||||||||||
| 1 Amounts for the fiscal year or period ended March 31, 2018 have been reclassified to match the current fiscal year presentation which conforms to the “Disclosure Update and Simplification” amendments adopted by the SEC and which became effective November 5, 2018. The amounts shown for the fiscal year or period ended March 31, 2018 represents a distribution entirely from net investment income. See Note 7 in the Notes to Financial Statements for more information. |
| |||||||||||||||||||||||
| 2 The “Disclosure Update and Simplification” amendments adopted by the SEC removed the requirement to disclose the amounts pertaining to undistributed (distributions in excess of) net investment income included in net assets for the current fiscal year ended March 31, 2019. The undistributed net investment income included in the net assets for the fiscal year or period ended March 31, 2018 were as follows: |
| |||||||||||||||||||||||
| Undistributednet investment income included in the net assets |
$ | 5,315 | $ | 480,177 | $ | 27,184 | ||||||||||||||||||
See Notes to Financial Statements.
| WisdomTree Trust | 117 |
Statements of Changes in Net Assets (continued)
WisdomTree Trust
| WisdomTree U.S. SmallCap Dividend Fund |
WisdomTree U.S. SmallCap Fund |
WisdomTree U.S. SmallCap Quality Dividend Growth Fund |
||||||||||||||||||||||
| For the Year Ended March 31, 2019 |
For the Year Ended March 31, 2018 |
For the Year Ended March 31, 2019 |
For the Year Ended March 31, 2018 |
For the Year Ended March 31, 2019 |
For the Year Ended March 31, 2018 |
|||||||||||||||||||
| INCREASE (DECREASE) IN NET ASSETS RESULTING FROM OPERATIONS: |
|
|||||||||||||||||||||||
| Net investment income |
$ | 60,197,738 | $ | 58,231,812 | $ | 10,917,123 | $ | 5,688,283 | $ | 2,754,660 | $ | 2,294,545 | ||||||||||||
| Net realized gain (loss) on investments |
(25,799,382 | ) | 166,312,516 | (20,905,486 | ) | 45,082,430 | (6,993,104 | ) | 6,643,829 | |||||||||||||||
| Net increase (decrease) in unrealized appreciation/depreciation on investments |
19,992,593 | (128,397,813 | ) | 17,632,066 | 7,485,991 | 7,710,228 | (2,756,291 | ) | ||||||||||||||||
| Net increase in net assets resulting from operations |
54,390,949 | 96,146,515 | 7,643,703 | 58,256,704 | 3,471,784 | 6,182,083 | ||||||||||||||||||
| DISTRIBUTIONS TO SHAREHOLDERS2: |
||||||||||||||||||||||||
| Distributable earnings |
(57,474,162 | ) | (57,037,610 | ) | (10,921,376 | ) | (5,289,781 | ) | (2,704,131 | ) | (2,305,555 | ) | ||||||||||||
| CAPITAL SHARE TRANSACTIONS: |
||||||||||||||||||||||||
| Net proceeds from sale of shares |
224,869,870 | 319,890,735 | 235,765,480 | 114,044,143 | 53,170,662 | 38,327,495 | ||||||||||||||||||
| Cost of shares redeemed |
(99,358,936 | ) | (369,197,048 | ) | (85,389,190 | ) | (68,383,642 | ) | (35,299,166 | ) | (43,641,576 | ) | ||||||||||||
| Payment by sub-advisor |
— | 1,245 | — | 2,213 | — | — | ||||||||||||||||||
| Net increase (decrease) in net assets resulting from capital share transactions |
125,510,934 | (49,305,068 | ) | 150,376,290 | 45,662,714 | 17,871,496 | (5,314,081 | ) | ||||||||||||||||
| Net Increase (Decrease) in Net Assets |
122,427,721 | (10,196,163 | ) | 147,098,617 | 98,629,637 | 18,639,149 | (1,437,553 | ) | ||||||||||||||||
| NET ASSETS: |
||||||||||||||||||||||||
| Beginning of year |
$ | 1,965,277,318 | $ | 1,975,473,481 | $ | 588,999,204 | $ | 490,369,567 | $ | 101,060,170 | $ | 102,497,723 | ||||||||||||
| End of year3 |
$ | 2,087,705,039 | $ | 1,965,277,318 | $ | 736,097,821 | $ | 588,999,204 | $ | 119,699,319 | $ | 101,060,170 | ||||||||||||
| SHARES CREATED AND REDEEMED: |
||||||||||||||||||||||||
| Shares outstanding, beginning of year |
71,650,000 | 73,500,000 | 1 | 16,500,000 | 15,250,000 | 2,950,000 | 3,100,000 | |||||||||||||||||
| Shares created |
7,800,000 | 11,300,000 | 1 | 6,500,000 | 3,200,000 | 1,600,000 | 1,100,000 | |||||||||||||||||
| Shares redeemed |
(3,650,000 | ) | (13,150,000 | )1 | (2,600,000 | ) | (1,950,000 | ) | (1,100,000 | ) | (1,250,000 | ) | ||||||||||||
| Shares outstanding, end of year |
75,800,000 | 71,650,000 | 1 | 20,400,000 | 16,500,000 | 3,450,000 | 2,950,000 | |||||||||||||||||
| 1 Shares were adjusted to reflect a 3:1 stock split effective November 10, 2017. |
| |||||||||||||||||||||||
| 2 Amounts for the fiscal year ended March 31, 2018 have been reclassified to match the current fiscal year presentation which conforms to the “Disclosure Update and Simplification” amendments adopted by the SEC and which became effective November 5, 2018. The amounts shown for the fiscal year ended March 31, 2018 represents a distribution entirely from net investment income. See Note 7 in the Notes to Financial Statements for more information. |
| |||||||||||||||||||||||
| 3 The “Disclosure Update and Simplification” amendments adopted by the SEC removed the requirement to disclose the amounts pertaining to undistributed (distributions in excess of) net investment income included in net assets for the current fiscal year ended March 31, 2019. The undistributed net investment income included in the net assets for the fiscal year ended March 31, 2018 were as follows: |
| |||||||||||||||||||||||
| Undistributednet investment income included in the net assets |
$ | 1,179,069 | $ | 377,733 | $ | 36,508 | ||||||||||||||||||
See Notes to Financial Statements.
| 118 | WisdomTree Trust |
Statements of Changes in Net Assets (concluded)
WisdomTree Trust
| WisdomTree U.S. Total Dividend Fund |
WisdomTree U.S. Total Market Fund |
|||||||||||||||
| For the Year Ended March 31, 2019 |
For the Year Ended March 31, 2018 |
For the Year Ended March 31, 2019 |
For the Year Ended March 31, 2018 |
|||||||||||||
| INCREASE (DECREASE) IN NET ASSETS RESULTING FROM OPERATIONS: |
|
|||||||||||||||
| Net investment income |
$ | 16,841,431 | $ | 15,428,675 | $ | 1,492,840 | $ | 1,170,571 | ||||||||
| Net realized gain (loss) on investments |
6,393,021 | 39,340,204 | (1,032,702 | ) | 5,272,800 | |||||||||||
| Net increase (decrease) in unrealized appreciation/depreciation on investments |
29,242,553 | (4,054,877 | ) | 4,233,368 | 1,491,776 | |||||||||||
| Net increase in net assets resulting from operations |
52,477,005 | 50,714,002 | 4,693,506 | 7,935,147 | ||||||||||||
| DISTRIBUTIONS TO SHAREHOLDERS2: |
||||||||||||||||
| Distributable earnings |
(16,303,635 | ) | (15,363,975 | ) | (1,733,962 | ) | (1,103,114 | ) | ||||||||
| CAPITAL SHARE TRANSACTIONS: |
||||||||||||||||
| Net proceeds from sale of shares |
76,547,498 | 30,667,395 | 51,103,813 | 4,955,325 | ||||||||||||
| Cost of shares redeemed |
(43,849,267 | ) | (58,290,258 | ) | (10,984,580 | ) | (4,595,880 | ) | ||||||||
| Payment by sub-advisor |
— | 662 | — | — | ||||||||||||
| Net increase (decrease) in net assets resulting from capital share transactions |
32,698,231 | (27,622,201 | ) | 40,119,233 | 359,445 | |||||||||||
| Net Increase in Net Assets |
68,871,601 | 7,727,826 | 43,078,777 | 7,191,478 | ||||||||||||
| NET ASSETS: |
||||||||||||||||
| Beginning of year |
$ | 579,231,508 | $ | 571,503,682 | $ | 69,946,299 | $ | 62,754,821 | ||||||||
| End of year3 |
$ | 648,103,109 | $ | 579,231,508 | $ | 113,025,076 | $ | 69,946,299 | ||||||||
| SHARES CREATED AND REDEEMED: |
||||||||||||||||
| Shares outstanding, beginning of year |
6,500,000 | 6,800,000 | 2,250,000 | 2,250,000 | 1 | |||||||||||
| Shares created |
850,000 | 350,000 | 1,600,000 | 150,000 | 1 | |||||||||||
| Shares redeemed |
(500,000 | ) | (650,000 | ) | (350,000 | ) | (150,000 | )1 | ||||||||
| Shares outstanding, end of year |
6,850,000 | 6,500,000 | 3,500,000 | 2,250,000 | 1 | |||||||||||
| 1 Shares were adjusted to reflect a 3:1 stock split effective November 10, 2017. |
| |||||||||||||||
| 2 Amounts for the fiscal year ended March 31, 2018 have been reclassified to match the current fiscal year presentation which conforms to the “Disclosure Update and Simplification” amendments adopted by the SEC and which became effective November 5, 2018. The amounts shown for the fiscal year ended March 31, 2018 represents a distribution entirely from net investment income. See Note 7 in the Notes to Financial Statements for more information. |
| |||||||||||||||
| 3 The “Disclosure Update and Simplification” amendments adopted by the SEC removed the requirement to disclose the amounts pertaining to undistributed (distributions in excess of) net investment income included in net assets for the current fiscal year ended March 31, 2019. The undistributed net investment income included in the net assets for the fiscal year ended March 31, 2018 were as follows: |
| |||||||||||||||
| Undistributednet investment income included in the net assets |
$ | 60,597 | $ | 66,563 | ||||||||||||
See Notes to Financial Statements.
| WisdomTree Trust | 119 |
WisdomTree Trust
Selected data for a share of beneficial interest outstanding throughout the period is presented below:
| WisdomTree U.S. Dividend ex-Financials Fund | For the Year Ended March 31, 2019 |
For the Year Ended March 31, 2018 |
For the Year Ended March 31, 2017 |
For the Year Ended March 31, 2016 |
For the Year Ended March 31, 2015 |
|||||||||||||||
| Net asset value, beginning of year |
$ | 84.43 | $ | 82.50 | $ | 75.41 | $ | 75.82 | $ | 70.27 | ||||||||||
| Investment operations: |
| |||||||||||||||||||
| Net investment income1 |
3.06 | 2.73 | 2.52 | 2.46 | 2.47 | |||||||||||||||
| Net realized and unrealized gain (loss) |
1.05 | 1.96 | 7.31 | (0.38 | ) | 5.38 | ||||||||||||||
| Total from investment operations |
4.11 | 4.69 | 9.83 | 2.08 | 7.85 | |||||||||||||||
| Dividends and distributions to shareholders: |
| |||||||||||||||||||
| Net investment income |
(2.96 | ) | (2.76 | ) | (2.69 | ) | (2.49 | ) | (2.30 | ) | ||||||||||
| Capital gains |
(0.06 | ) | — | — | — | — | ||||||||||||||
| Return of capital |
— | — | (0.05 | ) | — | — | ||||||||||||||
| Total dividends and distributions to shareholders |
(3.02 | ) | (2.76 | ) | (2.74 | ) | (2.49 | ) | (2.30 | ) | ||||||||||
| Net asset value, end of year |
$ | 85.52 | $ | 84.43 | $ | 82.50 | $ | 75.41 | $ | 75.82 | ||||||||||
| TOTAL RETURN2 |
4.99 | % | 5.71 | % | 13.27 | % | 2.96 | % | 11.27 | % | ||||||||||
| RATIOS/SUPPLEMENTAL DATA: |
| |||||||||||||||||||
| Net assets, end of year (000’s omitted) |
$ | 791,069 | $ | 810,510 | $ | 903,352 | $ | 916,193 | $ | 1,250,987 | ||||||||||
| Ratios to average net assets3 of: |
| |||||||||||||||||||
| Expenses4 |
0.38 | % | 0.38 | % | 0.38 | % | 0.38 | % | 0.39 | %5 | ||||||||||
| Net investment income |
3.57 | % | 3.22 | % | 3.21 | % | 3.39 | % | 3.34 | % | ||||||||||
| Portfolio turnover rate6 |
32 | % | 34 | % | 33 | % | 32 | % | 32 | % | ||||||||||
| WisdomTree U.S. High Dividend Fund | For the Year Ended March 31, 2019 |
For the Year Ended March 31, 2018 |
For the Year Ended March 31, 2017 |
For the Year Ended March 31, 2016 |
For the Year Ended March 31, 2015 |
|||||||||||||||
| Net asset value, beginning of year |
$ | 68.11 | $ | 68.48 | $ | 63.29 | $ | 60.74 | $ | 56.57 | ||||||||||
| Investment operations: |
| |||||||||||||||||||
| Net investment income1 |
2.49 | 2.21 | 2.10 | 2.10 | 1.95 | |||||||||||||||
| Net realized and unrealized gain (loss) |
4.28 | (0.34 | ) | 5.39 | 2.50 | 4.03 | ||||||||||||||
| Total from investment operations |
6.77 | 1.87 | 7.49 | 4.60 | 5.98 | |||||||||||||||
| Dividends to shareholders: |
| |||||||||||||||||||
| Net investment income |
(2.39 | ) | (2.24 | ) | (2.30 | ) | (2.05 | ) | (1.81 | ) | ||||||||||
| Net asset value, end of year |
$ | 72.49 | $ | 68.11 | $ | 68.48 | $ | 63.29 | $ | 60.74 | ||||||||||
| TOTAL RETURN2 |
10.15 | % | 2.69 | % | 12.02 | % | 7.88 | % | 10.64 | % | ||||||||||
| RATIOS/SUPPLEMENTAL DATA: |
| |||||||||||||||||||
| Net assets, end of year (000’s omitted) |
$ | 953,276 | $ | 1,035,295 | $ | 1,263,368 | $ | 1,025,362 | $ | 1,059,849 | ||||||||||
| Ratios to average net assets3 of: |
| |||||||||||||||||||
| Expenses4 |
0.38 | % | 0.38 | %7 | 0.38 | %7 | 0.38 | %7 | 0.39 | %8 | ||||||||||
| Net investment income |
3.55 | % | 3.17 | % | 3.17 | % | 3.53 | % | 3.25 | % | ||||||||||
| Portfolio turnover rate6 |
20 | % | 17 | % | 23 | % | 20 | % | 27 | % | ||||||||||
| 1 | Based on average shares outstanding. |
| 2 | Total return is calculated assuming an initial investment made at the net asset value at the beginning of the period, reinvestment of all dividends and distributions at net asset value during the period and redemption on the last day of the period. For the periods in which the investment advisor waived advisory fees, the total return would have been lower if certain expenses had not been waived (Notes 2 and 3). |
| 3 | The ratios to average net assets do not include net investment income (loss) or expenses of other funds in which the Fund invests. |
| 4 | The expense ratio includes investment advisory fee waivers. Without these investment advisory fee waivers, the expense ratio would have been unchanged. |
| 5 | Included in the expense ratio are proxy expenses. Without these proxy expenses, the expense ratio would have been 0.38%. |
| 6 | Portfolio turnover rate is not annualized and excludes the value of the portfolio securities received or delivered as a result of in-kind creations or redemptions of the Fund’s capital shares. Short-term securities with maturities less than or equal to 365 days are excluded from the portfolio turnover calculation. |
| 7 | Included in the expense ratio are legal expenses. Without these legal expenses, the annualized expense ratio would have been unchanged. |
| 8 | Included in the expense ratio are proxy and legal expenses. Without these proxy and legal expenses, the expense ratio would have been 0.38%. |
See Notes to Financial Statements.
| 120 | WisdomTree Trust |
Financial Highlights (continued)
WisdomTree Trust
Selected data for a share of beneficial interest outstanding throughout the period is presented below:
| WisdomTree U.S. LargeCap Dividend Fund | For the Year Ended March 31, 2019 |
For the Year Ended March 31, 2018 |
For the Year Ended March 31, 2017 |
For the Year Ended March 31, 2016 |
For the Year Ended March 31, 2015 |
|||||||||||||||
| Net asset value, beginning of year |
$ | 88.49 | $ | 82.92 | $ | 73.42 | $ | 73.27 | $ | 67.60 | ||||||||||
| Investment operations: |
| |||||||||||||||||||
| Net investment income1 |
2.54 | 2.22 | 2.04 | 2.01 | 1.86 | |||||||||||||||
| Net realized and unrealized gain |
5.66 | 5.57 | 9.63 | 0.13 | 5.59 | |||||||||||||||
| Total from investment operations |
8.20 | 7.79 | 11.67 | 2.14 | 7.45 | |||||||||||||||
| Dividends to shareholders: |
| |||||||||||||||||||
| Net investment income |
(2.48 | ) | (2.22 | ) | (2.17 | ) | (1.99 | ) | (1.78 | ) | ||||||||||
| Net asset value, end of year |
$ | 94.21 | $ | 88.49 | $ | 82.92 | $ | 73.42 | $ | 73.27 | ||||||||||
| TOTAL RETURN2 |
9.44 | % | 9.44 | % | 16.13 | % | 3.04 | % | 11.08 | % | ||||||||||
| RATIOS/SUPPLEMENTAL DATA: |
| |||||||||||||||||||
| Net assets, end of year (000’s omitted) |
$ | 2,034,965 | $ | 1,933,552 | $ | 1,940,332 | $ | 1,725,259 | $ | 2,106,618 | ||||||||||
| Ratios to average net assets3 of: |
| |||||||||||||||||||
| Expenses4 |
0.28 | % | 0.28 | % | 0.28 | % | 0.28 | % | 0.29 | %5 | ||||||||||
| Net investment income |
2.79 | % | 2.54 | % | 2.63 | % | 2.81 | % | 2.59 | % | ||||||||||
| Portfolio turnover rate6 |
11 | % | 10 | % | 11 | % | 11 | % | 12 | % | ||||||||||
| WisdomTree U.S. LargeCap Fund | For the Year Ended March 31, 2019 |
For the Year Ended March 31, 20187 |
For the Year Ended March 31, 20177 |
For the Year Ended March 31, 20167 |
For the Year Ended March 31, 20157 |
|||||||||||||||
| Net asset value, beginning of year |
$ | 30.30 | $ | 27.14 | $ | 23.22 | $ | 23.83 | $ | 21.80 | ||||||||||
| Investment operations: |
| |||||||||||||||||||
| Net investment income1 |
0.60 | 0.53 | 0.48 | 0.49 | 0.45 | |||||||||||||||
| Net realized and unrealized gain (loss) |
1.46 | 3.11 | 3.95 | (0.60 | ) | 2.00 | ||||||||||||||
| Total from investment operations |
2.06 | 3.64 | 4.43 | (0.11 | ) | 2.45 | ||||||||||||||
| Dividends to shareholders: |
| |||||||||||||||||||
| Net investment income |
(0.59 | ) | (0.48 | ) | (0.51 | ) | (0.50 | ) | (0.42 | ) | ||||||||||
| Net asset value, end of year |
$ | 31.77 | $ | 30.30 | $ | 27.14 | $ | 23.22 | $ | 23.83 | ||||||||||
| TOTAL RETURN2 |
6.93 | % | 13.49 | % | 19.31 | % | (0.45 | )% | 11.28 | % | ||||||||||
| RATIOS/SUPPLEMENTAL DATA: |
| |||||||||||||||||||
| Net assets, end of year (000’s omitted) |
$ | 239,851 | $ | 184,813 | $ | 130,254 | $ | 118,412 | $ | 139,386 | ||||||||||
| Ratios to average net assets3 of: |
| |||||||||||||||||||
| Expenses |
0.28 | %4 | 0.28 | %4 | 0.28 | % | 0.28 | %4 | 0.29 | %4,5 | ||||||||||
| Net investment income |
1.94 | % | 1.80 | % | 1.94 | % | 2.11 | % | 1.93 | % | ||||||||||
| Portfolio turnover rate6 |
14 | % | 17 | % | 19 | % | 18 | % | 16 | % | ||||||||||
| 1 | Based on average shares outstanding. |
| 2 | Total return is calculated assuming an initial investment made at the net asset value at the beginning of the period, reinvestment of all dividends and distributions at net asset value during the period and redemption on the last day of the period. For the periods in which the investment advisor waived advisory fees, the total return would have been lower if certain expenses had not been waived (Notes 2 and 3). |
| 3 | The ratios to average net assets do not include net investment income (loss) or expenses of other funds in which the Fund invests. |
| 4 | The expense ratio includes investment advisory fee waivers. Without these investment advisory fee waivers, the expense ratio would have been unchanged. |
| 5 | Included in the expense ratio are proxy expenses. Without these proxy expenses, the expense ratio would have been 0.28%. |
| 6 | Portfolio turnover rate is not annualized and excludes the value of the portfolio securities received or delivered as a result of in-kind creations or redemptions of the Fund’s capital shares. Short-term securities with maturities less than or equal to 365 days are excluded from the portfolio turnover calculation. |
| 7 | Per share amounts were adjusted to reflect a 3:1 stock split effective November 10, 2017. |
See Notes to Financial Statements.
| WisdomTree Trust | 121 |
Financial Highlights (continued)
WisdomTree Trust
Selected data for a share of beneficial interest outstanding throughout the period is presented below:
| WisdomTree U.S. MidCap Dividend Fund | For the Year Ended March 31, 2019 |
For the Year Ended March 31, 20181 |
For the Year Ended March 31, 20171 |
For the Year Ended March 31, 20161 |
For the Year Ended March 31, 20151 |
|||||||||||||||
| Net asset value, beginning of year |
$ | 34.11 | $ | 32.50 | $ | 28.69 | $ | 28.68 | $ | 25.66 | ||||||||||
| Investment operations: |
| |||||||||||||||||||
| Net investment income2 |
0.82 | 0.76 | 0.78 | 0.71 | 0.72 | |||||||||||||||
| Net realized and unrealized gain |
1.61 | 1.59 | 3.89 | 0.08 | 2.95 | |||||||||||||||
| Total from investment operations |
2.43 | 2.35 | 4.67 | 0.79 | 3.67 | |||||||||||||||
| Dividends and distributions to shareholders: |
| |||||||||||||||||||
| Net investment income |
(0.78 | ) | (0.74 | ) | (0.86 | ) | (0.68 | ) | (0.65 | ) | ||||||||||
| Capital gains |
— | — | — | (0.10 | ) | — | ||||||||||||||
| Total dividends and distributions to shareholders |
(0.78 | ) | (0.74 | ) | (0.86 | ) | (0.78 | ) | (0.65 | ) | ||||||||||
| Net asset value, end of year |
$ | 35.76 | $ | 34.11 | $ | 32.50 | $ | 28.69 | $ | 28.68 | ||||||||||
| TOTAL RETURN3 |
7.21 | % | 7.30 | % | 16.52 | % | 2.98 | % | 14.46 | % | ||||||||||
| RATIOS/SUPPLEMENTAL DATA: |
| |||||||||||||||||||
| Net assets, end of year (000’s omitted) |
$ | 3,733,683 | $ | 3,064,477 | $ | 2,822,559 | $ | 1,609,484 | $ | 1,595,896 | ||||||||||
| Ratios to average net assets4 of: |
| |||||||||||||||||||
| Expenses5 |
0.38 | % | 0.38 | %6 | 0.38 | %6 | 0.38 | % | 0.39 | %7 | ||||||||||
| Net investment income |
2.34 | % | 2.26 | % | 2.56 | % | 2.60 | % | 2.65 | % | ||||||||||
| Portfolio turnover rate8 |
27 | % | 27 | % | 33 | % | 32 | % | 30 | % | ||||||||||
| WisdomTree U.S. MidCap Fund | For the Year Ended March 31, 2019 |
For the Year Ended March 31, 2018 |
For the Year Ended March 31, 20179 |
For the Year Ended March 31, 20169 |
For the Year Ended March 31, 20159 |
|||||||||||||||
| Net asset value, beginning of year |
$ | 38.63 | $ | 35.25 | $ | 30.07 | $ | 32.14 | $ | 29.58 | ||||||||||
| Investment operations: |
| |||||||||||||||||||
| Net investment income2 |
0.53 | 0.47 | 0.50 | 0.40 | 0.42 | |||||||||||||||
| Net realized and unrealized gain (loss) |
0.68 | 3.32 | 5.25 | (2.10 | ) | 2.52 | ||||||||||||||
| Total from investment operations |
1.21 | 3.79 | 5.75 | (1.70 | ) | 2.94 | ||||||||||||||
| Dividends and distributions to shareholders: |
| |||||||||||||||||||
| Net investment income |
(0.54 | ) | (0.41 | ) | (0.54 | ) | (0.37 | ) | (0.38 | ) | ||||||||||
| Return of capital |
— | — | (0.03 | ) | — | — | ||||||||||||||
| Total dividends and distributions to shareholders |
(0.54 | ) | (0.41 | ) | (0.57 | ) | (0.37 | ) | (0.38 | ) | ||||||||||
| Net asset value, end of year |
$ | 39.30 | $ | 38.63 | $ | 35.25 | $ | 30.07 | $ | 32.14 | ||||||||||
| TOTAL RETURN3 |
3.22 | % | 10.77 | %10 | 19.31 | % | (5.29 | )% | 9.99 | % | ||||||||||
| RATIOS/SUPPLEMENTAL DATA: |
| |||||||||||||||||||
| Net assets, end of year (000’s omitted) |
$ | 1,098,311 | $ | 1,035,164 | $ | 794,832 | $ | 662,944 | $ | 737,532 | ||||||||||
| Ratios to average net assets4 of: |
| |||||||||||||||||||
| Expenses5 |
0.38 | % | 0.38 | % | 0.38 | % | 0.38 | % | 0.39 | %11 | ||||||||||
| Net investment income |
1.34 | % | 1.25 | % | 1.54 | % | 1.32 | % | 1.37 | % | ||||||||||
| Portfolio turnover rate8 |
36 | % | 45 | % | 42 | % | 40 | % | 36 | % | ||||||||||
| 1 | Per share amounts were adjusted to reflect a 3:1 stock split effective November 10, 2017. |
| 2 | Based on average shares outstanding. |
| 3 | Total return is calculated assuming an initial investment made at the net asset value at the beginning of the period, reinvestment of all dividends and distributions at net asset value during the period and redemption on the last day of the period. For the periods in which the investment advisor waived advisory fees, the total return would have been lower if certain expenses had not been waived (Notes 2 and 3). |
| 4 | The ratios to average net assets do not include net investment income (loss) or expenses of other funds in which the Fund invests. |
| 5 | The expense ratio includes investment advisory fee waivers. Without these investment advisory fee waivers, the expense ratio would have been unchanged. |
| 6 | Included in the expense ratio are legal expenses. Without these legal expenses, the annualized expense ratio would have been unchanged. |
| 7 | Included in the expense ratio are proxy and legal expenses. Without these proxy and legal expenses, the expense ratio would have been 0.38%. |
| 8 | Portfolio turnover rate is not annualized and excludes the value of the portfolio securities received or delivered as a result of in-kind creations or redemptions of the Fund’s capital shares. Short-term securities with maturities less than or equal to 365 days are excluded from the portfolio turnover calculation. |
| 9 | Per share amounts were adjusted to reflect a 3:1 stock split effective February 6, 2017. |
| 10 | Includes a reimbursement from the sub-advisor for an operational error. Excluding the reimbursement, total return would have been unchanged. |
| 11 | Included in the expense ratio are proxy expenses. Without these proxy expenses, the expense ratio would have been 0.38%. |
See Notes to Financial Statements.
| 122 | WisdomTree Trust |
Financial Highlights (continued)
WisdomTree Trust
Selected data for a share of beneficial interest outstanding throughout the period is presented below:
| WisdomTree U.S. Multifactor Fund | For the Year Ended March 31, 2019 |
For the Period June 29, 2017* through March 31, 2018 |
||||||
| Net asset value, beginning of period |
$ | 27.91 | $ | 24.75 | ||||
| Investment operations: |
||||||||
| Net investment income1 |
0.47 | 0.34 | ||||||
| Net realized and unrealized gain |
0.97 | 3.09 | ||||||
| Total from investment operations |
1.44 | 3.43 | ||||||
| Dividends to shareholders: |
||||||||
| Net investment income |
(0.37 | ) | (0.27 | ) | ||||
| Net asset value, end of period |
$ | 28.98 | $ | 27.91 | ||||
| TOTAL RETURN2 |
5.25 | % | 13.90 | % | ||||
| RATIOS/SUPPLEMENTAL DATA: |
||||||||
| Net assets, end of period (000’s omitted) |
$ | 114,481 | $ | 5,582 | ||||
| Ratios to average net assets of: |
||||||||
| Expenses |
0.28 | %3,9 | 0.28 | %4 | ||||
| Net investment income |
1.65 | %9 | 1.66 | %4 | ||||
| Portfolio turnover rate5 |
179 | % | 143 | % | ||||
| WisdomTree U.S. Quality Dividend Growth Fund | For the Year Ended March 31, 2019 |
For the Year Ended March 31, 2018 |
For the Year Ended March 31, 2017 |
For the Year Ended March 31, 2016 |
For the Year Ended March 31, 2015 |
|||||||||||||||
| Net asset value, beginning of year |
$ | 40.32 | $ | 35.45 | $ | 31.25 | $ | 31.23 | $ | 27.95 | ||||||||||
| Investment operations: |
| |||||||||||||||||||
| Net investment income1 |
0.97 | 0.78 | 0.73 | 0.70 | 0.66 | |||||||||||||||
| Net realized and unrealized gain (loss) |
2.71 | 4.84 | 4.20 | (0.02 | ) | 3.21 | ||||||||||||||
| Total from investment operations |
3.68 | 5.62 | 4.93 | 0.68 | 3.87 | |||||||||||||||
| Dividends and distributions to shareholders: |
| |||||||||||||||||||
| Net investment income |
(0.93 | ) | (0.75 | ) | (0.73 | ) | (0.66 | ) | (0.59 | ) | ||||||||||
| Capital gains |
(0.03 | ) | — | — | — | (0.00 | )6 | |||||||||||||
| Total dividends and distributions to shareholders |
(0.96 | ) | (0.75 | ) | (0.73 | ) | (0.66 | ) | (0.59 | ) | ||||||||||
| Net asset value, end of year |
$ | 43.04 | $ | 40.32 | $ | 35.45 | $ | 31.25 | $ | 31.23 | ||||||||||
| TOTAL RETURN2 |
9.25 | % | 15.95 | %7 | 15.99 | % | 2.25 | % | 13.94 | % | ||||||||||
| RATIOS/SUPPLEMENTAL DATA: |
| |||||||||||||||||||
| Net assets, end of year (000’s omitted) |
$ | 2,780,361 | $ | 2,064,305 | $ | 1,290,417 | $ | 595,351 | $ | 448,158 | ||||||||||
| Ratios to average net assets of: |
| |||||||||||||||||||
| Expenses |
0.28 | % | 0.28 | % | 0.28 | % | 0.28 | % | 0.29 | %8 | ||||||||||
| Net investment income |
2.33 | % | 1.99 | % | 2.22 | % | 2.30 | % | 2.19 | % | ||||||||||
| Portfolio turnover rate5 |
29 | % | 29 | % | 29 | % | 32 | % | 35 | % | ||||||||||
| * | Commencement of operations. |
| 1 | Based on average shares outstanding. |
| 2 | Total return is calculated assuming an initial investment made at the net asset value at the beginning of the period, reinvestment of all dividends and distributions at net asset value during the period and redemption on the last day of the period. Total return calculated for a period of less than one year is not annualized. For the periods in which the investment advisor waived advisory fees for the WisdomTree U.S. Multifactor Fund, the total return would have been lower if certain expenses had not been waived (Notes 2 and 3). |
| 3 | The expense ratio includes investment advisory fee waivers. Without these investment advisory fee waivers, the expense ratio would have been unchanged. |
| 4 | Annualized. |
| 5 | Portfolio turnover rate is not annualized and excludes the value of the portfolio securities received or delivered as a result of in-kind creations or redemptions of the Fund’s capital shares. Short-term securities with maturities less than or equal to 365 days are excluded from the portfolio turnover calculation. |
| 6 | Amount represents less than $0.005. |
| 7 | Includes a reimbursement from the sub-advisor for an operational error. Excluding the reimbursement, total return would have been unchanged. |
| 8 | Included in the expense ratio are proxy expenses. Without these proxy expenses, the expense ratio would have been 0.28%. |
| 9 | The ratios to average net assets do not include net investment income (loss) or expenses of other funds in which the Fund invests. |
See Notes to Financial Statements.
| WisdomTree Trust | 123 |
Financial Highlights (continued)
WisdomTree Trust
Selected data for a share of beneficial interest outstanding throughout the period is presented below:
| WisdomTree U.S. Quality Shareholder Yield Fund | For the Year Ended March 31, 2019 |
For the Year Ended March 31, 20181 |
For the Year Ended March 31, 20171 |
For the Year Ended March 31, 20161 |
For the Year Ended March 31, 20151 |
|||||||||||||||
| Net asset value, beginning of year |
$ | 80.85 | $ | 70.26 | $ | 62.76 | $ | 66.28 | $ | 58.57 | ||||||||||
| Investment operations: |
| |||||||||||||||||||
| Net investment income2 |
1.43 | 1.14 | 0.92 | 1.06 | 0.88 | |||||||||||||||
| Net realized and unrealized gain (loss) |
3.89 | 10.59 | 7.55 | (3.70 | ) | 7.71 | ||||||||||||||
| Total from investment operations |
5.32 | 11.73 | 8.47 | (2.64 | ) | 8.59 | ||||||||||||||
| Dividends to shareholders: |
| |||||||||||||||||||
| Net investment income |
(1.47 | ) | (1.14 | ) | (0.97 | ) | (0.88 | ) | (0.88 | ) | ||||||||||
| Net asset value, end of year |
$ | 84.70 | $ | 80.85 | $ | 70.26 | $ | 62.76 | $ | 66.28 | ||||||||||
| TOTAL RETURN3 |
6.70 | % | 16.77 | % | 13.61 | % | (4.00 | )% | 14.73 | % | ||||||||||
| RATIOS/SUPPLEMENTAL DATA: |
| |||||||||||||||||||
| Net assets, end of year (000’s omitted) |
$ | 38,113 | $ | 44,466 | $ | 59,718 | $ | 138,062 | $ | 26,511 | ||||||||||
| Ratios to average net assets of: |
| |||||||||||||||||||
| Expenses |
0.38 | % | 0.38 | %4,5 | 0.38 | %4 | 0.38 | %4,5 | 0.39 | %4,5,6 | ||||||||||
| Net investment income |
1.73 | % | 1.48 | %4 | 1.42 | %4 | 1.68 | %4 | 1.42 | %4 | ||||||||||
| Portfolio turnover rate7 |
54 | % | 82 | % | 106 | % | 85 | % | 63 | % | ||||||||||
| WisdomTree U.S. SmallCap Dividend Fund | For the Year Ended March 31, 2019 |
For the Year Ended March 31, 20188 |
For the Year Ended March 31, 20178 |
For the Year Ended March 31, 20168 |
For the Year Ended March 31, 20158 |
|||||||||||||||
| Net asset value, beginning of year |
$ | 27.43 | $ | 26.88 | $ | 22.91 | $ | 23.99 | $ | 22.78 | ||||||||||
| Investment operations: |
| |||||||||||||||||||
| Net investment income2 |
0.82 | 0.81 | 0.70 | 0.69 | 0.66 | |||||||||||||||
| Net realized and unrealized gain (loss) |
0.08 | 0.53 | 4.09 | (1.13 | ) | 1.20 | ||||||||||||||
| Total from investment operations |
0.90 | 1.34 | 4.79 | (0.44 | ) | 1.86 | ||||||||||||||
| Dividends to shareholders: |
| |||||||||||||||||||
| Net investment income |
(0.79 | ) | (0.79 | ) | (0.82 | ) | (0.64 | ) | (0.65 | ) | ||||||||||
| Net asset value, end of year |
$ | 27.54 | $ | 27.43 | $ | 26.88 | $ | 22.91 | $ | 23.99 | ||||||||||
| TOTAL RETURN3 |
3.25 | % | 5.02 | %9 | 21.21 | % | (1.69 | )% | 8.33 | % | ||||||||||
| RATIOS/SUPPLEMENTAL DATA: |
| |||||||||||||||||||
| Net assets, end of year (000’s omitted) |
$ | 2,087,705 | $ | 1,965,277 | $ | 1,975,473 | $ | 1,216,658 | $ | 1,248,932 | ||||||||||
| Ratios to average net assets4 of: |
| |||||||||||||||||||
| Expenses5 |
0.38 | % | 0.38 | % | 0.38 | % | 0.38 | % | 0.39 | %6 | ||||||||||
| Net investment income |
2.91 | % | 2.93 | % | 2.75 | % | 3.10 | % | 2.86 | % | ||||||||||
| Portfolio turnover rate7 |
26 | % | 36 | % | 44 | % | 33 | % | 33 | % | ||||||||||
| 1 | The information reflects the investment objective and strategy of the WisdomTree U.S. LargeCap Value Fund through December 17, 2017 and the investment objective and strategy of the WisdomTree U.S. Quality Shareholder Yield Fund thereafter. |
| 2 | Based on average shares outstanding. |
| 3 | Total return is calculated assuming an initial investment made at the net asset value at the beginning of the period, reinvestment of all dividends and distributions at net asset value during the period and redemption on the last day of the period. For the periods in which the investment advisor waived advisory fees for the WisdomTree U.S. SmallCap Dividend Fund, the total return would have been lower if certain expenses had not been waived (Notes 2 and 3). |
| 4 | The ratios to average net assets do not include net investment income (loss) or expenses of other funds in which the Fund invests. |
| 5 | The expense ratio includes investment advisory fee waivers. Without these investment advisory fee waivers, the expense ratio would have been unchanged. |
| 6 | Included in the expense ratio are proxy expenses. Without these proxy expenses, the expense ratio would have been 0.38%. |
| 7 | Portfolio turnover rate is not annualized and excludes the value of the portfolio securities received or delivered as a result of in-kind creations or redemptions of the Fund’s capital shares. Short-term securities with maturities less than or equal to 365 days are excluded from the portfolio turnover calculation. |
| 8 | Per share amounts were adjusted to reflect a 3:1 stock split effective November 10, 2017. |
| 9 | Includes a reimbursement from the sub-advisor for an operational error. Excluding the reimbursement, total return would have been unchanged. |
See Notes to Financial Statements.
| 124 | WisdomTree Trust |
Financial Highlights (continued)
WisdomTree Trust
Selected data for a share of beneficial interest outstanding throughout the period is presented below:
| WisdomTree U.S. SmallCap Fund | For the Year Ended March 31, 2019 |
For the Year Ended March 31, 2018 |
For the Year Ended March 31, 20171 |
For the Year Ended March 31, 20161 |
For the Year Ended March 31, 20151 |
|||||||||||||||
| Net asset value, beginning of year |
$ | 35.70 | $ | 32.16 | $ | 25.69 | $ | 28.14 | $ | 27.13 | ||||||||||
| Investment operations: |
| |||||||||||||||||||
| Net investment income2 |
0.58 | 0.37 | 0.31 | 0.34 | 0.33 | |||||||||||||||
| Net realized and unrealized gain (loss) |
0.38 | 3.51 | 6.53 | (2.48 | ) | 0.99 | ||||||||||||||
| Total from investment operations |
0.96 | 3.88 | 6.84 | (2.14 | ) | 1.32 | ||||||||||||||
| Dividends to shareholders: |
| |||||||||||||||||||
| Net investment income |
(0.58 | ) | (0.34 | ) | (0.37 | ) | (0.31 | ) | (0.31 | ) | ||||||||||
| Net asset value, end of year |
$ | 36.08 | $ | 35.70 | $ | 32.16 | $ | 25.69 | $ | 28.14 | ||||||||||
| TOTAL RETURN3 |
2.72 | % | 12.09 | %4 | 26.75 | % | (7.60 | )% | 4.89 | % | ||||||||||
| RATIOS/SUPPLEMENTAL DATA: |
| |||||||||||||||||||
| Net assets, end of year (000’s omitted) |
$ | 736,098 | $ | 588,999 | $ | 490,370 | $ | 369,965 | $ | 422,121 | ||||||||||
| Ratios to average net assets5 of: |
| |||||||||||||||||||
| Expenses6 |
0.38 | % | 0.38 | % | 0.38 | % | 0.38 | % | 0.39 | %7 | ||||||||||
| Net investment income |
1.56 | % | 1.08 | % | 1.06 | % | 1.31 | % | 1.24 | % | ||||||||||
| Portfolio turnover rate8 |
45 | % | 48 | % | 51 | % | 43 | % | 43 | % | ||||||||||
| WisdomTree U.S. SmallCap Quality Dividend Growth Fund |
For the Year Ended March 31, 2019 |
For the Year Ended March 31, 2018 |
For the Year Ended March 31, 2017 |
For the Year Ended March 31, 2016 |
For the Year Ended March 31, 2015 |
|||||||||||||||
| Net asset value, beginning of year |
$ | 34.26 | $ | 33.06 | $ | 28.17 | $ | 30.12 | $ | 28.43 | ||||||||||
| Investment operations: |
| |||||||||||||||||||
| Net investment income2 |
0.88 | 0.76 | 0.74 | 0.67 | 0.65 | |||||||||||||||
| Net realized and unrealized gain (loss) |
0.41 | 1.21 | 4.87 | (2.02 | ) | 1.69 | ||||||||||||||
| Total from investment operations |
1.29 | 1.97 | 5.61 | (1.35 | ) | 2.34 | ||||||||||||||
| Dividends and distributions to shareholders: |
| |||||||||||||||||||
| Net investment income |
(0.85 | ) | (0.77 | ) | (0.72 | ) | (0.60 | ) | (0.65 | ) | ||||||||||
| Capital gains |
— | — | — | — | (0.00 | )9 | ||||||||||||||
| Total dividends and distributions to shareholders |
(0.85 | ) | (0.77 | ) | (0.72 | ) | (0.60 | ) | (0.65 | ) | ||||||||||
| Net asset value, end of year |
$ | 34.70 | $ | 34.26 | $ | 33.06 | $ | 28.17 | $ | 30.12 | ||||||||||
| TOTAL RETURN3 |
3.81 | % | 5.97 | % | 20.12 | % | (4.42 | )% | 8.37 | % | ||||||||||
| RATIOS/SUPPLEMENTAL DATA: |
| |||||||||||||||||||
| Net assets, end of year (000’s omitted) |
$ | 119,699 | $ | 101,060 | $ | 102,498 | $ | 35,208 | $ | 22,594 | ||||||||||
| Ratios to average net assets of: |
| |||||||||||||||||||
| Expenses |
0.38 | % | 0.38 | % | 0.38 | % | 0.38 | % | 0.39 | %7 | ||||||||||
| Net investment income |
2.47 | % | 2.24 | % | 2.35 | % | 2.43 | % | 2.30 | % | ||||||||||
| Portfolio turnover rate8 |
42 | % | 51 | % | 56 | % | 50 | % | 53 | % | ||||||||||
| 1 | Per share amounts were adjusted to reflect a 3:1 stock split effective February 6, 2017. |
| 2 | Based on average shares outstanding. |
| 3 | Total return is calculated assuming an initial investment made at the net asset value at the beginning of the period, reinvestment of all dividends and distributions at net asset value during the period and redemption on the last day of the period. For the periods in which the investment advisor waived advisory fees for the WisdomTree U.S. SmallCap Fund, the total return would have been lower if certain expenses had not been waived (Notes 2 and 3). |
| 4 | Includes a reimbursement from the sub-advisor for an operational error. Excluding the reimbursement, total return would have been unchanged. |
| 5 | The ratios to average net assets do not include net investment income (loss) or expenses of other funds in which the Fund invests. |
| 6 | The expense ratio includes investment advisory fee waivers. Without these investment advisory fee waivers, the expense ratio would have been unchanged. |
| 7 | Included in the expense ratio are proxy expenses. Without these proxy expenses, the expense ratio would have been 0.38%. |
| 8 | Portfolio turnover rate is not annualized and excludes the value of the portfolio securities received or delivered as a result of in-kind creations or redemptions of the Fund’s capital shares. Short-term securities with maturities less than or equal to 365 days are excluded from the portfolio turnover calculation. |
| 9 | Amount represents less than $0.005. |
See Notes to Financial Statements.
| WisdomTree Trust | 125 |
Financial Highlights (concluded)
WisdomTree Trust
Selected data for a share of beneficial interest outstanding throughout the period is presented below:
| WisdomTree U.S. Total Dividend Fund | For the Year Ended March 31, 2019 |
For the Year Ended March 31, 2018 |
For the Year Ended March 31, 2017 |
For the Year Ended March 31, 2016 |
For the Year Ended March 31, 2015 |
|||||||||||||||
| Net asset value, beginning of year |
$ | 89.11 | $ | 84.04 | $ | 74.24 | $ | 74.25 | $ | 68.29 | ||||||||||
| Investment operations: |
| |||||||||||||||||||
| Net investment income1 |
2.56 | 2.27 | 2.07 | 2.04 | 1.91 | |||||||||||||||
| Net realized and unrealized gain (loss) |
5.41 | 5.05 | 9.97 | (0.03 | ) | 5.86 | ||||||||||||||
| Total from investment operations |
7.97 | 7.32 | 12.04 | 2.01 | 7.77 | |||||||||||||||
| Dividends to shareholders: |
| |||||||||||||||||||
| Net investment income |
(2.47 | ) | (2.25 | ) | (2.24 | ) | (2.02 | ) | (1.81 | ) | ||||||||||
| Net asset value, end of year |
$ | 94.61 | $ | 89.11 | $ | 84.04 | $ | 74.24 | $ | 74.25 | ||||||||||
| TOTAL RETURN2 |
9.10 | % | 8.76 | %3 | 16.47 | % | 2.84 | % | 11.47 | % | ||||||||||
| RATIOS/SUPPLEMENTAL DATA: |
| |||||||||||||||||||
| Net assets, end of year (000’s omitted) |
$ | 648,103 | $ | 579,232 | $ | 571,504 | $ | 493,708 | $ | 582,862 | ||||||||||
| Ratios to average net assets4 of: |
| |||||||||||||||||||
| Expenses5 |
0.28 | % | 0.28 | %6 | 0.28 | %6 | 0.28 | %6 | 0.29 | %7 | ||||||||||
| Net investment income |
2.78 | % | 2.56 | % | 2.63 | % | 2.83 | % | 2.64 | % | ||||||||||
| Portfolio turnover rate8 |
11 | % | 11 | % | 12 | % | 12 | % | 13 | % | ||||||||||
| WisdomTree U.S. Total Market Fund | For the Year Ended March 31, 2019 |
For the Year Ended March 31, 20189 |
For the Year Ended March 31, 20179 |
For the Year Ended March 31, 20169 |
For the Year Ended March 31, 20159 |
|||||||||||||||
| Net asset value, beginning of year |
$ | 31.09 | $ | 27.89 | $ | 23.83 | $ | 24.65 | $ | 22.60 | ||||||||||
| Investment operations: |
| |||||||||||||||||||
| Net investment income1 |
0.60 | 0.53 | 0.48 | 0.48 | 0.45 | |||||||||||||||
| Net realized and unrealized gain (loss) |
1.29 | 3.17 | 4.10 | (0.78 | ) | 2.01 | ||||||||||||||
| Total from investment operations |
1.89 | 3.70 | 4.58 | (0.30 | ) | 2.46 | ||||||||||||||
| Dividends and distributions to shareholders: |
| |||||||||||||||||||
| Net investment income |
(0.69 | ) | (0.50 | ) | (0.51 | ) | (0.52 | ) | (0.41 | ) | ||||||||||
| Return of capital |
— | — | (0.01 | ) | — | — | ||||||||||||||
| Total dividends and distributions to shareholders |
(0.69 | ) | (0.50 | ) | (0.52 | ) | (0.52 | ) | (0.41 | ) | ||||||||||
| Net asset value, end of year |
$ | 32.29 | $ | 31.09 | $ | 27.89 | $ | 23.83 | $ | 24.65 | ||||||||||
| TOTAL RETURN2 |
6.34 | % | 13.31 | % | 19.39 | % | (1.18 | )% | 10.93 | % | ||||||||||
| RATIOS/SUPPLEMENTAL DATA: |
| |||||||||||||||||||
| Net assets, end of year (000’s omitted) |
$ | 113,025 | $ | 69,946 | $ | 62,755 | $ | 57,204 | $ | 107,209 | ||||||||||
| Ratios to average net assets of: |
| |||||||||||||||||||
| Expenses |
0.28 | % | 0.28 | % | 0.28 | % | 0.28 | % | 0.29 | %10 | ||||||||||
| Net investment income |
1.89 | % | 1.75 | % | 1.87 | % | 2.00 | % | 1.88 | % | ||||||||||
| Portfolio turnover rate8 |
22 | % | 22 | % | 19 | % | 12 | % | 16 | % | ||||||||||
| 1 | Based on average shares outstanding. |
| 2 | Total return is calculated assuming an initial investment made at the net asset value at the beginning of the period, reinvestment of all dividends and distributions at net asset value during the period and redemption on the last day of the period. For the periods in which the investment advisor waived advisory fees for the WisdomTree U.S. Total Dividend Fund, the total return would have been lower if certain expenses had not been waived (Notes 2 and 3). |
| 3 | Includes a reimbursement from the sub-advisor for an operational error. Excluding the reimbursement, total return would have been unchanged. |
| 4 | The ratios to average net assets do not include net investment income (loss) or expenses of other funds in which the Fund invests. |
| 5 | The expense ratio includes investment advisory fee waivers. Without these investment advisory fee waivers, the expense ratio would have been unchanged. |
| 6 | Included in the expense ratio are legal expenses. Without these legal expenses, the annualized expense ratio would have been unchanged. |
| 7 | Included in the expense ratio are proxy and legal expenses. Without these proxy and legal expenses, the expense ratio would have been 0.28%. |
| 8 | Portfolio turnover rate is not annualized and excludes the value of the portfolio securities received or delivered as a result of in-kind creations or redemptions of the Fund’s capital shares. Short-term securities with maturities less than or equal to 365 days are excluded from the portfolio turnover calculation. |
| 9 | Per share amounts were adjusted to reflect a 3:1 stock split effective November 10, 2017. |
| 10 | Included in the expense ratio are proxy expenses. Without these proxy expenses, the expense ratio would have been 0.28%. |
See Notes to Financial Statements.
| 126 | WisdomTree Trust |
1. ORGANIZATION
WisdomTree Trust (the “Trust”) is registered under the Investment Company Act of 1940, as amended (the “1940 Act”), as an open-end management investment company. The Trust was established as a Delaware statutory trust on December 15, 2005. As of March 31, 2019, the Trust consisted of 76 operational investment funds (each a “Fund”, collectively, the “Funds”). In accordance with Accounting Standards Update (“ASU”) 2013-08, Financial Services-Investment Companies, each Fund listed below qualifies as an investment company and is applying the accounting and reporting guidance for investment companies. These notes relate only to the Funds listed in the table below:
| Fund | Commencement of Operations |
|||
| WisdomTree U.S. Dividend ex-Financials Fund (“U.S. Dividend ex-Financials Fund’’) |
June 16, 2006 | |||
| WisdomTree U.S. High Dividend Fund (“U.S. High Dividend Fund’’) |
June 16, 2006 | |||
| WisdomTree U.S. LargeCap Dividend Fund (“U.S. LargeCap Dividend Fund’’) |
June 16, 2006 | |||
| WisdomTree U.S. LargeCap Fund (“U.S. LargeCap Fund’’) (formerly, WisdomTree U.S. Earnings 500 Fund) |
February 23, 2007 | |||
| WisdomTree U.S. MidCap Dividend Fund (“U.S. MidCap Dividend Fund’’) |
June 16, 2006 | |||
| WisdomTree U.S. MidCap Fund (“U.S. MidCap Fund’’) (formerly, WisdomTree U.S. MidCap Earnings Fund) |
February 23, 2007 | |||
| WisdomTree U.S. Multifactor Fund (“U.S. Multifactor Fund’’) |
June 29, 2017 | |||
| WisdomTree U.S. Quality Dividend Growth Fund (“U.S. Quality Dividend Growth Fund’’) |
May 22, 2013 | |||
| WisdomTree U.S. Quality Shareholder Yield Fund (“U.S. Quality Shareholder Yield Fund’’) |
February 23, 2007 | |||
| WisdomTree U.S. SmallCap Dividend Fund (“U.S. SmallCap Dividend Fund’’) |
June 16, 2006 | |||
| WisdomTree U.S. SmallCap Fund (“U.S. SmallCap Fund’’) (formerly, WisdomTree U.S. SmallCap Earnings Fund) |
February 23, 2007 | |||
| WisdomTree U.S. SmallCap Quality Dividend Growth Fund (“U.S. SmallCap Quality Dividend Growth Fund’’) |
July 25, 2013 | |||
| WisdomTree U.S. Total Dividend Fund (“U.S. Total Dividend Fund’’) |
June 16, 2006 | |||
| WisdomTree U.S. Total Market Fund (“U.S. Total Market Fund’’) (formerly, WisdomTree U.S. Total Earnings Fund) |
February 23, 2007 | |||
Each Fund, except the WisdomTree U.S. Quality Shareholder Yield Fund, seeks to track the price and yield performance, before fees and expenses, of a particular index (“Index”) developed by WisdomTree Investments, Inc. (“WisdomTree Investments”). The WisdomTree U.S. Quality Shareholder Yield Fund is actively managed using a rules-based model approach seeking income and capital appreciation. WisdomTree Investments is the parent company of WisdomTree Asset Management, Inc. (“WTAM”), the investment adviser to each Fund and the Trust. “WisdomTree” is a registered trademark of WisdomTree Investments and has been licensed for use by the Trust. Each Fund described herein is considered to be non-diversified as defined under the 1940 Act.
In the normal course of business, the Funds may enter into contracts that contain a variety of representations or that provide indemnification for certain liabilities. The Funds’ maximum exposure under these arrangements is unknown, as this would involve future claims that may be made against the Funds that have not yet occurred. However, the Funds have not had prior claims or losses pursuant to these contracts and believes such exposure to be remote.
2. SIGNIFICANT ACCOUNTING POLICIES
The Financial Accounting Standards Board (“FASB”) Accounting Standards Codification (the “Codification”) is the exclusive reference of authoritative U.S. generally accepted accounting principles (“GAAP”) recognized by the FASB to be applied by nongovernmental entities. Rules and interpretive releases of the Securities and Exchange Commission (“SEC”) under authority of federal laws are also sources of authoritative GAAP for SEC registrants.
The following is a summary of significant accounting policies followed by the Funds:
Use of Estimates — The preparation of financial statements in conformity with GAAP, requires management to make certain estimates and assumptions that affect the reported amounts of assets and liabilities and disclosure of contingent assets and liabilities at the date of the financial statements and the reported amounts of increases and decreases in the net assets from operations during the reporting period. Actual results could differ from those estimates.
Investment Valuation — The net asset value (“NAV”) of each Fund’s shares is calculated each day a Fund is open for business as of the regularly scheduled close of regular trading on the New York Stock Exchange, normally 4:00 p.m. Eastern time (the “NAV Calculation Time”). NAV per share is calculated by dividing a Fund’s net assets by the number of Fund shares outstanding. Each Fund issues and redeems shares at NAV only in large blocks of shares known as creation units, which only certain institutions (e.g. broker-dealers) may purchase or redeem. Shares of each Fund are listed on a national securities exchange and trade at market prices. Most investors will buy and sell shares in the secondary market through brokers. Because Fund shares trade at market prices rather than NAV, shares may trade at a price greater than NAV or less than NAV. In calculating each Fund’s NAV, investments are valued under policies approved by the Board of Trustees of the Trust (the “Board of Trustees”). Equity securities (including
| WisdomTree Trust | 127 |
Notes to Financial Statements (continued)
preferred stock) traded on any recognized U.S. or non-U.S. exchange are valued at the last sale price or official closing price on the exchange or system on which they are principally traded. Unlisted equity securities (including preferred stock) are valued at the last quoted sale price or, if no sale price is available, at the mean between the highest bid and lowest ask price. Fixed income securities (including short-term debt securities with remaining maturities of 60 days or less), if any, generally are valued at current market quotations or mean prices obtained from broker-dealers or independent pricing service providers. Broker-dealers or independent pricing service providers, in determining the value of securities, may consider such factors as recent transactions, indications from broker-dealers yields and quoted prices on similar securities, and market sentiment for the type of security. Each Fund may invest in money market funds which are valued at their NAV per share and exchange-traded funds (“ETFs” or “ETF”) or exchange-traded notes (“ETNs” or “ETN”) which are valued at their last sale or official closing price on the exchange on which they are principally traded or at their NAV per share in instances where the ETF or ETN has not traded on its principal exchange.
In certain instances, such as when reliable market valuations are not readily available or are not deemed to reflect current market values, a Fund’s investments will be fair valued in accordance with the Fund’s pricing policy. The Board of Trustees has established a pricing committee (the “Pricing Committee”) which is comprised of senior representatives of WTAM and which reports to the Board of Trustees on a quarterly basis. In the event that a financial instrument cannot be valued based upon a price from a national securities exchange, independent pricing service provider or broker-dealer quotation, or such prices are deemed to not reflect current market value, the Pricing Committee may value the financial instrument in good faith under the policies and procedures approved by the Board of Trustees based on current facts and circumstances. Securities that may be valued using “fair value” pricing may include, but are not limited to, securities for which there are no current market quotations, securities whose issuer is in default or bankruptcy, securities subject to corporate actions (such as mergers or reorganizations), securities subject to non-U.S. investment limits or currency controls, and securities affected by “significant events.” An example of a significant event is an event occurring after the close of the market in which a security trades but before a Fund’s next NAV Calculation Time that may materially affect the value of a Fund’s investment (e.g., government action, natural disaster, or significant market fluctuation). When fair value pricing is employed, the prices of securities used by a Fund to calculate its NAV may differ from quoted or published prices for the same securities.
Fair Value Measurement — In accordance with Codification Topic 820 (“ASC 820”), Fair Value Measurements and Disclosures, fair value is defined as the price that each Fund would receive upon selling an investment in an orderly transaction to an independent buyer in the principal or most advantageous market of the investment. ASC 820 established a three-tier hierarchy of inputs to be used when determining fair value measurements for disclosure purposes. Inputs refer broadly to the assumptions that market participants would use in pricing the asset or liability, including assumptions about risk — for example, the risk inherent in a particular valuation technique used to measure fair value (such as a pricing model) and/or the risk inherent in the inputs to the valuation technique. Inputs may be observable or unobservable. Observable inputs reflect the assumptions market participants would use in pricing the asset or liability. Observable inputs are based on market data obtained from sources independent of the reporting entity. Unobservable inputs reflect the reporting entity’s own assumptions about the assumptions market participants would use in pricing the asset or liability. Unobservable inputs are based on the best information available in the circumstances. The three-tier hierarchy of inputs is summarized in the three broad levels listed below:
Level 1 – quoted prices in active markets for identical securities
Level 2 – other significant observable inputs (including quoted prices for similar securities, interest rates, prepayment speeds, credit risk, etc.)
Level 3 – significant unobservable inputs (including each Fund’s assumptions in determining the fair value of investments)
The inputs or methodology used for valuation are not necessarily an indication of the risk associated with investing in those investments.
Investments that use Level 2 or Level 3 inputs may include, but are not limited to: (i) an unlisted security related to corporate actions; (ii) a restricted security (e.g., one that may not be publicly sold without registration under the Securities Act of 1933, as amended); (iii) a security whose trading has been suspended or which has been de-listed from its primary trading exchange; (iv) a security that is thinly traded; (v) a security in default or bankruptcy proceedings for which there is no current market quotation or market activity; (vi) a security affected by currency controls or restrictions; and (vii) a security affected by a significant event (e.g., an event that occurs after the close of the markets on which the security is traded but before the time as of which a Fund’s NAV is computed and that may materially affect the value of the Fund’s investments).
The valuation techniques and significant inputs used in determining the fair market value measurements for Level 2 and Level 3 positions are as follows:
Financial instruments are generally valued by independent pricing service providers that use broker-dealer quotations, reported trades or valuation estimates from their internal pricing models. Depending on the type of financial instrument, the independent pricing service providers’ internal pricing models may use inputs that are observable such as issuer details, interest rates, yield curves, prepayment speeds, credit risks/spreads, default rates and quoted prices for similar assets. Financial instruments that use similar
| 128 | WisdomTree Trust |
Notes to Financial Statements (continued)
valuation techniques and observable inputs as described above and have an appropriate level of market activity are categorized as Level 2 of the fair value hierarchy, otherwise a Level 3 fair value classification is appropriate.
Determination of a fair value by the Pricing Committee may include significant unobservable inputs and therefore would be reflected as a Level 3 of the fair value hierarchy. The Pricing Committee may employ a market-based valuation approach which may use, among other potential considerations, related or comparable securities, recent transactions, market multiples, and other relevant information to determine fair value. The Pricing Committee may also use an income-based valuation approach in which anticipated future cash flows of the financial instrument are discounted to calculate fair value.
The following is a summary of the fair valuations according to the inputs used as of March 31, 2019 in valuing each Fund’s assets:
| U.S. Dividend ex-Financials Fund | Level 1 | Level 2 | Level 3 | |||||||||
| Common Stocks* |
$ | 783,986,086 | $ | — | $ | — | ||||||
| Exchange-Traded Funds |
5,457,727 | — | — | |||||||||
| Total |
$ | 789,443,813 | $ | — | $ | — | ||||||
| U.S. High Dividend Fund | Level 1 | Level 2 | Level 3 | |||||||||
| Common Stocks* |
$ | 944,404,544 | $ | — | $ | — | ||||||
| Exchange-Traded Fund |
6,952,088 | — | — | |||||||||
| Investment of Cash Collateral for Securities Loaned |
— | 2,952,420 | — | |||||||||
| Total |
$ | 951,356,632 | $ | 2,952,420 | $ | — | ||||||
| U.S. LargeCap Dividend Fund | Level 1 | Level 2 | Level 3 | |||||||||
| Common Stocks* |
$ | 2,024,240,890 | $ | — | $ | — | ||||||
| Exchange-Traded Fund |
7,208,819 | — | — | |||||||||
| Investment of Cash Collateral for Securities Loaned |
— | 561,537 | — | |||||||||
| Total |
$ | 2,031,449,709 | $ | 561,537 | $ | — | ||||||
| U.S. LargeCap Fund | Level 1 | Level 2 | Level 3 | |||||||||
| Common Stocks* |
$ | 239,157,858 | $ | — | $ | — | ||||||
| Exchange-Traded Fund |
535,191 | — | — | |||||||||
| Investment of Cash Collateral for Securities Loaned |
— | 56,980 | — | |||||||||
| Total |
$ | 239,693,049 | $ | 56,980 | $ | — | ||||||
| U.S. MidCap Dividend Fund | Level 1 | Level 2 | Level 3 | |||||||||
| Common Stocks* |
$ | 3,708,414,922 | $ | — | $ | — | ||||||
| Exchange-Traded Fund |
18,835,332 | — | — | |||||||||
| Investment of Cash Collateral for Securities Loaned |
— | 66,221,701 | — | |||||||||
| Total |
$ | 3,727,250,254 | $ | 66,221,701 | $ | — | ||||||
| U.S. MidCap Fund | Level 1 | Level 2 | Level 3 | |||||||||
| Common Stocks* |
$ | 1,093,591,937 | $ | — | $ | — | ||||||
| Exchange-Traded Fund |
3,984,501 | — | — | |||||||||
| Investment of Cash Collateral for Securities Loaned |
— | 1,864,173 | — | |||||||||
| Total |
$ | 1,097,576,438 | $ | 1,864,173 | $ | — | ||||||
| U.S. Multifactor Fund | Level 1 | Level 2 | Level 3 | |||||||||
| Common Stocks* |
$ | 115,590,042 | $ | — | $ | — | ||||||
| Total |
$ | 115,590,042 | $ | — | $ | — | ||||||
| WisdomTree Trust | 129 |
Notes to Financial Statements (continued)
| U.S. Quality Dividend Growth Fund | Level 1 | Level 2 | Level 3 | |||||||||
| Common Stocks* |
$ | 2,774,767,669 | $ | — | $ | — | ||||||
| Total |
$ | 2,774,767,669 | $ | — | $ | — | ||||||
| U.S. Quality Shareholder Yield Fund | Level 1 | Level 2 | Level 3 | |||||||||
| Common Stocks* |
$ | 38,072,742 | $ | — | $ | — | ||||||
| Total |
$ | 38,072,742 | $ | — | $ | — | ||||||
| U.S. SmallCap Dividend Fund | Level 1 | Level 2 | Level 3 | |||||||||
| Common Stocks* |
$ | 2,063,730,452 | $ | — | $ | — | ||||||
| Exchange-Traded Fund |
18,990,782 | — | — | |||||||||
| Rights |
— | — | 46,058 | ** | ||||||||
| Investment of Cash Collateral for Securities Loaned |
— | 52,465,765 | — | |||||||||
| Total |
$ | 2,082,721,234 | $ | 52,465,765 | $ | 46,058 | ||||||
| U.S. SmallCap Fund | Level 1 | Level 2 | Level 3 | |||||||||
| Common Stocks* |
$ | 733,903,720 | — | — | ||||||||
| Exchange-Traded Fund |
1,433,943 | — | — | |||||||||
| Rights |
— | — | 6,075 | ** | ||||||||
| Investment of Cash Collateral for Securities Loaned |
— | 19,556,200 | — | |||||||||
| Total |
$ | 735,337,663 | $ | 19,556,200 | $ | 6,075 | ||||||
| U.S. SmallCap Quality Dividend Growth Fund | Level 1 | Level 2 | Level 3 | |||||||||
| Common Stocks* |
$ | 119,594,551 | $ | — | $ | — | ||||||
| Investment of Cash Collateral for Securities Loaned |
— | 655,204 | — | |||||||||
| Total |
$ | 119,594,551 | $ | 655,204 | $ | — | ||||||
| U.S. Total Dividend Fund | Level 1 | Level 2 | Level 3 | |||||||||
| Common Stocks* |
$ | 645,909,687 | $ | — | $ | — | ||||||
| Exchange-Traded Fund |
1,355,082 | — | — | |||||||||
| Investment of Cash Collateral for Securities Loaned |
— | 1,829,310 | — | |||||||||
| Total |
$ | 647,264,769 | $ | 1,829,310 | $ | — | ||||||
| U.S. Total Market Fund | Level 1 | Level 2 | Level 3 | |||||||||
| Common Stocks* |
$ | 112,754,991 | $ | — | $ | — | ||||||
| Investment of Cash Collateral for Securities Loaned |
— | 203,221 | — | |||||||||
| Total |
$ | 112,754,991 | $ | 203,221 | $ | — | ||||||
| * | Please refer to the Schedule of Investments for a breakdown of the valuation by industry type and/or country. |
| ** | Security is being fair valued using significant unobservable inputs by the Pricing Committee. |
During the fiscal year ended March 31, 2019, there were no significant transfers into or out of Level 3 of the fair value hierarchy.
Investment Transactions and Investment Income — Investment transactions are recorded as of the date that the securities are purchased or sold (trade date). Realized gains and losses on sales of portfolio securities are calculated using the identified-cost method. Dividend income (net of foreign taxes withheld, if any) is recognized on the ex-dividend date or as soon as practicable after the existence of a dividend declaration has been determined. Non-cash dividend income is recognized at the fair value of securities received on the ex-dividend date or as soon as practicable after the existence of a dividend declaration has been determined. Income earned from securities lending activities (i.e. Securities lending income), net of fees payable to the securities borrower and/or securities lending agent, is accrued daily.
| 130 | WisdomTree Trust |
Notes to Financial Statements (continued)
Expenses/Reimbursements — Under the investment advisory agreement for each Fund, except for Funds that commenced operations on or after March 26, 2013, WTAM has agreed to pay all expenses of the Trust, except for: (i) brokerage expenses and other expenses (such as stamp taxes) connected with the execution of portfolio transactions or in connection with creation and redemption transactions; (ii) legal fees or expenses in connection with any arbitration, litigation or pending or threatened arbitration or litigation, including any settlements in connection therewith; (iii) compensation and expenses of trustees who are not interested persons of the Funds (“Independent Trustees”); (iv) compensation and expenses of counsel to the Independent Trustees; (v) compensation and expenses of the Trust’s Chief Compliance Officer (“CCO”); (vi) extraordinary expenses; (vii) distribution fees and expenses paid by the Trust under any distribution plan adopted pursuant to Rule 12b-1 under the 1940 Act; and (viii) the advisory fee payable to WTAM.
Under the investment advisory agreement for Funds that commenced operations on or after March 26, 2013, WTAM has agreed to pay all expenses of the Trust, except for: (i) brokerage expenses and other fees, charges, taxes, levies or expenses (such as stamp taxes) incurred in connection with the execution of portfolio transactions or in connection with creation and redemption transactions (including without limitation any fees, charges, taxes, levies or expenses related to the purchase or sale of an amount of any currency, or the partition or repatriation of any security or other asset, related to the execution of portfolio transactions or any creation or redemption transactions); (ii) legal fees or expenses in connection with any arbitration, litigation or pending or threatened arbitration or litigation, including any settlements in connection therewith; (iii) compensation and expenses of each Independent Trustee; (iv) compensation and expenses of counsel to the Independent Trustees; (v) compensation and expenses of the Trust’s CCO; (vi) extraordinary expenses (in each case as determined by a majority of the Independent Trustees); (vii) distribution fees and expenses paid by the Trust under any distribution plan adopted pursuant to Rule 12b-1 under the 1940 Act; (viii) interest and taxes of any kind or nature (including, but not limited to, income, excise, transfer and withholding taxes); (ix) fees and expenses related to the provision of securities lending services; and (x) the advisory fee payable to WTAM.
Acquired fund fees and expenses (“AFFEs”) (which are fees and expenses incurred indirectly by a Fund through its investments in certain underlying investment companies) are not operating expenses of the Funds and are not paid by WTAM.
Pursuant to a separate contractual arrangement, WTAM arranges for the provision of CCO services with respect to each Fund, and is liable and responsible for, and administers, payments to the CCO, the Independent Trustees and counsel to the Independent Trustees. WTAM receives a fee, as shown on the Statements of Operations under “Service fees”, of up to 0.0044% per annum of each Fund’s average daily net assets for providing such services and paying such expenses. WTAM provides CCO services to the Trust.
Securities Lending — Each Fund may lend portfolio securities to certain creditworthy borrowers, including the Funds’ securities lending agent. It is the Funds’ policy that, at origination, all loans are secured by collateral of at least 102% of the value of U.S. securities loaned and 105% of the value of foreign securities loaned. Collateral in the form of cash and/or high-grade debt obligations, equivalent to at least 100% of the market value of securities, is maintained at all times. The cash collateral can be invested in certain money market mutual funds which also have exposure to the fluctuations of the market. The values of the investments of cash collateral for securities on loan along with the obligations to return such collateral are included on the Statements of Assets and Liabilities. The total value of securities received as collateral for securities on loan is included in a footnote following each Schedule of Investments, but is not included within the Statements of Assets and Liabilities because the receiving Fund does not have the right to sell or repledge the securities received as collateral. Each Fund receives compensation for lending its securities from interest or dividends earned on the cash or U.S. government securities held as collateral, net of fee rebates paid to the borrower plus reasonable administrative and custody fees, all of which are included in the securities lending income earned by the Funds and disclosed on the Statements of Operations. The dividend and interest income earned on the securities loaned is accounted for in the same manner as other dividend and interest income. The borrower pays to the Funds an amount equal to any dividends or interest received on loaned securities. Dividends received while a security is out on loan are not considered Qualified Dividend Income (“QDI”) under the specific criteria issued by the Internal Revenue Service and are subject to taxation at the shareholder’s ordinary income tax rate instead of the lower long-term capital gains tax rate. Lending portfolio securities could result in a loss or delay in recovering each Fund’s securities if the borrower defaults. In the event of a borrower default with respect to the failure to return to each Fund some or all of the securities loaned, the securities lending agent shall indemnify each Fund against the failure of the borrower.
Master Netting Arrangements — ASU No. 2011-11 “Disclosures about Offsetting Assets and Liabilities” (“ASU 2011-11”) is generally intended to (i) help investors and other financial statement users to better assess the effect or potential effect of offsetting arrangements on a company’s financial position, (ii) improve transparency in the reporting of how companies mitigate credit risk, and (iii) facilitate comparisons between those entities that prepare their financial statements on the basis of GAAP and those entities that prepare their financial statements on the basis of international financial reporting standards. ASU 2011-11 requires entities to disclose (i) gross and net information about both instruments and transactions eligible for offset in the financial statements, and (ii) instruments and transactions subject to an agreement similar to a master netting agreement. ASU 2011-11 is limited in scope to the following financial instruments, to the extent they are offset in the financial statements or subject to an enforceable master
| WisdomTree Trust | 131 |
Notes to Financial Statements (continued)
netting arrangement or similar agreement: (i) recognized derivative instruments accounted for under ASC 815 (Derivatives and Hedging); (ii) repurchase agreements and reverse repurchase agreements; and (iii) securities borrowing and securities lending transactions.
The Funds’ security lending activities are governed by a Securities Lending Authorization Agreement (“Lending Agreement”) between the Funds and the lending agent. The Lending Agreement authorizes the lending agent to lend qualifying U.S. and foreign securities held by a Fund to approved borrowers (each a “Borrower”). To mitigate borrower risk, a Fund typically receives from a Borrower collateral in the form of U.S. dollar cash and/or securities issued or guaranteed by the U.S. government or its agencies in excess of the market value of the securities loaned. Under the provisions of the Lending Agreement, a Fund shall have, as to the collateral, all of the rights and remedies of a secured party under applicable law. A Fund is exposed to risk of loss if a Borrower defaults on its obligation to return borrowed securities and the value of the collateral a Fund received is insufficient to cover the market value of the securities loaned. Also, the lending agent is permitted to invest the cash collateral it receives from a Borrower into a money market fund which is subject to market fluctuation. Therefore, a Fund is exposed to risk of loss if the value of invested cash collateral is insufficient to satisfy the Fund’s obligation to return the full amount owed to such Borrower.
For financial reporting purposes, the Funds elect to not offset assets and liabilities subject to the Lending Agreement or similar arrangements in the Statements of Assets and Liabilities. Therefore, all qualifying transactions, if any at March 31, 2019, are presented on a gross basis in the Statements of Assets and Liabilities. As of March 31, 2019, certain of the Funds had securities on loan and the value of the related collateral received by each of those Funds exceeded the value of the securities loaned by each of those Funds. The value of the securities loaned by each Fund is located in the Statements of Assets and Liabilities in “Investments in securities, at value” and also in the footnotes below the Schedules of Investments. In addition, a breakout of the total amount of cash and non-cash securities lending collateral received is located in the footnotes below the Schedules of Investments.
Short-Term Investments — Each Fund may invest a portion of its assets in high-quality money market instruments on an ongoing basis to provide liquidity or for other reasons. The instruments include short-term obligations issued by the U.S. government, its agencies, non-U.S. government agencies, negotiable certificates of deposit (“CDs”), fixed time deposits and bankers’ acceptances of U.S. and foreign banks and similar institutions, commercial papers, repurchase agreements and money market funds. CDs are short-term negotiable obligations of commercial banks. Time deposits are non-negotiable deposits maintained in banking institutions for specified periods of time at stated interest rates. Banker’s acceptances are time drafts drawn on commercial banks by borrowers, usually in connection with international transactions.
Tax Information and Dividends and Distributions to Shareholders — It is each Fund’s policy to comply with all requirements of the Internal Revenue Code of 1986, as amended (the “Code”). Each Fund intends to qualify for and to elect treatment as a separate Regulated Investment Company (“RIC”) under Subchapter M of the Code. In order to qualify for the special tax treatment accorded RICs and their shareholders, each Fund must, among other things, distribute with respect to each taxable year an amount equal to or greater than the sum of 90% of its investment company taxable income and 90% of its net tax-exempt interest income. There can be no guarantee that a Fund will pay dividends. Taxable net realized gains from investment transactions, reduced by capital loss carryforwards, if any, are declared and distributed to shareholders at least annually. The capital loss carryforward amount, if any, is available to offset future net capital gains. The Funds may occasionally be required to make supplemental distributions at some other time during the year. The Trust reserves the right to declare special distributions if, in its reasonable discretion, such action is necessary or advisable to preserve the status of each Fund as a RIC or to avoid imposition of income or excise taxes on undistributed income. Dividends and distributions to shareholders are recorded on the ex-dividend date. The amount of dividends and distributions from net investment income and net realized capital gains are determined in accordance with the requirements of the Code and the U.S. Treasury regulations. These book/tax differences are either considered temporary or permanent in nature. To the extent these differences are permanent in nature, such amounts are reclassified within the components of net assets based on their Federal tax basis treatment; temporary differences do not require reclassification. Dividends and distributions that exceed earnings and profit for tax purposes are reported for tax purposes as a return of capital.
3. ADVISORY FEES AND OTHER TRANSACTIONS WITH AFFILIATES
WTAM has overall responsibility for the general management and administration of the Trust. WTAM provides an investment program for each Fund. WTAM has arranged for Mellon Investments Corporation (“Mellon”) to provide sub-advisory services to the Funds. Mellon is compensated by WTAM at no additional cost to the Funds. WTAM also arranges for transfer agency, custody, fund accounting, fund administration, securities lending and all other non-distribution related services necessary for the Funds to operate, which are generally under separate agreements entered into between the Trust on behalf of the Funds and the applicable service provider. Under the investment advisory agreement for each Fund, WTAM agrees to pay all expenses of the Funds, except for certain expenses described in Note 2.
Pursuant to a separate contractual arrangement, as also described in Note 2, WTAM arranges for the provision of CCO services with respect to each Fund, and is liable and responsible for, and administers, payments to the CCO, the Independent Trustees and
| 132 | WisdomTree Trust |
Notes to Financial Statements (continued)
counsel to the Independent Trustees in exchange for a fee, accrued daily and paid monthly in arrears, of up to 0.0044% per annum of each Fund’s average daily net assets. WTAM expects to receive advisory fees from each Fund, based on a percentage of the Fund’s average daily net assets, as shown in the following table:
| Fund | Advisory Fee Rate |
|||
| U.S. Dividend ex-Financials Fund |
0.38 | % | ||
| U.S. High Dividend Fund |
0.38 | % | ||
| U.S. LargeCap Dividend Fund |
0.28 | % | ||
| U.S. LargeCap Fund |
0.08 | %* | ||
| U.S. MidCap Dividend Fund |
0.38 | % | ||
| U.S. MidCap Fund |
0.38 | % | ||
| U.S. Multifactor Fund |
0.28 | % | ||
| U.S. Quality Dividend Growth Fund |
0.28 | % | ||
| U.S. Quality Shareholder Yield Fund |
0.38 | % | ||
| U.S. SmallCap Dividend Fund |
0.38 | % | ||
| U.S. SmallCap Fund |
0.38 | % | ||
| U.S. SmallCap Quality Dividend Growth Fund |
0.38 | % | ||
| U.S. Total Dividend Fund |
0.28 | % | ||
| U.S. Total Market Fund |
0.28 | % | ||
| * | From April 1, 2018 through March 28, 2019 the advisory fee rate was 0.28%. |
Each Fund may purchase shares of affiliated ETFs in secondary market transactions to reduce cash balances. For these transactions, WTAM waives its advisory fees for each Fund’s investment in affiliated funds. The waivers may be reduced to offset the incremental costs related to these investments (fund accounting, safekeeping, transaction fees, etc.) that are paid by WTAM out of its advisory fee. The dollar amount of advisory fees waived during the period for the Funds, if any, are shown in the Statements of Operations in “Expense waivers”.
Affiliated holdings are funds which are managed by, or an affiliate of, WTAM. Transactions with affiliated funds during the fiscal year ended March 31, 2019 are as follows:
| Fund | Value at 3/31/2018 |
Purchases/ Additions |
Sales/ Reductions |
Realized Gain/(Loss) |
Change in Unrealized Appreciation/ Depreciation |
Value at 3/31/2019 |
Dividend Income |
|||||||||||||||||||||
| U.S. Dividend ex-Financials Fund |
||||||||||||||||||||||||||||
| U.S. LargeCap Dividend Fund |
$ | 911,447 | $ | 8,303,033 | $ | 6,581,655 | $ | (25,503 | ) | $ | 120,630 | $ | 2,727,952 | $ | 47,856 | |||||||||||||
| U.S. MidCap Dividend Fund |
916,770 | 8,302,140 | 6,572,358 | (5,015 | ) | 88,238 | 2,729,775 | 35,470 | ||||||||||||||||||||
| Total |
$ | 1,828,217 | $ | 16,605,173 | $ | 13,154,013 | $ | (30,518 | ) | $ | 208,868 | $ | 5,457,727 | $ | 83,326 | |||||||||||||
| U.S. High Dividend Fund |
||||||||||||||||||||||||||||
| U.S. Total Dividend Fund |
$ | 3,058,050 | $ | 14,891,459 | $ | 11,499,141 | $ | 10,817 | $ | 490,903 | $ | 6,952,088 | $ | 121,537 | ||||||||||||||
| U.S. LargeCap Dividend Fund |
||||||||||||||||||||||||||||
| U.S. Total Dividend Fund |
$ | — | $ | 35,707,655 | $ | 28,193,691 | $ | (574,350 | ) | $ | 269,205 | $ | 7,208,819 | $ | 156,080 | |||||||||||||
| U.S. LargeCap Fund |
||||||||||||||||||||||||||||
| U.S. High Dividend Fund |
$ | 204,565 | $ | 3,331,854 | $ | 3,045,271 | $ | (9,351 | ) | $ | 53,394 | $ | 535,191 | $ | 33,947 | |||||||||||||
| U.S. MidCap Dividend Fund |
||||||||||||||||||||||||||||
| U.S. LargeCap Dividend Fund |
$ | 1,487,251 | $ | 63,381,222 | $ | 48,729,855 | $ | 1,019,836 | $ | 1,676,878 | $ | 18,835,332 | $ | 300,036 | ||||||||||||||
| U.S. MidCap Fund |
||||||||||||||||||||||||||||
| U.S. MidCap Dividend Fund |
$ | 2,110,629 | $ | 9,333,111 | $ | 7,649,595 | $ | 43,326 | $ | 147,030 | $ | 3,984,501 | $ | 79,588 | ||||||||||||||
| U.S. Multifactor Fund |
||||||||||||||||||||||||||||
| U.S. Quality Dividend Growth Fund |
$ | — | $ | 333,034 | $ | 334,086 | $ | 1,052 | $ | — | $ | — | $ | 1,325 | ||||||||||||||
| U.S. SmallCap Dividend Fund |
||||||||||||||||||||||||||||
| U.S. MidCap Dividend Fund |
$ | 10,549,153 | $ | 39,860,860 | $ | 32,155,489 | $ | (149,116 | ) | $ | 885,374 | $ | 18,990,782 | $ | 281,329 | |||||||||||||
| U.S. SmallCap Fund |
||||||||||||||||||||||||||||
| U.S. MidCap Fund |
$ | 681,155 | $ | 12,476,916 | $ | 11,501,553 | $ | (146,831 | ) | $ | (75,744 | ) | $ | 1,433,943 | $ | 22,164 | ||||||||||||
| U.S. Total Dividend Fund |
||||||||||||||||||||||||||||
| U.S. Total Market Fund |
$ | 11,117 | $ | 8,711,962 | $ | 7,318,724 | $ | (114,228 | ) | $ | 64,955 | $ | 1,355,082 | $ | 34,694 | |||||||||||||
| WisdomTree Trust | 133 |
Notes to Financial Statements (continued)
Related Party Transactions — WTAM or its affiliates may from time to time own shares of a Fund. As of March 31, 2019, WTAM held shares of the following Funds which were purchased through an unaffiliated broker in ordinary brokerage transactions in the secondary market in which the Funds’ shares trade:
| Fund | Fund Shares held by WTAM |
Market Value of Fund Shares held by WTAM |
Dividends and distributions paid to WTAM on Fund Shares held by WTAM |
|||||||||
| U.S. Dividend ex-Financials Fund |
30 | $ | 2,565 | $ | 84 | |||||||
| U.S. High Dividend Fund |
— | — | 30 | |||||||||
| U.S. LargeCap Dividend Fund |
50 | 4,711 | 281 | |||||||||
| U.S. LargeCap Fund |
611 | 19,424 | 410 | |||||||||
| U.S. MidCap Dividend Fund |
292 | 10,451 | 213 | |||||||||
| U.S. MidCap Fund |
59 | 2,321 | 109 | |||||||||
| U.S. Multifactor Fund |
1,556 | 45,100 | 412 | |||||||||
| U.S. Quality Dividend Growth Fund |
1,086 | 46,763 | 690 | |||||||||
| U.S. SmallCap Dividend Fund |
122 | 3,360 | 102 | |||||||||
| U.S. SmallCap Fund |
433 | 15,636 | 177 | |||||||||
| U.S. Total Dividend Fund |
78 | 7,381 | 193 | |||||||||
4. CAPITAL SHARE TRANSACTIONS
As of March 31, 2019, there were an unlimited number of $0.001 par value shares of beneficial interest authorized by the Trust. Shares are issued and redeemed by each Fund only in creation units or multiples thereof. Except when aggregated in creation units, shares of each Fund are not redeemable. Transactions in shares for each Fund are disclosed in detail in the Statements of Changes in Net Assets. The consideration for the purchase of creation units of a Fund generally consists of the in-kind contribution of a portfolio of equity securities and an amount of cash. Investors purchasing and redeeming creation units may be charged a purchase transaction fee and a redemption transaction fee to offset transfer and other transaction costs associated with the issuance and redemption of creation units.
5. INVESTMENT PORTFOLIO TRANSACTIONS
Purchases and sales of investments (excluding purchases and sales resulting from in-kind capital share transactions and short-term investments) and the cost of purchases and the proceeds from sales resulting from in-kind capital share transactions (excluding short-term investments) for the fiscal year ended March 31, 2019 are shown in the following table. Realized gains and losses on sales resulting from in-kind capital share redemptions, as shown on the Statements of Operations, are not recognized by the Funds for tax purposes.
| In-kind Capital Share Transactions | ||||||||||||||||
| Fund | Purchases | Sales | Purchases | Sales | ||||||||||||
| U.S. Dividend ex-Financials Fund |
$ | 258,177,886 | $ | 253,589,098 | $ | 97,136,768 | $ | 125,677,843 | ||||||||
| U.S. High Dividend Fund |
203,281,866 | 192,654,734 | 165,941,476 | 312,113,905 | ||||||||||||
| U.S. LargeCap Dividend Fund |
238,206,503 | 225,053,779 | 229,906,320 | 260,641,561 | ||||||||||||
| U.S. LargeCap Fund |
33,028,899 | 30,986,389 | 83,022,302 | 37,039,262 | ||||||||||||
| U.S. MidCap Dividend Fund |
932,121,415 | 902,616,838 | 825,250,838 | 314,920,492 | ||||||||||||
| U.S. MidCap Fund |
397,443,605 | 392,958,560 | 217,924,001 | 163,252,494 | ||||||||||||
| U.S. Multifactor Fund |
103,295,317 | 101,232,190 | 198,481,595 | 80,710,618 | ||||||||||||
| U.S. Quality Dividend Growth Fund |
707,879,277 | 683,576,642 | 783,459,990 | 236,481,370 | ||||||||||||
| U.S. Quality Shareholder Yield Fund |
21,251,899 | 20,841,095 | 7,787,243 | 15,949,451 | ||||||||||||
| U.S. SmallCap Dividend Fund |
573,957,672 | 533,850,673 | 223,767,485 | 99,098,958 | ||||||||||||
| U.S. SmallCap Fund |
322,058,112 | 316,672,228 | 235,130,051 | 84,002,337 | ||||||||||||
| U.S. SmallCap Quality Dividend Growth Fund |
47,528,883 | 46,675,570 | 48,495,139 | 30,735,697 | ||||||||||||
| U.S. Total Dividend Fund |
74,901,285 | 68,223,033 | 76,341,081 | 45,016,289 | ||||||||||||
| U.S. Total Market Fund |
18,024,512 | 17,742,217 | 51,104,205 | 10,959,494 | ||||||||||||
| 134 | WisdomTree Trust |
Notes to Financial Statements (continued)
6. FEDERAL INCOME TAXES
At March 31, 2019, the cost of investments (including securities on loan and derivatives) for Federal income tax purposes was as follows:
| Fund | Tax Cost | Gross Unrealized Appreciation |
Gross Unrealized Depreciation |
Net Unrealized Appreciation |
||||||||||||
| U.S. Dividend ex-Financials Fund |
$ | 739,562,850 | $ | 90,097,557 | $ | (40,216,594 | ) | $ | 49,880,963 | |||||||
| U.S. High Dividend Fund |
934,645,807 | 67,707,355 | (48,044,110 | ) | 19,663,245 | |||||||||||
| U.S. LargeCap Dividend Fund |
1,694,886,087 | 405,263,207 | (68,138,048 | ) | 337,125,159 | |||||||||||
| U.S. LargeCap Fund |
206,249,989 | 37,753,502 | (4,253,462 | ) | 33,500,040 | |||||||||||
| U.S. MidCap Dividend Fund |
3,440,880,848 | 457,341,901 | (104,750,794 | ) | 352,591,107 | |||||||||||
| U.S. MidCap Fund |
964,032,131 | 162,460,275 | (27,051,795 | ) | 135,408,480 | |||||||||||
| U.S. Multifactor Fund |
113,057,049 | 4,514,223 | (1,981,230 | ) | 2,532,993 | |||||||||||
| U.S. Quality Dividend Growth Fund |
2,399,288,197 | 414,209,086 | (38,729,614 | ) | 375,479,472 | |||||||||||
| U.S. Quality Shareholder Yield Fund |
35,278,077 | 3,757,339 | (962,674 | ) | 2,794,665 | |||||||||||
| U.S. SmallCap Dividend Fund |
2,127,843,177 | 215,754,669 | (208,364,789 | ) | 7,389,880 | |||||||||||
| U.S. SmallCap Fund |
693,033,905 | 95,190,207 | (33,324,174 | ) | 61,866,033 | |||||||||||
| U.S. SmallCap Quality Dividend Growth Fund |
114,041,274 | 10,601,095 | (4,392,614 | ) | 6,208,481 | |||||||||||
| U.S. Total Dividend Fund |
515,712,580 | 150,436,136 | (17,054,637 | ) | 133,381,499 | |||||||||||
| U.S. Total Market Fund |
96,214,446 | 18,129,782 | (1,386,016 | ) | 16,743,766 | |||||||||||
At March 31, 2019, the components of accumulated earnings/(loss) on a tax-basis were as follows:
| Fund | Undistributed Ordinary Income |
Undistributed Capital and Other Losses |
Net Unrealized Appreciation |
Total Accumulated Earnings/(Losses) |
||||||||||||
| U.S. Dividend ex-Financials Fund |
$ | 1,046,899 | $ | (31,893,742 | ) | $ | 49,880,963 | $ | 19,034,120 | |||||||
| U.S. High Dividend Fund |
1,472,301 | (14,104,120 | ) | 19,663,245 | 7,031,426 | |||||||||||
| U.S. LargeCap Dividend Fund |
1,711,356 | (25,859,173 | ) | 337,125,159 | 312,977,342 | |||||||||||
| U.S. LargeCap Fund |
144,485 | (5,025,861 | ) | 33,500,040 | 28,618,664 | |||||||||||
| U.S. MidCap Dividend Fund |
5,194,739 | (92,408,761 | ) | 352,591,107 | 265,377,085 | |||||||||||
| U.S. MidCap Fund |
559,743 | (103,990,629 | ) | 135,408,480 | 31,977,594 | |||||||||||
| U.S. Multifactor Fund |
59,678 | (11,641,681 | ) | 2,532,993 | (9,049,010 | ) | ||||||||||
| U.S. Quality Dividend Growth Fund |
2,280,349 | (66,874,487 | ) | 375,479,472 | 310,885,334 | |||||||||||
| U.S. Quality Shareholder Yield Fund |
18,182 | (2,303,101 | ) | 2,794,665 | 509,746 | |||||||||||
| U.S. SmallCap Dividend Fund |
3,917,778 | (97,397,913 | ) | 7,389,880 | (86,090,255 | ) | ||||||||||
| U.S. SmallCap Fund |
394,249 | (67,542,870 | ) | 61,866,033 | (5,282,588 | ) | ||||||||||
| U.S. SmallCap Quality Dividend Growth Fund |
87,037 | (17,876,064 | ) | 6,208,481 | (11,580,546 | ) | ||||||||||
| U.S. Total Dividend Fund |
602,496 | (9,806,380 | ) | 133,381,499 | 124,177,615 | |||||||||||
| U.S. Total Market Fund |
— | (4,506,363 | ) | 16,743,766 | 12,237,403 | |||||||||||
The tax character of distributions paid during the fiscal years or period ended March 31, 2019 and March 31, 2018, was as follows:
| Year Ended March 31, 2019 | Year Ended March 31, 2018 | |||||||||||
| Fund | Distributions Paid from Ordinary Income* |
Distributions Paid from Long-Term Capital Gains |
Distributions Paid from Ordinary Income* |
|||||||||
| U.S. Dividend ex-Financials Fund |
$ | 27,412,642 | $ | 560,514 | $ | 28,141,027 | ||||||
| U.S. High Dividend Fund |
32,229,868 | — | 38,366,808 | |||||||||
| U.S. LargeCap Dividend Fund |
53,410,696 | — | 49,979,017 | |||||||||
| U.S. LargeCap Fund |
4,134,218 | — | 2,586,608 | |||||||||
| U.S. MidCap Dividend Fund |
73,682,291 | — | 66,312,628 | |||||||||
| U.S. MidCap Fund |
15,362,214 | — | 10,100,147 | |||||||||
| U.S. Multifactor Fund |
905,199 | — | 35,735 | 1 | ||||||||
| U.S. Quality Dividend Growth Fund |
52,909,568 | 1,596,218 | 34,344,320 | |||||||||
| U.S. Quality Shareholder Yield Fund |
676,737 | — | 642,537 | |||||||||
| WisdomTree Trust | 135 |
Notes to Financial Statements (continued)
| Year Ended March 31, 2019 | Year Ended March 31, 2018 | |||||||||||
| Fund | Distributions Paid from Ordinary Income* |
Distributions Paid from Long-Term Capital Gains |
Distributions Paid from Ordinary Income* |
|||||||||
| U.S. SmallCap Dividend Fund |
$ | 57,474,162 | $ | — | $ | 57,037,610 | ||||||
| U.S. SmallCap Fund |
10,921,376 | — | 5,289,781 | |||||||||
| U.S. SmallCap Quality Dividend Growth Fund |
2,704,131 | — | 2,305,555 | |||||||||
| U.S. Total Dividend Fund |
16,303,635 | — | 15,363,975 | |||||||||
| U.S. Total Market Fund |
1,733,962 | — | 1,103,114 | |||||||||
| * | Includes short-term capital gains if any. |
| 1 | For the period June 29, 2017 (commencement of operations) through March 31, 2018. |
At March 31, 2019, for Federal tax purposes, the Funds have capital loss carryforwards available to offset future capital gains as indicated in the below table. To the extent that these loss carryforwards are utilized, capital gains so offset will not be distributed to shareholders.
| Fund | Short-Term Post-Effective No Expiration |
Long-Term Post-Effective No Expiration |
Capital Loss Available Total |
|||||||||
| U.S. Dividend ex-Financials Fund |
$ | — | $ | — | $ | — | ||||||
| U.S. High Dividend Fund |
— | — | — | |||||||||
| U.S. LargeCap Dividend Fund |
— | — | — | |||||||||
| U.S. LargeCap Fund |
1,535,490 | 3,490,371 | 5,025,861 | |||||||||
| U.S. MidCap Dividend Fund |
42,409,311 | 49,999,450 | 92,408,761 | |||||||||
| U.S. MidCap Fund |
43,253,568 | 60,737,061 | 103,990,629 | |||||||||
| U.S. Multifactor Fund |
11,634,899 | 6,782 | 11,641,681 | |||||||||
| U.S. Quality Dividend Growth Fund |
— | — | — | |||||||||
| U.S. Quality Shareholder Yield Fund |
2,040,227 | 262,874 | 2,303,101 | |||||||||
| U.S. SmallCap Dividend Fund |
41,185,709 | 56,212,204 | 97,397,913 | |||||||||
| U.S. SmallCap Fund |
38,948,383 | 28,594,487 | 67,542,870 | |||||||||
| U.S. SmallCap Quality Dividend Growth Fund |
8,868,615 | 9,007,449 | 17,876,064 | |||||||||
| U.S. Total Dividend Fund |
2,690,876 | 7,115,504 | 9,806,380 | |||||||||
| U.S. Total Market Fund |
— | — | — | |||||||||
Capital losses incurred after October 31 (“post-October capital losses”) and late year ordinary losses incurred after December 31 within the taxable year are deemed to arise on the first business day of each Fund’s next taxable year.
During the fiscal year ended March 31, 2019, the following Funds incurred and will elect to defer post-October capital losses and late year ordinary losses as follows:
| Fund | Short-Term Post-October Capital Losses |
Long-Term Post-October Capital Losses |
||||||
| U.S. Dividend ex-Financials Fund |
$ | 3,092,040 | $ | 28,801,702 | ||||
| U.S. High Dividend Fund |
686,742 | 13,417,378 | ||||||
| U.S. LargeCap Dividend Fund |
4,590,058 | 21,269,115 | ||||||
| U.S. LargeCap Fund |
— | — | ||||||
| U.S. MidCap Dividend Fund |
— | — | ||||||
| U.S. MidCap Fund |
— | — | ||||||
| U.S. Multifactor Fund |
— | — | ||||||
| U.S. Quality Dividend Growth Fund |
34,996,877 | 31,877,610 | ||||||
| U.S. Quality Shareholder Yield Fund |
— | — | ||||||
| U.S. SmallCap Dividend Fund |
— | — | ||||||
| U.S. SmallCap Fund |
— | — | ||||||
| U.S. SmallCap Quality Dividend Growth Fund |
— | — | ||||||
| U.S. Total Dividend Fund |
— | — | ||||||
| U.S. Total Market Fund |
1,845,157 | 2,661,206 | ||||||
| 136 | WisdomTree Trust |
Notes to Financial Statements (continued)
During the fiscal year ended March 31, 2019, the amount of expired capital loss carryforwards and the amount of capital loss carryforwards used to offset realized gains are shown in the following table:
| Fund | Expired Capital Loss Carryforward |
Utilized Capital Loss Carryforward |
||||||
| U.S. Dividend ex-Financials Fund |
$ | — | $ | 1,318,159 | ||||
| U.S. High Dividend Fund |
16,582,147 | 934,295 | ||||||
| U.S. LargeCap Dividend Fund |
19,363,746 | 3,774,331 | ||||||
| U.S. LargeCap Fund |
4,536,572 | — | ||||||
| U.S. MidCap Dividend Fund |
— | — | ||||||
| U.S. MidCap Fund |
346,722 | — | ||||||
| U.S. Multifactor Fund |
— | — | ||||||
| U.S. Quality Dividend Growth Fund |
— | 1,331,675 | ||||||
| U.S. Quality Shareholder Yield Fund |
295,465 | — | ||||||
| U.S. SmallCap Dividend Fund |
6,604,794 | — | ||||||
| U.S. SmallCap Fund |
921,406 | — | ||||||
| U.S. SmallCap Quality Dividend Growth Fund |
— | — | ||||||
| U.S. Total Dividend Fund |
5,967,514 | — | ||||||
| U.S. Total Market Fund |
935,380 | — | ||||||
At March 31, 2019, the effect of permanent “book/tax” reclassifications resulted in increases (decreases) to the components of net assets as follows:
| Fund | Total Distributable Earnings (Loss) |
Paid-in Capital | ||||||
| U.S. Dividend ex-Financials Fund |
$ | (27,581,803 | ) | $ | 27,581,803 | |||
| U.S. High Dividend Fund |
(29,320,753 | ) | 29,320,753 | |||||
| U.S. LargeCap Dividend Fund |
(64,485,490 | ) | 64,485,490 | |||||
| U.S. LargeCap Fund |
(8,362,944 | ) | 8,362,944 | |||||
| U.S. MidCap Dividend Fund |
(90,017,112 | ) | 90,017,112 | |||||
| U.S. MidCap Fund |
(40,364,334 | ) | 40,364,334 | |||||
| U.S. Multifactor Fund |
(194,824 | ) | 194,824 | |||||
| U.S. Quality Dividend Growth Fund |
(34,005,015 | ) | 34,005,015 | |||||
| U.S. Quality Shareholder Yield Fund |
(1,831,977 | ) | 1,831,977 | |||||
| U.S. SmallCap Dividend Fund |
(12,227,641 | ) | 12,227,641 | |||||
| U.S. SmallCap Fund |
(26,402,313 | ) | 26,402,313 | |||||
| U.S. SmallCap Quality Dividend Growth Fund |
(4,179,289 | ) | 4,179,289 | |||||
| U.S. Total Dividend Fund |
(12,577,797 | ) | 12,577,797 | |||||
| U.S. Total Market Fund |
(2,395,280 | ) | 2,395,280 | |||||
These differences are primarily due to redemptions-in-kind, distribution in excess of current earnings, expiration of capital loss carryforwards, investment in real estate investment trust and realized basis adjustments on securities.
GAAP provides guidance on tax provisions that prescribe a minimum threshold for financial statement recognition of the benefit of a tax position taken or expected to be taken in a tax return. Foreign taxes are provided for based on each Fund’s understanding of the tax rules and rates that exist in the foreign markets in which it invests. Taxes are accrued and applied to net investment income, net realized capital gains and net unrealized appreciation, as applicable, as the income is earned or capital gains are recorded. As of and during the fiscal year ended March 31, 2019, the Funds did not have any liabilities for unrecognized tax benefits relating to uncertain income tax positions they have taken or expect to take in the future. If applicable, the Funds will recognize interest accrued related to unrecognized tax benefits in interest expense and penalties in “Other” expenses on the Statements of Operations. The Funds file tax returns with the Internal Revenue Service, the State of New York, and various other states. Generally, each of the tax years in the four-year period ended March 31, 2019, remains subject to examination by taxing authorities.
| WisdomTree Trust | 137 |
Notes to Financial Statements (concluded)
7. RECENT ACCOUNTING PRONOUNCEMENTS
On August 17, 2018, the SEC voted to adopt “Disclosure Update and Simplification” amendments to certain of its disclosure requirements that have become redundant, duplicative, overlapping, outdated, or superseded, in light of other SEC disclosure requirements, GAAP, or changes in the information environment. The SEC will also be referring certain SEC disclosure requirements that overlap with, but require information incremental to, GAAP to the FASB for potential incorporation into GAAP. The amendments are intended to facilitate the disclosure of information to investors and simplify compliance without significantly altering the total mix of information provided to investors. These amendments became effective on November 5, 2018 (30 days after their publication in the Federal Register). WTAM has evaluated these amendments and determined that there is no significant impact on the Trust’s financial statements. All applicable amendments have been incorporated into the Trust’s financial statements and related disclosures. The specific amendments incorporated into the Trust’s financial statements pertain to (i) the amendment requiring the presentation of the distributable earnings in total on the Statements of Assets and Liabilities, rather than showing the 3 components of distributable earnings (i.e., (1) undistributed (distributions in excess of) net investment income, (2) accumulated net realized gain (loss) on investments and (3) net unrealized appreciation (depreciation) on investments, and (ii) the amendment requiring the presentation of distributions to shareholders in total on the Statements of Changes in Net Assets, except for tax return of capital distributions, which shall continue to be disclosed separately.
On August 28, 2018, the FASB issued ASU 2018-13, Fair Value Measurement (Topic 820): Disclosure Framework — Changes to the Disclosure Requirements for Fair Value Measurement. ASU 2018-13 includes removals, additions and modifications to the disclosure requirements for fair value measurements that are intended to improve the effectiveness of disclosures in the notes to financial statements. The amendments in ASU 2018-13 are effective for all entities for fiscal years, and interim periods within those fiscal years, beginning after December 15, 2019. An entity is permitted to early adopt any removed or modified disclosures upon issuance of this ASU and delay adoption of the additional disclosures until their effective date. WTAM has evaluated ASU 2018-13 and has adopted the disclosure framework for the Trust’s financial statements.
| 138 | WisdomTree Trust |
Report of Independent Registered Public Accounting Firm
To the Shareholders of WisdomTree U.S. Dividend ex-Financials Fund, WisdomTree U.S. High Dividend Fund, WisdomTree U.S. LargeCap Dividend Fund, WisdomTree U.S. LargeCap Fund (formerly, WisdomTree U.S. Earnings 500 Fund), WisdomTree U.S. MidCap Dividend Fund, WisdomTree U.S. MidCap Fund (formerly, WisdomTree U.S. MidCap Earnings Fund), WisdomTree U.S. Multifactor Fund, WisdomTree U.S. Quality Dividend Growth Fund, WisdomTree U.S. Quality Shareholder Yield Fund, WisdomTree U.S. SmallCap Dividend Fund, WisdomTree U.S. SmallCap Fund (formerly, WisdomTree U.S. SmallCap Earnings Fund), WisdomTree U.S. SmallCap Quality Dividend Growth Fund, WisdomTree U.S. Total Dividend Fund and WisdomTree U.S. Total Market Fund (formerly, WisdomTree U.S. Total Earnings Fund) and the Board of Trustees of WisdomTree Trust
Opinion on the Financial Statements
We have audited the accompanying statements of assets and liabilities of WisdomTree U.S. Dividend ex-Financials Fund, WisdomTree U.S. High Dividend Fund, WisdomTree U.S. LargeCap Dividend Fund, WisdomTree U.S. LargeCap Fund (formerly, WisdomTree U.S. Earnings 500 Fund), WisdomTree U.S. MidCap Dividend Fund, WisdomTree U.S. MidCap Fund (formerly, WisdomTree U.S. MidCap Earnings Fund), WisdomTree U.S. Multifactor Fund, WisdomTree U.S. Quality Dividend Growth Fund, WisdomTree U.S. Quality Shareholder Yield Fund, WisdomTree U.S. SmallCap Dividend Fund, WisdomTree U.S. SmallCap Fund (formerly, WisdomTree U.S. SmallCap Earnings Fund), WisdomTree U.S. SmallCap Quality Dividend Growth Fund, WisdomTree U.S. Total Dividend Fund and WisdomTree U.S. Total Market Fund (formerly, WisdomTree U.S. Total Earnings Fund) (collectively referred to as the “Funds”), (fourteen of the funds constituting WisdomTree Trust (the “Trust”)) including the schedules of investments, as of March 31, 2019, and the related statements of operations, and changes in net assets, and the financial highlights for each of the periods indicated in the table below and the related notes (collectively referred to as the “financial statements”). In our opinion, the financial statements present fairly, in all material respects, the financial position of each of the Funds (fourteen of the funds constituting WisdomTree Trust) at March 31, 2019, and the results of their operations, changes in net assets and financial highlights for each of the periods indicated in the table below, in conformity with U.S. generally accepted accounting principles.
| Individual fund constituting the WisdomTree Trust | Statement of operations |
Statements of changes in net assets |
Financial highlights | |||
| WisdomTree U.S. Dividend ex-Financials Fund WisdomTree U.S. High Dividend Fund WisdomTree U.S. LargeCap Dividend Fund WisdomTree U.S. LargeCap Fund WisdomTree U.S. MidCap Dividend Fund WisdomTree U.S. MidCap Fund WisdomTree U.S. Quality Dividend Growth Fund WisdomTree U.S. Quality Shareholder Yield Fund WisdomTree U.S. SmallCap Dividend Fund WisdomTree U.S. SmallCap Fund WisdomTree U.S. SmallCap Quality Dividend Growth Fund WisdomTree U.S. Total Dividend Fund WisdomTree U.S. Total Market Fund |
For the year ended March 31, 2019 | For each of the two years in the period ended March 31, 2019 | For each of the five years in the period ended March 31, 2019 | |||
| WisdomTree U.S. Multifactor Fund |
For the year ended March 31, 2019 | For the year ended March 31, 2019 and the period from June 29, 2017 (commencement of operations) through March 31, 2018 | ||||
Basis for Opinion
These financial statements are the responsibility of the Trust’s management. Our responsibility is to express an opinion on each of the Funds’ financial statements based on our audits. We are a public accounting firm registered with the Public Company Accounting Oversight Board (United States) (“PCAOB”) and are required to be independent with respect to the Trust in accordance with the U.S. federal securities laws and the applicable rules and regulations of the Securities and Exchange Commission and the PCAOB.
We conducted our audits in accordance with the standards of the PCAOB. Those standards require that we plan and perform the audit to obtain reasonable assurance about whether the financial statements are free of material misstatement, whether due to error or fraud. The Trust is not required to have, nor were we engaged to perform, an audit of the Trust’s internal control over financial reporting. As part of our audits, we are required to obtain an understanding of internal control over financial reporting, but not for the purpose of expressing an opinion on the effectiveness of the Trust’s internal control over financial reporting. Accordingly, we express no such opinion.
Our audits included performing procedures to assess the risks of material misstatement of the financial statements, whether due to error or fraud, and performing procedures that respond to those risks. Such procedures included examining, on a test basis, evidence regarding the amounts and disclosures in the financial statements. Our procedures included confirmation of securities
| WisdomTree Trust | 139 |
Report of Independent Registered Public Accounting Firm (concluded)
owned as of March 31, 2019, by correspondence with the custodian and brokers or by other appropriate auditing procedures where replies from brokers were not received. Our audits also included evaluating the accounting principles used and significant estimates made by management, as well as evaluating the overall presentation of the financial statements. We believe that our audits provide a reasonable basis for our opinion.

We have served as the auditor of one or more WisdomTree investment companies since 2006.
New York, NY
May 23, 2019
| 140 | WisdomTree Trust |
Trustees and Officers Information (unaudited)
The Board of Trustees is responsible for overseeing the management and affairs of the Funds and the Trust. The Board of Trustees elects the officers of the Trust who are responsible for administering the Trust’s day-to-day operations. Each Trustee serves until his or her successor is duly elected or appointed and qualified.
The address of each Trustee and Officer is c/o WisdomTree Asset Management, Inc., 245 Park Avenue, 35th Floor, New York, NY 10167.
Independent Trustees
| Name and Year of Birth |
Position(s) Held with |
Principal Occupation(s) |
Number of Portfolios in Fund Complex Overseen by Trustee/ Officer* |
Other During the Past | ||||||
| David G. Chrencik^ (1948) |
Trustee, 2014- present | Chief Financial Officer of Sarus Indochina Select LP (hedge fund) since 2012; Chief Financial Officer of GeoGreen BioFuels, Inc. (biodiesel fuel producer) from 2010 to 2014; Audit Partner at PricewaterhouseCoopers LLP (public accounting firm) from 1972 to 2009 (includes positions prior to becoming Audit Partner and predecessor firms). | 76 | Trustee, Vericimetry Funds (2011 to 2014). | ||||||
| Joel Goldberg#† (1945) |
Trustee, 2012- present | Attorney, Partner, Stroock & Stroock & Lavan LLP from 2010 to 2018; Attorney, Partner at Willkie Farr & Gallagher LLP from 2006 to 2010. | 76 | Director, Better Business Bureau (Metropolitan New York, Long Island and the Mid-Hudson Region). | ||||||
| Toni Massaro† (1955) |
Trustee, 2006- present | Dean Emerita at the University of Arizona James E. Rogers College of Law (“Rogers College of Law”) since 2009 (distinguished Emerita in July 2009); Dean at the Rogers College of Law from 1999 to 2009; Regents’ Professor since 2006; Milton O. Riepe Chair in Constitutional Law since 1997; Professor at the Rogers College of Law since 1990. | 76 | None | ||||||
| Melinda A. Raso Kirstein‡ (1955) |
Trustee, 2014- present | Retired since 2004, Merrill Lynch Investment Management, Vice President; Senior Portfolio Manager, Fixed Income Management; Director, Tax Exempt Fund Management. | 76 | Associate Alumnae of Douglass College, Chair of Investment Committee. | ||||||
| Victor Ugolyn (1947) |
Trustee, 2006- present; Chairman of the Board of Trustees, 2006-present | Private Investor, 2005 to present; President and Chief Executive Officer of William D. Witter, Inc. from 2005 to 2006; Consultant to AXA Enterprise in 2004; Chairman, President and Chief Executive Officer of Enterprise Capital Management (subsidiary of The MONY Group, Inc.) and Enterprise Group of Funds, Chairman of MONY Securities Corporation, and Chairman of the Fund Board of Enterprise Group of Funds from 1991 to 2004. | 76 | Member of the Board of Governors of Naismith Memorial Basketball Hall of Fame (2001-2016). | ||||||
| * | As of March 31, 2019. |
| ^ | Chair of the Audit Committee. |
| # | Chair of the Contracts Review Committee. |
| † | Co-Chair of the Governance, Nominating and Compliance Committee. |
| ‡ | Chair of the Investment Committee. |
| WisdomTree Trust | 141 |
Trustees and Officers Information (unaudited) (concluded)
Interested Trustee and Officers
| Name and Year of Birth |
Position(s) Held with the Trust, Term of Office and Length of Time Served |
Principal Occupation(s) |
Number of Portfolios in Fund Complex Overseen by Trustee/ Officer* |
Other During the Past | ||||||
| Jonathan Steinberg** (1964) |
Trustee, 2005- present; President, 2005-present |
President, WisdomTree Investments, Inc. and WisdomTree Asset Management, Inc. since 2012; Chief Executive Officer, WisdomTree Investments, Inc. and WisdomTree Asset Management, Inc. since 2005. | 76 | Director, WisdomTree Investments, Inc. and WisdomTree Asset Management, Inc. | ||||||
| David Castano** (1971) |
Treasurer, 2013- present | Director of Fund Accounting & Administration, WisdomTree Asset Management, Inc., since 2011. | 76 | None | ||||||
| Terry Jane Feld** (1960) |
Chief Compliance Officer, 2012- present | Chief Compliance Officer, WisdomTree Asset Management, Inc. since 2012; Senior Compliance Officer, WisdomTree Asset Management since 2011. | 76 | None | ||||||
| Ryan Louvar** (1972) |
Secretary and Chief Legal Officer, 2013- present |
General Counsel, WisdomTree Asset Management, Inc. since 2013; Vice President and Senior Managing Counsel, State Street, 2005 to 2013. | 76 | None | ||||||
| Joanne Antico** (1975) |
Assistant Secretary, 2018- present |
Assistant General Counsel, WisdomTree Asset Management, Inc. since 2016; Executive Director and Assistant Secretary, Morgan Stanley Investment Management Inc., 2005 to 2016. | 76 | None | ||||||
| Clint Martin** (1977) |
Assistant Treasurer, 2015-present | Fund Manager, Fund Accounting & Administration, WisdomTree Asset Management, Inc., since 2012. | 76 | None | ||||||
| * | As of March 31, 2019. |
| ** | Elected by and serves at the pleasure of the Board. |
| 142 | WisdomTree Trust |
Supplemental Information (unaudited)
Federal Income Tax Information
The following Federal tax information related to the Funds’ fiscal year ended March 31, 2019, is provided for information purposes only and should not be used for reporting to federal or state revenue agencies. Federal tax information for the calendar year will be reported to you on Form 1099-DIV in January 2020.
Certain dividends paid by the Funds may be subject to a maximum tax rate of 15%, as provided by the Jobs and Growth Tax Relief Reconciliation Act of 2003. Of the distributions paid during the fiscal year ended March 31, 2019, the following represents the maximum amount of ordinary income distributions that may be considered qualified dividend income:
| Fund | Qualified Dividend Income |
|||
| U.S. Dividend ex-Financials Fund |
$ | 27,412,552 | ||
| U.S. High Dividend Fund |
32,229,868 | |||
| U.S. LargeCap Dividend Fund |
53,410,696 | |||
| U.S. LargeCap Fund |
4,134,218 | |||
| U.S. MidCap Dividend Fund |
72,841,427 | |||
| U.S. MidCap Fund |
14,739,559 | |||
| U.S. Multifactor Fund |
905,199 | |||
| U.S. Quality Dividend Growth Fund |
52,909,568 | |||
| U.S. Quality Shareholder Yield Fund |
676,737 | |||
| U.S. SmallCap Dividend Fund |
56,226,053 | |||
| U.S. SmallCap Fund |
9,566,982 | |||
| U.S. SmallCap Quality Dividend Growth Fund |
2,611,466 | |||
| U.S. Total Dividend Fund |
16,303,635 | |||
| U.S. Total Market Fund |
1,630,987 | |||
The following represents the percentage of dividends paid during the fiscal year ended March 31, 2019, that qualify for the 70% dividends received deduction for corporate shareholders:
| Fund | Dividends-Received Deduction |
|||
| U.S. Dividend ex-Financials Fund |
96.32 | % | ||
| U.S. High Dividend Fund |
95.63 | % | ||
| U.S. LargeCap Dividend Fund |
97.30 | % | ||
| U.S. LargeCap Fund |
99.74 | % | ||
| U.S. MidCap Dividend Fund |
93.77 | % | ||
| U.S. MidCap Fund |
99.13 | % | ||
| U.S. Multifactor Fund |
94.29 | % | ||
| U.S. Quality Dividend Growth Fund |
96.74 | % | ||
| U.S. Quality Shareholder Yield Fund |
99.84 | % | ||
| U.S. SmallCap Dividend Fund |
93.13 | % | ||
| U.S. SmallCap Fund |
87.73 | % | ||
| U.S. SmallCap Quality Dividend Growth Fund |
93.63 | % | ||
| U.S. Total Dividend Fund |
96.82 | % | ||
| U.S. Total Market Fund |
99.78 | % | ||
| WisdomTree Trust | 143 |
General Information (unaudited)
Proxy Voting Policies, Procedures and Record
A complete copy of the Proxy Voting Policy may be obtained upon request, at no charge, by calling 1-866-909-WISE (9473) or writing to: WisdomTree Trust, c/o Foreside Fund Services, LLC, Three Canal Plaza Suite 100, Portland, ME, 04101.
The Trust is required to disclose annually the Funds’ complete proxy voting record on Form N-PX covering the most recent 12-month period ended June 30 and to file Form N-PX with the SEC no later than August 31 of each year. The current Form N-PX for the Funds is available at no charge upon request by calling 1-866-909-WISE (9473) or through the Trust’s website at www.wisdomtree.com. The Funds’ Form N-PX is also available on the SEC’s website at www.sec.gov.
Shareholder Reports and Quarterly Portfolio Disclosure
The Funds are required to file their complete schedule of portfolio holdings with the SEC for their first and third fiscal quarters on Form N-Q. Beginning in April 2019, the Funds will cease filing Form N-Q and will commence filing Form N-PORT. Part F of each Fund’s Form N-PORT filings for the first and third fiscal quarters will contain the complete schedule of portfolio holdings in the same manner as previously filed on Form N-Q. Copies of the filings are available, without charge, on the SEC’s website at www.sec.gov and are also available by calling the Trust at 1-866-909-WISE (9473). Copies of the filings may also be obtained, after paying a duplicating fee, by electronic request at the following E-mail address: publicinfo@sec.gov.
Information about each Fund’s portfolio holdings is available daily, without charge, at www.wisdomtree.com.
The Statement of Additional Information (“SAI”) has additional information about the Funds’ Trustees and Officers and is available without charge upon request. Contact your financial representative for a free prospectus or SAI.
Frequency Distribution of Discounts & Premiums
Information about differences between the per share net asset value of each Fund and the market trading price of shares of each Fund are available, without charge, at www.wisdomtree.com.
| 144 | WisdomTree Trust |
The WisdomTree Funds are exchange traded funds (“ETFs”) registered with the United States Securities and Exchange Commission as separate series (“Funds”) of WisdomTree Trust (“Trust”). WisdomTree Asset Management, Inc., a wholly owned subsidiary of WisdomTree Investments, Inc., serves as the investment adviser to the Trust. None of the WisdomTree entities are affiliated with Foreside Fund Services, LLC, the Funds’ distributor. WisdomTree Investments, its affiliates and their independent providers are not liable for any informational errors, incompleteness, delays, or for any actions taken in reliance on information contained herein.
Investors should consider the investment objectives, risks, charges and expenses of the Funds carefully before investing. A prospectus, containing this and other information, is available at www.wisdomtree.com, or by calling 1-866-909-WISE (9473). Investors should read the prospectus carefully before investing. There are risks associated with investing, including possible loss of principal. Past performance does not guarantee future results. Indexes are unmanaged and you cannot invest directly in an index.
There are risks associated with investing, including possible loss of principal. Funds focusing their investments on certain sectors and/or smaller companies increase their vulnerability to any single economic or regulatory development. This may result in greater share price volatility. Due to the investment strategy of certain Funds they may make higher capital gain distributions than other ETFs. Please read the Fund’s prospectus for specific details regarding the Fund’s risk profile.
Transactions in Fund shares will result in brokerage commissions and will generate tax consequences. Shares may be sold through brokerage accounts, but may be redeemed from the Funds only by Authorized Participants in large creation unit sizes of shares.
WisdomTree Trust
245 Park Avenue, 35th Floor
New York, NY 10167
WisdomTree Fund shares are distributed by Foreside Fund Services, LLC, in the U.S. only.
WTGM-2274


WisdomTree Trust
Annual Report
March 31, 2019
WisdomTree Europe Hedged Equity Fund (HEDJ)
WisdomTree Europe Hedged SmallCap Equity Fund (EUSC)
WisdomTree Germany Hedged Equity Fund (DXGE)
WisdomTree International Hedged Quality Dividend Growth Fund (IHDG)
WisdomTree Japan Hedged Equity Fund (DXJ)
WisdomTree Japan Hedged SmallCap Equity Fund (DXJS)
IMPORTANT NOTE: Beginning on January 1, 2021, as permitted by regulations adopted by the SEC, paper copies of the WisdomTree Funds’ annual and semi-annual shareholder reports will no longer be sent by mail, unless you specifically request paper copies of the reports. Instead, annual and semi-annual shareholder reports will be available on the WisdomTree Funds’ website (www.wisdomtree.com), and you will be notified by mail each time a report is posted and provided with a website link to access the report.
If you already elected to receive shareholder reports electronically, you will not be affected by this change and you need not take any action. You may elect to receive shareholder reports and other communications from a Fund electronically anytime by contacting your financial intermediary (such as a broker dealer or bank).
You may elect to receive all future reports in paper free of charge. Please contact your financial intermediary to request to continue receiving paper copies of your shareholder reports. Your election to receive reports in paper will apply to all funds held in your account.
| 1 | ||||
| Information about Performance and Shareholder Expense Examples (unaudited) |
2 | |||
| 3 | ||||
| 9 | ||||
| Schedules of Investments | ||||
| 11 | ||||
| 14 | ||||
| 18 | ||||
| WisdomTree International Hedged Quality Dividend Growth Fund |
21 | |||
| 29 | ||||
| 36 | ||||
| 46 | ||||
| 47 | ||||
| 48 | ||||
| 50 | ||||
| 53 | ||||
| 66 | ||||
| 67 | ||||
| 69 | ||||
| 70 | ||||
“WisdomTree” is a registered mark of WisdomTree Investments, Inc. and is licensed for use by the WisdomTree Trust.
(unaudited)
International equity markets, as measure by the MSCI EAFE Index, a broad measure of equity performance for the developed world outside the U.S. and Canada, returned -3.71% in the 12-month period ended March 31, 2019, which underperformed the S&P 500 Index by 13.21%. Measured in local currency, the MSCI EAFE Index returned +2.83% over the period, lagging the return of the S&P 500 Index by 6.67%. It is important to note that when foreign currencies weaken or strengthen relative to the U.S. dollar, there is also an impact on the returns experienced by U.S. investors who invest overseas. Over the period, the U.S. dollar experienced significant appreciation (i.e. strengthened) against most major currencies. In particular, the British pound, Japanese yen, and the Euro (which account for about 75% of the MSCI EAFE Index’s currency exposure) all experienced negative spot returns over the period against the U.S. dollar. Positive returns in local currency terms and negative performance in U.S. dollar terms was driven by broad strengthening of the U.S. dollar during the fiscal period. The U.S. dollar strengthened +8.73% vs. the Euro, +7.00% vs. the British pound, and +4.01% vs. the Japanese yen.
International equity markets experienced a market correction (in both local and U.S. dollar terms) in the fourth quarter of 2018, followed by a relief rally in the first quarter of 2019. Weak equity performance through the fourth quarter of 2018 in mainland Europe (“Eurozone”) was primarily driven by softening economic data, declining economic sentiment, and mounting fears of recession. The Eurozone saw three consecutive quarters of declining gross domestic product (“GDP”) growth in the last nine months of 2018. Importantly, major Eurozone economies, including Germany and France, were a significant drag on Eurozone growth during this time period. German and French GDP both grew 1.5% in 2018. This marked the slowest annual GDP growth rate for Germany since 2013. Meanwhile, export-oriented economies, including Germany, were negatively impacted by the U.S.-China trade dispute. German manufacturing activity exhibited signs of a slowdown, particularly in the automobile manufacturing sector, which led the nation’s Purchasing Managers’ Index to slip into contractionary territory in January 2019.
Political fragmentation and uncertainty also negatively impacted the Eurozone during this time period. The new populist governing body in Italy failed to defuse fears about the country’s budget deficit and slowing economic growth. Meanwhile, protests and demand for political reform in France provided evidence of political and economic divide. Most notably, a lack of resolution on the ultimate outcome and timing of the United Kingdom’s departure from the European Union (known as “BREXIT”) was a hindrance for the Eurozone during this time period. Following several months of negotiations with European Union counterparts, the draft BREXIT deal released by British Prime Minister Theresa May was met with substantial criticism from British Parliament and from within her own party. May’s exit deal was met with such resistance that she narrowly won a no confidence vote in her leadership from within her Conservative party. Multiple variations of a BREXIT resolution were ultimately rejected, including an exit plan negotiated with the European Union, a referendum to revoke BREXIT entirely, and an election to break away from the European Union without a deal altogether. During this time period of political uncertainty, the United Kingdom economy expanded 1.4%, marking the weakest economic growth for the nation in six years.
European equities rebounded alongside global equities, despite reductions in Eurozone economic growth forecasts and ongoing concerns about the political and financial strength of the European Union. During this time period the European Central Bank announced the end of its quantitative easing program. Measures taken by the European Central Bank to stimulate private sector bank lending and more positive news flow on the U.S.-China trade and economic growth helped fuel the rebound in European equities in the first quarter of 2019.
Japan experienced moderating economic growth during this time period, including a sharp decline in Q3 2018 GDP driven by natural disasters followed by a recovery in Q4 2018. Japanese export growth also declined over the period due to weak demand from China as well as the U.S.-China trade dispute. The ultra-accommodative monetary policy maintained by the Bank of Japan, including a near zero 10-year yield, did not spur price inflation during the period. Japanese equities recovered in Q1 2019 alongside global equities, driven by more constructive sentiment around global trade. Despite the equity rally in Q1 2019, Japan’s economic data continued to be negatively impacted by subdued global demand, as evidenced by a contraction in the nation’s manufacturing data and a steep decline in exports.
| WisdomTree Trust | 1 |
Information about Performance and Shareholder Expense Examples (unaudited)
Performance
The performance tables on the following pages are provided for comparative purposes and represent the period noted. Each Fund’s per share NAV is the value of one share of the Fund and is calculated by dividing the value of total assets less total liabilities by the number of shares outstanding. The NAV return is based on the NAV of the Fund and the market price return is based on the market price per share of the Fund. The price used to calculate market price returns is the midpoint of the bid and ask price for Fund shares as of the close of trading on the exchange where Fund shares are listed. NAV and market price returns assume that dividends and capital gain distributions have been reinvested in the Fund at NAV and market price, respectively. As with other ETFs, NAV returns and market price returns may differ because of factors such as the supply and demand for Fund shares and investors’ assessments of the underlying value of a Fund’s portfolio securities.
Fund shares are bought and sold at market price (not NAV) and are not individually redeemed from a Fund. Fund NAV returns are calculated using a Fund’s daily 4:00 p.m. eastern time NAV. Market price returns reflect the midpoint of the bid and ask price as of the close of trading on the exchange where Fund shares are listed. Market price returns do not represent the returns you would receive if you traded shares at other times. The returns do not reflect the deduction of taxes that a shareholder would pay on Fund distributions or on the redemption of Fund shares. Total returns for a period of less than one year are cumulative.
Performance is historical and does not guarantee future results. Current performance may be lower or higher than quoted. Investment returns and the principal value of an investment will fluctuate so that an investor’s shares, when redeemed, may be worth more or less than their original cost.
An index is a statistical measure of a specified financial market or sector. An index does not actually hold a portfolio of securities, incur expenses or pay any transaction costs. Therefore, index returns do not reflect deductions for fees or expenses and an index is not available for direct investment. In comparison, the Funds’ performance is negatively impacted by these deductions. Fund returns do not reflect brokerage commissions or taxes on transactions in Fund shares or taxes that a shareholder would pay on Fund distributions. Past performance is no guarantee of future results. For the most recent month-end performance information visit www.wisdomtree.com.
Shareholder Expense Examples
Each Fund’s performance table is accompanied by a shareholder expense example. As a shareholder of a WisdomTree Fund, you incur two types of cost: (1) transaction costs, including brokerage commissions on purchases and sales of your Fund shares and (2) ongoing costs, including management fees and other Fund expenses. The examples are intended to help you understand your ongoing costs (in dollars and cents) of investing in a Fund and to compare these costs with the ongoing costs of investing in other funds.
The examples are based on an investment of $1,000 invested at the beginning of the period and held for the entire period from October 1, 2018 to March 31, 2019. Except where noted, expenses are calculated using each Fund’s annualized expense ratio (after the effect of contractual or voluntary fee waivers, if any), multiplied by the average account value for the period, multiplied by 182/365 (to reflect the one-half year period). The annualized expense ratio does not include acquired fund fees and expenses (“AFFEs”), which are fees and expenses incurred indirectly by a Fund through its investments in certain underlying investment companies.
Actual expenses
The first line in the shareholder expense example table shown on the following pages provides information about actual account values and actual expenses. You may use the information in this line, together with the amount you invested, to estimate the expenses that you paid over the period. Simply divide your account value by $1,000 (for example, an $8,600 account value divided by $1,000 = 8.6), then multiply the result by the number in the first line for your Fund under the heading entitled “Expenses Paid During the Period” to estimate the expenses you paid on your account during the period.
Hypothetical example for comparison purposes
The second line in the shareholder expense example table shown on the following pages provides information about hypothetical account values and hypothetical expenses based on the Fund’s actual expense ratio and an assumed rate of return of 5% per year before expenses, which is not the Fund’s actual return. The hypothetical account values and expenses may not be used to estimate the actual ending account balance or expenses you paid for the period. You may use this information to compare the ongoing costs of investing in your Fund and other funds. To do so, compare this 5% hypothetical example with the 5% hypothetical examples that appear in the shareholder reports of the other funds.
Please note that the expenses shown in the table are meant to highlight your ongoing costs only and do not reflect any transactional costs, such as brokerage commissions paid on purchases and sales of Fund shares. Therefore, the second line in the table is useful in comparing ongoing Fund costs only and will not help you determine the relative total costs of owning different funds. In addition, if these transactional costs were included, your costs would have been higher.
| 2 | WisdomTree Trust |
Management’s Discussion of Funds’ Performance
as of March 31, 2019 (unaudited)
WisdomTree Europe Hedged Equity Fund (HEDJ)
Sector Breakdown†
| Sector | % of Net Assets | |||
| Consumer Staples |
22.1% | |||
| Consumer Discretionary |
16.8% | |||
| Industrials |
15.8% | |||
| Financials |
11.4% | |||
| Health Care |
10.2% | |||
| Materials |
10.2% | |||
| Information Technology |
6.8% | |||
| Communication Services |
4.4% | |||
| Energy |
1.5% | |||
| Utilities |
0.2% | |||
| Other Assets less Liabilities‡ |
0.6% | |||
| Total |
100.0% | |||
| † | The Fund’s sector breakdown is expressed as a percentage of net assets and may change over time. In addition, a sector may be comprised of several industries. It does not include derivatives (if any). |
| ‡ | Other assets includes investment of cash collateral for securities on loan (if any). |
Top Ten Holdings*
| Description | % of Net Assets | |||
| Anheuser-Busch InBev S.A./N.V. |
6.0% | |||
| Sanofi |
5.5% | |||
| Unilever N.V., CVA |
5.2% | |||
| Banco Santander S.A. |
4.8% | |||
| Telefonica S.A. |
3.9% | |||
| LVMH Moet Hennessy Louis Vuitton SE |
3.7% | |||
| Daimler AG, Registered Shares |
3.4% | |||
| L’Oreal S.A. |
3.0% | |||
| Banco Bilbao Vizcaya Argentaria S.A. |
2.8% | |||
| Siemens AG, Registered Shares |
2.8% | |||
| * | The ten largest holdings are subject to change, and there are no guarantees the Fund will remain invested in any particular company. Excludes derivatives and investment of cash collateral for securities on loan (if any). |
The WisdomTree Europe Hedged Equity Fund (the ‘‘Fund’’) seeks to track the price and yield performance, before fees and expenses, of the WisdomTree Europe Hedged Equity Index (the ‘‘Index’’). In seeking to track the Index, the Fund invests in European dividend-paying companies while at the same time hedging exposure to fluctuations of the value of the euro relative to the U.S. dollar. The Fund generally uses a representative sampling strategy to achieve its investment objective, meaning it generally will invest in a sample of securities in the Index.
The Fund returned 4.33% at net asset value (“NAV”) for the fiscal year ending March 31, 2019 (for more complete performance information please see the table below). The Fund’s sector position in Consumer Discretionary contributed most positively to performance, while its position in Utilities contributed least positively to performance. The Fund’s country position in France contributed most positively to performance, while its position in the Spain contributed least positively to performance. The U.S. dollar rallied by 8.73% against the euro during the fiscal year which served as a strong tailwind for the Fund’s currency hedge methodology. During the fiscal year, the Fund utilized forward foreign currency contracts to offset euro currency exposure from positions in European equities. The Fund’s use of forward foreign currency contracts contributed positively to Fund performance as a result of the U.S. dollar strengthening against the euro during the fiscal year. Hedging the currency, in addition to interest rate differentials between the U.S. and Europe, throughout the fiscal year added approximately 12.84% of performance to the Fund. This helped to greatly offset the negative local equity returns of the Fund, resulting in a net total return during the fiscal year of 4.33%. The Fund underperformed during the broad market correction in the fourth quarter of 2018 which was catalyzed by trade war apprehensions, ongoing BREXIT negotiations, and economic slowdown in the region. In the first quarter of 2019, however, there has been a strong rebound as markets began to stabilize.
Shareholder Expense Example
| Beginning Account Value |
Ending Account Value |
Annualized Expense Ratio |
Expenses Paid During the Period |
|||||||||||||
| Actual |
$ | 1,000.00 | $ | 1,009.00 | 0.58 | % | $ | 2.91 | ||||||||
| Hypothetical (5% return before expenses) |
$ | 1,000.00 | $ | 1,022.04 | 0.58 | % | $ | 2.92 | ||||||||
Performance
| Average Annual Total Return | ||||||||||||||||
| 1 Year | 3 Year | 5 Year | Since Inception1 | |||||||||||||
| Fund NAV Returns |
4.33 | % | 9.75 | % | 7.15 | % | 7.25 | % | ||||||||
| Fund Market Price Returns |
4.36 | % | 9.96 | % | 7.13 | % | 7.27 | % | ||||||||
| WisdomTree DEFA International Hedged Equity/Europe Hedged Equity Spliced Index2 |
4.59 | % | 10.21 | % | 7.54 | % | 7.72 | % | ||||||||
| MSCI EAFE Local Currency/MSCI EMU Local Currency Spliced Index3 |
0.44 | % | 7.11 | % | 5.05 | % | 6.25 | % | ||||||||
| 1 | Total returns are calculated based on the commencement of Fund trading on the NYSE Arca, Inc. on December 31, 2009. |
| 2 | WisdomTree DEFA International Hedged Equity Index prior to August 29, 2012; WisdomTree Europe Hedged Equity Index thereafter. |
| 3 | MSCI EAFE Local Currency Index prior to August 29, 2012; MSCI EMU Local Currency Index thereafter. |
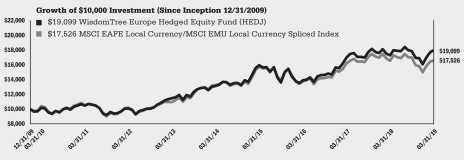
Performance is historical and does not guarantee future results. The returns do not reflect the deduction of taxes that a shareholder would pay on Fund distributions or on the redemption of Fund shares.
| WisdomTree Trust | 3 |
Management’s Discussion of Funds’ Performance
as of March 31, 2019 (unaudited)
WisdomTree Europe Hedged SmallCap Equity Fund (EUSC)
Sector Breakdown†
| Sector | % of Net Assets | |||
| Industrials |
21.5% | |||
| Financials |
19.3% | |||
| Communication Services |
11.0% | |||
| Consumer Staples |
9.1% | |||
| Utilities |
8.9% | |||
| Consumer Discretionary |
6.6% | |||
| Materials |
6.1% | |||
| Real Estate |
5.7% | |||
| Information Technology |
4.7% | |||
| Health Care |
3.2% | |||
| Energy |
2.4% | |||
| Other Assets less Liabilities‡ |
1.5% | |||
| Total |
100.0% | |||
| † | The Fund’s sector breakdown is expressed as a percentage of net assets and may change over time. In addition, a sector may be comprised of several industries. It does not include derivatives (if any). |
| ‡ | Other assets includes investment of cash collateral for securities on loan (if any). |
Top Ten Holdings*
| Description | % of Net Assets | |||
| UnipolSai Assicurazioni SpA |
2.8% | |||
| Casino Guichard Perrachon S.A. |
2.1% | |||
| METRO AG |
1.8% | |||
| Banca Mediolanum SpA |
1.7% | |||
| Eutelsat Communications S.A. |
1.4% | |||
| ASR Nederland N.V. |
1.3% | |||
| FinecoBank Banca Fineco SpA |
1.3% | |||
| Acciona S.A. |
1.2% | |||
| Orion Oyj, Class B |
1.2% | |||
| LEG Immobilien AG |
1.1% | |||
| * | The ten largest holdings are subject to change, and there are no guarantees the Fund will remain invested in any particular company. Excludes derivatives and investment of cash collateral for securities on loan (if any). |
The WisdomTree Europe Hedged SmallCap Equity Fund (the ‘‘Fund’’) seeks to track the price and yield performance, before fees and expenses, of the WisdomTree Europe Hedged SmallCap Equity Index (the ‘‘Index’’). In seeking to track the Index, the Fund invests in European small-cap dividend-paying companies while at the same time hedging exposure to fluctuations of the value of the euro relative to the U.S. dollar. The Fund generally uses a representative sampling strategy to achieve its investment objective, meaning it generally will invest in a sample of securities in the Index.
The Fund returned 0.54% at net asset value (“NAV”) for the fiscal year ending March 31, 2019 (for more complete performance information please see the table below). The Fund’s sector position in Financials contributed most positively to performance, while its position in Information Technology contributed least positively to performance. The U.S. dollar rallied by 8.73% against the euro during the fiscal year which served as a strong tailwind for the Fund’s currency hedge methodology. During the fiscal year, the Fund utilized forward foreign currency contracts to offset euro currency exposure from positions in European equities. The Fund’s use of forward foreign currency contracts contributed positively to Fund performance as a result of the U.S. dollar strengthening against the euro during the fiscal year. Hedging the currency, in addition to interest rate differentials between the U.S. and Europe, throughout the fiscal year added approximately 12.98% of performance to the Fund. This helped to greatly offset the negative local equity returns of the Fund, resulting in a net total return during the fiscal year of 0.54%. The Fund’s country position in Italy contributed most positively to performance, while its position in Belgium contributed least positively to performance. Additionally, small-cap companies faced additional pressures during the fiscal period when compared to their larger peers, particularly as the broad market correction was catalyzed by trade war apprehensions, ongoing BREXIT negotiations, and economic slowdown in the region. However, during the first quarter of 2019, there has been a strong rebound as markets began to stabilize.
Shareholder Expense Example
| Beginning Account Value |
Ending Account Value |
Annualized Expense Ratio |
Expenses Paid During the Period |
|||||||||||||
| Actual |
$ | 1,000.00 | $ | 993.40 | 0.58 | % | $ | 2.88 | ||||||||
| Hypothetical (5% return before expenses) |
$ | 1,000.00 | $ | 1,022.04 | 0.58 | % | $ | 2.92 | ||||||||
Performance
| Average Annual Total Return | ||||||||||
| 1 Year | 3 Year | Since Inception1 | ||||||||
| Fund NAV Returns |
0.54% | 10.34 | % | 7.61 | % | |||||
| Fund Market Price Returns |
0.55% | 10.40 | % | 7.37 | % | |||||
| WisdomTree Europe Hedged SmallCap Equity Index |
0.27% | 10.38 | % | 7.65 | % | |||||
| MSCI European Economic and Monetary Union (EMU) Small Cap Local Currency Index |
-4.77% | 8.23 | % | 6.38 | % | |||||
| 1 | Total returns are calculated based on the commencement of Fund trading on the NYSE Arca, Inc. on March 4, 2015. |
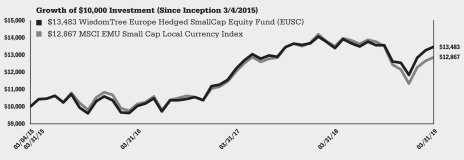
Performance is historical and does not guarantee future results. The returns do not reflect the deduction of taxes that a shareholder would pay on Fund distributions or on the redemption of Fund shares.
| 4 | WisdomTree Trust |
Management’s Discussion of Funds’ Performance
as of March 31, 2019 (unaudited)
WisdomTree Germany Hedged Equity Fund (DXGE)
Sector Breakdown†
| Sector | % of Net Assets | |||
| Consumer Discretionary |
19.5% | |||
| Financials |
18.4% | |||
| Industrials |
17.2% | |||
| Materials |
10.7% | |||
| Communication Services |
8.9% | |||
| Utilities |
7.4% | |||
| Health Care |
6.7% | |||
| Information Technology |
6.1% | |||
| Consumer Staples |
3.5% | |||
| Other Assets less Liabilities‡ |
1.6% | |||
| Total |
100.0% | |||
| † | The Fund’s sector breakdown is expressed as a percentage of net assets and may change over time. In addition, a sector may be comprised of several industries. It does not include derivatives (if any). |
| ‡ | Other assets includes investment of cash collateral for securities on loan (if any). |
Top Ten Holdings*
| Description | % of Net Assets | |||
| Allianz SE, Registered Shares |
7.5% | |||
| Deutsche Telekom AG, Registered Shares |
7.2% | |||
| Daimler AG, Registered Shares |
5.8% | |||
| Siemens AG, Registered Shares |
5.4% | |||
| Bayerische Motoren Werke AG |
5.2% | |||
| BASF SE |
5.0% | |||
| SAP SE |
4.8% | |||
| Muenchener Rueckversicherungs - Gesellschaft AG, Registered Shares |
4.4% | |||
| Deutsche Post AG, Registered Shares |
3.8% | |||
| Bayer AG, Registered Shares |
3.7% | |||
| * | The ten largest holdings are subject to change, and there are no guarantees the Fund will remain invested in any particular company. Excludes derivatives and investment of cash collateral for securities on loan (if any). |
The WisdomTree Germany Hedged Equity Fund (the ‘‘Fund’’) seeks to track the price and yield performance, before fees and expenses, of the WisdomTree Germany Hedged Equity Index (the ‘‘Index’’). In seeking to track the Index, the Fund invests in German dividend-paying companies with an exporter tilt while at the same time hedging exposure to fluctuations of the value of the euro relative to the U.S. dollar. The Fund generally uses a representative sampling strategy to achieve its investment objective, meaning it generally will invest in a sample of securities in the Index.
The Fund returned -5.07% at net asset value (“NAV”) for the fiscal year ending March 31, 2019 (for more complete performance information please see the table below). The Fund’s sector position in Health Care contributed most positively to performance, while its position in Consumer Discretionary contributed least positively to performance. The U.S. dollar rallied by 8.73% against the euro during the fiscal year which served as a strong tailwind for the Fund’s currency hedge methodology. During the fiscal year, the Fund utilized forward foreign currency contracts to offset euro currency exposure from positions in German equities. The Fund’s use of forward foreign currency contracts contributed positively to Fund performance as a result of the U.S. dollar strengthening against the euro during the fiscal year. Hedging the currency, in addition to interest rate differentials between the U.S. and Europe, throughout the fiscal year added approximately 12.97% of performance to the Fund. This helped to greatly offset the negative local equity returns of the Fund, resulting in a net total return during the fiscal year of -5.07%. Germany has faced increasing economic pressures of late. In addition to the general trade war apprehensions, ongoing BREXIT negotiations, and economic slowdown in the EU, the German economy has narrowly avoided falling into a recession during the fourth quarter of 2018. This came as a result of tightening global financial conditions, increases in U.S. policy rates, concentrations in manufacturing which have seen sluggish growth/data, and a downward shock in foreign trade. In the first quarter of 2019, however, there has been a strong rebound as markets began to stabilize.
Shareholder Expense Example
| Beginning Account Value |
Ending Account Value |
Annualized Expense Ratio |
Expenses Paid During the Period |
|||||||||||||
| Actual |
$ | 1,000.00 | $ | 954.30 | 0.48 | % | $ | 2.34 | ||||||||
| Hypothetical (5% return before expenses) |
$ | 1,000.00 | $ | 1,022.54 | 0.48 | % | $ | 2.42 | ||||||||
Performance
| Average Annual Total Return | ||||||||||||||||
| 1 Year | 3 Year | 5 Year | Since Inception1 | |||||||||||||
| Fund NAV Returns |
-5.07 | % | 7.08 | % | 5.38 | % | 6.39 | % | ||||||||
| Fund Market Price Returns |
-5.21 | % | 7.35 | % | 5.38 | % | 6.25 | % | ||||||||
| WisdomTree Germany Hedged Equity Index |
-5.12 | % | 7.23 | % | 5.51 | % | 6.55 | % | ||||||||
| MSCI Germany Local Currency Index |
-5.48 | % | 4.35 | % | 3.41 | % | 4.63 | % | ||||||||
| 1 | Total returns are calculated based on the commencement of Fund trading on the NASDAQ on October 17, 2013. |
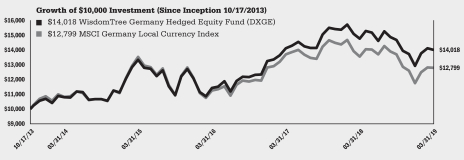
Performance is historical and does not guarantee future results. The returns do not reflect the deduction of taxes that a shareholder would pay on Fund distributions or on the redemption of Fund shares.
| WisdomTree Trust | 5 |
Management’s Discussion of Funds’ Performance
as of March 31, 2019 (unaudited)
WisdomTree International Hedged Quality Dividend Growth Fund (IHDG)
Sector Breakdown†
| Sector | % of Net Assets | |||
| Industrials |
20.0% | |||
| Consumer Discretionary |
18.2% | |||
| Health Care |
18.1% | |||
| Consumer Staples |
14.0% | |||
| Information Technology |
10.3% | |||
| Real Estate |
4.3% | |||
| Materials |
4.2% | |||
| Communication Services |
3.9% | |||
| Financials |
3.9% | |||
| Energy |
1.8% | |||
| Other Assets less Liabilities‡ |
1.3% | |||
| Total |
100.0% | |||
| † | The Fund’s sector breakdown is expressed as a percentage of net assets and may change over time. In addition, a sector may be comprised of several industries. It does not include derivatives (if any). |
| ‡ | Other assets includes investment of cash collateral for securities on loan (if any). |
Top Ten Holdings*
| Description | % of Net Assets | |||
| Novo Nordisk A/S, Class B |
7.4% | |||
| Diageo PLC |
6.2% | |||
| British American Tobacco PLC |
4.8% | |||
| Industria de Diseno Textil S.A. |
3.5% | |||
| China Overseas Land & Investment Ltd. |
3.1% | |||
| Airbus SE |
3.1% | |||
| Tokyo Electron Ltd. |
2.2% | |||
| Safran S.A. |
1.9% | |||
| CSL Ltd. |
1.8% | |||
| Astellas Pharma, Inc. |
1.7% | |||
| * | The ten largest holdings are subject to change, and there are no guarantees the Fund will remain invested in any particular company. Excludes derivatives and investment of cash collateral for securities on loan (if any). |
The WisdomTree International Hedged Quality Dividend Growth Fund (the ‘‘Fund’’) seeks to track the price and yield performance, before fees and expenses, of the WisdomTree International Hedged Quality Dividend Growth Index (the ‘‘Index’’). In seeking to track the Index, the Fund invests in dividend-paying companies with growth characteristics in the developed world, excluding U.S. and Canada, while at the same time hedging exposure to fluctuations of the value of the applicable foreign currencies relative to the U.S. dollar. The Fund generally uses a representative sampling strategy to achieve its investment objective, meaning it generally will invest in a sample of securities in the Index.
The Fund returned 4.78% at net asset value (“NAV”) for the fiscal year ending March 31, 2019 (for more complete performance information please see the table below). The Fund’s sector position in Financials contributed most positively to performance, while its position in Communication Services contributed least positively to performance. The Fund’s country position in Denmark contributed most positively to performance, while its position in the Switzerland contributed least positively to performance. The U.S. dollar rallied over the fiscal year which served as a strong tailwind for the Fund’s currency hedge methodology. During the fiscal year, the Fund utilized forward foreign currency contracts to offset applicable international currency exposure from positions in international equities. The Fund’s use of forward foreign currency contracts contributed positively to Fund performance as a result of the U.S. dollar strengthening against applicable international currencies during the fiscal year. Hedging the currency, in addition to interest rate differentials between the U.S. and the majority of the Fund’s country exposures, throughout the fiscal year added approximately 9.81% of performance to the Fund. This helped to greatly offset the negative local equity returns of the Fund, resulting in a net total return during the fiscal year of 4.78%. The Fund’s significant overweight to higher quality companies proved to be a source of outperformance when compared to companies with low quality (based on return on equity). Much of this quality outperformance came from the broad market correction in the fourth quarter of 2018 which was catalyzed by trade war apprehensions, ongoing BREXIT negotiations, and global economic slowdown. In the first quarter of 2019, however, there has been a strong rebound as markets began to stabilize.
Shareholder Expense Example
| Beginning Account Value |
Ending Account Value |
Annualized Expense Ratio |
Expenses Paid During the Period |
|||||||||||||
| Actual |
$ | 1,000.00 | $ | 1,002.50 | 0.58 | % | $ | 2.90 | ||||||||
| Hypothetical (5% return before expenses) |
$ | 1,000.00 | $ | 1,022.04 | 0.58 | % | $ | 2.92 | ||||||||
Performance
| Average Annual Total Return | ||||||||||||
| 1 Year | 3 Year | Since Inception1 | ||||||||||
| Fund NAV Returns |
4.78 | % | 8.97 | % | 7.64 | % | ||||||
| Fund Market Price Returns |
4.61 | % | 9.16 | % | 7.51 | % | ||||||
| WisdomTree International Hedged Quality Dividend Growth Index |
5.38 | % | 9.72 | % | 8.32 | % | ||||||
| MSCI EAFE Local Currency Index |
2.83 | % | 8.53 | % | 6.05 | % | ||||||
| 1 | Total returns are calculated based on the commencement of Fund trading on the NYSE Arca, Inc. on May 7, 2014. |
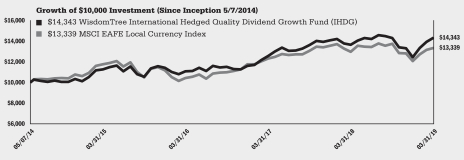
Performance is historical and does not guarantee future results. The returns do not reflect the deduction of taxes that a shareholder would pay on Fund distributions or on the redemption of Fund shares.
| 6 | WisdomTree Trust |
Management’s Discussion of Funds’ Performance
as of March 31, 2019 (unaudited)
WisdomTree Japan Hedged Equity Fund (DXJ)
Sector Breakdown†
| Sector | % of Net Assets | |||
| Consumer Discretionary |
23.1% | |||
| Industrials |
20.7% | |||
| Financials |
12.4% | |||
| Information Technology |
12.0% | |||
| Materials |
9.9% | |||
| Health Care |
9.3% | |||
| Consumer Staples |
8.4% | |||
| Communication Services |
2.8% | |||
| Energy |
0.3% | |||
| Utilities |
0.2% | |||
| Other Assets less Liabilities‡ |
0.9% | |||
| Total |
100.0% | |||
| † | The Fund’s sector breakdown is expressed as a percentage of net assets and may change over time. In addition, a sector may be comprised of several industries. It does not include derivatives (if any). |
| ‡ | Other assets includes investment of cash collateral for securities on loan (if any). |
Top Ten Holdings*
| Description | % of Net Assets | |||
| Toyota Motor Corp. |
4.9% | |||
| Japan Tobacco, Inc. |
3.6% | |||
| Mitsubishi UFJ Financial Group, Inc. |
3.3% | |||
| Sumitomo Mitsui Financial Group, Inc. |
3.1% | |||
| Nissan Motor Co., Ltd. |
2.8% | |||
| Canon, Inc. |
2.7% | |||
| Mizuho Financial Group, Inc. |
2.5% | |||
| Mitsubishi Corp. |
2.5% | |||
| Honda Motor Co., Ltd. |
2.3% | |||
| Takeda Pharmaceutical Co., Ltd. |
2.2% | |||
| * | The ten largest holdings are subject to change, and there are no guarantees the Fund will remain invested in any particular company. Excludes derivatives and investment of cash collateral for securities on loan (if any). |
The WisdomTree Japan Hedged Equity Fund (the ‘‘Fund’’) seeks to track the price and yield performance, before fees and expenses, of the WisdomTree Japan Hedged Equity Index. The Fund seeks to provide Japanese equity returns while mitigating or ‘‘hedging’’ against fluctuations between the value of the Japanese yen and the U.S. dollar. In seeking to track the Index, the Fund invests in Japanese dividend-paying companies with an exporter tilt while at the same time hedging exposure to fluctuations of the value of the Japanese yen relative to the U.S. dollar. The Fund generally uses a representative sampling strategy to achieve its investment objective, meaning it generally will invest in a sample of securities in the Index.
The Fund returned -7.20% at net asset value (“NAV”) for the fiscal year ending March 31, 2019 (for more complete performance information please see the table below). The Fund’s sector position in Communication Services contributed most positively to performance, while its position in Real Estate contributed least positively to performance. The U.S. dollar rallied by 4.01% against the Japanese yen during the fiscal year which served as a tailwind for the Fund’s currency hedge methodology. During the fiscal year, the Fund utilized forward foreign currency contracts to offset Japanese yen currency exposure from positions in Japanese equities. The Fund’s use of forward foreign currency contracts contributed positively to Fund performance as a result of the U.S. dollar strengthening against the Japanese yen during the fiscal year. Hedging the currency, in addition to interest rate differentials between the U.S. and Japan, throughout the fiscal year added approximately 7.00% of performance to the Fund. This helped to greatly offset the negative local equity returns of the Fund, resulting in a net total return during the fiscal year of -7.20%. The Fund’s overweight to large-cap equities provided more protection than mid- or small-cap peers during the fourth quarter of 2018, where a broad market correction catalyzed by trade war apprehension with China and fears of a U.S. Federal Reserve policy misstep sent global markets sharply downward. During the fiscal year, natural disasters in Japan also had an adverse effect on the Japanese equity market and overall economy.
Shareholder Expense Example
| Beginning Account Value |
Ending Account Value |
Annualized Expense Ratio |
Expenses Paid During the Period |
|||||||||||||
| Actual |
$ | 1,000.00 | $ | 875.40 | 0.48 | % | $ | 2.24 | ||||||||
| Hypothetical (5% return before expenses) |
$ | 1,000.00 | $ | 1,022.54 | 0.48 | % | $ | 2.42 | ||||||||
| Performance
|
| |||||||||||||||
| Average Annual Total Return | ||||||||||||||||
| 1 Year | 3 Year | 5 Year | 10 Year | |||||||||||||
| Fund NAV Returns |
-7.20 | % | 7.33 | % | 6.17 | % | 8.15 | % | ||||||||
| Fund Market Price Returns |
-7.26 | % | 7.61 | % | 6.30 | % | 7.87 | % | ||||||||
| WisdomTree Japan Dividend/Japan Hedged Equity Spliced Index1 |
-6.59 | % | 8.10 | % | 7.02 | % | 8.72 | % | ||||||||
| MSCI Japan/MSCI Japan Local Currency Spliced Index2 |
-4.08 | % | 7.51 | % | 7.15 | % | 9.74 | % | ||||||||
| 1 | WisdomTree Japan Dividend Index prior to April 1, 2010; WisdomTree Japan Hedged Equity Index thereafter. |
| 2 | MSCI Japan Index prior to April 1, 2010; MSCI Japan Local Currency Index thereafter. |
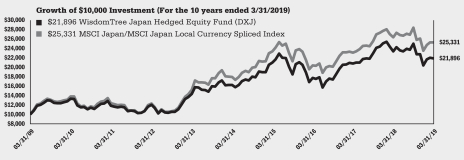
Performance is historical and does not guarantee future results. The returns do not reflect the deduction of taxes that a shareholder would pay on Fund distributions or on the redemption of Fund shares.
| WisdomTree Trust | 7 |
Management’s Discussion of Funds’ Performance
as of March 31, 2019 (unaudited)
WisdomTree Japan Hedged SmallCap Equity Fund (DXJS)
Sector Breakdown†
| Sector | % of Net Assets | |||
| Industrials |
25.3% | |||
| Consumer Discretionary |
20.8% | |||
| Materials |
12.9% | |||
| Information Technology |
10.0% | |||
| Financials |
8.8% | |||
| Consumer Staples |
7.3% | |||
| Health Care |
5.3% | |||
| Communication Services |
4.0% | |||
| Real Estate |
2.0% | |||
| Utilities |
1.3% | |||
| Energy |
1.3% | |||
| Other Assets less Liabilities‡ |
1.0% | |||
| Total |
100.0% | |||
| † | The Fund’s sector breakdown is expressed as a percentage of net assets and may change over time. In addition, a sector may be comprised of several industries. It does not include derivatives (if any). |
| ‡ | Other assets includes investment of cash collateral for securities on loan (if any). |
Top Ten Holdings*
| Description | % of Net Assets | |||
| Sankyo Co., Ltd. |
0.8% | |||
| Matsui Securities Co., Ltd. |
0.7% | |||
| DIC Corp. |
0.6% | |||
| Mitsubishi Materials Corp. |
0.6% | |||
| Yokohama Rubber Co., Ltd. (The) |
0.5% | |||
| Nippon Paper Industries Co., Ltd. |
0.5% | |||
| Canon Marketing Japan, Inc. |
0.5% | |||
| Nippon Electric Glass Co., Ltd. |
0.5% | |||
| Skylark Holdings Co., Ltd. |
0.5% | |||
| Mixi, Inc. |
0.5% | |||
| * | The ten largest holdings are subject to change, and there are no guarantees the Fund will remain invested in any particular company. Excludes derivatives and investment of cash collateral for securities on loan (if any). |
The WisdomTree Japan Hedged SmallCap Equity Fund (the ‘‘Fund’’) seeks to track the price and yield performance, before fees and expenses, of the WisdomTree Japan Hedged SmallCap Equity Index (the ‘‘Index’’). In seeking to track the Index, the Fund invests in Japanese small-cap dividend-paying companies while at the same time hedging exposure to fluctuations of the value of the Japanese yen relative to the U.S. dollar. The Fund generally uses a representative sampling strategy to achieve its investment objective, meaning it generally will invest in a sample of securities in the Index.
The Fund returned -8.77% at net asset value (“NAV”) for the fiscal year ending March 31, 2019 (for more complete performance information please see the table below). The Fund’s sector position in Communication Services contributed most positively to performance, while its position in Real Estate contributed least positively to performance. The U.S. dollar rallied by 4.01% against the Japanese yen during the fiscal year which served as a tailwind for the Fund’s currency hedge methodology. During the fiscal year, the Fund utilized forward foreign currency contracts to offset Japanese yen currency exposure from positions in Japanese equities. The Fund’s use of forward foreign currency contracts contributed positively to Fund performance as a result of the U.S. dollar strengthening against the Japanese yen during the fiscal year. Hedging the currency, in addition to interest rate differentials between the U.S. and Japan, throughout the fiscal year added approximately 7.00% of performance to the Fund. This helped to greatly offset the negative local equity returns of the Fund, resulting in a net total return during the fiscal year of -8.77%. The Fund’s overweight to large-cap equities provided more downside protection than mid- or small-cap peers during the fourth quarter of 2018, where a broad market correction catalyzed by trade war apprehension with China and fears of a U.S. Federal Reserve policy misstep sent global markets sharply downward. During the fiscal year, natural disasters in Japan have also had an adverse effect on the Japanese equity market and overall economy.
Shareholder Expense Example
| Beginning Account Value |
Ending Account Value |
Annualized Expense Ratio |
Expenses Paid During the Period |
|||||||||||||
| Actual |
$ | 1,000.00 | $ | 875.10 | 0.58 | % | $ | 2.71 | ||||||||
| Hypothetical (5% return before expenses) |
$ | 1,000.00 | $ | 1,022.04 | 0.58 | % | $ | 2.92 | ||||||||
Performance
| Average Annual Total Return | ||||||||||||||||
| 1 Year | 3 Year | 5 Year | Since Inception1 | |||||||||||||
| Fund NAV Returns |
-8.77 | % | 10.15 | % | 10.10 | % | 10.76 | % | ||||||||
| Fund Market Price Returns |
-8.64 | % | 10.46 | % | 10.21 | % | 10.67 | % | ||||||||
| WisdomTree Japan Hedged SmallCap Equity Index |
-8.24 | % | 10.87 | % | 10.89 | % | 11.68 | % | ||||||||
| MSCI Japan Small Cap Local Currency Index |
-8.27 | % | 8.32 | % | 9.90 | % | 10.85 | % | ||||||||
| 1 | Total returns are calculated based on the commencement of Fund trading on the NASDAQ on June 28, 2013. |
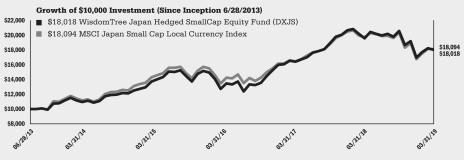
Performance is historical and does not guarantee future results. The returns do not reflect the deduction of taxes that a shareholder would pay on Fund distributions or on the redemption of Fund shares.
| 8 | WisdomTree Trust |
Description of Indexes (unaudited)
Below are descriptions of each Index referenced in this report:
The MSCI EAFE Local Currency Index is a free float-adjusted market capitalization
weighted index that is designed to measure developed market equity performance, excluding the U.S. and Canada which is calculated in local currency.
The MSCI European Economic and Monetary Union (EMU) Local Currency Index is a
free float-adjusted market capitalization weighted index that is designed to measure the
equity market performance of the developed market countries within the EMU. The
securities are priced in local currency terms with no conversion into U.S. dollars.
The MSCI European Economic and Monetary Union (EMU) Small Cap Local Currency
Index is a free float-adjusted market capitalization weighted index that is designed to measure the equity market performance of small-cap stocks from developed market countries within the EMU. The securities are priced in local currency terms with no conversion into U.S. dollars.
The MSCI Germany Local Currency Index is a capitalization weighted index that
measures the performance of the Germany equity market and provides local currency
returns, which are not translated back to U.S. dollars.
The MSCI Japan Index is a capitalization weighted index that is comprised of stocks in Japan.
The MSCI Japan Local Currency Index is a free float-adjusted market capitalization index
that is designed to measure developed market equity performance in Japan and calculated in local currency
The MSCI Japan Small Cap Local Currency Index is a free float-adjusted market
capitalization index that is designed to measure the performance of small cap stocks
within Japan and calculated in local currency.
The WisdomTree DEFA International Hedged Equity Index is comprised of dividend-paying companies in the industrialized world, excluding Canada and the United States, and is designed to neutralize exposure to fluctuations between the value of the U.S. dollar and non-U.S. currencies reflected in the index. This index is based on the WisdomTree International Equity Index.
The WisdomTree Europe Hedged Equity Index is designed to provide exposure to
European equities while at the same time neutralizing exposure to fluctuations
between the Euro and the U.S. dollar.
The WisdomTree Europe Hedged SmallCap Equity Index is a dividend weighted index
designed to provide exposure to small cap equity securities within Europe, while at the same time neutralizing exposure to fluctuations between the value of the Euro and the U.S. dollar.
The WisdomTree Germany Hedged Equity Index is designed to provide exposure to
Germany equity markets while at the same time neutralizing exposure to fluctuations
of the Euro movements relative to the U.S. dollar. In this sense, the Index “hedges”
against fluctuations in the relative value of the Euro against the U.S. dollar.
The WisdomTree International Hedged Quality Dividend Growth Index is designed to provide exposure to the developed market companies while at the same time neutralizing exposure to fluctuations between the value of foreign currencies and the U.S. dollar.
The WisdomTree Japan Dividend Index is comprised of dividend-paying companies incorporated in Japan, listed on the Tokyo Stock Exchange and that meet other requirements necessary to be included in the WisdomTree International Equity Index.
The WisdomTree Japan Hedged Equity Index is designed to provide exposure to
Japanese equity markets while at the same time neutralizing exposure to fluctuations of
the Japanese Yen movements relative to the U.S. dollar. This index is based on the
WisdomTree Japan Dividend Index.
The WisdomTree Japan Hedged SmallCap Equity Index is designed to provide exposure
to the small-capitalization segment of the Japanese equity markets while at the same time
neutralizing exposure to fluctuations of the Japanese Yen movements relative to the U.S.
dollar.
| WisdomTree Trust | 9 |
Description of Indexes (unaudited) (concluded)
The Global Industry Classification Standard (“GICS”) was developed by and is the exclusive property and a service mark of MSCI Inc. (“MSCI”) and Standard & Poor’s (“S&P”), a division of The McGraw-Hill Companies, Inc. and is licensed for use by WisdomTree Investments, Inc. Neither MSCI, S&P nor any other party involved in making or compiling the GICS or any GICS
classifications makes any express or implied warranties or representations with respect to such standard or classification (or the results to be obtained by the use thereof), and all such parties hereby expressly disclaim all warranties of originality, accuracy, completeness, merchantability and fitness for a particular purpose with respect to any such standard or classification. Without limiting any of the foregoing, in no event shall MSCI, S&P, any of their affiliates or any third party involved in making or compiling the GICS or any GICS classifications have any liability for any direct, indirect, special, punitive, consequential or any other damages (including lost profits) even if notified of the possibility of such damages.
Neither MSCI nor any other party involved in or related to compiling, computing or creating the
MSCI data makes any express or implied warranties or representations with respect to such data (or the results to be obtained by the use thereof), and all such parties hereby expressly disclaim all warranties of originality, accuracy, completeness, merchantability or fitness for a particular purpose with respect to any such data. Without limiting any of the foregoing, in no event shall MSCI, any of its affiliates or any third party involved in or related to compiling, computing or creating the data have any liability for any direct, indirect, special, punitive, consequential or any other damages (including lost profits) even if notified of the possibility of such damages. No further distribution or dissemination of the MSCI data is permitted without MSCI’s express written consent.
WisdomTree Investments, Inc. and WisdomTree Asset Management, Inc. (together, “WisdomTree”) and the Funds make no representation or warranty, express or implied, to the owners of shares of the Funds or any member of the public regarding the advisability of investing in securities generally or in the Funds particularly or the ability of the underlying Indexes to track the performance of their underlying securities. WisdomTree Investments is the licensor of certain trademarks, service marks and trade names of the Funds. WisdomTree Investments has no obligation to take the needs of the Funds or the owners of shares of the Funds into consideration in determining, composing, or calculating the underlying WisdomTree Indexes of the applicable Funds. WisdomTree Investments is not responsible for, and has not participated in, the determination of the timing of, prices of, or quantities of shares of the Funds
to be issued or in the determination or calculation of the equation by which the shares of the Funds are redeemable. WisdomTree and the Funds do not guarantee the accuracy, completeness, or performance of the underlying Indexes or the data included therein and shall have no liability in connection with the underlying Indexes or their calculation.
Index performance information assumes the reinvestment of dividends and excludes
Management fees, transaction costs and expenses. You cannot directly invest in an index.
| 10 | WisdomTree Trust |
WisdomTree Europe Hedged Equity Fund (HEDJ)
March 31, 2019
| Investments | Shares | Value | ||||||
| COMMON STOCKS – 99.4% | ||||||||
| Austria – 0.5% | ||||||||
| Andritz AG |
224,324 | $ | 9,631,975 | |||||
| Lenzing AG |
85,471 | 9,165,240 | ||||||
|
|
|
|||||||
| Total Austria | 18,797,215 | |||||||
| Belgium – 7.3% | ||||||||
| Anheuser-Busch InBev S.A./N.V. |
2,690,111 | 225,819,370 | ||||||
| Bekaert S.A. |
166,802 | 3,921,928 | ||||||
| Melexis N.V.(a) |
53,185 | 3,221,827 | ||||||
| Solvay S.A. |
207,438 | 22,448,997 | ||||||
| UCB S.A. |
204,687 | 17,595,997 | ||||||
|
|
|
|||||||
| Total Belgium | 273,008,119 | |||||||
| Finland – 4.8% | ||||||||
| Cargotec Oyj Class B |
60,455 | 2,230,599 | ||||||
| Huhtamaki Oyj(a) |
154,406 | 5,750,841 | ||||||
| Kemira Oyj |
539,089 | 6,670,583 | ||||||
| Kone Oyj Class B |
1,027,322 | 51,862,636 | ||||||
| Konecranes Oyj(a) |
162,734 | 5,790,582 | ||||||
| Metso Oyj |
321,918 | 11,082,535 | ||||||
| Nokia Oyj |
12,811,883 | 72,993,657 | ||||||
| Valmet Oyj(a) |
315,962 | 8,003,789 | ||||||
| Wartsila Oyj Abp |
960,028 | 15,506,560 | ||||||
|
|
|
|||||||
| Total Finland | 179,891,782 | |||||||
| France – 31.2% | ||||||||
| Air Liquide S.A. |
449,275 | 57,181,491 | ||||||
| Airbus SE |
700,353 | 92,715,532 | ||||||
| Arkema S.A. |
80,314 | 7,652,723 | ||||||
| BioMerieux |
33,515 | 2,773,502 | ||||||
| Bureau Veritas S.A. |
475,497 | 11,158,756 | ||||||
| Christian Dior SE |
107,144 | 51,094,225 | ||||||
| Cie Generale des Etablissements Michelin SCA |
252,592 | 29,893,853 | ||||||
| Danone S.A. |
882,285 | 68,049,370 | ||||||
| Dassault Systemes SE |
52,004 | 7,751,629 | ||||||
| Edenred |
327,429 | 14,915,707 | ||||||
| Eramet |
18,569 | 1,033,336 | ||||||
| EssilorLuxottica S.A. |
379,001 | 41,441,152 | ||||||
| Gaztransport Et Technigaz S.A. |
81,538 | 7,425,105 | ||||||
| Hermes International |
32,500 | 21,464,960 | ||||||
| Imerys S.A. |
113,512 | 5,664,186 | ||||||
| Ingenico Group S.A. |
58,567 | 4,183,775 | ||||||
| IPSOS |
80,576 | 2,019,396 | ||||||
| Kering S.A. |
66,397 | 38,111,935 | ||||||
| L’Oreal S.A. |
411,479 | 110,794,589 | ||||||
| Legrand S.A. |
227,020 | 15,207,894 | ||||||
| LVMH Moet Hennessy Louis Vuitton SE |
372,277 | 137,065,868 | ||||||
| Pernod Ricard S.A. |
163,338 | 29,344,649 | ||||||
| Publicis Groupe S.A. |
348,128 | 18,657,441 | ||||||
| Remy Cointreau S.A. |
30,849 | 4,118,553 | ||||||
| Rubis SCA |
102,279 | 5,583,714 | ||||||
| Safran S.A. |
286,373 | 39,309,963 | ||||||
| Sanofi |
2,347,949 | 207,589,684 | ||||||
| Sartorius Stedim Biotech |
8,792 | 1,114,560 | ||||||
| Schneider Electric SE |
777,462 | 61,055,740 | ||||||
| Investments | Shares | Value | ||||||
| SCOR SE |
504,946 | 21,522,506 | ||||||
| SEB S.A. |
22,538 | 3,796,019 | ||||||
| Societe BIC S.A. |
82,341 | 7,345,675 | ||||||
| Sodexo S.A. |
207,719 | 22,894,569 | ||||||
| Tarkett S.A.(a) |
108,776 | 2,337,743 | ||||||
| Teleperformance |
28,824 | 5,184,877 | ||||||
| Valeo S.A. |
263,868 | 7,658,945 | ||||||
| Vicat S.A. |
45,217 | 2,177,099 | ||||||
|
|
|
|||||||
| Total France | 1,167,290,721 | |||||||
| Germany – 20.2% | ||||||||
| adidas AG |
99,405 | 24,176,219 | ||||||
| BASF SE |
1,213,636 | 89,299,765 | ||||||
| Bayer AG Registered Shares |
865,512 | 55,977,987 | ||||||
| Bayerische Motoren Werke AG |
1,049,462 | 81,014,195 | ||||||
| Brenntag AG |
107,778 | 5,554,750 | ||||||
| Continental AG |
152,257 | 22,943,068 | ||||||
| Covestro AG(b) |
218,883 | 12,047,780 | ||||||
| Daimler AG Registered Shares |
2,185,844 | 128,241,077 | ||||||
| Duerr AG |
59,478 | 2,334,799 | ||||||
| Evonik Industries AG |
649,105 | 17,696,417 | ||||||
| Fresenius Medical Care AG & Co. KGaA |
138,418 | 11,174,887 | ||||||
| Fresenius SE & Co. KGaA |
222,170 | 12,413,307 | ||||||
| GEA Group AG |
189,904 | 4,979,007 | ||||||
| Hannover Rueck SE |
239,059 | 34,358,703 | ||||||
| HeidelbergCement AG |
214,216 | 15,432,559 | ||||||
| Henkel AG & Co. KGaA |
165,542 | 15,753,230 | ||||||
| Hochtief AG |
41,319 | 5,984,959 | ||||||
| Infineon Technologies AG |
450,917 | 8,954,130 | ||||||
| K+S AG Registered Shares |
114,485 | 2,100,498 | ||||||
| Krones AG |
10,859 | 957,762 | ||||||
| LANXESS AG |
45,796 | 2,444,603 | ||||||
| Merck KGaA |
66,165 | 7,551,920 | ||||||
| MTU Aero Engines AG |
27,538 | 6,239,866 | ||||||
| OSRAM Licht AG |
83,107 | 2,862,956 | ||||||
| Pfeiffer Vacuum Technology AG |
2,472 | 378,603 | ||||||
| SAP SE |
610,377 | 70,592,260 | ||||||
| Siemens AG Registered Shares |
977,731 | 105,327,263 | ||||||
| Siltronic AG |
20,535 | 1,813,259 | ||||||
| Symrise AG |
55,524 | 5,007,560 | ||||||
| Wacker Chemie AG |
43,843 | 3,780,795 | ||||||
|
|
|
|||||||
| Total Germany | 757,394,184 | |||||||
| Ireland – 1.3% | ||||||||
| CRH PLC |
1,088,960 | 33,808,723 | ||||||
| Glanbia PLC |
248,159 | 4,859,574 | ||||||
| Kerry Group PLC Class A |
70,193 | 7,842,212 | ||||||
|
|
|
|||||||
| Total Ireland | 46,510,509 | |||||||
| Italy – 1.0% | ||||||||
| Autogrill SpA |
220,043 | 2,118,670 | ||||||
| Brunello Cucinelli SpA |
29,240 | 1,006,305 | ||||||
| Davide Campari-Milano SpA |
449,560 | 4,416,898 | ||||||
| DiaSorin SpA |
29,776 | 2,999,028 | ||||||
| Ferrari N.V. |
67,079 | 9,000,698 | ||||||
| IMA Industria Macchine Automatiche SpA(a) |
46,282 | 3,458,453 | ||||||
See Notes to Financial Statements.
| WisdomTree Trust | 11 |
Schedule of Investments (continued)
WisdomTree Europe Hedged Equity Fund (HEDJ)
March 31, 2019
| Investments | Shares | Value | ||||||
| Interpump Group SpA |
54,777 | $ | 1,788,605 | |||||
| Maire Tecnimont SpA |
651,753 | 2,485,263 | ||||||
| Moncler SpA |
113,485 | 4,577,164 | ||||||
| Salini Impregilo SpA(a) |
810,751 | 1,888,069 | ||||||
| Salvatore Ferragamo SpA(a) |
149,096 | 3,200,926 | ||||||
|
|
|
|||||||
| Total Italy | 36,940,079 | |||||||
| Netherlands – 11.4% | ||||||||
| Aegon N.V. |
8,058,814 | 38,765,224 | ||||||
| Akzo Nobel N.V. |
445,436 | 39,507,462 | ||||||
| Arcadis N.V.(a) |
158,210 | 2,465,728 | ||||||
| ASM International N.V. |
52,469 | 2,845,585 | ||||||
| ASML Holding N.V. |
204,422 | 38,378,289 | ||||||
| BE Semiconductor Industries N.V. |
397,517 | 10,587,467 | ||||||
| Corbion N.V. |
72,043 | 2,167,945 | ||||||
| EXOR N.V. |
153,918 | 10,006,672 | ||||||
| Heineken Holding N.V. |
275,352 | 27,609,681 | ||||||
| Heineken N.V. |
597,319 | 63,099,416 | ||||||
| Koninklijke Ahold Delhaize N.V. |
2,389,027 | 63,642,756 | ||||||
| Koninklijke DSM N.V. |
245,767 | 26,812,220 | ||||||
| Koninklijke Philips N.V. |
1,290,529 | 52,622,989 | ||||||
| Koninklijke Vopak N.V. |
193,653 | 9,276,129 | ||||||
| SBM Offshore N.V. |
253,540 | 4,826,874 | ||||||
| Signify N.V.(b) |
441,134 | 11,813,555 | ||||||
| Wolters Kluwer N.V. |
314,567 | 21,439,939 | ||||||
|
|
|
|||||||
| Total Netherlands | 425,867,931 | |||||||
| Portugal – 0.7% | ||||||||
| Galp Energia, SGPS, S.A. |
1,703,336 | 27,311,794 | ||||||
| Spain – 15.8% | ||||||||
| Acerinox S.A. |
815,242 | 8,086,594 | ||||||
| ACS Actividades de Construccion y Servicios S.A. |
705,413 | 31,017,575 | ||||||
| Amadeus IT Group S.A. |
418,167 | 33,525,068 | ||||||
| Applus Services S.A. |
271,457 | 3,243,130 | ||||||
| Banco Bilbao Vizcaya Argentaria S.A. |
18,489,590 | 105,735,946 | ||||||
| Banco Santander S.A. |
38,458,033 | 178,970,277 | ||||||
| Investments | Shares | Value | ||||||
| Construcciones y Auxiliar de Ferrocarriles S.A. |
49,709 | 2,391,704 | ||||||
| Grifols S.A. |
417,918 | 11,712,709 | ||||||
| Mapfre S.A. |
13,806,695 | 38,074,989 | ||||||
| Obrascon Huarte Lain S.A.(a) |
2,512,271 | 3,166,464 | ||||||
| Prosegur Cash S.A.(b) |
2,322,091 | 5,131,284 | ||||||
| Prosegur Cia de Seguridad S.A. |
1,066,411 | 5,783,536 | ||||||
| Siemens Gamesa Renewable Energy S.A.* |
408,563 | 6,512,026 | ||||||
| Tecnicas Reunidas S.A.(a) |
230,248 | 6,481,446 | ||||||
| Telefonica S.A. |
17,367,652 | 145,654,956 | ||||||
| Viscofan S.A. |
113,680 | 7,116,241 | ||||||
|
|
|
|||||||
| Total Spain | 592,603,945 | |||||||
| United Kingdom – 5.2% | ||||||||
| Unilever N.V. CVA |
3,354,637 | 195,042,510 | ||||||
| TOTAL COMMON STOCKS (Cost: $3,986,329,314) |
3,720,658,789 | |||||||
| INVESTMENT OF CASH COLLATERAL FOR SECURITIES LOANED – 0.8% |
| |||||||
| United States – 0.8% | ||||||||
| State Street Navigator Securities Lending Government Money Market Portfolio, 2.46%(c) |
||||||||
| (Cost: $29,943,930)(d) |
29,943,930 | 29,943,930 | ||||||
| TOTAL INVESTMENTS IN SECURITIES – 100.2% (Cost: $4,016,273,244) |
|
3,750,602,719 | ||||||
| Other Assets less Liabilities – (0.2)% |
(6,244,461 | ) | ||||||
|
|
|
|||||||
| NET ASSETS – 100.0% | $ | 3,744,358,258 | ||||||
| * | Non-income producing security. |
| (a) | Security, or portion thereof, was on loan at March 31, 2019 (See Note 2). |
| (b) | This security is exempt from registration under rule 144A of the Securities Act of 1933. This security may be sold in transactions that are exempt from registration, normally to qualified institutional buyers. |
| (c) | Rate shown represents annualized 7-day yield as of March 31, 2019. |
| (d) | At March 31, 2019, the total market value of the Fund’s securities on loan identified in the Schedule of Investments was $35,415,714 and the total market value of the collateral held by the Fund was $37,220,279. The total market value of the collateral includes non-cash U.S. Government securities collateral having a value of $7,276,349. |
CVA – Certificaten Van Aandelen (Certificate of Stock)
| FINANCIAL DERIVATIVE INSTRUMENTS | ||||||||||||||||||||||||||||
| FOREIGN CURRENCY CONTRACTS (OTC – OVER THE COUNTER) | ||||||||||||||||||||||||||||
| Counterparty | Settlement Date |
Amount and Description of Currency to be Purchased |
Amount and be Sold |
Unrealized Appreciation |
Unrealized Depreciation |
|||||||||||||||||||||||
| Bank of America N.A. |
4/3/2019 | 19,223,659 | EUR | 21,822,544 | USD | $ | — | $ | (235,422 | ) | ||||||||||||||||||
| Bank of America N.A. |
4/3/2019 | 211,441,977 | EUR | 237,491,629 | USD | — | (53,802 | ) | ||||||||||||||||||||
| Bank of America N.A. |
4/3/2019 | 227,640,310 | USD | 199,324,998 | EUR | 3,809,191 | — | |||||||||||||||||||||
| Bank of America N.A. |
5/6/2019 | 240,973,954 | USD | 213,949,937 | EUR | 52,363 | — | |||||||||||||||||||||
| Bank of Montreal |
4/3/2019 | 211,441,977 | EUR | 237,491,629 | USD | — | (53,802 | ) | ||||||||||||||||||||
| Bank of Montreal |
4/3/2019 | 227,640,310 | USD | 199,445,673 | EUR | 3,673,680 | — | |||||||||||||||||||||
| Bank of Montreal |
5/6/2019 | 240,973,954 | USD | 213,949,937 | EUR | 52,363 | — | |||||||||||||||||||||
| Barclays Bank PLC |
4/3/2019 | 211,442,354 | EUR | 237,491,629 | USD | — | (53,379 | ) | ||||||||||||||||||||
| Barclays Bank PLC |
4/3/2019 | 227,640,310 | USD | 199,481,152 | EUR | 3,633,839 | — | |||||||||||||||||||||
| Barclays Bank PLC |
5/6/2019 | 240,973,954 | USD | 213,950,507 | EUR | 51,721 | — | |||||||||||||||||||||
| Canadian Imperial Bank of Commerce |
4/3/2019 | 211,479,634 | EUR | 237,491,629 | USD | — | (11,515 | ) | ||||||||||||||||||||
See Notes to Financial Statements.
| 12 | WisdomTree Trust |
Schedule of Investments (concluded)
WisdomTree Europe Hedged Equity Fund (HEDJ)
March 31, 2019
| FINANCIAL DERIVATIVE INSTRUMENTS | ||||||||||||||||||||||||||||
| FOREIGN CURRENCY CONTRACTS (OTC – OVER THE COUNTER) | ||||||||||||||||||||||||||||
| Counterparty | Settlement Date |
Amount and Description of Currency to be Purchased |
Amount and be Sold |
Unrealized Appreciation |
Unrealized Depreciation |
|||||||||||||||||||||||
| Canadian Imperial Bank of Commerce |
4/3/2019 | 227,640,310 | USD | 199,498,983 | EUR | $ | 3,613,815 | $ | — | |||||||||||||||||||
| Canadian Imperial Bank of Commerce |
5/6/2019 | 240,973,954 | USD | 213,991,736 | EUR | 5,295 | — | |||||||||||||||||||||
| Citibank N.A. |
4/3/2019 | 16,523,258 | EUR | 18,705,038 | USD | — | (150,320 | ) | ||||||||||||||||||||
| Citibank N.A. |
4/3/2019 | 19,326,061 | EUR | 21,822,544 | USD | — | (120,429 | ) | ||||||||||||||||||||
| Citibank N.A. |
4/3/2019 | 211,412,050 | EUR | 237,491,629 | USD | — | (87,409 | ) | ||||||||||||||||||||
| Citibank N.A. |
4/3/2019 | 227,640,310 | USD | 199,415,447 | EUR | 3,707,622 | — | |||||||||||||||||||||
| Citibank N.A. |
5/6/2019 | 240,973,954 | USD | 213,925,246 | EUR | 80,167 | — | |||||||||||||||||||||
| Commonwealth Bank of Australia |
4/3/2019 | 211,536,144 | EUR | 237,491,629 | USD | 51,942 | — | |||||||||||||||||||||
| Commonwealth Bank of Australia |
4/3/2019 | 227,640,310 | USD | 199,517,168 | EUR | 3,593,394 | — | |||||||||||||||||||||
| Commonwealth Bank of Australia |
5/6/2019 | 240,973,954 | USD | 214,048,760 | EUR | — | (58,918 | ) | ||||||||||||||||||||
| Credit Suisse International |
4/3/2019 | 22,156,663 | EUR | 24,940,050 | USD | — | (59,323 | ) | ||||||||||||||||||||
| Credit Suisse International |
4/3/2019 | 211,420,331 | EUR | 237,491,629 | USD | — | (78,110 | ) | ||||||||||||||||||||
| Credit Suisse International |
4/3/2019 | 227,640,310 | USD | 199,621,969 | EUR | 3,475,708 | — | |||||||||||||||||||||
| Credit Suisse International |
5/6/2019 | 240,973,954 | USD | 213,935,692 | EUR | 68,405 | — | |||||||||||||||||||||
| Goldman Sachs |
4/3/2019 | 211,384,577 | EUR | 237,491,629 | USD | — | (118,259 | ) | ||||||||||||||||||||
| Goldman Sachs |
4/3/2019 | 227,640,310 | USD | 199,420,862 | EUR | 3,701,541 | — | |||||||||||||||||||||
| Goldman Sachs |
5/6/2019 | 240,973,954 | USD | 213,902,649 | EUR | 105,613 | — | |||||||||||||||||||||
| HSBC Holdings PLC |
4/3/2019 | 211,347,894 | EUR | 237,491,629 | USD | — | (159,452 | ) | ||||||||||||||||||||
| HSBC Holdings PLC |
4/3/2019 | 227,640,310 | USD | 199,819,448 | EUR | 3,253,950 | — | |||||||||||||||||||||
| HSBC Holdings PLC |
5/6/2019 | 240,973,954 | USD | 213,856,899 | EUR | 157,130 | — | |||||||||||||||||||||
| JP Morgan Chase Bank N.A. |
4/3/2019 | 211,292,049 | EUR | 237,491,629 | USD | — | (222,163 | ) | ||||||||||||||||||||
| JP Morgan Chase Bank N.A. |
4/3/2019 | 227,640,310 | USD | 199,866,115 | EUR | 3,201,546 | — | |||||||||||||||||||||
| JP Morgan Chase Bank N.A. |
5/6/2019 | 240,973,954 | USD | 213,799,977 | EUR | 221,228 | — | |||||||||||||||||||||
| Morgan Stanley & Co. International |
4/3/2019 | 211,612,481 | EUR | 237,491,629 | USD | 137,664 | — | |||||||||||||||||||||
| Morgan Stanley & Co. International |
4/3/2019 | 227,640,310 | USD | 199,422,609 | EUR | 3,699,579 | — | |||||||||||||||||||||
| Morgan Stanley & Co. International |
5/6/2019 | 240,973,954 | USD | 214,131,119 | EUR | — | (151,659 | ) | ||||||||||||||||||||
| Royal Bank of Canada |
4/3/2019 | 211,592,684 | EUR | 237,491,629 | USD | 115,434 | — | |||||||||||||||||||||
| Royal Bank of Canada |
4/3/2019 | 227,640,310 | USD | 199,797,526 | EUR | 3,278,568 | — | |||||||||||||||||||||
| Royal Bank of Canada |
5/6/2019 | 240,973,954 | USD | 214,105,054 | EUR | — | (122,309 | ) | ||||||||||||||||||||
| Societe Generale |
4/3/2019 | 211,498,467 | EUR | 237,491,629 | USD | 9,633 | — | |||||||||||||||||||||
| Societe Generale |
4/3/2019 | 227,640,310 | USD | 199,483,249 | EUR | 3,631,483 | — | |||||||||||||||||||||
| Societe Generale |
5/6/2019 | 240,973,954 | USD | 214,010,741 | EUR | — | (16,105 | ) | ||||||||||||||||||||
| Standard Chartered Bank |
4/3/2019 | 211,366,704 | EUR | 237,491,629 | USD | — | (138,329 | ) | ||||||||||||||||||||
| Standard Chartered Bank |
4/3/2019 | 227,640,310 | USD | 199,515,070 | EUR | 3,595,751 | — | |||||||||||||||||||||
| Standard Chartered Bank |
5/6/2019 | 240,973,954 | USD | 213,875,880 | EUR | 135,757 | — | |||||||||||||||||||||
| State Street Bank and Trust |
4/3/2019 | 211,384,577 | EUR | 237,491,629 | USD | — | (118,259 | ) | ||||||||||||||||||||
| State Street Bank and Trust |
4/3/2019 | 227,640,310 | USD | 199,414,049 | EUR | 3,709,191 | — | |||||||||||||||||||||
| State Street Bank and Trust |
5/6/2019 | 240,973,954 | USD | 213,894,674 | EUR | 114,593 | — | |||||||||||||||||||||
| UBS AG |
4/3/2019 | 19,258,284 | EUR | 21,822,544 | USD | — | (196,539 | ) | ||||||||||||||||||||
| UBS AG |
4/3/2019 | 11,047,563 | EUR | 12,470,025 | USD | — | (64,213 | ) | ||||||||||||||||||||
| UBS AG |
4/3/2019 | 16,645,610 | EUR | 18,705,038 | USD | — | (12,924 | ) | ||||||||||||||||||||
| UBS AG |
4/3/2019 | 81,381,960 | EUR | 91,342,949 | USD | 44,561 | — | |||||||||||||||||||||
| UBS AG |
4/3/2019 | 227,640,310 | USD | 199,432,568 | EUR | 3,688,396 | — | |||||||||||||||||||||
| UBS AG |
5/6/2019 | 92,682,303 | USD | 82,349,792 | EUR | — | (48,937 | ) | ||||||||||||||||||||
| Wells Fargo Bank N.A. |
4/3/2019 | 151,760,207 | USD | 133,235,772 | EUR | 2,143,690 | — | |||||||||||||||||||||
| $ | 60,814,813 | $ | (2,331,577 | ) | ||||||||||||||||||||||||
| CURRENCY LEGEND | ||
| EUR | Euro | |
| USD | U.S. dollar | |
See Notes to Financial Statements.
| WisdomTree Trust | 13 |
Schedule of Investments
WisdomTree Europe Hedged SmallCap Equity Fund (EUSC)
March 31, 2019
| Investments | Shares | Value | ||||||
| COMMON STOCKS – 98.5% |
| |||||||
| Austria – 5.5% |
| |||||||
| Andritz AG |
21,498 | $ | 923,076 | |||||
| BAWAG Group AG(a) |
9,839 | 434,617 | ||||||
| Lenzing AG |
7,947 | 852,174 | ||||||
| Oesterreichische Post AG |
20,117 | 851,582 | ||||||
| Palfinger AG |
4,339 | 121,801 | ||||||
| POLYTEC Holding AG(b) |
7,260 | 69,047 | ||||||
| Porr AG(b) |
5,561 | 124,384 | ||||||
| S IMMO AG |
12,288 | 251,392 | ||||||
| Telekom Austria AG* |
48,651 | 353,988 | ||||||
| UNIQA Insurance Group AG |
94,433 | 941,583 | ||||||
| Verbund AG |
17,084 | 820,639 | ||||||
| Vienna Insurance Group AG Wiener Versicherung Gruppe |
25,716 | 661,242 | ||||||
| Wienerberger AG |
8,924 | 189,684 | ||||||
|
|
|
|||||||
| Total Austria | 6,595,209 | |||||||
| Belgium – 5.1% | ||||||||
| Ackermans & van Haaren N.V. |
3,223 | 486,748 | ||||||
| Bekaert S.A. |
13,738 | 323,015 | ||||||
| bpost S.A.(b) |
101,947 | 1,100,640 | ||||||
| Cofinimmo S.A. |
5,425 | 721,229 | ||||||
| D’ieteren S.A./N.V. |
10,088 | 399,854 | ||||||
| Econocom Group S.A./N.V.(b) |
25,262 | 103,080 | ||||||
| Elia System Operator S.A./N.V. |
12,045 | 845,296 | ||||||
| Euronav N.V. |
30,005 | 244,429 | ||||||
| Greenyard N.V.(b) |
2,138 | 8,018 | ||||||
| Kinepolis Group N.V. |
4,140 | 234,289 | ||||||
| Melexis N.V. |
6,088 | 368,797 | ||||||
| Ontex Group N.V. |
11,589 | 261,035 | ||||||
| Warehouses De Pauw CVA |
6,181 | 992,468 | ||||||
|
|
|
|||||||
| Total Belgium | 6,088,898 | |||||||
| Finland – 9.7% | ||||||||
| Cargotec Oyj Class B |
5,385 | 198,690 | ||||||
| Citycon Oyj(b) |
69,566 | 712,698 | ||||||
| Cramo Oyj |
12,209 | 240,317 | ||||||
| DNA Oyj |
24,825 | 515,125 | ||||||
| Finnair Oyj |
21,972 | 197,864 | ||||||
| Huhtamaki Oyj(b) |
15,087 | 561,914 | ||||||
| Kemira Oyj |
46,221 | 571,930 | ||||||
| Kesko Oyj Class B |
18,098 | 1,102,229 | ||||||
| Konecranes Oyj(b) |
14,998 | 533,676 | ||||||
| Lehto Group Oyj(b) |
9,196 | 43,884 | ||||||
| Metsa Board Oyj(b) |
41,679 | 255,758 | ||||||
| Metso Oyj |
31,237 | 1,075,383 | ||||||
| Nokian Renkaat Oyj |
35,378 | 1,185,370 | ||||||
| Oriola Oyj Class B |
31,025 | 81,691 | ||||||
| Orion Oyj Class B(b) |
37,191 | 1,395,616 | ||||||
| Outokumpu Oyj(b) |
117,419 | 426,911 | ||||||
| Ramirent Oyj |
30,310 | 186,674 | ||||||
| Sanoma Oyj |
25,261 | 247,762 | ||||||
| Tieto Oyj(b) |
21,232 | 648,457 | ||||||
| Tikkurila Oyj |
7,193 | 118,081 | ||||||
| Investments | Shares | Value | ||||||
| Tokmanni Group Corp. |
20,800 | 194,082 | ||||||
| Uponor Oyj |
10,132 | 115,929 | ||||||
| Valmet Oyj(b) |
30,017 | 760,375 | ||||||
| YIT Oyj(b) |
63,271 | 366,941 | ||||||
|
|
|
|||||||
| Total Finland | 11,737,357 | |||||||
| France – 15.1% |
| |||||||
| Alten S.A. |
2,543 | 272,406 | ||||||
| Altran Technologies S.A.(b) |
26,155 | 287,220 | ||||||
| Beneteau S.A. |
7,559 | 88,611 | ||||||
| Bonduelle SCA |
3,388 | 99,480 | ||||||
| Casino Guichard Perrachon S.A.(b) |
59,745 | 2,592,822 | ||||||
| Chargeurs S.A. |
4,994 | 105,533 | ||||||
| Coface S.A. |
36,811 | 325,706 | ||||||
| Derichebourg S.A. |
26,736 | 108,734 | ||||||
| Elior Group S.A.(a) |
28,599 | 383,101 | ||||||
| Elis S.A. |
25,720 | 413,846 | ||||||
| Eramet |
2,968 | 165,165 | ||||||
| Eurazeo SE |
9,027 | 679,110 | ||||||
| Eutelsat Communications S.A. |
94,605 | 1,656,613 | ||||||
| Gaztransport Et Technigaz S.A. |
10,790 | 982,571 | ||||||
| Ingenico Group S.A. |
7,527 | 537,697 | ||||||
| Interparfums S.A. |
4,516 | 245,680 | ||||||
| IPSOS |
8,252 | 206,812 | ||||||
| Jacquet Metal Service S.A. |
4,472 | 74,618 | ||||||
| Kaufman & Broad S.A. |
4,577 | 187,173 | ||||||
| Korian S.A. |
9,245 | 374,537 | ||||||
| Lagardere SCA |
42,229 | 1,086,794 | ||||||
| Lectra |
4,039 | 97,733 | ||||||
| LISI |
4,838 | 148,846 | ||||||
| Maisons du Monde S.A.(a) |
3,277 | 63,362 | ||||||
| Metropole Television S.A. |
33,455 | 617,568 | ||||||
| Neopost S.A. |
14,650 | 351,038 | ||||||
| Nexity S.A. |
16,332 | 797,720 | ||||||
| Oeneo S.A. |
9,826 | 103,822 | ||||||
| Rallye S.A.(b) |
29,165 | 345,491 | ||||||
| Rexel S.A. |
50,850 | 574,109 | ||||||
| Rothschild & Co. |
11,498 | 366,013 | ||||||
| Rubis SCA |
13,617 | 743,392 | ||||||
| Societe BIC S.A. |
11,478 | 1,023,957 | ||||||
| Sopra Steria Group |
1,882 | 218,717 | ||||||
| SPIE S.A. |
28,762 | 508,976 | ||||||
| Tarkett S.A.(b) |
10,607 | 227,959 | ||||||
| Television Francaise 1 |
64,907 | 598,351 | ||||||
| Trigano S.A. |
995 | 77,648 | ||||||
| Vicat S.A. |
5,989 | 288,357 | ||||||
| Vilmorin & Cie S.A. |
3,983 | 211,093 | ||||||
|
|
|
|||||||
| Total France | 18,238,381 | |||||||
| Germany – 15.2% | ||||||||
| Aareal Bank AG |
22,562 | 696,171 | ||||||
| alstria office REIT-AG |
42,396 | 690,263 | ||||||
| AURELIUS Equity Opportunities SE & Co. KGaA |
15,776 | 718,837 | ||||||
| Aurubis AG |
5,532 | 296,728 | ||||||
| BayWa AG |
7,344 | 209,041 | ||||||
See Notes to Financial Statements.
| 14 | WisdomTree Trust |
Schedule of Investments (continued)
WisdomTree Europe Hedged SmallCap Equity Fund (EUSC)
March 31, 2019
| Investments | Shares | Value | ||||||
| Bechtle AG |
2,470 | $ | 228,947 | |||||
| bet-at-home.com AG |
4,502 | 293,194 | ||||||
| Bilfinger SE |
8,753 | 304,678 | ||||||
| Carl Zeiss Meditec AG Bearer Shares |
5,198 | 434,533 | ||||||
| Comdirect Bank AG |
12,078 | 136,974 | ||||||
| CompuGroup Medical SE |
2,259 | 133,167 | ||||||
| CropEnergies AG |
29,389 | 171,597 | ||||||
| CTS Eventim AG & Co. KGaA |
9,849 | 467,130 | ||||||
| Deutz AG |
16,907 | 141,621 | ||||||
| DMG MORI AG |
5,779 | 279,998 | ||||||
| Duerr AG |
9,430 | 370,173 | ||||||
| Elmos Semiconductor AG |
3,844 | 84,080 | ||||||
| Encavis AG |
21,793 | 154,407 | ||||||
| Freenet AG |
50,841 | 1,093,498 | ||||||
| Gerresheimer AG |
2,826 | 212,603 | ||||||
| Hamburger Hafen und Logistik AG |
13,442 | 307,602 | ||||||
| Hugo Boss AG |
13,484 | 921,754 | ||||||
| Indus Holding AG |
4,425 | 213,402 | ||||||
| Jenoptik AG |
4,486 | 167,232 | ||||||
| K+S AG Registered Shares |
16,370 | 300,346 | ||||||
| Kloeckner & Co. SE |
19,545 | 143,857 | ||||||
| Krones AG |
2,982 | 263,012 | ||||||
| LEG Immobilien AG |
11,153 | 1,370,658 | ||||||
| METRO AG |
128,791 | 2,138,826 | ||||||
| MLP SE |
27,640 | 138,108 | ||||||
| Nemetschek SE |
1,595 | 272,224 | ||||||
| NORMA Group SE |
3,130 | 152,038 | ||||||
| Pfeiffer Vacuum Technology AG |
1,368 | 209,518 | ||||||
| Rheinmetall AG |
4,269 | 445,215 | ||||||
| RHOEN-KLINIKUM AG |
3,696 | 106,573 | ||||||
| Salzgitter AG |
3,656 | 105,831 | ||||||
| Scout24 AG(a) |
5,787 | 299,945 | ||||||
| Siltronic AG |
3,053 | 269,583 | ||||||
| Sixt Leasing SE |
4,510 | 53,274 | ||||||
| Sixt SE |
3,810 | 398,073 | ||||||
| Software AG |
6,753 | 228,616 | ||||||
| Stroeer SE & Co. KGaA |
7,175 | 420,547 | ||||||
| Suedzucker AG |
35,397 | 451,907 | ||||||
| Takkt AG |
11,352 | 186,865 | ||||||
| TLG Immobilien AG |
19,217 | 579,148 | ||||||
| VERBIO Vereinigte BioEnergie AG |
15,239 | 118,495 | ||||||
| Vossloh AG |
3,171 | 145,093 | ||||||
| Wacker Neuson SE |
10,785 | 256,731 | ||||||
| Washtec AG |
2,733 | 208,675 | ||||||
| Wuestenrot & Wuerttembergische AG |
15,078 | 289,847 | ||||||
|
|
|
|||||||
| Total Germany | 18,280,635 | |||||||
| Ireland – 1.0% | ||||||||
| C&C Group PLC |
94,722 | 340,347 | ||||||
| Glanbia PLC |
25,219 | 493,851 | ||||||
| Hibernia REIT PLC |
99,720 | 149,593 | ||||||
| Irish Continental Group PLC |
22,123 | 120,726 | ||||||
| Total Produce PLC(b) |
54,819 | 104,641 | ||||||
|
|
|
|||||||
| Total Ireland | 1,209,158 | |||||||
| Investments | Shares | Value | ||||||
| Italy – 25.5% | ||||||||
| A2A SpA |
688,408 | 1,257,250 | ||||||
| ACEA SpA |
49,531 | 838,131 | ||||||
| Amplifon SpA |
7,639 | 148,819 | ||||||
| Anima Holding SpA(a) |
61,242 | 250,582 | ||||||
| Aquafil SpA |
8,315 | 93,365 | ||||||
| Ascopiave SpA |
115,927 | 457,543 | ||||||
| ASTM SpA |
14,646 | 398,797 | ||||||
| Autogrill SpA |
22,363 | 215,321 | ||||||
| Avio SpA |
7,461 | 105,222 | ||||||
| Azimut Holding SpA(b) |
60,909 | 1,036,134 | ||||||
| Banca Farmafactoring SpA(a) |
101,867 | 620,519 | ||||||
| Banca Generali SpA |
36,888 | 918,689 | ||||||
| Banca IFIS SpA |
8,281 | 136,778 | ||||||
| Banca Mediolanum SpA |
286,369 | 2,030,584 | ||||||
| Banca Popolare di Sondrio SCPA |
45,453 | 124,428 | ||||||
| Banca Sistema SpA(a) |
45,802 | 77,143 | ||||||
| Biesse SpA |
4,228 | 92,005 | ||||||
| BPER Banca |
74,578 | 304,897 | ||||||
| Brembo SpA |
32,570 | 369,735 | ||||||
| Brunello Cucinelli SpA |
3,727 | 128,266 | ||||||
| Buzzi Unicem SpA RSP |
17,836 | 232,315 | ||||||
| Cairo Communication SpA |
41,442 | 175,430 | ||||||
| Cerved Group SpA |
30,416 | 302,592 | ||||||
| Credito Emiliano SpA |
43,313 | 243,656 | ||||||
| Datalogic SpA |
5,974 | 139,524 | ||||||
| De’ Longhi SpA |
34,792 | 939,933 | ||||||
| DiaSorin SpA |
4,245 | 427,555 | ||||||
| doBank SpA(a) |
19,042 | 255,507 | ||||||
| Enav SpA(a) |
130,780 | 713,379 | ||||||
| ERG SpA |
33,224 | 629,345 | ||||||
| Falck Renewables SpA |
46,353 | 168,374 | ||||||
| Fincantieri SpA |
72,964 | 89,793 | ||||||
| FinecoBank Banca Fineco SpA |
115,478 | 1,520,316 | ||||||
| Gamenet Group SpA(a) |
17,618 | 178,437 | ||||||
| Geox SpA(b) |
45,068 | 83,599 | ||||||
| Gima TT SpA(a) |
14,446 | 115,556 | ||||||
| Gruppo MutuiOnline SpA |
7,124 | 147,665 | ||||||
| Hera SpA |
277,379 | 1,004,131 | ||||||
| IMA Industria Macchine Automatiche SpA |
4,577 | 342,019 | ||||||
| Immobiliare Grande Distribuzione SIIQ SpA |
47,801 | 345,656 | ||||||
| Infrastrutture Wireless Italiane SpA(a) |
106,656 | 954,477 | ||||||
| Interpump Group SpA |
5,501 | 179,621 | ||||||
| Iren SpA |
178,564 | 455,938 | ||||||
| Italgas SpA |
195,830 | 1,210,262 | ||||||
| Maire Tecnimont SpA |
61,630 | 235,007 | ||||||
| MARR SpA |
12,111 | 275,784 | ||||||
| Massimo Zanetti Beverage Group SpA(a) |
12,536 | 84,175 | ||||||
| OVS SpA*(a)(b) |
69,464 | 127,526 | ||||||
| Piaggio & C. SpA |
53,433 | 130,434 | ||||||
| Prysmian SpA |
24,738 | 468,460 | ||||||
| RAI Way SpA(a) |
48,329 | 250,167 | ||||||
| Reply SpA |
1,835 | 118,269 | ||||||
| Salvatore Ferragamo SpA |
13,749 | 295,176 | ||||||
See Notes to Financial Statements.
| WisdomTree Trust | 15 |
Schedule of Investments (continued)
WisdomTree Europe Hedged SmallCap Equity Fund (EUSC)
March 31, 2019
| Investments | Shares | Value | ||||||
| Saras SpA |
317,581 | $ | 588,740 | |||||
| Societa Cattolica di Assicurazioni SC |
41,924 | 400,838 | ||||||
| Societa Iniziative Autostradali e Servizi SpA |
36,149 | 626,708 | ||||||
| Technogym SpA(a) |
10,617 | 130,777 | ||||||
| Telecom Italia SpA RSP |
1,709,925 | 972,282 | ||||||
| Tod’s SpA(b) |
4,468 | 207,198 | ||||||
| Unieuro SpA*(a) |
10,405 | 154,102 | ||||||
| Unione di Banche Italiane SpA(b) |
225,016 | 595,770 | ||||||
| Unipol Gruppo SpA |
235,411 | 1,173,631 | ||||||
| UnipolSai Assicurazioni SpA(b) |
1,246,567 | 3,364,897 | ||||||
| Zignago Vetro SpA |
14,631 | 163,791 | ||||||
|
|
|
|||||||
| Total Italy | 30,823,020 | |||||||
| Netherlands – 7.9% | ||||||||
| Aalberts Industries N.V. |
12,113 | 419,321 | ||||||
| Accell Group N.V. |
6,937 | 192,783 | ||||||
| Arcadis N.V. |
14,513 | 226,187 | ||||||
| ASM International N.V. |
6,242 | 338,526 | ||||||
| ASR Nederland N.V. |
38,258 | 1,593,742 | ||||||
| BE Semiconductor Industries N.V. |
36,648 | 976,083 | ||||||
| Boskalis Westminster(b) |
29,753 | 770,058 | ||||||
| Corbion N.V. |
9,688 | 291,535 | ||||||
| Euronext N.V.(a) |
11,574 | 734,266 | ||||||
| ForFarmers N.V. |
18,376 | 151,244 | ||||||
| IMCD N.V. |
4,575 | 348,548 | ||||||
| Intertrust N.V.(a) |
20,347 | 383,823 | ||||||
| Koninklijke Volkerwessels N.V. |
22,320 | 460,640 | ||||||
| PostNL N.V. |
210,425 | 538,472 | ||||||
| SBM Offshore N.V. |
20,242 | 385,366 | ||||||
| Signify N.V.(a) |
41,038 | 1,098,996 | ||||||
| Sligro Food Group N.V. |
9,584 | 343,827 | ||||||
| TKH Group N.V. CVA |
5,484 | 258,870 | ||||||
| Wessanen |
5,259 | 64,129 | ||||||
|
|
|
|||||||
| Total Netherlands | 9,576,416 | |||||||
| Portugal – 3.5% | ||||||||
| Altri, SGPS, S.A. |
57,359 | 449,551 | ||||||
| Corticeira Amorim, SGPS, S.A. |
15,566 | 185,969 | ||||||
| CTT-Correios de Portugal S.A. |
95,223 | 275,857 | ||||||
| Mota-Engil, SGPS, S.A.*(b) |
61,474 | 140,813 | ||||||
| Navigator Co. S.A. (The) |
127,448 | 583,868 | ||||||
| NOS, SGPS, S.A. |
183,256 | 1,172,883 | ||||||
| REN - Redes Energeticas Nacionais, SGPS, S.A. |
202,966 | 579,323 | ||||||
| Semapa-Sociedade de Investimento e Gestao |
14,129 | 230,356 | ||||||
| Sonae Capital, SGPS, S.A. |
135,067 | 132,702 | ||||||
| Sonae, SGPS, S.A. |
463,456 | 479,801 | ||||||
|
|
|
|||||||
| Total Portugal | 4,231,123 | |||||||
| Spain – 10.0% | ||||||||
| Acciona S.A.(b) |
13,438 | 1,498,324 | ||||||
| Acerinox S.A. |
49,737 | 493,354 | ||||||
| Almirall S.A. |
13,696 | 233,754 | ||||||
| Applus Services S.A. |
14,183 | 169,446 | ||||||
| Atresmedia Corp. de Medios de Comunicacion S.A.(b) |
59,438 | 278,840 | ||||||
| Bolsas y Mercados Espanoles SHMSF S.A. |
32,440 | 907,717 | ||||||
| Investments | Shares | Value | ||||||
| Cellnex Telecom S.A.*(a) |
7,512 | 220,656 | ||||||
| Cia de Distribucion Integral Logista Holdings S.A. |
37,052 | 873,681 | ||||||
| Cie Automotive S.A. |
15,551 | 418,725 | ||||||
| Construcciones y Auxiliar de Ferrocarriles S.A. |
3,783 | 182,016 | ||||||
| Ebro Foods S.A. |
28,459 | 609,066 | ||||||
| Ence Energia y Celulosa S.A. |
33,736 | 187,887 | ||||||
| Euskaltel S.A.(a) |
43,458 | 405,258 | ||||||
| Faes Farma S.A. |
74,166 | 313,955 | ||||||
| Fluidra S.A.* |
6,725 | 77,324 | ||||||
| Grupo Catalana Occidente S.A. |
14,155 | 505,427 | ||||||
| Lar Espana Real Estate Socimi S.A. |
34,910 | 291,638 | ||||||
| Mediaset Espana Comunicacion S.A. |
137,031 | 1,024,127 | ||||||
| Melia Hotels International S.A. |
19,758 | 183,583 | ||||||
| Obrascon Huarte Lain S.A.(b) |
203,320 | 256,264 | ||||||
| Prosegur Cash S.A.(a) |
167,077 | 369,202 | ||||||
| Prosegur Cia de Seguridad S.A. |
62,234 | 337,518 | ||||||
| Sacyr S.A. |
84,077 | 212,885 | ||||||
| Talgo S.A.*(a) |
21,546 | 139,351 | ||||||
| Tecnicas Reunidas S.A. |
15,465 | 435,337 | ||||||
| Unicaja Banco S.A.(a) |
169,512 | 182,342 | ||||||
| Viscofan S.A. |
8,416 | 526,832 | ||||||
| Zardoya Otis S.A. |
86,595 | 717,581 | ||||||
|
|
|
|||||||
| Total Spain | 12,052,090 | |||||||
| TOTAL COMMON STOCKS (Cost: $123,422,689) |
118,832,287 | |||||||
| INVESTMENT OF CASH COLLATERAL FOR SECURITIES LOANED – 7.1% |
| |||||||
| United States – 7.1% | ||||||||
| State Street Navigator Securities Lending Government Money Market Portfolio, 2.46%(c) |
||||||||
| (Cost: $8,591,779)(d) |
8,591,779 | 8,591,779 | ||||||
| TOTAL INVESTMENTS IN SECURITIES – 105.6% (Cost: $132,014,468) |
127,424,066 | |||||||
| Other Assets less Liabilities – (5.6)% |
(6,753,480 | ) | ||||||
|
|
|
|||||||
| NET ASSETS – 100.0% | $ | 120,670,586 | ||||||
| * | Non-income producing security. |
| (a) | This security is exempt from registration under rule 144A of the Securities Act of 1933. This security may be sold in transactions that are exempt from registration, normally to qualified institutional buyers. |
| (b) | Security, or portion thereof, was on loan at March 31, 2019 (See Note 2). |
| (c) | Rate shown represents annualized 7-day yield as of March 31, 2019. |
| (d) | At March 31, 2019, the total market value of the Fund’s securities on loan identified in the Schedule of Investments was $15,888,744 and the total market value of the collateral held by the Fund was $16,674,966. The total market value of the collateral includes non-cash U.S. Government securities collateral having a value of $8,083,187. |
CVA – Certificaten Van Aandelen (Certificate of Stock)
RSP – Risparmio Italian Savings Shares
See Notes to Financial Statements.
| 16 | WisdomTree Trust |
Schedule of Investments (concluded)
WisdomTree Europe Hedged SmallCap Equity Fund (EUSC)
March 31, 2019
| FINANCIAL DERIVATIVE INSTRUMENTS | ||||||||||||||||||||||||||||
| FOREIGN CURRENCY CONTRACTS (OTC – OVER THE COUNTER) | ||||||||||||||||||||||||||||
| Counterparty | Settlement Date |
Amount and Description of Purchased |
Amount and Description of be Sold |
Unrealized Appreciation |
Unrealized Depreciation |
|||||||||||||||||||||||
| Bank of America N.A. |
4/3/2019 | 22,108,918 | EUR | 24,826,480 | USD | $ | 631 | $ | — | |||||||||||||||||||
| Bank of America N.A. |
4/3/2019 | 27,309,128 | USD | 23,923,561 | EUR | 444,271 | — | |||||||||||||||||||||
| Bank of America N.A. |
5/6/2019 | 25,124,927 | USD | 22,313,097 | EUR | — | (1,077 | ) | ||||||||||||||||||||
| Barclays Bank PLC |
4/3/2019 | 22,108,938 | EUR | 24,826,480 | USD | 653 | — | |||||||||||||||||||||
| Barclays Bank PLC |
4/3/2019 | 27,309,128 | USD | 23,923,289 | EUR | 444,577 | — | |||||||||||||||||||||
| Barclays Bank PLC |
5/6/2019 | 25,124,927 | USD | 22,312,959 | EUR | — | (920 | ) | ||||||||||||||||||||
| Citibank N.A. |
4/3/2019 | 2,588,991 | EUR | 2,955,533 | USD | — | (48,237 | ) | ||||||||||||||||||||
| Citibank N.A. |
4/3/2019 | 22,108,603 | EUR | 24,826,480 | USD | 277 | — | |||||||||||||||||||||
| Citibank N.A. |
4/3/2019 | 27,309,128 | USD | 23,923,100 | EUR | 444,789 | — | |||||||||||||||||||||
| Citibank N.A. |
5/6/2019 | 25,124,927 | USD | 22,313,375 | EUR | — | (1,389 | ) | ||||||||||||||||||||
| Credit Suisse International |
4/3/2019 | 22,108,426 | EUR | 24,826,480 | USD | 79 | — | |||||||||||||||||||||
| Credit Suisse International |
5/6/2019 | 25,124,927 | USD | 22,313,296 | EUR | — | (1,300 | ) | ||||||||||||||||||||
| Goldman Sachs |
4/3/2019 | 27,309,128 | USD | 23,923,100 | EUR | 444,789 | — | |||||||||||||||||||||
| UBS AG |
4/2/2019 | 61,000 | USD | 54,370 | EUR | — | (49 | ) | ||||||||||||||||||||
| UBS AG |
4/3/2019 | 2,618,394 | EUR | 2,955,533 | USD | — | (15,219 | ) | ||||||||||||||||||||
| UBS AG |
4/3/2019 | 16,844,728 | EUR | 18,915,417 | USD | 296 | — | |||||||||||||||||||||
| UBS AG |
4/3/2019 | 14,895,891 | USD | 13,049,058 | EUR | 242,510 | — | |||||||||||||||||||||
| UBS AG |
5/6/2019 | 19,142,804 | USD | 17,000,291 | EUR | — | (633 | ) | ||||||||||||||||||||
| $ | 2,022,872 | $ | (68,824 | ) | ||||||||||||||||||||||||
| CURRENCY LEGEND | ||
| EUR | Euro | |
| USD | U.S. dollar | |
See Notes to Financial Statements.
| WisdomTree Trust | 17 |
Schedule of Investments
WisdomTree Germany Hedged Equity Fund (DXGE)
March 31, 2019
| Investments | Shares | Value | ||||||
| COMMON STOCKS – 98.4% | ||||||||
| Germany – 98.4% | ||||||||
| Aerospace & Defense – 0.8% | ||||||||
| MTU Aero Engines AG |
1,875 | $ | 424,858 | |||||
| Air Freight & Logistics – 3.8% | ||||||||
| Deutsche Post AG Registered Shares |
60,251 | 1,961,932 | ||||||
| Airlines – 1.0% | ||||||||
| Deutsche Lufthansa AG Registered Shares |
24,170 | 530,980 | ||||||
| Auto Components – 1.9% | ||||||||
| Continental AG |
5,298 | 798,337 | ||||||
| Hella GmbH & Co. KGaA |
4,065 | 178,924 | ||||||
|
|
|
|||||||
| Total Auto Components | 977,261 | |||||||
| Automobiles – 14.1% | ||||||||
| Bayerische Motoren Werke AG |
34,972 | 2,699,696 | ||||||
| Daimler AG Registered Shares |
51,159 | 3,001,442 | ||||||
| Volkswagen AG |
9,602 | 1,564,411 | ||||||
|
|
|
|||||||
| Total Automobiles | 7,265,549 | |||||||
| Capital Markets – 2.6% | ||||||||
| AURELIUS Equity Opportunities SE & Co. KGaA |
5,448 | 248,239 | ||||||
| Deutsche Bank AG Registered Shares |
40,718 | 331,929 | ||||||
| Deutsche Boerse AG |
5,981 | 767,612 | ||||||
|
|
|
|||||||
| Total Capital Markets | 1,347,780 | |||||||
| Chemicals – 9.0% | ||||||||
| BASF SE |
34,905 | 2,568,322 | ||||||
| Covestro AG(a) |
8,263 | 454,813 | ||||||
| Evonik Industries AG |
25,161 | 685,959 | ||||||
| Fuchs Petrolub SE |
3,671 | 144,682 | ||||||
| K+S AG Registered Shares |
8,348 | 153,164 | ||||||
| LANXESS AG |
2,924 | 156,084 | ||||||
| Symrise AG |
3,235 | 291,756 | ||||||
| Wacker Chemie AG |
2,331 | 201,013 | ||||||
|
|
|
|||||||
| Total Chemicals | 4,655,793 | |||||||
| Commercial Services & Supplies – 0.1% | ||||||||
| Bilfinger SE |
1,576 | 54,858 | ||||||
| Construction & Engineering – 0.7% | ||||||||
| Hochtief AG |
2,344 | 339,523 | ||||||
| Construction Materials – 1.1% | ||||||||
| HeidelbergCement AG |
7,468 | 538,010 | ||||||
| Diversified Telecommunication Services – 7.2% | ||||||||
| Deutsche Telekom AG Registered Shares |
223,498 | 3,712,875 | ||||||
| Electrical Equipment – 0.3% | ||||||||
| OSRAM Licht AG |
4,902 | 168,869 | ||||||
| Electronic Equipment, Instruments & Components – 0.0% |
|
|||||||
| Jenoptik AG |
377 | 14,054 | ||||||
| Entertainment – 0.4% | ||||||||
| CTS Eventim AG & Co. KGaA |
4,278 | 202,902 | ||||||
| Food & Staples Retailing – 1.2% | ||||||||
| METRO AG |
37,110 | 616,284 | ||||||
| Investments | Shares | Value | ||||||
| Food Products – 0.4% | ||||||||
| Suedzucker AG |
14,880 | 189,970 | ||||||
| Health Care Equipment & Supplies – 0.1% | ||||||||
| Carl Zeiss Meditec AG Bearer Shares |
879 | 73,481 | ||||||
| Health Care Providers & Services – 1.9% | ||||||||
| Fresenius Medical Care AG & Co. KGaA |
5,832 | 470,835 | ||||||
| Fresenius SE & Co. KGaA |
8,707 | 486,486 | ||||||
|
|
|
|||||||
| Total Health Care Providers & Services | 957,321 | |||||||
| Health Care Technology – 0.1% | ||||||||
| CompuGroup Medical SE |
570 | 33,601 | ||||||
| Hotels, Restaurants & Leisure – 0.5% | ||||||||
| TUI AG |
27,566 | 264,644 | ||||||
| Household Products – 1.3% | ||||||||
| Henkel AG & Co. KGaA |
6,868 | 653,569 | ||||||
| Independent Power & Renewable Electricity Producers – 1.1% | ||||||||
| Uniper SE |
19,301 | 582,764 | ||||||
| Industrial Conglomerates – 6.0% | ||||||||
| Indus Holding AG |
766 | 36,942 | ||||||
| Rheinmetall AG |
2,553 | 266,253 | ||||||
| Siemens AG Registered Shares |
25,848 | 2,784,507 | ||||||
|
|
|
|||||||
| Total Industrial Conglomerates | 3,087,702 | |||||||
| Insurance – 15.3% | ||||||||
| Allianz SE Registered Shares |
17,407 | 3,875,471 | ||||||
| Hannover Rueck SE |
7,664 | 1,101,507 | ||||||
| Muenchener Rueckversicherungs – Gesellschaft AG Registered Shares |
9,528 | 2,257,386 | ||||||
| Talanx AG |
16,743 | 645,964 | ||||||
|
|
|
|||||||
| Total Insurance | 7,880,328 | |||||||
| Internet & Direct Marketing Retail – 0.1% | ||||||||
| Takkt AG |
2,573 | 42,354 | ||||||
| IT Services – 0.2% | ||||||||
| Bechtle AG |
617 | 57,191 | ||||||
| Wirecard AG |
332 | 41,640 | ||||||
|
|
|
|||||||
| Total IT Services | 98,831 | |||||||
| Life Sciences Tools & Services – 0.1% | ||||||||
| Gerresheimer AG |
648 | 48,750 | ||||||
| Machinery – 3.0% | ||||||||
| DMG MORI AG |
3,750 | 181,691 | ||||||
| Duerr AG |
4,288 | 168,325 | ||||||
| GEA Group AG |
9,525 | 249,732 | ||||||
| KION Group AG |
3,760 | 196,699 | ||||||
| Krones AG |
884 | 77,969 | ||||||
| MAN SE |
6,932 | 569,759 | ||||||
| NORMA Group SE |
470 | 22,830 | ||||||
| Pfeiffer Vacuum Technology AG |
102 | 15,622 | ||||||
| Wacker Neuson SE |
1,595 | 37,968 | ||||||
| Washtec AG |
584 | 44,590 | ||||||
|
|
|
|||||||
| Total Machinery | 1,565,185 | |||||||
See Notes to Financial Statements.
| 18 | WisdomTree Trust |
Schedule of Investments (continued)
WisdomTree Germany Hedged Equity Fund (DXGE)
March 31, 2019
| Investments | Shares | Value | ||||||
| Media – 1.3% | ||||||||
| Axel Springer SE |
5,918 | $ | 305,937 | |||||
| ProSiebenSat.1 Media SE |
26,798 | 382,746 | ||||||
|
|
|
|||||||
| Total Media | 688,683 | |||||||
| Metals & Mining – 0.6% | ||||||||
| Aurubis AG |
3,001 | 160,970 | ||||||
| Salzgitter AG |
545 | 15,776 | ||||||
| ThyssenKrupp AG |
9,253 | 127,222 | ||||||
|
|
|
|||||||
| Total Metals & Mining | 303,968 | |||||||
| Multi-Utilities – 6.3% | ||||||||
| E.ON SE |
96,744 | 1,076,731 | ||||||
| Innogy SE |
35,742 | 1,531,070 | ||||||
| RWE AG |
23,102 | 619,968 | ||||||
|
|
|
|||||||
| Total Multi-Utilities | 3,227,769 | |||||||
| Personal Products – 0.6% | ||||||||
| Beiersdorf AG |
3,163 | 329,373 | ||||||
| Pharmaceuticals – 4.6% | ||||||||
| Bayer AG Registered Shares |
29,846 | 1,930,325 | ||||||
| Merck KGaA |
3,605 | 411,466 | ||||||
|
|
|
|||||||
| Total Pharmaceuticals | 2,341,791 | |||||||
| Road & Rail – 0.1% | ||||||||
| Sixt SE |
685 | 71,570 | ||||||
| Semiconductors & Semiconductor Equipment – 0.9% |
|
|||||||
| Infineon Technologies AG |
17,601 | 349,514 | ||||||
| Siltronic AG |
1,357 | 119,824 | ||||||
|
|
|
|||||||
| Total Semiconductors & Semiconductor Equipment | 469,338 | |||||||
| Software – 5.0% | ||||||||
| Nemetschek SE |
370 | 63,149 | ||||||
| RIB Software SE |
259 | 4,275 | ||||||
| SAP SE |
21,236 | 2,456,019 | ||||||
| Software AG |
1,259 | 42,622 | ||||||
|
|
|
|||||||
| Total Software | 2,566,065 | |||||||
| Investments | Shares | Value | ||||||
| Specialty Retail – 0.6% | ||||||||
| Fielmann AG |
4,203 | 290,239 | ||||||
| Textiles, Apparel & Luxury Goods – 2.3% | ||||||||
| adidas AG |
3,821 | 929,302 | ||||||
| Hugo Boss AG |
4,051 | 276,923 | ||||||
|
|
|
|||||||
| Total Textiles, Apparel & Luxury Goods | 1,206,225 | |||||||
| Thrifts & Mortgage Finance – 0.5% | ||||||||
| Aareal Bank AG |
7,698 | 237,529 | ||||||
| Trading Companies & Distributors – 0.7% | ||||||||
| BayWa AG |
1,082 | 30,798 | ||||||
| Brenntag AG |
6,222 | 320,674 | ||||||
| Kloeckner & Co. SE |
2,183 | 16,068 | ||||||
|
|
|
|||||||
| Total Trading Companies & Distributors | 367,540 | |||||||
| Transportation Infrastructure – 0.6% | ||||||||
| Fraport AG Frankfurt Airport Services Worldwide |
3,178 | 243,509 | ||||||
| Hamburger Hafen und Logistik AG |
2,883 | 65,973 | ||||||
|
|
|
|||||||
| Total Transportation Infrastructure | 309,482 | |||||||
| TOTAL INVESTMENTS IN SECURITIES – 98.4% (Cost: $58,265,329) |
50,699,600 | |||||||
| Other Assets less Liabilities – 1.6% |
841,077 | |||||||
|
|
|
|||||||
| NET ASSETS – 100.0% | $ | 51,540,677 | ||||||
| (a) | This security is exempt from registration under rule 144A of the Securities Act of 1933. This security may be sold in transactions that are exempt from registration, normally to qualified institutional buyers. |
| FINANCIAL DERIVATIVE INSTRUMENTS | ||||||||||||||||||||||||||||
| FOREIGN CURRENCY CONTRACTS (OTC – OVER THE COUNTER) | ||||||||||||||||||||||||||||
| Counterparty | Settlement Date |
Amount and Description of be Purchased |
Amount and Description of be Sold |
Unrealized Appreciation |
Unrealized Depreciation |
|||||||||||||||||||||||
| Bank of America N.A. |
4/3/2019 | 9,688,870 | EUR | 10,879,797 | USD | $ | 277 | $ | — | |||||||||||||||||||
| Bank of America N.A. |
4/3/2019 | 11,714,491 | USD | 10,262,222 | EUR | 190,574 | — | |||||||||||||||||||||
| Bank of America N.A. |
5/6/2019 | 10,733,580 | USD | 9,532,343 | EUR | — | (460 | ) | ||||||||||||||||||||
| Barclays Bank PLC |
4/3/2019 | 9,688,879 | EUR | 10,879,797 | USD | 286 | — | |||||||||||||||||||||
| Barclays Bank PLC |
4/3/2019 | 11,714,491 | USD | 10,262,105 | EUR | 190,705 | — | |||||||||||||||||||||
| Barclays Bank PLC |
5/6/2019 | 10,733,580 | USD | 9,532,284 | EUR | — | (393 | ) | ||||||||||||||||||||
| Canadian Imperial Bank of Commerce |
4/3/2019 | 11,714,491 | USD | 10,262,906 | EUR | 189,807 | — | |||||||||||||||||||||
| Citibank N.A. |
4/3/2019 | 9,688,732 | EUR | 10,879,797 | USD | 122 | — | |||||||||||||||||||||
| Citibank N.A. |
4/3/2019 | 11,714,491 | USD | 10,262,025 | EUR | 190,796 | — | |||||||||||||||||||||
| Citibank N.A. |
5/6/2019 | 10,733,580 | USD | 9,532,461 | EUR | — | (593 | ) | ||||||||||||||||||||
| Credit Suisse International |
4/3/2019 | 9,688,654 | EUR | 10,879,797 | USD | 34 | — | |||||||||||||||||||||
| Credit Suisse International |
5/6/2019 | 10,733,580 | USD | 9,532,427 | EUR | — | (555 | ) | ||||||||||||||||||||
| Goldman Sachs |
4/3/2019 | 6,389,724 | USD | 5,597,469 | EUR | 104,071 | — | |||||||||||||||||||||
See Notes to Financial Statements.
| WisdomTree Trust | 19 |
Schedule of Investments (concluded)
WisdomTree Germany Hedged Equity Fund (DXGE)
March 31, 2019
| FINANCIAL DERIVATIVE INSTRUMENTS | ||||||||||||||||||||||||||||
| FOREIGN CURRENCY CONTRACTS (OTC – OVER THE COUNTER) | ||||||||||||||||||||||||||||
| Counterparty | Settlement Date |
Amount and Description of be Purchased |
Amount and Description of be Sold |
Unrealized Appreciation |
Unrealized Depreciation |
|||||||||||||||||||||||
| JP Morgan Chase Bank N.A. |
4/3/2019 | 1,268,793 | EUR | 1,439,127 | USD | $ | — | $ | (14,342 | ) | ||||||||||||||||||
| Royal Bank of Canada |
4/2/2019 | 22,000 | USD | 19,612 | EUR | — | (22 | ) | ||||||||||||||||||||
| UBS AG |
4/3/2019 | 7,381,927 | EUR | 8,289,373 | USD | 129 | — | |||||||||||||||||||||
| UBS AG |
5/6/2019 | 8,177,969 | USD | 7,262,669 | EUR | — | (271 | ) | ||||||||||||||||||||
| $ | 866,801 | $ | (16,636 | ) | ||||||||||||||||||||||||
| CURRENCY LEGEND | ||
| EUR | Euro | |
| USD | U.S. dollar | |
See Notes to Financial Statements.
| 20 | WisdomTree Trust |
Schedule of Investments
WisdomTree International Hedged Quality Dividend Growth Fund (IHDG)
March 31, 2019
| Investments | Shares | Value | ||||||
| COMMON STOCKS – 98.7% | ||||||||
| Australia – 6.5% | ||||||||
| Altium Ltd. |
17,527 | $ | 402,394 | |||||
| ARB Corp., Ltd.(a) |
12,433 | 151,907 | ||||||
| Aristocrat Leisure Ltd. |
67,471 | 1,174,716 | ||||||
| Blackmores Ltd.(a) |
3,920 | 259,327 | ||||||
| Caltex Australia Ltd. |
123,298 | 2,295,595 | ||||||
| carsales.com Ltd. |
88,563 | 795,821 | ||||||
| Cochlear Ltd. |
10,024 | 1,233,848 | ||||||
| Computershare Ltd. |
138,749 | 1,683,411 | ||||||
| Corporate Travel Management Ltd. |
10,914 | 197,385 | ||||||
| Costa Group Holdings Ltd. |
12,876 | 47,013 | ||||||
| Crown Resorts Ltd. |
242,796 | 1,985,131 | ||||||
| CSL Ltd. |
58,443 | 8,092,930 | ||||||
| Domino’s Pizza Enterprises Ltd.(a) |
13,177 | 406,423 | ||||||
| Flight Centre Travel Group Ltd. |
15,115 | 451,488 | ||||||
| Inghams Group Ltd.(a) |
235,563 | 731,242 | ||||||
| Magellan Financial Group Ltd. |
81,536 | 2,109,992 | ||||||
| McMillan Shakespeare Ltd. |
36,926 | 314,765 | ||||||
| Mineral Resources Ltd. |
79,610 | 893,505 | ||||||
| Northern Star Resources Ltd. |
116,073 | 737,949 | ||||||
| Pendal Group Ltd. |
178,976 | 1,176,004 | ||||||
| Platinum Asset Management Ltd.(a) |
329,935 | 1,075,755 | ||||||
| Reece Ltd. |
80,516 | 563,938 | ||||||
| Sandfire Resources NL |
46,650 | 228,982 | ||||||
| Seek Ltd. |
72,971 | 909,185 | ||||||
| Technology One Ltd. |
78,934 | 448,566 | ||||||
| Webjet Ltd. |
18,216 | 188,273 | ||||||
|
|
|
|||||||
| Total Australia | 28,555,545 | |||||||
| Austria – 0.4% | ||||||||
| Lenzing AG |
16,893 | 1,811,473 | ||||||
| Belgium – 0.6% | ||||||||
| Kinepolis Group N.V. |
4,429 | 250,644 | ||||||
| Melexis N.V.(a) |
9,422 | 570,764 | ||||||
| Warehouses De Pauw CVA |
11,016 | 1,768,812 | ||||||
|
|
|
|||||||
| Total Belgium | 2,590,220 | |||||||
| China – 3.7% | ||||||||
| Beijing Tong Ren Tang Chinese Medicine Co., Ltd. |
138,000 | 252,796 | ||||||
| China Everbright International Ltd. |
831,481 | 845,256 | ||||||
| China Overseas Land & Investment Ltd. |
3,614,000 | 13,719,476 | ||||||
| China South City Holdings Ltd. |
3,488,000 | 559,861 | ||||||
| CSPC Pharmaceutical Group Ltd. |
470,000 | 874,146 | ||||||
|
|
|
|||||||
| Total China | 16,251,535 | |||||||
| Denmark – 10.3% | ||||||||
| Chr Hansen Holding A/S |
15,534 | 1,576,145 | ||||||
| Coloplast A/S Class B |
57,971 | 6,366,770 | ||||||
| DFDS A/S |
12,168 | 504,022 | ||||||
| DSV A/S |
7,851 | 649,935 | ||||||
| GN Store Nord A/S |
8,424 | 391,510 | ||||||
| Novo Nordisk A/S Class B |
622,219 | 32,605,281 | ||||||
| Pandora A/S |
28,785 | 1,349,057 | ||||||
| Rockwool International A/S Class B |
577 | 135,297 | ||||||
| Royal Unibrew A/S |
12,545 | 926,443 | ||||||
| SimCorp A/S |
6,426 | 620,984 | ||||||
|
|
|
|||||||
| Total Denmark |
|
45,125,444 | ||||||
| Finland – 2.0% |
| |||||||
| DNA Oyj |
50,262 | 1,042,950 | ||||||
| Neste Oyj(a) |
38,593 | 4,116,744 | ||||||
| Nokian Renkaat Oyj |
49,043 | 1,643,227 | ||||||
| Wartsila Oyj Abp |
128,255 | 2,071,600 | ||||||
|
|
|
|||||||
| Total Finland |
|
8,874,521 | ||||||
| France – 6.9% |
| |||||||
| Airbus SE |
102,522 | 13,572,273 | ||||||
| Alten S.A. |
5,108 | 547,168 | ||||||
| Eurazeo SE |
17,708 | 1,332,190 | ||||||
| Hermes International |
5,980 | 3,949,553 | ||||||
| Ipsen S.A. |
7,846 | 1,076,567 | ||||||
| Safran S.A. |
59,245 | 8,132,466 | ||||||
| SEB S.A. |
5,311 | 894,518 | ||||||
| Trigano S.A. |
15 | 1,171 | ||||||
| Valeo S.A. |
35,229 | 1,022,545 | ||||||
|
|
|
|||||||
| Total France |
|
30,528,451 | ||||||
| Germany – 4.7% |
| |||||||
| 1&1 Drillisch AG |
54,364 | 1,937,492 | ||||||
| adidas AG |
21,030 | 5,114,691 | ||||||
| AURELIUS Equity Opportunities SE & Co. KGaA |
36,564 | 1,666,048 | ||||||
| Bechtle AG |
6,946 | 643,833 | ||||||
| CompuGroup Medical SE |
5,893 | 347,390 | ||||||
| Continental AG |
28,542 | 4,300,893 | ||||||
| CTS Eventim AG & Co. KGaA |
11,287 | 535,333 | ||||||
| Fielmann AG |
15,495 | 1,070,011 | ||||||
| Fuchs Petrolub SE |
19,496 | 768,377 | ||||||
| Hugo Boss AG |
18,896 | 1,291,714 | ||||||
| Nemetschek SE |
3,389 | 578,411 | ||||||
| Pfeiffer Vacuum Technology AG |
1,717 | 262,970 | ||||||
| Siltronic AG |
7,529 | 664,818 | ||||||
| United Internet AG Registered Shares |
32,486 | 1,186,594 | ||||||
| Wirecard AG |
1,010 | 126,677 | ||||||
|
|
|
|||||||
| Total Germany |
|
20,495,252 | ||||||
| Hong Kong – 1.1% |
| |||||||
| Galaxy Entertainment Group Ltd. |
385,000 | 2,621,450 | ||||||
| Techtronic Industries Co., Ltd. |
206,500 | 1,387,636 | ||||||
| Vitasoy International Holdings Ltd. |
168,000 | 813,254 | ||||||
|
|
|
|||||||
| Total Hong Kong |
|
4,822,340 | ||||||
| Ireland – 0.5% |
| |||||||
| Glanbia PLC |
48,060 | 941,135 | ||||||
| Hibernia REIT PLC |
101,122 | 151,696 | ||||||
| Irish Continental Group PLC |
48,705 | 265,785 | ||||||
| Kingspan Group PLC |
16,031 | 742,697 | ||||||
|
|
|
|||||||
| Total Ireland |
|
2,101,313 | ||||||
| Israel – 0.5% | ||||||||
| Bezeq Israeli Telecommunication Corp., Ltd. |
3,098,636 | 2,224,075 | ||||||
See Notes to Financial Statements.
| WisdomTree Trust | 21 |
Schedule of Investments (continued)
WisdomTree International Hedged Quality Dividend Growth Fund (IHDG)
March 31, 2019
| Investments | Shares | Value | ||||||
| Italy – 2.0% | ||||||||
| Biesse SpA |
33 | $ | 718 | |||||
| Brembo SpA |
56,617 | 642,717 | ||||||
| Datalogic SpA |
7,140 | 166,757 | ||||||
| De’ Longhi SpA |
46,195 | 1,247,993 | ||||||
| DiaSorin SpA |
5,956 | 599,886 | ||||||
| Ferrari N.V. |
8,515 | 1,142,547 | ||||||
| Gima TT SpA(b) |
207 | 1,656 | ||||||
| IMA Industria Macchine Automatiche SpA |
8,682 | 648,768 | ||||||
| Interpump Group SpA |
9,962 | 325,284 | ||||||
| Moncler SpA |
13,186 | 531,828 | ||||||
| Recordati SpA |
64,906 | 2,529,654 | ||||||
| Reply SpA |
3,597 | 231,832 | ||||||
| Salvatore Ferragamo SpA |
19,750 | 424,011 | ||||||
| Technogym SpA(b) |
17,486 | 215,387 | ||||||
|
|
|
|||||||
| Total Italy | 8,709,038 | |||||||
| Japan – 16.1% | ||||||||
| Ai Holdings Corp. |
13,000 | 214,817 | ||||||
| Asahi Intecc Co., Ltd. |
8,700 | 408,727 | ||||||
| Astellas Pharma, Inc. |
506,000 | 7,581,886 | ||||||
| Benefit One, Inc.(a) |
20,000 | 392,465 | ||||||
| Calbee, Inc. |
12,500 | 336,766 | ||||||
| Chugai Pharmaceutical Co., Ltd. |
69,200 | 4,757,754 | ||||||
| Create SD Holdings Co., Ltd. |
10,100 | 237,524 | ||||||
| CyberAgent, Inc. |
6,900 | 281,461 | ||||||
| Daikin Industries Ltd. |
29,400 | 3,445,074 | ||||||
| Dip Corp.(a) |
8,900 | 153,741 | ||||||
| Disco Corp.(a) |
9,100 | 1,296,535 | ||||||
| en-japan, Inc. |
150 | 4,364 | ||||||
| Financial Products Group Co., Ltd. |
23,400 | 191,750 | ||||||
| GMO Payment Gateway, Inc.(a) |
3,800 | 269,847 | ||||||
| Harmonic Drive Systems, Inc.(a) |
6,000 | 205,448 | ||||||
| Haseko Corp. |
83,600 | 1,051,373 | ||||||
| Hazama Ando Corp. |
58,700 | 392,977 | ||||||
| Hikari Tsushin, Inc. |
5,800 | 1,098,848 | ||||||
| Hoya Corp. |
53,600 | 3,539,435 | ||||||
| Japan Lifeline Co., Ltd.(a) |
10,600 | 175,063 | ||||||
| Kakaku.com, Inc. |
33,200 | 637,994 | ||||||
| Kaken Pharmaceutical Co., Ltd. |
16,500 | 749,831 | ||||||
| Keyence Corp. |
2,200 | 1,370,863 | ||||||
| Koito Manufacturing Co., Ltd. |
14,300 | 810,056 | ||||||
| Kyudenko Corp. |
6,200 | 194,371 | ||||||
| Lasertec Corp. |
7,500 | 313,389 | ||||||
| M3, Inc. |
23,300 | 390,912 | ||||||
| Meitec Corp. |
12,600 | 572,598 | ||||||
| Mixi, Inc. |
30,900 | 714,118 | ||||||
| Modec, Inc. |
10,900 | 310,205 | ||||||
| MonotaRO Co., Ltd. |
12,700 | 282,375 | ||||||
| Murata Manufacturing Co., Ltd. |
115,920 | 5,772,698 | ||||||
| Nidec Corp. |
16,100 | 2,040,046 | ||||||
| Nihon M&A Center, Inc. |
11,100 | 303,862 | ||||||
| Nissan Chemical Corp. |
24,200 | 1,108,497 | ||||||
| Nitto Denko Corp. |
36,800 | 1,933,342 | ||||||
| Obara Group, Inc. |
7,700 | 254,962 | ||||||
| Open House Co., Ltd. |
9,800 | 336,008 | ||||||
| Oracle Corp. |
20,300 | 1,362,687 | ||||||
| Oriental Land Co., Ltd. |
8,800 | 999,377 | ||||||
| Park24 Co., Ltd. |
34,400 | 746,833 | ||||||
| Pigeon Corp. |
18,400 | 752,225 | ||||||
| Relo Group, Inc. |
15,400 | 432,705 | ||||||
| Ryohin Keikaku Co., Ltd. |
2,100 | 531,996 | ||||||
| Seria Co., Ltd.(a) |
1,400 | 48,254 | ||||||
| Shimano, Inc. |
7,500 | 1,219,677 | ||||||
| Sundrug Co., Ltd. |
23,200 | 639,292 | ||||||
| Sysmex Corp. |
14,500 | 876,406 | ||||||
| Systena Corp. |
13,300 | 144,433 | ||||||
| T-Gaia Corp. |
20,300 | 336,729 | ||||||
| TechnoPro Holdings, Inc. |
7,000 | 417,401 | ||||||
| Toei Animation Co., Ltd. |
6,100 | 300,908 | ||||||
| Tokyo Electron Ltd. |
65,300 | 9,439,400 | ||||||
| Trend Micro, Inc. |
37,800 | 1,840,737 | ||||||
| USS Co., Ltd. |
57,600 | 1,068,893 | ||||||
| V Technology Co., Ltd. |
1,000 | 126,756 | ||||||
| Yahoo Japan Corp. |
1,525,500 | 3,735,018 | ||||||
| Yaskawa Electric Corp.(a) |
32,900 | 1,032,909 | ||||||
| ZOZO, Inc. |
19,400 | 365,618 | ||||||
|
|
|
|||||||
| Total Japan | 70,550,236 | |||||||
| Netherlands – 2.4% | ||||||||
| ASM International N.V. |
13,038 | 707,098 | ||||||
| ASML Holding N.V. |
39,197 | 7,358,865 | ||||||
| BE Semiconductor Industries N.V. |
69,965 | 1,863,448 | ||||||
| Corbion N.V. |
16,985 | 511,119 | ||||||
|
|
|
|||||||
| Total Netherlands | 10,440,530 | |||||||
| New Zealand – 0.8% | ||||||||
| Fisher & Paykel Healthcare Corp., Ltd. |
106,725 | 1,142,747 | ||||||
| Mainfreight Ltd. |
24,265 | 593,272 | ||||||
| Ryman Healthcare Ltd. |
103,650 | 865,944 | ||||||
| Z Energy Ltd. |
252,260 | 1,076,978 | ||||||
|
|
|
|||||||
| Total New Zealand | 3,678,941 | |||||||
| Norway – 1.8% | ||||||||
| Borregaard ASA |
29,283 | 290,736 | ||||||
| Entra ASA(b) |
58,983 | 891,772 | ||||||
| Grieg Seafood ASA |
49,609 | 602,571 | ||||||
| Leroy Seafood Group ASA |
197,749 | 1,436,571 | ||||||
| Salmar ASA |
70,859 | 3,404,879 | ||||||
| Tomra Systems ASA |
21,075 | 628,951 | ||||||
| Veidekke ASA |
71,187 | 748,110 | ||||||
|
|
|
|||||||
| Total Norway | 8,003,590 | |||||||
| Portugal – 0.1% | ||||||||
| Altri, SGPS, S.A. |
55,614 | 435,874 | ||||||
| Singapore – 0.7% | ||||||||
| First Resources Ltd. |
438,200 | 530,563 | ||||||
| Sheng Siong Group Ltd. |
566,100 | 434,658 | ||||||
| SIA Engineering Co., Ltd. |
358,000 | 650,188 | ||||||
See Notes to Financial Statements.
| 22 | WisdomTree Trust |
Schedule of Investments (continued)
WisdomTree International Hedged Quality Dividend Growth Fund (IHDG)
March 31, 2019
| Investments | Shares | Value | ||||||
| Venture Corp., Ltd. |
104,000 | $ | 1,377,453 | |||||
|
|
|
|||||||
| Total Singapore | 2,992,862 | |||||||
| Spain – 4.3% | ||||||||
| Cie Automotive S.A. |
15,632 | 420,906 | ||||||
| Faes Farma S.A. |
110,348 | 467,119 | ||||||
| Industria de Diseno Textil S.A. |
521,723 | 15,348,395 | ||||||
| Prosegur Cash S.A.(b) |
233,500 | 515,981 | ||||||
| Prosegur Cia de Seguridad S.A. |
110,668 | 600,193 | ||||||
| Zardoya Otis S.A.(a) |
171,177 | 1,418,481 | ||||||
|
|
|
|||||||
| Total Spain | 18,771,075 | |||||||
| Sweden – 5.8% | ||||||||
| AddTech AB Class B |
10,837 | 225,496 | ||||||
| Atlas Copco AB Class A |
188,399 | 5,070,867 | ||||||
| Atlas Copco AB Class B |
103,758 | 2,574,010 | ||||||
| Beijer Ref AB |
14,748 | 237,709 | ||||||
| Bonava AB Class B |
35,931 | 452,852 | ||||||
| Electrolux AB Series B |
85,358 | 2,198,530 | ||||||
| Evolution Gaming Group AB(b) |
5,290 | 417,768 | ||||||
| Fagerhult AB |
14,544 | 111,958 | ||||||
| Hexpol AB |
78,521 | 661,587 | ||||||
| Indutrade AB |
22,347 | 637,501 | ||||||
| Intrum AB(a) |
52,933 | 1,523,736 | ||||||
| Investment AB Latour Class B(a) |
128,398 | 1,723,454 | ||||||
| JM AB(a) |
37,090 | 666,199 | ||||||
| Lifco AB Class B |
9,790 | 400,031 | ||||||
| Loomis AB Class B |
18,406 | 635,011 | ||||||
| Mycronic AB |
29,296 | 418,501 | ||||||
| NetEnt AB* |
122,064 | 444,154 | ||||||
| Nobia AB |
73,139 | 429,752 | ||||||
| Nolato AB Class B |
1,587 | 66,130 | ||||||
| Paradox Interactive AB |
5,683 | 88,229 | ||||||
| Peab AB |
142,581 | 1,235,150 | ||||||
| Sandvik AB |
253,399 | 4,125,284 | ||||||
| Sweco AB Class B |
25,422 | 613,945 | ||||||
| Thule Group AB(b) |
18,876 | 427,367 | ||||||
|
|
|
|||||||
| Total Sweden | 25,385,221 | |||||||
| Switzerland – 6.5% | ||||||||
| Bucher Industries AG Registered Shares |
1,959 | 655,033 | ||||||
| Comet Holding AG Registered Shares*(a) |
1,713 | 146,204 | ||||||
| EMS-Chemie Holding AG Registered Shares |
7,215 | 3,912,140 | ||||||
| Kuehne + Nagel International AG Registered Shares |
42,126 | 5,778,102 | ||||||
| Logitech International S.A. Registered Shares |
25,954 | 1,017,155 | ||||||
| Oriflame Holding AG |
14,848 | 285,745 | ||||||
| Partners Group Holding AG |
8,081 | 5,874,730 | ||||||
| SGS S.A. Registered Shares |
1,960 | 4,876,875 | ||||||
| Sonova Holding AG Registered Shares |
11,484 | 2,271,662 | ||||||
| Straumann Holding AG Registered Shares |
1,328 | 1,083,442 | ||||||
| Sunrise Communications Group AG*(a)(b) |
27,064 | 1,991,958 | ||||||
| Temenos AG Registered Shares* |
3,827 | 564,117 | ||||||
| Ypsomed Holding AG Registered Shares* |
1,970 | 252,209 | ||||||
|
|
|
|||||||
| Total Switzerland | 28,709,372 | |||||||
| United Kingdom – 21.0% | ||||||||
| A.G. Barr PLC |
36,423 | 383,010 | ||||||
| Abcam PLC |
19,754 | 292,154 | ||||||
| Ashtead Group PLC |
50,738 | 1,224,765 | ||||||
| Barratt Developments PLC |
542,168 | 4,233,182 | ||||||
| Bellway PLC |
36,950 | 1,466,098 | ||||||
| Bovis Homes Group PLC |
36,903 | 511,400 | ||||||
| British American Tobacco PLC |
509,914 | 21,222,331 | ||||||
| Cineworld Group PLC |
187,941 | 716,567 | ||||||
| Compass Group PLC |
235,004 | 5,525,777 | ||||||
| Computacenter PLC |
27,880 | 401,799 | ||||||
| Cranswick PLC |
6,394 | 226,789 | ||||||
| Croda International PLC |
24,619 | 1,616,180 | ||||||
| Diageo PLC |
662,453 | 27,087,520 | ||||||
| Diploma PLC |
20,251 | 384,738 | ||||||
| Domino’s Pizza Group PLC |
113,008 | 356,357 | ||||||
| Dunelm Group PLC |
67,355 | 763,134 | ||||||
| easyJet PLC |
69,681 | 1,014,666 | ||||||
| Electrocomponents PLC |
93,333 | 683,248 | ||||||
| Fevertree Drinks PLC |
3,142 | 123,603 | ||||||
| Games Workshop Group PLC |
9,286 | 380,549 | ||||||
| Greggs PLC |
21,587 | 517,291 | ||||||
| Hargreaves Lansdown PLC |
75,022 | 1,821,710 | ||||||
| Hill & Smith Holdings PLC |
14,115 | 228,620 | ||||||
| HomeServe PLC |
49,878 | 666,184 | ||||||
| Howden Joinery Group PLC |
114,763 | 725,727 | ||||||
| IMI PLC |
86,690 | 1,082,171 | ||||||
| Jardine Lloyd Thompson Group PLC |
68,532 | 1,709,215 | ||||||
| JD Sports Fashion PLC |
37,096 | 242,947 | ||||||
| Marshalls PLC |
79,951 | 644,354 | ||||||
| Moneysupermarket.com Group PLC |
190,590 | 924,104 | ||||||
| Next PLC |
26,510 | 1,927,548 | ||||||
| NMC Health PLC |
5,796 | 172,499 | ||||||
| Pagegroup PLC |
137,218 | 840,369 | ||||||
| Redrow PLC |
92,334 | 723,098 | ||||||
| RELX PLC |
224,643 | 4,805,018 | ||||||
| Renishaw PLC |
8,528 | 411,826 | ||||||
| Rentokil Initial PLC |
172,363 | 793,504 | ||||||
| Rightmove PLC |
113,333 | 753,161 | ||||||
| Rotork PLC |
134,643 | 496,163 | ||||||
| RWS Holdings PLC |
37,610 | 236,217 | ||||||
| Softcat PLC |
27,674 | 299,303 | ||||||
| Spirax-Sarco Engineering PLC |
8,539 | 800,013 | ||||||
| Superdry PLC |
132 | 943 | ||||||
| Synthomer PLC |
107,464 | 531,278 | ||||||
| Ted Baker PLC |
6,568 | 133,340 | ||||||
| Unite Group PLC (The) |
77,407 | 925,438 | ||||||
| Victrex PLC |
15,706 | 441,241 | ||||||
| WH Smith PLC |
18,678 | 516,460 | ||||||
|
|
|
|||||||
| Total United Kingdom | 91,983,609 | |||||||
| TOTAL COMMON STOCKS (Cost: $429,220,845) |
433,040,517 | |||||||
See Notes to Financial Statements.
| WisdomTree Trust | 23 |
Schedule of Investments (continued)
WisdomTree International Hedged Quality Dividend Growth Fund (IHDG)
March 31, 2019
| Investments | Shares | Value | ||||||
| INVESTMENT OF CASH COLLATERAL FOR SECURITIES LOANED – 2.4% |
| |||||||
| United States – 2.4% |
| |||||||
| State Street Navigator Securities Lending Government Money Market Portfolio, 2.46%(c) (Cost: $10,577,670)(d) |
10,577,670 | $ | 10,577,670 | |||||
| TOTAL INVESTMENTS IN SECURITIES – 101.1% (Cost: $439,798,515) |
|
443,618,187 | ||||||
| Other Assets less Liabilities – (1.1)% |
|
(4,910,385 | ) | |||||
|
|
|
|||||||
| NET ASSETS – 100.0% |
|
$ | 438,707,802 | |||||
| * | Non-income producing security. |
| (a) | Security, or portion thereof, was on loan at March 31, 2019 (See Note 2). |
| (b) | This security is exempt from registration under rule 144A of the Securities Act of 1933. This security may be sold in transactions that are exempt from registration, normally to qualified institutional buyers. |
| (c) | Rate shown represents annualized 7-day yield as of March 31, 2019. |
| (d) | At March 31, 2019, the total market value of the Fund’s securities on loan identified in the Schedule of Investments was $14,937,774 and the total market value of the collateral held by the Fund was $15,807,221. The total market value of the collateral includes non-cash U.S. Government securities collateral having a value of $5,229,551. |
CVA – Certificaten Van Aandelen (Certificate of Stock)
| FINANCIAL DERIVATIVE INSTRUMENTS | ||||||||||||||||||||||||||||
| FOREIGN CURRENCY CONTRACTS (OTC – OVER THE COUNTER) | ||||||||||||||||||||||||||||
| Counterparty | Settlement Date |
Amount and Description of be Purchased |
Amount and be Sold |
Unrealized |
Unrealized |
|||||||||||||||||||||||
| Bank of America N.A. |
4/3/2019 | 297,320 | AUD | 210,771 | USD | $ | 435 | $ | — | |||||||||||||||||||
| Bank of America N.A. |
4/3/2019 | 8,504,826 | AUD | 6,041,752 | USD | — | (216 | ) | ||||||||||||||||||||
| Bank of America N.A. |
4/3/2019 | 205,696 | CHF | 206,441 | USD | 122 | — | |||||||||||||||||||||
| Bank of America N.A. |
4/3/2019 | 5,892,943 | CHF | 5,917,625 | USD | 147 | — | |||||||||||||||||||||
| Bank of America N.A. |
4/3/2019 | 2,048,142 | DKK | 311,914 | USD | — | (3,832 | ) | ||||||||||||||||||||
| Bank of America N.A. |
4/3/2019 | 59,442,932 | DKK | 8,941,016 | USD | 391 | — | |||||||||||||||||||||
| Bank of America N.A. |
4/3/2019 | 671,077 | EUR | 762,640 | USD | — | (9,057 | ) | ||||||||||||||||||||
| Bank of America N.A. |
4/3/2019 | 19,468,120 | EUR | 21,861,083 | USD | 556 | — | |||||||||||||||||||||
| Bank of America N.A. |
4/3/2019 | 491,461 | GBP | 648,584 | USD | — | (8,153 | ) | ||||||||||||||||||||
| Bank of America N.A. |
4/3/2019 | 14,266,615 | GBP | 18,591,668 | USD | — | (591 | ) | ||||||||||||||||||||
| Bank of America N.A. |
4/3/2019 | 1,169,093 | HKD | 148,973 | USD | — | (39 | ) | ||||||||||||||||||||
| Bank of America N.A. |
4/3/2019 | 33,520,785 | HKD | 4,270,297 | USD | 14 | — | |||||||||||||||||||||
| Bank of America N.A. |
4/3/2019 | 74,014 | ILS | 20,508 | USD | — | (113 | ) | ||||||||||||||||||||
| Bank of America N.A. |
4/3/2019 | 2,133,281 | ILS | 587,866 | USD | — | (39 | ) | ||||||||||||||||||||
| Bank of America N.A. |
4/3/2019 | 58,128,601 | JPY | 522,111 | USD | 3,101 | — | |||||||||||||||||||||
| Bank of America N.A. |
4/3/2019 | 1,656,361,383 | JPY | 14,966,305 | USD | — | (500 | ) | ||||||||||||||||||||
| Bank of America N.A. |
4/3/2019 | 511,215 | NOK | 59,900 | USD | — | (534 | ) | ||||||||||||||||||||
| Bank of America N.A. |
4/3/2019 | 14,785,036 | NOK | 1,717,032 | USD | — | (86 | ) | ||||||||||||||||||||
| Bank of America N.A. |
4/3/2019 | 35,811 | NZD | 24,524 | USD | — | (100 | ) | ||||||||||||||||||||
| Bank of America N.A. |
4/3/2019 | 1,030,755 | NZD | 702,975 | USD | 15 | — | |||||||||||||||||||||
| Bank of America N.A. |
4/3/2019 | 1,750,033 | SEK | 190,736 | USD | — | (2,045 | ) | ||||||||||||||||||||
| Bank of America N.A. |
4/3/2019 | 50,706,044 | SEK | 5,467,450 | USD | — | (264 | ) | ||||||||||||||||||||
| Bank of America N.A. |
4/3/2019 | 30,389 | SGD | 22,511 | USD | — | (75 | ) | ||||||||||||||||||||
| Bank of America N.A. |
4/3/2019 | 873,955 | SGD | 645,274 | USD | — | (39 | ) | ||||||||||||||||||||
| Bank of America N.A. |
4/3/2019 | 6,375,824 | USD | 8,957,589 | AUD | 12,661 | — | |||||||||||||||||||||
| Bank of America N.A. |
4/3/2019 | 6,244,834 | USD | 6,203,737 | CHF | 14,958 | — | |||||||||||||||||||||
| Bank of America N.A. |
4/3/2019 | 9,435,400 | USD | 61,660,311 | DKK | 160,455 | — | |||||||||||||||||||||
| Bank of America N.A. |
4/3/2019 | 23,069,868 | USD | 20,209,851 | EUR | 375,306 | — | |||||||||||||||||||||
| Bank of America N.A. |
4/3/2019 | 19,619,674 | USD | 14,728,479 | GBP | 426,735 | — | |||||||||||||||||||||
| Bank of America N.A. |
4/3/2019 | 4,506,419 | USD | 35,341,884 | HKD | 4,112 | — | |||||||||||||||||||||
| Bank of America N.A. |
4/3/2019 | 620,372 | USD | 2,243,720 | ILS | 2,113 | — | |||||||||||||||||||||
See Notes to Financial Statements.
| 24 | WisdomTree Trust |
Schedule of Investments (continued)
WisdomTree International Hedged Quality Dividend Growth Fund (IHDG)
March 31, 2019
| FINANCIAL DERIVATIVE INSTRUMENTS | ||||||||||||||||||||||||||||
| FOREIGN CURRENCY CONTRACTS (OTC – OVER THE COUNTER) | ||||||||||||||||||||||||||||
| Counterparty | Settlement Date |
Amount and Description of be Purchased |
Amount and be Sold |
Unrealized |
Unrealized |
|||||||||||||||||||||||
| Bank of America N.A. |
4/3/2019 | 15,793,851 | USD | 1,754,038,242 | JPY | $ | — | $ | (54,498 | ) | ||||||||||||||||||
| Bank of America N.A. |
4/3/2019 | 1,811,974 | USD | 15,464,171 | NOK | 16,162 | — | |||||||||||||||||||||
| Bank of America N.A. |
4/3/2019 | 741,846 | USD | 1,087,846 | NZD | — | (81 | ) | ||||||||||||||||||||
| Bank of America N.A. |
4/3/2019 | 5,769,767 | USD | 53,135,175 | SEK | 40,669 | — | |||||||||||||||||||||
| Bank of America N.A. |
4/3/2019 | 680,954 | USD | 919,763 | SGD | 1,899 | — | |||||||||||||||||||||
| Bank of America N.A. |
5/3/2019 | 5,985,062 | USD | 8,420,284 | AUD | 73 | — | |||||||||||||||||||||
| Bank of America N.A. |
5/3/2019 | 9,560,816 | USD | 63,391,958 | DKK | — | (571 | ) | ||||||||||||||||||||
| Bank of America N.A. |
5/3/2019 | 19,418,503 | USD | 14,884,196 | GBP | — | (6,620 | ) | ||||||||||||||||||||
| Bank of America N.A. |
5/3/2019 | 493,245 | USD | 1,786,423 | ILS | 21 | — | |||||||||||||||||||||
| Bank of America N.A. |
5/3/2019 | 757,110 | USD | 1,109,546 | NZD | — | (48 | ) | ||||||||||||||||||||
| Bank of America N.A. |
5/6/2019 | 5,946,907 | USD | 5,903,727 | CHF | — | (226 | ) | ||||||||||||||||||||
| Bank of America N.A. |
5/6/2019 | 22,045,067 | USD | 19,577,917 | EUR | — | (945 | ) | ||||||||||||||||||||
| Bank of America N.A. |
5/6/2019 | 4,339,407 | USD | 34,030,432 | HKD | — | (473 | ) | ||||||||||||||||||||
| Bank of America N.A. |
5/6/2019 | 1,706,589 | USD | 14,676,290 | NOK | 80 | — | |||||||||||||||||||||
| Bank of America N.A. |
5/6/2019 | 5,393,966 | USD | 49,901,613 | SEK | 244 | — | |||||||||||||||||||||
| Bank of America N.A. |
5/6/2019 | 643,353 | USD | 870,857 | SGD | 16 | — | |||||||||||||||||||||
| Bank of America N.A. |
5/9/2019 | 14,939,991 | USD | 1,648,877,504 | JPY | — | (4,247 | ) | ||||||||||||||||||||
| Barclays Bank PLC |
4/3/2019 | 8,504,838 | AUD | 6,041,752 | USD | — | (208 | ) | ||||||||||||||||||||
| Barclays Bank PLC |
4/3/2019 | 5,892,901 | CHF | 5,917,625 | USD | 105 | — | |||||||||||||||||||||
| Barclays Bank PLC |
4/3/2019 | 59,441,689 | DKK | 8,941,016 | USD | 204 | — | |||||||||||||||||||||
| Barclays Bank PLC |
4/3/2019 | 19,468,137 | EUR | 21,861,083 | USD | 575 | — | |||||||||||||||||||||
| Barclays Bank PLC |
4/3/2019 | 14,266,703 | GBP | 18,591,668 | USD | — | (477 | ) | ||||||||||||||||||||
| Barclays Bank PLC |
4/3/2019 | 33,520,849 | HKD | 4,270,297 | USD | 23 | — | |||||||||||||||||||||
| Barclays Bank PLC |
4/3/2019 | 2,133,348 | ILS | 587,866 | USD | — | (20 | ) | ||||||||||||||||||||
| Barclays Bank PLC |
4/3/2019 | 1,656,365,873 | JPY | 14,966,305 | USD | — | (460 | ) | ||||||||||||||||||||
| Barclays Bank PLC |
4/3/2019 | 14,785,399 | NOK | 1,717,032 | USD | — | (44 | ) | ||||||||||||||||||||
| Barclays Bank PLC |
4/3/2019 | 1,030,757 | NZD | 702,975 | USD | 16 | — | |||||||||||||||||||||
| Barclays Bank PLC |
4/3/2019 | 50,707,258 | SEK | 5,467,450 | USD | — | (133 | ) | ||||||||||||||||||||
| Barclays Bank PLC |
4/3/2019 | 873,920 | SGD | 645,274 | USD | — | (64 | ) | ||||||||||||||||||||
| Barclays Bank PLC |
4/3/2019 | 6,375,824 | USD | 8,957,778 | AUD | 12,527 | — | |||||||||||||||||||||
| Barclays Bank PLC |
4/3/2019 | 6,244,834 | USD | 6,203,599 | CHF | 15,096 | — | |||||||||||||||||||||
| Barclays Bank PLC |
4/3/2019 | 9,435,400 | USD | 61,659,433 | DKK | 160,587 | — | |||||||||||||||||||||
| Barclays Bank PLC |
4/3/2019 | 23,069,868 | USD | 20,209,621 | EUR | 375,564 | — | |||||||||||||||||||||
| Barclays Bank PLC |
4/3/2019 | 19,619,674 | USD | 14,728,081 | GBP | 427,253 | — | |||||||||||||||||||||
| Barclays Bank PLC |
4/3/2019 | 4,506,419 | USD | 35,339,879 | HKD | 4,368 | — | |||||||||||||||||||||
| Barclays Bank PLC |
4/3/2019 | 620,372 | USD | 2,243,699 | ILS | 2,119 | — | |||||||||||||||||||||
| Barclays Bank PLC |
4/3/2019 | 15,793,851 | USD | 1,754,019,289 | JPY | — | (54,327 | ) | ||||||||||||||||||||
| Barclays Bank PLC |
4/3/2019 | 1,811,974 | USD | 15,464,944 | NOK | 16,072 | — | |||||||||||||||||||||
| Barclays Bank PLC |
4/3/2019 | 741,846 | USD | 1,087,872 | NZD | — | (98 | ) | ||||||||||||||||||||
| Barclays Bank PLC |
4/3/2019 | 5,769,767 | USD | 53,133,813 | SEK | 40,816 | — | |||||||||||||||||||||
| Barclays Bank PLC |
4/3/2019 | 680,954 | USD | 919,744 | SGD | 1,913 | — | |||||||||||||||||||||
| Barclays Bank PLC |
5/3/2019 | 5,985,062 | USD | 8,420,402 | AUD | — | (11 | ) | ||||||||||||||||||||
| Barclays Bank PLC |
5/3/2019 | 9,560,816 | USD | 63,391,652 | DKK | — | (525 | ) | ||||||||||||||||||||
| Barclays Bank PLC |
5/3/2019 | 19,418,503 | USD | 14,878,950 | GBP | 226 | — | |||||||||||||||||||||
| Barclays Bank PLC |
5/3/2019 | 493,245 | USD | 1,786,578 | ILS | — | (21 | ) | ||||||||||||||||||||
| Barclays Bank PLC |
5/3/2019 | 757,110 | USD | 1,109,550 | NZD | — | (50 | ) | ||||||||||||||||||||
| Barclays Bank PLC |
5/6/2019 | 5,946,907 | USD | 5,903,768 | CHF | — | (268 | ) | ||||||||||||||||||||
| Barclays Bank PLC |
5/6/2019 | 22,045,067 | USD | 19,577,795 | EUR | — | (808 | ) | ||||||||||||||||||||
| Barclays Bank PLC |
5/6/2019 | 4,339,407 | USD | 34,030,194 | HKD | — | (443 | ) | ||||||||||||||||||||
| Barclays Bank PLC |
5/6/2019 | 1,706,589 | USD | 14,676,749 | NOK | 27 | — | |||||||||||||||||||||
| Barclays Bank PLC |
5/6/2019 | 5,393,966 | USD | 49,903,673 | SEK | 21 | — | |||||||||||||||||||||
| Barclays Bank PLC |
5/6/2019 | 643,353 | USD | 870,907 | SGD | — | (20 | ) | ||||||||||||||||||||
| Barclays Bank PLC |
5/9/2019 | 14,939,991 | USD | 1,648,884,974 | JPY | — | (4,315 | ) | ||||||||||||||||||||
| Canadian Imperial Bank of Commerce |
4/3/2019 | 6,375,824 | USD | 8,957,828 | AUD | 12,491 | — | |||||||||||||||||||||
| Canadian Imperial Bank of Commerce |
4/3/2019 | 6,244,834 | USD | 6,204,243 | CHF | 14,450 | — | |||||||||||||||||||||
See Notes to Financial Statements.
| WisdomTree Trust | 25 |
Schedule of Investments (continued)
WisdomTree International Hedged Quality Dividend Growth Fund (IHDG)
March 31, 2019
| FINANCIAL DERIVATIVE INSTRUMENTS | ||||||||||||||||||||||||||||
| FOREIGN CURRENCY CONTRACTS (OTC – OVER THE COUNTER) | ||||||||||||||||||||||||||||
| Counterparty | Settlement Date |
Amount and Description of be Purchased |
Amount and be Sold |
Unrealized |
Unrealized |
|||||||||||||||||||||||
| Canadian Imperial Bank of Commerce |
4/3/2019 | 9,435,400 | USD | 61,664,396 | DKK | $ | 159,841 | $ | — | |||||||||||||||||||
| Canadian Imperial Bank of Commerce |
4/3/2019 | 23,069,868 | USD | 20,211,196 | EUR | 373,795 | — | |||||||||||||||||||||
| Canadian Imperial Bank of Commerce |
4/3/2019 | 19,619,674 | USD | 14,728,932 | GBP | 426,144 | — | |||||||||||||||||||||
| Canadian Imperial Bank of Commerce |
4/3/2019 | 4,506,419 | USD | 35,340,870 | HKD | 4,242 | — | |||||||||||||||||||||
| Canadian Imperial Bank of Commerce |
4/3/2019 | 620,372 | USD | 2,243,799 | ILS | 2,091 | — | |||||||||||||||||||||
| Canadian Imperial Bank of Commerce |
4/3/2019 | 15,793,851 | USD | 1,754,163,013 | JPY | — | (55,626 | ) | ||||||||||||||||||||
| Canadian Imperial Bank of Commerce |
4/3/2019 | 1,811,974 | USD | 15,466,285 | NOK | 15,916 | — | |||||||||||||||||||||
| Canadian Imperial Bank of Commerce |
4/3/2019 | 741,846 | USD | 1,087,942 | NZD | — | (146 | ) | ||||||||||||||||||||
| Canadian Imperial Bank of Commerce |
4/3/2019 | 5,769,767 | USD | 53,138,862 | SEK | 40,271 | — | |||||||||||||||||||||
| Canadian Imperial Bank of Commerce |
4/3/2019 | 680,954 | USD | 919,717 | SGD | 1,933 | — | |||||||||||||||||||||
| Citibank N.A. |
4/3/2019 | 8,505,149 | AUD | 6,041,752 | USD | 13 | — | |||||||||||||||||||||
| Citibank N.A. |
4/3/2019 | 5,892,919 | CHF | 5,917,625 | USD | 123 | — | |||||||||||||||||||||
| Citibank N.A. |
4/3/2019 | 59,440,751 | DKK | 8,941,016 | USD | 63 | — | |||||||||||||||||||||
| Citibank N.A. |
4/3/2019 | 19,467,843 | EUR | 21,861,083 | USD | 244 | — | |||||||||||||||||||||
| Citibank N.A. |
4/3/2019 | 14,266,604 | GBP | 18,591,668 | USD | — | (605 | ) | ||||||||||||||||||||
| Citibank N.A. |
4/3/2019 | 33,521,750 | HKD | 4,270,297 | USD | 137 | — | |||||||||||||||||||||
| Citibank N.A. |
4/3/2019 | 2,133,381 | ILS | 587,866 | USD | — | (11 | ) | ||||||||||||||||||||
| Citibank N.A. |
4/3/2019 | 1,656,370,363 | JPY | 14,966,305 | USD | — | (419 | ) | ||||||||||||||||||||
| Citibank N.A. |
4/3/2019 | 14,785,524 | NOK | 1,717,032 | USD | — | (29 | ) | ||||||||||||||||||||
| Citibank N.A. |
4/3/2019 | 1,030,740 | NZD | 702,975 | USD | 4 | — | |||||||||||||||||||||
| Citibank N.A. |
4/3/2019 | 50,707,619 | SEK | 5,467,450 | USD | — | (94 | ) | ||||||||||||||||||||
| Citibank N.A. |
4/3/2019 | 873,984 | SGD | 645,274 | USD | — | (17 | ) | ||||||||||||||||||||
| Citibank N.A. |
4/3/2019 | 6,375,824 | USD | 8,957,451 | AUD | 12,759 | — | |||||||||||||||||||||
| Citibank N.A. |
4/3/2019 | 6,244,834 | USD | 6,203,587 | CHF | 15,109 | — | |||||||||||||||||||||
| Citibank N.A. |
4/3/2019 | 9,435,400 | USD | 61,658,622 | DKK | 160,709 | — | |||||||||||||||||||||
| Citibank N.A. |
4/3/2019 | 23,069,868 | USD | 20,209,461 | EUR | 375,743 | — | |||||||||||||||||||||
| Citibank N.A. |
4/3/2019 | 19,619,674 | USD | 14,728,048 | GBP | 427,297 | — | |||||||||||||||||||||
| Citibank N.A. |
4/3/2019 | 4,506,419 | USD | 35,338,067 | HKD | 4,599 | — | |||||||||||||||||||||
| Citibank N.A. |
4/3/2019 | 620,372 | USD | 2,243,577 | ILS | 2,153 | — | |||||||||||||||||||||
| Citibank N.A. |
4/3/2019 | 15,793,851 | USD | 1,754,012,972 | JPY | — | (54,270 | ) | ||||||||||||||||||||
| Citibank N.A. |
4/3/2019 | 1,811,974 | USD | 15,465,182 | NOK | 16,045 | — | |||||||||||||||||||||
| Citibank N.A. |
4/3/2019 | 741,846 | USD | 1,087,864 | NZD | — | (93 | ) | ||||||||||||||||||||
| Citibank N.A. |
4/3/2019 | 5,769,767 | USD | 53,134,015 | SEK | 40,794 | — | |||||||||||||||||||||
| Citibank N.A. |
4/3/2019 | 680,954 | USD | 919,711 | SGD | 1,937 | — | |||||||||||||||||||||
| Citibank N.A. |
5/3/2019 | 5,985,062 | USD | 8,420,663 | AUD | — | (197 | ) | ||||||||||||||||||||
| Citibank N.A. |
5/3/2019 | 9,560,816 | USD | 63,393,469 | DKK | — | (799 | ) | ||||||||||||||||||||
| Citibank N.A. |
5/3/2019 | 19,418,503 | USD | 14,879,167 | GBP | — | (56 | ) | ||||||||||||||||||||
| Citibank N.A. |
5/3/2019 | 493,245 | USD | 1,786,478 | ILS | 6 | — | |||||||||||||||||||||
| Citibank N.A. |
5/3/2019 | 757,110 | USD | 1,109,530 | NZD | — | (36 | ) | ||||||||||||||||||||
| Citibank N.A. |
5/6/2019 | 5,946,907 | USD | 5,903,703 | CHF | — | (202 | ) | ||||||||||||||||||||
| Citibank N.A. |
5/6/2019 | 22,045,067 | USD | 19,578,160 | EUR | — | (1,219 | ) | ||||||||||||||||||||
| Citibank N.A. |
5/6/2019 | 4,339,407 | USD | 34,029,291 | HKD | — | (328 | ) | ||||||||||||||||||||
| Citibank N.A. |
5/6/2019 | 1,706,589 | USD | 14,676,957 | NOK | 3 | — | |||||||||||||||||||||
| Citibank N.A. |
5/6/2019 | 5,393,966 | USD | 49,904,704 | SEK | — | (90 | ) | ||||||||||||||||||||
| Citibank N.A. |
5/6/2019 | 643,353 | USD | 870,863 | SGD | 13 | — | |||||||||||||||||||||
| Citibank N.A. |
5/9/2019 | 14,939,991 | USD | 1,648,931,288 | JPY | — | (4,735 | ) | ||||||||||||||||||||
| Credit Suisse International |
4/3/2019 | 8,504,623 | AUD | 6,041,752 | USD | — | (361 | ) | ||||||||||||||||||||
| Credit Suisse International |
4/3/2019 | 5,892,801 | CHF | 5,917,625 | USD | 4 | — | |||||||||||||||||||||
| Credit Suisse International |
4/3/2019 | 59,440,017 | DKK | 8,941,016 | USD | — | (48 | ) | ||||||||||||||||||||
| Credit Suisse International |
4/3/2019 | 19,467,687 | EUR | 21,861,083 | USD | 69 | — | |||||||||||||||||||||
| Credit Suisse International |
4/3/2019 | 14,266,440 | GBP | 18,591,668 | USD | — | (819 | ) | ||||||||||||||||||||
| Credit Suisse International |
4/3/2019 | 33,522,438 | HKD | 4,270,297 | USD | 225 | — | |||||||||||||||||||||
| Credit Suisse International |
4/3/2019 | 2,133,042 | ILS | 587,866 | USD | — | (105 | ) | ||||||||||||||||||||
| Credit Suisse International |
4/3/2019 | 1,656,323,967 | JPY | 14,966,305 | USD | — | (838 | ) | ||||||||||||||||||||
| Credit Suisse International |
4/3/2019 | 14,785,165 | NOK | 1,717,032 | USD | — | (71 | ) | ||||||||||||||||||||
See Notes to Financial Statements.
| 26 | WisdomTree Trust |
Schedule of Investments (continued)
WisdomTree International Hedged Quality Dividend Growth Fund (IHDG)
March 31, 2019
| FINANCIAL DERIVATIVE INSTRUMENTS | ||||||||||||||||||||||||||||
| FOREIGN CURRENCY CONTRACTS (OTC – OVER THE COUNTER) | ||||||||||||||||||||||||||||
| Counterparty | Settlement Date |
Amount and Description of be Purchased |
Amount and be Sold |
Unrealized |
Unrealized |
|||||||||||||||||||||||
| Credit Suisse International |
4/3/2019 | 1,030,713 | NZD | 702,975 | USD | $ | — | $ | (14 | ) | ||||||||||||||||||
| Credit Suisse International |
4/3/2019 | 50,706,323 | SEK | 5,467,450 | USD | — | (234 | ) | ||||||||||||||||||||
| Credit Suisse International |
4/3/2019 | 873,951 | SGD | 645,274 | USD | — | (42 | ) | ||||||||||||||||||||
| Credit Suisse International |
5/3/2019 | 5,985,062 | USD | 8,420,556 | AUD | — | (121 | ) | ||||||||||||||||||||
| Credit Suisse International |
5/3/2019 | 9,560,816 | USD | 63,392,665 | DKK | — | (678 | ) | ||||||||||||||||||||
| Credit Suisse International |
5/3/2019 | 19,418,503 | USD | 14,879,133 | GBP | — | (12 | ) | ||||||||||||||||||||
| Credit Suisse International |
5/3/2019 | 493,245 | USD | 1,786,469 | ILS | 9 | — | |||||||||||||||||||||
| Credit Suisse International |
5/3/2019 | 757,110 | USD | 1,109,574 | NZD | — | (66 | ) | ||||||||||||||||||||
| Credit Suisse International |
5/6/2019 | 5,946,907 | USD | 5,903,822 | CHF | — | (322 | ) | ||||||||||||||||||||
| Credit Suisse International |
5/6/2019 | 22,045,067 | USD | 19,578,091 | EUR | — | (1,141 | ) | ||||||||||||||||||||
| Credit Suisse International |
5/6/2019 | 4,339,407 | USD | 34,030,246 | HKD | — | (449 | ) | ||||||||||||||||||||
| Credit Suisse International |
5/6/2019 | 1,706,589 | USD | 14,676,981 | NOK | — | — | |||||||||||||||||||||
| Credit Suisse International |
5/6/2019 | 5,393,966 | USD | 49,903,992 | SEK | — | (13 | ) | ||||||||||||||||||||
| Credit Suisse International |
5/6/2019 | 643,353 | USD | 870,992 | SGD | — | (83 | ) | ||||||||||||||||||||
| Credit Suisse International |
5/9/2019 | 14,939,991 | USD | 1,648,914,854 | JPY | — | (4,586 | ) | ||||||||||||||||||||
| Goldman Sachs |
4/3/2019 | 3,477,726 | USD | 4,885,448 | AUD | 7,272 | — | |||||||||||||||||||||
| Goldman Sachs |
4/3/2019 | 3,406,274 | USD | 3,383,701 | CHF | 8,316 | — | |||||||||||||||||||||
| Goldman Sachs |
4/3/2019 | 5,146,585 | USD | 33,631,590 | DKK | 87,721 | — | |||||||||||||||||||||
| Goldman Sachs |
4/3/2019 | 12,583,565 | USD | 11,023,343 | EUR | 204,951 | — | |||||||||||||||||||||
| Goldman Sachs |
4/3/2019 | 10,701,641 | USD | 8,033,318 | GBP | 233,283 | — | |||||||||||||||||||||
| Goldman Sachs |
4/3/2019 | 2,458,049 | USD | 19,278,849 | HKD | 2,060 | — | |||||||||||||||||||||
| Goldman Sachs |
4/3/2019 | 338,385 | USD | 1,223,748 | ILS | 1,180 | — | |||||||||||||||||||||
| Goldman Sachs |
4/3/2019 | 8,614,830 | USD | 956,727,698 | JPY | — | (29,540 | ) | ||||||||||||||||||||
| Goldman Sachs |
4/3/2019 | 988,350 | USD | 8,435,493 | NOK | 8,759 | — | |||||||||||||||||||||
| Goldman Sachs |
4/3/2019 | 404,644 | USD | 593,388 | NZD | — | (55 | ) | ||||||||||||||||||||
| Goldman Sachs |
4/3/2019 | 3,147,146 | USD | 28,981,413 | SEK | 22,335 | — | |||||||||||||||||||||
| Goldman Sachs |
4/3/2019 | 371,433 | USD | 501,682 | SGD | 1,045 | — | |||||||||||||||||||||
| Societe Generale |
4/2/2019 | 108,622 | CHF | 109,071 | USD | — | (2 | ) | ||||||||||||||||||||
| Societe Generale |
4/2/2019 | 1,469,411 | DKK | 221,020 | USD | — | (11 | ) | ||||||||||||||||||||
| Societe Generale |
4/2/2019 | 442,883 | EUR | 497,314 | USD | — | (22 | ) | ||||||||||||||||||||
| Societe Generale |
4/2/2019 | 775,790 | HKD | 98,830 | USD | — | (3 | ) | ||||||||||||||||||||
| Societe Generale |
4/2/2019 | 1,206,617 | SEK | 130,096 | USD | — | (6 | ) | ||||||||||||||||||||
| UBS AG |
4/2/2019 | 233,295 | AUD | 165,724 | USD | — | (3 | ) | ||||||||||||||||||||
| UBS AG |
4/2/2019 | 455,595 | GBP | 593,676 | USD | — | (12 | ) | ||||||||||||||||||||
| UBS AG |
4/2/2019 | 564,011 | NOK | 65,496 | USD | — | (1 | ) | ||||||||||||||||||||
| UBS AG |
4/3/2019 | 6,479,936 | AUD | 4,603,243 | USD | — | (119 | ) | ||||||||||||||||||||
| UBS AG |
4/3/2019 | 4,489,832 | CHF | 4,508,669 | USD | 80 | — | |||||||||||||||||||||
| UBS AG |
4/3/2019 | 45,288,594 | DKK | 6,812,207 | USD | 104 | — | |||||||||||||||||||||
| UBS AG |
4/3/2019 | 14,832,710 | EUR | 16,656,065 | USD | 260 | — | |||||||||||||||||||||
| UBS AG |
4/3/2019 | 10,869,911 | GBP | 14,165,081 | USD | — | (309 | ) | ||||||||||||||||||||
| UBS AG |
4/3/2019 | 25,539,784 | HKD | 3,253,564 | USD | 24 | — | |||||||||||||||||||||
| UBS AG |
4/3/2019 | 1,625,443 | ILS | 447,901 | USD | — | (9 | ) | ||||||||||||||||||||
| UBS AG |
4/3/2019 | 1,261,993,483 | JPY | 11,402,903 | USD | — | (350 | ) | ||||||||||||||||||||
| UBS AG |
4/3/2019 | 11,265,115 | NOK | 1,308,218 | USD | — | (31 | ) | ||||||||||||||||||||
| UBS AG |
4/3/2019 | 785,341 | NZD | 535,604 | USD | 10 | — | |||||||||||||||||||||
| UBS AG |
4/3/2019 | 38,634,260 | SEK | 4,165,678 | USD | — | (86 | ) | ||||||||||||||||||||
| UBS AG |
4/3/2019 | 665,899 | SGD | 491,642 | USD | — | (13 | ) | ||||||||||||||||||||
| UBS AG |
5/3/2019 | 4,560,050 | USD | 6,415,612 | AUD | — | (54 | ) | ||||||||||||||||||||
| UBS AG |
5/3/2019 | 7,284,435 | USD | 48,298,528 | DKK | — | (415 | ) | ||||||||||||||||||||
| UBS AG |
5/3/2019 | 14,795,050 | USD | 11,336,456 | GBP | 25 | — | |||||||||||||||||||||
| UBS AG |
5/3/2019 | 375,810 | USD | 1,361,254 | ILS | — | (26 | ) | ||||||||||||||||||||
| UBS AG |
5/3/2019 | 576,850 | USD | 845,351 | NZD | — | (20 | ) | ||||||||||||||||||||
| UBS AG |
5/6/2019 | 4,530,979 | USD | 4,498,084 | CHF | — | (177 | ) | ||||||||||||||||||||
| UBS AG |
5/6/2019 | 16,796,245 | USD | 14,916,365 | EUR | — | (556 | ) | ||||||||||||||||||||
| UBS AG |
5/6/2019 | 3,306,216 | USD | 25,927,984 | HKD | — | (364 | ) | ||||||||||||||||||||
See Notes to Financial Statements.
| WisdomTree Trust | 27 |
Schedule of Investments (concluded)
WisdomTree International Hedged Quality Dividend Growth Fund (IHDG)
March 31, 2019
| FINANCIAL DERIVATIVE INSTRUMENTS | ||||||||||||||||||||||||||||
| FOREIGN CURRENCY CONTRACTS (OTC – OVER THE COUNTER) | ||||||||||||||||||||||||||||
| Counterparty | Settlement Date |
Amount and Description of be Purchased |
Amount and be Sold |
Unrealized |
Unrealized |
|||||||||||||||||||||||
| UBS AG |
5/6/2019 | 1,300,262 | USD | 11,182,420 | NOK | $ | 9 | $ | — | |||||||||||||||||||
| UBS AG |
5/6/2019 | 4,109,692 | USD | 38,022,439 | SEK | — | (44 | ) | ||||||||||||||||||||
| UBS AG |
5/6/2019 | 490,175 | USD | 663,556 | SGD | — | (20 | ) | ||||||||||||||||||||
| UBS AG |
5/9/2019 | 11,382,853 | USD | 1,256,323,209 | JPY | — | (3,556 | ) | ||||||||||||||||||||
| $ | 4,804,463 | $ | (320,463 | ) | ||||||||||||||||||||||||
| CURRENCY LEGEND | ||
| AUD | Australian dollar | |
| CHF | Swiss franc | |
| DKK | Danish krone | |
| EUR | Euro | |
| GBP | British pound | |
| HKD | Hong Kong dollar | |
| ILS | Israeli new shekel | |
| JPY | Japanese yen | |
| NOK | Norwegian krone | |
| NZD | New Zealand dollar | |
| SEK | Swedish krona | |
| SGD | Singapore dollar | |
| USD | U.S. dollar | |
See Notes to Financial Statements.
| 28 | WisdomTree Trust |
Schedule of Investments
WisdomTree Japan Hedged Equity Fund (DXJ)
March 31, 2019
| Investments | Shares | Value | ||||||
| COMMON STOCKS – 99.1% | ||||||||
| Japan – 99.1% | ||||||||
| Air Freight & Logistics – 0.1% | ||||||||
| AIT Corp. |
63,600 | $ | 639,534 | |||||
| Kintetsu World Express, Inc. |
64,400 | 980,967 | ||||||
|
|
|
|||||||
| Total Air Freight & Logistics |
|
1,620,501 | ||||||
| Airlines – 0.5% |
| |||||||
| Japan Airlines Co., Ltd. |
477,700 | 16,827,504 | ||||||
| Auto Components – 5.9% |
| |||||||
| Ahresty Corp.(a) |
64,400 | 368,299 | ||||||
| Aisan Industry Co., Ltd. |
64,200 | 394,417 | ||||||
| Aisin Seiki Co., Ltd. |
412,008 | 14,721,883 | ||||||
| Bridgestone Corp. |
1,474,785 | 56,840,880 | ||||||
| Daido Metal Co., Ltd.(a) |
7,300 | 46,695 | ||||||
| Daikyonishikawa Corp. |
64,400 | 591,141 | ||||||
| Denso Corp. |
990,179 | 38,619,531 | ||||||
| Eagle Industry Co., Ltd. |
98,200 | 1,072,628 | ||||||
| Exedy Corp.(a) |
64,200 | 1,390,899 | ||||||
| FCC Co., Ltd. |
64,200 | 1,357,837 | ||||||
| Futaba Industrial Co., Ltd. |
1,100 | 5,416 | ||||||
| G-Tekt Corp. |
55,100 | 761,648 | ||||||
| H-One Co., Ltd. |
64,400 | 521,321 | ||||||
| Kasai Kogyo Co., Ltd. |
64,900 | 479,633 | ||||||
| Keihin Corp. |
63,500 | 1,039,545 | ||||||
| Koito Manufacturing Co., Ltd. |
73,801 | 4,180,623 | ||||||
| KYB Corp.(a) |
18,700 | 459,200 | ||||||
| Mitsuba Corp.(a) |
65,000 | 365,271 | ||||||
| Musashi Seimitsu Industry Co., Ltd. |
87,200 | 1,181,732 | ||||||
| NGK Spark Plug Co., Ltd. |
207,264 | 3,846,233 | ||||||
| NHK Spring Co., Ltd.(a) |
225,400 | 2,024,191 | ||||||
| Nichirin Co., Ltd. |
60,700 | 973,964 | ||||||
| Nifco, Inc.(a) |
75,390 | 1,920,764 | ||||||
| Nippon Piston Ring Co., Ltd. |
29,400 | 417,818 | ||||||
| Nissin Kogyo Co., Ltd. |
131,200 | 1,644,075 | ||||||
| NOK Corp.(a) |
192,300 | 2,993,476 | ||||||
| Pacific Industrial Co., Ltd.(a) |
115,900 | 1,629,312 | ||||||
| Piolax, Inc.(a) |
64,100 | 1,232,948 | ||||||
| Press Kogyo Co., Ltd. |
29,600 | 156,979 | ||||||
| Riken Corp. |
33,900 | 1,540,561 | ||||||
| Sanoh Industrial Co., Ltd.(a) |
64,400 | 293,825 | ||||||
| Shoei Co., Ltd.(a) |
31,700 | 1,353,232 | ||||||
| Showa Corp. |
34,100 | 435,011 | ||||||
| Stanley Electric Co., Ltd. |
85,207 | 2,290,200 | ||||||
| Sumitomo Electric Industries Ltd. |
1,124,883 | 14,924,251 | ||||||
| Sumitomo Riko Co., Ltd. |
114,600 | 960,824 | ||||||
| Sumitomo Rubber Industries Ltd. |
386,291 | 4,634,724 | ||||||
| T. RAD Co., Ltd. |
20,500 | 393,016 | ||||||
| Tachi-S Co., Ltd. |
64,400 | 921,621 | ||||||
| Taiho Kogyo Co., Ltd. |
96,500 | 789,018 | ||||||
| Tokai Rika Co., Ltd. |
191,314 | 3,261,594 | ||||||
| Topre Corp. |
64,200 | 1,198,910 | ||||||
| Toyo Tire Corp. |
173,900 | 1,971,762 | ||||||
| Toyoda Gosei Co., Ltd. |
125,700 | 2,661,976 | ||||||
| Toyota Boshoku Corp. |
225,736 | 3,416,071 | ||||||
| TPR Co., Ltd. |
64,294 | 1,222,739 | ||||||
| TS Tech Co., Ltd. |
64,932 | 1,868,441 | ||||||
| Unipres Corp. |
64,900 | 1,013,797 | ||||||
| Yokohama Rubber Co., Ltd. (The) |
205,300 | 3,813,496 | ||||||
| Yorozu Corp. |
64,400 | 841,328 | ||||||
|
|
|
|||||||
| Total Auto Components |
|
191,044,756 | ||||||
| Automobiles – 12.8% |
| |||||||
| Honda Motor Co., Ltd. |
2,744,747 | 74,269,479 | ||||||
| Isuzu Motors Ltd. |
951,600 | 12,500,577 | ||||||
| Mazda Motor Corp. |
786,415 | 8,799,521 | ||||||
| Mitsubishi Motors Corp. |
1,505,001 | 7,995,126 | ||||||
| Nissan Motor Co., Ltd.(a) |
10,958,404 | 89,916,633 | ||||||
| Subaru Corp.(a) |
1,750,167 | 39,886,130 | ||||||
| Suzuki Motor Corp. |
297,936 | 13,184,176 | ||||||
| Toyota Motor Corp. |
2,693,670 | 157,869,967 | ||||||
| Yamaha Motor Co., Ltd. |
542,400 | 10,638,753 | ||||||
|
|
|
|||||||
| Total Automobiles |
|
415,060,362 | ||||||
| Banks – 8.9% |
| |||||||
| Mitsubishi UFJ Financial Group, Inc. |
21,703,522 | 107,846,023 | ||||||
| Mizuho Financial Group, Inc. |
53,278,844 | 82,456,213 | ||||||
| Sumitomo Mitsui Financial Group, Inc. |
2,860,300 | 100,162,830 | ||||||
|
|
|
|||||||
| Total Banks |
|
290,465,066 | ||||||
| Beverages – 1.3% |
| |||||||
| Asahi Group Holdings Ltd. |
330,500 | 14,720,739 | ||||||
| Kirin Holdings Co., Ltd. |
740,745 | 17,684,588 | ||||||
| Suntory Beverage & Food Ltd. |
221,600 | 10,410,805 | ||||||
| Takara Holdings, Inc. |
88,700 | 1,048,998 | ||||||
|
|
|
|||||||
| Total Beverages |
|
43,865,130 | ||||||
| Building Products – 1.6% |
| |||||||
| AGC, Inc. |
286,247 | 10,034,227 | ||||||
| Aica Kogyo Co., Ltd. |
64,200 | 2,140,290 | ||||||
| Central Glass Co., Ltd. |
63,700 | 1,398,482 | ||||||
| Daikin Industries Ltd. |
173,949 | 20,383,236 | ||||||
| LIXIL Group Corp. |
474,900 | 6,341,439 | ||||||
| Nitto Boseki Co., Ltd. |
64,300 | 1,150,237 | ||||||
| Noritz Corp. |
47,200 | 736,880 | ||||||
| Okabe Co., Ltd. |
83,800 | 724,548 | ||||||
| Sanwa Holdings Corp. |
277,831 | 3,305,809 | ||||||
| TOTO Ltd. |
114,800 | 4,869,549 | ||||||
|
|
|
|||||||
| Total Building Products |
|
51,084,697 | ||||||
| Capital Markets – 1.1% |
| |||||||
| GCA Corp. |
88,200 | 627,923 | ||||||
| Monex Group, Inc.(a) |
115,696 | 400,339 | ||||||
| Nomura Holdings, Inc. |
7,108,745 | 25,702,848 | ||||||
| SBI Holdings, Inc. |
335,400 | 7,472,525 | ||||||
|
|
|
|||||||
| Total Capital Markets |
|
34,203,635 | ||||||
| Chemicals – 6.8% |
| |||||||
| ADEKA Corp. |
64,400 | 944,312 | ||||||
| Arakawa Chemical Industries Ltd. |
61,700 | 758,673 | ||||||
| Asahi Kasei Corp. |
1,726,722 | 17,815,571 | ||||||
See Notes to Financial Statements.
| WisdomTree Trust | 29 |
Schedule of Investments (continued)
WisdomTree Japan Hedged Equity Fund (DXJ)
March 31, 2019
| Investments | Shares | Value | ||||||
| Chugoku Marine Paints Ltd.(a) |
22,900 | $ | 205,031 | |||||
| Daicel Corp. |
437,742 | 4,753,724 | ||||||
| Dainichiseika Color & Chemicals Manufacturing Co., Ltd. |
50,600 | 1,380,603 | ||||||
| Denka Co., Ltd. |
110,615 | 3,187,983 | ||||||
| DIC Corp. |
167,853 | 4,905,854 | ||||||
| Fujimi, Inc. |
64,400 | 1,407,450 | ||||||
| Fujimori Kogyo Co., Ltd. |
36,300 | 996,992 | ||||||
| Hitachi Chemical Co., Ltd.(a) |
272,215 | 6,030,367 | ||||||
| JCU Corp. |
26,600 | 415,997 | ||||||
| JSP Corp.(a) |
51,000 | 1,125,654 | ||||||
| JSR Corp. |
295,200 | 4,576,620 | ||||||
| Kaneka Corp. |
64,200 | 2,404,201 | ||||||
| Kansai Paint Co., Ltd.(a) |
153,100 | 2,919,945 | ||||||
| KH Neochem Co., Ltd. |
32,000 | 771,920 | ||||||
| Kumiai Chemical Industry Co., Ltd. |
27,300 | 192,631 | ||||||
| Kuraray Co., Ltd. |
450,437 | 5,729,912 | ||||||
| Kureha Corp. |
58,400 | 3,276,542 | ||||||
| Lintec Corp. |
64,347 | 1,391,758 | ||||||
| Mitsubishi Chemical Holdings Corp. |
2,609,963 | 18,378,327 | ||||||
| Mitsubishi Gas Chemical Co., Inc. |
246,582 | 3,517,667 | ||||||
| Mitsui Chemicals, Inc. |
321,015 | 7,746,588 | ||||||
| Moriroku Holdings Co., Ltd. |
65,000 | 1,530,379 | ||||||
| Nihon Nohyaku Co., Ltd.(a) |
134,300 | 541,156 | ||||||
| Nihon Parkerizing Co., Ltd. |
71,600 | 893,989 | ||||||
| Nippon Fine Chemical Co., Ltd. |
64,400 | 700,525 | ||||||
| Nippon Kayaku Co., Ltd. |
193,100 | 2,281,924 | ||||||
| Nippon Paint Holdings Co., Ltd. |
150,300 | 5,906,898 | ||||||
| Nippon Shokubai Co., Ltd. |
64,100 | 4,181,253 | ||||||
| Nippon Soda Co., Ltd. |
64,200 | 1,695,991 | ||||||
| Nissan Chemical Corp. |
94,253 | 4,317,321 | ||||||
| Nitto Denko Corp. |
170,274 | 8,945,596 | ||||||
| NOF Corp. |
64,400 | 2,193,504 | ||||||
| Okamoto Industries, Inc. |
34,200 | 1,727,226 | ||||||
| Osaka Soda Co., Ltd. |
63,700 | 1,561,926 | ||||||
| Riken Technos Corp. |
180,400 | 738,322 | ||||||
| Sakata INX Corp. |
80,200 | 739,795 | ||||||
| Sanyo Chemical Industries Ltd. |
64,400 | 2,978,976 | ||||||
| Shikoku Chemicals Corp. |
64,900 | 709,482 | ||||||
| Shin-Etsu Chemical Co., Ltd. |
311,179 | 26,089,724 | ||||||
| Showa Denko K.K. |
74,931 | 2,633,434 | ||||||
| Sumitomo Bakelite Co., Ltd. |
64,400 | 2,306,961 | ||||||
| Sumitomo Chemical Co., Ltd. |
2,957,685 | 13,761,646 | ||||||
| Sumitomo Seika Chemicals Co., Ltd. |
16,800 | 617,753 | ||||||
| T Hasegawa Co., Ltd. |
23,400 | 377,368 | ||||||
| Taiyo Holdings Co., Ltd. |
64,026 | 2,108,459 | ||||||
| Taiyo Nippon Sanso Corp.(a) |
299,353 | 4,559,870 | ||||||
| Takasago International Corp. |
26,200 | 791,788 | ||||||
| Tayca Corp.(a) |
59,600 | 1,373,624 | ||||||
| Teijin Ltd. |
282,000 | 4,652,229 | ||||||
| Tokai Carbon Co., Ltd.(a) |
64,300 | 802,842 | ||||||
| Tokuyama Corp. |
17,800 | 420,053 | ||||||
| Tokyo Ohka Kogyo Co., Ltd. |
31,000 | 845,824 | ||||||
| Toray Industries, Inc. |
1,389,618 | 8,874,924 | ||||||
| Tosoh Corp. |
516,007 | 8,023,201 | ||||||
| Toyo Ink SC Holdings Co., Ltd. |
127,100 | 2,853,535 | ||||||
| Toyobo Co., Ltd. |
16,351 | 209,032 | ||||||
| Ube Industries Ltd. |
122,900 | 2,526,065 | ||||||
| Zeon Corp. |
128,700 | 1,302,290 | ||||||
|
|
|
|||||||
| Total Chemicals |
|
221,609,207 | ||||||
| Commercial Services & Supplies – 0.1% |
| |||||||
| Inui Global Logistics Co., Ltd.(a) |
65,000 | 525,591 | ||||||
| Mitsubishi Pencil Co., Ltd. |
65,000 | 1,259,656 | ||||||
| Pilot Corp. |
26,800 | 1,085,946 | ||||||
| Sato Holdings Corp. |
43,900 | 1,029,628 | ||||||
|
|
|
|||||||
| Total Commercial Services & Supplies |
|
3,900,821 | ||||||
| Construction & Engineering – 0.8% |
| |||||||
| JGC Corp.(a) |
141,300 | 1,877,872 | ||||||
| Kajima Corp. |
734,400 | 10,841,664 | ||||||
| Obayashi Corp. |
925,800 | 9,317,805 | ||||||
| Penta-Ocean Construction Co., Ltd. |
156,200 | 723,952 | ||||||
| Taikisha Ltd. |
63,700 | 1,936,581 | ||||||
| Toshiba Plant Systems & Services Corp. |
64,400 | 1,142,135 | ||||||
|
|
|
|||||||
| Total Construction & Engineering |
|
25,840,009 | ||||||
| Construction Materials – 0.1% |
| |||||||
| Krosaki Harima Corp. |
21,400 | 1,071,112 | ||||||
| Taiheiyo Cement Corp. |
87,400 | 2,913,728 | ||||||
|
|
|
|||||||
| Total Construction Materials |
|
3,984,840 | ||||||
| Consumer Finance – 0.0% |
| |||||||
| J Trust Co., Ltd.(a) |
64,900 | 221,640 | ||||||
| Containers & Packaging – 0.1% |
| |||||||
| Fuji Seal International, Inc. |
64,382 | 2,326,675 | ||||||
| Electrical Equipment – 1.9% |
| |||||||
| Chiyoda Integre Co., Ltd. |
32,142 | 596,174 | ||||||
| Daihen Corp.(a) |
50,600 | 1,300,601 | ||||||
| Denyo Co., Ltd. |
42,100 | 520,711 | ||||||
| Fuji Electric Co., Ltd. |
129,073 | 3,661,645 | ||||||
| Fujikura Ltd.(a) |
63,477 | 239,146 | ||||||
| Furukawa Electric Co., Ltd. |
64,181 | 1,618,369 | ||||||
| GS Yuasa Corp.(a) |
66,384 | 1,302,070 | ||||||
| Idec Corp.(a) |
7,800 | 134,457 | ||||||
| Mabuchi Motor Co., Ltd. |
72,100 | 2,507,883 | ||||||
| Mitsubishi Electric Corp. |
2,984,914 | 38,361,478 | ||||||
| Nidec Corp. |
80,758 | 10,232,922 | ||||||
| Nippon Carbon Co., Ltd.(a) |
6,100 | 270,597 | ||||||
| Nissin Electric Co., Ltd. |
21,600 | 198,076 | ||||||
| Sanyo Denki Co., Ltd. |
11,900 | 426,824 | ||||||
| Tatsuta Electric Wire and Cable Co., Ltd. |
87,600 | 360,894 | ||||||
|
|
|
|||||||
| Total Electrical Equipment |
|
61,731,847 | ||||||
| Electronic Equipment, Instruments & Components – 4.4% |
| |||||||
| Ai Holdings Corp. |
63,200 | 1,044,340 | ||||||
| Alps Alpine Co., Ltd. |
120,400 | 2,512,752 | ||||||
| Amano Corp. |
63,433 | 1,494,058 | ||||||
| Anritsu Corp.(a) |
63,400 | 1,174,233 | ||||||
| Canon Electronics, Inc. |
64,200 | 1,017,363 | ||||||
See Notes to Financial Statements.
| 30 | WisdomTree Trust |
Schedule of Investments (continued)
WisdomTree Japan Hedged Equity Fund (DXJ)
March 31, 2019
| Investments | Shares | Value | ||||||
| Citizen Watch Co., Ltd. |
465,585 | $ | 2,595,347 | |||||
| Dexerials Corp. |
30,500 | 202,259 | ||||||
| ESPEC Corp. |
55,100 | 1,026,980 | ||||||
| Excel Co., Ltd. |
37,900 | 801,247 | ||||||
| Hakuto Co., Ltd. |
64,019 | 678,451 | ||||||
| Hamamatsu Photonics K.K. |
64,300 | 2,486,371 | ||||||
| Hirose Electric Co., Ltd.(a) |
64,360 | 6,762,495 | ||||||
| Hitachi High-Technologies Corp. |
128,719 | 5,273,891 | ||||||
| Hitachi Ltd. |
950,205 | 30,776,392 | ||||||
| Horiba Ltd. |
64,900 | 3,606,044 | ||||||
| Ibiden Co., Ltd.(a) |
126,501 | 1,922,344 | ||||||
| Iriso Electronics Co., Ltd.(a) |
25,800 | 1,179,455 | ||||||
| Japan Aviation Electronics Industry Ltd. |
49,800 | 693,335 | ||||||
| Kaga Electronics Co., Ltd. |
62,800 | 1,152,908 | ||||||
| Keyence Corp. |
13,120 | 8,175,330 | ||||||
| Koa Corp. |
9,100 | 122,419 | ||||||
| Kyosan Electric Manufacturing Co., Ltd. |
64,400 | 211,205 | ||||||
| Macnica Fuji Electronics Holdings, Inc.(a) |
63,700 | 869,016 | ||||||
| Marubun Corp. |
64,300 | 370,051 | ||||||
| Murata Manufacturing Co., Ltd. |
532,468 | 26,516,363 | ||||||
| Nippon Electric Glass Co., Ltd. |
158,360 | 4,199,183 | ||||||
| Oki Electric Industry Co., Ltd. |
60,730 | 717,666 | ||||||
| Omron Corp. |
151,300 | 7,080,761 | ||||||
| Optex Group Co., Ltd. |
48,000 | 765,415 | ||||||
| Osaki Electric Co., Ltd. |
64,900 | 403,994 | ||||||
| Riken Keiki Co., Ltd. |
38,300 | 738,422 | ||||||
| Ryoden Corp. |
50,400 | 668,448 | ||||||
| Ryosan Co., Ltd.(a) |
64,245 | 1,722,719 | ||||||
| Sanshin Electronics Co., Ltd.(a) |
64,354 | 1,101,201 | ||||||
| Satori Electric Co., Ltd. |
64,400 | 546,921 | ||||||
| Shimadzu Corp. |
132,600 | 3,833,582 | ||||||
| Siix Corp.(a) |
48,100 | 728,334 | ||||||
| Sumida Corp.(a) |
64,400 | 908,821 | ||||||
| Taiyo Yuden Co., Ltd.(a) |
63,500 | 1,248,945 | ||||||
| TDK Corp. |
72,768 | 5,699,946 | ||||||
| Topcon Corp. |
35,500 | 418,873 | ||||||
| UKC Holdings Corp.(a) |
64,300 | 1,189,159 | ||||||
| Vitec Holdings Co., Ltd. |
66,400 | 1,227,997 | ||||||
| Yaskawa Electric Corp.(a) |
127,300 | 3,996,635 | ||||||
| Yokogawa Electric Corp. |
195,338 | 4,043,180 | ||||||
|
|
|
|||||||
| Total Electronic Equipment, Instruments & Components |
|
143,904,851 | ||||||
| Energy Equipment & Services – 0.1% |
| |||||||
| Modec, Inc. |
64,400 | 1,832,769 | ||||||
| Entertainment – 1.5% |
| |||||||
| Capcom Co., Ltd. |
73,900 | 1,655,798 | ||||||
| GungHo Online Entertainment, Inc.(a) |
548,100 | 1,995,612 | ||||||
| Koei Tecmo Holdings Co., Ltd. |
144,640 | 2,788,650 | ||||||
| Konami Holdings Corp. |
87,600 | 3,802,846 | ||||||
| Nintendo Co., Ltd. |
118,600 | 33,816,832 | ||||||
| Square Enix Holdings Co., Ltd.(a) |
74,300 | 2,604,544 | ||||||
| Toei Animation Co., Ltd. |
34,000 | 1,677,192 | ||||||
|
|
|
|||||||
| Total Entertainment |
|
48,341,474 | ||||||
| Food & Staples Retailing – 1.0% |
| |||||||
| Ministop Co., Ltd. |
64,200 | 994,162 | ||||||
| Nishimoto Co., Ltd. |
17,400 | 682,260 | ||||||
| Seven & I Holdings Co., Ltd. |
856,124 | 32,300,437 | ||||||
|
|
|
|||||||
| Total Food & Staples Retailing |
|
33,976,859 | ||||||
| Food Products – 0.9% |
| |||||||
| Ajinomoto Co., Inc. |
438,913 | 7,014,836 | ||||||
| Ariake Japan Co., Ltd. |
12,300 | 657,867 | ||||||
| Fuji Oil Holdings, Inc. |
64,300 | 2,201,716 | ||||||
| Kagome Co., Ltd. |
21,500 | 604,102 | ||||||
| Kikkoman Corp.(a) |
69,300 | 3,399,729 | ||||||
| Nippon Suisan Kaisha Ltd. |
192,300 | 1,468,071 | ||||||
| Nisshin Oillio Group Ltd. (The) |
63,481 | 1,875,438 | ||||||
| Nissin Foods Holdings Co., Ltd. |
64,300 | 4,415,052 | ||||||
| Sakata Seed Corp. |
60,439 | 2,055,860 | ||||||
| Toyo Suisan Kaisha Ltd. |
71,600 | 2,726,602 | ||||||
| Yakult Honsha Co., Ltd. |
63,687 | 4,453,516 | ||||||
|
|
|
|||||||
| Total Food Products |
|
30,872,789 | ||||||
| Health Care Equipment & Supplies – 1.4% |
| |||||||
| Asahi Intecc Co., Ltd. |
40,800 | 1,916,791 | ||||||
| Hoya Corp. |
232,657 | 15,363,328 | ||||||
| Jeol Ltd. |
77,500 | 1,394,769 | ||||||
| Nakanishi, Inc. |
64,200 | 1,254,593 | ||||||
| Nihon Kohden Corp. |
64,100 | 1,905,308 | ||||||
| Nikkiso Co., Ltd. |
34,300 | 400,376 | ||||||
| Nipro Corp. |
195,000 | 2,517,550 | ||||||
| Olympus Corp. |
480,800 | 5,221,318 | ||||||
| Sysmex Corp. |
69,660 | 4,210,375 | ||||||
| Terumo Corp. |
324,412 | 9,906,605 | ||||||
|
|
|
|||||||
| Total Health Care Equipment & Supplies |
|
44,091,013 | ||||||
| Health Care Providers & Services – 0.1% |
| |||||||
| Miraca Holdings, Inc. |
73,700 | 1,828,434 | ||||||
| Health Care Technology – 0.0% |
| |||||||
| M3, Inc. |
70,100 | 1,176,092 | ||||||
| Hotels, Restaurants & Leisure – 0.0% |
| |||||||
| Saizeriya Co., Ltd. |
4,800 | 92,457 | ||||||
| Household Durables – 2.0% |
| |||||||
| Casio Computer Co., Ltd.(a) |
387,457 | 5,058,277 | ||||||
| Foster Electric Co., Ltd. |
12,996 | 195,142 | ||||||
| Fujitsu General Ltd. |
64,400 | 911,148 | ||||||
| Nikon Corp.(a) |
430,200 | 6,067,147 | ||||||
| Panasonic Corp. |
2,479,470 | 21,375,166 | ||||||
| Rinnai Corp. |
60,800 | 4,301,071 | ||||||
| Sekisui Chemical Co., Ltd. |
542,400 | 8,717,799 | ||||||
| Sharp Corp.(a) |
77,800 | 856,127 | ||||||
| Sony Corp. |
333,300 | 13,987,248 | ||||||
| Sumitomo Forestry Co., Ltd. |
201,600 | 2,799,469 | ||||||
| Tamron Co., Ltd. |
65,000 | 1,185,662 | ||||||
| Toa Corp. |
64,900 | 654,365 | ||||||
| Zojirushi Corp.(a) |
17,400 | 180,783 | ||||||
|
|
|
|||||||
| Total Household Durables |
|
66,289,404 | ||||||
See Notes to Financial Statements.
| WisdomTree Trust | 31 |
Schedule of Investments (continued)
WisdomTree Japan Hedged Equity Fund (DXJ)
March 31, 2019
| Investments | Shares | Value | ||||||
| Household Products – 0.4% |
| |||||||
| Lion Corp. |
120,300 | $ | 2,532,403 | |||||
| Pigeon Corp. |
70,500 | 2,882,165 | ||||||
| Unicharm Corp. |
183,100 | 6,059,496 | ||||||
|
|
|
|||||||
| Total Household Products |
|
11,474,064 | ||||||
| Independent Power & Renewable Electricity Producers – 0.2% |
| |||||||
| Electric Power Development Co., Ltd. |
245,900 | 5,989,487 | ||||||
| Industrial Conglomerates – 0.1% |
| |||||||
| Nisshinbo Holdings, Inc. |
192,924 | 1,685,481 | ||||||
| Insurance – 2.4% |
| |||||||
| Dai-ichi Life Holdings, Inc. |
1,546,700 | 21,491,842 | ||||||
| Tokio Marine Holdings, Inc. |
1,148,000 | 55,613,462 | ||||||
|
|
|
|||||||
| Total Insurance |
|
77,105,304 | ||||||
| Internet & Direct Marketing Retail – 0.1% |
| |||||||
| Rakuten, Inc. |
457,200 | 4,328,912 | ||||||
| IT Services – 0.7% |
| |||||||
| Fujitsu Ltd. |
179,532 | 12,953,359 | ||||||
| NTT Data Corp. |
851,000 | 9,387,641 | ||||||
|
|
|
|||||||
| Total IT Services |
|
22,341,000 | ||||||
| Leisure Products – 1.0% |
| |||||||
| Bandai Namco Holdings, Inc. |
314,600 | 14,751,538 | ||||||
| Mizuno Corp.(a) |
57,700 | 1,337,132 | ||||||
| Shimano, Inc. |
64,100 | 10,424,177 | ||||||
| Yamaha Corp. |
91,207 | 4,556,848 | ||||||
|
|
|
|||||||
| Total Leisure Products |
|
31,069,695 | ||||||
| Machinery – 8.0% |
| |||||||
| Aida Engineering Ltd. |
64,400 | 464,301 | ||||||
| Amada Holdings Co., Ltd. |
746,193 | 7,382,042 | ||||||
| Anest Iwata Corp. |
64,400 | 565,540 | ||||||
| Asahi Diamond Industrial Co., Ltd. |
7,200 | 49,698 | ||||||
| Bando Chemical Industries Ltd. |
63,700 | 610,613 | ||||||
| CKD Corp. |
3,800 | 34,263 | ||||||
| Daifuku Co., Ltd.(a) |
83,300 | 4,334,896 | ||||||
| DMG Mori Co., Ltd. |
176,200 | 2,179,318 | ||||||
| Ebara Corp. |
64,031 | 1,804,912 | ||||||
| FANUC Corp. |
272,089 | 46,411,350 | ||||||
| Fujitec Co., Ltd.(a) |
64,400 | 712,743 | ||||||
| Furukawa Co., Ltd. |
64,400 | 810,491 | ||||||
| Glory Ltd. |
64,900 | 1,557,342 | ||||||
| Harmonic Drive Systems, Inc.(a) |
22,000 | 753,309 | ||||||
| Hino Motors Ltd. |
657,710 | 5,538,110 | ||||||
| Hitachi Construction Machinery Co., Ltd.(a) |
260,500 | 6,912,305 | ||||||
| Hitachi Zosen Corp. |
64,900 | 199,359 | ||||||
| Hokuetsu Industries Co., Ltd. |
64,400 | 670,852 | ||||||
| Hoshizaki Corp. |
37,069 | 2,297,451 | ||||||
| IHI Corp. |
119,200 | 2,863,557 | ||||||
| Iseki & Co., Ltd. |
64,300 | 946,331 | ||||||
| Japan Steel Works Ltd. (The) |
38,200 | 703,707 | ||||||
| JTEKT Corp. |
477,878 | 5,880,380 | ||||||
| Juki Corp. |
64,200 | 638,027 | ||||||
| Kawasaki Heavy Industries Ltd. |
148,351 | 3,659,016 | ||||||
| Kito Corp. |
64,100 | 967,711 | ||||||
| Kitz Corp.(a) |
112,100 | 821,368 | ||||||
| Komatsu Ltd. |
1,289,406 | 29,944,601 | ||||||
| Kubota Corp. |
1,147,702 | 16,585,349 | ||||||
| Kurita Water Industries Ltd. |
91,100 | 2,326,781 | ||||||
| Makino Milling Machine Co., Ltd. |
40,800 | 1,680,878 | ||||||
| Makita Corp. |
173,838 | 6,054,529 | ||||||
| Max Co., Ltd. |
64,400 | 947,221 | ||||||
| Meidensha Corp. |
64,400 | 882,638 | ||||||
| MINEBEA MITSUMI, Inc. |
321,601 | 4,831,933 | ||||||
| MISUMI Group, Inc.(a) |
88,400 | 2,197,920 | ||||||
| Mitsubishi Heavy Industries Ltd. |
518,819 | 21,552,421 | ||||||
| Mitsuboshi Belting Ltd. |
73,500 | 1,307,508 | ||||||
| Miura Co., Ltd. |
55,600 | 1,281,435 | ||||||
| Nabtesco Corp. |
133,400 | 3,886,841 | ||||||
| Nachi-Fujikoshi Corp. |
49,400 | 1,986,087 | ||||||
| NGK Insulators Ltd. |
358,875 | 5,213,633 | ||||||
| Nissei ASB Machine Co., Ltd.(a) |
31,500 | 1,077,179 | ||||||
| Nitta Corp. |
50,400 | 1,639,247 | ||||||
| Nitto Kohki Co., Ltd. |
58,200 | 1,148,383 | ||||||
| NSK Ltd. |
987,666 | 9,253,373 | ||||||
| NTN Corp.(a) |
902,100 | 2,673,251 | ||||||
| Obara Group, Inc. |
47,000 | 1,556,263 | ||||||
| Oiles Corp.(a) |
64,400 | 1,027,514 | ||||||
| OKUMA Corp.(a) |
64,000 | 3,463,523 | ||||||
| Organo Corp. |
27,500 | 778,900 | ||||||
| OSG Corp. |
86,924 | 1,676,675 | ||||||
| Ryobi Ltd. |
64,900 | 1,456,490 | ||||||
| Shibuya Corp. |
25,100 | 741,537 | ||||||
| Shima Seiki Manufacturing Ltd.(a) |
44,400 | 1,363,870 | ||||||
| Shinmaywa Industries Ltd. |
44,200 | 549,480 | ||||||
| SMC Corp. |
46,851 | 17,578,913 | ||||||
| Sodick Co., Ltd.(a) |
9,800 | 81,722 | ||||||
| Star Micronics Co., Ltd. |
46,300 | 704,843 | ||||||
| Sumitomo Heavy Industries Ltd. |
141,737 | 4,590,750 | ||||||
| Tadano Ltd.(a) |
13,700 | 130,087 | ||||||
| Takeuchi Manufacturing Co., Ltd. |
12,800 | 225,158 | ||||||
| THK Co., Ltd. |
125,179 | 3,092,012 | ||||||
| Toshiba Machine Co., Ltd.(a) |
42,500 | 855,107 | ||||||
| Tsubaki Nakashima Co., Ltd.(a) |
64,900 | 1,165,075 | ||||||
| Tsubakimoto Chain Co. |
64,400 | 2,298,234 | ||||||
| Tsugami Corp. |
26,000 | 200,136 | ||||||
| Union Tool Co. |
35,700 | 942,775 | ||||||
| YAMABIKO Corp. |
65,000 | 624,249 | ||||||
| Yushin Precision Equipment Co., Ltd.(a) |
64,400 | 584,740 | ||||||
|
|
|
|||||||
| Total Machinery |
|
261,928,253 | ||||||
| Marine – 0.1% |
| |||||||
| Iino Kaiun Kaisha Ltd. |
264,800 | 892,356 | ||||||
| Nippon Yusen K.K.(a) |
89,800 | 1,315,947 | ||||||
| NS United Kaiun Kaisha Ltd. |
64,900 | 1,389,060 | ||||||
|
|
|
|||||||
| Total Marine |
|
3,597,363 | ||||||
| Media – 0.3% |
| |||||||
| Dentsu, Inc. |
266,400 | 11,251,931 | ||||||
See Notes to Financial Statements.
| 32 | WisdomTree Trust |
Schedule of Investments (continued)
WisdomTree Japan Hedged Equity Fund (DXJ)
March 31, 2019
| Investments | Shares | Value | ||||||
| Metals & Mining – 2.7% |
| |||||||
| Aichi Steel Corp. |
33,000 | $ | 1,024,123 | |||||
| Daido Steel Co., Ltd.(a) |
64,900 | 2,559,412 | ||||||
| Daiki Aluminium Industry Co., Ltd.(a) |
62,200 | 373,138 | ||||||
| Dowa Holdings Co., Ltd.(a) |
81,000 | 2,663,776 | ||||||
| Hitachi Metals Ltd. |
481,318 | 5,592,221 | ||||||
| JFE Holdings, Inc. |
1,169,362 | 19,845,928 | ||||||
| Kobe Steel Ltd. |
540,200 | 4,055,709 | ||||||
| Kyoei Steel Ltd. |
64,100 | 913,853 | ||||||
| Maruichi Steel Tube Ltd. |
64,300 | 1,873,492 | ||||||
| Mitsubishi Materials Corp. |
192,200 | 5,073,934 | ||||||
| Mitsui Mining & Smelting Co., Ltd.(a) |
27,800 | 713,052 | ||||||
| Nippon Light Metal Holdings Co., Ltd. |
96,500 | 211,858 | ||||||
| Nippon Steel & Sumitomo Metal Corp. |
1,654,532 | 29,208,615 | ||||||
| Sanyo Special Steel Co., Ltd. |
64,300 | 1,318,125 | ||||||
| Sumitomo Metal Mining Co., Ltd. |
343,200 | 10,139,260 | ||||||
| Topy Industries Ltd. |
53,300 | 1,066,145 | ||||||
| UACJ Corp.(a) |
63,400 | 1,187,980 | ||||||
|
|
|
|||||||
| Total Metals & Mining | 87,820,621 | |||||||
| Multiline Retail - 0.2% | ||||||||
| Ryohin Keikaku Co., Ltd. |
23,400 | 5,927,958 | ||||||
| Oil, Gas & Consumable Fuels - 0.2% | ||||||||
| Idemitsu Kosan Co., Ltd. |
234,900 | 7,862,895 | ||||||
| Paper & Forest Products - 0.1% | ||||||||
| Hokuetsu Corp. |
28,700 | 167,764 | ||||||
| Oji Holdings Corp. |
742,500 | 4,608,551 | ||||||
|
|
|
|||||||
| Total Paper & Forest Products | 4,776,315 | |||||||
| Personal Products - 1.1% | ||||||||
| Kao Corp. |
332,780 | 26,211,104 | ||||||
| Kose Corp. |
26,500 | 4,867,371 | ||||||
| Mandom Corp. |
50,800 | 1,306,201 | ||||||
| Shiseido Co., Ltd. |
64,322 | 4,641,458 | ||||||
|
|
|
|||||||
| Total Personal Products | 37,026,134 | |||||||
| Pharmaceuticals - 7.9% | ||||||||
| Astellas Pharma, Inc. |
2,246,504 | 33,661,534 | ||||||
| Chugai Pharmaceutical Co., Ltd. |
309,800 | 21,299,887 | ||||||
| Daiichi Sankyo Co., Ltd. |
662,721 | 30,535,999 | ||||||
| Eisai Co., Ltd. |
293,777 | 16,490,369 | ||||||
| Hisamitsu Pharmaceutical Co., Inc.(a) |
64,300 | 2,956,923 | ||||||
| Kyowa Hakko Kirin Co., Ltd. |
328,770 | 7,158,474 | ||||||
| Mitsubishi Tanabe Pharma Corp. |
1,049,300 | 14,021,003 | ||||||
| Ono Pharmaceutical Co., Ltd. |
516,800 | 10,127,291 | ||||||
| Otsuka Holdings Co., Ltd. |
545,300 | 21,425,755 | ||||||
| Rohto Pharmaceutical Co., Ltd. |
43,600 | 1,119,494 | ||||||
| Santen Pharmaceutical Co., Ltd. |
255,900 | 3,812,433 | ||||||
| Shionogi & Co., Ltd. |
242,877 | 15,035,400 | ||||||
| Sumitomo Dainippon Pharma Co., Ltd. |
242,800 | 6,003,917 | ||||||
| Takeda Pharmaceutical Co., Ltd. |
1,754,063 | 71,645,831 | ||||||
| ZERIA Pharmaceutical Co., Ltd. |
64,300 | 1,111,315 | ||||||
|
|
|
|||||||
| Total Pharmaceuticals | 256,405,625 | |||||||
| Professional Services - 0.6% | ||||||||
| Outsourcing, Inc.(a) |
47,400 | 584,979 | ||||||
| Recruit Holdings Co., Ltd. |
646,200 | 18,454,517 | ||||||
|
|
|
|||||||
| Total Professional Services | 19,039,496 | |||||||
| Road & Rail - 0.2% | ||||||||
| Hitachi Transport System Ltd. |
64,400 | 1,911,316 | ||||||
| Nippon Express Co., Ltd. |
65,000 | 3,617,473 | ||||||
|
|
|
|||||||
| Total Road & Rail | 5,528,789 | |||||||
| Semiconductors & Semiconductor Equipment - 1.9% |
|
|||||||
| Advantest Corp. |
140,200 | 3,259,110 | ||||||
| Disco Corp.(a) |
57,800 | 8,235,136 | ||||||
| Lasertec Corp. |
33,900 | 1,416,520 | ||||||
| MegaChips Corp.(a) |
7,900 | 121,264 | ||||||
| NuFlare Technology, Inc. |
18,200 | 1,009,604 | ||||||
| Optorun Co., Ltd. |
9,100 | 175,858 | ||||||
| SCREEN Holdings Co., Ltd.(a) |
29,460 | 1,187,077 | ||||||
| Shinko Electric Industries Co., Ltd.(a) |
12,959 | 99,284 | ||||||
| SUMCO Corp. |
184,600 | 2,053,057 | ||||||
| Tokyo Electron Ltd.(a) |
291,053 | 42,072,982 | ||||||
| Tokyo Seimitsu Co., Ltd. |
65,200 | 1,658,790 | ||||||
| Ulvac, Inc.(a) |
20,400 | 589,782 | ||||||
|
|
|
|||||||
| Total Semiconductors & Semiconductor Equipment |
|
61,878,464 | ||||||
| Software - 0.3% | ||||||||
| Trend Micro, Inc. |
174,208 | 8,483,364 | ||||||
| Specialty Retail - 0.9% | ||||||||
| ABC-Mart, Inc. |
64,400 | 3,834,269 | ||||||
| Fast Retailing Co., Ltd. |
48,500 | 22,798,527 | ||||||
| Sanrio Co., Ltd.(a) |
97,200 | 2,319,241 | ||||||
| VT Holdings Co., Ltd.(a) |
192,400 | 724,857 | ||||||
|
|
|
|||||||
| Total Specialty Retail | 29,676,894 | |||||||
| Technology Hardware, Storage & Peripherals - 4.8% |
|
|||||||
| Brother Industries Ltd. |
325,843 | 6,029,060 | ||||||
| Canon, Inc. |
3,040,797 | 88,269,239 | ||||||
| FUJIFILM Holdings Corp. |
470,995 | 21,421,049 | ||||||
| Konica Minolta, Inc. |
752,238 | 7,401,068 | ||||||
| Maxell Holdings Ltd. |
6,400 | 90,780 | ||||||
| MCJ Co., Ltd. |
59,800 | 437,080 | ||||||
| NEC Corp. |
318,300 | 10,769,603 | ||||||
| Ricoh Co., Ltd.(a) |
575,578 | 6,016,567 | ||||||
| Riso Kagaku Corp. |
64,900 | 1,026,110 | ||||||
| Roland DG Corp. |
61,100 | 1,286,200 | ||||||
| Seiko Epson Corp.(a) |
668,800 | 10,241,821 | ||||||
| Toshiba TEC Corp. |
64,100 | 1,780,797 | ||||||
| Wacom Co., Ltd.(a) |
46,200 | 194,509 | ||||||
|
|
|
|||||||
| Total Technology Hardware, Storage & Peripherals |
|
154,963,883 | ||||||
| Textiles, Apparel & Luxury Goods - 0.3% | ||||||||
| Asics Corp. |
193,192 | 2,591,951 | ||||||
| Descente Ltd.(a) |
67,681 | 1,773,275 | ||||||
| Gunze Ltd.(a) |
24,100 | 974,364 | ||||||
| Kurabo Industries Ltd. |
17,947 | 329,316 | ||||||
| Onward Holdings Co., Ltd. |
18,800 | 99,363 | ||||||
| WisdomTree Trust | 33 |
Schedule of Investments (continued)
WisdomTree Japan Hedged Equity Fund (DXJ)
March 31, 2019
| Investments | Shares | Value | ||||||
| Seiko Holdings Corp.(a) |
64,900 | $ | 1,545,029 | |||||
| Seiren Co., Ltd.(a) |
64,210 | 948,487 | ||||||
| Wacoal Holdings Corp. |
64,400 | 1,601,200 | ||||||
|
|
|
|||||||
| Total Textiles, Apparel & Luxury Goods | 9,862,985 | |||||||
| Tobacco – 3.6% | ||||||||
| Japan Tobacco, Inc. |
4,747,431 | 117,736,803 | ||||||
| Trading Companies & Distributors – 6.7% | ||||||||
| Alconix Corp.(a) |
64,400 | 665,033 | ||||||
| Daiichi Jitsugyo Co., Ltd. |
30,000 | 865,971 | ||||||
| Hanwa Co., Ltd.(a) |
64,200 | 1,789,375 | ||||||
| Inabata & Co., Ltd. |
64,386 | 875,466 | ||||||
| ITOCHU Corp. |
2,916,094 | 52,757,630 | ||||||
| Japan Pulp & Paper Co., Ltd. |
25,800 | 967,340 | ||||||
| Marubeni Corp. |
3,305,878 | 22,848,594 | ||||||
| Mitsubishi Corp. |
2,919,100 | 81,070,727 | ||||||
| Nagase & Co., Ltd. |
193,100 | 2,772,154 | ||||||
| Nippon Steel & Sumikin Bussan Corp. |
64,200 | 2,610,110 | ||||||
| Sanyo Trading Co., Ltd.(a) |
33,100 | 559,517 | ||||||
| Shinsho Corp. |
32,500 | 758,142 | ||||||
| Sojitz Corp. |
1,774,021 | 6,250,785 | ||||||
| Sumitomo Corp. |
2,198,877 | 30,414,968 | ||||||
| Toyota Tsusho Corp. |
441,510 | 14,379,939 | ||||||
|
|
|
|||||||
| Total Trading Companies & Distributors | 219,585,751 | |||||||
| Transportation Infrastructure – 0.0% | ||||||||
| Nissin Corp. |
63,500 | 1,063,066 | ||||||
| Wireless Telecommunication Services – 0.9% |
|
|||||||
| SoftBank Group Corp. |
316,100 | 30,686,132 | ||||||
| TOTAL COMMON STOCKS (Cost: $3,537,893,698) |
3,225,289,497 | |||||||
| INVESTMENT OF CASH COLLATERAL FOR SECURITIES LOANED – 3.2% |
| |||||||
| United States – 3.2% | ||||||||
| State Street Navigator Securities Lending Government Money Market Portfolio, 2.46%(b) |
||||||||
| (Cost: $102,390,479)(c) | 102,390,479 | 102,390,479 | ||||||
| TOTAL INVESTMENTS IN SECURITIES – 102.3% (Cost: $3,640,284,177) |
|
3,327,679,976 | ||||||
| Other Assets less Liabilities – (2.3)% |
(73,263,005 | ) | ||||||
|
|
|
|||||||
| NET ASSETS – 100.0% | $ | 3,254,416,971 | ||||||
| (a) | Security, or portion thereof, was on loan at March 31, 2019 (See Note 2). |
| (b) | Rate shown represents annualized 7-day yield as of March 31, 2019. |
| (c) | At March 31, 2019, the total market value of the Fund’s securities on loan identified in the Schedule of Investments was $212,957,582 and the total market value of the collateral held by the Fund was $224,694,989. The total market value of the collateral includes non-cash U.S. Government securities collateral having a value of $122,304,510. |
| FINANCIAL DERIVATIVE INSTRUMENTS | ||||||||||||||||||||||||||||
| FOREIGN CURRENCY CONTRACTS (OTC – OVER THE COUNTER) | ||||||||||||||||||||||||||||
| Counterparty | Settlement Date |
Amount and Description of be Purchased |
Amount and Description of be Sold |
Unrealized Appreciation |
Unrealized Depreciation |
|||||||||||||||||||||||
| Bank of America N.A. |
4/3/2019 | 6,498,280,454 | JPY | 58,906,750 | USD | $ | — | $ | (192,512 | ) | ||||||||||||||||||
| Bank of America N.A. |
4/3/2019 | 23,819,583,267 | JPY | 214,919,997 | USD | 298,272 | — | |||||||||||||||||||||
| Bank of America N.A. |
4/3/2019 | 207,761,546 | USD | 23,026,606,890 | JPY | — | (291,904 | ) | ||||||||||||||||||||
| Bank of America N.A. |
5/9/2019 | 210,629,570 | USD | 23,279,601,531 | JPY | — | (359,971 | ) | ||||||||||||||||||||
| Bank of Montreal |
4/3/2019 | 23,813,135,667 | JPY | 214,919,997 | USD | 240,016 | — | |||||||||||||||||||||
| Bank of Montreal |
4/3/2019 | 207,761,546 | USD | 23,030,679,016 | JPY | — | (328,697 | ) | ||||||||||||||||||||
| Bank of Montreal |
5/9/2019 | 210,629,570 | USD | 23,273,240,518 | JPY | — | (302,319 | ) | ||||||||||||||||||||
| Barclays Bank PLC |
4/3/2019 | 23,804,775,279 | JPY | 214,919,997 | USD | 164,477 | — | |||||||||||||||||||||
| Barclays Bank PLC |
4/3/2019 | 207,761,546 | USD | 23,049,772,302 | JPY | — | (501,212 | ) | ||||||||||||||||||||
| Barclays Bank PLC |
5/9/2019 | 210,629,570 | USD | 23,265,047,028 | JPY | — | (228,059 | ) | ||||||||||||||||||||
| Canadian Imperial Bank of Commerce |
4/3/2019 | 23,802,389,667 | JPY | 214,919,997 | USD | 142,922 | — | |||||||||||||||||||||
| Canadian Imperial Bank of Commerce |
4/3/2019 | 207,761,546 | USD | 23,057,895,778 | JPY | — | (574,610 | ) | ||||||||||||||||||||
| Canadian Imperial Bank of Commerce |
5/9/2019 | 210,629,570 | USD | 23,263,193,488 | JPY | — | (211,260 | ) | ||||||||||||||||||||
| Citibank N.A. |
4/2/2019 | 1,375,752 | USD | 152,466,339 | JPY | — | (1,728 | ) | ||||||||||||||||||||
| Citibank N.A. |
4/3/2019 | 1,143,713,973 | JPY | 10,244,652 | USD | 89,204 | — | |||||||||||||||||||||
| Citibank N.A. |
4/3/2019 | 1,425,604,793 | JPY | 12,805,815 | USD | 75,023 | — | |||||||||||||||||||||
| Citibank N.A. |
4/3/2019 | 2,528,345,794 | JPY | 23,050,467 | USD | — | (205,978 | ) | ||||||||||||||||||||
| Citibank N.A. |
4/3/2019 | 1,408,938,025 | JPY | 12,805,815 | USD | — | (75,567 | ) | ||||||||||||||||||||
| Citibank N.A. |
4/3/2019 | 23,802,002,811 | JPY | 214,919,997 | USD | 139,427 | — | |||||||||||||||||||||
| Citibank N.A. |
4/3/2019 | 207,761,546 | USD | 23,073,270,133 | JPY | — | (713,523 | ) | ||||||||||||||||||||
| Citibank N.A. |
5/9/2019 | 210,629,570 | USD | 23,262,730,103 | JPY | — | (207,060 | ) | ||||||||||||||||||||
| Commonwealth Bank of Australia |
4/3/2019 | 23,810,986,467 | JPY | 214,919,997 | USD | 220,597 | — | |||||||||||||||||||||
| Commonwealth Bank of Australia |
4/3/2019 | 207,761,546 | USD | 23,070,008,277 | JPY | — | (684,051 | ) | ||||||||||||||||||||
See Notes to Financial Statements.
| 34 | WisdomTree Trust |
Schedule of Investments (concluded)
WisdomTree Japan Hedged Equity Fund (DXJ)
March 31, 2019
| FINANCIAL DERIVATIVE INSTRUMENTS | ||||||||||||||||||||||||||||
| FOREIGN CURRENCY CONTRACTS (OTC – OVER THE COUNTER) | ||||||||||||||||||||||||||||
| Counterparty | Settlement Date |
Amount and Description of be Purchased |
Amount and Description of be Sold |
Unrealized Appreciation |
Unrealized Depreciation |
|||||||||||||||||||||||
| Commonwealth Bank of Australia |
5/9/2019 | 210,629,570 | USD | 23,271,302,726 | JPY | $ | — | $ | (284,756 | ) | ||||||||||||||||||
| Credit Suisse International |
4/3/2019 | 23,806,731,051 | JPY | 214,919,997 | USD | 182,148 | — | |||||||||||||||||||||
| Credit Suisse International |
4/3/2019 | 207,761,546 | USD | 23,056,483,000 | JPY | — | (561,845 | ) | ||||||||||||||||||||
| Credit Suisse International |
5/9/2019 | 210,629,570 | USD | 23,267,553,520 | JPY | — | (250,776 | ) | ||||||||||||||||||||
| Goldman Sachs |
4/1/2019 | 1,046,085 | USD | 115,705,369 | JPY | 728 | — | |||||||||||||||||||||
| Goldman Sachs |
4/3/2019 | 23,821,796,943 | JPY | 214,919,997 | USD | 318,274 | — | |||||||||||||||||||||
| Goldman Sachs |
4/3/2019 | 207,761,546 | USD | 23,073,727,208 | JPY | — | (717,653 | ) | ||||||||||||||||||||
| Goldman Sachs |
5/9/2019 | 210,629,570 | USD | 23,282,592,471 | JPY | — | (387,079 | ) | ||||||||||||||||||||
| HSBC Holdings PLC |
4/3/2019 | 23,813,135,667 | JPY | 214,919,997 | USD | 240,016 | — | |||||||||||||||||||||
| HSBC Holdings PLC |
4/3/2019 | 207,761,546 | USD | 23,085,424,183 | JPY | — | (823,339 | ) | ||||||||||||||||||||
| HSBC Holdings PLC |
5/9/2019 | 210,629,570 | USD | 23,273,198,392 | JPY | — | (301,937 | ) | ||||||||||||||||||||
| JP Morgan Chase Bank N.A. |
4/3/2019 | 23,829,684,507 | JPY | 214,919,997 | USD | 389,541 | — | |||||||||||||||||||||
| JP Morgan Chase Bank N.A. |
4/3/2019 | 207,761,546 | USD | 23,092,217,986 | JPY | — | (884,724 | ) | ||||||||||||||||||||
| JP Morgan Chase Bank N.A. |
5/9/2019 | 210,629,570 | USD | 23,289,311,554 | JPY | — | (447,975 | ) | ||||||||||||||||||||
| Morgan Stanley & Co. International |
4/3/2019 | 23,821,947,387 | JPY | 214,919,997 | USD | 319,633 | — | |||||||||||||||||||||
| Morgan Stanley & Co. International |
4/3/2019 | 207,761,546 | USD | 23,073,955,746 | JPY | — | (719,718 | ) | ||||||||||||||||||||
| Morgan Stanley & Co. International |
5/9/2019 | 210,629,570 | USD | 23,282,803,101 | JPY | — | (388,988 | ) | ||||||||||||||||||||
| Royal Bank of Canada |
4/3/2019 | 23,819,798,187 | JPY | 214,919,997 | USD | 300,214 | — | |||||||||||||||||||||
| Royal Bank of Canada |
4/3/2019 | 207,761,546 | USD | 23,091,449,268 | JPY | — | (877,778 | ) | ||||||||||||||||||||
| Royal Bank of Canada |
5/9/2019 | 210,629,570 | USD | 23,279,727,909 | JPY | — | (361,116 | ) | ||||||||||||||||||||
| Societe Generale |
4/3/2019 | 23,828,180,067 | JPY | 214,919,997 | USD | 375,947 | — | |||||||||||||||||||||
| Societe Generale |
4/3/2019 | 207,761,546 | USD | 23,083,242,687 | JPY | — | (803,629 | ) | ||||||||||||||||||||
| Societe Generale |
5/9/2019 | 210,629,570 | USD | 23,288,258,407 | JPY | — | (438,430 | ) | ||||||||||||||||||||
| Standard Chartered Bank |
4/3/2019 | 23,826,030,867 | JPY | 214,919,997 | USD | 356,529 | — | |||||||||||||||||||||
| Standard Chartered Bank |
4/3/2019 | 207,761,546 | USD | 23,080,126,264 | JPY | — | (775,471 | ) | ||||||||||||||||||||
| Standard Chartered Bank |
5/9/2019 | 210,629,570 | USD | 23,285,941,481 | JPY | — | (417,432 | ) | ||||||||||||||||||||
| State Street Bank and Trust |
4/3/2019 | 23,821,839,927 | JPY | 214,919,997 | USD | 318,662 | — | |||||||||||||||||||||
| State Street Bank and Trust |
4/3/2019 | 207,761,546 | USD | 23,073,103,924 | JPY | — | (712,021 | ) | ||||||||||||||||||||
| State Street Bank and Trust |
5/9/2019 | 210,629,570 | USD | 23,281,728,890 | JPY | — | (379,252 | ) | ||||||||||||||||||||
| UBS AG |
4/3/2019 | 4,266,176,701 | JPY | 38,417,446 | USD | 128,953 | — | |||||||||||||||||||||
| UBS AG |
4/3/2019 | 9,167,264,423 | JPY | 82,661,544 | USD | 167,898 | — | |||||||||||||||||||||
| UBS AG |
4/3/2019 | 207,761,546 | USD | 23,071,088,637 | JPY | — | (693,813 | ) | ||||||||||||||||||||
| UBS AG |
5/9/2019 | 81,011,377 | USD | 8,959,542,351 | JPY | — | (191,462 | ) | ||||||||||||||||||||
| Wells Fargo Bank N.A. |
4/3/2019 | 138,507,708 | USD | 15,394,439,205 | JPY | — | (586,437 | ) | ||||||||||||||||||||
| $ | 4,468,481 | $ | (16,884,082 | ) | ||||||||||||||||||||||||
| CURRENCY LEGEND | ||
| JPY | Japanese yen | |
| USD | U.S. dollar | |
See Notes to Financial Statements.
| WisdomTree Trust | 35 |
Schedule of Investments
WisdomTree Japan Hedged SmallCap Equity Fund (DXJS)
March 31, 2019
| Investments | Shares | Value | ||||||
| COMMON STOCKS – 99.0% | ||||||||
| Japan – 99.0% | ||||||||
| Air Freight & Logistics – 0.3% | ||||||||
| Kintetsu World Express, Inc. |
5,000 | $ | 76,162 | |||||
| Konoike Transport Co., Ltd. |
6,200 | 102,563 | ||||||
| Maruwa Unyu Kikan Co., Ltd.(a) |
1,600 | 54,786 | ||||||
| SBS Holdings, Inc. |
2,800 | 47,078 | ||||||
|
|
|
|||||||
| Total Air Freight & Logistics |
|
280,589 | ||||||
| Auto Components – 5.9% | ||||||||
| Ahresty Corp.(a) |
5,200 | 29,738 | ||||||
| Aisan Industry Co., Ltd. |
9,400 | 57,749 | ||||||
| Daido Metal Co., Ltd.(a) |
7,600 | 48,614 | ||||||
| Daikyonishikawa Corp. |
6,800 | 62,419 | ||||||
| Eagle Industry Co., Ltd.(a) |
7,300 | 79,737 | ||||||
| Exedy Corp.(a) |
6,700 | 145,156 | ||||||
| FCC Co., Ltd. |
4,500 | 95,176 | ||||||
| Futaba Industrial Co., Ltd.(a) |
8,100 | 39,883 | ||||||
| G-Tekt Corp. |
5,998 | 82,910 | ||||||
| H-One Co., Ltd. |
3,800 | 30,761 | ||||||
| IJT Technology Holdings Co., Ltd.(a) |
6,400 | 33,594 | ||||||
| Imasen Electric Industrial |
5,200 | 47,027 | ||||||
| Kasai Kogyo Co., Ltd.(a) |
5,800 | 42,864 | ||||||
| Keihin Corp. |
9,000 | 147,337 | ||||||
| KYB Corp.(a) |
3,500 | 85,947 | ||||||
| Mitsuba Corp.(a) |
2,800 | 15,735 | ||||||
| Musashi Seimitsu Industry Co., Ltd. |
6,400 | 86,733 | ||||||
| NHK Spring Co., Ltd.(a) |
27,400 | 246,064 | ||||||
| Nichirin Co., Ltd. |
1,900 | 30,487 | ||||||
| Nifco, Inc.(a) |
10,000 | 254,777 | ||||||
| Nihon Tokushu Toryo Co., Ltd.(a) |
1,800 | 18,751 | ||||||
| Nippon Piston Ring Co., Ltd. |
1,000 | 14,212 | ||||||
| Nissin Kogyo Co., Ltd. |
8,700 | 109,020 | ||||||
| NOK Corp.(a) |
24,100 | 375,157 | ||||||
| Pacific Industrial Co., Ltd.(a) |
5,500 | 77,319 | ||||||
| Piolax, Inc.(a) |
3,200 | 61,551 | ||||||
| Press Kogyo Co., Ltd. |
11,500 | 60,988 | ||||||
| Riken Corp. |
1,700 | 77,255 | ||||||
| Sanoh Industrial Co., Ltd.(a) |
8,700 | 39,694 | ||||||
| Shoei Co., Ltd.(a) |
1,900 | 81,109 | ||||||
| Showa Corp. |
4,400 | 56,130 | ||||||
| Sumitomo Riko Co., Ltd. |
8,400 | 70,427 | ||||||
| T. RAD Co., Ltd. |
1,300 | 24,923 | ||||||
| Tachi-S Co., Ltd. |
2,100 | 30,053 | ||||||
| Taiho Kogyo Co., Ltd. |
4,600 | 37,611 | ||||||
| Tokai Rika Co., Ltd. |
15,725 | 268,086 | ||||||
| Topre Corp.(a) |
5,800 | 108,313 | ||||||
| Toyo Tire Corp. |
18,200 | 206,360 | ||||||
| Toyoda Gosei Co., Ltd. |
13,600 | 288,010 | ||||||
| Toyota Boshoku Corp. |
27,100 | 410,105 | ||||||
| TPR Co., Ltd. |
2,906 | 55,266 | ||||||
| TS Tech Co., Ltd. |
6,900 | 198,550 | ||||||
| Unipres Corp. |
7,000 | 109,346 | ||||||
| Yokohama Rubber Co., Ltd. (The) |
24,000 | 445,806 | ||||||
| Investments | Shares | Value | ||||||
| Yorozu Corp.(a) |
3,900 | $ | 50,950 | |||||
|
|
|
|||||||
| Total Auto Components |
|
4,937,700 | ||||||
| Banks – 5.8% | ||||||||
| 77 Bank Ltd. (The) |
8,400 | 117,403 | ||||||
| Akita Bank Ltd. (The)(a) |
2,800 | 56,842 | ||||||
| Aomori Bank Ltd. (The) |
1,200 | 31,809 | ||||||
| Awa Bank Ltd. (The) |
3,000 | 76,270 | ||||||
| Bank of Nagoya Ltd. (The) |
1,000 | 32,254 | ||||||
| Bank of Okinawa Ltd. (The) |
1,340 | 41,707 | ||||||
| Bank of Saga Ltd. (The) |
3,100 | 53,382 | ||||||
| Bank of the Ryukyus Ltd.(a) |
6,200 | 63,185 | ||||||
| Chugoku Bank Ltd. (The) |
15,500 | 145,498 | ||||||
| Chukyo Bank Ltd. (The) |
2,500 | 51,294 | ||||||
| Daishi Hokuetsu Financial Group, Inc. |
5,200 | 146,813 | ||||||
| Ehime Bank Ltd. (The)(a) |
3,100 | 31,872 | ||||||
| FIDEA Holdings Co., Ltd.(a) |
54,900 | 64,976 | ||||||
| First Bank of Toyama Ltd. (The) |
5,200 | 17,336 | ||||||
| Fukui Bank Ltd. (The) |
1,000 | 15,305 | ||||||
| Gunma Bank Ltd. (The) |
53,300 | 201,768 | ||||||
| Hachijuni Bank Ltd. (The) |
74,900 | 310,603 | ||||||
| Hiroshima Bank Ltd. (The)(a) |
40,600 | 206,879 | ||||||
| Hokkoku Bank Ltd. (The) |
3,100 | 97,186 | ||||||
| Hokuhoku Financial Group, Inc.(a) |
21,500 | 223,964 | ||||||
| Hyakugo Bank Ltd. (The) |
26,300 | 83,639 | ||||||
| Hyakujushi Bank Ltd. (The) |
3,300 | 68,334 | ||||||
| Iyo Bank Ltd. (The)(a) |
33,700 | 178,418 | ||||||
| Jimoto Holdings, Inc.(a) |
43,400 | 45,484 | ||||||
| Juroku Bank Ltd. (The) |
6,400 | 129,983 | ||||||
| Keiyo Bank Ltd. (The) |
16,700 | 97,468 | ||||||
| Kiyo Bank Ltd. (The)(a) |
6,298 | 87,797 | ||||||
| Kyushu Financial Group, Inc.(a) |
61,100 | 248,408 | ||||||
| Michinoku Bank Ltd. (The) |
3,800 | 55,205 | ||||||
| Miyazaki Bank Ltd. (The) |
1,700 | 42,529 | ||||||
| Musashino Bank Ltd. (The) |
3,700 | 73,843 | ||||||
| Nanto Bank Ltd. (The) |
5,200 | 97,390 | ||||||
| Nishi-Nippon Financial Holdings, Inc. |
24,000 | 203,822 | ||||||
| North Pacific Bank Ltd. |
72,300 | 180,938 | ||||||
| Ogaki Kyoritsu Bank Ltd. (The) |
6,500 | 135,068 | ||||||
| Oita Bank Ltd. (The) |
1,000 | 31,260 | ||||||
| San-In Godo Bank Ltd. (The)(a) |
25,000 | 179,338 | ||||||
| Senshu Ikeda Holdings, Inc. |
57,700 | 148,049 | ||||||
| Shiga Bank Ltd. (The)(a) |
3,100 | 73,884 | ||||||
| Shikoku Bank Ltd. (The) |
4,400 | 41,343 | ||||||
| Suruga Bank Ltd.*(a) |
23,500 | 108,917 | ||||||
| Tochigi Bank Ltd. (The) |
14,700 | 31,210 | ||||||
| Toho Bank Ltd. (The)(a) |
32,500 | 86,913 | ||||||
| Tokyo Kiraboshi Financial Group, Inc.(a) |
3,500 | 49,487 | ||||||
| TOMONY Holdings, Inc. |
18,300 | 69,606 | ||||||
| Towa Bank Ltd. (The)(a) |
5,200 | 33,450 | ||||||
| Yamagata Bank Ltd. (The) |
1,300 | 23,138 | ||||||
| Yamaguchi Financial Group, Inc. |
23,900 | 202,541 | ||||||
| Yamanashi Chuo Bank Ltd. (The) |
2,900 | 35,921 | ||||||
|
|
|
|||||||
| Total Banks |
|
4,829,729 | ||||||
See Notes to Financial Statements.
| 36 | WisdomTree Trust |
Schedule of Investments (continued)
WisdomTree Japan Hedged SmallCap Equity Fund (DXJS)
March 31, 2019
| Investments | Shares | Value | ||||||
| Beverages – 0.5% |
| |||||||
| Ito En Ltd. |
3,400 | $ | 176,627 | |||||
| Sapporo Holdings Ltd. |
5,000 | 109,184 | ||||||
| Takara Holdings, Inc. |
12,600 | 149,012 | ||||||
|
|
|
|||||||
| Total Beverages | 434,823 | |||||||
| Building Products – 2.1% | ||||||||
| Aica Kogyo Co., Ltd.(a) |
7,300 | 243,366 | ||||||
| Bunka Shutter Co., Ltd. |
7,800 | 56,517 | ||||||
| Central Glass Co., Ltd. |
4,100 | 90,012 | ||||||
| Komatsu Wall Industry Co., Ltd. |
1,900 | 32,375 | ||||||
| Kondotec, Inc. |
6,100 | 55,442 | ||||||
| Nichias Corp. |
7,300 | 144,569 | ||||||
| Nichiha Corp. |
2,300 | 63,378 | ||||||
| Nitto Boseki Co., Ltd. |
3,000 | 53,666 | ||||||
| Noritz Corp. |
3,800 | 59,325 | ||||||
| Okabe Co., Ltd. |
9,300 | 80,409 | ||||||
| Sankyo Tateyama, Inc. |
3,100 | 41,675 | ||||||
| Sanwa Holdings Corp. |
29,700 | 353,389 | ||||||
| Shin Nippon Air Technologies Co., Ltd. |
4,200 | 73,387 | ||||||
| Sinko Industries Ltd. |
2,900 | 39,222 | ||||||
| Takara Standard Co., Ltd. |
7,317 | 112,051 | ||||||
| Takasago Thermal Engineering Co., Ltd. |
11,500 | 185,147 | ||||||
| Toli Corp. |
13,000 | 31,242 | ||||||
|
|
|
|||||||
| Total Building Products | 1,715,172 | |||||||
| Capital Markets – 2.7% | ||||||||
| GCA Corp. |
11,500 | 81,872 | ||||||
| GMO Financial Holdings, Inc. |
22,000 | 128,202 | ||||||
| Ichiyoshi Securities Co., Ltd. |
13,600 | 95,348 | ||||||
| IwaiCosmo Holdings, Inc. |
9,400 | 104,968 | ||||||
| kabu.com Securities Co., Ltd. |
62,400 | 313,452 | ||||||
| Kyokuto Securities Co., Ltd.(a) |
7,600 | 70,586 | ||||||
| Marusan Securities Co., Ltd.(a) |
26,200 | 154,807 | ||||||
| Matsui Securities Co., Ltd.(a) |
61,900 | 582,733 | ||||||
| Mito Securities Co., Ltd. |
26,500 | 49,320 | ||||||
| Monex Group, Inc.(a) |
25,665 | 88,808 | ||||||
| Okasan Securities Group, Inc.(a) |
51,600 | 191,603 | ||||||
| Sparx Group Co., Ltd.(a) |
34,400 | 72,725 | ||||||
| Tokai Tokyo Financial Holdings, Inc.(a) |
75,400 | 273,166 | ||||||
| Toyo Securities Co., Ltd. |
31,000 | 39,770 | ||||||
|
|
|
|||||||
| Total Capital Markets | 2,247,360 | |||||||
| Chemicals – 7.3% | ||||||||
| Achilles Corp.(a) |
3,100 | 53,466 | ||||||
| ADEKA Corp.(a) |
11,800 | 173,026 | ||||||
| Arakawa Chemical Industries Ltd.(a) |
3,600 | 44,266 | ||||||
| Asahi Yukizai Corp. |
3,000 | 44,125 | ||||||
| C.I. Takiron Corp. |
13,500 | 73,181 | ||||||
| Chugoku Marine Paints Ltd.(a) |
10,500 | 94,010 | ||||||
| Dai Nippon Toryo Co., Ltd. |
5,100 | 50,961 | ||||||
| Dainichiseika Color & Chemicals |
2,100 | 57,298 | ||||||
| Denka Co., Ltd. |
13,300 | 383,313 | ||||||
| DIC Corp. |
17,900 | 523,165 | ||||||
| DKS Co., Ltd.(a) |
1,100 | 34,585 | ||||||
| Investments | Shares | Value | ||||||
| Fujimi, Inc. |
3,800 | 83,048 | ||||||
| Fujimori Kogyo Co., Ltd. |
1,100 | 30,212 | ||||||
| Fuso Chemical Co., Ltd.(a) |
3,100 | 52,150 | ||||||
| JCU Corp. |
3,100 | 48,481 | ||||||
| JSP Corp.(a) |
1,917 | 42,311 | ||||||
| Kaneka Corp. |
6,448 | 241,469 | ||||||
| KH Neochem Co., Ltd. |
3,700 | 89,253 | ||||||
| Koatsu Gas Kogyo Co., Ltd. |
6,600 | 50,923 | ||||||
| Konishi Co., Ltd. |
1,800 | 26,085 | ||||||
| Kumiai Chemical Industry Co., Ltd. |
7,894 | 55,700 | ||||||
| Kureha Corp.(a) |
2,100 | 117,821 | ||||||
| Lintec Corp. |
9,400 | 203,312 | ||||||
| Moriroku Holdings Co., Ltd. |
3,100 | 72,987 | ||||||
| Nihon Nohyaku Co., Ltd.(a) |
11,400 | 45,936 | ||||||
| Nihon Parkerizing Co., Ltd. |
8,500 | 106,130 | ||||||
| Nippon Kayaku Co., Ltd.(a) |
26,200 | 309,614 | ||||||
| Nippon Shokubai Co., Ltd. |
4,500 | 293,536 | ||||||
| Nippon Soda Co., Ltd. |
3,100 | 81,894 | ||||||
| NOF Corp. |
9,200 | 313,358 | ||||||
| Okamoto Industries, Inc. |
1,600 | 80,806 | ||||||
| Okura Industrial Co., Ltd. |
1,133 | 18,241 | ||||||
| Osaka Organic Chemical Industry Ltd. |
3,800 | 37,353 | ||||||
| Osaka Soda Co., Ltd. |
2,777 | 68,092 | ||||||
| Riken Technos Corp.(a) |
13,400 | 54,842 | ||||||
| Sakai Chemical Industry Co., Ltd. |
2,600 | 57,104 | ||||||
| Sakata INX Corp. |
6,700 | 61,803 | ||||||
| Sanyo Chemical Industries Ltd. |
2,500 | 115,643 | ||||||
| Sekisui Plastics Co., Ltd. |
5,700 | 45,781 | ||||||
| Shikoku Chemicals Corp.(a) |
4,500 | 49,194 | ||||||
| Sumitomo Bakelite Co., Ltd. |
3,100 | 111,049 | ||||||
| Sumitomo Seika Chemicals Co., Ltd. |
1,000 | 36,771 | ||||||
| T Hasegawa Co., Ltd. |
3,700 | 59,669 | ||||||
| Taiyo Holdings Co., Ltd.(a) |
5,600 | 184,415 | ||||||
| Takasago International Corp. |
2,300 | 69,508 | ||||||
| Tayca Corp.(a) |
1,300 | 29,962 | ||||||
| Toagosei Co., Ltd. |
14,400 | 152,216 | ||||||
| Tokuyama Corp. |
2,900 | 68,436 | ||||||
| Tokyo Ohka Kogyo Co., Ltd. |
3,900 | 106,410 | ||||||
| Toyo Ink SC Holdings Co., Ltd. |
8,500 | 190,834 | ||||||
| Toyobo Co., Ltd.(a) |
11,600 | 148,295 | ||||||
| Ube Industries Ltd. |
14,380 | 295,564 | ||||||
| Valqua Ltd.(a) |
3,100 | 61,980 | ||||||
| Zeon Corp. |
16,100 | 162,913 | ||||||
|
|
|
|||||||
| Total Chemicals | 6,062,497 | |||||||
| Commercial Services & Supplies – 1.6% | ||||||||
| Aeon Delight Co., Ltd. |
4,400 | 171,134 | ||||||
| Bell System24 Holdings, Inc. |
8,000 | 98,875 | ||||||
| Daiseki Co., Ltd. |
3,100 | 75,368 | ||||||
| Kokuyo Co., Ltd. |
9,400 | 137,919 | ||||||
| Kyoritsu Printing Co., Ltd. |
14,800 | 29,818 | ||||||
| Matsuda Sangyo Co., Ltd. |
3,400 | 42,790 | ||||||
| Mitsubishi Pencil Co., Ltd. |
3,500 | 67,828 | ||||||
| Nakamoto Packs Co., Ltd. |
3,100 | 42,683 | ||||||
See Notes to Financial Statements.
| WisdomTree Trust | 37 |
Schedule of Investments (continued)
WisdomTree Japan Hedged SmallCap Equity Fund (DXJS)
March 31, 2019
| Investments | Shares | Value | ||||||
| Nichiban Co., Ltd. |
1,000 | $ | 21,177 | |||||
| Nippon Air Conditioning Services Co., Ltd. |
9,100 | 55,989 | ||||||
| Nippon Parking Development Co., Ltd. |
37,600 | 58,429 | ||||||
| Okamura Corp. |
10,700 | 112,041 | ||||||
| Pilot Corp. |
1,000 | 40,521 | ||||||
| Prestige International, Inc. |
2,400 | 30,140 | ||||||
| Relia, Inc. |
8,400 | 73,235 | ||||||
| Sato Holdings Corp. |
4,100 | 96,161 | ||||||
| Toppan Forms Co., Ltd. |
14,900 | 127,212 | ||||||
| Uchida Yoko Co., Ltd. |
1,200 | 35,289 | ||||||
|
|
|
|||||||
| Total Commercial Services & Supplies | 1,316,609 | |||||||
| Construction & Engineering – 5.9% | ||||||||
| Asanuma Corp.(a) |
1,900 | 42,228 | ||||||
| Asunaro Aoki Construction Co., Ltd. |
3,000 | 26,562 | ||||||
| COMSYS Holdings Corp.(a) |
11,500 | 313,773 | ||||||
| Daiho Corp. |
2,000 | 58,454 | ||||||
| Fudo Tetra Corp.(a) |
3,440 | 44,816 | ||||||
| Hazama Ando Corp. |
25,500 | 170,714 | ||||||
| Kandenko Co., Ltd. |
22,400 | 191,448 | ||||||
| Kitano Construction Corp. |
1,000 | 28,098 | ||||||
| Kumagai Gumi Co., Ltd. |
5,200 | 162,551 | ||||||
| Kyowa Exeo Corp.(a) |
10,500 | 289,809 | ||||||
| Kyudenko Corp. |
5,800 | 181,831 | ||||||
| Maeda Corp. |
13,300 | 131,937 | ||||||
| Maeda Road Construction Co., Ltd. |
11,400 | 221,336 | ||||||
| Matsui Construction Co., Ltd. |
1,000 | 6,415 | ||||||
| Meisei Industrial Co., Ltd. |
9,200 | 62,090 | ||||||
| Mirait Holdings Corp.(a) |
7,544 | 110,210 | ||||||
| Nippo Corp. |
11,600 | 216,311 | ||||||
| Nippon Densetsu Kogyo Co., Ltd. |
4,500 | 93,671 | ||||||
| Nippon Koei Co., Ltd. |
1,500 | 31,766 | ||||||
| Nippon Road Co., Ltd. (The) |
1,400 | 82,342 | ||||||
| Nishimatsu Construction Co., Ltd. |
8,500 | 188,377 | ||||||
| Nittoc Construction Co., Ltd.(a) |
9,500 | 51,154 | ||||||
| Okumura Corp.(a) |
11,500 | 365,203 | ||||||
| OSJB Holdings Corp. |
10,400 | 26,027 | ||||||
| Penta-Ocean Construction Co., Ltd. |
27,700 | 128,383 | ||||||
| PS Mitsubishi Construction Co., Ltd.(a) |
8,200 | 49,044 | ||||||
| Raito Kogyo Co., Ltd. |
9,300 | 125,361 | ||||||
| Shinnihon Corp. |
5,200 | 46,088 | ||||||
| SHO-BOND Holdings Co., Ltd. |
2,300 | 153,562 | ||||||
| Sumitomo Densetsu Co., Ltd. |
3,300 | 55,991 | ||||||
| Sumitomo Mitsui Construction Co., Ltd. |
22,040 | 153,524 | ||||||
| Taihei Dengyo Kaisha Ltd. |
2,600 | 55,225 | ||||||
| Taikisha Ltd. |
3,900 | 118,566 | ||||||
| Tekken Corp. |
2,700 | 66,497 | ||||||
| Tobishima Corp. |
3,160 | 38,428 | ||||||
| Toda Corp. |
33,200 | 203,966 | ||||||
| Tokyo Energy & Systems, Inc. |
4,800 | 42,716 | ||||||
| Tokyu Construction Co., Ltd. |
15,600 | 116,981 | ||||||
| Toshiba Plant Systems & Services Corp. |
8,500 | 150,748 | ||||||
| Totetsu Kogyo Co., Ltd. |
3,100 | 85,423 | ||||||
| Toyo Construction Co., Ltd. |
13,600 | 52,466 | ||||||
| Investments | Shares | Value | ||||||
| Wakachiku Construction Co., Ltd. |
3,200 | 42,990 | ||||||
| Yahagi Construction Co., Ltd. |
3,700 | 25,639 | ||||||
| Yokogawa Bridge Holdings Corp.(a) |
2,800 | 48,140 | ||||||
| Yurtec Corp. |
10,500 | 76,840 | ||||||
|
|
|
|||||||
| Total Construction & Engineering | 4,933,701 | |||||||
| Construction Materials – 0.3% | ||||||||
| Geostr Corp. |
2,900 | 11,293 | ||||||
| Krosaki Harima Corp. |
1,200 | 60,062 | ||||||
| Sumitomo Osaka Cement Co., Ltd. |
4,700 | 185,138 | ||||||
|
|
|
|||||||
| Total Construction Materials | 256,493 | |||||||
| Consumer Finance – 0.0% | ||||||||
| J Trust Co., Ltd.(a) | 3,300 | 11,270 | ||||||
| Containers & Packaging – 0.9% |
| |||||||
| FP Corp. |
3,000 | 177,260 | ||||||
| Fuji Seal International, Inc. |
2,100 | 75,891 | ||||||
| Hokkan Holdings Ltd.(a) |
1,600 | 27,769 | ||||||
| Pack Corp. (The) |
1,900 | 58,278 | ||||||
| Rengo Co., Ltd. |
18,981 | 178,003 | ||||||
| Toyo Seikan Group Holdings Ltd. |
10,000 | 204,815 | ||||||
|
|
|
|||||||
| Total Containers & Packaging | 722,016 | |||||||
| Distributors – 0.7% | ||||||||
| Arata Corp. |
900 | 31,020 | ||||||
| Canon Marketing Japan, Inc. |
21,800 | 428,772 | ||||||
| Doshisha Co., Ltd. |
3,700 | 57,730 | ||||||
| Happinet Corp. |
5,100 | 65,844 | ||||||
|
|
|
|||||||
| Total Distributors | 583,366 | |||||||
| Diversified Consumer Services – 0.8% | ||||||||
| Asante, Inc. |
1,000 | 19,687 | ||||||
| Benesse Holdings, Inc. |
11,900 | 309,098 | ||||||
| Gakkyusha Co., Ltd. |
3,100 | 36,382 | ||||||
| Meiko Network Japan Co., Ltd.(a) |
5,200 | 45,242 | ||||||
| Riso Kyoiku Co., Ltd.(a) |
30,300 | 139,612 | ||||||
| Studio Alice Co., Ltd. |
1,800 | 37,111 | ||||||
| Tokyo Individualized Educational Institute, Inc. |
7,500 | 75,484 | ||||||
|
|
|
|||||||
| Total Diversified Consumer Services | 662,616 | |||||||
| Diversified Financial Services – 0.3% | ||||||||
| Financial Products Group Co., Ltd. |
17,400 | 142,583 | ||||||
| Ricoh Leasing Co., Ltd. |
2,300 | 69,404 | ||||||
|
|
|
|||||||
| Total Diversified Financial Services | 211,987 | |||||||
| Diversified Telecommunication Services – 0.1% | ||||||||
| Internet Initiative Japan, Inc. | 3,100 | 62,709 | ||||||
| Electric Utilities – 0.5% |
| |||||||
| Hokkaido Electric Power Co., Inc.(a) |
9,300 | 53,438 | ||||||
| Okinawa Electric Power Co., Inc. (The) |
6,218 | 105,894 | ||||||
| Shikoku Electric Power Co., Inc.(a) |
23,500 | 286,200 | ||||||
|
|
|
|||||||
| Total Electric Utilities |
|
445,532 | ||||||
| Electrical Equipment – 1.7% |
| |||||||
| Chiyoda Integre Co., Ltd. |
3,100 | 57,499 | ||||||
| Cosel Co., Ltd. |
6,200 | 65,257 | ||||||
| Daihen Corp.(a) |
2,500 | 64,259 | ||||||
See Notes to Financial Statements.
| 38 | WisdomTree Trust |
Schedule of Investments (continued)
WisdomTree Japan Hedged SmallCap Equity Fund (DXJS)
March 31, 2019
| Investments | Shares | Value | ||||||
| Denyo Co., Ltd.(a) |
2,400 | $ | 29,684 | |||||
| Fujikura Ltd.(a) |
25,600 | 96,447 | ||||||
| Furukawa Electric Co., Ltd.(a) |
6,126 | 154,471 | ||||||
| GS Yuasa Corp.(a) |
8,400 | 164,759 | ||||||
| Helios Techno Holding Co., Ltd.(a) |
6,100 | 36,649 | ||||||
| Idec Corp.(a) |
3,500 | 60,333 | ||||||
| Mabuchi Motor Co., Ltd. |
7,900 | 274,789 | ||||||
| Nippon Carbon Co., Ltd.(a) |
1,000 | 44,360 | ||||||
| Nissin Electric Co., Ltd. |
14,700 | 134,802 | ||||||
| Nitto Kogyo Corp.(a) |
5,200 | 104,014 | ||||||
| Sanyo Denki Co., Ltd. |
700 | 25,107 | ||||||
| Sinfonia Technology Co., Ltd. |
2,800 | 34,202 | ||||||
| Takaoka Toko Co., Ltd. |
3,100 | 36,886 | ||||||
| Tatsuta Electric Wire and Cable Co., Ltd. |
11,100 | 45,730 | ||||||
|
|
|
|||||||
| Total Electrical Equipment |
|
1,429,248 | ||||||
| Electronic Equipment, Instruments & Components – 5.5% |
| |||||||
| Ai Holdings Corp. |
3,400 | 56,183 | ||||||
| Amano Corp. |
9,000 | 211,980 | ||||||
| Anritsu Corp.(a) |
9,400 | 174,098 | ||||||
| Azbil Corp. |
12,800 | 299,401 | ||||||
| Canon Electronics, Inc. |
6,600 | 104,589 | ||||||
| Citizen Watch Co., Ltd. |
54,700 | 304,918 | ||||||
| CMK Corp. |
5,800 | 33,851 | ||||||
| CONEXIO Corp.(a) |
7,500 | 94,525 | ||||||
| Daiwabo Holdings Co., Ltd. |
2,600 | 149,632 | ||||||
| Dexerials Corp.(a) |
13,600 | 90,187 | ||||||
| Elematec Corp. |
2,929 | 44,801 | ||||||
| ESPEC Corp. |
3,900 | 72,690 | ||||||
| Excel Co., Ltd.(a) |
1,200 | 25,369 | ||||||
| FTGroup Co., Ltd. |
6,400 | 79,447 | ||||||
| Hagiwara Electric Holdings Co., Ltd. |
1,700 | 47,305 | ||||||
| Hakuto Co., Ltd. |
2,000 | 21,195 | ||||||
| Hioki EE Corp. |
900 | 38,542 | ||||||
| Hochiki Corp. |
900 | 9,050 | ||||||
| Horiba Ltd. |
3,300 | 183,358 | ||||||
| Ibiden Co., Ltd.(a) |
15,700 | 238,582 | ||||||
| Iriso Electronics Co., Ltd.(a) |
1,000 | 45,715 | ||||||
| Japan Aviation Electronics Industry Ltd. |
9,400 | 130,870 | ||||||
| Kaga Electronics Co., Ltd.(a) |
3,500 | 64,254 | ||||||
| Koa Corp. |
3,100 | 41,703 | ||||||
| Kyosan Electric Manufacturing Co., Ltd.(a) |
9,400 | 30,828 | ||||||
| Macnica Fuji Electronics Holdings, Inc.(a) |
9,300 | 126,874 | ||||||
| Marubun Corp. |
5,100 | 29,351 | ||||||
| Nippon Electric Glass Co., Ltd. |
16,100 | 426,919 | ||||||
| Nippon Signal Co., Ltd.(a) |
8,000 | 71,627 | ||||||
| Nissha Co., Ltd. |
2,500 | 26,404 | ||||||
| Nohmi Bosai Ltd. |
3,666 | 59,916 | ||||||
| Oki Electric Industry Co., Ltd.(a) |
20,700 | 244,619 | ||||||
| Optex Group Co., Ltd. |
1,600 | 25,514 | ||||||
| Osaki Electric Co., Ltd. |
6,900 | 42,952 | ||||||
| Riken Keiki Co., Ltd. |
900 | 17,352 | ||||||
| Ryoden Corp. |
3,800 | 50,399 | ||||||
| Ryosan Co., Ltd.(a) |
5,500 | 147,482 | ||||||
| Sanshin Electronics Co., Ltd.(a) |
3,200 | 54,757 | ||||||
| Satori Electric Co., Ltd. |
5,200 | 44,161 | ||||||
| Siix Corp.(a) |
3,100 | 46,940 | ||||||
| Sumida Corp.(a) |
5,900 | 83,262 | ||||||
| Tachibana Eletech Co., Ltd.(a) |
3,100 | 46,576 | ||||||
| Taiyo Yuden Co., Ltd.(a) |
5,200 | 102,276 | ||||||
| Tamura Corp.(a) |
9,400 | 51,890 | ||||||
| Tokyo Electron Device Ltd. |
2,600 | 41,812 | ||||||
| Topcon Corp. |
6,000 | 70,796 | ||||||
| Tsuzuki Denki Co., Ltd. |
3,100 | 23,834 | ||||||
| UKC Holdings Corp.(a) |
2,200 | 40,687 | ||||||
| V Technology Co., Ltd. |
400 | 50,702 | ||||||
| Vitec Holdings Co., Ltd. |
2,100 | 38,837 | ||||||
|
|
|
|||||||
| Total Electronic Equipment, Instruments & Components |
|
4,559,012 | ||||||
| Energy Equipment & Services – 0.3% |
| |||||||
| Modec, Inc. |
4,500 | 128,066 | ||||||
| Shinko Plantech Co., Ltd. |
11,000 | 117,270 | ||||||
| Toyo Kanetsu K.K. |
1,500 | 27,158 | ||||||
|
|
|
|||||||
| Total Energy Equipment & Services |
|
272,494 | ||||||
| Entertainment – 2.3% |
| |||||||
| Avex, Inc.(a) |
8,800 | 117,349 | ||||||
| Capcom Co., Ltd. |
9,400 | 210,616 | ||||||
| COLOPL, Inc.(a) |
17,700 | 109,861 | ||||||
| Daiichikosho Co., Ltd. |
6,600 | 337,498 | ||||||
| DeNA Co., Ltd. |
13,200 | 198,802 | ||||||
| GungHo Online Entertainment, Inc.(a) |
54,100 | 196,976 | ||||||
| Koei Tecmo Holdings Co., Ltd.(a) |
19,620 | 378,272 | ||||||
| Marvelous, Inc.(a) |
10,300 | 79,936 | ||||||
| Toei Animation Co., Ltd. |
3,000 | 147,988 | ||||||
| Toei Co., Ltd. |
800 | 106,464 | ||||||
|
|
|
|||||||
| Total Entertainment |
|
1,883,762 | ||||||
| Food & Staples Retailing – 2.3% |
| |||||||
| Aeon Hokkaido Corp. |
3,900 | 26,567 | ||||||
| Ain Holdings, Inc. |
1,300 | 97,719 | ||||||
| Arcs Co., Ltd. |
5,200 | 114,350 | ||||||
| Axial Retailing, Inc. |
1,700 | 52,374 | ||||||
| Belc Co., Ltd. |
1,200 | 54,316 | ||||||
| Cawachi Ltd. |
3,400 | 54,340 | ||||||
| Cocokara fine, Inc. |
1,200 | 47,649 | ||||||
| Create SD Holdings Co., Ltd. |
3,100 | 72,903 | ||||||
| Heiwado Co., Ltd. |
4,700 | 100,085 | ||||||
| Inageya Co., Ltd.(a) |
2,700 | 31,053 | ||||||
| Kato Sangyo Co., Ltd.(a) |
3,400 | 112,120 | ||||||
| Kobe Bussan Co., Ltd. |
4,000 | 151,782 | ||||||
| Life Corp. |
2,700 | 58,008 | ||||||
| Ministop Co., Ltd. |
4,000 | 61,941 | ||||||
| Mitsubishi Shokuhin Co., Ltd.(a) |
4,800 | 125,589 | ||||||
| Nihon Chouzai Co., Ltd. |
1,500 | 50,820 | ||||||
| Nishimoto Co., Ltd. |
1,400 | 54,894 | ||||||
| Okuwa Co., Ltd. |
7,700 | 77,289 | ||||||
| Qol Holdings Co., Ltd. |
2,100 | 28,611 | ||||||
| Retail Partners Co., Ltd. |
2,500 | 26,336 | ||||||
See Notes to Financial Statements.
| WisdomTree Trust | 39 |
Schedule of Investments (continued)
WisdomTree Japan Hedged SmallCap Equity Fund (DXJS)
March 31, 2019
| Investments | Shares | Value | ||||||
| San-A Co., Ltd. |
1,500 | $ | 60,035 | |||||
| Shoei Foods Corp.(a) |
1,300 | 36,997 | ||||||
| Sogo Medical Holdings Co., Ltd. |
2,300 | 35,222 | ||||||
| United Super Markets Holdings, Inc. |
9,000 | 89,036 | ||||||
| Valor Holdings Co., Ltd. |
5,300 | 128,424 | ||||||
| Yamatane Corp. |
1,400 | 19,782 | ||||||
| Yaoko Co., Ltd. |
2,300 | 113,041 | ||||||
| Yokohama Reito Co., Ltd.(a) |
7,700 | 62,193 | ||||||
|
|
|
|||||||
| Total Food & Staples Retailing |
|
1,943,476 | ||||||
| Food Products – 3.5% |
| |||||||
| Ariake Japan Co., Ltd. |
1,300 | 69,531 | ||||||
| Chubu Shiryo Co., Ltd. |
1,200 | 12,663 | ||||||
| DyDo Group Holdings, Inc. |
800 | 36,066 | ||||||
| Ezaki Glico Co., Ltd. |
3,300 | 173,519 | ||||||
| Feed One Co., Ltd. |
32,500 | 51,678 | ||||||
| Fuji Oil Holdings, Inc. |
6,251 | 214,043 | ||||||
| Fujicco Co., Ltd. |
2,900 | 56,357 | ||||||
| Hokuto Corp. |
5,200 | 90,108 | ||||||
| Itoham Yonekyu Holdings, Inc.(a) |
26,100 | 162,469 | ||||||
| J-Oil Mills, Inc. |
2,600 | 96,779 | ||||||
| Kagome Co., Ltd. |
3,200 | 89,913 | ||||||
| Kameda Seika Co., Ltd. |
1,000 | 47,974 | ||||||
| Kewpie Corp. |
11,500 | 275,850 | ||||||
| Kotobuki Spirits Co., Ltd. |
600 | 22,984 | ||||||
| Kyokuyo Co., Ltd.(a) |
1,000 | 25,622 | ||||||
| Marudai Food Co., Ltd.(a) |
3,000 | 50,983 | ||||||
| Maruha Nichiro Corp. |
3,100 | 110,909 | ||||||
| Megmilk Snow Brand Co., Ltd. |
5,200 | 126,565 | ||||||
| Mitsui Sugar Co., Ltd.(a) |
4,900 | 120,679 | ||||||
| Morinaga & Co., Ltd. |
2,500 | 108,529 | ||||||
| Morinaga Milk Industry Co., Ltd.(a) |
2,900 | 98,383 | ||||||
| Nippon Flour Mills Co., Ltd. |
7,300 | 125,311 | ||||||
| Nippon Suisan Kaisha Ltd. |
28,500 | 217,577 | ||||||
| Nisshin Oillio Group Ltd. (The) |
3,100 | 91,584 | ||||||
| Prima Meat Packers Ltd. |
5,200 | 96,497 | ||||||
| Rock Field Co., Ltd. |
3,200 | 47,269 | ||||||
| S Foods, Inc. |
1,500 | 54,886 | ||||||
| Sakata Seed Corp. |
1,600 | 54,425 | ||||||
| Showa Sangyo Co., Ltd.(a) |
3,400 | 92,092 | ||||||
| Starzen Co., Ltd.(a) |
1,000 | 34,196 | ||||||
| Warabeya Nichiyo Holdings Co., Ltd. |
2,600 | 42,752 | ||||||
|
|
|
|||||||
| Total Food Products |
|
2,898,193 | ||||||
| Gas Utilities – 0.7% |
| |||||||
| Hokkaido Gas Co., Ltd.(a) |
3,600 | 46,836 | ||||||
| Nippon Gas Co., Ltd. |
2,000 | 55,292 | ||||||
| Saibu Gas Co., Ltd.(a) |
3,700 | 79,927 | ||||||
| Shizuoka Gas Co., Ltd. |
8,000 | 60,785 | ||||||
| Toho Gas Co., Ltd.(a) |
8,200 | 368,198 | ||||||
|
|
|
|||||||
| Total Gas Utilities |
|
611,038 | ||||||
| Health Care Equipment & Supplies – 1.5% |
| |||||||
| Daiken Medical Co., Ltd. |
3,800 | 19,088 | ||||||
| Eiken Chemical Co., Ltd. |
3,000 | 70,633 | ||||||
| Hogy Medical Co., Ltd. |
2,600 | 91,729 | ||||||
| Jeol Ltd. |
3,400 | 61,190 | ||||||
| Mani, Inc. |
1,700 | 83,092 | ||||||
| Menicon Co., Ltd. |
1,500 | 43,299 | ||||||
| Nagaileben Co., Ltd. |
4,200 | 91,069 | ||||||
| Nakanishi, Inc. |
5,400 | 105,526 | ||||||
| Nihon Kohden Corp. |
6,400 | 190,234 | ||||||
| Nikkiso Co., Ltd. |
7,300 | 85,211 | ||||||
| Nipro Corp.(a) |
20,423 | 263,671 | ||||||
| Paramount Bed Holdings Co., Ltd. |
2,703 | 119,905 | ||||||
|
|
|
|||||||
| Total Health Care Equipment & Supplies |
|
1,224,647 | ||||||
| Health Care Providers & Services – 1.6% |
| |||||||
| As One Corp. |
2,100 | 166,960 | ||||||
| BML, Inc. |
3,400 | 98,604 | ||||||
| Japan Lifeline Co., Ltd.(a) |
4,700 | 77,622 | ||||||
| Miraca Holdings, Inc. |
12,200 | 302,672 | ||||||
| NichiiGakkan Co., Ltd. |
6,300 | 74,165 | ||||||
| Ship Healthcare Holdings, Inc. |
4,759 | 195,416 | ||||||
| Solasto Corp.(a) |
7,300 | 82,177 | ||||||
| Toho Holdings Co., Ltd.(a) |
5,200 | 129,806 | ||||||
| Tokai Corp. |
2,000 | 48,751 | ||||||
| Tsukui Corp. |
5,600 | 35,214 | ||||||
| Vital KSK Holdings, Inc.(a) |
7,500 | 73,994 | ||||||
| WIN-Partners Co., Ltd.(a) |
3,100 | 35,289 | ||||||
|
|
|
|||||||
| Total Health Care Providers & Services |
|
1,320,670 | ||||||
| Health Care Technology – 0.0% |
| |||||||
| EM Systems Co., Ltd.(a) |
2,900 | 34,847 | ||||||
| Hotels, Restaurants & Leisure – 2.8% |
| |||||||
| Aeon Fantasy Co., Ltd. |
400 | 10,318 | ||||||
| Create Restaurants Holdings, Inc.(a) |
4,300 | 53,145 | ||||||
| Doutor Nichires Holdings Co., Ltd. |
4,200 | 79,799 | ||||||
| Fuji Kyuko Co., Ltd.(a) |
1,100 | 41,343 | ||||||
| Hiday Hidaka Corp. |
2,122 | 41,027 | ||||||
| HIS Co., Ltd. |
3,100 | 113,990 | ||||||
| Ichibanya Co., Ltd.(a) |
2,100 | 91,828 | ||||||
| KOMEDA Holdings Co., Ltd. |
7,200 | 136,864 | ||||||
| Koshidaka Holdings Co., Ltd. |
2,900 | 43,519 | ||||||
| Kyoritsu Maintenance Co., Ltd.(a) |
1,600 | 79,360 | ||||||
| MOS Food Services, Inc.(a) |
1,400 | 34,025 | ||||||
| Ohsho Food Service Corp. |
2,900 | 183,665 | ||||||
| Plenus Co., Ltd.(a) |
8,400 | 134,024 | ||||||
| Renaissance, Inc. |
1,400 | 24,741 | ||||||
| Resorttrust, Inc.(a) |
11,900 | 161,268 | ||||||
| Round One Corp. |
6,500 | 82,274 | ||||||
| Royal Holdings Co., Ltd. |
1,700 | 42,513 | ||||||
| Saizeriya Co., Ltd. |
2,300 | 44,302 | ||||||
| SFP Holdings Co., Ltd. |
1,700 | 29,213 | ||||||
| Shidax Corp.(a) |
15,100 | 43,928 | ||||||
| Skylark Holdings Co., Ltd. |
25,400 | 421,096 | ||||||
| St. Marc Holdings Co., Ltd. |
2,300 | 51,721 | ||||||
| Tokyo Dome Corp. |
11,300 | 107,911 | ||||||
| Tokyotokeiba Co., Ltd. |
1,800 | 54,642 | ||||||
See Notes to Financial Statements.
| 40 | WisdomTree Trust |
Schedule of Investments (continued)
WisdomTree Japan Hedged SmallCap Equity Fund (DXJS)
March 31, 2019
| Investments | Shares | Value | ||||||
| Toridoll Holdings Corp.(a) |
1,900 | $ | 38,349 | |||||
| Yoshinoya Holdings Co., Ltd.(a) |
3,400 | 54,923 | ||||||
| Zensho Holdings Co., Ltd.(a) |
5,200 | 120,457 | ||||||
|
|
|
|||||||
| Total Hotels, Restaurants & Leisure |
|
2,320,245 | ||||||
| Household Durables – 1.9% |
| |||||||
| Cleanup Corp. |
3,100 | 16,552 | ||||||
| ES-Con Japan Ltd.(a) |
11,200 | 73,867 | ||||||
| FJ Next Co., Ltd. |
5,200 | 40,074 | ||||||
| Foster Electric Co., Ltd. |
5,206 | 78,171 | ||||||
| France Bed Holdings Co., Ltd.(a) |
1,200 | 9,779 | ||||||
| Fuji Corp., Ltd.(a) |
5,600 | 41,487 | ||||||
| Fujitsu General Ltd.(a) |
7,500 | 106,112 | ||||||
| Hoosiers Holdings(a) |
4,900 | 28,554 | ||||||
| JVC Kenwood Corp.(a) |
15,700 | 38,014 | ||||||
| Ki-Star Real Estate Co., Ltd. |
2,300 | 34,640 | ||||||
| Meiwa Estate Co., Ltd. |
3,500 | 18,056 | ||||||
| Misawa Homes Co., Ltd. |
6,800 | 48,657 | ||||||
| Nihon House Holdings Co., Ltd.(a) |
11,700 | 49,787 | ||||||
| Pressance Corp.(a) |
5,200 | 64,692 | ||||||
| Sanei Architecture Planning Co., Ltd.(a) |
2,000 | 28,278 | ||||||
| Sangetsu Corp. |
9,700 | 176,061 | ||||||
| Space Value Holdings Co., Ltd. |
7,400 | 34,231 | ||||||
| Starts Corp., Inc. |
6,700 | 143,038 | ||||||
| Sumitomo Forestry Co., Ltd.(a) |
25,200 | 349,934 | ||||||
| Tama Home Co., Ltd. |
4,100 | 39,561 | ||||||
| Tamron Co., Ltd. |
4,400 | 80,260 | ||||||
| Toa Corp. |
3,900 | 39,322 | ||||||
| Zojirushi Corp.(a) |
7,300 | 75,846 | ||||||
|
|
|
|||||||
| Total Household Durables |
|
1,614,973 | ||||||
| Household Products – 0.2% |
| |||||||
| Earth Corp.(a) |
2,300 | 106,807 | ||||||
| ST Corp.(a) |
800 | 13,675 | ||||||
|
|
|
|||||||
| Total Household Products |
|
120,482 | ||||||
| Independent Power & Renewable Electricity Producers – 0.1% |
| |||||||
| West Holdings Corp.(a) |
5,400 | 54,056 | ||||||
| Industrial Conglomerates – 0.5% |
| |||||||
| Mie Kotsu Group Holdings, Inc.(a) |
8,300 | 42,143 | ||||||
| Nisshinbo Holdings, Inc.(a) |
21,800 | 190,456 | ||||||
| TOKAI Holdings Corp. |
18,700 | 155,263 | ||||||
|
|
|
|||||||
| Total Industrial Conglomerates |
|
387,862 | ||||||
| Interactive Media & Services – 0.8% |
| |||||||
| Dip Corp.(a) |
5,200 | 89,826 | ||||||
| Gurunavi, Inc. |
11,700 | 73,465 | ||||||
| Mixi, Inc. |
17,800 | 411,369 | ||||||
| MTI Ltd. |
8,500 | 48,611 | ||||||
|
|
|
|||||||
| Total Interactive Media & Services |
|
623,271 | ||||||
| Internet & Direct Marketing Retail – 0.1% |
| |||||||
| ASKUL Corp.(a) |
2,700 | 67,375 | ||||||
| Belluna Co., Ltd. |
6,100 | 47,286 | ||||||
|
|
|
|||||||
| Total Internet & Direct Marketing Retail |
|
114,661 | ||||||
| IT Services – 2.1% |
| |||||||
| Digital Garage, Inc.(a) |
1,300 | 38,113 | ||||||
| DTS Corp. |
3,100 | 114,550 | ||||||
| Future Corp. |
5,700 | 97,742 | ||||||
| GMO Internet, Inc. |
6,100 | 99,421 | ||||||
| I-Net Corp. |
1,000 | 11,899 | ||||||
| Infocom Corp.(a) |
4,200 | 69,858 | ||||||
| Information Services International-Dentsu Ltd. |
3,100 | 106,848 | ||||||
| Kanematsu Electronics Ltd. |
4,000 | 120,883 | ||||||
| LAC Co., Ltd.(a) |
2,700 | 37,078 | ||||||
| NEC Networks & System Integration Corp. |
7,900 | 190,925 | ||||||
| NET One Systems Co., Ltd. |
8,600 | 216,544 | ||||||
| Nihon Unisys Ltd. |
9,400 | 249,002 | ||||||
| NS Solutions Corp. |
9,400 | 253,758 | ||||||
| NSD Co., Ltd. |
5,200 | 121,068 | ||||||
| Transcosmos, Inc. |
2,600 | 50,715 | ||||||
|
|
|
|||||||
| Total IT Services |
|
1,778,404 | ||||||
| Leisure Products – 1.5% |
| |||||||
| Fields Corp. |
7,800 | 51,020 | ||||||
| Furyu Corp. |
4,500 | 40,209 | ||||||
| GLOBERIDE, Inc. |
500 | 11,862 | ||||||
| Heiwa Corp.(a) |
17,800 | 355,726 | ||||||
| Mizuno Corp.(a) |
2,800 | 64,887 | ||||||
| Sankyo Co., Ltd. |
17,000 | 648,146 | ||||||
| Tomy Co., Ltd. |
9,200 | 94,922 | ||||||
|
|
|
|||||||
| Total Leisure Products |
|
1,266,772 | ||||||
| Life Sciences Tools & Services – 0.1% |
| |||||||
| EPS Holdings, Inc. |
3,100 | 51,702 | ||||||
| Machinery – 6.3% |
| |||||||
| Aichi Corp. |
13,600 | 86,010 | ||||||
| Aida Engineering Ltd. |
10,900 | 78,585 | ||||||
| Alinco, Inc. |
6,600 | 58,675 | ||||||
| Anest Iwata Corp. |
5,400 | 47,421 | ||||||
| Asahi Diamond Industrial Co., Ltd. |
3,300 | 22,778 | ||||||
| Bando Chemical Industries Ltd. |
6,500 | 62,307 | ||||||
| CKD Corp.(a) |
7,200 | 64,919 | ||||||
| DMG Mori Co., Ltd. |
15,000 | 185,527 | ||||||
| Ebara Corp. |
6,800 | 191,679 | ||||||
| Fujitec Co., Ltd.(a) |
11,400 | 126,169 | ||||||
| Fukushima Industries Corp. |
800 | 25,695 | ||||||
| Furukawa Co., Ltd. |
7,300 | 91,872 | ||||||
| Giken Ltd.(a) |
3,700 | 113,154 | ||||||
| Glory Ltd.(a) |
9,000 | 215,964 | ||||||
| Hirata Corp.(a) |
900 | 62,122 | ||||||
| Hitachi Zosen Corp. |
18,035 | 55,400 | ||||||
| Hokuetsu Industries Co., Ltd.(a) |
5,200 | 54,168 | ||||||
| Hosokawa Micron Corp. |
700 | 31,273 | ||||||
| Iseki & Co., Ltd. |
3,100 | 45,624 | ||||||
| Japan Steel Works Ltd. (The)(a) |
5,203 | 95,848 | ||||||
| Juki Corp. |
3,800 | 37,765 | ||||||
| Kato Works Co., Ltd.(a) |
1,700 | 40,133 | ||||||
| Kito Corp. |
2,700 | 40,762 | ||||||
| Kitz Corp.(a) |
12,600 | 92,321 | ||||||
See Notes to Financial Statements.
| WisdomTree Trust | 41 |
Schedule of Investments (continued)
WisdomTree Japan Hedged SmallCap Equity Fund (DXJS)
March 31, 2019
| Investments | Shares | Value | ||||||
| Kurita Water Industries Ltd. |
9,400 | $ | 240,085 | |||||
| Kyokuto Kaihatsu Kogyo Co., Ltd. |
4,500 | 60,211 | ||||||
| Makino Milling Machine Co., Ltd.(a) |
2,200 | 90,636 | ||||||
| Max Co., Ltd. |
6,100 | 89,721 | ||||||
| Meidensha Corp. |
5,300 | 72,640 | ||||||
| METAWATER Co., Ltd. |
3,000 | 84,564 | ||||||
| Mitsubishi Logisnext Co., Ltd.(a) |
4,000 | 43,547 | ||||||
| Mitsuboshi Belting Ltd.(a) |
4,900 | 87,167 | ||||||
| Miura Co., Ltd. |
6,400 | 147,503 | ||||||
| Morita Holdings Corp. |
3,100 | 50,974 | ||||||
| Nachi-Fujikoshi Corp. |
2,400 | 96,490 | ||||||
| Nippon Thompson Co., Ltd.(a) |
7,300 | 33,570 | ||||||
| Nissei ASB Machine Co., Ltd. |
1,000 | 34,196 | ||||||
| Nitta Corp.(a) |
2,200 | 71,554 | ||||||
| Nitto Kohki Co., Ltd. |
3,600 | 71,034 | ||||||
| Noritake Co., Ltd. |
1,000 | 47,884 | ||||||
| NTN Corp.(a) |
88,700 | 262,850 | ||||||
| Obara Group, Inc. |
1,400 | 46,357 | ||||||
| Oiles Corp.(a) |
3,100 | 49,461 | ||||||
| OKUMA Corp.(a) |
3,100 | 167,764 | ||||||
| OSG Corp. |
9,000 | 173,601 | ||||||
| Rheon Automatic Machinery Co., Ltd.(a) |
2,300 | 32,894 | ||||||
| Ryobi Ltd. |
3,100 | 69,570 | ||||||
| Shibuya Corp. |
1,700 | 50,224 | ||||||
| Shima Seiki Manufacturing Ltd.(a) |
1,600 | 49,149 | ||||||
| Shinmaywa Industries Ltd. |
9,400 | 116,858 | ||||||
| Sodick Co., Ltd.(a) |
8,300 | 69,214 | ||||||
| Star Micronics Co., Ltd.(a) |
7,600 | 115,698 | ||||||
| Tadano Ltd.(a) |
12,000 | 113,945 | ||||||
| Takeuchi Manufacturing Co., Ltd. |
3,400 | 59,808 | ||||||
| Takuma Co., Ltd. |
4,500 | 53,706 | ||||||
| Tocalo Co., Ltd. |
7,800 | 61,450 | ||||||
| Toshiba Machine Co., Ltd.(a) |
4,100 | 82,493 | ||||||
| Tsubaki Nakashima Co., Ltd.(a) |
5,400 | 96,940 | ||||||
| Tsubakimoto Chain Co. |
5,200 | 185,572 | ||||||
| Tsugami Corp. |
6,000 | 46,185 | ||||||
| Union Tool Co. |
1,000 | 26,408 | ||||||
| YAMABIKO Corp. |
5,200 | 49,940 | ||||||
|
|
|
|||||||
| Total Machinery |
|
5,228,034 | ||||||
| Marine – 0.5% |
| |||||||
| Iino Kaiun Kaisha Ltd.(a) |
14,500 | 48,864 | ||||||
| Mitsui OSK Lines Ltd. |
4,400 | 94,650 | ||||||
| Nippon Yusen K.K.(a) |
11,100 | 162,662 | ||||||
| NS United Kaiun Kaisha Ltd.(a) |
4,900 | 104,875 | ||||||
|
|
|
|||||||
| Total Marine |
|
411,051 | ||||||
| Media – 0.9% |
| |||||||
| AOI TYO Holdings, Inc. |
3,100 | 21,986 | ||||||
| Asahi Broadcasting Group Holdings Corp. |
3,400 | 23,776 | ||||||
| F@N Communications, Inc. |
13,400 | 68,159 | ||||||
| Intage Holdings, Inc. |
4,400 | 34,147 | ||||||
| Kadokawa Dwango(a) |
6,000 | 63,261 | ||||||
| SKY Perfect JSAT Holdings, Inc.(a) |
72,200 | 300,059 | ||||||
| Tow Co., Ltd. |
5,900 | 38,699 | ||||||
| Tv Tokyo Holdings Corp. |
2,800 | 58,866 | ||||||
| Wowow, Inc. |
3,100 | 83,014 | ||||||
| Zenrin Co., Ltd.(a) |
3,100 | 68,646 | ||||||
|
|
|
|||||||
| Total Media |
|
760,613 | ||||||
| Metals & Mining – 3.6% |
| |||||||
| Aichi Steel Corp. |
2,400 | 74,482 | ||||||
| Asahi Holdings, Inc.(a) |
6,400 | 115,759 | ||||||
| Daido Steel Co., Ltd.(a) |
5,300 | 209,012 | ||||||
| Daiki Aluminium Industry Co., Ltd.(a) |
6,000 | 35,994 | ||||||
| Dowa Holdings Co., Ltd.(a) |
8,600 | 282,821 | ||||||
| Godo Steel Ltd. |
3,800 | 56,819 | ||||||
| Hakudo Co., Ltd.(a) |
2,800 | 39,312 | ||||||
| Kobe Steel Ltd. |
53,400 | 400,916 | ||||||
| Kurimoto Ltd. |
3,100 | 40,779 | ||||||
| Kyoei Steel Ltd.(a) |
5,200 | 74,135 | ||||||
| Maruichi Steel Tube Ltd. |
11,500 | 335,072 | ||||||
| Mitsubishi Materials Corp. |
19,100 | 504,225 | ||||||
| Mitsui Mining & Smelting Co., Ltd.(a) |
3,900 | 100,033 | ||||||
| Nippon Light Metal Holdings Co., Ltd. |
112,900 | 247,863 | ||||||
| Sanyo Special Steel Co., Ltd. |
3,900 | 79,948 | ||||||
| Toho Titanium Co., Ltd.(a) |
5,100 | 43,727 | ||||||
| Toho Zinc Co., Ltd.(a) |
2,400 | 67,868 | ||||||
| Tokyo Rope Manufacturing Co., Ltd. |
2,000 | 17,636 | ||||||
| Tokyo Steel Manufacturing Co., Ltd. |
8,400 | 73,007 | ||||||
| Topy Industries Ltd. |
3,100 | 62,008 | ||||||
| UACJ Corp.(a) |
6,153 | 115,294 | ||||||
|
|
|
|||||||
| Total Metals & Mining |
|
2,976,710 | ||||||
| Multiline Retail – 0.7% |
| |||||||
| Fuji Co., Ltd. |
2,300 | 39,668 | ||||||
| H2O Retailing Corp.(a) |
13,200 | 183,895 | ||||||
| MrMax Holdings Ltd. |
5,200 | 20,765 | ||||||
| Parco Co., Ltd. |
8,800 | 80,300 | ||||||
| Seria Co., Ltd.(a) |
2,000 | 68,934 | ||||||
| Takashimaya Co., Ltd. |
11,400 | 151,815 | ||||||
|
|
|
|||||||
| Total Multiline Retail |
|
545,377 | ||||||
| Oil, Gas & Consumable Fuels – 0.9% |
| |||||||
| BP Castrol K.K.(a) |
5,900 | 73,667 | ||||||
| Cosmo Energy Holdings Co., Ltd.(a) |
7,000 | 140,651 | ||||||
| Fuji Oil Co., Ltd.(a) |
11,500 | 26,182 | ||||||
| Itochu Enex Co., Ltd. |
24,300 | 195,832 | ||||||
| Iwatani Corp.(a) |
3,300 | 105,990 | ||||||
| Nippon Coke & Engineering Co., Ltd. |
68,200 | 61,616 | ||||||
| Sala Corp. |
12,200 | 67,897 | ||||||
| San-Ai Oil Co., Ltd. |
7,800 | 64,058 | ||||||
| Sinanen Holdings Co., Ltd. |
2,300 | 43,741 | ||||||
|
|
|
|||||||
| Total Oil, Gas & Consumable Fuels |
|
779,634 | ||||||
| Paper & Forest Products – 0.9% |
| |||||||
| Daiken Corp. |
3,000 | 58,382 | ||||||
| Daio Paper Corp.(a) |
6,200 | 76,012 | ||||||
| Hokuetsu Corp. |
26,400 | 154,319 | ||||||
| Nippon Paper Industries Co., Ltd.(a) |
21,400 | 441,979 | ||||||
|
|
|
|||||||
| Total Paper & Forest Products |
|
730,692 | ||||||
See Notes to Financial Statements.
| 42 | WisdomTree Trust |
Schedule of Investments (continued)
WisdomTree Japan Hedged SmallCap Equity Fund (DXJS)
March 31, 2019
| Investments | Shares | Value | ||||||
| Personal Products – 0.8% |
| |||||||
| Artnature, Inc. |
4,900 | $ | 28,067 | |||||
| Fancl Corp. |
7,800 | 201,545 | ||||||
| Mandom Corp. |
4,900 | 125,992 | ||||||
| Milbon Co., Ltd. |
2,200 | 102,362 | ||||||
| Noevir Holdings Co., Ltd. |
3,300 | 160,103 | ||||||
|
|
|
|||||||
| Total Personal Products |
|
618,069 | ||||||
| Pharmaceuticals – 2.1% |
| |||||||
| Fuji Pharma Co., Ltd.(a) |
3,100 | 48,985 | ||||||
| JCR Pharmaceuticals Co., Ltd. |
1,000 | 58,906 | ||||||
| Kaken Pharmaceutical Co., Ltd. |
6,800 | 309,021 | ||||||
| KYORIN Holdings, Inc.(a) |
10,900 | 212,810 | ||||||
| Mochida Pharmaceutical Co., Ltd. |
4,600 | 236,057 | ||||||
| Nichi-iko Pharmaceutical Co., Ltd.(a) |
6,400 | 84,882 | ||||||
| Sawai Pharmaceutical Co., Ltd. |
5,800 | 335,890 | ||||||
| Seikagaku Corp. |
5,100 | 55,246 | ||||||
| Torii Pharmaceutical Co., Ltd. |
2,700 | 54,325 | ||||||
| Towa Pharmaceutical Co., Ltd. |
3,600 | 94,745 | ||||||
| Tsumura & Co. |
6,700 | 203,691 | ||||||
| ZERIA Pharmaceutical Co., Ltd.(a) |
4,600 | 79,503 | ||||||
|
|
|
|||||||
| Total Pharmaceuticals |
|
1,774,061 | ||||||
| Professional Services – 1.7% |
| |||||||
| Altech Corp. |
3,100 | 51,730 | ||||||
| Benefit One, Inc.(a) |
8,400 | 164,835 | ||||||
| en-japan, Inc.(a) |
2,200 | 64,002 | ||||||
| FULLCAST Holdings Co., Ltd. |
2,500 | 53,304 | ||||||
| Funai Soken Holdings, Inc. |
2,940 | 70,734 | ||||||
| JAC Recruitment Co., Ltd. |
4,800 | 105,987 | ||||||
| Link And Motivation, Inc.(a) |
600 | 4,342 | ||||||
| Meitec Corp.(a) |
5,200 | 236,310 | ||||||
| Nomura Co., Ltd. |
5,200 | 146,578 | ||||||
| Outsourcing, Inc.(a) |
4,200 | 51,834 | ||||||
| Tanseisha Co., Ltd. |
5,200 | 61,450 | ||||||
| TechnoPro Holdings, Inc. |
3,100 | 184,849 | ||||||
| Trust Tech, Inc. |
1,000 | 33,112 | ||||||
| Weathernews, Inc. |
1,000 | 29,137 | ||||||
| World Holdings Co., Ltd. |
1,900 | 32,426 | ||||||
| YAMADA Consulting Group Co., Ltd.(a) |
1,500 | 31,224 | ||||||
| Yumeshin Holdings Co., Ltd.(a) |
13,600 | 94,980 | ||||||
|
|
|
|||||||
| Total Professional Services |
|
1,416,834 | ||||||
| Real Estate Management & Development – 2.0% |
| |||||||
| Airport Facilities Co., Ltd.(a) |
3,800 | 18,985 | ||||||
| Daibiru Corp. |
11,100 | 105,299 | ||||||
| Goldcrest Co., Ltd. |
4,700 | 63,440 | ||||||
| Heiwa Real Estate Co., Ltd. |
3,600 | 69,310 | ||||||
| Ichigo, Inc. |
35,700 | 122,242 | ||||||
| Japan Property Management Center Co., Ltd. |
3,100 | 22,210 | ||||||
| Katitas Co., Ltd.(a) |
1,300 | 44,572 | ||||||
| Keihanshin Building Co., Ltd. |
8,400 | 82,038 | ||||||
| Kenedix, Inc. |
12,100 | 60,563 | ||||||
| Nippon Commercial Development Co., Ltd.(a) |
3,100 | 41,731 | ||||||
| Nisshin Fudosan Co. |
7,300 | 30,536 | ||||||
| Open House Co., Ltd.(a) |
4,000 | 137,146 | ||||||
| Prospect Co., Ltd.(a) |
244,500 | 39,762 | ||||||
| Raysum Co., Ltd.(a) |
6,600 | 60,702 | ||||||
| SAMTY Co., Ltd. |
3,800 | 51,498 | ||||||
| Shinoken Group Co., Ltd.(a) |
1,200 | 8,099 | ||||||
| Sun Frontier Fudousan Co., Ltd.(a) |
6,400 | 68,461 | ||||||
| Takara Leben Co., Ltd.(a) |
27,500 | 85,468 | ||||||
| TOC Co., Ltd. |
9,600 | 66,350 | ||||||
| Tokyo Tatemono Co., Ltd. |
23,600 | 289,336 | ||||||
| Tosei Corp. |
5,800 | 52,453 | ||||||
| Unizo Holdings Co., Ltd.(a) |
6,600 | 125,876 | ||||||
|
|
|
|||||||
| Total Real Estate Management & Development |
|
1,646,077 | ||||||
| Road & Rail – 1.9% |
| |||||||
| Fukuyama Transporting Co., Ltd. |
3,100 | 119,312 | ||||||
| Hamakyorex Co., Ltd. |
1,000 | 38,397 | ||||||
| Hitachi Transport System Ltd. |
7,200 | 213,687 | ||||||
| Ichinen Holdings Co., Ltd. |
4,500 | 46,795 | ||||||
| Maruzen Showa Unyu Co., Ltd. |
3,100 | 84,022 | ||||||
| Nankai Electric Railway Co., Ltd. |
5,200 | 143,524 | ||||||
| Nikkon Holdings Co., Ltd. |
7,400 | 175,097 | ||||||
| Nishi-Nippon Railroad Co., Ltd.(a) |
3,900 | 94,360 | ||||||
| Sakai Moving Service Co., Ltd.(a) |
1,000 | 63,423 | ||||||
| Sankyu, Inc. |
4,300 | 209,784 | ||||||
| Senko Group Holdings Co., Ltd.(a) |
19,600 | 162,736 | ||||||
| Sotetsu Holdings, Inc. |
7,300 | 224,570 | ||||||
| Trancom Co., Ltd. |
300 | 17,645 | ||||||
|
|
|
|||||||
| Total Road & Rail |
|
1,593,352 | ||||||
| Semiconductors & Semiconductor Equipment – 1.1% |
| |||||||
| Ferrotec Holdings Corp.(a) |
3,100 | 30,976 | ||||||
| Japan Material Co., Ltd.(a) |
4,400 | 53,904 | ||||||
| Lasertec Corp. |
3,700 | 154,606 | ||||||
| MegaChips Corp.(a) |
1,392 | 21,367 | ||||||
| Mimasu Semiconductor Industry Co., Ltd. |
4,000 | 53,268 | ||||||
| Mitsui High-Tec, Inc.(a) |
2,900 | 26,489 | ||||||
| NuFlare Technology, Inc. |
1,100 | 61,020 | ||||||
| Optorun Co., Ltd. |
2,000 | 38,650 | ||||||
| Sanken Electric Co., Ltd. |
1,300 | 24,124 | ||||||
| Shindengen Electric Manufacturing Co., Ltd. |
1,000 | 36,907 | ||||||
| Shinko Electric Industries Co., Ltd.(a) |
19,900 | 152,462 | ||||||
| Tokyo Seimitsu Co., Ltd.(a) |
5,100 | 129,752 | ||||||
| Ulvac, Inc.(a) |
2,500 | 72,277 | ||||||
| Yamaichi Electronics Co., Ltd. |
3,100 | 30,472 | ||||||
|
|
|
|||||||
| Total Semiconductors & Semiconductor Equipment |
|
886,274 | ||||||
| Software – 0.6% |
| |||||||
| Broadleaf Co., Ltd. |
12,600 | 66,253 | ||||||
| Computer Engineering & Consulting Ltd. |
1,700 | 31,762 | ||||||
| Cresco Ltd.(a) |
1,100 | 33,044 | ||||||
| Fuji Soft, Inc. |
1,400 | 55,400 | ||||||
| Fukui Computer Holdings, Inc. |
2,900 | 54,078 | ||||||
| Infomart Corp.(a) |
4,400 | 53,586 | ||||||
| Miroku Jyoho Service Co., Ltd. |
1,600 | 41,068 | ||||||
| SRA Holdings |
2,800 | 62,357 | ||||||
| Systena Corp. |
6,800 | 73,846 | ||||||
|
|
|
|||||||
| Total Software |
|
471,394 | ||||||
See Notes to Financial Statements.
| WisdomTree Trust | 43 |
Schedule of Investments (continued)
WisdomTree Japan Hedged SmallCap Equity Fund (DXJS)
March 31, 2019
| Investments | Shares | Value | ||||||
| Specialty Retail – 4.4% |
| |||||||
| Adastria Co., Ltd. |
9,122 | $ | 202,326 | |||||
| Alpen Co., Ltd. |
5,200 | 80,336 | ||||||
| AOKI Holdings, Inc. |
13,700 | 143,455 | ||||||
| Aoyama Trading Co., Ltd.(a) |
12,800 | 290,959 | ||||||
| Arcland Sakamoto Co., Ltd. |
3,100 | 41,983 | ||||||
| Autobacs Seven Co., Ltd.(a) |
14,000 | 232,733 | ||||||
| Bic Camera, Inc. |
7,200 | 75,653 | ||||||
| Chiyoda Co., Ltd. |
5,200 | 83,578 | ||||||
| DCM Holdings Co., Ltd.(a) |
19,900 | 185,543 | ||||||
| EDION Corp.(a) |
16,300 | 142,258 | ||||||
| Geo Holdings Corp.(a) |
6,700 | 93,098 | ||||||
| Gfoot Co., Ltd.(a) |
3,100 | 18,401 | ||||||
| Honeys Holdings Co., Ltd. |
6,000 | 59,791 | ||||||
| IDOM, Inc.(a) |
3,700 | 10,764 | ||||||
| JINS, Inc. |
800 | 43,222 | ||||||
| Joshin Denki Co., Ltd.(a) |
1,100 | 25,352 | ||||||
| K’s Holdings Corp. |
30,068 | 266,764 | ||||||
| Keiyo Co., Ltd. |
11,900 | 53,219 | ||||||
| Kohnan Shoji Co., Ltd. |
3,700 | 91,827 | ||||||
| Komeri Co., Ltd. |
3,900 | 95,522 | ||||||
| Konaka Co., Ltd. |
3,100 | 11,987 | ||||||
| LIXIL VIVA Corp. |
6,100 | 77,376 | ||||||
| Nishimatsuya Chain Co., Ltd. |
8,100 | 68,058 | ||||||
| Nojima Corp. |
4,100 | 74,417 | ||||||
| PAL GROUP Holdings Co., Ltd. |
3,100 | 84,162 | ||||||
| PC Depot Corp. |
10,100 | 40,424 | ||||||
| Right On Co., Ltd.(a) |
6,100 | 40,617 | ||||||
| Sac’s Bar Holdings, Inc. |
5,200 | 53,933 | ||||||
| Sanrio Co., Ltd.(a) |
13,057 | 311,547 | ||||||
| Shimachu Co., Ltd. |
7,300 | 190,208 | ||||||
| T-Gaia Corp. |
8,500 | 140,995 | ||||||
| United Arrows Ltd. |
3,400 | 118,417 | ||||||
| VT Holdings Co., Ltd.(a) |
24,354 | 91,752 | ||||||
| Xebio Holdings Co., Ltd. |
4,500 | 49,560 | ||||||
| Yellow Hat Ltd. |
6,200 | 81,558 | ||||||
|
|
|
|||||||
| Total Specialty Retail |
|
3,671,795 | ||||||
| Technology Hardware, Storage & Peripherals – 0.7% |
| |||||||
| Elecom Co., Ltd. |
3,700 | 114,157 | ||||||
| Maxell Holdings Ltd.(a) |
7,400 | 104,965 | ||||||
| MCJ Co., Ltd. |
12,000 | 87,708 | ||||||
| Riso Kagaku Corp. |
6,400 | 101,188 | ||||||
| Roland DG Corp. |
1,000 | 21,051 | ||||||
| Toshiba TEC Corp. |
3,700 | 102,792 | ||||||
| Wacom Co., Ltd.(a) |
10,300 | 43,364 | ||||||
|
|
|
|||||||
| Total Technology Hardware, Storage & Peripherals |
|
575,225 | ||||||
| Textiles, Apparel & Luxury Goods – 1.9% |
| |||||||
| Asics Corp. |
22,700 | 304,553 | ||||||
| Baroque Japan Ltd.(a) |
8,500 | 66,274 | ||||||
| Descente Ltd.(a) |
6,200 | 162,443 | ||||||
| Fujibo Holdings, Inc. |
1,400 | 33,329 | ||||||
| Goldwin, Inc.(a) |
800 | 116,511 | ||||||
| Gunze Ltd.(a) |
1,600 | 64,688 | ||||||
| Japan Wool Textile Co., Ltd. (The) |
11,800 | 100,532 | ||||||
| Kurabo Industries Ltd. |
2,600 | 47,708 | ||||||
| Onward Holdings Co., Ltd. |
25,739 | 136,038 | ||||||
| Seiko Holdings Corp.(a) |
6,900 | 164,263 | ||||||
| Seiren Co., Ltd.(a) |
6,200 | 91,584 | ||||||
| Wacoal Holdings Corp. |
8,000 | 198,907 | ||||||
| Yondoshi Holdings, Inc. |
3,600 | 67,782 | ||||||
|
|
|
|||||||
| Total Textiles, Apparel & Luxury Goods |
|
1,554,612 | ||||||
| Thrifts & Mortgage Finance – 0.0% |
| |||||||
| Aruhi Corp.(a) |
1,700 | 33,836 | ||||||
| Trading Companies & Distributors – 2.3% |
| |||||||
| Advan Co., Ltd. |
5,200 | 47,873 | ||||||
| Alconix Corp.(a) |
3,100 | 32,012 | ||||||
| Daiichi Jitsugyo Co., Ltd. |
2,000 | 57,731 | ||||||
| Gecoss Corp. |
3,000 | 28,053 | ||||||
| Hanwa Co., Ltd.(a) |
6,100 | 170,019 | ||||||
| Inaba Denki Sangyo Co., Ltd. |
3,600 | 139,369 | ||||||
| Inabata & Co., Ltd. |
9,400 | 127,813 | ||||||
| Japan Pulp & Paper Co., Ltd. |
1,600 | 59,990 | ||||||
| Kamei Corp. |
3,600 | 38,314 | ||||||
| Kanamoto Co., Ltd. |
2,500 | 61,887 | ||||||
| Kanematsu Corp. |
12,500 | 142,860 | ||||||
| Nagase & Co., Ltd. |
13,600 | 195,242 | ||||||
| Nippon Steel & Sumikin Bussan Corp. |
5,196 | 211,248 | ||||||
| Nishio Rent All Co., Ltd. |
1,900 | 54,759 | ||||||
| Onoken Co., Ltd.(a) |
3,100 | 43,468 | ||||||
| Sanyo Trading Co., Ltd.(a) |
1,200 | 20,285 | ||||||
| Sato Shoji Corp. |
3,700 | 30,253 | ||||||
| Seika Corp. |
1,500 | 18,376 | ||||||
| Shinsho Corp. |
1,700 | 39,657 | ||||||
| Trusco Nakayama Corp. |
4,400 | 121,841 | ||||||
| Wakita & Co., Ltd. |
5,200 | 51,913 | ||||||
| Yamazen Corp. |
13,400 | 141,282 | ||||||
| Yuasa Trading Co., Ltd. |
2,600 | 73,289 | ||||||
|
|
|
|||||||
| Total Trading Companies & Distributors |
|
1,907,534 | ||||||
| Transportation Infrastructure – 0.5% |
| |||||||
| Kamigumi Co., Ltd. |
10,500 | 243,231 | ||||||
| Mitsubishi Logistics Corp.(a) |
5,900 | 164,710 | ||||||
| Nissin Corp. |
1,400 | 23,438 | ||||||
|
|
|
|||||||
| Total Transportation Infrastructure |
|
431,379 | ||||||
| TOTAL COMMON STOCKS (Cost: $90,788,002) |
82,236,537 | |||||||
| INVESTMENT OF CASH COLLATERAL FOR SECURITIES LOANED – 5.4% |
| |||||||
| United States – 5.4% | ||||||||
| State Street Navigator Securities Lending Government Money Market Portfolio, 2.46%(b) |
||||||||
| (Cost: $4,509,372)(c) | 4,509,372 | 4,509,372 | ||||||
| TOTAL INVESTMENTS IN SECURITIES – 104.4% (Cost: $95,297,374) |
86,745,909 | |||||||
| Other Assets less Liabilities – (4.4)% |
(3,649,266 | ) | ||||||
|
|
|
|||||||
| NET ASSETS – 100.0% | $ | 83,096,643 | ||||||
See Notes to Financial Statements.
| 44 | WisdomTree Trust |
Schedule of Investments (concluded)
WisdomTree Japan Hedged SmallCap Equity Fund (DXJS)
March 31, 2019
| * | Non-income producing security. |
| (a) | Security, or portion thereof, was on loan at March 31, 2019 (See Note 2). |
| (b) | Rate shown represents annualized 7-day yield as of March 31, 2019. |
| (c) | At March 31, 2019, the total market value of the Fund’s securities on loan identified in the Schedule of Investments was $23,787,029 and the total market value of the collateral held by the Fund was $25,177,926. The total market value of the collateral includes non-cash U.S. Government securities collateral having a value of $20,668,554. |
| FINANCIAL DERIVATIVE INSTRUMENTS | ||||||||||||||||||||||||||||
| FOREIGN CURRENCY CONTRACTS (OTC – OVER THE COUNTER) | ||||||||||||||||||||||||||||
| Counterparty | Settlement Date |
Amount and Description of Purchased |
Amount and Description of be Sold |
Unrealized Appreciation |
Unrealized Depreciation |
|||||||||||||||||||||||
| Bank of America N.A. |
4/3/2019 | 1,960,978,472 | JPY | 17,718,719 | USD | $ | — | $ | (592 | ) | ||||||||||||||||||
| Bank of America N.A. |
4/3/2019 | 19,446,394 | USD | 2,159,683,458 | JPY | — | (67,102 | ) | ||||||||||||||||||||
| Bank of America N.A. |
5/9/2019 | 17,373,316 | USD | 1,917,435,554 | JPY | — | (4,939 | ) | ||||||||||||||||||||
| Barclays Bank PLC |
4/3/2019 | 1,960,983,787 | JPY | 17,718,719 | USD | — | (544 | ) | ||||||||||||||||||||
| Barclays Bank PLC |
4/3/2019 | 19,446,394 | USD | 2,159,660,123 | JPY | — | (66,891 | ) | ||||||||||||||||||||
| Barclays Bank PLC |
5/9/2019 | 17,373,316 | USD | 1,917,444,241 | JPY | — | (5,017 | ) | ||||||||||||||||||||
| Canadian Imperial Bank of Commerce |
4/3/2019 | 19,446,394 | USD | 2,159,837,085 | JPY | — | (68,490 | ) | ||||||||||||||||||||
| Citibank N.A. |
4/3/2019 | 446,779,696 | JPY | 4,017,850 | USD | 18,961 | — | |||||||||||||||||||||
| Citibank N.A. |
4/3/2019 | 1,960,989,103 | JPY | 17,718,719 | USD | — | (496 | ) | ||||||||||||||||||||
| Citibank N.A. |
4/3/2019 | 19,446,394 | USD | 2,159,652,344 | JPY | — | (66,821 | ) | ||||||||||||||||||||
| Citibank N.A. |
5/9/2019 | 17,373,316 | USD | 1,917,498,098 | JPY | — | (5,506 | ) | ||||||||||||||||||||
| Credit Suisse International |
4/3/2019 | 1,960,934,175 | JPY | 17,718,719 | USD | — | (993 | ) | ||||||||||||||||||||
| Credit Suisse International |
5/9/2019 | 17,373,316 | USD | 1,917,478,988 | JPY | — | (5,332 | ) | ||||||||||||||||||||
| Goldman Sachs |
4/3/2019 | 10,607,128 | USD | 1,177,984,146 | JPY | — | (36,371 | ) | ||||||||||||||||||||
| UBS AG |
4/3/2019 | 1,494,083,065 | JPY | 13,499,978 | USD | — | (415 | ) | ||||||||||||||||||||
| UBS AG |
5/9/2019 | 13,236,816 | USD | 1,460,944,734 | JPY | — | (4,135 | ) | ||||||||||||||||||||
| $ | 18,961 | $ | (333,644 | ) | ||||||||||||||||||||||||
| CURRENCY LEGEND | ||
| JPY | Japanese yen | |
| USD | U.S. dollar | |
See Notes to Financial Statements.
| WisdomTree Trust | 45 |
Statements of Assets and Liabilities
WisdomTree Trust
March 31, 2019
| WisdomTree Europe Hedged Equity Fund |
WisdomTree Europe Hedged Equity Fund |
WisdomTree Germany Hedged Equity Fund |
WisdomTree Hedged Quality Growth Fund |
WisdomTree Japan Hedged Equity Fund |
WisdomTree Japan Hedged Equity Fund |
|||||||||||||||||||
| ASSETS: |
||||||||||||||||||||||||
| Investments, at cost |
$ | 4,016,273,244 | $ | 132,014,468 | $ | 58,265,329 | $ | 439,798,515 | $ | 3,640,284,177 | $ | 95,297,374 | ||||||||||||
| Foreign currency, at cost |
— | 865,721 | 8,929 | 126,196 | 4,502,477 | 176,619 | ||||||||||||||||||
| Investments in securities, at value1,2 (Note 2) |
3,750,602,719 | 127,424,066 | 50,699,600 | 443,618,187 | 3,327,679,976 | 86,745,909 | ||||||||||||||||||
| Cash |
1,440 | 4,325 | 1,730 | 297,285 | 179,232 | 55,327 | ||||||||||||||||||
| Foreign currency, at value |
— | 865,713 | 8,867 | 126,153 | 4,496,962 | 176,368 | ||||||||||||||||||
| Unrealized appreciation on foreign currency contracts |
60,814,813 | 2,022,872 | 866,801 | 4,804,463 | 4,468,481 | 18,961 | ||||||||||||||||||
| Receivables: |
||||||||||||||||||||||||
| Investment securities sold |
18,773,139 | — | — | — | 58,064,624 | — | ||||||||||||||||||
| Capital shares sold |
462 | — | — | — | 5,405 | — | ||||||||||||||||||
| Dividends |
1,669,382 | 331,529 | 173,318 | 1,652,758 | 38,734,292 | 976,892 | ||||||||||||||||||
| Securities lending income |
242,078 | 25,386 | — | 20,778 | 54,094 | 8,353 | ||||||||||||||||||
| Foreign tax reclaims |
12,090,378 | 226,565 | 605,958 | 1,509,092 | — | — | ||||||||||||||||||
| Total Assets |
3,844,194,411 | 130,900,456 | 52,356,274 | 452,028,716 | 3,433,683,066 | 87,981,810 | ||||||||||||||||||
| LIABILITIES: |
||||||||||||||||||||||||
| Foreign currency due to custodian, at value |
209,096 | — | — | — | — | — | ||||||||||||||||||
| Unrealized depreciation on foreign currency contracts |
2,331,577 | 68,824 | 16,636 | 320,463 | 16,884,082 | 333,644 | ||||||||||||||||||
| Payables: |
||||||||||||||||||||||||
| Cash collateral received for securities loaned (Note 2) |
29,943,930 | 8,591,779 | — | 10,577,670 | 102,390,479 | 4,509,372 | ||||||||||||||||||
| Investment securities purchased |
46,484,095 | 1,508,300 | 777,473 | 2,206,544 | — | — | ||||||||||||||||||
| Capital shares redeemed |
18,979,309 | — | — | — | 58,614,994 | — | ||||||||||||||||||
| Advisory fees (Note 3) |
1,873,930 | 60,508 | 21,292 | 214,609 | 1,364,036 | 41,834 | ||||||||||||||||||
| Service fees (Note 2) |
14,216 | 459 | 196 | 1,628 | 12,504 | 317 | ||||||||||||||||||
| Total Liabilities |
99,836,153 | 10,229,870 | 815,597 | 13,320,914 | 179,266,095 | 4,885,167 | ||||||||||||||||||
| NET ASSETS |
$ | 3,744,358,258 | $ | 120,670,586 | $ | 51,540,677 | $ | 438,707,802 | $ | 3,254,416,971 | $ | 83,096,643 | ||||||||||||
| NET ASSETS: |
||||||||||||||||||||||||
| Paid-in capital |
$ | 5,643,944,760 | $ | 140,123,714 | $ | 86,602,631 | $ | 441,010,169 | $ | 5,214,460,682 | $ | 109,894,033 | ||||||||||||
| Total distributable earnings (loss) |
(1,899,586,502 | ) | (19,453,128 | ) | (35,061,954 | ) | (2,302,367 | ) | (1,960,043,711 | ) | (26,797,390 | ) | ||||||||||||
| NET ASSETS |
$ | 3,744,358,258 | $ | 120,670,586 | $ | 51,540,677 | $ | 438,707,802 | $ | 3,254,416,971 | $ | 83,096,643 | ||||||||||||
| Outstanding beneficial interest shares of $0.001 par value (unlimited number of shares authorized) |
58,600,000 | 4,000,000 | 1,800,000 | 13,650,000 | 64,550,000 | 2,100,000 | ||||||||||||||||||
| Net asset value per share |
$ | 63.90 | $ | 30.17 | $ | 28.63 | $ | 32.14 | $ | 50.42 | $ | 39.57 | ||||||||||||
| 1 Includes market value of securities out on loan of: |
$ | 35,415,714 | $ | 15,888,744 | — | $ | 14,937,774 | $ | 212,957,582 | $ | 23,787,029 | |||||||||||||
| 2 Investments in securities include investment of cash collateral for securities loaned (see Schedule of Investments for additional information). |
|
|||||||||||||||||||||||
See Notes to Financial Statements.
| 46 | WisdomTree Trust |
WisdomTree Trust
For the Year Ended March 31, 2019
| WisdomTree Europe Hedged Equity Fund |
WisdomTree Europe Hedged Equity Fund |
WisdomTree Germany Hedged Equity Fund |
WisdomTree Dividend Growth Fund |
WisdomTree Japan Hedged Equity Fund |
WisdomTree Japan Hedged Equity Fund |
|||||||||||||||||||
| INVESTMENT INCOME: |
|
|||||||||||||||||||||||
| Dividends1 |
$ | 148,028,905 | $ | 6,171,403 | $ | 2,917,936 | $ | 12,361,629 | $ | 125,047,545 | $ | 2,404,963 | ||||||||||||
| Non-cash dividends |
20,914,833 | 328,071 | — | 127,767 | — | — | ||||||||||||||||||
| Securities lending income (Note 2) |
2,985,524 | 267,701 | 45 | 286,578 | 916,026 | 96,282 | ||||||||||||||||||
| Total investment income |
171,929,262 | 6,767,175 | 2,917,981 | 12,775,974 | 125,963,571 | 2,501,245 | ||||||||||||||||||
| EXPENSES: |
|
|||||||||||||||||||||||
| Advisory fees (Note 3) |
28,986,835 | 950,073 | 337,783 | 2,791,301 | 24,710,787 | 814,121 | ||||||||||||||||||
| Service fees (Note 2) |
219,900 | 7,208 | 3,096 | 21,176 | 226,516 | 6,176 | ||||||||||||||||||
| Total expenses |
29,206,735 | 957,281 | 340,879 | 2,812,477 | 24,937,303 | 820,297 | ||||||||||||||||||
| Net investment income |
142,722,527 | 5,809,894 | 2,577,102 | 9,963,497 | 101,026,268 | 1,680,948 | ||||||||||||||||||
| NET REALIZED AND UNREALIZED GAIN (LOSS) ON INVESTMENTS: |
|
|||||||||||||||||||||||
| Net realized gain (loss) from: |
|
|||||||||||||||||||||||
| Investment transactions |
(63,359,433 | ) | (4,001,541 | ) | (342,459 | ) | (11,249,061 | ) | (59,464,942 | ) | 1,494,203 | |||||||||||||
| In-kind redemptions |
198,375,404 | 8,477,297 | 2,566,821 | 37,552,231 | 213,006,676 | 16,753,052 | ||||||||||||||||||
| Foreign currency contracts |
549,016,419 | 17,030,756 | 7,751,364 | 42,244,062 | 360,831,802 | 11,698,426 | ||||||||||||||||||
| Foreign currency related transactions |
(33,786 | ) | (24,894 | ) | (991 | ) | 87,413 | (2,678,454 | ) | (95,070 | ) | |||||||||||||
| Net realized gain |
683,998,604 | 21,481,618 | 9,974,735 | 68,634,645 | 511,695,082 | 29,850,611 | ||||||||||||||||||
| Net increase (decrease) in unrealized appreciation/depreciation: |
||||||||||||||||||||||||
| Investment transactions |
(743,920,042 | ) | (35,392,978 | ) | (17,419,840 | ) | (65,452,063 | ) | (1,075,475,386 | ) | (41,596,999 | ) | ||||||||||||
| Foreign currency contracts |
94,210,160 | 2,874,787 | 1,414,393 | 5,192,153 | 18,855,185 | (139,986 | ) | |||||||||||||||||
| Translation of assets and liabilities denominated in foreign currencies |
(1,722,889 | ) | (21,849 | ) | (66,207 | ) | (69,670 | ) | (35,232 | ) | 39 | |||||||||||||
| Net decrease in unrealized appreciation/depreciation |
(651,432,771 | ) | (32,540,040 | ) | (16,071,654 | ) | (60,329,580 | ) | (1,056,655,433 | ) | (41,736,946 | ) | ||||||||||||
| Net realized and unrealized gain (loss) on investments |
32,565,833 | (11,058,422 | ) | (6,096,919 | ) | 8,305,065 | (544,960,351 | ) | (11,886,335 | ) | ||||||||||||||
| NET INCREASE (DECREASE) IN NET ASSETS RESULTING FROM OPERATIONS |
$ | 175,288,360 | $ | (5,248,528 | ) | $ | (3,519,817 | ) | $ | 18,268,562 | $ | (443,934,083 | ) | $ | (10,205,387 | ) | ||||||||
| 1 Net of foreign withholding tax of: |
$ | 26,119,033 | $ | 1,042,979 | $ | 429,229 | $ | 1,146,886 | $ | 13,895,373 | $ | 273,725 | ||||||||||||
See Notes to Financial Statements.
| WisdomTree Trust | 47 |
Statements of Changes in Net Assets
WisdomTree Trust
| WisdomTree Europe Hedged Equity Fund |
WisdomTree Europe Hedged SmallCap Equity Fund |
WisdomTree Germany Hedged Equity Fund |
||||||||||||||||||||||
| For the Year Ended March 31, 2019 |
For the Year Ended March 31, 2018 |
For the Year Ended |
For the Year Ended |
For the Year Ended |
For the Year Ended |
|||||||||||||||||||
| INCREASE (DECREASE) IN NET ASSETS RESULTING FROM OPERATIONS: |
| |||||||||||||||||||||||
| Net investment income |
$ | 142,722,527 | $ | 164,056,097 | $ | 5,809,894 | $ | 3,823,229 | $ | 2,577,102 | $ | 3,178,901 | ||||||||||||
| Net realized gain (loss) on investments, foreign currency contracts and foreign currency related transactions |
683,998,604 | (581,912,220 | ) | 21,481,618 | (9,562,308 | ) | 9,974,735 | (10,598,776 | ) | |||||||||||||||
| Net increase (decrease) in unrealized appreciation/depreciation on investments, foreign currency contracts and translation of assets and liabilities denominated in foreign currencies |
(651,432,771 | ) | 665,756,677 | (32,540,040 | ) | 20,133,398 | (16,071,654 | ) | 13,348,528 | |||||||||||||||
| Net increase (decrease) in net assets resulting from operations |
175,288,360 | 247,900,554 | (5,248,528 | ) | 14,394,319 | (3,519,817 | ) | 5,928,653 | ||||||||||||||||
| DISTRIBUTIONS TO SHAREHOLDERS1: |
| |||||||||||||||||||||||
| Distributable earnings |
(113,154,749 | ) | (205,511,362 | ) | (3,894,030 | ) | (2,354,900 | ) | (1,590,516 | ) | (2,509,207 | ) | ||||||||||||
| Tax return of capital |
(15,257,371 | ) | — | — | (58,350 | ) | (525,501 | ) | (845,543 | ) | ||||||||||||||
| Total distributions to shareholders |
(128,412,120 | ) | (205,511,362 | ) | (3,894,030 | ) | (2,413,250 | ) | (2,116,017 | ) | (3,354,750 | ) | ||||||||||||
| CAPITAL SHARE TRANSACTIONS: |
| |||||||||||||||||||||||
| Net proceeds from sale of shares |
29,284,459 | 462,153,844 | 58,132,712 | 28,698,048 | 4,431,404 | 1,669,276 | ||||||||||||||||||
| Cost of shares redeemed |
(2,664,748,283 | ) | (3,471,771,615 | ) | (82,943,579 | ) | (41,649,166 | ) | (38,557,229 | ) | (37,589,190 | ) | ||||||||||||
| Net decrease in net assets resulting from capital share transactions |
(2,635,463,824 | ) | (3,009,617,771 | ) | (24,810,867 | ) | (12,951,118 | ) | (34,125,825 | ) | (35,919,914 | ) | ||||||||||||
| Net Decrease in Net Assets |
(2,588,587,584 | ) | (2,967,228,579 | ) | (33,953,425 | ) | (970,049 | ) | (39,761,659 | ) | (33,346,011 | ) | ||||||||||||
| NET ASSETS: |
| |||||||||||||||||||||||
| Beginning of year |
$ | 6,332,945,842 | $ | 9,300,174,421 | $ | 154,624,011 | $ | 155,594,060 | $ | 91,302,336 | $ | 124,648,347 | ||||||||||||
| End of year2 |
$ | 3,744,358,258 | $ | 6,332,945,842 | $ | 120,670,586 | $ | 154,624,011 | $ | 51,540,677 | $ | 91,302,336 | ||||||||||||
| SHARES CREATED AND REDEEMED: |
| |||||||||||||||||||||||
| Shares outstanding, beginning of year |
101,050,000 | 148,100,000 | 5,050,000 | 5,500,000 | 2,950,000 | 4,100,000 | ||||||||||||||||||
| Shares created |
450,000 | 7,100,000 | 1,800,000 | 950,000 | 150,000 | 50,000 | ||||||||||||||||||
| Shares redeemed |
(42,900,000 | ) | (54,150,000 | ) | (2,850,000 | ) | (1,400,000 | ) | (1,300,000 | ) | (1,200,000 | ) | ||||||||||||
| Shares outstanding, end of year |
58,600,000 | 101,050,000 | 4,000,000 | 5,050,000 | 1,800,000 | 2,950,000 | ||||||||||||||||||
| 1 Amounts for the fiscal year ended March 31, 2018 have been reclassified to match the current fiscal year presentation which conforms to the “Disclosure Update and Simplification” amendments adopted by the SEC and which became effective November 5, 2018. The amounts shown for the fiscal year ended March 31, 2018 represents a distribution entirely from net investment income. See Note 7 in the Notes to Financial Statements for more information. |
| |||||||||||||||||||||||
| 2 The “Disclosure Update and Simplification” amendments adopted by the SEC removed the requirement to disclose the amounts pertaining to undistributed (distributions in excess of) net investment income included in net assets for the current fiscal year ended March 31, 2019. The undistributed (distributions in excess of) net investment income included in the net assets for the fiscal year ended March 31, 2018 were as follows: |
| |||||||||||||||||||||||
| Undistributed(Distributions in excess of) net investment income included in the net assets |
$ | 15,797,064 | $ | (198,790 | ) | $ | (100,164 | ) | ||||||||||||||||
See Notes to Financial Statements.
| 48 | WisdomTree Trust |
Statements of Changes in Net Assets (concluded)
WisdomTree Trust
| WisdomTree International Hedged Quality Dividend Growth Fund |
WisdomTree Japan Hedged Equity Fund |
WisdomTree Japan Hedged SmallCap Equity Fund |
||||||||||||||||||||||
| For the Year Ended |
For the Year Ended |
For the Year Ended |
For the Year Ended |
For the Year Ended |
For the Year Ended |
|||||||||||||||||||
| INCREASE (DECREASE) IN NET ASSETS RESULTING FROM OPERATIONS: |
| |||||||||||||||||||||||
| Net investment income |
$ | 9,963,497 | $ | 9,817,857 | $ | 101,026,268 | $ | 140,746,169 | $ | 1,680,948 | $ | 2,562,966 | ||||||||||||
| Net realized gain (loss) on investments, foreign currency contracts and foreign currency related transactions |
68,634,645 | (27,297,499 | ) | 511,695,082 | 486,842,324 | 29,850,611 | 272,594 | |||||||||||||||||
| Net increase (decrease) in unrealized appreciation/depreciation on investments, foreign currency contracts and translation of assets and liabilities denominated in foreign currencies |
(60,329,580 | ) | 59,139,325 | (1,056,655,433 | ) | 503,760,938 | (41,736,946 | ) | 21,970,927 | |||||||||||||||
| Net increase (decrease) in net assets resulting from operations |
18,268,562 | 41,659,683 | (443,934,083 | ) | 1,131,349,431 | (10,205,387 | ) | 24,806,487 | ||||||||||||||||
| DISTRIBUTIONS TO SHAREHOLDERS1: |
| |||||||||||||||||||||||
| Distributable earnings |
(1,740,568 | ) | (2,883,500 | ) | (146,097,231 | ) | (218,205,485 | ) | (2,960,022 | ) | (2,644,796 | ) | ||||||||||||
| CAPITAL SHARE TRANSACTIONS: |
||||||||||||||||||||||||
| Net proceeds from sale of shares |
86,584,594 | 110,682,170 | 569,935,610 | 1,216,292,660 | – | 108,408,785 | ||||||||||||||||||
| Cost of shares redeemed |
(207,596,639 | ) | (85,993,497 | ) | (3,332,487,004 | ) | (3,934,107,108 | ) | (111,171,524 | ) | (38,697,447 | ) | ||||||||||||
| Net increase (decrease) in net assets resulting from capital share transactions |
(121,012,045 | ) | 24,688,673 | (2,762,551,394 | ) | (2,717,814,448 | ) | (111,171,524 | ) | 69,711,338 | ||||||||||||||
| Net Increase (Decrease) in Net Assets |
(104,484,051 | ) | 63,464,856 | (3,352,582,708 | ) | (1,804,670,502 | ) | (124,336,933 | ) | 91,873,029 | ||||||||||||||
| NET ASSETS: |
||||||||||||||||||||||||
| Beginning of year |
$ | 543,191,853 | $ | 479,726,997 | $ | 6,606,999,679 | $ | 8,411,670,181 | $ | 207,433,576 | $ | 115,560,547 | ||||||||||||
| End of year2 |
$ | 438,707,802 | $ | 543,191,853 | $ | 3,254,416,971 | $ | 6,606,999,679 | $ | 83,096,643 | $ | 207,433,576 | ||||||||||||
| SHARES CREATED AND REDEEMED: |
| |||||||||||||||||||||||
| Shares outstanding, beginning of year |
17,650,000 | 16,900,000 | 118,500,000 | 166,900,000 | 4,700,000 | 3,100,000 | ||||||||||||||||||
| Shares created |
2,700,000 | 3,600,000 | 10,050,000 | 22,000,000 | – | 2,500,000 | ||||||||||||||||||
| Shares redeemed |
(6,700,000 | ) | (2,850,000 | ) | (64,000,000 | ) | (70,400,000 | ) | (2,600,000 | ) | (900,000 | ) | ||||||||||||
| Shares outstanding, end of year |
13,650,000 | 17,650,000 | 64,550,000 | 118,500,000 | 2,100,000 | 4,700,000 | ||||||||||||||||||
| 1 Amounts for the fiscal year ended March 31, 2018 have been reclassified to match the current fiscal year presentation which conforms to the “Disclosure Update and Simplification” amendments adopted by the SEC and which became effective November 5, 2018. The amounts shown for the fiscal year ended March 31, 2018 represents a distribution entirely from net investment income. See Note 7 in the Notes to Financial Statements for more information. |
| |||||||||||||||||||||||
| 2 The “Disclosure Update and Simplification” amendments adopted by the SEC removed the requirement to disclose the amounts pertaining to undistributed (distributions in excess of) net investment income included in net assets for the current fiscal year ended March 31, 2019. The undistributed (distributions in excess of) net investment income included in the net assets for the fiscal year ended March 31, 2018 were as follows: |
| |||||||||||||||||||||||
| Undistributed(Distributions in excess of) net investment income included in the net assets |
$ | (1,813,823 | ) | $ | 106,092,832 | $ | 2,698,485 | |||||||||||||||||
See Notes to Financial Statements.
| WisdomTree Trust | 49 |
WisdomTree Trust
Selected data for a share of beneficial interest outstanding throughout the period is presented below:
| WisdomTree Europe Hedged Equity Fund | For the Year Ended March 31, 2019 |
For the Year Ended March 31, 2018 |
For the Year Ended March 31, 2017 |
For the Year Ended March 31, 2016 |
For the Year Ended March 31, 2015 |
|||||||||||||||
| Net asset value, beginning of year |
$ | 62.67 | $ | 62.80 | $ | 52.04 | $ | 66.16 | $ | 56.40 | ||||||||||
| Investment operations: |
||||||||||||||||||||
| Net investment income1 |
1.79 | 1.23 | 1.70 | 1.29 | 1.14 | |||||||||||||||
| Net realized and unrealized gain (loss) |
0.90 | 0.08 | 10.59 | (10.26 | ) | 11.83 | ||||||||||||||
| Total from investment operations |
2.69 | 1.31 | 12.29 | (8.97 | ) | 12.97 | ||||||||||||||
| Dividends and distributions to shareholders: |
||||||||||||||||||||
| Net investment income |
(1.29 | ) | (1.44 | ) | (1.53 | ) | (1.35 | ) | (1.19 | ) | ||||||||||
| Capital gains |
— | — | — | (3.80 | ) | (2.02 | ) | |||||||||||||
| Tax return of capital |
(0.17 | ) | — | — | — | — | ||||||||||||||
| Total dividends and distributions to shareholders |
(1.46 | ) | (1.44 | ) | (1.53 | ) | (5.15 | ) | (3.21 | ) | ||||||||||
| Net asset value, end of year |
$ | 63.90 | $ | 62.67 | $ | 62.80 | $ | 52.04 | $ | 66.16 | ||||||||||
| TOTAL RETURN2 |
4.33 | % | 2.03 | % | 24.20 | % | (13.85 | )% | 24.02 | % | ||||||||||
| RATIOS/SUPPLEMENTAL DATA: |
||||||||||||||||||||
| Net assets, end of year (000’s omitted) |
$ | 3,744,358 | $ | 6,332,946 | $ | 9,300,174 | $ | 13,716,953 | $ | 17,544,485 | ||||||||||
| Ratios to average net assets of: |
||||||||||||||||||||
| Expenses |
0.58 | % | 0.58 | % | 0.58 | % | 0.58 | % | 0.59 | %3 | ||||||||||
| Net investment income |
2.86 | % | 1.91 | % | 3.13 | % | 2.19 | % | 1.91 | % | ||||||||||
| Portfolio turnover rate4 |
18 | % | 20 | % | 24 | % | 29 | % | 12 | % | ||||||||||
| WisdomTree Europe Hedged SmallCap Equity Fund |
For the Year Ended March 31, 2019 |
For the Year Ended March 31, 2018 |
For the Year Ended March 31, 2017 |
For the Year Ended March 31, 2016 |
For the Period March 4, 2015* through March 31, 2015 |
|||||||||||||||
| Net asset value, beginning of period |
$ | 30.62 | $ | 28.29 | $ | 23.90 | $ | 25.94 | $ | 24.87 | ||||||||||
| Investment operations: |
||||||||||||||||||||
| Net investment income1 |
1.06 | 0.74 | 0.81 | 0.61 | 0.13 | |||||||||||||||
| Net realized and unrealized gain (loss) |
(0.89 | ) | 2.05 | 4.25 | (1.57 | ) | 0.94 | |||||||||||||
| Total from investment operations |
0.17 | 2.79 | 5.06 | (0.96 | ) | 1.07 | ||||||||||||||
| Dividends and distributions to shareholders: |
||||||||||||||||||||
| Net investment income |
(0.62 | ) | (0.45 | ) | (0.67 | ) | (1.02 | ) | — | |||||||||||
| Capital gains |
— | — | — | (0.06 | ) | — | ||||||||||||||
| Tax return of capital |
— | (0.01 | ) | — | — | — | ||||||||||||||
| Total dividends and distributions to shareholders |
(0.62 | ) | (0.46 | ) | (0.67 | ) | (1.08 | ) | — | |||||||||||
| Net asset value, end of period |
$ | 30.17 | $ | 30.62 | $ | 28.29 | $ | 23.90 | $ | 25.94 | ||||||||||
| TOTAL RETURN2 |
0.54 | % | 9.88 | % | 21.62 | % | (3.79 | )% | 4.30 | % | ||||||||||
| RATIOS/SUPPLEMENTAL DATA: |
||||||||||||||||||||
| Net assets, end of period (000’s omitted) |
$ | 120,671 | $ | 154,624 | $ | 155,594 | $ | 267,708 | $ | 125,829 | ||||||||||
| Ratios to average net assets of: |
||||||||||||||||||||
| Expenses |
0.58 | % | 0.58 | % | 0.58 | % | 0.58 | % | 0.58 | %5 | ||||||||||
| Net investment income |
3.55 | % | 2.43 | % | 3.27 | % | 2.47 | % | 6.87 | %5 | ||||||||||
| Portfolio turnover rate4 |
37 | % | 37 | % | 41 | % | 39 | % | 1 | % | ||||||||||
| * | Commencement of operations. |
| 1 | Based on average shares outstanding. |
| 2 | Total return is calculated assuming an initial investment made at the net asset value at the beginning of the period, reinvestment of all dividends and distributions at net asset value during the period and redemption on the last day of the period. Total return calculated for a period of less than one year is not annualized. |
| 3 | Included in the expense ratio are proxy expenses. Without these proxy expenses, the expense ratio would have been 0.58%. |
| 4 | Portfolio turnover rate is not annualized and excludes the value of the portfolio securities received or delivered as a result of in-kind creations or redemptions of the Fund’s capital shares. Short-term securities with maturities less than or equal to 365 days are excluded from the portfolio turnover calculation. |
| 5 | Annualized. |
See Notes to Financial Statements.
| 50 | WisdomTree Trust |
Financial Highlights (continued)
WisdomTree Trust
Selected data for a share of beneficial interest outstanding throughout the period is presented below:
| WisdomTree Germany Hedged Equity Fund |
For the Year Ended March 31, 2019 |
For the Year Ended March 31, 2018 |
For the Year Ended March 31, 2017 |
For the Year Ended March 31, 2016 |
For the Year Ended |
|||||||||||||||
| Net asset value, beginning of year |
$ | 30.95 | $ | 30.40 | $ | 25.54 | $ | 31.38 | $ | 26.98 | ||||||||||
| Investment operations: |
||||||||||||||||||||
| Net investment income1 |
1.10 | 0.87 | 0.84 | 0.60 | 0.16 | |||||||||||||||
| Net realized and unrealized gain (loss) |
(2.64 | ) | 0.54 | 4.99 | (5.05 | ) | 5.90 | |||||||||||||
| Total from investment operations |
(1.54 | ) | 1.41 | 5.83 | (4.45 | ) | 6.06 | |||||||||||||
| Dividends and distributions to shareholders: |
||||||||||||||||||||
| Net investment income |
(0.59 | ) | (0.64 | ) | (0.97 | ) | (0.73 | ) | (0.41 | ) | ||||||||||
| Capital gains |
— | — | — | (0.66 | ) | (1.25 | ) | |||||||||||||
| Tax return of capital |
(0.19 | ) | (0.22 | ) | — | — | — | |||||||||||||
| Total dividends and distributions to shareholders |
(0.78 | ) | (0.86 | ) | (0.97 | ) | (1.39 | ) | (1.66 | ) | ||||||||||
| Net asset value, end of year |
$ | 28.63 | $ | 30.95 | $ | 30.40 | $ | 25.54 | $ | 31.38 | ||||||||||
| TOTAL RETURN2 |
(5.07 | )% | 4.63 | % | 23.62 | % | (14.44 | )% | 23.70 | % | ||||||||||
| RATIOS/SUPPLEMENTAL DATA: |
||||||||||||||||||||
| Net assets, end of year (000’s omitted) |
$ | 51,541 | $ | 91,302 | $ | 124,648 | $ | 200,501 | $ | 291,816 | ||||||||||
| Ratios to average net assets of: |
||||||||||||||||||||
| Expenses |
0.48 | % | 0.48 | % | 0.48 | % | 0.48 | % | 0.49 | %3 | ||||||||||
| Net investment income |
3.66 | % | 2.78 | % | 3.14 | % | 2.18 | % | 0.55 | % | ||||||||||
| Portfolio turnover rate4 |
16 | % | 20 | % | 28 | % | 38 | % | 11 | % | ||||||||||
| WisdomTree International Hedged Quality Dividend Growth Fund |
For the Year Ended March 31, 2019 |
For the Year Ended March 31, 2018 |
For the Year Ended March 31, 2017 |
For the Year Ended March 31, 2016 |
For the Period May 7, 2014* through March 31, 2015 |
|||||||||||||||
| Net asset value, beginning of period |
$ | 30.78 | $ | 28.39 | $ | 25.73 | $ | 26.99 | $ | 24.90 | ||||||||||
| Investment operations: |
||||||||||||||||||||
| Net investment income1 |
0.64 | 0.58 | 0.56 | 0.71 | 0.90 | |||||||||||||||
| Net realized and unrealized gain (loss) |
0.83 | 1.99 | 2.80 | (1.17 | ) | 2.18 | ||||||||||||||
| Total from investment operations |
1.47 | 2.57 | 3.36 | (0.46 | ) | 3.08 | ||||||||||||||
| Dividends and distributions to shareholders: |
||||||||||||||||||||
| Net investment income |
(0.11 | ) | (0.18 | ) | (0.70 | ) | (0.55 | ) | (0.23 | ) | ||||||||||
| Capital gains |
— | — | — | (0.25 | ) | (0.76 | ) | |||||||||||||
| Total dividends and distributions to shareholders |
(0.11 | ) | (0.18 | ) | (0.70 | ) | (0.80 | ) | (0.99 | ) | ||||||||||
| Net asset value, end of period |
$ | 32.14 | $ | 30.78 | $ | 28.39 | $ | 25.73 | $ | 26.99 | ||||||||||
| TOTAL RETURN2 |
4.78 | % | 9.05 | % | 13.26 | % | (1.73 | )% | 12.78 | % | ||||||||||
| RATIOS/SUPPLEMENTAL DATA: |
||||||||||||||||||||
| Net assets, end of period (000’s omitted) |
$ | 438,708 | $ | 543,192 | $ | 479,727 | $ | 732,050 | $ | 206,452 | ||||||||||
| Ratios to average net assets of: |
||||||||||||||||||||
| Expenses |
0.58 | % | 0.58 | % | 0.58 | % | 0.58 | %5 | 0.58 | %6 | ||||||||||
| Net investment income |
2.07 | % | 1.89 | % | 2.14 | % | 2.75 | % | 3.89 | %6 | ||||||||||
| Portfolio turnover rate4 |
56 | % | 42 | % | 53 | % | 48 | % | 14 | % | ||||||||||
| * | Commencement of operations. |
| 1 | Based on average shares outstanding. |
| 2 | Total return is calculated assuming an initial investment made at the net asset value at the beginning of the period, reinvestment of all dividends and distributions at net asset value during the period and redemption on the last day of the period. Total return calculated for a period of less than one year is not annualized. |
| 3 | Included in the expense ratio are proxy expenses. Without these proxy expenses, the expense ratio would have been 0.48%. |
| 4 | Portfolio turnover rate is not annualized and excludes the value of the portfolio securities received or delivered as a result of in-kind creations or redemptions of the Fund’s capital shares. Short-term securities with maturities less than or equal to 365 days are excluded from the portfolio turnover calculation. |
| 5 | Included in the expense ratio are non-recurring professional expenses. Without these expenses, the expense ratio would have been unchanged. |
| 6 | Annualized. |
See Notes to Financial Statements.
| WisdomTree Trust | 51 |
Financial Highlights (concluded)
WisdomTree Trust
Selected data for a share of beneficial interest outstanding throughout the period is presented below:
| WisdomTree Japan Hedged Equity Fund |
For the Year Ended March 31, 2019 |
For the Year Ended March 31, 2018 |
For the Year Ended March 31, 2017 |
For the Year Ended March 31, 2016 |
For the Year Ended March 31, 2015 |
|||||||||||||||
| Net asset value, beginning of year |
$ | 55.76 | $ | 50.40 | $ | 43.85 | $ | 55.03 | $ | 47.50 | ||||||||||
| Investment operations: |
||||||||||||||||||||
| Net investment income1 |
1.06 | 0.92 | 0.86 | 0.80 | 0.91 | |||||||||||||||
| Net realized and unrealized gain (loss) |
(5.03 | ) | 5.81 | 6.67 | (9.00 | ) | 12.34 | |||||||||||||
| Total from investment operations |
(3.97 | ) | 6.73 | 7.53 | (8.20 | ) | 13.25 | |||||||||||||
| Dividends and distributions to shareholders: |
||||||||||||||||||||
| Net investment income |
(1.37 | ) | (1.37 | ) | (0.98 | ) | (0.76 | ) | (0.94 | ) | ||||||||||
| Capital gains |
— | — | — | (2.22 | ) | (4.78 | ) | |||||||||||||
| Total dividends and distributions to shareholders |
(1.37 | ) | (1.37 | ) | (0.98 | ) | (2.98 | ) | (5.72 | ) | ||||||||||
| Net asset value, end of year |
$ | 50.42 | $ | 55.76 | $ | 50.40 | $ | 43.85 | $ | 55.03 | ||||||||||
| TOTAL RETURN2 |
(7.20 | )% | 13.45 | % | 17.45 | % | (15.64 | )% | 29.30 | % | ||||||||||
| RATIOS/SUPPLEMENTAL DATA: |
||||||||||||||||||||
| Net assets, end of year (000’s omitted) |
$ | 3,254,417 | $ | 6,607,000 | $ | 8,411,670 | $ | 9,737,132 | $ | 15,806,850 | ||||||||||
| Ratios to average net assets of: |
||||||||||||||||||||
| Expenses |
0.48 | % | 0.48 | % | 0.48 | % | 0.48 | % | 0.49 | %3 | ||||||||||
| Net investment income |
1.96 | % | 1.67 | % | 1.91 | % | 1.52 | % | 1.81 | % | ||||||||||
| Portfolio turnover rate4 |
23 | % | 18 | % | 37 | % | 27 | % | 31 | % | ||||||||||
| WisdomTree Japan Hedged SmallCap Equity Fund |
For the Year Ended March 31, 2019 |
For the Year Ended March 31, 2018 |
For the Year Ended March 31, 2017 |
For the Year Ended March 31, 2016 |
For the Year Ended March 31, 2015 |
|||||||||||||||
| Net asset value, beginning of year |
$ | 44.13 | $ | 37.28 | $ | 31.24 | $ | 33.65 | $ | 29.08 | ||||||||||
| Investment operations: |
||||||||||||||||||||
| Net investment income1 |
0.51 | 0.64 | 0.70 | 0.41 | 0.47 | |||||||||||||||
| Net realized and unrealized gain (loss) |
(4.31 | ) | 6.91 | 5.94 | (1.59 | ) | 6.74 | |||||||||||||
| Total from investment operations |
(3.80 | ) | 7.55 | 6.64 | (1.18 | ) | 7.21 | |||||||||||||
| Dividends and distributions to shareholders: |
||||||||||||||||||||
| Net investment income |
(0.76 | ) | (0.70 | ) | (0.60 | ) | (0.35 | ) | (0.41 | ) | ||||||||||
| Capital gains |
— | — | — | (0.88 | ) | (2.23 | ) | |||||||||||||
| Total dividends and distributions to shareholders |
(0.76 | ) | (0.70 | ) | (0.60 | ) | (1.23 | ) | (2.64 | ) | ||||||||||
| Net asset value, end of year |
$ | 39.57 | $ | 44.13 | $ | 37.28 | $ | 31.24 | $ | 33.65 | ||||||||||
| TOTAL RETURN2 |
(8.77 | )% | 20.42 | % | 21.64 | % | (3.83 | )%5 | 25.86 | % | ||||||||||
| RATIOS/SUPPLEMENTAL DATA: |
||||||||||||||||||||
| Net assets, end of year (000’s omitted) |
$ | 83,097 | $ | 207,434 | $ | 115,561 | $ | 90,584 | $ | 117,762 | ||||||||||
| Ratios to average net assets of: |
||||||||||||||||||||
| Expenses |
0.58 | % | 0.58 | % | 0.58 | % | 0.58 | % | 0.59 | %3 | ||||||||||
| Net investment income |
1.20 | % | 1.51 | % | 2.11 | % | 1.20 | % | 1.52 | % | ||||||||||
| Portfolio turnover rate4 |
38 | % | 30 | % | 48 | % | 45 | % | 41 | % | ||||||||||
| 1 | Based on average shares outstanding. |
| 2 | Total return is calculated assuming an initial investment made at the net asset value at the beginning of the period, reinvestment of all dividends and distributions at net asset value during the period and redemption on the last day of the period. |
| 3 | Included in the expense ratio are proxy expenses. Without these proxy expenses, the expense ratio would have been 0.48% and 0.58%, for WisdomTree Japan Hedged Equity Fund and WisdomTree Japan Hedged SmallCap Equity Fund, respectively. |
| 4 | Portfolio turnover rate is not annualized and excludes the value of the portfolio securities received or delivered as a result of in-kind creations or redemptions of the Fund’s capital shares. Short-term securities with maturities less than or equal to 365 days are excluded from the portfolio turnover calculation. |
| 5 | Includes a voluntary reimbursement from the sub-advisor for investment losses on certain foreign exchange transactions during the period. Excluding this voluntary reimbursement, total return would have been 0.95% lower. |
See Notes to Financial Statements.
| 52 | WisdomTree Trust |
1. ORGANIZATION
WisdomTree Trust (the “Trust”) is registered under the Investment Company Act of 1940, as amended (the “1940 Act”), as an open-end management investment company. The Trust was established as a Delaware statutory trust on December 15, 2005. As of March 31, 2019, the Trust consisted of 76 operational investment funds (each a “Fund”, collectively, the “Funds”). In accordance with Accounting Standards Update (“ASU”) 2013-08, Financial Services-Investment Companies, each Fund listed below qualifies as an investment company and is applying the accounting and reporting guidance for investment companies. These notes relate only to the Funds listed in the table below:
| Fund | Commencement of Operations |
|||
| WisdomTree Europe Hedged Equity Fund (“Europe Hedged Equity Fund’’) |
December 31, 2009 | |||
| WisdomTree Europe Hedged SmallCap Equity Fund (“Europe Hedged SmallCap Equity Fund’’) |
March 4, 2015 | |||
| WisdomTree Germany Hedged Equity Fund (“Germany Hedged Equity Fund’’) |
October 17, 2013 | |||
| WisdomTree International Hedged Quality Dividend Growth Fund (“International Hedged Quality Dividend Growth Fund’’) |
May 7, 2014 | |||
| WisdomTree Japan Hedged Equity Fund (“Japan Hedged Equity Fund’’) |
June 16, 2006 | |||
| WisdomTree Japan Hedged SmallCap Equity Fund (“Japan Hedged SmallCap Equity Fund’’) |
June 28, 2013 | |||
Each Fund seeks to track the price and yield performance, before fees and expenses, of a particular index (“Index”) developed by WisdomTree Investments, Inc. (“WisdomTree Investments’’). WisdomTree Investments is the parent company of WisdomTree Asset Management, Inc. (‘‘WTAM’’), the investment adviser to each Fund and the Trust. “WisdomTree” is a registered trademark of WisdomTree Investments and has been licensed for use by the Trust. Each Fund described herein is considered to be non-diversified as defined under the 1940 Act.
In the normal course of business, the Funds may enter into contracts that contain a variety of representations or that provide indemnification for certain liabilities. The Funds’ maximum exposure under these arrangements is unknown, as this would involve future claims that may be made against the Funds that have not yet occurred. However, the Funds have not had prior claims or losses pursuant to these contracts and believes such exposure to be remote.
2. SIGNIFICANT ACCOUNTING POLICIES
The Financial Accounting Standards Board (“FASB”) Accounting Standards Codification (the “Codification”) is the exclusive reference of authoritative U.S. generally accepted accounting principles (“GAAP”) recognized by the FASB to be applied by nongovernmental entities. Rules and interpretive releases of the Securities and Exchange Commission (“SEC”) under authority of federal laws are also sources of authoritative GAAP for SEC registrants.
The following is a summary of significant accounting policies followed by the Funds:
Use of Estimates — The preparation of financial statements in conformity with GAAP, requires management to make certain estimates and assumptions that affect the reported amounts of assets and liabilities and disclosure of contingent assets and liabilities at the date of the financial statements and the reported amounts of increases and decreases in the net assets from operations during the reporting period. Actual results could differ from those estimates.
Investment Valuation — The net asset value (“NAV”) of each Fund’s shares is calculated each day a Fund is open for business as of the regularly scheduled close of regular trading on the New York Stock Exchange, normally 4:00 p.m. Eastern time (the “NAV Calculation Time”). NAV per share is calculated by dividing a Fund’s net assets by the number of Fund shares outstanding. Each Fund issues and redeems shares at NAV only in large blocks of shares known as creation units, which only certain institutions (e.g. broker-dealers) may purchase or redeem. Shares of each Fund are listed on a national securities exchange and trade at market prices. Most investors will buy and sell shares in the secondary market through brokers. Because Fund shares trade at market prices rather than NAV, shares may trade at a price greater than NAV or less than NAV. In calculating each Fund’s NAV, investments are valued under policies approved by the Board of Trustees of the Trust (the “Board of Trustees”). Equity securities (including preferred stock) traded on any recognized U.S. or non-U.S. exchange are valued at the last sale price or official closing price on the exchange or system on which they are principally traded. Unlisted equity securities (including preferred stock) are valued at the last quoted sale price or, if no sale price is available, at the mean between the highest bid and lowest ask price. Each Fund may invest in money market funds which are valued at their NAV per share and exchange-traded funds (“ETFs” or “ETF”) or exchange-traded notes (“ETNs” or “ETN”) which are valued at their last sale or official closing price on the exchange on which they are principally traded or at their NAV per share in instances where the ETF or ETN has not traded on its principal exchange. Foreign currency contracts are valued daily using WM/Reuters closing spot and forward rates as of 4:00 p.m. London time.
| WisdomTree Trust | 53 |
Notes to Financial Statements (continued)
In certain instances, such as when reliable market valuations are not readily available or are not deemed to reflect current market values, a Fund’s investments, which include derivatives, will be fair valued in accordance with the Fund’s pricing policy. The Board of Trustees has established a pricing committee (the “Pricing Committee”) which is comprised of senior representatives of WTAM and which reports to the Board of Trustees on a quarterly basis. In the event that a financial instrument cannot be valued based upon a price from a national securities exchange, independent pricing service provider or broker-dealer quotation, or such prices are deemed to not reflect current market value, the Pricing Committee may value the financial instrument in good faith under the policies and procedures approved by the Board of Trustees based on current facts and circumstances. Securities that may be valued using “fair value” pricing may include, but are not limited to, securities for which there are no current market quotations, securities whose issuer is in default or bankruptcy, securities subject to corporate actions (such as mergers or reorganizations), securities subject to non-U.S. investment limits or currency controls, and securities affected by “significant events.” An example of a significant event is an event occurring after the close of the market in which a security trades but before a Fund’s next NAV Calculation Time that may materially affect the value of a Fund’s investment (e.g., government action, natural disaster, or significant market fluctuation). When fair value pricing is employed, the prices of securities used by a Fund to calculate its NAV may differ from quoted or published prices for the same securities.
Fair Value Measurement — In accordance with Codification Topic 820 (“ASC 820”), Fair Value Measurements and Disclosures, fair value is defined as the price that each Fund would receive upon selling an investment in an orderly transaction to an independent buyer in the principal or most advantageous market of the investment. ASC 820 established a three-tier hierarchy of inputs to be used when determining fair value measurements for disclosure purposes. Inputs refer broadly to the assumptions that market participants would use in pricing the asset or liability, including assumptions about risk — for example, the risk inherent in a particular valuation technique used to measure fair value (such as a pricing model) and/or the risk inherent in the inputs to the valuation technique. Inputs may be observable or unobservable. Observable inputs reflect the assumptions market participants would use in pricing the asset or liability. Observable inputs are based on market data obtained from sources independent of the reporting entity. Unobservable inputs reflect the reporting entity’s own assumptions about the assumptions market participants would use in pricing the asset or liability. Unobservable inputs are based on the best information available in the circumstances. The three-tier hierarchy of inputs is summarized in the three broad levels listed below:
Level 1 – quoted prices in active markets for identical securities
Level 2 – other significant observable inputs (including quoted prices for similar securities, interest rates,
prepayment speeds, credit risk, etc.)
Level 3 – significant unobservable inputs (including each Fund’s assumptions in determining the fair value of investments)
The inputs or methodology used for valuation are not necessarily an indication of the risk associated with investing in those investments.
Investments that use Level 2 or Level 3 inputs may include, but are not limited to: (i) an unlisted security related to corporate actions; (ii) a restricted security (e.g., one that may not be publicly sold without registration under the Securities Act of 1933, as amended); (iii) a security whose trading has been suspended or which has been de-listed from its primary trading exchange; (iv) a security that is thinly traded; (v) a security in default or bankruptcy proceedings for which there is no current market quotation or market activity; (vi) a security affected by currency controls or restrictions; and (vii) a security affected by a significant event (e.g., an event that occurs after the close of the markets on which the security is traded but before the time as of which a Fund’s NAV is computed and that may materially affect the value of the Fund’s investments).
The valuation techniques and significant inputs used in determining the fair market value measurements for Level 2 and Level 3 positions are as follows:
Financial instruments are generally valued by independent pricing service providers that use broker-dealer quotations, reported trades or valuation estimates from their internal pricing models. Depending on the type of financial instrument, the independent pricing service providers’ internal pricing models may use inputs that are observable such as issuer details, interest rates, yield curves, prepayment speeds, credit risks/spreads, default rates and quoted prices for similar assets. Financial instruments that use similar valuation techniques and observable inputs as described above and have an appropriate level of market activity are categorized as Level 2 of the fair value hierarchy, otherwise a Level 3 fair value classification is appropriate. Over-the-counter financial derivative instruments derive their value from underlying asset prices, indices, reference rates, and other inputs or a combination of these factors. These instruments are normally valued on the basis of broker-dealer quotations or prices obtained from independent pricing service providers. Depending on the product and the terms of the transaction, the value of the financial derivative instruments can be estimated by an independent pricing service provider using a series of techniques including simulation pricing models. The pricing models use inputs that are observed from actively quoted markets such as issuer details, indices, credit risks/spreads, interest rates, yield curves, default and exchange rates. Derivative contracts that use valuation techniques and observable inputs as described above and have an appropriate level of market activity are categorized as Level 2 of the fair value hierarchy, otherwise a Level 3 fair value classification is appropriate.
| 54 | WisdomTree Trust |
Notes to Financial Statements (continued)
Determination of a fair value by the Pricing Committee may include significant unobservable inputs and therefore would be reflected as a Level 3 of the fair value hierarchy. The Pricing Committee may employ a market-based valuation approach which may use, among other potential considerations, related or comparable securities, recent transactions, market multiples, and other relevant information to determine fair value. The Pricing Committee may also use an income-based valuation approach in which anticipated future cash flows of the financial instrument are discounted to calculate fair value.
The following is a summary of the fair valuations according to the inputs used as of March 31, 2019 in valuing each Fund’s assets:
| Europe Hedged Equity Fund | Level 1 | Level 2 | Level 3 | |||||||||
| Common Stocks* |
$ | 3,720,658,789 | $ | — | $ | — | ||||||
| Investment of Cash Collateral for Securities Loaned |
— | 29,943,930 | — | |||||||||
| Total |
$ | 3,720,658,789 | $ | 29,943,930 | $ | — | ||||||
| Unrealized Appreciation on Foreign Currency Contracts |
— | 60,814,813 | — | |||||||||
| Unrealized Depreciation on Foreign Currency Contracts |
— | (2,331,577 | ) | — | ||||||||
| Total - Net |
$ | 3,720,658,789 | $ | 88,427,166 | $ | — | ||||||
| Europe Hedged SmallCap Equity Fund | Level 1 | Level 2 | Level 3 | |||||||||
| Common Stocks* |
$ | 118,832,287 | $ | — | $ | — | ||||||
| Investment of Cash Collateral for Securities Loaned |
— | 8,591,779 | — | |||||||||
| Total |
$ | 118,832,287 | $ | 8,591,779 | $ | — | ||||||
| Unrealized Appreciation on Foreign Currency Contracts |
— | 2,022,872 | — | |||||||||
| Unrealized Depreciation on Foreign Currency Contracts |
— | (68,824 | ) | — | ||||||||
| Total – Net |
$ | 118,832,287 | $ | 10,545,827 | $ | — | ||||||
| Germany Hedged Equity Fund | Level 1 | Level 2 | Level 3 | |||||||||
| Common Stocks* |
$ | 50,699,600 | $ | — | $ | — | ||||||
| Total |
$ | 50,699,600 | $ | — | $ | — | ||||||
| Unrealized Appreciation on Foreign Currency Contracts |
— | 866,801 | — | |||||||||
| Unrealized Depreciation on Foreign Currency Contracts |
— | (16,636 | ) | — | ||||||||
| Total – Net |
$ | 50,699,600 | $ | 850,165 | $ | — | ||||||
| International Hedged Quality Dividend Growth Fund | Level 1 | Level 2 | Level 3 | |||||||||
| Common Stocks* |
$ | 433,040,517 | $ | — | $ | — | ||||||
| Investment of Cash Collateral for Securities Loaned |
— | 10,577,670 | — | |||||||||
| Total |
$ | 433,040,517 | $ | 10,577,670 | $ | — | ||||||
| Unrealized Appreciation on Foreign Currency Contracts |
— | 4,804,463 | — | |||||||||
| Unrealized Depreciation on Foreign Currency Contracts |
— | (320,463 | ) | — | ||||||||
| Total - Net |
$ | 433,040,517 | $ | 15,061,670 | $ | — | ||||||
| Japan Hedged Equity Fund | Level 1 | Level 2 | Level 3 | |||||||||
| Common Stocks |
||||||||||||
| Electronic Equipment, Instruments & Components |
$ | 142,676,854 | $ | 1,227,997 | $ | — | ||||||
| Other* |
3,081,384,646 | — | — | |||||||||
| Investment of Cash Collateral for Securities Loaned |
— | 102,390,479 | — | |||||||||
| Total |
$ | 3,224,061,500 | $ | 103,618,476 | $ | — | ||||||
| Unrealized Appreciation on Foreign Currency Contracts |
— | 4,468,481 | — | |||||||||
| Unrealized Depreciation on Foreign Currency Contracts |
— | (16,884,082 | ) | — | ||||||||
| Total – Net |
$ | 3,224,061,500 | $ | 91,202,875 | $ | — | ||||||
| WisdomTree Trust | 55 |
Notes to Financial Statements (continued)
| Japan Hedged SmallCap Equity Fund | Level 1 | Level 2 | Level 3 | |||||||||
| Common Stocks |
||||||||||||
| Electronic Equipment, Instruments & Components |
$ | 4,520,175 | $ | 38,837 | $ | — | ||||||
| Other* |
77,677,525 | — | — | |||||||||
| Investment of Cash Collateral for Securities Loaned |
— | 4,509,372 | — | |||||||||
| Total |
$ | 82,197,700 | $ | 4,548,209 | $ | — | ||||||
| Unrealized Appreciation on Foreign Currency Contracts |
— | 18,961 | — | |||||||||
| Unrealized Depreciation on Foreign Currency Contracts |
— | (333,644 | ) | — | ||||||||
| Total - Net |
$ | 82,197,700 | $ | 4,233,526 | $ | — | ||||||
| * | Please refer to the Schedule of Investments for a breakdown of the valuation by industry type and/or country. |
During the fiscal year ended March 31, 2019, there were no significant transfers into or out of Level 3 of the fair value hierarchy.
Derivatives and Hedging Disclosure — Codification Topic 815 (“ASC 815”), Derivatives and Hedging, requires qualitative disclosures about objectives and strategies for using derivatives, quantitative disclosures about fair value amounts of gains and losses on derivative instruments, and disclosures about credit-risk-related contingent features in derivative agreements. The Funds have invested in derivatives, specifically foreign currency contracts during the year ended March 31, 2019 and open positions in such derivatives as of March 31, 2019 are detailed in each Fund’s Schedule of Investments. All of the derivative instruments disclosed and described herein are subject to risk. Risks may arise upon entering into foreign currency contracts from potential inability of a counterparty to meet the terms of their contracts and from unanticipated movements in the value of the foreign currencies relative to the U.S. dollar or each other. The Funds’ derivative agreements also contain credit-risk related contingent features which include, but are not limited to, a percentage decline in the Funds’ NAV over a specified time period. If an event occurred at March 31, 2019 that triggered a contingent feature, the counterparty to the agreement may require the Funds to post additional collateral or terminate the derivative positions and demand payment. Any collateral posted with respect to the derivative positions would be used to offset or reduce the payment. The maximum exposure to derivatives agreements with credit-risk related contingent features would be the total value of derivatives in net liability positions for each Fund, as disclosed on page 60. At March 31, 2019, the Funds did not receive or post collateral with any counterparty for derivatives and no event occurred that triggered a credit-risk-related contingent feature. Information with respect to the amounts and types of collateral received and/or posted for derivative instruments as of March 31, 2019, if any, is reflected as a footnote below the respective derivatives tables on each Fund’s Schedule of Investments.
As of March 31, 2019, the effects of such derivative instruments on each Fund’s financial position as reflected in the Statements of Assets and Liabilities are presented in the summary below:
| Asset Derivatives | Liability Derivatives | |||||||||||
| Fund | Balance Sheet Location | Value | Balance Sheet Location | Value | ||||||||
| Europe Hedged Equity Fund |
| |||||||||||
| Foreign exchange contracts |
Unrealized appreciation on foreign currency contracts | $ | 60,814,813 | Unrealized depreciation on foreign currency contracts | $ | 2,331,577 | ||||||
| Europe Hedged SmallCap Equity Fund |
| |||||||||||
| Foreign exchange contracts |
Unrealized appreciation on foreign currency contracts |
2,022,872 | Unrealized depreciation on foreign currency contracts |
68,824 | ||||||||
| Germany Hedged Equity Fund |
| |||||||||||
| Foreign exchange contracts |
Unrealized appreciation on foreign currency contracts |
866,801 | Unrealized depreciation on foreign currency contracts |
16,636 | ||||||||
| International Hedged Quality Dividend Growth Fund |
| |||||||||||
| Foreign exchange contracts |
Unrealized appreciation on foreign currency contracts |
4,804,463 | Unrealized depreciation on foreign currency contracts |
320,463 | ||||||||
| Japan Hedged Equity Fund |
| |||||||||||
| Foreign exchange contracts |
Unrealized appreciation on foreign currency contracts |
4,468,481 | Unrealized depreciation on foreign currency contracts |
16,884,082 | ||||||||
| Japan Hedged SmallCap Equity Fund |
| |||||||||||
| Foreign exchange contracts |
Unrealized appreciation on foreign currency contracts |
18,961 | Unrealized depreciation on foreign currency contracts |
333,644 | ||||||||
| 56 | WisdomTree Trust |
Notes to Financial Statements (continued)
For the fiscal year ended March 31, 2019, the effects of derivative instruments on each Fund’s financial performance as reflected in the Statements of Operations are presented in the summary below:
| Fund | Amount of Realized Gain or (Loss) on Derivatives Recognized1 |
Change in Unrealized Appreciation or (Depreciation) on Derivatives Recognized2 |
||||||
| Europe Hedged Equity Fund |
||||||||
| Foreign exchange contracts |
$ | 549,016,419 | $ | 94,210,160 | ||||
| Europe Hedged SmallCap Equity Fund |
||||||||
| Foreign exchange contracts |
17,030,756 | 2,874,787 | ||||||
| Germany Hedged Equity Fund |
||||||||
| Foreign exchange contracts |
7,751,364 | 1,414,393 | ||||||
| International Hedged Quality Dividend Growth Fund |
||||||||
| Foreign exchange contracts |
42,244,062 | 5,192,153 | ||||||
| Japan Hedged Equity Fund |
||||||||
| Foreign exchange contracts |
360,831,802 | 18,855,185 | ||||||
| Japan Hedged SmallCap Equity Fund |
||||||||
| Foreign exchange contracts |
11,698,426 | (139,986 | ) | |||||
| 1 | Realized gains (losses) on derivatives are located on the Statements of Operations as follows: |
| Foreign exchange contracts |
Net realized gain (loss) from foreign currency contracts | |
| Equity contracts |
Net realized gain (loss) from futures contracts |
| 2 | Change in unrealized appreciation (depreciation) is located on the Statements of Operations as follows: |
| Foreign exchange contracts |
Net increase (decrease) in unrealized appreciation/depreciation from foreign currency contracts |
During the fiscal year ended March 31, 2019, the volume of derivative activity (based on the average of month-end balances, except where footnoted) for each Fund was as follows:
| Average Notional | ||||||||
| Fund | Foreign currency USD) |
Foreign currency USD) |
||||||
| Europe Hedged Equity Fund |
| |||||||
| Foreign exchange contracts |
$ | 5,242,421,510 | $ | 10,200,705,263 | ||||
| Europe Hedged SmallCap Equity Fund |
| |||||||
| Foreign exchange contracts |
167,940,016 | 327,586,260 | ||||||
| Germany Hedged Equity Fund |
| |||||||
| Foreign exchange contracts |
74,332,799 | 144,810,036 | ||||||
| International Hedged Quality Dividend Growth Fund |
| |||||||
| Foreign exchange contracts |
499,392,884 | 978,876,270 | ||||||
| Japan Hedged Equity Fund |
| |||||||
| Foreign exchange contracts |
5,471,004,547 | 10,557,044,640 | ||||||
| Japan Hedged SmallCap Equity Fund |
| |||||||
| Foreign exchange contracts |
151,401,417 | 292,200,424 | ||||||
Investment Transactions and Investment Income — Investment transactions are recorded as of the date that the securities are purchased or sold (trade date). Realized gains and losses on sales of portfolio securities are calculated using the identified-cost method. Dividend income (net of foreign taxes withheld, if any) is recognized on the ex-dividend date or as soon as practicable after the existence of a dividend declaration has been determined. Non-cash dividend income is recognized at the fair value of securities received on the ex-dividend date or as soon as practicable after the existence of a dividend declaration has been determined. Income earned from securities lending activities (i.e. Securities lending income), net of fees payable to the securities borrower and/or securities lending agent, is accrued daily.
Foreign Currency Translation — The accounting records of the Funds are maintained in U.S. dollars. Foreign currencies, as well as investment securities and other assets and liabilities denominated in foreign currencies, are translated into U.S. dollars using exchange rates prevailing on the respective dates of such transactions that are deemed appropriate by WTAM. Realized and unrealized foreign exchange gains and losses on investments are included as a component of net realized gain (loss) from investment transactions and net increase (decrease) in unrealized appreciation (depreciation) from investment transactions, respectively, on the Statements of Operations. Realized and unrealized foreign exchange gains or losses from foreign currency contracts are included in net realized gain
| WisdomTree Trust | 57 |
Notes to Financial Statements (continued)
(loss) from foreign currency contracts and net increase (decrease) in unrealized appreciation/depreciation from foreign currency contracts, respectively, on the Statements of Operations. Realized and unrealized foreign exchange gains or losses arising from sales of foreign currencies, currency gains or losses recognized between the trade and settlement dates on investment transactions, and the difference between the amounts of dividends and foreign withholding taxes recorded on the Funds’ books and the U.S. dollar equivalent of the amounts actually received or paid are included in net realized gain (loss) from foreign currency related transactions and/or increase (decrease) in unrealized appreciation (depreciation) from translation of assets and liabilities denominated in foreign currencies in the Statements of Operations. Certain foreign exchange gains and losses included in realized and unrealized gains or losses are included in, or are a reduction of, ordinary income in accordance with U.S. Federal income tax regulations.
Expenses/Reimbursements — Under the investment advisory agreement for each Fund, except for Funds that commenced operations on or after March 26, 2013, WTAM has agreed to pay all expenses of the Trust, except for: (i) brokerage expenses and other expenses (such as stamp taxes) connected with the execution of portfolio transactions or in connection with creation and redemption transactions; (ii) legal fees or expenses in connection with any arbitration, litigation or pending or threatened arbitration or litigation, including any settlements in connection therewith; (iii) compensation and expenses of trustees who are not interested persons of the Funds (“Independent Trustees”); (iv) compensation and expenses of counsel to the Independent Trustees; (v) compensation and expenses of the Trust’s Chief Compliance Officer (‘‘CCO’’); (vi) extraordinary expenses; (vii) distribution fees and expenses paid by the Trust under any distribution plan adopted pursuant to Rule 12b-1 under the 1940 Act; and (viii) the advisory fee payable to WTAM.
Under the investment advisory agreement for Funds that commenced operations on or after March 26, 2013, WTAM has agreed to pay all expenses of the Trust, except for: (i) brokerage expenses and other fees, charges, taxes, levies or expenses (such as stamp taxes) incurred in connection with the execution of portfolio transactions or in connection with creation and redemption transactions (including without limitation any fees, charges, taxes, levies or expenses related to the purchase or sale of an amount of any currency, or the partition or repatriation of any security or other asset, related to the execution of portfolio transactions or any creation or redemption transactions); (ii) legal fees or expenses in connection with any arbitration, litigation or pending or threatened arbitration or litigation, including any settlements in connection therewith; (iii) compensation and expenses of each Independent Trustee; (iv) compensation and expenses of counsel to the Independent Trustees; (v) compensation and expenses of the Trust’s CCO; (vi) extraordinary expenses (in each case as determined by a majority of the Independent Trustees); (vii) distribution fees and expenses paid by the Trust under any distribution plan adopted pursuant to Rule 12b-1 under the 1940 Act; (viii) interest and taxes of any kind or nature (including, but not limited to, income, excise, transfer and withholding taxes); (ix) fees and expenses related to the provision of securities lending services; and (x) the advisory fee payable to WTAM.
Acquired fund fees and expenses (“AFFEs”) (which are fees and expenses incurred indirectly by a Fund through its investments in certain underlying investment companies) are not operating expenses of the Funds and are not paid by WTAM.
Pursuant to a separate contractual arrangement, WTAM arranges for the provision of CCO services with respect to each Fund, and is liable and responsible for, and administers, payments to the CCO, the Independent Trustees and counsel to the Independent Trustees. WTAM receives a fee, as shown on the Statements of Operations under “Service fees”, of up to 0.0044% per annum of each Fund’s average daily net assets for providing such services and paying such expenses. WTAM provides CCO services to the Trust.
Currency Transactions — The Funds may enter into foreign currency forward and foreign currency futures contracts to facilitate local securities settlements or to protect against currency exposure. The Funds may not enter into such contracts for speculative purposes.
Forward Foreign Currency Contracts — The Funds utilized forward foreign currency contracts (“Forward Contracts”) to obtain a net short exposure to foreign currencies consistent with each Fund’s investment objective. A Forward Contract involves an obligation to purchase or sell a specific currency at a future date, which may be any fixed number of days from the date of the contract agreed upon by the parties, at a price set at the time of the contract. These contracts are principally traded in the inter-bank market conducted directly between currency traders (usually large, commercial banks) and their customers. A Forward Contract generally does not require an initial margin deposit and no commissions are charged at any stage for trades. However, if a Fund is in an unrealized loss position on a Forward Contract, it may be required to pledge collateral (or additional collateral) to the counterparty. If a Fund is in an unrealized gain position on a Forward Contract, it may receive collateral from the counterparty.
Risks may arise upon entering into Forward Contracts from the potential inability of counterparties to meet the terms of their contracts and from unanticipated movements in the value of foreign currencies relative to the U.S. dollar or each other.
Fluctuations in the value of open Forward Contracts are recorded for book purposes as unrealized gains or losses on Forward Contracts by the Funds and included in net increase (decrease) in unrealized appreciation (depreciation) from foreign currency contracts on the Statements of Operations. Realized gains and losses on Forward Contracts include net gains or losses recognized by the Funds on contracts which have settled are included in net realized gain (loss) from foreign currency contracts on the Statements of Operations.
| 58 | WisdomTree Trust |
Notes to Financial Statements (continued)
Securities Lending — Each Fund may lend portfolio securities to certain creditworthy borrowers, including the Funds’ securities lending agent. It is the Funds’ policy that, at origination, all loans are secured by collateral of at least 102% of the value of U.S. securities loaned and 105% of the value of foreign securities loaned. Collateral in the form of cash and/or high-grade debt obligations, equivalent to at least 100% of the market value of securities, is maintained at all times. The cash collateral can be invested in certain money market mutual funds which also have exposure to the fluctuations of the market. The values of the investments of cash collateral for securities on loan along with the obligations to return such collateral are included on the Statements of Assets and Liabilities. The total value of securities received as collateral for securities on loan is included in a footnote following each Schedule of Investments, but is not included within the Statements of Assets and Liabilities because the receiving Fund does not have the right to sell or repledge the securities received as collateral. Each Fund receives compensation for lending its securities from interest or dividends earned on the cash or U.S. government securities held as collateral, net of fee rebates paid to the borrower plus reasonable administrative and custody fees, all of which are included in the securities lending income earned by the Funds and disclosed on the Statements of Operations. The dividend and interest income earned on the securities loaned is accounted for in the same manner as other dividend and interest income. The borrower pays to the Funds an amount equal to any dividends or interest received on loaned securities. Dividends received while a security is out on loan are not considered Qualified Dividend Income (“QDI”) under the specific criteria issued by the Internal Revenue Service and are subject to taxation at the shareholder’s ordinary income tax rate instead of the lower long-term capital gains tax rate. Lending portfolio securities could result in a loss or delay in recovering each Fund’s securities if the borrower defaults. In the event of a borrower default with respect to the failure to return to each Fund some or all of the securities loaned, the securities lending agent shall indemnify each Fund against the failure of the borrower.
Master Netting Arrangements — ASU No. 2011-11 “Disclosures about Offsetting Assets and Liabilities” (“ASU 2011-11”) is generally intended to (i) help investors and other financial statement users to better assess the effect or potential effect of offsetting arrangements on a company’s financial position, (ii) improve transparency in the reporting of how companies mitigate credit risk, and (iii) facilitate comparisons between those entities that prepare their financial statements on the basis of GAAP and those entities that prepare their financial statements on the basis of international financial reporting standards. ASU 2011-11 requires entities to disclose (i) gross and net information about both instruments and transactions eligible for offset in the financial statements, and (ii) instruments and transactions subject to an agreement similar to a master netting agreement. ASU 2011-11 is limited in scope to the following financial instruments, to the extent they are offset in the financial statements or subject to an enforceable master netting arrangement or similar agreement: (i) recognized derivative instruments accounted for under ASC 815 (Derivatives and Hedging); (ii) repurchase agreements and reverse repurchase agreements; and (iii) securities borrowing and securities lending transactions.
In order to better define its contractual rights and to secure rights that will help a Fund mitigate its counterparty risk, a Fund may enter into an International Swaps and Derivatives Association, Inc. Master Agreement (“ISDA Master Agreement”) or similar agreement with its counterparties. An ISDA Master Agreement is a bilateral agreement between a Fund and a counterparty that governs over-the-counter derivatives (“OTC”), such as total return swap contracts and Forward Contracts, and typically contains, among other things, collateral posting terms, netting and rights of set-off provisions in the event of a default and/or termination event. Under an ISDA Master Agreement, a Fund may, under certain circumstances, offset with the counterparty certain derivative financial instruments’ payables and receivables to create a single net payment. The provisions of the ISDA Master Agreement typically permit a single net payment in the event of a default (close-out netting) or similar event, including the bankruptcy or insolvency of the counterparty.
Collateral requirements generally differ by type of derivative. Collateral terms are contract-specific for OTC derivatives (e.g. foreign exchange contracts, options and certain swaps). Generally, for transactions traded under an ISDA Master Agreement, the collateral requirements are calculated by netting the marked to market amount for each transaction under such agreement and comparing that amount to the value of any collateral currently pledged by a Fund and the counterparty. Generally, the amount of collateral due from or to a counterparty must exceed a minimum transfer amount threshold before a transfer is required to be made. To the extent amounts due to a Fund from its derivatives counterparties are not fully collateralized, contractually or otherwise, the Fund bears the risk of loss from a counterparty’s non-performance.
The Funds’ security lending activities are governed by a Securities Lending Authorization Agreement (“Lending Agreement”) between the Funds and the lending agent. The Lending Agreement authorizes the lending agent to lend qualifying U.S. and foreign securities held by a Fund to approved borrowers (each a “Borrower”). To mitigate borrower risk, a Fund typically receives from a Borrower collateral in the form of U.S. dollar cash and/or securities issued or guaranteed by the U.S. government or its agencies in excess of the market value of the securities loaned. Under the provisions of the Lending Agreement, a Fund shall have, as to the collateral, all of the rights and remedies of a secured party under applicable law. A Fund is exposed to risk of loss if a Borrower defaults on its obligation to return borrowed securities and the value of the collateral a Fund received is insufficient to cover the market value of the securities loaned. Also, the lending agent is permitted to invest the cash collateral it receives from a Borrower into a money market fund which is subject to market fluctuation. Therefore, a Fund is exposed to risk of loss if the value of invested cash collateral is insufficient to satisfy the Fund’s obligation to return the full amount owed to such Borrower.
| WisdomTree Trust | 59 |
Notes to Financial Statements (continued)
For financial reporting purposes, the Funds elect to not offset assets and liabilities subject to an ISDA Master Agreement or Lending Agreement, if any, in the Statements of Assets and Liabilities. Therefore, all qualifying transactions are presented on a gross basis in the Statements of Assets and Liabilities. As of March 31, 2019, the impact of netting of assets and liabilities and the offsetting of collateral pledged or received based on contractual netting/set-off provisions in the ISDA Master Agreement and the Lending Agreement are detailed in the following table:
| Assets | Liabilities | |||||||||||||||||||||||||||||||
| Gross Amounts Statements of Assets
and |
Gross Amounts Not Offset in the Statements of Assets and Liabilities |
Net Amount |
Gross Amounts Statements of Assets
and |
Gross Amounts Not Offset in the Statements of Assets and Liabilities |
Net Amount |
|||||||||||||||||||||||||||
| Fund | Financial Instruments |
Collateral Received |
Financial Instruments |
Collateral Posted |
||||||||||||||||||||||||||||
| Europe Hedged Equity Fund |
| |||||||||||||||||||||||||||||||
| Securities Lending |
$ | 35,415,714 | $ | — | $ | (35,415,714 | )1 | $ | — | $ | — | $ | — | $ | — | $ | — | |||||||||||||||
| Foreign Currency Contracts |
60,814,813 | (2,331,577 | ) | — | 58,483,236 | 2,331,577 | (2,331,577 | ) | — | — | ||||||||||||||||||||||
| Europe Hedged SmallCap Equity Fund |
| |||||||||||||||||||||||||||||||
| Securities Lending |
15,888,744 | — | (15,888,744 | )1 | — | — | — | — | — | |||||||||||||||||||||||
| Foreign Currency Contracts |
2,022,872 | (67,603 | ) | — | 1,955,269 | 68,824 | (67,603 | ) | — | 1,221 | ||||||||||||||||||||||
| Germany Hedged Equity Fund |
| |||||||||||||||||||||||||||||||
| Foreign Currency Contracts |
866,801 | (1,609 | ) | — | 865,192 | 16,636 | (1,609 | ) | — | 15,027 | ||||||||||||||||||||||
| International Hedged Quality Dividend |
| |||||||||||||||||||||||||||||||
| Securities Lending |
14,937,774 | — | (14,937,774 | )1 | — | — | — | — | — | |||||||||||||||||||||||
| Foreign Currency Contracts |
4,804,463 | (305,070 | ) | — | 4,499,393 | 320,463 | (305,070 | ) | — | 15,393 | ||||||||||||||||||||||
| Japan Hedged Equity Fund |
| |||||||||||||||||||||||||||||||
| Securities Lending |
212,957,582 | — | (212,957,582 | )1 | — | — | — | — | — | |||||||||||||||||||||||
| Foreign Currency Contracts |
4,468,481 | (4,468,481 | ) | — | — | 16,884,082 | (4,468,481 | ) | — | 12,415,601 | ||||||||||||||||||||||
| Japan Hedged SmallCap Equity Fund |
| |||||||||||||||||||||||||||||||
| Securities Lending |
23,787,029 | — | (23,787,029 | )1 | — | — | — | — | — | |||||||||||||||||||||||
| Foreign Currency Contracts |
18,961 | (18,961 | ) | — | — | 333,644 | (18,961 | ) | — | 314,683 | ||||||||||||||||||||||
| 1 | The amount of collateral presented has been limited such that the net amount by counterparty cannot be less than zero. |
Short-Term Investments — Each Fund may invest a portion of its assets in high-quality money market instruments on an ongoing basis to provide liquidity or for other reasons. The instruments include short-term obligations issued by the U.S. government, its agencies, non-U.S. government agencies, negotiable certificates of deposit (“CDs”), fixed time deposits and bankers’ acceptances of U.S. and foreign banks and similar institutions, commercial papers, repurchase agreements and money market funds. CDs are short-term negotiable obligations of commercial banks. Time deposits are non-negotiable deposits maintained in banking institutions for specified periods of time at stated interest rates. Banker’s acceptances are time drafts drawn on commercial banks by borrowers, usually in connection with international transactions.
Tax Information and Dividends and Distributions to Shareholders — It is each Fund’s policy to comply with all requirements of the Internal Revenue Code of 1986, as amended (the “Code”). Each Fund intends to qualify for and to elect treatment as a separate Regulated Investment Company (“RIC”) under Subchapter M of the Code. In order to qualify for the special tax treatment accorded RICs and their shareholders, each Fund must, among other things, distribute with respect to each taxable year an amount equal to or greater than the sum of 90% of its investment company taxable income and 90% of its net tax-exempt interest income. There can be no guarantee that a Fund will pay dividends. Taxable net realized gains from investment transactions, reduced by capital loss carryforwards, if any, are declared and distributed to shareholders at least annually. The capital loss carryforward amount, if any, is available to offset future net capital gains. The Funds may occasionally be required to make supplemental distributions at some other time during the year. The Trust reserves the right to declare special distributions if, in its reasonable discretion, such action is necessary or advisable to preserve the status of each Fund as a RIC or to avoid imposition of income or excise taxes on undistributed income. Dividends and distributions to shareholders are recorded on the ex-dividend date. The amount of dividends and distributions from net investment income and net realized capital gains are determined in accordance with the requirements of the Code and the U.S. Treasury regulations. These book/tax differences are either considered temporary or permanent in nature. To the extent these differences are permanent in nature, such amounts are reclassified within the components of net assets based on their Federal tax basis treatment; temporary differences do not require reclassification. Dividends and distributions that exceed earnings and profit for tax purposes are reported for tax purposes as a return of capital.
3. ADVISORY FEES AND OTHER TRANSACTIONS WITH AFFILIATES
WTAM has overall responsibility for the general management and administration of the Trust. WTAM provides an investment program for each Fund. WTAM has arranged for Mellon Investments Corporation (‘‘Mellon”) to provide sub-advisory services to the
| 60 | WisdomTree Trust |
Notes to Financial Statements (continued)
Funds. Mellon is compensated by WTAM at no additional cost to the Funds. WTAM also arranges for transfer agency, custody, fund accounting, fund administration, securities lending and all other non-distribution related services necessary for the Funds to operate, which are generally under separate agreements entered into between the Trust on behalf of the Funds and the applicable service provider. Under the investment advisory agreement for each Fund, WTAM agrees to pay all expenses of the Funds, except for certain expenses described in Note 2.
Pursuant to a separate contractual arrangement, as also described in Note 2, WTAM arranges for the provision of CCO services with respect to each Fund, and is liable and responsible for, and administers, payments to the CCO, the Independent Trustees and counsel to the Independent Trustees in exchange for a fee, accrued daily and paid monthly in arrears, of up to 0.0044% per annum of each Fund’s average daily net assets. WTAM expects to receive advisory fees from each Fund, based on a percentage of the Fund’s average daily net assets, as shown in the following table:
| Fund | Advisory Fee Rate |
|||
| Europe Hedged Equity Fund |
0.58 | % | ||
| Europe Hedged SmallCap Equity Fund |
0.58 | % | ||
| Germany Hedged Equity Fund |
0.48 | % | ||
| International Hedged Quality Dividend Growth Fund |
0.58 | % | ||
| Japan Hedged Equity Fund |
0.48 | % | ||
| Japan Hedged SmallCap Equity Fund |
0.58 | % | ||
During the fiscal year ended March 31, 2019, certain Funds engaged in purchase and sale transactions with funds that have a common investment adviser, WTAM. These interfund purchase and sale transactions were effected in accordance with Rule 17a-7 under the 1940 Act. For the fiscal year ended March 31, 2019, the cost of purchases, proceeds from sales and the net realized gain or loss recognized upon the disposal of securities resulting from interfund transactions are shown in the following table:
| Fund | Purchases | Sales | Net Realized Gain/(Loss) |
|||||||||
| Europe Hedged Equity Fund |
$ | 39,737,547 | $ | 36,650,074 | $ | 3,285 | ||||||
| Europe Hedged SmallCap Equity Fund |
6,028,052 | 16,971,749 | (1,931,088 | ) | ||||||||
| Germany Hedged Equity Fund |
470,900 | 1,823,617 | (196,590 | ) | ||||||||
| International Hedged Quality Dividend Growth Fund |
73,654,665 | 53,992,452 | (668,612 | ) | ||||||||
| Japan Hedged Equity Fund |
34,043,531 | 45,013,975 | (690,315 | ) | ||||||||
| Japan Hedged SmallCap Equity Fund |
5,157,252 | 7,943,417 | 801,201 | |||||||||
Related Party Transactions — WTAM or its affiliates may from time to time own shares of a Fund. As of March 31, 2019, WTAM held shares of the following Funds which were purchased through an unaffiliated broker in ordinary brokerage transactions in the secondary market in which the Funds’ shares trade:
| Fund | Fund Shares held by WTAM |
Market Value of Fund Shares held by WTAM |
Dividends and Distributions paid to WTAM on Fund Shares held by WTAM |
|||||||||
| International Hedged Quality Dividend Growth Fund |
48 | $ | 1,546 | $ | 2 | |||||||
| Japan Hedged Equity Fund |
17 | 860 | 133 | |||||||||
4. CAPITAL SHARE TRANSACTIONS
As of March 31, 2019, there were an unlimited number of $0.001 par value shares of beneficial interest authorized by the Trust. Shares are issued and redeemed by each Fund only in creation units or multiples thereof. Except when aggregated in creation units, shares of each Fund are not redeemable. Transactions in shares for each Fund are disclosed in detail in the Statements of Changes in Net Assets. The consideration for the purchase of creation units of a Fund generally consists of the in-kind contribution of a portfolio of equity securities and an amount of cash. Investors purchasing and redeeming creation units may be charged a purchase transaction fee and a redemption transaction fee to offset transfer and other transaction costs associated with the issuance and redemption of creation units.
| WisdomTree Trust | 61 |
Notes to Financial Statements (continued)
5. INVESTMENT PORTFOLIO TRANSACTIONS
Purchases and sales of investments (excluding purchases and sales resulting from in-kind capital share transactions and short-term investments) and the cost of purchases and the proceeds from sales resulting from in-kind capital share transactions (excluding short-term investments) for the fiscal year ended March 31, 2019 are shown in the following table. Realized gains and losses on sales resulting from in-kind capital share redemptions, as shown on the Statements of Operations, are not recognized by the Funds for tax purposes.
| In-kind Capital Share Transactions | ||||||||||||||||
| Fund | Purchases | Sales | Purchases | Sales | ||||||||||||
| Europe Hedged Equity Fund |
$ | 1,507,923,903 | $ | 873,636,201 | $ | — | $ | 2,628,949,995 | ||||||||
| Europe Hedged SmallCap Equity Fund |
80,683,360 | 58,603,138 | 57,090,139 | 82,331,434 | ||||||||||||
| Germany Hedged Equity Fund |
19,739,378 | 10,862,240 | 4,377,355 | 37,899,399 | ||||||||||||
| International Hedged Quality Dividend Growth Fund |
317,866,453 | 267,440,050 | 82,903,975 | 201,116,247 | ||||||||||||
| Japan Hedged Equity Fund |
1,409,470,620 | 1,147,913,027 | 506,468,599 | 3,162,295,219 | ||||||||||||
| Japan Hedged SmallCap Equity Fund |
63,610,237 | 53,112,922 | — | 110,218,256 | ||||||||||||
6. FEDERAL INCOME TAXES
At March 31, 2019, the cost of investments (including securities on loan and derivatives) for Federal income tax purposes was as follows:
| Investments in Long Securities | Investments in Financial Derivatives1 | |||||||||||||||||||||||||||||||||||
| Fund | Tax Cost | Gross Unrealized Appreciation |
Gross Unrealized Depreciation |
Net Unrealized Appreciation/ (Depreciation) |
Gross Unrealized Appreciation |
Gross Unrealized Depreciation |
Net Unrealized Appreciation/ (Depreciation) |
Total Net Unrealized Appreciation/ (Depreciation) |
||||||||||||||||||||||||||||
| Europe Hedged Equity Fund |
$ | 4,048,058,163 | $ | 481,884,483 | $ | (779,339,926 | ) | $ | (297,455,443 | ) | $ | — | $ | — | $ | — | $ | (297,455,443 | ) | |||||||||||||||||
| Europe Hedged SmallCap Equity Fund |
132,542,107 | 10,637,007 | (15,755,048 | ) | (5,118,041 | ) | — | (48 | ) | (48 | ) | (5,118,089 | ) | |||||||||||||||||||||||
| Germany Hedged Equity Fund |
58,319,470 | 4,221,766 | (11,841,637 | ) | (7,619,871 | ) | — | (22 | ) | (22 | ) | (7,619,893 | ) | |||||||||||||||||||||||
| International Hedged Quality Dividend Growth Fund |
441,528,643 | 42,494,573 | (40,405,029 | ) | 2,089,544 | 758,633 | (9,397 | ) | 749,236 | 2,838,780 | ||||||||||||||||||||||||||
| Japan Hedged Equity Fund |
3,653,889,598 | 216,288,491 | (542,498,113 | ) | (326,209,622 | ) | 728 | (1,728 | ) | (1,000 | ) | (326,210,622 | ) | |||||||||||||||||||||||
| Japan Hedged SmallCap Equity Fund |
95,466,338 | 4,705,071 | (13,425,500 | ) | (8,720,429 | ) | — | — | — | (8,720,429 | ) | |||||||||||||||||||||||||
| 1 | Certain financial derivatives may be considered section 1256 contracts under the Code. Each section 1256 contract held at the close of a taxable year shall be treated as sold for its fair market value on the last business day of such taxable year (and any realized gain or loss shall be taken into account for the taxable year). As such, the unrealized appreciation/(deprecation) for financial derivatives on a tax basis may not correspond to the unrealized appreciation/(depreciation) on a GAAP basis. The unrealized appreciation/(depreciation) for financial derivatives on a GAAP basis is located in the respective financial derivatives tables in each Fund’s Schedule of Investments. |
At March 31, 2019, the components of accumulated earnings/(loss) on a tax-basis were as follows:
| Fund | Undistributed Ordinary Income |
Undistributed Capital and Other Losses |
Net Unrealized Appreciation/ (Depreciation) |
Currency and Other Unrealized Depreciation |
Total Accumulated Losses |
|||||||||||||||
| Europe Hedged Equity Fund |
$ | — | $ | (1,601,746,100 | ) | $ | (297,455,443 | ) | $ | (384,959 | ) | $ | (1,899,586,502 | ) | ||||||
| Europe Hedged SmallCap Equity Fund |
— | (14,327,371 | ) | (5,118,089 | ) | (7,668 | ) | (19,453,128 | ) | |||||||||||
| Germany Hedged Equity Fund |
— | (27,428,848 | ) | (7,619,893 | ) | (13,213 | ) | (35,061,954 | ) | |||||||||||
| International Hedged Quality Dividend Growth Fund |
1,434,385 | (6,537,702 | ) | 2,838,780 | (37,830 | ) | (2,302,367 | ) | ||||||||||||
| Japan Hedged Equity Fund |
34,601,740 | (1,668,322,531 | ) | (326,210,622 | ) | (112,298 | ) | (1,960,043,711 | ) | |||||||||||
| Japan Hedged SmallCap Equity Fund |
739,227 | (18,813,361 | ) | (8,720,429 | ) | (2,827 | ) | (26,797,390 | ) | |||||||||||
| 62 | WisdomTree Trust |
Notes to Financial Statements (continued)
The tax character of distributions paid during the fiscal years ended March 31, 2019 and March 31, 2018, was as follows:
| Year Ended March 31, 2019 | Year Ended March 31, 2018 | |||||||||||||||
| Fund | Distributions Paid from Ordinary Income* |
Distributions Paid from Return of Capital |
Distributions Paid from Ordinary Income* |
Distributions Paid from Return of Capital |
||||||||||||
| Europe Hedged Equity Fund |
$ | 113,154,749 | $ | 15,257,371 | $ | 205,511,362 | $ | — | ||||||||
| Europe Hedged SmallCap Equity Fund |
3,894,030 | — | 2,354,900 | 58,350 | ||||||||||||
| Germany Hedged Equity Fund |
1,590,516 | 525,501 | 2,509,207 | 845,543 | ||||||||||||
| International Hedged Quality Dividend Growth Fund |
1,740,568 | — | 2,883,500 | — | ||||||||||||
| Japan Hedged Equity Fund |
146,097,231 | — | 218,205,485 | — | ||||||||||||
| Japan Hedged SmallCap Equity Fund |
2,960,022 | — | 2,644,796 | — | ||||||||||||
| * | Includes short-term capital gains if any. |
At March 31, 2019, for Federal tax purposes, the Funds have capital loss carryforwards available to offset future capital gains as indicated in the below table. To the extent that these loss carryforwards are utilized, capital gains so offset will not be distributed to shareholders.
| Fund | Short-Term Post-Effective No Expiration |
Long-Term Post-Effective No Expiration |
Capital Loss Available Total |
|||||||||
| Europe Hedged Equity Fund |
$ | 1,032,083,555 | $ | 569,662,545 | $ | 1,601,746,100 | ||||||
| Europe Hedged SmallCap Equity Fund |
13,574,746 | 234,902 | 13,809,648 | |||||||||
| Germany Hedged Equity Fund |
15,932,012 | 11,496,836 | 27,428,848 | |||||||||
| International Hedged Quality Dividend Growth Fund |
6,537,702 | — | 6,537,702 | |||||||||
| Japan Hedged Equity Fund |
1,054,847,667 | 613,474,864 | 1,668,322,531 | |||||||||
| Japan Hedged SmallCap Equity Fund |
11,870,183 | 6,943,178 | 18,813,361 | |||||||||
Capital losses incurred after October 31 (“post-October capital losses”) and late year ordinary losses incurred after December 31 within the taxable year are deemed to arise on the first business day of each Fund’s next taxable year.
During the fiscal year ended March 31, 2019, the following Funds incurred and will elect to defer post-October capital losses and late year ordinary losses as follows:
| Fund | Short-Term Post-October Capital Losses |
Long-Term Post-October Capital Losses |
||||||
| Europe Hedged Equity Fund |
$ | — | $ | — | ||||
| Europe Hedged SmallCap Equity Fund |
1,221,614 | (703,891 | ) | |||||
| Germany Hedged Equity Fund |
— | — | ||||||
| International Hedged Quality Dividend Growth Fund |
— | — | ||||||
| Japan Hedged Equity Fund |
— | — | ||||||
| Japan Hedged SmallCap Equity Fund |
— | — | ||||||
During the fiscal year ended March 31, 2019, the amount of capital loss carryforwards used to offset realized gains are shown in the following table:
| Fund | Utilized Capital Loss Carryforward |
|||
| Europe Hedged Equity Fund |
$ | 683,830,102 | ||
| Europe Hedged SmallCap Equity Fund |
19,140,064 | |||
| Germany Hedged Equity Fund |
9,751,540 | |||
| International Hedged Quality Dividend Growth Fund |
42,184,958 | |||
| Japan Hedged Equity Fund |
362,407,072 | |||
| Japan Hedged SmallCap Equity Fund |
14,167,730 | |||
| WisdomTree Trust | 63 |
Notes to Financial Statements (continued)
At March 31, 2019, the effect of permanent “book/tax” reclassifications resulted in increases (decreases) to the components of net assets as follows:
| Fund | Total Distributable Earnings (Loss) |
Paid-in Capital | ||||||
| Europe Hedged Equity Fund |
$ | (150,508,548 | ) | $ | 150,508,548 | |||
| Europe Hedged SmallCap Equity Fund |
(7,888,487 | ) | 7,888,487 | |||||
| Germany Hedged Equity Fund |
(2,519,332 | ) | 2,519,332 | |||||
| International Hedged Quality Dividend Growth Fund |
(36,716,538 | ) | 36,716,538 | |||||
| Japan Hedged Equity Fund |
(185,040,346 | ) | 185,040,346 | |||||
| Japan Hedged SmallCap Equity Fund |
(16,259,737 | ) | 16,259,737 | |||||
The differences are primarily due to redemptions-in-kind, foreign currency transactions, and investments in passive foreign investment companies.
GAAP provides guidance on tax provisions that prescribe a minimum threshold for financial statement recognition of the benefit of a tax position taken or expected to be taken in a tax return. Foreign taxes are provided for based on each Fund’s understanding of the tax rules and rates that exist in the foreign markets in which it invests. Taxes are accrued and applied to net investment income, net realized capital gains and net unrealized appreciation, as applicable, as the income is earned or capital gains are recorded. As of and during the fiscal year ended March 31, 2019, the Funds did not have any liabilities for unrecognized tax benefits relating to uncertain income tax positions they have taken or expect to take in the future. If applicable, the Funds will recognize interest accrued related to unrecognized tax benefits in interest expense and penalties in “Other” expenses on the Statements of Operations. The Funds file tax returns with the Internal Revenue Service, the State of New York, and various other states. Generally, each of the tax years in the four-year period ended March 31, 2019, remains subject to examination by taxing authorities.
7. RECENT ACCOUNTING PRONOUNCEMENTS
On August 17, 2018, the SEC voted to adopt “Disclosure Update and Simplification” amendments to certain of its disclosure requirements that have become redundant, duplicative, overlapping, outdated, or superseded, in light of other SEC disclosure requirements, GAAP, or changes in the information environment. The SEC will also be referring certain SEC disclosure requirements that overlap with, but require information incremental to, GAAP to the FASB for potential incorporation into GAAP. The amendments are intended to facilitate the disclosure of information to investors and simplify compliance without significantly altering the total mix of information provided to investors. These amendments became effective on November 5, 2018 (30 days after their publication in the Federal Register). WTAM has evaluated these amendments and determined that there is no significant impact on the Trust’s financial statements. All applicable amendments have been incorporated into the Trust’s financial statements and related disclosures. The specific amendments incorporated into the Trust’s financial statements pertain to (i) the amendment requiring the presentation of the distributable earnings in total on the Statements of Assets and Liabilities, rather than showing the 3 components of distributable earnings (i.e., (1) undistributed (distributions in excess of) net investment income, (2) accumulated net realized gain (loss) on investments and (3) net unrealized appreciation (depreciation) on investments, and (ii) the amendment requiring the presentation of distributions to shareholders in total on the Statements of Changes in Net Assets, except for tax return of capital distributions, which shall continue to be disclosed separately.
On August 28, 2018, the FASB issued ASU 2018-13, Fair Value Measurement (Topic 820): Disclosure Framework — Changes to the Disclosure Requirements for Fair Value Measurement. ASU 2018-13 includes removals, additions and modifications to the disclosure requirements for fair value measurements that are intended to improve the effectiveness of disclosures in the notes to financial statements. The amendments in ASU 2018-13 are effective for all entities for fiscal years, and interim periods within those fiscal years, beginning after December 15, 2019. An entity is permitted to early adopt any removed or modified disclosures upon issuance of this ASU and delay adoption of the additional disclosures until their effective date. WTAM has evaluated ASU 2018-13 and has adopted the disclosure framework for the Trust’s financial statements.
8. ADDITIONAL INFORMATION
The Board of Trustees, after careful consideration, approved the liquidation of the WisdomTree Japan Hedged Financials Fund and the WisdomTree Japan Hedged Quality Dividend Growth Fund.
The last day of secondary market trading of shares of the Funds on their respective exchanges was March 14, 2019. Shareholders were able to sell Fund shares through a broker in the standard manner through this date. Customary brokerage charges may have applied to such transactions. Each Fund was closed to new investors after the close of business on March 14, 2019.
| 64 | WisdomTree Trust |
Notes to Financial Statements (concluded)
Beginning on or about this date, each Fund was in the process of liquidating its portfolio assets. This caused each Fund to increase its cash holdings and deviate from the investment objective and strategies stated in its prospectus.
Shareholders that remained in the Funds had their shares automatically redeemed and received cash in an amount equal to the net asset value of their shares as of the close of business on March 22, 2019 and were not charged any transaction fees by the Funds. This amount included any accrued capital gains and dividends.
Whether an investor sold their shares or were automatically redeemed, an investor generally would have recognized a capital gain (or loss) equal to the amount received above (or below) their adjusted cost basis in such shares.
| WisdomTree Trust | 65 |
Report of Independent Registered Public Accounting Firm
To the Shareholders of WisdomTree Europe Hedged Equity Fund, WisdomTree Germany Hedged Equity Fund, WisdomTree Japan Hedged Equity Fund, WisdomTree Japan Hedged SmallCap Equity Fund, WisdomTree Europe Hedged SmallCap Equity Fund and WisdomTree International Hedged Quality Dividend Growth Fund and the Board of Trustees of WisdomTree Trust
Opinion on the Financial Statements
We have audited the accompanying statements of assets and liabilities of WisdomTree Europe Hedged Equity Fund, WisdomTree Germany Hedged Equity Fund, WisdomTree Japan Hedged Equity Fund, WisdomTree Japan Hedged SmallCap Equity Fund, WisdomTree Europe Hedged SmallCap Equity Fund and WisdomTree International Hedged Quality Dividend Growth Fund (collectively referred to as the “Funds”), (six of the funds constituting WisdomTree Trust (the “Trust”)) including the schedules of investments, as of March 31, 2019, and the related statements of operations, and changes in net assets, and the financial highlights for each of the periods indicated in the table below and the related notes (collectively referred to as the “financial statements”). In our opinion, the financial statements present fairly, in all material respects, the financial position of each of the Funds (six of the funds constituting WisdomTree Trust) at March 31, 2019, and the results of their operations, changes in net assets and financial highlights for each of the periods indicated in the table below, in conformity with U.S. generally accepted accounting principles.
| Individual fund constituting the WisdomTree Trust | Statement of operations |
Statements of changes in net assets |
Financial highlights | |||
| WisdomTree Europe Hedged Equity Fund WisdomTree Germany Hedged Equity Fund WisdomTree Japan Hedged Equity Fund WisdomTree Japan Hedged SmallCap Equity Fund |
For the year ended March 31, 2019 | For each of the two years in the period ended March 31, 2019 | For each of the five years in the period ended March 31, 2019 | |||
| WisdomTree Europe Hedged SmallCap Equity Fund |
For the year ended March 31, 2019 | For each of the two years in the period ended March 31, 2019 | For each of the four periods in the period ended March 31, 2019 and the period from March 4, 2015 (commencement of operations) through March 31, 2015 | |||
| WisdomTree International Hedged Quality Dividend Growth Fund |
For the year ended March 31, 2019 | For each of the two years in the period ended March 31, 2019 | For each of the four years in the period ended March 31, 2019 and the period from May 7, 2014 (commencement of operations) through March 31, 2015 | |||
Basis for Opinion
These financial statements are the responsibility of the Trust’s management. Our responsibility is to express an opinion on each of the Funds’ financial statements based on our audits. We are a public accounting firm registered with the Public Company Accounting Oversight Board (United States) (“PCAOB”) and are required to be independent with respect to the Trust in accordance with the U.S. federal securities laws and the applicable rules and regulations of the Securities and Exchange Commission and the PCAOB.
We conducted our audits in accordance with the standards of the PCAOB. Those standards require that we plan and perform the audit to obtain reasonable assurance about whether the financial statements are free of material misstatement, whether due to error or fraud. The Trust is not required to have, nor were we engaged to perform, an audit of the Trust’s internal control over financial reporting. As part of our audits, we are required to obtain an understanding of internal control over financial reporting, but not for the purpose of expressing an opinion on the effectiveness of the Trust’s internal control over financial reporting. Accordingly, we express no such opinion.
Our audits included performing procedures to assess the risks of material misstatement of the financial statements, whether due to error or fraud, and performing procedures that respond to those risks. Such procedures included examining, on a test basis, evidence regarding the amounts and disclosures in the financial statements. Our procedures included confirmation of securities owned as of March 31, 2019, by correspondence with the custodian and brokers or by other appropriate auditing procedures where replies from brokers were not received. Our audits also included evaluating the accounting principles used and significant estimates made by management, as well as evaluating the overall presentation of the financial statements. We believe that our audits provide a reasonable basis for our opinion.

We have served as the auditor of one or more WisdomTree investment companies since 2006.
New York, NY
May 23, 2019
| 66 | WisdomTree Trust |
Trustees and Officers Information (unaudited)
The Board of Trustees is responsible for overseeing the management and affairs of the Funds and the Trust. The Board of Trustees elects the officers of the Trust who are responsible for administering the Trust’s day-to-day operations. Each Trustee serves until his or her successor is duly elected or appointed and qualified.
The address of each Trustee and Officer is c/o WisdomTree Asset Management, Inc., 245 Park Avenue, 35th Floor, New York, NY 10167.
Independent Trustees
| Name |
Position(s) Held with |
Principal Occupation(s) |
Number of Portfolios in Fund Complex Overseen by Trustee/ Officer* |
Other | ||||||
| David G. Chrencik^ (1948) |
Trustee, 2014-present | Chief Financial Officer of Sarus Indochina Select LP (hedge fund) since 2012; Chief Financial Officer of GeoGreen BioFuels, Inc. (biodiesel fuel producer) from 2010 to 2014; Audit Partner at PricewaterhouseCoopers LLP (public accounting firm) from 1972 to 2009 (includes positions prior to becoming Audit Partner and predecessor firms). | 76 | Trustee, Vericimetry Funds (2011 to 2014). | ||||||
| Joel Goldberg#† (1945) |
Trustee, 2012-present | Attorney, Partner, Stroock & Stroock & Lavan LLP from 2010 to 2018; Attorney, Partner at Willkie Farr & Gallagher LLP from 2006 to 2010. | 76 | Director, Better Business Bureau (Metropolitan New York, Long Island and the Mid-Hudson Region). | ||||||
| Toni Massaro† (1955) |
Trustee, 2006-present | Dean Emerita at the University of Arizona James E. Rogers College of Law (“Rogers College of Law”) since 2009 (distinguished Emerita in July 2009); Dean at the Rogers College of Law from 1999 to 2009; Regents’ Professor since 2006; Milton O. Riepe Chair in Constitutional Law since 1997; Professor at the Rogers College of Law since 1990. | 76 | None | ||||||
| Melinda A. Raso Kirstein‡ (1955) |
Trustee, 2014-present | Retired since 2004, Merrill Lynch Investment Management, Vice President; Senior Portfolio Manager, Fixed Income Management; Director, Tax Exempt Fund Management. | 76 | Associate Alumnae of Douglass College, Chair of Investment Committee. | ||||||
| Victor Ugolyn (1947) |
Trustee, 2006-present; Chairman of the Board of Trustees, 2006-present | Private Investor, 2005 to present; President and Chief Executive Officer of William D. Witter, Inc. from 2005 to 2006; Consultant to AXA Enterprise in 2004; Chairman, President and Chief Executive Officer of Enterprise Capital Management (subsidiary of The MONY Group, Inc.) and Enterprise Group of Funds, Chairman of MONY Securities Corporation, and Chairman of the Fund Board of Enterprise Group of Funds from 1991 to 2004. | 76 | Member of the Board of Governors of Naismith Memorial Basketball Hall of Fame (2001-2016). | ||||||
| * | As of March 31, 2019. |
| ^ | Chair of the Audit Committee. |
| # | Chair of the Contracts Review Committee. |
| † | Co-Chair of the Governance, Nominating and Compliance Committee. |
| ‡ | Chair of the Investment Committee. |
| WisdomTree Trust | 67 |
Trustees and Officers Information (unaudited) (concluded)
Interested Trustee and Officers
| Name |
Position(s) Held with |
Principal Occupation(s) |
Number of Portfolios in Fund Complex Overseen by Trustee/ Officer* |
Other | ||||||
| Jonathan Steinberg** (1964) |
Trustee, 2005-present; President, 2005-present | President, WisdomTree Investments, Inc. and WisdomTree Asset Management, Inc. since 2012; Chief Executive Officer, WisdomTree Investments, Inc. and WisdomTree Asset Management, Inc. since 2005. | 76 | Director, WisdomTree Investments, Inc. and WisdomTree Asset Management, Inc. | ||||||
| David Castano** (1971) |
Treasurer, 2013-present | Director of Fund Accounting & Administration, WisdomTree Asset Management, Inc., since 2011. | 76 | None | ||||||
| Terry Jane Feld** (1960) |
Chief Compliance Officer, 2012-present | Chief Compliance Officer, WisdomTree Asset Management, Inc. since 2012; Senior Compliance Officer, WisdomTree Asset Management since 2011. | 76 | None | ||||||
| Ryan Louvar** (1972) |
Secretary and Chief Legal Officer, 2013-present | General Counsel, WisdomTree Asset Management, Inc. since 2013; Vice President and Senior Managing Counsel, State Street, 2005 to 2013. | 76 | None | ||||||
| Joanne Antico** (1975) |
Assistant Secretary, 2018-present | Assistant General Counsel, WisdomTree Asset Management, Inc. since 2016; Executive Director and Assistant Secretary, Morgan Stanley Investment Management Inc., 2005 to 2016. | 76 | None | ||||||
| Clint Martin** (1977) |
Assistant Treasurer, 2015-present | Fund Manager, Fund Accounting & Administration, WisdomTree Asset Management, Inc., since 2012. | 76 | None | ||||||
| * | As of March 31, 2019. |
| ** | Elected by and serves at the pleasure of the Board. |
| 68 | WisdomTree Trust |
Supplemental Information (unaudited)
Federal Income Tax Information
The following Federal tax information related to the Funds’ fiscal year ended March 31, 2019, is provided for information purposes only and should not be used for reporting to federal or state revenue agencies. Federal tax information for the calendar year will be reported to you on Form 1099-DIV in January 2020.
Certain dividends paid by the Funds may be subject to a maximum tax rate of 15%, as provided by the Jobs and Growth Tax Relief Reconciliation Act of 2003. Of the distributions paid during the fiscal year ended March 31, 2019, the following represents the maximum amount of ordinary income distributions that may be considered qualified dividend income:
| Fund | Qualified Dividend Income |
|||
| Europe Hedged Equity Fund |
$ | 112,005,754 | ||
| Europe Hedged SmallCap Equity Fund |
3,894,030 | |||
| Germany Hedged Equity Fund |
2,116,017 | |||
| International Hedged Quality Dividend Growth Fund |
1,740,568 | |||
| Japan Hedged Equity Fund |
125,005,077 | |||
| Japan Hedged SmallCap Equity Fund |
2,406,299 | |||
The Funds intend to elect to pass through to shareholders the credit for taxes paid to foreign countries during the fiscal year ended March 31, 2019. The gross foreign source income and foreign taxes paid are as follows:
| Fund | Gross Foreign Income |
Foreign Taxes Paid |
||||||
| Europe Hedged Equity Fund |
$ | 113,632,352 | $ | 13,063,319 | ||||
| Europe Hedged SmallCap Equity Fund |
5,426,992 | 710,013 | ||||||
| Germany Hedged Equity Fund |
3,347,542 | 429,229 | ||||||
| International Hedged Quality Dividend Growth Fund |
11,721,642 | 867,167 | ||||||
| Japan Hedged Equity Fund |
126,891,428 | 12,686,000 | ||||||
| Japan Hedged SmallCap Equity Fund |
2,437,993 | 243,508 | ||||||
| WisdomTree Trust | 69 |
General Information (unaudited)
Proxy Voting Policies, Procedures and Record
A complete copy of the Proxy Voting Policy may be obtained upon request, at no charge, by calling 1-866-909-WISE (9473) or writing to: WisdomTree Trust, c/o Foreside Fund Services, LLC, Three Canal Plaza Suite 100, Portland, ME, 04101.
The Trust is required to disclose annually the Funds’ complete proxy voting record on Form N-PX covering the most recent 12-month period ended June 30 and to file Form N-PX with the SEC no later than August 31 of each year. The current Form N-PX for the Funds is available at no charge upon request by calling 1-866-909-WISE (9473) or through the Trust’s website at www.wisdomtree.com. The Funds’ Form N-PX is also available on the SEC’s website at www.sec.gov.
Shareholder Reports and Quarterly Portfolio Disclosure
The Funds are required to file their complete schedule of portfolio holdings with the SEC for their first and third fiscal quarters on Form N-Q. Beginning in April 2019, the Funds will cease filing Form N-Q and will commence filing Form N-PORT. Part F of each Fund’s Form N-PORT filings for the first and third fiscal quarters will contain the complete schedule of portfolio holdings in the same manner as previously filed on Form N-Q. Copies of the filings are available, without charge, on the SEC’s website at www.sec.gov and are also available by calling the Trust at 1-866-909-WISE (9473). Copies of the filings may also be obtained, after paying a duplicating fee, by electronic request at the following E-mail address: publicinfo@sec.gov.
Information about each Fund’s portfolio holdings is available daily, without charge, at www.wisdomtree.com.
The Statement of Additional Information (“SAI”) has additional information about the Funds’ Trustees and Officers and is available without charge upon request. Contact your financial representative for a free prospectus or SAI.
Frequency Distribution of Discounts & Premiums
Information about differences between the per share net asset value of each Fund and the market trading price of shares of each Fund are available, without charge, at www.wisdomtree.com.
| 70 | WisdomTree Trust |
The WisdomTree Funds are exchange traded funds (“ETFs”) registered with the United States Securities and Exchange Commission as separate series (“Funds”) of WisdomTree Trust (“Trust”). WisdomTree Asset Management, Inc., a wholly owned subsidiary of WisdomTree Investments, Inc., serves as the investment adviser to the Trust. None of the WisdomTree entities are affiliated with Foreside Fund Services, LLC, the Funds’ distributor. WisdomTree Investments, its affiliates and their independent providers are not liable for any informational errors, incompleteness, delays, or for any actions taken in reliance on information contained herein.
Investors should consider the investment objectives, risks, charges and expenses of the Funds carefully before investing. A prospectus, containing this and other information, is available at www.wisdomtree.com, or by calling 1-866-909-WISE (9473). Investors should read the prospectus carefully before investing. There are risks associated with investing, including possible loss of principal. Past performance does not guarantee future results. Indexes are unmanaged and you cannot invest directly in an index.
There are risks associated with investing including possible loss of principal. Foreign investing involves special risks, such as risk of loss from currency fluctuation or political or economic uncertainty. Investments in real estate involve additional special risks, such as credit risk, interest rate fluctuations and the effect of varied economic conditions. Funds that focus their investments in one country or region may be significantly impacted by events and developments associated with the region which can adversely affect performance. Funds focusing on a single sector and/or smaller companies generally experience greater price volatility. Investments in emerging, offshore or frontier markets are generally less liquid and less efficient than investments in developed markets and are subject to additional risks, such as risks of adverse governmental regulation and intervention or political developments. Inflation protected securities do not eliminate risks associated with inflation or deflation. Investments in currency involve additional special risks, such as credit risk and interest rate fluctuations. Derivative investments can be volatile and these investments may be less liquid than other securities, and more sensitive to the effect of varied economic conditions. As these Funds can have a high concentration in some issuers the Funds can be adversely impacted by changes affecting such issuers. Due to the investment strategy of certain Funds they may make higher capital gain distributions than other ETFs. Please read the Fund’s prospectus for specific details regarding the Fund’s risk profile.
Transactions in Fund shares will result in brokerage commissions and will generate tax consequences. Shares may be sold through brokerage accounts, but may be redeemed from the Funds only by Authorized Participants in large creation unit sizes of shares.
WisdomTree Trust
245 Park Avenue, 35th Floor
New York, NY 10167
WisdomTree Fund shares are distributed by Foreside Fund Services, LLC, in the U.S. only.
WTGM-2277
Item 2. Code of Ethics.
| (a) | The registrant, as of the end of the period covered by this report, has adopted a code of ethics that applies to the registrant’s principal executive officer, principal financial officer, principal accounting officer or controller, or persons performing similar functions, regardless of whether these individuals are employed by the registrant or a third party. |
| (c) | There have been no amendments, during the period covered by this report, to a provision of the code of ethics that applies to the registrant’s principal executive officer, principal financial officer, principal accounting officer or controller, or persons performing similar functions, regardless of whether these individuals are employed by the registrant or a third party, and that relates to any element of the code of ethics description. |
| (d) | The registrant has not granted any waivers, including an implicit waiver, from a provision of the code of ethics that applies to the registrant’s principal executive officer, principal financial officer, principal accounting officer or controller, or persons performing similar functions, regardless of whether these individuals are employed by the registrant or a third party, that relates to one or more of the items set forth in paragraph (b) of this item’s instructions. |
| (f) | The code of ethics is attached hereto as exhibit 13(a)(1). |
Item 3. Audit Committee Financial Expert.
The Registrant’s Board of Trustees has determined that the Registrant has one audit committee financial expert, as that term is defined under Item 3(b) and 3(c), serving on its audit committee. The audit committee financial expert serving on the Registrant’s audit committee is David Chrencik, who is an independent Trustee of the Trust, as that term is defined under Item 3(a) (2).
Item 4. Principal Accountant Fees and Services.
Audit Fees
| (a) | The aggregate fees billed for each of the last two fiscal years for professional services rendered by the principal accountant for the audit of the registrant’s annual financial statements or services that are normally provided by the accountant in connection with statutory and regulatory filings or engagements for those fiscal years are $987,203 for 2019 and $1,151,110 for 2018. |
Audit-Related Fees
| (b) | The aggregate fees billed in each of the last two fiscal years for assurance and related services by the principal accountant that are reasonably related to the performance of the audit of the registrant’s financial statements and are not reported under paragraph (a) of this Item are $88,580 for 2019 and $119,774 for 2018. |
Tax Fees
| (c) | The aggregate fees billed in each of the last two fiscal years for professional services rendered by the principal accountant for tax compliance, tax advice, and tax planning are $441,140 for 2019 and $657,960 for 2018. |
All Other Fees
| (d) | The aggregate fees billed in each of the last two fiscal years for products and services provided by the principal accountant, other than the services reported in paragraphs (a) through (c) of this Item are $0 for 2019 and $0 for 2018. | |
| (e)(1) | Disclose the audit committee’s pre-approval policies and procedures described in paragraph (c)(7) of Rule 2-01 of Regulation S-X. | |
| Per Rule 2-01(c) (7) (A), the Registrant’s audit committee charter provides that the audit committee shall select and approve in advance the retention of independent accountants to annually audit and provide their opinion on the Registrant’s financial statements. The audit committee must also approve prior to appointment the engagement of the principal accountant to provide other audit services to the Registrant or to provide non-audit services to the Registrant, its investment adviser, or any entity controlling, controlled by, or under common control with its investment adviser (“adviser/affiliate”) that provides ongoing services to the Registrant, if the engagement by the investment adviser or adviser affiliate relates directly to the operations and financial reporting of the Registrant. The audit committee must also, prior to appointment of the engagement of the principal accountant, review and approve the fees proposed to be charged to the Registrant by the auditors for each audit and non-audit service. The audit committee must also consider whether non-audit services provided by the Registrant’s principal accountant to the Registrant’s investment adviser, or adviser/affiliate that provides ongoing services to the Trust are compatible with maintaining the auditor’s independence. | ||
| (e)(2) | The Registrant’s Audit committee has approved 100% of services described in each of Items 4(b) through (d) pursuant to paragraph (c)(7)(i)(C) of Rule 2-01 of Regulation S-X. | |
| (f) | The percentage of hours expended on the principal accountant’s engagement to audit the registrant’s financial statements for the most recent fiscal year that were attributed to work performed by persons other than the principal accountant’s full-time, permanent employees was 0%. | |
| (g) | The aggregate non-audit fees billed by the registrant’s accountant for services rendered to the registrant, and rendered to the registrant’s investment adviser (not including any sub-adviser whose role is primarily portfolio management and is subcontracted with or overseen by another investment adviser), and any entity controlling, controlled by, or under common control with the adviser that provides ongoing services to the registrant for each of the last two fiscal years of the registrant was $441,140 for 2019 and $657,960 for 2018. | |
| (h) | Not applicable. | |
Item 5. Audit Committee of Listed registrants.
The Registrant is an issuer as defined in Rule 10A-3 under the Exchange Act and has a separately-designated standing audit committee established in accordance with Section 3(a) (58)A of the Exchange Act. The Registrant’s audit committee members are David Chrencik, Melinda Raso Kirstein and Victor Ugolyn.
Item 6. Investments.
| (a) | Schedule of Investments in securities of unaffiliated issuers as of the close of the reporting period is included as part of the report to shareholders filed under Item 1 of this form. |
| (b) | Not applicable. |
Item 7. Disclosure of Proxy Voting Policies and Procedures for Closed-End Management Investment Companies.
Not applicable.
Item 8. Portfolio Managers of Closed-End Management Investment Companies.
Not applicable.
Item 9. Purchases of Equity Securities by Closed-End Management Investment Company and Affiliated Purchasers.
Not applicable.
Item 10. Submission of Matters to a Vote of Security Holders.
There have been no material changes to the procedures by which the shareholders may recommend nominees to the registrant’s board of directors, where those changes were implemented after the registrant last provided disclosure in response to the requirements of Item 407(c)(2)(iv) of Regulation S-K (17 CFR 229.407) (as required by Item 22(b)(15) of Schedule 14A (17 CFR 240.14a-101)), or this Item.
Item 11. Controls and Procedures.
| (a) | The registrant’s principal executive and principal financial officers, or persons performing similar functions, have concluded that the registrant’s disclosure controls and procedures (as defined in Rule 30a-3(c) under the Investment Company Act of 1940, as amended (the “1940 Act”) (17 CFR 270.30a-3(c))) are effective, as of a date within 90 days of the filing date of the report that includes the disclosure required by this paragraph, based on their evaluation of these controls and procedures required by Rule 30a-3(b) under the 1940 Act (17 CFR 270.30a-3(b)) and Rules 13a-15(b) or 15d-15(b) under the Securities Exchange Act of 1934, as amended (17 CFR 240.13a-15(b) or 240.15d-15(b)). |
| (b) | There were no changes in the registrant’s internal control over financial reporting (as defined in Rule 30a-3(d) under the 1940 Act (17 CFR 270.30a-3(d)) that occurred during the registrant’s second fiscal quarter of the period covered by this report that has materially affected, or is reasonably likely to materially affect, the registrant’s internal control over financial reporting. |
Item 12. Disclosure of Securities Lending Activities for Closed-End Management Investment Companies
Not applicable.
Item 13. Exhibits.
| (a)(1) |
Code of ethics, or any amendment thereto, that is the subject of disclosure required by Item 2 is attached hereto. | |
| (a)(2) |
Certifications pursuant to Rule 30a-2(a) under the 1940 Act and Section 302 of the Sarbanes-Oxley Act of 2002 are attached hereto. | |
| (a)(3) |
Not applicable. | |
| (a)(4) |
Not applicable. | |
| (b) |
Certifications pursuant to Rule 30a-2(b) under the 1940 Act and Section 906 of the Sarbanes-Oxley Act of 2002 are attached hereto. | |
SIGNATURES
Pursuant to the requirements of the Securities Exchange Act of 1934 and the Investment Company Act of 1940, the registrant has duly caused this report to be signed on its behalf by the undersigned, thereunto duly authorized.
| (Registrant) | WisdomTree Trust |
| By (Signature and Title) | /s/ Jonathan Steinberg | |
| Jonathan L. Steinberg, President | ||
| (principal executive officer) | ||
Date: May 31, 2019
Pursuant to the requirements of the Securities Exchange Act of 1934 and the Investment Company Act of 1940, this report has been signed below by the following persons on behalf of the registrant and in the capacities and on the dates indicated.
| By (Signature and Title) | /s/ Jonathan Steinberg | |
| Jonathan L. Steinberg, President | ||
| (principal executive officer) |
| Date: May 31, 2019 | ||
| By (Signature and Title) | /s/ David Castano | |
| David Castano, Treasurer | ||
| (principal financial officer) | ||
Date: May 31, 2019
EX-99.CODE ETH
WISDOMTREE TRUST
CODE OF ETHICS
FOR PRINCIPAL EXECUTIVE AND FINANCIAL OFFICERS
| I. | PURPOSE OF THE CODE |
The WisdomTree Trust (the “Trust”) Code of Ethics for Principal Executive and Financial Officers (this “Code”) is intended to serve as the code of ethics described in Section 406 of the Sarbanes-Oxley Act of 2002 and Item 2 of Form N-CSR. This Code shall be the sole code of ethics adopted by the Trust for purposes of Section 406 of the Sarbanes-Oxley Act and the rules and forms applicable to registered investment companies thereunder. Insofar as other policies or procedures of the Trust, the Trust’s adviser, principal underwriter, or other service providers govern or purport to govern the behavior or activities of the Covered Officers, as defined herein, who are subject to this Code, they are superseded by this Code to the extent that they overlap or conflict with the provisions of this Code. The Trust’s and its investment adviser’s, and principal underwriter’s codes of ethics pursuant to Rule 17j-1 under the Investment Company Act of 1940 (the “1940 Act”) are separate requirements applying to the Covered Officers and others, and are not part of this Code.
All Covered Officers must become familiar and fully comply with this Code. Because this Code cannot and does not cover every applicable law or provide answers to all questions that might arise, all Covered Officers are expected to use common sense about what is right and wrong, including a sense of when it is proper to seek guidance from others on the appropriate course of conduct.
The purpose of this Code is to set standards for the Covered Officers that are reasonably designed to deter wrongdoing and to promote:
| • | honest and ethical conduct, including the ethical handling of actual or apparent conflicts of interest between personal and professional relationships; |
| • | full, fair, accurate, timely, and understandable disclosure in reports and documents that the Trust files with, or submits to, the Securities and Exchange Commission (the “SEC”) and in any other public communications by the Trust; |
| • | compliance with applicable governmental laws, rules and regulations; |
| • | the prompt internal reporting of violations of the Code to the appropriate persons as set forth in the Code; and |
| • | accountability for adherence to the Code. |
| II. | COVERED PERSONS |
This Code applies to the Trust’s Principal Executive Officers and Principal Financial Officers, or any persons performing similar functions on behalf of the Trust (the “Covered Officers”). Each Covered Person should adhere to a high standard of business ethics and should be sensitive to situations that may give rise to actual as well as apparent conflicts of interest. Covered Officers are expected to act in accordance with the standards set forth in this Code.
| III. | HONEST AND ETHICAL CONDUCT |
| A. | Honesty, Diligence and Professional Responsibility |
Covered Officers are expected to observe both the form and the spirit of the ethical principles contained in this Code. Covered Officers must perform their duties and responsibilities for the Trust:
| • | with honesty, diligence, and a commitment to professional and ethical responsibility; |
| • | carefully, thoroughly and in a timely manner; and |
| • | in conformity with applicable professional and technical standards. |
Covered Officers who are certified public accountants are expected to carry out their duties and responsibilities in a manner consistent with the principles governing the accounting profession, including any guidelines or principles issued by the Public Company Accounting Oversight Board or the American Institute of Certified Public Accountants from time to time.
| B. | Objectivity/Avoidance of Undisclosed Conflicts of Interest |
Covered Officers are expected to maintain objectivity and avoid undisclosed conflicts of interest. In the performance of their duties and responsibilities for the Trust, Covered Officers must not subordinate their judgment to personal gain and advantage, or be unduly influenced by their own interests or by the interests of others. Covered Officers must avoid participation in any activity or relationship that constitutes a conflict of interest unless that conflict has been completely disclosed to affected parties and waived by the Trustees on behalf of the Trust. Further, Covered Officers should avoid participation in any activity or relationship that could create the appearance of a conflict of interest.
A conflict of interest would generally arise if, for instance, a Covered Officer directly or indirectly participates in any investment, interest, association, activity or relationship that may impair or appear to impair the Covered Officer’s objectivity or interfere with the interests of, or the Covered Officer’s service to, the Trust.
2
Any Covered Officer who may be involved in a situation or activity that might be a conflict of interest or give the appearance of a conflict of interest must report such situation or activity using the reporting procedures set forth in Section VI of this Code.
Each Covered Officer must not:
| • | use his or her personal influence or personal relationships improperly to influence investment decisions or financial reporting by the Trust whereby the Covered Officer would benefit personally to the detriment of the Trust; |
| • | cause the Trust to take action, or fail to take actions, for the individual personal benefit of the Covered Officer rather than the benefit of the Trust; or |
| • | use material non-public knowledge of portfolio transactions made or contemplated for the Trust to trade personally or cause others to trade personally in contemplation of the market effect of such transactions. |
Each Covered Officer is responsible for his or her compliance with this conflict of interest policy.
| C. | Preparation of Financial Statements |
Covered Officers must not knowingly make any misrepresentations regarding the Trust’s financial statements or any facts in the preparation of the Trust’s financial statements, and must comply with all applicable laws, standards, principles, guidelines, rules and regulations in the preparation of the Trust’s financial statements. This section is intended to prohibit:
| • | making, or permitting or directing another to make, materially false or misleading entries in the Trust’s financial statements or records; |
| • | failing to correct the Trust’s financial statements or records that are materially false or misleading when he or she has the authority to record an entry; and |
| • | signing, or permitting or directing another to sign, a document containing materially false or misleading financial information. |
Covered Officers must be scrupulous in their application of generally accepted accounting principles. No Covered Officer may (i) express an opinion or state affirmatively that the financial statements or other financial data of the Trust are presented in conformity with generally accepted accounting principles, or (ii) state that he or she is not aware of any material modifications that should be made to such statements or data in order for them to be in conformity with generally accepted accounting principles, if such statements or data contain any departure from generally accepted accounting principles then in effect in the United States.
3
Covered Officers must follow the laws, standards, principles, guidelines, rules and regulations established by all applicable governmental bodies, commissions or other regulatory agencies in the preparation of financial statements, records and related information. If a Covered Officer prepares financial statements, records or related information for purposes of reporting to such bodies, commissions or regulatory agencies, the Covered Officer must follow the requirements of such organizations in addition to generally accepted accounting principles.
If a Covered Officer and his or her supervisor have a disagreement or dispute relating to the preparation of financial statements or the recording of transactions, the Covered Officer should take the following steps to ensure that the situation does not constitute an impermissible subordination of judgment:
| • | The Covered Officer should consider whether (i) the entry or the failure to record a transaction in the records, or (ii) the financial statement presentation or the nature or omission of disclosure in the financial statements, as proposed by the supervisor, represents the use of an acceptable alternative and does not materially misrepresent the facts or result in an omission of a material fact. If, after appropriate research or consultation, the Covered Officer concludes that the matter has authoritative support and/or does not result in a material misrepresentation, the Covered Officer need do nothing further. |
| • | If the Covered Officer concludes that the financial statements or records could be materially misstated as a result of the supervisor’s determination, the Covered Officer should follow the reporting procedures set forth in Section VI of this Code. |
| D. | Obligations to the Independent Auditor of the Trust |
In dealing with the Trust’s independent auditor, Covered Officers must be candid and not knowingly misrepresent facts or knowingly fail to disclose material facts, and must respond to specific inquiries and requests by the Trust’s independent auditor.
Covered Officers must not take any action, or direct any person to take any action, to fraudulently influence, coerce, manipulate or mislead the Trust’s independent auditor in the performance of an audit of the Trust’s financial statements for the purpose of rendering such financial statements materially misleading.
| IV. | FULL, FAIR, ACCURATE, TIMELY AND UNDERSTANDABLE DISCLOSURE |
It is the Trust’s policy to provide full, fair, accurate, timely, and understandable disclosure in reports and documents that the Trust files with, or submits to, the SEC and in any other public communications by the Trust. The Trust has designed and implemented Disclosure Controls and Procedures to carry out this policy.
Covered Officers are expected to familiarize themselves with the disclosure requirements generally applicable to the Trust, and to use their best efforts to promote, facilitate, and prepare full, fair, accurate, timely, and understandable disclosure in all reports and documents that the Trust files with, or submits to, the SEC and in any other public communications by the Trust.
4
Covered Officers must review the Trust’s Disclosure Controls and Procedures to ensure they are aware of and carry out their duties and responsibilities in accordance with the Disclosure Controls and Procedures and the disclosure obligations of the Trust. Covered Officers are responsible for monitoring the integrity and effectiveness of the Trust’s Disclosure Controls and Procedures.
| V. | COMPLIANCE WITH APPLICABLE LAWS, RULES AND REGULATIONS |
Covered Officers are expected to know, respect and comply with all laws, rules and regulations applicable to the conduct of the Trust’s business. If a Covered Officer is in doubt about the legality or propriety of an action, business practice or policy, the Covered Officer should seek advice from the Covered Officer’s supervisor or the Trust’s legal counsel.
In the performance of their work, Covered Officers must not knowingly be a party to any illegal activity or engage in acts that are discreditable to the Trust.
Covered Officers are expected to promote the Trust’s compliance with applicable laws, rules and regulations. To promote such compliance, Covered Officers may establish and maintain mechanisms to educate employees carrying out the finance and compliance functions of the Trust about any applicable laws, rules or regulations that affect the operation of the finance and compliance functions and the Trust generally.
| VI. | REPORTING AND ACCOUNTABILITY |
All Covered Officers will be held accountable for adherence to this Code. Each Covered Officer must, upon the Trust’s adoption of this Code (or thereafter as applicable, upon becoming a Covered Officer), affirm in writing to the Board that he/she has received, read, and understands this Code by signing the Acknowledgement Form attached hereto as Appendix A. Thereafter, each Covered Officer, on an annual basis, must affirm to the Board that he/she has complied with the requirements of this Code.
Covered Officers may not retaliate against any other Covered Officer of the Trust or their affiliated persons for reports of potential violations that are made in good faith.
The Trust will follow these procedures in investigating and enforcing this Code:
| A. | Any Covered Officer who knows of any violation of this Code or who questions whether a situation, activity or practice is acceptable must immediately report such practice to the Trust’s Audit Committee. The Audit Committee shall take appropriate action to investigate any reported potential violations. If, after such investigation, the Audit Committee believes that no violation has occurred, the Audit Committee is not required to take any further action. Any matter that the Audit Committee believes is a violation will be reported to the Chairman of the Board of Trustees. The Audit Committee shall respond to the Covered Officer within a reasonable period of time. |
5
| B. | If the Covered Officer is not satisfied with the response of the Audit Committee, the Covered Officer shall report the matter to the Chairman of the Board of Trustees. If the Chairman is unavailable, the Covered Officer may report the matter to any other member of the Board of Trustees. The person receiving the report shall consider the matter, refer it to the full Board of Trustees if he or she deems appropriate, and respond to the Covered Officer within a reasonable amount of time. If the Board of Trustees concurs that a violation has occurred, it will consider appropriate action, which may include review of and appropriate modifications to applicable policies and procedures or notification to appropriate personnel of the investment adviser or its board. |
| C. | If the Board of Trustees determines that a Covered Officer violated this Code, failed to report a known or suspected violation of this Code, or provided intentionally false or malicious information in connection with an alleged violation of this Code, the Board of Trustees may take disciplinary action against any such Covered Officer to the extent the Board of Trustees deems appropriate. No Covered Officer will be disciplined for reporting a concern in good faith. |
To the extent possible and as allowed by law, reports will be treated as confidential. The Trust may report violations of the law to the appropriate authorities.
| VII. | DISCLOSURE OF THIS CODE |
This Code shall be disclosed to the public by at least one of the following methods in the manner prescribed by the SEC, unless otherwise required by law:
| • | Filing a copy of this Code as an exhibit to the Trust’s annual report on Form N- CSR; |
| • | Posting the text of this Code on the Trust’s Internet website and disclosing, in its most recent report on Form N-CSR, its Internet address and the fact that it has posted this Code on its Internet website; or |
| • | Providing an undertaking in the Trust’s most recent report on Form N-CSR to provide a copy of this Code to any person without charge upon request, and explaining the manner in which such a request may be made. |
| VIII. | WAIVERS |
Any waiver of this Code, including an implicit waiver, granted to a Covered Officer may be made only by the Board of Trustees or a committee of the Board to which such responsibility has been delegated, and must be disclosed by the Trust in the manner prescribed by law and as set forth above in Section VII (Disclosure of this Code).
6
| IX. | AMENDMENTS |
This Code may be amended by the affirmative vote of a majority of the Board of Trustees, including a majority of the independent Trustees. Any amendment of this Code must be disclosed by the Trust in the manner prescribed by law and as set forth above in Section VII (Disclosure of this Code), unless such amendment is deemed to be technical, administrative, or otherwise non-substantive. Any amendments to this Code will be provided to the Covered Officers.
| X. | CONFIDENTIALITY |
All reports and records prepared or maintained pursuant to this Code will be considered confidential and shall be maintained and protected accordingly. Except as otherwise required by law or this Code, such matters shall not be disclosed to anyone other than the Board of Trustees of the Trust, the Audit Committee, the legal counsel to the Trust, legal counsel to the independent trustees and such other persons as a majority of the Board of Trustees, including a majority of the independent Trustees, shall determine to be appropriate.
Adopted: February 2007
7
Appendix A
WISDOMTREE TRUST
Certification and Acknowledgment of Receipt of Code of Ethics for Principal Executive Officers and Principal Financial Officers
I acknowledge and certify that I have received a copy of the WisdomTree Trust’s Code of Ethics for Principal Executive Officers and Principal Financial Officers (the “Code”). I understand and agree that it is my responsibility to read and familiarize myself with the policies and procedures contained in the Code and to abide by those policies and procedures.
I acknowledge and certify that I have read and understand the Code.
| Officer Name (Please Print) | Officer Signature | |||||
| Date | ||||||
Certification Pursuant to Rule 30a-2(a) under the 1940 Act and
Section 302 of the Sarbanes-Oxley Act
I, Jonathan L. Steinberg, certify that:
| 1. | I have reviewed this report on Form N-CSR of the WisdomTree Trust; |
| 2. | Based on my knowledge, this report does not contain any untrue statement of a material fact or omit to state a material fact necessary to make the statements made, in light of the circumstances under which such statements were made, not misleading with respect to the period covered by this report; |
| 3. | Based on my knowledge, the financial statements, and other financial information included in this report, fairly present in all material respects the financial condition, results of operations, changes in net assets, and cash flows (if the financial statements are required to include a statement of cash flows) of the registrant as of, and for, the periods presented in this report; |
| 4. | The registrant’s other certifying officer(s) and I are responsible for establishing and maintaining disclosure controls and procedures (as defined in Rule 30a-3(c) under the Investment Company Act of 1940) and internal control over financial reporting (as defined in Rule 30a-3(d) under the Investment Company Act of 1940) for the registrant and have: |
| (a) | Designed such disclosure controls and procedures, or caused such disclosure controls and procedures to be designed under our supervision, to ensure that material information relating to the registrant, including its consolidated subsidiaries, is made known to us by others within those entities, particularly during the period in which this report is being prepared; |
| (b) | Designed such internal control over financial reporting, or caused such internal control over financial reporting to be designed under our supervision, to provide reasonable assurance regarding the reliability of financial reporting and the preparation of financial statements for external purposes in accordance with generally accepted accounting principles; |
| (c) | Evaluated the effectiveness of the registrant’s disclosure controls and procedures and presented in this report our conclusions about the effectiveness of the disclosure controls and procedures, as of a date within 90 days prior to the filing date of this report based on such evaluation; and |
| (d) | Disclosed in this report any change in the registrant’s internal control over financial reporting that occurred during the second fiscal quarter of the period covered by this report that has materially affected, or is reasonably likely to materially affect, the registrant’s internal control over financial reporting; and |
| 5. | The registrant’s other certifying officer(s) and I have disclosed to the registrant’s auditors and the audit committee of the registrant’s board of directors (or persons performing the equivalent functions): |
| (a) | All significant deficiencies and material weaknesses in the design or operation of internal control over financial reporting which are reasonably likely to adversely affect the registrant’s ability to record, process, summarize, and report financial information; and |
| (b) | Any fraud, whether or not material, that involves management or other employees who have a significant role in the registrant’s internal control over financial reporting. |
| Date: May 31, 2019 | /s/ Jonathan Steinberg | |||||
| Jonathan L. Steinberg, President | ||||||
| (principal executive officer) |
Certification Pursuant to Rule 30a-2(a) under the 1940 Act and
Section 302 of the Sarbanes-Oxley Act
I, David Castano, certify that:
| 1. | I have reviewed this report on Form N-CSR of the WisdomTree Trust; |
| 2. | Based on my knowledge, this report does not contain any untrue statement of a material fact or omit to state a material fact necessary to make the statements made, in light of the circumstances under which such statements were made, not misleading with respect to the period covered by this report; |
| 3. | Based on my knowledge, the financial statements, and other financial information included in this report, fairly present in all material respects the financial condition, results of operations, changes in net assets, and cash flows (if the financial statements are required to include a statement of cash flows) of the registrant as of, and for, the periods presented in this report; |
| 4. | The registrant’s other certifying officer(s) and I are responsible for establishing and maintaining disclosure controls and procedures (as defined in Rule 30a-3(c) under the Investment Company Act of 1940) and internal control over financial reporting (as defined in Rule 30a-3(d) under the Investment Company Act of 1940) for the registrant and have: |
| (a) | Designed such disclosure controls and procedures, or caused such disclosure controls and procedures to be designed under our supervision, to ensure that material information relating to the registrant, including its consolidated subsidiaries, is made known to us by others within those entities, particularly during the period in which this report is being prepared; |
| (b) | Designed such internal control over financial reporting, or caused such internal control over financial reporting to be designed under our supervision, to provide reasonable assurance regarding the reliability of financial reporting and the preparation of financial statements for external purposes in accordance with generally accepted accounting principles; |
| (c) | Evaluated the effectiveness of the registrant’s disclosure controls and procedures and presented in this report our conclusions about the effectiveness of the disclosure controls and procedures, as of a date within 90 days prior to the filing date of this report based on such evaluation; and |
| (d) | Disclosed in this report any change in the registrant’s internal control over financial reporting that occurred during the second fiscal quarter of the period covered by this report that has materially affected, or is reasonably likely to materially affect, the registrant’s internal control over financial reporting; and |
| 5. | The registrant’s other certifying officer(s) and I have disclosed to the registrant’s auditors and the audit committee of the registrant’s board of directors (or persons performing the equivalent functions): |
| (a) | All significant deficiencies and material weaknesses in the design or operation of internal control over financial reporting which are reasonably likely to adversely affect the registrant’s ability to record, process, summarize, and report financial information; and |
| (b) | Any fraud, whether or not material, that involves management or other employees who have a significant role in the registrant’s internal control over financial reporting. |
| Date: May 31, 2019 | /s/ David Castano | |||||
| David Castano, Treasurer | ||||||
| (principal financial officer) |
Certification Pursuant to Rule 30a-2(b) under the 1940 Act
and Section 906 of the Sarbanes-Oxley Act
I, Jonathan L. Steinberg, President of the WisdomTree Trust (the “Registrant”), certify that:
| 1. | The Form N-CSR of the Registrant (the “Report”) fully complies with the requirements of Section 13(a) or 15(d) of the Securities Exchange Act of 1934, as amended; and |
| 2. | The information contained in the Report fairly presents, in all material respects, the financial condition and results of operations of the Registrant. |
| Date: May 31, 2019 | /s/ Jonathan Steinberg | |||||
| Jonathan L. Steinberg, President | ||||||
| (principal executive officer) |
I, David Castano, Treasurer of the WisdomTree Trust (the “Registrant”), certify that:
| 1. | The Form N-CSR of the Registrant (the “Report”) fully complies with the requirements of Section 13(a) or 15(d) of the Securities Exchange Act of 1934, as amended; and |
| 2. | The information contained in the Report fairly presents, in all material respects, the financial condition and results of operations of the Registrant. |
| Date: May 31, 2019 | /s/ David Castano | |||||
| David Castano, Treasurer | ||||||
| (principal financial officer) |