UNITED
STATES
SECURITIES
AND EXCHANGE COMMISSION
Washington,
D.C. 20549
FORM
N-CSR
CERTIFIED
SHAREHOLDER REPORT
OF
REGISTERED
MANAGEMENT INVESTMENT COMPANIES
Investment
Company Act file number: 811-02968-99
| Name of Registrant: |
Vanguard Trustees’
Equity Fund |
| Address of Registrant: |
P.O. Box 2600 |
| |
Valley Forge, PA 19482 |
| Name
and address of agent for service: |
Anne E. Robinson,
Esquire |
| |
P.O. Box 876 |
| |
Valley Forge, PA 19482 |
Registrant’s
telephone number, including area code: (610) 669-1000
Date
of fiscal year end: October 31
Date
of reporting period: November 1, 2021—October 31, 2022
Item
1: Reports to Shareholders
Annual Report | October 31, 2022
Vanguard
International Value Fund
Contents
Please note: The
opinions expressed in this report are just that—informed opinions. They should not be considered promises or advice. Also, please keep in mind that the information and opinions cover the period through the date
on the front of this report. Of course, the risks of investing in your fund are spelled out in the prospectus.
Your Fund’s Performance at a Glance
| •
| The 12 months ended October 31, 2022, were a volatile, challenging period for financial markets. Vanguard International Value Fund returned –21.28%, which, was ahead of the –24.73% return of its
benchmark.
|
| •
| The global economic backdrop deteriorated as inflation reached multidecade highs, notably in energy and food prices after Russia invaded Ukraine. Price increases then broadened to other goods and services, adding to
concerns that inflation would remain stubbornly high. Many central banks tightened aggressively to try to rein in inflation, which increased fears of a recession.
|
| •
| All sectors except energy declined for both the fund and its benchmark. The advisors’ selections in energy and financial stocks helped performance relative to the benchmark, as did an underweight to
information technology. The health care, utilities, and consumer staples sectors all detracted slightly.
|
| •
| Declines prevailed in most regions, but emerging markets aided relative performance primarily through an underweight to China, an overweight to Brazil, and security selection in Indonesia. European stocks were
strong contributors, notably through stock selection in France and the Netherlands. Pacific markets, particularly Japan, Australia, and Hong Kong, hurt relative performance the most.
|
| •
| For the decade ended October 31, 2022, the fund’s average annualized return was 3.93%, outpacing the 3.27% return of its benchmark.
|
Market Barometer
|
| Average Annual Total Returns
Periods Ended October 31, 2022
|
|
| One Year
| Three Years
| Five Years
|
| Stocks
|
|
|
|
| Russell 1000 Index (Large-caps)
| -16.38%
| 9.99%
| 10.19%
|
| Russell 2000 Index (Small-caps)
| -18.54
| 7.05
| 5.56
|
| Russell 3000 Index (Broad U.S. market)
| -16.52
| 9.79
| 9.87
|
| FTSE All-World ex US Index (International)
| -24.20
| -1.16
| -0.18
|
| Bonds
|
|
|
|
Bloomberg U.S. Aggregate Float Adjusted Index
(Broad taxable market)
| -15.69%
| -3.73%
| -0.50%
|
Bloomberg Municipal Bond Index
(Broad tax-exempt market)
| -11.98
| -2.18
| 0.37
|
| FTSE Three-Month U.S. Treasury Bill Index
| 0.88
| 0.59
| 1.15
|
| CPI
|
|
|
|
| Consumer Price Index
| 7.75%
| 5.01%
| 3.85%
|
For the 12 months ended October 31, 2022,
Vanguard International Value Fund returned –21.28%. It outpaced its benchmark, the MSCI ACWI ex USA Index, which returned –24.73%.
Your fund is managed by three
independent advisors, a strategy that enhances its diversification by providing exposure to distinct yet complementary investment approaches. It’s not uncommon for different advisors to have different views
about individual securities or the broader investment environment.
The accompanying table lists
the advisors, the amount and percentage of fund assets each manages, and brief descriptions of their investment strategies.
The advisors have provided the
following assessment of the investment environment during the past 12 months and the notable successes and shortfalls in their portfolios. These comments were prepared on November 15, 2022.
Lazard Asset Management LLC
Portfolio Managers:
Michael G. Fry, Managing
Director
Michael A. Bennett, CPA,
Managing Director
International markets fell
sharply as the level and sustainability of inflation continued to surprise investors. The resulting higher interest rate environment, along with some rolling COVID
lockdowns, drove very weak equity markets for
international investors. The U.S. dollar appreciated on interest rate differentials and its perceived safe-haven status. The deeply discounted valuations of international benchmarks relative to the U.S. have supported
outperformance versus the U.S. in local terms. Weaker currencies contributed to a nearly 12-percentage-point headwind for international equities, a level that now represents the largest headwind to local performance
over the past 20 years.
Stock selection in the
financial sector was a large driver of strong relative performance during the period, where our preference for high-quality, strong deposit franchise banks was rewarded amid rising rates. Key outperformers were
Mexico’s Grupo Banorte, Indonesia’s Bank Mandiri, and India’s ICICI Bank. Stock selection in the energy sector was also beneficial, as shares of U.K.-based integrated oil and gas company BP rose
after the company announced a 10% dividend increase and a $3.5 billion share buyback. These results support our investment thesis of strong cash-flow production and should enable shareholder returns in the low-to-mid
teens (through buyback and dividends) as well as debt paydown.
In contrast, stock selection
in the utilities sector hurt relative returns. China Longyuan, the Chinese wind farm company, underperformed as investors gauged the impact of COVID restrictions in China, which prompted a general sell-off in Hong
Kong stocks. Additionally, slightly weaker wind speeds in China
during the first half led to some concerns
over results, which proved to be fine.
In this environment, where the
market, in our opinion, is expecting a contraction in earnings, we are finding an increasing number of relative value opportunities. Many are high-quality compounders whose valuations have fallen enough in our
estimation because of higher interest rates. Others are very inexpensive but higher-quality cyclicals whose valuations, in our view, are already discounting pressure to earnings. We believe the portfolio is well
balanced within relative value, between more defensive compounders and higher-quality cyclicals, and we continue to avoid the extremes of still-expensive growth and low quality.
Higher inflation and interest
rates have changed the investment landscape, and we anticipate a much broader set of relative value ideas to materialize. This leadership, driven by the combination of higher financial productivity and less expensive
valuations, should enable stock selection to drive performance once again.
Sprucegrove Investment
Management Ltd.
Portfolio Managers:
Arjun Kumar, CFA,
Chief Executive Officer and Managing
Director
Co-Lead of International
Equities
Shirley Woo, CFA, Managing
Director
Co-Lead of International Equities
The global economy was still
facing several post-COVID challenges during the period, including inflation concerns, and the start of the conflict in Ukraine added another layer of uncertainty. International equities steadily declined to reach
two-year lows.
The sharp rise in commodity
prices, particularly in energy, further fueled inflationary pressures that forced central banks to raise rates quicker and by wider margins than anticipated. This, combined with the magnitude of the energy shock in
Europe, makes a recession in the region highly likely in the coming months.
This environment was also
marked by large currency extremes. The U.S. dollar has risen to its highest level in decades, supported by the Federal Reserve’s aggressive rate hikes and its safe-haven appeal during times of market volatility.
This has weighed on currency-adjusted returns for U.S.-based investors.
Outperformance over the past
year was led by stock selection in the information technology, communication services, and consumer discretionary sectors, which contain some of the most highly valued stocks in the index. Our discipline on valuations
was an advantage this year, as higher interest rates hurt growth stocks the most.
From a regional perspective,
emerging markets was a significant contributor due to an underweight position to China, no
exposure to Russia, and strong performance
from several of our Brazilian and Indonesian holdings, which provided rare positive returns.
Critical to understanding is
how the portfolio is positioned today. Our bottom-up, fundamental approach has been consistently applied over the decades, as we continue to focus on constructing portfolios of quality companies at attractive
valuations. Over the course of the past year, we have added new names to the portfolio and augmented several existing positions as opportunities presented themselves.
As compared to the benchmark
at the end of the period, the fund represents higher quality and lower risk (as gauged by financial leverage) and was more attractively valued. These characteristics are critical to our quest to achieve superior
investment returns through a full market cycle.
ARGA Investment Management,
LP
Portfolio Managers:
A. Rama Krishna, CFA, Founder
and
Chief Investment Officer
Steven Morrow, CFA, Director
of Research
International equities plunged
as world markets reacted to rate hikes, ongoing inflation, recessionary fears, supply chain disruptions, adverse regulation, and geopolitical tensions. Investor attention generally fixated on risks rather than
opportunities.
In ARGA’s experience as
a value manager, fear and uncertainty create opportunity. Accordingly, ARGA’s response to the year’s chaos was to identify new investment opportunities and control risk. The portfolio’s long-term
orientation took advantage of significant near-term stress affecting many global businesses. Fundamental research showed many stressed businesses appear capable of surviving prolonged economic weakness and emerging
competitively stronger when conditions normalize. Companies deemed most underpriced relative to their earning power were added to the portfolio.
This valuation discipline,
coupled with rigorous risk management, led to a smaller decline in the ARGA portfolio than the broader market. ARGA believes that mandatory stress tests for every portfolio company helped mitigate the downside.
The current portfolio reflects
a combination of older opportunities where full potential has yet to be realized and newer opportunities resulting from recent stress. While portfolio composition arises from company valuations rather than targeted
industries or geographies, broad areas of opportunity include: (1) aerospace, airline, lodging, and other travel holdings positioned to benefit from travel recovery; (2) Chinese internet companies facing regulatory
risk and slowing Chinese growth but with solid franchises generating strong cash flows; and (3) select opportunities in auto, steel, chemical, and other industries.
Market risks and challenges of
the past year may well persist. ARGA believes this creates meaningful opportunity for patient investors in general and value investors in particular.
Vanguard International Value
Fund Investment Advisors
|
| Fund Assets Managed
|
|
| Investment Advisor
| %
| $ Million
| Investment Strategy
|
| Lazard Asset Management LLC
| 39
| 4,594
| The advisor uses a research-driven, bottom-up, relative-value approach in selecting stocks. The goal is to
identify individual stocks that offer an appropriate trade-off between low relative valuation and high financial productivity.
|
| Sprucegrove Investment Management Ltd.
| 35
| 4,090
| The advisor employs a concentrated, low-turnover, value-oriented investment approach that results in a
portfolio of companies with good long-term prospects and below-market price/earnings ratios. In-depth fundamental research on industries and companies is central to this investment process.
|
| ARGA Investment Management, LP
| 24
| 2,767
| The advisor invests in deeply undervalued securities with long-term upside. Its valuation discipline is
based on fundamental research and present value, with full integration of ESG risks and opportunities.
|
| Cash Investments
| 2
| 281
| These short-term reserves are invested by Vanguard in equity index products to simulate investments in
stocks. Each advisor may also maintain a modest cash position.
|
About Your Fund’s Expenses
As a shareholder of the fund,
you incur ongoing costs, which include costs for portfolio management, administrative services, and shareholder reports (like this one), among others. Operating expenses, which are deducted from a fund’s gross
income, directly reduce the investment return of the fund.
A fund‘s expenses are
expressed as a percentage of its average net assets. This figure is known as the expense ratio. The following examples are intended to help you understand the ongoing costs (in dollars) of investing in your fund and
to compare these costs with those of other mutual funds. The examples are based on an investment of $1,000 made at the beginning of the period shown and held for the entire period.
The accompanying table
illustrates your fund’s costs in two ways:
| •
| Based on actual fund return. This section helps you to estimate the actual expenses that you paid over the period. The ”Ending Account Value“ shown is derived from the fund’s actual return, and the
third column shows the dollar amount that would have been paid by an investor who started with $1,000 in the fund. You may use the information here, together with the amount you invested, to estimate the expenses that
you paid over the period.
|
To do so, simply divide your
account value by $1,000 (for example, an $8,600 account value divided by $1,000 = 8.6), then multiply the result by the number given for your fund under the heading ”Expenses Paid During Period.“
| •
| Based on hypothetical 5% yearly return. This section is intended to help you compare your fund‘s costs with those of other mutual funds. It assumes that the fund had a yearly return of 5% before expenses, but that the
expense ratio is unchanged. In this case—because the return used is not the fund’s actual return—the results do not apply to your investment. The example is useful in making comparisons because the
Securities and Exchange Commission requires all mutual funds to calculate expenses based on a 5% return. You can assess your fund’s costs by comparing this hypothetical example with the hypothetical examples
that appear in shareholder reports of other funds.
|
Note that the expenses shown
in the table are meant to highlight and help you compare ongoing costs only and do not reflect transaction costs incurred by the fund for buying and selling securities. Further, the expenses do not include any purchase, redemption, or
account service fees described in the fund prospectus. If such fees were applied to your account, your costs would be higher. Your fund does not carry a “sales load.”
The calculations assume no
shares were bought or sold during the period. Your actual costs may have been higher or lower, depending on the amount of your investment and the timing of any purchases or redemptions.
You can find more information
about the fund’s expenses, including annual expense ratios, in the Financial Statements section of this report. For additional information on operating expenses and other shareholder costs, please refer to your
fund’s current prospectus.
| Six Months Ended October 31, 2022
|
|
|
|
| International Value Fund
| Beginning
Account Value
4/30/2022
| Ending
Account Value
10/31/2022
| Expenses
Paid During
Period
|
| Based on Actual Fund Return
| $1,000.00
| $884.60
| $1.85
|
| Based on Hypothetical 5% Yearly Return
| 1,000.00
| 1,023.24
| 1.99
|
The calculations are
based on expenses incurred in the most recent six-month period. The fund's annualized six-month expense ratio for that period is 0.39%. The dollar amounts shown as ”Expenses Paid” are equal to the
annualized expense ratio multiplied by the average account value over the period, multiplied by the number of days in the most recent six-month period, then divided by the number of days in the most recent 12-month
period (184/365).
All of the returns in this
report represent past performance, which is not a guarantee of future results that may be achieved by the fund. (Current performance may be lower or higher than the performance data cited. For performance data current
to the most recent month-end, visit our website at vanguard.com/performance.) Note, too, that both investment returns and principal value can fluctuate widely, so an investor’s shares, when sold, could be worth
more or less than their original cost. The returns shown do not reflect taxes that a shareholder would pay on fund distributions or on the sale of fund shares.
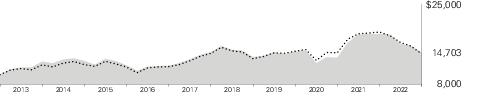
Cumulative Performance: October
31, 2012, Through October 31, 2022
Initial Investment of
$10,000
|
|
| Average Annual Total Returns
Periods Ended October 31, 2022
|
|
|
|
| One
Year
| Five
Years
| Ten
Years
| Final Value
of a $10,000
Investment
|

| International Value Fund
| -21.28%
| -0.13%
| 3.93%
| $14,703
|

| MSCI All Country World Index ex USA
| -24.73
| -0.60
| 3.27
| 13,796
|
See Financial
Highlights for dividend and capital gains information.
|
|
| United Kingdom
| 13.9%
|
| Japan
| 11.3
|
| Germany
| 9.3
|
| France
| 8.9
|
| Switzerland
| 6.9
|
| China
| 6.3
|
| India
| 5.4
|
| Hong Kong
| 4.7
|
| Netherlands
| 4.4
|
| Brazil
| 3.9
|
| South Korea
| 3.4
|
| United States
| 3.4
|
| Singapore
| 2.6
|
| Canada
| 2.5
|
| Indonesia
| 2.4
|
| Ireland
| 2.2
|
| Finland
| 1.2
|
| Other
| 7.3
|
The table reflects the fund’s
investments, except for short-term investments and derivatives.
The fund files its complete
schedule of portfolio holdings with the Securities and Exchange Commission (SEC) for the first and third quarters of each fiscal year as an exhibit to its reports on Form N-PORT. The fund’s Form N-PORT reports
are available on the SEC’s website at www.sec.gov.
|
|
|
|
|
| Shares
| Market
Value•
($000)
|
| Common Stocks (94.6%)
|
| Australia (0.8%)
|
|
| National Australia Bank Ltd.
| 2,155,160
| 44,767
|
|
| QBE Insurance Group Ltd.
| 4,298,322
| 33,677
|
|
| Adbri Ltd.
| 9,598,354
| 9,677
|
|
|
|
|
|
|
| 88,121
|
| Brazil (3.7%)
|
| 1
| Banco Bradesco SA ADR
| 42,762,052
| 162,068
|
|
| Ambev SA ADR
| 33,935,500
| 103,164
|
|
| Gerdau SA Preference Shares
| 12,126,300
| 60,450
|
|
| Petroleo Brasileiro SA Preference Shares
| 10,417,600
| 60,120
|
|
| Petroleo Brasileiro SA ADR
| 3,893,780
| 49,918
|
|
|
|
|
|
|
| 435,720
|
| Canada (2.3%)
|
|
| Suncor Energy Inc.
| 3,256,143
| 112,000
|
|
| Saputo Inc.
| 2,201,749
| 53,591
|
|
| Bank of Nova Scotia
| 761,351
| 36,801
|
|
| Alimentation Couche-Tard Inc.
| 693,700
| 31,061
|
|
| Stella-Jones Inc.
| 915,400
| 27,569
|
|
| North West Co. Inc.
| 435,500
| 11,332
|
|
|
|
|
|
|
| 272,354
|
| China (5.9%)
|
| *
| Alibaba Group Holding Ltd.
| 21,140,600
| 164,366
|
| *
| Baidu Inc. ADR
| 1,152,791
| 88,269
|
|
| Tencent Holdings Ltd.
| 3,113,800
| 81,821
|
|
| ENN Energy Holdings Ltd.
| 4,943,400
| 49,148
|
|
| China Longyuan Power Group Corp. Ltd. Class H
| 39,737,000
| 45,406
|
|
| Shandong Weigao Group Medical Polymer Co. Ltd. Class H
| 32,448,000
| 44,706
|
|
| Sungrow Power Supply Co. Ltd. Class A
| 2,380,460
| 42,769
|
|
|
|
|
|
| Shares
| Market
Value•
($000)
|
| *
| Alibaba Group Holding Ltd. ADR
| 620,407
| 39,445
|
|
| Wuxi Lead Intelligent Equipment Co. Ltd. Class A
| 4,502,616
| 30,957
|
|
| Autohome Inc. ADR
| 1,112,003
| 29,046
|
|
| Hengan International Group Co. Ltd.
| 7,215,500
| 27,976
|
|
| Ping An Insurance Group Co. of China Ltd. Class H
| 5,304,000
| 21,234
|
| *
| Weibo Corp. ADR
| 1,429,981
| 16,187
|
| *
| Trip.com Group Ltd. ADR
| 641,343
| 14,514
|
|
|
|
|
|
|
| 695,844
|
| Denmark (0.8%)
|
|
| Carlsberg A/S Class B
| 498,698
| 58,720
|
|
| Vestas Wind Systems A/S
| 1,969,298
| 38,822
|
|
|
|
|
|
|
| 97,542
|
| Egypt (0.3%)
|
|
| Commercial International Bank Egypt SAE (Registered) GDR
| 25,685,548
| 32,597
|
| Finland (1.2%)
|
|
| Sampo OYJ Class A
| 1,571,237
| 71,849
|
|
| Nokian Renkaat OYJ
| 2,855,350
| 32,199
|
|
| Nokia OYJ
| 6,980,867
| 31,023
|
|
|
|
|
|
|
| 135,071
|
| France (8.4%)
|
|
| Airbus SE
| 1,637,523
| 177,186
|
|
| TotalEnergies SE
| 3,033,640
| 165,495
|
|
| Air Liquide SA
| 902,385
| 118,044
|
|
| Engie SA
| 8,409,958
| 109,274
|
|
| Bureau Veritas SA
| 2,962,936
| 73,304
|
|
| Pernod Ricard SA
| 416,762
| 73,147
|
|
| Thales SA
| 567,781
| 72,210
|
|
| Legrand SA
| 842,306
| 64,188
|
|
| Societe Generale SA
| 1,854,645
| 42,540
|
|
| Teleperformance
| 158,348
| 42,426
|
| *
| Accor SA
| 1,309,358
| 31,374
|
|
|
|
|
|
| Shares
| Market
Value•
($000)
|
|
| Publicis Groupe SA
| 247,452
| 13,859
|
|
| Safran SA
| 41,270
| 4,596
|
|
|
|
|
|
|
| 987,643
|
| Germany (8.8%)
|
|
| MTU Aero Engines AG
| 628,158
| 112,414
|
|
| Henkel AG & Co. KGaA Preference Shares
| 1,561,313
| 98,361
|
|
| Merck KGaA
| 531,717
| 86,651
|
|
| Fresenius SE & Co. KGaA
| 3,519,031
| 80,984
|
|
| Bayerische Motoren Werke AG
| 919,000
| 72,134
|
|
| Porsche Automobil Holding SE Preference Shares
| 1,209,821
| 67,596
|
|
| BASF SE
| 1,476,590
| 66,256
|
|
| Infineon Technologies AG
| 2,451,511
| 59,487
|
|
| Henkel AG & Co. KGaA
| 975,920
| 57,292
|
| 2
| Covestro AG
| 1,681,860
| 57,093
|
|
| SAP SE
| 478,150
| 46,023
|
|
| Fresenius Medical Care AG & Co. KGaA
| 1,585,910
| 43,867
|
|
| Continental AG
| 830,599
| 43,021
|
|
| Jungheinrich AG Preference Shares
| 1,566,012
| 38,917
|
| 2
| Siemens Healthineers AG
| 790,012
| 36,193
|
|
| FUCHS PETROLUB SE Preference Shares
| 1,257,070
| 36,001
|
|
| Vonovia SE
| 1,612,640
| 35,656
|
|
|
|
|
|
|
| 1,037,946
|
| Hong Kong (4.4%)
|
|
| AIA Group Ltd.
| 18,921,000
| 143,323
|
| *
| Sands China Ltd.
| 47,010,000
| 82,184
|
| *
| Melco Resorts & Entertainment Ltd. ADR
| 10,563,690
| 57,783
|
|
| Jardine Matheson Holdings Ltd.
| 1,173,100
| 54,042
|
|
| Galaxy Entertainment Group Ltd.
| 9,079,000
| 41,479
|
| 2
| ESR Group Ltd.
| 19,250,600
| 32,829
|
|
| Xinyi Glass Holdings Ltd.
| 20,644,000
| 26,531
|
|
| Hongkong Land Holdings Ltd.
| 5,380,000
| 20,712
|
| 2
| WH Group Ltd.
| 40,747,243
| 20,578
|
|
| CK Asset Holdings Ltd.
| 3,466,500
| 19,165
|
|
| Yue Yuen Industrial Holdings Ltd.
| 18,050,500
| 18,351
|
|
|
|
|
|
|
| 516,977
|
| India (5.1%)
|
|
| ICICI Bank Ltd. ADR
| 6,094,587
| 134,325
|
|
| Zee Entertainment Enterprises Ltd. Class B
| 31,279,583
| 99,370
|
|
| Housing Development Finance Corp. Ltd.
| 3,133,250
| 93,680
|
|
| Reliance Industries Ltd.
| 2,790,471
| 86,105
|
|
| Adani Ports & Special Economic Zone Ltd.
| 7,612,517
| 75,799
|
|
|
|
|
|
| Shares
| Market
Value•
($000)
|
|
| UPL Ltd.
| 5,608,124
| 49,509
|
|
| GAIL India Ltd.
| 30,736,329
| 33,881
|
|
| Ambuja Cements Ltd.
| 4,670,849
| 30,099
|
|
|
|
|
|
|
| 602,768
|
| Indonesia (2.2%)
|
|
| Astra International Tbk. PT
| 212,997,700
| 91,020
|
|
| Bank Mandiri Persero Tbk. PT
| 133,290,200
| 90,045
|
|
| Telkom Indonesia Persero Tbk. PT ADR
| 1,567,073
| 43,596
|
|
| Telkom Indonesia Persero Tbk. PT
| 77,847,500
| 21,863
|
|
| Selamat Sempurna Tbk. PT
| 164,317,700
| 15,797
|
|
|
|
|
|
|
| 262,321
|
| Ireland (2.1%)
|
| *
| Ryanair Holdings plc ADR
| 1,534,725
| 105,727
|
| *
| ICON plc
| 379,267
| 75,034
|
|
| CRH plc
| 1,732,400
| 62,398
|
|
|
|
|
|
|
| 243,159
|
| Israel (0.1%)
|
| *
| Check Point Software Technologies Ltd.
| 94,500
| 12,212
|
| Italy (0.8%)
|
|
| Brembo SpA
| 5,290,233
| 55,306
|
|
| UniCredit SpA
| 2,776,866
| 34,437
|
|
|
|
|
|
|
| 89,743
|
| Japan (10.7%)
|
|
| Olympus Corp.
| 4,512,800
| 95,150
|
|
| Mitsubishi Electric Corp.
| 9,260,100
| 81,476
|
|
| Toyota Motor Corp.
| 5,410,100
| 75,063
|
|
| Disco Corp.
| 285,100
| 68,190
|
|
| Bandai Namco Holdings Inc.
| 1,022,700
| 67,603
|
|
| Daikin Industries Ltd.
| 431,600
| 64,648
|
|
| Denso Corp.
| 1,268,100
| 62,918
|
|
| Nidec Corp.
| 1,066,800
| 58,657
|
|
| Hoya Corp.
| 561,100
| 52,161
|
|
| Nomura Research Institute Ltd.
| 2,304,800
| 51,006
|
|
| Nitto Denko Corp.
| 953,000
| 50,210
|
|
| Nihon Kohden Corp.
| 2,226,200
| 49,849
|
|
| ITOCHU Corp.
| 1,803,300
| 46,605
|
|
| Daiwa Securities Group Inc.
| 11,814,800
| 46,097
|
|
| Kubota Corp.
| 3,035,300
| 42,341
|
|
| Daito Trust Construction Co. Ltd.
| 400,000
| 39,610
|
|
| Ain Holdings Inc.
| 939,600
| 39,473
|
|
| Koito Manufacturing Co. Ltd.
| 2,623,200
| 37,241
|
|
| Suzuki Motor Corp.
| 1,063,800
| 35,967
|
|
| Shimano Inc.
| 227,500
| 35,204
|
|
| Subaru Corp.
| 1,996,600
| 31,209
|
|
|
|
|
|
| Shares
| Market
Value•
($000)
|
|
| Kansai Electric Power Co. Inc.
| 4,020,200
| 30,454
|
|
| Komatsu Ltd.
| 1,453,900
| 28,482
|
|
| Nomura Holdings Inc.
| 7,414,800
| 23,994
|
|
| Seria Co. Ltd.
| 1,123,400
| 18,352
|
|
| FANUC Corp.
| 82,900
| 10,848
|
|
| Omron Corp.
| 163,100
| 7,607
|
|
| Taiheiyo Cement Corp.
| 222,600
| 3,025
|
|
|
|
|
|
|
| 1,253,440
|
| Mexico (0.8%)
|
|
| Grupo Financiero Banorte SAB de CV
| 11,158,700
| 90,703
|
| Netherlands (4.1%)
|
|
| Wolters Kluwer NV
| 729,476
| 77,513
|
|
| Koninklijke DSM NV
| 561,313
| 66,028
|
|
| Aegon NV
| 13,585,908
| 62,891
|
|
| Universal Music Group NV
| 2,940,057
| 57,729
|
|
| Akzo Nobel NV
| 749,534
| 46,273
|
|
| SBM Offshore NV
| 3,001,810
| 40,625
|
| *
| AerCap Holdings NV
| 563,815
| 30,113
|
| 2
| ABN AMRO Bank NV
| 2,835,943
| 27,879
|
| *
| Prosus NV
| 621,904
| 26,892
|
|
| Koninklijke Vopak NV
| 1,229,500
| 25,121
|
|
| IMCD NV
| 176,025
| 22,830
|
|
|
|
|
|
|
| 483,894
|
| Norway (0.5%)
|
|
| Equinor ASA
| 1,014,614
| 36,966
|
|
| Bakkafrost P/F
| 481,190
| 24,068
|
|
|
|
|
|
|
| 61,034
|
| Panama (0.7%)
|
| *
| Copa Holdings SA Class A
| 1,114,653
| 83,855
|
| Philippines (0.2%)
|
|
| Puregold Price Club Inc.
| 43,303,300
| 22,468
|
| Singapore (2.5%)
|
|
| United Overseas Bank Ltd.
| 4,032,700
| 79,117
|
|
| DBS Group Holdings Ltd.
| 2,860,400
| 69,154
|
|
| Singapore Telecommunications Ltd.
| 28,890,600
| 50,869
|
|
| Venture Corp. Ltd.
| 3,731,000
| 41,986
|
|
| Sembcorp Industries Ltd.
| 20,083,100
| 41,284
|
| *,1
| SATS Ltd.
| 6,163,700
| 11,897
|
|
|
|
|
|
|
| 294,307
|
| South Africa (0.3%)
|
|
| Mr Price Group Ltd.
| 3,450,376
| 33,209
|
| South Korea (3.3%)
|
|
| Samsung Electronics Co. Ltd.
| 2,498,844
| 104,002
|
|
| POSCO Holdings Inc.
| 568,173
| 99,027
|
|
|
|
|
|
| Shares
| Market
Value•
($000)
|
| 2
| Samsung Electronics Co. Ltd. GDR
| 91,980
| 94,997
|
|
| SK Hynix Inc.
| 1,303,719
| 75,474
|
| *
| SK Square Co. Ltd.
| 309,162
| 7,994
|
|
|
|
|
|
|
| 381,494
|
| Spain (0.3%)
|
| 1
| Industria de Diseno Textil SA
| 1,577,858
| 35,815
|
| Sweden (0.3%)
|
|
| Assa Abloy AB Class B
| 1,845,802
| 37,271
|
| Switzerland (6.5%)
|
| *
| Holcim AG
| 3,855,713
| 175,174
|
|
| Novartis AG (Registered)
| 1,526,264
| 123,461
|
|
| Roche Holding AG
| 332,866
| 110,444
|
|
| Cie Financiere Richemont SA (Registered)
| 974,903
| 95,281
|
|
| ABB Ltd. (Registered)
| 3,243,410
| 90,070
|
|
| Adecco Group AG (Registered)
| 2,048,922
| 64,123
|
|
| Credit Suisse Group AG (Registered)
| 9,768,204
| 40,464
|
|
| Swatch Group AG
| 154,510
| 34,720
|
|
| UBS Group AG (Registered)
| 1,811,608
| 28,722
|
|
|
|
|
|
|
| 762,459
|
| Taiwan (0.6%)
|
|
| Taiwan Semiconductor Manufacturing Co. Ltd.
| 5,694,000
| 68,454
|
| United Kingdom (13.2%)
|
|
| BP plc
| 32,156,484
| 177,909
|
|
| RELX plc
| 5,282,048
| 141,878
|
|
| Shell plc
| 4,693,650
| 130,022
|
|
| Unilever plc
| 2,049,036
| 93,138
|
|
| Compass Group plc
| 4,213,789
| 88,750
|
|
| Anglo American plc
| 2,858,401
| 85,621
|
|
| Smiths Group plc
| 4,720,940
| 84,564
|
|
| HSBC Holdings plc (XHKG)
| 14,812,400
| 76,022
|
|
| HSBC Holdings plc
| 14,415,035
| 73,979
|
|
| Berkeley Group Holdings plc
| 1,592,176
| 63,349
|
|
| IMI plc
| 4,136,690
| 58,273
|
|
| Victrex plc
| 2,598,116
| 49,345
|
|
| Weir Group plc
| 2,721,260
| 47,415
|
|
| Travis Perkins plc
| 4,999,053
| 47,116
|
|
| Ferguson plc
| 428,260
| 46,706
|
|
| Spectris plc
| 1,176,470
| 40,775
|
|
| Smith & Nephew plc
| 3,445,023
| 40,710
|
|
| Barclays plc
| 22,953,206
| 39,003
|
|
| RS Group plc
| 2,786,400
| 30,660
|
|
| Prudential plc
| 2,736,608
| 25,422
|
| *,1
| easyJet plc
| 6,237,379
| 24,835
|
|
| Taylor Wimpey plc
| 20,793,159
| 22,355
|
|
| Renishaw plc
| 530,507
| 21,288
|
|
|
|
|
|
| Shares
| Market
Value•
($000)
|
|
| Whitbread plc
| 653,543
| 19,235
|
|
| Lloyds Banking Group plc
| 31,286,248
| 15,026
|
|
| Direct Line Insurance Group plc
| 220,462
| 509
|
|
|
|
|
|
|
| 1,543,905
|
| United States (3.2%)
|
|
| Aon plc Class A
| 416,187
| 117,152
|
|
| Accenture plc Class A
| 237,551
| 67,441
|
|
| RenaissanceRe Holdings Ltd.
| 407,363
| 63,011
|
| *
| TechnipFMC plc
| 4,627,975
| 49,010
|
| 1
| Linde plc
| 130,895
| 39,083
|
|
| NXP Semiconductors NV
| 201,591
| 29,448
|
| *
| Capri Holdings Ltd.
| 317,426
| 14,500
|
|
|
|
|
|
|
| 379,645
|
| Vietnam (0.5%)
|
|
| Vietnam Dairy Products JSC
| 16,775,900
| 52,952
|
|
| Phu Nhuan Jewelry JSC
| 2,229,200
| 9,251
|
|
|
|
|
|
|
| 62,203
|
Total Common Stocks
(Cost $12,065,534)
| 11,104,174
|
| Temporary Cash Investments (5.9%)
|
| Money Market Fund (5.9%)
|
| 3,4
| Vanguard Market Liquidity Fund, 3.117% (Cost $685,572)
| 6,858,440
| 685,707
|
Total Investments (100.5%)
(Cost $12,751,106)
|
| 11,789,881
|
| Other Assets and Liabilities—Net (-0.5%)
|
| (57,350)
|
| Net Assets (100%)
|
| 11,732,531
|
| •
| See Note A in Notes to Financial Statements.
|
| *
| Non-income-producing security.
|
| 1
| Includes partial security positions on loan to broker-dealers. The total value of securities on loan is $106,341,000.
|
| 2
| Security exempt from registration under Rule 144A of the Securities Act of 1933. Such securities may be sold in transactions exempt from registration, normally to qualified
institutional buyers. At October 31, 2022, the aggregate value was $269,569,000, representing 2.3% of net assets.
|
| 3
| Affiliated money market fund available only to Vanguard funds and certain trusts and accounts managed by Vanguard. Rate shown is the 7-day yield.
|
| 4
| Collateral of $113,548,000 was received for securities on loan.
|
|
| ADR—American Depositary Receipt.
|
|
| GDR—Global Depositary Receipt.
|
Derivative Financial
Instruments Outstanding as of Period End
| Futures Contracts
|
|
|
|
| ($000)
|
|
| Expiration
| Number of
Long (Short)
Contracts
| Notional
Amount
| Value and
Unrealized
Appreciation
(Depreciation)
|
| Long Futures Contracts
|
| MSCI EAFE Index
| December 2022
| 2,328
| 204,387
| (6,775)
|
| MSCI Emerging Market Index
| December 2022
| 1,997
| 85,232
| (9,844)
|
|
|
|
|
| (16,619)
|
See accompanying
Notes, which are an integral part of the Financial Statements.
Statement of Assets and Liabilities
|
|
| ($000s, except shares and per-share amounts)
| Amount
|
| Assets
|
|
| Investments in Securities, at Value1
|
|
| Unaffiliated Issuers (Cost $12,065,534)
| 11,104,174
|
| Affiliated Issuers (Cost $685,572)
| 685,707
|
| Total Investments in Securities
| 11,789,881
|
| Investment in Vanguard
| 452
|
| Foreign Currency, at Value (Cost $18,195)
| 18,096
|
| Cash Collateral Pledged—Futures Contracts
| 14,752
|
| Receivables for Investment Securities Sold
| 27,765
|
| Receivables for Accrued Income
| 42,841
|
| Receivables for Capital Shares Issued
| 7,815
|
| Total Assets
| 11,901,602
|
| Liabilities
|
|
| Due to Custodian
| 860
|
| Payables for Investment Securities Purchased
| 20,329
|
| Collateral for Securities on Loan
| 113,548
|
| Payables for Capital Shares Redeemed
| 11,894
|
| Payables to Investment Advisor
| 5,305
|
| Payables to Vanguard
| 1,496
|
| Variation Margin Payable—Futures Contracts
| 2,122
|
| Deferred Foreign Capital Gains Taxes
| 13,517
|
| Total Liabilities
| 169,071
|
| Net Assets
| 11,732,531
|
| 1 Includes $106,341 of securities on loan.
|
|
At October 31, 2022, net assets consisted of:
|
|
|
|
|
| Paid-in Capital
| 12,745,069
|
| Total Distributable Earnings (Loss)
| (1,012,538)
|
| Net Assets
| 11,732,531
|
|
|
|
| Net Assets
|
|
Applicable to 355,915,884 outstanding $.001 par value shares of
beneficial interest (unlimited authorization)
| 11,732,531
|
| Net Asset Value Per Share
| $32.96
|
See accompanying Notes, which are an
integral part of the Financial Statements.
|
|
|
| Year Ended
October 31, 2022
|
|
| ($000)
|
| Investment Income
|
|
| Income
|
|
| Dividends1
| 410,933
|
| Interest2
| 5,917
|
| Securities Lending—Net
| 822
|
| Total Income
| 417,672
|
| Expenses
|
|
| Investment Advisory Fees—Note B
|
|
| Basic Fee
| 22,279
|
| Performance Adjustment
| 492
|
| The Vanguard Group—Note C
|
|
| Management and Administrative
| 26,339
|
| Marketing and Distribution
| 1,181
|
| Custodian Fees
| 737
|
| Auditing Fees
| 42
|
| Shareholders’ Reports
| 223
|
| Trustees’ Fees and Expenses
| 5
|
| Other Expenses
| 545
|
| Total Expenses
| 51,843
|
| Net Investment Income
| 365,829
|
| Realized Net Gain (Loss)
|
|
| Investment Securities Sold2,3
| (230,362)
|
| Futures Contracts
| (74,220)
|
| Forward Currency Contracts
| 95
|
| Foreign Currencies
| (9,992)
|
| Realized Net Gain (Loss)
| (314,479)
|
| Change in Unrealized Appreciation (Depreciation)
|
|
| Investment Securities2,4
| (3,243,240)
|
| Futures Contracts
| (13,965)
|
| Foreign Currencies
| (2,315)
|
| Change in Unrealized Appreciation (Depreciation)
| (3,259,520)
|
| Net Increase (Decrease) in Net Assets Resulting from Operations
| (3,208,170)
|
| 1
| Dividends are net of foreign withholding taxes of $28,171,000.
|
| 2
| Interest income, realized net gain (loss), capital gain distributions received, and change in unrealized appreciation (depreciation) from an affiliated company of the fund were
$5,917,000, ($263,000), $19,000, and $82,000, respectively. Purchases and sales are for temporary cash investment purposes.
|
| 3
| Realized Gain (Loss) is net of foreign capital gains taxes of $4,497,000.
|
| 4
| The change in unrealized appreciation (depreciation) is net of the change in deferred foreign capital gains taxes of ($7,973,000).
|
See accompanying Notes, which are an
integral part of the Financial Statements.
Statement of Changes in Net Assets
|
|
|
| Year Ended October 31,
|
|
| 2022
($000)
| 2021
($000)
|
| Increase (Decrease) in Net Assets
|
|
|
| Operations
|
|
|
| Net Investment Income
| 365,829
| 351,127
|
| Realized Net Gain (Loss)
| (314,479)
| 897,431
|
| Change in Unrealized Appreciation (Depreciation)
| (3,259,520)
| 2,275,436
|
| Net Increase (Decrease) in Net Assets Resulting from Operations
| (3,208,170)
| 3,523,994
|
| Distributions
|
|
|
| Total Distributions
| (633,591)
| (189,189)
|
| Capital Share Transactions
|
|
|
| Issued
| 2,352,101
| 4,442,988
|
| Issued in Lieu of Cash Distributions
| 576,930
| 173,403
|
| Redeemed
| (2,573,910)
| (2,140,447)
|
| Net Increase (Decrease) from Capital Share Transactions
| 355,121
| 2,475,944
|
| Total Increase (Decrease)
| (3,486,640)
| 5,810,749
|
| Net Assets
|
|
|
| Beginning of Period
| 15,219,171
| 9,408,422
|
| End of Period
| 11,732,531
| 15,219,171
|
See accompanying Notes, which are an
integral part of the Financial Statements.
For a Share Outstanding
Throughout Each Period
| Year Ended October 31,
|
| 2022
| 2021
| 2020
| 2019
| 2018
|
| Net Asset Value, Beginning of Period
| $43.76
| $32.48
| $36.63
| $35.86
| $39.26
|
| Investment Operations
|
|
|
|
|
|
| Net Investment Income1
| 1.019
| 1.091
| .684
| 1.104
| .950
|
| Net Realized and Unrealized Gain (Loss) on Investments
| (10.011)
| 10.824
| (3.723)
| 1.669
| (3.607)
|
| Total from Investment Operations
| (8.992)
| 11.915
| (3.039)
| 2.773
| (2.657)
|
| Distributions
|
|
|
|
|
|
| Dividends from Net Investment Income
| (1.087)
| (.635)
| (1.111)
| (.943)
| (.743)
|
| Distributions from Realized Capital Gains
| (.721)
| —
| —
| (1.060)
| —
|
| Total Distributions
| (1.808)
| (.635)
| (1.111)
| (2.003)
| (.743)
|
| Net Asset Value, End of Period
| $32.96
| $43.76
| $32.48
| $36.63
| $35.86
|
| Total Return2
| -21.28%
| 36.91%
| -8.69%
| 8.48%
| -6.95%
|
| Ratios/Supplemental Data
|
|
|
|
|
|
| Net Assets, End of Period (Millions)
| $11,733
| $15,219
| $9,408
| $10,360
| $9,524
|
| Ratio of Total Expenses to Average Net Assets3
| 0.38%
| 0.36%
| 0.35%
| 0.37%
| 0.38%
|
| Ratio of Net Investment Income to Average Net Assets
| 2.68%
| 2.56%
| 2.05%
| 3.15%
| 2.41%
|
| Portfolio Turnover Rate
| 37%
| 33%
| 72%
| 38%
| 28%
|
| 1
| Calculated based on average shares outstanding.
|
| 2
| Total returns do not include account service fees that may have applied in the periods shown. Fund prospectuses provide information about any applicable account service fees.
|
| 3
| Includes performance-based investment advisory fee increases (decreases) of 0.00%, (0.01%), (0.02%), (0.01%), and (0.01%).
|
See accompanying Notes, which are an
integral part of the Financial Statements.
Notes to Financial Statements
Vanguard International Value
Fund is registered under the Investment Company Act of 1940 as an open-end investment company, or mutual fund. The fund invests in securities of foreign issuers, which may subject it to investment risks not normally
associated with investing in securities of U.S. corporations. Significant market disruptions, such as those caused by pandemics (e.g., COVID-19 pandemic), natural or environmental disasters, war (e.g., Russia's
invasion of Ukraine), acts of terrorism, or other events, can adversely affect local and global markets and normal market operations. Any such disruptions could have an adverse impact on the value of the fund's
investments and fund performance.
A. The following significant accounting policies conform to generally accepted accounting principles for U.S. investment companies. The fund consistently follows such policies in preparing its
financial statements.
1. Security Valuation:
Securities are valued as of the close of trading on the New York Stock Exchange (generally 4 p.m., Eastern time) on the valuation date. Equity securities are valued at the latest quoted sales prices or official
closing prices taken from the primary market in which each security trades; such securities not traded on the valuation date are valued at the mean of the latest quoted bid and asked prices. Securities for which
market quotations are not readily available, or whose values have been affected by events occurring before the fund’s pricing time but after the close of the securities’ primary markets, are valued by
methods deemed by the valuation designee to represent fair value and subject to oversight by the board of trustees. These procedures include obtaining quotations from an independent pricing service, monitoring news to
identify significant market- or security-specific events, and evaluating changes in the values of foreign market proxies (for example, ADRs, futures contracts, or exchange-traded funds), between the time the foreign
markets close and the fund’s pricing time. When fair-value pricing is employed, the prices of securities used by a fund to calculate its net asset value may differ from quoted or published prices for the same
securities. Investments in Vanguard Market Liquidity Fund are valued at that fund's net asset value.
2. Foreign Currency:
Securities and other assets and liabilities denominated in foreign currencies are translated into U.S. dollars using exchange rates obtained from an independent third party as of the fund’s pricing time on the
valuation date. Realized gains (losses) and unrealized appreciation (depreciation) on investment securities include the effects of changes in exchange rates since the securities were purchased, combined with the
effects of changes in security prices. Fluctuations in the value of other assets and liabilities resulting from changes in exchange rates are recorded as unrealized foreign currency gains (losses) until the assets or
liabilities are settled in cash, at which time they are recorded as realized foreign currency gains (losses).
3. Futures Contracts:
The fund uses index futures contracts to a limited extent, with the objective of maintaining full exposure to the stock market while maintaining liquidity. The fund may purchase or sell futures contracts to achieve a
desired level of investment, whether to accommodate portfolio turnover or cash flows from capital share transactions. The primary risks associated with the use of futures contracts are imperfect correlation between
changes in market values of stocks held by the fund and the prices of futures contracts, and the possibility of an illiquid market. Counterparty risk involving futures is mitigated because a regulated clearinghouse is
the counterparty instead of the clearing broker. To further mitigate counterparty risk, the fund trades futures contracts on an exchange, monitors the financial strength of its clearing brokers and clearinghouse, and
has entered into clearing agreements with its clearing brokers. The
clearinghouse imposes initial margin
requirements to secure the fund’s performance and requires daily settlement of variation margin representing changes in the market value of each contract. Any securities pledged as initial margin for open
contracts are noted in the Schedule of Investments.
Futures contracts are valued
at their quoted daily settlement prices. The notional amounts of the contracts are not recorded in the Statement of Assets and Liabilities. Fluctuations in the value of the contracts are recorded in the Statement of
Assets and Liabilities as an asset (liability) and in the Statement of Operations as unrealized appreciation (depreciation) until the contracts are closed, when they are recorded as realized gains (losses) on futures
contracts.
During the year ended October
31, 2022, the fund’s average investments in long and short futures contracts represented 2% and 0% of net assets, respectively, based on the average of the notional amounts at each quarter-end during the
period.
4. Forward Currency
Contracts: The fund enters into forward currency contracts to protect the value of securities and related receivables and payables against changes in future foreign exchange rates. The fund’s risks in using
these contracts include movement in the values of the foreign currencies relative to the U.S. dollar and the ability of the counterparties to fulfill their obligations under the contracts. The fund mitigates its
counterparty risk by entering into forward currency contracts only with a diverse group of prequalified counterparties, monitoring their financial strength, entering into master netting arrangements with its
counterparties, and requiring its counterparties to transfer collateral as security for their performance. In the absence of a default, the collateral pledged or received by the fund cannot be repledged, resold, or
rehypothecated. The master netting arrangements provide that, in the event of a counterparty’s default (including bankruptcy), the fund may terminate the forward currency contracts, determine the net amount owed
by either party in accordance with its master netting arrangements, and sell or retain any collateral held up to the net amount owed to the fund under the master netting arrangements. The forward currency contracts
contain provisions whereby a counterparty may terminate open contracts if the fund’s net assets decline below a certain level, triggering a payment by the fund if the fund is in a net liability position at the
time of the termination. The payment amount would be reduced by any collateral the fund has pledged. Any securities pledged as collateral for open contracts are noted in the Schedule of Investments. The value of
collateral received or pledged is compared daily to the value of the forward currency contracts exposure with each counterparty, and any difference, if in excess of a specified minimum transfer amount, is adjusted and
settled within two business days.
Forward currency contracts are
valued at their quoted daily prices obtained from an independent third party, adjusted for currency risk based on the expiration date of each contract. The notional amounts of the contracts are not recorded in the
Statement of Assets and Liabilities. Fluctuations in the value of the contracts are recorded in the Statement of Assets and Liabilities as an asset (liability) and in the Statement of Operations as unrealized
appreciation (depreciation) until the contracts are closed, when they are recorded as realized gains (losses) on forward currency contracts.
During the year ended October
31, 2022, the fund’s average investment in forward currency contracts represented less than 1% of net assets, based on the average of the notional amounts at each quarter-end during the period. The fund had no
open forward currency contracts at October 31, 2022.
5. Federal Income Taxes:
The fund intends to continue to qualify as a regulated investment company and distribute virtually all of its taxable income. The fund’s tax returns are open to examination by the relevant tax authorities until
expiration of the applicable statute of limitations, which is generally three years after the filing of the tax return. Management has analyzed the fund’s tax positions taken for all open federal and state
income tax years, and has concluded that no provision for income tax is required in the fund’s financial statements.
6. Distributions:
Distributions to shareholders are recorded on the ex-dividend date. Distributions are determined on a tax basis at the fiscal year-end and may differ from net investment income and realized capital gains for financial
reporting purposes.
7. Securities Lending:
To earn additional income, the fund lends its securities to qualified institutional borrowers. Security loans are subject to termination by the fund at any time, and are required to be secured at all times by
collateral in an amount at least equal to the market value of securities loaned. Daily market fluctuations could cause the value of loaned securities to be more or less than the value of the collateral received. When
this occurs, the collateral is adjusted and settled before the opening of the market on the next business day. The fund further mitigates its counterparty risk by entering into securities lending transactions only
with a diverse group of prequalified counterparties, monitoring their financial strength, and entering into master securities lending agreements with its counterparties. The master securities lending agreements
provide that, in the event of a counterparty’s default (including bankruptcy), the fund may terminate any loans with that borrower, determine the net amount owed, and sell or retain the collateral up to the net
amount owed to the fund; however, such actions may be subject to legal proceedings. While collateral mitigates counterparty risk, in the event of a default, the fund may experience delays and costs in recovering the
securities loaned. The fund invests cash collateral received in Vanguard Market Liquidity Fund, and records a liability in the Statement of Assets and Liabilities for the return of the collateral, during the period
the securities are on loan. Collateral investments in Vanguard Market Liquidity Fund are subject to market appreciation or depreciation. Securities lending income represents fees charged to borrowers plus income
earned on invested cash collateral, less expenses associated with the loan. During the term of the loan, the fund is entitled to all distributions made on or in respect of the loaned securities.
8. Credit Facilities and
Interfund Lending Program: The fund and certain other funds managed by The Vanguard Group ("Vanguard") participate in a $4.4 billion committed credit facility provided by a syndicate of lenders pursuant to a credit
agreement and an uncommitted credit facility provided by Vanguard. Both facilities may be renewed annually. Each fund is individually liable for its borrowings, if any, under the credit facilities. Borrowings may be
utilized for temporary or emergency purposes and are subject to the fund’s regulatory and contractual borrowing restrictions. With respect to the committed credit facility, the participating funds are charged
administrative fees and an annual commitment fee of 0.10% of the undrawn committed amount of the facility, which are allocated to the funds based on a method approved by the fund’s board of trustees and included
in Management and Administrative expenses on the fund’s Statement of Operations. Any borrowings under either facility bear interest at an agreed-upon spread plus the higher of the federal funds effective rate,
the overnight bank funding rate, or the Daily Simple Secured Overnight Financing Rate inclusive of an additional agreed-upon spread. However, borrowings under the uncommitted credit facility may bear interest based
upon an alternate rate agreed to by the fund and Vanguard.
In accordance with an
exemptive order (the “Order”) from the SEC, the fund may participate in a joint lending and borrowing program that allows registered open-end Vanguard funds to borrow
money from and lend money to each other for
temporary or emergency purposes (the “Interfund Lending Program”), subject to compliance with the terms and conditions of the Order, and to the extent permitted by the fund’s investment objective and
investment policies. Interfund loans and borrowings normally extend overnight but can have a maximum duration of seven days. Loans may be called on one business day’s notice. The interest rate to be charged is
governed by the conditions of the Order and internal procedures adopted by the board of trustees. The board of trustees is responsible for overseeing the Interfund Lending Program.
For the year ended October 31,
2022, the fund did not utilize the credit facilities or the Interfund Lending Program.
9. Other: Dividend
income is recorded on the ex-dividend date. Non-cash dividends included in income, if any, are recorded at the fair value of the securities received. Interest income includes income distributions received from
Vanguard Market Liquidity Fund and is accrued daily. Security transactions are accounted for on the date securities are bought or sold. Costs used to determine realized gains (losses) on the sale of investment
securities are those of the specific securities sold.
Taxes on foreign dividends and
capital gains have been provided for in accordance with the fund’s understanding of the applicable countries’ tax rules and rates. Deferred foreign capital gains tax, if any, is accrued daily based upon
net unrealized gains. The fund has filed tax reclaims for previously withheld taxes on dividends earned in certain European Union countries. These filings are subject to various administrative and judicial proceedings
within these countries. Amounts related to these reclaims are recorded when there are no significant uncertainties as to the ultimate resolution of proceedings, the likelihood of receipt of these reclaims, and
the potential timing of payment. Such tax reclaims and related professional fees, if any, are included in dividend income and other expenses, respectively.
B. The investment advisory firms Lazard Asset Management LLC, ARGA Investment Management, LP, and Sprucegrove Investment Management Ltd. each provide investment advisory services to a portion
of the fund for a fee calculated at an annual percentage rate of average net assets managed by the advisor. The basic fees of Lazard Asset Management LLC and ARGA Investment Management, LP, are subject to quarterly
adjustments based on performance relative to the MSCI All Country World Index ex US for the preceding five years. The basic fee of Sprucegrove Investment Management Ltd. is subject to quarterly adjustments based on
performance relative to the MSCI All Country World Index ex US since October 31, 2020.
Vanguard manages the cash
reserves of the fund as described below.
For the year ended October 31,
2022, the aggregate investment advisory fee represented an effective annual basic rate of 0.16% of the fund’s average net assets, before a increase of $492,000 (0.00%) based on performance.
C. In accordance with the terms of a Funds’ Service Agreement (the “FSA”) between Vanguard and the fund, Vanguard furnishes to the fund corporate management, administrative,
marketing, distribution, and cash management services at Vanguard’s cost of operations (as defined by the FSA). These costs of operations are allocated to the fund based on methods and guidelines approved by the
board of trustees and are generally settled twice a month.
Upon the request of Vanguard,
the fund may invest up to 0.40% of its net assets as capital in Vanguard. At October 31, 2022, the fund had contributed to Vanguard capital in the amount of $452,000, representing less than 0.01% of the fund’s
net assets and 0.18% of Vanguard’s capital
received pursuant to the FSA. The
fund’s trustees and officers are also directors and employees, respectively, of Vanguard.
D. Various inputs may be used to determine the value of the fund’s investments and derivatives. These inputs are summarized in three broad levels for financial statement purposes. The
inputs or methodologies used to value securities are not necessarily an indication of the risk associated with investing in those securities.
Level 1—Quoted prices in active markets for identical securities.
Level 2—Other significant observable inputs (including quoted prices for similar securities, interest rates, prepayment speeds, credit risk, etc.).
Level 3—Significant unobservable inputs (including the fund’s own assumptions used to determine the fair value of investments). Any investments and derivatives valued with significant
unobservable inputs are noted on the Schedule of Investments.
The following table summarizes
the market value of the fund's investments and derivatives as of October 31, 2022, based on the inputs used to value them:
|
| Level 1
($000)
| Level 2
($000)
| Level 3
($000)
| Total
($000)
|
| Investments
|
|
|
|
|
| Assets
|
|
|
|
|
| Common Stocks—North and South America
| 1,223,194
| 39,083
| —
| 1,262,277
|
| Common Stocks—Other
| 741,248
| 9,100,649
| —
| 9,841,897
|
| Temporary Cash Investments
| 685,707
| —
| —
| 685,707
|
| Total
| 2,650,149
| 9,139,732
| —
| 11,789,881
|
|
|
|
|
|
|
| Derivative Financial Instruments
|
|
|
|
|
| Liabilities
|
|
|
|
|
| Futures Contracts1
| 16,619
| —
| —
| 16,619
|
| 1
| Includes cumulative appreciation (depreciation) on futures contracts and centrally cleared swaps, if any, as reported in the Schedule of Investments. Only current
day’s variation margin is reported within the Statement of Assets and Liabilities.
|
E. Realized net gain (loss) and the change in unrealized appreciation (depreciation) on derivatives for the year ended October 31, 2022, were:
| Realized Net Gain (Loss) on Derivatives
| Equity
Contracts
($000)
| Foreign
Exchange
Contracts
($000)
| Total
($000)
|
| Futures Contracts
| (74,220)
| —
| (74,220)
|
| Forward Currency Contracts
| —
| 95
| 95
|
| Realized Net Gain (Loss) on Derivatives
| (74,220)
| 95
| (74,125)
|
|
|
| Change in Unrealized Appreciation (Depreciation) on Derivatives
|
| Futures Contracts
| (13,965)
| —
| (13,965)
|
F. Permanent differences between book-basis and tax-basis components of net assets are reclassified among capital accounts in the financial statements to reflect their tax character. These
reclassifications have no effect on net assets or net asset value per share. As of period end, permanent differences primarily attributable to the accounting for applicable foreign currency transactions, passive
foreign investment companies, and tax expense on capital gains were reclassified between the individual components of total distributable earnings (loss).
Temporary differences between
book-basis and tax-basis components of total distributable earnings (loss) arise when certain items of income, gain, or loss are recognized in different periods for financial statement and tax purposes; these
differences will reverse at some time in the future. The differences are primarily related to the deferral of losses from wash sales; the recognition of unrealized gains or losses from certain derivative contracts;
and the recognition of unrealized gains from passive foreign investment companies. As of period end, the tax-basis components of total distributable earnings (loss) are detailed in the table as follows:
|
| Amount
($000)
|
| Undistributed Ordinary Income
| 303,807
|
| Undistributed Long-Term Gains
| —
|
| Capital Loss Carryforwards
| (290,452)
|
| Qualified Late-Year Losses
| —
|
| Net Unrealized Gains (Losses)
| (1,029,753)
|
The tax character of
distributions paid was as follows:
|
| Year Ended October 31,
|
|
| 2022
Amount
($000)
| 2021
Amount
($000)
|
| Ordinary Income*
| 633,591
| 189,189
|
| Long-Term Capital Gains
| —
| —
|
| Total
| 633,591
| 189,189
|
| *
| Includes short-term capital gains, if any.
|
As of October 31, 2022, gross
unrealized appreciation and depreciation for investments and derivatives based on cost for U.S. federal income tax purposes were as follows:
|
| Amount
($000)
|
| Tax Cost
| 12,804,237
|
| Gross Unrealized Appreciation
| 1,279,290
|
| Gross Unrealized Depreciation
| (2,293,646)
|
| Net Unrealized Appreciation (Depreciation)
| (1,014,356)
|
G. During the year ended October 31, 2022, the fund purchased $5,116,196,000 of investment securities and sold $4,812,568,000 of investment securities, other than temporary cash
investments.
H. Capital shares issued and redeemed were:
|
| Year Ended October 31,
|
|
|
| 2022
Shares
(000)
|
| 2021
Shares
(000)
|
|
|
|
|
|
| Issued
| 61,320
|
| 104,505
|
|
| Issued in Lieu of Cash Distributions
| 14,416
|
| 4,428
|
|
| Redeemed
| (67,638)
|
| (50,767)
|
|
| Net Increase (Decrease) in Shares Outstanding
| 8,098
|
| 58,166
|
|
I. Management has determined that no events or transactions occurred subsequent to October 31, 2022, that would require recognition or disclosure in these financial statements.
Report of Independent Registered
Public Accounting Firm
To the Board of Trustees of Vanguard
Trustees' Equity Fund and Shareholders of Vanguard International Value Fund
Opinion on the Financial
Statements
We have audited the accompanying statement of
assets and liabilities, including the schedule of investments, of Vanguard International Value Fund (one of the funds constituting Vanguard Trustees' Equity Fund, referred to hereafter as the "Fund") as of October 31,
2022, the related statement of operations for the year ended October 31, 2022, the statement of changes in net assets for each of the two years in the period ended October 31, 2022, including the related notes, and
the financial highlights for each of the five years in the period ended October 31, 2022 (collectively referred to as the "financial statements"). In our opinion, the financial statements present fairly, in all
material respects, the financial position of the Fund as of October 31, 2022, the results of its operations for the year then ended, the changes in its net assets for each of the two years in the period ended October
31, 2022 and the financial highlights for each of the five years in the period ended October 31, 2022 in conformity with accounting principles generally accepted in the United States of America.
Basis for Opinion
These financial statements are the
responsibility of the Fund’s management. Our responsibility is to express an opinion on the Fund’s financial statements based on our audits. We are a public accounting firm registered with the Public
Company Accounting Oversight Board (United States) (PCAOB) and are required to be independent with respect to the Fund in accordance with the U.S. federal securities laws and the applicable rules and regulations of
the Securities and Exchange Commission and the PCAOB.
We conducted our audits of
these financial statements in accordance with the standards of the PCAOB. Those standards require that we plan and perform the audit to obtain reasonable assurance about whether the financial statements are free of
material misstatement, whether due to error or fraud.
Our audits included performing
procedures to assess the risks of material misstatement of the financial statements, whether due to error or fraud, and performing procedures that respond to those risks. Such procedures included examining, on a test
basis, evidence regarding the amounts and disclosures in the financial statements. Our audits also included evaluating the accounting principles used and significant estimates made by management, as well as evaluating
the overall presentation of the financial statements. Our procedures included confirmation of securities owned as of October 31, 2022 by correspondence with the custodian, transfer agent and brokers; when replies were
not received from brokers, we performed other auditing procedures. We believe that our audits provide a reasonable basis for our opinion.
/s/PricewaterhouseCoopers
LLP
Philadelphia, Pennsylvania
December 16, 2022
We have served as the auditor
of one or more investment companies in The Vanguard Group of Funds since 1975.
Tax information
(unaudited)
The fund hereby designates
$370,335,000, or if subsequently determined to be different, the maximum amount allowable by law, as qualified dividend income for individual shareholders for the fiscal year.
The fund hereby designates
$31,000, or if subsequently determined to be different, the maximum amount allowable by law, of interest earned from obligations of the U.S. government which is generally exempt from state income tax.
For nonresident alien
shareholders, 100% of short-term capital gain dividends distributed by the fund for the fiscal year are qualified short-term capital gains.
The fund designates to
shareholders foreign source income of $439,020,000 and foreign taxes paid of $29,451,000, or if subsequently determined to be different, the maximum amounts allowable by law. Shareholders will receive more detailed
information with their Form 1099-DIV to determine the calendar-year amounts to be included on their tax returns.
This page intentionally left blank.
The People Who Govern Your Fund
The trustees of your mutual
fund are there to see that the fund is operated and managed in your best interests since, as a shareholder, you are a part owner of the fund. Your fund’s trustees also serve on the board of directors of The
Vanguard Group, Inc., which is owned by the Vanguard funds and provides services to them.
A majority of Vanguard’s
board members are independent, meaning that they have no affiliation with Vanguard or the funds they oversee, apart from the sizable personal investments they have made as private individuals. The independent board
members have distinguished backgrounds in business, academia, and public service. Each of the trustees and executive officers oversees 206 Vanguard funds.
Information for each trustee
and executive officer of the fund appears below. That information, as well as the Vanguard fund count, is as of the date on the cover of this fund report. The mailing address of the trustees and officers is P.O. Box
876, Valley Forge, PA 19482. More information about the trustees is in the Statement of Additional Information, which can be obtained, without charge, by contacting Vanguard at 800-662-7447, or online at vanguard.com.
Interested Trustee1
Mortimer J. Buckley
Born in 1969. Trustee since January 2018.
Principal occupation(s) during the past five years and other experience: chairman of the board (2019–present) of Vanguard and of each of the investment companies served by Vanguard; chief executive officer
(2018–present) of Vanguard; chief executive officer, president, and trustee (2018–present) of each of the investment companies served by Vanguard; president and director (2017–present) of Vanguard;
and president (2018–present) of Vanguard Marketing Corporation. Chief investment officer (2013–2017), managing director (2002–2017), head of the Retail Investor Group (2006–2012), and chief
information officer (2001–2006) of Vanguard. Member of the board of governors of the Investment Company Institute and the board of governors of FINRA. Trustee and vice chair of The Shipley School.
Independent Trustees
Tara Bunch
Born in 1962. Trustee since November 2021.
Principal occupation(s) during the past five years and other experience: head of global operations at Airbnb (2020–present). Vice president of AppleCare (2012–2020). Member of the board of directors of Out
& Equal (2002–2006), the advisory board of the University of California, Berkeley School of Engineering (2020–present), and the advisory board of Santa Clara University’s Leavey School of
Business (2018–present).
Emerson U. Fullwood
Born in 1948. Trustee since January 2008.
Principal occupation(s) during the past five years and other experience: executive chief staff and marketing officer for North America and corporate vice president (retired 2008) of Xerox Corporation (document
management products and services). Former president of the Worldwide Channels Group, Latin America, and Worldwide Customer Service and executive chief staff officer of Developing Markets of Xerox. Executive in
residence and 2009–2010 Distinguished Minett Professor at the Rochester Institute of Technology. Member of the board of directors of the University of Rochester Medical Center, the Monroe Community College
Foundation, the United Way of Rochester, North Carolina A&T University, Roberts Wesleyan College, and the Rochester Philharmonic Orchestra. Trustee of the University of Rochester.
1 Mr.
Buckley is considered an “interested person,” as defined in the Investment Company Act of 1940, because he is an officer of the Vanguard funds.
F. Joseph Loughrey
Born in 1949. Trustee since October 2009.
Principal occupation(s) during the past five years and other experience: president and chief operating officer (retired 2009) and vice chairman of the board (2008–2009) of Cummins Inc. (industrial machinery).
Chairman of the board of Hillenbrand, Inc. (specialized consumer services). Director of the V Foundation. Member of the advisory council for the College of Arts and Letters at the University of Notre Dame. Chairman of
the board of Saint Anselm College.
Mark Loughridge
Born in 1953. Trustee since March 2012.
Principal occupation(s) during the past five years and other experience: senior vice president and chief financial officer (retired 2013) of IBM (information technology services). Fiduciary member of IBM’s
Retirement Plan Committee (2004–2013), senior vice president and general manager (2002–2004) of IBM Global Financing, vice president and controller (1998–2002) of IBM, and a variety of other prior
management roles at IBM. Member of the Council on Chicago Booth.
Scott C. Malpass
Born in 1962. Trustee since March 2012.
Principal occupation(s) during the past five years and other experience: adjunct professor of finance at the University of Notre Dame (2020–present). Chief investment officer (retired 2020) and vice president
(retired 2020) of the University of Notre Dame. Assistant professor (retired June 2020) of finance at the Mendoza College of Business, University of Notre Dame, and member of the Notre Dame 403(b) Investment
Committee. Member of the board of Catholic Investment Services, Inc. (investment advisors), the board of superintendence of the Institute for the Works of Religion, and the board of directors of Paxos Trust Company
(finance).
Deanna Mulligan
Born in 1963. Trustee since January 2018.
Principal occupation(s) during the past five years and other experience: chief executive officer of Purposeful (advisory firm for CEOs and C-level executives; 2021–present). Board chair (2020), chief executive
officer (2011–2020), and president (2010–2019) of The Guardian Life Insurance Company of America. Chief operating officer (2010–2011) and executive vice president (2008–2010) of Individual Life
and Disability of the Guardian Life Insurance Company of America. Member of the board of the Economic Club of New York. Trustee of the Partnership for New York City (business leadership), Chief Executives for
Corporate Purpose, and the NewYork-Presbyterian Hospital.
André F. Perold
Born in 1952. Trustee since December 2004.
Principal occupation(s) during the past five years and other experience: George Gund Professor of Finance and Banking, Emeritus at the Harvard Business School (retired 2011). Chief investment officer and co-managing
partner of HighVista Strategies (private investment firm). Member of the board (2018–present) of RIT Capital Partners (investment firm). Member of the investment committee of Partners Health Care System.
Sarah Bloom Raskin
Born in 1961. Trustee since January 2018.
Principal occupation(s) during the past five years and other experience: deputy secretary (2014–2017) of the United States Department of the Treasury. Governor (2010–2014) of the Federal Reserve Board.
Commissioner (2007–2010) of financial regulation for the State of Maryland. Colin W. Brown Distinguished Professor of the Practice of Law (2021–present), professor (2020–present), Distinguished
Fellow of the Global Financial Markets Center (2020–present), and Rubenstein Fellow (2017–2020) at Duke University. Trustee (2017–present) of Amherst College and member of Amherst College Investment
Committee (2019–present). Member of the Regenerative Crisis Response Committee (2020–present).
David A. Thomas
Born in 1956. Trustee since July 2021.
Principal occupation(s) during the past five years and other experience: president of Morehouse College (2018–present). Professor of business administration, emeritus at Harvard University (2017–2018).
Dean (2011–2016) and professor of management (2016–2017) at the Georgetown University McDonough School of Business. Director of DTE Energy Company (2013–present). Trustee of Common Fund
(2019–present).
Peter F. Volanakis
Born in 1955. Trustee since July 2009.
Principal occupation(s) during the past five years and other experience: president and chief operating officer (retired 2010) of Corning Incorporated (communications equipment) and director of Corning Incorporated
(2000–2010) and Dow Corning (2001–2010). Director (2012) of SPX Corporation (multi-industry manufacturing). Overseer of the Amos Tuck School of Business Administration, Dartmouth College (2001–2013).
Member of the BMW Group Mobility Council.
Executive Officers
Christine M. Buchanan
Born in 1970. Principal occupation(s) during
the past five years and other experience: principal of Vanguard. Chief financial officer (2021–present) and treasurer (2017–present) of each of the investment companies served by Vanguard. Partner
(2005–2017) at KPMG (audit, tax, and advisory services).
John Galloway
Born in 1973. Principal occupation(s) during
the past five years and other experience: principal of Vanguard. Investment stewardship officer (September 2020–present) of each of the investment companies served by Vanguard. Head of Investor Advocacy
(February 2020–present) and head of Marketing Strategy and Planning (2017–2020) at Vanguard. Special assistant to the President of the United States (2015).
Ashley Grim
Born in 1984. Principal occupation(s) during
the past five years and other experience: treasurer (February 2022–present) of each of the investment companies served by Vanguard. Fund transfer agent controller (2019–2022) and director of Audit
Services (2017–2019) at Vanguard. Senior manager (2015–2017) at PriceWaterhouseCoopers (audit and assurance, consulting, and tax services).
Peter Mahoney
Born in 1974. Principal occupation(s) during
the past five years and other experience: principal of Vanguard. Controller (2015–present) of each of the investment companies served by Vanguard. Head of International Fund Services (2008–2014) at
Vanguard.
Anne E. Robinson
Born in 1970. Principal occupation(s) during
the past five years and other experience: general counsel (2016–present) of Vanguard. Secretary (2016–present) of Vanguard and of each of the investment companies served by Vanguard. Managing director
(2016–present) of Vanguard. Managing director and general counsel of Global Cards and Consumer Services (2014–2016) at Citigroup. Counsel (2003–2014) at American Express. Nonexecutive director of the
board of National Grid (energy).
Michael Rollings
Born in 1963. Principal occupation(s) during
the past five years and other experience: finance director (2017–present) and treasurer (2017) of each of the investment companies served by Vanguard. Managing director (2016–present) of Vanguard. Chief
financial officer (2016–present) of Vanguard. Director (2016–present) of Vanguard Marketing Corporation. Executive vice president and chief financial officer (2006–2016) of MassMutual Financial
Group.
John E. Schadl
Born in 1972. Principal occupation(s) during
the past five years and other experience: principal of Vanguard. Chief compliance officer (2019–present) of Vanguard and of each of the investment companies served by Vanguard. Assistant vice president
(2019–present) of Vanguard Marketing Corporation.
Vanguard Senior Management
Team
| Matthew Benchener
| Thomas M. Rampulla
|
| Joseph Brennan
| Karin A. Risi
|
| Mortimer J. Buckley
| Anne E. Robinson
|
| Gregory Davis
| Michael Rollings
|
| John James
| Nitin Tandon
|
| Chris D. McIsaac
| Lauren Valente
|
Connect with
Vanguard®>vanguard.com
Fund Information > 800-662-7447
Direct Investor Account
Services > 800-662-2739
Institutional Investor
Services > 800-523-1036
Text Telephone for People
Who Are Deaf or Hard of Hearing > 800-749-7273
This material may be used in
conjunction with the offering of shares of any Vanguard fund only if preceded or accompanied by the fund’s current prospectus.
All comparative mutual
fund data are from Morningstar, Inc., unless otherwise noted.
You can obtain a free
copy of Vanguard’s proxy voting guidelines by visiting vanguard.com/proxyreporting or by calling Vanguard at 800-662-2739. The guidelines are also available from the SEC’s website, www.sec.gov. In
addition, you may obtain a free report on how your fund voted the proxies for securities it owned during the 12 months ended June 30. To get the report, visit either vanguard.com/proxyreporting or www.sec.gov.
You can review
information about your fund on the SEC’s website, and you can receive copies of this information, for a fee, by sending a request via email addressed to publicinfo@sec.gov.
Source for Bloomberg indexes:
Bloomberg Index Services Limited. Copyright 2022, Bloomberg. All rights reserved.
CFA® is a registered trademark owned by CFA Institute.
© 2022 The Vanguard Group,
Inc.
All rights reserved.
Vanguard Marketing Corporation, Distributor.
Q460 122022
Annual Report | October 31, 2022
Vanguard Diversified Equity Fund
Contents
Please note: The
opinions expressed in this report are just that—informed opinions. They should not be considered promises or advice. Also, please keep in mind that the information and opinions cover the period through the date on the front of this report. Of
course, the risks of investing in your fund are spelled out in the prospectus.
Your Fund’s Performance at a
Glance
| •
|
The 12 months ended
October 31, 2022, were a volatile, challenging period for financial markets. Vanguard Diversified Equity Fund returned –21.42%, lagging the –16.50% return of its benchmark, the MSCI US Broad Market Index. |
| •
|
The economic backdrop
deteriorated as inflation soared to multidecade highs, fueled in part by higher energy and food prices in the wake of Russia’s invasion of Ukraine. Then price increases broadened to other categories of goods and services, adding to concerns
that inflation would remain stubbornly high. That prompted aggressive tightening by the Federal Reserve to bring inflation back in check and increased fears of a recession. |
| •
|
The Diversified Equity
Fund invests in six actively managed Vanguard funds selected to provide broad exposure to all segments of the U.S. equity market. Together, these funds cover the style and capitalization spectrum. |
| •
|
Returns
of the underlying funds ranged from about –39% for Vanguard U.S. Growth Fund to roughly –3% for Vanguard Windsor Fund. Value-oriented stocks generally held up better than growth stocks. |
Market Barometer
| |
Average
Annual Total Returns
Periods Ended October 31, 2022 |
| |
One
Year |
Three
Years |
Five
Years |
| Stocks
|
|
|
|
| Russell
1000 Index (Large-caps) |
-16.38%
|
9.99%
|
10.19%
|
| Russell
2000 Index (Small-caps) |
-18.54
|
7.05
|
5.56
|
| Russell
3000 Index (Broad U.S. market) |
-16.52
|
9.79
|
9.87
|
| FTSE
All-World ex US Index (International) |
-24.20
|
-1.16
|
-0.18
|
| Bonds
|
|
|
|
Bloomberg
U.S. Aggregate Float Adjusted Index
(Broad taxable market) |
-15.69%
|
-3.73%
|
-0.50%
|
Bloomberg
Municipal Bond Index
(Broad tax-exempt market) |
-11.98
|
-2.18
|
0.37
|
| FTSE
Three-Month U.S. Treasury Bill Index |
0.88
|
0.59
|
1.15
|
| CPI
|
|
|
|
| Consumer
Price Index |
7.75%
|
5.01%
|
3.85%
|
About Your Fund’s
Expenses
As a shareholder of the fund, you incur ongoing costs,
which include costs for portfolio management, administrative services, and shareholder reports (like this one), among others. Operating expenses, which are deducted from a fund’s gross income, directly reduce the investment return of the
fund.
A fund’s expenses are expressed as a
percentage of its average net assets. The Diversified Equity Fund has no direct expenses, but bears its proportionate share of the costs for the underlying funds in which it invests. These indirect expenses make up the acquired fund fees and
expenses, also expressed as a percentage of average net assets. The following examples are intended to help you understand the ongoing cost (in dollars) of investing in your fund and to compare these costs with those of other mutual funds. The
examples are based on an investment of $1,000 made at the beginning of the period shown and held for the entire period. The costs were calculated using the acquired fund fees and expenses for the Diversified Equity Fund.
The accompanying table illustrates your fund’s
costs in two ways:
| •
|
Based on actual fund
return. This section helps you to estimate the actual expenses that you paid over the period. The ”Ending Account Value“ shown is derived from the fund’s actual return, and the third column shows
the dollar amount that would have been paid by an investor who started with $1,000 in the fund. You may use the information here, together with the amount you invested, to estimate the expenses that you paid over the period.
|
To do so, simply divide your
account value by $1,000 (for example, an $8,600 account value divided by $1,000 = 8.6), then multiply the result by the number given for your fund under the heading ”Expenses Paid During Period.“
| •
|
Based on hypothetical 5%
yearly return. This section is intended to help you compare your fund‘s costs with those of other mutual funds. It assumes that the fund had a yearly return of 5% before expenses, but that the expense ratio is
unchanged. In this case—because the return used is not the fund’s actual return—the results do not apply to your investment. The example is useful in making comparisons because the Securities and Exchange Commission requires all
mutual funds to calculate expenses based on a 5% return. You can assess your fund’s costs by comparing this hypothetical example with the hypothetical examples that appear in shareholder reports of other funds. |
Note that the expenses shown in the table are meant to
highlight and help you compare ongoing costs only and do not reflect transaction costs incurred by the fund for buying and selling securities. Further, the expenses do not include any purchase, redemption, or
account service fees described in the fund prospectus. If such fees were applied to your account, your costs would be higher. Your fund does not carry a “sales load.”
The calculations assume no shares were bought or sold
during the period. Your actual costs may have been higher or lower, depending on the amount of your investment and the timing of any purchases or redemptions.
You can find more information about the fund’s
expenses, including annual expense ratios, in the Financial Statements section of this report. For additional information on operating expenses and other shareholder costs, please refer to your fund’s current prospectus.
| Six
Months Ended October 31, 2022 |
|
|
|
| Diversified
Equity Fund |
Beginning
Account Value
4/30/2022 |
Ending
Account Value
10/31/2022 |
Expenses
Paid During
Period |
| Based
on Actual Fund Return |
$1,000.00
|
$
939.40 |
$1.71
|
| Based
on Hypothetical 5% Yearly Return |
1,000.00
|
1,023.44
|
1.79
|
The calculations are
based on acquired fund fees and expenses for the most recent six-month period. The underlying funds' annualized expense figure for that period is 0.35%. The dollar amounts shown as ”Expenses Paid” are equal to the annualized average
weighted expense ratio for the underlying funds multiplied by the average account value over the period, multiplied by the number of days in the most recent six-month period, then divided by the number of days in the most recent 12-month period
(184/365).
All of the returns in this report represent past
performance, which is not a guarantee of future results that may be achieved by the fund. (Current performance may be lower or higher than the performance data cited. For performance data current to the most recent month-end, visit our website at
vanguard.com/performance.) Note, too, that both investment returns and principal value can fluctuate widely, so an investor’s shares, when sold, could be worth more or less than their original cost. The
returns shown do not reflect taxes that a shareholder would pay on fund distributions or on the sale of fund shares.
Cumulative Performance: October 31, 2012, Through
October 31, 2022
Initial Investment of
$10,000
| |
|
Average
Annual Total Returns
Periods Ended October 31, 2022 |
|
| |
|
One
Year |
Five
Years |
Ten
Years |
Final
Value
of a $10,000
Investment |
 |
Diversified
Equity Fund |
-21.42%
|
9.75%
|
12.31%
|
$31,923
|
 |
MSCI
US Broad Market Index |
-16.50
|
9.96
|
12.53
|
32,563
|
See Financial Highlights for dividend and capital
gains information.
Underlying
Vanguard Funds
| Vanguard
U.S. Growth Fund Investor Shares |
29.3%
|
| Vanguard
WindsorTM Fund Investor Shares |
20.3
|
| Vanguard
Growth and Income Fund Investor Shares |
20.2
|
| Vanguard
Windsor II Fund Investor Shares |
15.2
|
| Vanguard
ExplorerTM Fund Investor Shares |
10.1
|
| Vanguard
Mid-Cap Growth Fund |
4.9
|
The table reflects the fund's
investments, except for short-term investments.
The fund files its complete schedule of portfolio
holdings with the Securities and Exchange Commission (SEC) for the first and third quarters of each fiscal year as an exhibit to its reports on Form N-PORT. The fund’s Form N-PORT reports are available on the SEC’s website at
www.sec.gov.
| |
|
|
|
|
Shares
|
Market
Value•
($000) |
| Investment
Companies (100.0%) |
| U.S.
Stock Funds (100.0%) |
| |
Vanguard
U.S. Growth Fund Investor Shares |
15,410,935
|
638,320
|
| |
Vanguard
Windsor Fund Investor Shares |
19,507,240
|
443,595
|
| |
Vanguard
Growth and Income Fund Investor Shares |
8,285,085
|
440,104
|
| |
Vanguard
Windsor II Fund Investor Shares |
8,409,928
|
331,267
|
| |
Vanguard
Explorer Fund Investor Shares |
2,205,770
|
219,915
|
| |
Vanguard
Mid-Cap Growth Fund |
5,589,451
|
107,541
|
| Total
Investment Companies (Cost $1,670,038) |
2,180,742
|
| Temporary
Cash Investments (0.0%) |
| Money
Market Fund (0.0%) |
|
1 |
Vanguard
Market Liquidity Fund, 3.117% (Cost $—) |
1
|
— |
| Total
Investments (100.0%) (Cost $1,670,038) |
|
2,180,742
|
| Other
Assets and Liabilities—Net (0.0%) |
|
(441)
|
| Net
Assets (100%) |
|
2,180,301
|
| •
|
See
Note A in Notes to Financial Statements. |
| 1
|
Affiliated
money market fund available only to Vanguard funds and certain trusts and accounts managed by Vanguard. Rate shown is the 7-day yield. |
See accompanying Notes, which are an integral
part of the Financial Statements.
Statement of Assets and Liabilities
| |
| ($000s,
except shares and per-share amounts) |
Amount
|
| Assets
|
|
| Investments
in Securities, at Value—Affiliated Funds (Cost $1,670,038) |
2,180,742
|
| Receivables
for Investment Securities Sold |
155
|
| Receivables
for Accrued Income |
1
|
| Receivables
for Capital Shares Issued |
674
|
| Total
Assets |
2,181,572
|
| Liabilities
|
|
| Due
to Custodian |
199
|
| Payables
for Capital Shares Redeemed |
1,072
|
| Total
Liabilities |
1,271
|
| Net
Assets |
2,180,301
|
At October 31, 2022, net assets consisted of: |
|
| |
|
| Paid-in
Capital |
1,443,943
|
| Total
Distributable Earnings (Loss) |
736,358
|
| Net
Assets |
2,180,301
|
| |
|
| Net
Assets |
|
Applicable
to 52,691,895 outstanding $.001 par value shares of
beneficial interest (unlimited authorization) |
2,180,301
|
| Net
Asset Value Per Share |
$41.38
|
See accompanying Notes, which are an
integral part of the Financial Statements.
| |
| |
Year
Ended
October 31, 2022 |
| |
($000)
|
| Investment
Income |
|
| Income
|
|
| Income
Distributions Received from Affiliated Funds |
19,185
|
| Net
Investment Income—Note B |
19,185
|
| Realized
Net Gain (Loss) |
|
| Capital
Gain Distributions Received from Affiliated Funds |
331,854
|
| Affiliated
Funds Sold |
(4,196)
|
| Realized
Net Gain (Loss) |
327,658
|
| Change
in Unrealized Appreciation (Depreciation) from Affiliated Funds |
(967,703)
|
| Net
Increase (Decrease) in Net Assets Resulting from Operations |
(620,860)
|
See accompanying Notes, which are an
integral part of the Financial Statements.
Statement of Changes in Net Assets
| |
| |
Year
Ended October 31, |
| |
2022
($000) |
2021
($000) |
| Increase
(Decrease) in Net Assets |
|
|
| Operations
|
|
|
| Net
Investment Income |
19,185
|
19,851
|
| Realized
Net Gain (Loss) |
327,658
|
126,784
|
| Change
in Unrealized Appreciation (Depreciation) |
(967,703)
|
757,953
|
| Net
Increase (Decrease) in Net Assets Resulting from Operations |
(620,860)
|
904,588
|
| Distributions
|
|
|
| Total
Distributions |
(196,729)
|
(129,748)
|
| Capital
Share Transactions |
|
|
| Issued
|
293,317
|
591,473
|
| Issued
in Lieu of Cash Distributions |
182,595
|
121,380
|
| Redeemed
|
(443,391)
|
(441,166)
|
| Net
Increase (Decrease) from Capital Share Transactions |
32,521
|
271,687
|
| Total
Increase (Decrease) |
(785,068)
|
1,046,527
|
| Net
Assets |
|
|
| Beginning
of Period |
2,965,369
|
1,918,842
|
| End
of Period |
2,180,301
|
2,965,369
|
See accompanying Notes, which are an
integral part of the Financial Statements.
For
a Share Outstanding
Throughout Each Period |
Year
Ended October 31, |
| 2022
|
2021
|
2020
|
2019
|
2018
|
| Net
Asset Value, Beginning of Period |
$56.40
|
$40.98
|
$37.95
|
$35.88
|
$35.57
|
| Investment
Operations |
|
|
|
|
|
| Net
Investment Income1 |
.356
|
.385
|
.452
|
.455
|
.395
|
| Capital
Gain Distributions Received1 |
6.162
|
2.294
|
1.866
|
3.087
|
1.686
|
| Net
Realized and Unrealized Gain (Loss) on Investments |
(17.785)
|
15.438
|
3.447
|
.575
|
.206
|
| Total
from Investment Operations |
(11.267)
|
18.117
|
5.765
|
4.117
|
2.287
|
| Distributions
|
|
|
|
|
|
| Dividends
from Net Investment Income |
(.317)
|
(.346)
|
(.369)
|
(.383)
|
(.358)
|
| Distributions
from Realized Capital Gains |
(3.436)
|
(2.351)
|
(2.366)
|
(1.664)
|
(1.619)
|
| Total
Distributions |
(3.753)
|
(2.697)
|
(2.735)
|
(2.047)
|
(1.977)
|
| Net
Asset Value, End of Period |
$41.38
|
$56.40
|
$40.98
|
$37.95
|
$35.88
|
| Total
Return2 |
-21.42%
|
45.67%
|
15.73%
|
12.82%
|
6.55%
|
| Ratios/Supplemental
Data |
|
|
|
|
|
| Net
Assets, End of Period (Millions) |
$2,180
|
$2,965
|
$1,919
|
$1,789
|
$1,709
|
| Ratio
of Total Expenses to Average Net Assets |
—
|
—
|
—
|
—
|
—
|
| Acquired
Fund Fees and Expenses |
0.35%
|
0.35%
|
0.35%
|
0.35%
|
0.36%
|
| Ratio
of Net Investment Income to Average Net Assets |
0.77%
|
0.76%
|
1.19%
|
1.27%
|
1.07%
|
| Portfolio
Turnover Rate |
12%
|
6%
|
14%
|
9%
|
8%
|
| 1
|
Calculated
based on average shares outstanding. |
| 2
|
Total
returns do not include account service fees that may have applied in the periods shown. Fund prospectuses provide information about any applicable account service fees. |
See
accompanying Notes, which are an integral part of the Financial Statements.
Notes to Financial Statements
Vanguard Diversified Equity Fund is registered under the
Investment Company Act of 1940 as an open-end investment company, or mutual fund. The fund invests in selected Vanguard actively managed U.S. Stock Funds. Financial Statements and other information about each underlying fund are available on
www.vanguard.com.
Significant market disruptions,
such as those caused by pandemics (e.g., COVID-19 pandemic), natural or environmental disasters, war (e.g., Russia's invasion of Ukraine), acts of terrorism, or other events, can adversely affect local and global markets and normal market
operations. Any such disruptions could have an adverse impact on the value of the fund's investments and fund performance.
A. The
following significant accounting policies conform to generally accepted accounting principles for U.S. investment companies. The fund consistently follows such policies in preparing its financial statements.
1. Security Valuation: Investments are valued at the
net asset value of each underlying Vanguard fund determined as of the close of the New York Stock Exchange (generally 4 p.m., Eastern time) on the valuation date.
2. Federal Income Taxes: The fund intends to
continue to qualify as a regulated investment company and distribute virtually all of its taxable income. The fund’s tax returns are open to examination by the relevant tax authorities until expiration of the applicable statute of limitations,
which is generally three years after the filing of the tax return. Management has analyzed the fund’s tax positions taken for all open federal and state income tax years, and has concluded that no provision for income tax is required in the
fund’s financial statements.
3. Distributions: Distributions to shareholders are
recorded on the ex-dividend date. Distributions are determined on a tax basis at the fiscal year-end and may differ from net investment income and realized capital gains for financial reporting purposes.
4. Credit Facilities and Interfund Lending Program:
The fund and certain other funds managed by The Vanguard Group ("Vanguard") participate in a $4.4 billion committed credit facility provided by a syndicate of lenders pursuant to a credit agreement and an uncommitted credit facility provided by
Vanguard. Both facilities may be renewed annually. Each fund is individually liable for its borrowings, if any, under the credit facilities. Borrowings may be utilized for temporary or emergency purposes and are subject to the fund’s
regulatory and contractual borrowing restrictions. With respect to the committed credit facility, the participating funds are charged administrative fees and an annual commitment fee of 0.10% of the undrawn committed amount of the facility, which
are allocated to the funds based on a method approved by the fund’s board of trustees and borne by the funds in which the fund invests (see Note B). Any borrowings under either facility bear interest at an agreed-upon spread plus the higher of
the federal funds effective rate, the overnight bank funding rate, or the Daily Simple Secured Overnight Financing Rate inclusive of an additional agreed-upon spread. However, borrowings under the uncommitted credit facility may bear interest based
upon an alternate rate agreed to by the fund and Vanguard.
In accordance with an exemptive order (the
“Order”) from the SEC, the fund may participate in a joint lending and borrowing program that allows registered open-end Vanguard funds to borrow money from and lend money to each other for temporary or emergency purposes (the
“Interfund Lending Program”), subject to compliance with the terms and conditions of the Order, and to the extent permitted by the fund’s investment objective and investment policies. Interfund loans and
borrowings normally extend overnight but can have a maximum duration of
seven days. Loans may be called on one business day’s notice. The interest rate to be charged is governed by the conditions of the Order and internal procedures adopted by the board of trustees. The board of trustees is responsible for
overseeing the Interfund Lending Program.
For the
year ended October 31, 2022, the fund did not utilize the credit facilities or the Interfund Lending Program.
5. Other: Income and capital gain distributions
received are recorded on the ex-dividend date.
Security
transactions are accounted for on the date securities are bought or sold. Costs used to determine realized gains (losses) on the sale of investment securities are those of the specific securities sold.
B. In
accordance with the terms of a Funds’ Service Agreement (the “FSA”) between Vanguard and the fund, Vanguard furnishes to the fund investment advisory, corporate management, administrative, marketing, and distribution services at
Vanguard’s cost of operations (as defined by the FSA). These costs of operations are allocated to the fund based on methods and guidelines approved by the board of trustees. The FSA provides that expenses otherwise allocable to Vanguard
funds-of-funds may be reduced or eliminated to the extent of savings realized by the underlying Vanguard funds by virtue of being part of a fund-of-funds. Accordingly, all expenses for services provided by Vanguard to the fund and all other expenses
incurred by the fund during the year ended October 31, 2022, were borne by the underlying Vanguard funds in which the fund invests. The fund's trustees and officers are also trustees and officers, respectively, of the underlying Vanguard funds, as
well as directors and employees, respectively, of Vanguard.
C. Various
inputs may be used to determine the value of the fund’s investments. These inputs are summarized in three broad levels for financial statement purposes. The inputs or methodologies used to value securities are not necessarily an indication of
the risk associated with investing in those securities.
Level 1—Quoted
prices in active markets for identical securities.
Level 2—Other
significant observable inputs (including quoted prices for similar securities, interest rates, prepayment speeds, credit risk, etc.).
Level 3—Significant
unobservable inputs (including the fund’s own assumptions used to determine the fair value of investments). Any investments valued with significant unobservable inputs are noted on the Schedule of Investments.
At October 31, 2022, 100% of the market value of the
fund's investments was determined based on Level 1 inputs.
D. Permanent
differences between book-basis and tax-basis components of net assets are reclassified among capital accounts in the financial statements to reflect their tax character. These reclassifications have no effect on net assets or net asset value per
share. As of period end, permanent differences primarily attributable to the accounting for applicable distributions in connection with fund share redemptions were reclassified between the following accounts:
| |
Amount
($000) |
| Paid-in
Capital |
32,107
|
| Total
Distributable Earnings (Loss) |
(32,107)
|
Temporary differences between book-basis and tax-basis
components of total distributable earnings (loss) arise when certain items of income, gain, or loss are recognized in different periods for financial statement and tax purposes; these differences will reverse at some time in the future. The
differences are primarily related to the deferral of losses from wash sales. As of period end, the tax-basis components of total distributable earnings (loss) are detailed in the table as follows:
| |
Amount
($000) |
| Undistributed
Ordinary Income |
—
|
| Undistributed
Long-Term Gains |
229,192
|
| Capital
Loss Carryforwards |
—
|
| Qualified
Late-Year Losses |
—
|
| Net
Unrealized Gains (Losses) |
507,166
|
The tax character of
distributions paid was as follows:
| |
Year
Ended October 31, |
| |
2022
Amount
($000) |
2021
Amount
($000) |
| Ordinary
Income* |
100,746
|
31,671
|
| Long-Term
Capital Gains |
95,983
|
98,077
|
| Total
|
196,729
|
129,748
|
| *
|
Includes
short-term capital gains, if any. |
As of October 31, 2022, gross unrealized appreciation
and depreciation for investments based on cost for U.S. federal income tax purposes were as follows:
| |
Amount
($000) |
| Tax
Cost |
1,673,576
|
| Gross
Unrealized Appreciation |
641,596
|
| Gross
Unrealized Depreciation |
(134,430)
|
| Net
Unrealized Appreciation (Depreciation) |
507,166
|
E. Capital shares issued and redeemed were:
| |
Year
Ended October 31, |
|
| |
2022
Shares
(000) |
|
2021
Shares
(000) |
|
| |
|
|
| Issued
|
6,163
|
|
11,844
|
|
| Issued
in Lieu of Cash Distributions |
3,454
|
|
2,628
|
|
| Redeemed
|
(9,499)
|
|
(8,723)
|
|
| Net
Increase (Decrease) in Shares Outstanding |
118
|
|
5,749
|
|
F.
Transactions during the period in affiliated underlying Vanguard funds were as follows:
| |
|
Current
Period Transactions |
|
| |
Oct.
31, 2021
Market Value
($000) |
Purchases
at Cost
($000) |
Proceeds
from
Securities
Sold
($000) |
Realized
Net Gain
(Loss)
($000) |
Change
in
Unrealized
App. (Dep.)
($000) |
Income
($000) |
Capital
Gain
Distributions
Received
($000) |
Oct. 31, 2022
Market Value
($000) |
| Vanguard
Explorer Fund |
295,430
|
39,796
|
7,604
|
(2,898)
|
(104,809)
|
540
|
39,256
|
219,915
|
| Vanguard
Growth and Income Fund |
596,559
|
80,459
|
87,379
|
(2,132)
|
(147,403)
|
6,506
|
73,955
|
440,104
|
| Vanguard
Market Liquidity Fund |
145
|
NA
1 |
NA
1 |
—
|
—
|
2
|
—
|
—
|
| Vanguard
Mid-Cap Growth Fund |
147,655
|
44,241
|
—
|
—
|
(84,355)
|
18
|
35,761
|
107,541
|
| Vanguard
U.S. Growth Fund |
893,949
|
229,764
|
12,213
|
(4,119)
|
(469,061)
|
15
|
100,709
|
638,320
|
| Vanguard
Windsor Fund |
587,802
|
71,116
|
140,887
|
4,770
|
(79,206)
|
7,056
|
54,102
|
443,595
|
| Vanguard
Windsor II Fund |
442,795
|
33,637
|
62,479
|
183
|
(82,869)
|
5,048
|
28,071
|
331,267
|
| Total
|
2,964,335
|
499,013
|
310,562
|
(4,196)
|
(967,703)
|
19,185
|
331,854
|
2,180,742
|
| 1
|
Not
applicable—purchases and sales are for temporary cash investment purposes. |
G. Management
has determined that no events or transactions occurred subsequent to October 31, 2022, that would require recognition or disclosure in these financial statements.
Report of Independent
Registered
Public Accounting Firm
To the Board of
Trustees of Vanguard Trustees' Equity Fund and Shareholders of Vanguard Diversified Equity Fund
Opinion on the Financial Statements
We have audited the accompanying statement of assets and liabilities,
including the schedule of investments, of Vanguard Diversified Equity Fund (one of the funds constituting Vanguard Trustees' Equity Fund, referred to hereafter as the "Fund") as of October 31, 2022, the related statement of operations for the year
ended October 31, 2022, the statement of changes in net assets for each of the two years in the period ended October 31, 2022, including the related notes, and the financial highlights for each of the five years in the period ended October 31, 2022
(collectively referred to as the "financial statements"). In our opinion, the financial statements present fairly, in all material respects, the financial position of the Fund as of October 31, 2022, the results of its operations for the year then
ended, the changes in its net assets for each of the two years in the period ended October 31, 2022 and the financial highlights for each of the five years in the period ended October 31, 2022 in conformity with accounting principles generally
accepted in the United States of America.
Basis for
Opinion
These financial statements are the responsibility of the
Fund’s management. Our responsibility is to express an opinion on the Fund’s financial statements based on our audits. We are a public accounting firm registered with the Public Company Accounting Oversight Board (United States) (PCAOB)
and are required to be independent with respect to the Fund in accordance with the U.S. federal securities laws and the applicable rules and regulations of the Securities and Exchange Commission and the PCAOB.
We conducted our audits of these financial statements in
accordance with the standards of the PCAOB. Those standards require that we plan and perform the audit to obtain reasonable assurance about whether the financial statements are free of material misstatement, whether due to error or fraud.
Our audits included performing procedures to assess the
risks of material misstatement of the financial statements, whether due to error or fraud, and performing procedures that respond to those risks. Such procedures included examining, on a test basis, evidence regarding the amounts and disclosures in
the financial statements. Our audits also included evaluating the accounting principles used and significant estimates made by management, as well as evaluating the overall presentation of the financial statements. Our procedures included
confirmation of securities owned as of October 31, 2022 by correspondence with the transfer agent and brokers; when replies were not received from brokers, we performed other auditing procedures. We believe that our audits provide a reasonable basis
for our opinion.
/s/PricewaterhouseCoopers LLP
Philadelphia, Pennsylvania
December 15, 2022
We
have served as the auditor of one or more investment companies in The Vanguard Group of Funds since 1975.
Tax information (unaudited)
For corporate shareholders, 22.4%, or if subsequently
determined to be different, the maximum percentage allowable by law, of ordinary income (dividend income plus short-term gains, if any) for the fiscal year qualified for the dividends-received deduction.
The fund hereby designates $21,425,000, or if
subsequently determined to be different, the maximum amount allowable by law, as qualified dividend income for individual shareholders for the fiscal year.
The fund hereby designates $6,000, or if subsequently
determined to be different, the maximum amount allowable by law, of interest earned from obligations of the U.S. government which is generally exempt from state income tax.
For nonresident alien shareholders, 100% of short-term
capital gain dividends distributed by the fund for the fiscal year are qualified short-term capital gains.
The fund distributed $119,719,000 as capital gain
dividends (20% rate gain distributions) to shareholders during the fiscal year.
This page intentionally
left blank.
The People Who Govern Your
Fund
The trustees of your mutual fund are there to see that
the fund is operated and managed in your best interests since, as a shareholder, you are a part owner of the fund. Your fund’s trustees also serve on the board of directors of The Vanguard Group, Inc., which is owned by the Vanguard funds and
provides services to them.
A majority of
Vanguard’s board members are independent, meaning that they have no affiliation with Vanguard or the funds they oversee, apart from the sizable personal investments they have made as private individuals. The independent board members have
distinguished backgrounds in business, academia, and public service. Each of the trustees and executive officers oversees 206 Vanguard funds.
Information for each trustee and executive officer of the
fund appears below. That information, as well as the Vanguard fund count, is as of the date on the cover of this fund report. The mailing address of the trustees and officers is P.O. Box 876, Valley Forge, PA 19482. More information about the
trustees is in the Statement of Additional Information, which can be obtained, without charge, by contacting Vanguard at 800-662-7447, or online at vanguard.com.
Interested Trustee1
Mortimer J. Buckley
Born in 1969. Trustee since January 2018. Principal occupation(s) during
the past five years and other experience: chairman of the board (2019–present) of Vanguard and of each of the investment companies served by Vanguard; chief executive officer (2018–present) of Vanguard; chief executive officer,
president, and trustee (2018–present) of each of the investment companies served by Vanguard; president and director (2017–present) of Vanguard; and president (2018–present) of Vanguard Marketing Corporation. Chief investment
officer (2013–2017), managing director (2002–2017), head of the Retail Investor Group (2006–2012), and chief information officer (2001–2006) of Vanguard. Member of the board of governors of the Investment Company Institute
and the board of governors of FINRA. Trustee and vice chair of The Shipley School.
Independent Trustees
Tara Bunch
Born in 1962. Trustee since November 2021. Principal occupation(s)
during the past five years and other experience: head of global operations at Airbnb (2020–present). Vice president of AppleCare (2012–2020). Member of the board of directors of Out & Equal (2002–2006), the advisory board of
the University of California, Berkeley School of Engineering (2020–present), and the advisory board of Santa Clara University’s Leavey School of Business (2018–present).
Emerson U. Fullwood
Born in 1948. Trustee since January 2008. Principal occupation(s) during
the past five years and other experience: executive chief staff and marketing officer for North America and corporate vice president (retired 2008) of Xerox Corporation (document management products and services). Former president of the Worldwide
Channels Group, Latin America, and Worldwide Customer Service and executive chief staff officer of Developing Markets of Xerox. Executive in residence and 2009–2010 Distinguished Minett Professor at the Rochester Institute of Technology.
Member of the board of directors of the University of Rochester Medical Center, the Monroe Community College Foundation, the United Way of Rochester, North Carolina A&T University, Roberts Wesleyan College, and the Rochester Philharmonic
Orchestra. Trustee of the University of Rochester.
1 Mr. Buckley is considered an
“interested person,” as defined in the Investment Company Act of 1940, because he is an officer of the Vanguard funds.
F. Joseph Loughrey
Born in 1949. Trustee since October 2009. Principal occupation(s) during
the past five years and other experience: president and chief operating officer (retired 2009) and vice chairman of the board (2008–2009) of Cummins Inc. (industrial machinery). Chairman of the board of Hillenbrand, Inc. (specialized consumer
services). Director of the V Foundation. Member of the advisory council for the College of Arts and Letters at the University of Notre Dame. Chairman of the board of Saint Anselm College.
Mark Loughridge
Born in 1953. Trustee since March 2012. Principal occupation(s) during
the past five years and other experience: senior vice president and chief financial officer (retired 2013) of IBM (information technology services). Fiduciary member of IBM’s Retirement Plan Committee (2004–2013), senior vice president
and general manager (2002–2004) of IBM Global Financing, vice president and controller (1998–2002) of IBM, and a variety of other prior management roles at IBM. Member of the Council on Chicago Booth.
Scott C. Malpass
Born in 1962. Trustee since March 2012. Principal occupation(s) during
the past five years and other experience: adjunct professor of finance at the University of Notre Dame (2020–present). Chief investment officer (retired 2020) and vice president (retired 2020) of the University of Notre Dame. Assistant
professor (retired June 2020) of finance at the Mendoza College of Business, University of Notre Dame, and member of the Notre Dame 403(b) Investment Committee. Member of the board of Catholic Investment Services, Inc. (investment advisors), the
board of superintendence of the Institute for the Works of Religion, and the board of directors of Paxos Trust Company (finance).
Deanna Mulligan
Born in 1963. Trustee since January 2018. Principal occupation(s) during
the past five years and other experience: chief executive officer of Purposeful (advisory firm for CEOs and C-level executives; 2021–present). Board chair (2020), chief executive officer (2011–2020), and president (2010–2019) of
The Guardian Life Insurance Company of America. Chief operating officer (2010–2011) and executive vice president (2008–2010) of Individual Life and Disability of the Guardian Life Insurance Company of America. Member of the board of the
Economic Club of New York. Trustee of the Partnership for New York City (business leadership), Chief Executives for Corporate Purpose, and the NewYork-Presbyterian Hospital.
André F. Perold
Born in 1952. Trustee since December 2004. Principal occupation(s)
during the past five years and other experience: George Gund Professor of Finance and Banking, Emeritus at the Harvard Business School (retired 2011). Chief investment officer and co-managing partner of HighVista Strategies (private investment
firm). Member of the board (2018–present) of RIT Capital Partners (investment firm). Member of the investment committee of Partners Health Care System.
Sarah Bloom Raskin
Born in 1961. Trustee since January 2018. Principal occupation(s) during
the past five years and other experience: deputy secretary (2014–2017) of the United States Department of the Treasury. Governor (2010–2014) of the Federal Reserve Board. Commissioner (2007–2010) of financial regulation for the
State of Maryland. Colin W. Brown Distinguished Professor of the Practice of Law (2021–present), professor (2020–present), Distinguished Fellow of the Global Financial Markets Center (2020–present), and Rubenstein Fellow
(2017–2020) at Duke University. Trustee (2017–present) of Amherst College and member of Amherst College Investment Committee (2019–present). Member of the Regenerative Crisis Response Committee (2020–present).
David A. Thomas
Born in 1956. Trustee since July 2021. Principal occupation(s) during
the past five years and other experience: president of Morehouse College (2018–present). Professor of business administration, emeritus at Harvard University (2017–2018). Dean (2011–2016) and professor of management
(2016–2017) at the Georgetown University McDonough School of Business. Director of DTE Energy Company (2013–present). Trustee of Common Fund (2019–present).
Peter F. Volanakis
Born in 1955. Trustee since July 2009. Principal occupation(s) during
the past five years and other experience: president and chief operating officer (retired 2010) of Corning Incorporated (communications equipment) and director of Corning Incorporated (2000–2010) and Dow Corning (2001–2010). Director
(2012) of SPX Corporation (multi-industry manufacturing). Overseer of the Amos Tuck School of Business Administration, Dartmouth College (2001–2013). Member of the BMW Group Mobility Council.
Executive Officers
Christine M. Buchanan
Born in 1970. Principal occupation(s) during the past five years and
other experience: principal of Vanguard. Chief financial officer (2021–present) and treasurer (2017–present) of each of the investment companies served by Vanguard. Partner (2005–2017) at KPMG (audit, tax, and advisory
services).
John Galloway
Born in 1973. Principal occupation(s) during the past five years and
other experience: principal of Vanguard. Investment stewardship officer (September 2020–present) of each of the investment companies served by Vanguard. Head of Investor Advocacy (February 2020–present) and head of Marketing Strategy and
Planning (2017–2020) at Vanguard. Special assistant to the President of the United States (2015).
Ashley Grim
Born in 1984. Principal occupation(s) during the past five years and
other experience: treasurer (February 2022–present) of each of the investment companies served by Vanguard. Fund transfer agent controller (2019–2022) and director of Audit Services (2017–2019) at Vanguard. Senior
manager (2015–2017) at PriceWaterhouseCoopers (audit and assurance, consulting, and tax services).
Peter Mahoney
Born in 1974. Principal occupation(s) during the past five years and
other experience: principal of Vanguard. Controller (2015–present) of each of the investment companies served by Vanguard. Head of International Fund Services (2008–2014) at Vanguard.
Anne E. Robinson
Born in 1970. Principal occupation(s) during the past five years and
other experience: general counsel (2016–present) of Vanguard. Secretary (2016–present) of Vanguard and of each of the investment companies served by Vanguard. Managing director (2016–present) of Vanguard. Managing director and
general counsel of Global Cards and Consumer Services (2014–2016) at Citigroup. Counsel (2003–2014) at American Express. Nonexecutive director of the board of National Grid (energy).
Michael Rollings
Born in 1963. Principal occupation(s) during the past five years and
other experience: finance director (2017–present) and treasurer (2017) of each of the investment companies served by Vanguard. Managing director (2016–present) of Vanguard. Chief financial officer (2016–present) of Vanguard.
Director (2016–present) of Vanguard Marketing Corporation. Executive vice president and chief financial officer (2006–2016) of MassMutual Financial Group.
John E. Schadl
Born in 1972. Principal occupation(s) during the past five years and
other experience: principal of Vanguard. Chief compliance officer (2019–present) of Vanguard and of each of the investment companies served by Vanguard. Assistant vice president (2019–present) of Vanguard Marketing Corporation.
Vanguard Senior Management Team
| Matthew
Benchener |
Thomas
M. Rampulla |
| Joseph
Brennan |
Karin
A. Risi |
| Mortimer
J. Buckley |
Anne E.
Robinson |
| Gregory
Davis |
Michael
Rollings |
| John
James |
Nitin
Tandon |
| Chris
D. McIsaac |
Lauren
Valente |
Connect with Vanguard®>vanguard.com
Fund Information >
800-662-7447
Direct Investor Account Services > 800-662-2739
Institutional Investor Services > 800-523-1036
Text Telephone for People
Who Are Deaf or Hard of
Hearing > 800-749-7273
This material may be used in conjunction with the
offering of shares of any Vanguard fund only if preceded or accompanied by the fund’s current prospectus.
All comparative mutual fund data are from
Morningstar, Inc., unless otherwise noted.
You can obtain a free copy of Vanguard’s
proxy voting guidelines by visiting vanguard.com/proxyreporting or by calling Vanguard at 800-662-2739. The guidelines are also available from the SEC’s website, www.sec.gov. In addition, you may obtain a free report on how your fund voted the
proxies for securities it owned during the 12 months ended June 30. To get the report, visit either vanguard.com/proxyreporting or www.sec.gov.
You can review information about your fund on the
SEC’s website, and you can receive copies of this information, for a fee, by sending a request via email addressed to publicinfo@sec.gov.
Source for Bloomberg indexes: Bloomberg Index
Services Limited. Copyright 2022, Bloomberg. All rights reserved.
© 2022 The Vanguard Group, Inc.
All rights reserved.
Vanguard Marketing Corporation, Distributor.
Q6080 122022
Annual Report | October 31, 2022
Vanguard Emerging
Markets Select Stock Fund
Contents
Your Fund’s Performance at a Glance
| 1
|
Advisors’ Report
| 2
|
About Your Fund’s Expenses
| 7
|
Performance Summary
| 9
|
Financial Statements
| 11
|
Please note: The
opinions expressed in this report are just that—informed opinions. They should not be considered promises or advice. Also, please keep in mind that the information and opinions cover the period through the date
on the front of this report. Of course, the risks of investing in your fund are spelled out in the prospectus.
Your Fund’s Performance at a Glance
| •
| The 12 months ended October 31, 2022, were a volatile, challenging period for financial markets. Vanguard Emerging Markets Select Stock Fund returned –31.16%, lagging the –28.35% return of its benchmark,
the FTSE Emerging Index.
|
| •
| The economic backdrop deteriorated as inflation soared to multidecade highs, fueled in part by higher energy and food prices in the wake of Russia’s invasion of Ukraine. Then price increases broadened to other
categories of goods and services, adding to concerns that inflation would remain stubbornly high. That prompted aggressive tightening by many central banks to bring inflation back in check and increased fears of a
recession.
|
| •
| Most countries posted negative returns for the period, but declines were much steeper in places such as Russia and Hong Kong. The fund’s modest weightings in those two markets were a drag on both absolute and
relative performance. However, the fund’s superior stock selection in Hong Kong offset some of the gap in underperformance relative to the index. (The fund’s weighting in Russia was 6.4% at the start of
the period and near zero at the end.)
|
| •
| With the sole exception of utilities, declines were universal across sectors in both the fund and the benchmark. The fund’s stocks in materials and financials substantially
trailed their benchmark counterparts, contributing the most to underperformance.
|
Market Barometer
|
| Average Annual Total Returns
Periods Ended October 31, 2022
|
|
| One Year
| Three Years
| Five Years
|
| Stocks
|
|
|
|
| Russell 1000 Index (Large-caps)
| -16.38%
| 9.99%
| 10.19%
|
| Russell 2000 Index (Small-caps)
| -18.54
| 7.05
| 5.56
|
| Russell 3000 Index (Broad U.S. market)
| -16.52
| 9.79
| 9.87
|
| FTSE All-World ex US Index (International)
| -24.20
| -1.16
| -0.18
|
| Bonds
|
|
|
|
Bloomberg U.S. Aggregate Float Adjusted Index
(Broad taxable market)
| -15.69%
| -3.73%
| -0.50%
|
Bloomberg Municipal Bond Index
(Broad tax-exempt market)
| -11.98
| -2.18
| 0.37
|
| FTSE Three-Month U.S. Treasury Bill Index
| 0.88
| 0.59
| 1.15
|
| CPI
|
|
|
|
| Consumer Price Index
| 7.75%
| 5.01%
| 3.85%
|
For the 12 months ended October 31, 2022,
Vanguard Emerging Markets Select Stock Fund returned –31.16%. Your fund is managed by four independent advisors, a strategy that enhances the fund’s diversification by providing exposure to distinct yet
complementary investment approaches. It’s not uncommon for different advisors to have different views about individual securities or the broader investment environment.
The advisors, the percentage
of fund assets each manages, and brief descriptions of their investment strategies are presented in the accompanying table. The advisors have also prepared a discussion of the investment environment that existed
during the fiscal year and of how portfolio positioning reflects this assessment.
These comments were prepared
on November 10, 2022.
Pzena Investment Management,
LLC
Portfolio Managers:
Rakesh Bordia, Principal
Caroline Cai, CFA, Managing
Principal
Allison Fisch,
Principal
The one-year period can be
summed up by a relatively stagnant Chinese economy, predominantly because of the zero-COVID policy, and Russia’s war in Ukraine—both of which contributed to the material rise in global inflation. The
result has been weaker GDP growth, higher global interest rates, and sinking
emerging-market currencies, which hurt
emerging-market stocks. The portfolio posted a negative return but outpaced the benchmark. Only the defensive utilities sector contributed positively to absolute performance.
Brazilian utility Cemig was
the portfolio’s top performer; the rebounding Brazilian economy boosted the company’s power and gas distribution volumes. Indonesian lender PT Bank Mandiri also was up materially on rising interest rates
and benign credit costs, and investors bought up shares of Brazilian lender Itaú Unibanco after management raised forecasts on net interest margins and loan growth.
Russian oil company Lukoil was
the largest detractor. With heavy trading restrictions resulting in no clear price discovery, we fair-valued the position at US$0.01 in all our portfolios. We subsequently found some liquidity in Lukoil and were able
to dispose of our remaining position. Shares of Chinese e-commerce giant Alibaba have been pressured for months by myriad issues that were mostly systematic, including the Chinese government’s crackdown on
technology companies, the threat of American depositary receipts being delisted from U.S. exchanges, and, perhaps most consequentially, the government’s zero-COVID policy impacting consumer spending. TSMC, the
world’s largest chipmaker, was lower after softening global demand and U.S. regulations affected the sector.
Fear of recession, rising
rates, and heightened geopolitical tensions are likely to hurt emerging-market valuations regardless of geography, market cap, or style. But short-term market dislocations have enabled us to uncover high-quality
businesses trading at bargain-basement prices, sowing the seeds for long-term alpha generation—a strategy that’s particularly effective in developing markets.
Oaktree Fund Advisors, LLC
Portfolio Manager:
Frank J. Carroll III,
Managing Director and Co-Head
of Emerging Markets Equities
Janet Wang,
Managing Director and Co-Portfolio Manager
Emerging markets equities fell
sharply during the 12 months. Stocks tumbled from a number of macro headwinds, including Russia’s invasion of Ukraine, China’s zero-COVID policy, rising inflation, tightening monetary policy, and fears of
slowing global economic growth.
Despite weak absolute
performance for the asset class, our portfolio outpaced the benchmark. At the country level, stock selection in China contributed the most to our relative results, followed by selection in Brazil and India. Our
overweight allocations to Brazil and Indonesia also contributed positively, as did our underweight exposure to Taiwan. Stock selection in Russia, Indonesia, Taiwan, and Mexico detracted from our relative
performance, as did our underweight exposures
to Saudi Arabia, India, and the UAE.
By sector, stock selection in
consumer discretionary helped our relative returns, while selection in materials, real estate, health care, energy, and financials hurt. Overweight allocations to materials, energy, and industrials contributed
positively to relative performance, as did underweight exposures to communication services, consumer discretionary, and information technology. Underweights in utilities and consumer staples detracted.
We maintain our view that
emerging markets will be hurt less during this downturn than in previous cycles. Many of the biggest emerging-market economies are in sound fiscal shape, and most emerging-market governments understand how to manage
their economies in an inflationary environment. We’ve remained disciplined in our research process and conduct thorough due diligence on high-quality, fundamentally sound companies. We expect the market to
remain volatile through year-end, as election news and geopolitical headlines dominate the conversation about emerging-market countries. But much of this negative sentiment is already reflected in today’s
prices.
Baillie Gifford Overseas
Ltd.
Portfolio Managers:
Mike Gush
Andrew Stobart
The 12 months have been
terrible for growth equities, with rising inflation and interest rates dominating the market narrative and sentiment. The news around the Chinese Communist Party’s National Congress has left sentiment on China
particularly weak in the near term.
On top of this, there appears
to be a belief in the markets that a strong U.S. dollar is always bad for emerging markets. We need to be careful not to lazily bucket together all emerging-market currencies, as some of the commodity-exporting
currencies have held up well this year. But perhaps more importantly, we should also point out that the risk of capital outflow from emerging markets is materially different now than it was in the early 2010s. Put
simply, if capital flight is one of the biggest triggers for emerging-market crises, then it's significant that these markets have already experienced outflows for almost a decade.
Emerging-market countries have
been relatively swift in raising interest rates to counter inflation and, unlike in developed markets, inflation is not materially different from the average over the last decade. Emerging markets’ macro health
is relatively good.
Looking at market performance,
apart from energy, very little that is of long-term interest to us has held up well this year, with “capital preservation” sectors such as utilities and consumer staples doing best. Long-duration growth
stocks have been savaged by the anticipation of higher interest rates.
Against this backdrop, we have
been careful to remember where we believe we can add value. We have very little to add to the debate around the next movements of the Federal Reserve or the direction of the U.S. dollar over the next quarter. Instead,
we have been re-examining our holdings’ fundamentals and finding real dissonance between their operational and share-price performance.
Wellington Management Company
LLP
Portfolio Manager:
Mary Pryshlak, CFA,
Senior Managing Director and
Head of Investment Research
Emerging-market equities fell
sharply during the 12 months. Within the FTSE Emerging Index, the consumer discretionary, communication services, and real estate sectors experienced the steepest declines, while utilities, financials, and industrials
performed better.
Emerging markets were
pressured by persistent inflation, rising interest rates, elevated geopolitical tensions, and concerns of a deeper economic slowdown, which we believe will continue to create volatility moving forward. However, the
market downturn has not been felt equally across all regions as it has become increasingly evident that there is divergence in both policy and performance across economies. Central and Eastern European countries
continue to feel the spillover effects of the war in Ukraine that have driven increases in food and energy costs. In contrast, soaring
commodity prices have benefited
export-oriented economies such as Brazil, Indonesia, and Saudi Arabia. In China, uncertainty around the government’s zero-COVID policy, rising geopolitical tension with the U.S., and a downturn in the property
market have caused volatility.
In this environment, our
portion of the portfolio underperformed the benchmark index. Most notably, security selection in energy, materials, and information technology detracted most from relative results. On a regional basis, stock selection
in China and our exposure to Russia were the primary drivers of underperformance, while selection within India and Brazil contributed.
At the security level, Russian
energy companies Gazprom and Lukoil were the
top relative detractors. Bharti Airtel, an
Indian telecommunications services company, and Sabesp, a Brazilian waste management company, partially offset the underperformance.
Our global industry analysts
will continue to focus on identifying companies with the potential to emerge from this period of volatility stronger than their peers. We believe that the team’s deep fundamental research, experience managing in
a variety of market environments, and long-term orientation will be critical in navigating today’s market environment. We maintain conviction that we will be able to generate alpha for Vanguard shareholders over
the long term.
Vanguard Emerging Markets
Select Stock Fund Investment Advisors
|
|
|
| Fund Assets Managed
|
|
| Investment Advisor
| %
| $ Million
| Investment Strategy
|
| Pzena Investment Management, LLC
| 25
| 156
| Uses a deep-value approach that focuses on the most undervalued companies based on price-to-normalized
earnings. The firm believes that this value philosophy works well globally and is especially effective in emerging markets because of generally wider valuation spreads.
|
| Oaktree Fund Advisors, LLC
| 24
| 153
| Seeks securities that have been undervalued by investors. Oaktree’s investment process is driven by
bottom-up research, which includes extensive travel to meet company management and maintaining in-house models focused on deriving reliable cash-flow projections.
|
| Baillie Gifford Overseas Ltd.
| 24
| 152
| Believes that companies that can sustainably grow their business and increase earnings faster than market
average will perform best. Stock selection is driven by bottom-up, fundamental analysis, focusing on a company’s potential over a meaningful time period, typically three to five years and beyond.
|
| Wellington Management Company LLP
| 24
| 148
| Allocates the assets in its portion of the fund to a team of global analysts who seek to add value through
in-depth fundamental research and understanding of their industries. By covering the same companies over a period of many years, these investment professionals gain comprehensive insight to guide decisions for their
subportfolios.
|
| Cash Investments
| 3
| 20
| These short-term reserves are invested by Vanguard in equity index products to simulate investment in
stocks. Each advisor may also maintain a modest cash position.
|
About Your Fund’s Expenses
As a shareholder of the fund,
you incur ongoing costs, which include costs for portfolio management, administrative services, and shareholder reports (like this one), among others. Operating expenses, which are deducted from a fund’s gross
income, directly reduce the investment return of the fund.
A fund’s expenses are
expressed as a percentage of its average net assets. This figure is known as the expense ratio. The following examples are intended to help you understand the ongoing costs (in dollars) of investing in your fund and
to compare these costs with those of other mutual funds. The examples are based on an investment of $1,000 made at the beginning of the period shown and held for the entire period.
The accompanying table
illustrates your fund’s costs in two ways:
| •
| Based on actual fund return. This section helps you to estimate the actual expenses that you paid over the period. The ”Ending Account Value“ shown is derived from the fund‘s actual return, and the
third column shows the dollar amount that would have been paid by an investor who started with $1,000 in the fund. You may use the information here, together with the amount you invested, to estimate the expenses that
you paid over the period.
|
To do so, simply divide your
account value by $1,000 (for example, an $8,600 account value divided by $1,000 = 8.6), then multiply the result by the number given for your fund under the heading ”Expenses Paid During Period.“
| •
| Based on hypothetical 5% yearly return. This section is intended to help you compare your fund‘s costs with those of other mutual funds. It assumes that the fund had a yearly return of 5% before expenses, but that the
expense ratio is unchanged. In this case—because the return used is not the fund’s actual return—the results do not apply to your investment. The example is useful in making comparisons because the
Securities and Exchange Commission requires all mutual funds to calculate expenses based on a 5% return. You can assess your fund’s costs by comparing this hypothetical example with the hypothetical examples
that appear in shareholder reports of other funds.
|
Note that the expenses shown
in the table are meant to highlight and help you compare ongoing costs only and do not reflect transaction costs incurred by the fund for buying and selling securities. Further, the expenses do not include any purchase, redemption, or
account service fees described in the fund prospectus. If such fees were applied to your account, your costs would be higher. Your fund does not carry a “sales load.”
The calculations assume no
shares were bought or sold during the period. Your actual costs may have been higher or lower, depending on the amount of your investment and the timing of any purchases or redemptions.
You can find more information
about the fund’s expenses, including annual expense ratios, in the Financial Statements section of this report. For additional information on operating expenses and other shareholder costs, please refer to your
fund’s current prospectus.
| Six Months Ended October 31, 2022
|
|
|
|
| Emerging Markets Select Stock Fund
| Beginning
Account Value
4/30/2022
| Ending
Account Value
10/31/2022
| Expenses
Paid During
Period
|
| Based on Actual Fund Return
| $1,000.00
| $824.00
| $3.49
|
| Based on Hypothetical 5% Yearly Return
| 1,000.00
| 1,021.37
| 3.87
|
The calculations are
based on expenses incurred in the most recent six-month period. The fund’s annualized six-month expense ratio for that period is 0.76%. The dollar amounts shown as “Expenses Paid” are equal to the
annualized expense ratio multiplied by the average account value over the period, multiplied by the number of days in the most recent six-month period, then divided by the number of days in the most recent 12-month
period (184/365).
Emerging Markets Select Stock Fund
All of the returns in this
report represent past performance, which is not a guarantee of future results that may be achieved by the fund. (Current performance may be lower or higher than the performance data cited. For performance data current
to the most recent month-end, visit our website at vanguard.com/performance.) Note, too, that both investment returns and principal value can fluctuate widely, so an investor’s shares, when sold, could be worth
more or less than their original cost. The returns shown do not reflect taxes that a shareholder would pay on fund distributions or on the sale of fund shares.
Cumulative Performance: October
31, 2012, Through October 31, 2022
Initial Investment of $10,000
|
|
| Average Annual Total Returns
Periods Ended October 31, 2022
|
|
|
|
| One
Year
| Five
Years
| Ten
Years
| Final Value
of a $10,000
Investment
|

| Emerging Markets Select Stock Fund
| -31.16%
| -2.34%
| 1.41%
| $11,498
|

| FTSE Emerging Index
| -28.35
| -1.78
| 1.35
| 11,434
|

| MSCI All Country World Index ex USA
| -24.73
| -0.60
| 3.27
| 13,796
|
See Financial
Highlights for dividend and capital gains information.
Emerging Markets Select Stock Fund
| China
| 24.9%
|
| India
| 13.1
|
| Brazil
| 11.9
|
| Taiwan
| 10.8
|
| South Korea
| 7.9
|
| United States
| 5.5
|
| Hong Kong
| 4.6
|
| Indonesia
| 3.8
|
| Thailand
| 3.5
|
| South Africa
| 2.4
|
| Mexico
| 2.2
|
| United Kingdom
| 1.7
|
| Canada
| 1.1
|
| Hungary
| 1.0
|
| Other
| 5.6
|
The table reflects the fund’s
investments, except for short-term investments and derivatives.
Emerging Markets Select Stock Fund
The fund files its complete
schedule of portfolio holdings with the Securities and Exchange Commission (SEC) for the first and third quarters of each fiscal year as an exhibit to its reports on Form N-PORT. The fund’s Form N-PORT reports
are available on the SEC’s website at www.sec.gov.
|
|
| Shares
| Market
Value•
($000)
|
| Common Stocks (95.3%)
|
| Brazil (11.4%)
|
|
| Petroleo Brasileiro SA ADR (XNYS)
| 904,674
| 11,598
|
|
| Vale SA Class B ADR
| 563,073
| 7,286
|
|
| Ambev SA
| 2,121,666
| 6,572
|
|
| Cia Energetica de Minas Gerais Preference Shares
| 2,746,665
| 6,046
|
|
| Banco Bradesco SA ADR
| 1,411,609
| 5,350
|
|
| Itau Unibanco Holding SA Preference Shares
| 698,900
| 4,113
|
|
| B3 SA - Brasil Bolsa Balcao
| 1,332,100
| 3,879
|
|
| Centrais Eletricas Brasileiras SA
| 379,218
| 3,657
|
|
| Itau Unibanco Holding SA ADR
| 593,658
| 3,455
|
|
| Raizen SA Preference Shares
| 4,023,535
| 3,342
|
|
| Banco Bradesco SA Preference Shares
| 798,600
| 3,070
|
|
| Petroleo Brasileiro SA ADR
| 183,700
| 2,114
|
|
| Neoenergia SA
| 570,300
| 1,832
|
|
| Cia de Saneamento Basico do Estado de Sao Paulo
| 146,947
| 1,710
|
|
| Petroleo Brasileiro SA
| 264,473
| 1,703
|
| *
| Azul SA ADR
| 160,531
| 1,507
|
|
| TIM SA
| 478,100
| 1,222
|
|
| Banco Do Brasil SA
| 162,600
| 1,165
|
| *
| Magazine Luiza SA
| 621,020
| 537
|
| 1
| Hapvida Participacoes e Investimentos SA
| 324,862
| 491
|
|
| Raia Drogasil SA
| 94,470
| 481
|
|
| Hypera SA
| 18,424
| 181
|
|
| Totvs SA
| 21,400
| 137
|
|
| Caixa Seguridade Participacoes SA
| 68,870
| 118
|
|
|
|
| 71,566
|
| Canada (1.0%)
|
|
| First Quantum Minerals Ltd.
| 160,978
| 2,839
|
|
| Lundin Mining Corp.
| 372,945
| 1,955
|
|
| Parex Resources Inc.
| 102,230
| 1,559
|
| *
| Valeura Energy Inc.
| 264,800
| 132
|
|
|
|
| 6,485
|
|
|
| Shares
| Market
Value•
($000)
|
| China (23.7%)
|
| *
| Alibaba Group Holding Ltd.
| 2,134,340
| 16,594
|
|
| Tencent Holdings Ltd.
| 528,550
| 13,889
|
| *,1
| Meituan Class B
| 359,392
| 5,754
|
| *
| Trip.com Group Ltd. ADR
| 247,376
| 5,598
|
|
| Ping An Insurance Group Co. of China Ltd. Class H
| 990,527
| 3,965
|
|
| China Merchants Bank Co. Ltd. Class H
| 1,099,289
| 3,599
|
|
| China Overseas Land & Investment Ltd.
| 1,740,805
| 3,327
|
|
| Zijin Mining Group Co. Ltd. Class H
| 3,426,446
| 3,268
|
|
| JD.com Inc. Class A
| 169,070
| 3,079
|
| 1
| Ganfeng Lithium Co. Ltd. Class H
| 450,517
| 3,047
|
| *
| Shanghai International Airport Co. Ltd. Class A
| 407,510
| 2,981
|
| *
| Baidu Inc. Class A
| 296,686
| 2,844
|
|
| Contemporary Amperex Technology Co. Ltd. Class A (XSHE)
| 54,273
| 2,785
|
|
| China Construction Bank Corp. Class H
| 5,188,694
| 2,754
|
|
| China Tourism Group Duty Free Corp. Ltd. Class A
| 123,549
| 2,715
|
|
| Anhui Conch Cement Co. Ltd. Class H
| 1,006,625
| 2,591
|
|
| Aluminum Corp. of China Ltd. Class H
| 8,785,233
| 2,505
|
|
| Midea Group Co. Ltd. Class A
| 424,086
| 2,336
|
|
| Geely Automobile Holdings Ltd.
| 2,157,301
| 2,322
|
| *
| Air China Ltd. Class H
| 3,156,872
| 2,197
|
| 1
| WuXi AppTec Co. Ltd. Class H
| 267,524
| 2,147
|
| *
| Baidu Inc. ADR
| 27,944
| 2,140
|
|
| China Longyuan Power Group Corp. Ltd. Class H
| 1,786,350
| 2,041
|
|
| GF Securities Co. Ltd. Class H
| 1,948,400
| 1,982
|
| *
| China Tourism Group Duty Free Corp. Ltd. Class A (XHKG)
| 94,746
| 1,687
|
|
| ANTA Sports Products Ltd.
| 188,013
| 1,653
|
Emerging Markets Select Stock Fund
|
|
| Shares
| Market
Value•
($000)
|
|
| Muyuan Foods Co. Ltd.Class A
| 245,170
| 1,579
|
|
| Haier Smart Home Co. Ltd. Class H
| 625,800
| 1,566
|
| *
| Brilliance China Automotive Holdings Ltd.
| 3,486,000
| 1,501
|
| *
| KE Holdings Inc. ADR
| 147,459
| 1,501
|
|
| Nine Dragons Paper Holdings Ltd.
| 2,388,888
| 1,416
|
|
| Contemporary Amperex Technology Co. Ltd. Class A
| 27,500
| 1,411
|
|
| CITIC Securities Co. Ltd. Class H
| 903,554
| 1,350
|
|
| Riyue Heavy Industry Co. Ltd. Class A (XSHG)
| 439,054
| 1,332
|
|
| Weichai Power Co. Ltd. Class H
| 1,387,349
| 1,329
|
|
| ENN Energy Holdings Ltd.
| 132,041
| 1,313
|
|
| Li Ning Co. Ltd.
| 251,768
| 1,302
|
|
| Dongfeng Motor Group Co. Ltd. Class H
| 2,838,000
| 1,284
|
|
| Midea Group Co. Ltd. Class A (XSEC)
| 205,194
| 1,130
|
|
| Ping An Bank Co. Ltd. Class A
| 768,940
| 1,092
|
|
| Xtep International Holdings Ltd.
| 1,119,891
| 1,026
|
|
| China Oilfield Services Ltd. Class H
| 904,508
| 1,018
|
|
| Industrial & Commercial Bank of China Ltd. Class H
| 2,267,666
| 985
|
| 1
| Pharmaron Beijing Co. Ltd. Class H
| 283,084
| 955
|
|
| Minth Group Ltd.
| 474,000
| 935
|
|
| Sinoma Science & Technology Co. Ltd. Class A
| 353,800
| 869
|
| *
| BeiGene Ltd.
| 66,950
| 863
|
|
| Yunnan Energy New Material Co. Ltd. Class A
| 42,200
| 856
|
| 1
| CSC Financial Co. Ltd. Class H
| 1,047,657
| 760
|
|
| Yihai International Holding Ltd.
| 452,690
| 746
|
|
| Guangzhou Tinci Materials Technology Co. Ltd. Class A
| 126,300
| 736
|
|
| Shenzhou International Group Holdings Ltd.
| 105,500
| 732
|
| *
| Trip.com Group Ltd.
| 31,278
| 703
|
|
| Suofeiya Home Collection Co. Ltd. Class A
| 354,790
| 680
|
|
| China Resources Beer Holdings Co. Ltd.
| 131,800
| 622
|
| *
| Zai Lab Ltd.
| 266,900
| 614
|
|
| China Yangtze Power Co. Ltd. Class A
| 217,600
| 606
|
|
| Anker Innovations Technology Co. Ltd. Class A
| 80,600
| 598
|
|
| Bank of Ningbo Co. Ltd. Class A
| 160,000
| 522
|
|
|
| Shares
| Market
Value•
($000)
|
|
| China National Building Material Co. Ltd. Class H
| 884,093
| 513
|
| *
| Kingdee International Software Group Co. Ltd.
| 304,575
| 499
|
| *,1
| Haidilao International Holding Ltd.
| 326,000
| 484
|
| *
| Tencent Music Entertainment Group ADR
| 132,550
| 479
|
| *
| XPeng Inc. Class A
| 148,952
| 477
|
|
| China Railway Group Ltd. Class A
| 683,200
| 467
|
|
| CSPC Pharmaceutical Group Ltd.
| 443,199
| 455
|
|
| China Pacific Insurance Group Co. Ltd. Class H
| 281,922
| 454
|
|
| Shanghai Putailai New Energy Technology Co. Ltd. Class A
| 65,720
| 450
|
|
| Zoomlion Heavy Industry Science and Technology Co. Ltd. Class A
| 591,100
| 434
|
|
| JD.com Inc. ADR
| 11,146
| 416
|
|
| Baoshan Iron & Steel Co. Ltd. Class A
| 630,300
| 416
|
|
| Shandong Weigao Group Medical Polymer Co. Ltd. Class H
| 294,318
| 406
|
| *
| KE Holdings Inc. Class A
| 121,500
| 403
|
|
| Suofeiya Home Collection Co. Ltd. Class A (XSHE)
| 207,345
| 397
|
|
| Glodon Co. Ltd. Class A (XSHE)
| 58,400
| 396
|
| *,1
| Kuaishou Technology
| 95,900
| 396
|
|
| Lufax Holding Ltd. ADR
| 245,187
| 390
|
|
| Hangzhou Tigermed Consulting Co. Ltd. Class A
| 32,600
| 373
|
| *
| Yatsen Holding Ltd. ADR
| 326,250
| 369
|
|
| Shenzhen Mindray Bio-Medical Electronics Co. Ltd. Class A
| 8,100
| 362
|
|
| Zhejiang HangKe Technology Inc. Co Class A
| 47,879
| 328
|
|
| WuXi AppTec Co. Ltd. Class A
| 30,200
| 316
|
| *
| Grand Baoxin Auto Group Ltd.
| 6,482,000
| 313
|
|
| China Vanke Co. Ltd. Class H
| 243,700
| 313
|
|
| Sany Heavy Industry Co. Ltd. Class A
| 168,200
| 312
|
|
| NetEase Inc.
| 26,901
| 298
|
|
| Wuxi Lead Intelligent Equipment Co. Ltd. Class A
| 41,400
| 285
|
|
| Metallurgical Corp of China Ltd. Class A
| 652,600
| 258
|
|
| Zhongsheng Group Holdings Ltd.
| 66,311
| 252
|
| *
| Qinghai Salt Lake Industry Co. Ltd. Class A
| 79,800
| 236
|
| *,1
| Remegen Co. Ltd. Class H
| 37,359
| 235
|
Emerging Markets Select Stock Fund
|
|
| Shares
| Market
Value•
($000)
|
|
| CIMC Enric Holdings Ltd.
| 240,000
| 234
|
| *
| New Oriental Educatio Sp ADR
| 9,612
| 228
|
|
| SAIC Motor Corp. Ltd. Class A
| 114,500
| 216
|
|
| Yifeng Pharmacy Chain Co. Ltd. Class A (XSHG)
| 27,170
| 209
|
|
| Angang Steel Co. Ltd.Class A
| 560,600
| 189
|
| *
| Alibaba Group Holding Ltd. ADR
| 2,826
| 180
|
|
| Great Wall Motor Co. Ltd. Class H
| 146,500
| 160
|
|
| Yifeng Pharmacy Chain Co. Ltd. Class A
| 19,300
| 149
|
| 1
| Asymchem Laboratories Tianjin Co. Ltd. Class H
| 11,491
| 123
|
| *
| Microport Scientific Corp.
| 56,946
| 120
|
|
| Amoy Diagnostics Co. Ltd. Class A
| 37,094
| 119
|
|
| NetEase Inc. ADR
| 2,103
| 117
|
| *
| Vnet Group Inc. ADR
| 27,521
| 115
|
|
| Shanghai Fosun Pharmaceutical Group Co. Ltd. Class H
| 44,000
| 111
|
|
| Vinda International Holdings Ltd.
| 57,000
| 107
|
| 1
| Hangzhou Tigermed Consulting Co. Ltd. Class H
| 15,616
| 106
|
|
| Shenzhen Mindray Bio-Medical Electronics Co. Ltd. Class A (XSHE)
| 2,300
| 103
|
|
| Asymchem Laboratories Tianjin Co. Ltd. Class A
| 5,160
| 101
|
|
| Jinyu Bio-Technology Co. Ltd. Class A
| 73,900
| 84
|
| *
| Onewo Inc. Class H
| 21,415
| 81
|
|
| H World Group Ltd. AD
| 2,393
| 65
|
|
| Poly Developments and Holdings Group Co. Ltd. Class A
| 34,300
| 65
|
|
| Proya Cosmetics Co. Ltd. Class A
| 2,800
| 64
|
| *,1
| Venus MedTech Hangzhou Inc. Class H
| 48,977
| 60
|
| *
| GDS Holdings Ltd. ADR
| 6,127
| 53
|
|
| Country Garden Services Holdings Co. Ltd.
| 40,440
| 35
|
|
| Angang Steel Co. Ltd. Class H
| 73,662
| 15
|
|
| Amoy Diagnostics Co. Ltd. Class A (XSHE)
| 3,080
| 10
|
| *,2
| Tianhe Chemicals Group Ltd.
| 4,142,000
| —
|
|
|
|
| 149,133
|
| Cyprus (0.0%)
|
| *
| Galaxy Cosmos Mezz plc
| 110,618
| 18
|
| Czech Republic (0.4%)
|
|
| Komercni banka A/S
| 73,436
| 2,103
|
|
| CEZ A/S
| 8,341
| 273
|
|
|
|
| 2,376
|
|
|
| Shares
| Market
Value•
($000)
|
| Egypt (0.0%)
|
|
| Commercial International Bank Egypt SAE GDR (Registered)
| 2
| —
|
| Greece (0.6%)
|
| *
| Alpha Services and Holdings SA
| 2,986,676
| 2,766
|
|
| Hellenic Telecommunications Organization SA
| 75,316
| 1,183
|
|
|
|
| 3,949
|
| Hong Kong (4.4%)
|
|
| Galaxy Entertainment Group Ltd.
| 1,952,070
| 8,918
|
|
| Pacific Basin Shipping Ltd.
| 14,975,140
| 3,625
|
| *
| Sands China Ltd.
| 1,847,505
| 3,230
|
|
| Lenovo Group Ltd.
| 3,878,000
| 3,099
|
|
| Yue Yuen Industrial Holdings Ltd.
| 2,572,000
| 2,615
|
|
| AIA Group Ltd.
| 274,437
| 2,079
|
|
| VTech Holdings Ltd.
| 289,500
| 1,541
|
|
| Orient Overseas International Ltd.
| 104,814
| 1,532
|
| *
| Melco Resorts & Entertainment Ltd. ADR
| 130,301
| 713
|
|
| Kerry Properties Ltd.
| 99,000
| 156
|
| 1
| ESR Cayman Ltd.
| 45,606
| 78
|
|
|
|
| 27,586
|
| Hungary (0.9%)
|
|
| OTP Bank Nyrt
| 241,310
| 5,264
|
|
| MOL Hungarian Oil & Gas plc
| 98,379
| 591
|
|
|
|
| 5,855
|
| India (12.5%)
|
|
| Reliance Industries Ltd.
| 612,122
| 18,888
|
|
| Housing Development Finance Corp. Ltd.
| 172,975
| 5,172
|
|
| Axis Bank Ltd.
| 469,483
| 5,149
|
|
| Larsen & Toubro Ltd.
| 200,033
| 4,897
|
|
| Shriram Transport Finance Co. Ltd.
| 317,842
| 4,727
|
|
| ICICI Bank Ltd. ADR
| 192,267
| 4,238
|
|
| Bharti Airtel Ltd (XNSE)
| 413,482
| 4,158
|
|
| UltraTech Cement Ltd.
| 47,059
| 3,823
|
|
| Aurobindo Pharma Ltd.
| 524,778
| 3,412
|
|
| Tata Consultancy Services Ltd.
| 86,478
| 3,337
|
|
| Tech Mahindra Ltd.
| 204,449
| 2,629
|
|
| State Bank of India
| 377,274
| 2,620
|
| 1
| HDFC Life Insurance Co. Ltd.
| 376,278
| 2,459
|
|
| Kotak Mahindra Bank Ltd.
| 92,184
| 2,123
|
|
| Infosys Ltd. ADR
| 82,214
| 1,540
|
|
| Mahindra & Mahindra Ltd.
| 86,547
| 1,412
|
|
| ICICI Bank Ltd.
| 114,287
| 1,257
|
|
| Power Grid Corp. of India Ltd.
| 386,533
| 1,066
|
| 1
| SBI Life Insurance Co. Ltd.
| 60,556
| 928
|
|
| Piramal Enterprises Ltd.
| 66,542
| 684
|
|
| Bharat Electronics Ltd.
| 508,827
| 657
|
|
| UPL Ltd.
| 73,290
| 647
|
Emerging Markets Select Stock Fund
|
|
| Shares
| Market
Value•
($000)
|
| *
| Piramal Pharma Ltd.
| 266,168
| 530
|
|
| Apollo Hospitals Enterprise Ltd.
| 8,998
| 491
|
| *
| Zomato Ltd.
| 502,368
| 383
|
| *
| Fortis Healthcare Ltd.
| 96,586
| 324
|
|
| Tata Steel Ltd.
| 240,069
| 294
|
|
| Dabur India Ltd.
| 41,301
| 277
|
|
| PI Industries Ltd.
| 4,819
| 189
|
|
| Bharti Airtel Ltd.
| 31,225
| 166
|
|
|
|
| 78,477
|
| Indonesia (3.6%)
|
|
| Bank Rakyat Indonesia Persero Tbk PT
| 39,396,025
| 11,753
|
|
| Bank Mandiri Persero Tbk PT
| 7,321,200
| 4,946
|
|
| Semen Indonesia Persero Tbk PT
| 4,429,400
| 2,260
|
|
| Telkom Indonesia Persero Tbk PT
| 7,196,637
| 2,021
|
|
| Bank Central Asia Tbk PT
| 2,712,155
| 1,533
|
|
| Aneka Tambang Tbk
| 1,641,300
| 194
|
|
|
|
| 22,707
|
| Japan (0.1%)
|
| *
| Universal Entertainment Corp.
| 41,000
| 553
|
| Kenya (0.2%)
|
|
| Equity Group Holdings plc
| 2,758,414
| 1,062
|
| Mexico (2.1%)
|
|
| Grupo Financiero Banorte SAB de CV Class O
| 1,028,915
| 8,363
|
|
| Wal-Mart de Mexico SAB de CV
| 540,268
| 2,087
|
| *
| Cemex SAB de CV ADR
| 308,447
| 1,191
|
|
| Qualitas Controladora SAB de CV
| 143,044
| 562
|
|
| Grupo Mexico SAB de CV Series B
| 111,163
| 403
|
|
| Corp. Inmobiliaria Vesta SAB de CV
| 108,500
| 236
|
|
| Orbia Advance Corp. SAB de CV
| 132,500
| 224
|
|
|
|
| 13,066
|
| Netherlands (0.1%)
|
|
| ASML Holding NV
| 1,329
| 623
|
| Other (0.8%)
|
| 3
| Vanguard FTSE Emerging Markets ETF
| 150,681
| 5,342
|
| Philippines (0.4%)
|
|
| Bdo Unibank Inc.
| 1,037,747
| 2,294
|
|
| Ayala Land Inc.
| 484,700
| 215
|
|
|
|
| 2,509
|
| Poland (0.2%)
|
| *,1
| Allegro.eu SA
| 147,294
| 714
|
|
| KGHM Polska Miedz SA
| 34,440
| 689
|
|
|
|
| 1,403
|
| Romania (0.2%)
|
|
| Banca Transilvania SA
| 441,537
| 1,512
|
| Russia (0.0%)
|
| 2
| MMC Norilsk Nickel PJSC ADR
| 200,203
| —
|
| *,2
| Sberbank of Russia PJSC
| 1,473,153
| —
|
|
|
| Shares
| Market
Value•
($000)
|
| *,2
| Mobile TeleSystems PJSC ADR
| 93,946
| —
|
| *,2
| Moscow Exchange MICEX-RTS PJSC
| 536,630
| —
|
| 2
| Magnit PJSC GDR (Registered)
| 2
| —
|
| 2
| MMC Norilsk Nickel PJSC
| 1,247
| —
|
| *,2
| Sberbank of Russia PJSC ADR
| 476,234
| —
|
| 2
| LUKOIL PJSC ADR
| 102,385
| —
|
| 2
| Novatek PJSC GDR (Registered)
| 6,724
| —
|
| *,2,4
| Ozon Holdings plc ADR
| 37,493
| —
|
| 2
| Magnit PJSC
| 12,527
| —
|
| 2
| Gazprom PJSC
| 926,846
| —
|
|
|
|
| —
|
| Saudi Arabia (0.6%)
|
|
| Saudi British Bank
| 180,813
| 2,095
|
| 1
| Saudi Arabian Oil Co.
| 163,398
| 1,516
|
|
|
|
| 3,611
|
| Singapore (0.7%)
|
|
| Wilmar International Ltd.
| 1,612,000
| 4,416
|
| South Africa (2.3%)
|
|
| Sasol Ltd.
| 210,194
| 3,533
|
|
| AngloGold Ashanti Ltd. ADR
| 267,213
| 3,487
|
|
| Impala Platinum Holdings Ltd.
| 224,903
| 2,303
|
|
| FirstRand Ltd.
| 315,005
| 1,101
|
|
| Thungela Resources Ltd.
| 51,383
| 784
|
|
| Gold Fields Ltd.
| 85,598
| 686
|
|
| Naspers Ltd. Class N
| 6,400
| 660
|
|
| Reunert Ltd.
| 262,523
| 660
|
| *
| Discovery Ltd.
| 80,486
| 527
|
|
| Sibanye Stillwater Ltd.
| 193,046
| 452
|
|
| Harmony Gold Mining Co. Ltd.
| 81,675
| 226
|
|
| Old Mutual Ltd. (XZIM)
| 365,405
| 207
|
|
|
|
| 14,626
|
| South Korea (7.5%)
|
|
| Samsung Electronics Co. Ltd.
| 305,176
| 12,701
|
|
| LG Chem Ltd.
| 12,491
| 5,482
|
|
| SK Hynix Inc.
| 80,367
| 4,653
|
|
| Samsung SDI Co. Ltd.
| 6,880
| 3,550
|
|
| Hankook Tire & Technology Co. Ltd.
| 136,687
| 3,501
|
|
| POSCO Holdings Inc.
| 18,626
| 3,246
|
|
| Hyundai Motor Co.
| 23,863
| 2,750
|
|
| Samsung Electronics Co. Ltd. Preference Shares
| 71,045
| 2,655
|
|
| DB Insurance Co. Ltd.
| 61,070
| 2,410
|
|
| Hana Financial Group Inc.
| 60,283
| 1,743
|
|
| Shinhan Financial Group Co. Ltd.
| 53,870
| 1,369
|
| *
| Korea Shipbuilding & Offshore Engineering Co. Ltd.
| 21,091
| 1,074
|
|
| KB Financial Group Inc.
| 26,800
| 902
|
|
| Doosan Bobcat Inc.
| 36,396
| 854
|
|
| NAVER Corp.
| 4,531
| 538
|
|
|
|
| 47,428
|
Emerging Markets Select Stock Fund
|
|
| Shares
| Market
Value•
($000)
|
| Taiwan (10.3%)
|
|
| Taiwan Semiconductor Manufacturing Co. Ltd.
| 2,854,656
| 34,319
|
|
| Hon Hai Precision Industry Co. Ltd.
| 2,323,685
| 7,380
|
|
| MediaTek Inc.
| 281,014
| 5,122
|
|
| Compal Electronics Inc.
| 6,334,000
| 4,143
|
|
| Lite-On Technology Corp.
| 1,878,000
| 3,719
|
|
| Elite Material Co. Ltd.
| 504,000
| 2,280
|
|
| United Microelectronics Corp.
| 1,455,926
| 1,751
|
|
| United Integrated Services Co. Ltd.
| 328,000
| 1,472
|
|
| E Ink Holdings Inc.
| 221,000
| 1,404
|
|
| Chroma ATE Inc.
| 160,000
| 874
|
|
| ASPEED Technology Inc.
| 11,553
| 599
|
|
| Airtac International Group
| 25,783
| 590
|
|
| Nanya Technology Corp.
| 199,000
| 335
|
|
| Realtek Semiconductor Corp.
| 33,738
| 266
|
|
| Unimicron Technology Corp.
| 60,800
| 234
|
|
| Globalwafers Co. Ltd.
| 14,456
| 160
|
|
| Parade Technologies Ltd.
| 3,058
| 58
|
|
|
|
| 64,706
|
| Thailand (3.3%)
|
|
| PTT Exploration & Production PCL
| 912,100
| 4,361
|
|
| Charoen Pokphand Foods PCL
| 5,818,600
| 3,869
|
|
| SCB X PCL NVDR
| 1,316,300
| 3,678
|
|
| Kasikornbank PCL
| 644,207
| 2,479
|
|
| Kasikornbank PCL NVDR
| 499,579
| 1,922
|
|
| Bangkok Bank PCL NVDR
| 469,100
| 1,796
|
|
| Bangkok Bank PCL (Registered)
| 215,800
| 827
|
| *
| Thai Life Insurance PCL
| 1,897,897
| 774
|
|
| Bangkok Dusit Medical Services PCL Class F
| 469,300
| 364
|
|
| CP ALL PCL
| 181,500
| 286
|
|
| PTT Exploration & Production PCL (XBKK)
| 39,800
| 190
|
|
| Central Pattana PCL
| 92,270
| 167
|
|
|
|
| 20,713
|
| Turkey (0.4%)
|
|
| Akbank TAS
| 2,890,926
| 2,273
|
| United Arab Emirates (0.7%)
|
|
| Abu Dhabi Commercial Bank PJSC
| 1,508,969
| 3,884
|
|
| Emaar Properties PJSC
| 182,311
| 301
|
|
| Borouge plc
| 351,373
| 260
|
|
|
|
| 4,445
|
| United Kingdom (1.6%)
|
|
| Standard Chartered plc
| 762,825
| 4,558
|
|
| Fresnillo plc
| 241,232
| 2,017
|
|
| Antofagasta plc
| 88,926
| 1,198
|
| *,1
| Network International Holdings plc
| 285,409
| 1,069
|
|
| Anglo American plc
| 29,712
| 890
|
|
| Polymetal International plc
| 121,016
| 286
|
|
| Hikma Pharmaceuticals plc
| 16,009
| 230
|
|
|
|
| 10,248
|
|
|
| Shares
| Market
Value•
($000)
|
| United States (5.3%)
|
|
| Credicorp Ltd.
| 52,800
| 7,728
|
| *
| Flex Ltd.
| 241,216
| 4,723
|
| *
| MercadoLibre Inc.
| 4,814
| 4,340
|
|
| Freeport-McMoRan Inc.
| 126,596
| 4,012
|
|
| Cognizant Technology Solutions Corp. Class A
| 51,280
| 3,192
|
| *
| Coupang Inc.
| 128,048
| 2,211
|
| *
| Copa Holdings SA Class A
| 25,130
| 1,890
|
| *
| Afya Ltd. Class A
| 87,070
| 1,283
|
| *
| PagSeguro Digital Ltd. Class A
| 87,254
| 1,194
|
|
| Ternium SA ADR
| 25,307
| 729
|
|
| Patria Investments Ltd. Class A
| 44,816
| 637
|
| *
| Sea Ltd. ADR
| 12,438
| 618
|
|
| Yum China Holdings Inc.
| 5,513
| 228
|
| *
| StoneCo. Ltd. Class A
| 18,159
| 191
|
| *
| MakeMyTrip Ltd.
| 3,118
| 87
|
| *,2
| Yandex NV Class A
| 11,746
| —
|
|
|
|
| 33,063
|
| Vietnam (0.0%)
|
| 1
| Vinhomes JSC
| 107,002
| 194
|
Total Common Stocks
(Cost $714,406)
| 599,945
|
| Temporary Cash Investments (4.3%)
|
| Money Market Fund (4.3%)
|
| 5,6
| Vanguard Market Liquidity Fund, 3.117% (Cost $27,135)
| 271,459
| 27,141
|
| Total Investments (99.6%) (Cost $741,541)
| 627,086
|
| Other Assets and Liabilities—Net (0.4%)
| 2,316
|
| Net Assets (100%)
| 629,402
|
| Cost is in $000.
|
| •
| See Note A in Notes to Financial Statements.
|
| *
| Non-income-producing security.
|
| 1
| Security exempt from registration under Rule 144A of the Securities Act of 1933. Such securities may be sold in transactions exempt from registration, normally to qualified
institutional buyers. At October 31, 2022, the aggregate value was $21,516,000, representing 3.4% of net assets.
|
| 2
| Security value determined using significant unobservable inputs.
|
| 3
| Considered an affiliated company of the fund as the issuer is another member of The Vanguard Group.
|
| 4
| Includes partial security positions on loan to broker-dealers. The total value of securities on loan is $0.
|
| 5
| Affiliated money market fund available only to Vanguard funds and certain trusts and accounts managed by Vanguard. Rate shown is the 7-day yield.
|
| 6
| Collateral of $630,000 was received for securities on loan.
|
|
| ADR—American Depositary Receipt.
|
|
| GDR—Global Depositary Receipt.
|
|
| NVDR—Non-Voting Depository Receipt.
|
Emerging Markets Select Stock Fund
Derivative Financial
Instruments Outstanding as of Period End
| Futures Contracts
|
|
|
|
| ($000)
|
|
| Expiration
| Number of
Long (Short)
Contracts
| Notional
Amount
| Value and
Unrealized
Appreciation
(Depreciation)
|
| Long Futures Contracts
|
|
|
|
|
| MSCI Emerging Markets Index
| December 2022
| 519
| 22,151
| (2,014)
|
See accompanying
Notes, which are an integral part of the Financial Statements.
Emerging Markets Select Stock Fund
Statement of Assets and Liabilities
|
|
| ($000s, except shares and per-share amounts)
| Amount
|
| Assets
|
|
| Investments in Securities, at Value1
|
|
| Unaffiliated Issuers (Cost $707,872)
| 594,603
|
| Affiliated Issuers (Cost $33,669)
| 32,483
|
| Total Investments in Securities
| 627,086
|
| Investment in Vanguard
| 26
|
| Cash
| 1,530
|
| Cash Collateral Pledged—Futures Contracts
| 1,137
|
| Foreign Currency, at Value (Cost $1,406)
| 1,432
|
| Receivables for Investment Securities Sold
| 1,866
|
| Receivables for Accrued Income
| 1,287
|
| Receivables for Capital Shares Issued
| 252
|
| Total Assets
| 634,616
|
| Liabilities
|
|
| Payables for Investment Securities Purchased
| 1,622
|
| Collateral for Securities on Loan
| 630
|
| Payables to Investment Advisor
| 803
|
| Payables for Capital Shares Redeemed
| 501
|
| Payables to Vanguard
| 87
|
| Variation Margin Payable—Futures Contracts
| 67
|
| Deferred Foreign Capital Gains Taxes
| 1,504
|
| Total Liabilities
| 5,214
|
| Net Assets
| 629,402
|
| 1 Includes $0 of securities on loan.
|
|
| At October 31, 2022, net assets consisted of:
|
|
|
|
|
| Paid-in Capital
| 789,080
|
| Total Distributable Earnings (Loss)
| (159,678)
|
| Net Assets
| 629,402
|
|
|
| Net Assets
|
|
Applicable to 36,122,580 outstanding $.001 par value shares of
beneficial interest (unlimited authorization)
| 629,402
|
| Net Asset Value Per Share
| $17.42
|
See accompanying
Notes, which are an integral part of the Financial Statements.
Emerging Markets Select Stock Fund
|
|
|
| Year Ended
October 31, 2022
|
|
| ($000)
|
| Investment Income
|
|
| Income
|
|
| Dividends—Unaffiliated Issuers1
| 32,105
|
| Dividends—Affiliated Issuers
| 169
|
| Interest—Unaffiliated Issuers
| 10
|
| Interest—Affiliated Issuers
| 384
|
| Securities Lending—Net
| 30
|
| Total Income
| 32,698
|
| Expenses
|
|
| Investment Advisory Fees—Note B
|
|
| Basic Fee
| 4,203
|
| Performance Adjustment
| (315)
|
| The Vanguard Group—Note C
|
|
| Management and Administrative
| 2,110
|
| Marketing and Distribution
| 72
|
| Custodian Fees
| 158
|
| Auditing Fees
| 35
|
| Shareholders’ Reports
| 41
|
| Trustees’ Fees and Expenses
| —
|
| Other Expenses
| 16
|
| Total Expenses
| 6,320
|
| Net Investment Income
| 26,378
|
| Realized Net Gain (Loss)
|
|
| Capital Gains Distributions Received – Affiliated Issuers
| 1
|
| Investment Securities Sold—Unaffiliated Issuers2
| (47,847)
|
| Investment Securities Sold—Affiliated Issuers
| (548)
|
| Futures Contracts
| (10,831)
|
| Forward Currency Contracts
| (18)
|
| Foreign Currencies
| (624)
|
| Realized Net Gain (Loss)
| (59,867)
|
| Change in Unrealized Appreciation (Depreciation)
|
|
| Investment Securities—Unaffiliated Issuers3
| (258,668)
|
| Investment Securities—Affiliated Issuers
| (1,205)
|
| Futures Contracts
| (1,775)
|
| Foreign Currencies
| 36
|
| Change in Unrealized Appreciation (Depreciation)
| (261,612)
|
| Net Increase (Decrease) in Net Assets Resulting from Operations
| (295,101)
|
| 1
| Dividends are net of foreign withholding taxes of $2,401,000.
|
| 2
| Realized gain (loss) is net of foreign capital gain taxes of $644,000.
|
| 3
| The change in unrealized appreciation (depreciation) is net of the change in deferred foreign capital gains taxes of ($1,654,000).
|
See accompanying
Notes, which are an integral part of the Financial Statements.
Emerging Markets Select Stock Fund
Statement of Changes in Net Assets
|
|
|
| Year Ended October 31,
|
|
| 2022
($000)
| 2021
($000)
|
|
|
|
|
| Increase (Decrease) in Net Assets
|
|
|
| Operations
|
|
|
| Net Investment Income
| 26,378
| 15,932
|
| Realized Net Gain (Loss)
| (59,867)
| 57,460
|
| Change in Unrealized Appreciation (Depreciation)
| (261,612)
| 77,997
|
| Net Increase (Decrease) in Net Assets Resulting from Operations
| (295,101)
| 151,389
|
| Distributions
|
|
|
| Total Distributions
| (59,107)
| (8,567)
|
| Capital Share Transactions
|
|
|
| Issued
| 179,568
| 384,600
|
| Issued in Lieu of Cash Distributions
| 50,609
| 7,584
|
| Redeemed
| (220,976)
| (230,893)
|
| Net Increase (Decrease) from Capital Share Transactions
| 9,201
| 161,291
|
| Total Increase (Decrease)
| (345,007)
| 304,113
|
| Net Assets
|
|
|
| Beginning of Period
| 974,409
| 670,296
|
| End of Period
| 629,402
| 974,409
|
See accompanying
Notes, which are an integral part of the Financial Statements.
Emerging Markets Select Stock Fund
For a Share Outstanding
Throughout Each Period
| Year Ended October 31,
|
| 2022
| 2021
| 2020
| 2019
| 2018
|
| Net Asset Value, Beginning of Period
| $27.09
| $22.18
| $21.87
| $19.68
| $22.56
|
| Investment Operations
|
|
|
|
|
|
| Net Investment Income1
| .715
| .457
| .298
| .4742
| .414
|
| Net Realized and Unrealized Gain (Loss) on Investments
| (8.724)
| 4.729
| .483
| 2.208
| (2.943)
|
| Total from Investment Operations
| (8.009)
| 5.186
| .781
| 2.682
| (2.529)
|
| Distributions
|
|
|
|
|
|
| Dividends from Net Investment Income
| (.486)
| (.276)
| (.471)
| (.492)
| (.351)
|
| Distributions from Realized Capital Gains
| (1.175)
| —
| —
| —
| —
|
| Total Distributions
| (1.661)
| (.276)
| (.471)
| (.492)
| (.351)
|
| Net Asset Value, End of Period
| $17.42
| $27.09
| $22.18
| $21.87
| $19.68
|
| Total Return3
| -31.16%
| 23.44%
| 3.51%
| 13.96%
| -11.39%
|
| Ratios/Supplemental Data
|
|
|
|
|
|
| Net Assets, End of Period (Millions)
| $629
| $974
| $670
| $702
| $564
|
| Ratio of Total Expenses to Average Net Assets4
| 0.78%
| 0.84%
| 0.85%
| 0.93%
| 0.94%
|
| Ratio of Net Investment Income to Average Net Assets
| 3.26%
| 1.65%
| 1.43%
| 2.25%2
| 1.85%
|
| Portfolio Turnover Rate
| 41%
| 48%
| 52%
| 46%
| 76%
|
| 1
| Calculated based on average shares outstanding.
|
| 2
| Net investment income per share and the ratio of net investment income to average net assets include $0.071 and 0.34%, respectively, resulting from a special dividend from Naspers
Ltd. in September 2019.
|
| 3
| Total returns do not include account service fees that may have applied in the periods shown. Fund prospectuses provide information about any applicable account service fees.
|
| 4
| Includes performance-based investment advisory fee increases (decreases) of (0.04%), 0.02%, (0.01%), 0.07%, and 0.05%.
|
See accompanying
Notes, which are an integral part of the Financial Statements.
Emerging Markets Select Stock Fund
Notes to Financial Statements
Vanguard Emerging Markets
Select Stock Fund is registered under the Investment Company Act of 1940 as an open-end investment company, or mutual fund.
The fund invests in securities
of foreign issuers, which may subject it to investment risks not normally associated with investing in securities of U.S. corporations. Significant market disruptions, such as those caused by pandemics (e.g., COVID-19
pandemic), natural or environmental disasters, war (e.g., Russia’s invasion of Ukraine), acts of terrorism, or other events, can adversely affect local and global markets and normal market operations. Any such
disruptions could have an adverse impact on the value of the fund’s investments and fund performance.
| A.
| The following significant accounting policies conform to generally accepted accounting principles for U.S. investment companies. The fund consistently follows such policies in preparing its financial statements.
|
1. Security Valuation:
Securities are valued as of the close of trading on the New York Stock Exchange (generally 4 p.m., Eastern time) on the valuation date. Equity securities are valued at the latest quoted sales prices or official
closing prices taken from the primary market in which each security trades; such securities not traded on the valuation date are valued at the mean of the latest quoted bid and asked prices. Securities for which
market quotations are not readily available, or whose values have been affected by events occurring before the fund’s pricing time but after the close of the securities’ primary markets, are valued by
methods deemed by the valuation designee to represent fair value and subject to oversight by the board of trustees. These procedures include obtaining quotations from an independent pricing service, monitoring
news to identify significant market- or security-specific events, and evaluating changes in the values of foreign market proxies (for example, ADRs, futures contracts, or exchange-traded funds), between the time the
foreign markets close and the fund’s pricing time. When fair-value pricing is employed, the prices of securities used by a fund to calculate its net asset value may differ from quoted or published prices for the
same securities. Investments in Vanguard Market Liquidity Fund are valued at that fund's net asset value. Temporary cash investments are valued using the latest bid prices or using valuations based on a matrix system
(which considers such factors as security prices, yields, maturities, and ratings), both as furnished by independent pricing services.
2. Foreign Currency:
Securities and other assets and liabilities denominated in foreign currencies are translated into U.S. dollars using exchange rates obtained from an independent third party as of the fund’s pricing time on the
valuation date. Realized gains (losses) and unrealized appreciation (depreciation) on investment securities include the effects of changes in exchange rates since the securities were purchased, combined with the
effects of changes in security prices. Fluctuations in the value of other assets and liabilities resulting from changes in exchange rates are recorded as unrealized foreign currency gains (losses) until the assets or
liabilities are settled in cash, at which time they are recorded as realized foreign currency gains (losses).
3. Futures Contracts:
The fund uses index futures contracts to a limited extent, with the objective of maintaining full exposure to the stock market while maintaining liquidity. The fund may purchase or sell futures contracts to achieve a
desired level of investment, whether to accommodate portfolio turnover or cash flows from capital share transactions. The primary risks associated with the use of futures contracts are imperfect correlation between
changes in market values of stocks held by the fund and the prices of futures contracts, and the possibility of an illiquid market. Counterparty risk involving futures is mitigated because a regulated clearinghouse is
the counterparty instead of the clearing broker. To further mitigate counterparty risk, the fund trades futures contracts on an exchange, monitors the financial strength of its clearing brokers and
Emerging Markets Select Stock Fund
clearinghouse, and has entered into clearing
agreements with its clearing brokers. The clearinghouse imposes initial margin requirements to secure the fund’s performance and requires daily settlement of variation margin representing changes in the market
value of each contract. Any securities pledged as initial margin for open contracts are noted in the Schedule of Investments.
Futures contracts are valued
at their quoted daily settlement prices. The notional amounts of the contracts are not recorded in the Statement of Assets and Liabilities. Fluctuations in the value of the contracts are recorded in the Statement of
Assets and Liabilities as an asset (liability) and in the Statement of Operations as unrealized appreciation (depreciation) until the contracts are closed, when they are recorded as realized gains (losses) on futures
contracts.
During the year ended October
31, 2022, the fund’s average investments in long and short futures contracts represented 4% and 0% of net assets, respectively, based on the average of the notional amounts at each quarter-end during the
period.
4. Forward Currency
Contracts: The fund enters into forward currency contracts to protect the value of securities and related receivables and payables against changes in future foreign exchange rates. The fund’s risks in using
these contracts include movement in the values of the foreign currencies relative to the U.S. dollar and the ability of the counterparties to fulfill their obligations under the contracts. The fund mitigates its
counterparty risk by entering into forward currency contracts only with a diverse group of prequalified counterparties, monitoring their financial strength, entering into master netting arrangements with its
counterparties, and requiring its counterparties to transfer collateral as security for their performance. In the absence of a default, the collateral pledged or received by the fund cannot be repledged, resold, or
rehypothecated. The master netting arrangements provide that, in the event of a counterparty’s default (including bankruptcy), the fund may terminate the forward currency contracts, determine the net amount owed
by either party in accordance with its master netting arrangements, and sell or retain any collateral held up to the net amount owed to the fund under the master netting arrangements. The forward currency contracts
contain provisions whereby a counterparty may terminate open contracts if the fund’s net assets decline below a certain level, triggering a payment by the fund if the fund is in a net liability position at the
time of the termination. The payment amount would be reduced by any collateral the fund has pledged. Any securities pledged as collateral for open contracts are noted in the Schedule of Investments. The value of
collateral received or pledged is compared daily to the value of the forward currency contracts exposure with each counterparty, and any difference, if in excess of a specified minimum transfer amount, is adjusted and
settled within two business days.
Forward currency contracts are
valued at their quoted daily prices obtained from an independent third party, adjusted for currency risk based on the expiration date of each contract. The notional amounts of the contracts are not recorded in the
Statement of Assets and Liabilities. Fluctuations in the value of the contracts are recorded in the Statement of Assets and Liabilities as an asset (liability) and in the Statement of Operations as unrealized
appreciation (depreciation) until the contracts are closed, when they are recorded as realized gains (losses) on forward currency contracts.
During the year ended October
31, 2022, the fund’s average investment in forward currency contracts represented less than 1% of net assets, based on the average of the notional amounts at each quarter-end during the period. The fund had no
open forward currency contracts at October 31, 2022.
Emerging Markets Select Stock Fund
5. Federal Income Taxes:
The fund intends to continue to qualify as a regulated investment company and distribute virtually all of its taxable income. The fund’s tax returns are open to examination by the relevant tax authorities until
expiration of the applicable statute of limitations, which is generally three years after the filing of the tax return. Management has analyzed the fund’s tax positions taken for all open federal and state
income tax years, and has concluded that no provision for income tax is required in the fund’s financial statements.
6. Distributions:
Distributions to shareholders are recorded on the ex-dividend date. Distributions are determined on a tax basis at the fiscal year-end and may differ from net investment income and realized capital gains for financial
reporting purposes.
7. Securities Lending:
To earn additional income, the fund lends its securities to qualified institutional borrowers. Security loans are subject to termination by the fund at any time, and are required to be secured at all times by
collateral in an amount at least equal to the market value of securities loaned. Daily market fluctuations could cause the value of loaned securities to be more or less than the value of the collateral received. When
this occurs, the collateral is adjusted and settled before the opening of the market on the next business day. The fund further mitigates its counterparty risk by entering into securities lending transactions only
with a diverse group of prequalified counterparties, monitoring their financial strength, and entering into master securities lending agreements with its counterparties. The master securities lending agreements
provide that, in the event of a counterparty’s default (including bankruptcy), the fund may terminate any loans with that borrower, determine the net amount owed, and sell or retain the collateral up to the net
amount owed to the fund; however, such actions may be subject to legal proceedings. While collateral mitigates counterparty risk, in the event of a default, the fund may experience delays and costs in recovering the
securities loaned. The fund invests cash collateral received in Vanguard Market Liquidity Fund, and records a liability in the Statement of Assets and Liabilities for the return of the collateral, during the period
the securities are on loan. Collateral investments in Vanguard Market Liquidity Fund are subject to market appreciation or depreciation. Securities lending income represents fees charged to borrowers plus income
earned on invested cash collateral, less expenses associated with the loan. During the term of the loan, the fund is entitled to all distributions made on or in respect of the loaned securities.
8. Credit Facilities and
Interfund Lending Program: The fund and certain other funds managed by The Vanguard Group ("Vanguard") participate in a $4.4 billion committed credit facility provided by a syndicate of lenders pursuant to a credit
agreement and an uncommitted credit facility provided by Vanguard. Both facilities may be renewed annually. Each fund is individually liable for its borrowings, if any, under the credit facilities. Borrowings may be
utilized for temporary or emergency purposes and are subject to the fund’s regulatory and contractual borrowing restrictions. With respect to the committed credit facility, the participating funds are charged
administrative fees and an annual commitment fee of 0.10% of the undrawn committed amount of the facility, which are allocated to the funds based on a method approved by the fund’s board of trustees and included
in Management and Administrative expenses on the fund’s Statement of Operations. Any borrowings under either facility bear interest at an agreed-upon spread plus the higher of the federal funds effective rate,
the overnight bank funding rate, or the Daily Simple Secured Overnight Financing Rate inclusive of an additional agreed-upon spread. However, borrowings under the uncommitted credit facility may bear interest based
upon an alternate rate agreed to by the fund and Vanguard.
In accordance with an
exemptive order (the “Order”) from the SEC, the fund may participate in a joint lending and borrowing program that allows registered open-end Vanguard funds to borrow
Emerging Markets Select Stock Fund
money from and lend money to each other for
temporary or emergency purposes (the “Interfund Lending Program”), subject to compliance with the terms and conditions of the Order, and to the extent permitted by the fund’s investment objective and
investment policies. Interfund loans and borrowings normally extend overnight but can have a maximum duration of seven days. Loans may be called on one business day’s notice. The interest rate to be charged is
governed by the conditions of the Order and internal procedures adopted by the board of trustees. The board of trustees is responsible for overseeing the Interfund Lending Program.
For the year ended October 31,
2022, the fund did not utilize the credit facilities or the Interfund Lending Program.
9. Other: Dividend
income is recorded on the ex-dividend date. Non-cash dividends included in income, if any, are recorded at the fair value of the securities received. Interest income includes income distributions received from
Vanguard Market Liquidity Fund and is accrued daily. Premiums and discounts on debt securities are amortized and accreted, respectively, to interest income over the lives of the respective securities, except for
premiums on certain callable debt securities that are amortized to the earliest call date. Security transactions are accounted for on the date securities are bought or sold. Costs used to determine realized gains
(losses) on the sale of investment securities are those of the specific securities sold.
Taxes on foreign dividends and
capital gains have been provided for in accordance with the fund’s understanding of the applicable countries’ tax rules and rates. Deferred foreign capital gains tax, if any, is accrued daily based upon
net unrealized gains.
| B.
| The investment advisory firms Wellington Management Company llp, Baillie Gifford Overseas Ltd., Oaktree Fund Advisors, LLC, and Pzena Investment Management, LLC, each provide investment advisory services to a portion of the fund for a
fee calculated at an annual percentage rate of average net assets managed by the advisor. The basic fees of Wellington Management Company llp, Baillie Gifford Overseas Ltd., Oaktree Fund Advisors, LLC, and Pzena Investment Management, LLC are subject to quarterly adjustments based on performance relative to the
FTSE Emerging Index for the preceding three years.
|
Vanguard manages the cash
reserves of the fund as described below.
For the year ended October 31,
2022, the aggregate investment advisory fee paid to all advisors represented an effective annual basic rate of 0.52% of the fund’s average net assets, before a net decrease of $315,000 (0.04%) based on
performance.
| C.
| In accordance with the terms of a Funds' Service Agreement (the “FSA”) between Vanguard and the fund, Vanguard furnishes to the fund corporate management, administrative, marketing, distribution and cash
management services at Vanguard’s cost of operations (as defined by the FSA). These costs of operations are allocated to the fund based on methods and guidelines approved by the board of trustees and are
generally settled twice a month.
|
Upon the request of Vanguard,
the fund may invest up to 0.40% of its net assets as capital in Vanguard. At October 31, 2022, the fund had contributed to Vanguard capital in the amount of $26,000, representing less than 0.01% of the fund’s
net assets and 0.01% of Vanguard’s capital received pursuant to the FSA. The fund’s trustees and officers are also directors and employees, respectively, of Vanguard.
Emerging Markets Select Stock Fund
| D.
| Various inputs may be used to determine the value of the fund’s investments and derivatives. These inputs are summarized in three broad levels for financial statement purposes. The inputs or methodologies used
to value securities are not necessarily an indication of the risk associated with investing in those securities.
|
Level 1—Quoted prices in active markets for identical securities.
Level 2—Other significant observable inputs (including quoted prices for similar securities, interest rates, prepayment speeds, credit risk, etc.).
Level 3—Significant unobservable inputs (including the fund’s own assumptions used to determine the fair value of investments). Any investments and derivatives valued with significant
unobservable inputs are noted on the Schedule of Investments.
The following table summarizes
the market value of the fund’s investments and derivatives as of October 31, 2022, based on the inputs used to value them:
|
| Level 1
($000)
| Level 2
($000)
| Level 3
($000)
| Total
($000)
|
| Investments
|
|
|
|
|
| Assets
|
|
|
|
|
| Common Stocks—North and South America
| 124,180
| —
| —
| 124,180
|
| Common Stocks—Other
| 26,971
| 448,794
| —
| 475,765
|
| Temporary Cash Investments
| 27,141
| —
| —
| 27,141
|
| Total
| 178,292
| 448,794
| —
| 627,086
|
| Derivative Financial Instruments
|
|
|
|
|
| Liabilities
|
|
|
|
|
| Futures Contracts1
| 2,014
| —
| —
| 2,014
|
| 1
| Includes cumulative appreciation (depreciation) on futures contracts and centrally cleared swaps, if any, as reported in the Schedule of Investments. Only current
day’s variation margin is reported within the Statement of Assets and Liabilities.
|
| E.
| At October 31, 2022, the fair values of derivatives were reflected in the Statement of Assets and Liabilities as follows:
|
| Statement of Assets and Liabilities
| Equity
Contracts
($000)
| Foreign
Exchange
Contracts
($000)
| Total
($000)
|
| Unrealized Depreciation—Futures Contracts1
| 2,014
| —
| 2,014
|
| 1
| Includes cumulative appreciation (depreciation) on futures contracts and centrally cleared swaps, if any, as reported in the Schedule of Investments. Only current
day’s variation margin is reported within the Statement of Assets and Liabilities.
|
Realized net gain (loss) and
the change in unrealized appreciation (depreciation) on derivatives for the year ended October 31, 2022, were:
| Realized Net Gain (Loss) on Derivatives
| Equity
Contracts
($000)
| Foreign
Exchange
Contracts
($000)
| Total
($000)
|
| Futures Contracts
| (10,831)
| —
| (10,831)
|
| Forward Currency Contracts
| —
| (18)
| (18)
|
| Realized Net Gain (Loss) on Derivatives
| (10,831)
| (18)
| (10,849)
|
Emerging Markets Select Stock Fund
|
| Equity
Contracts
($000)
| Foreign
Exchange
Contracts
($000)
| Total
($000)
|
| Change in Unrealized Appreciation (Depreciation) on Derivatives
|
| Futures Contracts
| (1,775)
| —
| (1,775)
|
| F.
| Permanent differences between book-basis and tax-basis components of net assets are reclassified among capital accounts in the financial statements to reflect their tax character. These reclassifications have no
effect on net assets or net asset value per share. As of period end, permanent differences primarily attributable to the accounting for applicable foreign currency transactions, passive foreign investment companies,
and tax expense on capital gains were reclassified between the individual components of total distributable earnings (loss).
|
Temporary differences between
book-basis and tax-basis components of total distributable earnings (loss) arise when certain items of income, gain, or loss are recognized in different periods for financial statement and tax purposes; these
differences will reverse at some time in the future. The differences are primarily related to the deferral of losses from wash sales; the recognition of unrealized gains or losses from certain derivative contracts;
and the recognition of unrealized gains from passive foreign investment companies. As of period end, the tax-basis components of total distributable earnings (loss) are detailed in the table as follows:
|
| Amount
($000)
|
| Undistributed Ordinary Income
| 21,737
|
| Undistributed Long-Term Gains
| —
|
| Capital Loss Carryforwards
| (52,483)
|
| Qualified Late-Year Losses
| —
|
| Net Unrealized Gains (Losses)
| (128,932)
|
The tax character of
distributions paid was as follows:
|
| Year Ended October 31,
|
|
| 2022
Amount
($000)
| 2021
Amount
($000)
|
| Ordinary Income*
| 32,782
| 8,567
|
| Long-Term Capital Gains
| 26,325
| —
|
| Total
| 59,107
| 8,567
|
| *
| Includes short-term capital gains, if any.
|
As of October 31, 2022, gross
unrealized appreciation and depreciation for investments and derivatives based on cost for U.S. federal income tax purposes were as follows:
|
| Amount
($000)
|
| Tax Cost
| 754,528
|
| Gross Unrealized Appreciation
| 82,789
|
| Gross Unrealized Depreciation
| (210,232)
|
| Net Unrealized Appreciation (Depreciation)
| (127,443)
|
Emerging Markets Select Stock Fund
| G.
| During the year ended October 31, 2022, the fund purchased $307,393,000 of investment securities and sold $317,198,000 of investment securities, other than temporary cash investments.
|
| H.
| Capital shares issued and redeemed were:
|
|
| Year Ended October 31,
|
|
| 2022
Shares
(000)
| 2021
Shares
(000)
|
|
|
|
|
| Issued
| 8,139
| 13,807
|
| Issued in Lieu of Cash Distributions
| 2,150
| 294
|
| Redeemed
| (10,131)
| (8,359)
|
| Net Increase (Decrease) in Shares Outstanding
| 158
| 5,742
|
| I.
| Transactions during the period in investments where the issuer is another member of The Vanguard Group were as follows:
|
|
|
| Current Period Transactions
|
|
|
| Oct. 31,
2021
Market
Value
($000)
| Purchases
at Cost
($000)
| Proceeds
from
Securities
Sold
($000)
| Realized
Net
Gain
(Loss)
($000)
| Change in
Unrealized
App. (Dep.)
($000)
| Income
($000)
| Capital Gain
Distributions
Received
($000)
| Oct. 31,
2022
Market
Value
($000)
|
| Vanguard FTSE Emerging Markets ETF
| 1,764
| 15,842
| 10,522
| (536)
| (1,206)
| 169
| —
| 5,342
|
| Vanguard Market Liquidity Fund
| 59,595
| NA1
| NA1
| (12)
| 1
| 384
| 1
| 27,141
|
| Total
| 61,359
| 15,842
| 10,522
| (548)
| (1,205)
| 553
| 1
| 32,483
|
| 1
| Not applicable—purchases and sales are for temporary cash investment purposes.
|
| J.
| Management has determined that no events or transactions occurred subsequent to October 31, 2022, that would require recognition or disclosure in these financial statements.
|
Report of Independent Registered Public Accounting
Firm
To the Board of Trustees of Vanguard
Trustees' Equity Fund and Shareholders of Vanguard Emerging Markets Select Stock Fund
Opinion on the Financial
Statements
We have audited the accompanying statement of
assets and liabilities, including the schedule of investments, of Vanguard Emerging Markets Select Stock Fund (one of the funds constituting Vanguard Trustees' Equity Fund, referred to hereafter as the "Fund") as of
October 31, 2022, the related statement of operations for the year ended October 31, 2022, the statement of changes in net assets for each of the two years in the period ended October 31, 2022, including the related
notes, and the financial highlights for each of the five years in the period ended October 31, 2022 (collectively referred to as the "financial statements"). In our opinion, the financial statements present fairly, in
all material respects, the financial position of the Fund as of October 31, 2022, the results of its operations for the year then ended, the changes in its net assets for each of the two years in the period ended
October 31, 2022 and the financial highlights for each of the five years in the period ended October 31, 2022 in conformity with accounting principles generally accepted in the United States of America.
Basis for Opinion
These financial statements are the
responsibility of the Fund’s management. Our responsibility is to express an opinion on the Fund’s financial statements based on our audits. We are a public accounting firm registered with the Public
Company Accounting Oversight Board (United States) (PCAOB) and are required to be independent with respect to the Fund in accordance with the U.S. federal securities laws and the applicable rules and regulations of
the Securities and Exchange Commission and the PCAOB.
We conducted our audits of
these financial statements in accordance with the standards of the PCAOB. Those standards require that we plan and perform the audit to obtain reasonable assurance about whether the financial statements are free of
material misstatement, whether due to error or fraud.
Our audits included performing
procedures to assess the risks of material misstatement of the financial statements, whether due to error or fraud, and performing procedures that respond to those risks. Such procedures included examining, on a test
basis, evidence regarding the amounts and disclosures in the financial statements. Our audits also included evaluating the accounting principles used and significant estimates made by management, as well as evaluating
the overall presentation of the financial statements. Our procedures included confirmation of securities owned as of October 31, 2022 by correspondence with the custodian, transfer agent and brokers; when replies were
not received from brokers, we performed other auditing procedures. We believe that our audits provide a reasonable basis for our opinion.
/s/PricewaterhouseCoopers
LLP
Philadelphia, Pennsylvania
December 16, 2022
We have served as the auditor
of one or more investment companies in The Vanguard Group of Funds since 1975.
Tax information
(unaudited)
The fund hereby designates
$12,675,000, or if subsequently determined to be different, the maximum amount allowable by law, as qualified dividend income for individual shareholders for the fiscal year.
The fund hereby designates
$111,000, or if subsequently determined to be different, the maximum amount allowable by law, of interest earned from obligations of the U.S. government which is generally exempt from state income tax.
For nonresident alien
shareholders, 100% of short-term capital gain dividends distributed by the fund for the fiscal year are qualified short-term capital gains.
The fund distributed
$26,325,000 as capital gain dividends (20% rate gain distributions) to shareholders during the fiscal year.
The fund designates to
shareholders foreign source income of $34,364,000 and foreign taxes paid of $2,784,000, or if subsequently determined to be different, the maximum amounts allowable by law. Shareholders will receive more detailed
information with their Form 1099-DIV to determine the calendar-year amounts to be included on their tax returns.
This page intentionally left blank.
The People Who Govern Your Fund
The trustees of your mutual
fund are there to see that the fund is operated and managed in your best interests since, as a shareholder, you are a part owner of the fund. Your fund’s trustees also serve on the board of directors of The
Vanguard Group, Inc., which is owned by the Vanguard funds and provides services to them.
A majority of Vanguard’s
board members are independent, meaning that they have no affiliation with Vanguard or the funds they oversee, apart from the sizable personal investments they have made as private individuals. The independent board
members have distinguished backgrounds in business, academia, and public service. Each of the trustees and executive officers oversees 206 Vanguard funds.
Information for each trustee
and executive officer of the fund appears below. That information, as well as the Vanguard fund count, is as of the date on the cover of this fund report. The mailing address of the trustees and officers is P.O. Box
876, Valley Forge, PA 19482. More information about the trustees is in the Statement of Additional Information, which can be obtained, without charge, by contacting Vanguard at 800-662-7447, or online at vanguard.com.
Interested Trustee1
Mortimer J. Buckley
Born in 1969. Trustee since January 2018.
Principal occupation(s) during the past five years and other experience: chairman of the board (2019–present) of Vanguard and of each of the investment companies served by Vanguard; chief executive officer
(2018–present) of Vanguard; chief executive officer, president, and trustee (2018–present) of each of the investment companies served by Vanguard; president and director (2017–present) of Vanguard;
and president (2018–present) of Vanguard Marketing Corporation. Chief investment officer (2013–2017), managing director (2002–2017), head of the Retail Investor Group (2006–2012), and chief
information officer (2001–2006) of Vanguard. Member of the board of governors of the Investment Company Institute and the board of governors of FINRA. Trustee and vice chair of The Shipley School.
Independent Trustees
Tara Bunch
Born in 1962. Trustee since November 2021.
Principal occupation(s) during the past five years and other experience: head of global operations at Airbnb (2020–present). Vice president of AppleCare (2012–2020). Member of the board of directors of Out
& Equal (2002–2006), the advisory board of the University of California, Berkeley School of Engineering (2020–present), and the advisory board
of Santa Clara University’s Leavey
School of Business (2018–present).
Emerson U. Fullwood
Born in 1948. Trustee since January 2008.
Principal occupation(s) during the past five years and other experience: executive chief staff and marketing officer for North America and corporate vice president (retired 2008) of Xerox Corporation (document
management products and services). Former president of the Worldwide Channels Group, Latin America, and Worldwide Customer Service and executive chief staff officer of Developing Markets of Xerox. Executive in
residence and 2009–2010 Distinguished Minett Professor at the Rochester Institute of Technology. Member of the board of directors of the University of Rochester Medical Center, the Monroe Community College
Foundation, the United Way of Rochester, North Carolina A&T University, Roberts Wesleyan College, and the Rochester Philharmonic Orchestra. Trustee of the University of
Rochester.
F. Joseph Loughrey
Born in 1949. Trustee since October 2009.
Principal occupation(s) during the past five years and other experience: president and chief operating officer (retired 2009) and vice chairman of the board (2008–2009) of Cummins Inc. (industrial machinery).
Chairman of the board of Hillenbrand, Inc. (specialized consumer services). Director of the V Foundation. Member of the advisory council for the College of
1 Mr. Buckley is considered an “interested
person,” as defined in the Investment Company Act of 1940, because he is an officer of the Vanguard funds.
Arts and Letters at the University of Notre
Dame. Chairman of the board of Saint Anselm College.
Mark Loughridge
Born in 1953. Trustee since March 2012.
Principal occupation(s) during the past five years and other experience: senior vice president and chief financial officer (retired 2013) of IBM (information technology services). Fiduciary member of IBM’s
Retirement Plan Committee (2004–2013), senior vice president and general manager (2002–2004) of IBM Global Financing, vice president and controller (1998–2002) of IBM, and a variety of other prior
management roles at IBM. Member of the Council on Chicago Booth.
Scott C. Malpass
Born in 1962. Trustee since March 2012.
Principal occupation(s) during the past five years and other experience: adjunct professor of finance at the University of Notre Dame (2020–present). Chief investment officer (retired 2020) and vice president
(retired 2020) of the University of Notre Dame. Assistant professor (retired June 2020) of finance at the Mendoza College of Business, University of Notre Dame, and member of the Notre Dame 403(b) Investment
Committee. Member of the board of Catholic Investment Services, Inc. (investment advisors), the board of superintendence of the Institute for the Works of Religion, and the board of directors of Paxos Trust Company
(finance).
Deanna Mulligan
Born in 1963. Trustee since January 2018.
Principal occupation(s) during the past five years and other experience: chief executive officer of Purposeful (advisory firm for CEOs and C-level executives; 2021–present). Board chair (2020), chief executive
officer (2011–2020), and president (2010–2019) of The Guardian Life Insurance Company of America. Chief operating officer (2010–2011) and executive vice president (2008–2010) of Individual Life
and Disability of the Guardian Life Insurance Company of America. Member of the board of the Economic Club of New York. Trustee of the Partnership for New York City (business leadership), Chief Executives for
Corporate Purpose, and the NewYork-Presbyterian Hospital.
André F. Perold
Born in 1952. Trustee since December 2004.
Principal occupation(s) during the past five years and other experience: George Gund Professor of Finance and Banking, Emeritus at the Harvard Business School (retired 2011). Chief investment officer and co-managing
partner of HighVista Strategies (private investment firm). Member of the board (2018–present) of RIT Capital Partners (investment
firm). Member of the investment committee of
Partners Health Care System.
Sarah Bloom Raskin
Born in 1961. Trustee since January 2018.
Principal occupation(s) during the past five years and other experience: deputy secretary (2014–2017) of the United States Department of the Treasury. Governor (2010–2014) of the Federal Reserve Board.
Commissioner (2007–2010) of financial regulation for the State of Maryland. Colin W. Brown Distinguished Professor of the Practice of Law (2021–present), professor (2020–present), Distinguished
Fellow of the Global Financial Markets Center (2020–present), and Rubenstein Fellow (2017–2020) at Duke University. Trustee (2017–present) of Amherst College and member of Amherst College Investment
Committee (2019–present). Member of the Regenerative Crisis Response Committee (2020–present).
David A. Thomas
Born in 1956. Trustee since July 2021.
Principal occupation(s) during the past five years and other experience: president of Morehouse College (2018–present). Professor of business administration, emeritus at Harvard University (2017–2018).
Dean (2011–2016) and professor of management (2016–2017) at the Georgetown University McDonough School of Business. Director of DTE Energy Company (2013–present). Trustee of Common Fund
(2019–present).
Peter F. Volanakis
Born in 1955. Trustee since July 2009.
Principal occupation(s) during the past five years and other experience: president and chief operating officer (retired 2010) of Corning Incorporated (communications equipment) and director of Corning Incorporated
(2000–2010) and Dow Corning (2001–2010). Director (2012) of SPX Corporation (multi-industry manufacturing). Overseer of the Amos Tuck School of Business Administration, Dartmouth College (2001–2013).
Member of the BMW Group Mobility Council.
Executive Officers
Christine M. Buchanan
Born in 1970. Principal occupation(s) during
the past five years and other experience: principal of Vanguard. Chief financial officer (2021–present) and treasurer (2017–present) of each of the investment companies served by Vanguard. Partner
(2005–2017) at KPMG (audit, tax, and advisory services).
John Galloway
Born in 1973. Principal occupation(s) during
the past five years and other experience: principal of Vanguard. Investment stewardship officer (September 2020–present) of each of the investment companies served by Vanguard. Head of Investor Advocacy
(February 2020–present) and head of Marketing Strategy and Planning (2017–2020) at Vanguard. Special assistant to the President of the United States (2015).
Ashley Grim
Born in 1984. Principal occupation(s) during
the past five years and other experience: treasurer (February 2022–present) of each of the investment companies served by Vanguard. Fund transfer agent controller (2019–2022) and director of Audit Services
(2017–2019) at Vanguard. Senior manager (2015–2017) at PriceWaterhouseCoopers (audit and assurance, consulting, and tax services).
Peter Mahoney
Born in 1974. Principal occupation(s) during
the past five years and other experience: principal of Vanguard. Controller (2015–present) of each of the investment companies served by Vanguard. Head of International Fund Services (2008–2014) at
Vanguard.
Anne E. Robinson
Born in 1970. Principal occupation(s) during
the past five years and other experience: general counsel (2016–present) of Vanguard. Secretary (2016–present) of Vanguard and of each of the investment companies served by Vanguard. Managing director
(2016–present) of Vanguard. Managing director and general counsel of Global Cards and Consumer Services (2014–2016) at Citigroup. Counsel (2003–2014) at American Express. Nonexecutive director of the
board of National Grid (energy).
Michael Rollings
Born in 1963. Principal occupation(s) during
the past five years and other experience: finance director (2017–present) and treasurer (2017) of each of the investment companies served by Vanguard. Managing director (2016–present) of Vanguard. Chief
financial officer (2016–present) of Vanguard. Director (2016–present) of Vanguard Marketing Corporation. Executive vice president and chief financial officer (2006–2016) of MassMutual Financial
Group.
John E. Schadl
Born in 1972. Principal occupation(s) during
the past five years and other experience: principal of Vanguard. Chief compliance officer (2019–present) of Vanguard and of each of the investment companies served by Vanguard. Assistant vice president
(2019–present) of Vanguard Marketing Corporation.
Vanguard Senior Management
Team
| Matthew Benchener
| Thomas M. Rampulla
|
| Joseph Brennan
| Karin A. Risi
|
| Mortimer J. Buckley
| Anne E. Robinson
|
| Gregory Davis
| Michael Rollings
|
| John James
| Nitin Tandon
|
| Chris D. Mclsaac
| Lauren Valente
|
Connect with
Vanguard®>vanguard.com
Fund Information > 800-662-7447
Direct Investor Account
Services > 800-662-2739
Institutional Investor
Services > 800-523-1036
Text Telephone for People Who
Are Deaf or Hard of Hearing > 800-749-7273
This material may be used in
conjunction with the offering of shares of any Vanguard fund only if preceded or accompanied by the fund’s current prospectus.
All comparative mutual
fund data are from Morningstar, Inc., unless otherwise noted.
You can obtain a free
copy of Vanguard’s proxy voting guidelines by visiting vanguard.com/proxyreporting or by calling Vanguard at 800-662-2739. The guidelines are also available from the SEC’s website, www.sec.gov. In
addition, you may obtain a free report on how your fund voted the proxies for securities it owned during the 12 months ended June 30. To get the report, visit either vanguard.com/proxyreporting or www.sec.gov.
You can review
information about your fund on the SEC’s website, and you can receive copies of this information, for a fee, by sending a request via email addressed to publicinfo@sec.gov.
Source for Bloomberg
indexes: Bloomberg Index Services Limited. Copyright 2022, Bloomberg. All rights reserved.
CFA® is a registered trademark owned by CFA Institute.
© 2022 The Vanguard Group,
Inc.
All rights reserved.
Vanguard Marketing Corporation, Distributor.
Q7520 122022
Annual Report | October 31, 2022
Vanguard
Alternative Strategies Fund
Contents
Your Fund’s Performance at a Glance
| 1
|
Advisor's Report
| 2
|
About Your Fund’s Expenses
| 5
|
Performance Summary
| 7
|
Consolidated Financial Statements
| 9
|
Please note: The
opinions expressed in this report are just that—informed opinions. They should not be considered promises or advice. Also, please keep in mind that the information and opinions cover the period through the date
on the front of this report. Of course, the risks of investing in your fund are spelled out in the prospectus.
Your Fund’s Performance at a Glance
| •
| Vanguard Alternative Strategies Fund returned 2.38% for the 12 months ended October 31, 2022. Its benchmark, the FTSE 3-Month Treasury Bill Index, returned 0.88%.
|
| •
| The fund seeks to generate returns using a combination of alternative strategies that collectively are expected to have low correlation with traditional capital markets. These strategies are long/short equity,
event-driven, fixed income relative value, currencies, equity futures, and commodity-linked investments.
|
| •
| Five of the six strategies contributed to returns for the 12-month period. Fixed income relative value was the sole detractor, hurt by a focus on longer-duration issues, which suffered during a rising interest rate
environment.
|
| •
| The diversification resulting from the fund’s variety of exposures helped reduce overall volatility compared with the broad U.S. stock market.
|
| •
| The fund regularly uses derivatives to hedge portfolio risks. Its holdings in forward foreign currencies and futures contributed to total returns.
|
Market Barometer
|
| Average Annual Total Returns
Periods Ended October 31, 2022
|
|
| One Year
| Three Years
| Five Years
|
| Stocks
|
|
|
|
| Russell 1000 Index (Large-caps)
| -16.38%
| 9.99%
| 10.19%
|
| Russell 2000 Index (Small-caps)
| -18.54
| 7.05
| 5.56
|
| Russell 3000 Index (Broad U.S. market)
| -16.52
| 9.79
| 9.87
|
| FTSE All-World ex US Index (International)
| -24.20
| -1.16
| -0.18
|
| Bonds
|
|
|
|
Bloomberg U.S. Aggregate Float Adjusted Index
(Broad taxable market)
| -15.69%
| -3.73%
| -0.50%
|
Bloomberg Municipal Bond Index
(Broad tax-exempt market)
| -11.98
| -2.18
| 0.37
|
| FTSE Three-Month U.S. Treasury Bill Index
| 0.88
| 0.59
| 1.15
|
| CPI
|
|
|
|
| Consumer Price Index
| 7.75%
| 5.01%
| 3.85%
|
For the 12 months ended October 31, 2022,
Vanguard Alternative Strategies Fund returned 2.38%. The fund outpaced its benchmark, the FTSE 3-Month Treasury Bill Index, which returned 0.88%.
Investment objective and
strategy
The Alternative Strategies Fund seeks both
capital appreciation and low correlations with the returns of stock and bond markets. We target a fixed range of volatility and expect to produce a portfolio with lower volatility than that of the broader U.S. stock
market. The range of volatility may change from time to time. In determining it, we consider the risk levels of our individual strategies, the composition of the portfolio, and market conditions.
To achieve our objectives, we
combine six alternative investment strategies that span multiple asset classes: equities, fixed income, currencies, and commodities. Each strategy can use long and short positions to try to minimize market exposure
while attempting to capture attractive risk premiums. Individually, the strategies are expected to have low long-term correlation with one another and with traditional capital markets.
In addition, the fund can use
limited amounts of leverage as it seeks to match the expected risk profile for each strategy. The goal is to achieve a similar risk profile across the portfolio to maximize diversification and performance.
The strategies the fund currently employs
are:
| •
| Long/short equity. This approach focuses on building a long/short portfolio of equity securities based on their volatility characteristics by executing long positions in low-volatility
stocks and short positions in high-volatility stocks. It seeks to capture a risk-adjusted spread by constructing positions to reduce the net market exposure of the overall portfolio to general market movements (beta).
|
| •
| Event-driven. This strategy seeks to profit from the expectation that a specific event or catalyst (such as a merger/acquisition deal closure) will affect the stock price of a U.S. or
foreign company.
|
| •
| Fixed income relative value. This approach seeks to exploit the steepness of the U.S. Treasury yield curve that is created by investors’ desire to hold shorter-maturity bonds
because they tend to be more liquid (easily traded) and less sensitive to growth and inflation risk. We try to capture this premium by investing in Treasury futures with longer times to maturity and borrowing those
with short maturities.
|
| •
| Currencies. The fund seeks to benefit from expected currency movements by using long and short foreign currency exchange forward contracts. It does this by selling currencies of
countries with poor fundamental characteristics and buying those of countries with strong ones.
|
| •
| Commodity-linked investments. This strategy seeks to capture the risk premium associated with inventory levels of commodities, which are reflected in the prices of their futures
contracts. We take long positions in commodities whose prices are expected to rise because of limited inventory and short positions in those whose prices are expected to fall.
|
| •
| Equity futures. The fund uses long and short positions in global equity index futures to capture excess return opportunities. The strategy seeks to benefit from global differences in market and
fundamental characteristics by buying equity index futures with strong characteristics and selling those with poor characteristics.
|
Investment environment
The economic backdrop deteriorated as
inflation soared to multidecade highs, fueled in part by higher energy and food prices in the wake of Russia’s invasion of Ukraine. Then price increases broadened to other categories of goods and services,
adding to concerns that inflation would remain stubbornly high. That prompted aggressive tightening by many central banks to bring inflation back in check and increased fears of a recession.
Within the U.S., the Federal
Reserve raised interest rates six times during the year (the most recent increase was announced on November 2, right after the end of the fund’s fiscal year) and committed to further hikes until they’re
“sufficiently restrictive” to quell inflation.
In this environment, there
were few safe havens for investors. For the 12-month period, both stock and bond markets around the world experienced significant losses.
Successes and shortfalls
Five of the six strategies contributed to
returns for the 12-month period. Our long/short equity holdings responded well to our selected combination of low-volatility, high-dividend-paying stocks (on the long end) and highly cyclical and speculative stocks
(on the short end). Equity futures benefited from global dividend harvesting. In the commodity-linked investments strategy, we selectively overweighted commodities in short supply while underweighting those available
in ample quantities.
The currency strategy allowed
us to benefit from the interest rate differentials between currencies, particularly as central banks pushed through rate hikes. (This led to the most attractive carry environment we’ve experienced in many
years.) Finally, event-driven performance reflected a combination of benign conditions in the credit market and our selection of lower-yield, close-to-maturity securities.
Our fixed income relative
value strategy was the sole detractor, hurt by our focus on longer-duration issues, which suffered during a rising interest rate environment.
Despite heightened
uncertainty, the diversification resulting from the fund’s variety of exposures helped reduce overall volatility compared with that of the broad stock market. The correlations of the
fund’s daily returns with the equity
markets fell to 0.02, compared with 0.15 over the previous 12 months. Fixed income markets were held back by the uncertain interest rate environment and, as a result, had a higher correlation with the fund.
Although markets can be
unpredictable, we are confident that our team of experienced managers and analysts can find opportunities to produce competitive returns over the long term at volatility levels lower than those of the market.
Portfolio Manager:
Fei Xu, CFA, FRM
Vanguard Quantitative Equity
Group
November 15, 2022
About Your Fund’s Expenses
As a shareholder of the fund,
you incur ongoing costs, which include costs for portfolio management, administrative services, and shareholder reports (like this one), among others. Operating expenses, which are deducted from a fund’s gross
income, directly reduce the investment return of the fund.
A fund’s expenses are
expressed as a percentage of its average net assets. This figure is known as the expense ratio. The following examples are intended to help you understand the ongoing costs (in dollars) of investing in your fund and
to compare these costs with those of other mutual funds. The examples are based on an investment of $1,000 made at the beginning of the period shown and held for the entire period.
The accompanying table
illustrates your fund’s costs in two ways:
| •
| Based on actual fund return. This section helps you to estimate the actual expenses that you paid over the period. The ”Ending Account Value“ shown is derived from the fund‘s actual return, and the
third column shows the dollar amount that would have been paid by an investor who started with $1,000 in the fund. You may use the information here, together with the amount you invested, to estimate the expenses that
you paid over the period.
|
To do so, simply divide your
account value by $1,000 (for example, an $8,600 account value divided by $1,000 = 8.6), then multiply the result by the number given for your fund under the heading ”Expenses Paid During Period.“
| •
| Based on hypothetical 5% yearly return. This section is intended to help you compare your fund‘s costs with those of other mutual funds. It assumes that the fund had a yearly return of 5% before expenses, but that the
expense ratio is unchanged. In this case—because the return used is not the fund’s actual return—the results do not apply to your investment. The example is useful in making comparisons because the
Securities and Exchange Commission requires all mutual funds to calculate expenses based on a 5% return. You can assess your fund’s costs by comparing this hypothetical example with the hypothetical examples
that appear in shareholder reports of other funds.
|
Note that the expenses shown
in the table are meant to highlight and help you compare ongoing costs only and do not reflect transaction costs incurred by the fund for buying and selling securities. Further, the expenses do not include any purchase, redemption, or
account service fees described in the fund prospectus. If such fees were applied to your account, your costs would be higher. Your fund does not carry a “sales load.”
The calculations assume no
shares were bought or sold during the period. Your actual costs may have been higher or lower, depending on the amount of your investment and the timing of any purchases or redemptions.
You can find more information
about the fund’s expenses, including annual expense ratios, in the Consolidated Financial Statements section of this report. For additional information on operating expenses and other shareholder costs, please
refer to your fund’s current prospectus.
| Six Months Ended October 31, 2022
|
|
|
|
| Alternative Strategies Fund
| Beginning
Account Value
4/30/2022
| Ending
Account Value
10/31/2022
| Expenses
Paid During
Period
|
| Based on Actual Fund Return
| $1,000.00
| $1,007.70
| $1.32
|
| Based on Hypothetical 5% Yearly Return
| 1,000.00
| 1,023.90
| 1.33
|
The calculations are
based on expenses incurred in the most recent six-month period. The fund’s annualized six-month expense ratio for that period is 0.26%. The dollar amounts shown as “Expenses Paid” are equal to the
annualized expense ratio multiplied by the average account value over the period, multiplied by the number of days in the most recent six-month period, then divided by the number of days in the most recent 12-month
period (184/365).
Alternative Strategies Fund
All of the returns in this
report represent past performance, which is not a guarantee of future results that may be achieved by the fund. (Current performance may be lower or higher than the performance data cited. For performance data current
to the most recent month-end, visit our website at vanguard.com/performance.) Note, too, that both investment returns and principal value can fluctuate widely, so an investor’s shares, when sold, could be worth
more or less than their original cost. The returns shown do not reflect taxes that a shareholder would pay on fund distributions or on the sale of fund shares.
Cumulative Performance: August
11, 2015, Through October 31, 2022
Initial Investment of $50,000
|
|
| Average Annual Total Returns
Periods Ended October 31, 2022
|
|
|
|
| One
Year
| Five
Years
| Since
Inception
(8/11/2015)
| Final Value
of a $50,000
Investment
|

| Alternative Strategies Fund
| 2.38%
| -1.53%
| -0.13%
| $49,523
|

| Spliced Alternative Strategies Index
| 0.88
| 2.79
| 3.33
| 63,349
|
|
| FTSE Three-Month Treasury Bill Index
| 0.88
| 1.16
| 0.93
| 53,460
|
Spliced Alternative Strategies Index:
FTSE 3-Month U.S. T-Bill Index + 4% through October 31, 2019; FTSE 3-Month Treasury Bill Index thereafter.
"Since Inception"
performance is calculated from the fund’s inception date for both the fund and its comparative standard(s).
See Financial
Highlights for dividend and capital gains information.
Alternative Strategies Fund
|
| Long
Portfolio1
| Short
Portfolio2
|
| Communication Services
| 4.8%
| 8.0%
|
| Consumer Discretionary
| 12.2
| 16.0
|
| Consumer Staples
| 6.4
| 1.1
|
| Energy
| —
| 8.3
|
| Financials
| 7.0
| —
|
| Health Care
| 12.3
| 13.7
|
| Industrials
| 12.8
| 11.7
|
| Information Technology
| 26.0
| 34.8
|
| Materials
| 5.1
| 2.8
|
| Real Estate
| 7.7
| 1.8
|
| Utilities
| 5.7
| 1.8
|
| 1
| Percentage of investments in long portfolio.
|
| 2
| Percentage of investments in short portfolio.
|
The table reflects the
fund’s investments, except for short-term investments and derivatives. Sector categories are based on the Global Industry Classification Standard (“GICS”), except for the “Other” category
(if applicable), which includes securities that have not been provided a GICS classification as of the effective reporting period.
Global Industry
Classification Standard (“GICS”) was developed by and is the exclusive property and a service mark of MSCI Inc. (“MSCI”) and Standard and Poor’s, a division of McGraw-Hill Companies, Inc.
(“S&P”), and is licensed for use by Vanguard. Neither MSCI, S&P nor any third party involved in making or compiling the GICS or any GICS classification makes any express or implied warranties or
representations with respect to such standard or classification (or the results to be obtained by the use thereof), and all such parties hereby expressly disclaim all warranties of originality, accuracy, completeness,
merchantability or fitness for a particular purpose with respect to any such standard or classification. Without limiting any of the foregoing, in no event shall MSCI, S&P, any of its affiliates or any third party
involved in making or compiling the GICS or any GICS classification have any liability for any direct, indirect, special, punitive, consequential or any other damages (including lost profits) even if notified of the
possibility of such damages.
Alternative Strategies Fund
Consolidated Financial Statements
Consolidated Schedule of Investments
The fund files its complete
schedule of portfolio holdings with the Securities and Exchange Commission (SEC) for the first and third quarters of each fiscal year as an exhibit to its reports on Form N-PORT. The fund’s Form N-PORT reports
are available on the SEC’s website at www.sec.gov.
|
|
| Shares
| Market
Value•
($000)
|
| Common Stocks—Long Positions (32.3%)
|
| Communication Services (1.5%)
|
|
| TEGNA Inc.
| 35,000
| 731
|
| 1
| Electronic Arts Inc.
| 906
| 114
|
| 1
| Madison Square Garden Sports Corp.
| 668
| 105
|
|
| Sirius XM Holdings Inc.
| 17,354
| 105
|
| *
| Liberty Media Corp.-Liberty Formula One Class C
| 1,757
| 101
|
| 1
| Verizon Communications Inc.
| 2,446
| 91
|
| 1
| Comcast Corp. Class A
| 2,631
| 84
|
| *
| Alphabet Inc. Class A
| 860
| 81
|
| *,1
| Charter Communications Inc. Class A
| 183
| 67
|
| *,1
| Liberty Broadband Corp. Class C
| 777
| 66
|
|
|
|
| 1,545
|
| Consumer Discretionary (3.9%)
|
| *
| iRobot Corp.
| 20,500
| 1,158
|
| *
| Tenneco Inc. Class A
| 51,000
| 1,005
|
| *,1
| O'Reilly Automotive Inc.
| 151
| 126
|
| 1
| Genuine Parts Co.
| 689
| 123
|
| 1
| McDonald's Corp.
| 452
| 123
|
| *,1
| AutoZone Inc.
| 48
| 122
|
|
| Advance Auto Parts Inc.
| 615
| 117
|
|
| Darden Restaurants Inc.
| 810
| 116
|
| 1
| Dollar General Corp.
| 442
| 113
|
| 1
| Yum! Brands Inc.
| 929
| 110
|
|
| Lowe's Cos. Inc.
| 560
| 109
|
| 1
| Starbucks Corp.
| 1,265
| 109
|
| 1
| Wendy's Co.
| 5,108
| 106
|
| 1
| Gentex Corp.
| 3,825
| 101
|
| 1
| Service Corp. International
| 1,656
| 100
|
| 1
| Home Depot Inc.
| 326
| 97
|
|
| Leggett & Platt Inc.
| 2,865
| 97
|
| 1
| Columbia Sportswear Co.
| 1,200
| 89
|
|
|
|
| 3,921
|
| Consumer Staples (2.1%)
|
| 1
| Flowers Foods Inc.
| 4,154
| 119
|
| 1
| J M Smucker Co.
| 776
| 117
|
| 1
| Mondelez International Inc. Class A
| 1,883
| 116
|
|
| Hershey Co.
| 483
| 115
|
|
| Kellogg Co.
| 1,491
| 115
|
| 1
| PepsiCo Inc.
| 633
| 115
|
|
| Casey's General Stores Inc.
| 490
| 114
|
|
| General Mills Inc.
| 1,391
| 114
|
|
|
| Shares
| Market
Value•
($000)
|
|
| Reynolds Consumer Products Inc.
| 3,730
| 114
|
|
| Keurig Dr Pepper Inc.
| 2,749
| 107
|
| 1
| Coca-Cola Co.
| 1,762
| 105
|
| 1
| Colgate-Palmolive Co.
| 1,400
| 103
|
| 1
| Kimberly-Clark Corp.
| 823
| 102
|
| 1
| Brown-Forman Corp. Class B
| 1,484
| 101
|
| 1
| Altria Group Inc.
| 2,162
| 100
|
| 1
| McCormick & Co. Inc.
| 1,269
| 100
|
| 1
| Procter & Gamble Co.
| 726
| 98
|
| 1
| Philip Morris International Inc.
| 982
| 90
|
| 1
| Church & Dwight Co. Inc.
| 1,072
| 79
|
| 1
| Archer-Daniels-Midland Co.
| 313
| 30
|
|
| Campbell Soup Co.
| 185
| 10
|
|
|
|
| 2,064
|
| Financials (2.3%)
|
|
| First Horizon Corp.
| 13,918
| 341
|
|
| Travelers Cos. Inc.
| 635
| 117
|
|
| Aflac Inc.
| 1,802
| 117
|
| 1
| W R Berkley Corp.
| 1,548
| 115
|
| *,1
| Berkshire Hathaway Inc. Class B
| 390
| 115
|
| 1
| Arthur J Gallagher & Co.
| 606
| 113
|
| 1
| Hanover Insurance Group Inc.
| 764
| 112
|
| 1
| White Mountains Insurance Group Ltd.
| 79
| 112
|
| 1
| Marsh & McLennan Cos. Inc.
| 672
| 109
|
|
| Cboe Global Markets Inc.
| 870
| 108
|
|
| Nasdaq Inc.
| 1,739
| 108
|
|
| Starwood Property Trust Inc.
| 5,092
| 105
|
| 1
| CNA Financial Corp.
| 2,472
| 103
|
| 1
| TFS Financial Corp.
| 6,660
| 94
|
|
| Moody's Corp.
| 327
| 87
|
|
| Assurant Inc.
| 615
| 84
|
| 1
| Intercontinental Exchange Inc.
| 836
| 80
|
|
| Chubb Ltd.
| 349
| 75
|
| 1
| Annaly Capital Management Inc.
| 3,828
| 71
|
| 1
| AGNC Investment Corp.
| 7,713
| 63
|
| *
| Markel Corp.
| 10
| 12
|
| 1
| Allstate Corp.
| 83
| 11
|
|
| Willis Towers Watson plc
| 45
| 10
|
|
|
|
| 2,262
|
| Health Care (4.0%)
|
| *
| Meridian Bioscience Inc.
| 34,400
| 1,100
|
|
| Gilead Sciences Inc.
| 1,602
| 126
|
|
| Cigna Corp.
| 382
| 123
|
| 1
| Merck & Co. Inc.
| 1,208
| 122
|
Alternative Strategies Fund
|
|
| Shares
| Market
Value•
($000)
|
| 1
| Amgen Inc.
| 447
| 121
|
|
| McKesson Corp.
| 312
| 121
|
| 1
| Quest Diagnostics Inc.
| 798
| 115
|
| 1
| AmerisourceBergen Corp. Class A
| 720
| 113
|
| 1
| UnitedHealth Group Inc.
| 200
| 111
|
| 1
| Johnson & Johnson
| 623
| 108
|
| 1
| Bristol-Myers Squibb Co.
| 1,385
| 107
|
|
| Stryker Corp.
| 467
| 107
|
|
| AbbVie Inc.
| 712
| 104
|
| 1
| Becton Dickinson and Co.
| 436
| 103
|
| 1
| Medtronic plc
| 1,185
| 103
|
| 1
| CVS Health Corp.
| 1,076
| 102
|
|
| Premier Inc. Class A
| 2,925
| 102
|
| 1
| Danaher Corp.
| 395
| 99
|
| *
| Hologic Inc.
| 1,454
| 99
|
| *
| Integra LifeSciences Holdings Corp.
| 1,969
| 99
|
|
| Laboratory Corp. of America Holdings
| 444
| 99
|
| *,1
| QIAGEN NV
| 2,272
| 99
|
| 1
| Abbott Laboratories
| 918
| 91
|
| 1
| Baxter International Inc.
| 1,656
| 90
|
| *,1
| Henry Schein Inc.
| 1,310
| 90
|
| 1
| STERIS plc
| 471
| 81
|
| *
| Enovis Corp.
| 1,613
| 80
|
| 1
| Zoetis Inc.
| 525
| 79
|
| 1
| Thermo Fisher Scientific Inc.
| 42
| 22
|
| *
| Boston Scientific Corp.
| 407
| 18
|
|
| Elevance Health Inc.
| 20
| 11
|
|
|
|
| 3,945
|
| Industrials (4.1%)
|
| *
| Atlas Air Worldwide Holdings Inc.
| 10,000
| 1,011
|
| 1
| General Dynamics Corp.
| 493
| 123
|
|
| Eaton Corp. plc
| 790
| 119
|
| 1
| Cummins Inc.
| 481
| 118
|
| 1
| Honeywell International Inc.
| 578
| 118
|
|
| MSC Industrial Direct Co. Inc. Class A
| 1,416
| 117
|
| 1
| AMETEK Inc.
| 896
| 116
|
| 1
| Illinois Tool Works Inc.
| 544
| 116
|
|
| MSA Safety Inc.
| 867
| 116
|
| 1
| PACCAR Inc.
| 1,189
| 115
|
| 1
| Hubbell Inc. Class B
| 478
| 114
|
| 1
| Ingersoll Rand Inc.
| 2,250
| 114
|
| 1
| IDEX Corp.
| 508
| 113
|
|
| Lincoln Electric Holdings Inc.
| 797
| 113
|
|
| Nordson Corp.
| 502
| 113
|
| 1
| Lockheed Martin Corp.
| 224
| 109
|
| 1
| Expeditors International of Washington Inc.
| 1,104
| 108
|
|
| Otis Worldwide Corp.
| 1,505
| 106
|
| 1
| Waste Management Inc.
| 664
| 105
|
|
| MDU Resources Group Inc.
| 3,641
| 104
|
| 1
| AMERCO
| 179
| 103
|
|
| 3M Co.
| 822
| 103
|
| 1
| Republic Services Inc. Class A
| 772
| 102
|
| 1
| Fastenal Co.
| 2,040
| 99
|
| 1
| Norfolk Southern Corp.
| 425
| 97
|
| 1
| Verisk Analytics Inc. Class A
| 523
| 96
|
| *
| FTI Consulting Inc.
| 588
| 91
|
|
| Union Pacific Corp.
| 419
| 83
|
|
| Pentair plc
| 1,879
| 81
|
|
| Johnson Controls International plc
| 898
| 52
|
|
|
| Shares
| Market
Value•
($000)
|
|
| Donaldson Co. Inc.
| 696
| 40
|
| 1
| Allegion plc
| 178
| 19
|
|
|
|
| 4,134
|
| Information Technology (8.4%)
|
|
| Computer Services Inc.
| 16,500
| 953
|
| *
| Sierra Wireless Inc.
| 27,500
| 816
|
| *
| ChannelAdvisor Corp.
| 29,700
| 684
|
| *
| Evo Payments Inc. Class A
| 18,902
| 637
|
| *
| CyberOptics Corp.
| 9,500
| 513
|
| *
| Zendesk Inc.
| 5,000
| 383
|
| *
| MoneyGram International Inc.
| 30,000
| 318
|
| *
| BTRS Holdings Inc. Class 1
| 31,947
| 302
|
|
| Switch Inc. Class A
| 8,000
| 272
|
| *
| ForgeRock Inc. Class A
| 10,000
| 226
|
| 1
| International Business Machines Corp.
| 856
| 118
|
| *,1
| VeriSign Inc.
| 585
| 117
|
|
| Genpact Ltd.
| 2,404
| 117
|
| 1
| Amphenol Corp. Class A
| 1,531
| 116
|
| 1
| Automatic Data Processing Inc.
| 471
| 114
|
| 1
| Motorola Solutions Inc.
| 449
| 112
|
| 1
| Amdocs Ltd.
| 1,292
| 112
|
| *,1
| Keysight Technologies Inc.
| 639
| 111
|
|
| Cisco Systems Inc.
| 2,429
| 110
|
| 1
| Jack Henry & Associates Inc.
| 545
| 109
|
| *,1
| Fiserv Inc.
| 1,053
| 108
|
| *
| Teledyne Technologies Inc.
| 270
| 108
|
| 1
| Visa Inc. Class A
| 518
| 107
|
| 1
| CDW Corp.
| 613
| 106
|
| 1
| Apple Inc.
| 683
| 105
|
| 1
| Broadridge Financial Solutions Inc.
| 698
| 105
|
|
| NetApp Inc.
| 1,521
| 105
|
| 1
| Roper Technologies Inc.
| 252
| 105
|
| 1
| Texas Instruments Inc.
| 656
| 105
|
| 1
| Juniper Networks Inc.
| 3,344
| 102
|
|
| Cognizant Technology Solutions Corp. Class A
| 1,619
| 101
|
|
| National Instruments Corp.
| 2,647
| 101
|
| 1
| Accenture plc Class A
| 357
| 101
|
| 1
| Paychex Inc.
| 843
| 100
|
| 1
| Analog Devices Inc.
| 689
| 98
|
| 1
| Microsoft Corp.
| 414
| 96
|
| 1
| Dolby Laboratories Inc. Class A
| 1,398
| 93
|
| 1
| Broadcom Inc.
| 195
| 92
|
| *,1
| Akamai Technologies Inc.
| 1,004
| 89
|
| 1
| SS&C Technologies Holdings Inc.
| 1,710
| 88
|
| 1
| Western Union Co.
| 6,459
| 87
|
|
| Skyworks Solutions Inc.
| 132
| 11
|
|
|
|
| 8,353
|
| Materials (1.6%)
|
| 1
| RPM International Inc.
| 1,252
| 118
|
|
| Silgan Holdings Inc.
| 2,498
| 118
|
| 1
| Sonoco Products Co.
| 1,862
| 116
|
|
| Amcor plc
| 9,649
| 112
|
|
| Linde plc
| 370
| 110
|
| 1
| Ecolab Inc.
| 692
| 109
|
| 1
| Air Products and Chemicals Inc.
| 431
| 108
|
|
| Ashland Inc.
| 1,022
| 107
|
| 1
| Avery Dennison Corp.
| 611
| 104
|
|
| AptarGroup Inc.
| 1,022
| 101
|
| 1
| Sherwin-Williams Co.
| 432
| 97
|
Alternative Strategies Fund
|
|
| Shares
| Market
Value•
($000)
|
|
| PPG Industries Inc.
| 817
| 93
|
| 1
| Packaging Corp. of America
| 755
| 91
|
|
| International Flavors & Fragrances Inc.
| 893
| 87
|
|
| International Paper Co.
| 2,536
| 85
|
|
| Sealed Air Corp.
| 1,760
| 84
|
|
|
|
| 1,640
|
| Real Estate (2.5%)
|
|
| STORE Capital Corp.
| 18,000
| 572
|
|
| Gaming and Leisure Properties Inc.
| 2,233
| 112
|
|
| WP Carey Inc. REIT
| 1,436
| 110
|
|
| National Retail Properties Inc.
| 2,474
| 104
|
| 1
| Prologis Inc.
| 934
| 103
|
| 1
| AvalonBay Communities Inc.
| 526
| 92
|
| 1
| CubeSmart
| 2,172
| 91
|
| 1
| Invitation Homes Inc.
| 2,826
| 90
|
| 1
| Public Storage
| 291
| 90
|
| 1
| Life Storage Inc.
| 807
| 89
|
|
| Spirit Realty Capital Inc.
| 2,297
| 89
|
| 1
| Mid-America Apartment Communities Inc.
| 558
| 88
|
|
| Realty Income Corp.
| 1,420
| 88
|
| 1
| American Homes 4 Rent Class A
| 2,726
| 87
|
|
| Healthpeak Properties Inc.
| 3,686
| 87
|
|
| First Industrial Realty Trust Inc.
| 1,808
| 86
|
| 1
| Extra Space Storage Inc.
| 472
| 84
|
| 1
| Equity Residential
| 1,317
| 83
|
| 1
| Sun Communities Inc.
| 616
| 83
|
| 1
| Camden Property Trust
| 697
| 81
|
| 1
| UDR Inc.
| 1,979
| 79
|
| 1
| Equinix Inc.
| 75
| 43
|
|
| Healthcare Realty Trust Inc. Class A
| 1,511
| 31
|
|
| Essex Property Trust Inc.
| 60
| 13
|
|
| Apartment Income REIT Corp.
| 301
| 12
|
|
|
|
| 2,487
|
| Utilities (1.9%)
|
| 1
| Consolidated Edison Inc.
| 1,220
| 107
|
| 1
| OGE Energy Corp.
| 2,886
| 106
|
|
| PPL Corp.
| 3,994
| 106
|
| 1
| IDACORP Inc.
| 1,006
| 105
|
| 1
| NextEra Energy Inc.
| 1,326
| 103
|
| 1
| Atmos Energy Corp.
| 954
| 102
|
| 1
| Ameren Corp.
| 1,237
| 101
|
| 1
| American Electric Power Co. Inc.
| 1,118
| 98
|
| 1
| DTE Energy Co.
| 876
| 98
|
|
| Xcel Energy Inc.
| 1,503
| 98
|
| 1
| Southern Co.
| 1,486
| 97
|
| 1
| Alliant Energy Corp.
| 1,811
| 95
|
| 1
| CMS Energy Corp.
| 1,671
| 95
|
| 1
| Dominion Energy Inc.
| 1,352
| 95
|
| 1
| Duke Energy Corp.
| 1,020
| 95
|
| 1
| Avangrid Inc.
| 2,317
| 94
|
| 1
| Exelon Corp.
| 2,367
| 91
|
|
| Public Service Enterprise Group Inc.
| 1,631
| 91
|
|
| Hawaiian Electric Industries Inc.
| 1,853
| 71
|
|
|
|
| 1,848
|
Total Common Stocks—Long Positions
(Cost $28,521)
| 32,199
|
|
|
| Shares
| Market
Value•
($000)
|
| Temporary Cash Investments (39.3%)
|
| Money Market Fund (39.3%)
|
| 2
| Vanguard Market Liquidity Fund, 3.117% (Cost $39,087)
| 390,991
| 39,091
|
| Common Stocks Sold Short (-8.8%)
|
| Communication Services (-0.7%)
|
| *
| Roblox Corp. Class A
| (2,615)
| (117)
|
| *
| Netflix Inc.
| (388)
| (113)
|
| *
| Pinterest Inc. Class A
| (4,575)
| (113)
|
| *
| ZoomInfo Technologies Inc. Class A
| (2,529)
| (113)
|
| *
| DISH Network Corp. Class A
| (5,933)
| (88)
|
| *
| Roku Inc.
| (1,504)
| (83)
|
| *
| Playtika Holding Corp.
| (8,035)
| (76)
|
|
|
|
| (703)
|
| Consumer Discretionary (-1.4%)
|
|
| Macy's Inc.
| (5,807)
| (121)
|
| *
| Carnival Corp.
| (12,298)
| (111)
|
| *
| Victoria's Secret & Co.
| (2,953)
| (111)
|
| *
| Capri Holdings Ltd.
| (2,403)
| (110)
|
| *
| Penn National Gaming Inc.
| (3,229)
| (107)
|
| *
| DraftKings Inc. Class A
| (6,530)
| (103)
|
| *
| Etsy Inc.
| (1,048)
| (98)
|
| *
| Peloton Interactive Inc. Class A
| (11,588)
| (97)
|
| *
| Under Armour Inc. Class A
| (12,771)
| (95)
|
| *
| Norwegian Cruise Line Holdings Ltd.
| (5,354)
| (91)
|
| *
| Kohl's Corp.
| (2,981)
| (89)
|
| *
| Nordstrom Inc.
| (3,931)
| (80)
|
| *
| Wayfair Inc. Class A
| (1,843)
| (70)
|
| *
| DoorDash Inc. Class A
| (1,503)
| (66)
|
| *
| Royal Caribbean Cruises Ltd.
| (1,007)
| (54)
|
|
|
|
| (1,403)
|
| Consumer Staples (-0.1%)
|
| *
| Freshpet Inc.
| (1,685)
| (99)
|
| Energy (-0.7%)
|
|
| New Fortress Energy Inc. Class A
| (2,084)
| (115)
|
|
| APA Corp.
| (2,463)
| (112)
|
| *
| Antero Resources Corp.
| (2,916)
| (107)
|
|
| EQT Corp.
| (2,529)
| (106)
|
|
| Range Resources Corp.
| (3,388)
| (96)
|
| *
| Southwestern Energy Co.
| (13,656)
| (95)
|
|
| Ovintiv Inc. (XNYS)
| (1,837)
| (93)
|
|
|
|
| (724)
|
| Health Care (-1.2%)
|
| *
| Moderna Inc.
| (773)
| (116)
|
| *
| Sarepta Therapeutics Inc.
| (964)
| (110)
|
| *
| Natera Inc.
| (2,325)
| (109)
|
| *
| QuidelOrtho Corp.
| (1,152)
| (103)
|
| *
| Mirati Therapeutics Inc.
| (1,464)
| (99)
|
| *
| Guardant Health Inc.
| (1,980)
| (98)
|
| *
| Teladoc Health Inc.
| (3,203)
| (95)
|
| *
| Novocure Ltd.
| (1,310)
| (93)
|
| *
| agilon health Inc.
| (4,442)
| (88)
|
| *
| Oak Street Health Inc.
| (3,863)
| (78)
|
| *
| Definitive Healthcare Corp. Class A
| (4,170)
| (66)
|
| *
| Maravai LifeSciences Holdings Inc. Class A
| (3,744)
| (62)
|
| *
| 10X Genomics Inc. Class A
| (2,190)
| (60)
|
Alternative Strategies Fund
|
|
| Shares
| Market
Value•
($000)
|
| *
| Novavax Inc.
| (917)
| (20)
|
|
|
|
| (1,197)
|
| Industrials (-1.0%)
|
| *
| Avis Budget Group Inc.
| (490)
| (116)
|
|
| Ingersoll Rand Inc.
| (2,250)
| (114)
|
|
| Vertiv Holdings Co. Class A
| (7,986)
| (114)
|
| *
| AZEK Co. Inc. Class A
| (5,894)
| (103)
|
| *
| Hertz Global Holdings Inc.
| (5,541)
| (102)
|
| *
| Lyft Inc. Class A
| (6,849)
| (100)
|
| *
| Uber Technologies Inc.
| (3,404)
| (91)
|
|
| Spirit AeroSystems Holdings Inc. Class A
| (3,631)
| (84)
|
| *
| Sunrun Inc.
| (3,639)
| (82)
|
| *
| Plug Power Inc.
| (4,311)
| (69)
|
| *
| Generac Holdings Inc.
| (466)
| (54)
|
|
|
|
| (1,029)
|
| Information Technology (-3.1%)
|
| *
| Toast Inc. Class A
| (5,403)
| (119)
|
| *
| Enphase Energy Inc.
| (383)
| (118)
|
| *
| Wix.com Ltd.
| (1,363)
| (115)
|
| *
| New Relic Inc.
| (1,840)
| (109)
|
| *
| Smartsheet Inc. Class A
| (3,102)
| (108)
|
| *
| Kyndryl Holdings Inc.
| (10,877)
| (105)
|
| *
| Crowdstrike Holdings Inc. Class A
| (634)
| (102)
|
| *
| Shift4 Payments Inc. Class A
| (2,213)
| (102)
|
| *
| Jamf Holding Corp.
| (4,295)
| (102)
|
| *
| Zscaler Inc.
| (649)
| (100)
|
| *
| Confluent Inc. Class A
| (3,720)
| (100)
|
| *
| Cloudflare Inc. Class A
| (1,758)
| (99)
|
| *
| Snowflake Inc. Class A
| (607)
| (97)
|
| *
| Informatica Inc. Class A
| (4,973)
| (96)
|
| *
| ON Semiconductor Corp.
| (1,539)
| (95)
|
| *
| EPAM Systems Inc.
| (272)
| (95)
|
| *
| Bill.com Holdings Inc.
| (710)
| (95)
|
| *
| Palantir Technologies Inc. Class A
| (10,804)
| (95)
|
| *
| ViaSat Inc.
| (2,296)
| (94)
|
| *
| Trade Desk Inc. Class A
| (1,716)
| (91)
|
| *
| Elastic NV
| (1,409)
| (90)
|
| *
| SentinelOne Inc. Class A
| (3,899)
| (89)
|
| *
| nCino Inc.
| (2,790)
| (88)
|
| *
| Coupa Software Inc.
| (1,616)
| (86)
|
| *
| DocuSign Inc. Class A
| (1,718)
| (83)
|
|
|
| Shares
| Market
Value•
($000)
|
| *
| Datadog Inc. Class A
| (1,032)
| (83)
|
| *
| Block Inc. (XNYS)
| (1,363)
| (82)
|
| *
| Wolfspeed Inc.
| (999)
| (79)
|
| *
| NCR Corp.
| (3,419)
| (73)
|
| *
| RingCentral Inc. Class A
| (2,036)
| (72)
|
| *
| UiPath Inc. Class A
| (5,406)
| (68)
|
| *
| Okta Inc.
| (1,087)
| (61)
|
| *
| MongoDB Inc. Class A
| (333)
| (61)
|
|
|
|
| (3,052)
|
| Materials (-0.2%)
|
|
| US Steel Corp.
| (5,010)
| (102)
|
| *
| Cleveland-Cliffs Inc.
| (6,397)
| (83)
|
|
| Alcoa Corp.
| (1,543)
| (60)
|
|
|
|
| (245)
|
| Real Estate (-0.2%)
|
| *
| Zillow Group Inc. Class A
| (2,156)
| (67)
|
| *
| Opendoor Technologies Inc.
| (23,622)
| (61)
|
| *
| Zillow Group Inc. Class C
| (940)
| (29)
|
|
|
|
| (157)
|
| Utilities (-0.2%)
|
|
| Constellation Energy Corp.
| (1,281)
| (121)
|
|
| NRG Energy Inc.
| (906)
| (40)
|
|
|
|
| (161)
|
Total Common Stocks Sold Short
(Proceeds $11,093)
| (8,770)
|
| Other Assets and Other Liabilities—Net (37.2%)
| 37,039
|
| Net Assets (100%)
| 99,559
|
| Cost is in $000.
|
| •
| See Note A in Notes to Consolidated Financial Statements.
|
| *
| Non-income-producing security.
|
| 1
| Long security positions with a value of $13,414,000 are held in a segregated account at the fund's custodian bank and pledged to a broker-dealer as collateral for the fund's
obligation to return borrowed securities. For so long as such obligations continue, the fund’s access to these assets is subject to authorization from the broker-dealer.
|
| 2
| Affiliated money market fund available only to Vanguard funds and certain trusts and accounts managed by Vanguard. Rate shown is the 7-day yield.
|
|
| REIT—Real Estate Investment Trust.
|
Alternative Strategies Fund
Derivative Financial
Instruments Outstanding as of Period End
| Futures Contracts
|
|
|
|
| ($000)
|
|
| Expiration
| Number of
Long (Short)
Contracts
| Notional
Amount
| Value and
Unrealized
Appreciation
(Depreciation)
|
| Long Futures Contracts
|
|
|
|
|
| 2-Year U.S. Treasury Note
| December 2022
| 237
| 48,439
| (1,070)
|
| 5-Year U.S. Treasury Note
| December 2022
| 107
| 11,406
| (518)
|
| 10-Year U.S. Treasury Note
| December 2022
| 66
| 7,299
| (470)
|
| AEX Index
| November 2022
| 31
| 4,098
| 169
|
| Coffee1
| December 2022
| 18
| 1,199
| (212)
|
| Cotton No. 21
| December 2022
| 7
| 252
| (67)
|
| FTSE MIB Index
| December 2022
| 38
| 4,233
| 338
|
| FTSE Taiwan Index
| November 2022
| 89
| 4,074
| 30
|
| IBEX 35 Index
| November 2022
| 54
| 4,243
| 219
|
| Lean Hogs1
| December 2022
| 17
| 577
| 6
|
| LME Aluminum1
| November 2022
| 17
| 944
| (44)
|
| LME Lead1
| November 2022
| 13
| 642
| (29)
|
| LME Nickel1
| November 2022
| 12
| 1,564
| (28)
|
| LME Tin1
| November 2022
| 6
| 530
| (75)
|
| Low Sulphur Gasoil1
| December 2022
| 13
| 1,326
| (25)
|
| NY Harbor ULSD1
| November 2022
| 9
| 1,389
| 2
|
| S&P ASX 200 Index
| December 2022
| 38
| 4,166
| (84)
|
| S&P TSX 60 Index
| December 2022
| 24
| 4,149
| (61)
|
| Soybean1
| January 2023
| 12
| 852
| 9
|
| Soybean Meal1
| December 2022
| 33
| 1,413
| 16
|
| Soybean Oil1
| December 2022
| 34
| 1,493
| 176
|
| Sugar #111
| February 2023
| 64
| 1,288
| 5
|
|
|
|
|
| (1,713)
|
Alternative Strategies Fund
| Futures Contracts (continued)
|
|
|
|
| ($000)
|
|
| Expiration
| Number of
Long (Short)
Contracts
| Notional
Amount
| Value and
Unrealized
Appreciation
(Depreciation)
|
| Short Futures Contracts
|
|
|
|
|
| CAC40 Index
| November 2022
| (67)
| (4,151)
| (139)
|
| Cattle Feeder1
| January 2023
| (9)
| (808)
| (16)
|
| Cocoa1
| December 2022
| (11)
| (257)
| 9
|
| Copper1
| December 2022
| (16)
| (1,350)
| 75
|
| DAX Index
| December 2022
| (13)
| (4,268)
| 50
|
| E-Mini S&P 500 Index
| December 2022
| (21)
| (4,077)
| 190
|
| FTSE 100 Index
| December 2022
| (51)
| (4,157)
| 217
|
| KC HRW Wheat1
| December 2022
| (17)
| (832)
| (71)
|
| KOSPI 200 Index
| December 2022
| (79)
| (4,169)
| (168)
|
| Live Cattle1
| December 2022
| (14)
| (854)
| (12)
|
| LME Aluminum1
| November 2022
| (17)
| (944)
| 31
|
| LME Aluminum1
| December 2022
| (23)
| (1,280)
| 61
|
| LME Lead1
| November 2022
| (13)
| (642)
| (11)
|
| LME Lead1
| December 2022
| (10)
| (494)
| 20
|
| LME Nickel1
| November 2022
| (12)
| (1,564)
| 126
|
| LME Nickel1
| December 2022
| (10)
| (1,305)
| 18
|
| LME Tin1
| November 2022
| (6)
| (530)
| 92
|
| LME Tin1
| December 2022
| (5)
| (442)
| 62
|
| MSCI Singapore Index
| November 2022
| (216)
| (4,242)
| (204)
|
| Natural Gas1
| November 2022
| (8)
| (508)
| 43
|
| Wheat1
| December 2022
| (31)
| (1,367)
| (87)
|
|
|
|
|
| 286
|
|
|
|
|
| (1,427)
|
| 1
| Security is owned by the Vanguard ASF Portfolio, which is a wholly owned subsidiary of the Alternative Strategies Fund.
|
| Forward Currency Contracts
|
|
| Contract
Settlement
Date
| Contract Amount (000)
| Unrealized
Appreciation
($000)
| Unrealized
Depreciation
($000)
|
| Counterparty
| Receive
| Deliver
|
| Morgan Stanley Capital Services Inc.
| 11/10/22
| AUD
| 9,023
| USD
| 5,846
| —
| (73)
|
| Morgan Stanley Capital Services Inc.
| 11/10/22
| BRL
| 12,551
| USD
| 2,382
| 42
| —
|
| Royal Bank of Canada
| 11/10/22
| CAD
| 7,971
| USD
| 5,821
| 30
| —
|
| Morgan Stanley Capital Services Inc.
| 11/10/22
| CLP
| 2,222,876
| USD
| 2,309
| 44
| —
|
| Standard Chartered Bank
| 11/10/22
| HUF
| 1,002,134
| USD
| 2,283
| 128
| —
|
| Morgan Stanley Capital Services Inc.
| 11/10/22
| MXN
| 46,659
| USD
| 2,311
| 40
| —
|
| Bank of America, N.A.
| 11/10/22
| NOK
| 63,217
| USD
| 5,856
| 226
| —
|
| Morgan Stanley Capital Services Inc.
| 11/10/22
| PLN
| 11,461
| USD
| 2,308
| 90
| —
|
| Morgan Stanley Capital Services Inc.
| 11/10/22
| USD
| 5,781
| CHF
| 5,710
| 73
| —
|
| Standard Chartered Bank
| 11/10/22
| USD
| 5,798
| EUR
| 5,922
| —
| (58)
|
Alternative Strategies Fund
| Forward Currency Contracts (continued)
|
|
| Contract
Settlement
Date
| Contract Amount (000)
| Unrealized
Appreciation
($000)
| Unrealized
Depreciation
($000)
|
| Counterparty
| Receive
| Deliver
|
| Bank of America, N.A.
| 11/10/22
| USD
| 2,312
| ILS
| 8,254
| —
| (25)
|
| Morgan Stanley Capital Services Inc.
| 11/10/22
| USD
| 5,813
| JPY
| 839,698
| 159
| —
|
| BNP Paribas
| 11/10/22
| USD
| 2,306
| KRW
| 3,319,922
| —
| (24)
|
| Royal Bank of Canada
| 11/10/22
| USD
| 2,322
| SGD
| 3,330
| —
| (30)
|
| Bank of America, N.A.
| 11/10/22
| USD
| 2,306
| THB
| 87,529
| 5
| —
|
| Royal Bank of Canada
| 11/10/22
| USD
| 2,310
| TWD
| 73,673
| 22
| —
|
|
|
|
|
|
|
| 859
| (210)
|
| AUD—Australian dollar.
|
| BRL—Brazilian real.
|
| CAD—Canadian dollar.
|
| CHF—Swiss franc.
|
| CLP—Chilean peso.
|
| EUR—euro.
|
| HUF—Hungarian forint.
|
| ILS—Israeli shekel.
|
| JPY—Japanese yen.
|
| KRW—Korean won.
|
| MXN—Mexican peso.
|
| NOK—Norwegian krone.
|
| PLN—Polish zloty.
|
| SGD—Singapore dollar.
|
| THB—Thai baht.
|
| TWD—Taiwanese dollar.
|
| USD—U.S. dollar.
|
See accompanying
Notes, which are an integral part of the Financial Statements.
Alternative Strategies Fund
Consolidated Statement of Assets and Liabilities
|
|
| ($000s, except shares and per-share amounts)
| Amount
|
| Assets
|
|
| Investments in Securities, at Value
|
|
| Unaffiliated Issuers (Cost $28,521)
| 32,199
|
| Affiliated Issuers (Cost $39,087)
| 39,091
|
| Total Investments in Securities
| 71,290
|
| Investment in Vanguard
| 6
|
| Cash
| 16,307
|
| Cash Segregated for Short Positions
| 14,540
|
| Cash Collateral Pledged—Futures Contracts
| 5,154
|
| Cash Collateral Pledged—Forward Currency Contracts
| 110
|
| Receivables for Accrued Income
| 133
|
| Receivables for Capital Shares Issued
| 3
|
| Unrealized Appreciation—Forward Currency Contracts
| 859
|
| Receivables from Broker-Dealer
| 393
|
| Other Assets
| 2,493
|
| Total Assets
| 111,288
|
| Liabilities
|
|
| Securities Sold Short, at Value (Proceeds $11,093)
| 8,770
|
| Payables for Investment Securities Purchased
| 103
|
| Payables for Capital Shares Redeemed
| 121
|
| Payables to Vanguard
| 52
|
| Variation Margin Payable—Futures Contracts
| 2,472
|
| Unrealized Depreciation—Forward Currency Contracts
| 210
|
| Accrued Dividend Expense on Securities Sold Short
| 1
|
| Total Liabilities
| 11,729
|
| Net Assets
| 99,559
|
| At October 31, 2022, net assets consisted of:
|
|
|
|
|
| Paid-in Capital
| 133,627
|
| Total Distributable Earnings (Loss)
| (34,068)
|
| Net Assets
| 99,559
|
|
|
| Net Assets
|
|
Applicable to 5,816,801 outstanding $.001 par value shares of
beneficial interest (unlimited authorization)
| 99,559
|
| Net Asset Value Per Share
| $17.12
|
See accompanying
Notes, which are an integral part of the Financial Statements.
Alternative Strategies Fund
Consolidated Statement of Operations
|
|
|
| Year Ended
October 31, 2022
|
|
| ($000)
|
| Investment Income
|
|
| Income
|
|
| Dividends1
| 500
|
| Interest2
| 471
|
| Total Income
| 971
|
| Expenses
|
|
| The Vanguard Group—Note B
|
|
| Investment Advisory Services
| 28
|
| Management and Administrative
| 242
|
| Marketing and Distribution
| 11
|
| Custodian Fees
| 27
|
| Auditing Fees
| 56
|
| Shareholders’ Reports
| 25
|
| Trustees’ Fees and Expenses—Note B
| 15
|
| Dividend Expense on Securities Sold Short
| 55
|
| Borrowing Expense on Securities Sold Short
| 111
|
| Other Expenses
| 24
|
| Total Expenses
| 594
|
| Expenses Paid Indirectly
| (1)
|
| Net Expenses
| 593
|
| Net Investment Income
| 378
|
| Payment from Affiliate - Note B
| 637
|
| Realized Net Gain (Loss)
|
|
| Investment Securities Sold—Long Positions2
| 3,831
|
| Investment Securities Sold—Short Positions
| 1,286
|
| Futures Contracts
| (2,408)
|
| Forward Currency Contracts
| (61)
|
| Foreign Currencies
| 18
|
| Realized Net Gain (Loss)
| 2,666
|
| Change in Unrealized Appreciation (Depreciation)
|
|
| Investment Securities—Long Positions2
| (5,100)
|
| Investment Securities—Short Positions
| 4,442
|
| Futures Contracts
| (929)
|
| Forward Currency Contracts
| 903
|
| Foreign Currencies
| (464)
|
| Change in Unrealized Appreciation (Depreciation)
| (1,148)
|
| Net Increase (Decrease) in Net Assets Resulting from Operations
| 2,533
|
| 1
| Dividends are net of foreign withholding taxes of $5,000.
|
| 2
| Interest income, realized net gain (loss), capital gain distributions received, and change in unrealized appreciation (depreciation) from an affiliated company of
the fund were $457,000, ($1,000), $2,000, and ($2,000), respectively. Purchases and sales are for temporary cash investment purposes.
|
See accompanying
Notes, which are an integral part of the Financial Statements.
Alternative Strategies Fund
Consolidated Statement of Changes in Net Assets
|
|
|
| Year Ended October 31,
|
|
| 2022
($000)
| 2021
($000)
|
|
|
|
|
| Increase (Decrease) in Net Assets
|
|
|
| Operations
|
|
|
| Net Investment Income
| 378
| (439)
|
| Payment from Affiliate - Note B
| 637
| —
|
| Realized Net Gain (Loss)
| 2,666
| 7,084
|
| Change in Unrealized Appreciation (Depreciation)
| (1,148)
| (8,835)
|
| Net Increase (Decrease) in Net Assets Resulting from Operations
| 2,533
| (2,190)
|
| Distributions
|
|
|
| Total Distributions
| (2,262)
| (2,074)
|
| Capital Share Transactions
|
|
|
| Issued
| 21,574
| 31,827
|
| Issued in Lieu of Cash Distributions
| 2,197
| 2,047
|
| Redeemed
| (61,620)
| (198,840)
|
| Net Increase (Decrease) from Capital Share Transactions
| (37,849)
| (164,966)
|
| Total Increase (Decrease)
| (37,578)
| (169,230)
|
| Net Assets
|
|
|
| Beginning of Period
| 137,137
| 306,367
|
| End of Period
| 99,559
| 137,137
|
See accompanying
Notes, which are an integral part of the Financial Statements.
Alternative Strategies Fund
Consolidated Financial Highlights
For a Share Outstanding
Throughout Each Period
| Year Ended October 31,
|
| 2022
| 2021
| 2020
| 2019
| 2018
|
| Net Asset Value, Beginning of Period
| $17.00
| $17.15
| $22.23
| $20.41
| $20.46
|
| Investment Operations
|
|
|
|
|
|
| Net Investment Income (Loss)1
| .055
| (.042)
| .023
| .252
| .197
|
| Payment from Affiliate
| .092
| —
| —
| —
| —
|
| Net Realized and Unrealized Gain (Loss) on Investments
| .251
| .020
| (3.835)
| 1.828
| (.143)
|
| Total from Investment Operations
| .398
| (.022)
| (3.812)
| 2.080
| .054
|
| Distributions
|
|
|
|
|
|
| Dividends from Net Investment Income
| (.278)
| (.128)
| (.385)
| (.260)
| (.104)
|
| Distributions from Realized Capital Gains
| —
| —
| (.883)
| —
| —
|
| Total Distributions
| (.278)
| (.128)
| (1.268)
| (.260)
| (.104)
|
| Net Asset Value, End of Period
| $17.12
| $17.00
| $17.15
| $22.23
| $20.41
|
| Total Return2
| 2.38%3
| -0.12%
| -18.17%
| 10.30%
| 0.27%
|
| Ratios/Supplemental Data
|
|
|
|
|
|
| Net Assets, End of Period (Millions)
| $100
| $137
| $306
| $297
| $320
|
Ratio of Total Expenses
to Average Net Assets
|
|
|
|
|
|
| Based on Total Expenses4,5
| 0.51%6
| 1.28%
| 0.78%
| 0.79%6
| 0.66%6
|
| Net of Dividend and Borrowing Expense on Securities Sold Short
| 0.37%6
| 0.35%
| 0.34%
| 0.38%6
| 0.33%6
|
| Ratio of Net Investment Income (Loss) to Average Net Assets
| 0.32%
| (0.25)%
| 0.12%
| 1.18%
| 0.93%
|
| Portfolio Turnover Rate
| 112%
| 166%
| 173%
| 157%
| 131%
|
| 1
| Calculated based on average shares outstanding.
|
| 2
| Total returns do not include account service fees that may have applied in the periods shown. Fund prospectuses provide information about any applicable account service fees.
|
| 3
| Payment received from an affiliate increased the fund's total return by 0.68%. See Note B in the Notes to Financial Statements.
|
| 4
| Includes dividend expense on securities sold short of 0.05%, 0.37%, 0.44%, 0.41% and 0.33%, respectively.
|
| 5
| Includes borrowing expense on securities sold short of 0.09%, 0.56%, 0.00%, 0.00%, and 0.00%, respectively.
|
| 6
| The ratio of total expenses to average net assets for the periods ended 2022, 2019, and 2018, net of reduction from custody fee offset arrangement for total
expenses and net of dividend and borrowing expense on securities sold short, was 0.51% and 0.37%, 0.74% and 0.33%, and 0.65% and 0.32%, respectively.
|
See accompanying
Notes, which are an integral part of the Financial Statements.
Alternative Strategies Fund
Notes to Consolidated Financial Statements
Vanguard Alternative
Strategies Fund is registered under the Investment Company Act of 1940 as an open-end investment company, or mutual fund. Significant market disruptions, such as those caused by pandemics (e.g., COVID-19 pandemic),
natural or environmental disasters, war (e.g., Russia’s invasion of Ukraine), acts of terrorism, or other events, can adversely affect local and global markets and normal market operations. Any such disruptions
could have an adverse impact on the value of the fund’s investments and fund performance.
The Consolidated Financial
Statements include Vanguard ASF Portfolio ("the subsidiary"), which commenced operations on August 11, 2015. The subsidiary is wholly owned by the fund and is a unit trust established in the Cayman Islands under the
Trusts Law (2011 Revision) of the Cayman Islands, which is organized to invest in certain commodity-linked investments on behalf of the fund, consistent with the fund's investment objectives and policies. The
commodity-linked investments and other investments held by the subsidiary are subject to the same risks that apply to similar investments if held directly by the fund. As of October 31, 2022, the fund held $16,712,000
in the subsidiary, representing 17% of the fund's net assets. All inter-fund transactions and balances (including the fund's investment in the subsidiary) have been eliminated, and the Consolidated Financial
Statements include all investments and other accounts of the subsidiary as if held directly by the fund.
| A.
| The following significant accounting policies conform to generally accepted accounting principles for U.S. investment companies. The fund consistently follows such policies in preparing its financial statements.
|
1. Security Valuation:
Securities are valued as of the close of trading on the New York Stock Exchange (generally 4 p.m., Eastern time) on the valuation date. Equity securities are valued at the latest quoted sales prices or official
closing prices taken from the primary market in which each security trades; such securities not traded on the valuation date are valued at the mean of the latest quoted bid and asked prices. Securities for which
market quotations are not readily available, or whose values have been affected by events occurring before the fund’s pricing time but after the close of the securities’ primary markets, are valued by
methods deemed by the valuation designee to represent fair value and subject to oversight by the board of trustees. Investments in Vanguard Market Liquidity Fund are valued at that fund's net asset value.
2. Foreign Currency:
Securities and other assets and liabilities denominated in foreign currencies are translated into U.S. dollars using exchange rates obtained from an independent third party as of the fund’s pricing time on the
valuation date. Realized gains (losses) and unrealized appreciation (depreciation) on investment securities include the effects of changes in exchange rates since the securities were purchased, combined with the
effects of changes in security prices. Fluctuations in the value of other assets and liabilities resulting from changes in exchange rates are recorded as unrealized foreign currency gains (losses) until the assets or
liabilities are settled in cash, at which time they are recorded as realized foreign currency gains (losses).
3. Short Sales: Short
sales are the sales of securities that the fund does not own. The fund sells a security it does not own in anticipation of a decline in the value of that security. In order to deliver the security to the purchaser,
the fund borrows the security from a broker-dealer. The fund must segregate, as collateral for its obligation to return the borrowed security, an amount of cash and long security positions at least equal to the market
value of the security sold short. In the absence of a default, the collateral segregated by the fund cannot be repledged, resold or rehypothecated. This results in the fund holding a significant portion of its assets
in cash. The fund later closes out the position by returning the security to the lender, typically by purchasing the security in the open
Alternative Strategies Fund
market. A gain, limited to the price at which
the fund sold the security short, or a loss, theoretically unlimited in size, is recognized upon the termination of the short sale. The fund may receive a portion of the income from the investment of collateral, or be
charged a fee on borrowed securities, based on the market value of each borrowed security and a variable rate that is dependent upon the availability of such security. The net amounts of income or fees are recorded as
interest income (for net income received) or borrowing expense on securities sold short (for net fees charged) on the Consolidated Statement of Operations. Dividends on securities sold short are reported as an expense
in the Consolidated Statement of Operations. Cash collateral segregated for securities sold short is recorded as an asset in the Consolidated Statement of Assets and Liabilities. Long security positions segregated as
collateral are shown in the Consolidated Schedule of Investments.
4. Futures Contracts:
The fund gains exposure to commodities through the subsidiary’s investment in exchange-traded commodity futures contracts. The fund also uses interest rate futures contracts to invest in fixed income asset
classes with greater efficiency and lower cost than is possible through direct investment, to add value when these instruments are attractively priced, or to adjust sensitivity to changes in interest rates. The fund
uses global equity index futures contracts to capture excess return opportunities. The primary risk associated with the use of futures contracts are imperfect correlation between changes in market values of the
underlying securities or commodities and the prices of futures contracts, and the possibility of an illiquid market. In addition, commodity futures trading is volatile, and even a small movement in market prices could
cause large losses. Counterparty risk involving futures is mitigated because a regulated clearinghouse is the counterparty instead of the clearing broker. To further mitigate counterparty risk, the fund trades futures
contracts on an exchange, monitors the financial strength of its clearing brokers and clearinghouse, and has entered into clearing agreements with its clearing brokers. The clearinghouse imposes initial margin
requirements to secure the fund’s performance and requires daily settlement of variation margin representing changes in the market value of each contract. Any assets pledged as initial margin for open contracts
are noted in the Consolidated Schedule of Investments.
Futures contracts are valued
at their quoted daily settlement prices. The notional amounts of the contracts are not recorded in the Consolidated Statement of Assets and Liabilities. Fluctuations in the value of the contracts are recorded in the
Consolidated Statement of Assets and Liabilities as an asset (liability) and in the Consolidated Statement of Operations as unrealized appreciation (depreciation) until the contracts are closed, when they are recorded
as realized gains (losses) on futures contracts.
During the year ended October
31, 2022, the fund average investments in long and short futures contracts represented 148% and 43% of net assets, respectively, based on the average of the notional amounts at each quarter-end during the period.
5. Forward Currency
Contracts: The fund enters into forward currency contracts to protect the value of securities and related receivables and payables against changes in future foreign exchange rates. The fund’s risks in using
these contracts include movement in the values of the foreign currencies relative to the U.S. dollar and the ability of the counterparties to fulfill their obligations under the contracts. The fund mitigates its
counterparty risk by entering into forward currency contracts only with a diverse group of prequalified counterparties, monitoring their financial strength, entering into master netting arrangements with its
counterparties, and requiring its counterparties to transfer collateral as security for their performance. In the absence of a default, the collateral pledged or received by the fund cannot be repledged, resold, or
rehypothecated. The
Alternative Strategies Fund
master netting arrangements provide that, in
the event of a counterparty’s default (including bankruptcy), the fund may terminate the forward currency contracts, determine the net amount owed by either party in accordance with its master netting
arrangements, and sell or retain any collateral held up to the net amount owed to the fund under the master netting arrangements. The forward currency contracts contain provisions whereby a counterparty may terminate
open contracts if the fund’s net assets decline below a certain level, triggering a payment by the fund if the fund is in a net liability position at the time of the termination. The payment amount would be
reduced by any collateral the fund has pledged. Any securities pledged as collateral for open contracts are noted in the Consolidated Schedule of Investments. The value of collateral received or pledged is compared
daily to the value of the forward currency contracts exposure with each counterparty, and any difference, if in excess of a specified minimum transfer amount, is adjusted and settled within two business days.
Forward currency contracts are
valued at their quoted daily prices obtained from an independent third party, adjusted for currency risk based on the expiration date of each contract. The notional amounts of the contracts are not recorded in the
Consolidated Statement of Assets and Liabilities. Fluctuations in the value of the contracts are recorded in the Consolidated Statement of Assets and Liabilities as an asset (liability) and in the Consolidated
Statement of Operations as unrealized appreciation (depreciation) until the contracts are closed, when they are recorded as realized gains (losses) on forward currency contracts.
During the year ended October
31, 2022, the fund’s average investment in forward currency contracts represented 60% of net assets, based on the average of the notional amounts at each quarter-end during the period.
The following table summarizes
the fund’s derivative assets and liabilities by counterparty for derivatives subject to arrangements that provide for offsetting assets and liabilities. Exchange-traded and centrally cleared derivatives are
listed separately.
|
| Assets
Reflected in
Consolidated
Statement of
Assets and
Liabilities1
($000)
| Liabilities
Reflected in
Consolidated
Statement of
Assets and
Liabilities1
($000)
| Net Amount
Receivable
(Payable)
($000)
| Amounts Not Offset in
the Consolidated
Statement of Assets
and Liabilities
| Net
Exposure3
(Not Less
Than $0)
($000)
|
|
| Collateral
Pledged2
($000)
| Collateral
Received2
($000)
|
Derivatives Subject to
Offsetting Arrangements, by Counterparty
|
|
|
|
|
|
|
| Bank of America, N.A.
| 231
| (25)
| 206
| —
| —
| 206
|
| BNP Paribas
| —
| (24)
| (24)
| —
| —
| —
|
| Morgan Stanley Capital Services Inc.
| 448
| (73)
| 375
| 110
| —
| 375
|
| Royal Bank of Canada
| 52
| (30)
| 22
| —
| —
| 22
|
| Standard Chartered Bank
| 128
| (58)
| 70
| —
| —
| 70
|
Exchange-Traded
Futures Contracts
| —
| (2,472)
| (2,472)
| 5,154
| —
| —
|
| Total
| 859
| (2,682)
| (1,823)
| 5,264
| —
| 673
|
1 Absent an event of default or early termination, derivative assets and liabilities are presented gross and not offset in the Consolidated Statement of Assets and Liabilities.
Alternative Strategies Fund
2 Securities or other assets pledged as collateral are noted in the Consolidated Schedule of Investments and Consolidated Statement of Assets and Liabilities. Securities or other
assets received as collateral are held in a segregated account and not included in the fund’s security holdings in the Consolidated Schedule of Investments.
3 Net Exposure represents the net amount receivable from the counterparty in the event of default. Counterparties are not required to exchange collateral if amount is below a
specified minimum transfer amount.
6. Federal Income Taxes:
The fund intends to continue to qualify as a regulated investment company and distribute virtually all of its taxable income. The subsidiary is classified as a foreign corporation for U.S. tax purposes, and because it
does not carry on a U.S. trade or business, is generally not subject to U.S. federal income tax. The subsidiary also complies with the Foreign Account Tax Compliance Act ("FATCA") and thus will not be subject to 30%
withholding under FATCA on any income from U.S. investments. In addition, the subsidiary is not subject to Cayman Islands income tax. The subsidiary is not required to distribute any earnings and profits to the fund.
The fund’s tax returns are open to examination by the relevant tax authorities until expiration of the applicable statute of limitations, which is generally three years after filing the tax return. Management
has analyzed the fund’s tax positions taken for all open federal and state income tax years, and has concluded that no provision for income tax is required in the fund’s financial statements.
7. Distributions:
Distributions to shareholders are recorded on the ex-dividend date. Distributions are determined on a tax basis at the fiscal year-end and may differ from net investment income and realized capital gains for financial
reporting purposes.
8. Credit Facilities and
Interfund Lending Program: The fund and certain other funds managed by The Vanguard Group ("Vanguard") participate in a $4.4 billion committed credit facility provided by a syndicate of lenders pursuant to a credit
agreement and an uncommitted credit facility provided by Vanguard. Both facilities may be renewed annually. Each fund is individually liable for its borrowings, if any, under the credit facilities. Borrowings may be
utilized for temporary or emergency purposes and are subject to the fund’s regulatory and contractual borrowing restrictions. With respect to the committed credit facility, the participating funds are charged
administrative fees and an annual commitment fee of 0.10% of the undrawn committed amount of the facility, which are allocated to the funds based on a method approved by the fund’s board of trustees and included
in Management and Administrative expenses on the fund’s Consolidated Statement of Operations. Any borrowings under either facility bear interest at an agreed-upon spread plus the higher of the federal funds
effective rate, the overnight bank funding rate, or the Daily Simple Secured Overnight Financing Rate inclusive of an additional agreed-upon spread. However, borrowings under the uncommitted credit facility may bear
interest based upon an alternate rate agreed to by the fund and Vanguard.
In accordance with an
exemptive order (the “Order”) from the SEC, the fund may participate in a joint lending and borrowing program that allows registered open-end Vanguard funds to borrow money from and lend money to each
other for temporary or emergency purposes (the “Interfund Lending Program”), subject to compliance with the terms and conditions of the Order, and to the extent permitted by the fund’s investment
objective and investment policies. Interfund loans and borrowings normally extend overnight but can have a maximum duration of seven days. Loans may be called on one business day’s notice. The interest rate to
be charged is governed by the conditions of the Order and internal procedures adopted by the board of trustees. The board of trustees is responsible for overseeing the Interfund Lending Program.
For the year ended October 31,
2022, the fund did not utilize the credit facilities or the Interfund Lending Program.
Alternative Strategies Fund
9. Other: Dividend
income (or dividend expense on short positions) is recorded on the ex-dividend date. Non-cash dividends included in income, if any, are recorded at the fair value of the securities received. Interest income includes
income distributions received from Vanguard Market Liquidity Fund and is accrued daily. Security transactions are accounted for on the date securities are bought or sold. Costs used to determine realized gains
(losses) on the sale of investment securities are those of the specific securities sold.
| B.
| In accordance with the terms of a Funds' Service Agreement (the “FSA”) between Vanguard and the fund, Vanguard furnishes to the fund investment advisory, corporate management, administrative, marketing,
and distribution services at Vanguard’s cost of operations (as defined by the FSA). These costs of operations are allocated to the fund based on methods and guidelines approved by the board of trustees and are
generally settled twice a month.
|
During the period ended
October 31, 2022, the fund received a voluntary payment of $637,000 from Vanguard related to higher-than-anticipated costs associated with short sale transactions, which is included in Payment from Affiliate on the
Consolidated Statement of Operations; the fund is not obligated to repay this amount to Vanguard.
Under a separate agreement,
Vanguard provides corporate management and administrative services to the subsidiary for an annual fee of 0.40% of average net assets of the subsidiary, generally settled once a month. In addition, the subsidiary pays
an unaffiliated third party, VGMF I (Cayman) Limited, an affiliate of Maples Trustee Services (Cayman) Limited, a fee plus reasonable additional expenses for trustee services. All of the subsidiary’s expenses
are reflected in the Consolidated Statement of Operations and in the Ratio of Total Expenses to Average Net Assets in the Consolidated Financial Highlights.
Upon the request of Vanguard,
the fund may invest up to 0.40% of its net assets as capital in Vanguard. At October 31, 2022, the fund had contributed to Vanguard capital in the amount of $6,000, representing 0.01% of the fund’s net assets
and less than 0.01% of Vanguard’s capital received pursuant to the FSA. The fund’s trustees and officers are also directors and employees, respectively, of Vanguard.
| C.
| The fund’s custodian bank has agreed to reduce its fees when the fund maintains cash on deposit in the non-interest-bearing custody account. For the year ended October 31, 2022, custodian fee offset
arrangements reduced the fund’s expenses by $1,000 (an annual rate of less than 0.01% of average net assets).
|
| D.
| Various inputs may be used to determine the value of the fund’s investments and derivatives. These inputs are summarized in three broad levels for financial statement purposes.
The inputs or methodologies used to value securities are not necessarily an indication of the risk associated with investing in those securities.
|
Level 1—Quoted prices in active markets for identical securities.
Level 2—Other significant observable inputs (including quoted prices for similar securities, interest rates, prepayment speeds, credit risk, etc.).
Level 3—Significant unobservable inputs (including the fund’s own assumptions used to determine the fair value of investments). Any investments and derivatives valued with significant
unobservable inputs are noted on the Consolidated Schedule of Investments.
Alternative Strategies Fund
The following table summarizes
the market value of the fund’s investments and derivatives as of October 31, 2022, based on the inputs used to value them:
|
| Level 1
($000)
| Level 2
($000)
| Level 3
($000)
| Total
($000)
|
| Investments
|
|
|
|
|
| Assets
|
|
|
|
|
| Common Stocks
| 32,199
| —
| —
| 32,199
|
| Temporary Cash Investments
| 39,091
| —
| —
| 39,091
|
| Total
| 71,290
| —
| —
| 71,290
|
| Liabilities
|
|
|
|
|
| Common Stocks
| 8,770
| —
| —
| 8,770
|
| Derivative Financial Instruments
|
|
|
|
|
| Assets
|
|
|
|
|
| Futures Contracts1
| 1,964
| —
| —
| 1,964
|
| Forward Currency Contracts
| —
| 859
| —
| 859
|
| Total
| 1,964
| 859
| —
| 2,823
|
| Liabilities
|
|
|
|
|
| Futures Contracts1
| 3,391
| —
| —
| 3,391
|
| Forward Currency Contracts
| —
| 210
| —
| 210
|
| Total
| 3,391
| 210
| —
| 3,601
|
| 1
| Includes cumulative appreciation (depreciation) on futures contracts and centrally cleared swaps, if any, as reported in the Consolidated Schedule of Investments.
Only current day’s variation margin is reported within the Consolidated Statement of Assets and Liabilities.
|
| E.
| At October 31, 2022, the fair values of derivatives were reflected in the Consolidated Schedule of Investments and Consolidated Statement of Assets and Liabilities as follows:
|
| Consolidated Statement of Assets and Liabilities Caption
| Equity
Contracts
($000)
| Commodity
Contracts
($000)
| Interest Rate
Contracts
($000)
| Foreign
Exchange
Contracts
($000)
| Total
($000)
|
| Unrealized Appreciation—Futures Contracts1
| 1,213
| 751
| —
| —
| 1,964
|
| Unrealized Appreciation—Forward Currency Contracts
| —
| —
| —
| 859
| 859
|
| Total Assets
| 1,213
| 751
| —
| 859
| 2,823
|
|
|
|
|
|
|
|
| Unrealized Depreciation—Futures Contracts1
| 656
| 677
| 2,058
| —
| 3,391
|
| Unrealized Depreciation—Forward Currency Contracts
| —
| —
| —
| 210
| 210
|
| Total Liabilities
| 656
| 677
| 2,058
| 210
| 3,601
|
| 1
| Includes cumulative appreciation (depreciation) on futures contracts and centrally cleared swaps, if any, as reported in the Consolidated Schedule of Investments.
Only current day’s variation margin is reported within the Consolidated Statement of Assets and Liabilities.
|
Alternative Strategies Fund
Realized net gain (loss) and
the change in unrealized appreciation (depreciation) on derivatives for the year ended October 31, 2022, were:
| Realized Net Gain (Loss) on Derivatives
| Equity
Contracts
($000)
| Commodity
Contracts
($000)
| Interest Rate
Contracts
($000)
| Foreign
Exchange
Contracts
($000)
| Total
($000)
|
| Futures Contracts
| 4,197
| 1,729
| (8,334)
| —
| (2,408)
|
| Forward Currency Contracts
| —
| —
| —
| (61)
| (61)
|
| Realized Net Gain (Loss) on Derivatives
| 4,197
| 1,729
| (8,334)
| (61)
| (2,469)
|
| Change in Unrealized Appreciation (Depreciation) on Derivatives
|
| Futures Contracts
| (210)
| 106
| (825)
| —
| (929)
|
| Forward Currency Contracts
| —
| —
| —
| 903
| 903
|
| Change in Unrealized Appreciation (Depreciation) on Derivatives
| (210)
| 106
| (825)
| 903
| (26)
|
| F.
| Permanent differences between book-basis and tax-basis components of net assets are reclassified among capital accounts in the financial statements to reflect their tax character. These reclassifications have no
effect on net assets or net asset value per share. As of period end, permanent differences primarily attributable to the accounting for applicable foreign currency transactions, passive foreign investment companies,
and operations of the subsidiary were reclassified between the following accounts:
|
|
| Amount
($000)
|
| Paid-in Capital
| 23
|
| Total Distributable Earnings (Loss)
| (23)
|
Temporary differences between
book-basis and tax-basis components of total distributable earnings (loss) arise when certain items of income, gain, or loss are recognized in different periods for financial statement and tax purposes; these
differences will reverse at some time in the future. The differences are primarily related to the deferral of losses from wash sales; the recognition of unrealized gains or losses from certain derivative contracts;
and the recognition of unrealized gain from constructive sales. As of period end, the tax-basis components of total distributable earnings (loss) are detailed in the table as follows:
|
| Amount
($000)
|
| Undistributed Ordinary Income
| 2,674
|
| Undistributed Long-Term Gains
| —
|
| Capital Loss Carryforwards
| (42,375)
|
| Qualified Late-Year Losses
| —
|
| Net Unrealized Gains (Losses)
| 5,633
|
Alternative Strategies Fund
The tax character of
distributions paid was as follows:
|
| Year Ended October 31,
|
|
| 2022
Amount
($000)
| 2021
Amount
($000)
|
| Ordinary Income*
| 2,262
| 2,074
|
| Long-Term Capital Gains
| —
| —
|
| Total
| 2,262
| 2,074
|
| *
| Includes short-term capital gains, if any.
|
As of October 31, 2022, gross
unrealized appreciation and depreciation for investments and derivatives based on cost for U.S. federal income tax purposes were as follows:
|
| Amount
($000)
|
| Tax Cost
| 67,773
|
| Gross Unrealized Appreciation
| 15,211
|
| Gross Unrealized Depreciation
| (9,051)
|
| Net Unrealized Appreciation (Depreciation)
| 6,160
|
| G.
| During the year ended October 31, 2022, the fund purchased $44,128,000 of investment securities and sold $72,004,000 of investment securities, other than temporary cash investments. The proceeds of short sales and
the cost of purchases to cover short sales were $13,338,000 and $12,352,000, respectively.
|
| H.
| Capital shares issued and redeemed were:
|
|
| Year Ended October 31,
|
|
| 2022
Shares
(000)
| 2021
Shares
(000)
|
|
|
|
|
| Issued
| 1,266
| 1,865
|
| Issued in Lieu of Cash Distributions
| 132
| 122
|
| Redeemed
| (3,647)
| (11,786)
|
| Net Increase (Decrease) in Shares Outstanding
| (2,249)
| (9,799)
|
At October 31, 2022, Vanguard
Managed Allocation Fund, was the record or beneficial owner of 72% of the fund’s net assets. If this shareholder were to redeem its investment in the fund, the redemption might result in an increase in the
fund’s expense ratio, cause the fund to incur higher transaction costs, or lead to the realization of taxable capital gains.
| I.
| Management has determined that no material events or transactions occurred subsequent to October 31, 2022, that would require recognition or disclosure in these financial statements.
|
Report of Independent Registered Public Accounting
Firm
To the Board of Trustees of Vanguard
Trustees' Equity Fund and Shareholders of Vanguard Alternative Strategies Fund
Opinion on the Financial
Statements
We have audited the accompanying consolidated
statement of assets and liabilities, including the consolidated schedule of investments, of Vanguard Alternative Strategies Fund and its subsidiary (one of the funds constituting Vanguard Trustees' Equity Fund,
referred to hereafter as the "Fund") as of October 31, 2022, the related consolidated statement of operations for the year ended October 31, 2022, the consolidated statement of changes in net assets for each of the
two years in the period ended October 31, 2022, including the related notes, and the consolidated financial highlights for each of the five years in the period ended October 31, 2022 (collectively referred to as the
"consolidated financial statements"). In our opinion, the consolidated financial statements present fairly, in all material respects, the financial position of the Fund as of October 31, 2022, the results of its
operations for the year then ended, the changes in its net assets for each of the two years in the period ended October 31, 2022 and the financial highlights for each of the five years in the period ended October 31,
2022 in conformity with accounting principles generally accepted in the United States of America.
Basis for Opinion
These consolidated financial statements are
the responsibility of the Fund’s management. Our responsibility is to express an opinion on the Fund’s consolidated financial statements based on our audits. We are a public accounting firm registered with
the Public Company Accounting Oversight Board (United States) (PCAOB) and are required to be independent with respect to the Fund in accordance with the U.S. federal securities laws and the applicable rules and
regulations of the Securities and Exchange Commission and the PCAOB.
We conducted our audits of
these consolidated financial statements in accordance with the standards of the PCAOB. Those standards require that we plan and perform the audit to obtain reasonable assurance about whether the consolidated financial
statements are free of material misstatement, whether due to error or fraud.
Our audits included performing
procedures to assess the risks of material misstatement of the consolidated financial statements, whether due to error or fraud, and performing procedures that respond to those risks. Such procedures included
examining, on a test basis, evidence regarding the amounts and disclosures in the consolidated financial statements. Our audits also included evaluating the accounting principles used and significant estimates made by
management, as well as evaluating the overall presentation of the consolidated financial statements. Our procedures included confirmation of securities owned as of October 31, 2022 by correspondence with the
custodian, transfer agent and brokers; when replies were not received from brokers, we performed other auditing procedures. We believe that our audits provide a reasonable basis for our opinion.
/s/PricewaterhouseCoopers
LLP
Philadelphia, Pennsylvania
December 16, 2022
We have served as the auditor
of one or more investment companies in The Vanguard Group of Funds since 1975.
Tax information
(unaudited)
For corporate shareholders,
16.1%, or if subsequently determined to be different, the maximum percentage allowable by law, of ordinary income (dividend income plus short-term gains, if any) for the fiscal year qualified for the
dividends-received deduction.
The fund hereby designates
$1,355,000, or if subsequently determined to be different, the maximum amount allowable by law, as qualified dividend income for individual shareholders for the fiscal year.
The fund hereby designates
$136,000, or if subsequently determined to be different, the maximum amount allowable by law, of interest earned from obligations of the U.S. government which is generally exempt from state income tax.
The fund hereby designates
$114,000, or if subsequently determined to be different, the maximum amount allowable by law, of qualified business income for individual shareholders for the fiscal year.
This page intentionally left blank.
The People Who Govern Your Fund
The trustees of your mutual
fund are there to see that the fund is operated and managed in your best interests since, as a shareholder, you are a part owner of the fund. Your fund’s trustees also serve on the board of directors of The
Vanguard Group, Inc., which is owned by the Vanguard funds and provides services to them.
A majority of Vanguard’s
board members are independent, meaning that they have no affiliation with Vanguard or the funds they oversee, apart from the sizable personal investments they have made as private individuals. The independent board
members have distinguished backgrounds in business, academia, and public service. Each of the trustees and executive officers oversees 206 Vanguard funds.
Information for each trustee
and executive officer of the fund appears below. That information, as well as the Vanguard fund count, is as of the date on the cover of this fund report. The mailing address of the trustees and officers is P.O. Box
876, Valley Forge, PA 19482. More information about the trustees is in the Statement of Additional Information, which can be obtained, without charge, by contacting Vanguard at 800-662-7447, or online at vanguard.com.
Interested Trustee1
Mortimer J. Buckley
Born in 1969. Trustee since January 2018.
Principal occupation(s) during the past five years and other experience: chairman of the board (2019–present) of Vanguard and of each of the investment companies served by Vanguard; chief executive officer
(2018–present) of Vanguard; chief executive officer, president, and trustee (2018–present) of each of the investment companies served by Vanguard; president and director (2017–present) of Vanguard;
and president (2018–present) of Vanguard Marketing Corporation. Chief investment officer (2013–2017), managing director (2002–2017), head of the Retail Investor Group (2006–2012), and chief
information officer (2001–2006) of Vanguard. Member of the board of governors of the Investment Company Institute and the board of governors of FINRA. Trustee and vice chair of The Shipley School.
Independent Trustees
Tara Bunch
Born in 1962. Trustee since November 2021.
Principal occupation(s) during the past five years and other experience: head of global operations at Airbnb (2020–present). Vice president of AppleCare (2012–2020). Member of the board of directors of Out
& Equal (2002–2006), the advisory board of the University of California, Berkeley School of Engineering (2020–present), and the advisory board
of Santa Clara University’s Leavey
School of Business (2018–present).
Emerson U. Fullwood
Born in 1948. Trustee since January 2008.
Principal occupation(s) during the past five years and other experience: executive chief staff and marketing officer for North America and corporate vice president (retired 2008) of Xerox Corporation (document
management products and services). Former president of the Worldwide Channels Group, Latin America, and Worldwide Customer Service and executive chief staff officer of Developing Markets of Xerox. Executive in
residence and 2009–2010 Distinguished Minett Professor at the Rochester Institute of Technology. Member of the board of directors of the University of Rochester Medical Center, the Monroe Community College
Foundation, the United Way of Rochester, North Carolina A&T University, Roberts Wesleyan College, and the Rochester Philharmonic Orchestra. Trustee of the University of
Rochester.
F. Joseph Loughrey
Born in 1949. Trustee since October 2009.
Principal occupation(s) during the past five years and other experience: president and chief operating officer (retired 2009) and vice chairman of the board (2008–2009) of Cummins Inc. (industrial machinery).
Chairman of the board of Hillenbrand, Inc. (specialized consumer services). Director of the V Foundation. Member of the advisory council for the College of
1 Mr. Buckley is considered an “interested
person,” as defined in the Investment Company Act of 1940, because he is an officer of the Vanguard funds.
Arts and Letters at the University of Notre
Dame. Chairman of the board of Saint Anselm College.
Mark Loughridge
Born in 1953. Trustee since March 2012.
Principal occupation(s) during the past five years and other experience: senior vice president and chief financial officer (retired 2013) of IBM (information technology services). Fiduciary member of IBM’s
Retirement Plan Committee (2004–2013), senior vice president and general manager (2002–2004) of IBM Global Financing, vice president and controller (1998–2002) of IBM, and a variety of other prior
management roles at IBM. Member of the Council on Chicago Booth.
Scott C. Malpass
Born in 1962. Trustee since March 2012.
Principal occupation(s) during the past five years and other experience: adjunct professor of finance at the University of Notre Dame (2020–present). Chief investment officer (retired 2020) and vice president
(retired 2020) of the University of Notre Dame. Assistant professor (retired June 2020) of finance at the Mendoza College of Business, University of Notre Dame, and member of the Notre Dame 403(b) Investment
Committee. Member of the board of Catholic Investment Services, Inc. (investment advisors), the board of superintendence of the Institute for the Works of Religion, and the board of directors of Paxos Trust Company
(finance).
Deanna Mulligan
Born in 1963. Trustee since January 2018.
Principal occupation(s) during the past five years and other experience: chief executive officer of Purposeful (advisory firm for CEOs and C-level executives; 2021–present). Board chair (2020), chief executive
officer (2011–2020), and president (2010–2019) of The Guardian Life Insurance Company of America. Chief operating officer (2010–2011) and executive vice president (2008–2010) of Individual Life
and Disability of the Guardian Life Insurance Company of America. Member of the board of the Economic Club of New York. Trustee of the Partnership for New York City (business leadership), Chief Executives for
Corporate Purpose, and the NewYork-Presbyterian Hospital.
André F. Perold
Born in 1952. Trustee since December 2004.
Principal occupation(s) during the past five years and other experience: George Gund Professor of Finance and Banking, Emeritus at the Harvard Business School (retired 2011). Chief investment officer and co-managing
partner of HighVista Strategies (private investment firm). Member of the board (2018–present) of RIT Capital Partners (investment
firm). Member of the investment committee of
Partners Health Care System.
Sarah Bloom Raskin
Born in 1961. Trustee since January 2018.
Principal occupation(s) during the past five years and other experience: deputy secretary (2014–2017) of the United States Department of the Treasury. Governor (2010–2014) of the Federal Reserve Board.
Commissioner (2007–2010) of financial regulation for the State of Maryland. Colin W. Brown Distinguished Professor of the Practice of Law (2021–present), professor (2020–present), Distinguished
Fellow of the Global Financial Markets Center (2020–present), and Rubenstein Fellow (2017–2020) at Duke University. Trustee (2017–present) of Amherst College and member of Amherst College Investment
Committee (2019–present). Member of the Regenerative Crisis Response Committee (2020–present).
David A. Thomas
Born in 1956. Trustee since July 2021.
Principal occupation(s) during the past five years and other experience: president of Morehouse College (2018–present). Professor of business administration, emeritus at Harvard University (2017–2018).
Dean (2011–2016) and professor of management (2016–2017) at the Georgetown University McDonough School of Business. Director of DTE Energy Company (2013–present). Trustee of Common Fund
(2019–present).
Peter F. Volanakis
Born in 1955. Trustee since July 2009.
Principal occupation(s) during the past five years and other experience: president and chief operating officer (retired 2010) of Corning Incorporated (communications equipment) and director of Corning Incorporated
(2000–2010) and Dow Corning (2001–2010). Director (2012) of SPX Corporation (multi-industry manufacturing). Overseer of the Amos Tuck School of Business Administration, Dartmouth College (2001–2013).
Member of the BMW Group Mobility Council.
Executive Officers
Christine M. Buchanan
Born in 1970. Principal occupation(s) during
the past five years and other experience: principal of Vanguard. Chief financial officer (2021–present) and treasurer (2017–present) of each of the investment companies served by Vanguard. Partner
(2005–2017) at KPMG (audit, tax, and advisory services).
John Galloway
Born in 1973. Principal occupation(s) during
the past five years and other experience: principal of Vanguard. Investment stewardship officer (September 2020–present) of each of the investment companies served by Vanguard. Head of Investor Advocacy
(February 2020–present) and head of Marketing Strategy and Planning (2017–2020) at Vanguard. Special assistant to the President of the United States (2015).
Ashley Grim
Born in 1984. Principal occupation(s) during
the past five years and other experience: treasurer (February 2022–present) of each of the investment companies served by Vanguard. Fund transfer agent controller (2019–2022) and director of Audit Services
(2017–2019) at Vanguard. Senior manager (2015–2017) at PriceWaterhouseCoopers (audit and assurance, consulting, and tax services).
Peter Mahoney
Born in 1974. Principal occupation(s) during
the past five years and other experience: principal of Vanguard. Controller (2015–present) of each of the investment companies served by Vanguard. Head of International Fund Services (2008–2014) at
Vanguard.
Anne E. Robinson
Born in 1970. Principal occupation(s) during
the past five years and other experience: general counsel (2016–present) of Vanguard. Secretary (2016–present) of Vanguard and of each of the investment companies served by Vanguard. Managing director
(2016–present) of Vanguard. Managing director and general counsel of Global Cards and Consumer Services (2014–2016) at Citigroup. Counsel (2003–2014) at American Express. Nonexecutive director of the
board of National Grid (energy).
Michael Rollings
Born in 1963. Principal occupation(s) during
the past five years and other experience: finance director (2017–present) and treasurer (2017) of each of the investment companies served by Vanguard. Managing director (2016–present) of Vanguard. Chief
financial officer (2016–present) of Vanguard. Director (2016–present) of Vanguard Marketing Corporation. Executive vice president and chief financial officer (2006–2016) of MassMutual Financial
Group.
John E. Schadl
Born in 1972. Principal occupation(s) during
the past five years and other experience: principal of Vanguard. Chief compliance officer (2019–present) of Vanguard and of each of the investment companies served by Vanguard. Assistant vice president
(2019–present) of Vanguard Marketing Corporation.
Vanguard Senior Management
Team
| Matthew Benchener
| Thomas M. Rampulla
|
| Joseph Brennan
| Karin A. Risi
|
| Mortimer J. Buckley
| Anne E. Robinson
|
| Gregory Davis
| Michael Rollings
|
| John James
| Nitin Tandon
|
| Chris D. Mclsaac
| Lauren Valente
|
Connect with
Vanguard®>vanguard.com
Fund Information > 800-662-7447
Direct Investor Account
Services > 800-662-2739
Institutional Investor
Services > 800-523-1036
Text Telephone for People Who
Are Deaf or Hard of Hearing > 800-749-7273
This material may be used in
conjunction with the offering of shares of any Vanguard fund only if preceded or accompanied by the fund’s current prospectus.
All comparative mutual
fund data are from Lipper, a Thomson Reuters Company, or Morningstar, Inc., unless otherwise noted.
You can obtain a free
copy of Vanguard’s proxy voting guidelines by visiting vanguard.com/proxyreporting or by calling Vanguard at 800-662-2739. The guidelines are also available from the SEC’s website, www.sec.gov. In
addition, you may obtain a free report on how your fund voted the proxies for securities it owned during the 12 months ended June 30. To get the report, visit either vanguard.com/proxyreporting or www.sec.gov.
You can review
information about your fund on the SEC’s website, and you can receive copies of this information, for a fee, by sending a request via email addressed to publicinfo@sec.gov.
Source for Bloomberg
indexes: Bloomberg Index Services Limited. Copyright 2022, Bloomberg. All rights reserved.
CFA® is a registered trademark owned by CFA Institute.
© 2022 The Vanguard Group,
Inc.
All rights reserved.
Vanguard Marketing Corporation, Distributor.
Q12980 122022
Annual Report | October 31, 2022
Vanguard
Commodity Strategy Fund
Contents
Your Fund’s Performance at a Glance
| 1
|
Advisors' Report
| 2
|
About Your Fund’s Expenses
| 4
|
Performance Summary
| 6
|
Consolidated Financial Statements
| 8
|
Please note: The
opinions expressed in this report are just that—informed opinions. They should not be considered promises or advice. Also, please keep in mind that the information and opinions cover the period through the date
on the front of this report. Of course, the risks of investing in your fund are spelled out in the prospectus.
Your Fund’s Performance at a Glance
| •
| For the 12 months ended October 31, 2022, Vanguard Commodity Strategy Fund returned 9.80%, falling short of its benchmark, the Bloomberg Commodity Total Return Index, which returned 11.15%.
|
| •
| The economic backdrop deteriorated as inflation soared to multidecade highs, fueled in part by higher energy and food prices in the wake of Russia’s invasion of Ukraine. Then price increases broadened to other
categories of goods and services, adding to concerns that inflation would remain stubbornly high. That prompted aggressive tightening by the Federal Reserve to bring inflation back in check, which increased fears of
recession.
|
| •
| Commodities generally performed well due to limited supply and increased demand. West Texas Intermediate Crude rose and grain prices soared. Gold and other precious metals fell.
|
| •
| The fund benefited from its positions in commodities but fell short of its benchmark, largely because of its exposure to short-term U.S.Treasury Inflation-Protected Securities (TIPS) as the market began to price in
higher inflation and real yields soared.
|
| •
| The fund uses derivatives to obtain its exposure to commodities. Its holdings of commodity index swaps contributed to total returns.
|
Market Barometer
|
| Average Annual Total Returns
Periods Ended October 31, 2022
|
|
| One Year
| Three Years
| Five Years
|
| Stocks
|
|
|
|
| Russell 1000 Index (Large-caps)
| -16.38%
| 9.99%
| 10.19%
|
| Russell 2000 Index (Small-caps)
| -18.54
| 7.05
| 5.56
|
| Russell 3000 Index (Broad U.S. market)
| -16.52
| 9.79
| 9.87
|
| FTSE All-World ex US Index (International)
| -24.20
| -1.16
| -0.18
|
| Bonds
|
|
|
|
Bloomberg U.S. Aggregate Float Adjusted Index
(Broad taxable market)
| -15.69%
| -3.73%
| -0.50%
|
Bloomberg Municipal Bond Index
(Broad tax-exempt market)
| -11.98
| -2.18
| 0.37
|
| FTSE Three-Month U.S. Treasury Bill Index
| 0.88
| 0.59
| 1.15
|
| CPI
|
|
|
|
| Consumer Price Index
| 7.75%
| 5.01%
| 3.85%
|
For the 12 months ended October 31, 2022,
Vanguard Commodity Strategy Fund returned 9.80%. It underperformed its benchmark, the Bloomberg Commodity Total Return Index, which returned 11.15%.
Investment objective and
strategy
The Commodity Strategy Fund is designed to
serve investors as a potential hedge against inflation risk and as further diversification for a traditional stock/bond portfolio. It invests in commodity-linked derivative investments, such as commodity futures and
swaps, collateralized by a mix of short-term U.S. Treasury Inflation-Protected Securities (TIPS) and U.S. Treasury bills. This blend of investments is expected to offer a controlled approach with the potential to
enhance returns over time without taking on excessive risk.
The fund uses multiple
strategies to enhance commodity returns, such as commodity curve positioning and over- and underweighting securities. It also takes advantage of roll schedules, a practice that involves rolling over commodity futures
before or after the Bloomberg Commodity Total Return Index rolls shorter-term futures contracts into longer-term contracts.
Investment environment
The period was defined by a sharp rise in
interest rates, which caused ripple effects across every sector of the financial markets and brought with it renewed volatility.
Concerns that had been weighing on market
sentiment in late 2021 carried into 2022. Supply-chain bottlenecks persisted, labor remained in short supply in some sectors of the economy as unemployment rates continued to fall, and year-on-year inflation
readings—which had been accelerating—climbed to multidecade highs across much of the world.
In late February,
Russia’s invasion of Ukraine injected more uncertainty into the markets. Oil headed north of $100 per barrel and staple food prices soared. Energy prices eventually began to cool amid slowing economic growth and
the U.S. government’s release of some of its strategic oil reserves to boost supply. But price increases broadened to other categories of goods and services, heightening concerns that inflation might remain
stubbornly high.
Equity and fixed income
markets suffered as, in response to this environment, major central banks wound down their bond-purchasing programs and began raising short-term interest rates. The Federal Reserve was especially aggressive, raising
rates five times during the period to bring inflation in check, which increased fears of recession. The yield on the benchmark 10-year Treasury rose 250 basis points during the period. (A basis point is one-hundredth
of a percentage point.)
The environment for
commodities remained strong in general because of limited supply and increased demand worldwide. West Texas Intermediate Crude continued to climb while natural
gas fell modestly after a strong 2021. Prices
for corn, soybeans, and wheat soared while safe-haven commodities such as gold continued to lag.
Successes and shortfalls
Our positions in commodities benefited from
the geopolitical environment and supply constraints, producing nearly 70 basis points of outperformance. Exposure to energy and grains helped the most but was somewhat offset by industrial metals, which were in
negative territory due to recessionary concerns, and precious metals, which fell due to declining gold prices on the strength of the U.S. dollar.
Relative performance was held
back by our exposure to short-term TIPS as the market began to price in high inflation and inflation expectations modified. This development, along with the spike in real yields, created headwinds for inflation-linked
bonds.
The fund continued to fulfill
its mandate of providing further diversification for a stock/bond portfolio as correlations with other asset classes remained low during the period.
Although markets can be
unpredictable, we are confident that our team of experienced managers and analysts can find opportunities to produce competitive returns without taking excessive risks.
Portfolio Managers:
Fei Xu, CFA, FRM
Vanguard Quantitative Equity
Group
Joshua C. Barrickman, CFA,
Principal
Vanguard Fixed Income Group
November 11, 2022
About Your Fund’s Expenses
As a shareholder of the fund,
you incur ongoing costs, which include costs for portfolio management, administrative services, and shareholder reports (like this one), among others. Operating expenses, which are deducted from a fund’s gross
income, directly reduce the investment return of the fund.
A fund’s expenses are
expressed as a percentage of its average net assets. This figure is known as the expense ratio. The following examples are intended to help you understand the ongoing costs (in dollars) of investing in your fund and
to compare these costs with those of other mutual funds. The examples are based on an investment of $1,000 made at the beginning of the period shown and held for the entire period.
The accompanying table
illustrates your fund’s costs in two ways:
| •
| Based on actual fund return. This section helps you to estimate the actual expenses that you paid over the period. The ”Ending Account Value“ shown is derived from the fund‘s actual return, and the
third column shows the dollar amount that would have been paid by an investor who started with $1,000 in the fund. You may use the information here, together with the amount you invested, to estimate the expenses that
you paid over the period.
|
To do so, simply divide your
account value by $1,000 (for example, an $8,600 account value divided by $1,000 = 8.6), then multiply the result by the number given for your fund under the heading ”Expenses Paid During Period.“
| •
| Based on hypothetical 5% yearly return. This section is intended to help you compare your fund‘s costs with those of other mutual funds. It assumes that the fund had a yearly return of 5% before expenses, but that the
expense ratio is unchanged. In this case—because the return used is not the fund’s actual return—the results do not apply to your investment. The example is useful in making comparisons because the
Securities and Exchange Commission requires all mutual funds to calculate expenses based on a 5% return. You can assess your fund’s costs by comparing this hypothetical example with the hypothetical examples
that appear in shareholder reports of other funds.
|
Note that the expenses shown
in the table are meant to highlight and help you compare ongoing costs only and do not reflect transaction costs incurred by the fund for buying and selling securities. Further, the expenses do not include any purchase, redemption, or
account service fees described in the fund prospectus. If such fees were applied to your account, your costs would be higher. Your fund does not carry a “sales load.”
The calculations assume no
shares were bought or sold during the period. Your actual costs may have been higher or lower, depending on the amount of your investment and the timing of any purchases or redemptions.
You can find more information
about the fund’s expenses, including annual expense ratios, in the Consolidated Financial Statements section of this report. For additional information on operating expenses and other shareholder costs, please
refer to your fund’s current prospectus.
| Six Months Ended October 31, 2022
|
|
|
|
| Commodity Strategy Fund
| Beginning
Account Value
4/30/2022
| Ending
Account Value
10/31/2022
| Expenses
Paid During
Period
|
| Based on Actual Fund Return
| $1,000.00
| $867.40
| $0.99
|
| Based on Hypothetical 5% Yearly Return
| 1,000.00
| 1,024.15
| 1.07
|
The calculations are
based on expenses incurred in the most recent six-month period. The fund’s annualized six-month expense ratio for that period is 0.21%. The dollar amounts shown as “Expenses Paid” are equal to the
annualized expense ratio multiplied by the average account value over the period, multiplied by the number of days in the most recent six-month period, then divided by the number of days in the most recent 12-month
period (184/365).
All of the returns in this
report represent past performance, which is not a guarantee of future results that may be achieved by the fund. (Current performance may be lower or higher than the performance data cited. For performance data current
to the most recent month-end, visit our website at vanguard.com/performance.) Note, too, that both investment returns and principal value can fluctuate widely, so an investor’s shares, when sold, could be worth
more or less than their original cost. The returns shown do not reflect taxes that a shareholder would pay on fund distributions or on the sale of fund shares.
Cumulative Performance: June
25, 2019, Through October 31, 2022
Initial Investment of $50,000
|
|
| Average Annual Total Returns
Periods Ended October 31, 2022
|
|
|
|
| One
Year
| Since
Inception
(6/25/2019)
| Final Value
of a $50,000
Investment
|

| Commodity Strategy Fund
| 9.80%
| 15.84%
| $81,832
|

| Bloomberg Commodity Index Total Return
| 11.15
| 11.93
| 72,947
|
"Since Inception" performance is
calculated from the fund’s inception date for both the fund and its comparative standard(s).
See Financial
Highlights for dividend and capital gains information.
| U.S. Government Securities
| 100.0%
|
The table reflects the fund’s
investments, except for short-term investments and derivatives. The agency and mortgage-backed securities may include issues from government-sponsored enterprises; such issues are generally not backed by the full
faith and credit of the U.S. government.
Consolidated Financial Statements
Consolidated Schedule of Investments
The fund files its complete
schedule of portfolio holdings with the Securities and Exchange Commission (SEC) for the first and third quarters of each fiscal year as an exhibit to its reports on Form N-PORT. The fund’s Form N-PORT reports
are available on the SEC’s website at www.sec.gov.
|
|
|
| Coupon
| Maturity
Date
| Face
Amount
($000)
| Market
Value•
($000)
|
| U.S. Government and Agency Obligations (77.9%)
|
| U.S. Government Securities (77.9%)
|
|
| United States Treasury Inflation Indexed Bonds
| 0.125%
| 1/15/23
| 104,744
| 104,499
|
|
| United States Treasury Inflation Indexed Bonds
| 0.625%
| 4/15/23
| 89,406
| 88,819
|
|
| United States Treasury Inflation Indexed Bonds
| 0.375%
| 7/15/23
| 100,557
| 99,724
|
|
| United States Treasury Inflation Indexed Bonds
| 0.625%
| 1/15/24
| 95,737
| 94,166
|
|
| United States Treasury Inflation Indexed Bonds
| 0.500%
| 4/15/24
| 53,759
| 52,625
|
|
| United States Treasury Inflation Indexed Bonds
| 0.125%
| 7/15/24
| 86,924
| 84,669
|
|
| United States Treasury Inflation Indexed Bonds
| 0.125%
| 10/15/24
| 77,537
| 75,223
|
|
| United States Treasury Inflation Indexed Bonds
| 0.250%
| 1/15/25
| 79,492
| 76,772
|
|
| United States Treasury Inflation Indexed Bonds
| 2.375%
| 1/15/25
| 54,180
| 54,756
|
|
| United States Treasury Inflation Indexed Bonds
| 0.125%
| 4/15/25
| 63,516
| 60,906
|
|
| United States Treasury Inflation Indexed Bonds
| 0.375%
| 7/15/25
| 87,168
| 84,212
|
|
| United States Treasury Inflation Indexed Bonds
| 0.125%
| 10/15/25
| 77,276
| 73,883
|
|
| United States Treasury Inflation Indexed Bonds
| 0.625%
| 1/15/26
| 73,389
| 70,740
|
|
| United States Treasury Inflation Indexed Bonds
| 2.000%
| 1/15/26
| 34,969
| 35,155
|
|
| United States Treasury Inflation Indexed Bonds
| 0.125%
| 4/15/26
| 59,708
| 56,331
|
|
| United States Treasury Inflation Indexed Bonds
| 0.125%
| 7/15/26
| 73,147
| 69,136
|
|
| United States Treasury Inflation Indexed Bonds
| 0.125%
| 10/15/26
| 82,599
| 77,733
|
|
| United States Treasury Inflation Indexed Bonds
| 0.375%
| 1/15/27
| 68,117
| 64,381
|
|
| United States Treasury Inflation Indexed Bonds
| 2.375%
| 1/15/27
| 33,809
| 34,644
|
|
| United States Treasury Inflation Indexed Bonds
| 0.125%
| 4/15/27
| 84,379
| 78,737
|
|
| United States Treasury Inflation Indexed Bonds
| 0.375%
| 7/15/27
| 75,099
| 70,922
|
|
| United States Treasury Inflation Indexed Bonds
| 1.625%
| 10/15/27
| 43,992
| 44,067
|
| Total U.S. Government and Agency Obligations (Cost $1,657,236)
| 1,552,100
|
|
|
|
|
|
| Shares
|
|
| Temporary Cash Investments (22.8%)
|
| Money Market Fund (3.3%)
|
| 1
| Vanguard Market Liquidity Fund
| 3.117%
|
| 657,830
| 65,770
|
|
|
|
|
| Maturity
Date
| Face
Amount
($000)
|
|
| U.S. Government and Agency Obligations (19.5%)
|
| 2
| United States Cash Management Bill
| 3.949%
| 1/24/23
| 25,900
| 25,659
|
| 2
| United States Cash Management Bill
| 4.082%–4.094%
| 2/7/23
| 36,300
| 35,899
|
|
|
|
| Coupon
| Maturity
Date
| Face
Amount
($000)
| Market
Value•
($000)
|
| 2,3
| United States Treasury Bill
| 1.998%
| 11/3/22
| 23,700
| 23,697
|
| 2,3
| United States Treasury Bill
| 2.058%
| 11/10/22
| 40,300
| 40,273
|
| 2,3
| United States Treasury Bill
| 2.897%
| 1/19/23
| 52,400
| 51,943
|
| 2,3
| United States Treasury Bill
| 2.842%–2.885%
| 1/26/23
| 49,300
| 48,829
|
| 2
| United States Treasury Bill
| 3.023%–3.050%
| 2/9/23
| 84,500
| 83,539
|
| 2,3
| United States Treasury Bill
| 3.722%–3.755%
| 3/9/23
| 56,800
| 55,948
|
| 2,3
| United States Treasury Bill
| 3.784%
| 3/16/23
| 24,000
| 23,618
|
|
|
|
|
|
|
| 389,405
|
| Total Temporary Cash Investments (Cost $455,874)
| 455,175
|
| Total Investments (100.7%) (Cost $2,113,110)
| 2,007,275
|
| Other Assets and Liabilities—Net (-0.7%)
| (13,020)
|
| Net Assets (100%)
| 1,994,255
|
| Cost is in $000.
|
|
|
|
| •
| See Note A in Notes to Consolidated Financial Statements.
|
| 1
| Affiliated money market fund available only to Vanguard funds and certain trusts and accounts managed by Vanguard. Rate shown is the 7-day yield.
|
| 2
| Security is owned by the Vanguard CSF Portfolio, which is a wholly owned subsidiary of the Commodity Strategy Fund.
|
| 3
| Securities with a value of $34,816,000 have been segregated as collateral for open over-the-counter swap contracts.
|
Derivative Financial
Instruments Outstanding as of Period End
| Over-the-Counter Total Return Swaps
|
| Reference Entity
| Termination
Date
| Counterparty
| Notional
Amount
($000)
| Fixed
Interest Rate
Received
(Paid)1
(%)
| Value and
Unrealized
Appreciation
($000)
| Value and
Unrealized
(Depreciation)
($000)
|
| Bloomberg Commodity Index2
| 11/9/22
| MLI
| 220,000
| (0.060)
| —
| (3,999)
|
| Bloomberg Commodity Index2
| 11/22/22
| BARC
| 20,000
| (0.100)
| 92
| —
|
| Bloomberg Commodity Index 2 Month Forward2
| 11/22/22
| BARC
| 215,000
| (0.110)
| 364
| —
|
| Bloomberg Commodity Index 3 Month Forward2
| 11/22/22
| GSI
| 30,000
| (0.120)
| 63
| —
|
| BofA Merrill Lynch Commodity MLBXAKSV Excess Return Strategy2,3
| 11/9/22
| MLI
| 130,000
| (0.170)
| —
| (1,072)
|
| BofA Merrill Lynch Commodity MLBXSTGV Excess Return Strategy2,3
| 11/9/22
| MLI
| 320,000
| (0.110)
| —
| (6,444)
|
| BofA Merrill Lynch Commodity MLCILP3E Excess Return Strategy2,3
| 11/9/22
| MLI
| 230,000
| (0.140)
| —
| (5,244)
|
| CIBC Commodity CIBZC51EC Excess Return Strategy2,3
| 11/9/22
| CIBC
| 200,000
| (0.160)
| —
| (3,433)
|
| Goldman Sachs Commodity i-Select Strategy 11292,3
| 11/22/22
| GSI
| 450,000
| (0.120)
| 582
| —
|
| Over-the-Counter Total Return Swaps (continued)
|
| Reference Entity
| Termination
Date
| Counterparty
| Notional
Amount
($000)
| Fixed
Interest Rate
Received
(Paid)1
(%)
| Value and
Unrealized
Appreciation
($000)
| Value and
Unrealized
(Depreciation)
($000)
|
| Modified Strategy DBS18 on the Bloomberg Commodity Index2,3
| 11/22/22
| GSI
| 30,000
| (0.120)
| 50
| —
|
Societe Generale Commodity SGIXCSB1 Excess
Return Strategy2,3
| 11/9/22
| SOCG
| 150,000
| (0.180)
| —
| (3,507)
|
|
|
|
|
|
| 1,151
| (23,699)
|
| 1
| Fixed interest payment received/paid monthly.
|
| 2
| Security is owned by the subsidiary.
|
| 3
| Information on the components of the reference entity is available on www.vanguard.com.
|
|
| BARC—Barclays Bank plc.
|
|
| CIBC—Canadian Imperial Bank of Commerce.
|
|
| GSI—Goldman Sachs International.
|
|
| MLI—Merrill Lynch International.
|
|
| SOCG—Société Generale.
|
At October 31, 2022, the
counterparties had deposited in segregated accounts securities with a value of $4,827,000 in connection with open over-the-counter swap contracts.
See accompanying
Notes, which are an integral part of the Financial Statements.
Consolidated Statement of Assets and Liabilities
|
|
| ($000s, except shares and per-share amounts)
| Amount
|
| Assets
|
|
| Investments in Securities, at Value
|
|
| Unaffiliated Issuers (Cost $2,047,352)
| 1,941,505
|
| Affiliated Issuers (Cost $65,758)
| 65,770
|
| Total Investments in Securities
| 2,007,275
|
| Investment in Vanguard
| 80
|
| Cash
| 118
|
| Receivables for Investment Securities Sold
| 54,107
|
| Receivables for Accrued Income
| 1,937
|
| Receivables for Capital Shares Issued
| 4,624
|
| Unrealized Appreciation—Over-the-Counter Swap Contracts
| 1,151
|
| Receivables from Broker-Dealer
| 235
|
| Total Assets
| 2,069,527
|
| Liabilities
|
|
| Payables for Investment Securities Purchased
| 44,292
|
| Payables for Capital Shares Redeemed
| 7,086
|
| Payables to Vanguard
| 195
|
| Unrealized Depreciation—Over-the-Counter Swap Contracts
| 23,699
|
| Total Liabilities
| 75,272
|
| Net Assets
| 1,994,255
|
| At October 31, 2022, net assets consisted of:
|
|
|
|
|
| Paid-in Capital
| 1,885,044
|
| Total Distributable Earnings (Loss)
| 109,211
|
| Net Assets
| 1,994,255
|
|
|
| Net Assets
|
|
Applicable to 64,979,653 outstanding $.001 par value shares of
beneficial interest (unlimited authorization)
| 1,994,255
|
| Net Asset Value Per Share
| $30.69
|
See accompanying
Notes, which are an integral part of the Financial Statements.
Consolidated Statement of Operations
|
|
|
| Year Ended
October 31, 2022
|
|
| ($000)
|
| Investment Income
|
|
| Income
|
|
| Interest1
| 98,752
|
| Total Income
| 98,752
|
| Expenses
|
|
| The Vanguard Group—Note B
|
|
| Investment Advisory Services
| 283
|
| Management and Administrative
| 3,755
|
| Marketing and Distribution
| 114
|
| Custodian Fees
| 24
|
| Auditing Fees
| 96
|
| Shareholders’ Reports
| 48
|
| Trustees’ Fees and Expenses—Note B
| 15
|
| Other Expenses
| 16
|
| Total Expenses
| 4,351
|
| Expenses Paid Indirectly
| (13)
|
| Net Expenses
| 4,338
|
| Net Investment Income
| 94,414
|
| Realized Net Gain (Loss)
|
|
| Investment Securities Sold1
| (22,628)
|
| Swap Contracts
| 154,601
|
| Realized Net Gain (Loss)
| 131,973
|
| Change in Unrealized Appreciation (Depreciation)
|
|
| Investment Securities1
| (120,812)
|
| Swap Contracts
| (2,731)
|
| Change in Unrealized Appreciation (Depreciation)
| (123,543)
|
| Net Increase (Decrease) in Net Assets Resulting from Operations
| 102,844
|
|
|
|
| 1
| Interest income, realized net gain (loss), capital gain distributions received, and change in unrealized appreciation (depreciation) from an affiliated company of
the fund were $1,427,000, ($71,000), $4,000, and $2,000, respectively. Purchases and sales are for temporary cash investment purposes.
|
See accompanying
Notes, which are an integral part of the Financial Statements.
Consolidated Statement of Changes in Net Assets
|
|
|
| Year Ended October 31,
|
|
| 2022
($000)
| 2021
($000)
|
|
|
|
|
| Increase (Decrease) in Net Assets
|
|
|
| Operations
|
|
|
| Net Investment Income
| 94,414
| 28,926
|
| Realized Net Gain (Loss)
| 131,973
| 364,225
|
| Change in Unrealized Appreciation (Depreciation)
| (123,543)
| (672)
|
| Net Increase (Decrease) in Net Assets Resulting from Operations
| 102,844
| 392,479
|
| Distributions
|
|
|
| Total Distributions
| (390,043)
| (2,526)
|
| Capital Share Transactions
|
|
|
| Issued
| 1,800,077
| 1,233,852
|
| Issued in Lieu of Cash Distributions
| 271,967
| 2,099
|
| Redeemed
| (1,476,116)
| (313,092)
|
| Net Increase (Decrease) from Capital Share Transactions
| 595,928
| 922,859
|
| Total Increase (Decrease)
| 308,729
| 1,312,812
|
| Net Assets
|
|
|
| Beginning of Period
| 1,685,526
| 372,714
|
| End of Period
| 1,994,255
| 1,685,526
|
See accompanying
Notes, which are an integral part of the Financial Statements.
Consolidated Financial Highlights
For a Share Outstanding
Throughout Each Period
| Year Ended October 31,
| June 25,
20191 to
October 31,
2019
|
| 2022
| 2021
| 2020
|
|
| Net Asset Value, Beginning of Period
| $36.85
| $24.32
| $24.83
| $25.00
|
| Investment Operations
|
|
|
|
|
| Net Investment Income2
| 1.474
| .890
| .265
| .143
|
| Net Realized and Unrealized Gain (Loss) on Investments
| .751
| 11.774
| (.620)
| (.313)
|
| Total from Investment Operations
| 2.225
| 12.664
| (.355)
| (.170)
|
| Distributions
|
|
|
|
|
| Dividends from Net Investment Income
| (8.385)
| (.134)
| (.155)
| —
|
| Distributions from Realized Capital Gains
| —
| —
| —
| —
|
| Total Distributions
| (8.385)
| (.134)
| (.155)
| —
|
| Net Asset Value, End of Period
| $30.69
| $36.85
| $24.32
| $24.83
|
| Total Return3
| 9.80%
| 52.30%
| -1.45%
| -0.68%
|
| Ratios/Supplemental Data
|
|
|
|
|
| Net Assets, End of Period (Millions)
| $1,994
| $1,686
| $373
| $207
|
| Ratio of Total Expenses to Average Net Assets
| 0.21%4
| 0.20%
| 0.20%
| 0.20%5
|
| Ratio of Net Investment Income to Average Net Assets
| 4.47%
| 2.79%
| 1.15%
| 1.65%5
|
| Portfolio Turnover Rate
| 47%
| 15%
| 38%
| 7%
|
| 1
| Inception.
|
| 2
| Calculated based on average shares outstanding.
|
| 3
| Total returns do not include account service fees that may have applied in the periods shown. Fund prospectuses provide information about any applicable account service fees.
|
| 4
| The ratio of expenses to average net assets for the period net of reduction from custody fee offset arrangements was 0.21%.
|
| 5
| Annualized.
|
See accompanying
Notes, which are an integral part of the Financial Statements.
Notes to Consolidated Financial Statements
Vanguard Commodity Strategy
Fund is registered under the Investment Company Act of 1940 as an open-end investment company, or mutual fund. Significant market disruptions, such as those caused by pandemics (e.g., COVID-19 pandemic), natural or
environmental disasters, war (e.g., Russia’s invasion of Ukraine), acts of terrorism, or other events, can adversely affect local and global markets and normal market operations. Any such disruptions could have
an adverse impact on the value of the fund’s investments and fund performance.
The Consolidated Financial
Statements include Vanguard CSF Portfolio (“the subsidiary”), which commenced operations on June 25, 2019. The subsidiary is wholly owned by the fund and is a unit trust established in the Cayman Islands
under the Trusts Law (2011 Revision) of the Cayman Islands, which is organized to invest in certain commodity-linked investments on behalf of the fund, consistent with the fund’s investment objectives and
policies. The commodity-linked investments and other investments held by the subsidiary are subject to the same risks that apply to similar investments if held directly by the fund. As of October 31, 2022, the fund
held $367,184,000 in the subsidiary, representing 18% of the fund’s net assets. All inter-fund transactions and balances (including the fund’s investment in the subsidiary) have been eliminated, and the
Consolidated Financial Statements include all investments and other accounts of the subsidiary as if held directly by the fund.
| A.
| The following significant accounting policies conform to generally accepted accounting principles for U.S. investment companies. The fund consistently follows such policies in preparing its financial statements.
|
1. Security Valuation:
Securities are valued as of the close of trading on the New York Stock Exchange (generally 4 p.m., Eastern time) on the valuation date. Bonds and temporary cash investments are valued using the latest bid prices or
using valuations based on a matrix system (which considers such factors as security prices, yields, maturities, and ratings), both as furnished by independent pricing services. Investments in Vanguard Market Liquidity
Fund are valued at that fund's net asset value. Securities for which market quotations are not readily available, or whose values have been affected by events occurring before the fund’s pricing time but after
the close of the securities’ primary markets, are valued by methods deemed by the valuation designee to represent fair value and subject to oversight by the board of trustees.
2. Swap Contracts: The
fund gains exposure to commodities through the subsidiary's investment in swaps that earn the total return on a specified commodity index. Under the terms of the swaps, the subsidiary receives the total return on the
specified index (receiving the increase or paying the decrease in the value of the specified index), applied to a notional amount. The subsidiary also pays a fixed rate applied to the notional amount. At the same
time, the subsidiary invests an amount approximating the notional amount of the swap in high-quality temporary cash investments.
A risk associated with all
types of swaps is the possibility that a counterparty may default on its obligation to pay net amounts due to the subsidiary. The subsidiary’s maximum amount subject to counterparty risk is the unrealized
appreciation on the swap contract. The subsidiary mitigates its counterparty risk by entering into swaps only with a diverse group of prequalified counterparties, monitoring their financial strength, entering into
master netting arrangements with its counterparties, and requiring its counterparties to transfer collateral as security for their performance. In the absence of a default, the collateral pledged or received by the
subsidiary cannot be repledged, resold, or rehypothecated. In the event of a counterparty’s default (including bankruptcy), the subsidiary may terminate any swap contracts with that counterparty, determine
the net amount owed by either party in
accordance with its master netting arrangements, and sell or retain any collateral held up to the net amount owed to the subsidiary under the master netting arrangements. The swap contracts contain provisions whereby
a counterparty may terminate open contracts if the subsidiary net assets decline below a certain level, triggering a payment by the subsidiary if the subsidiary is in a net liability position at the time of the
termination. The payment amount would be reduced by any collateral the subsidiary has pledged. Any securities pledged as collateral for open contracts are noted in the Consolidated Schedule of Investments. The value
of collateral received or pledged is compared daily to the value of the swap contracts exposure with each counterparty, and any difference, if in excess of a specified minimum transfer amount, is adjusted and settled
within two business days.
The notional amounts of swap
contracts are not recorded in the Consolidated Statement of Assets and Liabilities. Swaps are valued daily based on market quotations received from independent pricing services or recognized dealers and the change in
value is recorded in the Consolidated Statement of Assets and Liabilities as an asset (liability) and in the Consolidated Statement of Operations as unrealized appreciation (depreciation) until periodic payments are
made or the termination of the swap, at which time realized gain (loss) is recorded.
During the year ended October
31, 2022, the fund’s average amounts of investments in total return swaps represented 99% of net assets, based on the average of notional amounts at each quarter-end during the period.
The following table summarizes
the fund’s derivative assets and liabilities by counterparty for derivatives subject to arrangements that provide for offsetting assets and liabilities.
|
| Assets
Reflected in
Consolidated
Statement of
Assets and
Liabilities1
($000)
| Liabilities
Reflected in
Consolidated
Statement of
Assets and
Liabilities1
($000)
| Net Amount
Receivable
(Payable)
($000)
| Amounts Not Offset in
the Consolidated
Statement of Assets
and Liabilities
| Net
Exposure3
(Not Less
Than $0)
($000)
|
|
| Collateral
Pledged2
($000)
| Collateral
Received2
($000)
|
Derivatives Subject to
Offsetting Arrangements, by Counterparty
|
|
|
|
|
|
|
| Barclays Bank plc
| 456
| —
| 456
| 2,070
| —
| 456
|
| Canadian Imperial Bank of Commerce
| —
| (3,433)
| (3,433)
| 1,679
| —
| —
|
| Goldman Sachs International
| 695
| —
| 695
| —
| 4,827
| —
|
| Merrill Lynch International
| —
| (16,759)
| (16,759)
| 25,931
| —
| —
|
| Société Generale
| —
| (3,507)
| (3,507)
| 5,136
| —
| —
|
| Total
| 1,151
| (23,699)
| (22,548)
| 34,816
| 4,827
| 456
|
1 Absent an event of default or early termination, derivative assets and liabilities are presented gross and not offset in the Consolidated Statement of Assets and Liabilities.
2 Securities or other assets pledged as collateral are noted in the Consolidated Schedule of Investments and Consolidated Statement of Assets and Liabilities. Securities or other
assets received as collateral are held in a segregated account and not included in the fund’s security holdings in the Consolidated Schedule of Investments.
3 Net Exposure represents the net amount receivable from the counterparty in the event of default. Counterparties are not required to exchange collateral if amount is below a
specified minimum transfer amount.
3. Federal Income Taxes:
The fund intends to continue to qualify as a regulated investment company and distribute virtually all of its taxable income. The subsidiary is classified as a foreign corporation for U.S. tax purposes, and because it
does not carry on a U.S. trade or business, is generally not subject to U.S. federal income tax. The subsidiary also complies with the Foreign Account Tax Compliance Act ("FATCA") and thus will not be subject to 30%
withholding under FATCA on any income from U.S. investments. In addition, the subsidiary is not subject to Cayman Islands income tax. The subsidiary is not required to distribute any earnings and profits to the fund.
The fund’s tax returns are open to examination by the relevant tax authorities until expiration of the applicable statute of limitations, which is generally three years after filing the tax return. Management
has analyzed the fund’s tax positions taken for all open federal and state income tax years, and has concluded that no provision for income tax is required in the fund’s financial statements.
4. Distributions:
Distributions to shareholders are recorded on the ex-dividend date. Distributions are determined on a tax basis at the fiscal year-end and may differ from net investment income and realized capital gains for financial
reporting purposes.
5. Credit Facilities and
Interfund Lending Program: The fund and certain other funds managed by The Vanguard Group ("Vanguard") participate in a $4.4 billion committed credit facility provided by a syndicate of lenders pursuant to a credit
agreement and an uncommitted credit facility provided by Vanguard. Both facilities may be renewed annually. Each fund is individually liable for its borrowings, if any, under the credit facilities. Borrowings may be
utilized for temporary or emergency purposes and are subject to the fund’s regulatory and contractual borrowing restrictions. With respect to the committed credit facility, the participating funds are charged
administrative fees and an annual commitment fee of 0.10% of the undrawn committed amount of the facility, which are allocated to the funds based on a method approved by the fund’s board of trustees and included
in Management and Administrative expenses on the fund’s Consolidated Statement of Operations. Any borrowings under either facility bear interest at an agreed-upon spread plus the higher of the federal funds
effective rate, the overnight bank funding rate, or the Daily Simple Secured Overnight Financing Rate inclusive of an additional agreed-upon spread. However, borrowings under the uncommitted credit facility may bear
interest based upon an alternate rate agreed to by the fund and Vanguard.
In accordance with an
exemptive order (the “Order”) from the SEC, the fund may participate in a joint lending and borrowing program that allows registered open-end Vanguard funds to borrow money from and lend money to each
other for temporary or emergency purposes (the “Interfund Lending Program”), subject to compliance with the terms and conditions of the Order, and to the extent permitted by the fund’s investment
objective and investment policies. Interfund loans and borrowings normally extend overnight but can have a maximum duration of seven days. Loans may be called on one business day’s notice. The interest rate to
be charged is governed by the conditions of the Order and internal procedures adopted by the board of trustees. The board of trustees is responsible for overseeing the Interfund Lending Program.
For the year ended October 31,
2022, the fund did not utilize the credit facilities or the Interfund Lending Program.
6. Other: Interest
income includes income distributions received from Vanguard Market Liquidity Fund and is accrued daily. Premiums and discounts on debt securities are amortized and accreted, respectively, to interest income over the
lives of the respective securities, except for premiums on certain callable debt securities that are amortized to the earliest call date. Inflation adjustments to
the face amount of inflation-indexed
securities are included in interest income. Security transactions are accounted for on the date securities are bought or sold. Costs used to determine realized gains (losses) on the sale of investment securities are
those of the specific securities sold.
| B.
| In accordance with the terms of a Funds' Service Agreement (the “FSA”) between Vanguard and the fund, Vanguard furnishes to the fund investment advisory, corporate management, administrative, marketing,
and distribution services at Vanguard’s cost of operations (as defined by the FSA). These costs of operations are allocated to the fund based on methods and guidelines approved by the board of trustees and are
generally settled twice a month.
|
Under a separate agreement,
Vanguard provides corporate management and administrative services to the subsidiary for an annual fee of 0.10% of average net assets of the subsidiary, generally settled once a month. In addition, the subsidiary pays
an unaffiliated third party, VGMF I (Cayman) Limited, an affiliate of Maples Trustee Services (Cayman) Limited, a fee plus reasonable additional expenses for trustee services. All of the subsidiary’s expenses
are reflected in the Consolidated Statement of Operations and in the Ratio of Total Expenses to Average Net Assets in the Consolidated Financial Highlights.
Upon the request of Vanguard,
the fund may invest up to 0.40% of its net assets as capital in Vanguard. At October 31, 2022, the fund had contributed to Vanguard capital in the amount of $80,000, representing less than 0.01% of the fund’s
net assets and 0.03% of Vanguard’s capital received pursuant to the FSA. The fund’s trustees and officers are also directors and employees, respectively, of Vanguard.
| C.
| The fund’s custodian bank has agreed to reduce its fees when the fund maintains cash on deposit in the non-interest-bearing custody account. For the year ended October 31, 2022, custodian fee offset
arrangements reduced the fund’s expenses by $13,000 (an annual rate of less than 0.01% of average net assets).
|
| D.
| Various inputs may be used to determine the value of the fund’s investments and derivatives. These inputs are summarized in three broad levels for financial statement purposes.
The inputs or methodologies used to value securities are not necessarily an indication of the risk associated with investing in those securities.
|
Level 1—Quoted prices in active markets for identical securities.
Level 2—Other significant observable inputs (including quoted prices for similar securities, interest rates, prepayment speeds, credit risk, etc.).
Level 3—Significant unobservable inputs (including the fund’s own assumptions used to determine the fair value of investments). Any investments and derivatives valued with significant
unobservable inputs are noted on the Consolidated Schedule of Investments.
The following table summarizes
the market value of the fund’s investments and derivatives as of October 31, 2022, based on the inputs used to value them:
|
| Level 1
($000)
| Level 2
($000)
| Level 3
($000)
| Total
($000)
|
| Investments
|
|
|
|
|
| Assets
|
|
|
|
|
| U.S. Government and Agency Obligations
| —
| 1,552,100
| —
| 1,552,100
|
| Temporary Cash Investments
| 65,770
| 389,405
| —
| 455,175
|
| Total
| 65,770
| 1,941,505
| —
| 2,007,275
|
| Derivative Financial Instruments
|
|
|
|
|
| Assets
|
|
|
|
|
| Swap Contracts
| —
| 1,151
| —
| 1,151
|
| Liabilities
|
|
|
|
|
| Swap Contracts
| —
| 23,699
| —
| 23,699
|
| E.
| Permanent differences between book-basis and tax-basis components of net assets are reclassified among capital accounts in the financial statements to reflect their tax character. These reclassifications have no
effect on net assets or net asset value per share. As of period end, permanent differences primarily attributable to the accounting for applicable operations of the subsidiary were reclassified between the individual
components of total distributable earnings (loss).
|
Temporary differences between
book-basis and tax-basis components of total distributable earnings (loss) arise when certain items of income, gain, or loss are recognized in different periods for financial statement and tax purposes; these
differences will reverse at some time in the future. The differences are primarily related to the deferral of losses from wash sales; and amortization adjustments from certain fixed income securities. As of period
end, the tax-basis components of total distributable earnings (loss) are detailed in the table as follows:
|
| Amount
($000)
|
| Undistributed Ordinary Income
| 237,921
|
| Undistributed Long-Term Gains
| —
|
| Capital Loss Carryforwards
| (18,622)
|
| Qualified Late-Year Losses
| —
|
| Net Unrealized Gains (Losses)
| (110,088)
|
The tax character of
distributions paid was as follows:
|
| Year Ended October 31,
|
|
| 2022
Amount
($000)
| 2021
Amount
($000)
|
| Ordinary Income*
| 390,043
| 2,526
|
| Long-Term Capital Gains
| —
| —
|
| Total
| 390,043
| 2,526
|
| *
| Includes short-term capital gains, if any.
|
As of October 31, 2022, gross
unrealized appreciation and depreciation for investments and derivatives based on cost for U.S. federal income tax purposes were as follows:
|
| Amount
($000)
|
| Tax Cost
| 2,117,363
|
| Gross Unrealized Appreciation
| 3,351
|
| Gross Unrealized Depreciation
| (113,439)
|
| Net Unrealized Appreciation (Depreciation)
| (110,088)
|
| F.
| During the year ended October 31, 2022, the fund purchased $1,150,565,000 of investment securities and sold $661,128,000 of investment securities, other than temporary cash investments.
|
| G.
| Capital shares issued and redeemed were:
|
|
| Year Ended October 31,
|
|
| 2022
Shares
(000)
| 2021
Shares
(000)
|
|
|
|
|
| Issued
| 54,611
| 40,091
|
| Issued in Lieu of Cash Distributions
| 10,325
| 81
|
| Redeemed
| (45,700)
| (9,752)
|
| Net Increase (Decrease) in Shares Outstanding
| 19,236
| 30,420
|
| H.
| Management has determined that no events or transactions occurred subsequent to October 31, 2022, that would require recognition or disclosure in these financial statements.
|
Report of Independent Registered Public Accounting
Firm
To the Board of Trustees of Vanguard
Trustees' Equity Fund and Shareholders of Vanguard Commodity Strategy Fund
Opinion on the Financial
Statements
We have audited the accompanying consolidated
statement of assets and liabilities, including the consolidated schedule of investments, of Vanguard Commodity Strategy Fund and its subsidiary (one of the funds constituting Vanguard Trustees' Equity Fund, referred
to hereafter as the "Fund") as of October 31, 2022, the related consolidated statement of operations for the year ended October 31, 2022, the consolidated statement of changes in net assets for each of the two years
in the period ended October 31, 2022, including the related notes, and the consolidated financial highlights for each of the three years in the period ended October 31, 2022 and for the period June 25, 2019
(inception) through October 31, 2019 (collectively referred to as the "consolidated financial statements"). In our opinion, the consolidated financial statements present fairly, in all material respects, the financial
position of the Fund as of October 31, 2022, the results of its operations for the year then ended, the changes in its net assets for each of the two years in the period ended October 31, 2022 and the financial
highlights for each of the three years in the period ended October 31, 2022 and for the period June 25, 2019 (inception) through October 31, 2019 in conformity with accounting principles generally accepted in the
United States of America.
Basis for Opinion
These consolidated financial statements are
the responsibility of the Fund’s management. Our responsibility is to express an opinion on the Fund’s consolidated financial statements based on our audits. We are a public accounting firm registered with
the Public Company Accounting Oversight Board (United States) (PCAOB) and are required to be independent with respect to the Fund in accordance with the U.S. federal securities laws and the applicable rules and
regulations of the Securities and Exchange Commission and the PCAOB.
We conducted our audits of
these consolidated financial statements in accordance with the standards of the PCAOB. Those standards require that we plan and perform the audit to obtain reasonable assurance about whether the consolidated financial
statements are free of material misstatement, whether due to error or fraud.
Our audits included performing
procedures to assess the risks of material misstatement of the consolidated financial statements, whether due to error or fraud, and performing procedures that respond to those risks. Such procedures included
examining, on a test basis, evidence regarding the amounts and disclosures in the consolidated financial statements. Our audits also included evaluating the accounting principles used and significant estimates made by
management, as well as evaluating the overall presentation of the consolidated financial statements. Our procedures included confirmation of securities owned as of October 31, 2022 by correspondence with the
custodian, transfer agent and brokers; when replies were not received from brokers, we performed other auditing procedures. We believe that our audits provide a reasonable basis for our opinion.
/s/PricewaterhouseCoopers
LLP
Philadelphia, Pennsylvania
December 16, 2022
We have served as the auditor
of one or more investment companies in The Vanguard Group of Funds since 1975.
Tax information
(unaudited)
The fund hereby designates
$91,946,000, or if subsequently determined to be different, the maximum amount allowable by law, of interest earned from obligations of the U.S. government which is generally exempt from state income tax.
The fund hereby designates
23.8%, or if subsequently determined to be different, the maximum percentage allowable by law, of ordinary income dividends eligible to be treated as interest income for purposes of Section 163(j) and the regulations
thereunder for the fiscal year.
This page intentionally left blank.
The People Who Govern Your Fund
The trustees of your mutual
fund are there to see that the fund is operated and managed in your best interests since, as a shareholder, you are a part owner of the fund. Your fund’s trustees also serve on the board of directors of The
Vanguard Group, Inc., which is owned by the Vanguard funds and provides services to them.
A majority of Vanguard’s
board members are independent, meaning that they have no affiliation with Vanguard or the funds they oversee, apart from the sizable personal investments they have made as private individuals. The independent board
members have distinguished backgrounds in business, academia, and public service. Each of the trustees and executive officers oversees 206 Vanguard funds.
Information for each trustee
and executive officer of the fund appears below. That information, as well as the Vanguard fund count, is as of the date on the cover of this fund report. The mailing address of the trustees and officers is P.O. Box
876, Valley Forge, PA 19482. More information about the trustees is in the Statement of Additional Information, which can be obtained, without charge, by contacting Vanguard at 800-662-7447, or online at vanguard.com.
Interested Trustee1
Mortimer J. Buckley
Born in 1969. Trustee since January 2018.
Principal occupation(s) during the past five years and other experience: chairman of the board (2019–present) of Vanguard and of each of the investment companies served by Vanguard; chief executive officer
(2018–present) of Vanguard; chief executive officer, president, and trustee (2018–present) of each of the investment companies served by Vanguard; president and director (2017–present) of Vanguard;
and president (2018–present) of Vanguard Marketing Corporation. Chief investment officer (2013–2017), managing director (2002–2017), head of the Retail Investor Group (2006–2012), and chief
information officer (2001–2006) of Vanguard. Member of the board of governors of the Investment Company Institute and the board of governors of FINRA. Trustee and vice chair of The Shipley School.
Independent Trustees
Tara Bunch
Born in 1962. Trustee since November 2021.
Principal occupation(s) during the past five years and other experience: head of global operations at Airbnb (2020–present). Vice president of AppleCare (2012–2020). Member of the board of directors of Out
& Equal (2002–2006), the advisory board of the University of California, Berkeley School of Engineering (2020–present), and the advisory board
of Santa Clara University’s Leavey
School of Business (2018–present).
Emerson U. Fullwood
Born in 1948. Trustee since January 2008.
Principal occupation(s) during the past five years and other experience: executive chief staff and marketing officer for North America and corporate vice president (retired 2008) of Xerox Corporation (document
management products and services). Former president of the Worldwide Channels Group, Latin America, and Worldwide Customer Service and executive chief staff officer of Developing Markets of Xerox. Executive in
residence and 2009–2010 Distinguished Minett Professor at the Rochester Institute of Technology. Member of the board of directors of the University of Rochester Medical Center, the Monroe Community College
Foundation, the United Way of Rochester, North Carolina A&T University, Roberts Wesleyan College, and the Rochester Philharmonic Orchestra. Trustee of the University of
Rochester.
F. Joseph Loughrey
Born in 1949. Trustee since October 2009.
Principal occupation(s) during the past five years and other experience: president and chief operating officer (retired 2009) and vice chairman of the board (2008–2009) of Cummins Inc. (industrial machinery).
Chairman of the board of Hillenbrand, Inc. (specialized consumer services). Director of the V Foundation. Member of the advisory council for the College of
1 Mr. Buckley is considered an “interested
person,” as defined in the Investment Company Act of 1940, because he is an officer of the Vanguard funds.
Arts and Letters at the University of Notre
Dame. Chairman of the board of Saint Anselm College.
Mark Loughridge
Born in 1953. Trustee since March 2012.
Principal occupation(s) during the past five years and other experience: senior vice president and chief financial officer (retired 2013) of IBM (information technology services). Fiduciary member of IBM’s
Retirement Plan Committee (2004–2013), senior vice president and general manager (2002–2004) of IBM Global Financing, vice president and controller (1998–2002) of IBM, and a variety of other prior
management roles at IBM. Member of the Council on Chicago Booth.
Scott C. Malpass
Born in 1962. Trustee since March 2012.
Principal occupation(s) during the past five years and other experience: adjunct professor of finance at the University of Notre Dame (2020–present). Chief investment officer (retired 2020) and vice president
(retired 2020) of the University of Notre Dame. Assistant professor (retired June 2020) of finance at the Mendoza College of Business, University of Notre Dame, and member of the Notre Dame 403(b) Investment
Committee. Member of the board of Catholic Investment Services, Inc. (investment advisors), the board of superintendence of the Institute for the Works of Religion, and the board of directors of Paxos Trust Company
(finance).
Deanna Mulligan
Born in 1963. Trustee since January 2018.
Principal occupation(s) during the past five years and other experience: chief executive officer of Purposeful (advisory firm for CEOs and C-level executives; 2021–present). Board chair (2020), chief executive
officer (2011–2020), and president (2010–2019) of The Guardian Life Insurance Company of America. Chief operating officer (2010–2011) and executive vice president (2008–2010) of Individual Life
and Disability of the Guardian Life Insurance Company of America. Member of the board of the Economic Club of New York. Trustee of the Partnership for New York City (business leadership), Chief Executives for
Corporate Purpose, and the NewYork-Presbyterian Hospital.
André F. Perold
Born in 1952. Trustee since December 2004.
Principal occupation(s) during the past five years and other experience: George Gund Professor of Finance and Banking, Emeritus at the Harvard Business School (retired 2011). Chief investment officer and co-managing
partner of HighVista Strategies (private investment firm). Member of the board (2018–present) of RIT Capital Partners (investment
firm). Member of the investment committee of
Partners Health Care System.
Sarah Bloom Raskin
Born in 1961. Trustee since January 2018.
Principal occupation(s) during the past five years and other experience: deputy secretary (2014–2017) of the United States Department of the Treasury. Governor (2010–2014) of the Federal Reserve Board.
Commissioner (2007–2010) of financial regulation for the State of Maryland. Colin W. Brown Distinguished Professor of the Practice of Law (2021–present), professor (2020–present), Distinguished
Fellow of the Global Financial Markets Center (2020–present), and Rubenstein Fellow (2017–2020) at Duke University. Trustee (2017–present) of Amherst College and member of Amherst College Investment
Committee (2019–present). Member of the Regenerative Crisis Response Committee (2020–present).
David A. Thomas
Born in 1956. Trustee since July 2021.
Principal occupation(s) during the past five years and other experience: president of Morehouse College (2018–present). Professor of business administration, emeritus at Harvard University (2017–2018).
Dean (2011–2016) and professor of management (2016–2017) at the Georgetown University McDonough School of Business. Director of DTE Energy Company (2013–present). Trustee of Common Fund
(2019–present).
Peter F. Volanakis
Born in 1955. Trustee since July 2009.
Principal occupation(s) during the past five years and other experience: president and chief operating officer (retired 2010) of Corning Incorporated (communications equipment) and director of Corning Incorporated
(2000–2010) and Dow Corning (2001–2010). Director (2012) of SPX Corporation (multi-industry manufacturing). Overseer of the Amos Tuck School of Business Administration, Dartmouth College (2001–2013).
Member of the BMW Group Mobility Council.
Executive Officers
Christine M. Buchanan
Born in 1970. Principal occupation(s) during
the past five years and other experience: principal of Vanguard. Chief financial officer (2021–present) and treasurer (2017–present) of each of the investment companies served by Vanguard. Partner
(2005–2017) at KPMG (audit, tax, and advisory services).
John Galloway
Born in 1973. Principal occupation(s) during
the past five years and other experience: principal of Vanguard. Investment stewardship officer (September 2020–present) of each of the investment companies served by Vanguard. Head of Investor Advocacy
(February 2020–present) and head of Marketing Strategy and Planning (2017–2020) at Vanguard. Special assistant to the President of the United States (2015).
Ashley Grim
Born in 1984. Principal occupation(s) during
the past five years and other experience: treasurer (February 2022–present) of each of the investment companies served by Vanguard. Fund transfer agent controller (2019–2022) and director of Audit Services
(2017–2019) at Vanguard. Senior manager (2015–2017) at PriceWaterhouseCoopers (audit and assurance, consulting, and tax services).
Peter Mahoney
Born in 1974. Principal occupation(s) during
the past five years and other experience: principal of Vanguard. Controller (2015–present) of each of the investment companies served by Vanguard. Head of International Fund Services (2008–2014) at
Vanguard.
Anne E. Robinson
Born in 1970. Principal occupation(s) during
the past five years and other experience: general counsel (2016–present) of Vanguard. Secretary (2016–present) of Vanguard and of each of the investment companies served by Vanguard. Managing director
(2016–present) of Vanguard. Managing director and general counsel of Global Cards and Consumer Services (2014–2016) at Citigroup. Counsel (2003–2014) at American Express. Nonexecutive director of the
board of National Grid (energy).
Michael Rollings
Born in 1963. Principal occupation(s) during
the past five years and other experience: finance director (2017–present) and treasurer (2017) of each of the investment companies served by Vanguard. Managing director (2016–present) of Vanguard. Chief
financial officer (2016–present) of Vanguard. Director (2016–present) of Vanguard Marketing Corporation. Executive vice president and chief financial officer (2006–2016) of MassMutual Financial
Group.
John E. Schadl
Born in 1972. Principal occupation(s) during
the past five years and other experience: principal of Vanguard. Chief compliance officer (2019–present) of Vanguard and of each of the investment companies served by Vanguard. Assistant vice president
(2019–present) of Vanguard Marketing Corporation.
Vanguard Senior Management
Team
| Matthew Benchener
| Thomas M. Rampulla
|
| Joseph Brennan
| Karin A. Risi
|
| Mortimer J. Buckley
| Anne E. Robinson
|
| Gregory Davis
| Michael Rollings
|
| John James
| Nitin Tandon
|
| Chris D. Mclsaac
| Lauren Valente
|
Connect with
Vanguard®>vanguard.com
Fund Information > 800-662-7447
Direct Investor Account
Services > 800-662-2739
Institutional Investor
Services > 800-523-1036
Text Telephone for People Who
Are Deaf or Hard of Hearing > 800-749-7273
This material may be used in
conjunction with the offering of shares of any Vanguard fund only if preceded or accompanied by the fund’s current prospectus.
All comparative mutual
fund data are from Morningstar, Inc., unless otherwise noted.
You can obtain a free
copy of Vanguard’s proxy voting guidelines by visiting vanguard.com/proxyreporting or by calling Vanguard at 800-662-2739. The guidelines are also available from the SEC’s website, www.sec.gov. In
addition, you may obtain a free report on how your fund voted the proxies for securities it owned during the 12 months ended June 30. To get the report, visit either vanguard.com/proxyreporting or www.sec.gov.
You can review
information about your fund on the SEC’s website, and you can receive copies of this information, for a fee, by sending a request via email addressed to publicinfo@sec.gov.
Source for Bloomberg
indexes: Bloomberg Index Services Limited. Copyright 2022, Bloomberg. All rights reserved.
CFA® is a registered trademark owned by CFA Institute.
© 2022 The Vanguard Group,
Inc.
All rights reserved.
Vanguard Marketing Corporation, Distributor.
Q5170 122022
Item
2: Code of Ethics.
The Registrant has adopted a code of ethics that applies to the Registrant’s
principal executive officer, principal financial officer, principal accounting officer or controller or persons performing similar functions.
The Code of Ethics was amended during the reporting period covered by this report to make certain technical, non-material changes.
Item
3: Audit Committee Financial Expert.
All members of the Audit Committee have been determined by the Registrant’s
Board of Trustees to be Audit Committee Financial Experts and to be independent: F. Joseph Loughrey, Mark Loughridge, Sarah Bloom Raskin,
and Peter F. Volanakis.
Item
4: Principal Accountant Fees and Services.
(a) Audit Fees.
Audit Fees of the Registrant.
Fiscal Year Ended October 31, 2022: $182,000
Fiscal Year Ended October 31, 2021: $192,000
Aggregate Audit Fees of Registered Investment Companies in the Vanguard
Group.
Fiscal Year Ended October 31, 2022: $10,494,508
Fiscal Year Ended October 31, 2021: $11,244,694
Includes fees billed in connection with audits of the Registrant, other
registered investment companies in the Vanguard complex, The Vanguard Group, Inc., and Vanguard Marketing Corporation.
(b) Audit-Related Fees.
Fiscal Year Ended October 31, 2022: $2,757,764
Fiscal Year Ended October 31, 2021: $2,955,181
Includes fees billed in connection with assurance and related services
provided to the Registrant, other registered investment companies in the Vanguard complex, The Vanguard Group, Inc., and Vanguard Marketing
Corporation.
(c) Tax Fees.
Fiscal Year Ended October 31, 2022: $5,202,689
Fiscal Year Ended October 31, 2021: $2,047,574
Includes fees billed in connection with tax compliance, planning, and
advice services provided to the Registrant, other registered investment companies in the Vanguard complex, The Vanguard Group, Inc., and
Vanguard Marketing Corporation.
(d) All Other Fees.
Fiscal Year Ended October 31, 2022: $298,000
Fiscal Year Ended October 31, 2021: $280,000
Includes fees billed for services related to tax reported information
provided to the Registrant, other registered investment companies in the Vanguard complex, The Vanguard Group, Inc., and Vanguard Marketing
Corporation.
(e) (1)
Pre-Approval Policies. The policy of the Registrant’s Audit Committee is to consider, and, if appropriate, approve before the
principal accountant is engaged for such services, all specific audit and non-audit services provided to: the Registrant, other
registered investment companies in the Vanguard complex, The Vanguard Group, Inc., and entities controlled by The Vanguard
Group, Inc. that provide ongoing services to the Registrant. In making a determination, the Audit Committee considers whether the
services are consistent with maintaining the principal accountant’s independence.
In the event of a contingency situation in which
the principal accountant is needed to provide services in between scheduled Audit Committee meetings, the Chairman of the Audit Committee
would be called on to consider and, if appropriate, pre-approve audit or permitted non-audit services in an amount sufficient to complete
services through the next Audit Committee meeting, and to determine if such services would be consistent with maintaining the accountant’s
independence. At the next scheduled Audit Committee meeting, services and fees would be presented to the Audit Committee for formal consideration,
and, if appropriate, approval by the entire Audit Committee. The Audit Committee would again consider whether such services and fees are
consistent with maintaining the principal accountant’s independence.
The
Registrant’s Audit Committee is informed at least annually of all audit and non-audit services provided by the principal accountant
to the Vanguard complex, whether such services are provided to: the Registrant, other registered investment companies in the Vanguard
complex, The Vanguard Group, Inc., or other entities controlled by The Vanguard Group, Inc. that provide ongoing services to the
Registrant.
(2) No percentage of the principal accountant’s
fees or services were approved pursuant to the waiver provision of paragraph (c)(7)(i)(C) of Rule 2-01 of Regulation S-X.
(f) For the most recent fiscal
year, over 50% of the hours worked under the principal accountant’s engagement were not performed by persons other than full-time,
permanent employees of the principal accountant.
(g) Aggregate Non-Audit Fees.
Fiscal Year Ended October 31, 2022: $5,500,689
Fiscal Year Ended October 31, 2021: $2,327,574
Includes fees billed for non-audit services provided to the Registrant,
other registered investment companies in the Vanguard complex, The Vanguard Group, Inc., and Vanguard Marketing Corporation.
(h) For the most recent fiscal
year, the Audit Committee has determined that the provision of all non-audit services was consistent with maintaining the principal accountant’s
independence.
Item
5: Audit Committee of Listed Registrants.
The
Registrant is a listed issuer as defined in rule 10A-3 under the Securities Exchange Act of 1934 (“Exchange Act”). The Registrant
has a separately-designated standing audit committee established in accordance with Section 3(a)(58)(A) of the Exchange Act. The Registrant’s
audit committee members are: F. Joseph Loughrey, Mark Loughridge, Sarah Bloom Raskin, and Peter F. Volanakis.
Item 6:
Investments.
Not applicable.
The complete schedule of investments is included as part of the report to shareholders filed under Item 1 of this Form.
Item 7:
Disclosure of Proxy Voting Policies and Procedures for Closed-End Management Investment Companies.
Not applicable.
Item 8:
Portfolio Managers of Closed-End Management Investment Companies.
Not applicable.
Item 9:
Purchase of Equity Securities by Closed-End Management Investment Company and Affiliated Purchasers.
Not applicable.
Item 10:
Submission of Matters to a Vote of Security Holders.
Not applicable.
Item 11:
Controls and Procedures.
(a)
Disclosure Controls and Procedures. The Principal Executive and Financial Officers concluded that the Registrant’s Disclosure Controls
and Procedures are effective based on their evaluation of the Disclosure Controls and Procedures as of a date within 90 days of the filing
date of this report.
(b)
Internal Control Over Financial Reporting. There were no significant changes in the Registrant’s Internal Control Over Financial
Reporting or in other factors that could significantly affect this control subsequent to the date of the evaluation, including any corrective
actions with regard to significant deficiencies and material weaknesses.
Item 12:
Disclosure of Securities Lending Activities for Closed-End Management Investment Companies.
Not applicable.
Item 13:
Exhibits.
Pursuant to
the requirements of the Securities Exchange Act of 1934 and the Investment Company Act of 1940, the registrant has duly caused this report
to be signed on its behalf by the undersigned, thereunto duly authorized.
| |
VANGUARD TRUSTEES’ EQUITY fund |
| |
|
|
| BY: |
/s/ MORTIMER J.
BUCKLEY* |
|
| |
MORTIMER J. BUCKLEY |
|
| |
CHIEF EXECUTIVE OFFICER |
|
Date: December 19, 2022
Pursuant to
the requirements of the Securities Exchange Act of 1934 and the Investment Company Act of 1940, this report has been signed below by
the following persons on behalf of the registrant and in the capacities and on the dates indicated.
| |
VANGUARD trustees’ equity fund |
| |
|
|
| BY: |
/s/ MORTIMER J.
BUCKLEY* |
|
| |
MORTIMER J. BUCKLEY |
|
| |
CHIEF EXECUTIVE OFFICER |
|
Date: December 19, 2022
| |
VANGUARD trustees’ equity fund |
| |
|
|
| BY: |
/s/ CHRISTINE BUCHANAN* |
|
| |
CHRISTINE BUCHANAN |
|
| |
CHIEF FINANCIAL OFFICER |
|
Date: December 19, 2022
| * By: | /s/
Anne E. Robinson |
|
Anne
E. Robinson, pursuant to a Power of Attorney filed on October 11, 2022 (see File Number
333-11763), Incorporated by Reference.
Exhibit
99.CODEETH

|
Access Person Code of Conduct
Effective
Date: 01 March 2022 | Contact: Code_of_Ethics@vanguard.com
|
Background – Why This Access Person Code of Conduct Matters
Vanguard was founded with a singular focus
on clients and serving their best interests, and this has been the foundation of our strong ethical culture. One way in which we consistently
seek to earn and maintain the trust and loyalty of our clients is by adhering to the highest standards of ethical behavior. Acting with
integrity and complying with applicable laws and regulations necessarily extends to your conduct in general and to your personal investing
and trading activities in particular.
Some crew and contingent workers at Vanguard, by virtue of their
role or department, are designated as an “Access Person” (i.e., an Advisor Access Person, Fund Access Person, or Investment
Access Person) because they or their department are authorized to know about present or future transactions by Vanguard funds, or have
the authority to influence those transactions, or otherwise have access to sensitive market or client activity. Because of that knowledge,
authority, and access, Access Persons are subject to additional standards of business conduct, stricter personal investment rules, and
greater oversight, among other things. These standards and rules, as set forth in this Access Person Code of Conduct (APCC)1,
have been adopted with the goals of ensuring we comply with applicable law and avoiding conflicts of interest or the appearance of conflicts
of interest. This is especially true regarding any potential conflicts of interest that could arise between the securities trading that
Vanguard undertakes on behalf of the Vanguard funds or our clients and the personal securities trading by crew, contingent workers, and
their household or family members.
Policy Coverage
To Whom Does the APCC Apply?
This policy2 applies to all crew members and contingent
workers globally who are in a role that has been designated as an “Access Person” role. Certain provisions of this
policy also apply to Associated Persons.
Are you an Access Person? Visit Appendix A to learn
whether the role you’re in is an Access Person role, and if so, which Access Person “designation” applies.
What
about Non-Access Persons? Any crew member or contingent worker who is not in a role that has been designated as an Access
Person role is a “Non-Access Person” and must comply with the Personal Investment Activity Policy for Non-Access Persons,
not this policy.
Are you a contingent worker? A “contingent
worker” is any person other than a crew member who provides services to or on behalf of Vanguard through staffing firms, consulting
1 The APCC constitutes
the code of ethics that the Vanguard funds have adopted in compliance with U.S. SEC Rules 17j-1 and 204A-1.
2 The APCC is a policy
that has been created and approved, and is governed, similar to other policies at Vanguard. As used herein, references to “this
policy” mean the APCC.
firms,
service providers, or as independent contractors. Like crew, a contingent worker can be in either an Access Person or Non-Access Person
role.
What
about Associated Persons? For U.S. crew and contingent workers who are Associated Persons (to reiterate, not Access Persons, but Associated
Persons) under FINRA rules and regulations, please note you have additional investment-related obligations under the FINRA Licensing
Policy, including the Securities Account Reporting Obligations
for Associated Persons. Please review and comply with those
documents, as well.
Policy Overview
There are four primary sections to this policy:
Section 1
– Standards of Business Conduct, sets forth rules and expectations regarding your behavior and conduct.
Section 2
– Personal Investment Activities, contains rules on how you and your Household or Family Members may own and trade securities
for your own personal benefit. Note that some of these rules differ based on your Access Person designation. While the details are set
forth in Section 2, at a high level there are four subsections applicable to you and your personal investment activities:
A – Reminders on who is covered
B – Brokerage firms you may use
C – Disclosure obligations
D – Investment and trading restrictions
Section 3
– Penalties and Sanctions, describes how violations of this policy are addressed and enforced.
Section 4
– Defined terms, provides definitions for the capitalized terms used in this policy.
Please carefully read the rest of this policy and ensure you understand
and comply with its terms. Understanding and following this policy is one of the most important ways we can ensure our clients’
interests always come first.
Be sure you are familiar with the following other Vanguard policies
that relate to your ethical conduct and personal investment activities:
·
Standards of Conduct Policy
·
Conflicts of Interest Policy
·
Insider Trading Policy
·
Outside Business Activity Policy
Please
also ensure you are familiar with Vanguard’s Code of Ethical Conduct.
Policy Requirements
Section 1 – Standards of Business Conduct
Everyone at Vanguard is expected to promote high standards of integrity
and manage the company’s affairs honestly and ethically. We all have a personal responsibility to conduct ourselves
in a manner that reflects a commitment to ethics and compliance with
all applicable laws and regulations. Doing so is part and parcel of Vanguard’s mission to “take a stand for all investors,
to treat them fairly, and to give them the best chance for investment success.”
Putting
these values into practice means having and adhering to expected standards of business conduct. The Vanguard policy that explains
these standards is the Standards of Conduct Policy,
which is incorporated herein by reference. You must comply with that policy, including the following standards of conduct that are
explained therein:
| 1. | Always put Vanguard clients’ interests first and
treat them fairly. |
| 2. | Avoid conflicts of interest. |
| 3. | Be candid and clear with clients and provide them with
accurate information. |
| 4. | Comply with applicable laws, rules, regulations, and policies. |
| 5. | Comply with applicable professional standards. |
| 6. | Complete mandatory training and regularly certify that
you are compliant with our policies. |
| 7. | Maintain accurate, timely, and complete business records. |
At Vanguard, you are expected to always do
the right thing. It sounds simple and it’s usually very clear what doing the right thing entails. But sometimes it isn’t.
How do you make the best choice when facing difficult or unclear circumstances? How do you navigate an ethical dilemma?
In those situations, you should pause and
reflect, and then work through the following “ethical decision-making guide.” This guide will help you consider important
questions before deciding whether or how to proceed with an action. It is not a substitute for this or any policy, and it may not tell
you exactly what to do in every situation, but it can be used as a tool to help guide you when you face an ethical dilemma or a complex
situation where the answer might not be clear.
If you’re still in doubt as you work through the decision-making
guide, err on the side of caution—ask questions, elevate the issue, and enlist the help of others to ensure we reach the right
answer every time for Vanguard and our clients.
Speaking Up – As mentioned above, you are encouraged
to help protect our clients, crew, and Vanguard by reporting concerns about ethics, financial or business integrity, information security
and privacy, workplace practices, or alleged violations of policy, regulation, or law. Indeed, speaking up is one of the most effective
ways to help ensure Vanguard maintains its high standards for ethics and compliance. To that end, if you become aware that you or anyone
else violated any of the terms of this policy, you must contact Compliance immediately.
Likewise, it is your responsibility to know whether the role you are
in is designated as an Access Person, and if so, which Access Person designation applies to you (visit the Appendix A to learn more).
It is also your responsibility to know the policies and trading restrictions that apply to you accordingly, and to ask questions if you
are unsure.
Section 2 – Personal Investment Activities
Introduction
Vanguard recognizes the importance to crew and contingent workers
of being able to manage and develop their own financial resources through long-term investments and strategies. With that in mind, the
rules and requirements set forth in this policy have been adopted with the goals of (1) ensuring we comply with all applicable laws and
regulations, and (2) avoiding any conflicts of interest, or any appearances of conflicts of interest, between the securities trading that
Vanguard undertakes on behalf of Vanguard funds or our clients and the personal securities trading or investing by crew, contingent workers,
or their Household or Family Members (defined in Section 4, below). Our industry and Vanguard have implemented certain standards and limitations
designed to minimize these conflicts and help ensure that we focus on meeting our duty to clients.
Granted, the rules in this policy are demanding and strict and they
may feel like an imposition. But at Vanguard, we take our ethical obligations very seriously, and the rules in this policy are intended
to ensure that trading on behalf of Vanguard funds and clients are given priority over trading for your personal accounts, and that trades
for your personal accounts do not adversely affect trades for our funds or clients.
Similarly, keep in mind that you must comply with applicable securities
laws and must avoid taking personal advantage of your knowledge of securities activity in Vanguard funds or client accounts.
This policy includes specific restrictions on personal investing but
cannot anticipate every fact pattern or situation. You should adhere to the spirit, and not just the letter, of this policy.
Compliance will keep all records relating to personal account trading
as confidential as necessary. Information will be accessible within Compliance and may be reported to senior management or HR. Records
may also need to be made available to Internal Audit and/or any regulator. All non-U.S. crew and contingent workers are required to sign
a data consent / data privacy notice.
The Compliance Department reserves the right to monitor any and all
investment or trading activity by you or by any Household or Family Member based on any information or system to which it has access.
Checklist
Given the complexity of this policy and the steps you must take to
ensure you remain in compliance with it, we have created this brief checklist to help you keep track of your obligations. This is merely
a summary, so be sure to comply with the full terms of this policy as well.
| Checklist item |
Where this topic is covered in this policy |
| ¨ I
know my Access Person “designation,” and I am aware that this policy applies not only to me but also to my Household
or Family Members |
Subsection
2-A – Who Is Covered Under this Policy |
| ¨ For the region where I work, I know what brokerage firm I and my Household or Family Members may use to maintain the accounts where I or they hold and trade Reportable Securities |
Subsection
2-B – Brokerage Firms You May Use |
| ¨ For
my Access Person designation, I know the initial and ongoing account and holdings disclosure obligations that apply to me and
my Household or Family Members |
Subsection
2-C – Disclosure Obligations |
| ¨ For
my Access Person designation, I know the rules and limitations for transacting securities in my personal accounts and
those of my Household or Family Members |
Subsections
2-D-1 and 2-D-2 – Investment and Trading Restrictions |
| ¨ For Fund Access Person and Investment Access Person designations, I know how to seek trade preclearance |
Subsection
2-D-3 – How to Seek and Abide by Preclearance
Requirements |
| ¨ I know the penalties and sanctions that may apply for violations of any of the requirements under this policy |
Section
3 – Penalties and Sanctions |
| ¨ I understand the meaning of the defined terms used in this policy |
Section
4 – Defined Terms |
|
Quick Tip:
The rules in this policy cover most of the personal investing situations
you are likely to find. Yet it’s always possible you will encounter a situation that isn’t fully addressed by the rules. If
that happens, you need to know what to do. The easiest way to make sure you are making the right decision is to follow these three principles:
1. Know the policy. If you think your situation isn’t
covered, check again. It never hurts to take a second look at the rules.
2.
Seek guidance. Asking questions is always appropriate. Talk with your manager or contact Compliance if
you’re not sure about the policy requirements or how they apply to your situation.
3. Use sound judgment. Analyze the situation and weigh the
options. Think about how your decision would look to someone outside of Vanguard.
|
Note
for crew in China:
Because
you may not have access to MCO, different systems and procedures are in place for you to disclose accounts and holdings. Please consult
with your manager or the China Compliance team to learn more. |
Subsection
2-A – Who Is Covered Under this Policy
As
stated in the introduction to this policy, above, this policy applies to all crew members and contingent workers globally who are in
a role that has been designated as an “Access Person” role.
Access
Persons are covered – This policy applies to crew and contingent worker Access Persons and, in certain instances, to their
Household or Family Members.
| o | Access
Persons – Please note that the specific trading prohibitions and reporting requirements
vary depending on your Access Person “designation,” meaning Advisor Access
Person, Fund Access Person, or Investment Access Person. To learn the Access
Person designation that applies to your role, visit Appendix A. Note further that, regardless
of your designation, the Compliance Department has the authority, with appropriate notice
to you, to apply to you any or all of the trading restrictions within this policy |
| o | Household
or Family Members – Certain aspects of this policy apply not only to you but to
your Household or Family Members, as well. Why? Doing so is required by applicable law and
regulations in many jurisdictions. It is also consistent with industry best practices and
helps Vanguard ensure we are effectively monitoring and guarding against conflicts of interest
and other issues. See Section 4, below, for the definition of Household or Family Members
in the region where you work. |
Non-Access
Persons are not covered – If the role you are in is not an Access Person role, you do not need to comply with this policy;
instead, with regard to your personal investments, you must comply with the Personal Investment Activity Policy for Non-Access Persons
(and other applicable policies). Note, however, that in the event a Non-Access Person is a Household or Family Member of an Access Person,
then the terms of this policy will apply to the Non-Access Person as a Household or Family Member hereunder and any conflicting terms
of this policy will take precedence over the Personal Investment Activity Policy for Non-Access Persons.
Associated
Persons also have obligations under other policies and documents – For U.S. crew and contingent workers who are deemed to be
Associated Persons (to reiterate, not Access Persons, but Associated Persons) under the FINRA Licensing Policy, you have certain
obligations under this policy and have additional investment-related obligations under the FINRA Licensing Policy and the Securities
Account Reporting Obligations for Associated Persons.
Your
designation may change – Keep in mind that your Access Person designation may change over time, for instance if you change
roles, if there are changes made in your department, or if the Compliance Department determines a designation change is appropriate.
You are advised to regularly consult the My Ethics and Compliance Resource Center available on CrewNet to check your designation.
Subsection
2-B – Brokerage Firms You May Use
The
terms of Subsection 2-B apply to all Access Person designations.
The
following requirements and restrictions on which brokerage firms you may use to hold and transact Reportable Securities apply to you
based on whether you are a crew member or contingent worker and where you work:
| U.S. Crew: |
Crew who are Access Persons employed in the U.S., and their Household or Family Members (parts (a) and (b) of that defined term only), must maintain and trade all Reportable Securities in a Vanguard Brokerage Account (VBA). This obligation does not apply to any Household or Family Members covered under part (c) of that defined term. See the Defined Terms in Section 4, below, for all definitions. Securities or investments that are not “Reportable Securities” may be held in a brokerage account at the firm of your choice. Employer-sponsored retirement accounts (e.g., 401(k) and 403(b)), 529 college savings plans, and Compliance-approved accounts (e.g., Approved Managed Accounts) may be held in a brokerage account at the firm of your choice. However, if you hold any Reportable Securities through any of those accounts, then such accounts are considered Covered Accounts under this policy and you are required to disclose them to Compliance under Subsection 2-C of this policy. Newly hired U.S. crew who are Access Persons, and their Household or Family Members (parts (a) and (b) of that defined term only), must transfer any existing applicable Reportable Securities to a VBA by submitting a request or other applicable paperwork with Vanguard and each firm at which you have an existing applicable brokerage account within 60 days of your joining Vanguard. Visit Vanguard.com > Personal Investors > Open an Account to transfer assets from another firm to Vanguard. For a more detailed list of Securities that must be held in a VBA, as well as Securities that may be held elsewhere, visit the Appendices C-F. |
| Ex-U.S. Crew: |
Crew who are Access Persons employed outside the U.S., and their Household or Family Members, may maintain Reportable Securities (as well as Securities or investments that are not Reportable Securities) in a brokerage account or other type of account at the firm of their choice.
|
| Contingent Workers, Globally |
Contingent workers who are Access Persons may maintain Reportable Securities (as well as Securities or investments that are not Reportable Securities) in a brokerage account at the firm of their choice. |
Subsection
2-C – Disclosure Obligations
The
terms of this Subsection 2-C apply to all Access Person designations and to all Associated Persons.
This
policy requires the disclosure of a variety of account and holdings information to the Compliance Department for monitoring and oversight.
This policy requires (1) an initial disclosure of information, and (2) periodic ongoing disclosures. Even if you do not have any personal
brokerage
account
holdings or do not trade in Reportable Securities, you are still required to complete the necessary initial and periodic disclosures.
1.
Initial Disclosure of Accounts and Holdings
Within
ten (10) calendar days of joining Vanguard, or if applicable within ten (10) calendar days of moving from a Non-Access Person role at
Vanguard into an Access Person role, all Access Persons and Associated Persons must disclose the following to Compliance:
(a)
All Covered Accounts and all Reportable Securities held by you or a Household or Family Member;
(b)
All Covered Accounts in which you exercise Investment Discretion;
(c)
All Covered Accounts over which you exercise control (e.g., agent authority (full or limited), trustee, power of attorney authority,
etc.);
(d)
All accounts in which you have, or will acquire, Beneficial Ownership of Securities; and
(e)
All accounts held by you and any Household or Family Member in which there are college saving plan products (including, in the U.S.,
529 plans), annuity products, or other insurance products that, in turn, hold or invest in Vanguard Funds.
This
includes Brokerage Accounts held at Vanguard, as well as those held at another financial institution. For clarity, you do not need to
disclose an account or submit transaction confirmations or statements if the account does not have the ability to hold Securities –
for example, a traditional checking, savings, or deposit account with a bank, credit union, or building society for holding cash would
not need to be disclosed.
This
information must be current as of no more than 45 calendar days before joining Vanguard.
To
make this initial disclosure, you will receive an Initial Certification assignment by email to complete which will include a section
to disclose Covered Accounts and all Reportable Securities by including account information in the “Account Attestation”
section of the assignment and uploading corresponding account statements via MCO. You must
complete and submit the Initial Certification within ten (10) calendar days of receiving it; the failure to do so may be considered a
violation of this policy.
| Note: We
use an application called MyComplianceOffice, or MCO, to help manage this policy. You may use MCO to disclose accounts and holdings,
and to secure trading permissions, if those obligations apply to you. Visit My Ethics and Compliance Resource Center on CrewNet for
resources on how to access and use MCO |
2.
Ongoing Disclosure of Accounts, Transactions, and Duplicate Statements
After
the Initial Disclosure, Access Persons and Associated Persons may need to disclose account and transaction information to Compliance
on a periodic basis regarding Covered Accounts and any transactions in Reportable Securities made by you and your Household or Family
Members.
Further,
if at any time you or a Household or Family Member subsequently:
| · | open,
or intend to open, a Covered Account with a financial institution (e.g., broker, dealer,
advisor, or any other professional money manager), or |
| · | acquire
holdings in Reportable Securities, or |
| · | have
a preexisting Covered Account (including a Vanguard Brokerage Account) that becomes associated
with you or a Household or Family Member (such as through marriage or inheritance or some
other life event), |
or
there becomes an account in which you acquire Beneficial Ownership of Securities, then you must notify Compliance as soon as possible
(and in any event within 10 calendar days) and disclose these Covered Accounts and Reportable Securities by listing them and including
associated information in the Accounts tab in MCO.
For
U.S. crew, keep in mind that, as explained in Section 2-B of this policy above, you and your Household or Family Members (parts (a) and
(b) of that defined term only) must maintain Reportable Securities in a VBA.
What
and how to disclose this information:
| · | For
VBAs disclosed by U.S. crew as required under this policy, Compliance will receive transaction
confirmations automatically. No additional action by you is needed to disclose transactions
of Reportable Securities in VBAs you have disclosed. |
| · | For
Covered Accounts and holdings of Reportable Securities held outside of Vanguard (including
in any account that would require disclosure under Section 2-C(1) of this policy), it is
your responsibility to ensure that duplicate statements and transaction confirmations
are available to or delivered to Compliance: |
| o | Because
Vanguard has file feed contracts in place with many brokerage firms worldwide, for many Covered
Accounts you disclose the holdings and transactions information will be sent to Compliance
electronically with no additional action needed by you. |
| o | For
Covered Accounts held at firms where Vanguard does not have a file feed in place, you must
do the following: |
| § | Contact
the firm where your Covered Account is held and take steps to send duplicate statements and
daily transaction confirmations (electronic or paper) to Vanguard. You do this often by making
Vanguard Compliance an interested party and having duplicate statements and confirmations
sent to the third party scanning service Vanguard uses, called “Earth Class Mail”
at this address: Vanguard, c/o TerraNua, 9450 SW Gemini Drive #37880, Beaverton, OR, 97008-7105. |
| § | If
the firm where your Covered Account is held is not able to send statements and daily transaction
confirmations (electronic or paper) to Vanguard, you are required to scan and upload copies
into the Trading Documents folder in MCO immediately after you receive them, unless you receive
an exemption from this requirement from Compliance. You must ensure the documents you upload
clearly show the firm/institution at which the account is held, the account number or ID,
the account owner, and the account type. |
| · | If
Compliance does not receive the information automatically via a file feed, you will receive
email notifications on a calendar quarterly basis to complete a Quarterly Securities Transaction
Report and thereby disclose Covered Accounts and Reportable Securities, via MCO. You must
complete and submit that assignment within 30 calendar days; the failure to do so may be
considered a violation of this policy. |
| · | On
an annual basis (usually in January or February), you will receive an assignment from Compliance
in which you must certify, among other things, that all Covered Accounts and Reportable Securities
are recorded accurately in MCO. |
3.
Additional notes related to disclosures under this policy:
| · | For
clarity, you do not need to disclose an account or submit transaction confirmations or statements
if the account does not have the ability to hold Securities (for example, a traditional checking,
savings, or deposit account with a bank, credit union, or building society for holding cash
would not need to be disclosed). |
| · | As
stated above, U.S. crew and contingent workers who are Associated Persons are also required
to comply with and are subject to the FINRA Licensing Policy and Securities Account Reporting
Obligations. |
| · | The
Compliance Department will keep personal trading information confidential, but please note
that such information may be accessible to authorized personnel within Compliance and may
be reported to or summarized for senior management, HR, or the OGC for investigative purposes.
Applicable records may also be provided to internal or external auditors and/or to any regulator
if required. All ex-U.S. crew and contingent workers are required to sign a data consent
/ data privacy notice. |
| · | Please
note that crew and contingent workers in Australia are required to disclose all transactions
in VIA funds in MCO in the same manner as is required for Reportable Securities. |
Subsection
2-D – Investment and Trading Restrictions
This
Subsection 2-D contains three segments:
Segment
2-D-1 applies to all Access Person designations.
Segment
2-D-2 has terms and requirements that differ based on your Access Person designation.
| o | Segment
2-D-2(a): Advisor Access Person requirements |
| o | Segment
2-D-2(b): Fund Access Person requirements |
| o | Segment
2-D-2(c): Investment Access Person requirements |
Segment
2-D-3 explains how to seek and abide by preclearance requirements, if applicable to your activity.
Segment
2-D-1: Rules and Limitations applicable to all Access Person designations
The
terms of this Segment 2-D-1 apply to all Access Person designations.
| (1) | You
must comply with all applicable securities-related rules and laws. |
| (2) | You
may not engage in conduct that is deceitful, fraudulent, or manipulative, or that involves
false or misleading statements, in connection with the purchase or sale of a Security by
a Vanguard Fund or Vanguard Client account or otherwise. |
| (3) | You
may not intentionally, recklessly, or negligently circulate false information or rumors that
may affect the securities markets or may be perceived as market manipulation. |
| (1) | You
may not take personal advantage of knowledge of recent, impending, or planned Securities
activities of the Vanguard Funds or their investment advisors or any Vanguard Client. You
are prohibited from purchasing or selling—directly or indirectly—any Security
or Related Security when you know that the Security is being purchased or sold, or considered
for purchase or sale, by a Vanguard Fund (with the exception of an index fund) or by a Vanguard
Client. |
| (2) | You
are subject to and must comply with the Insider Trading Policy and/or any similar policy
of the Vanguard affiliate or region for which you work. Each of these policies is considered
an integral part of your obligations under this policy. Each policy prohibits you from buying
or selling any Security while in possession of material, nonpublic information about the
issuer of the Security. The policies also prohibit you from communicating any nonpublic information
about any Security or issuer of Securities to third parties. |
| (3) | You
must comply with the Confidential Information Policy, including that you may not share information
with any third party about any planned, upcoming, or recently executed trading activity by
any Vanguard Fund or Vanguard Client unless such information is publicly available through
no action by you. |
| iii) | Fund
policies and excessive trading: |
| (1) | When
purchasing, exchanging, or redeeming shares of a Vanguard Fund, you must adhere to the policies
and standards set forth in the fund’s prospectus, or offering document, including policies
on market-timing and frequent trading. |
| (2) | Excessive
trading in Covered Accounts is strongly discouraged. The Compliance Department reserves the
right to monitor trading across all of your Covered Accounts, and may conduct scrutiny of
any trades in your Covered Accounts where such trading may appear excessive in nature (including,
but not limited to, if the number of trades is so frequent as to potentially impact your
ability to carry out your assigned responsibilities or the trades involve positions that
are disproportionate to your net assets). If Compliance in its sole discretion determines
you have engaged in excessive trading, then Compliance may limit the number of trades allowed
in your Covered Accounts during a given period. This Section 2-D-1(a)(iii)(2) does not apply
to transactions in an Approved Managed Account. |
| iv) | Beneficial
ownership and discretion: |
| (1) | The
terms and restrictions of this policy apply to all Securities in which you have acquired
or will acquire Beneficial Ownership. |
| (2) | You
must comply with these investment and trading restrictions with respect to any account you
own as well as any account over which you have Investment Discretion or in which you have
the authority to transact. |
| v) | No
circumvention – You are not permitted to assist,
aid, or enable any other person in doing anything that you are prohibited from doing under
this policy. |
| (1) | The
Chief Compliance Officer may grant exceptions to this policy, including preclearance, other
trading restrictions, and certain reporting requirements on a case-by-case basis if it is
determined that (1) the proposed conduct involves no opportunity for abuse, (2) the proposed
conduct does not conflict with Vanguard’s interests, and (3) not granting an exception
would result in an unfair or unjust outcome. |
| (2) | The
Chief Compliance Officer may waive the applicability of this policy for a contingent worker
if the policy’s requirements are covered through the applicable service provider’s
contract with Vanguard. |
| (b) | Rules
regarding specific investments or investment types: |
| (1) | You
and your Household or Family Members may not use a derivative to avoid or circumvent a rule
or requirement set forth in this policy. If something is prohibited by these rules, then
it is also against these rules to effectively accomplish the same thing by using a derivative.
This includes futures, options, and other types of derivatives. |
| (2) | You
and your Household or Family Members are permitted to trade futures or options on commodities. |
| (1) | You
and your Household or Family Members are prohibited from acquiring Securities in an Initial
Public Offering (IPO) or Secondary Offering. |
| (2) | You
and your Household or Family Members are prohibited from participating in an Initial Coin
Offering (ICO). |
| (1) | You
and your Household or Family Members are not permitted to invest in securities offered to
potential investors in a Private Placement or other limited investment offering without first
obtaining preclearance from Compliance. |
| (2) | You
must provide documentation describing the investment (e.g., offering memorandum, subscription
documents, etc.) so as to enable Compliance to conduct a thorough review of the investment.
|
| (3) | Approval
by Compliance may be granted or denied after a review of the facts and circumstances, including
whether: |
| · | An
investment in the securities is likely to result in future conflicts with Vanguard Client
accounts. |
| · | You
are being offered the opportunity due to your employment at, or association with, Vanguard. |
| (4) | If
you or your Household or Family Members receive approval to purchase Securities in a Private
Placement, you must immediately inform Compliance if that Security goes to public offer or
is pending listing on an exchange. |
| (5) | To
initiate the process for obtaining preclearance of a Private Placement, complete the Outside
Business Activity request form (the form for U.S. crew is in LARS, and for ex-U.S. crew
is in MCO). |
iv)
SPACs – You and your Household or Family Members are prohibited from acquiring a SPAC at any
stage of its lifecycle (i.e., pre-IPO, IPO, pre-merger, post-merger).
v)
Short-Selling – You are prohibited from selling short any Security that you do not own or from
otherwise engaging in short-selling activities.
vi)
Limit Orders – Same-day limit orders are permitted; however, good 'til cancelled orders (such
as limit orders that stay open over the course of multiple trading days until a security reaches a specified market price) are not permitted.
vii)
Digital Currencies and Related Investments – Refer to the Trading and Reporting Requirements
for Digital Currency Investments and Activities for details on which digital currency account and product
types are permitted, and what must be disclosed, under this policy.
| (c) | Short
term trading in a Vanguard Fund (other than Vanguard ETFs): |
i)
Compliance may monitor trading in Vanguard Funds, other than Vanguard ETFs, and will review situations
where Vanguard Fund shares are redeemed within 30 calendar days of purchase (a “short-term trade”). You may be required to
relinquish to Vanguard any profit made on a short-term trade and will be subject to disciplinary action if Compliance determines the
short-term trade was detrimental to a Vanguard Fund or a Vanguard Client or that there is a history of frequent trading by you or your
Household or Family Members. For purposes of this paragraph:
| (1) | A
redemption includes a redemption by any means, including an exchange out of a Vanguard Fund. |
| (2) | This
policy does not cover purchases and redemptions/sales (i) into or out of Vanguard money market
funds, Vanguard short-term bond funds, or (ii) through an Automatic Investment Program. |
ii)
Nothing in this section is intended to replace, nullify, or modify any requirements imposed by a Vanguard
Fund.
Segment
2-D-2: Specific Limitations and Prohibitions that Apply Based on Access Person Designation
The
terms and requirements of this Segment 2-D-2 are in addition to the terms and requirement of Segment 2-D-1, and you must
comply with the portions of this Segment 2-D-2 that apply to your Access Person designation. Note, an Access Person designation can apply
to crew members or contingent workers.
Segment
2-D-2(a): Advisor Access Person requirements
The
following terms and requirements apply to Advisor Access Persons only and are in addition to the terms and requirements of Segment
2-D-1:
| Securities transactions for which you must obtain preclearance (meaning, approval from Compliance before transacting) |
None.
You are not required to obtain preclearance of any Covered Securities transactions by you or your Household or Family Members,
except Private Placements as described above. |
| Prohibited Securities transactions |
In addition to Segment 2-D-1, you are subject to the following restrictions with respect to any transaction in which you will acquire any direct or indirect Beneficial Ownership: · Short-Term Trading. You are prohibited from purchasing and then selling any Covered Security at a profit, as well as selling and then repurchasing a Covered Security at a lower price, within 60 calendar days. A last-in/first-out accounting methodology will be applied to a series of Security purchases when applying this rule. (Note, as stated, this is based on last-in/first-out accounting regardless of how you placed the trade or plan to report it for tax purposes.) If you realize profits on short-term trades, you will be required to relinquish the profits to Vanguard (exclusive of commissions). In addition, the trade will be recorded as a violation of this policy. For example: you would not be permitted to sell a Covered Security at $12 that you purchased within the prior 60 days for $10. Similarly, you would not be permitted to purchase a Covered Security at $10 that you had sold within the prior 60 days for $12. ·
Short-term trading on options. You may hold options on a Covered Security until you exercise the options or the options expire.
However, you may not otherwise close any open positions within 60 calendar days. If you realize profits on such short-term trades, you
must relinquish such profits to Vanguard (exclusive of commissions). In addition, the trade will be recorded as a violation of this policy. Note:
These types of transactions can have unintended consequences. |
| |
For example, your call option could be assigned, causing the underlying Security to be called away within sixty (60) calendar days following the purchase of the Covered Security.
|
| |
Visit
the Appendix C for a table summarizing the trading and reporting requirements for Advisor Access Persons. |
Segment
2-D-2(b): Fund Access Person requirements
The
following terms and requirements apply to Fund Access Persons only and are in addition to the terms and requirements of Segment
2-D-1:
| Securities transactions for which you must obtain preclearance (meaning, approval from Compliance before transacting) |
Yes, you must obtain, for yourself and on behalf of your Household or Family Members, preclearance for any transaction of a Covered Security by you or any Household or Family Member. See
Segment 2-D-3, below, for instructions on how to seek preclearance. |
| Securities transactions that do not require preclearance |
You are not required to obtain preclearance for the following:
·
Purchases or sales of Vanguard Funds.
·
Purchases or sales where the person requesting preclearance has no direct or indirect influence or control over the account (e.g., you
have a trust in your name but you are not the trustee who places the transaction, provided you have granted Investment Discretion to
the trustee and there has been no prior communication between you and the trustee regarding the transaction).
·
Corporate actions in Covered Securities such as stock dividends, stock splits, mergers, consolidations, spin-offs, or other similar corporate
reorganizations or distributions.
·
Purchases or sales made as a part of an Automatic Investment Program.
·
Purchases effected upon the exercise of Rights which were issued by an issuer pro rata to all holders of a class of its Securities, to
the extent such Rights were acquired from such issuer.
· Acquisitions of Covered Securities
through gifts or bequests.
Visit the Appendix D for a table summarizing the trading and reporting requirements for Fund
Access Persons. |
| Is preclearance required for trades in an Approved Managed Account? |
No, you are not required to seek preclearance of a transaction in a Covered Security in an Approved Managed Account so long as you have no prior communication with the portfolio manager of that account in connection with that transaction. Note,
Vanguard PAS accounts generally do not qualify as Approved Managed Accounts because PAS account owners generally retain some level
of investment discretion. Further, any |
| |
trades of Covered Securities in a PAS account must be precleared under this policy. |
“Blackout
period” restrictions that may apply to personal trading in Covered Securities
|
You may be subject to certain restrictions if you purchase or sell a Covered Security within seven (7) days before or after a Vanguard Fund purchases or sells the same Covered Security or a Related Security (the “blackout period”). Purchasing or selling before a Vanguard Fund: · If you purchase a Covered Security within seven days before a Vanguard Fund purchases the same Covered Security or a Related Security, you may be required to hold the Covered Security for 6 months before being permitted to sell the Covered Security for a profit. · If you sell a Covered Security within seven days before a Vanguard Fund sells the same Covered Security or a Related Security, you may be required to relinquish to Vanguard any profits earned from your sale of the Covered Security (exclusive of commissions), where profits are calculated based on the price that the Vanguard Fund received for selling the Covered Security or a Related Security. Note: Compliance will review your sale to determine if the relinquishment is required. This decision will be based on several factors, such as your role, access to fund trades, and the Covered Security sold. Purchasing or selling after a Vanguard Fund: · In general, you will not receive preclearance to purchase a Covered Security within seven days after a Vanguard Fund trades the same Covered Security or a Related Security. If you execute the transaction without receiving preclearance, you will have violated this policy and must immediately sell the Covered Security and relinquish all profits received from the sale to Vanguard (exclusive of commissions). · In general, you will not receive preclearance to sell a Covered Security within seven days after a Vanguard Fund trades the same Covered Security or a Related Security. If you execute the transaction without receiving preclearance, you will have violated this policy and must relinquish to Vanguard the difference (exclusive of commissions) between the sale price you received and the Vanguard Fund's sale price (as long as your sales price is higher), multiplied by the number of shares you sold. In addition to these restrictions, local law may dictate the extent to which any gains must be relinquished. Compliance
may exempt from these restrictions certain trades during blackout periods that coincide with trading by certain Vanguard Funds (e.g.,
index funds). |
| |
The
blackout period restrictions set forth above will not apply
to a Fund Access Person’s sale of stock of any issuer which has a market capitalization
that exceeds US$5 billion (or local currency equivalent), provided that the total value of
any sales of the Security by the Fund Access Person do not exceed US$10,000 (or local currency
equivalent) in any 30-day rolling period. Sales of securities of issuers with market capitalizations
below US$5 billion, or that exceed US$10,000 in any 30-day rolling period, will continue
to be subject to the blackout periods unless Compliance grants a waiver.
Compliance may waive
the blackout period as it applies to the sale of a Covered Security if the Chief Compliance
Officer determines its application creates a significant hardship to you (e.g., you need
cash for a home purchase or to cover a major medical expense) and, in the opinion of the
Chief Compliance Officer, satisfies the requirements for a waiver in the Waivers paragraph
of Segment 2-D-1, above. Request and complete a Hardship Waiver Request Form. |
| Prohibited
Securities transactions |
In
addition to Segment 2-D-1, you are subject to the following restrictions with respect to
any transaction in which you will acquire any direct or indirect Beneficial Ownership: ·
Futures and Options. You are prohibited from entering into, acquiring, or selling
any Futures contract (including single stock futures) or any Option on any Security (including
Options on ETFs, Digital Utility Tokens, Digital Security Tokens, and Digital Currencies). ·
Short-Term Trading. You are prohibited from purchasing and then selling any Covered
Security at a profit, as well as selling and then repurchasing a Covered Security at a lower
price, within 60 calendar days. A last-in/first-out accounting methodology will be applied
to a series of Security purchases when applying this rule. (Note, as stated, this is based
on last-in/first-out accounting regardless of how you placed the trade or plan to report
it for tax purposes.) If you realize profits on short-term trades, you will be required to
relinquish the profits to Vanguard (exclusive of commissions). In addition, the trade will
be recorded as a violation of this policy. Example: You are not permitted to sell
a security at $12 that you purchased within the prior 60 days for $10. Similarly, you are
not permitted to purchase a security at $10 that you sold within the prior 60 days for $12. ·
Spread Bets. You are prohibited from participating in Spread Betting on Securities,
indexes, interest rates, currencies, or commodities. |
Segment 2-D-2(c): Investment Access Person requirements
The following terms and requirements apply to Investment
Access Persons only and are in addition to the terms and requirements of Segment 2-D-1:
| Securities transactions for which you must obtain preclearance (meaning, approval from Compliance before transacting) |
Yes, you must obtain, for yourself and on behalf
of your Household or Family Members, preclearance for any transaction of (i) a Covered Security, or (ii) a Vanguard ETF, by you or
any Household or Family Member.
See Segment 2-D-3, below, for instructions on how to seek
preclearance.
|
| Securities transactions that do not require preclearance |
You are not required to obtain preclearance for the following:
· Purchases
or sales of Vanguard Funds. (Reminder: The purchase or sale of Vanguard ETFs does require preclearance.)
·
Purchases or sales where the person requesting preclearance
has no direct or indirect influence or control over the Covered Security (e.g., you have a trust in your name but you are not the trustee
who places the transaction, provided you have granted Investment Discretion to the trustee and there has been no prior communication between
you and the trustee regarding the transaction).
·
Corporate actions in Covered Securities such as stock
dividends, stock splits, mergers, consolidations, spin-offs, or other similar corporate reorganizations or distributions.
·
Purchases or sales made as a part of an Automatic Investment
Program.
·
Purchases effected upon the exercise of Rights which
were issued by an issuer pro rata to all holders of a class of its Securities, to the extent such Rights were acquired from such issuer.
·
Acquisitions of Covered Securities through gifts or
bequests.
Visit the Appendix for a table summarizing the trading and
reporting requirements for Investment Access Persons.
|
| Is preclearance required for trades in an Approved Managed Account? |
No, you are not required to seek preclearance of a transaction
in a Covered Security in an Approved Managed Account so long as you have no prior communication with the portfolio manager of that account
in connection with that transaction.
Note, Vanguard PAS accounts generally do not qualify
as Approved Managed Accounts because PAS account owners generally retain some level of investment discretion. Further, any trades of Covered
Securities (but not trades of Vanguard ETFs) in a PAS account must be precleared under this policy.
|
|
“Blackout period” restrictions that may apply to
personal trading in Covered Securities |
You may be subject to certain restrictions if you purchase
or sell a Covered Security within seven (7) days before or after a Vanguard Fund purchases or sells the same Covered Security or a Related
Security (the “blackout period”).
Purchasing or selling before a Vanguard Fund:
·
If you purchase a Covered Security
within seven days before a Vanguard Fund purchases the same Covered Security or a Related Security, you may be required to hold the Covered
Security for 6 months before being permitted to sell the Covered Security for a profit.
·
If you sell a Covered Security within
seven days before a Vanguard Fund sells the same Covered Security or a Related Security, you may be required to relinquish to Vanguard
any profits earned from your sale of the Covered Security (exclusive of commissions), where profits are calculated based on the price
that the Vanguard Fund received for selling the Covered Security or a Related Security.
Purchasing or selling after a Vanguard Fund:
·
In general, you will not receive preclearance to purchase a
Covered Security within seven days after a Vanguard Fund trades the same Covered Security or a Related Security. If you execute the transaction
without receiving preclearance, you will have violated this policy and must immediately sell the Covered Security and relinquish all profits
received from the sale to Vanguard (exclusive of commissions).
·
In general, you will not receive preclearance to sell a
Covered Security within seven days after a Vanguard Fund trades the same Covered Security or a Related Security. If you execute the transaction
without receiving preclearance, you will have violated this policy and must relinquish to Vanguard the difference (exclusive of commissions)
between the sale price you received and the Vanguard Fund’s sale price (as long as your sales price is higher), multiplied by the
number of shares you sold.
In addition to these restrictions, local law may dictate
the extent to which any gains must be relinquished.
Compliance may exempt from these restrictions certain trades
during blackout periods that coincide with trading by certain Vanguard Funds (e.g., index funds).
Compliance may waive
the blackout period as it applies to the sale of a Covered Security if the Chief Compliance Officer determines its application creates
a significant hardship to you (e.g., you need cash for a home purchase or to cover a major medical expense) and, in the opinion of the
Chief Compliance Officer, satisfies the requirements for a waiver in the Waivers |
| |
paragraph of Segment D-1, above. Request and complete a Hardship Waiver Request Form.
|
| Prohibited Securities transactions |
In addition to Segment 2-D-1, you are subject to the
following restrictions with respect to any transaction in which you will acquire any direct or indirect Beneficial Ownership:
Futures
and Options. You are prohibited from entering into, acquiring, or selling any Futures contract (including single stock futures)
or any Option on any Security (including Options on ETFs, Digital Utility Tokens, Digital Security Tokens, and Digital Currencies).
Short-Term
Trading. You are prohibited from purchasing and then selling any Covered Security or a Vanguard ETF at a profit, as well
as selling and then repurchasing a Covered Security or a Vanguard ETF at a lower price, within 60 calendar days. A last-in/first-out
accounting methodology will be applied to a series of Security purchases when applying this rule. (Note, as stated, this is based
on last-in/first-out accounting regardless of how you placed the trade or plan to report it for tax purposes.) If you realize profits
on short-term trades, you will be required to relinquish the profits to Vanguard (exclusive of commissions). In addition, the trade
will be recorded as a violation of this policy. Example: You are not permitted to sell a security at $12 that you purchased
within the prior 60 days for $10. Similarly, you are not permitted to purchase a security at $10 that you sold within the prior 60
days for $12.
Spread
Bets. You are prohibited from participating in Spread Betting on Securities, indexes, interest rates, currencies, or commodities.
|
Segment 2-D-3: How to Seek and Abide by Preclearance
Requirements
If you are required to obtain preclearance of any trade or transaction
under this policy, then the terms of this Segment 2-D-3 apply to that trade or transaction.
Preclearance representations.
By seeking preclearance, you will be deemed to be advising
and representing to Compliance that you:
| · | Do not possess any material, nonpublic information relating
to the security. |
| · | Do not use knowledge of any proposed trade or investment
program relating to the Vanguard Funds for personal benefit. |
| · | Believe the proposed trade is available to any market participant
on the same terms. |
How do I obtain preclearance?
Preclearance must be obtained via the “Personal Trade
Pre-Clearance” path in MCO. Once the required information is submitted, your preclearance request will usually be approved
or denied
immediately. Transactions in Covered Securities (including,
for Investment Access Persons, transactions in Vanguard ETFs) may not be executed before you receive approval.
As a reminder, preclearance of Private Placements is addressed
in Segment 2-D-1 of this policy, above.
Attempting to gain approval after the transaction has occurred
is not permitted. Completing a personal trade before receiving approval or after the approval window expires constitutes a violation of
this policy. See Section 3 of this policy for more information regarding the sanctions that may be imposed as a result of a violation.
How long is my preclearance approval valid?
In the U.S.: Preclearance approval will expire
at the end of the trading day on which it is issued (e.g., if you receive approval for a trade on Monday, it is effective until the market
closes on that Monday). Preclearance for permitted limit orders is good for transactions on the same day that approval is granted
only. If you receive approval for a limit order, it must be executed or expire at the close of regular trading on the same business
day for which approval was granted. If you wish to execute the limit order after the close of regular trading on the day you received
approval, you must submit a new preclearance request for the day you wish to execute the trade.
Outside the U.S.: If you receive approval,
transactions must be executed no later than the end of trading on the next business day after the preclearance is granted. If the transaction
is not placed within that time, you must submit a new request for approval before placing the transaction. If you preclear a limit order,
that limit order must either be executed or expire at the end of the next business day. If you want to execute the order after the next
business day period expires, you must resubmit your preclearance request.
Section 3 – Penalties and Sanctions
How we enforce this policy
The Compliance Department regularly reviews the forms, reports, and
other information it receives. If these reviews turn up information that is incomplete, questionable, or potentially in violation of this
policy, the Compliance Department will investigate the matter and may contact you. If it is determined that you or any of your Household
or Family Members have violated this policy, the Compliance Department or another appropriate party may take action.
Violations
If
the Compliance Department determines that there has been a violation, you may be subject to penalties and sanctions as described in this
policy and otherwise as described in the Disciplinary Action Policy and,
for crew and contingent workers in Australia, the Managing Misconduct Policy. The Compliance Department will generally utilize a rolling
24-month period when evaluating whether and how to sanction a violation. Any violation of this policy may result in disciplinary
action up to and including termination of employment.
Vanguard takes all policy violations seriously and at times provides
the Vanguard Funds’ board with a summary of actions taken in response to material violations of this policy and other policies.
You should be aware that other securities laws and regulations not addressed by this policy may also apply to you, depending upon your
role at Vanguard.
Exceptions
The Chief Compliance Officer or designee retains the discretion to
interpret and grant exceptions to this policy and to decide how the rules apply to any given situation for the purpose of protecting the
funds and being consistent with the general principles of this policy and the Code of Ethical Conduct.
In cases where exceptions to this policy are noted and you may qualify
for them, you need to get prior written approval from the Compliance Department. If you believe that you have a situation that warrants
an exception that is not discussed in this policy, you may submit a written request to the Compliance Department, which will consider
your request and notify you of the outcome.
Section 4 – Defined Terms
The following definitions apply throughout this policy:
| Access Person |
Any person designated as an Investment Access Person, Fund Access Person, or Advisor Access Person. |
| Approved Managed Account |
An investment account where (i) the account is owned by an investor and overseen by a hired professional money manager, (ii) the investor has no trading discretion on the account, and (iii) Compliance has approved it as an Approved Managed Account. |
| Associated Person |
Any person who conducts securities business on behalf of Vanguard Marketing Corporation (VMC). This includes all FINRA-licensed contingent workers, as well as non-licensed contingent workers who perform certain operational and administrative functions for VMC. |
| Automatic Investment Program |
A program in which regular periodic purchases (or withdrawals) are made automatically in (or from) Investment accounts, according to a predetermined schedule and allocation. An Automatic Investment Program includes a dividend reinvestment plan. |
| Bankers’ Acceptance |
A time draft drawn on a commercial bank by a borrower usually in connection with an international commercial transaction. Bankers’ Acceptances are usually guaranteed by the bank. |
| Beneficial Ownership |
The opportunity to directly or indirectly—through
any contract, arrangement, understanding, relationship, or otherwise—share at any time in any economic interest or profit derived
from an ownership of or a transaction in a Security. For clarity, what you are deemed to have Beneficial Ownership of includes the following:
·
Any Security owned individually by you.
·
Any Security owned by a Household or Family Member.
·
Any Security owned in joint tenancy, as tenants in common,
or in other joint ownership arrangements.
·
Any Security in which a Household or Family Member has
Beneficial Ownership if the Security is held in a Covered Account over which you have decision making authority (for example, you act
as a trustee, executor, or guardian or you provide Investment advice).
·
Your interest as a general partner or manager/member
in Securities held by a general or limited partnership or limited liability company.
|
| |
· Your interest as a member of an Investment club or an organization that is formed for the purpose of investing in a pool of monies or Securities.
· Your ownership of Securities as a trustee of a trust in which either you or a Household or Family Member has a vested interest in the principal or income of the trust or your ownership of a vested interest in a trust.
· Securities owned by a corporation which is directly or indirectly controlled by, or under common control with, such person. |
| Bond |
A debt obligation issued by a corporation, government, or government agency that entails repayment of the principal amount of the obligation at a future date, usually with interest. |
| Certificate |
In Germany, a right or obligation issued by a bank where the payout profile or benefit of ownership depends upon or is tied to the performance of an agreed-upon underlying asset or security. |
| Certificate of Deposit (CD) |
An insured, interest-bearing deposit at a bank that requires the depositor to keep the money invested for a specified period. |
| Commercial Paper |
A promissory note issued by a large company in need of short-term financing. |
| Covered Account |
Any Vanguard Fund account, any brokerage account, and any other type of account that holds, or is capable of holding, Reportable Securities. |
| Covered Security |
Any Security (including through an IPO), but not
including any:
·
Direct Obligations of a Government;
·
Bankers' Acceptances, Certificates of Deposit (CD),
Commercial Paper, and High-Quality Short-Term Debt Instruments, including Repurchase Agreements;
·
Shares issued by Open-End Funds (although for European
subsidiaries, this is limited to UCITS schemes, a non-UCITS retail scheme, or another fund subject to supervision under the law of an
European Economic Area (EEA) state which is an index fund or which requires an equivalent level of risk spreading in their assets);
·
Life policies;
·
ETFs;
·
ETNs; or
·
Digital Currencies. |
| Debenture |
An unsecured debt obligation backed only by the general credit of the borrower. |
| Digital Currency |
A digital asset that: (1) serves solely as a store of value, a medium of exchange, or a unit of account; (2) is not issued or guaranteed by any jurisdiction, central bank, or public authority; (3) relies on algorithmic techniques to regulate the generation of new units of the digital asset; and (4) has transactions involving the digital asset recorded on a decentralized network or distributed ledger (e.g., blockchain). Common examples of a Digital Currency are Bitcoin and Ether. A Digital Currency is distinguishable from a Digital Security Token or a Digital Utility Token. |
| Digital Security Token |
Any digital asset that is not a Digital Currency or
Digital Utility Token. In general, a Digital Security Token may: (1) derive its value primarily from, or represent an interest in, a
separate asset or pool of assets; or (2) represent an interest in an enterprise or venture. A Digital Security Token may provide owners
or holders with voting rights, rights to distributions, or other rights associated with ownership. Digital Security |
| |
Tokens
are generally held for speculative investment purposes and not to provide holders with access to a particular network, product, or service.
Digital Security Tokens, like other investments, are generally not used as a medium of exchange.
Note, whether or not an asset is a Digital Security Token depends on specific facts and circumstances. Merely referring to an asset as a Digital Currency or Digital Utility Token does not prevent the asset from being a Digital Security Token. Furthermore, an asset may be a Digital Security Token even if it has some purported utility. Please contact Compliance if you have any questions regarding whether an asset is a Digital Security Token. |
| Digital Utility Token |
A digital asset that (1) provides access to a particular network, product, or service; (2) derives its value primarily from providing access to a particular network, product, or service; and (3) does not function as a Digital Currency or Digital Security Token. |
| Direct Obligation of a Government |
A debt that is backed by the full taxing power of any government. These Securities are generally considered to be of the very highest quality. |
| ETF or Exchange-Traded Fund |
An investment with characteristics of both mutual funds and individual stocks. Many ETFs track an index, a commodity, or a basket of assets. Unlike mutual funds, ETFs can be traded throughout the day. ETFs often have lower expense ratios but must be purchased and sold through a broker, which means you may incur commissions. |
| ETN or Exchange-Traded Note |
A senior, unsecured, unsubordinated debt Security issued by a financial institution, whose returns are based on the performance of an underlying index and backed only by the credit of the issuer. ETNs have a maturity date, but typically pay no periodic coupon interest and offer no principal protection. At maturity an ETN investor receives a cash payment linked to the performance of the corresponding index, less fees. |
| Futures / Futures Contract |
A contract to buy or sell specific amounts of a commodity or financial instrument (such as grain, a currency, including foreign currencies and Digital Currencies (e.g., Bitcoin), a Digital Security Token, or an index) for an agreed-upon price at a certain time in the future. Sometimes the arrangements in a contract prescribe that settlements are made through cash payments, rather than the delivery of physical goods or Securities; this is called Contract for Difference. |
| High-Quality Short-Term Debt Instrument |
An instrument that has a maturity at issuance of less than 366 days and is rated in one of the two highest ratings categories by a nationally recognized statistical rating organization, or an instrument that is unrated but determined by Vanguard to be of comparable quality. |
| Household or Family Member (U.S., Australia, Canada, China, Hong Kong, and Mexico) |
For the U.S., Australia, Canada, China, Hong Kong, and Mexico
regions, the term “Household or Family Member” includes:
a)
Your spouse or domestic partner (an unrelated adult
with whom you share your home and contribute to each other's support);
b)
Any child of yours or of your spouse or domestic partner,
provided that the child resides in the same household as or is financially dependent upon you; or
c)
Any other individual over whose accounts you have control
(e.g., agent authority (full or limited), trustee, power of attorney authority) and to whose financial support you materially contribute.
|
| |
For purposes of parts (a) and (b) of this definition, those
persons may not be deemed Household or Family Members under this policy if you demonstrate, to the satisfaction of the Compliance Department,
that you derive no economic benefit from, and exercise no control over, that person’s accounts. |
| Household or Family Member (Europe) |
For Europe crew members, the term “Household or Family Member” includes your spouse, domestic partner (an unrelated adult with whom you share your home and contribute to each other's support), and minor children, as well as relatives whether by blood, adoption, or marriage (e.g., children, grandchildren, siblings, parents, parents-in-law, stepchildren) residing in the same household for at least one year prior to the date of the personal transaction. |
| Initial Coin Offering (ICO) |
An initial offer or sale of Digital Currencies or Digital Security Tokens. Note, whether or not an offering is an ICO depends on specific facts and circumstances. Please contact Compliance before participating in an initial offering of a Digital Currency, Digital Security Token, or Digital Utility Token |
| Initial Public Offering (IPO) |
A corporation's first offering of common stock to the public. |
| Investment Contract |
Any contract, transaction, or scheme whereby a person invests money in a common enterprise and is led to expect profits solely from the efforts of the promoter or third party. |
| Investment Discretion |
The authority an individual may exercise, with respect to investment control or trading discretion, on another person's account (e.g., executor, trustee, power of attorney). |
| Non-Access Person |
Any person in a role that has not been designated as an Access Person role. |
| Note |
A financial security that generally has a longer term than a bill, but a shorter term than a Bond. However, the duration of a note can vary significantly and may not always fall neatly into this categorization. Notes are similar to Bonds in that they are sold at, above, or below face (par) value; make regular interest payments; and have a specified term until maturity. |
| Open-End Fund |
A mutual fund that has an unlimited number of shares available for purchase. |
| Option |
The right, but not the obligation, to buy (for a call option) or sell (for a put option) a specific amount of a given stock, commodity, currency, including foreign currencies and Digital Currencies (e.g., Bitcoin), index, or debt, at a specified price (the strike price) during a specified period or on one particular date. |
| Private Placement |
A Security that is not registered or required to be registered under applicable securities laws. Private Placements are generally sold to a relatively small number of select investors (as opposed to a public issue, in which Securities are made available for sale on the open market) in order to raise capital. Private Placements may include, among others, interests in hedge funds (including limited partnership interests) and shares of private companies. Investors in Private Placements are usually banks, mutual funds, insurance companies, pension funds, hedge funds, and high net worth individuals. Private Placements are typically held or maintained outside of Vanguard. |
| Related Security |
Any
Security or instrument that provides economic exposure to the same company or entity—provided, however, that equity instruments
will |
| |
generally not be considered related to fixed income instruments (other than convertible Bonds) and vice versa. For example, all of the following instruments would be related to the common Stock of Company X: Options, Futures, Rights, and Warrants on Company X common Stock; preferred Stock issued by Company X; and Bonds convertible into Company X common Stock. Similarly, different Bonds issued by Company X would be related to one another. |
| Reportable Security |
Any Covered Security, ETF, ETN, or Digital Security Token. |
| Repurchase Agreement |
An arrangement by which the seller of an asset agrees, at the time of the sale, to buy back the asset at a specific price and, typically, on a given date (normally the next day). |
| Right |
A Security giving stockholders entitlement to purchase new shares issued by the corporation issuer at a predetermined price (normally at a discount to the current market price) in proportion to the number of shares already owned. Rights are issued only for a short period of time, after which they expire. |
| Secondary Offering |
The sale of new or closely held shares by a company that has already made an Initial Public Offering. |
| Security |
Any Stock, Bond, money market instrument, Note, evidence of indebtedness, Debenture, Warrant, Option, Right, Investment Contract, ETF, ETN, Digital Currency that has been deemed to be a security by the US Securities and Exchange Commission, Certificate, or any other investment or interest commonly known as a Security. |
| SPAC (Special Purpose Acquisition Company) |
A shell company or company with no commercial operations that is formed strictly to raise capital through an Initial Public Offering (IPO) for the purpose of acquiring an existing company. |
| Spread Betting |
A way of trading that enables you to profit from movements in a wide range of markets from Securities to currencies, including foreign currencies and Digital Currencies, Digital Security Tokens, commodities, and interest rates. Spread betting allows you to trade on whether the price quoted for these financial instruments will go up or down. |
| Stock |
A Security that represents part ownership, or equity, in a corporation. Each share of stock is a proportional stake in the corporation's assets and profits, some of which could be paid out as dividends. |
| UCITS (Undertakings for the Collective Investment of Transferable Securities) |
A regulatory framework of the European Commission that creates a harmonized regime throughout Europe for the management and sale of mutual funds. UCITS funds can be registered in Europe and sold to investors worldwide using unified regulatory and investor protection requirements. |
| Vanguard Client |
The clients of VGI, or any of the International Subsidiaries, and investors in the Vanguard Funds, including the Vanguard Funds themselves. |
| Vanguard Fund |
Vanguard mutual funds, Vanguard managed funds, Vanguard UCITS funds, Vanguard ETFs, and any other accounts sponsored or managed by Vanguard. This includes, but is not limited to, separately managed accounts and collective trusts. |
| Warrant |
An entitlement to purchase a certain amount of common Stock at a set price (usually higher than the current price) during an extended period of time. Usually issued with a fixed-income security to enhance its marketability, a Warrant can be transferred, traded, or exercised by the holder. |
Policy Compliance
Questions regarding this policy may be submitted to Code_of_Ethics@vanguard.com.
Please be aware of and comply with any supplemental policies that
may apply to your role, department, or geographic region. Check with your manager for more information.
If you believe you may have breached this policy, you should immediately
report it to your manager, notify the policy contact for your region, and work with them to take swift corrective action. Alternatively,
you may report concerns regarding this policy via the Anonymous Reporting channel that Vanguard has arranged for your region. You are
expected to cooperate with any research or investigation into conduct regarding this policy.
The
Compliance Department is the owner of this policy. Any violations or potential violations of this policy may be investigated by the Compliance
Department, and if it is determined that there has been a violation, you may be subject to penalties and sanctions as described in the
Disciplinary Action Policy and, for crew and contingent workers
in Australia, the Managing Misconduct Policy. Any violation of this policy may result in disciplinary action up to and including termination
of employment.
Refer
to the Policy Disclaimer Statement for more information.
Appendix
Appendix A
Am I an Access Person, and if
so, which Access Person “designation” applies?
Appendix B
What accounts must be disclosed?
Appendix C
Trading and Reporting Requirements for Advisor Access Persons
Appendix D
Trading and Reporting Requirements for Fund Access Persons
Appendix E
Trading and Reporting Requirements for Fund Access Persons
Appendices Endnotes
Clarifications and explanations to the content within the appendices
APPENDIX A
Am I an Access Person, and if so, which Access Person
“designation” applies?
To determine if you are designated as an Access Person, review your
offer letter for specifics. If you are unsure, ask your recruiter to confirm for you which designation you fall under. They can look up
your designation by referencing our internal Access Person Code of Conduct policy. Your designation will be one of the following:
| 4. | Non-Access (If this is your designation,
this packet does not apply to you.) |
APPENDIX B
What accounts must be disclosed?
This list provides a snapshot of what accounts you will need to disclose.
Come prepared knowing how to access the statements for these accounts. Please note, this is list is subject to change.
| Common Account Types |
Access
Person
disclosure
required? |
| |
|
|
Employer sponsored retirement plans (plan doesn't have
the ability to hold Vanguard funds)
Examples: 401k, 403b, 457b, Employee
Stock Options Plan (ESOP), Employee Stock Purchase Plan (ESPP), and pension plans |
No |
| |
|
|
Employer sponsored retirement plans (plan does have
the ability to hold Vanguard funds)
Examples: 401k, 403b, 457b, Employee
Stock Options Plan (ESOP), Employee Stock Purchase Plan (ESPP), and pension plans |
Yes |
| |
|
| 529 Plans (plan doesn't have the ability to hold Vanguard funds) |
No |
| |
|
| 529 plans (plan does have the ability to hold Vanguard funds) |
Yes |
| |
|
| Health Savings Account (plan doesn't have the ability to hold Vanguard funds) |
No |
| |
|
| Health Savings Account (plan does have the ability to hold Vanguard funds) - Including Vanguard's HSA |
Yes |
| |
|
|
Vanguard personal accountsi
Examples: Vanguard Brokerage Accounts,
Transfer Agent Accounts (Mutual Fund Only account) |
Yes |
| |
|
|
Outside brokerage accounts (including retirement
accounts not listed above)3
Please Note: Accounts that are open
but have a $0 balance also must be reported because they still have the ability to hold securities. |
Yes |
| |
|
| Bank accounts - checking and savings |
No |
| |
|
| Annuities |
No |
| |
|
| Fully managed accountsii |
Yes2 |
APPENDIX C
Trading and Reporting Requirements for Advisor Access
Persons
| Securities
and Activities |
Can
I Trade |
60
Day Hold |
Reportableiii |
| American Depository Receipts (ADRs) |
Yes |
Yes |
Yes |
| Annuities and Insurance Products |
Yes |
No |
No |
| Bankers' Acceptances, Certificates of Deposits, and Commercial Paper |
Yes |
No |
No |
| Bonds (municipal and corporate) |
Yes |
Yes |
Yes |
| Cash |
No |
No |
No |
| Closed-End Funds |
Yes |
Yes |
Yes |
| Commodities (ex: futures & options) |
Yes |
No |
No |
| Currencies |
Yes |
No |
No |
| Debentures |
Yes |
Yes |
Yes |
| Digital Currency |
Yes |
No |
No |
| Digital Utility Tokens |
Yes |
No |
Yes |
| Digital Security Tokens |
Yes |
No |
Yes |
| Direct Obligations |
Yes |
No |
No |
| Non-Vanguard ETFs and ETNs |
Yes |
No |
Yes |
| Evidence of Indebtedness |
Yes |
Yes |
Yes |
| Government bonds |
Yes |
No |
No |
| High Quality Short Term Debt Instruments |
Yes |
No |
Yes |
| Investment Contracts |
Yes |
Yes |
Yes |
| IPOs (and ICOs) |
Prohibited |
| Money market instruments (non-Vanguard) |
Yes |
No |
No |
| Money market instruments (Vanguard) |
Yes |
No |
Yes |
| Open-End funds (non-Vanguard) |
Yes |
No |
No |
| Notes |
Yes |
Yes |
Yes |
| Options on Covered Securities |
Yes |
Yesiv |
Yes |
| Private placements (unlisted securities) |
Yesv |
No |
Yes |
| Rights |
Yes |
Yes |
Yes |
| Real Estate Investment Trusts |
Yes |
Yes |
Yes |
| Security Futures |
Prohibited |
| Short Positions |
Prohibited |
| SPACs |
Prohibited |
| Stocks |
Yes |
Yes |
Yes |
| Unit Investment Trusts |
Yes |
Yes |
Yes |
| Securities
and Activities |
Can
I Trade |
60
Day Hold |
Reportableiii |
| UCITs Funds (non-Vanguard) |
Yes |
No |
No |
| Vanguard Annuities and Insurance Products |
Yes |
No |
Yes |
| Vanguard ETFs |
Yes |
No |
Yes |
| Vanguard Funds |
Yes |
No |
Yes |
| Warrants |
Yes |
Yes |
Yes |
APPENDIX D
Trading and Reporting Requirements for Fund Access
Persons
| Securities
and Activities |
Can
I Trade |
Preclear |
7
Day Blackout |
60
Day Hold |
Reportableiii |
| American Depository Receipts (ADRs) |
Yes |
Yes |
Yes |
Yes |
Yes |
| Annuities and Insurance Products |
Yes |
No |
No |
No |
No |
| Bankers' Acceptances, Certificates of Deposits, and Commercial Paper |
Yes |
No |
No |
No |
No |
| Bonds (municipal and corporate) |
Yes |
Yes |
Yes |
Yes |
Yes |
| Cash |
No |
No |
No |
No |
No |
| Closed-End Funds |
Yes |
Yes |
No |
Yes |
Yes |
| Commodities (ex: futures & options) |
Yes |
No |
No |
No |
No |
| Currencies |
Yes |
No |
No |
No |
No |
| Debentures |
Yes |
Yes |
Yes |
Yes |
Yes |
| Digital Currency |
Yes |
No |
No |
No |
No |
| Digital Utility Tokens |
Yes |
No |
No |
No |
Yes |
| Digital Security Tokens |
Yes |
No |
No |
No |
Yes |
| Direct Obligations |
Yes |
No |
No |
No |
No |
| Non-Vanguard ETFs and ETNs |
Yes |
No |
No |
No |
Yes |
| Evidence of Indebtedness |
Yes |
Yes |
Yes |
Yes |
Yes |
| Government bonds |
Yes |
No |
No |
No |
No |
| High Quality Short Term Debt Instruments |
Yes |
No |
No |
No |
Yes |
| Investment Contracts |
Yes |
Yes |
Yes |
Yes |
Yes |
| IPOs (and ICOs) |
Prohibited |
| Money market instruments (non-Vanguard) |
Yes |
No |
No |
No |
No |
| Money market instruments (Vanguard) |
Yes |
No |
No |
No |
Yes |
| Open-End funds (non-Vanguard) |
Yes |
No |
No |
No |
No |
| Notes |
Yes |
Yes |
Yes |
Yes |
Yes |
| Options on Securities |
Prohibited |
| Private placements (unlisted securities) |
Yesv |
Yes |
No |
No |
Yes |
| Rights |
Yes |
Yes |
Yes |
Yes |
Yes |
| Real Estate Investment Trusts |
Yes |
Yes |
Yes |
Yes |
Yes |
| Security Futures |
Prohibited |
| Short Positions |
Prohibited |
| Securities
and Activities |
Can
I Trade |
Preclear |
7
Day Blackout |
60
Day Hold |
Reportableiii |
| SPACs |
Prohibited |
| Stocks |
Yes |
Yes |
Yesvi |
Yes |
Yes |
| Unit Investment Trusts |
Yes |
Yes |
Yes |
Yes |
Yes |
| UCIT Funds (non-Vanguard) |
Yes |
No |
No |
No |
No |
| Vanguard Annuities and Insurance Products |
Yes |
No |
No |
No |
Yes |
| Vanguard ETFs |
Yes |
No |
No |
No |
Yes |
| Vanguard Funds |
Yes |
No |
No |
No |
Yes |
| Warrants |
Yes |
Yes |
Yes |
Yes |
Yes |
APPENDIX E
Trading and Reporting Requirements
for Investment Access Persons
| Securities and Activities |
Can I Trade |
Preclear |
7 Day Blackout |
60 Day Hold |
Reportableiii |
| American Depository Receipts (ADRs) |
Yes |
Yes |
Yes |
Yes |
Yes |
| Annuities and Insurance Products |
Yes |
No |
No |
No |
No |
| Bankers' Acceptances, Certificates of Deposits, and Commercial Paper |
Yes |
No |
No |
No |
No |
| Bonds (municipal and corporate) |
Yes |
Yes |
Yes |
Yes |
Yes |
| Cash |
No |
No |
No |
No |
No |
| Closed-End Funds |
Yes |
Yes |
No |
Yes |
Yes |
| Commodities (ex: futures & options) |
Yes |
No |
No |
No |
No |
| Currencies |
Yes |
No |
No |
No |
No |
| Debentures |
Yes |
Yes |
Yes |
Yes |
Yes |
| Digital Currency |
Yes |
No |
No |
No |
No |
| Digital Utility Tokens |
Yes |
No |
No |
No |
Yes |
| Digital Security Tokens |
Yes |
No |
No |
No |
Yes |
| Direct Obligations |
Yes |
No |
No |
No |
No |
| Non-Vanguard ETFs and ETNs |
Yes |
No |
No |
No |
Yes |
| Evidence of Indebtedness |
Yes |
Yes |
Yes |
Yes |
Yes |
| Government bonds |
Yes |
No |
No |
No |
No |
| High Quality Short Term Debt Instruments |
Yes |
No |
No |
No |
Yes |
| Investment Contracts |
Yes |
Yes |
Yes |
Yes |
Yes |
| IPOs (and ICOs) |
Prohibited |
| Money market instruments (non-Vanguard) |
Yes |
No |
No |
No |
No |
| Money market instruments (Vanguard) |
Yes |
No |
No |
No |
Yes |
| Open-End funds (non-Vanguard) |
Yes |
No |
No |
No |
No |
| Notes |
Yes |
Yes |
Yes |
Yes |
Yes |
| Options on Securities |
Prohibited |
| Private placements (unlisted securities) |
Yesv |
Yes |
No |
No |
Yes |
| Rights |
Yes |
Yes |
Yes |
Yes |
Yes |
| Real Estate Investment Trusts |
Yes |
Yes |
Yes |
Yes |
Yes |
| Security Futures |
Prohibited |
| Short Positions |
Prohibited |
| Securities
and Activities |
Can
I Trade |
Preclear |
7
Day Blackout |
60
Day Hold |
Reportableiii |
| SPACs |
Prohibited |
| Stocks |
Yes |
Yes |
Yes |
Yes |
Yes |
| Unit Investment Trusts |
Yes |
Yes |
Yes |
Yes |
Yes |
| UCITs Funds (non-Vanguard) |
Yes |
No |
No |
No |
No |
| Vanguard Annuities and Insurance Products |
Yes |
No |
No |
No |
Yes |
| Vanguard ETFs |
Yes |
Yes |
No |
Yes |
Yes |
| Vanguard Funds |
Yes |
Novii |
No |
Noviii |
Yes |
| Warrants |
Yes |
Yes |
Yes |
Yes |
Yes |
APPENDICES ENDNOTES
Clarifications and explanations
to the content within the appendices
i
Accounts you share ownership with will need to be disclosed, e.g., a joint account
ii Fully managed accounts can be
maintained outside of Vanguard with review and approval from the Code team. Please provide one of the following documents for review:
| · | A
signed discretionary/advisory agreement from the outside firm, or |
| · | A
signed letter from your advisor on their firm's letterhead. |
This documentation should include the following
information:
| · | The account number(s) for any account considered fully managed |
| · | The name of your advisor or the name of the program in
which the account is enrolled |
| · | A statement that you have no discretion/trading authority
over your managed account(s) |
iii
Reportable on Initial Holdings Report or when acquired. All Crew and Contingent Workers deemed Associated Persons must report their accounts,
holdings, and transactions through My Compliance Office (MCO).
iv
Options on Covered Securities include trades that are exercised or assigned involuntarily by the crew member.
v
Prohibited from acquiring Securities in a Private Placement without prior approval from Compliance.
vi
Permitted to sell stock with a market cap above US $5 billion, so long as, over a rolling 30 day period, their total value aggregate
sales of the stock does not exceed $10,000.
vii
Vanguard ETFs require preclearance.
viii
Vanguard ETFs require a 60 day hold.
Exhibit 99.CERT
CERTIFICATIONS
I, Mortimer
J. Buckley, certify that:
1. I have
reviewed this report on Form N-CSR of Vanguard Trustees’ Equity Fund;
2. Based
on my knowledge, this report does not contain any untrue statement of a material fact or omit to state a material fact necessary to make
the statements made, in light of the circumstances under which such statements were made, not misleading with respect to the period covered
by this report;
3. Based
on my knowledge, the financial statements, and other financial information included in this report, fairly present in all material respects
the financial condition, results of operations, changes in net assets, and cash flows (if the financial statements are required to include
a statement of cash flows) of the registrant as of, and for, the periods presented in this report;
4. The registrant’s
other certifying officer(s) and I are responsible for establishing and maintaining disclosure controls and procedures (as defined in
Rule 30a-3(c) under the Investment Company Act of 1940) and internal control over financial reporting (as defined in Rule 30a-3(d) under
the Investment Company Act of 1940) for the registrant and have:
(a) Designed
such disclosure controls and procedures, or caused such disclosure controls and procedures to be designed under our supervision, to ensure
that material information relating to the registrant, including its consolidated subsidiaries, is made known to us by others within those
entities, particularly during the period in which this report is being prepared;
(b) Designed
such internal control over financial reporting, or caused such internal control over financial reporting to be designed under our supervision,
to provide reasonable assurance regarding the reliability of financial reporting and the preparation of financial statements for external
purposes in accordance with generally accepted accounting principles;
(c) Evaluated
the effectiveness of the registrant’s disclosure controls and procedures and presented in this report our conclusions about the
effectiveness of the disclosure controls and procedures, as of a date within 90 days prior to the filing date of this report based on
such evaluation; and
(d) Disclosed
in this report any change in the registrant’s internal control over financial reporting that occurred during the period covered
by this report that has materially affected, or is reasonably likely to materially affect, the registrant’s internal control over
financial reporting; and
5. The registrant’s
other certifying officer(s) and I have disclosed to the registrant’s auditors and the audit committee of the registrant’s
board of directors (or persons performing the equivalent functions):
(a) All significant
deficiencies and material weaknesses in the design or operation of internal control over financial reporting which are reasonably likely
to adversely affect the registrant’s ability to record, process, summarize, and report financial information; and
(b) Any fraud,
whether or not material, that involves management or other employees who have a significant role in the registrant’s internal control
over financial reporting.
Date: December
19, 2022
| |
/s/
Mortimer J. Buckley |
| |
Mortimer
J. Buckley |
| |
Chief
Executive Officer |
CERTIFICATIONS
I, Christine
Buchanan, certify that:
1. I have
reviewed this report on Form N-CSR of Vanguard Trustees’ Equity;
2. Based
on my knowledge, this report does not contain any untrue statement of a material fact or omit to state a material fact necessary to make
the statements made, in light of the circumstances under which such statements were made, not misleading with respect to the period covered
by this report;
3. Based
on my knowledge, the financial statements, and other financial information included in this report, fairly present in all material respects
the financial condition, results of operations, changes in net assets, and cash flows (if the financial statements are required to include
a statement of cash flows) of the registrant as of, and for, the periods presented in this report;
4. The registrant’s
other certifying officer(s) and I are responsible for establishing and maintaining disclosure controls and procedures (as defined in
Rule 30a-3(c) under the Investment Company Act of 1940) and internal control over financial reporting (as defined in Rule 30a-3(d) under
the Investment Company Act of 1940) for the registrant and have:
(a) Designed
such disclosure controls and procedures, or caused such disclosure controls and procedures to be designed under our supervision, to ensure
that material information relating to the registrant, including its consolidated subsidiaries, is made known to us by others within those
entities, particularly during the period in which this report is being prepared;
(b) Designed
such internal control over financial reporting, or caused such internal control over financial reporting to be designed under our supervision,
to provide reasonable assurance regarding the reliability of financial reporting and the preparation of financial statements for external
purposes in accordance with generally accepted accounting principles;
(c) Evaluated
the effectiveness of the registrant’s disclosure controls and procedures and presented in this report our conclusions about the
effectiveness of the disclosure controls and procedures, as of a date within 90 days prior to the filing date of this report based on
such evaluation; and
(d) Disclosed
in this report any change in the registrant’s internal control over financial reporting that occurred during the period covered
by this report that has materially affected, or is reasonably likely to materially affect, the registrant’s internal control over
financial reporting; and
5. The registrant’s
other certifying officer(s) and I have disclosed to the registrant’s auditors and the audit committee of the registrant’s
board of directors (or persons performing the equivalent functions):
(a) All significant
deficiencies and material weaknesses in the design or operation of internal control over financial reporting which are reasonably likely
to adversely affect the registrant’s ability to record, process, summarize, and report financial information; and
(b) Any fraud,
whether or not material, that involves management or other employees who have a significant role in the registrant’s internal control
over financial reporting.
Date: December 19, 2022
| |
/s/
Christine Buchanan |
| |
Christine
Buchanan |
| |
Chief
Financial Officer |
Exhibit
99.906CERT
Certification
Pursuant to 18 U.S.C. Section 1350,
As
Adopted Pursuant to
Section
906 of the Sarbanes-Oxley Act of 2002
Name
of Issuer: Vanguard Trustees’ Equity Fund
In
connection with the Report on Form N-CSR of the above-named issuer that is accompanied by this certification, the undersigned hereby
certifies, to his knowledge, that:
| 1. | The
Report fully complies with the requirements of Section 13(a) or 15(d) of the Securities Exchange
Act of 1934; and |
| 2. | The
information contained in the Report fairly presents, in all material respects, the financial
condition and results of operations of the issuer. |
Date: December 19, 2022
| |
/s/
Mortimer J. Buckley |
| |
Mortimer
J. Buckley |
| |
Chief
Executive Officer |
Certification
Pursuant to 18 U.S.C. Section 1350,
As
Adopted Pursuant to
Section
906 of the Sarbanes-Oxley Act of 2002
Name
of Issuer: Vanguard Trustees’ Equity
In
connection with the Report on Form N-CSR of the above-named issuer that is accompanied by this certification, the undersigned hereby
certifies, to her knowledge, that:
| 1. | The
Report fully complies with the requirements of Section 13(a) or 15(d) of the Securities Exchange
Act of 1934; and |
| 2. | The
information contained in the Report fairly presents, in all material respects, the financial
condition and results of operations of the issuer. |
Date: December 19, 2022
| |
/s/
Christine Buchanan |
| |
Christine
Buchanan |
| |
Chief
Financial Officer |