
UNITED STATES
SECURITIES AND EXCHANGE COMMISSION
Washington, D.C. 20549
FORM N-CSR
CERTIFIED SHAREHOLDER REPORT OF REGISTERED MANAGEMENT
INVESTMENT COMPANIES
Investment Company Act file number: 811-23564
| Name of Fund: | BlackRock Capital Allocation Term Trust (BCAT) |
| Fund Address: | 100 Bellevue Parkway, Wilmington, DE 19809 |
Name and address of agent for service: John M. Perlowski, Chief Executive Officer, BlackRock Capital Allocation Term Trust, 50 Hudson Yards, New York, NY 10001
Registrant’s telephone number, including area code: (800) 882-0052, Option 4
Date of fiscal year end: 12/31/2023
Date of reporting period: 12/31/2023
Item 1 – Report to Stockholders
(a) The Report to Shareholders is attached herewith.
|
|
DECEMBER 31, 2023 |
| 2023 Annual Report | ||
BlackRock Capital Allocation Term Trust (BCAT)
BlackRock ESG Capital Allocation Term Trust (ECAT)
| Not FDIC Insured • May Lose Value • No Bank Guarantee |
Supplemental Information (unaudited)
Section 19(a) Notices
BlackRock Capital Allocation Term Trust’s (BCAT) and BlackRock ESG Capital Allocation Term Trust’s (ECAT) (collectively, the “Trusts” or individually, a “Trust”) amounts and sources of distributions reported are estimates and are being provided pursuant to regulatory requirements and are not being provided for tax reporting purposes. The actual amounts and sources for tax reporting purposes will depend upon each Trust’s investment experience during its fiscal year and may be subject to changes based on tax regulations. Each Trust will provide a Form 1099-DIV each calendar year that will tell you how to report these distributions for U.S. federal income tax purposes.
December 31, 2023
| Total Cumulative Distributions for the Fiscal Period |
% Breakdown of the Total Cumulative Distributions for the Fiscal Period |
|||||||||||||||||||||||||||||||||||||||||
| Trust Name |
|
Net Income |
|
|
Net Realized Capital Gains Short-Term |
|
|
Net Realized Capital Gains Long-Term |
|
|
Return of Capital |
(a) |
|
Total Per Common Share |
|
|
Net Income |
|
|
Net Realized Capital Gains Short-Term |
|
|
Net Realized Capital Gains Long-Term |
|
|
Return of Capital |
|
|
Total Per Common Share |
| ||||||||||||
| BCAT |
$ | 0.398705 | $ | — | $ | — | $ | 1.107895 | $ | 1.506600 | 26 | % | — | % | — | % | 74 | % | 100 | % | ||||||||||||||||||||||
| ECAT |
0.190122 | — | — | 1.284878 | 1.475000 | 13 | — | — | 87 | 100 | ||||||||||||||||||||||||||||||||
| (a) | Each Trust estimates that it has distributed more than its net income and net realized capital gains; therefore, a portion of the distribution may be a return of capital. A return of capital may occur, for example, when some or all of the shareholder’s investment in a Trust is returned to the shareholder. A return of capital does not necessarily reflect a Trust’s investment performance and should not be confused with “yield” or “income.” When distributions exceed total return performance, the difference will reduce a Trust’s net asset value per share. |
Section 19(a) notices for the Trusts, as applicable, are available on the BlackRock website at blackrock.com.
Section 19(b) Disclosure
The Trusts, acting pursuant to a U.S. Securities and Exchange Commission (“SEC”) exemptive order and with the approval of each Trust’s Board of Trustees (the “Board”), each has adopted a managed distribution plan, consistent with its investment objectives and policies, to support a level distribution of income, capital gains and/or return of capital (the “Plan”). In accordance with the Plans, the Trusts currently distribute the following fixed amounts per share on a monthly basis:
| Trust Name | Amount Per Common Share |
|||
| BCAT |
$ | 0.127500 | ||
| ECAT |
0.125000 | |||
The fixed amounts distributed per share are subject to change at the discretion of each Trust’s Board. Under its Plan, each Trust will distribute all available net income to its shareholders as required by the Internal Revenue Code of 1986, as amended (the “Code”). If sufficient income (inclusive of net income and short-term capital gains) is not earned on a monthly basis, the Trusts will distribute long-term capital gains and/or return of capital to shareholders in order to maintain a level distribution. Each monthly distribution to shareholders is expected to be at the fixed amount established by the Board; however, each Trust may make additional distributions from time to time, including additional capital gain distributions at the end of the taxable year, if required to meet requirements imposed by the Code and/or the Investment Company Act of 1940, as amended (the “1940 Act”).
Shareholders should not draw any conclusions about a Trust’s investment performance from the amount of these distributions or from the terms of the Plan. Each Trust’s total return performance is presented in its financial highlights table.
The Board may amend, suspend or terminate a Trust’s Plan at any time without prior notice to the Trust’s shareholders if it deems such actions to be in the best interests of the Trust or its shareholders. The suspension or termination of the Plan could have the effect of creating a trading discount (if the Trust’s stock is trading at or above net asset value) or widening an existing trading discount. The Trusts are subject to risks that could have an adverse impact on their ability to maintain level distributions. Examples of potential risks include, but are not limited to, economic downturns impacting the markets, changes in interest rates, decreased market volatility, companies suspending or decreasing corporate dividend distributions and changes in the Code.
| 2 | 2 0 2 3 B L A C K R O C K A N N U A L R E P O R T T O S H A R E H O L D E R S |
Dear Shareholder,
The combination of continued economic growth and cooling inflation provided a supportive backdrop for investors during the 12-month reporting period ended December 31, 2023. Significantly tighter monetary policy helped to rein in inflation, and the Consumer Price Index decelerated substantially in the first half of the year before stalling between 3% and 4% in the second half. A moderating labor market helped ease inflationary pressure, although wages continued to grow. Wage and job growth powered robust consumer spending, backstopping the economy. On October 7, 2023, Hamas launched a horrific attack on Israel. The ensuing war will have a significant humanitarian impact and could lead to heightened economic and market volatility. We see geopolitics as a structural market risk going forward. See our geopolitical risk dashboard at blackrock.com for more details.
Equity returns were robust during the period, as interest rates stabilized and the economy proved to be more resilient than many investors expected. The U.S. economy continued to show strength, and growth further accelerated in the third quarter of 2023. Large-capitalization U.S. stocks posted particularly substantial gains, supported by the performance of a few notable technology companies and small-capitalization U.S. stocks also advanced. Meanwhile, international developed market equities and emerging market stocks posted solid gains.
The 10-year U.S. Treasury yield ended 2023 where it began despite an eventful year that saw significant moves in bond markets. Overall, U.S. Treasuries gained as investors began to anticipate looser financial conditions. The corporate bond market benefited from improving economic sentiment, although high-yield corporate bond prices fared significantly better than investment-grade bonds as demand from yield-seeking investors remained strong.
The U.S. Federal Reserve (the “Fed”), attempting to manage persistent inflation, raised interest rates four times during the 12-month period, but paused its tightening in the second half of the period. The Fed also wound down its bond-buying programs and incrementally reduced its balance sheet by not replacing securities that reach maturity.
Supply constraints appear to have become an embedded feature of the new macroeconomic environment, making it difficult for developed economies to increase production without sparking higher inflation. Geopolitical fragmentation and an aging population risk further exacerbating these constraints, keeping the labor market tight and wage growth high. Although the Fed has stopped tightening for now, we believe that the new economic regime means that the Fed will need to maintain high rates for an extended period despite the market’s hopes for interest rate cuts, as reflected in the recent rally. In this new regime, we anticipate greater volatility and dispersion of returns, creating more opportunities for selective portfolio management.
We believe developed market equities have priced in an optimistic scenario for rate cuts, which we view as premature, so we prefer an underweight stance in the near term. Nevertheless, we are overweight on Japanese stocks as shareholder-friendly policies generate increased investor interest. We also believe that stocks with an AI tilt should benefit from an investment cycle that is set to support revenues and margins. In credit, there are selective opportunities in the near term despite tighter credit and financial conditions. For fixed income investing with a six- to twelve-month horizon, we see the most attractive investments in short-term U.S. Treasuries, U.S. mortgage-backed securities, and hard-currency emerging market bonds.
Overall, our view is that investors need to think globally, position themselves to be prepared for a decarbonizing economy, and be nimble as market conditions change. We encourage you to talk with your financial advisor and visit blackrock.com for further insight about investing in today’s markets.
Sincerely,

Rob Kapito
President, BlackRock Advisors, LLC

Rob Kapito
President, BlackRock Advisors, LLC
| Total Returns as of December 31, 2023
| ||||
| 6-Month | 12-Month | |||
| U.S. large cap equities |
8.04% | 26.29% | ||
| U.S. small cap equities |
8.18 | 16.93 | ||
| International equities |
5.88 | 18.24 | ||
| Emerging market equities |
4.71 | 9.83 | ||
| 3-month Treasury bills |
2.70 | 5.02 | ||
| U.S. Treasury securities |
1.11 | 2.83 | ||
| U.S. investment grade bonds |
3.37 | 5.53 | ||
| Tax-exempt municipal bonds |
3.63 | 6.40 | ||
| U.S. high yield bonds |
7.65 | 13.44 | ||
|
Past performance is not an indication of future results. Index performance is shown for illustrative purposes only. You cannot invest directly in an index.
| ||||
| T H I S P A G E I S N O T P A R T O F Y O U R F U N D R E P O R T |
3 |
| Page | ||||
| 2 | ||||
| 3 | ||||
| Annual Report: |
||||
| 5 | ||||
| 6 | ||||
| 6 | ||||
| 7 | ||||
| Financial Statements: |
||||
| 13 | ||||
| 70 | ||||
| 72 | ||||
| 73 | ||||
| 74 | ||||
| 76 | ||||
| 78 | ||||
| 92 | ||||
| 93 | ||||
| 94 | ||||
| 108 | ||||
| 109 | ||||
| 113 | ||||
| 116 | ||||
| 4 |
The Benefits and Risks of Leveraging
The Trusts may utilize leverage to seek to enhance the distribution rate on, and net asset value (“NAV”) of, their common shares (“Common Shares”). However, there is no guarantee that these objectives can be achieved in all interest rate environments.
In general, the concept of leveraging is based on the premise that the financing cost of leverage, which is based on short-term interest rates, is normally lower than the income earned by a Trust on its longer-term portfolio investments purchased with the proceeds from leverage. To the extent that the total assets of each Trust (including the assets obtained from leverage) are invested in higher-yielding portfolio investments, each Trust’s shareholders benefit from the incremental net income. The interest earned on securities purchased with the proceeds from leverage (after paying the leverage costs) is paid to shareholders in the form of dividends, and the value of these portfolio holdings (less the leverage liability) is reflected in the per share NAV.
To illustrate these concepts, assume a Trust’s capitalization is $100 million and it utilizes leverage for an additional $30 million, creating a total value of $130 million available for investment in longer-term income securities. If prevailing short-term interest rates are 3% and longer-term interest rates are 6%, the yield curve has a strongly positive slope. In this case, a Trust’s financing costs on the $30 million of proceeds obtained from leverage are based on the lower short-term interest rates. At the same time, the securities purchased by a Trust with the proceeds from leverage earn income based on longer-term interest rates. In this case, a Trust’s financing cost of leverage is significantly lower than the income earned on a Trust’s longer-term investments acquired from such leverage proceeds, and therefore the holders of Common Shares (“Common Shareholders”) are the beneficiaries of the incremental net income.
However, in order to benefit shareholders, the return on assets purchased with leverage proceeds must exceed the ongoing costs associated with the leverage. If interest and other costs of leverage exceed a Trust’s return on assets purchased with leverage proceeds, income to shareholders is lower than if a Trust had not used leverage. Furthermore, the value of the Trusts’ portfolio investments generally varies inversely with the direction of long-term interest rates, although other factors can influence the value of portfolio investments. In contrast, the amount of each Trust’s obligations under its respective leverage arrangement generally does not fluctuate in relation to interest rates. As a result, changes in interest rates can influence the Trusts’ NAVs positively or negatively. Changes in the future direction of interest rates are very difficult to predict accurately, and there is no assurance that a Trust’s intended leveraging strategy will be successful.
The use of leverage also generally causes greater changes in each Trust’s NAV, market price and dividend rates than comparable portfolios without leverage. In a declining market, leverage is likely to cause a greater decline in the NAV and market price of a Trust’s shares than if the Trust were not leveraged. In addition, each Trust may be required to sell portfolio securities at inopportune times or at distressed values in order to comply with regulatory requirements applicable to the use of leverage or as required by the terms of leverage instruments, which may cause the Trust to incur losses. The use of leverage may limit a Trust’s ability to invest in certain types of securities or use certain types of hedging strategies. Each Trust incurs expenses in connection with the use of leverage, all of which are borne by shareholders and may reduce income to the shareholders. Moreover, to the extent the calculation of each Trust’s investment advisory fees includes assets purchased with the proceeds of leverage, the investment advisory fees payable to the Trusts’ investment adviser will be higher than if the Trusts did not use leverage.
Each Trust may utilize leverage through a credit facility or reverse repurchase agreements as described in the Notes to Consolidated Financial Statements, if applicable.
Under the Investment Company Act of 1940, as amended (the “1940 Act”), each Trust is permitted to borrow money (including through the use of TOB Trusts) or issue debt securities up to 33 1/3% of its total managed assets. A Trust may voluntarily elect to limit its leverage to less than the maximum amount permitted under the 1940 Act. In addition, a Trust may also be subject to certain asset coverage, leverage or portfolio composition requirements imposed by its credit facility, which may be more stringent than those imposed by the 1940 Act.
| T H E B E N E F I T S A N D R I S K S O F L E V E R A G I N G |
5 |
Overview
In general, the goal of each of the Trusts is to provide total return through a combination of current income and realized and unrealized gains (capital appreciation). The Trusts seek to pursue these goals primarily by investing in a portfolio of equity securities and also by employing a strategy of writing (selling) call and put options in an effort to generate current gains from option premiums and to enhance each Trust’s risk-adjusted return. Each Trust’s objectives cannot be achieved in all market conditions.
Each Trust primarily writes single stock covered call options and may also from time to time write single stock put options. When writing (selling) a covered call option, a Trust holds an underlying equity security and enters into an option transaction which allows the counterparty to purchase the equity security at an agreed-upon price (“strike price”) within an agreed-upon time period. The Trust receives cash premiums from the counterparties upon writing (selling) the option, which along with net investment income and net realized gains, if any, are generally available to support current or future distributions paid by the Trust. During the option term, the counterparty may elect to exercise the option if the market value of the equity security rises above the strike price, and the Trust is obligated to sell the equity security to the counterparty at the strike price, realizing a gain or loss. Premiums received increase gains or reduce losses realized on the sale of the equity security. If the option remains unexercised upon its expiration, the Trust realizes gains equal to the premiums received. Alternatively, an option may be closed out by an offsetting purchase or sale of an option prior to expiration. The Trust realizes a capital gain from a closing purchase or sale transaction if the premium paid is less than the premium received from writing the option. The Trust realizes a capital loss from a closing purchase or sale transaction if the premium received is less than the premium paid to purchase the option.
Writing covered call options entails certain risks, which include, but are not limited to, the following: an increase in the value of the underlying equity security above the strike price can result in the exercise of a written option (sale by a Trust to the counterparty) when the Trust might not otherwise have sold the security; exercise of the option by the counterparty may result in a sale below the current market value and a gain or loss being realized by the Trust; and limiting the potential appreciation that could be realized on the underlying equity security to the extent of the strike price of the option. The premium that a Trust receives from writing a covered call option may not be sufficient to offset the potential appreciation on the underlying equity security above the strike price of the option that could have otherwise been realized by the Trust. As such, an option over-writing strategy may outperform the general equity market in flat or falling markets but underperform in rising markets.
Option Over-Writing Strategy Illustration
To illustrate these concepts, assume the following: (1) a common stock purchased at and currently trading at $37.15 per share; (2) a three-month call option is written by a Trust with a strike price of $40 (i.e., 7.7% higher than the current market price); and (3) the Trust receives $2.45, or 6.6% of the common stock’s value, as a premium. If the stock price remains unchanged, the option expires and there would be a 6.6% return for the three-month period. If the stock were to decline in price by 6.6% (i.e., decline to $34.70 per share), the option strategy would “break-even” from an economic perspective resulting in neither a gain nor a loss. If the stock were to climb to a price of $40 or above, the option would be exercised and the stock would return 7.7% coupled with the option premium received of 6.6% for a total return of 14.3%. Under this scenario, the Trust loses the benefit of any appreciation of the stock above $40, and thus is limited to a 14.3% total return. The premium from writing the call option serves to offset some of the unrealized loss on the stock in the event that the price of the stock declines, but if the stock were to decline more than 6.6% under this scenario, the Trust’s downside protection is eliminated and the stock could eventually become worthless.
Each Trust intends to write covered call and other options to varying degrees depending upon market conditions. Please refer to each Trust’s Consolidated Schedule of Investments and the Notes to Consolidated Financial Statements for details of written options.
Derivative Financial Instruments
The Trusts may invest in various derivative financial instruments. These instruments are used to obtain exposure to a security, commodity, index, market, and/or other assets without owning or taking physical custody of securities, commodities and/or other referenced assets or to manage market, equity, credit, interest rate, foreign currency exchange rate, commodity and/or other risks. Derivative financial instruments may give rise to a form of economic leverage and involve risks, including the imperfect correlation between the value of a derivative financial instrument and the underlying asset, possible default of the counterparty to the transaction or illiquidity of the instrument. Pursuant to Rule 18f-4 under the 1940 Act, among other things, the Trusts must either use derivative financial instruments with embedded leverage in a limited manner or comply with an outer limit on fund leverage risk based on value-at-risk. The Trusts’ successful use of a derivative financial instrument depends on the investment adviser’s ability to predict pertinent market movements accurately, which cannot be assured. The use of these instruments may result in losses greater than if they had not been used, may limit the amount of appreciation a Trust can realize on an investment and/or may result in lower distributions paid to shareholders. The Trusts’ investments in these instruments, if any, are discussed in detail in the Notes to Consolidated Financial Statements.
| 6 | 2 0 2 3 B L A C K R O C K A N N U A L R E P O R T T O S H A R E H O L D E R S |
| Trust Summary as of December 31, 2023 | BlackRock Capital Allocation Term Trust (BCAT) |
Investment Objective
BlackRock Capital Allocation Term Trust’s (BCAT) (the “Trust”) (formerly known as BlackRock Capital Allocation Trust) investment objectives are to provide total return and income through a combination of current income, current gains and long-term capital appreciation. The Trust invests in a portfolio of equity and debt securities. Generally, the Trust’s portfolio will include both equity and debt securities. At any given time, however, the Trust may emphasize either debt securities or equity securities. The Trust utilizes an option writing (selling) strategy in an effort to generate current gains from options premiums and to enhance the Trust’s risk-adjusted returns.
On March 31, 2023, the Board approved a proposal to change the name of BlackRock Capital Allocation Trust, effective as of April 5, 2023, to BlackRock Capital Allocation Term Trust. There were no changes to the Trust’s investment policies or strategies in conjunction with the name change.
No assurance can be given that the Trust’s investment objective will be achieved.
Trust Information
| Symbol on New York Stock Exchange |
BCAT | |||
| Initial Offering Date |
September 28, 2020 | |||
| Current Distribution Rate on Closing Market Price as of December 31, 2023 ($14.95)(a) |
10.23% | |||
| Current Monthly Distribution per Common Share(b) |
$0.127500 | |||
| Current Annualized Distribution per Common Share(b) |
$1.530000 |
| (a) | Current distribution rate on closing market price is calculated by dividing the current annualized distribution per share by the closing market price. The current distribution rate may consist of income, net realized gains and/or a return of capital. Past performance is not an indication of future results. |
| (b) | The distribution rate is not constant and is subject to change. A portion of the distribution may be deemed a return of capital or net realized gain. |
Market Price and Net Asset Value Per Share Summary
| 12/31/23 | 12/31/22 | Change | High | Low | ||||||||||||||||
| Closing Market Price |
$ 14.95 | $ 13.87 | 7.79 | % | $ 15.47 | $ 13.71 | ||||||||||||||
| Net Asset Value |
17.25 | 16.84 | 2.43 | 17.74 | 16.04 | |||||||||||||||
GROWTH OF $10,000 INVESTMENT
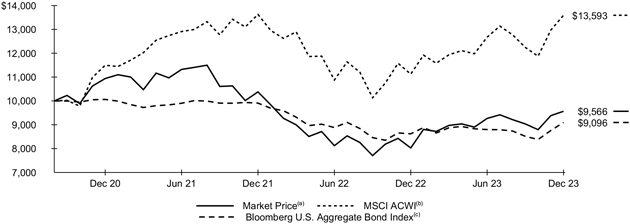
| BCAT commenced operations on September 28, 2020. |
| (a) | Represents the Trust’s closing market price on the NYSE and reflects the reinvestment of dividends and/or distributions at actual reinvestment prices. |
| (b) | An index that captures large- and mid-cap representation across certain developed and emerging markets. |
| (c) | A broad-based flagship benchmark that measures the investment grade, U.S. dollar-denominated, fixed-rate taxable bond market. |
| T R U S T S U M M A R Y |
7 |
| Trust Summary as of December 31, 2023 (continued) | BlackRock Capital Allocation Term Trust (BCAT) |
Performance
Returns for the period ended December 31, 2023 were as follows:
| Average Annual Total Returns | ||||||||
| 1 Year | |
Since Inception |
(a) | |||||
| Trust at NAV(b)(c) |
13.24 | % | 3.08 | % | ||||
| Trust at Market Price(b)(c) |
19.16 | (1.35 | ) | |||||
| MSCI ACWI |
22.20 | 9.89 | ||||||
| Bloomberg U.S. Aggregate Bond Index |
5.53 | (2.87 | ) | |||||
| (a) | BCAT commenced operations on September 28, 2020. |
| (b) | All returns reflect reinvestment of dividends and/or distributions at actual reinvestment prices. Performance results reflect the Trust’s use of leverage, if any. |
| (c) | The Trust’s discount to NAV narrowed during the period, which accounts for the difference between performance based on market price and performance based on NAV. |
Performance results may include adjustments made for financial reporting purposes in accordance with U.S. generally accepted accounting principles. Past performance is not an indication of future results.
The Trust is presenting the performance of one or more indices for informational purposes only. The Trust is actively managed and does not seek to track or replicate the performance of any index. The index performance shown is not intended to be indicative of the Trust’s investment strategies, portfolio components or past or future performance.
More information about the Trust’s historical performance can be found in the “Closed End Funds” section of blackrock.com.
The following discussion relates to the Trust’s absolute performance based on NAV:
What factors influenced performance?
Due to the nature of the Trust’s mandate, performance is reviewed on an absolute return basis. The Trust has an unconstrained approach (i.e., flexibility to invest across all equity and fixed-income asset classes, spanning public and private markets). As such, the Trust is not managed specifically to a benchmark. The index returns listed above are for reference purposes only. Performance information below is expressed on a contribution to return basis.
Positioning in information technology, particularly the software and semiconductor industries, contributed to absolute performance in equities. Holdings in select areas of the consumer discretionary sector contributed, as well. In fixed-income, the Trust’s holdings in collateralized loan obligations (“CLO“s) and high yield bonds were additive.
Short positions in U.S. equity index futures, which the investment adviser used to manage risk, detracted from performance. Positioning in the utilities sector also pressured results. Positioning in agency mortgage-backed securities (“MBS”), which the investment adviser viewed as a source of high-quality income, was a modest detractor in bonds given periodic spikes in market volatility.
The Trust used derivatives, which included options, futures, swaps and forward contracts, in an effort to enhance returns and manage the risk of adverse market movements. The Trust also used an options overlay strategy in which calls were written on a portion of the portfolio’s holdings. In the aggregate, the Trust’s use of derivatives had a minimal impact on performance.
Private investments comprised approximately 12% of the Trust’s total assets at the close of the reporting period. In total, the Trust’s holdings in this area detracted from absolute performance. The effect was partially offset by a contribution from the Trust’s holdings in private credit.
The Trust’s practice of maintaining a specified level of monthly distributions to shareholders did not have a material impact on the Trust’s investment strategy.
Describe recent portfolio activity.
The Trust’s allocation to equities rose by 6.6%, with the largest increases in the industrials, financials, information technology, and consumer discretionary sectors. Its weightings in materials and energy decreased. The Trust’s allocation to bonds fell by 2.8%, largely through reductions in investment-grade corporates and securitized assets. On the other hand, the Trust added to agency MBS and developed market government issues. The Trust’s cash position decreased.
Describe portfolio positioning at period end.
The Trust had a 56.2% allocation to equities at the close of the reporting period. It had holdings across all sectors, with the largest absolute weightings in information technology, financials, healthcare, and industrials. The Trust used options as an additional source of income. As of December 31, 2023, the Trust had sold options on approximately 7% of its equity positions.
The Trust finished the period with a weighting of 48.5% in fixed income, comprised predominately of high yield bonds, securitized assets, agency MBS and, to a lesser extent, investment-grade corporates and emerging market bonds.
The views expressed reflect the opinions of BlackRock as of the date of this report and are subject to change based on changes in market, economic or other conditions. These views are not intended to be a forecast of future events and are no guarantee of future results.
| 8 | 2 0 2 3 B L A C K R O C K A N N U A L R E P O R T T O S H A R E H O L D E R S |
| Trust Summary as of December 31, 2023 (continued) | BlackRock Capital Allocation Term Trust (BCAT) |
Overview of the Trust’s Total Investments
TEN LARGEST HOLDINGS
| Security(a) | Percent of Total Investments |
|||
| Uniform Mortgage-Backed Securities, 4.50%, 01/16/54 |
4.4 | % | ||
| Uniform Mortgage-Backed Securities, 3.50%, 01/16/54 |
3.6 | |||
| Microsoft Corp. |
2.7 | |||
| Amazon.com, Inc. |
1.7 | |||
| Alphabet, Inc. |
1.2 | |||
| Spain Government Bond, 2.55%, 10/31/32 |
1.0 | |||
| Mastercard, Inc. |
0.9 | |||
| JPMorgan Chase & Co. |
0.8 | |||
| ASML Holding NV |
0.8 | |||
| Shell PLC |
0.8 | |||
GEOGRAPHIC ALLOCATION
| Country/Geographic Region(b) | Percentage of Total Investments |
|||
| United States |
67.1 | % | ||
| Cayman Islands |
4.7 | |||
| United Kingdom |
3.2 | |||
| Japan |
3.2 | |||
| Netherlands |
2.7 | |||
| France |
2.3 | |||
| Canada |
2.1 | |||
| Spain |
2.0 | |||
| Switzerland |
1.8 | |||
| Germany |
1.4 | |||
| China |
1.1 | |||
| Italy |
1.0 | |||
| Other# |
7.4 | |||
| (a) | Excludes short-term securities. |
| (b) | Excludes underlying investment in total return swaps. |
| # | Includes holdings within countries/geographic regions that are less than 1.0% of total investments. Please refer to the Consolidated Schedule of Investments for such countries/geographic regions. |
| T R U S T S U M M A R Y |
9 |
| Trust Summary as of December 31, 2023 | BlackRock ESG Capital Allocation Term Trust (ECAT) |
Investment Objective
BlackRock ESG Capital Allocation Term Trust’s (ECAT) (the “Trust”) (formerly known as BlackRock ESG Capital Allocation Trust) investment objectives are to provide total return and income through a combination of current income, current gains and long-term capital appreciation. The Trust will invest in a portfolio of equity and debt securities. Generally, the Trust’s portfolio will include both equity and debt securities. At any given time, however, the Trust may emphasize either debt securities or equity securities. In addition, the Trust may invest without limit in “junk bonds,” corporate loans and distressed securities. The Trust will invest at least 80% of its total assets in securities that, in the investment adviser’s assessment, meet certain environmental, social and governance (“ESG”) criteria. The Trust utilizes an option writing (selling) strategy in an effort to generate current gains from options premiums and to enhance the Trust’s risk-adjusted returns.
On March 31, 2023, the Board approved a proposal to change the name of BlackRock ESG Capital Allocation Trust, effective as of April 5, 2023, to BlackRock ESG Capital Allocation Term Trust. There were no changes to the Trust’s investment policies or strategies in conjunction with the name change.
No assurance can be given that the Trust’s investment objective will be achieved.
Trust Information
| Symbol on New York Stock Exchange |
ECAT | |||
| Initial Offering Date |
September 27, 2021 | |||
| Current Distribution Rate on Closing Market Price as of December 31, 2023 ($16.13)(a) |
9.30% | |||
| Current Monthly Distribution per Common Share(b) |
$0.125000 | |||
| Current Annualized Distribution per Common Share(b) |
$1.500000 |
| (a) | Current distribution rate on closing market price is calculated by dividing the current annualized distribution per share by the closing market price. The current distribution rate may consist of income, net realized gains and/or a return of capital. Past performance is not an indication of future results. |
| (b) | The monthly distribution per Common Share, declared on January 2, 2024, was increased to $0.150000 per share. The current distribution rate on closing market price, current monthly distribution per Common Share, and current annualized distribution per Common Share do not reflect the new distribution rate. The new distribution rate is not constant and is subject to change in the future. A portion of the distribution may be deemed a return of capital or net realized gain. |
Market Price and Net Asset Value Per Share Summary
| 12/31/23 | 12/31/22 | Change | High | Low | ||||||||||||||||
| Closing Market Price |
$ | 16.13 | $ | 13.43 | 20.10 | % | $ | 16.42 | $ | 13.43 | ||||||||||
| Net Asset Value |
18.05 | 16.62 | 8.60 | 18.10 | 16.23 | |||||||||||||||
GROWTH OF $10,000 INVESTMENT
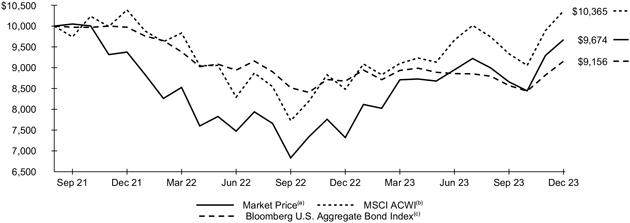
| ECAT commenced operations on September 27, 2021. |
| (a) | Represents the Trust’s closing market price on the NYSE and reflects the reinvestment of dividends and/or distributions at actual reinvestment prices. |
| (b) | An index that captures large- and mid-cap representation across certain developed and emerging markets. |
| (c) | A broad-based flagship benchmark that measures the investment grade, U.S. dollar-denominated, fixed-rate taxable bond market. |
| 10 | 2 0 2 3 B L A C K R O C K A N N U A L R E P O R T T O S H A R E H O L D E R S |
| Trust Summary as of December 31, 2023 (continued) | BlackRock ESG Capital Allocation Term Trust (ECAT) |
Performance
Returns for the period ended December 31, 2023 were as follows:
| Average Annual Total Returns | ||||||||
| 1 Year | |
Since Inception |
(a) | |||||
| Trust at NAV(b)(c) |
19.50 | % | 3.57 | % | ||||
| Trust at Market Price(b)(c) |
32.15 | (1.46 | ) | |||||
| MSCI ACWI |
22.20 | 1.60 | ||||||
| Bloomberg U.S. Aggregate Bond Index |
5.53 | (3.83 | ) | |||||
| (a) | ECAT commenced operations on September 27, 2021. |
| (b) | All returns reflect reinvestment of dividends and/or distributions at actual reinvestment prices. Performance results reflect the Trust’s use of leverage, if any. |
| (c) | The Trust’s discount to NAV narrowed during the period, which accounts for the difference between performance based on market price and performance based on NAV. |
Performance results may include adjustments made for financial reporting purposes in accordance with U.S. generally accepted accounting principles. Past performance is not an indication of future results.
The Trust is presenting the performance of one or more indices for informational purposes only. The Trust is actively managed and does not seek to track or replicate the performance of any index. The index performance shown is not intended to be indicative of the Trust’s investment strategies, portfolio components or past or future performance.
More information about the Trust’s historical performance can be found in the “Closed End Funds” section of blackrock.com.
The following discussion relates to the Trust’s absolute performance based on NAV:
What factors influenced performance?
Due to the nature of the Trust’s mandate, performance is reviewed on an absolute return basis. The Trust has an unconstrained approach (i.e., the flexibility to invest across all equity and fixed-income asset classes, spanning public and private markets) with ESG considerations. As such, the Trust is not managed specifically to a benchmark. The index returns listed above are for reference purposes only. Performance information below is expressed on a contribution to return basis.
Positioning in information technology, particularly in the software and semiconductor industries, contributed to absolute performance in equities. Holdings in select areas of the industrials and healthcare sectors contributed, as well. The Trust used U.S. equity futures as a way to manage its broader equity positioning, which was also additive. In fixed income, the Trust’s holdings in corporate bonds made the largest contribution to performance.
Positioning in the utilities, consumer staples, and energy sectors detracted from performance in equities. Positioning in agency mortgage-backed securities (“MBS”), which the investment adviser viewed as a source of high-quality income, was a modest detractor in fixed income given periodic spikes in bond market volatility.
The Trust used derivatives, which included options, futures, swaps and forward contracts, in an effort to enhance returns and manage the risk of adverse market movements. In the aggregate, the Trust’s use of derivatives modestly contributed to performance. The Trust’s cash position had no material impact on performance.
Private investments comprised approximately 4% of the Trust’s total assets at the close of the period. The Trust’s positions in this area detracted from absolute performance, but the adverse effect was offset by a contribution from the Trust’s holdings in private credit.
The Trust’s practice of maintaining a specified level of monthly distributions to shareholders did not have a material impact on the Trust’s investment strategy.
Describe recent portfolio activity.
The Trust’s allocation to equities rose by 4.3%, with the largest increases in the financials, information technology, and industrials sectors. On the other hand, its weightings in healthcare, utilities, and real estate decreased. The Trust’s allocation to bonds fell by 19.5%, largely through reductions in investment-grade corporates. However, it added to developed market government issues. The Trust’s cash position increased.
Describe portfolio positioning at period end.
The Trust had a 68.6% weighting in equities at the close of the reporting period. It had holdings across all sectors, with the largest absolute weightings in information technology, healthcare, and financials. The Trust used options as an additional source of income. As of December 31, 2023, the team had sold options on approximately 6% of its equity positions.
The Trust finished the period with a weighting of 27.4% in fixed income, comprised predominately of high yield bonds, investment-grade corporates, securitized assets, agency MBS and, to a lesser extent, developed and emerging market government bonds.
The views expressed reflect the opinions of BlackRock as of the date of this report and are subject to change based on changes in market, economic or other conditions. These views are not intended to be a forecast of future events and are no guarantee of future results.
| T R U S T S U M M A R Y |
11 |
| Trust Summary as of December 31, 2023 (continued) | BlackRock ESG Capital Allocation Term Trust (ECAT) |
Overview of the Trust’s Total Investments
TEN LARGEST HOLDINGS
| Security(a) | Percent of Total Investments |
|||
| Uniform Mortgage-Backed Securities, 4.50%, 01/16/54 |
4.8 | % | ||
| Microsoft Corp. |
3.6 | |||
| Uniform Mortgage-Backed Securities, 5.50%, 01/16/54 |
2.1 | |||
| Marsh & McLennan Cos., Inc. |
2.1 | |||
| Mastercard, Inc. |
2.0 | |||
| Eli Lilly & Co. |
1.8 | |||
| Boston Scientific Corp. |
1.6 | |||
| ServiceNow, Inc. |
1.6 | |||
| ASML Holding NV |
1.5 | |||
| Alphabet, Inc. |
1.5 | |||
GEOGRAPHIC ALLOCATION
| Country/Geographic Region(a) | Percentage of Total Investments |
|||
| United States |
77.1 | % | ||
| France |
4.2 | |||
| Netherlands |
2.4 | |||
| Japan |
2.3 | |||
| United Kingdom |
2.1 | |||
| Germany |
1.8 | |||
| Switzerland |
1.8 | |||
| Cayman Islands |
1.7 | |||
| Other# |
6.6 | |||
| (a) | Excludes short-term securities. |
| # | Includes holdings within countries/geographic regions that are less than 1.0% of total investments. Please refer to the Consolidated Schedule of Investments for such countries/geographic regions. |
| 12 | 2 0 2 3 B L A C K R O C K A N N U A L R E P O R T T O S H A R E H O L D E R S |
| Consolidated Schedule of Investments December 31, 2023 |
BlackRock Capital Allocation Term Trust (BCAT) (Percentages shown are based on Net Assets) |
| Security | Par (000) |
Value | ||||||
| Asset-Backed Securities |
||||||||
| Canada — 0.0% | ||||||||
| Fairstone Financial Issuance Trust I, Series 2020-1A, Class D, 6.87%, 10/20/39(a) |
CAD | 1,270 | $ | 890,960 | ||||
|
|
|
|||||||
| Cayman Islands(a)(b) — 4.7% | ||||||||
| 522 Funding CLO Ltd., Series 2019-4A, Class DR, (3-mo. CME Term SOFR + 3.91%), 9.33%, 04/20/30 |
USD | 1,950 | 1,924,464 | |||||
| AGL CLO Ltd. |
||||||||
| Series 2020-3A, Class D, (3-mo. CME Term SOFR + 3.56%), 8.96%, 01/15/33 |
550 | 539,100 | ||||||
| Series 2020-7A, Class DR, (3-mo. CME Term SOFR + 3.36%), 8.76%, 07/15/34 |
250 | 247,253 | ||||||
| Series 2020-9A, Class D, (3-mo. CME Term SOFR + 3.96%), 9.38%, 01/20/34 |
850 | 840,759 | ||||||
| AIMCO CLO, Series 2017-AA, Class DR, (3-mo. CME Term SOFR + 3.41%), 8.83%, 04/20/34 |
250 | 239,822 | ||||||
| ALM Ltd., Series 2020-1A, Class D, (3-mo. CME Term SOFR + 6.26%), 11.66%, 10/15/29 |
950 | 927,325 | ||||||
| Apidos CLO XXII, Series 2015-22A, Class CR, (3-mo. CME Term SOFR + 3.21%), 8.63%, 04/20/31 |
250 | 245,523 | ||||||
| Apidos CLO XXXII, Series 2019-32A, Class D, (3-mo. CME Term SOFR + 3.76%), 9.18%, 01/20/33 |
250 | 247,286 | ||||||
| Apidos CLO XXXV, Series 2021-35A, Class E, (3-mo. CME Term SOFR + 6.01%), 11.43%, 04/20/34 |
375 | 362,378 | ||||||
| Apidos CLO XXXVII, Series 2021-37A, Class E, (3-mo. CME Term SOFR + 6.56%), 11.97%, 10/22/34 |
250 | 250,618 | ||||||
| Ares Loan Funding I Ltd. |
||||||||
| Series 2021-ALFA, Class E, (3-mo. CME Term SOFR + 6.96%), 12.36%, 10/15/34 |
1,250 | 1,254,282 | ||||||
| Series 2021-ALFA, Class SUB, 0.00%, 10/15/34 |
2,150 | 1,471,460 | ||||||
| Ares LV CLO Ltd., Series 2020-55A, Class DR, (3-mo. CME Term SOFR + 3.41%), 8.81%, 07/15/34 |
1,500 | 1,451,737 | ||||||
| Ares LVI CLO Ltd., Series 2020-56A, Class ER, (3-mo. CME Term SOFR + 6.76%), 12.14%, 10/25/34 |
625 | 626,131 | ||||||
| Ballyrock CLO Ltd., Series 2019-1A, Class CR, (3-mo. CME Term SOFR + 3.31%), 8.71%, 07/15/32 |
2,700 | 2,663,376 | ||||||
| Bardot CLO Ltd., Series 2019-2A, Class DR, (3-mo. CME Term SOFR + 3.26%), 8.67%, 10/22/32 |
250 | 243,616 | ||||||
| Battalion CLO IX Ltd., Series 2015-9A, Class DR, (3-mo. CME Term SOFR + 3.51%), 8.91%, 07/15/31 |
250 | 249,320 | ||||||
| Benefit Street Partners CLO XX Ltd., Series 2020-20A, Class ER, (3-mo. CME Term SOFR + 7.01%), 12.41%, 07/15/34 |
250 | 248,666 | ||||||
| Birch Grove CLO Ltd. |
||||||||
| Series 19A, Class DR, (3-mo. CME Term SOFR + 3.61%), 9.00%, 06/15/31 |
1,500 | 1,494,464 | ||||||
| Series 2021-2A, Class D1, (3-mo. CME Term SOFR + 3.56%), 8.96%, 10/19/34 |
750 | 741,749 | ||||||
| BlueMountain CLO Ltd., Series 2016-2A, Class C1R2, (3-mo. CME Term SOFR + 3.36%), 8.73%, 08/20/32 |
1,000 | 983,126 | ||||||
| Buttermilk Park CLO Ltd., Series 2018-1A, Class D, (3-mo. CME Term SOFR + 3.36%), 8.76%, 10/15/31 |
250 | 243,555 | ||||||
| Canyon CLO Ltd., Series 2020-3A, Class E, (3-mo. CME Term SOFR + 7.51%), 12.91%, 01/15/34 |
250 | 243,271 | ||||||
| Security | Par (000) |
Value | ||||||
| Cayman Islands (continued) | ||||||||
| CarVal CLO II Ltd., Series 2019-1A, Class DR, (3-mo. CME Term SOFR + 3.46%), 8.88%, 04/20/32 |
USD | 1,425 | $ | 1,373,509 | ||||
| CarVal CLO VC Ltd., Series 2021-2A, Class E, (3-mo. CME Term SOFR + 7.01%), 12.41%, 10/15/34 |
500 | 483,194 | ||||||
| CIFC Funding Ltd. |
||||||||
| Series 2014-2RA, Class B1, (3-mo. CME Term SOFR + 3.06%), 8.46%, 04/24/30 |
1,000 | 991,750 | ||||||
| Series 2019-3A, Class CR, (3-mo. CME Term SOFR + 3.31%), 8.71%, 10/16/34 |
1,000 | 993,017 | ||||||
| Crown City CLO III, Series 2021-1A, Class C, (3-mo. CME Term SOFR + 3.56%), 8.98%, 07/20/34 |
1,250 | 1,219,683 | ||||||
| Crown Point CLO Ltd., Series 2020-9A, Class DR, (3-mo. CME Term SOFR + 4.01%), 9.41%, 07/14/34 |
500 | 484,196 | ||||||
| Elmwood CLO I Ltd. |
||||||||
| Series 2019-1A, Class DR, (3-mo. CME Term SOFR + 4.66%), 10.08%, 10/20/33 |
5,750 | 5,689,383 | ||||||
| Series 2019-1A, Class ER, (3-mo. CME Term SOFR + 7.97%), 13.39%, 10/20/33 |
2,375 | 2,407,864 | ||||||
| Elmwood CLO II Ltd. |
||||||||
| Series 2019-2A, Class ER, (3-mo. CME Term SOFR + 7.06%), 12.48%, 04/20/34 |
3,000 | 2,985,276 | ||||||
| Series 2019-2A, Class SUB, 0.00%, 04/20/34 |
1,000 | 806,400 | ||||||
| Elmwood CLO V Ltd., Series 2020-2A, Class ER, (3-mo. CME Term SOFR + 6.36%), 11.78%, 10/20/34 |
250 | 246,790 | ||||||
| Elmwood CLO VIII Ltd., Series 2021-1A, Class E1, (3-mo. CME Term SOFR + 6.26%), 11.68%, 01/20/34 |
500 | 490,334 | ||||||
| Elmwood CLO X Ltd., Series 2021-3A, Class E, (3-mo. CME Term SOFR + 6.11%), 11.53%, 10/20/34 |
1,000 | 976,339 | ||||||
| Flatiron CLO Ltd., Series 2019-1A, Class DR, (3-mo. CME Term SOFR + 3.26%), 8.65%, 11/16/34 |
700 | 685,743 | ||||||
| GoldenTree Loan Management U.S. CLO Ltd., Series 2021-9A, Class E, (3-mo. CME Term SOFR + 5.01%), 10.43%, 01/20/33 |
1,000 | 956,137 | ||||||
| Golub Capital Partners CLO Ltd. |
||||||||
| Series 2021-53A, Class E, (3-mo. CME Term SOFR + 6.96%), 12.38%, 07/20/34 |
250 | 245,763 | ||||||
| Series 2021-55A, Class E, (3-mo. CME Term SOFR + 6.82%), 12.24%, 07/20/34 |
1,000 | 997,610 | ||||||
| Madison Park Funding XLIX Ltd., Series 2021-49A, Class E, (3-mo. CME Term SOFR + 6.51%), 11.91%, 10/19/34 |
250 | 246,351 | ||||||
| Madison Park Funding XXIX Ltd., Series 2018-29A, Class E, (3-mo. CME Term SOFR + 5.96%), 11.36%, 10/18/30 |
500 | 480,911 | ||||||
| Niagara Park CLO Ltd., Series 2019-1A, Class ER, (3-mo. CME Term SOFR + 6.21%), 11.61%, 07/17/32 |
1,000 | 966,404 | ||||||
| OCP CLO Ltd. |
||||||||
| Series 2019-16A, Class ER, (3-mo. CME Term SOFR + 6.61%), 12.02%, 04/10/33 |
400 | 389,408 | ||||||
| Series 2020-18A, Class DR, (3-mo. CME Term SOFR + 3.46%), 8.88%, 07/20/32 |
500 | 483,788 | ||||||
| Series 2020-20A, Class D1, (3-mo. CME Term SOFR + 4.21%), 9.62%, 10/09/33 |
3,500 | 3,498,885 | ||||||
| Series 2020-20A, Class E, (3-mo. CME Term SOFR + 7.92%), 13.33%, 10/09/33 |
2,250 | 2,225,801 | ||||||
| Octagon 54 Ltd., Series 2021-1A, Class D, (3-mo. CME Term SOFR + 3.31%), 8.71%, 07/15/34 |
250 | 242,583 | ||||||
| C O N S O L I D A T E D S C H E D U L E O F I N V E S T M E N T S |
13 |
| Consolidated Schedule of Investments (continued) December 31, 2023 |
BlackRock Capital Allocation Term Trust (BCAT) (Percentages shown are based on Net Assets) |
| Security | Par (000) |
Value | ||||||
| Cayman Islands (continued) | ||||||||
| OSD CLO Ltd., Series 2021-23A, Class E, (3-mo. CME Term SOFR + 6.26%), 11.66%, 04/17/31 |
USD | 250 | $ | 240,840 | ||||
| Palmer Square CLO Ltd. |
||||||||
| Series 2018-2A, Class D, (3-mo. CME Term SOFR + 5.86%), 11.26%, 07/16/31 |
250 | 244,917 | ||||||
| Series 2021-2A, Class E, (3-mo. CME Term SOFR + 6.61%), 12.01%, 07/15/34 |
250 | 248,981 | ||||||
| Palmer Square Loan Funding Ltd. |
||||||||
| Series 2020-4A, Class C, (3-mo. CME Term SOFR + 3.86%), 9.24%, 11/25/28 |
1,000 | 998,797 | ||||||
| Series 2021-1A, Class D, (3-mo. CME Term SOFR + 6.26%), 11.68%, 04/20/29 |
1,250 | 1,252,181 | ||||||
| Series 2021-3A, Class C, (3-mo. CME Term SOFR + 2.76%), 8.18%, 07/20/29 |
250 | 246,277 | ||||||
| Series 2021-3A, Class D, (3-mo. CME Term SOFR + 5.26%), 10.68%, 07/20/29 |
250 | 244,359 | ||||||
| Series 2021-4A, Class D, (3-mo. CME Term SOFR + 5.26%), 10.66%, 10/15/29 |
750 | 723,927 | ||||||
| Series 2021-4A, Class E, (3-mo. CME Term SOFR + 7.77%), 13.17%, 10/15/29 |
500 | 504,626 | ||||||
| Park Avenue Institutional Advisers CLO Ltd. |
||||||||
| Series 2021-1A, Class D, (3-mo. CME Term SOFR + 7.56%), 12.98%, 01/20/34 |
600 | 552,104 | ||||||
| Series 2021-2A, Class D, (3-mo. CME Term SOFR + 3.66%), 9.06%, 07/15/34 |
1,000 | 982,284 | ||||||
| Pikes Peak CLO |
||||||||
| Series 2019-4A, Class DR, (3-mo. CME Term SOFR + 3.51%), 8.91%, 07/15/34 |
1,000 | 970,960 | ||||||
| Series 2020-6A, Class ER2, (3-mo. CME Term SOFR + 6.69%), 12.06%, 05/18/34 |
500 | 487,671 | ||||||
| Post CLO Ltd. |
||||||||
| Series 2018-1A, Class D, (3-mo. CME Term SOFR + 3.21%), 8.61%, 04/16/31 |
500 | 489,923 | ||||||
| Series 2021-1A, Class E, (3-mo. CME Term SOFR + 6.71%), 12.11%, 10/15/34 |
750 | 723,569 | ||||||
| Rad CLO Ltd. |
||||||||
| Series 2019-3A, Class DR, (3-mo. CME Term SOFR + 3.01%), 8.41%, 04/15/32 |
250 | 246,398 | ||||||
| Series 2020-9A, Class E, (3-mo. CME Term SOFR + 7.85%), 13.25%, 01/15/34 |
5,000 | 4,894,775 | ||||||
| Regatta XVII Funding Ltd. |
||||||||
| Series 2020-1A, Class D, (3-mo. CME Term SOFR + 4.41%), 9.81%, 10/15/33 |
750 | 724,526 | ||||||
| Series 2020-1A, Class E, (3-mo. CME Term SOFR + 7.87%), 13.27%, 10/15/33 |
250 | 252,017 | ||||||
| Regatta XX Funding Ltd., Series 2021-2A, Class D, (3-mo. CME Term SOFR + 3.36%), 8.76%, 10/15/34 |
1,500 | 1,476,804 | ||||||
| Regatta XXIV Funding Ltd., Series 2021-5A, Class E, (3-mo. CME Term SOFR + 7.06%), 12.48%, 01/20/35 |
500 | 491,083 | ||||||
| RR Ltd., Series 2021-19A, Class D, (3-mo. CME Term SOFR + 6.76%), 12.16%, 10/15/35 |
250 | 252,140 | ||||||
| RRX Ltd. |
||||||||
| Series 2020-1A, Class E, (3-mo. CME Term SOFR + 6.71%), 12.11%, 04/15/33 |
2,625 | 2,589,129 | ||||||
| Series 2022-7A, Class D, (3-mo. CME Term SOFR + 6.85%), 12.24%, 07/15/35 |
750 | 743,911 | ||||||
| Security | Par (000) |
Value | ||||||
| Cayman Islands (continued) | ||||||||
| Sixth Street CLO XIX Ltd., Series 2021-19A, Class E, (3-mo. CME Term SOFR + 6.16%), 11.58%, 07/20/34 |
USD | 3,750 | $ | 3,590,429 | ||||
| Sound Point CLO XXVI Ltd., Series 2020-1A, Class DR, (3-mo. CME Term SOFR + 3.61%), 9.03%, 07/20/34 |
250 | 232,061 | ||||||
| Stratus CLO Ltd. |
||||||||
| Series 2021-1A, Class E, (3-mo. CME Term SOFR + 5.26%), 10.68%, 12/29/29 |
1,500 | 1,444,836 | ||||||
| Series 2021-1A, Class SUB, 0.00%, 12/29/29 |
1,000 | 642,660 | ||||||
| Series 2021-2A, Class E, (3-mo. CME Term SOFR + 6.01%), 11.43%, 12/28/29 |
1,000 | 995,676 | ||||||
| Series 2021-3A, Class E, (3-mo. CME Term SOFR + 6.01%), 11.43%, 12/29/29 |
500 | 495,055 | ||||||
| Symphony CLO XXI Ltd., Series 2019-21A, Class DR, (3-mo. CME Term SOFR + 3.56%), 8.96%, 07/15/32 |
500 | 473,094 | ||||||
| Symphony CLO XXIII Ltd., Series 2020-23A, Class ER, (3-mo. CME Term SOFR + 6.41%), 11.81%, 01/15/34 |
500 | 495,904 | ||||||
| TICP CLO IX Ltd., Series 2017-9A, Class D, (3-mo. CME Term SOFR + 3.16%), 8.58%, 01/20/31 |
500 | 499,946 | ||||||
| TICP CLO XI Ltd. |
||||||||
| Series 2018-11A, Class D, (3-mo. CME Term SOFR + 3.31%), 8.73%, 10/20/31 |
250 | 249,598 | ||||||
| Series 2018-11A, Class E, (3-mo. CME Term SOFR + 6.26%), 11.68%, 10/20/31 |
500 | 496,130 | ||||||
| TICP CLO XV Ltd., Series 2020-15A, Class E, (3-mo. CME Term SOFR + 6.41%), 11.83%, 04/20/33 |
500 | 495,461 | ||||||
| Trestles CLO Ltd., Series 2017-1A, Class CR, (3-mo. CME Term SOFR + 3.16%), 8.54%, 04/25/32 |
500 | 487,054 | ||||||
| Trimaran CAVU Ltd., Series 2019-1A, Class D, (3-mo. CME Term SOFR + 4.41%), 9.83%, 07/20/32 |
1,750 | 1,736,469 | ||||||
| Whitebox CLO I Ltd. |
||||||||
| Series 2019-1A, Class CR, (3-mo. CME Term SOFR + 3.31%), 8.71%, 07/24/32 |
250 | 246,253 | ||||||
| Series 2019-1A, Class DR, (3-mo. CME Term SOFR + 6.66%), 12.06%, 07/24/32 |
1,300 | 1,253,435 | ||||||
| Series 2019-1A, Class SUB, 0.00%, 07/24/32 |
1,000 | 593,050 | ||||||
| Whitebox CLO II Ltd., Series 2020-2A, Class DR, (3-mo. CME Term SOFR + 3.61%), 9.01%, 10/24/34 |
2,750 | 2,662,824 | ||||||
| Whitebox CLO III Ltd. |
||||||||
| Series 2021-3A, Class D, (3-mo. CME Term SOFR + 3.61%), 9.01%, 10/15/34 |
500 | 490,829 | ||||||
| Series 2021-3A, Class E, (3-mo. CME Term SOFR + 7.11%), 12.51%, 10/15/34 |
500 | 492,465 | ||||||
|
|
|
|||||||
| 86,961,828 | ||||||||
| Ireland(a)(b) — 0.5% | ||||||||
| Anchorage Capital Europe CLO DAC, Series 4A, Class D, (3-mo. EURIBOR + 3.20%), 7.16%, 04/25/34 |
EUR | 868 | 917,515 | |||||
| CIFC European Funding CLO III DAC, Series 3A, Class D, (3-mo. EURIBOR + 3.60%), 7.57%, 01/15/34 |
700 | 741,899 | ||||||
| CVC Cordatus Loan Fund XIX DAC, Series 19A, Class D, (3-mo. EURIBOR + 3.80%), 7.76%, 12/23/33 |
2,300 | 2,457,467 | ||||||
| 14 | 2 0 2 3 B L A C K R O C K A N N U A L R E P O R T T O S H A R E H O L D E R S |
| Consolidated Schedule of Investments (continued) December 31, 2023 |
BlackRock Capital Allocation Term Trust (BCAT) (Percentages shown are based on Net Assets) |
| Security | Par (000) |
Value | ||||||
| Ireland (continued) | ||||||||
| Henley CLO IV DAC, Series 4A, Class D, (3-mo. EURIBOR + 3.00%), 6.96%, 04/25/34 |
EUR | 1,000 | $ | 1,047,860 | ||||
| Invesco Euro CLO V DAC, Series D, Class 5A, (3-mo. EURIBOR + 3.80%), 7.77%, 01/15/34 |
3,150 | 3,282,836 | ||||||
| Prodigy Finance DAC |
||||||||
| Series 2021-1A, Class C, (1-mo. Term SOFR + 3.86%), 9.22%, 07/25/51 |
USD | 117 | 117,182 | |||||
| Series 2021-1A, Class D, (1-mo. Term SOFR + 6.01%), 11.37%, 07/25/51 |
228 | 226,599 | ||||||
|
|
|
|||||||
| 8,791,358 | ||||||||
| Netherlands — 0.1% | ||||||||
| Alme Loan Funding V DAC, Series ER, Class 5A, (3-mo. EURIBOR + 5.41%), 9.38%, 07/15/31(a)(b) |
EUR | 2,250 | 2,461,368 | |||||
|
|
|
|||||||
| United Kingdom — 0.1% | ||||||||
| Ares European CLO XII DAC, Series 12A, Class DR, (3-mo. EURIBOR + 3.00%), 6.99%, 04/20/32(a)(b) |
875 | 916,363 | ||||||
|
|
|
|||||||
| United States — 3.0% | ||||||||
| 510 Loan Acquisition Trust, Series 2020-1, Class A, 8.11%, 09/25/60(a)(c) |
USD | 3,920 | 3,872,964 | |||||
| Ajax Mortgage Loan Trust(a) |
||||||||
| Series 2021-G, Class A, 1.88%, 06/25/61(b) |
4,357 | 4,148,225 | ||||||
| Series 2021-G, Class B, 3.75%, 06/25/61(b) |
706 | 660,051 | ||||||
| Series 2021-G, Class C, 0.00%, 06/25/61 |
1,270 | 1,075,971 | ||||||
| AMSR Trust, Series 2020-SFR5, Class G, 4.11%, 11/17/37(a) |
2,899 | 2,687,654 | ||||||
| Citigroup Mortgage Loan Trust(b) |
||||||||
| Series 2007-AHL2, Class A3B, (1-mo. Term SOFR + 0.31%), 5.67%, 05/25/37 |
4,241 | 2,748,899 | ||||||
| Series 2007-AHL3, Class A3B, (1-mo. Term SOFR + 0.28%), 5.64%, 07/25/45 |
3,170 | 2,163,194 | ||||||
| College Ave Student Loans LLC, Series 2021-A, Class D, 4.12%, 07/25/51(a) |
241 | 217,186 | ||||||
| Credit Suisse ABS Repackaging Trust, Series 2013-A, Class R1, 0.00%, 04/25/43(a)(d) |
5 | 3,178,480 | ||||||
| Eaton Vance CLO Ltd., Series 2019-1A, Class ER, (3-mo. CME Term SOFR + 6.76%), 12.16%, 04/15/31(a)(b) |
500 | 488,677 | ||||||
| GoldenTree Loan Opportunities X Ltd., Series 2015-10A, Class DR, (3-mo. CME Term SOFR + 3.31%), 8.73%, 07/20/31(a)(b) |
750 | 742,777 | ||||||
| Home Partners of America Trust, Series 2021-2, Class F, 3.80%, 12/17/26(a) |
2,406 | 2,099,701 | ||||||
| Lending Funding Trust(a) |
||||||||
| Series 2020-2A, Class C, 4.30%, 04/21/31 |
980 | 889,746 | ||||||
| Series 2020-2A, Class D, 6.77%, 04/21/31 |
2,830 | 2,572,658 | ||||||
| Lendmark Funding Trust, Series 2021-1A, Class D, 5.05%, 11/20/31(a) |
2,320 | 1,942,232 | ||||||
| Litigation Fee Residual, Series 2020-1, Class A, 4.00%, 10/30/27(d) |
1,578 | 1,544,879 | ||||||
| Mariner Finance Issuance Trust(a) |
||||||||
| Series 2021-BA, Class E, 4.68%, 11/20/36 |
540 | 443,342 | ||||||
| Series 2022-AA, Class E, 5.40%, 03/20/36 |
1,420 | 1,228,766 | ||||||
| Navient Private Education Refi Loan Trust, Series 2021-DA, Class D, 4.00%, 04/15/60(a) |
1,340 | 1,216,583 | ||||||
| Nelnet Student Loan Trust(a) |
||||||||
| Series 2021-A, Class D, 4.93%, 04/20/62 |
1,670 | 1,389,860 | ||||||
| Series 2021-BA, Class D, 4.75%, 04/20/62 |
340 | 283,428 | ||||||
| Series 2021-CA, Class D, 4.44%, 04/20/62 |
110 | 90,526 | ||||||
| Progress Residential(a) |
||||||||
| Series 2021-SFR1, Class H, 5.00%, 04/17/38 |
750 | 670,117 | ||||||
| Security | Par (000) |
Value | ||||||
| United States (continued) | ||||||||
| Progress Residential(a) (continued) |
||||||||
| Series 2021-SFR3, Class H, 4.75%, 05/17/26 |
USD | 1,140 | $ | 1,021,887 | ||||
| Regional Management Issuance Trust |
||||||||
| Series 2020-1, Class D, 6.77%, 10/15/30(a) |
2,050 | 1,887,657 | ||||||
| Series 2021-3, Class A, 3.88%, 10/17/33(d) |
4,780 | 4,224,564 | ||||||
| Republic Finance Issuance Trust(a) |
||||||||
| Series 2020-A, Class D, 7.00%, 11/20/30 |
5,110 | 4,772,450 | ||||||
| Series 2021-A, Class D, 5.23%, 12/22/31 |
800 | 676,709 | ||||||
| Residential Mortgage Loan Trust, Series 2020-1, Class B1, 3.95%, 01/26/60(a)(b) |
400 | 337,794 | ||||||
| SMB Private Education Loan Trust(a) |
||||||||
| Series 2021-A, Class D1, 3.86%, 01/15/53 |
1,945 | 1,749,199 | ||||||
| Series 2021-A, Class D2, 3.86%, 01/15/53 |
1,062 | 954,563 | ||||||
| Series 2021-C, Class D, 3.93%, 01/15/53 |
689 | 636,951 | ||||||
| SoFi Professional Loan Program LLC, Series 2018-A, Class R1, 0.00%, 02/25/42(a) |
115 | 1,564,177 | ||||||
| Structured Asset Securities Corp. Mortgage Loan Trust, Series 2005-WF2, Class M8, (1-mo. Term SOFR + 1.91%), 7.27%, 05/25/35(b) |
182 | 181,023 | ||||||
| Tricon Residential Trust(a) |
||||||||
| Series 2021-SFR1, Class F, 3.69%, 07/17/38 |
1,375 | 1,232,512 | ||||||
| Series 2021-SFR1, Class G, 4.13%, 07/17/38 |
887 | 791,742 | ||||||
|
|
|
|||||||
| 56,387,144 | ||||||||
|
|
|
|||||||
|
Total Asset-Backed Securities — 8.4% |
156,409,021 | |||||||
|
|
|
|||||||
|
Shares |
||||||||
| Common Stocks |
||||||||
| Australia — 0.4% | ||||||||
| Glencore PLC |
1,068,824 | 6,424,749 | ||||||
|
|
|
|||||||
| Canada — 1.2% | ||||||||
| Cameco Corp. |
193,537 | 8,341,445 | ||||||
| Enbridge, Inc. |
228,354 | 8,220,434 | ||||||
| Suncor Energy, Inc. |
185,564 | 5,944,826 | ||||||
|
|
|
|||||||
| 22,506,705 | ||||||||
| Cayman Islands — 0.0% | ||||||||
| Crown PropTech Acquisitions, Class A (e) |
29,568 | 314,899 | ||||||
|
|
|
|||||||
| China — 0.8% | ||||||||
| Alibaba Group Holding Ltd. (e) |
66,900 | 644,417 | ||||||
| BYD Co. Ltd., Class H |
275,079 | 7,587,953 | ||||||
| Contemporary Amperex Technology Co. Ltd., Class A |
96,100 | 2,201,890 | ||||||
| Kindstar Globalgene Technology, Inc. (a)(e) |
2,024,500 | 435,571 | ||||||
| Meituan, Class B (a)(e) |
13,088 | 137,408 | ||||||
| Tencent Holdings Ltd. |
95,888 | 3,620,237 | ||||||
|
|
|
|||||||
| 14,627,476 | ||||||||
| France — 2.3% | ||||||||
| Accor SA |
53,647 | 2,053,397 | ||||||
| BNP Paribas SA |
105,765 | 7,344,920 | ||||||
| Cie de Saint-Gobain SA |
85,547 | 6,308,862 | ||||||
| EssilorLuxottica SA |
18,320 | 3,678,632 | ||||||
| Kering SA |
8,020 | 3,552,044 | ||||||
| LVMH Moet Hennessy Louis Vuitton SE |
12,531 | 10,181,899 | ||||||
| Sanofi SA |
25,748 | 2,558,650 | ||||||
| C O N S O L I D A T E D S C H E D U L E O F I N V E S T M E N T S |
15 |
| Consolidated Schedule of Investments (continued) December 31, 2023 |
BlackRock Capital Allocation Term Trust (BCAT) (Percentages shown are based on Net Assets) |
| Security |
Shares |
Value | ||||||
| France (continued) | ||||||||
| TotalEnergies SE |
44,293 | $ | 3,011,879 | |||||
| Vinci SA |
25,626 | 3,224,910 | ||||||
|
|
|
|||||||
| 41,915,193 | ||||||||
| Germany — 0.8% | ||||||||
| Commerzbank AG |
119,690 | 1,422,611 | ||||||
| Mercedes-Benz Group AG, Class N, Registered Shares |
77,008 | 5,313,383 | ||||||
| SAP SE |
14,750 | 2,270,343 | ||||||
| SAP SE, ADR |
7,100 | 1,097,589 | ||||||
| Siemens AG, Registered Shares |
21,083 | 3,955,366 | ||||||
|
|
|
|||||||
| 14,059,292 | ||||||||
| Hong Kong — 0.2% | ||||||||
| AIA Group Ltd. |
508,370 | 4,424,283 | ||||||
|
|
|
|||||||
| India — 0.2% | ||||||||
| HDFC Bank Ltd. |
110,289 | 2,258,280 | ||||||
| Think & Learn Private Ltd., (Acquired 12/11/20, Cost: $5,113,105) (d)(e)(f) |
2,279 | 477,875 | ||||||
|
|
|
|||||||
| 2,736,155 | ||||||||
| Ireland — 0.2% | ||||||||
| CRH PLC |
63,152 | 4,346,075 | ||||||
|
|
|
|||||||
| Israel — 0.4% | ||||||||
| Nice Ltd., ADR (e) |
39,424 | 7,865,482 | ||||||
|
|
|
|||||||
| Italy — 0.8% | ||||||||
| Ariston Holding NV |
476,063 | 3,305,447 | ||||||
| Intesa Sanpaolo SpA |
2,332,817 | 6,826,739 | ||||||
| UniCredit SpA |
158,291 | 4,310,216 | ||||||
|
|
|
|||||||
| 14,442,402 | ||||||||
| Japan — 3.4% | ||||||||
| Daikin Industries Ltd. |
7,100 | 1,151,762 | ||||||
| FANUC Corp. |
195,915 | 5,749,931 | ||||||
| Honda Motor Co. Ltd. |
343,200 | 3,540,181 | ||||||
| Hoya Corp. |
35,186 | 4,382,034 | ||||||
| Japan Airlines Co. Ltd. |
337,400 | 6,628,247 | ||||||
| Keyence Corp. |
17,400 | 7,644,799 | ||||||
| Komatsu Ltd. |
106,300 | 2,766,281 | ||||||
| Kose Corp. |
25,298 | 1,890,905 | ||||||
| Mitsubishi UFJ Financial Group, Inc. |
1,096,000 | 9,406,013 | ||||||
| Mitsui & Co. Ltd. |
117,800 | 4,413,250 | ||||||
| SMC Corp. |
9,100 | 4,867,917 | ||||||
| Sysmex Corp. |
74,200 | 4,124,815 | ||||||
| Toyota Motor Corp. |
315,200 | 5,775,633 | ||||||
|
|
|
|||||||
| 62,341,768 | ||||||||
| Macau(e) — 0.0% | ||||||||
| Sands China Ltd. |
74,225 | 217,254 | ||||||
| Wynn Macau Ltd. |
742,255 | 611,362 | ||||||
|
|
|
|||||||
| 828,616 | ||||||||
| Netherlands — 2.2% | ||||||||
| Adyen NV (a)(e) |
2,986 | 3,854,750 | ||||||
| ASML Holding NV |
19,804 | 14,949,792 | ||||||
| ING Groep NV, Series N |
485,615 | 7,281,571 | ||||||
| Shell PLC |
453,292 | 14,914,791 | ||||||
| Shell PLC, ADR |
9,533 | 627,271 | ||||||
|
|
|
|||||||
| 41,628,175 | ||||||||
| Security |
Shares |
Value | ||||||
| South Korea — 0.4% | ||||||||
| Amorepacific Corp. |
28,737 | $ | 3,223,696 | |||||
| SK Hynix, Inc. |
36,095 | 3,939,333 | ||||||
|
|
|
|||||||
| 7,163,029 | ||||||||
| Spain — 0.6% | ||||||||
| Cellnex Telecom SA (a) |
270,763 | 10,660,752 | ||||||
|
|
|
|||||||
| Sweden — 0.0% | ||||||||
| Volta Trucks, Series C, (Acquired 02/22/22, Cost: $322,253) (d)(e)(f) |
2,732 | — | ||||||
|
|
|
|||||||
| Switzerland — 1.7% | ||||||||
| Alcon, Inc. |
82,631 | 6,464,716 | ||||||
| Nestle SA, Registered Shares |
113,219 | 13,124,331 | ||||||
| On Holding AG, Class A (e) |
104,674 | 2,823,058 | ||||||
| TE Connectivity Ltd. |
33,449 | 4,699,584 | ||||||
| UBS Group AG, Registered Shares |
168,471 | 5,232,972 | ||||||
|
|
|
|||||||
| 32,344,661 | ||||||||
| Taiwan — 0.4% | ||||||||
| Taiwan Semiconductor Manufacturing Co. Ltd., ADR. |
69,341 | 7,211,464 | ||||||
|
|
|
|||||||
| United Kingdom — 2.3% | ||||||||
| 10X future Technologies Service Ltd. (d)(e) |
114,500 | 1,922,128 | ||||||
| AstraZeneca PLC |
58,058 | 7,831,434 | ||||||
| AstraZeneca PLC, ADR |
48,396 | 3,259,471 | ||||||
| BAE Systems PLC |
606,231 | 8,581,194 | ||||||
| BP PLC |
73,129 | 433,514 | ||||||
| Compass Group PLC |
127,075 | 3,477,194 | ||||||
| Genius Sports Ltd. (e) |
186,939 | 1,155,283 | ||||||
| RELX PLC |
115,222 | 4,571,295 | ||||||
| Teya Services Ltd., (Acquired 11/16/21, Cost: $2,398,802) (d)(e)(f) |
1,235 | 533,261 | ||||||
| Unilever PLC |
241,569 | 11,694,593 | ||||||
|
|
|
|||||||
| 43,459,367 | ||||||||
| United States — 33.8% | ||||||||
| Abbott Laboratories (g) |
88,465 | 9,737,343 | ||||||
| ACV Auctions, Inc., Class A (e) |
203,406 | 3,081,601 | ||||||
| Advanced Micro Devices, Inc. (e) |
46,239 | 6,816,091 | ||||||
| Air Products and Chemicals, Inc. |
25,389 | 6,951,508 | ||||||
| Albemarle Corp. |
18,104 | 2,615,666 | ||||||
| Alphabet, Inc., Class C (e) |
155,757 | 21,950,834 | ||||||
| Amazon.com, Inc. (e)(g) |
210,379 | 31,964,985 | ||||||
| American Tower Corp. |
36,035 | 7,779,236 | ||||||
| Amgen, Inc. |
5,487 | 1,580,366 | ||||||
| Apple, Inc. |
65,452 | 12,601,474 | ||||||
| Applied Materials, Inc. |
37,128 | 6,017,335 | ||||||
| Aptiv PLC (e) |
34,079 | 3,057,568 | ||||||
| Archer-Daniels-Midland Co. |
89,964 | 6,497,200 | ||||||
| Astra Space, Inc. |
13,702 | 31,241 | ||||||
| Autodesk, Inc. (e) |
2,102 | 511,795 | ||||||
| Boston Scientific Corp. (e)(g) |
140,725 | 8,135,312 | ||||||
| Boyd Gaming Corp. |
2,409 | 150,827 | ||||||
| Bunge Global SA |
59,551 | 6,011,673 | ||||||
| California Resources Corp. |
29,217 | 1,597,586 | ||||||
| Cencora, Inc. |
8,277 | 1,699,930 | ||||||
| Centene Corp. (e) |
10,766 | 798,945 | ||||||
| CF Industries Holdings, Inc. |
72,325 | 5,749,837 | ||||||
| Charles Schwab Corp. |
10,771 | 741,045 | ||||||
| Charter Communications, Inc., Class A (e) |
9,297 | 3,613,558 | ||||||
| Cheniere Energy, Inc. |
6,166 | 1,052,598 | ||||||
| Chesapeake Energy Corp. |
4,446 | 342,075 | ||||||
| Chevron Corp. |
32,605 | 4,863,362 | ||||||
| 16 | 2 0 2 3 B L A C K R O C K A N N U A L R E P O R T T O S H A R E H O L D E R S |
| Consolidated Schedule of Investments (continued) December 31, 2023 |
BlackRock Capital Allocation Term Trust (BCAT) (Percentages shown are based on Net Assets) |
| Security |
Shares |
Value | ||||||
| United States (continued) | ||||||||
| Chubb Ltd. |
37,128 | $ | 8,390,928 | |||||
| Citigroup, Inc. |
6,914 | 355,656 | ||||||
| Comcast Corp., Class A |
66,064 | 2,896,906 | ||||||
| Comerica, Inc. |
1,353 | 75,511 | ||||||
| ConocoPhillips |
37,888 | 4,397,660 | ||||||
| Costco Wholesale Corp. |
11,975 | 7,904,458 | ||||||
| Crown PropTech Acquisitions(d)(e) |
62,088 | 16,320 | ||||||
| Customers Bancorp, Inc. (e) |
537 | 30,942 | ||||||
| Cxaap, Inc., (Acquired 06/29/23, Cost: $128) (e)(f) |
35,190 | 45,395 | ||||||
| Datadog, Inc., Class A (e) |
35,670 | 4,329,625 | ||||||
| Davidson Kempner Merchant Co-investment Fund LP, (Acquired 04/01/21, Cost: $908,457) (e)(f)(h) |
— | (i) | 4,500,171 | |||||
| Delta Air Lines, Inc. |
60,749 | 2,443,932 | ||||||
| Dexcom, Inc. (e) |
16,293 | 2,021,798 | ||||||
| Edwards Lifesciences Corp. (e) |
38,634 | 2,945,842 | ||||||
| Element Solutions, Inc. |
49,065 | 1,135,364 | ||||||
| Eli Lilly & Co. |
14,155 | 8,251,233 | ||||||
| Enterprise Products Partners LP |
328,803 | 8,663,959 | ||||||
| Epic Games, Inc., (Acquired 03/29/21, Cost: $2,499,240) (d)(e)(f) |
2,824 | 1,731,536 | ||||||
| F5, Inc. (e) |
30,129 | 5,392,488 | ||||||
| Fanatics Holdings, Inc., (Acquired 12/15/21, Cost: $8,566,971) (d)(e)(f) |
126,282 | 9,314,560 | ||||||
| First Citizens BancShares, Inc., Class A |
126 | 178,790 | ||||||
| Ford Motor Co. |
29,355 | 357,837 | ||||||
| Formentera Partners Fund II LP (d)(h) |
— | (i) | 2,483,734 | |||||
| Fortive Corp. |
110,603 | 8,143,699 | ||||||
| Freeport-McMoRan, Inc. (g) |
172,408 | 7,339,409 | ||||||
| General Dynamics Corp. |
2,429 | 630,738 | ||||||
| General Motors Co. |
10,095 | 362,612 | ||||||
| GLOBALFOUNDRIES, Inc. (e) |
73,546 | 4,456,888 | ||||||
| Golden Entertainment, Inc. |
2,119 | 84,612 | ||||||
| Green Plains, Inc. (e) |
46,023 | 1,160,700 | ||||||
| Hawkeye 360(d)(e) |
406,081 | 3,833,405 | ||||||
| HCA Healthcare, Inc. |
2,320 | 627,978 | ||||||
| Hilton Worldwide Holdings, Inc. |
11,838 | 2,155,581 | ||||||
| Humana, Inc. |
24,828 | 11,366,507 | ||||||
| Informatica, Inc., Class A (e) |
46,671 | 1,324,990 | ||||||
| Ingersoll Rand, Inc. |
127,661 | 9,873,302 | ||||||
| Intel Corp. |
2,686 | 134,971 | ||||||
| Intuitive Surgical, Inc. (e) |
11,948 | 4,030,777 | ||||||
| Invesco S&P 500 Equal Weight ETF |
26,085 | 4,116,213 | ||||||
| Johnson & Johnson |
31,322 | 4,909,410 | ||||||
| JPMorgan Chase & Co. |
89,035 | 15,144,853 | ||||||
| Kenvue, Inc. |
126,721 | 2,728,303 | ||||||
| KLA Corp. |
5,148 | 2,992,532 | ||||||
| Las Vegas Sands Corp. |
8,436 | 415,136 | ||||||
| Latch, Inc. |
142,273 | 95,323 | ||||||
| Lennar Corp., Class A |
541 | 80,631 | ||||||
| Lessen Holdings, Inc. (d)(e) |
514,906 | 3,349,731 | ||||||
| Liberty Broadband Corp., Class C (e) |
39,610 | 3,192,170 | ||||||
| Liberty Media Corp.-Liberty Live, Class C (e) |
39,993 | 1,495,338 | ||||||
| Lions Gate Entertainment Corp., Class A (e) |
38,588 | 420,609 | ||||||
| LKQ Corp. |
116,054 | 5,546,221 | ||||||
| Lockheed Martin Corp. |
9,569 | 4,337,054 | ||||||
| LPL Financial Holdings, Inc. |
31,193 | 7,100,151 | ||||||
| M/I Homes, Inc. (e) |
4,300 | 592,282 | ||||||
| Marathon Petroleum Corp. |
5,414 | 803,221 | ||||||
| Marsh & McLennan Cos., Inc. |
65,085 | 12,331,655 | ||||||
| Masco Corp. |
11,041 | 739,526 | ||||||
| Security |
Shares |
Value | ||||||
| United States (continued) | ||||||||
| Mastercard, Inc., Class A |
39,242 | $ | 16,737,105 | |||||
| McDonald’s Corp. |
8,130 | 2,410,626 | ||||||
| McKesson Corp. |
3,319 | 1,536,631 | ||||||
| Merck & Co., Inc. |
111,534 | 12,159,437 | ||||||
| MGM Resorts International |
6,400 | 285,952 | ||||||
| Micron Technology, Inc. |
98,188 | 8,379,364 | ||||||
| Microsoft Corp. |
135,242 | 50,856,402 | ||||||
| Mirion Technologies, Inc., Class A |
477,390 | 4,893,247 | ||||||
| Mirion Technologies, Inc., Class A (e) |
219,122 | 2,246,000 | ||||||
| Mr. Cooper Group, Inc. (e) |
15,882 | 1,034,236 | ||||||
| Mythic AI, Inc., Series C, (Acquired 01/26/21, Cost: $560,518) (d)(e)(f) |
816 | — | ||||||
| NextEra Energy, Inc. (g) |
125,403 | 7,616,978 | ||||||
| Northrop Grumman Corp. |
22,340 | 10,458,248 | ||||||
| NVIDIA Corp. |
10,412 | 5,156,231 | ||||||
| Paramount Global, Class B |
6,918 | 102,317 | ||||||
| Park Hotels & Resorts, Inc. |
29,136 | 445,781 | ||||||
| Pfizer, Inc. |
153,754 | 4,426,578 | ||||||
| Phillips 66 |
7,853 | 1,045,548 | ||||||
| Playstudios, Inc., Class A |
226,924 | 614,964 | ||||||
| Progressive Corp. |
56,114 | 8,937,838 | ||||||
| Roche Holding AG |
7,920 | 2,302,293 | ||||||
| Rockwell Automation, Inc. |
16,250 | 5,045,300 | ||||||
| RXO, Inc. (e) |
5,629 | 130,931 | ||||||
| Salesforce, Inc. (e) |
28,436 | 7,482,649 | ||||||
| Sarcos Technology & Robotics Corp.(e) |
172,238 | 124,235 | ||||||
| Schlumberger NV |
31,466 | 1,637,491 | ||||||
| Sempra |
187,144 | 13,985,271 | ||||||
| Snorkel AI, Inc., (Acquired 06/30/21, Cost: $189,563) (d)(e)(f) |
12,621 | 109,803 | ||||||
| Sonder Holdings, Inc., Class A |
11,166 | 37,853 | ||||||
| Space Exploration Technologies Corp., A Shares, (Acquired 08/21/23, Cost: $1,663,335) (d)(e)(f) |
20,535 | 1,663,335 | ||||||
| Space Exploration Technologies Corp., C Shares, (Acquired 08/21/23, Cost: $1,785,240) (d)(e)(f) |
22,040 | 1,785,240 | ||||||
| SPDR S&P Biotech ETF |
45,000 | 4,018,050 | ||||||
| Starbucks Corp. |
23,557 | 2,261,708 | ||||||
| Sun Country Airlines Holdings, Inc. |
175,935 | 2,767,458 | ||||||
| Tesla, Inc. (e) |
11,369 | 2,824,969 | ||||||
| Texas Capital Bancshares, Inc. (e) |
1,817 | 117,433 | ||||||
| Thermo Fisher Scientific, Inc. |
19,809 | 10,514,419 | ||||||
| TJX Cos., Inc. |
74,278 | 6,968,019 | ||||||
| Transocean Ltd. (e) |
255,487 | 1,622,342 | ||||||
| Uber Technologies, Inc. (e) |
5,773 | 355,444 | ||||||
| United Airlines Holdings, Inc. (e) |
58,231 | 2,402,611 | ||||||
| United Parcel Service, Inc., Class B |
41,070 | 6,457,436 | ||||||
| UnitedHealth Group, Inc. (g) |
23,745 | 12,501,030 | ||||||
| Valero Energy Corp. |
24,193 | 3,145,090 | ||||||
| Veralto Corp. (e) |
45,672 | 3,756,979 | ||||||
| Visa, Inc., Class A |
15,139 | 3,941,439 | ||||||
| Volato Group, Inc., Class A, (Acquired 12/03/23, Cost: $146) (d)(f) |
29,114 | 117,329 | ||||||
| Vulcan Materials Co. |
20,840 | 4,730,888 | ||||||
| Walmart, Inc. |
60,339 | 9,512,443 | ||||||
| Walt Disney Co. (e) |
79,945 | 7,218,234 | ||||||
| C O N S O L I D A T E D S C H E D U L E O F I N V E S T M E N T S |
17 |
| Consolidated Schedule of Investments (continued) December 31, 2023 |
BlackRock Capital Allocation Term Trust (BCAT) (Percentages shown are based on Net Assets) |
| Security |
Shares |
Value | ||||||
| United States (continued) | ||||||||
| Wells Fargo & Co. |
112,305 | $ | 5,527,652 | |||||
| Zoetis, Inc., Class A |
12,652 | 2,497,125 | ||||||
|
|
|
|||||||
| 626,638,146 | ||||||||
|
|
|
|||||||
| Total Common Stocks — 52.1% |
965,938,689 | |||||||
|
|
|
|||||||
| Par (000) |
||||||||
| Corporate Bonds |
||||||||
| Australia — 0.4% | ||||||||
| Mineral Resources Ltd., 9.25%, 10/01/28 |
USD | 699 | 743,575 | |||||
| Oceana Australian Fixed Income Trust, A Note Upsize(d) |
||||||||
| 12.00%, 08/31/25 |
AUD | 1,881 | 1,280,269 | |||||
| 12.50%, 08/31/26 |
2,822 | 1,924,206 | ||||||
| 12.50%, 08/31/27 |
4,703 | 3,209,026 | ||||||
|
|
|
|||||||
| 7,157,076 | ||||||||
| Austria — 0.0% | ||||||||
| ams-OSRAM AG, 12.25%, 03/30/29 |
USD | 200 | 222,416 | |||||
| Suzano Austria GmbH, 3.13%, 01/15/32 |
200 | 165,250 | ||||||
|
|
|
|||||||
| 387,666 | ||||||||
| Belgium(j) — 0.0% | ||||||||
| Anheuser-Busch InBev SA, 4.00%, 09/24/25 |
GBP | 100 | 126,510 | |||||
| KBC Group NV, (1-year UK Government Bond + 0.92%), 1.25%, 09/21/27(b) |
100 | 115,893 | ||||||
|
|
|
|||||||
| 242,403 | ||||||||
| Brazil — 0.1% | ||||||||
| Azul Secured Finance LLP, 11.93%, 08/28/28 |
USD | 207 | 213,728 | |||||
| Banco Votorantim SA, 4.50%, 09/24/24(j) |
243 | 238,762 | ||||||
| Braskem Netherlands Finance BV(a) |
||||||||
| 8.50%, 01/12/31 |
329 | 306,793 | ||||||
| 7.25%, 02/13/33 |
469 | 390,442 | ||||||
| (5-year CMT + 8.22%), 8.50%, 01/23/81(b) |
354 | 304,440 | ||||||
| Embraer Netherlands Finance BV, 7.00%, 07/28/30(a) |
370 | 386,609 | ||||||
| Minerva Luxembourg SA, 8.88%, 09/13/33 |
327 | 345,806 | ||||||
|
|
|
|||||||
| 2,186,580 | ||||||||
| Canada — 0.8% | ||||||||
| Bausch & Lomb Escrow Corp., 8.38%, 10/01/28(a) |
171 | 180,395 | ||||||
| First Quantum Minerals Ltd.(a) |
||||||||
| 7.50%, 04/01/25 |
344 | 329,184 | ||||||
| 6.88%, 03/01/26 |
200 | 179,038 | ||||||
| Garda World Security Corp., 9.50%, 11/01/27(a) |
425 | 428,463 | ||||||
| HR Ottawa LP, 11.00%, 03/31/31(a) |
9,658 | 10,083,881 | ||||||
| Rogers Communications, Inc., 3.80%, 03/15/32 |
2,675 | 2,461,597 | ||||||
| Toronto-Dominion Bank, 2.88%, 04/05/27(j) |
GBP | 100 | 120,847 | |||||
|
|
|
|||||||
| 13,783,405 | ||||||||
| Cayman Islands — 0.3% | ||||||||
| Fantasia Holdings Group Co. Ltd., 6.95%, 12/17/21(e)(j)(k) |
USD | 320 | 7,200 | |||||
| Gaci First Investment Co., 5.13%, 02/14/53(j) |
250 | 225,703 | ||||||
| Melco Resorts Finance Ltd., 5.38%, 12/04/29(j) |
250 | 220,000 | ||||||
| Seagate HDD Cayman |
||||||||
| 8.25%, 12/15/29(a) |
569 | 613,682 | ||||||
| 8.50%, 07/15/31(a) |
326 | 353,809 | ||||||
| 9.63%, 12/01/32 |
550 | 628,925 | ||||||
| Security | Par (000) |
Value | ||||||
| Cayman Islands (continued) | ||||||||
| Shelf Drilling North Sea Holdings Ltd., 10.25%, 10/31/25(a) |
USD | 1,083 | $ | 1,083,000 | ||||
| Transocean Titan Financing Ltd., 8.38%, 02/01/28(a) |
424 | 439,895 | ||||||
| Transocean, Inc., 8.75%, 02/15/30(a) |
428 | 446,635 | ||||||
| Vantage Drilling International, 9.50%, 02/15/28(a) |
1,352 | 1,331,739 | ||||||
| Wynn Macau Ltd., 5.63%, 08/26/28(j) |
248 | 229,167 | ||||||
|
|
|
|||||||
| 5,579,755 | ||||||||
| Chile — 0.1% | ||||||||
| Empresa Nacional del Petroleo, 6.15%, 05/10/33(a) |
200 | 200,122 | ||||||
| Engie Energia Chile SA, 3.40%, 01/28/30(j) |
395 | 338,836 | ||||||
| Kenbourne Invest SA, 6.88%, 11/26/24(a) |
300 | 207,656 | ||||||
|
|
|
|||||||
| 746,614 | ||||||||
| China(j) — 0.0% | ||||||||
| Fantasia Holdings Group Co. Ltd.(e)(k) |
||||||||
| 11.75%, 04/17/22 |
520 | 11,700 | ||||||
| 9.25%, 07/28/23 |
1,200 | 27,000 | ||||||
| Fortune Star BVI Ltd., 5.05%, 01/27/27 |
200 | 130,687 | ||||||
|
|
|
|||||||
| 169,387 | ||||||||
| Colombia — 0.1% | ||||||||
| Ecopetrol SA |
||||||||
| 4.13%, 01/16/25 |
455 | 442,772 | ||||||
| 8.88%, 01/13/33 |
439 | 475,903 | ||||||
| Millicom International Cellular SA, 5.13%, 01/15/28(j) |
338 | 313,892 | ||||||
| SURA Asset Management SA, 4.88%, 04/17/24(j) |
530 | 525,267 | ||||||
|
|
|
|||||||
| 1,757,834 | ||||||||
| Costa Rica — 0.0% | ||||||||
| Liberty Costa Rica Senior Secured Finance, 10.88%, 01/15/31(a) |
211 | 216,374 | ||||||
|
|
|
|||||||
| Dominican Republic — 0.0% | ||||||||
| Aeropuertos Dominicanos Siglo XXI SA, 6.75%, 03/30/29(a) |
272 | 269,906 | ||||||
|
|
|
|||||||
| France — 0.2% | ||||||||
| BNP Paribas SA(j) |
||||||||
| 3.38%, 01/23/26 |
GBP | 100 | 123,552 | |||||
| 1.88%, 12/14/27 |
100 | 114,675 | ||||||
| Sabena Technics Sas, (3-mo. EURIBOR + 5.00% ), (Acquired 10/28/22, Cost: $2,354,522), 8.93%, 09/30/29(d)(f) |
EUR | 2,397 | 2,646,169 | |||||
| Societe Generale SA, 1.88%, 10/03/24(j) |
GBP | 100 | 124,133 | |||||
| TotalEnergies Capital International SA, 1.66%, 07/22/26(j) |
100 | 120,095 | ||||||
|
|
|
|||||||
| 3,128,624 | ||||||||
| Germany — 0.4% | ||||||||
| Adler Pelzer Holding GmbH, 9.50%, 04/01/27(a) |
EUR | 1,725 | 1,894,830 | |||||
| APCOA Parking Holdings GmbH, (3-mo. EURIBOR + 5.00%), 8.97%, 01/15/27(a)(b) |
852 | 938,835 | ||||||
| Douglas GmbH, 6.00%, 04/08/26(a) |
702 | 764,970 | ||||||
| Envalior, (6-mo. EURIBOR + 9.50%), 13.63%, 03/31/31(d)(l) |
3,099 | 3,078,542 | ||||||
|
|
|
|||||||
| 6,677,177 | ||||||||
| India — 0.1% | ||||||||
| Continuum Energy Aura Pte Ltd., 9.50%, 02/24/27(a) |
USD | 222 | 226,163 | |||||
| Diamond II Ltd., 7.95%, 07/28/26(a) |
270 | 271,012 | ||||||
| India Green Energy Holdings, 5.38%, 04/29/24(a) |
281 | 278,892 | ||||||
| 18 | 2 0 2 3 B L A C K R O C K A N N U A L R E P O R T T O S H A R E H O L D E R S |
| Consolidated Schedule of Investments (continued) December 31, 2023 |
BlackRock Capital Allocation Term Trust (BCAT) (Percentages shown are based on Net Assets) |
| Security | Par (000) |
Value | ||||||
| India (continued) | ||||||||
| ReNew Pvt Ltd., 5.88%, 03/05/27(j) |
USD | 200 | $ | 190,818 | ||||
| Vedanta Resources Finance II PLC, 13.88%, 01/21/24(j) |
200 | 177,108 | ||||||
|
|
|
|||||||
| 1,143,993 | ||||||||
| Indonesia(j) — 0.1% | ||||||||
| Freeport Indonesia PT, 4.76%, 04/14/27 |
231 | 227,560 | ||||||
| Medco Oak Tree Pte. Ltd., 7.38%, 05/14/26 |
300 | 298,219 | ||||||
| Pertamina Persero PT, 3.65%, 07/30/29 |
354 | 332,871 | ||||||
| Theta Capital Pte. Ltd., 8.13%, 01/22/25 |
200 | 177,772 | ||||||
|
|
|
|||||||
| 1,036,422 | ||||||||
| Isle of Man — 0.0% | ||||||||
| AngloGold Ashanti Holdings PLC, 3.75%, 10/01/30 |
300 | 260,344 | ||||||
|
|
|
|||||||
| Israel — 0.0% | ||||||||
| Energean Israel Finance Ltd., 8.50%, 09/30/33 |
261 | 247,859 | ||||||
| Leviathan Bond Ltd., 6.75%, 06/30/30(a)(j) |
101 | 92,499 | ||||||
|
|
|
|||||||
| 340,358 | ||||||||
| Italy(a) — 0.3% | ||||||||
| Forno d’Asolo SpA, (3-mo. EURIBOR + 5.50%), 9.43%, 04/30/27(b) |
EUR | 3,040 | 3,028,798 | |||||
| Marcolin SpA, 6.13%, 11/15/26 |
734 | 773,100 | ||||||
| Shiba Bidco SpA, 4.50%, 10/31/28 |
1,882 | 1,943,232 | ||||||
|
|
|
|||||||
| 5,745,130 | ||||||||
| Japan — 0.0% | ||||||||
| Rakuten Group, Inc., 10.25%, 11/30/24(a) |
USD | 605 | 617,099 | |||||
|
|
|
|||||||
| Kuwait — 0.0% | ||||||||
| MEGlobal BV, 2.63%, 04/28/28(a) |
205 | 184,116 | ||||||
|
|
|
|||||||
| Luxembourg — 0.1% | ||||||||
| EIG Pearl Holdings SARL, 3.55%, 08/31/36(a) |
517 | 449,305 | ||||||
| Herens Midco SARL, 5.25%, 05/15/29(a) |
EUR | 1,006 | 666,313 | |||||
| MC Brazil Downstream Trading SARL, 7.25%, 06/30/31(j) |
USD | 193 | 149,769 | |||||
| MHP Lux SA, 6.25%, 09/19/29(j) |
226 | 150,290 | ||||||
| Sani/Ikos Financial Holdings 1 SARL, 5.63%, 12/15/26(a) |
EUR | 718 | 746,664 | |||||
|
|
|
|||||||
| 2,162,341 | ||||||||
| Macau(j) — 0.0% | ||||||||
| MGM China Holdings Ltd., 5.88%, 05/15/26 |
USD | 250 | 243,750 | |||||
| Studio City Co. Ltd., 7.00%, 02/15/27 |
300 | 294,750 | ||||||
|
|
|
|||||||
| 538,500 | ||||||||
| Mauritius(j) — 0.0% | ||||||||
| CA Magnum Holdings, 5.38%, 10/31/26 |
200 | 186,000 | ||||||
| Network i2i Ltd., (5-year CMT + 3.39%), 3.98%(b)(m) |
300 | 278,250 | ||||||
|
|
|
|||||||
| 464,250 | ||||||||
| Mexico — 0.1% | ||||||||
| Braskem Idesa SAPI, 6.99%, 02/20/32(a) |
686 | 387,672 | ||||||
| Grupo KUO SAB De CV, 5.75%, 07/07/27(a) |
321 | 283,956 | ||||||
| Petroleos Mexicanos |
||||||||
| 3.75%, 02/21/24(j) |
EUR | 104 | 114,151 | |||||
| 4.25%, 01/15/25 |
USD | 248 | 240,405 | |||||
| 6.50%, 03/13/27 |
170 | 157,994 | ||||||
| 8.75%, 06/02/29 |
533 | 513,638 | ||||||
| 5.95%, 01/28/31 |
652 | 517,362 | ||||||
| 6.70%, 02/16/32 |
306 | 253,215 | ||||||
| 6.38%, 01/23/45 |
85 | 55,133 | ||||||
|
|
|
|||||||
| 2,523,526 | ||||||||
| Security | Par (000) |
Value | ||||||
| Morocco — 0.0% | ||||||||
| OCP SA, 3.75%, 06/23/31(j) |
USD | 231 | $ | 198,371 | ||||
|
|
|
|||||||
| Netherlands — 0.3% | ||||||||
| Braskem Netherlands Finance BV, 4.50%, 01/31/30(j) |
305 | 233,386 | ||||||
| GTCR W-2 Merger Sub LLC/GTCR W Dutch Finance Sub BV, 8.50%, 01/15/31(a) |
GBP | 408 | 561,662 | |||||
| ING Groep NV, 3.00%, 02/18/26(j) |
100 | 122,851 | ||||||
| MEGlobal BV(j) |
||||||||
| 4.25%, 11/03/26 |
USD | 297 | 286,605 | |||||
| 2.63%, 04/28/28 |
253 | 227,226 | ||||||
| Metinvest BV(j) |
||||||||
| 8.50%, 04/23/26 |
230 | 159,850 | ||||||
| 7.65%, 10/01/27 |
200 | 128,000 | ||||||
| NXP BV/NXP Funding LLC/NXP USA, Inc., 3.40%, 05/01/30 |
3,260 | 2,990,626 | ||||||
| Sigma Holdco BV, 5.75%, 05/15/26(j) |
EUR | 774 | 763,104 | |||||
| Trivium Packaging Finance BV, 8.50%, 08/15/27(a) |
USD | 267 | 261,793 | |||||
| Volkswagen Financial Services NV, 1.88%, 12/03/24(j) |
GBP | 100 | 123,098 | |||||
|
|
|
|||||||
| 5,858,201 | ||||||||
| Oman — 0.0% | ||||||||
| EDO Sukuk Ltd., 5.88%, 09/21/33 |
USD | 594 | 611,449 | |||||
|
|
|
|||||||
| Panama — 0.0% | ||||||||
| Aeropuerto Internacional de Tocumen SA, 5.13%, 08/11/61(a) |
200 | 150,014 | ||||||
| AES Panama Generation Holdings SRL, 4.38%, 05/31/30(j) |
249 | 208,916 | ||||||
|
|
|
|||||||
| 358,930 | ||||||||
| Peru — 0.0% | ||||||||
| Inkia Energy Ltd., 5.88%, 11/09/27(j) |
238 | 226,555 | ||||||
| Intercorp Peru Ltd., 3.88%, 08/15/29(a) |
307 | 265,917 | ||||||
|
|
|
|||||||
| 492,472 | ||||||||
| Singapore — 0.1% | ||||||||
| Pfizer Investment Enterprises Pte. Ltd., 4.75%, 05/19/33 |
1,867 | 1,871,191 | ||||||
| Puma International Financing SA, 5.00%, 01/24/26(j). |
493 | 465,114 | ||||||
|
|
|
|||||||
| 2,336,305 | ||||||||
| South Africa — 0.0% | ||||||||
| Sasol Financing USA LLC, 6.50%, 09/27/28 |
400 | 377,625 | ||||||
|
|
|
|||||||
| Spain(j) — 0.0% | ||||||||
| Banco Santander SA, (1-year UK Government Bond + 1.80%), 3.13%, 10/06/26(b) |
GBP | 300 | 367,204 | |||||
| Telefonica Emisiones SA, 5.38%, 02/02/26 |
133 | 171,376 | ||||||
|
|
|
|||||||
| 538,580 | ||||||||
| Sweden — 0.1% | ||||||||
| Verisure Holding AB |
||||||||
| 3.25%, 02/15/27(j) |
EUR | 751 | 794,271 | |||||
| 7.13%, 02/01/28(a) |
414 | 479,834 | ||||||
| Verisure Midholding AB, 5.25%, 02/15/29(j) |
751 | 789,686 | ||||||
|
|
|
|||||||
| 2,063,791 | ||||||||
| Switzerland — 0.1% | ||||||||
| UBS Group AG, (1-year EUR Swap + 0.77%), 0.65%, 01/14/28(b)(j) |
2,200 | 2,218,604 | ||||||
|
|
|
|||||||
| C O N S O L I D A T E D S C H E D U L E O F I N V E S T M E N T S |
19 |
| Consolidated Schedule of Investments (continued) December 31, 2023 |
BlackRock Capital Allocation Term Trust (BCAT) (Percentages shown are based on Net Assets) |
| Security | Par (000) |
Value | ||||||
| Thailand — 0.1% | ||||||||
| Bangkok Bank PCL/Hong Kong |
||||||||
| 5.30%, 09/21/28 |
USD | 441 | $ | 448,440 | ||||
| 5.50%, 09/21/33 |
441 | 453,070 | ||||||
|
|
|
|||||||
| 901,510 | ||||||||
| Ukraine — 0.0% | ||||||||
| VF Ukraine PAT via VFU Funding PLC, 6.20%, 02/11/25(j) |
334 | 255,510 | ||||||
|
|
|
|||||||
| United Arab Emirates — 0.3% | ||||||||
| DP World Salaam, (5-year CMT + 5.75%), 6.00%(b)(j)(m) |
352 | 350,472 | ||||||
| GEMS MENASA Cayman Ltd./GEMS Education Delaware LLC, 7.13%, 07/31/26(a) |
333 | 326,340 | ||||||
| MDGH GMTN RSC Ltd., 4.38%, 11/22/33(a) |
329 | 320,071 | ||||||
| Shelf Drilling Holdings Ltd., 9.63%, 04/15/29 |
3,590 | 3,486,788 | ||||||
|
|
|
|||||||
| 4,483,671 | ||||||||
| United Kingdom — 0.7% | ||||||||
| 10X future Technologies Service Ltd., (15.00% PIK), (Acquired 12/19/23, Cost: $1,606,100), 15.00%, 06/19/26(d)(f)(l)(n)(o) |
GBP | 1,301 | 1,608,849 | |||||
| Barclays PLC(j) |
||||||||
| 3.00%, 05/08/26 |
100 | 120,875 | ||||||
| 3.25%, 02/12/27 |
100 | 120,375 | ||||||
| BCP V Modular Services Finance II PLC, 6.13%, 11/30/28(a) |
2,355 | 2,679,108 | ||||||
| BCP V Modular Services Finance PLC, 6.75%, 11/30/29(a) |
EUR | 3,137 | 2,839,181 | |||||
| BG Energy Capital PLC, 5.13%, 12/01/25(j) |
GBP | 133 | 171,539 | |||||
| Connect Finco SARL/Connect U.S. Finco LLC, 6.75%, 10/01/26(a) |
USD | 1,900 | 1,888,619 | |||||
| Deuce Finco PLC, 5.50%, 06/15/27(a) |
GBP | 345 | 409,103 | |||||
| HSBC Holdings PLC, (3-mo. LIBOR GBP + 1.31%), 1.75%, 07/24/27(b) |
100 | 117,036 | ||||||
| Informa PLC, 3.13%, 07/05/26(j) |
100 | 121,951 | ||||||
| Kane Bidco Ltd.(a) |
||||||||
| 5.00%, 02/15/27 |
EUR | 478 | 504,074 | |||||
| 6.50%, 02/15/27 |
GBP | 699 | 825,493 | |||||
| Lloyds Banking Group PLC, 2.25%, 10/16/24(j) |
100 | 124,152 | ||||||
| NatWest Group PLC(b)(j) |
||||||||
| (1-year GBP Swap + 1.49%), 2.88%, 09/19/26 |
100 | 122,052 | ||||||
| (1-year GBP Swap + 2.01%), 3.13%, 03/28/27 |
100 | 121,087 | ||||||
| Santander U.K. Group Holdings PLC, 3.63%, 01/14/26(j) |
100 | 123,291 | ||||||
| Vedanta Resources Finance II PLC |
||||||||
| 8.95%, 03/11/25(j) |
USD | 293 | 217,154 | |||||
| 8.95%, 03/11/25(a) |
200 | 148,228 | ||||||
|
|
|
|||||||
| 12,262,167 | ||||||||
| United States — 8.1% | ||||||||
| AbbVie, Inc., 3.20%, 11/21/29 |
3,265 | 3,052,088 | ||||||
| Affinity Interactive, 6.88%, 12/15/27(a) |
1,000 | 891,234 | ||||||
| Alexandria Real Estate Equities, Inc., 2.95%, 03/15/34 |
2,370 | 1,976,210 | ||||||
| Alteryx, Inc., 8.75%, 03/15/28(a) |
132 | 140,497 | ||||||
| Amgen, Inc. |
||||||||
| 5.50%, 12/07/26(j) |
GBP | 100 | 131,225 | |||||
| 4.05%, 08/18/29 |
USD | 3,355 | 3,284,545 | |||||
| Amkor Technology, Inc., 6.63%, 09/15/27(a) |
400 | 404,998 | ||||||
| Aptiv PLC/Aptiv Corp., 3.25%, 03/01/32 |
3,000 | 2,650,189 | ||||||
| Ardagh Packaging Finance PLC/Ardagh Holdings USA, Inc., 5.25%, 08/15/27(a) |
402 | 312,300 | ||||||
| Security | Par (000) |
Value | ||||||
| United States (continued) | ||||||||
| AT&T, Inc. |
||||||||
| 2.90%, 12/04/26 |
GBP | 100 | $ | 125,411 | ||||
| 5.50%, 03/15/27(j) |
50 | 65,287 | ||||||
| Bank of America Corp., (1-day SOFR + 1.53%), 1.90%, 07/23/31(b) |
USD | 3,340 | 2,732,330 | |||||
| Big River Steel LLC/BRS Finance Corp., 6.63%, 01/31/29(a) |
1,082 | 1,103,186 | ||||||
| Broadcom, Inc., 3.42%, 04/15/33(a) |
2,615 | 2,296,773 | ||||||
| Calumet Specialty Products Partners LP/Calumet Finance Corp., 9.75%, 07/15/28 |
1,000 | 993,311 | ||||||
| Carrols Restaurant Group, Inc., 5.88%, 07/01/29(a) |
163 | 143,954 | ||||||
| Cinemark Holdings, Inc., 4.50%, 08/15/25(n) |
4,035 | 4,874,684 | ||||||
| Citigroup, Inc., 1.75%, 10/23/26 |
GBP | 100 | 117,913 | |||||
| Citizens Bank NA/Providence RI, (1-day SOFR + 1.45%), 6.06%, 10/24/25(b) |
USD | 250 | 243,892 | |||||
| Civitas Resources, Inc.(a) |
||||||||
| 5.00%, 10/15/26 |
1,187 | 1,151,156 | ||||||
| 8.38%, 07/01/28 |
40 | 41,758 | ||||||
| Cloud Software Group, Inc.(a) |
||||||||
| 6.50%, 03/31/29 |
280 | 266,683 | ||||||
| 9.00%, 09/30/29 |
300 | 285,136 | ||||||
| Clydesdale Acquisition Holdings, Inc., 8.75%, 04/15/30(a) |
756 | 704,869 | ||||||
| CommScope Technologies LLC, 6.00%, 06/15/25(a) |
173 | 140,995 | ||||||
| Concentrix Corp., 6.65%, 08/02/26 |
200 | 205,001 | ||||||
| CSC Holdings LLC |
||||||||
| 5.25%, 06/01/24 |
2,318 | 2,269,104 | ||||||
| 5.50%, 04/15/27(a) |
2,324 | 2,148,066 | ||||||
| DAE Funding LLC, 1.55%, 08/01/24(j) |
332 | 322,663 | ||||||
| DISH DBS Corp., 5.88%, 11/15/24 |
366 | 343,221 | ||||||
| DISH Network Corp., 0.00%, 12/15/25(n)(p) |
1,286 | 797,320 | ||||||
| EquipmentShare.com, Inc., 9.00%, 05/15/28(a) |
3,760 | 3,868,476 | ||||||
| First Horizon Bank, 5.75%, 05/01/30 |
250 | 235,706 | ||||||
| Flyr Convertible Notes, 8.00%, 08/10/27(d) |
2,322 | 2,654,038 | ||||||
| Flyr Secured Notes, (1-mo. CME Term SOFR + 5.00%), 10.34%, |
1,136 | 1,057,667 | ||||||
| Forestar Group, Inc., 5.00%, 03/01/28(a) |
2,600 | 2,501,224 | ||||||
| Freed Corp., 12.00%, 11/30/28(d) |
9,390 | 9,108,300 | ||||||
| FreeWire Technologies, Inc., (3-mo. CME Term SOFR +11.00%), 16.39%, 04/26/25(d) |
2,480 | 2,609,925 | ||||||
| Frontier Communications Holdings LLC(a) |
||||||||
| 5.88%, 10/15/27 |
923 | 891,711 | ||||||
| 8.75%, 05/15/30 |
1,250 | 1,285,886 | ||||||
| 8.63%, 03/15/31 |
745 | 759,604 | ||||||
| Frontier Florida LLC, Series E, 6.86%, 02/01/28 |
845 | 817,438 | ||||||
| Full House Resorts, Inc., 8.25%, 02/15/28(a) |
230 | 216,200 | ||||||
| Gen Digital, Inc., 7.13%, 09/30/30(a) |
200 | 208,964 | ||||||
| General Mills, Inc., 2.88%, 04/15/30 |
3,210 | 2,900,803 | ||||||
| General Motors Co., 5.60%, 10/15/32 |
1,265 | 1,293,404 | ||||||
| Goldman Sachs Group, Inc., 7.25%, 04/10/28 |
GBP | 50 | 69,696 | |||||
| GoTo Group, Inc., 5.50%, 09/01/27(a) |
USD | 1,675 | 810,185 | |||||
| GrafTech Global Enterprises, Inc., 9.88%, 12/15/28 |
254 | 195,898 | ||||||
| HCA, Inc., 3.63%, 03/15/32 |
2,120 | 1,895,650 | ||||||
| Homes By West Bay LLC, 9.50%, 04/30/27(d) |
5,256 | 4,966,920 | ||||||
| Howard Hughes Corp.(a) |
||||||||
| 4.13%, 02/01/29 |
1,002 | 893,493 | ||||||
| 4.38%, 02/01/31 |
1,102 | 955,710 | ||||||
| JPMorgan Chase & Co., (3-mo. LIBOR GBP + 0.68%), 0.99%, 04/28/26(b)(j) |
GBP | 100 | 120,312 | |||||
| Kraft Heinz Foods Co., 3.75%, 04/01/30 |
USD | 3,150 | 3,009,623 | |||||
| Landsea Homes Corp., 11.00%, 07/17/28(d) |
9,310 | 9,042,803 | ||||||
| 20 | 2 0 2 3 B L A C K R O C K A N N U A L R E P O R T T O S H A R E H O L D E R S |
| Consolidated Schedule of Investments (continued) December 31, 2023 |
BlackRock Capital Allocation Term Trust (BCAT) (Percentages shown are based on Net Assets) |
| Security | Par (000) |
Value | ||||||
| United States (continued) | ||||||||
| Lessen, Inc., (3-mo. CME Term SOFR + 8.50%), 13.40%, 01/05/28(d) |
USD | 1,902 | $ | 1,738,041 | ||||
| Level 3 Financing, Inc., 4.63%, 09/15/27(a) |
559 | 335,400 | ||||||
| Level 3 New Money TSA, 11.00%, 11/15/29(o) |
1,543 | 1,542,867 | ||||||
| LGI Homes, Inc., 8.75%, 12/15/28 |
2,163 | 2,300,891 | ||||||
| Lightning eMotors, Inc., 7.50%, 05/15/24(a)(n) |
945 | 47,250 | ||||||
| Lions Gate Capital Holdings LLC, 5.50%, 04/15/29(a) |
1,410 | 1,054,821 | ||||||
| Lowe’s Cos., Inc., 2.63%, 04/01/31 |
2,960 | 2,590,115 | ||||||
| Mauser Packaging Solutions Holding Co., 7.88%, 08/15/26(a) |
2,240 | 2,279,605 | ||||||
| Morgan Stanley, (1-day SOFR + 1.02%), 1.93%, 04/28/32(b) |
3,055 | 2,456,601 | ||||||
| Nationstar Mortgage Holdings, Inc.(a) |
||||||||
| 6.00%, 01/15/27 |
242 | 240,185 | ||||||
| 5.50%, 08/15/28 |
1,128 | 1,084,661 | ||||||
| 5.75%, 11/15/31 |
488 | 455,015 | ||||||
| NCR Atleos Corp., 9.50%, 04/01/29 |
430 | 456,873 | ||||||
| Nexstar Media, Inc., 4.75%, 11/01/28(a) |
511 | 470,876 | ||||||
| Olympus Water U.S. Holding Corp., 9.75%, 11/15/28(a) |
2,000 | 2,122,786 | ||||||
| Parsley Energy LLC/Parsley Finance Corp., 4.13%, 02/15/28(a) |
1,275 | 1,228,632 | ||||||
| PennyMac Financial Services, Inc., 7.88%, 12/15/29 |
820 | 844,081 | ||||||
| Permian Resources Operating LLC, 7.00%, 01/15/32 |
572 | 590,117 | ||||||
| PG&E Corp., 4.25%, 12/01/27 |
223 | 233,704 | ||||||
| Pioneer Midco Notes, (10.50% PIK), 10.50%, 11/18/30(d)(l) |
4,252 | 4,251,942 | ||||||
| Pitney Bowes, Inc., 6.88%, 03/15/27(a) |
2,120 | 1,979,963 | ||||||
| Rand Parent LLC, 8.50%, 02/15/30(a) |
587 | 561,363 | ||||||
| Republic Services, Inc., 1.45%, 02/15/31 |
3,080 | 2,498,505 | ||||||
| RingCentral, Inc., 8.50%, 08/15/30 |
605 | 618,613 | ||||||
| Sabre GLBL, Inc. |
||||||||
| 9.25%, 04/15/25(a) |
158 | 151,680 | ||||||
| 8.63%, 06/01/27 |
825 | 750,766 | ||||||
| 11.25%, 12/15/27(a) |
1,308 | 1,285,148 | ||||||
| Sasol Financing USA LLC |
||||||||
| 4.38%, 09/18/26 |
204 | 189,720 | ||||||
| 8.75%, 05/03/29(a) |
271 | 276,000 | ||||||
| Service Properties Trust, 8.63%, 11/15/31(a) |
1,704 | 1,784,826 | ||||||
| SierraCol Energy Andina LLC, 6.00%, 06/15/28(j) |
323 | 268,930 | ||||||
| Sitio Royalties Operating Partnership LP/Sitio Finance Corp., 7.88%, 11/01/28 |
813 | 842,447 | ||||||
| Sonder Secured Notes, (3-mo. CME Term SOFR at 1.00% Floor + 9.00%), 14.61%, 01/19/27(b)(d) |
8,843 | 7,704,964 | ||||||
| Spirit AeroSystems, Inc.(a) |
||||||||
| 9.38%, 11/30/29 |
402 | 439,898 | ||||||
| 9.75%, 11/15/30 |
1,131 | 1,215,796 | ||||||
| Stem, Inc., 0.50%, 12/01/28(a)(n) |
200 | 101,582 | ||||||
| Tapestry, Inc., 7.35%, 11/27/28 |
350 | 367,148 | ||||||
| Tenneco, Inc., 8.00%, 11/17/28(a) |
1,648 | 1,406,980 | ||||||
| Texas Capital Bancshares, Inc., (5-year CMT + 3.15%), 4.00%, 05/06/31(b) |
174 | 150,939 | ||||||
| Texas Capital Bank NA, (3-mo. LIBOR US + 4.50%), 10.09%, 09/30/24(a)(b) |
2,763 | 2,745,125 | ||||||
| T-Mobile U.S., Inc., 2.70%, 03/15/32 |
2,955 | 2,518,255 | ||||||
| Uber Technologies, Inc., 0.88%, 12/01/28 |
753 | 818,888 | ||||||
| UnitedHealth Group, Inc., 4.20%, 05/15/32 |
2,430 | 2,377,818 | ||||||
| Uniti Group LP/Uniti Group Finance, Inc./CSL Capital LLC, 10.50%, 02/15/28(a) |
611 | 619,435 | ||||||
| Univision Communications, Inc., 8.00%, 08/15/28(a) |
335 | 345,593 | ||||||
| Security | Par (000) |
Value | ||||||
| United States (continued) | ||||||||
| Verizon Communications, Inc., 1.13%, 11/03/28 |
GBP | 100 | $ | 110,211 | ||||
| Viasat, Inc., 5.63%, 04/15/27(a) |
USD | 492 | 476,010 | |||||
| Vistra Operations Co. LLC, 7.75%, 10/15/31(a) |
320 | 332,348 | ||||||
| Waste Management, Inc., 4.15%, 04/15/32 |
1,875 | 1,830,552 | ||||||
| Xerox Holdings Corp., 5.00%, 08/15/25(a) |
1,630 | 1,596,555 | ||||||
|
|
|
|||||||
| 149,276,156 | ||||||||
|
|
|
|||||||
| Total Corporate Bonds — 12.9% |
239,552,222 | |||||||
|
|
|
|||||||
| Fixed Rate Loan Interests |
||||||||
| United States(d) — 0.6% | ||||||||
| AMF MF Portfolio, Term Loan, 6.67%, 11/01/28 |
2,975 | 2,965,530 | ||||||
| CML ST Regis Aspen, Term Loan, 8.26%, 02/09/27 |
6,407 | 6,406,581 | ||||||
| OD Intermediate SUBI Holdco II LLC, Mezzanine Term Loan, 10.00%, 01/23/26 |
2,665 | 2,548,031 | ||||||
|
|
|
|||||||
| Total Fixed Rate Loan Interests — 0.6% (Cost: $11,931,690) |
11,920,142 | |||||||
|
|
|
|||||||
| Floating Rate Loan Interests(b) |
||||||||
| Colombia — 0.2% | ||||||||
| Ecopetrol SA, 2023 Term Loan, (3-mo. CME Term SOFR + 4.75%), 10.13%, 09/06/30 |
3,600 | 3,573,000 | ||||||
|
|
|
|||||||
| Ireland — 0.2% | ||||||||
| Promontoria Beech Designated Activity Co., EUR Term Loan, (1-mo. EURIBOR + 3.75%), 7.63%, 05/17/27(d) |
EUR | 3,484 | 3,826,675 | |||||
|
|
|
|||||||
| Jersey(d) — 0.4% | ||||||||
| Vita Global Finco Ltd. |
||||||||
| EUR Term Loan B, (6-mo. EURIBOR + 7.00%), 10.95%, 07/06/27 |
4,749 | 4,948,209 | ||||||
| GBP Incremental Term Loan, (6-mo. SONIA + 7.00%), 12.19%, 07/06/27 |
GBP | 2,908 | 3,507,225 | |||||
|
|
|
|||||||
| 8,455,434 | ||||||||
| Luxembourg(d) — 0.2% | ||||||||
| Euro Parfums Fze, Term Loan B, (3-mo. CME Term SOFR + 6.75%), 12.21%, 06/23/28 |
USD | 603 | 589,433 | |||||
| Speed Midco 3 SARL, EUR Term Loan B1, (3-mo. EURIBOR + 6.40%), 10.33%, 05/16/29 |
EUR | 2,566 | 2,875,181 | |||||
|
|
|
|||||||
| 3,464,614 | ||||||||
| Netherlands — 0.2% | ||||||||
| Cypher Bidco BV, EUR Term Loan, (6-mo. EURIBOR + 4.50%), 8.60%, 03/01/28(d) |
1,827 | 1,906,685 | ||||||
| Upfield BV, 2023 GBP Term Loan B8, (1-day SONIA + 4.00%), 8.97%, 01/02/28 |
GBP | 1,388 | 1,677,552 | |||||
|
|
|
|||||||
| 3,584,237 | ||||||||
| United States — 3.5% | ||||||||
| Alorica, Inc., 2022 Term Loan, (1-mo. CME Term SOFR at 1.50% Floor + 6.88%), 12.23%, 12/21/27(d) |
USD | 3,295 | 3,228,865 | |||||
| Altar Bidco, Inc., 2021 2nd Lien Term Loan, (3-mo. CME Term SOFR at 0.50% Floor + 5.60%), 10.81%, 02/01/30 |
2,077 | 2,035,950 | ||||||
| City Brewing Co. LLC, Closing Date Term Loan, (1-mo. CME Term SOFR at 0.75% Floor + 3.50%), 9.16%, 04/05/28 |
694 | 543,887 | ||||||
| C O N S O L I D A T E D S C H E D U L E O F I N V E S T M E N T S |
21 |
| Consolidated Schedule of Investments (continued) December 31, 2023 |
BlackRock Capital Allocation Term Trust (BCAT) (Percentages shown are based on Net Assets) |
| Security | Par (000) |
Value | ||||||
| United States (continued) | ||||||||
| CML Hyatt Lost Pines, Term Loan, (1-mo. CME Term SOFR + 3.55%), 8.91%, 09/09/26(d) |
USD | 5,000 | $ | 4,915,858 | ||||
| CML La Quinta Resort, Term Loan, (1-mo. LIBOR US + 3.00%), 8.44%, 12/09/26(d) |
6,885 | 6,703,250 | ||||||
| Coreweave Compute Acquisition Co. II, LLC, Delayed Draw Term Loan, (3-mo. CME Term SOFR + 8.75%), 14.13%, 06/30/28(d) |
4,442 | 4,370,235 | ||||||
| ECL Entertainment, LLC, 2023 Term Loan B, (1-mo. CME Term SOFR at 0.75% Floor + 4.75%), 10.11%, 08/31/30 |
2,964 | 2,965,795 | ||||||
| EIS Buyer, Inc., Revolver, (1-mo. CME Term SOFR at 0.75% Floor + 7.00%), 12.36%, 07/10/28(d) |
373 | 361,721 | ||||||
| EIS Group, Inc., Term Loan, (1-mo. CME Term SOFR + 7.00%), 12.36%, 05/01/28(d) |
3,734 | 3,617,206 | ||||||
| Emerald Electronics Manufacturing Services, Term Loan, (3-mo. CME Term SOFR at 1.00% Floor + 6.25%), 11.79%, 12/29/27 |
1,130 | 1,009,720 | ||||||
| Galaxy Universal LLC, 1st Lien Term Loan, (3-mo. CME Term SOFR at 1.00% Floor + 5.75%), 11.28%, 11/12/26(d) |
13,091 | 12,846,604 | ||||||
| GoTo Group, Inc., Term Loan B, (3-mo. CME Term SOFR + 4.75%), 10.28%, 08/31/27 |
1,953 | 1,282,996 | ||||||
| Green Plains Operating Co. LLC, Term Loan, (3-mo. LIBOR US + 8.00%), 13.65%, 07/20/26(d) |
6,737 | 6,484,262 | ||||||
| Helios Service Partners LLC(d) |
||||||||
| 2023 Delayed Draw Term Loan, (3-mo. CME Term SOFR at 1.00% Floor + 6.25%), 11.88%, 03/19/27 |
628 | 623,931 | ||||||
| 2023 Term Loan B, (3-mo. CME Term SOFR at 1.00% Floor + 6.25%), 11.86%, 03/19/27 |
618 | 614,380 | ||||||
| Hydrofarm Holdings LLC, 2021 Term Loan, (3-mo. CME Term SOFR at -4.50% Floor + 5.50%), 11.15%, 10/25/28(d) |
1,902 | 1,521,696 | ||||||
| Indy U.S. Holdco LLC, 2023 EUR Incremental Term Loan, (1-mo. EURIBOR + 6.50%), 10.34%, 03/06/28 |
EUR | 2,763 | 3,035,146 | |||||
| Level 3 Financing, Inc. |
||||||||
| 2019 Term Loan B, (1-mo. CME Term SOFR + 1.75%), 7.22%, 03/01/27 |
USD | 528 | 500,845 | |||||
| 2023 TSA Term Loan B, (1-mo. CME Term SOFR + 1.75%), 7.21%, 03/01/27(d) |
328 | 311,600 | ||||||
| Maverick Gaming LLC, Term Loan B, (3-mo. CME Term SOFR + 7.50%), 13.15%, 09/03/26 |
927 | 665,005 | ||||||
| Medical Solutions Holdings, Inc., 2021 2nd Lien Term Loan, (1-mo. CME Term SOFR at 0.50% Floor + 7.00%), 12.46%, 11/01/29 |
1,052 | 882,365 | ||||||
| Orion Group Holdco LLC(d) |
||||||||
| 2022 1st Amendment Term Loan, (3-mo. CME Term SOFR at 1.00% Floor + 6.50%), 12.11%, 03/19/27 |
118 | 117,775 | ||||||
| 2022 First A&R Amendment Incremental DDTL, (3-mo. CME Term SOFR at 1.00% Floor + 6.50%), 11.88%, 03/19/27 |
527 | 526,713 | ||||||
| Delayed Draw Term Loan, (3-mo. CME Term SOFR at 1.00% Floor + 6.00%), 11.61%, 03/19/27 |
199 | 196,480 | ||||||
| First Lien Delayed Draw Term Loan, (3-mo. CME Term SOFR at 1.00% Floor + 6.00%), 11.61%, 03/19/27 |
1,179 | 1,179,333 | ||||||
| First Lien Term Loan, (3-mo. CME Term SOFR at 1.00% Floor + 6.00%), 11.61%, 03/19/27 |
101 | 100,715 | ||||||
| Security | Par (000) |
Value | ||||||
| United States (continued) | ||||||||
| Orion Group Holdco LLC(d) (continued) Term Loan, (3-mo. CME Term SOFR at 1.00% Floor + 6.00%), 11.61%, 03/19/27 |
USD | 20 | $ | 19,627 | ||||
| Quartz Acquireco LLC, Term Loan B, (1-mo. CME Term SOFR + 3.50%), 8.86%, 06/28/30(d) |
174 | 174,999 | ||||||
| Redstone Holdco 2 LP |
||||||||
| 2021 2nd Lien Term Loan, (1-mo. CME Term SOFR at 0.75% Floor + 7.75%), 13.22%, 04/27/29 |
620 | 375,100 | ||||||
| 2021 Term Loan, (1-mo. CME Term SOFR at 0.75% Floor + 4.75%), 10.22%, 04/27/28 |
1,681 | 1,263,012 | ||||||
| Roper Industrial Products Investment Co., USD Term Loan, (3-mo. CME Term SOFR at 0.50% Floor + 4.00%), 9.35%, 11/22/29 |
1,879 | 1,881,644 | ||||||
| Xerox Holdings Corp., 2023 Term Loan B, (1-mo. CME Term SOFR at 0.50% Floor + 4.00%), 9.36%, 11/17/29 |
90 | 89,890 | ||||||
|
|
|
|||||||
| 64,446,605 | ||||||||
|
|
|
|||||||
| Total Floating Rate Loan Interests — 4.7% |
|
87,350,565 | ||||||
|
|
|
|||||||
| Foreign Agency Obligations |
||||||||
| Bahrain(j) — 0.0% | ||||||||
| Bahrain Government International Bond |
||||||||
| 5.45%, 09/16/32 |
257 | 235,557 | ||||||
| 7.50%, 09/20/47 |
257 | 241,419 | ||||||
|
|
|
|||||||
| 476,976 | ||||||||
| Brazil — 0.6% | ||||||||
| Brazil Letras do Tesouro Nacional, 0.00%, 07/01/24(p) |
BRL | 54,542 | 10,682,517 | |||||
|
|
|
|||||||
| Chile — 0.0% | ||||||||
| Chile Government International Bond, 4.34%, 03/07/42 |
USD | 478 | 425,868 | |||||
|
|
|
|||||||
| Colombia — 0.1% | ||||||||
| Colombia Government International Bond |
||||||||
| 3.88%, 04/25/27 |
710 | 676,497 | ||||||
| 3.13%, 04/15/31 |
494 | 401,529 | ||||||
| 8.00%, 04/20/33 |
524 | 571,979 | ||||||
| 8.00%, 11/14/35 |
200 | 218,563 | ||||||
|
|
|
|||||||
| 1,868,568 | ||||||||
| Costa Rica — 0.0% | ||||||||
| Costa Rica Government, 7.30%, 11/13/54 |
210 | 227,619 | ||||||
| Costa Rica Government International Bond, 6.55%, 04/03/34(j) |
226 | 234,023 | ||||||
|
|
|
|||||||
| 461,642 | ||||||||
| Dominican Republic — 0.1% | ||||||||
| Dominican Republic International Bond |
||||||||
| 5.95%, 01/25/27(j) |
717 | 718,491 | ||||||
| 4.50%, 01/30/30(a) |
720 | 661,500 | ||||||
| 7.05%, 02/03/31(a) |
360 | 377,622 | ||||||
| 4.88%, 09/23/32(a) |
548 | 498,209 | ||||||
|
|
|
|||||||
| 2,255,822 | ||||||||
| Egypt — 0.0% | ||||||||
| Egypt Government International Bond, 8.50%, 01/31/47(a) |
400 | 248,250 | ||||||
|
|
|
|||||||
| 22 | 2 0 2 3 B L A C K R O C K A N N U A L R E P O R T T O S H A R E H O L D E R S |
| Consolidated Schedule of Investments (continued) December 31, 2023 |
BlackRock Capital Allocation Term Trust (BCAT) (Percentages shown are based on Net Assets) |
| Security | Par (000) |
Value | ||||||
| Guatemala — 0.1% | ||||||||
| Guatemala Government Bond |
||||||||
| 5.25%, 08/10/29(a) |
USD | 277 | $ | 271,183 | ||||
| 7.05%, 10/04/32 |
410 | 435,625 | ||||||
| 3.70%, 10/07/33(j) |
298 | 247,936 | ||||||
| 6.60%, 06/13/36 |
230 | 236,325 | ||||||
| 4.65%, 10/07/41(a) |
551 | 449,065 | ||||||
|
|
|
|||||||
| 1,640,134 | ||||||||
| Honduras — 0.0% | ||||||||
| Honduras Government International Bond, 5.63%, 06/24/30(a) |
195 | 173,550 | ||||||
|
|
|
|||||||
| Hungary — 0.1% | ||||||||
| Hungary Government International Bond |
||||||||
| 5.38%, 03/25/24 |
162 | 161,960 | ||||||
| 5.25%, 06/16/29(a) |
389 | 391,151 | ||||||
| Magyar Export-Import Bank, 6.00%, 05/16/29 |
EUR | 384 | 448,949 | |||||
|
|
|
|||||||
| 1,002,060 | ||||||||
| Ivory Coast(j) — 0.1% | ||||||||
| Ivory Coast Government International Bond |
||||||||
| 6.38%, 03/03/28 |
USD | 818 | 801,895 | |||||
| 5.88%, 10/17/31 |
EUR | 153 | 151,064 | |||||
|
|
|
|||||||
| 952,959 | ||||||||
| Jordan — 0.0% | ||||||||
| Jordan Government International Bond, 4.95%, 07/07/25(j) |
USD | 200 | 195,375 | |||||
|
|
|
|||||||
| Mexico — 0.1% | ||||||||
| Mexico Government International Bond |
||||||||
| 2.66%, 05/24/31 |
594 | 501,002 | ||||||
| 6.35%, 02/09/35 |
550 | 575,266 | ||||||
| 6.34%, 05/04/53 |
200 | 203,625 | ||||||
|
|
|
|||||||
| 1,279,893 | ||||||||
| Morocco(a) — 0.0% | ||||||||
| Morocco Government International Bond |
||||||||
| 2.38%, 12/15/27 |
303 | 270,996 | ||||||
| 5.95%, 03/08/28 |
200 | 204,875 | ||||||
|
|
|
|||||||
| 475,871 | ||||||||
| Nigeria — 0.0% | ||||||||
| Nigeria Government International Bond, 8.38%, 03/24/29(a) |
553 | 529,670 | ||||||
|
|
|
|||||||
| Oman(j) — 0.1% | ||||||||
| Oman Government International Bond |
||||||||
| 6.50%, 03/08/47 |
439 | 447,231 | ||||||
| 6.75%, 01/17/48 |
527 | 550,221 | ||||||
| Oman Sovereign Sukuk Co., 4.40%, 06/01/24 |
238 | 236,141 | ||||||
|
|
|
|||||||
| 1,233,593 | ||||||||
| Panama — 0.0% | ||||||||
| Panama Government International Bond |
||||||||
| 6.40%, 02/14/35 |
374 | 364,650 | ||||||
| 6.85%, 03/28/54 |
401 | 374,434 | ||||||
|
|
|
|||||||
| 739,084 | ||||||||
| Paraguay — 0.0% | ||||||||
| Republic of Paraguay, 2.74%, 01/29/33 |
395 | 323,900 | ||||||
|
|
|
|||||||
| Peru — 0.1% | ||||||||
| Corp. Financiera de Desarrollo SA, 4.75%, 07/15/25(j) |
406 | 401,014 | ||||||
| Security | Par (000) |
Value | ||||||
| Peru (continued) | ||||||||
| Peruvian Government International Bond |
||||||||
| 2.78%, 01/23/31 |
USD | 250 | $ | 217,266 | ||||
| 1.86%, 12/01/32 |
850 | 664,062 | ||||||
| 3.00%, 01/15/34 |
200 | 168,375 | ||||||
|
|
|
|||||||
| 1,450,717 | ||||||||
| Poland — 0.1% | ||||||||
| Bank Gospodarstwa Krajowego, 6.25%, 10/31/28(a) |
200 | 210,960 | ||||||
| Republic of Poland Government International Bond |
||||||||
| 4.88%, 10/04/33 |
220 | 222,365 | ||||||
| 4.25%, 02/14/43(j) |
EUR | 147 | 170,555 | |||||
| 5.50%, 04/04/53 |
USD | 348 | 362,063 | |||||
|
|
|
|||||||
| 965,943 | ||||||||
| Republic of North Macedonia — 0.0% | ||||||||
| North Macedonia Government International Bond, 6.96%, 03/13/27(j) |
EUR | 187 | 215,177 | |||||
|
|
|
|||||||
| Romania — 0.1% | ||||||||
| Romanian Government International Bond |
||||||||
| 5.25%, 11/25/27(a) |
USD | 206 | 204,127 | |||||
| 2.88%, 03/11/29(j) |
EUR | 473 | 472,051 | |||||
| 2.50%, 02/08/30(j) |
503 | 480,617 | ||||||
| 2.12%, 07/16/31(j) |
690 | 605,519 | ||||||
|
|
|
|||||||
| 1,762,314 | ||||||||
| Saudi Arabia — 0.1% | ||||||||
| Saudi Government International Bond, 5.00%, 01/18/53(a) |
USD | 1,058 | 994,189 | |||||
|
|
|
|||||||
| Senegal — 0.0% | ||||||||
| Senegal Government International Bond, 6.25%, 05/23/33(j) |
278 | 247,594 | ||||||
|
|
|
|||||||
| South Africa — 0.1% | ||||||||
| Republic of South Africa Government International Bond |
||||||||
| 5.88%, 04/20/32 |
680 | 644,096 | ||||||
| 5.00%, 10/12/46 |
706 | 519,793 | ||||||
|
|
|
|||||||
| 1,163,889 | ||||||||
| Spain(a)(j) — 1.5% | ||||||||
| Spain Government Bond |
||||||||
| 0.50%, 10/31/31 |
EUR | 1,487 | 1,381,105 | |||||
| 2.55%, 10/31/32 |
17,348 | 18,681,737 | ||||||
| 3.15%, 04/30/33 |
1,057 | 1,186,191 | ||||||
| 3.90%, 07/30/39 |
2,343 | 2,739,477 | ||||||
| 2.90%, 10/31/46 |
2,252 | 2,245,651 | ||||||
| 3.45%, 07/30/66 |
2,440 | 2,511,548 | ||||||
|
|
|
|||||||
| 28,745,709 | ||||||||
| Trinidad And Tobago — 0.0% | ||||||||
| Trinidad & Tobago Government International Bond, 5.95%, 01/14/31 |
USD | 200 | 206,500 | |||||
|
|
|
|||||||
| Ukraine(e)(k) — 0.0% | ||||||||
| Ukraine Government International Bond |
||||||||
| 7.75%, 09/01/25(j) |
261 | 76,734 | ||||||
| 8.99%, 02/01/26(j) |
413 | 121,009 | ||||||
| 7.25%, 03/15/35(a) |
644 | 149,408 | ||||||
|
|
|
|||||||
| 347,151 | ||||||||
| C O N S O L I D A T E D S C H E D U L E O F I N V E S T M E N T S |
23 |
| Consolidated Schedule of Investments (continued) December 31, 2023 |
BlackRock Capital Allocation Term Trust (BCAT) (Percentages shown are based on Net Assets) |
| Security | Par (000) |
Value | ||||||
| United Kingdom(j) — 0.4% | ||||||||
| United Kingdom Gilt |
||||||||
| 3.75%, 10/22/53 |
GBP | 1,911 | $ | 2,273,916 | ||||
| 0.50%, 10/22/61 |
10,627 | 4,583,863 | ||||||
|
|
|
|||||||
| 6,857,779 | ||||||||
| Uzbekistan — 0.0% | ||||||||
| Republic of Uzbekistan International Bond, 7.85%, 10/12/28 |
USD | 209 | 218,274 | |||||
|
|
|
|||||||
| Total Foreign Agency Obligations — 3.7% |
|
68,140,968 | ||||||
|
|
|
|||||||
| Shares | ||||||||
| Investment Companies |
||||||||
| United States — 0.9% | ||||||||
| iShares iBoxx $ Investment Grade Corporate Bond ETF (q) |
37,594 | 4,160,152 | ||||||
| iShares JP Morgan USD Emerging Markets Bond ETF (q) |
71,155 | 6,337,064 | ||||||
| iShares MSCI Brazil ETF (q) |
23,271 | 813,554 | ||||||
| iShares Russell 2000 ETF (q) |
9,800 | 1,966,958 | ||||||
| iShares Russell Mid-Cap Growth ETF (q) |
3,986 | 416,378 | ||||||
| VanEck J. P. Morgan EM Local Currency Bond ETF |
87,582 | 2,220,204 | ||||||
| VanEck Semiconductor ETF (e) |
5,362 | 937,653 | ||||||
|
|
|
|||||||
| Total Investment Companies — 0.9% |
|
16,851,963 | ||||||
|
|
|
|||||||
| Par (000) |
||||||||
| Municipal Bonds |
||||||||
| Puerto Rico(b) — 0.2% | ||||||||
| Commonwealth of Puerto Rico, GO |
||||||||
| 0.00%, 11/01/51 |
USD | 4,482 | 1,828,912 | |||||
| Series A-1, 0.00%, 11/01/43 |
393 | 212,365 | ||||||
| Commonwealth of Puerto Rico, RB, 0.00%, 11/01/51 |
1,911 | 668,870 | ||||||
|
|
|
|||||||
| Total Municipal Bonds — 0.2% |
2,710,147 | |||||||
|
|
|
|||||||
| Non-Agency Mortgage-Backed Securities |
| |||||||
| United States — 5.2% | ||||||||
| Ajax Mortgage Loan Trust(a) |
||||||||
| Series 2020-C, Class A, 2.25%, 09/27/60(c) |
62 | 61,528 | ||||||
| Series 2020-C, Class B, 5.00%, 09/27/60(c) |
375 | 366,444 | ||||||
| Series 2020-C, Class C, 0.00%, 09/27/60 |
1,176 | 960,170 | ||||||
| Series 2020-D, Class B, 5.00%, 06/25/60(c) |
525 | 514,313 | ||||||
| Series 2020-D, Class C, 0.00%, 06/25/60 |
1,236 | 926,275 | ||||||
| Series 2021-E, Class B3, 3.77%, 12/25/60(b) |
952 | 290,122 | ||||||
| Series 2021-E, Class SA, 0.00%, 12/25/60(b) |
11 | 5,104 | ||||||
| Series 2021-E, Class XS, 0.00%, 12/25/60(b) |
13,200 | 532,000 | ||||||
| BAMLL Commercial Mortgage Securities Trust(a)(b) |
||||||||
| Series 2017-SCH, Class AL, |
2,000 | 1,774,886 | ||||||
| Series 2018-DSNY, Class D, |
2,000 | 1,970,154 | ||||||
| Security | Par (000) |
Value | ||||||
| United States (continued) | ||||||||
| BFLD Trust, Series 2021-EYP, Class E, |
USD | 790 | $ | 80,030 | ||||
| BX Commercial Mortgage Trust(a)(b) |
||||||||
| Series 2020-VIV3, Class B, 3.54%, 03/09/44 |
1,600 | 1,400,029 | ||||||
| Series 2020-VKNG, Class G, (1-mo. Term SOFR + 3.36%), 8.73%, 10/15/37 |
1,610 | 1,546,432 | ||||||
| Series 2021-MFM1, Class G, (1-mo. Term SOFR + 4.01%), 9.38%, 01/15/34 |
1,364 | 1,335,797 | ||||||
| BX Trust, Series 2021-VIEW, Class E, (1-mo. Term SOFR + 3.71%), 9.08%, 06/15/36(a)(b) |
897 | 816,777 | ||||||
| Cold Storage Trust, Series 2020-ICE5, Class F, (1-mo. Term SOFR + 3.61%), 8.96%, 11/15/37(a)(b) |
3,932 | 3,890,327 | ||||||
| Commercial Mortgage Trust(b) |
||||||||
| Series 2015-CR25, Class C, 4.52%, 08/10/48 |
2,000 | 1,842,822 | ||||||
| Series 2019-GC44, Class 180B, 3.40%, 08/15/57(a) |
1,900 | 1,742,938 | ||||||
| Credit Suisse Mortgage Capital Certificates Trust Class A, 8.80%, 02/15/27(d) |
3,400 | 3,064,065 | ||||||
| Series 2019-ICE4, Class F, (1-mo. Term SOFR + 2.70%), 8.06%, 05/15/36(a)(b) |
3,392 | 3,357,461 | ||||||
| Series 2020-FACT, Class F, (1-mo. Term SOFR + 6.52%), 11.88%, 10/15/37(a)(b) |
1,700 | 1,446,265 | ||||||
| Series 2020-NET, Class D, 3.70%, 08/15/37(a)(b) |
1,275 | 1,126,396 | ||||||
| Series 2021-980M, Class E, 3.54%, 07/15/31(a)(b) |
2,410 | 2,017,280 | ||||||
| Series 2021-BHAR, Class E, (1-mo. Term SOFR + 3.61%), 8.98%, 11/15/38(a)(b) |
2,500 | 2,427,108 | ||||||
| CSMC Trust, Series 2020-FACT, Class E, (1-mo. Term SOFR + 5.23%), 10.59%, 10/15/37(a)(b) |
1,000 | 894,460 | ||||||
| Deephaven Residential Mortgage Trust, Series 2021-1, Class B2, 3.96%, 05/25/65(a)(b) |
1,550 | 1,282,669 | ||||||
| FREMF Trust, Series 2018-W5FX, Class CFX, 3.66%, 04/25/28(a)(b) |
437 | 374,499 | ||||||
| GS Mortgage Securities Corp. Trust, Series 2021-IP, Class E, (1-mo. Term SOFR + 3.66%), 9.03%, 10/15/36(a)(b) |
1,540 | 1,382,302 | ||||||
| Imperial Fund Mortgage Trust, Series 2020-NQM1, Class B1, 4.00%, 10/25/55(a)(b) |
3,602 | 2,967,978 | ||||||
| JP Morgan Mortgage Trust(a)(b) |
||||||||
| Series 2021-1, Class A3X, 0.50%, 06/25/51 |
49,148 | 1,333,463 | ||||||
| Series 2021-1, Class AX1, 0.13%, 06/25/51 |
199,442 | 1,049,243 | ||||||
| Series 2021-1, Class AX4, 0.40%, 06/25/51 |
12,736 | 259,609 | ||||||
| Series 2021-1, Class B4, 3.03%, 06/25/51 |
803 | 577,316 | ||||||
| Series 2021-1, Class B5, 3.03%, 06/25/51 |
963 | 663,366 | ||||||
| Series 2021-1, Class B6, 2.90%, 06/25/51 |
1,536 | 531,990 | ||||||
| Series 2021-4, Class B4, 2.90%, 08/25/51 |
1,199 | 829,002 | ||||||
| Series 2021-4, Class B5, 2.90%, 08/25/51 |
899 | 603,722 | ||||||
| Series 2021-4, Class B6, 2.90%, 08/25/51 |
2,190 | 678,115 | ||||||
| Lehman Brothers Small Balance Commercial Mortgage Trust, Series 2007-2A, Class M2, (1-mo. Term SOFR + 0.71%), 6.07%, 06/25/37(a)(b) |
2,735 | 2,201,027 | ||||||
| MCM Trust(d) |
||||||||
| 3.00%, 09/25/31(r) |
3,287 | 2,162,853 | ||||||
| 1.00%, 01/01/59 |
4,378 | 4,199,214 | ||||||
| MED Trust, Series 2021-MDLN, |
4,923 | 4,709,610 | ||||||
| New Residential Mortgage Loan Trust(a)(b) |
||||||||
| Series 2019-RPL2, Class B3, 4.01%, 02/25/59 |
9,329 | 6,192,465 | ||||||
| Series 2021-NQ1R, Class B1, 3.53%, 07/25/55 |
1,370 | 1,043,327 | ||||||
| Series 2021-NQ1R, Class B2, 4.33%, 07/25/55 |
1,022 | 773,406 | ||||||
| Seasoned Credit Risk Transfer Trust, Series 2020-3, Class BXS, 5.83%, 05/25/60(a)(b) |
7,626 | 2,985,856 | ||||||
| 24 | 2 0 2 3 B L A C K R O C K A N N U A L R E P O R T T O S H A R E H O L D E R S |
| Consolidated Schedule of Investments (continued) December 31, 2023 |
BlackRock Capital Allocation Term Trust (BCAT) (Percentages shown are based on Net Assets) |
| Security | Par (000) |
Value | ||||||
| United States (continued) | ||||||||
| Seasoned Loans Structured Transaction Trust(a)(b) |
||||||||
| Series 2020-2, Class M1, 4.75%, 09/25/60 |
USD | 4,217 | $ | 4,035,280 | ||||
| Series 2020-3, Class M1, 4.75%, 04/26/60 |
6,328 | 6,126,363 | ||||||
| Starwood Mortgage Residential Trust, Series 2020- INV, Class B2, 4.26%, 11/25/55(a) |
1,225 | 959,630 | ||||||
| TVC DSCR(d) |
||||||||
| 0.00%, 02/01/51 |
1,323 | 1,148,269 | ||||||
| 2.38%, 02/01/51 |
5,291 | 4,832,657 | ||||||
| Verus Securitization Trust(a)(b) |
||||||||
| Series 2020-5, Class B1, 3.71%, 05/25/65 |
2,400 | 2,005,623 | ||||||
| Series 2020-5, Class B2, 4.71%, 05/25/65 |
1,400 | 1,194,518 | ||||||
| Series 2021-R2, Class B1, 3.25%, 02/25/64 |
2,735 | 2,000,198 | ||||||
| WaMu Mortgage Pass-Through Certificates Trust, Series 2007-OA6, Class 1A, (12-mo. MTA + 0.81%), 5.82%, 07/25/47(b) |
1,129 | 891,951 | ||||||
| Wells Fargo Commercial Mortgage Trust, Series 2019-C50, Class XA, 1.41%, 05/15/52(b) |
22,820 | 1,206,163 | ||||||
|
|
|
|||||||
| Total Non-Agency Mortgage-Backed Securities — 5.2% (Cost: $106,642,633) |
95,590,867 | |||||||
|
|
|
|||||||
| Benefical Interest (000) |
||||||||
| Other Interests |
||||||||
| Canada — 0.2% | ||||||||
| Sprott Private Resource |
USD | 4,640 | 4,065,568 | |||||
|
|
|
|||||||
| Total Other Interests — 0.2% |
4,065,568 | |||||||
|
|
|
|||||||
| Par (000) |
||||||||
| Preferred Securities |
||||||||
| Capital Trusts — 0.1%(b) | ||||||||
| Mexico — 0.0% | ||||||||
| Banco Mercantil del Norte SA, |
USD | 501 | 493,725 | |||||
|
|
|
|||||||
| United States — 0.1% | ||||||||
| Edison International, 7.88%, 06/15/54 |
155 | 156,163 | ||||||
| Paramount Global, 6.38%, 03/30/62 |
401 | 360,900 | ||||||
|
|
|
|||||||
| 517,063 | ||||||||
|
|
|
|||||||
| 1,010,788 | ||||||||
| Shares | ||||||||
| Preferred Stocks — 3.2% | ||||||||
| China — 0.3% | ||||||||
| ByteDance Ltd., Series E-1, (Acquired 11/11/20, |
40,071 | 6,539,452 | ||||||
|
|
|
|||||||
| Finland — 0.2% | ||||||||
| Aiven, Series D(d)(e) |
37,890 | 3,050,903 | ||||||
|
|
|
|||||||
| Security |
Shares |
Value | ||||||
| Germany — 0.3% | ||||||||
| Dr Ing hc F Porsche AG(a) |
40,630 | $ | 3,578,573 | |||||
| Volocopter GmbH, Series D-2, (Acquired 03/03/21, Cost: $4,145,649)(d)(e)(f) |
780 | 2,900,853 | ||||||
|
|
|
|||||||
| 6,479,426 | ||||||||
|
|
|
|||||||
| Israel(d)(e)(f) — 0.2% | ||||||||
| Deep Instinct Ltd. |
||||||||
| Series D-2, (Acquired 03/19/21, |
350,490 | 1,927,695 | ||||||
| Series D-4, (Acquired 09/20/22, |
310,467 | 1,810,022 | ||||||
|
|
|
|||||||
| 3,737,717 | ||||||||
| United States — 2.2% | ||||||||
| Breeze Aviation Group, Inc., Series B, (Acquired 07/30/21, |
5,637 | 1,206,374 | ||||||
| Cap Hill Brands(d)(e) |
1,185,824 | 308,314 | ||||||
| Caresyntax, Inc.(d)(e) |
||||||||
| Series C-2 |
12,214 | 1,195,995 | ||||||
| Series C-3 |
1,759 | 145,997 | ||||||
| Clarify Health(d)(e) |
345,315 | 2,500,081 | ||||||
| Databricks, Inc., Series G, (Acquired 02/01/21, Cost: $2,392,693)(d)(e)(f) |
40,470 | 3,126,712 | ||||||
| Dream Finders Homes, Inc., 9.00%(d) |
10,172 | 9,650,685 | ||||||
| Exo Imaging, Inc., Series C, (Acquired 06/24/21, Cost: $1,482,935)(d)(e)(f) |
253,147 | 668,308 | ||||||
| GM Cruise Holdings LLC, Series G, (Acquired 03/25/21, |
71,581 | 872,572 | ||||||
| Jumpcloud, Inc.(d)(e)(f) |
||||||||
| Series E-1, (Acquired 10/30/20, |
1,125,428 | 2,914,859 | ||||||
| Series F, (Acquired 09/03/21, |
74,023 | 191,720 | ||||||
| MNTN Digital, Inc., Series D, (Acquired 11/05/21, |
58,924 | 745,389 | ||||||
| Noodle Partners, Inc., Series C, (Acquired 08/26/21, Cost: $1,751,669)(d)(e)(f) |
196,272 | 908,739 | ||||||
| PsiQuantum Corp., Series D, (Acquired 05/21/21, Cost: $945,402)(d)(e)(f) |
36,048 | 1,024,484 | ||||||
| RapidSOS, Series C-1(e) |
1,707,127 | 2,487,113 | ||||||
| Relativity Space, Inc., Series E, (Acquired 05/27/21, Cost: $814,688)(d)(e)(f) |
35,677 | 714,254 | ||||||
| SambaNova Systems, Inc., Series D, (Acquired 04/09/21, |
13,158 | 840,533 | ||||||
| SCI PH Parent, Inc., Series F, (Acquired 02/10/23, Cost: $1,183,000), 12.50%, 12/31/79(d)(e)(f)(l) |
1,183 | 1,105,537 | ||||||
| Snorkel AI, Inc., Series C, (Acquired 06/30/21, Cost: $678,934)(d)(e)(f) |
45,203 | 393,266 | ||||||
| Ursa Major Technologies, Inc.(d)(e)(f) |
||||||||
| Series C, (Acquired 09/13/21, |
290,420 | 926,440 | ||||||
| Series D, (Acquired 10/14/22, |
35,579 | 117,767 | ||||||
| Verge Genomics, Inc.(d)(e)(f) |
||||||||
| Series B, (Acquired 11/05/21, |
305,363 | 1,975,699 | ||||||
| Series C, (Acquired 09/06/23, |
36,142 | 260,222 | ||||||
| C O N S O L I D A T E D S C H E D U L E O F I N V E S T M E N T S |
25 |
| Consolidated Schedule of Investments (continued) December 31, 2023 |
BlackRock Capital Allocation Term Trust (BCAT) (Percentages shown are based on Net Assets) |
| Security | Shares |
Value | ||||||
| United States (continued) | ||||||||
| Versa Networks, Inc., Series E, (Acquired 10/14/22, Cost: $4,906,958), 12.00%, |
1,681,498 | $ | 5,481,683 | |||||
| Zero Mass Water, Inc., Series D, (Acquired 07/05/22, |
6,628 | 193,272 | ||||||
|
|
|
|||||||
| 39,956,015 | ||||||||
|
|
|
|||||||
| 59,763,513 | ||||||||
|
|
|
|||||||
| Total Preferred Securities — 3.3% |
60,774,301 | |||||||
|
|
|
|||||||
| Par (000) |
||||||||
| U.S. Government Sponsored Agency Securities |
| |||||||
| Commercial Mortgage-Backed Securities — 0.0% | ||||||||
| Freddie Mac Multifamily Structured Pass Through Certificates, Series KL06, Class XFX, 1.36%, 12/25/29(b) |
USD | 18,250 | 1,003,946 | |||||
|
|
|
|||||||
| Mortgage-Backed Securities(t) — 9.3% | ||||||||
| Uniform Mortgage-Backed Securities |
||||||||
| 3.00%, 01/16/54 |
9,557 | 8,452,840 | ||||||
| 3.50%, 01/16/54 |
74,731 | 68,554,026 | ||||||
| 4.50%, 01/16/54 |
86,126 | 83,481,982 | ||||||
| 5.50%, 01/16/54 |
11,500 | 11,548,515 | ||||||
|
|
|
|||||||
| 172,037,363 | ||||||||
|
|
|
|||||||
| Total U.S. Government Sponsored Agency Securities — 9.3% (Cost: $168,199,870) |
173,041,309 | |||||||
|
|
|
|||||||
| U.S. Treasury Obligations |
|
|||||||
| U.S. Treasury Notes, 4.63%, 09/30/28 |
6,848 | 7,068,317 | ||||||
|
|
|
|||||||
| Total U.S. Treasury Obligations — 0.4% |
|
7,068,317 | ||||||
|
|
|
|||||||
|
Shares |
||||||||
| Warrants |
||||||||
| Cayman Islands — 0.0% | ||||||||
| Lavoro Ltd., Class A, (Issued 12/27/22, Exercisable 12/27/23, 1 Share for 1 Warrant, Expires 12/27/27,
Strike Price |
25,681 | 17,168 | ||||||
|
|
|
|||||||
| Israel(e) — 0.0% | ||||||||
| Deep Instinct Ltd., (Acquired 09/20/22, Cost: $0), (Exercisable 09/20/22, 1 Share for 1 Warrant, Expires 09/20/32, Strike Price USD 0.01)(d)(f) |
21,889 | 62,165 | ||||||
| Innovid Corp., (Issued/Exercisable 01/28/21, 1 Share for 1 Warrant, Expires 12/31/27, Strike Price USD 11.50) |
8,959 | 269 | ||||||
|
|
|
|||||||
| 62,434 | ||||||||
| United Kingdom — 0.0% | ||||||||
| 10X future Technologies Service Ltd., (Expires 11/17/30, Strike Price GBP 0.01)(d)(e) |
137,950 | 256,724 | ||||||
|
|
|
|||||||
| Security | Shares |
Value | ||||||
| United States(e) — 0.1% |
||||||||
| Cano Health, Inc., (Issued 07/06/20, Exercisable 07/06/21, 0.01 Shares for 1 Warrant, Expires 06/03/26, Strike Price USD 1,150.00) |
33,630 | $ | 24 | |||||
| Caresyntax, Inc., (Exercisable 06/30/23, 1 Share for 1 Warrant, Expires 06/21/33, Strike Price USD 0.01)(d) |
1,386 | 135,703 | ||||||
| Crown PropTech Acquisitions, (Issued 02/05/21, 1 Share for 1 Warrant, Expires 02/01/26, Strike Price USD 11.50)(d) |
74,120 | 1,149 | ||||||
| Crown PropTech Acquisitions, (Issued/Exercisable 01/25/21, 1 Share for 1 Warrant, Expires 12/31/27, Strike Price USD 11.50) |
44,352 | — | ||||||
| CXApp, Inc., Class A, (Issued/Exercisable 02/02/21, 1 Share for 1 Warrant, Expires 12/15/25, Strike Price USD 11.50) |
340,429 | 27,234 | ||||||
| EVgo, Inc., (Issued/Exercisable 11/10/20, 1 Share for 1 Warrant, Expires 09/15/25, Strike Price USD 11.50) |
40,220 | 12,106 | ||||||
| Flyr Warrants, (Issued/Exercisable 05/10/22, 1 Share for 1 Warrant, Expires 05/10/32, Strike Price USD 3.95)(d) |
5,990 | 34,383 | ||||||
| FreeWire Technologies, Inc., Tranche A, (Issued 04/27/22, 1 Share for 1 Warrant, Expires 04/26/27, Strike
Price |
252,094 | 15,126 | ||||||
| FreeWire Technologies, Inc., Tranche B Unvest, (Exercisable 06/03/23, 1 Share for 1 Warrant, Expires 04/26/29, Strike Price USD 3.35)(d) |
239,489 | 2 | ||||||
| FreeWire Technologies, Inc., Tranche B Vested, (Issued 05/02/22, Exercisable 05/03/23, 1 Share for 1 Warrant, Expires 04/26/27, Strike Price USD 3.35)(d) |
12,605 | 756 | ||||||
| Hawkeye 360, (Issued 07/07/23, 1 Share for 1 Warrant, Expires 07/07/33, Strike Price USD 11.17)(d) |
19,736 | 49,537 | ||||||
| Hawkeye 360, (Issued 07/07/23, 1 Share for 1 Warrant, Expires 07/07/33, Strike Price USD 0.01)(d) |
173,677 | 844,070 | ||||||
| Hippo Holdings, Inc., (Issued/Exercisable 01/04/21, 0.04 Share for 1 Warrant, Expires 08/02/26, Strike Price USD 287.50) |
11,689 | 234 | ||||||
| Latch, Inc., (Issued/Exercisable 12/29/20, 1 Share for 1 Warrant, Expires 06/04/26, Strike Price USD 11.50) |
10,196 | — | ||||||
| Lightning eMotors, Inc., (Issued/Exercisable 05/13/20, 1 Share for 1 Warrant, Expires 05/18/25, Strike Price USD 11.50) |
82,174 | 90 | ||||||
| Offerpad Solutions, Inc., (Issued/Exercisable 10/13/20, 1 Share for 1 Warrant, Expires 09/01/26, Strike Price USD 11.50) |
60,706 | 1,154 | ||||||
| Pear Therapeutics, Inc., (Issued/Exercisable 03/23/21, 1 Share for 1 Warrant, Expires 12/03/26, Strike Price USD 11.50)(d) |
9,900 | — | ||||||
| RapidSOS, Series C-1, (Expires 12/13/33, Strike Price USD 0.01)(d) |
946,544 | — | ||||||
| Sarcos Technology & Robotics Corp., (Issued 01/15/21, 1 Share for 1 Warrant, Expires 06/15/27, Strike Price USD 69.00) |
25,291 | 137 | ||||||
| Sarcos Technology & Robotics Corp., Class A, (Issued/Exercisable 12/21/20, 1 Share for 1 Warrant, Expires 09/24/26, Strike Price USD 11.50) |
68,671 | 371 | ||||||
| 26 | 2 0 2 3 B L A C K R O C K A N N U A L R E P O R T T O S H A R E H O L D E R S |
| Consolidated Schedule of Investments (continued) December 31, 2023 |
BlackRock Capital Allocation Term Trust (BCAT) (Percentages shown are based on Net Assets) |
| Security | Shares |
Value | ||||||
| United States (continued) | ||||||||
| Sonder Holdings, Inc., (Issued 11/19/20, Exercisable 01/19/21, 1 Share for 1 Warrant, Expires 11/19/26, Strike Price USD 12.50)(d) |
126,000 | $ | 1 | |||||
| Versa Networks, Inc., (Acquired 10/14/22, Cost: $0), (Exercisable 10/14/22, 1 Share for 1 Warrant, Expires 10/07/32, Strike Price USD 0.01)(d)(f) |
207,248 | 584,439 | ||||||
| Volato Group, Inc., (Acquired 12/03/23, Cost: $72,784), (Expires 12/03/28, Strike Price USD 11.50)(d)(f) |
72,784 | 6,587 | ||||||
|
|
|
|||||||
| 1,713,103 | ||||||||
|
|
|
|||||||
| Total Warrants — 0.1% |
2,049,429 | |||||||
|
|
|
|||||||
| Total Long-Term Investments — 102.0% |
1,891,463,508 | |||||||
|
|
|
|||||||
| Short-Term Securities |
||||||||
| Money Market Funds — 4.3% | ||||||||
| BlackRock Liquidity Funds, T-Fund, Institutional Class, 5.26%(q)(u) |
78,480,297 | 78,480,297 | ||||||
|
|
|
|||||||
| Par (000) |
||||||||
| U.S. Treasury Obligations — 0.0% | ||||||||
| U.S. Treasury Bills, 5.49%, 05/09/24(r) |
USD 309 | 303,355 | ||||||
|
|
|
|||||||
| Total Short-Term Securities — 4.3% |
78,783,652 | |||||||
|
|
|
|||||||
| Options Purchased — 0.6% |
11,307,407 | |||||||
|
|
|
|||||||
| Total Investments Before Options Written — 106.9% |
1,981,554,567 | |||||||
|
|
|
|||||||
| Options Written — (0.2)% |
(3,096,845 | ) | ||||||
|
|
|
|||||||
| Total Investments, Net of Options Written — 106.7% |
|
1,978,457,722 | ||||||
|
|
|
|||||||
| Liabilities in Excess of Other Assets — (6.7)% |
|
(124,761,858 | ) | |||||
|
|
|
|||||||
| Net Assets — 100.0% |
$ | 1,853,695,864 | ||||||
|
|
|
|||||||
| (a) | Security exempt from registration pursuant to Rule 144A under the Securities Act of 1933, as amended. These securities may be resold in transactions exempt from registration to qualified institutional investors. |
| (b) | Variable rate security. Interest rate resets periodically. The rate shown is the effective interest rate as of period end. Security description also includes the reference rate and spread if published and available. |
| (c) | Step coupon security. Coupon rate will either increase (step-up bond) or decrease (step-down bond) at regular intervals until maturity. Interest rate shown reflects the rate currently in effect. |
| (d) | Security is valued using significant unobservable inputs and is classified as Level 3 in the fair value hierarchy. |
| (e) | Non-income producing security. |
| (f) | Restricted security as to resale, excluding 144A securities. The Trust held restricted securities with a current value of $62,032,566, representing 3.4% of its net assets as of period end, and an original cost of $69,209,034. |
| (g) | All or a portion of the security has been pledged and/or segregated as collateral in connection with outstanding exchange-traded options written. |
| (h) | All or a portion of the security is held by a wholly-owned subsidiary. See Note 1 of the Notes to Consolidated Financial Statements for details on the wholly-owned subsidiary. |
| (i) | Investment does not issue shares. |
| (j) | This security may be resold to qualified foreign investors and foreign institutional buyers under Regulation S of the Securities Act of 1933. |
| (k) | Issuer filed for bankruptcy and/or is in default. |
| (l) | Payment-in-kind security which may pay interest/dividends in additional par/shares and/or in cash. Rates shown are the current rate and possible payment rates. |
| (m) | Perpetual security with no stated maturity date. |
| (n) | Convertible security. |
| (o) | When-issued security. |
| (p) | Zero-coupon bond. |
| (q) | Affiliate of the Trust. |
| (r) | Rates are discount rates or a range of discount rates as of period end. |
| (s) | Other interests represent beneficial interests in liquidation trusts and other reorganization or private entities. |
| (t) | Represents or includes a TBA transaction. |
| (u) | Annualized 7-day yield as of period end. |
Affiliates
Investments in issuers considered to be affiliate(s) of the Trust during the year ended December 31, 2023 for purposes of Section 2(a)(3) of the Investment Company Act of 1940, as amended, were as follows:
| Affiliated Issuer | Value at 12/31/22 |
Purchases at Cost |
Proceeds from Sale |
Net Realized Gain (Loss) |
Change in (Depreciation) |
Value at 12/31/23 |
Shares Held at 12/31/23 |
Income | Capital Gain Distributions from Underlying Funds |
|||||||||||||||||||||||||||
| BlackRock Liquidity Funds, T-Fund, Institutional Class |
$ | 49,048,882 | $ | 29,431,415 | (a) | $ | — | $ | — | $ | — | $ | 78,480,297 | 78,480,297 | $ | 2,769,958 | $ | — | ||||||||||||||||||
| iShares China Large-Cap ETF(b) |
903,534 | 3,077,546 | (4,235,051 | ) | 169,652 | 84,319 | — | — | — | — | ||||||||||||||||||||||||||
| iShares iBoxx $ High Yield Corporate Bond ETF(b) |
3,877,356 | — | (3,947,978 | ) | 82,471 | (11,849 | ) | — | — | 61,077 | — | |||||||||||||||||||||||||
| iShares iBoxx $ Investment Grade Corporate Bond ETF |
— | 25,713,893 | (21,521,222 | ) | (99,812 | ) | 67,293 | 4,160,152 | 37,594 | 190,821 | — | |||||||||||||||||||||||||
| iShares JP Morgan USD Emerging Markets Bond ETF |
8,837,878 | 2,423,502 | (5,040,265 | ) | (355,385 | ) | 471,334 | 6,337,064 | 71,155 | 478,797 | — | |||||||||||||||||||||||||
| iShares MSCI Brazil ETF |
650,890 | — | — | — | 162,664 | 813,554 | 23,271 | 46,011 | — | |||||||||||||||||||||||||||
| C O N S O L I D A T E D S C H E D U L E O F I N V E S T M E N T S |
27 |
| Consolidated Schedule of Investments (continued) December 31, 2023
|
BlackRock Capital Allocation Term Trust (BCAT) |
| Affiliated Issuer | Value at 12/31/22 |
Purchases at Cost |
Proceeds from Sale |
Net Realized Gain (Loss) |
Change in (Depreciation) |
Value at 12/31/23 |
Shares Held at 12/31/23 |
Income | Capital Gain Distributions from Underlying Funds |
|||||||||||||||||||||||||||
| iShares Russell 2000 ETF |
$ | 1,708,728 | $ | — | $ | — | $ | — | $ | 258,230 | $ | 1,966,958 | 9,800 | $ | 26,480 | $ | — | |||||||||||||||||||
| iShares Russell Mid-Cap Growth ETF |
— | 380,073 | — | — | 36,305 | 416,378 | 3,986 | 1,329 | — | |||||||||||||||||||||||||||
|
|
|
|
|
|
|
|
|
|
|
|||||||||||||||||||||||||||
| $ | (203,074 | ) | $ | 1,068,296 | $ | 92,174,403 | $ | 3,574,473 | $ | — | ||||||||||||||||||||||||||
|
|
|
|
|
|
|
|
|
|
|
|||||||||||||||||||||||||||
| (a) | Represents net amount purchased (sold). |
| (b) | As of period end, the entity is no longer held. |
Derivative Financial Instruments Outstanding as of Period End
Futures Contracts
| Description | Number of Contracts |
Expiration Date |
Notional Amount (000) |
Value/ Unrealized Appreciation (Depreciation) |
||||||||||||
| Long Contracts |
||||||||||||||||
| Euro BOBL |
819 | 03/07/24 | $ | 107,845 | $ | 502,992 | ||||||||||
| Euro Bund |
280 | 03/07/24 | 42,416 | 1,164,952 | ||||||||||||
| Nikkei 225 Index |
22 | 03/07/24 | 5,202 | 99,979 | ||||||||||||
| Euro Stoxx Banks Index |
100 | 03/15/24 | 659 | (5,591 | ) | |||||||||||
| MSCI Emerging Markets Index |
14 | 03/15/24 | 724 | 31,666 | ||||||||||||
| U.S. Long Bond |
223 | 03/19/24 | 27,861 | 2,021,192 | ||||||||||||
| Ultra U.S. Treasury Bond |
107 | 03/19/24 | 14,295 | 507,070 | ||||||||||||
| Long Gilt |
28 | 03/26/24 | 3,664 | 233,383 | ||||||||||||
| 5-Year U.S. Treasury Note |
3,664 | 03/28/24 | 398,546 | 7,533,777 | ||||||||||||
| Carbon Emissions(a) |
9 | 12/16/24 | 799 | 95,303 | ||||||||||||
|
|
|
|||||||||||||||
| 12,184,723 | ||||||||||||||||
|
|
|
|||||||||||||||
| Short Contracts |
||||||||||||||||
| 30-Year Euro Buxl Bond |
21 | 03/07/24 | 3,285 | (252,713 | ) | |||||||||||
| Euro BTP |
266 | 03/07/24 | 34,988 | (1,132,568 | ) | |||||||||||
| Euro OAT |
17 | 03/07/24 | 2,468 | (33,920 | ) | |||||||||||
| Euro-Schatz |
62 | 03/07/24 | 7,292 | (29,486 | ) | |||||||||||
| 10-Year Japanese Government Treasury Bonds |
41 | 03/13/24 | 42,660 | (251,876 | ) | |||||||||||
| E-mini Russell 2000 Index |
42 | 03/15/24 | 4,300 | (297,792 | ) | |||||||||||
| Euro Stoxx 50 Index |
148 | 03/15/24 | 7,436 | 60,561 | ||||||||||||
| NASDAQ 100 E-Mini Index |
80 | 03/15/24 | 27,238 | (920,153 | ) | |||||||||||
| S&P 500 E-Mini Index |
309 | 03/15/24 | 74,469 | (1,593,614 | ) | |||||||||||
| 10-Year U.S. Treasury Note |
164 | 03/19/24 | 18,514 | (433,845 | ) | |||||||||||
| 10-Year U.S. Ultra Long Treasury Note |
2,152 | 03/19/24 | 253,970 | (11,257,170 | ) | |||||||||||
| 2-Year U.S. Treasury Note |
1,669 | 03/28/24 | 343,671 | (2,509,727 | ) | |||||||||||
|
|
|
|||||||||||||||
| (18,652,303 | ) | |||||||||||||||
|
|
|
|||||||||||||||
| $ | (6,467,580) | |||||||||||||||
|
|
|
|||||||||||||||
| (a) | All or a portion of the security is held by a wholly-owned subsidiary. See Note 1 of the Notes to Consolidated Financial Statements for details on the wholly-owned subsidiary. |
Forward Foreign Currency Exchange Contracts
| Currency Purchased | Currency Sold | Counterparty | Settlement Date | Unrealized Appreciation (Depreciation) |
||||||||||||||
| JPY |
30,850,634 | USD | 214,200 | Deutsche Bank AG | 03/19/24 | $ | 7,144 | |||||||||||
| EUR |
291,973 | USD | 319,994 | Barclays Bank PLC | 03/20/24 | 3,320 | ||||||||||||
| EUR |
1,552,844 | USD | 1,717,761 | Deutsche Bank AG | 03/20/24 | 1,773 | ||||||||||||
| EUR |
2,198,399 | USD | 2,421,533 | Deutsche Bank AG | 03/20/24 | 12,851 | ||||||||||||
| EUR |
404,931 | USD | 444,174 | HSBC Bank PLC | 03/20/24 | 4,223 | ||||||||||||
| EUR |
1,114,743 | USD | 1,227,788 | HSBC Bank PLC | 03/20/24 | 6,617 | ||||||||||||
| EUR |
432,022 | USD | 466,326 | Morgan Stanley & Co. International PLC | 03/20/24 | 12,071 | ||||||||||||
| EUR |
3,714,251 | USD | 4,025,525 | Morgan Stanley & Co. International PLC | 03/20/24 | 87,431 | ||||||||||||
| EUR |
321,333 | USD | 347,614 | State Street Bank and Trust Co. | 03/20/24 | 8,212 | ||||||||||||
| 28 | 2 0 2 3 B L A C K R O C K A N N U A L R E P O R T T O S H A R E H O L D E R S |
| Consolidated Schedule of Investments (continued) December 31, 2023 |
BlackRock Capital Allocation Term Trust (BCAT) |
Forward Foreign Currency Exchange Contracts (continued)
| Currency Purchased | Currency Sold | Counterparty | Settlement Date | Unrealized Appreciation (Depreciation) |
||||||||||||||
| EUR |
4,416,404 | USD | 4,871,721 | State Street Bank and Trust Co. | 03/20/24 | $ | 18,760 | |||||||||||
| GBP |
223,161 | USD | 280,034 | Citibank N.A. | 03/20/24 | 4,525 | ||||||||||||
| GBP |
287,115 | USD | 365,831 | Morgan Stanley & Co. International PLC | 03/20/24 | 278 | ||||||||||||
| GBP |
316,948 | USD | 401,623 | State Street Bank and Trust Co. | 03/20/24 | 2,528 | ||||||||||||
| GBP |
872,641 | USD | 1,106,600 | State Street Bank and Trust Co. | 03/20/24 | 6,133 | ||||||||||||
| MXN |
31,873,515 | USD | 1,823,991 | Citibank N.A. | 03/20/24 | 29,751 | ||||||||||||
| THB |
63,475,757 | EUR | 1,681,143 | Citibank N.A. | 03/20/24 | 10,441 | ||||||||||||
| USD |
11,297,230 | CNH | 80,002,465 | UBS AG | 03/20/24 | 10,020 | ||||||||||||
| USD |
141,649 | GBP | 111,053 | Deutsche Bank AG | 03/20/24 | 41 | ||||||||||||
| USD |
65,118,061 | GBP | 50,981,207 | Deutsche Bank AG | 03/20/24 | 110,272 | ||||||||||||
| USD |
2,175,727 | GBP | 1,704,703 | Morgan Stanley & Co. International PLC | 03/20/24 | 2,005 | ||||||||||||
| USD |
808,753 | HKD | 6,301,071 | HSBC Bank PLC | 03/20/24 | 391 | ||||||||||||
| USD |
753,313 | HKD | 5,867,697 | UBS AG | 03/20/24 | 548 | ||||||||||||
| ZAR |
33,715,234 | USD | 1,824,911 | Citibank N.A. | 03/20/24 | 5,929 | ||||||||||||
|
|
|
|||||||||||||||||
| 345,264 | ||||||||||||||||||
|
|
|
|||||||||||||||||
| USD |
143,709 | EUR | 133,078 | Barclays Bank PLC | 03/14/24 | (3,618 | ) | |||||||||||
| USD |
215,912 | EUR | 199,940 | Barclays Bank PLC | 03/14/24 | (5,436 | ) | |||||||||||
| USD |
413,115 | EUR | 382,556 | Barclays Bank PLC | 03/14/24 | (10,400 | ) | |||||||||||
| USD |
2,390,170 | EUR | 2,213,362 | Barclays Bank PLC | 03/14/24 | (60,172 | ) | |||||||||||
| USD |
110,219 | EUR | 102,038 | UBS AG | 03/14/24 | (2,743 | ) | |||||||||||
| USD |
534,386 | EUR | 494,718 | UBS AG | 03/14/24 | (13,300 | ) | |||||||||||
| USD |
58,808,980 | JPY | 8,217,908,075 | BNP Paribas SA | 03/19/24 | (152,037 | ) | |||||||||||
| USD |
243,275 | JPY | 33,995,597 | State Street Bank and Trust Co. | 03/19/24 | (633 | ) | |||||||||||
| USD |
6,016,346 | AUD | 8,960,961 | Morgan Stanley & Co. International PLC | 03/20/24 | (104,223 | ) | |||||||||||
| USD |
3,608,229 | BRL | 17,901,506 | Citibank N.A. | 03/20/24 | (50,349 | ) | |||||||||||
| USD |
691,079 | CAD | 923,202 | Citibank N.A. | 03/20/24 | (6,385 | ) | |||||||||||
| USD |
6,377,088 | CAD | 8,538,903 | Deutsche Bank AG | 03/20/24 | (73,917 | ) | |||||||||||
| USD |
567,892 | CAD | 755,537 | Morgan Stanley & Co. International PLC | 03/20/24 | (2,904 | ) | |||||||||||
| USD |
560,524 | CAD | 746,550 | UBS AG | 03/20/24 | (3,483 | ) | |||||||||||
| USD |
836,944 | CHF | 715,590 | Citibank N.A. | 03/20/24 | (20,575 | ) | |||||||||||
| USD |
1,133,227 | CHF | 974,233 | Goldman Sachs International | 03/20/24 | (34,234 | ) | |||||||||||
| USD |
745,341 | CHF | 631,964 | HSBC Bank PLC | 03/20/24 | (11,965 | ) | |||||||||||
| USD |
745,356 | CHF | 641,287 | Morgan Stanley & Co. International PLC | 03/20/24 | (23,123 | ) | |||||||||||
| USD |
869,997 | CHF | 741,868 | State Street Bank and Trust Co. | 03/20/24 | (19,012 | ) | |||||||||||
| USD |
24,591,147 | CHF | 21,094,655 | UBS AG | 03/20/24 | (687,382 | ) | |||||||||||
| USD |
499,514 | DKK | 3,371,861 | Morgan Stanley & Co. International PLC | 03/20/24 | (1,785 | ) | |||||||||||
| USD |
1,129,474 | EUR | 1,023,795 | State Street Bank and Trust Co. | 03/20/24 | (4,220 | ) | |||||||||||
| USD |
3,796,301 | EUR | 3,446,374 | UBS AG | 03/20/24 | (20,021 | ) | |||||||||||
| USD |
46,124,211 | EUR | 41,814,022 | UBS AG | 03/20/24 | (178,309 | ) | |||||||||||
| USD |
194,823,800 | EUR | 176,618,015 | UBS AG | 03/20/24 | (753,156 | ) | |||||||||||
| USD |
879,158 | GBP | 693,484 | Morgan Stanley & Co. International PLC | 03/20/24 | (5,125 | ) | |||||||||||
| USD |
20,571,297 | HKD | 160,408,800 | Barclays Bank PLC | 03/20/24 | (7,503 | ) | |||||||||||
| USD |
159,471 | HKD | 1,243,830 | State Street Bank and Trust Co. | 03/20/24 | (100 | ) | |||||||||||
| USD |
160,363 | HKD | 1,250,524 | UBS AG | 03/20/24 | (67 | ) | |||||||||||
| USD |
621,548 | HKD | 4,848,261 | UBS AG | 03/20/24 | (434 | ) | |||||||||||
| USD |
695,942 | HKD | 5,429,730 | UBS AG | 03/20/24 | (637 | ) | |||||||||||
| USD |
3,730,662 | IDR | 57,749,532,470 | BNP Paribas SA | 03/20/24 | (19,760 | ) | |||||||||||
| USD |
1,448,739 | MXN | 25,316,126 | Citibank N.A. | 03/20/24 | (23,630 | ) | |||||||||||
| USD |
179,084 | NOK | 1,881,150 | Deutsche Bank AG | 03/20/24 | (6,386 | ) | |||||||||||
| USD |
409,577 | SEK | 4,178,345 | Barclays Bank PLC | 03/20/24 | (5,944 | ) | |||||||||||
| USD |
1,866,363 | SEK | 19,039,884 | Barclays Bank PLC | 03/20/24 | (27,086 | ) | |||||||||||
| USD |
958,975 | JPY | 134,080,501 | State Street Bank and Trust Co. | 03/21/24 | (3,313 | ) | |||||||||||
|
|
|
|||||||||||||||||
| (2,343,367 | ) | |||||||||||||||||
|
|
|
|||||||||||||||||
| $ | (1,998,103 | ) | ||||||||||||||||
|
|
|
|||||||||||||||||
| C O N S O L I D A T E D S C H E D U L E O F I N V E S T M E N T S |
29 |
| Consolidated Schedule of Investments (continued) December 31, 2023 |
BlackRock Capital Allocation Term Trust (BCAT) |
Exchange-Traded Options Purchased
| Description | Number of Contracts |
Expiration Date |
Exercise Price | Notional Amount (000) |
Value | |||||||||||||||||||||||
| Call |
||||||||||||||||||||||||||||
| SPDR S&P 500 ETF Trust |
1,112 | 01/05/24 | USD | 476.00 | USD | 52,854 | $ | 243,528 | ||||||||||||||||||||
| SPDR S&P 500 ETF Trust |
488 | 01/12/24 | USD | 476.00 | USD | 23,195 | 186,172 | |||||||||||||||||||||
| SPX Volatility Index |
128 | 01/17/24 | USD | 20.00 | USD | 159 | 3,648 | |||||||||||||||||||||
| Alphabet, Inc., Class C |
131 | 01/19/24 | USD | 137.50 | USD | 1,846 | 68,447 | |||||||||||||||||||||
| Alphabet, Inc., Class C |
203 | 01/19/24 | USD | 142.50 | USD | 2,861 | 47,502 | |||||||||||||||||||||
| Amazon.com, Inc. |
193 | 01/19/24 | USD | 150.00 | USD | 2,932 | 90,710 | |||||||||||||||||||||
| Amazon.com, Inc. |
132 | 01/19/24 | USD | 155.00 | USD | 2,006 | 28,644 | |||||||||||||||||||||
| Apple, Inc. |
209 | 01/19/24 | USD | 195.00 | USD | 4,024 | 44,099 | |||||||||||||||||||||
| Apple, Inc. |
146 | 01/19/24 | USD | 200.00 | USD | 2,811 | 10,001 | |||||||||||||||||||||
| Applied Materials, Inc. |
174 | 01/19/24 | USD | 160.00 | USD | 2,820 | 99,180 | |||||||||||||||||||||
| Applied Materials, Inc. |
126 | 01/19/24 | USD | 165.00 | USD | 2,042 | 39,375 | |||||||||||||||||||||
| Charles Schwab Corp. |
356 | 01/19/24 | USD | 65.00 | USD | 2,449 | 168,210 | |||||||||||||||||||||
| Cheniere Energy, Inc. |
53 | 01/19/24 | USD | 180.00 | USD | 905 | 4,240 | |||||||||||||||||||||
| Chevron Corp. |
124 | 01/19/24 | USD | 155.00 | USD | 1,850 | 12,028 | |||||||||||||||||||||
| Chevron Corp. |
227 | 01/19/24 | USD | 150.00 | USD | 3,386 | 60,836 | |||||||||||||||||||||
| ConocoPhillips |
131 | 01/19/24 | USD | 125.00 | USD | 1,521 | 3,603 | |||||||||||||||||||||
| ConocoPhillips |
55 | 01/19/24 | USD | 120.00 | USD | 638 | 5,830 | |||||||||||||||||||||
| Costco Wholesale Corp. |
24 | 01/19/24 | USD | 605.00 | USD | 1,584 | 139,680 | |||||||||||||||||||||
| Costco Wholesale Corp. |
26 | 01/19/24 | USD | 625.00 | USD | 1,716 | 100,490 | |||||||||||||||||||||
| Datadog, Inc., Class A |
38 | 01/19/24 | USD | 120.00 | USD | 461 | 17,005 | |||||||||||||||||||||
| Delta Air Lines, Inc. |
210 | 01/19/24 | USD | 35.00 | USD | 845 | 113,925 | |||||||||||||||||||||
| Delta Air Lines, Inc. |
123 | 01/19/24 | USD | 38.00 | USD | 495 | 35,670 | |||||||||||||||||||||
| Dynatrace, Inc. |
88 | 01/19/24 | USD | 50.00 | USD | 481 | 41,360 | |||||||||||||||||||||
| General Dynamics Corp. |
26 | 01/19/24 | USD | 260.00 | USD | 675 | 8,450 | |||||||||||||||||||||
| Hilton Worldwide Holdings, Inc. |
27 | 01/19/24 | USD | 170.00 | USD | 492 | 36,720 | |||||||||||||||||||||
| Humana, Inc. |
41 | 01/19/24 | USD | 505.00 | USD | 1,877 | 2,768 | |||||||||||||||||||||
| Intuitive Surgical, Inc. |
14 | 01/19/24 | USD | 320.00 | USD | 472 | 30,170 | |||||||||||||||||||||
| InvesCo QQQ Trust, Series 1 |
754 | 01/19/24 | USD | 409.78 | USD | 30,878 | 432,796 | |||||||||||||||||||||
| Invesco S&P 500 Equal Weight ETF |
580 | 01/19/24 | USD | 160.00 | USD | 9,152 | 63,800 | |||||||||||||||||||||
| Lockheed Martin Corp. |
65 | 01/19/24 | USD | 460.00 | USD | 2,946 | 23,725 | |||||||||||||||||||||
| Lockheed Martin Corp. |
10 | 01/19/24 | USD | 450.00 | USD | 453 | 8,800 | |||||||||||||||||||||
| Mastercard, Inc., Class A |
27 | 01/19/24 | USD | 420.00 | USD | 1,152 | 28,080 | |||||||||||||||||||||
| McDonald’s Corp. |
17 | 01/19/24 | USD | 285.00 | USD | 504 | 22,058 | |||||||||||||||||||||
| Meta Platforms, Inc., Class A |
13 | 01/19/24 | USD | 345.00 | USD | 460 | 18,980 | |||||||||||||||||||||
| Micron Technology, Inc. |
58 | 01/19/24 | USD | 80.00 | USD | 495 | 35,235 | |||||||||||||||||||||
| Microsoft Corp. |
48 | 01/19/24 | USD | 365.00 | USD | 1,805 | 70,080 | |||||||||||||||||||||
| Microsoft Corp. |
93 | 01/19/24 | USD | 380.00 | USD | 3,497 | 47,197 | |||||||||||||||||||||
| Microsoft Corp. |
99 | 01/19/24 | USD | 385.00 | USD | 3,723 | 31,927 | |||||||||||||||||||||
| Nice Ltd., ADR |
28 | 01/19/24 | USD | 200.00 | USD | 559 | 15,820 | |||||||||||||||||||||
| Nice Ltd., ADR |
72 | 01/19/24 | USD | 210.00 | USD | 1,436 | 14,760 | |||||||||||||||||||||
| Northrop Grumman Corp. |
16 | 01/19/24 | USD | 480.00 | USD | 749 | 5,920 | |||||||||||||||||||||
| NVIDIA Corp. |
83 | 01/19/24 | USD | 520.00 | USD | 4,110 | 51,460 | |||||||||||||||||||||
| NVIDIA Corp. |
66 | 01/19/24 | USD | 540.00 | USD | 3,268 | 17,523 | |||||||||||||||||||||
| NVIDIA Corp. |
19 | 01/19/24 | USD | 490.00 | USD | 941 | 34,960 | |||||||||||||||||||||
| NVIDIA Corp. |
132 | 01/19/24 | USD | 505.00 | USD | 6,537 | 145,860 | |||||||||||||||||||||
| Paramount Global, Class B |
180 | 01/19/24 | USD | 17.50 | USD | 266 | 3,600 | |||||||||||||||||||||
| Pfizer, Inc. |
321 | 01/19/24 | USD | 47.00 | USD | 924 | 642 | |||||||||||||||||||||
| Pfizer, Inc. |
534 | 01/19/24 | USD | 50.00 | USD | 1,537 | 801 | |||||||||||||||||||||
| Sabre Corp. |
81 | 01/19/24 | USD | 6.00 | USD | 36 | 284 | |||||||||||||||||||||
| Sabre Corp. |
72 | 01/19/24 | USD | 7.00 | USD | 32 | 144 | |||||||||||||||||||||
| Sabre Corp. |
170 | 01/19/24 | USD | 5.00 | USD | 75 | 1,360 | |||||||||||||||||||||
| Sabre Corp. |
125 | 01/19/24 | USD | 5.50 | USD | 55 | 625 | |||||||||||||||||||||
| Salesforce, Inc. |
28 | 01/19/24 | USD | 260.00 | USD | 737 | 20,160 | |||||||||||||||||||||
| Salesforce, Inc. |
81 | 01/19/24 | USD | 270.00 | USD | 2,131 | 20,493 | |||||||||||||||||||||
| Shell PLC, ADR |
69 | 01/19/24 | USD | 67.50 | USD | 454 | 3,450 | |||||||||||||||||||||
| SPDR S&P 500 ETF Trust |
246 | 01/19/24 | USD | 481.00 | USD | 11,693 | 63,222 | |||||||||||||||||||||
| Tenet Healthcare Corp. |
47 | 01/19/24 | USD | 85.00 | USD | 355 | 1,175 | |||||||||||||||||||||
| Tesla, Inc. |
26 | 01/19/24 | USD | 260.00 | USD | 646 | 16,250 | |||||||||||||||||||||
| Tesla, Inc. |
79 | 01/19/24 | USD | 250.00 | USD | 1,963 | 80,382 | |||||||||||||||||||||
| T-Mobile U.S., Inc. |
228 | 01/19/24 | USD | 155.00 | USD | 3,656 | 149,340 | |||||||||||||||||||||
| Uber Technologies, Inc. |
275 | 01/19/24 | USD | 62.50 | USD | 1,693 | 39,187 | |||||||||||||||||||||
| United Airlines Holdings, Inc. |
114 | 01/19/24 | USD | 42.00 | USD | 470 | 13,737 | |||||||||||||||||||||
| 30 | 2 0 2 3 B L A C K R O C K A N N U A L R E P O R T T O S H A R E H O L D E R S |
| Consolidated Schedule of Investments (continued) December 31, 2023 |
BlackRock Capital Allocation Term Trust (BCAT) |
Exchange-Traded Options Purchased (continued)
| Description | Number of Contracts |
Expiration Date |
Exercise Price | Notional Amount (000) |
Value | |||||||||||||||||||||||
| Call (continued) |
||||||||||||||||||||||||||||
| UnitedHealth Group, Inc. |
18 | 01/19/24 | USD | 560.00 | USD | 948 | $ | 2,538 | ||||||||||||||||||||
| Valero Energy Corp. |
37 | 01/19/24 | USD | 130.00 | USD | 481 | 13,783 | |||||||||||||||||||||
| Viasat, Inc. |
60 | 01/19/24 | USD | 35.00 | USD | 168 | 1,200 | |||||||||||||||||||||
| Walmart, Inc. |
47 | 01/19/24 | USD | 160.00 | USD | 741 | 6,251 | |||||||||||||||||||||
| Walt Disney Co. |
206 | 01/19/24 | USD | 90.00 | USD | 1,860 | 45,011 | |||||||||||||||||||||
| Walt Disney Co. |
10 | 01/19/24 | USD | 100.00 | USD | 90 | 155 | |||||||||||||||||||||
| Wynn Resorts Ltd. |
88 | 01/19/24 | USD | 95.00 | USD | 802 | 11,132 | |||||||||||||||||||||
| Wynn Resorts Ltd. |
61 | 01/19/24 | USD | 90.00 | USD | 556 | 20,740 | |||||||||||||||||||||
| Advanced Micro Devices, Inc. |
167 | 02/16/24 | USD | 130.00 | USD | 2,462 | 351,117 | |||||||||||||||||||||
| Advanced Micro Devices, Inc. |
208 | 02/16/24 | USD | 140.00 | USD | 3,066 | 290,160 | |||||||||||||||||||||
| Advanced Micro Devices, Inc. |
66 | 02/16/24 | USD | 150.00 | USD | 973 | 57,090 | |||||||||||||||||||||
| Alphabet, Inc., Class C |
207 | 02/16/24 | USD | 145.00 | USD | 2,917 | 91,080 | |||||||||||||||||||||
| Amazon.com, Inc. |
305 | 02/16/24 | USD | 165.00 | USD | 4,634 | 84,332 | |||||||||||||||||||||
| Amazon.com, Inc. |
300 | 02/16/24 | USD | 160.00 | USD | 4,558 | 127,500 | |||||||||||||||||||||
| Apple, Inc. |
128 | 02/16/24 | USD | 205.00 | USD | 2,464 | 20,992 | |||||||||||||||||||||
| Applied Materials, Inc. |
9 | 02/16/24 | USD | 170.00 | USD | 146 | 4,230 | |||||||||||||||||||||
| Applied Materials, Inc. |
50 | 02/16/24 | USD | 165.00 | USD | 810 | 33,625 | |||||||||||||||||||||
| Autodesk, Inc. |
160 | 02/16/24 | USD | 250.00 | USD | 3,896 | 103,200 | |||||||||||||||||||||
| Boston Scientific Corp. |
171 | 02/16/24 | USD | 57.50 | USD | 989 | 39,330 | |||||||||||||||||||||
| Chevron Corp. |
122 | 02/16/24 | USD | 150.00 | USD | 1,820 | 61,610 | |||||||||||||||||||||
| ConocoPhillips |
106 | 02/16/24 | USD | 125.00 | USD | 1,230 | 14,946 | |||||||||||||||||||||
| Datadog, Inc., Class A |
54 | 02/16/24 | USD | 130.00 | USD | 655 | 24,705 | |||||||||||||||||||||
| Delta Air Lines, Inc. |
180 | 02/16/24 | USD | 44.00 | USD | 724 | 13,320 | |||||||||||||||||||||
| Humana, Inc. |
102 | 02/16/24 | USD | 555.00 | USD | 4,670 | 10,455 | |||||||||||||||||||||
| Intel Corp. |
181 | 02/16/24 | USD | 55.00 | USD | 910 | 21,087 | |||||||||||||||||||||
| Intuitive Surgical, Inc. |
24 | 02/16/24 | USD | 355.00 | USD | 810 | 24,000 | |||||||||||||||||||||
| Intuitive Surgical, Inc. |
80 | 02/16/24 | USD | 340.00 | USD | 2,699 | 131,200 | |||||||||||||||||||||
| iShares China Large-Cap ETF |
3,116 | 02/16/24 | USD | 27.00 | USD | 7,488 | 73,226 | |||||||||||||||||||||
| iShares China Large-Cap ETF |
1,884 | 02/16/24 | USD | 26.00 | USD | 4,527 | 76,302 | |||||||||||||||||||||
| JPMorgan Chase & Co. |
254 | 02/16/24 | USD | 175.00 | USD | 4,321 | 62,992 | |||||||||||||||||||||
| KLA Corp. |
12 | 02/16/24 | USD | 610.00 | USD | 698 | 19,920 | |||||||||||||||||||||
| Mastercard, Inc., Class A |
44 | 02/16/24 | USD | 445.00 | USD | 1,877 | 22,000 | |||||||||||||||||||||
| Meta Platforms, Inc., Class A |
38 | 02/16/24 | USD | 380.00 | USD | 1,345 | 38,285 | |||||||||||||||||||||
| Micron Technology, Inc. |
98 | 02/16/24 | USD | 87.50 | USD | 836 | 28,126 | |||||||||||||||||||||
| Micron Technology, Inc. |
63 | 02/16/24 | USD | 85.00 | USD | 538 | 25,830 | |||||||||||||||||||||
| Microsoft Corp. |
136 | 02/16/24 | USD | 390.00 | USD | 5,114 | 116,280 | |||||||||||||||||||||
| Nice Ltd., ADR |
32 | 02/16/24 | USD | 210.00 | USD | 638 | 19,840 | |||||||||||||||||||||
| NVIDIA Corp. |
28 | 02/16/24 | USD | 520.00 | USD | 1,387 | 44,660 | |||||||||||||||||||||
| Oracle Corp. |
129 | 02/16/24 | USD | 110.00 | USD | 1,360 | 21,285 | |||||||||||||||||||||
| Salesforce, Inc. |
18 | 02/16/24 | USD | 280.00 | USD | 474 | 5,391 | |||||||||||||||||||||
| Spirit AeroSystems Holdings, Inc., Class A |
36 | 02/16/24 | USD | 40.00 | USD | 114 | 1,440 | |||||||||||||||||||||
| Tesla, Inc. |
90 | 02/16/24 | USD | 280.00 | USD | 2,236 | 64,575 | |||||||||||||||||||||
| Tesla, Inc. |
26 | 02/16/24 | USD | 275.00 | USD | 646 | 21,905 | |||||||||||||||||||||
| Uber Technologies, Inc. |
226 | 02/16/24 | USD | 70.00 | USD | 1,391 | 22,826 | |||||||||||||||||||||
| UBS Group AG, Registered Shares |
357 | 02/16/24 | USD | 30.00 | USD | 1,103 | 68,544 | |||||||||||||||||||||
| UnitedHealth Group, Inc. |
61 | 02/16/24 | USD | 610.00 | USD | 3,211 | 2,074 | |||||||||||||||||||||
| Visa, Inc., Class A |
33 | 02/16/24 | USD | 270.00 | USD | 859 | 11,220 | |||||||||||||||||||||
| Walmart, Inc. |
58 | 02/16/24 | USD | 155.00 | USD | 914 | 33,350 | |||||||||||||||||||||
| Wells Fargo & Co. |
356 | 02/16/24 | USD | 47.50 | USD | 1,752 | 98,612 | |||||||||||||||||||||
| Wells Fargo & Co. |
165 | 02/16/24 | USD | 52.50 | USD | 812 | 9,240 | |||||||||||||||||||||
| Charles Schwab Corp. |
203 | 03/15/24 | USD | 65.00 | USD | 1,397 | 130,427 | |||||||||||||||||||||
| iShares China Large-Cap ETF |
2,783 | 03/15/24 | USD | 24.85 | USD | 6,688 | 288,040 | |||||||||||||||||||||
| Norfolk Southern Corp. |
20 | 03/15/24 | USD | 230.00 | USD | 473 | 29,200 | |||||||||||||||||||||
| Oracle Corp. |
130 | 03/15/24 | USD | 110.00 | USD | 1,371 | 45,825 | |||||||||||||||||||||
| Paramount Global, Class B |
88 | 03/15/24 | USD | 22.50 | USD | 130 | 1,804 | |||||||||||||||||||||
|
|
|
|||||||||||||||||||||||||||
| 6,114,132 | ||||||||||||||||||||||||||||
|
|
|
|||||||||||||||||||||||||||
| Put |
||||||||||||||||||||||||||||
| Carnival Corp. |
75 | 01/19/24 | USD | 9.00 | USD | 139 | 225 | |||||||||||||||||||||
| Carvana Co., Class A |
73 | 01/19/24 | USD | 15.00 | USD | 386 | 110 | |||||||||||||||||||||
| Frontier Communications Parent, Inc. |
80 | 01/19/24 | USD | 20.00 | USD | 203 | 800 | |||||||||||||||||||||
| iShares iBoxx $ High Yield Corporate Bond ETF |
1,019 | 01/19/24 | USD | 77.00 | USD | 7,886 | 24,456 | |||||||||||||||||||||
| C O N S O L I D A T E D S C H E D U L E O F I N V E S T M E N T S |
31 |
| Consolidated Schedule of Investments (continued) December 31, 2023 |
BlackRock Capital Allocation Term Trust (BCAT) |
Exchange-Traded Options Purchased (continued)
| Description | Number of Contracts |
Expiration Date |
Exercise Price | Notional Amount (000) |
Value | |||||||||||||||||||||||
| Put (continued) |
||||||||||||||||||||||||||||
| iShares iBoxx $ Investment Grade Corporate Bond ETF |
1,791 | 01/19/24 | USD | 108.00 | USD | 19,819 | $ | 25,970 | ||||||||||||||||||||
| Paramount Global, Class B |
70 | 01/19/24 | USD | 10.00 | USD | 104 | 105 | |||||||||||||||||||||
| Ford Motor Co. |
121 | 03/15/24 | USD | 9.00 | USD | 147 | 666 | |||||||||||||||||||||
| Ford Motor Co. |
193 | 03/15/24 | USD | 8.00 | USD | 235 | 579 | |||||||||||||||||||||
| iShares iBoxx $ High Yield Corporate Bond ETF |
105 | 03/15/24 | USD | 72.00 | USD | 813 | 12,443 | |||||||||||||||||||||
|
|
|
|||||||||||||||||||||||||||
| 65,354 | ||||||||||||||||||||||||||||
|
|
|
|||||||||||||||||||||||||||
| $ | 6,179,486 | |||||||||||||||||||||||||||
|
|
|
|||||||||||||||||||||||||||
OTC Barrier Options Purchased
| Description | Type of Option | Counterparty | Number of Contracts |
Expiration Date |
Exercise Price | Barrier Price/Range |
Notional Amount (000) |
Value | ||||||||||||||||||||||||||||||||||||
| Call |
||||||||||||||||||||||||||||||||||||||||||||
| USD Currency |
Up-and-in | |
Morgan Stanley & Co. International PLC |
|
— | 03/07/24 | CNH | 7.70 | CNH | 8.25 | USD | 23,928 | $ | 1,795 | ||||||||||||||||||||||||||||||
|
|
|
|||||||||||||||||||||||||||||||||||||||||||
| Put |
||||||||||||||||||||||||||||||||||||||||||||
| USD Currency |
Down-and-out | Bank of America N.A. | — | 02/06/24 | KRW | 1,290.00 | KRW | 1240.00 | USD | 5,316 | 21,553 | |||||||||||||||||||||||||||||||||
| EUR Currency |
One Touch | Deutsche Bank AG | — | 02/09/24 | USD | 1.07 | USD | 1.07 | EUR | 408 | 35,140 | |||||||||||||||||||||||||||||||||
| USD Currency |
Down-and-out | Goldman Sachs International | — | 02/27/24 | CNH | 7.10 | CNH | 6.95 | USD | 5,099 | 8,581 | |||||||||||||||||||||||||||||||||
| EUR Currency |
One Touch | Goldman Sachs International | — | 03/13/24 | USD | 1.02 | USD | 1.02 | EUR | 371 | 3,949 | |||||||||||||||||||||||||||||||||
|
|
|
|||||||||||||||||||||||||||||||||||||||||||
| 69,223 | ||||||||||||||||||||||||||||||||||||||||||||
|
|
|
|||||||||||||||||||||||||||||||||||||||||||
| $ | 71,018 | |||||||||||||||||||||||||||||||||||||||||||
|
|
|
|||||||||||||||||||||||||||||||||||||||||||
OTC Options Purchased
| Description | Counterparty | Number of Contracts |
Expiration Date |
Exercise Price | Notional Amount (000) |
Value | ||||||||||||||||||||||||
| Call |
||||||||||||||||||||||||||||||
| TOPIX Banks Index |
BNP Paribas SA | 576,720 | 01/12/24 | JPY | 286.63 | JPY | 144,405 | $ | 13 | |||||||||||||||||||||
| TOPIX Banks Index |
Goldman Sachs International | 960,816 | 01/12/24 | JPY | 286.49 | JPY | 240,579 | 124 | ||||||||||||||||||||||
| TOPIX Banks Index |
JPMorgan Chase Bank N.A. | 384,864 | 01/12/24 | JPY | 286.56 | JPY | 96,366 | 49 | ||||||||||||||||||||||
| USD Currency |
HSBC Bank PLC | — | 08/21/24 | CNH | 8.50 | USD | 51,043 | 9,545 | ||||||||||||||||||||||
|
|
|
|||||||||||||||||||||||||||||
| 9,731 | ||||||||||||||||||||||||||||||
|
|
|
|||||||||||||||||||||||||||||
| Put |
||||||||||||||||||||||||||||||
| EUR Currency |
JPMorgan Chase Bank N.A. | — | 01/04/24 | USD | 1.06 | EUR | 19,380 | 21 | ||||||||||||||||||||||
| EUR Currency |
Deutsche Bank AG | — | 01/12/24 | USD | 1.06 | EUR | 26,632 | 1,323 | ||||||||||||||||||||||
| USD Currency |
JPMorgan Chase Bank N.A. | — | 01/30/24 | JPY | 144.00 | USD | 4,993 | 145,071 | ||||||||||||||||||||||
| EUR Currency |
Citibank N.A. | — | 02/13/24 | USD | 1.07 | EUR | 25,650 | 34,602 | ||||||||||||||||||||||
|
|
|
|||||||||||||||||||||||||||||
| 181,017 | ||||||||||||||||||||||||||||||
|
|
|
|||||||||||||||||||||||||||||
| $ | 190,748 | |||||||||||||||||||||||||||||
|
|
|
|||||||||||||||||||||||||||||
| 32 | 2 0 2 3 B L A C K R O C K A N N U A L R E P O R T T O S H A R E H O L D E R S |
| Consolidated Schedule of Investments (continued) December 31, 2023 |
BlackRock Capital Allocation Term Trust (BCAT) |
OTC Dual Binary Options Purchased
| Description(a) | Counterparty | Units | Expiration Date |
Notional Amount (000) |
Value | |||||||||||||||||||
| Call |
||||||||||||||||||||||||
| Dual Binary Option payout at expiry if USD JPY >= 154.25 and JPY 10-year swap > 1.25% |
Bank of America N.A. | 285,100 | 04/08/24 | USD | 43,977 | $ | 6,436 | |||||||||||||||||
| Dual Binary Option payout at expiry if USD JPY >= 154.25 and JPY 10-year swap > 1.27% |
Bank of America N.A. | 285,100 | 05/08/24 | USD | 43,977 | 9,278 | ||||||||||||||||||
|
|
|
|||||||||||||||||||||||
| 15,714 | ||||||||||||||||||||||||
|
|
|
|||||||||||||||||||||||
| Put |
||||||||||||||||||||||||
| Dual Binary Option payout at expiry if S&P 500 < 4,663.22 and US 2-year swap > 4.42% |
UBS AG | 346,977 | 03/01/24 | USD | 1,618,030 | 7,678 | ||||||||||||||||||
| Dual Binary Option payout at expiry if S&P 500 < 4,666.87 and US 2-year swap > 4.37% |
UBS AG | 173,489 | 03/15/24 | USD | 809,650 | 4,731 | ||||||||||||||||||
|
|
|
|||||||||||||||||||||||
| 12,409 | ||||||||||||||||||||||||
|
|
|
|||||||||||||||||||||||
| $ | 28,123 | |||||||||||||||||||||||
|
|
|
|||||||||||||||||||||||
| (a) | Option only pays if both terms are met on the expiration date. |
OTC Credit Default Swaptions Purchased
| Paid by the Trust | Received by the Trust | Expiration | Credit | Exercise | Notional | |||||||||||||||||||||||||||||||||
| Description | Rate/Reference | Rate/Reference | Frequency | Counterparty | Date | Rating(a) | Price | Amount (000)(b) | Value | |||||||||||||||||||||||||||||
| Put |
||||||||||||||||||||||||||||||||||||||
| Bought Protection 5-Year Credit Default Swap, 12/20/28 |
5.00% | CDX.NA.HY.41.V2 | Quarterly | Goldman Sachs International |
01/17/24 | N/R | USD 101.00 | USD | 2,750 | $ | 859 | |||||||||||||||||||||||||||
| Bought Protection 5-Year Credit Default Swap, 12/20/28 |
5.00% | iTraxx.XO.40.V1 | Quarterly | Morgan Stanley & Co. International PLC |
02/21/24 | N/R | EUR 400.00 | EUR | 1,720 | 2,513 | ||||||||||||||||||||||||||||
| Bought Protection 5-Year Credit Default Swap, 12/20/28 |
5.00% | CDX.NA.HY.41.V2 | Quarterly | JPMorgan Chase Bank N.A. |
02/21/24 | N/R | USD 100.50 | USD | 1,740 | 1,657 | ||||||||||||||||||||||||||||
|
|
|
|||||||||||||||||||||||||||||||||||||
| $ | 5,029 | |||||||||||||||||||||||||||||||||||||
|
|
|
|||||||||||||||||||||||||||||||||||||
| (a) | Using the rating of the issuer or the underlying securities of the index, as applicable, provided by S&P Global Ratings. |
| (b) | The maximum potential amount the Trust may pay should a negative credit event take place as defined under the terms of the agreement. |
OTC Interest Rate Swaptions Purchased
| Paid by the Trust | Received by the Trust | Expiration | Exercise | Notional | ||||||||||||||||||||||||||||||||||
| Description | Rate | Frequency | Rate | Frequency | Counterparty | Date | Rate | Amount (000) | Value | |||||||||||||||||||||||||||||
| Call |
||||||||||||||||||||||||||||||||||||||
| 10-Year Interest Rate Swap, 01/12/34 |
|
1-Day SOFR, 5.38% |
|
Quarterly | 4.00% | Annual | Goldman Sachs International |
01/10/24 | 4.00 | % | USD | 9,940 | $ | 419,351 | ||||||||||||||||||||||||
| 10-Year Interest Rate Swap, 01/14/34 |
|
1-Day SOFR, 5.38% |
|
Quarterly | 4.00% | Annual | JPMorgan Chase Bank N.A. |
01/12/24 | 4.00 | USD | 2,863 | 121,467 | ||||||||||||||||||||||||||
| 2-Year Interest Rate Swap, 01/25/26 |
|
1-Day SOFR, 5.38% |
|
Quarterly | 4.00% | Annual | Citibank N.A. |
01/23/24 | 4.00 | USD | 24,493 | 389,494 | ||||||||||||||||||||||||||
| 2-Year Interest Rate Swap, 02/03/26 |
|
1-Day SOFR, 5.38% |
|
Annual | 3.87% | Annual | Deutsche Bank AG |
02/01/24 | 3.87 | USD | 24,747 | 345,321 | ||||||||||||||||||||||||||
| 10-Year Interest Rate Swap, 02/08/34 |
|
1-Day SOFR, 5.38% |
|
Annual | 3.45% | Annual | JPMorgan Chase Bank N.A. |
02/06/24 | 3.45 | USD | 15,984 | 176,302 | ||||||||||||||||||||||||||
| 1-Year Interest Rate Swap, 02/14/25 |
|
1-Day SOFR, 5.38% |
|
Annual | 4.45% | Annual | Citibank N.A. |
02/12/24 | 4.45 | USD | 208,377 | 206,539 | ||||||||||||||||||||||||||
| 5-Year Interest Rate Swap, 03/03/29 |
|
6-mo. EURIBOR, |
|
Semi-Annual | 3.00% | Annual | JPMorgan Chase Bank N.A. |
03/01/24 | 3.00 | EUR | 15,660 | 528,184 | ||||||||||||||||||||||||||
| 10-Year Interest Rate Swap, 03/20/34 |
|
1-Day SOFR, 5.38% |
|
Annual | 3.65% | Annual | Nomura International, Inc. |
03/18/24 | 3.65 | USD | 10,148 | 274,708 | ||||||||||||||||||||||||||
| 5-Year Interest Rate Swap, 03/20/29 |
|
6-mo. EURIBOR, |
|
Semi-Annual | 3.18% | Annual | JPMorgan Chase Bank N.A. |
03/18/24 | 3.18 | EUR | 12,926 | 562,039 | ||||||||||||||||||||||||||
| C O N S O L I D A T E D S C H E D U L E O F I N V E S T M E N T S |
33 |
| Consolidated Schedule of Investments (continued) December 31, 2023
|
BlackRock Capital Allocation Term Trust (BCAT) |
OTC Interest Rate Swaptions Purchased (continued)
| Paid by the Trust | Received by the Trust | Expiration | Exercise | Notional | ||||||||||||||||||||||||||||||||||
| Description | Rate | Frequency | Rate | Frequency | Counterparty | Date | Rate | Amount (000) | Value | |||||||||||||||||||||||||||||
| Call (continued) |
||||||||||||||||||||||||||||||||||||||
| 2-Year Interest Rate Swap, 03/30/26 |
|
1-Day SOFR, 5.38% |
|
Quarterly | 4.20% | Annual | JPMorgan Chase Bank N.A. |
03/28/24 | 4.20 | % | USD | 75,842 | $ | 710,432 | ||||||||||||||||||||||||
| 10-Year Interest Rate Swap, 05/30/34 |
|
1-Day SOFR, 5.38% |
|
Annual | 3.67% | Annual | Citibank N.A. |
05/28/24 | 3.67 | USD | 12,763 | 459,327 | ||||||||||||||||||||||||||
| 2-Year Interest Rate Swap, 10/26/26 |
|
1-Day SOFR, 5.38% |
|
Quarterly | 4.00% | Annual | JPMorgan Chase Bank N.A. |
10/24/24 | 4.00 | USD | 39,747 | 639,839 | ||||||||||||||||||||||||||
|
|
|
|||||||||||||||||||||||||||||||||||||
| $ | 4,833,003 | |||||||||||||||||||||||||||||||||||||
|
|
|
|||||||||||||||||||||||||||||||||||||
Exchange-Traded Options Written
| Description | Number of Contracts |
Expiration Date |
Exercise Price | Notional Amount (000) |
Value | |||||||||||||||||||||||
| Call |
||||||||||||||||||||||||||||
| SPX Volatility Index |
128 | 01/17/24 | USD | 35.00 | USD | 159 | $ | (1,216 | ) | |||||||||||||||||||
| Amazon.com, Inc. |
135 | 01/19/24 | USD | 165.00 | USD | 2,051 | (3,915 | ) | ||||||||||||||||||||
| Applied Materials, Inc. |
174 | 01/19/24 | USD | 175.00 | USD | 2,820 | (12,789 | ) | ||||||||||||||||||||
| Delta Air Lines, Inc. |
123 | 01/19/24 | USD | 42.00 | USD | 495 | (2,533 | ) | ||||||||||||||||||||
| Hilton Worldwide Holdings, Inc. |
27 | 01/19/24 | USD | 180.00 | USD | 492 | (12,690 | ) | ||||||||||||||||||||
| InvesCo QQQ Trust, Series 1 |
754 | 01/19/24 | USD | 423.78 | USD | 30,878 | (76,908 | ) | ||||||||||||||||||||
| Lockheed Martin Corp. |
10 | 01/19/24 | USD | 470.00 | USD | 453 | (1,275 | ) | ||||||||||||||||||||
| Mastercard, Inc., Class A |
27 | 01/19/24 | USD | 430.00 | USD | 1,152 | (11,880 | ) | ||||||||||||||||||||
| Microsoft Corp. |
48 | 01/19/24 | USD | 390.00 | USD | 1,805 | (9,264 | ) | ||||||||||||||||||||
| Nice Ltd., ADR |
72 | 01/19/24 | USD | 230.00 | USD | 1,436 | (16,920 | ) | ||||||||||||||||||||
| Paramount Global, Class B |
180 | 01/19/24 | USD | 25.00 | USD | 266 | (450 | ) | ||||||||||||||||||||
| T-Mobile U.S., Inc. |
228 | 01/19/24 | USD | 165.00 | USD | 3,656 | (20,178 | ) | ||||||||||||||||||||
| Uber Technologies, Inc. |
275 | 01/19/24 | USD | 70.00 | USD | 1,693 | (3,575 | ) | ||||||||||||||||||||
| United Airlines Holdings, Inc. |
114 | 01/19/24 | USD | 45.00 | USD | 470 | (4,560 | ) | ||||||||||||||||||||
| Valero Energy Corp. |
37 | 01/19/24 | USD | 140.00 | USD | 481 | (2,609 | ) | ||||||||||||||||||||
| Advanced Micro Devices, Inc. |
223 | 02/16/24 | USD | 145.00 | USD | 3,287 | (247,530 | ) | ||||||||||||||||||||
| Advanced Micro Devices, Inc. |
208 | 02/16/24 | USD | 160.00 | USD | 3,066 | (103,480 | ) | ||||||||||||||||||||
| Alphabet, Inc., Class C |
131 | 02/16/24 | USD | 150.00 | USD | 1,846 | (35,042 | ) | ||||||||||||||||||||
| ConocoPhillips |
55 | 02/16/24 | USD | 130.00 | USD | 638 | (3,685 | ) | ||||||||||||||||||||
| Datadog, Inc., Class A |
38 | 02/16/24 | USD | 140.00 | USD | 461 | (8,303 | ) | ||||||||||||||||||||
| Intuitive Surgical, Inc. |
14 | 02/16/24 | USD | 350.00 | USD | 472 | (16,660 | ) | ||||||||||||||||||||
| iShares China Large-Cap ETF |
3,116 | 02/16/24 | USD | 30.00 | USD | 7,488 | (28,044 | ) | ||||||||||||||||||||
| iShares China Large-Cap ETF |
1,884 | 02/16/24 | USD | 28.00 | USD | 4,527 | (26,376 | ) | ||||||||||||||||||||
| McDonald’s Corp. |
17 | 02/16/24 | USD | 300.00 | USD | 504 | (9,987 | ) | ||||||||||||||||||||
| Micron Technology, Inc. |
58 | 02/16/24 | USD | 90.00 | USD | 495 | (4,257 | ) | ||||||||||||||||||||
| Microsoft Corp. |
48 | 02/16/24 | USD | 420.00 | USD | 1,805 | (9,120 | ) | ||||||||||||||||||||
| Nice Ltd., ADR |
28 | 02/16/24 | USD | 220.00 | USD | 559 | (9,240 | ) | ||||||||||||||||||||
| Northrop Grumman Corp. |
16 | 02/16/24 | USD | 510.00 | USD | 749 | (4,400 | ) | ||||||||||||||||||||
| NVIDIA Corp. |
19 | 02/16/24 | USD | 550.00 | USD | 941 | (14,915 | ) | ||||||||||||||||||||
| Tesla, Inc. |
26 | 02/16/24 | USD | 310.00 | USD | 646 | (7,332 | ) | ||||||||||||||||||||
| UnitedHealth Group, Inc. |
18 | 02/16/24 | USD | 590.00 | USD | 948 | (2,124 | ) | ||||||||||||||||||||
| Walmart, Inc. |
47 | 02/16/24 | USD | 170.00 | USD | 741 | (2,021 | ) | ||||||||||||||||||||
| iShares China Large-Cap ETF |
2,783 | 03/15/24 | USD | 28.85 | USD | 6,688 | (59,834 | ) | ||||||||||||||||||||
|
|
|
|||||||||||||||||||||||||||
| (773,112 | ) | |||||||||||||||||||||||||||
|
|
|
|||||||||||||||||||||||||||
| Put |
||||||||||||||||||||||||||||
| Applied Materials, Inc. |
70 | 01/19/24 | USD | 140.00 | USD | 1,134 | (1,400 | ) | ||||||||||||||||||||
| Cheniere Energy, Inc. |
53 | 01/19/24 | USD | 160.00 | USD | 905 | (2,915 | ) | ||||||||||||||||||||
| Chevron Corp. |
71 | 01/19/24 | USD | 135.00 | USD | 1,059 | (1,101 | ) | ||||||||||||||||||||
| ConocoPhillips |
82 | 01/19/24 | USD | 110.00 | USD | 952 | (5,084 | ) | ||||||||||||||||||||
| Humana, Inc. |
41 | 01/19/24 | USD | 445.00 | USD | 1,877 | (18,040 | ) | ||||||||||||||||||||
| Invesco S&P 500 Equal Weight ETF |
580 | 01/19/24 | USD | 150.00 | USD | 9,152 | (11,600 | ) | ||||||||||||||||||||
| iShares iBoxx $ High Yield Corporate Bond ETF |
1,019 | 01/19/24 | USD | 75.00 | USD | 7,886 | (7,133 | ) | ||||||||||||||||||||
| Walt Disney Co. |
216 | 01/19/24 | USD | 85.00 | USD | 1,950 | (6,804 | ) | ||||||||||||||||||||
| Advanced Micro Devices, Inc. |
100 | 02/16/24 | USD | 120.00 | USD | 1,474 | (11,450 | ) | ||||||||||||||||||||
| Amazon.com, Inc. |
87 | 02/16/24 | USD | 130.00 | USD | 1,322 | (9,222 | ) | ||||||||||||||||||||
| Amazon.com, Inc. |
31 | 02/16/24 | USD | 140.00 | USD | 471 | (8,076 | ) | ||||||||||||||||||||
| Amazon.com, Inc. |
140 | 02/16/24 | USD | 135.00 | USD | 2,127 | (23,380 | ) | ||||||||||||||||||||
| 34 | 2 0 2 3 B L A C K R O C K A N N U A L R E P O R T T O S H A R E H O L D E R S |
| Consolidated Schedule of Investments (continued) December 31, 2023 |
BlackRock Capital Allocation Term Trust (BCAT) |
Exchange-Traded Options Written (continued)
| Description | Number of Contracts |
Expiration Date |
Exercise Price | Notional Amount (000) |
Value | |||||||||||||||||||||||
| Put (continued) |
||||||||||||||||||||||||||||
| Chevron Corp. |
122 | 02/16/24 | USD | 130.00 | USD | 1,820 | $ | (7,198 | ) | |||||||||||||||||||
| ConocoPhillips |
106 | 02/16/24 | USD | 110.00 | USD | 1,230 | (23,267 | ) | ||||||||||||||||||||
| Delta Air Lines, Inc. |
180 | 02/16/24 | USD | 35.00 | USD | 724 | (7,470 | ) | ||||||||||||||||||||
| Humana, Inc. |
51 | 02/16/24 | USD | 455.00 | USD | 2,335 | (76,500 | ) | ||||||||||||||||||||
| Intel Corp. |
181 | 02/16/24 | USD | 45.00 | USD | 910 | (14,842 | ) | ||||||||||||||||||||
| JPMorgan Chase & Co. |
103 | 02/16/24 | USD | 155.00 | USD | 1,752 | (8,291 | ) | ||||||||||||||||||||
| Meta Platforms, Inc., Class A |
38 | 02/16/24 | USD | 315.00 | USD | 1,345 | (20,995 | ) | ||||||||||||||||||||
| Micron Technology, Inc. |
63 | 02/16/24 | USD | 75.00 | USD | 538 | (3,749 | ) | ||||||||||||||||||||
| Micron Technology, Inc. |
36 | 02/16/24 | USD | 80.00 | USD | 307 | (5,130 | ) | ||||||||||||||||||||
| Oracle Corp. |
129 | 02/16/24 | USD | 97.50 | USD | 1,360 | (11,352 | ) | ||||||||||||||||||||
| Tesla, Inc. |
50 | 02/16/24 | USD | 210.00 | USD | 1,242 | (20,500 | ) | ||||||||||||||||||||
| UBS Group AG, Registered Shares |
357 | 02/16/24 | USD | 27.50 | USD | 1,103 | (9,639 | ) | ||||||||||||||||||||
| UnitedHealth Group, Inc. |
31 | 02/16/24 | USD | 500.00 | USD | 1,632 | (17,205 | ) | ||||||||||||||||||||
| Walmart, Inc. |
58 | 02/16/24 | USD | 145.00 | USD | 914 | (2,784 | ) | ||||||||||||||||||||
| Wells Fargo & Co. |
356 | 02/16/24 | USD | 40.00 | USD | 1,752 | (4,272 | ) | ||||||||||||||||||||
| Norfolk Southern Corp. |
20 | 03/15/24 | USD | 200.00 | USD | 473 | (2,550 | ) | ||||||||||||||||||||
| Oracle Corp. |
130 | 03/15/24 | USD | 95.00 | USD | 1,371 | (19,175 | ) | ||||||||||||||||||||
|
|
|
|||||||||||||||||||||||||||
| (361,124 | ) | |||||||||||||||||||||||||||
|
|
|
|||||||||||||||||||||||||||
| $ | (1,134,236 | ) | ||||||||||||||||||||||||||
|
|
|
|||||||||||||||||||||||||||
OTC Options Written
| Description | Counterparty | Number of Contracts |
Expiration Date |
Exercise Price | Notional Amount (000) |
Value | ||||||||||||||||||||||||||
| Call |
||||||||||||||||||||||||||||||||
| TOPIX Banks Index |
BNP Paribas SA | 576,720 | 01/12/24 | JPY | 313.92 | JPY | 144,405 | $ | — | |||||||||||||||||||||||
| TOPIX Banks Index |
Goldman Sachs International | 960,816 | 01/12/24 | JPY | 313.77 | JPY | 240,579 | — | ||||||||||||||||||||||||
| TOPIX Banks Index |
JPMorgan Chase Bank N.A. | 384,864 | 01/12/24 | JPY | 313.85 | JPY | 96,366 | — | ||||||||||||||||||||||||
|
|
|
|||||||||||||||||||||||||||||||
| 0 | ||||||||||||||||||||||||||||||||
|
|
|
|||||||||||||||||||||||||||||||
| Put |
||||||||||||||||||||||||||||||||
| EUR Currency |
Deutsche Bank AG | — | 01/12/24 | USD | 1.05 | USD | 26,631 | (59 | ) | |||||||||||||||||||||||
| USD Currency |
JPMorgan Chase Bank N.A. | — | 01/30/24 | JPY | 136.00 | JPY | 9,987 | (37,242 | ) | |||||||||||||||||||||||
| EUR Currency |
Citibank N.A. | — | 02/13/24 | USD | 1.05 | USD | 25,650 | (8,806 | ) | |||||||||||||||||||||||
|
|
|
|||||||||||||||||||||||||||||||
| (46,107 | ) | |||||||||||||||||||||||||||||||
|
|
|
|||||||||||||||||||||||||||||||
| $ | (46,107 | ) | ||||||||||||||||||||||||||||||
|
|
|
|||||||||||||||||||||||||||||||
OTC Interest Rate Swaptions Written
| Paid by the Trust | Received by the Trust | Expiration | Exercise | Notional | ||||||||||||||||||||||||||||||||||
| Description | Rate | Frequency | Rate | Frequency | Counterparty | Date | Rate | Amount (000) | Value | |||||||||||||||||||||||||||||
| Call |
||||||||||||||||||||||||||||||||||||||
| 2-Year Interest Rate Swap, 01/25/26 |
3.45% | Semi-Annual | |
1-Day SOFR, 5.38% |
|
Annual | Citibank N.A. |
01/23/24 | 3.45 | % | USD | 24,493 | $ | (164,038 | ) | |||||||||||||||||||||||
| 2-Year Interest Rate Swap, 02/03/26 |
3.27% | Semi-Annual | |
1-Day SOFR, 5.38% |
|
Annual | Deutsche Bank AG |
02/01/24 | 3.27 | USD | 24,747 | (119,368 | ) | |||||||||||||||||||||||||
| 1-Year Interest Rate Swap, 02/14/25 |
3.75% | Semi-Annual | |
1-Day SOFR, 5.38% 6-mo. |
|
Annual | Citibank N.A. |
02/12/24 | 3.75 | USD | 156,283 | (18,277 | ) | |||||||||||||||||||||||||
| 5-Year Interest Rate Swap, 03/03/29 |
2.50% | Annual | EURIBOR, 3.86% | Semi-Annual | JPMorgan Chase Bank N.A. |
03/01/24 | 2.50 | EUR | 15,660 | (202,704 | ) | |||||||||||||||||||||||||||
| 10-Year Interest Rate Swap, 03/20/34 |
3.15% | Semi-Annual | |
1-Day SOFR, 5.38% 6-mo. |
|
Annual | Nomura International, Inc. |
03/18/24 | 3.15 | USD | 10,148 | (81,114 | ) | |||||||||||||||||||||||||
| 5-Year Interest Rate Swap, 03/20/29 |
2.68% | Annual | EURIBOR, 3.86% | Semi-Annual | JPMorgan Chase Bank N.A. |
03/18/24 | 2.68 | EUR | 12,926 | (272,542 | ) | |||||||||||||||||||||||||||
| C O N S O L I D A T E D S C H E D U L E O F I N V E S T M E N T S |
35 |
| Consolidated Schedule of Investments (continued) December 31, 2023 |
BlackRock Capital Allocation Term Trust (BCAT) |
OTC Interest Rate Swaptions Written (continued)
| Paid by the Trust | Received by the Trust | Expiration | Exercise | Notional | ||||||||||||||||||||||||||||||||||
| Description | Rate | Frequency | Rate | Frequency | Counterparty | Date | Rate | Amount (000) | Value | |||||||||||||||||||||||||||||
| Call (continued) |
||||||||||||||||||||||||||||||||||||||
| 2-Year Interest Rate Swap, 03/30/26 |
3.80% | Semi-Annual | |
1-Day SOFR, 5.38% |
|
Annual | JPMorgan Chase Bank N.A. |
03/28/24 | 3.80 | % | USD | 75,842 | $ | (380,106 | ) | |||||||||||||||||||||||
| 2-Year Interest Rate Swap, 10/26/26 |
3.30% | Semi-Annual | |
1-Day SOFR, 5.38% |
|
Annual | JPMorgan Chase Bank N.A. |
10/24/24 | 3.30 | USD | 39,747 | (339,183 | ) | |||||||||||||||||||||||||
|
|
|
|||||||||||||||||||||||||||||||||||||
| (1,577,332 | ) | |||||||||||||||||||||||||||||||||||||
|
|
|
|||||||||||||||||||||||||||||||||||||
| Put |
||||||||||||||||||||||||||||||||||||||
| 2-Year Interest Rate Swap, 01/14/26 |
|
1-Day SOFR, 5.38% 6-mo. |
|
Quarterly | 5.15% | Annual | JPMorgan Chase Bank N.A. |
01/12/24 | 5.15 | USD | 43,953 | — | ||||||||||||||||||||||||||
| 5-Year Interest Rate Swap, 03/03/29 |
|
EURIBOR, 3.86% 6-mo. |
|
Semi-Annual | 3.45% | Annual | JPMorgan Chase Bank N.A. |
03/01/24 | 3.45 | EUR | 15,660 | (4,026 | ) | |||||||||||||||||||||||||
| 2-Year Interest Rate Swap, 03/20/26 |
|
EURIBOR, 3.86% 6-mo. |
|
Semi-Annual | 4.05% | Annual | BNP Paribas SA |
03/18/24 | 4.05 | EUR | 18,121 | (697 | ) | |||||||||||||||||||||||||
| 5-Year Interest Rate Swap, 03/20/29 |
|
EURIBOR, 3.86% |
|
Semi-Annual | 3.58% | Annual | JPMorgan Chase Bank N.A. |
03/18/24 | 3.58 | EUR | 12,926 | (3,618 | ) | |||||||||||||||||||||||||
| 5-Year Interest Rate Swap, 03/29/29 |
|
1-Day SOFR, 5.38% |
|
Quarterly | 3.79% | Annual | JPMorgan Chase Bank N.A. |
03/27/24 | 3.79 | USD | 35,313 | (169,171 | ) | |||||||||||||||||||||||||
| 2-Year Interest Rate Swap, 05/08/26 |
|
1-Day SOFR, 5.38% |
|
Annual | 4.50% | Annual | Goldman Sachs International |
05/06/24 | 4.50 | USD | 25,254 | (22,868 | ) | |||||||||||||||||||||||||
| 10-Year Interest Rate Swap, 05/30/34 |
|
1-Day SOFR, 5.38% 6-mo. |
|
Annual | 4.42% | Annual | Citibank N.A. |
05/28/24 | 4.42 | USD | 12,763 | (42,208 | ) | |||||||||||||||||||||||||
| 5-Year Interest Rate Swap, 06/01/29 |
|
EURIBOR, 3.86% |
|
Annual | 3.40% | Annual | JPMorgan Chase Bank N.A. |
05/30/24 | 3.40 | EUR | 25,129 | (35,872 | ) | |||||||||||||||||||||||||
| 2-Year Interest Rate Swap, 10/26/26 |
|
1-Day SOFR, 5.38% |
|
Quarterly | 5.00% | Annual | JPMorgan Chase Bank N.A. |
10/24/24 | 5.00 | USD | 19,874 | (15,705 | ) | |||||||||||||||||||||||||
| 2-Year Interest Rate Swap, 11/23/26 |
|
1-Day SOFR, 5.38% |
|
Annual | 5.00% | Annual | JPMorgan Chase Bank N.A. |
11/21/24 | 5.00 | USD | 50,148 | (45,005 | ) | |||||||||||||||||||||||||
|
|
|
|||||||||||||||||||||||||||||||||||||
| (339,170 | ) | |||||||||||||||||||||||||||||||||||||
|
|
|
|||||||||||||||||||||||||||||||||||||
| $ | (1,916,502 | ) | ||||||||||||||||||||||||||||||||||||
|
|
|
|||||||||||||||||||||||||||||||||||||
Centrally Cleared Credit Default Swaps — Buy Protection
| Reference Obligation/Index | |
Financing Rate Paid by the Trust |
|
|
Payment Frequency |
|
|
Termination Date |
|
|
Notional Amount (000) |
|
Value | |
Upfront Premium Paid (Received) |
|
|
Unrealized Appreciation (Depreciation) |
| |||||||||
| iTraxx.XO.38.V2 |
5.00 | % | Quarterly | 12/20/27 | EUR 4,590 | $ | (512,303 | ) | $ | 72,303 | $ | (584,606 | ) | |||||||||||||||
|
|
|
|
|
|
|
Centrally Cleared Credit Default Swaps — Sell Protection
| Reference Obligation/Index | |
Financing Rate Received by the Trust |
|
|
Payment Frequency |
|
|
Termination Date |
|
|
Credit Rating |
(a) |
|
Notional Amount (000) |
(b) |
Value | |
Upfront Premium Paid (Received) |
|
Unrealized Appreciation (Depreciation) |
| |||||||||||
| iTraxx.XO.34.V3 |
5.00 | % | Quarterly | 12/20/25 | CC | EUR | 33,645 | $ | 2,802,989 | $ | 1,586,237 | $ | 1,216,752 | |||||||||||||||||||
| iTraxx.XO.35.V2 |
5.00 | Quarterly | 06/20/26 | CC+ | EUR | 1,421 | 132,139 | 115,372 | 16,767 | |||||||||||||||||||||||
| CDX.NA.HY.41.V2 |
5.00 | Quarterly | 12/20/28 | B | USD | 3,367 | 202,315 | 101,866 | 100,449 | |||||||||||||||||||||||
|
|
|
|
|
|
|
|||||||||||||||||||||||||||
| $ | 3,137,443 | $ | 1,803,475 | $ | 1,333,968 | |||||||||||||||||||||||||||
|
|
|
|
|
|
|
| (a) | Using the rating of the issuer or the underlying securities of the index, as applicable, provided by S&P Global Ratings. |
| (b) | The maximum potential amount the Trust may pay should a negative credit event take place as defined under the terms of the agreement. |
| 36 | 2 0 2 3 B L A C K R O C K A N N U A L R E P O R T T O S H A R E H O L D E R S |
| Consolidated Schedule of Investments (continued) December 31, 2023 |
BlackRock Capital Allocation Term Trust (BCAT) |
Centrally Cleared Inflation Swaps
| Paid by the Trust |
Received by the Trust |
Termination Date |
Notional Amount (000) |
Value | Upfront Premium Paid (Received) |
Unrealized Appreciation (Depreciation) |
||||||||||||||||||||||
| Reference | Frequency | Rate | Frequency | |||||||||||||||||||||||||
| Eurostat Eurozone HICP Ex Tobacco Unrevised |
At Termination | 2.69% | At Termination | 08/15/32 | EUR 1,425 | $ | 22,842 | $ | 30 | $ | 22,812 | |||||||||||||||||
|
|
|
|
|
|
|
|||||||||||||||||||||||
Centrally Cleared Interest Rate Swaps
| Paid by the Trust |
Received by the Trust |
Effective Date |
Termination Date |
Notional Amount (000) |
Value |
Upfront (Received) |
Unrealized (Depreciation) |
|||||||||||||||||||||||||||
| Rate | Frequency | Rate | Frequency | |||||||||||||||||||||||||||||||
| 28-Day MXIBTIIE, 11.50% | Monthly | 4.68% | Monthly | N/A | 02/27/24 | MXN | 62,782 | $ | (60,152 | ) | $ | 2 | $ | (60,154 | ) | |||||||||||||||||||
| 28-Day MXIBTIIE, 11.50% | Monthly | 4.86% | Monthly | N/A | 03/01/24 | MXN | 62,782 | (58,582 | ) | 2 | (58,584 | ) | ||||||||||||||||||||||
| 2.47% | At Termination | 1-Day SONIA, 5.19% | At Termination | N/A | 04/03/24 | GBP | 46,645 | 1,533,957 | (628 | ) | 1,534,585 | |||||||||||||||||||||||
| 1-Day SONIA, 5.19% | At Termination | 3.22% | At Termination | N/A | 04/03/24 | GBP | 93,289 | (2,189,582 | ) | 783 | (2,190,365 | ) | ||||||||||||||||||||||
| 1-Day SONIA, 5.19% | At Termination | 4.26% | At Termination | N/A | 09/06/24 | GBP | 25,649 | (274,984 | ) | 92 | (275,076 | ) | ||||||||||||||||||||||
| 1-Day SOFR, 5.38% | At Termination | 5.45% | At Termination | N/A | 10/02/24 | USD | 174,570 | 577,902 | 5,479 | 572,423 | ||||||||||||||||||||||||
| 28-Day MXIBTIIE, 11.50% | Monthly | 9.78% | Monthly | N/A | 02/04/25 | MXN | 48,743 | (30,230 | ) | 5 | (30,235 | ) | ||||||||||||||||||||||
| 28-Day MXIBTIIE, 11.50% | Monthly | 9.79% | Monthly | N/A | 02/04/25 | MXN | 24,371 | (14,957 | ) | 2 | (14,959 | ) | ||||||||||||||||||||||
| 28-Day MXIBTIIE, 11.50% | Monthly | 9.80% | Monthly | N/A | 02/04/25 | MXN | 24,371 | (14,720 | ) | 2 | (14,722 | ) | ||||||||||||||||||||||
| 28-Day MXIBTIIE, 11.50% | Monthly | 9.95% | Monthly | N/A | 02/07/25 | MXN | 550,963 | (274,794 | ) | 68 | (274,862 | ) | ||||||||||||||||||||||
| 1-Day SOFR, 5.38% | Annual | 5.00% | Annual | N/A | 10/02/25 | USD | 169,290 | 2,050,066 | 24,887 | 2,025,179 | ||||||||||||||||||||||||
| 4.69% | Annual | 1-Day SOFR, 5.38% | Annual | N/A | 10/02/26 | USD | 115,533 | (2,387,818 | ) | (22,623 | ) | (2,365,195 | ) | |||||||||||||||||||||
| 1-Day SOFR, 5.38% | At Termination | 4.17% | At Termination | 10/23/25 | (a) | 10/23/26 | USD | 19,696 | 196,205 | 36 | 196,169 | |||||||||||||||||||||||
| 1-Day SOFR, 5.38% | At Termination | 4.21% | At Termination | 10/27/25 | (a) | 10/27/26 | USD | 39,419 | 407,944 | 72 | 407,872 | |||||||||||||||||||||||
| 1-Day SOFR, 5.38% | Annual | 3.47% | Annual | 03/10/25 | (a) | 03/10/27 | USD | 9,910 | 57,306 | 44 | 57,262 | |||||||||||||||||||||||
| 1-Day SOFR, 5.38% | Annual | 3.30% | Annual | 10/23/25 | (a) | 10/23/27 | USD | 7,036 | 26,015 | 32 | 25,983 | |||||||||||||||||||||||
| 1-Day SOFR, 5.38% | Annual | 4.20% | Annual | 10/23/25 | (a) | 10/23/27 | USD | 10,250 | 203,896 | 47 | 203,849 | |||||||||||||||||||||||
| 1-Day SOFR, 5.38% | Annual | 3.92% | Annual | 11/03/25 | (a) | 11/03/27 | USD | 4,880 | 72,496 | 22 | 72,474 | |||||||||||||||||||||||
| 1-Day SOFR, 5.38% | Annual | 3.95% | Annual | 11/03/25 | (a) | 11/03/27 | USD | 4,881 | 75,123 | 22 | 75,101 | |||||||||||||||||||||||
| 1-Day SOFR, 5.38% | Annual | 3.99% | Annual | 11/03/25 | (a) | 11/03/27 | USD | 9,761 | 156,376 | 45 | 156,331 | |||||||||||||||||||||||
| 1-Day SOFR, 5.38% | Annual | 4.07% | Annual | 11/03/25 | (a) | 11/03/27 | USD | 19,787 | 347,249 | 90 | 347,159 | |||||||||||||||||||||||
| 1-Day SOFR, 5.38% | Annual | 3.86% | Annual | 11/10/25 | (a) | 11/10/27 | USD | 20,267 | 279,563 | 92 | 279,471 | |||||||||||||||||||||||
| 1-Day SONIA, 5.19% | At Termination | 3.18% | At Termination | 02/10/27 | (a) | 02/10/28 | GBP | 85,657 | 284,748 | 524 | 284,224 | |||||||||||||||||||||||
| 1-Day SONIA, 5.19% | Annual | 4.86% | Annual | N/A | 06/20/28 | GBP | 6,480 | 460,835 | (16 | ) | 460,851 | |||||||||||||||||||||||
| 28-Day MXIBTIIE, 11.50% | Monthly | 9.13% | Monthly | N/A | 08/15/28 | MXN | 104,580 | 112,396 | 53 | 112,343 | ||||||||||||||||||||||||
| 1-Day SOFR, 5.38% | Annual | 4.42% | Annual | N/A | 10/02/28 | USD | 81,301 | 2,874,171 | 18,433 | 2,855,738 | ||||||||||||||||||||||||
| 1-Day SOFR, 5.38% | Annual | 4.40% | Annual | N/A | 10/31/28 | USD | 13,191 | 474,278 | 121 | 474,157 | ||||||||||||||||||||||||
| 1-Day SONIA, 5.19% | Annual | 4.12% | Annual | N/A | 11/17/28 | GBP | 6,091 | 239,634 | 288 | 239,346 | ||||||||||||||||||||||||
| 1-Day SONIA, 5.19% | Annual | 4.12% | Annual | N/A | 11/21/28 | GBP | 6,085 | 241,593 | 291 | 241,302 | ||||||||||||||||||||||||
| 1-Day SOFR, 5.38% | Annual | 3.25% | Annual | 12/15/26 | (a) | 12/15/28 | USD | 21,232 | 29,334 | 97 | 29,237 | |||||||||||||||||||||||
| 0.02% | Annual | 6-mo. EURIBOR, 3.86% | Semi-Annual | N/A | 08/26/31 | EUR | 9,317 | 1,870,113 | 151 | 1,869,962 | ||||||||||||||||||||||||
| 1-Day ESTR, 1,232.85% | Annual | 2.34% | Annual | 01/19/28 | (a) | 01/19/33 | EUR | 7,414 | 16,955 | 104 | 16,851 | |||||||||||||||||||||||
| 1-Day SOFR, 5.38% | Annual | 3.14% | Annual | 05/12/28 | (a) | 05/12/33 | USD | 13,769 | (129,563 | ) | 127 | (129,690 | ) | |||||||||||||||||||||
| 1-Day SOFR, 5.38% | Annual | 4.31% | Annual | N/A | 09/29/33 | USD | 121,626 | 7,974,739 | 10,327 | 7,964,412 | ||||||||||||||||||||||||
| 4.40% | Annual | 1-Day SOFR, 5.38% | Annual | N/A | 11/01/33 | USD | 11,317 | (844,692 | ) | 185 | (844,877 | ) | ||||||||||||||||||||||
| 3.46% | Annual | 1-Day SOFR, 5.38% | Annual | 12/15/26 | (a) | 12/15/36 | USD | 4,853 | (23,676 | ) | 80 | (23,756 | ) | |||||||||||||||||||||
| 4.25% | Annual | 1-Day SOFR, 5.38% | Annual | N/A | 09/29/43 | USD | 1,467 | (153,701 | ) | 995 | (154,696 | ) | ||||||||||||||||||||||
| 4.03% | Annual | 1-Day SOFR, 5.38% | Annual | N/A | 09/29/53 | USD | 30,617 | (3,932,777 | ) | 9,652 | (3,942,429 | ) | ||||||||||||||||||||||
| 3.65% | Annual | 1-Day SOFR, 5.38% | Annual | N/A | 11/03/53 | USD | 5,251 | (314,908 | ) | 168 | (315,076 | ) | ||||||||||||||||||||||
| 1-Day SOFR, 5.38% | Annual | 4.00% | Annual | N/A | 11/03/53 | USD | 5,251 | 660,156 | 168 | 659,988 | ||||||||||||||||||||||||
|
|
|
|
|
|
|
|||||||||||||||||||||||||||||
| $ | 10,517,914 | $ | 50,321 | $ | 10,467,593 | |||||||||||||||||||||||||||||
|
|
|
|
|
|
|
|||||||||||||||||||||||||||||
| (a) | Forward Swap. |
| C O N S O L I D A T E D S C H E D U L E O F I N V E S T M E N T S |
37 |
| Consolidated Schedule of Investments (continued) December 31, 2023 |
BlackRock Capital Allocation Term Trust (BCAT) |
OTC Credit Default Swaps — Buy Protection
| Reference Obligations/Index | |
Financing Rate Paid by the Trust |
|
|
Payment Frequency |
|
Counterparty | |
Termination Date |
|
Notional Amount (000) |
|
Value | |
Upfront Premium Paid (Received) |
|
|
Unrealized Appreciation (Depreciation) |
| |||||||||||||
| American Airlines Group Inc. |
5.00 | % | Quarterly | JPMorgan Chase Bank N.A. |
12/20/24 | USD | 95 | $ | (2,791 | ) | $ | (1,070 | ) | $ | (1,721 | ) | ||||||||||||||||
| UBS Group AG |
1.00 | Quarterly | JPMorgan Chase Bank N.A. |
06/20/28 | EUR | 3,700 | (55,176 | ) | 119,347 | (174,523 | ) | |||||||||||||||||||||
| UBS Group AG |
1.00 | Quarterly | JPMorgan Chase Bank N.A. |
06/20/28 | EUR | 2,160 | (32,210 | ) | 67,319 | (99,529 | ) | |||||||||||||||||||||
| Republic of Panama |
1.00 | Quarterly | Barclays Bank PLC |
12/20/28 | USD | 75 | 2,046 | 2,353 | (307 | ) | ||||||||||||||||||||||
| Republic of Panama |
1.00 | Quarterly | Goldman Sachs International |
12/20/28 | USD | 80 | 2,183 | 2,682 | (499 | ) | ||||||||||||||||||||||
| Xerox Corp |
1.00 | Quarterly | JPMorgan Chase Bank N.A. |
12/20/28 | USD | 10 | 875 | 1,210 | (335 | ) | ||||||||||||||||||||||
| Xerox Corp |
1.00 | Quarterly | Morgan Stanley & Co. International PLC |
12/20/28 | USD | 30 | 2,625 | 3,627 | (1,002 | ) | ||||||||||||||||||||||
|
|
|
|
|
|
|
|||||||||||||||||||||||||||
| $ | (82,448 | ) | $ | 195,468 | $ | (277,916 | ) | |||||||||||||||||||||||||
|
|
|
|
|
|
|
|||||||||||||||||||||||||||
OTC Credit Default Swaps — Sell Protection
| Reference Obligation/Index | |
Financing Rate Received by the Trust |
|
|
Payment Frequency |
|
Counterparty | |
Termination Date |
|
|
Credit Rating |
(a) |
|
Notional Amount (000)(b) |
|
Value | |
Upfront Premium Paid (Received) |
|
|
Unrealized Appreciation (Depreciation) |
| |||||||||||||||
| Vistra Operations Company LLC |
5.00 | % | Quarterly | JPMorgan Chase Bank N.A. |
12/20/25 | BB | USD | 642 | $ | 47,264 | $ | 22,772 | $ | 24,492 | ||||||||||||||||||||||||
| CMBX.NA.9 |
3.00 | Monthly | Morgan Stanley & Co. International PLC | 09/17/58 | N/R | USD | 332 | (57,844 | ) | (69,972 | ) | 12,128 | ||||||||||||||||||||||||||
|
|
|
|
|
|
|
|||||||||||||||||||||||||||||||||
| $ | (10,580 | ) | $ | (47,200 | ) | $ | 36,620 | |||||||||||||||||||||||||||||||
|
|
|
|
|
|
|
|||||||||||||||||||||||||||||||||
| (a) | Using the rating of the issuer or the underlying securities of the index, as applicable, provided by S&P Global Ratings. |
| (b) | The maximum potential amount the Trust may pay should a negative credit event take place as defined under the terms of the agreement. |
OTC Interest Rate Swaps
| Paid by the Trust |
Received by the Trust |
|
Effective Date |
Termination Date |
|
Notional Amount (000) |
Value |
Upfront (Received) |
Unrealized (Depreciation) |
|||||||||||||||||||||||||||
| Rate | Frequency | Rate | Frequency | Counterparty | ||||||||||||||||||||||||||||||||
| 1-Day BZDIOVER, 0.04% |
At Termination | 12.78% | At Termination | Morgan Stanley & Co. International PLC |
N/A | 01/02/25 | BRL | 143,165 | $ | 741,864 | $ | — | $ | 741,864 | ||||||||||||||||||||||
| 1-Day BZDIOVER, 0.04% |
At Termination | 13.15% | At Termination | JPMorgan Chase Bank N.A. |
N/A | 01/02/25 | BRL | 7,385 | 48,987 | — | 48,987 | |||||||||||||||||||||||||
| 1-Day BZDIOVER, 0.04% |
At Termination | 13.18% | At Termination | JPMorgan Chase Bank N.A. |
N/A | 01/02/25 | BRL | 7,381 | 49,827 | — | 49,827 | |||||||||||||||||||||||||
| 1-Day BZDIOVER, 0.04% |
At Termination | 13.22% | At Termination | Citibank N.A. |
N/A | 01/02/25 | BRL | 3,883 | 26,846 | — | 26,846 | |||||||||||||||||||||||||
| China Fixing Repo Rates 7-Day, 2.40% |
Quarterly | 2.60% | Quarterly | Morgan Stanley & Co. International PLC |
N/A | 09/15/26 | CNY | 157,107 | 313,773 | — | 313,773 | |||||||||||||||||||||||||
| 1-Day BZDIOVER, 0.04% |
At Termination | 10.03% | At Termination | JPMorgan Chase Bank N.A. |
N/A | 01/04/27 | BRL | 14,158 | 6,014 | — | 6,014 | |||||||||||||||||||||||||
| 1-Day BZDIOVER, 0.04% |
At Termination | 10.03% | At Termination | BNP Paribas SA |
N/A | 01/04/27 | BRL | 12,635 | 963 | — | 963 | |||||||||||||||||||||||||
| 1-Day BZDIOVER, 0.04% |
At Termination | 10.10% | At Termination | Bank of America N.A. |
N/A | 01/04/27 | BRL | 13,441 | 6,968 | — | 6,968 | |||||||||||||||||||||||||
| 1-Day BZDIOVER, 0.04% |
At Termination | 10.12% | At Termination | Bank of America N.A. |
N/A | 01/04/27 | BRL | 17,910 | 11,786 | — | 11,786 | |||||||||||||||||||||||||
| 1-Day BZDIOVER, 0.04% |
At Termination | 10.12% | At Termination | BNP Paribas SA |
N/A | 01/04/27 | BRL | 96 | 63 | — | 63 | |||||||||||||||||||||||||
| 38 | 2 0 2 3 B L A C K R O C K A N N U A L R E P O R T T O S H A R E H O L D E R S |
| Consolidated Schedule of Investments (continued) December 31, 2023 |
BlackRock Capital Allocation Term Trust (BCAT) |
OTC Interest Rate Swaps (continued)
| Paid by the Trust |
Received by the Trust |
|
Effective Date |
Termination Date |
|
Notional Amount (000) |
Value |
Upfront (Received) |
Unrealized (Depreciation) |
|||||||||||||||||||||||||||
| Rate | Frequency | Rate | Frequency | Counterparty | ||||||||||||||||||||||||||||||||
| 1-Day BZDIOVER, 0.04% |
At Termination | 10.12% | At Termination | BNP Paribas SA |
N/A | 01/04/27 | BRL | 17,183 | $ | 11,608 | $ | — | $ | 11,608 | ||||||||||||||||||||||
| 1-Day BZDIOVER, 0.04% |
At Termination | 10.32% | At Termination | Barclays Bank PLC |
N/A | 01/04/27 | BRL | 29,050 | 73,169 | — | 73,169 | |||||||||||||||||||||||||
| 1-Day BZDIOVER, 0.04% |
At Termination | 9.95% | At Termination | Citibank N.A. |
N/A | 01/04/27 | BRL | 14,191 | (1,203 | ) | — | (1,203 | ) | |||||||||||||||||||||||
| 1-Day BZDIOVER, 0.04% |
At Termination | 9.97% | At Termination | Bank of America N.A. |
N/A | 01/04/27 | BRL | 14,578 | 249 | — | 249 | |||||||||||||||||||||||||
| 1-Day BZDIOVER, 0.04% |
At Termination | 9.99% | At Termination | Morgan Stanley & Co. International PLC |
N/A | 01/04/27 | BRL | 14,173 | 2,649 | — | 2,649 | |||||||||||||||||||||||||
|
|
|
|
|
|
|
|||||||||||||||||||||||||||||||
| $ | 1,293,563 | $ | — | $ | 1,293,563 | |||||||||||||||||||||||||||||||
|
|
|
|
|
|
|
|||||||||||||||||||||||||||||||
OTC Total Return Swaps
| Paid by the Trust |
Received by the Trust |
Counterparty | Effective Date |
Termination Date |
Notional Amount (000) |
Value |
Upfront (Received) |
Unrealized (Depreciation) |
||||||||||||||||||||||||||||
| Rate/Reference | Frequency | Rate/Reference | Frequency | |||||||||||||||||||||||||||||||||
| 1-Day SOFR minus 0.35%, 5.38% |
At Termination | iShares iBoxx $ High Yield Corporate Bond ETF |
At Termination | BNP Paribas SA |
N/A | 03/15/24 | USD | 2,547 | $ | 40,490 | $ | — | $ | 40,490 | ||||||||||||||||||||||
| 1-Day SOFR minus 0.35%, 5.38% |
At Termination | iShares iBoxx $ High Yield Corporate Bond ETF |
At Termination | BNP Paribas SA |
N/A | 03/15/24 | USD | 3,850 | 54,651 | — | 54,651 | |||||||||||||||||||||||||
| 1-Day SOFR minus 0.35%, 5.38% |
At Termination | iShares iBoxx $ High Yield Corporate Bond ETF |
At Termination | JPMorgan Chase Bank N.A. |
N/A | 03/15/24 | USD | 2,545 | 42,509 | — | 42,509 | |||||||||||||||||||||||||
| 1-Day SOFR minus 0.25%, 5.38% |
At Termination | iShares iBoxx $ High Yield Corporate Bond ETF |
At Termination | BNP Paribas SA |
N/A | 03/15/24 | USD | 5,122 | 21,203 | — | 21,203 | |||||||||||||||||||||||||
| 1-Day SOFR minus 0.13%, 5.38% |
At Termination | iShares iBoxx $ High Yield Corporate Bond ETF |
At Termination | Goldman Sachs International |
N/A | 03/15/24 | USD | 5,249 | 21,495 | — | 21,495 | |||||||||||||||||||||||||
| 1-Day SOFR minus 0.13%, 5.38% |
At Termination | iShares iBoxx $ High Yield Corporate Bond ETF |
At Termination | JPMorgan Chase Bank N.A. |
N/A | 03/15/24 | USD | 5,249 | 21,495 | — | 21,495 | |||||||||||||||||||||||||
| 1-Day SOFR minus 0.10%, 5.38% |
At Termination | iShares iBoxx $ High Yield Corporate Bond ETF |
At Termination | JPMorgan Chase Bank N.A. |
N/A | 03/15/24 | USD | 2,544 | 42,404 | — | 42,404 | |||||||||||||||||||||||||
|
|
|
|
|
|
|
|||||||||||||||||||||||||||||||
| $ | 244,247 | $ | — | $ | 244,247 | |||||||||||||||||||||||||||||||
|
|
|
|
|
|
|
|||||||||||||||||||||||||||||||
| C O N S O L I D A T E D S C H E D U L E O F I N V E S T M E N T S |
39 |
| Consolidated Schedule of Investments (continued) December 31, 2023 |
BlackRock Capital Allocation Term Trust (BCAT) |
OTC Total Return Swaps
| Reference Entity | Payment Frequency |
Counterparty(a) | Termination Date |
Net Notional |
Accrued (Depreciation) |
Net Value of Reference Entity |
Gross Notional Amount Net Asset Percentage |
|||||||||||||||||||
| Equity Securities Long/Short |
Monthly | Citibank N.A.(b) | 10/25/24 | $ | 7,534,665 | $ | 86,154 | (c) | $ | 7,664,392 | 0.4 | % | ||||||||||||||
| Monthly | JPMorgan Chase Bank N.A.(d) | 02/08/24 | (10,652,828) | (498,883 | )(e) | (11,159,853) | 0.6 | |||||||||||||||||||
|
|
|
|
|
|||||||||||||||||||||||
| $ | (412,729 | ) | $ | (3,495,461 | ) | |||||||||||||||||||||
|
|
|
|
|
|||||||||||||||||||||||
| (a) | The Trust receives the total return on a portfolio of long positions underlying the total return swap. The Trust pays the total return on a portfolio of short positions underlying the total return swap. In addition, the Trust pays or receives a variable rate of interest, based on a specified benchmark. The benchmark and spread are determined based upon the country and/or currency of the individual underlying positions. |
| (c) | Amount includes $(43,573) of net dividends and financing fees. |
| (e) | Amount includes $8,142 of net dividends and financing fees. |
The following are the specified benchmarks (plus or minus a range) used in determining the variable rate of interest:
| (b) | (d) | |||
| Range: |
26 basis points | 15-57 basis points | ||
| Benchmarks: |
USD - 1D Overnight Bank Funding Rate (OBFR01) | USD - 1D Overnight Bank Funding Rate (OBFR01) |
The following table represents the individual long positions and related values of the equity securities underlying the total return swap with Citibank N.A. as of period end, termination date 10/25/24:
| Security | Shares | Value | % of Basket Value |
|||||||||
|
Reference Entity — Long |
||||||||||||
| Common Stocks |
||||||||||||
| Italy |
||||||||||||
| Leonardo SpA |
463,859 | $ | 7,664,392 | 100.0 | % | |||||||
|
|
|
|
|
|||||||||
| Net Value of Reference Entity — Citibank N.A. |
$ | 7,664,392 | ||||||||||
|
|
|
|||||||||||
The following table represents the individual long and short positions and related values of the equity securities underlying the total return swap with JPMorgan Chase Bank N.A. as of period end, termination date 02/08/24:
| Security | Shares | Value | % of Basket Value |
|||||||||
|
Reference Entity — Long |
||||||||||||
| Common Stocks |
||||||||||||
| United States |
||||||||||||
| Banc of California, Inc. |
1 | $ | 14 | (0.0 | )% | |||||||
|
|
|
|
|
|||||||||
| Total Reference Entity — Long |
14 | |||||||||||
|
|
|
|||||||||||
|
Reference Entity — Short |
||||||||||||
| Common Stocks |
||||||||||||
| United States |
||||||||||||
| Air Transport Services Group, Inc. |
(309 | ) | (5,441 | ) | 0.0 | |||||||
| Atlantic Union Bankshares Corp. |
(3,100 | ) | (113,274 | ) | 1.0 | |||||||
| Bank of Hawaii Corp. |
(2,684 | ) | (194,483 | ) | 1.7 | |||||||
| Banner Corp. |
(1,227 | ) | (65,718 | ) | 0.6 | |||||||
| Columbia Banking System, Inc. |
(2,360 | ) | (62,965 | ) | 0.6 | |||||||
| Security | Shares | Value | %of Basket Value |
|||||||||
|
United States (continued) |
|
|||||||||||
| Community Bank System, Inc. |
(2,832) | $ | (147,576) | 1.3 | % | |||||||
| Cullen/Frost Bankers, Inc. |
(495) | (53,703) | 0.5 | |||||||||
| CVB Financial Corp. |
(7,483) | (151,082) | 1.4 | |||||||||
| First Bancorp/Southern Pines NC |
(1,699) | (62,880) | 0.6 | |||||||||
| Glacier Bancorp, Inc. |
(3,312) | (136,852) | 1.2 | |||||||||
| Independent Bank Group, Inc. |
(3,635) | (184,949) | 1.7 | |||||||||
| Lakeland Bancorp, Inc. |
(4,154) | (61,438) | 0.6 | |||||||||
| Marriott International, Inc. |
(3,655) | (824,239) | 7.4 | |||||||||
| OceanFirst Financial Corp. |
(3,487) | (60,534) | 0.5 | |||||||||
| Old National Bancorp |
(6,042) | (102,049) | 0.9 | |||||||||
| Provident Financial Services, Inc. |
(3,493) | (62,979) | 0.6 | |||||||||
| Sabre Corp. |
(7,741) | (34,060) | 0.3 | |||||||||
| Sandy Spring Bancorp, Inc. |
(2,455) | (66,874) | 0.6 | |||||||||
| Simmons First National Corp., Class A |
(4,322) | (85,748) | 0.8 | |||||||||
| Snowflake, Inc., Class A |
(14,101) | (2,806,099) | 25.1 | |||||||||
| SouthState Corp. |
(1,340) | (113,163) | 1.0 | |||||||||
| Valley National Bancorp |
(22,756) | (247,130) | 2.2 | |||||||||
| WaFd, Inc. |
(5,453) | (179,731) | 1.6 | |||||||||
| WesBanco, Inc. |
(1,983) | (62,207) | 0.6 | |||||||||
| WSFS Financial Corp. |
(1,511) | (69,400) | 0.6 | |||||||||
|
|
|
|
|
|||||||||
| (5,954,574) | ||||||||||||
|
Investment Companies |
||||||||||||
| United States |
||||||||||||
| iShares iBoxx $ High Yield Corporate Bond ETF |
(24,105) | (1,865,486) | 16.7 | |||||||||
| SPDR S&P Regional Banking ETF |
(4,065) | (213,128) | 1.9 | |||||||||
| Vanguard Intermediate-Term Corporate Bond ETF |
(38,468) | (3,126,679) | 28.0 | |||||||||
|
|
|
|
|
|||||||||
| (5,205,293) | ||||||||||||
|
|
|
|||||||||||
| Total Reference Entity — Short |
(11,159,867) | |||||||||||
|
|
|
|||||||||||
| Net Value of Reference Entity — JPMorgan Chase Bank N.A |
$ | (11,159,853 | ) | |||||||||
|
|
|
|||||||||||
| 40 | 2 0 2 3 B L A C K R O C K A N N U A L R E P O R T T O S H A R E H O L D E R S |
| Consolidated Schedule of Investments (continued) December 31, 2023 |
BlackRock Capital Allocation Term Trust (BCAT) |
Balances Reported in the Consolidated Statement of Assets and Liabilities for Centrally Cleared Swaps, OTC Swaps and Options Written
| Description | Swap Premiums Paid |
Swap Premiums Received |
Unrealized Appreciation |
Unrealized Depreciation |
Value | |||||||||||||||
| Centrally Cleared Swaps(a) |
$ | 1,949,396 | $ | (23,267 | ) | $ | 22,519,049 | $ | (11,279,282 | ) | $ | — | ||||||||
| OTC Swaps |
219,310 | (71,042 | ) | 1,661,787 | (778,002 | ) | — | |||||||||||||
| Options Written |
N/A | N/A | 1,353,442 | (1,380,740 | ) | (3,096,845 | ) | |||||||||||||
| (a) | Includes cumulative appreciation (depreciation) on centrally cleared swaps, as reported in the Consolidated Schedule of Investments. Only current day’s variation margin is reported within the Consolidated Statement of Assets and Liabilities and is net of any previously paid (received) swap premium amounts. |
Derivative Financial Instruments Categorized by Risk Exposure
As of period end, the fair values of derivative financial instruments located in the Consolidated Statement of Assets and Liabilities were as follows:
| Commodity Contracts |
Credit Contracts |
Equity Contracts |
Foreign Currency Exchange Contracts |
Interest Rate Contracts |
Other Contracts |
Total | ||||||||||||||||||||||
| Assets — Derivative Financial Instruments |
||||||||||||||||||||||||||||
| Futures contracts |
||||||||||||||||||||||||||||
| Unrealized appreciation on futures contracts(a) |
$ | 95,303 | $ | — | $ | 192,206 | $ | — | $ | 11,963,366 | $ | — | $ | 12,250,875 | ||||||||||||||
| Forward foreign currency exchange contracts |
||||||||||||||||||||||||||||
| Unrealized appreciation on forward foreign currency exchange contracts |
— | — | — | 345,264 | — | — | 345,264 | |||||||||||||||||||||
| Options purchased |
||||||||||||||||||||||||||||
| Investments at value — unaffiliated(b) |
— | 5,029 | 6,179,672 | 261,580 | 4,833,003 | 28,123 | 11,307,407 | |||||||||||||||||||||
| Swaps — centrally cleared |
||||||||||||||||||||||||||||
| Unrealized appreciation on centrally cleared swaps(a) |
— | 1,333,968 | — | — | 21,162,269 | 22,812 | 22,519,049 | |||||||||||||||||||||
| Swaps — OTC |
||||||||||||||||||||||||||||
| Unrealized appreciation on OTC swaps; Swap premiums paid |
— | 255,930 | 330,401 | — | 1,294,766 | — | 1,881,097 | |||||||||||||||||||||
|
|
|
|
|
|
|
|
|
|
|
|
|
|
|
|||||||||||||||
| $ | 95,303 | $ | 1,594,927 | $ | 6,702,279 | $ | 606,844 | $ | 39,253,404 | $ | 50,935 | $ | 48,303,692 | |||||||||||||||
|
|
|
|
|
|
|
|
|
|
|
|
|
|
|
|||||||||||||||
| Liabilities — Derivative Financial Instruments |
||||||||||||||||||||||||||||
| Futures contracts |
||||||||||||||||||||||||||||
| Unrealized depreciation on futures contracts(a) |
$ | — | $ | — | $ | 2,817,150 | $ | — | $ | 15,901,305 | $ | — | $ | 18,718,455 | ||||||||||||||
| Forward foreign currency exchange contracts |
||||||||||||||||||||||||||||
| Unrealized depreciation on forward foreign currency exchange contracts |
— | — | — | 2,343,367 | — | — | 2,343,367 | |||||||||||||||||||||
| Options written |
||||||||||||||||||||||||||||
| Options written at value |
— | — | 1,134,236 | 46,107 | 1,916,502 | — | 3,096,845 | |||||||||||||||||||||
| Swaps — centrally cleared |
||||||||||||||||||||||||||||
| Unrealized depreciation on centrally cleared swaps(a) |
— | 584,606 | — | — | 10,694,676 | — | 11,279,282 | |||||||||||||||||||||
| Swaps — OTC |
||||||||||||||||||||||||||||
| Unrealized depreciation on OTC swaps; Swap premiums received . |
— | 348,958 | 498,883 | — | 1,203 | — | 849,044 | |||||||||||||||||||||
|
|
|
|
|
|
|
|
|
|
|
|
|
|
|
|||||||||||||||
| $ | — | $ | 933,564 | $ | 4,450,269 | $ | 2,389,474 | $ | 28,513,686 | $ | — | $ | 36,286,993 | |||||||||||||||
|
|
|
|
|
|
|
|
|
|
|
|
|
|
|
|||||||||||||||
| (a) | Net cumulative unrealized appreciation (depreciation) on futures contracts and centrally cleared swaps, if any, are reported in the Consolidated Schedule of Investments. In the Consolidated Statement of Assets and Liabilities, only current day’s variation margin is reported in receivables or payables and the net cumulative unrealized appreciation (depreciation) is included in accumulated earnings (loss). |
| (b) | Includes options purchased at value as reported in the Consolidated Schedule of Investments. |
For the period ended December 31, 2023, the effect of derivative financial instruments in the Consolidated Statement of Operations was as follows:
| Commodity Contracts |
Credit Contracts |
Equity Contracts |
Foreign Currency Exchange Contracts |
Interest Rate Contracts |
Other Contracts |
Total | ||||||||||||||||||||||
| Net Realized Gain (Loss) from: |
||||||||||||||||||||||||||||
| Futures contracts |
$ | 3,590 | $ | — | $ | (12,494,950 | ) | $ | — | $ | 9,943,780 | $ | — | $ | (2,547,580 | ) | ||||||||||||
| Forward foreign currency exchange contracts |
— | — | — | (1,859,579 | ) | — | — | (1,859,579 | ) | |||||||||||||||||||
| Options purchased(a) |
— | (233,748 | ) | (4,256,351 | ) | 309,379 | (2,749,702 | ) | (181,496 | ) | (7,111,918 | ) | ||||||||||||||||
| Options written |
— | 34,571 | 9,008,291 | 168,033 | 5,615,312 | — | 14,826,207 | |||||||||||||||||||||
| Swaps |
— | 6,087,623 | 2,593,972 | — | (27,777,251 | ) | — | (19,095,656 | ) | |||||||||||||||||||
|
|
|
|
|
|
|
|
|
|
|
|
|
|
|
|||||||||||||||
| $ | 3,590 | $ | 5,888,446 | $ | (5,149,038 | ) | $ | (1,382,167 | ) | $ | (14,967,861 | ) | $ | (181,496 | ) | $ | (15,788,526 | ) | ||||||||||
|
|
|
|
|
|
|
|
|
|
|
|
|
|
|
|||||||||||||||
| C O N S O L I D A T E D S C H E D U L E O F I N V E S T M E N T S |
41 |
| Consolidated Schedule of Investments (continued) December 31, 2023 |
BlackRock Capital Allocation Term Trust (BCAT) |
| Commodity Contracts |
Credit Contracts |
Equity Contracts |
Foreign Currency Exchange Contracts |
Interest Rate Contracts |
Other Contracts |
Total | ||||||||||||||||||||||
| Net Change in Unrealized Appreciation (Depreciation) on: |
||||||||||||||||||||||||||||
| Futures contracts |
$ | 95,303 | $ | — | $ | (5,504,204 | ) | $ | — | $ | (10,276,685 | ) | $ | — | $ | (15,685,586 | ) | |||||||||||
| Forward foreign currency exchange contracts |
— | — | — | 4,484,993 | — | — | 4,484,993 | |||||||||||||||||||||
| Options purchased(b) |
— | (15,766 | ) | 3,463,517 | (298,732 | ) | 1,006,023 | (70,187 | ) | 4,084,855 | ||||||||||||||||||
| Options written |
— | — | (862,989 | ) | 14,529 | 5,963,274 | — | 5,114,814 | ||||||||||||||||||||
| Swaps |
— | (1,629,721 | ) | 571,029 | — | 24,349,933 | 35,851 | 23,327,092 | ||||||||||||||||||||
|
|
|
|
|
|
|
|
|
|
|
|
|
|
|
|||||||||||||||
| $ | 95,303 | $ | (1,645,487 | ) | $ | (2,332,647 | ) | $ | 4,200,790 | $ | 21,042,545 | $ | (34,336 | ) | $ | 21,326,168 | ||||||||||||
|
|
|
|
|
|
|
|
|
|
|
|
|
|
|
|||||||||||||||
| (a) | Options purchased are included in net realized gain (loss) from investments — unaffiliated. |
| (b) | Options purchased are included in net change in unrealized appreciation (depreciation) on investments — unaffiliated. |
Average Quarterly Balances of Outstanding Derivative Financial Instruments
| Futures contracts: |
||||
| Average notional value of contracts — long |
$ | 428,352,241 | ||
| Average notional value of contracts — short |
$ | 619,773,512 | ||
| Forward foreign currency exchange contracts: |
||||
| Average amounts purchased — in USD |
$ | 456,045,730 | ||
| Average amounts sold — in USD |
$ | 36,857,239 | ||
| Options: |
||||
| Average value of option contracts purchased |
$ | 5,421,088 | ||
| Average value of option contracts written |
$ | 2,155,759 | ||
| Average notional value of swaption contracts purchased |
$ | 308,354,893 | ||
| Average notional value of swaption contracts written |
$ | 761,729,253 | ||
| Credit default swaps: |
||||
| Average notional value — buy protection |
$ | 9,877,810 | ||
| Average notional value — sell protection |
$ | 41,167,669 | ||
| Interest rate swaps: |
||||
| Average notional value — pays fixed rate |
$ | 425,964,543 | ||
| Average notional value — receives fixed rate |
$ | 1,216,049,981 | ||
| Inflation swaps: |
||||
| Average notional value — receives fixed rate |
$ | 1,545,021 | ||
| Total return swaps: |
||||
| Average notional value |
$ | 14,913,119 |
For more information about the Trust’s investment risks regarding derivative financial instruments, refer to the Notes to Consolidated Financial Statements.
Derivative Financial Instruments — Offsetting as of Period End
The Trust’s derivative assets and liabilities (by type) were as follows:
| Assets | Liabilities | |||||||
| Derivative Financial Instruments |
||||||||
| Futures contracts |
$ | 1,397,919 | $ | 1,128,809 | ||||
| Forward foreign currency exchange contracts |
345,264 | 2,343,367 | ||||||
| Options |
11,307,407 | (a) | 3,096,845 | |||||
| Swaps — centrally cleared |
47,302 | — | ||||||
| Swaps — OTC(b) |
1,881,097 | 849,044 | ||||||
|
|
|
|
|
|||||
| Total derivative assets and liabilities in the Consolidated Statement of Assets and Liabilities |
14,978,989 | 7,418,065 | ||||||
|
|
|
|
|
|||||
| Derivatives not subject to a Master Netting Agreement or similar agreement (“MNA”) |
(7,624,707 | ) | (2,263,045 | ) | ||||
|
|
|
|
|
|||||
| Total derivative assets and liabilities subject to an MNA |
$ | 7,354,282 | $ | 5,155,020 | ||||
|
|
|
|
|
|||||
| (a) | Includes options purchased at value which is included in Investments at value — unaffiliated in the Consolidated Statement of Assets and Liabilities and reported in the Consolidated Schedule of Investments. |
| (b) | Includes unrealized appreciation (depreciation) on OTC swaps and swap premiums (paid/received) in the Consolidated Statement of Assets and Liabilities. |
| 42 | 2 0 2 3 B L A C K R O C K A N N U A L R E P O R T T O S H A R E H O L D E R S |
| Consolidated Schedule of Investments (continued) December 31, 2023 |
BlackRock Capital Allocation Term Trust (BCAT) |
The following table presents the Trust’s derivative assets and liabilities by counterparty net of amounts available for offset under an MNA and net of the related collateral received and pledged by the Trust:
| Counterparty |
|
Derivative Assets Subject to an MNA by Counterparty |
|
|
Derivatives Available for Offset |
(a) |
|
Non-Cash Collateral Received |
|
|
Cash Collateral Received |
(b) |
|
Net Amount of Derivative Assets |
(c)(d) | |||||
| Bank of America N.A. |
$ | 56,270 | $ | — | $ | — | $ | — | $ | 56,270 | ||||||||||
| Barclays Bank PLC |
78,842 | (78,842 | ) | — | — | — | ||||||||||||||
| BNP Paribas SA |
128,991 | (128,991 | ) | — | — | — | ||||||||||||||
| Citibank N.A. |
1,253,608 | (335,471 | ) | — | (918,137 | ) | — | |||||||||||||
| Deutsche Bank AG |
513,865 | (199,730 | ) | — | — | 314,135 | ||||||||||||||
| Goldman Sachs International |
457,041 | (57,601 | ) | — | (399,440 | ) | — | |||||||||||||
| HSBC Bank PLC |
20,776 | (11,965 | ) | — | — | 8,811 | ||||||||||||||
| JPMorgan Chase Bank N.A. |
3,331,437 | (2,281,235 | ) | — | — | 1,050,202 | ||||||||||||||
| Morgan Stanley & Co. International PLC |
1,180,134 | (208,134 | ) | — | (960,000 | ) | 12,000 | |||||||||||||
| Nomura International, Inc. |
274,708 | (81,114 | ) | — | — | 193,594 | ||||||||||||||
| State Street Bank and Trust Co. |
35,633 | (27,278 | ) | — | — | 8,355 | ||||||||||||||
| UBS AG |
22,977 | (22,977 | ) | — | — | — | ||||||||||||||
|
|
|
|
|
|
|
|
|
|
|
|||||||||||
| $ | 7,354,282 | $ | (3,433,338 | ) | $ | — | $ | (2,277,577 | ) | $ | 1,643,367 | |||||||||
|
|
|
|
|
|
|
|
|
|
|
| Counterparty |
|
Derivative Liabilities Subject to an MNA by Counterparty |
|
|
Derivatives Available for Offset |
(a) |
|
Non-Cash Collateral Pledged |
|
|
Cash Collateral Pledged |
|
|
Net Amount of Derivative Liabilities |
(c)(e) | |||||
| Barclays Bank PLC |
$ | 120,466 | $ | (78,842 | ) | $ | — | $ | — | $ | 41,624 | |||||||||
| BNP Paribas SA |
172,494 | (128,991 | ) | — | — | 43,503 | ||||||||||||||
| Citibank N.A. |
335,471 | (335,471 | ) | — | — | — | ||||||||||||||
| Deutsche Bank AG |
199,730 | (199,730 | ) | — | — | — | ||||||||||||||
| Goldman Sachs International |
57,601 | (57,601 | ) | — | — | — | ||||||||||||||
| HSBC Bank PLC |
11,965 | (11,965 | ) | — | — | — | ||||||||||||||
| JPMorgan Chase Bank N.A. |
2,281,235 | (2,281,235 | ) | — | — | — | ||||||||||||||
| Morgan Stanley & Co. International PLC |
208,134 | (208,134 | ) | — | — | — | ||||||||||||||
| Nomura International, Inc. |
81,114 | (81,114 | ) | — | — | — | ||||||||||||||
| State Street Bank and Trust Co. |
27,278 | (27,278 | ) | — | — | — | ||||||||||||||
| UBS AG |
1,659,532 | (22,977 | ) | — | — | 1,636,555 | ||||||||||||||
|
|
|
|
|
|
|
|
|
|
|
|||||||||||
| $ | 5,155,020 | $ | (3,433,338 | ) | $ | — | $ | — | $ | 1,721,682 | ||||||||||
|
|
|
|
|
|
|
|
|
|
|
| (a) | The amount of derivatives available for offset is limited to the amount of derivative asset and/or liabilities that are subject to an MNA. |
| (b) | Excess of collateral received/pledged, if any, from the individual counterparty is not shown for financial reporting purposes. |
| (c) | Net amount may also include forward foreign currency exchange contracts that are not required to be collateralized. |
| (d) | Net amount represents the net amount receivable from the counterparty in the event of default. |
| (e) | Net amount represents the net amount payable due to counterparty in the event of default. Net amount may be offset further by the options written receivable/payable on the Consolidated Statement of Assets and Liabilities. |
Fair Value Hierarchy as of Period End
Various inputs are used in determining the fair value of financial instruments. For a description of the input levels and information about the Trust’s policy regarding valuation of financial instruments, refer to the Notes to Consolidated Financial Statements.
The following table summarizes the Trust’s financial instruments categorized in the fair value hierarchy. The breakdown of the Trust’s financial instruments into major categories is disclosed in the Consolidated Schedule of Investments above.
| Level 1 | Level 2 | Level 3 | Total | |||||||||||||
| Assets |
||||||||||||||||
| Investments |
||||||||||||||||
| Long-Term Investments |
||||||||||||||||
| Asset-Backed Securities |
$ | — | $ | 147,461,098 | $ | 8,947,923 | $ | 156,409,021 | ||||||||
| Common Stocks |
||||||||||||||||
| Australia |
— | 6,424,749 | — | 6,424,749 | ||||||||||||
| Canada |
22,506,705 | — | — | 22,506,705 | ||||||||||||
| C O N S O L I D A T E D S C H E D U L E O F I N V E S T M E N T S |
43 |
| Consolidated Schedule of Investments (continued) December 31, 2023 |
BlackRock Capital Allocation Term Trust (BCAT) |
Fair Value Hierarchy as of Period End (continued)
| Level 1 | Level 2 | Level 3 | Total | |||||||||||||
| Common Stocks (continued) |
||||||||||||||||
| Cayman Islands |
$ | 314,899 | $ | — | $ | — | $ | 314,899 | ||||||||
| China |
435,571 | 14,191,905 | — | 14,627,476 | ||||||||||||
| France |
— | 41,915,193 | — | 41,915,193 | ||||||||||||
| Germany |
1,097,589 | 12,961,703 | — | 14,059,292 | ||||||||||||
| Hong Kong |
— | 4,424,283 | — | 4,424,283 | ||||||||||||
| India |
— | 2,258,280 | 477,875 | 2,736,155 | ||||||||||||
| Ireland |
— | 4,346,075 | — | 4,346,075 | ||||||||||||
| Israel |
7,865,482 | — | — | 7,865,482 | ||||||||||||
| Italy |
— | 14,442,402 | — | 14,442,402 | ||||||||||||
| Japan |
— | 62,341,768 | — | 62,341,768 | ||||||||||||
| Macau |
— | 828,616 | — | 828,616 | ||||||||||||
| Netherlands |
627,271 | 41,000,904 | — | 41,628,175 | ||||||||||||
| South Korea |
— | 7,163,029 | — | 7,163,029 | ||||||||||||
| Spain |
— | 10,660,752 | — | 10,660,752 | ||||||||||||
| Sweden |
— | — | — | — | ||||||||||||
| Switzerland |
7,522,642 | 24,822,019 | — | 32,344,661 | ||||||||||||
| Taiwan |
7,211,464 | — | — | 7,211,464 | ||||||||||||
| United Kingdom |
12,995,948 | 28,008,030 | 2,455,389 | 43,459,367 | ||||||||||||
| United States |
586,826,395 | 10,906,587 | 24,404,993 | 622,137,975 | ||||||||||||
| Corporate Bonds |
— | 182,670,561 | 56,881,661 | 239,552,222 | ||||||||||||
| Fixed Rate Loan Interests |
— | — | 11,920,142 | 11,920,142 | ||||||||||||
| Floating Rate Loan Interests |
— | 21,781,907 | 65,568,658 | 87,350,565 | ||||||||||||
| Foreign Agency Obligations |
— | 68,140,968 | — | 68,140,968 | ||||||||||||
| Investment Companies |
16,851,963 | — | — | 16,851,963 | ||||||||||||
| Municipal Bonds |
— | 2,710,147 | — | 2,710,147 | ||||||||||||
| Non-Agency Mortgage-Backed Securities |
— | 80,183,809 | 15,407,058 | 95,590,867 | ||||||||||||
| Other Interests |
— | — | 4,065,568 | 4,065,568 | ||||||||||||
| Preferred Securities |
||||||||||||||||
| Capital Trusts |
— | 1,010,788 | — | 1,010,788 | ||||||||||||
| Preferred Stocks |
— | 6,065,686 | 53,697,827 | 59,763,513 | ||||||||||||
| U.S. Government Sponsored Agency Securities |
— | 173,041,309 | — | 173,041,309 | ||||||||||||
| U.S. Treasury Obligations |
— | 7,068,317 | — | 7,068,317 | ||||||||||||
| Warrants |
||||||||||||||||
| Cayman Islands |
17,168 | — | — | 17,168 | ||||||||||||
| Israel |
269 | — | 62,165 | 62,434 | ||||||||||||
| United Kingdom |
— | — | 256,724 | 256,724 | ||||||||||||
| United States |
41,123 | 227 | 1,671,753 | 1,713,103 | ||||||||||||
| Short-Term Securities |
||||||||||||||||
| Money Market Funds |
78,480,297 | — | — | 78,480,297 | ||||||||||||
| U.S. Treasury Obligations |
— | 303,355 | — | 303,355 | ||||||||||||
| Options Purchased |
||||||||||||||||
| Credit Contracts |
— | 5,029 | — | 5,029 | ||||||||||||
| Equity Contracts |
6,179,486 | 186 | — | 6,179,672 | ||||||||||||
| Foreign Currency Exchange Contracts |
— | 261,580 | — | 261,580 | ||||||||||||
| Interest Rate Contracts |
— | 4,833,003 | — | 4,833,003 | ||||||||||||
| Other Contracts |
— | 28,123 | — | 28,123 | ||||||||||||
| Unfunded Floating Rate Loan Interests(a) |
— | — | 191 | 191 | ||||||||||||
| Liabilities |
||||||||||||||||
| Unfunded Floating Rate Loan Interests(a) |
— | — | (49,569 | ) | (49,569 | ) | ||||||||||
|
|
|
|
|
|
|
|
|
|||||||||
| $ | 748,974,272 | $ | 982,262,388 | $ | 245,768,358 | 1,977,005,018 | ||||||||||
|
|
|
|
|
|
|
|
|
|||||||||
| Investments Valued at NAV(b) |
4,500,171 | |||||||||||||||
|
|
|
|||||||||||||||
| $ | 1,981,505,189 | |||||||||||||||
|
|
|
|||||||||||||||
| Derivative Financial Instruments(c) |
||||||||||||||||
| Assets |
||||||||||||||||
| Commodity Contracts |
$ | 95,303 | $ | — | $ | — | $ | 95,303 | ||||||||
| Credit Contracts |
— | 1,370,588 | — | 1,370,588 | ||||||||||||
| Equity Contracts |
31,666 | 490,941 | — | 522,607 | ||||||||||||
| Foreign Currency Exchange Contracts |
— | 345,264 | — | 345,264 | ||||||||||||
| 44 | 2 0 2 3 B L A C K R O C K A N N U A L R E P O R T T O S H A R E H O L D E R S |
| Consolidated Schedule of Investments (continued) December 31, 2023 |
BlackRock Capital Allocation Term Trust (BCAT) |
Fair Value Hierarchy as of Period End (continued)
| Level 1 | Level 2 | Level 3 | Total | |||||||||||||
| Derivative Financial Instruments(c) |
||||||||||||||||
| Interest Rate Contracts |
$ | 11,963,366 | $ | 22,457,035 | $ | — | $ | 34,420,401 | ||||||||
| Other Contracts |
— | 22,812 | — | 22,812 | ||||||||||||
| Liabilities |
||||||||||||||||
| Credit Contracts |
— | (862,522 | ) | — | (862,522 | ) | ||||||||||
| Equity Contracts |
(3,945,795 | ) | (504,474 | ) | — | (4,450,269 | ) | |||||||||
| Foreign Currency Exchange Contracts |
— | (2,389,474 | ) | — | (2,389,474 | ) | ||||||||||
| Interest Rate Contracts |
(15,901,305 | ) | (12,612,381 | ) | — | (28,513,686 | ) | |||||||||
|
|
|
|
|
|
|
|
|
|||||||||
| $ | (7,756,765 | ) | $ | 8,317,789 | $ | — | $ | 561,024 | ||||||||
|
|
|
|
|
|
|
|
|
|||||||||
| (a) | Unfunded floating rate loan interests are valued at the unrealized appreciation (depreciation) on the commitment. |
| (b) | Certain investments of the Trust were fair valued using NAV as a practical expedient as no quoted market value is available and therefore have been excluded from the fair value hierarchy. |
| (c) | Derivative financial instruments are swaps, futures contracts, forward foreign currency exchange contracts and options written. Swaps, futures contracts and forward foreign currency exchange contracts are valued at the unrealized appreciation (depreciation) on the instrument and options written are shown at value. |
A reconciliation of Level 3 financial instruments is presented when the Trust had a significant amount of Level 3 investments and derivative financial instruments at the beginning and/or end of the year in relation to net assets. The following table is a reconciliation of Level 3 investments for which significant unobservable inputs were used in determining fair value:
|
| ||||||||||||||||||||||||||
| Asset-Backed Securities |
Common Stocks |
Corporate Bonds |
Fixed Rate Loan Interests |
Floating Rate Loan Interests |
Non-Agency Mortgage-Backed Securities |
Options Purchased | ||||||||||||||||||||
|
| ||||||||||||||||||||||||||
| Assets |
||||||||||||||||||||||||||
| Opening balance, as of December 31, 2022 |
$ | 11,817,455 | $ | 27,126,641 | $ | 36,101,303 | $ | — | $ | 80,651,617 | $ | 10,549,081 | $ 23,343 | |||||||||||||
| Transfers into Level 3 |
— | — | — | — | — | 3,324,346 | — | |||||||||||||||||||
| Transfers out of Level 3 |
— | — | — | — | — | (866,700 | ) | — | ||||||||||||||||||
| Other(a) |
— | (8,047,101 | ) | 4,657,185 | 11,971,635 | (20,726,363 | ) | 4,097,543 | — | |||||||||||||||||
| Accrued discounts/premiums |
5,172 | — | 304,057 | 38,150 | 125,043 | 112,124 | — | |||||||||||||||||||
| Net realized gain (loss) |
(2,214,374 | ) | (298 | ) | (239,909 | ) | 48,764 | (9,286 | ) | (202,487 | ) | (43,332) | ||||||||||||||
| Net change in unrealized appreciation (depreciation)(b)(c) |
1,332,369 | (11,324,204 | ) | 1,199,062 | 331,691 | 534,202 | (539,855 | ) | 19,989 | |||||||||||||||||
| Purchases |
— | 19,583,492 | 36,730,854 | 1,306,772 | 20,716,423 | 2,827,559 | — | |||||||||||||||||||
| Sales |
(1,992,699 | ) | (273 | ) | (21,870,891 | ) | (1,776,870 | ) | (15,722,978 | ) | (3,894,553 | ) | — | |||||||||||||
|
|
|
|
|
|
|
|
|
|
|
|
|
| ||||||||||||||
| Closing balance, as of December 31, 2023 |
$ | 8,947,923 | $ | 27,338,257 | $ | 56,881,661 | $ | 11,920,142 | $ | 65,568,658 | $ | 15,407,058 | $ — | |||||||||||||
|
|
|
|
|
|
|
|
|
|
|
|
|
| ||||||||||||||
| Net change in unrealized appreciation (depreciation) on investments still held at December 31, 2023(c) |
$ | 125,235 | $ | (11,180,430 | ) | $ | 676,273 | $ | 331,691 | $ | 220,792 | $ | (762,476 | ) | $ — | |||||||||||
|
|
|
|
|
|
|
|
|
|
|
|
|
| ||||||||||||||
|
|
||||||||||||||||||||
| Other Interests |
Preferred Stocks |
Unfunded Floating Rate Loan Interests |
Warrants | Total | ||||||||||||||||
|
|
||||||||||||||||||||
| Assets |
||||||||||||||||||||
| Opening balance, as of December 31, 2022 |
$ | 6,069,584 | $ | 56,384,367 | $ | — | $ | 957,038 | $ | 229,680,429 | ||||||||||
| Transfers into Level 3 |
— | — | — | 1,474 | 3,325,820 | |||||||||||||||
| Transfers out of Level 3 |
— | — | — | — | (866,700 | ) | ||||||||||||||
| Other(a) |
— | 8,047,101 | — | — | — | |||||||||||||||
| Accrued discounts/premiums |
— | — | — | — | 584,546 | |||||||||||||||
| Net realized gain (loss) |
— | (408,092 | ) | — | — | (3,069,014 | ) | |||||||||||||
| Net change in unrealized appreciation (depreciation)(b)(c) |
(2,004,016 | ) | (3,997,635 | ) | (49,378 | ) | 1,216,147 | (13,281,628 | ) | |||||||||||
| Purchases |
— | 2,265,589 | — | 72,783 | 83,503,472 | |||||||||||||||
| Sales |
— | (8,593,503 | ) | — | (256,800 | ) | (54,108,567 | ) | ||||||||||||
|
|
|
|
|
|
|
|
|
|
|
|||||||||||
| Closing balance, as of December 31, 2023 |
$ | 4,065,568 | $ | 53,697,827 | $ | (49,378 | ) | $ | 1,990,642 | $ | 245,768,358 | |||||||||
|
|
|
|
|
|
|
|
|
|
|
|||||||||||
| Net change in unrealized appreciation (depreciation) on investments still held at December 31, 2023(c) |
$ | (2,004,016 | ) | $ | (5,235,868 | ) | $ | (49,378 | ) | $ | 968,163 | $ | (16,910,014 | ) | ||||||
|
|
|
|
|
|
|
|
|
|
|
|||||||||||
| (a) | Certain Level 3 investments were re-classified between Common Stocks, Corporate Bonds, Fixed Rate Loan Interests, Floating Rate Loan Interests, Non-Agency Mortgage-Backed Securities and Preferred Stocks. |
| (b) | Included in the related net change in unrealized appreciation (depreciation) in the Consolidated Statements of Operations. |
| (c) | Any difference between net change in unrealized appreciation (depreciation) and net change in unrealized appreciation (depreciation) on investments still held at December 31, 2023 is generally due to investments no longer held or categorized as Level 3 at period end. |
| C O N S O L I D A T E D S C H E D U L E O F I N V E S T M E N T S |
45 |
| Consolidated Schedule of Investments (continued) December 31, 2023 |
BlackRock Capital Allocation Term Trust (BCAT) |
The following table summarizes the valuation approaches used and unobservable inputs utilized by the BlackRock Valuation Committee (the “Valuation Committee”) to determine the value of certain of the Trust’s Level 3 financial instruments as of period end. The table does not include Level 3 financial instruments with values based upon unadjusted third-party pricing information in the amount of $20,355,576. A significant change in third party information could result in a significantly lower or higher value of such Level 3 financial instruments.
| Value | Valuation Approach |
Unobservable Inputs |
|
Range of Unobservable Inputs Utilized |
(a) |
|
Weighted Average of Unobservable Inputs Based on Fair Value |
| ||||||||
| Assets |
||||||||||||||||
| Common Stocks |
$ | 27,338,257 | Market | Revenue Multiple | 1.00x -16.00x | 5.25x | ||||||||||
| Volatility | 59% - 88% | 76% | ||||||||||||||
| Time to Exit | 0.1 - 3.0 years | 2.5 years | ||||||||||||||
| EBITDA Multiple | 10.72x | — | ||||||||||||||
| Gross Profit Multiple | 15.00x | — | ||||||||||||||
| Direct Profit Multiple | 4.50x | — | ||||||||||||||
| Income | Discount Rate | 11% | — | |||||||||||||
| Asset Backed Securities |
5,769,443 | Income | Discount Rate | 9% - 9% | 9% | |||||||||||
| Non-Agency Mortgage-Backed Securities |
3,064,065 | Income | Credit Spread | 517 | — | |||||||||||
| Corporate Bonds |
56,881,661 | Income | Discount Rate | 7% - 56% | 17% | |||||||||||
| Floating Rate Loan Interests |
60,685,181 | Income | Discount Rate | 7% - 15% | 11% | |||||||||||
| Credit Spread | 406 - 420 | 412 | ||||||||||||||
| Fixed Rate Loan Interests |
11,920,142 | Income | Credit Spread | 725 - 819 | 755 | |||||||||||
| Discount Rate | 13% | — | ||||||||||||||
| Other Interests |
4,065,568 | Income | Discount Rate | 8% - 10% | 9% | |||||||||||
| Preferred Stock(b) |
53,697,827 | Market | Revenue Multiple | 1.60x - 31.00x | 13.32x | |||||||||||
| Volatility | 50% - 90% | 68% | ||||||||||||||
| Time to Exit | 1.5 - 5.0 years | 2.8 years | ||||||||||||||
| EBITDA Multiple | 7.50x | — | ||||||||||||||
| Market Adjustment Multiple | 1.20x | — | ||||||||||||||
| EBITDAR Multiple | 8.75x | — | ||||||||||||||
| Income | Discount Rate | 11% - 15% | 11% | |||||||||||||
| Warrants |
1,990,638 | Market | Revenue Multiple | 4.22x - 31.00x | 9.61x | |||||||||||
| Volatility | 36% - 88% | 73% | ||||||||||||||
| Time to Exit | 0.1 - 3.0 years | 2.6 years | ||||||||||||||
| Income | Discount Rate | 26% | — | |||||||||||||
|
|
|
|||||||||||||||
| $ | 225,412,782 | |||||||||||||||
|
|
|
|||||||||||||||
| (a) | A significant change in unobservable input would have resulted in a correlated (inverse) significant change to value. |
| (b) | For the period end December 31, 2023, the valuation technique for certain investments classified as Preferred Stock used recent prior transaction prices as inputs within the model used for the approximation of fair value. |
See notes to consolidated financial statements.
| 46 | 2 0 2 3 B L A C K R O C K A N N U A L R E P O R T T O S H A R E H O L D E R S |
| Consolidated Schedule of Investments December 31, 2023 |
BlackRock ESG Capital Allocation Term Trust (ECAT) (Percentages shown are based on Net Assets) |
| Security | Par (000) |
Value | ||||||
| Asset-Backed Securities |
||||||||
| Cayman Islands — 1.8% | ||||||||
| ALM Ltd., Series 2020-1A, Class D, (3-mo. CME Term SOFR + 6.26%), 11.66%, 10/15/29(a)(b) |
USD | 325 | $ | 317,244 | ||||
| Apidos CLO XXXVI, Series 2021-36A, Class B, (3-mo. CME Term SOFR + 1.86%), 7.28%, 07/20/34(a)(b) |
250 | 248,805 | ||||||
| Ares LVI CLO Ltd., Series 2020-56A, Class ER, (3-mo. CME Term SOFR + 6.76%), 12.14%, 10/25/34(a)(b) |
250 | 250,452 | ||||||
| Battalion CLO IX Ltd., Series 2015-9A, Class DR, (3-mo. CME Term SOFR + 3.51%), 8.91%, 07/15/31(a)(b) |
250 | 249,320 | ||||||
| Birch Grove CLO Ltd.(a)(b) |
||||||||
| Series 19A, Class DR, (3-mo. CME Term SOFR + 3.61%), 9.00%, 06/15/31 |
500 | 498,155 | ||||||
| Series 2021-3A, Class D1, (3-mo. CME Term SOFR + 3.46%), 8.86%, 01/19/35 |
500 | 493,200 | ||||||
| BlueMountain CLO Ltd., Series 2013-2A, Class A1R, (3-mo. CME Term SOFR + 1.44%), 6.85%, 10/22/30(a)(b) |
172 | 172,727 | ||||||
| Carlyle U.S. CLO Ltd., Series 2018-4A, Class A2, (3-mo. CME Term SOFR + 2.06%), 7.48%, 01/20/31(a)(b) |
500 | 499,458 | ||||||
| CarVal CLO VC Ltd.(a)(b) |
||||||||
| Series 2021-2A, Class D, (3-mo. CME Term SOFR + 3.51%), 8.91%, 10/15/34 |
250 | 239,923 | ||||||
| Series 2021-2A, Class E, (3-mo. CME Term SOFR + 7.01%), 12.41%, 10/15/34 |
250 | 241,597 | ||||||
| Cedar Funding IX CLO Ltd., Series 2018-9A, Class D, (3-mo. CME Term SOFR + 2.86%), 8.28%, 04/20/31(a)(b) |
250 | 240,837 | ||||||
| Cedar Funding XIV CLO Ltd.(a)(b) |
||||||||
| Series 2021-14A, Class B, (3-mo. CME Term SOFR + 1.86%), 7.26%, 07/15/33 |
500 | 495,373 | ||||||
| Series 2021-14A, Class E, (3-mo. CME Term SOFR + 6.60%), 12.00%, 07/15/33 |
250 | 235,572 | ||||||
| CIFC Funding Ltd., Series 2013-1A, Class CR, (3-mo. CME Term SOFR + 3.81%), 9.21%, 07/16/30(a)(b) |
500 | 497,735 | ||||||
| Elmwood CLO I Ltd., Series 2019-1A, Class AR, (3-mo. CME Term SOFR + 1.71%), 7.13%, 10/20/33(a)(b) |
250 | 250,462 | ||||||
| Elmwood CLO II Ltd., Series 2019-2A, Class ER, (3-mo. CME Term SOFR + 7.06%), 12.48%, 04/20/34(a)(b) |
750 | 746,319 | ||||||
| Elmwood CLO IV Ltd., Series 2020-1A, Class B, (3-mo. CME Term SOFR + 1.96%), 7.36%, 04/15/33(a)(b) |
500 | 499,708 | ||||||
| Elmwood CLO VII Ltd., Series 2020-4A, Class SUB, 0.00%, 01/17/34(a)(b) |
1,000 | 648,300 | ||||||
| Generate CLO Ltd., Series 6A, Class DR, (3-mo. CME Term SOFR + 3.76%), 9.17%, 01/22/35(a)(b) . |
750 | 758,730 | ||||||
| GoldenTree Loan Management U.S. CLO Ltd.(a)(b) |
||||||||
| Series 2019-5A, Class BR, (3-mo. CME Term SOFR + 1.81%), 7.23%, 10/20/32 |
250 | 249,953 | ||||||
| Series 2021-11A, Class E, (3-mo. CME Term SOFR + 5.61%), 11.03%, 10/20/34 |
1,500 | 1,402,014 | ||||||
| Series 2021-9A, Class E, (3-mo. CME Term SOFR + 5.01%), 10.43%, 01/20/33 |
750 | 717,103 | ||||||
| Security | Par (000) |
Value | ||||||
| Cayman Islands (continued) | ||||||||
| Golub Capital Partners CLO Ltd.(a)(b) |
||||||||
| Series 2021-53A, Class E, (3-mo. CME Term SOFR + 6.96%), 12.38%, 07/20/34 |
USD | 250 | $ | 245,763 | ||||
| Series 2021-55A, Class E, (3-mo. CME Term SOFR + 6.82%), 12.24%, 07/20/34 |
250 | 249,403 | ||||||
| Madison Park Funding XLIX Ltd., Series 2021-49A, Class E, (3-mo. CME Term SOFR + 6.51%), 11.91%, 10/19/34(a)(b) |
500 | 492,702 | ||||||
| Madison Park Funding XXIX Ltd., Series 2018-29A, Class E, (3-mo. CME Term SOFR + 5.96%), 11.36%, 10/18/30(a)(b) |
250 | 240,456 | ||||||
| Madison Park Funding XXXIV Ltd., Series 2019-34A, Class DR, (3-mo. CME Term SOFR + 3.61%), 8.99%, 04/25/32(a)(b) |
250 | 249,430 | ||||||
| Madison Park Funding XXXVIII Ltd., Series 2021- 38A, Class B, (3-mo. CME Term SOFR + 1.91%), 7.31%, 07/17/34(a)(b) |
500 | 498,809 | ||||||
| Marble Point CLO XXIII Ltd., Series 2021-4A, Class D1, (3-mo. CME Term SOFR + 3.91%), 9.32%, 01/22/35(a)(b) |
250 | 249,598 | ||||||
| Mill City Solar Loan Ltd.(b) |
||||||||
| Series 2019-1A, Class C, 5.92%, 03/20/43 |
1,242 | 1,026,818 | ||||||
| Series 2019-1A, Class D, 7.14%, 03/20/43 |
1,900 | 1,272,448 | ||||||
| Myers Park CLO Ltd., Series 2018-1A, Class E, (3-mo. CME Term SOFR + 5.76%), 11.18%, 10/20/30(a)(b) |
250 | 235,966 | ||||||
| Neuberger Berman CLO XIV Ltd., Series 2012-14A, Class AR2, (3-mo. CME Term SOFR + 1.29%), 6.68%, 01/28/30(a)(b) |
208 | 208,014 | ||||||
| Neuberger Berman Loan Advisers CLO Ltd., Series 2021- 46A, Class B, (3-mo. CME Term SOFR + 1.91%), 7.33%, 01/20/36(a)(b) |
250 | 248,855 | ||||||
| Octagon 54 Ltd., Series 2021-1A, Class D, (3-mo. CME Term SOFR + 3.31%), 8.71%, 07/15/34(a)(b) . |
1,500 | 1,455,499 | ||||||
| OHA Credit Partners XIII Ltd., Series 2016-13A, Class BR, (3-mo. CME Term SOFR + 1.96%), 7.37%, 10/25/34(a)(b) |
250 | 250,377 | ||||||
| OHA Loan Funding Ltd., Series 2013-2A, Class AR, (3-mo. CME Term SOFR + 1.30%), 6.68%, 05/23/31(a)(b) |
494 | 494,233 | ||||||
| Palmer Square CLO Ltd.(a) |
||||||||
| Series 2013-2A, Class A2R3, (3-mo. CME Term SOFR + 1.76%), 7.16%, 10/17/31(b) |
250 | 249,331 | ||||||
| Series 2020-3ARR, Class A2R2, (3-mo. CME Term SOFR + 2.30%), 7.67%, 11/15/36(c) |
500 | 500,050 | ||||||
| Palmer Square Loan Funding Ltd., Series 2021-4A, Class E, (3-mo. CME Term SOFR + 7.77%), 13.17%, 10/15/29(a)(b) |
500 | 504,626 | ||||||
| Park Avenue Institutional Advisers CLO Ltd., Series 2021-2A, Class D, (3-mo. CME Term SOFR + 3.66%), 9.06%, 07/15/34(a)(b) |
1,650 | 1,620,769 | ||||||
| Pikes Peak CLO, Series 2021-11A, Class A1, (3-mo. CME Term SOFR + 1.95%), 7.33%, 07/25/34(a)(b) . |
1,500 | 1,514,452 | ||||||
| Rad CLO Ltd., Series 2021-15A, Class E, (3-mo. CME Term SOFR + 6.46%), 11.88%, 01/20/34(a)(b) |
250 | 238,559 | ||||||
| Regatta XVII Funding Ltd., Series 2020-1A, Class E, (3-mo. CME Term SOFR + 7.87%), 13.27%, 10/15/33(a)(b) |
250 | 252,017 | ||||||
| Regatta XXIV Funding Ltd.(a)(b) |
||||||||
| Series 2021-5A, Class D, (3-mo. CME Term SOFR + 3.36%), 8.78%, 01/20/35 |
250 | 248,765 | ||||||
| C O N S O L I D A T E D S C H E D U L E O F I N V E S T M E N T S |
47 |
| Consolidated Schedule of Investments (continued) December 31, 2023 |
BlackRock ESG Capital Allocation Term Trust (ECAT) (Percentages shown are based on Net Assets) |
| Security | Par (000) |
Value | ||||||
| Cayman Islands (continued) | ||||||||
| Regatta XXIV Funding Ltd.(a)(b) (continued) |
||||||||
| Series 2021-5A, Class E, (3-mo. CME Term SOFR + 7.06%), 12.48%, 01/20/35 |
USD | 250 | $ | 245,542 | ||||
| RRX Ltd.(a)(b) |
||||||||
| Series 2020-1A, Class E, (3-mo. CME Term SOFR + 6.71%), 12.11%, 04/15/33 |
375 | 369,876 | ||||||
| Series 2022-7A, Class D, (3-mo. CME Term SOFR + 6.85%), 12.24%, 07/15/35 |
250 | 247,970 | ||||||
| Sixth Street CLO XVII Ltd., Series 2021-17A, Class E, (3-mo. CME Term SOFR + 6.46%), 11.88%, 01/20/34(a)(b) |
750 | 723,521 | ||||||
| Stratus CLO Ltd.(a)(b) |
||||||||
| Series 2021-1A, Class E, (3-mo. CME Term SOFR + 5.26%), 10.68%, 12/29/29 |
1,250 | 1,204,030 | ||||||
| Series 2021-1A, Class SUB, 0.00%, 12/29/29 |
1,250 | 803,325 | ||||||
| Series 2021-2A, Class E, (3-mo. CME Term SOFR + 6.01%), 11.43%, 12/28/29 |
300 | 298,703 | ||||||
| Series 2021-3A, Class E, (3-mo. CME Term SOFR + 6.01%), 11.43%, 12/29/29 |
250 | 247,527 | ||||||
| Symphony CLO XXIII Ltd., Series 2020-23A, Class ER, (3-mo. CME Term SOFR + 6.41%), 11.81%, 01/15/34(a)(b) |
500 | 495,904 | ||||||
| TICP CLO IX Ltd., Series 2017-9A, Class D, (3-mo. CME Term SOFR + 3.16%), 8.58%, 01/20/31(a)(b) . |
250 | 249,973 | ||||||
| TICP CLO XIV Ltd., Series 2019-14A, Class DR, (3-mo. CME Term SOFR + 6.96%), 12.38%, 10/20/32(a)(b) |
500 | 497,577 | ||||||
| Trestles CLO V Ltd., Series 2021-5A, Class E, (3-mo. CME Term SOFR + 6.61%), 12.03%, 10/20/34(a)(b) |
1,000 | 963,570 | ||||||
| Trimaran CAVU Ltd.(a)(b) |
||||||||
| Series 2019-1A, Class E, (3-mo. CME Term SOFR + 7.30%), 12.72%, 07/20/32 |
500 | 481,151 | ||||||
| Series 2021-2A, Class D1, (3-mo. CME Term SOFR + 3.51%), 8.89%, 10/25/34 |
550 | 539,901 | ||||||
| Voya CLO Ltd., Series 2019-3A, Class BR, (3-mo. CME Term SOFR + 1.91%), 7.31%, 10/17/32(a)(b) . |
250 | 248,757 | ||||||
| Whitebox CLO II Ltd., Series 2020-2A, Class ER, (3-mo. CME Term SOFR + 7.36%), 12.76%, 10/24/34(a)(b) |
250 | 249,387 | ||||||
| Whitebox CLO III Ltd.(a)(b) |
||||||||
| Series 2021-3A, Class D, (3-mo. CME Term SOFR + 3.61%), 9.01%, 10/15/34 |
1,000 | 981,659 | ||||||
| Series 2021-3A, Class E, (3-mo. CME Term SOFR + 7.11%), 12.51%, 10/15/34 |
1,250 | 1,231,161 | ||||||
|
|
|
|||||||
| 32,579,461 | ||||||||
| United States(b) — 1.7% | ||||||||
| FirstKey Homes Trust, Series 2022-SFR1, Class E1, 5.00%, 05/19/39 |
3,000 | 2,795,931 | ||||||
| Home Partners of America Trust |
||||||||
| Series 2021-2, Class F, 3.80%, 12/17/26 |
2,406 | 2,099,701 | ||||||
| Series 2021-3, Class F, 4.24%, 01/17/41 |
3,674 | 3,111,055 | ||||||
| Mariner Finance Issuance Trust, Series 2021-BA, Class E, 4.68%, 11/20/36 |
470 | 385,872 | ||||||
| Mosaic Solar Loan Trust, Series 2018-2GS, Class C, 5.97%, 02/22/44 |
353 | 300,389 | ||||||
| New Residential Mortgage Loan Trust, Series 2022- SFR1, Class F, 4.44%, 02/17/39 |
3,000 | 2,586,739 | ||||||
| Progress Residential Trust |
||||||||
| Series 2021-SFR10, Class F, 4.61%, 12/17/40 |
2,979 | 2,579,052 | ||||||
| Series 2021-SFR11, Class G, 4.69%, 01/17/39 |
3,000 | 2,538,238 | ||||||
| Security | Par (000) |
Value | ||||||
| United States (continued) | ||||||||
| Progress Residential Trust (continued) |
||||||||
| Series 2021-SFR9, Class F, 4.05%, 11/17/40 |
USD | 2,400 | $ | 1,989,949 | ||||
| Series 2022-SFR1, Class F, 4.88%, 02/17/41 |
2,000 | 1,706,125 | ||||||
| Series 2022-SFR1, Class G, 5.52%, 02/17/41 |
2,000 | 1,661,133 | ||||||
| Series 2022-SFR3, Class E1, 5.20%, 04/17/39 |
2,700 | 2,551,518 | ||||||
| Republic Finance Issuance Trust |
||||||||
| Series 2020-A, Class D, 7.00%, 11/20/30 |
600 | 560,366 | ||||||
| Series 2021-A, Class D, 5.23%, 12/22/31 |
800 | 676,710 | ||||||
| RMF Buyout Issuance Trust, Series 2021-HB1, Class M4, 4.70%, 11/25/31(a) |
3,500 | 3,034,933 | ||||||
| RRX Ltd., Series 2020-IA, Class A1, (3-mo. CME Term SOFR + 1.63%), 7.03%, 04/15/33(a) |
500 | 500,929 | ||||||
| Tricon Residential Trust |
||||||||
| Series 2021-SFR1, Class F, 3.69%, 07/17/38 |
1,375 | 1,232,512 | ||||||
| Series 2021-SFR1, Class G, 4.13%, 07/17/38 |
887 | 791,742 | ||||||
| Series 2022-SFR1, Class E2, 5.74%, 04/17/39 |
1,200 | 1,129,198 | ||||||
|
|
|
|||||||
| 32,232,092 | ||||||||
|
|
|
|||||||
| Total Asset-Backed Securities — 3.5% |
|
64,811,553 | ||||||
|
|
|
|||||||
| Shares | ||||||||
| Common Stocks |
||||||||
| Canada — 0.3% | ||||||||
| Cameco Corp. |
112,872 | 4,864,783 | ||||||
| Enbridge, Inc. |
22,000 | 791,970 | ||||||
|
|
|
|||||||
| 5,656,753 | ||||||||
| China — 0.7% | ||||||||
| BYD Co. Ltd., Class H |
448,376 | 12,368,287 | ||||||
|
|
|
|||||||
| Finland — 0.5% | ||||||||
| Neste OYJ |
281,730 | 10,015,447 | ||||||
|
|
|
|||||||
| France — 4.4% | ||||||||
| Accor SA |
53,969 | 2,065,722 | ||||||
| BNP Paribas SA |
133,966 | 9,303,357 | ||||||
| Cie de Saint-Gobain SA |
228,168 | 16,826,777 | ||||||
| EssilorLuxottica SA |
15,113 | 3,034,671 | ||||||
| Hermes International SCA |
1,133 | 2,408,208 | ||||||
| Kering SA |
10,105 | 4,475,487 | ||||||
| LVMH Moet Hennessy Louis Vuitton SE |
13,860 | 11,261,761 | ||||||
| Sanofi SA |
16,656 | 1,655,153 | ||||||
| Schneider Electric SE |
112,362 | 22,619,165 | ||||||
| TotalEnergies SE |
38,467 | 2,615,717 | ||||||
| TotalEnergies SE, ADR |
44,000 | 2,964,720 | ||||||
| Vinci SA |
8,419 | 1,059,491 | ||||||
|
|
|
|||||||
| 80,290,229 | ||||||||
| Germany — 1.6% | ||||||||
| Commerzbank AG |
112,661 | 1,339,066 | ||||||
| Mercedes-Benz Group AG, Class N, Registered Shares |
169,046 | 11,663,803 | ||||||
| SAP SE |
41,442 | 6,378,816 | ||||||
| SAP SE, ADR |
6,500 | 1,004,835 | ||||||
| Siemens AG, Registered Shares |
48,708 | 9,138,073 | ||||||
|
|
|
|||||||
| 29,524,593 | ||||||||
| Hong Kong — 0.2% | ||||||||
| AIA Group Ltd. |
393,600 | 3,425,453 | ||||||
|
|
|
|||||||
| 48 | 2 0 2 3 B L A C K R O C K A N N U A L R E P O R T T O S H A R E H O L D E R S |
| Consolidated Schedule of Investments (continued) December 31, 2023 |
BlackRock ESG Capital Allocation Term Trust (ECAT) (Percentages shown are based on Net Assets) |
| Security | Shares | Value | ||||||
| India — 0.2% | ||||||||
| HDFC Bank Ltd. |
163,516 | $ | 3,348,157 | |||||
|
|
|
|||||||
| Ireland — 0.4% | ||||||||
| CRH PLC |
115,333 | 7,937,134 | ||||||
|
|
|
|||||||
| Israel — 0.2% | ||||||||
| Nice Ltd., ADR (d)(e) |
19,560 | 3,902,416 | ||||||
|
|
|
|||||||
| Italy — 0.9% | ||||||||
| Ariston Holding NV |
450,912 | 3,130,816 | ||||||
| Intesa Sanpaolo SpA |
2,922,891 | 8,553,528 | ||||||
| UniCredit SpA |
175,605 | 4,781,670 | ||||||
|
|
|
|||||||
| 16,466,014 | ||||||||
| Japan — 2.3% | ||||||||
| Daikin Industries Ltd. |
13,900 | 2,254,858 | ||||||
| FANUC Corp. |
201,100 | 5,902,107 | ||||||
| Honda Motor Co. Ltd. |
462,000 | 4,765,628 | ||||||
| Japan Airlines Co. Ltd. |
290,200 | 5,701,000 | ||||||
| Keyence Corp. |
16,700 | 7,337,249 | ||||||
| Komatsu Ltd. |
178,000 | 4,632,154 | ||||||
| Mitsubishi UFJ Financial Group, Inc. |
211,600 | 1,815,978 | ||||||
| Sysmex Corp. |
77,500 | 4,308,264 | ||||||
| Toyota Motor Corp. |
320,000 | 5,863,587 | ||||||
|
|
|
|||||||
| 42,580,825 | ||||||||
| Netherlands — 2.2% | ||||||||
| Adyen NV (d) |
2,897 | 3,739,856 | ||||||
| ASML Holding NV |
31,186 | 23,541,921 | ||||||
| ING Groep NV, Series N |
849,311 | 12,735,023 | ||||||
|
|
|
|||||||
| 40,016,800 | ||||||||
| Norway — 0.0% | ||||||||
| Equinor ASA, ADR |
24,000 | 759,360 | ||||||
|
|
|
|||||||
| South Korea — 0.4% | ||||||||
| Samsung SDI Co. Ltd. (d) |
11,213 | 4,082,547 | ||||||
| SK Hynix, Inc. |
36,765 | 4,012,456 | ||||||
|
|
|
|||||||
| 8,095,003 | ||||||||
| Spain — 0.4% | ||||||||
| Cellnex Telecom SA |
167,039 | 6,576,827 | ||||||
|
|
|
|||||||
| Sweden — 0.2% | ||||||||
| Volta Trucks, Series C, (Acquired 02/22/22, Cost: $293,944) (c)(d)(f) |
2,492 | — | ||||||
| Volvo AB, Class B |
125,246 | 3,258,901 | ||||||
|
|
|
|||||||
| 3,258,901 | ||||||||
| Switzerland — 1.9% | ||||||||
| Alcon, Inc. |
107,035 | 8,373,986 | ||||||
| Nestle SA, Registered Shares |
125,168 | 14,509,457 | ||||||
| TE Connectivity Ltd. |
38,269 | 5,376,795 | ||||||
| UBS Group AG, Registered Shares |
215,169 | 6,683,485 | ||||||
|
|
|
|||||||
| 34,943,723 | ||||||||
| Taiwan — 0.6% | ||||||||
| Taiwan Semiconductor Manufacturing Co. Ltd., ADR . |
114,856 | 11,945,024 | ||||||
|
|
|
|||||||
| United Kingdom — 1.9% | ||||||||
| AstraZeneca PLC |
4,000 | 539,559 | ||||||
| AstraZeneca PLC, ADR |
152,542 | 10,273,704 | ||||||
| Compass Group PLC |
88,911 | 2,432,900 | ||||||
| RELX PLC |
221,926 | 8,804,650 | ||||||
| Security | Shares | Value | ||||||
| United Kingdom (continued) | ||||||||
| Teya Services Ltd., (Acquired 11/16/21, Cost: $1,099,370) (c)(d)(f) |
566 | $ | 244,393 | |||||
| Unilever PLC |
261,155 | 12,642,771 | ||||||
|
|
|
|||||||
| 34,937,977 | ||||||||
| United States — 37.7% | ||||||||
| Abbott Laboratories (g) |
129,288 | 14,230,730 | ||||||
| Adobe, Inc. (d) |
9,282 | 5,537,641 | ||||||
| Advanced Micro Devices, Inc. (d)(e) |
64,155 | 9,457,088 | ||||||
| Air Products and Chemicals, Inc. |
41,236 | 11,290,417 | ||||||
| Albemarle Corp. |
12,755 | 1,842,842 | ||||||
| Alphabet, Inc., Class C (d) |
164,692 | 23,210,044 | ||||||
| Amazon.com, Inc. (d) |
104,768 | 15,918,450 | ||||||
| American Tower Corp. (g) |
83,710 | 18,071,315 | ||||||
| Amgen, Inc. |
5,762 | 1,659,571 | ||||||
| Apple, Inc. |
88,803 | 17,097,242 | ||||||
| Applied Materials, Inc. |
122,387 | 19,835,261 | ||||||
| Archer-Daniels-Midland Co. |
92,541 | 6,683,311 | ||||||
| Autodesk, Inc. (d) |
10,061 | 2,449,652 | ||||||
| Boston Scientific Corp. (d) |
428,580 | 24,776,210 | ||||||
| Bunge Global SA |
47,047 | 4,749,395 | ||||||
| Cadence Design Systems, Inc. (d) |
17,272 | 4,704,375 | ||||||
| Cencora, Inc. |
9,469 | 1,944,743 | ||||||
| CF Industries Holdings, Inc. |
58,830 | 4,676,985 | ||||||
| Charles Schwab Corp. |
10,655 | 733,064 | ||||||
| Comcast Corp., Class A |
129,963 | 5,698,877 | ||||||
| Costco Wholesale Corp. |
10,670 | 7,043,054 | ||||||
| Delta Air Lines, Inc. |
104,097 | 4,187,822 | ||||||
| Dexcom, Inc. (d) |
33,634 | 4,173,643 | ||||||
| Edwards Lifesciences Corp. (d) |
139,935 | 10,670,044 | ||||||
| Eli Lilly & Co. |
48,401 | 28,213,911 | ||||||
| Ford Motor Co. |
28,873 | 351,962 | ||||||
| Fortive Corp. |
54,170 | 3,988,537 | ||||||
| General Motors Co. |
9,924 | 356,470 | ||||||
| Hilton Worldwide Holdings, Inc. |
15,713 | 2,861,180 | ||||||
| Humana, Inc. |
27,404 | 12,545,825 | ||||||
| Informatica, Inc., Class A (d) |
30,389 | 862,744 | ||||||
| Ingersoll Rand, Inc. |
125,308 | 9,691,321 | ||||||
| Intel Corp. |
2,671 | 134,218 | ||||||
| Intuit, Inc. |
6,589 | 4,118,323 | ||||||
| Intuitive Surgical, Inc. (d) |
47,944 | 16,174,388 | ||||||
| Invesco S&P 500 Equal Weight ETF |
12,975 | 2,047,455 | ||||||
| Johnson Controls International PLC |
81,791 | 4,714,433 | ||||||
| JPMorgan Chase & Co. |
69,489 | 11,820,079 | ||||||
| KLA Corp. |
3,241 | 1,883,993 | ||||||
| Lennar Corp., Class A |
528 | 78,693 | ||||||
| Lessen Holdings, Inc. (c)(d) |
480,897 | 3,128,485 | ||||||
| Linde PLC |
16,438 | 6,751,251 | ||||||
| Lions Gate Entertainment Corp., Class A (d) |
18,500 | 201,650 | ||||||
| LKQ Corp. |
217,079 | 10,374,205 | ||||||
| LPL Financial Holdings, Inc. (e) |
39,912 | 9,084,769 | ||||||
| M/I Homes, Inc. (d) |
4,220 | 581,263 | ||||||
| Marsh & McLennan Cos., Inc. |
171,217 | 32,440,485 | ||||||
| Masco Corp. |
136,372 | 9,134,197 | ||||||
| Mastercard, Inc., Class A |
71,396 | 30,451,108 | ||||||
| McDonald’s Corp. |
3,598 | 1,066,843 | ||||||
| McKesson Corp. |
4,870 | 2,254,713 | ||||||
| Merck & Co., Inc. |
168,506 | 18,370,524 | ||||||
| Micron Technology, Inc. |
73,991 | 6,314,392 | ||||||
| Microsoft Corp. (g) |
146,073 | 54,929,291 | ||||||
| Mr. Cooper Group, Inc. (d) |
14,649 | 953,943 | ||||||
| C O N S O L I D A T E D S C H E D U L E O F I N V E S T M E N T S |
49 |
| Consolidated Schedule of Investments (continued) December 31, 2023 |
BlackRock ESG Capital Allocation Term Trust (ECAT) (Percentages shown are based on Net Assets) |
| Security |
Shares |
Value | ||||||
| United States (continued) | ||||||||
| NextEra Energy, Inc. (g) |
206,914 | $ | 12,567,956 | |||||
| NIKE, Inc., Class B |
64,966 | 7,053,359 | ||||||
| NVIDIA Corp. |
28,453 | 14,090,495 | ||||||
| Palo Alto Networks, Inc. (d) |
22,970 | 6,773,394 | ||||||
| Progressive Corp. |
68,699 | 10,942,377 | ||||||
| Rockwell Automation, Inc. |
22,429 | 6,963,756 | ||||||
| RXO, Inc. (d) |
5,166 | 120,161 | ||||||
| Salesforce, Inc. (d) |
87,645 | 23,062,905 | ||||||
| Schlumberger NV |
32,609 | 1,696,972 | ||||||
| ServiceNow, Inc. (d)(g) |
33,998 | 24,019,247 | ||||||
| SPDR S&P Biotech ETF (e) |
40,000 | 3,571,600 | ||||||
| Tesla, Inc. (d) |
26,849 | 6,671,439 | ||||||
| Thermo Fisher Scientific, Inc. (g) |
41,334 | 21,939,674 | ||||||
| Uber Technologies, Inc. (d) |
5,672 | 349,225 | ||||||
| United Parcel Service, Inc., Class B |
22,163 | 3,484,688 | ||||||
| UnitedHealth Group, Inc. |
22,700 | 11,950,869 | ||||||
| Veralto Corp. (d) |
62,255 | 5,121,096 | ||||||
| Visa, Inc., Class A |
17,759 | 4,623,556 | ||||||
| Volato Group, Inc., Class A, (Acquired 12/03/23, Cost: $124) (c)(f) |
24,722 | 99,630 | ||||||
| Walmart, Inc. |
52,576 | 8,288,606 | ||||||
| Walt Disney Co. (d) |
101,801 | 9,191,612 | ||||||
| Zoetis, Inc., Class A |
17,451 | 3,444,304 | ||||||
|
|
|
|||||||
| 692,549,348 | ||||||||
|
|
|
|||||||
| Total Common Stocks — 57.0% |
|
1,048,598,271 | ||||||
|
|
|
|||||||
| Par (000) |
||||||||
| Corporate Bonds |
||||||||
| Australia — 0.4% | ||||||||
| FMG Resources August Pty. Ltd., 6.13%, 04/15/32(b) |
USD | 1,257 | 1,266,055 | |||||
| Oceana Australian Fixed Income Trust, A Note Upsize(c) |
||||||||
| 12.00%, 08/31/25 |
AUD | 1,682 | 1,144,824 | |||||
| 12.50%, 08/31/26 |
2,524 | 1,721,012 | ||||||
| 12.50%, 08/31/27 |
4,206 | 2,869,905 | ||||||
|
|
|
|||||||
| 7,001,796 | ||||||||
| Belgium — 0.0% | ||||||||
| Anheuser-Busch InBev SA, 4.00%, 09/24/25(h) |
GBP | 100 | 126,510 | |||||
|
|
|
|||||||
| Canada — 0.2% | ||||||||
| Mattamy Group Corp., 5.25%, 12/15/27(b) |
USD | 938 | 911,924 | |||||
| Rogers Communications, Inc., 3.20%, 03/15/27 |
2,500 | 2,386,260 | ||||||
|
|
|
|||||||
| 3,298,184 | ||||||||
| Cayman Islands — 0.0% | ||||||||
| Seagate HDD Cayman, 8.25%, 12/15/29(b) |
383 | 413,076 | ||||||
|
|
|
|||||||
| France — 0.1% | ||||||||
| Altice France SA/France, 5.50%, 01/15/28(b) |
267 | 219,895 | ||||||
| BNP Paribas SA(h) |
||||||||
| 3.38%, 01/23/26 |
GBP | 100 | 123,552 | |||||
| 1.88%, 12/14/27 |
100 | 114,675 | ||||||
| Societe Generale SA, 1.88%, 10/03/24(h) |
100 | 124,133 | ||||||
| TotalEnergies Capital International SA, 1.66%, 07/22/26(h) |
100 | 120,095 | ||||||
|
|
|
|||||||
| 702,350 | ||||||||
| Security | Par (000) |
Value | ||||||
| Germany — 0.3% | ||||||||
| Adler Pelzer Holding GmbH, 9.50%, 04/01/27 |
EUR | 1,668 | $ | 1,832,219 | ||||
| Deutsche Bank AG/New York, (1-day SOFR + 2.51%), 6.82%, 11/20/29(a) |
USD | 875 | 921,239 | |||||
| Envalior, (6-mo. EURIBOR + 9.50%), 13.63%, 03/31/31(c) |
EUR | 2,778 | 2,760,072 | |||||
|
|
|
|||||||
| 5,513,530 | ||||||||
| Japan — 0.1% | ||||||||
| Mizuho Financial Group, Inc., (1-year CMT + 1.25%), 3.26%, 05/22/30(a) |
USD | 2,040 | 1,858,673 | |||||
| Rakuten Group, Inc., 10.25%, 11/30/24(b) |
555 | 566,099 | ||||||
|
|
|
|||||||
| 2,424,772 | ||||||||
| MultiNational — 0.1% | ||||||||
| NXP BV/NXP Funding LLC/NXP USA, Inc., 3.25%, 11/30/51 |
3,380 | 2,426,130 | ||||||
|
|
|
|||||||
| Netherlands — 0.2% | ||||||||
| Cooperatieve Rabobank UA, (1-year UK Government Bond + 1.05%), 1.88%, 07/12/28(a)(h) |
GBP | 100 | 116,011 | |||||
| ING Groep NV, 3.00%, 02/18/26(h) |
100 | 122,851 | ||||||
| Sigma Holdco BV, 5.75%, 05/15/26(h) |
EUR | 757 | 746,343 | |||||
| Trivium Packaging Finance BV, 5.50%, 08/15/26(b) |
USD | 2,654 | 2,603,863 | |||||
|
|
|
|||||||
| 3,589,068 | ||||||||
| Spain(h) — 0.0% | ||||||||
| Banco Santander SA, (1-year UK Government Bond + 1.80%), 3.13%, 10/06/26(a) |
GBP | 300 | 367,204 | |||||
| Telefonica Emisiones SA, 5.38%, 02/02/26 |
133 | 171,376 | ||||||
|
|
|
|||||||
| 538,580 | ||||||||
| Sweden — 0.0% | ||||||||
| Swedbank AB, (1-year UK Government Bond + 1.00%), 1.38%, |
100 | 115,050 | ||||||
|
|
|
|||||||
| United Kingdom — 0.2% | ||||||||
| Barclays PLC, 3.00%, 05/08/26(h) |
100 | 120,875 | ||||||
| BG Energy Capital PLC, 5.13%, 12/01/25(h) |
133 | 171,539 | ||||||
| Connect Finco SARL/Connect U.S. Finco LLC, 6.75%, 10/01/26(b) |
USD | 1,250 | 1,242,512 | |||||
| Deuce Finco PLC, 5.50%, 06/15/27 |
GBP | 337 | 399,617 | |||||
| HSBC Holdings PLC, (3-mo. LIBOR GBP + 1.31%), 1.75%, 07/24/27(a) |
100 | 117,036 | ||||||
| Informa PLC, 3.13%, 07/05/26(h) |
100 | 121,951 | ||||||
| Lloyds Banking Group PLC, 2.25%, 10/16/24(h) |
100 | 124,152 | ||||||
| NatWest Group PLC, (1-year GBP Swap + 1.49%), 2.88%, 09/19/26(a)(h) |
100 | 122,052 | ||||||
| Santander U.K. Group Holdings PLC, 3.63%, 01/14/26(h) |
100 | 123,291 | ||||||
|
|
|
|||||||
| 2,543,025 | ||||||||
| United States — 8.6% | ||||||||
| AbbVie, Inc., 3.20%, 11/21/29 |
USD | 5,310 | 4,963,732 | |||||
| Acadia Healthcare Co., Inc., 5.00%, 04/15/29(b) |
2,176 | 2,088,958 | ||||||
| Albertsons Cos., Inc./Safeway, Inc./New Albertsons LP/Albertsons LLC, 4.63%, 01/15/27(b) |
431 | 419,019 | ||||||
| Alexandria Real Estate Equities, Inc., 2.95%, 03/15/34 |
792 | 660,404 | ||||||
| Allegiant Travel Co., 7.25%, 08/15/27(b) |
635 | 621,310 | ||||||
| Amgen, Inc. |
||||||||
| 5.50%, 12/07/26(h) |
GBP | 100 | 131,225 | |||||
| 2.45%, 02/21/30 |
USD | 2,080 | 1,844,518 | |||||
| 3.00%, 01/15/52 |
2,590 | 1,808,547 | ||||||
| 2.77%, 09/01/53 |
2,025 | 1,299,318 | ||||||
| 50 | 2 0 2 3 B L A C K R O C K A N N U A L R E P O R T T O S H A R E H O L D E R S |
| Consolidated Schedule of Investments (continued) December 31, 2023 |
BlackRock ESG Capital Allocation Term Trust (ECAT) (Percentages shown are based on Net Assets) |
| Security | Par (000) |
Value | ||||||
| United States (continued) | ||||||||
| Ardagh Metal Packaging Finance USA LLC/Ardagh Metal Packaging Finance PLC, 3.25%, 09/01/28(b) |
USD | 753 | $ | 658,742 | ||||
| Ashton Woods USA LLC/Ashton Woods Finance Co., Series B, 4.63%, 08/01/29(b) |
2,661 | 2,366,302 | ||||||
| AT&T, Inc. |
||||||||
| 2.90%, 12/04/26 |
GBP | 100 | 121,400 | |||||
| 5.50%, 03/15/27(h) |
50 | 65,287 | ||||||
| Bank of America Corp., (1-day SOFR + 1.37%), 1.92%, 10/24/31(a) |
USD | 119 | 96,610 | |||||
| Broadcom, Inc.(b) |
||||||||
| 1.95%, 02/15/28 |
2,124 | 1,905,308 | ||||||
| 2.45%, 02/15/31 |
2,010 | 1,718,677 | ||||||
| Calpine Corp., 4.50%, 02/15/28(b) |
860 | 817,989 | ||||||
| CCO Holdings LLC/CCO Holdings Capital Corp., 5.38%, 06/01/29(b) |
1,245 | 1,173,520 | ||||||
| Citigroup, Inc., 1.75%, 10/23/26 |
GBP | 100 | 117,913 | |||||
| Cloud Software Group, Inc., 6.50%, 03/31/29(b) |
USD | 2,073 | 1,974,410 | |||||
| Comcast Corp., 4.65%, 02/15/33 |
2,331 | 2,345,042 | ||||||
| Commercial Metals Co., 4.38%, 03/15/32 |
1,987 | 1,783,244 | ||||||
| Coty, Inc./HFC Prestige Products, Inc./HFC Prestige International U.S. LLC, 6.63%, 07/15/30(b) |
245 | 251,691 | ||||||
| Covanta Holding Corp., 4.88%, 12/01/29(b) |
3,498 | 3,056,168 | ||||||
| CSC Holdings LLC(b) |
||||||||
| 5.38%, 02/01/28 |
1,294 | 1,143,033 | ||||||
| 7.50%, 04/01/28 |
1,264 | 945,586 | ||||||
| Dana, Inc. |
||||||||
| 5.63%, 06/15/28 |
1,309 | 1,290,568 | ||||||
| 4.25%, 09/01/30 |
383 | 339,463 | ||||||
| Dell International LLC/EMC Corp., 5.30%, 10/01/29 |
1,500 | 1,544,703 | ||||||
| Duke Energy Florida LLC, 2.40%, 12/15/31 |
1,500 | 1,265,509 | ||||||
| Elevance Health, Inc. |
||||||||
| 2.25%, 05/15/30 |
2,500 | 2,164,488 | ||||||
| 2.55%, 03/15/31 |
3,625 | 3,147,480 | ||||||
| Equinix, Inc., 1.55%, 03/15/28 |
3,500 | 3,070,196 | ||||||
| Flyr Convertible Notes, 8.00%, 08/10/27(c) |
2,206 | 2,521,147 | ||||||
| Flyr Secured Notes, (1-mo. CME Term SOFR + 5.00%), 10.34%, 05/10/27(c) |
1,062 | 988,850 | ||||||
| Ford Motor Co. |
||||||||
| 3.25%, 02/12/32 |
2,518 | 2,094,230 | ||||||
| 6.10%, 08/19/32 |
2,250 | 2,268,070 | ||||||
| Forestar Group, Inc., 3.85%, 05/15/26(b) |
399 | 380,077 | ||||||
| Freed Corp., 12.00%, 11/30/28(c) |
4,337 | 4,206,890 | ||||||
| FreeWire Technologies, Inc., (3-mo. CME Term SOFR +11.00%), 16.39%, 04/26/25(c) |
3,491 | 3,674,728 | ||||||
| Frontier Communications Holdings LLC(b) |
||||||||
| 8.75%, 05/15/30 |
1,250 | 1,285,886 | ||||||
| 8.63%, 03/15/31 |
395 | 402,743 | ||||||
| Frontier Florida LLC, Series E, 6.86%, 02/01/28 |
500 | 483,691 | ||||||
| Gen Digital, Inc., 6.75%, 09/30/27(b) |
1,394 | 1,418,157 | ||||||
| Goldman Sachs Group, Inc. |
||||||||
| 7.25%, 04/10/28 |
GBP | 50 | 69,696 | |||||
| (1-day SOFR + 0.80%), 1.43%, 03/09/27(a) |
USD | 2,500 | 2,305,219 | |||||
| HCA, Inc., 5.88%, 02/01/29 |
2,605 | 2,689,013 | ||||||
| Healthpeak OP LLC, 5.25%, 12/15/32 |
3,000 | 3,032,670 | ||||||
| Hilton Grand Vacations Borrower Escrow LLC/Hilton Grand Vacations Borrower Esc(b) |
||||||||
| 5.00%, 06/01/29 |
865 | 798,002 | ||||||
| 4.88%, 07/01/31 |
1,335 | 1,181,745 | ||||||
| JPMorgan Chase & Co., (3-mo. LIBOR GBP + 0.68%), 0.99%, 04/28/26(a)(h) |
GBP | 100 | 120,312 | |||||
| KB Home, 4.80%, 11/15/29 |
USD | 2,081 | 1,988,396 | |||||
| Kilroy Realty LP, 2.50%, 11/15/32 |
119 | 90,117 | ||||||
| Security | Par (000) |
Value | ||||||
| United States (continued) | ||||||||
| Kraft Heinz Foods Co., 4.25%, 03/01/31 |
USD | 3,000 | $ | 2,938,667 | ||||
| Landsea Homes Corp., 11.00%, 07/17/28(c) |
9,092 | 8,831,060 | ||||||
| Lessen, Inc., (3-mo. CME Term SOFR + 8.50%), 13.40%, 01/05/28(c) |
1,779 | 1,626,116 | ||||||
| Lions Gate Capital Holdings LLC, 5.50%, 04/15/29(b) |
1,098 | 821,414 | ||||||
| Lowe’s Cos., Inc. |
||||||||
| 1.70%, 10/15/30 |
2,014 | 1,672,696 | ||||||
| 3.00%, 10/15/50 |
1,740 | 1,183,587 | ||||||
| Marriott Ownership Resorts, Inc. |
||||||||
| 4.75%, 01/15/28 |
1,294 | 1,188,630 | ||||||
| 4.50%, 06/15/29(b) |
888 | 782,515 | ||||||
| Mauser Packaging Solutions Holding Co., 7.88%, 08/15/26(b) |
2,105 | 2,142,218 | ||||||
| Medline Borrower LP, 3.88%, 04/01/29(b) |
1,641 | 1,483,701 | ||||||
| Morgan Stanley(a) |
||||||||
| (1-day SOFR + 1.03%), 1.79%, 02/13/32 |
119 | 95,024 | ||||||
| (1-day SOFR + 1.14%), 2.70%, 01/22/31 |
2,500 | 2,185,441 | ||||||
| Nationstar Mortgage Holdings, Inc.(b) |
||||||||
| 6.00%, 01/15/27 |
224 | 222,320 | ||||||
| 5.50%, 08/15/28 |
1,921 | 1,847,192 | ||||||
| 5.13%, 12/15/30 |
961 | 868,871 | ||||||
| 5.75%, 11/15/31 |
454 | 423,313 | ||||||
| NCR Atleos Corp., 9.50%, 04/01/29 |
295 | 313,436 | ||||||
| Northern States Power Co., 2.90%, 03/01/50 |
1,225 | 858,136 | ||||||
| NRG Energy, Inc., 3.38%, 02/15/29(b) |
1,391 | 1,228,593 | ||||||
| Olympus Water U.S. Holding Corp.(b) |
||||||||
| 7.13%, 10/01/27 |
705 | 705,790 | ||||||
| 9.75%, 11/15/28 |
4,020 | 4,266,800 | ||||||
| Oncor Electric Delivery Co. LLC, 2.75%, 05/15/30 |
2,025 | 1,811,372 | ||||||
| Oracle Corp., 3.60%, 04/01/50 |
2,135 | 1,581,409 | ||||||
| Pitney Bowes, Inc., 6.88%, 03/15/27(b) |
1,290 | 1,204,789 | ||||||
| PNC Financial Services Group, Inc., (1-day SOFR Index + 1.09%), 4.76%, 01/26/27(a) |
2,427 | 2,407,888 | ||||||
| Prologis LP, 2.25%, 01/15/32 |
119 | 99,232 | ||||||
| Public Service Electric and Gas Co., 4.65%, 03/15/33 |
2,650 | 2,650,272 | ||||||
| Republic Services, Inc. |
||||||||
| 1.45%, 02/15/31 |
4,119 | 3,341,345 | ||||||
| 1.75%, 02/15/32 |
1,375 | 1,119,192 | ||||||
| RingCentral, Inc., 8.50%, 08/15/30 |
320 | 327,200 | ||||||
| Rocket Mortgage LLC/Rocket Mortgage Co-Issuer, Inc., 2.88%, 10/15/26(b) |
2,062 | 1,902,195 | ||||||
| Sabre GLBL, Inc.(b) |
||||||||
| 9.25%, 04/15/25 |
122 | 117,120 | ||||||
| 11.25%, 12/15/27 |
900 | 884,276 | ||||||
| Sonder Secured Notes, (3-mo. CME Term SOFR at 1.00% Floor + 9.00%), 14.61%, 01/19/27(a)(c) |
5,282 | 4,601,881 | ||||||
| Steel Dynamics, Inc., 3.45%, 04/15/30 |
3,060 | 2,824,459 | ||||||
| Stem, Inc., 0.50%, |
275 | 139,675 | ||||||
| Taylor Morrison Communities, Inc., 5.88%, 06/15/27(b) |
1,643 | 1,651,215 | ||||||
| T-Mobile U.S., Inc. |
||||||||
| 3.75%, 04/15/27 |
2,750 | 2,667,299 | ||||||
| 3.38%, 04/15/29 |
3,930 | 3,651,376 | ||||||
| 3.40%, 10/15/52 |
1,360 | 990,554 | ||||||
| Travel & Leisure Co., 4.63%, 03/01/30(b) |
440 | 393,492 | ||||||
| Uber Technologies, Inc., 0.88%, 12/01/28 |
743 | 808,012 | ||||||
| United Wholesale Mortgage LLC(b) |
||||||||
| 5.50%, 11/15/25 |
1,304 | 1,295,757 | ||||||
| 5.75%, 06/15/27 |
1,346 | 1,319,228 | ||||||
| UnitedHealth Group, Inc., 5.35%, 02/15/33 |
2,325 | 2,459,621 | ||||||
| Verizon Communications, Inc., 1.13%, 11/03/28 |
GBP | 100 | 110,211 | |||||
| C O N S O L I D A T E D S C H E D U L E O F I N V E S T M E N T S |
51 |
| Consolidated Schedule of Investments (continued) December 31, 2023 |
BlackRock ESG Capital Allocation Term Trust (ECAT) (Percentages shown are based on Net Assets) |
| Security | Par (000) |
Value | ||||||
| United States (continued) | ||||||||
| Viasat, Inc., 5.63%, 04/15/27(b) |
USD | 500 | $ | 483,750 | ||||
| Xerox Holdings Corp., 5.00%, 08/15/25(b) |
425 | 416,280 | ||||||
| Xylem, Inc./New York, 2.25%, 01/30/31 |
3,000 | 2,570,004 | ||||||
|
|
|
|||||||
| 158,714,623 | ||||||||
|
|
|
|||||||
| Total Corporate Bonds — 10.2% |
|
187,406,694 | ||||||
|
|
|
|||||||
| Fixed Rate Loan Interests |
|
|||||||
| United States — 0.2% | ||||||||
| AMF MF Portfolio, Term Loan, 6.67%, 11/01/28(c) |
4,075 | 4,062,028 | ||||||
|
|
|
|||||||
| Total Fixed Rate Loan Interests — 0.2% |
|
4,062,028 | ||||||
|
|
|
|||||||
| Floating Rate Loan Interests(a) |
|
|||||||
| Ireland — 0.2% | ||||||||
| Promontoria Beech Designated Activity Co., EUR Term Loan, (3-mo. EURIBOR + 3.75%), 7.63%, 05/17/27(c) |
EUR | 3,434 | 3,771,482 | |||||
|
|
|
|||||||
| Luxembourg — 0.1% | ||||||||
| Speed Midco 3 SARL, EUR Term Loan B1, (3-mo. EURIBOR + 6.40%), 10.33%, 05/16/29(c) |
2,488 | 2,787,810 | ||||||
|
|
|
|||||||
| Netherlands — 0.1% | ||||||||
| Upfield BV, 2023 GBP Term Loan B8, (1-day SONIA + 4.00%), 8.97%, 01/02/28 |
GBP | 1,358 | 1,641,293 | |||||
|
|
|
|||||||
| United States — 1.2% | ||||||||
| Altar Bidco, Inc., 2021 2nd Lien Term Loan, (3-mo. CME Term SOFR at 0.50% Floor + 5.60%), 10.81%, 02/01/30 |
USD | 1,637 | 1,603,984 | |||||
| American Auto Auction Group, LLC, 2021 Term Loan B, (3-mo. CME Term SOFR at 0.75% Floor + 5.00%), 10.50%, 12/30/27 |
426 | 418,003 | ||||||
| Coreweave Compute Acquisition Co. II, LLC, Delayed Draw Term Loan, (3-mo. CME Term SOFR + 8.75%), 14.13%, 06/30/28(c) |
4,339 | 4,269,080 | ||||||
| EIS Buyer, Inc., Revolver, (1-mo. CME Term SOFR at 0.75% Floor + 7.00%), 12.36%, 07/10/28(c) |
341 | 330,003 | ||||||
| EIS Group, Inc., Term Loan, (1-mo. CME Term SOFR + 7.00%), 12.36%, 05/01/28(c) |
3,406 | 3,300,033 | ||||||
| Galaxy Universal LLC, 1st Lien Term Loan, (3-mo. CME Term SOFR at 1.00% Floor + 5.75%), 11.28%, 11/12/26(c) |
6,178 | 6,062,465 | ||||||
| GoTo Group, Inc., Term Loan B, (3-mo. CME Term SOFR + 4.75%), 10.28%, 08/31/27 |
248 | 162,938 | ||||||
| Helios Service Partners LLC(c) |
||||||||
| 2023 Delayed Draw Term Loan, (3-mo. CME Term SOFR at 1.00% Floor + 6.25%), 11.88%, 03/19/27 |
617 | 612,921 | ||||||
| 2023 Term Loan B, (3-mo. CME Term SOFR at 1.00% Floor + 6.25%), 11.86%, 03/19/27 |
607 | 603,578 | ||||||
| Hydrofarm Holdings LLC, 2021 Term Loan, (3-mo. CME Term SOFR at -4.50% Floor + 5.50%), 11.15%, 10/25/28(c) |
1,110 | 888,272 | ||||||
| Orion Group Holdco LLC(c) |
||||||||
| 2022 1st Amendment Term Loan, (3-mo. CME Term SOFR at 1.00% Floor + 6.50%), 12.11%, 03/19/27 |
116 | 115,704 | ||||||
| Security | Par (000) |
Value | ||||||
| United States (continued) | ||||||||
| Orion Group Holdco LLC(c) (continued) |
||||||||
| 2022 First A&R Amendment Incremental DDTL, (3-mo. CME Term SOFR at 1.00% Floor + 6.50%), 11.88%, 03/19/27 |
USD | 517 | $ | 517,453 | ||||
| Delayed Draw Term Loan, (3-mo. CME Term SOFR at 1.00% Floor + 6.00%), 11.61%, 03/19/27 |
196 | 193,026 | ||||||
| First Lien Delayed Draw Term Loan, (3-mo. CME Term SOFR at 1.00% Floor + 6.00%), 11.61%, 03/19/27 |
1,159 | 1,158,599 | ||||||
| First Lien Term Loan, (3-mo. CME Term SOFR at 1.00% Floor + 6.00%), 11.61%, 03/19/27 |
99 | 98,944 | ||||||
| Term Loan, (3-mo. CME Term SOFR at 1.00% Floor + 6.00%), 11.61%, 03/19/27 |
39 | 38,614 | ||||||
| Redstone Holdco 2 LP, 2021 Term Loan, (1-mo. CME Term SOFR at 0.75% Floor + 4.75%), 10.22%, 04/27/28 |
673 | 505,481 | ||||||
| Signal Parent, Inc., Term Loan B, (1-mo. CME Term SOFR at 0.75% Floor + 3.50%), 8.96%, 04/03/28 .. |
977 | 867,437 | ||||||
|
|
|
|||||||
| 21,746,535 | ||||||||
|
|
|
|||||||
| Total Floating Rate Loan Interests — 1.6% |
|
29,947,120 | ||||||
|
|
|
|||||||
| Foreign Agency Obligations |
|
|||||||
| Spain(h) — 0.3% | ||||||||
| Spain Government Bond |
||||||||
| 2.55%, 10/31/32 |
EUR | 1,839 | 1,980,385 | |||||
| 3.15%, 04/30/33 |
410 | 460,112 | ||||||
| 3.90%, 07/30/39 |
2,222 | 2,598,001 | ||||||
|
|
|
|||||||
| 5,038,498 | ||||||||
| United Kingdom(h) — 0.2% | ||||||||
| United Kingdom Gilt |
||||||||
| 3.75%, 10/22/53 |
GBP | 943 | 1,122,506 | |||||
| 0.50%, 10/22/61 |
5,221 | 2,251,947 | ||||||
|
|
|
|||||||
| 3,374,453 | ||||||||
|
|
|
|||||||
| Total Foreign Agency Obligations — 0.5% |
|
8,412,951 | ||||||
|
|
|
|||||||
| Shares | ||||||||
| Investment Companies |
|
|||||||
| United States — 0.7% | ||||||||
| iShares iBoxx $ Investment Grade Corporate Bond ETF (e)(j) |
35,863 | 3,968,600 | ||||||
| iShares JP Morgan USD Emerging Markets Bond ETF (j) |
66,207 | 5,896,395 | ||||||
| iShares Russell 2000 ETF (j) |
100 | 20,071 | ||||||
| iShares Russell Mid-Cap Growth ETF (j) |
3,916 | 409,065 | ||||||
| VanEck J. P. Morgan EM Local Currency Bond ETF |
84,550 | 2,143,342 | ||||||
|
|
|
|||||||
| Total Investment Companies — 0.7% |
|
12,437,473 | ||||||
|
|
|
|||||||
| 52 | 2 0 2 3 B L A C K R O C K A N N U A L R E P O R T T O S H A R E H O L D E R S |
| Consolidated Schedule of Investments (continued) December 31, 2023 |
BlackRock ESG Capital Allocation Term Trust (ECAT) (Percentages shown are based on Net Assets) |
| Security | Par (000) |
Value | ||||||
| Municipal Bonds |
||||||||
| Puerto Rico(a) — 0.1% | ||||||||
| Commonwealth of Puerto Rico, GO |
||||||||
| 0.00%, 11/01/51 |
USD | 4,125 | $ | 1,683,470 | ||||
| Series A-1, 0.00%, 11/01/43 |
361 | 194,628 | ||||||
| Commonwealth of Puerto Rico, RB, 0.00%, 11/01/51 |
1,767 | 618,349 | ||||||
|
|
|
|||||||
| Total Municipal Bonds — 0.1% |
|
2,496,447 | ||||||
|
|
|
|||||||
| Non-Agency Mortgage-Backed Securities |
|
|||||||
| United States(a)(b) — 1.9% | ||||||||
| Barclays Mortgage Loan Trust, Series 2021-NQM1, Class B1, 4.38%, 09/25/51 |
2,047 | 1,563,914 | ||||||
| CHNGE Mortgage Trust |
||||||||
| Series 2022-1, Class M1, 3.99%, 01/25/67 |
2,000 | 1,621,647 | ||||||
| Series 2022-2, Class M1, 4.61%, 03/25/67 |
5,000 | 4,242,295 | ||||||
| DBUBS Mortgage Trust, Series 2017-BRBK, Class F, 3.53%, 10/10/34 |
1,470 | 1,031,977 | ||||||
| FREMF Trust, Series 2018-W5FX, Class CFX, 3.66%, 04/25/28 |
1,923 | 1,647,966 | ||||||
| Grace Trust, Series 2020-GRCE, Class D, 2.68%, 12/10/40 |
2,000 | 1,484,749 | ||||||
| GS Mortgage Securities Corp. Trust |
||||||||
| Series 2021-DM, Class E, (1-mo. Term SOFR + 3.05%), 8.41%, 11/15/36 |
2,150 | 2,083,074 | ||||||
| Series 2021-DM, Class F, (1-mo. Term SOFR + 3.55%), 8.91%, 11/15/36 |
2,150 | 2,049,282 | ||||||
| Hudson Yards Mortgage Trust, Series 2019-55HY, Class F, 2.94%, 12/10/41 |
2,000 | 1,427,795 | ||||||
| JP Morgan Chase Commercial Mortgage Securities Trust |
||||||||
| Series 2021-MHC, Class E, (1-mo. Term SOFR + 2.56%), 7.93%, 04/15/38 |
2,270 | 2,195,767 | ||||||
| Series 2021-NYAH, Class E, (1-mo. Term SOFR + 1.95%), 7.32%, 06/15/38 |
2,000 | 1,622,004 | ||||||
| Series 2022-NLP, Class F, (1-mo. Term SOFR + 3.54%), 8.90%, 04/15/37 |
1,953 | 1,328,766 | ||||||
| Series 2022-OPO, Class D, 3.45%, 01/05/39 |
860 | 503,099 | ||||||
| MFRA Trust, Series 2022-CHM1, Class M1, 4.57%, 09/25/56 |
4,000 | 3,407,982 | ||||||
| MHC Commercial Mortgage Trust, Series 2021- MHC, Class F, (1-mo. Term SOFR + 2.72%), 8.08%, 04/15/38 |
934 | 908,695 | ||||||
| RIAL Issuer Ltd., Series 2022-FL8, Class A, (1-mo. Term SOFR + 2.25%), 7.61%, 01/19/37 |
2,315 | 2,277,628 | ||||||
| SUMIT Mortgage Trust, Series 2022-BVUE, Class D, 2.89%, 02/12/41 |
650 | 448,899 | ||||||
| Security | Par (000) |
Value | ||||||
| United States (continued) | ||||||||
| Taubman Centers Commercial Mortgage Trust, Series 2022-DPM, Class A, (1-mo. Term SOFR + 2.19%), 7.55%, 05/15/37 |
USD | 2,410 | $ | 2,395,621 | ||||
| Velocity Commercial Capital Loan Trust, Series 2021-4, Class M4, 4.48%, 12/26/51 |
2,787 | 2,022,753 | ||||||
|
|
|
|||||||
| Total Non-Agency Mortgage-Backed |
|
34,263,913 | ||||||
|
|
|
|||||||
| Preferred Securities |
|
|||||||
| Capital Trust — 0.0% | ||||||||
| United States — 0.0% | ||||||||
| Paramount Global, 6.38%, 03/30/62(a) |
250 | 225,000 | ||||||
|
|
|
|||||||
| 225,000 | ||||||||
| Shares | ||||||||
| Preferred Stocks — 1.1%(d) | ||||||||
| Finland — 0.2% | ||||||||
| Aiven, Series D(c) |
35,053 | 2,822,468 | ||||||
|
|
|
|||||||
| Israel — 0.2% | ||||||||
| Deep Instinct Ltd., Series D-4, (Acquired 09/20/22, Cost: $3,691,502)(c)(f) |
523,592 | 3,052,541 | ||||||
|
|
|
|||||||
| United States — 0.7% | ||||||||
| Cap Hill Brands(c) |
1,088,268 | 282,950 | ||||||
| Clarify Health(c) |
318,926 | 2,309,024 | ||||||
| MNTN Digital, Inc., Series D, (Acquired 11/05/21, Cost: $1,239,070)(c)(f) |
53,954 | 682,518 | ||||||
| RapidSOS, Series C-1 |
1,707,127 | 2,487,113 | ||||||
| Verge Genomics, Inc.(c)(f) |
||||||||
| Series B, (Acquired 11/05/21, Cost: $1,437,421) |
269,847 | 1,745,910 | ||||||
| Series C, (Acquired 09/06/23, Cost: $345,314) |
48,019 | 345,737 | ||||||
| Versa Networks, Inc., Series E, (Acquired 10/14/22, Cost: $4,623,422), 12.00%, 10/07/32(c)(f) |
1,584,337 | 5,164,939 | ||||||
| Zero Mass Water, Inc., Series D, (Acquired 07/05/22, Cost: |
6,084 | 177,409 | ||||||
|
|
|
|||||||
| 13,195,600 | ||||||||
|
|
|
|||||||
| 19,070,609 | ||||||||
|
|
|
|||||||
| Total Preferred Securities — 1.1% |
19,295,609 | |||||||
|
|
|
|||||||
| Par (000) |
||||||||
| U.S. Government Sponsored Agency Securities |
| |||||||
| Mortgage-Backed Securities — 6.7% | ||||||||
| Uniform Mortgage-Backed Securities(k) |
USD | 18,006 | 16,518,025 | |||||
| C O N S O L I D A T E D S C H E D U L E O F I N V E S T M E N T S |
53 |
| Consolidated Schedule of Investments (continued) December 31, 2023 |
BlackRock ESG Capital Allocation Term Trust (ECAT) (Percentages shown are based on Net Assets) |
| Security | Par (000) |
Value | ||||||
| Mortgage-Backed Securities (continued) | ||||||||
| Uniform Mortgage-Backed Securities(k) (continued) |
||||||||
| 4.50%, 01/16/54 |
USD | 76,345 | $ | 74,000,995 | ||||
| 5.50%, 01/16/54 |
32,500 | 32,637,109 | ||||||
|
|
|
|||||||
| Total U.S. Government Sponsored Agency |
|
123,156,129 | ||||||
|
|
|
|||||||
| U.S. Treasury Obligations |
||||||||
| U.S. Treasury Notes, 4.63%, 09/30/28 |
6,777 | 6,995,135 | ||||||
|
|
|
|||||||
| Total U.S. Treasury Obligations — 0.4% |
|
6,995,135 | ||||||
|
|
|
|||||||
| Shares | ||||||||
| Warrants |
||||||||
| Israel — 0.0% | ||||||||
| Deep Instinct Ltd., (Acquired 09/20/22, Cost: $0), (Exercisable 09/20/22, 1 Share for 1 Warrant, Expires
09/20/32, Strike Price |
36,915 | 104,839 | ||||||
|
|
|
|||||||
| United States(c)(d) — 0.0% | ||||||||
| Flyr Warrants, (Issued/Exercisable 05/10/22, 1 Share for 1 Warrant, Expires 05/10/32, Strike Price |
5,576 | 32,006 | ||||||
| FreeWire Technologies, Inc., Tranche A, (Issued 04/27/22, 1 Share for 1 Warrant, Expires 04/26/27, Strike Price USD 3.35) |
354,944 | 21,297 | ||||||
| FreeWire Technologies, Inc., Tranche B Unvest, (Exercisable 06/03/23, 1 Share for 1 Warrant, Expires 04/26/29, Strike Price USD 3.35) |
337,197 | 3 | ||||||
| FreeWire Technologies, Inc., Tranche B Vested, (Issued 05/02/22, Exercisable 05/03/23, 1 Share for 1 Warrant, Expires 04/26/27, Strike Price USD 3.35) |
17,747 | 1,065 | ||||||
| RapidSOS, Series C-1, (Expires 12/13/33, Strike Price USD 0.01) |
946,544 | — | ||||||
| Sonder Holdings, Inc., (Issued 11/19/20, Exercisable 01/19/21, 1 Share for 1 Warrant, Expires 11/19/26, Strike Price USD 12.50) |
75,255 | 1 | ||||||
| Versa Networks, Inc., (Acquired 10/14/22, Cost: $0), (Exercisable 10/14/22, 1 Share for 1 Warrant, Expires
10/07/32, Strike Price |
195,273 | 550,670 | ||||||
| Volato Group, Inc., (Acquired 12/03/23, Cost: $61,805), (Expires 12/03/28, Strike Price USD 11.50)(f) |
61,805 | 5,593 | ||||||
|
|
|
|||||||
| 610,635 | ||||||||
|
|
|
|||||||
| Total Warrants — 0.0% |
715,474 | |||||||
|
|
|
|||||||
| Total Long-Term Investments — 83.9% |
|
1,542,598,797 | ||||||
|
|
|
|||||||
|
Security |
Shares | Value | ||||||
| Short-Term Securities |
|
|||||||
| Money Market Funds — 20.8% | ||||||||
| BlackRock Liquidity Funds, T-Fund, Institutional Class, 5.26%(j)(l) |
378,536,662 | $ | 378,536,662 | |||||
| SL Liquidity Series, LLC, Money Market Series, 5.58%(j)(l)(m) |
3,508,081 | 3,509,133 | ||||||
|
|
|
|||||||
| Total Short-Term Securities — 20.8% |
|
382,045,795 | ||||||
|
|
|
|||||||
| Options Purchased — 0.4% |
|
7,179,418 | ||||||
|
|
|
|||||||
| Total Investments Before Options Written — 105.1% |
|
1,931,824,010 | ||||||
|
|
|
|||||||
| Options Written — (0.1)% |
|
(1,885,800 | ) | |||||
|
|
|
|||||||
| Total Investments, Net of Options Written — 105.0% |
|
1,929,938,210 | ||||||
| Liabilities in Excess of Other Assets — (5.0)% |
|
(91,243,265 | ) | |||||
|
|
|
|||||||
| Net Assets — 100.0% |
|
$ | 1,838,694,945 | |||||
|
|
|
|||||||
| (a) | Variable rate security. Interest rate resets periodically. The rate shown is the effective interest rate as of period end. Security description also includes the reference rate and spread if published and available. |
| (b) | Security exempt from registration pursuant to Rule 144A under the Securities Act of 1933, as amended. These securities may be resold in transactions exempt from registration to qualified institutional investors. |
| (c) | Security is valued using significant unobservable inputs and is classified as Level 3 in the fair value hierarchy. |
| (d) | Non-income producing security. |
| (e) | All or a portion of this security is on loan. |
| (f) | Restricted security as to resale, excluding 144A securities. The Trust held restricted securities with a current value of $12,174,179, representing 0.7% of its net assets as of period end, and an original cost of $13,041,180. |
| (g) | All or a portion of the security has been pledged and/or segregated as collateral in connection with outstanding exchange-traded options written. |
| (h) | This security may be resold to qualified foreign investors and foreign institutional buyers under Regulation S of the Securities Act of 1933. |
| (i) | Convertible security. |
| (j) | Affiliate of the Trust. |
| (k) | Represents or includes a TBA transaction. |
| (l) | Annualized 7-day yield as of period end. |
| (m) | All or a portion of this security was purchased with the cash collateral from loaned securities. |
| 54 | 2 0 2 3 B L A C K R O C K A N N U A L R E P O R T T O S H A R E H O L D E R S |
| Consolidated Schedule of Investments (continued) December 31, 2023 |
BlackRock ESG Capital Allocation Term Trust (ECAT) |
Affiliates
Investments in issuers considered to be affiliate(s) of the Trust during the year ended December 31, 2023 for purposes of Section 2(a)(3) of the Investment Company Act of 1940, as amended, were as follows:
| Affiliated Issuer | Value at 12/31/22 |
Purchases at Cost |
Proceeds from Sale |
Net Realized Gain (Loss) |
Change in Unrealized Appreciation (Depreciation) |
Value at 12/31/23 |
Shares Held at 12/31/23 |
Income | Capital Gain Distributions from Underlying Funds |
|||||||||||||||||||||||||||
| BlackRock Liquidity Funds, T-Fund, Institutional Class |
$ | 5,346,114 | $ | 373,190,548 | (a) | $ | — | $ | — | $ | — | $ | 378,536,662 | 378,536,662 | $ | 10,003,634 | $ | — | ||||||||||||||||||
| iShares China Large-Cap ETF(b) |
582,272 | 1,983,184 | (2,739,771 | ) | 237,969 | (63,654 | ) | — | — | — | — | |||||||||||||||||||||||||
| iShares iBoxx $ High Yield Corporate Bond ETF(b) |
4,819,673 | — | (4,907,458 | ) | 102,514 | (14,729 | ) | — | — | 75,920 | — | |||||||||||||||||||||||||
| iShares iBoxx $ Investment Grade Corporate Bond ETF |
2,649,878 | 24,462,039 | (23,227,344 | ) | (99,959 | ) | 183,986 | 3,968,600 | 35,863 | 183,214 | — | |||||||||||||||||||||||||
| iShares JP Morgan USD Emerging Markets Bond ETF |
10,786,409 | 2,286,203 | (7,221,109 | ) | (526,517 | ) | 571,409 | 5,896,395 | 66,207 | 531,558 | — | |||||||||||||||||||||||||
| iShares Russell 2000 ETF |
17,436 | — | — | — | 2,635 | 20,071 | 100 | 270 | — | |||||||||||||||||||||||||||
| iShares Russell Mid-Cap Growth ETF |
— | 373,399 | — | — | 35,666 | 409,065 | 3,916 | 1,305 | — | |||||||||||||||||||||||||||
| SL Liquidity Series, LLC, Money Market Series . |
— | 3,506,270 | (a) | — | 2,898 | (35 | ) | 3,509,133 | 3,508,081 | 37,718 | (c) | — | ||||||||||||||||||||||||
|
|
|
|
|
|
|
|
|
|
|
|||||||||||||||||||||||||||
| $ | (283,095 | ) | $ | 715,278 | $ | 392,339,926 | $ | 10,833,619 | $ | — | ||||||||||||||||||||||||||
|
|
|
|
|
|
|
|
|
|
|
|||||||||||||||||||||||||||
| (a) | Represents net amount purchased (sold). |
| (b) | As of period end, the entity is no longer held. |
| (c) | All or a portion represents securities lending income earned from the reinvestment of cash collateral from loaned securities, net of fees and collateral investment expenses, and other payments to and from borrowers of securities. |
Derivative Financial Instruments Outstanding as of Period End
Futures Contracts
| Description | Number of Contracts |
Expiration Date |
Notional Amount (000) |
Value/ Unrealized Appreciation (Depreciation) |
||||||||||||
| Long Contracts |
||||||||||||||||
| Euro BOBL |
412 | 03/07/24 | $ | 54,252 | $ | 257,468 | ||||||||||
| Nikkei 225 Index |
16 | 03/07/24 | 3,783 | 72,712 | ||||||||||||
| Euro Stoxx 50 Index |
124 | 03/15/24 | 6,230 | (58,694 | ) | |||||||||||
| Euro Stoxx Banks Index |
93 | 03/15/24 | 613 | (5,199 | ) | |||||||||||
| MSCI Emerging Markets Index |
4 | 03/15/24 | 207 | 9,047 | ||||||||||||
| NASDAQ 100 E-Mini Index |
175 | 03/15/24 | 59,582 | 2,011,080 | ||||||||||||
| S&P 500 E-Mini Index |
209 | 03/15/24 | 50,369 | 1,476,668 | ||||||||||||
| U.S. Long Bond |
36 | 03/19/24 | 4,498 | 326,291 | ||||||||||||
| Long Gilt |
35 | 03/26/24 | 4,579 | 291,729 | ||||||||||||
| 5-Year U.S. Treasury Note |
2,602 | 03/28/24 | 283,028 | 5,669,916 | ||||||||||||
| Carbon Emissions(a) |
9 | 12/16/24 | 799 | 95,313 | ||||||||||||
|
|
|
|||||||||||||||
| 10,146,331 | ||||||||||||||||
|
|
|
|||||||||||||||
| Short Contracts |
||||||||||||||||
| Euro Bund |
2 | 03/07/24 | 303 | 1,590 | ||||||||||||
| Euro OAT |
24 | 03/07/24 | 3,484 | (48,065 | ) | |||||||||||
| 10-Year Japanese Government Treasury Bonds |
19 | 03/13/24 | 19,769 | (117,282 | ) | |||||||||||
| E-mini Russell 2000 Index |
67 | 03/15/24 | 6,860 | (475,049 | ) | |||||||||||
| 10-Year U.S. Treasury Note |
152 | 03/19/24 | 17,159 | (392,942 | ) | |||||||||||
| 10-Year U.S. Ultra Long Treasury Note |
318 | 03/19/24 | 37,529 | (1,596,707 | ) | |||||||||||
| Ultra U.S. Treasury Bond |
195 | 03/19/24 | 26,051 | (2,263,820 | ) | |||||||||||
| 2-Year U.S. Treasury Note |
487 | 03/28/24 | 100,280 | (620,179 | ) | |||||||||||
|
|
|
|||||||||||||||
| (5,512,454 | ) | |||||||||||||||
|
|
|
|||||||||||||||
| $ | 4,633,877 | |||||||||||||||
|
|
|
|||||||||||||||
| (a) | All or a portion of the security is held by a wholly-owned subsidiary. See Note 1 of the Notes to Consolidated Financial Statements for details on the wholly-owned subsidiary. |
| C O N S O L I D A T E D S C H E D U L E O F I N V E S T M E N T S |
55 |
| Consolidated Schedule of Investments (continued) December 31, 2023 |
BlackRock ESG Capital Allocation Term Trust (ECAT) |
Forward Foreign Currency Exchange Contracts
| Currency Purchased | Currency Sold | Counterparty | Settlement Date | Unrealized Appreciation (Depreciation) |
||||||||||||||
| AUD |
275,262 | USD | 187,122 | Westpac Banking Corp. | 03/20/24 | $ | 889 | |||||||||||
| BRL |
24,921,636 | USD | 5,023,207 | Citibank N.A. | 03/20/24 | 70,093 | ||||||||||||
| EUR |
320,054 | USD | 350,770 | Barclays Bank PLC | 03/20/24 | 3,640 | ||||||||||||
| EUR |
381,027 | USD | 412,164 | Barclays Bank PLC | 03/20/24 | 9,764 | ||||||||||||
| EUR |
2,654,673 | USD | 2,924,039 | Deutsche Bank AG | 03/20/24 | 15,598 | ||||||||||||
| EUR |
3,088,885 | USD | 3,416,900 | Deutsche Bank AG | 03/20/24 | 3,560 | ||||||||||||
| EUR |
1,011,014 | USD | 1,113,557 | Morgan Stanley & Co. International PLC | 03/20/24 | 5,984 | ||||||||||||
| EUR |
1,438,323 | USD | 1,558,862 | Morgan Stanley & Co. International PLC | 03/20/24 | 33,857 | ||||||||||||
| EUR |
1,452,500 | USD | 1,599,820 | Morgan Stanley & Co. International PLC | 03/20/24 | 8,598 | ||||||||||||
| EUR |
456,170 | USD | 492,261 | The Bank of New York Mellon | 03/20/24 | 12,876 | ||||||||||||
| EUR |
194,007 | USD | 212,807 | UBS AG | 03/20/24 | 2,025 | ||||||||||||
| GBP |
734,958 | USD | 932,033 | Deutsche Bank AG | 03/20/24 | 5,135 | ||||||||||||
| GBP |
233,518 | USD | 297,541 | Morgan Stanley & Co. International PLC | 03/20/24 | 226 | ||||||||||||
| MXN |
32,826,195 | USD | 1,878,509 | Citibank N.A. | 03/20/24 | 30,640 | ||||||||||||
| MXN |
64,090,190 | USD | 3,667,620 | Citibank N.A. | 03/20/24 | 59,822 | ||||||||||||
| USD |
2,682,909 | GBP | 2,100,000 | Deutsche Bank AG | 03/20/24 | 5,131 | ||||||||||||
| USD |
37,198,351 | GBP | 29,116,353 | Deutsche Bank AG | 03/20/24 | 71,146 | ||||||||||||
| USD |
1,069,764 | HKD | 8,334,712 | Deutsche Bank AG | 03/20/24 | 506 | ||||||||||||
| USD |
1,493,020 | HKD | 11,629,416 | UBS AG | 03/20/24 | 1,086 | ||||||||||||
| USD |
10,958,561 | KRW | 14,092,161,000 | BNP Paribas SA | 03/20/24 | 27,965 | ||||||||||||
| ZAR |
33,712,048 | USD | 1,823,158 | Deutsche Bank AG | 03/20/24 | 7,509 | ||||||||||||
| JPY |
67,243,345 | USD | 481,385 | The Bank of New York Mellon | 03/21/24 | 1,217 | ||||||||||||
|
|
|
|||||||||||||||||
| 377,267 | ||||||||||||||||||
|
|
|
|||||||||||||||||
| USD |
41,548,772 | JPY | 5,805,653,958 | Deutsche Bank AG | 03/19/24 | (105,048 | ) | |||||||||||
| USD |
1,685,242 | JPY | 242,719,641 | Morgan Stanley & Co. International PLC | 03/19/24 | (56,199 | ) | |||||||||||
| USD |
5,689,661 | AUD | 8,467,854 | The Bank of New York Mellon | 03/20/24 | (94,103 | ) | |||||||||||
| USD |
455,156 | CAD | 609,404 | Citibank N.A. | 03/20/24 | (5,239 | ) | |||||||||||
| USD |
736,230 | CHF | 633,427 | BNP Paribas SA | 03/20/24 | (22,830 | ) | |||||||||||
| USD |
1,104,860 | CHF | 936,778 | BNP Paribas SA | 03/20/24 | (17,717 | ) | |||||||||||
| USD |
1,103,466 | CHF | 943,357 | Citibank N.A. | 03/20/24 | (26,995 | ) | |||||||||||
| USD |
1,528,857 | CHF | 1,303,699 | Citibank N.A. | 03/20/24 | (33,415 | ) | |||||||||||
| USD |
937,699 | CHF | 806,147 | Goldman Sachs International | 03/20/24 | (28,338 | ) | |||||||||||
| USD |
25,529,568 | CHF | 21,888,653 | Goldman Sachs International | 03/20/24 | (700,440 | ) | |||||||||||
| USD |
52,354 | DKK | 353,233 | Morgan Stanley & Co. International PLC | 03/20/24 | (162 | ) | |||||||||||
| USD |
1,350,376 | EUR | 1,223,310 | Standard Chartered Bank | 03/20/24 | (4,249 | ) | |||||||||||
| USD |
71,343,879 | EUR | 64,630,631 | Standard Chartered Bank | 03/20/24 | (224,483 | ) | |||||||||||
| USD |
145,519,988 | EUR | 131,826,987 | Standard Chartered Bank | 03/20/24 | (457,878 | ) | |||||||||||
| USD |
648,267 | GBP | 511,356 | Morgan Stanley & Co. International PLC | 03/20/24 | (3,779 | ) | |||||||||||
| USD |
469,632 | GBP | 373,773 | Societe Generale | 03/20/24 | (6,978 | ) | |||||||||||
| USD |
11,624,033 | HKD | 90,638,505 | Barclays Bank PLC | 03/20/24 | (3,955 | ) | |||||||||||
| USD |
1,078,360 | HKD | 8,411,670 | UBS AG | 03/20/24 | (771 | ) | |||||||||||
| USD |
1,105,168 | HKD | 8,622,499 | UBS AG | 03/20/24 | (1,010 | ) | |||||||||||
| USD |
2,023,158 | SEK | 20,635,404 | BNP Paribas SA | 03/20/24 | (28,960 | ) | |||||||||||
|
|
|
|||||||||||||||||
| (1,822,549 | ) | |||||||||||||||||
|
|
|
|||||||||||||||||
| $ | (1,445,282 | ) | ||||||||||||||||
|
|
|
|||||||||||||||||
Exchange-Traded Options Purchased
| Description | Number of Contracts |
Expiration Date |
Exercise Price | Notional Amount (000) |
Value | |||||||||||||||||||||||
| Call |
||||||||||||||||||||||||||||
| SPDR S&P 500 ETF Trust |
552 | 01/05/24 | USD | 476.00 | USD | 26,237 | $ | 120,888 | ||||||||||||||||||||
| SPDR S&P 500 ETF Trust |
242 | 01/12/24 | USD | 476.00 | USD | 11,503 | 92,323 | |||||||||||||||||||||
| Alphabet, Inc., Class C |
130 | 01/19/24 | USD | 137.50 | USD | 1,832 | 67,925 | |||||||||||||||||||||
| Alphabet, Inc., Class C |
201 | 01/19/24 | USD | 142.50 | USD | 2,833 | 47,034 | |||||||||||||||||||||
| Amazon.com, Inc. |
191 | 01/19/24 | USD | 150.00 | USD | 2,902 | 89,770 | |||||||||||||||||||||
| Amazon.com, Inc. |
132 | 01/19/24 | USD | 155.00 | USD | 2,006 | 28,644 | |||||||||||||||||||||
| Apple, Inc. |
206 | 01/19/24 | USD | 195.00 | USD | 3,966 | 43,466 | |||||||||||||||||||||
| Apple, Inc. |
145 | 01/19/24 | USD | 200.00 | USD | 2,792 | 9,933 | |||||||||||||||||||||
| 56 | 2 0 2 3 B L A C K R O C K A N N U A L R E P O R T T O S H A R E H O L D E R S |
| Consolidated Schedule of Investments (continued) December 31, 2023 |
BlackRock ESG Capital Allocation Term Trust (ECAT) |
Exchange-Traded Options Purchased (continued)
| Description | Number of Contracts |
Expiration Date |
Exercise Price | Notional Amount (000) |
Value | |||||||||||||||||||||||
| Call (continued) |
||||||||||||||||||||||||||||
| Applied Materials, Inc. |
168 | 01/19/24 | USD | 160.00 | USD | 2,723 | $ | 95,760 | ||||||||||||||||||||
| Applied Materials, Inc. |
126 | 01/19/24 | USD | 165.00 | USD | 2,042 | 39,375 | |||||||||||||||||||||
| Chevron Corp. |
71 | 01/19/24 | USD | 150.00 | USD | 1,059 | 19,028 | |||||||||||||||||||||
| Costco Wholesale Corp. |
24 | 01/19/24 | USD | 605.00 | USD | 1,584 | 139,680 | |||||||||||||||||||||
| Costco Wholesale Corp. |
26 | 01/19/24 | USD | 625.00 | USD | 1,716 | 100,490 | |||||||||||||||||||||
| Delta Air Lines, Inc. |
205 | 01/19/24 | USD | 35.00 | USD | 825 | 111,212 | |||||||||||||||||||||
| Delta Air Lines, Inc. |
122 | 01/19/24 | USD | 38.00 | USD | 491 | 35,380 | |||||||||||||||||||||
| Dynatrace, Inc. |
86 | 01/19/24 | USD | 50.00 | USD | 470 | 40,420 | |||||||||||||||||||||
| Hilton Worldwide Holdings, Inc. |
27 | 01/19/24 | USD | 170.00 | USD | 492 | 36,720 | |||||||||||||||||||||
| Humana, Inc. |
40 | 01/19/24 | USD | 505.00 | USD | 1,831 | 2,700 | |||||||||||||||||||||
| Intuitive Surgical, Inc. |
14 | 01/19/24 | USD | 320.00 | USD | 472 | 30,170 | |||||||||||||||||||||
| InvesCo QQQ Trust, Series 1 |
734 | 01/19/24 | USD | 409.78 | USD | 30,059 | 421,316 | |||||||||||||||||||||
| Invesco S&P 500 Equal Weight ETF |
288 | 01/19/24 | USD | 160.00 | USD | 4,545 | 31,680 | |||||||||||||||||||||
| Mastercard, Inc., Class A |
27 | 01/19/24 | USD | 420.00 | USD | 1,152 | 28,080 | |||||||||||||||||||||
| Micron Technology, Inc. |
58 | 01/19/24 | USD | 80.00 | USD | 495 | 35,235 | |||||||||||||||||||||
| Microsoft Corp. |
46 | 01/19/24 | USD | 365.00 | USD | 1,730 | 67,160 | |||||||||||||||||||||
| Microsoft Corp. |
91 | 01/19/24 | USD | 380.00 | USD | 3,422 | 46,182 | |||||||||||||||||||||
| Microsoft Corp. |
98 | 01/19/24 | USD | 385.00 | USD | 3,685 | 31,605 | |||||||||||||||||||||
| Nice Ltd., ADR |
28 | 01/19/24 | USD | 200.00 | USD | 559 | 15,820 | |||||||||||||||||||||
| Nice Ltd., ADR |
72 | 01/19/24 | USD | 210.00 | USD | 1,436 | 14,760 | |||||||||||||||||||||
| NVIDIA Corp. |
82 | 01/19/24 | USD | 520.00 | USD | 4,061 | 50,840 | |||||||||||||||||||||
| NVIDIA Corp. |
65 | 01/19/24 | USD | 540.00 | USD | 3,219 | 17,258 | |||||||||||||||||||||
| NVIDIA Corp. |
19 | 01/19/24 | USD | 490.00 | USD | 941 | 34,960 | |||||||||||||||||||||
| NVIDIA Corp. |
131 | 01/19/24 | USD | 505.00 | USD | 6,487 | 144,755 | |||||||||||||||||||||
| Salesforce, Inc. |
27 | 01/19/24 | USD | 260.00 | USD | 710 | 19,440 | |||||||||||||||||||||
| Salesforce, Inc. |
81 | 01/19/24 | USD | 270.00 | USD | 2,131 | 20,493 | |||||||||||||||||||||
| SPDR S&P 500 ETF Trust |
122 | 01/19/24 | USD | 481.00 | USD | 5,799 | 31,354 | |||||||||||||||||||||
| Tesla, Inc. |
26 | 01/19/24 | USD | 260.00 | USD | 646 | 16,250 | |||||||||||||||||||||
| Tesla, Inc. |
78 | 01/19/24 | USD | 250.00 | USD | 1,938 | 79,365 | |||||||||||||||||||||
| T-Mobile U.S., Inc. |
220 | 01/19/24 | USD | 155.00 | USD | 3,527 | 144,100 | |||||||||||||||||||||
| Uber Technologies, Inc. |
269 | 01/19/24 | USD | 62.50 | USD | 1,656 | 38,332 | |||||||||||||||||||||
| UnitedHealth Group, Inc. |
18 | 01/19/24 | USD | 560.00 | USD | 948 | 2,538 | |||||||||||||||||||||
| Walmart, Inc. |
46 | 01/19/24 | USD | 160.00 | USD | 725 | 6,118 | |||||||||||||||||||||
| Walt Disney Co. |
201 | 01/19/24 | USD | 90.00 | USD | 1,815 | 43,918 | |||||||||||||||||||||
| Walt Disney Co. |
7 | 01/19/24 | USD | 100.00 | USD | 63 | 109 | |||||||||||||||||||||
| Advanced Micro Devices, Inc. |
165 | 02/16/24 | USD | 130.00 | USD | 2,432 | 346,912 | |||||||||||||||||||||
| Advanced Micro Devices, Inc. |
207 | 02/16/24 | USD | 140.00 | USD | 3,051 | 288,765 | |||||||||||||||||||||
| Advanced Micro Devices, Inc. |
66 | 02/16/24 | USD | 150.00 | USD | 973 | 57,090 | |||||||||||||||||||||
| Alphabet, Inc., Class C |
206 | 02/16/24 | USD | 145.00 | USD | 2,903 | 90,640 | |||||||||||||||||||||
| Amazon.com, Inc. |
306 | 02/16/24 | USD | 165.00 | USD | 4,649 | 84,609 | |||||||||||||||||||||
| Amazon.com, Inc. |
298 | 02/16/24 | USD | 160.00 | USD | 4,528 | 126,650 | |||||||||||||||||||||
| Apple, Inc. |
128 | 02/16/24 | USD | 205.00 | USD | 2,464 | 20,992 | |||||||||||||||||||||
| Applied Materials, Inc. |
9 | 02/16/24 | USD | 170.00 | USD | 146 | 4,230 | |||||||||||||||||||||
| Applied Materials, Inc. |
50 | 02/16/24 | USD | 165.00 | USD | 810 | 33,625 | |||||||||||||||||||||
| Autodesk, Inc. |
159 | 02/16/24 | USD | 250.00 | USD | 3,871 | 102,555 | |||||||||||||||||||||
| Boston Scientific Corp. |
170 | 02/16/24 | USD | 57.50 | USD | 983 | 39,100 | |||||||||||||||||||||
| Delta Air Lines, Inc. |
178 | 02/16/24 | USD | 44.00 | USD | 716 | 13,172 | |||||||||||||||||||||
| Humana, Inc. |
101 | 02/16/24 | USD | 555.00 | USD | 4,624 | 10,353 | |||||||||||||||||||||
| Intel Corp. |
177 | 02/16/24 | USD | 55.00 | USD | 889 | 20,621 | |||||||||||||||||||||
| Intuitive Surgical, Inc. |
24 | 02/16/24 | USD | 355.00 | USD | 810 | 24,000 | |||||||||||||||||||||
| Intuitive Surgical, Inc. |
79 | 02/16/24 | USD | 340.00 | USD | 2,665 | 129,560 | |||||||||||||||||||||
| iShares China Large-Cap ETF |
1,538 | 02/16/24 | USD | 27.00 | USD | 3,696 | 36,143 | |||||||||||||||||||||
| iShares China Large-Cap ETF |
932 | 02/16/24 | USD | 26.00 | USD | 2,240 | 37,746 | |||||||||||||||||||||
| JPMorgan Chase & Co. |
251 | 02/16/24 | USD | 175.00 | USD | 4,270 | 62,248 | |||||||||||||||||||||
| KLA Corp. |
12 | 02/16/24 | USD | 610.00 | USD | 698 | 19,920 | |||||||||||||||||||||
| Mastercard, Inc., Class A |
44 | 02/16/24 | USD | 445.00 | USD | 1,877 | 22,000 | |||||||||||||||||||||
| Micron Technology, Inc. |
98 | 02/16/24 | USD | 87.50 | USD | 836 | 28,126 | |||||||||||||||||||||
| Micron Technology, Inc. |
62 | 02/16/24 | USD | 85.00 | USD | 529 | 25,420 | |||||||||||||||||||||
| Microsoft Corp. |
136 | 02/16/24 | USD | 390.00 | USD | 5,114 | 116,280 | |||||||||||||||||||||
| Nice Ltd., ADR |
32 | 02/16/24 | USD | 210.00 | USD | 638 | 19,840 | |||||||||||||||||||||
| NVIDIA Corp. |
28 | 02/16/24 | USD | 520.00 | USD | 1,387 | 44,660 | |||||||||||||||||||||
| Oracle Corp. |
129 | 02/16/24 | USD | 110.00 | USD | 1,360 | 21,285 | |||||||||||||||||||||
| C O N S O L I D A T E D S C H E D U L E O F I N V E S T M E N T S |
57 |
| Consolidated Schedule of Investments (continued) December 31, 2023 |
BlackRock ESG Capital Allocation Term Trust (ECAT) |
Exchange-Traded Options Purchased (continued)
| Description | Number of Contracts |
Expiration Date |
Exercise Price |
Notional Amount (000) |
Value | |||||||||||||||||||||||
| Call (continued) |
||||||||||||||||||||||||||||
| Salesforce, Inc. |
18 | 02/16/24 | USD | 280.00 | USD | 474 | $ | 5,391 | ||||||||||||||||||||
| Tesla, Inc. |
90 | 02/16/24 | USD | 280.00 | USD | 2,236 | 64,575 | |||||||||||||||||||||
| Tesla, Inc. |
26 | 02/16/24 | USD | 275.00 | USD | 646 | 21,905 | |||||||||||||||||||||
| Uber Technologies, Inc. |
220 | 02/16/24 | USD | 70.00 | USD | 1,355 | 22,220 | |||||||||||||||||||||
| UBS Group AG, Registered Shares |
355 | 02/16/24 | USD | 30.00 | USD | 1,097 | 68,160 | |||||||||||||||||||||
| UnitedHealth Group, Inc. |
61 | 02/16/24 | USD | 610.00 | USD | 3,211 | 2,074 | |||||||||||||||||||||
| Visa, Inc., Class A |
33 | 02/16/24 | USD | 270.00 | USD | 859 | 11,220 | |||||||||||||||||||||
| Walmart, Inc. |
58 | 02/16/24 | USD | 155.00 | USD | 914 | 33,350 | |||||||||||||||||||||
| Wells Fargo & Co. |
352 | 02/16/24 | USD | 47.50 | USD | 1,733 | 97,504 | |||||||||||||||||||||
| iShares China Large-Cap ETF |
1,385 | 03/15/24 | USD | 24.85 | USD | 3,328 | 143,347 | |||||||||||||||||||||
| Norfolk Southern Corp. |
20 | 03/15/24 | USD | 230.00 | USD | 473 | 29,200 | |||||||||||||||||||||
| Oracle Corp. |
129 | 03/15/24 | USD | 110.00 | USD | 1,360 | 45,472 | |||||||||||||||||||||
|
|
|
|||||||||||||||||||||||||||
| 4,863,546 | ||||||||||||||||||||||||||||
|
|
|
|||||||||||||||||||||||||||
| Put |
||||||||||||||||||||||||||||
| Frontier Communications Parent, Inc. |
80 | 01/19/24 | USD | 20.00 | USD | 203 | 800 | |||||||||||||||||||||
| iShares iBoxx $ High Yield Corporate Bond ETF |
1,011 | 01/19/24 | USD | 77.00 | USD | 7,824 | 24,264 | |||||||||||||||||||||
| iShares iBoxx $ Investment Grade Corporate Bond ETF |
1,782 | 01/19/24 | USD | 108.00 | USD | 19,720 | 25,839 | |||||||||||||||||||||
| Paramount Global, Class B |
69 | 01/19/24 | USD | 10.00 | USD | 102 | 104 | |||||||||||||||||||||
|
|
|
|||||||||||||||||||||||||||
| 51,007 | ||||||||||||||||||||||||||||
|
|
|
|||||||||||||||||||||||||||
| $ | 4,914,553 | |||||||||||||||||||||||||||
|
|
|
|||||||||||||||||||||||||||
OTC Options Purchased
| Description | Counterparty | Number of Contracts |
Expiration Date |
Exercise Price |
Notional Amount (000) |
Value | ||||||||||||||||||||||||||
| Call |
||||||||||||||||||||||||||||||||
| TOPIX Banks Index |
BNP Paribas SA | 0 | 01/12/24 | JPY | 286.63 | JPY | 142,482 | $ | 12 | |||||||||||||||||||||||
| TOPIX Banks Index |
Goldman Sachs International | 0 | 01/12/24 | JPY | 286.49 | JPY | 237,375 | 122 | ||||||||||||||||||||||||
| TOPIX Banks Index |
JPMorgan Chase Bank N.A. | 0 | 01/12/24 | JPY | 286.56 | JPY | 95,083 | 48 | ||||||||||||||||||||||||
|
|
|
|||||||||||||||||||||||||||||||
| $ | 182 | |||||||||||||||||||||||||||||||
|
|
|
|||||||||||||||||||||||||||||||
OTC Dual Binary Options Purchased
| Description(a) | Counterparty | Units | Expiration Date |
Notional Amount (000) |
Value | |||||||||||||||||||||
| Put |
||||||||||||||||||||||||||
| Dual Binary Option payout at expiry if S&P 500 < 4,663.22 and US 2-year swap > 4.42% |
UBS AG | 172,537 | 03/01/24 | USD | 804,578 | $ | 3,818 | |||||||||||||||||||
| Dual Binary Option payout at expiry if S&P 500 < 4,666.87 and US 2-year swap > 4.37% |
UBS AG | 86,269 | 03/15/24 | USD | 402,606 | 2,353 | ||||||||||||||||||||
|
|
|
|||||||||||||||||||||||||
| $ | 6,171 | |||||||||||||||||||||||||
|
|
|
|||||||||||||||||||||||||
| (a) | Option only pays if both terms are met on the expiration date. |
| 58 | 2 0 2 3 B L A C K R O C K A N N U A L R E P O R T T O S H A R E H O L D E R S |
| Consolidated Schedule of Investments (continued) December 31, 2023 |
BlackRock ESG Capital Allocation Term Trust (ECAT) |
OTC Credit Default Swaptions Purchased
| Paid by the Trust | Received by the Trust | Expiration | Credit | Exercise | Notional | |||||||||||||||||||||||||||||||||
| Description | Rate/Reference | Rate/Reference | Frequency | Counterparty | Date | Rating(a) | Price | Amount (000)(b) | Value | |||||||||||||||||||||||||||||
| Put |
||||||||||||||||||||||||||||||||||||||
| Bought Protection |
5.00% | CDX.NA.HY.41.V2 | Quarterly | Goldman Sachs International |
01/17/24 | N/R | USD | 101.00 | USD | 2,715 | $ | 848 | ||||||||||||||||||||||||||
| Bought Protection |
5.00% | iTraxx.XO.40.V1 | Quarterly | Morgan Stanley & Co. International PLC |
02/21/24 | N/R | EUR | 400.00 | EUR | 1,710 | 2,499 | |||||||||||||||||||||||||||
| Bought Protection |
5.00% | CDX.NA.HY.41.V2 | Quarterly | JPMorgan Chase Bank N.A. |
02/21/24 | N/R | USD | 100.50 | USD | 1,720 | 1,638 | |||||||||||||||||||||||||||
|
|
|
|||||||||||||||||||||||||||||||||||||
| $ | 4,985 | |||||||||||||||||||||||||||||||||||||
|
|
|
|||||||||||||||||||||||||||||||||||||
| (a) | Using the rating of the issuer or the underlying securities of the index, as applicable, provided by S&P Global Ratings. |
| (b) | The maximum potential amount the Trust may pay should a negative credit event take place as defined under the terms of the agreement. |
OTC Interest Rate Swaptions Purchased
| Paid by the Trust | Received by the Trust | Expiration | Exercise | Notional | ||||||||||||||||||||||||||||||||
| Description | Rate | Frequency | Rate | Frequency | Counterparty | Date | Rate | Amount (000) | Value | |||||||||||||||||||||||||||
| Call |
||||||||||||||||||||||||||||||||||||
| 10-Year Interest Rate Swap, 01/12/34 |
|
1-Day SOFR, 5.38% |
Quarterly | 4.00% | Annual | Goldman Sachs International |
01/10/24 | 4.00 | % | USD | 4,817 | $ | 203,220 | |||||||||||||||||||||||
| 10-Year Interest Rate Swap, 01/14/34 |
|
1-Day SOFR, 5.38% |
Quarterly | 4.00% | Annual | JPMorgan Chase Bank N.A. |
01/12/24 | 4.00 | USD | 1,389 | 58,920 | |||||||||||||||||||||||||
| 2-Year Interest Rate Swap, 01/25/24 |
|
1-Day SOFR, 5.38% |
Quarterly | 4.00% | Annual | Citibank N.A. |
01/23/24 | 4.00 | USD | 11,825 | 188,048 | |||||||||||||||||||||||||
| 2-Year Interest Rate Swap, 02/05/28 |
|
1-Day SOFR, 5.38% |
Annual | 3.87% | Annual | Deutsche Bank AG |
02/01/24 | 3.87 | USD | 11,932 | 166,507 | |||||||||||||||||||||||||
| 10-Year Interest Rate Swap, 02/08/34 |
|
1-Day SOFR, 5.38% |
Annual | 3.45% | Annual | JPMorgan Chase Bank N.A. |
02/06/24 | 3.45 | USD | 7,909 | 87,238 | |||||||||||||||||||||||||
| 5-Year Interest Rate Swap, 03/03/29 |
|
6-mo. EURIBOR, 3.86% |
Semi-Annual | 3.00% | Annual | JPMorgan Chase Bank N.A. |
03/01/24 | 3.00 | EUR | 7,713 | 260,144 | |||||||||||||||||||||||||
| 10-Year Interest Rate Swap, 03/20/34 |
|
1-Day SOFR, 5.38% |
Quarterly | 3.65% | Annual | Citibank N.A. |
03/18/24 | 3.65 | USD | 4,959 | 134,247 | |||||||||||||||||||||||||
| 5-Year Interest Rate Swap, 03/20/29 |
|
6-mo. EURIBOR, 3.86% |
Semi-Annual | 3.18% | Annual | JPMorgan Chase Bank N.A. |
03/18/24 | 3.18 | EUR | 6,317 | 274,663 | |||||||||||||||||||||||||
| 2-Year Interest Rate Swap, 03/30/26 |
|
1-Day SOFR, 5.38% |
Quarterly | 4.20% | Annual | JPMorgan Chase Bank N.A. |
03/28/24 | 4.20 | USD | 36,764 | 344,378 | |||||||||||||||||||||||||
| 10-Year Interest Rate Swap, 05/30/34 |
|
1-Day SOFR, 5.38% |
Annual | 3.67% | Annual | Citibank N.A. |
05/28/24 | 3.67 | USD | 6,303 | 226,824 | |||||||||||||||||||||||||
| 2-Year Interest Rate Swap, 10/26/26 |
|
1-Day SOFR, 5.38% |
Quarterly | 4.00% | Annual | JPMorgan Chase Bank N.A. |
10/24/24 | 4.00 | USD | 19,216 | 309,338 | |||||||||||||||||||||||||
|
|
|
|||||||||||||||||||||||||||||||||||
| $ | 2,253,527 | |||||||||||||||||||||||||||||||||||
|
|
|
|||||||||||||||||||||||||||||||||||
Exchange-Traded Options Written
| Description | Number of Contracts |
Expiration Date |
Exercise Price | Notional Amount (000) |
Value | |||||||||||||||||||||||
| Call |
||||||||||||||||||||||||||||
| Amazon.com, Inc. |
133 | 01/19/24 | USD | 165.00 | USD | 2,021 | $ | (3,857 | ) | |||||||||||||||||||
| Applied Materials, Inc. |
168 | 01/19/24 | USD | 175.00 | USD | 2,723 | (12,348 | ) | ||||||||||||||||||||
| Delta Air Lines, Inc. |
34 | 01/19/24 | USD | 42.00 | USD | 137 | (2,533 | ) | ||||||||||||||||||||
| Hilton Worldwide Holdings, Inc. |
27 | 01/19/24 | USD | 180.00 | USD | 492 | (12,690 | ) | ||||||||||||||||||||
| InvesCo QQQ Trust, Series 1 |
734 | 01/19/24 | USD | 423.78 | USD | 30,059 | (74,868 | ) | ||||||||||||||||||||
| Mastercard, Inc., Class A |
27 | 01/19/24 | USD | 430.00 | USD | 1,152 | (11,880 | ) | ||||||||||||||||||||
| Microsoft Corp. |
46 | 01/19/24 | USD | 390.00 | USD | 1,730 | (8,877 | ) | ||||||||||||||||||||
| Nice Ltd., ADR |
72 | 01/19/24 | USD | 230.00 | USD | 1,436 | (16,920 | ) | ||||||||||||||||||||
| T-Mobile U.S., Inc. |
220 | 01/19/24 | USD | 165.00 | USD | 3,527 | (19,470 | ) | ||||||||||||||||||||
| Uber Technologies, Inc. |
269 | 01/19/24 | USD | 70.00 | USD | 1,656 | (3,499 | ) | ||||||||||||||||||||
| Advanced Micro Devices, Inc. |
220 | 02/16/24 | USD | 145.00 | USD | 3,243 | (244,200 | ) | ||||||||||||||||||||
| C O N S O L I D A T E D S C H E D U L E O F I N V E S T M E N T S |
59 |
| Consolidated Schedule of Investments (continued) December 31, 2023 |
BlackRock ESG Capital Allocation Term Trust (ECAT) |
Exchange-Traded Options Written (continued)
| Description | Number of Contracts |
Expiration Date |
Exercise Price | Notional Amount (000) |
Value | |||||||||||||||||||||||
| Call (continued) |
||||||||||||||||||||||||||||
| Advanced Micro Devices, Inc. |
207 | 02/16/24 | USD | 160.00 | USD | 3,051 | $ | (102,982 | ) | |||||||||||||||||||
| Alphabet, Inc., Class C |
130 | 02/16/24 | USD | 150.00 | USD | 1,832 | (34,775 | ) | ||||||||||||||||||||
| Intuitive Surgical, Inc. |
14 | 02/16/24 | USD | 350.00 | USD | 472 | (16,660 | ) | ||||||||||||||||||||
| iShares China Large-Cap ETF |
1,538 | 02/16/24 | USD | 30.00 | USD | 3,696 | (13,842 | ) | ||||||||||||||||||||
| iShares China Large-Cap ETF |
932 | 02/16/24 | USD | 28.00 | USD | 2,240 | (13,048 | ) | ||||||||||||||||||||
| Micron Technology, Inc. |
23 | 02/16/24 | USD | 90.00 | USD | 196 | (4,451 | ) | ||||||||||||||||||||
| Microsoft Corp. |
47 | 02/16/24 | USD | 420.00 | USD | 1,767 | (8,930 | ) | ||||||||||||||||||||
| Nice Ltd., ADR |
28 | 02/16/24 | USD | 220.00 | USD | 559 | (9,240 | ) | ||||||||||||||||||||
| NVIDIA Corp. |
19 | 02/16/24 | USD | 550.00 | USD | 941 | (14,915 | ) | ||||||||||||||||||||
| Tesla, Inc. |
26 | 02/16/24 | USD | 310.00 | USD | 646 | (7,332 | ) | ||||||||||||||||||||
| UnitedHealth Group, Inc. |
18 | 02/16/24 | USD | 590.00 | USD | 948 | (2,124 | ) | ||||||||||||||||||||
| Walmart, Inc. |
46 | 02/16/24 | USD | 170.00 | USD | 725 | (1,978 | ) | ||||||||||||||||||||
| iShares China Large-Cap ETF |
1,385 | 03/15/24 | USD | 28.85 | USD | 3,328 | (29,777 | ) | ||||||||||||||||||||
|
|
|
|||||||||||||||||||||||||||
| (671,196 | ) | |||||||||||||||||||||||||||
|
|
|
|||||||||||||||||||||||||||
| Put |
||||||||||||||||||||||||||||
| Applied Materials, Inc. |
67 | 01/19/24 | USD | 140.00 | USD | 1,086 | (1,340 | ) | ||||||||||||||||||||
| Chevron Corp. |
71 | 01/19/24 | USD | 135.00 | USD | 1,059 | (1,101 | ) | ||||||||||||||||||||
| Humana, Inc. |
40 | 01/19/24 | USD | 445.00 | USD | 1,831 | (17,600 | ) | ||||||||||||||||||||
| Invesco S&P 500 Equal Weight ETF |
288 | 01/19/24 | USD | 150.00 | USD | 4,545 | (5,760 | ) | ||||||||||||||||||||
| iShares iBoxx $ High Yield Corporate Bond ETF |
1,011 | 01/19/24 | USD | 75.00 | USD | 7,824 | (7,077 | ) | ||||||||||||||||||||
| Walt Disney Co. |
208 | 01/19/24 | USD | 85.00 | USD | 1,878 | (6,552 | ) | ||||||||||||||||||||
| Advanced Micro Devices, Inc. |
100 | 02/16/24 | USD | 120.00 | USD | 1,474 | (11,450 | ) | ||||||||||||||||||||
| Amazon.com, Inc. |
86 | 02/16/24 | USD | 130.00 | USD | 1,307 | (9,116 | ) | ||||||||||||||||||||
| Amazon.com, Inc. |
31 | 02/16/24 | USD | 140.00 | USD | 471 | (8,076 | ) | ||||||||||||||||||||
| Amazon.com, Inc. |
139 | 02/16/24 | USD | 135.00 | USD | 2,112 | (23,213 | ) | ||||||||||||||||||||
| Delta Air Lines, Inc. |
178 | 02/16/24 | USD | 35.00 | USD | 716 | (7,387 | ) | ||||||||||||||||||||
| Humana, Inc. |
50 | 02/16/24 | USD | 455.00 | USD | 2,289 | (75,000 | ) | ||||||||||||||||||||
| Intel Corp. |
177 | 02/16/24 | USD | 45.00 | USD | 889 | (14,514 | ) | ||||||||||||||||||||
| JPMorgan Chase & Co. |
101 | 02/16/24 | USD | 155.00 | USD | 1,718 | (8,130 | ) | ||||||||||||||||||||
| Micron Technology, Inc. |
62 | 02/16/24 | USD | 75.00 | USD | 529 | (3,689 | ) | ||||||||||||||||||||
| Micron Technology, Inc. |
35 | 02/16/24 | USD | 80.00 | USD | 299 | (4,988 | ) | ||||||||||||||||||||
| Oracle Corp. |
129 | 02/16/24 | USD | 97.50 | USD | 1,360 | (11,352 | ) | ||||||||||||||||||||
| Tesla, Inc. |
50 | 02/16/24 | USD | 210.00 | USD | 1,242 | (20,500 | ) | ||||||||||||||||||||
| UBS Group AG, Registered Shares |
355 | 02/16/24 | USD | 27.50 | USD | 1,097 | (9,585 | ) | ||||||||||||||||||||
| UnitedHealth Group, Inc. |
30 | 02/16/24 | USD | 500.00 | USD | 1,579 | (16,650 | ) | ||||||||||||||||||||
| Walmart, Inc. |
58 | 02/16/24 | USD | 145.00 | USD | 914 | (2,784 | ) | ||||||||||||||||||||
| Wells Fargo & Co. |
352 | 02/16/24 | USD | 40.00 | USD | 1,733 | (4,224 | ) | ||||||||||||||||||||
| Norfolk Southern Corp. |
20 | 03/15/24 | USD | 200.00 | USD | 473 | (2,550 | ) | ||||||||||||||||||||
| Oracle Corp. |
129 | 03/15/24 | USD | 95.00 | USD | 1,360 | (19,027 | ) | ||||||||||||||||||||
|
|
|
|||||||||||||||||||||||||||
| (291,665 | ) | |||||||||||||||||||||||||||
|
|
|
|||||||||||||||||||||||||||
| $ | (962,861 | ) | ||||||||||||||||||||||||||
|
|
|
|||||||||||||||||||||||||||
OTC Options Written
| Description | Counterparty | Number of Contracts |
Expiration Date |
Exercise Price | Notional Amount (000) |
Value | ||||||||||||||||||||||||
| Call |
||||||||||||||||||||||||||||||
| TOPIX Banks Index |
BNP Paribas SA | 569,040 | 01/12/24 | JPY | 313.92 | JPY | 142,482 | $ | — | |||||||||||||||||||||
| TOPIX Banks Index |
Goldman Sachs International | 948,021 | 01/12/24 | JPY | 313.77 | JPY | 237,375 | — | ||||||||||||||||||||||
| TOPIX Banks Index |
JPMorgan Chase Bank N.A. | 379,740 | 01/12/24 | JPY | 313.85 | JPY | 95,083 | — | ||||||||||||||||||||||
|
|
|
|||||||||||||||||||||||||||||
| $ | 0 | |||||||||||||||||||||||||||||
|
|
|
|||||||||||||||||||||||||||||
| 60 | 2 0 2 3 B L A C K R O C K A N N U A L R E P O R T T O S H A R E H O L D E R S |
| Consolidated Schedule of Investments (continued) December 31, 2023 |
BlackRock ESG Capital Allocation Term Trust (ECAT) |
OTC Interest Rate Swaptions Written
|
|
Paid by the Trust |
Received by the Trust |
|
Expiration | Exercise | Notional |
|
|||||||||||||||||||||||
| Description | Rate | Frequency | Rate | Frequency | Counterparty | Date | Rate | Amount (000) | Value | |||||||||||||||||||||
| Call |
||||||||||||||||||||||||||||||
| 2-Year Interest Rate Swap, 01/25/24 |
3.45% | Semi-Annual | 1-Day SOFR, 5.38% |
Annual | Citibank N.A. |
01/23/24 | 3.45 | % | USD | 11,825 | $ | (79,197 | ) | |||||||||||||||||
| 2-Year Interest Rate Swap, 02/05/28 |
3.27% | Semi-Annual | 1-Day SOFR, 5.38% |
Annual | Deutsche Bank AG |
02/01/24 | 3.27 | USD | 11,932 | (57,557 | ) | |||||||||||||||||||
| 5-Year Interest Rate Swap, 03/03/29 |
2.50% | Annual | 6-mo. EURIBOR, 3.86% |
Semi-Annual | JPMorgan Chase Bank N.A. |
03/01/24 | 2.50 | EUR | 7,713 | (99,837 | ) | |||||||||||||||||||
| 10-Year Interest Rate Swap, 03/20/34 |
3.15% | Semi-Annual | 1-Day SOFR, 5.38% |
Annual | Citibank N.A. |
03/18/24 | 3.15 | USD | 4,959 | (39,640 | ) | |||||||||||||||||||
| 5-Year Interest Rate Swap, 03/20/29 |
2.68% | Annual | 6-mo. EURIBOR, 3.86% |
Semi-Annual | JPMorgan Chase Bank N.A. |
03/18/24 | 2.68 | EUR | 6,317 | (133,188 | ) | |||||||||||||||||||
| 2-Year Interest Rate Swap, 03/30/26 |
3.80% | Semi-Annual | 1-Day SOFR, 5.38% |
Annual | JPMorgan Chase Bank N.A. |
03/28/24 | 3.80 | USD | 36,764 | (184,254 | ) | |||||||||||||||||||
| 2-Year Interest Rate Swap, 10/26/26 |
3.30% | Semi-Annual | 1-Day SOFR, 5.38% |
Annual | JPMorgan Chase Bank N.A. |
10/24/24 | 3.30 | USD | 19,216 | (163,982 | ) | |||||||||||||||||||
|
|
|
|||||||||||||||||||||||||||||
| (757,655 | ) | |||||||||||||||||||||||||||||
|
|
|
|||||||||||||||||||||||||||||
| Put |
||||||||||||||||||||||||||||||
| 2-Year Interest Rate Swap, 01/14/26 |
1-Day SOFR, 5.38% |
Quarterly | 5.15% | Annual | JPMorgan Chase Bank N.A. |
01/12/24 | 5.15 | USD | 21,319 | — | ||||||||||||||||||||
| 5-Year Interest Rate Swap, 03/03/29 |
6-mo. EURIBOR, 3.86% |
Semi-Annual | 3.45% | Annual | JPMorgan Chase Bank N.A. |
03/01/24 | 3.45 | EUR | 7,713 | (1,983 | ) | |||||||||||||||||||
| 2-Year Interest Rate Swap, 03/20/26 |
6-mo. EURIBOR, 3.86% |
Semi-Annual | 4.05% | Annual | BNP Paribas SA |
03/18/24 | 4.05 | EUR | 8,856 | (341 | ) | |||||||||||||||||||
| 5-Year Interest Rate Swap, 03/20/29 |
6-mo. EURIBOR, 3.86% |
Semi-Annual | 3.58% | Annual | JPMorgan Chase Bank N.A. |
03/18/24 | 3.58 | EUR | 6,317 | (1,768 | ) | |||||||||||||||||||
| 5-Year Interest Rate Swap, 03/29/29 |
1-Day SOFR, 5.38% |
Quarterly | 3.79% | Annual | JPMorgan Chase Bank N.A. |
03/27/24 | 3.79 | USD | 17,015 | (81,514 | ) | |||||||||||||||||||
| 2-Year Interest Rate Swap, 05/08/26 |
1-Day SOFR, 5.38% |
Annual | 4.50% | Annual | Goldman Sachs International |
05/06/24 | 4.50 | USD | 12,488 | (11,308 | ) | |||||||||||||||||||
| 10-Year Interest Rate Swap, 05/30/34 |
1-Day SOFR, 5.38% |
Annual | 4.42% | Annual | Citibank N.A. |
05/28/24 | 4.42 | USD | 6,303 | (20,843 | ) | |||||||||||||||||||
| 5-Year Interest Rate Swap, 06/01/29 |
6-mo. EURIBOR, 3.86% |
Annual | 3.40% | Annual | JPMorgan Chase Bank N.A. |
05/30/24 | 3.40 | EUR | 12,412 | (17,718 | ) | |||||||||||||||||||
| 2-Year Interest Rate Swap, 10/26/26 |
1-Day SOFR, 5.38% |
Quarterly | 5.00% | Annual | JPMorgan Chase Bank N.A. |
10/24/24 | 5.00 | USD | 9,608 | (7,592 | ) | |||||||||||||||||||
| 2-Year Interest Rate Swap, 11/23/26 |
1-Day SOFR, 5.38% |
Annual | 5.00% | Annual | JPMorgan Chase Bank N.A. |
11/21/24 | 5.00 | USD | 24,755 | (22,217 | ) | |||||||||||||||||||
|
|
|
|||||||||||||||||||||||||||||
| (165,284 | ) | |||||||||||||||||||||||||||||
|
|
|
|||||||||||||||||||||||||||||
| $ | (922,939 | ) | ||||||||||||||||||||||||||||
|
|
|
|||||||||||||||||||||||||||||
Centrally Cleared Credit Default Swaps — Buy Protection
| Reference Obligation/Index | |
Financing Rate Paid by the Trust |
|
|
Payment Frequency |
|
|
Termination Date |
|
Notional Amount (000) |
|
Value | |
Upfront Premium Paid (Received) |
|
|
Unrealized Appreciation (Depreciation) |
| ||||||||||||
| iTraxx.XO.38.V2 |
5.00 | % | Quarterly | 12/20/27 | EUR | 831 | $ | (92,693 | ) | $ | (11,134 | ) | $ | (81,559 | ) | |||||||||||||||
|
|
|
|
|
|
|
|||||||||||||||||||||||||
| C O N S O L I D A T E D S C H E D U L E O F I N V E S T M E N T S |
61 |
| Consolidated Schedule of Investments (continued) December 31, 2023 |
BlackRock ESG Capital Allocation Term Trust (ECAT) |
Centrally Cleared Credit Default Swaps — Sell Protection
| Reference Obligation/Index | |
Financing Rate Received by the Trust |
|
|
Payment Frequency |
|
|
Termination Date |
|
|
Credit Rating |
(a) |
|
Notional Amount (000) |
(b) |
Value | |
Upfront Premium Paid (Received) |
|
|
Unrealized Appreciation (Depreciation) |
| ||||||||||
| CDX.NA.HY.41.V2 |
5.00 | % | Quarterly | 12/20/28 | B | USD | 3,316 | $ | 199,245 | $ | 100,321 | $ | 98,924 | |||||||||||||||||||
|
|
|
|
|
|
|
| (a) | Using the rating of the issuer or the underlying securities of the index, as applicable, provided by S&P Global Ratings. |
| (b) | The maximum potential amount the Trust may pay should a negative credit event take place as defined under the terms of the agreement. |
Centrally Cleared Interest Rate Swaps
| Paid by the Trust |
Received by the Trust |
Effective | Termination | Notional |
|
Upfront Premium Paid |
Unrealized Appreciation |
|||||||||||||||||||||||||||
| Rate | Frequency | Rate | Frequency | Date | Date | Amount (000) | Value | (Received) | (Depreciation) | |||||||||||||||||||||||||
| 1-Day SOFR, 5.38% | At Termination | 5.45% | At Termination | N/A | 10/02/24 | USD | 187,577 | $ | 620,961 | $ | 5,888 | $ | 615,073 | |||||||||||||||||||||
| 28-Day MXIBTIIE, 11.50% | Monthly | 9.78% | Monthly | N/A | 02/04/25 | MXN | 46,651 | (28,933 | ) | 5 | (28,938 | ) | ||||||||||||||||||||||
| 28-Day MXIBTIIE, 11.50% | Monthly | 9.79% | Monthly | N/A | 02/04/25 | MXN | 23,326 | (14,315 | ) | 2 | (14,317 | ) | ||||||||||||||||||||||
| 28-Day MXIBTIIE, 11.50% | Monthly | 9.80% | Monthly | N/A | 02/04/25 | MXN | 23,326 | (14,088 | ) | 2 | (14,090 | ) | ||||||||||||||||||||||
| 28-Day MXIBTIIE, 11.50% | Monthly | 9.95% | Monthly | N/A | 02/07/25 | MXN | 510,185 | (254,456 | ) | 63 | (254,519 | ) | ||||||||||||||||||||||
| 1-Day SOFR, 5.38% | Annual | 5.00% | Annual | N/A | 10/02/25 | USD | 84,698 | 1,025,673 | 12,451 | 1,013,222 | ||||||||||||||||||||||||
| 1-Day SOFR, 5.38% | At Termination | 4.17% | At Termination | 10/23/25 | (a) | 10/23/26 | USD | 9,509 | 94,727 | 17 | 94,710 | |||||||||||||||||||||||
| 1-Day SOFR, 5.38% | At Termination | 4.21% | At Termination | 10/27/25 | (a) | 10/27/26 | USD | 18,989 | 196,519 | 35 | 196,484 | |||||||||||||||||||||||
| 1-Day SOFR, 5.38% | Annual | 3.47% | Annual | 03/10/25 | (a) | 03/10/27 | USD | 4,700 | 27,178 | 21 | 27,157 | |||||||||||||||||||||||
| 1-Day SOFR, 5.38% | Annual | 3.30% | Annual | 10/23/25 | (a) | 10/23/27 | USD | 3,403 | 12,580 | 15 | 12,565 | |||||||||||||||||||||||
| 1-Day SOFR, 5.38% | Annual | 4.20% | Annual | 10/23/25 | (a) | 10/23/27 | USD | 4,949 | 98,448 | 23 | 98,425 | |||||||||||||||||||||||
| 1-Day SOFR, 5.38% | Annual | 3.92% | Annual | 11/03/25 | (a) | 11/03/27 | USD | 2,364 | 35,116 | 11 | 35,105 | |||||||||||||||||||||||
| 1-Day SOFR, 5.38% | Annual | 3.95% | Annual | 11/03/25 | (a) | 11/03/27 | USD | 2,364 | 36,388 | 11 | 36,377 | |||||||||||||||||||||||
| 1-Day SOFR, 5.38% | Annual | 3.99% | Annual | 11/03/25 | (a) | 11/03/27 | USD | 4,728 | 75,745 | 22 | 75,723 | |||||||||||||||||||||||
| 1-Day SOFR, 5.38% | Annual | 4.07% | Annual | 11/03/25 | (a) | 11/03/27 | USD | 9,541 | 167,437 | 43 | 167,394 | |||||||||||||||||||||||
| 1-Day SOFR, 5.38% | Annual | 3.86% | Annual | 11/10/25 | (a) | 11/10/27 | USD | 9,919 | 136,821 | 45 | 136,776 | |||||||||||||||||||||||
| 1-Day SONIA, 5.19% | Annual | 4.86% | Annual | N/A | 06/20/28 | GBP | 6,370 | 453,013 | (15 | ) | 453,028 | |||||||||||||||||||||||
| 28-Day MXIBTIIE, 11.50% | Monthly | 9.13% | Monthly | N/A | 08/15/28 | MXN | 104,580 | 112,396 | 53 | 112,343 | ||||||||||||||||||||||||
| 1-Day SOFR, 5.38% | Annual | 4.42% | Annual | N/A | 10/02/28 | USD | 135,611 | 4,794,132 | 30,746 | 4,763,386 | ||||||||||||||||||||||||
| 1-Day SOFR, 5.38% | Annual | 4.40% | Annual | N/A | 10/31/28 | USD | 6,490 | 233,347 | 59 | 233,288 | ||||||||||||||||||||||||
| 1-Day SONIA, 5.19% | Annual | 4.12% | Annual | N/A | 11/17/28 | GBP | 3,004 | 118,196 | 142 | 118,054 | ||||||||||||||||||||||||
| 1-Day SONIA, 5.19% | Annual | 4.12% | Annual | N/A | 11/21/28 | GBP | 3,004 | 119,268 | 143 | 119,125 | ||||||||||||||||||||||||
| 1-Day SOFR, 5.38% | Annual | 3.25% | Annual | 12/15/26 | (a) | 12/15/28 | USD | 21,108 | 29,164 | 96 | 29,068 | |||||||||||||||||||||||
| 1-Day SOFR, 5.38% | Annual | 3.14% | Annual | 05/12/28 | (a) | 05/12/33 | USD | 6,701 | (63,052 | ) | 62 | (63,114 | ) | |||||||||||||||||||||
| 1-Day SOFR, 5.38% | Annual | 4.31% | Annual | N/A | 09/29/33 | USD | 26,166 | 1,715,663 | 2,222 | 1,713,441 | ||||||||||||||||||||||||
| 3.46% | Annual | 1-Day SOFR, 5.38% | Annual | 12/15/26 | (a) | 12/15/36 | USD | 4,824 | (23,538 | ) | 80 | (23,618 | ) | |||||||||||||||||||||
| 3.65% | Annual | 1-Day SOFR, 5.38% | Annual | N/A | 11/03/53 | USD | 2,577 | (154,546 | ) | 83 | (154,629 | ) | ||||||||||||||||||||||
| 1-Day SOFR, 5.38% | Annual | 4.00% | Annual | N/A | 11/03/53 | USD | 2,577 | 323,984 | 83 | 323,901 | ||||||||||||||||||||||||
|
|
|
|
|
|
|
|||||||||||||||||||||||||||||
| $ | 9,873,828 | $ | 52,408 | $ | 9,821,420 | |||||||||||||||||||||||||||||
|
|
|
|
|
|
|
|||||||||||||||||||||||||||||
| (a) | Forward Swap. |
OTC Interest Rate Swaps
| Paid by the Trust |
Received by the Trust |
|
Effective | Termination | Notional |
|
Upfront Premium Paid |
Unrealized Appreciation |
||||||||||||||||||||||||||||
| Rate | Frequency | Rate | Frequency | Counterparty | Date | Date | Amount (000) | Value | (Received) | (Depreciation) | ||||||||||||||||||||||||||
| 1-Day BZDIOVER, 0.04% |
At Termination | 12.78% | At Termination | Morgan Stanley & Co. International PLC |
N/A | 01/02/25 | BRL | 136,435 | $ | 706,988 | $ | — | $ | 706,988 | ||||||||||||||||||||||
| 1-Day BZDIOVER, 0.04% |
At Termination | 13.15% | At Termination | JPMorgan Chase Bank N.A. |
N/A | 01/02/25 | BRL | 7,068 | 46,884 | — | 46,884 | |||||||||||||||||||||||||
| 1-Day BZDIOVER, 0.04% |
At Termination | 13.18% | At Termination | JPMorgan Chase Bank N.A. |
N/A | 01/02/25 | BRL | 7,065 | 47,689 | — | 47,689 | |||||||||||||||||||||||||
| 62 | 2 0 2 3 B L A C K R O C K A N N U A L R E P O R T T O S H A R E H O L D E R S |
| Consolidated Schedule of Investments (continued) December 31, 2023 |
BlackRock ESG Capital Allocation Term Trust (ECAT) |
OTC Interest Rate Swaps (continued)
| Paid by the Trust |
Received by the Trust |
|
Effective Date |
Termination | Notional |
|
Upfront Premium Paid |
Unrealized Appreciation |
||||||||||||||||||||||||||||
| Rate | Frequency | Rate | Frequency | Counterparty | Date | Amount (000) | Value | (Received) | (Depreciation) | |||||||||||||||||||||||||||
| 1-Day BZDIOVER, 0.04% |
At Termination | 13.22% | At Termination | Citibank N.A. |
N/A | 01/02/25 | BRL | 3,716 | $ | 25,692 | $ | — | $ | 25,692 | ||||||||||||||||||||||
| 1-Day BZDIOVER, 0.04% |
At Termination | 10.03% | At Termination | JPMorgan Chase Bank N.A. |
N/A | 01/04/27 | BRL | 14,158 | 6,014 | — | 6,014 | |||||||||||||||||||||||||
| 1-Day BZDIOVER, 0.04% |
At Termination | 10.32% | At Termination | Barclays Bank PLC |
N/A | 01/04/27 | BRL | 29,050 | 73,170 | — | 73,170 | |||||||||||||||||||||||||
| 1-Day BZDIOVER, 0.04% |
At Termination | 9.95% | At Termination | Citibank N.A. |
N/A | 01/04/27 | BRL | 14,191 | (1,203 | ) | — | (1,203 | ) | |||||||||||||||||||||||
| 1-Day BZDIOVER, 0.04% |
At Termination | 9.97% | At Termination | Bank of America N.A. |
N/A | 01/04/27 | BRL | 14,578 | 249 | — | 249 | |||||||||||||||||||||||||
| 1-Day BZDIOVER, 0.04% |
At Termination | 9.99% | At Termination | Morgan Stanley & Co. International PLC |
N/A | 01/04/27 | BRL | 14,173 | 2,648 | — | 2,648 | |||||||||||||||||||||||||
|
|
|
|
|
|
|
|||||||||||||||||||||||||||||||
| $ | 908,131 | $ | — | $ | 908,131 | |||||||||||||||||||||||||||||||
|
|
|
|
|
|
|
|||||||||||||||||||||||||||||||
OTC Total Return Swaps
| Paid by the Trust |
Received by the Trust |
|
Effective Date |
Termination | Notional |
|
Upfront Premium Paid |
Unrealized Appreciation |
||||||||||||||||||||||||||||
| Rate/Reference | Frequency | Rate/Reference | Frequency | Counterparty | Date | Amount (000) | Value | (Received) | (Depreciation) | |||||||||||||||||||||||||||
| 1-Day SOFR minus 0.35%, 5.38% |
At Termination | iShares iBoxx $ High Yield Corporate Bond ETF |
At Termination | BNP Paribas SA |
N/A | 03/15/24 | USD | 2,515 | $ | 39,990 | $ | — | $ | 39,990 | ||||||||||||||||||||||
| 1-Day SOFR minus 0.35%, 5.38% |
At Termination | iShares iBoxx $ High Yield Corporate Bond ETF |
At Termination | BNP Paribas SA |
N/A | 03/15/24 | USD | 3,834 | 54,414 | — | 54,414 | |||||||||||||||||||||||||
| 1-Day SOFR minus 0.35%, 5.38% |
At Termination | iShares iBoxx $ High Yield Corporate Bond ETF |
At Termination | JPMorgan Chase Bank N.A. |
N/A | 03/15/24 | USD | 2,513 | 41,985 | — | 41,985 | |||||||||||||||||||||||||
| 1-Day SOFR minus 0.25%, 5.38% |
At Termination | iShares iBoxx $ High Yield Corporate Bond ETF |
At Termination | BNP Paribas SA |
N/A | 03/15/24 | USD | 4,983 | 20,628 | — | 20,628 | |||||||||||||||||||||||||
| 1-Day SOFR minus 0.13%, 5.38% |
At Termination | iShares iBoxx $ High Yield Corporate Bond ETF |
At Termination | Goldman Sachs International |
N/A | 03/15/24 | USD | 5,085 | 20,823 | — | 20,823 | |||||||||||||||||||||||||
| 1-Day SOFR minus 0.13%, 5.38% |
At Termination | iShares iBoxx $ High Yield Corporate Bond ETF |
At Termination | JPMorgan Chase Bank N.A. |
N/A | 03/15/24 | USD | 5,085 | 20,823 | — | 20,823 | |||||||||||||||||||||||||
| 1-Day SOFR minus 0.10%, 5.38% |
At Termination | iShares iBoxx $ High Yield Corporate Bond ETF |
At Termination | JPMorgan Chase Bank N.A. |
N/A | 03/15/24 | USD | 2,513 | 41,881 | — | 41,881 | |||||||||||||||||||||||||
|
|
|
|
|
|
|
|||||||||||||||||||||||||||||||
| $ | 240,544 | $ | — | $ | 240,544 | |||||||||||||||||||||||||||||||
|
|
|
|
|
|
|
|||||||||||||||||||||||||||||||
| C O N S O L I D A T E D S C H E D U L E O F I N V E S T M E N T S |
63 |
| Consolidated Schedule of Investments (continued) December 31, 2023 |
BlackRock ESG Capital Allocation Term Trust (ECAT) |
Balances Reported in the Consolidated Statements of Assets and Liabilities for Centrally Cleared Swaps, OTC Swaps and Options Written
|
|
||||||||||||||||||||
| Description | Swap Premiums Paid |
Swap Premiums Received |
Unrealized Appreciation |
Unrealized Depreciation |
Value | |||||||||||||||
|
|
||||||||||||||||||||
| Centrally Cleared Swaps(a) |
$ | 152,744 | $ | (11,149 | ) | $ | 10,473,569 | $ | (634,784 | ) | $ | — | ||||||||
| OTC Swaps |
— | — | 1,149,878 | (1,203 | ) | — | ||||||||||||||
| Options Written |
N/A | N/A | 626,287 | (847,571 | ) | (1,885,800 | ) | |||||||||||||
| (a) | Includes cumulative appreciation (depreciation) on centrally cleared swaps, as reported in the Consolidated Schedule of Investments. Only current day’s variation margin is reported within the Consolidated Statements of Assets and Liabilities and is net of any previously paid (received) swap premium amounts. |
Derivative Financial Instruments Categorized by Risk Exposure
As of period end, the fair values of derivative financial instruments located in the Consolidated Statements of Assets and Liabilities were as follows:
|
|
||||||||||||||||||||||||||||
| Commodity Contracts |
Credit Contracts |
Equity Contracts |
Foreign Currency Exchange Contracts |
Interest Rate Contracts |
Other Contracts |
Total | ||||||||||||||||||||||
|
|
||||||||||||||||||||||||||||
| Assets — Derivative Financial Instruments |
||||||||||||||||||||||||||||
| Futures contracts |
||||||||||||||||||||||||||||
| Unrealized appreciation on futures contracts(a) |
$ | 95,313 | $ | — | $ | 3,569,507 | $ | — | $ | 6,546,994 | $ | — | $ | 10,211,814 | ||||||||||||||
| Forward foreign currency exchange contracts |
||||||||||||||||||||||||||||
| Unrealized appreciation on forward foreign currency exchange contracts |
— | — | — | 377,267 | — | — | 377,267 | |||||||||||||||||||||
| Options purchased |
||||||||||||||||||||||||||||
| Investments at value — unaffiliated(b) |
— | 4,985 | 4,914,735 | — | 2,253,527 | 6,171 | 7,179,418 | |||||||||||||||||||||
| Swaps — centrally cleared |
||||||||||||||||||||||||||||
| Unrealized appreciation on centrally cleared swaps(a) |
— | 98,924 | — | — | 10,374,645 | — | 10,473,569 | |||||||||||||||||||||
| Swaps — OTC |
||||||||||||||||||||||||||||
| Unrealized appreciation on OTC swaps; Swap premiums paid |
— | — | 240,544 | — | 909,334 | — | 1,149,878 | |||||||||||||||||||||
|
|
|
|
|
|
|
|
|
|
|
|
|
|
|
|||||||||||||||
| $ | 95,313 | $ | 103,909 | $ | 8,724,786 | $ | 377,267 | $ | 20,084,500 | $ | 6,171 | $ | 29,391,946 | |||||||||||||||
|
|
|
|
|
|
|
|
|
|
|
|
|
|
|
|||||||||||||||
| Liabilities — Derivative Financial Instruments |
||||||||||||||||||||||||||||
| Futures contracts |
||||||||||||||||||||||||||||
| Unrealized depreciation on futures contracts(a) |
$ | — | $ | — | $ | 538,942 | $ | — | $ | 5,038,995 | $ | — | $ | 5,577,937 | ||||||||||||||
| Forward foreign currency exchange contracts |
||||||||||||||||||||||||||||
| Unrealized depreciation on forward foreign currency exchange contracts |
— | — | — | 1,822,549 | — | — | 1,822,549 | |||||||||||||||||||||
| Options written |
||||||||||||||||||||||||||||
| Options written at value |
— | — | 962,861 | — | 922,939 | — | 1,885,800 | |||||||||||||||||||||
| Swaps — centrally cleared |
||||||||||||||||||||||||||||
| Unrealized depreciation on centrally cleared swaps(a) |
— | 81,559 | — | — | 553,225 | — | 634,784 | |||||||||||||||||||||
| Swaps — OTC |
||||||||||||||||||||||||||||
| Unrealized depreciation on OTC swaps; Swap premiums received . |
— | — | — | — | 1,203 | — | 1,203 | |||||||||||||||||||||
|
|
|
|
|
|
|
|
|
|
|
|
|
|
|
|||||||||||||||
| $ | — | $ | 81,559 | $ | 1,501,803 | $ | 1,822,549 | $ | 6,516,362 | $ | — | $ | 9,922,273 | |||||||||||||||
|
|
|
|
|
|
|
|
|
|
|
|
|
|
|
|||||||||||||||
| (a) | Net cumulative unrealized appreciation (depreciation) on futures contracts and centrally cleared swaps, if any, are reported in the Consolidated Schedule of Investments. In the Consolidated Statements of Assets and Liabilities, only current day’s variation margin is reported in receivables or payables and the net cumulative unrealized appreciation (depreciation) is included in accumulated earnings (loss). |
| (b) | Includes options purchased at value as reported in the Consolidated Schedule of Investments. |
For the period ended December 31, 2023, the effect of derivative financial instruments in the Consolidated Statements of Operations was as follows:
|
|
||||||||||||||||||||||||||||
| Commodity Contracts |
Credit Contracts |
Equity Contracts |
Foreign Currency Exchange Contracts |
Interest Rate Contracts |
Other Contracts |
Total | ||||||||||||||||||||||
|
|
||||||||||||||||||||||||||||
| Net Realized Gain (Loss) from: |
||||||||||||||||||||||||||||
| Futures contracts |
$ | 3,579 | $ | — | $ | 23,164,221 | $ | — | $ | 4,176,840 | $ | — | $ | 27,344,640 | ||||||||||||||
| Forward foreign currency exchange contracts |
— | — | — | 4,292,829 | — | — | 4,292,829 | |||||||||||||||||||||
| Options purchased(a) |
— | (42,196 | ) | (250,430 | ) | (7,609 | ) | (194,690 | ) | (172,187 | ) | (667,112 | ) | |||||||||||||||
| Options written |
— | 5,943 | 7,604,439 | (41,859 | ) | 792,063 | — | 8,360,586 | ||||||||||||||||||||
| Swaps |
— | 696,213 | (128,957 | ) | — | (7,522,723 | ) | — | (6,955,467 | ) | ||||||||||||||||||
|
|
|
|
|
|
|
|
|
|
|
|
|
|
|
|||||||||||||||
| $ | 3,579 | $ | 659,960 | $ | 30,389,273 | $ | 4,243,361 | $ | (2,748,510 | ) | $ | (172,187 | ) | $ | 32,375,476 | |||||||||||||
|
|
|
|
|
|
|
|
|
|
|
|
|
|
|
|||||||||||||||
| 64 | 2 0 2 3 B L A C K R O C K A N N U A L R E P O R T T O S H A R E H O L D E R S |
| Consolidated Schedule of Investments (continued) December 31, 2023 |
BlackRock ESG Capital Allocation Term Trust (ECAT) |
|
|
||||||||||||||||||||||||||||
| Commodity Contracts |
Credit Contracts |
Equity Contracts |
Foreign Currency Exchange Contracts |
Interest Rate Contracts |
Other Contracts |
Total | ||||||||||||||||||||||
|
|
||||||||||||||||||||||||||||
| Net Change in Unrealized Appreciation (Depreciation) on: |
||||||||||||||||||||||||||||
| Futures contracts |
$ | 95,313 | $ | — | $ | 8,491,811 | $ | — | $ | (530,233 | ) | $ | — | $ | 8,056,891 | |||||||||||||
| Forward foreign currency exchange contracts |
— | — | — | (1,287,774) | — | — | (1,287,774) | |||||||||||||||||||||
| Options purchased(b) |
— | (15,596 | ) | 2,371,390 | — | 1,327,731 | (14,361 | ) | 3,669,164 | |||||||||||||||||||
| Options written |
— | — | (869,756 | ) | — | 756,355 | — | (113,401) | ||||||||||||||||||||
| Swaps |
— | (385,196 | ) | 1,496,655 | — | 10,865,220 | — | 11,976,679 | ||||||||||||||||||||
|
|
|
|
|
|
|
|
|
|
|
|
|
|
|
|||||||||||||||
| $ | 95,313 | $ | (400,792 | ) | $ | 11,490,100 | $ | (1,287,774 | ) | $ | 12,419,073 | $ | (14,361 | ) | $ | 22,301,559 | ||||||||||||
|
|
|
|
|
|
|
|
|
|
|
|
|
|
|
|||||||||||||||
| (a) | Options purchased are included in net realized gain (loss) from investments — unaffiliated. |
| (b) | Options purchased are included in net change in unrealized appreciation (depreciation) on investments — unaffiliated. |
Average Quarterly Balances of Outstanding Derivative Financial Instruments
|
|
||||
| Futures contracts: |
||||
| Average notional value of contracts — long |
$ | 390,694,105 | ||
| Average notional value of contracts — short |
$ | 203,064,732 | ||
| Forward foreign currency exchange contracts: |
||||
| Average amounts purchased — in USD |
$ | 362,310,471 | ||
| Average amounts sold — in USD |
$ | 36,527,883 | ||
| Options: |
||||
| Average value of option contracts purchased |
$ | 4,436,874 | ||
| Average value of option contracts written |
$ | 1,781,940 | ||
| Average notional value of swaption contracts purchased |
$ | 63,208,960 | ||
| Average notional value of swaption contracts written |
$ | 302,863,246 | ||
| Credit default swaps: |
||||
| Average notional value — buy protection |
$ | 3,563,895 | ||
| Average notional value — sell protection |
$ | 829,100 | ||
| Interest rate swaps: |
||||
| Average notional value — pays fixed rate |
$ | 2,975,138 | ||
| Average notional value — receives fixed rate |
$ | 427,368,770 | ||
| Total return swaps: |
||||
| Average notional value |
$ | 20,311,755 | ||
|
|
||||
For more information about the Trust’s investment risks regarding derivative financial instruments, refer to the Notes to Consolidated Financial Statements.
Derivative Financial Instruments — Offsetting as of Period End
The Trust’s derivative assets and liabilities (by type) were as follows:
|
|
||||||||
| Assets | Liabilities | |||||||
|
|
||||||||
| Derivative Financial Instruments |
||||||||
| Futures contracts |
$ | 551,395 | $ | 684,493 | ||||
| Forward foreign currency exchange contracts |
377,267 | 1,822,549 | ||||||
| Options |
7,179,418 | (a) | 1,885,800 | |||||
| Swaps — centrally cleared |
— | 77,894 | ||||||
| Swaps — OTC(b) |
1,149,878 | 1,203 | ||||||
|
|
|
|
|
|||||
| Total derivative assets and liabilities in the Consolidated Statements of Assets and Liabilities |
9,257,958 | 4,471,939 | ||||||
|
|
|
|
|
|||||
| Derivatives not subject to a Master Netting Agreement or similar agreement (“MNA”) |
(5,465,948 | ) | (1,725,248) | |||||
|
|
|
|
|
|||||
| Total derivative assets and liabilities subject to an MNA |
$ | 3,792,010 | $ | 2,746,691 | ||||
|
|
|
|
|
|||||
| (a) | Includes options purchased at value which is included in Investments at value — unaffiliated in the Consolidated Statements of Assets and Liabilities and reported in the Consolidated Schedule of Investments. |
| (b) | Includes unrealized appreciation (depreciation) on OTC swaps and swap premiums (paid/received) in the Consolidated Statements of Assets and Liabilities. |
| C O N S O L I D A T E D S C H E D U L E O F I N V E S T M E N T S |
65 |
| Consolidated Schedule of Investments (continued) December 31, 2023 |
BlackRock ESG Capital Allocation Term Trust (ECAT) |
The following table presents the Trust’s derivative assets and liabilities by counterparty net of amounts available for offset under an MNA and net of the related collateral received and pledged by the Trust:
| Counterparty |
|
Derivative Assets Subject to an MNA by Counterparty |
|
Derivatives Available for Offset |
(a) |
|
Non-Cash Collateral Received |
|
Cash Collateral Received |
(b) |
|
Net Amount of Derivative Assets |
(c)(d) | |||||||
| Bank of America N.A. |
$ | 249 | $ | — | $ | — | $ | — | $ | 249 | ||||||||||
| Barclays Bank PLC |
86,574 | (3,955) | — | — | 82,619 | |||||||||||||||
| BNP Paribas SA |
143,009 | (69,848) | — | — | 73,161 | |||||||||||||||
| Citibank N.A. |
735,366 | (206,532) | — | (528,834) | — | |||||||||||||||
| Deutsche Bank AG |
275,092 | (162,605) | — | — | 112,487 | |||||||||||||||
| Goldman Sachs International |
225,013 | (225,013) | — | — | — | |||||||||||||||
| JPMorgan Chase Bank N.A. |
1,541,643 | (714,053) | — | (827,590) | — | |||||||||||||||
| Morgan Stanley & Co. International PLC |
760,800 | (60,140) | — | (430,000) | 270,660 | |||||||||||||||
| The Bank of New York Mellon |
14,093 | (14,093) | — | — | — | |||||||||||||||
| UBS AG |
9,282 | (1,781) | — | — | 7,501 | |||||||||||||||
| Westpac Banking Corp. |
889 | — | — | — | 889 | |||||||||||||||
|
|
|
|
|
|
|
|
|
|
|
|||||||||||
| $ | 3,792,010 | $ | (1,458,020) | $ | — | $ | (1,786,424) | $ | 547,566 | |||||||||||
|
|
|
|
|
|
|
|
|
|
|
|||||||||||
| Counterparty |
|
Derivative Liabilities Subject to an MNA by Counterparty |
|
|
Derivatives Available for Offset |
(a) |
|
Non-Cash Collateral Pledged |
|
|
Cash Collateral Pledged |
|
|
Net Amount of Derivative Liabilities |
(c)(e) | |||||
| Barclays Bank PLC |
$ | 3,955 | $ | (3,955) | $ | — | $ | — | $ | — | ||||||||||
| BNP Paribas SA |
69,848 | (69,848) | — | — | — | |||||||||||||||
| Citibank N.A. |
206,532 | (206,532) | — | — | — | |||||||||||||||
| Deutsche Bank AG |
162,605 | (162,605) | — | — | — | |||||||||||||||
| Goldman Sachs International |
740,086 | (225,013) | — | — | 515,073 | |||||||||||||||
| JPMorgan Chase Bank N.A. |
714,053 | (714,053) | — | — | — | |||||||||||||||
| Morgan Stanley & Co. International PLC |
60,140 | (60,140) | — | — | — | |||||||||||||||
| Societe Generale |
6,978 | — | — | — | 6,978 | |||||||||||||||
| Standard Chartered Bank |
686,610 | — | — | — | 686,610 | |||||||||||||||
| The Bank of New York Mellon |
94,103 | (14,093) | — | — | 80,010 | |||||||||||||||
| UBS AG |
1,781 | (1,781) | — | — | — | |||||||||||||||
|
|
|
|
|
|
|
|
|
|
|
|||||||||||
| $ | 2,746,691 | $ | (1,458,020) | $ | — | $ | — | $ | 1,288,671 | |||||||||||
|
|
|
|
|
|
|
|
|
|
|
|||||||||||
| (a) | The amount of derivatives available for offset is limited to the amount of derivative asset and/or liabilities that are subject to an MNA. |
| (b) | Excess of collateral received/pledged, if any, from the individual counterparty is not shown for financial reporting purposes. |
| (c) | Net amount may also include forward foreign currency exchange contracts that are not required to be collateralized. |
| (d) | Net amount represents the net amount receivable from the counterparty in the event of default. |
| (e) | Net amount represents the net amount payable due to counterparty in the event of default. Net amount may be offset further by the options written receivable/payable on the Consolidated Statements of Assets and Liabilities. |
Fair Value Hierarchy as of Period End
Various inputs are used in determining the fair value of financial instruments. For a description of the input levels and information about the Trust’s policy regarding valuation of financial instruments, refer to the Notes to Consolidated Financial Statements.
The following table summarizes the Trust’s financial instruments categorized in the fair value hierarchy. The breakdown of the Trust’s financial instruments into major categories is disclosed in the Consolidated Schedule of Investments above.
|
|
||||||||||||||||
| Level 1 | Level 2 | Level 3 | Total | |||||||||||||
|
|
||||||||||||||||
| Assets |
||||||||||||||||
| Investments |
||||||||||||||||
| Long-Term Investments |
||||||||||||||||
| Asset-Backed Securities |
$ | — | $ | 64,311,503 | $ | 500,050 | $ | 64,811,553 | ||||||||
| Common Stocks |
||||||||||||||||
| Canada |
5,656,753 | — | — | 5,656,753 | ||||||||||||
| China |
— | 12,368,287 | — | 12,368,287 | ||||||||||||
| Finland |
— | 10,015,447 | — | 10,015,447 | ||||||||||||
| 66 | 2 0 2 3 B L A C K R O C K A N N U A L R E P O R T T O S H A R E H O L D E R S |
| Consolidated Schedule of Investments (continued) December 31, 2023 |
BlackRock ESG Capital Allocation Term Trust (ECAT) |
Fair Value Hierarchy as of Period End (continued)
|
|
||||||||||||||||
| Level 1 | Level 2 | Level 3 | Total | |||||||||||||
|
|
||||||||||||||||
| Common Stocks (continued) |
||||||||||||||||
| France |
$ | 2,964,720 | $ | 77,325,509 | $ | — | $ | 80,290,229 | ||||||||
| Germany |
1,004,835 | 28,519,758 | — | 29,524,593 | ||||||||||||
| Hong Kong |
— | 3,425,453 | — | 3,425,453 | ||||||||||||
| India |
— | 3,348,157 | — | 3,348,157 | ||||||||||||
| Ireland |
— | 7,937,134 | — | 7,937,134 | ||||||||||||
| Israel |
3,902,416 | — | — | 3,902,416 | ||||||||||||
| Italy |
— | 16,466,014 | — | 16,466,014 | ||||||||||||
| Japan |
— | 42,580,825 | — | 42,580,825 | ||||||||||||
| Netherlands |
— | 40,016,800 | — | 40,016,800 | ||||||||||||
| Norway |
759,360 | — | — | 759,360 | ||||||||||||
| South Korea |
— | 8,095,003 | — | 8,095,003 | ||||||||||||
| Spain |
— | 6,576,827 | — | 6,576,827 | ||||||||||||
| Sweden |
— | 3,258,901 | — | 3,258,901 | ||||||||||||
| Switzerland |
5,376,795 | 29,566,928 | — | 34,943,723 | ||||||||||||
| Taiwan |
11,945,024 | — | — | 11,945,024 | ||||||||||||
| United Kingdom |
10,273,704 | 24,419,880 | 244,393 | 34,937,977 | ||||||||||||
| United States |
689,321,233 | — | 3,228,115 | 692,549,348 | ||||||||||||
| Corporate Bonds |
— | 152,460,209 | 34,946,485 | 187,406,694 | ||||||||||||
| Fixed Rate Loan Interests |
— | — | 4,062,028 | 4,062,028 | ||||||||||||
| Floating Rate Loan Interests |
— | 5,199,136 | 24,747,984 | 29,947,120 | ||||||||||||
| Foreign Agency Obligations |
— | 8,412,951 | — | 8,412,951 | ||||||||||||
| Investment Companies |
12,437,473 | — | — | 12,437,473 | ||||||||||||
| Municipal Bonds |
— | 2,496,447 | — | 2,496,447 | ||||||||||||
| Non-Agency Mortgage-Backed Securities |
— | 34,263,913 | — | 34,263,913 | ||||||||||||
| Preferred Securities |
||||||||||||||||
| Capital Trust |
— | 225,000 | — | 225,000 | ||||||||||||
| Preferred Stocks |
— | 2,487,113 | 16,583,496 | 19,070,609 | ||||||||||||
| U.S. Government Sponsored Agency Securities |
— | 123,156,129 | — | 123,156,129 | ||||||||||||
| U.S. Treasury Obligations |
— | 6,995,135 | — | 6,995,135 | ||||||||||||
| Warrants |
— | — | 715,474 | 715,474 | ||||||||||||
| Short-Term Securities |
||||||||||||||||
| Money Market Funds |
378,536,662 | — | — | 378,536,662 | ||||||||||||
| Options Purchased |
||||||||||||||||
| Credit Contracts |
— | 4,985 | — | 4,985 | ||||||||||||
| Equity Contracts |
4,914,553 | 182 | — | 4,914,735 | ||||||||||||
| Interest Rate Contracts |
— | 2,253,527 | — | 2,253,527 | ||||||||||||
| Other Contracts |
— | 6,171 | — | 6,171 | ||||||||||||
| Unfunded Floating Rate Loan Interests(a) |
— | — | 2,464 | 2,464 | ||||||||||||
| Liabilities |
||||||||||||||||
| Unfunded Floating Rate Loan Interests(a) |
— | — | (47,298 | ) | (47,298 | ) | ||||||||||
|
|
|
|
|
|
|
|
|
|||||||||
| $ | 1,127,093,528 | $ | 716,193,324 | $ | 84,983,191 | 1,928,270,043 | ||||||||||
|
|
|
|
|
|
|
|
|
|||||||||
| Investments Valued at NAV(b) |
3,509,133 | |||||||||||||||
|
|
|
|||||||||||||||
| $ | 1,931,779,176 | |||||||||||||||
|
|
|
|||||||||||||||
| Derivative Financial Instruments(c) |
||||||||||||||||
| Assets |
||||||||||||||||
| Commodity Contracts |
$ | 95,313 | $ | — | $ | — | $ | 95,313 | ||||||||
| Credit Contracts |
— | 98,924 | — | 98,924 | ||||||||||||
| Equity Contracts |
3,496,795 | 313,256 | — | 3,810,051 | ||||||||||||
| Foreign Currency Exchange Contracts |
— | 377,267 | — | 377,267 | ||||||||||||
| Interest Rate Contracts |
6,546,994 | 11,283,979 | — | 17,830,973 | ||||||||||||
| Liabilities |
||||||||||||||||
| Credit Contracts |
— | (81,559 | ) | — | (81,559 | ) | ||||||||||
| Equity Contracts |
(1,437,910 | ) | (63,893 | ) | — | (1,501,803 | ) | |||||||||
| C O N S O L I D A T E D S C H E D U L E O F I N V E S T M E N T S |
67 |
| Consolidated Schedule of Investments (continued) December 31, 2023 |
BlackRock ESG Capital Allocation Term Trust (ECAT) |
Fair Value Hierarchy as of Period End (continued)
|
|
||||||||||||||||
| Level 1 | Level 2 | Level 3 | Total | |||||||||||||
|
|
||||||||||||||||
| Derivative Financial Instruments(c) |
||||||||||||||||
| Foreign Currency Exchange Contracts |
$ | — | $ | (1,822,549 | ) | $ | — | $ | (1,822,549 | ) | ||||||
| Interest Rate Contracts |
(5,038,995 | ) | (1,477,367 | ) | — | (6,516,362 | ) | |||||||||
|
|
|
|
|
|
|
|
|
|||||||||
| $ | 3,662,197 | $ | 8,628,058 | $ | — | $ | 12,290,255 | |||||||||
|
|
|
|
|
|
|
|
|
|||||||||
| (a) | Unfunded floating rate loan interests are valued at the unrealized appreciation (depreciation) on the commitment. |
| (b) | Certain investments of the Trust were fair valued using NAV as a practical expedient as no quoted market value is available and therefore have been excluded from the fair value hierarchy. |
| (c) | Derivative financial instruments are swaps, futures contracts and options written. Swaps and futures contracts are valued at the unrealized appreciation (depreciation) on the instrument and options written are shown at value. |
A reconciliation of Level 3 financial instruments is presented when the Trust had a significant amount of Level 3 investments and derivative financial instruments at the beginning and/or end of the year in relation to net assets. The following table is a reconciliation of Level 3 investments for which significant unobservable inputs were used in determining fair value:
|
|
||||||||||||||||||||||||||||
| Asset-Backed Securities |
Common Stocks |
Corporate Bonds |
Fixed Rate Loan Interests |
Floating Rate Loan Interests |
Non-Agency Mortgage-Backed Securities |
Preferred Stocks |
||||||||||||||||||||||
|
|
||||||||||||||||||||||||||||
| Assets |
||||||||||||||||||||||||||||
| Opening balance, as of December 31, 2022 |
$ | 343,613 | $ | 8,327,854 | $ | 9,087,060 | $ | — | $ | 36,182,630 | $ | 1,236,659 | $ | 16,001,110 | ||||||||||||||
| Transfers into Level 3 |
— | — | — | — | — | — | — | |||||||||||||||||||||
| Transfers out of Level 3 |
(343,613 | ) | — | — | — | — | (1,236,659 | ) | — | |||||||||||||||||||
| Other(a) |
— | (7,447,709 | ) | 10,387,480 | 4,020,197 | (14,407,677 | ) | — | 7,447,709 | |||||||||||||||||||
| Accrued discounts/premiums |
— | — | 163,342 | 8,613 | 46,102 | — | — | |||||||||||||||||||||
| Net realized gain (loss) |
— | — | (540,237 | ) | — | 33,806 | — | — | ||||||||||||||||||||
| Net change in unrealized appreciation (depreciation)(b)(c) |
50 | (2,079,302 | ) | 1,079,788 | 33,218 | 449,850 | — | (2,851,859 | ) | |||||||||||||||||||
| Purchases |
500,000 | 4,671,789 | 24,304,527 | — | 17,118,702 | — | 345,314 | |||||||||||||||||||||
| Sales |
— | (124 | ) | (9,535,475 | ) | — | (14,675,429 | ) | — | (4,358,778 | ) | |||||||||||||||||
|
|
|
|
|
|
|
|
|
|
|
|
|
|
|
|||||||||||||||
| Closing balance, as of December 31, 2023 |
$ | 500,050 | $ | 3,472,508 | $ | 34,946,485 | $ | 4,062,028 | $ | 24,747,984 | $ | — | $ | 16,583,496 | ||||||||||||||
|
|
|
|
|
|
|
|
|
|
|
|
|
|
|
|||||||||||||||
| Net change in unrealized appreciation (depreciation) on investments still held at December 31, 2023(c) |
$ | 50 | $ | (2,051,490 | ) | $ | 541,604 | $ | 33,218 | $ | (9,972 | ) | $ | — | $ | (1,373,640 | ) | |||||||||||
|
|
|
|
|
|
|
|
|
|
|
|
|
|
|
|||||||||||||||
| Unfunded Floating Rate Loan Interest |
Warrants | Total | ||||||||||
| Assets |
||||||||||||
| Opening balance, as of December 31, 2022 |
$ | (2,950 | ) | $ | 1,079,629 | $ | 72,255,605 | |||||
| Transfers into Level 3 |
— | — | — | |||||||||
| Transfers out of Level 3 |
— | — | (1,580,272 | ) | ||||||||
| Other(a) |
— | — | — | |||||||||
| Accrued discounts/premiums |
— | — | 218,057 | |||||||||
| Net realized gain (loss) |
— | — | (506,431 | ) | ||||||||
| Net change in unrealized appreciation (depreciation)(b)(c) |
(41,884 | ) | (364,156 | ) | (3,774,295 | ) | ||||||
| Purchases |
— | 61,806 | 47,002,138 | |||||||||
| Sales |
— | (61,805 | ) | (28,631,611 | ) | |||||||
|
|
|
|
|
|
|
|||||||
| Closing balance, as of December 31, 2023 |
$ | (44,834 | ) | $ | 715,474 | $ | 84,983,191 | |||||
|
|
|
|
|
|
|
|||||||
| Net change in unrealized appreciation (depreciation) on investments still held at December 31, 2023(c) |
$ | (44,834 | ) | $ | (424,725 | ) | $ | (3,329,789 | ) | |||
|
|
|
|
|
|
|
|||||||
| (a) | Certain Level 3 investments were re-classified between Common Stocks, Corporate Bonds, Fixed Rate Loan Interests, Floating Rate Loan Interests and Preferred Stocks. |
| (b) | Included in the related net change in unrealized appreciation (depreciation) in the Consolidated Statements of Operations. |
| (c) | Any difference between net change in unrealized appreciation (depreciation) and net change in unrealized appreciation (depreciation) on investments still held at December 31, 2023 is generally due to investments no longer held or categorized as Level 3 at period end. |
The following table summarizes the valuation approaches used and unobservable inputs utilized by the BlackRock Valuation Committee (the “Valuation Committee”) to determine the value of certain of the Trust’s Level 3 financial instruments as of period end. The table does not include Level 3 financial instruments with values based upon
| 68 | 2 0 2 3 B L A C K R O C K A N N U A L R E P O R T T O S H A R E H O L D E R S |
| Consolidated Schedule of Investments (continued) December 31, 2023 |
BlackRock ESG Capital Allocation Term Trust (ECAT) |
unadjusted third-party pricing information in the amount of $4,131,302. A significant change in third party information could result in a significantly lower or higher value of such Level 3 financial instruments.
| Value | |
Valuation Approach |
|
Unobservable Inputs |
|
Range of Unobservable Inputs Utilized |
(a) |
|
Weighted Average of Unobservable Inputs Based on Fair Value |
|||||||||
| Assets |
||||||||||||||||||
| Common Stocks |
$ | 3,472,508 | Market | Gross Profit Multiple | 15.00x | — | ||||||||||||
| Direct Profit Multiple | 4.50x | — | ||||||||||||||||
| Time to Exit | 0.1 - 3.0 years | 2.9 years | ||||||||||||||||
| Volatility | 80% -88% | 80% | ||||||||||||||||
| Corporate Bonds |
34,946,485 | Income | Discount Rate | 12% - 56% | 19% | |||||||||||||
| Floating Rate Loan Interests |
21,071,902 | Income | Discount Rate | 7% - 15% | 11% | |||||||||||||
| Fixed Rate Loan Interests |
4,062,028 | Income | Credit Spread | 819 | — | |||||||||||||
| Preferred Stock |
16,583,496 | Market | Revenue Multiple | 6.25x - 31.00x | 18.52x | |||||||||||||
| Time to Exit | 2.0 - 3.0 years | 2.2 years | ||||||||||||||||
| Volatility | 50% - 90% | 70% | ||||||||||||||||
| EBITDA Multiple | 7.50x | — | ||||||||||||||||
| Warrants |
715,470 | Market | Revenue Multiple | 4.22x -31.00x | 12.65x | |||||||||||||
| Volatility | 36% - 88% | 59% | ||||||||||||||||
| Time to Exit | 0.1 - 2.0 years | 1.9 years | ||||||||||||||||
| Income | Discount Rate | 26% | — | |||||||||||||||
|
|
|
|||||||||||||||||
| $ | 80,851,889 | |||||||||||||||||
|
|
|
|||||||||||||||||
| (a) | A significant change in unobservable input would have resulted in a correlated (inverse) significant change to value. |
See notes to consolidated financial statements.
| C O N S O L I D A T E D S C H E D U L E O F I N V E S T M E N T S |
69 |
Consolidated Statements of Assets and Liabilities
December 31, 2023
| BCAT | ECAT | |||||||
| ASSETS |
||||||||
| Investments, at value — unaffiliated(a)(b) |
$ | 1,889,380,164 | $ | 1,539,484,084 | ||||
| Investments, at value — affiliated(c) |
92,174,403 | 392,339,926 | ||||||
| Cash |
2,088,026 | 204,129 | ||||||
| Cash pledged: |
||||||||
| Futures contracts |
13,612,000 | 10,308,000 | ||||||
| Centrally cleared swaps |
13,757,000 | 10,235,000 | ||||||
| Foreign currency, at value(d) |
4,838,585 | 3,487,037 | ||||||
| Receivables: |
||||||||
| Investments sold |
16,479,598 | 10,324,414 | ||||||
| Options written |
10,175 | 10,175 | ||||||
| Securities lending income — affiliated |
— | 1,871 | ||||||
| Swaps |
340,832 | 56,677 | ||||||
| Dividends — unaffiliated |
1,388,339 | 1,565,125 | ||||||
| Dividends — affiliated |
332,573 | 1,449,330 | ||||||
| Interest — unaffiliated |
9,451,580 | 4,766,462 | ||||||
| From custodian |
772,356 | 1,146,112 | ||||||
| Variation margin on futures contracts |
1,397,919 | 551,395 | ||||||
| Variation margin on centrally cleared swaps |
47,302 | — | ||||||
| Swap premiums paid |
219,310 | — | ||||||
| Unrealized appreciation on: |
||||||||
| Forward foreign currency exchange contracts |
345,264 | 377,267 | ||||||
| OTC swaps |
1,661,787 | 1,149,878 | ||||||
| Unfunded floating rate loan interests |
191 | 2,464 | ||||||
| Prepaid expenses |
16,664 | 389,582 | ||||||
|
|
|
|
|
|||||
| Total assets |
2,048,314,068 | 1,977,848,928 | ||||||
|
|
|
|
|
|||||
| LIABILITIES |
||||||||
| Due to broker |
780,000 | — | ||||||
| Cash received: |
||||||||
| Collateral — OTC derivatives |
2,760,000 | 2,170,000 | ||||||
| Collateral — TBA commitments |
4,714,000 | 1,860,000 | ||||||
| Collateral on securities loaned |
— | 3,506,271 | ||||||
| Options written, at value(e) |
3,096,845 | 1,885,800 | ||||||
| Payables: |
||||||||
| Investments purchased |
175,044,728 | 124,804,145 | ||||||
| Swaps |
1,100,563 | — | ||||||
| Accounting services fees |
76,506 | 67,951 | ||||||
| Custodian fees |
73,377 | 45,224 | ||||||
| Deferred foreign capital gain tax |
3,070 | 3,771 | ||||||
| Interest expense and fees |
118,403 | — | ||||||
| Investment advisory fees |
1,926,227 | 1,878,660 | ||||||
| Trustees’ and Officer’s fees |
79,235 | 75,767 | ||||||
| Options written |
25,318 | 25,318 | ||||||
| Other accrued expenses |
74,768 | 54,522 | ||||||
| Professional fees |
290,493 | 124,487 | ||||||
| Proxy fees |
63,856 | — | ||||||
| Transfer agent fees |
20,026 | 18,630 | ||||||
| Variation margin on futures contracts |
1,128,809 | 684,493 | ||||||
| Variation margin on centrally cleared swaps |
— | 77,894 | ||||||
| Swap premiums received |
71,042 | — | ||||||
| 70 | 2 0 2 3 B L A C K R O C K A N N U A L R E P O R T T O S H A R E H O L D E R S |
Consolidated Statements of Assets and Liabilities (continued)
December 31, 2023
| BCAT | ECAT | |||||||
| Unrealized depreciation on: |
||||||||
| Forward foreign currency exchange contracts |
2,343,367 | 1,822,549 | ||||||
| OTC swaps |
778,002 | 1,203 | ||||||
| Unfunded floating rate loan interests |
49,569 | 47,298 | ||||||
|
|
|
|
|
|||||
| Total liabilities |
194,618,204 | 139,153,983 | ||||||
|
|
|
|
|
|||||
| Commitments and contingent liabilities |
||||||||
| NET ASSETS |
$ | 1,853,695,864 | $ | 1,838,694,945 | ||||
|
|
|
|
|
|||||
| NET ASSETS CONSIST OF |
||||||||
| Paid-in capital(f)(g)(h) |
$ | 1,990,725,834 | $ | 1,879,911,949 | ||||
| Accumulated loss |
(137,029,970 | ) | (41,217,004 | ) | ||||
|
|
|
|
|
|||||
| NET ASSETS |
$ | 1,853,695,864 | $ | 1,838,694,945 | ||||
|
|
|
|
|
|||||
| Net asset value |
$ | 17.25 | $ | 18.05 | ||||
|
|
|
|
|
|||||
| (a) Investments, at cost — unaffiliated |
$ | 1,824,881,681 | $ | 1,428,385,026 | ||||
| (b) Securities loaned, at value |
$ | — | $ | 3,399,974 | ||||
| (c) Investments, at cost — affiliated |
$ | 91,723,637 | $ | 392,057,398 | ||||
| (d) Foreign currency, at cost |
$ | 4,922,193 | $ | 3,484,218 | ||||
| (e) Premiums received |
$ | 3,069,547 | $ | 1,664,516 | ||||
| (f) Shares outstanding |
107,461,816 | 101,893,121 | ||||||
| (g) Shares authorized |
Unlimited | Unlimited | ||||||
| (h) Par value |
$ | 0.001 | $ | 0.001 | ||||
See notes to consolidated financial statements.
| C O N S O L I D A T E D F I N A N C I A L S T A T E M E N T S |
71 |
Consolidated Statements of Operations
Year Ended December 31, 2023
| BCAT | ECAT | |||||||
| INVESTMENT INCOME |
||||||||
| Dividends — unaffiliated |
$ | 19,677,382 | $ | 17,301,704 | ||||
| Dividends — affiliated |
3,574,473 | 10,795,901 | ||||||
| Interest — unaffiliated |
61,500,230 | 32,299,366 | ||||||
| Securities lending income — affiliated — net |
— | 37,718 | ||||||
| Other income — unaffiliated |
370,553 | 128,660 | ||||||
| Foreign taxes withheld |
(1,038,382 | ) | (1,235,525 | ) | ||||
|
|
|
|
|
|||||
| Total investment income |
84,084,256 | 59,327,824 | ||||||
|
|
|
|
|
|||||
| EXPENSES |
||||||||
| Investment advisory |
22,968,449 | 22,255,842 | ||||||
| Proxy |
341,041 | 971,637 | ||||||
| Custodian |
214,749 | 196,710 | ||||||
| Accounting services |
214,120 | 191,320 | ||||||
| Professional |
171,959 | 205,667 | ||||||
| Trustees and Officer |
110,450 | 107,150 | ||||||
| Transfer agent |
94,040 | 65,690 | ||||||
| Registration |
37,165 | 35,397 | ||||||
| Offering |
14,957 | — | ||||||
| Printing and postage |
5,613 | 43,911 | ||||||
| Miscellaneous |
204,239 | 211,917 | ||||||
|
|
|
|
|
|||||
| Total expenses excluding interest expense |
24,376,782 | 24,285,241 | ||||||
| Interest expense and fees |
1,397,752 | 868 | ||||||
|
|
|
|
|
|||||
| Total expenses |
25,774,534 | 24,286,109 | ||||||
| Less: |
||||||||
| Fees waived and/or reimbursed by the Manager |
(268,349 | ) | (744,091 | ) | ||||
|
|
|
|
|
|||||
| Total expenses after fees waived and/or reimbursed |
25,506,185 | 23,542,018 | ||||||
|
|
|
|
|
|||||
| Net investment income |
58,578,071 | 35,785,806 | ||||||
|
|
|
|
|
|||||
| REALIZED AND UNREALIZED GAIN (LOSS) |
||||||||
| Net realized gain (loss) from: |
||||||||
| Investments — unaffiliated |
(47,700,734 | ) | (47,319,441 | ) | ||||
| Investments — affiliated |
(203,074 | ) | (283,095 | ) | ||||
| Forward foreign currency exchange contracts |
(1,859,579 | ) | 4,292,829 | |||||
| Foreign currency transactions |
(229,892 | ) | (226,234 | ) | ||||
| Futures contracts |
(2,547,580 | ) | 27,344,640 | |||||
| Options written |
14,826,207 | 8,360,586 | ||||||
| Swaps |
(19,095,656 | ) | (6,955,467 | ) | ||||
|
|
|
|
|
|||||
| (56,810,308 | ) | (14,786,182 | ) | |||||
|
|
|
|
|
|||||
| Net change in unrealized appreciation (depreciation) on: |
||||||||
| Investments — unaffiliated(a) |
184,529,818 | 254,544,550 | ||||||
| Investments — affiliated |
1,068,296 | 715,278 | ||||||
| Forward foreign currency exchange contracts |
4,484,993 | (1,287,774 | ) | |||||
| Foreign currency translations |
161,363 | 70,980 | ||||||
| Futures contracts |
(15,685,586 | ) | 8,056,891 | |||||
| Options written |
5,114,814 | (113,401 | ) | |||||
| Swaps |
23,327,092 | 11,976,679 | ||||||
| Unfunded floating rate loan interests |
(44,336 | ) | (41,884 | ) | ||||
|
|
|
|
|
|||||
| 202,956,454 | 273,921,319 | |||||||
|
|
|
|
|
|||||
| Net realized and unrealized gain |
146,146,146 | 259,135,137 | ||||||
|
|
|
|
|
|||||
| NET INCREASE IN NET ASSETS RESULTING FROM OPERATIONS |
$ | 204,724,217 | $ | 294,920,943 | ||||
|
|
|
|
|
|||||
| (a) Net of reduction in/(increase in) deferred foreign capital gain tax of |
$ | 110,936 | $ | (3,771 | ) | |||
See notes to consolidated financial statements.
| 72 | 2 0 2 3 B L A C K R O C K A N N U A L R E P O R T T O S H A R E H O L D E R S |
Statements of Changes in Net Assets
| BCAT(a) | ECAT | |||||||||||||||||
| |
Year Ended 12/31/23 |
|
|
Year Ended 12/31/22 |
|
|
Year Ended 12/31/23 |
(a) |
|
Year Ended 12/31/22 |
| |||||||
| INCREASE (DECREASE) IN NET ASSETS |
||||||||||||||||||
| OPERATIONS |
||||||||||||||||||
| Net investment income |
$ | 58,578,071 | $ | 55,631,648 | $ | 35,785,806 | $ | 18,954,913 | ||||||||||
| Net realized loss |
(56,810,308 | ) | (79,620,786 | ) | (14,786,182 | ) | (113,097,041 | ) | ||||||||||
| Net change in unrealized appreciation (depreciation) |
202,956,454 | (298,534,539 | ) | 273,921,319 | (218,754,424 | ) | ||||||||||||
|
|
|
|
|
|
|
|
|
|||||||||||
| Net increase (decrease) in net assets resulting from operations |
204,724,217 | (322,523,677 | ) | 294,920,943 | (312,896,552 | ) | ||||||||||||
|
|
|
|
|
|
|
|
|
|||||||||||
| DISTRIBUTIONS TO SHAREHOLDERS(b) |
||||||||||||||||||
| From net investment income and net realized gain |
(62,938,896 | ) | (109,547,627 | ) | (35,941,083 | ) | (60,724,637 | ) | ||||||||||
| Return of capital |
(99,719,802 | ) | (28,661,646 | ) | (114,889,303 | ) | (64,828,979 | ) | ||||||||||
|
|
|
|
|
|
|
|
|
|||||||||||
| Decrease in net assets resulting from distributions to shareholders |
(162,658,698 | ) | (138,209,273 | ) | (150,830,386 | ) | (125,553,616 | ) | ||||||||||
|
|
|
|
|
|
|
|
|
|||||||||||
| CAPITAL SHARE TRANSACTIONS |
||||||||||||||||||
| Redemption of shares resulting from share repurchase program (including transaction costs) |
(9,718,056 | ) | (50,901,644 | ) | (7,268,837 | ) | (47,257,972 | ) | ||||||||||
|
|
|
|
|
|
|
|
|
|||||||||||
| NET ASSETS |
||||||||||||||||||
| Total increase (decrease) in net assets |
32,347,463 | (511,634,594 | ) | 136,821,720 | (485,708,140 | ) | ||||||||||||
| Beginning of year |
1,821,348,401 | 2,332,982,995 | 1,701,873,225 | 2,187,581,365 | ||||||||||||||
|
|
|
|
|
|
|
|
|
|||||||||||
| End of year |
$ | 1,853,695,864 | $ | 1,821,348,401 | $ | 1,838,694,945 | $ | 1,701,873,225 | ||||||||||
|
|
|
|
|
|
|
|
|
|||||||||||
| (a) | Consolidated Statement of Changes in Net Assets. |
| (b) | Distributions for annual periods determined in accordance with U.S. federal income tax regulations. |
See notes to consolidated financial statements.
| C O N S O L I D A T E D F I N A N C I A L S T A T E M E N T S |
73 |
Consolidated Statements of Cash Flows
Year Ended December 31, 2023
| BCAT | ECAT | |||||||
| CASH PROVIDED BY (USED FOR) OPERATING ACTIVITIES |
||||||||
| Net increase in net assets resulting from operations |
$ | 204,724,217 | $ | 294,920,943 | ||||
| Adjustments to reconcile net increase in net assets resulting from operations to net cash provided by operating activities: |
||||||||
| Proceeds from sales of long-term investments and principal paydowns/payups |
4,813,361,134 | 4,702,306,565 | ||||||
| Purchases of long-term investments |
(4,660,549,746 | ) | (4,281,090,839 | ) | ||||
| Net purchases of short-term securities |
(28,019,571 | ) | (344,564,842 | ) | ||||
| Amortization of premium and accretion of discount on investments and other fees |
(1,291,894 | ) | (3,287,727 | ) | ||||
| Premiums paid on closing options written |
(13,728,527 | ) | (10,143,412 | ) | ||||
| Premiums received from options written |
25,875,839 | 20,266,153 | ||||||
| Net realized loss on investments and options written |
31,976,644 | 37,351,095 | ||||||
| Net unrealized appreciation on investments, options written, swaps, foreign currency translations and unfunded floating rate loan interests |
(196,838,955 | ) | (256,296,306 | ) | ||||
| (Increase) Decrease in Assets |
||||||||
| Receivables |
||||||||
| Dividends — affiliated |
(12,021 | ) | (1,383,328 | ) | ||||
| Dividends — unaffiliated |
(327,276 | ) | (571,988 | ) | ||||
| From custodian |
(772,356 | ) | (1,146,112 | ) | ||||
| Interest — unaffiliated |
(289,120 | ) | 1,069,953 | |||||
| Securities lending income — affiliated |
— | (1,871 | ) | |||||
| Swaps |
249,865 | 498,167 | ||||||
| Variation margin on futures contracts |
764,896 | 285,357 | ||||||
| Variation margin on centrally cleared swaps |
(47,302 | ) | — | |||||
| Swap premiums paid |
(218,916 | ) | 371 | |||||
| Prepaid expenses |
(1,625 | ) | (375,256 | ) | ||||
| Deferred offering costs |
14,957 | — | ||||||
| Increase (Decrease) in Liabilities |
||||||||
| Due to broker |
496,999 | — | ||||||
| Cash received |
||||||||
| Collateral — OTC derivatives |
1,550,000 | 2,170,000 | ||||||
| Collateral — TBA commitments |
4,703,000 | 1,860,000 | ||||||
| Collateral on securities loaned |
— | 3,506,271 | ||||||
| Payables |
||||||||
| Swaps |
976,593 | (187,482 | ) | |||||
| Accounting services fees |
(3,311 | ) | 1,670 | |||||
| Custodian fees |
(12,176 | ) | 6,480 | |||||
| Deferred foreign capital gain tax |
(110,936 | ) | 3,771 | |||||
| Investment advisory fees |
(21,990 | ) | 25,507 | |||||
| Trustees’ and Officer’s fees |
64,942 | 63,138 | ||||||
| Other accrued expenses |
(201 | ) | 22,975 | |||||
| Professional fees |
(99,988 | ) | (51,752 | ) | ||||
| Proxy fees |
63,856 | — | ||||||
| Transfer agent fees |
(16,631 | ) | (13,404 | ) | ||||
| Variation margin on futures contracts |
(350,010 | ) | 372,541 | |||||
| Variation margin on centrally cleared swaps |
(314,903 | ) | (10,488 | ) | ||||
| Swap premiums received |
(469,793 | ) | — | |||||
|
|
|
|
|
|||||
| Net cash provided by operating activities |
181,325,694 | 165,606,150 | ||||||
|
|
|
|
|
|||||
| CASH PROVIDED BY (USED FOR) FINANCING ACTIVITIES |
||||||||
| Cash dividends paid to shareholders |
(164,289,173 | ) | (151,812,125 | ) | ||||
| Net payments on redemption of capital shares |
(11,498,106 | ) | (8,967,481 | ) | ||||
| Decrease in bank overdraft |
(1,804,769 | ) | — | |||||
|
|
|
|
|
|||||
| Net cash used for financing activities |
(177,592,048 | ) | (160,779,606 | ) | ||||
|
|
|
|
|
|||||
| CASH IMPACT FROM FOREIGN EXCHANGE FLUCTUATIONS |
||||||||
| Cash impact from foreign exchange fluctuations |
43,500 | (257 | ) | |||||
|
|
|
|
|
|||||
| 74 | 2 0 2 3 B L A C K R O C K A N N U A L R E P O R T T O S H A R E H O L D E R S |
Consolidated Statements of Cash Flows (continued)
Year Ended December 31, 2023
| BCAT | ECAT | |||||||
| CASH AND FOREIGN CURRENCY |
||||||||
| Net increase in restricted and unrestricted cash and foreign currency |
$ | 3,777,146 | $ | 4,826,287 | ||||
| Restricted and unrestricted cash and foreign currency at beginning of year |
30,518,465 | 19,407,879 | ||||||
|
|
|
|
|
|||||
| Restricted and unrestricted cash and foreign currency at end of year |
$ | 34,295,611 | $ | 24,234,166 | ||||
|
|
|
|
|
|||||
| SUPPLEMENTAL DISCLOSURE OFCASH FLOW INFORMATION |
||||||||
| Cash paid during the year for interest expense |
$ | 1,397,752 | $ | 868 | ||||
|
|
|
|
|
|||||
| RECONCILIATION OF RESTRICTED AND UNRESTRICTED CASH AND FOREIGN CURRENCY AT THE END OF YEAR TO THE CONSOLIDATED STATEMENTS OF ASSETS AND LIABILITIES |
||||||||
| Cash |
$ | 2,088,026 | $ | 204,129 | ||||
| Cash pledged |
||||||||
| Futures contracts |
13,612,000 | 10,308,000 | ||||||
| Centrally cleared swaps |
13,757,000 | 10,235,000 | ||||||
| Foreign currency at value |
4,838,585 | 3,487,037 | ||||||
|
|
|
|
|
|||||
| $ | 34,295,611 | $ | 24,234,166 | |||||
|
|
|
|
|
|||||
See notes to consolidated financial statements.
| C O N S O L I D A T E D F I N A N C I A L S T A T E M E N T S |
75 |
(For a share outstanding throughout each period)
| BCAT | ||||||||||||||||
| |
Year Ended 12/31/23 |
(a) |
|
Year Ended 12/31/22 |
(a) |
|
Year Ended 12/31/21 |
(a) |
|
Period from 09/28/20 to 12/31/20 |
(b)
| |||||
| Net asset value, beginning of period |
$ | 16.84 | $ | 20.90 | $ | 21.05 | $ | 20.00 | ||||||||
|
|
|
|
|
|
|
|
|
|||||||||
| Net investment income(c) |
0.55 | 0.50 | 0.53 | 0.04 | ||||||||||||
| Net realized and unrealized gain (loss) |
1.37 | (3.31 | ) | 0.57 | 1.11 | |||||||||||
|
|
|
|
|
|
|
|
|
|||||||||
| Net increase (decrease) from investment operations |
1.92 | (2.81 | ) | 1.10 | 1.15 | |||||||||||
|
|
|
|
|
|
|
|
|
|||||||||
| Distributions(d) |
||||||||||||||||
| From net investment income |
(0.58 | ) | (0.99 | ) | (0.75 | ) | (0.03 | ) | ||||||||
| From net realized gain |
— | — | (0.03 | ) | (0.07 | ) | ||||||||||
| Return of capital |
(0.93 | ) | (0.26 | ) | (0.47 | ) | — | |||||||||
|
|
|
|
|
|
|
|
|
|||||||||
| Total distributions |
(1.51 | ) | (1.25 | ) | (1.25 | ) | (0.10 | ) | ||||||||
|
|
|
|
|
|
|
|
|
|||||||||
| Net asset value, end of period |
$ | 17.25 | $ | 16.84 | $ | 20.90 | $ | 21.05 | ||||||||
|
|
|
|
|
|
|
|
|
|||||||||
| Market price, end of period |
$ | 14.95 | $ | 13.87 | $ | 19.45 | $ | 21.77 | ||||||||
|
|
|
|
|
|
|
|
|
|||||||||
| Total Return(e) |
||||||||||||||||
| Based on net asset value |
13.24 | % | (12.61 | )% | 5.44 | % | 5.77 | %(f) | ||||||||
|
|
|
|
|
|
|
|
|
|||||||||
| Based on market price |
19.16 | % | (22.66 | )% | (5.12 | )% | 9.39 | %(f) | ||||||||
|
|
|
|
|
|
|
|
|
|||||||||
| Ratios to Average Net Assets(g) |
||||||||||||||||
| Total expenses |
1.40 | %(h) | 1.58 | % | 1.61 | % | 1.30 | %(i) | ||||||||
|
|
|
|
|
|
|
|
|
|||||||||
| Total expenses after fees waived and/or reimbursed |
1.39 | %(h) | 1.57 | % | 1.60 | % | 1.26 | %(i) | ||||||||
|
|
|
|
|
|
|
|
|
|||||||||
| Total expenses after fees waived and/or reimbursed and excluding interest expense, fees and amortization of offering costs |
1.31 | %(h) | 1.42 | % | 1.51 | % | 1.26 | %(i) | ||||||||
|
|
|
|
|
|
|
|
|
|||||||||
| Net investment income |
3.19 | % | 2.77 | % | 2.49 | % | 0.84 | %(i) | ||||||||
|
|
|
|
|
|
|
|
|
|||||||||
| Supplemental Data |
||||||||||||||||
| Net assets, end of period (000) |
$ | 1,853,696 | $ | 1,821,348 | $ | 2,332,983 | $ | 2,351,695 | ||||||||
|
|
|
|
|
|
|
|
|
|||||||||
| Borrowings outstanding, end of period (000) |
$ | — | $ | — | $ | 687,791 | $ | — | ||||||||
|
|
|
|
|
|
|
|
|
|||||||||
| Asset coverage, end of year per $1,000 of bank borrowings |
$ | — | $ | — | $ | 6,290 | $ | — | ||||||||
|
|
|
|
|
|
|
|
|
|||||||||
| Portfolio turnover rate(j) |
234 | %(k) | 98 | % | 90 | % | 13 | % | ||||||||
|
|
|
|
|
|
|
|
|
|||||||||
| (a) | Consolidated Financial Highlights. |
| (b) | Commencement of operations. |
| (c) | Based on average shares outstanding. |
| (d) | Distributions for annual periods determined in accordance with U.S. federal income tax regulations. |
| (e) | Total returns based on market price, which can be significantly greater or less than the net asset value, may result in substantially different returns. Where applicable, excludes the effects of any sales charges and assumes the reinvestment of distributions at actual reinvestment prices. |
| (f) | Not annualized. |
| (g) | Excludes fees and expenses incurred indirectly as a result of investments in underlying funds. |
| (h) | Includes non-recurring expenses of proxy costs and offering costs. Without these costs, total expenses, total expenses after fees waived and/or reimbursed and total expenses after fees waived and/or reimbursed and excluding interest expense, fees and amortization of offering costs would have been 1.38%, 1.37% and 1.29%, respectively. |
| (i) | Annualized. |
| (j) | Includes mortgage dollar roll transactions (“MDRs”). Additional information regarding portfolio turnover rate is as follows: |
| |
Year Ended 12/31/23 |
(a) |
|
Year Ended 12/31/22 |
(a) |
|
Year Ended 12/31/21 |
(a) |
|
Period from 09/28/20 to 12/31/20 |
(b)
| |||||
| Portfolio turnover rate (excluding MDRs) |
135 | % | 88 | % | 86 | % | 13 | % | ||||||||
|
|
|
|
|
|
|
|
|
|||||||||
| (k) | Excludes underlying investments in total return swaps. |
See notes to consolidated financial statements.
| 76 | 2 0 2 3 B L A C K R O C K A N N U A L R E P O R T T O S H A R E H O L D E R S |
Financial Highlights (continued)
(For a share outstanding throughout each period)
| ECAT | ||||||||||||
| |
Year Ended 12/31/23 |
(a) |
|
Year Ended 12/31/22 |
|
|
Period from 09/27/21 to 12/31/21 |
(b)
| ||||
| Net asset value, beginning of period |
$ | 16.62 | $ | 20.69 | $ | 20.00 | ||||||
|
|
|
|
|
|
|
|||||||
| Net investment income (loss)(c) |
0.35 | 0.18 | (0.04 | ) | ||||||||
| Net realized and unrealized gain (loss) |
2.56 | (3.05 | ) | 0.83 | ||||||||
|
|
|
|
|
|
|
|||||||
| Net increase (decrease) from investment operations |
2.91 | (2.87 | ) | 0.79 | ||||||||
|
|
|
|
|
|
|
|||||||
| Distributions(d) |
||||||||||||
| From net investment income |
(0.35 | ) | (0.50 | ) | (0.05 | ) | ||||||
| From net realized gain |
— | (0.08 | ) | (0.05 | ) | |||||||
| Return of capital |
(1.13 | ) | (0.62 | ) | — | |||||||
|
|
|
|
|
|
|
|||||||
| Total distributions |
(1.48 | ) | (1.20 | ) | (0.10 | ) | ||||||
|
|
|
|
|
|
|
|||||||
| Net asset value, end of period |
$ | 18.05 | $ | 16.62 | $ | 20.69 | ||||||
|
|
|
|
|
|
|
|||||||
| Market price, end of period |
$ | 16.13 | $ | 13.43 | $ | 18.65 | ||||||
|
|
|
|
|
|
|
|||||||
| Total Return(e) |
||||||||||||
| Based on net asset value |
19.50 | % | (12.89 | )% | 4.00 | %(f) | ||||||
|
|
|
|
|
|
|
|||||||
| Based on market price |
32.15 | % | (21.91 | )% | (6.25 | )%(f) | ||||||
|
|
|
|
|
|
|
|||||||
| Ratios to Average Net Assets(g) |
||||||||||||
| Total expenses |
1.36 | %(h) | 1.29 | % | 1.30 | % | ||||||
|
|
|
|
|
|
|
|||||||
| Total expenses after fees waived and/or reimbursed |
1.32 | %(h) | 1.28 | % | 1.30 | %(i) | ||||||
|
|
|
|
|
|
|
|||||||
| Net investment income (loss) |
2.01 | % | 1.02 | % | (0.77 | )%(i) | ||||||
|
|
|
|
|
|
|
|||||||
| Supplemental Data |
||||||||||||
| Net assets, end of period (000) |
$ | 1,838,695 | $ | 1,701,873 | $ | 2,187,581 | ||||||
|
|
|
|
|
|
|
|||||||
| Portfolio turnover rate(j) |
246 | % | 106 | % | 15 | % | ||||||
|
|
|
|
|
|
|
|||||||
| (a) | Consolidated Financial Highlights. |
| (b) | Commencement of operations. |
| (c) | Based on average shares outstanding. |
| (d) | Distributions for annual periods determined in accordance with U.S. federal income tax regulations. |
| (e) | Total returns based on market price, which can be significantly greater or less than the net asset value, may result in substantially different returns. Where applicable, excludes the effects of any sales charges and assumes the reinvestment of distributions at actual reinvestment prices. |
| (f) | Not annualized. |
| (g) | Excludes fees and expenses incurred indirectly as a result of investments in underlying funds. |
| (h) | Includes non-recurring expenses of proxy cost. Without these costs, total expenses and total expenses after fees waived and/or reimbursed would have been 1.31% and 1.27%, respectively. |
| (i) | Annualized. |
| (j) | Includes mortgage dollar roll transactions (“MDRs”). Additional information regarding portfolio turnover rate is as follows: |
| |
Year Ended 12/31/23 |
(a) |
|
Year Ended 12/31/22 |
|
|
Period from 09/27/21 to 12/31/21 |
(b)
| ||||
| Portfolio turnover rate (excluding MDRs) |
152 | % | 95 | % | 15 | % | ||||||
|
|
|
|
|
|
|
|||||||
See notes to consolidated financial statements.
| F I N A N C I A L H I G H L I G H T S |
77 |
Notes to Consolidated Financial Statements
| 1. | ORGANIZATION |
The following are registered under the Investment Company Act of 1940, as amended (the “1940 Act”), as closed-end management investment companies and are referred to herein collectively as the “Trusts”, or individually as a “Trust”:
|
|
||||||||||||
| Trust Name | Herein Referred To As | Organized | Diversification Classification |
|||||||||
|
|
||||||||||||
| BlackRock Capital Allocation Term Trust |
BCAT | Maryland | Diversified* | |||||||||
| BlackRock ESG Capital Allocation Term Trust |
ECAT | Maryland | Non-diversified | |||||||||
|
|
||||||||||||
| * | The Trust’s classification changed from non-diversified to diversified during the reporting period. |
The Boards of Trustees of the Trusts are collectively referred to throughout this report as the “Board,” and the trustees thereof are collectively referred to throughout this report as “Trustees”. The Trusts determine and make available for publication the net asset values (“NAVs”) of their Common Shares on a daily basis.
On March 31, 2023, the Board approved a proposal to change the name of BlackRock Capital Allocation Trust and BlackRock ESG Capital Allocation Trust, effective as of April 05, 2023, to BlackRock Capital Allocation Term Trust and BlackRock ESG Capital Allocation Term Trust, respectively. There were no changes to the Trusts’ investment policies or strategies in conjunction with the name changes.
The Trusts, together with certain other registered investment companies advised by BlackRock Advisors, LLC (the “Manager”) or its affiliates, are included in a complex of funds referred to as the BlackRock Fixed-Income Complex.
Basis of Consolidation: The accompanying consolidated financial statements of BCAT include the account of Cayman Capital Allocation Fund, Ltd. (the “BCAT Cayman Subsidiary”), which is a wholly-owned subsidiary of BCAT and primarily invests in commodity-related instruments and other derivatives. The BCAT Cayman Subsidiary enables BCAT to hold these commodity-related instruments and satisfy regulated investment company tax requirements. BCAT may invest up to 25% of its total assets in the BCAT Cayman Subsidiary. The net assets of the BCAT Cayman Subsidiary as of period end were $4,707,381, which is 0.3% of BCAT’s consolidated net assets. Intercompany accounts and transactions, if any, have been eliminated. The BCAT Cayman Subsidiary is subject to the same investment policies and restrictions that apply to BCAT, except that the BCAT Cayman Subsidiary may invest without limitation in commodity-related instruments.
The accompanying consolidated financial statements of ECAT include the account of Cayman ESG Capital Allocation Fund, Ltd. (the “ECAT Cayman Subsidiary”, and together with the BCAT Cayman Subsidiary, the “Cayman Subsidiaries”), which is a wholly-owned subsidiary of the ECAT and primarily invests in commodity-related instruments and other derivatives. The ECAT Cayman Subsidiary enables ECAT to hold these commodity related instruments and satisfy regulated investment company tax requirements. ECAT may invest up to 25% of its total assets in the ECAT Cayman Subsidiary. The net assets of the ECAT Cayman Subsidiary as of period end were $106,207, which is less than 0.1% of ECAT’s consolidated net assets. Intercompany accounts and transactions, if any, have been eliminated. The ECAT Cayman Subsidiary is subject to the same investment policies and restrictions that apply to ECAT, except that the ECAT Cayman Subsidiary may invest without limitation in commodity-related instruments.
The accompanying consolidated financial statements of BCAT include the account of BCAT Subsidiary LLC (the “BCAT Taxable Subsidiary”), which is a wholly-owned subsidiary of BCAT and primarily invests in commodity-related instruments and other derivatives. The BCAT Taxable Subsidiary enables BCAT to hold these commodity-related instruments and satisfy regulated investment company tax requirements. BCAT may invest up to 25% of its total assets in the BCAT Taxable Subsidiary. The net assets of the BCAT Taxable Subsidiary as of period end were $2,817,687, which is 0.2% of BCAT’s consolidated net assets. Intercompany accounts and transactions, if any, have been eliminated. The BCAT Taxable Subsidiary is subject to the same investment policies and restrictions that apply to BCAT, except that the BCAT Taxable Subsidiary may invest without limitation in commodity-related instruments.
| 2. | SIGNIFICANT ACCOUNTING POLICIES |
The consolidated financial statements are prepared in conformity with accounting principles generally accepted in the United States of America (“U.S. GAAP”), which may require management to make estimates and assumptions that affect the reported amounts of assets and liabilities in the consolidated financial statements, disclosure of contingent assets and liabilities at the date of the consolidated financial statements and the reported amounts of increases and decreases in net assets from operations during the reporting period. Actual results could differ from those estimates. Each Trust is considered an investment company under U.S. GAAP and follows the accounting and reporting guidance applicable to investment companies. Below is a summary of significant accounting policies:
Investment Transactions and Income Recognition: For financial reporting purposes, investment transactions are recorded on the dates the transactions are executed. Realized gains and losses on investment transactions are determined using the specific identification method. Dividend income and capital gain distributions, if any, are recorded on the ex-dividend dates. Non-cash dividends, if any, are recorded on the ex-dividend dates at fair value. Dividends from foreign securities where the ex-dividend dates may have passed are subsequently recorded when the Trusts are informed of the ex-dividend dates. Under the applicable foreign tax laws, a withholding tax at various rates may be imposed on capital gains, dividends and interest. Upon notification from issuers, a portion of the dividend income received from a real estate investment trust may be redesignated as a reduction of cost of the related investment and/or realized gain. Interest income, including amortization and accretion of premiums and discounts on debt securities, is recognized daily on an accrual basis. Income, expenses and realized and unrealized gains and losses are allocated daily to each class based on its relative net assets. For convertible securities, premiums attributable to the debt instrument are amortized, but premiums attributable to the conversion feature are not amortized.
Foreign Currency Translation: Each Trust’s books and records are maintained in U.S. dollars. Securities and other assets and liabilities denominated in foreign currencies are translated into U.S. dollars using exchange rates determined as of the close of trading on the New York Stock Exchange (“NYSE”). Purchases and sales of investments are recorded at the rates of exchange prevailing on the respective dates of such transactions. Generally, when the U.S. dollar rises in value against a foreign currency, the investments denominated in that currency will lose value; the opposite effect occurs if the U.S. dollar falls in relative value.
| 78 | 2 0 2 3 B L A C K R O C K A N N U A L R E P O R T T O S H A R E H O L D E R S |
Notes to Consolidated Financial Statements (continued)
Each Trust does not isolate the effect of fluctuations in foreign exchange rates from the effect of fluctuations in the market prices of investments for financial reporting purposes. Accordingly, the effects of changes in exchange rates on investments are not segregated in the Consolidated Statements of Operations from the effects of changes in market prices of those investments, but are included as a component of net realized and unrealized gain (loss) from investments. Each Trust reports realized currency gains (losses) on foreign currency related transactions as components of net realized gain (loss) for financial reporting purposes, whereas such components are generally treated as ordinary income for U.S. federal income tax purposes.
Foreign Taxes: The Trusts may be subject to foreign taxes (a portion of which may be reclaimable) on income, stock dividends, capital gains on investments, or certain foreign currency transactions. All foreign taxes are recorded in accordance with the applicable foreign tax regulations and rates that exist in the foreign jurisdictions in which each Trust invests. These foreign taxes, if any, are paid by each Trust and are reflected in its Consolidated Statements of Operations as follows: foreign taxes withheld at source are presented as a reduction of income, foreign taxes on securities lending income are presented as a reduction of securities lending income, foreign taxes on stock dividends are presented as “Foreign taxes withheld”, and foreign taxes on capital gains from sales of investments and foreign taxes on foreign currency transactions are included in their respective net realized gain (loss) categories. Foreign taxes payable or deferred as of December 31, 2023, if any, are disclosed in the Consolidated Statements of Assets and Liabilities.
The Trusts file withholding tax reclaims in certain jurisdictions to recover a portion of amounts previously withheld. The Trusts may record a reclaim receivable based on collectability, which includes factors such as the jurisdiction’s applicable laws, payment history and market convention. The Consolidated Statements of Operations include tax reclaims recorded as well as professional and other fees, if any, associated with recovery of foreign withholding taxes.
Bank Overdraft: The Trusts had outstanding cash disbursements exceeding deposited cash amounts at the custodian during the reporting period. The Trusts are obligated to repay the custodian for any overdraft, including any related costs or expenses, where applicable. For financial reporting purposes, overdraft fees, if any, are included in interest expense in the Consolidated Statements of Operations.
Collateralization: If required by an exchange or counterparty agreement, the Trusts may be required to deliver/deposit cash and/or securities to/with an exchange, or broker-dealer or custodian as collateral for certain investments.
Distributions: Distributions paid by the Trusts are recorded on the ex-dividend dates. Subject to the Trusts’ managed distribution plan, the Trusts intend to make monthly cash distributions to shareholders, which may consist of net investment income, and net realized and unrealized gains on investments and/or return of capital.
The character of distributions is determined in accordance with U.S. federal income tax regulations, which may differ from U.S. GAAP. The portion of distributions that exceeds a Trust’s current and accumulated earnings and profits, which are measured on a tax basis, will constitute a non-taxable return of capital. See Income Tax Information note for the tax character of each Trust’s distributions paid during the period.
Net income and realized gains from investments held by the Cayman Subsidiaries are treated as ordinary income for tax purposes. If a net loss is realized by the Cayman Subsidiaries in any taxable year, the loss will generally not be available to offset the Trusts’ ordinary income and/or capital gains for that year.
Deferred Compensation Plan: Under the Deferred Compensation Plan (the “Plan”) approved by each Trust’s Board, the trustees who are not “interested persons” of the Trusts, as defined in the 1940 Act (“Independent Trustees”), may defer a portion of their annual complex-wide compensation. Deferred amounts earn an approximate return as though equivalent dollar amounts had been invested in common shares of certain funds in the BlackRock Fixed-Income Complex selected by the Independent Trustees. This has the same economic effect for the Independent Trustees as if the Independent Trustees had invested the deferred amounts directly in certain funds in the BlackRock Fixed-Income Complex.
The Plan is not funded and obligations thereunder represent general unsecured claims against the general assets of each Trust, as applicable. Deferred compensation liabilities, if any, are included in the Trustees’ and Officer’s fees payable in the Consolidated Statements of Assets and Liabilities and will remain as a liability of the Trusts until such amounts are distributed in accordance with the Plan. Net appreciation (depreciation) in the value of participants’ deferral accounts is allocated among the participating funds in the BlackRock Fixed-Income Complex and reflected as Trustees and Officer expense on the Consolidated Statements of Operations. The Trustees and Officer expense may be negative as a result of a decrease in value of the deferred accounts.
Indemnifications: In the normal course of business, a Trust enters into contracts that contain a variety of representations that provide general indemnification. A Trust’s maximum exposure under these arrangements is unknown because it involves future potential claims against a Trust, which cannot be predicted with any certainty.
Other: Expenses directly related to a Trust are charged to that Trust. Other operating expenses shared by several funds, including other funds managed by the Manager, are prorated among those funds on the basis of relative net assets or other appropriate methods.
| 3. | INVESTMENT VALUATION AND FAIR VALUE MEASUREMENTS |
Investment Valuation Policies: Each Trust’s investments are valued at fair value (also referred to as “market value” within the consolidated financial statements) each day that the Trust is open for business and, for financial reporting purposes, as of the report date. U.S. GAAP defines fair value as the price a fund would receive to sell an asset or pay to transfer a liability in an orderly transaction between market participants at the measurement date. The Board has approved the designation of each Trust’s Manager as the valuation designee for each Trust. Each Trust determines the fair values of its financial instruments using various independent dealers or pricing services under the Manager’s policies. If a security’s market price is not readily available or does not otherwise accurately represent the fair value of the security, the security will be valued in accordance with the Manager’s policies and procedures as reflecting fair value. The Manager has formed a committee (the “Valuation Committee”) to develop pricing policies and procedures and to oversee the pricing function for all financial instruments, with assistance from other BlackRock pricing committees.
| N O T E S T O C O N S O L I D A T E D F I N A N C I A L S T A T E M E N T S |
79 |
Notes to Consolidated Financial Statements (continued)
Fair Value Inputs and Methodologies: The following methods and inputs are used to establish the fair value of each Trust’s assets and liabilities:
| • | Equity investments traded on a recognized securities exchange are valued at that day’s official closing price, as applicable, on the exchange where the stock is primarily traded. Equity investments traded on a recognized exchange for which there were no sales on that day may be valued at the last available bid (long positions) or ask (short positions) price. |
| • | Fixed-income investments for which market quotations are readily available are generally valued using the last available bid price or current market quotations provided by independent dealers or third-party pricing services. Floating rate loan interests are valued at the mean of the bid prices from one or more independent brokers or dealers as obtained from a third-party pricing service. Pricing services generally value fixed-income securities assuming orderly transactions of an institutional round lot size, but a fund may hold or transact in such securities in smaller, odd lot sizes. Odd lots may trade at lower prices than institutional round lots. The pricing services may use matrix pricing or valuation models that utilize certain inputs and assumptions to derive values, including transaction data (e.g., recent representative bids and offers), market data, credit quality information, perceived market movements, news, and other relevant information. Certain fixed-income securities, including asset-backed and mortgage related securities may be valued based on valuation models that consider the estimated cash flows of each tranche of the entity, establish a benchmark yield and develop an estimated tranche specific spread to the benchmark yield based on the unique attributes of the tranche. The amortized cost method of valuation may be used with respect to debt obligations with sixty days or less remaining to maturity unless the Manager determines such method does not represent fair value. |
| • | Exchange-traded funds (“ETFs”) and closed-end funds traded on a recognized securities exchange are valued at that day’s official closing price, as applicable, on the exchange where the stock is primarily traded. ETFs and closed-end funds traded on a recognized exchange for which there were no sales on that day may be valued at the last available bid (long positions) or ask (short positions) price. |
| • | Investments in open-end U.S. mutual funds (including money market funds) are valued at that day’s published NAV. |
| • | The Trusts value their investment in SL Liquidity Series, LLC, Money Market Series (the “Money Market Series”) at fair value, which is ordinarily based upon their pro rata ownership in the underlying fund’s net assets. |
| • | Futures contracts are valued based on that day’s last reported settlement or trade price on the exchange where the contract is traded. |
| • | Forward foreign currency exchange contracts are valued at the mean between the bid and ask prices and are determined as of the close of trading on the NYSE based on that day’s prevailing forward exchange rate for the underlying currencies. |
| • | Exchange-traded options are valued at the mean between the last bid and ask prices at the close of the options market in which the options trade. An exchange-traded option for which there is no mean price is valued at the last bid (long positions) or ask (short positions) price. If no bid or ask price is available, the prior day’s price will be used, unless it is determined that the prior day’s price no longer reflects the fair value of the option. Over-the-counter (“OTC”) options and options on swaps (“swaptions”) are valued by an independent pricing service using a mathematical model, which incorporates a number of market data factors, such as the trades and prices of the underlying instruments. |
| • | Swap agreements are valued utilizing quotes received daily by independent pricing services or through brokers, which are derived using daily swap curves and models that incorporate a number of market data factors, such as discounted cash flows, trades and values of the underlying reference instruments. |
Generally, trading in foreign instruments is substantially completed each day at various times prior to the close of trading on the NYSE. Each business day, the Trusts use current market factors supplied by independent pricing services to value certain foreign instruments (“Systematic Fair Value Price”). The Systematic Fair Value Price is designed to value such foreign securities at fair value as of the close of trading on the NYSE, which follows the close of the local markets.
If events (e.g., market volatility, company announcement or a natural disaster) occur that are expected to materially affect the value of such investment, or in the event that application of these methods of valuation results in a price for an investment that is deemed not to be representative of the market value of such investment, or if a price is not available, the investment will be valued by the Valuation Committee in accordance with the Manager’s policies and procedures as reflecting fair value (“Fair Valued Investments”). The fair valuation approaches that may be used by the Valuation Committee include market approach, income approach and cost approach. Valuation techniques such as discounted cash flow, use of market comparables and matrix pricing are types of valuation approaches and are typically used in determining fair value. When determining the price for Fair Valued Investments, the Valuation Committee seeks to determine the price that each Trust might reasonably expect to receive or pay from the current sale or purchase of that asset or liability in an arm’s-length transaction. Fair value determinations shall be based upon all available factors that the Valuation Committee deems relevant and consistent with the principles of fair value measurement.
For investments in equity or debt issued by privately held companies or funds (“Private Company” or collectively, the “Private Companies”) and other Fair Valued Investments, the fair valuation approaches that are used by the Valuation Committee and third-party pricing services utilized by the Valuation Committee include one or a combination of, but not limited to, the following inputs.
| Standard Inputs Generally Considered By The Valuation Committee And Third-Party Pricing Services | ||
| Market approach |
(i) recent market transactions, including subsequent rounds of financing, in the underlying investment or comparable issuers; | |
| (ii) recapitalizations and other transactions across the capital structure; and | ||
| (iii) market multiples of comparable issuers. | ||
| Income approach |
(i) future cash flows discounted to present and adjusted as appropriate for liquidity, credit, and/or market risks; | |
| (ii) quoted prices for similar investments or assets in active markets; and |
| 80 | 2 0 2 3 B L A C K R O C K A N N U A L R E P O R T T O S H A R E H O L D E R S |
Notes to Consolidated Financial Statements (continued)
| Standard Inputs Generally Considered By The Valuation Committee And Third-Party Pricing Services | ||
| (iii) other risk factors, such as interest rates, yield curves, volatilities, prepayment speeds, loss severities, credit risks, recovery rates, liquidation amounts and/or default rates. | ||
| Cost approach |
(i) audited or unaudited financial statements, investor communications and financial or operational metrics issued by the Private Company; | |
| (ii) changes in the valuation of relevant indices or publicly traded companies comparable to the Private Company; | ||
| (iii) relevant news and other public sources; and | ||
| (iv) known secondary market transactions in the Private Company’s interests and merger or acquisition activity in companies comparable to the Private Company. |
Investments in series of preferred stock issued by Private Companies are typically valued utilizing market approach in determining the enterprise value of the company. Such investments often contain rights and preferences that differ from other series of preferred and common stock of the same issuer. Enterprise valuation techniques such as an option pricing model (“OPM”), a probability weighted expected return model (“PWERM”), current value method or a hybrid of those techniques are used as deemed appropriate under the circumstances. The use of these valuation techniques involves a determination of the exit scenarios of the investment in order to appropriately allocate the enterprise value of the company among the various parts of its capital structure.
The Private Companies are not subject to the public company disclosure, timing, and reporting standards applicable to other investments held by a Trust. Typically, the most recently available information by a Private Company is as of a date that is earlier than the date a Trust is calculating its NAV. This factor may result in a difference between the value of the investment and the price a Trust could receive upon the sale of the investment.
Fair Value Hierarchy: Various inputs are used in determining the fair value of financial instruments. These inputs to valuation techniques are categorized into a fair value hierarchy consisting of three broad levels for financial reporting purposes as follows:
| • | Level 1 – Unadjusted price quotations in active markets/exchanges for identical assets or liabilities that each Trust has the ability to access; |
| • | Level 2 – Other observable inputs (including, but not limited to, quoted prices for similar assets or liabilities in markets that are active, quoted prices for identical or similar assets or liabilities in markets that are not active, inputs other than quoted prices that are observable for the assets or liabilities (such as interest rates, yield curves, volatilities, prepayment speeds, loss severities, credit risks and default rates) or other market–corroborated inputs); and |
| • | Level 3 – Unobservable inputs based on the best information available in the circumstances, to the extent observable inputs are not available (including the Valuation Committee’s assumptions used in determining the fair value of financial instruments). |
The hierarchy gives the highest priority to unadjusted quoted prices in active markets for identical assets or liabilities (Level 1 measurements) and the lowest priority to unobservable inputs (Level 3 measurements). Accordingly, the degree of judgment exercised in determining fair value is greatest for instruments categorized in Level 3. The inputs used to measure fair value may fall into different levels of the fair value hierarchy. In such cases, for disclosure purposes, the fair value hierarchy classification is determined based on the lowest level input that is significant to the fair value measurement in its entirety. Investments classified within Level 3 have significant unobservable inputs used by the Valuation Committee in determining the price for Fair Valued Investments. Level 3 investments include equity or debt issued by Private Companies that may not have a secondary market and/or may have a limited number of investors. The categorization of a value determined for financial instruments is based on the pricing transparency of the financial instruments and is not necessarily an indication of the risks associated with investing in those securities.
As of December 31, 2023, certain investments of BCAT and ECAT were fair valued using NAV as a practical expedient as no quoted market value is available and therefore have been excluded from the fair value hierarchy.
| 4. | SECURITIES AND OTHER INVESTMENTS |
Asset-Backed and Mortgage-Backed Securities: Asset-backed securities are generally issued as pass-through certificates or as debt instruments. Asset-backed securities issued as pass-through certificates represent undivided fractional ownership interests in an underlying pool of assets. Asset-backed securities issued as debt instruments, which are also known as collateralized obligations, are typically issued as the debt of a special purpose entity organized solely for the purpose of owning such assets and issuing such debt. Asset-backed securities are often backed by a pool of assets representing the obligations of a number of different parties. The yield characteristics of certain asset-backed securities may differ from traditional debt securities. One such major difference is that all or a principal part of the obligations may be prepaid at any time because the underlying assets (i.e., loans) may be prepaid at any time. As a result, a decrease in interest rates in the market may result in increases in the level of prepayments as borrowers, particularly mortgagors, refinance and repay their loans. An increased prepayment rate with respect to an asset-backed security will have the effect of shortening the maturity of the security. In addition, a fund may subsequently have to reinvest the proceeds at lower interest rates. If a fund has purchased such an asset-backed security at a premium, a faster than anticipated prepayment rate could result in a loss of principal to the extent of the premium paid.
For mortgage pass-through securities (the “Mortgage Assets”) there are a number of important differences among the agencies and instrumentalities of the U.S. Government that issue mortgage-related securities and among the securities that they issue. For example, mortgage-related securities guaranteed by Ginnie Mae are guaranteed as to the timely payment of principal and interest by Ginnie Mae and such guarantee is backed by the full faith and credit of the United States. However, mortgage-related securities issued by Freddie Mac and Fannie Mae, including Freddie Mac and Fannie Mae guaranteed mortgage pass-through certificates, which are solely the obligations of Freddie Mac and Fannie Mae, are not backed by or entitled to the full faith and credit of the United States, but are supported by the right of the issuer to borrow from the U.S. Treasury.
Non-agency mortgage-backed securities are securities issued by non-governmental issuers and have no direct or indirect government guarantees of payment and are subject to various risks. Non-agency mortgage loans are obligations of the borrowers thereunder only and are not typically insured or guaranteed by any other person or entity. The
| N O T E S T O C O N S O L I D A T E D F I N A N C I A L S T A T E M E N T S |
81 |
Notes to Consolidated Financial Statements (continued)
ability of a borrower to repay a loan is dependent upon the income or assets of the borrower. A number of factors, including a general economic downturn, acts of God, terrorism, social unrest and civil disturbances, may impair a borrower’s ability to repay its loans.
Collateralized Debt Obligations: Collateralized debt obligations (“CDOs”), including collateralized bond obligations (“CBOs”) and collateralized loan obligations (“CLOs”), are types of asset-backed securities. A CDO is an entity that is backed by a diversified pool of debt securities (CBOs) or syndicated bank loans (CLOs). The cash flows of the CDO can be split into multiple segments, called “tranches,” which will vary in risk profile and yield. The riskiest segment is the subordinated or “equity” tranche. This tranche bears the greatest risk of defaults from the underlying assets in the CDO and serves to protect the other, more senior, tranches from default in all but the most severe circumstances. Since it is shielded from defaults by the more junior tranches, a “senior” tranche will typically have higher credit ratings and lower yields than their underlying securities, and often receive investment grade ratings from one or more of the nationally recognized rating agencies. Despite the protection from the more junior tranches, senior tranches can experience substantial losses due to actual defaults, increased sensitivity to future defaults and the disappearance of one or more protecting tranches as a result of changes in the credit profile of the underlying pool of assets.
Multiple Class Pass-Through Securities: Multiple class pass-through securities, including collateralized mortgage obligations (“CMOs”) and commercial mortgage-backed securities, may be issued by Ginnie Mae, U.S. Government agencies or instrumentalities or by trusts formed by private originators of, or investors in, mortgage loans. In general, CMOs are debt obligations of a legal entity that are collateralized by a pool of residential or commercial mortgage loans or Mortgage Assets. The payments on these are used to make payments on the CMOs or multiple pass-through securities. Multiple class pass-through securities represent direct ownership interests in the Mortgage Assets. Classes of CMOs include interest only (“IOs”), principal only (“POs”), planned amortization classes and targeted amortization classes. IOs and POs are stripped mortgage-backed securities representing interests in a pool of mortgages, the cash flow from which has been separated into interest and principal components. IOs receive the interest portion of the cash flow while POs receive the principal portion. IOs and POs can be extremely volatile in response to changes in interest rates. As interest rates rise and fall, the value of IOs tends to move in the same direction as interest rates. POs perform best when prepayments on the underlying mortgages rise since this increases the rate at which the principal is returned and the yield to maturity on the PO. When payments on mortgages underlying a PO are slower than anticipated, the life of the PO is lengthened and the yield to maturity is reduced. If the underlying Mortgage Assets experience greater than anticipated prepayments of principal, a fund’s initial investment in the IOs may not fully recoup.
Zero-Coupon Bonds: Zero-coupon bonds are normally issued at a significant discount from face value and do not provide for periodic interest payments. These bonds may experience greater volatility in market value than other debt obligations of similar maturity which provide for regular interest payments.
Capital Securities and Trust Preferred Securities: Capital securities, including trust preferred securities, are typically issued by corporations, generally in the form of interest-bearing notes with preferred securities characteristics. In the case of trust preferred securities, an affiliated business trust of a corporation issues these securities, generally in the form of beneficial interests in subordinated debentures or similarly structured securities. The securities can be structured with either a fixed or adjustable coupon that can have either a perpetual or stated maturity date. For trust preferred securities, the issuing bank or corporation pays interest to the trust, which is then distributed to holders of these securities as a dividend. Dividends can be deferred without creating an event of default or acceleration, although maturity cannot take place unless all cumulative payment obligations have been met. The deferral of payments does not affect the purchase or sale of these securities in the open market. These securities generally are rated below that of the issuing company’s senior debt securities and are freely callable at the issuer’s option.
Preferred Stocks: Preferred stock has a preference over common stock in liquidation (and generally in receiving dividends as well), but is subordinated to the liabilities of the issuer in all respects. As a general rule, the market value of preferred stock with a fixed dividend rate and no conversion element varies inversely with interest rates and perceived credit risk, while the market price of convertible preferred stock generally also reflects some element of conversion value. Because preferred stock is junior to debt securities and other obligations of the issuer, deterioration in the credit quality of the issuer will cause greater changes in the value of a preferred stock than in a more senior debt security with similar stated yield characteristics. Unlike interest payments on debt securities, preferred stock dividends are payable only if declared by the issuer’s board of directors. Preferred stock also may be subject to optional or mandatory redemption provisions.
Warrants: Warrants entitle a fund to purchase a specified number of shares of common stock and are non-income producing. The purchase price and number of shares are subject to adjustment under certain conditions until the expiration date of the warrants, if any. If the price of the underlying stock does not rise above the strike price before the warrant expires, the warrant generally expires without any value and a fund will lose any amount it paid for the warrant. Thus, investments in warrants may involve more risk than investments in common stock. Warrants may trade in the same markets as their underlying stock; however, the price of the warrant does not necessarily move with the price of the underlying stock.
Floating Rate Loan Interests: Floating rate loan interests are typically issued to companies (the “borrower”) by banks, other financial institutions, or privately and publicly offered corporations (the “lender”). Floating rate loan interests are generally non-investment grade, often involve borrowers whose financial condition is troubled or uncertain and companies that are highly leveraged or in bankruptcy proceedings. In addition, transactions in floating rate loan interests may settle on a delayed basis, which may result in proceeds from the sale not being readily available for a fund to make additional investments or meet its redemption obligations. Floating rate loan interests may include fully funded term loans or revolving lines of credit. Floating rate loan interests are typically senior in the corporate capital structure of the borrower. Floating rate loan interests generally pay interest at rates that are periodically determined by reference to a base lending rate plus a premium. Since the rates reset only periodically, changes in prevailing interest rates (and particularly sudden and significant changes) can be expected to cause some fluctuations in the NAV of a fund to the extent that it invests in floating rate loan interests. The base lending rates are generally the lending rate offered by one or more European banks, such as the Secured Overnight Financing Rate (“SOFR”), the prime rate offered by one or more U.S. banks or the certificate of deposit rate. Floating rate loan interests may involve foreign borrowers, and investments may be denominated in foreign currencies. These investments are treated as investments in debt securities for purposes of a fund’s investment policies.
When a fund purchases a floating rate loan interest, it may receive a facility fee and when it sells a floating rate loan interest, it may pay a facility fee. On an ongoing basis, a fund may receive a commitment fee based on the undrawn portion of the underlying line of credit amount of a floating rate loan interest. Facility and commitment fees are typically amortized to income over the term of the loan or term of the commitment, respectively. Consent and amendment fees are recorded to income as earned. Prepayment penalty fees, which may be received by a fund upon the prepayment of a floating rate loan interest by a borrower, are recorded as realized gains. A fund may invest in multiple series or tranches of a loan. A different series or tranche may have varying terms and carry different associated risks.
| 82 | 2 0 2 3 B L A C K R O C K A N N U A L R E P O R T T O S H A R E H O L D E R S |
Notes to Consolidated Financial Statements (continued)
Floating rate loan interests are usually freely callable at the borrower’s option. A fund may invest in such loans in the form of participations in loans (“Participations”) or assignments (“Assignments”) of all or a portion of loans from third parties. Participations typically will result in a fund having a contractual relationship only with the lender, not with the borrower. A fund has the right to receive payments of principal, interest and any fees to which it is entitled only from the lender selling the Participation and only upon receipt by the lender of the payments from the borrower. In connection with purchasing Participations, a fund generally will have no right to enforce compliance by the borrower with the terms of the loan agreement, nor any rights of offset against the borrower. A fund may not benefit directly from any collateral supporting the loan in which it has purchased the Participation. As a result, a fund assumes the credit risk of both the borrower and the lender that is selling the Participation. A fund’s investment in loan participation interests involves the risk of insolvency of the financial intermediaries who are parties to the transactions. In the event of the insolvency of the lender selling the Participation, a fund may be treated as a general creditor of the lender and may not benefit from any offset between the lender and the borrower. Assignments typically result in a fund having a direct contractual relationship with the borrower, and a fund may enforce compliance by the borrower with the terms of the loan agreement.
In connection with floating rate loan interests, the Trusts may also enter into unfunded floating rate loan interests (“commitments”). In connection with these commitments, a fund earns a commitment fee, typically set as a percentage of the commitment amount. Such fee income, which is included in interest income in the Consolidated Statements of Operations, is recognized ratably over the commitment period. Unfunded floating rate loan interests are marked-to-market daily, and any unrealized appreciation (depreciation) is included in the Consolidated Statements of Assets and Liabilities and Consolidated Statements of Operations. As of period end, the Trusts had the following unfunded floating rate loan interests:
|
|
||||||||||||||||||
| Trust Name | Borrower | Par | Commitment Amount |
Value | Unrealized Appreciation (Depreciation) |
|||||||||||||
|
|
||||||||||||||||||
| BCAT |
CML ST Regis Aspen | $ | 62,617 | $ | 62,427 | $ | 62,618 | $ | 191 | |||||||||
| Coreweave Compute Acquisition Co. II, LLC |
2,988,801 | 2,988,801 | 2,940,382 | (48,419) | ||||||||||||||
| Helios Service Partners LLC |
534,813 | 532,647 | 531,497 | (1,150) | ||||||||||||||
| Vedanta Hold Mauritius II Ltd. |
1,963,000 | 1,963,000 | 1,963,000 | — | ||||||||||||||
|
|
|
|||||||||||||||||
| $ | (49,378) | |||||||||||||||||
|
|
|
|||||||||||||||||
| ECAT |
Coreweave Compute Acquisition Co. II, LLC | $ | 2,919,622 | $ | 2,919,622 | $ | 2,872,324 | (47,298) | ||||||||||
| Helios Service Partners LLC |
525,410 | 519,689 | 522,153 | 2,464 | ||||||||||||||
|
|
|
|||||||||||||||||
| $ | (44,834) | |||||||||||||||||
|
|
|
|||||||||||||||||
Forward Commitments, When-Issued and Delayed Delivery Securities: The Trusts may purchase securities on a when-issued basis and may purchase or sell securities on a forward commitment basis. Settlement of such transactions normally occurs within a month or more after the purchase or sale commitment is made. The Trusts may purchase securities under such conditions with the intention of actually acquiring them but may enter into a separate agreement to sell the securities before the settlement date. Since the value of securities purchased may fluctuate prior to settlement, the Trusts may be required to pay more at settlement than the security is worth. In addition, a fund is not entitled to any of the interest earned prior to settlement. When purchasing a security on a delayed delivery basis, the Trusts assume the rights and risks of ownership of the security, including the risk of price and yield fluctuations. In the event of default by the counterparty, the Trusts’ maximum amount of loss is the unrealized appreciation of unsettled when-issued transactions. These types of securities may be considered unfunded and may obligate the Trusts to make future cash payments. An unfunded commitment is marked-to-market and any unrealized appreciation (depreciation) is separately presented in the Consolidated Statements of Assets and Liabilities and Consolidated Statements of Operations.
TBA Commitments: TBA commitments are forward agreements for the purchase or sale of securities, including mortgage-backed securities for a fixed price, with payment and delivery on an agreed upon future settlement date. The specific securities to be delivered are not identified at the trade date. However, delivered securities must meet specified terms, including issuer, rate and mortgage terms. When entering into TBA commitments, a fund may take possession of or deliver the underlying mortgage-backed securities but can extend the settlement or roll the transaction. TBA commitments involve a risk of loss if the value of the security to be purchased or sold declines or increases, respectively, prior to settlement date, if there are expenses or delays in connection with the TBA transactions, or if the counterparty fails to complete the transaction.
In order to better define contractual rights and to secure rights that will help a fund mitigate its counterparty risk, TBA commitments may be entered into by a fund under Master Securities Forward Transaction Agreements (each, an “MSFTA”). An MSFTA typically contains, among other things, collateral posting terms and netting provisions in the event of default and/or termination event. The collateral requirements are typically calculated by netting the mark-to-market amount for each transaction under such agreement and comparing that amount to the value of the collateral currently pledged by a fund and the counterparty. Cash collateral that has been pledged to cover the obligations of a fund and cash collateral received from the counterparty, if any, is reported separately in the Consolidated Statements of Assets and Liabilities as cash pledged as collateral for TBA commitments or cash received as collateral for TBA commitments, respectively. Non-cash collateral pledged by a fund, if any, is noted in the Consolidated Schedules of Investments. Typically, a fund is permitted to sell, re-pledge or use the collateral it receives; however, the counterparty is not permitted to do so. To the extent amounts due to a fund are not fully collateralized, contractually or otherwise, a fund bears the risk of loss from counterparty non-performance.
Mortgage Dollar Roll Transactions: The Trusts may sell TBA mortgage-backed securities and simultaneously contract to repurchase substantially similar (i.e., same type, coupon and maturity) securities on a specific future date at an agreed upon price. During the period between the sale and repurchase, a fund is not entitled to receive interest and principal payments on the securities sold. Mortgage dollar roll transactions are treated as purchases and sales and a fund realizes gains and losses on these transactions. Mortgage dollar rolls involve the risk that the market value of the securities that a fund is required to purchase may decline below the agreed upon repurchase price of those securities.
Commitments: Commitments are agreements to acquire an investment at a future date (subject to conditions) in connection with a potential public or non-public offering. Such agreements may obligate a fund to make future cash payments. As of December 31, 2023, BCAT and ECAT had outstanding commitments of $7,014,804 and $1,183,000, respectively. These commitments are not included in the net assets of a Trust as of December 31, 2023.
| N O T E S T O C O N S O L I D A T E D F I N A N C I A L S T A T E M E N T S |
83 |
Notes to Consolidated Financial Statements (continued)
Securities Lending: Certain Trusts may lend their securities to approved borrowers, such as brokers, dealers and other financial institutions. The borrower pledges and maintains with the Trusts collateral consisting of cash, an irrevocable letter of credit issued by a bank, or securities issued or guaranteed by the U.S. Government. The initial collateral received by each Trust is required to have a value of at least 102% of the current value of the loaned securities for securities traded on U.S. exchanges and a value of at least 105% for all other securities. The collateral is maintained thereafter at a value equal to at least 100% of the current market value of the securities on loan. The market value of the loaned securities is determined at the close of each business day of the Trust and any additional required collateral is delivered to the Trust, or excess collateral returned by the Trust, on the next business day. During the term of the loan, the Trusts are entitled to all distributions made on or in respect of the loaned securities, but do not receive interest income on securities received as collateral. Loans of securities are terminable at any time and the borrower, after notice, is required to return borrowed securities within the standard time period for settlement of securities transactions.
As of period end, any securities on loan were collateralized by cash and/or U.S. Government obligations. Cash collateral invested by the securities lending agent, BlackRock Investment Management, LLC (“BIM”), if any, is disclosed in the Consolidated Schedules of Investments. Any non-cash collateral received cannot be sold, re-invested or pledged by the Trust, except in the event of borrower default. The securities on loan, if any, are disclosed in the Trusts’ Consolidated Schedules of Investments. The market value of any securities on loan and the value of related collateral, if any, are shown separately in the Consolidated Statements of Assets and Liabilities as a component of investments at value – affiliated and collateral on securities loaned, respectively.
Securities lending transactions are entered into by the Trusts under Master Securities Lending Agreements (each, an “MSLA”), which provide the right, in the event of default (including bankruptcy or insolvency), for the non-defaulting party to liquidate the collateral and calculate a net exposure to the defaulting party or request additional collateral. In the event that a borrower defaults, the Trusts, as lender, would offset the market value of the collateral received against the market value of the securities loaned. When the value of the collateral is greater than that of the market value of the securities loaned, the lender is left with a net amount payable to the defaulting party. However, bankruptcy or insolvency laws of a particular jurisdiction may impose restrictions on or prohibitions against such a right of offset in the event of an MSLA counterparty’s bankruptcy or insolvency. Under the MSLA, absent an event of default, the borrower can resell or re-pledge the loaned securities, and the Trusts can reinvest cash collateral received in connection with loaned securities. Upon an event of default, the parties’ obligations to return the securities or collateral to the other party are extinguished, and the parties can resell or re-pledge the loaned securities or the collateral received in connection with the loaned securities in order to satisfy the defaulting party’s net payment obligation for all transactions under the MSLA. The defaulting party remains liable for any deficiency.
As of period end, the following table is a summary of ECAT’s securities on loan by counterparty which are subject to offset under an MSLA:
|
|
||||||||||||||||
| Trust Name/Counterparty | |
Securities Loaned at Value |
|
|
Cash Collateral Received |
(a) |
|
Non-Cash Collateral Received, at Fair Value |
(a) |
|
Net Amount |
| ||||
|
|
||||||||||||||||
| ECAT |
||||||||||||||||
| J.P. Morgan Securities LLC |
$ | 1,076,749 | $ | (1,076,749 | ) | $ | — | $ | — | |||||||
| Jefferies LLC |
616,101 | (616,101 | ) | — | — | |||||||||||
| Mizuho Securities USA LLC |
1,587,418 | (1,587,418 | ) | — | — | |||||||||||
| Toronto-Dominion Bank |
119,706 | (119,706 | ) | — | — | |||||||||||
|
|
|
|
|
|
|
|
|
|||||||||
| $ | 3,399,974 | $ | (3,399,974 | ) | $ | — | $ | — | ||||||||
|
|
|
|
|
|
|
|
|
|||||||||
| (a) | Collateral received, if any, in excess of the market value of securities on loan is not presented in this table. The total cash collateral received by each Trust is disclosed in the Trust’s Consolidated Statements of Assets and Liabilities. |
The risks of securities lending include the risk that the borrower may not provide additional collateral when required or may not return the securities when due. To mitigate these risks, the Trusts benefit from a borrower default indemnity provided by BIM. BIM’s indemnity allows for full replacement of the securities loaned to the extent the collateral received does not cover the value on the securities loaned in the event of borrower default. Each Trust could incur a loss if the value of an investment purchased with cash collateral falls below the market value of loaned securities or if the value of an investment purchased with cash collateral falls below the value of the original cash collateral received. Such losses are borne entirely by the Trusts.
| 5. | DERIVATIVE FINANCIAL INSTRUMENTS |
The Trusts engage in various portfolio investment strategies using derivative contracts both to increase the returns of the Trusts and/or to manage their exposure to certain risks such as credit risk, equity risk, interest rate risk, foreign currency exchange rate risk, commodity price risk or other risks (e.g., inflation risk). Derivative financial instruments categorized by risk exposure are included in the Consolidated Schedules of Investments. These contracts may be transacted on an exchange or OTC.
Futures Contracts: Futures contracts are purchased or sold to gain exposure to, or manage exposure to, changes in interest rates (interest rate risk) and changes in the value of equity securities (equity risk) or foreign currencies (foreign currency exchange rate risk) or carbon credits (commodity risk).
Futures contracts are exchange-traded agreements between the Trusts and a counterparty to buy or sell a specific quantity of an underlying instrument at a specified price and on a specified date. Depending on the terms of a contract, it is settled either through physical delivery of the underlying instrument on the settlement date or by payment of a cash amount on the settlement date. The Trusts may invest in carbon credit futures that are traded on commodity exchanges with the Commodity Futures Trading Commission. Upon entering into a futures contract, the Trusts are required to deposit initial margin with the broker in the form of cash or securities in an amount that varies depending on a contract’s size and risk profile. The initial margin deposit must then be maintained at an established level over the life of the contract. Amounts pledged, which are considered restricted, are included in cash pledged for futures contracts in the Consolidated Statements of Assets and Liabilities.
Securities deposited as initial margin are designated in the Consolidated Schedules of Investments and cash deposited, if any, are shown as cash pledged for futures contracts in the Consolidated Statements of Assets and Liabilities. Pursuant to the contract, the Trusts agree to receive from or pay to the broker an amount of cash equal to the daily fluctuation in market value of the contract (“variation margin”). Variation margin is recorded as unrealized appreciation (depreciation) and, if any, shown as variation margin receivable (or payable) on futures contracts in the Consolidated Statements of Assets and Liabilities. When the contract is closed, a realized gain or loss is recorded in the
| 84 | 2 0 2 3 B L A C K R O C K A N N U A L R E P O R T T O S H A R E H O L D E R S |
Notes to Consolidated Financial Statements (continued)
Consolidated Statements of Operations equal to the difference between the notional amount of the contract at the time it was opened and the notional amount at the time it was closed. The use of futures contracts involves the risk of an imperfect correlation in the movements in the price of futures contracts and interest rates, foreign currency exchange rates or underlying assets.
Forward Foreign Currency Exchange Contracts: Forward foreign currency exchange contracts are entered into to gain or reduce exposure to foreign currencies (foreign currency exchange rate risk).
A forward foreign currency exchange contract is an agreement between two parties to buy and sell a currency at a set exchange rate on a specified date. These contracts help to manage the overall exposure to the currencies in which some of the investments held by the Trusts are denominated and in some cases, may be used to obtain exposure to a particular market. The contracts are traded OTC and not on an organized exchange.
The contract is marked-to-market daily and the change in market value is recorded as unrealized appreciation (depreciation) in the Consolidated Statements of Assets and Liabilities. When a contract is closed, a realized gain or loss is recorded in the Consolidated Statements of Operations equal to the difference between the value at the time it was opened and the value at the time it was closed. Non-deliverable forward foreign currency exchange contracts are settled with the counterparty in cash without the delivery of foreign currency. The use of forward foreign currency exchange contracts involves the risk that the value of a forward foreign currency exchange contract changes unfavorably due to movements in the value of the referenced foreign currencies, and such value may exceed the amount(s) reflected in the Consolidated Statements of Assets and Liabilities. Cash amounts pledged for forward foreign currency exchange contracts are considered restricted and are included in cash pledged as collateral for OTC derivatives in the Consolidated Statements of Assets and Liabilities. The Trust’s risk of loss from counterparty credit risk on OTC derivatives is generally limited to the aggregate unrealized gain netted against any collateral held by the Trust.
Options: The Trusts may purchase and write call and put options to increase or decrease their exposure to the risks of underlying instruments, including equity risk, interest rate risk and/or commodity price risk and/or, in the case of options written, to generate gains from options premiums.
A call option gives the purchaser (holder) of the option the right (but not the obligation) to buy, and obligates the seller (writer) to sell (when the option is exercised) the underlying instrument at the exercise or strike price at any time or at a specified time during the option period. A put option gives the holder the right to sell and obligates the writer to buy the underlying instrument at the exercise or strike price at any time or at a specified time during the option period.
Premiums paid on options purchased and premiums received on options written, as well as the daily fluctuation in market value, are included in investments at value –unaffiliated and options written at value, respectively, in the Consolidated Statements of Assets and Liabilities. When an instrument is purchased or sold through the exercise of an option, the premium is offset against the cost or proceeds of the underlying instrument. When an option expires, a realized gain or loss is recorded in the Consolidated Statements of Operations to the extent of the premiums received or paid. When an option is closed or sold, a gain or loss is recorded in the Consolidated Statements of Operations to the extent the cost of the closing transaction exceeds the premiums received or paid. When the Trusts write a call option, such option is typically “covered,” meaning that they hold the underlying instrument subject to being called by the option counterparty. When the Trusts write a put option, cash is segregated in an amount sufficient to cover the obligation. These amounts, which are considered restricted, are included in cash pledged as collateral for options written in the Consolidated Statements of Assets and Liabilities.
| • | Swaptions — The Trusts may purchase and write options on swaps (“swaptions”) primarily to preserve a return or spread on a particular investment or portion of the Trusts’ holdings, as a duration management technique or to protect against an increase in the price of securities it anticipates purchasing at a later date. The purchaser and writer of a swaption is buying or granting the right to enter into a previously agreed upon interest rate or credit default swap agreement (interest rate risk and/or credit risk) at any time before the expiration of the option. |
| • | Interest rate caps and floors — Interest rate caps and floors are entered into to gain or reduce exposure to interest rates (interest rate risk and/or other risk). Caps are agreements whereby one party agrees to make payments to the other, in return for a premium, to the extent that interest rate indexes exceed a specified rate, or “cap.” Floors are agreements whereby one party agrees to make payments to the other, in return for a premium, to the extent that interest rate indexes fall below a specified rate, or “floor.” The maximum potential amount of future payments that a Fund would be required to make under an interest rate cap would be the notional amount times the percentage increase in interest rates determined by the difference between the interest rate index current value and the value at the time the cap was entered into. |
| • | Foreign currency options — The Trusts may purchase and write foreign currency options, foreign currency futures and options on foreign currency futures to gain or reduce exposure to foreign currencies (foreign currency exchange rate risk). Foreign currency options give the purchaser the right to buy from or sell to the writer a foreign currency at any time before the expiration of the option. |
| • | Barrier options – The Trusts may purchase and write a variety of options with non-standard payout structures or other features (“barrier options”) that are generally traded OTC. |
The Trusts may invest in various types of barrier options, including down-and-out options, down-and-in options, double no-touch options, one-touch options, instant one-touch options, up-and-out options and up-and-in options. Down-and-out options expire worthless to the purchaser if the price of the underlying instrument falls below a specific barrier price level prior to the expiration date. Down-and-in options expire worthless to the purchaser unless the price of the underlying instrument falls below a specific barrier price level prior to the expiration date. Double no-touch options provide the purchaser an agreed-upon payout if the price of the underlying instrument does not reach or surpass predetermined barrier price levels prior to the option’s expiration date. One-touch options and instant one-touch options provide the purchaser an agreed-upon payout if the price of the underlying instrument reaches or surpasses predetermined barrier price levels prior to the expiration date. Up-and-out options expire worthless to the purchaser if the price of the underlying instrument increases beyond a predetermined barrier price level prior to the expiration date. Up-and-in options can only be exercised when the price of the underlying instrument increases beyond a predetermined barrier price level.
| N O T E S T O C O N S O L I D A T E D F I N A N C I A L S T A T E M E N T S |
85 |
Notes to Consolidated Financial Statements (continued)
In purchasing and writing options, the Trusts bear the risk of an unfavorable change in the value of the underlying instrument or the risk that they may not be able to enter into a closing transaction due to an illiquid market. Exercise of a written option could result in the Trusts purchasing or selling a security when they otherwise would not, or at a price different from the current market value.
Swaps: Swap contracts are entered into to manage exposure to issuers, markets and securities. Such contracts are agreements between the Trusts and a counterparty to make periodic net payments on a specified notional amount or a net payment upon termination. Swap agreements are privately negotiated in the OTC market and may be entered into as a bilateral contract (“OTC swaps”) or centrally cleared (“centrally cleared swaps”).
For OTC swaps, any upfront premiums paid and any upfront fees received are shown as swap premiums paid and swap premiums received, respectively, in the Consolidated Statements of Assets and Liabilities and amortized over the term of the contract. The daily fluctuation in market value is recorded as unrealized appreciation (depreciation) on OTC Swaps in the Consolidated Statements of Assets and Liabilities. Payments received or paid are recorded in the Consolidated Statements of Operations as realized gains or losses, respectively. When an OTC swap is terminated, a realized gain or loss is recorded in the Consolidated Statements of Operations equal to the difference between the proceeds from (or cost of) the closing transaction and the Trusts’ basis in the contract, if any. Generally, the basis of the contract is the premium received or paid.
In a centrally cleared swap, immediately following execution of the swap contract, the swap contract is novated to a central counterparty (the “CCP”) and the CCP becomes the Trusts’ counterparty on the swap. Each Trust is required to interface with the CCP through the broker. Upon entering into a centrally cleared swap, each Trust is required to deposit initial margin with the broker in the form of cash or securities in an amount that varies depending on the size and risk profile of the particular swap. Securities deposited as initial margin are designated in the Consolidated Schedules of Investments and cash deposited is shown as cash pledged for centrally cleared swaps in the Consolidated Statements of Assets and Liabilities. Amounts pledged, which are considered restricted cash, are included in cash pledged for centrally cleared swaps in the Consolidated Statements of Assets and Liabilities. Pursuant to the contract, each Trust agrees to receive from or pay to the broker variation margin. Variation margin is recorded as unrealized appreciation (depreciation) and shown as variation margin receivable (or payable) on centrally cleared swaps in the Consolidated Statements of Assets and Liabilities. Payments received from (paid to) the counterparty are amortized over the term of the contract and recorded as realized gains (losses) in the Consolidated Statements of Operations, including those at termination.
| • | Credit default swaps — Credit default swaps are entered into to manage exposure to the market or certain sectors of the market, to reduce risk exposure to defaults of corporate and/or sovereign issuers or to create exposure to corporate and/or sovereign issuers to which a fund is not otherwise exposed (credit risk). |
The Trusts may either buy or sell (write) credit default swaps on single-name issuers (corporate or sovereign), a combination or basket of single-name issuers or traded indexes. Credit default swaps are agreements in which the protection buyer pays fixed periodic payments to the seller in consideration for a promise from the protection seller to make a specific payment should a negative credit event take place with respect to the referenced entity (e.g., bankruptcy, failure to pay, obligation acceleration, repudiation, moratorium or restructuring). As a buyer, if an underlying credit event occurs, the Trusts will either (i) receive from the seller an amount equal to the notional amount of the swap and deliver the referenced security or underlying securities comprising the index, or (ii) receive a net settlement of cash equal to the notional amount of the swap less the recovery value of the security or underlying securities comprising the index. As a seller (writer), if an underlying credit event occurs, the Trusts will either pay the buyer an amount equal to the notional amount of the swap and take delivery of the referenced security or underlying securities comprising the index or pay a net settlement of cash equal to the notional amount of the swap less the recovery value of the security or underlying securities comprising the index.
| • | Total return swaps — Total return swaps are entered into to obtain exposure to a security or market without owning such security or investing directly in such market or to exchange the risk/return of one security or market (e.g., fixed-income) with another security or market (e.g., equity or commodity prices) (equity risk, commodity price risk and/or interest rate risk). |
Total return swaps are agreements in which there is an exchange of cash flows whereby one party commits to make payments based on the total return (distributions plus capital gains/losses) of an underlying instrument, or basket of underlying instruments, in exchange for fixed or floating rate interest payments. If the total return of the instrument(s) or index underlying the transaction exceeds or falls short of the offsetting fixed or floating interest rate obligation, the Trusts receive payment from or make a payment to the counterparty.
Certain total return swaps are designed to function as a portfolio of direct investments in long and short equity positions. This means that the Trust has the ability to trade in and out of these long and short positions within the swap and will receive the economic benefits and risks equivalent to direct investment in these positions, subject to certain adjustments due to events related to the counterparty. Benefits and risks include capital appreciation (depreciation), corporate actions and dividends received and paid, all of which are reflected in the swap’s market value. The market value also includes interest charges and credits (“financing fees”) related to the notional values of the long and short positions and cash balances within the swap. These interest charges and credits are based on a specified benchmark rate plus or minus a specified spread determined based upon the country and/or currency of the positions in the portfolio.
Positions within the swap and financing fees are reset periodically. During a reset, any unrealized appreciation (depreciation) on positions and accrued financing fees become available for cash settlement between the Trusts and the counterparty. The amounts that are available for cash settlement are recorded as realized gains or losses in the Consolidated Statements of Operations. Cash settlement in and out of the swap may occur at a reset date or any other date, at the discretion of the Trusts and the counterparty, over the life of the agreement. Certain swaps have no stated expiration and can be terminated by either party at any time.
| • | Interest rate swaps — Interest rate swaps are entered into to gain or reduce exposure to interest rates or to manage duration, the yield curve or interest rate (interest rate risk). |
Interest rate swaps are agreements in which one party pays a stream of interest payments, either fixed or floating, in exchange for another party’s stream of interest payments, either fixed or floating, on the same notional amount for a specified period of time. In more complex interest rate swaps, the notional principal amount may decline (or amortize) over time.
| 86 | 2 0 2 3 B L A C K R O C K A N N U A L R E P O R T T O S H A R E H O L D E R S |
Notes to Consolidated Financial Statements (continued)
| • | Forward swaps — The Trusts may enter into forward interest rate swaps and forward total return swaps. In a forward swap, each Trust and the counterparty agree to make periodic net payments beginning on a specified date or a net payment at termination. |
| • | Inflation swaps — Inflation swaps are entered into to gain or reduce exposure to inflation (inflation risk). In an inflation swap, one party makes fixed interest payments on a notional principal amount in exchange for another party’s variable payments based on an inflation index, such as the Consumer Price Index. |
Master Netting Arrangements: In order to define its contractual rights and to secure rights that will help it mitigate its counterparty risk, a Trust may enter into an International Swaps and Derivatives Association, Inc. Master Agreement (“ISDA Master Agreement”) or similar agreement with its derivative contract counterparties. An ISDA Master Agreement is a bilateral agreement between a Trust and a counterparty that governs certain OTC derivatives and typically contains, among other things, collateral posting terms and netting provisions in the event of a default and/or termination event. Under an ISDA Master Agreement, a Trust may, under certain circumstances, offset with the counterparty certain derivative financial instruments’ payables and/or receivables with collateral held and/or posted and create one single net payment. The provisions of the ISDA Master Agreement typically permit a single net payment in the event of default including the bankruptcy or insolvency of the counterparty. However, bankruptcy or insolvency laws of a particular jurisdiction may impose restrictions on or prohibitions against the right of offset in bankruptcy, insolvency or other events.
Collateral Requirements: For derivatives traded under an ISDA Master Agreement, the collateral requirements are typically calculated by netting the mark-to-market amount for each transaction under such agreement and comparing that amount to the value of any collateral currently pledged by the Trusts and the counterparty.
Cash collateral that has been pledged to cover obligations of the Trusts and cash collateral received from the counterparty, if any, is reported separately in the Consolidated Statements of Assets and Liabilities as cash pledged as collateral and cash received as collateral, respectively. Non-cash collateral pledged by the Trusts, if any, is noted in the Consolidated Schedules of Investments. Generally, the amount of collateral due from or to a counterparty is subject to a certain minimum transfer amount threshold before a transfer is required, which is determined at the close of business of the Trusts. Any additional required collateral is delivered to/pledged by the Trusts on the next business day. Typically, the counterparty is not permitted to sell, re-pledge or use cash and non-cash collateral it receives. A Trust generally agrees not to use non-cash collateral that it receives but may, absent default or certain other circumstances defined in the underlying ISDA Master Agreement, be permitted to use cash collateral received. In such cases, interest may be paid pursuant to the collateral arrangement with the counterparty. To the extent amounts due to the Trusts from the counterparties are not fully collateralized, each Trust bears the risk of loss from counterparty non-performance. Likewise, to the extent the Trusts have delivered collateral to a counterparty and stand ready to perform under the terms of their agreement with such counterparty, each Trust bears the risk of loss from a counterparty in the amount of the value of the collateral in the event the counterparty fails to return such collateral. Based on the terms of agreements, collateral may not be required for all derivative contracts.
For financial reporting purposes, the Trusts do not offset derivative assets and derivative liabilities that are subject to netting arrangements, if any, in the Consolidated Statements of Assets and Liabilities.
| 6. | INVESTMENT ADVISORY AGREEMENT AND OTHER TRANSACTIONS WITH AFFILIATES |
Investment Advisory: Each Trust entered into an Investment Advisory Agreement with the Manager, the Trusts’ investment adviser and an indirect, wholly-owned subsidiary of BlackRock, to provide investment advisory and administrative services. The Manager is responsible for the management of each Trust’s portfolio and provides the personnel, facilities, equipment and certain other services necessary to the operations of each Trust.
For such services, each Trust pays the Manager a monthly fee at an annual rate equal to 1.25% of the average daily value of each Trust’s managed assets. For purposes of calculating these fees, “managed assets” are determined as total assets of each Trust (including any assets attributable to money borrowed for investment purposes) less the sum of its accrued liabilities (other than money borrowed for investment purposes).
With respect to each Trust, the Manager entered into separate sub-advisory agreements with BlackRock (Singapore) Limited (“BSL”), an affiliate of the Manager. The Manager pays BSL for services it provides for that portion of each Trust for which BSL acts as sub-adviser, a monthly fee that is equal to a percentage of the investment advisory fees paid by each Trust to the Manager.
The Manager provides investment management and other services to the Cayman Subsidiaries and the BCAT Taxable Subsidiary. The Manager does not receive separate compensation from the Cayman Subsidiaries and the BCAT Taxable Subsidiary for providing investment management or administrative services. However, the Trusts pay the Manager based on the Trusts’ net assets, plus the proceeds of any debt securities or outstanding borrowings used for leverage which includes the assets of the Cayman Subsidiaries and the BCAT Taxable Subsidiary.
Expense Waivers and Reimbursements: With respect to each Trust, the Manager contractually agreed to waive its investment advisory fees by the amount of investment advisory fees each Trust pays to the Manager indirectly through its investment in affiliated money market funds (the “affiliated money market fund waiver”) through June 30, 2025. The contractual agreement may be terminated upon 90 days’ notice by a majority of the Independent Trustees, or by a vote of a majority of the outstanding voting securities of a Trust. These amounts are included in fees waived and/or reimbursed by the Manager in the Consolidated Statements of Operations. For the year ended December 31, 2023, the amounts waived were as follows:
| Trust Name | Fees Waived and/or Reimbursed by the Manager |
|||
| BCAT |
$ | 41,089 | ||
| ECAT |
147,413 | |||
The Manager contractually agreed to waive its investment advisory fee with respect to any portion of each Trust’s assets invested in affiliated equity and fixed-income mutual funds and affiliated exchange-traded funds that have a contractual management fee through June 30, 2025. The agreement can be renewed for annual periods thereafter, and may be terminated on 90 days’ notice, each subject to approval by a majority of the Trusts’ Independent Trustees. These amounts are included in fees waived and/or
| N O T E S T O C O N S O L I D A T E D F I N A N C I A L S T A T E M E N T S |
87 |
Notes to Consolidated Financial Statements (continued)
reimbursed by the Manager in the Consolidated Statements of Operations. For the year ended December 31, 2023, the amounts waived in investment advisory fees pursuant to these arrangements were as follows:
| Trust Name | Fees Waived and/or Reimbursed by the Manager |
|||
| BCAT |
$ | 227,260 | ||
| ECAT |
418,631 | |||
With respect to ECAT, the Manager contractually agreed to waive a portion of its investment advisory fees equal to the annual rate of 0.01% of the average daily value of managed assets through December 31, 2023. The contractual agreement may be terminated upon 90 days’ notice by a majority of the Independent Trustees or by a vote of a majority of the outstanding voting securities of the Trust. This amount is included in fees waived and/or reimbursed by the Manager in the Consolidated Statements of Operations. For the year ended December 31, 2023, the Manager waived $178,047 pursuant to this agreement.
Securities Lending: The U.S. Securities and Exchange Commission (“SEC”) has issued an exemptive order which permits BIM, an affiliate of the Manager, to serve as securities lending agent for the Trusts, subject to applicable conditions. As securities lending agent, BIM bears all operational costs directly related to securities lending. The Trusts are responsible for expenses in connection with the investment of cash collateral received for securities on loan (the “collateral investment expenses”). The cash collateral is invested in a private investment company, Money Market Series, managed by the Manager or its affiliates. However, BIM has agreed to cap the collateral investment expenses of the Money Market Series to an annual rate of 0.04%. The investment adviser to the Money Market Series will not charge any advisory fees with respect to shares purchased by the Trusts. The Money Market Series may impose a discretionary liquidity fee of up to 2% of the value withdrawn, if such fee is determined to be in the best interests of the Money Market Series. The Money Market Series seeks current income consistent with maintaining liquidity and preserving capital. Although the Money Market Series is not registered under the 1940 Act, its investments may follow the parameters of investments by a money market fund that is subject to Rule 2a-7 under the 1940 Act.
Securities lending income is equal to the total of income earned from the reinvestment of cash collateral, net of fees and other payments to and from borrowers of securities, and less the collateral investment expenses. Each Trust retains a portion of securities lending income and remits a remaining portion to BIM as compensation for its services as securities lending agent.
Pursuant to the current securities lending agreement, each Trust retains 82% of securities lending income (which excludes collateral investment expenses), and this amount retained can never be less than 70% of the total of securities lending income plus the collateral investment expenses.
In addition, commencing the business day following the date that the aggregate securities lending income earned across the BlackRock Fixed-Income Complex in a calendar year exceeds a specified threshold, each Trust, pursuant to the securities lending agreement, will retain for the remainder of that calendar year securities lending income in an amount equal to 85% of securities lending income (which excludes collateral investment expenses), and this amount retained can never be less than 70% of the total of securities lending income plus the collateral investment expenses.
Prior to January 1, 2023, BIM was permitted to lend ECAT’s securities only when the difference between the borrower rebate rate (i.e., a negotiated interest rate payment for cash collateral pledged in connection with a securities lending transaction) and the risk free rate exceeded a certain level (such securities, the “specials only securities”). Effective January 1, 2023, this limitation no longer applies.
The share of securities lending income earned by each Trust is shown as securities lending income — affiliated — net in the Consolidated Statements of Operations. For the year ended December 31, 2023, each Trust paid BIM the following amounts for securities lending agent services:
| Trust Name | Amounts | |
| ECAT |
$ 7,700 |
Trustees and Officers: Certain trustees and/or officers of the Trusts are directors and/or officers of BlackRock or its affiliates. The Trusts reimburse the Manager for a portion of the compensation paid to the Trusts’ Chief Compliance Officer, which is included in Trustees and Officer in the Consolidated Statements of Operations.
| 7. | PURCHASES AND SALES |
For the year ended December 31, 2023, purchases and sales of investments, including paydowns/payups, mortgage dollar rolls and excluding short-term securities, were as follows:
| U.S. Government Securities | Other Securities | |||||||||||||
| Trust Name | Purchases | Sales | Purchases | Sales | ||||||||||
| BCAT |
$ | 23,317,004 | $ | 24,786,217 | $ | 4,491,578,510 | $ 4,624,847,546 | |||||||
| ECAT |
19,399,772 | 13,016,887 | 4,131,472,457 | 4,548,847,703 | ||||||||||
For the year ended December 31, 2023, purchases and sales related to mortgage dollar rolls were as follows:
| Trust Name | Purchases | Sales | ||||
| BCAT |
$ | 1,918,629,714 | $1,917,543,932 | |||
| ECAT |
1,593,501,952 | 1,592,720,837 | ||||
| 88 | 2 0 2 3 B L A C K R O C K A N N U A L R E P O R T T O S H A R E H O L D E R S |
Notes to Consolidated Financial Statements (continued)
| 8. | INCOME TAX INFORMATION |
It is each Trust’s policy to comply with the requirements of the Internal Revenue Code of 1986, as amended, applicable to regulated investment companies, and to distribute substantially all of its taxable income to its shareholders. Therefore, no U.S. federal income tax provision is required.
Each Trust files U.S. federal and various state and local tax returns. No income tax returns are currently under examination. The statute of limitations on each Trust’s U.S. federal tax returns generally remains open for a period of three years after they are filed. The statutes of limitations on each Trust’s state and local tax returns may remain open for an additional year depending upon the jurisdiction.
Management has analyzed tax laws and regulations and their application to the Trusts as of December 31, 2023, inclusive of the open tax return years, and does not believe that there are any uncertain tax positions that require recognition of a tax liability in the Trusts’ consolidated financial statements.
U.S. GAAP requires that certain components of net assets be adjusted to reflect permanent differences between financial and tax reporting. These reclassifications have no effect on net assets or NAVs per share. As of period end, permanent differences attributable to nondeductible expenses and income recognized from the fund’s wholly owned subsidiary were reclassified to the following accounts:
|
|
||||||||
| Trust Name | Paid-in Capital | Accumulated Earnings (Loss) |
||||||
|
|
||||||||
| BCAT |
$ | (2,075,496 | ) | $ | 2,075,496 | |||
|
|
||||||||
The tax character of distributions paid was as follows:
|
|
||||||||
| Trust Name | Year Ended 12/31/23 |
Year Ended 12/31/22 |
||||||
|
|
||||||||
| BCAT |
||||||||
| Ordinary income |
$ | 62,938,896 | $ | 109,547,627 | ||||
| Return of capital |
99,719,802 | 28,661,646 | ||||||
|
|
|
|
|
|||||
| $ | 162,658,698 | $ | 138,209,273 | |||||
|
|
|
|
|
|||||
| ECAT |
||||||||
| Ordinary income |
$ | 35,941,083 | $ | 56,829,735 | ||||
| Long-term capital gains |
— | 3,894,902 | ||||||
| Return of capital |
114,889,303 | 64,828,979 | ||||||
|
|
|
|
|
|||||
| $ | 150,830,386 | $ | 125,553,616 | |||||
|
|
|
|
|
|||||
As of December 31, 2023, the tax components of accumulated earnings (loss) were as follows:
|
|
||||||||||||||||
| Trust Name | Non-Expiring Capital Loss |
Net Unrealized Gains (Losses)(b) |
Qualified Late-Year |
Total | ||||||||||||
|
|
||||||||||||||||
| BCAT |
$ | (183,393,168 | ) | $ | 66,775,823 | $ | (20,412,625 | ) | $ | (137,029,970 | ) | |||||
| ECAT |
(130,433,346 | ) | 102,507,963 | (13,291,621 | ) | (41,217,004 | ) | |||||||||
|
|
||||||||||||||||
| (a) | Amounts available to offset future realized capital gains. |
| (b) | The difference between book-basis and tax-basis net unrealized gains (losses) were attributable primarily to the tax deferral of losses on wash sales and straddles, the realization for tax purposes of unrealized gains/losses on certain futures, foreign currency contracts and investments in passive foreign investment companies, the accounting for swap agreements, timing and recognition of partnership income, amortization methods for premiums and discounts on fixed income securities, the accrual of income on securities in default, classification of investments, characterization of corporate actions and the deferral of compensation to trustees. |
| (c) | The Trust has elected to defer these qualified late-year losses and recognize such losses in the next taxable year. |
As of December 31, 2023, gross unrealized appreciation and depreciation based on cost of investments (including short positions and derivatives, if any) for U.S. federal income tax purposes were as follows:
| Trust Name | Tax Cost | Gross Unrealized Appreciation |
Gross Unrealized Depreciation |
Net Unrealized Appreciation (Depreciation) | ||||||||||
| BCAT |
$ | 1,920,110,769 | $ | 231,790,899 | $ | (159,074,700 | ) | $ 72,716,199 | ||||||
| ECAT |
1,836,903,720 | 176,234,802 | (70,090,316) | 106,144,486 | ||||||||||
| 9. | BANK BORROWINGS |
BCAT entered into a 179-day rolling line of credit facility with BNP Paribas Prime Brokerage International, Limited (“BNP”). BNP is required to provide 179 days’ notice of termination to BCAT absent a default or certain similar events. BCAT has granted a security interest in substantially all of its assets to BNP. BCAT can borrow up to $550,000,000 at any time, subject to asset coverage and other limitations as specified in the credit facility. Advances will be made by BNP to BCAT at the Overnight Bank Funding Rate plus 0.75%. In addition, BCAT pays a commitment fee on the daily unused amount if utilization is less than 80% of the committed line amount. For the year ended December 31, 2023, the Trust did not borrow under the credit agreement.
| N O T E S T O C O N S O L I D A T E D F I N A N C I A L S T A T E M E N T S |
89 |
Notes to Consolidated Financial Statements (continued)
| 10. | PRINCIPAL RISKS |
In the normal course of business, the Trusts invest in securities or other instruments and may enter into certain transactions, and such activities subject each Trust to various risks, including among others, fluctuations in the market (market risk) or failure of an issuer to meet all of its obligations. The value of securities or other instruments may also be affected by various factors, including, without limitation: (i) the general economy; (ii) the overall market as well as local, regional or global political and/or social instability; (iii) regulation, taxation or international tax treaties between various countries; or (iv) currency, interest rate and price fluctuations. Local, regional or global events such as war, acts of terrorism, the spread of infectious illness or other public health issues, recessions, or other events could have a significant impact on the Trusts and their investments. Each Trust’s prospectus provides details of the risks to which each Trust is subject.
Illiquidity Risk: Each Trust may invest without limitation in illiquid or less liquid investments or investments in which no secondary market is readily available or which are otherwise illiquid, including private placement securities. A Trust may not be able to readily dispose of such investments at prices that approximate those at which a Trust could sell such investments if they were more widely traded and, as a result of such illiquidity, a Trust may have to sell other investments or engage in borrowing transactions if necessary to raise funds to meet its obligations. Limited liquidity can also affect the market price of investments, thereby adversely affecting a Trust’s NAV and ability to make dividend distributions. Privately issued debt securities are often of below investment grade quality, frequently are unrated and present many of the same risks as investing in below investment grade public debt securities.
Market Risk: Each Trust may be exposed to prepayment risk, which is the risk that borrowers may exercise their option to prepay principal earlier than scheduled during periods of declining interest rates, which would force each Trust to reinvest in lower yielding securities. Each Trust may also be exposed to reinvestment risk, which is the risk that income from each Trust’s portfolio will decline if each Trust invests the proceeds from matured, traded or called fixed-income securities at market interest rates that are below each Trust portfolio’s current earnings rate.
Valuation Risk: The market values of equities, such as common stocks and preferred securities or equity related investments, such as futures and options, may decline due to general market conditions which are not specifically related to a particular company. They may also decline due to factors which affect a particular industry or industries. A Trust may invest in illiquid investments. An illiquid investment is any investment that a Trust reasonably expects cannot be sold or disposed of in current market conditions in seven calendar days or less without the sale or disposition significantly changing the market value of the investment. A Trust may experience difficulty in selling illiquid investments in a timely manner at the price that it believes the investments are worth. Prices may fluctuate widely over short or extended periods in response to company, market or economic news. Markets also tend to move in cycles, with periods of rising and falling prices. This volatility may cause each Trust’s NAV to experience significant increases or decreases over short periods of time. If there is a general decline in the securities and other markets, the NAV of a Trust may lose value, regardless of the individual results of the securities and other instruments in which a Trust invests.
The price a Trust could receive upon the sale of any particular portfolio investment may differ from a Trust’s valuation of the investment, particularly for securities that trade in thin or volatile markets or that are valued using a fair valuation technique or a price provided by an independent pricing service. Changes to significant unobservable inputs and assumptions (i.e., publicly traded company multiples, growth rate, time to exit) due to the lack of observable inputs may significantly impact the resulting fair value and therefore a Trust’s results of operations. As a result, the price received upon the sale of an investment may be less than the value ascribed by a Trust, and a Trust could realize a greater than expected loss or lesser than expected gain upon the sale of the investment. A Trust’s ability to value its investments may also be impacted by technological issues and/or errors by pricing services or other third-party service providers.
Counterparty Credit Risk: The Trusts may be exposed to counterparty credit risk, or the risk that an entity may fail to or be unable to perform on its commitments related to unsettled or open transactions, including making timely interest and/or principal payments or otherwise honoring its obligations. The Trusts manage counterparty credit risk by entering into transactions only with counterparties that the Manager believes have the financial resources to honor their obligations and by monitoring the financial stability of those counterparties. Financial assets, which potentially expose the Trusts to market, issuer and counterparty credit risks, consist principally of financial instruments and receivables due from counterparties. The extent of the Trusts’ exposure to market, issuer and counterparty credit risks with respect to these financial assets is approximately their value recorded in the Consolidated Statements of Assets and Liabilities, less any collateral held by the Trusts.
A derivative contract may suffer a mark-to-market loss if the value of the contract decreases due to an unfavorable change in the market rates or values of the underlying instrument. Losses can also occur if the counterparty does not perform under the contract.
For OTC options purchased, each Trust bears the risk of loss in the amount of the premiums paid plus the positive change in market values net of any collateral held by the Trusts should the counterparty fail to perform under the contracts. Options written by the Trusts do not typically give rise to counterparty credit risk, as options written generally obligate the Trusts, and not the counterparty, to perform. The Trusts may be exposed to counterparty credit risk with respect to options written to the extent each Trust deposits collateral with its counterparty to a written option.
With exchange-traded options purchased, exchange-traded futures and centrally cleared swaps, there is less counterparty credit risk to the Trusts since the exchange or clearinghouse, as counterparty to such instruments, guarantees against a possible default. The clearinghouse stands between the buyer and the seller of the contract; therefore, credit risk is limited to failure of the clearinghouse. While offset rights may exist under applicable law, a Trust does not have a contractual right of offset against a clearing broker or clearinghouse in the event of a default (including the bankruptcy or insolvency). Additionally, credit risk exists in exchange-traded futures and centrally cleared swaps with respect to initial and variation margin that is held in a clearing broker’s customer accounts. While clearing brokers are required to segregate customer margin from their own assets, in the event that a clearing broker becomes insolvent or goes into bankruptcy and at that time there is a shortfall in the aggregate amount of margin held by the clearing broker for all its clients, typically the shortfall would be allocated on a pro rata basis across all the clearing broker’s customers, potentially resulting in losses to the Trusts.
Geographic/Asset Class Risk: A diversified portfolio, where this is appropriate and consistent with a fund’s objectives, minimizes the risk that a price change of a particular investment will have a material impact on the NAV of a fund. The investment concentrations within each Trust’s portfolio are disclosed in its Consolidated Schedule of Investments.
| 90 | 2 0 2 3 B L A C K R O C K A N N U A L R E P O R T T O S H A R E H O L D E R S |
Notes to Consolidated Financial Statements (continued)
The Trusts invest a significant portion of their assets in fixed-income securities and/or use derivatives tied to the fixed-income markets. Changes in market interest rates or economic conditions may affect the value and/or liquidity of such investments. Interest rate risk is the risk that prices of bonds and other fixed-income securities will decrease as interest rates rise and increase as interest rates fall. The Trusts may be subject to a greater risk of rising interest rates due to the period of historically low interest rates that ended in March 2022. The Federal Reserve has recently been raising the federal funds rate as part of its efforts to address inflation. There is a risk that interest rates will continue to rise, which will likely drive down the prices of bonds and other fixed-income securities, and could negatively impact the Trusts’ performance.
The Trusts invest a significant portion of their assets in securities of issuers located in the United States. A decrease in imports or exports, changes in trade regulations, inflation and/or an economic recession in the United States may have a material adverse effect on the U.S. economy and the securities listed on U.S. exchanges. Proposed and adopted policy and legislative changes in the United States may also have a significant effect on U.S. markets generally, as well as on the value of certain securities. Governmental agencies project that the United States will continue to maintain elevated public debt levels for the foreseeable future which may constrain future economic growth. Circumstances could arise that could prevent the timely payment of interest or principal on U.S. government debt, such as reaching the legislative “debt ceiling.” Such non-payment would result in substantial negative consequences for the U.S. economy and the global financial system. If U.S. relations with certain countries deteriorate, it could adversely affect issuers that rely on the United States for trade. The United States has also experienced increased internal unrest and discord. If these trends were to continue, they may have an adverse impact on the U.S. economy and the issuers in which the Trusts invest.
LIBOR Transition Risk: The Trusts may be exposed to financial instruments that recently transitioned from, or continue to be tied to, the London Interbank Offered Rate (“LIBOR”) to determine payment obligations, financing terms, hedging strategies or investment value. The United Kingdom’s Financial Conduct Authority, which regulates LIBOR, has ceased publishing all LIBOR settings, but some USD LIBOR settings will continue to be published under a synthetic methodology until September 30, 2024 for certain legacy contracts. SOFR has been used increasingly on a voluntary basis in new instruments and transactions. Under U.S. regulations that implement a statutory fallback mechanism to replace LIBOR, benchmark rates based on SOFR have replaced LIBOR in certain financial contracts. The ultimate effect of the LIBOR transition process on the Trusts is uncertain.
| 11. | CAPITAL SHARE TRANSACTIONS |
Each Trust is authorized to issue an unlimited number of shares, all of which were initially classified as Common Shares. Each Board is authorized, however, to reclassify any unissued Common Shares to Preferred Shares without the approval of Common Shareholders.
Common Shares
The Trusts participate in an open market share repurchase program (the “Repurchase Program”). From December 1, 2022 through November 30, 2023, each Trust may repurchase up to 5% of its outstanding common shares under the Repurchase Program, based on common shares outstanding as of the close of business on November 30, 2022, subject to certain conditions. From December 1, 2023 through November 30, 2024, each Trust may repurchase up to 5% of its outstanding common shares under the Repurchase Program, based on common shares outstanding as of the close of business on November 30, 2023, subject to certain conditions. The Repurchase Program has an accretive effect as shares are purchased at a discount to the Trust’s NAV. There is no assurance that the Trusts will purchase shares in any particular amounts.
The total cost of the shares repurchased is reflected in Trusts’ Statements of Changes in Net Assets. For the periods shown, shares repurchased and cost, including transaction costs, were as follows:
| BCAT | ECAT | |||||||||||||||
| Shares | Amounts | Shares | Amounts | |||||||||||||
| Year Ended December 31, 2023 |
673,184 | $ | 9,718,056 | 489,120 | $ | 7,268,837 | ||||||||||
| Year Ended December 31, 2022 |
3,502,458 | 50,901,644 | 3,325,611 | 47,257,972 | ||||||||||||
As of December 31, 2023, BlackRock Financial Management, Inc., an affiliate of the Trusts, owned 5,000 shares of each of BCAT and ECAT.
| 12. | SUBSEQUENT EVENTS |
Management’s evaluation of the impact of all subsequent events on the Trusts’ consolidated financial statements was completed through the date the consolidated financial statements were issued and the following items were noted:
The Trusts declared and paid or will pay distributions to Common Shareholders as follows:
| Trust Name | Declaration Date |
Record Date |
Payable/ Paid Date |
Dividend Per Common Share |
||||||||||||
| BCAT |
01/02/24 | 01/12/24 | 01/31/24 | $ | 0.127500 | |||||||||||
| 02/01/24 | 02/15/24 | 02/29/24 | 0.127500 | |||||||||||||
| ECAT |
01/02/24 | 01/12/24 | 01/31/24 | 0.150000 | ||||||||||||
| 02/01/24 | 02/15/24 | 02/29/24 | 0.150000 | |||||||||||||
| N O T E S T O C O N S O L I D A T E D F I N A N C I A L S T A T E M E N T S |
91 |
Report of Independent Registered Public Accounting Firm
To the Shareholders and the Board of Trustees of BlackRock Capital Allocation Term Trust and BlackRock ESG Capital Allocation Term Trust:
Opinion on the Financial Statements and Financial Highlights
We have audited the accompanying statements of assets and liabilities of BlackRock Capital Allocation Term Trust (formerly, BlackRock Capital Allocation Trust) and BlackRock ESG Capital Allocation Term Trust (formerly, BlackRock ESG Capital Allocation Trust) (the “Funds”), including the schedules of investments, as of December 31, 2023, the related statements of operations and cash flows for the year then ended, the statements of changes in net assets for each of the two years in the period ended, and the financial highlights for the periods indicated in the table below, and the related notes. Such financial statements and financial highlights are consolidated for BlackRock Capital Allocation Term Trust as of and for the three years in the period ended December 31, 2023. Such financial statements and financial highlights are consolidated for BlackRock ESG Capital Allocation Term Trust as of and for the year ended December 31, 2023. In our opinion, the financial statements and financial highlights present fairly, in all material respects, the financial position of the Funds as of December 31, 2023, and the results of their operations and their cash flows for the year then ended, the changes in their net assets for each of the two years in the period ended, and the financial highlights for the periods indicated in the table below, in conformity with accounting principles generally accepted in the United States of America.
| Fund | Financial Highlights | |
| BlackRock Capital Allocation Term Trust |
For each of the three years in the period ended December 31, 2023 and for the period from September 28, 2020 (commencement of operations) through December 31, 2020 | |
| BlackRock ESG Capital Allocation Term Trust |
For each of the two years in the period ended December 31, 2023 and for the period from September 27, 2021 (commencement of operations) through December 31, 2021 |
Basis for Opinion
These financial statements and financial highlights are the responsibility of the Funds’ management. Our responsibility is to express an opinion on the Funds’ financial statements and financial highlights based on our audits. We are a public accounting firm registered with the Public Company Accounting Oversight Board (United States) (PCAOB) and are required to be independent with respect to the Funds in accordance with the U.S. federal securities laws and the applicable rules and regulations of the Securities and Exchange Commission and the PCAOB.
We conducted our audits in accordance with the standards of the PCAOB. Those standards require that we plan and perform the audit to obtain reasonable assurance about whether the financial statements and financial highlights are free of material misstatement, whether due to error or fraud. The Funds are not required to have, nor were we engaged to perform, an audit of their internal control over financial reporting. As part of our audits we are required to obtain an understanding of internal control over financial reporting but not for the purpose of expressing an opinion on the effectiveness of the Funds’ internal control over financial reporting. Accordingly, we express no such opinion.
Our audits included performing procedures to assess the risks of material misstatement of the financial statements and financial highlights, whether due to error or fraud, and performing procedures that respond to those risks. Such procedures included examining, on a test basis, evidence regarding the amounts and disclosures in the financial statements and financial highlights. Our audits also included evaluating the accounting principles used and significant estimates made by management, as well as evaluating the overall presentation of the financial statements and financial highlights. Our procedures included confirmation of securities owned as of December 31, 2023, by correspondence with custodians or counterparties; when replies were not received, we performed other auditing procedures. We believe that our audits provide a reasonable basis for our opinion.
Deloitte & Touche LLP
Boston, Massachusetts
February 23, 2024
We have served as the auditor of one or more BlackRock investment companies since 1992.
| 92 | 2 0 2 3 B L A C K R O C K A N N U A L R E P O R T T O S H A R E H O L D E R S |
Important Tax Information (unaudited)
The following amounts, or maximum amounts allowable by law, are hereby designated as qualified dividend income for individuals for the fiscal year ended December 31, 2023:
| Trust Name | Qualified Dividend Income |
|||
| BCAT |
$ | 19,922,452 | ||
| ECAT |
15,038,169 | |||
The following amounts, or maximum amounts allowable by law, are hereby designated as qualified business income for individuals for the fiscal year ended December 31, 2023:
| Trust Name | Qualified Business Income |
|||
| BCAT |
$ | 156,814 | ||
| ECAT |
420,949 | |||
The Trusts hereby designate the following amounts, or maximum amounts allowable by law, of distributions from direct federal obligation interest for the fiscal year ended December 31, 2023:
| Trust Name | Federal Obligation Interest |
|||
| BCAT |
$ | 309,217 | ||
| ECAT |
925,749 | |||
The law varies in each state as to whether and what percent of ordinary income dividends attributable to federal obligations is exempt from state income tax. Shareholders are advised to check with their tax advisers to determine if any portion of the dividends received is exempt from state income tax.
The following percentages, or maximum percentages allowable by law, of ordinary income distributions paid during the fiscal year ended December 31, 2023 qualified for the dividends-received deduction for corporate shareholders:
| Trust Name | Dividends-Received Deduction |
|||
| BCAT |
14.46 | % | ||
| ECAT |
13.77 | |||
The Trusts hereby designate the following amounts, or maximum amounts allowable by law, as interest income eligible to be treated as a Section 163(j) interest dividend for the fiscal year ended December 31, 2023:
| Trust Name | Interest Dividends |
|||
| BCAT |
$ | 42,841,737 | ||
| ECAT |
24,424,396 | |||
The Trusts hereby designate the following amounts, or maximum amounts allowable by law, as interest-related dividends eligible for exemption from U.S. withholding tax for nonresident aliens and foreign corporations for the fiscal year ended December 31, 2023:
| Trust Name | Interest- Related Dividends |
|||
| BCAT |
$ | 28,594,422 | ||
| ECAT |
20,300,915 | |||
|
I M P O R T A N T T A X I N F O R M A T I O N |
93 |
Investment Objectives, Policies and Risks
Recent Changes
The following information is a summary of certain changes since December 31, 2022.This information may not reflect all of the changes that have occurred since you purchased the relevant Trust.
Effective September 25, 2023, BlackRock Capital Allocation Term Trust (BCAT) began operating as a diversified fund.
Except as noted above, during each Trust’s most recent fiscal year, there were no material changes in the Trust’s investment objectives or policies that have not been approved by shareholders or in the principal risk factors associated with investment in the Trust.
Investment Objectives and Policies
BlackRock Capital Allocation Term Trust (BCAT)
The Trust’s investment objectives are to provide total return and income through a combination of current income, current gains and long-term capital appreciation. The Trust’s investment objectives may be changed by the Trust’s Board of Trustees (the “Board”) without prior shareholder approval.
In making investment decisions, Trust management tries to identify the long term trends and changes that could benefit particular markets and/or industries relative to other markets and industries. Trust management will consider a variety of factors when selecting the markets, such as the rate of economic growth, natural resources, capital reinvestment and the social and political environment. In choosing investments, Trust management may look at various fundamental and systematic factors, such as the relative opportunity for equity or debt instruments to increase in value, capital recovery risk, dividend yields and the level of interest rates paid on debt securities of different maturities. The Trust may invest in individual securities, baskets of securities or particular measurements of value or rate, and may consider a variety of factors and systematic inputs. Trust management may employ derivatives for a variety of reasons, including but not limited to, adjusting its exposures to markets, sectors, asset classes and securities. As a result, the economic exposure of the Trust to any particular market, sector, or asset class may vary relative to the market value of any particular exposure.
Trust management will invest in “junk” bonds, corporate loans and distressed securities only when it believes that they will provide an attractive total return, relative to their risk, as compared to higher quality debt securities.
Trust management will invest in distressed securities when Trust management believes they offer significant potential for higher returns or can be exchanged for other securities that offer this potential. However, there can be no assurance that the Trust will generally achieve these returns or that the issuer will make an exchange offer or adopt a plan of reorganization.
BlackRock Advisors, LLC (the “Manager”) intends to utilize option strategies that consist of writing (selling) call options on a portion of the common stocks in the Trust’s portfolio, as well as other option strategies such as writing other calls and puts or using options to manage risk. The portfolio management team will work closely to determine which option strategies to pursue to seek to generate current gains from options premiums and to enhance the Trust’s risk-adjusted returns.
The Trust seeks to achieve its objectives by investing in both equity and debt securities of issuers located around the world. There is no limit on the percentage of assets the Trust can invest in a particular type of security. Generally, the Trust seeks diversification across markets and industries. The Trust has no geographic limits on where it may invest. This flexibility will allow Trust management to look for investments in markets around the world that it believes will provide the best relative asset allocation to meet the Trust’s objectives.
Trust management intends to use the Trust’s investment flexibility to create a portfolio of assets that, over time, is expected to be relatively balanced between equity and debt securities and that is widely differentiated among many individual investments. The Trust may invest in both developed and emerging markets. In addition to investing in foreign securities, the Trust will actively manage its exposure to foreign currencies through the use of forward currency contracts and other currency derivatives. From time to time, the Trust may own foreign cash equivalents or foreign bank deposits as part of the Trust’s investment strategy. The Trust will also invest in non-U.S. currencies, however, the Trust may underweight or overweight a currency based on the Trust management team’s outlook.
The Trust may invest in shares of companies through initial public offerings (“IPOs”). The Trust may also invest, without limit, in privately placed or restricted securities (including in Rule 144A securities, which are privately placed securities purchased by qualified institutional buyers), illiquid securities and securities in which no secondary market is readily available, including those of private companies. Issuers of these securities may not have a class of securities registered, and may not be subject to periodic reporting, pursuant to the Securities Exchange Act of 1934, as amended (the “Exchange Act”). Under normal market conditions, the Trust currently intends to invest up to 25% of its total assets, measured at the time of investment, in illiquid privately placed or restricted securities. The Trust expects certain of such investments to be in “late-stage private securities,” which are securities of private companies that have demonstrated sustainable business operations and generally have a well-known product or service with a strong market presence. Late-stage private companies have generally had large cash flows from their core business operations and are expanding into new markets with their products or services. Late-stage private companies may also be referred to as “pre-IPO companies.”
The Trust may seek to provide exposure to the investment returns of real assets that trade in the commodity markets through investment in commodity-linked derivative instruments and investment vehicles such as exchange traded funds that invest exclusively in commodities and are designed to provide this exposure without direct investment in physical commodities. The Trust may also gain exposure to commodity markets by investing in Cayman Capital Allocation Fund, Ltd. (the “Subsidiary”). The Subsidiary will invest primarily in commodity-related instruments. The Subsidiary may also hold cash and invest in other instruments, including fixed-income securities, either as investments or to serve as margin or collateral for the Subsidiary’s derivative positions. The Manager is the manager of the Subsidiary. The Subsidiary (unlike the Trust) may invest without limitation in commodity-related instruments. However, the Subsidiary will otherwise be subject to the same fundamental, non-fundamental and certain other investment restrictions as the Trust. The Trust will limit its investments in the Subsidiary to 25% of its total assets.
| 94 | 2 0 2 3 B L A C K R O C K A N N U A L R E P O R T T O S H A R E H O L D E R S |
Investment Objectives, Policies and Risks (continued)
The Subsidiary will be managed pursuant to compliance policies and procedures that are the same, in all material respects, as the policies and procedures adopted by the Trust. As a result, the Manager, in managing the Subsidiary’s portfolio, will be subject to the same investment policies and restrictions that apply to the management of the Trust, and, in particular, to the requirements relating to portfolio leverage, liquidity, brokerage, and the timing and method of the valuation of the Subsidiary’s portfolio investments and shares of the Subsidiary. The Trust’s Chief Compliance Officer will oversee implementation of the Subsidiary’s policies and procedures, and make periodic reports to the Board regarding the Subsidiary’s compliance with its policies and procedures. The Trust and Subsidiary will test for compliance with certain investment restrictions on a consolidated basis, except that with respect to the Subsidiary’s investments in certain securities that may involve leverage, the Subsidiary will comply with asset segregation requirements to the same extent as the Trust.
The Manager will provide investment management and other services to the Subsidiary pursuant to a separate investment management agreement (the “Subsidiary Management Agreement”). The Manager does not receive separate compensation from the Subsidiary for providing it with investment management or administrative services pursuant to the Subsidiary Management Agreement. However, the Trust pays the Manager based on the Trust’s assets, including the assets invested in the Subsidiary. The Subsidiary has also entered into separate contracts for the provision of custody and audit services with the same or with affiliates of the same service providers that provide those services to the Trust. The financial statements of the Subsidiary are consolidated with the Trust’s financial statements in the Trust’s annual and semi-annual reports.
The Trust can invest in all types of equity securities, including common stock, preferred stock, warrants, convertible securities and stock purchase rights of companies of any market capitalization. Trust management may seek to invest in the stock of smaller or emerging growth companies that it expects will provide a higher total return than other equity investments. Investing in smaller or emerging growth companies involves greater risk than investing in more established companies.
The Trust can invest in all types of debt securities, including U.S. and foreign government bonds, corporate bonds, convertible bonds, municipal bonds, structured notes, credit-linked notes, loan assignments and participations, mortgage- and asset-backed securities, and securities issued or guaranteed by certain international organizations such as the World Bank. The Trust may invest in debt securities paying a fixed or fluctuating rate of interest. The Trust has no set policy regarding portfolio maturity or duration of the fixed-income securities it may hold.
The Trust may invest without limit in “junk” bonds, corporate loans and distressed securities. Junk bonds are bonds that are rated below investment grade by independent rating agencies or are bonds that are not rated but which Trust management considers to be of comparable quality. These securities offer the possibility of relatively higher returns but are significantly riskier than higher rated debt securities.
As part of its investment strategy, the Trust intends to employ a strategy of writing (selling) covered call options on a portion of the common stocks in its portfolio, writing (selling) other call and put options on individual common stocks, including uncovered call and put options, and, to a lesser extent, writing (selling) call and put options on indices of securities and sectors of securities (collectively referred to as “index options”). This options writing strategy is intended to generate current gains from options premiums and to enhance the Trust’s risk-adjusted returns. A substantial portion of the options written by the Trust may be over-the-counter (“OTC”) options.
The Trust may also purchase and sell futures contracts, enter into various interest rate transactions such as swaps, caps, floors or collars, currency transactions such as currency forward contracts, currency futures contracts, currency swaps or options on currency or currency futures and swap contracts (including, but not limited to, credit default swaps) and may purchase and sell exchange-listed and OTC put and call options on securities and swap contracts, financial indices and futures contracts and use other derivative instruments or management techniques for duration management and other risk management purposes, including to attempt to protect against possible changes in the market value of the Trust’s portfolio resulting from trends in the securities markets and changes in interest rates or to protect the Trust’s unrealized gains in the value of its portfolio securities, to facilitate the sale of portfolio securities for investment purposes, to establish a position in the securities markets as a temporary substitute for purchasing particular securities or to enhance income or gain.
During temporary defensive periods (i.e., in response to adverse market, economic or political conditions), the Trust may invest up to 100% of its total assets in liquid, short-term investments, including high quality, short-term securities. The Trust may not achieve its investment objectives under these circumstances. The Manager’s determination that it is temporarily unable to follow the Trust’s investment strategy or that it is impractical to do so will generally occur only in situations in which a market disruption event has occurred and where trading in the securities selected through application of the Trust’s investment strategy is extremely limited or absent.
The Trust may also invest in securities of other open- or closed-end investment companies, including exchange-traded funds (“ETFs”) and business development companies, subject to applicable regulatory limits, that invest primarily in securities of the types in which the Trust may invest directly.
The Trust may lend securities with a value of up to 33 1/3% of its total assets (including such loans) to financial institutions that provide cash or securities issued or guaranteed by the U.S. Government as collateral.
Unless otherwise stated herein, the Trust’s investment policies are non-fundamental policies and may be changed by the Board without prior shareholder approval. The percentage limitations applicable to the Trust’s portfolio described herein apply only at the time of initial investment and the Trust will not be required to sell investments due to subsequent changes in the value of investments that it owns. The Trust’s investment objectives may be changed by the Board without prior shareholder approval.
Leverage: The Trust may use leverage to seek to achieve its investment objectives. The Trust’s use of leverage may increase or decrease from time to time in its discretion and the Trust may, in the future, determine not to use leverage. The Trust may utilize leverage for investment purposes through the bank credit facility described below and by entering into reverse repurchase agreements or other derivative instruments with leverage embedded in them. The Trust may issue debt securities or preferred shares.
The Trust entered into a 179-day rolling line credit facility with BNP Paribas Prime Brokerage International, Limited (“BNP”). BNP is required to provide 179 days’ notice of termination to the Trust absent a default or certain similar events. The Trust has granted a security interest in substantially all of its assets to BNP. The Trust can borrow up to $550,000,000 at any time, subject to asset coverage and other limitations as specified in the credit facility. Advances will be made by BNP to the Trust at the Overnight Bank Funding Rate plus 0.75%. In addition, the Trust pays a commitment fee on the daily unused amount if utilization is less than 80% of the committed line amount.
The Trust may enter into “dollar roll” transactions.
| I N V E S T M E N T O B J E C T I V E S , P O L I C I E S A N D R I S K S |
95 |
Investment Objectives, Policies and Risks (continued)
The Trust may also borrow money as a temporary measure for extraordinary or emergency purposes, including the payment of dividends and the settlement of securities transactions which otherwise might require untimely dispositions of Trust securities.
BlackRock ESG Capital Allocation Term Trust (ECAT)
The Trust’s investment objectives are to provide total return and income through a combination of current income, current gains and long-term capital appreciation. The Trust’s investment objectives may be changed by the Trust’s Board of Trustees (the “Board”) without prior shareholder approval.
The Trust will invest at least 80% of its total assets in securities that, in the Manager’s assessment, meet the ESG criteria described below. To determine the Trust’s investable universe, Trust management will first seek to screen out certain issuers based on ESG criteria determined by BlackRock, subject to the considerations noted below. Such screening criteria principally includes:
| • | (i) issuers that derive more than zero percent of revenue from the production of controversial weapons; |
| • | (ii) issuers that derive more than zero percent of revenue from the production of civilian firearms; |
| • | (iii) issuers that derive more than zero percent of revenue from the production of tobacco-related products; |
| • | (iv) issuers that derive more than twenty percent of revenue from thermal coal generation, unless the Trust is investing in green bonds of such issuers or the issuers have made certain commitments to reduce climate impact, or more than five percent of revenue from thermal coal mining, unless the Trust is investing in green bonds of such issuers; |
| • | (v) issuers that derive more than five percent of revenue from oil sands extraction, unless the Trust is investing in green bonds of such issuers or the issuers have set certain targets to reduce climate impact; |
| • | (vi) issuers ranked in the bottom half of the applicable fossil fuel issuers peer group by internal or external ESG criteria, other than green bonds of such issuers; |
| • | (vii) issuers identified as violators of the United Nations Global Compact, which are globally accepted principles covering corporate behavior in the areas of human rights, labor, environment, and anti-corruption; and |
| • | (viii) issuers receiving an ESG rating of CCC or equivalent by recognized third-party rating agencies. |
The Trust relies on one or more third-party ratings agencies to identify issuers for purposes of the above screening criteria. Third-party rating agencies may base the above screening criteria on an estimate when revenue for a covered business activity is not disclosed by the issuer or publicly available.
The Trust’s screening criteria is measured at the time of investment and is dependent upon information and data that may be incomplete, inaccurate, unavailable or estimated. Where the Trust’s screening criteria looks solely to third-party ratings or data, issuers are only screened to the extent such ratings or data have been assigned or made available by the third parties. This screening criteria is subject to change over time at the Manager’s discretion. In addition, the Trust may gain indirect exposure (through, including but not limited to, derivatives and investments in other investment companies) to issuers with exposures that are inconsistent with the ESG-related criteria used by Trust management.
Trust management then seeks to allocate the Trust’s assets to issuers that have been identified by the Manager as having positive sustainability metrics within their respective sector using a proprietary sustainability scoring system, fundamental sector research and third-party ESG data. In evaluating potential investments, the Manager considers certain criteria, including but not limited to: (i) whether, based on the Manager’s proprietary methodologies using internal data sources and third-party data, the issuer provides positive environmental and social benefits to third parties relative to other companies in its sector; (ii) whether a bond is a green, social or sustainability bond (e.g., the proceeds of the bond issuance are used for environmental projects that benefit the entire planet by either directly or indirectly reducing carbon-emissions) as determined through the Manager’s proprietary methodology and in line with global norms; (iii) whether it has been determined, based on metrics provided by third parties, that the issuer has established a decarbonization strategy; and (iv) whether the issuer is aligned with the Manager’s social and environmental criteria and/or generates revenue associated with the UN Sustainable Development goals. Some examples of third-party data and metrics utilized by the Trust include green revenue metrics, forward looking emissions reduction commitments, revenue from socially controversial business lines, exposure to biodiversity controversies, product mix and targeted populations.
After the investable universe is determined, Trust management tries to identify the long term trends and changes that could benefit particular markets and/or industries relative to other markets and industries. Trust management will consider a variety of factors when selecting the markets, such as the rate of economic growth, natural resources, capital reinvestment and the social and political environment. In choosing investments, Trust management may look at various fundamental and systematic factors, such as the relative opportunity for equity or debt instruments to increase in value, capital recovery risk, dividend yields and the level of interest rates paid on debt securities of different maturities. In selecting investments, the Trust may consider a variety of factors and systematic inputs. Trust management may employ derivatives for a variety of reasons, including but not limited to, adjusting its exposures to markets, sectors, asset classes and securities. As a result, the economic exposure of the Trust to any particular market, sector, or asset class may vary relative to the market value of any particular exposure.
Trust management will invest in “junk” bonds, corporate loans and distressed securities only when it believes that they will provide an attractive total return, relative to their risk, as compared to higher quality debt securities.
Trust management will invest in distressed securities when Trust management believes they offer significant potential for higher returns or can be exchanged for other securities that offer this potential. However, there can be no assurance that the Trust will generally achieve these returns or that the issuer will make an exchange offer or adopt a plan of reorganization.
| 96 | 2 0 2 3 B L A C K R O C K A N N U A L R E P O R T T O S H A R E H O L D E R S |
Investment Objectives, Policies and Risks (continued)
The Trust intends to utilize option strategies that consist of writing (selling) call and put options on a portion of the common stocks in its portfolio, as well as other option strategies such as writing other calls and puts or using options to manage risk. The portfolio management team will work to determine which option strategies to pursue to seek to generate current gains from options premiums and to enhance the Trust’s risk-adjusted returns.
The Trust seeks to achieve its objectives by investing in both equity and debt securities of issuers located around the world. There is no limit on the percentage of assets the Trust can invest in a particular type of security. Generally, the Trust seeks diversification across markets and industries. The Trust has no geographic limits on where it may invest. This flexibility will allow Trust management to look for investments in markets around the world that it believes will provide the best relative asset allocation to meet the Trust’s objectives.
The Trust may invest in both developed and emerging markets. In addition to investing in foreign securities, the Trust will actively manage its exposure to foreign currencies through the use of forward currency contracts and other currency derivatives. From time to time, the Trust may own foreign cash equivalents or foreign bank deposits as part of the Trust’s investment strategy. The Trust will also invest in non-U.S. currencies. The Trust may underweight or overweight a currency based on the Trust management team’s outlook.
The Trust may invest in shares of companies through initial public offerings (“IPOs”). The Trust may also invest, without limit, in privately placed or restricted securities (including in Rule 144A securities, which are privately placed securities purchased by qualified institutional buyers), illiquid securities and securities in which no secondary market is readily available, including those of private companies. Issuers of these securities may not have a class of securities registered, and may not be subject to periodic reporting, pursuant to the Securities Exchange Act of 1934, as amended. Under normal market conditions, the Trust currently intends to invest up to 25% of its total assets, measured at the time of investment, in illiquid privately placed or restricted securities. The Trust expects certain of such investments to be in “late-stage private securities,” which are securities of private companies that have demonstrated sustainable business operations and generally have a well-known product or service with a strong market presence. Late-stage private companies have generally had large cash flows from their core business operations and are expanding into new markets with their products or services. Late-stage private companies may also be referred to as “pre-IPO companies.”
The Trust may seek to provide exposure to the investment returns of real assets that trade in the commodity markets through investment in commodity-linked derivative instruments and investment vehicles such as exchange traded funds that invest exclusively in commodities and are designed to provide this exposure without direct investment in physical commodities.
The Trust may also gain exposure to commodity markets by investing in Cayman ESG Capital Allocation Fund, Ltd. (the “Subsidiary”). The Subsidiary will invest primarily in commodity-related instruments. The Subsidiary may also hold cash and invest in other instruments, including fixed-income securities, either as investments or to serve as margin or collateral for the Subsidiary’s derivative positions. The Manager is the manager of the Subsidiary. The Subsidiary (unlike the Trust) may invest without limitation in commodity-related instruments. However, the Subsidiary will otherwise be subject to the same fundamental, non-fundamental and certain other investment restrictions as the Trust. The Trust will limit its investments in the Subsidiary to 25% of its total assets.
The Subsidiary will be managed pursuant to compliance policies and procedures that are the same, in all material respects, as the policies and procedures adopted by the Trust. As a result, the Manager, in managing the Subsidiary’s portfolio, will be subject to the same investment policies and restrictions that apply to the management of the Trust, and, in particular, to the requirements relating to portfolio leverage, liquidity, brokerage, and the timing and method of the valuation of the Subsidiary’s portfolio investments and shares of the Subsidiary. The Trust’s Chief Compliance Officer will oversee implementation of the Subsidiary’s policies and procedures, and make periodic reports to the Board regarding the Subsidiary’s compliance with its policies and procedures. The Trust and Subsidiary will test for compliance with certain investment restrictions on a consolidated basis, except that with respect to the Subsidiary’s investments in certain securities that may involve leverage, the Subsidiary will comply with asset segregation requirements to the same extent as the Trust.
The Manager will provide investment management and other services to the Subsidiary pursuant to a separate investment management agreement (the “Subsidiary Management Agreement”). The Manager does not receive separate compensation from the Subsidiary for providing it with investment management or administrative services pursuant to the Subsidiary Management Agreement. However, the Trust pays the Manager based on the Trust’s assets, including the assets invested in the Subsidiary. The Subsidiary has also entered into separate contracts for the provision of custody and audit services with the same or with affiliates of the same service providers that provide those services to the Trust.
The financial statements of the Subsidiary are consolidated with the Trust’s financial statements in the Trust’s annual and semi-annual reports.
The Trust can invest in all types of equity securities, including common stock, preferred stock, warrants, convertible securities and stock purchase rights of companies of any market capitalization. Trust management may seek to invest in the stock of smaller or emerging growth companies that it expects will provide a higher total return than other equity investments. Investing in smaller or emerging growth companies involves greater risk than investing in more established companies.
The Trust can invest in all types of debt securities, including U.S. and foreign government bonds, corporate bonds, convertible bonds, municipal bonds, structured notes, credit-linked notes, loan assignments and participations, mortgage- and asset-backed securities, and securities issued or guaranteed by certain international organizations such as the World Bank. The Trust may invest in debt securities paying a fixed or fluctuating rate of interest. The Trust has no set policy regarding portfolio maturity or duration of the fixed-income securities it may hold. The Trust will apply the ESG criteria described above to municipal bonds, government sponsored asset-backed securities/mortgage-backed securities and government securities.
The Trust may invest without limit in “junk” bonds, corporate loans and distressed securities. Junk bonds are bonds that are rated below investment grade by independent rating agencies or are bonds that are not rated but which Trust management considers to be of comparable quality. These securities offer the possibility of relatively higher returns but are significantly riskier than higher rated debt securities.
As part of its investment strategy, the Trust intends to employ a strategy of writing (selling) covered call options on a portion of the common stocks in its portfolio, writing (selling) other call and put options on individual common stocks, including uncovered call and put options, and, to a lesser extent, writing (selling) covered and uncovered call and put
| I N V E S T M E N T O B J E C T I V E S , P O L I C I E S A N D R I S K S |
97 |
Investment Objectives, Policies and Risks (continued)
options on indices of securities and sectors of securities (collectively referred to as “index options”). This options writing strategy is intended to generate current gains from options premiums and to enhance the Trust’s risk-adjusted returns. A substantial portion of the options written by the Trust may be over-the-counter (“OTC”) options.
The Trust may also purchase and sell futures contracts, enter into various interest rate transactions such as swaps, caps, floors or collars, currency transactions such as currency forward contracts, currency futures contracts, currency swaps or options on currency or currency futures and swap contracts (including, but not limited to, credit default swaps) and may purchase and sell exchange-listed and OTC put and call options on securities and swap contracts, financial indices and futures contracts and use other derivative instruments or management techniques for duration management and other investment and risk management purposes, including to attempt to protect against possible changes in the market value of the Trust’s portfolio resulting from trends in the securities markets and changes in interest rates or to protect the Trust’s unrealized gains in the value of its portfolio securities, to facilitate the sale of portfolio securities for investment purposes, to establish a position in the securities markets as a temporary substitute for purchasing particular securities or to enhance income or gain. Derivatives will be marked to market for purposes of the Trust’s 80% investment policy set out above.
During temporary defensive periods (i.e., in response to adverse market, economic or political conditions), the Trust may invest up to 100% of its total assets in liquid, short-term investments, including high quality, short-term securities. The Trust may not achieve its investment objectives under these circumstances. An Advisor’s determination that it is temporarily unable to follow the Trust’s investment strategy or that it is impractical to do so will generally occur only in situations in which a market disruption event has occurred and where trading in the securities selected through application of the Trust’s investment strategy is extremely limited or absent.
The Trust may also invest in securities of other open- or closed-end investment companies, including ETFs and business development companies, including those advised by the Advisor or one of its affiliates, subject to applicable regulatory limits, that invest primarily in securities of the types in which the Trust may invest directly.
The Trust may lend securities with a value of up to 33 1/3% of its total assets (including such loans) to financial institutions that provide cash or securities issued or guaranteed by the U.S. Government as collateral.
Unless otherwise stated herein, the Trust’s investment policies are non-fundamental policies and may be changed by the Board without prior shareholder approval. The percentage limitations applicable to the Trust’s portfolio described herein apply only at the time of initial investment and the Trust will not be required to sell investments due to subsequent changes in the value of investments that it owns. The Trust’s investment objectives may be changed by the Board without prior shareholder approval.
Leverage: The Trust currently does not intend to borrow money or issue debt securities or preferred shares. The Trust is, however, permitted to borrow money or issue debt securities in an amount up to 33 1/3% of its Managed Assets (50% of its net assets), and issue preferred shares in an amount up to 50% of its Managed Assets (100% of its net assets). “Managed Assets” means the total assets of the Trust (including any assets attributable to money borrowed for investment purposes) minus the sum of the Trust’s accrued liabilities (other than money borrowed for investment purposes). Although it has no present intention to do so, the Trust reserves the right to borrow money from banks or other financial institutions, or issue debt securities or preferred shares, in the future if it believes that market conditions would be conducive to the successful implementation of a leveraging strategy through borrowing money or issuing debt securities or preferred shares. Any such leveraging will not be fully achieved until the proceeds resulting from the use of leverage have been invested in accordance with the Trust’s investment objectives and policies.
The Trust may enter into reverse repurchase agreements with respect to its portfolio investments subject to the Trust’s investment restrictions.
The Trust may enter into “dollar roll” transactions.
The Trust may enter into derivative transactions that have leverage embedded in them.
The Trust may also borrow money as a temporary measure for extraordinary or emergency purposes, including the payment of dividends and the settlement of securities transactions which otherwise might require untimely dispositions of Trust securities.
Risk Factors
This section contains a discussion of the general risks of investing in the Trust. The net asset value and market price of, and dividends paid on, the common shares will fluctuate with and be affected by, among other things, the risks more fully described below. As with any fund, there can be no guarantee that the Trust will meet its investment objective or that the Trust’s performance will be positive for any period of time. Each risk noted below is applicable to each Trust unless the specific Trust or Trusts are noted in a parenthetical. The order of the below risk factors does not indicate the significance of any particular risk.
Limited Term Risk: In accordance with the Trust’s Agreement and Declaration of Trust, the Trust intends to dissolve as of the first business day following the twelfth anniversary of the effective date of the Trust’s initial registration statement (the “Dissolution Date”); provided that the Board may, by a vote of a majority of the Board and seventy-five percent (75%) of the members of the Board who either (i) have been a member of the Board for a period of at least thirty-six months (or since the commencement of the Trust’s operations, if less than thirty-six months) or (ii) were nominated to serve as a member of the Board by a majority of the Continuing Trustees then members of the Board (a “Board Action Vote”), without shareholder approval, extend the Dissolution Date: (i) once for up to one year, and (ii) once for up to an additional six months, to a date up to and including eighteen months after the initial Dissolution Date (which date shall then become the Dissolution Date). As of a date within twelve months preceding the Dissolution Date (as may be extended as described above), the Board may, by a Board Action Vote, cause the Trust to conduct a tender offer to all common shareholders to purchase 100% of the then outstanding common shares of the Trust at a price equal to the net asset value (“NAV”) per common share on the expiration date of the tender offer (an “Eligible Tender Offer”). The Board has established that the Trust must have at least $200 million of aggregate net assets immediately following the completion of an Eligible Tender Offer to ensure the continued viability of the Trust (the “Dissolution Threshold”). In an Eligible Tender Offer, the Trust will offer to purchase all common shares held by each common shareholder; provided that if the payment for properly tendered common shares would result in the Trust having aggregate net assets below the Dissolution Threshold, the Eligible Tender Offer will be canceled and no common shares will be repurchased pursuant to the Eligible Tender Offer. Instead, the Trust will begin (or continue) liquidating its portfolio and proceed to dissolve on or about the Dissolution Date. If the payment for properly tendered common shares would result in the Trust having aggregate net assets greater than or equal to the Dissolution Threshold, all common shares properly tendered and not withdrawn will be purchased by the Trust pursuant to
| 98 | 2 0 2 3 B L A C K R O C K A N N U A L R E P O R T T O S H A R E H O L D E R S |
Investment Objectives, Policies and Risks (continued)
the terms of the Eligible Tender Offer. Following the completion of an Eligible Tender Offer, the Board may, by a Board Action Vote, eliminate the Dissolution Date without shareholder approval and provide for the Trust’s perpetual existence.
Unless the limited term provision of the Trust’s Agreement and Declaration of Trust is amended by shareholders in accordance with the Agreement and Declaration of Trust, or unless the Trust completes an Eligible Tender Offer and converts to perpetual existence, the Trust will dissolve on or about the first business day following the Dissolution Date. The Trust is not a so called “target date” or “life cycle” fund whose asset allocation becomes more conservative over time as its target date, often associated with retirement, approaches. In addition, the Trust is not a “target term” fund and thus does not seek to return its initial public offering price per common share upon dissolution. As the assets of the Trust will be liquidated in connection with its dissolution, the Trust may be required to sell portfolio securities when it otherwise would not, including at times when market conditions are not favorable, which may cause the Trust to lose money. In addition, as the Trust approaches the Dissolution Date, the Manager may invest the proceeds of sold, matured or called securities in money market mutual funds, cash, cash equivalents, securities issued or guaranteed by the U.S. government or its instrumentalities or agencies, high quality, short-term money market instruments, short-term debt securities, certificates of deposit, bankers’ acceptances and other bank obligations, commercial paper or other liquid debt securities, which may adversely affect the Trust’s investment performance.
Rather than reinvesting proceeds received from sales of or payments received in respect of portfolio securities, the Trust may distribute such proceeds in one or more liquidating distributions prior to the final dissolution, which may cause the Trust’s fixed expenses to increase when expressed as a percentage of net assets attributable to common shares, or the Trust may invest the proceeds in lower yielding securities or hold the proceeds in cash or cash equivalents, which may adversely affect the performance of the Trust. The final distribution of net assets upon dissolution may be more than, equal to or less than $20.00 per common share. Because the Trust may adopt a plan of liquidation and make liquidating distributions in advance of the Dissolution Date, the total value of the Trust’s assets returned to common shareholders upon dissolution will be impacted by decisions of the Board and the Manager regarding the timing of adopting a plan of liquidation and making liquidating distributions. This may result in common shareholders receiving liquidating distributions with a value more or less than the value that would have been received if the Trust had liquidated all of its assets on the Dissolution Date, or any other potential date for liquidation, and distributed the proceeds thereof to shareholders.
If the Trust conducts an Eligible Tender Offer, the Trust anticipates that funds to pay the aggregate purchase price of shares accepted for purchase pursuant to the tender offer will be first derived from any cash on hand and then from the proceeds from the sale of portfolio investments held by the Trust. The risks related to the disposition of securities in connection with the Trust’s dissolution also would be present in connection with the disposition of securities in connection with an Eligible Tender Offer. It is likely that during the pendency of a tender offer, and possibly for a time thereafter, the Trust will hold a greater than normal percentage of its total assets in cash and cash equivalents, which may impede the Trust’s ability to achieve its investment objectives and decrease returns to shareholders. The tax effect of any such dispositions of portfolio investments will depend on the difference between the price at which the investments are sold and the tax basis of the Trust in the investments.
Any capital gains recognized on such dispositions, as reduced by any capital losses the Trust realizes in the year of such dispositions and by any available capital loss carryforwards, will be distributed to shareholders as capital gain dividends (to the extent of net long-term capital gains over net short-term capital losses) or ordinary dividends (to the extent of net short-term capital gains over net long-term capital losses) during or with respect to such year, and such distributions will generally be taxable to common shareholders. If the Trust’s tax basis for the investments sold is less than the sale proceeds, the Trust will recognize capital gains, which the Trust intends to distribute to common shareholders. In addition, the Trust’s purchase of tendered common shares pursuant to an Eligible Tender Offer will have tax consequences for tendering common shareholders and may have tax consequences for non-tendering common shareholders.
The purchase of common shares by the Trust pursuant to an Eligible Tender Offer will have the effect of increasing the proportionate interest in the Trust of non-tendering common shareholders. All common shareholders remaining after an Eligible Tender Offer will be subject to any increased risks associated with the reduction in the Trust’s assets resulting from payment for the tendered common shares, such as greater volatility due to decreased diversification and proportionately higher expenses. The reduced assets of the Trust as a result of an Eligible Tender Offer may result in less investment flexibility for the Trust and may have an adverse effect on the Trust’s investment performance. Such reduction in the Trust’s assets may also cause common shares of the Trust to become thinly traded or otherwise negatively impact secondary trading of common shares. A reduction in assets, and the corresponding increase in the Trust’s expense ratio, could result in lower returns and put the Trust at a disadvantage relative to its peers and potentially cause the Trust’s common shares to trade at a wider discount, or smaller premium, to NAV than they otherwise would. Furthermore, the portfolio of the Trust following an Eligible Tender Offer could be significantly different and, therefore, common shareholders retaining an investment in the Trust could be subject to greater risk. For example, the Trust may be required to sell its more liquid, higher quality portfolio investments to purchase common shares that are tendered in an Eligible Tender Offer, which would leave a less liquid, lower quality portfolio for remaining shareholders. The prospects of an Eligible Tender Offer may attract arbitrageurs who would purchase the common shares prior to the tender offer for the sole purpose of tendering those shares which could have the effect of exacerbating the risks described herein for shareholders retaining an investment in the Trust following an Eligible Tender Offer.
The Trust is not required to conduct an Eligible Tender Offer. If the Trust conducts an Eligible Tender Offer, there can be no assurance that the payment for tendered common shares would not result in the Trust having aggregate net assets below the Dissolution Threshold, in which case the Eligible Tender Offer will be canceled, no common shares will be repurchased pursuant to the Eligible Tender Offer and the Trust will liquidate on the Dissolution Date (subject to possible extensions). Following the completion of an Eligible Tender Offer in which the payment for tendered common shares would result in the Trust having aggregate net assets greater than or equal to the Dissolution Threshold, the Board may, by a Board Action Vote, eliminate the Dissolution Date without shareholder approval and provide for the Trust’s perpetual existence. Thereafter, the Trust will have a perpetual existence. There is no guarantee that the Board will eliminate the Dissolution Date following the completion of an Eligible Tender Offer so that the Trust will have a perpetual existence. The Manager may have a conflict of interest in recommending to the Board that the Dissolution Date be eliminated and the Trust have a perpetual existence. The Trust is not required to conduct additional tender offers following an Eligible Tender Offer and conversion to perpetual existence. Therefore, remaining common shareholders may not have another opportunity to participate in a tender offer. Shares of closed-end management investment companies frequently trade at a discount from their NAV, and as a result remaining common shareholders may only be able to sell their shares at a discount to NAV.
Although it is anticipated that the Trust will have distributed substantially all of its net assets to shareholders as soon as practicable after the Dissolution Date, securities for which no market exists or securities trading at depressed prices, if any, may be placed in a liquidating trust. Securities placed in a liquidating trust may be held for an indefinite period of time, potentially several years or longer, until they can be sold or pay out all of their cash flows. During such time, the shareholders will continue to be exposed to the risks associated with the Trust and the value of their interest in the liquidating trust will fluctuate with the value of the liquidating trust’s remaining assets. Additionally, the tax
| I N V E S T M E N T O B J E C T I V E S , P O L I C I E S A N D R I S K S |
99 |
Investment Objectives, Policies and Risks (continued)
treatment of the liquidating trust’s assets may differ from the tax treatment applicable to such assets when held by the Trust. To the extent the costs associated with a liquidating trust exceed the value of the remaining securities, the liquidating trust trustees may determine to dispose of the remaining securities in a manner of their choosing. The Trust cannot predict the amount, if any, of securities that will be required to be placed in a liquidating trust or how long it will take to sell or otherwise dispose of such securities.
Non-Diversification Risk: The Trust is a non-diversified fund. Because the Trust may invest in securities of a smaller number of issuers, it may be more exposed to the risks associated with and developments affecting an individual issuer than a fund that invests more widely.
Investment and Market Discount Risk: An investment in the Trust’s common shares is subject to investment risk, including the possible loss of the entire amount that you invest. As with any stock, the price of the Trust’s common shares will fluctuate with market conditions and other factors. If shares are sold, the price received may be more or less than the original investment. Common shares are designed for long-term investors and the Trust should not be treated as a trading vehicle. Shares of closed-end management investment companies frequently trade at a discount from their net asset value. This risk is separate and distinct from the risk that the Trust’s net asset value could decrease as a result of its investment activities. At any point in time an investment in the Trust’s common shares may be worth less than the original amount invested, even after taking into account distributions paid by the Trust. During periods in which the Trust may use leverage, the Trust’s investment, market discount and certain other risks will be magnified.
Equity Securities Risk: Stock markets are volatile. The price of equity securities fluctuates based on changes in a company’s financial condition and overall market and economic conditions.
Debt Securities Risk: Debt securities, such as bonds, involve interest rate risk, such as credit risk, interest rate risk, extension risk, and prepayment risk, each of which are described in further detail below:
| • | Credit Risk — Credit risk refers to the possibility that the issuer of a debt security (i.e., the borrower) will not be able to make payments of interest and principal when due. Changes in an issuer’s credit rating or the market’s perception of an issuer’s creditworthiness may also affect the value of the Trust’s investment in that issuer. The degree of credit risk depends on both the financial condition of the issuer and the terms of the obligation. |
| • | Interest Rate Risk — The market value of bonds and other fixed-income securities changes in response to interest rate changes and other factors. Interest rate risk is the risk that prices of bonds and other fixed-income securities will increase as interest rates fall and decrease as interest rates rise. |
The Trust may be subject to a greater risk of rising interest rates due to the recent period of historically low interest rates. For example, if interest rates increase by 1%, assuming a current portfolio duration of ten years, and all other factors being equal, the value of the Trust’s investments would be expected to decrease by 10%. (Duration is a measure of the price sensitivity of a debt security or portfolio of debt securities to relative changes in interest rates.) The magnitude of these fluctuations in the market price of bonds and other fixed-income securities is generally greater for those securities with longer maturities. Fluctuations in the market price of the Trust’s investments will not affect interest income derived from instruments already owned by the Trust, but will be reflected in the Trust’s net asset value. The Trust may lose money if short-term or long-term interest rates rise sharply in a manner not anticipated by Trust management
To the extent the Trust invests in debt securities that may be prepaid at the option of the obligor (such as mortgage-backed securities), the sensitivity of such securities to changes in interest rates may increase (to the detriment of the Trust) when interest rates rise. Moreover, because rates on certain floating rate debt securities typically reset only periodically, changes in prevailing interest rates (and particularly sudden and significant changes) can be expected to cause some fluctuations in the net asset value of the Trust to the extent that it invests in floating rate debt securities.
These basic principles of bond prices also apply to U.S. Government securities. A security backed by the “full faith and credit” of the U.S. Government is guaranteed only as to its stated interest rate and face value at maturity, not its current market price. Just like other fixed-income securities, government-guaranteed securities will fluctuate in value when interest rates change.
A general rise in interest rates has the potential to cause investors to move out of fixed-income securities on a large scale, which may increase redemptions from funds that hold large amounts of fixed-income securities. Heavy redemptions could cause the Trust to sell assets at inopportune times or at a loss or depressed value and could hurt the Trust’s performance.
| • | Extension Risk — When interest rates rise, certain obligations will be paid off by the obligor more slowly than anticipated, causing the value of these obligations to fall. |
| • | Prepayment Risk — When interest rates fall, certain obligations will be paid off by the obligor more quickly than originally anticipated, and the Trust may have to invest the proceeds in securities with lower yields. |
Risks Associated with the Trust’s Options Strategy: The ability of the Trust to generate current gains from options premiums and to enhance the Trust’s risk-adjusted returns is partially dependent on the successful implementation of its options strategy. There are several risks associated with transactions in options on securities. For example, there are significant differences between the securities and options markets that could result in an imperfect correlation between these markets, causing a given transaction not to achieve its objectives. A decision as to whether, when and how to use options involves the exercise of skill and judgment, and even a well-conceived transaction may be unsuccessful to some degree because of market behavior or unexpected events.
| • | Risks of Writing Options — As the writer of a covered call option, the Trust forgoes, during the option’s life, the opportunity to profit from increases in the market value of the security covering the call option above the sum of the premium and the strike price of the call, but has retained the risk of loss should the price of the underlying security decline. In other words, as the Trust writes covered calls over more of its portfolio, the Trust’s ability to benefit from capital appreciation becomes more limited. |
| 100 | 2 0 2 3 B L A C K R O C K A N N U A L R E P O R T T O S H A R E H O L D E R S |
Investment Objectives, Policies and Risks (continued)
If the Trust writes call options on individual securities or index call options that include securities, in each case, that are not in the Trust’s portfolio or that are not in the same proportion as securities in the Trust’s portfolio, the Trust will experience loss, which theoretically could be unlimited, if the value of the individual security, index or basket of securities appreciates above the exercise price of the index option written by the Trust.
When the Trust writes put options, it bears the risk of loss if the value of the underlying stock declines below the exercise price minus the put premium. If the option is exercised, the Trust could incur a loss if it is required to purchase the stock underlying the put option at a price greater than the market price of the stock at the time of exercise plus the put premium the Trust received when it wrote the option. While the Trust’s potential gain in writing a put option is limited to the premium received from the purchaser of the put option, the Trust risks a loss equal to the entire exercise price of the option minus the put premium.
| • | Exchange-Listed Options Risks — There can be no assurance that a liquid market will exist when the Trust seeks to close out an exchange-listed option position. Reasons for the absence of a liquid secondary market on an exchange include the following: (i) there may be insufficient trading interest in certain options; (ii) restrictions may be imposed by an exchange on opening transactions or closing transactions or both; (iii) trading halts, suspensions or other restrictions may be imposed with respect to particular classes or series of options; (iv) unusual or unforeseen circumstances may interrupt normal operations on an exchange; (v) the facilities of an exchange or the Options Clearing Corporation (the “OCC”) may not at all times be adequate to handle current trading volume; or (vi) one or more exchanges could, for economic or other reasons, decide or be compelled at some future date to discontinue the trading of options (or a particular class or series of options). |
| • | Over-the-Counter Options Risk — The Trust may write (sell) unlisted OTC options. OTC options differ from exchange-listed options in that they are two-party contracts, with exercise price, premium and other terms negotiated between buyer and seller, and generally do not have as much market liquidity as exchange-listed options. The OTC options written by the Trust will not be issued, guaranteed or cleared by the OCC. In addition, the Trust’s ability to terminate OTC options may be more limited than with exchange-traded options. Banks, broker-dealers or other financial institutions participating in such transactions may fail to settle a transaction in accordance with the terms of the option as written. In the event of default or insolvency of the counterparty, the Trust may be unable to liquidate an OTC option position. |
| • | Index Options Risk — The Trust may sell index put and call options from time to time. The purchaser of an index put option has the right to any depreciation in the value of the index below the exercise price of the option on or before the expiration date. The purchaser of an index call option has the right to any appreciation in the value of the index over the exercise price of the option on or before the expiration date. Because the exercise of index options is settled in cash, sellers of index call options, such as the Trust, cannot provide in advance for their potential settlement obligations by acquiring and holding the underlying securities. The Trust will lose money if it is required to pay the purchaser of an index option the difference between the cash value of the index on which the option was written and the exercise price and such difference is greater than the premium received by the Trust for writing the option. |
| • | Limitation on Options Writing Risk — The number of call options the Trust can write is limited by the total assets the Trust holds and is further limited by the fact that all options represent 100 share lots of the underlying common stock. Furthermore, the Trust’s options transactions will be subject to limitations established by each of the exchanges, boards of trade or other trading facilities on which such options are traded. |
| • | Tax Risk — Income on options on individual stocks will generally not be recognized by the Trust for tax purposes until an option is exercised, lapses or is subject to a “closing transaction” (as defined by applicable regulations) pursuant to which the Trust’s obligations with respect to the option are otherwise terminated. If the option lapses without exercise or is otherwise subject to a closing transaction, the premiums received by the Trust from the writing of such options will generally be characterized as short-term capital gain. If an option written by the Trust is exercised, the Trust may recognize taxable gain depending on the exercise price of the option, the option premium, and the tax basis of the security underlying the option. The character of any gain on the sale of the underlying security as short-term or long-term capital gain will depend on the holding period of the Trust in the underlying security. In general, distributions received by shareholders of the Trust that are attributable to short-term capital gains recognized by the Trust from its options writing activities will be taxed to such shareholders as ordinary income and will not be eligible for the reduced tax rate applicable to qualified dividend income. |
Index options will generally be “marked-to-market” for U.S. federal income tax purposes. As a result, the Trust will generally recognize gain or loss on the last day of each taxable year equal to the difference between the value of the index option on that date and the adjusted basis of the index option. The adjusted basis of the index option will consequently be increased by such gain or decreased by such loss. Any gain or loss with respect to index options will be treated as short-term capital gain or loss to the extent of 40% of such gain or loss and long-term capital gain or loss to the extent of 60% of such gain or loss. Because the mark-to-market rules may cause the Trust to recognize gain in advance of the receipt of cash, the Trust may be required to dispose of investments in order to meet its distribution requirements.
ESG Investing Risk (ECAT): The Trust intends to screen out particular issuers pursuant to certain criteria established by the Manager, and to incorporate ESG criteria in selecting Trust investments pursuant to a methodology determined by the Manager. This may affect the Trust’s exposure to certain issuers and the Trust may forego certain investment opportunities. The Trust’s results may be lower than other funds that do not seek to invest in issuers based on ESG criteria, or that use a different methodology to screen out issuers or evaluate ESG criteria. The Trust seeks to identify issuers that it believes are better positioned to manage ESG risks and opportunities related to their businesses and to avoid certain companies and industries with ESG related risks, but investors may differ in their views of what constitutes positive or negative ESG criteria. As a result, the Trust may invest in issuers that do not reflect the beliefs and values of any particular investor. In evaluating a security or issuer based on ESG criteria, the Manager is dependent upon certain information and data from third party providers of ESG research, which may be incomplete, inaccurate or unavailable. As a result, there is a risk that the Manager may incorrectly assess a security or issuer. There is also a risk that the Manager may not apply the relevant ESG criteria correctly or that the Trust could have indirect exposure to issuers who do not meet the relevant ESG criteria used by the Trust. Neither the Trust nor the Manager make any representation or warranty, express or implied, with respect to the fairness, correctness, accuracy, reasonableness or completeness of such ESG assessment. There may be limitations with respect to availability of ESG data in certain sectors, as well as limited availability of investments with positive ESG assessments in certain sectors. The Manager’s evaluation of ESG criteria is subjective and may change over time.
The Trust’s ESG screening criteria is measured at the time of investment and is dependent upon information and data that may change over time. If a particular portfolio holding no longer meets the applicable screening criteria subsequent to the time of investment, the Trust will generally look to sell the holding in a reasonable amount of time. The Trust
| I N V E S T M E N T O B J E C T I V E S , P O L I C I E S A N D R I S K S |
101 |
Investment Objectives, Policies and Risks (continued)
may be forced to sell investments at an inopportune time or at a time when those investments may be difficult to sell. In addition, the Trust may incur expenses in an effort to dispose of such investments.
The Trust may not include all instruments in its ESG-related assessments, and may place weight on other factors when selecting investments. In addition, the Trust may not be successful in its objectives related to ESG characteristics. There is no guarantee that these objectives will be achieved, and such assessments are at the Manager’s discretion.
Risks Associated with Private Company Investments: Private companies are generally not subject to Securities and Exchange Commission (“SEC”) reporting requirements, are not required to maintain their accounting records in accordance with generally accepted accounting principles, and are not required to maintain effective internal controls over financial reporting. As a result, the Manager may not have timely or accurate information about the business, financial condition and results of operations of the private companies in which the Trust invests. There is risk that the Trust may invest on the basis of incomplete or inaccurate information, which may adversely affect the Trust’s investment performance. Private companies in which the Trust may invest may have limited financial resources, shorter operating histories, more asset concentration risk, narrower product lines and smaller market shares than larger businesses, which tend to render such private companies more vulnerable to competitors’ actions and market conditions, as well as general economic downturns.
These companies generally have less predictable operating results, may from time to time be parties to litigation, may be engaged in rapidly changing businesses with products subject to a substantial risk of obsolescence, and may require substantial additional capital to support their operations, finance expansion or maintain their competitive position. These companies may have difficulty accessing the capital markets to meet future capital needs, which may limit their ability to grow or to repay their outstanding indebtedness upon maturity. In addition, the Trust’s investment also may be structured as pay-in-kind securities with minimal or no cash interest or dividends until the company meets certain growth and liquidity objectives.
Typically, investments in private companies are in restricted securities that are not traded in public markets and subject to substantial holding periods, so that the Trust may not be able to resell some of its holdings for extended periods, which may be several years. There can be no assurance that the Trust will be able to realize the value of private company investments in a timely manner.
| • | Late-Stage Private Companies Risk — Investments in late-stage private companies involve greater risks than investments in shares of companies that have traded publicly on an exchange for extended periods of time. These investments may present significant opportunities for capital appreciation but involve a high degree of risk that may result in significant decreases in the value of these investments. The Trust may not be able to sell such investments when the Manager deems it appropriate to do so because they are not publicly traded. As such, these investments are generally considered to be illiquid until a company’s public offering (which may never occur) and are often subject to additional contractual restrictions on resale following any public offering that may prevent the Trust from selling its shares of these companies for a period of time. See “Illiquid Investments Risk.” Market conditions, developments within a company, investor perception or regulatory decisions may adversely affect a late-stage private company and delay or prevent such a company from ultimately offering its securities to the public. If a company does issue shares in an IPO, IPOs are risky and volatile and may cause the value of the Trust’s investment to decrease significantly. |
Illiquid Investments Risk: The Trust may invest without limitation in illiquid or less liquid investments or investments in which no secondary market is readily available or which are otherwise illiquid, including private placement securities. The Trust may not be able to readily dispose of such investments at prices that approximate those at which the Trust could sell such investments if they were more widely traded and, as a result of such illiquidity, the Trust may have to sell other investments or engage in borrowing transactions if necessary to raise cash to meet its obligations. Limited liquidity can also affect the market price of investments, thereby adversely affecting the Trust’s net asset value and ability to make dividend distributions. The financial markets in general, and certain segments of the mortgage-related securities markets in particular, have in recent years experienced periods of extreme secondary market supply and demand imbalance, resulting in a loss of liquidity during which market prices were suddenly and substantially below traditional measures of intrinsic value. During such periods, some investments could be sold only at arbitrary prices and with substantial losses. Periods of such market dislocation may occur again at any time. Privately issued debt securities are often of below investment grade quality, frequently are unrated and present many of the same risks as investing in below investment grade public debt securities.
Initial Public Offerings (“IPOs”) Risk: The Trust may invest in shares of companies through IPOs. Securities issued in IPOs have no trading history, and information about the companies may be available for limited periods of time. In addition, the prices of securities sold in IPOs may be highly volatile or may decline shortly after the IPO.
Leverage Risk: The Trust’s use of leverage may increase or decrease from time to time in its discretion and the Trust may, in the future, determine not to use leverage.
The use of leverage creates an opportunity for increased common share net investment income dividends, but also creates risks for the holders of common shares. The Trust cannot assure you that the use of leverage will result in a higher yield on the common shares. Any leveraging strategy the Trust employs may not be successful.
Leverage involves risks and special considerations for common shareholders, including:
| • | the likelihood of greater volatility of net asset value, market price and dividend rate of the common shares than a comparable portfolio without leverage; |
| • | the risk that fluctuations in interest rates or dividend rates on any leverage that the Trust must pay will reduce the return to the common shareholders; |
| • | the effect of leverage in a declining market, which is likely to cause a greater decline in the net asset value of the common shares than if the Trust were not leveraged, which may result in a greater decline in the market price of the common shares; |
| • | leverage may increase operating costs, which may reduce total return. |
| 102 | 2 0 2 3 B L A C K R O C K A N N U A L R E P O R T T O S H A R E H O L D E R S |
Investment Objectives, Policies and Risks (continued)
Any decline in the net asset value of the Trust’s investments will be borne entirely by the holders of common shares. Therefore, if the market value of the Trust’s portfolio declines, leverage will result in a greater decrease in net asset value to the holders of common shares than if the Trust were not leveraged. This greater net asset value decrease will also tend to cause a greater decline in the market price for the common shares.
Investment Style Risk: Under certain market conditions, growth investments have performed better during the later stages of economic expansion and value investments have performed better during periods of economic recovery. Therefore, these investment styles may over time go in and out of favor. At times when the investment style used by the Trust is out of favor, the Trust may underperform other equity funds that use different investment styles.
Dividend Paying Equity Securities Risk: Dividends on common equity securities that the Trust may hold are not fixed but are declared at the discretion of an issuer’s board of directors. Companies that have historically paid dividends on their securities are not required to continue to pay dividends on such securities. There is no guarantee that the issuers of the common equity securities in which the Trust invests will declare dividends in the future or that, if declared, they will remain at current levels or increase over time. Therefore, there is the possibility that such companies could reduce or eliminate the payment of dividends in the future. Dividend producing equity securities, in particular those whose market price is closely related to their yield, may exhibit greater sensitivity to interest rate changes. The Trust’s investments in dividend producing equity securities may also limit its potential for appreciation during a broad market advance.
The prices of dividend producing equity securities can be highly volatile. Investors should not assume that the Trust’s investments in these securities will necessarily reduce the volatility of the Trust’s NAV or provide “protection,” compared to other types of equity securities, when markets perform poorly.
Small and Mid-Capitalization Company Risk: Companies with small or mid-size market capitalizations will normally have more limited product lines, markets and financial resources and will be dependent upon a more limited management group than larger capitalized companies. In addition, it is more difficult to get information on smaller companies, which tend to be less well known, have shorter operating histories, do not have significant ownership by large investors and are followed by relatively few securities analysts.
Preferred Securities Risk: Preferred securities may pay fixed or adjustable rates of return. Preferred securities are subject to issuer-specific and market risks applicable generally to equity securities. In addition, a company’s preferred securities generally pay dividends only after the company makes required payments to holders of its bonds and other debt. For this reason, the value of preferred securities will usually react more strongly than bonds and other debt to actual or perceived changes in the company’s financial condition or prospects. Preferred securities of smaller companies may be more vulnerable to adverse developments than preferred securities of larger companies.
Convertible Securities Risk: The market value of a convertible security performs like that of a regular debt security; that is, if market interest rates rise, the value of a convertible security usually falls. In addition, convertible securities are subject to the risk that the issuer will not be able to pay interest, principal or dividends when due, and their market value may change based on changes in the issuer’s credit rating or the market’s perception of the issuer’s creditworthiness. Since it derives a portion of its value from the common stock into which it may be converted, a convertible security is also subject to the same types of market and issuer risks that apply to the underlying common stock, including the potential for increased volatility in the price of the convertible security.
Warrants Risk: If the price of the underlying stock does not rise above the exercise price before the warrant expires, the warrant generally expires without any value and the Trust will lose any amount it paid for the warrant. Thus, investments in warrants may involve substantially more risk than investments in common stock. Warrants may trade in the same markets as their underlying stock; however, the price of the warrant does not necessarily move with the price of the underlying stock.
Municipal Securities Risks: Municipal securities risks include the ability of the issuer to repay the obligation, the relative lack of information about certain issuers of municipal securities, and the possibility of future legislative changes which could affect the market for and value of municipal securities. Budgetary constraints of local, state, and federal governments upon which the issuers may be relying for funding may also impact municipal securities. These risks include:
| • | General Obligation Bonds Risks — Timely payments depend on the issuer’s credit quality, ability to raise tax revenues and ability to maintain an adequate tax base. |
| • | Revenue Bonds Risks — These payments depend on the money earned by the particular facility or class of facilities, or the amount of revenues derived from another source. |
| • | Private Activity Bonds Risks — Municipalities and other public authorities issue private activity bonds to finance development of industrial facilities for use by a private enterprise. The private enterprise pays the principal and interest on the bond, and the issuer does not pledge its full faith, credit and taxing power for repayment. |
| • | Moral Obligation Bonds Risks — Moral obligation bonds are generally issued by special purpose public authorities of a state or municipality. If the issuer is unable to meet its obligations, repayment of these bonds becomes a moral commitment, but not a legal obligation, of the state or municipality. |
| • | Municipal Notes Risks — Municipal notes are shorter term municipal debt obligations. If there is a shortfall in the anticipated proceeds, the notes may not be fully repaid and the Trust may lose money. |
| • | Municipal Lease Obligations Risks{em_dash;1In a municipal lease obligation, the issuer agrees to make payments when due on the lease obligation. Although the issuer does not pledge its unlimited taxing power for payment of the lease obligation, the lease obligation is secured by the leased property. |
| • | Tax-Exempt Status Risk — The Trust and its investment manager will rely on the opinion of issuers’ bond counsel and, in the case of derivative securities, sponsors’ counsel, on the tax-exempt status of interest on municipal bonds and payments under derivative securities. Neither the Trust nor its investment manager will independently review the bases for those tax opinions, which may ultimately be determined to be incorrect and subject the Trust and its shareholders to substantial tax liabilities. |
| I N V E S T M E N T O B J E C T I V E S , P O L I C I E S A N D R I S K S |
103 |
Investment Objectives, Policies and Risks (continued)
High Yield Bonds Risk: Although junk bonds generally pay higher rates of interest than investment grade bonds, junk bonds are high risk investments that are considered speculative and may cause income and principal losses for the Trust.
Corporate Loans Risk: Commercial banks and other financial institutions or institutional investors make corporate loans to companies that need capital to grow or restructure. Borrowers generally pay interest on corporate loans at rates that change in response to changes in market interest rates such as the Secured Overnight Financing Rate (“SOFR”), the London Interbank Offered Rate (“LIBOR”) or the prime rates of U.S. banks. As a result, the value of corporate loan investments is generally less exposed to the adverse effects of shifts in market interest rates than investments that pay a fixed rate of interest. The market for corporate loans may be subject to irregular trading activity and wide bid/ask spreads. In addition, transactions in corporate loans may settle on a delayed basis. As a result, the proceeds from the sale of corporate loans may not be readily available to make additional investments or to meet the Trust’s redemption obligations. To the extent the extended settlement process gives rise to short-term liquidity needs, the Trust may hold additional cash, sell investments or temporarily borrow from banks and other lenders. The corporate loans in which the Trust invests are usually rated below investment grade.
Risks of Loan Assignments and Participations: As the purchaser of an assignment, the Trust typically succeeds to all the rights and obligations of the assigning institution and becomes a lender under the credit agreement with respect to the debt obligation; however, the Trust may not be able unilaterally to enforce all rights and remedies under the loan and with regard to any associated collateral. Because assignments may be arranged through private negotiations between potential assignees and potential assignors, the rights and obligations acquired by the Trust as the purchaser of an assignment may differ from, and be more limited than, those held by the assigning lender. In addition, if the loan is foreclosed, the Trust could become part owner of any collateral and could bear the costs and liabilities of owning and disposing of the collateral. The Trust may be required to pass along to a purchaser that buys a loan from the Trust by way of assignment a portion of any fees to which the Trust is entitled under the loan. In connection with purchasing participations, the Trust generally will have no right to enforce compliance by the borrower with the terms of the loan agreement relating to the loan, nor any rights of set-off against the borrower, and the Trust may not directly benefit from any collateral supporting the loan in which it has purchased the participation. As a result, the Trust will be subject to the credit risk of both the borrower and the lender that is selling the participation. In the event of the insolvency of the lender selling a participation, the Trust may be treated as a general creditor of the lender and may not benefit from any set-off between the lender and the borrower.
Distressed Securities Risk: Distressed securities are speculative and involve substantial risks in addition to the risks of investing in junk bonds. The Trust will generally not receive interest payments on the distressed securities and may incur costs to protect its investment. In addition, distressed securities involve the substantial risk that principal will not be repaid. These securities may present a substantial risk of default or may be in default at the time of investment. The Trust may incur additional expenses to the extent it is required to seek recovery upon a default in the payment of principal of or interest on its portfolio holdings. In any reorganization or liquidation proceeding relating to a portfolio company, the Trust may lose its entire investment or may be required to accept cash or securities with a value less than its original investment. Distressed securities and any securities received in an exchange for such securities may be subject to restrictions on resale.
Unrated Securities Risk: Because the Trust may purchase securities that are not rated by any rating organization, the Manager may, after assessing their credit quality, internally assign ratings to certain of those securities in categories similar to those of rating organizations. Some unrated securities may not have an active trading market or may be difficult to value, which means the Trust might have difficulty selling them promptly at an acceptable price. To the extent that the Trust invests in unrated securities, the Trust’s ability to achieve its investment objectives will be more dependent on the Manager’s credit analysis than would be the case when the Trust invests in rated securities.
Mortgage- and Asset-Backed Securities Risks: Mortgage- and asset-backed securities represent interests in “pools” of mortgages or other assets, including consumer loans or receivables held in trust. Mortgage- and asset-backed securities are subject to credit, interest rate, prepayment and extension risks. These securities also are subject to risk of default on the underlying mortgage or asset, particularly during periods of economic downturn. Small movements in interest rates (both increases and decreases) may quickly and significantly reduce the value of certain mortgage-backed securities.
U.S. Government Obligations Risk: Certain securities in which the Trust may invest, including securities issued by certain U.S. Government agencies and U.S. Government sponsored enterprises, are not guaranteed by the U.S. Government or supported by the full faith and credit of the United States. In addition, circumstances could arise that could prevent the timely payment of interest or principal on U.S. Government obligations, such as reaching the legislative “debt ceiling.” Such non-payment could result in losses to the Trust and substantial negative consequences for the U.S. economy and the global financial system.
Sovereign Debt Risk: Sovereign debt instruments are subject to the risk that a governmental entity may delay or refuse to pay interest or repay principal on its sovereign debt, due, for example, to cash flow problems, insufficient foreign currency reserves, political considerations, the relative size of the governmental entity’s debt position in relation to the economy or the failure to put in place economic reforms required by the International Monetary Fund or other multilateral agencies.
Foreign Securities Risk: Foreign investments often involve special risks not present in U.S. investments that can increase the chances that the Trust will lose money. These risks include:
| • | The Trust generally holds its foreign securities and cash in foreign banks and securities depositories, which may be recently organized or new to the foreign custody business and may be subject to only limited or no regulatory oversight. |
| • | Changes in foreign currency exchange rates can affect the value of the Trust’s portfolio. |
| • | The economies of certain foreign markets may not compare favorably with the economy of the United States with respect to such issues as growth of gross national product, reinvestment of capital, resources and balance of payments position. |
| • | The governments of certain countries, or the U.S. Government with respect to certain countries, may prohibit or impose substantial restrictions through capital controls and/or sanctions on foreign investments in the capital markets or certain industries in those countries, which may prohibit or restrict the ability to own or transfer currency, securities, derivatives or other assets. |
| 104 | 2 0 2 3 B L A C K R O C K A N N U A L R E P O R T T O S H A R E H O L D E R S |
Investment Objectives, Policies and Risks (continued)
| • | Many foreign governments do not supervise and regulate stock exchanges, brokers and the sale of securities to the same extent as does the United States and may not have laws to protect investors that are comparable to U.S. securities laws. |
| • | Settlement and clearance procedures in certain foreign markets may result in delays in payment for or delivery of securities not typically associated with settlement and clearance of U.S. investments. |
| • | The Trust’s claims to recover foreign withholding taxes may not be successful, and if the likelihood of recovery of foreign withholding taxes materially decreases, due to, for example, a change in tax regulation or approach in the foreign country, accruals in the Trust’s net asset value for such refunds may be written down partially or in full, which will adversely affect the Trust’s net asset value. |
| • | The European financial markets have recently experienced volatility and adverse trends due to concerns about economic downturns in, or rising government debt levels of, several European countries as well as acts of war in the region. These events may spread to other countries in Europe and may affect the value and liquidity of certain of the Trust’s investments. |
Emerging Markets Risk: Emerging markets are riskier than more developed markets because they tend to develop unevenly and may never fully develop. Investments in emerging markets may be considered speculative. Emerging markets are more likely to experience hyperinflation and currency devaluations, which adversely affect returns to U.S. investors. In addition, many emerging securities markets have far lower trading volumes and less liquidity than developed markets.
Foreign Currency Transactions Risk: The Trust may invest in forward foreign currency exchange contracts. Forward foreign currency exchange contracts do not eliminate movements in the value of non-U.S. currencies and securities but rather allow the Trust to establish a fixed rate of exchange for a future point in time. This strategy can have the effect of reducing returns and minimizing opportunities for gain.
Commodities Related Investments Risk: Exposure to the commodities markets may subject the Trust to greater volatility than investments in traditional securities. The value of commodity-linked derivative investments may be affected by changes in overall market movements, commodity index volatility, changes in inflation, interest rates, or factors affecting a particular industry or commodity, such as drought, floods, weather, embargoes, tariffs and international economic, political and regulatory developments.
Repurchase Agreements and Purchase and Sale Contracts Risk: If the other party to a repurchase agreement or purchase and sale contract defaults on its obligation under the agreement, the Trust may suffer delays and incur costs or lose money in exercising its rights under the agreement. If the seller fails to repurchase the security in either situation and the market value of the security declines, the Trust may lose money.
Reverse Repurchase Agreements Risk: Reverse repurchase agreements involve the sale of securities held by the Trust with an agreement to repurchase the securities at an agreed-upon price, date and interest payment. Reverse repurchase agreements involve the risk that the other party may fail to return the securities in a timely manner or at all. The Trust could lose money if it is unable to recover the securities and the value of the collateral held by the Trust, including the value of the investments made with cash collateral, is less than the value of the securities. These events could also trigger adverse tax consequences for the Trust. In addition, reverse repurchase agreements involve the risk that the interest income earned in the investment of the proceeds will be less than the interest expense.
Dollar Rolls Risk: Dollar rolls involve the risk that the market value of the securities that the Trust is committed to buy may decline below the price of the securities the Trust has sold. These transactions may involve leverage.
Structured Securities Risk: Because structured securities of the type in which the Trust may invest typically involve no credit enhancement, their credit risk generally will be equivalent to that of the underlying instruments, index or reference obligation and will also be subject to counterparty risk. The Trust may have the right to receive payments only from the structured security, and generally does not have direct rights against the issuer or the entity that sold the assets to be securitized. In addition to the general risks associated with debt securities discussed herein, structured securities carry additional risks, including, but not limited to: the possibility that distributions from collateral securities will not be adequate to make interest or other payments; the quality of the collateral may decline in value or default; and the possibility that the structured securities are subordinate to other classes. The Trust is permitted to invest in a class of structured securities that is either subordinated or unsubordinated to the right of payment of another class. Subordinated structured securities typically have higher yields and present greater risks than unsubordinated structured securities. Structured securities are typically sold in private placement transactions, and there currently is no active trading market for structured securities. Structured securities are based upon the movement of one or more factors, including currency exchange rates, interest rates, reference bonds and stock indices, and changes in interest rates and impact of these factors may cause significant price fluctuations. Additionally, changes in the reference instrument or security may cause the interest rate on the structured security to be reduced to zero. Certain issuers of such structured securities may be deemed to be “investment companies” as defined in the Investment Company Act of 1940, as amended (the “Investment Company Act”). As a result, the Trust’s investment in such securities may be limited by certain investment restrictions contained in the Investment Company Act.
Investment Companies and ETFs Risk: Subject to the limitations set forth in the Investment Company Act and the rules thereunder, the Trust may acquire shares in other investment companies and in ETFs, some of which may be affiliated investment companies. The market value of the shares of other investment companies and ETFs may differ from their net asset value. As an investor in investment companies and ETFs, the Trust would bear its ratable share of that entity’s expenses, including its investment advisory and administration fees, while continuing to pay its own advisory and administration fees and other expenses (to the extent not offset by the Manager through waivers). As a result, shareholders will be absorbing duplicate levels of fees with respect to investments in other investment companies and ETFs (to the extent not offset by the Manager through waivers).
The securities of other investment companies and ETFs in which the Trust may invest may be leveraged. As a result, the Trust may be indirectly exposed to leverage through an investment in such securities. An investment in securities of other investment companies and ETFs that use leverage may expose the Trust to higher volatility in the market value of such securities and the possibility that the Trust’s long-term returns on such securities (and, indirectly, the long-term returns of shares of the Trust) will be diminished.
As with other investments, investments in other investment companies, including ETFs, are subject to market and selection risk. To the extent the Trust is held by an affiliated fund, the ability of the Trust itself to hold other investment companies may be limited
| I N V E S T M E N T O B J E C T I V E S , P O L I C I E S A N D R I S K S |
105 |
Investment Objectives, Policies and Risks (continued)
Derivatives Risk: The Trust’s use of derivatives may increase its costs, reduce the Trust’s returns and/or increase volatility. Derivatives involve significant risks, including:
| • | Leverage Risk — The Trust’s use of derivatives can magnify the Trust’s gains and losses. Relatively small market movements may result in large changes in the value of a derivatives position and can result in losses that greatly exceed the amount originally invested. |
| • | Market Risk — Some derivatives are more sensitive to interest rate changes and market price fluctuations than other securities. The Trust could also suffer losses related to its derivatives positions as a result of unanticipated market movements, which losses are potentially unlimited. Finally, the Manager may not be able to predict correctly the direction of securities prices, interest rates and other economic factors, which could cause the Trust’s derivatives positions to lose value. |
| • | Counterparty Risk — Derivatives are also subject to counterparty risk, which is the risk that the other party in the transaction will be unable or unwilling to fulfill its contractual obligation, and the related risks of having concentrated exposure to such a counterparty. |
| • | Illiquidity Risk — The possible lack of a liquid secondary market for derivatives and the resulting inability of the Trust to sell or otherwise close a derivatives position could expose the Trust to losses and could make derivatives more difficult for the Trust to value accurately. |
| • | Operational Risk — The use of derivatives includes the risk of potential operational issues, including documentation issues, settlement issues, systems failures, inadequate controls and human error. |
| • | Legal Risk — The risk of insufficient documentation, insufficient capacity or authority of counterparty, or legality or enforceability of a contract. |
| • | Volatility and Correlation Risk — Volatility is defined as the characteristic of a security, an index or a market to fluctuate significantly in price within a short time period. A risk of the Trust’s use of derivatives is that the fluctuations in their values may not correlate with the overall securities markets. |
| • | Valuation Risk — Valuation for derivatives may not be readily available in the market. Valuation may be more difficult in times of market turmoil since many investors and market makers may be reluctant to purchase complex instruments or quote prices for them. |
| • | Hedging Risk — Hedges are sometimes subject to imperfect matching between the derivative and the underlying security, and there can be no assurance that the Trust’s hedging transactions will be effective. The use of hedging may result in certain adverse tax consequences. |
| • | Tax Risk — Certain aspects of the tax treatment of derivative instruments, including swap agreements and commodity-linked derivative instruments, are currently unclear and may be affected by changes in legislation, regulations or other legally binding authority. Such treatment may be less favorable than that given to a direct investment in an underlying asset and may adversely affect the timing, character and amount of income the Trust realizes from its investments. |
Securities Lending Risk: Securities lending involves the risk that the borrower may fail to return the securities in a timely manner or at all. As a result, the Trust may lose money and there may be a delay in recovering the loaned securities. The Trust could also lose money if it does not recover the securities and/or the value of the collateral falls, including the value of investments made with cash collateral. These events could trigger adverse tax consequences for the Trust.
Subsidiary Risk: By investing in the Subsidiary, the Trust is indirectly exposed to the risks associated with the Subsidiary’s investments. The commodity-related instruments held by the Subsidiary are generally similar to those that are permitted to be held by the Trust and are subject to the same risks that apply to similar investments if held directly by the Trust (see “Commodities Related Investments Risk” above). There can be no assurance that the investment objective of the Subsidiary will be achieved. The Subsidiary is not registered under the Investment Company Act, and, unless otherwise noted, is not subject to all the investor protections of the Investment Company Act. However, the Trust wholly owns and controls the Subsidiary, and the Trust and the Subsidiary are both managed by the Manager, making it unlikely that the Subsidiary will take action contrary to the interests of the Trust and its shareholders. The Board has oversight responsibility for the investment activities of the Trust, including its investment in the Subsidiary, and the Trust’s role as sole shareholder of the Subsidiary. The Subsidiary is subject to the same investment restrictions and limitations, and follows the same compliance policies and procedures, as the Trust. Changes in the laws of the United States and/or the Cayman Islands could result in the inability of the Trust and/or the Subsidiary to operate as described and could adversely affect the Trust.
Variable and Floating Rate Instrument Risk: Variable and floating rate securities provide for periodic adjustment in the interest rate paid on the securities. These securities may be subject to greater illiquidity risk than other fixed-income securities, meaning the absence of an active market for these securities could make it difficult for the Trust to dispose of them at any given time.
Risk of Investing in the United States: Certain changes in the U.S. economy, such as when the U.S. economy weakens or when its financial markets decline, may have an adverse effect on the securities to which the Trust has exposure.
Market Risk and Selection Risk: Market risk is the risk that one or more markets in which the Trust invests will go down in value, including the possibility that the markets will go down sharply and unpredictably. The value of a security or other asset may decline due to changes in general market conditions, economic trends or events that are not specifically related to the issuer of the security or other asset, or factors that affect a particular issuer or issuers, exchange, country, group of countries, region, market, industry, group of industries, sector or asset class. Local, regional or global events such as war, acts of terrorism, the spread of infectious illness or other public health issues like pandemics or epidemics, recessions, or other events could have a significant impact on the Trust and its investments. Selection risk is the risk that the securities selected by Trust management will underperform the markets, the relevant indices or the securities selected by other funds with similar investment objectives and investment strategies. This means you may lose money.
An outbreak of an infectious coronavirus (COVID-19) that was first detected in December 2019 developed into a global pandemic that has resulted in numerous disruptions in the market and has had significant economic impact leaving general concern and uncertainty. Although vaccines have been developed and approved for use by various
| 106 | 2 0 2 3 B L A C K R O C K A N N U A L R E P O R T T O S H A R E H O L D E R S |
Investment Objectives, Policies and Risks (continued)
governments, the duration of the pandemic and its effects cannot be predicted with certainty. The impact of this coronavirus, and other epidemics and pandemics that may arise in the future, could affect the economies of many nations, individual companies and the market in general ways that cannot necessarily be foreseen at the present time.
Shareholder Activism Risk: Shareholder activism involving closed-end funds has recently been increasing. Shareholder activism can take many forms, including engaging in public campaigns to demand that the Trust consider significant transactions such as a tender offer, merger or liquidation or to attempt to influence the Trust’s corporate governance and/or management, commencing proxy contests to attempt to elect the activists’ representatives or others to the Trust’s Board of Trustees, or to seek other actions such as a termination of the Trust’s investment advisory contract with its current investment manager or commencing litigation. If the Trust becomes the subject of shareholder activism, then management and the Board may be required to divert significant resources and attention to respond to the activist and the Trust may incur substantial costs defending against such activism if management and the Board determine that the activist’s demands are not in the best interest of the Trust. Further, the Trust’s share price could be subject to significant fluctuation or otherwise be adversely affected by the events, risks and uncertainties of any shareholder activism.
| I N V E S T M E N T O B J E C T I V E S , P O L I C I E S A N D R I S K S |
107 |
Automatic Dividend Reinvestment Plan
Pursuant to BCAT and ECAT’s Dividend Reinvestment Plan (the “Reinvestment Plan”), Common Shareholders are automatically enrolled to have all distributions of dividends and capital gains and other distributions reinvested by Computershare Trust Company, N.A. (the “Reinvestment Plan Agent”) in the respective Trust’s Common Shares pursuant to the Reinvestment Plan. Shareholders who do not participate in the Reinvestment Plan will receive all distributions in cash paid by check and mailed directly to the shareholders of record (or if the shares are held in street name or other nominee name, then to the nominee) by the Reinvestment Plan Agent, which serves as agent for the shareholders in administering the Reinvestment Plan.
After BCAT and ECAT declare a dividend or determine to make a capital gain or other distribution, the Reinvestment Plan Agent will acquire shares for the participants’ accounts, depending upon the following circumstances, either (i) through receipt of unissued but authorized shares from the Trusts (“newly issued shares”) or (ii) by purchase of outstanding shares on the open market or on the Trust’s primary exchange (“open-market purchases”). If, on the dividend payment date, the net asset value (“NAV”) per share is equal to or less than the market price per share plus estimated brokerage commissions (such condition often referred to as a “market premium”), the Reinvestment Plan Agent will invest the dividend amount in newly issued shares acquired on behalf of the participants. The number of newly issued shares to be credited to each participant’s account will be determined by dividing the dollar amount of the dividend by the NAV on the date the shares are issued. However, if the NAV is less than 95% of the market price on the dividend payment date, the dollar amount of the dividend will be divided by 95% of the market price on the dividend payment date. If, on the dividend payment date, the NAV is greater than the market price per share plus estimated brokerage commissions (such condition often referred to as a “market discount”), the Reinvestment Plan Agent will invest the dividend amount in shares acquired on behalf of the participants in open-market purchases. If the Reinvestment Plan Agent is unable to invest the full dividend amount in open-market purchases, or if the market discount shifts to a market premium during the purchase period, the Reinvestment Plan Agent will invest any un-invested portion in newly issued shares. Investments in newly issued shares made in this manner would be made pursuant to the same process described above and the date of issue for such newly issued shares will substitute for the dividend payment date.
You may elect not to participate in the Reinvestment Plan and to receive all dividends in cash by contacting the Reinvestment Plan Agent, at the address set forth below.
Participation in the Reinvestment Plan is completely voluntary and may be terminated or resumed at any time without penalty by notice if received and processed by the Reinvestment Plan Agent prior to the dividend record date. Additionally, the Reinvestment Plan Agent seeks to process notices received after the record date but prior to the payable date and such notices often will become effective by the payable date. Where late notices are not processed by the applicable payable date, such termination or resumption will be effective with respect to any subsequently declared dividend or other distribution.
The Reinvestment Plan Agent’s fees for the handling of the reinvestment of distributions will be paid by each Trust. However, each participant will pay a pro rata share of brokerage commissions incurred with respect to the Reinvestment Plan Agent’s open-market purchases in connection with the reinvestment of all distributions. The automatic reinvestment of all distributions will not relieve participants of any U.S. federal, state or local income tax that may be payable on such dividends or distributions.
Each Trust reserves the right to amend or terminate the Reinvestment Plan. There is no direct service charge to participants in the Reinvestment Plan; however, each Trust reserves the right to amend the Reinvestment Plan to include a service charge payable by the participants. Participants in BCAT and ECAT that request a sale of shares are subject to a $2.50 sales fee and a $0.15 per share sold fee. Per share fees include any applicable brokerage commissions the Reinvestment Plan Agent is required to pay. All correspondence concerning the Reinvestment Plan should be directed to Computershare Trust Company, N.A. through the internet at computershare.com/blackrock, or in writing to Computershare, P.O. Box 43006, Providence, RI 02940-3078, Telephone: (800) 699-1236. Overnight correspondence should be directed to the Reinvestment Plan Agent at Computershare, 150 Royall Street, Suite 101, Canton, MA 02021.
| 108 | 2 0 2 3 B L A C K R O C K A N N U A L R E P O R T T O S H A R E H O L D E R S |
Trustee and Officer Information
| Independent Trustees(a) | ||||||||
| Name Year of Birth(b) |
Position(s) Held (Length of Service)(c) |
Principal Occupation(s) During Past 5 Years | Number of BlackRock-Advised Registered Investment Companies (“RICs”) Consisting of Investment Portfolios (“Portfolios”) Overseen |
Public Company and Other Investment Company Directorships Held During Past 5 Years | ||||
| R. Glenn Hubbard 1958 |
Chair of the Board (Since 2022) Trustee (Since 2007) |
Dean, Columbia Business School from 2004 to 2019; Faculty member, Columbia Business School since 1988. | 69 RICs consisting of 102 Portfolios | ADP (data and information services) from 2004 to 2020; Metropolitan Life Insurance Company (insurance); TotalEnergies SE (multi-energy) | ||||
| W. Carl Kester(d) 1951 |
Vice Chair of the Board (Since 2022) Trustee (Since 2007) |
Baker Foundation Professor and George Fisher Baker Jr. Professor of Business Administration, Emeritus, Harvard Business School since 2022; George Fisher Baker Jr. Professor of Business Administration, Harvard Business School from 2008 to 2022; Deputy Dean for Academic Affairs from 2006 to 2010; Chairman of the Finance Unit, from 2005 to 2006; Senior Associate Dean and Chairman of the MBA Program from 1999 to 2005; Member of the faculty of Harvard Business School since 1981. | 71 RICs consisting of 104 Portfolios | None | ||||
| Cynthia L. Egan 1955 |
Trustee (Since 2016) |
Advisor, U.S. Department of the Treasury from 2014 to 2015; President, Retirement Plan Services, for T. Rowe Price Group, Inc. from 2007 to 2012; executive positions within Fidelity Investments from 1989 to 2007. | 71 RICs consisting of 104 Portfolios | Unum (insurance); The Hanover Insurance Group (Board Chair); Huntsman Corporation (Lead Independent Director and non- Executive Vice Chair of the Board) (chemical products) | ||||
| Frank J. Fabozzi(d) 1948 |
Trustee (Since 2007) |
Editor of The Journal of Portfolio Management since 1986; Professor of Finance, EDHEC Business School (France) from 2011 to 2022; Professor of Practice, Johns Hopkins University since 2021; Professor in the Practice of Finance, Yale University School of Management from 1994 to 2011 and currently a Teaching Fellow in Yale’s Executive Programs; Visiting Professor, Rutgers University for the Spring 2019 semester; Visiting Professor, New York University for the 2019 academic year; Adjunct Professor of Finance, Carnegie Mellon University in fall 2020 semester. | 71 RICs consisting of 104 Portfolios | None | ||||
| Lorenzo A. Flores 1964 |
Trustee (Since 2021) |
Vice Chairman, Kioxia, Inc. since 2019; Chief Financial Officer, Xilinx, Inc. from 2016 to 2019; Corporate Controller, Xilinx, Inc. from 2008 to 2016. | 69 RICs consisting of 102 Portfolios | None | ||||
| Stayce D. Harris 1959 |
Trustee (Since 2021) |
Lieutenant General, Inspector General of the United States Air Force from 2017 to 2019; Lieutenant General, Assistant Vice Chief of Staff and Director, Air Staff, United States Air Force from 2016 to 2017; Major General, Commander, 22nd Air Force, AFRC, Dobbins Air Reserve Base, Georgia from 2014 to 2016; Pilot, United Airlines from 1990 to 2020. | 69 RICs consisting of 102 Portfolios | KULR Technology Group, Inc. in 2021; The Boeing Company (airplane manufacturer) | ||||
| T R U S T E E A N D O F F I C E R I N F O R M A T I O N |
109 |
Trustee and Officer Information (continued)
| Independent Trustees(a) (continued) | ||||||||
| Name Year of Birth(b) |
Position(s) Held (Length of Service)(c) |
Principal Occupation(s) During Past 5 Years | Number of BlackRock-Advised Registered Investment Companies (“RICs”) Consisting of Investment Portfolios (“Portfolios”) Overseen |
Public Company and Other Investment Company Directorships Held During Past 5 Years | ||||
| J. Phillip Holloman 1955 |
Trustee (Since 2021) |
President and Chief Operating Officer, Cintas Corporation from 2008 to 2018. | 69 RICs consisting of 102 Portfolios | PulteGroup, Inc. (home construction); Rockwell Automation Inc. (industrial automation); Vestis Corporation (uniforms and facilities services) | ||||
| Catherine A. Lynch(d) 1961 |
Trustee (Since 2016) |
Chief Executive Officer, Chief Investment Officer and various other positions, National Railroad Retirement Investment Trust from 2003 to 2016; Associate Vice President for Treasury Management, The George Washington University from 1999 to 2003; Assistant Treasurer, Episcopal Church of America from 1995 to 1999. | 71 RICs consisting of 104 Portfolios | PennyMac Mortgage Investment Trust | ||||
| Non-Management Interested Trustee(a)(f) | ||||||||
| Name Year of Birth(b) |
Position(s) Held (Length of Service) |
Principal Occupation(s) During Past 5 Years | Number of BlackRock-Advised Registered Investment Companies (“RICs”) Consisting of Investment Portfolios (“Portfolios”) Overseen |
Public Company and Other Investment Company Directorships Held During Past 5 Years | ||||
| Arthur P. Steinmetz 1958 |
Trustee (Since 2023) |
Consultant, Posit PBC (enterprise data science) since 2020; Director, ScotiaBank (U.S.) from 2020 to 2023; Chairman, Chief Executive Officer and President of OppenheimerFunds, Inc. from 2015, 2014 and 2013, respectively to 2019; Trustee, President and Principal Executive Officer of 104 OppenheimerFunds funds from 2014 to 2019; Portfolio manager of various OppenheimerFunds fixed income mutual funds from 1986 to 2014. | 70 RICs consisting of 103 Portfolios | Trustee of 104 OppenheimerFunds funds from 2014 to 2019 | ||||
| 110 | 2 0 2 3 B L A C K R O C K A N N U A L R E P O R T T O S H A R E H O L D E R S |
Trustee and Officer Information (continued)
| Interested Trustees(a)(e) | ||||||||
| Name Year of Birth(b) |
Position(s) Held (Length of Service)(c) |
Principal Occupation(s) During Past 5 Years | Number of BlackRock-Advised Registered Investment Companies (“RICs”) Consisting of Investment Portfolios (“Portfolios”) Overseen |
Public Company and Other Investment Company Directorships Held During Past 5 Years | ||||
| Robert Fairbairn 1965 |
Trustee (Since 2018) |
Vice Chairman of BlackRock, Inc. since 2019; Member of BlackRock’s Global Executive and Global Operating Committees; Co-Chair of BlackRock’s Human Capital Committee; Senior Managing Director of BlackRock, Inc. from 2010 to 2019; oversaw BlackRock’s Strategic Partner Program and Strategic Product Management Group from 2012 to 2019; Member of the Board of Managers of BlackRock Investments, LLC from 2011 to 2018; Global Head of BlackRock’s Retail and iShares® businesses from 2012 to 2016. | 97 RICs consisting of 268 Portfolios | None | ||||
| John M. Perlowski(d) 1964 |
Trustee (Since 2015) President and Chief Executive Officer (Since 2010) |
Managing Director of BlackRock, Inc. since 2009; Head of BlackRock Global Accounting and Product Services since 2009; Advisory Director of Family Resource Network (charitable foundation) since 2009. | 99 RICs consisting of 270 Portfolios | None | ||||
| (a) | The address of each Trustee is c/o BlackRock, Inc., 50 Hudson Yards, New York, New York 10001. |
| (b) | Each Independent Trustee holds office until his or her successor is duly elected and qualifies or until his or her earlier death, resignation, retirement or removal as provided by the Trust’s by-laws or charter or statute, or until December 31 of the year in which he or she turns 75. Trustees who are “interested persons,” as defined in the Investment Company Act serve until their successor is duly elected and qualifies or until their earlier death, resignation, retirement or removal as provided by the Trust’s by-laws or statute, or until December 31 of the year in which they turn 72. The Board may determine to extend the terms of Independent Trustees on a case-by-case basis, as appropriate. |
| (c) | Following the combination of Merrill Lynch Investment Managers, L.P. (“MLIM”) and BlackRock, Inc. in September 2006, the various legacy MLIM and legacy BlackRock fund boards were realigned and consolidated into three new fund boards in 2007. Certain Independent Trustees first became members of the boards of other legacy MLIM or legacy BlackRock funds as follows: Frank J. Fabozzi, 1988; R. Glenn Hubbard, 2004; and W. Carl Kester, 1995. |
| (d) | Dr. Fabozzi, Ms. Egan, Dr. Kester, Ms. Lynch, Mr. Steinmetz and Mr. Perlowski are also trustees of the BlackRock Credit Strategies Fund and BlackRock Private Investments Fund. |
| (e) | Mr. Fairbairn and Mr. Perlowski are both “interested persons,” as defined in the 1940 Act, of the Corporation based on their positions with BlackRock, Inc. and its affiliates. Mr. Fairbairn and Mr. Perlowski are also board members of the BlackRock Multi-Asset Complex. |
| (f) | Mr. Steinmetz is currently classified as a non-management interested Trustee based on his former directorship at another company that is not an affiliate of BlackRock, Inc. Mr. Steinmetz does not currently serve as an officer or employee of BlackRock, Inc. or its affiliates or own any securities of BlackRock, Inc. It is anticipated that Mr. Steinmetz will become an Independent Trustee effective January 19, 2024. |
| T R U S T E E A N D O F F I C E R I N F O R M A T I O N |
111 |
Trustee and Officer Information (continued)
| Officers Who Are Not Trustees(a) | ||||
| Name Year of Birth(b) |
Position(s) Held (Length of Service) |
Principal Occupation(s) During Past 5 Years | ||
| Jonathan Diorio 1980 |
Vice President (Since 2015) |
Managing Director of BlackRock, Inc. since 2015; Director of BlackRock, Inc. from 2011 to 2015. | ||
| Trent Walker 1974 |
Chief Financial Officer (Since 2021) |
Managing Director of BlackRock, Inc. since September 2019; Executive Vice President of PIMCO from 2016 to 2019; Senior Vice President of PIMCO from 2008 to 2015; Treasurer from 2013 to 2019 and Assistant Treasurer from 2007 to 2017 of PIMCO Funds, PIMCO Variable Insurance Trust, PIMCO ETF Trust, PIMCO Equity Series, PIMCO Equity Series VIT, PIMCO Managed Accounts Trust, 2 PIMCO-sponsored interval funds and 21 PIMCO-sponsored closed-end funds. | ||
| Jay M. Fife 1970 |
Treasurer (Since 2007) |
Managing Director of BlackRock, Inc. since 2007. | ||
| Aaron Wasserman 1974 |
Chief Compliance Officer (Since 2023) |
Managing Director of BlackRock, Inc. since 2018; Chief Compliance Officer of the BlackRock-advised funds in the BlackRock Multi-Asset Complex, the BlackRock Fixed-Income Complex and the iShares Complex since 2023; Deputy Chief Compliance Officer for the BlackRock-advised funds in the BlackRock Multi-Asset Complex, the BlackRock Fixed-Income Complex and the iShares Complex from 2014 to 2023. | ||
| Janey Ahn 1975 |
Secretary (Since 2012) |
Managing Director of BlackRock, Inc. since 2018; Director of BlackRock, Inc. from 2009 to 2017. | ||
| (a) | The address of each Officer is c/o BlackRock, Inc., 50 Hudson Yards, New York, New York 10001. |
| (b) | Officers of the Trust serve at the pleasure of the Board. |
Effective July 1, 2023, Aaron Wasserman replaced Charles Park as Chief Compliance Officer of the Trusts.
Effective December 31, 2023, Frank Fabozzi retired as Trustee of the Trusts.
Effective January 19, 2024, Arthur Steinmetz became an Independent Trustee of the Trusts.
| 112 | 2 0 2 3 B L A C K R O C K A N N U A L R E P O R T T O S H A R E H O L D E R S |
Proxy Results
The Annual Meeting of Shareholders of BCAT was held on July 11, 2023 for shareholders of record on May 12, 2023, to elect trustee nominees for BCAT. There were no broker non-votes with regard to BCAT.
Shareholders elected the Class I Trustees as follows:
| Cynthia L. Egan | Lorenzo A. Flores | Stayce D. Harris | Catherine A. Lynch | |||||||||||||||||||||||||||||||||
| Fund Name | Votes For | Votes Withheld | Votes For | Votes Withheld | Votes For | Votes Withheld | Votes For | Votes Withheld | ||||||||||||||||||||||||||||
| BCAT |
90,910,739 | 4,295,906 | 88,748,704 | 6,457,941 | 90,959,602 | 4,247,043 | 88,915,271 | 6,291,374 | ||||||||||||||||||||||||||||
For the Trust listed above, Trustees whose term of office continued after the Annual Meeting of Shareholders because they were not up for election are Robert Fairbairn, J. Phillip Holloman, R. Glenn Hubbard, John M. Perlowski, Frank J. Fabozzi and W. Carl Kester.
The Annual Meeting of Shareholders of ECAT (the “Meeting”) was called for July 10, 2023 for shareholders of record on May 12, 2023 to consider and vote on a proposal to elect four Class I Trustees. The Board of Trustees of ECAT (the “Board”) nominated four nominees who currently serve as Class I Trustees. A hedge fund managed by Saba Capital Management, L.P. (“Saba”) also nominated four nominees. The Meeting was adjourned to July 25, 2023 and further adjourned to August 7, 2023 to seek additional shareholder participation. A quorum of shareholders required to conduct business at the Meeting was not obtained.
The ballots and proxies received by First Coast Results, Inc., the independent Inspector of Election of the Meeting, reflected votes with respect to the nominees as follows:
Board Nominees/Incumbent Trustees
| Cynthia L. Egan | Lorenzo A. Flores | Stayce D. Harris | ||||||||||||||||||||||||||||||||||||||||
| Fund Name | Votes For | Votes Against | Abstain | Votes For | Votes Against | Abstain | Votes For | Votes Against | Abstain | |||||||||||||||||||||||||||||||||
| ECAT |
19,647,693 | 1,426,869 | 414,490 | 19,578,563 | 1,476,063 | 434,426 | 19,568,775 | 1,467,554 | 452,723 | |||||||||||||||||||||||||||||||||
| Catherine A. Lynch | ||||||||||||||||||||||||||||||||||||||||||
| Fund Name | Votes For | Votes Against | Abstain | |||||||||||||||||||||||||||||||||||||||
| ECAT | 19,618,201 | 1,421,536 | 449,315 | |||||||||||||||||||||||||||||||||||||||
|
Saba Nominees(a)
|
| |||||||||||||||||||||||||||||||||||||||||
| Ravi Bhasin | Ilya Gurevich | Richard Thiemann | ||||||||||||||||||||||||||||||||||||||||
| Fund Name | Votes For | Votes Against | Abstain | Votes For | Votes Against | Abstain | Votes For | Votes Against | Abstain | |||||||||||||||||||||||||||||||||
| ECAT |
0 | 0 | 0 | 0 | 0 | 0 | 0 | 0 | 0 | |||||||||||||||||||||||||||||||||
| Emmanuel Werthenschlag | ||||||||||||||||||||||||||||||||||||||||||
| Fund Name | Votes For | Votes Against | Abstain | |||||||||||||||||||||||||||||||||||||||
| ECAT | 0 | 0 | 0 | |||||||||||||||||||||||||||||||||||||||
| (a) | Saba did not submit for voting any shares held directly or for other shareholders who authorized Saba via proxy to vote on their behalf. A quorum of shareholders required to conduct business at the Meeting was not obtained |
Because a quorum was not obtained to conduct business at the Meeting, each incumbent Class I Trustee listed above will continue to serve on the Board of ECAT as a “holdover” Trustee until his or her successor has been duly elected and qualified.
The Trustees of ECAT whose term of office continued after the Meeting because they were not up for election are Frank J. Fabozzi, Robert Fairbairn, J. Phillip Holloman, R. Glenn Hubbard, W. Carl Kester and John M. Perlowski.
Trust Certification
The Trusts are listed for trading on the NYSE and have filed with the NYSE their annual chief executive officer certification regarding compliance with the NYSE’s listing standards. The Trusts filed with the SEC the certification of its chief executive officer and chief financial officer required by Section 302 of the Sarbanes-Oxley Act.
Environmental, Social and Governance (“ESG”) Integration
Although the Trusts do not seek to implement a specific sustainability objective, strategy or process unless otherwise disclosed, Trust management will consider ESG factors as part of the investment process for the Trusts. Trust management views ESG integration as the practice of incorporating financially material ESG data or information into investment processes with the objective of enhancing risk-adjusted returns. These ESG considerations will vary depending on the Trusts’ particular investment strategies and may include consideration of third-party research as well as consideration of proprietary BlackRock research across the ESG risks and opportunities regarding an issuer. The ESG characteristics utilized in the Trusts’ investment process are anticipated to evolve over time and one or more characteristics may not be relevant with respect to all issuers
| A D D I T I O N A L I N F O R M A T I O N |
113 |
Additional Information (continued)
Environmental, Social and Governance (“ESG”) Integration (continued)
that are eligible for investment. Certain of these considerations may affect the Trusts’ exposure to certain companies or industries. While Trust management views ESG considerations as having the potential to contribute to the Trusts’ long-term performance, there is no guarantee that such results will be achieved.
Dividend Policy
Each Trust’s policy is to make monthly distributions to shareholders. In order to provide shareholders with a more stable level of dividend distributions, each Trust employs a managed distribution plan (the “Plan”), the goal of which is to provide shareholders with consistent and predictable cash flows by setting distribution rates based on expected long-term returns of each Trust.
The distributions paid by each Trust for any particular month may be more or less than the amount of net investment income earned by each Trust during such month. Furthermore, the final tax characterization of distributions is determined after the year-end of a Trust and is reported in each Trust’s annual report to shareholders. Distributions can be characterized as ordinary income, capital gains and/or return of capital. Each Trust’s taxable net investment income and net realized capital gains (“taxable income”) may not be sufficient to support the level of distributions paid. To the extent that distributions exceed the Trust’s current and accumulated earnings and profits, the excess may be treated as a non-taxable return of capital.
A return of capital is a return of a portion of an investor’s original investment. A return of capital is not expected to be taxable, but it reduces a shareholder’s tax basis in his or her shares, thus reducing any loss or increasing any gain on a subsequent disposition by the shareholder of his or her shares. It is possible that a substantial portion of the distributions paid during a calendar year may ultimately be classified as return of capital for U.S. federal income tax purposes when the final determination of the source and character of the distributions is made.
Such distributions, under certain circumstances, may exceed a Trust’s total return performance. When total distributions exceed total return performance for the period, the difference reduces the Trust’s total assets and net asset value (“NAV”) per share and, therefore, could have the effect of increasing the Trust’s expense ratio and reducing the amount of assets the Trust has available for long term investment.
General Information
The Trusts do not make available copies of their Statements of Additional Information because the Trusts’ shares are not continuously offered, which means that the Statement of Additional Information of each Trust has not been updated after completion of the respective Trust’s offerings and the information contained in each Trust’s Statement of Additional Information may have become outdated.
The following information is a summary of certain changes since December 31, 2022. This information may not reflect all of the changes that have occurred since you purchased the relevant Trust.
Except if noted otherwise herein, there were no changes to the Trusts’ charters or by-laws that would delay or prevent a change of control of the Trusts that were not approved by the shareholders. Except if noted otherwise herein, there have been no changes in the persons who are primarily responsible for the day-to-day management of the Trusts’ portfolios.
In accordance with Section 23(c) of the Investment Company Act of 1940, each Trust may from time to time purchase shares of its common stock in the open market or in private transactions.
Quarterly performance, semi-annual and annual reports, current net asset value and other information regarding the Trusts may be found on BlackRock’s website, which can be accessed at blackrock.com. Any reference to BlackRock’s website in this report is intended to allow investors public access to information regarding the Trusts and does not, and is not intended to, incorporate BlackRock’s website in this report.
Electronic Delivery
Shareholders can sign up for e-mail notifications of quarterly statements, annual and semi-annual shareholder reports by enrolling in the electronic delivery program. Electronic copies of shareholder reports are available on BlackRock’s website.
To enroll in electronic delivery:
Shareholders Who Hold Accounts with Investment Advisers, Banks or Brokerages:
Please contact your financial adviser. Please note that not all investment advisers, banks or brokerages may offer this service.
Householding
The Trusts will mail only one copy of shareholder documents, annual and semi-annual reports, Rule 30e-3 notices and proxy statements, to shareholders with multiple accounts at the same address. This practice is commonly called “householding” and is intended to reduce expenses and eliminate duplicate mailings of shareholder documents. Mailings of your shareholder documents may be householded indefinitely unless you instruct us otherwise. If you do not want the mailing of these documents to be combined with those for other members of your household, please call the Trusts at (800) 882-0052.
| 114 | 2 0 2 3 B L A C K R O C K A N N U A L R E P O R T T O S H A R E H O L D E R S |
Additional Information (continued)
Availability of Quarterly Schedule of Investments
The Trusts file their complete schedules of portfolio holdings with the SEC for the first and third quarters of each fiscal year as an exhibit to their reports on Form N-PORT. The Trusts’ Forms N-PORT are available on the SEC’s website at sec.gov. Additionally, each Trust makes its portfolio holdings for the first and third quarters of each fiscal year available at blackrock.com/fundreports.
Availability of Proxy Voting Policies, Procedures and Voting Records
A description of the policies and procedures that the Trusts use to determine how to vote proxies relating to portfolio securities and information about how the Trusts voted proxies relating to securities held in the Trusts’ portfolios during the most recent 12-month period ended June 30 is available without charge, upon request (1) by calling (800) 882-0052; (2) on the BlackRock website at blackrock.com; and (3) on the SEC’s website at sec.gov.
Availability of Trust Updates
BlackRock will update performance and certain other data for the Trusts on a monthly basis on its website in the “Closed-end Funds” section of blackrock.com as well as certain other material information as necessary from time to time. Investors and others are advised to check the website for updated performance information and the release of other material information about the Trusts. This reference to BlackRock’s website is intended to allow investors public access to information regarding the Trusts and does not, and is not intended to, incorporate BlackRock’s website in this report.
BlackRock Privacy Principles
BlackRock is committed to maintaining the privacy of its current and former fund investors and individual clients (collectively, “Clients”) and to safeguarding their non-public personal information. The following information is provided to help you understand what personal information BlackRock collects, how we protect that information and why in certain cases we share such information with select parties.
If you are located in a jurisdiction where specific laws, rules or regulations require BlackRock to provide you with additional or different privacy-related rights beyond what is set forth below, then BlackRock will comply with those specific laws, rules or regulations.
BlackRock obtains or verifies personal non-public information from and about you from different sources, including the following: (i) information we receive from you or, if applicable, your financial intermediary, on applications, forms or other documents; (ii) information about your transactions with us, our affiliates, or others; (iii) information we receive from a consumer reporting agency; and (iv) from visits to our websites.
BlackRock does not sell or disclose to non-affiliated third parties any non-public personal information about its Clients, except as permitted by law or as is necessary to respond to regulatory requests or to service Client accounts. These non-affiliated third parties are required to protect the confidentiality and security of this information and to use it only for its intended purpose.
We may share information with our affiliates to service your account or to provide you with information about other BlackRock products or services that may be of interest to you. In addition, BlackRock restricts access to non-public personal information about its Clients to those BlackRock employees with a legitimate business need for the information. BlackRock maintains physical, electronic and procedural safeguards that are designed to protect the non-public personal information of its Clients, including procedures relating to the proper storage and disposal of such information.
Trust and Service Providers
| Investment Adviser | Independent Registered Public Accounting Firm | |
| BlackRock Advisors, LLC | Deloitte & Touche LLP | |
| Wilmington, DE 19809 | Boston, MA 02116 | |
| Sub-Adviser | Legal Counsel | |
| BlackRock (Singapore) Limited | Willkie Farr & Gallagher LLP | |
| 079912 Singapore | New York, NY 10019 | |
| Accounting Agent and Custodian | Address of the Trusts | |
| State Street Bank and Trust Company | 100 Bellevue Parkway | |
| Boston, MA 02114 | Wilmington, DE 19809 | |
| Transfer Agent | ||
| Computershare Trust Company, N.A. | ||
| Canton, MA 02021 | ||
| A D D I T I O N A L I N F O R M A T I O N |
115 |
Glossary of Terms Used in this Report
| Currency Abbreviation | ||
| AUD | Australian Dollar | |
| BRL | Brazilian Real | |
| CAD | Canadian Dollar | |
| CHF | Swiss Franc | |
| CNH | Chinese Yuan | |
| CNY | Chinese Yuan | |
| DKK | Danish Krone | |
| EUR | Euro | |
| GBP | British Pound | |
| HKD | Hong Kong Dollar | |
| IDR | Indonesian Rupiah | |
| JPY | Japanese Yen | |
| KRW | South Korean Won | |
| MXN | Mexican Peso | |
| NOK | Norwegian Krone | |
| SEK | Swedish Krona | |
| THB | Thai Baht | |
| USD | United States Dollar | |
| ZAR | South African Rand | |
| Portfolio Abbreviation | ||
| ABS | Asset-Backed Security | |
| ADR | American Depositary Receipt | |
| BZDIOVER | Overnight Brazil Interbank Deposit (CETIP) | |
| CLO | Collateralized Loan Obligation | |
| CMT | Constant Maturity Treasury | |
| CR | Custodian Receipt | |
| DAC | Designated Activity Company | |
| ESTR | Euro Short Term Rate | |
| ETF | Exchange-Traded Fund | |
| EURIBOR | Euro Interbank Offered Rate | |
| FREMF | Freddie Mac Multifamily Securities | |
| GMTN | Global Medium-Term Note | |
| GO | General Obligation Bonds | |
| LIBOR | London Interbank Offered Rate | |
| MSCI | Morgan Stanley Capital International | |
| MTA | Month Treasury Average | |
| MXIBTIIE | Mexico Interbank TIIE 28-Day | |
| PIK | Payment-in-Kind | |
| RB | Revenue Bond | |
| S&P | Standard & Poor’s | |
| SAB | Special Assessment Bonds | |
| SCA | Societe en Commandite par Actions | |
| SOFR | Secured Overnight Financing Rate | |
| SONIA | Sterling Overnight Interbank Average Rate | |
| SPDR | Standard & Poor’s Depository Receipt | |
| 116 | 2 0 2 3 B L A C K R O C K A N N U A L R E P O R T T O S H A R E H O L D E R S |
Want to know more?
blackrock.com | 800-882-0052
This report is intended for current holders. It is not a prospectus. Past performance results shown in this report should not be considered a representation of future performance. Statements and other information herein are as dated and are subject to change.
BCAT-12/23-AR
|
|

|
(b) Not Applicable
| Item 3 – | Audit Committee Financial Expert – The registrant’s board of directors (the “board of directors”), has determined that (i) the registrant has the following audit committee financial experts serving on its audit committee and (ii) each audit committee financial expert is independent: |
Frank J. Fabozzi
Lorenzo A. Flores
Catherine A. Lynch
Under applicable securities laws, a person determined to be an audit committee financial expert will not be deemed an “expert” for any purpose, including without limitation for the purposes of Section 11 of the Securities Act of 1933, as a result of being designated or identified as an audit committee financial expert. The designation or identification of a person as an audit committee financial expert does not impose on such person any duties, obligations, or liabilities greater than the duties, obligations, and liabilities imposed on such person as a member of the audit committee and board of directors in the absence of such designation or identification. The designation or identification of a person as an audit committee financial expert does not affect the duties, obligations, or liability of any other member of the audit committee or board of directors.
| Item 4 – | Principal Accountant Fees and Services |
The following table presents fees billed by Deloitte & Touche LLP (“D&T”) in each of the last two fiscal years for the services rendered to the Fund:
| (a) Audit Fees | (b) Audit-Related Fees1 |
(c) Tax Fees2 | (d) All Other Fees | |||||||||||||
| Entity Name | Current Fiscal Year End |
Previous End |
Current Fiscal Year End |
Previous End |
Current Fiscal Year End |
Previous End |
Current Fiscal Year End |
Previous End | ||||||||
| BlackRock Capital Allocation Term Trust | $77,928 | $74,970 | $0 | $2,000 | $26,464 | $21,600 | $407 | $431 | ||||||||
The following table presents fees billed by D&T that were required to be approved by the registrant’s audit committee (the “Committee”) for services that relate directly to the operations or financial reporting of the Fund and that are rendered on behalf of BlackRock Advisors, LLC ( the “Investment Adviser” or “BlackRock”) and entities controlling, controlled by, or under common control with BlackRock (not including any sub-adviser whose role is primarily portfolio management and is subcontracted with or overseen by another investment adviser) that provide ongoing services to the Fund (“Affiliated Service Providers”):
2
| Current Fiscal Year End | Previous Fiscal Year End | |||
| (b) Audit-Related Fees1 |
$0 | $0 | ||
| (c) Tax Fees2 |
$0 | $0 | ||
| (d) All Other Fees3 |
$2,154,000 | $2,098,000 |
1 The nature of the services includes assurance and related services reasonably related to the performance of the audit or review of financial statements not included in Audit Fees, including accounting consultations, agreed-upon procedure reports, attestation reports, comfort letters, out-of-pocket expenses and internal control reviews not required by regulators.
2 The nature of the services includes tax compliance and/or tax preparation, including services relating to the filing or amendment of federal, state or local income tax returns, regulated investment company qualification reviews, taxable income and tax distribution calculations.
3 Non-audit fees of $2,154,000 and $2,098,000 for the current fiscal year and previous fiscal year, respectively, were paid to the Fund’s principal accountant in their entirety by BlackRock, in connection with services provided to the Affiliated Service Providers of the Fund and of certain other funds sponsored and advised by BlackRock or its affiliates for a service organization review and an accounting research tool subscription. These amounts represent aggregate fees paid by BlackRock and were not allocated on a per fund basis.
(e)(1) Audit Committee Pre-Approval Policies and Procedures:
The Committee has adopted policies and procedures with regard to the pre-approval of services. Audit, audit-related and tax compliance services provided to the registrant on an annual basis require specific pre-approval by the Committee. The Committee also must approve other non-audit services provided to the registrant and those non-audit services provided to the Investment Adviser and Affiliated Service Providers that relate directly to the operations and the financial reporting of the registrant. Certain of these non-audit services that the Committee believes are (a) consistent with the SEC’s auditor independence rules and (b) routine and recurring services that will not impair the independence of the independent accountants may be approved by the Committee without consideration on a specific case-by-case basis (“general pre-approval”). The term of any general pre-approval is 12 months from the date of the pre-approval, unless the Committee provides for a different period. Tax or other non-audit services provided to the registrant which have a direct impact on the operations or financial reporting of the registrant will only be deemed pre-approved provided that any individual project does not exceed $10,000 attributable to the registrant or $50,000 per project. For this purpose, multiple projects will be aggregated to determine if they exceed the previously mentioned cost levels.
Any proposed services exceeding the pre-approved cost levels will require specific pre-approval by the Committee, as will any other services not subject to general pre-approval (e.g., unanticipated but permissible services). The Committee is informed of each service approved subject to general pre-approval at the next regularly scheduled in-person board meeting. At this meeting, an analysis of such services is presented to the Committee for ratification. The Committee may delegate to the Committee Chairman the authority to approve the provision of and fees for any specific engagement of permitted non-audit services, including services exceeding pre-approved cost levels.
(e)(2) None of the services described in each of Items 4(b) through (d) were approved by the Committee pursuant to the de minimis exception in paragraph (c)(7)(i)(C) of Rule 2-01 of Regulation S-X.
(f) Not Applicable
(g) The aggregate non-audit fees, defined as the sum of the fees shown under “Audit-Related Fees,” “Tax Fees”
3
and “All Other Fees,” paid to the accountant for services rendered by the accountant to the registrant, the Investment Adviser and the Affiliated Service Providers were:
| Entity Name |
Current Fiscal Year End |
Previous Fiscal Year End | ||
| BlackRock Capital Allocation Term Trust | $26,871 | $24,031 |
Additionally, the amounts billed by D&T in connection with services provided to the Affiliated Service Providers of the Fund and of other funds sponsored or advised by BlackRock or its affiliates during the current and previous fiscal years for a service organization review and an accounting research tool subscription were:
| Current Fiscal Year End |
Previous Fiscal Year End | |
|
$2,154,000 |
$2,098,000 |
These amounts represent aggregate fees paid by BlackRock and were not allocated on a per fund basis.
(h) The Committee has considered and determined that the provision of non-audit services that were rendered to the Investment Adviser, and the Affiliated Service Providers that were not pre-approved pursuant to paragraph (c)(7)(ii) of Rule 2-01 of Regulation S-X is compatible with maintaining the principal accountant’s independence.
(i) – Not Applicable
(j) – Not Applicable
| Item 5 – | Audit Committee of Listed Registrant |
(a) The following individuals are members of the registrant’s separately designated standing audit committee established in accordance with Section 3(a)(58)(A) of the Securities Exchange Act of 1934 (15 U.S.C. 78c(a)(58)(A)):
Frank J. Fabozzi
Lorenzo A. Flores
J. Phillip Holloman
Catherine A. Lynch
(b) Not Applicable
| Item 6 – | Investments |
(a) The registrant’s Schedule of Investments is included as part of the Report to Stockholders filed under Item 1(a) of this Form.
4
(b) Not Applicable due to no such divestments during the semi-annual period covered since the previous Form N-CSR filing.
| Item 7 – | Disclosure of Proxy Voting Policies and Procedures for Closed-End Management Investment Companies – The board of directors has delegated the voting of proxies for the Fund’s portfolio securities to the Investment Adviser pursuant to the Investment Adviser’s proxy voting guidelines. Under these guidelines, the Investment Adviser will vote proxies related to Fund securities in the best interests of the Fund and its stockholders. From time to time, a vote may present a conflict between the interests of the Fund’s stockholders, on the one hand, and those of the Investment Adviser, or any affiliated person of the Fund or the Investment Adviser, on the other. In such event, provided that the Investment Adviser’s Equity Investment Policy Oversight Committee, or a sub-committee thereof (the “Oversight Committee”) is aware of the real or potential conflict or material non-routine matter and if the Oversight Committee does not reasonably believe it is able to follow its general voting guidelines (or if the particular proxy matter is not addressed in the guidelines) and vote impartially, the Oversight Committee may retain an independent fiduciary to advise the Oversight Committee on how to vote or to cast votes on behalf of the Investment Adviser’s clients. If the Investment Adviser determines not to retain an independent fiduciary, or does not desire to follow the advice of such independent fiduciary, the Oversight Committee shall determine how to vote the proxy after consulting with the Investment Adviser’s Portfolio Management Group and/or the Investment Adviser’s Legal and Compliance Department and concluding that the vote cast is in its client’s best interest notwithstanding the conflict. A copy of the Fund’s Proxy Voting Policy and Procedures are attached as Exhibit 99.PROXYPOL, a copy of the Fund’s Global Corporate Governance & Engagement Principles are attached as Exhibit 99.GLOBAL.CORP.GOV and a copy of the Fund’s Corporate Governance and Proxy Voting Guidelines for U.S. Securities are attached as Exhibit 99.US.CORP.GOV. Information on how the Fund voted proxies relating to portfolio securities during the most recent 12-month period ended June 30 is available without charge, (i) at www.blackrock.com and (ii) on the SEC’s website at http://www.sec.gov. |
| Item 8 – | Portfolio Managers of Closed-End Management Investment Companies |
(a)(1) As of the date of filing this Report:
The registrant is managed by a team of investment professionals comprised of Rick Rieder, Managing Director at BlackRock, David Clayton, CFA, JD, Managing Director at BlackRock, and Russ Koesterich, CFA, JD, Managing Director at BlackRock. Messrs. Rieder, Clayton and Koesterich are the Fund’s portfolio managers and are responsible for the day-to-day management of the Fund’s portfolio and the selection of its investments. Messrs. Rieder, Clayton and Koesterich have been members of the Fund’s portfolio management team since 2020.
|
Portfolio Manager
|
Biography
| |
| Rick Rieder | Global Chief Investment Officer of Fixed Income, Co-head of BlackRock’s Global Fixed Income platform, member of Global Operating Committee and Chairman of the BlackRock firmwide Investment Council. Managing Director of BlackRock, Inc. since 2009. President and Chief Executive Officer of R3 Capital Partners from 2008 to 2009; Managing Director of Lehman Brothers from 1994 to 2008. | |
5
| David Clayton, CFA, JD | Managing Director of BlackRock, Inc. since 2012; Director of BlackRock, Inc. from 2010 to 2011. | |
| Russ Koesterich, CFA, JD | Managing Director of BlackRock, Inc. since 2009. | |
(a)(2) As of December 31, 2023:
| (ii) Number of Other Accounts Managed and Assets by Account Type |
(iii)
Number of Other Accounts and Assets for Which Advisory Fee is Performance-Based | |||||||||||
| (i) Name of Portfolio Manager |
Other Registered Investment Companies |
Other Investment Vehicles |
Other Accounts |
Other Registered Investment Companies |
Other Investment Vehicles |
Other Accounts | ||||||
| Rick Rieder |
27 | 41 | 18 | 0 | 7 | 2 | ||||||
| $103.8 Billion | $37.97 Billion | $3.97 Billion | $0 | $415.2 Million | $237.0 Million | |||||||
| David Clayton, CFA, JD |
10 | 9 | 32 | 0 | 0 | 0 | ||||||
| $29.86 Billion | $18.65 Billion | $2.07 Million | $0 | $0 | $0 | |||||||
| Russ Koesterich, CFA, JD |
8 | 9 | 32 | 0 | 0 | 0 | ||||||
| $29.86 Billion | $18.65 Billion | $2.07 Million | $0 | $0 | $0 | |||||||
(iv) Portfolio Manager Potential Material Conflicts of Interest
BlackRock has built a professional working environment, firm-wide compliance culture and compliance procedures and systems designed to protect against potential incentives that may favor one account over another. BlackRock has adopted policies and procedures that address the allocation of investment opportunities, execution of portfolio transactions, personal trading by employees and other potential conflicts of interest that are designed to ensure that all client accounts are treated equitably over time. Nevertheless, BlackRock furnishes investment management and advisory services to numerous clients in addition to the Fund, and BlackRock may, consistent with applicable law, make investment recommendations to other clients or accounts (including accounts which are hedge funds or have performance or higher fees paid to BlackRock, or in which portfolio managers have a personal interest in the receipt of such fees), which may be the same as or different from those made to the Fund. In addition, BlackRock, Inc., its affiliates and significant shareholders and any officer, director, shareholder or employee may or may not have an interest in the securities whose purchase and sale BlackRock recommends to the Fund. BlackRock, Inc., or any of its affiliates or significant shareholders, or any officer, director, shareholder, employee or any member of their families may take different actions than those recommended to the Fund by BlackRock with respect to the same securities. Moreover, BlackRock may refrain from rendering any advice or services concerning securities of companies of which any of BlackRock, Inc.’s (or its affiliates’ or significant shareholders’) officers, directors or employees are directors or officers, or companies as to which BlackRock, Inc. or any of its affiliates or significant shareholders or the officers, directors and employees of any of them has any substantial economic interest or possesses material non-public information. Certain portfolio managers also may manage accounts
6
whose investment strategies may at times be opposed to the strategy utilized for a fund. It should also be noted that Messrs. Rieder, Clayton and Koesterich may be managing hedge fund and/or long only accounts, or may be part of a team managing hedge fund and/or long only accounts, subject to incentive fees. Messrs. Rieder, Clayton and Koesterich may therefore be entitled to receive a portion of any incentive fees earned on such accounts.
As a fiduciary, BlackRock owes a duty of loyalty to its clients and must treat each client fairly. When BlackRock purchases or sells securities for more than one account, the trades must be allocated in a manner consistent with its fiduciary duties. BlackRock attempts to allocate investments in a fair and equitable manner among client accounts, with no account receiving preferential treatment. To this end, BlackRock, Inc. has adopted policies that are intended to ensure reasonable efficiency in client transactions and provide BlackRock with sufficient flexibility to allocate investments in a manner that is consistent with the particular investment discipline and client base, as appropriate.
(a)(3) As of December 31, 2023:
Portfolio Manager Compensation Overview
The discussion below describes the portfolio managers’ compensation as of December 31, 2023.
BlackRock’s financial arrangements with its portfolio managers, its competitive compensation and its career path emphasis at all levels reflect the value senior management places on key resources. Compensation may include a variety of components and may vary from year to year based on a number of factors. The principal components of compensation include a base salary, a performance-based discretionary bonus, participation in various benefits programs and one or more of the incentive compensation programs established by BlackRock.
Base Compensation. Generally, portfolio managers receive base compensation based on their position with the firm.
Discretionary Incentive Compensation
Discretionary incentive compensation is a function of several components: the performance of BlackRock, Inc., the performance of the portfolio manager’s group within BlackRock, the investment performance, including risk-adjusted returns, of the firm’s assets under management or supervision by that portfolio manager relative to predetermined benchmarks, and the individual’s performance and contribution to the overall performance of these portfolios and BlackRock. In most cases, these benchmarks are the same as the benchmark or benchmarks against which the performance of the funds or other accounts managed by the portfolio managers are measured. Among other things, BlackRock’s Chief Investment Officers make a subjective determination with respect to each portfolio manager’s compensation based on the performance of the funds and other accounts managed by each portfolio manager relative to the various benchmarks. Performance is generally assessed over trailing 1-,3-, and 5-year periods relative to benchmarks plus an alpha target as well as against peer groups. With respect to these portfolio managers, such benchmarks for the Fund and other accounts are: S&P 500 Index, FTSE World ex-US Index, ICE BofA Current 5-Year Treasury Index and FTSE Non-US Dollar World Government Bond Index.
7
Distribution of Discretionary Incentive Compensation
Discretionary incentive compensation is distributed to portfolio managers in a combination of cash, deferred BlackRock, Inc. stock awards, and/or deferred cash awards that notionally track the return of certain BlackRock investment products.
Portfolio managers receive their annual discretionary incentive compensation in the form of cash. Portfolio managers whose total compensation is above a specified threshold also receive deferred BlackRock, Inc. stock awards annually as part of their discretionary incentive compensation. Paying a portion of discretionary incentive compensation in the form of deferred BlackRock, Inc. stock puts compensation earned by a portfolio manager for a given year “at risk” based on BlackRock’s ability to sustain and improve its performance over future periods. In some cases, additional deferred BlackRock, Inc. stock may be granted to certain key employees as part of a long-term incentive award to aid in retention, align interests with long-term shareholders and motivate performance. Deferred BlackRock, Inc. stock awards are generally granted in the form of BlackRock, Inc. restricted stock units that vest pursuant to the terms of the applicable plan and, once vested, settle in BlackRock, Inc. common stock. The portfolio managers of this Fund have deferred BlackRock, Inc. stock awards.
For certain portfolio managers, a portion of the discretionary incentive compensation is also distributed in the form of deferred cash awards that notionally track the returns of select BlackRock investment products they manage, which provides direct alignment of portfolio manager discretionary incentive compensation with investment product results. Deferred cash awards vest ratably over a number of years and, once vested, settle in the form of cash. Only portfolio managers who manage specified products and whose total compensation is above a specified threshold are eligible to participate in the deferred cash award program.
Other Compensation Benefits. In addition to base salary and discretionary incentive compensation, portfolio managers may be eligible to receive or participate in one or more of the following:
Incentive Savings Plans — BlackRock, Inc. has created a variety of incentive savings plans in which BlackRock, Inc. employees are eligible to participate, including a 401(k) plan, the BlackRock Retirement Savings Plan (RSP), and the BlackRock Employee Stock Purchase Plan (ESPP). The employer contribution components of the RSP include a company match equal to 50% of the first 8% of eligible pay contributed to the plan capped at $5,000 per year, and a company retirement contribution equal to 3-5% of eligible compensation up to the Internal Revenue Service limit ($330,000 for 2023). The RSP offers a range of investment options, including registered investment companies and collective investment funds managed by the firm. BlackRock, Inc. contributions follow the investment direction set by participants for their own contributions or, absent participant investment direction, are invested into a target date fund that corresponds to, or is closest to, the year in which the participant attains age 65. The ESPP allows for investment in BlackRock, Inc. common stock at a 5% discount on the fair market value of the stock on the purchase date. Annual participation in the ESPP is limited to the purchase of 1,000 shares of common stock or a dollar value of $25,000 based on its fair market value on the purchase date. All of the eligible portfolio managers are eligible to participate in these plans.
(a)(4) Beneficial Ownership of Securities – As of December 31, 2023.
8
| Portfolio Manager |
Dollar Range of Equity Securities of the Fund Beneficially Owned | |
| Rick Rieder | None | |
| David Clayton, CFA, JD | $100,001 - $500,000 | |
| Russ Koesterich, CFA, JD | None |
(b) Not Applicable
| Item 9 – | Purchases of Equity Securities by Closed-End Management Investment Company and Affiliated Purchasers |
| Period | (a) Total Number of Shares Purchased1 |
(b) Average Price Paid per Share |
(c) Total Number of Shares Purchased as Part of Publicly Announced Plans or Programs1 |
(d) Maximum Number of Shares that May Yet Be Purchased Under the Plans or Programs1 | ||||
| July 1-31, 2023 |
0 | $- | 0 | 4,890,567 | ||||
| August 1-31, 2023 |
0 | $- | 0 | 4,890,567 | ||||
| September 1-30, 2023 |
673,184 | $14.4260 | 673,184 | 4,217,383 | ||||
| October 1-31, 2023 |
0 | $- | 0 | 4,217,383 | ||||
| November 1-30, 2023 |
0 | $- | 0 | 4,217,383 | ||||
| December 1-31, 2023 |
0 | $- | 0 | 5,373,091 | ||||
| Total: |
673,184 | 14.4260 | 673,184 | 5,373,091 |
1 On September 8, 2022, the Fund announced a continuation of its open market share repurchase program. Commencing on December 1, 2022, the Fund may repurchase through November 30, 2023, up to 5% of its common shares outstanding as of the close of business on November 30, 2022, subject to certain conditions. On November 15, 2023, the Fund announced a further continuation of its open market share repurchase program. Commencing on December 1, 2023, the Fund may repurchase through November 30, 2024, up to 5% of its common shares outstanding as of the close of business on November 30, 2023, subject to certain conditions.
| Item 10 – | Submission of Matters to a Vote of Security Holders – There have been no material changes to these procedures. |
| Item 11 – | Controls and Procedures |
(a) The registrant’s principal executive and principal financial officers, or persons performing similar functions, have concluded that the registrant’s disclosure controls and procedures (as defined in Rule 30a-3(c) under the Investment Company Act of 1940, as amended (the “1940 Act”)) are effective as of a date within 90 days of the filing of this report based on the evaluation of these
9
controls and procedures required by Rule 30a-3(b) under the 1940 Act and Rule 13a-15(b) under the Securities Exchange Act of 1934, as amended.
(b) There were no changes in the registrant’s internal control over financial reporting (as defined in Rule 30a-3(d) under the 1940 Act) that occurred during the period covered by this report that have materially affected, or are reasonably likely to materially affect, the registrant’s internal control over financial reporting.
| Item 12 – | Disclosure of Securities Lending Activities for Closed-End Management Investment Companies – Not Applicable |
| Item 13 – | Recovery of Erroneously Awarded Compensation – Not Applicable |
| Item 14 – | Exhibits attached hereto |
(a)(1) Code of Ethics – See Item 2
(a)(2) Section 302 Certifications are attached
(a)(3) Any written solicitation to purchase securities under Rule 23c-1 – Not Applicable
(a)(4) Change in Registrant’s independent public accountant – Not Applicable
(b) Section 906 Certifications are attached
1The Fund has received exemptive relief from the Securities and Exchange Commission permitting it to make periodic distributions of long-term capital gains with respect to its outstanding common stock as frequently as twelve times each year, and as frequently as distributions are specified by or in accordance with the terms of its outstanding preferred stock. This relief is conditioned, in part, on an undertaking by the Fund to make the disclosures to the holders of the Fund’s common shares, in addition to the information required by Section 19(a) of the 1940 Act and Rule 19a-1 thereunder. The Fund is likewise obligated to file with the SEC the information contained in any such notice to shareholders and, in that regard, has attached hereto copies of each such notice made during the period.
10
Pursuant to the requirements of the Securities Exchange Act of 1934 and the Investment Company Act of 1940, the registrant has duly caused this report to be signed on its behalf by the undersigned, thereunto duly authorized.
BlackRock Capital Allocation Term Trust
| By: | /s/ John M. Perlowski | |||
| John M. Perlowski | ||||
| Chief Executive Officer (principal executive officer) of | ||||
| BlackRock Capital Allocation Term Trust |
Date: February 23, 2024
Pursuant to the requirements of the Securities Exchange Act of 1934 and the Investment Company Act of 1940, this report has been signed below by the following persons on behalf of the registrant and in the capacities and on the dates indicated.
| By: | /s/ John M. Perlowski | |||
| John M. Perlowski | ||||
| Chief Executive Officer (principal executive officer) of | ||||
| BlackRock Capital Allocation Term Trust |
Date: February 23, 2024
| By: | /s/ Trent Walker | |||
| Trent Walker | ||||
| Chief Financial Officer (principal financial officer) of | ||||
| BlackRock Capital Allocation Term Trust |
Date: February 23, 2024
11
EX-99. CERT
CERTIFICATION PURSUANT TO RULE 30a-2(a) UNDER THE 1940 ACT AND SECTION 302 OF THE
SARBANES-OXLEY ACT OF 2002
I, John M. Perlowski, Chief Executive Officer (principal executive officer) of BlackRock Capital Allocation Term Trust, certify that:
1. I have reviewed this report on Form N-CSR of BlackRock Capital Allocation Term Trust;
2. Based on my knowledge, this report does not contain any untrue statement of a material fact or omit to state a material fact necessary to make the statements made, in light of the circumstances under which such statements were made, not misleading with respect to the period covered by this report;
3. Based on my knowledge, the financial statements, and other financial information included in this report, fairly present in all material respects the financial condition, results of operations, changes in net assets, and cash flows (if the financial statements are required to include a statement of cash flows) of the registrant as of, and for, the periods presented in this report;
4. The registrant’s other certifying officer(s) and I are responsible for establishing and maintaining disclosure controls and procedures (as defined in Rule 30a-3(c) under the Investment Company Act of 1940) and internal control over financial reporting (as defined in Rule 30a-3(d) under the Investment Company Act of 1940) for the registrant and have:
a) designed such disclosure controls and procedures, or caused such disclosure controls and procedures to be designed under our supervision, to ensure that material information relating to the registrant, including its consolidated subsidiaries, is made known to us by others within those entities, particularly during the period in which this report is being prepared;
b) designed such internal control over financial reporting, or caused such internal control over financial reporting to be designed under our supervision, to provide reasonable assurance regarding the reliability of financial reporting and the preparation of financial statements for external purposes in accordance with generally accepted accounting principles;
c) evaluated the effectiveness of the registrant’s disclosure controls and procedures and presented in this report our conclusions about the effectiveness of the disclosure controls and procedures, as of a date within 90 days prior to the filing date of this report based on such evaluation; and
d) disclosed in this report any change in the registrant’s internal control over financial reporting that occurred during the period covered by this report that has materially affected, or is reasonably likely to materially affect, the registrant’s internal control over financial reporting; and
5. The registrant’s other certifying officer(s) and I have disclosed to the registrant’s auditors and the audit committee of the registrant’s board of directors (or persons performing the equivalent functions):
a) all significant deficiencies and material weaknesses in the design or operation of internal control over financial reporting which are reasonably likely to adversely affect the registrant’s ability to record, process, summarize, and report financial information; and
b) any fraud, whether or not material, that involves management or other employees who have a significant role in the registrant’s internal control over financial reporting.
Date: February 23, 2024
/s/ John M. Perlowski
John M. Perlowski
Chief Executive Officer (principal executive officer) of
BlackRock Capital Allocation Term Trust
EX-99. CERT
CERTIFICATION PURSUANT TO RULE 30a-2(a) UNDER THE 1940 ACT AND SECTION 302 OF THE
SARBANES-OXLEY ACT OF 2002
I, Trent Walker, Chief Financial Officer (principal financial officer) of BlackRock Capital Allocation Term Trust, certify that:
1. I have reviewed this report on Form N-CSR of BlackRock Capital Allocation Term Trust;
2. Based on my knowledge, this report does not contain any untrue statement of a material fact or omit to state a material fact necessary to make the statements made, in light of the circumstances under which such statements were made, not misleading with respect to the period covered by this report;
3. Based on my knowledge, the financial statements, and other financial information included in this report, fairly present in all material respects the financial condition, results of operations, changes in net assets, and cash flows (if the financial statements are required to include a statement of cash flows) of the registrant as of, and for, the periods presented in this report;
4. The registrant’s other certifying officer(s) and I are responsible for establishing and maintaining disclosure controls and procedures (as defined in Rule 30a-3(c) under the Investment Company Act of 1940) and internal control over financial reporting (as defined in Rule 30a-3(d) under the Investment Company Act of 1940) for the registrant and have:
a) designed such disclosure controls and procedures, or caused such disclosure controls and procedures to be designed under our supervision, to ensure that material information relating to the registrant, including its consolidated subsidiaries, is made known to us by others within those entities, particularly during the period in which this report is being prepared;
b) designed such internal control over financial reporting, or caused such internal control over financial reporting to be designed under our supervision, to provide reasonable assurance regarding the reliability of financial reporting and the preparation of financial statements for external purposes in accordance with generally accepted accounting principles;
c) evaluated the effectiveness of the registrant’s disclosure controls and procedures and presented in this report our conclusions about the effectiveness of the disclosure controls and procedures, as of a date within 90 days prior to the filing date of this report based on such evaluation; and
d) disclosed in this report any change in the registrant’s internal control over financial reporting that occurred during the period covered by this report that has materially affected, or is reasonably likely to materially affect, the registrant’s internal control over financial reporting; and
5. The registrant’s other certifying officer(s) and I have disclosed to the registrant’s auditors and the audit committee of the registrant’s board of directors (or persons performing the equivalent functions):
a) all significant deficiencies and material weaknesses in the design or operation of internal control over financial reporting which are reasonably likely to adversely affect the registrant’s ability to record, process, summarize, and report financial information; and
b) any fraud, whether or not material, that involves management or other employees who have a significant role in the registrant’s internal control over financial reporting.
Date: February 23, 2024
/s/ Trent Walker
Trent Walker
Chief Financial Officer (principal financial officer) of
BlackRock Capital Allocation Term Trust
Exhibit 99.906CERT
Certification Pursuant to Rule 30a-2(b) under the 1940 Act and
Section 906 of the Sarbanes-Oxley Act of 2002
Pursuant to 18 U.S.C. § 1350, the undersigned officer of BlackRock Capital Allocation Term Trust (the “Registrant”), hereby certifies, to the best of his knowledge, that the Registrant’s Report on Form N-CSR for the period ended December 31, 2023 (the “Report”) fully complies with the requirements of Section 13(a) of the Securities Exchange Act of 1934, as amended, and that the information contained in the Report fairly presents, in all material respects, the financial condition and results of operations of the Registrant.
Date: February 23, 2024
/s/ John M. Perlowski
John M. Perlowski
Chief Executive Officer (principal executive officer) of
BlackRock Capital Allocation Term Trust
Pursuant to 18 U.S.C. § 1350, the undersigned officer of BlackRock Capital Allocation Term Trust (the “Registrant”), hereby certifies, to the best of his knowledge, that the Registrant’s Report on Form N-CSR for the period ended December 31, 2023 (the “Report”) fully complies with the requirements of Section 13(a) of the Securities Exchange Act of 1934, as amended, and that the information contained in the Report fairly presents, in all material respects, the financial condition and results of operations of the Registrant.
Date: February 23, 2024
/s/ Trent Walker
Trent Walker
Chief Financial Officer (principal financial officer) of
BlackRock Capital Allocation Term Trust
This certification is being furnished pursuant to Rule 30a-2(b) under the Investment Company Act of 1940, as amended, and 18 U.S.C. § 1350 and is not being filed as part of the Form N-CSR with the Securities and Exchange Commission.
Closed-End Fund Proxy Voting Policy
August 1, 2021

| Closed-End Fund Proxy Voting Policy
Procedures Governing Delegation of Proxy Voting to Fund Adviser
|
| Effective Date: August 1, 2021 Last Review Date: August 25, 2023 |
|
Applies to the following types of Funds registered under the 1940 Act: |
|
☐ Open-End Mutual Funds (including money market funds) |
|
☐ Money Market Funds |
|
☐ Exchange-Traded Funds |
|
☒ Closed-End Funds |
|
☐ Other |
Objective and Scope
Set forth below is the Closed-End Fund Proxy Voting Policy.
Policy / Document Requirements and Statements
The Boards of Trustees/Directors (the “Directors”) of the closed-end funds advised by BlackRock Advisors, LLC (“BlackRock”), (the “Funds”) have the responsibility for the oversight of voting proxies relating to portfolio securities of the Funds, and have determined that it is in the best interests of the Funds and their shareholders to delegate that responsibility to BlackRock as part of BlackRock’s authority to manage, acquire and dispose of account assets, all as contemplated by the Funds’ respective investment management agreements.
BlackRock has adopted guidelines and procedures (together and as from time to time amended, the “BlackRock proxy voting guidelines”) governing proxy voting by accounts managed by BlackRock. BlackRock will cast votes on behalf of each of the Funds on specific proxy issues in respect of securities held by each such Fund in accordance with the BlackRock Proxy voting guidelines; provided, however, that in the case of underlying closed-end funds (including business development companies and other similarly-situated asset pools) held by the Funds that have, or are proposing to adopt, a classified board structure, BlackRock will typically (a) vote in favor of proposals to adopt classification and against proposals to eliminate classification, and (b) not vote against directors as a result of their adoption of a classified board structure.
BlackRock will report on an annual basis to the Directors on (1) a summary of the proxy voting process as applicable to the Funds in the preceding year together with a representation that all votes were in accordance with the BlackRock proxy voting guidelines (as modified pursuant to the immediately preceding paragraph), and (2) any changes to the BlackRock proxy voting guidelines that have not previously been reported.

|
||||
| Public | Page 1 of 1 |

BlackRock Investment Stewardship Global Principles Effective as of January 2024
| 3 | ||||
| 3 | ||||
| 3 | ||||
| 5 | ||||
| 6 | ||||
| 8 | ||||
| Capital structure, mergers, asset sales, and other special transactions |
9 | |||
| 10 | ||||
| 11 | ||||
| Other corporate governance matters and shareholder protections |
13 | |||
| 14 | ||||
| BlackRock’s oversight of its investment stewardship activities |
15 | |||
| 16 | ||||
| 17 | ||||
| 17 | ||||
| 18 | ||||
| 19 | ||||
| 19 | ||||
The purpose of this document is to provide an overarching explanation of BlackRock’s approach globally to our responsibilities as a shareholder on behalf of our clients, our expectations of companies, and our commitments to clients in terms of our own governance and transparency.
| BlackRock Investment Stewardship | Global Principles | 2 |
BlackRock’s purpose is to help more and more people experience financial well-being. We manage assets on behalf of institutional and individual clients, across a full spectrum of investment strategies, asset classes, and regions. Our client base includes pension plans, endowments, foundations, charities, official institutions, insurers, and other financial institutions, as well as individuals around the world.
Philosophy on investment stewardship
As part of our fiduciary duty to our clients, we consider it one of our responsibilities to promote sound corporate governance as an informed, engaged shareholder on their behalf. At BlackRock, this is the responsibility of the BlackRock Investment Stewardship (BIS) team.
In our experience, sound governance is critical to the success of a company, the protection of investors’ interests, and long-term financial value creation. We take a constructive, long-term approach with companies and seek to understand how they are managing the drivers of risk and financial value creation in their business models. We have observed that well-managed companies will effectively evaluate and address risks and opportunities relevant to their businesses, which supports durable, long-term financial value creation. As one of many minority shareholders, BlackRock cannot – and does not try to – direct a company’s strategy or its implementation.
We believe that there are certain fundamental rights attached to shareholding. Shareholders should have the right to:
| • | Elect, remove, and nominate directors, approve the appointment of the auditor, and amend the corporate charter or by-laws. |
| • | Vote on key board decisions that are material to the protection of their investment, including but not limited to, changes to the purpose of the business, dilution levels and pre-emptive rights, and the distribution of income and capital structure. |
| • | Access sufficient and timely information on material governance, strategic, and business matters to make informed decisions. |
In our view, shareholder voting rights should be proportionate to economic ownership—the principle of “one share, one vote” helps to achieve this balance.
Consistent with these shareholder rights, BlackRock monitors and provides feedback to companies in our role as stewards of our clients’ assets. Investment stewardship is how we use our voice as an investor to promote sound corporate governance and business practices that support the ability of companies to deliver long-term financial performance for our clients. We do this through engagement with companies, proxy voting on behalf of those clients who have given us authority, and participating in market-level dialogue to improve corporate governance standards.
Engagement is an important mechanism for providing feedback on company practices and disclosures, particularly where our observations indicate that they could be enhanced to support a company’s ability to deliver financial performance. Similarly, it provides us with an opportunity to hear directly from company boards and management on how they believe their actions are aligned with the long-term
| BlackRock Investment Stewardship | Global Principles | 3 |
economic interests of shareholders. Engagement with companies may also inform our proxy voting decisions.
As a fiduciary, we vote in the long-term economic interests of our clients. Generally, we support the recommendations of the board of directors and management. However, there may be instances where we vote against the election of directors or other management proposals, or support shareholder proposals. For instance, we may vote against management recommendations where we are concerned that the board may not be acting in the long-term economic interests of shareholders, or disclosures do not provide sufficient information to assess how material, strategic risks and opportunities are being managed. Our regional proxy voting guidelines are informed by our market-specific approach and standards of corporate governance best practices.
| BlackRock Investment Stewardship | Global Principles | 4 |
While accepted standards and norms of corporate governance can differ between markets, in our experience, there are certain globally-applicable fundamental elements of governance that contribute to a company’s ability to create long-term financial value for shareholders. These global themes are set out in this overarching set of principles (the “Principles”), which are anchored in transparency and accountability. At a minimum, it is our view that companies should observe the accepted corporate governance standards in their domestic market and we ask that, if they do not, they explain how their approach better supports durable, long-term financial value creation.
These Principles cover seven key subjects:
| • | Boards and directors |
| • | Auditors and audit-related issues |
| • | Capital structure, mergers, asset sales, and other special transactions |
| • | Executive compensation |
| • | Material sustainability-related risks and opportunities |
| • | Other corporate governance matters and shareholder protections |
| • | Shareholder proposals |
Our regional and market-specific voting guidelines explain how these Principles inform our voting decisions in relation to common ballot items for shareholder meetings in those markets. Alongside the Principles and regional voting guidelines, BIS publishes our engagement priorities which reflect the five themes on which we most frequently engage companies, where they are relevant, as these can be a source of material business risk or opportunity. Collectively, these BIS policies set out the core elements of corporate governance that guide our investment stewardship efforts globally and within each market, including when engaging with companies and voting at shareholder meetings. The BIS policies are applied on a case-by-case basis, taking into consideration the context within which a company is operating.
| BlackRock Investment Stewardship | Global Principles | 5 |
We believe that an effective and well-functioning board that has appropriate governance structures to facilitate oversight of a company’s management and strategic initiatives is critical to the long-term financial success of a company and the protection of shareholders’ economic interests. In our view, a strong board can be a competitive advantage to a company, providing valuable oversight of and perspectives to management on the most important decisions in support of long-term financial performance. As part of their responsibilities, board members have a fiduciary duty to shareholders to oversee the strategic direction, operations, and risk management of a company. For this reason, BIS sees engagement with and the election of directors as one of our most important responsibilities. Disclosure of material risks that may affect a company’s long-term strategy and financial value creation, including material sustainability-related factors when relevant, is essential for shareholders to appropriately understand and assess how effectively management is identifying, managing, and mitigating such risks.
The board should establish and maintain a framework of robust and effective governance mechanisms to support its oversight of the company’s strategy and operations consistent with the long-term economic interests of investors. There should be clear descriptions of the role of the board and the committees of the board and how directors engage with and oversee management. We look to the board to articulate the effectiveness of these mechanisms in overseeing the management of business risks and opportunities and the fulfillment of the company’s purpose and strategy.
Where a company has not adequately disclosed and demonstrated that its board has fulfilled these corporate governance and risk oversight responsibilities, we will consider voting against the election of directors who, on our assessment, have particular responsibility for the issues. We assess director performance on a case-by-case basis and in light of each company’s circumstances, taking into consideration their governance, business practices that support durable, long-term financial value creation, and performance. Set out below are ways in which boards and directors can demonstrate a commitment to acting in the long-term economic interests of all shareholders.
Regular accountability through director elections
It is our view that directors should stand for election on a regular basis, ideally annually. In our experience, annual director elections allow shareholders to reaffirm their support for board members and/or hold them accountable for their decisions in a timely manner. When board members are not elected annually, in our experience, it is good practice for boards to have a rotation policy to ensure that, through a board cycle, all directors have had their appointment re-confirmed, with a proportion of directors being put forward for election at each annual general meeting.
Effective board composition
Regular director elections also give boards the opportunity to adjust their composition in an orderly way to reflect developments in the company’s strategy and the market environment. In our view, it is beneficial for new directors to be brought onto the board periodically to refresh the group’s thinking, while supporting both continuity and appropriate succession planning. We consider the average overall tenure of the board, and seek a balance between the knowledge and experience of longer-serving directors and the fresh perspectives of directors who joined more recently. We encourage companies to regularly review the effectiveness of their board (including its size), and assess directors nominated for election in the context of the composition of the board as a whole. In our view, the company’s assessment should consider a number of factors, including each director’s independence and time commitments, as well as
| BlackRock Investment Stewardship | Global Principles | 6 |
the diversity and relevance of director experiences and skillsets, and how these factors may contribute to the financial performance of the company.
Similarly, there should be a sufficient number of independent directors, free from conflicts of interest or undue influence from connected parties, to ensure objectivity in the decision-making of the board and its ability to oversee management. Common impediments to independence may include but are not limited to:
| • | Current or recent employment at the company or a subsidiary |
| • | Being, or representing, a shareholder with a substantial shareholding in the company |
| • | Interlocking directorships |
| • | Having any other interest, business, or other relationship which could, or could reasonably be perceived to, materially interfere with a director’s ability to act in the best interests of the company and shareholders. |
In our experience, boards are most effective at overseeing and advising management when there is a senior, independent board leader. This director may chair the board, or, where the chair is also the CEO (or is otherwise not independent), be designated as a lead independent director. The role of this director is to enhance the effectiveness of the independent members of the board through shaping the agenda, ensuring adequate information is provided to the board, and encouraging independent director participation in board deliberations. The lead independent director or another appropriate director should be available to meet with shareholders in those situations where an independent director is best placed to explain and contextualize a company’s approach.
There are matters for which the board has responsibility that may involve a conflict of interest for executives or for affiliated directors, or require additional focus. It is our view that objective oversight of such matters is best achieved when the board forms committees comprised entirely of independent directors. In many markets, these committees of the board specialize in audit, director nominations, and compensation matters. An ad hoc committee might also be formed to decide on a special transaction, particularly one involving a related party, or to investigate a significant adverse event.
When nominating directors to the board, we look to companies to provide sufficient information on the individual candidates so that shareholders can assess the capabilities and suitability of each individual nominee and their fit within overall board composition. These disclosures should give an understanding of how the collective experience and expertise of the board, as well as the particular skill-sets of individual directors, aligns with the company’s long-term strategy and business model. Highly qualified, engaged directors with professional characteristics relevant to a company’s business and strategy enhance the ability of the board to add value and be the voice of shareholders in board discussions.
It is in this context that we are interested in diversity in the board room. We see it as a means to promoting diversity of thought and avoiding “group think” when the board advises and oversees management. This position is based on our view that diversity of perspective and thought – in the board room, in the management team, and throughout the company – leads to better long-term economic outcomes for companies. Academic research has revealed correlations between specific dimensions of diversity and effects on decision-making processes and outcomes.1 In our experience, greater diversity in the board
1 For a discussion on the different impacts of diversity see: McKinsey, “Diversity Wins: How Inclusion Matters,” May 2022; Harvard Business Review, “Diverse Teams Feel Less Comfortable – and That’s Why They Perform Better,” September 2016; “Do Diverse Directors Influence DEI Outcomes,” September 2022.
| BlackRock Investment Stewardship | Global Principles | 7 |
room can contribute to more robust discussions and more innovative and resilient decisions. Over time, greater diversity in the board room can also promote greater diversity and resilience in the leadership team, and the workforce more broadly. That diversity can enable companies to develop businesses that better address the needs of the customers and communities they serve.
We ask boards to disclose how diversity is considered in board composition, including professional characteristics, such as a director’s industry experience, specialist areas of expertise and geographic location; as well as demographic characteristics such as gender, race/ethnicity, and age.
We look to understand a board’s diversity in the context of a company’s domicile, market capitalization, business model, and strategy. Increasingly, we see the most effective boards nominating directors from diverse backgrounds which helps ensure boards can more effectively understand the company’s customers, employees, and communities. We note that in many markets, policymakers have set board gender diversity goals which we may discuss with companies, particularly if there is a risk their board composition may be misaligned. Self-identified board demographic diversity can usefully be disclosed in aggregate, consistent with local law. We encourage boards to aspire to meaningful diversity of membership, while recognizing that building a strong, diverse board can take time.
Sufficient capacity
As the role and expectations of a director are increasingly demanding, directors must be able to commit an appropriate amount of time to board and committee matters. It is important that directors have the capacity to meet all of their responsibilities - including when there are unforeseen events – and therefore, they should not take on an excessive number of roles that would impair their ability to fulfill their duties.
Auditors and audit-related issues
BlackRock recognizes the critical importance of financial statements, which should provide a true and fair picture of a company’s financial condition. Accordingly, the assumptions made by management and reviewed by the auditor in preparing the financial statements should be reasonable and justified.
The accuracy of financial statements, inclusive of financial and non-financial information as required or permitted under market-specific accounting rules, is of paramount importance to BlackRock. Investors increasingly recognize that a broader range of risks and opportunities have the potential to materially impact financial performance. Over time, we anticipate investors and other users of company reporting will increasingly seek to understand and scrutinize the assumptions underlying financial statements, particularly those that pertain to the impact of the transition to a low-carbon economy on a company’s business model and asset mix. We recognize that this is an area of evolving practice and note that international standards setters, such as the International Financial Reporting Standards (IFRS) Board and the International Auditing and Assurance Standards Board (IAASB), continue to develop their guidance to companies.2
In this context, audit committees, or equivalent, play a vital role in a company’s financial reporting system by providing independent oversight of the accounts, material financial and, where appropriate to the jurisdiction, non-financial information and internal control frameworks. Moreover, in the absence of a dedicated risk committee, these committees can provide oversight of Enterprise Risk Management
2 IFRS, “IFRS S1 General Requirements for Disclosure of Sustainability-related Financial Information”, June 2023, and IAASB, “IAASB Launches Public Consultation on Landmark Proposed Global Sustainability Assurance Standard”, August 2023.
| BlackRock Investment Stewardship | Global Principles | 8 |
systems.3 In our view, effective audit committee oversight strengthens the quality and reliability of a company’s financial statements and provides an important level of reassurance to shareholders.
We hold members of the audit committee or equivalent responsible for overseeing the management of the audit function. Audit committees or equivalent should have clearly articulated charters that set out their responsibilities and have a rotation plan in place that allows for a periodic refreshment of the committee membership to introduce fresh perspectives to audit oversight. We recognize that audit committees will rely on management, internal audit, and the independent auditor in fulfilling their responsibilities but look to committee members to demonstrate they have relevant expertise to monitor and oversee the audit process and related activities.
We take particular note of unexplained changes in reporting methodology, cases involving significant financial restatements, or ad hoc notifications of material financial weakness. In this respect, audit committees should provide timely disclosure on the remediation of Key and Critical Audit Matters identified either by the external auditor or internal audit function.
The integrity of financial statements depends on the auditor being free of any impediments to being an effective check on management. To that end, it is important that auditors are, and are seen to be, independent. Where an audit firm provides services to the company in addition to the audit, the fees earned should be disclosed and explained. Audit committees should have in place a procedure for assessing annually the independence of the auditor and the quality of the external audit process.
Comprehensive disclosure provides investors with a sense of the company’s long-term operational risk management practices and, more broadly, the quality of the board’s oversight. The audit or risk committee, should periodically review the company’s risk assessment and risk management policies and the significant risks and exposures identified by management, the internal auditors or the independent auditors and management’s steps to address them. In the absence of detailed disclosures, we may reasonably conclude that companies are not adequately managing risk.
Capital structure, mergers, asset sales, and other special transactions
The capital structure of a company is critical to shareholders as it impacts the value of their investment and the priority of their interest in the company relative to that of other equity or debt investors. Preemptive rights are a key protection for shareholders against the dilution of their interests.
Effective voting rights are basic rights of share ownership and a core principle of effective governance. Shareholders, as the residual claimants, have the strongest interest in protecting the financial value of the company, and voting rights should match economic exposure, i.e. one share, one vote.
In principle, we disagree with the creation of a share class with equivalent economic exposure and preferential, differentiated voting rights. In our view, this structure violates the fundamental corporate governance principle of proportionality and results in a concentration of power in the hands of a few shareholders, thus disenfranchising other shareholders and amplifying any potential conflicts of interest. However, we recognize that in certain markets, at least for a period of time, companies may have a valid
3 Enterprise risk management is a process, effected by the entity’s board of directors, management, and other personnel, applied in strategy setting and across the enterprise, designed to identify potential events that may affect the entity, and manage risk to be within the risk appetite, to provide reasonable assurance regarding the achievement of objectives. (Committee of Sponsoring Organizations of the Treadway Commission (COSO), Enterprise Risk Management — Integrated Framework, September 2004, New York, NY, updated in 2017. Please see: https://www.coso.org/SitePages/Home.aspx).
| BlackRock Investment Stewardship | Global Principles | 9 |
argument for listing dual classes of shares with differentiated voting rights. In our view, such companies should review these share class structures on a regular basis or as company circumstances change. Additionally, they should seek shareholder approval of their capital structure on a periodic basis via a management proposal at the company’s shareholder meeting. The proposal should give unaffiliated shareholders the opportunity to affirm the current structure or establish mechanisms to end or phase out controlling structures at the appropriate time, while minimizing costs to shareholders.
In assessing mergers, asset sales, or other special transactions, BlackRock’s primary consideration is the long-term economic interests of our clients as shareholders. Boards proposing a transaction should clearly explain the economic and strategic rationale behind it. We will review a proposed transaction to determine the degree to which it can enhance long-term shareholder value. We find long-term investors like our clients typically benefit when proposed transactions have the unanimous support of the board and have been negotiated at arm’s length. We may seek reassurance from the board that the financial interests of executives and/or board members in a given transaction have not adversely affected their ability to place shareholders’ interests before their own. Where the transaction involves related parties, the recommendation to support should come from the independent directors, a best practice in most markets, and ideally, the terms should have been assessed through an independent appraisal process. In addition, it is good practice that it be approved by a separate vote of the non-conflicted parties.
As a matter of sound governance practice, shareholders should have a right to dispose of company shares in the open market without unnecessary restriction. In our view, corporate mechanisms designed to limit shareholders’ ability to sell their shares are contrary to basic property rights. Such mechanisms can serve to protect and entrench interests other than those of the shareholders. In our view, shareholders are broadly capable of making decisions in their own best interests. We encourage any so-called “shareholder rights plans” proposed by a board to be subject to shareholder approval upon introduction and periodically thereafter.
In most markets, one of the most important roles for a company’s board of directors is to put in place a compensation structure that incentivizes and rewards executives appropriately. There should be a clear link between variable pay and operational and financial performance. Performance metrics should be stretching and aligned with a company’s strategy and business model. BIS does not have a position on the use of sustainability-related criteria in compensation structures, but in our view, where companies choose to include these components, they should be adequately disclosed, material to the company’s strategy, and as rigorous as other financial or operational targets. Long-term incentive plans should encompass timeframes that 1) are distinct from annual executive compensation structures and metrics, and 2) encourage the delivery of strong financial results over a period of years. Compensation committees should guard against contractual arrangements that would entitle executives to material compensation for early termination of their employment. Finally, pension contributions and other deferred compensation arrangements should be reasonable, in light of market practices.
We are not supportive of one-off or special bonuses unrelated to company or individual performance. Where discretion has been used by the compensation committee or its equivalent, we expect disclosure relating to how and why the discretion was used, and how the adjusted outcome is aligned with the interests of shareholders. We acknowledge that the use of peer group evaluation by compensation committees can help ensure competitive pay; however, we are concerned when the rationale for increases in total compensation at a company is solely based on peer benchmarking, rather than a rigorous
| BlackRock Investment Stewardship | Global Principles | 10 |
measure of outperformance. We encourage companies to clearly explain how compensation outcomes have rewarded performance.
We encourage boards to consider building clawback provisions into incentive plans such that companies could clawback compensation or require executives to forgo awards when compensation was based on faulty financial statements or deceptive business practices. We also favor recoupment from or the foregoing of the grant of any awards by any senior executive whose behavior caused material financial harm to shareholders, material reputational risk to the company, or resulted in a criminal investigation, even if such actions did not ultimately result in a material restatement of past results.
Non-executive directors should be compensated in a manner that is commensurate with the time and effort expended in fulfilling their professional responsibilities. Additionally, these compensation arrangements should not risk compromising directors’ independence or aligning their interests too closely with those of the management, whom they are charged with overseeing.
We use third party research, in addition to our own analysis, to evaluate existing and proposed compensation structures. BIS may signal concerns through not supporting management’s proposals to approve compensation, where they are on the agenda. We may also vote against members of the compensation committee or equivalent board members for poor compensation practices or structures.
Material sustainability-related risks and opportunities
It is our view that well-managed companies will effectively evaluate and manage material sustainability-related risks and opportunities relevant to their businesses. As with all risks and opportunities in a company’s business model, appropriate oversight of material sustainability considerations is a core component of having an effective governance framework, which supports durable, long-term financial value creation.
Robust disclosure is essential for investors to effectively evaluate companies’ strategy and business practices related to material sustainability-related risks and opportunities. Long-term investors like our clients can benefit when companies demonstrate that they have a resilient business model through disclosures thatcover governance, strategy, risk management, and metrics and targets, including industry-specific metrics. The International Sustainability Standards Board (ISSB) standards, IFRS S1 and S2,4 provide companies with a useful guide to preparing this disclosure. The standards build on the Task Force on Climate-related Financial Disclosures (TCFD) framework and the standards and metrics developed by the Sustainability Accounting Standards Board (SASB), which have converged under the ISSB. We recognize that companies may phase in reporting aligned with the ISSB standards over several years. We also recognize that some companies may report using different standards, which may be required by regulation, or one of a number of voluntary standards. In such cases, we ask that companies highlight the metrics that are industry- or company-specific.
We note that climate and other sustainability-related disclosures often require companies to collect and aggregate data from various internal and external sources. We recognize that the practical realities of data collection and reporting may not line up with financial reporting cycles and companies may require additional time after their fiscal year-end to accurately collect, analyze, and report this data to investors.
4 The objective of IFRS S1 General Requirements for Disclosure of Sustainability-related Financial Information is to require an entity to disclose information about its sustainability-related risks and opportunities that is useful to primary users of general-purpose financial reports in making decisions relating to providing resources to the entity. The objective of IFRS S2 Climate-related Disclosures is to require an entity to disclose information about its climate-related risks and opportunities that is useful to primary users of general-purpose financial reports in making decisions relating to providing resources to the entity.
| BlackRock Investment Stewardship | Global Principles | 11 |
That said, to give investors time to assess the data, we encourage companies to produce climate and other sustainability-related disclosures sufficiently in advance of their annual meeting, to the best of their abilities.
Companies may also choose to adopt or refer to guidance on sustainable and responsible business conduct issued by supranational organizations such as the United Nations or the Organization for Economic Cooperation and Development. Further, industry initiatives on managing specific operational risks may provide useful guidance to companies on best practices and disclosures. We find it helpful to our understanding of investment risk when companies disclose any relevant global climate and other sustainability-related standards adopted, the industry initiatives in which they participate, any peer group benchmarking undertaken, and any assurance processes to help investors understand their approach to sustainable and responsible business practices. We will express any concerns through our voting where a company’s actions or disclosures do not seem adequate in light of the materiality of the business risks.
Climate and nature-related risk
While companies in various sectors and geographies may be affected differently by climate-related risks and opportunities, the low-carbon transition is an investment factor that can be material for many companies and economies around the globe.
We seek to understand, from company disclosures and engagement, the strategies companies have in place to manage material risks to, and opportunities for, their long-term business model associated with a range of climate-related scenarios, including a scenario in which global warming is limited to well below 2°C, considering global ambitions to achieve a limit of 1.5°C. As one of many shareholders, and typically a minority one, BlackRock does not tell companies what to do. It is the role of the board and management to set and implement a company’s long-term strategy to deliver long-term financial returns.
Our research shows that the low-carbon transition is a structural shift in the global economy that will be shaped by changes in government policies, technology, and consumer preferences, which may be material for many companies.5 Yet the path to a low-carbon economy is deeply uncertain and uneven, with different parts of the economy moving at different speeds. BIS recognizes that it can be challenging for companies to predict the impact of climate-related risk and opportunity on their businesses and operating environments. Many companies are assessing how to navigate the low-carbon transition while delivering long-term value to investors. In this context, we encourage companies to publicly disclose, consistent with their business model and sector, how they intend to deliver long-term financial performance through the transition to a low-carbon economy. Where available, we appreciate companies publishing their transition plan.6
Consistent with the ISSB standards, we are better able to assess preparedness for the low-carbon transition when companies disclose short-, medium- and long-term targets, ideally science-based where these are available for their sector, for scope 1 and 2 greenhouse gas emissions (GHG) reductions and to demonstrate how their targets are consistent with the long-term financial interests of their investors.
5 BlackRock Investment Institute, “Tracking the low-carbon transition”, July 2023.
6 We have observed that more companies are developing such plans, and public policy makers in a number of markets are signaling their intentions to require them. We view transition plans (TPs) as a method for a company to both internally assess and externally communicate long-term strategy, ambition, objectives, and actions to create financial value through the global transition towards a low-carbon economy. While many initiatives across jurisdictions outline a framework for TPs, there is no consensus on the key elements these plans should contain. We view useful disclosure as that which communicates a company’s approach to managing financially material, business relevant risks and opportunities – including climate-related risks – to deliver long-term financial performance, thus enabling investors to make more informed decisions.
| BlackRock Investment Stewardship | Global Principles | 12 |
While we recognize that regulators in some markets are moving to mandate certain disclosures, at this stage, we view scope 3 emissions differently from scopes 1 and 2, given methodological complexity, regulatory uncertainty, concerns about double-counting, and lack of direct control by companies. We welcome disclosures and commitments companies choose to make regarding scope 3 emissions and recognize these are provided on a good-faith basis as methodology develops. Our publicly available commentary provides more information on our approach to climate-related risks and opportunities.
In addition to climate-related risks and opportunities, the management of nature-related factors is increasingly a component of some companies’ ability to generate durable, long-term financial returns for shareholders, particularly where a company’s strategy is heavily reliant on the availability of natural capital, or whose supply chains are exposed to locations with nature-related risks. We look for such companies to disclose how they manage any reliance and impact on, as well as use of, natural capital, including appropriate risk oversight and relevant metrics and targets, to understand how these factors are integrated into strategy. We will evaluate these disclosures to inform our view of how a company is managing material nature-related risks and opportunities, as well as in our assessment of relevant shareholder proposals. Our publicly available commentary provides more information on our approach to natural capital.7
Key stakeholder interests
In order to advance long-term shareholders’ interests, companies should consider the interests of the various parties on whom they depend for their success over time. It is for each company to determine their key stakeholders based on what is material to their business and long-term financial performance. For many companies, key stakeholders include employees, business partners (such as suppliers and distributors), clients and consumers, regulators, and the communities in which they operate.
As a long-term shareholder on behalf of our clients, we find it helpful when companies disclose how they have identified their key stakeholders and considered their interests in business decision-making. In addition to understanding broader stakeholder relationships, BIS finds it helpful when companies consider the needs of their workforce today, and the skills required for their future business strategy. We are also interested to understand the role of the board, which is well positioned to ensure that the approach taken is informed by and aligns with the company’s strategy and purpose.
Companies should articulate how they address material adverse impacts that could arise from their business practices and affect critical relationships with their stakeholders. We encourage companies to implement, to the extent appropriate, monitoring processes (often referred to as due diligence) to identify and mitigate potential adverse impacts and grievance mechanisms to remediate any actual adverse material impacts. In our view, maintaining trust within these relationships can contribute to a company’s long-term success.
Other corporate governance matters and shareholder protections
7 Given the growing awareness of the materiality of these issues for certain businesses, enhanced reporting on a company’s natural capital dependencies and impacts would aid investors’ understanding. In our view, the final recommendations of the Taskforce on Nature-related Financial Disclosures may prove useful to some companies. We recognize that some companies may report using different standards, which may be required by regulation, or one of a number of other private sector standards.
| BlackRock Investment Stewardship | Global Principles | 13 |
In our view, shareholders have a right to material and timely information on the financial performance and viability of the companies in which they invest. In addition, companies should publish information on the governance structures in place and the rights of shareholders to influence these structures. The reporting and disclosure provided by companies help shareholders assess the effectiveness of the board’s oversight of management and whether investors’ economic interests have been protected. We believe shareholders should have the right to vote on key corporate governance matters, including changes to governance mechanisms, to submit proposals to the shareholders’ meeting, and to call special meetings of shareholders.
Corporate form
In our view, it is the responsibility of the board to determine the corporate form that is most appropriate given the company’s purpose and business model.8 Companies proposing to change their corporate form to a public benefit corporation or similar entity should put it to a shareholder vote if not already required to do so under applicable law. Supporting documentation from companies or shareholder proponents proposing to alter the corporate form should clearly articulate how the interests of shareholders and different stakeholders would be impacted as well as the accountability and voting mechanisms that would be available to shareholders. As a fiduciary on behalf of clients, we generally support management proposals if our analysis indicates that shareholders’ economic interests are adequately protected. Relevant shareholder proposals are evaluated on a case-by-case basis.
In most markets in which BlackRock invests on behalf of clients, shareholders have the right to submit proposals to be voted on by shareholders at a company’s annual or extraordinary meeting, as long as eligibility and procedural requirements are met. The matters that we see put forward by shareholders address a wide range of topics, including governance reforms, capital management, and improvements in the management or disclosure of sustainability-related risks.
BlackRock is subject to legal and regulatory requirements in the U.S. that place restrictions and limitations on how BlackRock can interact with the companies in which we invest on behalf of our clients, including our ability to submit shareholder proposals. We can vote, on behalf of clients who authorize us to do so, on proposals put forth by others.
When assessing shareholder proposals, we evaluate each proposal on its merit, with a singular focus on its implications for long-term financial value creation by that company. We believe it is helpful for companies to disclose the names of the proponent or organization that has submitted or advised on the proposal. We consider the business and economic relevance of the issue raised, as well as its materiality and the urgency with which our experience indicates it should be addressed. We would not support proposals that we believe would result in over-reaching into the basic business decisions of the company. We take into consideration the legal effect of the proposal, as shareholder proposals may be advisory or legally binding depending on the jurisdiction, while others may make requests that would be deemed illegal in a given jurisdiction.
Where a proposal is focused on a material business risk that we agree needs to be addressed and the intended outcome is consistent with long-term financial value creation, we will look to the board and management to demonstrate that the company has met the intent of the request made in the shareholder proposal. Where our analysis and/or engagement indicate an opportunity for improvement in the
8 Corporate form refers to the legal structure by which a business is organized.
| BlackRock Investment Stewardship | Global Principles | 14 |
company’s approach to the issue, we may support shareholder proposals that are reasonable and not unduly prescriptive or constraining on management.
We recognize that some shareholder proposals bundle topics and/or specific requests and include supporting statements that explain the reasoning or objectives of the proponent. In voting on behalf of clients, we do not submit or edit proposals or the supporting statements – we must vote yes or no on the proposal as phrased by the proponent. Therefore, when we vote in support of a proposal, we are not necessarily endorsing every element of the proposal or the reasoning, objectives, or supporting statement of the proponent. We may support a proposal for different reasons from those put forth by the proponent, when we believe that, overall, it can advance our clients’ long-term financial interests. We would normally explain to the company our rationale for supporting such proposals.
Alternatively, or in addition, we may vote against the election of one or more directors if, in our assessment, the board has not responded sufficiently or with an appropriate sense of urgency. We may also support a proposal if management is on track, but we believe that voting in favor might accelerate efforts to address a material risk.
BlackRock’s oversight of its investment stewardship activities
Oversight
BlackRock maintains three regional advisory committees (Stewardship Advisory Committees) for a) the Americas; b) Europe, the Middle East and Africa; and c) Asia-Pacific, generally consisting of senior BlackRock investment professionals and/or senior employees with practical boardroom experience. The regional Stewardship Advisory Committees review and advise on amendments to BIS regional proxy voting guidelines (the Guidelines) covering markets within each respective region. The advisory committees do not determine voting decisions, which are the responsibility of BIS.
In addition to the regional Stewardship Advisory Committees, the Investment Stewardship Global Oversight Committee (Global Oversight Committee) is a risk-focused committee, comprised of senior representatives from various BlackRock investment teams, a senior legal representative, the Global Head of Investment Stewardship (Global Head), and other senior executives with relevant experience and team oversight. The Global Committee does not determine voting decisions, which are the responsibility of BIS.
The Global Head has primary oversight of the activities of BIS, including voting in accordance with the Guidelines, which require the application of professional judgment and consideration of each company’s unique circumstances. The Global Committee reviews and approves amendments to these Principles. The Global Committee also reviews and approves amendments to the regional Guidelines, as proposed by the regional Stewardship Advisory Committees.
In addition, the Global Committee receives and reviews periodic reports regarding the votes cast by BIS, as well as updates on material process issues, procedural changes, and other risk oversight considerations. The Global Committee reviews these reports in an oversight capacity as informed by the Guidelines.
BIS carries out engagement with companies, executes proxy votes, and conducts vote operations (including maintaining records of votes cast) in a manner consistent with the relevant Guidelines. BIS also conducts research on corporate governance issues and participates in industry discussions to contribute to and keep abreast of important developments in the corporate governance field. BIS may
| BlackRock Investment Stewardship | Global Principles | 15 |
utilize third parties for certain of the foregoing activities and performs oversight of those third parties. BIS may raise complicated or particularly controversial matters for internal discussion with the relevant investment teams and governance specialists for discussion and guidance prior to making a voting decision.
Vote execution
BlackRock votes on proxy issues when our clients authorize us to do so. When BlackRock has been authorized to vote on behalf of our clients, we carefully consider proxies submitted to funds and other fiduciary account(s) (Fund or Funds) for which we have voting authority. BlackRock votes (or refrains from voting) proxies for each Fund for which we have voting authority based on our evaluation of the alignment of the voting items with the long-term economic interests of our clients, in the exercise of our independent business judgment, and without regard to the relationship of the issuer of the proxy (or any shareholder proponent or dissident shareholder) to the Fund, the Fund’s affiliates (if any), BlackRock or BlackRock’s affiliates, or BlackRock employees (see “Conflicts management policies and procedures,” below).
When exercising voting rights, BIS will normally vote on specific proxy issues in accordance with the Guidelines for the relevant market, as well as the Global Principles. The Guidelines are reviewed annually and are amended consistent with changes in the local market practice, as developments in corporate governance occur, or as otherwise deemed advisable by the applicable Stewardship Advisory Committees. BIS analysts may, in the exercise of their professional judgment, conclude that the Guidelines do not cover the specific matter upon which a proxy vote is required or that an exception to the Guidelines would be in the long-term economic interests of BlackRock’s clients.
In the uncommon circumstance of there being a vote with respect to fixed income securities or the securities of privately held issuers, the decision generally will be made by a Fund’s portfolio managers and/or BIS based on an assessment of the particular transactions or other matters at issue.
In certain markets, proxy voting involves logistical issues which can affect BIS’ ability to vote such proxies, as well as the desirability of voting such proxies. These issues include, but are not limited to: i) untimely notice of shareholder meetings; ii) restrictions on a foreigner’s ability to exercise votes; iii) requirements to vote proxies in person; iv) “share-blocking” (requirements that investors who exercise their voting rights surrender the right to dispose of their holdings for some specified period in proximity to the shareholder meeting); v) potential difficulties in translating the proxy; vi) regulatory constraints; and vii) requirements to provide local agents with unrestricted powers of attorney to facilitate voting instructions. We are not supportive of impediments to the exercise of voting rights such as share-blocking or overly burdensome administrative requirements.
As a consequence, BlackRock votes proxies in these situations on a “best-efforts” basis. In addition, BIS may determine that it is generally in the interests of BlackRock’s clients not to vote proxies (or not to vote our full allocation) if the costs (including but not limited to opportunity costs associated with share-blocking constraints) associated with exercising a vote are expected to outweigh the benefit the client would derive by voting on the proposal.
Active portfolio managers have full discretion to vote the shares in the Funds they manage based on their analysis of the economic impact of a particular ballot item on their investors. Portfolio managers may, from time to time, reach differing views on how to maximize economic value with respect to a particular investment. Therefore, portfolio managers may, and sometimes do, vote shares in the Funds under their
| BlackRock Investment Stewardship | Global Principles | 16 |
management differently from BIS or from one another. However, because BlackRock’s clients are mostly long-term investors with long-term economic goals, ballots are generally cast in a uniform manner.
BlackRock offers a Voting Choice program, which provides eligible clients with more opportunities to participate in the proxy voting process where legally and operationally viable. BlackRock Voting Choice aims to make proxy voting easier and more accessible for eligible clients.
Voting Choice is currently available for eligible clients invested in certain institutional pooled funds in the U.S., UK, Ireland, and Canada that utilize equity index investment strategies, as well as eligible clients in certain institutional pooled funds in the U.S., UK, and Canada that use systematic active equity (SAE) strategies. Currently, this includes over 650 pooled investment funds, including equity index funds and SAE investment funds. In addition, institutional clients in separately managed accounts (SMAs) continue to be eligible for BlackRock Voting Choice regardless of their investment strategies.9
As a result, the shares attributed to BlackRock in company share registers may be voted differently depending on whether our clients have authorized BIS to vote on their behalf, have authorized BIS to vote in accordance with a third-party policy, or have elected to vote shares in accordance with their own policy. Agreements with our clients to allow them greater control over their voting, including which policies they have selected, will be treated confidentially consistent with our treatment of similar client agreements.
Conflicts management policies and procedures
BIS maintains policies and procedures that seek to prevent undue influence on BlackRock’s proxy voting activity. Such influence might stem from any relationship between the investee company (or any shareholder proponent or dissident shareholder) and BlackRock, BlackRock’s affiliates, a Fund or a Fund’s affiliates, or BlackRock employees. The following are examples of sources of perceived or potential conflicts of interest:
| • | BlackRock clients who may be issuers of securities or proponents of shareholder resolutions |
| • | BlackRock business partners or third parties who may be issuers of securities or proponents of shareholder resolutions |
| • | BlackRock employees who may sit on the boards of public companies held in Funds managed by BlackRock |
| • | Significant BlackRock, Inc. investors who may be issuers of securities held in Funds managed by BlackRock |
| • | Securities of BlackRock, Inc. or BlackRock investment funds held in Funds managed by BlackRock |
| • | BlackRock, Inc. board members who serve as senior executives or directors of public companies held in Funds managed by BlackRock |
9 Read more about BlackRock Voting Choice on our website.
| BlackRock Investment Stewardship | Global Principles | 17 |
BlackRock has taken certain steps to mitigate perceived or potential conflicts including, but not limited to, the following:
| • | Adopted the Guidelines which are designed to advance our clients’ long-term economic interests in the companies in which BlackRock invests on their behalf |
| • | Established a reporting structure that separates BIS from employees with sales, vendor management, or business partnership roles. In addition, BlackRock seeks to ensure that all engagements with corporate issuers, dissident shareholders or shareholder proponents are managed consistently and without regard to BlackRock’s relationship with such parties. Clients or business partners are not given special treatment or differentiated access to BIS. BIS prioritizes engagements based on factors including, but not limited to, our need for additional information to make a voting decision or our view on the likelihood that an engagement could lead to positive outcome(s) over time for the economic value of the company. Within the normal course of business, BIS may engage directly with BlackRock clients, business partners and/or third parties, and/or with employees with sales, vendor management, or business partnership roles, in discussions regarding our approach to stewardship, general corporate governance matters, client reporting needs, and/or to otherwise ensure that proxy-related client service levels are met |
| • | Determined to engage, in certain instances, an independent third-party voting service provider to make proxy voting recommendations as a further safeguard to avoid potential conflicts of interest, to satisfy regulatory compliance requirements, or as may be otherwise required by applicable law. In such circumstances, the independent third-party voting service provider provides BlackRock with recommendations, in accordance with the Guidelines, as to how to vote such proxies. BlackRock uses an independent third-party voting service provider to make proxy voting recommendations for shares of BlackRock, Inc. and companies affiliated with BlackRock, Inc. BlackRock may also use an independent third-party voting service provider to make proxy voting recommendations for: |
| ○ | public companies that include BlackRock employees on their boards of directors |
| ○ | public companies of which a BlackRock, Inc. board member serves as a senior executive or a member of the board of directors |
| ○ | public companies that are the subject of certain transactions involving BlackRock Funds |
| ○ | public companies that are joint venture partners with BlackRock, and |
| ○ | public companies when legal or regulatory requirements compel BlackRock to use an independent third-party voting service provider |
In selecting an independent third-party voting service provider, we assess several characteristics, including but not limited to: independence, an ability to analyze proxy issues and make recommendations in the economic interest of our clients in accordance with the Guidelines, reputation for reliability and integrity, and operational capacity to accurately deliver the assigned recommendations in a timely manner. We may engage more than one independent third-party voting service provider, in part to mitigate potential or perceived conflicts of interest at a single voting service provider. The Global Committee appoints and reviews the performance of the independent third-party voting service providers, generally on an annual basis.
| BlackRock Investment Stewardship | Global Principles | 18 |
When so authorized, BlackRock acts as a securities lending agent on behalf of Funds. Securities lending is a well-regulated practice that contributes to capital market efficiency. It also enables funds to generate additional returns while allowing fund providers to keep fund expenses lower.
With regard to the relationship between securities lending and proxy voting, BlackRock cannot vote shares on loan and may determine to recall them for voting, as guided by our fiduciary responsibility to act in our clients’ financial interests. While this has occurred in a limited number of cases, the decision to recall securities on loan as part of BlackRock’s securities lending program in order to vote is based on an evaluation of various factors that include, but are not limited to, assessing potential securities lending revenue alongside the potential long-term financial value to clients of voting those securities (based on the information available at the time of recall consideration).10 BIS works with colleagues in the Securities Lending and Risk and Quantitative Analysis teams to evaluate the costs and benefits to clients of recalling shares on loan.
In almost all instances, BlackRock anticipates that the potential long-term financial value to the Fund of voting shares would be less than the potential revenue the loan may provide the Fund. However, in certain instances, BlackRock may determine, in our independent business judgment as a fiduciary, that the value of voting outweighs the securities lending revenue loss to clients and would therefore recall shares to be voted in those instances.
Periodically, BlackRock reviews our process for determining whether to recall securities on loan in order to vote and may modify it as necessary.
The voting guidelines published for each region/country in which we vote are intended to summarize BlackRock’s general philosophy and approach to issues that may commonly arise in the proxy voting context in each market where we invest. The Guidelines are not intended to be exhaustive. BIS applies the Guidelines on a case-by-case basis, in the context of the individual circumstances of each company and the specific issue under review. As such, the Guidelines do not indicate how BIS will vote in every instance. Rather, they reflect our view about corporate governance issues generally, and provide insight into how we typically approach issues that commonly arise on corporate ballots. As previously discussed, the Guidelines should be read in conjunction with the Principles and engagement priorities. Collectively, these “BIS policies” set out the core elements of corporate governance that guide our investment stewardship efforts globally and within each market, including when engaging with companies and voting at shareholder meetings. The BIS policies are applied on a case-by-case basis, taking into consideration the context within which a company is operating.
Reporting and vote transparency
We are committed to transparency in the stewardship work we do on behalf of clients. We inform clients about our engagement and voting policies and activities through direct communication and through disclosure on our website. Each year we publish an annual report that provides a global overview of our
10 Recalling securities on loan can be impacted by the timing of record dates. In the U.S., for example, the record date of a shareholder meeting typically falls before the proxy statements are released. Accordingly, it is not practicable to evaluate a proxy statement, determine that a vote has a material impact on a fund and recall any shares on loan in advance of the record date for the annual meeting. As a result, managers must weigh independent business judgement as a fiduciary, the benefit to a fund’s shareholders of recalling loaned shares in advance of an estimated record date without knowing whether there will be a vote on matters which have a material impact on the fund (thereby forgoing potential securities lending revenue for the fund’s shareholders) or leaving shares on loan to potentially earn revenue for the fund (thereby forgoing the opportunity to vote).
| BlackRock Investment Stewardship | Global Principles | 19 |
investment stewardship engagement and voting activities and a voting spotlight that summarizes our voting over a proxy year.11 Additionally, we make public our regional proxy voting guidelines for the benefit of clients and the companies in which we invest on their behalf. We also publish commentaries to share our perspective on market developments and emerging key themes.
At a more granular level, on a quarterly basis, we publish our vote record for each company that held a shareholder meeting during the period, showing how BIS voted on each proposal and providing our rationale for any votes against management proposals or on shareholder proposals. For shareholder meetings where a vote might be high profile or of significant interest to clients, we may publish a vote bulletin after the meeting, disclosing and explaining our vote on key proposals. We also publish a quarterly list of all companies with which we engaged and the key topics addressed in the engagement meeting.
In this way, we help inform our clients about the work we do on their behalf in promoting the governance and business practices that support durable, long-term financial value creation.
11 The proxy year runs from July 1 to June 30.
| BlackRock Investment Stewardship | Global Principles | 20 |
Want to know more?
blackrock.com/stewardship | contactstewardship@blackrock.com
This document is provided for information and educational purposes only. Investing involves risk, including the loss of principal.
Prepared by BlackRock, Inc.
©2024 BlackRock, Inc. All rights reserved. BLACKROCK is a trademark of BlackRock, Inc., or its subsidiaries in the United States and elsewhere. All other trademarks are those of their respective owners.
BlackRock Investment Stewardship Proxy voting guidelines for U.S. securities Effective as of January 2024
Contents
| 3 | ||||
| 3 | ||||
| 4 | ||||
| 6 | ||||
| 8 | ||||
| 9 | ||||
| 11 | ||||
| 11 | ||||
| Mergers, acquisitions, transactions, and other special situations |
12 | |||
| 14 | ||||
| 17 | ||||
| 20 | ||||
| 23 | ||||
| BlackRock Investment Stewardship | Proxy voting guidelines for U.S. securities | 2 |
These guidelines should be read in conjunction with the BlackRock Investment Stewardship Global Principles.
BlackRock’s clients depend on us to help them meet their long-term investment goals. Given that the business decisions that companies make have a direct impact on our clients’ long-term investment outcomes and financial well-being, we consider it one of our responsibilities to promote sound corporate governance as an informed, engaged shareholder on their behalf. At BlackRock, this is the responsibility of the BlackRock Investment Stewardship (BIS) team, which serves as a link between BlackRock’s clients and the companies we invest in on their behalf. In BIS’ experience, sound governance is critical to the success of a company, the protection of investors’ interests, and long-term financial value creation.
To that end, BIS takes a long-term approach to stewardship, focused on understanding the drivers of risk and financial value creation in companies’ business models. We do this in three ways:
| 1. | Engaging with companies to build our understanding of a company’s approach to corporate governance and business risks and opportunities. |
| 2. | Voting at shareholder meetings on management and shareholder proposals on behalf of clients who have delegated voting authority to BlackRock. Voting is the formal mechanism through which we signal our support for, or concerns about, how companies are serving the long-term financial interests of BlackRock’s clients. |
| 3. | Contributing to emerging thinking on stewardship to share our perspectives with clients, policymakers, and others in the corporate governance ecosystem, on topical and emerging stewardship issues that we believe may impact clients’ financial interests as long-term investors. |
The following issue-specific proxy voting guidelines (the “Guidelines”) summarize BIS’ philosophy and approach to engagement and voting, as well as our view of governance best practices and the roles and responsibilities of boards and directors for publicly listed U.S. companies. These Guidelines are not intended to limit the analysis of individual issues at specific companies or provide a guide to how BIS will engage and/or vote in every instance. They are to be applied with discretion, taking into consideration the range of issues and facts specific to the company, as well as individual ballot items at shareholder meetings.
These guidelines are divided into eight key themes, which group together the issues that frequently appear on the agenda of shareholder meetings:
| • | Boards and directors |
| • | Auditors and audit-related issues |
| • | Capital structure |
| • | Mergers, acquisitions, asset sales, and other special transactions |
| • | Executive compensation |
| BlackRock Investment Stewardship | Proxy voting guidelines for U.S. securities | 3 |
| • | Material sustainability-related risks and opportunities |
| • | General corporate governance matters |
| • | Shareholder protections |
We believe that an effective and well-functioning board that has appropriate governance structures to facilitate oversight of a company’s management and strategic initiatives is critical to the long-term financial success of a company and the protection of shareholders’ economic interests. In our view, a strong board can be a competitive advantage to a company, providing valuable oversight of and perspectives to management on the most important decisions in support of long-term financial performance. As part of their responsibilities, board members have a fiduciary duty to shareholders to oversee the strategic direction, operations, and risk management of a company. For this reason, BIS sees engagement with and the election of directors as one of our most important responsibilities.
Disclosure of material risks that may affect a company’s long-term strategy and financial value creation, including material sustainability-related factors when relevant, is essential for shareholders to appropriately understand and assess how effectively management is identifying, managing, and mitigating such risks.
Where a company has not adequately disclosed and demonstrated that its board has fulfilled these corporate governance and risk oversight responsibilities, we will consider voting against the election of directors who, on our assessment, have particular responsibility for the issues, as indicated below.
Independence
It is our view that a majority of the directors on the board should be independent to ensure objectivity in the decision-making of the board and its ability to oversee management. In addition, all members of audit, compensation, and nominating/governance board committees should be independent. Our view of independence may vary from listing standards.
Common impediments to independence may include:
| • | Employment as a senior executive by the company or a subsidiary within the past five years |
| • | An equity ownership in the company in excess of 20% |
| • | Having any other interest, business, or relationship (professional or personal) which could, or could reasonably be perceived to, materially interfere with the director’s ability to act in the best interests of the company and its shareholders |
We may vote against directors who we do not consider to be independent, including at controlled companies, when we believe oversight could be enhanced with greater independent director representation. To signal our concerns, we may also vote against the chair of the nominating/governance committee, or where no chair exists, the nominating/governance committee member with the longest tenure.
| BlackRock Investment Stewardship | Proxy voting guidelines for U.S. securities | 4 |
Oversight role of the board
The board should exercise appropriate oversight of management and the business activities of the company. Where we determine that a board has failed to do so in a way that may impede a company’s ability to deliver long-term financial value, we may vote against the responsible committees and/or individual directors.
Common circumstances are illustrated below:
| • | Where the board has failed to facilitate quality, independent auditing or accounting practices, we may vote against members of the audit committee |
| • | Where the company has failed to provide shareholders with adequate disclosure to conclude that appropriate strategic consideration is given to material risk factors (including, where relevant, material sustainability factors), we may vote against members of the responsible committee, or the most relevant director |
| • | Where it appears that a director has acted (at the company or at other companies) in a manner that compromises their ability to represent the best long-term economic interests of shareholders, we may vote against that individual |
| • | Where a director has a multi-year pattern of poor attendance at combined board and applicable committee meetings, or a director has poor attendance in a single year with no disclosed rationale, we may vote against that individual. Excluding exigent circumstances, BIS generally considers attendance at less than 75% of the combined board and applicable committee meetings to be poor attendance |
Sufficient capacity
Where a director serves on an excessive number of boards, which may limit their capacity to focus on each board’s needs, we may vote against that individual. The following identifies the maximum number of boards on which a director may serve, before BIS considers them to be over-committed:
| Total # of Public Boards | ||
|
Public Company Executives1 |
2 | |
|
Non-Executive Directors |
4 | |
In addition, we recognize that board leadership roles may vary in responsibility and time requirements in different markets around the world. In particular, where a director maintains a Chair role of a publicly listed company in European markets, we may consider that responsibility as equal to two board commitments, consistent with our EMEA Proxy Voting Guidelines. We will take the total number of board commitments across our global policies into account for director elections.
1 A public company executive is defined as a Named Executive Officer or Executive Chair.
| BlackRock Investment Stewardship | Proxy voting guidelines for U.S. securities | 5 |
Risk oversight
Companies should have an established process for identifying, monitoring, and managing business and material risks. Independent directors should have access to relevant management information and outside advice, as appropriate, to ensure they can properly oversee risk. We encourage companies to provide transparency around risk management, mitigation, and reporting to the board. We are particularly interested in understanding how risk oversight processes evolve in response to changes in corporate strategy and/or shifts in the business and related risk environment. Comprehensive disclosures provide investors with a sense of the company’s long-term risk management practices and, more broadly, the quality of the board’s oversight. In the absence of robust disclosures, we may reasonably conclude that companies are not adequately managing risk.
Classified board of directors/staggered terms
Directors should be re-elected annually; classification of the board generally limits shareholders’ rights to regularly evaluate a board’s performance and select directors. While we will typically support proposals requesting board de-classification, we may make exceptions, should the board articulate an appropriate strategic rationale for a classified board structure. This may include when a company needs consistency and stability during a time of transition, e.g., newly public companies or companies undergoing a strategic restructuring. A classified board structure may also be justified at non-operating companies, e.g., closed-end funds or business development companies (“BDC”),2 in certain circumstances. However, in these instances, boards should periodically review the rationale for a classified structure and consider when annual elections might be more appropriate.
Without a voting mechanism to immediately address concerns about a specific director, we may choose to vote against the directors up for election at the time (see “Shareholder rights” for additional detail).
Independent leadership
There are two commonly accepted structures for independent leadership to balance the CEO role in the boardroom: 1) an independent Chair; or 2) a Lead Independent Director when the roles of Chair and CEO are combined, or when the Chair is otherwise not independent.
In the absence of a significant governance concern, we defer to boards to designate the most appropriate leadership structure to ensure adequate balance and independence.3 However, BIS may vote against the most senior non-executive member of the board when appropriate independence is lacking in designated leadership roles.
In the event that the board chooses to have a combined Chair/CEO or a non-independent Chair, we support the designation of a Lead Independent Director, with the ability to: 1) provide formal input into board meeting agendas; 2) call meetings of the independent directors; and 3) preside at meetings of independent directors. These roles and responsibilities should be disclosed and easily accessible.
2 A BDC is a special investment vehicle under the Investment Company Act of 1940 that is designed to facilitate capital formation for small and middle-market companies.
3 To this end, we do not view shareholder proposals asking for the separation of Chair and CEO to be a proxy for other concerns we may have at the company for which a vote against directors would be more appropriate. Rather, support for such a proposal might arise in the case of overarching and sustained governance concerns such as lack of independence or failure to oversee a material risk over consecutive years.
| BlackRock Investment Stewardship | Proxy voting guidelines for U.S. securities | 6 |
The following table illustrates examples4 of responsibilities under each board leadership model:
| Combined Chair/CEO or CEO + Non-independent Chair | Separate Independent Chair | |||||
| Chair/CEO or Non- independent Chair |
Lead Independent Director | Independent Chair | ||||
| Board Meetings |
Authority to call full meetings of the board of directors | Authority to call meetings of independent directors | Authority to call full meetings of the board of directors | |||
| Attends full meetings of the board of directors | ||||||
| Briefs CEO on issues arising from executive sessions | ||||||
| Agenda | Primary responsibility for shaping board agendas, consulting with the lead independent director | Collaborates with chair/CEO to set board agenda and board information | Primary responsibility for shaping board agendas, in conjunction with CEO | |||
| Board Communications | Communicates with all directors on key issues and concerns outside of full board meetings | Facilitates discussion among independent directors on key issues and concerns outside of full board meetings, including contributing to the oversight of CEO and management succession planning | Facilitates discussion among independent directors on key issues and concerns outside of full board meetings, including contributing to the oversight of CEO and management succession planning | |||
CEO and management succession planning
Companies should have a robust CEO and senior management succession plan in place at the board level that is reviewed and updated on a regular basis. Succession planning should cover scenarios over both the long-term, consistent with the strategic direction of the company and identified leadership needs over time, as well as the short-term, in the event of an unanticipated executive departure. We encourage the company to explain their executive succession planning process, including where accountability lies within the boardroom for this task, without prematurely divulging sensitive information commonly associated with this exercise.
Where there is significant concern regarding the board’s succession planning efforts, we may vote against members of the responsible committee, or the most relevant director.
During a CEO transition, companies may elect for the departing CEO to maintain a role in the boardroom. We ask for disclosures to understand the timeframe and responsibilities of this role. In such instances, we typically look for the board to have appropriate independent leadership structures in place. (See chart above.)
Director compensation and equity programs
Compensation for directors should generally be structured to attract and retain directors, while also aligning their interests with those of shareholders. In our view, director compensation packages that are
4 This table is for illustrative purposes only. The roles and responsibilities cited here are not all-encompassing and are noted for reference as to how these leadership positions may be defined.
| BlackRock Investment Stewardship | Proxy voting guidelines for U.S. securities | 7 |
based on the company’s long-term value creation and include some form of long-term equity compensation are more likely to meet this goal.
Board composition and effectiveness
Director qualifications and skills
We encourage boards to periodically review director qualifications and skills to ensure relevant experience and diverse perspectives are represented in the boardroom. To this end, performance reviews and skills assessments should be conducted by the nominating/governance committee or the Lead Independent Director. This process may include internal board evaluations; however, boards may also find it useful to periodically conduct an assessment with a third party. We encourage boards to disclose their approach to evaluations, including objectives of the evaluation; if an external party conducts the evaluation; the frequency of the evaluations; and, whether that evaluation occurs on an individual director basis.
Board term limits and director tenure
Where boards find that age limits or term limits are a valuable mechanism for ensuring periodic board refreshment, we generally defer to the board’s determination in setting such limits. BIS will also consider the average board tenure to evaluate processes for board renewal. We may oppose boards that appear to have an insufficient mix of short-, medium-, and long-tenured directors.
In addition, where boards have adopted corporate governance guidelines regarding committee leadership and/or membership rotation, we appreciate clear disclosure of those policies.
Board diversity
As noted above, highly qualified, engaged directors with professional characteristics relevant to a company’s business enhance the ability of the board to add value and be the voice of shareholders in board discussions. In our view, a strong board provides a competitive advantage to a company, providing valuable oversight and contributing to the most important management decisions that support long-term financial performance.
It is in this context that we are interested in diversity in the boardroom. We see it as a means to promoting diversity of thought and avoiding ‘group think’ in the board’s advising of and overseeing management. It can help boards to have deeper discussions and make more resilient decisions. We ask boards to disclose how diversity is considered in board composition, including professional characteristics, such as a director’s relevant industry experience, specialist areas of expertise and geographic location; as well as demographic characteristics such as gender, race/ethnicity, and age.
We look to understand a board’s diversity in the context of a company’s domicile, market capitalization, business model, and strategy. Increasingly, we see leading boards nominating directors from diverse backgrounds which helps ensure boards can more effectively understand the company’s customers, employees, and communities. Self-identified board demographic diversity can usefully be disclosed in aggregate, consistent with local law. We encourage boards to aspire to meaningful diversity of membership, at least consistent with local regulatory requirements and best practices, while recognizing that building a strong, diverse board can take time. We take a case-by-case approach and consider the size of the board in our evaluation of overall composition and diversity. Business model, strategy, location, and company size may also impact our analysis of board diversity. We acknowledge that these factors
| BlackRock Investment Stewardship | Proxy voting guidelines for U.S. securities | 8 |
may also play into the various elements of diversity that a board may attract. We look for disclosures from companies to help us understand their approach and do not prescribe any particular board composition.
In the U.S., we believe that boards should aspire to at least 30% diversity of membership,5 and we encourage large companies, such as those in the S&P 500, to lead in achieving this standard. In light of market developments,6 an informative indicator of diversity for such companies is having at least two women and a director who identifies as a member of an underrepresented group.7 We recognize that companies with smaller market capitalizations and in certain sectors may face more challenges. Among these smaller companies, we look for the presence of diversity and take into consideration the steps that companies are taking to ensure diversity on their board.
In order to help investors understand overall diversity, we look to boards to disclose:
| • | The process by which candidates for board positions are identified, including whether professional firms or other resources outside of incumbent directors’ networks are engaged to identify and/or assess candidates, and whether a diverse slate of nominees is considered for all available board nominations |
| • | How directors’ professional characteristics, which may include domain expertise such as finance or technology, and sector- or market-specific experience, are complementary and link to the company’s long-term strategy |
| • | How diversity, including professional characteristics and demographic factors, is considered in board composition, given the company’s long-term strategy and business model |
To the extent that, based on our assessment of corporate disclosures, a company has not adequately explained their approach to diversity in their board composition, we may vote against members of the nominating/governance committee. Our publicly available commentary provides more information on our approach to board diversity.
Board size
We typically defer to the board in setting the appropriate size and believe that directors are generally in the best position to assess the optimal board size to ensure effectiveness. However, we may vote against the appropriate committees and/or individual directors if, in our view, the board is ineffective in its oversight, either because it is too small to allow for the necessary range of skills and experience or too large to function efficiently.
Board responsiveness and shareholder rights
Shareholder rights
5 For a discussion on the different impacts of diversity see: McKinsey, “Diversity Wins: How Inclusion Matters”, May 2022; Harvard Business Review, “Diverse Teams Feel Less Comfortable – and That’s Why They Perform Better”, September 2016; “Do Diverse Directors Influence DEI Outcomes”, September 2022
6 Spierings, Merel “Corporate Director Diversity Can Contribute to Board Effectiveness” Harvard Law School Forum on Corporate Governance (Nov. 2023) https://corpgov.law.harvard.edu/2023/11/24/us-public-company-board-diversity-in-2023/
7 Including, but not limited to, individuals who identify as Black or African American, Hispanic or Latinx, Asian, Native American or Alaska Native, or Native Hawaiian or Pacific Islander; individuals who identify as LGBTQ+; individuals who identify as underrepresented based on national, Indigenous, religious, or cultural identity; individuals with disabilities; and veterans.
| BlackRock Investment Stewardship | Proxy voting guidelines for U.S. securities | 9 |
Where we determine that a board has not acted in the best interests of the company’s shareholders, or takes action to unreasonably limit shareholder rights, we may vote against the relevant committees and/or individual directors. Common circumstances are illustrated below:
| • | The independent Chair or Lead Independent Director and members of the nominating/governance committee, where a board implements or renews a poison pill without shareholder approval |
| • | The independent Chair or Lead Independent Director and members of the nominating/governance committee, where a board amends the charter/articles/bylaws and where the effect may be to entrench directors or to unreasonably reduce shareholder rights |
| • | Members of the compensation committee where the company has repriced options without shareholder approval |
If a board maintains a classified structure, it is possible that the director(s) or committee members with whom we have a particular concern may not be subject to election in the year that the concern arises. In such situations, we may register our concern by voting against the most relevant director(s) up for election.
Responsiveness to shareholders
A board should be engaged with and responsive to the company’s shareholders, including acknowledging voting outcomes for director elections, compensation, shareholder proposals, and other ballot items. Where we determine that a board has not substantially addressed shareholder concerns that we deem material to the business, we may vote against the responsible committees and/or individual directors. Common circumstances are illustrated below:
| • | The Independent Chair or Lead Independent Director, members of the nominating/governance committee, and/or the longest tenured director(s), where we observe a lack of board responsiveness to shareholders, evidence of board entrenchment, and/or failure to plan for adequate board member succession |
| • | The chair of the nominating/governance committee, or where the chair is not standing for election, the nominating/governance committee member with the longest tenure, where board member(s) at the most recent election of directors have received against votes from more than 25% of shares voted, and the board has not taken appropriate action to respond to shareholder concerns. This may not apply in cases where BIS did not support the initial vote against such board member(s) |
| • | The Independent Chair or Lead Independent Director and/or members of the nominating/governance committee, where a board fails to consider shareholder proposals that (1) receive substantial support, and (2) in our view, have a material impact on the business, shareholder rights, or the potential for long-term value creation |
Majority vote requirements
Directors should generally be elected by a majority of the shares voted. We will normally support proposals seeking to introduce bylaws requiring a majority vote standard for director elections. Majority vote standards generally assist in ensuring that directors who are not broadly supported by shareholders are not elected to serve as their representatives. As a best practice, companies with either a majority vote standard or a plurality vote standard should adopt a resignation policy for directors who do not receive support from at least a majority of votes cast. Where the company already has a sufficiently robust
| BlackRock Investment Stewardship | Proxy voting guidelines for U.S. securities | 10 |
majority voting process in place, we are unlikely to support a shareholder proposal seeking an alternative mechanism.
We note that majority voting may not be appropriate in all circumstances, for example, in the context of a contested election, or for majority-controlled companies or those with concentrated ownership structures.
Cumulative voting
As stated above, a majority vote standard is generally in the best long-term interests of shareholders, as it ensures director accountability through the requirement to be elected by more than half of the votes cast. As such, we will generally oppose proposals requesting the adoption of cumulative voting, which may disproportionately aggregate votes on certain issues or director candidates.
Auditors and audit-related issues
BIS recognizes the critical importance of financial statements to provide a complete and accurate portrayal of a company’s financial condition. Consistent with our approach to voting on directors, we seek to hold the audit committee of the board responsible for overseeing the management of the independent auditor and the internal audit function at a company.
We may vote against the audit committee members where the board has failed to facilitate quality, independent auditing. We look to public disclosures for insight into the scope of the audit committee responsibilities, including an overview of audit committee processes, issues on the audit committee agenda, and key decisions taken by the audit committee. We take particular note of cases involving significant financial restatements or material weakness disclosures, and we look for timely disclosure and remediation of accounting irregularities.
The integrity of financial statements depends on the auditor effectively fulfilling its role. To that end, we favor an independent auditor. In addition, to the extent that an auditor fails to reasonably identify and address issues that eventually lead to a significant financial restatement, or the audit firm has violated standards of practice, we may also vote against ratification.
From time to time, shareholder proposals may be presented to promote auditor independence or the rotation of audit firms. We may support these proposals when they are consistent with our views as described above.
Equal voting rights
In our view, shareholders should be entitled to voting rights in proportion to their economic interests. In addition, companies that have implemented dual or multiple class share structures should review these structures on a regular basis, or as company circumstances change. Companies with multiple share classes should receive shareholder approval of their capital structure on a periodic basis via a management proposal on the company’s proxy. The proposal should give unaffiliated shareholders the opportunity to affirm the current structure or establish mechanisms to end or phase out controlling structures at the appropriate time, while minimizing costs to shareholders. Where companies are unwilling to voluntarily implement “one share, one vote” within a specified timeframe, or are unresponsive
| BlackRock Investment Stewardship | Proxy voting guidelines for U.S. securities | 11 |
to shareholder feedback for change over time, we generally support shareholder proposals to recapitalize stock into a single voting class.
Blank check preferred stock
We frequently oppose proposals requesting authorization of a class of preferred stock with unspecified voting, conversion, dividend distribution, and other rights (“blank check” preferred stock) because they may serve as a transfer of authority from shareholders to the board and as a possible entrenchment device. We generally view the board’s discretion to establish voting rights on a when-issued basis as a potential anti-takeover device, as it affords the board the ability to place a block of stock with an investor sympathetic to management, thereby foiling a takeover bid without a shareholder vote.
Nonetheless, we may support the proposal where the company:
| • | Appears to have a legitimate financing motive for requesting blank check authority |
| • | Has committed publicly that blank check preferred shares will not be used for anti-takeover purposes |
| • | Has a history of using blank check preferred stock for financings |
| • | Has blank check preferred stock previously outstanding such that an increase would not necessarily provide further anti-takeover protection but may provide greater financing flexibility |
Increase in authorized common shares
BIS will evaluate requests to increase authorized shares on a case-by-case basis, in conjunction with industry-specific norms and potential dilution, as well as a company’s history with respect to the use of its common shares.
Increase or issuance of preferred stock
We generally support proposals to increase or issue preferred stock in cases where the company specifies the voting, dividend, conversion, and other rights of such stock and where the terms of the preferred stock appear reasonable.
Stock splits
We generally support stock splits that are not likely to negatively affect the ability to trade shares or the economic value of a share. We generally support reverse stock splits that are designed to avoid delisting or to facilitate trading in the stock, where the reverse split will not have a negative impact on share value (e.g., one class is reduced while others remain at pre-split levels). In the event of a proposal for a reverse split that would not proportionately reduce the company’s authorized stock, we apply the same analysis we would use for a proposal to increase authorized stock.
Mergers, acquisitions, transactions, and other special situations
Mergers, acquisitions, and transactions
In assessing mergers, acquisitions, or other transactions – including business combinations involving Special Purpose Acquisition Companies (“SPACs”) – BIS’ primary consideration is the long-term economic interests of our clients as shareholders. Boards should clearly explain the economic and
| BlackRock Investment Stewardship | Proxy voting guidelines for U.S. securities | 12 |
strategic rationale for any proposed transactions or material changes to the business. We will review a proposed transaction to determine the degree to which it has the potential to enhance long-term shareholder value. While mergers, acquisitions, asset sales, business combinations, and other special transaction proposals vary widely in scope and substance, we closely examine certain salient features in our analyses, such as:
| • | The degree to which the proposed transaction represents a premium to the company’s trading price. We consider the share price over multiple time periods prior to the date of the merger announcement. We may consider comparable transaction analyses provided by the parties’ financial advisors and our own valuation assessments. For companies facing insolvency or bankruptcy, a premium may not apply |
| • | There should be clear strategic, operational, and/or financial rationale for the combination |
| • | Unanimous board approval and arm’s-length negotiations are preferred. We will consider whether the transaction involves a dissenting board or does not appear to be the result of an arm’s-length bidding process. We may also consider whether executive and/or board members’ financial interests appear likely to affect their ability to place shareholders’ interests before their own, as well as measures taken to address conflicts of interest |
| • | We prefer transaction proposals that include the fairness opinion of a reputable financial advisor assessing the value of the transaction to shareholders in comparison to recent similar transactions |
Contested director elections and special situations
Contested elections and other special situations8 are assessed on a case-by-case basis. We evaluate a number of factors, which may include: the qualifications and past performance of the dissident and management candidates; the validity of the concerns identified by the dissident; the viability of both the dissident’s and management’s plans; the ownership stake and holding period of the dissident; the likelihood that the dissident’s strategy will produce the desired change; and whether the dissident represents the best option for enhancing long-term shareholder value.
We will evaluate the actions that the company has taken to limit shareholders’ ability to exercise the right to nominate dissident director candidates, including those actions taken absent the immediate threat of a contested situation. BIS may take voting action against directors (up to and including the full board) where those actions are viewed as egregiously infringing on shareholder rights.
We will consider a variety of possible voting outcomes in contested situations, including the ability to support a mix of management and dissident nominees.
Poison pill plans
Where a poison pill is put to a shareholder vote by management, our policy is to examine these plans individually. Although we have historically opposed most plans, we may support plans that include a reasonable “qualifying offer clause.” Such clauses typically require shareholder ratification of the pill and stipulate a sunset provision whereby the pill expires unless it is renewed. These clauses also tend to specify that an all-cash bid for all shares that includes a fairness opinion and evidence of financing does
8 Special situations are broadly defined as events that are non-routine and differ from the normal course of business for a company’s shareholder meeting, involving a solicitation other than by management with respect to the exercise of voting rights in a manner inconsistent with management’s recommendation. These may include instances where shareholders nominate director candidates, oppose the view of management and/or the board on mergers, acquisitions, or other transactions, etc.
| BlackRock Investment Stewardship | Proxy voting guidelines for U.S. securities | 13 |
not trigger the pill, but forces either a special meeting at which the offer is put to a shareholder vote or requires the board to seek the written consent of shareholders, where shareholders could rescind the pill at their discretion. We may also support a pill where it is the only effective method for protecting tax or other economic benefits that may be associated with limiting the ownership changes of individual shareholders. Lastly, we look for shareholder approval of poison pill plans within one year of adoption of implementation.
Reimbursement of expense for successful shareholder campaigns
We generally do not support shareholder proposals seeking the reimbursement of proxy contest expenses, even in situations where we support the shareholder campaign. Introducing the possibility of such reimbursement may incentivize disruptive and unnecessary shareholder campaigns.
A company’s board of directors should put in place a compensation structure that balances incentivizing, rewarding, and retaining executives appropriately across a wide range of business outcomes. This structure should be aligned with shareholder interests, particularly the generation of sustainable, long-term value.
The compensation committee should carefully consider the specific circumstances of the company and the key individuals the board is focused on incentivizing. We encourage companies to ensure that their compensation plans incorporate appropriate and rigorous performance metrics, consistent with corporate strategy and market practice. Performance-based compensation should include metrics that are relevant to the business and stated strategy and/or risk mitigation efforts. Goals, and the processes used to set these goals, should be clearly articulated and appropriately rigorous. We use third party research, in addition to our own analysis, to evaluate existing and proposed compensation structures. We hold members of the compensation committee, or equivalent board members, accountable for poor compensation practices and/or structures.
There should be a clear link between variable pay and company performance that drives sustained value creation for our clients as shareholders. Where compensation structures provide for a front-loaded9 award, we look for appropriate structures (including vesting and/or holding periods) that motivate sustained performance for shareholders over a number of years. We generally do not favor programs focused on awards that require performance levels to be met and maintained for a relatively short time period for payouts to be earned, unless there are extended vesting and/or holding requirements.
Compensation structures should generally drive outcomes that align the pay of the executives with performance of the company and the value received by shareholders. When evaluating performance, we examine both executive teams’ efforts, as well as outcomes realized by shareholders. Payouts to executives should reflect both the executive’s contributions to the company’s ongoing success, as well as exogenous factors that impacted shareholder value. Where discretion has been used by the compensation committee, we look for disclosures relating to how and why the discretion was used and how the adjusted outcome is aligned with the interests of shareholders. While we believe special awards10 should be used sparingly, we acknowledge that there may be instances when such awards are appropriate. When evaluating these awards, we consider a variety of factors, including the magnitude and
9 Front-loaded awards are generally those that accelerate the grant of multiple years’ worth of compensation in a single year.
10 “Special awards” refers to awards granted outside the company’s typical compensation program.
| BlackRock Investment Stewardship | Proxy voting guidelines for U.S. securities | 14 |
structure of the award, the scope of award recipients, the alignment of the grant with shareholder value, and the company’s historical use of such awards, in addition to other company-specific circumstances.
We acknowledge that the use of peer group evaluation by compensation committees can help calibrate competitive pay; however, we are concerned when the rationale for increases in total compensation is solely based on peer benchmarking.
We support incentive plans that foster the sustainable achievement of results – both financial and non-financial – consistent with the company’s strategic initiatives. Compensation committees should guard against contractual arrangements that would entitle executives to material compensation for early termination of their contract. Finally, pension contributions and other deferred compensation arrangements should be reasonable in light of market practices. Our publicly available commentary provides more information on our approach to executive compensation.
Where executive compensation appears excessive relative to the performance of the company and/or compensation paid by peers, or where an equity compensation plan is not aligned with shareholders’ interests, we may vote against members of the compensation committee.
“Say on Pay” advisory resolutions
In cases where there is a “Say on Pay” vote, BIS will respond to the proposal as informed by our evaluation of compensation practices at that particular company and in a manner that appropriately addresses the specific question posed to shareholders. Where we conclude that a company has failed to align pay with performance, we will generally vote against the management compensation proposal and relevant compensation committee members.
Frequency of “Say on Pay” advisory resolutions
BIS will generally support annual advisory votes on executive compensation. It is our view that shareholders should have the opportunity to express feedback on annual incentive programs and changes to long-term compensation before multiple cycles are issued. Where a company has failed to implement a “Say on Pay” advisory vote within the frequency period that received the most support from shareholders or a “Say on Pay” resolution is omitted without explanation, BIS may vote against members of the compensation committee.
Clawback proposals
We generally favor prompt recoupment from any senior executive whose compensation was based on faulty financial reporting or deceptive business practices. We appreciate when companies disclose recovery policies in compliance with the Dodd-Frank Wall Street Reform and Consumer Protection Act. We also favor recoupment from or the foregoing of the grant of any awards by any senior executive whose behavior caused material financial harm to shareholders, material reputational risk to the company, or resulted in a criminal investigation, even if such actions did not ultimately result in a material restatement of past results. This includes, but is not limited to, settlement agreements arising from such behavior and paid for directly by the company. We typically support shareholder proposals on these matters unless the company already has a robust clawback policy that sufficiently addresses our concerns.
Employee stock purchase plans
Employee stock purchase plans (“ESPP”) are an important part of a company’s overall human capital management strategy and can provide performance incentives to help align employees’ interests with
| BlackRock Investment Stewardship | Proxy voting guidelines for U.S. securities | 15 |
those of shareholders. The most common form of ESPP qualifies for favorable tax treatment under Section 423 of the Internal Revenue Code. We will typically support qualified ESPP proposals.
Equity compensation plans
BIS supports equity plans that align the economic interests of directors, managers, and other employees with those of shareholders. Boards should establish policies prohibiting the use of equity awards in a manner that could disrupt the intended alignment with shareholder interests, such as the excessive pledging or heading of stock. We may support shareholder proposals requesting the establishment of such policies.
Our evaluation of equity compensation plans is based on a company’s executive pay and performance relative to peers and whether the plan plays a significant role in a pay-for-performance disconnect. We generally oppose plans that contain “evergreen” provisions, which allow for automatic annual increases of shares available for grant without requiring further shareholder approval; we note that the aggregate impacts of such increases are difficult to predict and may lead to significant dilution. We also generally oppose plans that allow for repricing without shareholder approval. We may oppose plans that provide for the acceleration of vesting of equity awards even in situations where an actual change of control may not occur. We encourage companies to structure their change of control provisions to require the termination of the covered employee before acceleration or special payments are triggered (commonly referred to as “double trigger” change of control provisions).
Golden parachutes
We generally view golden parachutes as encouragement to management to consider transactions that might be beneficial to shareholders. However, a large potential payout under a golden parachute arrangement also presents the risk of motivating a management team to support a sub-optimal sale price for a company.
When determining whether to support or oppose an advisory vote on a golden parachute plan, BIS may consider several factors, including:
| • | Whether we determine that the triggering event is in the best interests of shareholders |
| • | Whether management attempted to maximize shareholder value in the triggering event |
| • | The percentage of total premium or transaction value that will be transferred to the management team, rather than shareholders, as a result of the golden parachute payment |
| • | Whether excessively large excise tax gross-up payments are part of the pay-out |
| • | Whether the pay package that serves as the basis for calculating the golden parachute payment was reasonable in light of performance and peers |
| • | Whether the golden parachute payment will have the effect of rewarding a management team that has failed to effectively manage the company |
It may be difficult to anticipate the results of a plan until after it has been triggered; as a result, BIS may vote against a golden parachute proposal even if the golden parachute plan under review was approved by shareholders when it was implemented.
We may support shareholder proposals requesting that implementation of such arrangements require shareholder approval.
| BlackRock Investment Stewardship | Proxy voting guidelines for U.S. securities | 16 |
Option exchanges
There may be legitimate instances where underwater options create an overhang on a company’s capital structure and a repricing or option exchange may be warranted. We will evaluate these instances on a case-by-case basis. BIS may support a request to reprice or exchange underwater options under the following circumstances:
| • | The company has experienced significant stock price decline as a result of macroeconomic trends, not individual company performance |
| • | Directors and executive officers are excluded; the exchange is value neutral or value creative to shareholders; tax, accounting, and other technical considerations have been fully contemplated |
| • | There is clear evidence that absent repricing, employee incentives, retention, and/or recruiting may be impacted |
BIS may also support a request to exchange underwater options in other circumstances, if we determine that the exchange is in the best interests of shareholders.
Supplemental executive retirement plans
BIS may support shareholder proposals requesting to put extraordinary benefits contained in supplemental executive retirement plans (“SERP”) to a shareholder vote unless the company’s executive pension plans do not contain excessive benefits beyond what is offered under employee-wide plans.
Material sustainability-related risks and opportunities
It is our view that well-managed companies will effectively evaluate and manage material sustainability-related risks and opportunities relevant to their businesses. As with all risks and opportunities in a company’s business model, appropriate oversight of material sustainability considerations is a core component of having an effective governance framework, which supports durable, long-term financial value creation.
When assessing how to vote – including on the election of directors and relevant shareholder proposals – robust disclosures are essential for investors to understand, where appropriate, how companies are integrating material sustainability risks and opportunities across their business and strategic, long-term planning. Where a company has failed to appropriately provide the necessary disclosures and evidence of effective business practices to support our assessment, BIS may express concerns through our engagement and voting. As part of this consideration, we encourage companies to produce sustainability-related disclosures sufficiently in advance of their annual meeting so that the disclosures can be considered in relevant vote decisions.
Robust disclosure is essential for investors to effectively evaluate companies’ strategy and business practices related to material sustainability-related risks and opportunities. Long-term investors like our clients can benefit when companies demonstrate that they have a resilient business model through disclosures that cover governance, strategy, risk management, and metrics and targets, including industry-specific metrics. The International Sustainability Standards Board (ISSB) standards, IFRS S1 and
| BlackRock Investment Stewardship | Proxy voting guidelines for U.S. securities | 17 |
S2,11 provide companies with a useful guide to preparing this disclosure. The standards build on the Task Force on Climate-related Financial Disclosures (TCFD) framework and the standards and metrics developed by the Sustainability Accounting Standards Board (SASB), which have converged under the ISSB. We recognize that companies may phase in reporting aligned with the ISSB standards over several years. We also recognize that some companies may report using different standards, which may be required by regulation, or one of a number of voluntary standards. In such cases, we ask that companies highlight the metrics that are industry-or company-specific.
Companies may also disclose any material supranational standards adopted, the industry initiatives in which they participate, any peer group benchmarking undertaken, and any assurance processes to help investors understand their approach to sustainable and responsible business conduct.
Climate risk
While companies in various sectors and geographies may be affected differently by climate-related risks and opportunities, the low-carbon transition is an investment factor that can be material for many companies and economies around the globe.
We seek to understand, from company disclosures and engagement, the strategies companies have in place to manage material risks to, and opportunities for, their long-term business model associated with a range of climate-related scenarios, including a scenario in which global warming is limited to well below 2°C, considering global ambitions to achieve a limit of 1.5°C. As one of many shareholders, and typically a minority one, BlackRock does not tell companies what to do. It is the role of the board and management to set and implement a company’s long-term strategy to deliver long-term financial returns.
Our research shows that the low-carbon transition is a structural shift in the global economy that will be shaped by changes in government policies, technology, and consumer preferences, which may be material for many companies.12 Yet the path to a low-carbon economy is deeply uncertain and uneven, with different parts of the economy moving at different speeds. BIS recognizes that it can be challenging for companies to predict the impact of climate-related risk and opportunity on their businesses and operating environments. Many companies are assessing how to navigate the low-carbon transition while delivering long-term value to investors. In this context, we encourage companies to publicly disclose, consistent with their business model and sector, how they intend to deliver long-term financial performance through the transition to a low-carbon economy. Where available, we appreciate companies publishing their transition plan.13
Consistent with the ISSB standards, we are better able to assess preparedness for the low-carbon transition when companies disclose short-, medium- and long-term targets, ideally science-based where
11 The objective of IFRS S1 General Requirements for Disclosure of Sustainability-related Financial Information is to require an entity to disclose information about its sustainability-related risks and opportunities that is useful to primary users of general-purpose financial reports in making decisions relating to providing resources to the entity. The objective of IFRS S2 Climate-related Disclosures is to require an entity to disclose information about its climate-related risks and opportunities that is useful to primary users of general-purpose financial reports in making decisions relating to providing resources to the entity.
12 BlackRock Investment Institute, “Tracking the low-carbon transition”, July 2023.
13 We have observed that more companies are developing such plans, and public policy makers in a number of markets are signaling their intentions to require them. We view transition plans (TPs) as a method for a company to both internally assess and externally communicate long-term strategy, ambition, objectives, and actions to create financial value through the global transition towards a low-carbon economy. While many initiatives across jurisdictions outline a framework for TPs, there is no consensus on the key elements these plans should contain. We view useful disclosure as that which communicates a company’s approach to managing financially material, business relevant risks and opportunities – including climate-related risks – to deliver long-term financial performance, thus enabling investors to make more informed decisions.
| BlackRock Investment Stewardship | Proxy voting guidelines for U.S. securities | 18 |
these are available for their sector, for scope 1 and 2 greenhouse gas emissions (GHG) reductions and to demonstrate how their targets are consistent with the long-term financial interests of their investors.
While we recognize that regulators in some markets are moving to mandate certain disclosures, at this stage, we view scope 3 emissions differently from scopes 1 and 2, given methodological complexity, regulatory uncertainty, concerns about double-counting, and lack of direct control by companies. We welcome disclosures and commitments companies choose to make regarding scope 3 emissions and recognize these are provided on a good-faith basis as methodology develops. Our publicly available commentary provides more information on our approach to climate-related risks and opportunities.
Natural capital
In addition to climate-related risks and opportunities, the management of nature-related factors is increasingly a component of some companies’ ability to generate durable, long-term financial returns for shareholders, particularly where a company’s strategy is heavily reliant on the availability of natural capital, or whose supply chains are exposed to locations with nature-related risks. We look for such companies to disclose how they manage any reliance and impact on, as well as use of, natural capital, including appropriate risk oversight and relevant metrics and targets, to understand how these factors are integrated into strategy. We will evaluate these disclosures to inform our view of how a company is managing material nature-related risks and opportunities, as well as in our assessment of relevant shareholder proposals. Our publicly available commentary provides more information on our approach to natural capital.14
Key stakeholder interests
In order to advance long-term shareholders’ interests, companies should consider the interests of the various parties on whom they depend for their success over time. It is for each company to determine their key stakeholders based on what is material to their business and long-term financial performance. For many companies, key stakeholders include employees, business partners (such as suppliers and distributors), clients and consumers, regulators, and the communities in which they operate.
As a long-term shareholder on behalf of our clients, we find it helpful when companies disclose how they have identified their key stakeholders and considered their interests in business decision-making. In addition to understanding broader stakeholder relationships, BIS finds it helpful when companies consider the needs of their workforce today, and the skills required for their future business strategy. We are also interested to understand the role of the board, which is well positioned to ensure that the approach taken is informed by and aligns with the company’s strategy and purpose.
Companies should articulate how they address material adverse impacts that could arise from their business practices and affect critical relationships with their stakeholders. We encourage companies to implement, to the extent appropriate, monitoring processes (often referred to as due diligence) to identify and mitigate potential adverse impacts and grievance mechanisms to remediate any actual adverse material impacts. In our view, maintaining trust within these relationships can contribute to a company’s long-term success.
14 Given the growing awareness of the materiality of these issues for certain businesses, enhanced reporting on a company’s natural capital dependencies and impacts would aid investors’ understanding. In our view, the final recommendations of the Taskforce on Nature-related Financial Disclosures may prove useful to some companies. We recognize that some companies may report using different standards, which may be required by regulation, or one of a number of other private sector standards.
| BlackRock Investment Stewardship | Proxy voting guidelines for U.S. securities | 19 |
Human capital management
A company’s approach to human capital management (“HCM”) is a critical factor in fostering an inclusive, diverse, and engaged workforce, which contributes to business continuity, innovation, and long-term value creation. Consequently, we ask companies to demonstrate a robust approach to HCM and provide shareholders with clear and consistent disclosures to help investors understand how a company’s approach aligns with its stated strategy and business model.
Some components of HCM are consistent across most companies, such as the approach to diversity, equity, and inclusion (“DEI”). We ask companies to disclose their approach to DEI as well as workforce demographics, which are baselined by their responses to the U.S. Equal Employment Opportunity Commission’s EEO-1 Survey.
Other relevant HCM factors may be more nuanced to a company’s strategy and business model. Those more nuanced factors may include the company’s approach to workplace safety, compensation, benefits, talent development, and performance management. We ask companies to disclose and provide context on the most relevant HCM factors for their business.
Our publicly available commentary provides more information on our approach to HCM.
Corporate political activities
Companies may engage in certain political activities, within legal and regulatory limits, in order to support public policy matters material to their long-term strategies. These activities can also create risks, including: the potential for allegations of corruption; certain reputational risks; and risks that arise from the complex legal, regulatory, and compliance considerations associated with corporate political spending and lobbying activity. Companies that engage in political activities should develop and maintain robust processes, including board oversight, to guide these activities and mitigate risks.
We depend on companies to provide accessible and clear disclosures so that investors can easily understand how their political activities support their long-term strategy, including on stated public policy priorities. When presented with shareholder proposals requesting increased disclosure on corporate political activities, BIS will evaluate publicly available information to consider how a company’s lobbying and political activities may impact the company. We will also evaluate whether there is general consistency between a company’s stated positions on policy matters material to their strategy and the material positions taken by significant industry groups of which they are a member. We may decide to support a shareholder proposal requesting additional disclosures if we identify a material inconsistency or determine that further transparency may clarify how the company’s political activities support its long-term strategy. Our publicly available commentary provides more information on our approach to corporate political activities.
General corporate governance matters
IPO governance
Boards should disclose how the corporate governance structures adopted upon a company’s initial public offering (“IPO”) are in shareholders’ best long-term interests. We also ask boards to conduct a regular review of corporate governance and control structures, such that boards might evolve foundational corporate governance structures as company circumstances change, without undue costs and disruption
| BlackRock Investment Stewardship | Proxy voting guidelines for U.S. securities | 20 |
to shareholders. In our letter on unequal voting structures, we articulate our view that “one vote for one share” is the preferred structure for publicly-traded companies. We also recognize the potential benefits of dual class shares to newly public companies as they establish themselves; however, these structures should have a specific and limited duration. We will generally engage newly listed companies on topics such as classified boards and supermajority vote provisions to amend bylaws, as we think that such arrangements may not be in the best interests of shareholders over the long-term.
We may apply a one-year grace period for the application of certain director-related guidelines (including, but not limited to, responsibilities on other public company boards and board composition concerns), during which we ask boards to take steps to bring corporate governance standards in line with market norms.
Further, if a company qualifies as an emerging growth company (an “EGC”) under the Jumpstart Our Business Startups Act of 2012 (the “JOBS Act”), we will give consideration to the NYSE and NASDAQ governance exemptions granted under the JOBS Act for the duration such a company is categorized as an EGC. An EGC should have an independent audit committee by the first anniversary of its IPO, with our standard approach to voting on auditors and audit-related issues applicable in full for an EGC on the first anniversary of its IPO.
Corporate form
Proposals to change a corporation’s form, including those to convert to a public benefit corporation (“PBC”) structure, should clearly articulate the stakeholder groups the company seeks to benefit and provide detail on how the interests of shareholders would be augmented or adversely affected with the change to a PBC. These disclosures should also include the accountability and voting mechanisms that would be available to shareholders. We generally support management proposals to convert to a PBC if our analysis indicates that shareholders’ interests are adequately protected. Corporate form shareholder proposals are evaluated on a case-by-case basis.
Shareholder Proposals
When assessing shareholder proposals, BIS evaluates each proposal on its merit, with a singular focus on its implications for long-term financial value creation by that company. We would not support proposals that we believe would result in over-reaching into the basic business decisions of the company. In addition, we believe it helpful for companies to disclose the names of the proponent or organization that has submitted or advised on the proposal. We consider the business and economic relevance of the issue raised, as well as its materiality and the urgency with which our experience indicates it should be addressed.
Where a proposal is focused on a material business risk that we agree needs to be addressed and the intended outcome is consistent with long-term financial value creation, we will look to the board and management to demonstrate that the company has met the intent of the request made in the shareholder proposal. Where our analysis and/or engagement indicate an opportunity for improvement in the company’s approach to the issue, we may support shareholder proposals that are reasonable and not unduly prescriptive or constraining on management.
We recognize that some shareholder proposals bundle topics and/or specific requests and include supporting statements that explain the reasoning or objectives of the proponent. In voting on behalf of clients, we do not submit or edit proposals or the supporting statements – we must vote yes or no on the proposal as phrased by the proponent. Therefore, when we vote in support of a proposal, we are not necessarily endorsing every element of the proposal or the reasoning, objectives, or supporting statement
| BlackRock Investment Stewardship | Proxy voting guidelines for U.S. securities | 21 |
of the proponent. We may support a proposal for different reasons from those put forth by the proponent, when we believe that, overall, it can advance our clients’ long-term financial interests. We would normally explain to the company our rationale for supporting such proposals.
Alternatively, or in addition, we may vote against the election of one or more directors if, in our assessment, the board has not responded sufficiently or with an appropriate sense of urgency. We may also support a proposal if management is on track, but we believe that voting in favor might accelerate efforts to address a material risk.
Exclusive forum provisions
BIS generally supports proposals to seek exclusive forum for certain shareholder litigation. In cases where a board unilaterally adopts exclusive forum provisions that we consider unfavorable to the interests of shareholders, we will vote against the Independent Chair or Lead Independent director and members of the nominating/governance committee.
Reincorporation
We will evaluate the economic and strategic rationale behind the company’s proposal to reincorporate on a case-by-case basis. In all instances, we will evaluate the changes to shareholder protections under the new charter/articles/bylaws to assess whether the move increases or decreases shareholder protections. Where we find that shareholder protections are diminished, we may support reincorporation if we determine that the overall benefits outweigh the diminished rights.
Multi-jurisdictional companies
Where a company is listed on multiple exchanges or incorporated in a country different from their primary listing, we will seek to apply the most relevant market guideline(s) to our analysis of the company’s governance structure and specific proposals on the shareholder meeting agenda. In doing so, we typically consider the governance standards of the company’s primary listing, the market standards by which the company governs themselves, and the market context of each specific proposal on the agenda. If the relevant standards are silent on the issue under consideration, we will use our professional judgment as to what voting outcome would best protect the long-term economic interests of investors. Companies should disclose the rationale for their selection of primary listing, country of incorporation, and choice of governance structures, particularly where there is conflict between relevant market governance practices.
Adjourn meeting to solicit additional votes
We generally support such proposals unless the agenda contains items that we judge to be detrimental to shareholders’ best long-term economic interests.
Bundled proposals
Shareholders should have the opportunity to review substantial governance changes individually without having to accept bundled proposals. Where several measures are grouped into one proposal, BIS may reject certain positive changes when linked with proposals that generally contradict or impede the rights and economic interests of shareholders.
Other business
We oppose voting on matters where we are not given the opportunity to review and understand those measures and carry out an appropriate level of shareholder oversight.
| BlackRock Investment Stewardship | Proxy voting guidelines for U.S. securities | 22 |
Amendment to charter/articles/bylaws
Shareholders should have the right to vote on key corporate governance matters, including changes to governance mechanisms and amendments to the charter/articles/bylaws. We may vote against certain directors where changes to governing documents are not put to a shareholder vote within a reasonable period of time, particularly if those changes have the potential to impact shareholder rights (see “Director elections”). In cases where a board’s unilateral adoption of changes to the charter/articles/bylaws promotes cost and operational efficiency benefits for the company and its shareholders, we may support such action if it does not have a negative effect on shareholder rights or the company’s corporate governance structure.
When voting on a management or shareholder proposal to make changes to the charter/articles/bylaws, we will consider in part the company’s and/or proponent’s publicly stated rationale for the changes; the company’s governance profile and history; relevant jurisdictional laws; and situational or contextual circumstances which may have motivated the proposed changes, among other factors. We will typically support amendments to the charter/articles/bylaws where the benefits to shareholders outweigh the costs of failing to make such changes.
Proxy access
It is our view that long-term shareholders should have the opportunity, when necessary and under reasonable conditions, to nominate directors on the company’s proxy card.15
Securing the right of shareholders to nominate directors without engaging in a control contest can enhance shareholders’ ability to meaningfully participate in the director election process, encourage board attention to shareholder interests, and provide shareholders an effective means of directing that attention where it is lacking. Proxy access mechanisms should provide shareholders with a reasonable opportunity to use this right without stipulating overly restrictive or onerous parameters for use, and also provide assurances that the mechanism will not be subject to abuse by short-term investors, investors without a substantial investment in the company, or investors seeking to take control of the board.
In general, we support market-standardized proxy access proposals, which allow a shareholder (or group of up to 20 shareholders) holding three percent of a company’s outstanding shares for at least three years the right to nominate the greater of up to two directors or 20% of the board. Where a standardized proxy access provision exists, we will generally oppose shareholder proposals requesting outlier thresholds.
Right to act by written consent
In exceptional circumstances and with sufficiently broad support, shareholders should have the opportunity to raise issues of substantial importance without having to wait for management to schedule a meeting. Accordingly, shareholders should have the right to solicit votes by written consent provided that: 1) there are reasonable requirements to initiate the consent solicitation process (in order to avoid the waste of corporate resources in addressing narrowly supported interests); and 2) shareholders receive a minimum of 50% of outstanding shares to effectuate the action by written consent.
15 BlackRock is subject to certain regulations and laws in the United States that place restrictions and limitations on how BlackRock can interact with the companies in which we invest on behalf of our clients, including our ability to submit shareholder proposals or elect directors to the board.
| BlackRock Investment Stewardship | Proxy voting guidelines for U.S. securities | 23 |
We may oppose shareholder proposals requesting the right to act by written consent in cases where the proposal is structured for the benefit of a dominant shareholder to the exclusion of others, or if the proposal is written to discourage the board from incorporating appropriate mechanisms to avoid the waste of corporate resources when establishing a right to act by written consent. Additionally, we may oppose shareholder proposals requesting the right to act by written consent if the company already provides a shareholder right to call a special meeting that offers shareholders a reasonable opportunity to raise issues of substantial importance without having to wait for management to schedule a meeting.
Right to call a special meeting
In exceptional circumstances and with sufficiently broad support, shareholders should have the opportunity to raise issues of substantial importance without having to wait for management to schedule a meeting. Accordingly, shareholders should have the right to call a special meeting in cases where a reasonably high proportion of shareholders (typically a minimum of 15% but no higher than 25%) are required to agree to such a meeting before it is called. However, we may oppose this right in cases where the proposal is structured for the benefit of a dominant shareholder, or where a lower threshold may lead to an ineffective use of corporate resources. We generally think that a right to act via written consent is not a sufficient alternative to the right to call a special meeting.
Consent solicitation
While BlackRock is supportive of the shareholder rights to act by written consent and call a special meeting, BlackRock is subject to certain regulations and laws that place restrictions and limitations on how BlackRock can interact with the companies in which we invest on behalf of our clients, including our ability to participate in consent solicitations. As a result, BlackRock will generally not participate in consent solicitations or related processes. However, once an item comes to a shareholder vote, we uphold our fiduciary duty to vote in the best long-term interests of our clients, where we are authorized to do so.
Simple majority voting
We generally favor a simple majority voting requirement to pass proposals. Therefore, we will generally support the reduction or the elimination of supermajority voting requirements to the extent that we determine shareholders’ ability to protect their economic interests is improved. Nonetheless, in situations where there is a substantial or dominant shareholder, supermajority voting may be protective of minority shareholder interests, and we may support supermajority voting requirements in those situations.
Virtual meetings
Shareholders should have the opportunity to participate in the annual and special meetings for the companies in which they are invested, as these meetings are an opportunity for shareholders to provide feedback and hear from the board and management. While these meetings have traditionally been conducted in-person, virtual meetings are an increasingly viable way for companies to utilize technology to facilitate shareholder accessibility, inclusiveness, and cost efficiencies. Shareholders should have a meaningful opportunity to participate in the meeting and interact with the board and management in these virtual settings; companies should facilitate open dialogue and allow shareholders to voice concerns and provide feedback without undue censorship. Relevant shareholder proposals are assessed on a case-by-case basis.
| BlackRock Investment Stewardship | Proxy voting guidelines for U.S. securities | 24 |
Want to know more?
blackrock.com/stewardship | contactstewardship@blackrock.com
This document is provided for information and educational purposes only. Investing involves risk, including the loss of principal.
Prepared by BlackRock, Inc.
©2024 BlackRock, Inc. All rights reserved. BLACKROCK is a trademark of BlackRock, Inc., or its subsidiaries in the United States and elsewhere. All other trademarks are those of their respective owners.
BlackRock Capital Allocation Term Trust
Cusip: 09260U109
Ticker: BCAT
| Record Date |
December 15, 2023 | |||
| Pay Date |
December 20, 2023 | |||
| Distribution Amount per share |
$ | 0.127500 | ||
The following table sets forth the estimated amounts of the current distribution and the cumulative distributions paid this fiscal year to date from the following sources: net income, net realized short-term capital gains, net realized long-term capital gains and return of capital. All amounts are expressed per common share.
| Current Distribution | % Breakdown of the Current Distribution |
Total Cumulative Distributions for the Fiscal Year to Date |
% Breakdown of the Total Cumulative Distributions for the |
|||||||||||||
| Net Income |
$ | 0.042444 | 33% | $ | 0.398705 | 26% | ||||||||||
| Net Realized Short-Term Capital Gains |
$ | - | 0% | $ | - | 0% | ||||||||||
| Net Realized Long-Term Capital Gains |
$ | - | 0% | $ | - | 0% | ||||||||||
| Return of Capital |
$ | 0.085056 | 67% | $ | 1.107895 | 74% | ||||||||||
|
|
|
|
|
|
|
|
|
|
|
|||||||
| Total (per common share) |
$ | 0.127500 | 100% | $ | 1.506600 | 100% | ||||||||||
|
|
|
|
|
|
|
|
|
|
|
|||||||
| Average annual total return (in relation to NAV) for the 5-year period ending on November 30, 2023* |
|
2.07% | ||||||||||||||
|
|
|
|||||||||||||||
| Annualized current distribution rate expressed as a percentage of NAV as of November 30, 2023 |
|
9.10% | ||||||||||||||
|
|
|
|||||||||||||||
| Cumulative total return (in relation to NAV) for the fiscal year through November 30, 2023 |
|
9.36% | ||||||||||||||
|
|
|
|||||||||||||||
| Cumulative fiscal year distributions as a percentage of NAV as of November 30, 2023 |
|
8.20% | ||||||||||||||
|
|
|
|||||||||||||||
*Portfolio launched within the past 5 years; the performance and distribution rate information presented for this Fund reflects data from inception to 11/30/23 You should not draw any conclusions about the Fund’s investment performance from the amount of this distribution or from the terms of the Fund’s Managed Distribution Plan.
The Fund estimates that it has distributed more than its net income and net realized capital gains; therefore, a portion of your distribution may be a return of capital. A return of capital may occur, for example, when some or all of the money that you invested in the Fund is paid back to you. A return of capital does not necessarily reflect the Fund’s investment performance and should not be confused with ‘yield’ or ‘income’.
When distributions exceed total return performance, the difference will reduce the Fund’s net asset value per share.
The amounts and sources of distributions reported in this Notice are only estimates and are not being provided for tax reporting purposes. The actual amounts and sources of the amounts for tax reporting purposes will depend upon the Fund’s investment experience during its fiscal year and may be subject to changes based on tax regulations. The Fund will send you a Form 1099-DIV for the calendar year that will tell you how to report these distributions for federal income tax purposes.
Contact Number: 800-882-0052
NM1223U-3293131-1/1
BlackRock Capital Allocation Term Trust
Cusip: 09260U109
Ticker: BCAT
| Record Date |
January 12, 2024 | |||
| Pay Date |
January 31, 2024 | |||
| Distribution Amount per share |
$ | 0.127500 | ||
The following table sets forth the estimated amounts of the current distribution and the cumulative distributions paid this fiscal year to date from the following sources: net income, net realized short-term capital gains, net realized long-term capital gains and return of capital. All amounts are expressed per common share.
| Current Distribution | % Breakdown of the Current Distribution |
Total Cumulative Distributions for the Fiscal Year to Date |
% Breakdown of the Total Cumulative Distributions for the Fiscal Year to Date |
|||||||||||||
| Net Income |
$ | 0.032534 | 26% | $ | 0.032534 | 26% | ||||||||||
| Net Realized Short-Term Capital Gains |
$ | 0.005677 | 4% | $ | 0.005677 | 4% | ||||||||||
| Net Realized Long-Term Capital Gains |
$ | 0.026947 | 21% | $ | 0.026947 | 21% | ||||||||||
| Return of Capital |
$ | 0.062342 | 49% | $ | 0.062342 | 49% | ||||||||||
|
|
|
|
|
|
|
|
|
|
|
|||||||
| Total (per common share) |
$ | 0.127500 | 100% | $ | 0.127500 | 100% | ||||||||||
|
|
|
|
|
|
|
|
|
|
|
|||||||
| Average annual total return (in relation to NAV) for the 5-year period ending on December 31, 2023* |
|
3.06% | ||||||||||||||
|
|
|
|||||||||||||||
| Annualized current distribution rate expressed as a percentage of NAV as of December 31, 2023 |
|
8.87% | ||||||||||||||
|
|
|
|||||||||||||||
| Cumulative total return (in relation to NAV) for the fiscal year through December 31, 2023 |
|
13.04% | ||||||||||||||
|
|
|
|||||||||||||||
| Cumulative fiscal year distributions as a percentage of NAV as of December 31, 2023 |
|
0.74% | ||||||||||||||
|
|
|
|||||||||||||||
*Portfolio launched within the past 5 years; the performance and distribution rate information presented for this Fund reflects data from inception to 12/31/23 You should not draw any conclusions about the Fund’s investment performance from the amount of this distribution or from the terms of the Fund’s Managed Distribution Plan.
The Fund estimates that it has distributed more than its net income and net realized capital gains; therefore, a portion of your distribution may be a return of capital. A return of capital may occur, for example, when some or all of the money that you invested in the Fund is paid back to you. A return of capital does not necessarily reflect the Fund’s investment performance and should not be confused with ‘yield’ or ‘income’.
When distributions exceed total return performance, the difference will reduce the Fund’s net asset value per share.
The amounts and sources of distributions reported in this Notice are only estimates and are not being provided for tax reporting purposes. The actual amounts and sources of the amounts for tax reporting purposes will depend upon the Fund’s investment experience during its fiscal year and may be subject to changes based on tax regulations. The Fund will send you a Form 1099-DIV for the calendar year that will tell you how to report these distributions for federal income tax purposes.
Contact Number: 800-882-0052