UNITED STATES
SECURITIES AND EXCHANGE COMMISSION
Washington, D.C. 20549
FORM N-CSR
CERTIFIED SHAREHOLDER REPORT OF REGISTERED MANAGEMENT INVESTMENT COMPANIES
Investment Company Act file number 811-21779
JOHN HANCOCK FUNDS II
---------------------------------------------------------
(Exact name of registrant as specified in charter)
200 BERKELEY STREET, BOSTON, MA 02116
-------------------------------------------------------------
(Address of principal executive offices) (Zip code)
SALVATORE SCHIAVONE, 200 Berkeley Street, BOSTON, MA 02116
------------------------------------------------------------------------------------------
(Name and address of agent for service)
Registrant's telephone number, including area code: (617) 543-9634
--------------
Date of fiscal year end: August 31
------
Date of reporting period: August 31, 2023
-------
ITEM 1. REPORTS TO STOCKHOLDERS.
The Registrant prepared the following annual reports to shareholders for the period ended August 31, 2023:
Opportunistic Fixed Income Fund
John Hancock Funds II - Underlying Funds
Capital Appreciation Fund
Capital Appreciation Value Fund
Core Bond Fund
Health Sciences Fund
High Yield Fund
International Strategic Equity Allocation Fund
Mid Value Fund
Science & Technology Fund
U.S. Sector Rotation Fund
Annual report
John Hancock
Opportunistic Fixed Income Fund
Fixed income
August 31, 2023
A message to shareholders
Dear shareholder,
Bonds posted mixed results for
the 12 months ended August 31, 2023. Inflation remained a key factor; while rates cooled off from their 40-year highs during the summer of 2022, they remained elevated through period end. To curb inflationary
pressures, the U.S. Federal Reserve (Fed) continued to raise short-term interest rates and emphasized that further interest rate increases may be necessary to bring inflation under control.
U.S. bond yields moved broadly
higher, with short- and intermediate-term bond yields rising the most. On a sector basis, U.S. Treasury securities and residential mortgage-backed securities declined the most, while high-yield corporate bonds posted
positive returns, reflecting signs of improving economic growth late in the period.
In these uncertain times, your
financial professional can assist with positioning your portfolio so that it’s sufficiently diversified to help meet your long-term objectives and to withstand the inevitable bouts of market volatility along the
way.
On behalf of everyone at John
Hancock Investment Management, I’d like to take this opportunity to welcome new shareholders and thank existing shareholders for the continued trust you’ve placed in us.
Sincerely,
Kristie M. Feinberg
Head of Wealth and Asset
Management,
United States and Europe
Manulife Investment Management
President and CEO,
John Hancock Investment Management
This commentary reflects the CEO’s views as
of this report’s period end and are subject to change at any time. Diversification does not guarantee investment returns and does not eliminate risk of loss. All investments entail risks, including the possible
loss of principal. For more up-to-date information, you can visit our website at jhinvestments.com.
John Hancock
Opportunistic Fixed Income Fund
|
| ANNUAL REPORT | JOHN HANCOCK OPPORTUNISTIC FIXED INCOME FUND
| 1
|
INVESTMENT OBJECTIVE
The fund seeks maximum total
return, consistent with preservation of capital and prudent investment management.
AVERAGE ANNUAL TOTAL RETURNS AS
OF 8/31/2023 (%)
The Bloomberg Global Aggregate
Bond USD Hedged Index tracks the performance of global investment-grade debt in fixed-rate treasury, government-related, corporate, and securitized bond markets. Currency exposure is hedged to the U.S. dollar
(USD).
It is not possible to invest
directly in an index. Index figures do not reflect expenses or sales charges, which would result in lower returns.
The fund’s Morningstar
category average is a group of funds with similar investment objectives and strategies and is the equal-weighted return of all funds per category. Morningstar places funds in certain categories based on their
historical portfolio holdings. Figures from Morningstar, Inc. include reinvested distributions and do not take into account sales charges. Actual load-adjusted performance is lower.
1Class A shares were first offered on 6-4-21. Returns prior to this date are those of Class 1 shares and have not been adjusted for class-specific expenses; otherwise, returns
would vary.
The past performance shown here
reflects reinvested distributions and the beneficial effect of any expense reductions, and does not guarantee future results. Performance of the other share classes will vary based on the difference in the fees and
expenses of those classes. Shares will fluctuate in value and, when redeemed, may be worth more or less than their original cost. Current month-end performance may be lower or higher than the performance cited, and
can be found at jhinvestments.com or by calling 800-225-5291. For further information on the fund’s objectives, risks, and strategy, see the fund’s prospectus.
| 2
| JOHN HANCOCK OPPORTUNISTIC FIXED INCOME FUND | ANNUAL REPORT
|
|
PERFORMANCE HIGHLIGHTS OVER THE
LAST TWELVE MONTHS
A volatile market
backdrop for fixed income
Fixed-income
markets were up and down for the period, as changes in expectations about interest rates, inflation, and economic growth drove security prices.
The fund
outperformed its benchmark, the Bloomberg Global Aggregate Bond USD Hedged Index, prior to expenses
The fund saw
relative outperformance in several investment categories, especially emerging-market debt, the best-performing fixed-income sector for the period.
Embracing
tactical investment opportunities
The fund
embraced opportunities to rotate into market areas seen as providing sufficiently attractive pricing amid elevated concern about global economic growth.
PORTFOLIO COMPOSITION AS OF
8/31/2023 (% of net assets)
|
| ANNUAL REPORT | JOHN HANCOCK OPPORTUNISTIC FIXED INCOME FUND
| 3
|
QUALITY COMPOSITION AS OF
8/31/2023 (% of net assets)
Ratings are from Moody’s
Investors Service, Inc. If not available, we have used S&P Global Ratings. In the absence of ratings from these agencies, we have used Fitch Ratings, Inc. “Not rated” securities are those with no
ratings available from these agencies. All ratings are as of 8-31-23 and do not reflect subsequent downgrades or upgrades, if any.
Notes about risk
The fund is subject to various
risks as described in the fund’s prospectuses. Political tensions and armed conflicts, including the Russian invasion of Ukraine, and any resulting economic sanctions on entities and/or individuals of a
particular country could lead such a country into an economic recession. The COVID-19 disease has resulted in significant disruptions to global business activity. A widespread health crisis such as a global pandemic
could cause substantial market volatility, exchange-trading suspensions, and closures, which may lead to less liquidity in certain instruments, industries, sectors, or the markets, generally, and may ultimately affect
fund performance. For more information, please refer to the “Principal risks” section of the prospectuses.
| 4
| JOHN HANCOCK OPPORTUNISTIC FIXED INCOME FUND | ANNUAL REPORT
|
|
Management’s discussion of fund
performance
How did the global bond market
perform during the 12 months ended August 31, 2023?
The fixed-income markets were
volatile. Interest rates rose and credit spreads widened last September following the release of the U.K.’s mini-budget, which the market perceived as inflationary. Then, between the fourth quarter of 2022 and
January 2023, fixed-income markets rallied sharply after softer-than-expected inflation data. In the subsequent two months, however, fixed-income securities struggled amid robust employment data and the U.S. regional
banking crisis. The period finished with a summer market rally amid stronger-than-expected economic data. U.S. monetary policy remained tight, as the U.S. Federal Reserve raised its short-term benchmark interest rate
by an additional 0.25% in July.
In this environment, how did the
fund perform?
The fund outperformed its
benchmark. In managing the fund, we focus on noncore sectors of global fixed-income markets and invest according to several themes. Within the fund’s strategic sector theme, investments in emerging-markets local
debt provided the main performance benefit. This was the best-performing fixed-income sector for the period, and the fund’s allocation to the category added significant value. Other helpful exposures included
allocations to bank loans, securitized credit, convertible securities, and high-yield bonds, as well as to diversified inflation-linked exposure.
COUNTRY COMPOSITION
AS OF 8/31/2023 (% of net assets)
|
| United States
| 58.0
|
| New Zealand
| 4.5
|
| Brazil
| 3.7
|
| Iceland
| 2.4
|
| Canada
| 2.3
|
| Australia
| 2.2
|
| South Korea
| 1.9
|
| South Africa
| 1.7
|
| Mexico
| 1.6
|
| Sweden
| 1.6
|
| Other countries
| 20.1
|
| TOTAL
| 100.0
|
|
| ANNUAL REPORT | JOHN HANCOCK OPPORTUNISTIC FIXED INCOME FUND
| 5
|
Within the fund’s market
neutral theme, exposure to our global credit absolute return theme drove positive performance. Within the fund’s tactical sector theme, exposure to peripheral European sovereign debt added value. In contrast,
the fund’s duration positioning detracted.
The fund employed derivatives
through credit-default swaps, bond futures, and currency forwards. We implemented these positions because we saw them as an efficient, lower-transaction-cost approach to reposition the portfolio’s sector,
country, and currency exposure. The derivative positions detracted on an absolute basis.
The views expressed in
this report are exclusively those of Brian M. Garvey and Brij S. Khurana, Wellington Management Company LLP, and are subject to change. They are not meant as investment advice. Please note that the holdings discussed
in this report may not have been held by the fund for the entire period. Portfolio composition is subject to review in accordance with the fund’s investment strategy and may vary in the future. Current and
future portfolio holdings are subject to risk.
| 6
| JOHN HANCOCK OPPORTUNISTIC FIXED INCOME FUND | ANNUAL REPORT
|
|
TOTAL RETURNS FOR THE PERIOD
ENDED AUGUST 31, 2023
Average annual total returns (%)
with maximum sales charge
|
| Cumulative total returns (%)
with maximum sales charge
| SEC 30-day
yield (%)
subsidized
| SEC 30-day
yield (%)
unsubsidized†
|
|
|
| 1-year
| 5-year
| 10-year
| 5-year
| 10-year
| as of
8-31-23
| as of
8-31-23
|
| Class A1
|
| 0.06
| 0.29
| 1.17
| 1.44
| 12.33
| 5.11
| 4.66
|
| Class C1
|
| 3.54
| 0.99
| 1.52
| 5.06
| 16.31
| 4.63
| 4.16
|
| Class I1,2
|
| 5.54
| 1.44
| 1.75
| 7.43
| 18.93
| 5.63
| 5.16
|
| Class R61,2
|
| 5.60
| 1.49
| 1.77
| 7.67
| 19.19
| 5.76
| 5.28
|
| Class 12
|
| 5.58
| 1.46
| 1.75
| 7.49
| 19.00
| 5.69
| 5.21
|
| Index 1††
|
| 0.55
| 0.85
| 2.10
| 4.30
| 23.15
| —
| —
|
| Index 2††
|
| -0.09
| -1.21
| 0.06
| -5.90
| 0.56
| —
| —
|
Performance figures assume all
distributions have been reinvested. Figures reflect maximum sales charges on Class A shares of 5% and the applicable contingent deferred sales charge (CDSC) on Class C shares. Class C shares sold within one year of
purchase are subject to a 1% CDSC. Sales charges are not applicable to Class I, Class R6 and Class 1 shares.
The expense ratios of the fund,
both net (including any fee waivers and/or expense limitations) and gross (excluding any fee waivers and/or expense limitations), are set forth according to the most recent publicly available prospectuses for the fund
and may differ from those disclosed in the Financial highlights tables in this report. Net expenses reflect contractual fee waivers and expense limitations in effect until December 31, 2023 and are subject to change.
Had the contractual fee waivers and expense limitations not been in place, gross expenses would apply. The expense ratios are as follows:
|
| Class A
| Class C
| Class I
| Class R6
| Class 1
|
| Gross (%)
| 1.41
| 2.16
| 1.16
| 1.05
| 1.10
|
| Net (%)
| 1.19
| 1.94
| 0.94
| 0.83
| 0.87
|
Please refer to the most recent
prospectuses and annual or semiannual report for more information on expenses and any expense limitation arrangements for each class.
The returns reflect past results
and should not be considered indicative of future performance. The return and principal value of an investment will fluctuate so that shares, when redeemed, may be worth more or less than their original cost. Due to
market volatility and other factors, the fund’s current performance may be higher or lower than the performance shown. For current to the most recent month-end performance data, please call
800–225–5291 or visit the fund’s website at jhinvestments.com.
The performance table above and
the chart on the next page do not reflect the deduction of taxes that a shareholder would pay on fund distributions or the redemption of fund shares. The fund’s performance results reflect any applicable fee
waivers or expense reductions, without which the expenses would increase and results would have been less favorable.
† Unsubsidized yield reflects what the yield would have been without the effect of reimbursements and waivers.
†† Index 1 is the Bloomberg Global Aggregate Bond USD Hedged Index; Index 2 is the Bloomberg Global Aggregate Bond Index.
See the following page for
footnotes.
|
| ANNUAL REPORT | JOHN HANCOCK OPPORTUNISTIC FIXED INCOME FUND
| 7
|
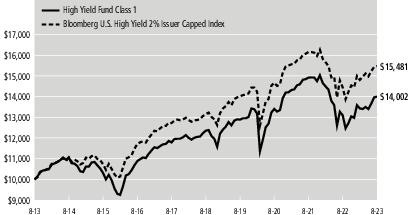
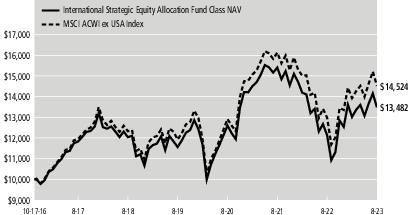
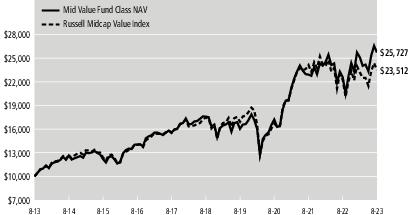
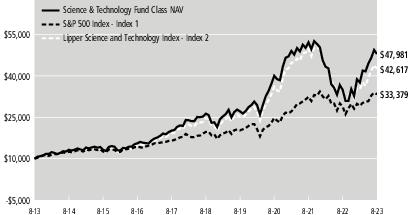
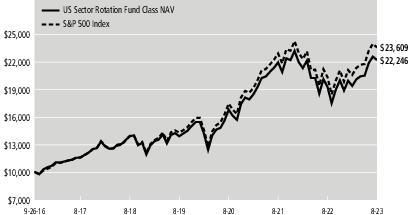
This chart and table show what
happened to a hypothetical $10,000 investment in John Hancock Opportunistic Fixed Income Fund for the share classes and periods indicated, assuming all distributions were reinvested. For comparison, we’ve shown
the same investment in two separate indexes.
|
| Start date
| With maximum
sales charge ($)
| Without
sales charge ($)
| Index 1 ($)
| Index 2 ($)
|
| Class C1,3
| 8-31-13
| 11,631
| 11,631
| 12,315
| 10,056
|
| Class I1,2
| 8-31-13
| 11,893
| 11,893
| 12,315
| 10,056
|
| Class R61,2
| 8-31-13
| 11,919
| 11,919
| 12,315
| 10,056
|
| Class 12
| 8-31-13
| 11,900
| 11,900
| 12,315
| 10,056
|
The Bloomberg Global Aggregate
Bond USD Hedged Index tracks the performance of global investment-grade debt in fixed-rate treasury, government-related, corporate, and securitized bond markets. Currency exposure is hedged to the U.S. dollar
(USD).
The Bloomberg Global Aggregate
Bond Index tracks the performance of global investment-grade debt in fixed-rate treasury, government-related, corporate, and securitized bond markets.
It is not possible to invest
directly in an index. Index figures do not reflect expenses or sales charges, which would result in lower returns.
Footnotes related to performance
pages
| 1
| Class A, Class C, Class I, and Class R6 shares were first offered on 6-4-21. Returns prior to this date are those of Class 1 shares that have not been adjusted for class-specific expenses; otherwise,
returns would vary.
|
| 2
| For certain types of investors, as described in the fund’s prospectuses.
|
| 3
| The contingent deferred sales charge is not applicable.
|
| 8
| JOHN HANCOCK OPPORTUNISTIC FIXED INCOME FUND | ANNUAL REPORT
|
|
These examples are intended to help
you understand your ongoing operating expenses of investing in the fund so you can compare these costs with the ongoing costs of investing in other mutual funds.
Understanding fund expenses
As a shareholder of the fund,
you incur two types of costs:
■Transaction costs, which include sales charges (loads) on purchases or redemptions (varies by share class), minimum account fee charge, etc.
■Ongoing operating expenses, including management fees, distribution and service fees (if applicable), and other fund expenses.
We are presenting only your ongoing
operating expenses here.
Actual expenses/actual returns
The first line of each share
class in the table on the following page is intended to provide information about the fund’s actual ongoing operating expenses, and is based on the fund’s actual return. It assumes an account value of
$1,000.00 on March 1, 2023, with the same investment held until August 31, 2023.
Together with the value of your
account, you may use this information to estimate the operating expenses that you paid over the period. Simply divide your account value at August 31, 2023, by $1,000.00, then multiply it by the “expenses
paid” for your share class from the table. For example, for an account value of $8,600.00, the operating expenses should be calculated as follows:
Hypothetical example for comparison
purposes
The second line of each share
class in the table on the following page allows you to compare the fund’s ongoing operating expenses with those of any other fund. It provides an example of the fund’s hypothetical account values and
hypothetical expenses based on each class’s actual expense ratio and an assumed 5% annualized return before expenses (which is not the class’s actual return). It assumes an account value of $1,000.00 on
March 1, 2023, with the same investment held until August 31, 2023. Look in any other fund shareholder report
|
| ANNUAL REPORT | JOHN HANCOCK OPPORTUNISTIC FIXED INCOME FUND
| 9
|
to find its hypothetical example and you will be
able to compare these expenses. Please remember that these hypothetical account values and expenses may not be used to estimate the actual ending account balance or expenses you paid for the period.
Remember, these examples do not
include any transaction costs, therefore, these examples will not help you to determine the relative total costs of owning different funds. If transaction costs were included, your expenses would have been higher. See
the prospectuses for details regarding transaction costs.
SHAREHOLDER EXPENSE EXAMPLE
CHART
|
|
| Account
value on
3-1-2023
| Ending
value on
8-31-2023
| Expenses
paid during
period ended
8-31-20231
| Annualized
expense
ratio
|
| Class A
| Actual expenses/actual returns
| $1,000.00
| $1,030.20
| $5.99
| 1.17%
|
|
| Hypothetical example
| 1,000.00
| 1,019.30
| 5.95
| 1.17%
|
| Class C
| Actual expenses/actual returns
| 1,000.00
| 1,026.60
| 9.81
| 1.92%
|
|
| Hypothetical example
| 1,000.00
| 1,015.50
| 9.75
| 1.92%
|
| Class I
| Actual expenses/actual returns
| 1,000.00
| 1,032.10
| 4.71
| 0.92%
|
|
| Hypothetical example
| 1,000.00
| 1,020.60
| 4.69
| 0.92%
|
| Class R6
| Actual expenses/actual returns
| 1,000.00
| 1,032.10
| 4.15
| 0.81%
|
|
| Hypothetical example
| 1,000.00
| 1,021.10
| 4.13
| 0.81%
|
| Class 1
| Actual expenses/actual returns
| 1,000.00
| 1,032.10
| 4.35
| 0.85%
|
|
| Hypothetical example
| 1,000.00
| 1,020.90
| 4.33
| 0.85%
|
| 1
| Expenses are equal to the annualized expense ratio, multiplied by the average account value over the period, multiplied by 184/365 (to reflect the one-half year period).
|
| 10
| JOHN HANCOCK OPPORTUNISTIC FIXED INCOME FUND | ANNUAL REPORT
|
|
AS OF
8-31-23
|
| Rate (%)
| Maturity date
|
| Par value^
| Value
|
| U.S. Government and Agency obligations 34.8%
| $43,398,986
|
| (Cost $43,813,844)
|
|
|
|
|
|
| U.S. Government 14.1%
|
|
|
| 17,533,703
|
| U.S. Treasury
|
|
|
|
|
|
| Bond
| 4.125
| 08-15-53
|
| 39,200
| 38,673
|
| Inflation Protected Security
| 0.375
| 01-15-27
|
| 921,954
| 863,134
|
| Inflation Protected Security
| 1.125
| 01-15-33
|
| 3,533,421
| 3,294,363
|
| Inflation Protected Security
| 1.250
| 04-15-28
|
| 5,426,229
| 5,223,381
|
| Inflation Protected Security (A)
| 1.625
| 10-15-27
|
| 8,063,882
| 7,910,401
|
| Note
| 3.500
| 02-15-33
|
| 64,000
| 60,950
|
| Note
| 3.875
| 08-15-33
|
| 130,000
| 127,684
|
| Note
| 4.000
| 06-30-28
|
| 15,300
| 15,117
|
| U.S. Government Agency 20.7%
|
|
|
| 25,865,283
|
| Federal National Mortgage Association
|
|
|
|
|
|
| 30 Yr Pass Thru (B)
| 4.500
| TBA
|
| 235,000
| 222,846
|
| 30 Yr Pass Thru (B)
| 5.000
| TBA
|
| 7,115,000
| 6,899,048
|
| 30 Yr Pass Thru (B)
| 5.500
| TBA
|
| 11,721,000
| 11,577,987
|
| 30 Yr Pass Thru (B)
| 6.000
| TBA
|
| 3,995,000
| 4,005,768
|
|
|
| 30 Yr Pass Thru (B)
| 6.000
| TBA
|
| 3,152,000
| 3,159,634
|
| Foreign government obligations 35.5%
|
|
|
| $44,195,684
|
| (Cost $49,241,938)
|
|
|
|
|
|
| Angola 0.1%
|
|
|
|
| 164,000
|
| Republic of Angola
|
|
|
|
|
|
| Bond
| 8.750
| 04-14-32
|
| 200,000
| 164,000
|
| Argentina 0.0%
|
|
|
|
| 70,180
|
| Republic of Argentina
|
|
|
|
|
|
| Bond
| 1.000
| 07-09-29
|
| 7,467
| 2,405
|
| Bond (3.625% to 7-9-24, then 4.125% to 7-9-27, then 4.750% to 7-9-28, then 5.000%
thereafter)
| 3.625
| 07-09-35
|
| 229,987
| 67,775
|
| Australia 2.1%
|
|
|
|
| 2,649,416
|
| Commonwealth of Australia
|
|
|
|
|
|
| Bond
| 0.250
| 11-21-32
| AUD
| 1,715,000
| 1,108,556
|
| Bond
| 1.750
| 06-21-51
| AUD
| 4,140,000
| 1,540,860
|
| Benin 0.2%
|
|
|
|
| 262,955
|
| Republic of Benin
|
|
|
|
|
|
| Bond
| 4.875
| 01-19-32
| EUR
| 100,000
| 80,784
|
| Bond
| 4.950
| 01-22-35
| EUR
| 240,000
| 182,171
|
| Brazil 3.7%
|
|
|
|
| 4,666,923
|
| Federative Republic of Brazil
|
|
|
|
|
|
| SEE NOTES TO FINANCIAL STATEMENTS
| ANNUAL REPORT | JOHN HANCOCK OPPORTUNISTIC FIXED INCOME FUND
| 11
|
|
| Rate (%)
| Maturity date
|
| Par value^
| Value
|
| Brazil (continued)
|
|
|
|
|
|
| Bill (C)
| 10.081
| 01-01-26
| BRL
| 1,138,000
| $182,979
|
| Bill (C)
| 10.084
| 07-01-26
| BRL
| 1,387,000
| 212,490
|
| Bill (C)
| 10.418
| 07-01-27
| BRL
| 839,000
| 115,237
|
| Note
| 6.000
| 08-15-50
| BRL
| 72,000
| 63,462
|
| Note
| 6.000
| 05-15-55
| BRL
| 1,398,000
| 1,255,563
|
| Note
| 10.000
| 01-01-25
| BRL
| 2,104,000
| 428,354
|
| Note
| 10.000
| 01-01-27
| BRL
| 3,323,000
| 675,030
|
| Note
| 10.000
| 01-01-29
| BRL
| 8,351,000
| 1,660,761
|
| Note
| 10.000
| 01-01-33
| BRL
| 379,000
| 73,047
|
| Bulgaria 0.3%
|
|
|
|
| 337,064
|
| Republic of Bulgaria
|
|
|
|
|
|
| Bond
| 1.375
| 09-23-50
| EUR
| 450,000
| 267,462
|
| Bond
| 4.500
| 01-27-33
| EUR
| 65,000
| 69,602
|
| Canada 1.8%
|
|
|
|
| 2,249,976
|
| Government of Canada
|
|
|
|
|
|
| Bond
| 4.000
| 12-01-31
| CAD
| 2,614,658
| 2,249,976
|
| Chile 0.6%
|
|
|
|
| 701,890
|
| Republic of Chile
|
|
|
|
|
|
| Bond
| 1.250
| 01-22-51
| EUR
| 125,000
| 68,878
|
| Bond
| 4.125
| 07-05-34
| EUR
| 100,000
| 105,453
|
| Bond (D)
| 4.700
| 09-01-30
| CLP
| 80,000,000
| 91,038
|
| Bond
| 5.000
| 03-01-35
| CLP
| 25,000,000
| 28,405
|
| Bond (D)
| 5.300
| 11-01-37
| CLP
| 15,000,000
| 17,221
|
| Bond (D)
| 6.000
| 04-01-33
| CLP
| 270,000,000
| 332,106
|
| Bond
| 6.000
| 01-01-43
| CLP
| 10,000,000
| 12,386
|
| Bond (D)
| 7.000
| 05-01-34
| CLP
| 35,000,000
| 46,403
|
| Colombia 1.0%
|
|
|
|
| 1,214,087
|
| Republic of Colombia
|
|
|
|
|
|
| Bond
| 3.000
| 03-25-33
| COP
| 396,593,021
| 86,800
|
| Bond
| 3.875
| 02-15-61
|
| 260,000
| 145,566
|
| Bond
| 4.125
| 02-22-42
|
| 400,000
| 258,243
|
| Bond
| 6.000
| 04-28-28
| COP
| 597,300,000
| 124,990
|
| Bond
| 7.000
| 03-26-31
| COP
| 286,800,000
| 58,131
|
| Bond
| 7.750
| 09-18-30
| COP
| 1,296,500,000
| 279,723
|
| Bond
| 9.250
| 05-28-42
| COP
| 510,200,000
| 108,274
|
| Bond
| 13.250
| 02-09-33
| COP
| 542,600,000
| 152,360
|
| Czech Republic 1.0%
|
|
|
|
| 1,269,295
|
| Czech Republic
|
|
|
|
|
|
| Bond
| 0.950
| 05-15-30
| CZK
| 5,090,000
| 184,004
|
| Bond
| 1.200
| 03-13-31
| CZK
| 1,620,000
| 58,339
|
| Bond
| 1.500
| 04-24-40
| CZK
| 740,000
| 21,604
|
| Bond
| 1.750
| 06-23-32
| CZK
| 1,930,000
| 70,345
|
| Bond
| 1.750
| 06-23-32
| CZK
| 1,260,000
| 45,925
|
| 12
| JOHN HANCOCK OPPORTUNISTIC FIXED INCOME FUND | ANNUAL REPORT
| SEE NOTES TO FINANCIAL STATEMENTS
|
|
| Rate (%)
| Maturity date
|
| Par value^
| Value
|
| Czech Republic (continued)
|
|
|
|
|
|
| Bond
| 1.950
| 07-30-37
| CZK
| 310,000
| $10,454
|
| Bond
| 2.000
| 10-13-33
| CZK
| 3,050,000
| 111,305
|
| Bond
| 2.500
| 08-25-28
| CZK
| 6,420,000
| 263,909
|
| Bond
| 3.500
| 05-30-35
| CZK
| 10,000
| 413
|
| Bond
| 4.900
| 04-14-34
| CZK
| 5,580,000
| 261,958
|
| Bond
| 5.000
| 09-30-30
| CZK
| 3,550,000
| 164,898
|
| Bond
| 6.000
| 02-26-26
| CZK
| 1,640,000
| 76,141
|
| Greece 0.4%
|
|
|
|
| 465,434
|
| Republic of Greece
|
|
|
|
|
|
| GDP-Linked Note (E)
| 4.484*
| 10-15-42
| EUR
| 119,230,000
| 465,434
|
| Hungary 0.9%
|
|
|
|
| 1,114,302
|
| Republic of Hungary
|
|
|
|
|
|
| Bond
| 1.000
| 11-26-25
| HUF
| 7,410,000
| 18,015
|
| Bond
| 1.625
| 04-28-32
| EUR
| 110,000
| 90,973
|
| Bond
| 1.750
| 06-05-35
| EUR
| 520,000
| 392,615
|
| Bond
| 2.250
| 06-22-34
| HUF
| 61,110,000
| 113,656
|
| Bond
| 3.000
| 10-27-27
| HUF
| 37,520,000
| 90,759
|
| Bond
| 3.000
| 08-21-30
| HUF
| 19,120,000
| 42,061
|
| Bond
| 3.250
| 10-22-31
| HUF
| 39,880,000
| 89,041
|
| Bond
| 4.500
| 03-23-28
| HUF
| 13,010,000
| 32,970
|
| Bond
| 4.750
| 11-24-32
| HUF
| 36,320,000
| 87,432
|
| Bond
| 6.750
| 10-22-28
| HUF
| 56,270,000
| 156,780
|
| Iceland 2.4%
|
|
|
|
| 2,981,529
|
| Republic of Iceland
|
|
|
|
|
|
| Bond
| 5.000
| 11-15-28
| ISK
| 431,960,000
| 2,981,529
|
| Indonesia 1.4%
|
|
|
|
| 1,738,362
|
| Republic of Indonesia
|
|
|
|
|
|
| Bond
| 1.400
| 10-30-31
| EUR
| 670,000
| 574,019
|
| Bond
| 6.375
| 08-15-28
| IDR
| 5,057,000,000
| 333,344
|
| Bond
| 6.375
| 04-15-32
| IDR
| 2,583,000,000
| 169,181
|
| Bond
| 6.500
| 02-15-31
| IDR
| 1,401,000,000
| 92,252
|
| Bond
| 7.000
| 05-15-27
| IDR
| 923,000,000
| 61,995
|
| Bond
| 7.000
| 02-15-33
| IDR
| 1,952,000,000
| 133,006
|
| Bond
| 7.500
| 08-15-32
| IDR
| 2,995,000,000
| 210,182
|
| Bond
| 7.500
| 06-15-35
| IDR
| 127,000,000
| 8,971
|
| Bond
| 7.500
| 05-15-38
| IDR
| 1,676,000,000
| 118,370
|
| Bond
| 8.375
| 03-15-34
| IDR
| 496,000,000
| 37,042
|
| Malaysia 1.1%
|
|
|
|
| 1,352,964
|
| Government of Malaysia
|
|
|
|
|
|
| Bond
| 2.632
| 04-15-31
| MYR
| 1,065,000
| 211,028
|
| Bond
| 3.478
| 06-14-24
| MYR
| 85,000
| 18,352
|
| Bond
| 3.502
| 05-31-27
| MYR
| 205,000
| 43,977
|
| Bond
| 3.582
| 07-15-32
| MYR
| 1,535,000
| 323,538
|
| SEE NOTES TO FINANCIAL STATEMENTS
| ANNUAL REPORT | JOHN HANCOCK OPPORTUNISTIC FIXED INCOME FUND
| 13
|
|
| Rate (%)
| Maturity date
|
| Par value^
| Value
|
| Malaysia (continued)
|
|
|
|
|
|
| Bond
| 3.882
| 03-14-25
| MYR
| 735,000
| $159,747
|
| Bond
| 3.885
| 08-15-29
| MYR
| 750,000
| 162,621
|
| Bond
| 3.906
| 07-15-26
| MYR
| 955,000
| 208,174
|
| Bond
| 4.254
| 05-31-35
| MYR
| 160,000
| 35,094
|
| Bond
| 4.696
| 10-15-42
| MYR
| 275,000
| 63,304
|
| Bond
| 4.893
| 06-08-38
| MYR
| 540,000
| 127,129
|
| Mexico 1.6%
|
|
|
|
| 2,009,587
|
| Government of Mexico
|
|
|
|
|
|
| Bill (C)
| 10.677
| 07-10-25
| MXN
| 8,060,910
| 390,434
|
| Bill (C)
| 11.009
| 03-20-25
| MXN
| 7,955,790
| 395,830
|
| Bill (C)
| 11.076
| 01-23-25
| MXN
| 1,040,080
| 52,550
|
| Bond
| 5.500
| 03-04-27
| MXN
| 4,334,000
| 222,357
|
| Bond
| 7.500
| 05-26-33
| MXN
| 6,177,000
| 321,513
|
| Bond
| 7.750
| 05-29-31
| MXN
| 401,400
| 21,510
|
| Bond
| 7.750
| 11-13-42
| MXN
| 3,448,400
| 172,684
|
| Bond
| 8.000
| 05-24-35
| MXN
| 1,030,500
| 55,018
|
| Bond
| 8.000
| 11-07-47
| MXN
| 1,334,800
| 68,037
|
| Bond
| 8.000
| 07-31-53
| MXN
| 1,044,600
| 52,820
|
| Bond
| 8.500
| 05-31-29
| MXN
| 1,814,500
| 102,457
|
| Bond
| 8.500
| 11-18-38
| MXN
| 1,531,300
| 83,351
|
| Bond
| 10.000
| 11-20-36
| MXN
| 1,151,600
| 71,026
|
| New Zealand 4.5%
|
|
|
|
| 5,621,887
|
| Government of New Zealand
|
|
|
|
|
|
| Bond
| 1.500
| 05-15-31
| NZD
| 145,000
| 67,992
|
| Bond
| 2.750
| 05-15-51
| NZD
| 2,030,000
| 795,763
|
| Inflation Linked Bond
| 3.089
| 09-20-40
| NZD
| 1,510,000
| 1,057,445
|
| Inflation Linked Bond
| 3.122
| 09-20-35
| NZD
| 1,110,000
| 808,158
|
| Inflation Linked Bond
| 3.804
| 09-20-30
| NZD
| 3,735,000
| 2,892,529
|
| North Macedonia 0.3%
|
|
|
|
| 334,819
|
| Republic of North Macedonia
|
|
|
|
|
|
| Bond
| 1.625
| 03-10-28
| EUR
| 200,000
| 178,311
|
| Bond
| 2.750
| 01-18-25
| EUR
| 150,000
| 156,508
|
| Norway 1.3%
|
|
|
|
| 1,691,348
|
| Kingdom of Norway
|
|
|
|
|
|
| Bond (D)
| 1.250
| 09-17-31
| NOK
| 21,810,000
| 1,691,348
|
| Peru 0.7%
|
|
|
|
| 870,462
|
| Republic of Peru
|
|
|
|
|
|
| Bond
| 5.400
| 08-12-34
| PEN
| 380,000
| 91,841
|
| Bond
| 5.940
| 02-12-29
| PEN
| 680,000
| 182,321
|
| Bond
| 6.150
| 08-12-32
| PEN
| 50,000
| 13,106
|
| Bond
| 6.350
| 08-12-28
| PEN
| 215,000
| 59,011
|
| Bond
| 6.900
| 08-12-37
| PEN
| 265,000
| 71,769
|
| Bond
| 6.950
| 08-12-31
| PEN
| 1,155,000
| 320,560
|
| 14
| JOHN HANCOCK OPPORTUNISTIC FIXED INCOME FUND | ANNUAL REPORT
| SEE NOTES TO FINANCIAL STATEMENTS
|
|
| Rate (%)
| Maturity date
|
| Par value^
| Value
|
| Peru (continued)
|
|
|
|
|
|
| Bond (D)
| 7.300
| 08-12-33
| PEN
| 468,000
| $131,854
|
| Philippines 0.2%
|
|
|
|
| 231,706
|
| Republic of the Philippines
|
|
|
|
|
|
| Bond
| 1.750
| 04-28-41
| EUR
| 330,000
| 231,706
|
| Poland 0.9%
|
|
|
|
| 1,135,100
|
| Republic of Poland
|
|
|
|
|
|
| Bond
| 1.750
| 04-25-32
| PLN
| 915,000
| 164,827
|
| Bond
| 2.750
| 04-25-28
| PLN
| 395,000
| 85,838
|
| Bond
| 2.750
| 10-25-29
| PLN
| 395,000
| 82,839
|
| Bond
| 3.250
| 07-25-25
| PLN
| 495,000
| 115,535
|
| Bond
| 3.750
| 05-25-27
| PLN
| 1,040,000
| 238,996
|
| Bond
| 6.000
| 10-25-33
| PLN
| 530,000
| 131,546
|
| Bond
| 7.500
| 07-25-28
| PLN
| 1,195,000
| 315,519
|
| Romania 1.0%
|
|
|
|
| 1,246,245
|
| Republic of Romania
|
|
|
|
|
|
| Bond (D)
| 2.625
| 12-02-40
| EUR
| 120,000
| 80,025
|
| Bond (D)
| 2.750
| 04-14-41
| EUR
| 360,000
| 240,481
|
| Bond
| 3.650
| 09-24-31
| RON
| 240,000
| 43,032
|
| Bond
| 3.700
| 11-25-24
| RON
| 60,000
| 12,781
|
| Bond
| 3.875
| 10-29-35
| EUR
| 110,000
| 96,004
|
| Bond
| 4.750
| 10-11-34
| RON
| 255,000
| 47,108
|
| Bond
| 4.850
| 07-25-29
| RON
| 220,000
| 44,447
|
| Bond
| 5.800
| 07-26-27
| RON
| 760,000
| 163,704
|
| Bond
| 6.700
| 02-25-32
| RON
| 465,000
| 101,647
|
| Bond
| 8.000
| 04-29-30
| RON
| 195,000
| 45,569
|
| Bond
| 8.250
| 09-29-32
| RON
| 965,000
| 232,121
|
| Bond
| 8.750
| 10-30-28
| RON
| 580,000
| 139,326
|
| Russia 0.5%
|
|
|
|
| 601,653
|
| Government of Russia
|
|
|
|
|
|
| Bond
| 5.900
| 03-12-31
| RUB
| 164,810,000
| 601,653
|
| Saudi Arabia 0.3%
|
|
|
|
| 385,058
|
| Kingdom of Saudi Arabia
|
|
|
|
|
|
| Bond (D)
| 2.250
| 02-02-33
|
| 486,000
| 385,058
|
| Serbia 0.3%
|
|
|
|
| 392,086
|
| Republic of Serbia
|
|
|
|
|
|
| Bond
| 1.500
| 06-26-29
| EUR
| 280,000
| 238,720
|
| Bond
| 1.650
| 03-03-33
| EUR
| 210,000
| 153,366
|
| Slovakia 0.2%
|
|
|
|
| 202,266
|
| Republic of Slovakia
|
|
|
|
|
|
| Bond
| 4.000
| 02-23-43
| EUR
| 190,000
| 202,266
|
| South Africa 1.7%
|
|
|
|
| 2,106,158
|
| Republic of South Africa
|
|
|
|
|
|
| SEE NOTES TO FINANCIAL STATEMENTS
| ANNUAL REPORT | JOHN HANCOCK OPPORTUNISTIC FIXED INCOME FUND
| 15
|
|
| Rate (%)
| Maturity date
|
| Par value^
| Value
|
| South Africa (continued)
|
|
|
|
|
|
| Bond
| 6.250
| 03-31-36
| ZAR
| 8,875,000
| $300,768
|
| Bond
| 7.000
| 02-28-31
| ZAR
| 1,430,000
| 61,334
|
| Bond
| 8.000
| 01-31-30
| ZAR
| 4,835,000
| 229,115
|
| Bond
| 8.250
| 03-31-32
| ZAR
| 7,470,000
| 334,795
|
| Bond
| 8.500
| 01-31-37
| ZAR
| 4,760,000
| 192,467
|
| Bond
| 8.750
| 01-31-44
| ZAR
| 17,515,000
| 671,756
|
| Bond
| 9.000
| 01-31-40
| ZAR
| 6,925,000
| 279,860
|
| Bond
| 11.625
| 03-31-53
| ZAR
| 720,000
| 36,063
|
| South Korea 1.9%
|
|
|
|
| 2,341,365
|
| Republic of Korea
|
|
|
|
|
|
| Inflation Linked Bond
| 1.125
| 06-10-30
| KRW
| 2,744,475,963
| 2,072,627
|
| Inflation Linked Bond
| 1.750
| 06-10-28
| KRW
| 351,390,840
| 268,738
|
| Sweden 1.6%
|
|
|
|
| 1,965,978
|
| Kingdom of Sweden
|
|
|
|
|
|
| Inflation Linked Bond
| 0.163
| 06-01-32
| SEK
| 17,930,000
| 1,965,978
|
| Thailand 0.8%
|
|
|
|
| 962,178
|
| Kingdom of Thailand
|
|
|
|
|
|
| Bond
| 1.000
| 06-17-27
| THB
| 5,360,000
| 145,157
|
| Bond
| 1.585
| 12-17-35
| THB
| 7,025,000
| 173,981
|
| Bond
| 1.600
| 12-17-29
| THB
| 605,000
| 16,288
|
| Bond
| 2.000
| 12-17-31
| THB
| 5,300,000
| 143,118
|
| Bond
| 2.000
| 06-17-42
| THB
| 1,150,000
| 27,665
|
| Bond
| 2.875
| 12-17-28
| THB
| 6,500,000
| 188,642
|
| Bond
| 2.875
| 06-17-46
| THB
| 500,000
| 13,366
|
| Bond
| 3.350
| 06-17-33
| THB
| 5,270,000
| 157,749
|
| Bond
| 3.450
| 06-17-43
| THB
| 3,250,000
| 96,212
|
| United Kingdom 0.5%
|
|
|
|
| 609,933
|
| United Kingdom of Great Britain
|
|
|
|
|
|
| Bond
| 0.500
| 10-22-61
| GBP
| 1,620,000
| 609,933
|
| Uruguay 0.2%
|
|
|
|
| 249,478
|
| Republic of Uruguay
|
|
|
|
|
|
| Bond
| 8.500
| 03-15-28
| UYU
| 5,270,000
| 135,539
|
|
|
| Bond
| 9.750
| 07-20-33
| UYU
| 4,165,500
| 113,939
|
| Corporate bonds 11.6%
|
|
|
|
| $14,444,994
|
| (Cost $15,089,157)
|
|
|
|
|
|
| Australia 0.1%
|
|
|
|
| 158,737
|
| FMG Resources Proprietary, Ltd. (D)
| 4.375
| 04-01-31
|
| 95,000
| 79,604
|
| FMG Resources Proprietary, Ltd. (D)
| 5.875
| 04-15-30
|
| 12,000
| 11,135
|
| Macquarie Group, Ltd. (5.887% to 6-15-33, then SOFR + 2.380%) (D)
| 5.887
| 06-15-34
|
| 70,000
| 67,998
|
| 16
| JOHN HANCOCK OPPORTUNISTIC FIXED INCOME FUND | ANNUAL REPORT
| SEE NOTES TO FINANCIAL STATEMENTS
|
|
| Rate (%)
| Maturity date
|
| Par value^
| Value
|
| Austria 0.2%
|
|
|
|
| $223,133
|
| Klabin Austria GmbH (D)
| 7.000
| 04-03-49
|
| 230,000
| 223,133
|
| Bermuda 0.0%
|
|
|
|
| 5,438
|
| Carnival Holdings Bermuda, Ltd. (D)
| 10.375
| 05-01-28
|
| 5,000
| 5,438
|
| Canada 0.4%
|
|
|
|
| 497,476
|
| Bausch Health Companies, Inc. (D)
| 4.875
| 06-01-28
|
| 22,000
| 13,055
|
| Emera, Inc. (6.750% to 6-15-26, then 3 month LIBOR + 5.440%)
| 6.750
| 06-15-76
|
| 94,000
| 90,240
|
| Enbridge, Inc. (5.750% to 4-15-30, then 5 Year CMT + 5.314%)
| 5.750
| 07-15-80
|
| 63,000
| 57,359
|
| Enerflex, Ltd. (D)
| 9.000
| 10-15-27
|
| 5,000
| 4,974
|
| goeasy, Ltd. (D)
| 4.375
| 05-01-26
|
| 99,000
| 90,891
|
| NOVA Chemicals Corp. (D)
| 4.250
| 05-15-29
|
| 65,000
| 52,796
|
| Ontario Gaming GTA LP (D)
| 8.000
| 08-01-30
|
| 60,000
| 60,647
|
| The Bank of Nova Scotia (4.900% to 6-4-25, then 5 Year CMT + 4.551%) (F)
| 4.900
| 06-04-25
|
| 75,000
| 69,181
|
| Transcanada Trust (5.600% to 12-7-31, then 5 Year CMT + 3.986%)
| 5.600
| 03-07-82
|
| 70,000
| 58,333
|
| Chile 0.1%
|
|
|
|
| 122,621
|
| VTR Comunicaciones SpA
| 4.375
| 04-15-29
|
| 200,000
| 122,621
|
| China 0.0%
|
|
|
|
| 28,998
|
| CIFI Holdings Group Company, Ltd. (G)
| 4.375
| 04-12-27
|
| 200,000
| 13,500
|
| Country Garden Holdings Company, Ltd.
| 3.875
| 10-22-30
|
| 210,000
| 15,498
|
| Colombia 0.0%
|
|
|
|
| 32,595
|
| Ecopetrol SA
| 6.875
| 04-29-30
|
| 35,000
| 32,595
|
| France 1.0%
|
|
|
|
| 1,281,296
|
| Elior Group SA
| 3.750
| 07-15-26
| EUR
| 100,000
| 85,787
|
| Societe Generale SA (6.221% to 6-15-32, then 1 Year CMT + 3.200%) (D)
| 6.221
| 06-15-33
|
| 400,000
| 375,797
|
| Societe Generale SA (D)
| 7.367
| 01-10-53
|
| 200,000
| 194,087
|
| TotalEnergies SE (2.125% to 1-25-33, then 5 Year Euro Swap Rate + 2.513% to 1-25-53, then 5 Year Euro Swap
Rate + 3.263%) (F)
| 2.125
| 07-25-32
| EUR
| 340,000
| 268,675
|
| Valeo SE
| 1.000
| 08-03-28
| EUR
| 400,000
| 356,950
|
| Germany 0.2%
|
|
|
|
| 295,489
|
| Allianz SE (2.600% to 10-30-31, then 5 Year Euro Swap Rate + 2.579%) (F)
| 2.600
| 10-30-31
| EUR
| 200,000
| 145,303
|
| SEE NOTES TO FINANCIAL STATEMENTS
| ANNUAL REPORT | JOHN HANCOCK OPPORTUNISTIC FIXED INCOME FUND
| 17
|
|
| Rate (%)
| Maturity date
|
| Par value^
| Value
|
| Germany (continued)
|
|
|
|
|
|
| Deutsche Bank AG (3.742% to 10-7-31, then SOFR + 2.257%)
| 3.742
| 01-07-33
|
| 200,000
| 150,186
|
| Israel 0.1%
|
|
|
|
| $68,628
|
| Energean Israel Finance, Ltd. (D)
| 8.500
| 09-30-33
|
| 35,425
| 35,868
|
| Leviathan Bond, Ltd. (D)
| 6.750
| 06-30-30
|
| 35,000
| 32,760
|
| Italy 0.6%
|
|
|
|
| 746,148
|
| Assicurazioni Generali SpA
| 2.429
| 07-14-31
| EUR
| 510,000
| 455,558
|
| Castor SpA
| 6.000
| 02-15-29
| EUR
| 100,000
| 93,215
|
| Intesa Sanpaolo SpA (D)
| 6.625
| 06-20-33
|
| 200,000
| 197,375
|
| Japan 0.1%
|
|
|
|
| 102,363
|
| Rakuten Group, Inc. (4.250% to 4-22-27, then 5 Year Euro Swap Rate + 4.740%) (F)
| 4.250
| 04-22-27
| EUR
| 200,000
| 102,363
|
| Luxembourg 0.0%
|
|
|
|
| 54,027
|
| Trinseo Materials Operating SCA (D)
| 5.125
| 04-01-29
|
| 100,000
| 54,027
|
| Malta 0.1%
|
|
|
|
| 91,126
|
| VistaJet Malta Finance PLC (D)
| 6.375
| 02-01-30
|
| 92,000
| 75,438
|
| VistaJet Malta Finance PLC (D)
| 9.500
| 06-01-28
|
| 17,000
| 15,688
|
| Netherlands 0.5%
|
|
|
|
| 648,910
|
| Braskem Netherlands Finance BV
| 7.250
| 02-13-33
|
| 200,000
| 189,466
|
| Petrobras Global Finance BV
| 6.500
| 07-03-33
|
| 135,000
| 131,750
|
| Teva Pharmaceutical Finance Netherlands II BV
| 4.375
| 05-09-30
| EUR
| 350,000
| 327,694
|
| Norway 0.2%
|
|
|
|
| 210,976
|
| Var Energi ASA (D)
| 8.000
| 11-15-32
|
| 200,000
| 210,976
|
| Romania 0.1%
|
|
|
|
| 112,339
|
| Banca Transilvania SA (8.875% to 4-27-26, then 1 Year EURIBOR ICE Swap Rate + 5.580%)
| 8.875
| 04-27-27
| EUR
| 100,000
| 112,339
|
| United Kingdom 0.5%
|
|
|
|
| 594,460
|
| Anglo American Capital PLC (D)
| 5.625
| 04-01-30
|
| 400,000
| 394,730
|
| Barclays PLC (7.119% to 6-27-33, then SOFR + 3.570%)
| 7.119
| 06-27-34
|
| 200,000
| 199,730
|
| United States 7.4%
|
|
|
|
| 9,170,234
|
| Acrisure LLC (D)
| 7.000
| 11-15-25
|
| 97,000
| 93,740
|
| Advanced Drainage Systems, Inc. (D)
| 6.375
| 06-15-30
|
| 13,000
| 12,806
|
| Aircastle, Ltd. (5.250% to 9-15-26, then 5 Year CMT + 4.410% to 9-15-31, then 5 Year CMT + 4.660% to 9-15-46, then 5 Year
CMT + 5.160%) (D)(F)
| 5.250
| 06-15-26
|
| 98,000
| 75,950
|
| 18
| JOHN HANCOCK OPPORTUNISTIC FIXED INCOME FUND | ANNUAL REPORT
| SEE NOTES TO FINANCIAL STATEMENTS
|
|
| Rate (%)
| Maturity date
|
| Par value^
| Value
|
| United States (continued)
|
|
|
|
|
|
| Alliant Holdings Intermediate LLC (D)
| 6.750
| 10-15-27
|
| 125,000
| 118,153
|
| Ally Financial, Inc. (4.700% to 5-15-28, then 7 Year CMT + 3.481%) (F)
| 4.700
| 05-15-28
|
| 54,000
| 34,760
|
| Altria Group, Inc.
| 3.125
| 06-15-31
| EUR
| 170,000
| 158,785
|
| AmeriGas Partners LP
| 5.750
| 05-20-27
|
| 85,000
| 78,600
|
| AmWINS Group, Inc. (D)
| 4.875
| 06-30-29
|
| 27,000
| 24,226
|
| Antero Resources Corp. (D)
| 5.375
| 03-01-30
|
| 59,000
| 55,163
|
| APX Group, Inc. (D)
| 5.750
| 07-15-29
|
| 12,000
| 10,338
|
| Aramark Services, Inc. (D)
| 6.375
| 05-01-25
|
| 16,000
| 16,027
|
| Ares Finance Company III LLC (4.125% to 6-30-26, then 5 Year CMT + 3.237%) (D)
| 4.125
| 06-30-51
|
| 40,000
| 30,295
|
| AssuredPartners, Inc. (D)
| 5.625
| 01-15-29
|
| 161,000
| 139,865
|
| ATI, Inc.
| 4.875
| 10-01-29
|
| 3,000
| 2,708
|
| AutoZone, Inc.
| 4.750
| 08-01-32
|
| 50,000
| 47,826
|
| BAT Capital Corp.
| 7.081
| 08-02-53
|
| 135,000
| 132,909
|
| BCPE Ulysses Intermediate, Inc. (7.750% Cash or 8.500% PIK) (D)
| 7.750
| 04-01-27
|
| 66,000
| 60,412
|
| Black Knight InfoServ LLC (D)
| 3.625
| 09-01-28
|
| 210,000
| 193,200
|
| Broadcom, Inc.
| 4.300
| 11-15-32
|
| 18,000
| 16,272
|
| Buckeye Partners LP (3 month LIBOR + 4.020%) (H)
| 9.627
| 01-22-78
|
| 97,000
| 80,197
|
| Builders FirstSource, Inc. (D)
| 4.250
| 02-01-32
|
| 20,000
| 17,003
|
| Caesars Entertainment, Inc. (D)
| 7.000
| 02-15-30
|
| 45,000
| 45,172
|
| Caesars Entertainment, Inc. (D)
| 8.125
| 07-01-27
|
| 18,000
| 18,276
|
| Capital One Financial Corp. (2.359% to 7-29-31, then SOFR + 1.337%)
| 2.359
| 07-29-32
|
| 85,000
| 60,635
|
| Capital One Financial Corp. (6.377% to 6-8-33, then SOFR + 2.860%)
| 6.377
| 06-08-34
|
| 61,000
| 60,254
|
| Carnival Corp. (D)
| 6.000
| 05-01-29
|
| 139,000
| 125,500
|
| Carnival Corp. (D)
| 7.625
| 03-01-26
|
| 3,000
| 2,991
|
| CCO Holdings LLC (D)
| 4.500
| 06-01-33
|
| 14,000
| 11,051
|
| CCO Holdings LLC (D)
| 5.375
| 06-01-29
|
| 117,000
| 106,487
|
| CenterPoint Energy, Inc. (6.125% to 9-1-23, then 3 month LIBOR + 3.270%) (F)
| 6.125
| 09-01-23
|
| 48,000
| 48,000
|
| Citigroup, Inc. (4.000% to 12-10-25, then 5 Year CMT + 3.597%) (F)
| 4.000
| 12-10-25
|
| 69,000
| 61,758
|
| Citigroup, Inc. (7.375% to 5-15-28, then 5 Year CMT + 3.209%) (F)
| 7.375
| 05-15-28
|
| 44,000
| 44,275
|
| Citizens Financial Group, Inc. (5.650% to 10-6-25, then 5 Year CMT + 5.313%) (F)
| 5.650
| 10-06-25
|
| 80,000
| 73,881
|
| SEE NOTES TO FINANCIAL STATEMENTS
| ANNUAL REPORT | JOHN HANCOCK OPPORTUNISTIC FIXED INCOME FUND
| 19
|
|
| Rate (%)
| Maturity date
|
| Par value^
| Value
|
| United States (continued)
|
|
|
|
|
|
| Clear Channel Outdoor Holdings, Inc. (D)
| 9.000
| 09-15-28
|
| 150,000
| 150,750
|
| Clydesdale Acquisition Holdings, Inc. (D)
| 6.625
| 04-15-29
|
| 10,000
| 9,516
|
| Clydesdale Acquisition Holdings, Inc. (D)
| 8.750
| 04-15-30
|
| 167,000
| 151,024
|
| CMS Energy Corp. (4.750% to 3-1-30, then 5 Year CMT + 4.116%)
| 4.750
| 06-01-50
|
| 54,000
| 47,165
|
| CoBank ACB (6.250% to 10-1-26, then 3 month LIBOR + 4.660%) (F)
| 6.250
| 10-01-26
|
| 29,000
| 27,815
|
| Coherent Corp. (D)
| 5.000
| 12-15-29
|
| 9,000
| 7,994
|
| Columbia Pipelines Operating Company LLC (D)
| 6.714
| 08-15-63
|
| 50,000
| 51,110
|
| Community Health Systems, Inc. (D)
| 4.750
| 02-15-31
|
| 70,000
| 52,150
|
| Compass Group Diversified Holdings LLC (D)
| 5.250
| 04-15-29
|
| 121,000
| 111,121
|
| Corebridge Financial, Inc. (6.875% to 9-15-27, then 5 Year CMT + 3.846%)
| 6.875
| 12-15-52
|
| 49,000
| 47,641
|
| Crestwood Midstream Partners LP (D)
| 6.000
| 02-01-29
|
| 2,000
| 1,963
|
| Crestwood Midstream Partners LP (D)
| 7.375
| 02-01-31
|
| 8,000
| 8,241
|
| CSC Holdings LLC (D)
| 4.125
| 12-01-30
|
| 200,000
| 142,615
|
| CSC Holdings LLC (D)
| 4.500
| 11-15-31
|
| 200,000
| 142,213
|
| CSC Holdings LLC
| 5.250
| 06-01-24
|
| 3,000
| 2,846
|
| Cushman & Wakefield US Borrower LLC (D)
| 8.875
| 09-01-31
|
| 15,000
| 15,123
|
| Discover Financial Services (6.125% to 6-23-25, then 5 Year CMT + 5.783%) (F)
| 6.125
| 06-23-25
|
| 49,000
| 47,084
|
| Discovery Communications LLC
| 4.000
| 09-15-55
|
| 35,000
| 22,826
|
| DISH DBS Corp.
| 5.125
| 06-01-29
|
| 12,000
| 6,488
|
| DISH DBS Corp. (D)
| 5.750
| 12-01-28
|
| 22,000
| 17,078
|
| Dominion Energy, Inc. (4.350% to 1-15-27, then 5 Year CMT + 3.195%) (F)
| 4.350
| 01-15-27
|
| 51,000
| 43,082
|
| Dominion Energy, Inc. (4.650% to 12-15-24, then 5 Year CMT + 2.993%) (F)
| 4.650
| 12-15-24
|
| 31,000
| 28,210
|
| Duke Energy Corp. (4.875% to 9-16-24, then 5 Year CMT + 3.388%) (F)
| 4.875
| 09-16-24
|
| 22,000
| 21,444
|
| Earthstone Energy Holdings LLC (D)
| 8.000
| 04-15-27
|
| 7,000
| 7,145
|
| Edison International (5.375% to 3-15-26, then 5 Year CMT + 4.698%) (F)
| 5.375
| 03-15-26
|
| 106,000
| 93,649
|
| 20
| JOHN HANCOCK OPPORTUNISTIC FIXED INCOME FUND | ANNUAL REPORT
| SEE NOTES TO FINANCIAL STATEMENTS
|
|
| Rate (%)
| Maturity date
|
| Par value^
| Value
|
| United States (continued)
|
|
|
|
|
|
| Embarq Corp.
| 7.995
| 06-01-36
|
| 3,000
| 1,827
|
| Enact Holdings, Inc. (D)
| 6.500
| 08-15-25
|
| 64,000
| 63,422
|
| EnLink Midstream LLC (D)
| 5.625
| 01-15-28
|
| 51,000
| 49,336
|
| EnLink Midstream LLC (D)
| 6.500
| 09-01-30
|
| 5,000
| 5,013
|
| EnLink Midstream Partners LP
| 5.450
| 06-01-47
|
| 83,000
| 68,890
|
| Enterprise Products Operating LLC (5.250% to 8-16-27, then 3 month CME Term SOFR + 3.295%)
| 5.250
| 08-16-77
|
| 12,000
| 10,558
|
| Enterprise Products Operating LLC (3 month CME Term SOFR + 3.248%) (H)
| 8.619
| 08-16-77
|
| 66,000
| 64,781
|
| Fifth Third Bancorp (4.500% to 9-30-25, then 5 Year CMT + 4.215%) (F)
| 4.500
| 09-30-25
|
| 67,000
| 60,958
|
| First Student Bidco, Inc. (D)
| 4.000
| 07-31-29
|
| 95,000
| 80,751
|
| FirstCash, Inc. (D)
| 4.625
| 09-01-28
|
| 71,000
| 63,148
|
| FirstCash, Inc. (D)
| 5.625
| 01-01-30
|
| 104,000
| 94,414
|
| Flex, Ltd.
| 4.875
| 05-12-30
|
| 10,000
| 9,581
|
| Freedom Mortgage Corp. (D)
| 7.625
| 05-01-26
|
| 62,000
| 57,026
|
| Frontier Communications Holdings LLC (D)
| 5.000
| 05-01-28
|
| 2,000
| 1,714
|
| Frontier Communications Holdings LLC (D)
| 5.875
| 10-15-27
|
| 7,000
| 6,376
|
| Frontier Communications Holdings LLC (D)
| 6.750
| 05-01-29
|
| 133,000
| 103,217
|
| Gen Digital, Inc. (D)
| 6.750
| 09-30-27
|
| 4,000
| 4,010
|
| Gen Digital, Inc. (D)
| 7.125
| 09-30-30
|
| 4,000
| 4,027
|
| General Motors Financial Company, Inc. (5.700% to 9-30-30, then 5 Year CMT + 4.997%) (F)
| 5.700
| 09-30-30
|
| 66,000
| 56,547
|
| Global Atlantic Fin Company (D)
| 7.950
| 06-15-33
|
| 72,000
| 70,653
|
| Great Lakes Dredge & Dock Corp. (D)
| 5.250
| 06-01-29
|
| 170,000
| 145,593
|
| Hanesbrands, Inc. (D)
| 9.000
| 02-15-31
|
| 50,000
| 50,195
|
| Hawaiian Brand Intellectual Property, Ltd. (D)
| 5.750
| 01-20-26
|
| 52,000
| 48,119
|
| Hightower Holding LLC (D)
| 6.750
| 04-15-29
|
| 132,000
| 114,894
|
| HUB International, Ltd. (D)
| 5.625
| 12-01-29
|
| 96,000
| 84,894
|
| HUB International, Ltd. (D)
| 7.250
| 06-15-30
|
| 4,000
| 4,072
|
| Huntington Bancshares, Inc. (4.450% to 10-15-27, then 7 Year CMT + 4.045%) (F)
| 4.450
| 10-15-27
|
| 29,000
| 24,594
|
| Huntington Bancshares, Inc. (3 month CME Term SOFR + 3.142%) (F)(H)
| 8.450
| 10-15-23
|
| 25,000
| 22,673
|
| Iron Mountain, Inc. (D)
| 5.250
| 07-15-30
|
| 2,000
| 1,805
|
| Iron Mountain, Inc. (D)
| 7.000
| 02-15-29
|
| 115,000
| 114,685
|
| SEE NOTES TO FINANCIAL STATEMENTS
| ANNUAL REPORT | JOHN HANCOCK OPPORTUNISTIC FIXED INCOME FUND
| 21
|
|
| Rate (%)
| Maturity date
|
| Par value^
| Value
|
| United States (continued)
|
|
|
|
|
|
| KB Home
| 6.875
| 06-15-27
|
| 5,000
| 5,049
|
| KeySpan Gas East Corp. (D)
| 5.994
| 03-06-33
|
| 65,000
| 64,525
|
| Ladder Capital Finance Holdings LLLP (D)
| 4.250
| 02-01-27
|
| 32,000
| 28,939
|
| Ladder Capital Finance Holdings LLLP (D)
| 4.750
| 06-15-29
|
| 5,000
| 4,204
|
| LBM Acquisition LLC (D)
| 6.250
| 01-15-29
|
| 67,000
| 58,463
|
| Lennar Corp.
| 4.750
| 11-29-27
|
| 18,000
| 17,453
|
| LFS Topco LLC (D)
| 5.875
| 10-15-26
|
| 64,000
| 55,361
|
| Liberty Mutual Group, Inc. (4.125% to 9-15-26, then 5 Year CMT + 3.315%) (D)
| 4.125
| 12-15-51
|
| 89,000
| 71,868
|
| Liberty Mutual Group, Inc. (D)
| 4.300
| 02-01-61
|
| 25,000
| 15,300
|
| LSF9 Atlantis Holdings LLC (D)
| 7.750
| 02-15-26
|
| 55,000
| 50,119
|
| M&T Bank Corp. (5.125% to 11-1-26, then 3 month LIBOR + 3.520%) (F)
| 5.125
| 11-01-26
|
| 44,000
| 36,418
|
| MajorDrive Holdings IV LLC (D)
| 6.375
| 06-01-29
|
| 70,000
| 57,684
|
| Matador Resources Company (D)
| 6.875
| 04-15-28
|
| 5,000
| 4,992
|
| Mauser Packaging Solutions Holding Company (D)
| 7.875
| 08-15-26
|
| 3,000
| 2,954
|
| McAfee Corp. (D)
| 7.375
| 02-15-30
|
| 10,000
| 8,749
|
| Medline Borrower LP (D)
| 3.875
| 04-01-29
|
| 10,000
| 8,730
|
| Medline Borrower LP (D)
| 5.250
| 10-01-29
|
| 139,000
| 123,436
|
| Micron Technology, Inc.
| 5.875
| 09-15-33
|
| 5,000
| 4,903
|
| Mileage Plus Holdings LLC (D)
| 6.500
| 06-20-27
|
| 38,543
| 38,409
|
| MSCI, Inc. (D)
| 3.625
| 09-01-30
|
| 131,000
| 113,285
|
| MSCI, Inc. (D)
| 3.875
| 02-15-31
|
| 20,000
| 17,450
|
| Nabors Industries, Inc. (D)
| 7.375
| 05-15-27
|
| 3,000
| 2,928
|
| National Rural Utilities Cooperative Finance Corp. (3 month CME Term SOFR + 3.172%) (H)
| 8.541
| 04-30-43
|
| 30,000
| 29,407
|
| Nationstar Mortgage Holdings, Inc. (D)
| 5.750
| 11-15-31
|
| 103,000
| 88,894
|
| NCL Corp., Ltd. (D)
| 7.750
| 02-15-29
|
| 154,000
| 146,504
|
| Noble Finance II LLC (D)
| 8.000
| 04-15-30
|
| 5,000
| 5,170
|
| Novelis Corp. (D)
| 4.750
| 01-30-30
|
| 97,000
| 86,809
|
| NRG Energy, Inc. (D)
| 7.000
| 03-15-33
|
| 70,000
| 69,593
|
| Occidental Petroleum Corp.
| 4.500
| 07-15-44
|
| 35,000
| 25,367
|
| Occidental Petroleum Corp.
| 6.450
| 09-15-36
|
| 10,000
| 10,227
|
| OneMain Finance Corp.
| 9.000
| 01-15-29
|
| 140,000
| 141,925
|
| Open Text Holdings, Inc. (D)
| 4.125
| 12-01-31
|
| 98,000
| 81,348
|
| Oracle Corp.
| 6.500
| 04-15-38
|
| 5,000
| 5,274
|
| Outfront Media Capital LLC (D)
| 4.625
| 03-15-30
|
| 130,000
| 105,693
|
| Owens & Minor, Inc. (D)
| 4.500
| 03-31-29
|
| 70,000
| 59,325
|
| Owens & Minor, Inc. (D)
| 6.625
| 04-01-30
|
| 10,000
| 9,097
|
| 22
| JOHN HANCOCK OPPORTUNISTIC FIXED INCOME FUND | ANNUAL REPORT
| SEE NOTES TO FINANCIAL STATEMENTS
|
|
| Rate (%)
| Maturity date
|
| Par value^
| Value
|
| United States (continued)
|
|
|
|
|
|
| Pacific Gas & Electric Company
| 6.700
| 04-01-53
|
| 49,000
| 47,640
|
| Pacific Gas & Electric Company
| 6.750
| 01-15-53
|
| 80,000
| 77,756
|
| Paramount Global (6.250% to 2-28-27, then 3 month LIBOR + 3.899%)
| 6.250
| 02-28-57
|
| 65,000
| 50,893
|
| PennyMac Financial Services, Inc. (D)
| 5.750
| 09-15-31
|
| 63,000
| 52,951
|
| Performance Food Group, Inc. (D)
| 4.250
| 08-01-29
|
| 144,000
| 126,728
|
| Post Holdings, Inc. (D)
| 4.625
| 04-15-30
|
| 19,000
| 16,834
|
| Post Holdings, Inc. (D)
| 5.500
| 12-15-29
|
| 116,000
| 107,306
|
| PPL Capital Funding, Inc. (3 month LIBOR + 2.665%) (H)
| 8.203
| 03-30-67
|
| 28,000
| 25,360
|
| Presidio Holdings, Inc. (D)
| 8.250
| 02-01-28
|
| 58,000
| 56,189
|
| Range Resources Corp. (D)
| 4.750
| 02-15-30
|
| 13,000
| 11,739
|
| Range Resources Corp.
| 8.250
| 01-15-29
|
| 40,000
| 41,526
|
| Reinsurance Group of America, Inc. (3 month LIBOR + 2.665%) (H)
| 8.217
| 12-15-65
|
| 25,000
| 22,499
|
| RHP Hotel Properties LP (D)
| 7.250
| 07-15-28
|
| 23,000
| 23,115
|
| Royal Caribbean Cruises, Ltd. (D)
| 5.500
| 08-31-26
|
| 15,000
| 14,373
|
| Sasol Financing USA LLC (D)
| 8.750
| 05-03-29
|
| 200,000
| 195,250
|
| Sempra (4.125% to 1-1-27, then 5 Year CMT + 2.868%)
| 4.125
| 04-01-52
|
| 125,000
| 101,074
|
| Sempra (4.875% to 10-15-25, then 5 Year CMT + 4.550%) (F)
| 4.875
| 10-15-25
|
| 50,000
| 47,290
|
| Signal Parent, Inc. (D)
| 6.125
| 04-01-29
|
| 14,000
| 9,100
|
| Spirit AeroSystems, Inc. (D)
| 9.375
| 11-30-29
|
| 3,000
| 3,126
|
| SRS Distribution, Inc. (D)
| 6.125
| 07-01-29
|
| 10,000
| 8,695
|
| STL Holding Company LLC (D)
| 7.500
| 02-15-26
|
| 68,000
| 63,264
|
| Synchrony Financial
| 7.250
| 02-02-33
|
| 130,000
| 119,530
|
| Sysco Corp.
| 6.600
| 04-01-40
|
| 13,000
| 13,717
|
| Terex Corp. (D)
| 5.000
| 05-15-29
|
| 83,000
| 76,206
|
| The Charles Schwab Corp. (4.000% to 6-1-26, then 5 Year CMT + 3.168%) (F)
| 4.000
| 06-01-26
|
| 28,000
| 24,228
|
| The Charles Schwab Corp. (5.375% to 6-1-25, then 5 Year CMT + 4.971%) (F)
| 5.375
| 06-01-25
|
| 25,000
| 24,125
|
| The Dun & Bradstreet Corp. (D)
| 5.000
| 12-15-29
|
| 20,000
| 17,950
|
| The Gap, Inc. (D)
| 3.625
| 10-01-29
|
| 76,000
| 57,858
|
| The Gap, Inc. (D)
| 3.875
| 10-01-31
|
| 144,000
| 104,350
|
| The Goldman Sachs Group, Inc. (7.500% to 2-10-29, then 5 Year CMT + 3.156%) (F)
| 7.500
| 02-10-29
|
| 24,000
| 24,120
|
| The Hertz Corp. (D)
| 5.000
| 12-01-29
|
| 5,000
| 4,111
|
| The Michaels Companies, Inc. (D)
| 5.250
| 05-01-28
|
| 4,000
| 3,335
|
| The Michaels Companies, Inc. (D)
| 7.875
| 05-01-29
|
| 102,000
| 70,706
|
| SEE NOTES TO FINANCIAL STATEMENTS
| ANNUAL REPORT | JOHN HANCOCK OPPORTUNISTIC FIXED INCOME FUND
| 23
|
|
| Rate (%)
| Maturity date
|
| Par value^
| Value
|
| United States (continued)
|
|
|
|
|
|
| The Southern Company (4.000% to 10-15-25, then 5 Year CMT + 3.733%)
| 4.000
| 01-15-51
|
| 46,000
| 42,657
|
| The William Carter Company (D)
| 5.625
| 03-15-27
|
| 164,000
| 158,988
|
| TransDigm, Inc. (D)
| 6.250
| 03-15-26
|
| 16,000
| 15,848
|
| Transocean, Inc. (D)
| 8.750
| 02-15-30
|
| 4,750
| 4,859
|
| TriNet Group, Inc. (D)
| 7.125
| 08-15-31
|
| 3,000
| 3,017
|
| U.S. Steel Corp.
| 6.875
| 03-01-29
|
| 7,000
| 6,973
|
| Uber Technologies, Inc. (D)
| 4.500
| 08-15-29
|
| 121,000
| 110,789
|
| United Wholesale Mortgage LLC (D)
| 5.500
| 04-15-29
|
| 5,000
| 4,338
|
| Venture Global Calcasieu Pass LLC (D)
| 3.875
| 08-15-29
|
| 60,000
| 51,901
|
| Viking Cruises, Ltd. (D)
| 5.875
| 09-15-27
|
| 3,000
| 2,805
|
| Viking Cruises, Ltd. (D)
| 7.000
| 02-15-29
|
| 60,000
| 56,892
|
| Viking Cruises, Ltd. (D)
| 9.125
| 07-15-31
|
| 60,000
| 61,988
|
| Viper Energy Partners LP (D)
| 5.375
| 11-01-27
|
| 290,000
| 279,432
|
| Vistra Corp. (8.000% to 10-15-26, then 5 Year CMT + 6.930%) (D)(F)
| 8.000
| 10-15-26
|
| 12,000
| 11,468
|
| WarnerMedia Holdings, Inc.
| 3.755
| 03-15-27
|
| 6,000
| 5,628
|
| Weatherford International, Ltd. (D)
| 8.625
| 04-30-30
|
| 5,000
| 5,121
|
| Wells Fargo & Company (3.900% to 3-15-26, then 5 Year CMT + 3.453%) (F)
| 3.900
| 03-15-26
|
| 51,000
| 45,212
|
| Western Midstream Operating LP
| 4.050
| 02-01-30
|
| 124,000
| 110,609
|
| Windsor Holdings III LLC (D)
| 8.500
| 06-15-30
|
| 88,000
| 88,384
|
|
|
| Wynn Resorts Finance LLC (D)
| 7.125
| 02-15-31
|
| 3,000
| 2,948
|
| Convertible bonds 3.6%
|
|
|
|
| $4,509,958
|
| (Cost $4,846,069)
|
|
|
|
|
|
| Canada 0.1%
|
|
|
|
| 77,223
|
| Shopify, Inc.
| 0.125
| 11-01-25
|
| 85,000
| 77,223
|
| China 0.1%
|
|
|
|
| 138,105
|
| NIO, Inc.
| 0.500
| 02-01-27
|
| 162,000
| 138,105
|
| Denmark 0.2%
|
|
|
|
| 241,150
|
| Ascendis Pharma A/S
| 2.250
| 04-01-28
|
| 260,000
| 241,150
|
| Israel 0.0%
|
|
|
|
| 2,910
|
| SolarEdge Technologies, Inc. (C)
| 1.481
| 09-15-25
|
| 3,000
| 2,910
|
| Luxembourg 0.0%
|
|
|
|
| 11,900
|
| Arrival SA (D)
| 3.500
| 12-01-26
|
| 170,000
| 11,900
|
| Singapore 0.2%
|
|
|
|
| 322,547
|
| Sea, Ltd.
| 0.250
| 09-15-26
|
| 407,000
| 322,547
|
| 24
| JOHN HANCOCK OPPORTUNISTIC FIXED INCOME FUND | ANNUAL REPORT
| SEE NOTES TO FINANCIAL STATEMENTS
|
|
| Rate (%)
| Maturity date
|
| Par value^
| Value
|
| United States 3.0%
|
|
|
|
| $3,716,123
|
| 3D Systems Corp. (C)
| 9.713
| 11-15-26
|
| 21,000
| 15,530
|
| Affirm Holdings, Inc. (C)
| 8.822
| 11-15-26
|
| 75,000
| 56,955
|
| Airbnb, Inc. (C)
| 5.252
| 03-15-26
|
| 110,000
| 96,415
|
| Alarm.com Holdings, Inc. (C)
| 6.610
| 01-15-26
|
| 110,000
| 94,270
|
| Axon Enterprise, Inc. (D)
| 0.500
| 12-15-27
|
| 23,000
| 25,599
|
| Bandwidth, Inc.
| 0.250
| 03-01-26
|
| 39,000
| 31,220
|
| Bentley Systems, Inc.
| 0.125
| 01-15-26
|
| 95,000
| 92,445
|
| Beyond Meat, Inc. (C)
| 44.027
| 03-15-27
|
| 125,000
| 33,750
|
| BILL Holdings, Inc. (C)
| 5.877
| 04-01-27
|
| 76,000
| 61,750
|
| Block, Inc.
| 0.125
| 03-01-25
|
| 55,000
| 50,793
|
| Block, Inc.
| 0.250
| 11-01-27
|
| 142,000
| 108,455
|
| Cable One, Inc.
| 1.125
| 03-15-28
|
| 35,000
| 26,303
|
| Cardlytics, Inc.
| 1.000
| 09-15-25
|
| 55,000
| 32,725
|
| Carnival Corp. (D)
| 5.750
| 12-01-27
|
| 2,000
| 2,943
|
| Ceridian HCM Holding, Inc.
| 0.250
| 03-15-26
|
| 111,000
| 98,446
|
| Cracker Barrel Old Country Store, Inc.
| 0.625
| 06-15-26
|
| 85,000
| 71,719
|
| Cytokinetics, Inc.
| 3.500
| 07-01-27
|
| 50,000
| 47,065
|
| DigitalOcean Holdings, Inc. (C)
| 8.217
| 12-01-26
|
| 90,000
| 69,354
|
| DISH Network Corp.
| 3.375
| 08-15-26
|
| 38,000
| 22,990
|
| DraftKings Holdings, Inc. (C)
| 6.246
| 03-15-28
|
| 27,000
| 20,426
|
| Dropbox, Inc. (C)
| 0.840
| 03-01-28
|
| 100,000
| 96,250
|
| Etsy, Inc.
| 0.125
| 10-01-26
|
| 2,000
| 2,170
|
| Etsy, Inc.
| 0.250
| 06-15-28
|
| 130,000
| 99,255
|
| Euronet Worldwide, Inc.
| 0.750
| 03-15-49
|
| 28,000
| 25,760
|
| Exact Sciences Corp.
| 0.375
| 03-15-27
|
| 81,000
| 80,798
|
| Fluor Corp. (D)
| 1.125
| 08-15-29
|
| 26,000
| 26,208
|
| Health Catalyst, Inc.
| 2.500
| 04-15-25
|
| 5,000
| 4,794
|
| JetBlue Airways Corp.
| 0.500
| 04-01-26
|
| 190,000
| 149,264
|
| John Bean Technologies Corp.
| 0.250
| 05-15-26
|
| 88,000
| 80,740
|
| Lumentum Holdings, Inc.
| 0.500
| 06-15-28
|
| 75,000
| 57,285
|
| MP Materials Corp. (D)
| 0.250
| 04-01-26
|
| 230,000
| 200,537
|
| Nabors Industries, Inc.
| 0.750
| 01-15-24
|
| 16,000
| 15,456
|
| Nabors Industries, Inc. (D)
| 1.750
| 06-15-29
|
| 5,000
| 4,085
|
| NCL Corp., Ltd.
| 2.500
| 02-15-27
|
| 104,000
| 90,272
|
| Nutanix, Inc.
| 0.250
| 10-01-27
|
| 35,000
| 30,297
|
| Okta, Inc.
| 0.125
| 09-01-25
|
| 85,000
| 77,520
|
| ON Semiconductor Corp. (D)
| 0.500
| 03-01-29
|
| 15,000
| 17,130
|
| PAR Technology Corp.
| 1.500
| 10-15-27
|
| 15,000
| 12,900
|
| Patrick Industries, Inc.
| 1.750
| 12-01-28
|
| 37,000
| 36,945
|
| Pebblebrook Hotel Trust
| 1.750
| 12-15-26
|
| 55,000
| 46,717
|
| Pegasystems, Inc.
| 0.750
| 03-01-25
|
| 37,000
| 33,929
|
| Pioneer Natural Resources Company
| 0.250
| 05-15-25
|
| 3,000
| 7,577
|
| Rapid7, Inc.
| 0.250
| 03-15-27
|
| 100,000
| 88,063
|
| SEE NOTES TO FINANCIAL STATEMENTS
| ANNUAL REPORT | JOHN HANCOCK OPPORTUNISTIC FIXED INCOME FUND
| 25
|
|
| Rate (%)
| Maturity date
|
| Par value^
| Value
|
| United States (continued)
|
|
|
|
|
|
| Redfin Corp.
| 0.500
| 04-01-27
|
| 95,000
| 60,325
|
| Repay Holdings Corp. (C)(D)
| 7.975
| 02-01-26
|
| 415,000
| 343,662
|
| Shake Shack, Inc. (C)
| 5.890
| 03-01-28
|
| 15,000
| 11,550
|
| Shift4 Payments, Inc.
| 0.500
| 08-01-27
|
| 70,000
| 57,960
|
| Snap, Inc.
| 0.125
| 03-01-28
|
| 485,000
| 341,967
|
| Southwest Airlines Company
| 1.250
| 05-01-25
|
| 17,000
| 17,833
|
| Splunk, Inc.
| 1.125
| 06-15-27
|
| 133,000
| 116,708
|
| Spotify USA, Inc. (C)
| 6.369
| 03-15-26
|
| 105,000
| 89,565
|
| Stem, Inc. (D)
| 0.500
| 12-01-28
|
| 85,000
| 50,405
|
| Teladoc Health, Inc.
| 1.250
| 06-01-27
|
| 74,000
| 59,385
|
| The Greenbrier Companies, Inc.
| 2.875
| 04-15-28
|
| 90,000
| 87,921
|
| The Middleby Corp.
| 1.000
| 09-01-25
|
| 2,000
| 2,444
|
| Uber Technologies, Inc. (C)
| 2.883
| 12-15-25
|
| 112,000
| 104,837
|
| Welltower OP LLC (D)
| 2.750
| 05-15-28
|
| 2,000
| 2,057
|
|
|
| Western Digital Corp.
| 1.500
| 02-01-24
|
| 27,000
| 26,399
|
| Term loans (I) 4.1%
|
|
|
| $5,124,733
|
| (Cost $5,187,715)
|
|
|
|
|
|
| Cayman Islands 0.0%
|
|
|
|
| 0
|
| Paragon Offshore Finance Company, Term Loan B (G)(J)
| 0.000
| 07-18-22
|
| 9,802
| 0
|
| Luxembourg 0.2%
|
|
|
|
| 225,313
|
| Belron Luxembourg Sarl, 2023 Term Loan (3 month SOFR + 2.750%)
| 8.160
| 04-18-29
|
| 100,000
| 100,000
|
| Delta 2 Lux Sarl, Term Loan B (1 month SOFR + 3.000%)
| 8.331
| 01-15-30
|
| 125,000
| 125,313
|
| United States 3.9%
|
|
|
|
| 4,899,420
|
| Aretec Group, Inc., 2023 Incremental Term Loan
| 9.916
| 08-09-30
|
| 100,000
| 99,719
|
| Asurion LLC, 2020 Term Loan B8 (3 month LIBOR + 3.250%)
| 8.788
| 12-23-26
|
| 96,571
| 93,794
|
| Asurion LLC, 2021 2nd Lien Term Loan B3 (1 month SOFR + 5.250%)
| 10.695
| 01-31-28
|
| 230,000
| 205,346
|
| athenahealth, Inc., 2022 Term Loan B (1 month SOFR + 3.500%)
| 8.820
| 02-15-29
|
| 88,835
| 87,687
|
| Barnes Group, Inc., Term Loan B (K)
| TBD
| 08-09-30
|
| 100,000
| 100,083
|
| Berlin Packaging LLC, 2021 Term Loan B5 (1 and 3 month SOFR + 3.750%)
| 9.188
| 03-11-28
|
| 147,375
| 145,810
|
| Caesars Entertainment, Inc., Term Loan B (1 month SOFR + 3.250%)
| 8.681
| 02-06-30
|
| 104,738
| 104,725
|
| Carnival Corp., 2021 Incremental Term Loan B (1 month SOFR + 3.250%)
| 8.696
| 10-18-28
|
| 123,125
| 122,779
|
| 26
| JOHN HANCOCK OPPORTUNISTIC FIXED INCOME FUND | ANNUAL REPORT
| SEE NOTES TO FINANCIAL STATEMENTS
|
|
| Rate (%)
| Maturity date
|
| Par value^
| Value
|
| United States (continued)
|
|
|
|
|
|
| Cinemark USA, Inc., 2023 Term Loan B (1 and 3 month SOFR + 3.750%)
| 9.054
| 05-24-30
|
| 124,688
| $124,272
|
| Coherent Corp., 2022 Term Loan B (1 month SOFR + 2.750%)
| 8.196
| 07-02-29
|
| 96,248
| 95,912
|
| Core & Main LP, 2021 Term Loan B (1 and 3 month SOFR + 2.500%)
| 7.846
| 07-27-28
|
| 145,000
| 144,518
|
| Crocs, Inc., 2023 Term Loan B (1 month SOFR + 3.100%)
| 8.431
| 02-20-29
|
| 114,000
| 114,272
|
| Dcert Buyer, Inc., 2019 Term Loan B (1 month SOFR + 4.000%)
| 9.331
| 10-16-26
|
| 198,424
| 197,553
|
| Elanco Animal Health, Inc., Term Loan B (1 month SOFR + 1.750%)
| 7.168
| 08-01-27
|
| 111,316
| 110,169
|
| Emerald Debt Merger Sub LLC, Term Loan B (3 month SOFR + 3.000%)
| 8.331
| 05-31-30
|
| 183,486
| 183,602
|
| Filtration Group Corp., 2023 USD Term Loan (1 month SOFR + 4.250%)
| 9.696
| 10-21-28
|
| 109,725
| 109,976
|
| First Brands Group LLC, 2022 Incremental Term Loan (6 month SOFR + 5.000%)
| 10.881
| 03-30-27
|
| 100,000
| 98,500
|
| Great Outdoors Group LLC, 2021 Term Loan B1 (1 month SOFR + 3.750%)
| 9.196
| 03-06-28
|
| 112,140
| 111,685
|
| Hanesbrands, Inc., 2023 Term Loan B (1 month SOFR + 3.750%)
| 9.081
| 03-08-30
|
| 114,713
| 114,569
|
| Hightower Holding LLC, 2021 Term Loan B (3 month SOFR + 4.000%)
| 9.351
| 04-21-28
|
| 147,375
| 145,287
|
| HUB International, Ltd., 2023 Term Loan B (3 month SOFR + 4.250%)
| 9.584
| 06-20-30
|
| 148,423
| 148,825
|
| Hyland Software, Inc., 2018 1st Lien Term Loan (1 month SOFR + 3.500%)
| 8.946
| 07-01-24
|
| 97,194
| 97,080
|
| IRB Holding Corp., 2022 Term Loan B (1 month SOFR + 3.000%)
| 8.431
| 12-15-27
|
| 423,605
| 421,000
|
| Medline Borrower LP, USD Term Loan B (1 month SOFR + 3.250%)
| 8.696
| 10-23-28
|
| 187,625
| 187,409
|
| NEP Group, Inc., 2018 1st Lien Term Loan (1 month SOFR + 3.250%)
| 8.696
| 10-20-25
|
| 50,987
| 47,464
|
| Polaris Newco LLC, USD Term Loan B (3 month LIBOR + 4.000%)
| 9.538
| 06-02-28
|
| 98,250
| 95,242
|
| Quartz Acquireco LLC, Term Loan B (1 month SOFR + 3.500%)
| 8.820
| 06-28-30
|
| 100,000
| 99,875
|
| Quikrete Holdings, Inc., 2016 1st Lien Term Loan (1 month SOFR + 2.625%)
| 8.071
| 02-01-27
|
| 96,500
| 96,369
|
| SEE NOTES TO FINANCIAL STATEMENTS
| ANNUAL REPORT | JOHN HANCOCK OPPORTUNISTIC FIXED INCOME FUND
| 27
|
|
| Rate (%)
| Maturity date
|
| Par value^
| Value
|
| United States (continued)
|
|
|
|
|
|
| Sedgwick Claims Management Services, Inc., 2023 Term Loan B (1 month SOFR + 3.750%)
| 9.081
| 02-24-28
|
| 226,917
| $227,119
|
| SRS Distribution, Inc., 2021 Term Loan B (1 month SOFR + 3.500%)
| 8.946
| 06-02-28
|
| 107,308
| 105,766
|
| SS&C Technologies, Inc., 2018 Term Loan B3 (1 month SOFR + 1.750%)
| 7.196
| 04-16-25
|
| 70,999
| 70,992
|
| SS&C Technologies, Inc., 2018 Term Loan B4 (1 month SOFR + 1.750%)
| 7.196
| 04-16-25
|
| 67,043
| 67,037
|
| Surgery Center Holdings, Inc., 2021 Term Loan (1 month SOFR + 3.750%)
| 9.178
| 08-31-26
|
| 124,310
| 124,457
|
| The Dun & Bradstreet Corp., 2023 Term Loan B (1 month SOFR + 2.750%)
| 8.170
| 02-06-26
|
| 141,533
| 141,622
|
| TransDigm, Inc., 2020 Term Loan E (3 month LIBOR + 2.250%)
| 7.788
| 05-30-25
|
| 167,274
| 167,349
|
| Windsor Holdings III LLC, USD Term Loan B (1 month SOFR + 4.500%)
| 9.818
| 08-01-30
|
| 115,000
| 114,497
|
|
|
| WW International, Inc., 2021 Term Loan B (1 month SOFR + 3.500%)
| 8.946
| 04-13-28
|
| 236,605
| 177,059
|
| Collateralized mortgage obligations 3.7%
|
|
|
| $4,532,540
|
| (Cost $4,652,416)
|
|
|
|
|
|
| Commercial and residential 1.3%
|
|
| 1,525,556
|
| Angel Oak Mortgage Trust
|
|
|
|
|
|
| Series 2020-3, Class M1 (D)(L)
| 3.809
| 04-25-65
|
| 50,000
| 44,800
|
| BANK
|
|
|
|
|
|
| Series 2020-BN25, Class AS
| 2.841
| 01-15-63
|
| 40,000
| 32,437
|
| Series 2021-BN31, Class C (L)
| 2.545
| 02-15-54
|
| 30,000
| 18,885
|
| Series 2022-BNK42, Class AS (L)
| 4.879
| 06-15-55
|
| 40,000
| 36,077
|
| BBCMS Mortgage Trust
|
|
|
|
|
|
| Series 2023-C20, Class AS (L)
| 5.973
| 07-15-56
|
| 10,000
| 9,973
|
| Benchmark Mortgage Trust
|
|
|
|
|
|
| Series 2020-B16, Class AM (L)
| 2.944
| 02-15-53
|
| 40,000
| 32,873
|
| BRAVO Residential Funding Trust
|
|
|
|
|
|
| Series 2020-NQM1, Class M1 (D)(L)
| 3.181
| 05-25-60
|
| 129,000
| 118,481
|
| Series 2021-NQM1, Class M1 (D)(L)
| 2.316
| 02-25-49
|
| 100,000
| 71,792
|
| BX Trust
|
|
|
|
|
|
| Series 2021-ARIA, Class C (1 month CME Term SOFR + 1.760%) (D)(H)
| 7.070
| 10-15-36
|
| 20,000
| 19,222
|
| 28
| JOHN HANCOCK OPPORTUNISTIC FIXED INCOME FUND | ANNUAL REPORT
| SEE NOTES TO FINANCIAL STATEMENTS
|
|
| Rate (%)
| Maturity date
|
| Par value^
| Value
|
| Commercial and residential (continued)
|
|
|
|
| Series 2021-MFM1, Class D (1 month CME Term SOFR + 1.614%) (D)(H)
| 6.924
| 01-15-34
|
| 9,042
| $8,818
|
| Series 2023-DELC, Class A (1 month CME Term SOFR + 2.690%) (D)(H)
| 8.000
| 05-15-38
|
| 50,000
| 50,016
|
| CAMB Commercial Mortgage Trust
|
|
|
|
|
|
| Series 2019-LIFE, Class E (1 month CME Term SOFR + 2.264%) (D)(H)
| 7.575
| 12-15-37
|
| 134,000
| 132,312
|
| CIM Trust
|
|
|
|
|
|
| Series 2021-R4, Class A1 (D)(L)
| 2.000
| 05-01-61
|
| 63,692
| 54,810
|
| Citigroup Commercial Mortgage Trust
|
|
|
|
|
|
| Series 2023-PRM3, Class A (D)(L)
| 6.572
| 07-10-28
|
| 100,000
| 101,295
|
| Commercial Mortgage Trust (Deutsche Bank AG)
|
|
|
|
|
|
| Series 2013-LC13, Class AM (D)(L)
| 4.557
| 08-10-46
|
| 52,446
| 52,315
|
| Deephaven Residential Mortgage Trust
|
|
|
|
|
|
| Series 2020-2, Class M1 (D)(L)
| 4.112
| 05-25-65
|
| 100,000
| 91,629
|
| New Residential Mortgage Loan Trust
|
|
|
|
|
|
| Series 2015-2A, Class B4 (D)(L)
| 5.371
| 08-25-55
|
| 51,280
| 48,158
|
| NYMT Loan Trust I
|
|
|
|
|
|
| Series 2021-BPL1, Class A1 (2.239% to 5-25-24, then 4.239% thereafter) (D)
| 2.239
| 05-25-26
|
| 89,387
| 88,482
|
| OBX Trust
|
|
|
|
|
|
| Series 2022-NQM5, Class A1 (4.310% to 5-1-26, then 5.310% thereafter) (D)
| 4.310
| 05-25-62
|
| 88,132
| 83,737
|
| OPG Trust
|
|
|
|
|
|
| Series 2021-PORT, Class D (1 month CME Term SOFR + 1.245%) (D)(H)
| 6.556
| 10-15-36
|
| 19,975
| 19,361
|
| UBS Commercial Mortgage Trust
|
|
|
|
|
|
| Series 2019-C16, Class ASB
| 3.460
| 04-15-52
|
| 154,000
| 144,056
|
| Verus Securitization Trust
|
|
|
|
|
|
| Series 2020-5, Class M1 (D)(L)
| 2.601
| 05-25-65
|
| 200,000
| 161,567
|
| Wells Fargo Commercial Mortgage Trust
|
|
|
|
|
|
| Series 2020-C58, Class B
| 2.704
| 07-15-53
|
| 65,000
| 46,256
|
| Wells Fargo Mortgage Backed Securities Trust
|
|
|
|
|
|
| Series 2019-3, Class A1 (D)(L)
| 3.500
| 07-25-49
|
| 6,128
| 5,426
|
| WF-RBS Commercial Mortgage Trust
|
|
|
|
|
|
| Series 2011-C4, Class C (D)(L)
| 4.993
| 06-15-44
|
| 35,353
| 32,878
|
| WSTN Trust
|
|
|
|
|
|
| Series 2023-MAUI, Class B (D)(L)
| 7.263
| 07-05-37
|
| 20,000
| 19,900
|
| SEE NOTES TO FINANCIAL STATEMENTS
| ANNUAL REPORT | JOHN HANCOCK OPPORTUNISTIC FIXED INCOME FUND
| 29
|
|
| Rate (%)
| Maturity date
|
| Par value^
| Value
|
| U.S. Government Agency 2.4%
|
|
| $3,006,984
|
| Federal Home Loan Mortgage Corp.
|
|
|
|
|
|
| Series 2020-HQA3, Class B1 (1 month SOFR + 5.864%) (D)(H)
| 11.152
| 07-25-50
|
| 40,068
| 43,470
|
| Series 2021-DNA6, Class M2 (1 month SOFR + 1.500%) (D)(H)
| 6.788
| 10-25-41
|
| 178,000
| 174,309
|
| Series 2021-HQA1, Class M2 (1 month SOFR + 2.250%) (D)(H)
| 7.538
| 08-25-33
|
| 167,833
| 165,945
|
| Series 2021-HQA2, Class M2 (1 month SOFR + 2.050%) (D)(H)
| 7.338
| 12-25-33
|
| 100,000
| 98,071
|
| Series 2021-HQA3, Class M2 (1 month SOFR + 2.100%) (D)(H)
| 7.388
| 09-25-41
|
| 180,000
| 175,804
|
| Series 2021-P011, Class X1 IO
| 1.783
| 09-25-45
|
| 94,603
| 11,330
|
| Series 2022-DNA1, Class B1 (1 month SOFR + 3.400%) (D)(H)
| 8.688
| 01-25-42
|
| 150,000
| 148,970
|
| Series 2022-DNA3, Class M1B (1 month SOFR + 2.900%) (D)(H)
| 8.188
| 04-25-42
|
| 50,000
| 50,853
|
| Series 2022-DNA5, Class M2 (1 month SOFR + 6.750%) (D)(H)
| 12.038
| 06-25-42
|
| 50,000
| 55,512
|
| Series 2022-DNA6, Class M2 (1 month SOFR + 5.750%) (D)(H)
| 11.038
| 09-25-42
|
| 120,000
| 130,350
|
| Series 2022-HQA1, Class M1B (1 month SOFR + 3.500%) (D)(H)
| 8.788
| 03-25-42
|
| 15,000
| 15,450
|
| Series 2022-HQA1, Class M2 (1 month SOFR + 5.250%) (D)(H)
| 10.538
| 03-25-42
|
| 540,000
| 568,015
|
| Series 2022-HQA3, Class M1B (1 month SOFR + 3.550%) (D)(H)
| 8.838
| 08-25-42
|
| 40,000
| 40,898
|
| Series 2023-DNA1, Class M2 (1 month SOFR + 5.500%) (D)(H)
| 10.796
| 03-25-43
|
| 25,000
| 26,875
|
| Series 2023-DNA2, Class B1 (1 month SOFR + 7.600%) (D)(H)
| 12.896
| 04-25-43
|
| 15,000
| 16,188
|
| Series 2023-HQA2, Class M1B (1 month SOFR + 3.350%) (D)(H)
| 8.638
| 06-25-43
|
| 35,000
| 35,656
|
| Series 4898, Class SA IO
| 0.797
| 07-15-49
|
| 373,025
| 34,907
|
| Series 4954, Class SL IO
| 0.648
| 02-25-50
|
| 1,052,330
| 101,864
|
| Series 4999, Class KS IO
| 0.748
| 12-25-42
|
| 299,064
| 24,993
|
| Series 4999, Class PS IO
| 0.548
| 03-25-44
|
| 375,511
| 29,405
|
| Series K103, Class X1 IO
| 0.757
| 11-25-29
|
| 224,049
| 7,196
|
| Series K105, Class X1 IO
| 1.644
| 01-25-30
|
| 169,387
| 12,920
|
| Series K737, Class X1 IO
| 0.747
| 10-25-26
|
| 111,418
| 1,711
|
| Series K740, Class X1 IO
| 0.831
| 09-25-27
|
| 98,533
| 2,501
|
| Series Q014, Class X IO
| 2.789
| 10-25-55
|
| 93,920
| 16,527
|
| Federal National Mortgage Association
|
|
|
|
|
|
| Series 2016-88, Class SK IO
| 0.598
| 12-25-46
|
| 300,417
| 29,502
|
| Series 2017-C07, Class 2B1 (1 month SOFR + 4.564%) (H)
| 9.852
| 05-25-30
|
| 55,000
| 59,400
|
| Series 2019-25, Class SA IO
| 0.648
| 06-25-49
|
| 1,280,341
| 123,008
|
| Series 2019-50, Class S IO
| 0.648
| 09-25-49
|
| 753,843
| 76,965
|
| 30
| JOHN HANCOCK OPPORTUNISTIC FIXED INCOME FUND | ANNUAL REPORT
| SEE NOTES TO FINANCIAL STATEMENTS
|
|
| Rate (%)
| Maturity date
|
| Par value^
| Value
|
| U.S. Government Agency (continued)
|
|
|
|
| Series 2019-68, Class SC IO
| 0.598
| 11-25-49
|
| 247,910
| $24,131
|
| Series 2020-R01, Class 1M2 (1 month SOFR + 2.164%) (D)(H)
| 7.452
| 01-25-40
|
| 13,497
| 13,578
|
| Series 2022-R02, Class 2B1 (1 month SOFR + 4.500%) (D)(H)
| 9.788
| 01-25-42
|
| 150,000
| 152,284
|
| Series 2022-R03, Class 1B1 (1 month SOFR + 6.250%) (D)(H)
| 11.538
| 03-25-42
|
| 67,000
| 73,100
|
| Series 2022-R03, Class 1M2 (1 month SOFR + 3.500%) (D)(H)
| 8.788
| 03-25-42
|
| 49,000
| 50,377
|
| Series 2022-R04, Class 1B1 (1 month SOFR + 5.250%) (D)(H)
| 10.538
| 03-25-42
|
| 115,000
| 121,775
|
| Series 2022-R05, Class 2B1 (1 month SOFR + 4.500%) (D)(H)
| 9.788
| 04-25-42
|
| 100,000
| 101,742
|
| Series 2022-R09, Class 2M2 (1 month SOFR + 4.750%) (D)(H)
| 10.046
| 09-25-42
|
| 60,000
| 63,600
|
| Series 2023-R01, Class 1B1 (1 month SOFR + 5.100%) (D)(H)
| 10.396
| 12-25-42
|
| 15,000
| 15,983
|
| Series 2023-R02, Class 1M2 (1 month SOFR + 3.350%) (D)(H)
| 8.638
| 01-25-43
|
| 25,000
| 25,608
|
| Series 2023-R03, Class 2M2 (1 month SOFR + 3.900%) (D)(H)
| 9.188
| 04-25-43
|
| 20,000
| 20,750
|
| Series 2023-R04, Class 1M2 (1 month SOFR + 3.550%) (D)(H)
| 8.846
| 05-25-43
|
| 25,000
| 25,938
|
| Series 2023-R05, Class 1M2 (1 month SOFR + 3.100%) (D)(H)
| 8.396
| 06-25-43
|
| 24,000
| 24,420
|
|
|
| Series 2023-R06, Class 1B1 (1 month SOFR + 3.900%) (D)(H)
| 9.188
| 07-25-43
|
| 15,000
| 15,103
|
| Asset backed securities 2.9%
|
|
|
|
| $3,659,518
|
| (Cost $3,813,812)
|
|
|
|
|
|
| Asset backed securities 2.9%
|
|
| 3,659,518
|
| AASET Trust
|
|
|
|
|
|
| Series 2021-2A, Class A (D)
| 2.798
| 01-15-47
|
| 207,618
| 179,413
|
| Avis Budget Rental Car Funding AESOP LLC
|
|
|
|
|
|
| Series 2022-5A, Class A (D)
| 6.120
| 04-20-27
|
| 100,000
| 100,223
|
| Bain Capital Credit CLO, Ltd.
|
|
|
|
|
|
| Series 2020-5A, Class D (3 month CME Term SOFR + 3.812%) (D)(H)
| 9.138
| 01-20-32
|
| 250,000
| 249,880
|
| Benefit Street Partners CLO XIX, Ltd.
|
|
|
|
|
|
| Series 2019-19A, Class E (3 month CME Term SOFR + 7.282%) (D)(H)
| 12.590
| 01-15-33
|
| 250,000
| 241,916
|
| Bojangles Issuer LLC
|
|
|
|
|
|
| Series 2020-1A, Class A2 (D)
| 3.832
| 10-20-50
|
| 29,550
| 26,996
|
| Carvana Auto Receivables Trust
|
|
|
|
|
|
| Series 2023-P3, Class A4 (D)
| 5.710
| 07-10-29
|
| 10,000
| 10,012
|
| CIM Trust
|
|
|
|
|
|
| SEE NOTES TO FINANCIAL STATEMENTS
| ANNUAL REPORT | JOHN HANCOCK OPPORTUNISTIC FIXED INCOME FUND
| 31
|
|
| Rate (%)
| Maturity date
|
| Par value^
| Value
|
| Asset backed securities (continued)
|
|
|
|
| Series 2021-NR2, Class A1 (2.568% to 3-1-24, then 5.568% to 3-1-25, then 6.568%
thereafter) (D)
| 2.568
| 07-25-59
|
| 47,143
| $45,408
|
| DataBank Issuer
|
|
|
|
|
|
| Series 2021-1A, Class B (D)
| 2.650
| 02-27-51
|
| 40,000
| 33,906
|
| Domino’s Pizza Master Issuer LLC
|
|
|
|
|
|
| Series 2019-1A, Class A2 (D)
| 3.668
| 10-25-49
|
| 48,250
| 42,316
|
| Series 2021-1A, Class A2II (D)
| 3.151
| 04-25-51
|
| 48,875
| 40,101
|
| Exeter Automobile Receivables Trust
|
|
|
|
|
|
| Series 2023-4A, Class C
| 6.510
| 08-15-28
|
| 35,000
| 35,137
|
| First Investors Auto Owner Trust
|
|
|
|
|
|
| Series 2021-2A, Class D (D)
| 1.660
| 12-15-27
|
| 190,000
| 171,199
|
| Series 2022-1A, Class D (D)
| 3.790
| 06-15-28
|
| 55,000
| 51,503
|
| FS Rialto
|
|
|
|
|
|
| Series 2021-FL3, Class A (1 month CME Term SOFR + 1.364%) (D)(H)
| 6.677
| 11-16-36
|
| 105,000
| 102,812
|
| GLS Auto Receivables Issuer Trust
|
|
|
|
|
|
| Series 2023-1A, Class C (D)
| 6.380
| 12-15-28
|
| 21,000
| 20,972
|
| Series 2023-3A, Class D (D)
| 6.440
| 05-15-29
|
| 20,000
| 19,943
|
| Greystone Commercial Real Estate Notes, Ltd.
|
|
|
|
|
|
| Series 2021-FL3, Class B (1 month CME Term SOFR + 1.764%) (D)(H)
| 7.075
| 07-15-39
|
| 100,000
| 94,804
|
| Hertz Vehicle Financing III LP
|
|
|
|
|
|
| Series 2021-2A, Class B (D)
| 2.120
| 12-27-27
|
| 100,000
| 87,968
|
| Hertz Vehicle Financing LLC
|
|
|
|
|
|
| Series 2022-2A, Class C (D)
| 2.950
| 06-26-28
|
| 100,000
| 86,883
|
| JFIN CLO, Ltd.
|
|
|
|
|
|
| Series 2016-1A, Class DR (3 month CME Term SOFR + 3.662%) (D)(H)
| 9.019
| 10-27-28
|
| 150,000
| 149,039
|
| Lendbuzz Securitization Trust
|
|
|
|
|
|
| Series 2021-1A, Class A (D)
| 1.460
| 06-15-26
|
| 33,632
| 32,422
|
| LoanCore Issuer, Ltd.
|
|
|
|
|
|
| Series 2021-CRE4, Class A (1 month SOFR + 0.914%) (D)(H)
| 6.103
| 07-15-35
|
| 12,571
| 12,482
|
| MF1, Ltd.
|
|
|
|
|
|
| Series 2022-FL8, Class AS (1 month CME Term SOFR + 1.750%) (D)(H)
| 7.064
| 02-19-37
|
| 100,000
| 97,705
|
| New Economy Assets Phase 1 Sponsor LLC
|
|
|
|
|
|
| Series 2021-1, Class A1 (D)
| 1.910
| 10-20-61
|
| 100,000
| 86,226
|
| Palmer Square Loan Funding, Ltd.
|
|
|
|
|
|
| Series 2021-4A, Class C (3 month CME Term SOFR + 2.862%) (D)(H)
| 8.170
| 10-15-29
|
| 250,000
| 247,534
|
| Pretium Mortgage Credit Partners LLC
|
|
|
|
|
|
| 32
| JOHN HANCOCK OPPORTUNISTIC FIXED INCOME FUND | ANNUAL REPORT
| SEE NOTES TO FINANCIAL STATEMENTS
|
|
| Rate (%)
| Maturity date
|
| Par value^
| Value
|
| Asset backed securities (continued)
|
|
|
|
| Series 2021-RN1, Class A2 (3.598% to 6-25-25, then 7.598% thereafter) (D)
| 3.598
| 02-25-61
|
| 100,000
| $85,088
|
| Progress Residential Trust
|
|
|
|
|
|
| Series 2021-SFR2, Class E1 (D)
| 2.547
| 04-19-38
|
| 100,000
| 88,227
|
| Series 2021-SFR3, Class D (D)
| 2.288
| 05-17-26
|
| 100,000
| 88,489
|
| Series 2022-SFR4, Class C (D)
| 4.888
| 05-17-41
|
| 100,000
| 93,580
|
| Series 2022-SFR5, Class D (D)
| 5.734
| 06-17-39
|
| 100,000
| 95,942
|
| Sixth Street CLO XVI, Ltd.
|
|
|
|
|
|
| Series 2020-16A, Class E (3 month CME Term SOFR + 7.582%) (D)(H)
| 12.908
| 10-20-32
|
| 150,000
| 150,142
|
| Sound Point CLO XXVIII, Ltd.
|
|
|
|
|
|
| Series 2020-3A, Class C (3 month CME Term SOFR + 2.512%) (D)(H)
| 7.863
| 01-25-32
|
| 250,000
| 239,710
|
| Texas Natural Gas Securitization Finance Corp.
|
|
|
|
|
|
| Series 2023-1, Class A2
| 5.169
| 04-01-41
|
| 30,000
| 29,893
|
| Textainer Marine Containers, Ltd.
|
|
|
|
|
|
| Series 2021-3A, Class A (D)
| 1.940
| 08-20-46
|
| 84,000
| 69,882
|
| Tricon American Homes Trust
|
|
|
|
|
|
| Series 2020-SFR2, Class E1 (D)
| 2.730
| 11-17-39
|
| 100,000
| 85,293
|
| TRTX Issuer, Ltd.
|
|
|
|
|
|
| Series 2019-FL3, Class D (1 month CME Term SOFR + 2.564%) (D)(H)
| 7.878
| 10-15-34
|
| 100,000
| 93,057
|
| Venture XIII CLO, Ltd.
|
|
|
|
|
|
| Series 2013-13A, Class DR (3 month LIBOR + 3.300%) (D)(H)
| 8.840
| 09-10-29
|
| 175,000
| 159,914
|
| VOLT XCV LLC
|
|
|
|
|
|
| Series 2021-NPL4, Class A1 (2.240% to 2-25-24, then 5.240% to 2-25-25, then 6.240%
thereafter) (D)
| 2.240
| 03-27-51
|
| 81,919
| 78,588
|
| Westlake Automobile Receivables Trust
|
|
|
|
|
|
| Series 2023-2A, Class C (D)
| 6.290
| 03-15-28
|
| 35,000
| 34,913
|
|
|
|
|
|
|
| Shares
| Value
|
| Common stocks 0.0%
|
|
|
|
| $32,915
|
| (Cost $69,029)
|
|
|
|
|
|
| United Kingdom 0.0%
|
|
|
|
| 19,879
|
| Endeavour Mining PLC
|
| 961
| 19,879
|
| United States 0.0%
|
|
|
|
| 13,036
|
| Becton, Dickinson and Company
|
| 7
| 1,956
|
| Bloomin’ Brands, Inc.
|
| 85
| 2,385
|
| Paragon Offshore PLC, Litigation Trust A (E)(J)
|
| 2,695
| 270
|
| SEE NOTES TO FINANCIAL STATEMENTS
| ANNUAL REPORT | JOHN HANCOCK OPPORTUNISTIC FIXED INCOME FUND
| 33
|
|
|
|
|
| Shares
| Value
|
| United States (continued)
|
|
|
|
|
|
| Paragon Offshore PLC, Litigation Trust B (E)(J)
|
| 1,348
| $8,425
|
|
|
| Southcross Holdings GP, Class A (E)(J)
|
| 246
| 0
|
| Preferred securities 0.6%
|
|
|
|
| $750,772
|
| (Cost $723,386)
|
|
|
|
|
|
| Bermuda 0.1%
|
|
|
|
| 70,662
|
| Athene Holding, Ltd., 6.375% (6.375% to 6-30-25, then 5 Year CMT + 5.970%)
|
|
| 2,896
| 70,662
|
| United States 0.5%
|
|
|
|
| 680,110
|
| AGNC Investment Corp., 6.125% (6.125% to 4-15-25, then 3 month LIBOR + 4.697%)
|
|
| 10,000
| 218,300
|
| AGNC Investment Corp., 7.750% (7.750% to 10-15-27, then 5 Year CMT + 4.390%)
|
|
| 10,000
| 225,600
|
| AT&T, Inc., 5.000%
|
|
| 550
| 11,182
|
| Bank of America Corp., 7.250%
|
|
| 77
| 89,235
|
| Fluor Corp., 6.500%
|
|
| 1
| 1,613
|
| NextEra Energy, Inc., 6.926%
|
|
| 1,071
| 45,303
|
|
|
| Wells Fargo & Company, 7.500%
|
|
| 77
| 88,877
|
| Exchange-traded funds 0.1%
|
|
|
|
| $155,844
|
| (Cost $155,173)
|
|
|
|
|
|
| SPDR Blackstone Senior Loan ETF
|
| 3,700
| 155,844
|
|
|
|
|
|
|
| Par value^
| Value
|
| Escrow certificates 0.0%
|
|
|
| $46
|
| (Cost $491,686)
|
|
|
|
|
|
| Alta Mesa Holdings LP (E)(J)
|
| 460,000
| 46
|
| Texas Competitive Electric Holdings Company LLC (E)(J)
|
| 10,820,544
| 0
|
|
|
|
|
| Yield (%)
|
| Shares
| Value
|
| Short-term investments 22.8%
|
|
|
| $28,403,194
|
| (Cost $28,403,194)
|
|
|
|
|
|
| Short-term funds 22.8%
|
|
|
|
| 28,403,194
|
| State Street Institutional U.S. Government Money Market Fund, Premier Class
| 5.2681(M)
|
| 28,403,194
| 28,403,194
|
|
|
| Total investments (Cost $156,487,419) 119.7%
|
|
| $149,209,184
|
| Other assets and liabilities, net (19.7%)
|
|
| (24,583,689)
|
| Total net assets 100.0%
|
|
|
|
| $124,625,495
|
| The percentage shown for each investment category is the total value of the category as a percentage of the net assets of the fund.
|
| ^All par values are denominated in U.S. dollars unless otherwise indicated.
|
| Currency Abbreviations
|
| AUD
| Australian Dollar
|
| BRL
| Brazilian Real
|
| 34
| JOHN HANCOCK OPPORTUNISTIC FIXED INCOME FUND | ANNUAL REPORT
| SEE NOTES TO FINANCIAL STATEMENTS
|
| CAD
| Canadian Dollar
|
| CLP
| Chilean Peso
|
| COP
| Colombian Peso
|
| CZK
| Czech Republic Koruna
|
| EUR
| Euro
|
| GBP
| Pound Sterling
|
| HUF
| Hungarian Forint
|
| IDR
| Indonesian Rupiah
|
| ISK
| Icelandic Krona
|
| KRW
| Korean Won
|
| MXN
| Mexican Peso
|
| MYR
| Malaysian Ringgit
|
| NOK
| Norwegian Krone
|
| NZD
| New Zealand Dollar
|
| PEN
| Peruvian Nuevo Sol
|
| PLN
| Polish Zloty
|
| RON
| Romanian New Leu
|
| RUB
| Russian Ruble
|
| SEK
| Swedish Krona
|
| THB
| Thai Bhat
|
| UYU
| Uruguayan Peso
|
| ZAR
| South African Rand
|
| Security Abbreviations and Legend
|
| CME
| Chicago Mercantile Exchange
|
| CMT
| Constant Maturity Treasury
|
| EURIBOR
| Euro Interbank Offered Rate
|
| ICE
| Intercontinental Exchange
|
| IO
| Interest-Only Security - (Interest Tranche of Stripped Mortgage Pool). Rate shown is the annualized yield at the end of the period.
|
| LIBOR
| London Interbank Offered Rate
|
| PIK
| Pay-in-Kind Security - Represents a payment-in-kind which may pay interest in additional par and/or cash. Rates shown are the current rate and most recent payment rate.
|
| SOFR
| Secured Overnight Financing Rate
|
| TBA
| To Be Announced. A forward mortgage-backed securities trade issued by a U.S. Government Agency, to be delivered at an agreed-upon future settlement date.
|
| (A)
| All or a portion of this security is segregated at the custodian as collateral for certain derivatives.
|
| (B)
| Security purchased or sold on a when-issued or delayed delivery basis.
|
| (C)
| Zero coupon bonds are issued at a discount from their principal amount in lieu of paying interest periodically. Rate shown is the effective yield at period end.
|
| (D)
| These securities are exempt from registration under Rule 144A of the Securities Act of 1933. Such securities may be resold, normally to qualified institutional buyers, in transactions exempt from
registration. Rule 144A securities amounted to $19,600,443 or 15.7% of the fund’s net assets as of 8-31-23.
|
| (E)
| Non-income producing security.
|
| (F)
| Perpetual bonds have no stated maturity date. Date shown as maturity date is next call date.
|
| (G)
| Non-income producing - Issuer is in default.
|
| (H)
| Variable rate obligation. The coupon rate shown represents the rate at period end.
|
| (I)
| Term loans are variable rate obligations. The rate shown represents the rate at period end.
|
| SEE NOTES TO FINANCIAL STATEMENTS
| ANNUAL REPORT | JOHN HANCOCK OPPORTUNISTIC FIXED INCOME FUND
| 35
|
| (J)
| Security is valued using significant unobservable inputs and is classified as Level 3 in the fair value hierarchy. Refer to Note 2 to the financial statements.
|
| (K)
| This position represents an unsettled loan commitment at period end. Certain details associated with this purchase are not known prior to the settlement date, including coupon rate, which is disclosed
as TBD (To Be Determined).
|
| (L)
| Variable or floating rate security, the interest rate of which adjusts periodically based on a weighted average of interest rates and prepayments on the underlying pool of assets. The interest rate
shown is the current rate as of period end.
|
| (M)
| The rate shown is the annualized seven-day yield as of 8-31-23.
|
| *
| Yield represents either the annualized yield at the date of purchase, the stated coupon rate or, for floating rate securities, the rate at period end.
|
| 36
| JOHN HANCOCK OPPORTUNISTIC FIXED INCOME FUND | ANNUAL REPORT
| SEE NOTES TO FINANCIAL STATEMENTS
|
DERIVATIVES
FUTURES
| Open contracts
| Number of
contracts
| Position
| Expiration
date
| Notional
basis^
| Notional
value^
| Unrealized
appreciation
(depreciation)
|
| 10-Year Australian Treasury Bond Futures
| 5
| Long
| Sep 2023
| $374,273
| $377,386
| $3,113
|
| 10-Year U.S. Treasury Note Futures
| 67
| Long
| Dec 2023
| 7,385,452
| 7,439,094
| 53,642
|
| 2-Year U.S. Treasury Note Futures
| 153
| Long
| Dec 2023
| 31,083,624
| 31,181,937
| 98,313
|
| 30-Day Federal Funds Futures
| 15
| Long
| Dec 2023
| 5,914,379
| 5,911,098
| (3,281)
|
| 5-Year U.S. Treasury Note Futures
| 173
| Long
| Dec 2023
| 18,359,082
| 18,497,484
| 138,402
|
| German Euro BUND Futures
| 8
| Long
| Sep 2023
| 1,155,958
| 1,155,397
| (561)
|
| Ultra U.S. Treasury Bond Futures
| 3
| Long
| Dec 2023
| 344,445
| 348,328
| 3,883
|
| 10-Year Canada Government Bond Futures
| 3
| Short
| Dec 2023
| (264,716)
| (264,898)
| (182)
|
| 10-Year Japan Government Bond Future
| 8
| Short
| Sep 2023
| (8,145,811)
| (8,072,855)
| 72,956
|
| 5-Year Canada Government Bond Futures
| 2
| Short
| Dec 2023
| (161,705)
| (162,655)
| (950)
|
| Euro-BTP Italian Government Bond Futures
| 33
| Short
| Sep 2023
| (4,130,441)
| (4,148,031)
| (17,590)
|
| Euro-Buxl Futures
| 12
| Short
| Sep 2023
| (1,763,005)
| (1,741,033)
| 21,972
|
| Euro-OAT Futures
| 11
| Short
| Sep 2023
| (1,512,528)
| (1,525,692)
| (13,164)
|
| German Euro BOBL Futures
| 3
| Short
| Sep 2023
| (377,015)
| (377,712)
| (697)
|
| U.K. Long Gilt Bond Futures
| 1
| Short
| Dec 2023
| (120,522)
| (121,068)
| (546)
|
| U.S. Treasury Long Bond Futures
| 3
| Short
| Dec 2023
| (360,316)
| (365,063)
| (4,747)
|
| Ultra U.S. Treasury Bond Futures
| 3
| Short
| Dec 2023
| (384,073)
| (388,406)
| (4,333)
|
|
|
|
|
|
|
| $346,230
|
^ Notional basis refers to the
contractual amount agreed upon at inception of open contracts; notional value represents the current value of the open contract.
FORWARD FOREIGN CURRENCY CONTRACTS
| Contract to buy
| Contract to sell
| Counterparty (OTC)
| Contractual
settlement
date
| Unrealized
appreciation
| Unrealized
depreciation
|
| AUD
| 40,000
| USD
| 26,735
| BARC
| 9/20/2023
| —
| $(802)
|
| AUD
| 35,000
| USD
| 23,037
| CITI
| 9/20/2023
| —
| (346)
|
| AUD
| 5,000
| USD
| 3,393
| JPM
| 9/20/2023
| —
| (151)
|
| BRL
| 150,000
| USD
| 30,488
| BOA
| 9/5/2023
| —
| (197)
|
| BRL
| 105,000
| USD
| 21,333
| CITI
| 9/5/2023
| —
| (130)
|
| BRL
| 175,000
| USD
| 35,335
| DB
| 9/5/2023
| $3
| —
|
| BRL
| 22,369,000
| USD
| 4,574,844
| GSI
| 9/5/2023
| —
| (57,726)
|
| BRL
| 2,304,000
| USD
| 468,446
| MSI
| 9/5/2023
| —
| (3,184)
|
| BRL
| 200,000
| USD
| 40,667
| SCB
| 9/5/2023
| —
| (280)
|
| BRL
| 867,000
| USD
| 178,656
| SSB
| 9/5/2023
| —
| (3,577)
|
| BRL
| 3,758,000
| USD
| 768,767
| SSB
| 10/3/2023
| —
| (13,307)
|
| CAD
| 25,000
| USD
| 19,058
| GSI
| 9/20/2023
| —
| (550)
|
| CAD
| 30,000
| USD
| 22,782
| JPM
| 9/20/2023
| —
| (573)
|
| SEE NOTES TO FINANCIAL STATEMENTS
| ANNUAL REPORT | JOHN HANCOCK OPPORTUNISTIC FIXED INCOME FUND
| 37
|
FORWARD
FOREIGN CURRENCY CONTRACTS (continued)
| Contract to buy
| Contract to sell
| Counterparty (OTC)
| Contractual
settlement
date
| Unrealized
appreciation
| Unrealized
depreciation
|
| CAD
| 3,455,000
| USD
| 2,548,546
| BARC
| 9/29/2023
| $9,470
| —
|
| CLP
| 116,550,000
| USD
| 138,712
| BOA
| 9/20/2023
| —
| $(2,228)
|
| CLP
| 12,700,000
| USD
| 14,828
| CITI
| 9/20/2023
| 44
| —
|
| CLP
| 30,062,000
| USD
| 35,305
| GSI
| 9/20/2023
| —
| (101)
|
| CLP
| 12,200,000
| USD
| 14,966
| JPM
| 9/20/2023
| —
| (679)
|
| CLP
| 15,732,000
| USD
| 19,763
| MSI
| 9/20/2023
| —
| (1,340)
|
| CNY
| 355,000
| USD
| 48,799
| CITI
| 9/20/2023
| 16
| —
|
| CNY
| 518,000
| USD
| 72,077
| GSI
| 9/20/2023
| —
| (848)
|
| CNY
| 383,000
| USD
| 53,702
| HSBC
| 9/20/2023
| —
| (1,036)
|
| CNY
| 322,000
| USD
| 44,146
| JPM
| 9/20/2023
| 132
| —
|
| COP
| 122,363,000
| USD
| 30,507
| BOA
| 9/20/2023
| —
| (749)
|
| COP
| 555,300,000
| USD
| 131,148
| CITI
| 9/20/2023
| 3,900
| —
|
| COP
| 678,050,000
| USD
| 162,881
| DB
| 9/20/2023
| 2,018
| —
|
| COP
| 164,400,000
| USD
| 39,694
| GSI
| 9/20/2023
| 288
| —
|
| COP
| 990,436,000
| USD
| 231,939
| MSI
| 9/20/2023
| 8,933
| —
|
| COP
| 527,450,000
| USD
| 126,913
| SCB
| 9/20/2023
| 1,361
| —
|
| COP
| 67,300,000
| USD
| 16,473
| SSB
| 9/20/2023
| —
| (106)
|
| COP
| 1,904,347,000
| USD
| 463,091
| JPM
| 9/29/2023
| —
| (1,402)
|
| CZK
| 9,589,000
| USD
| 435,351
| MSI
| 9/20/2023
| —
| (3,593)
|
| EGP
| 137,000
| USD
| 4,099
| GSI
| 9/11/2023
| 314
| —
|
| EGP
| 146,000
| USD
| 4,390
| BOA
| 9/20/2023
| 281
| —
|
| EGP
| 2,410,000
| USD
| 73,147
| CITI
| 9/20/2023
| 3,955
| —
|
| EGP
| 1,560,000
| USD
| 47,032
| CITI
| 11/28/2023
| 384
| —
|
| EGP
| 1,620,000
| USD
| 49,076
| GSI
| 11/28/2023
| 164
| —
|
| EGP
| 137,000
| USD
| 3,782
| GSI
| 12/11/2023
| 336
| —
|
| EUR
| 181,000
| USD
| 197,962
| BOA
| 9/20/2023
| —
| (1,554)
|
| EUR
| 49,000
| USD
| 53,530
| BARC
| 9/20/2023
| —
| (359)
|
| EUR
| 305,000
| USD
| 333,925
| GSI
| 9/20/2023
| —
| (2,961)
|
| EUR
| 29,000
| USD
| 31,634
| HSBC
| 9/20/2023
| —
| (166)
|
| EUR
| 127,000
| USD
| 137,846
| JPM
| 9/20/2023
| —
| (35)
|
| EUR
| 58,000
| USD
| 63,237
| MSI
| 9/20/2023
| —
| (300)
|
| GBP
| 21,000
| USD
| 26,979
| BARC
| 9/20/2023
| —
| (374)
|
| GBP
| 24,000
| USD
| 30,851
| GSI
| 9/20/2023
| —
| (446)
|
| GBP
| 1,136,000
| USD
| 1,443,454
| JPM
| 9/29/2023
| —
| (4,207)
|
| HUF
| 30,400,000
| USD
| 88,318
| BOA
| 9/20/2023
| —
| (2,140)
|
| HUF
| 26,784,000
| USD
| 76,408
| BARC
| 9/20/2023
| —
| (481)
|
| HUF
| 6,987,000
| USD
| 20,047
| CITI
| 9/20/2023
| —
| (241)
|
| HUF
| 39,516,000
| USD
| 112,145
| GSI
| 9/20/2023
| —
| (125)
|
| HUF
| 145,730,000
| USD
| 412,603
| JPM
| 9/20/2023
| 513
| —
|
| HUF
| 21,700,000
| USD
| 64,030
| MSI
| 9/20/2023
| —
| (2,515)
|
| HUF
| 73,309,000
| USD
| 205,791
| BOA
| 9/29/2023
| 1,649
| —
|
| HUF
| 440,246,000
| USD
| 1,238,035
| BARC
| 9/29/2023
| 7,717
| —
|
| 38
| JOHN HANCOCK OPPORTUNISTIC FIXED INCOME FUND | ANNUAL REPORT
| SEE NOTES TO FINANCIAL STATEMENTS
|
FORWARD
FOREIGN CURRENCY CONTRACTS (continued)
| Contract to buy
| Contract to sell
| Counterparty (OTC)
| Contractual
settlement
date
| Unrealized
appreciation
| Unrealized
depreciation
|
| IDR
| 5,322,000,000
| USD
| 346,927
| BOA
| 9/20/2023
| $2,577
| —
|
| IDR
| 846,478,000
| USD
| 55,751
| BARC
| 9/20/2023
| —
| $(161)
|
| IDR
| 1,357,000,000
| USD
| 90,596
| CITI
| 9/20/2023
| —
| (1,480)
|
| IDR
| 2,186,000,000
| USD
| 143,481
| DB
| 9/20/2023
| 77
| —
|
| IDR
| 2,221,944,000
| USD
| 146,568
| GSI
| 9/20/2023
| —
| (650)
|
| IDR
| 4,168,399,000
| USD
| 279,411
| JPM
| 9/20/2023
| —
| (5,667)
|
| IDR
| 65,000,000
| USD
| 4,325
| MSI
| 9/20/2023
| —
| (57)
|
| IDR
| 21,340,082,000
| USD
| 1,395,141
| BARC
| 9/29/2023
| 5,914
| —
|
| INR
| 14,810,000
| USD
| 178,939
| BOA
| 9/20/2023
| 182
| —
|
| INR
| 3,300,000
| USD
| 39,872
| HSBC
| 9/20/2023
| 40
| —
|
| INR
| 2,020,000
| USD
| 24,305
| MSI
| 9/20/2023
| 126
| —
|
| JPY
| 825,109,000
| USD
| 5,707,766
| BARC
| 9/29/2023
| —
| (14,930)
|
| KRW
| 41,310,000
| USD
| 32,404
| BOA
| 9/20/2023
| —
| (1,205)
|
| KZT
| 15,300,000
| USD
| 32,692
| BOA
| 12/20/2023
| —
| (98)
|
| KZT
| 5,550,000
| USD
| 11,928
| BOA
| 2/7/2024
| —
| (221)
|
| KZT
| 7,350,000
| USD
| 15,783
| BOA
| 2/9/2024
| —
| (285)
|
| MXN
| 2,181,000
| USD
| 128,161
| CITI
| 9/20/2023
| —
| (580)
|
| MXN
| 7,666,000
| USD
| 448,248
| GSI
| 9/20/2023
| 186
| —
|
| MXN
| 1,675,000
| USD
| 96,430
| MSI
| 9/20/2023
| 1,552
| —
|
| MXN
| 10,370,000
| USD
| 609,426
| GSI
| 9/29/2023
| —
| (3,794)
|
| MXN
| 8,390,000
| USD
| 467,618
| GSI
| 7/24/2024
| —
| (3,205)
|
| MYR
| 1,886,000
| USD
| 410,793
| HSBC
| 9/20/2023
| —
| (3,841)
|
| NOK
| 26,716,000
| USD
| 2,507,373
| BARC
| 9/29/2023
| 7,427
| —
|
| NZD
| 40,000
| USD
| 24,242
| BARC
| 9/20/2023
| —
| (389)
|
| NZD
| 60,000
| USD
| 37,613
| GSI
| 9/20/2023
| —
| (1,834)
|
| NZD
| 5,000
| USD
| 3,073
| MSI
| 9/20/2023
| —
| (91)
|
| NZD
| 360,000
| USD
| 212,791
| CITI
| 9/29/2023
| 1,888
| —
|
| PEN
| 422,000
| USD
| 114,741
| CITI
| 9/20/2023
| —
| (674)
|
| PEN
| 430,000
| USD
| 115,068
| HSBC
| 9/20/2023
| 1,161
| —
|
| PEN
| 320,000
| USD
| 86,956
| SCB
| 9/20/2023
| —
| (460)
|
| PHP
| 2,680,000
| USD
| 48,359
| MSI
| 9/20/2023
| —
| (1,010)
|
| PLN
| 98,000
| USD
| 24,420
| BOA
| 9/20/2023
| —
| (685)
|
| PLN
| 874,000
| USD
| 210,041
| BARC
| 9/20/2023
| 1,635
| —
|
| PLN
| 438,000
| USD
| 106,702
| GSI
| 9/20/2023
| —
| (622)
|
| PLN
| 190,000
| USD
| 46,732
| HSBC
| 9/20/2023
| —
| (716)
|
| PLN
| 189,000
| USD
| 45,917
| JPM
| 9/20/2023
| —
| (143)
|
| PLN
| 1,194,000
| USD
| 294,816
| MSI
| 9/20/2023
| —
| (5,639)
|
| RON
| 364,000
| USD
| 78,296
| BOA
| 9/20/2023
| 1,566
| —
|
| RON
| 30,000
| USD
| 6,581
| BARC
| 9/20/2023
| 1
| —
|
| RON
| 495,000
| USD
| 109,197
| GSI
| 9/20/2023
| —
| (592)
|
| RON
| 125,000
| USD
| 27,263
| HSBC
| 9/20/2023
| 162
| —
|
| RON
| 150,000
| USD
| 32,637
| JPM
| 9/20/2023
| 274
| —
|
| SEE NOTES TO FINANCIAL STATEMENTS
| ANNUAL REPORT | JOHN HANCOCK OPPORTUNISTIC FIXED INCOME FUND
| 39
|
FORWARD
FOREIGN CURRENCY CONTRACTS (continued)
| Contract to buy
| Contract to sell
| Counterparty (OTC)
| Contractual
settlement
date
| Unrealized
appreciation
| Unrealized
depreciation
|
| RON
| 4,735,000
| USD
| 1,034,204
| GSI
| 9/29/2023
| $4,466
| —
|
| RON
| 855,000
| USD
| 186,672
| HSBC
| 9/29/2023
| 881
| —
|
| SEK
| 11,151,000
| USD
| 1,020,306
| BARC
| 9/29/2023
| —
| $(606)
|
| SGD
| 50,000
| USD
| 36,880
| BARC
| 9/20/2023
| 141
| —
|
| SGD
| 45,000
| USD
| 33,899
| GSI
| 9/20/2023
| —
| (580)
|
| SGD
| 50,000
| USD
| 37,076
| HSBC
| 9/20/2023
| —
| (56)
|
| THB
| 3,500,000
| USD
| 100,041
| BARC
| 9/20/2023
| 59
| —
|
| THB
| 1,130,000
| USD
| 32,458
| GSI
| 9/20/2023
| —
| (140)
|
| THB
| 12,980,000
| USD
| 371,336
| HSBC
| 9/20/2023
| —
| (108)
|
| THB
| 25,721,000
| USD
| 743,684
| JPM
| 9/20/2023
| —
| (8,063)
|
| TRY
| 5,940,000
| USD
| 225,153
| GSI
| 9/20/2023
| —
| (5,771)
|
| TRY
| 5,998,000
| USD
| 213,228
| GSI
| 9/29/2023
| 6,882
| —
|
| USD
| 20,375
| AUD
| 30,000
| JPM
| 9/20/2023
| 926
| —
|
| USD
| 73,067
| AUD
| 110,000
| MSI
| 9/20/2023
| 1,754
| —
|
| USD
| 3,260,154
| AUD
| 5,068,000
| MSI
| 9/29/2023
| —
| (26,567)
|
| USD
| 30,476
| BRL
| 150,000
| BOA
| 9/5/2023
| 186
| —
|
| USD
| 21,519
| BRL
| 105,000
| CITI
| 9/5/2023
| 315
| —
|
| USD
| 36,076
| BRL
| 175,000
| DB
| 9/5/2023
| 737
| —
|
| USD
| 4,611,104
| BRL
| 22,369,000
| GSI
| 9/5/2023
| 93,985
| —
|
| USD
| 469,122
| BRL
| 2,304,000
| MSI
| 9/5/2023
| 3,861
| —
|
| USD
| 40,772
| BRL
| 200,000
| SCB
| 9/5/2023
| 385
| —
|
| USD
| 181,881
| BRL
| 895,000
| SSB
| 9/5/2023
| 1,148
| —
|
| USD
| 130,215
| BRL
| 639,000
| GSI
| 10/3/2023
| 1,759
| —
|
| USD
| 2,322,256
| BRL
| 11,352,000
| SSB
| 10/3/2023
| 40,198
| —
|
| USD
| 291,366
| BRL
| 1,436,000
| GSI
| 12/4/2023
| 5,037
| —
|
| USD
| 41,167
| CAD
| 55,000
| BARC
| 9/20/2023
| 451
| —
|
| USD
| 33,196
| CAD
| 45,000
| JPM
| 9/20/2023
| —
| (117)
|
| USD
| 4,073,985
| CAD
| 5,523,000
| BARC
| 9/29/2023
| —
| (15,139)
|
| USD
| 1,420,628
| CHF
| 1,246,000
| GSI
| 9/29/2023
| 6,426
| —
|
| USD
| 69,352
| CLP
| 56,893,000
| BOA
| 9/20/2023
| 2,729
| —
|
| USD
| 119,290
| CLP
| 104,021,000
| CITI
| 9/20/2023
| —
| (2,522)
|
| USD
| 40,423
| CLP
| 34,500,000
| DB
| 9/20/2023
| 22
| —
|
| USD
| 9,542
| CLP
| 7,700,000
| GSI
| 9/20/2023
| 525
| —
|
| USD
| 171,062
| CLP
| 139,476,000
| MSI
| 9/20/2023
| 7,732
| —
|
| USD
| 23,168
| CLP
| 18,780,000
| SSB
| 9/20/2023
| 1,176
| —
|
| USD
| 848,954
| CLP
| 728,530,000
| MSI
| 9/29/2023
| —
| (3,251)
|
| USD
| 32,349
| CNY
| 231,000
| BARC
| 9/20/2023
| 584
| —
|
| USD
| 82,642
| CNY
| 585,000
| MSI
| 9/20/2023
| 2,200
| —
|
| USD
| 14,441
| COP
| 57,100,000
| BOA
| 9/20/2023
| 555
| —
|
| USD
| 122,530
| COP
| 504,624,000
| CITI
| 9/20/2023
| —
| (194)
|
| USD
| 24,571
| COP
| 101,600,000
| DB
| 9/20/2023
| —
| (138)
|
| USD
| 146,548
| COP
| 601,786,000
| GSI
| 9/20/2023
| 196
| —
|
| 40
| JOHN HANCOCK OPPORTUNISTIC FIXED INCOME FUND | ANNUAL REPORT
| SEE NOTES TO FINANCIAL STATEMENTS
|
FORWARD
FOREIGN CURRENCY CONTRACTS (continued)
| Contract to buy
| Contract to sell
| Counterparty (OTC)
| Contractual
settlement
date
| Unrealized
appreciation
| Unrealized
depreciation
|
| USD
| 47,606
| COP
| 192,360,000
| MSI
| 9/20/2023
| $824
| —
|
| USD
| 52,210
| COP
| 213,740,000
| SCB
| 9/20/2023
| 229
| —
|
| USD
| 55,631
| COP
| 237,600,000
| SSB
| 9/20/2023
| —
| $(2,153)
|
| USD
| 101,179
| CZK
| 2,229,000
| BARC
| 9/20/2023
| 815
| —
|
| USD
| 49,184
| CZK
| 1,070,000
| GSI
| 9/20/2023
| 1,006
| —
|
| USD
| 22,914
| CZK
| 490,000
| HSBC
| 9/20/2023
| 851
| —
|
| USD
| 157,970
| CZK
| 3,480,000
| JPM
| 9/20/2023
| 1,279
| —
|
| USD
| 296,376
| CZK
| 6,582,000
| MSI
| 9/20/2023
| 12
| —
|
| USD
| 366,233
| CZK
| 8,146,000
| HSBC
| 9/29/2023
| —
| (424)
|
| USD
| 8,576
| EGP
| 280,000
| CITI
| 9/20/2023
| —
| (382)
|
| USD
| 30,817
| EUR
| 28,000
| BOA
| 9/20/2023
| 434
| —
|
| USD
| 63,570
| EUR
| 58,000
| BARC
| 9/20/2023
| 633
| —
|
| USD
| 56,894
| EUR
| 51,000
| CITI
| 9/20/2023
| 1,553
| —
|
| USD
| 332,704
| EUR
| 305,000
| GSI
| 9/20/2023
| 1,742
| —
|
| USD
| 76,799
| EUR
| 70,000
| HSBC
| 9/20/2023
| 840
| —
|
| USD
| 224,802
| EUR
| 204,000
| MSI
| 9/20/2023
| 3,436
| —
|
| USD
| 6,693,427
| EUR
| 6,155,000
| BARC
| 9/29/2023
| 11,560
| —
|
| USD
| 16,556
| GBP
| 13,000
| BOA
| 9/20/2023
| 87
| —
|
| USD
| 52,195
| GBP
| 42,000
| BARC
| 9/20/2023
| —
| (1,014)
|
| USD
| 67,302
| GBP
| 53,000
| GSI
| 9/20/2023
| 156
| —
|
| USD
| 1,209,655
| GBP
| 952,000
| JPM
| 9/29/2023
| 3,526
| —
|
| USD
| 166,433
| HUF
| 58,823,000
| BOA
| 9/20/2023
| —
| (320)
|
| USD
| 61,553
| HUF
| 21,800,000
| BARC
| 9/20/2023
| —
| (246)
|
| USD
| 34,965
| HUF
| 12,200,000
| CITI
| 9/20/2023
| 380
| —
|
| USD
| 119,795
| HUF
| 42,200,000
| GSI
| 9/20/2023
| 167
| —
|
| USD
| 168,670
| HUF
| 59,802,000
| JPM
| 9/20/2023
| —
| (858)
|
| USD
| 133,869
| HUF
| 47,490,000
| MSI
| 9/20/2023
| —
| (756)
|
| USD
| 134,552
| IDR
| 2,022,000,000
| BARC
| 9/20/2023
| 1,765
| —
|
| USD
| 342,995
| IDR
| 5,245,000,000
| DB
| 9/20/2023
| —
| (1,451)
|
| USD
| 100,250
| IDR
| 1,516,047,000
| GSI
| 9/20/2023
| 690
| —
|
| USD
| 44,872
| IDR
| 675,047,000
| JPM
| 9/20/2023
| 540
| —
|
| USD
| 56,461
| IDR
| 848,660,000
| SCB
| 9/20/2023
| 728
| —
|
| USD
| 53,212
| INR
| 4,410,000
| CITI
| 9/20/2023
| —
| (125)
|
| USD
| 18,870
| INR
| 1,570,000
| GSI
| 9/20/2023
| —
| (119)
|
| USD
| 11,180
| INR
| 920,000
| SCB
| 9/20/2023
| 53
| —
|
| USD
| 640,939
| INR
| 52,948,000
| BARC
| 9/29/2023
| 788
| —
|
| USD
| 277,119
| JPY
| 40,060,000
| BARC
| 9/29/2023
| 725
| —
|
| USD
| 41,322
| KRW
| 54,830,000
| BOA
| 9/20/2023
| —
| (88)
|
| USD
| 37,915
| KRW
| 50,610,000
| SCB
| 9/20/2023
| —
| (307)
|
| USD
| 2,451,785
| KRW
| 3,228,413,000
| MSI
| 9/27/2023
| 12,677
| —
|
| USD
| 21,535
| KZT
| 10,100,000
| GSI
| 12/20/2023
| 19
| —
|
| USD
| 51,250
| MXN
| 902,000
| BOA
| 9/20/2023
| —
| (1,514)
|
| SEE NOTES TO FINANCIAL STATEMENTS
| ANNUAL REPORT | JOHN HANCOCK OPPORTUNISTIC FIXED INCOME FUND
| 41
|
FORWARD
FOREIGN CURRENCY CONTRACTS (continued)
| Contract to buy
| Contract to sell
| Counterparty (OTC)
| Contractual
settlement
date
| Unrealized
appreciation
| Unrealized
depreciation
|
| USD
| 657,471
| MXN
| 11,305,000
| BARC
| 9/20/2023
| —
| $(3,833)
|
| USD
| 153,781
| MXN
| 2,708,000
| CITI
| 9/20/2023
| —
| (4,628)
|
| USD
| 180,333
| MXN
| 3,111,000
| GSI
| 9/20/2023
| —
| (1,650)
|
| USD
| 31,502
| MXN
| 550,000
| HSBC
| 9/20/2023
| —
| (671)
|
| USD
| 158,056
| MXN
| 2,749,000
| MSI
| 9/20/2023
| —
| (2,751)
|
| USD
| 2,748,967
| MXN
| 46,510,000
| BARC
| 9/29/2023
| $32,675
| —
|
| USD
| 482,073
| MXN
| 8,390,000
| GSI
| 1/24/2024
| 2,365
| —
|
| USD
| 156,871
| MYR
| 725,000
| HSBC
| 9/20/2023
| 434
| —
|
| USD
| 1,689,070
| NOK
| 17,997,000
| BARC
| 9/29/2023
| —
| (5,003)
|
| USD
| 63,395
| NZD
| 105,000
| BARC
| 9/20/2023
| 781
| —
|
| USD
| 30,411
| NZD
| 50,000
| HSBC
| 9/20/2023
| 595
| —
|
| USD
| 17,831
| NZD
| 30,000
| JPM
| 9/20/2023
| —
| (58)
|
| USD
| 32,933
| NZD
| 55,000
| MSI
| 9/20/2023
| 135
| —
|
| USD
| 6,126,874
| NZD
| 10,337,000
| JPM
| 9/29/2023
| —
| (37,419)
|
| USD
| 358,842
| PEN
| 1,320,000
| BOA
| 9/20/2023
| 2,044
| —
|
| USD
| 274,485
| PEN
| 1,017,000
| CITI
| 9/20/2023
| —
| (412)
|
| USD
| 22,993
| PEN
| 85,000
| GSI
| 9/20/2023
| 17
| —
|
| USD
| 44,967
| PEN
| 165,000
| SCB
| 9/20/2023
| 367
| —
|
| USD
| 145,387
| PHP
| 8,170,000
| BOA
| 9/20/2023
| 1,044
| —
|
| USD
| 1,101,387
| PHP
| 62,507,000
| MSI
| 9/29/2023
| —
| (2,822)
|
| USD
| 91,463
| PLN
| 375,000
| BOA
| 9/20/2023
| 641
| —
|
| USD
| 83,426
| PLN
| 342,000
| BARC
| 9/20/2023
| 596
| —
|
| USD
| 63,218
| PLN
| 260,000
| CITI
| 9/20/2023
| 248
| —
|
| USD
| 59,766
| PLN
| 245,000
| GSI
| 9/20/2023
| 429
| —
|
| USD
| 42,930
| PLN
| 175,000
| HSBC
| 9/20/2023
| 546
| —
|
| USD
| 98,237
| PLN
| 405,000
| MSI
| 9/20/2023
| 149
| —
|
| USD
| 359,098
| PLN
| 1,489,000
| BOA
| 9/29/2023
| —
| (1,338)
|
| USD
| 645,005
| PLN
| 2,661,000
| HSBC
| 9/29/2023
| 868
| —
|
| USD
| 55,878
| RON
| 255,000
| BOA
| 9/20/2023
| —
| (69)
|
| USD
| 123,000
| RON
| 555,000
| GSI
| 9/20/2023
| 1,231
| —
|
| USD
| 48,833
| RON
| 215,000
| HSBC
| 9/20/2023
| 1,661
| —
|
| USD
| 1,229,310
| RON
| 5,590,000
| BARC
| 9/29/2023
| 3,087
| —
|
| USD
| 1,998,431
| SEK
| 21,841,000
| BARC
| 9/29/2023
| 1,188
| —
|
| USD
| 129,847
| SGD
| 175,000
| GSI
| 9/20/2023
| 275
| —
|
| USD
| 18,518
| SGD
| 25,000
| JPM
| 9/20/2023
| 8
| —
|
| USD
| 1,438,700
| SGD
| 1,944,000
| MSI
| 9/29/2023
| —
| (1,241)
|
| USD
| 471,969
| THB
| 16,445,000
| BARC
| 9/20/2023
| 1,642
| —
|
| USD
| 49,415
| THB
| 1,723,000
| GSI
| 9/20/2023
| 137
| —
|
| USD
| 51,900
| THB
| 1,820,000
| JPM
| 9/20/2023
| —
| (152)
|
| USD
| 54,468
| TRY
| 1,415,000
| GSI
| 9/20/2023
| 2,207
| —
|
| USD
| 24,967
| UYU
| 960,000
| DB
| 9/20/2023
| —
| (439)
|
| USD
| 119,311
| UYU
| 4,635,000
| GSI
| 9/20/2023
| —
| (3,357)
|
| 42
| JOHN HANCOCK OPPORTUNISTIC FIXED INCOME FUND | ANNUAL REPORT
| SEE NOTES TO FINANCIAL STATEMENTS
|
FORWARD
FOREIGN CURRENCY CONTRACTS (continued)
| Contract to buy
| Contract to sell
| Counterparty (OTC)
| Contractual
settlement
date
| Unrealized
appreciation
| Unrealized
depreciation
|
| USD
| 39,481
| UYU
| 1,494,000
| HSBC
| 9/20/2023
| —
| $(59)
|
| USD
| 85,808
| ZAR
| 1,611,000
| BARC
| 9/20/2023
| $615
| —
|
| USD
| 341,351
| ZAR
| 6,622,000
| CITI
| 9/20/2023
| —
| (8,836)
|
| USD
| 240,777
| ZAR
| 4,417,000
| GSI
| 9/20/2023
| 7,194
| —
|
| USD
| 21,287
| ZAR
| 406,000
| JPM
| 9/20/2023
| —
| (183)
|
| USD
| 69,457
| ZAR
| 1,283,000
| MSI
| 9/20/2023
| 1,609
| —
|
| USD
| 517,759
| ZAR
| 9,650,000
| GSI
| 9/29/2023
| 7,848
| —
|
| UYU
| 740,000
| USD
| 19,469
| CITI
| 9/20/2023
| 116
| —
|
| ZAR
| 530,000
| USD
| 28,598
| BOA
| 9/20/2023
| —
| (570)
|
| ZAR
| 2,414,000
| USD
| 129,518
| BARC
| 9/20/2023
| —
| (1,860)
|
| ZAR
| 1,363,000
| USD
| 73,450
| CITI
| 9/20/2023
| —
| (1,371)
|
| ZAR
| 2,768,000
| USD
| 153,842
| GSI
| 9/20/2023
| —
| (7,463)
|
| ZAR
| 990,000
| USD
| 53,569
| JPM
| 9/20/2023
| —
| (1,216)
|
| ZAR
| 2,161,000
| USD
| 115,265
| MSI
| 9/20/2023
| —
| (987)
|
| ZAR
| 26,171,000
| USD
| 1,404,174
| GSI
| 9/29/2023
| —
| (21,283)
|
|
|
|
|
|
|
| $371,829
| $(340,518)
|
SWAPS
| Interest rate swaps
|
Counterparty (OTC)/
Centrally cleared
| Notional
amount
| Currency
| Payments
made
| Payments
received
| Fixed
payment
frequency
| Floating
payment
frequency
| Maturity
date
| Unamortized
upfront
payment paid
(received)
| Unrealized
appreciation
(depreciation)
| Value
|
| Centrally cleared
| 25,540,000
| CAD
| CAD CORRA Compounded OIS
| Fixed 4.500%
| Semi-Annual
| Semi-Annual
| Sep 2025
| $(20,673)
| $(82,776)
| $(103,449)
|
| Centrally cleared
| 6,440,000
| GBP
| GBP SONIA Compounded OIS
| Fixed 5.717%
| Annual
| Annual
| Sep 2025
| —
| 35,436
| 35,436
|
| Centrally cleared
| 9,330,000
| MXN
| MXN TIIE Banxico
| Fixed 7.840%
| Monthly
| Monthly
| Mar 2027
| 322
| (23,399)
| (23,077)
|
| Centrally cleared
| 8,650,000
| NZD
| NZD BBR FRA
| Fixed 2.660%
| Semi-Annual
| Quarterly
| Mar 2027
| (15,110)
| (374,925)
| (390,035)
|
| Centrally cleared
| 2,700,000
| NZD
| NZD BBR FRA
| Fixed 2.750%
| Semi-Annual
| Quarterly
| Mar 2027
| 2,052
| (118,490)
| (116,438)
|
| Centrally cleared
| 2,770,000
| NZD
| NZD BBR FRA
| Fixed 2.590%
| Semi-Annual
| Quarterly
| Mar 2027
| 1,018
| (130,154)
| (129,136)
|
| Centrally cleared
| 16,020,000
| SEK
| SEK STIBOR SIDE
| Fixed 3.042%
| Annual
| Quarterly
| Mar 2028
| —
| (15,524)
| (15,524)
|
| Centrally cleared
| 26,195,000
| MXN
| MXN TIIE Banxico
| Fixed 8.840%
| Monthly
| Monthly
| Jun 2028
| (1,920)
| (5,493)
| (7,413)
|
| Centrally cleared
| 36,820,000
| MXN
| MXN TIIE Banxico
| Fixed 9.053%
| Monthly
| Monthly
| Jun 2028
| —
| 7,496
| 7,496
|
| Centrally cleared
| 3,020,000
| AUD
| AUD BBR BBSW
| Fixed 4.190%
| Semi-Annual
| Semi-Annual
| Sep 2028
| (436)
| 6,310
| 5,874
|
| Centrally cleared
| 22,480,000
| NOK
| NOK NIBOR NIBR
| Fixed 3.810%
| Annual
| Semi-Annual
| Sep 2028
| (8,825)
| (36,104)
| (44,929)
|
| Centrally cleared
| 18,800,000
| CNY
| Fixed 2.445%
| CNY CNREPOFIX Reuters
| Quarterly
| Quarterly
| Sep 2028
| —
| (16,872)
| (16,872)
|
| Centrally cleared
| 7,190,000
| CNY
| Fixed 2.468%
| CNY CNREPOFIX Reuters
| Quarterly
| Quarterly
| Sep 2028
| —
| (7,497)
| (7,497)
|
| Centrally cleared
| 11,730,000
| CNY
| Fixed 2.467%
| CNY CNREPOFIX Reuters
| Quarterly
| Quarterly
| Sep 2028
| —
| (12,134)
| (12,134)
|
| Centrally cleared
| 1,120,000
| GBP
| GBP SONIA Compounded OIS
| Fixed 4.767%
| Annual
| Annual
| Dec 2028
| —
| 5,576
| 5,576
|
| SEE NOTES TO FINANCIAL STATEMENTS
| ANNUAL REPORT | JOHN HANCOCK OPPORTUNISTIC FIXED INCOME FUND
| 43
|
| Interest rate swaps (continued)
|
Counterparty (OTC)/
Centrally cleared
| Notional
amount
| Currency
| Payments
made
| Payments
received
| Fixed
payment
frequency
| Floating
payment
frequency
| Maturity
date
| Unamortized
upfront
payment paid
(received)
| Unrealized
appreciation
(depreciation)
| Value
|
| Centrally cleared
| 1,840,000
| CAD
| CAD CORRA Compounded OIS
| Fixed 3.910%
| Semi-Annual
| Semi-Annual
| Dec 2028
| $(348)
| $1,805
| $1,457
|
| Centrally cleared
| 4,980,000
| PLN
| Fixed 4.309%
| PLN WIBOR WIBO
| Annual
| Semi-Annual
| Dec 2028
| —
| 2,066
| 2,066
|
| Centrally cleared
| 4,020,000
| PLN
| Fixed 4.398%
| PLN WIBOR WIBO
| Annual
| Semi-Annual
| Dec 2028
| —
| —
| —
|
| Centrally cleared
| 18,755,000
| MXN
| MXN TIIE Banxico
| Fixed 7.340%
| Monthly
| Monthly
| Mar 2032
| 308
| (93,013)
| (92,705)
|
| Centrally cleared
| 13,350,000
| MXN
| MXN TIIE Banxico
| Fixed 8.852%
| Monthly
| Monthly
| Dec 2033
| —
| 11,146
| 11,146
|
|
|
|
|
|
|
|
|
| $(43,612)
| $(846,546)
| $(890,158)
|
| Credit default swaps - Buyer
|
Counterparty
(OTC)/
Centrally
cleared
| Reference
obligation
| Notional
amount
| Currency
| USD
notional
amount
| Pay
fixed
rate
| Fixed
payment
frequency
| Maturity
date
| Unamortized
upfront
payment
paid
(received)
| Unrealized
appreciation
(depreciation)
| Value
|
| BARC
| Federative Republic of Brazil
| 482,000
| USD
| $482,000
| 1.000%
| Quarterly
| Dec 2026
| $19,447
| $(18,714)
| $733
|
| BARC
| Federative Republic of Brazil
| 615,000
| USD
| 615,000
| 1.000%
| Quarterly
| Jun 2028
| 31,228
| (14,886)
| 16,342
|
| BARC
| Federative Republic of Brazil
| 500,000
| USD
| 500,000
| 1.000%
| Quarterly
| Jun 2028
| 22,898
| (9,612)
| 13,286
|
| BARC
| Republic of Colombia
| 5,000
| USD
| 5,000
| 1.000%
| Quarterly
| Jun 2028
| 363
| (149)
| 214
|
| BARC
| Republic of Indonesia
| 500,000
| USD
| 500,000
| 1.000%
| Quarterly
| Jun 2028
| (2,665)
| (2,280)
| (4,945)
|
| BARC
| Republic of Indonesia
| 500,000
| USD
| 500,000
| 1.000%
| Quarterly
| Jun 2028
| (3,421)
| (1,524)
| (4,945)
|
| BARC
| Republic of Peru
| 500,000
| USD
| 500,000
| 1.000%
| Quarterly
| Jun 2028
| 962
| (7,815)
| (6,853)
|
| BOA
| Federative Republic of Brazil
| 1,530,000
| USD
| 1,530,000
| 1.000%
| Quarterly
| Dec 2027
| 84,853
| (58,274)
| 26,579
|
| BOA
| Federative Republic of Brazil
| 405,000
| USD
| 405,000
| 1.000%
| Quarterly
| Dec 2027
| 22,532
| (15,496)
| 7,036
|
| CITI
| Federative Republic of Brazil
| 315,000
| USD
| 315,000
| 1.000%
| Quarterly
| Dec 2027
| 17,799
| (12,327)
| 5,472
|
| CITI
| United Mexican States
| 585,000
| USD
| 585,000
| 1.000%
| Quarterly
| Jun 2028
| 4,219
| (5,352)
| (1,133)
|
| GSI
| Government of Malaysia
| 1,000,000
| USD
| 1,000,000
| 1.000%
| Quarterly
| Jun 2028
| (14,176)
| (8,726)
| (22,902)
|
| GSI
| Republic of Chile
| 500,000
| USD
| 500,000
| 1.000%
| Quarterly
| Jun 2028
| (3,224)
| (7,030)
| (10,254)
|
| GSI
| Republic of Chile
| 500,000
| USD
| 500,000
| 1.000%
| Quarterly
| Jun 2028
| (3,878)
| (6,376)
| (10,254)
|
| GSI
| Republic of Indonesia
| 75,000
| USD
| 75,000
| 1.000%
| Quarterly
| Jun 2028
| (255)
| (487)
| (742)
|
| GSI
| Republic of Peru
| 500,000
| USD
| 500,000
| 1.000%
| Quarterly
| Jun 2028
| 1,386
| (8,239)
| (6,853)
|
| GSI
| Republic of Peru
| 500,000
| USD
| 500,000
| 1.000%
| Quarterly
| Jun 2028
| (1,286)
| (5,567)
| (6,853)
|
| GSI
| Republic of the Philippines
| 500,000
| USD
| 500,000
| 1.000%
| Quarterly
| Jun 2028
| (1,914)
| (4,421)
| (6,335)
|
| GSI
| United Mexican States
| 460,000
| USD
| 460,000
| 1.000%
| Quarterly
| Jun 2028
| 3,247
| (4,138)
| (891)
|
| MSI
| Government of Japan
| 2,090,000
| USD
| 2,090,000
| 1.000%
| Quarterly
| Dec 2024
| (19,911)
| (9,776)
| (29,687)
|
| MSI
| Government of Malaysia
| 500,000
| USD
| 500,000
| 1.000%
| Quarterly
| Jun 2028
| (6,261)
| (5,190)
| (11,451)
|
| MSI
| Republic of Colombia
| 500,000
| USD
| 500,000
| 1.000%
| Quarterly
| Jun 2028
| 27,937
| (6,570)
| 21,367
|
| MSI
| Republic of Colombia
| 500,000
| USD
| 500,000
| 1.000%
| Quarterly
| Jun 2028
| 22,006
| (873)
| 21,133
|
| MSI
| Republic of Peru
| 500,000
| USD
| 500,000
| 1.000%
| Quarterly
| Jun 2028
| 859
| (7,712)
| (6,853)
|
| MSI
| Republic of South Africa
| 500,000
| USD
| 500,000
| 1.000%
| Quarterly
| Jun 2028
| 28,667
| 93
| 28,760
|
|
|
|
|
| $14,562,000
|
|
|
| $231,412
| $(221,441)
| $9,971
|
| Centrally cleared
| CDX.NA.HY.38
| 331,240
| USD
| 331,240
| 5.000%
| Quarterly
| Jun 2027
| (11)
| (16,043)
| (16,054)
|
| Centrally cleared
| CDX.EM.38
| 7,255,000
| USD
| 7,255,000
| 1.000%
| Quarterly
| Dec 2027
| 346,976
| (102,560)
| 244,416
|
| 44
| JOHN HANCOCK OPPORTUNISTIC FIXED INCOME FUND | ANNUAL REPORT
| SEE NOTES TO FINANCIAL STATEMENTS
|
| Credit default swaps - Buyer (continued)
|
Counterparty
(OTC)/
Centrally
cleared
| Reference
obligation
| Notional
amount
| Currency
| USD
notional
amount
| Pay
fixed
rate
| Fixed
payment
frequency
| Maturity
date
| Unamortized
upfront
payment
paid
(received)
| Unrealized
appreciation
(depreciation)
| Value
|
| Centrally cleared
| CDX.NA.HY.39
| 49,500
| USD
| $49,500
| 5.000%
| Quarterly
| Dec 2027
| $(179)
| $(1,894)
| $(2,073)
|
| Centrally cleared
| CDX.EM.39
| 5,785,000
| USD
| 5,785,000
| 1.000%
| Quarterly
| Jun 2028
| 315,311
| (86,925)
| 228,386
|
| Centrally cleared
| CDX.NA.HY.40
| 200,000
| USD
| 200,000
| 5.000%
| Quarterly
| Jun 2028
| (5,999)
| (1,668)
| (7,667)
|
| Centrally cleared
| CDX.NA.IG.40
| 3,810,000
| USD
| 3,810,000
| 1.000%
| Quarterly
| Jun 2028
| (55,491)
| (11,276)
| (66,767)
|
| Centrally cleared
| iTraxx Europe Senior Financials Series 39 Version 1
| 6,935,000
| EUR
| 7,507,745
| 1.000%
| Quarterly
| Jun 2028
| (68,916)
| (7,849)
| (76,765)
|
| Centrally cleared
| iTraxx Europe Series 39 Version 1
| 3,055,000
| EUR
| 3,330,803
| 1.000%
| Quarterly
| Jun 2028
| (67,177)
| 17,617
| (49,560)
|
| Centrally cleared
| iTraxx Europe Sub Financials Series 39 Version 1
| 1,755,000
| EUR
| 1,934,100
| 1.000%
| Quarterly
| Jun 2028
| 45,029
| (9,455)
| 35,574
|
|
|
|
|
| $30,203,388
|
|
|
| $509,543
| $(220,053)
| $289,490
|
|
|
|
|
| $44,765,388
|
|
|
| $740,955
| $(441,494)
| $299,461
|
| Credit default swaps - Seller
|
Counterparty
(OTC)/
Centrally
cleared
| Reference
obligation
| Implied
credit
spread
| Notional
amount
| Currency
| USD
notional
amount
| Received
fixed
rate
| Fixed
payment
frequency
| Maturity
date
| Unamortized
upfront
payment
paid
(received)
| Unrealized
appreciation
(depreciation)
| Value
|
| GSI
| CMBX.NA.BBB-.14
| 8.284%
| 25,000
| USD
| $25,000
| 3.000%
| Monthly
| Dec 2072
| $(4,137)
| $(1,875)
| $(6,012)
|
| MSI
| CMBX.NA.AAA.15
| 0.940%
| 75,000
| USD
| 75,000
| 0.500%
| Monthly
| Nov 2064
| (2,388)
| 314
| (2,074)
|
|
|
|
|
|
| $100,000
|
|
|
| $(6,525)
| $(1,561)
| $(8,086)
|
| Centrally cleared
| CDX.NA.HY.40
| 4.259%
| 175,000
| USD
| 175,000
| 5.000%
| Quarterly
| Jun 2028
| 1,903
| 4,806
| 6,709
|
|
|
|
|
|
| $175,000
|
|
|
| $1,903
| $4,806
| $6,709
|
|
|
|
|
|
| $275,000
|
|
|
| $(4,622)
| $3,245
| $(1,377)
|
| Total return swaps
|
Pay/
receive
total
return*
| Reference
entity
| Floating/
fixed
rate
| Payment
frequency
| Currency
| Notional
amount
| Maturity
date
| Counterparty
(OTC)
| Unamortized
upfront
payment paid
(received)
| Unrealized
appreciation
(depreciation)
| Value
|
| Pay
| iBoxx $ Liquid High Yield Index
| 1-Day USD Compounded SOFR
| At Maturity
| USD
| 420,000
| Sep 2023
| JPM
| —
| $(4,364)
| $(4,364)
|
| Pay
| iBoxx $ Liquid High Yield Index
| 1-Day USD Compounded SOFR
| At Maturity
| USD
| 1,190,000
| Sep 2023
| JPM
| —
| (14,964)
| (14,964)
|
| Pay
| iBoxx $ Liquid High Yield Index
| 1-Day USD Compounded SOFR
| At Maturity
| USD
| 1,190,000
| Sep 2023
| JPM
| —
| (15,753)
| (15,753)
|
| Pay
| iBoxx $ Liquid High Yield Index
| 1-Day USD Compounded SOFR
| At Maturity
| USD
| 415,000
| Sep 2023
| JPM
| —
| (5,907)
| (5,907)
|
| SEE NOTES TO FINANCIAL STATEMENTS
| ANNUAL REPORT | JOHN HANCOCK OPPORTUNISTIC FIXED INCOME FUND
| 45
|
| Total return swaps (continued)
|
Pay/
receive
total
return*
| Reference
entity
| Floating/
fixed
rate
| Payment
frequency
| Currency
| Notional
amount
| Maturity
date
| Counterparty
(OTC)
| Unamortized
upfront
payment paid
(received)
| Unrealized
appreciation
(depreciation)
| Value
|
| Pay
| iBoxx $ Liquid High Yield Index
| 1-Day USD Compounded SOFR
| At Maturity
| USD
| 420,000
| Sep 2023
| JPM
| —
| $(5,128)
| $(5,128)
|
| Pay
| iBoxx $ Liquid Investment Grade Index
| 1-Day USD Compounded SOFR
| At Maturity
| USD
| 835,000
| Sep 2023
| JPM
| —
| 11,992
| 11,992
|
| Pay
| iBoxx $ Liquid Investment Grade Index
| 1-Day USD Compounded SOFR
| At Maturity
| USD
| 835,000
| Sep 2023
| JPM
| —
| 6,889
| 6,889
|
| Pay
| iBoxx $ Liquid Investment Grade Index
| 1-Day USD Compounded SOFR
| At Maturity
| USD
| 830,000
| Sep 2023
| JPM
| —
| 16,739
| 16,739
|
| Pay
| iBoxx $ Liquid High Yield Index
| 1-Day USD Compounded SOFR
| At Maturity
| USD
| 405,000
| Sep 2023
| MSI
| —
| (6,371)
| (6,371)
|
| Pay
| iBoxx $ Liquid High Yield Index
| 1-Day USD Compounded SOFR
| At Maturity
| USD
| 415,000
| Sep 2023
| MSI
| —
| (4,189)
| (4,189)
|
| Pay
| iBoxx $ Liquid High Yield Index
| 1-Day USD Compounded SOFR
| At Maturity
| USD
| 415,000
| Sep 2023
| MSI
| —
| (1,403)
| (1,403)
|
| Pay
| iBoxx $ Liquid High Yield Index
| 1-Day USD Compounded SOFR
| At Maturity
| USD
| 420,000
| Sep 2023
| MSI
| —
| 621
| 621
|
| Pay
| iBoxx $ Liquid High Yield Index
| 1-Day USD Compounded SOFR
| At Maturity
| USD
| 2,390,000
| Dec 2023
| MSI
| —
| (35,192)
| (35,192)
|
| Pay
| iBoxx $ Liquid High Yield Index
| 1-Day USD Compounded SOFR
| At Maturity
| USD
| 930,000
| Dec 2023
| MSI
| —
| 382
| 382
|
|
|
|
|
|
|
|
|
| —
| $(56,648)
| $(56,648)
|
* Fund will pay or receive the
total return of the reference asset depending on whether the return is positive or negative. For contracts where the fund has elected to receive the total return of the reference asset if positive, it will be
responsible for paying the floating rate and the total return of the reference asset if negative. If the fund has elected to pay the total return of the reference asset if positive, it will receive the floating rate
and the total return of the reference asset if negative. The total return of the reference asset is paid out at maturity while the floating rate is paid on a quarterly basis until maturity.
| Inflation swaps
|
Counterparty (OTC)/
Centrally
cleared
| Notional
amount
| Currency
| USD notional
amount
| Payments
made
| Payments
received
| Fixed
payment
frequency
| Floating
payment
frequency
| Maturity date
| Unamortized
upfront
payment paid
(received)
| Unrealized
appreciation
(depreciation)
| Value
|
| BARC
| 1,990,000
| USD
| $1,990,000
| Fixed 3.243%
| USA CPI All Urban Consumers
| At Maturity
| At Maturity
| Apr 2027
| —
| $(967)
| $(967)
|
| BARC
| 2,010,000
| USD
| 2,010,000
| Fixed 3.243%
| USA CPI All Urban Consumers
| At Maturity
| At Maturity
| Apr 2027
| —
| (977)
| (977)
|
| BARC
| 3,910,000
| USD
| 3,910,000
| Fixed 3.147%
| USA CPI All Urban Consumers
| At Maturity
| At Maturity
| Apr 2027
| —
| 16,308
| 16,308
|
| 46
| JOHN HANCOCK OPPORTUNISTIC FIXED INCOME FUND | ANNUAL REPORT
| SEE NOTES TO FINANCIAL STATEMENTS
|
| Inflation swaps (continued)
|
Counterparty (OTC)/
Centrally
cleared
| Notional
amount
| Currency
| USD notional
amount
| Payments
made
| Payments
received
| Fixed
payment
frequency
| Floating
payment
frequency
| Maturity date
| Unamortized
upfront
payment paid
(received)
| Unrealized
appreciation
(depreciation)
| Value
|
| CITI
| 1,260,000
| USD
| $1,260,000
| Fixed 3.257%
| USA CPI All Urban Consumers
| At Maturity
| At Maturity
| Apr 2027
| —
| $(1,505)
| $(1,505)
|
| CITI
| 1,170,000
| USD
| 1,170,000
| Fixed 3.257%
| USA CPI All Urban Consumers
| At Maturity
| At Maturity
| Apr 2027
| $(113)
| (1,285)
| (1,398)
|
| CITI
| 1,155,000
| USD
| 1,155,000
| Fixed 2.793%
| USA CPI All Urban Consumers
| At Maturity
| At Maturity
| Feb 2052
| —
| (43,806)
| (43,806)
|
|
|
|
| $11,495,000
|
|
|
|
|
| $(113)
| $(32,232)
| $(32,345)
|
| Derivatives Currency Abbreviations
|
| AUD
| Australian Dollar
|
| BRL
| Brazilian Real
|
| CAD
| Canadian Dollar
|
| CHF
| Swiss Franc
|
| CLP
| Chilean Peso
|
| CNY
| Chinese Yuan Renminbi
|
| COP
| Colombian Peso
|
| CZK
| Czech Republic Koruna
|
| EGP
| Egyptian Pound
|
| EUR
| Euro
|
| GBP
| Pound Sterling
|
| HUF
| Hungarian Forint
|
| IDR
| Indonesian Rupiah
|
| INR
| Indian Rupee
|
| JPY
| Japanese Yen
|
| KRW
| Korean Won
|
| KZT
| Kazakhstan Tenge
|
| MXN
| Mexican Peso
|
| MYR
| Malaysian Ringgit
|
| NOK
| Norwegian Krone
|
| NZD
| New Zealand Dollar
|
| PEN
| Peruvian Nuevo Sol
|
| PHP
| Philippine Peso
|
| PLN
| Polish Zloty
|
| RON
| Romanian New Leu
|
| SEK
| Swedish Krona
|
| SGD
| Singapore Dollar
|
| THB
| Thai Bhat
|
| TRY
| Turkish Lira
|
| USD
| U.S. Dollar
|
| UYU
| Uruguayan Peso
|
| ZAR
| South African Rand
|
| SEE NOTES TO FINANCIAL STATEMENTS
| ANNUAL REPORT | JOHN HANCOCK OPPORTUNISTIC FIXED INCOME FUND
| 47
|
| Derivatives Abbreviations
|
| BARC
| Barclays Bank PLC
|
| BBR
| Bank Bill Rate
|
| BBSW
| Bank Bill Swap Rate
|
| BOA
| Bank of America, N.A.
|
| CITI
| Citibank, N.A.
|
| CNREPOFIX
| China Fixing Repo Rate
|
| CORRA
| Canadian Overnight Repo Rate Average
|
| CPI
| Consumer Price Index
|
| DB
| Deutsche Bank AG
|
| GSI
| Goldman Sachs International
|
| HSBC
| HSBC Bank PLC
|
| JPM
| JPMorgan Chase Bank, N.A.
|
| MSI
| Morgan Stanley & Co. International PLC
|
| NIBOR
| Norwegian Interbank Offered Rate
|
| OIS
| Overnight Index Swap
|
| OTC
| Over-the-counter
|
| SCB
| Standard Chartered Bank
|
| SOFR
| Secured Overnight Financing Rate
|
| SONIA
| Sterling Overnight Interbank Average Rate
|
| SSB
| State Street Bank and Trust Company
|
| STIBOR
| Stockholm Interbank Offered Rate
|
| TIIE
| Tasa de Interes Interbancario de Equilibrio (Interbank Equilibrium Interest Rate)
|
| WIBOR
| Warsaw Interbank Offered Rate
|
At 8-31-23, the aggregate cost of
investments for federal income tax purposes was $158,730,451. Net unrealized depreciation aggregated to $9,824,793, of which $1,918,291 related to gross unrealized appreciation and $11,743,084 related to gross
unrealized depreciation.
See Notes to financial statements
regarding investment transactions and other derivatives information.
| 48
| JOHN HANCOCK OPPORTUNISTIC FIXED INCOME FUND | ANNUAL REPORT
| SEE NOTES TO FINANCIAL STATEMENTS
|
STATEMENT OF ASSETS AND
LIABILITIES 8-31-23
| Assets
|
|
| Unaffiliated investments, at value (Cost $156,487,419)
| $149,209,184
|
| Swap contracts, at value (net unamortized upfront payment of $277,730)
| 193,853
|
| Receivable for centrally cleared swaps
| 72,531
|
| Unrealized appreciation on forward foreign currency contracts
| 371,829
|
| Cash
| 186,093
|
| Foreign currency, at value (Cost $7,949)
| 8,241
|
| Collateral held at broker for futures contracts
| 395,000
|
| Collateral segregated at custodian for OTC derivative contracts
| 60,000
|
| Dividends and interest receivable
| 1,072,924
|
| Receivable for fund shares sold
| 229,948
|
| Receivable for investments sold
| 434,193
|
| Receivable for delayed delivery securities sold
| 2,762,731
|
| Other assets
| 65,669
|
| Total assets
| 155,062,196
|
| Liabilities
|
|
| Unrealized depreciation on forward foreign currency contracts
| 340,518
|
| Swap contracts, at value (net unamortized upfront payment of $52,956)
| 280,961
|
| Payable for futures variation margin
| 7,210
|
| Payable for collateral on OTC derivatives
| 538,000
|
| Payable for investments purchased
| 484,436
|
| Payable for delayed delivery securities purchased
| 28,685,019
|
| Payable for fund shares repurchased
| 13,885
|
| Payable to affiliates
|
|
| Accounting and legal services fees
| 6,255
|
| Transfer agent fees
| 5,707
|
| Trustees’ fees
| 9
|
| Other liabilities and accrued expenses
| 74,701
|
| Total liabilities
| 30,436,701
|
| Net assets
| $124,625,495
|
| Net assets consist of
|
|
| Paid-in capital
| $223,536,918
|
| Total distributable earnings (loss)
| (98,911,423)
|
| Net assets
| $124,625,495
|
|
|
| SEE NOTES TO FINANCIAL STATEMENTS
| ANNUAL REPORT | JOHN HANCOCK Opportunistic Fixed Income Fund
| 49
|
STATEMENT OF ASSETS AND LIABILITIES (continued)
| Net asset value per share
|
|
| Based on net asset value and shares outstanding - the fund has an unlimited number of shares authorized
with no par value
|
|
| Class A ($36,114,623 ÷ 3,117,970 shares)1
| $11.58
|
| Class C ($1,439,488 ÷ 124,467 shares)1
| $11.57
|
| Class I ($19,025,086 ÷ 1,641,597 shares)
| $11.59
|
| Class R6 ($4,274,882 ÷ 368,723 shares)
| $11.59
|
| Class 1 ($63,771,416 ÷ 5,506,566 shares)
| $11.58
|
| Maximum offering price per share
|
|
| Class A (net asset value per share ÷ 95%)2
| $12.19
|
| 1
| Redemption price per share is equal to net asset value less any applicable contingent deferred sales charge.
|
| 2
| On single retail sales of less than $50,000. On sales of $50,000 or more and on group sales the offering price is reduced.
|
| 50
| JOHN HANCOCK Opportunistic Fixed Income Fund | ANNUAL REPORT
| SEE NOTES TO FINANCIAL STATEMENTS
|
STATEMENT OF OPERATIONS For the year ended 8-31-23
| Investment income
|
|
| Interest
| $5,270,190
|
| Dividends
| 705,452
|
| Securities lending
| 255
|
| Less foreign taxes withheld
| (14,226)
|
| Total investment income
| 5,961,671
|
| Expenses
|
|
| Investment management fees
| 731,169
|
| Distribution and service fees
| 139,579
|
| Accounting and legal services fees
| 23,087
|
| Transfer agent fees
| 56,506
|
| Trustees’ fees
| 2,653
|
| Custodian fees
| 148,138
|
| State registration fees
| 75,868
|
| Printing and postage
| 27,393
|
| Professional fees
| 146,427
|
| Other
| 29,374
|
| Total expenses
| 1,380,194
|
| Less expense reductions
| (280,900)
|
| Net expenses
| 1,099,294
|
| Net investment income
| 4,862,377
|
| Realized and unrealized gain (loss)
|
|
| Net realized gain (loss) on
|
|
| Unaffiliated investments and foreign currency transactions
| (9,048,096)
|
| Affiliated investments
| (70)
|
| Futures contracts
| (1,760,620)
|
| Forward foreign currency contracts
| 139,481
|
| Swap contracts
| (1,983,097)
|
|
| (12,652,402)
|
| Change in net unrealized appreciation (depreciation) of
|
|
| Unaffiliated investments and translation of assets and liabilities in foreign currencies
| 11,856,930
|
| Futures contracts
| 51,838
|
| Forward foreign currency contracts
| 60,786
|
| Swap contracts
| 1,232,778
|
|
| 13,202,332
|
| Net realized and unrealized gain
| 549,930
|
| Increase in net assets from operations
| $5,412,307
|
| SEE NOTES TO FINANCIAL STATEMENTS
| ANNUAL REPORT | JOHN HANCOCK Opportunistic Fixed Income Fund
| 51
|
STATEMENTS OF CHANGES IN NET
ASSETS
|
| Year ended
8-31-23
| Year ended
8-31-22
|
| Increase (decrease) in net assets
|
|
|
| From operations
|
|
|
| Net investment income
| $4,862,377
| $3,764,512
|
| Net realized loss
| (12,652,402)
| (5,340,394)
|
| Change in net unrealized appreciation (depreciation)
| 13,202,332
| (20,667,097)
|
| Increase (decrease) in net assets resulting from operations
| 5,412,307
| (22,242,979)
|
| Distributions to shareholders
|
|
|
| From earnings
|
|
|
| Class A
| (1,503,353)
| (1,217,048)
|
| Class C
| (51,526)
| (22,958)
|
| Class I
| (229,258)
| (444,039)
|
| Class R6
| (34,323)
| (1,021,827)
|
| Class 1
| (2,431,202)
| (1,060,733)
|
| Total distributions
| (4,249,662)
| (3,766,605)
|
| From fund share transactions
|
|
|
| Fund share transactions
| 9,928,065
| (41,614,668)
|
| Issued in reorganization
| —
| 94,289,023
|
| From fund share transactions
| 9,928,065
| 52,674,355
|
| Total increase
| 11,090,710
| 26,664,771
|
| Net assets
|
|
|
| Beginning of year
| 113,534,785
| 86,870,014
|
| End of year
| $124,625,495
| $113,534,785
|
| 52
| JOHN HANCOCK Opportunistic Fixed Income Fund | ANNUAL REPORT
| SEE NOTES TO FINANCIAL STATEMENTS
|
| CLASS A SHARES Period ended
| 8-31-23
| 8-31-22
| 8-31-211
|
| Per share operating performance
|
|
|
|
| Net asset value, beginning of period
| $11.44
| $13.66
| $13.52
|
| Net investment income2
| 0.47
| 0.35
| 0.07
|
| Net realized and unrealized gain (loss) on investments
| 0.10
| (2.30)
| 0.07
|
| Total from investment operations
| 0.57
| (1.95)
| 0.14
|
| Less distributions
|
|
|
|
| From net investment income
| (0.43)
| (0.27)
| —
|
| Net asset value, end of period
| $11.58
| $11.44
| $13.66
|
| Total return (%)3,4
| 5.31
| (14.51)
| 1.045
|
| Ratios and supplemental data
|
|
|
|
| Net assets, end of period (in millions)
| $36
| $41
| $—6
|
| Ratios (as a percentage of average net assets):
|
|
|
|
| Expenses before reductions
| 1.42
| 1.39
| 1.537
|
| Expenses including reductions
| 1.17
| 1.17
| 1.167
|
| Net investment income
| 4.11
| 2.88
| 2.227
|
| Portfolio turnover (%)
| 92
| 1428
| 619
|
| 1
| The inception date for Class A shares is 6-4-21.
|
| 2
| Based on average daily shares outstanding.
|
| 3
| Total returns would have been lower had certain expenses not been reduced during the applicable periods.
|
| 4
| Does not reflect the effect of sales charges, if any.
|
| 5
| Not annualized.
|
| 6
| Less than $500,000.
|
| 7
| Annualized.
|
| 8
| Excludes merger activity.
|
| 9
| Portfolio turnover is shown for the period from 9-1-20 to 8-31-21.
|
| SEE NOTES TO FINANCIAL STATEMENTS
| ANNUAL REPORT | JOHN HANCOCK Opportunistic Fixed Income Fund
| 53
|
| CLASS C SHARES Period ended
| 8-31-23
| 8-31-22
| 8-31-211
|
| Per share operating performance
|
|
|
|
| Net asset value, beginning of period
| $11.46
| $13.64
| $13.52
|
| Net investment income2
| 0.38
| 0.26
| 0.05
|
| Net realized and unrealized gain (loss) on investments
| 0.12
| (2.32)
| 0.07
|
| Total from investment operations
| 0.50
| (2.06)
| 0.12
|
| Less distributions
|
|
|
|
| From net investment income
| (0.39)
| (0.12)
| —
|
| Net asset value, end of period
| $11.57
| $11.46
| $13.64
|
| Total return (%)3,4
| 4.54
| (15.15)
| 0.895
|
| Ratios and supplemental data
|
|
|
|
| Net assets, end of period (in millions)
| $1
| $2
| $—6
|
| Ratios (as a percentage of average net assets):
|
|
|
|
| Expenses before reductions
| 2.17
| 2.14
| 2.287
|
| Expenses including reductions
| 1.92
| 1.92
| 1.917
|
| Net investment income
| 3.36
| 2.12
| 1.527
|
| Portfolio turnover (%)
| 92
| 1428
| 619
|
| 1
| The inception date for Class C shares is 6-4-21.
|
| 2
| Based on average daily shares outstanding.
|
| 3
| Total returns would have been lower had certain expenses not been reduced during the applicable periods.
|
| 4
| Does not reflect the effect of sales charges, if any.
|
| 5
| Not annualized.
|
| 6
| Less than $500,000.
|
| 7
| Annualized.
|
| 8
| Excludes merger activity.
|
| 9
| Portfolio turnover is shown for the period from 9-1-20 to 8-31-21.
|
| 54
| JOHN HANCOCK Opportunistic Fixed Income Fund | ANNUAL REPORT
| SEE NOTES TO FINANCIAL STATEMENTS
|
| CLASS I SHARES Period ended
| 8-31-23
| 8-31-22
| 8-31-211
|
| Per share operating performance
|
|
|
|
| Net asset value, beginning of period
| $11.43
| $13.67
| $13.52
|
| Net investment income2
| 0.51
| 0.38
| 0.07
|
| Net realized and unrealized gain (loss) on investments
| 0.10
| (2.31)
| 0.08
|
| Total from investment operations
| 0.61
| (1.93)
| 0.15
|
| Less distributions
|
|
|
|
| From net investment income
| (0.45)
| (0.31)
| —
|
| Net asset value, end of period
| $11.59
| $11.43
| $13.67
|
| Total return (%)3
| 5.54
| (14.24)
| 1.114
|
| Ratios and supplemental data
|
|
|
|
| Net assets, end of period (in millions)
| $19
| $7
| $—5
|
| Ratios (as a percentage of average net assets):
|
|
|
|
| Expenses before reductions
| 1.17
| 1.14
| 1.286
|
| Expenses including reductions
| 0.92
| 0.92
| 0.916
|
| Net investment income
| 4.49
| 3.03
| 2.116
|
| Portfolio turnover (%)
| 92
| 1427
| 618
|
| 1
| The inception date for Class I shares is 6-4-21.
|
| 2
| Based on average daily shares outstanding.
|
| 3
| Total returns would have been lower had certain expenses not been reduced during the applicable periods.
|
| 4
| Not annualized.
|
| 5
| Less than $500,000.
|
| 6
| Annualized.
|
| 7
| Excludes merger activity.
|
| 8
| Portfolio turnover is shown for the period from 9-1-20 to 8-31-21.
|
| SEE NOTES TO FINANCIAL STATEMENTS
| ANNUAL REPORT | JOHN HANCOCK Opportunistic Fixed Income Fund
| 55
|
| CLASS R6 SHARES Period ended
| 8-31-23
| 8-31-22
| 8-31-211
|
| Per share operating performance
|
|
|
|
| Net asset value, beginning of period
| $11.43
| $13.68
| $13.52
|
| Net investment income2
| 0.53
| 0.37
| 0.08
|
| Net realized and unrealized gain (loss) on investments
| 0.08
| (2.28)
| 0.08
|
| Total from investment operations
| 0.61
| (1.91)
| 0.16
|
| Less distributions
|
|
|
|
| From net investment income
| (0.45)
| (0.34)
| —
|
| Net asset value, end of period
| $11.59
| $11.43
| $13.68
|
| Total return (%)3
| 5.60
| (14.16)
| 1.184
|
| Ratios and supplemental data
|
|
|
|
| Net assets, end of period (in millions)
| $4
| $1
| $50
|
| Ratios (as a percentage of average net assets):
|
|
|
|
| Expenses before reductions
| 1.06
| 1.03
| 1.185
|
| Expenses including reductions
| 0.81
| 0.81
| 0.815
|
| Net investment income
| 4.64
| 2.80
| 2.495
|
| Portfolio turnover (%)
| 92
| 1426
| 617
|
| 1
| The inception date for Class R6 shares is 6-4-21.
|
| 2
| Based on average daily shares outstanding.
|
| 3
| Total returns would have been lower had certain expenses not been reduced during the applicable periods.
|
| 4
| Not annualized.
|
| 5
| Annualized.
|
| 6
| Excludes merger activity.
|
| 7
| Portfolio turnover is shown for the period from 9-1-20 to 8-31-21.
|
| 56
| JOHN HANCOCK Opportunistic Fixed Income Fund | ANNUAL REPORT
| SEE NOTES TO FINANCIAL STATEMENTS
|
| CLASS 1 SHARES Period ended
| 8-31-23
| 8-31-22
| 8-31-21
| 8-31-20
| 8-31-19
|
| Per share operating performance
|
|
|
|
|
|
| Net asset value, beginning of period
| $11.42
| $13.67
| $13.98
| $13.27
| $12.72
|
| Net investment income1
| 0.50
| 0.38
| 0.36
| 0.23
| 0.24
|
| Net realized and unrealized gain (loss) on investments
| 0.11
| (2.30)
| 0.03
| 0.94
| 0.48
|
| Total from investment operations
| 0.61
| (1.92)
| 0.39
| 1.17
| 0.72
|
| Less distributions
|
|
|
|
|
|
| From net investment income
| (0.45)
| (0.33)
| (0.70)
| (0.46)
| (0.17)
|
| Net asset value, end of period
| $11.58
| $11.42
| $13.67
| $13.98
| $13.27
|
| Total return (%)2
| 5.58
| (14.23)
| 2.84
| 9.15
| 5.75
|
| Ratios and supplemental data
|
|
|
|
|
|
| Net assets, end of period (in millions)
| $64
| $63
| $36
| $41
| $47
|
| Ratios (as a percentage of average net assets):
|
|
|
|
|
|
| Expenses before reductions
| 1.10
| 1.08
| 1.22
| 1.663
| 1.203
|
| Expenses including reductions
| 0.85
| 0.85
| 0.85
| 0.963
| 1.163
|
| Net investment income
| 4.44
| 3.16
| 2.62
| 1.77
| 2.05
|
| Portfolio turnover (%)
| 92
| 1424
| 61
| 2245
| 53
|
| 1
| Based on average daily shares outstanding.
|
| 2
| Total returns would have been lower had certain expenses not been reduced during the applicable periods.
|
| 3
| Includes interest expense of 0.09% and 0.26% for the year ended August 31, 2020 and the year ended August 31, 2019, respectively.
|
| 4
| Excludes merger activity.
|
| 5
| Increase in portfolio turnover rate resulted from repositioning of the portfolio during the period in accordance with investment policy changes approved by the Board of Trustees.
|
| SEE NOTES TO FINANCIAL STATEMENTS
| ANNUAL REPORT | JOHN HANCOCK Opportunistic Fixed Income Fund
| 57
|
Notes to financial statements
Note 1—Organization
John Hancock Opportunistic Fixed
Income Fund (the fund) is a series of John Hancock Funds II (the Trust), an open-end management investment company organized as a Massachusetts business trust and registered under the Investment Company Act
of 1940, as amended (the 1940 Act). The investment objective of the fund is to seek maximum total return, consistent with preservation of capital and prudent investment management.
The fund may offer multiple
classes of shares. The shares currently outstanding are detailed in the Statement of assets and liabilities. Class A and Class C shares are offered to all investors. Class I shares are offered to institutions and
certain investors. Class R6 shares are only available to certain retirement plans, institutions and other investors. Class 1 shares are offered only to certain affiliates of Manulife Financial Corporation. Class
C shares convert to Class A shares eight years after purchase (certain exclusions may apply). Shareholders of each class have exclusive voting rights to matters that affect that class. The distribution and service
fees, if any, and transfer agent fees for each class may differ.
Note 2—Significant accounting policies
The financial statements have been
prepared in conformity with accounting principles generally accepted in the United States of America (US GAAP), which require management to make certain estimates and assumptions as of the date of the financial
statements. Actual results could differ from those estimates and those differences could be significant. The fund qualifies as an investment company under Topic 946 of Accounting Standards Codification of US GAAP.
Events or transactions occurring
after the end of the fiscal period through the date that the financial statements were issued have been evaluated in the preparation of the financial statements. The following summarizes the significant accounting
policies of the fund:
Security valuation. Investments are stated at value as of the scheduled close of regular trading on the New York Stock Exchange (NYSE), normally at 4:00 P.M., Eastern Time. In case of emergency or other
disruption resulting in the NYSE not opening for trading or the NYSE closing at a time other than the regularly scheduled close, the net asset value (NAV) may be determined as of the regularly scheduled close of the
NYSE pursuant to the Advisor’s Valuation Policies and Procedures.
In order to value the securities,
the fund uses the following valuation techniques: Debt obligations are typically valued based on evaluated prices provided by an independent pricing vendor. Independent pricing vendors utilize matrix pricing, which
takes into account factors such as institutional-size trading in similar groups of securities, yield, quality, coupon rate, maturity, type of issue, trading characteristics and other market data, as well as broker
supplied prices. Equity securities, including exchange-traded or closed-end funds, are typically valued at the last sale price or official closing price on the exchange or principal market where the security trades.
In the event there were no sales during the day or closing prices are not available, the securities are valued using the last available bid price. Investments by the fund in open-end mutual funds are valued at their
respective NAVs each business day. Futures contracts whose settlement prices are determined as of the close of the NYSE are typically valued based on the settlement price while other futures contracts are
typically valued at the last traded price on the exchange on which they trade. Swaps are generally valued using evaluated prices obtained from an independent pricing vendor. Forward foreign currency contracts are
valued at the prevailing forward rates which are based on foreign currency exchange spot rates and forward points supplied by an independent pricing vendor. Foreign securities and currencies are valued in U.S. dollars
based on foreign currency exchange rates supplied by an independent pricing vendor.
In certain instances, the Pricing
Committee of the Advisor may determine to value equity securities using prices obtained from another exchange or market if trading on the exchange or market on which prices are typically obtained did not open for
trading as scheduled, or if trading closed earlier than scheduled, and trading occurred as normal on another exchange or market.
| 58
| JOHN HANCOCK Opportunistic Fixed Income Fund | ANNUAL REPORT
|
|
Other portfolio securities and
assets, for which reliable market quotations are not readily available, are valued at fair value as determined in good faith by the Pricing Committee following procedures established by the Advisor and adopted by the
Board of Trustees. The frequency with which these fair valuation procedures are used cannot be predicted and fair value of securities may differ significantly from the value that would have been used had a ready
market for such securities existed. Trading in foreign securities may be completed before the scheduled daily close of trading on the NYSE. Significant events at the issuer or market level may affect the values of
securities between the time when the valuation of the securities is generally determined and the close of the NYSE. If a significant event occurs, these securities may be fair valued, as determined in good faith by
the Pricing Committee, following procedures established by the Advisor and adopted by the Board of Trustees. The Advisor uses fair value adjustment factors provided by an independent pricing vendor to value certain
foreign securities in order to adjust for events that may occur between the close of foreign exchanges or markets and the close of the NYSE.
The fund uses a three tier hierarchy
to prioritize the pricing assumptions, referred to as inputs, used in valuation techniques to measure fair value. Level 1 includes securities valued using quoted prices in active markets for identical securities,
including registered investment companies. Level 2 includes securities valued using other significant observable inputs. Observable inputs may include quoted prices for similar securities, interest rates, prepayment
speeds and credit risk. Prices for securities valued using these inputs are received from independent pricing vendors and brokers and are based on an evaluation of the inputs described. Level 3 includes securities
valued using significant unobservable inputs when market prices are not readily available or reliable, including the Advisor’s assumptions in determining the fair value of investments. Factors used in
determining value may include market or issuer specific events or trends, changes in interest rates and credit quality. The inputs or methodology used for valuing securities are not necessarily an indication of the
risks associated with investing in those securities. Changes in valuation techniques and related inputs may result in transfers into or out of an assigned level within the disclosure hierarchy.
The following is a summary of the
values by input classification of the fund’s investments as of August 31, 2023, by major security category or type:
|
| Total
value at
8-31-23
| Level 1
quoted
price
| Level 2
significant
observable
inputs
| Level 3
significant
unobservable
inputs
|
| Investments in securities:
|
|
|
|
|
| Assets
|
|
|
|
|
| U.S. Government and Agency obligations
| $43,398,986
| —
| $43,398,986
| —
|
| Foreign government obligations
| 44,195,684
| —
| 44,195,684
| —
|
| Corporate bonds
| 14,444,994
| —
| 14,444,994
| —
|
| Convertible bonds
| 4,509,958
| —
| 4,509,958
| —
|
| Term loans
| 5,124,733
| —
| 5,124,733
| —
|
| Collateralized mortgage obligations
| 4,532,540
| —
| 4,532,540
| —
|
| Asset backed securities
| 3,659,518
| —
| 3,659,518
| —
|
| Common stocks
| 32,915
| $24,220
| —
| $8,695
|
| Preferred securities
| 750,772
| 749,159
| 1,613
| —
|
| Exchange-traded funds
| 155,844
| 155,844
| —
| —
|
| Escrow certificates
| 46
| —
| —
| 46
|
| Short-term investments
| 28,403,194
| 28,403,194
| —
| —
|
| Total investments in securities
| $149,209,184
| $29,332,417
| $119,868,026
| $8,741
|
|
| ANNUAL REPORT | JOHN HANCOCK Opportunistic Fixed Income Fund
| 59
|
|
| Total
value at
8-31-23
| Level 1
quoted
price
| Level 2
significant
observable
inputs
| Level 3
significant
unobservable
inputs
|
| Derivatives:
|
|
|
|
|
| Assets
|
|
|
|
|
| Futures
| $392,281
| $392,281
| —
| —
|
| Forward foreign currency contracts
| 371,829
| —
| $371,829
| —
|
| Swap contracts
| 777,989
| —
| 777,989
| —
|
| Liabilities
|
|
|
|
|
| Futures
| (46,051)
| (46,051)
| —
| —
|
| Forward foreign currency contracts
| (340,518)
| —
| (340,518)
| —
|
| Swap contracts
| (1,459,056)
| —
| (1,459,056)
| —
|
| Level 3 includes securities valued at $0. Refer to Fund’s investments.
|
When-issued/delayed-delivery
securities. The fund may purchase or sell securities on a when-issued or delayed-delivery basis, or in a “To Be Announced” (TBA) or “forward commitment” transaction, with
delivery or payment to occur at a later date beyond the normal settlement period. TBA securities resulting from these transactions are included in the portfolio or in a schedule to the portfolio (Sale Commitments
Outstanding). At the time a fund enters into a commitment to purchase or sell a security, the transaction is recorded and the value of the security is reflected in its NAV. The price of such security and the date that
the security will be delivered and paid for are fixed at the time the transaction is negotiated. The value of the security may vary with market fluctuations. No interest accrues on debt securities until settlement
takes place. At the time that the fund enters into this type of transaction, the fund is required to have sufficient cash and/or liquid securities to cover its commitments.
Certain risks may arise upon
entering into when-issued or delayed-delivery securities transactions, including the potential inability of counterparties to meet the terms of their contracts, and the issuer’s failure to issue the securities
due to political, economic or other factors. Additionally, losses may arise due to changes in the value of the securities purchased or sold prior to settlement date.
Term loans (Floating rate
loans). The fund may invest in term loans, which are debt securities and are often rated below investment grade at the time of purchase. Term loans are generally subject to legal or contractual
restrictions on resale and generally have longer settlement periods than conventional debt securities. Term loans involve special types of risk, including credit risk, interest-rate risk, counterparty risk, and risk
associated with extended settlement. The liquidity of term loans, including the volume and frequency of secondary market trading in such loans, varies significantly over time and among individual loans. During periods
of infrequent trading, valuing a term loan can be more difficult and buying and selling a term loan at an acceptable price can be more difficult and delayed, which could result in a loss.
The fund’s ability to receive
payments of principal, interest and other amounts in connection with term loans will depend primarily on the financial condition of the borrower. The fund’s failure to receive scheduled payments on a term loan
due to a default, bankruptcy or other reason would adversely affect the fund’s income and would likely reduce the value of its assets. Transactions in loan investments typically take a significant amount of time
(i.e., seven days or longer) to settle. This could pose a liquidity risk to the fund and, if the fund’s exposure to such investments is substantial, it could impair the fund’s ability to meet redemptions.
Because term loans may not be rated by independent credit rating agencies, a decision to invest in a particular loan could depend exclusively on the subadvisor’s credit analysis of the borrower and/or term loan
agents. There is greater risk that the fund may have limited rights to enforce the terms of an underlying loan than for other types of debt instruments.
At August 31, 2023, the fund had
$10,753 in unfunded loan commitments outstanding.
| 60
| JOHN HANCOCK Opportunistic Fixed Income Fund | ANNUAL REPORT
|
|
Inflation-indexed bonds. Inflation-indexed bonds are securities that generally have a lower coupon interest rate fixed at issuance but whose principal value is periodically adjusted based on a rate of inflation,
such as the Consumer Price Index. Over the life of an inflation-indexed bond, interest is paid on the inflation adjusted principal value as described above. Increases in the principal amount of these securities are
recorded as interest income. Decreases in the principal amount of these securities may reduce interest income to the extent of income previously recorded. If these decreases are in excess of income previously
recorded, an adjustment to the cost of the security is made.
Mortgage and asset backed
securities. The fund may invest in mortgage-related securities, such as mortgage-backed securities, and other asset-backed securities, which are debt obligations that represent interests in pools of
mortgages or other income-bearing assets, such as consumer loans or receivables. Such securities often involve risks that are different from the risks associated with investing in other types of debt securities.
Mortgage-backed and other asset-backed securities are subject to changes in the payment patterns of borrowers of the underlying debt. When interest rates fall, borrowers are more likely to refinance or prepay their
debt before its stated maturity. This may result in the fund having to reinvest the proceeds in lower yielding securities, effectively reducing the fund’s income. Conversely, if interest rates rise and borrowers
repay their debt more slowly than expected, the time in which the mortgage-backed and other asset-backed securities are paid off could be extended, reducing the fund’s cash available for reinvestment in higher
yielding securities. The timely payment of principal and interest of certain mortgage-related securities is guaranteed with the full faith and credit of the U.S. Government. Pools created and guaranteed by
non-governmental issuers, including government-sponsored corporations (e.g. FNMA), may be supported by various forms of insurance or guarantees, but there can be no assurance that private insurers or guarantors can
meet their obligations under the insurance policies or guarantee arrangements. The fund is also subject to risks associated with securities with contractual cash flows including asset-backed and mortgage related
securities such as collateralized mortgage obligations, mortgage pass-through securities and commercial mortgage-backed securities. The value, liquidity and related income of these securities are sensitive to changes
in economic conditions, including real estate value, pre-payments, delinquencies and/or defaults, and may be adversely affected by shifts in the market’s perception of the issuers and changes in interest
rates.
Real estate investment trusts. The fund may invest in real estate investment trusts (REITs). Distributions from REITs may be recorded as income and subsequently characterized by the REIT at the end of their fiscal year
as a reduction of cost of investments and/or as a realized gain. As a result, the fund will estimate the components of distributions from these securities. Such estimates are revised when the actual components of the
distributions are known.
Security transactions and related
investment income. Investment security transactions are accounted for on a trade date plus one basis for daily NAV calculations. However, for financial reporting purposes, investment transactions are
reported on trade date. Interest income is accrued as earned. Interest income includes coupon interest and amortization/accretion of premiums/discounts on debt securities. Debt obligations may be placed in a
non-accrual status and related interest income may be reduced by stopping current accruals and writing off interest receivable when the collection of all or a portion of interest has become doubtful. Dividend income
is recorded on ex-date, except for dividends of certain foreign securities where the dividend may not be known until after the ex-date. In those cases, dividend income, net of withholding taxes, is recorded when the
fund becomes aware of the dividends. Non-cash dividends, if any, are recorded at the fair market value of the securities received. Gains and losses on securities sold are determined on the basis of identified cost and
may include proceeds from litigation.
Securities lending. The fund may lend its securities to earn additional income. The fund receives collateral from the borrower in an amount not less than the market value of the loaned securities. The fund
may invest its cash collateral in John Hancock Collateral Trust (JHCT), an affiliate of the fund, which has a floating NAV and is registered with the Securities and Exchange Commission (SEC) as an investment company.
JHCT is a prime money market fund and invests in short-term money market investments. The fund will receive the benefit of any gains
|
| ANNUAL REPORT | JOHN HANCOCK Opportunistic Fixed Income Fund
| 61
|
and bear any losses generated by JHCT with respect
to the cash collateral.
The fund has the right to recall
loaned securities on demand. If a borrower fails to return loaned securities when due, then the lending agent is responsible and indemnifies the fund for the lent securities. The lending agent uses the collateral
received from the borrower to purchase replacement securities of the same issue, type, class and series of the loaned securities. If the value of the collateral is less than the purchase cost of replacement
securities, the lending agent is responsible for satisfying the shortfall but only to the extent that the shortfall is not due to any decrease in the value of JHCT.
Although the risk of loss on
securities lent is mitigated by receiving collateral from the borrower and through lending agent indemnification, the fund could experience a delay in recovering securities or could experience a lower than expected
return if the borrower fails to return the securities on a timely basis. During the existence of the loan, the fund will receive from the borrower amounts equivalent to any dividends, interest or other distributions
on the loaned securities, as well as interest on such amounts. The fund receives compensation for lending its securities by retaining a portion of the return on the investment of the collateral and compensation from
fees earned from borrowers of the securities. Securities lending income received by the fund is net of fees retained by the securities lending agent. Net income received from JHCT is a component of securities lending
income as recorded on the Statement of operations. As of August 31, 2023, there were no securities on loan.
Foreign investing. Assets, including investments, and liabilities denominated in foreign currencies are translated into U.S. dollar values each day at the prevailing exchange rate. Purchases and sales of
securities, income and expenses are translated into U.S. dollars at the prevailing exchange rate on the date of the transaction. The effect of changes in foreign currency exchange rates on the value of securities is
reflected as a component of the realized and unrealized gains (losses) on investments. Foreign investments are subject to a decline in the value of a foreign currency versus the U.S. dollar, which reduces the dollar
value of securities denominated in that currency.
Funds that invest internationally
generally carry more risk than funds that invest strictly in U.S. securities. These risks are heightened for investments in emerging markets. Risks can result from differences in economic and political conditions,
regulations, market practices (including higher transaction costs), accounting standards and other factors.
Foreign taxes. The fund may be subject to withholding tax on income, capital gains or repatriations imposed by certain countries, a portion of which may be recoverable. Foreign taxes are accrued based
upon the fund’s understanding of the tax rules and rates that exist in the foreign markets in which it invests. Taxes are accrued based on gains realized by the fund as a result of certain foreign security
sales. In certain circumstances, estimated taxes are accrued based on unrealized appreciation of such securities. Investment income is recorded net of foreign withholding taxes.
Overdraft. The fund may have the ability to borrow from banks for temporary or emergency purposes, including meeting redemption requests that otherwise might require the untimely sale of securities.
Pursuant to the fund’s custodian agreement, the custodian may loan money to the fund to make properly authorized payments. The fund is obligated to repay the custodian for any overdraft, including any related
costs or expenses. The custodian may have a lien, security interest or security entitlement in any fund property that is not otherwise segregated or pledged, to the extent of any overdraft, and to the maximum extent
permitted by law.
Line of credit. The fund and other affiliated funds have entered into a syndicated line of credit agreement with Citibank, N.A. as the administrative agent that enables them to participate in a $1 billion
unsecured committed line of credit. Excluding commitments designated for a certain fund and subject to the needs of all other affiliated funds, the fund can borrow up to an aggregate commitment amount of $750 million,
subject to asset coverage and other limitations as specified in the agreement. A commitment fee payable at the end of each calendar quarter, based on the average daily unused portion of the line of credit, is charged
to each participating fund
| 62
| JOHN HANCOCK Opportunistic Fixed Income Fund | ANNUAL REPORT
|
|
based on a combination of fixed and asset-based
allocations and is reflected in Other expenses on the Statement of operations. For the year ended August 31, 2023, the fund had no borrowings under the line of credit. Commitment fees for the year ended August 31,
2023 were $3,435.
Expenses. Within the John Hancock group of funds complex, expenses that are directly attributable to an individual fund are allocated to such fund. Expenses that are not readily attributable to
a specific fund are allocated among all funds in an equitable manner, taking into consideration, among other things, the nature and type of expense and the fund’s relative net assets. Expense estimates are
accrued in the period to which they relate and adjustments are made when actual amounts are known.
Class allocations. Income, common expenses and realized and unrealized gains (losses) are determined at the fund level and allocated daily to each class of shares based on the net assets of the class.
Class-specific expenses, such as distribution and service fees, if any, and transfer agent fees, for all classes, are charged daily at the class level based on the net assets of each class and the specific expense
rates applicable to each class.
Federal income taxes. The fund intends to continue to qualify as a regulated investment company by complying with the applicable provisions of the Internal Revenue Code and will not be subject to federal income
tax on taxable income that is distributed to shareholders. Therefore, no federal income tax provision is required.
For federal income tax purposes, as
of August 31, 2023, the fund has a short-term capital loss carryforward of $26,202,825 and a long-term capital loss carryforward of $61,125,677 available to offset future net realized capital gains. These
carryforwards do not expire. Availability of a certain amount of the loss carryforwards may be limited in a given year due to I.R.S. Regulations.
Qualified late year ordinary losses
of $1,531,633 are treated as occurring on September 1, 2023, the first day of the fund’s next taxable year.
As of August 31, 2023, the fund had
no uncertain tax positions that would require financial statement recognition, derecognition or disclosure. The fund’s federal tax returns are subject to examination by the Internal Revenue Service for a period
of three years.
Distribution of income and
gains. Distributions to shareholders from net investment income and net realized gains, if any, are recorded on the ex-date. The fund generally declares and pays dividends quarterly. Capital gain
distributions, if any, are typically distributed annually.
The tax character of distributions
for the years ended August 31, 2023 and 2022 was as follows:
|
| August 31, 2023
| August 31, 2022
|
| Ordinary income
| $4,249,662
| $3,766,605
|
Distributions paid by the fund with
respect to each class of shares are calculated in the same manner, at the same time and in the same amount, except for the effect of class level expenses that may be applied differently to each class. As of August 31,
2023, there were no distributable earnings on a tax basis.
Such distributions and distributable
earnings, on a tax basis, are determined in conformity with income tax regulations, which may differ from US GAAP. Distributions in excess of tax basis earnings and profits, if any, are reported in the fund’s
financial statements as a return of capital.
Capital accounts within the
financial statements are adjusted for permanent book-tax differences. These adjustments have no impact on net assets or the results of operations. Temporary book-tax differences, if any, will reverse in a subsequent
period. Book-tax differences are primarily attributable to straddle loss deferrals, defaulted bonds, foreign currency transactions, amortization and accretion on debt securities, wash sale loss deferrals and
derivative transactions.
|
| ANNUAL REPORT | JOHN HANCOCK Opportunistic Fixed Income Fund
| 63
|
Note 3—Derivative instruments
The fund may invest in derivatives
in order to meet its investment objective. Derivatives include a variety of different instruments that may be traded in the over-the-counter (OTC) market, on a regulated exchange or through a clearing facility. The
risks in using derivatives vary depending upon the structure of the instruments, including the use of leverage, optionality, the liquidity or lack of liquidity of the contract, the creditworthiness of the counterparty
or clearing organization and the volatility of the position. Some derivatives involve risks that are potentially greater than the risks associated with investing directly in the referenced securities or other
referenced underlying instrument. Specifically, the fund is exposed to the risk that the counterparty to an OTC derivatives contract will be unable or unwilling to make timely settlement payments or otherwise honor
its obligations. OTC derivatives transactions typically can only be closed out with the other party to the transaction.
Derivatives which are typically
traded through the OTC market are regulated by the Commodity Futures Trading Commission (the CFTC). Derivative counterparty risk is managed through an ongoing evaluation of the creditworthiness of all potential
counterparties and, if applicable, designated clearing organizations. The fund attempts to reduce its exposure to counterparty risk for derivatives traded in the OTC market, whenever possible, by entering into an
International Swaps and Derivatives Association (ISDA) Master Agreement with each of its OTC counterparties. The ISDA gives each party to the agreement the right to terminate all transactions traded under the
agreement if there is certain deterioration in the credit quality or contractual default of the other party, as defined in the ISDA. Upon an event of default or a termination of the ISDA, the non-defaulting party has
the right to close out all transactions and to net amounts owed.
As defined by the ISDA, the fund may
have collateral agreements with certain counterparties to mitigate counterparty risk on OTC derivatives. Subject to established minimum levels, collateral for OTC transactions is generally determined based on the net
aggregate unrealized gain or loss on contracts with a particular counterparty. Collateral pledged to the fund, if any, is held in a segregated account by a third-party agent or held by the custodian bank for the
benefit of the fund and can be in the form of cash or debt securities issued by the U.S. government or related agencies; collateral posted by the fund, if any, for OTC transactions is held in a segregated account at
the fund’s custodian and is noted in the accompanying Fund’s investments, or if cash is posted, on the Statement of assets and liabilities. The fund’s risk of loss due to counterparty risk is equal
to the asset value of outstanding contracts offset by collateral received.
Certain derivatives are traded or
cleared on an exchange or central clearinghouse. Exchange-traded or centrally-cleared transactions generally present less counterparty risk to a fund than OTC transactions. The exchange or clearinghouse stands between
the fund and the broker to the contract and therefore, credit risk is generally limited to the failure of the exchange or clearinghouse and the clearing member.
Centrally-cleared swap contracts are
subject to clearinghouse rules, including initial and variation margin requirements, daily settlement of obligations and the clearinghouse guarantee of payments to the broker. There is, however, still counterparty
risk due to the potential insolvency of the broker with respect to any margin held in the brokers’ customer accounts. While clearing members are required to segregate customer assets from their own assets, in
the event of insolvency, there may be a shortfall in the amount of margin held by the broker for its clients. Collateral or margin requirements for centrally-cleared derivatives are set by the broker or applicable
clearinghouse. Margin for centrally-cleared transactions is detailed in the Statement of assets and liabilities as Receivable/Payable for centrally-cleared swaps. Securities pledged by the fund for centrally-cleared
transactions, if any, are identified in the Fund’s investments.
Futures. A futures contract is a contractual agreement to buy or sell a particular currency or financial instrument at a pre-determined price in the future. Futures are traded on an exchange and
cleared through a central clearinghouse. Risks related to the use of futures contracts include possible illiquidity of the futures markets and contract prices that can be highly volatile and imperfectly correlated to
movements in the underlying financial instrument and potential losses in excess of the amounts recognized on the Statement of assets and liabilities. Use of long futures contracts subjects the fund to the risk of loss
up to the notional value of the futures contracts. Use
| 64
| JOHN HANCOCK Opportunistic Fixed Income Fund | ANNUAL REPORT
|
|
of short futures contracts subjects the fund to
unlimited risk of loss.
Upon entering into a futures
contract, the fund is required to deposit initial margin with the broker in the form of cash or securities. The amount of required margin is set by the broker and is generally based on a percentage of the contract
value. The margin deposit must then be maintained at the established level over the life of the contract. Cash that has been pledged by the fund, if any, is detailed in the Statement of assets and liabilities as
Collateral held at broker for futures contracts. Securities pledged by the fund, if any, are identified in the Fund’s investments. Subsequent payments, referred to as variation margin, are made or received by
the fund periodically and are based on changes in the market value of open futures contracts. Futures contracts are marked-to-market daily and unrealized gain or loss is recorded by the fund. Payable for futures
variation margin is included on the Statement of assets and liabilities. When the contract is closed, the fund records a realized gain or loss equal to the difference between the value of the contract at the time it
was opened and the value at the time it was closed.
During the year ended August 31,
2023, the fund used futures contracts to manage against changes in interest rates, gain exposure to certain bond markets and manage duration of the fund. The fund held futures contracts with USD notional values
ranging from $49.6 million to $82.1 million as measured at each quarter end.
Forward foreign currency
contracts. A forward foreign currency contract is an agreement between two parties to buy and sell specific currencies at a price that is set on the date of the contract. The forward contract calls
for delivery of the currencies on a future date that is specified in the contract. Forwards are typically traded OTC. Risks related to the use of forwards include the possible failure of counterparties to meet the
terms of the forward agreement, the failure of the counterparties to timely post collateral if applicable, and the risk that currency movements will not favor the fund thereby reducing the fund’s total return,
and the potential for losses in excess of the amounts recognized on the Statement of assets and liabilities.
The market value of a forward
foreign currency contract fluctuates with changes in foreign currency exchange rates. Forward foreign currency contracts are marked-to-market daily and the change in value is recorded by the fund as an unrealized gain
or loss. Realized gains or losses, equal to the difference between the value of the contract at the time it was opened and the value at the time it was closed, are recorded upon delivery or receipt of the currency or
settlement with the counterparty.
During the year ended August 31,
2023, the fund used forward foreign currency contracts to manage against changes in foreign currency exchange rates and to gain exposure to foreign currencies. The fund held forward foreign currency contracts with USD
notional values ranging from $93.1 million to $125.5 million as measured at each quarter end.
Swaps. Swap agreements are agreements between the fund and a counterparty to exchange cash flows, assets, foreign currencies or market-linked returns at specified intervals. Swap agreements are
privately negotiated in the OTC market (OTC swaps) or may be executed on a registered commodities exchange (centrally cleared swaps). Swaps are marked-to-market daily and the change in value is recorded as a component
of unrealized appreciation/depreciation of swap contracts. The value of the swap will typically impose collateral posting obligations on the party that is considered out-of-the-money on the swap.
Upfront payments made/received by
the fund, if any, are amortized/accreted for financial reporting purposes, with the unamortized/unaccreted portion included in the Statement of assets and liabilities. A termination payment by the counterparty or the
fund is recorded as realized gain or loss, as well as the net periodic payments received or paid by the fund.
Entering into swap agreements
involves, to varying degrees, elements of credit, market and documentation risk that may provide outcomes that produce losses in excess of the amounts recognized on the Statement of assets and liabilities. Such risks
involve the possibility that there will be no liquid market for the swap, or that a counterparty may default on its obligation or delay payment under the swap terms. The counterparty may disagree
|
| ANNUAL REPORT | JOHN HANCOCK Opportunistic Fixed Income Fund
| 65
|
or contest the terms of the swap. In addition to
interest rate risk, market risks may also impact the swap. The fund may also suffer losses if it is unable to terminate or assign outstanding swaps or reduce its exposure through offsetting transactions.
Interest rate swaps. Interest rate swaps represent an agreement between the fund and a counterparty to exchange cash flows based on the difference between two interest rates applied to a notional amount. The
payment flows are usually netted against each other, with the difference being paid by one party to the other. The fund settles accrued net interest receivable or payable under the swap contracts at specified, future
intervals.
During the year ended August 31,
2023, the fund used interest rate swap contracts to manage against changes in interest rates and to manage duration of the fund. The fund held interest rate swaps with total USD notional amounts ranging from $22.9
million to $58.7 million as measured at each quarter end.
Credit default swaps. Credit default swaps (CDS) involve the exchange of a fixed rate premium (paid by the Buyer), for protection against the loss in value of an underlying debt instrument, referenced entity or
index, in the event of a defined credit event (such as payment default or bankruptcy). Under the terms of the swap, one party acts as a “guarantor” (the Seller), receiving the premium and agreeing to
contingent payments that are specified within the credit default agreement. The fund may enter into CDS in which it may act as either Buyer or Seller. By acting as the Seller, the fund may incur economic leverage
since it would be obligated to pay the Buyer the notional amount of the contract in the event of a default. The amount of loss in such case could be significant, but would typically be reduced by any recovery value on
the underlying credit.
Credit default swaps — Buyer
During the year ended August 31,
2023, the fund used credit default swap contracts as the buyer to manage against potential credit events. The fund held credit default swaps with total USD notional amounts ranging from $7.3 million to $44.8 million
as measured at each quarter end.
Credit default swaps — Seller
Implied credit spreads are utilized
in determining the market value of CDS agreements in which the fund is the Seller at period end. The implied credit spread generally represents the yield of the instrument above a credit-risk free rate, such as the
U.S. Treasury Bond Yield, and may include upfront payments required to be made to enter into the agreement. It also serves as an indicator of the current status of the payment/performance risk and represents the
likelihood or risk of default for the credit derivative. Wider credit spreads represent a deterioration of the referenced entity’s creditworthiness and an increased risk of default or other credit event
occurring as defined under the terms of the agreement.
For CDS agreements where implied
credit spreads are not reported or available, the average credit rating on the underlying index is shown. A deterioration of the referenced entity’s creditworthiness would indicate a greater likelihood of a
credit event occurring and result in increasing market values, in absolute terms when compared to the notional amount of the swap. The maximum potential amount of future payments (undiscounted) that the fund as the
Seller could be required to make under any CDS agreement equals the notional amount of the agreement.
During the year ended August 31,
2023, the fund used credit default swap contracts as the seller to gain credit exposure to an issuer or index. The fund held credit default swaps with total USD notional amounts ranging up to $462,000 as measured at
each quarter end.
Inflation swaps. In an inflation swap, one party pays a fixed rate on a notional principal amount while the other party pays a floating rate linked to an inflation index on that same notional amount. The
party paying the floating rate pays the inflation adjusted rate multiplied by the notional principal amount. If the average inflation rate over the term of the swap is the same as the fixed rate of the swap, the two
legs will have the same value and the swap will break even.
| 66
| JOHN HANCOCK Opportunistic Fixed Income Fund | ANNUAL REPORT
|
|
During the year ended August 31,
2023, the fund used inflation swaps to manage exposure to inflation risk. The fund held inflation swaps with total USD notional amounts ranging from $11.4 million to $13.8 million as measured at each quarter end.
Total Return Swaps. The fund may enter into total return swap contracts to obtain synthetic exposure to a specific reference asset or index without owning, taking physical custody of, or short selling the
underlying assets. Total return swaps are commitments where one party pays a fixed or variable rate premium (the Buyer) in exchange for a market-linked return (the Seller). The Seller pays the total return of a
specific reference asset or index and in return receives interest payments from the Buyer. To the extent the total return of the underlying asset or index exceeds or falls short of the offsetting interest rate
obligation, the Buyer will receive or make a payment to the Seller. A fund may enter into total return swaps in which it may act as either the Buyer or the Seller. Total return swap contracts are subject to the risk
associated with the investment in the underlying reference asset or index. The risk in the case of short total return swap contracts is unlimited based on the potential for unlimited increases in the market value of
the underlying reference asset or index.
During the year ended August 31,
2023, the fund used total return swaps to gain exposure to a security or market without investing directly in such security or market. The fund held total return swaps with total USD notional amounts ranging from $2.6
million to $11.1 million as measured at each quarter end.
Fair value of derivative instruments
by risk category
The table below summarizes the fair
value of derivatives held by the fund at August 31, 2023 by risk category:
| Risk
| Statement of assets
and liabilities
location
| Financial
instruments
location
| Assets
derivatives
fair value
| Liabilities
derivatives
fair value
|
| Interest rate
| Receivable/payable for futures variation margin1
| Futures
| $392,281
| $(46,051)
|
| Currency
| Unrealized appreciation (depreciation) on forward foreign currency contracts
| Forward foreign currency contracts
| 371,829
| (340,518)
|
| Credit
| Swap contracts, at value2
| Credit default swaps
| 656,007
| (357,923)
|
| Interest rate
| Swap contracts, at value
| Total return swaps
| 36,623
| (93,271)
|
| Interest rate
| Swap contracts, at value2
| Interest rate swaps
| 69,051
| (959,209)
|
| Inflation
| Swap contracts, at value
| Inflation swaps
| 16,308
| (48,653)
|
|
|
|
| $1,542,099
| $(1,845,625)
|
| 1
| Reflects cumulative appreciation/depreciation on open futures as disclosed in the Derivatives section of Fund’s investments. Only the year end variation margin
receivable/payable is separately reported on the Statement of assets and liabilities.
|
| 2
| Reflects cumulative value of swap contracts. Receivable/payable for centrally cleared swaps, which includes value and margin, and swap contracts at value, which represents OTC
swaps, are shown separately on the Statement of assets and liabilities.
|
For financial reporting purposes,
the fund does not offset OTC derivative assets or liabilities that are subject to master netting arrangements, as defined by the ISDAs, in the Statement of assets and liabilities. In the event of default by the
counterparty or a termination of the agreement, the ISDA allows an offset of amounts across the various transactions between the fund and the applicable counterparty.
|
| ANNUAL REPORT | JOHN HANCOCK Opportunistic Fixed Income Fund
| 67
|
Effect of derivative instruments on the Statement of operations
The table below summarizes the net
realized gain (loss) included in the net increase (decrease) in net assets from operations, classified by derivative instrument and risk category, for the year ended August 31, 2023:
|
| Statement of operations location - Net realized gain (loss) on:
|
| Risk
| Futures contracts
| Forward foreign
currency contracts
| Swap contracts
| Total
|
| Interest rate
| $(1,760,620)
| —
| $(1,596,459)
| $(3,357,079)
|
| Currency
| —
| $139,481
| —
| 139,481
|
| Credit
| —
| —
| (213,267)
| (213,267)
|
| Inflation
| —
| —
| (173,371)
| (173,371)
|
| Total
| $(1,760,620)
| $139,481
| $(1,983,097)
| $(3,604,236)
|
The table below summarizes the net
change in unrealized appreciation (depreciation) included in the net increase (decrease) in net assets from operations, classified by derivative instrument and risk category, for the year ended August 31, 2023:
|
| Statement of operations location - Change in net unrealized appreciation (depreciation) of:
|
| Risk
| Futures contracts
| Forward foreign
currency contracts
| Swap contracts
| Total
|
| Interest rate
| $51,838
| —
| $1,638,257
| $1,690,095
|
| Currency
| —
| $60,786
| —
| 60,786
|
| Credit
| —
| —
| (462,128)
| (462,128)
|
| Inflation
| —
| —
| 56,649
| 56,649
|
| Total
| $51,838
| $60,786
| $1,232,778
| $1,345,402
|
Note 4—Guarantees and indemnifications
Under the Trust’s
organizational documents, its Officers and Trustees are indemnified against certain liabilities arising out of the performance of their duties to the Trust, including the fund. Additionally, in the normal course of
business, the fund enters into contracts with service providers that contain general indemnification clauses. The fund’s maximum exposure under these arrangements is unknown, as this would involve future claims
that may be made against the fund that have not yet occurred. The risk of material loss from such claims is considered remote.
Note 5—Fees and transactions with affiliates
John Hancock Investment Management
LLC (the Advisor) serves as investment advisor for the fund. John Hancock Investment Management Distributors LLC (the Distributor), an affiliate of the Advisor, serves as principal underwriter of the fund. The Advisor
and the Distributor are indirect, principally owned subsidiaries of John Hancock Life Insurance Company (U.S.A.), which in turn is a subsidiary of Manulife Financial Corporation.
Management fee. The fund has an investment management agreement with the Advisor under which the fund pays a daily management fee to the Advisor equivalent on an annual basis to the sum of: (a)
0.650% of the first $1 billion of the fund’s aggregate net assets and (b) 0.625% of the fund’s aggregate net assets in excess of $1 billion. Aggregate net assets include the net assets of the fund and
Opportunistic Fixed Income Trust, a series of John Hancock Variable Insurance Trust. The Advisor has a subadvisory agreement with Wellington Management Company LLP. The fund is not responsible for payment of the
subadvisory fees.
The Advisor has contractually agreed
to waive a portion of its management fee and/or reimburse expenses for certain funds of the John Hancock group of funds complex, including the fund (the participating portfolios). This waiver is based upon aggregate
net assets of all the participating portfolios. The amount of the reimbursement is calculated daily and allocated among all the participating portfolios in proportion to the daily net assets of each
| 68
| JOHN HANCOCK Opportunistic Fixed Income Fund | ANNUAL REPORT
|
|
fund. During the year ended August 31, 2023, this
waiver amounted to 0.01% of the fund’s average daily net assets. This arrangement expires on July 31, 2025, unless renewed by mutual agreement of the fund and the Advisor based upon a determination that this is
appropriate under the circumstances at that time.
The Advisor has contractually agreed
to reduce its management fee or, if necessary, make payment to the fund, in an amount equal to the amount by which the expenses of the fund exceed 0.80% of average net assets for the fund. Expenses excluded from this
waiver are taxes, brokerage commissions, interest expense, litigation and indemnification expenses and other extraordinary expenses not incurred in the ordinary course of the fund’s business, Rule 12b-1 fees,
transfer agent fees and service fees, shareholder servicing fees, borrowing costs, prime brokerage fees, acquired fund fees and expenses paid indirectly and short dividend expenses. This agreement expires on December
31, 2023, unless renewed by mutual agreement of the fund and the Advisor based upon a determination that this is appropriate under the circumstances at that time.
For the year ended August 31, 2023,
the expense reductions described above amounted to the following:
| Class
| Expense reduction
|
| Class A
| $92,866
|
| Class C
| 3,699
|
| Class I
| 25,932
|
| Class
| Expense reduction
|
| Class R6
| $4,985
|
| Class 1
| 153,418
|
| Total
| $280,900
|
Expenses waived or
reimbursed in the current fiscal period are not subject to recapture in future fiscal periods.
The investment management
fees, including the impact of the waivers and reimbursements as described above, incurred for the year ended August 31, 2023, were equivalent to a net annual effective rate of 0.40% of the fund’s average daily
net assets.
Accounting and legal
services. Pursuant to a service agreement, the fund reimburses the Advisor for all expenses associated with providing the administrative, financial, legal, compliance, accounting and
recordkeeping services to the fund, including the preparation of all tax returns, periodic reports to shareholders and regulatory reports, among other services. These expenses are allocated to each share class based
on its relative net assets at the time the expense was incurred. These accounting and legal services fees incurred, for the year ended August 31, 2023, amounted to an annual rate of 0.02% of the fund’s
average daily net assets.
Distribution and service
plans. The fund has a distribution agreement with the Distributor. The fund has adopted distribution and service plans for certain classes as detailed below pursuant to Rule 12b-1 under the 1940
Act, to pay the Distributor for services provided as the distributor of shares of the fund. The fund may pay up to the following contractual rates of distribution and service fees under these arrangements, expressed
as an annual percentage of average daily net assets for each class of the fund’s shares:
| Class
| Rule 12b-1 Fee
|
| Class A
| 0.25%
|
| Class C
| 1.00%
|
| Class 1
| 0.05%
|
Sales charges. Class A shares are assessed up-front sales charges, which resulted in payments to the Distributor amounting to $13,036 for the year ended August 31, 2023. Of this amount, $2,396 was
retained and used for printing prospectuses, advertising, sales literature and other purposes and $10,640 was paid as sales commissions to broker-dealers.
Class A and Class C shares may be
subject to contingent deferred sales charges (CDSCs). Certain Class A shares purchased, including those that are acquired through purchases of $1 million or more, and redeemed within one year of purchase are subject
to a 1.00% sales charge. Class C shares that are redeemed within one year of purchase are subject to a 1.00% CDSC. CDSCs are applied to the lesser of the current market value at the time of redemption or the original
purchase cost of the shares being redeemed. Proceeds from CDSCs are used to
|
| ANNUAL REPORT | JOHN HANCOCK Opportunistic Fixed Income Fund
| 69
|
compensate the Distributor for providing
distribution-related services in connection with the sale of these shares. During the year ended August 31, 2023, CDSCs received by the Distributor amounted to $336 and $700 for Class A and Class C shares,
respectively.
Transfer agent fees. The John Hancock group of funds has a complex-wide transfer agent agreement with John Hancock Signature Services, Inc. (Signature Services), an affiliate of the Advisor. The transfer agent
fees paid to Signature Services are determined based on the cost to Signature Services (Signature Services Cost) of providing recordkeeping services. It also includes out-of-pocket expenses, including payments made to
third-parties for recordkeeping services provided to their clients who invest in one or more John Hancock funds. In addition, Signature Services Cost may be reduced by certain fees that Signature Services receives in
connection with retirement and small accounts. Signature Services Cost is calculated monthly and allocated, as applicable, to five categories of share classes: Retail Share and Institutional Share Classes of
Non-Municipal Bond Funds, Class R6 Shares, Retirement Share Classes and Municipal Bond Share Classes. Within each of these categories, the applicable costs are allocated to the affected John Hancock affiliated funds
and/or classes, based on the relative average daily net assets.
Class level expenses. Class level expenses for the year ended August 31, 2023 were as follows:
| Class
| Distribution and service fees
| Transfer agent fees
|
| Class A
| $93,819
| $43,170
|
| Class C
| 14,922
| 1,713
|
| Class I
| —
| 11,501
|
| Class R6
| —
| 122
|
| Class 1
| 30,838
| —
|
| Total
| $139,579
| $56,506
|
Trustee expenses. The fund compensates each Trustee who is not an employee of the Advisor or its affiliates. The costs of paying Trustee compensation and expenses are allocated to the fund based on its net
assets relative to other funds within the John Hancock group of funds complex.
Interfund lending program. Pursuant to an Exemptive Order issued by the SEC, the fund, along with certain other funds advised by the Advisor or its affiliates, may participate in an interfund lending program. This
program provides an alternative credit facility allowing the fund to borrow from, or lend money to, other participating affiliated funds. At period end, no interfund loans were outstanding. The fund’s activity
in this program during the period for which loans were outstanding was as follows:
Borrower
or Lender
| Weighted Average
Loan Balance
| Days
Outstanding
| Weighted Average
Interest Rate
| Interest Income
(Expense)
|
|
| Lender
| $5,540,000
| 5
| 4.667%
| $3,591
|
|
| 70
| JOHN HANCOCK Opportunistic Fixed Income Fund | ANNUAL REPORT
|
|
Note 6—Fund share transactions
Transactions in fund shares for the
years ended August 31, 2023 and 2022 were as follows:
|
| Year Ended 8-31-23
| Year Ended 8-31-22
|
|
| Shares
| Amount
| Shares
| Amount
|
| Class A shares
|
|
|
|
|
| Sold
| 345,198
| $3,969,928
| 101,942
| $1,229,764
|
| Issued in reorganization (Note 9)
| —
| —
| 5,073,351
| 67,630,816
|
| Distributions reinvested
| 135,878
| 1,502,289
| 97,996
| 1,215,988
|
| Repurchased
| (980,222)
| (11,096,135)
| (1,661,986)
| (20,049,186)
|
| Net increase (decrease)
| (499,146)
| $(5,623,918)
| 3,611,303
| $50,027,382
|
| Class C shares
|
|
|
|
|
| Sold
| 57,890
| $639,248
| 276
| $3,461
|
| Issued in reorganization (Note 9)
| —
| —
| 215,078
| 2,855,762
|
| Distributions reinvested
| 4,642
| 51,526
| 1,908
| 22,889
|
| Repurchased
| (76,008)
| (849,281)
| (83,017)
| (988,742)
|
| Net increase (decrease)
| (13,476)
| $(158,507)
| 134,245
| $1,893,370
|
| Class I shares
|
|
|
|
|
| Sold
| 1,591,705
| $18,471,967
| 187,348
| $2,368,805
|
| Issued in reorganization (Note 9)
| —
| —
| 1,778,097
| 23,732,623
|
| Distributions reinvested
| 20,785
| 229,082
| 35,061
| 443,246
|
| Repurchased
| (585,649)
| (6,598,640)
| (1,402,104)
| (17,326,349)
|
| Net increase
| 1,026,841
| $12,102,409
| 598,402
| $9,218,325
|
| Class R6 shares
|
|
|
|
|
| Sold
| 368,109
| $4,238,607
| 678,597
| $8,674,407
|
| Issued in reorganization (Note 9)
| —
| —
| 5,228
| 69,822
|
| Distributions reinvested
| 3,107
| 34,323
| 5,170
| 61,848
|
| Repurchased
| (73,108)
| (826,663)
| (4,285,220)
| (50,414,978)
|
| Net increase (decrease)
| 298,108
| $3,446,267
| (3,596,225)
| $(41,608,901)
|
| Class 1 shares
|
|
|
|
|
| Sold
| 836,247
| $9,643,746
| 3,914,042
| $46,466,242
|
| Distributions reinvested
| 220,422
| 2,431,202
| 87,581
| 1,060,733
|
| Repurchased
| (1,047,346)
| (11,913,134)
| (1,164,879)
| (14,382,796)
|
| Net increase
| 9,323
| $161,814
| 2,836,744
| $33,144,179
|
| Total net increase
| 821,650
| $9,928,065
| 3,584,469
| $52,674,355
|
Affiliates of the fund owned 100% of
shares of Class 1 on August 31, 2023. Such concentration of shareholders’ capital could have a material effect on the fund if such shareholders redeem from the fund.
|
| ANNUAL REPORT | JOHN HANCOCK Opportunistic Fixed Income Fund
| 71
|
Note 7—Purchase and sale of securities
Purchases and sales of securities,
other than short-term investments and U.S. Treasury obligations, amounted to $82,987,233 and $115,189,923, respectively, for the year ended August 31, 2023. Purchases and sales of U.S. Treasury obligations aggregated
$20,341,278 and $3,840,462, respectively, for the year ended August 31, 2023.
Note 8—Investment in affiliated underlying funds
The fund may invest in affiliated
underlying funds that are managed by the Advisor and its affiliates. Information regarding the fund’s fiscal year to date purchases and sales of the affiliated underlying funds as well as income and capital
gains earned by the fund, if any, is as follows:
|
|
|
|
|
|
|
| Dividends and distributions
|
| Affiliate
| Ending
share
amount
| Beginning
value
| Cost of
purchases
| Proceeds
from shares
sold
| Realized
gain
(loss)
| Change in
unrealized
appreciation
(depreciation)
| Income
distributions
received
| Capital gain
distributions
received
| Ending
value
|
| John Hancock Collateral Trust*
| —
| —
| $779,708
| $(779,638)
| $(70)
| —
| $255
| —
| —
|
| *
| Refer to the Securities lending note within Note 2 for details regarding this investment.
|
Note 9—Reorganization
On June 24, 2021, the shareholders
of John Hancock Funds II (the Trust) Short Duration Credit Opportunities Fund (the Acquired Fund) voted to approve an Agreement and Plan of Reorganization (the Agreement) which provided for an exchange of shares of
Opportunistic Fixed Income Fund (the Acquiring Fund) with a value equal to the net assets transferred. The Agreement provided for (a) the acquisition of all the assets, subject to all of the liabilities, of the
Acquired Fund in exchange for shares of the Acquiring Fund with a value equal to the net assets transferred; (b) the liquidation of the Acquired Fund; and (c) the distribution to the Acquired Fund’s shareholders
of such Acquiring Fund’s shares. The reorganization was intended to achieve potential opportunities for economies of scale and potentially lower expenses in the future. As a result of the reorganization, the
Acquiring Fund is the legal and accounting survivor.
The reorganization qualified as a
tax-free reorganization for federal income tax purposes with no gain or loss recognized by the Acquired Fund or their shareholders. Thus, the investments were transferred to the Acquiring Fund at the Acquired
Fund’s identified cost. All distributable amounts of net income and realized gains from the Acquired Fund were distributed prior to the reorganization. In addition, the Acquired Fund will bear the costs that are
incurred in connection with the reorganization. The effective time of the reorganization occurred immediately after the close of regularly scheduled trading on the New York Stock Exchange (NYSE) on December 10, 2021.
The following outlines the reorganization:
Acquiring
Portfolio
| Acquired
Portfolio
| Net Asset
Value of the
Acquired
Portfolio
| Depreciation
of the
Acquired
Portfolio’s
Investments
| Shares
Redeemed
by the
Acquired
Portfolio
| Shares
Issued
by the
Acquiring
Portfolio
| Acquiring
Portfolio
Net Assets
Prior to
Combination
| Acquiring
Portfolio
Total Net
Assets After
Combination
|
| Opportunistic Fixed Income Fund
| Short Duration Credit Opportunities Fund
| $94,289,023
| ($977,122)
| 9,816,061
| 7,071,754
| $85,743,663
| $180,032,686
|
See Note 6 for capital shares issued
in connection with the above referenced reorganization.
| 72
| JOHN HANCOCK Opportunistic Fixed Income Fund | ANNUAL REPORT
|
|
Note 10—LIBOR discontinuation risk
LIBOR (London Interbank Offered
Rate) is a measure of the average interest rate at which major global banks can borrow from one another. Following allegations of rate manipulation and concerns regarding its thin liquidity, in July 2017, the U.K.
Financial Conduct Authority, which regulates LIBOR, announced that it will stop encouraging banks to provide the quotations needed to sustain LIBOR. As market participants transition away from LIBOR, LIBOR’s
usefulness may deteriorate and these effects could be experienced until the permanent cessation of the majority of U.S. LIBOR rates in 2023. The transition process may lead to increased volatility and illiquidity in
markets that currently rely on LIBOR to determine interest rates. LIBOR’s deterioration may adversely affect the liquidity and/or market value of securities that use LIBOR as a benchmark interest rate.
The ICE Benchmark Administration
Limited, the administrator of LIBOR, ceased publishing certain LIBOR maturities, including some U.S. LIBOR maturities, on December 31, 2021, and ceased publishing the remaining and most liquid U.S. LIBOR maturities on
June 30, 2023 on a representative basis. The 1-, 3- and 6-month USD LIBOR maturities will continue to be published based on a synthetic methodology through September 30, 2024 and are permitted to be used in all legacy
contracts except cleared derivatives. It is expected that market participants have or will transition to the use of alternative reference or benchmark rates prior to the applicable LIBOR publication cessation
date. Additionally, although regulators have encouraged the development and adoption of alternative rates such as the Secured Overnight Financing Rate ("SOFR"), the future utilization of LIBOR or of any particular
replacement rate remains uncertain.
The impact on the transition away
from LIBOR referenced financial instruments remains uncertain. It is expected that market participants will adopt alternative rates such as SOFR or otherwise amend such financial instruments to include fallback
provisions and other measures that contemplate the discontinuation of LIBOR. Uncertainty and risk remain regarding the willingness and ability of issuers and lenders to include alternative rates and revised provisions
in new and existing contracts or instruments. To facilitate the transition of legacy derivatives contracts referencing LIBOR, the International Swaps and Derivatives Association, Inc. launched a protocol to
incorporate fallback provisions. There are obstacles to converting certain longer term securities to a new benchmark or benchmarks and the effectiveness of one versus multiple alternative reference rates has not been
determined. Certain proposed replacement rates, such as SOFR, are materially different from LIBOR, and will require changes to the applicable spreads. Furthermore, the risks associated with the conversion from LIBOR
may be exacerbated if an orderly transition is not completed in a timely manner.
Note 11—New accounting pronouncement
In March 2020, the Financial
Accounting Standards Board (FASB) issued an Accounting Standards Update (ASU), ASU 2020-04, Reference Rate Reform (Topic 848), which provides optional, temporary relief with respect to the financial reporting of
contracts subject to certain types of modifications due to the planned discontinuation of the LIBOR and other IBOR-based reference rates as of the end of 2021. In January 2021 and December 2022, the FASB issued
ASU No. 2021-01 and ASU No. 2022-06, with further amendments to Topic 848. The temporary relief provided by ASU 2020-04 is effective for certain reference rate-related contract modifications that occur during the
period March 12, 2020 through December 31, 2024. Management expects that the adoption of the guidance will not have a material impact to the financial statements.
|
| ANNUAL REPORT | JOHN HANCOCK Opportunistic Fixed Income Fund
| 73
|
Report of Independent Registered
Public Accounting Firm
To the Board of Trustees of John
Hancock Funds II and Shareholders of John Hancock Opportunistic Fixed Income Fund
Opinion on the Financial Statements
We have audited the accompanying
statement of assets and liabilities, including the fund’s investments, of John Hancock Opportunistic Fixed Income Fund (one of the funds constituting John Hancock Funds II, referred to hereafter as the "Fund")
as of August 31, 2023, the related statement of operations for the year ended August 31, 2023, the statements of changes in net assets for each of the two years in the period ended August 31, 2023, including the
related notes, and the financial highlights for each of the periods indicated therein (collectively referred to as the “financial statements”). In our opinion, the financial statements present fairly, in
all material respects, the financial position of the Fund as of August 31, 2023, the results of its operations for the year then ended, the changes in its net assets for each of the two years in the period ended
August 31, 2023 and the financial highlights for each of the periods indicated therein in conformity with accounting principles generally accepted in the United States of America.
Basis for Opinion
These financial statements are the
responsibility of the Fund’s management. Our responsibility is to express an opinion on the Fund’s financial statements based on our audits. We are a public accounting firm registered with the Public
Company Accounting Oversight Board (United States) (PCAOB) and are required to be independent with respect to the Fund in accordance with the U.S. federal securities laws and the applicable rules and regulations of
the Securities and Exchange Commission and the PCAOB.
We conducted our audits of these
financial statements in accordance with the standards of the PCAOB. Those standards require that we plan and perform the audit to obtain reasonable assurance about whether the financial statements are free of material
misstatement, whether due to error or fraud.
Our audits included performing
procedures to assess the risks of material misstatement of the financial statements, whether due to error or fraud, and performing procedures that respond to those risks. Such procedures included examining, on a test
basis, evidence regarding the amounts and disclosures in the financial statements. Our audits also included evaluating the accounting principles used and significant estimates made by management, as well as evaluating
the overall presentation of the financial statements. Our procedures included confirmation of securities owned as of August 31, 2023 by correspondence with the custodian, agent banks and brokers; when replies were not
received from agent banks and brokers, we performed other auditing procedures. We believe that our audits provide a reasonable basis for our opinion.
/s/ PricewaterhouseCoopers LLP
Boston, Massachusetts
October 19, 2023
We have served as the auditor of one
or more investment companies in the John Hancock group of funds since 1988.
| 74
| JOHN HANCOCK OPPORTUNISTIC FIXED INCOME FUND | ANNUAL REPORT
|
|
(Unaudited)
For federal income tax purposes, the
following information is furnished with respect to the distributions of the fund, if any, paid during its taxable year ended August 31, 2023.
The fund reports the maximum amount
allowable of its net taxable income as eligible for the corporate dividends-received deduction.
The fund reports the maximum amount
allowable of its net taxable income as qualified dividend income as provided in the Jobs and Growth Tax Relief Reconciliation Act of 2003.
The fund reports the maximum amount
allowable as Section 163(j) Interest Dividends.
The fund reports the maximum amount
allowable of its Section 199A dividends as defined in Proposed Treasury Regulation §1.199A-3(d).
Eligible shareholders will be mailed
a 2023 Form 1099-DIV in early 2024. This will reflect the tax character of all distributions paid in calendar year 2023.
Please consult a tax advisor regarding
the tax consequences of your investment in the fund.
|
| ANNUAL REPORT | JOHN HANCOCK OPPORTUNISTIC FIXED INCOME FUND
| 75
|
EVALUATION OF ADVISORY AND
SUBADVISORY AGREEMENTS BY THE BOARD OF TRUSTEES
This section describes the
evaluation by the Board of Trustees (the Board) of John Hancock Funds II (the Trust) of the Advisory Agreement (the Advisory Agreement) with John Hancock Investment Management LLC (the Advisor) and the Subadvisory
Agreement (the Subadvisory Agreement) with Wellington Management Company LLP (the Subadvisor) for John Hancock Opportunistic Fixed Income Fund (the fund). The Advisory Agreement and Subadvisory Agreement are
collectively referred to as the Agreements. Prior to the June 26-29, 2023 meeting at which the Agreements were approved, the Board also discussed and considered information regarding the proposed continuation of the
Agreements at the meeting held on May 30-June 1, 2023. Trustees who are not “interested persons” of the Trust as defined by the Investment Company Act of 1940, as amended (the 1940 Act) (the Independent
Trustees) also met separately to evaluate and discuss the information presented, including with counsel to the Independent Trustees and a third-party consulting firm.
Approval of Advisory and Subadvisory
Agreements
At meetings held on June 26-29,
2023, the Board, including the Trustees who are not parties to any Agreement or considered to be interested persons of the Trust under the 1940 Act, reapproved for an annual period the continuation of the Advisory
Agreement between the Trust and the Advisor and the Subadvisory Agreement between the Advisor and the Subadvisor with respect to the fund.
In considering the Advisory
Agreement and the Subadvisory Agreement, the Board received in advance of the meetings a variety of materials relating to the fund, the Advisor and the Subadvisor, including comparative performance, fee and expense
information for a peer group of similar funds prepared by an independent third-party provider of fund data, performance information for an applicable benchmark index; and, with respect to the Subadvisor, comparative
performance information for comparably managed accounts, as applicable, and other information provided by the Advisor and the Subadvisor regarding the nature, extent and quality of services provided by the Advisor and
the Subadvisor under their respective Agreements, as well as information regarding the Advisor’s revenues and costs of providing services to the fund and any compensation paid to affiliates of the Advisor. At
the meetings at which the renewal of the Advisory Agreement and Subadvisory Agreement are considered, particular focus is given to information concerning fund performance, comparability of fees and total expenses, and
profitability. However, the Board noted that the evaluation process with respect to the Advisor and the Subadvisor is an ongoing one. In this regard, the Board also took into account discussions with management and
information provided to the Board (including its various committees) at prior meetings with respect to the services provided by the Advisor and the Subadvisor to the fund, including quarterly performance reports
prepared by management containing reviews of investment results and prior presentations from the Subadvisor with respect to the fund. The information received and considered by the Board in connection with the May and
June meetings and throughout the year was both written and oral. The Board also considered the nature, quality, and extent of non-advisory services, if any, to be provided to the fund by the Advisor’s
affiliates, including distribution services. The Board considered the Advisory Agreement and the Subadvisory Agreement separately in the course of its review. In doing so, the Board noted the respective roles of
the Advisor and Subadvisor in providing services to the fund.
Throughout the process, the Board
asked questions of and requested additional information from management. The Board is assisted by counsel for the Trust and the Independent Trustees are also separately assisted by independent legal counsel throughout
the process. The Independent Trustees also received a memorandum from their independent legal counsel discussing the legal standards for their consideration of the proposed continuation of the Agreements and discussed
the proposed continuation of the Agreements in private sessions with their independent legal counsel at which no representatives of management were present.
| 76
| JOHN HANCOCK OPPORTUNISTIC FIXED INCOME FUND | ANNUAL REPORT
|
|
Approval of Advisory Agreement
In approving the Advisory Agreement
with respect to the fund, the Board, including the Independent Trustees, considered a variety of factors, including those discussed below. The Board also considered other factors (including conditions and trends
prevailing generally in the economy, the securities markets, and the industry) and did not treat any single factor as determinative, and each Trustee may have attributed different weights to different factors. The
Board’s conclusions may be based in part on its consideration of the advisory and subadvisory arrangements in prior years and on the Board’s ongoing regular review of fund performance and operations
throughout the year.
Nature, extent, and quality of services. Among the information received by the Board from the Advisor relating to the nature, extent, and quality of services provided to the fund, the Board reviewed information provided by the
Advisor relating to its operations and personnel, descriptions of its organizational and management structure, and information regarding the Advisor’s compliance and regulatory history, including its Form ADV.
The Board also noted that on a regular basis it receives and reviews information from the Trust’s Chief Compliance Officer (CCO) regarding the fund’s compliance policies and procedures established pursuant
to Rule 38a-1 under the 1940 Act. The Board observed that the scope of services provided by the Advisor, and of the undertakings required of the Advisor in connection with those services, including maintaining and
monitoring its own and the fund’s compliance programs, risk management programs, liquidity management programs, derivatives risk management programs, and cybersecurity programs, had expanded over time as a
result of regulatory, market and other developments. The Board considered that the Advisor is responsible for the management of the day-to-day operations of the fund, including, but not limited to, general supervision
of and coordination of the services provided by the Subadvisor, and is also responsible for monitoring and reviewing the activities of the Subadvisor and other third-party service providers. The Board also considered
the significant risks assumed by the Advisor in connection with the services provided to the fund including entrepreneurial risk in sponsoring new funds and ongoing risks including investment, operational, enterprise,
litigation, regulatory and compliance risks with respect to all funds.
In considering the nature, extent,
and quality of the services provided by the Advisor, the Trustees also took into account their knowledge of the Advisor’s management and the quality of the performance of the Advisor’s duties, through
Board meetings, discussions and reports during the preceding year and through each Trustee’s experience as a Trustee of the Trust and of the other trusts in the John Hancock group of funds complex (the John
Hancock Fund Complex).
In the course of their deliberations
regarding the Advisory Agreement, the Board considered, among other things:
| (a)
| the skills and competency with which the Advisor has in the past managed the Trust’s affairs and its subadvisory relationship, the Advisor’s oversight and monitoring of the Subadvisor’s investment
performance and compliance programs, such as the Subadvisor’s compliance with fund policies and objectives, review of brokerage matters, including with respect to trade allocation and best execution and the
Advisor’s timeliness in responding to performance issues;
|
| (b)
| the background, qualifications and skills of the Advisor’s personnel;
|
| (c)
| the Advisor’s compliance policies and procedures and its responsiveness to regulatory changes and fund industry developments;
|
| (d)
| the Advisor’s administrative capabilities, including its ability to supervise the other service providers for the fund, as well as the Advisor’s oversight of any securities lending activity, its
monitoring of class action litigation and collection of class action settlements on behalf of the fund, and bringing loss recovery actions on behalf of the fund;
|
| (e)
| the financial condition of the Advisor and whether it has the financial wherewithal to provide a high level and quality of services to the fund;
|
|
| ANNUAL REPORT | JOHN HANCOCK OPPORTUNISTIC FIXED INCOME FUND
| 77
|
| (f)
| the Advisor’s initiatives intended to improve various aspects of the Trust’s operations and investor experience with the fund; and
|
| (g)
| the Advisor’s reputation and experience in serving as an investment advisor to the Trust and the benefit to shareholders of investing in funds that are part of a family of funds offering a variety
of investments.
|
The Board concluded that the Advisor
may reasonably be expected to continue to provide a high quality of services under the Advisory Agreement with respect to the fund.
Investment performance. In considering the fund’s performance, the Board noted that it reviews at its regularly scheduled meetings information about the fund’s performance results. In connection with
the consideration of the Advisory Agreement, the Board:
| (a)
| reviewed information prepared by management regarding the fund’s performance;
|
| (b)
| considered the comparative performance of an applicable benchmark index;
|
| (c)
| considered the performance of comparable funds, if any, as included in the report prepared by an independent third-party provider of fund data; and
|
| (d)
| took into account the Advisor’s analysis of the fund’s performance and its plans and recommendations regarding the Trust’s subadvisory arrangements generally.
|
The Board noted that while it found
the data provided by the independent third-party generally useful it recognized its limitations, including in particular that the data may vary depending on the end date selected and that the results of the
performance comparisons may vary depending on the selection of the peer group. The Board noted that the fund outperformed its benchmark index for the one-, three- and five-year periods and underperformed for the
ten-year period ended December 31, 2022. The Board also noted that the fund outperformed its peer group median for the one-, three-, five- and ten-year periods ended December 31, 2022. The Board took into account
management’s discussion of the fund’s performance, including the favorable performance relative to the benchmark index for the one-, three- and five-year periods and relative to its peer group median for
the one-, three-, five- and ten-year periods. The Board concluded that the fund’s performance has generally been in line with or outperformed the historical performance of comparable funds and the fund’s
benchmark index.
Fees and expenses. The Board reviewed comparative information prepared by an independent third-party provider of fund data, including, among other data, the fund’s contractual and net management fees
(and subadvisory fees, to the extent available) and total expenses as compared to similarly situated investment companies deemed to be comparable to the fund in light of the nature, extent and quality of the
management and advisory and subadvisory services provided by the Advisor and Subadvisor. The Board considered the fund’s ranking within a smaller group of peer funds chosen by the independent third-party
provider, as well as the fund’s ranking within a broader group of funds. In comparing the fund’s contractual and net management fees to those of comparable funds, the Board noted that such fees include
both advisory and administrative costs. The Board noted that net management fees are equal to the peer group median and net total expenses for the fund were lower than the peer group median.
The Board took into account
management’s discussion with respect to overall management fee and the fees of the Subadvisor, including the amount of the advisory fee retained by the Advisor after payment of the subadvisory fees, in each case
in light of the services rendered for those amounts and the risks undertaken by the Advisor. The Board also noted that the Advisor pays the subadvisory fees, and that such fees are negotiated at arm’s length
with respect to the Subadvisor. In addition, the Board took into account that management had agreed to implement an overall fee waiver across the complex, including the fund, which is discussed further below. The
Board also noted actions taken over the past several years to reduce the fund’s operating expenses. The Board also noted that, in addition, the Advisor is currently waiving fees and/or reimbursing expenses with
respect to the fund and that the fund has breakpoints in its contractual management fee schedule that reduces management fees as
| 78
| JOHN HANCOCK OPPORTUNISTIC FIXED INCOME FUND | ANNUAL REPORT
|
|
assets increase. The Board reviewed information
provided by the Advisor concerning the investment advisory fee charged by the Advisor or one of its advisory affiliates to other clients (including other funds in the John Hancock Fund Complex) having similar
investment mandates, if any. The Board considered any differences between the Advisor’s and Subadvisor’s services to the fund and the services they provide to other comparable clients or funds. The Board
concluded that the advisory fee paid with respect to the fund is reasonable in light of the nature, extent and quality of the services provided to the fund under the Advisory Agreement.
Profitability/indirect benefits. In considering the costs of the services to be provided and the profits to be realized by the Advisor and its affiliates from the Advisor’s relationship with the Trust, the
Board:
| (a)
| reviewed financial information of the Advisor;
|
| (b)
| reviewed and considered information presented by the Advisor regarding the net profitability to the Advisor and its affiliates with respect to the fund;
|
| (c)
| received and reviewed profitability information with respect to the John Hancock Fund Complex as a whole and with respect to the fund;
|
| (d)
| received information with respect to the Advisor’s allocation methodologies used in preparing the profitability data and considered that the Advisor hired an independent third-party consultant to provide an
analysis of the Advisor’s allocation methodologies;
|
| (e)
| considered that the John Hancock insurance companies that are affiliates of the Advisor, as shareholders of the Trust directly or through their separate accounts, receive certain tax credits or deductions relating
to foreign taxes paid and dividends received by certain funds of the Trust and noted that these tax benefits, which are not available to participants in qualified retirement plans under applicable income tax law, are
reflected in the profitability information reviewed by the Board;
|
| (f)
| considered that the Advisor also provides administrative services to the fund on a cost basis pursuant to an administrative services agreement;
|
| (g)
| noted that affiliates of the Advisor provide transfer agency services and distribution services to the fund, and that the fund’s distributor also receives Rule 12b-1 payments to support distribution of the fund;
|
| (h)
| noted that the Advisor also derives reputational and other indirect benefits from providing advisory services to the fund;
|
| (i)
| noted that the subadvisory fee for the fund is paid by the Advisor and is negotiated at arm’s length;
|
| (j)
| considered the Advisor’s ongoing costs and expenditures necessary to improve services, meet new regulatory and compliance requirements, and adapt to other challenges impacting the fund industry; and
|
| (k)
| considered that the Advisor should be entitled to earn a reasonable level of profits in exchange for the level of services it provides to the fund and the risks that it assumes as Advisor including
entrepreneurial, operational, reputational, litigation and regulatory risk.
|
Based upon its review, the Board
concluded that the level of profitability, if any, of the Advisor and its affiliates from their relationship with the fund was reasonable and not excessive.
Economies of scale. In considering the extent to which economies of scale would be realized as the fund grows and whether fee levels reflect these economies of scale for the benefit of fund shareholders, the
Board:
| (a)
| considered that the Advisor has contractually agreed to waive a portion of its management fee for certain funds of the John Hancock Fund Complex, including the fund (the participating portfolios) or otherwise
reimburse the expenses of the participating portfolios (the reimbursement). This waiver is
|
|
| ANNUAL REPORT | JOHN HANCOCK OPPORTUNISTIC FIXED INCOME FUND
| 79
|
|
| based upon aggregate net assets of all the participating portfolios. The amount of the reimbursement is calculated daily and allocated among all the participating portfolios in proportion to the daily net assets of
each fund;
|
| (b)
| reviewed the fund’s advisory fee structure and concluded that: (i) the fund’s fee structure contains breakpoints at the subadvisory fee level and that such breakpoints are reflected as breakpoints in the
advisory fees for the fund; and (ii) although economies of scale cannot be measured with precision, these arrangements permit shareholders of the fund to benefit from economies of scale if the fund grows. The Board
also took into account management’s discussion of the fund’s advisory fee structure; and
|
| (c)
| the Board also considered the effect of the fund’s growth in size on its performance and fees. The Board also noted that if the fund’s assets increase over time, the fund may realize other
economies of scale
|
Approval of Subadvisory Agreement
In making its determination with
respect to approval of the Subadvisory Agreement, the Board reviewed:
| (1)
| information relating to the Subadvisor’s business, including current subadvisory services to the Trust (and other funds in the John Hancock Fund Complex);
|
| (2)
| the historical and current performance of the fund and comparative performance information relating to an applicable benchmark index and comparable funds;
|
| (3)
| the subadvisory fee for the fund, including any breakpoints, and to the extent available, comparable fee information prepared by an independent third party provider of fund data; and
|
| (4)
| information relating to the nature and scope of any material relationships and their significance to the Trust’s Advisor and Subadvisor.
|
Nature, extent, and quality of services. With respect to the services provided by the Subadvisor, the Board received information provided to the Board by the Subadvisor, including the Subadvisor’s Form ADV, as well as took
into account information presented throughout the past year. The Board considered the Subadvisor’s current level of staffing and its overall resources, as well as received information relating to the
Subadvisor’s compensation program. The Board reviewed the Subadvisor’s history and investment experience, as well as information regarding the qualifications, background, and responsibilities of the
Subadvisor’s investment and compliance personnel who provide services to the fund. The Board also considered, among other things, the Subadvisor’s compliance program and any disciplinary history. The Board
also considered the Subadvisor’s risk assessment and monitoring process. The Board reviewed the Subadvisor’s regulatory history, including whether it was involved in any regulatory actions or
investigations as well as material litigation, and any settlements and amelioratory actions undertaken, as appropriate. The Board noted that the Advisor conducts regular, periodic reviews of the Subadvisor and its
operations, including regarding investment processes and organizational and staffing matters. The Board also noted that the Trust’s CCO and his staff conduct regular, periodic compliance reviews with the
Subadvisor and present reports to the Independent Trustees regarding the same, which includes evaluating the regulatory compliance systems of the Subadvisor and procedures reasonably designed to assure compliance with
the federal securities laws. The Board also took into account the financial condition of the Subadvisor.
The Board considered the
Subadvisor’s investment process and philosophy. The Board took into account that the Subadvisor’s responsibilities include the development and maintenance of an investment program for the fund that is
consistent with the fund’s investment objective, the selection of investment securities and the placement of orders for the purchase and sale of such securities, as well as the implementation of compliance
controls related to performance of these services. The Board also received information with respect to the Subadvisor’s brokerage policies and practices, including with respect to best execution and soft
dollars.
| 80
| JOHN HANCOCK OPPORTUNISTIC FIXED INCOME FUND | ANNUAL REPORT
|
|
Subadvisor compensation. In considering the cost of services to be provided by the Subadvisor and the profitability to the Subadvisor of its relationship with the fund, the Board noted that the fees under the
Subadvisory Agreement are paid by the Advisor and not the fund.
The Board also relied on the ability
of the Advisor to negotiate the Subadvisory Agreement with the Subadvisor, which is not affiliated with the Advisor, and the fees thereunder at arm’s length. As a result, the costs of the services to be provided
and the profits to be realized by the Subadvisor from its relationship with the Trust were not a material factor in the Board’s consideration of the Subadvisory Agreement.
The Board also received information
regarding the nature and scope (including their significance to the Advisor and its affiliates and to the Subadvisor) of any material relationships with respect to the Subadvisor, which include arrangements in which
the Subadvisor or its affiliates provide advisory, distribution, or management services in connection with financial products sponsored by the Advisor or its affiliates, and may include other registered investment
companies, a 529 education savings plan, managed separate accounts and exempt group annuity contracts sold to qualified plans. The Board also received information and took into account any other potential conflicts of
interest the Advisor might have in connection with the Subadvisory Agreement.
In addition, the Board considered
other potential indirect benefits that the Subadvisor and its affiliates may receive from the Subadvisor’s relationship with the fund, such as the opportunity to provide advisory services to additional funds in
the John Hancock Fund Complex and reputational benefits.
Subadvisory fees. The Board considered that the fund pays an advisory fee to the Advisor and that, in turn, the Advisor pays a subadvisory fee to the Subadvisor. As noted above, the Board also considered the
fund’s subadvisory fees as compared to similarly situated investment companies deemed to be comparable to the fund as included in the report prepared by the independent third party provider of fund data, to the
extent available. The Board noted that the limited size of the Lipper peer group was not sufficient for comparative purposes. The Board also took into account the subadvisory fees paid by the Advisor to the Subadvisor
with respect to the fund and compared them to fees charged by the Subadvisor to manage other subadvised portfolios and portfolios not subject to regulation under the 1940 Act, as applicable.
Subadvisor performance. As noted above, the Board considered the fund’s performance as compared to the fund’s peer group median and the benchmark index and noted that the Board reviews information
about the fund’s performance results at its regularly scheduled meetings. The Board noted the Advisor’s expertise and resources in monitoring the performance, investment style and risk-adjusted performance
of the Subadvisor. The Board was mindful of the Advisor’s focus on the Subadvisor’s performance. The Board also noted the Subadvisor’s long-term performance record for similar accounts, as
applicable.
The Board’s decision to
approve the Subadvisory Agreement was based on a number of determinations, including the following:
| (1)
| the Subadvisor has extensive experience and demonstrated skills as a manager;
|
| (2)
| the performance of the fund has generally been in line with or outperformed the historical performance of comparable funds and the fund’s benchmark index;
|
| (3)
| the subadvisory fees are reasonable in relation to the level and quality of services being provided under the Subadvisory Agreement; and
|
| (4)
| the subadvisory fees are paid by the Advisor not the fund and that the subadvisory fee breakpoints are reflected as breakpoints in the advisory fees for the fund in order to permit shareholders to
benefit from economies of scale if the fund grows.
|
***
|
| ANNUAL REPORT | JOHN HANCOCK OPPORTUNISTIC FIXED INCOME FUND
| 81
|
Based on the Board’s
evaluation of all factors that the Board deemed to be material, including those factors described above, the Board, including the Independent Trustees, concluded that renewal of the Advisory Agreement and the
Subadvisory Agreement would be in the best interest of the fund and its shareholders. Accordingly, the Board, and the Independent Trustees voting separately, approved the Advisory Agreement and Subadvisory Agreement
for an additional one-year period.
| 82
| JOHN HANCOCK OPPORTUNISTIC FIXED INCOME FUND | ANNUAL REPORT
|
|
STATEMENT REGARDING LIQUIDITY
RISK MANAGEMENT
Operation of the Liquidity Risk
Management Program
This section describes the operation
and effectiveness of the Liquidity Risk Management Program (LRMP) established in accordance with Rule 22e-4 under the Investment Company Act of 1940, as amended (the Liquidity Rule). The Board of Trustees (the Board)
of each Fund in the John Hancock Group of Funds (each a Fund and collectively, the Funds) that is subject to the requirements of the Liquidity Rule has appointed John Hancock Investment Management LLC and John Hancock
Variable Trust Advisers LLC (together, the Advisor) to serve as Administrator of the LRMP with respect to each of the Funds, including John Hancock Opportunistic Fixed Income Fund, subject to the oversight of the
Board. In order to provide a mechanism and process to perform the functions necessary to administer the LRMP, the Advisor established the Liquidity Risk Management Committee (the Committee). The
Fund’s subadvisor, Wellington Management Company LLP (the Subadvisor) executes the day-to-day investment management and security-level activities of the Fund in accordance with the requirements of the LRMP,
subject to the supervision of the Advisor and the Board.
The Committee receives monthly
reports and holds quarterly in person meetings to: (1) review the day-to-day operations of the LRMP; (2) monitor current market and liquidity conditions and assess liquidity risks; (3) review and approve month-end
liquidity classifications; (4) monitor illiquid investment levels against the 15% limit on illiquid investments and established Highly Liquid Investment Minimums (HLIMs), if any; (5) review quarterly testing and
determinations, as applicable; (6) review redemption-in-kind activities; and (7) review other LRMP related material. The Advisor also conducts daily, monthly, quarterly, and annual quantitative and qualitative
assessments of each subadvisor to a Fund that is subject to the requirements of the Liquidity Rule and is a part of the LRMP to monitor investment performance issues, risks and trends. In addition, the Advisor may
conduct ad-hoc reviews and meetings with subadvisors as issues and trends are identified, including potential liquidity issues. The Committee also monitors global events, such as the ongoing Russian invasion of
Ukraine and related U.S. imposed sanctions on the Russian government, companies and oligarchs, and other amendments to the Office of Foreign Assets Control sanctioned company lists, that could impact the markets and
liquidity of portfolio investments and their classifications. In addition, the Committee monitors macro events and assesses their potential impact on liquidity brought on by fear of contagion (e.g. regional banking
crisis).
The Committee provided the Board at
a meeting held on March 28-30, 2023 with a written report which addressed the Committee’s assessment of the adequacy and effectiveness of the implementation and operation of the LRMP and any material changes to
the LRMP. The report, which covered the period January 1, 2022 through December 31, 2022, included an assessment of important aspects of the LRMP including, but not limited to: (1) Security-level liquidity
classifications; (2) Fund-level liquidity risk assessment; (3) Reasonably Anticipated Trade Size (RATS) determination; (4) HLIM determination and daily monitoring; (5) Daily compliance with the 15% limit on illiquid
investments; (6) Operation of the Fund’s Redemption-In-Kind Procedures; and (7) Review of liquidity management facilities.
The report provided an update on
Committee activities over the previous year. Additionally, the report included a discussion of notable changes and enhancements to the LRMP implemented during 2022 and key initiatives for 2023.
The report also covered material
liquidity matters which occurred or were reported during this period applicable to the Fund, if any, and the Committee’s actions to address such matters.
The report stated, in relevant part,
that during the period covered by the report:
| •
| The Fund’s investment strategy remained appropriate for an open-end fund structure;
|
| •
| The Fund was able to meet requests for redemption without significant dilution of remaining shareholders’ interests in the Fund;
|
|
| ANNUAL REPORT | JOHN HANCOCK OPPORTUNISTIC FIXED INCOME FUND
| 83
|
| •
| The Fund did not experience any breaches of the 15% limit on illiquid investments, or any applicable HLIM, that would require reporting to the Securities and Exchange Commission;
|
| •
| The Fund continued to qualify as a Primarily Highly Liquid Fund under the Liquidity Rule and therefore is not required to establish a HLIM; and
|
| •
| The Chief Compliance Officer’s office, as a part of their annual Rule 38a-1 assessment of the Fund’s policies and procedures, reviewed the LRMP’s control environment and deemed it to
be operating effectively and in compliance with the Board approved procedures.
|
Adequacy and Effectiveness
Based on the annual review and
assessment conducted by the Committee, the Committee has determined that the LRMP and its controls have been implemented and are operating in a manner that is adequately and effectively managing the liquidity risk of
the Fund.
| 84
| JOHN HANCOCK OPPORTUNISTIC FIXED INCOME FUND | ANNUAL REPORT
|
|
This chart
provides information about the Trustees and Officers who oversee your John Hancock fund. Officers elected by the Trustees manage the day-to-day operations of the fund and execute policies formulated by the
Trustees.
| Independent Trustees
|
|
|
Name, year of birth
Position(s) held with Trust
Principal occupation(s) and other
directorships during past 5 years
| Trustee
of the
Trust
since1
| Number of John
Hancock funds
overseen by
Trustee
|
| Hassell H. McClellan,2 Born: 1945
| 2005
| 186
|
| Trustee and Chairperson of the Board
|
|
|
| Director/Trustee, Virtus Funds (2008-2020); Director, The Barnes Group (2010-2021); Associate Professor, The Wallace E. Carroll School of Management,
Boston College (retired 2013). Trustee (since 2005) and Chairperson of the Board (since 2017) of various trusts within the John Hancock Fund Complex.
|
| James R. Boyle, Born: 1959
| 2015
| 183
|
| Trustee
|
|
|
| Board Member, United of Omaha Life Insurance Company (since 2022). Board Member, Mutual of Omaha Investor Services, Inc. (since 2022). Foresters
Financial, Chief Executive Officer (2018–2022) and board member (2017–2022). Manulife Financial and John Hancock, more than 20 years, retiring in 2012 as Chief Executive Officer, John Hancock and Senior
Executive Vice President, Manulife Financial. Trustee of various trusts within the John Hancock Fund Complex (2005–2014 and since 2015).
|
| William H. Cunningham,3 Born: 1944
| 2012
| 184
|
| Trustee
|
|
|
| Professor, University of Texas, Austin, Texas (since 1971); former Chancellor, University of Texas System and former President of the University of
Texas, Austin, Texas; Director (since 2006), Lincoln National Corporation (insurance); Director, Southwest Airlines (since 2000). Trustee of various trusts within the John Hancock Fund Complex (since 1986).
|
| Noni L. Ellison,* Born: 1971
| 2022
| 183
|
| Trustee
|
|
|
| Senior Vice President, General Counsel & Corporate Secretary, Tractor Supply Company (rural lifestyle retailer) (since 2021); General Counsel,
Chief Compliance Officer & Corporate Secretary, Carestream Dental, L.L.C.(2017–2021); Associate General Counsel & Assistant Corporate Secretary, W.W. Grainger, Inc. (global industrial supplier)
(2015–2017); Board Member, Goodwill of North Georgia, 2018 (FY2019)–2020 (FY2021); Board Member, Howard University School of Law Board of Visitors (since 2021); Board Member, University of Chicago Law
School Board of Visitors (since 2016); Board member, Children’s Healthcare of Atlanta Foundation Board (2021–present). Trustee of various trusts within the John Hancock Fund Complex (since 2022).
|
| Grace K. Fey, Born: 1946
| 2008
| 186
|
| Trustee
|
|
|
| Chief Executive Officer, Grace Fey Advisors (since 2007); Director and Executive Vice President, Frontier Capital Management Company
(1988–2007); Director, Fiduciary Trust (since 2009). Trustee of various trusts within the John Hancock Fund Complex (since 2008).
|
| Dean C. Garfield,* Born: 1968
| 2022
| 183
|
| Trustee
|
|
|
| Vice President, Netflix, Inc. (since 2019); President & Chief Executive Officer, Information Technology Industry Council (2009–2019); NYU School of Law Board of
Trustees (since 2021); Member, U.S. Department of Transportation, Advisory Committee on Automation (since 2021); President of the United States Trade Advisory Council (2010–2018); Board Member, College for Every
Student (2017–2021); Board Member, The Seed School of Washington, D.C. (2012–2017). Trustee of various trusts within the John Hancock Fund Complex (since 2022).
|
|
| ANNUAL REPORT | JOHN HANCOCK OPPORTUNISTIC FIXED INCOME FUND
| 85
|
| Independent Trustees (continued)
|
|
|
Name, year of birth
Position(s) held with Trust
Principal occupation(s) and other
directorships during past 5 years
| Trustee
of the
Trust
since1
| Number of John
Hancock funds
overseen by
Trustee
|
| Deborah C. Jackson, Born: 1952
| 2012
| 185
|
| Trustee
|
|
|
| President, Cambridge College, Cambridge, Massachusetts (since 2011); Board of Directors, Amwell Corporation (since 2020); Board of Directors,
Massachusetts Women’s Forum (2018-2020); Board of Directors, National Association of Corporate Directors/New England (2015-2020); Chief Executive Officer, American Red Cross of Massachusetts Bay
(2002–2011); Board of Directors of Eastern Bank Corporation (since 2001); Board of Directors of Eastern Bank Charitable Foundation (since 2001); Board of Directors of Boston Stock Exchange (2002–2008);
Board of Directors of Harvard Pilgrim Healthcare (health benefits company) (2007–2011). Trustee of various trusts within the John Hancock Fund Complex (since 2008).
|
| Steven R. Pruchansky, Born: 1944
| 2012
| 183
|
| Trustee and Vice Chairperson of the Board
|
|
|
| Managing Director, Pru Realty (since 2017); Chairman and Chief Executive Officer, Greenscapes of Southwest Florida, Inc. (2014-2020); Director and
President, Greenscapes of Southwest Florida, Inc. (until 2000); Member, Board of Advisors, First American Bank (until 2010); Managing Director, Jon James, LLC (real estate) (since 2000); Partner, Right Funding, LLC
(2014-2017); Director, First Signature Bank & Trust Company (until 1991); Director, Mast Realty Trust (until 1994); President, Maxwell Building Corp. (until 1991). Trustee (since 1992), Chairperson of the Board
(2011–2012), and Vice Chairperson of the Board (since 2012) of various trusts within the John Hancock Fund Complex.
|
| Frances G. Rathke,3 Born: 1960
| 2020
| 183
|
| Trustee
|
|
|
| Director, Audit Committee Chair, Oatly Group AB (plant-based drink company) (since 2021); Director, Audit Committee Chair and Compensation Committee
Member, Green Mountain Power Corporation (since 2016); Director, Treasurer and Finance & Audit Committee Chair, Flynn Center for Performing Arts (since 2016); Director and Audit Committee Chair, Planet Fitness
(since 2016); Chief Financial Officer and Treasurer, Keurig Green Mountain, Inc. (2003-retired 2015). Trustee of various trusts within the John Hancock Fund Complex (since 2020).
|
| Gregory A. Russo, Born: 1949
| 2012
| 183
|
| Trustee
|
|
|
| Director and Audit Committee Chairman (2012-2020), and Member, Audit Committee and Finance Committee (2011-2020), NCH Healthcare System, Inc. (holding company for
multi-entity healthcare system); Director and Member (2012-2018), and Finance Committee Chairman (2014-2018), The Moorings, Inc. (nonprofit continuing care community); Global Vice Chairman, Risk & Regulatory
Matters, KPMG LLP (KPMG) (2002–2006); Vice Chairman, Industrial Markets, KPMG (1998–2002). Trustee of various trusts within the John Hancock Fund Complex (since 2008).
|
| 86
| JOHN HANCOCK OPPORTUNISTIC FIXED INCOME FUND | ANNUAL REPORT
|
|
| Non-Independent Trustees4
|
|
|
Name, year of birth
Position(s) held with Trust
Principal occupation(s) and other
directorships during past 5 years
| Trustee
of the
Trust
since1
| Number of John
Hancock funds
overseen by
Trustee
|
| Andrew G. Arnott, Born: 1971
| 2017
| 184
|
| Non-Independent Trustee
|
|
|
| Global Head of Retail for Manulife (since 2022); Head of Wealth and Asset Management, United States and Europe, for John Hancock and Manulife
(2018-2023); Director and Chairman, John Hancock Investment Management LLC (since 2005, including prior positions); Director and Chairman, John Hancock Variable Trust Advisers LLC (since 2006, including prior
positions); Director and Chairman, John Hancock Investment Management Distributors LLC (since 2004, including prior positions); President of various trusts within the John Hancock Fund Complex (2007-2023, including
prior positions). Trustee of various trusts within the John Hancock Fund Complex (since 2017).
|
| Paul Lorentz,† Born: 1968
| 2022
| 183
|
| Non-Independent Trustee
|
|
|
| Global Head, Manulife Wealth and Asset Management (since 2017); General Manager, Manulife, Individual Wealth Management and Insurance (2013–2017); President,
Manulife Investments (2010–2016). Trustee of various trusts within the John Hancock Fund Complex (since 2022).
|
| Principal officers who are not Trustees
|
|
Name, year of birth
Position(s) held with Trust
Principal occupation(s)
during past 5 years
| Current
Position(s)
with the
Trust
since
|
| Kristie M. Feinberg, Born: 1975
| 2023
|
| President
|
|
| Head of Wealth and Asset Management, United States and Europe, for John Hancock and Manulife (since 2023); CFO and Global Head of Strategy, Manulife
Investment Management (2021-2023, including prior positions); CFO Americas & Global Head of Treasury, Invesco, Ltd., Invesco US (2019-2020, including prior positions); Senior Vice President, Corporate Treasurer
and Business Controller, Oppenheimer Funds (2001-2019, including prior positions); President of various trusts within the John Hancock Fund Complex (since 2023).
|
| Charles A. Rizzo, Born: 1957
| 2007
|
| Chief Financial Officer
|
|
| Vice President, John Hancock Financial Services (since 2008); Senior Vice President, John Hancock Investment Management LLC and John Hancock Variable
Trust Advisers LLC (since 2008); Chief Financial Officer of various trusts within the John Hancock Fund Complex (since 2007).
|
| Salvatore Schiavone, Born: 1965
| 2009
|
| Treasurer
|
|
| Assistant Vice President, John Hancock Financial Services (since 2007); Vice President, John Hancock Investment Management LLC and John Hancock Variable Trust Advisers
LLC (since 2007); Treasurer of various trusts within the John Hancock Fund Complex (since 2007, including prior positions).
|
|
| ANNUAL REPORT | JOHN HANCOCK OPPORTUNISTIC FIXED INCOME FUND
| 87
|
| Principal officers who are not Trustees (continued)
|
|
Name, year of birth
Position(s) held with Trust
Principal occupation(s)
during past 5 years
| Current
Position(s)
with the
Trust
since
|
| Christopher (Kit) Sechler, Born: 1973
| 2018
|
| Secretary and Chief Legal Officer
|
|
| Vice President and Deputy Chief Counsel, John Hancock Investment Management (since 2015); Assistant Vice President and Senior Counsel
(2009–2015), John Hancock Investment Management; Assistant Secretary of John Hancock Investment Management LLC and John Hancock Variable Trust Advisers LLC (since 2009); Chief Legal Officer and Secretary of
various trusts within the John Hancock Fund Complex (since 2009, including prior positions).
|
| Trevor Swanberg, Born: 1979
| 2020
|
| Chief Compliance Officer
|
|
| Chief Compliance Officer, John Hancock Investment Management LLC and John Hancock Variable Trust Advisers LLC (since 2020); Deputy Chief Compliance Officer, John Hancock
Investment Management LLC and John Hancock Variable Trust Advisers LLC (2019–2020); Assistant Chief Compliance Officer, John Hancock Investment Management LLC and John Hancock Variable Trust Advisers LLC
(2016–2019); Vice President, State Street Global Advisors (2015–2016); Chief Compliance Officer of various trusts within the John Hancock Fund Complex (since 2016, including prior positions).
|
The business
address for all Trustees and Officers is 200 Berkeley Street, Boston, Massachusetts 02116-5023.
The Statement
of Additional Information of the fund includes additional information about members of the Board of Trustees of the Trust and is available without charge, upon request, by calling 800-225-5291.
| 1
| Each Trustee holds office until his or her successor is duly elected and qualified, or until the Trustee’s death, retirement, resignation, or removal. Mr. Boyle has served as Trustee at various
times prior to the date listed in the table.
|
| 2
| Member of the Audit Committee as of September 26, 2023.
|
| 3
| Member of the Audit Committee.
|
| 4
| The Trustee is a Non-Independent Trustee due to current or former positions with the Advisor and certain affiliates.
|
| *
| Elected to serve as Independent Trustee effective as of September 9, 2022.
|
| †
| Elected to serve as Non-Independent Trustee effective as of September 9, 2022.
|
| 88
| JOHN HANCOCK OPPORTUNISTIC FIXED INCOME FUND | ANNUAL REPORT
|
|
Trustees
Hassell H. McClellan, Chairpersonπ
Steven R. Pruchansky, Vice Chairperson
Andrew G. Arnott†
James R. Boyle
William H. Cunningham*
Grace K. Fey
Noni L. Ellison^
Dean C. Garfield^
Deborah C. Jackson
Patricia Lizarraga*,^,§
Paul Lorentz‡
Frances G. Rathke*
Gregory A. Russo
Officers
Kristie M. Feinberg#
President
Charles A. Rizzo
Chief Financial Officer
Salvatore Schiavone
Treasurer
Christopher (Kit) Sechler
Secretary and Chief Legal Officer
Trevor Swanberg
Chief Compliance Officer
Investment advisor
John Hancock Investment Management
LLC
Subadvisor
Wellington Management Company LLP
Portfolio Managers
Brian M. Garvey
Brij S. Khurana
Principal distributor
John Hancock Investment Management
Distributors LLC
Custodian
State Street Bank and Trust
Company
Transfer agent
John Hancock Signature Services,
Inc.
Legal counsel
K&L Gates LLP
Independent registered public
accounting firm
PricewaterhouseCoopers LLP
π Member of the Audit Committee as of September 26, 2023.
† Non-Independent Trustee
* Member of the Audit Committee
^ Elected to serve as Independent Trustee effective as of September 9, 2022.
§ Effective September 21, 2023, Ms. Lizarraga is no longer a Trustee.
‡ Elected to serve as Non-Independent Trustee effective as of September 9, 2022.
# Effective June 29, 2023.
The fund’s proxy
voting policies and procedures, as well as the fund proxy voting record for the most recent twelve-month period ended June 30, are available free of charge on the Securities and Exchange Commission (SEC) website at
sec.gov or on our website.
All of the fund’s
holdings as of the end of the third month of every fiscal quarter are filed with the SEC on Form N-PORT within 60 days of the end of the fiscal quarter. The fund’s Form N-PORT filings are available on our
website and the SEC’s website, sec.gov.
We make this information
on your fund, as well as monthly portfolio holdings, and other fund details available on our website at jhinvestments.com or by calling 800-225-5291.
| You can also contact us:
|
|
|
| 800-225-5291
| Regular mail:
| Express mail:
|
| jhinvestments.com
| John Hancock Signature Services, Inc.
P.O. Box 219909
Kansas City, MO 64121-9909
| John Hancock Signature Services, Inc.
430 W 7th Street
Suite 219909
Kansas City, MO 64105-1407
|
|
| ANNUAL REPORT | JOHN HANCOCK OPPORTUNISTIC FIXED INCOME FUND
| 89
|
John Hancock family of funds
U.S. EQUITY FUNDS
Blue Chip Growth
Classic Value
Disciplined Value
Disciplined Value Mid Cap
Equity Income
Financial Industries
Fundamental All Cap Core
Fundamental Large Cap Core
Mid Cap Growth
New Opportunities
Regional Bank
Small Cap Core
Small Cap Growth
Small Cap Value
U.S. Global Leaders Growth
U.S. Growth
INTERNATIONAL EQUITY FUNDS
Disciplined Value International
Emerging Markets
Emerging Markets Equity
Fundamental Global Franchise
Global Environmental
Opportunities
Global Equity
Global Shareholder Yield
Global Thematic Opportunities
International Dynamic Growth
International Growth
International Small Company
FIXED-INCOME FUNDS
Bond
California Municipal Bond
Emerging Markets Debt
Floating Rate Income
Government Income
High Yield
High Yield Municipal Bond
Income
Investment Grade Bond
Money Market
Municipal Opportunities
Opportunistic Fixed Income
Short Duration Bond
Short Duration Municipal
Opportunities
Strategic Income Opportunities
ALTERNATIVE FUNDS
Alternative Asset Allocation
Diversified Macro
Infrastructure
Multi-Asset Absolute Return
Real Estate Securities
Seaport Long/Short
A fund’s investment
objectives, risks, charges, and expenses should be considered carefully before investing. The prospectus contains this and other important information about the fund. To obtain a prospectus, contact your financial
professional, call John Hancock Investment Management at 800-225-5291, or visit our website at jhinvestments.com. Please read the prospectus carefully before investing or sending money.
EXCHANGE-TRADED FUNDS
John Hancock Corporate Bond ETF
John Hancock International High
Dividend ETF
John Hancock Mortgage-Backed
Securities ETF
John Hancock Multifactor Developed
International ETF
John Hancock Multifactor Emerging
Markets ETF
John Hancock Multifactor Large Cap
ETF
John Hancock Multifactor Mid Cap
ETF
John Hancock Multifactor Small Cap
ETF
John Hancock Preferred Income
ETF
John Hancock U.S. High Dividend
ETF
ASSET ALLOCATION/TARGET DATE FUNDS
Balanced
Multi-Asset High Income
Lifestyle Blend Portfolios
Lifetime Blend Portfolios
Multimanager Lifestyle
Portfolios
Multimanager Lifetime Portfolios
Preservation Blend Portfolios
ENVIRONMENTAL, SOCIAL, AND
GOVERNANCE FUNDS
ESG Core Bond
ESG International Equity
ESG Large Cap Core
CLOSED-END FUNDS
Asset-Based Lending
Financial Opportunities
Hedged Equity & Income
Income Securities Trust
Investors Trust
Preferred Income
Preferred Income II
Preferred Income III
Premium Dividend
Tax-Advantaged Dividend Income
Tax-Advantaged Global Shareholder
Yield
John Hancock ETF shares are bought
and sold at market price (not NAV), and are not individually redeemed from the fund. Brokerage commissions will reduce returns.
John Hancock ETFs are distributed by
Foreside Fund Services, LLC, and are subadvised by Manulife Investment Management (US) LLC or Dimensional Fund Advisors LP. Foreside is not affiliated with John Hancock Investment Management Distributors LLC, Manulife
Investment Management (US) LLC or Dimensional Fund Advisors LP.
Dimensional Fund Advisors LP
receives compensation from John Hancock in connection with licensing rights to the John Hancock Dimensional indexes. Dimensional Fund Advisors LP does not sponsor, endorse, or sell, and makes no representation as to
the advisability of investing in, John Hancock Multifactor ETFs.
A trusted brand
John Hancock Investment Management
is a premier asset manager
with a heritage of financial stewardship dating back to 1862. Helping
our shareholders pursue their financial goals is at the core of everything
we do. It’s why we support the role of professional financial advice
and operate with the highest standards of conduct and integrity.
A better way to invest
We serve investors globally through
a unique multimanager approach:
We search the world to find proven portfolio teams with specialized
expertise for every strategy we offer, then we apply robust investment
oversight to ensure they continue to meet our uncompromising
standards and serve the best interests of our shareholders.
Results for investors
Our unique approach to asset
management enables us to provide
a diverse set of investments backed by some of the world’s best
managers, along with strong risk-adjusted returns across asset classes.
“A trusted brand” is
based on a survey of 6,651 respondents conducted by Medallia between 3/18/20 and 5/13/20.
John Hancock Investment Management
Distributors LLC, Member FINRA, SIPC
200 Berkeley Street, Boston, MA 02116-5010, 800-225-5291, jhinvestments.com
Manulife Investment Management, the
Stylized M Design, and Manulife Investment Management & Stylized M Design are trademarks of The Manufacturers Life Insurance Company and are used by its affiliates under license.
NOT FDIC INSURED. MAY LOSE VALUE. NO
BANK GUARANTEE. NOT INSURED BY ANY GOVERNMENT AGENCY.
This report is for the information
of the shareholders of John Hancock Opportunistic Fixed Income Fund. It is not authorized for distribution to prospective investors unless preceded or accompanied by a prospectus.
10/2023
Annual report
John Hancock
Funds II
August 31, 2023
John
Hancock Funds II
Annual report — table of
contents
| 3
|
| 13
|
| 15
|
| 82
|
| 85
|
| 88
|
| 90
|
| 92
|
| 110
|
| 111
|
| 112
|
| 116
|
| 120
|
| 121
|
| 124
|
| Fund
| Manager’s commentary and fund performance
| Portfolio of investments
|
| 4
|
| 15
|
| 5
|
| 16
|
| 6
|
| 25
|
| 7
|
| 37
|
| 8
|
| 39
|
| Fund
| Manager’s commentary and fund performance
| Portfolio of investments
|
| 9
|
| 46
|
| 10
|
| 71
|
| 11
|
| 73
|
| 12
|
| 74
|
John Hancock Funds
II
Manager’s commentary and fund
performance
Fund performance
In the following pages,
we've set forth information regarding the performance of certain funds of John Hancock Funds II (the Trust). There are several ways to evaluate a fund’s historical performance. One can look at the total
percentage change in value, the average annual percentage change, or the growth of a hypothetical $10,000 investment. With respect to all performance information presented, it's important to understand that past
performance does not guarantee future results. Return and principal fluctuate, and shares, when redeemed, may be worth more or less than their original cost.
Performance tables
The performance tables
show two types of total return information: cumulative and average annual total returns. A cumulative total return is an expression of a fund’s total change in share value in percentage terms over a set period
of time—one, five, and ten years (or since the fund’s inception if less than the applicable period). An average annual total return takes the fund’s cumulative total return for a time period
greater than one year and shows what would have happened if the fund had performed at a constant rate each year. The tables show all cumulative and average annual total returns, net of fees and expenses of the Trust,
but do not reflect the expenses of any insurance company separate accounts (including a possible contingent deferred sales charge) that may invest in the funds, as applicable. If these were included, performance
would be lower.
Graph—change in value of
$10,000 investment and comparative indexes
The performance graph for
each fund (or portfolio) shows the change in value of a $10,000 investment over the life or
ten-year period of each fund (or
portfolio), whichever is shorter. Each fund’s (or portfolio’s) performance is compared with the performance of one or more broad-based securities indexes as a “benchmark.” All performance
information includes the reinvestment of dividends and capital gain distributions, as well as the deduction of ongoing management fees and fund (or portfolio) operating expenses. The benchmarks used for comparison are
unmanaged and include reinvestment of dividends and capital gains distributions, if any, but do not reflect any fees or expenses. Funds (or portfolios), that invest in multiple asset classes are compared with a
customized benchmark. This benchmark comprises a set percentage allocation from each of the asset classes in which the fund invests.
Portfolio manager’s
commentary
Finally, we've provided a
commentary by each portfolio manager regarding each fund’s (or portfolio’s) performance during the period ended August 31, 2023. The views expressed are those of the portfolio managers as of August
31, 2023, and are subject to change based on market and other conditions. Information about a fund’s (or portfolio’s) holdings, asset allocation, or country diversification is historical and is no
indication of future fund composition, which will vary. Information provided in this report should not be considered a recommendation to purchase or sell securities. The funds (or portfolios) are not insured by the
Federal Deposit Insurance Corp., are not deposits or other obligations of, or guaranteed by, banks, and are subject to investment risks, including loss of principal amount invested. For a more detailed discussion of
the funds' objectives, risks and strategies, see the funds’ prospectuses.
Notes about risk
The funds are subject to various risks
as described in the funds' prospectuses. Political tensions and armed conflicts, including the Russian invasion of Ukraine, and any resulting economic sanctions on entities and/or individuals of a particular country
could lead such a country into an economic recession. The COVID-19 disease has resulted in significant disruptions to global business activity. A widespread health crisis such as a global pandemic could cause
substantial market volatility, exchange-trading suspensions, and closures, which may lead to less liquidity in certain instruments, industries, sectors, or the markets, generally, and may ultimately affect fund
performance. For more information, see the funds’ prospectuses.
Standard &
Poor’s, Standard & Poor’s 500, “S&P 500,” and “S&P MidCap 400 Index” are trademarks of S&P Global, Inc. “Russell 1000,” “Russell 2000,”
“Russell 3000,” and “Russell Midcap” are trademarks of Frank Russell Company. “EAFE” and “MSCI” are trademarks of MSCI, Inc. “Bloomberg” is a registered
trademark of Bloomberg LP. “Lipper” is a registered trademark of Reuters S.A. None of the funds in the Trust is sponsored, endorsed, managed, advised, sold, or promoted by any of these companies, and none
of these companies makes any representation regarding the advisability of investing in the Trust.
Capital Appreciation Fund
Subadvisor: Jennison Associates LLC
Portfolio Managers: Blair A. Boyer,
Michael A. Del Balso, Natasha Kuhlkin, CFA, Kathleen A. McCarragher. Effective January 4, 2023 and March 30, 2023, Spiros (Sig) Segalas and Rebecca Irwin, respectively, no longer served as Portfolio Managers.
INVESTMENT OBJECTIVE & POLICIES ► The fund seeks long-term growth of capital. Under normal market conditions, the fund invests at least 65% of its fund’s total assets in equity and equity-related securities of
companies that, at the time of investment, exceed $1 billion in market capitalization and that the subadvisor believes to have above-average growth prospects.
CHANGE IN VALUE OF $10,000 INVESTMENT
AND COMPARATIVE INDEX
| Sector Composition (% of net assets)
|
|
| Information technology
| 39.3
|
| Consumer discretionary
| 24.1
|
| Health care
| 11.3
|
| Communication services
| 10.3
|
| Financials
| 8.7
|
| Consumer staples
| 3.0
|
| Industrials
| 2.2
|
| Real estate
| 0.9
|
| Short-term investments and other
| 0.2
|
PORTFOLIO MANAGERS'
COMMENTARY
Performance ► For the year ended August 31, 2023, the Capital Appreciation Fund Class NAV shares returned 25.49% and the Russell 1000 Growth Index returned 21.94%.
Environment ► The past 12 months has been dominated by the U.S. Federal Reserve’s historic campaign of interest-rate hikes, which has continued since March 2022. The success of this effort
to lower inflation, along with clearing of the supply chain, resilient consumer spending, and, most important, healthy earnings, have driven the fund’s strong performance.
Positions in information
technology sector were strong contributors to the fund's returns during the period. The top performer was NVIDIA Corp. This semiconductor designer and manufacturer is the leader in accelerated computing, which is a
critical element in the progression of artificial intelligence (AI). Broadcom, Inc., another producer of semiconductors and infrastructure software, was lifted by strong results and positive AI sentiment.
The strategy also saw strong
returns within the health care sector, Eli Lilly & Company and Novo Nordisk A/S (an out of benchmark holding). Both companies are benefiting from demand growth for their diabetes and obesity medications. Resilient
demand for luxury
products boosted LVMH Moet Hennessey Louis
Vuitton SE (an out of benchmark holding), which holds a dominant position in established luxury brands and enjoys significant global scale.
On the negative side, the stock
of Tesla, Inc. fell and partially recovered, but was still down for the full period. It remains a meaningful position in the fund’s strategy. Atlassian Corp. PLC, a collaboration software company, was a
detractor due to a disappointing slowdown in revenue. Adyen NV (an out of benchmark holding), a payments platform company, also disappointed as competition increased and growth rates slowed. Atlassian and Adyen were
sold during the period.
| PERFORMANCE TABLE
| Average Annual Total Return
| Cumulative Total Return
|
| Total returns for the period ended 8-31-23 (%)
| 1-year
| 5-year
| 10-year
| 5-year
| 10-year
|
| Capital Appreciation Fund Class 1
| 25.42
| 11.98
| 15.01
| 76.08
| 304.97
|
| Capital Appreciation Fund Class NAV
| 25.49
| 12.03
| 15.07
| 76.51
| 307.08
|
| Russell 1000 Growth Index
| 21.94
| 13.81
| 15.63
| 90.93
| 327.13
|
Performance does not
reflect the deduction of taxes on fund distributions or redemptions of fund shares. Past performance does not guarantee future results.
Since inception, a
portion of the Capital Appreciation Fund expenses was reimbursed. If such expenses had not been reimbursed, returns would be lower.
The Russell 1000
Growth Index tracks the performance of publicly traded large-cap companies in the United States with higher price-to-book ratios and higher forecasted growth values.
It is not possible to
invest directly in an index. Index figures do not reflect expenses or sales charges, which would result in lower returns.
The expense ratios of
the fund, both net (including any fee waivers or expense limitations) and gross (excluding any fee waivers or expense limitations), are set forth according to the most recent publicly available prospectus for the fund
and may differ from the expense ratios disclosed in the financial highlights tables in this report. Net expenses reflect contractual expense limitations in effect until July 31, 2025 and are subject to change. Had the
contractual fee waivers and expense limitations not been in place, gross expenses would apply. The expense ratios are as follows:
|
| Class 1
| Class NAV
|
| Gross (%)
| 0.79
| 0.74
|
| Net (%)
| 0.78
| 0.73
|
Capital Appreciation Value Fund
Subadvisor: T. Rowe Price
Associates, Inc.
Portfolio Manager: David R. Giroux,
CFA
INVESTMENT OBJECTIVE & POLICIES ► The fund seeks long-term capital appreciation. Common stocks typically constitute at least 50% of the fund’s total assets. The remaining assets are generally invested in other
securities, including convertible securities, corporate and government debt, bank loans, foreign securities, futures, and options.
CHANGE IN VALUE OF $10,000 INVESTMENT
AND COMPARATIVE INDEXES
| Portfolio Composition (% of net assets)
|
|
| Common stocks
| 65.0
|
| U.S. Government
| 11.1
|
| Term loans
| 10.7
|
| Corporate bonds
| 10.4
|
| Preferred securities
| 0.4
|
| Short-term investments and other
| 2.4
|
PORTFOLIO MANAGER'S
COMMENTARY
Performance ► For the year ended August 31, 2023, the Capital Appreciation Value Fund Class NAV shares returned 11.38% and the S&P 500 Index returned 15.94%.
Environment ► U.S. stocks recorded strong gains, reversing the losses from the preceding year and powering many major indexes near all-time highs by the end of the period.
Entering the period, global
equity indexes had posted steep losses, as central banks began aggressively raising interest rates in response to elevated inflation, exacerbated by heightened geopolitical uncertainty in the wake of Russia’s
invasion of Ukraine. Through most of the second half of 2022, investor sentiment was dampened by worse-than-expected inflation data and growing expectations that hawkish monetary policy would lead to an inevitable
global recession. Despite this challenging backdrop, the global economy proved resilient, and markets surged over the latter half of the period, overcoming periods of volatility and numerous headwinds en route to
delivering robust returns for the period.
Notable headwinds during the
year included regional bank turmoil in the U.S. following the failures of Silicon Valley Bank and Signature Bank, a contentious debt ceiling debate that threatened the U.S. government’s ability to borrow money,
and continued monetary tightening.
From an asset class perspective,
the fund’s underlying equity holdings advanced and underperformed the S&P 500 Index. The fund’s bond holdings also advanced and outperformed the Bloomberg U.S. Aggregate Bond Index.
Among equities, the industrials
& business services sector was the top contributor due to stock selection. Industrial conglomerate General Electric Company made meaningful strides in its reorganization in early January, completing the spinoff of
its healthcare business into GE HealthCare, a separate, publicly traded company. This successful spin, coupled with strong fourth-quarter results in the company’s remaining aerospace and power divisions,
propelled GE’s shares significantly higher.
Stock choices in the consumer
discretionary sector also added value over the period, driven primarily by a position in Yum! Brands, Inc., which outpaced sector peers. The company generated strong returns despite concerns over the durability of
consumer spending that weighed on some competitors.
The healthcare sector hurt
relative performance due to stock choices. Earlier in the year, PerkinElmer divested its businesses outside of diagnostics and life sciences, creating a more streamlined company called Revvity, Inc., which is focused
on scientific innovation. Shares traded lower and lagged sector peers following the divestiture amid an environment where health care lagged more growth-oriented sectors. An overweight allocation to the utilities
sector also detracted from relative results. Utility stocks generally fell out of favor as U.S. Treasury yields rose over the year and investors favored high-growth investments. Against this backdrop, the fund’s
overweight allocation to the sector detracted.
| PERFORMANCE TABLE
| Average Annual Total Return
| Cumulative Total Return
|
| Total returns for the period ended 8-31-23 (%)
| 1-year
| 5-year
| 10-year
| 5-year
| 10-year
|
| Capital Appreciation Value Fund Class NAV
| 11.38
| 10.09
| 10.75
| 61.71
| 177.63
|
| S&P 500 Index
| 15.94
| 11.12
| 12.81
| 69.43
| 233.79
|
| Blended Index
| 9.04
| 7.14
| 8.41
| 41.14
| 124.15
|
Performance does not
reflect the deduction of taxes on fund distributions or redemptions of fund shares. Past performance does not guarantee future results.
Since inception, a
portion of the Capital Appreciation Value Fund expenses was reimbursed. If such expenses had not been reimbursed, returns would be lower.
The S&P 500 Index
tracks the performance of 500 of the largest publicly traded companies in the United States.
The Blended Index is
60% S&P 500 Index and 40% Bloomberg U.S. Aggregate Bond Index.
It is not possible to
invest directly in an index. Index figures do not reflect expenses or sales charges, which would result in lower returns.
The expense ratios of
the fund, both net (including any fee waivers or expense limitations) and gross (excluding any fee waivers or expense limitations), are set forth according to the most recent publicly available prospectus for the fund
and may differ from the expense ratios disclosed in the financial highlights tables in this report. Net expenses reflect contractual expense limitations in effect until July 31, 2025 and are subject to change. Had the
contractual fee waivers and expense limitations not been in place, gross expenses would apply. The expense ratios are as follows:
|
| Class NAV
|
| Gross (%)
| 0.87
|
| Net (%)
| 0.86
|
Core Bond Fund
Subadvisor: Allspring Global
Investments, LLC
Portfolio Managers: Maulik Bhansali,
CFA, Jarad Vasquez
INVESTMENT OBJECTIVE & POLICIES ► The fund seeks total return consisting of income and capital appreciation. Under normal market conditions, the fund invests at least 80% of its net assets (plus any borrowings for
investment purposes) in a broad range of investment-grade debt securities, including U.S. government obligations, corporate bonds, mortgage-backed and other asset-backed securities, and money market
instruments.
CHANGE IN VALUE OF $10,000 INVESTMENT
AND COMPARATIVE INDEX
| Portfolio Composition (% of total investments)
|
|
| U.S. Government Agency
| 29.1
|
| U.S. Government
| 24.8
|
| Corporate bonds
| 20.3
|
| Collateralized mortgage obligations
| 10.7
|
| Asset backed securities
| 9.3
|
| Foreign government obligations
| 0.6
|
| Municipal bonds
| 0.2
|
| Short-term investments
| 5.0
|
PORTFOLIO MANAGERS'
COMMENTARY
Performance ► For the year ended August 31, 2023, the Core Bond Fund Class NAV shares declined 0.97% and the Bloomberg U.S. Aggregate Bond Index declined 1.19%.
Environment ► Bonds posted mixed results for the period. Inflation remained a key factor as rates gradually fell but remained elevated through period end. To curb inflationary pressures, the U.S.
Federal Reserve (Fed) continued to raise short-term interest rates and emphasized that further interest rate increases may be necessary to bring inflation under control.
U.S. bond yields moved broadly
higher, with short- and intermediate-term bond yields rising the most. High-yield corporate bonds posted positive returns, reflecting signs of improving economic growth late in the period.
The fund posted a loss but
outperformed its benchmark. Security selection in credit was the largest contributor to overall performance. Contributions were broad-based across subsectors, most notably in banks, communications, and healthcare. In
agency mortgages, active sector positioning has been a contributor to performance as the dynamic sector and coupon adjustments performed well amid elevated spread volatility. In addition, security selection within
asset-backed securities (ABS) contributed, as certain positions in private credit student loan ABS, auto ABS, FFELP
student loan ABS, credit card ABS, and rental
car ABS all outperformed. A sector overweight as active sector positioning within ABS contributed to performance. Furthermore, security selection within the collateralized mortgage-backed securities (CMBS) sector was
also a contributor.
Positioning in agency
collateralized mortgage obligations was a detractor. An overweight to non-qualified mortgage residential mortgage-backed securities was a detractor, as the sector lagged the performance of other ABS. Additionally, a
sector underweight to CMBS in the first half of 2023 was a modest detractor.
We maintain our largest
overweight to ABS, seeing value in high-quality segments of the market. We maintain our underweight in credit as spreads remained tight and the issue calendar muted.
| PERFORMANCE TABLE
| Average Annual Total Return
| Cumulative Total Return
|
| Total returns for the period ended 8-31-23 (%)
| 1-year
| 5-year
| 10-year
| 5-year
| 10-year
|
| Core Bond Fund Class 1
| -1.11
| 0.32
| 1.32
| 1.62
| 13.96
|
| Core Bond Fund Class NAV
| -0.97
| 0.39
| 1.38
| 1.97
| 14.66
|
| Bloomberg U.S. Aggregate Bond Index
| -1.19
| 0.49
| 1.48
| 2.47
| 15.86
|
Performance does not
reflect the deduction of taxes on fund distributions or redemptions of fund shares. Past performance does not guarantee future results.
Since inception, a
portion of the Core Bond Fund expenses was reimbursed. If such expenses had not been reimbursed, returns would be lower.
The Bloomberg U.S.
Aggregate Bond Index tracks the performance of U.S. investment-grade bonds in government, asset-backed, and corporate debt markets.
It is not possible to
invest directly in an index. Index figures do not reflect expenses or sales charges, which would result in lower returns.
The expense ratios of
the fund, both net (including any fee waivers or expense limitations) and gross (excluding any fee waivers or expense limitations), are set forth according to the most recent publicly available prospectus for the fund
and may differ from the expense ratios disclosed in the financial highlights tables in this report. Net expenses reflect contractual expense limitations in effect until July 31, 2025 and are subject to change. Had the
contractual fee waivers and expense limitations not been in place, gross expenses would apply. The expense ratios are as follows:
|
| Class 1
| Class NAV
|
| Gross (%)
| 0.67
| 0.62
|
| Net (%)
| 0.66
| 0.61
|
Health Sciences Fund
Subadvisor: T. Rowe Price
Associates, Inc.
Portfolio Manager: Ziad Bakri, MD,
CFA
INVESTMENT OBJECTIVE & POLICIES ► The fund seeks long-term capital appreciation. Under normal market conditions, the fund invests at least 80% of its net assets (plus any borrowings for investment purposes) in common
stocks of companies engaged, at the time of investment, in the research, development, production, or distribution of products or services related to healthcare, medicine, or the life sciences.
CHANGE IN VALUE OF $10,000 INVESTMENT
AND COMPARATIVE INDEXES
| Industry Composition (% of net assets)
|
|
| Biotechnology
| 30.5
|
| Health care providers and services
| 18.7
|
| Pharmaceuticals
| 18.4
|
| Health care equipment and supplies
| 15.8
|
| Life sciences tools and services
| 15.0
|
| Health care technology
| 1.0
|
| Chemicals
| 0.1
|
| Specialty retail
| 0.1
|
| Short-term investments and other
| 0.4
|
PORTFOLIO MANAGER'S
COMMENTARY
Performance ► For the year ended August 31, 2023, the Health Sciences Fund Class NAV shares returned 4.65% and the Lipper Health/Biotechnology Index returned 5.11%.
Environment ► Equity markets generated significant gains during the period. Despite starting the period lower, the major indexes rebounded in the first half of 2023. Thanks in part to generally
favorable corporate earnings and a resilient economy, equities climbed the proverbial wall of worry, overcoming bearish factors such as regional banking crisis in March; uncertainty about Congress and President Joe
Biden agreeing to raise the debt ceiling—the statutory limit on U.S. government
borrowing—before the government ran out
of money; and continued U.S. Federal Reserve (Fed) interest rate increases to combat elevated inflation. Stocks rose further in July, buoyed by mostly positive economic data and second-quarter corporate earnings
reports. Although the Fed raised short-term interest rates by 25 basis points (0.25%) on July 26—as was widely expected—investors were hopeful that lower-than-expected inflation readings would prompt the
Fed to stop raising rates.
Security selection within the
health care equipment and supplies subsector contributed the most to relative performance. A significant position in Intuitive Surgical, Inc. added value as the robotic
surgical company benefited from a broad
acceleration in procedure volumes during the period, with management citing strength in general surgery in the U.S. and non-urology growth outside the U.S.
Conversely, the biotechnology
subsector hindered relative returns due to adverse stock picks. The fund’s lack of exposure to Prometheus Biosciences, Inc., a clinical-stage biotechnology company developing a monoclonal antibody treatment for
ulcerative colitis, detracted. Shares of Prometheus surged in April 2023 following news that Merck & Company, Inc. had agreed to acquire the company. We eliminated the fund’s position in Prometheus
Biosciences, Inc. following the acquisition announcement.
| PERFORMANCE TABLE
| Average Annual Total Return
| Cumulative Total Return
|
| Total returns for the period ended 8-31-23 (%)
| 1-year
| 5-year
| 10-year
| 5-year
| 10-year
|
| Health Sciences Fund Class NAV
| 4.65
| 6.07
| 11.89
| 34.25
| 207.60
|
| S&P 500 Index
| 15.94
| 11.12
| 12.81
| 69.43
| 233.79
|
| Lipper Health/Biotechnology Index
| 5.11
| 4.77
| 10.71
| 26.24
| 176.63
|
Performance does not
reflect the deduction of taxes on fund distributions or redemptions of fund shares. Past performance does not guarantee future results.
Since inception, a
portion of the Health Sciences Fund expenses was reimbursed. If such expenses had not been reimbursed, returns would be lower.
The S&P 500 Index
tracks the performance of 500 of the largest publicly traded companies in the United States.
The Lipper
Health/Biotechnology Index tracks the largest mutual funds within the health biotechnology category.
It is not possible to
invest directly in an index. Index figures do not reflect expenses or sales charges, which would result in lower returns.
The expense ratios of
the fund, both net (including any fee waivers or expense limitations) and gross (excluding any fee waivers or expense limitations), are set forth according to the most recent publicly available prospectus for the fund
and may differ from the expense ratios disclosed in the financial highlights tables in this report. Net expenses reflect contractual expense limitations in effect until July 31, 2025 and are subject to change. Had the
contractual fee waivers and expense limitations not been in place, gross expenses would apply. The expense ratios are as follows:
|
| Class NAV
|
| Gross (%)
| 1.00
|
| Net (%)
| 0.99
|
High Yield Fund
Subadvisor: Western Asset Management
Company, LLC
Portfolio Managers: Michael C.
Buchanan, CFA, Walter E. Kilcullen, S. Kenneth Leech
INVESTMENT OBJECTIVE & POLICIES ► The fund seeks to realize an above-average total return over a market cycle of three to five years, consistent with reasonable risk. Under normal market conditions, the fund invests
at least 80% of its net assets (plus any borrowings for investment purposes) at the time of investment in high-yield securities.
CHANGE IN VALUE OF $10,000 INVESTMENT
AND COMPARATIVE INDEX
| Portfolio Composition (% of net assets)
|
|
| Corporate bonds
| 81.8
|
| Asset backed securities
| 6.5
|
| Term loans
| 6.4
|
| Convertible bonds
| 0.7
|
| Common stocks
| 0.6
|
| Preferred securities
| 0.5
|
| Foreign government obligations
| 0.4
|
| Short-term investments and other
| 3.1
|
PORTFOLIO MANAGERS'
COMMENTARY
Performance ► For the year ended August 31, 2023, the High Yield Fund Class 1 shares returned 6.91% and the Bloomberg Barclays U.S. High-Yield 2% Issuer Capped Index returned 7.19%.
Environment ► During the first half of the period bond yields fluctuated and ultimately fell and risk assets were mixed as investors shifted from a narrative of a higher for longer federal funds
rate to significantly repricing the U.S. Federal Reserve’s (Fed’s) interest-rate trajectory, on the back of banking sector concerns. Risk assets then had a recovery later in the period as concerns over a
near-term economic hard landing eased. Government bond yield curves flattened significantly as front-end yields rose with global central banks reiterating their resolve to bring inflation back to target
rates.
In line with our expectations,
global growth is downshifting and the disinflation process is clearly underway, albeit unevenly. Lessening bottleneck pressures, financial stability concerns contributing to tighter credit conditions in the United
States and Europe, and softer manufacturing and services demand worldwide are helping to alleviate price pressures globally. These trends, combined with the major central banks continuing to advocate for restrictive
monetary policy for an extended period, should further temper growth and inflation.
Within high yield, valuations
remain attractive after a substantial rise in yields following the first quarter of 2022. While fundamentals are expected to decline and default rates to increase, spreads are pricing in default rates that are likely
in excess of long-term
average default rates. Credit quality remains
well above historical average, ability to service debt remains near decade high levels, and other fundamental measures remain supportive for relatively low default rates.
Quality allocation was a
detractor to relative performance mainly driven by the fund’s opportunistic allocation to investment-grade-rated securities (mainly in investment-grade corporates). Industry allocation was positive to relative
performance mainly due to an underweight to communications along with an overweight to transportation. Issue selection was the largest detractor to relative performance, led by issuer tilts within banking and consumer
noncyclical.
| PERFORMANCE TABLE
| Average Annual Total Return
| Cumulative Total Return
|
| Total returns for the period ended 8-31-23 (%)
| 1-year
| 5-year
| 10-year
| 5-year
| 10-year
|
| High Yield Fund Class 1
| 6.91
| 2.54
| 3.42
| 13.36
| 40.02
|
| Bloomberg U.S. High Yield 2% Issuer Capped Index
| 7.19
| 3.31
| 4.47
| 17.68
| 54.81
|
Performance does not
reflect the deduction of taxes on fund distributions or redemptions of fund shares. Past performance does not guarantee future results.
Since inception, a
portion of the High Yield Fund expenses was reimbursed. If such expenses had not been reimbursed, returns would be lower.
The Bloomberg U.S.
High Yield 2% Issuer Capped Index tracks the performance of U.S. dollar-denominated, non-investment-grade, fixed-rate, taxable corporate bonds with exposure of each issuer capped at 2%.
It is not possible to
invest directly in an index. Index figures do not reflect expenses or sales charges, which would result in lower returns.
The expense ratios of
the fund, both net (including any fee waivers or expense limitations) and gross (excluding any fee waivers or expense limitations), are set forth according to the most recent publicly available prospectus for the fund
and may differ from the expense ratios disclosed in the financial highlights tables in this report. Net expenses reflect contractual expense limitations in effect until July 31, 2025 and are subject to change. Had the
contractual fee waivers and expense limitations not been in place, gross expenses would apply. The expense ratios are as follows:
|
| Class 1
|
| Gross (%)
| 0.84
|
| Net (%)
| 0.83
|
International Strategic Equity Allocation Fund
Subadvisor: Manulife Investment
Management (US) LLC
Portfolio Managers: Nathan W.
Thooft, CFA, Matthew Murphy, CFA
INVESTMENT OBJECTIVE & POLICIES ► The fund seeks capital appreciation. The fund seeks to achieve its investment objective by investing under normal market conditions at least 80% of its net assets (plus any
borrowings for investment purposes) in equity securities of any market capitalization, including futures on indexes of equity securities. The fund invests primarily in foreign securities.
CHANGE IN VALUE OF $10,000 INVESTMENT
AND COMPARATIVE INDEX
| Sector Composition (% of net assets)
|
|
| Financials
| 18.9
|
| Industrials
| 12.5
|
| Consumer discretionary
| 12.0
|
| Information technology
| 10.8
|
| Health care
| 10.1
|
| Consumer staples
| 8.6
|
| Materials
| 6.8
|
| Communication services
| 5.3
|
| Energy
| 5.0
|
| Utilities
| 3.3
|
| Real estate
| 1.9
|
| Short-term investments and other
| 4.8
|
PORTFOLIO MANAGERS'
COMMENTARY
Performance ► For the year ended August 31, 2023, the International Strategic Equity Allocation Fund Class NAV shares returned 11.14% and the MSCI ACWI ex USA Index returned 11.89%.
Environment ► Global equities shook off a number of concerns to register a robust gain during the period. Although central banks continued to raise interest rates, falling inflation gave investors
confidence that the tightening cycle would likely slow at some point within the next year. In addition, continued global growth fueled optimism that the world economy would experience a soft landing
rather than a recession. Corporate earnings
also came in much better than the markets had been anticipating in late 2022. Together, these factors helped stocks overcome potential headwinds such as ongoing geopolitical instability and short-lived turmoil in the
U.S. and European banking sectors in March.
European equities also performed
very well, as the impact of the conflict in Ukraine did not hamper growth as much as initially feared.
The fund underperformed its
benchmark for the period. One of the key detractors was an overweight
allocation to Canada that faded along with the
relative performance of energy at the end of 2022. Underweight positions to Japan and Netherlands were both modest headwinds given a sharp move in Japanese equities in March 2023.
Key contributors included an
underweight to India and an overweight and stock selection in United Kingdom. In addition, derivatives had a positive impact to performance and were used to manage against changes in foreign currency exchange rates,
change in certain securities markets and to gain exposure to certain securities markets.
| PERFORMANCE TABLE
| Average Annual Total Return
| Cumulative Total Return
|
| Total returns for the period ended 8-31-23 (%)
| 1-year
| 5-year
| Since
inception
| 5-year
| Since
inception
|
| International Strategic Equity Allocation Fund Class NAV (began 10/17/16)
| 11.14
| 2.29
| 4.44
| 11.98
| 34.82
|
| MSCI ACWI ex USA Index
| 11.89
| 3.33
| 5.58
| 17.81
| 45.24
|
Performance does not
reflect the deduction of taxes on fund distributions or redemptions of fund shares. Past performance does not guarantee future results.
Since inception, a
portion of the International Strategic Equity Allocation Fund expenses was reimbursed. If such expenses had not been reimbursed, returns would be lower.
The MSCI All Country
World (ACWI) ex USA Index tracks the performance of publicly traded large- and mid-cap stocks of companies in both developed markets and emerging markets, excluding the United States.
It is not possible to
invest directly in an index. Index figures do not reflect expenses or sales charges, which would result in lower returns.
The expense ratios of
the fund, both net (including any fee waivers or expense limitations) and gross (excluding any fee waivers or expense limitations), are set forth according to the most recent publicly available prospectus for the fund
and may differ from the expense ratios disclosed in the financial highlights tables in this report. Net expenses reflect contractual expense limitations in effect until July 31, 2025 and are subject to change. Had the
contractual fee waivers and expense limitations not been in place, gross expenses would apply. The expense ratios are as follows:
|
| Class NAV
|
| Gross (%)
| 0.72
|
| Net (%)
| 0.71
|
Mid Value Fund
Subadvisor: T. Rowe Price
Associates, Inc.
Portfolio Manager: Vincent
DeAugustino, CFA
INVESTMENT OBJECTIVE & POLICIES ► The fund seeks long-term capital appreciation. Under normal market conditions, the fund invests at least 80% of its net assets (plus any borrowings for investment purposes) in
companies with market capitalizations that are within the S&P MidCap 400 Index or the Russell Midcap Value Index.
CHANGE IN VALUE OF $10,000 INVESTMENT
AND COMPARATIVE INDEX
| Sector Composition (% of net assets)
|
|
| Industrials
| 16.9
|
| Financials
| 15.5
|
| Information technology
| 10.3
|
| Health care
| 10.1
|
| Consumer staples
| 7.5
|
| Consumer discretionary
| 7.4
|
| Energy
| 6.9
|
| Utilities
| 6.4
|
| Real estate
| 6.3
|
| Materials
| 5.6
|
| Communication services
| 4.0
|
| Short-term investments and other
| 3.1
|
PORTFOLIO MANAGER'S
COMMENTARY
Performance ► For the year ended August 31, 2023, the Mid Value Fund Class NAV shares returned 13.82% and the Russell Midcap Value Index returned 5.65%.
Environment ► U.S. stocks rallied from mid-October 2022 onward to post positive returns for the period. Although the U.S. Federal Reserve continued to raise interest rates, falling inflation gave
investors confidence that the tightening cycle would likely slow at some point within next year. Economic growth remained in positive territory even as interest rates rose. Together, these factors helped
stocks
overcome potential headwinds such as ongoing
geopolitical instability and turmoil in the U.S. and European banking sectors in March.
The fund posted a positive
return for the period and outperformed its benchmark. Overall, stock selection drove performance, especially holdings in the energy, financials, and utilities sectors.
Top individual holdings in the
energy sector included global oil and gas company TechnipFMC PLC and an out-of-benchmark position in petroleum service company Tidewater, Inc. Both companies benefited from elevated oil prices. In financials, top
performers included reinsurance firm RenaissanceRe
Holdings, Ltd. and First Republic Bank. Limited
exposure to First Republic Bank, which was sold in mid-March contributed to performance. PG&E Corp. was the top performer in the utilities sector. The consumer discretionary and industrials sectors were the only
ones to post losses for the period. The biggest overall detractor was a position in Signature Bank, a New York-headquartered bank that was closed two days after the failure of Silicon Valley Bank. Other key detractors
included an out-of-benchmark position in energy company Equitrans Midstream Corp., which was sold prior to period end, automotive parts provider Advance Auto Parts, Inc., and regional bank Fifth Third Bancorp.
| PERFORMANCE TABLE
| Average Annual Total Return
| Cumulative Total Return
|
| Total returns for the period ended 8-31-23 (%)
| 1-year
| 5-year
| 10-year
| 5-year
| 10-year
|
| Mid Value Fund Class NAV
| 13.82
| 7.91
| 9.91
| 46.30
| 157.27
|
| Russell Midcap Value Index
| 5.65
| 6.12
| 8.93
| 34.57
| 135.12
|
Performance does not
reflect the deduction of taxes on fund distributions or redemptions of fund shares. Past performance does not guarantee future results.
Since inception, a
portion of the Mid Value Fund expenses was reimbursed. If such expenses had not been reimbursed, returns would be lower.
The Russell Midcap
Value Index tracks the performance of publicly traded mid-cap companies with lower price-to-book ratios and lower forecasted growth values.
It is not possible to
invest directly in an index. Index figures do not reflect expenses or sales charges, which would result in lower returns.
The expense ratios of
the fund, both net (including any fee waivers or expense limitations) and gross (excluding any fee waivers or expense limitations), are set forth according to the most recent publicly available prospectus for the fund
and may differ from the expense ratios disclosed in the financial highlights tables in this report. Net expenses reflect contractual expense limitations in effect until July 31, 2025 and are subject to change. Had the
contractual fee waivers and expense limitations not been in place, gross expenses would apply. The expense ratios are as follows:
|
| Class NAV
|
| Gross (%)
| 0.92
|
| Net (%)
| 0.91
|
Science & Technology Fund
Subadvisor: T. Rowe Price
Associates, Inc.
Portfolio Manager: Ken Allen
INVESTMENT OBJECTIVE & POLICIES ► The fund seeks long-term growth of capital. Current income is incidental to the fund’s objective. Under normal market conditions, the fund invests at least 80% of its net
assets (plus any borrowings for investment purposes) in the common stocks of companies expected to benefit from the development, advancement, and/or use of science and technology.
CHANGE IN VALUE OF $10,000 INVESTMENT
AND COMPARATIVE INDEXES
| Sector Composition (% of net assets)
|
|
| Information technology
| 53.7
|
| Consumer discretionary
| 20.3
|
| Communication services
| 14.5
|
| Financials
| 5.6
|
| Industrials
| 0.7
|
| Real estate
| 0.4
|
| Health care
| 0.2
|
| Short-term investments and other
| 4.6
|
PORTFOLIO MANAGER'S
COMMENTARY
Performance ► For the year ended August 31, 2023, the Science & Technology Fund Class NAV shares returned 37.29% and the Lipper Science & Technology Index returned 20.84%.
Environment ► Overall, U.S. stocks produced strong gains during the period. While equities declined at the beginning of the period amid fears that inflation would remain stubbornly high, forcing
the U.S. Federal Reserve (Fed) to continue raising interest rates and making a recession more likely, some better-than-expected corporate earnings reports released during the fourth quarter of 2022 lifted sentiment,
as did indications that China, the world’s second-largest economy, was easing various pandemic-related restrictions.
Stocks rose during most of the
remainder of the period. Thanks in part to generally favorable corporate earnings and a resilient economy, equities climbed the proverbial wall of worry, overcoming bearish factors such as regional bank turmoil in
March following the failures of Silicon Valley Bank and Signature Bank; uncertainty about Congress and President Joe Biden agreeing to raise the debt ceiling—the statutory limit on U.S. government
borrowing—before the government ran out
of money; and continued Fed interest-rate increases to combat elevated inflation.
Stock selection in software
contributed to relative performance. Shares of Salesforce, Inc., a leading provider of customer relationship management software, advanced after the company announced significant cost-cutting actions. Another
contributor was Fortinet, Inc., the second-largest global network security provider to enterprise and telecom service providers. Shares advanced after the company reported strong back-to-back quarterly results that
included market share gains and strong product revenue growth.
In the internet space, stock
selection and an overweight position helped relative performance as the subsector outpaced the index. Shares of Zalando SE, Europe’s leading online apparel retailer, advanced during much of the first half of the
period. Shares of Meta Platforms, Inc., the parent company of Facebook, advanced during the period after the company announced additional expense control measures.
Conversely, stock selection and
an underweight position in semiconductors detracted from relative results. Shares of chip maker Qualcomm, Inc. saw significant volatility and ended the period lower. Shares declined early in the period as ongoing
COVID-19 restrictions in China and a decrease in consumer spending amid higher inflation pressured shares. An underweight position in NVIDIA Corp., a semiconductor company that designs graphics processing units (GPUs)
used in data centers, gaming, and professional graphics, detracted from relative results. Shares surged after the company issued an earnings announcement that featured strong quarterly revenue and much higher guidance
due to artificial intelligence-driven demand for its GPUs.
Within real estate, stock
selection weighed on relative performance. Shares of Opendoor Technologies, Inc., a U.S. residential real estate transactions platform, fell after the company’s struggles to turn over its inventory led to
larger-than-expected losses. We eliminated the fund’s position due to concerns over a lack of a clear path to profitability for the company in a declining housing market.
| PERFORMANCE TABLE
| Average Annual Total Return
| Cumulative Total Return
|
| Total returns for the period ended 8-31-23 (%)
| 1-year
| 5-year
| 10-year
| 5-year
| 10-year
|
| Science & Technology Fund Class NAV
| 37.29
| 12.78
| 16.98
| 82.42
| 379.81
|
| S&P 500 Index
| 15.94
| 11.12
| 12.81
| 69.43
| 233.79
|
| Lipper Science and Technology Index
| 20.84
| 11.54
| 15.60
| 72.62
| 326.17
|
Performance does not
reflect the deduction of taxes on fund distributions or redemptions of fund shares. Past performance does not guarantee future results.
Since inception, a
portion of the Science & Technology Fund expenses was reimbursed. If such expenses had not been reimbursed, returns would be lower.
The S&P 500 Index
tracks the performance of 500 of the largest publicly traded companies in the United States.
The Lipper Science
and Technology Index consists of the 30 largest funds in the Lipper peer category that invest primarily in the equity securities of domestic companies engaged in science and technology.
It is not possible to
invest directly in an index. Index figures do not reflect expenses or sales charges, which would result in lower returns.
The expense ratios of
the fund, both net (including any fee waivers or expense limitations) and gross (excluding any fee waivers or expense limitations), are set forth according to the most recent publicly available prospectus for the fund
and may differ from the expense ratios disclosed in the financial highlights tables in this report. Net expenses reflect contractual expense limitations in effect until July 31, 2025 and are subject to change. Had the
contractual fee waivers and expense limitations not been in place, gross expenses would apply. The expense ratios are as follows:
|
| Class NAV
|
| Gross (%)
| 1.04
|
| Net (%)
| 1.03
|
U.S. Sector Rotation Fund
Subadvisor: Manulife Investment
Management (US) LLC
Portfolio Managers: Nathan W.
Thooft, CFA, and Matthew Murphy, CFA
INVESTMENT OBJECTIVE & POLICIES ► The fund seeks capital appreciation. The fund seeks to achieve its objective by investing under normal market conditions at least 80% of its net assets (plus any borrowings for
investment purposes) in U.S. equity securities of any market capitalization, including futures on indexes of equity securities.
CHANGE IN VALUE OF $10,000 INVESTMENT
AND COMPARATIVE INDEX
| Sector Composition (% of net assets)
|
|
| Information technology
| 28.7
|
| Financials
| 12.4
|
| Health care
| 12.1
|
| Consumer discretionary
| 11.3
|
| Communication services
| 9.8
|
| Industrials
| 8.4
|
| Consumer staples
| 5.3
|
| Energy
| 5.1
|
| Materials
| 2.3
|
| Real estate
| 1.6
|
| Utilities
| 0.6
|
| Short-term investments and other
| 2.4
|
PORTFOLIO MANAGERS'
COMMENTARY
Performance ► For the year ended August 31, 2023, the U.S. Sector Rotation Fund Class NAV shares returned 15.27% and the S&P 500 Index returned 15.94%.
Environment ► U.S. stocks rallied from mid-October 2022 onward to post positive returns for the period. Although the U.S. Federal Reserve continued to raise interest rates, falling inflation gave
investors confidence that the tightening cycle would likely slow at some point within next year. Economic growth remained in positive territory even as interest rates rose. Together, these factors helped stocks
overcome potential headwinds such as ongoing geopolitical instability and turmoil in the U.S. and European banking sectors in March.
Driven by a strong market
environment, the fund produced a positive return but trailed its respective benchmark. The underperformance was driven by selection across a variety of sectors.
Detractors included an
overweight to the energy sector and an underweight to the information technology sector. Additionally, industry selection within the information technology sector weighed on returns. Underweights in tech giants NVIDIA
Corp. and Apple, Inc. and banking firm JPMorgan Chase & Co. negatively affected performance.
Several positions in the
portfolio contributed positively. Most notably, an underweight to consumer
discretionary and industry selection within
that sector contributed to results. Additionally, an underweight to the utilities and financials sectors helped returns. Underweights in Amazon.com, Inc. and Tesla, Inc. aided performance. At the end of the period,
the fund was overweight in the energy, communication services, and information technology sectors. It was underweight in the utilities, consumer staples, and healthcare sectors.
| PERFORMANCE TABLE
| Average Annual Total Return
| Cumulative Total Return
|
| Total returns for the period ended 8-31-23 (%)
| 1-year
| 5-year
| Since
inception
| 5-year
| Since
inception
|
| U.S. Sector Rotation Fund Class NAV (began 9/26/16)
| 15.27
| 9.74
| 12.23
| 59.13
| 122.46
|
| S&P 500 Index
| 15.94
| 11.12
| 13.19
| 69.43
| 136.09
|
Performance does not
reflect the deduction of taxes on fund distributions or redemptions of fund shares. Past performance does not guarantee future results.
Since inception, a
portion of the U.S. Sector Rotation Fund expenses was reimbursed. If such expenses had not been reimbursed, returns would be lower.
The S&P 500 Index
tracks the performance of 500 of the largest publicly traded companies in the United States.
It is not possible to
invest directly in an index. Index figures do not reflect expenses or sales charges, which would result in lower returns.
The expense ratios of
the fund, both net (including any fee waivers or expense limitations) and gross (excluding any fee waivers or expense limitations), are set forth according to the most recent publicly available prospectus for the fund
and may differ from the expense ratios disclosed in the financial highlights tables in this report. Net expenses reflect contractual expense limitations in effect until July 31, 2025 and are subject to change. Had the
contractual fee waivers and expense limitations not been in place, gross expenses would apply. The expense ratios are as follows:
|
| Class NAV
|
| Gross (%)
| 0.66
|
| Net (%)
| 0.65
|
John Hancock Funds II
Shareholder expense example
As a shareholder of John
Hancock Funds II, you incur ongoing costs, such as management fees, distribution (Rule 12b-1) fees and other expenses.
These examples are
intended to help you understand your ongoing costs (in dollars) of investing in a fund so you can compare these costs with the ongoing costs of investing in other mutual funds. The examples are based on an investment
of $1,000 at the beginning of the period and held for the entire period (March 1, 2023 through August 31, 2023).
Actual expenses:
The first line of each
share class in the following table provides information about actual account values and actual expenses. You may use the information in this line, together with the amount you invested, to estimate the expenses that
you paid over the period. Simply divide your account value by $1,000 (for example, an $8,600 account value divided by $1,000 = 8.6), then multiply the result by the number in the first line under the heading entitled
“Expenses paid during period ended” to estimate the expenses you paid on your account during this period.
Hypothetical example for
comparison purposes:
The second line of each
share class in the following table provides information about hypothetical account values and hypothetical expenses based on the actual expense ratio for the share class and an assumed annualized rate of return of 5%
per year before expenses, which is not the actual return of the share class. The hypothetical account values and expenses may not be used to estimate the actual ending account balance or expenses you paid for the
period. You may use this information to compare the ongoing costs of investing in a fund and other funds. To do so, compare this 5% hypothetical example with the 5% hypothetical examples that appear in the shareholder
reports of the other funds. Please remember that these hypothetical account values and expenses may not be used to estimate the actual ending account balance or expenses you paid for the period.
Please note that the
expenses shown in the table are meant to highlight your ongoing costs only and do not reflect any transactional costs and insurance-related charges. Therefore, the second line of each share class in the table is
useful in comparing ongoing costs only, and will not help you determine the relative total costs of owning different funds. In addition, if these transactional costs were included, your costs would have been
higher.
|
|
| Account
value on
3-1-2023
| Ending
value on
8-31-2023
| Expenses
paid during
period ended
8-31-20231
| Annualized
expense
ratio
|
| Capital Appreciation Fund
|
| Class 1
| Actual expenses/actual returns
| $1,000.00
| $1,276.90
| $4.65
| 0.81%
|
|
| Hypothetical example
| 1,000.00
| 1,021.10
| 4.13
| 0.81%
|
| Class NAV
| Actual expenses/actual returns
| 1,000.00
| 1,277.40
| 4.36
| 0.76%
|
|
| Hypothetical example
| 1,000.00
| 1,021.40
| 3.87
| 0.76%
|
| Capital Appreciation Value Fund
|
| Class NAV
| Actual expenses/actual returns
| $1,000.00
| $1,097.70
| $4.44
| 0.84%
|
|
| Hypothetical example
| 1,000.00
| 1,021.00
| 4.28
| 0.84%
|
| Core Bond Fund
|
| Class 1
| Actual expenses/actual returns
| $1,000.00
| $1,008.70
| $3.39
| 0.67%
|
|
| Hypothetical example
| 1,000.00
| 1,021.80
| 3.41
| 0.67%
|
| Class NAV
| Actual expenses/actual returns
| 1,000.00
| 1,009.90
| 3.19
| 0.63%
|
|
| Hypothetical example
| 1,000.00
| 1,022.00
| 3.21
| 0.63%
|
| Health Sciences Fund
|
| Class NAV
| Actual expenses/actual returns
| $1,000.00
| $1,040.90
| $4.94
| 0.96%
|
|
| Hypothetical example
| 1,000.00
| 1,020.40
| 4.89
| 0.96%
|
| High Yield Fund
|
| Class 1
| Actual expenses/actual returns
| $1,000.00
| $1,042.80
| $4.48
| 0.87%
|
|
| Hypothetical example
| 1,000.00
| 1,020.80
| 4.43
| 0.87%
|
| International Strategic Equity Allocation Fund
|
| Class NAV
| Actual expenses/actual returns
| $1,000.00
| $1,035.80
| $2.82
| 0.55%
|
|
| Hypothetical example
| 1,000.00
| 1,022.40
| 2.80
| 0.55%
|
| Mid Value Fund
|
| Class NAV
| Actual expenses/actual returns
| $1,000.00
| $1,024.30
| $4.49
| 0.88%
|
|
| Hypothetical example
| 1,000.00
| 1,020.80
| 4.48
| 0.88%
|
| Science & Technology Fund
|
| Class NAV
| Actual expenses/actual returns
| $1,000.00
| $1,274.80
| $5.68
| 0.99%
|
|
| Hypothetical example
| 1,000.00
| 1,020.20
| 5.04
| 0.99%
|
John Hancock Funds II
Shareholder expense example
|
|
| Account
value on
3-1-2023
| Ending
value on
8-31-2023
| Expenses
paid during
period ended
8-31-20231
| Annualized
expense
ratio
|
| U.S. Sector Rotation Fund
|
| Class NAV
| Actual expenses/actual returns
| $1,000.00
| $1,145.60
| $2.92
| 0.54%
|
|
| Hypothetical example
| 1,000.00
| 1,022.50
| 2.75
| 0.54%
|
| 1
| Expenses are equal to the annualized expense ratio, multiplied by the average account value over the period, multiplied by 184/365 (to reflect the one-half year period).
|
John Hancock Funds II
Portfolio of Investments —
August 31, 2023 (showing percentage of total net assets)
Capital Appreciation Fund
|
|
| Shares or
Principal
Amount
|
| Value
|
| COMMON STOCKS – 99.3%
|
|
|
|
| Communication services – 10.3%
|
|
|
|
|
|
| Entertainment – 1.7%
|
|
|
|
| Netflix, Inc. (A)
|
| 57,812
|
| $
| 25,071,908
|
| Interactive media and services – 8.0%
|
|
|
|
| Alphabet, Inc., Class A (A)
|
| 244,162
|
|
| 33,247,540
|
| Alphabet, Inc., Class C (A)
|
| 243,004
|
|
| 33,376,599
|
| Meta Platforms, Inc., Class A (A)
|
| 176,018
|
|
| 52,081,966
|
|
|
|
|
|
| 118,706,105
|
| Media – 0.6%
|
|
|
|
| The Trade Desk, Inc., Class A (A)
|
| 104,381
|
|
| 8,353,611
|
|
|
|
|
|
| 152,131,624
|
| Consumer discretionary – 23.6%
|
|
|
|
|
|
| Automobile components – 0.2%
|
|
|
|
| Mobileye Global, Inc., Class A (A)
|
| 99,899
|
|
| 3,547,413
|
| Automobiles – 4.6%
|
|
|
|
| Tesla, Inc. (A)
|
| 263,725
|
|
| 68,062,148
|
| Broadline retail – 7.1%
|
|
|
|
| Amazon.com, Inc. (A)
|
| 575,829
|
|
| 79,470,160
|
| MercadoLibre, Inc. (A)
|
| 19,148
|
|
| 26,277,949
|
|
|
|
|
|
| 105,748,109
|
| Hotels, restaurants and leisure – 2.9%
|
|
|
|
| Airbnb, Inc., Class A (A)
|
| 114,349
|
|
| 15,042,611
|
| Chipotle Mexican Grill, Inc. (A)
|
| 4,241
|
|
| 8,170,880
|
| Marriott International, Inc., Class A
|
| 53,902
|
|
| 10,969,596
|
| McDonald's Corp.
|
| 31,141
|
|
| 8,755,292
|
|
|
|
|
|
| 42,938,379
|
| Specialty retail – 4.2%
|
|
|
|
| O'Reilly Automotive, Inc. (A)
|
| 18,795
|
|
| 17,661,662
|
| The Home Depot, Inc.
|
| 56,184
|
|
| 18,557,575
|
| The TJX Companies, Inc.
|
| 176,437
|
|
| 16,316,894
|
| Ulta Beauty, Inc. (A)
|
| 23,032
|
|
| 9,558,971
|
|
|
|
|
|
| 62,095,102
|
| Textiles, apparel and luxury goods – 4.6%
|
|
|
|
| Lululemon Athletica, Inc. (A)
|
| 62,698
|
|
| 23,904,239
|
| LVMH Moet Hennessy Louis Vuitton SE
|
| 37,243
|
|
| 31,494,817
|
| NIKE, Inc., Class B
|
| 120,133
|
|
| 12,218,727
|
|
|
|
|
|
| 67,617,783
|
|
|
|
|
|
| 350,008,934
|
| Consumer staples – 3.0%
|
|
|
|
|
|
| Consumer staples distribution and retail – 1.9%
|
|
|
|
| Costco Wholesale Corp.
|
| 52,322
|
|
| 28,739,428
|
| Personal care products – 1.1%
|
|
|
|
| L'Oreal SA
|
| 35,204
|
|
| 15,462,727
|
|
|
|
|
|
| 44,202,155
|
| Financials – 8.7%
|
|
|
|
|
|
| Capital markets – 2.5%
|
|
|
|
| Moody's Corp.
|
| 20,284
|
|
| 6,831,651
|
| S&P Global, Inc.
|
| 47,496
|
|
| 18,564,287
|
| The Goldman Sachs Group, Inc.
|
| 33,655
|
|
| 11,029,080
|
|
|
|
|
|
| 36,425,018
|
| Consumer finance – 0.4%
|
|
|
|
| American Express Company
|
| 41,816
|
|
| 6,606,510
|
| Financial services – 5.8%
|
|
|
|
| Mastercard, Inc., Class A
|
| 95,924
|
|
| 39,582,079
|
| Visa, Inc., Class A
|
| 188,465
|
|
| 46,302,081
|
|
|
|
|
|
| 85,884,160
|
|
|
|
|
|
| 128,915,688
|
| Health care – 11.3%
|
|
|
|
|
|
| Biotechnology – 1.3%
|
|
|
|
| Argenx SE, ADR (A)
|
| 8,651
|
|
| 4,347,041
|
Capital Appreciation Fund (continued)
|
|
| Shares or
Principal
Amount
|
| Value
|
| COMMON STOCKS (continued)
|
|
|
|
| Biotechnology (continued)
|
|
|
|
| Vertex Pharmaceuticals, Inc. (A)
|
| 44,755
|
| $
| 15,589,957
|
|
|
|
|
|
| 19,936,998
|
| Health care equipment and supplies – 1.8%
|
|
|
|
| DexCom, Inc. (A)
|
| 73,264
|
|
| 7,398,199
|
| Intuitive Surgical, Inc. (A)
|
| 60,396
|
|
| 18,884,621
|
|
|
|
|
|
| 26,282,820
|
| Health care providers and services – 0.9%
|
|
|
|
| UnitedHealth Group, Inc.
|
| 29,467
|
|
| 14,043,383
|
| Pharmaceuticals – 7.3%
|
|
|
|
| AstraZeneca PLC, ADR
|
| 291,489
|
|
| 19,768,784
|
| Eli Lilly & Company
|
| 98,152
|
|
| 54,395,838
|
| Novo Nordisk A/S, ADR
|
| 179,226
|
|
| 33,267,930
|
|
|
|
|
|
| 107,432,552
|
|
|
|
|
|
| 167,695,753
|
| Industrials – 2.2%
|
|
|
|
|
|
| Ground transportation – 2.2%
|
|
|
|
| Uber Technologies, Inc. (A)
|
| 677,608
|
|
| 32,003,426
|
| Information technology – 39.3%
|
|
|
|
|
|
| IT services – 2.1%
|
|
|
|
| MongoDB, Inc. (A)
|
| 36,015
|
|
| 13,732,520
|
| Snowflake, Inc., Class A (A)
|
| 106,907
|
|
| 16,768,363
|
|
|
|
|
|
| 30,500,883
|
| Semiconductors and semiconductor equipment – 15.9%
|
|
|
|
| Advanced Micro Devices, Inc. (A)
|
| 395,378
|
|
| 41,799,362
|
| ASML Holding NV, NYRS
|
| 24,517
|
|
| 16,194,214
|
| Broadcom, Inc.
|
| 39,770
|
|
| 36,703,335
|
| Micron Technology, Inc.
|
| 103,345
|
|
| 7,227,949
|
| NVIDIA Corp.
|
| 271,293
|
|
| 133,896,664
|
|
|
|
|
|
| 235,821,524
|
| Software – 15.0%
|
|
|
|
| Adobe, Inc. (A)
|
| 48,070
|
|
| 26,887,474
|
| Cadence Design Systems, Inc. (A)
|
| 62,381
|
|
| 14,998,888
|
| Crowdstrike Holdings, Inc., Class A (A)
|
| 70,676
|
|
| 11,522,308
|
| HubSpot, Inc. (A)
|
| 8,625
|
|
| 4,713,735
|
| Microsoft Corp.
|
| 354,841
|
|
| 116,302,686
|
| Salesforce, Inc. (A)
|
| 128,161
|
|
| 28,382,535
|
| ServiceNow, Inc. (A)
|
| 33,129
|
|
| 19,507,349
|
|
|
|
|
|
| 222,314,975
|
| Technology hardware, storage and peripherals – 6.3%
|
|
|
|
| Apple, Inc.
|
| 500,381
|
|
| 94,006,578
|
|
|
|
|
|
| 582,643,960
|
| Real estate – 0.9%
|
|
|
|
|
|
| Specialized REITs – 0.9%
|
|
|
|
| American Tower Corp.
|
| 73,785
|
|
| 13,378,696
|
| TOTAL COMMON STOCKS (Cost $618,218,734)
|
| $
| 1,470,980,236
|
| PREFERRED SECURITIES – 0.5%
|
|
|
|
|
|
| Consumer discretionary – 0.5%
|
|
|
|
|
|
| Automobiles – 0.5%
|
|
|
|
| Dr. Ing. h.c. F. Porsche AG (B)
|
| 68,344
|
|
| 7,537,646
|
| TOTAL PREFERRED SECURITIES (Cost $5,526,458)
|
| $
| 7,537,646
|
| The accompanying notes are an integral part of the financial statements.
| 15
|
|
John Hancock Funds II
Portfolio of Investments —
August 31, 2023 (showing percentage of total net assets)
Capital Appreciation Fund (continued)
|
|
| Shares or
Principal
Amount
|
| Value
|
| SHORT-TERM INVESTMENTS – 0.4%
|
|
|
|
| Short-term funds – 0.4%
|
|
|
|
|
|
| State Street Institutional U.S. Government Money Market Fund, Premier Class,
5.2681% (C)
|
| 5,374,366
|
| $
| 5,374,366
|
| TOTAL SHORT-TERM INVESTMENTS (Cost $5,374,366)
|
| $
| 5,374,366
|
Total Investments (Capital Appreciation Fund)
(Cost $629,119,558) – 100.2%
|
| $
| 1,483,892,248
|
| Other assets and liabilities, net – (0.2%)
|
|
| (2,711,279)
|
| TOTAL NET ASSETS – 100.0%
|
| $
| 1,481,180,969
|
| Security Abbreviations and Legend
|
| ADR
| American Depositary Receipt
|
| NYRS
| New York Registry Shares
|
| (A)
| Non-income producing security.
|
| (B)
| These securities are exempt from registration under Rule 144A of the Securities Act of 1933. Such securities may be resold, normally to qualified institutional buyers, in transactions
exempt from registration.
|
| (C)
| The rate shown is the annualized seven-day yield as of 8-31-23.
|
Capital Appreciation Value
Fund
|
|
| Shares or
Principal
Amount
|
| Value
|
| COMMON STOCKS – 65.0%
|
|
|
|
| Communication services – 3.7%
|
|
|
|
|
|
| Interactive media and services – 3.7%
|
|
|
|
| Alphabet, Inc., Class A (A)(B)
|
| 248,907
|
| $
| 33,893,666
|
| Meta Platforms, Inc., Class A (B)
|
| 29,174
|
|
| 8,632,295
|
|
|
|
|
|
| 42,525,961
|
| Consumer discretionary – 5.2%
|
|
|
|
|
|
| Automobile components – 0.3%
|
|
|
|
| Mobileye Global, Inc., Class A (B)
|
| 101,642
|
|
| 3,609,307
|
| Broadline retail – 2.4%
|
|
|
|
| Amazon.com, Inc. (A)(B)
|
| 196,098
|
|
| 27,063,485
|
| Hotels, restaurants and leisure – 2.5%
|
|
|
|
| Hilton Worldwide Holdings, Inc. (A)
|
| 53,147
|
|
| 7,900,302
|
| Starbucks Corp. (A)
|
| 25,200
|
|
| 2,455,488
|
| Yum! Brands, Inc. (A)
|
| 145,264
|
|
| 18,794,256
|
|
|
|
|
|
| 29,150,046
|
|
|
|
|
|
| 59,822,838
|
| Consumer staples – 0.6%
|
|
|
|
|
|
| Beverages – 0.6%
|
|
|
|
| Keurig Dr. Pepper, Inc.
|
| 225,072
|
|
| 7,573,673
|
| Energy – 1.6%
|
|
|
|
|
|
| Oil, gas and consumable fuels – 1.6%
|
|
|
|
| Canadian Natural Resources, Ltd.
|
| 133,720
|
|
| 8,650,347
|
| Chesapeake Energy Corp.
|
| 77,500
|
|
| 6,836,275
|
| EOG Resources, Inc.
|
| 26,690
|
|
| 3,432,868
|
|
|
|
|
|
| 18,919,490
|
| Financials – 7.3%
|
|
|
|
|
|
| Banks – 0.6%
|
|
|
|
| The PNC Financial Services Group, Inc.
|
| 59,787
|
|
| 7,218,085
|
| Capital markets – 3.5%
|
|
|
|
| CME Group, Inc. (A)
|
| 14,085
|
|
| 2,854,748
|
| Intercontinental Exchange, Inc.
|
| 153,667
|
|
| 18,131,169
|
| KKR & Company, Inc. (A)
|
| 146,397
|
|
| 9,195,196
|
| S&P Global, Inc. (A)
|
| 6,885
|
|
| 2,691,071
|
Capital Appreciation Value Fund
(continued)
|
|
| Shares or
Principal
Amount
|
| Value
|
| COMMON STOCKS (continued)
|
|
|
|
| Capital markets (continued)
|
|
|
|
| The Goldman Sachs Group, Inc.
|
| 22,000
|
| $
| 7,209,620
|
|
|
|
|
|
| 40,081,804
|
| Financial services – 2.5%
|
|
|
|
| Mastercard, Inc., Class A (A)
|
| 38,346
|
|
| 15,823,093
|
| Visa, Inc., Class A (A)
|
| 54,796
|
|
| 13,462,281
|
|
|
|
|
|
| 29,285,374
|
| Insurance – 0.7%
|
|
|
|
| Marsh & McLennan Companies, Inc. (A)
|
| 39,951
|
|
| 7,790,045
|
|
|
|
|
|
| 84,375,308
|
| Health care – 15.8%
|
|
|
|
|
|
| Biotechnology – 2.2%
|
|
|
|
| AbbVie, Inc.
|
| 88,973
|
|
| 13,075,472
|
| Biogen, Inc. (B)
|
| 39,316
|
|
| 10,511,526
|
| Karuna Therapeutics, Inc. (B)
|
| 8,031
|
|
| 1,507,901
|
|
|
|
|
|
| 25,094,899
|
| Health care equipment and supplies – 3.7%
|
|
|
|
| Becton, Dickinson and Company (A)
|
| 91,151
|
|
| 25,472,147
|
| GE HealthCare Technologies, Inc. (A)
|
| 74,415
|
|
| 5,242,537
|
| Stryker Corp. (A)
|
| 17,900
|
|
| 5,075,545
|
| Teleflex, Inc.
|
| 34,680
|
|
| 7,377,823
|
|
|
|
|
|
| 43,168,052
|
| Health care providers and services – 3.2%
|
|
|
|
| Humana, Inc.
|
| 12,500
|
|
| 5,770,375
|
| UnitedHealth Group, Inc.
|
| 64,728
|
|
| 30,848,071
|
|
|
|
|
|
| 36,618,446
|
| Life sciences tools and services – 5.8%
|
|
|
|
| Avantor, Inc. (B)
|
| 500,084
|
|
| 10,826,819
|
| Danaher Corp.
|
| 81,522
|
|
| 21,603,330
|
| Revvity, Inc.
|
| 179,637
|
|
| 21,022,918
|
| Thermo Fisher Scientific, Inc.
|
| 25,857
|
|
| 14,404,935
|
|
|
|
|
|
| 67,858,002
|
| Pharmaceuticals – 0.9%
|
|
|
|
| Eli Lilly & Company
|
| 18,159
|
|
| 10,063,718
|
|
|
|
|
|
| 182,803,117
|
| Industrials – 7.8%
|
|
|
|
|
|
| Aerospace and defense – 0.3%
|
|
|
|
| RTX Corp.
|
| 47,100
|
|
| 4,052,484
|
| Commercial services and supplies – 1.5%
|
|
|
|
| Republic Services, Inc.
|
| 8,750
|
|
| 1,261,138
|
| Waste Connections, Inc.
|
| 121,732
|
|
| 16,676,067
|
|
|
|
|
|
| 17,937,205
|
| Electrical equipment – 0.5%
|
|
|
|
| AMETEK, Inc.
|
| 33,526
|
|
| 5,347,732
|
| Industrial conglomerates – 0.5%
|
|
|
|
| General Electric Company (A)
|
| 47,650
|
|
| 5,454,019
|
| Machinery – 3.6%
|
|
|
|
| Fortive Corp.
|
| 327,777
|
|
| 25,845,216
|
| Ingersoll Rand, Inc. (A)
|
| 233,208
|
|
| 16,233,609
|
|
|
|
|
|
| 42,078,825
|
| Professional services – 1.4%
|
|
|
|
| Equifax, Inc.
|
| 47,723
|
|
| 9,864,344
|
| TransUnion (A)
|
| 77,702
|
|
| 6,310,956
|
|
|
|
|
|
| 16,175,300
|
|
|
|
|
|
| 91,045,565
|
| Information technology – 15.7%
|
|
|
|
|
|
| Electronic equipment, instruments and components – 1.3%
|
|
|
|
| TE Connectivity, Ltd.
|
| 8,856
|
|
| 1,172,446
|
| The accompanying notes are an integral part of the financial statements.
| 16
|
|
John Hancock Funds II
Portfolio of Investments —
August 31, 2023 (showing percentage of total net assets)
Capital Appreciation Value Fund
(continued)
|
|
| Shares or
Principal
Amount
|
| Value
|
| COMMON STOCKS (continued)
|
|
|
|
Electronic equipment, instruments and
components (continued)
|
|
|
|
| Teledyne Technologies, Inc. (B)
|
| 32,206
|
| $
| 13,471,770
|
|
|
|
|
|
| 14,644,216
|
| Semiconductors and semiconductor equipment – 3.6%
|
|
|
|
| Analog Devices, Inc.
|
| 30,000
|
|
| 5,453,400
|
| NVIDIA Corp.
|
| 35,992
|
|
| 17,763,852
|
| NXP Semiconductors NV (A)
|
| 47,202
|
|
| 9,710,395
|
| Texas Instruments, Inc. (A)
|
| 55,635
|
|
| 9,350,018
|
|
|
|
|
|
| 42,277,665
|
| Software – 8.6%
|
|
|
|
| Aurora Innovation, Inc. (B)(C)
|
| 1,653,210
|
|
| 5,240,676
|
| Black Knight, Inc. (B)
|
| 82,230
|
|
| 6,229,745
|
| Intuit, Inc.
|
| 18,512
|
|
| 10,029,987
|
| Microsoft Corp. (A)
|
| 155,436
|
|
| 50,945,697
|
| PTC, Inc. (B)
|
| 48,127
|
|
| 7,082,851
|
| Roper Technologies, Inc.
|
| 26,266
|
|
| 13,108,310
|
| Salesforce, Inc. (A)(B)
|
| 30,546
|
|
| 6,764,717
|
|
|
|
|
|
| 99,401,983
|
| Technology hardware, storage and peripherals – 2.2%
|
|
|
|
| Apple, Inc.
|
| 138,700
|
|
| 26,057,569
|
|
|
|
|
|
| 182,381,433
|
| Materials – 0.9%
|
|
|
|
|
|
| Chemicals – 0.9%
|
|
|
|
| Linde PLC (A)
|
| 27,106
|
|
| 10,491,106
|
| Utilities – 6.4%
|
|
|
|
|
|
| Electric utilities – 2.9%
|
|
|
|
| Exelon Corp.
|
| 420,706
|
|
| 16,878,725
|
| Xcel Energy, Inc.
|
| 297,217
|
|
| 16,980,007
|
|
|
|
|
|
| 33,858,732
|
| Multi-utilities – 3.5%
|
|
|
|
| Ameren Corp.
|
| 216,589
|
|
| 17,169,010
|
| CenterPoint Energy, Inc.
|
| 234,912
|
|
| 6,551,696
|
| DTE Energy Company
|
| 105,234
|
|
| 10,879,091
|
| WEC Energy Group, Inc.
|
| 73,100
|
|
| 6,149,172
|
|
|
|
|
|
| 40,748,969
|
|
|
|
|
|
| 74,607,701
|
| TOTAL COMMON STOCKS (Cost $626,478,628)
|
| $
| 754,546,192
|
| PREFERRED SECURITIES – 0.4%
|
|
|
|
|
|
| Financials – 0.0%
|
|
|
|
|
|
| Capital markets – 0.0%
|
|
|
|
| The Charles Schwab Corp., 5.950%
|
| 8,000
|
|
| 198,800
|
| Utilities – 0.4%
|
|
|
|
|
|
| Electric utilities – 0.1%
|
|
|
|
| SCE Trust IV, 5.375% (5.375% to 9-15-25, then 3 month LIBOR + 3.132%)
|
| 34,784
|
|
| 730,464
|
| Multi-utilities – 0.3%
|
|
|
|
| CMS Energy Corp., 5.875%
|
| 71,243
|
|
| 1,699,146
|
| CMS Energy Corp., 5.875%
|
| 63,712
|
|
| 1,534,822
|
| NiSource, Inc., 6.500% (6.500% to 3-15-24, then 5 Year CMT + 3.632%)
|
| 14,343
|
|
| 357,141
|
|
|
|
|
|
| 3,591,109
|
|
|
|
|
|
| 4,321,573
|
| TOTAL PREFERRED SECURITIES (Cost $4,802,050)
|
| $
| 4,520,373
|
U.S. GOVERNMENT AND AGENCY
OBLIGATIONS – 11.1%
|
|
|
|
|
|
| U.S. Government – 11.1%
|
|
|
|
|
|
| U.S. Treasury Notes
|
|
|
|
|
|
| 3.375%, 05/15/2033
| $
| 58,503,000
|
|
| 55,111,654
|
| 3.500%, 02/15/2033
|
| 47,732,600
|
|
| 45,457,843
|
Capital Appreciation Value Fund
(continued)
|
|
| Shares or
Principal
Amount
|
| Value
|
U.S. Government and Agency
obligations (continued)
|
|
|
|
|
|
| U.S. Government (continued)
|
|
|
|
|
|
| U.S. Treasury Notes (continued)
|
|
|
|
|
|
| 3.875%, 08/15/2033
| $
| 12,044,300
|
| $
| 11,829,761
|
| 4.125%, 11/15/2032
|
| 16,717,300
|
|
| 16,709,464
|
|
|
|
|
|
| 129,108,722
|
| TOTAL U.S. GOVERNMENT AND AGENCY OBLIGATIONS (Cost $132,390,171)
|
| $
| 129,108,722
|
| CORPORATE BONDS - 10.4%
|
|
|
|
|
|
| Communication services - 1.1%
|
|
|
|
|
|
| CCO Holdings LLC
|
|
|
|
|
|
| 5.000%, 02/01/2028 (D)
|
| 5,162,000
|
|
| 4,756,762
|
| 5.125%, 05/01/2027 (D)
|
| 6,953,000
|
|
| 6,536,445
|
| 5.500%, 05/01/2026 (D)
|
| 325,000
|
|
| 317,416
|
| Lamar Media Corp.
|
|
|
|
|
|
| 3.625%, 01/15/2031
|
| 120,000
|
|
| 100,200
|
| 3.750%, 02/15/2028
|
| 754,000
|
|
| 684,934
|
| 4.875%, 01/15/2029
|
| 137,000
|
|
| 127,410
|
Live Nation Entertainment, Inc.
4.875%, 11/01/2024 (D)
|
| 90,000
|
|
| 88,407
|
|
|
|
|
|
| 12,611,574
|
| Consumer discretionary - 2.9%
|
|
|
|
|
|
| Cedar Fair LP
|
|
|
|
|
|
| 5.250%, 07/15/2029
|
| 1,719,000
|
|
| 1,547,393
|
| 5.375%, 04/15/2027
|
| 1,913,000
|
|
| 1,808,509
|
| 5.500%, 05/01/2025 (D)
|
| 1,606,000
|
|
| 1,593,338
|
| 6.500%, 10/01/2028
|
| 1,537,000
|
|
| 1,485,844
|
| Clarios Global LP
|
|
|
|
|
|
| 6.250%, 05/15/2026 (D)
|
| 689,000
|
|
| 682,368
|
| 6.750%, 05/15/2025 (D)
|
| 539,000
|
|
| 538,793
|
| 8.500%, 05/15/2027 (D)
|
| 1,465,000
|
|
| 1,479,748
|
| Hilton Domestic Operating Company, Inc.
|
|
|
|
|
|
| 3.625%, 02/15/2032 (D)
|
| 1,381,000
|
|
| 1,154,924
|
| 3.750%, 05/01/2029 (D)
|
| 1,224,000
|
|
| 1,078,339
|
| 4.000%, 05/01/2031 (D)
|
| 1,841,000
|
|
| 1,600,208
|
| 4.875%, 01/15/2030
|
| 1,106,000
|
|
| 1,031,800
|
| 5.375%, 05/01/2025 (D)
|
| 541,000
|
|
| 535,104
|
| 5.750%, 05/01/2028 (D)
|
| 1,239,000
|
|
| 1,215,645
|
Hilton Worldwide Finance LLC
4.875%, 04/01/2027
|
| 379,000
|
|
| 365,268
|
KFC Holding Company/Pizza Hut Holdings LLC/Taco Bell of America LLC
4.750%, 06/01/2027 (D)
|
| 3,113,000
|
|
| 2,996,263
|
Life Time, Inc.
5.750%, 01/15/2026 (D)
|
| 1,160,000
|
|
| 1,131,748
|
Service Corp. International
3.375%, 08/15/2030
|
| 669,000
|
|
| 552,256
|
Six Flags Entertainment Corp.
5.500%, 04/15/2027 (D)
|
| 2,622,000
|
|
| 2,467,958
|
Six Flags Theme Parks, Inc.
7.000%, 07/01/2025 (D)
|
| 669,000
|
|
| 668,831
|
Vail Resorts, Inc.
6.250%, 05/15/2025 (D)
|
| 418,000
|
|
| 416,534
|
| Yum! Brands, Inc.
|
|
|
|
|
|
| 3.625%, 03/15/2031
|
| 1,239,000
|
|
| 1,050,702
|
| 4.625%, 01/31/2032
|
| 2,357,000
|
|
| 2,108,901
|
| 4.750%, 01/15/2030 (D)
|
| 1,106,000
|
|
| 1,018,479
|
| 5.350%, 11/01/2043
|
| 2,072,000
|
|
| 1,822,937
|
| 5.375%, 04/01/2032
|
| 2,622,000
|
|
| 2,460,751
|
| 6.875%, 11/15/2037
|
| 511,000
|
|
| 538,280
|
|
|
|
|
|
| 33,350,921
|
| The accompanying notes are an integral part of the financial statements.
| 17
|
|
John Hancock Funds II
Portfolio of Investments —
August 31, 2023 (showing percentage of total net assets)
Capital Appreciation Value Fund
(continued)
|
|
| Shares or
Principal
Amount
|
| Value
|
| CORPORATE BONDS (continued)
|
|
|
|
|
|
| Energy - 0.0%
|
|
|
|
|
|
| Pioneer Natural Resources Company
|
|
|
|
|
|
| 1.125%, 01/15/2026
| $
| 57,000
|
| $
| 51,671
|
| 2.150%, 01/15/2031
|
| 36,000
|
|
| 29,174
|
| 5.100%, 03/29/2026
|
| 205,000
|
|
| 203,406
|
|
|
|
|
|
| 284,251
|
| Financials - 3.0%
|
|
|
|
|
|
| Alliant Holdings Intermediate LLC
|
|
|
|
|
|
| 4.250%, 10/15/2027 (D)
|
| 375,000
|
|
| 340,474
|
| 5.875%, 11/01/2029 (D)
|
| 609,000
|
|
| 533,296
|
| 6.750%, 10/15/2027 to 04/15/2028 (D)
|
| 5,163,000
|
|
| 5,027,069
|
AmWINS Group, Inc.
4.875%, 06/30/2029 (D)
|
| 570,000
|
|
| 511,431
|
BroadStreet Partners, Inc.
5.875%, 04/15/2029 (D)
|
| 795,000
|
|
| 699,623
|
| HUB International, Ltd.
|
|
|
|
|
|
| 5.625%, 12/01/2029 (D)
|
| 908,000
|
|
| 802,953
|
| 7.000%, 05/01/2026 (D)
|
| 7,262,000
|
|
| 7,248,392
|
| 7.250%, 06/15/2030 (D)
|
| 11,507,000
|
|
| 11,712,860
|
Intercontinental Exchange, Inc.
4.000%, 09/15/2027
|
| 167,000
|
|
| 160,081
|
| MSCI, Inc.
|
|
|
|
|
|
| 3.250%, 08/15/2033 (D)
|
| 738,000
|
|
| 593,749
|
| 3.625%, 09/01/2030 to 11/01/2031 (D)
|
| 2,760,000
|
|
| 2,369,738
|
| 3.875%, 02/15/2031 (D)
|
| 1,165,000
|
|
| 1,016,447
|
| 4.000%, 11/15/2029 (D)
|
| 958,000
|
|
| 861,851
|
Ryan Specialty LLC
4.375%, 02/01/2030 (D)
|
| 80,000
|
|
| 71,503
|
USI, Inc.
6.875%, 05/01/2025 (D)
|
| 2,826,000
|
|
| 2,821,422
|
|
|
|
|
|
| 34,770,889
|
| Health care - 1.3%
|
|
|
|
|
|
| Avantor Funding, Inc.
|
|
|
|
|
|
| 3.875%, 11/01/2029 (D)
|
| 2,539,000
|
|
| 2,226,731
|
| 4.625%, 07/15/2028 (D)
|
| 2,874,000
|
|
| 2,667,888
|
Charles River Laboratories
International, Inc.
|
|
|
|
|
|
| 3.750%, 03/15/2029 (D)
|
| 1,232,000
|
|
| 1,087,400
|
| 4.000%, 03/15/2031 (D)
|
| 899,000
|
|
| 776,345
|
| 4.250%, 05/01/2028 (D)
|
| 310,000
|
|
| 284,565
|
| Heartland Dental LLC
|
|
|
|
|
|
| 8.500%, 05/01/2026 (D)
|
| 1,686,000
|
|
| 1,584,840
|
| 10.500%, 04/30/2028 (D)
|
| 1,169,000
|
|
| 1,180,690
|
Hologic, Inc.
3.250%, 02/15/2029 (D)
|
| 609,000
|
|
| 528,968
|
| IQVIA, Inc.
|
|
|
|
|
|
| 5.000%, 05/15/2027 (D)
|
| 350,000
|
|
| 336,906
|
| 5.700%, 05/15/2028 (D)
|
| 1,562,000
|
|
| 1,556,200
|
| 6.500%, 05/15/2030 (D)
|
| 391,000
|
|
| 393,093
|
PRA Health Sciences, Inc.
2.875%, 07/15/2026 (D)
|
| 436,000
|
|
| 397,783
|
Surgery Center Holdings, Inc.
10.000%, 04/15/2027 (D)
|
| 808,000
|
|
| 822,106
|
| Teleflex, Inc.
|
|
|
|
|
|
| 4.250%, 06/01/2028 (D)
|
| 145,000
|
|
| 133,200
|
| 4.625%, 11/15/2027
|
| 952,000
|
|
| 897,755
|
|
|
|
|
|
| 14,874,470
|
| Industrials - 1.6%
|
|
|
|
|
|
| Booz Allen Hamilton, Inc.
|
|
|
|
|
|
| 3.875%, 09/01/2028 (D)
|
| 692,000
|
|
| 628,329
|
| 4.000%, 07/01/2029 (D)
|
| 416,000
|
|
| 373,345
|
| 5.950%, 08/04/2033
|
| 363,000
|
|
| 367,145
|
Delta Air Lines, Inc.
4.750%, 10/20/2028 (D)
|
| 925,000
|
|
| 888,238
|
Capital Appreciation Value Fund
(continued)
|
|
| Shares or
Principal
Amount
|
| Value
|
| CORPORATE BONDS (continued)
|
|
|
|
|
|
| Industrials (continued)
|
|
|
|
|
|
General Electric Company
8.882%, (3 month LIBOR + 3.330%), 09/15/2023 (E)(F)
| $
| 3,123,000
|
| $
| 3,123,000
|
| GFL Environmental, Inc.
|
|
|
|
|
|
| 4.000%, 08/01/2028 (D)
|
| 526,000
|
|
| 469,570
|
| 4.375%, 08/15/2029 (D)
|
| 520,000
|
|
| 459,951
|
| 4.750%, 06/15/2029 (D)
|
| 1,220,000
|
|
| 1,105,218
|
| Howmet Aerospace, Inc.
|
|
|
|
|
|
| 3.000%, 01/15/2029
|
| 550,000
|
|
| 474,342
|
| 5.900%, 02/01/2027
|
| 83,000
|
|
| 82,415
|
Korn Ferry
4.625%, 12/15/2027 (D)
|
| 818,000
|
|
| 760,791
|
Lennox International, Inc.
3.000%, 11/15/2023
|
| 510,000
|
|
| 506,736
|
Mileage Plus Holdings LLC
6.500%, 06/20/2027 (D)
|
| 1,812,906
|
|
| 1,806,580
|
| Sensata Technologies BV
|
|
|
|
|
|
| 4.000%, 04/15/2029 (D)
|
| 1,016,000
|
|
| 892,368
|
| 5.000%, 10/01/2025 (D)
|
| 700,000
|
|
| 682,224
|
| 5.625%, 11/01/2024 (D)
|
| 415,000
|
|
| 411,286
|
| 5.875%, 09/01/2030 (D)
|
| 427,000
|
|
| 403,989
|
| Sensata Technologies, Inc.
|
|
|
|
|
|
| 3.750%, 02/15/2031 (D)
|
| 796,000
|
|
| 666,996
|
| 4.375%, 02/15/2030 (D)
|
| 322,000
|
|
| 285,084
|
TransDigm UK Holdings PLC
6.875%, 05/15/2026
|
| 200,000
|
|
| 203,399
|
| TransDigm, Inc.
|
|
|
|
|
|
| 5.500%, 11/15/2027
|
| 1,107,000
|
|
| 1,050,566
|
| 6.250%, 03/15/2026 (D)
|
| 1,025,000
|
|
| 1,015,231
|
| 6.375%, 06/15/2026
|
| 145,000
|
|
| 144,984
|
United Airlines 2012-1 Class A Pass Through Trust
4.150%, 04/11/2024
|
| 675,391
|
|
| 664,085
|
US Airways 2012-2 Class A Pass Through Trust
4.625%, 06/03/2025
|
| 118,274
|
|
| 113,389
|
US Airways 2013-1 Class A Pass Through Trust
3.950%, 11/15/2025
|
| 267,161
|
|
| 251,183
|
|
|
|
|
|
| 17,830,444
|
| Information technology - 0.2%
|
|
|
|
|
|
Black Knight InfoServ LLC
3.625%, 09/01/2028 (D)
|
| 264,000
|
|
| 242,880
|
| Clarivate Science Holdings Corp.
|
|
|
|
|
|
| 3.875%, 07/01/2028 (D)
|
| 299,000
|
|
| 263,464
|
| 4.875%, 07/01/2029 (D)
|
| 220,000
|
|
| 191,853
|
Crowdstrike Holdings, Inc.
3.000%, 02/15/2029
|
| 150,000
|
|
| 128,970
|
Entegris Escrow Corp.
4.750%, 04/15/2029 (D)
|
| 274,000
|
|
| 254,916
|
| Gartner, Inc.
|
|
|
|
|
|
| 3.625%, 06/15/2029 (D)
|
| 893,000
|
|
| 784,367
|
| 3.750%, 10/01/2030 (D)
|
| 333,000
|
|
| 287,564
|
| 4.500%, 07/01/2028 (D)
|
| 321,000
|
|
| 299,344
|
PTC, Inc.
4.000%, 02/15/2028 (D)
|
| 166,000
|
|
| 152,513
|
|
|
|
|
|
| 2,605,871
|
| Materials - 0.1%
|
|
|
|
|
|
Ball Corp.
6.000%, 06/15/2029
|
| 1,342,000
|
|
| 1,322,918
|
| Real estate - 0.2%
|
|
|
|
|
|
| SBA Communications Corp.
|
|
|
|
|
|
| 3.125%, 02/01/2029
|
| 1,256,000
|
|
| 1,075,374
|
| 3.875%, 02/15/2027
|
| 1,659,000
|
|
| 1,533,863
|
| The accompanying notes are an integral part of the financial statements.
| 18
|
|
John Hancock Funds II
Portfolio of Investments —
August 31, 2023 (showing percentage of total net assets)
Capital Appreciation Value Fund
(continued)
|
|
| Shares or
Principal
Amount
|
| Value
|
| CORPORATE BONDS (continued)
|
|
|
|
|
|
| Real estate (continued)
|
|
|
|
|
|
SBA Tower Trust
6.599%, 01/15/2028 (D)
| $
| 68,000
|
| $
| 69,052
|
|
|
|
|
|
| 2,678,289
|
| TOTAL CORPORATE BONDS (Cost $121,824,178)
|
| $
| 120,329,627
|
| TERM LOANS (G) – 10.7%
|
|
|
|
|
|
| Communication services – 0.2%
|
|
|
|
|
|
| Charter Communications Operating LLC, 2019 Term Loan B1 (1 and 3 month SOFR + 1.750%) 7.115%, 04/30/2025
|
| 1,427,192
|
|
| 1,427,334
|
| Charter Communications Operating LLC, 2019 Term Loan B2 (1 and 3 month SOFR + 1.750%) 7.116%, 02/01/2027
|
| 891,133
|
|
| 886,570
|
|
|
|
|
|
| 2,313,904
|
| Consumer discretionary – 0.6%
|
|
|
|
|
|
| Hilton Worldwide Finance LLC, 2019 Term Loan B2 (1 month SOFR + 1.750%) 7.165%, 06/22/2026
|
| 3,404,518
|
|
| 3,401,148
|
| IRB Holding Corp., 2022 Term Loan B (1 month SOFR + 3.000%) 8.431%, 12/15/2027
|
| 2,792,384
|
|
| 2,775,211
|
| New Red Finance, Inc., Term Loan B4 (1 month LIBOR + 1.750%) 7.196%, 11/19/2026
|
| 751,686
|
|
| 746,469
|
| Woof Holdings, Inc., 1st Lien Term Loan (1 month SOFR + 3.750%) 9.185%, 12/21/2027
|
| 184,712
|
|
| 172,244
|
|
|
|
|
|
| 7,095,072
|
| Consumer staples – 0.2%
|
|
|
|
|
|
| Sunshine Luxembourg VII Sarl, 2021 Term Loan B3 (3 month SOFR + 3.750%) 9.092%, 10/01/2026
|
| 2,685,927
|
|
| 2,687,431
|
| Financials – 3.7%
|
|
|
|
|
|
| Alliant Holdings Intermediate LLC, 2021 Term Loan B4 (1 month LIBOR + 3.500%) 8.935%, 11/06/2027
|
| 4,776,561
|
|
| 4,771,880
|
| Alliant Holdings Intermediate LLC, 2023 Term Loan B5 (1 month SOFR + 3.500%) 8.814%, 11/05/2027
|
| 2,027,924
|
|
| 2,026,301
|
| AssuredPartners, Inc., 2020 Term Loan B (1 month SOFR + 3.500%) 8.946%, 02/12/2027
|
| 173,572
|
|
| 172,921
|
| AssuredPartners, Inc., 2021 Term Loan B (1 month SOFR + 3.500%) 8.946%, 02/12/2027
|
| 233,014
|
|
| 231,751
|
| AssuredPartners, Inc., 2022 Term Loan (1 month SOFR + 3.500%) 8.831%, 02/12/2027
|
| 232,912
|
|
| 232,232
|
| BroadStreet Partners, Inc., 2020 Term Loan B (1 month SOFR + 3.000%) 8.446%, 01/27/2027
|
| 50,254
|
|
| 49,780
|
| BroadStreet Partners, Inc., 2023 Term Loan B3 (1 month SOFR + 4.000%) 9.331%, 01/27/2029
|
| 1,189,536
|
|
| 1,188,299
|
| Howden Group Holdings, Ltd., 2021 Term Loan B (1 month LIBOR + 3.250%) 8.696%, 11/12/2027
|
| 3,858,352
|
|
| 3,830,880
|
| HUB International, Ltd., 2022 Term Loan B (3 month SOFR + 4.000%) 9.365%, 11/10/2029
|
| 1,157,394
|
|
| 1,158,956
|
| HUB International, Ltd., 2023 Term Loan B (3 month SOFR + 4.250%) 9.584%, 06/20/2030
|
| 19,172,000
|
|
| 19,223,956
|
Capital Appreciation Value Fund
(continued)
|
|
| Shares or
Principal
Amount
|
| Value
|
| TERM LOANS (G)(continued)
|
|
|
|
|
|
| Financials (continued)
|
|
|
|
|
|
| Ryan Specialty LLC, Term Loan (1 month SOFR + 3.000%) 8.331%, 09/01/2027
| $
| 1,002,701
|
|
| 1,001,869
|
| USI, Inc., 2019 Incremental Term Loan B (3 month LIBOR + 3.250%) 8.788%, 12/02/2026
|
| 5,024,310
|
|
| 5,024,310
|
| USI, Inc., 2022 Incremental Term Loan (3 month SOFR + 3.750%) 8.992%, 11/22/2029
|
| 4,298,044
|
|
| 4,299,119
|
|
|
|
|
|
| 43,212,254
|
| Health care – 1.8%
|
|
|
|
|
|
| ADMI Corp., 2018 Term Loan B (1 month SOFR + 3.000%) 8.446%, 04/30/2025
|
| 894,946
|
|
| 858,450
|
| ADMI Corp., 2021 Incremental Term Loan B3 (1 month SOFR + 3.750%) 9.196%, 12/23/2027
|
| 3,178,161
|
|
| 2,922,573
|
| ADMI Corp., 2021 Term Loan B2 (1 month SOFR + 3.375%) 8.821%, 12/23/2027
|
| 1,913,668
|
|
| 1,741,840
|
| athenahealth, Inc., 2022 Term Loan B (1 month SOFR + 3.500%) 8.820%, 02/15/2029
|
| 4,368,729
|
|
| 4,312,285
|
| Avantor Funding, Inc., 2021 Term Loan B5 (1 month SOFR + 2.250%) 7.681%, 11/08/2027
|
| 655,948
|
|
| 656,059
|
| Heartland Dental LLC, 2023 Term Loan B (1 month SOFR + 5.000%) 10.314%, 04/28/2028
|
| 4,108,094
|
|
| 4,037,394
|
| Loire Finco Luxembourg Sarl, 2021 USD Term Loan B2 (1 month SOFR + 3.750%) 9.065%, 04/21/2027
|
| 555,690
|
|
| 541,798
|
| Loire Finco Luxembourg Sarl, USD Term Loan B (1 month SOFR + 3.250%) 8.565%, 04/21/2027
|
| 3,132,425
|
|
| 3,050,199
|
| PetVet Care Centers LLC, 2018 1st Lien Term Loan (1 month SOFR + 2.750%) 8.181%, 02/14/2025
|
| 349,400
|
|
| 345,033
|
| PetVet Care Centers LLC, 2018 2nd Lien Term Loan (1 month SOFR + 6.250%) 11.681%, 02/13/2026
|
| 25,000
|
|
| 24,400
|
| PetVet Care Centers LLC, 2018 Incremental Term Loan (1 month SOFR + 3.250%) 8.570%, 02/14/2025
|
| 1,081,086
|
|
| 1,070,611
|
| PetVet Care Centers LLC, 2021 Term Loan B3 (1 month SOFR + 3.500%) 8.931%, 02/14/2025
|
| 1,285,635
|
|
| 1,275,196
|
|
|
|
|
|
| 20,835,838
|
| Industrials – 1.2%
|
|
|
|
|
|
| Filtration Group Corp., 2021 Incremental Term Loan (1 month SOFR + 3.500%) 8.946%, 10/21/2028
|
| 869,716
|
|
| 864,645
|
| Filtration Group Corp., 2023 EUR Term Loan TBD 10/21/2028 (H)
| EUR
| 2,283,423
|
|
| 2,463,651
|
| Filtration Group Corp., 2023 USD Term Loan (1 month SOFR + 4.250%) 9.696%, 10/21/2028
| $
| 3,002,070
|
|
| 3,008,944
|
| Mileage Plus Holdings LLC, 2020 Term Loan B (3 month LIBOR + 5.250%) 10.764%, 06/21/2027
|
| 4,769,900
|
|
| 4,968,804
|
| SkyMiles IP, Ltd., 2020 Skymiles Term Loan B (3 month SOFR + 3.750%) 9.076%, 10/20/2027
|
| 1,659,700
|
|
| 1,725,889
|
| The accompanying notes are an integral part of the financial statements.
| 19
|
|
John Hancock Funds II
Portfolio of Investments —
August 31, 2023 (showing percentage of total net assets)
Capital Appreciation Value Fund
(continued)
|
|
| Shares or
Principal
Amount
|
| Value
|
| TERM LOANS (G)(continued)
|
|
|
|
|
|
| Industrials (continued)
|
|
|
|
|
|
| TransUnion LLC, 2019 Term Loan B5 (1 month SOFR + 1.750%) 7.181%, 11/16/2026
| $
| 797,237
|
|
| 795,747
|
|
|
|
|
|
| 13,827,680
|
| Information technology – 2.8%
|
|
|
|
|
|
| Applied Systems, Inc., 2021 2nd Lien Term Loan (3 month SOFR + 6.750%) 11.992%, 09/17/2027
|
| 1,242,700
|
|
| 1,243,321
|
| Applied Systems, Inc., 2022 Extended 1st Lien Term Loan (3 month SOFR + 4.500%) 9.742%, 09/18/2026
|
| 6,753,275
|
|
| 6,775,290
|
| Azalea TopCo, Inc., 2021 Term Loan B (1 and 3 month SOFR + 3.750%) 9.196%, 07/24/2026
|
| 1,541,600
|
|
| 1,501,781
|
| Azalea TopCo, Inc., 2022 Incremental Term Loan (3 month SOFR + 3.750%) 9.196%, 07/24/2026
|
| 721,379
|
|
| 703,345
|
| Azalea TopCo, Inc., Term Loan (1 month SOFR + 3.500%) 8.820%, 07/24/2026
|
| 4,073,981
|
|
| 3,976,205
|
| Epicor Software Corp., 2023 Incremental Term Loan TBD 07/30/2027 (H)
|
| 143,715
|
|
| 143,806
|
| Quartz Acquireco LLC, Term Loan B (1 month SOFR + 3.500%) 8.820%, 06/28/2030
|
| 239,886
|
|
| 239,586
|
| RealPage, Inc., 1st Lien Term Loan (1 month SOFR + 3.000%) 8.446%, 04/24/2028
|
| 4,209,481
|
|
| 4,158,294
|
| RealPage, Inc., 2nd Lien Term Loan (1 month SOFR + 6.500%) 11.946%, 04/23/2029
|
| 225,000
|
|
| 225,187
|
| Sophia LP, 2021 Term Loan B (3 month LIBOR + 3.500%) 9.038%, 10/07/2027
|
| 1,872,186
|
|
| 1,867,898
|
| Sophia LP, 2022 Incremental Term Loan B (1 month SOFR + 4.250%) 9.581%, 10/07/2027
|
| 561,762
|
|
| 558,077
|
| Storable, Inc., Term Loan B (1 and 3 month SOFR + 3.500%) 8.833%, 04/17/2028
|
| 812,594
|
|
| 802,607
|
| UKG, Inc., 2021 Term Loan (3 month SOFR + 3.250%) 8.618%, 05/04/2026
|
| 9,903,787
|
|
| 9,892,398
|
|
|
|
|
|
| 32,087,795
|
| Real estate – 0.2%
|
|
|
|
|
|
| SBA Senior Finance II LLC, 2018 Term Loan B (1 month SOFR + 1.750%) 7.190%, 04/11/2025
|
| 1,702,960
|
|
| 1,703,063
|
| TOTAL TERM LOANS (Cost $123,604,178)
|
| $
| 123,763,037
|
Capital Appreciation Value Fund
(continued)
|
|
| Shares or
Principal
Amount
|
| Value
|
| SHORT-TERM INVESTMENTS – 2.6%
|
|
|
|
| Short-term funds – 2.6%
|
|
|
|
|
|
| John Hancock Collateral Trust, 5.4789% (I)(J)
|
| 201,946
|
| $
| 2,018,771
|
| State Street Institutional U.S. Government Money Market Fund, Premier Class, 5.2681% (I)
|
| 9,081,282
|
|
| 9,081,282
|
| T. Rowe Price Government Reserve Fund, 5.3678% (I)
|
| 19,070,825
|
|
| 19,070,825
|
| TOTAL SHORT-TERM INVESTMENTS (Cost $30,170,092)
|
| $
| 30,170,878
|
Total Investments (Capital Appreciation Value Fund)
(Cost $1,039,269,297) – 100.2%
|
| $
| 1,162,438,829
|
| Other assets and liabilities, net – (0.2%)
|
|
| (2,007,754)
|
| TOTAL NET ASSETS – 100.0%
|
| $
| 1,160,431,075
|
| Currency Abbreviations
|
| EUR
| Euro
|
| Security Abbreviations and Legend
|
| CMT
| Constant Maturity Treasury
|
| LIBOR
| London Interbank Offered Rate
|
| SOFR
| Secured Overnight Financing Rate
|
| (A)
| All or a portion of this security is segregated at the custodian as collateral for certain derivatives.
|
| (B)
| Non-income producing security.
|
| (C)
| All or a portion of this security is on loan as of 8-31-23.
|
| (D)
| These securities are exempt from registration under Rule 144A of the Securities Act of 1933. Such securities may be resold, normally to qualified institutional buyers, in transactions
exempt from registration.
|
| (E)
| Perpetual bonds have no stated maturity date. Date shown as maturity date is next call date.
|
| (F)
| Variable rate obligation. The coupon rate shown represents the rate at period end.
|
| (G)
| Term loans are variable rate obligations. The rate shown represents the rate at period end.
|
| (H)
| This position represents an unsettled loan commitment at period end. Certain details associated with this purchase are not known prior to the settlement date, including coupon rate,
which is disclosed as TBD (To Be Determined).
|
| (I)
| The rate shown is the annualized seven-day yield as of 8-31-23.
|
| (J)
| Investment is an affiliate of the fund, the advisor and/or subadvisor. This security represents the investment of cash collateral received for securities lending.
|
DERIVATIVES
WRITTEN
OPTIONS
| Options on securities
|
Counterparty (OTC)/
Exchange-
traded
| Name of issuer
| Currency
| Exercise
price
| Expiration
date
| Number of
contracts
| Notional
amount
| Premium
| Value
|
| Calls
|
|
|
|
|
|
|
|
| JPM
| AbbVie, Inc.
| USD
| 145.00
| Jan 2024
| 8
| 800
| $4,482
| $(6,878)
|
| JPM
| AbbVie, Inc.
| USD
| 150.00
| Jan 2024
| 8
| 800
| 3,053
| (4,680)
|
| CITI
| AbbVie, Inc.
| USD
| 155.00
| Jan 2024
| 52
| 5,200
| 54,724
| (19,482)
|
| CITI
| AbbVie, Inc.
| USD
| 155.00
| Jan 2024
| 51
| 5,100
| 49,062
| (19,107)
|
| CITI
| AbbVie, Inc.
| USD
| 160.00
| Jan 2024
| 52
| 5,200
| 43,770
| (11,745)
|
| CITI
| AbbVie, Inc.
| USD
| 160.00
| Jan 2024
| 52
| 5,200
| 39,624
| (11,745)
|
| CITI
| AbbVie, Inc.
| USD
| 170.00
| Jan 2024
| 130
| 13,000
| 73,938
| (9,357)
|
| The accompanying notes are an integral part of the financial statements.
| 20
|
|
John Hancock Funds II
Portfolio of Investments —
August 31, 2023 (showing percentage of total net assets)
Capital Appreciation Value Fund
(continued)
| Options on securities (continued)
|
Counterparty (OTC)/
Exchange-
traded
| Name of issuer
| Currency
| Exercise
price
| Expiration
date
| Number of
contracts
| Notional
amount
| Premium
| Value
|
| Calls (continued)
|
|
|
|
|
|
|
|
| JPM
| AbbVie, Inc.
| USD
| 175.00
| Jan 2024
| 65
| 6,500
| $32,937
| $(2,536)
|
| JPM
| AbbVie, Inc.
| USD
| 180.00
| Jan 2024
| 33
| 3,300
| 32,844
| (692)
|
| JPM
| AbbVie, Inc.
| USD
| 180.00
| Jan 2024
| 64
| 6,400
| 30,708
| (1,341)
|
| JPM
| AbbVie, Inc.
| USD
| 185.00
| Jan 2024
| 33
| 3,300
| 27,409
| (382)
|
| JPM
| AbbVie, Inc.
| USD
| 195.00
| Jan 2024
| 33
| 3,300
| 18,505
| (121)
|
| JPM
| AbbVie, Inc.
| USD
| 200.00
| Jan 2024
| 33
| 3,300
| 15,049
| (73)
|
| WFB
| Alphabet, Inc., Class A
| USD
| 120.00
| Jan 2024
| 306
| 30,600
| 241,458
| (662,919)
|
| CITI
| Alphabet, Inc., Class A
| USD
| 142.00
| Jan 2024
| 155
| 15,500
| 99,694
| (118,136)
|
| WFB
| Amazon.com, Inc.
| USD
| 120.00
| Jan 2024
| 98
| 9,800
| 72,961
| (236,441)
|
| WFB
| Amazon.com, Inc.
| USD
| 132.50
| Jan 2024
| 232
| 23,200
| 222,609
| (356,472)
|
| WFB
| Amazon.com, Inc.
| USD
| 135.00
| Jan 2024
| 167
| 16,700
| 156,053
| (231,507)
|
| UBS
| Analog Devices, Inc.
| USD
| 200.00
| Jan 2024
| 30
| 3,000
| 23,992
| (16,232)
|
| UBS
| Analog Devices, Inc.
| USD
| 200.00
| Jan 2024
| 8
| 800
| 9,234
| (4,328)
|
| UBS
| Analog Devices, Inc.
| USD
| 210.00
| Jan 2024
| 8
| 800
| 6,227
| (2,455)
|
| UBS
| Analog Devices, Inc.
| USD
| 210.00
| Jun 2024
| 8
| 800
| 11,085
| (7,105)
|
| UBS
| Analog Devices, Inc.
| USD
| 220.00
| Jun 2024
| 8
| 800
| 8,302
| (5,062)
|
| JPM
| Apple, Inc.
| USD
| 195.00
| Jan 2024
| 78
| 7,800
| 56,187
| (64,910)
|
| JPM
| Apple, Inc.
| USD
| 195.00
| Jan 2024
| 16
| 1,600
| 15,760
| (13,315)
|
| JPM
| Apple, Inc.
| USD
| 200.00
| Jan 2024
| 78
| 7,800
| 42,557
| (48,124)
|
| JPM
| Apple, Inc.
| USD
| 205.00
| Jan 2024
| 16
| 1,600
| 9,255
| (7,086)
|
| GSI
| Becton, Dickinson and Company
| USD
| 270.00
| Jan 2024
| 50
| 5,000
| 74,350
| (103,472)
|
| GSI
| Becton, Dickinson and Company
| USD
| 280.00
| Jan 2024
| 50
| 5,000
| 55,850
| (71,353)
|
| GSI
| Becton, Dickinson and Company
| USD
| 290.00
| Jan 2024
| 17
| 1,700
| 25,031
| (15,718)
|
| GSI
| Becton, Dickinson and Company
| USD
| 290.00
| Jan 2024
| 17
| 1,700
| 10,988
| (15,718)
|
| GSI
| Becton, Dickinson and Company
| USD
| 300.00
| Jan 2024
| 17
| 1,700
| 19,946
| (9,341)
|
| GSI
| Becton, Dickinson and Company
| USD
| 300.00
| Jan 2024
| 17
| 1,700
| 7,853
| (9,341)
|
| WFB
| CME Group, Inc.
| USD
| 190.00
| Jan 2024
| 12
| 1,200
| 15,706
| (22,887)
|
| WFB
| CME Group, Inc.
| USD
| 200.00
| Jan 2024
| 12
| 1,200
| 10,830
| (14,666)
|
| WFB
| CME Group, Inc.
| USD
| 210.00
| Jan 2024
| 12
| 1,200
| 6,675
| (8,347)
|
| JPM
| Danaher Corp.
| USD
| 290.00
| Jan 2024
| 1
| 100
| 2,163
| (699)
|
| JPM
| Danaher Corp.
| USD
| 290.00
| Jan 2024
| 16
| 1,600
| 41,739
| (11,179)
|
| JPM
| Danaher Corp.
| USD
| 290.00
| Jan 2024
| 66
| 6,600
| 107,349
| (46,111)
|
| JPM
| Danaher Corp.
| USD
| 300.00
| Jan 2024
| 1
| 100
| 1,811
| (443)
|
| JPM
| Danaher Corp.
| USD
| 300.00
| Jan 2024
| 16
| 1,600
| 35,321
| (7,091)
|
| JPM
| Danaher Corp.
| USD
| 310.00
| Jan 2024
| 1
| 100
| 1,510
| (268)
|
| JPM
| Danaher Corp.
| USD
| 310.00
| Jan 2024
| 16
| 1,600
| 29,543
| (4,291)
|
| JPM
| Danaher Corp.
| USD
| 320.00
| Jan 2024
| 1
| 100
| 1,218
| (155)
|
| JPM
| Danaher Corp.
| USD
| 320.00
| Jan 2024
| 16
| 1,600
| 24,885
| (2,483)
|
| CITI
| Equifax, Inc.
| USD
| 220.00
| Dec 2023
| 11
| 1,100
| 27,370
| (7,184)
|
| CITI
| Equifax, Inc.
| USD
| 220.00
| Dec 2023
| 8
| 800
| 18,869
| (5,225)
|
| CITI
| Equifax, Inc.
| USD
| 220.00
| Dec 2023
| 7
| 700
| 17,588
| (4,572)
|
| CITI
| Equifax, Inc.
| USD
| 220.00
| Dec 2023
| 2
| 200
| 6,348
| (1,306)
|
| CITI
| Equifax, Inc.
| USD
| 220.00
| Dec 2023
| 1
| 100
| 3,276
| (653)
|
| CITI
| Equifax, Inc.
| USD
| 220.00
| Dec 2023
| 10
| 1,000
| 14,994
| (6,531)
|
| CITI
| Equifax, Inc.
| USD
| 220.00
| Dec 2023
| 15
| 1,500
| 23,579
| (9,797)
|
| CITI
| Equifax, Inc.
| USD
| 220.00
| Dec 2023
| 25
| 2,500
| 34,129
| (16,328)
|
| CITI
| Equifax, Inc.
| USD
| 240.00
| Dec 2023
| 11
| 1,100
| 18,732
| (2,146)
|
| CITI
| Equifax, Inc.
| USD
| 240.00
| Dec 2023
| 8
| 800
| 12,813
| (1,561)
|
| CITI
| Equifax, Inc.
| USD
| 240.00
| Dec 2023
| 7
| 700
| 12,054
| (1,366)
|
| CITI
| Equifax, Inc.
| USD
| 240.00
| Dec 2023
| 2
| 200
| 4,470
| (390)
|
| CITI
| Equifax, Inc.
| USD
| 240.00
| Dec 2023
| 1
| 100
| 2,289
| (195)
|
| CITI
| Equifax, Inc.
| USD
| 240.00
| Dec 2023
| 65
| 6,500
| 110,367
| (12,680)
|
| CITI
| Equifax, Inc.
| USD
| 230.00
| Jan 2024
| 7
| 700
| 9,119
| (3,733)
|
| CITI
| Equifax, Inc.
| USD
| 240.00
| Jan 2024
| 8
| 800
| 7,581
| (2,512)
|
| JPM
| Exelon Corp.
| USD
| 45.00
| Jan 2024
| 112
| 11,200
| 24,864
| (4,090)
|
| JPM
| Exelon Corp.
| USD
| 45.00
| Jan 2024
| 219
| 21,900
| 40,515
| (7,997)
|
| JPM
| Exelon Corp.
| USD
| 45.00
| Jan 2024
| 122
| 12,200
| 20,374
| (4,455)
|
| JPM
| Exelon Corp.
| USD
| 45.00
| Jan 2024
| 16
| 1,600
| 1,664
| (584)
|
| JPM
| Exelon Corp.
| USD
| 47.00
| Jan 2024
| 112
| 11,200
| 17,024
| (1,483)
|
| JPM
| Exelon Corp.
| USD
| 50.00
| Jan 2024
| 128
| 12,800
| 24,915
| (289)
|
| JPM
| Exelon Corp.
| USD
| 47.00
| Jun 2024
| 16
| 1,600
| 2,144
| (1,214)
|
| CITI
| Fortive Corp.
| USD
| 75.00
| Dec 2023
| 4
| 400
| 1,521
| (2,653)
|
| CITI
| Fortive Corp.
| USD
| 75.00
| Dec 2023
| 12
| 1,200
| 4,744
| (7,960)
|
| CITI
| Fortive Corp.
| USD
| 80.00
| Dec 2023
| 4
| 400
| 718
| (1,376)
|
| The accompanying notes are an integral part of the financial statements.
| 21
|
|
John Hancock Funds II
Portfolio of Investments —
August 31, 2023 (showing percentage of total net assets)
Capital Appreciation Value Fund
(continued)
| Options on securities (continued)
|
Counterparty (OTC)/
Exchange-
traded
| Name of issuer
| Currency
| Exercise
price
| Expiration
date
| Number of
contracts
| Notional
amount
| Premium
| Value
|
| Calls (continued)
|
|
|
|
|
|
|
|
| CITI
| Fortive Corp.
| USD
| 80.00
| Dec 2023
| 12
| 1,200
| $2,273
| $(4,129)
|
| WFB
| GE HealthCare Technologies, Inc.
| USD
| 85.00
| Jan 2024
| 31
| 3,100
| 14,681
| (3,125)
|
| WFB
| GE HealthCare Technologies, Inc.
| USD
| 90.00
| Jan 2024
| 62
| 6,200
| 20,237
| (2,853)
|
| WFB
| GE HealthCare Technologies, Inc.
| USD
| 90.00
| Jan 2024
| 31
| 3,100
| 8,899
| (1,426)
|
| WFB
| General Electric Company
| USD
| 95.00
| Jan 2024
| 33
| 3,300
| 18,032
| (75,124)
|
| WFB
| General Electric Company
| USD
| 95.00
| Jan 2024
| 79
| 7,900
| 39,734
| (179,842)
|
| WFB
| General Electric Company
| USD
| 110.00
| Jan 2024
| 78
| 7,800
| 63,447
| (86,870)
|
| WFB
| General Electric Company
| USD
| 110.00
| Jan 2024
| 53
| 5,300
| 40,252
| (59,027)
|
| WFB
| General Electric Company
| USD
| 110.00
| Jan 2024
| 51
| 5,100
| 40,391
| (56,800)
|
| WFB
| General Electric Company
| USD
| 115.00
| Jan 2024
| 78
| 7,800
| 47,823
| (63,461)
|
| WFB
| General Electric Company
| USD
| 115.00
| Jan 2024
| 53
| 5,300
| 28,821
| (43,121)
|
| WFB
| General Electric Company
| USD
| 115.00
| Jan 2024
| 51
| 5,100
| 29,513
| (41,494)
|
| WFB
| Hilton Worldwide Holdings, Inc.
| USD
| 140.00
| Jan 2024
| 9
| 900
| 12,112
| (14,234)
|
| WFB
| Hilton Worldwide Holdings, Inc.
| USD
| 140.00
| Jan 2024
| 8
| 800
| 14,596
| (12,653)
|
| WFB
| Hilton Worldwide Holdings, Inc.
| USD
| 155.00
| Jan 2024
| 9
| 900
| 7,693
| (6,461)
|
| WFB
| Hilton Worldwide Holdings, Inc.
| USD
| 155.00
| Jan 2024
| 8
| 800
| 8,931
| (5,743)
|
| WFB
| Hilton Worldwide Holdings, Inc.
| USD
| 155.00
| Jan 2024
| 31
| 3,100
| 22,037
| (22,255)
|
| WFB
| Hilton Worldwide Holdings, Inc.
| USD
| 160.00
| Jan 2024
| 31
| 3,100
| 16,763
| (16,517)
|
| GSI
| Ingersoll Rand, Inc.
| USD
| 60.00
| Dec 2023
| 34
| 3,400
| 12,368
| (38,656)
|
| GSI
| Ingersoll Rand, Inc.
| USD
| 60.00
| Dec 2023
| 33
| 3,300
| 14,732
| (37,519)
|
| GSI
| Ingersoll Rand, Inc.
| USD
| 75.00
| Dec 2023
| 78
| 7,800
| 10,136
| (13,334)
|
| CITI
| Intercontinental Exchange, Inc.
| USD
| 115.00
| Jan 2024
| 80
| 8,000
| 47,190
| (65,649)
|
| CITI
| Intercontinental Exchange, Inc.
| USD
| 115.00
| Jan 2024
| 15
| 1,500
| 5,226
| (12,309)
|
| UBS
| Intuit, Inc.
| USD
| 480.00
| Jan 2024
| 16
| 1,600
| 40,386
| (134,129)
|
| CITI
| Keurig Dr. Pepper, Inc.
| USD
| 37.00
| Jan 2024
| 87
| 8,700
| 15,399
| (3,077)
|
| CITI
| Keurig Dr. Pepper, Inc.
| USD
| 40.00
| Jan 2024
| 88
| 8,800
| 6,952
| (462)
|
| UBS
| KKR & Company, Inc.
| USD
| 55.00
| Jan 2024
| 81
| 8,100
| 44,473
| (83,634)
|
| UBS
| KKR & Company, Inc.
| USD
| 55.00
| Jan 2024
| 80
| 8,000
| 41,413
| (82,601)
|
| UBS
| KKR & Company, Inc.
| USD
| 65.00
| Jan 2024
| 16
| 1,600
| 4,697
| (6,041)
|
| UBS
| KKR & Company, Inc.
| USD
| 65.00
| Jun 2024
| 16
| 1,600
| 8,136
| (10,286)
|
| WFB
| Linde PLC
| USD
| 390.00
| Jan 2024
| 17
| 1,700
| 28,852
| (33,304)
|
| WFB
| Linde PLC
| USD
| 390.00
| Jan 2024
| 16
| 1,600
| 29,376
| (31,345)
|
| WFB
| Linde PLC
| USD
| 395.00
| Jan 2024
| 8
| 800
| 9,640
| (13,511)
|
| WFB
| Linde PLC
| USD
| 410.00
| Jan 2024
| 8
| 800
| 6,234
| (8,158)
|
| GSI
| Marsh & McLennan Companies, Inc.
| USD
| 190.00
| Jan 2024
| 64
| 6,400
| 33,236
| (86,072)
|
| GSI
| Marsh & McLennan Companies, Inc.
| USD
| 190.00
| Jan 2024
| 8
| 800
| 3,956
| (10,759)
|
| GSI
| Marsh & McLennan Companies, Inc.
| USD
| 200.00
| Jan 2024
| 8
| 800
| 2,365
| (5,802)
|
| GSI
| Mastercard, Inc., Class A
| USD
| 380.00
| Jan 2024
| 16
| 1,600
| 58,784
| (75,925)
|
| GSI
| Mastercard, Inc., Class A
| USD
| 380.00
| Jan 2024
| 17
| 1,700
| 81,302
| (80,671)
|
| GSI
| Mastercard, Inc., Class A
| USD
| 400.00
| Jan 2024
| 16
| 1,600
| 45,521
| (52,056)
|
| GSI
| Mastercard, Inc., Class A
| USD
| 400.00
| Jan 2024
| 17
| 1,700
| 64,278
| (55,310)
|
| GSI
| Mastercard, Inc., Class A
| USD
| 400.00
| Jan 2024
| 49
| 4,900
| 90,951
| (159,422)
|
| GSI
| Mastercard, Inc., Class A
| USD
| 400.00
| Jan 2024
| 8
| 800
| 19,352
| (26,028)
|
| GSI
| Mastercard, Inc., Class A
| USD
| 405.00
| Jan 2024
| 8
| 800
| 14,979
| (23,349)
|
| GSI
| Mastercard, Inc., Class A
| USD
| 410.00
| Jan 2024
| 48
| 4,800
| 89,196
| (124,875)
|
| GSI
| Mastercard, Inc., Class A
| USD
| 420.00
| Jan 2024
| 16
| 1,600
| 35,115
| (32,397)
|
| GSI
| Mastercard, Inc., Class A
| USD
| 420.00
| Jan 2024
| 17
| 1,700
| 48,913
| (34,422)
|
| GSI
| Mastercard, Inc., Class A
| USD
| 420.00
| Jan 2024
| 8
| 800
| 11,621
| (16,198)
|
| GSI
| Mastercard, Inc., Class A
| USD
| 425.00
| Jan 2024
| 8
| 800
| 9,198
| (14,136)
|
| GSI
| Mastercard, Inc., Class A
| USD
| 430.00
| Jan 2024
| 16
| 1,600
| 30,861
| (24,488)
|
| GSI
| Mastercard, Inc., Class A
| USD
| 430.00
| Jan 2024
| 17
| 1,700
| 42,549
| (26,019)
|
| BARC
| Meta Platforms, Inc., Class A
| USD
| 290.00
| Jan 2024
| 78
| 7,800
| 178,843
| (261,484)
|
| UBS
| Microsoft Corp.
| USD
| 360.00
| Jan 2024
| 31
| 3,100
| 61,111
| (29,801)
|
| UBS
| Microsoft Corp.
| USD
| 365.00
| Jan 2024
| 11
| 1,100
| 23,908
| (9,037)
|
| UBS
| Microsoft Corp.
| USD
| 375.00
| Jan 2024
| 31
| 3,100
| 44,014
| (18,438)
|
| UBS
| Microsoft Corp.
| USD
| 385.00
| Jan 2024
| 11
| 1,100
| 15,491
| (4,704)
|
| WFB
| NXP Semiconductors NV
| USD
| 190.00
| Jan 2024
| 64
| 6,400
| 93,072
| (169,875)
|
| WFB
| NXP Semiconductors NV
| USD
| 195.00
| Jan 2024
| 2
| 200
| 2,548
| (4,663)
|
| WFB
| NXP Semiconductors NV
| USD
| 195.00
| Jan 2024
| 23
| 2,300
| 32,606
| (53,626)
|
| WFB
| NXP Semiconductors NV
| USD
| 195.00
| Jan 2024
| 27
| 2,700
| 40,244
| (62,952)
|
| WFB
| NXP Semiconductors NV
| USD
| 195.00
| Jan 2024
| 50
| 5,000
| 84,222
| (116,578)
|
| WFB
| NXP Semiconductors NV
| USD
| 200.00
| Jan 2024
| 65
| 6,500
| 104,703
| (132,188)
|
| WFB
| NXP Semiconductors NV
| USD
| 210.00
| Jan 2024
| 16
| 1,600
| 24,648
| (24,250)
|
| WFB
| NXP Semiconductors NV
| USD
| 220.00
| Jan 2024
| 16
| 1,600
| 18,703
| (17,555)
|
| The accompanying notes are an integral part of the financial statements.
| 22
|
|
John Hancock Funds II
Portfolio of Investments —
August 31, 2023 (showing percentage of total net assets)
Capital Appreciation Value Fund
(continued)
| Options on securities (continued)
|
Counterparty (OTC)/
Exchange-
traded
| Name of issuer
| Currency
| Exercise
price
| Expiration
date
| Number of
contracts
| Notional
amount
| Premium
| Value
|
| Calls (continued)
|
|
|
|
|
|
|
|
| WFB
| NXP Semiconductors NV
| USD
| 220.00
| Jun 2024
| 11
| 1,100
| $20,519
| $(23,089)
|
| CITI
| Revvity, Inc.
| USD
| 155.00
| Sep 2023
| 9
| 900
| 7,369
| —
|
| CITI
| Revvity, Inc.
| USD
| 155.00
| Sep 2023
| 33
| 3,300
| 22,758
| —
|
| CITI
| Revvity, Inc.
| USD
| 165.00
| Sep 2023
| 9
| 900
| 4,373
| —
|
| CITI
| Revvity, Inc.
| USD
| 165.00
| Sep 2023
| 33
| 3,300
| 12,894
| —
|
| CITI
| Revvity, Inc.
| USD
| 170.00
| Sep 2023
| 9
| 900
| 3,371
| —
|
| CITI
| Revvity, Inc.
| USD
| 170.00
| Sep 2023
| 33
| 3,300
| 9,415
| —
|
| CITI
| Revvity, Inc.
| USD
| 175.00
| Sep 2023
| 9
| 900
| 2,552
| —
|
| CITI
| Revvity, Inc.
| USD
| 175.00
| Sep 2023
| 33
| 3,300
| 7,091
| —
|
| CITI
| Roper Technologies, Inc.
| USD
| 510.00
| Feb 2024
| 8
| 800
| 9,317
| (19,596)
|
| BOA
| S&P Global, Inc.
| USD
| 400.00
| Jan 2024
| 3
| 300
| 6,057
| (5,472)
|
| BOA
| S&P Global, Inc.
| USD
| 400.00
| Jan 2024
| 5
| 500
| 10,909
| (9,121)
|
| BOA
| S&P Global, Inc.
| USD
| 400.00
| Jan 2024
| 3
| 300
| 8,399
| (5,472)
|
| UBS
| S&P Global, Inc.
| USD
| 400.00
| Jan 2024
| 8
| 800
| 12,437
| (14,593)
|
| BOA
| S&P Global, Inc.
| USD
| 410.00
| Jan 2024
| 6
| 600
| 14,278
| (8,122)
|
| UBS
| S&P Global, Inc.
| USD
| 410.00
| Jan 2024
| 8
| 800
| 9,785
| (10,830)
|
| BOA
| S&P Global, Inc.
| USD
| 420.00
| Jan 2024
| 3
| 300
| 4,421
| (2,906)
|
| BOA
| S&P Global, Inc.
| USD
| 420.00
| Jan 2024
| 5
| 500
| 8,114
| (4,844)
|
| BOA
| S&P Global, Inc.
| USD
| 420.00
| Jan 2024
| 3
| 300
| 6,058
| (2,906)
|
| BOA
| S&P Global, Inc.
| USD
| 430.00
| Jan 2024
| 6
| 600
| 10,444
| (3,998)
|
| BOA
| S&P Global, Inc.
| USD
| 450.00
| Jan 2024
| 6
| 600
| 7,526
| (1,659)
|
| BOA
| S&P Global, Inc.
| USD
| 470.00
| Jan 2024
| 6
| 600
| 5,134
| (569)
|
| GSI
| Salesforce, Inc.
| USD
| 230.00
| Jan 2024
| 15
| 1,500
| 29,282
| (20,760)
|
| GSI
| Salesforce, Inc.
| USD
| 230.00
| Jan 2024
| 8
| 800
| 12,086
| (11,072)
|
| GSI
| Salesforce, Inc.
| USD
| 240.00
| Jan 2024
| 15
| 1,500
| 23,153
| (14,767)
|
| GSI
| Salesforce, Inc.
| USD
| 240.00
| Jan 2024
| 8
| 800
| 9,255
| (7,876)
|
| GSI
| Salesforce, Inc.
| USD
| 230.00
| Jun 2024
| 8
| 800
| 19,198
| (20,237)
|
| GSI
| Salesforce, Inc.
| USD
| 240.00
| Jun 2024
| 8
| 800
| 15,965
| (16,668)
|
| GSI
| Starbucks Corp.
| USD
| 100.00
| Jan 2024
| 96
| 9,600
| 103,567
| (47,403)
|
| GSI
| Starbucks Corp.
| USD
| 105.00
| Jan 2024
| 96
| 9,600
| 85,251
| (28,032)
|
| GSI
| Starbucks Corp.
| USD
| 115.00
| Jan 2024
| 60
| 6,000
| 15,538
| (4,891)
|
| WFB
| Stryker Corp.
| USD
| 270.00
| Jan 2024
| 10
| 1,000
| 24,023
| (25,777)
|
| WFB
| Stryker Corp.
| USD
| 270.00
| Jan 2024
| 6
| 600
| 15,775
| (15,466)
|
| WFB
| Stryker Corp.
| USD
| 270.00
| Jan 2024
| 2
| 200
| 5,034
| (5,155)
|
| WFB
| Stryker Corp.
| USD
| 270.00
| Jan 2024
| 15
| 1,500
| 47,375
| (38,665)
|
| WFB
| Stryker Corp.
| USD
| 280.00
| Jan 2024
| 10
| 1,000
| 19,518
| (19,071)
|
| WFB
| Stryker Corp.
| USD
| 280.00
| Jan 2024
| 6
| 600
| 13,346
| (11,443)
|
| WFB
| Stryker Corp.
| USD
| 280.00
| Jan 2024
| 2
| 200
| 4,145
| (3,814)
|
| WFB
| Stryker Corp.
| USD
| 280.00
| Jan 2024
| 15
| 1,500
| 38,359
| (28,607)
|
| WFB
| Stryker Corp.
| USD
| 290.00
| Jan 2024
| 10
| 1,000
| 15,613
| (13,387)
|
| WFB
| Stryker Corp.
| USD
| 290.00
| Jan 2024
| 6
| 600
| 10,968
| (8,032)
|
| WFB
| Stryker Corp.
| USD
| 290.00
| Jan 2024
| 2
| 200
| 3,336
| (2,677)
|
| WFB
| Stryker Corp.
| USD
| 290.00
| Jan 2024
| 15
| 1,500
| 29,343
| (20,080)
|
| WFB
| Stryker Corp.
| USD
| 300.00
| Jan 2024
| 10
| 1,000
| 12,808
| (8,861)
|
| WFB
| Stryker Corp.
| USD
| 300.00
| Jan 2024
| 6
| 600
| 9,133
| (5,316)
|
| WFB
| Stryker Corp.
| USD
| 300.00
| Jan 2024
| 2
| 200
| 2,504
| (1,772)
|
| WFB
| Stryker Corp.
| USD
| 300.00
| Jan 2024
| 15
| 1,500
| 24,074
| (13,291)
|
| WFB
| Stryker Corp.
| USD
| 310.00
| Jan 2024
| 25
| 2,500
| 34,689
| (13,798)
|
| WFB
| Stryker Corp.
| USD
| 320.00
| Jan 2024
| 22
| 2,200
| 29,405
| (7,207)
|
| JPM
| Teledyne Technologies, Inc.
| USD
| 460.00
| Dec 2023
| 4
| 400
| 3,120
| (1,900)
|
| BOA
| Texas Instruments, Inc.
| USD
| 180.00
| Jan 2024
| 33
| 3,300
| 55,588
| (19,413)
|
| BOA
| Texas Instruments, Inc.
| USD
| 180.00
| Jan 2024
| 33
| 3,300
| 62,696
| (19,413)
|
| BOA
| Texas Instruments, Inc.
| USD
| 190.00
| Jan 2024
| 33
| 3,300
| 42,664
| (9,877)
|
| BOA
| Texas Instruments, Inc.
| USD
| 190.00
| Jan 2024
| 33
| 3,300
| 47,834
| (9,877)
|
| BOA
| Texas Instruments, Inc.
| USD
| 190.00
| Jan 2024
| 23
| 2,300
| 18,547
| (6,884)
|
| BOA
| Texas Instruments, Inc.
| USD
| 195.00
| Jan 2024
| 33
| 3,300
| 37,063
| (6,856)
|
| BOA
| Texas Instruments, Inc.
| USD
| 195.00
| Jan 2024
| 33
| 3,300
| 41,311
| (6,856)
|
| BOA
| Texas Instruments, Inc.
| USD
| 195.00
| Jan 2024
| 23
| 2,300
| 14,396
| (4,778)
|
| BOA
| Texas Instruments, Inc.
| USD
| 200.00
| Jan 2024
| 33
| 3,300
| 32,070
| (4,723)
|
| BOA
| Texas Instruments, Inc.
| USD
| 200.00
| Jan 2024
| 33
| 3,300
| 34,952
| (4,723)
|
| BOA
| Texas Instruments, Inc.
| USD
| 200.00
| Jan 2024
| 122
| 12,200
| 139,533
| (17,460)
|
| BOA
| Texas Instruments, Inc.
| USD
| 200.00
| Jan 2024
| 79
| 7,900
| 69,388
| (11,306)
|
| BOA
| Texas Instruments, Inc.
| USD
| 195.00
| Jun 2024
| 16
| 1,600
| 17,579
| (10,731)
|
| BOA
| Texas Instruments, Inc.
| USD
| 200.00
| Jun 2024
| 16
| 1,600
| 14,763
| (8,723)
|
| The accompanying notes are an integral part of the financial statements.
| 23
|
|
John Hancock Funds II
Portfolio of Investments —
August 31, 2023 (showing percentage of total net assets)
Capital Appreciation Value Fund
(continued)
| Options on securities (continued)
|
Counterparty (OTC)/
Exchange-
traded
| Name of issuer
| Currency
| Exercise
price
| Expiration
date
| Number of
contracts
| Notional
amount
| Premium
| Value
|
| Calls (continued)
|
|
|
|
|
|
|
|
| JPM
| The PNC Financial Services Group, Inc.
| USD
| 170.00
| Jan 2024
| 20
| 2,000
| $18,432
| $(271)
|
| JPM
| The PNC Financial Services Group, Inc.
| USD
| 170.00
| Jan 2024
| 20
| 2,000
| 18,412
| (271)
|
| JPM
| The PNC Financial Services Group, Inc.
| USD
| 175.00
| Jan 2024
| 14
| 1,400
| 17,775
| (122)
|
| JPM
| The PNC Financial Services Group, Inc.
| USD
| 175.00
| Jan 2024
| 11
| 1,100
| 12,496
| (96)
|
| JPM
| The PNC Financial Services Group, Inc.
| USD
| 175.00
| Jan 2024
| 20
| 2,000
| 15,071
| (174)
|
| JPM
| The PNC Financial Services Group, Inc.
| USD
| 175.00
| Jan 2024
| 20
| 2,000
| 15,379
| (174)
|
| JPM
| The PNC Financial Services Group, Inc.
| USD
| 185.00
| Jan 2024
| 11
| 1,100
| 9,254
| (40)
|
| JPM
| The PNC Financial Services Group, Inc.
| USD
| 185.00
| Jan 2024
| 15
| 1,500
| 14,135
| (55)
|
| JPM
| The PNC Financial Services Group, Inc.
| USD
| 190.00
| Jan 2024
| 15
| 1,500
| 12,049
| (35)
|
| JPM
| The PNC Financial Services Group, Inc.
| USD
| 190.00
| Jan 2024
| 11
| 1,100
| 7,743
| (26)
|
| JPM
| The PNC Financial Services Group, Inc.
| USD
| 200.00
| Jan 2024
| 11
| 1,100
| 5,292
| (10)
|
| JPM
| The PNC Financial Services Group, Inc.
| USD
| 200.00
| Jan 2024
| 15
| 1,500
| 8,361
| (14)
|
| CITI
| Thermo Fisher Scientific, Inc.
| USD
| 560.00
| Jan 2024
| 4
| 400
| 12,628
| (13,957)
|
| CITI
| Thermo Fisher Scientific, Inc.
| USD
| 590.00
| Jan 2024
| 4
| 400
| 7,102
| (8,094)
|
| CITI
| Thermo Fisher Scientific, Inc.
| USD
| 600.00
| Jan 2024
| 31
| 3,100
| 50,294
| (50,923)
|
| CITI
| Thermo Fisher Scientific, Inc.
| USD
| 610.00
| Jan 2024
| 11
| 1,100
| 47,299
| (14,458)
|
| JPM
| Thermo Fisher Scientific, Inc.
| USD
| 610.00
| Jan 2024
| 4
| 400
| 21,891
| (5,257)
|
| JPM
| Thermo Fisher Scientific, Inc.
| USD
| 610.00
| Jan 2024
| 4
| 400
| 29,352
| (5,257)
|
| CITI
| Thermo Fisher Scientific, Inc.
| USD
| 620.00
| Jan 2024
| 11
| 1,100
| 42,147
| (11,395)
|
| CITI
| Thermo Fisher Scientific, Inc.
| USD
| 630.00
| Jan 2024
| 11
| 1,100
| 37,489
| (8,844)
|
| JPM
| Thermo Fisher Scientific, Inc.
| USD
| 630.00
| Jan 2024
| 4
| 400
| 17,785
| (3,216)
|
| JPM
| Thermo Fisher Scientific, Inc.
| USD
| 630.00
| Jan 2024
| 4
| 400
| 25,158
| (3,216)
|
| JPM
| Thermo Fisher Scientific, Inc.
| USD
| 660.00
| Jan 2024
| 4
| 400
| 13,809
| (1,368)
|
| JPM
| Thermo Fisher Scientific, Inc.
| USD
| 660.00
| Jan 2024
| 4
| 400
| 19,368
| (1,368)
|
| JPM
| Thermo Fisher Scientific, Inc.
| USD
| 690.00
| Jan 2024
| 4
| 400
| 10,390
| (506)
|
| JPM
| Thermo Fisher Scientific, Inc.
| USD
| 690.00
| Jan 2024
| 4
| 400
| 14,622
| (506)
|
| GSI
| TransUnion
| USD
| 80.00
| Dec 2023
| 31
| 3,100
| 12,799
| (18,826)
|
| JPM
| UnitedHealth Group, Inc.
| USD
| 550.00
| Jan 2024
| 15
| 1,500
| 16,875
| (6,739)
|
| CITI
| UnitedHealth Group, Inc.
| USD
| 580.00
| Jan 2024
| 54
| 5,400
| 302,234
| (9,620)
|
| JPM
| UnitedHealth Group, Inc.
| USD
| 600.00
| Jan 2024
| 58
| 5,800
| 192,454
| (5,576)
|
| GSI
| Visa, Inc., Class A
| USD
| 230.00
| Jan 2024
| 25
| 2,500
| 47,691
| (62,979)
|
| GSI
| Visa, Inc., Class A
| USD
| 230.00
| Jan 2024
| 25
| 2,500
| 58,965
| (62,979)
|
| GSI
| Visa, Inc., Class A
| USD
| 240.00
| Jan 2024
| 25
| 2,500
| 37,758
| (44,679)
|
| GSI
| Visa, Inc., Class A
| USD
| 240.00
| Jan 2024
| 25
| 2,500
| 46,683
| (44,679)
|
| GSI
| Visa, Inc., Class A
| USD
| 240.00
| Jan 2024
| 8
| 800
| 9,336
| (14,297)
|
| GSI
| Visa, Inc., Class A
| USD
| 245.00
| Jan 2024
| 24
| 2,400
| 23,924
| (35,072)
|
| GSI
| Visa, Inc., Class A
| USD
| 250.00
| Jan 2024
| 25
| 2,500
| 28,951
| (29,174)
|
| GSI
| Visa, Inc., Class A
| USD
| 250.00
| Jan 2024
| 25
| 2,500
| 36,182
| (29,174)
|
| GSI
| Visa, Inc., Class A
| USD
| 260.00
| Jan 2024
| 25
| 2,500
| 22,144
| (17,259)
|
| GSI
| Visa, Inc., Class A
| USD
| 260.00
| Jan 2024
| 25
| 2,500
| 27,430
| (17,259)
|
| GSI
| Visa, Inc., Class A
| USD
| 260.00
| Jan 2024
| 8
| 800
| 3,536
| (5,523)
|
| GSI
| Visa, Inc., Class A
| USD
| 250.00
| Jun 2024
| 4
| 400
| 5,788
| (8,650)
|
| GSI
| Visa, Inc., Class A
| USD
| 260.00
| Jun 2024
| 4
| 400
| 4,268
| (6,534)
|
| WFB
| Yum! Brands, Inc.
| USD
| 140.00
| Jan 2024
| 118
| 11,800
| 117,658
| (25,703)
|
| WFB
| Yum! Brands, Inc.
| USD
| 140.00
| Jan 2024
| 117
| 11,700
| 114,766
| (25,485)
|
| CITI
| Yum! Brands, Inc.
| USD
| 145.00
| Jan 2024
| 58
| 5,800
| 32,602
| (6,302)
|
| CITI
| Yum! Brands, Inc.
| USD
| 150.00
| Jan 2024
| 58
| 5,800
| 29,121
| (2,892)
|
|
|
|
|
|
|
|
| $7,666,409
| $(6,616,180)
|
| Derivatives Currency Abbreviations
|
| USD
| U.S. Dollar
|
| Derivatives Abbreviations
|
| BARC
| Barclays Bank PLC
|
| BOA
| Bank of America, N.A.
|
| CITI
| Citibank, N.A.
|
| GSI
| Goldman Sachs International
|
| JPM
| JPMorgan Chase Bank, N.A.
|
| OTC
| Over-the-counter
|
| UBS
| UBS AG
|
| WFB
| Wells Fargo Bank, N.A.
|
See Notes to financial
statements regarding investment transactions and other derivatives information.
| The accompanying notes are an integral part of the financial statements.
| 24
|
|
John Hancock Funds II
Portfolio of Investments —
August 31, 2023 (showing percentage of total net assets)
Core Bond Fund
|
|
| Shares or
Principal
Amount
|
| Value
|
U.S. GOVERNMENT AND AGENCY OBLIGATIONS –
59.5%
|
|
|
|
| U.S. Government – 27.4%
|
|
|
|
|
|
| U.S. Treasury Bonds
|
|
|
|
|
|
| 1.125%, 05/15/2040 to 08/15/2040
| $
| 18,429,000
|
| $
| 11,323,077
|
| 1.375%, 11/15/2040
|
| 34,648,000
|
|
| 22,119,229
|
| 1.750%, 08/15/2041
|
| 51,140,000
|
|
| 34,361,685
|
| 1.875%, 02/15/2041
|
| 9,197,000
|
|
| 6,382,574
|
| 2.000%, 11/15/2041 to 08/15/2051
|
| 39,444,000
|
|
| 27,192,406
|
| 2.250%, 05/15/2041
|
| 7,622,000
|
|
| 5,616,164
|
| 2.375%, 02/15/2042
|
| 4,972,000
|
|
| 3,698,896
|
| 2.875%, 05/15/2052
|
| 5,468,000
|
|
| 4,244,749
|
| 3.000%, 08/15/2052
|
| 16,053,000
|
|
| 12,792,861
|
| 3.625%, 02/15/2053 to 05/15/2053
|
| 32,896,000
|
|
| 29,660,082
|
| 3.875%, 02/15/2043 to 05/15/2043
|
| 37,707,000
|
|
| 35,076,497
|
| 4.125%, 08/15/2053
|
| 5,147,000
|
|
| 5,080,331
|
| 4.375%, 08/15/2043
|
| 1,953,000
|
|
| 1,947,812
|
| 5.250%, 11/15/2028
|
| 801,000
|
|
| 836,419
|
| U.S. Treasury Notes
|
|
|
|
|
|
| 0.375%, 07/31/2027
|
| 13,419,000
|
|
| 11,501,551
|
| 0.750%, 01/31/2028
|
| 8,975,000
|
|
| 7,697,815
|
| 1.125%, 02/29/2028 to 08/31/2028
|
| 8,003,000
|
|
| 6,931,988
|
| 1.250%, 09/30/2028
|
| 3,243,000
|
|
| 2,798,734
|
| 1.375%, 10/31/2028
|
| 4,932,000
|
|
| 4,275,235
|
| 1.500%, 08/15/2026
|
| 22,366,000
|
|
| 20,500,710
|
| 1.750%, 12/31/2026
|
| 3,215,000
|
|
| 2,947,000
|
| 2.000%, 11/15/2026
|
| 8,142,000
|
|
| 7,537,711
|
| 2.375%, 03/31/2029
|
| 20,412,000
|
|
| 18,511,930
|
| 2.625%, 02/15/2029 to 07/31/2029
|
| 23,597,000
|
|
| 21,714,858
|
| 2.750%, 07/31/2027 to 05/31/2029
|
| 17,745,000
|
|
| 16,494,547
|
| 2.875%, 04/30/2025 to 08/15/2028
|
| 16,504,000
|
|
| 15,880,001
|
| 3.000%, 07/15/2025
|
| 3,614,000
|
|
| 3,490,616
|
| 3.250%, 06/30/2029
|
| 10,627,000
|
|
| 10,078,215
|
| 3.500%, 01/31/2028 to 04/30/2028
|
| 16,353,000
|
|
| 15,810,040
|
| 3.875%, 08/15/2033
|
| 31,123,000
|
|
| 30,568,622
|
| 4.000%, 06/30/2028
|
| 4,817,000
|
|
| 4,759,422
|
| 4.125%, 01/31/2025 to 08/31/2030
|
| 10,607,000
|
|
| 10,539,240
|
| 4.250%, 05/31/2025 to 10/15/2025
|
| 9,299,000
|
|
| 9,192,433
|
| 4.375%, 10/31/2024 to 08/31/2028
|
| 39,588,000
|
|
| 39,643,568
|
| 4.500%, 11/30/2024
|
| 88,000
|
|
| 87,209
|
| 4.750%, 07/31/2025
|
| 3,342,000
|
|
| 3,332,992
|
| 5.000%, 08/31/2025
|
| 28,324,000
|
|
| 28,404,768
|
|
|
|
|
|
| 493,031,987
|
| U.S. Government Agency – 32.1%
|
|
|
|
|
|
Federal Home Loan Bank
1.000%, (1.000% to 9-30-23, 1.250% to 9-30-24, 1.500% to 9-30-25, 1.750% to 9-30-26, 2.000% to 9-30-27, 2.250% to 9-30-28, 2.500% to 9-30-29, 3.000% to 3-30-30, 3.500% to 9-30-30, 4.000% to 3-30-31, then 4.500%
thereafter), 09/30/2031
|
| 3,105,000
|
|
| 2,542,005
|
| Federal Home Loan Mortgage Corp.
|
|
|
|
|
|
| 2.000%, 06/01/2040 to 12/01/2051
|
| 33,175,416
|
|
| 27,622,187
|
| 2.500%, 04/01/2042 to 03/01/2052
|
| 12,470,467
|
|
| 10,606,527
|
| 2.873%, (12 month LIBOR + 1.641%), 05/01/2049 (A)
|
| 789,490
|
|
| 773,677
|
| 3.000%, 04/01/2040 to 02/01/2047
|
| 14,055,147
|
|
| 12,484,410
|
| 3.139%, (12 month LIBOR + 1.640%), 11/01/2048 (A)
|
| 1,030,485
|
|
| 994,878
|
| 3.151%, (12 month LIBOR + 1.611%), 10/01/2043 (A)
|
| 146,739
|
|
| 148,483
|
| 3.913%, (1 month SOFR + 2.130%), 07/01/2052 (A)
|
| 723,238
|
|
| 686,620
|
| 3.986%, (1 month SOFR + 2.140%), 08/01/2052 (A)
|
| 1,003,095
|
|
| 939,595
|
| 4.000%, 07/01/2049
|
| 946,632
|
|
| 895,858
|
Core Bond Fund (continued)
|
|
| Shares or
Principal
Amount
|
| Value
|
U.S. GOVERNMENT AND AGENCY
OBLIGATIONS (continued)
|
|
|
|
| U.S. Government Agency (continued)
|
|
|
|
|
|
Federal Home Loan
Mortgage Corp. (continued)
|
|
|
|
|
|
| 4.118%, (1 month SOFR + 2.191%), 10/01/2052 (A)
| $
| 23,322,804
|
| $
| 21,916,796
|
| 4.123%, (1 month SOFR + 2.380%), 09/01/2052 (A)
|
| 498,911
|
|
| 476,092
|
| 4.191%, (12 month LIBOR + 1.605%), 09/01/2043 (A)
|
| 74,806
|
|
| 74,855
|
| 4.197%, (1 month SOFR + 2.304%), 05/01/2053 (A)
|
| 3,253,504
|
|
| 3,132,258
|
| 4.299%, (1 month SOFR + 2.130%), 07/01/2052 (A)
|
| 853,064
|
|
| 819,271
|
| 4.437%, 12/14/2029 (B)
|
| 2,068,000
|
|
| 1,567,603
|
| 4.500%, 06/01/2039 to 07/01/2039
|
| 98,140
|
|
| 95,531
|
| 4.661%, (12 month LIBOR + 1.637%), 03/01/2049 (A)
|
| 638,874
|
|
| 642,150
|
| 5.120%, (1 month SOFR + 2.216%), 08/01/2053 (A)
|
| 718,649
|
|
| 707,104
|
| 5.250%, (12 month LIBOR + 1.637%), 04/01/2048 (A)
|
| 1,587,370
|
|
| 1,591,915
|
| 5.252%, (1 month SOFR + 2.283%), 06/01/2053 (A)
|
| 781,061
|
|
| 770,717
|
| 5.311%, (12 month LIBOR + 1.628%), 11/01/2043 (A)
|
| 118,417
|
|
| 118,225
|
| 5.391%, (12 month LIBOR + 1.688%), 09/01/2047 (A)
|
| 757,723
|
|
| 761,864
|
| 5.504%, (12 month LIBOR + 1.642%), 10/01/2043 (A)
|
| 158,035
|
|
| 158,526
|
| 5.616%, (12 month LIBOR + 1.770%), 09/01/2042 (A)
|
| 137,040
|
|
| 139,347
|
| 5.824%, (12 month LIBOR + 1.722%), 01/01/2044 (A)
|
| 280,957
|
|
| 280,252
|
| 6.336%, (12 month LIBOR + 1.683%), 02/01/2043 (A)
|
| 196,753
|
|
| 198,248
|
| 6.818%, (12 month LIBOR + 1.642%), 08/01/2043 (A)
|
| 130,433
|
|
| 129,770
|
| 6.836%, (12 month LIBOR + 1.637%), 09/01/2045 (A)
|
| 1,119,864
|
|
| 1,121,192
|
| 6.881%, (12 month LIBOR + 1.635%), 07/01/2043 (A)
|
| 73,787
|
|
| 73,962
|
| 7.042%, (12 month LIBOR + 1.650%), 03/01/2043 (A)
|
| 119,051
|
|
| 118,867
|
| Federal National Mortgage Association
|
|
|
|
|
|
| 1.500%, 10/01/2041 to 07/01/2051
|
| 24,737,180
|
|
| 19,474,429
|
| 1.520%, 08/21/2035
|
| 2,984,000
|
|
| 2,074,041
|
| 1.900%, 01/25/2036
|
| 2,659,000
|
|
| 1,909,050
|
| 2.000%, 06/01/2040 to 03/01/2047
|
| 94,466,250
|
|
| 78,505,209
|
| 2.500%, 12/01/2040 to 03/01/2052
|
| 19,965,101
|
|
| 17,097,829
|
| 3.000%, 11/01/2039 (C)
|
| 938,423
|
|
| 867,126
|
| 3.000%, 05/01/2040 to 02/01/2055
|
| 94,076,567
|
|
| 83,255,743
|
| 3.027%, (12 month LIBOR + 1.603%), 03/01/2050 (A)
|
| 2,001,438
|
|
| 1,955,523
|
| 3.500%, TBA (C)
|
| 6,000,000
|
|
| 5,361,328
|
| 3.500%, 06/01/2041 to 01/01/2044 (C)
|
| 2,222,255
|
|
| 2,063,033
|
| 3.500%, 03/01/2042 to 04/01/2050
|
| 27,485,901
|
|
| 25,209,039
|
| 3.679%, (1 month SOFR + 2.370%), 08/01/2052 (A)
|
| 1,047,705
|
|
| 990,585
|
| 3.968%, (1 month SOFR + 2.120%), 08/01/2052 (A)
|
| 429,281
|
|
| 403,262
|
| 4.000%, 01/01/2027 to 05/01/2049
|
| 20,810,873
|
|
| 20,029,694
|
| 4.136%, (1 month SOFR + 2.120%), 09/01/2052 (A)
|
| 1,671,914
|
|
| 1,616,217
|
| 4.149%, (1 month SOFR + 2.132%), 10/01/2052 (A)
|
| 4,433,243
|
|
| 4,282,948
|
| The accompanying notes are an integral part of the financial statements.
| 25
|
|
John Hancock Funds II
Portfolio of Investments —
August 31, 2023 (showing percentage of total net assets)
Core Bond Fund (continued)
|
|
| Shares or
Principal
Amount
|
| Value
|
U.S. GOVERNMENT AND AGENCY
OBLIGATIONS (continued)
|
|
|
|
| U.S. Government Agency (continued)
|
|
|
|
|
|
Federal National
Mortgage Association (continued)
|
|
|
|
|
|
| 4.168%, (1 month SOFR + 2.120%), 07/01/2052 (A)
| $
| 1,558,392
|
| $
| 1,474,031
|
| 4.218%, (1 month SOFR + 2.370%), 09/01/2052 (A)
|
| 500,070
|
|
| 480,185
|
| 4.240%, (1 month SOFR + 2.127%), 11/01/2052 (A)
|
| 1,310,662
|
|
| 1,268,433
|
| 4.303%, (1 month SOFR + 2.125%), 08/01/2052 (A)
|
| 1,922,801
|
|
| 1,854,027
|
| 4.345%, (1 month SOFR + 2.124%), 07/01/2052 (A)
|
| 1,827,045
|
|
| 1,764,250
|
| 4.500%, 06/01/2041 to 11/01/2048
|
| 4,205,414
|
|
| 4,086,446
|
| 4.511%, (1 month SOFR + 2.120%), 11/01/2052 (A)
|
| 728,265
|
|
| 708,767
|
| 4.531%, 11/15/2030 (B)
|
| 6,077,000
|
|
| 4,394,708
|
| 4.627%, (1 month SOFR + 2.125%), 08/01/2052 (A)
|
| 2,164,073
|
|
| 2,105,958
|
| 4.633%, (1 month SOFR + 2.123%), 08/01/2052 (A)
|
| 1,594,182
|
|
| 1,533,499
|
| 4.653%, (1 month SOFR + 2.130%), 08/01/2052 (A)
|
| 1,679,739
|
|
| 1,635,934
|
| 4.687%, (12 month LIBOR + 1.582%), 01/01/2046 (A)
|
| 1,799,038
|
|
| 1,813,354
|
| 4.797%, (12 month LIBOR + 1.578%), 06/01/2045 (A)
|
| 699,157
|
|
| 705,034
|
| 5.500%, TBA (C)
|
| 10,800,000
|
|
| 10,668,375
|
| 5.500%, 09/01/2052
|
| 1,456,914
|
|
| 1,475,547
|
| 5.627%, (12 month LIBOR + 1.578%), 10/01/2043 (A)
|
| 341,230
|
|
| 343,655
|
| 6.000%, TBA (C)
|
| 109,500,000
|
|
| 109,786,686
|
| 6.000%, 05/01/2053
|
| 4,609,756
|
|
| 4,622,216
|
| 6.500%, 11/01/2052 to 02/01/2053
|
| 1,516,551
|
|
| 1,590,434
|
| 6.571%, (12 month LIBOR + 1.653%), 01/01/2043 (A)
|
| 82,271
|
|
| 83,621
|
| 6.739%, (12 month LIBOR + 1.560%), 06/01/2043 (A)
|
| 84,158
|
|
| 85,059
|
| 6.953%, (12 month LIBOR + 1.560%), 03/01/2043 (A)
|
| 18,910
|
|
| 19,149
|
| 7.000%, 02/01/2053
|
| 1,451,095
|
|
| 1,495,962
|
Government National
Mortgage Association
|
|
|
|
|
|
| 3.000%, 06/20/2043 to 10/20/2050
|
| 15,063,759
|
|
| 13,355,182
|
| 3.500%, 01/20/2048
|
| 722,334
|
|
| 659,866
|
| 4.000%, 03/20/2048 to 04/20/2048
|
| 878,187
|
|
| 823,489
|
| 4.500%, 08/15/2047 to 02/20/2049
|
| 1,992,880
|
|
| 1,925,681
|
| 6.000%, TBA (C)
|
| 41,500,000
|
|
| 41,623,053
|
| 6.000%, 01/20/2053
|
| 6,811,973
|
|
| 6,944,890
|
|
|
|
|
|
| 577,011,332
|
| TOTAL U.S. GOVERNMENT AND AGENCY OBLIGATIONS (Cost $1,114,539,315)
|
| $
| 1,070,043,319
|
| FOREIGN GOVERNMENT OBLIGATIONS – 0.7%
|
|
|
|
| Australia – 0.1%
|
|
|
|
|
|
Export Finance & Insurance Corp.
4.625%, 10/26/2027 (D)
|
| 2,310,000
|
|
| 2,312,868
|
| Bermuda – 0.1%
|
|
|
|
|
|
Government of Bermuda
5.000%, 07/15/2032 (D)
|
| 693,000
|
|
| 664,241
|
| Israel – 0.1%
|
|
|
|
|
|
State of Israel
4.500%, 01/17/2033
|
| 1,912,000
|
|
| 1,835,302
|
Core Bond Fund (continued)
|
|
| Shares or
Principal
Amount
|
| Value
|
| FOREIGN GOVERNMENT OBLIGATIONS (continued)
|
|
|
|
| Italy – 0.0%
|
|
|
|
|
|
Republic of Italy
3.875%, 05/06/2051
| $
| 406,000
|
| $
| 283,952
|
| Mexico – 0.3%
|
|
|
|
|
|
| Government of Mexico
|
|
|
|
|
|
| 3.500%, 02/12/2034
|
| 2,506,000
|
|
| 2,076,819
|
| 3.750%, 04/19/2071
|
| 1,249,000
|
|
| 800,952
|
| 3.771%, 05/24/2061
|
| 465,000
|
|
| 305,588
|
| 6.338%, 05/04/2053
|
| 1,798,000
|
|
| 1,794,778
|
|
|
|
|
|
| 4,978,137
|
| Panama – 0.0%
|
|
|
|
|
|
Republic of Panama
6.853%, 03/28/2054
|
| 635,000
|
|
| 649,187
|
| Paraguay – 0.1%
|
|
|
|
|
|
| Republic of Paraguay
|
|
|
|
|
|
| 5.400%, 03/30/2050 (D)
|
| 568,000
|
|
| 473,798
|
| 5.850%, 08/21/2033 (D)
|
| 1,568,000
|
|
| 1,542,758
|
|
|
|
|
|
| 2,016,556
|
| TOTAL FOREIGN GOVERNMENT OBLIGATIONS (Cost $13,543,269)
|
| $
| 12,740,243
|
| CORPORATE BONDS – 22.4%
|
|
|
|
| Communication services – 2.0%
|
|
|
|
|
|
| AT&T, Inc.
|
|
|
|
|
|
| 3.500%, 06/01/2041 to 09/15/2053
|
| 1,646,000
|
|
| 1,130,272
|
| 3.550%, 09/15/2055
|
| 1,023,000
|
|
| 667,680
|
| 3.650%, 09/15/2059
|
| 647,000
|
|
| 418,720
|
| 3.800%, 12/01/2057
|
| 1,861,000
|
|
| 1,255,059
|
| 5.400%, 02/15/2034
|
| 4,918,000
|
|
| 4,775,867
|
Charter Communications Operating LLC
3.500%, 06/01/2041 to 03/01/2042
|
| 2,597,000
|
|
| 1,701,001
|
| Comcast Corp.
|
|
|
|
|
|
| 2.987%, 11/01/2063
|
| 773,000
|
|
| 467,324
|
| 4.049%, 11/01/2052
|
| 667,000
|
|
| 533,519
|
| 5.350%, 11/15/2027
|
| 1,358,000
|
|
| 1,377,051
|
Discovery Communications LLC
4.000%, 09/15/2055
|
| 723,000
|
|
| 471,529
|
| Meta Platforms, Inc.
|
|
|
|
|
|
| 5.600%, 05/15/2053
|
| 1,303,000
|
|
| 1,308,357
|
| 5.750%, 05/15/2063
|
| 1,303,000
|
|
| 1,315,855
|
Paramount Global
4.950%, 05/19/2050
|
| 835,000
|
|
| 611,904
|
| T-Mobile USA, Inc.
|
|
|
|
|
|
| 1.500%, 02/15/2026
|
| 463,000
|
|
| 421,861
|
| 2.250%, 02/15/2026
|
| 1,444,000
|
|
| 1,335,248
|
| 2.550%, 02/15/2031
|
| 1,033,000
|
|
| 851,213
|
| 3.750%, 04/15/2027
|
| 2,199,000
|
|
| 2,084,200
|
| 4.800%, 07/15/2028
|
| 1,373,000
|
|
| 1,342,292
|
| 4.950%, 03/15/2028
|
| 1,371,000
|
|
| 1,351,911
|
| 5.050%, 07/15/2033
|
| 1,716,000
|
|
| 1,655,832
|
| Verizon Communications, Inc.
|
|
|
|
|
|
| 2.355%, 03/15/2032
|
| 3,780,000
|
|
| 2,989,747
|
| 2.650%, 11/20/2040
|
| 866,000
|
|
| 578,253
|
| 5.050%, 05/09/2033
|
| 3,767,000
|
|
| 3,655,190
|
| WarnerMedia Holdings, Inc.
|
|
|
|
|
|
| 5.050%, 03/15/2042
|
| 1,357,000
|
|
| 1,115,497
|
| 5.141%, 03/15/2052
|
| 1,057,000
|
|
| 842,545
|
| 5.391%, 03/15/2062
|
| 856,000
|
|
| 679,382
|
|
|
|
|
|
| 34,937,309
|
| Consumer discretionary – 1.0%
|
|
|
|
|
|
| Ford Motor Credit Company LLC
|
|
|
|
|
|
| 2.900%, 02/10/2029
|
| 957,000
|
|
| 789,803
|
| 7.200%, 06/10/2030
|
| 1,814,000
|
|
| 1,842,480
|
General Motors Company
5.200%, 04/01/2045
|
| 552,000
|
|
| 456,152
|
| The accompanying notes are an integral part of the financial statements.
| 26
|
|
John Hancock Funds II
Portfolio of Investments —
August 31, 2023 (showing percentage of total net assets)
Core Bond Fund (continued)
|
|
| Shares or
Principal
Amount
|
| Value
|
| CORPORATE BONDS (continued)
|
|
|
|
| Consumer discretionary (continued)
|
|
|
|
|
|
Harley-Davidson Financial Services, Inc.
6.500%, 03/10/2028 (D)
| $
| 1,032,000
|
| $
| 1,034,944
|
| Hyundai Capital America
|
|
|
|
|
|
| 0.800%, 01/08/2024 (D)
|
| 544,000
|
|
| 534,526
|
| 1.300%, 01/08/2026 (D)
|
| 1,303,000
|
|
| 1,179,267
|
| 5.500%, 03/30/2026 (D)
|
| 1,384,000
|
|
| 1,378,178
|
| 5.600%, 03/30/2028 (D)
|
| 2,151,000
|
|
| 2,139,627
|
| 5.700%, 06/26/2030 (D)
|
| 1,363,000
|
|
| 1,341,377
|
| Lowe's Companies, Inc.
|
|
|
|
|
|
| 4.250%, 04/01/2052
|
| 1,296,000
|
|
| 1,025,250
|
| 5.625%, 04/15/2053
|
| 1,679,000
|
|
| 1,630,612
|
| 5.750%, 07/01/2053
|
| 690,000
|
|
| 682,018
|
| 5.850%, 04/01/2063
|
| 344,000
|
|
| 336,411
|
| McDonald's Corp.
|
|
|
|
|
|
| 4.800%, 08/14/2028
|
| 2,042,000
|
|
| 2,032,446
|
| 5.450%, 08/14/2053
|
| 1,361,000
|
|
| 1,361,905
|
The Trustees of the University of Pennsylvania
3.610%, 02/15/2119
|
| 954,000
|
|
| 664,057
|
|
|
|
|
|
| 18,429,053
|
| Consumer staples – 1.8%
|
|
|
|
|
|
Anheuser-Busch Companies LLC
4.700%, 02/01/2036
|
| 3,480,000
|
|
| 3,330,741
|
Anheuser-Busch InBev Worldwide, Inc.
4.375%, 04/15/2038
|
| 1,833,000
|
|
| 1,678,364
|
BAT International Finance PLC
5.931%, 02/02/2029
|
| 2,596,000
|
|
| 2,585,761
|
| Bunge, Ltd. Finance Corp.
|
|
|
|
|
|
| 1.630%, 08/17/2025
|
| 709,000
|
|
| 656,379
|
| 2.750%, 05/14/2031
|
| 147,000
|
|
| 122,951
|
| Constellation Brands, Inc.
|
|
|
|
|
|
| 4.750%, 05/09/2032
|
| 520,000
|
|
| 498,443
|
| 4.900%, 05/01/2033
|
| 995,000
|
|
| 959,338
|
| 5.250%, 11/15/2048
|
| 1,430,000
|
|
| 1,335,944
|
| Kenvue, Inc.
|
|
|
|
|
|
| 4.900%, 03/22/2033 (D)
|
| 2,751,000
|
|
| 2,735,722
|
| 5.050%, 03/22/2028 to 03/22/2053 (D)
|
| 2,923,000
|
|
| 2,894,504
|
| 5.200%, 03/22/2063 (D)
|
| 344,000
|
|
| 336,571
|
Keurig Dr. Pepper, Inc.
4.500%, 04/15/2052
|
| 1,298,000
|
|
| 1,104,930
|
| Philip Morris International, Inc.
|
|
|
|
|
|
| 4.875%, 02/13/2026 to 02/15/2028
|
| 4,094,000
|
|
| 4,044,667
|
| 5.000%, 11/17/2025
|
| 1,459,000
|
|
| 1,450,458
|
| 5.125%, 11/17/2027 to 02/15/2030
|
| 4,429,000
|
|
| 4,398,878
|
| 5.375%, 02/15/2033
|
| 1,131,000
|
|
| 1,116,821
|
| 5.750%, 11/17/2032
|
| 350,000
|
|
| 354,979
|
| Walmart, Inc.
|
|
|
|
|
|
| 4.100%, 04/15/2033
|
| 1,724,000
|
|
| 1,642,914
|
| 4.500%, 04/15/2053
|
| 1,035,000
|
|
| 963,116
|
|
|
|
|
|
| 32,211,481
|
| Energy – 1.4%
|
|
|
|
|
|
| Aker BP ASA
|
|
|
|
|
|
| 5.600%, 06/13/2028 (D)
|
| 2,086,000
|
|
| 2,067,913
|
| 6.000%, 06/13/2033 (D)
|
| 1,618,000
|
|
| 1,617,526
|
BP Capital Markets America, Inc.
4.812%, 02/13/2033
|
| 3,772,000
|
|
| 3,651,056
|
| Energy Transfer LP
|
|
|
|
|
|
| 4.400%, 03/15/2027
|
| 305,000
|
|
| 292,516
|
| 4.950%, 05/15/2028
|
| 2,276,000
|
|
| 2,211,048
|
| 5.300%, 04/15/2047
|
| 1,780,000
|
|
| 1,509,518
|
| 5.400%, 10/01/2047
|
| 523,000
|
|
| 450,485
|
| 5.750%, 02/15/2033
|
| 2,503,000
|
|
| 2,488,565
|
| 6.125%, 12/15/2045
|
| 550,000
|
|
| 516,519
|
| Exxon Mobil Corp.
|
|
|
|
|
|
| 3.452%, 04/15/2051
|
| 1,730,000
|
|
| 1,287,216
|
Core Bond Fund (continued)
|
|
| Shares or
Principal
Amount
|
| Value
|
| CORPORATE BONDS (continued)
|
|
|
|
| Energy (continued)
|
|
|
|
|
|
| Exxon Mobil Corp. (continued)
|
|
|
|
|
|
| 4.327%, 03/19/2050
| $
| 2,276,000
|
| $
| 1,972,234
|
| Galaxy Pipeline Assets Bidco, Ltd.
|
|
|
|
|
|
| 1.750%, 09/30/2027 (D)
|
| 561,614
|
|
| 518,096
|
| 2.160%, 03/31/2034 (D)
|
| 1,146,133
|
|
| 962,055
|
| 2.625%, 03/31/2036 (D)
|
| 817,000
|
|
| 645,697
|
| 2.940%, 09/30/2040 (D)
|
| 472,075
|
|
| 371,436
|
| MPLX LP
|
|
|
|
|
|
| 4.950%, 03/14/2052
|
| 1,276,000
|
|
| 1,051,520
|
| 5.000%, 03/01/2033
|
| 2,069,000
|
|
| 1,952,989
|
| Petroleos Mexicanos
|
|
|
|
|
|
| 2.378%, 04/15/2025
|
| 175,000
|
|
| 169,869
|
| 2.460%, 12/15/2025
|
| 850,250
|
|
| 816,603
|
|
|
|
|
|
| 24,552,861
|
| Financials – 5.4%
|
|
|
|
|
|
| American Express Company
|
|
|
|
|
|
| 5.043%, (5.043% to 5-1-33, then SOFR + 1.835%), 05/01/2034
|
| 775,000
|
|
| 744,673
|
| 5.282%, (5.282% to 7-27-28, then SOFR + 1.280%), 07/27/2029
|
| 3,419,000
|
|
| 3,381,925
|
| 5.389%, (5.389% to 7-28-26, then SOFR + 0.970%), 07/28/2027
|
| 2,053,000
|
|
| 2,040,822
|
Antares Holdings LP
3.750%, 07/15/2027 (D)
|
| 1,518,000
|
|
| 1,308,146
|
Banco Santander SA
6.921%, 08/08/2033
|
| 1,000,000
|
|
| 999,669
|
| Bank of America Corp.
|
|
|
|
|
|
| 1.734%, (1.734% to 7-22-26, then SOFR + 0.960%), 07/22/2027
|
| 2,080,000
|
|
| 1,861,162
|
| 3.419%, (3.419% to 12-20-27, then 3 month CME Term SOFR + 1.302%), 12/20/2028
|
| 4,823,000
|
|
| 4,422,721
|
| 5.202%, (5.202% to 4-25-28, then SOFR + 1.630%), 04/25/2029
|
| 1,500,000
|
|
| 1,477,322
|
| 5.288%, (5.288% to 4-25-33, then SOFR + 1.910%), 04/25/2034
|
| 3,887,000
|
|
| 3,792,965
|
| Barclays PLC
|
|
|
|
|
|
| 6.224%, (6.224% to 5-9-33, then SOFR + 2.980%), 05/09/2034
|
| 1,977,000
|
|
| 1,952,485
|
| 7.437%, (7.437% to 11-2-32, then 1 Year CMT + 3.500%), 11/02/2033
|
| 2,214,000
|
|
| 2,369,571
|
BNP Paribas SA
5.335%, (5.335% to 6-12-28, then 1 Year CMT + 1.500%), 06/12/2029 (D)
|
| 2,782,000
|
|
| 2,741,225
|
Brighthouse Financial, Inc.
3.850%, 12/22/2051
|
| 610,000
|
|
| 383,135
|
Capital One Financial Corp.
6.377%, (6.377% to 6-8-33, then SOFR + 2.860%), 06/08/2034
|
| 2,051,000
|
|
| 2,025,928
|
Citigroup, Inc.
6.174%, (6.174% to 5-25-33, then SOFR + 2.661%), 05/25/2034
|
| 4,094,000
|
|
| 4,079,709
|
Cooperatieve Rabobank UA
5.564%, (5.564% to 2-28-28, then 1 Year CMT + 1.400%), 02/28/2029 (D)
|
| 4,809,000
|
|
| 4,751,681
|
Deutsche Bank AG
3.742%, (3.742% to 10-7-31, then SOFR + 2.257%), 01/07/2033
|
| 2,728,000
|
|
| 2,048,535
|
| Fiserv, Inc.
|
|
|
|
|
|
| 5.375%, 08/21/2028
|
| 2,047,000
|
|
| 2,052,492
|
| 5.600%, 03/02/2033
|
| 352,000
|
|
| 354,121
|
| 5.625%, 08/21/2033
|
| 2,047,000
|
|
| 2,062,400
|
HSBC Holdings PLC
6.332%, (6.332% to 3-9-43, then SOFR + 2.650%), 03/09/2044
|
| 759,000
|
|
| 765,355
|
| The accompanying notes are an integral part of the financial statements.
| 27
|
|
John Hancock Funds II
Portfolio of Investments —
August 31, 2023 (showing percentage of total net assets)
Core Bond Fund (continued)
|
|
| Shares or
Principal
Amount
|
| Value
|
| CORPORATE BONDS (continued)
|
|
|
|
| Financials (continued)
|
|
|
|
|
|
KeyBank NA
5.000%, 01/26/2033
| $
| 2,003,000
|
| $
| 1,739,786
|
M&T Bank Corp.
5.053%, (5.053% to 1-27-33, then SOFR + 1.850%), 01/27/2034
|
| 1,269,000
|
|
| 1,154,001
|
Macquarie Group, Ltd.
5.887%, (5.887% to 6-15-33, then SOFR + 2.380%), 06/15/2034 (D)
|
| 419,000
|
|
| 407,017
|
Manufacturers & Traders Trust Company
4.700%, 01/27/2028
|
| 974,000
|
|
| 910,528
|
MetLife, Inc.
5.375%, 07/15/2033
|
| 1,703,000
|
|
| 1,695,274
|
Mizuho Financial Group, Inc.
5.748%, (5.748% to 7-6-33, then 1 Year CMT + 1.900%), 07/06/2034
|
| 1,389,000
|
|
| 1,375,483
|
| Morgan Stanley
|
|
|
|
|
|
| 5.123%, (5.123% to 2-1-28, then SOFR + 1.730%), 02/01/2029
|
| 682,000
|
|
| 668,449
|
| 5.164%, (5.164% to 4-20-28, then SOFR + 1.590%), 04/20/2029
|
| 682,000
|
|
| 668,926
|
| 5.250%, (5.250% to 4-21-33, then SOFR + 1.870%), 04/21/2034
|
| 2,061,000
|
|
| 2,001,887
|
| 5.449%, (5.449% to 7-20-28, then SOFR + 1.630%), 07/20/2029
|
| 1,363,000
|
|
| 1,355,000
|
| 6.342%, (6.342% to 10-18-32, then SOFR + 2.560%), 10/18/2033
|
| 2,349,000
|
|
| 2,460,928
|
| Santander Holdings USA, Inc.
|
|
|
|
|
|
| 6.499%, (6.499% to 3-9-28, then SOFR + 2.356%), 03/09/2029
|
| 1,618,000
|
|
| 1,608,731
|
| 6.565%, (6.565% to 6-12-28, then SOFR + 2.700%), 06/12/2029
|
| 885,000
|
|
| 881,117
|
SBL Holdings, Inc.
5.000%, 02/18/2031 (D)
|
| 790,000
|
|
| 612,808
|
Sumitomo Mitsui Financial Group, Inc.
6.184%, 07/13/2043
|
| 681,000
|
|
| 684,407
|
Svenska Handelsbanken AB
5.500%, 06/15/2028 (D)
|
| 1,330,000
|
|
| 1,310,341
|
Swedbank AB
5.472%, 06/15/2026 (D)
|
| 2,939,000
|
|
| 2,923,978
|
| The Bank of New York Mellon Corp.
|
|
|
|
|
|
| 4.947%, (4.947% to 4-26-26, then SOFR + 1.026%), 04/26/2027
|
| 2,768,000
|
|
| 2,724,658
|
| 4.967%, (4.967% to 4-26-33, then SOFR + 1.606%), 04/26/2034
|
| 3,116,000
|
|
| 2,991,741
|
The Bank of Nova Scotia
5.250%, 06/12/2028
|
| 2,057,000
|
|
| 2,038,910
|
The Charles Schwab Corp.
6.136%, (6.136% to 8-24-33, then SOFR + 2.010%), 08/24/2034
|
| 1,364,000
|
|
| 1,387,323
|
The Goldman Sachs Group, Inc.
1.948%, (1.948% to 10-21-26, then SOFR + 0.913%), 10/21/2027
|
| 1,531,000
|
|
| 1,362,460
|
| Truist Financial Corp.
|
|
|
|
|
|
| 5.867%, (5.867% to 6-8-33, then SOFR + 2.361%), 06/08/2034
|
| 1,709,000
|
|
| 1,693,306
|
| 6.047%, (6.047% to 6-8-26, then SOFR + 2.050%), 06/08/2027
|
| 2,392,000
|
|
| 2,390,328
|
Trust Fibra Uno
6.390%, 01/15/2050 (D)
|
| 682,000
|
|
| 549,434
|
| UBS Group AG
|
|
|
|
|
|
| 4.194%, (4.194% to 4-1-30, then SOFR + 3.730%), 04/01/2031 (D)
|
| 1,013,000
|
|
| 912,133
|
| 4.282%, 01/09/2028 (D)
|
| 3,021,000
|
|
| 2,826,036
|
| 6.442%, (6.442% to 8-11-27, then SOFR + 3.700%), 08/11/2028 (D)
|
| 1,186,000
|
|
| 1,207,683
|
Core Bond Fund (continued)
|
|
| Shares or
Principal
Amount
|
| Value
|
| CORPORATE BONDS (continued)
|
|
|
|
| Financials (continued)
|
|
|
|
|
|
| Wells Fargo & Company
|
|
|
|
|
|
| 4.611%, (4.611% to 4-25-52, then SOFR + 2.130%), 04/25/2053
| $
| 682,000
|
| $
| 577,009
|
| 4.897%, (4.897% to 7-25-32, then SOFR + 2.100%), 07/25/2033
|
| 5,722,000
|
|
| 5,384,042
|
| 5.557%, (5.557% to 7-25-33, then SOFR + 1.990%), 07/25/2034
|
| 1,022,000
|
|
| 1,008,557
|
| 5.574%, (5.574% to 7-25-28, then SOFR + 1.740%), 07/25/2029
|
| 2,044,000
|
|
| 2,035,535
|
|
|
|
|
|
| 97,163,858
|
| Health care – 2.5%
|
|
|
|
|
|
| Abbott Laboratories
|
|
|
|
|
|
| 1.400%, 06/30/2030
|
| 1,547,000
|
|
| 1,260,775
|
| 4.750%, 11/30/2036
|
| 1,377,000
|
|
| 1,367,037
|
| AbbVie, Inc.
|
|
|
|
|
|
| 3.200%, 11/21/2029
|
| 1,880,000
|
|
| 1,694,543
|
| 4.050%, 11/21/2039
|
| 730,000
|
|
| 625,693
|
| 4.250%, 11/21/2049
|
| 3,507,000
|
|
| 2,953,450
|
| 4.300%, 05/14/2036
|
| 447,000
|
|
| 409,512
|
| 4.450%, 05/14/2046
|
| 455,000
|
|
| 393,601
|
| 4.550%, 03/15/2035
|
| 1,720,000
|
|
| 1,626,932
|
| Amgen, Inc.
|
|
|
|
|
|
| 5.250%, 03/02/2025
|
| 3,432,000
|
|
| 3,417,382
|
| 5.650%, 03/02/2053
|
| 3,897,000
|
|
| 3,863,273
|
| Astrazeneca Finance LLC
|
|
|
|
|
|
| 4.875%, 03/03/2028
|
| 1,507,000
|
|
| 1,502,033
|
| 4.900%, 03/03/2030
|
| 2,060,000
|
|
| 2,049,125
|
CVS Health Corp.
4.875%, 07/20/2035
|
| 202,000
|
|
| 187,944
|
DH Europe Finance II Sarl
2.200%, 11/15/2024
|
| 1,691,000
|
|
| 1,626,622
|
| Eli Lilly & Company
|
|
|
|
|
|
| 4.700%, 02/27/2033
|
| 687,000
|
|
| 685,743
|
| 4.875%, 02/27/2053
|
| 692,000
|
|
| 680,585
|
| 4.950%, 02/27/2063
|
| 481,000
|
|
| 469,859
|
| Gilead Sciences, Inc.
|
|
|
|
|
|
| 2.600%, 10/01/2040
|
| 1,069,000
|
|
| 746,840
|
| 4.000%, 09/01/2036
|
| 550,000
|
|
| 485,507
|
| 4.600%, 09/01/2035
|
| 781,000
|
|
| 741,167
|
| HCA, Inc.
|
|
|
|
|
|
| 4.625%, 03/15/2052
|
| 659,000
|
|
| 528,776
|
| 5.200%, 06/01/2028
|
| 1,058,000
|
|
| 1,042,544
|
| 5.900%, 06/01/2053
|
| 2,404,000
|
|
| 2,305,523
|
| Merck & Company, Inc.
|
|
|
|
|
|
| 4.500%, 05/17/2033
|
| 349,000
|
|
| 340,142
|
| 5.000%, 05/17/2053
|
| 696,000
|
|
| 679,796
|
| 5.150%, 05/17/2063
|
| 522,000
|
|
| 509,538
|
| Pfizer Investment Enterprises Pte, Ltd.
|
|
|
|
|
|
| 4.750%, 05/19/2033
|
| 5,431,000
|
|
| 5,344,393
|
| 5.300%, 05/19/2053
|
| 2,253,000
|
|
| 2,253,820
|
| 5.340%, 05/19/2063
|
| 1,031,000
|
|
| 1,015,869
|
Shire Acquisitions Investments Ireland DAC
2.875%, 09/23/2023
|
| 507,000
|
|
| 506,060
|
Takeda Pharmaceutical Company, Ltd.
4.400%, 11/26/2023
|
| 349,000
|
|
| 347,698
|
| UnitedHealth Group, Inc.
|
|
|
|
|
|
| 3.050%, 05/15/2041
|
| 324,000
|
|
| 241,940
|
| 4.000%, 05/15/2029
|
| 1,308,000
|
|
| 1,250,383
|
| 5.200%, 04/15/2063
|
| 711,000
|
|
| 681,498
|
| 5.875%, 02/15/2053
|
| 1,642,000
|
|
| 1,756,123
|
|
|
|
|
|
| 45,591,726
|
| The accompanying notes are an integral part of the financial statements.
| 28
|
|
John Hancock Funds II
Portfolio of Investments —
August 31, 2023 (showing percentage of total net assets)
Core Bond Fund (continued)
|
|
| Shares or
Principal
Amount
|
| Value
|
| CORPORATE BONDS (continued)
|
|
|
|
| Industrials – 2.5%
|
|
|
|
|
|
Adani International Container Terminal Private, Ltd.
3.000%, 02/16/2031 (D)
| $
| 457,500
|
| $
| 346,731
|
AerCap Ireland Capital DAC
1.150%, 10/29/2023
|
| 4,261,000
|
|
| 4,228,350
|
Burlington Northern Santa Fe LLC
4.450%, 01/15/2053
|
| 275,000
|
|
| 245,044
|
| Canadian Pacific Railway Company
|
|
|
|
|
|
| 1.350%, 12/02/2024
|
| 1,531,000
|
|
| 1,451,197
|
| 1.750%, 12/02/2026
|
| 296,000
|
|
| 266,001
|
Crowley Conro LLC
4.181%, 08/15/2043
|
| 730,598
|
|
| 691,585
|
Delta Air Lines, Inc.
4.750%, 10/20/2028 (D)
|
| 2,268,000
|
|
| 2,177,862
|
Ingersoll Rand, Inc.
5.700%, 08/14/2033
|
| 1,376,000
|
|
| 1,395,272
|
| John Deere Capital Corp.
|
|
|
|
|
|
| 4.150%, 09/15/2027
|
| 3,245,000
|
|
| 3,167,454
|
| 4.700%, 06/10/2030
|
| 4,227,000
|
|
| 4,174,477
|
| 4.900%, 03/03/2028
|
| 1,716,000
|
|
| 1,721,618
|
| 4.950%, 07/14/2028
|
| 2,386,000
|
|
| 2,393,887
|
L3Harris Technologies, Inc.
5.400%, 01/15/2027 to 07/31/2033
|
| 4,466,000
|
|
| 4,475,305
|
Lockheed Martin Corp.
4.750%, 02/15/2034
|
| 2,464,000
|
|
| 2,430,766
|
Northrop Grumman Corp.
4.400%, 05/01/2030
|
| 791,000
|
|
| 761,190
|
Quanta Services, Inc.
0.950%, 10/01/2024
|
| 1,228,000
|
|
| 1,164,535
|
| Republic Services, Inc.
|
|
|
|
|
|
| 4.875%, 04/01/2029
|
| 1,033,000
|
|
| 1,019,144
|
| 5.000%, 04/01/2034
|
| 1,033,000
|
|
| 1,014,484
|
RTX Corp.
5.375%, 02/27/2053
|
| 810,000
|
|
| 789,537
|
| The Boeing Company
|
|
|
|
|
|
| 2.196%, 02/04/2026
|
| 2,338,000
|
|
| 2,156,818
|
| 3.250%, 02/01/2035
|
| 757,000
|
|
| 607,743
|
| 3.750%, 02/01/2050
|
| 1,350,000
|
|
| 984,322
|
| 5.805%, 05/01/2050
|
| 1,199,000
|
|
| 1,166,490
|
| Union Pacific Corp.
|
|
|
|
|
|
| 2.375%, 05/20/2031
|
| 655,000
|
|
| 549,733
|
| 2.800%, 02/14/2032
|
| 889,000
|
|
| 759,823
|
| 3.375%, 02/14/2042
|
| 739,000
|
|
| 576,927
|
Waste Management, Inc.
4.875%, 02/15/2029 to 02/15/2034
|
| 4,100,000
|
|
| 4,035,157
|
|
|
|
|
|
| 44,751,452
|
| Information technology – 1.8%
|
|
|
|
|
|
| Apple, Inc.
|
|
|
|
|
|
| 2.375%, 02/08/2041
|
| 501,000
|
|
| 358,057
|
| 2.650%, 05/11/2050 to 02/08/2051
|
| 966,000
|
|
| 642,886
|
| 3.950%, 08/08/2052
|
| 967,000
|
|
| 819,274
|
| 4.000%, 05/10/2028
|
| 2,060,000
|
|
| 2,013,302
|
| 4.150%, 05/10/2030
|
| 1,030,000
|
|
| 1,007,075
|
| 4.850%, 05/10/2053
|
| 348,000
|
|
| 343,391
|
| Broadcom, Inc.
|
|
|
|
|
|
| 2.450%, 02/15/2031 (D)
|
| 1,077,000
|
|
| 868,270
|
| 3.150%, 11/15/2025
|
| 807,000
|
|
| 768,044
|
| 3.469%, 04/15/2034 (D)
|
| 691,000
|
|
| 564,622
|
| 4.926%, 05/15/2037 (D)
|
| 984,000
|
|
| 886,415
|
| Intel Corp.
|
|
|
|
|
|
| 2.800%, 08/12/2041
|
| 592,000
|
|
| 410,840
|
| 5.625%, 02/10/2043
|
| 395,000
|
|
| 393,150
|
| 5.700%, 02/10/2053
|
| 685,000
|
|
| 678,351
|
| 5.900%, 02/10/2063
|
| 960,000
|
|
| 964,959
|
Core Bond Fund (continued)
|
|
| Shares or
Principal
Amount
|
| Value
|
| CORPORATE BONDS (continued)
|
|
|
|
| Information technology (continued)
|
|
|
|
|
|
KLA Corp.
3.300%, 03/01/2050
| $
| 564,000
|
| $
| 405,355
|
| Micron Technology, Inc.
|
|
|
|
|
|
| 3.477%, 11/01/2051
|
| 337,000
|
|
| 217,628
|
| 5.375%, 04/15/2028
|
| 3,450,000
|
|
| 3,391,628
|
| 5.875%, 02/09/2033
|
| 405,000
|
|
| 400,479
|
| NXP BV
|
|
|
|
|
|
| 2.500%, 05/11/2031
|
| 686,000
|
|
| 554,536
|
| 3.250%, 05/11/2041
|
| 675,000
|
|
| 480,744
|
| 4.400%, 06/01/2027
|
| 746,000
|
|
| 717,402
|
| Oracle Corp.
|
|
|
|
|
|
| 4.000%, 07/15/2046
|
| 1,196,000
|
|
| 899,895
|
| 4.375%, 05/15/2055
|
| 415,000
|
|
| 318,844
|
| 5.550%, 02/06/2053
|
| 916,000
|
|
| 851,501
|
| 6.900%, 11/09/2052
|
| 1,540,000
|
|
| 1,677,201
|
Qualcomm, Inc.
6.000%, 05/20/2053
|
| 1,552,000
|
|
| 1,671,949
|
| Texas Instruments, Inc.
|
|
|
|
|
|
| 4.900%, 03/14/2033
|
| 2,751,000
|
|
| 2,764,134
|
| 5.000%, 03/14/2053
|
| 1,719,000
|
|
| 1,671,182
|
| 5.050%, 05/18/2063
|
| 1,030,000
|
|
| 986,826
|
| VMware, Inc.
|
|
|
|
|
|
| 1.000%, 08/15/2024
|
| 2,141,000
|
|
| 2,046,200
|
| 1.400%, 08/15/2026
|
| 2,003,000
|
|
| 1,776,087
|
| 4.700%, 05/15/2030
|
| 1,238,000
|
|
| 1,166,814
|
|
|
|
|
|
| 32,717,041
|
| Materials – 0.5%
|
|
|
|
|
|
| Anglo American Capital PLC
|
|
|
|
|
|
| 4.750%, 03/16/2052 (D)
|
| 1,943,000
|
|
| 1,560,157
|
| 5.500%, 05/02/2033 (D)
|
| 951,000
|
|
| 918,034
|
BHP Billiton Finance USA, Ltd.
4.875%, 02/27/2026
|
| 3,435,000
|
|
| 3,410,951
|
Celanese US Holdings LLC
6.700%, 11/15/2033
|
| 1,364,000
|
|
| 1,369,736
|
| Glencore Finance Canada, Ltd.
|
|
|
|
|
|
| 5.550%, 10/25/2042 (D)
|
| 309,000
|
|
| 282,142
|
| 6.000%, 11/15/2041 (D)
|
| 251,000
|
|
| 241,701
|
| 6.900%, 11/15/2037 (D)
|
| 711,000
|
|
| 752,790
|
Rohm and Haas Company
7.850%, 07/15/2029
|
| 1,095,000
|
|
| 1,210,327
|
|
|
|
|
|
| 9,745,838
|
| Real estate – 1.4%
|
|
|
|
|
|
| Agree LP
|
|
|
|
|
|
| 2.000%, 06/15/2028
|
| 1,289,000
|
|
| 1,081,845
|
| 2.600%, 06/15/2033
|
| 293,000
|
|
| 222,661
|
| 4.800%, 10/01/2032
|
| 646,000
|
|
| 594,646
|
| American Homes 4 Rent LP
|
|
|
|
|
|
| 3.625%, 04/15/2032
|
| 1,186,000
|
|
| 1,016,076
|
| 4.300%, 04/15/2052
|
| 531,000
|
|
| 410,230
|
| American Tower Corp.
|
|
|
|
|
|
| 2.950%, 01/15/2051
|
| 344,000
|
|
| 208,212
|
| 3.125%, 01/15/2027
|
| 581,000
|
|
| 535,076
|
| 5.500%, 03/15/2028
|
| 1,373,000
|
|
| 1,365,729
|
Brixmor Operating Partnership LP
2.500%, 08/16/2031
|
| 1,134,000
|
|
| 891,921
|
| Crown Castle, Inc.
|
|
|
|
|
|
| 1.050%, 07/15/2026
|
| 1,849,000
|
|
| 1,634,435
|
| 2.900%, 03/15/2027 to 04/01/2041
|
| 1,680,000
|
|
| 1,374,516
|
| 3.800%, 02/15/2028
|
| 680,000
|
|
| 632,451
|
| 4.800%, 09/01/2028
|
| 679,000
|
|
| 659,169
|
| 5.000%, 01/11/2028
|
| 2,308,000
|
|
| 2,265,742
|
Essex Portfolio LP
2.550%, 06/15/2031
|
| 612,000
|
|
| 490,044
|
Federal Realty Investment Trust
3.950%, 01/15/2024
|
| 820,000
|
|
| 813,598
|
| The accompanying notes are an integral part of the financial statements.
| 29
|
|
John Hancock Funds II
Portfolio of Investments —
August 31, 2023 (showing percentage of total net assets)
Core Bond Fund (continued)
|
|
| Shares or
Principal
Amount
|
| Value
|
| CORPORATE BONDS (continued)
|
|
|
|
| Real estate (continued)
|
|
|
|
|
|
| Invitation Homes Operating Partnership LP
|
|
|
|
|
|
| 2.000%, 08/15/2031
| $
| 204,000
|
| $
| 156,099
|
| 4.150%, 04/15/2032
|
| 1,181,000
|
|
| 1,051,088
|
Mid-America Apartments LP
4.300%, 10/15/2023
|
| 608,000
|
|
| 606,756
|
NNN REIT, Inc.
5.600%, 10/15/2033
|
| 1,023,000
|
|
| 1,002,463
|
| Realty Income Corp.
|
|
|
|
|
|
| 2.200%, 06/15/2028
|
| 635,000
|
|
| 551,100
|
| 2.850%, 12/15/2032
|
| 859,000
|
|
| 696,198
|
| 4.900%, 07/15/2033
|
| 1,145,000
|
|
| 1,087,248
|
| 5.625%, 10/13/2032
|
| 1,200,000
|
|
| 1,199,542
|
Regency Centers LP
2.950%, 09/15/2029
|
| 1,625,000
|
|
| 1,404,187
|
| STORE Capital Corp.
|
|
|
|
|
|
| 2.700%, 12/01/2031
|
| 412,000
|
|
| 291,490
|
| 2.750%, 11/18/2030
|
| 1,049,000
|
|
| 769,559
|
| 4.500%, 03/15/2028
|
| 682,000
|
|
| 609,629
|
| 4.625%, 03/15/2029
|
| 757,000
|
|
| 651,551
|
Sun Communities Operating LP
4.200%, 04/15/2032
|
| 1,186,000
|
|
| 1,042,938
|
|
|
|
|
|
| 25,316,199
|
| Utilities – 2.1%
|
|
|
|
|
|
American Transmission Systems, Inc.
2.650%, 01/15/2032 (D)
|
| 428,000
|
|
| 350,504
|
| Baltimore Gas & Electric Company
|
|
|
|
|
|
| 2.250%, 06/15/2031
|
| 919,000
|
|
| 752,074
|
| 5.400%, 06/01/2053
|
| 1,030,000
|
|
| 1,015,753
|
CenterPoint Energy Houston Electric LLC
3.600%, 03/01/2052
|
| 679,000
|
|
| 502,776
|
Commonwealth Edison Company
5.300%, 02/01/2053
|
| 276,000
|
|
| 270,249
|
Consolidated Edison Company of New York, Inc.
5.200%, 03/01/2033
|
| 1,924,000
|
|
| 1,921,245
|
Consumers Energy Company
2.500%, 05/01/2060
|
| 559,000
|
|
| 308,909
|
| DTE Electric Company
|
|
|
|
|
|
| 2.950%, 03/01/2050
|
| 1,073,000
|
|
| 711,954
|
| 3.650%, 03/01/2052
|
| 491,000
|
|
| 366,351
|
| Duke Energy Carolinas LLC
|
|
|
|
|
|
| 2.550%, 04/15/2031
|
| 625,000
|
|
| 529,088
|
| 2.850%, 03/15/2032
|
| 1,142,000
|
|
| 963,663
|
| 3.550%, 03/15/2052
|
| 831,000
|
|
| 604,322
|
| 4.950%, 01/15/2033
|
| 1,024,000
|
|
| 1,008,659
|
| 5.350%, 01/15/2053
|
| 1,378,000
|
|
| 1,339,380
|
| Duke Energy Corp.
|
|
|
|
|
|
| 2.550%, 06/15/2031
|
| 673,000
|
|
| 549,688
|
| 3.500%, 06/15/2051
|
| 190,000
|
|
| 130,641
|
Duke Energy Florida LLC
2.400%, 12/15/2031
|
| 916,000
|
|
| 747,559
|
| Duke Energy Progress LLC
|
|
|
|
|
|
| 2.500%, 08/15/2050
|
| 927,000
|
|
| 546,459
|
| 5.250%, 03/15/2033
|
| 684,000
|
|
| 684,515
|
| Entergy Arkansas LLC
|
|
|
|
|
|
| 2.650%, 06/15/2051
|
| 828,000
|
|
| 494,289
|
| 5.150%, 01/15/2033
|
| 1,379,000
|
|
| 1,366,701
|
Eversource Energy
1.650%, 08/15/2030
|
| 1,044,000
|
|
| 821,358
|
| Exelon Corp.
|
|
|
|
|
|
| 5.300%, 03/15/2033
|
| 562,000
|
|
| 554,873
|
| 5.600%, 03/15/2053
|
| 455,000
|
|
| 438,989
|
Israel Electric Corp., Ltd.
3.750%, 02/22/2032 (D)
|
| 490,000
|
|
| 414,638
|
Core Bond Fund (continued)
|
|
| Shares or
Principal
Amount
|
| Value
|
| CORPORATE BONDS (continued)
|
|
|
|
| Utilities (continued)
|
|
|
|
|
|
Jersey Central Power & Light Company
2.750%, 03/01/2032 (D)
| $
| 1,010,000
|
| $
| 822,345
|
| Metropolitan Edison Company
|
|
|
|
|
|
| 4.300%, 01/15/2029 (D)
|
| 1,080,000
|
|
| 1,022,514
|
| 5.200%, 04/01/2028 (D)
|
| 1,034,000
|
|
| 1,021,105
|
MidAmerican Energy Company
2.700%, 08/01/2052
|
| 797,000
|
|
| 483,644
|
| Mississippi Power Company
|
|
|
|
|
|
| 3.100%, 07/30/2051
|
| 1,102,000
|
|
| 703,325
|
| 4.250%, 03/15/2042
|
| 422,000
|
|
| 345,154
|
NSTAR Electric Company
3.100%, 06/01/2051
|
| 567,000
|
|
| 379,834
|
| Pacific Gas & Electric Company
|
|
|
|
|
|
| 2.100%, 08/01/2027
|
| 492,000
|
|
| 424,808
|
| 3.950%, 12/01/2047
|
| 2,093,000
|
|
| 1,395,013
|
| 4.200%, 06/01/2041
|
| 534,000
|
|
| 386,373
|
| 4.500%, 07/01/2040
|
| 316,000
|
|
| 243,353
|
| 4.750%, 02/15/2044
|
| 309,000
|
|
| 236,266
|
| 4.950%, 07/01/2050
|
| 2,938,000
|
|
| 2,271,736
|
| 6.100%, 01/15/2029
|
| 684,000
|
|
| 675,967
|
PacifiCorp
5.500%, 05/15/2054
|
| 1,099,000
|
|
| 973,343
|
PECO Energy Company
2.850%, 09/15/2051
|
| 1,108,000
|
|
| 697,983
|
| Pennsylvania Electric Company
|
|
|
|
|
|
| 3.250%, 03/15/2028 (D)
|
| 895,000
|
|
| 814,867
|
| 5.150%, 03/30/2026 (D)
|
| 690,000
|
|
| 678,819
|
Public Service Company of Oklahoma
3.150%, 08/15/2051
|
| 622,000
|
|
| 406,312
|
| Public Service Electric & Gas Company
|
|
|
|
|
|
| 1.900%, 08/15/2031
|
| 1,577,000
|
|
| 1,259,971
|
| 2.050%, 08/01/2050
|
| 255,000
|
|
| 143,357
|
| 2.700%, 05/01/2050
|
| 430,000
|
|
| 274,916
|
| 5.200%, 08/01/2033
|
| 1,702,000
|
|
| 1,717,897
|
| 5.450%, 08/01/2053
|
| 545,000
|
|
| 552,864
|
Southern California Edison Company
4.125%, 03/01/2048
|
| 693,000
|
|
| 546,169
|
| Virginia Electric and Power Company
|
|
|
|
|
|
| 2.950%, 11/15/2051
|
| 919,000
|
|
| 587,948
|
| 5.450%, 04/01/2053
|
| 311,000
|
|
| 301,003
|
|
|
|
|
|
| 36,761,523
|
| TOTAL CORPORATE BONDS (Cost $423,111,653)
|
|
| $
| 402,178,341
|
| MUNICIPAL BONDS – 0.2%
|
|
|
|
|
|
Board of Regents of the University of Texas System
2.439%, 08/15/2049
|
| 600,000
|
|
| 386,682
|
County of Clark Department of Aviation (Nevada)
6.820%, 07/01/2045
|
| 1,115,000
|
|
| 1,316,739
|
North Texas Tollway Authority
6.718%, 01/01/2049
|
| 459,000
|
|
| 551,693
|
Ohio State University
4.800%, 06/01/2111
|
| 600,000
|
|
| 522,589
|
Port Authority of New York & New Jersey
4.458%, 10/01/2062
|
| 1,010,000
|
|
| 898,027
|
| TOTAL MUNICIPAL BONDS (Cost $4,182,695)
|
| $
| 3,675,730
|
| COLLATERALIZED MORTGAGE OBLIGATIONS – 11.8%
|
|
|
|
| Commercial and residential – 2.2%
|
|
|
|
|
|
| Angel Oak Mortgage Trust LLC
|
|
|
|
|
|
Series 2020-2, Class A1A,
2.531%, 01/26/2065 (D)(E)
|
| 220,820
|
|
| 201,469
|
| The accompanying notes are an integral part of the financial statements.
| 30
|
|
John Hancock Funds II
Portfolio of Investments —
August 31, 2023 (showing percentage of total net assets)
Core Bond Fund (continued)
|
|
| Shares or
Principal
Amount
|
| Value
|
COLLATERALIZED MORTGAGE
OBLIGATIONS (continued)
|
|
|
|
| Commercial and residential (continued)
|
|
|
|
|
|
Angel Oak Mortgage
Trust LLC (continued)
|
|
|
|
|
|
Series 2020-5, Class A1,
1.373%, 05/25/2065 (D)(E)
| $
| 202,631
|
| $
| 185,759
|
Series 2021-6, Class A1,
1.458%, 09/25/2066 (D)(E)
|
| 827,145
|
|
| 652,766
|
BBCMS Mortgage Trust
Series 2018-C2, Class ASB
4.236%, 12/15/2051
|
| 362,585
|
|
| 348,608
|
Bunker Hill Loan Depositary Trust
Series 2019-2, Class A1
2.879%, 07/25/2049 (D)
|
| 684,178
|
|
| 636,380
|
| BX Commercial Mortgage Trust
|
|
|
|
|
|
Series 2021-VOLT, Class A (1 month CME Term SOFR + 0.814%),
6.125%, 09/15/2036 (A)(D)
|
| 3,519,000
|
|
| 3,424,045
|
Series 2021-XL2, Class A (1 month CME Term SOFR + 0.803%),
6.113%, 10/15/2038 (A)(D)
|
| 1,366,814
|
|
| 1,333,796
|
CFCRE Commercial Mortgage Trust
Series 2017-C8, Class ASB
3.367%, 06/15/2050
|
| 388,022
|
|
| 370,925
|
| COLT Mortgage Loan Trust
|
|
|
|
|
|
Series 2021-2, Class A1,
0.924%, 08/25/2066 (D)(E)
|
| 1,106,849
|
|
| 847,381
|
Series 2021-4, Class A1,
1.397%, 10/25/2066 (D)(E)
|
| 1,187,069
|
|
| 928,854
|
Commercial Mortgage Trust (Cantor
Fitzgerald/Deutsche Bank AG)
|
|
|
|
|
|
Series 2013-CR13, Class A4,
4.194%, 11/10/2046 (E)
|
| 612,000
|
|
| 608,381
|
Series 2014-UBS4, Class A4,
3.420%, 08/10/2047
|
| 1,279,000
|
|
| 1,245,032
|
Series 2015-LC23, Class A3,
3.521%, 10/10/2048
|
| 622,767
|
|
| 601,904
|
EQUS Mortgage Trust
Series 2021-EQAZ, Class A (1 month CME Term SOFR + 0.869%)
6.180%, 10/15/2038 (A)(D)
|
| 1,387,972
|
|
| 1,356,602
|
| GS Mortgage Securities Trust
|
|
|
|
|
|
Series 2014-GC18, Class A4,
4.074%, 01/10/2047
|
| 1,530,000
|
|
| 1,516,743
|
Series 2015-GC32, Class A3,
3.498%, 07/10/2048
|
| 625,252
|
|
| 596,922
|
Series 2020-GSA2, Class A4,
1.721%, 12/12/2053
|
| 1,786,000
|
|
| 1,399,347
|
Impact Funding Affordable Multifamily Housing Mortgage Loan Trust
Series 2010-1, Class A1
5.314%, 01/25/2051 (D)
|
| 951,705
|
|
| 923,105
|
JPMBB Commercial Mortgage
Securities Trust
|
|
|
|
|
|
Series 2013-C17, Class A4,
4.199%, 01/15/2047
|
| 318,367
|
|
| 316,063
|
Series 2014-C23, Class A4,
3.670%, 09/15/2047
|
| 532,099
|
|
| 520,192
|
Series 2015-C28, Class A3,
2.912%, 10/15/2048
|
| 1,857,161
|
|
| 1,792,188
|
Series 2015-C30, Class A5,
3.822%, 07/15/2048
|
| 981,000
|
|
| 926,134
|
JPMorgan Chase Commercial Mortgage
Securities Trust
|
|
|
|
|
|
Series 2013-C16, Class A4,
4.166%, 12/15/2046
|
| 339,564
|
|
| 337,861
|
Core Bond Fund (continued)
|
|
| Shares or
Principal
Amount
|
| Value
|
COLLATERALIZED MORTGAGE
OBLIGATIONS (continued)
|
|
|
|
| Commercial and residential (continued)
|
|
|
|
|
|
JPMorgan Chase Commercial Mortgage
Securities Trust (continued)
|
|
|
|
|
|
Series 2016-JP4, Class A3,
3.393%, 12/15/2049
| $
| 346,000
|
| $
| 322,410
|
Med Trust
Series 2021-MDLN, Class A (1 month CME Term SOFR + 1.064%)
6.374%, 11/15/2038 (A)(D)
|
| 2,225,320
|
|
| 2,169,476
|
MFA Trust
Series 2021-NQM2, Class A1
1.029%, 11/25/2064 (D)(E)
|
| 461,837
|
|
| 381,484
|
Morgan Stanley Capital I Trust
Series 2020-HR8, Class A3
1.790%, 07/15/2053
|
| 982,000
|
|
| 776,708
|
New Residential Mortgage Loan Trust
Series 2019-NQM4, Class A1
2.492%, 09/25/2059 (D)(E)
|
| 345,483
|
|
| 319,642
|
NewRez Warehouse Securitization Trust
Series 2021-1, Class A (1 month CME Term SOFR + 0.864%)
6.179%, 05/25/2055 (A)(D)
|
| 2,870,400
|
|
| 2,856,494
|
| Starwood Mortgage Residential Trust
|
|
|
|
|
|
Series 2020-1, Class A1,
2.275%, 02/25/2050 (D)(E)
|
| 124,671
|
|
| 115,316
|
Series 2020-3, Class A1,
1.486%, 04/25/2065 (D)(E)
|
| 537,660
|
|
| 495,739
|
Series 2020-INV1, Class A1,
1.027%, 11/25/2055 (D)(E)
|
| 497,220
|
|
| 436,972
|
Series 2021-1, Class A1,
1.219%, 05/25/2065 (D)(E)
|
| 661,077
|
|
| 564,960
|
Series 2021-4, Class A1,
1.162%, 08/25/2056 (D)(E)
|
| 1,072,446
|
|
| 887,929
|
| Verus Securitization Trust
|
|
|
|
|
|
Series 2019-INV3, Class A1,
2.692%, 11/25/2059 (D)(E)
|
| 451,581
|
|
| 432,795
|
Series 2020-2, Class A1,
2.226%, 05/25/2060 (D)(E)
|
| 229,539
|
|
| 223,727
|
Series 2021-1, Class A1,
0.815%, 01/25/2066 (D)(E)
|
| 843,087
|
|
| 714,990
|
Series 2021-3, Class A1,
1.046%, 06/25/2066 (D)(E)
|
| 779,155
|
|
| 652,720
|
Series 2021-4, Class A1,
0.938%, 07/25/2066 (D)(E)
|
| 978,227
|
|
| 757,663
|
Series 2021-5, Class A1,
1.013%, 09/25/2066 (D)(E)
|
| 2,498,929
|
|
| 2,016,668
|
Series 2021-7, Class A1,
1.829%, 10/25/2066 (D)(E)
|
| 979,617
|
|
| 830,455
|
Series 2021-8, Class A1,
1.824%, 11/25/2066 (D)(E)
|
| 1,057,222
|
|
| 885,538
|
Series 2021-R1, Class A1,
0.820%, 10/25/2063 (D)(E)
|
| 677,194
|
|
| 603,547
|
Series 2021-R3, Class A1,
1.020%, 04/25/2064 (D)(E)
|
| 465,967
|
|
| 409,934
|
Visio Trust
Series 2020-1R, Class A1
1.312%, 11/25/2055 (D)
|
| 524,037
|
|
| 462,610
|
|
|
|
|
|
| 38,388,234
|
| U.S. Government Agency – 9.6%
|
|
|
|
|
|
| Federal Home Loan Mortgage Corp.
|
|
|
|
|
|
Series 264, Class 30,
3.000%, 07/15/2042
|
| 1,584,078
|
|
| 1,420,576
|
Series 271, Class F5 (1 month SOFR + 0.614%),
5.803%, 08/15/2042 (A)
|
| 608,820
|
|
| 588,677
|
| The accompanying notes are an integral part of the financial statements.
| 31
|
|
John Hancock Funds II
Portfolio of Investments —
August 31, 2023 (showing percentage of total net assets)
Core Bond Fund (continued)
|
|
| Shares or
Principal
Amount
|
| Value
|
COLLATERALIZED MORTGAGE
OBLIGATIONS (continued)
|
|
|
|
| U.S. Government Agency (continued)
|
|
|
|
|
|
Federal Home Loan
Mortgage Corp. (continued)
|
|
|
|
|
|
Series 272, Class F1 (1 month SOFR + 0.614%),
5.803%, 08/15/2042 (A)
| $
| 942,864
|
| $
| 911,926
|
Series 280, Class F1 (1 month SOFR + 0.614%),
5.803%, 09/15/2042 (A)
|
| 958,937
|
|
| 927,162
|
Series 4047, Class CX,
3.500%, 05/15/2042
|
| 1,877,000
|
|
| 1,683,269
|
Series 4091, Class EX,
3.375%, 07/15/2042
|
| 685,767
|
|
| 627,595
|
Series 4117, Class HB,
2.500%, 10/15/2042
|
| 646,000
|
|
| 548,019
|
Series 4122, Class FP (1 month SOFR + 0.514%),
5.703%, 10/15/2042 (A)
|
| 725,588
|
|
| 699,930
|
Series 4205, Class PA,
1.750%, 05/15/2043
|
| 818,469
|
|
| 683,838
|
Series 4240, Class FA (1 month SOFR + 0.614%),
5.803%, 08/15/2043 (A)
|
| 1,769,316
|
|
| 1,707,909
|
Series 4248, Class FT (1 month SOFR + 0.614%),
5.803%, 09/15/2043 (A)
|
| 633,617
|
|
| 614,704
|
Series 4286, Class VF (1 month SOFR + 0.564%),
5.753%, 12/15/2043 (A)
|
| 1,422,839
|
|
| 1,376,769
|
Series 4446, Class CP,
2.250%, 03/15/2045
|
| 836,103
|
|
| 721,013
|
Series 4582, Class HA,
3.000%, 09/15/2045
|
| 3,362,581
|
|
| 3,069,211
|
Series 4614, Class FG (1 month SOFR + 0.614%),
5.803%, 09/15/2046 (A)
|
| 768,743
|
|
| 738,972
|
Series 4631, Class FA (1 month SOFR + 0.614%),
5.803%, 11/15/2046 (A)
|
| 1,210,973
|
|
| 1,164,800
|
Series 4719, Class LA,
3.500%, 09/15/2047
|
| 947,339
|
|
| 868,264
|
Series 4719, Class LM,
3.000%, 09/15/2047
|
| 709,558
|
|
| 628,731
|
Series 4742, Class PA,
3.000%, 10/15/2047
|
| 1,104,551
|
|
| 984,561
|
Series 4793, Class FD (1 month SOFR + 0.414%),
5.603%, 06/15/2048 (A)
|
| 266,322
|
|
| 252,930
|
Series 4826, Class KF (1 month SOFR + 0.414%),
5.603%, 09/15/2048 (A)
|
| 555,856
|
|
| 531,319
|
Series 4857, Class JA,
3.350%, 01/15/2049
|
| 3,075,431
|
|
| 2,871,051
|
Series 4880, Class DA,
3.000%, 05/15/2050
|
| 1,669,789
|
|
| 1,493,407
|
Series 4903, Class NF (1 month SOFR + 0.514%),
5.802%, 08/25/2049 (A)
|
| 593,636
|
|
| 571,740
|
Series 4927, Class BG,
3.000%, 11/25/2049
|
| 1,294,403
|
|
| 1,149,873
|
Series 4937, Class MD,
2.500%, 10/25/2049
|
| 1,309,835
|
|
| 1,135,360
|
Series 4941, Class GA,
2.000%, 12/15/2047
|
| 743,170
|
|
| 613,098
|
Core Bond Fund (continued)
|
|
| Shares or
Principal
Amount
|
| Value
|
COLLATERALIZED MORTGAGE
OBLIGATIONS (continued)
|
|
|
|
| U.S. Government Agency (continued)
|
|
|
|
|
|
Federal Home Loan
Mortgage Corp. (continued)
|
|
|
|
|
|
Series 4979, Class UC,
1.500%, 06/25/2050
| $
| 2,400,254
|
| $
| 1,851,556
|
Series 4993, Class KF (1 month SOFR + 0.564%),
5.852%, 07/25/2050 (A)
|
| 4,906,580
|
|
| 4,664,222
|
Series 5004, Class FM (1 month SOFR + 0.464%),
5.752%, 08/25/2050 (A)
|
| 1,038,816
|
|
| 979,851
|
Series 5091, Class AB,
1.500%, 03/25/2051
|
| 2,357,504
|
|
| 1,859,980
|
Series 5116, Class PB,
2.250%, 02/25/2051
|
| 1,355,932
|
|
| 1,133,081
|
Series 5118, Class CA,
1.500%, 10/15/2033
|
| 1,095,000
|
|
| 937,092
|
Series 5119, Class AB,
1.500%, 08/25/2049
|
| 586,281
|
|
| 460,278
|
Series 5119, Class QF (1 month SOFR + 0.200%),
5.488%, 06/25/2051 (A)
|
| 1,481,181
|
|
| 1,380,485
|
Series 5143, Class GA,
2.000%, 06/25/2049
|
| 741,228
|
|
| 592,159
|
Series 5178, Class TP,
2.500%, 04/25/2049
|
| 1,476,956
|
|
| 1,267,432
|
Series 5182, Class D,
2.500%, 11/25/2043
|
| 5,606,956
|
|
| 4,998,468
|
Series 5182, Class M,
2.500%, 05/25/2049
|
| 912,824
|
|
| 786,030
|
Series 5184, Class AB,
2.500%, 05/25/2048
|
| 826,474
|
|
| 716,290
|
Series 5201, Class CA,
2.500%, 07/25/2048
|
| 1,290,520
|
|
| 1,131,240
|
Series 5202, Class BH,
2.000%, 12/25/2047
|
| 860,154
|
|
| 762,278
|
Series 5202, Class LA,
2.500%, 05/25/2049
|
| 1,364,797
|
|
| 1,178,357
|
Series 5203, Class G,
2.500%, 11/25/2048
|
| 606,705
|
|
| 521,046
|
Series 5207, Class PA,
3.000%, 06/25/2051
|
| 1,735,946
|
|
| 1,513,080
|
Series 5220, Class QK,
3.500%, 09/25/2050
|
| 2,597,735
|
|
| 2,417,966
|
Series 5300, Class C,
2.000%, 09/25/2047
|
| 2,051,344
|
|
| 1,856,323
|
Series 5335, Class FB (1 month SOFR + 0.814%),
6.003%, 10/15/2039 (A)
|
| 2,264,000
|
|
| 2,264,844
|
Series KG08, Class A2,
4.134%, 05/25/2033 (E)
|
| 2,214,000
|
|
| 2,091,175
|
| Federal National Mortgage Association
|
|
|
|
|
|
Series 1998-61, Class PL,
6.000%, 11/25/2028
|
| 93,270
|
|
| 93,316
|
Series 2012-111, Class FC (1 month SOFR + 0.514%),
5.802%, 10/25/2042 (A)
|
| 845,638
|
|
| 823,918
|
Series 2012-133, Class JF (1 month SOFR + 0.464%),
5.752%, 12/25/2042 (A)
|
| 804,860
|
|
| 774,379
|
Series 2012-151, Class NX,
1.500%, 01/25/2043
|
| 742,546
|
|
| 615,835
|
Series 2013-11, Class AP,
1.500%, 01/25/2043
|
| 2,863,201
|
|
| 2,505,065
|
| The accompanying notes are an integral part of the financial statements.
| 32
|
|
John Hancock Funds II
Portfolio of Investments —
August 31, 2023 (showing percentage of total net assets)
Core Bond Fund (continued)
|
|
| Shares or
Principal
Amount
|
| Value
|
COLLATERALIZED MORTGAGE
OBLIGATIONS (continued)
|
|
|
|
| U.S. Government Agency (continued)
|
|
|
|
|
|
Federal National
Mortgage Association (continued)
|
|
|
|
|
|
Series 2013-15, Class FA (1 month SOFR + 0.464%),
5.752%, 03/25/2043 (A)
| $
| 969,678
|
| $
| 932,478
|
Series 2013-43, Class BP,
1.750%, 05/25/2043
|
| 1,021,514
|
|
| 855,993
|
Series 2014-25, Class EL,
3.000%, 05/25/2044
|
| 902,594
|
|
| 798,579
|
Series 2014-74, Class PC,
2.500%, 06/25/2044
|
| 774,414
|
|
| 705,495
|
Series 2015-20, Class EF (1 month SOFR + 0.464%),
5.752%, 04/25/2045 (A)
|
| 2,272,018
|
|
| 2,176,787
|
Series 2015-26, Class GF (1 month SOFR + 0.414%),
5.702%, 05/25/2045 (A)
|
| 1,406,468
|
|
| 1,351,105
|
Series 2015-32, Class FA (1 month SOFR + 0.414%),
5.702%, 05/25/2045 (A)
|
| 853,041
|
|
| 814,716
|
Series 2015-48, Class FB (1 month SOFR + 0.414%),
5.702%, 07/25/2045 (A)
|
| 1,049,793
|
|
| 1,003,724
|
Series 2015-8, Class AP,
2.000%, 03/25/2045
|
| 1,701,678
|
|
| 1,461,520
|
Series 2015-84, Class PA,
1.700%, 08/25/2033
|
| 3,124,771
|
|
| 2,811,715
|
Series 2016-48, Class MA,
2.000%, 06/25/2038
|
| 2,953,050
|
|
| 2,639,139
|
Series 2016-57, Class PC,
1.750%, 06/25/2046
|
| 5,955,141
|
|
| 4,882,898
|
Series 2017-13, Class PA,
3.000%, 08/25/2046
|
| 755,154
|
|
| 681,659
|
Series 2017-78, Class FC (1 month SOFR + 0.464%),
5.752%, 10/25/2047 (A)
|
| 1,058,901
|
|
| 1,014,488
|
Series 2018-14, Class KC,
3.000%, 03/25/2048
|
| 1,150,795
|
|
| 1,062,901
|
Series 2018-38, Class MA,
3.300%, 06/25/2048
|
| 1,511,158
|
|
| 1,403,716
|
Series 2018-8, Class KL,
2.500%, 03/25/2047
|
| 798,575
|
|
| 684,917
|
Series 2018-85, Class EA,
3.500%, 12/25/2048
|
| 761,504
|
|
| 710,314
|
Series 2019-15, Class FA (1 month SOFR + 0.614%),
5.902%, 04/25/2049 (A)
|
| 543,946
|
|
| 524,004
|
Series 2019-25, Class PA,
3.000%, 05/25/2048
|
| 2,186,467
|
|
| 1,969,443
|
Series 2019-43, Class FC (1 month SOFR + 0.514%),
5.802%, 08/25/2049 (A)
|
| 1,091,432
|
|
| 1,049,126
|
Series 2019-67, Class FB (1 month SOFR + 0.564%),
5.852%, 11/25/2049 (A)
|
| 538,765
|
|
| 517,787
|
Series 2019-8, Class GA,
3.000%, 03/25/2049
|
| 3,200,611
|
|
| 2,824,134
|
Series 2020-34, Class F (1 month SOFR + 0.564%),
5.852%, 06/25/2050 (A)
|
| 743,768
|
|
| 710,669
|
Series 2020-45, Class JL,
3.000%, 07/25/2040
|
| 2,235,374
|
|
| 1,985,658
|
Series 2020-48, Class AB,
2.000%, 07/25/2050
|
| 1,163,021
|
|
| 942,465
|
Core Bond Fund (continued)
|
|
| Shares or
Principal
Amount
|
| Value
|
COLLATERALIZED MORTGAGE
OBLIGATIONS (continued)
|
|
|
|
| U.S. Government Agency (continued)
|
|
|
|
|
|
Federal National
Mortgage Association (continued)
|
|
|
|
|
|
Series 2020-48, Class DA,
2.000%, 07/25/2050
| $
| 3,520,567
|
| $
| 2,874,899
|
Series 2020-59, Class NC,
3.000%, 08/25/2040
|
| 1,224,128
|
|
| 1,096,777
|
Series 2021-27, Class EC,
1.500%, 05/25/2051
|
| 4,173,816
|
|
| 3,254,051
|
Series 2021-42, Class AC,
2.000%, 02/25/2051
|
| 1,099,370
|
|
| 914,708
|
Series 2021-73, Class A,
2.500%, 11/25/2049
|
| 1,434,884
|
|
| 1,223,596
|
Series 2021-78, Class ND,
1.500%, 11/25/2051
|
| 1,668,045
|
|
| 1,339,396
|
Series 2021-78, Class PA,
2.500%, 11/25/2051
|
| 1,016,324
|
|
| 869,122
|
Series 2021-86, Class MA,
2.500%, 11/25/2047
|
| 2,384,322
|
|
| 2,084,877
|
Series 2021-91, Class AB,
2.500%, 09/25/2049
|
| 1,376,749
|
|
| 1,174,529
|
Series 2022-11, Class A,
2.500%, 07/25/2047
|
| 2,750,849
|
|
| 2,431,982
|
Series 2022-28, Class CA,
2.000%, 01/25/2048
|
| 1,095,795
|
|
| 964,969
|
Series 2022-3, Class N,
2.000%, 10/25/2047
|
| 1,840,555
|
|
| 1,558,777
|
Series 2023-37, Class FH (1 month SOFR + 0.514%),
5.802%, 01/25/2050 (A)
|
| 2,369,408
|
|
| 2,283,539
|
Series 2023-38, Class FC (1 month SOFR + 0.664%),
5.821%, 06/25/2040 (A)
|
| 1,535,000
|
|
| 1,521,329
|
Series 414, Class A35,
3.500%, 10/25/2042
|
| 851,333
|
|
| 784,001
|
Government National
Mortgage Association
|
|
|
|
|
|
Series 2012-141, Class WA,
4.516%, 11/16/2041 (E)
|
| 264,740
|
|
| 254,332
|
Series 2013-152, Class HA,
2.500%, 06/20/2043
|
| 1,300,893
|
|
| 1,169,602
|
Series 2014-181, Class L,
3.000%, 12/20/2044
|
| 774,000
|
|
| 680,928
|
Series 2015-144, Class CA,
2.500%, 10/20/2045
|
| 1,344,096
|
|
| 1,158,697
|
Series 2015-161, Class GF (1 month CME Term SOFR + 0.414%),
5.728%, 11/20/2045 (A)
|
| 728,412
|
|
| 698,921
|
Series 2016-93, Class AB,
1.750%, 07/20/2044
|
| 1,410,621
|
|
| 1,117,340
|
Series 2017-167, Class BQ,
2.500%, 08/20/2044
|
| 750,826
|
|
| 676,970
|
Series 2018-65, Class DC,
3.500%, 05/20/2048
|
| 948,000
|
|
| 845,803
|
Series 2021-227, Class E,
2.500%, 07/20/2050
|
| 5,463,023
|
|
| 4,633,505
|
Series 2021-23, Class MG,
1.500%, 02/20/2051
|
| 3,367,158
|
|
| 2,728,417
|
Series 2021-27, Class BD,
5.000%, 02/20/2051
|
| 872,936
|
|
| 858,997
|
Series 2021-27, Class CW,
5.001%, 02/20/2051 (E)
|
| 1,274,488
|
|
| 1,236,282
|
Series 2021-27, Class NT,
5.000%, 02/20/2051
|
| 999,275
|
|
| 952,248
|
| The accompanying notes are an integral part of the financial statements.
| 33
|
|
John Hancock Funds II
Portfolio of Investments —
August 31, 2023 (showing percentage of total net assets)
Core Bond Fund (continued)
|
|
| Shares or
Principal
Amount
|
| Value
|
COLLATERALIZED MORTGAGE
OBLIGATIONS (continued)
|
|
|
|
| U.S. Government Agency (continued)
|
|
|
|
|
|
Government National
Mortgage Association (continued)
|
|
|
|
|
|
Series 2021-27, Class Q,
5.000%, 02/20/2051
| $
| 882,806
|
| $
| 843,775
|
Series 2021-8, Class CY,
5.000%, 01/20/2051
|
| 894,383
|
|
| 867,687
|
Series 2022-107, Class C,
2.500%, 06/20/2051
|
| 3,773,380
|
|
| 3,152,392
|
Series 2022-191, Class B,
4.000%, 06/20/2041
|
| 5,488,000
|
|
| 5,067,306
|
Series 2022-191, Class BY,
4.000%, 08/20/2041
|
| 6,020,000
|
|
| 5,562,262
|
Series 2022-197, Class LF (1 month SOFR + 0.700%),
5.938%, 11/20/2052 (A)
|
| 3,906,766
|
|
| 3,817,928
|
Series 2022-205, Class A,
2.000%, 09/20/2051
|
| 1,523,453
|
|
| 1,181,656
|
Series 2022-31, Class GH,
2.500%, 12/20/2049
|
| 2,849,952
|
|
| 2,469,534
|
Series 2022-66, Class CG,
3.500%, 04/20/2052
|
| 2,834,931
|
|
| 2,648,109
|
Series 2022-84, Class A,
2.500%, 01/20/2052
|
| 1,116,457
|
|
| 932,806
|
|
|
|
|
|
| 173,207,929
|
| TOTAL COLLATERALIZED MORTGAGE OBLIGATIONS (Cost $225,967,316)
|
| $
| 211,596,163
|
| ASSET BACKED SECURITIES – 10.2%
|
|
|
|
Ally Auto Receivables Trust
Series 2022-3, Class A4
5.070%, 06/15/2031
|
| 666,000
|
|
| 662,165
|
American Express Credit Account Master Trust
Series 2023-1, Class A
4.870%, 05/15/2028
|
| 1,728,000
|
|
| 1,718,237
|
| AmeriCredit Automobile Receivables Trust
|
|
|
|
|
|
Series 2022-2, Class A3
4.380%, 04/18/2028
|
| 1,232,000
|
|
| 1,211,000
|
Series 2023-1, Class A3
5.620%, 11/18/2027
|
| 684,000
|
|
| 683,584
|
Avis Budget Rental Car Funding
AESOP LLC
|
|
|
|
|
|
Series 2019-3A, Class A
2.360%, 03/20/2026 (D)
|
| 1,054,000
|
|
| 1,003,249
|
Series 2020-1A, Class A
2.330%, 08/20/2026 (D)
|
| 869,000
|
|
| 814,420
|
Series 2021-2A, Class A
1.660%, 02/20/2028 (D)
|
| 840,000
|
|
| 735,496
|
Series 2023-1A, Class A
5.250%, 04/20/2029 (D)
|
| 2,366,000
|
|
| 2,315,071
|
Series 2023-2A, Class A
5.200%, 10/20/2027 (D)
|
| 1,350,000
|
|
| 1,327,019
|
Series 2023-4A, Class A
5.490%, 06/20/2029 (D)
|
| 2,885,000
|
|
| 2,839,349
|
Series 2023-6A, Class A
5.810%, 12/20/2029 (D)
|
| 1,271,000
|
|
| 1,270,668
|
BA Credit Card Trust
Series 2023-A1, Class A1
4.790%, 05/15/2028
|
| 552,000
|
|
| 547,397
|
BMW Vehicle Lease Trust
Series 2023-1, Class A4
5.070%, 06/25/2026
|
| 960,000
|
|
| 952,333
|
Core Bond Fund (continued)
|
|
| Shares or
Principal
Amount
|
| Value
|
| ASSET BACKED SECURITIES (continued)
|
|
|
|
| Capital One Multi-Asset Execution Trust
|
|
|
|
|
|
Series 2022-A2, Class A
3.490%, 05/15/2027
| $
| 1,749,000
|
| $
| 1,695,736
|
Series 2023-A1, Class A
4.420%, 05/15/2028
|
| 1,524,000
|
|
| 1,496,833
|
Capital One Prime Auto Receivables Trust
Series 2023-1, Class A3
4.870%, 02/15/2028
|
| 3,984,000
|
|
| 3,946,914
|
Chase Auto Owner Trust
Series 2022-AA, Class A4
3.990%, 03/27/2028 (D)
|
| 814,000
|
|
| 785,344
|
| College Ave Student Loans LLC
|
|
|
|
|
|
Series 2017-A, Class A1 (1 month CME Term SOFR + 1.764%)
7.079%, 11/26/2046 (A)(D)
|
| 429,279
|
|
| 430,703
|
Series 2018-A, Class A2
4.130%, 12/26/2047 (D)
|
| 572,327
|
|
| 541,431
|
Series 2019-A, Class A2
3.280%, 12/28/2048 (D)
|
| 630,835
|
|
| 583,274
|
| Discover Card Execution Note Trust
|
|
|
|
|
|
Series 2022-A3, Class A3
3.560%, 07/15/2027
|
| 3,395,000
|
|
| 3,286,581
|
Series 2023-A1, Class A
4.310%, 03/15/2028
|
| 3,155,000
|
|
| 3,089,568
|
Series 2023-A2, Class A
4.930%, 06/15/2028
|
| 5,801,000
|
|
| 5,768,972
|
| Enterprise Fleet Financing LLC
|
|
|
|
|
|
Series 2023-1, Class A2
5.510%, 01/22/2029 (D)
|
| 1,916,000
|
|
| 1,904,566
|
Series 2023-1, Class A3
5.420%, 10/22/2029 (D)
|
| 1,181,000
|
|
| 1,172,269
|
| Ford Credit Auto Owner Trust
|
|
|
|
|
|
Series 2022-1, Class A
3.880%, 11/15/2034 (D)
|
| 2,744,000
|
|
| 2,608,438
|
Series 2022-D, Class A4
5.300%, 03/15/2028
|
| 603,000
|
|
| 601,406
|
Series 2023-1, Class A
4.850%, 08/15/2035 (D)
|
| 2,575,000
|
|
| 2,538,234
|
Series 2023-2, Class A
5.280%, 02/15/2036 (D)
|
| 3,398,000
|
|
| 3,410,725
|
Series 2023-A, Class A3
4.650%, 02/15/2028
|
| 2,798,000
|
|
| 2,756,640
|
Ford Credit Floorplan Master Owner Trust A
Series 2023-1, Class A1
4.920%, 05/15/2028 (D)
|
| 2,563,000
|
|
| 2,532,638
|
| GM Financial Automobile Leasing Trust
|
|
|
|
|
|
Series 2023-1, Class A4
5.160%, 01/20/2027
|
| 1,433,000
|
|
| 1,422,240
|
Series 2023-2, Class A3
5.050%, 07/20/2026
|
| 1,957,000
|
|
| 1,941,797
|
Series 2023-2, Class A4
5.090%, 05/20/2027
|
| 897,000
|
|
| 886,556
|
Series 2023-3, Class A3
5.380%, 11/20/2026
|
| 1,795,000
|
|
| 1,794,510
|
Series 2023-3, Class A4
5.440%, 08/20/2027
|
| 610,000
|
|
| 609,938
|
GM Financial Consumer Automobile
Receivables Trust
|
|
|
|
|
|
Series 2022-2, Class A3
3.100%, 02/16/2027
|
| 2,531,000
|
|
| 2,456,346
|
Series 2022-4, Class A3
4.820%, 08/16/2027
|
| 1,082,000
|
|
| 1,071,566
|
| GM Financial Revolving Receivables Trust
|
|
|
|
|
|
Series 2022-1, Class A
5.910%, 10/11/2035 (D)
|
| 1,576,000
|
|
| 1,610,264
|
| The accompanying notes are an integral part of the financial statements.
| 34
|
|
John Hancock Funds II
Portfolio of Investments —
August 31, 2023 (showing percentage of total net assets)
Core Bond Fund (continued)
|
|
| Shares or
Principal
Amount
|
| Value
|
| ASSET BACKED SECURITIES (continued)
|
|
|
|
GM Financial Revolving
Receivables Trust (continued)
|
|
|
|
|
|
Series 2023-1, Class A
5.120%, 04/11/2035 (D)
| $
| 1,799,000
|
| $
| 1,794,821
|
GMF Floorplan Owner Revolving Trust
Series 2023-1, Class A1
5.340%, 06/15/2028 (D)
|
| 3,348,000
|
|
| 3,344,089
|
Hertz Vehicle Financing III LLC
Series 2023-4A, Class A
6.150%, 03/25/2030 (D)
|
| 2,033,000
|
|
| 2,037,520
|
| Hertz Vehicle Financing LLC
|
|
|
|
|
|
Series 2021-2A, Class A
1.680%, 12/27/2027 (D)
|
| 1,441,000
|
|
| 1,269,854
|
Series 2022-1A, Class A
1.990%, 06/25/2026 (D)
|
| 2,291,000
|
|
| 2,145,505
|
Series 2022-4A, Class A
3.730%, 09/25/2026 (D)
|
| 1,680,000
|
|
| 1,611,658
|
Series 2023-2A, Class A
5.570%, 09/25/2029 (D)
|
| 3,193,000
|
|
| 3,152,718
|
Honda Auto Receivables Owner Trust
Series 2023-1, Class A3
5.040%, 04/21/2027
|
| 2,752,000
|
|
| 2,735,850
|
Hyundai Auto Lease Securitization Trust
Series 2023-B, Class A4
5.170%, 04/15/2027 (D)
|
| 1,433,000
|
|
| 1,412,938
|
| Hyundai Auto Receivables Trust
|
|
|
|
|
|
Series 2021-C, Class A4
1.030%, 12/15/2027
|
| 963,000
|
|
| 886,274
|
Series 2022-A, Class A3
2.220%, 10/15/2026
|
| 1,779,000
|
|
| 1,712,932
|
Series 2022-A, Class A4
2.350%, 04/17/2028
|
| 606,000
|
|
| 568,757
|
Series 2023-A, Class A4
4.480%, 07/17/2028
|
| 1,261,000
|
|
| 1,237,391
|
Series 2023-B, Class A3
5.480%, 04/17/2028
|
| 781,000
|
|
| 785,108
|
Mercedes-Benz Auto Lease Trust
Series 2023-A, Class A3
4.740%, 01/15/2027
|
| 1,925,000
|
|
| 1,901,579
|
| Mercedes-Benz Auto Receivables Trust
|
|
|
|
|
|
Series 2022-1, Class A4
5.250%, 02/15/2029
|
| 1,392,000
|
|
| 1,394,227
|
Series 2023-1, Class A4
4.310%, 04/16/2029
|
| 1,131,000
|
|
| 1,104,047
|
| Navient Private Education Loan Trust
|
|
|
|
|
|
Series 2014-AA, Class A3 (1 month CME Term SOFR + 1.714%)
7.025%, 10/15/2031 (A)(D)
|
| 512,417
|
|
| 513,670
|
Series 2016-AA, Class A2B (1 month CME Term SOFR + 2.264%)
7.575%, 12/15/2045 (A)(D)
|
| 154,265
|
|
| 155,149
|
| Navient Private Education Refi Loan Trust
|
|
|
|
|
|
Series 2018-A, Class A2
3.190%, 02/18/2042 (D)
|
| 3,190
|
|
| 3,188
|
Series 2018-DA, Class A2A
4.000%, 12/15/2059 (D)
|
| 650,235
|
|
| 621,424
|
Series 2019-CA, Class A2
3.130%, 02/15/2068 (D)
|
| 1,184,085
|
|
| 1,123,434
|
Series 2019-D, Class A2A
3.010%, 12/15/2059 (D)
|
| 1,780,533
|
|
| 1,647,481
|
Series 2019-FA, Class A2
2.600%, 08/15/2068 (D)
|
| 942,848
|
|
| 868,509
|
Series 2020-BA, Class A2
2.120%, 01/15/2069 (D)
|
| 451,104
|
|
| 410,789
|
Series 2020-EA, Class A
1.690%, 05/15/2069 (D)
|
| 126,923
|
|
| 113,623
|
Core Bond Fund (continued)
|
|
| Shares or
Principal
Amount
|
| Value
|
| ASSET BACKED SECURITIES (continued)
|
|
|
|
Navient Private Education Refi
Loan Trust (continued)
|
|
|
|
|
|
Series 2020-GA, Class A
1.170%, 09/16/2069 (D)
| $
| 45,899
|
| $
| 40,805
|
Series 2021-BA, Class A
0.940%, 07/15/2069 (D)
|
| 399,541
|
|
| 346,247
|
Series 2021-CA, Class A
1.060%, 10/15/2069 (D)
|
| 107,005
|
|
| 91,548
|
Series 2021-EA, Class A
0.970%, 12/16/2069 (D)
|
| 2,725,924
|
|
| 2,294,542
|
Series 2021-FA, Class A
1.110%, 02/18/2070 (D)
|
| 1,453,514
|
|
| 1,222,432
|
Series 2021-GA, Class A
1.580%, 04/15/2070 (D)
|
| 427,636
|
|
| 368,743
|
Series 2022-A, Class A
2.230%, 07/15/2070 (D)
|
| 3,646,647
|
|
| 3,183,932
|
| Navient Student Loan Trust
|
|
|
|
|
|
Series 2019-BA, Class A2A
3.390%, 12/15/2059 (D)
|
| 1,063,344
|
|
| 1,007,690
|
Series 2021-3A, Class A1A
1.770%, 08/25/2070 (D)
|
| 1,582,654
|
|
| 1,363,916
|
| Nelnet Student Loan Trust
|
|
|
|
|
|
Series 2004-3, Class A5 (3 month SOFR + 0.442%)
5.496%, 10/27/2036 (A)
|
| 132,161
|
|
| 129,270
|
Series 2004-4, Class A5 (3 month SOFR + 0.422%)
5.476%, 01/25/2037 (A)
|
| 1,195,400
|
|
| 1,177,894
|
Series 2005-1, Class A5 (3 month SOFR + 0.372%)
5.426%, 10/25/2033 (A)
|
| 2,420,655
|
|
| 2,367,484
|
Series 2005-2, Class A5 (3 month SOFR + 0.362%)
5.328%, 03/23/2037 (A)
|
| 2,725,708
|
|
| 2,672,150
|
Series 2005-3, Class A5 (3 month SOFR + 0.382%)
5.348%, 12/24/2035 (A)
|
| 1,972,353
|
|
| 1,936,363
|
Series 2005-4, Class A4 (3 month SOFR + 0.442%)
5.408%, 03/22/2032 (A)
|
| 319,946
|
|
| 306,414
|
| Nissan Auto Lease Trust
|
|
|
|
|
|
Series 2023-B, Class A3
5.690%, 07/15/2026
|
| 3,368,000
|
|
| 3,373,395
|
Series 2023-B, Class A4
5.610%, 11/15/2027
|
| 1,289,000
|
|
| 1,291,937
|
| Nissan Auto Receivables Owner Trust
|
|
|
|
|
|
Series 2022-B, Class A4
4.450%, 11/15/2029
|
| 820,000
|
|
| 804,234
|
Series 2023-A, Class A4
4.850%, 06/17/2030
|
| 667,000
|
|
| 661,449
|
| PenFed Auto Receivables Owner Trust
|
|
|
|
|
|
Series 2022-A, Class A3
3.960%, 04/15/2026 (D)
|
| 1,216,000
|
|
| 1,198,001
|
Series 2022-A, Class A4
4.180%, 12/15/2028 (D)
|
| 598,000
|
|
| 582,887
|
| Santander Drive Auto Receivables Trust
|
|
|
|
|
|
Series 2022-2, Class A3
2.980%, 10/15/2026
|
| 1,876,372
|
|
| 1,859,018
|
Series 2022-3, Class A3
3.400%, 12/15/2026
|
| 977,337
|
|
| 966,638
|
Series 2022-4, Class A3
4.140%, 02/16/2027
|
| 1,697,000
|
|
| 1,680,570
|
Series 2022-5, Class A3
4.110%, 08/17/2026
|
| 1,434,000
|
|
| 1,423,530
|
Series 2022-6, Class A3
4.490%, 11/16/2026
|
| 3,031,000
|
|
| 3,007,038
|
| The accompanying notes are an integral part of the financial statements.
| 35
|
|
John Hancock Funds II
Portfolio of Investments —
August 31, 2023 (showing percentage of total net assets)
Core Bond Fund (continued)
|
|
| Shares or
Principal
Amount
|
| Value
|
| ASSET BACKED SECURITIES (continued)
|
|
|
|
Santander Drive Auto
Receivables Trust (continued)
|
|
|
|
|
|
Series 2022-7, Class A3
5.750%, 04/15/2027
| $
| 685,000
|
| $
| 682,954
|
| SMB Private Education Loan Trust
|
|
|
|
|
|
Series 2016-B, Class A2A
2.430%, 02/17/2032 (D)
|
| 78,585
|
|
| 76,022
|
Series 2016-B, Class A2B (1 month CME Term SOFR + 1.564%)
6.875%, 02/17/2032 (A)(D)
|
| 129,332
|
|
| 129,367
|
Series 2018-C, Class A2A
3.630%, 11/15/2035 (D)
|
| 499,874
|
|
| 477,925
|
Series 2020-B, Class A1A
1.290%, 07/15/2053 (D)
|
| 846,924
|
|
| 756,363
|
Series 2020-PTA, Class A2A
1.600%, 09/15/2054 (D)
|
| 1,215,501
|
|
| 1,083,009
|
Series 2020-PTB, Class A2A
1.600%, 09/15/2054 (D)
|
| 3,637,115
|
|
| 3,239,858
|
Series 2021-A, Class APT1
1.070%, 01/15/2053 (D)
|
| 2,912,852
|
|
| 2,510,204
|
Series 2021-B, Class A
1.310%, 07/17/2051 (D)
|
| 733,446
|
|
| 648,775
|
Series 2021-D, Class A1A
1.340%, 03/17/2053 (D)
|
| 2,310,001
|
|
| 2,041,040
|
Series 2021-E, Class A1A
1.680%, 02/15/2051 (D)
|
| 1,647,832
|
|
| 1,475,060
|
Series 2023-B, Class A1B (1 month SOFR + 1.800%)
6.989%, 10/16/2056 (A)(D)
|
| 1,607,034
|
|
| 1,621,071
|
| SoFi Professional Loan Program LLC
|
|
|
|
|
|
Series 2017-D, Class A2FX
2.650%, 09/25/2040 (D)
|
| 190,322
|
|
| 181,439
|
Series 2020-C, Class AFX
1.950%, 02/15/2046 (D)
|
| 143,512
|
|
| 128,594
|
Series 2021-A, Class AFX
1.030%, 08/17/2043 (D)
|
| 499,860
|
|
| 422,214
|
Series 2021-B, Class AFX
1.140%, 02/15/2047 (D)
|
| 1,154,854
|
|
| 963,137
|
| Synchrony Card Funding LLC
|
|
|
|
|
|
Series 2022-A2, Class A
3.860%, 07/15/2028
|
| 902,000
|
|
| 876,043
|
Series 2023-A1, Class A
5.540%, 07/15/2029
|
| 5,777,000
|
|
| 5,802,849
|
T-Mobile US Trust
Series 2022-1A, Class A
4.910%, 05/22/2028 (D)
|
| 1,285,000
|
|
| 1,272,224
|
| Toyota Auto Receivables Owner Trust
|
|
|
|
|
|
Series 2022-D, Class A4
5.430%, 04/17/2028
|
| 757,000
|
|
| 764,736
|
Series 2023-A, Class A4
4.420%, 08/15/2028
|
| 1,064,000
|
|
| 1,042,307
|
Series 2023-B, Class A3
4.710%, 02/15/2028
|
| 1,672,000
|
|
| 1,655,504
|
Series 2023-C, Class A3
5.160%, 04/17/2028
|
| 2,819,000
|
|
| 2,812,066
|
| Verizon Master Trust
|
|
|
|
|
|
Series 2022-2, Class A
1.530%, 07/20/2028
|
| 1,023,000
|
|
| 968,023
|
Series 2022-4, Class A (3.400% to 6-20-25, then 4.150% thereafter)
3.400%, 11/20/2028
|
| 2,260,000
|
|
| 2,178,301
|
Series 2022-6, Class A (3.670% to 7-20-25, then 4.420% thereafter)
3.670%, 01/22/2029
|
| 1,676,000
|
|
| 1,623,858
|
Series 2023-1, Class A (4.490% to 1-20-26, then 5.240% thereafter)
4.490%, 01/22/2029
|
| 2,468,000
|
|
| 2,428,045
|
Core Bond Fund (continued)
|
|
| Shares or
Principal
Amount
|
| Value
|
| ASSET BACKED SECURITIES (continued)
|
|
|
|
| Verizon Master Trust (continued)
|
|
|
|
|
|
Series 2023-2, Class A
4.890%, 04/13/2028
| $
| 925,000
|
| $
| 916,141
|
Series 2023-4, Class A1A
5.160%, 06/20/2029
|
| 4,573,000
|
|
| 4,570,114
|
Volkswagen Auto Loan Enhanced Trust
Series 2023-1, Class A3
5.020%, 06/20/2028
|
| 1,870,000
|
|
| 1,862,059
|
World Omni Select Auto Trust
Series 2023-A, Class A2A
5.920%, 03/15/2027
|
| 1,612,000
|
|
| 1,609,737
|
| TOTAL ASSET BACKED SECURITIES (Cost $189,927,529)
|
|
| $
| 183,753,178
|
| SHORT-TERM INVESTMENTS – 5.5%
|
|
|
|
| Short-term funds – 5.5%
|
|
|
|
|
|
| State Street Institutional U.S. Government Money Market Fund, Premier Class,
5.2681% (F)
|
| 99,548,456
|
|
| 99,548,456
|
| TOTAL SHORT-TERM INVESTMENTS (Cost $99,548,456)
|
| $
| 99,548,456
|
Total Investments (Core Bond Fund)
(Cost $2,070,820,233) – 110.3%
|
| $
| 1,983,535,430
|
| Other assets and liabilities, net – (10.3%)
|
|
|
| (185,595,371)
|
| TOTAL NET ASSETS – 100.0%
|
|
|
| $
| 1,797,940,059
|
SALE COMMITMENTS
OUTSTANDING - (0.3)%
|
|
|
|
|
| U.S. Government Agency – (0.3%)
|
|
|
|
|
|
Federal National Mortgage Association
3.500%, TBA (C)
| $
| (6,000,000)
|
| $
| (5,361,328)
|
| TOTAL SALE COMMITMENTS OUTSTANDING (Proceeds received $5,407,734)
|
| $
| (5,361,328)
|
| Security Abbreviations and Legend
|
| CME
| Chicago Mercantile Exchange
|
| CMT
| Constant Maturity Treasury
|
| LIBOR
| London Interbank Offered Rate
|
| SOFR
| Secured Overnight Financing Rate
|
| TBA
| To Be Announced. A forward mortgage-backed securities trade issued by a U.S. Government Agency, to be delivered at an agreed-upon future settlement date.
|
| (A)
| Variable rate obligation. The coupon rate shown represents the rate at period end.
|
| (B)
| Zero coupon bonds are issued at a discount from their principal amount in lieu of paying interest periodically. Rate shown is the effective yield at period end.
|
| (C)
| Security purchased or sold on a when-issued or delayed delivery basis.
|
| (D)
| These securities are exempt from registration under Rule 144A of the Securities Act of 1933. Such securities may be resold, normally to qualified institutional buyers, in transactions
exempt from registration.
|
| (E)
| Variable or floating rate security, the interest rate of which adjusts periodically based on a weighted average of interest rates and prepayments on the underlying pool of assets. The
interest rate shown is the current rate as of period end.
|
| (F)
| The rate shown is the annualized seven-day yield as of 8-31-23.
|
| The accompanying notes are an integral part of the financial statements.
| 36
|
|
John Hancock Funds II
Portfolio of Investments —
August 31, 2023 (showing percentage of total net assets)
Health Sciences Fund
|
|
| Shares or
Principal
Amount
|
| Value
|
| COMMON STOCKS – 99.1%
|
|
|
|
| Consumer discretionary – 0.1%
|
|
|
|
|
|
| Specialty retail – 0.1%
|
|
|
|
| Warby Parker, Inc., Class A (A)
|
| 16,006
|
| $
| 192,232
|
| Financials – 0.0%
|
|
|
|
|
|
| Insurance – 0.0%
|
|
|
|
| Oscar Health, Inc., Class A (A)
|
| 7,400
|
|
| 46,398
|
| Health care – 98.9%
|
|
|
|
|
|
| Biotechnology – 30.5%
|
|
|
|
| 4D Molecular Therapeutics, Inc. (A)
|
| 1,500
|
|
| 24,420
|
| 89bio, Inc. (A)
|
| 3,500
|
|
| 59,990
|
| Aadi Bioscience, Inc. (A)
|
| 4,411
|
|
| 27,789
|
| AbbVie, Inc.
|
| 11,631
|
|
| 1,709,292
|
| ACADIA Pharmaceuticals, Inc. (A)
|
| 32,443
|
|
| 876,610
|
| ACELYRIN, Inc. (A)
|
| 13,912
|
|
| 352,391
|
| ADC Therapeutics SA (A)
|
| 23,441
|
|
| 28,129
|
| Agios Pharmaceuticals, Inc. (A)
|
| 6,382
|
|
| 175,058
|
| Akero Therapeutics, Inc. (A)
|
| 13,167
|
|
| 653,478
|
| Alector, Inc. (A)
|
| 15,178
|
|
| 82,720
|
| Alkermes PLC (A)
|
| 5,600
|
|
| 163,464
|
| Allakos, Inc. (A)
|
| 26,930
|
|
| 77,558
|
| Allogene Therapeutics, Inc. (A)
|
| 46,738
|
|
| 181,811
|
| Alnylam Pharmaceuticals, Inc. (A)
|
| 24,316
|
|
| 4,810,191
|
| Alpine Immune Sciences, Inc. (A)
|
| 4,400
|
|
| 54,340
|
| Ambrx Biopharma, Inc., ADR (A)
|
| 14,299
|
|
| 201,902
|
| Amgen, Inc.
|
| 7,023
|
|
| 1,800,276
|
| AnaptysBio, Inc. (A)
|
| 3,200
|
|
| 62,976
|
| Apellis Pharmaceuticals, Inc. (A)
|
| 14,189
|
|
| 598,918
|
| Apogee Therapeutics, Inc. (A)
|
| 9,380
|
|
| 215,177
|
| Arcellx, Inc. (A)
|
| 7,106
|
|
| 254,679
|
| Ardelyx, Inc. (A)
|
| 26,309
|
|
| 112,076
|
| Argenx SE, ADR (A)
|
| 12,549
|
|
| 6,305,747
|
| Ascendis Pharma A/S, ADR (A)
|
| 13,128
|
|
| 1,286,807
|
| Aura Biosciences, Inc. (A)
|
| 11,763
|
|
| 122,100
|
| Avidity Biosciences, Inc. (A)
|
| 36,946
|
|
| 279,312
|
| BeiGene, Ltd., ADR (A)
|
| 10,875
|
|
| 2,257,106
|
| Bicycle Therapeutics PLC, ADR (A)
|
| 11,039
|
|
| 239,988
|
| Biogen, Inc. (A)
|
| 5,144
|
|
| 1,375,300
|
| Biohaven, Ltd. (A)
|
| 21,046
|
|
| 384,931
|
| BioMarin Pharmaceutical, Inc. (A)
|
| 16,235
|
|
| 1,483,554
|
| Blueprint Medicines Corp. (A)
|
| 30,194
|
|
| 1,505,473
|
| C4 Therapeutics, Inc. (A)
|
| 7,349
|
|
| 21,312
|
| Caribou Biosciences, Inc. (A)
|
| 4,000
|
|
| 23,560
|
| Celldex Therapeutics, Inc. (A)
|
| 7,307
|
|
| 203,865
|
| Centessa Pharmaceuticals PLC, ADR (A)
|
| 34,369
|
|
| 259,142
|
| Cerevel Therapeutics Holdings, Inc. (A)
|
| 35,011
|
|
| 829,761
|
| Crinetics Pharmaceuticals, Inc. (A)
|
| 7,000
|
|
| 121,240
|
| CRISPR Therapeutics AG (A)
|
| 7,406
|
|
| 370,374
|
| CureVac NV (A)
|
| 35,900
|
|
| 320,587
|
| Cytokinetics, Inc. (A)
|
| 10,328
|
|
| 360,860
|
| Day One Biopharmaceuticals, Inc. (A)
|
| 14,310
|
|
| 193,042
|
| Denali Therapeutics, Inc. (A)
|
| 20,593
|
|
| 475,492
|
| Disc Medicine, Inc. (A)
|
| 1,282
|
|
| 67,882
|
| Dyne Therapeutics, Inc. (A)
|
| 2,300
|
|
| 26,220
|
| Entrada Therapeutics, Inc. (A)
|
| 15,167
|
|
| 223,258
|
| Exact Sciences Corp. (A)
|
| 23,652
|
|
| 1,978,963
|
| Exelixis, Inc. (A)
|
| 34,796
|
|
| 779,082
|
| Fate Therapeutics, Inc. (A)
|
| 22,456
|
|
| 56,365
|
| Generation Bio Company (A)
|
| 45,593
|
|
| 217,935
|
| Genmab A/S (A)
|
| 3,594
|
|
| 1,376,988
|
| Gossamer Bio, Inc. (A)
|
| 21,700
|
|
| 22,568
|
| Icosavax, Inc. (A)
|
| 3,500
|
|
| 27,090
|
| Ideaya Biosciences, Inc. (A)
|
| 8,378
|
|
| 245,978
|
| IGM Biosciences, Inc. (A)
|
| 16,325
|
|
| 116,724
|
| Immatics NV (A)
|
| 18,386
|
|
| 217,690
|
| Immuneering Corp., Class A (A)
|
| 37,514
|
|
| 338,001
|
Health Sciences Fund (continued)
|
|
| Shares or
Principal
Amount
|
| Value
|
| COMMON STOCKS (continued)
|
|
|
|
| Biotechnology (continued)
|
|
|
|
| Immunocore Holdings PLC, ADR (A)
|
| 32,593
|
| $
| 1,834,008
|
| ImmunoGen, Inc. (A)
|
| 28,505
|
|
| 451,519
|
| Immunome, Inc. (A)
|
| 15,000
|
|
| 96,750
|
| Immunovant, Inc. (A)
|
| 3,800
|
|
| 86,298
|
| Incyte Corp. (A)
|
| 11,510
|
|
| 742,740
|
| Insmed, Inc. (A)
|
| 41,102
|
|
| 899,723
|
| Intellia Therapeutics, Inc. (A)
|
| 5,442
|
|
| 203,966
|
| Ionis Pharmaceuticals, Inc. (A)
|
| 19,240
|
|
| 774,795
|
| Iovance Biotherapeutics, Inc. (A)
|
| 43,815
|
|
| 264,643
|
| Karuna Therapeutics, Inc. (A)
|
| 13,488
|
|
| 2,532,507
|
| Keros Therapeutics, Inc. (A)
|
| 5,907
|
|
| 207,395
|
| Krystal Biotech, Inc. (A)
|
| 3,302
|
|
| 411,033
|
| Kymera Therapeutics, Inc. (A)
|
| 19,426
|
|
| 370,648
|
| Leap Therapeutics, Inc. (A)
|
| 283
|
|
| 631
|
| Legend Biotech Corp., ADR (A)
|
| 28,409
|
|
| 1,970,448
|
| LianBio, ADR (A)
|
| 47,800
|
|
| 86,996
|
| Lyell Immunopharma, Inc. (A)
|
| 97,310
|
|
| 232,571
|
| Mirati Therapeutics, Inc. (A)
|
| 21,363
|
|
| 794,704
|
| Moderna, Inc. (A)
|
| 4,261
|
|
| 481,791
|
| Monte Rosa Therapeutics, Inc. (A)
|
| 35,064
|
|
| 205,826
|
| MoonLake Immunotherapeutics (A)
|
| 17,682
|
|
| 1,017,953
|
| Morphic Holding, Inc. (A)
|
| 11,046
|
|
| 608,414
|
| Neurocrine Biosciences, Inc. (A)
|
| 5,822
|
|
| 633,958
|
| Nuvalent, Inc., Class A (A)
|
| 5,692
|
|
| 259,384
|
| Pharming Group NV (A)
|
| 87,750
|
|
| 111,482
|
| Prelude Therapeutics, Inc. (A)
|
| 17,193
|
|
| 64,130
|
| Prime Medicine, Inc. (A)
|
| 14,441
|
|
| 191,199
|
| Protagonist Therapeutics, Inc. (A)
|
| 15,864
|
|
| 314,424
|
| Prothena Corp. PLC (A)
|
| 14,457
|
|
| 763,619
|
| PTC Therapeutics, Inc. (A)
|
| 11,830
|
|
| 467,285
|
| RAPT Therapeutics, Inc. (A)
|
| 11,675
|
|
| 222,993
|
| Regeneron Pharmaceuticals, Inc. (A)
|
| 13,344
|
|
| 11,028,683
|
| Relay Therapeutics, Inc. (A)
|
| 48,509
|
|
| 495,762
|
| Replimune Group, Inc. (A)
|
| 31,946
|
|
| 652,337
|
| REVOLUTION Medicines, Inc. (A)
|
| 27,457
|
|
| 932,714
|
| Rocket Pharmaceuticals, Inc. (A)
|
| 14,022
|
|
| 219,444
|
| Sage Therapeutics, Inc. (A)
|
| 12,750
|
|
| 255,000
|
| Sana Biotechnology, Inc. (A)
|
| 51,869
|
|
| 277,499
|
| Sarepta Therapeutics, Inc. (A)
|
| 8,756
|
|
| 1,059,564
|
| Scholar Rock Holding Corp. (A)
|
| 43,766
|
|
| 273,538
|
| Senti Biosciences, Inc. (A)
|
| 26,772
|
|
| 17,402
|
| SpringWorks Therapeutics, Inc. (A)
|
| 16,074
|
|
| 452,965
|
| Stoke Therapeutics, Inc. (A)
|
| 11,180
|
|
| 62,832
|
| Taysha Gene Therapies, Inc. (A)
|
| 14,273
|
|
| 45,674
|
| Tenaya Therapeutics, Inc. (A)
|
| 33,831
|
|
| 130,926
|
| Twist Bioscience Corp. (A)
|
| 8,701
|
|
| 191,335
|
| Ultragenyx Pharmaceutical, Inc. (A)
|
| 22,943
|
|
| 844,073
|
| uniQure NV (A)
|
| 6,400
|
|
| 55,744
|
| Vaxcyte, Inc. (A)
|
| 14,507
|
|
| 753,203
|
| Vera Therapeutics, Inc. (A)
|
| 1,600
|
|
| 28,304
|
| Vertex Pharmaceuticals, Inc. (A)
|
| 22,112
|
|
| 7,702,494
|
| Voyager Therapeutics, Inc. (A)
|
| 18,592
|
|
| 186,292
|
| Xencor, Inc. (A)
|
| 14,335
|
|
| 315,083
|
| Xenon Pharmaceuticals, Inc. (A)
|
| 700
|
|
| 27,286
|
| Zai Lab, Ltd., ADR (A)
|
| 25,635
|
|
| 652,923
|
| Zentalis Pharmaceuticals, Inc. (A)
|
| 15,606
|
|
| 414,495
|
|
|
|
|
|
| 81,016,947
|
| Health care equipment and supplies – 15.8%
|
|
|
|
| Baxter International, Inc.
|
| 10,554
|
|
| 428,492
|
| Becton, Dickinson and Company
|
| 16,774
|
|
| 4,687,494
|
| Boston Scientific Corp. (A)
|
| 24,011
|
|
| 1,295,153
|
| DexCom, Inc. (A)
|
| 13,845
|
|
| 1,398,068
|
| Edwards Lifesciences Corp. (A)
|
| 12,273
|
|
| 938,516
|
| Hologic, Inc. (A)
|
| 23,346
|
|
| 1,744,880
|
| Inari Medical, Inc. (A)
|
| 11,541
|
|
| 768,861
|
| The accompanying notes are an integral part of the financial statements.
| 37
|
|
John Hancock Funds II
Portfolio of Investments —
August 31, 2023 (showing percentage of total net assets)
Health Sciences Fund (continued)
|
|
| Shares or
Principal
Amount
|
| Value
|
| COMMON STOCKS (continued)
|
|
|
|
| Health care equipment and supplies (continued)
|
|
|
|
| Insulet Corp. (A)
|
| 6,462
|
| $
| 1,238,830
|
| Intuitive Surgical, Inc. (A)
|
| 29,493
|
|
| 9,221,871
|
| iRhythm Technologies, Inc. (A)
|
| 5,371
|
|
| 555,200
|
| Lantheus Holdings, Inc. (A)
|
| 8,608
|
|
| 589,132
|
| Masimo Corp. (A)
|
| 4,400
|
|
| 502,832
|
| Nevro Corp. (A)
|
| 6,498
|
|
| 130,220
|
| Novocure, Ltd. (A)
|
| 23,582
|
|
| 520,219
|
| Orchestra BioMed Holdings, Inc. (A)
|
| 19,166
|
|
| 119,596
|
| Penumbra, Inc. (A)
|
| 13,567
|
|
| 3,588,472
|
| PROCEPT BioRobotics Corp. (A)
|
| 18,225
|
|
| 621,655
|
| QuidelOrtho Corp. (A)
|
| 4,131
|
|
| 340,229
|
| Shockwave Medical, Inc. (A)
|
| 10,073
|
|
| 2,219,988
|
| STERIS PLC
|
| 1,916
|
|
| 439,894
|
| Stryker Corp.
|
| 27,044
|
|
| 7,668,326
|
| Teleflex, Inc.
|
| 4,930
|
|
| 1,048,808
|
| The Cooper Companies, Inc.
|
| 2,246
|
|
| 830,998
|
| Zimmer Biomet Holdings, Inc.
|
| 9,158
|
|
| 1,090,901
|
|
|
|
|
|
| 41,988,635
|
| Health care providers and services – 18.7%
|
|
|
|
| agilon health, Inc. (A)
|
| 54,437
|
|
| 964,624
|
| Alignment Healthcare, Inc. (A)
|
| 31,904
|
|
| 186,319
|
| Cencora, Inc.
|
| 3,054
|
|
| 537,443
|
| Centene Corp. (A)
|
| 32,357
|
|
| 1,994,809
|
| Elevance Health, Inc.
|
| 19,128
|
|
| 8,454,767
|
| GeneDx Holdings Corp. (A)
|
| 990
|
|
| 4,406
|
| Guardant Health, Inc. (A)
|
| 27,141
|
|
| 1,060,670
|
| HCA Healthcare, Inc.
|
| 7,531
|
|
| 2,088,346
|
| Humana, Inc.
|
| 11,453
|
|
| 5,287,048
|
| McKesson Corp.
|
| 1,900
|
|
| 783,408
|
| Molina Healthcare, Inc. (A)
|
| 13,334
|
|
| 4,135,140
|
| Option Care Health, Inc. (A)
|
| 9,935
|
|
| 346,036
|
| Privia Health Group, Inc. (A)
|
| 14,031
|
|
| 368,314
|
| Surgery Partners, Inc. (A)
|
| 23,510
|
|
| 852,473
|
| Tenet Healthcare Corp. (A)
|
| 1,800
|
|
| 139,608
|
| The Cigna Group
|
| 11,526
|
|
| 3,184,173
|
| UnitedHealth Group, Inc.
|
| 40,313
|
|
| 19,212,370
|
|
|
|
|
|
| 49,599,954
|
| Health care technology – 1.0%
|
|
|
|
| Doximity, Inc., Class A (A)
|
| 13,103
|
|
| 312,376
|
| Schrodinger, Inc. (A)
|
| 12,890
|
|
| 475,512
|
| Sophia Genetics SA (A)
|
| 4,231
|
|
| 10,324
|
| Veeva Systems, Inc., Class A (A)
|
| 8,704
|
|
| 1,816,525
|
|
|
|
|
|
| 2,614,737
|
| Life sciences tools and services – 14.5%
|
|
|
|
| 10X Genomics, Inc., Class A (A)
|
| 20,256
|
|
| 1,050,274
|
| Agilent Technologies, Inc.
|
| 31,796
|
|
| 3,849,542
|
| Avantor, Inc. (A)
|
| 56,259
|
|
| 1,218,007
|
| Bio-Techne Corp.
|
| 9,119
|
|
| 714,930
|
| Bruker Corp.
|
| 18,925
|
|
| 1,241,480
|
| Charles River Laboratories International, Inc. (A)
|
| 2,963
|
|
| 612,808
|
| Danaher Corp.
|
| 27,964
|
|
| 7,410,460
|
| Evotec SE (A)
|
| 13,450
|
|
| 315,221
|
| ICON PLC (A)
|
| 1,856
|
|
| 482,449
|
| Illumina, Inc. (A)
|
| 3,113
|
|
| 514,330
|
| IQVIA Holdings, Inc. (A)
|
| 3,905
|
|
| 869,370
|
| Mettler-Toledo International, Inc. (A)
|
| 695
|
|
| 843,369
|
| Olink Holding AB, ADR (A)
|
| 42,991
|
|
| 710,641
|
| Pacific Biosciences of California, Inc. (A)
|
| 60,092
|
|
| 677,838
|
| Repligen Corp. (A)
|
| 5,539
|
|
| 963,287
|
| Seer, Inc. (A)
|
| 31,895
|
|
| 83,884
|
| Thermo Fisher Scientific, Inc.
|
| 24,863
|
|
| 13,851,177
|
| West Pharmaceutical Services, Inc.
|
| 6,726
|
|
| 2,736,809
|
Health Sciences Fund (continued)
|
|
| Shares or
Principal
Amount
|
| Value
|
| COMMON STOCKS (continued)
|
|
|
|
| Life sciences tools and services (continued)
|
|
|
|
| WuXi Biologics Cayman, Inc. (A)(B)
|
| 68,000
|
| $
| 383,357
|
|
|
|
|
|
| 38,529,233
|
| Pharmaceuticals – 18.4%
|
|
|
|
| Arvinas, Inc. (A)
|
| 11,764
|
|
| 331,862
|
| Astellas Pharma, Inc.
|
| 68,200
|
|
| 1,031,891
|
| AstraZeneca PLC, ADR
|
| 111,627
|
|
| 7,570,543
|
| Catalent, Inc. (A)
|
| 23,051
|
|
| 1,151,858
|
| Daiichi Sankyo Company, Ltd.
|
| 36,100
|
|
| 1,063,277
|
| Eli Lilly & Company
|
| 36,819
|
|
| 20,405,090
|
| EyePoint Pharmaceuticals, Inc. (A)
|
| 7,200
|
|
| 71,352
|
| Longboard Pharmaceuticals, Inc. (A)
|
| 12,631
|
|
| 73,133
|
| Merck & Company, Inc.
|
| 95,056
|
|
| 10,359,203
|
| Novo Nordisk A/S, ADR
|
| 14,381
|
|
| 2,669,401
|
| Nuvation Bio, Inc. (A)
|
| 11,900
|
|
| 19,516
|
| Pfizer, Inc.
|
| 14,200
|
|
| 502,396
|
| Pliant Therapeutics, Inc. (A)
|
| 13,397
|
|
| 226,141
|
| Relmada Therapeutics, Inc. (A)
|
| 2,900
|
|
| 9,802
|
| Roche Holding AG
|
| 4,292
|
|
| 1,259,651
|
| Royalty Pharma PLC, Class A
|
| 27,032
|
|
| 806,094
|
| Structure Therapeutics, Inc., ADR (A)
|
| 13,852
|
|
| 390,488
|
| Theseus Pharmaceuticals, Inc. (A)
|
| 25,222
|
|
| 79,197
|
| Ventyx Biosciences, Inc. (A)
|
| 19,735
|
|
| 661,123
|
| WaVe Life Sciences, Ltd. (A)
|
| 16,200
|
|
| 70,470
|
|
|
|
|
|
| 48,752,488
|
|
|
|
|
|
| 262,501,994
|
| Materials – 0.1%
|
|
|
|
|
|
| Chemicals – 0.1%
|
|
|
|
| Ginkgo Bioworks Holdings, Inc. (A)
|
| 91,101
|
|
| 213,176
|
| TOTAL COMMON STOCKS (Cost $185,141,939)
|
| $
| 262,953,800
|
| PREFERRED SECURITIES – 0.5%
|
|
|
|
|
|
| Health care – 0.5%
|
|
|
|
|
|
| Life sciences tools and services – 0.5%
|
|
|
|
| Sartorius AG
|
| 3,323
|
|
| 1,358,862
|
| TOTAL PREFERRED SECURITIES (Cost $494,302)
|
| $
| 1,358,862
|
| WARRANTS – 0.0%
|
|
|
|
|
|
| EQRx, Inc. (Expiration Date: 12-20-26; Strike Price: $11.50) (A)
|
| 6,524
|
|
| 262
|
| GeneDx Holdings Corp. (Expiration Date: 7-22-26; Strike Price: $11.50) (A)
|
| 7,150
|
|
| 247
|
| SomaLogic, Inc. (Expiration Date: 8-31-26; Strike Price: $11.50) (A)
|
| 2,900
|
|
| 639
|
| TOTAL WARRANTS (Cost $42,435)
|
| $
| 1,148
|
| SHORT-TERM INVESTMENTS – 0.6%
|
|
|
|
| Short-term funds – 0.6%
|
|
|
|
|
|
| State Street Institutional U.S. Government Money Market Fund, Premier Class, 5.2681% (C)
|
| 1,494,082
|
|
| 1,494,082
|
| T. Rowe Price Government Reserve Fund, 5.3678% (C)
|
| 73,342
|
|
| 73,342
|
| TOTAL SHORT-TERM INVESTMENTS (Cost $1,567,424)
|
| $
| 1,567,424
|
Total Investments (Health Sciences Fund)
(Cost $187,246,100) – 100.2%
|
| $
| 265,881,234
|
| Other assets and liabilities, net – (0.2%)
|
|
| (623,746)
|
| TOTAL NET ASSETS – 100.0%
|
| $
| 265,257,488
|
| Security Abbreviations and Legend
|
| ADR
| American Depositary Receipt
|
| (A)
| Non-income producing security.
|
| The accompanying notes are an integral part of the financial statements.
| 38
|
|
John Hancock Funds II
Portfolio of Investments —
August 31, 2023 (showing percentage of total net assets)
Health Sciences Fund (continued)
| (B)
| These securities are exempt from registration under Rule 144A of the Securities Act of 1933. Such securities may be resold, normally to qualified institutional buyers, in transactions
exempt from registration.
|
| (C)
| The rate shown is the annualized seven-day yield as of 8-31-23.
|
High Yield Fund
|
|
| Shares or
Principal
Amount
|
| Value
|
| FOREIGN GOVERNMENT OBLIGATIONS – 0.4%
|
|
|
|
| Argentina – 0.4%
|
|
|
|
|
|
Provincia de Buenos Aires
5.250%, (5.250% to 9-1-23, then 6.375% to 9-1-24, then 6.625% thereafter), 09/01/2037 (A)
| $
| 968,484
|
| $
| 362,926
|
| Republic of Argentina
|
|
|
|
|
|
| 0.750%, (0.750% to 7-9-27, then 1.750% thereafter), 07/09/2030
|
| 716,203
|
|
| 239,047
|
| 1.000%, 07/09/2029
|
| 54,775
|
|
| 17,643
|
| 3.625%, (3.625% to 7-9-24, then 4.125% to 7-9-27, then 4.750% to 7-9-28, then 5.000% thereafter), 07/09/2035
|
| 476,895
|
|
| 140,537
|
|
|
|
|
|
| 760,153
|
| TOTAL FOREIGN GOVERNMENT OBLIGATIONS (Cost $1,264,227)
|
| $
| 760,153
|
| CORPORATE BONDS – 81.8%
|
|
|
|
| Communication services – 11.2%
|
|
|
|
|
|
Accelerate360 Holdings LLC
8.000%, 03/01/2028 (A)
|
| 873,000
|
|
| 901,373
|
Allen Media LLC
10.500%, 02/15/2028 (A)
|
| 1,860,000
|
|
| 1,064,850
|
Altice Financing SA
5.750%, 08/15/2029 (A)
|
| 1,050,000
|
|
| 831,769
|
Altice France Holding SA
10.500%, 05/15/2027 (A)
|
| 770,000
|
|
| 417,802
|
| Altice France SA
|
|
|
|
|
|
| 5.125%, 07/15/2029 (A)
|
| 900,000
|
|
| 636,234
|
| 5.500%, 01/15/2028 (A)
|
| 840,000
|
|
| 629,493
|
AMC Entertainment Holdings, Inc.
7.500%, 02/15/2029 (A)
|
| 1,350,000
|
|
| 921,458
|
| CCO Holdings LLC
|
|
|
|
|
|
| 4.250%, 01/15/2034 (A)
|
| 1,440,000
|
|
| 1,102,748
|
| 4.500%, 05/01/2032
|
| 1,740,000
|
|
| 1,410,609
|
| 4.750%, 02/01/2032 (A)
|
| 350,000
|
|
| 289,625
|
Clear Channel Outdoor Holdings, Inc.
7.500%, 06/01/2029 (A)
|
| 700,000
|
|
| 521,704
|
| CSC Holdings LLC
|
|
|
|
|
|
| 4.500%, 11/15/2031 (A)
|
| 330,000
|
|
| 234,652
|
| 5.000%, 11/15/2031 (A)
|
| 430,000
|
|
| 229,822
|
| 5.750%, 01/15/2030 (A)
|
| 660,000
|
|
| 364,967
|
| 6.500%, 02/01/2029 (A)
|
| 900,000
|
|
| 743,992
|
| 11.250%, 05/15/2028 (A)
|
| 430,000
|
|
| 424,119
|
Directv Financing LLC
5.875%, 08/15/2027 (A)
|
| 950,000
|
|
| 841,907
|
| DISH DBS Corp.
|
|
|
|
|
|
| 5.125%, 06/01/2029
|
| 1,020,000
|
|
| 551,514
|
| 5.750%, 12/01/2028 (A)
|
| 1,210,000
|
|
| 939,287
|
| 5.875%, 11/15/2024
|
| 110,000
|
|
| 102,313
|
| 7.750%, 07/01/2026
|
| 1,800,000
|
|
| 1,346,220
|
Gannett Holdings LLC
6.000%, 11/01/2026 (A)
|
| 860,000
|
|
| 737,708
|
| iHeartCommunications, Inc.
|
|
|
|
|
|
| 4.750%, 01/15/2028 (A)
|
| 30,000
|
|
| 23,121
|
| 5.250%, 08/15/2027 (A)
|
| 780,000
|
|
| 616,766
|
| Match Group Holdings II LLC
|
|
|
|
|
|
| 3.625%, 10/01/2031 (A)
|
| 260,000
|
|
| 211,955
|
High Yield Fund (continued)
|
|
| Shares or
Principal
Amount
|
| Value
|
| CORPORATE BONDS (continued)
|
|
|
|
| Communication services (continued)
|
|
|
|
|
|
| Match Group Holdings II LLC (continued)
|
|
|
|
|
|
| 4.625%, 06/01/2028 (A)
| $
| 720,000
|
| $
| 664,286
|
Playtika Holding Corp.
4.250%, 03/15/2029 (A)
|
| 700,000
|
|
| 605,500
|
Sprint Capital Corp.
8.750%, 03/15/2032
|
| 350,000
|
|
| 417,151
|
Telecom Italia Capital SA
6.000%, 09/30/2034
|
| 570,000
|
|
| 477,590
|
Time Warner Cable LLC
7.300%, 07/01/2038
|
| 400,000
|
|
| 405,219
|
Univision Communications, Inc.
8.000%, 08/15/2028 (A)
|
| 410,000
|
|
| 409,775
|
UPC Holding BV
5.500%, 01/15/2028 (A)
|
| 400,000
|
|
| 356,000
|
Urban One, Inc.
7.375%, 02/01/2028 (A)
|
| 400,000
|
|
| 347,822
|
Virgin Media Secured Finance PLC
5.500%, 05/15/2029 (A)
|
| 550,000
|
|
| 502,755
|
Virgin Media Vendor Financing Notes IV DAC
5.000%, 07/15/2028 (A)
|
| 510,000
|
|
| 451,922
|
Vmed O2 UK Financing I PLC
4.750%, 07/15/2031 (A)
|
| 500,000
|
|
| 417,954
|
ZipRecruiter, Inc.
5.000%, 01/15/2030 (A)
|
| 430,000
|
|
| 360,731
|
|
|
|
|
|
| 21,512,713
|
| Consumer discretionary – 20.1%
|
|
|
|
|
|
Academy, Ltd.
6.000%, 11/15/2027 (A)
|
| 650,000
|
|
| 622,830
|
Adtalem Global Education, Inc.
5.500%, 03/01/2028 (A)
|
| 196,000
|
|
| 182,672
|
American Axle & Manufacturing, Inc.
5.000%, 10/01/2029
|
| 1,000,000
|
|
| 823,254
|
American News Company LLC
8.500%, (8.500% Cash or 10.000% PIK), 09/01/2026 (A)
|
| 718,710
|
|
| 810,346
|
| Bath & Body Works, Inc.
|
|
|
|
|
|
| 5.250%, 02/01/2028
|
| 850,000
|
|
| 815,517
|
| 6.625%, 10/01/2030 (A)
|
| 340,000
|
|
| 331,610
|
| 9.375%, 07/01/2025 (A)
|
| 370,000
|
|
| 387,097
|
Boyne USA, Inc.
4.750%, 05/15/2029 (A)
|
| 480,000
|
|
| 433,204
|
| Caesars Entertainment, Inc.
|
|
|
|
|
|
| 4.625%, 10/15/2029 (A)
|
| 530,000
|
|
| 463,926
|
| 7.000%, 02/15/2030 (A)
|
| 680,000
|
|
| 682,602
|
| 8.125%, 07/01/2027 (A)
|
| 240,000
|
|
| 243,680
|
| Carnival Corp.
|
|
|
|
|
|
| 6.000%, 05/01/2029 (A)
|
| 1,050,000
|
|
| 948,020
|
| 7.000%, 08/15/2029 (A)
|
| 400,000
|
|
| 405,863
|
| 7.625%, 03/01/2026 (A)
|
| 500,000
|
|
| 498,482
|
| 10.500%, 06/01/2030 (A)
|
| 950,000
|
|
| 1,011,874
|
Carnival Holdings Bermuda, Ltd.
10.375%, 05/01/2028 (A)
|
| 620,000
|
|
| 674,302
|
Carriage Purchaser, Inc.
7.875%, 10/15/2029 (A)
|
| 980,000
|
|
| 735,000
|
Carriage Services, Inc.
4.250%, 05/15/2029 (A)
|
| 420,000
|
|
| 364,476
|
Carrols Restaurant Group, Inc.
5.875%, 07/01/2029 (A)
|
| 470,000
|
|
| 404,482
|
Dornoch Debt Merger Sub, Inc.
6.625%, 10/15/2029 (A)
|
| 550,000
|
|
| 474,152
|
Empire Communities Corp.
7.000%, 12/15/2025 (A)
|
| 900,000
|
|
| 868,587
|
Fertitta Entertainment LLC
4.625%, 01/15/2029 (A)
|
| 560,000
|
|
| 484,439
|
| The accompanying notes are an integral part of the financial statements.
| 39
|
|
John Hancock Funds II
Portfolio of Investments —
August 31, 2023 (showing percentage of total net assets)
High Yield Fund (continued)
|
|
| Shares or
Principal
Amount
|
| Value
|
| CORPORATE BONDS (continued)
|
|
|
|
| Consumer discretionary (continued)
|
|
|
|
|
|
Fontainebleau Las Vegas Holdings LLC
11.000%, 06/15/2015 (A)(B)
| $
| 2,983,778
|
| $
| 298
|
Foot Locker, Inc.
4.000%, 10/01/2029 (A)
|
| 760,000
|
|
| 572,029
|
| Ford Motor Company
|
|
|
|
|
|
| 3.250%, 02/12/2032
|
| 530,000
|
|
| 413,723
|
| 6.100%, 08/19/2032
|
| 1,070,000
|
|
| 1,022,417
|
| Ford Motor Credit Company LLC
|
|
|
|
|
|
| 4.000%, 11/13/2030
|
| 1,230,000
|
|
| 1,040,764
|
| 5.113%, 05/03/2029
|
| 1,160,000
|
|
| 1,066,981
|
| 7.350%, 03/06/2030
|
| 520,000
|
|
| 529,252
|
Full House Resorts, Inc.
8.250%, 02/15/2028 (A)
|
| 1,110,000
|
|
| 987,614
|
Marston's Issuer PLC
7.736%, (SONIA + 2.669%), 07/16/2035 (C)
| GBP
| 380,000
|
|
| 336,997
|
Melco Resorts Finance, Ltd.
5.375%, 12/04/2029 (A)
| $
| 650,000
|
|
| 542,704
|
Mohegan Tribal Gaming Authority
13.250%, 12/15/2027 (A)
|
| 650,000
|
|
| 691,340
|
| NCL Corp., Ltd.
|
|
|
|
|
|
| 5.875%, 02/15/2027 (A)
|
| 2,000,000
|
|
| 1,938,096
|
| 7.750%, 02/15/2029 (A)
|
| 800,000
|
|
| 761,061
|
| 8.375%, 02/01/2028 (A)
|
| 1,240,000
|
|
| 1,278,154
|
NMG Holding Company, Inc.
7.125%, 04/01/2026 (A)
|
| 430,000
|
|
| 408,679
|
PetSmart, Inc.
7.750%, 02/15/2029 (A)
|
| 250,000
|
|
| 238,753
|
| Royal Caribbean Cruises, Ltd.
|
|
|
|
|
|
| 3.700%, 03/15/2028
|
| 940,000
|
|
| 818,814
|
| 7.250%, 01/15/2030 (A)
|
| 970,000
|
|
| 984,740
|
| 11.625%, 08/15/2027 (A)
|
| 1,010,000
|
|
| 1,100,522
|
Sands China, Ltd.
5.650%, 08/08/2028
|
| 200,000
|
|
| 188,788
|
Sizzling Platter LLC
8.500%, 11/28/2025 (A)
|
| 460,000
|
|
| 455,562
|
Speedway Motorsports LLC
4.875%, 11/01/2027 (A)
|
| 590,000
|
|
| 545,257
|
StoneMor, Inc.
8.500%, 05/15/2029 (A)
|
| 340,000
|
|
| 283,735
|
Sugarhouse HSP Gaming Prop Mezz LP
5.875%, 05/15/2025 (A)
|
| 280,000
|
|
| 270,911
|
| The Michaels Companies, Inc.
|
|
|
|
|
|
| 5.250%, 05/01/2028 (A)
|
| 540,000
|
|
| 450,225
|
| 7.875%, 05/01/2029 (A)
|
| 1,140,000
|
|
| 790,248
|
TopBuild Corp.
3.625%, 03/15/2029 (A)
|
| 400,000
|
|
| 344,200
|
Upbound Group, Inc.
6.375%, 02/15/2029 (A)
|
| 930,000
|
|
| 844,905
|
| Viking Cruises, Ltd.
|
|
|
|
|
|
| 5.875%, 09/15/2027 (A)
|
| 310,000
|
|
| 289,850
|
| 7.000%, 02/15/2029 (A)
|
| 1,590,000
|
|
| 1,507,638
|
| 9.125%, 07/15/2031 (A)
|
| 1,110,000
|
|
| 1,146,783
|
VOC Escrow, Ltd.
5.000%, 02/15/2028 (A)
|
| 700,000
|
|
| 649,734
|
WW International, Inc.
4.500%, 04/15/2029 (A)
|
| 1,000,000
|
|
| 692,500
|
Wynn Macau, Ltd.
5.625%, 08/26/2028 (A)
|
| 1,490,000
|
|
| 1,314,584
|
| Wynn Resorts Finance LLC
|
|
|
|
|
|
| 5.125%, 10/01/2029 (A)
|
| 510,000
|
|
| 456,555
|
| 7.125%, 02/15/2031 (A)
|
| 390,000
|
|
| 383,255
|
ZF North America Capital, Inc.
7.125%, 04/14/2030 (A)
|
| 520,000
|
|
| 526,772
|
|
|
|
|
|
| 38,540,855
|
High Yield Fund (continued)
|
|
| Shares or
Principal
Amount
|
| Value
|
| CORPORATE BONDS (continued)
|
|
|
|
| Consumer staples – 1.0%
|
|
|
|
|
|
Darling Ingredients, Inc.
6.000%, 06/15/2030 (A)
| $
| 630,000
|
| $
| 615,721
|
Simmons Foods, Inc.
4.625%, 03/01/2029 (A)
|
| 700,000
|
|
| 582,568
|
Triton Water Holdings, Inc.
6.250%, 04/01/2029 (A)
|
| 720,000
|
|
| 612,039
|
|
|
|
|
|
| 1,810,328
|
| Energy – 9.4%
|
|
|
|
|
|
Berry Petroleum Company LLC
7.000%, 02/15/2026 (A)
|
| 1,100,000
|
|
| 1,057,659
|
Blue Racer Midstream LLC
6.625%, 07/15/2026 (A)
|
| 1,100,000
|
|
| 1,081,088
|
Chord Energy Corp.
6.375%, 06/01/2026 (A)
|
| 1,160,000
|
|
| 1,143,319
|
CNX Midstream Partners LP
4.750%, 04/15/2030 (A)
|
| 700,000
|
|
| 604,057
|
Crescent Energy Finance LLC
9.250%, 02/15/2028 (A)
|
| 800,000
|
|
| 818,376
|
| Earthstone Energy Holdings LLC
|
|
|
|
|
|
| 8.000%, 04/15/2027 (A)
|
| 180,000
|
|
| 183,724
|
| 9.875%, 07/15/2031 (A)
|
| 620,000
|
|
| 679,675
|
Endeavor Energy Resources LP
5.750%, 01/30/2028 (A)
|
| 1,000,000
|
|
| 978,200
|
Energy Transfer LP
6.500%, (6.500% to 11-15-26, then 5 Year CMT + 5.694%), 11/15/2026 (D)
|
| 230,000
|
|
| 209,772
|
| EQM Midstream Partners LP
|
|
|
|
|
|
| 5.500%, 07/15/2028
|
| 400,000
|
|
| 382,153
|
| 6.500%, 07/15/2048
|
| 990,000
|
|
| 898,670
|
Hilcorp Energy I LP
6.250%, 04/15/2032 (A)
|
| 670,000
|
|
| 614,835
|
| Howard Midstream Energy Partners LLC
|
|
|
|
|
|
| 6.750%, 01/15/2027 (A)
|
| 810,000
|
|
| 780,057
|
| 8.875%, 07/15/2028 (A)
|
| 420,000
|
|
| 434,948
|
MEG Energy Corp.
5.875%, 02/01/2029 (A)
|
| 350,000
|
|
| 334,366
|
Nabors Industries, Ltd.
7.250%, 01/15/2026 (A)
|
| 750,000
|
|
| 721,475
|
Noble Finance II LLC
8.000%, 04/15/2030 (A)
|
| 430,000
|
|
| 444,624
|
Northern Oil and Gas, Inc.
8.125%, 03/01/2028 (A)
|
| 700,000
|
|
| 701,687
|
Permian Resources Operating LLC
5.875%, 07/01/2029 (A)
|
| 1,000,000
|
|
| 964,446
|
Range Resources Corp.
8.250%, 01/15/2029
|
| 800,000
|
|
| 830,520
|
| Southwestern Energy Company
|
|
|
|
|
|
| 4.750%, 02/01/2032
|
| 1,080,000
|
|
| 956,724
|
| 8.375%, 09/15/2028
|
| 700,000
|
|
| 728,594
|
Summit Midstream Holdings LLC
9.000%, 10/15/2026 (A)
|
| 430,000
|
|
| 414,950
|
Tallgrass Energy Partners LP
6.000%, 12/31/2030 (A)
|
| 670,000
|
|
| 599,378
|
Transocean, Inc.
8.750%, 02/15/2030 (A)
|
| 418,000
|
|
| 427,620
|
| Venture Global Calcasieu Pass LLC
|
|
|
|
|
|
| 3.875%, 11/01/2033 (A)
|
| 280,000
|
|
| 227,497
|
| 4.125%, 08/15/2031 (A)
|
| 420,000
|
|
| 356,268
|
| 6.250%, 01/15/2030 (A)
|
| 500,000
|
|
| 487,080
|
|
|
|
|
|
| 18,061,762
|
| Financials – 10.3%
|
|
|
|
|
|
Acuris Finance U.S., Inc.
5.000%, 05/01/2028 (A)
|
| 350,000
|
|
| 283,500
|
| The accompanying notes are an integral part of the financial statements.
| 40
|
|
John Hancock Funds II
Portfolio of Investments —
August 31, 2023 (showing percentage of total net assets)
High Yield Fund (continued)
|
|
| Shares or
Principal
Amount
|
| Value
|
| CORPORATE BONDS (continued)
|
|
|
|
| Financials (continued)
|
|
|
|
|
|
Apollo Commercial Real Estate Finance, Inc.
4.625%, 06/15/2029 (A)
| $
| 860,000
|
| $
| 674,429
|
Barclays PLC
8.000%, (8.000% to 6-15-24, then 5 Year CMT + 5.672%), 06/15/2024 (D)
|
| 400,000
|
|
| 391,687
|
| BNP Paribas SA
|
|
|
|
|
|
| 7.375%, (7.375% to 8-19-25, then 5 Year U.S. Swap Rate + 5.150%), 08/19/2025 (A)(D)
|
| 820,000
|
|
| 803,559
|
| 7.750%, (7.750% to 8-16-29, then 5 Year CMT + 4.899%), 08/16/2029 (A)(D)
|
| 540,000
|
|
| 524,135
|
Bread Financial Holdings, Inc.
4.750%, 12/15/2024 (A)
|
| 600,000
|
|
| 585,619
|
| Burford Capital Global Finance LLC
|
|
|
|
|
|
| 6.250%, 04/15/2028 (A)
|
| 700,000
|
|
| 644,350
|
| 6.875%, 04/15/2030 (A)
|
| 630,000
|
|
| 577,814
|
| 9.250%, 07/01/2031 (A)
|
| 570,000
|
|
| 576,413
|
Coinbase Global, Inc.
3.625%, 10/01/2031 (A)
|
| 720,000
|
|
| 484,733
|
Credit Agricole SA
8.125%, (8.125% to 12-23-25, then 5 Year U.S. Swap Rate + 6.185%), 12/23/2025 (A)(D)
|
| 560,000
|
|
| 557,977
|
Credit Suisse AG
3.625%, 09/09/2024
|
| 250,000
|
|
| 243,175
|
| FirstCash, Inc.
|
|
|
|
|
|
| 4.625%, 09/01/2028 (A)
|
| 530,000
|
|
| 471,388
|
| 5.625%, 01/01/2030 (A)
|
| 170,000
|
|
| 154,331
|
Global Aircraft Leasing Company, Ltd.
6.500%, (6.500% Cash or 7.250% PIK), 09/15/2024 (A)
|
| 1,964,665
|
|
| 1,845,213
|
Highlands Holdings Bond Issuer, Ltd.
7.625%, (7.625% Cash or 8.375% PIK), 10/15/2025 (A)
|
| 977,637
|
|
| 922,645
|
Intesa Sanpaolo SpA
4.198%, (4.198% to 6-1-31, then 1 Year CMT + 2.600%), 06/01/2032 (A)
|
| 640,000
|
|
| 487,748
|
Jane Street Group
4.500%, 11/15/2029 (A)
|
| 440,000
|
|
| 386,107
|
| Ladder Capital Finance Holdings LLLP
|
|
|
|
|
|
| 4.250%, 02/01/2027 (A)
|
| 230,000
|
|
| 208,000
|
| 4.750%, 06/15/2029 (A)
|
| 490,000
|
|
| 411,948
|
Lloyds Banking Group PLC
8.000%, (8.000% to 9-27-29, then 5 Year CMT + 3.913%), 09/27/2029 (D)
|
| 810,000
|
|
| 733,239
|
| Midcap Financial Issuer Trust
|
|
|
|
|
|
| 5.625%, 01/15/2030 (A)
|
| 450,000
|
|
| 362,250
|
| 6.500%, 05/01/2028 (A)
|
| 590,000
|
|
| 525,100
|
NMI Holdings, Inc.
7.375%, 06/01/2025 (A)
|
| 800,000
|
|
| 805,416
|
Paysafe Finance PLC
4.000%, 06/15/2029 (A)
|
| 900,000
|
|
| 762,786
|
| Rocket Mortgage LLC
|
|
|
|
|
|
| 3.875%, 03/01/2031 (A)
|
| 860,000
|
|
| 700,010
|
| 4.000%, 10/15/2033 (A)
|
| 890,000
|
|
| 703,683
|
Ryan Specialty LLC
4.375%, 02/01/2030 (A)
|
| 670,000
|
|
| 598,840
|
StoneX Group, Inc.
8.625%, 06/15/2025 (A)
|
| 640,000
|
|
| 648,058
|
The Toronto-Dominion Bank
8.125%, (8.125% to 10-31-27, then 5 Year CMT + 4.075%), 10/31/2082
|
| 550,000
|
|
| 552,762
|
High Yield Fund (continued)
|
|
| Shares or
Principal
Amount
|
| Value
|
| CORPORATE BONDS (continued)
|
|
|
|
| Financials (continued)
|
|
|
|
|
|
| UBS Group AG
|
|
|
|
|
|
| 6.537%, (6.537% to 8-12-32, then SOFR + 3.920%), 08/12/2033 (A)
| $
| 330,000
|
| $
| 342,727
|
| 7.000%, (7.000% to 1-31-24, then 5 Year U.S. Swap Rate + 4.344%), 01/31/2024 (A)(D)
|
| 1,170,000
|
|
| 1,160,055
|
UniCredit SpA
5.459%, (5.459% to 6-30-30, then 5 Year CMT + 4.750%), 06/30/2035 (A)
|
| 790,000
|
|
| 685,988
|
|
|
|
|
|
| 19,815,685
|
| Health care – 5.1%
|
|
|
|
|
|
| AdaptHealth LLC
|
|
|
|
|
|
| 4.625%, 08/01/2029 (A)
|
| 500,000
|
|
| 408,550
|
| 5.125%, 03/01/2030 (A)
|
| 600,000
|
|
| 492,172
|
Akumin, Inc.
7.000%, 11/01/2025 (A)
|
| 1,000,000
|
|
| 755,063
|
AthenaHealth Group, Inc.
6.500%, 02/15/2030 (A)
|
| 890,000
|
|
| 772,939
|
| Bausch Health Companies, Inc.
|
|
|
|
|
|
| 6.125%, 02/01/2027 (A)
|
| 180,000
|
|
| 118,350
|
| 6.250%, 02/15/2029 (A)
|
| 2,081,000
|
|
| 910,438
|
Cano Health LLC
6.250%, 10/01/2028 (A)
|
| 570,000
|
|
| 193,800
|
| Community Health Systems, Inc.
|
|
|
|
|
|
| 5.250%, 05/15/2030 (A)
|
| 420,000
|
|
| 331,224
|
| 6.125%, 04/01/2030 (A)
|
| 70,000
|
|
| 40,282
|
| 6.875%, 04/15/2029 (A)
|
| 1,240,000
|
|
| 760,517
|
LifePoint Health, Inc.
9.875%, 08/15/2030 (A)
|
| 1,100,000
|
|
| 1,086,250
|
| Medline Borrower LP
|
|
|
|
|
|
| 3.875%, 04/01/2029 (A)
|
| 280,000
|
|
| 244,433
|
| 5.250%, 10/01/2029 (A)
|
| 740,000
|
|
| 657,139
|
Par Pharmaceutical, Inc.
7.500%, 04/01/2027 (A)(B)
|
| 770,000
|
|
| 548,159
|
Teva Pharmaceutical Finance Company LLC
6.150%, 02/01/2036
|
| 760,000
|
|
| 700,475
|
Teva Pharmaceutical Finance Netherlands
III BV
|
|
|
|
|
|
| 4.750%, 05/09/2027
|
| 300,000
|
|
| 280,323
|
| 5.125%, 05/09/2029
|
| 500,000
|
|
| 462,500
|
| 7.875%, 09/15/2029
|
| 200,000
|
|
| 208,458
|
| 8.125%, 09/15/2031
|
| 520,000
|
|
| 550,926
|
US Renal Care, Inc.
10.625%, 06/28/2028 (A)
|
| 430,500
|
|
| 269,325
|
|
|
|
|
|
| 9,791,323
|
| Industrials – 13.8%
|
|
|
|
|
|
Advanced Drainage Systems, Inc.
6.375%, 06/15/2030 (A)
|
| 430,000
|
|
| 423,567
|
Allied Universal Holdco LLC
6.625%, 07/15/2026 (A)
|
| 770,000
|
|
| 732,381
|
Alta Equipment Group, Inc.
5.625%, 04/15/2026 (A)
|
| 800,000
|
|
| 740,408
|
| American Airlines, Inc.
|
|
|
|
|
|
| 5.750%, 04/20/2029 (A)
|
| 1,370,000
|
|
| 1,310,242
|
| 7.250%, 02/15/2028 (A)
|
| 490,000
|
|
| 481,336
|
| 11.750%, 07/15/2025 (A)
|
| 270,000
|
|
| 295,527
|
Anagram International, Inc.
10.000%, (0.000% Cash and 10.000% PIK), 08/15/2026 (A)
|
| 101,368
|
|
| 70,958
|
ATS Corp.
4.125%, 12/15/2028 (A)
|
| 460,000
|
|
| 408,402
|
Beacon Roofing Supply, Inc.
6.500%, 08/01/2030 (A)
|
| 300,000
|
|
| 296,352
|
| The accompanying notes are an integral part of the financial statements.
| 41
|
|
John Hancock Funds II
Portfolio of Investments —
August 31, 2023 (showing percentage of total net assets)
High Yield Fund (continued)
|
|
| Shares or
Principal
Amount
|
| Value
|
| CORPORATE BONDS (continued)
|
|
|
|
| Industrials (continued)
|
|
|
|
|
|
| Bombardier, Inc.
|
|
|
|
|
|
| 7.500%, 02/01/2029 (A)
| $
| 620,000
|
| $
| 607,529
|
| 7.875%, 04/15/2027 (A)
|
| 200,000
|
|
| 199,483
|
Brundage-Bone Concrete Pumping Holdings, Inc.
6.000%, 02/01/2026 (A)
|
| 680,000
|
|
| 652,800
|
Clean Harbors, Inc.
6.375%, 02/01/2031 (A)
|
| 360,000
|
|
| 357,995
|
CoreCivic, Inc.
8.250%, 04/15/2026
|
| 1,000,000
|
|
| 1,003,968
|
Covanta Holding Corp.
4.875%, 12/01/2029 (A)
|
| 570,000
|
|
| 490,200
|
Doman Building Materials Group, Ltd.
5.250%, 05/15/2026 (A)
| CAD
| 340,000
|
|
| 228,353
|
H&E Equipment Services, Inc.
3.875%, 12/15/2028 (A)
| $
| 1,050,000
|
|
| 916,810
|
Hawaiian Brand Intellectual Property, Ltd.
5.750%, 01/20/2026 (A)
|
| 450,000
|
|
| 416,413
|
Legends Hospitality Holding Company LLC
5.000%, 02/01/2026 (A)
|
| 1,000,000
|
|
| 939,700
|
| Madison IAQ LLC
|
|
|
|
|
|
| 4.125%, 06/30/2028 (A)
|
| 250,000
|
|
| 221,183
|
| 5.875%, 06/30/2029 (A)
|
| 850,000
|
|
| 715,699
|
Mileage Plus Holdings LLC
6.500%, 06/20/2027 (A)
|
| 440,027
|
|
| 438,491
|
MIWD Holdco II LLC
5.500%, 02/01/2030 (A)
|
| 1,230,000
|
|
| 1,042,573
|
Park-Ohio Industries, Inc.
6.625%, 04/15/2027
|
| 360,000
|
|
| 312,300
|
PGT Innovations, Inc.
4.375%, 10/01/2029 (A)
|
| 470,000
|
|
| 436,132
|
PM General Purchaser LLC
9.500%, 10/01/2028 (A)
|
| 710,000
|
|
| 683,510
|
Prime Security Services Borrower LLC
6.250%, 01/15/2028 (A)
|
| 1,000,000
|
|
| 952,401
|
R.R. Donnelley & Sons Company
9.750%, 07/31/2028 (A)
|
| 380,000
|
|
| 380,029
|
Roller Bearing Company of America, Inc.
4.375%, 10/15/2029 (A)
|
| 980,000
|
|
| 876,777
|
Smyrna Ready Mix Concrete LLC
6.000%, 11/01/2028 (A)
|
| 1,000,000
|
|
| 960,135
|
Spirit Loyalty Cayman, Ltd.
8.000%, 09/20/2025 (A)
|
| 902,000
|
|
| 902,989
|
| The GEO Group, Inc.
|
|
|
|
|
|
| 9.500%, 12/31/2028 (A)
|
| 1,500,000
|
|
| 1,470,000
|
| 10.500%, 06/30/2028
|
| 360,000
|
|
| 360,107
|
Titan International, Inc.
7.000%, 04/30/2028
|
| 520,000
|
|
| 495,433
|
TransDigm, Inc.
6.750%, 08/15/2028 (A)
|
| 820,000
|
|
| 822,875
|
United Airlines 2020-1 Class B Pass Through Trust
4.875%, 01/15/2026
|
| 200,415
|
|
| 193,400
|
United Airlines, Inc.
4.625%, 04/15/2029 (A)
|
| 900,000
|
|
| 800,236
|
| United Rentals North America, Inc.
|
|
|
|
|
|
| 3.875%, 02/15/2031
|
| 360,000
|
|
| 307,931
|
| 5.250%, 01/15/2030
|
| 800,000
|
|
| 760,256
|
Vertiv Group Corp.
4.125%, 11/15/2028 (A)
|
| 920,000
|
|
| 825,941
|
| VistaJet Malta Finance PLC
|
|
|
|
|
|
| 6.375%, 02/01/2030 (A)
|
| 880,000
|
|
| 721,584
|
| 7.875%, 05/01/2027 (A)
|
| 250,000
|
|
| 226,250
|
| 9.500%, 06/01/2028 (A)
|
| 80,000
|
|
| 73,824
|
High Yield Fund (continued)
|
|
| Shares or
Principal
Amount
|
| Value
|
| CORPORATE BONDS (continued)
|
|
|
|
| Industrials (continued)
|
|
|
|
|
|
XPO CNW, Inc.
6.700%, 05/01/2034
| $
| 740,000
|
| $
| 734,931
|
XPO Escrow Sub LLC
7.500%, 11/15/2027 (A)
|
| 200,000
|
|
| 203,352
|
|
|
|
|
|
| 26,490,763
|
| Information technology – 2.9%
|
|
|
|
|
|
CA Magnum Holdings
5.375%, 10/31/2026 (A)
|
| 430,000
|
|
| 383,370
|
Central Parent, Inc.
7.250%, 06/15/2029 (A)
|
| 500,000
|
|
| 493,134
|
Clarivate Science Holdings Corp.
4.875%, 07/01/2029 (A)
|
| 320,000
|
|
| 279,058
|
CommScope Technologies LLC
5.000%, 03/15/2027 (A)
|
| 1,040,000
|
|
| 578,218
|
CommScope, Inc.
4.750%, 09/01/2029 (A)
|
| 1,400,000
|
|
| 1,040,393
|
Elastic NV
4.125%, 07/15/2029 (A)
|
| 750,000
|
|
| 644,724
|
Gen Digital, Inc.
7.125%, 09/30/2030 (A)
|
| 410,000
|
|
| 412,757
|
Open Text Corp.
6.900%, 12/01/2027 (A)
|
| 430,000
|
|
| 435,605
|
Rackspace Technology Global, Inc.
3.500%, 02/15/2028 (A)
|
| 900,000
|
|
| 427,189
|
Vericast Corp.
11.000%, 09/15/2026 (A)
|
| 860,000
|
|
| 896,610
|
|
|
|
|
|
| 5,591,058
|
| Materials – 4.7%
|
|
|
|
|
|
ARD Finance SA
6.500%, (6.500% Cash or 7.250% PIK), 06/30/2027 (A)
|
| 1,220,000
|
|
| 980,541
|
Ardagh Metal Packaging Finance USA LLC
4.000%, 09/01/2029 (A)
|
| 1,000,000
|
|
| 812,800
|
Arsenal AIC Parent LLC
8.000%, 10/01/2030 (A)
|
| 70,000
|
|
| 71,487
|
Canpack SA
3.875%, 11/15/2029 (A)
|
| 750,000
|
|
| 606,014
|
Cascades, Inc.
5.375%, 01/15/2028 (A)
|
| 400,000
|
|
| 376,500
|
| First Quantum Minerals, Ltd.
|
|
|
|
|
|
| 6.875%, 10/15/2027 (A)
|
| 1,500,000
|
|
| 1,460,392
|
| 8.625%, 06/01/2031 (A)
|
| 1,370,000
|
|
| 1,394,142
|
Freeport-McMoRan, Inc.
5.450%, 03/15/2043
|
| 1,160,000
|
|
| 1,041,151
|
Hudbay Minerals, Inc.
6.125%, 04/01/2029 (A)
|
| 770,000
|
|
| 723,927
|
LSF11 A5 HoldCo LLC
6.625%, 10/15/2029 (A)
|
| 700,000
|
|
| 583,331
|
Midwest Vanadium Proprietary, Ltd.
11.500%, 02/15/2018 (A)(B)
|
| 1,951,648
|
|
| 3,903
|
Northwest Acquisitions ULC
7.125%, 11/01/2022 (A)(B)
|
| 1,140,000
|
|
| 11
|
Olin Corp.
5.000%, 02/01/2030
|
| 360,000
|
|
| 329,641
|
Pactiv LLC
8.375%, 04/15/2027
|
| 30,000
|
|
| 30,212
|
Summit Materials LLC
5.250%, 01/15/2029 (A)
|
| 610,000
|
|
| 571,414
|
|
|
|
|
|
| 8,985,466
|
| Real estate – 2.4%
|
|
|
|
|
|
Cushman & Wakefield US Borrower LLC
8.875%, 09/01/2031 (A)
|
| 200,000
|
|
| 201,640
|
| The accompanying notes are an integral part of the financial statements.
| 42
|
|
John Hancock Funds II
Portfolio of Investments —
August 31, 2023 (showing percentage of total net assets)
High Yield Fund (continued)
|
|
| Shares or
Principal
Amount
|
| Value
|
| CORPORATE BONDS (continued)
|
|
|
|
| Real estate (continued)
|
|
|
|
|
|
| Diversified Healthcare Trust
|
|
|
|
|
|
| 4.375%, 03/01/2031
| $
| 500,000
|
| $
| 377,256
|
| 4.750%, 02/15/2028
|
| 270,000
|
|
| 206,185
|
| 9.750%, 06/15/2025
|
| 170,000
|
|
| 167,164
|
Five Point Operating Company LP
7.875%, 11/15/2025 (A)
|
| 640,000
|
|
| 596,810
|
| Forestar Group, Inc.
|
|
|
|
|
|
| 3.850%, 05/15/2026 (A)
|
| 580,000
|
|
| 537,019
|
| 5.000%, 03/01/2028 (A)
|
| 420,000
|
|
| 388,129
|
IIP Operating Partnership LP
5.500%, 05/25/2026
|
| 1,080,000
|
|
| 958,027
|
Iron Mountain Information Management Services, Inc.
5.000%, 07/15/2032 (A)
|
| 170,000
|
|
| 146,789
|
| MPT Operating Partnership LP
|
|
|
|
|
|
| 3.500%, 03/15/2031
|
| 300,000
|
|
| 194,430
|
| 4.625%, 08/01/2029
|
| 250,000
|
|
| 180,540
|
Service Properties Trust
5.500%, 12/15/2027
|
| 640,000
|
|
| 566,459
|
|
|
|
|
|
| 4,520,448
|
| Utilities – 0.9%
|
|
|
|
|
|
Suburban Propane Partners LP
5.000%, 06/01/2031 (A)
|
| 460,000
|
|
| 395,407
|
Sunnova Energy Corp.
5.875%, 09/01/2026 (A)
|
| 1,100,000
|
|
| 967,952
|
TransAlta Corp.
7.750%, 11/15/2029
|
| 380,000
|
|
| 393,460
|
|
|
|
|
|
| 1,756,819
|
| TOTAL CORPORATE BONDS (Cost $179,364,536)
|
|
| $
| 156,877,220
|
| CONVERTIBLE BONDS – 0.7%
|
|
|
|
| Communication services – 0.2%
|
|
|
|
|
|
DISH Network Corp.
3.375%, 08/15/2026
|
| 700,000
|
|
| 423,500
|
| Consumer discretionary – 0.2%
|
|
|
|
|
|
DraftKings Holdings, Inc.
6.246%, 03/15/2028 (E)
|
| 530,000
|
|
| 400,945
|
| Industrials – 0.2%
|
|
|
|
|
|
Spirit Airlines, Inc.
1.000%, 05/15/2026
|
| 440,000
|
|
| 371,580
|
| Utilities – 0.1%
|
|
|
|
|
|
NextEra Energy Partners LP
2.500%, 06/15/2026 (A)
|
| 220,000
|
|
| 194,590
|
| TOTAL CONVERTIBLE BONDS (Cost $1,762,500)
|
|
| $
| 1,390,615
|
| TERM LOANS (F) – 6.4%
|
|
|
|
| Consumer discretionary – 1.8%
|
|
|
|
|
|
| Adtalem Global Education, Inc., 2021 Term Loan B (1 month SOFR + 4.000%) 9.446%, 08/12/2028
|
| 300,953
|
|
| 300,860
|
| Clarios Global LP, 2023 Incremental Term Loan (1 month SOFR + 3.750%) 9.081%, 05/06/2030
|
| 390,000
|
|
| 388,904
|
| Equinox Holdings, Inc. , 2020 Term Loan B2 (3 and 6 month LIBOR + 9.000%) 14.731%, 03/08/2024
|
| 407,400
|
|
| 391,361
|
| First Brands Group LLC, 2021 Term Loan (6 month SOFR + 5.000%) 10.881%, 03/30/2027
|
| 361,675
|
|
| 356,250
|
| Great Outdoors Group LLC, 2021 Term Loan B1 (1 month SOFR + 3.750%) 9.196%, 03/06/2028
|
| 351,047
|
|
| 349,622
|
High Yield Fund (continued)
|
|
| Shares or
Principal
Amount
|
| Value
|
| TERM LOANS (F) (continued)
|
|
|
|
| Consumer discretionary (continued)
|
|
|
|
|
|
| Spencer Spirit IH LLC, Term Loan B (1 month SOFR + 6.000%) 11.429%, 06/19/2026
| $
| 706,553
|
| $
| 699,841
|
| Truck Hero, Inc., 2021 Term Loan B (1 month SOFR + 3.750%) 9.196%, 01/31/2028
|
| 351,900
|
|
| 340,270
|
| Upbound Group, Inc., 2021 First Lien Term Loan B (3 month SOFR + 3.250%) 8.881%, 02/17/2028
|
| 585,796
|
|
| 583,599
|
|
|
|
|
|
| 3,410,707
|
| Financials – 1.0%
|
|
|
|
|
|
| Acrisure LLC, 2020 Term Loan B (1 month LIBOR + 3.500%) 8.946%, 02/15/2027
|
| 522,450
|
|
| 511,536
|
| Asurion LLC, 2021 Term Loan B9 (3 month LIBOR + 3.250%) 8.788%, 07/31/2027
|
| 782,000
|
|
| 751,330
|
| Asurion LLC, 2022 Term Loan B10 (1 month SOFR + 4.000%) 9.431%, 08/19/2028
|
| 466,475
|
|
| 448,464
|
| Deerfield Dakota Holding LLC, 2021 USD 2nd Lien Term Loan (3 month LIBOR + 6.750%) 12.288%, 04/07/2028
|
| 250,000
|
|
| 234,063
|
|
|
|
|
|
| 1,945,393
|
| Health care – 1.0%
|
|
|
|
|
|
| Agiliti Health, Inc., 2023 Term Loan (1 month SOFR + 3.000%) 8.247%, 05/01/2030
|
| 240,000
|
|
| 238,951
|
| Eyecare Partners LLC, 2020 Term Loan (3 month SOFR + 3.750%) 9.253%, 02/18/2027
|
| 562,061
|
|
| 442,022
|
| Eyecare Partners LLC, 2022 Incremental Term Loan (3 month SOFR + 4.500%) 9.842%, 11/15/2028
|
| 437,800
|
|
| 342,360
|
| LifePoint Health, Inc., 2018 Term Loan B (3 month LIBOR + 3.750%) 9.377%, 11/16/2025
|
| 478,269
|
|
| 473,964
|
| US Renal Care, Inc. , 2023 Superpriority Term Loan (3 month SOFR + 5.000%) 10.346%, 06/20/2028
|
| 678,028
|
|
| 427,158
|
|
|
|
|
|
| 1,924,455
|
| Industrials – 0.9%
|
|
|
|
|
|
| Allied Universal Holdco LLC, 2021 USD Incremental Term Loan B (1 month SOFR + 3.750%) 9.181%, 05/12/2028
|
| 786,000
|
|
| 763,159
|
| Mileage Plus Holdings LLC, 2020 Term Loan B (3 month LIBOR + 5.250%) 10.764%, 06/21/2027
|
| 384,000
|
|
| 400,013
|
| R.R. Donnelley & Sons Company, 2023 Term Loan B (1 month SOFR + 7.250%) 12.681%, 03/08/2028
|
| 651,117
|
|
| 650,576
|
|
|
|
|
|
| 1,813,748
|
| Information technology – 1.5%
|
|
|
|
|
|
| Dcert Buyer, Inc., 2019 Term Loan B (1 month SOFR + 4.000%) 9.331%, 10/16/2026
|
| 684,091
|
|
| 681,088
|
| Dcert Buyer, Inc., 2021 2nd Lien Term Loan (1 month SOFR + 7.000%) 12.331%, 02/19/2029
|
| 880,000
|
|
| 819,870
|
| Global Tel*Link Corp., 2018 1st Lien Term Loan (3 month SOFR + 4.250%) 9.769%, 11/29/2025
|
| 548,206
|
|
| 514,629
|
| The accompanying notes are an integral part of the financial statements.
| 43
|
|
John Hancock Funds II
Portfolio of Investments —
August 31, 2023 (showing percentage of total net assets)
High Yield Fund (continued)
|
|
| Shares or
Principal
Amount
|
| Value
|
| TERM LOANS (F) (continued)
|
|
|
|
| Information technology (continued)
|
|
|
|
|
|
| MRI Software LLC, 2020 Term Loan (3 month SOFR + 5.500%) 10.842%, 02/10/2026
| $
| 69,018
|
| $
| 67,206
|
| MRI Software LLC, 2020 Term Loan B (3 month SOFR + 5.500%) 10.842%, 02/10/2026
|
| 120,008
|
|
| 116,858
|
| Neptune Bidco US, Inc., 2022 USD Term Loan B (3 month SOFR + 5.000%) 10.398%, 04/11/2029
|
| 239,400
|
|
| 217,753
|
| Peraton Corp., Term Loan B (1 month SOFR + 3.750%) 9.181%, 02/01/2028
|
| 431,826
|
|
| 427,171
|
|
|
|
|
|
| 2,844,575
|
| Materials – 0.2%
|
|
|
|
|
|
| Arctic Canadian Diamond Company, Ltd., 2nd Lien PIK Term Loan (3 month LIBOR + 10.000% or
12.500% PIK) 10.000%, 12/31/2027 (G)
|
| 511,968
|
|
| 439,166
|
| TOTAL TERM LOANS (Cost $12,863,200)
|
| $
| 12,378,044
|
| ASSET BACKED SECURITIES – 6.5%
|
|
|
|
Aimco CLO, Ltd.
Series 2020-12A, Class DR (3 month CME Term SOFR + 2.900%)
8.208%, 01/17/2032 (A)(C)
|
| 440,000
|
|
| 424,551
|
Ares CLO, Ltd.
Series 2017-44A, Class CR (3 month CME Term SOFR + 3.662%)
8.970%, 04/15/2034 (A)(C)
|
| 410,000
|
|
| 407,927
|
Balboa Bay Loan Funding, Ltd.
Series 2022-1A, Class D (3 month CME Term SOFR + 4.000%)
9.326%, 04/20/2034 (A)(C)
|
| 290,000
|
|
| 282,097
|
Ballyrock CLO, Ltd.
Series 2022-19A, Class D (3 month CME Term SOFR + 7.110%)
12.436%, 04/20/2035 (A)(C)
|
| 900,000
|
|
| 843,600
|
| Barings CLO, Ltd.
|
|
|
|
|
|
Series 2018-3A, Class D (3 month CME Term SOFR + 3.162%)
8.488%, 07/20/2029 (A)(C)
|
| 250,000
|
|
| 246,415
|
Series 2020-4A, Class E (3 month CME Term SOFR + 5.942%)
11.268%, 01/20/2032 (A)(C)
|
| 350,000
|
|
| 320,787
|
Series 2023-3A, Class D (3 month CME Term SOFR + 4.500%)
9.910%, 10/15/2036 (A)(C)
|
| 250,000
|
|
| 250,000
|
Battalion CLO, Ltd.
Series 2021-20A, Class D (3 month CME Term SOFR + 3.362%)
8.670%, 07/15/2034 (A)(C)
|
| 250,000
|
|
| 228,382
|
BlueMountain CLO XXXI, Ltd.
Series 2021-31A, Class E (3 month CME Term SOFR + 6.792%)
12.112%, 04/19/2034 (A)(C)
|
| 170,000
|
|
| 156,353
|
BlueMountain CLO, Ltd.
Series 2016-2A, Class DR (3 month CME Term SOFR + 8.052%)
13.431%, 08/20/2032 (A)(C)
|
| 375,000
|
|
| 329,363
|
Bristol Park CLO, Ltd.
Series 2016-1A, Class ER (3 month CME Term SOFR + 7.262%)
12.570%, 04/15/2029 (A)(C)
|
| 400,000
|
|
| 356,366
|
High Yield Fund (continued)
|
|
| Shares or
Principal
Amount
|
| Value
|
| ASSET BACKED SECURITIES (continued)
|
|
|
|
Clover CLO LLC
Series 2018-1A, Class DR (3 month CME Term SOFR + 3.362%)
8.688%, 04/20/2032 (A)(C)
| $
| 320,000
|
| $
| 314,277
|
Cook Park CLO, Ltd.
Series 2018-1A, Class E (3 month CME Term SOFR + 5.662%)
10.970%, 04/17/2030 (A)(C)
|
| 750,000
|
|
| 622,589
|
Dryden CLO, Ltd.
Series 2018-70A, Class E (3 month CME Term SOFR + 6.312%)
11.620%, 01/16/2032 (A)(C)
|
| 750,000
|
|
| 691,172
|
Dryden Senior Loan Fund
Series 2015-40A, Class DR (3 month CME Term SOFR + 3.362%)
8.726%, 08/15/2031 (A)(C)
|
| 250,000
|
|
| 242,441
|
| Greenwood Park CLO, Ltd.
|
|
|
|
|
|
Series 2018-1A, Class D (3 month CME Term SOFR + 2.762%)
8.070%, 04/15/2031 (A)(C)
|
| 530,000
|
|
| 493,659
|
Series 2018-1A, Class E (3 month CME Term SOFR + 5.212%)
10.520%, 04/15/2031 (A)(C)
|
| 750,000
|
|
| 609,632
|
Greywolf CLO IV, Ltd.
Series 2019-1A, Class CR (3 month CME Term SOFR + 3.910%)
9.218%, 04/17/2034 (A)(C)
|
| 390,000
|
|
| 365,657
|
Grippen Park CLO, Ltd.
Series 2017-1A, Class E (3 month CME Term SOFR + 5.962%)
11.288%, 01/20/2030 (A)(C)
|
| 440,000
|
|
| 397,631
|
Halsey Point CLO I, Ltd.
Series 2019-1A, Class E (3 month CME Term SOFR + 7.962%)
13.288%, 01/20/2033 (A)(C)
|
| 600,000
|
|
| 562,175
|
Magnetite XXIV, Ltd.
Series 2019-24A, Class ER (3 month CME Term SOFR + 6.400%)
11.708%, 04/15/2035 (A)(C)
|
| 250,000
|
|
| 235,872
|
Mountain View CLO IX, Ltd.
Series 2015-9A, Class CR (3 month CME Term SOFR + 3.382%)
8.690%, 07/15/2031 (A)(C)
|
| 670,000
|
|
| 587,357
|
Neuberger Berman Loan Advisers CLO, Ltd.
Series 2017-25A, Class DR (3 month CME Term SOFR + 3.112%)
8.422%, 10/18/2029 (A)(C)
|
| 250,000
|
|
| 242,288
|
OZLM XI, Ltd.
Series 2015-11A, Class CR (3 month CME Term SOFR + 3.862%)
9.231%, 10/30/2030 (A)(C)
|
| 1,000,000
|
|
| 981,119
|
Palmer Square Loan Funding, Ltd.
Series 2022-3A, Class C (3 month CME Term SOFR + 5.400%)
10.708%, 04/15/2031 (A)(C)
|
| 470,000
|
|
| 473,760
|
Rockland Park CLO, Ltd.
Series 2021-1A, Class E (3 month CME Term SOFR + 6.512%)
11.838%, 04/20/2034 (A)(C)
|
| 200,000
|
|
| 187,559
|
Sculptor CLO XXVI, Ltd.
Series 2026-A, Class E (3 month CME Term SOFR + 7.512%)
12.838%, 07/20/2034 (A)(C)
|
| 390,000
|
|
| 358,248
|
| The accompanying notes are an integral part of the financial statements.
| 44
|
|
John Hancock Funds II
Portfolio of Investments —
August 31, 2023 (showing percentage of total net assets)
High Yield Fund (continued)
|
|
| Shares or
Principal
Amount
|
| Value
|
| ASSET BACKED SECURITIES (continued)
|
|
|
|
Shackleton CLO, Ltd.
Series 2013-3A, Class DR (3 month CME Term SOFR + 3.282%)
8.590%, 07/15/2030 (A)(C)
| $
| 500,000
|
| $
| 463,977
|
Symphony CLO XXII, Ltd.
Series 2020-22A, Class D (3 month CME Term SOFR + 3.412%)
8.722%, 04/18/2033 (A)(C)
|
| 500,000
|
|
| 485,477
|
TCI-Symphony CLO, Ltd.
Series 2016-1A, Class DR2 (3 month CME Term SOFR + 3.362%)
8.663%, 10/13/2032 (A)(C)
|
| 300,000
|
|
| 286,523
|
| TOTAL ASSET BACKED SECURITIES (Cost $13,142,796)
|
|
| $
| 12,447,254
|
| COMMON STOCKS – 0.6%
|
|
|
|
|
| Communication services – 0.0%
|
|
|
|
|
|
| New Cotai, Inc., Class B (G)(H)(I)
|
| 11
|
|
| 0
|
| Energy – 0.6%
|
|
|
|
|
|
| Berry Corp.
|
| 75,327
|
|
| 645,550
|
| Chord Energy Corp.
|
| 3,199
|
|
| 516,639
|
| KCAD Holdings I, Ltd. (G)(H)(I)
|
| 752,218,031
|
|
| 752
|
| MWO Holdings LLC (G)(H)(I)
|
| 1,134
|
|
| 7,053
|
| Permian Production (G)(I)
|
| 35,417
|
|
| 21,250
|
|
|
|
|
|
| 1,191,244
|
| TOTAL COMMON STOCKS (Cost $8,212,135)
|
| $
| 1,191,244
|
| PREFERRED SECURITIES – 0.5%
|
|
|
|
|
| Energy – 0.5%
|
|
|
|
|
|
| Equitrans Midstream Corp., 9.750% (9.750% to 3-31-24, then 3 month LIBOR + 8.150%)
|
| 25,612
|
|
| 551,426
|
| MPLX LP, 9.538% (G)
|
| 8,687
|
|
| 295,358
|
| TOTAL PREFERRED SECURITIES (Cost $852,195)
|
| $
| 846,784
|
| ESCROW CERTIFICATES – 0.0%
|
|
|
|
|
|
| Magellan Health, Inc. (G)(I)
| $
| 4,380,000
|
|
| 0
|
| TOTAL ESCROW CERTIFICATES (Cost $0)
|
| $
| 0
|
| SHORT-TERM INVESTMENTS – 0.9%
|
|
|
|
| Short-term funds – 0.9%
|
|
|
|
|
|
| State Street Institutional Treasury Plus Money Market Fund, Premier Class,
5.2692% (J)
|
| 1,663,979
|
|
| 1,663,979
|
| TOTAL SHORT-TERM INVESTMENTS (Cost $1,663,979)
|
| $
| 1,663,979
|
Total Investments (High Yield Fund)
(Cost $219,125,568) – 97.8%
|
| $
| 187,555,293
|
| Other assets and liabilities, net – 2.2%
|
|
|
| 4,234,455
|
| TOTAL NET ASSETS – 100.0%
|
|
|
| $
| 191,789,748
|
High Yield Fund (continued)
| Currency Abbreviations
|
| CAD
| Canadian Dollar
|
| GBP
| Pound Sterling
|
| Security Abbreviations and Legend
|
| CME
| Chicago Mercantile Exchange
|
| CMT
| Constant Maturity Treasury
|
| LIBOR
| London Interbank Offered Rate
|
| PIK
| Pay-in-Kind Security - Represents a payment-in-kind which may pay interest in additional par and/or cash. Rates shown are the current rate and most recent payment rate.
|
| SOFR
| Secured Overnight Financing Rate
|
| SONIA
| Sterling Overnight Interbank Average Rate
|
| (A)
| These securities are exempt from registration under Rule 144A of the Securities Act of 1933. Such securities may be resold, normally to qualified institutional buyers, in transactions
exempt from registration. Rule 144A securities amounted to $141,372,038 or 73.7% of the fund's net assets as of 8-31-23.
|
| (B)
| Non-income producing - Issuer is in default.
|
| (C)
| Variable rate obligation. The coupon rate shown represents the rate at period end.
|
| (D)
| Perpetual bonds have no stated maturity date. Date shown as maturity date is next call date.
|
| (E)
| Zero coupon bonds are issued at a discount from their principal amount in lieu of paying interest periodically. Rate shown is the effective yield at period end.
|
| (F)
| Term loans are variable rate obligations. The rate shown represents the rate at period end.
|
| (G)
| Security is valued using significant unobservable inputs and is classified as Level 3 in the fair value hierarchy. Refer to Note 2 to the financial statements.
|
| (H)
| Restricted security as to resale, excluding 144A securities. For more information on this security refer to the Notes to financial statements.
|
| (I)
| Non-income producing security.
|
| (J)
| The rate shown is the annualized seven-day yield as of 8-31-23.
|
DERIVATIVES
FUTURES
| Open contracts
| Number of
contracts
| Position
| Expiration
date
| Notional
basis^
| Notional
value^
| Unrealized
appreciation
(depreciation)
|
| 5-Year U.S. Treasury Note Futures
| 117
| Long
| Dec 2023
| $12,432,432
| $12,509,859
| $77,427
|
|
|
|
|
|
|
| $77,427
|
^ Notional
basis refers to the contractual amount agreed upon at inception of open contracts; notional value represents the current value of the open contract.
| The accompanying notes are an integral part of the financial statements.
| 45
|
|
John Hancock Funds II
Portfolio of Investments —
August 31, 2023 (showing percentage of total net assets)
FORWARD FOREIGN CURRENCY
CONTRACTS
| Contract to buy
| Contract to sell
| Counterparty (OTC)
| Contractual
settlement
date
| Unrealized
appreciation
| Unrealized
depreciation
|
| GBP
| 587,667
| USD
| 754,853
| MSCS
| 10/20/2023
| —
| $(10,284)
|
| MXN
| 1,466,420
| USD
| 84,255
| JPM
| 10/20/2023
| $1,062
| —
|
| USD
| 151,340
| CAD
| 200,571
| BNP
| 10/20/2023
| 2,799
| —
|
| USD
| 280,456
| EUR
| 254,004
| MSCS
| 10/20/2023
| 4,431
| —
|
|
|
|
|
|
|
| $8,292
| $(10,284)
|
SWAPS
| Credit default swaps - Buyer
|
Counterparty
(OTC)/
Centrally
cleared
| Reference
obligation
| Notional
amount
| Currency
| USD
notional
amount
| Pay
fixed
rate
| Fixed
payment
frequency
| Maturity
date
| Unamortized
upfront
payment
paid
(received)
| Unrealized
appreciation
(depreciation)
| Value
|
| Centrally cleared
| NOVA Chemicals Corp.
| 441,000
| USD
| $441,000
| 5.000%
| Quarterly
| Jun 2027
| $(8,388)
| $(11,923)
| $(20,311)
|
| Centrally cleared
| The Goodyear Tire & Rubber Company
| 590,000
| USD
| 590,000
| 5.000%
| Quarterly
| Jun 2027
| (8,123)
| (40,735)
| (48,858)
|
| Centrally cleared
| Xerox Holdings Corp.
| 237,000
| USD
| 237,000
| 1.000%
| Quarterly
| Jun 2027
| 25,538
| (12,205)
| 13,333
|
|
|
|
|
| $1,268,000
|
|
|
| $9,027
| $(64,863)
| $(55,836)
|
| Credit default swaps - Seller
|
Counterparty
(OTC)/
Centrally
cleared
| Reference
obligation
| Implied
credit
spread
| Notional
amount
| Currency
| USD
notional
amount
| Received
fixed
rate
| Fixed
payment
frequency
| Maturity
date
| Unamortized
upfront
payment
paid
(received)
| Unrealized
appreciation
(depreciation)
| Value
|
| Centrally cleared
| Occidental Petroleum Corp.
| 0.571%
| 810,000
| USD
| $810,000
| 1.000%
| Quarterly
| Jun 2026
| $(20,875)
| $31,618
| $10,743
|
| Centrally cleared
| Ford Motor Credit Company LLC
| 3.402%
| 1,000,000
| USD
| 1,000,000
| 5.000%
| Quarterly
| Dec 2026
| 102,096
| (49,600)
| 52,496
|
|
|
|
|
|
| $1,810,000
|
|
|
| $81,221
| $(17,982)
| $63,239
|
| Derivatives Currency Abbreviations
|
| CAD
| Canadian Dollar
|
| EUR
| Euro
|
| GBP
| Pound Sterling
|
| MXN
| Mexican Peso
|
| USD
| U.S. Dollar
|
| Derivatives Abbreviations
|
| BNP
| BNP Paribas
|
| JPM
| JPMorgan Chase Bank, N.A.
|
| MSCS
| Morgan Stanley Capital Services LLC
|
| OTC
| Over-the-counter
|
See Notes to financial
statements regarding investment transactions and other derivatives information.
International Strategic Equity Allocation
Fund
|
|
| Shares or
Principal
Amount
|
| Value
|
| COMMON STOCKS - 94.3%
|
|
|
|
| Australia - 1.6%
|
|
|
|
|
|
| Ampol, Ltd.
|
| 11,488
|
| $
| 261,685
|
| ANZ Group Holdings, Ltd.
|
| 148,331
|
|
| 2,421,815
|
| APA Group
|
| 57,825
|
|
| 335,911
|
| Aristocrat Leisure, Ltd.
|
| 29,346
|
|
| 774,678
|
| ASX, Ltd.
|
| 9,710
|
|
| 361,361
|
| Aurizon Holdings, Ltd.
|
| 91,984
|
|
| 216,802
|
| BHP Group, Ltd.
|
| 250,514
|
|
| 7,201,809
|
| BlueScope Steel, Ltd.
|
| 22,952
|
|
| 310,300
|
| Brambles, Ltd.
|
| 68,643
|
|
| 664,737
|
| Cochlear, Ltd.
|
| 3,224
|
|
| 565,891
|
| Coles Group, Ltd.
|
| 65,501
|
|
| 689,170
|
| Commonwealth Bank of Australia
|
| 83,695
|
|
| 5,513,580
|
| Computershare, Ltd.
|
| 28,457
|
|
| 462,624
|
International Strategic Equity Allocation
Fund (continued)
|
|
| Shares or
Principal
Amount
|
| Value
|
| COMMON STOCKS (continued)
|
|
|
|
| Australia (continued)
|
|
|
|
|
|
| CSL, Ltd.
|
| 23,876
|
| $
| 4,216,473
|
| Dexus
|
| 55,168
|
|
| 275,681
|
| EBOS Group, Ltd.
|
| 21,197
|
|
| 479,638
|
| Endeavour Group, Ltd.
|
| 70,008
|
|
| 248,992
|
| Fortescue Metals Group, Ltd.
|
| 83,724
|
|
| 1,152,661
|
| Goodman Group
|
| 84,406
|
|
| 1,271,765
|
| IDP Education, Ltd.
|
| 12,537
|
|
| 199,387
|
| IGO, Ltd.
|
| 33,546
|
|
| 299,374
|
| Insurance Australia Group, Ltd.
|
| 124,013
|
|
| 465,423
|
| Lendlease Corp., Ltd.
|
| 34,021
|
|
| 171,313
|
| Macquarie Group, Ltd.
|
| 18,467
|
|
| 2,111,342
|
| Medibank Private, Ltd.
|
| 138,866
|
|
| 328,515
|
| The accompanying notes are an integral part of the financial statements.
| 46
|
|
John Hancock Funds II
Portfolio of Investments —
August 31, 2023 (showing percentage of total net assets)
International Strategic Equity Allocation
Fund (continued)
|
|
| Shares or
Principal
Amount
|
| Value
|
| COMMON STOCKS (continued)
|
|
|
|
| Australia (continued)
|
|
|
|
|
|
| Mineral Resources, Ltd.
|
| 8,487
|
| $
| 389,570
|
| Mirvac Group
|
| 198,807
|
|
| 309,961
|
| National Australia Bank, Ltd.
|
| 155,308
|
|
| 2,894,393
|
| Newcrest Mining, Ltd.
|
| 44,049
|
|
| 734,149
|
| Northern Star Resources, Ltd.
|
| 55,852
|
|
| 427,946
|
| Orica, Ltd.
|
| 22,655
|
|
| 229,514
|
| Origin Energy, Ltd.
|
| 84,965
|
|
| 477,805
|
| Pilbara Minerals, Ltd.
|
| 132,548
|
|
| 397,381
|
| Qantas Airways, Ltd. (A)
|
| 44,304
|
|
| 168,781
|
| QBE Insurance Group, Ltd.
|
| 76,019
|
|
| 733,270
|
| Ramsay Health Care, Ltd.
|
| 9,103
|
|
| 302,074
|
| REA Group, Ltd.
|
| 2,574
|
|
| 274,434
|
| Reece, Ltd.
|
| 10,930
|
|
| 143,787
|
| Rio Tinto, Ltd.
|
| 18,579
|
|
| 1,345,610
|
| Santos, Ltd.
|
| 160,529
|
|
| 794,303
|
| Scentre Group
|
| 257,378
|
|
| 456,218
|
| SEEK, Ltd.
|
| 16,419
|
|
| 245,131
|
| Sonic Healthcare, Ltd.
|
| 22,103
|
|
| 459,393
|
| South32, Ltd.
|
| 226,511
|
|
| 493,906
|
| Stockland
|
| 120,543
|
|
| 329,221
|
| Suncorp Group, Ltd.
|
| 64,943
|
|
| 569,621
|
| Telstra Corp., Ltd. (A)
|
| 201,298
|
|
| 522,190
|
| The GPT Group
|
| 96,538
|
|
| 261,387
|
| The Lottery Corp., Ltd.
|
| 108,295
|
|
| 352,260
|
| Transurban Group
|
| 151,852
|
|
| 1,300,123
|
| Treasury Wine Estates, Ltd.
|
| 35,916
|
|
| 270,478
|
| Vicinity, Ltd.
|
| 194,239
|
|
| 234,301
|
| Washington H. Soul Pattinson & Company, Ltd.
|
| 11,419
|
|
| 243,268
|
| Wesfarmers, Ltd.
|
| 56,029
|
|
| 1,950,056
|
| Westpac Banking Corp.
|
| 173,161
|
|
| 2,449,782
|
| WiseTech Global, Ltd.
|
| 8,146
|
|
| 365,420
|
| Woodside Energy Group, Ltd.
|
| 93,617
|
|
| 2,234,846
|
| Woolworths Group, Ltd.
|
| 59,925
|
|
| 1,476,724
|
|
|
|
|
|
| 54,838,230
|
| Austria - 0.1%
|
|
|
|
|
|
| Erste Group Bank AG
|
| 47,697
|
|
| 1,701,539
|
| OMV AG
|
| 20,240
|
|
| 937,275
|
| Verbund AG
|
| 9,410
|
|
| 770,108
|
| voestalpine AG
|
| 15,956
|
|
| 466,223
|
|
|
|
|
|
| 3,875,145
|
| Belgium - 0.5%
|
|
|
|
|
|
| Ageas SA/NV
|
| 23,146
|
|
| 920,525
|
| Anheuser-Busch InBev SA/NV
|
| 120,084
|
|
| 6,816,219
|
| D'ieteren Group
|
| 3,007
|
|
| 491,116
|
| Elia Group SA/NV
|
| 4,015
|
|
| 462,908
|
| Groupe Bruxelles Lambert NV
|
| 13,809
|
|
| 1,111,949
|
| KBC Group NV
|
| 34,340
|
|
| 2,253,054
|
| Sofina SA
|
| 2,127
|
|
| 477,869
|
| Solvay SA
|
| 10,261
|
|
| 1,188,200
|
| UCB SA
|
| 17,499
|
|
| 1,569,612
|
| Umicore SA
|
| 28,772
|
|
| 762,409
|
| Warehouses De Pauw CVA
|
| 22,261
|
|
| 636,144
|
|
|
|
|
|
| 16,690,005
|
| Brazil - 1.0%
|
|
|
|
|
|
| Ambev SA
|
| 618,900
|
|
| 1,729,703
|
| Atacadao SA
|
| 82,800
|
|
| 171,551
|
| B3 SA - Brasil Bolsa Balcao
|
| 764,260
|
|
| 1,995,513
|
| Banco Bradesco SA
|
| 201,238
|
|
| 538,038
|
| Banco BTG Pactual SA
|
| 156,600
|
|
| 1,026,807
|
| Banco do Brasil SA
|
| 112,700
|
|
| 1,071,914
|
| Banco Santander Brasil SA
|
| 47,400
|
|
| 259,491
|
| BB Seguridade Participacoes SA
|
| 93,000
|
|
| 570,539
|
International Strategic Equity Allocation
Fund (continued)
|
|
| Shares or
Principal
Amount
|
| Value
|
| COMMON STOCKS (continued)
|
|
|
|
| Brazil (continued)
|
|
|
|
|
|
| CCR SA
|
| 130,400
|
| $
| 328,103
|
| Centrais Eletricas Brasileiras SA
|
| 155,800
|
|
| 1,109,340
|
| Cia de Saneamento Basico do Estado de Sao Paulo
|
| 44,400
|
|
| 519,310
|
| Cia Siderurgica Nacional SA
|
| 86,300
|
|
| 211,043
|
| Cosan SA
|
| 158,000
|
|
| 558,993
|
| CPFL Energia SA
|
| 29,200
|
|
| 201,367
|
| Energisa SA
|
| 27,900
|
|
| 259,729
|
| Eneva SA (A)
|
| 111,500
|
|
| 268,390
|
| Engie Brasil Energia SA
|
| 25,725
|
|
| 218,806
|
| Equatorial Energia SA
|
| 134,600
|
|
| 860,540
|
| Hapvida Participacoes e Investimentos SA (A)(B)
|
| 688,909
|
|
| 592,634
|
| Hypera SA
|
| 53,800
|
|
| 423,595
|
| JBS SA
|
| 101,200
|
|
| 376,022
|
| Klabin SA
|
| 98,800
|
|
| 454,092
|
| Localiza Rent a Car SA
|
| 117,445
|
|
| 1,500,065
|
| Lojas Renner SA
|
| 125,742
|
|
| 407,032
|
| Magazine Luiza SA (A)
|
| 397,600
|
|
| 221,600
|
| Natura & Company Holding SA (A)
|
| 118,400
|
|
| 362,943
|
| Petroleo Brasileiro SA
|
| 483,400
|
|
| 3,371,661
|
| PRIO SA (A)
|
| 98,000
|
|
| 918,642
|
| Raia Drogasil SA
|
| 167,264
|
|
| 928,184
|
| Rede D'Or Sao Luiz SA (B)
|
| 74,600
|
|
| 431,748
|
| Rumo SA
|
| 170,500
|
|
| 769,515
|
| Sendas Distribuidora SA
|
| 175,000
|
|
| 410,285
|
| Suzano SA
|
| 103,527
|
|
| 1,048,430
|
| Telefonica Brasil SA
|
| 55,600
|
|
| 464,264
|
| TIM SA
|
| 111,700
|
|
| 325,037
|
| TOTVS SA
|
| 68,500
|
|
| 383,718
|
| Ultrapar Participacoes SA
|
| 95,600
|
|
| 350,581
|
| Vale SA
|
| 445,838
|
|
| 5,859,217
|
| Vibra Energia SA
|
| 152,600
|
|
| 568,855
|
| WEG SA
|
| 219,540
|
|
| 1,590,674
|
|
|
|
|
|
| 33,657,971
|
| Canada - 5.2%
|
|
|
|
|
|
| Agnico Eagle Mines, Ltd.
|
| 49,384
|
|
| 2,397,931
|
| Air Canada (A)
|
| 18,837
|
|
| 318,132
|
| Algonquin Power & Utilities Corp.
|
| 69,976
|
|
| 529,792
|
| Alimentation Couche-Tard, Inc.
|
| 78,732
|
|
| 4,117,231
|
| AltaGas, Ltd.
|
| 28,968
|
|
| 566,411
|
| ARC Resources, Ltd.
|
| 61,623
|
|
| 939,942
|
| Atco, Ltd., Class I
|
| 974
|
|
| 26,887
|
| Bank of Montreal
|
| 71,473
|
|
| 6,155,501
|
| Barrick Gold Corp.
|
| 175,969
|
|
| 2,852,073
|
| BCE, Inc.
|
| 9,261
|
|
| 392,318
|
| Brookfield Asset Management, Ltd., Class A
|
| 36,111
|
|
| 1,247,796
|
| Brookfield Corp. (A)(C)
|
| 142,383
|
|
| 4,859,905
|
| Brookfield Reinsurance, Ltd. (A)
|
| 790
|
|
| 27,362
|
| BRP, Inc.
|
| 3,787
|
|
| 289,602
|
| CAE, Inc. (A)
|
| 32,762
|
|
| 790,197
|
| Cameco Corp.
|
| 43,364
|
|
| 1,604,648
|
| Canadian Apartment Properties REIT
|
| 9,526
|
|
| 341,715
|
| Canadian Imperial Bank of Commerce (C)
|
| 91,740
|
|
| 3,635,109
|
| Canadian National Railway Company
|
| 56,980
|
|
| 6,418,262
|
| Canadian Natural Resources, Ltd.
|
| 110,740
|
|
| 7,164,662
|
| Canadian Pacific Kansas City, Ltd.
|
| 93,019
|
|
| 7,383,968
|
| Canadian Tire Corp., Ltd., Class A
|
| 5,601
|
|
| 664,476
|
| Canadian Utilities, Ltd., Class A
|
| 14,704
|
|
| 348,447
|
| CCL Industries, Inc., Class B
|
| 15,363
|
|
| 686,628
|
| Cenovus Energy, Inc.
|
| 142,967
|
|
| 2,850,452
|
| CGI, Inc. (A)
|
| 21,427
|
|
| 2,234,358
|
| The accompanying notes are an integral part of the financial statements.
| 47
|
|
John Hancock Funds II
Portfolio of Investments —
August 31, 2023 (showing percentage of total net assets)
International Strategic Equity Allocation
Fund (continued)
|
|
| Shares or
Principal
Amount
|
| Value
|
| COMMON STOCKS (continued)
|
|
|
|
| Canada (continued)
|
|
|
|
|
|
| CI Financial Corp.
|
| 2,662
|
| $
| 34,162
|
| Constellation Software, Inc.
|
| 2,017
|
|
| 4,143,060
|
| Dollarama, Inc.
|
| 28,825
|
|
| 1,868,974
|
| Element Fleet Management Corp.
|
| 40,229
|
|
| 618,381
|
| Emera, Inc. (C)
|
| 28,264
|
|
| 1,059,482
|
| Empire Company, Ltd., Class A
|
| 16,894
|
|
| 440,104
|
| Enbridge, Inc.
|
| 203,520
|
|
| 7,145,492
|
| Fairfax Financial Holdings, Ltd.
|
| 2,295
|
|
| 1,892,577
|
| First Capital Real Estate Investment Trust
|
| 1,903
|
|
| 19,351
|
| First Quantum Minerals, Ltd.
|
| 58,986
|
|
| 1,584,659
|
| FirstService Corp.
|
| 4,150
|
|
| 627,568
|
| Fortis, Inc.
|
| 49,556
|
|
| 1,943,437
|
| Franco-Nevada Corp.
|
| 19,289
|
|
| 2,778,861
|
| George Weston, Ltd.
|
| 6,494
|
|
| 720,194
|
| GFL Environmental, Inc.
|
| 23,537
|
|
| 762,793
|
| Gildan Activewear, Inc.
|
| 18,657
|
|
| 556,451
|
| Great-West Lifeco, Inc. (C)
|
| 31,351
|
|
| 900,947
|
| Hydro One, Ltd. (B)
|
| 34,320
|
|
| 892,036
|
| iA Financial Corp., Inc.
|
| 11,331
|
|
| 710,871
|
| IGM Financial, Inc.
|
| 10,752
|
|
| 306,518
|
| Imperial Oil, Ltd.
|
| 20,612
|
|
| 1,170,485
|
| Intact Financial Corp.
|
| 17,939
|
|
| 2,529,144
|
| Ivanhoe Mines, Ltd., Class A (A)
|
| 61,427
|
|
| 546,442
|
| Keyera Corp.
|
| 23,689
|
|
| 585,212
|
| Kinross Gold Corp.
|
| 126,880
|
|
| 644,166
|
| Loblaw Companies, Ltd.
|
| 16,317
|
|
| 1,416,869
|
| Lundin Mining Corp.
|
| 66,950
|
|
| 519,269
|
| Magna International, Inc. (C)
|
| 27,615
|
|
| 1,624,364
|
| Metro, Inc.
|
| 23,931
|
|
| 1,233,389
|
| National Bank of Canada
|
| 34,724
|
|
| 2,420,041
|
| Northland Power, Inc.
|
| 25,866
|
|
| 489,103
|
| Nutrien, Ltd.
|
| 49,987
|
|
| 3,166,361
|
| Nuvei Corp. (B)
|
| 6,598
|
|
| 119,098
|
| Onex Corp.
|
| 7,293
|
|
| 450,631
|
| Open Text Corp.
|
| 27,623
|
|
| 1,113,138
|
| Pan American Silver Corp.
|
| 36,683
|
|
| 606,497
|
| Parkland Corp.
|
| 14,295
|
|
| 378,217
|
| Pembina Pipeline Corp.
|
| 56,563
|
|
| 1,758,175
|
| Power Corp. of Canada
|
| 61,575
|
|
| 1,681,555
|
| Quebecor, Inc., Class B
|
| 16,018
|
|
| 366,190
|
| RB Global, Inc.
|
| 18,230
|
|
| 1,127,367
|
| Restaurant Brands International, Inc.
|
| 29,851
|
|
| 2,073,354
|
| RioCan Real Estate Investment Trust
|
| 17,816
|
|
| 254,608
|
| Rogers Communications, Inc., Class B
|
| 36,210
|
|
| 1,473,108
|
| Royal Bank of Canada
|
| 139,070
|
|
| 12,529,886
|
| Saputo, Inc.
|
| 25,832
|
|
| 558,432
|
| Shopify, Inc., Class A (A)
|
| 119,279
|
|
| 7,935,161
|
| SmartCentres Real Estate Investment Trust
|
| 1,819
|
|
| 32,376
|
| Sun Life Financial, Inc. (C)
|
| 61,475
|
|
| 2,998,681
|
| Suncor Energy, Inc.
|
| 133,140
|
|
| 4,509,930
|
| TC Energy Corp. (C)
|
| 101,926
|
|
| 3,681,164
|
| Teck Resources, Ltd., Class B
|
| 45,606
|
|
| 1,886,074
|
| TELUS Corp.
|
| 49,633
|
|
| 871,663
|
| TFI International, Inc.
|
| 7,881
|
|
| 1,073,897
|
| The Bank of Nova Scotia
|
| 119,829
|
|
| 5,686,379
|
| The Descartes Systems Group, Inc. (A)
|
| 8,746
|
|
| 655,756
|
| The Toronto-Dominion Bank
|
| 182,134
|
|
| 11,109,743
|
| Thomson Reuters Corp.
|
| 16,345
|
|
| 2,104,697
|
| TMX Group, Ltd.
|
| 29,520
|
|
| 653,233
|
| Toromont Industries, Ltd.
|
| 8,526
|
|
| 699,394
|
| Tourmaline Oil Corp.
|
| 32,280
|
|
| 1,655,329
|
| West Fraser Timber Company, Ltd.
|
| 5,759
|
|
| 435,335
|
| Wheaton Precious Metals Corp.
|
| 45,495
|
|
| 1,984,514
|
International Strategic Equity Allocation
Fund (continued)
|
|
| Shares or
Principal
Amount
|
| Value
|
| COMMON STOCKS (continued)
|
|
|
|
| Canada (continued)
|
|
|
|
|
|
| WSP Global, Inc.
|
| 12,653
|
| $
| 1,772,282
|
|
|
|
|
|
| 178,430,432
|
| Chile - 0.1%
|
|
|
|
|
|
| Antofagasta PLC
|
| 42,822
|
|
| 784,239
|
| Banco de Chile
|
| 5,882,591
|
|
| 641,688
|
| Banco de Credito e Inversiones SA
|
| 8,804
|
|
| 253,278
|
| Banco Santander Chile
|
| 8,511,271
|
|
| 407,312
|
| Cencosud SA
|
| 163,505
|
|
| 349,999
|
| Cia Cervecerias Unidas SA
|
| 16,159
|
|
| 119,425
|
| Cia Sud Americana de Vapores SA
|
| 1,971,995
|
|
| 131,611
|
| Empresas CMPC SA
|
| 149,304
|
|
| 271,091
|
| Empresas COPEC SA
|
| 50,399
|
|
| 364,027
|
| Enel Americas SA (A)
|
| 2,724,223
|
|
| 323,750
|
| Enel Chile SA
|
| 3,689,440
|
|
| 248,613
|
| Falabella SA
|
| 113,354
|
|
| 279,222
|
|
|
|
|
|
| 4,174,255
|
| China - 6.2%
|
|
|
|
|
|
| 360 Security Technology, Inc., Class A (A)
|
| 47,500
|
|
| 72,723
|
| 37 Interactive Entertainment Network Technology Group Company, Ltd., Class A
|
| 14,600
|
|
| 49,402
|
| 3Peak, Inc., Class A
|
| 782
|
|
| 19,700
|
| 3SBio, Inc. (A)(B)
|
| 211,719
|
|
| 177,054
|
| AAC Technologies Holdings, Inc.
|
| 82,144
|
|
| 159,117
|
| Advanced Micro-Fabrication Equipment, Inc., Class A (A)
|
| 4,328
|
|
| 90,685
|
| AECC Aero-Engine Control Company, Ltd., Class A
|
| 11,200
|
|
| 34,378
|
| AECC Aviation Power Company, Ltd., Class A
|
| 19,800
|
|
| 106,513
|
| Agricultural Bank of China, Ltd., Class A
|
| 598,200
|
|
| 283,834
|
| Agricultural Bank of China, Ltd., H Shares
|
| 3,462,544
|
|
| 1,186,803
|
| Aier Eye Hospital Group Company, Ltd., Class A
|
| 64,784
|
|
| 160,272
|
| Aima Technology Group Company, Ltd., Class A
|
| 4,800
|
|
| 18,675
|
| Air China, Ltd., Class A (A)
|
| 52,000
|
|
| 61,773
|
| Air China, Ltd., H Shares (A)
|
| 209,953
|
|
| 155,411
|
| Akeso, Inc. (A)(B)
|
| 57,504
|
|
| 252,568
|
| Alibaba Group Holding, Ltd. (A)
|
| 1,928,183
|
|
| 22,378,773
|
| Aluminum Corp. of China, Ltd., A Shares
|
| 87,300
|
|
| 70,765
|
| Aluminum Corp. of China, Ltd., H Shares
|
| 456,805
|
|
| 220,379
|
| Amlogic Shanghai Company, Ltd., Class A (A)
|
| 3,063
|
|
| 36,807
|
| Angel Yeast Company, Ltd., Class A
|
| 6,100
|
|
| 27,760
|
| Anhui Conch Cement Company, Ltd., Class A
|
| 28,100
|
|
| 99,082
|
| Anhui Conch Cement Company, Ltd., H Shares
|
| 143,439
|
|
| 399,400
|
| Anhui Gujing Distillery Company, Ltd., B Shares
|
| 12,000
|
|
| 199,742
|
| Anhui Gujing Distillery Company, Ltd., Class A
|
| 2,900
|
|
| 114,503
|
| Anhui Honglu Steel Construction Group Company, Ltd., Class A
|
| 4,840
|
|
| 17,790
|
| Anhui Kouzi Distillery Company, Ltd., Class A
|
| 4,600
|
|
| 35,970
|
| Anhui Yingjia Distillery Company, Ltd., Class A
|
| 4,600
|
|
| 48,377
|
| Anjoy Foods Group Company, Ltd., Class A
|
| 1,900
|
|
| 34,084
|
| ANTA Sports Products, Ltd.
|
| 141,883
|
|
| 1,599,477
|
| The accompanying notes are an integral part of the financial statements.
| 48
|
|
John Hancock Funds II
Portfolio of Investments —
August 31, 2023 (showing percentage of total net assets)
International Strategic Equity Allocation
Fund (continued)
|
|
| Shares or
Principal
Amount
|
| Value
|
| COMMON STOCKS (continued)
|
|
|
|
| China (continued)
|
|
|
|
|
|
| Apeloa Pharmaceutical Company, Ltd., Class A
|
| 8,800
|
| $
| 21,207
|
| Asia - Potash International Investment Guangzhou Company, Ltd., Class A (A)
|
| 5,000
|
|
| 19,184
|
| ASR Microelectronics Company, Ltd., Class A (A)
|
| 2,793
|
|
| 26,814
|
| Asymchem Laboratories Tianjin Company, Ltd., Class A
|
| 2,540
|
|
| 46,306
|
| Autobio Diagnostics Company, Ltd., Class A
|
| 4,100
|
|
| 25,840
|
| Autohome, Inc., ADR
|
| 8,761
|
|
| 253,193
|
| Avary Holding Shenzhen Company, Ltd., Class A
|
| 14,100
|
|
| 41,300
|
| AVIC Airborne Systems Company, Ltd.
|
| 28,980
|
|
| 59,699
|
| AVIC Industry-Finance Holdings Company, Ltd., Class A
|
| 69,700
|
|
| 35,288
|
| AviChina Industry & Technology Company, Ltd., H Shares
|
| 303,295
|
|
| 135,918
|
| AVICOPTER PLC, Class A
|
| 5,500
|
|
| 28,768
|
| Baidu, Inc., Class A (A)
|
| 262,885
|
|
| 4,694,926
|
| Bank of Beijing Company, Ltd., Class A
|
| 167,200
|
|
| 102,497
|
| Bank of Changsha Company, Ltd., Class A
|
| 28,900
|
|
| 32,253
|
| Bank of Chengdu Company, Ltd., Class A
|
| 28,900
|
|
| 54,317
|
| Bank of China, Ltd., Class A
|
| 244,000
|
|
| 125,476
|
| Bank of China, Ltd., H Shares
|
| 9,332,899
|
|
| 3,163,080
|
| Bank of Communications Company, Ltd., Class A
|
| 290,100
|
|
| 220,957
|
| Bank of Communications Company, Ltd., H Shares
|
| 1,019,090
|
|
| 583,277
|
| Bank of Hangzhou Company, Ltd., Class A
|
| 42,400
|
|
| 65,207
|
| Bank of Jiangsu Company, Ltd., Class A
|
| 113,500
|
|
| 111,084
|
| Bank of Nanjing Company, Ltd., Class A
|
| 74,300
|
|
| 80,727
|
| Bank of Ningbo Company, Ltd., Class A
|
| 47,300
|
|
| 169,746
|
| Bank of Shanghai Company, Ltd., Class A
|
| 102,200
|
|
| 83,410
|
| Bank of Suzhou Company, Ltd., Class A
|
| 28,500
|
|
| 26,358
|
| Baoshan Iron & Steel Company, Ltd., Class A
|
| 150,900
|
|
| 125,428
|
| BBMG Corp., Class A
|
| 63,900
|
|
| 19,279
|
| Beijing Capital International Airport Company, Ltd., H Shares (A)
|
| 203,850
|
|
| 106,741
|
| Beijing Dabeinong Technology Group Company, Ltd., Class A
|
| 30,300
|
|
| 26,966
|
| Beijing Easpring Material Technology Company, Ltd., Class A
|
| 3,400
|
|
| 20,670
|
| Beijing E-Hualu Information Technology Company, Ltd., Class A (A)
|
| 3,600
|
|
| 14,894
|
| Beijing Enlight Media Company, Ltd., Class A
|
| 18,200
|
|
| 23,320
|
| Beijing Kingsoft Office Software, Inc., Class A
|
| 3,232
|
|
| 174,917
|
| Beijing New Building Materials PLC, Class A
|
| 11,900
|
|
| 48,820
|
| Beijing Roborock Technology Company, Ltd., Class A
|
| 815
|
|
| 32,852
|
| Beijing Shiji Information Technology Company, Ltd., Class A (A)
|
| 15,550
|
|
| 28,928
|
| Beijing Tiantan Biological Products Corp., Ltd., Class A
|
| 10,200
|
|
| 35,113
|
| Beijing Tongrentang Company, Ltd., Class A
|
| 9,400
|
|
| 72,506
|
| Beijing United Information Technology Company, Ltd., Class A
|
| 4,208
|
|
| 20,845
|
| Beijing Wantai Biological Pharmacy Enterprise Company, Ltd., Class A
|
| 5,869
|
|
| 40,287
|
International Strategic Equity Allocation
Fund (continued)
|
|
| Shares or
Principal
Amount
|
| Value
|
| COMMON STOCKS (continued)
|
|
|
|
| China (continued)
|
|
|
|
|
|
| Beijing Yanjing Brewery Company, Ltd., Class A
|
| 20,900
|
| $
| 29,731
|
| Beijing-Shanghai High Speed Railway Company, Ltd., Class A
|
| 217,600
|
|
| 152,396
|
| Bethel Automotive Safety Systems Company, Ltd., Class A
|
| 2,600
|
|
| 26,827
|
| Betta Pharmaceuticals Company, Ltd., Class A
|
| 3,400
|
|
| 23,054
|
| BGI Genomics Company, Ltd., Class A
|
| 2,700
|
|
| 19,877
|
| Bilibili, Inc., Class Z (A)
|
| 22,553
|
|
| 340,782
|
| Bloomage Biotechnology Corp., Ltd., Class A
|
| 3,171
|
|
| 40,330
|
| BOC International China Company, Ltd., Class A
|
| 23,500
|
|
| 38,369
|
| BOE Technology Group Company, Ltd., Class A
|
| 256,500
|
|
| 141,015
|
| BTG Hotels Group Company, Ltd., Class A (A)
|
| 8,400
|
|
| 20,052
|
| BYD Company, Ltd., Class A
|
| 12,500
|
|
| 427,988
|
| BYD Company, Ltd., H Shares
|
| 114,972
|
|
| 3,611,349
|
| BYD Electronic International Company, Ltd.
|
| 91,801
|
|
| 425,177
|
| By-health Company, Ltd., Class A
|
| 10,600
|
|
| 28,094
|
| Caitong Securities Company, Ltd., Class A
|
| 36,500
|
|
| 40,110
|
| Cambricon Technologies Corp., Ltd., Class A (A)
|
| 2,709
|
|
| 59,171
|
| Canmax Technologies Company, Ltd., Class A
|
| 5,160
|
|
| 19,107
|
| CECEP Solar Energy Company, Ltd., Class A
|
| 25,900
|
|
| 21,404
|
| CECEP Wind-Power Corp., Class A
|
| 40,500
|
|
| 18,659
|
| CETC Cyberspace Security Technology Company, Ltd., Class A
|
| 6,100
|
|
| 20,904
|
| CGN Power Company, Ltd., H Shares (B)
|
| 1,230,089
|
|
| 307,374
|
| Changchun High & New Technology Industry Group, Inc., Class A
|
| 2,700
|
|
| 51,009
|
| Changjiang Securities Company, Ltd., Class A
|
| 48,500
|
|
| 39,779
|
| Changzhou Xingyu Automotive Lighting Systems Company, Ltd., Class A
|
| 1,800
|
|
| 36,494
|
| Chaozhou Three-Circle Group Company, Ltd., Class A
|
| 13,300
|
|
| 58,533
|
| Chengxin Lithium Group Company, Ltd., Class A
|
| 6,000
|
|
| 18,807
|
| Chifeng Jilong Gold Mining Company, Ltd., Class A (A)
|
| 8,800
|
|
| 18,112
|
| China Baoan Group Company, Ltd., Class A
|
| 20,000
|
|
| 29,229
|
| China Cinda Asset Management Company, Ltd., H Shares
|
| 1,135,408
|
|
| 111,343
|
| China CITIC Bank Corp., Ltd., H Shares
|
| 1,057,061
|
|
| 470,465
|
| China Coal Energy Company, Ltd., H Shares
|
| 239,593
|
|
| 163,445
|
| China Communications Services Corp., Ltd., H Shares
|
| 292,874
|
|
| 131,855
|
| China Conch Venture Holdings, Ltd.
|
| 174,790
|
|
| 171,738
|
| China Construction Bank Corp., Class A
|
| 81,900
|
|
| 67,437
|
| China Construction Bank Corp., H Shares
|
| 11,232,124
|
|
| 6,009,758
|
| China CSSC Holdings, Ltd., Class A
|
| 31,600
|
|
| 123,050
|
| China Eastern Airlines Corp., Ltd., Class A (A)
|
| 63,800
|
|
| 38,021
|
| China Energy Engineering Corp., Ltd., Class A
|
| 228,100
|
|
| 71,651
|
| The accompanying notes are an integral part of the financial statements.
| 49
|
|
John Hancock Funds II
Portfolio of Investments —
August 31, 2023 (showing percentage of total net assets)
International Strategic Equity Allocation
Fund (continued)
|
|
| Shares or
Principal
Amount
|
| Value
|
| COMMON STOCKS (continued)
|
|
|
|
| China (continued)
|
|
|
|
|
|
| China Everbright Bank Company, Ltd., Class A
|
| 352,000
|
| $
| 145,339
|
| China Everbright Bank Company, Ltd., H Shares
|
| 372,138
|
|
| 107,184
|
| China Evergrande Group (A)
|
| 667,935
|
|
| 23,422
|
| China Feihe, Ltd. (B)
|
| 427,868
|
|
| 257,243
|
| China Galaxy Securities Company, Ltd., Class A
|
| 31,500
|
|
| 49,892
|
| China Galaxy Securities Company, Ltd., H Shares
|
| 420,020
|
|
| 225,956
|
| China Great Wall Securities Company, Ltd., Class A
|
| 33,300
|
|
| 40,101
|
| China Greatwall Technology Group Company, Ltd., Class A
|
| 22,900
|
|
| 34,182
|
| China Hongqiao Group, Ltd.
|
| 277,832
|
|
| 276,561
|
| China Huishan Dairy Holdings Company, Ltd. (A)(D)
|
| 175,000
|
|
| 0
|
| China International Capital Corp., Ltd., Class A
|
| 13,200
|
|
| 70,645
|
| China International Capital Corp., Ltd., H Shares (B)
|
| 180,049
|
|
| 345,808
|
| China Jushi Company, Ltd., Class A
|
| 29,700
|
|
| 56,886
|
| China Lesso Group Holdings, Ltd.
|
| 125,986
|
|
| 69,287
|
| China Life Insurance Company, Ltd., Class A
|
| 19,700
|
|
| 96,437
|
| China Life Insurance Company, Ltd., H Shares
|
| 877,911
|
|
| 1,330,598
|
| China Literature, Ltd. (A)(B)
|
| 46,850
|
|
| 188,146
|
| China Longyuan Power Group Corp., Ltd., H Shares
|
| 388,016
|
|
| 307,152
|
| China Meheco Company, Ltd., Class A
|
| 12,060
|
|
| 20,730
|
| China Meidong Auto Holdings, Ltd.
|
| 78,817
|
|
| 59,361
|
| China Mengniu Dairy Company, Ltd. (A)
|
| 368,329
|
|
| 1,238,494
|
| China Merchants Bank Company, Ltd., Class A
|
| 145,900
|
|
| 632,661
|
| China Merchants Bank Company, Ltd., H Shares
|
| 453,887
|
|
| 1,797,311
|
| China Merchants Energy Shipping Company, Ltd., Class A
|
| 59,900
|
|
| 48,274
|
| China Merchants Securities Company, Ltd., Class A
|
| 56,700
|
|
| 110,634
|
| China Merchants Shekou Industrial Zone Holdings Company, Ltd., Class A
|
| 52,600
|
|
| 98,713
|
| China Minsheng Banking Corp., Ltd., Class A
|
| 259,900
|
|
| 134,698
|
| China Minsheng Banking Corp., Ltd., H Shares
|
| 723,767
|
|
| 232,463
|
| China National Building Material Company, Ltd., H Shares
|
| 459,361
|
|
| 233,477
|
| China National Chemical Engineering Company, Ltd., Class A
|
| 48,300
|
|
| 51,570
|
| China National Medicines Corp., Ltd., Class A
|
| 5,200
|
|
| 23,239
|
| China National Nuclear Power Company, Ltd., Class A
|
| 130,700
|
|
| 129,126
|
| China National Software & Service Company, Ltd., Class A
|
| 6,060
|
|
| 35,873
|
| China Northern Rare Earth Group High-Tech Company, Ltd., Class A
|
| 24,000
|
|
| 72,652
|
| China Oilfield Services, Ltd., H Shares
|
| 211,334
|
|
| 239,343
|
| China Pacific Insurance Group Company, Ltd., Class A
|
| 50,800
|
|
| 193,389
|
| China Pacific Insurance Group Company, Ltd., H Shares
|
| 310,763
|
|
| 710,731
|
International Strategic Equity Allocation
Fund (continued)
|
|
| Shares or
Principal
Amount
|
| Value
|
| COMMON STOCKS (continued)
|
|
|
|
| China (continued)
|
|
|
|
|
|
| China Petroleum & Chemical Corp., Class A
|
| 213,600
|
| $
| 177,818
|
| China Petroleum & Chemical Corp., H Shares
|
| 2,903,946
|
|
| 1,697,956
|
| China Railway Group, Ltd., Class A
|
| 146,400
|
|
| 134,732
|
| China Railway Group, Ltd., H Shares
|
| 485,115
|
|
| 256,641
|
| China Railway Signal & Communication Corp., Ltd., Class A
|
| 52,733
|
|
| 40,607
|
| China Rare Earth Resources and Technology Company, Ltd., Class A
|
| 6,600
|
|
| 25,863
|
| China Resources Microelectronics, Ltd., Class A
|
| 8,873
|
|
| 71,244
|
| China Resources Mixc Lifestyle Services, Ltd. (B)
|
| 79,281
|
|
| 342,584
|
| China Resources Pharmaceutical Group, Ltd. (B)
|
| 180,750
|
|
| 120,659
|
| China Resources Sanjiu Medical & Pharmaceutical Company, Ltd., Class A
|
| 7,200
|
|
| 47,037
|
| China Shenhua Energy Company, Ltd., Class A
|
| 46,000
|
|
| 177,779
|
| China Shenhua Energy Company, Ltd., H Shares
|
| 394,502
|
|
| 1,148,204
|
| China Southern Airlines Company, Ltd., Class A (A)
|
| 77,200
|
|
| 67,038
|
| China Southern Airlines Company, Ltd., H Shares (A)
|
| 209,872
|
|
| 111,488
|
| China State Construction Engineering Corp., Ltd., Class A
|
| 303,600
|
|
| 234,405
|
| China Three Gorges Renewables Group Company, Ltd., Class A
|
| 196,800
|
|
| 132,846
|
| China Tourism Group Duty Free Corp., Ltd., Class A
|
| 13,600
|
|
| 203,543
|
| China Tourism Group Duty Free Corp., Ltd., H Shares (B)
|
| 9,236
|
|
| 124,031
|
| China Tower Corp., Ltd., H Shares (B)
|
| 5,176,852
|
|
| 500,871
|
| China United Network Communications, Ltd., Class A
|
| 229,200
|
|
| 164,068
|
| China Vanke Company, Ltd., Class A
|
| 70,900
|
|
| 132,726
|
| China Vanke Company, Ltd., H Shares
|
| 259,523
|
|
| 302,739
|
| China Yangtze Power Company, Ltd., Class A
|
| 164,900
|
|
| 499,266
|
| China Zhenhua Group Science & Technology Company, Ltd., Class A
|
| 3,700
|
|
| 46,517
|
| China Zheshang Bank Company, Ltd., Class A
|
| 192,500
|
|
| 67,921
|
| Chinasoft International, Ltd. (A)
|
| 315,998
|
|
| 209,441
|
| Chongqing Brewery Company, Ltd., Class A
|
| 3,200
|
|
| 40,114
|
| Chongqing Changan Automobile Company, Ltd., Class A
|
| 59,910
|
|
| 103,197
|
| Chongqing Fuling Zhacai Group Company, Ltd., Class A
|
| 9,540
|
|
| 20,825
|
| Chongqing Rural Commercial Bank Company, Ltd., Class A
|
| 76,200
|
|
| 39,318
|
| Chongqing Zhifei Biological Products Company, Ltd., Class A
|
| 16,650
|
|
| 100,807
|
| CIFI Holdings Group Company, Ltd. (A)(D)
|
| 7,348
|
|
| 534
|
| CITIC Securities Company, Ltd., Class A
|
| 89,400
|
|
| 272,724
|
| CITIC Securities Company, Ltd., H Shares
|
| 215,342
|
|
| 420,482
|
| CITIC, Ltd.
|
| 685,235
|
|
| 680,027
|
| CMOC Group, Ltd., Class A
|
| 116,800
|
|
| 91,700
|
| CMOC Group, Ltd., H Shares
|
| 438,272
|
|
| 261,458
|
| The accompanying notes are an integral part of the financial statements.
| 50
|
|
John Hancock Funds II
Portfolio of Investments —
August 31, 2023 (showing percentage of total net assets)
International Strategic Equity Allocation
Fund (continued)
|
|
| Shares or
Principal
Amount
|
| Value
|
| COMMON STOCKS (continued)
|
|
|
|
| China (continued)
|
|
|
|
|
|
| CNGR Advanced Material Company, Ltd., Class A
|
| 3,400
|
| $
| 25,583
|
| CNNC Hua Yuan Titanium Dioxide Company, Ltd., Class A
|
| 29,355
|
|
| 20,839
|
| Contemporary Amperex Technology Company, Ltd., Class A
|
| 30,620
|
|
| 992,919
|
| COSCO SHIPPING Development Company, Ltd., Class A
|
| 63,900
|
|
| 20,874
|
| COSCO SHIPPING Energy Transportation Company, Ltd., Class A
|
| 23,600
|
|
| 42,794
|
| COSCO SHIPPING Energy Transportation Company, Ltd., H Shares
|
| 147,224
|
|
| 153,804
|
| COSCO SHIPPING Holdings Company, Ltd., Class A
|
| 89,400
|
|
| 120,219
|
| COSCO SHIPPING Holdings Company, Ltd., H Shares
|
| 374,991
|
|
| 384,548
|
| Country Garden Holdings Company, Ltd. (A)(C)
|
| 1,440,443
|
|
| 163,270
|
| Country Garden Services Holdings Company, Ltd. (C)
|
| 253,430
|
|
| 294,446
|
| CRRC Corp., Ltd., Class A
|
| 173,900
|
|
| 141,651
|
| CRRC Corp., Ltd., H Shares
|
| 515,773
|
|
| 253,952
|
| CSC Financial Company, Ltd., Class A
|
| 30,800
|
|
| 109,009
|
| CSPC Pharmaceutical Group, Ltd.
|
| 1,041,785
|
|
| 783,014
|
| Daan Gene Company, Ltd., Class A
|
| 11,200
|
|
| 14,416
|
| Dajin Heavy Industry Company, Ltd., Class A
|
| 4,000
|
|
| 13,534
|
| Dali Foods Group Company, Ltd. (B)
|
| 229,184
|
|
| 109,315
|
| Daqin Railway Company, Ltd., Class A
|
| 107,600
|
|
| 105,205
|
| Daqo New Energy Corp., ADR (A)
|
| 7,049
|
|
| 260,602
|
| DaShenLin Pharmaceutical Group Company, Ltd., Class A
|
| 6,804
|
|
| 24,870
|
| Datang International Power Generation Company, Ltd., Class A
|
| 48,300
|
|
| 18,440
|
| DHC Software Company, Ltd., Class A
|
| 24,800
|
|
| 22,848
|
| Do-Fluoride New Materials Company, Ltd., Class A
|
| 5,140
|
|
| 11,538
|
| Dong-E-E-Jiao Company, Ltd., Class A
|
| 5,100
|
|
| 36,312
|
| Dongfang Electric Corp., Ltd., Class A
|
| 18,400
|
|
| 42,330
|
| Dongfeng Motor Group Company, Ltd., H Shares
|
| 311,965
|
|
| 114,435
|
| Dongxing Securities Company, Ltd., Class A
|
| 29,400
|
|
| 33,445
|
| Dongyue Group, Ltd.
|
| 186,854
|
|
| 160,339
|
| East Buy Holding, Ltd. (A)(B)(C)
|
| 47,865
|
|
| 242,474
|
| East Money Information Company, Ltd., Class A
|
| 113,456
|
|
| 247,273
|
| Ecovacs Robotics Company, Ltd., Class A
|
| 3,500
|
|
| 25,477
|
| ENN Energy Holdings, Ltd.
|
| 91,977
|
|
| 721,616
|
| ENN Natural Gas Company, Ltd., Class A
|
| 16,800
|
|
| 40,174
|
| Eve Energy Company, Ltd., Class A
|
| 14,300
|
|
| 96,876
|
| Everbright Securities Company, Ltd., Class A
|
| 28,100
|
|
| 66,162
|
| Fangda Carbon New Material Company, Ltd., Class A (A)
|
| 19,700
|
|
| 15,754
|
| FAW Jiefang Group Company, Ltd., Class A (A)
|
| 14,600
|
|
| 17,184
|
| First Capital Securities Company, Ltd., Class A
|
| 37,600
|
|
| 31,024
|
| Flat Glass Group Company, Ltd., Class A
|
| 10,700
|
|
| 45,306
|
| Flat Glass Group Company, Ltd., H Shares
|
| 51,745
|
|
| 128,505
|
| Focus Media Information Technology Company, Ltd., Class A
|
| 102,200
|
|
| 107,764
|
International Strategic Equity Allocation
Fund (continued)
|
|
| Shares or
Principal
Amount
|
| Value
|
| COMMON STOCKS (continued)
|
|
|
|
| China (continued)
|
|
|
|
|
|
| Foshan Haitian Flavouring & Food Company, Ltd., Class A
|
| 32,244
|
| $
| 173,277
|
| Fosun International, Ltd.
|
| 285,435
|
|
| 178,421
|
| Founder Securities Company, Ltd., Class A
|
| 63,200
|
|
| 62,689
|
| Foxconn Industrial Internet Company, Ltd., Class A
|
| 68,800
|
|
| 206,464
|
| Fujian Sunner Development Company, Ltd., Class A
|
| 7,500
|
|
| 20,029
|
| Fuyao Glass Industry Group Company, Ltd., Class A
|
| 14,200
|
|
| 74,060
|
| Fuyao Glass Industry Group Company, Ltd., H Shares (B)
|
| 69,174
|
|
| 313,002
|
| Galaxycore, Inc., Class A
|
| 8,436
|
|
| 17,561
|
| Ganfeng Lithium Group Company, Ltd., Class A
|
| 10,960
|
|
| 71,314
|
| Ganfeng Lithium Group Company, Ltd., H Shares (B)
|
| 46,954
|
|
| 224,281
|
| G-bits Network Technology Xiamen Company, Ltd., Class A
|
| 500
|
|
| 28,632
|
| GD Power Development Company, Ltd., Class A
|
| 114,700
|
|
| 55,235
|
| GDS Holdings, Ltd., Class A (A)
|
| 108,178
|
|
| 160,614
|
| GEM Company, Ltd., Class A
|
| 30,000
|
|
| 25,761
|
| Gemdale Corp., Class A
|
| 34,600
|
|
| 34,229
|
| Genscript Biotech Corp. (A)
|
| 134,044
|
|
| 312,878
|
| GF Securities Company, Ltd., Class A
|
| 43,600
|
|
| 90,047
|
| GF Securities Company, Ltd., H Shares
|
| 122,345
|
|
| 174,570
|
| Giant Network Group Company, Ltd., Class A
|
| 15,700
|
|
| 31,430
|
| GigaDevice Semiconductor, Inc., Class A
|
| 4,500
|
|
| 57,962
|
| Ginlong Technologies Company, Ltd., Class A
|
| 2,400
|
|
| 24,704
|
| GoerTek, Inc., Class A
|
| 22,100
|
|
| 46,375
|
| GoodWe Technologies Company, Ltd., Class A
|
| 1,277
|
|
| 24,268
|
| Gotion High-tech Company, Ltd., Class A (A)
|
| 11,800
|
|
| 39,185
|
| Great Wall Motor Company, Ltd., Class A
|
| 15,500
|
|
| 55,584
|
| Great Wall Motor Company, Ltd., H Shares (C)
|
| 273,249
|
|
| 323,746
|
| Gree Electric Appliances, Inc. of Zhuhai, Class A
|
| 20,200
|
|
| 99,181
|
| Greenland Holdings Corp., Ltd., Class A (A)
|
| 88,900
|
|
| 35,760
|
| Greentown China Holdings, Ltd.
|
| 116,901
|
|
| 138,829
|
| Greentown Service Group Company, Ltd. (C)
|
| 158,388
|
|
| 73,847
|
| GRG Banking Equipment Company, Ltd., Class A
|
| 17,300
|
|
| 29,790
|
| Guangdong Haid Group Company, Ltd., Class A
|
| 10,800
|
|
| 71,434
|
| Guangdong Hec Technology Holding Company, Ltd., Class A
|
| 23,300
|
|
| 21,725
|
| Guangdong Kinlong Hardware Products Company, Ltd., Class A
|
| 2,400
|
|
| 18,774
|
| Guanghui Energy Company, Ltd., Class A
|
| 48,400
|
|
| 43,690
|
| Guangzhou Automobile Group Company, Ltd., Class A
|
| 34,000
|
|
| 47,046
|
| Guangzhou Automobile Group Company, Ltd., H Shares
|
| 352,155
|
|
| 185,440
|
| Guangzhou Baiyun International Airport Company, Ltd., Class A (A)
|
| 14,000
|
|
| 22,662
|
| Guangzhou Baiyunshan Pharmaceutical Holdings Company, Ltd., Class A
|
| 11,200
|
|
| 47,518
|
| The accompanying notes are an integral part of the financial statements.
| 51
|
|
John Hancock Funds II
Portfolio of Investments —
August 31, 2023 (showing percentage of total net assets)
International Strategic Equity Allocation
Fund (continued)
|
|
| Shares or
Principal
Amount
|
| Value
|
| COMMON STOCKS (continued)
|
|
|
|
| China (continued)
|
|
|
|
|
|
| Guangzhou Great Power Energy & Technology Company, Ltd., Class A (A)
|
| 2,500
|
| $
| 12,278
|
| Guangzhou Haige Communications Group, Inc. Company, Class A
|
| 17,300
|
|
| 25,118
|
| Guangzhou Kingmed Diagnostics Group Company, Ltd., Class A
|
| 3,300
|
|
| 27,070
|
| Guangzhou Shiyuan Electronic Technology Company, Ltd., Class A
|
| 4,300
|
|
| 31,417
|
| Guangzhou Tinci Materials Technology Company, Ltd., Class A
|
| 12,900
|
|
| 58,051
|
| Guangzhou Yuexiu Capital Holdings Group Company, Ltd., Class A
|
| 29,945
|
|
| 28,237
|
| Guolian Securities Company, Ltd., Class A (A)
|
| 19,100
|
|
| 28,463
|
| Guosen Securities Company, Ltd., Class A
|
| 48,600
|
|
| 61,887
|
| Guotai Junan Securities Company, Ltd., Class A
|
| 57,900
|
|
| 115,741
|
| Guoyuan Securities Company, Ltd., Class A
|
| 34,800
|
|
| 33,160
|
| H World Group, Ltd., ADR (A)
|
| 22,590
|
|
| 909,925
|
| Haidilao International Holding, Ltd. (B)
|
| 193,816
|
|
| 527,144
|
| Haier Smart Home Company, Ltd., Class A
|
| 43,500
|
|
| 140,248
|
| Haier Smart Home Company, Ltd., H Shares
|
| 282,786
|
|
| 875,868
|
| Hainan Airlines Holding Company, Ltd., Class A (A)
|
| 245,300
|
|
| 52,565
|
| Hainan Airport Infrastructure Company, Ltd., Class A (A)
|
| 69,900
|
|
| 38,455
|
| Haitian International Holdings, Ltd.
|
| 63,963
|
|
| 137,350
|
| Haitong Securities Company, Ltd., Class A
|
| 76,000
|
|
| 102,556
|
| Haitong Securities Company, Ltd., H Shares
|
| 327,971
|
|
| 203,500
|
| Hangzhou Binjiang Real Estate Group Company, Ltd., Class A
|
| 21,100
|
|
| 30,402
|
| Hangzhou Chang Chuan Technology Company, Ltd., Class A
|
| 4,300
|
|
| 22,032
|
| Hangzhou First Applied Material Company, Ltd., Class A
|
| 13,508
|
|
| 57,758
|
| Hangzhou Lion Electronics Company, Ltd., Class A
|
| 4,500
|
|
| 20,358
|
| Hangzhou Oxygen Plant Group Company, Ltd., Class A
|
| 6,500
|
|
| 27,262
|
| Hangzhou Robam Appliances Company, Ltd., Class A
|
| 6,200
|
|
| 23,381
|
| Hangzhou Silan Microelectronics Company, Ltd., Class A
|
| 9,500
|
|
| 32,999
|
| Hangzhou Tigermed Consulting Company, Ltd., A Shares
|
| 2,600
|
|
| 23,698
|
| Hangzhou Tigermed Consulting Company, Ltd., H Shares (B)
|
| 13,394
|
|
| 73,109
|
| Hansoh Pharmaceutical Group Company, Ltd. (B)
|
| 135,299
|
|
| 175,795
|
| Haohua Chemical Science & Technology Company, Ltd., Class A
|
| 4,400
|
|
| 20,284
|
| Hebei Hengshui Laobaigan Liquor Company, Ltd., Class A
|
| 6,600
|
|
| 21,334
|
| Hebei Yangyuan Zhihui Beverage Company, Ltd., Class A
|
| 7,900
|
|
| 26,598
|
| Heilongjiang Agriculture Company, Ltd., Class A
|
| 11,700
|
|
| 21,523
|
| Henan Shenhuo Coal & Power Company, Ltd., Class A
|
| 15,300
|
|
| 33,299
|
| Henan Shuanghui Investment & Development Company, Ltd., Class A
|
| 24,300
|
|
| 89,530
|
International Strategic Equity Allocation
Fund (continued)
|
|
| Shares or
Principal
Amount
|
| Value
|
| COMMON STOCKS (continued)
|
|
|
|
| China (continued)
|
|
|
|
|
|
| Hengan International Group Company, Ltd.
|
| 74,690
|
| $
| 277,052
|
| Hengdian Group DMEGC Magnetics Company, Ltd., Class A
|
| 12,400
|
|
| 27,890
|
| Hengli Petrochemical Company, Ltd., Class A (A)
|
| 49,400
|
|
| 97,336
|
| Hengtong Optic-electric Company, Ltd., Class A
|
| 19,500
|
|
| 37,811
|
| Hengyi Petrochemical Company, Ltd., Class A (A)
|
| 26,600
|
|
| 27,992
|
| Hesteel Company, Ltd., Class A
|
| 70,800
|
|
| 21,944
|
| Hithink RoyalFlush Information Network Company, Ltd., Class A
|
| 3,900
|
|
| 89,596
|
| Hongfa Technology Company, Ltd., Class A
|
| 2,920
|
|
| 14,074
|
| Hoshine Silicon Industry Company, Ltd., Class A
|
| 5,700
|
|
| 48,325
|
| Hoymiles Power Electronics, Inc., Class A
|
| 510
|
|
| 18,653
|
| Hoyuan Green Energy Company, Ltd., Class A
|
| 3,534
|
|
| 20,188
|
| Hua Hong Semiconductor, Ltd. (A)(B)
|
| 66,732
|
|
| 173,953
|
| Huadian Power International Corp., Ltd., Class A
|
| 55,200
|
|
| 38,524
|
| Huadong Medicine Company, Ltd., Class A
|
| 12,400
|
|
| 64,581
|
| Huafon Chemical Company, Ltd., Class A
|
| 35,500
|
|
| 34,060
|
| Huagong Tech Company, Ltd., Class A
|
| 6,400
|
|
| 27,518
|
| Huaibei Mining Holdings Company, Ltd., Class A
|
| 18,700
|
|
| 30,094
|
| Hualan Biological Engineering, Inc., Class A
|
| 12,000
|
|
| 34,948
|
| Huaneng Power International, Inc., Class A (A)
|
| 60,400
|
|
| 67,416
|
| Huaneng Power International, Inc., H Shares (A)
|
| 494,352
|
|
| 246,917
|
| Huatai Securities Company, Ltd., Class A
|
| 55,700
|
|
| 121,534
|
| Huatai Securities Company, Ltd., H Shares (B)
|
| 154,306
|
|
| 203,035
|
| Huaxi Securities Company, Ltd., Class A
|
| 20,200
|
|
| 23,613
|
| Huaxia Bank Company, Ltd., Class A
|
| 101,500
|
|
| 77,133
|
| Huaxin Cement Company, Ltd., Class A
|
| 7,300
|
|
| 13,204
|
| Huayu Automotive Systems Company, Ltd., Class A
|
| 24,300
|
|
| 62,630
|
| Hubei Feilihua Quartz Glass Company, Ltd., Class A
|
| 3,300
|
|
| 21,279
|
| Hubei Jumpcan Pharmaceutical Company, Ltd., Class A
|
| 6,300
|
|
| 22,649
|
| Hubei Xingfa Chemicals Group Company, Ltd., Class A
|
| 7,500
|
|
| 20,888
|
| Huizhou Desay Sv Automotive Company, Ltd., Class A
|
| 3,900
|
|
| 77,822
|
| Humanwell Healthcare Group Company, Ltd., Class A
|
| 12,300
|
|
| 39,448
|
| Hunan Changyuan Lico Company, Ltd., Class A
|
| 9,252
|
|
| 11,944
|
| Hunan Valin Steel Company, Ltd., Class A
|
| 47,200
|
|
| 38,313
|
| Hundsun Technologies, Inc., Class A
|
| 13,800
|
|
| 68,158
|
| Hygeia Healthcare Holdings Company, Ltd. (B)
|
| 40,602
|
|
| 205,496
|
| Iflytek Company, Ltd., Class A
|
| 16,500
|
|
| 123,949
|
| Imeik Technology Development Company, Ltd., Class A
|
| 1,500
|
|
| 90,268
|
| Industrial & Commercial Bank of China, Ltd., Class A
|
| 437,600
|
|
| 277,300
|
| The accompanying notes are an integral part of the financial statements.
| 52
|
|
John Hancock Funds II
Portfolio of Investments —
August 31, 2023 (showing percentage of total net assets)
International Strategic Equity Allocation
Fund (continued)
|
|
| Shares or
Principal
Amount
|
| Value
|
| COMMON STOCKS (continued)
|
|
|
|
| China (continued)
|
|
|
|
|
|
| Industrial & Commercial Bank of China, Ltd., H Shares
|
| 6,616,826
|
| $
| 3,033,665
|
| Industrial Bank Company, Ltd., Class A
|
| 149,100
|
|
| 323,527
|
| Industrial Securities Company, Ltd., Class A
|
| 67,300
|
|
| 59,236
|
| Ingenic Semiconductor Company, Ltd., Class A
|
| 3,400
|
|
| 34,407
|
| Inner Mongolia BaoTou Steel Union Company, Ltd., Class A (A)
|
| 307,600
|
|
| 75,552
|
| Inner Mongolia Dian Tou Energy Corp., Ltd., Class A
|
| 16,000
|
|
| 29,044
|
| Inner Mongolia Junzheng Energy & Chemical Industry Group Company, Ltd., Class A
|
| 66,400
|
|
| 38,076
|
| Inner Mongolia Yili Industrial Group Company, Ltd., Class A
|
| 45,600
|
|
| 162,764
|
| Inner Mongolia Yitai Coal Company, Ltd., Class B (A)
|
| 127,373
|
|
| 169,696
|
| Inner Mongolia Yuan Xing Energy Company, Ltd., Class A
|
| 26,000
|
|
| 25,168
|
| Innovent Biologics, Inc. (A)(B)
|
| 133,521
|
|
| 597,125
|
| Inspur Electronic Information Industry Company, Ltd., Class A
|
| 10,000
|
|
| 53,508
|
| iQIYI, Inc., ADR (A)
|
| 51,800
|
|
| 261,072
|
| IRay Technology Company, Ltd., Class A
|
| 607
|
|
| 20,463
|
| Isoftstone Information Technology Group Company, Ltd., Class A
|
| 6,950
|
|
| 19,656
|
| JA Solar Technology Company, Ltd., Class A
|
| 22,088
|
|
| 84,295
|
| Jafron Biomedical Company, Ltd., Class A
|
| 4,000
|
|
| 11,757
|
| Jason Furniture Hangzhou Company, Ltd., Class A
|
| 5,030
|
|
| 28,741
|
| JCET Group Company, Ltd., Class A
|
| 12,200
|
|
| 54,520
|
| JD Health International, Inc. (A)(B)
|
| 129,258
|
|
| 696,916
|
| JD Logistics, Inc. (A)(B)
|
| 227,694
|
|
| 303,510
|
| JD.com, Inc., Class A
|
| 272,953
|
|
| 4,533,232
|
| Jiangsu Eastern Shenghong Company, Ltd., Class A
|
| 43,300
|
|
| 68,245
|
| Jiangsu Expressway Company, Ltd., H Shares
|
| 142,837
|
|
| 128,991
|
| Jiangsu Hengli Hydraulic Company, Ltd., Class A
|
| 9,700
|
|
| 82,743
|
| Jiangsu Hengrui Pharmaceuticals Company, Ltd., Class A
|
| 44,300
|
|
| 254,245
|
| Jiangsu King's Luck Brewery JSC, Ltd., Class A
|
| 8,400
|
|
| 69,004
|
| Jiangsu Pacific Quartz Company, Ltd., Class A
|
| 2,200
|
|
| 28,799
|
| Jiangsu Yanghe Brewery Joint-Stock Company, Ltd., Class A
|
| 10,600
|
|
| 194,951
|
| Jiangsu Yangnong Chemical Company, Ltd., Class A
|
| 2,730
|
|
| 23,924
|
| Jiangsu Yoke Technology Company, Ltd., Class A
|
| 3,500
|
|
| 32,564
|
| Jiangsu Yuyue Medical Equipment & Supply Company, Ltd., Class A
|
| 7,900
|
|
| 36,671
|
| Jiangsu Zhongtian Technology Company, Ltd., Class A
|
| 22,900
|
|
| 45,770
|
| Jiangxi Copper Company, Ltd., Class A
|
| 13,100
|
|
| 33,848
|
| Jiangxi Copper Company, Ltd., H Shares
|
| 128,515
|
|
| 200,163
|
| Jiangxi Special Electric Motor Company, Ltd., Class A (A)
|
| 9,900
|
|
| 12,318
|
| Jinduicheng Molybdenum Company, Ltd., Class A
|
| 21,700
|
|
| 32,293
|
International Strategic Equity Allocation
Fund (continued)
|
|
| Shares or
Principal
Amount
|
| Value
|
| COMMON STOCKS (continued)
|
|
|
|
| China (continued)
|
|
|
|
|
|
| Jinko Solar Company, Ltd., Class A
|
| 44,668
|
| $
| 66,082
|
| JiuGui Liquor Company, Ltd., Class A
|
| 2,200
|
|
| 27,027
|
| Jiumaojiu International Holdings, Ltd. (B)
|
| 109,448
|
|
| 175,543
|
| Jizhong Energy Resources Company, Ltd., Class A
|
| 26,600
|
|
| 22,236
|
| Joincare Pharmaceutical Group Industry Company, Ltd., Class A
|
| 15,700
|
|
| 24,578
|
| Joinn Laboratories China Company, Ltd., Class A
|
| 3,976
|
|
| 13,102
|
| Jointown Pharmaceutical Group Company, Ltd., Class A
|
| 21,969
|
|
| 31,116
|
| Jonjee Hi-Tech Industrial And Commercial Holding Company, Ltd., Class A (A)
|
| 4,800
|
|
| 22,234
|
| Juewei Food Company, Ltd., Class A
|
| 4,500
|
|
| 22,021
|
| Juneyao Airlines Company, Ltd., Class A (A)
|
| 15,000
|
|
| 32,636
|
| Kanzhun, Ltd., ADR (A)
|
| 21,056
|
|
| 311,629
|
| KE Holdings, Inc., ADR (A)
|
| 76,554
|
|
| 1,316,729
|
| Keda Industrial Group Company, Ltd., Class A
|
| 15,600
|
|
| 21,535
|
| Kingdee International Software Group Company, Ltd. (A)
|
| 321,412
|
|
| 496,618
|
| Kingsoft Corp., Ltd.
|
| 110,796
|
|
| 441,626
|
| Kuaishou Technology (A)(B)
|
| 269,471
|
|
| 2,205,869
|
| Kuang-Chi Technologies Company, Ltd., Class A
|
| 16,700
|
|
| 34,160
|
| Kunlun Tech Company, Ltd., Class A (A)
|
| 8,700
|
|
| 43,069
|
| Kweichow Moutai Company, Ltd., Class A
|
| 8,800
|
|
| 2,233,147
|
| LB Group Company, Ltd., Class A
|
| 16,500
|
|
| 41,025
|
| Lenovo Group, Ltd.
|
| 844,690
|
|
| 954,776
|
| Lens Technology Company, Ltd., Class A
|
| 35,700
|
|
| 60,188
|
| Lepu Medical Technology Beijing Company, Ltd., Class A
|
| 13,800
|
|
| 30,650
|
| Li Auto, Inc., Class A (A)
|
| 130,798
|
|
| 2,723,195
|
| Li Ning Company, Ltd.
|
| 276,102
|
|
| 1,304,943
|
| Liaoning Port Company, Ltd., Class A
|
| 128,000
|
|
| 27,736
|
| Lingyi iTech Guangdong Company, Class A
|
| 43,100
|
|
| 35,501
|
| Livzon Pharmaceutical Group, Inc., Class A
|
| 5,300
|
|
| 25,037
|
| Longfor Group Holdings, Ltd. (B)
|
| 222,827
|
|
| 470,299
|
| LONGi Green Energy Technology Company, Ltd., Class A
|
| 53,440
|
|
| 194,979
|
| Lufax Holding, Ltd., ADR
|
| 78,552
|
|
| 95,048
|
| Luxi Chemical Group Company, Ltd., Class A
|
| 17,200
|
|
| 23,973
|
| Luxshare Precision Industry Company, Ltd., Class A
|
| 49,900
|
|
| 225,680
|
| Luzhou Laojiao Company, Ltd., Class A
|
| 10,200
|
|
| 325,184
|
| Mango Excellent Media Company, Ltd., Class A
|
| 13,700
|
|
| 55,547
|
| Maxscend Microelectronics Company, Ltd., Class A
|
| 3,600
|
|
| 61,216
|
| Meihua Holdings Group Company, Ltd., Class A
|
| 19,500
|
|
| 24,422
|
| Meinian Onehealth Healthcare Holdings Company, Ltd., Class A (A)
|
| 23,400
|
|
| 21,827
|
| Meituan, Class B (A)(B)
|
| 589,446
|
|
| 9,754,833
|
| Metallurgical Corp. of China, Ltd., Class A
|
| 130,600
|
|
| 65,201
|
| Microport Scientific Corp. (A)
|
| 93,153
|
|
| 159,516
|
| Ming Yang Smart Energy Group, Ltd., Class A
|
| 15,600
|
|
| 31,933
|
| MINISO Group Holding, Ltd., ADR
|
| 11,048
|
|
| 286,143
|
| Minth Group, Ltd.
|
| 87,559
|
|
| 259,923
|
| The accompanying notes are an integral part of the financial statements.
| 53
|
|
John Hancock Funds II
Portfolio of Investments —
August 31, 2023 (showing percentage of total net assets)
International Strategic Equity Allocation
Fund (continued)
|
|
| Shares or
Principal
Amount
|
| Value
|
| COMMON STOCKS (continued)
|
|
|
|
| China (continued)
|
|
|
|
|
|
| Montage Technology Company, Ltd., Class A
|
| 7,545
|
| $
| 53,034
|
| Muyuan Foods Company, Ltd., Class A
|
| 38,600
|
|
| 214,715
|
| Nanjing King-Friend Biochemical Pharmaceutical Company, Ltd., Class A
|
| 11,760
|
|
| 19,096
|
| Nanjing Securities Company, Ltd., Class A
|
| 25,900
|
|
| 29,322
|
| NARI Technology Company, Ltd., Class A
|
| 56,448
|
|
| 184,247
|
| National Silicon Industry Group Company, Ltd., Class A (A)
|
| 16,926
|
|
| 47,235
|
| NAURA Technology Group Company, Ltd., Class A
|
| 3,700
|
|
| 137,683
|
| NavInfo Company, Ltd., Class A (A)
|
| 13,100
|
|
| 18,519
|
| NetEase, Inc.
|
| 229,496
|
|
| 4,754,575
|
| New China Life Insurance Company, Ltd., Class A
|
| 16,400
|
|
| 91,205
|
| New China Life Insurance Company, Ltd., H Shares
|
| 96,717
|
|
| 241,958
|
| New Hope Liuhe Company, Ltd., Class A (A)
|
| 29,100
|
|
| 46,561
|
| New Oriental Education & Technology Group, Inc. (A)
|
| 177,858
|
|
| 964,926
|
| Ninestar Corp., Class A
|
| 9,200
|
|
| 35,306
|
| Ningbo Deye Technology Company, Ltd., Class A
|
| 3,080
|
|
| 38,953
|
| Ningbo Joyson Electronic Corp., Class A
|
| 8,900
|
|
| 22,391
|
| Ningbo Orient Wires & Cables Company, Ltd., Class A
|
| 5,200
|
|
| 26,381
|
| Ningbo Ronbay New Energy Technology Company, Ltd., Class A
|
| 2,785
|
|
| 19,468
|
| Ningbo Shanshan Company, Ltd., Class A
|
| 15,200
|
|
| 28,376
|
| Ningbo Tuopu Group Company, Ltd., Class A
|
| 7,700
|
|
| 82,389
|
| Ningxia Baofeng Energy Group Company, Ltd., Class A
|
| 50,400
|
|
| 94,841
|
| NIO, Inc., ADR (A)(C)
|
| 159,172
|
|
| 1,634,696
|
| Nongfu Spring Company, Ltd., H Shares (B)
|
| 204,606
|
|
| 1,149,151
|
| North Industries Group Red Arrow Company, Ltd., Class A
|
| 11,200
|
|
| 23,436
|
| Offcn Education Technology Company, Ltd., Class A (A)
|
| 44,300
|
|
| 25,928
|
| Offshore Oil Engineering Company, Ltd., Class A
|
| 25,100
|
|
| 20,077
|
| Oppein Home Group, Inc., Class A
|
| 3,800
|
|
| 51,056
|
| Orient Securities Company, Ltd., Class A
|
| 58,900
|
|
| 80,622
|
| Ovctek China, Inc., Class A
|
| 5,600
|
|
| 20,255
|
| Pangang Group Vanadium Titanium & Resources Company, Ltd., Class A (A)
|
| 66,300
|
|
| 34,111
|
| Perfect World Company, Ltd., Class A
|
| 15,800
|
|
| 29,933
|
| PetroChina Company, Ltd., Class A
|
| 147,500
|
|
| 156,950
|
| PetroChina Company, Ltd., H Shares
|
| 2,466,130
|
|
| 1,778,983
|
| Pharmaron Beijing Company, Ltd., Class A
|
| 11,625
|
|
| 47,439
|
| Pharmaron Beijing Company, Ltd., H Shares (B)
|
| 34,809
|
|
| 81,164
|
| PICC Property & Casualty Company, Ltd., H Shares
|
| 811,292
|
|
| 932,952
|
| Ping An Bank Company, Ltd., Class A
|
| 138,000
|
|
| 210,684
|
| Ping An Healthcare and Technology Company, Ltd. (A)(B)
|
| 64,516
|
|
| 161,038
|
| Ping An Insurance Group Company of China, Ltd., Class A
|
| 76,700
|
|
| 514,079
|
| Ping An Insurance Group Company of China, Ltd., H Shares
|
| 739,162
|
|
| 4,425,473
|
International Strategic Equity Allocation
Fund (continued)
|
|
| Shares or
Principal
Amount
|
| Value
|
| COMMON STOCKS (continued)
|
|
|
|
| China (continued)
|
|
|
|
|
|
| Pingdingshan Tianan Coal Mining Company, Ltd., Class A
|
| 12,700
|
| $
| 14,865
|
| Poly Developments and Holdings Group Company, Ltd., Class A
|
| 83,800
|
|
| 161,089
|
| Pop Mart International Group, Ltd. (B)
|
| 54,207
|
|
| 176,313
|
| Porton Pharma Solutions, Ltd., Class A
|
| 3,800
|
|
| 12,834
|
| Postal Savings Bank of China Company, Ltd., Class A
|
| 210,200
|
|
| 140,182
|
| Postal Savings Bank of China Company, Ltd., H Shares (B)
|
| 937,504
|
|
| 462,406
|
| Power Construction Corp. of China, Ltd., Class A
|
| 123,200
|
|
| 87,040
|
| Pylon Technologies Company, Ltd., Class A
|
| 1,344
|
|
| 25,493
|
| Qi An Xin Technology Group, Inc., Class A (A)
|
| 3,703
|
|
| 27,216
|
| Qifu Technology, Inc., ADR
|
| 12,939
|
|
| 219,963
|
| Qinghai Salt Lake Industry Company, Ltd., Class A (A)
|
| 36,100
|
|
| 88,576
|
| Raytron Technology Company, Ltd., Class A
|
| 3,030
|
|
| 21,288
|
| Risen Energy Company, Ltd., Class A
|
| 8,200
|
|
| 22,586
|
| Riyue Heavy Industry Company, Ltd., Class A
|
| 6,100
|
|
| 13,525
|
| Rockchip Electronics Company, Ltd., Class A
|
| 2,100
|
|
| 18,871
|
| Rongsheng Petrochemical Company, Ltd., Class A
|
| 69,800
|
|
| 115,396
|
| SAIC Motor Corp., Ltd., Class A
|
| 57,700
|
|
| 113,785
|
| Sailun Group Company, Ltd., Class A
|
| 22,200
|
|
| 37,639
|
| Sanan Optoelectronics Company, Ltd., Class A
|
| 35,000
|
|
| 75,350
|
| Sangfor Technologies, Inc., Class A (A)
|
| 2,700
|
|
| 40,444
|
| Sany Heavy Equipment International Holdings Company, Ltd.
|
| 127,354
|
|
| 198,441
|
| Sany Heavy Industry Company, Ltd., Class A
|
| 61,300
|
|
| 130,381
|
| Satellite Chemical Company, Ltd., Class A
|
| 25,143
|
|
| 52,731
|
| SDIC Capital Company, Ltd., Class A
|
| 54,000
|
|
| 54,300
|
| SDIC Power Holdings Company, Ltd., Class A
|
| 49,800
|
|
| 86,837
|
| Seazen Holdings Company, Ltd., Class A (A)
|
| 18,300
|
|
| 36,544
|
| Seres Group Company, Ltd., Class A (A)
|
| 9,900
|
|
| 49,028
|
| SF Holding Company, Ltd., Class A
|
| 34,200
|
|
| 203,897
|
| SG Micro Corp., Class A
|
| 3,170
|
|
| 33,638
|
| Shaanxi Coal Industry Company, Ltd., Class A
|
| 68,800
|
|
| 157,026
|
| Shan Xi Hua Yang Group New Energy Company, Ltd., Class A
|
| 28,350
|
|
| 29,396
|
| Shandong Buchang Pharmaceuticals Company, Ltd., Class A
|
| 7,800
|
|
| 18,737
|
| Shandong Gold Mining Company, Ltd., Class A
|
| 23,600
|
|
| 84,335
|
| Shandong Gold Mining Company, Ltd., H Shares (B)
|
| 80,787
|
|
| 162,681
|
| Shandong Hualu Hengsheng Chemical Company, Ltd., Class A
|
| 15,200
|
|
| 68,975
|
| Shandong Linglong Tyre Company, Ltd., Class A
|
| 9,000
|
|
| 26,869
|
| Shandong Nanshan Aluminum Company, Ltd., Class A
|
| 87,000
|
|
| 37,209
|
| Shandong Sun Paper Industry JSC, Ltd., Class A
|
| 17,300
|
|
| 27,196
|
| The accompanying notes are an integral part of the financial statements.
| 54
|
|
John Hancock Funds II
Portfolio of Investments —
August 31, 2023 (showing percentage of total net assets)
International Strategic Equity Allocation
Fund (continued)
|
|
| Shares or
Principal
Amount
|
| Value
|
| COMMON STOCKS (continued)
|
|
|
|
| China (continued)
|
|
|
|
|
|
| Shandong Weigao Group Medical Polymer Company, Ltd., H Shares
|
| 287,895
|
| $
| 286,653
|
| Shanghai Aiko Solar Energy Company, Ltd., Class A
|
| 11,140
|
|
| 33,926
|
| Shanghai Bairun Investment Holding Group Company, Ltd., Class A
|
| 7,820
|
|
| 34,395
|
| Shanghai Baosight Software Company, Ltd., Class A
|
| 11,760
|
|
| 77,410
|
| Shanghai Baosight Software Company, Ltd., Class B
|
| 68,868
|
|
| 156,444
|
| Shanghai Construction Group Company, Ltd., Class A
|
| 56,500
|
|
| 21,710
|
| Shanghai Electric Group Company, Ltd., Class A (A)
|
| 86,000
|
|
| 52,683
|
| Shanghai Electric Power Company, Ltd., Class A
|
| 20,500
|
|
| 25,746
|
| Shanghai Fosun Pharmaceutical Group Company, Ltd., Class A
|
| 15,500
|
|
| 59,342
|
| Shanghai Fosun Pharmaceutical Group Company, Ltd., H Shares
|
| 58,288
|
|
| 136,844
|
| Shanghai Friendess Electronic Technology Corp., Ltd., Class A
|
| 893
|
|
| 32,275
|
| Shanghai Fudan Microelectronics Group Company, Ltd., Class A
|
| 3,186
|
|
| 23,081
|
| Shanghai Fudan Microelectronics Group Company, Ltd., H Shares (C)
|
| 33,245
|
|
| 79,576
|
| Shanghai International Airport Company, Ltd., Class A (A)
|
| 8,700
|
|
| 46,877
|
| Shanghai International Port Group Company, Ltd., Class A
|
| 51,000
|
|
| 35,704
|
| Shanghai Jinjiang International Hotels Company, Ltd., Class A
|
| 7,100
|
|
| 37,621
|
| Shanghai Junshi Biosciences Company, Ltd., Class A (A)
|
| 5,110
|
|
| 26,716
|
| Shanghai Lingang Holdings Corp., Ltd., Class A
|
| 10,800
|
|
| 17,601
|
| Shanghai Lujiazui Finance & Trade Zone Development Company, Ltd., B Shares
|
| 118,380
|
|
| 48,604
|
| Shanghai M&G Stationery, Inc., Class A
|
| 5,500
|
|
| 28,411
|
| Shanghai Pharmaceuticals Holding Company, Ltd., Class A
|
| 19,500
|
|
| 47,797
|
| Shanghai Pharmaceuticals Holding Company, Ltd., H Shares
|
| 86,496
|
|
| 142,211
|
| Shanghai Pudong Development Bank Company, Ltd., Class A
|
| 214,700
|
|
| 205,725
|
| Shanghai Putailai New Energy Technology Company, Ltd., Class A
|
| 14,110
|
|
| 63,345
|
| Shanghai RAAS Blood Products Company, Ltd., Class A
|
| 44,000
|
|
| 42,953
|
| Shanghai Rural Commercial Bank Company, Ltd., Class A
|
| 69,400
|
|
| 55,424
|
| Shanghai Yuyuan Tourist Mart Group Company, Ltd., Class A
|
| 30,800
|
|
| 31,082
|
| Shanxi Coal International Energy Group Company, Ltd., Class A
|
| 14,600
|
|
| 33,594
|
| Shanxi Coking Coal Energy Group Company, Ltd., Class A
|
| 37,700
|
|
| 43,047
|
| Shanxi Lu'an Environmental Energy Development Company, Ltd., Class A
|
| 19,500
|
|
| 43,543
|
| Shanxi Meijin Energy Company, Ltd., Class A (A)
|
| 25,800
|
|
| 25,344
|
| Shanxi Securities Company, Ltd., Class A
|
| 29,400
|
|
| 24,423
|
| Shanxi Taigang Stainless Steel Company, Ltd., Class A
|
| 34,800
|
|
| 18,811
|
International Strategic Equity Allocation
Fund (continued)
|
|
| Shares or
Principal
Amount
|
| Value
|
| COMMON STOCKS (continued)
|
|
|
|
| China (continued)
|
|
|
|
|
|
| Shanxi Xinghuacun Fen Wine Factory Company, Ltd., Class A
|
| 8,500
|
| $
| 282,370
|
| Shede Spirits Company, Ltd., Class A
|
| 2,400
|
|
| 44,418
|
| Shenergy Company, Ltd., Class A
|
| 29,400
|
|
| 26,298
|
| Shenghe Resources Holding Company, Ltd., Class A
|
| 11,500
|
|
| 17,435
|
| Shengyi Technology Company, Ltd., Class A
|
| 17,100
|
|
| 34,749
|
| Shennan Circuits Company, Ltd., Class A
|
| 3,400
|
|
| 30,858
|
| Shenwan Hongyuan Group Company, Ltd., Class A
|
| 171,500
|
|
| 102,575
|
| Shenzhen Capchem Technology Company, Ltd., Class A
|
| 5,240
|
|
| 34,507
|
| Shenzhen Dynanonic Company, Ltd., Class A
|
| 1,740
|
|
| 22,414
|
| Shenzhen Energy Group Company, Ltd., Class A
|
| 29,200
|
|
| 25,951
|
| Shenzhen Inovance Technology Company, Ltd., Class A
|
| 9,300
|
|
| 87,170
|
| Shenzhen Kaifa Technology Company, Ltd., Class A
|
| 9,900
|
|
| 24,207
|
| Shenzhen Kangtai Biological Products Company, Ltd., Class A
|
| 7,220
|
|
| 27,569
|
| Shenzhen Kedali Industry Company, Ltd., Class A
|
| 1,600
|
|
| 25,507
|
| Shenzhen Kstar Science And Technology Company, Ltd., Class A
|
| 3,300
|
|
| 13,717
|
| Shenzhen Mindray Bio-Medical Electronics Company, Ltd., Class A
|
| 8,400
|
|
| 311,420
|
| Shenzhen New Industries Biomedical Engineering Company, Ltd., Class A
|
| 5,500
|
|
| 45,880
|
| Shenzhen Overseas Chinese Town Company, Ltd., Class A (A)
|
| 53,700
|
|
| 32,099
|
| Shenzhen Salubris Pharmaceuticals Company, Ltd., Class A
|
| 7,200
|
|
| 27,295
|
| Shenzhen SC New Energy Technology Corp., Class A
|
| 2,300
|
|
| 27,951
|
| Shenzhen Sed Industry Company, Ltd., Class A
|
| 7,100
|
|
| 26,699
|
| Shenzhen Senior Technology Material Company, Ltd., Class A
|
| 10,485
|
|
| 20,206
|
| Shenzhen Sunlord Electronics Company, Ltd., Class A
|
| 5,700
|
|
| 20,933
|
| Shenzhen Transsion Holdings Company, Ltd., Class A
|
| 5,404
|
|
| 108,890
|
| Shenzhen YUTO Packaging Technology Company, Ltd., Class A
|
| 5,700
|
|
| 18,866
|
| Shenzhou International Group Holdings, Ltd.
|
| 96,791
|
|
| 991,756
|
| Shijiazhuang Yiling Pharmaceutical Company, Ltd., Class A
|
| 11,500
|
|
| 36,710
|
| Shuangliang Eco-Energy Systems Company, Ltd., Class A
|
| 13,800
|
|
| 19,285
|
| Sichuan Chuantou Energy Company, Ltd., Class A
|
| 30,300
|
|
| 62,174
|
| Sichuan Hebang Biotechnology Company, Ltd., Class A
|
| 71,500
|
|
| 23,445
|
| Sichuan Kelun Pharmaceutical Company, Ltd., Class A
|
| 10,300
|
|
| 38,293
|
| Sichuan New Energy Power Company, Ltd., Class A (A)
|
| 10,400
|
|
| 17,998
|
| Sichuan Road and Bridge Group Company, Ltd., Class A
|
| 50,600
|
|
| 61,766
|
| Sichuan Swellfun Company, Ltd., Class A
|
| 3,000
|
|
| 27,268
|
| The accompanying notes are an integral part of the financial statements.
| 55
|
|
John Hancock Funds II
Portfolio of Investments —
August 31, 2023 (showing percentage of total net assets)
International Strategic Equity Allocation
Fund (continued)
|
|
| Shares or
Principal
Amount
|
| Value
|
| COMMON STOCKS (continued)
|
|
|
|
| China (continued)
|
|
|
|
|
|
| Sichuan Yahua Industrial Group Company, Ltd., Class A
|
| 9,000
|
| $
| 19,343
|
| Sieyuan Electric Company, Ltd., Class A
|
| 5,400
|
|
| 37,892
|
| Silergy Corp.
|
| 42,000
|
|
| 375,478
|
| Sinolink Securities Company, Ltd., Class A
|
| 32,000
|
|
| 41,277
|
| Sinoma International Engineering Company, Class A
|
| 20,800
|
|
| 33,548
|
| Sinoma Science & Technology Company, Ltd., Class A
|
| 12,900
|
|
| 38,794
|
| Sinomine Resource Group Company, Ltd., Class A
|
| 4,980
|
|
| 25,414
|
| Sinopec Shanghai Petrochemical Company, Ltd., Class A (A)
|
| 33,500
|
|
| 13,916
|
| Sinopharm Group Company, Ltd., H Shares
|
| 157,353
|
|
| 456,626
|
| Skshu Paint Company, Ltd., Class A (A)
|
| 3,300
|
|
| 34,163
|
| Smoore International Holdings, Ltd. (B)(C)
|
| 213,334
|
|
| 215,526
|
| Songcheng Performance Development Company, Ltd., Class A
|
| 18,100
|
|
| 30,825
|
| SooChow Securities Company, Ltd., Class A
|
| 40,100
|
|
| 45,027
|
| Southwest Securities Company, Ltd., Class A
|
| 51,300
|
|
| 29,716
|
| Spring Airlines Company, Ltd., Class A (A)
|
| 7,000
|
|
| 56,343
|
| StarPower Semiconductor, Ltd., Class A
|
| 1,000
|
|
| 27,172
|
| Sungrow Power Supply Company, Ltd., Class A
|
| 10,400
|
|
| 142,320
|
| Sunny Optical Technology Group Company, Ltd.
|
| 82,664
|
|
| 674,967
|
| Sunresin New Materials Company, Ltd., Class A
|
| 3,400
|
|
| 28,350
|
| Sunwoda Electronic Company, Ltd., Class A
|
| 14,200
|
|
| 30,845
|
| Suzhou Dongshan Precision Manufacturing Company, Ltd., Class A
|
| 11,000
|
|
| 28,340
|
| Suzhou Maxwell Technologies Company, Ltd., Class A
|
| 1,884
|
|
| 39,413
|
| TAL Education Group, ADR (A)
|
| 52,630
|
|
| 371,042
|
| Tangshan Jidong Cement Company, Ltd., Class A
|
| 14,700
|
|
| 15,287
|
| TBEA Company, Ltd., Class A
|
| 35,710
|
|
| 72,022
|
| TCL Technology Group Corp., Class A (A)
|
| 132,770
|
|
| 74,610
|
| TCL Zhonghuan Renewable Energy Technology Company, Ltd., Class A
|
| 28,400
|
|
| 99,758
|
| Tencent Holdings, Ltd.
|
| 724,995
|
|
| 30,044,059
|
| Tencent Music Entertainment Group, ADR (A)
|
| 83,241
|
|
| 567,704
|
| The People's Insurance Company Group of China, Ltd., Class A
|
| 73,100
|
|
| 58,639
|
| The People's Insurance Company Group of China, Ltd., H Shares
|
| 1,054,879
|
|
| 359,063
|
| Thunder Software Technology Company, Ltd., Class A
|
| 3,200
|
|
| 35,040
|
| Tianjin 712 Communication & Broadcasting Company, Ltd., Class A
|
| 5,400
|
|
| 19,720
|
| Tianma Microelectronics Company, Ltd., Class A (A)
|
| 12,200
|
|
| 14,388
|
| Tianqi Lithium Corp., Class A
|
| 10,400
|
|
| 82,052
|
| Tianshan Aluminum Group Company, Ltd., Class A
|
| 30,600
|
|
| 26,462
|
| Tianshui Huatian Technology Company, Ltd., Class A
|
| 21,600
|
|
| 26,613
|
International Strategic Equity Allocation
Fund (continued)
|
|
| Shares or
Principal
Amount
|
| Value
|
| COMMON STOCKS (continued)
|
|
|
|
| China (continued)
|
|
|
|
|
|
| Tibet Summit Resources Company, Ltd., Class A (A)
|
| 5,300
|
| $
| 10,528
|
| Tingyi Cayman Islands Holding Corp.
|
| 227,102
|
|
| 333,454
|
| Titan Wind Energy Suzhou Company, Ltd., Class A (A)
|
| 12,000
|
|
| 21,379
|
| Toly Bread Company, Ltd., Class A
|
| 9,808
|
|
| 11,744
|
| Tongcheng Travel Holdings, Ltd. (A)
|
| 143,112
|
|
| 320,722
|
| TongFu Microelectronics Company, Ltd., Class A
|
| 10,800
|
|
| 30,180
|
| Tongkun Group Company, Ltd., Class A (A)
|
| 18,600
|
|
| 37,825
|
| Tongling Nonferrous Metals Group Company, Ltd., Class A
|
| 61,500
|
|
| 26,993
|
| Tongwei Company, Ltd., Class A
|
| 30,400
|
|
| 133,744
|
| Topchoice Medical Corp., Class A (A)
|
| 2,000
|
|
| 25,573
|
| Topsports International Holdings, Ltd. (B)
|
| 213,128
|
|
| 173,566
|
| TravelSky Technology, Ltd., H Shares
|
| 109,173
|
|
| 195,467
|
| Trina Solar Company, Ltd., Class A
|
| 15,247
|
|
| 71,189
|
| Trip.com Group, Ltd. (A)
|
| 63,949
|
|
| 2,518,693
|
| Tsingtao Brewery Company, Ltd., Class A
|
| 5,400
|
|
| 67,407
|
| Tsingtao Brewery Company, Ltd., H Shares
|
| 72,597
|
|
| 603,691
|
| Unigroup Guoxin Microelectronics Company, Ltd., Class A (A)
|
| 6,179
|
|
| 78,509
|
| Uni-President China Holdings, Ltd.
|
| 150,163
|
|
| 111,043
|
| Unisplendour Corp., Ltd., Class A (A)
|
| 20,600
|
|
| 76,076
|
| Universal Scientific Industrial Shanghai Company, Ltd., Class A
|
| 9,500
|
|
| 19,229
|
| Verisilicon Microelectronics Shanghai Company, Ltd., Class A (A)
|
| 3,009
|
|
| 27,583
|
| Vipshop Holdings, Ltd., ADR (A)
|
| 41,473
|
|
| 654,859
|
| Walvax Biotechnology Company, Ltd., Class A
|
| 11,700
|
|
| 37,907
|
| Wanda Film Holding Company, Ltd., Class A (A)
|
| 15,300
|
|
| 28,257
|
| Wanhua Chemical Group Company, Ltd., Class A
|
| 22,100
|
|
| 284,309
|
| Weibo Corp., ADR
|
| 8,266
|
|
| 106,631
|
| Weichai Power Company, Ltd., Class A
|
| 51,200
|
|
| 82,736
|
| Weichai Power Company, Ltd., H Shares
|
| 227,633
|
|
| 294,881
|
| Weihai Guangwei Composites Company, Ltd., Class A
|
| 5,700
|
|
| 21,873
|
| Wens Foodstuffs Group Company, Ltd., Class A
|
| 45,600
|
|
| 104,155
|
| Western Mining Company, Ltd., Class A
|
| 19,300
|
|
| 33,736
|
| Western Securities Company, Ltd., Class A
|
| 34,900
|
|
| 32,316
|
| Western Superconducting Technologies Company, Ltd., Class A
|
| 4,351
|
|
| 28,329
|
| Will Semiconductor Company, Ltd., Class A
|
| 8,345
|
|
| 105,425
|
| Wingtech Technology Company, Ltd., Class A (A)
|
| 8,200
|
|
| 51,881
|
| Wintime Energy Group Company, Ltd., Class A (A)
|
| 137,000
|
|
| 27,445
|
| Wuchan Zhongda Group Company, Ltd., Class A
|
| 42,900
|
|
| 27,370
|
| Wuhan Guide Infrared Company, Ltd., Class A
|
| 23,278
|
|
| 24,597
|
| Wuliangye Yibin Company, Ltd., Class A
|
| 27,300
|
|
| 583,859
|
| WUS Printed Circuit Kunshan Company, Ltd., Class A
|
| 12,400
|
|
| 35,881
|
| WuXi AppTec Company, Ltd., Class A
|
| 18,100
|
|
| 202,835
|
| WuXi AppTec Company, Ltd., H Shares (B)
|
| 41,894
|
|
| 459,085
|
| The accompanying notes are an integral part of the financial statements.
| 56
|
|
John Hancock Funds II
Portfolio of Investments —
August 31, 2023 (showing percentage of total net assets)
International Strategic Equity Allocation
Fund (continued)
|
|
| Shares or
Principal
Amount
|
| Value
|
| COMMON STOCKS (continued)
|
|
|
|
| China (continued)
|
|
|
|
|
|
| Wuxi Autowell Technology Company, Ltd., Class A
|
| 827
|
| $
| 19,113
|
| WuXi Biologics Cayman, Inc. (A)(B)
|
| 443,620
|
|
| 2,500,954
|
| XCMG Construction Machinery Company, Ltd., Class A
|
| 86,400
|
|
| 71,737
|
| Xiamen C & D, Inc., Class A
|
| 19,900
|
|
| 29,683
|
| Xiamen Faratronic Company, Ltd., Class A
|
| 1,600
|
|
| 24,926
|
| Xiamen Tungsten Company, Ltd., Class A
|
| 8,600
|
|
| 20,465
|
| Xiaomi Corp., Class B (A)(B)
|
| 1,784,434
|
|
| 2,813,015
|
| Xinjiang Daqo New Energy Company, Ltd., Class A
|
| 11,456
|
|
| 65,247
|
| Xinjiang Goldwind Science & Technology Company, Ltd., Class A
|
| 25,200
|
|
| 32,821
|
| Xinjiang Zhongtai Chemical Company, Ltd., Class A
|
| 14,100
|
|
| 12,998
|
| Xinyi Solar Holdings, Ltd.
|
| 567,086
|
|
| 473,175
|
| XPeng, Inc., A Shares (A)
|
| 120,276
|
|
| 1,080,977
|
| Xtep International Holdings, Ltd.
|
| 165,363
|
|
| 163,582
|
| Yadea Group Holdings, Ltd. (B)
|
| 140,485
|
|
| 270,104
|
| Yangzhou Yangjie Electronic Technology Company, Ltd., Class A
|
| 4,100
|
|
| 20,068
|
| Yankuang Energy Group Company, Ltd., Class A
|
| 28,200
|
|
| 66,520
|
| Yankuang Energy Group Company, Ltd., H Shares
|
| 265,065
|
|
| 416,122
|
| Yantai Jereh Oilfield Services Group Company, Ltd., Class A
|
| 7,800
|
|
| 30,579
|
| Yealink Network Technology Corp., Ltd., Class A
|
| 8,880
|
|
| 45,085
|
| Yifeng Pharmacy Chain Company, Ltd., Class A
|
| 6,340
|
|
| 30,942
|
| Yihai International Holding, Ltd. (A)
|
| 59,699
|
|
| 111,878
|
| Yihai Kerry Arawana Holdings Company, Ltd., Class A
|
| 10,300
|
|
| 50,380
|
| Yintai Gold Company, Ltd., Class A
|
| 19,800
|
|
| 38,888
|
| Yonghui Superstores Company, Ltd., Class A (A)
|
| 48,100
|
|
| 21,249
|
| YongXing Special Materials Technology Company, Ltd., Class A
|
| 4,050
|
|
| 27,648
|
| Yonyou Network Technology Company, Ltd., Class A
|
| 22,500
|
|
| 56,037
|
| Youngor Group Company, Ltd., Class A
|
| 37,300
|
|
| 35,570
|
| Youngy Company, Ltd., Class A
|
| 1,700
|
|
| 11,973
|
| YTO Express Group Company, Ltd., Class A
|
| 24,400
|
|
| 50,576
|
| Yuan Longping High-tech Agriculture Company, Ltd., Class A (A)
|
| 9,500
|
|
| 19,609
|
| Yum China Holdings, Inc. (New York Stock Exchange)
|
| 48,848
|
|
| 2,622,649
|
| Yunda Holding Company, Ltd., Class A
|
| 20,100
|
|
| 27,137
|
| Yunnan Aluminium Company, Ltd., Class A
|
| 25,200
|
|
| 49,743
|
| Yunnan Baiyao Group Company, Ltd., Class A
|
| 13,240
|
|
| 99,270
|
| Yunnan Botanee Bio-Technology Group Company, Ltd., Class A
|
| 2,600
|
|
| 36,310
|
| Yunnan Energy New Material Company, Ltd., Class A
|
| 6,900
|
|
| 62,881
|
| Yunnan Tin Company, Ltd., Class A
|
| 10,000
|
|
| 19,138
|
| Yunnan Yuntianhua Company, Ltd., Class A
|
| 12,500
|
|
| 29,570
|
| Zai Lab, Ltd. (A)
|
| 107,875
|
|
| 280,918
|
| Zangge Mining Company, Ltd., Class A
|
| 10,700
|
|
| 32,973
|
International Strategic Equity Allocation
Fund (continued)
|
|
| Shares or
Principal
Amount
|
| Value
|
| COMMON STOCKS (continued)
|
|
|
|
| China (continued)
|
|
|
|
|
|
| Zhangzhou Pientzehuang Pharmaceutical Company, Ltd., Class A
|
| 4,200
|
| $
| 159,338
|
| Zhaojin Mining Industry Company, Ltd., H Shares
|
| 147,743
|
|
| 206,810
|
| Zhefu Holding Group Company, Ltd., Class A
|
| 25,800
|
|
| 13,974
|
| Zhejiang Century Huatong Group Company, Ltd., Class A (A)
|
| 48,100
|
|
| 35,680
|
| Zhejiang China Commodities City Group Company, Ltd., Class A
|
| 39,900
|
|
| 44,892
|
| Zhejiang Chint Electrics Company, Ltd., Class A
|
| 14,800
|
|
| 50,288
|
| Zhejiang Dahua Technology Company, Ltd., Class A
|
| 22,000
|
|
| 65,157
|
| Zhejiang Dingli Machinery Company, Ltd., Class A
|
| 3,600
|
|
| 26,248
|
| Zhejiang Expressway Company, Ltd., H Shares
|
| 150,255
|
|
| 112,200
|
| Zhejiang Huahai Pharmaceutical Company, Ltd., Class A
|
| 11,500
|
|
| 26,464
|
| Zhejiang Huayou Cobalt Company, Ltd., Class A
|
| 11,410
|
|
| 62,526
|
| Zhejiang Jingsheng Mechanical & Electrical Company, Ltd., Class A
|
| 9,100
|
|
| 70,326
|
| Zhejiang Jiuzhou Pharmaceutical Company, Ltd., Class A
|
| 5,700
|
|
| 21,272
|
| Zhejiang Juhua Company, Ltd., Class A
|
| 20,200
|
|
| 45,379
|
| Zhejiang Longsheng Group Company, Ltd., Class A
|
| 23,800
|
|
| 30,075
|
| Zhejiang NHU Company, Ltd., Class A
|
| 23,380
|
|
| 52,222
|
| Zhejiang Sanhua Intelligent Controls Company, Ltd., Class A
|
| 11,800
|
|
| 48,057
|
| Zhejiang Supcon Technology Company, Ltd., Class A
|
| 4,711
|
|
| 32,564
|
| Zhejiang Supor Company, Ltd., Class A
|
| 2,800
|
|
| 18,283
|
| Zhejiang Weiming Environment Protection Company, Ltd., Class A
|
| 11,080
|
|
| 27,204
|
| Zhejiang Weixing New Building Materials Company, Ltd., Class A
|
| 9,600
|
|
| 26,607
|
| Zhejiang Wolwo Bio-Pharmaceutical Company, Ltd., Class A
|
| 2,600
|
|
| 11,400
|
| Zhejiang Zheneng Electric Power Company, Ltd., Class A (A)
|
| 75,600
|
|
| 45,675
|
| Zheshang Securities Company, Ltd., Class A
|
| 33,400
|
|
| 47,157
|
| ZhongAn Online P&C Insurance Company, Ltd., H Shares (A)(B)
|
| 80,904
|
|
| 239,966
|
| Zhongji Innolight Company, Ltd., Class A
|
| 5,800
|
|
| 91,190
|
| Zhongjin Gold Corp., Ltd., Class A
|
| 31,900
|
|
| 48,316
|
| Zhongsheng Group Holdings, Ltd.
|
| 83,554
|
|
| 254,575
|
| Zhongtai Securities Company, Ltd., Class A
|
| 47,800
|
|
| 47,945
|
| Zhuzhou CRRC Times Electric Company, Ltd., Class A
|
| 5,190
|
|
| 31,114
|
| Zhuzhou CRRC Times Electric Company, Ltd., H Shares
|
| 60,592
|
|
| 211,171
|
| Zhuzhou Kibing Group Company, Ltd., Class A
|
| 19,500
|
|
| 23,333
|
| Zibo Qixiang Tengda Chemical Company, Ltd., Class A
|
| 13,800
|
|
| 11,592
|
| Zijin Mining Group Company, Ltd., Class A
|
| 145,500
|
|
| 245,077
|
| Zijin Mining Group Company, Ltd., H Shares
|
| 634,396
|
|
| 993,690
|
| The accompanying notes are an integral part of the financial statements.
| 57
|
|
John Hancock Funds II
Portfolio of Investments —
August 31, 2023 (showing percentage of total net assets)
International Strategic Equity Allocation
Fund (continued)
|
|
| Shares or
Principal
Amount
|
| Value
|
| COMMON STOCKS (continued)
|
|
|
|
| China (continued)
|
|
|
|
|
|
| Zoomlion Heavy Industry Science and Technology Company, Ltd., Class A
|
| 51,300
|
| $
| 45,486
|
| ZTE Corp., Class A
|
| 29,100
|
|
| 141,400
|
| ZTE Corp., H Shares
|
| 87,575
|
|
| 281,853
|
| ZTO Express Cayman, Inc., ADR
|
| 49,313
|
|
| 1,239,729
|
|
|
|
|
|
| 210,971,122
|
| Colombia - 0.0%
|
|
|
|
|
|
| Bancolombia SA
|
| 33,227
|
|
| 236,378
|
| Interconexion Electrica SA ESP
|
| 58,084
|
|
| 212,712
|
|
|
|
|
|
| 449,090
|
| Czech Republic - 0.0%
|
|
|
|
|
|
| CEZ AS
|
| 21,142
|
|
| 899,758
|
| Komercni banka AS
|
| 9,844
|
|
| 307,392
|
| Moneta Money Bank AS (B)
|
| 43,931
|
|
| 163,639
|
|
|
|
|
|
| 1,370,789
|
| Denmark - 2.0%
|
|
|
|
|
|
| A.P. Moller - Maersk A/S, Series A
|
| 404
|
|
| 721,980
|
| A.P. Moller - Maersk A/S, Series B
|
| 719
|
|
| 1,305,247
|
| Carlsberg A/S, Class B
|
| 13,616
|
|
| 1,968,846
|
| Chr. Hansen Holding A/S
|
| 14,539
|
|
| 948,009
|
| Coloplast A/S, B Shares
|
| 16,449
|
|
| 1,873,470
|
| Danske Bank A/S
|
| 95,216
|
|
| 2,137,251
|
| Demant A/S (A)
|
| 12,713
|
|
| 518,998
|
| DSV A/S
|
| 25,748
|
|
| 4,889,535
|
| Genmab A/S (A)
|
| 9,116
|
|
| 3,492,663
|
| Novo Nordisk A/S, B Shares
|
| 229,009
|
|
| 42,241,565
|
| Novozymes A/S, B Shares
|
| 28,255
|
|
| 1,223,040
|
| Orsted A/S (B)
|
| 26,097
|
|
| 1,674,246
|
| Pandora A/S
|
| 12,604
|
|
| 1,305,249
|
| ROCKWOOL A/S, B Shares
|
| 1,288
|
|
| 328,723
|
| Tryg A/S
|
| 50,569
|
|
| 964,821
|
| Vestas Wind Systems A/S (A)
|
| 139,731
|
|
| 3,228,501
|
|
|
|
|
|
| 68,822,144
|
| Finland - 0.6%
|
|
|
|
|
|
| Elisa OYJ
|
| 19,170
|
|
| 941,077
|
| Fortum OYJ
|
| 60,963
|
|
| 818,401
|
| Kesko OYJ, B Shares
|
| 37,272
|
|
| 727,561
|
| Kone OYJ, B Shares
|
| 46,323
|
|
| 2,107,200
|
| Metso OYJ
|
| 90,082
|
|
| 1,034,641
|
| Neste OYJ
|
| 57,558
|
|
| 2,105,651
|
| Nokia OYJ
|
| 730,868
|
|
| 2,922,795
|
| Nordea Bank ABP
|
| 158,376
|
|
| 1,735,051
|
| Orion OYJ, Class B
|
| 14,536
|
|
| 594,094
|
| Sampo OYJ, A Shares
|
| 63,268
|
|
| 2,777,093
|
| Stora Enso OYJ, R Shares
|
| 79,365
|
|
| 1,009,331
|
| UPM-Kymmene OYJ
|
| 72,819
|
|
| 2,492,054
|
| Wartsila OYJ ABP
|
| 64,726
|
|
| 821,432
|
|
|
|
|
|
| 20,086,381
|
| France - 9.2%
|
|
|
|
|
|
| Accor SA
|
| 31,590
|
|
| 1,129,764
|
| Aeroports de Paris
|
| 5,006
|
|
| 658,829
|
| Air Liquide SA
|
| 89,592
|
|
| 16,187,167
|
| Airbus SE
|
| 101,589
|
|
| 14,863,213
|
| Alstom SA
|
| 55,314
|
|
| 1,525,365
|
| Amundi SA (B)
|
| 10,807
|
|
| 643,283
|
| Arkema SA
|
| 9,653
|
|
| 1,008,731
|
| AXA SA
|
| 315,784
|
|
| 9,487,708
|
| BioMerieux
|
| 7,059
|
|
| 729,052
|
| BNP Paribas SA
|
| 190,451
|
|
| 12,316,038
|
| Bollore SE
|
| 150,202
|
|
| 888,495
|
| Bouygues SA
|
| 35,042
|
|
| 1,209,999
|
| Bureau Veritas SA
|
| 50,037
|
|
| 1,340,399
|
International Strategic Equity Allocation
Fund (continued)
|
|
| Shares or
Principal
Amount
|
| Value
|
| COMMON STOCKS (continued)
|
|
|
|
| France (continued)
|
|
|
|
|
|
| Capgemini SE
|
| 28,187
|
| $
| 5,260,302
|
| Carrefour SA
|
| 101,464
|
|
| 1,939,358
|
| Cie de Saint-Gobain SA
|
| 83,887
|
|
| 5,457,039
|
| Cie Generale des Etablissements Michelin SCA
|
| 116,219
|
|
| 3,636,029
|
| Covivio SA
|
| 7,822
|
|
| 381,393
|
| Credit Agricole SA
|
| 207,990
|
|
| 2,621,776
|
| Danone SA
|
| 109,700
|
|
| 6,394,730
|
| Dassault Aviation SA
|
| 4,341
|
|
| 852,400
|
| Dassault Systemes SE
|
| 114,166
|
|
| 4,524,462
|
| Edenred
|
| 42,625
|
|
| 2,716,209
|
| Eiffage SA
|
| 12,425
|
|
| 1,228,003
|
| Engie SA
|
| 312,439
|
|
| 5,031,600
|
| EssilorLuxottica SA
|
| 49,795
|
|
| 9,359,321
|
| Eurazeo SE
|
| 7,384
|
|
| 435,081
|
| Gecina SA
|
| 7,760
|
|
| 830,132
|
| Getlink SE
|
| 60,575
|
|
| 1,013,869
|
| Hermes International SCA
|
| 5,414
|
|
| 11,134,911
|
| Ipsen SA
|
| 6,440
|
|
| 834,267
|
| Kering SA
|
| 12,732
|
|
| 6,808,191
|
| Klepierre SA
|
| 36,386
|
|
| 961,087
|
| La Francaise des Jeux SAEM (B)
|
| 17,667
|
|
| 638,833
|
| Legrand SA
|
| 45,689
|
|
| 4,501,260
|
| L'Oreal SA
|
| 41,200
|
|
| 18,096,396
|
| LVMH Moet Hennessy Louis Vuitton SE
|
| 47,241
|
|
| 39,949,775
|
| Orange SA
|
| 318,225
|
|
| 3,572,608
|
| Pernod Ricard SA
|
| 35,306
|
|
| 6,928,942
|
| Publicis Groupe SA
|
| 39,188
|
|
| 3,057,765
|
| Remy Cointreau SA
|
| 3,881
|
|
| 600,364
|
| Renault SA
|
| 33,009
|
|
| 1,331,890
|
| Safran SA
|
| 58,637
|
|
| 9,397,485
|
| Sanofi
|
| 194,203
|
|
| 20,683,423
|
| Sartorius Stedim Biotech
|
| 4,744
|
|
| 1,345,453
|
| Schneider Electric SE
|
| 91,655
|
|
| 15,710,458
|
| Schneider Electric SE (Euronext London Exchange)
|
| 1,178
|
|
| 202,244
|
| SEB SA
|
| 4,274
|
|
| 469,139
|
| Societe Generale SA
|
| 124,810
|
|
| 3,536,017
|
| Sodexo SA
|
| 15,133
|
|
| 1,623,476
|
| Teleperformance SE
|
| 10,082
|
|
| 1,393,048
|
| Thales SA
|
| 18,107
|
|
| 2,640,536
|
| TotalEnergies SE
|
| 404,402
|
|
| 25,367,728
|
| Unibail-Rodamco-Westfield (A)
|
| 20,190
|
|
| 1,077,637
|
| Valeo SE
|
| 35,232
|
|
| 684,851
|
| Veolia Environnement SA
|
| 115,883
|
|
| 3,615,199
|
| Vinci SA
|
| 90,849
|
|
| 10,119,512
|
| Vivendi SE
|
| 122,770
|
|
| 1,118,174
|
| Wendel SE
|
| 4,515
|
|
| 412,544
|
| Worldline SA (A)(B)
|
| 40,906
|
|
| 1,331,336
|
|
|
|
|
|
| 312,814,296
|
| Germany - 6.1%
|
|
|
|
|
|
| adidas AG
|
| 27,453
|
|
| 5,478,804
|
| Allianz SE
|
| 68,683
|
|
| 16,695,431
|
| BASF SE
|
| 151,587
|
|
| 7,672,946
|
| Bayer AG
|
| 166,700
|
|
| 9,120,592
|
| Bayerische Motoren Werke AG
|
| 56,239
|
|
| 5,915,180
|
| Bechtle AG
|
| 13,918
|
|
| 676,637
|
| Beiersdorf AG
|
| 17,001
|
|
| 2,226,033
|
| Brenntag SE
|
| 26,120
|
|
| 2,112,698
|
| Carl Zeiss Meditec AG, Bearer Shares
|
| 6,766
|
|
| 671,087
|
| Commerzbank AG
|
| 179,804
|
|
| 1,975,595
|
| Continental AG
|
| 18,657
|
|
| 1,383,946
|
| Covestro AG (A)(B)
|
| 32,725
|
|
| 1,737,841
|
| The accompanying notes are an integral part of the financial statements.
| 58
|
|
John Hancock Funds II
Portfolio of Investments —
August 31, 2023 (showing percentage of total net assets)
International Strategic Equity Allocation
Fund (continued)
|
|
| Shares or
Principal
Amount
|
| Value
|
| COMMON STOCKS (continued)
|
|
|
|
| Germany (continued)
|
|
|
|
|
|
| Daimler Truck Holding AG
|
| 83,808
|
| $
| 2,948,925
|
| Delivery Hero SE (A)(B)
|
| 29,385
|
|
| 1,071,896
|
| Deutsche Bank AG
|
| 330,203
|
|
| 3,592,207
|
| Deutsche Boerse AG
|
| 32,223
|
|
| 5,720,364
|
| Deutsche Lufthansa AG (A)
|
| 100,892
|
|
| 901,002
|
| Deutsche Telekom AG
|
| 549,580
|
|
| 11,762,968
|
| DHL Group
|
| 170,716
|
|
| 7,961,018
|
| E.ON SE
|
| 379,930
|
|
| 4,676,819
|
| Evonik Industries AG
|
| 35,421
|
|
| 678,672
|
| Fresenius Medical Care AG & Company KGaA
|
| 34,743
|
|
| 1,672,789
|
| Fresenius SE & Company KGaA
|
| 71,650
|
|
| 2,297,045
|
| GEA Group AG
|
| 25,464
|
|
| 1,004,132
|
| Hannover Rueck SE
|
| 10,321
|
|
| 2,195,057
|
| Heidelberg Materials AG
|
| 24,519
|
|
| 1,971,493
|
| HelloFresh SE (A)
|
| 27,613
|
|
| 889,916
|
| Henkel AG & Company KGaA
|
| 16,913
|
|
| 1,168,829
|
| Infineon Technologies AG
|
| 221,660
|
|
| 7,921,181
|
| Knorr-Bremse AG
|
| 12,142
|
|
| 829,306
|
| LEG Immobilien SE (A)
|
| 12,511
|
|
| 900,999
|
| Mercedes-Benz Group AG
|
| 145,252
|
|
| 10,628,796
|
| Merck KGaA
|
| 21,965
|
|
| 3,943,278
|
| MTU Aero Engines AG
|
| 9,161
|
|
| 2,138,369
|
| Muenchener Rueckversicherungs-Gesellschaft AG
|
| 23,888
|
|
| 9,272,359
|
| Nemetschek SE
|
| 9,726
|
|
| 671,733
|
| Puma SE
|
| 17,829
|
|
| 1,194,876
|
| Rational AG
|
| 862
|
|
| 656,629
|
| Rheinmetall AG
|
| 7,431
|
|
| 2,018,448
|
| RWE AG
|
| 107,035
|
|
| 4,407,352
|
| SAP SE
|
| 177,162
|
|
| 24,714,921
|
| Scout24 SE (B)
|
| 12,636
|
|
| 870,450
|
| Siemens AG
|
| 128,972
|
|
| 19,375,601
|
| Siemens Energy AG (A)
|
| 88,358
|
|
| 1,257,501
|
| Siemens Healthineers AG (B)
|
| 47,731
|
|
| 2,389,524
|
| Symrise AG
|
| 22,520
|
|
| 2,347,599
|
| Talanx AG
|
| 11,060
|
|
| 743,490
|
| Telefonica Deutschland Holding AG
|
| 149,688
|
|
| 284,581
|
| Volkswagen AG
|
| 4,891
|
|
| 698,950
|
| Vonovia SE
|
| 121,698
|
|
| 2,919,939
|
| Wacker Chemie AG
|
| 3,120
|
|
| 459,548
|
| Zalando SE (A)(B)
|
| 37,940
|
|
| 1,179,386
|
|
|
|
|
|
| 208,004,738
|
| Hong Kong - 1.9%
|
|
|
|
|
|
| AIA Group, Ltd.
|
| 1,613,274
|
|
| 14,597,323
|
| Alibaba Health Information Technology, Ltd. (A)
|
| 543,746
|
|
| 321,024
|
| Beijing Enterprises Holdings, Ltd.
|
| 58,970
|
|
| 220,931
|
| Beijing Enterprises Water Group, Ltd.
|
| 485,340
|
|
| 111,817
|
| BOC Hong Kong Holdings, Ltd.
|
| 513,301
|
|
| 1,426,100
|
| Bosideng International Holdings, Ltd.
|
| 445,812
|
|
| 174,943
|
| Budweiser Brewing Company APAC, Ltd. (B)
|
| 234,316
|
|
| 507,399
|
| C&D International Investment Group, Ltd.
|
| 69,246
|
|
| 175,974
|
| China Everbright Environment Group, Ltd.
|
| 443,333
|
|
| 161,490
|
| China Gas Holdings, Ltd.
|
| 315,502
|
|
| 322,024
|
| China Jinmao Holdings Group, Ltd.
|
| 672,360
|
|
| 95,200
|
| China Medical System Holdings, Ltd.
|
| 159,843
|
|
| 230,216
|
| China Merchants Port Holdings Company, Ltd.
|
| 166,231
|
|
| 198,860
|
| China Overseas Land & Investment, Ltd.
|
| 448,752
|
|
| 946,008
|
| China Overseas Property Holdings, Ltd.
|
| 152,224
|
|
| 181,752
|
International Strategic Equity Allocation
Fund (continued)
|
|
| Shares or
Principal
Amount
|
| Value
|
| COMMON STOCKS (continued)
|
|
|
|
| Hong Kong (continued)
|
|
|
|
|
|
| China Power International Development, Ltd.
|
| 567,969
|
| $
| 202,423
|
| China Resources Beer Holdings Company, Ltd.
|
| 188,162
|
|
| 1,104,764
|
| China Resources Cement Holdings, Ltd.
|
| 273,330
|
|
| 90,536
|
| China Resources Gas Group, Ltd.
|
| 108,373
|
|
| 304,243
|
| China Resources Land, Ltd.
|
| 375,211
|
|
| 1,585,904
|
| China Resources Power Holdings Company, Ltd.
|
| 224,808
|
|
| 440,138
|
| China Ruyi Holdings, Ltd. (A)
|
| 705,326
|
|
| 187,036
|
| China State Construction International Holdings, Ltd.
|
| 233,116
|
|
| 259,282
|
| China Taiping Insurance Holdings Company, Ltd.
|
| 171,529
|
|
| 180,469
|
| China Traditional Chinese Medicine Holdings Company, Ltd.
|
| 347,316
|
|
| 135,767
|
| Chow Tai Fook Jewellery Group, Ltd.
|
| 228,031
|
|
| 345,778
|
| CK Asset Holdings, Ltd.
|
| 274,073
|
|
| 1,512,271
|
| CK Hutchison Holdings, Ltd.
|
| 373,134
|
|
| 2,033,579
|
| CK Infrastructure Holdings, Ltd.
|
| 86,299
|
|
| 436,208
|
| CLP Holdings, Ltd.
|
| 226,844
|
|
| 1,778,805
|
| COSCO SHIPPING Ports, Ltd.
|
| 180,534
|
|
| 111,153
|
| ESR Group, Ltd. (B)
|
| 269,901
|
|
| 404,994
|
| Far East Horizon, Ltd.
|
| 157,693
|
|
| 107,731
|
| Futu Holdings, Ltd., ADR (A)(C)
|
| 7,609
|
|
| 453,496
|
| Galaxy Entertainment Group, Ltd. (A)
|
| 302,387
|
|
| 1,998,689
|
| GCL Technology Holdings, Ltd.
|
| 2,376,736
|
|
| 411,665
|
| Geely Automobile Holdings, Ltd.
|
| 701,860
|
|
| 871,273
|
| Guangdong Investment, Ltd.
|
| 344,587
|
|
| 268,993
|
| Hang Lung Properties, Ltd.
|
| 244,852
|
|
| 326,109
|
| Hang Seng Bank, Ltd.
|
| 104,933
|
|
| 1,337,279
|
| Henderson Land Development Company, Ltd.
|
| 200,796
|
|
| 551,415
|
| HKT Trust & HKT, Ltd.
|
| 518,846
|
|
| 552,917
|
| Hong Kong & China Gas Company, Ltd.
|
| 1,535,498
|
|
| 1,128,534
|
| Hong Kong Exchanges & Clearing, Ltd.
|
| 166,685
|
|
| 6,460,414
|
| Hongkong Land Holdings, Ltd.
|
| 153,246
|
|
| 543,651
|
| Jardine Matheson Holdings, Ltd.
|
| 21,967
|
|
| 1,044,382
|
| Kingboard Holdings, Ltd.
|
| 77,354
|
|
| 175,535
|
| Kingboard Laminates Holdings, Ltd.
|
| 103,587
|
|
| 86,089
|
| Kunlun Energy Company, Ltd.
|
| 449,215
|
|
| 328,863
|
| Link REIT
|
| 350,085
|
|
| 1,735,734
|
| MTR Corp., Ltd.
|
| 211,712
|
|
| 883,361
|
| New World Development Company, Ltd.
|
| 208,084
|
|
| 441,841
|
| Nine Dragons Paper Holdings, Ltd. (A)
|
| 190,339
|
|
| 105,621
|
| Orient Overseas International, Ltd.
|
| 15,227
|
|
| 204,214
|
| Power Assets Holdings, Ltd.
|
| 191,306
|
|
| 941,710
|
| Prudential PLC
|
| 304,015
|
|
| 3,702,621
|
| Shenzhen International Holdings, Ltd.
|
| 165,252
|
|
| 117,467
|
| Sino Biopharmaceutical, Ltd.
|
| 1,206,160
|
|
| 457,844
|
| Sino Land Company, Ltd.
|
| 507,297
|
|
| 581,098
|
| SITC International Holdings Company, Ltd.
|
| 185,947
|
|
| 346,812
|
| Sun Hung Kai Properties, Ltd.
|
| 200,863
|
|
| 2,261,049
|
| Swire Pacific, Ltd., Class A
|
| 60,625
|
|
| 499,877
|
| Swire Properties, Ltd.
|
| 161,125
|
|
| 336,714
|
| Techtronic Industries Company, Ltd.
|
| 190,113
|
|
| 1,875,025
|
| Vinda International Holdings, Ltd.
|
| 42,189
|
|
| 97,619
|
| Want Want China Holdings, Ltd.
|
| 545,564
|
|
| 360,831
|
| WH Group, Ltd. (B)
|
| 1,160,366
|
|
| 597,583
|
| Wharf Real Estate Investment Company, Ltd.
|
| 230,027
|
|
| 958,656
|
| Xinyi Glass Holdings, Ltd.
|
| 226,149
|
|
| 333,615
|
| The accompanying notes are an integral part of the financial statements.
| 59
|
|
John Hancock Funds II
Portfolio of Investments —
August 31, 2023 (showing percentage of total net assets)
International Strategic Equity Allocation
Fund (continued)
|
|
| Shares or
Principal
Amount
|
| Value
|
| COMMON STOCKS (continued)
|
|
|
|
| Hong Kong (continued)
|
|
|
|
|
|
| Yuexiu Property Company, Ltd.
|
| 210,075
|
| $
| 260,278
|
|
|
|
|
|
| 64,531,016
|
| Hungary - 0.1%
|
|
|
|
|
|
| MOL Hungarian Oil & Gas PLC
|
| 55,755
|
|
| 421,621
|
| OTP Bank NYRT
|
| 29,325
|
|
| 1,195,796
|
| Richter Gedeon NYRT
|
| 17,240
|
|
| 431,680
|
|
|
|
|
|
| 2,049,097
|
| India - 4.3%
|
|
|
|
|
|
| ABB India, Ltd.
|
| 7,876
|
|
| 416,873
|
| ACC, Ltd.
|
| 9,691
|
|
| 235,737
|
| Adani Enterprises, Ltd.
|
| 25,564
|
|
| 748,095
|
| Adani Green Energy, Ltd. (A)
|
| 47,038
|
|
| 529,838
|
| Adani Ports & Special Economic Zone, Ltd.
|
| 78,665
|
|
| 752,369
|
| Adani Power, Ltd. (A)
|
| 115,454
|
|
| 447,612
|
| Ambuja Cements, Ltd.
|
| 88,366
|
|
| 456,286
|
| Apollo Hospitals Enterprise, Ltd.
|
| 15,028
|
|
| 874,830
|
| Asian Paints, Ltd.
|
| 57,027
|
|
| 2,241,297
|
| AU Small Finance Bank, Ltd. (B)
|
| 24,235
|
|
| 211,103
|
| Aurobindo Pharma, Ltd.
|
| 39,163
|
|
| 392,970
|
| Avenue Supermarts, Ltd. (A)(B)
|
| 24,009
|
|
| 1,077,169
|
| Axis Bank, Ltd.
|
| 339,422
|
|
| 3,979,540
|
| Bajaj Auto, Ltd.
|
| 10,124
|
|
| 563,275
|
| Bajaj Finance, Ltd.
|
| 40,530
|
|
| 3,505,986
|
| Bajaj Finserv, Ltd.
|
| 57,153
|
|
| 1,027,723
|
| Bajaj Holdings & Investment, Ltd.
|
| 3,965
|
|
| 354,734
|
| Balkrishna Industries, Ltd.
|
| 11,325
|
|
| 318,406
|
| Bandhan Bank, Ltd. (B)
|
| 107,275
|
|
| 297,446
|
| Bank of Baroda
|
| 154,945
|
|
| 349,972
|
| Berger Paints India, Ltd.
|
| 35,395
|
|
| 308,101
|
| Bharat Electronics, Ltd.
|
| 548,854
|
|
| 884,106
|
| Bharat Forge, Ltd.
|
| 37,558
|
|
| 486,051
|
| Bharat Petroleum Corp., Ltd.
|
| 112,238
|
|
| 461,032
|
| Bharti Airtel, Ltd.
|
| 331,607
|
|
| 3,431,104
|
| Britannia Industries, Ltd.
|
| 16,067
|
|
| 865,473
|
| CG Power & Industrial Solutions, Ltd.
|
| 90,069
|
|
| 455,606
|
| Cholamandalam Investment and Finance Company, Ltd.
|
| 61,707
|
|
| 835,192
|
| Cipla, Ltd.
|
| 78,511
|
|
| 1,187,636
|
| Coal India, Ltd.
|
| 228,542
|
|
| 635,256
|
| Colgate-Palmolive India, Ltd.
|
| 17,894
|
|
| 418,281
|
| Container Corp. of India, Ltd.
|
| 41,123
|
|
| 333,351
|
| Dabur India, Ltd.
|
| 92,838
|
|
| 621,279
|
| Divi's Laboratories, Ltd.
|
| 17,690
|
|
| 765,112
|
| DLF, Ltd.
|
| 92,744
|
|
| 564,132
|
| Dr. Reddy's Laboratories, Ltd.
|
| 16,174
|
|
| 1,096,465
|
| Eicher Motors, Ltd.
|
| 20,420
|
|
| 823,651
|
| GAIL India, Ltd.
|
| 346,519
|
|
| 482,479
|
| Godrej Consumer Products, Ltd. (A)
|
| 60,891
|
|
| 740,079
|
| Godrej Properties, Ltd. (A)
|
| 18,475
|
|
| 365,830
|
| Grasim Industries, Ltd.
|
| 39,385
|
|
| 850,899
|
| Havells India, Ltd.
|
| 36,934
|
|
| 617,852
|
| HCL Technologies, Ltd.
|
| 141,151
|
|
| 2,001,669
|
| HDFC Bank, Ltd.
|
| 413,649
|
|
| 7,860,513
|
| HDFC Life Insurance Company, Ltd. (B)
|
| 145,093
|
|
| 1,131,283
|
| Hero MotoCorp, Ltd.
|
| 16,324
|
|
| 575,435
|
| Hindalco Industries, Ltd.
|
| 184,408
|
|
| 1,025,243
|
| Hindustan Aeronautics, Ltd.
|
| 12,712
|
|
| 600,022
|
| Hindustan Petroleum Corp., Ltd. (A)
|
| 85,390
|
|
| 255,755
|
| Hindustan Unilever, Ltd.
|
| 122,338
|
|
| 3,709,569
|
| ICICI Bank, Ltd.
|
| 771,290
|
|
| 8,913,945
|
| ICICI Lombard General Insurance Company, Ltd. (B)
|
| 36,525
|
|
| 577,781
|
International Strategic Equity Allocation
Fund (continued)
|
|
| Shares or
Principal
Amount
|
| Value
|
| COMMON STOCKS (continued)
|
|
|
|
| India (continued)
|
|
|
|
|
|
| ICICI Prudential Life Insurance Company, Ltd. (B)
|
| 55,143
|
| $
| 373,863
|
| Indian Oil Corp., Ltd.
|
| 424,098
|
|
| 455,632
|
| Indian Railway Catering & Tourism Corp., Ltd.
|
| 35,727
|
|
| 290,349
|
| Indraprastha Gas, Ltd.
|
| 45,865
|
|
| 258,185
|
| Info Edge India, Ltd.
|
| 10,513
|
|
| 549,422
|
| Infosys, Ltd.
|
| 494,608
|
|
| 8,577,410
|
| InterGlobe Aviation, Ltd. (A)(B)
|
| 20,108
|
|
| 591,713
|
| ITC, Ltd.
|
| 445,122
|
|
| 2,361,792
|
| Jindal Steel & Power, Ltd.
|
| 53,521
|
|
| 442,142
|
| Jio Financial Services, Ltd. (A)
|
| 419,627
|
|
| 1,216,512
|
| JSW Steel, Ltd.
|
| 90,214
|
|
| 849,451
|
| Jubilant Foodworks, Ltd.
|
| 58,736
|
|
| 363,338
|
| Kotak Mahindra Bank, Ltd.
|
| 163,111
|
|
| 3,463,557
|
| Larsen & Toubro, Ltd.
|
| 102,768
|
|
| 3,369,538
|
| LTIMindtree, Ltd. (B)
|
| 13,200
|
|
| 833,484
|
| Lupin, Ltd.
|
| 30,595
|
|
| 403,251
|
| Mahindra & Mahindra, Ltd.
|
| 138,919
|
|
| 2,645,215
|
| Marico, Ltd.
|
| 76,410
|
|
| 529,841
|
| Maruti Suzuki India, Ltd.
|
| 20,244
|
|
| 2,443,769
|
| Max Healthcare Institute, Ltd. (A)
|
| 116,133
|
|
| 823,861
|
| Mphasis, Ltd.
|
| 11,347
|
|
| 331,681
|
| MRF, Ltd.
|
| 281
|
|
| 368,558
|
| Muthoot Finance, Ltd.
|
| 17,851
|
|
| 271,544
|
| Nestle India, Ltd.
|
| 5,005
|
|
| 1,328,516
|
| NTPC, Ltd.
|
| 651,702
|
|
| 1,724,793
|
| Oil & Natural Gas Corp., Ltd.
|
| 467,581
|
|
| 981,803
|
| Page Industries, Ltd.
|
| 904
|
|
| 438,721
|
| Petronet LNG, Ltd.
|
| 111,417
|
|
| 289,567
|
| PI Industries, Ltd.
|
| 11,300
|
|
| 494,065
|
| Pidilite Industries, Ltd.
|
| 22,611
|
|
| 683,855
|
| Power Grid Corp. of India, Ltd.
|
| 520,676
|
|
| 1,540,578
|
| Reliance Industries, Ltd.
|
| 491,864
|
|
| 14,295,103
|
| Samvardhana Motherson International, Ltd.
|
| 351,335
|
|
| 405,529
|
| SBI Cards & Payment Services, Ltd.
|
| 41,612
|
|
| 409,903
|
| SBI Life Insurance Company, Ltd. (B)
|
| 67,621
|
|
| 1,059,380
|
| Shree Cement, Ltd.
|
| 1,352
|
|
| 388,523
|
| Shriram Finance, Ltd.
|
| 41,843
|
|
| 972,254
|
| Siemens, Ltd.
|
| 13,260
|
|
| 628,220
|
| Sona BLW Precision Forgings, Ltd. (B)
|
| 60,976
|
|
| 437,979
|
| SRF, Ltd.
|
| 22,127
|
|
| 630,152
|
| State Bank of India
|
| 267,535
|
|
| 1,814,465
|
| Sun Pharmaceutical Industries, Ltd.
|
| 143,051
|
|
| 1,920,485
|
| Tata Consultancy Services, Ltd.
|
| 136,074
|
|
| 5,518,421
|
| Tata Consumer Products, Ltd.
|
| 82,890
|
|
| 837,442
|
| Tata Elxsi, Ltd.
|
| 5,115
|
|
| 447,313
|
| Tata Motors, Ltd.
|
| 247,705
|
|
| 1,798,757
|
| Tata Steel, Ltd.
|
| 1,092,568
|
|
| 1,629,524
|
| Tech Mahindra, Ltd.
|
| 79,954
|
|
| 1,161,323
|
| The Indian Hotels Company, Ltd.
|
| 126,911
|
|
| 645,583
|
| The Tata Power Company, Ltd.
|
| 213,796
|
|
| 635,324
|
| Titan Company, Ltd.
|
| 52,802
|
|
| 1,983,367
|
| Torrent Pharmaceuticals, Ltd.
|
| 15,035
|
|
| 334,936
|
| Trent, Ltd.
|
| 26,665
|
|
| 661,122
|
| Tube Investments of India, Ltd.
|
| 15,672
|
|
| 543,782
|
| TVS Motor Company, Ltd.
|
| 35,076
|
|
| 603,776
|
| UltraTech Cement, Ltd.
|
| 17,247
|
|
| 1,730,901
|
| United Spirits, Ltd. (A)
|
| 43,499
|
|
| 530,169
|
| UPL, Ltd.
|
| 72,432
|
|
| 517,612
|
| Varun Beverages, Ltd.
|
| 67,580
|
|
| 736,064
|
| Vedanta, Ltd.
|
| 110,887
|
|
| 310,576
|
| Wipro, Ltd.
|
| 205,489
|
|
| 1,016,036
|
| Yes Bank, Ltd. (A)
|
| 1,904,166
|
|
| 386,229
|
| The accompanying notes are an integral part of the financial statements.
| 60
|
|
John Hancock Funds II
Portfolio of Investments —
August 31, 2023 (showing percentage of total net assets)
International Strategic Equity Allocation
Fund (continued)
|
|
| Shares or
Principal
Amount
|
| Value
|
| COMMON STOCKS (continued)
|
|
|
|
| India (continued)
|
|
|
|
|
|
| Zomato, Ltd. (A)
|
| 640,677
|
| $
| 761,611
|
|
|
|
|
|
| 147,709,310
|
| Indonesia - 0.5%
|
|
|
|
|
|
| Adaro Energy Indonesia Tbk PT
|
| 1,875,366
|
|
| 328,540
|
| Aneka Tambang Tbk
|
| 1,080,662
|
|
| 140,986
|
| Astra International Tbk PT
|
| 2,671,051
|
|
| 1,130,134
|
| Bank Central Asia Tbk PT
|
| 7,230,014
|
|
| 4,352,509
|
| Bank Mandiri Persero Tbk PT
|
| 4,880,689
|
|
| 1,930,010
|
| Bank Negara Indonesia Persero Tbk PT
|
| 992,762
|
|
| 597,847
|
| Bank Rakyat Indonesia Persero Tbk PT
|
| 8,925,449
|
|
| 3,251,506
|
| Barito Pacific Tbk PT
|
| 3,664,556
|
|
| 257,430
|
| Charoen Pokphand Indonesia Tbk PT (A)
|
| 968,882
|
|
| 329,130
|
| GoTo Gojek Tokopedia Tbk PT (A)
|
| 109,000,398
|
|
| 685,950
|
| Indah Kiat Pulp & Paper Tbk PT
|
| 368,850
|
|
| 220,280
|
| Indofood CBP Sukses Makmur Tbk PT
|
| 300,836
|
|
| 221,260
|
| Indofood Sukses Makmur Tbk PT
|
| 598,130
|
|
| 278,684
|
| Kalbe Farma Tbk PT
|
| 2,736,725
|
|
| 325,592
|
| Merdeka Copper Gold Tbk PT (A)
|
| 1,552,882
|
|
| 344,200
|
| Sarana Menara Nusantara Tbk PT
|
| 2,576,357
|
|
| 174,219
|
| Semen Indonesia Persero Tbk PT
|
| 438,275
|
|
| 195,570
|
| Sumber Alfaria Trijaya Tbk PT
|
| 2,160,916
|
|
| 411,802
|
| Telkom Indonesia Persero Tbk PT
|
| 6,482,464
|
|
| 1,584,566
|
| Unilever Indonesia Tbk PT
|
| 992,032
|
|
| 239,048
|
| United Tractors Tbk PT
|
| 195,778
|
|
| 334,060
|
| Vale Indonesia Tbk PT
|
| 321,258
|
|
| 124,333
|
|
|
|
|
|
| 17,457,656
|
| Ireland - 0.9%
|
|
|
|
|
|
| AerCap Holdings NV (A)
|
| 22,997
|
|
| 1,414,775
|
| AIB Group PLC
|
| 183,373
|
|
| 834,631
|
| Bank of Ireland Group PLC
|
| 148,184
|
|
| 1,475,584
|
| CRH PLC
|
| 102,594
|
|
| 5,902,618
|
| DCC PLC
|
| 10,844
|
|
| 593,353
|
| Experian PLC
|
| 100,853
|
|
| 3,522,154
|
| Flutter Entertainment PLC (A)
|
| 24,401
|
|
| 4,437,707
|
| James Hardie Industries PLC, CHESS Depositary Interest (A)
|
| 21,839
|
|
| 656,420
|
| Kerry Group PLC, Class A
|
| 22,046
|
|
| 2,056,897
|
| Kingspan Group PLC
|
| 21,416
|
|
| 1,809,536
|
| PDD Holdings, Inc., ADR (A)
|
| 58,904
|
|
| 5,829,729
|
| Smurfit Kappa Group PLC
|
| 30,108
|
|
| 1,263,047
|
| Smurfit Kappa Group PLC
|
| 6,453
|
|
| 270,911
|
|
|
|
|
|
| 30,067,362
|
| Israel - 0.4%
|
|
|
|
|
|
| Azrieli Group, Ltd.
|
| 5,739
|
|
| 307,646
|
| Bank Hapoalim BM
|
| 175,134
|
|
| 1,449,960
|
| Bank Leumi Le-Israel BM
|
| 212,807
|
|
| 1,651,918
|
| Check Point Software Technologies, Ltd. (A)
|
| 13,340
|
|
| 1,795,431
|
| CyberArk Software, Ltd. (A)
|
| 5,638
|
|
| 936,134
|
| Elbit Systems, Ltd.
|
| 3,703
|
|
| 726,798
|
| ICL Group, Ltd.
|
| 106,227
|
|
| 634,792
|
| Israel Discount Bank, Ltd., Class A
|
| 170,290
|
|
| 851,687
|
| Mizrahi Tefahot Bank, Ltd.
|
| 21,190
|
|
| 696,736
|
| Monday.com, Ltd. (A)
|
| 2,613
|
|
| 463,651
|
| Nice, Ltd. (A)
|
| 8,788
|
|
| 1,712,812
|
| Teva Pharmaceutical Industries, Ltd., ADR (A)
|
| 153,662
|
|
| 1,499,741
|
| Tower Semiconductor, Ltd. (A)
|
| 15,043
|
|
| 438,855
|
| Wix.com, Ltd. (A)
|
| 7,471
|
|
| 737,911
|
|
|
|
|
|
| 13,904,072
|
| Italy - 1.7%
|
|
|
|
|
|
| Amplifon SpA
|
| 21,487
|
|
| 697,756
|
International Strategic Equity Allocation
Fund (continued)
|
|
| Shares or
Principal
Amount
|
| Value
|
| COMMON STOCKS (continued)
|
|
|
|
| Italy (continued)
|
|
|
|
|
|
| Assicurazioni Generali SpA
|
| 176,988
|
| $
| 3,665,955
|
| Davide Campari-Milano NV
|
| 89,103
|
|
| 1,164,134
|
| DiaSorin SpA
|
| 4,362
|
|
| 460,614
|
| Enel SpA
|
| 1,400,346
|
|
| 9,403,093
|
| Eni SpA
|
| 399,607
|
|
| 6,178,734
|
| Ferrari NV
|
| 21,657
|
|
| 6,866,623
|
| FinecoBank Banca Fineco SpA
|
| 104,098
|
|
| 1,422,754
|
| Infrastrutture Wireless Italiane SpA (B)
|
| 56,988
|
|
| 705,078
|
| Intesa Sanpaolo SpA
|
| 2,775,931
|
|
| 7,412,861
|
| Mediobanca Banca di Credito Finanziario SpA
|
| 95,404
|
|
| 1,245,460
|
| Moncler SpA
|
| 35,447
|
|
| 2,401,703
|
| Nexi SpA (A)(B)
|
| 101,758
|
|
| 730,042
|
| Poste Italiane SpA (B)
|
| 90,666
|
|
| 1,006,479
|
| Prysmian SpA
|
| 43,699
|
|
| 1,785,391
|
| Recordati Industria Chimica e Farmaceutica SpA
|
| 17,978
|
|
| 901,201
|
| Snam SpA
|
| 342,961
|
|
| 1,769,801
|
| Telecom Italia SpA (A)
|
| 1,693,963
|
|
| 525,522
|
| Terna - Rete Elettrica Nazionale
|
| 240,456
|
|
| 1,982,939
|
| UniCredit SpA
|
| 317,351
|
|
| 7,731,672
|
|
|
|
|
|
| 58,057,812
|
| Japan - 14.2%
|
|
|
|
|
|
| Advantest Corp.
|
| 26,521
|
|
| 3,319,651
|
| Aeon Company, Ltd. (C)
|
| 89,785
|
|
| 1,860,721
|
| AGC, Inc.
|
| 28,342
|
|
| 994,334
|
| Aisin Corp.
|
| 20,489
|
|
| 683,778
|
| Ajinomoto Company, Inc.
|
| 62,312
|
|
| 2,639,714
|
| ANA Holdings, Inc. (A)
|
| 21,623
|
|
| 488,142
|
| Asahi Group Holdings, Ltd.
|
| 66,840
|
|
| 2,600,435
|
| Asahi Intecc Company, Ltd.
|
| 30,285
|
|
| 614,347
|
| Asahi Kasei Corp.
|
| 172,790
|
|
| 1,115,341
|
| Astellas Pharma, Inc.
|
| 250,012
|
|
| 3,782,773
|
| Azbil Corp.
|
| 15,771
|
|
| 525,387
|
| Bandai Namco Holdings, Inc.
|
| 82,776
|
|
| 1,920,182
|
| BayCurrent Consulting, Inc.
|
| 18,140
|
|
| 623,520
|
| Bridgestone Corp.
|
| 79,034
|
|
| 3,068,555
|
| Brother Industries, Ltd.
|
| 31,857
|
|
| 539,134
|
| Canon, Inc.
|
| 138,493
|
|
| 3,408,876
|
| Capcom Company, Ltd.
|
| 23,994
|
|
| 1,012,144
|
| Central Japan Railway Company
|
| 19,902
|
|
| 2,551,824
|
| Chubu Electric Power Company, Inc.
|
| 89,229
|
|
| 1,189,297
|
| Chugai Pharmaceutical Company, Ltd.
|
| 92,890
|
|
| 2,831,466
|
| Concordia Financial Group, Ltd.
|
| 147,617
|
|
| 654,097
|
| CyberAgent, Inc.
|
| 59,569
|
|
| 379,042
|
| Dai Nippon Printing Company, Ltd.
|
| 30,043
|
|
| 820,938
|
| Daifuku Company, Ltd.
|
| 42,348
|
|
| 781,557
|
| Dai-ichi Life Holdings, Inc.
|
| 131,048
|
|
| 2,435,607
|
| Daiichi Sankyo Company, Ltd.
|
| 255,888
|
|
| 7,536,839
|
| Daikin Industries, Ltd.
|
| 36,534
|
|
| 6,315,219
|
| Daito Trust Construction Company, Ltd.
|
| 8,506
|
|
| 938,079
|
| Daiwa House Industry Company, Ltd.
|
| 82,955
|
|
| 2,304,139
|
| Daiwa House REIT Investment Corp. (C)
|
| 301
|
|
| 571,198
|
| Daiwa Securities Group, Inc.
|
| 186,764
|
|
| 1,062,062
|
| Denso Corp.
|
| 59,937
|
|
| 4,090,858
|
| Dentsu Group, Inc.
|
| 27,967
|
|
| 835,264
|
| Disco Corp.
|
| 12,724
|
|
| 2,514,828
|
| East Japan Railway Company
|
| 41,530
|
|
| 2,348,071
|
| Eisai Company, Ltd.
|
| 34,825
|
|
| 2,201,504
|
| ENEOS Holdings, Inc.
|
| 395,748
|
|
| 1,486,087
|
| FANUC Corp.
|
| 132,802
|
|
| 3,777,069
|
| Fast Retailing Company, Ltd.
|
| 24,191
|
|
| 5,549,689
|
| Fuji Electric Company, Ltd.
|
| 17,564
|
|
| 827,626
|
| The accompanying notes are an integral part of the financial statements.
| 61
|
|
John Hancock Funds II
Portfolio of Investments —
August 31, 2023 (showing percentage of total net assets)
International Strategic Equity Allocation
Fund (continued)
|
|
| Shares or
Principal
Amount
|
| Value
|
| COMMON STOCKS (continued)
|
|
|
|
| Japan (continued)
|
|
|
|
|
|
| FUJIFILM Holdings Corp.
|
| 51,755
|
| $
| 3,058,537
|
| Fujitsu, Ltd.
|
| 24,352
|
|
| 3,043,803
|
| GLP J-REIT
|
| 605
|
|
| 570,552
|
| GMO Payment Gateway, Inc.
|
| 5,719
|
|
| 362,145
|
| Hakuhodo DY Holdings, Inc.
|
| 32,053
|
|
| 304,099
|
| Hamamatsu Photonics KK
|
| 19,334
|
|
| 894,555
|
| Hankyu Hanshin Holdings, Inc.
|
| 31,300
|
|
| 1,123,400
|
| Hikari Tsushin, Inc.
|
| 2,791
|
|
| 464,326
|
| Hirose Electric Company, Ltd.
|
| 4,088
|
|
| 494,955
|
| Hitachi Construction Machinery Company, Ltd.
|
| 15,054
|
|
| 468,091
|
| Hitachi, Ltd.
|
| 129,898
|
|
| 8,633,312
|
| Honda Motor Company, Ltd.
|
| 213,408
|
|
| 6,896,577
|
| Hoshizaki Corp.
|
| 15,016
|
|
| 576,289
|
| Hoya Corp.
|
| 49,333
|
|
| 5,473,544
|
| Hulic Company, Ltd.
|
| 52,718
|
|
| 473,083
|
| Ibiden Company, Ltd.
|
| 15,612
|
|
| 940,625
|
| Idemitsu Kosan Company, Ltd.
|
| 28,432
|
|
| 605,213
|
| Iida Group Holdings Company, Ltd.
|
| 22,243
|
|
| 364,271
|
| Inpex Corp.
|
| 133,935
|
|
| 1,875,603
|
| Isuzu Motors, Ltd.
|
| 80,667
|
|
| 1,032,663
|
| ITOCHU Corp.
|
| 164,583
|
|
| 6,176,692
|
| Itochu Techno-Solutions Corp.
|
| 12,983
|
|
| 385,484
|
| Japan Airlines Company, Ltd.
|
| 19,653
|
|
| 404,728
|
| Japan Exchange Group, Inc.
|
| 69,853
|
|
| 1,218,778
|
| Japan Metropolitan Fund Investment Corp.
|
| 947
|
|
| 635,902
|
| Japan Post Bank Company, Ltd.
|
| 203,897
|
|
| 1,636,083
|
| Japan Post Holdings Company, Ltd.
|
| 306,065
|
|
| 2,346,494
|
| Japan Post Insurance Company, Ltd.
|
| 29,745
|
|
| 478,807
|
| Japan Real Estate Investment Corp.
|
| 175
|
|
| 727,266
|
| Japan Tobacco, Inc.
|
| 166,226
|
|
| 3,639,732
|
| JFE Holdings, Inc.
|
| 68,025
|
|
| 1,074,667
|
| JSR Corp.
|
| 24,611
|
|
| 686,919
|
| Kajima Corp.
|
| 58,827
|
|
| 982,573
|
| Kao Corp.
|
| 64,304
|
|
| 2,483,913
|
| Kawasaki Kisen Kaisha, Ltd. (A)
|
| 19,253
|
|
| 645,191
|
| KDDI Corp.
|
| 207,190
|
|
| 6,159,227
|
| Keio Corp.
|
| 13,956
|
|
| 482,887
|
| Keisei Electric Railway Company, Ltd.
|
| 17,611
|
|
| 674,359
|
| Keyence Corp.
|
| 26,904
|
|
| 11,169,783
|
| Kikkoman Corp.
|
| 18,677
|
|
| 1,078,895
|
| Kintetsu Group Holdings Company, Ltd.
|
| 24,711
|
|
| 782,166
|
| Kirin Holdings Company, Ltd.
|
| 107,603
|
|
| 1,510,666
|
| Kobayashi Pharmaceutical Company, Ltd.
|
| 6,933
|
|
| 342,315
|
| Kobe Bussan Company, Ltd.
|
| 20,687
|
|
| 515,400
|
| Koei Tecmo Holdings Company, Ltd.
|
| 15,503
|
|
| 240,789
|
| Koito Manufacturing Company, Ltd.
|
| 28,752
|
|
| 487,936
|
| Komatsu, Ltd.
|
| 128,184
|
|
| 3,647,886
|
| Konami Group Corp.
|
| 13,879
|
|
| 805,387
|
| Kose Corp.
|
| 4,626
|
|
| 383,656
|
| Kubota Corp.
|
| 140,209
|
|
| 2,256,456
|
| Kurita Water Industries, Ltd.
|
| 14,388
|
|
| 560,488
|
| Kyocera Corp.
|
| 44,417
|
|
| 2,278,134
|
| Kyowa Kirin Company, Ltd.
|
| 37,493
|
|
| 685,439
|
| Lasertec Corp.
|
| 10,436
|
|
| 1,622,169
|
| Lixil Corp.
|
| 40,019
|
|
| 501,264
|
| M3, Inc.
|
| 60,919
|
|
| 1,214,287
|
| Makita Corp.
|
| 30,960
|
|
| 848,677
|
| Marubeni Corp.
|
| 211,813
|
|
| 3,460,730
|
| MatsukiyoCocokara & Company
|
| 15,771
|
|
| 928,604
|
| Mazda Motor Corp.
|
| 78,739
|
|
| 820,375
|
| McDonald's Holdings Company Japan, Ltd.
|
| 11,691
|
|
| 465,209
|
| MEIJI Holdings Company, Ltd.
|
| 30,343
|
|
| 760,853
|
International Strategic Equity Allocation
Fund (continued)
|
|
| Shares or
Principal
Amount
|
| Value
|
| COMMON STOCKS (continued)
|
|
|
|
| Japan (continued)
|
|
|
|
|
|
| MINEBEA MITSUMI, Inc.
|
| 50,668
|
| $
| 859,108
|
| MISUMI Group, Inc.
|
| 39,539
|
|
| 688,756
|
| Mitsubishi Chemical Group Corp.
|
| 178,210
|
|
| 1,063,862
|
| Mitsubishi Corp.
|
| 171,702
|
|
| 8,469,192
|
| Mitsubishi Electric Corp.
|
| 267,966
|
|
| 3,491,082
|
| Mitsubishi Estate Company, Ltd.
|
| 155,677
|
|
| 1,982,859
|
| Mitsubishi HC Capital, Inc.
|
| 121,840
|
|
| 791,577
|
| Mitsubishi Heavy Industries, Ltd.
|
| 44,350
|
|
| 2,511,636
|
| Mitsubishi UFJ Financial Group, Inc.
|
| 1,579,254
|
|
| 12,598,784
|
| Mitsui & Company, Ltd.
|
| 181,595
|
|
| 6,763,564
|
| Mitsui Chemicals, Inc.
|
| 23,814
|
|
| 645,569
|
| Mitsui Fudosan Company, Ltd.
|
| 124,844
|
|
| 2,733,225
|
| Mitsui OSK Lines, Ltd.
|
| 47,821
|
|
| 1,324,208
|
| Mizuho Financial Group, Inc.
|
| 333,113
|
|
| 5,489,378
|
| MonotaRO Company, Ltd.
|
| 34,304
|
|
| 405,140
|
| MS&AD Insurance Group Holdings, Inc.
|
| 59,998
|
|
| 2,154,627
|
| Murata Manufacturing Company, Ltd.
|
| 79,452
|
|
| 4,444,806
|
| NEC Corp.
|
| 33,906
|
|
| 1,787,216
|
| Nexon Company, Ltd.
|
| 54,071
|
|
| 1,096,976
|
| NGK Insulators, Ltd.
|
| 32,534
|
|
| 431,603
|
| Nidec Corp.
|
| 57,774
|
|
| 3,006,239
|
| Nintendo Company, Ltd.
|
| 143,663
|
|
| 6,159,823
|
| Nippon Building Fund, Inc.
|
| 209
|
|
| 882,656
|
| Nippon Express Holdings, Inc.
|
| 10,101
|
|
| 524,539
|
| Nippon Paint Holdings Company, Ltd.
|
| 130,614
|
|
| 1,009,197
|
| Nippon Prologis REIT, Inc.
|
| 301
|
|
| 605,365
|
| Nippon Sanso Holdings Corp.
|
| 23,833
|
|
| 574,665
|
| Nippon Shinyaku Company, Ltd.
|
| 7,350
|
|
| 321,757
|
| Nippon Steel Corp. (C)
|
| 111,942
|
|
| 2,647,242
|
| Nippon Telegraph & Telephone Corp.
|
| 4,127,390
|
|
| 4,765,633
|
| Nippon Yusen KK (C)
|
| 67,192
|
|
| 1,787,603
|
| Nissan Chemical Corp.
|
| 17,583
|
|
| 753,083
|
| Nissan Motor Company, Ltd.
|
| 321,591
|
|
| 1,367,475
|
| Nisshin Seifun Group, Inc.
|
| 26,637
|
|
| 351,305
|
| Nissin Foods Holdings Company, Ltd.
|
| 8,539
|
|
| 745,731
|
| Nitori Holdings Company, Ltd.
|
| 11,053
|
|
| 1,258,139
|
| Nitto Denko Corp.
|
| 20,803
|
|
| 1,419,234
|
| Nomura Holdings, Inc.
|
| 408,688
|
|
| 1,582,282
|
| Nomura Real Estate Holdings, Inc.
|
| 15,114
|
|
| 380,321
|
| Nomura Real Estate Master Fund, Inc.
|
| 578
|
|
| 679,496
|
| Nomura Research Institute, Ltd.
|
| 53,135
|
|
| 1,527,055
|
| NTT Data Group Corp.
|
| 87,297
|
|
| 1,173,770
|
| Obayashi Corp.
|
| 89,164
|
|
| 807,536
|
| Obic Company, Ltd.
|
| 9,640
|
|
| 1,676,089
|
| Odakyu Electric Railway Company, Ltd.
|
| 40,459
|
|
| 601,609
|
| Oji Holdings Corp.
|
| 117,633
|
|
| 481,161
|
| Olympus Corp.
|
| 166,267
|
|
| 2,245,671
|
| Omron Corp.
|
| 24,225
|
|
| 1,168,916
|
| Ono Pharmaceutical Company, Ltd.
|
| 53,636
|
|
| 1,013,288
|
| Open House Group Company, Ltd.
|
| 10,814
|
|
| 365,305
|
| Oracle Corp.
|
| 5,260
|
|
| 367,396
|
| Oriental Land Company, Ltd.
|
| 151,058
|
|
| 5,441,293
|
| ORIX Corp.
|
| 163,139
|
|
| 3,041,674
|
| Osaka Gas Company, Ltd.
|
| 51,603
|
|
| 823,812
|
| Otsuka Corp.
|
| 15,612
|
|
| 695,795
|
| Otsuka Holdings Company, Ltd.
|
| 54,032
|
|
| 2,052,770
|
| Pan Pacific International Holdings Corp.
|
| 52,560
|
|
| 1,047,268
|
| Panasonic Holdings Corp.
|
| 305,530
|
|
| 3,516,668
|
| Persol Holdings Company, Ltd.
|
| 24,571
|
|
| 419,952
|
| Rakuten Group, Inc.
|
| 205,906
|
|
| 801,189
|
| Recruit Holdings Company, Ltd.
|
| 199,412
|
|
| 7,103,554
|
| Renesas Electronics Corp. (A)
|
| 176,081
|
|
| 2,933,451
|
| Resona Holdings, Inc.
|
| 295,835
|
|
| 1,567,193
|
| Ricoh Company, Ltd.
|
| 76,332
|
|
| 621,831
|
| The accompanying notes are an integral part of the financial statements.
| 62
|
|
John Hancock Funds II
Portfolio of Investments —
August 31, 2023 (showing percentage of total net assets)
International Strategic Equity Allocation
Fund (continued)
|
|
| Shares or
Principal
Amount
|
| Value
|
| COMMON STOCKS (continued)
|
|
|
|
| Japan (continued)
|
|
|
|
|
|
| Rohm Company, Ltd.
|
| 12,167
|
| $
| 1,014,822
|
| SBI Holdings, Inc.
|
| 34,335
|
|
| 700,810
|
| SCSK Corp.
|
| 21,287
|
|
| 368,997
|
| Secom Company, Ltd.
|
| 28,964
|
|
| 2,027,126
|
| Seiko Epson Corp.
|
| 39,731
|
|
| 622,124
|
| Sekisui Chemical Company, Ltd.
|
| 50,150
|
|
| 769,169
|
| Sekisui House, Ltd.
|
| 85,703
|
|
| 1,746,576
|
| Seven & i Holdings Company, Ltd.
|
| 104,313
|
|
| 4,280,084
|
| SG Holdings Company, Ltd.
|
| 44,357
|
|
| 640,731
|
| Sharp Corp. (A)
|
| 30,273
|
|
| 186,356
|
| Shimadzu Corp.
|
| 32,710
|
|
| 961,239
|
| Shimano, Inc.
|
| 10,756
|
|
| 1,577,801
|
| Shimizu Corp.
|
| 75,808
|
|
| 510,032
|
| Shin-Etsu Chemical Company, Ltd.
|
| 252,391
|
|
| 8,044,652
|
| Shionogi & Company, Ltd.
|
| 36,186
|
|
| 1,589,265
|
| Shiseido Company, Ltd.
|
| 55,406
|
|
| 2,248,332
|
| Shizuoka Financial Group, Inc.
|
| 61,296
|
|
| 498,101
|
| SMC Corp.
|
| 7,965
|
|
| 3,871,954
|
| SoftBank Corp.
|
| 396,356
|
|
| 4,545,692
|
| SoftBank Group Corp.
|
| 142,518
|
|
| 6,387,155
|
| Sompo Holdings, Inc.
|
| 43,628
|
|
| 1,898,582
|
| Sony Group Corp.
|
| 174,527
|
|
| 14,519,339
|
| Square Enix Holdings Company, Ltd.
|
| 11,768
|
|
| 446,693
|
| Subaru Corp.
|
| 85,204
|
|
| 1,637,910
|
| SUMCO Corp.
|
| 48,737
|
|
| 650,919
|
| Sumitomo Chemical Company, Ltd.
|
| 192,901
|
|
| 534,013
|
| Sumitomo Corp.
|
| 156,317
|
|
| 3,214,881
|
| Sumitomo Electric Industries, Ltd.
|
| 99,300
|
|
| 1,215,661
|
| Sumitomo Metal Mining Company, Ltd.
|
| 34,265
|
|
| 1,063,367
|
| Sumitomo Mitsui Financial Group, Inc.
|
| 180,382
|
|
| 8,246,429
|
| Sumitomo Mitsui Trust Holdings, Inc.
|
| 45,960
|
|
| 1,721,608
|
| Sumitomo Realty & Development Company, Ltd.
|
| 39,485
|
|
| 1,009,368
|
| Suntory Beverage & Food, Ltd.
|
| 19,136
|
|
| 615,690
|
| Suzuki Motor Corp.
|
| 50,947
|
|
| 2,001,831
|
| Sysmex Corp.
|
| 23,256
|
|
| 1,233,976
|
| T&D Holdings, Inc.
|
| 70,116
|
|
| 1,111,298
|
| Taisei Corp.
|
| 23,395
|
|
| 787,382
|
| Takeda Pharmaceutical Company, Ltd.
|
| 219,018
|
|
| 6,768,766
|
| TDK Corp.
|
| 53,871
|
|
| 1,960,750
|
| Terumo Corp.
|
| 93,247
|
|
| 2,821,418
|
| The Chiba Bank, Ltd.
|
| 73,739
|
|
| 526,526
|
| The Kansai Electric Power Company, Inc.
|
| 97,471
|
|
| 1,382,902
|
| TIS, Inc.
|
| 30,085
|
|
| 709,295
|
| Tobu Railway Company, Ltd.
|
| 25,844
|
|
| 708,495
|
| Toho Company, Ltd.
|
| 15,314
|
|
| 583,689
|
| Tokio Marine Holdings, Inc.
|
| 250,265
|
|
| 5,522,974
|
| Tokyo Electric Power Company Holdings, Inc. (A)
|
| 210,794
|
|
| 923,486
|
| Tokyo Electron, Ltd.
|
| 62,051
|
|
| 9,216,166
|
| Tokyo Gas Company, Ltd.
|
| 54,010
|
|
| 1,249,821
|
| Tokyu Corp.
|
| 72,839
|
|
| 920,439
|
| Toppan, Inc.
|
| 34,088
|
|
| 823,427
|
| Toray Industries, Inc.
|
| 192,082
|
|
| 1,035,644
|
| Toshiba Corp.
|
| 56,620
|
|
| 1,789,365
|
| Tosoh Corp.
|
| 36,452
|
|
| 471,681
|
| TOTO, Ltd.
|
| 18,380
|
|
| 504,050
|
| Toyota Industries Corp.
|
| 20,394
|
|
| 1,439,989
|
| Toyota Motor Corp.
|
| 1,467,397
|
|
| 25,281,949
|
| Toyota Tsusho Corp.
|
| 29,421
|
|
| 1,751,392
|
| Trend Micro, Inc.
|
| 18,420
|
|
| 781,776
|
| Unicharm Corp.
|
| 55,853
|
|
| 2,228,180
|
| USS Company, Ltd.
|
| 28,193
|
|
| 492,312
|
| Welcia Holdings Company, Ltd.
|
| 12,607
|
|
| 231,934
|
International Strategic Equity Allocation
Fund (continued)
|
|
| Shares or
Principal
Amount
|
| Value
|
| COMMON STOCKS (continued)
|
|
|
|
| Japan (continued)
|
|
|
|
|
|
| West Japan Railway Company
|
| 30,085
|
| $
| 1,302,501
|
| Yakult Honsha Company, Ltd.
|
| 17,683
|
|
| 926,478
|
| Yamaha Corp.
|
| 19,394
|
|
| 598,194
|
| Yamaha Motor Company, Ltd.
|
| 41,271
|
|
| 1,067,939
|
| Yamato Holdings Company, Ltd.
|
| 39,421
|
|
| 740,474
|
| Yaskawa Electric Corp. (C)
|
| 33,129
|
|
| 1,298,897
|
| Yokogawa Electric Corp.
|
| 31,600
|
|
| 625,710
|
| Z Holdings Corp.
|
| 369,754
|
|
| 1,110,322
|
| ZOZO, Inc.
|
| 17,124
|
|
| 341,984
|
|
|
|
|
|
| 483,750,392
|
| Jordan - 0.0%
|
|
|
|
|
|
| Hikma Pharmaceuticals PLC
|
| 18,256
|
|
| 504,289
|
| Luxembourg - 0.2%
|
|
|
|
|
|
| ArcelorMittal SA
|
| 82,836
|
|
| 2,200,508
|
| Eurofins Scientific SE
|
| 23,101
|
|
| 1,421,930
|
| Reinet Investments SCA
|
| 13,817
|
|
| 297,130
|
| Tenaris SA
|
| 80,794
|
|
| 1,290,268
|
|
|
|
|
|
| 5,209,836
|
| Macau - 0.0%
|
|
|
|
|
|
| Sands China, Ltd. (A)
|
| 334,478
|
|
| 1,131,439
|
| Malaysia - 0.4%
|
|
|
|
|
|
| AMMB Holdings BHD
|
| 221,700
|
|
| 178,353
|
| Axiata Group BHD
|
| 354,800
|
|
| 180,552
|
| CelcomDigi BHD
|
| 451,100
|
|
| 425,970
|
| CIMB Group Holdings BHD
|
| 839,600
|
|
| 1,017,785
|
| Dialog Group BHD
|
| 444,300
|
|
| 196,142
|
| Gamuda BHD
|
| 249,200
|
|
| 241,928
|
| Genting BHD
|
| 287,100
|
|
| 270,557
|
| Genting Malaysia BHD
|
| 392,800
|
|
| 217,593
|
| Hong Leong Bank BHD
|
| 87,200
|
|
| 375,205
|
| Hong Leong Financial Group BHD
|
| 31,100
|
|
| 121,963
|
| IHH Healthcare BHD
|
| 292,500
|
|
| 373,731
|
| Inari Amertron BHD
|
| 339,600
|
|
| 231,011
|
| IOI Corp. BHD
|
| 329,400
|
|
| 286,196
|
| Kuala Lumpur Kepong BHD
|
| 63,400
|
|
| 294,441
|
| Malayan Banking BHD
|
| 712,700
|
|
| 1,399,016
|
| Malaysia Airports Holdings BHD
|
| 94,600
|
|
| 150,217
|
| Maxis BHD
|
| 310,400
|
|
| 268,347
|
| MISC BHD
|
| 176,400
|
|
| 273,455
|
| Mr. D.I.Y Group M BHD (B)
|
| 418,300
|
|
| 139,735
|
| Nestle Malaysia BHD
|
| 8,400
|
|
| 236,433
|
| Petronas Chemicals Group BHD
|
| 366,400
|
|
| 562,290
|
| Petronas Dagangan BHD
|
| 36,300
|
|
| 173,702
|
| Petronas Gas BHD
|
| 101,800
|
|
| 375,366
|
| PPB Group BHD
|
| 84,100
|
|
| 284,896
|
| Press Metal Aluminium Holdings BHD
|
| 483,800
|
|
| 505,724
|
| Public Bank BHD
|
| 1,913,500
|
|
| 1,744,212
|
| QL Resources BHD
|
| 138,750
|
|
| 161,701
|
| RHB Bank BHD
|
| 194,300
|
|
| 234,871
|
| Sime Darby BHD
|
| 358,400
|
|
| 177,428
|
| Sime Darby Plantation BHD
|
| 273,200
|
|
| 259,256
|
| Telekom Malaysia BHD
|
| 150,800
|
|
| 165,866
|
| Tenaga Nasional BHD
|
| 341,100
|
|
| 723,455
|
| Top Glove Corp. BHD (A)
|
| 653,700
|
|
| 107,842
|
|
|
|
|
|
| 12,355,239
|
| Mexico - 1.1%
|
|
|
|
|
|
| Alfa SAB de CV, Class A
|
| 602,944
|
|
| 399,240
|
| America Movil SAB de CV (A)
|
| 6,152,636
|
|
| 5,917,904
|
| Arca Continental SAB de CV
|
| 102,517
|
|
| 1,001,090
|
| Banco del Bajio SA (B)
|
| 150,154
|
|
| 472,729
|
| Cemex SAB de CV, Series CPO (A)
|
| 2,964,084
|
|
| 2,362,506
|
| Coca-Cola Femsa SAB de CV
|
| 103,575
|
|
| 878,995
|
| The accompanying notes are an integral part of the financial statements.
| 63
|
|
John Hancock Funds II
Portfolio of Investments —
August 31, 2023 (showing percentage of total net assets)
International Strategic Equity Allocation
Fund (continued)
|
|
| Shares or
Principal
Amount
|
| Value
|
| COMMON STOCKS (continued)
|
|
|
|
| Mexico (continued)
|
|
|
|
|
|
| Fibra Uno Administracion SA de CV
|
| 564,143
|
| $
| 819,224
|
| Fomento Economico Mexicano SAB de CV
|
| 379,266
|
|
| 4,246,320
|
| Gruma SAB de CV, Class B
|
| 35,830
|
|
| 596,000
|
| Grupo Aeroportuario del Pacifico SAB de CV, B Shares
|
| 75,505
|
|
| 1,380,660
|
| Grupo Aeroportuario del Sureste SAB de CV, B Shares
|
| 38,003
|
|
| 1,034,521
|
| Grupo Bimbo SAB de CV, Series A
|
| 257,957
|
|
| 1,269,172
|
| Grupo Carso SAB de CV, Series A1
|
| 109,356
|
|
| 864,432
|
| Grupo Financiero Banorte SAB de CV, Series O
|
| 505,881
|
|
| 4,294,077
|
| Grupo Financiero Inbursa SAB de CV, Series O (A)
|
| 414,213
|
|
| 928,004
|
| Grupo Mexico SAB de CV, Series B
|
| 608,089
|
|
| 2,906,616
|
| Grupo Televisa SAB, Series CPO
|
| 494,486
|
|
| 442,559
|
| Industrias Penoles SAB de CV (A)
|
| 38,701
|
|
| 547,700
|
| Kimberly-Clark de Mexico SAB de CV, Class A
|
| 297,317
|
|
| 669,598
|
| Operadora de Sites Mexicanos SAB de CV, Class A1
|
| 251,995
|
|
| 237,060
|
| Orbia Advance Corp. SAB de CV
|
| 198,762
|
|
| 442,393
|
| Promotora y Operadora de Infraestructura SAB de CV
|
| 36,762
|
|
| 351,072
|
| Wal-Mart de Mexico SAB de CV
|
| 1,018,697
|
|
| 4,016,118
|
|
|
|
|
|
| 36,077,990
|
| Netherlands - 3.1%
|
|
|
|
|
|
| ABN AMRO Bank NV (B)
|
| 55,255
|
|
| 812,797
|
| Adyen NV (A)(B)
|
| 3,007
|
|
| 2,510,913
|
| Aegon NV
|
| 239,552
|
|
| 1,227,704
|
| Akzo Nobel NV
|
| 23,614
|
|
| 1,917,070
|
| Argenx SE (A)
|
| 7,691
|
|
| 3,865,381
|
| ASM International NV
|
| 6,483
|
|
| 3,120,723
|
| ASML Holding NV
|
| 55,789
|
|
| 36,682,897
|
| Euronext NV (B)
|
| 14,680
|
|
| 1,059,760
|
| EXOR NV
|
| 15,081
|
|
| 1,334,626
|
| Heineken Holding NV
|
| 15,828
|
|
| 1,266,606
|
| Heineken NV
|
| 35,832
|
|
| 3,483,250
|
| IMCD NV
|
| 7,863
|
|
| 1,082,990
|
| ING Groep NV
|
| 499,979
|
|
| 7,084,216
|
| JDE Peet's NV
|
| 17,110
|
|
| 476,248
|
| Just Eat Takeaway.com NV (A)(B)
|
| 28,676
|
|
| 402,782
|
| Koninklijke Ahold Delhaize NV
|
| 134,744
|
|
| 4,407,482
|
| Koninklijke DSM NV (A)(C)(D)
|
| 30,685
|
|
| 2,493,836
|
| Koninklijke KPN NV
|
| 444,550
|
|
| 1,555,658
|
| Koninklijke Philips NV (A)
|
| 128,753
|
|
| 2,893,289
|
| NEPI Rockcastle NV
|
| 46,456
|
|
| 277,339
|
| NN Group NV
|
| 35,341
|
|
| 1,360,471
|
| OCI NV
|
| 14,275
|
|
| 361,033
|
| Prosus NV (A)
|
| 110,898
|
|
| 7,649,134
|
| QIAGEN NV (A)
|
| 38,500
|
|
| 1,756,660
|
| Randstad NV
|
| 15,270
|
|
| 896,122
|
| Stellantis NV
|
| 387,672
|
|
| 7,196,466
|
| Universal Music Group NV
|
| 113,304
|
|
| 2,809,170
|
| Wolters Kluwer NV
|
| 35,606
|
|
| 4,290,187
|
|
|
|
|
|
| 104,274,810
|
| New Zealand - 0.1%
|
|
|
|
|
|
| Auckland International Airport, Ltd. (A)
|
| 173,058
|
|
| 805,755
|
| Fisher & Paykel Healthcare Corp., Ltd.
|
| 80,456
|
|
| 1,086,615
|
| Mercury NZ, Ltd.
|
| 94,089
|
|
| 348,201
|
| Meridian Energy, Ltd.
|
| 178,377
|
|
| 570,595
|
| Spark New Zealand, Ltd.
|
| 260,167
|
|
| 787,085
|
International Strategic Equity Allocation
Fund (continued)
|
|
| Shares or
Principal
Amount
|
| Value
|
| COMMON STOCKS (continued)
|
|
|
|
| New Zealand (continued)
|
|
|
|
|
|
| Xero, Ltd. (A)
|
| 7,082
|
| $
| 573,242
|
|
|
|
|
|
| 4,171,493
|
| Norway - 0.4%
|
|
|
|
|
|
| Adevinta ASA (A)
|
| 39,480
|
|
| 280,070
|
| Aker BP ASA (C)
|
| 42,506
|
|
| 1,156,073
|
| DNB Bank ASA
|
| 126,278
|
|
| 2,496,081
|
| Equinor ASA
|
| 128,610
|
|
| 3,949,772
|
| Gjensidige Forsikring ASA
|
| 28,238
|
|
| 438,469
|
| Kongsberg Gruppen ASA
|
| 12,189
|
|
| 505,611
|
| Mowi ASA
|
| 59,666
|
|
| 1,081,586
|
| Norsk Hydro ASA
|
| 182,387
|
|
| 1,009,128
|
| Orkla ASA
|
| 102,504
|
|
| 782,560
|
| Salmar ASA
|
| 9,758
|
|
| 476,379
|
| Telenor ASA
|
| 94,019
|
|
| 1,006,601
|
| Yara International ASA
|
| 22,576
|
|
| 822,881
|
|
|
|
|
|
| 14,005,211
|
| Peru - 0.1%
|
|
|
|
|
|
| Cia de Minas Buenaventura SAA, ADR (C)
|
| 29,089
|
|
| 248,420
|
| Credicorp, Ltd.
|
| 9,185
|
|
| 1,299,035
|
|
|
|
|
|
| 1,547,455
|
| Philippines - 0.2%
|
|
|
|
|
|
| Aboitiz Equity Ventures, Inc.
|
| 222,160
|
|
| 184,503
|
| ACEN Corp.
|
| 1,033,660
|
|
| 91,356
|
| Ayala Corp.
|
| 39,770
|
|
| 432,347
|
| Ayala Land, Inc.
|
| 882,280
|
|
| 422,779
|
| Bank of the Philippine Islands
|
| 260,087
|
|
| 505,140
|
| BDO Unibank, Inc.
|
| 311,820
|
|
| 766,634
|
| International Container Terminal Services, Inc.
|
| 131,870
|
|
| 481,976
|
| JG Summit Holdings, Inc.
|
| 339,132
|
|
| 218,722
|
| Jollibee Foods Corp.
|
| 58,510
|
|
| 244,779
|
| Manila Electric Company
|
| 36,630
|
|
| 222,466
|
| Metropolitan Bank & Trust Company
|
| 245,889
|
|
| 239,630
|
| PLDT, Inc.
|
| 9,785
|
|
| 198,579
|
| SM Investments Corp.
|
| 32,035
|
|
| 470,916
|
| SM Prime Holdings, Inc.
|
| 1,323,200
|
|
| 682,296
|
| Universal Robina Corp.
|
| 115,740
|
|
| 228,449
|
|
|
|
|
|
| 5,390,572
|
| Poland - 0.2%
|
|
|
|
|
|
| Allegro.eu SA (A)(B)
|
| 62,583
|
|
| 500,573
|
| Bank Polska Kasa Opieki SA
|
| 24,349
|
|
| 635,656
|
| CD Projekt SA
|
| 8,527
|
|
| 304,361
|
| Cyfrowy Polsat SA
|
| 32,385
|
|
| 106,426
|
| Dino Polska SA (A)(B)
|
| 6,495
|
|
| 595,602
|
| KGHM Polska Miedz SA
|
| 18,748
|
|
| 516,983
|
| LPP SA
|
| 147
|
|
| 494,527
|
| mBank SA (A)
|
| 1,984
|
|
| 206,052
|
| ORLEN SA
|
| 77,107
|
|
| 1,177,183
|
| PGE Polska Grupa Energetyczna SA (A)
|
| 119,770
|
|
| 245,849
|
| Powszechna Kasa Oszczednosci Bank Polski SA (A)
|
| 116,549
|
|
| 1,052,528
|
| Powszechny Zaklad Ubezpieczen SA
|
| 82,985
|
|
| 831,082
|
| Santander Bank Polska SA (A)
|
| 4,778
|
|
| 429,869
|
|
|
|
|
|
| 7,096,691
|
| Portugal - 0.1%
|
|
|
|
|
|
| EDP - Energias de Portugal SA
|
| 395,876
|
|
| 1,803,655
|
| Galp Energia SGPS SA
|
| 66,064
|
|
| 911,829
|
| Jeronimo Martins SGPS SA
|
| 38,071
|
|
| 970,506
|
|
|
|
|
|
| 3,685,990
|
| The accompanying notes are an integral part of the financial statements.
| 64
|
|
John Hancock Funds II
Portfolio of Investments —
August 31, 2023 (showing percentage of total net assets)
International Strategic Equity Allocation
Fund (continued)
|
|
| Shares or
Principal
Amount
|
| Value
|
| COMMON STOCKS (continued)
|
|
|
|
| Qatar - 0.2%
|
|
|
|
|
|
| Barwa Real Estate Company
|
| 287,205
|
| $
| 206,439
|
| Commercial Bank PSQC
|
| 420,399
|
|
| 655,824
|
| Dukhan Bank
|
| 248,243
|
|
| 284,884
|
| Industries Qatar QSC
|
| 197,905
|
|
| 671,538
|
| Masraf Al Rayan QSC
|
| 722,969
|
|
| 440,586
|
| Mesaieed Petrochemical Holding Company
|
| 574,104
|
|
| 289,946
|
| Ooredoo QPSC
|
| 104,878
|
|
| 311,191
|
| Qatar Electricity & Water Company QSC
|
| 57,987
|
|
| 284,746
|
| Qatar Fuel QSC
|
| 77,708
|
|
| 341,569
|
| Qatar Gas Transport Company, Ltd.
|
| 325,148
|
|
| 330,927
|
| Qatar International Islamic Bank QSC
|
| 126,394
|
|
| 343,192
|
| Qatar Islamic Bank SAQ
|
| 216,631
|
|
| 1,149,028
|
| Qatar National Bank QPSC
|
| 602,086
|
|
| 2,579,273
|
|
|
|
|
|
| 7,889,143
|
| Saudi Arabia - 1.1%
|
|
|
|
|
|
| ACWA Power Company
|
| 10,417
|
|
| 535,478
|
| Advanced Petrochemical Company
|
| 16,642
|
|
| 188,683
|
| Al Rajhi Bank
|
| 257,118
|
|
| 4,942,909
|
| Alinma Bank
|
| 128,012
|
|
| 1,257,745
|
| Almarai Company JSC
|
| 32,619
|
|
| 550,890
|
| Arab National Bank
|
| 89,110
|
|
| 612,414
|
| Arabian Internet & Communications Services Company
|
| 3,113
|
|
| 292,508
|
| Bank AlBilad
|
| 64,289
|
|
| 734,173
|
| Bank Al-Jazira (A)
|
| 53,713
|
|
| 253,701
|
| Banque Saudi Fransi
|
| 77,469
|
|
| 791,249
|
| Bupa Arabia for Cooperative Insurance Company
|
| 9,862
|
|
| 529,732
|
| Dallah Healthcare Company
|
| 4,411
|
|
| 164,635
|
| Dar Al Arkan Real Estate Development Company (A)
|
| 68,964
|
|
| 341,953
|
| Dr Sulaiman Al Habib Medical Services Group Company
|
| 11,434
|
|
| 739,732
|
| Elm Company
|
| 3,141
|
|
| 710,718
|
| Emaar Economic City (A)
|
| 49,284
|
|
| 110,456
|
| Etihad Etisalat Company
|
| 49,878
|
|
| 600,043
|
| Jarir Marketing Company
|
| 77,300
|
|
| 304,153
|
| Mobile Telecommunications Company Saudi Arabia
|
| 57,874
|
|
| 208,280
|
| Mouwasat Medical Services Company
|
| 12,699
|
|
| 371,981
|
| Nahdi Medical Company
|
| 5,141
|
|
| 207,862
|
| National Industrialization Company (A)
|
| 43,905
|
|
| 148,892
|
| Rabigh Refining & Petrochemical Company (A)
|
| 52,609
|
|
| 144,738
|
| Riyad Bank
|
| 192,660
|
|
| 1,562,396
|
| SABIC Agri-Nutrients Company
|
| 30,502
|
|
| 1,117,743
|
| Sahara International Petrochemical Company
|
| 47,107
|
|
| 457,280
|
| Saudi Arabian Mining Company (A)
|
| 168,794
|
|
| 1,818,314
|
| Saudi Arabian Oil Company (B)
|
| 347,909
|
|
| 3,239,646
|
| Saudi Aramco Base Oil Company
|
| 6,655
|
|
| 259,554
|
| Saudi Awwal Bank
|
| 131,567
|
|
| 1,255,185
|
| Saudi Basic Industries Corp.
|
| 117,870
|
|
| 2,775,974
|
| Saudi Electricity Company
|
| 108,849
|
|
| 600,432
|
| Saudi Industrial Investment Group
|
| 48,201
|
|
| 331,317
|
| Saudi Kayan Petrochemical Company (A)
|
| 94,614
|
|
| 306,838
|
| Saudi Research & Media Group (A)
|
| 4,684
|
|
| 221,319
|
| Saudi Tadawul Group Holding Company
|
| 6,253
|
|
| 329,644
|
| Saudi Telecom Company
|
| 261,892
|
|
| 2,779,038
|
| The Saudi Investment Bank
|
| 65,248
|
|
| 288,512
|
| The Saudi National Bank
|
| 384,829
|
|
| 3,664,824
|
| The Savola Group
|
| 34,296
|
|
| 346,059
|
International Strategic Equity Allocation
Fund (continued)
|
|
| Shares or
Principal
Amount
|
| Value
|
| COMMON STOCKS (continued)
|
|
|
|
| Saudi Arabia (continued)
|
|
|
|
|
|
| Yanbu National Petrochemical Company
|
| 35,978
|
| $
| 405,428
|
|
|
|
|
|
| 36,502,428
|
| Singapore - 0.9%
|
|
|
|
|
|
| BOC Aviation, Ltd. (B)
|
| 23,721
|
|
| 177,917
|
| CapitaLand Ascendas REIT
|
| 464,584
|
|
| 951,520
|
| CapitaLand Integrated Commercial Trust
|
| 731,907
|
|
| 1,033,884
|
| CapitaLand Investment, Ltd.
|
| 356,230
|
|
| 853,353
|
| City Developments, Ltd.
|
| 68,251
|
|
| 337,188
|
| DBS Group Holdings, Ltd.
|
| 250,011
|
|
| 6,153,682
|
| Genting Singapore, Ltd.
|
| 837,081
|
|
| 541,591
|
| Grab Holdings, Ltd., Class A (A)
|
| 257,655
|
|
| 971,359
|
| Jardine Cycle & Carriage, Ltd.
|
| 13,575
|
|
| 335,420
|
| JOYY, Inc., ADR
|
| 5,319
|
|
| 182,548
|
| Keppel Corp., Ltd.
|
| 201,566
|
|
| 1,034,070
|
| Mapletree Logistics Trust
|
| 475,582
|
|
| 590,886
|
| Mapletree Pan Asia Commercial Trust
|
| 322,022
|
|
| 361,982
|
| Oversea-Chinese Banking Corp., Ltd.
|
| 471,761
|
|
| 4,377,148
|
| Sea, Ltd., ADR (A)
|
| 50,580
|
|
| 1,903,325
|
| Seatrium, Ltd. (A)
|
| 5,693,167
|
|
| 610,285
|
| Singapore Airlines, Ltd.
|
| 186,169
|
|
| 945,951
|
| Singapore Exchange, Ltd.
|
| 119,190
|
|
| 848,502
|
| Singapore Technologies Engineering, Ltd.
|
| 217,946
|
|
| 614,065
|
| Singapore Telecommunications, Ltd.
|
| 1,142,056
|
|
| 2,006,637
|
| United Overseas Bank, Ltd.
|
| 175,568
|
|
| 3,688,221
|
| UOL Group, Ltd.
|
| 66,180
|
|
| 324,908
|
| Venture Corp., Ltd.
|
| 38,464
|
|
| 372,815
|
| Wilmar International, Ltd.
|
| 268,101
|
|
| 749,420
|
|
|
|
|
|
| 29,966,677
|
| South Africa - 0.6%
|
|
|
|
|
|
| Absa Group, Ltd.
|
| 83,481
|
|
| 804,884
|
| African Rainbow Minerals, Ltd.
|
| 11,078
|
|
| 104,616
|
| Anglo American Platinum, Ltd.
|
| 6,217
|
|
| 216,814
|
| AngloGold Ashanti, Ltd.
|
| 40,136
|
|
| 683,233
|
| Aspen Pharmacare Holdings, Ltd.
|
| 37,162
|
|
| 339,056
|
| Bid Corp., Ltd.
|
| 32,562
|
|
| 731,133
|
| Capitec Bank Holdings, Ltd.
|
| 8,424
|
|
| 706,501
|
| Clicks Group, Ltd.
|
| 23,241
|
|
| 336,476
|
| Discovery, Ltd. (A)
|
| 54,400
|
|
| 422,212
|
| Exxaro Resources, Ltd.
|
| 23,555
|
|
| 208,467
|
| FirstRand, Ltd.
|
| 494,547
|
|
| 1,921,521
|
| Gold Fields, Ltd.
|
| 86,780
|
|
| 1,110,235
|
| Growthpoint Properties, Ltd.
|
| 334,855
|
|
| 208,936
|
| Harmony Gold Mining Company, Ltd.
|
| 52,077
|
|
| 215,801
|
| Impala Platinum Holdings, Ltd.
|
| 83,893
|
|
| 431,892
|
| Kumba Iron Ore, Ltd.
|
| 6,242
|
|
| 136,689
|
| Momentum Metropolitan Holdings
|
| 15,313
|
|
| 16,295
|
| Mr. Price Group, Ltd.
|
| 24,720
|
|
| 173,010
|
| MTN Group, Ltd.
|
| 165,665
|
|
| 1,053,491
|
| MultiChoice Group
|
| 28,687
|
|
| 119,191
|
| Naspers, Ltd., N Shares
|
| 19,155
|
|
| 3,251,261
|
| Nedbank Group, Ltd.
|
| 45,136
|
|
| 516,655
|
| Northam Platinum Holdings, Ltd. (A)
|
| 34,536
|
|
| 228,367
|
| Old Mutual, Ltd.
|
| 497,524
|
|
| 333,211
|
| OUTsurance Group, Ltd.
|
| 83,590
|
|
| 177,277
|
| Pepkor Holdings, Ltd. (B)
|
| 197,041
|
|
| 169,932
|
| Remgro, Ltd.
|
| 52,044
|
|
| 436,483
|
| Sanlam, Ltd.
|
| 176,870
|
|
| 635,843
|
| Sasol, Ltd.
|
| 56,088
|
|
| 722,759
|
| Shoprite Holdings, Ltd.
|
| 48,687
|
|
| 679,488
|
| Sibanye Stillwater, Ltd.
|
| 275,710
|
|
| 416,001
|
| Standard Bank Group, Ltd.
|
| 131,987
|
|
| 1,347,573
|
| The Bidvest Group, Ltd.
|
| 27,943
|
|
| 421,594
|
| The Foschini Group, Ltd.
|
| 32,501
|
|
| 179,382
|
| The accompanying notes are an integral part of the financial statements.
| 65
|
|
John Hancock Funds II
Portfolio of Investments —
August 31, 2023 (showing percentage of total net assets)
International Strategic Equity Allocation
Fund (continued)
|
|
| Shares or
Principal
Amount
|
| Value
|
| COMMON STOCKS (continued)
|
|
|
|
| South Africa (continued)
|
|
|
|
|
|
| Vodacom Group, Ltd.
|
| 60,035
|
| $
| 342,433
|
| Woolworths Holdings, Ltd.
|
| 92,415
|
|
| 363,191
|
|
|
|
|
|
| 20,161,903
|
| South Korea - 3.0%
|
|
|
|
|
|
| Amorepacific Corp.
|
| 3,820
|
|
| 386,356
|
| BGF retail Company, Ltd.
|
| 963
|
|
| 113,866
|
| Celltrion Healthcare Company, Ltd.
|
| 14,011
|
|
| 685,570
|
| Celltrion Pharm, Inc. (A)
|
| 2,404
|
|
| 124,913
|
| Celltrion, Inc.
|
| 14,361
|
|
| 1,562,853
|
| CJ CheilJedang Corp.
|
| 1,107
|
|
| 250,154
|
| CJ Corp.
|
| 1,963
|
|
| 104,298
|
| CosmoAM&T Company, Ltd. (A)
|
| 3,009
|
|
| 358,187
|
| Coway Company, Ltd.
|
| 7,332
|
|
| 239,412
|
| DB Insurance Company, Ltd.
|
| 6,280
|
|
| 387,837
|
| Doosan Bobcat, Inc.
|
| 6,666
|
|
| 270,877
|
| Doosan Enerbility Company, Ltd. (A)
|
| 58,504
|
|
| 805,200
|
| Ecopro BM Company, Ltd.
|
| 6,385
|
|
| 1,563,621
|
| E-MART, Inc.
|
| 2,602
|
|
| 145,103
|
| F&F Company, Ltd.
|
| 2,248
|
|
| 174,932
|
| GS Holdings Corp.
|
| 6,299
|
|
| 178,784
|
| Hana Financial Group, Inc.
|
| 38,967
|
|
| 1,164,437
|
| Hankook Tire & Technology Company, Ltd.
|
| 9,846
|
|
| 288,204
|
| Hanmi Pharm Company, Ltd.
|
| 910
|
|
| 202,655
|
| Hanon Systems
|
| 23,978
|
|
| 165,093
|
| Hanwha Solutions Corp. (A)
|
| 12,991
|
|
| 357,574
|
| HD Hyundai Company, Ltd.
|
| 5,640
|
|
| 251,945
|
| HD Hyundai Heavy Industries Company, Ltd. (A)
|
| 2,906
|
|
| 287,159
|
| HD Korea Shipbuilding & Offshore Engineering Company, Ltd. (A)
|
| 5,595
|
|
| 523,184
|
| HLB, Inc. (A)
|
| 15,335
|
|
| 334,291
|
| HMM Company, Ltd.
|
| 31,988
|
|
| 402,689
|
| Hotel Shilla Company, Ltd.
|
| 4,102
|
|
| 273,252
|
| HYBE Company, Ltd. (A)
|
| 2,458
|
|
| 469,335
|
| Hyundai Engineering & Construction Company, Ltd.
|
| 10,672
|
|
| 286,244
|
| Hyundai Glovis Company, Ltd.
|
| 2,490
|
|
| 324,675
|
| Hyundai Mipo Dockyard Company, Ltd. (A)
|
| 3,097
|
|
| 212,895
|
| Hyundai Mobis Company, Ltd.
|
| 8,103
|
|
| 1,414,663
|
| Hyundai Motor Company
|
| 18,052
|
|
| 2,579,347
|
| Hyundai Steel Company
|
| 11,870
|
|
| 324,578
|
| Industrial Bank of Korea
|
| 38,365
|
|
| 312,107
|
| Kakao Corp.
|
| 40,702
|
|
| 1,477,159
|
| Kakao Games Corp. (A)
|
| 4,925
|
|
| 105,802
|
| KakaoBank Corp.
|
| 21,736
|
|
| 432,366
|
| Kakaopay Corp. (A)
|
| 3,612
|
|
| 123,262
|
| Kangwon Land, Inc.
|
| 12,504
|
|
| 146,604
|
| KB Financial Group, Inc.
|
| 51,159
|
|
| 2,084,024
|
| Kia Corp.
|
| 34,615
|
|
| 2,098,156
|
| Korea Aerospace Industries, Ltd.
|
| 9,858
|
|
| 376,513
|
| Korea Electric Power Corp. (A)
|
| 33,086
|
|
| 445,295
|
| Korea Investment Holdings Company, Ltd.
|
| 5,927
|
|
| 232,821
|
| Korea Zinc Company, Ltd.
|
| 1,044
|
|
| 415,672
|
| Korean Air Lines Company, Ltd.
|
| 24,906
|
|
| 428,905
|
| Krafton, Inc. (A)
|
| 3,887
|
|
| 455,087
|
| KT Corp.
|
| 8,789
|
|
| 219,226
|
| KT&G Corp.
|
| 13,481
|
|
| 885,719
|
| Kumho Petrochemical Company, Ltd.
|
| 2,398
|
|
| 226,097
|
| L&F Company, Ltd.
|
| 3,298
|
|
| 535,090
|
| LG Chem, Ltd.
|
| 6,464
|
|
| 2,846,152
|
| LG Corp.
|
| 12,553
|
|
| 778,765
|
International Strategic Equity Allocation
Fund (continued)
|
|
| Shares or
Principal
Amount
|
| Value
|
| COMMON STOCKS (continued)
|
|
|
|
| South Korea (continued)
|
|
|
|
|
|
| LG Display Company, Ltd. (A)
|
| 30,174
|
| $
| 305,269
|
| LG Electronics, Inc.
|
| 14,006
|
|
| 1,042,348
|
| LG Energy Solution, Ltd. (A)
|
| 4,603
|
|
| 1,891,862
|
| LG H&H Company, Ltd.
|
| 1,245
|
|
| 436,891
|
| LG Innotek Company, Ltd.
|
| 1,874
|
|
| 382,062
|
| LG Uplus Corp.
|
| 28,429
|
|
| 224,609
|
| Lotte Chemical Corp.
|
| 2,839
|
|
| 292,998
|
| Lotte Energy Materials Corp.
|
| 2,955
|
|
| 108,712
|
| Meritz Financial Group, Inc. (A)
|
| 13,685
|
|
| 565,536
|
| Mirae Asset Securities Company, Ltd.
|
| 39,503
|
|
| 198,829
|
| NAVER Corp.
|
| 17,173
|
|
| 2,779,832
|
| NCSoft Corp.
|
| 1,877
|
|
| 356,610
|
| Netmarble Corp. (A)(B)
|
| 2,773
|
|
| 89,781
|
| NH Investment & Securities Company, Ltd.
|
| 22,089
|
|
| 171,988
|
| Orion Corp.
|
| 3,071
|
|
| 282,831
|
| Pan Ocean Company, Ltd.
|
| 36,071
|
|
| 121,578
|
| Pearl Abyss Corp. (A)
|
| 4,116
|
|
| 150,170
|
| POSCO Future M Company, Ltd.
|
| 4,058
|
|
| 1,377,303
|
| POSCO Holdings, Inc.
|
| 9,405
|
|
| 4,112,275
|
| Posco International Corp.
|
| 6,862
|
|
| 410,886
|
| Samsung Biologics Company, Ltd. (A)(B)
|
| 2,323
|
|
| 1,294,195
|
| Samsung C&T Corp.
|
| 11,162
|
|
| 883,118
|
| Samsung Electro-Mechanics Company, Ltd.
|
| 7,363
|
|
| 752,963
|
| Samsung Electronics Company, Ltd.
|
| 624,088
|
|
| 31,564,030
|
| Samsung Engineering Company, Ltd. (A)
|
| 20,519
|
|
| 527,107
|
| Samsung Fire & Marine Insurance Company, Ltd.
|
| 4,115
|
|
| 766,546
|
| Samsung Heavy Industries Company, Ltd. (A)
|
| 81,275
|
|
| 541,211
|
| Samsung Life Insurance Company, Ltd.
|
| 10,891
|
|
| 556,649
|
| Samsung SDI Company, Ltd.
|
| 7,193
|
|
| 3,336,124
|
| Samsung SDS Company, Ltd.
|
| 5,109
|
|
| 548,294
|
| Samsung Securities Company, Ltd.
|
| 8,893
|
|
| 250,995
|
| Shinhan Financial Group Company, Ltd.
|
| 56,226
|
|
| 1,510,322
|
| SK Biopharmaceuticals Company, Ltd. (A)
|
| 4,095
|
|
| 265,154
|
| SK Bioscience Company, Ltd. (A)
|
| 3,593
|
|
| 199,723
|
| SK Hynix, Inc.
|
| 71,324
|
|
| 6,558,256
|
| SK IE Technology Company, Ltd. (A)(B)
|
| 3,293
|
|
| 224,538
|
| SK Innovation Company, Ltd. (A)
|
| 7,810
|
|
| 1,047,564
|
| SK Square Company, Ltd. (A)
|
| 12,901
|
|
| 439,536
|
| SK, Inc.
|
| 4,828
|
|
| 527,169
|
| SKC Company, Ltd.
|
| 2,543
|
|
| 175,734
|
| S-Oil Corp.
|
| 5,883
|
|
| 324,942
|
| Woori Financial Group, Inc.
|
| 80,329
|
|
| 722,683
|
| Yuhan Corp.
|
| 7,129
|
|
| 392,421
|
|
|
|
|
|
| 100,550,649
|
| Spain - 3.3%
|
|
|
|
|
|
| Acciona SA
|
| 6,785
|
|
| 969,704
|
| ACS Actividades de Construccion y Servicios SA
|
| 60,214
|
|
| 2,113,845
|
| Aena SME SA (B)
|
| 20,654
|
|
| 3,246,753
|
| Amadeus IT Group SA
|
| 124,067
|
|
| 8,512,677
|
| Banco Bilbao Vizcaya Argentaria SA
|
| 1,661,165
|
|
| 13,106,423
|
| Banco Santander SA
|
| 4,532,848
|
|
| 17,694,498
|
| CaixaBank SA
|
| 1,133,097
|
|
| 4,589,320
|
| Cellnex Telecom SA (A)(B)
|
| 155,496
|
|
| 5,947,025
|
| Corp ACCIONA Energias Renovables SA
|
| 17,893
|
|
| 531,713
|
| EDP Renovaveis SA
|
| 34,562
|
|
| 632,109
|
| Enagas SA
|
| 67,979
|
|
| 1,160,067
|
| Endesa SA
|
| 87,046
|
|
| 1,807,769
|
| Ferrovial SE
|
| 140,528
|
|
| 4,457,167
|
| The accompanying notes are an integral part of the financial statements.
| 66
|
|
John Hancock Funds II
Portfolio of Investments —
August 31, 2023 (showing percentage of total net assets)
International Strategic Equity Allocation
Fund (continued)
|
|
| Shares or
Principal
Amount
|
| Value
|
| COMMON STOCKS (continued)
|
|
|
|
| Spain (continued)
|
|
|
|
|
|
| Grifols SA (A)
|
| 82,142
|
| $
| 1,125,334
|
| Iberdrola SA
|
| 1,647,570
|
|
| 19,544,715
|
| Industria de Diseno Textil SA
|
| 300,429
|
|
| 11,509,859
|
| Mapfre SA
|
| 12,889
|
|
| 27,263
|
| Naturgy Energy Group SA (C)
|
| 34,588
|
|
| 1,001,808
|
| Redeia Corp. SA
|
| 111,095
|
|
| 1,804,108
|
| Repsol SA
|
| 365,252
|
|
| 5,645,383
|
| Telefonica SA
|
| 1,432,193
|
|
| 5,934,546
|
|
|
|
|
|
| 111,362,086
|
| Sweden - 0.6%
|
|
|
|
|
|
| Alfa Laval AB
|
| 14,336
|
|
| 503,338
|
| Assa Abloy AB, B Shares
|
| 49,641
|
|
| 1,117,217
|
| Atlas Copco AB, A Shares
|
| 132,670
|
|
| 1,754,059
|
| Atlas Copco AB, B Shares
|
| 76,606
|
|
| 881,937
|
| Beijer Ref AB
|
| 19,003
|
|
| 217,816
|
| Boliden AB
|
| 13,440
|
|
| 357,376
|
| Embracer Group AB (A)
|
| 36,827
|
|
| 89,158
|
| Epiroc AB, A Shares
|
| 32,567
|
|
| 624,811
|
| Epiroc AB, B Shares
|
| 19,011
|
|
| 311,181
|
| EQT AB
|
| 18,086
|
|
| 363,552
|
| Essity AB, B Shares
|
| 30,090
|
|
| 702,487
|
| Evolution AB (B)
|
| 9,039
|
|
| 977,631
|
| Fastighets AB Balder, B Shares (A)
|
| 32,387
|
|
| 154,798
|
| Getinge AB, B Shares
|
| 11,377
|
|
| 197,247
|
| Hennes & Mauritz AB, B Shares
|
| 32,404
|
|
| 494,744
|
| Hexagon AB, B Shares
|
| 102,350
|
|
| 913,797
|
| Holmen AB, B Shares
|
| 4,585
|
|
| 173,790
|
| Husqvarna AB, B Shares
|
| 20,765
|
|
| 178,778
|
| Industrivarden AB, A Shares
|
| 3,815
|
|
| 99,377
|
| Industrivarden AB, C Shares
|
| 10,137
|
|
| 263,570
|
| Indutrade AB
|
| 13,036
|
|
| 250,182
|
| Investment AB Latour, B Shares
|
| 7,175
|
|
| 130,375
|
| Investor AB, A Shares
|
| 20,219
|
|
| 385,849
|
| Investor AB, B Shares
|
| 86,933
|
|
| 1,673,272
|
| Kinnevik AB, B Shares (A)
|
| 11,957
|
|
| 140,402
|
| L.E. Lundbergforetagen AB, B Shares
|
| 3,807
|
|
| 154,722
|
| Lifco AB, B Shares
|
| 11,439
|
|
| 209,179
|
| Nibe Industrier AB, B Shares
|
| 74,703
|
|
| 559,157
|
| Saab AB, B Shares
|
| 4,132
|
|
| 217,815
|
| Sagax AB, B Shares
|
| 9,295
|
|
| 193,311
|
| Sandvik AB
|
| 52,662
|
|
| 995,934
|
| Securitas AB, B Shares
|
| 24,260
|
|
| 197,383
|
| Skandinaviska Enskilda Banken AB, A Shares
|
| 79,502
|
|
| 921,714
|
| Skanska AB, B Shares
|
| 17,021
|
|
| 249,162
|
| SKF AB, B Shares
|
| 16,940
|
|
| 274,282
|
| Svenska Cellulosa AB SCA, B Shares
|
| 29,828
|
|
| 397,069
|
| Svenska Handelsbanken AB, A Shares
|
| 70,495
|
|
| 588,214
|
| Swedbank AB, A Shares
|
| 41,307
|
|
| 731,040
|
| Swedish Orphan Biovitrum AB (A)(C)
|
| 8,391
|
|
| 161,849
|
| Tele2 AB, B Shares
|
| 25,585
|
|
| 180,753
|
| Telefonaktiebolaget LM Ericsson, B Shares
|
| 143,945
|
|
| 738,724
|
| Telia Company AB
|
| 116,936
|
|
| 236,071
|
| Volvo AB, A Shares
|
| 7,613
|
|
| 155,715
|
| Volvo AB, B Shares
|
| 77,039
|
|
| 1,552,615
|
| Volvo Car AB, B Shares (A)
|
| 29,099
|
|
| 110,478
|
|
|
|
|
|
| 21,781,931
|
| Switzerland - 9.8%
|
|
|
|
|
|
| ABB, Ltd.
|
| 321,081
|
|
| 12,210,145
|
| Adecco Group AG
|
| 32,540
|
|
| 1,399,712
|
| Alcon, Inc.
|
| 102,214
|
|
| 8,530,739
|
| Bachem Holding AG
|
| 6,875
|
|
| 639,871
|
| Baloise Holding AG
|
| 9,684
|
|
| 1,512,848
|
International Strategic Equity Allocation
Fund (continued)
|
|
| Shares or
Principal
Amount
|
| Value
|
| COMMON STOCKS (continued)
|
|
|
|
| Switzerland (continued)
|
|
|
|
|
|
| Banque Cantonale Vaudoise
|
| 6,083
|
| $
| 659,060
|
| Barry Callebaut AG
|
| 721
|
|
| 1,256,372
|
| BKW AG
|
| 4,228
|
|
| 726,469
|
| Chocoladefabriken Lindt & Spruengli AG
|
| 22
|
|
| 2,592,029
|
| Chocoladefabriken Lindt & Spruengli AG, Participation Certificates
|
| 206
|
|
| 2,462,271
|
| Cie Financiere Richemont SA, A Shares
|
| 106,769
|
|
| 15,144,287
|
| Clariant AG (A)
|
| 43,598
|
|
| 725,297
|
| Coca-Cola HBC AG (A)
|
| 24,116
|
|
| 694,708
|
| DSM-Firmenich AG
|
| 24,175
|
|
| 2,236,215
|
| Dufry AG (A)
|
| 19,930
|
|
| 885,541
|
| EMS-Chemie Holding AG
|
| 1,410
|
|
| 1,058,159
|
| Geberit AG
|
| 6,948
|
|
| 3,595,884
|
| Givaudan SA
|
| 1,885
|
|
| 6,278,997
|
| Glencore PLC
|
| 1,170,536
|
|
| 6,233,340
|
| Helvetia Holding AG
|
| 7,734
|
|
| 1,176,143
|
| Holcim, Ltd. (A)
|
| 113,440
|
|
| 7,501,808
|
| Julius Baer Group, Ltd.
|
| 43,863
|
|
| 3,044,507
|
| Kuehne + Nagel International AG
|
| 11,073
|
|
| 3,326,828
|
| Logitech International SA
|
| 33,516
|
|
| 2,318,722
|
| Lonza Group AG
|
| 15,226
|
|
| 8,398,529
|
| Nestle SA
|
| 562,256
|
|
| 67,605,332
|
| Novartis AG
|
| 419,116
|
|
| 42,180,576
|
| Partners Group Holding AG
|
| 4,661
|
|
| 5,024,116
|
| Roche Holding AG
|
| 143,678
|
|
| 42,167,829
|
| Roche Holding AG, Bearer Shares
|
| 6,494
|
|
| 2,023,910
|
| Schindler Holding AG
|
| 4,537
|
|
| 952,016
|
| Schindler Holding AG, Participation Certificates
|
| 8,516
|
|
| 1,896,504
|
| SGS SA (A)
|
| 30,460
|
|
| 2,766,463
|
| SIG Group AG (A)
|
| 62,467
|
|
| 1,643,222
|
| Sika AG
|
| 29,856
|
|
| 8,436,781
|
| Sonova Holding AG
|
| 10,635
|
|
| 2,810,113
|
| STMicroelectronics NV
|
| 116,834
|
|
| 5,513,957
|
| Straumann Holding AG
|
| 22,832
|
|
| 3,451,959
|
| Swiss Life Holding AG
|
| 6,358
|
|
| 3,981,795
|
| Swiss Prime Site AG
|
| 15,559
|
|
| 1,494,035
|
| Swiss Re AG
|
| 62,071
|
|
| 6,027,568
|
| Swisscom AG
|
| 5,283
|
|
| 3,216,763
|
| Temenos AG
|
| 13,082
|
|
| 1,036,826
|
| The Swatch Group AG
|
| 10,322
|
|
| 549,939
|
| The Swatch Group AG, Bearer Shares
|
| 5,997
|
|
| 1,683,600
|
| UBS Group AG
|
| 672,991
|
|
| 17,825,312
|
| VAT Group AG (B)
|
| 5,520
|
|
| 2,206,052
|
| Zurich Insurance Group AG
|
| 30,916
|
|
| 14,496,302
|
|
|
|
|
|
| 333,599,451
|
| Taiwan - 3.8%
|
|
|
|
|
|
| Accton Technology Corp.
|
| 66,000
|
|
| 984,346
|
| Acer, Inc.
|
| 381,000
|
|
| 436,847
|
| Advantech Company, Ltd.
|
| 60,844
|
|
| 654,766
|
| Airtac International Group
|
| 18,000
|
|
| 518,514
|
| ASE Technology Holding Company, Ltd.
|
| 400,000
|
|
| 1,480,508
|
| Asia Cement Corp.
|
| 302,000
|
|
| 378,297
|
| Asustek Computer, Inc.
|
| 93,000
|
|
| 1,171,707
|
| AUO Corp. (A)
|
| 846,800
|
|
| 472,864
|
| Catcher Technology Company, Ltd.
|
| 85,000
|
|
| 480,926
|
| Cathay Financial Holding Company, Ltd. (A)
|
| 1,257,000
|
|
| 1,797,305
|
| Chailease Holding Company, Ltd.
|
| 200,895
|
|
| 1,119,872
|
| Chang Hwa Commercial Bank, Ltd.
|
| 727,288
|
|
| 394,696
|
| Cheng Shin Rubber Industry Company, Ltd.
|
| 248,000
|
|
| 308,081
|
| China Airlines, Ltd.
|
| 383,000
|
|
| 271,458
|
| The accompanying notes are an integral part of the financial statements.
| 67
|
|
John Hancock Funds II
Portfolio of Investments —
August 31, 2023 (showing percentage of total net assets)
International Strategic Equity Allocation
Fund (continued)
|
|
| Shares or
Principal
Amount
|
| Value
|
| COMMON STOCKS (continued)
|
|
|
|
| Taiwan (continued)
|
|
|
|
|
|
| China Development Financial Holding Corp. (A)
|
| 2,124,548
|
| $
| 789,327
|
| China Steel Corp.
|
| 1,536,000
|
|
| 1,277,572
|
| Chunghwa Telecom Company, Ltd.
|
| 499,000
|
|
| 1,819,280
|
| Compal Electronics, Inc.
|
| 545,000
|
|
| 544,153
|
| CTBC Financial Holding Company, Ltd.
|
| 2,324,000
|
|
| 1,737,012
|
| Delta Electronics, Inc.
|
| 255,000
|
|
| 2,755,760
|
| E Ink Holdings, Inc.
|
| 112,000
|
|
| 640,171
|
| E.Sun Financial Holding Company, Ltd.
|
| 1,809,733
|
|
| 1,387,904
|
| Eclat Textile Company, Ltd.
|
| 25,340
|
|
| 403,711
|
| eMemory Technology, Inc.
|
| 8,000
|
|
| 453,198
|
| Eva Airways Corp.
|
| 338,000
|
|
| 333,573
|
| Evergreen Marine Corp. Taiwan, Ltd.
|
| 133,560
|
|
| 446,027
|
| Far Eastern New Century Corp.
|
| 382,000
|
|
| 337,210
|
| Far EasTone Telecommunications Company, Ltd.
|
| 207,000
|
|
| 459,132
|
| Feng TAY Enterprise Company, Ltd.
|
| 64,110
|
|
| 337,412
|
| First Financial Holding Company, Ltd.
|
| 1,421,252
|
|
| 1,172,989
|
| Formosa Chemicals & Fibre Corp.
|
| 458,000
|
|
| 891,327
|
| Formosa Petrochemical Corp.
|
| 144,000
|
|
| 358,660
|
| Formosa Plastics Corp.
|
| 501,000
|
|
| 1,250,703
|
| Fubon Financial Holding Company, Ltd.
|
| 981,255
|
|
| 1,956,782
|
| Giant Manufacturing Company, Ltd.
|
| 41,000
|
|
| 251,676
|
| Global Unichip Corp.
|
| 11,000
|
|
| 500,642
|
| Globalwafers Company, Ltd.
|
| 29,000
|
|
| 416,472
|
| Hon Hai Precision Industry Company, Ltd.
|
| 1,635,800
|
|
| 5,461,519
|
| Hotai Motor Company, Ltd.
|
| 39,820
|
|
| 846,993
|
| Hua Nan Financial Holdings Company, Ltd.
|
| 1,142,104
|
|
| 734,902
|
| Innolux Corp.
|
| 1,172,822
|
|
| 531,266
|
| Inventec Corp.
|
| 351,000
|
|
| 618,339
|
| Largan Precision Company, Ltd.
|
| 13,000
|
|
| 834,980
|
| Lite-On Technology Corp.
|
| 263,000
|
|
| 1,124,342
|
| MediaTek, Inc.
|
| 199,000
|
|
| 4,388,638
|
| Mega Financial Holding Company, Ltd.
|
| 1,474,475
|
|
| 1,659,407
|
| Micro-Star International Company, Ltd.
|
| 88,000
|
|
| 440,049
|
| momo.com, Inc.
|
| 11,220
|
|
| 183,006
|
| Nan Ya Plastics Corp.
|
| 623,000
|
|
| 1,292,966
|
| Nan Ya Printed Circuit Board Corp.
|
| 30,000
|
|
| 226,578
|
| Nanya Technology Corp.
|
| 164,000
|
|
| 341,722
|
| Nien Made Enterprise Company, Ltd.
|
| 22,000
|
|
| 206,187
|
| Novatek Microelectronics Corp.
|
| 76,000
|
|
| 950,069
|
| Pegatron Corp.
|
| 264,000
|
|
| 645,577
|
| PharmaEssentia Corp. (A)
|
| 31,000
|
|
| 348,134
|
| Pou Chen Corp.
|
| 293,000
|
|
| 262,900
|
| Powerchip Semiconductor Manufacturing Corp.
|
| 391,000
|
|
| 341,000
|
| President Chain Store Corp.
|
| 73,000
|
|
| 612,146
|
| Quanta Computer, Inc.
|
| 354,000
|
|
| 2,806,069
|
| Realtek Semiconductor Corp.
|
| 60,000
|
|
| 784,101
|
| Ruentex Development Company, Ltd. (A)
|
| 223,464
|
|
| 258,161
|
| Shin Kong Financial Holding Company, Ltd. (A)
|
| 1,752,988
|
|
| 520,641
|
| SinoPac Financial Holdings Company, Ltd.
|
| 1,379,273
|
|
| 740,320
|
| Synnex Technology International Corp.
|
| 166,000
|
|
| 318,167
|
| Taishin Financial Holding Company, Ltd.
|
| 1,459,003
|
|
| 814,560
|
| Taiwan Business Bank
|
| 800,768
|
|
| 335,077
|
| Taiwan Cement Corp.
|
| 795,442
|
|
| 872,058
|
| Taiwan Cooperative Financial Holding Company, Ltd.
|
| 1,328,932
|
|
| 1,095,156
|
| Taiwan High Speed Rail Corp.
|
| 243,000
|
|
| 226,758
|
| Taiwan Mobile Company, Ltd.
|
| 222,000
|
|
| 649,482
|
| Taiwan Semiconductor Manufacturing Company, Ltd.
|
| 3,222,816
|
|
| 55,377,511
|
International Strategic Equity Allocation
Fund (continued)
|
|
| Shares or
Principal
Amount
|
| Value
|
| COMMON STOCKS (continued)
|
|
|
|
| Taiwan (continued)
|
|
|
|
|
|
| The Shanghai Commercial & Savings Bank, Ltd.
|
| 501,000
|
| $
| 670,081
|
| Unimicron Technology Corp.
|
| 179,000
|
|
| 1,035,745
|
| Uni-President Enterprises Corp.
|
| 629,000
|
|
| 1,394,629
|
| United Microelectronics Corp.
|
| 1,476,000
|
|
| 2,107,358
|
| Vanguard International Semiconductor Corp.
|
| 116,000
|
|
| 248,022
|
| Voltronic Power Technology Corp.
|
| 8,000
|
|
| 363,100
|
| Walsin Lihwa Corp.
|
| 367,000
|
|
| 436,474
|
| Wan Hai Lines, Ltd.
|
| 92,545
|
|
| 131,364
|
| Win Semiconductors Corp.
|
| 44,000
|
|
| 187,471
|
| Winbond Electronics Corp. (A)
|
| 388,000
|
|
| 319,539
|
| Wistron Corp.
|
| 341,000
|
|
| 1,246,647
|
| Wiwynn Corp.
|
| 11,000
|
|
| 536,079
|
| WPG Holdings, Ltd.
|
| 207,960
|
|
| 357,867
|
| Yageo Corp.
|
| 41,646
|
|
| 632,656
|
| Yang Ming Marine Transport Corp.
|
| 230,000
|
|
| 304,645
|
| Yuanta Financial Holding Company, Ltd.
|
| 1,330,472
|
|
| 1,018,042
|
| Zhen Ding Technology Holding, Ltd.
|
| 87,000
|
|
| 263,380
|
|
|
|
|
|
| 129,092,760
|
| Thailand - 0.5%
|
|
|
|
|
|
| Advanced Info Service PCL, NVDR
|
| 154,691
|
|
| 953,671
|
| Airports of Thailand PCL, NVDR (A)
|
| 552,167
|
|
| 1,142,737
|
| Asset World Corp. PCL, NVDR
|
| 982,586
|
|
| 122,243
|
| B. Grimm Power PCL, NVDR
|
| 117,679
|
|
| 114,277
|
| Bangkok Dusit Medical Services PCL, NVDR
|
| 1,458,155
|
|
| 1,165,566
|
| Bangkok Expressway & Metro PCL, NVDR
|
| 984,018
|
|
| 243,037
|
| Banpu PCL, NVDR
|
| 983,119
|
|
| 241,275
|
| Berli Jucker PCL, NVDR
|
| 130,520
|
|
| 125,726
|
| BTS Group Holdings PCL, NVDR
|
| 989,688
|
|
| 207,627
|
| Bumrungrad Hospital PCL, NVDR
|
| 77,479
|
|
| 572,765
|
| Carabao Group PCL, NVDR
|
| 46,148
|
|
| 113,319
|
| Central Pattana PCL, NVDR
|
| 264,086
|
|
| 518,084
|
| Central Retail Corp. PCL, NVDR
|
| 228,083
|
|
| 268,319
|
| Charoen Pokphand Foods PCL, NVDR
|
| 501,572
|
|
| 296,464
|
| CP ALL PCL, NVDR
|
| 761,840
|
|
| 1,418,628
|
| CP Axtra PCL, NVDR
|
| 269,453
|
|
| 278,699
|
| Delta Electronics Thailand PCL, NVDR
|
| 405,869
|
|
| 1,256,100
|
| Electricity Generating PCL, NVDR
|
| 31,593
|
|
| 120,319
|
| Energy Absolute PCL, NVDR
|
| 216,759
|
|
| 391,391
|
| Global Power Synergy PCL, NVDR
|
| 93,304
|
|
| 140,395
|
| Gulf Energy Development PCL, NVDR
|
| 381,716
|
|
| 523,029
|
| Home Product Center PCL, NVDR
|
| 756,378
|
|
| 295,670
|
| Indorama Ventures PCL, NVDR
|
| 224,092
|
|
| 185,463
|
| Intouch Holdings PCL, NVDR
|
| 122,286
|
|
| 253,924
|
| Kasikornbank PCL, NVDR
|
| 79,765
|
|
| 297,136
|
| Krung Thai Bank PCL, NVDR
|
| 470,756
|
|
| 259,328
|
| Krungthai Card PCL, NVDR
|
| 132,844
|
|
| 183,888
|
| Land & Houses PCL, NVDR
|
| 1,133,125
|
|
| 268,464
|
| Minor International PCL, NVDR
|
| 417,629
|
|
| 396,258
|
| Muangthai Capital PCL, NVDR
|
| 96,269
|
|
| 111,888
|
| Osotspa PCL, NVDR
|
| 179,326
|
|
| 153,577
|
| PTT Exploration & Production PCL, NVDR
|
| 181,092
|
|
| 819,845
|
| PTT Global Chemical PCL, NVDR
|
| 294,044
|
|
| 312,465
|
| PTT Oil & Retail Business PCL, NVDR
|
| 395,716
|
|
| 230,427
|
| PTT PCL, NVDR
|
| 1,306,410
|
|
| 1,296,196
|
| Ratch Group PCL, NVDR
|
| 140,894
|
|
| 142,834
|
| SCB X PCL, NVDR
|
| 110,092
|
|
| 370,775
|
| SCG Packaging PCL, NVDR
|
| 171,621
|
|
| 200,810
|
| Srisawad Corp. PCL, NVDR
|
| 95,783
|
|
| 139,345
|
| The accompanying notes are an integral part of the financial statements.
| 68
|
|
John Hancock Funds II
Portfolio of Investments —
August 31, 2023 (showing percentage of total net assets)
International Strategic Equity Allocation
Fund (continued)
|
|
| Shares or
Principal
Amount
|
| Value
|
| COMMON STOCKS (continued)
|
|
|
|
| Thailand (continued)
|
|
|
|
|
|
| Thai Oil PCL, NVDR
|
| 156,169
|
| $
| 229,687
|
| The Siam Cement PCL, NVDR
|
| 102,398
|
|
| 914,805
|
| True Corp. PCL, NVDR
|
| 1,325,613
|
|
| 260,961
|
|
|
|
|
|
| 17,537,417
|
| Turkey - 0.2%
|
|
|
|
|
|
| Akbank TAS
|
| 393,566
|
|
| 423,378
|
| Aselsan Elektronik Sanayi Ve Ticaret AS
|
| 174,098
|
|
| 250,259
|
| BIM Birlesik Magazalar AS
|
| 57,225
|
|
| 540,169
|
| Eregli Demir ve Celik Fabrikalari TAS (A)
|
| 173,784
|
|
| 279,291
|
| Ford Otomotiv Sanayi AS
|
| 8,793
|
|
| 283,706
|
| Haci Omer Sabanci Holding AS
|
| 127,866
|
|
| 285,896
|
| Hektas Ticaret TAS (A)
|
| 144,809
|
|
| 138,835
|
| KOC Holding AS
|
| 95,411
|
|
| 506,265
|
| Koza Altin Isletmeleri AS
|
| 117,391
|
|
| 124,867
|
| Pegasus Hava Tasimaciligi AS (A)
|
| 5,901
|
|
| 193,045
|
| Petkim Petrokimya Holding AS (A)
|
| 1
|
|
| 1
|
| Sasa Polyester Sanayi AS (A)
|
| 133,021
|
|
| 262,461
|
| Tofas Turk Otomobil Fabrikasi AS
|
| 15,592
|
|
| 157,353
|
| Turk Hava Yollari AO (A)
|
| 69,876
|
|
| 640,119
|
| Turkcell Iletisim Hizmetleri AS
|
| 153,351
|
|
| 319,802
|
| Turkiye Is Bankasi AS, Class C
|
| 439,566
|
|
| 346,048
|
| Turkiye Petrol Rafinerileri AS
|
| 120,275
|
|
| 634,767
|
| Turkiye Sise ve Cam Fabrikalari AS
|
| 172,704
|
|
| 330,850
|
| Yapi ve Kredi Bankasi AS
|
| 418,596
|
|
| 248,615
|
|
|
|
|
|
| 5,965,727
|
| United Arab Emirates - 0.8%
|
|
|
|
|
|
| Abu Dhabi Commercial Bank PJSC
|
| 949,798
|
|
| 2,231,635
|
| Abu Dhabi Islamic Bank PJSC
|
| 470,658
|
|
| 1,335,294
|
| Abu Dhabi National Oil Company for Distribution PJSC
|
| 1,010,124
|
|
| 1,047,559
|
| Aldar Properties PJSC
|
| 1,249,754
|
|
| 1,788,877
|
| Americana Restaurants International PLC
|
| 829,253
|
|
| 995,766
|
| Dubai Islamic Bank PJSC
|
| 946,051
|
|
| 1,452,424
|
| Emaar Properties PJSC
|
| 2,158,020
|
|
| 4,147,199
|
| Emirates NBD Bank PJSC
|
| 615,004
|
|
| 2,736,624
|
| Emirates Telecommunications Group Company PJSC
|
| 1,130,717
|
|
| 6,106,129
|
| First Abu Dhabi Bank PJSC
|
| 1,434,572
|
|
| 5,341,704
|
| Multiply Group PJSC (A)
|
| 1,285,670
|
|
| 1,332,934
|
| NMC Health PLC (A)
|
| 5,577
|
|
| 1
|
|
|
|
|
|
| 28,516,146
|
| United Kingdom - 6.9%
|
|
|
|
|
|
| 3i Group PLC
|
| 107,586
|
|
| 2,709,174
|
| abrdn PLC
|
| 223,929
|
|
| 467,133
|
| Admiral Group PLC
|
| 23,541
|
|
| 741,637
|
| Anglo American PLC
|
| 139,463
|
|
| 3,708,559
|
| Ashtead Group PLC
|
| 48,188
|
|
| 3,361,516
|
| Associated British Foods PLC
|
| 38,417
|
|
| 967,719
|
| AstraZeneca PLC
|
| 170,071
|
|
| 22,844,418
|
| Auto Trader Group PLC (B)
|
| 100,589
|
|
| 771,364
|
| Aviva PLC
|
| 311,757
|
|
| 1,479,215
|
| BAE Systems PLC
|
| 336,973
|
|
| 4,288,918
|
| Barclays PLC
|
| 1,703,394
|
|
| 3,172,845
|
| Barratt Developments PLC
|
| 107,701
|
|
| 617,394
|
| BP PLC
|
| 1,938,729
|
|
| 11,979,973
|
| British American Tobacco PLC
|
| 233,430
|
|
| 7,732,231
|
| BT Group PLC
|
| 761,528
|
|
| 1,114,050
|
| Bunzl PLC
|
| 36,915
|
|
| 1,321,893
|
| Burberry Group PLC
|
| 41,439
|
|
| 1,144,117
|
| Centrica PLC
|
| 622,850
|
|
| 1,195,478
|
| CNH Industrial NV
|
| 176,651
|
|
| 2,435,638
|
| Coca-Cola Europacific Partners PLC
|
| 28,455
|
|
| 1,824,250
|
| Compass Group PLC
|
| 191,468
|
|
| 4,828,203
|
International Strategic Equity Allocation
Fund (continued)
|
|
| Shares or
Principal
Amount
|
| Value
|
| COMMON STOCKS (continued)
|
|
|
|
| United Kingdom (continued)
|
|
|
|
|
|
| Croda International PLC
|
| 15,304
|
| $
| 1,068,801
|
| Diageo PLC
|
| 247,458
|
|
| 10,134,160
|
| Endeavour Mining PLC
|
| 19,917
|
|
| 406,724
|
| Entain PLC
|
| 70,104
|
|
| 1,025,392
|
| Ferguson PLC
|
| 30
|
|
| 4,867
|
| GSK PLC
|
| 449,339
|
|
| 7,870,604
|
| Haleon PLC
|
| 556,810
|
|
| 2,279,885
|
| Halma PLC
|
| 41,772
|
|
| 1,132,375
|
| Hargreaves Lansdown PLC
|
| 39,303
|
|
| 378,221
|
| HSBC Holdings PLC
|
| 2,193,548
|
|
| 16,182,293
|
| Imperial Brands PLC
|
| 96,521
|
|
| 2,185,391
|
| Informa PLC
|
| 152,441
|
|
| 1,408,480
|
| InterContinental Hotels Group PLC
|
| 19,114
|
|
| 1,437,668
|
| Intertek Group PLC
|
| 17,662
|
|
| 924,953
|
| J Sainsbury PLC
|
| 179,520
|
|
| 613,915
|
| JD Sports Fashion PLC
|
| 283,648
|
|
| 520,636
|
| Johnson Matthey PLC
|
| 20,056
|
|
| 413,479
|
| Kingfisher PLC
|
| 213,944
|
|
| 634,022
|
| Land Securities Group PLC
|
| 76,335
|
|
| 581,665
|
| Legal & General Group PLC
|
| 669,193
|
|
| 1,848,914
|
| Lloyds Banking Group PLC
|
| 7,280,855
|
|
| 3,889,897
|
| London Stock Exchange Group PLC
|
| 44,104
|
|
| 4,562,748
|
| M&G PLC
|
| 240,602
|
|
| 581,137
|
| Mondi PLC
|
| 53,174
|
|
| 883,265
|
| National Grid PLC
|
| 403,014
|
|
| 5,030,588
|
| NatWest Group PLC
|
| 626,982
|
|
| 1,823,317
|
| Next PLC
|
| 13,375
|
|
| 1,182,067
|
| Ocado Group PLC (A)
|
| 63,609
|
|
| 700,663
|
| Pearson PLC
|
| 70,855
|
|
| 750,973
|
| Pepco Group NV (A)
|
| 21,767
|
|
| 170,526
|
| Persimmon PLC
|
| 35,157
|
|
| 473,962
|
| Phoenix Group Holdings PLC
|
| 83,044
|
|
| 547,045
|
| Reckitt Benckiser Group PLC
|
| 78,501
|
|
| 5,665,087
|
| RELX PLC
|
| 208,734
|
|
| 6,803,642
|
| Rentokil Initial PLC
|
| 275,893
|
|
| 2,100,505
|
| Rio Tinto PLC
|
| 123,513
|
|
| 7,606,516
|
| Rolls-Royce Holdings PLC (A)
|
| 919,812
|
|
| 2,580,373
|
| Schroders PLC
|
| 93,928
|
|
| 488,642
|
| Segro PLC
|
| 132,471
|
|
| 1,234,931
|
| Severn Trent PLC
|
| 27,115
|
|
| 823,428
|
| Shell PLC
|
| 751,730
|
|
| 22,984,370
|
| Smith & Nephew PLC
|
| 95,687
|
|
| 1,291,300
|
| Smiths Group PLC
|
| 38,894
|
|
| 806,657
|
| Spirax-Sarco Engineering PLC
|
| 8,080
|
|
| 1,035,423
|
| SSE PLC
|
| 119,313
|
|
| 2,451,784
|
| St. James's Place PLC
|
| 61,321
|
|
| 685,683
|
| Standard Chartered PLC
|
| 263,272
|
|
| 2,368,848
|
| Taylor Wimpey PLC
|
| 388,876
|
|
| 562,004
|
| Tesco PLC
|
| 800,704
|
|
| 2,693,798
|
| The Berkeley Group Holdings PLC
|
| 11,903
|
|
| 611,532
|
| The British Land Company PLC
|
| 95,184
|
|
| 389,452
|
| The Sage Group PLC
|
| 112,553
|
|
| 1,383,121
|
| Unilever PLC
|
| 277,170
|
|
| 14,154,879
|
| United Utilities Group PLC
|
| 74,049
|
|
| 886,718
|
| Vodafone Group PLC
|
| 2,520,449
|
|
| 2,336,594
|
| Whitbread PLC
|
| 22,231
|
|
| 966,905
|
| Wise PLC, Class A (A)
|
| 67,395
|
|
| 545,528
|
| WPP PLC
|
| 118,040
|
|
| 1,144,210
|
|
|
|
|
|
| 234,956,288
|
| United States - 0.1%
|
|
|
|
|
|
| BeiGene, Ltd. (A)
|
| 79,438
|
|
| 1,274,337
|
| Brookfield Renewable Corp., Class A (C)
|
| 13,200
|
|
| 368,490
|
| Legend Biotech Corp., ADR (A)
|
| 6,683
|
|
| 463,533
|
| The accompanying notes are an integral part of the financial statements.
| 69
|
|
John Hancock Funds II
Portfolio of Investments —
August 31, 2023 (showing percentage of total net assets)
International Strategic Equity Allocation
Fund (continued)
|
|
| Shares or
Principal
Amount
|
| Value
|
| COMMON STOCKS (continued)
|
|
|
|
| United States (continued)
|
|
|
|
|
|
| Parade Technologies, Ltd.
|
| 9,924
|
| $
| 278,621
|
| Southern Copper Corp.
|
| 11,510
|
|
| 928,397
|
|
|
|
|
|
| 3,313,378
|
| TOTAL COMMON STOCKS (Cost $3,285,827,149)
|
| $
| 3,208,358,314
|
| PREFERRED SECURITIES - 0.9%
|
|
|
|
| Brazil - 0.4%
|
|
|
|
|
|
| Banco Bradesco SA
|
| 700,987
|
|
| 2,116,246
|
| Centrais Eletricas Brasileiras SA, B Shares
|
| 35,800
|
|
| 280,064
|
| Cia Energetica de Minas Gerais
|
| 184,594
|
|
| 459,617
|
| Gerdau SA
|
| 152,345
|
|
| 795,250
|
| Itau Unibanco Holding SA
|
| 635,000
|
|
| 3,517,341
|
| Itausa SA
|
| 670,440
|
|
| 1,250,970
|
| Petroleo Brasileiro SA
|
| 628,500
|
|
| 4,053,733
|
|
|
|
|
|
| 12,473,221
|
| Chile - 0.0%
|
|
|
|
|
|
| Sociedad Quimica y Minera de Chile SA, B Shares
|
| 18,539
|
|
| 1,148,134
|
| Colombia - 0.0%
|
|
|
|
|
|
| Bancolombia SA
|
| 60,688
|
|
| 403,548
|
| Germany - 0.4%
|
|
|
|
|
|
| Bayerische Motoren Werke AG
|
| 9,941
|
|
| 955,148
|
| Dr. Ing. h.c. F. Porsche AG (B)
|
| 19,302
|
|
| 2,128,817
|
| Henkel AG & Company KGaA
|
| 29,077
|
|
| 2,228,199
|
| Porsche Automobil Holding SE
|
| 26,004
|
|
| 1,394,779
|
| Sartorius AG
|
| 4,454
|
|
| 1,821,361
|
| Volkswagen AG
|
| 35,160
|
|
| 4,302,971
|
|
|
|
|
|
| 12,831,275
|
| South Korea - 0.1%
|
|
|
|
|
|
| Hyundai Motor Company
|
| 3,063
|
|
| 235,725
|
| Hyundai Motor Company, 2nd Preferred
|
| 4,698
|
|
| 369,710
|
| LG Chem, Ltd.
|
| 1,017
|
|
| 262,479
|
| Samsung Electronics Company, Ltd.
|
| 107,617
|
|
| 4,392,921
|
|
|
|
|
|
| 5,260,835
|
| TOTAL PREFERRED SECURITIES (Cost $35,945,239)
|
| $
| 32,117,013
|
| WARRANTS - 0.0%
|
|
|
|
|
|
| BTS Group Holdings PCL (Expiration Date: 11-20-26; Strike Price: THB 14.90) (A)
|
| 100,920
|
|
| 490
|
| BTS Group Holdings PCL (Expiration Date: 11-7-24; Strike Price: THB 11.90) (A)
|
| 50,460
|
|
| 217
|
| Cie Financiere Richemont SA (Expiration Date: 11-22-23; Strike Price: CHF 67.00) (A)
|
| 72,322
|
|
| 69,182
|
| Constellation Software, Inc. (Expiration Date: 3-31-40) (A)(D)(E)
|
| 2,017
|
|
| 0
|
| Minor International PCL (Expiration Date: 2-15-24; Strike Price: THB 31.00) (A)
|
| 5,503
|
|
| 462
|
| Srisawad Corp. PCL (Expiration Date: 8-29-25; Strike Price: THB 100.00) (A)
|
| 2,652
|
|
| 207
|
| TOTAL WARRANTS (Cost $0)
|
| $
| 70,558
|
| RIGHTS - 0.0%
|
|
|
|
|
|
| Alstom SA (Expiration Date: 9-7-23; Strike Price: EUR 23.75) (A)(C)
|
| 45,028
|
|
| 12,207
|
| Constellation Software, Inc. (Expiration Date: 10-2-23; Strike Price: CAD 133.00) (A)
|
| 2,017
|
|
| 1,120
|
International Strategic Equity Allocation
Fund (continued)
|
|
| Shares or
Principal
Amount
|
| Value
|
| RIGHTS (continued)
|
|
|
|
|
|
| Itausa SA (Expiration Date: 9-25-23; Strike Price: BRL 6.50) (A)
|
| 12,018
|
| $
| 6,722
|
| SK Innovation Company, Ltd. (Expiration Date: 9-7-23; Strike Price: KRW 158,900.00) (A)
|
| 535
|
|
| 15,320
|
| Swedish Orphan Biovitrum AB (Expiration Date: 9-15-23; Strike Price: SEK
142.00) (A)(C)
|
| 8,391
|
|
| 7,580
|
| TOTAL RIGHTS (Cost $12,452)
|
| $
| 42,949
|
| SHORT-TERM INVESTMENTS - 4.9%
|
|
|
|
| U.S. Government - 1.5%
|
|
|
|
|
|
U.S. Treasury Bill
5.270%, 09/19/2023 *
| $
| 50,000,000
|
|
| 49,868,125
|
| U.S. Government Agency - 2.7%
|
|
|
|
|
|
Federal Home Loan Bank Discount Note
5.170%, 09/01/2023 *
|
| 41,200,000
|
|
| 41,200,000
|
Tennessee Valley Authority Discount Note
5.245%, 09/06/2023 *
|
| 50,000,000
|
|
| 49,964,512
|
|
|
|
|
|
| 91,164,512
|
| Short-term funds - 0.7%
|
|
|
|
|
|
| John Hancock Collateral Trust, 5.4789% (F)(G)
|
| 2,522,734
|
|
| 25,218,768
|
| TOTAL SHORT-TERM INVESTMENTS (Cost $166,245,896)
|
| $
| 166,251,405
|
Total Investments (International Strategic Equity Allocation Fund)
(Cost $3,488,030,736) - 100.1%
|
| $
| 3,406,840,239
|
| Other assets and liabilities, net - (0.1%)
|
|
| (4,544,970)
|
| TOTAL NET ASSETS - 100.0%
|
| $
| 3,402,295,269
|
| Currency Abbreviations
|
| BRL
| Brazilian Real
|
| CAD
| Canadian Dollar
|
| CHF
| Swiss Franc
|
| EUR
| Euro
|
| KRW
| Korean Won
|
| SEK
| Swedish Krona
|
| THB
| Thai Bhat
|
| Security Abbreviations and Legend
|
| ADR
| American Depositary Receipt
|
| NVDR
| Non-Voting Depositary Receipt
|
| (A)
| Non-income producing security.
|
| (B)
| These securities are exempt from registration under Rule 144A of the Securities Act of 1933. Such securities may be resold, normally to qualified institutional buyers, in transactions
exempt from registration.
|
| (C)
| All or a portion of this security is on loan as of 8-31-23.
|
| (D)
| Security is valued using significant unobservable inputs and is classified as Level 3 in the fair value hierarchy. Refer to Note 2 to the financial statements.
|
| (E)
| Strike price and/or expiration date not available.
|
| (F)
| The rate shown is the annualized seven-day yield as of 8-31-23.
|
| (G)
| Investment is an affiliate of the fund, the advisor and/or subadvisor. This security represents the investment of cash collateral received for securities lending.
|
| *
| Yield represents either the annualized yield at the date of purchase, the stated coupon rate or, for floating rate securities, the rate at period end.
|
| The accompanying notes are an integral part of the financial statements.
| 70
|
|
John Hancock Funds II
Portfolio of Investments —
August 31, 2023 (showing percentage of total net assets)
International Strategic Equity Allocation
Fund (continued)
DERIVATIVES
FUTURES
| Open contracts
| Number of
contracts
| Position
| Expiration
date
| Notional
basis^
| Notional
value^
| Unrealized
appreciation
(depreciation)
|
| Canadian Dollar Currency Futures
| 112
| Long
| Sep 2023
| $8,340,109
| $8,289,120
| $(50,989)
|
| Mini MSCI EAFE Index Futures
| 1,010
| Long
| Sep 2023
| 105,902,771
| 106,499,450
| 596,679
|
| Mini MSCI Emerging Markets Index Futures
| 856
| Long
| Sep 2023
| 41,700,577
| 41,896,920
| 196,343
|
| S&P/TSX 60 Index Futures
| 47
| Long
| Sep 2023
| 8,304,865
| 8,460,139
| 155,274
|
|
|
|
|
|
|
| $897,307
|
^ Notional basis refers to
the contractual amount agreed upon at inception of open contracts; notional value represents the current value of the open contract.
See Notes to financial
statements regarding investment transactions and other derivatives information.
Mid Value Fund
|
|
| Shares or
Principal
Amount
|
| Value
|
| COMMON STOCKS – 96.9%
|
|
|
|
| Communication services – 4.0%
|
|
|
|
|
|
| Entertainment – 0.5%
|
|
|
|
| Madison Square Garden Entertainment Corp. (A)
|
| 123,996
|
| $
| 3,979,032
|
| Sphere Entertainment Company (A)
|
| 104,296
|
|
| 3,656,618
|
|
|
|
|
|
| 7,635,650
|
| Media – 3.5%
|
|
|
|
| DISH Network Corp., Class A (A)
|
| 321,841
|
|
| 1,931,046
|
| News Corp., Class A
|
| 1,379,234
|
|
| 29,639,739
|
| News Corp., Class B
|
| 124,876
|
|
| 2,747,272
|
| Paramount Global, Class B (B)
|
| 399,638
|
|
| 6,030,537
|
| Scholastic Corp.
|
| 220,695
|
|
| 9,589,198
|
|
|
|
|
|
| 49,937,792
|
|
|
|
|
|
| 57,573,442
|
| Consumer discretionary – 7.4%
|
|
|
|
|
|
| Automobiles – 1.2%
|
|
|
|
| General Motors Company
|
| 503,474
|
|
| 16,871,414
|
| Diversified consumer services – 1.1%
|
|
|
|
| Bright Horizons Family Solutions, Inc. (A)
|
| 169,247
|
|
| 15,980,302
|
| Hotels, restaurants and leisure – 0.8%
|
|
|
|
| Compass Group PLC
|
| 437,288
|
|
| 11,026,965
|
| Specialty retail – 3.1%
|
|
|
|
| Advance Auto Parts, Inc.
|
| 161,800
|
|
| 11,135,076
|
| Bath & Body Works, Inc.
|
| 363,624
|
|
| 13,406,817
|
| Best Buy Company, Inc.
|
| 137,662
|
|
| 10,524,260
|
| Burlington Stores, Inc. (A)
|
| 60,696
|
|
| 9,848,533
|
|
|
|
|
|
| 44,914,686
|
| Textiles, apparel and luxury goods – 1.2%
|
|
|
|
| Ralph Lauren Corp.
|
| 145,252
|
|
| 16,940,741
|
|
|
|
|
|
| 105,734,108
|
| Consumer staples – 7.5%
|
|
|
|
|
|
| Beverages – 1.9%
|
|
|
|
| Constellation Brands, Inc., Class A
|
| 74,072
|
|
| 19,300,200
|
| Monster Beverage Corp. (A)
|
| 129,276
|
|
| 7,421,735
|
|
|
|
|
|
| 26,721,935
|
| Consumer staples distribution and retail – 1.9%
|
|
|
|
| Dollar General Corp.
|
| 97,500
|
|
| 13,503,750
|
| Sysco Corp.
|
| 193,560
|
|
| 13,481,454
|
|
|
|
|
|
| 26,985,204
|
| Food products – 3.0%
|
|
|
|
| Bunge, Ltd.
|
| 95,046
|
|
| 10,865,659
|
| Flowers Foods, Inc.
|
| 699,279
|
|
| 16,475,013
|
Mid Value Fund (continued)
|
|
| Shares or
Principal
Amount
|
| Value
|
| COMMON STOCKS (continued)
|
|
|
|
| Food products (continued)
|
|
|
|
| Tyson Foods, Inc., Class A
|
| 309,557
|
| $
| 16,490,101
|
|
|
|
|
|
| 43,830,773
|
| Personal care products – 0.7%
|
|
|
|
| Kenvue, Inc.
|
| 460,500
|
|
| 10,614,525
|
|
|
|
|
|
| 108,152,437
|
| Energy – 6.9%
|
|
|
|
|
|
| Energy equipment and services – 5.2%
|
|
|
|
| Baker Hughes Company
|
| 314,300
|
|
| 11,374,517
|
| Expro Group Holdings NV (A)
|
| 393,423
|
|
| 9,249,375
|
| SEACOR Marine Holdings, Inc. (A)(B)
|
| 317,873
|
|
| 3,652,361
|
| TechnipFMC PLC
|
| 1,407,076
|
|
| 26,790,727
|
| Tidewater, Inc. (A)(B)
|
| 355,627
|
|
| 23,126,424
|
|
|
|
|
|
| 74,193,404
|
| Oil, gas and consumable fuels – 1.7%
|
|
|
|
| Cameco Corp.
|
| 312,651
|
|
| 11,568,087
|
| Suncor Energy, Inc. (B)
|
| 396,885
|
|
| 13,446,464
|
|
|
|
|
|
| 25,014,551
|
|
|
|
|
|
| 99,207,955
|
| Financials – 15.5%
|
|
|
|
|
|
| Banks – 4.6%
|
|
|
|
| Fifth Third Bancorp
|
| 858,700
|
|
| 22,798,485
|
| Popular, Inc.
|
| 274,053
|
|
| 18,712,339
|
| Webster Financial Corp.
|
| 345,770
|
|
| 14,664,106
|
| Western Alliance Bancorp
|
| 190,800
|
|
| 9,541,908
|
|
|
|
|
|
| 65,716,838
|
| Capital markets – 1.6%
|
|
|
|
| Main Street Capital Corp. (B)
|
| 217,141
|
|
| 8,759,468
|
| Morningstar, Inc.
|
| 40,600
|
|
| 9,446,402
|
| Open Lending Corp. (A)
|
| 666,800
|
|
| 5,501,100
|
|
|
|
|
|
| 23,706,970
|
| Consumer finance – 0.8%
|
|
|
|
| OneMain Holdings, Inc.
|
| 260,953
|
|
| 10,832,159
|
| Financial services – 5.5%
|
|
|
|
| Apollo Global Management, Inc.
|
| 193,293
|
|
| 16,882,211
|
| Corebridge Financial, Inc.
|
| 385,306
|
|
| 6,870,006
|
| FleetCor Technologies, Inc. (A)
|
| 84,148
|
|
| 22,865,536
|
| Global Payments, Inc.
|
| 175,023
|
|
| 22,173,664
|
| Jackson Financial, Inc., Class A (B)
|
| 259,630
|
|
| 9,762,088
|
|
|
|
|
|
| 78,553,505
|
| Insurance – 3.0%
|
|
|
|
| Assurant, Inc.
|
| 63,366
|
|
| 8,828,785
|
| Kemper Corp.
|
| 263,992
|
|
| 12,399,704
|
| RenaissanceRe Holdings, Ltd.
|
| 71,040
|
|
| 13,347,706
|
| The accompanying notes are an integral part of the financial statements.
| 71
|
|
John Hancock Funds II
Portfolio of Investments —
August 31, 2023 (showing percentage of total net assets)
Mid Value Fund (continued)
|
|
| Shares or
Principal
Amount
|
| Value
|
| COMMON STOCKS (continued)
|
|
|
|
| Insurance (continued)
|
|
|
|
| The Allstate Corp.
|
| 85,700
|
| $
| 9,239,317
|
|
|
|
|
|
| 43,815,512
|
|
|
|
|
|
| 222,624,984
|
| Health care – 10.1%
|
|
|
|
|
|
| Health care equipment and supplies – 3.8%
|
|
|
|
| Baxter International, Inc.
|
| 418,974
|
|
| 17,010,344
|
| Dentsply Sirona, Inc.
|
| 293,612
|
|
| 10,890,069
|
| Koninklijke Philips NV (A)
|
| 416,556
|
|
| 9,360,672
|
| Teleflex, Inc.
|
| 34,000
|
|
| 7,233,160
|
| Zimmer Biomet Holdings, Inc.
|
| 82,249
|
|
| 9,797,501
|
|
|
|
|
|
| 54,291,746
|
| Health care providers and services – 3.3%
|
|
|
|
| Cardinal Health, Inc.
|
| 97,035
|
|
| 8,474,067
|
| Centene Corp. (A)
|
| 136,917
|
|
| 8,440,933
|
| Select Medical Holdings Corp.
|
| 1,047,336
|
|
| 30,592,685
|
|
|
|
|
|
| 47,507,685
|
| Life sciences tools and services – 1.2%
|
|
|
|
| Charles River Laboratories International, Inc. (A)
|
| 82,149
|
|
| 16,990,056
|
| Pharmaceuticals – 1.8%
|
|
|
|
| Catalent, Inc. (A)
|
| 235,400
|
|
| 11,762,938
|
| Elanco Animal Health, Inc. (A)
|
| 445,280
|
|
| 5,432,416
|
| Viatris, Inc.
|
| 835,467
|
|
| 8,981,270
|
|
|
|
|
|
| 26,176,624
|
|
|
|
|
|
| 144,966,111
|
| Industrials – 16.9%
|
|
|
|
|
|
| Aerospace and defense – 5.2%
|
|
|
|
| Huntington Ingalls Industries, Inc.
|
| 48,575
|
|
| 10,702,044
|
| L3Harris Technologies, Inc.
|
| 64,000
|
|
| 11,397,760
|
| Rolls-Royce Holdings PLC (A)
|
| 6,057,353
|
|
| 16,992,811
|
| Spirit AeroSystems Holdings, Inc., Class A (B)
|
| 684,244
|
|
| 14,588,082
|
| Textron, Inc.
|
| 265,561
|
|
| 20,636,745
|
|
|
|
|
|
| 74,317,442
|
| Building products – 1.2%
|
|
|
|
| Armstrong World Industries, Inc.
|
| 36,800
|
|
| 2,818,512
|
| Fortune Brands Innovations, Inc.
|
| 74,303
|
|
| 5,128,393
|
| Trane Technologies PLC
|
| 48,189
|
|
| 9,891,274
|
|
|
|
|
|
| 17,838,179
|
| Ground transportation – 2.1%
|
|
|
|
| JB Hunt Transport Services, Inc.
|
| 92,140
|
|
| 17,311,263
|
| Norfolk Southern Corp.
|
| 66,822
|
|
| 13,699,178
|
|
|
|
|
|
| 31,010,441
|
| Machinery – 5.2%
|
|
|
|
| Alstom SA (B)
|
| 355,453
|
|
| 9,802,121
|
| Esab Corp.
|
| 147,763
|
|
| 10,664,056
|
| PACCAR, Inc.
|
| 102,114
|
|
| 8,402,961
|
| Stanley Black & Decker, Inc.
|
| 349,633
|
|
| 32,998,363
|
| The Middleby Corp. (A)
|
| 86,771
|
|
| 12,632,990
|
|
|
|
|
|
| 74,500,491
|
| Passenger airlines – 1.2%
|
|
|
|
| Southwest Airlines Company
|
| 547,976
|
|
| 17,316,042
|
| Professional services – 1.3%
|
|
|
|
| SS&C Technologies Holdings, Inc.
|
| 213,300
|
|
| 12,247,686
|
| Verra Mobility Corp. (A)
|
| 338,342
|
|
| 6,019,104
|
|
|
|
|
|
| 18,266,790
|
| Trading companies and distributors – 0.7%
|
|
|
|
| Ashtead Group PLC
|
| 142,551
|
|
| 9,944,110
|
|
|
|
|
|
| 243,193,495
|
Mid Value Fund (continued)
|
|
| Shares or
Principal
Amount
|
| Value
|
| COMMON STOCKS (continued)
|
|
|
|
| Information technology – 10.3%
|
|
|
|
|
|
| Communications equipment – 0.6%
|
|
|
|
| Arista Networks, Inc. (A)
|
| 43,587
|
| $
| 8,509,490
|
| Electronic equipment, instruments and components – 2.8%
|
|
|
|
| Corning, Inc.
|
| 673,801
|
|
| 22,114,149
|
| TE Connectivity, Ltd.
|
| 82,052
|
|
| 10,862,864
|
| Zebra Technologies Corp., Class A (A)
|
| 26,100
|
|
| 7,177,761
|
|
|
|
|
|
| 40,154,774
|
| Semiconductors and semiconductor equipment – 3.3%
|
|
|
|
| Marvell Technology, Inc.
|
| 360,489
|
|
| 20,998,484
|
| MKS Instruments, Inc.
|
| 271,568
|
|
| 27,219,261
|
|
|
|
|
|
| 48,217,745
|
| Technology hardware, storage and peripherals – 3.6%
|
|
|
|
| Pure Storage, Inc., Class A (A)
|
| 290,960
|
|
| 10,646,226
|
| Western Digital Corp. (A)
|
| 903,947
|
|
| 40,677,611
|
|
|
|
|
|
| 51,323,837
|
|
|
|
|
|
| 148,205,846
|
| Materials – 5.6%
|
|
|
|
|
|
| Chemicals – 0.8%
|
|
|
|
| FMC Corp.
|
| 44,700
|
|
| 3,854,481
|
| The Scotts Miracle-Gro Company (B)
|
| 132,107
|
|
| 7,485,183
|
|
|
|
|
|
| 11,339,664
|
| Construction materials – 1.5%
|
|
|
|
| Summit Materials, Inc., Class A (A)
|
| 283,774
|
|
| 10,615,985
|
| Vulcan Materials Company
|
| 47,597
|
|
| 10,388,045
|
|
|
|
|
|
| 21,004,030
|
| Containers and packaging – 2.1%
|
|
|
|
| Ball Corp.
|
| 244,059
|
|
| 13,289,013
|
| Westrock Company
|
| 528,780
|
|
| 17,296,394
|
|
|
|
|
|
| 30,585,407
|
| Metals and mining – 1.2%
|
|
|
|
| Franco-Nevada Corp.
|
| 78,063
|
|
| 11,246,110
|
| Freeport-McMoRan, Inc.
|
| 157,236
|
|
| 6,275,289
|
|
|
|
|
|
| 17,521,399
|
|
|
|
|
|
| 80,450,500
|
| Real estate – 6.3%
|
|
|
|
|
|
| Industrial REITs – 1.1%
|
|
|
|
| Rexford Industrial Realty, Inc.
|
| 305,759
|
|
| 16,348,934
|
| Office REITs – 0.7%
|
|
|
|
| Douglas Emmett, Inc.
|
| 196,228
|
|
| 2,682,437
|
| Vornado Realty Trust
|
| 322,669
|
|
| 7,750,509
|
|
|
|
|
|
| 10,432,946
|
| Residential REITs – 1.5%
|
|
|
|
| Apartment Investment and Management Company, Class A
|
| 1,033,393
|
|
| 7,864,121
|
| Equity Residential
|
| 200,213
|
|
| 12,979,809
|
|
|
|
|
|
| 20,843,930
|
| Retail REITs – 1.1%
|
|
|
|
| Regency Centers Corp.
|
| 190,299
|
|
| 11,836,598
|
| Simon Property Group, Inc.
|
| 31,900
|
|
| 3,620,331
|
|
|
|
|
|
| 15,456,929
|
| Specialized REITs – 1.9%
|
|
|
|
| Digital Realty Trust, Inc.
|
| 59,413
|
|
| 7,825,880
|
| Rayonier, Inc.
|
| 340,495
|
|
| 10,180,801
|
| Weyerhaeuser Company
|
| 286,788
|
|
| 9,392,307
|
|
|
|
|
|
| 27,398,988
|
|
|
|
|
|
| 90,481,727
|
| Utilities – 6.4%
|
|
|
|
|
|
| Electric utilities – 4.5%
|
|
|
|
| Constellation Energy Corp.
|
| 125,000
|
|
| 13,020,000
|
| The accompanying notes are an integral part of the financial statements.
| 72
|
|
John Hancock Funds II
Portfolio of Investments —
August 31, 2023 (showing percentage of total net assets)
Mid Value Fund (continued)
|
|
| Shares or
Principal
Amount
|
| Value
|
| COMMON STOCKS (continued)
|
|
|
|
| Electric utilities (continued)
|
|
|
|
| Evergy, Inc.
|
| 223,934
|
| $
| 12,309,652
|
| FirstEnergy Corp.
|
| 683,918
|
|
| 24,668,922
|
| PG&E Corp. (A)
|
| 874,923
|
|
| 14,261,245
|
|
|
|
|
|
| 64,259,819
|
| Multi-utilities – 1.9%
|
|
|
|
| Ameren Corp.
|
| 216,301
|
|
| 17,146,180
|
| CenterPoint Energy, Inc.
|
| 392,643
|
|
| 10,950,813
|
|
|
|
|
|
| 28,096,993
|
|
|
|
|
|
| 92,356,812
|
| TOTAL COMMON STOCKS (Cost $1,139,065,977)
|
| $
| 1,392,947,417
|
| SHORT-TERM INVESTMENTS – 4.4%
|
|
|
|
| Short-term funds – 4.4%
|
|
|
|
|
|
| John Hancock Collateral Trust, 5.4789% (C)(D)
|
| 1,995,190
|
|
| 19,945,112
|
| State Street Institutional U.S. Government Money Market Fund, Premier Class, 5.2681% (C)
|
| 2,013,254
|
|
| 2,013,254
|
| T. Rowe Price Government Reserve Fund, 5.3678% (C)
|
| 41,696,332
|
|
| 41,696,332
|
| TOTAL SHORT-TERM INVESTMENTS (Cost $63,645,648)
|
| $
| 63,654,698
|
Total Investments (Mid Value Fund)
(Cost $1,202,711,625) – 101.3%
|
| $
| 1,456,602,115
|
| Other assets and liabilities, net – (1.3%)
|
|
| (18,769,392)
|
| TOTAL NET ASSETS – 100.0%
|
| $
| 1,437,832,723
|
| Security Abbreviations and Legend
|
| (A)
| Non-income producing security.
|
| (B)
| All or a portion of this security is on loan as of 8-31-23.
|
| (C)
| The rate shown is the annualized seven-day yield as of 8-31-23.
|
| (D)
| Investment is an affiliate of the fund, the advisor and/or subadvisor. This security represents the investment of cash collateral received for securities lending.
|
Science & Technology
Fund
|
|
| Shares or
Principal
Amount
|
| Value
|
| COMMON STOCKS – 95.4%
|
|
|
|
| Communication services – 14.5%
|
|
|
|
|
|
| Interactive media and services – 14.0%
|
|
|
|
| Alphabet, Inc., Class A (A)
|
| 123,028
|
| $
| 16,752,723
|
| Baidu, Inc., ADR (A)
|
| 23,968
|
|
| 3,423,349
|
| Kanzhun, Ltd., ADR (A)
|
| 29,287
|
|
| 433,448
|
| Match Group, Inc. (A)
|
| 18,271
|
|
| 856,362
|
| Meta Platforms, Inc., Class A (A)
|
| 14,203
|
|
| 4,202,526
|
| Pinterest, Inc., Class A (A)
|
| 100,197
|
|
| 2,754,416
|
|
|
|
|
|
| 28,422,824
|
| Wireless telecommunication services – 0.5%
|
|
|
|
| T-Mobile US, Inc. (A)
|
| 7,753
|
|
| 1,056,346
|
|
|
|
|
|
| 29,479,170
|
| Consumer discretionary – 20.3%
|
|
|
|
|
|
| Automobiles – 0.2%
|
|
|
|
| Rivian Automotive, Inc., Class A (A)
|
| 11,934
|
|
| 271,260
|
| Broadline retail – 11.2%
|
|
|
|
| Alibaba Group Holding, Ltd., ADR (A)
|
| 47,227
|
|
| 4,387,388
|
| Amazon.com, Inc. (A)
|
| 76,587
|
|
| 10,569,772
|
| Coupang, Inc. (A)
|
| 29,559
|
|
| 561,030
|
| D-Market Elektronik Hizmetler ve Ticaret AS, ADR (A)
|
| 8,845
|
|
| 12,825
|
Science & Technology Fund
(continued)
|
|
| Shares or
Principal
Amount
|
| Value
|
| COMMON STOCKS (continued)
|
|
|
|
| Broadline retail (continued)
|
|
|
|
| Etsy, Inc. (A)
|
| 54,018
|
| $
| 3,974,104
|
| JD.com, Inc., ADR
|
| 25,850
|
|
| 858,479
|
| MercadoLibre, Inc. (A)
|
| 976
|
|
| 1,339,423
|
| Prosus NV (A)
|
| 17,001
|
|
| 1,172,634
|
|
|
|
|
|
| 22,875,655
|
| Hotels, restaurants and leisure – 4.5%
|
|
|
|
| Booking Holdings, Inc. (A)
|
| 1,426
|
|
| 4,427,773
|
| Deliveroo PLC (A)(B)
|
| 580,762
|
|
| 831,440
|
| Delivery Hero SE (A)(B)
|
| 61,533
|
|
| 2,244,576
|
| DoorDash, Inc., Class A (A)
|
| 11,615
|
|
| 977,170
|
| Tongcheng Travel Holdings, Ltd. (A)
|
| 327,600
|
|
| 734,170
|
|
|
|
|
|
| 9,215,129
|
| Specialty retail – 4.4%
|
|
|
|
| Auto1 Group SE (A)(B)
|
| 113,961
|
|
| 954,577
|
| Warby Parker, Inc., Class A (A)
|
| 29,913
|
|
| 359,255
|
| Zalando SE (A)(B)
|
| 247,878
|
|
| 7,705,413
|
|
|
|
|
|
| 9,019,245
|
|
|
|
|
|
| 41,381,289
|
| Financials – 5.6%
|
|
|
|
|
|
| Financial services – 5.6%
|
|
|
|
| Mastercard, Inc., Class A
|
| 20,255
|
|
| 8,358,023
|
| Visa, Inc., Class A
|
| 12,409
|
|
| 3,048,643
|
|
|
|
|
|
| 11,406,666
|
| Health care – 0.2%
|
|
|
|
|
|
| Health care technology – 0.2%
|
|
|
|
| Veeva Systems, Inc., Class A (A)
|
| 2,240
|
|
| 467,488
|
| Industrials – 0.7%
|
|
|
|
|
|
| Ground transportation – 0.7%
|
|
|
|
| Uber Technologies, Inc. (A)
|
| 30,154
|
|
| 1,424,173
|
| Information technology – 53.7%
|
|
|
|
|
|
| Communications equipment – 0.4%
|
|
|
|
| Arista Networks, Inc. (A)
|
| 3,621
|
|
| 706,928
|
| IT services – 3.6%
|
|
|
|
| Accenture PLC, Class A
|
| 22,785
|
|
| 7,377,099
|
| Semiconductors and semiconductor equipment – 19.6%
|
|
|
|
| Advanced Micro Devices, Inc. (A)
|
| 45,300
|
|
| 4,789,116
|
| ASML Holding NV, NYRS
|
| 730
|
|
| 482,187
|
| KLA Corp.
|
| 6,330
|
|
| 3,176,837
|
| Lam Research Corp.
|
| 4,436
|
|
| 3,115,846
|
| Micron Technology, Inc.
|
| 16,818
|
|
| 1,176,251
|
| NVIDIA Corp.
|
| 19,967
|
|
| 9,854,713
|
| Qualcomm, Inc.
|
| 64,811
|
|
| 7,422,804
|
| Silergy Corp.
|
| 124,000
|
|
| 1,108,553
|
| Taiwan Semiconductor Manufacturing Company, Ltd.
|
| 176,000
|
|
| 3,024,199
|
| Texas Instruments, Inc.
|
| 34,596
|
|
| 5,814,204
|
|
|
|
|
|
| 39,964,710
|
| Software – 25.1%
|
|
|
|
| Adobe, Inc. (A)
|
| 3,932
|
|
| 2,199,325
|
| DocuSign, Inc. (A)
|
| 92,390
|
|
| 4,647,217
|
| Fortinet, Inc. (A)
|
| 34,935
|
|
| 2,103,436
|
| Gen Digital, Inc.
|
| 90,429
|
|
| 1,831,187
|
| Intuit, Inc.
|
| 7,904
|
|
| 4,282,466
|
| Microsoft Corp.
|
| 64,288
|
|
| 21,071,035
|
| Salesforce, Inc. (A)
|
| 47,252
|
|
| 10,464,428
|
| TeamViewer SE (A)(B)
|
| 50,833
|
|
| 942,107
|
| Workday, Inc., Class A (A)
|
| 8,471
|
|
| 2,071,160
|
| The accompanying notes are an integral part of the financial statements.
| 73
|
|
John Hancock Funds II
Portfolio of Investments —
August 31, 2023 (showing percentage of total net assets)
Science & Technology Fund
(continued)
|
|
| Shares or
Principal
Amount
|
| Value
|
| COMMON STOCKS (continued)
|
|
|
|
| Software (continued)
|
|
|
|
| Zoom Video Communications, Inc., Class A (A)
|
| 20,934
|
| $
| 1,486,942
|
|
|
|
|
|
| 51,099,303
|
| Technology hardware, storage and peripherals – 5.0%
|
|
|
|
| Pure Storage, Inc., Class A (A)
|
| 100,991
|
|
| 3,695,261
|
| Samsung Electronics Company, Ltd.
|
| 93,483
|
|
| 4,728,019
|
| Western Digital Corp. (A)
|
| 40,813
|
|
| 1,836,585
|
|
|
|
|
|
| 10,259,865
|
|
|
|
|
|
| 109,407,905
|
| Real estate – 0.4%
|
|
|
|
|
|
| Real estate management and development – 0.4%
|
|
|
|
| KE Holdings, Inc., ADR (A)
|
| 41,653
|
|
| 716,432
|
| TOTAL COMMON STOCKS (Cost $166,093,110)
|
| $
| 194,283,123
|
| SHORT-TERM INVESTMENTS – 5.3%
|
|
|
|
| Short-term funds – 5.3%
|
|
|
|
|
|
| State Street Institutional U.S. Government Money Market Fund, Premier Class, 5.2681% (C)
|
| 2,426,713
|
|
| 2,426,713
|
| T. Rowe Price Government Reserve Fund, 5.3678% (C)
|
| 8,457,855
|
|
| 8,457,855
|
| TOTAL SHORT-TERM INVESTMENTS (Cost $10,884,568)
|
| $
| 10,884,568
|
Total Investments (Science & Technology Fund)
(Cost $176,977,678) – 100.7%
|
| $
| 205,167,691
|
| Other assets and liabilities, net – (0.7%)
|
|
| (1,411,051)
|
| TOTAL NET ASSETS – 100.0%
|
| $
| 203,756,640
|
| Security Abbreviations and Legend
|
| ADR
| American Depositary Receipt
|
| NYRS
| New York Registry Shares
|
| (A)
| Non-income producing security.
|
| (B)
| These securities are exempt from registration under Rule 144A of the Securities Act of 1933. Such securities may be resold, normally to qualified institutional buyers, in transactions
exempt from registration.
|
| (C)
| The rate shown is the annualized seven-day yield as of 8-31-23.
|
U.S. Sector Rotation
Fund
|
|
| Shares or
Principal
Amount
|
| Value
|
| COMMON STOCKS – 97.6%
|
|
|
|
| Communication services – 9.8%
|
|
|
|
|
|
| Diversified telecommunication services – 0.8%
|
|
|
|
| AT&T, Inc.
|
| 657,104
|
| $
| 9,718,568
|
| Verizon Communications, Inc.
|
| 392,138
|
|
| 13,716,987
|
|
|
|
|
|
| 23,435,555
|
| Entertainment – 1.5%
|
|
|
|
| Activision Blizzard, Inc.
|
| 69,747
|
|
| 6,416,027
|
| Electronic Arts, Inc.
|
| 23,559
|
|
| 2,826,609
|
| Live Nation Entertainment, Inc. (A)
|
| 12,662
|
|
| 1,070,319
|
| Netflix, Inc. (A)
|
| 41,751
|
|
| 18,106,574
|
| Take-Two Interactive Software, Inc. (A)
|
| 15,050
|
|
| 2,140,110
|
| The Walt Disney Company (A)
|
| 177,281
|
|
| 14,834,874
|
| Warner Brothers Discovery, Inc. (A)
|
| 220,884
|
|
| 2,902,416
|
|
|
|
|
|
| 48,296,929
|
| Interactive media and services – 6.4%
|
|
|
|
| Alphabet, Inc., Class A (A)
|
| 558,539
|
|
| 76,056,256
|
| Alphabet, Inc., Class C (A)
|
| 480,924
|
|
| 66,054,911
|
| Match Group, Inc. (A)
|
| 23,758
|
|
| 1,113,537
|
U.S. Sector Rotation Fund (continued)
|
|
| Shares or
Principal
Amount
|
| Value
|
| COMMON STOCKS (continued)
|
|
|
|
| Interactive media and services (continued)
|
|
|
|
| Meta Platforms, Inc., Class A (A)
|
| 207,952
|
| $
| 61,530,917
|
|
|
|
|
|
| 204,755,621
|
| Media – 0.9%
|
|
|
|
| Charter Communications, Inc., Class A (A)
|
| 9,575
|
|
| 4,194,999
|
| Comcast Corp., Class A
|
| 397,790
|
|
| 18,600,660
|
| Fox Corp., Class A
|
| 21,567
|
|
| 713,005
|
| Fox Corp., Class B
|
| 11,632
|
|
| 355,009
|
| News Corp., Class A
|
| 33,578
|
|
| 721,591
|
| News Corp., Class B
|
| 16,455
|
|
| 362,010
|
| Omnicom Group, Inc.
|
| 17,650
|
|
| 1,429,827
|
| Paramount Global, Class B (B)
|
| 47,954
|
|
| 723,626
|
| The Interpublic Group of Companies, Inc.
|
| 32,630
|
|
| 1,064,064
|
|
|
|
|
|
| 28,164,791
|
| Wireless telecommunication services – 0.2%
|
|
|
|
| T-Mobile US, Inc. (A)
|
| 55,018
|
|
| 7,496,203
|
|
|
|
|
|
| 312,149,099
|
| Consumer discretionary – 11.3%
|
|
|
|
|
|
| Automobile components – 0.1%
|
|
|
|
| Aptiv PLC (A)
|
| 23,608
|
|
| 2,395,032
|
| BorgWarner, Inc.
|
| 25,081
|
|
| 1,022,051
|
|
|
|
|
|
| 3,417,083
|
| Automobiles – 2.2%
|
|
|
|
| Ford Motor Company
|
| 365,964
|
|
| 4,439,143
|
| General Motors Company
|
| 121,745
|
|
| 4,079,675
|
| Tesla, Inc. (A)
|
| 232,195
|
|
| 59,924,886
|
|
|
|
|
|
| 68,443,704
|
| Broadline retail – 3.6%
|
|
|
|
| Amazon.com, Inc. (A)
|
| 808,954
|
|
| 111,643,742
|
| eBay, Inc.
|
| 45,545
|
|
| 2,039,505
|
| Etsy, Inc. (A)
|
| 9,134
|
|
| 671,988
|
|
|
|
|
|
| 114,355,235
|
| Distributors – 0.1%
|
|
|
|
| Genuine Parts Company
|
| 13,116
|
|
| 2,016,323
|
| LKQ Corp.
|
| 25,696
|
|
| 1,349,811
|
| Pool Corp.
|
| 3,694
|
|
| 1,350,526
|
|
|
|
|
|
| 4,716,660
|
| Hotels, restaurants and leisure – 2.2%
|
|
|
|
| Booking Holdings, Inc. (A)
|
| 3,384
|
|
| 10,507,422
|
| Caesars Entertainment, Inc. (A)
|
| 19,080
|
|
| 1,054,361
|
| Carnival Corp. (A)
|
| 84,789
|
|
| 1,341,362
|
| Chipotle Mexican Grill, Inc. (A)
|
| 2,489
|
|
| 4,795,407
|
| Darden Restaurants, Inc.
|
| 10,886
|
|
| 1,692,882
|
| Domino's Pizza, Inc.
|
| 3,486
|
|
| 1,350,476
|
| Expedia Group, Inc. (A)
|
| 12,302
|
|
| 1,333,414
|
| Hilton Worldwide Holdings, Inc.
|
| 24,835
|
|
| 3,691,723
|
| Las Vegas Sands Corp.
|
| 31,047
|
|
| 1,703,238
|
| Marriott International, Inc., Class A
|
| 23,026
|
|
| 4,686,021
|
| McDonald's Corp.
|
| 66,975
|
|
| 18,830,021
|
| MGM Resorts International
|
| 31,147
|
|
| 1,369,845
|
| Norwegian Cruise Line Holdings, Ltd. (A)
|
| 40,039
|
|
| 663,446
|
| Royal Caribbean Cruises, Ltd. (A)
|
| 20,165
|
|
| 1,995,125
|
| Starbucks Corp.
|
| 102,671
|
|
| 10,004,262
|
| Wynn Resorts, Ltd.
|
| 10,371
|
|
| 1,051,412
|
| Yum! Brands, Inc.
|
| 26,251
|
|
| 3,396,354
|
|
|
|
|
|
| 69,466,771
|
| Household durables – 0.4%
|
|
|
|
| D.R. Horton, Inc.
|
| 28,937
|
|
| 3,444,082
|
| Garmin, Ltd.
|
| 12,833
|
|
| 1,360,555
|
| Hamilton Beach Brands Holding Company, Class B
|
| 294
|
|
| 3,449
|
| Lennar Corp., A Shares
|
| 23,392
|
|
| 2,785,753
|
| Mohawk Industries, Inc. (A)
|
| 3,385
|
|
| 343,205
|
| The accompanying notes are an integral part of the financial statements.
| 74
|
|
John Hancock Funds II
Portfolio of Investments —
August 31, 2023 (showing percentage of total net assets)
U.S. Sector Rotation Fund (continued)
|
|
| Shares or
Principal
Amount
|
| Value
|
| COMMON STOCKS (continued)
|
|
|
|
| Household durables (continued)
|
|
|
|
| Newell Brands, Inc.
|
| 32,416
|
| $
| 342,961
|
| NVR, Inc. (A)
|
| 270
|
|
| 1,721,879
|
| PulteGroup, Inc.
|
| 21,303
|
|
| 1,748,124
|
| Whirlpool Corp.
|
| 4,893
|
|
| 684,824
|
|
|
|
|
|
| 12,434,832
|
| Leisure products – 0.0%
|
|
|
|
| Hasbro, Inc.
|
| 9,598
|
|
| 691,056
|
| Specialty retail – 2.3%
|
|
|
|
| AutoZone, Inc. (A)
|
| 1,606
|
|
| 4,065,316
|
| Bath & Body Works, Inc.
|
| 18,425
|
|
| 679,330
|
| Best Buy Company, Inc.
|
| 17,349
|
|
| 1,326,331
|
| CarMax, Inc. (A)
|
| 12,473
|
|
| 1,018,795
|
| Lowe's Companies, Inc.
|
| 53,879
|
|
| 12,418,032
|
| O'Reilly Automotive, Inc. (A)
|
| 5,365
|
|
| 5,041,491
|
| Ross Stores, Inc.
|
| 30,744
|
|
| 3,744,927
|
| The Home Depot, Inc.
|
| 91,614
|
|
| 30,260,104
|
| The TJX Companies, Inc.
|
| 104,236
|
|
| 9,639,745
|
| Tractor Supply Company
|
| 9,124
|
|
| 1,993,594
|
| Ulta Beauty, Inc. (A)
|
| 4,885
|
|
| 2,027,422
|
|
|
|
|
|
| 72,215,087
|
| Textiles, apparel and luxury goods – 0.4%
|
|
|
|
| NIKE, Inc., Class B
|
| 109,930
|
|
| 11,180,980
|
| Ralph Lauren Corp.
|
| 2,945
|
|
| 343,475
|
| Tapestry, Inc.
|
| 20,315
|
|
| 676,896
|
| VF Corp.
|
| 34,864
|
|
| 688,913
|
|
|
|
|
|
| 12,890,264
|
|
|
|
|
|
| 358,630,692
|
| Consumer staples – 5.3%
|
|
|
|
|
|
| Beverages – 1.3%
|
|
|
|
| Brown-Forman Corp., Class B
|
| 11,103
|
|
| 734,241
|
| Constellation Brands, Inc., Class A
|
| 10,737
|
|
| 2,797,633
|
| Keurig Dr. Pepper, Inc.
|
| 60,239
|
|
| 2,027,042
|
| Molson Coors Beverage Company, Class B
|
| 12,099
|
|
| 768,166
|
| Monster Beverage Corp. (A)
|
| 52,427
|
|
| 3,009,834
|
| PepsiCo, Inc.
|
| 94,606
|
|
| 16,832,300
|
| The Coca-Cola Company
|
| 270,035
|
|
| 16,156,194
|
|
|
|
|
|
| 42,325,410
|
| Consumer staples distribution and retail – 1.4%
|
|
|
|
| Costco Wholesale Corp.
|
| 30,166
|
|
| 16,569,580
|
| Dollar General Corp.
|
| 14,752
|
|
| 2,043,152
|
| Dollar Tree, Inc. (A)
|
| 14,421
|
|
| 1,764,554
|
| Sysco Corp.
|
| 36,069
|
|
| 2,512,206
|
| Target Corp.
|
| 30,241
|
|
| 3,826,999
|
| The Kroger Company
|
| 44,007
|
|
| 2,041,485
|
| Walgreens Boots Alliance, Inc.
|
| 50,002
|
|
| 1,265,551
|
| Walmart, Inc.
|
| 95,534
|
|
| 15,534,784
|
|
|
|
|
|
| 45,558,311
|
| Food products – 0.8%
|
|
|
|
| Archer-Daniels-Midland Company
|
| 37,755
|
|
| 2,993,972
|
| Bunge, Ltd.
|
| 11,167
|
|
| 1,276,611
|
| Campbell Soup Company
|
| 12,061
|
|
| 502,944
|
| Conagra Brands, Inc.
|
| 33,640
|
|
| 1,005,163
|
| General Mills, Inc.
|
| 40,876
|
|
| 2,765,670
|
| Hormel Foods Corp.
|
| 19,221
|
|
| 741,738
|
| Kellogg Company
|
| 16,613
|
|
| 1,013,725
|
| Lamb Weston Holdings, Inc.
|
| 10,540
|
|
| 1,026,701
|
| McCormick & Company, Inc.
|
| 18,521
|
|
| 1,520,204
|
| Mondelez International, Inc., Class A
|
| 93,225
|
|
| 6,643,214
|
| The Hershey Company
|
| 10,534
|
|
| 2,263,335
|
| The J.M. Smucker Company
|
| 6,994
|
|
| 1,013,780
|
| The Kraft Heinz Company
|
| 52,803
|
|
| 1,747,251
|
U.S. Sector Rotation Fund (continued)
|
|
| Shares or
Principal
Amount
|
| Value
|
| COMMON STOCKS (continued)
|
|
|
|
| Food products (continued)
|
|
|
|
| Tyson Foods, Inc., Class A
|
| 18,634
|
| $
| 992,633
|
|
|
|
|
|
| 25,506,941
|
| Household products – 1.1%
|
|
|
|
| Church & Dwight Company, Inc.
|
| 16,094
|
|
| 1,557,416
|
| Colgate-Palmolive Company
|
| 55,590
|
|
| 4,084,197
|
| Kimberly-Clark Corp.
|
| 23,661
|
|
| 3,048,247
|
| The Clorox Company
|
| 8,166
|
|
| 1,277,571
|
| The Procter & Gamble Company
|
| 162,839
|
|
| 25,132,571
|
|
|
|
|
|
| 35,100,002
|
| Personal care products – 0.2%
|
|
|
|
| Kenvue, Inc.
|
| 121,466
|
|
| 2,799,791
|
| The Estee Lauder Companies, Inc., Class A
|
| 15,970
|
|
| 2,563,664
|
|
|
|
|
|
| 5,363,455
|
| Tobacco – 0.5%
|
|
|
|
| Altria Group, Inc.
|
| 121,441
|
|
| 5,370,121
|
| Philip Morris International, Inc.
|
| 105,851
|
|
| 10,168,047
|
|
|
|
|
|
| 15,538,168
|
|
|
|
|
|
| 169,392,287
|
| Energy – 5.1%
|
|
|
|
|
|
| Energy equipment and services – 0.5%
|
|
|
|
| Baker Hughes Company
|
| 101,024
|
|
| 3,656,059
|
| Halliburton Company
|
| 84,738
|
|
| 3,272,582
|
| Schlumberger, Ltd.
|
| 137,940
|
|
| 8,132,942
|
|
|
|
|
|
| 15,061,583
|
| Oil, gas and consumable fuels – 4.6%
|
|
|
|
| APA Corp.
|
| 33,571
|
|
| 1,471,753
|
| Chevron Corp.
|
| 175,878
|
|
| 28,333,946
|
| ConocoPhillips
|
| 117,865
|
|
| 14,029,471
|
| Coterra Energy, Inc.
|
| 78,281
|
|
| 2,206,741
|
| Devon Energy Corp.
|
| 64,692
|
|
| 3,305,114
|
| Diamondback Energy, Inc.
|
| 16,957
|
|
| 2,573,733
|
| EOG Resources, Inc.
|
| 57,285
|
|
| 7,367,997
|
| EQT Corp.
|
| 34,288
|
|
| 1,481,927
|
| Exxon Mobil Corp.
|
| 396,528
|
|
| 44,089,948
|
| Hess Corp.
|
| 26,130
|
|
| 4,037,085
|
| Kinder Morgan, Inc.
|
| 188,783
|
|
| 3,250,843
|
| Marathon Oil Corp.
|
| 55,962
|
|
| 1,474,599
|
| Marathon Petroleum Corp.
|
| 41,045
|
|
| 5,859,995
|
| Occidental Petroleum Corp.
|
| 70,368
|
|
| 4,418,407
|
| ONEOK, Inc.
|
| 44,854
|
|
| 2,924,481
|
| Phillips 66
|
| 45,489
|
|
| 5,193,024
|
| Pioneer Natural Resources Company
|
| 23,081
|
|
| 5,491,662
|
| Targa Resources Corp.
|
| 21,332
|
|
| 1,839,885
|
| The Williams Companies, Inc.
|
| 115,334
|
|
| 3,982,483
|
| Valero Energy Corp.
|
| 36,230
|
|
| 4,706,277
|
|
|
|
|
|
| 148,039,371
|
|
|
|
|
|
| 163,100,954
|
| Financials – 12.4%
|
|
|
|
|
|
| Banks – 2.9%
|
|
|
|
| Bank of America Corp.
|
| 580,643
|
|
| 16,647,035
|
| Citigroup, Inc.
|
| 165,850
|
|
| 6,847,947
|
| Citizens Financial Group, Inc.
|
| 44,625
|
|
| 1,255,301
|
| Comerica, Inc.
|
| 12,943
|
|
| 622,688
|
| Fifth Third Bancorp
|
| 59,489
|
|
| 1,579,433
|
| Huntington Bancshares, Inc.
|
| 112,871
|
|
| 1,251,739
|
| JPMorgan Chase & Co.
|
| 245,005
|
|
| 35,851,582
|
| KeyCorp
|
| 83,715
|
|
| 948,491
|
| M&T Bank Corp.
|
| 14,680
|
|
| 1,835,734
|
| Regions Financial Corp.
|
| 83,049
|
|
| 1,523,119
|
| The PNC Financial Services Group, Inc.
|
| 33,738
|
|
| 4,073,189
|
| Truist Financial Corp.
|
| 113,628
|
|
| 3,471,335
|
| The accompanying notes are an integral part of the financial statements.
| 75
|
|
John Hancock Funds II
Portfolio of Investments —
August 31, 2023 (showing percentage of total net assets)
U.S. Sector Rotation Fund (continued)
|
|
| Shares or
Principal
Amount
|
| Value
|
| COMMON STOCKS (continued)
|
|
|
|
| Banks (continued)
|
|
|
|
| U.S. Bancorp
|
| 120,640
|
| $
| 4,406,979
|
| Wells Fargo & Company
|
| 312,214
|
|
| 12,891,316
|
| Zions Bancorp NA
|
| 8,838
|
|
| 313,749
|
|
|
|
|
|
| 93,519,637
|
| Capital markets – 2.7%
|
|
|
|
| Ameriprise Financial, Inc.
|
| 8,323
|
|
| 2,809,678
|
| BlackRock, Inc.
|
| 12,324
|
|
| 8,633,455
|
| Cboe Global Markets, Inc.
|
| 8,338
|
|
| 1,248,282
|
| CME Group, Inc.
|
| 31,034
|
|
| 6,289,971
|
| FactSet Research Systems, Inc.
|
| 2,918
|
|
| 1,273,444
|
| Franklin Resources, Inc.
|
| 23,755
|
|
| 635,209
|
| Intercontinental Exchange, Inc.
|
| 47,787
|
|
| 5,638,388
|
| Invesco, Ltd.
|
| 40,105
|
|
| 638,472
|
| MarketAxess Holdings, Inc.
|
| 3,833
|
|
| 923,485
|
| Moody's Corp.
|
| 12,997
|
|
| 4,377,390
|
| Morgan Stanley
|
| 110,239
|
|
| 9,386,851
|
| MSCI, Inc.
|
| 7,023
|
|
| 3,817,843
|
| Nasdaq, Inc.
|
| 29,388
|
|
| 1,542,282
|
| Northern Trust Corp.
|
| 16,518
|
|
| 1,256,524
|
| Raymond James Financial, Inc.
|
| 15,027
|
|
| 1,571,674
|
| S&P Global, Inc.
|
| 28,012
|
|
| 10,948,770
|
| State Street Corp.
|
| 27,413
|
|
| 1,884,370
|
| T. Rowe Price Group, Inc.
|
| 19,706
|
|
| 2,211,604
|
| The Bank of New York Mellon Corp.
|
| 63,612
|
|
| 2,854,270
|
| The Charles Schwab Corp.
|
| 126,465
|
|
| 7,480,405
|
| The Goldman Sachs Group, Inc.
|
| 27,439
|
|
| 8,992,035
|
|
|
|
|
|
| 84,414,402
|
| Consumer finance – 0.4%
|
|
|
|
| American Express Company
|
| 50,857
|
|
| 8,034,897
|
| Capital One Financial Corp.
|
| 30,111
|
|
| 3,083,065
|
| Discover Financial Services
|
| 20,893
|
|
| 1,881,833
|
| Synchrony Financial
|
| 38,542
|
|
| 1,244,136
|
|
|
|
|
|
| 14,243,931
|
| Financial services – 4.3%
|
|
|
|
| Berkshire Hathaway, Inc., Class B (A)
|
| 150,215
|
|
| 54,107,443
|
| Fidelity National Information Services, Inc.
|
| 50,637
|
|
| 2,828,583
|
| Fiserv, Inc. (A)
|
| 51,074
|
|
| 6,199,873
|
| FleetCor Technologies, Inc. (A)
|
| 5,775
|
|
| 1,569,241
|
| Global Payments, Inc.
|
| 22,672
|
|
| 2,872,316
|
| Jack Henry & Associates, Inc.
|
| 5,975
|
|
| 936,761
|
| Mastercard, Inc., Class A
|
| 70,460
|
|
| 29,074,614
|
| PayPal Holdings, Inc. (A)
|
| 95,463
|
|
| 5,967,392
|
| Visa, Inc., Class A
|
| 137,314
|
|
| 33,735,304
|
|
|
|
|
|
| 137,291,527
|
| Insurance – 2.1%
|
|
|
|
| Aflac, Inc.
|
| 46,332
|
|
| 3,454,977
|
| American International Group, Inc.
|
| 59,287
|
|
| 3,469,475
|
| Aon PLC, Class A
|
| 17,019
|
|
| 5,673,964
|
| Arch Capital Group, Ltd. (A)
|
| 29,021
|
|
| 2,230,554
|
| Arthur J. Gallagher & Company
|
| 17,764
|
|
| 4,094,247
|
| Assurant, Inc.
|
| 4,526
|
|
| 630,608
|
| Brown & Brown, Inc.
|
| 21,373
|
|
| 1,583,739
|
| Chubb, Ltd.
|
| 34,322
|
|
| 6,894,260
|
| Cincinnati Financial Corp.
|
| 12,024
|
|
| 1,272,019
|
| Everest Group, Ltd.
|
| 3,497
|
|
| 1,261,298
|
| Globe Life, Inc.
|
| 8,451
|
|
| 942,878
|
| Lincoln National Corp.
|
| 12,123
|
|
| 311,076
|
| Loews Corp.
|
| 15,141
|
|
| 940,105
|
| Marsh & McLennan Companies, Inc.
|
| 41,724
|
|
| 8,135,763
|
| MetLife, Inc.
|
| 54,821
|
|
| 3,472,362
|
| Principal Financial Group, Inc.
|
| 20,227
|
|
| 1,571,840
|
| Prudential Financial, Inc.
|
| 29,980
|
|
| 2,838,207
|
| The Allstate Corp.
|
| 20,626
|
|
| 2,223,689
|
U.S. Sector Rotation Fund (continued)
|
|
| Shares or
Principal
Amount
|
| Value
|
| COMMON STOCKS (continued)
|
|
|
|
| Insurance (continued)
|
|
|
|
| The Hartford Financial Services Group, Inc.
|
| 26,095
|
| $
| 1,874,143
|
| The Progressive Corp.
|
| 50,134
|
|
| 6,691,385
|
| The Travelers Companies, Inc.
|
| 19,507
|
|
| 3,145,114
|
| W.R. Berkley Corp.
|
| 15,335
|
|
| 948,623
|
| Willis Towers Watson PLC
|
| 9,110
|
|
| 1,883,584
|
|
|
|
|
|
| 65,543,910
|
|
|
|
|
|
| 395,013,407
|
| Health care – 12.1%
|
|
|
|
|
|
| Biotechnology – 1.9%
|
|
|
|
| AbbVie, Inc.
|
| 137,793
|
|
| 20,250,059
|
| Amgen, Inc.
|
| 41,402
|
|
| 10,612,989
|
| Biogen, Inc. (A)
|
| 10,833
|
|
| 2,896,311
|
| Gilead Sciences, Inc.
|
| 96,917
|
|
| 7,412,212
|
| Incyte Corp. (A)
|
| 13,465
|
|
| 868,896
|
| Moderna, Inc. (A)
|
| 25,182
|
|
| 2,847,329
|
| Regeneron Pharmaceuticals, Inc. (A)
|
| 8,404
|
|
| 6,945,822
|
| Vertex Pharmaceuticals, Inc. (A)
|
| 19,829
|
|
| 6,907,234
|
|
|
|
|
|
| 58,740,852
|
| Health care equipment and supplies – 2.4%
|
|
|
|
| Abbott Laboratories
|
| 134,132
|
|
| 13,802,183
|
| ABIOMED, Inc. (A)(C)
|
| 6,547
|
|
| 101,609
|
| Align Technology, Inc. (A)
|
| 5,529
|
|
| 2,046,504
|
| Baxter International, Inc.
|
| 40,988
|
|
| 1,664,113
|
| Becton, Dickinson and Company
|
| 22,611
|
|
| 6,318,644
|
| Boston Scientific Corp. (A)
|
| 111,519
|
|
| 6,015,335
|
| Dentsply Sirona, Inc.
|
| 15,412
|
|
| 571,631
|
| DexCom, Inc. (A)
|
| 28,632
|
|
| 2,891,259
|
| Edwards Lifesciences Corp. (A)
|
| 44,817
|
|
| 3,427,156
|
| GE HealthCare Technologies, Inc.
|
| 28,835
|
|
| 2,031,426
|
| Hologic, Inc. (A)
|
| 19,002
|
|
| 1,420,209
|
| IDEXX Laboratories, Inc. (A)
|
| 6,234
|
|
| 3,188,130
|
| Insulet Corp. (A)
|
| 4,563
|
|
| 874,773
|
| Intuitive Surgical, Inc. (A)
|
| 27,168
|
|
| 8,494,890
|
| Medtronic PLC
|
| 102,615
|
|
| 8,363,123
|
| ResMed, Inc.
|
| 10,655
|
|
| 1,700,431
|
| STERIS PLC
|
| 7,531
|
|
| 1,729,042
|
| Stryker Corp.
|
| 25,546
|
|
| 7,243,568
|
| Teleflex, Inc.
|
| 3,994
|
|
| 849,684
|
| The Cooper Companies, Inc.
|
| 3,847
|
|
| 1,423,352
|
| Zimmer Biomet Holdings, Inc.
|
| 17,042
|
|
| 2,030,043
|
|
|
|
|
|
| 76,187,105
|
| Health care providers and services – 2.5%
|
|
|
|
| Cardinal Health, Inc.
|
| 19,329
|
|
| 1,688,002
|
| Cencora, Inc.
|
| 12,886
|
|
| 2,267,678
|
| Centene Corp. (A)
|
| 40,400
|
|
| 2,490,660
|
| CVS Health Corp.
|
| 99,143
|
|
| 6,461,149
|
| DaVita, Inc. (A)
|
| 5,670
|
|
| 580,721
|
| Elevance Health, Inc.
|
| 18,357
|
|
| 8,113,978
|
| HCA Healthcare, Inc.
|
| 15,579
|
|
| 4,320,057
|
| Henry Schein, Inc. (A)
|
| 11,113
|
|
| 850,589
|
| Humana, Inc.
|
| 9,619
|
|
| 4,440,419
|
| Laboratory Corp. of America Holdings
|
| 6,834
|
|
| 1,422,155
|
| McKesson Corp.
|
| 10,981
|
|
| 4,527,686
|
| Molina Healthcare, Inc. (A)
|
| 4,481
|
|
| 1,389,648
|
| Quest Diagnostics, Inc.
|
| 8,720
|
|
| 1,146,680
|
| The Cigna Group
|
| 22,537
|
|
| 6,226,072
|
| UnitedHealth Group, Inc.
|
| 72,383
|
|
| 34,496,290
|
| Universal Health Services, Inc., Class B
|
| 4,295
|
|
| 578,537
|
|
|
|
|
|
| 81,000,321
|
| Life sciences tools and services – 1.5%
|
|
|
|
| Agilent Technologies, Inc.
|
| 23,723
|
|
| 2,872,144
|
| Bio-Rad Laboratories, Inc., Class A (A)
|
| 1,468
|
|
| 587,494
|
| The accompanying notes are an integral part of the financial statements.
| 76
|
|
John Hancock Funds II
Portfolio of Investments —
August 31, 2023 (showing percentage of total net assets)
U.S. Sector Rotation Fund (continued)
|
|
| Shares or
Principal
Amount
|
| Value
|
| COMMON STOCKS (continued)
|
|
|
|
| Life sciences tools and services (continued)
|
|
|
|
| Bio-Techne Corp.
|
| 10,931
|
| $
| 856,990
|
| Charles River Laboratories International, Inc. (A)
|
| 4,274
|
|
| 883,949
|
| Danaher Corp.
|
| 51,575
|
|
| 13,667,375
|
| Illumina, Inc. (A)
|
| 12,537
|
|
| 2,071,363
|
| IQVIA Holdings, Inc. (A)
|
| 14,154
|
|
| 3,151,105
|
| Mettler-Toledo International, Inc. (A)
|
| 1,687
|
|
| 2,047,141
|
| Revvity, Inc.
|
| 9,711
|
|
| 1,136,478
|
| Thermo Fisher Scientific, Inc.
|
| 29,681
|
|
| 16,535,285
|
| Waters Corp. (A)
|
| 4,036
|
|
| 1,133,309
|
| West Pharmaceutical Services, Inc.
|
| 5,637
|
|
| 2,293,695
|
|
|
|
|
|
| 47,236,328
|
| Pharmaceuticals – 3.8%
|
|
|
|
| Bristol-Myers Squibb Company
|
| 161,818
|
|
| 9,976,080
|
| Catalent, Inc. (A)
|
| 11,989
|
|
| 599,090
|
| Eli Lilly & Company
|
| 61,742
|
|
| 34,217,416
|
| Johnson & Johnson
|
| 189,423
|
|
| 30,625,911
|
| Merck & Company, Inc.
|
| 199,114
|
|
| 21,699,444
|
| Organon & Company
|
| 26,064
|
|
| 572,365
|
| Pfizer, Inc.
|
| 441,656
|
|
| 15,625,789
|
| Viatris, Inc.
|
| 105,157
|
|
| 1,130,438
|
| Zoetis, Inc.
|
| 34,925
|
|
| 6,653,562
|
|
|
|
|
|
| 121,100,095
|
|
|
|
|
|
| 384,264,701
|
| Industrials – 8.4%
|
|
|
|
|
|
| Aerospace and defense – 1.6%
|
|
|
|
| Axon Enterprise, Inc. (A)
|
| 6,126
|
|
| 1,304,287
|
| General Dynamics Corp.
|
| 19,445
|
|
| 4,407,015
|
| Howmet Aerospace, Inc.
|
| 31,797
|
|
| 1,572,998
|
| Huntington Ingalls Industries, Inc.
|
| 2,865
|
|
| 631,217
|
| L3Harris Technologies, Inc.
|
| 15,811
|
|
| 2,815,781
|
| Lockheed Martin Corp.
|
| 19,520
|
|
| 8,751,792
|
| Northrop Grumman Corp.
|
| 12,370
|
|
| 5,357,323
|
| RTX Corp.
|
| 124,240
|
|
| 10,689,610
|
| Textron, Inc.
|
| 16,279
|
|
| 1,265,041
|
| The Boeing Company (A)
|
| 48,095
|
|
| 10,774,723
|
| TransDigm Group, Inc. (A)
|
| 4,221
|
|
| 3,815,151
|
|
|
|
|
|
| 51,384,938
|
| Air freight and logistics – 0.6%
|
|
|
|
| CH Robinson Worldwide, Inc.
|
| 9,983
|
|
| 902,763
|
| Expeditors International of Washington, Inc.
|
| 13,382
|
|
| 1,561,813
|
| FedEx Corp.
|
| 19,307
|
|
| 5,039,513
|
| United Parcel Service, Inc., Class B
|
| 60,156
|
|
| 10,190,426
|
|
|
|
|
|
| 17,694,515
|
| Building products – 0.4%
|
|
|
|
| A.O. Smith Corp.
|
| 8,765
|
|
| 635,463
|
| Allegion PLC
|
| 8,336
|
|
| 948,720
|
| Carrier Global Corp.
|
| 71,982
|
|
| 4,135,366
|
| Johnson Controls International PLC
|
| 58,240
|
|
| 3,439,654
|
| Masco Corp.
|
| 16,185
|
|
| 955,077
|
| Trane Technologies PLC
|
| 19,885
|
|
| 4,081,595
|
|
|
|
|
|
| 14,195,875
|
| Commercial services and supplies – 0.5%
|
|
|
|
| Cintas Corp.
|
| 7,509
|
|
| 3,785,813
|
| Copart, Inc. (A)
|
| 70,628
|
|
| 3,166,253
|
| Republic Services, Inc.
|
| 17,262
|
|
| 2,487,972
|
| Rollins, Inc.
|
| 15,748
|
|
| 623,148
|
U.S. Sector Rotation Fund (continued)
|
|
| Shares or
Principal
Amount
|
| Value
|
| COMMON STOCKS (continued)
|
|
|
|
| Commercial services and supplies (continued)
|
|
|
|
| Waste Management, Inc.
|
| 31,853
|
| $
| 4,993,913
|
|
|
|
|
|
| 15,057,099
|
| Construction and engineering – 0.1%
|
|
|
|
| Quanta Services, Inc.
|
| 12,050
|
|
| 2,528,934
|
| Electrical equipment – 0.6%
|
|
|
|
| AMETEK, Inc.
|
| 19,582
|
|
| 3,123,525
|
| Eaton Corp. PLC
|
| 32,972
|
|
| 7,595,760
|
| Emerson Electric Company
|
| 47,744
|
|
| 4,690,848
|
| Generac Holdings, Inc. (A)
|
| 5,248
|
|
| 623,515
|
| Rockwell Automation, Inc.
|
| 9,904
|
|
| 3,090,840
|
|
|
|
|
|
| 19,124,488
|
| Ground transportation – 0.8%
|
|
|
|
| CSX Corp.
|
| 172,542
|
|
| 5,210,768
|
| JB Hunt Transport Services, Inc.
|
| 6,592
|
|
| 1,238,505
|
| Norfolk Southern Corp.
|
| 19,465
|
|
| 3,990,520
|
| Old Dominion Freight Line, Inc.
|
| 7,342
|
|
| 3,137,751
|
| Union Pacific Corp.
|
| 51,751
|
|
| 11,414,718
|
|
|
|
|
|
| 24,992,262
|
| Industrial conglomerates – 0.8%
|
|
|
|
| 3M Company
|
| 47,229
|
|
| 5,037,917
|
| General Electric Company
|
| 92,979
|
|
| 10,642,376
|
| Honeywell International, Inc.
|
| 56,240
|
|
| 10,569,746
|
|
|
|
|
|
| 26,250,039
|
| Machinery – 1.8%
|
|
|
|
| Caterpillar, Inc.
|
| 42,677
|
|
| 11,997,785
|
| Cummins, Inc.
|
| 12,341
|
|
| 2,838,924
|
| Deere & Company
|
| 22,525
|
|
| 9,256,424
|
| Dover Corp.
|
| 10,697
|
|
| 1,586,365
|
| Fortive Corp.
|
| 27,969
|
|
| 2,205,356
|
| IDEX Corp.
|
| 6,887
|
|
| 1,559,217
|
| Illinois Tool Works, Inc.
|
| 22,925
|
|
| 5,670,499
|
| Ingersoll Rand, Inc.
|
| 35,736
|
|
| 2,487,583
|
| Nordson Corp.
|
| 5,153
|
|
| 1,258,053
|
| Otis Worldwide Corp.
|
| 33,014
|
|
| 2,824,348
|
| PACCAR, Inc.
|
| 45,523
|
|
| 3,746,088
|
| Parker-Hannifin Corp.
|
| 10,553
|
|
| 4,399,546
|
| Pentair PLC
|
| 13,677
|
|
| 960,946
|
| Snap-on, Inc.
|
| 4,698
|
|
| 1,261,883
|
| Stanley Black & Decker, Inc.
|
| 13,434
|
|
| 1,267,901
|
| Wabtec Corp.
|
| 13,967
|
|
| 1,571,567
|
| Xylem, Inc.
|
| 21,509
|
|
| 2,227,042
|
|
|
|
|
|
| 57,119,527
|
| Passenger airlines – 0.2%
|
|
|
|
| Alaska Air Group, Inc. (A)
|
| 7,386
|
|
| 309,990
|
| American Airlines Group, Inc. (A)
|
| 62,917
|
|
| 926,767
|
| Delta Air Lines, Inc.
|
| 50,185
|
|
| 2,151,933
|
| Southwest Airlines Company
|
| 49,200
|
|
| 1,554,720
|
| United Airlines Holdings, Inc. (A)
|
| 24,869
|
|
| 1,238,725
|
|
|
|
|
|
| 6,182,135
|
| Professional services – 0.8%
|
|
|
|
| Automatic Data Processing, Inc.
|
| 34,569
|
|
| 8,801,613
|
| Broadridge Financial Solutions, Inc.
|
| 10,106
|
|
| 1,881,838
|
| Ceridian HCM Holding, Inc. (A)
|
| 13,048
|
|
| 946,241
|
| Equifax, Inc.
|
| 10,667
|
|
| 2,204,869
|
| Jacobs Solutions, Inc.
|
| 11,595
|
|
| 1,563,238
|
| Leidos Holdings, Inc.
|
| 12,945
|
|
| 1,262,267
|
| Paychex, Inc.
|
| 28,308
|
|
| 3,460,087
|
| Paycom Software, Inc.
|
| 4,272
|
|
| 1,259,556
|
| Robert Half, Inc.
|
| 8,306
|
|
| 614,312
|
| The accompanying notes are an integral part of the financial statements.
| 77
|
|
John Hancock Funds II
Portfolio of Investments —
August 31, 2023 (showing percentage of total net assets)
U.S. Sector Rotation Fund (continued)
|
|
| Shares or
Principal
Amount
|
| Value
|
| COMMON STOCKS (continued)
|
|
|
|
| Professional services (continued)
|
|
|
|
| Verisk Analytics, Inc.
|
| 11,830
|
| $
| 2,865,463
|
|
|
|
|
|
| 24,859,484
|
| Trading companies and distributors – 0.2%
|
|
|
|
| Fastenal Company
|
| 48,950
|
|
| 2,818,541
|
| United Rentals, Inc.
|
| 5,268
|
|
| 2,510,413
|
| W.W. Grainger, Inc.
|
| 3,915
|
|
| 2,795,858
|
|
|
|
|
|
| 8,124,812
|
|
|
|
|
|
| 267,514,108
|
| Information technology – 28.7%
|
|
|
|
|
|
| Communications equipment – 0.9%
|
|
|
|
| Arista Networks, Inc. (A)
|
| 20,955
|
|
| 4,091,045
|
| Cisco Systems, Inc.
|
| 355,541
|
|
| 20,390,276
|
| F5, Inc. (A)
|
| 6,062
|
|
| 992,107
|
| Juniper Networks, Inc.
|
| 22,818
|
|
| 664,460
|
| Motorola Solutions, Inc.
|
| 14,973
|
|
| 4,245,894
|
|
|
|
|
|
| 30,383,782
|
| Electronic equipment, instruments and components – 0.6%
|
|
|
|
| Amphenol Corp., Class A
|
| 52,031
|
|
| 4,598,500
|
| CDW Corp.
|
| 12,540
|
|
| 2,647,821
|
| Corning, Inc.
|
| 69,271
|
|
| 2,273,474
|
| Keysight Technologies, Inc. (A)
|
| 14,825
|
|
| 1,976,173
|
| TE Connectivity, Ltd.
|
| 27,338
|
|
| 3,619,278
|
| Teledyne Technologies, Inc. (A)
|
| 3,910
|
|
| 1,635,553
|
| Trimble, Inc. (A)
|
| 23,925
|
|
| 1,310,851
|
| Zebra Technologies Corp., Class A (A)
|
| 4,746
|
|
| 1,305,197
|
|
|
|
|
|
| 19,366,847
|
| IT services – 1.2%
|
|
|
|
| Accenture PLC, Class A
|
| 55,474
|
|
| 17,960,817
|
| Akamai Technologies, Inc. (A)
|
| 12,539
|
|
| 1,317,724
|
| Cognizant Technology Solutions Corp., Class A
|
| 45,779
|
|
| 3,278,234
|
| DXC Technology Company (A)
|
| 15,784
|
|
| 327,360
|
| EPAM Systems, Inc. (A)
|
| 5,168
|
|
| 1,338,460
|
| Gartner, Inc. (A)
|
| 6,519
|
|
| 2,279,564
|
| IBM Corp.
|
| 80,156
|
|
| 11,769,305
|
| VeriSign, Inc. (A)
|
| 7,862
|
|
| 1,633,645
|
|
|
|
|
|
| 39,905,109
|
| Semiconductors and semiconductor equipment – 7.8%
|
|
|
|
| Advanced Micro Devices, Inc. (A)
|
| 138,027
|
|
| 14,592,214
|
| Analog Devices, Inc.
|
| 44,536
|
|
| 8,095,754
|
| Applied Materials, Inc.
|
| 71,717
|
|
| 10,955,489
|
| Broadcom, Inc.
|
| 35,627
|
|
| 32,879,802
|
| Enphase Energy, Inc. (A)
|
| 12,578
|
|
| 1,591,494
|
| First Solar, Inc. (A)
|
| 8,920
|
|
| 1,686,950
|
| Intel Corp.
|
| 360,328
|
|
| 12,661,926
|
| KLA Corp.
|
| 11,728
|
|
| 5,885,931
|
| Lam Research Corp.
|
| 11,360
|
|
| 7,979,264
|
| Microchip Technology, Inc.
|
| 47,698
|
|
| 3,903,604
|
| Micron Technology, Inc.
|
| 92,686
|
|
| 6,482,459
|
| Monolithic Power Systems, Inc.
|
| 3,813
|
|
| 1,987,374
|
| NVIDIA Corp.
|
| 208,413
|
|
| 102,862,236
|
| NXP Semiconductors NV
|
| 22,199
|
|
| 4,566,778
|
| ON Semiconductor Corp. (A)
|
| 36,739
|
|
| 3,617,322
|
| Qorvo, Inc. (A)
|
| 9,217
|
|
| 989,814
|
| Qualcomm, Inc.
|
| 97,522
|
|
| 11,169,195
|
| Skyworks Solutions, Inc.
|
| 15,095
|
|
| 1,641,430
|
| SolarEdge Technologies, Inc. (A)
|
| 3,932
|
|
| 639,225
|
| Teradyne, Inc.
|
| 12,136
|
|
| 1,309,110
|
| Texas Instruments, Inc.
|
| 78,294
|
|
| 13,158,090
|
|
|
|
|
|
| 248,655,461
|
| Software – 10.4%
|
|
|
|
| Adobe, Inc. (A)
|
| 39,864
|
|
| 22,297,530
|
U.S. Sector Rotation Fund (continued)
|
|
| Shares or
Principal
Amount
|
| Value
|
| COMMON STOCKS (continued)
|
|
|
|
| Software (continued)
|
|
|
|
| ANSYS, Inc. (A)
|
| 7,271
|
| $
| 2,318,504
|
| Autodesk, Inc. (A)
|
| 19,396
|
|
| 4,304,748
|
| Cadence Design Systems, Inc. (A)
|
| 23,357
|
|
| 5,615,957
|
| Fair Isaac Corp. (A)
|
| 2,214
|
|
| 2,002,762
|
| Fortinet, Inc. (A)
|
| 53,693
|
|
| 3,232,856
|
| Gen Digital, Inc.
|
| 46,963
|
|
| 951,001
|
| Intuit, Inc.
|
| 23,807
|
|
| 12,898,871
|
| Microsoft Corp.
|
| 646,044
|
|
| 211,747,381
|
| Oracle Corp.
|
| 132,300
|
|
| 15,927,597
|
| Palo Alto Networks, Inc. (A)
|
| 26,438
|
|
| 6,432,365
|
| PTC, Inc. (A)
|
| 8,902
|
|
| 1,310,107
|
| Roper Technologies, Inc.
|
| 9,171
|
|
| 4,576,879
|
| Salesforce, Inc. (A)
|
| 86,177
|
|
| 19,084,758
|
| ServiceNow, Inc. (A)
|
| 17,433
|
|
| 10,265,073
|
| Synopsys, Inc. (A)
|
| 12,959
|
|
| 5,946,756
|
| Tyler Technologies, Inc. (A)
|
| 3,342
|
|
| 1,331,553
|
|
|
|
|
|
| 330,244,698
|
| Technology hardware, storage and peripherals – 7.8%
|
|
|
|
| Apple, Inc.
|
| 1,274,014
|
|
| 239,349,003
|
| Hewlett Packard Enterprise Company
|
| 116,103
|
|
| 1,972,590
|
| HP, Inc.
|
| 72,020
|
|
| 2,139,714
|
| NetApp, Inc.
|
| 17,044
|
|
| 1,307,275
|
| Seagate Technology Holdings PLC
|
| 14,684
|
|
| 1,039,480
|
| Western Digital Corp. (A)
|
| 31,460
|
|
| 1,415,700
|
|
|
|
|
|
| 247,223,762
|
|
|
|
|
|
| 915,779,659
|
| Materials – 2.3%
|
|
|
|
|
|
| Chemicals – 1.6%
|
|
|
|
| Air Products & Chemicals, Inc.
|
| 17,733
|
|
| 5,239,924
|
| Albemarle Corp.
|
| 9,259
|
|
| 1,839,856
|
| Celanese Corp.
|
| 7,517
|
|
| 949,848
|
| CF Industries Holdings, Inc.
|
| 16,049
|
|
| 1,236,896
|
| Corteva, Inc.
|
| 59,633
|
|
| 3,012,063
|
| Dow, Inc.
|
| 55,395
|
|
| 3,022,351
|
| DuPont de Nemours, Inc.
|
| 35,890
|
|
| 2,759,582
|
| Eastman Chemical Company
|
| 10,911
|
|
| 927,544
|
| Ecolab, Inc.
|
| 20,161
|
|
| 3,705,793
|
| FMC Corp.
|
| 10,341
|
|
| 891,704
|
| International Flavors & Fragrances, Inc.
|
| 22,393
|
|
| 1,577,587
|
| Linde PLC
|
| 40,425
|
|
| 15,646,092
|
| LyondellBasell Industries NV, Class A
|
| 21,702
|
|
| 2,143,507
|
| PPG Industries, Inc.
|
| 19,587
|
|
| 2,776,653
|
| The Mosaic Company
|
| 23,591
|
|
| 916,510
|
| The Sherwin-Williams Company
|
| 19,351
|
|
| 5,258,054
|
|
|
|
|
|
| 51,903,964
|
| Construction materials – 0.1%
|
|
|
|
| Martin Marietta Materials, Inc.
|
| 4,822
|
|
| 2,152,589
|
| Vulcan Materials Company
|
| 11,239
|
|
| 2,452,912
|
|
|
|
|
|
| 4,605,501
|
| Containers and packaging – 0.2%
|
|
|
|
| Amcor PLC
|
| 126,764
|
|
| 1,234,681
|
| Avery Dennison Corp.
|
| 6,543
|
|
| 1,232,570
|
| Ball Corp.
|
| 22,908
|
|
| 1,247,341
|
| International Paper Company
|
| 26,469
|
|
| 924,297
|
| Packaging Corp. of America
|
| 8,236
|
|
| 1,227,988
|
| Sealed Air Corp.
|
| 8,361
|
|
| 309,859
|
| Westrock Company
|
| 18,748
|
|
| 613,247
|
|
|
|
|
|
| 6,789,983
|
| Metals and mining – 0.4%
|
|
|
|
| Freeport-McMoRan, Inc.
|
| 114,563
|
|
| 4,572,209
|
| Newmont Corp.
|
| 62,284
|
|
| 2,455,235
|
| Nucor Corp.
|
| 19,819
|
|
| 3,410,850
|
| The accompanying notes are an integral part of the financial statements.
| 78
|
|
John Hancock Funds II
Portfolio of Investments —
August 31, 2023 (showing percentage of total net assets)
U.S. Sector Rotation Fund (continued)
|
|
| Shares or
Principal
Amount
|
| Value
|
| COMMON STOCKS (continued)
|
|
|
|
| Metals and mining (continued)
|
|
|
|
| Steel Dynamics, Inc.
|
| 11,708
|
| $
| 1,247,956
|
|
|
|
|
|
| 11,686,250
|
|
|
|
|
|
| 74,985,698
|
| Real estate – 1.6%
|
|
|
|
|
|
| Health care REITs – 0.1%
|
|
|
|
| Healthpeak Properties, Inc.
|
| 29,439
|
|
| 605,855
|
| Ventas, Inc.
|
| 23,131
|
|
| 1,010,362
|
| Welltower, Inc.
|
| 26,724
|
|
| 2,214,885
|
|
|
|
|
|
| 3,831,102
|
| Hotel and resort REITs – 0.0%
|
|
|
|
| Host Hotels & Resorts, Inc.
|
| 37,380
|
|
| 590,230
|
| Industrial REITs – 0.2%
|
|
|
|
| Prologis, Inc.
|
| 49,826
|
|
| 6,188,389
|
| Office REITs – 0.1%
|
|
|
|
| Alexandria Real Estate Equities, Inc.
|
| 8,567
|
|
| 996,685
|
| Boston Properties, Inc.
|
| 8,980
|
|
| 599,595
|
|
|
|
|
|
| 1,596,280
|
| Real estate management and development – 0.1%
|
|
|
|
| CBRE Group, Inc., Class A (A)
|
| 16,436
|
|
| 1,397,882
|
| CoStar Group, Inc. (A)
|
| 21,932
|
|
| 1,798,205
|
|
|
|
|
|
| 3,196,087
|
| Residential REITs – 0.2%
|
|
|
|
| AvalonBay Communities, Inc.
|
| 7,673
|
|
| 1,410,451
|
| Camden Property Trust
|
| 5,575
|
|
| 599,982
|
| Equity Residential
|
| 18,558
|
|
| 1,203,115
|
| Essex Property Trust, Inc.
|
| 3,387
|
|
| 807,427
|
| Invitation Homes, Inc.
|
| 29,586
|
|
| 1,008,587
|
| Mid-America Apartment Communities, Inc.
|
| 6,889
|
|
| 1,000,489
|
| UDR, Inc.
|
| 15,192
|
|
| 606,161
|
|
|
|
|
|
| 6,636,212
|
| Retail REITs – 0.2%
|
|
|
|
| Federal Realty Investment Trust
|
| 4,105
|
|
| 402,044
|
| Kimco Realty Corp.
|
| 32,079
|
|
| 607,576
|
| Realty Income Corp.
|
| 35,646
|
|
| 1,997,602
|
| Regency Centers Corp.
|
| 9,702
|
|
| 603,464
|
| Simon Property Group, Inc.
|
| 17,788
|
|
| 2,018,760
|
|
|
|
|
|
| 5,629,446
|
| Specialized REITs – 0.7%
|
|
|
|
| American Tower Corp.
|
| 24,555
|
|
| 4,452,313
|
| Crown Castle, Inc.
|
| 23,965
|
|
| 2,408,483
|
| Digital Realty Trust, Inc.
|
| 15,479
|
|
| 2,038,894
|
| Equinix, Inc.
|
| 5,108
|
|
| 3,991,289
|
| Extra Space Storage, Inc.
|
| 10,854
|
|
| 1,396,693
|
| Iron Mountain, Inc.
|
| 16,081
|
|
| 1,021,787
|
| Public Storage
|
| 8,679
|
|
| 2,398,702
|
| SBA Communications Corp.
|
| 6,205
|
|
| 1,393,209
|
| VICI Properties, Inc.
|
| 52,178
|
|
| 1,609,170
|
| Weyerhaeuser Company
|
| 36,754
|
|
| 1,203,694
|
|
|
|
|
|
| 21,914,234
|
|
|
|
|
|
| 49,581,980
|
| Utilities – 0.6%
|
|
|
|
|
|
| Electric utilities – 0.4%
|
|
|
|
| Alliant Energy Corp.
|
| 4,763
|
|
| 238,960
|
| American Electric Power Company, Inc.
|
| 11,169
|
|
| 875,650
|
| Constellation Energy Corp.
|
| 6,894
|
|
| 718,079
|
U.S. Sector Rotation Fund (continued)
|
|
| Shares or
Principal
Amount
|
| Value
|
| COMMON STOCKS (continued)
|
|
|
|
| Electric utilities (continued)
|
|
|
|
| Duke Energy Corp.
|
| 16,960
|
| $
| 1,506,048
|
| Edison International
|
| 8,086
|
|
| 556,721
|
| Entergy Corp.
|
| 4,108
|
|
| 391,287
|
| Evergy, Inc.
|
| 5,664
|
|
| 311,350
|
| Eversource Energy
|
| 7,399
|
|
| 472,204
|
| Exelon Corp.
|
| 21,971
|
|
| 881,477
|
| FirstEnergy Corp.
|
| 11,077
|
|
| 399,547
|
| NextEra Energy, Inc.
|
| 44,299
|
|
| 2,959,173
|
| NRG Energy, Inc.
|
| 4,302
|
|
| 161,540
|
| PG&E Corp. (A)
|
| 33,916
|
|
| 552,831
|
| Pinnacle West Capital Corp.
|
| 2,044
|
|
| 157,940
|
| PPL Corp.
|
| 15,992
|
|
| 398,521
|
| The Southern Company
|
| 23,643
|
|
| 1,601,340
|
| Xcel Energy, Inc.
|
| 12,545
|
|
| 716,696
|
|
|
|
|
|
| 12,899,364
|
| Gas utilities – 0.0%
|
|
|
|
| Atmos Energy Corp.
|
| 3,456
|
|
| 400,723
|
Independent power and renewable electricity producers –
0.0%
|
|
|
|
| The AES Corp.
|
| 13,285
|
|
| 238,200
|
| Multi-utilities – 0.2%
|
|
|
|
| Ameren Corp.
|
| 6,001
|
|
| 475,699
|
| CenterPoint Energy, Inc.
|
| 14,300
|
|
| 398,827
|
| CMS Energy Corp.
|
| 5,674
|
|
| 318,822
|
| Consolidated Edison, Inc.
|
| 7,215
|
|
| 641,846
|
| Dominion Energy, Inc.
|
| 18,001
|
|
| 873,769
|
| DTE Energy Company
|
| 4,600
|
|
| 475,548
|
| NiSource, Inc.
|
| 9,078
|
|
| 242,927
|
| Public Service Enterprise Group, Inc.
|
| 10,506
|
|
| 641,706
|
| Sempra
|
| 13,501
|
|
| 948,040
|
| WEC Energy Group, Inc.
|
| 6,629
|
|
| 557,631
|
|
|
|
|
|
| 5,574,815
|
| Water utilities – 0.0%
|
|
|
|
| American Water Works Company, Inc.
|
| 4,044
|
|
| 561,065
|
|
|
|
|
|
| 19,674,167
|
| TOTAL COMMON STOCKS (Cost $2,740,933,468)
|
| $
| 3,110,086,752
|
| SHORT-TERM INVESTMENTS – 2.1%
|
|
|
|
| Short-term funds – 2.1%
|
|
|
|
|
|
| John Hancock Collateral Trust, 5.4789% (D)(E)
|
| 6,570,132
|
|
| 65,678,983
|
| TOTAL SHORT-TERM INVESTMENTS (Cost $65,666,992)
|
| $
| 65,678,983
|
Total Investments (U.S. Sector Rotation Fund)
(Cost $2,806,600,460) – 99.7%
|
| $
| 3,175,765,735
|
| Other assets and liabilities, net – 0.3%
|
|
| 8,790,343
|
| TOTAL NET ASSETS – 100.0%
|
| $
| 3,184,556,078
|
| Security Abbreviations and Legend
|
| (A)
| Non-income producing security.
|
| (B)
| All or a portion of this security is on loan as of 8-31-23.
|
| (C)
| Security is valued using significant unobservable inputs and is classified as Level 3 in the fair value hierarchy. Refer to Note 2 to the financial statements.
|
| (D)
| The rate shown is the annualized seven-day yield as of 8-31-23.
|
| (E)
| Investment is an affiliate of the fund, the advisor and/or subadvisor. A portion of this security represents the investment of cash collateral received for
securities lending. Market value of this investment amounted to $676,678.
|
| The accompanying notes are an integral part of the financial statements.
| 79
|
|
John Hancock Funds II
Portfolio of Investments —
August 31, 2023 (showing percentage of total net assets)
U.S. Sector Rotation Fund
(continued)
DERIVATIVES
FUTURES
| Open contracts
| Number of
contracts
| Position
| Expiration
date
| Notional
basis^
| Notional
value^
| Unrealized
appreciation
(depreciation)
|
| S&P 500 E-Mini Index Futures
| 328
| Long
| Sep 2023
| $73,498,804
| $74,062,400
| $563,596
|
|
|
|
|
|
|
| $563,596
|
^ Notional basis refers to
the contractual amount agreed upon at inception of open contracts; notional value represents the current value of the open contract.
See Notes to financial
statements regarding investment transactions and other derivatives information.
| The accompanying notes are an integral part of the financial statements.
| 80
|
|
John Hancock Funds II
Portfolio of Investments —
August 31, 2023 (showing percentage of total net assets)
The following funds had
the following country composition as a percentage of net assets on 8-31-23:
Capital Appreciation Fund
| United States
| 87.7%
|
| France
| 3.2%
|
| Denmark
| 2.3%
|
| Uruguay
| 1.8%
|
| Canada
| 1.6%
|
| Netherlands
| 1.4%
|
| United Kingdom
| 1.3%
|
| Other countries
| 0.7%
|
| TOTAL
| 100.0%
|
Health Sciences Fund
| United States
| 87.9%
|
| United Kingdom
| 3.6%
|
| Netherlands
| 2.5%
|
| Denmark
| 2.0%
|
| Switzerland
| 1.0%
|
| Other countries
| 3.0%
|
| TOTAL
| 100.0%
|
High Yield Fund
| United States
| 76.4%
|
| Cayman Islands
| 7.5%
|
| Canada
| 4.7%
|
| France
| 1.6%
|
| United Kingdom
| 1.6%
|
| Luxembourg
| 1.2%
|
| Netherlands
| 1.0%
|
| Other countries
| 6.0%
|
| TOTAL
| 100.0%
|
Mid Value Fund
| United States
| 88.7%
|
| United Kingdom
| 4.5%
|
| Canada
| 2.5%
|
| Puerto Rico
| 1.3%
|
| Other countries
| 3.0%
|
| TOTAL
| 100.0%
|
Science & Technology Fund
| United States
| 79.1%
|
| Germany
| 5.8%
|
| China
| 5.8%
|
| Ireland
| 3.6%
|
| South Korea
| 2.3%
|
| Taiwan
| 1.5%
|
| Other countries
| 1.9%
|
| TOTAL
| 100.0%
|
| The accompanying notes are an integral part of the financial statements.
| 81
|
|
John Hancock Funds II
Statements of assets and liabilities
— August 31, 2023
| Assets
| Capital Appreciation Fund
| Capital Appreciation Value Fund
| Core Bond Fund
| Health Sciences Fund
|
| Unaffiliated investments, at value (including securities loaned)
| $1,483,892,248
| $1,160,420,058
| $1,983,535,430
| $265,881,234
|
| Affiliated investments, at value
| —
| 2,018,771
| —
| —
|
| Total investments, at value
| 1,483,892,248
| 1,162,438,829
| 1,983,535,430
| 265,881,234
|
| Cash
| —
| 89,859
| —
| —
|
| Foreign currency, at value
| 237
| 107,473
| —
| 629
|
| Cash collateral at broker for sale commitments
| —
| —
| 220,000
| —
|
| Dividends and interest receivable
| 1,063,999
| 4,804,377
| 10,851,855
| 239,911
|
| Receivable for fund shares sold
| 20,527
| —
| 17,200
| —
|
| Receivable for investments sold
| 497,666
| 4,636,860
| 40,624,693
| 21,153
|
| Receivable for delayed delivery securities sold
| —
| —
| 46,028,774
| —
|
| Receivable for securities lending income
| 1,178
| 1,407
| 34
| —
|
| Other assets
| 64,475
| 49,152
| 77,034
| 237,790
|
| Total assets
| 1,485,540,330
| 1,172,127,957
| 2,081,355,020
| 266,380,717
|
| Liabilities
|
|
|
|
|
| Payable for sale commitments outstanding, at value
| —
| —
| 5,361,328
| —
|
| Written options, at value
| —
| 6,616,180
| —
| —
|
| Due to custodian
| —
| —
| —
| 1,633
|
| Payable for investments purchased
| 1,322,347
| 1,166,243
| 69,185,290
| 930,141
|
| Payable for delayed delivery securities purchased
| —
| —
| 207,504,456
| —
|
| Payable for fund shares repurchased
| 2,881,712
| 1,752,415
| 1,170,635
| 135,214
|
| Payable upon return of securities loaned
| —
| 2,018,769
| —
| —
|
| Payable to affiliates
|
|
|
|
|
| Accounting and legal services fees
| 74,756
| 60,485
| 90,248
| 14,348
|
| Trustees' fees
| 103
| 80
| 125
| 17
|
| Other liabilities and accrued expenses
| 80,443
| 82,710
| 102,879
| 41,876
|
| Total liabilities
| 4,359,361
| 11,696,882
| 283,414,961
| 1,123,229
|
| Net assets
| $1,481,180,969
| $1,160,431,075
| $1,797,940,059
| $265,257,488
|
| Net assets consist of
|
|
|
|
|
| Paid-in capital
| $595,273,544
| $1,027,382,255
| $2,089,210,200
| $176,030,503
|
| Total distributable earnings (loss)
| 885,907,425
| 133,048,820
| (291,270,141)
| 89,226,985
|
| Net assets
| $1,481,180,969
| $1,160,431,075
| $1,797,940,059
| $265,257,488
|
| Unaffiliated investments, including repurchase agreements, at cost
| $629,119,558
| $1,037,251,312
| $2,070,820,233
| $187,246,100
|
| Affiliated investments, at cost
| —
| $2,017,985
| —
| —
|
| Foreign currency, at cost
| $237
| $108,494
| —
| $693
|
| Proceeds received on sale commitments outstanding
| —
| —
| $5,407,734
| —
|
| Premiums received on written options
| —
| $7,666,409
| —
| —
|
| Securities loaned, at value
| —
| $1,976,076
| —
| —
|
| Net asset value per share
|
|
|
|
|
| The funds have an unlimited number of shares authorized with no par value. Net asset value is calculated by dividing the net assets of each class of
shares by the number of outstanding shares in the class.
|
| Class 1
|
|
|
|
|
| Net assets
| $585,967,240
| —
| $118,882,662
| —
|
| Shares outstanding
| 44,434,060
| —
| 10,932,123
| —
|
| Net asset value, offering price and redemption price per share
| $13.19
| —
| $10.87
| —
|
| Class NAV
|
|
|
|
|
| Net assets
| $895,213,729
| $1,160,431,075
| $1,679,057,397
| $265,257,488
|
| Shares outstanding
| 67,270,091
| 127,522,915
| 154,680,018
| 54,925,586
|
| Net asset value, offering price and redemption price per share
| $13.31
| $9.10
| $10.86
| $4.83
|
| The accompanying notes are an integral part of the financial statements.
| 82
|
|
John Hancock Funds II
Statements of assets and liabilities
— August 31, 2023
| Assets
| High Yield Fund
| International Strategic Equity Allocation Fund
| Mid Value Fund
| Science & Technology Fund
|
| Unaffiliated investments, at value (including securities loaned)
| $187,555,293
| $3,381,621,471
| $1,436,657,003
| $205,167,691
|
| Affiliated investments, at value
| —
| 25,218,768
| 19,945,112
| —
|
| Total investments, at value
| 187,555,293
| 3,406,840,239
| 1,456,602,115
| 205,167,691
|
| Receivable for centrally cleared swaps
| 932,303
| —
| —
| —
|
| Unrealized appreciation on forward foreign currency contracts
| 8,292
| —
| —
| —
|
| Receivable for futures variation margin
| 18,440
| —
| —
| —
|
| Cash
| 5,454
| 1,456,782
| —
| —
|
| Foreign currency, at value
| 418,151
| 3,828,577
| —
| 1,188
|
| Collateral held at broker for futures contracts
| 185,141
| 5,778,000
| —
| —
|
| Dividends and interest receivable
| 2,931,240
| 11,427,998
| 3,559,358
| 180,960
|
| Receivable for fund shares sold
| —
| 2,478,055
| 8,360
| —
|
| Receivable for investments sold
| —
| —
| 483,873
| 572,978
|
| Receivable for delayed delivery securities sold
| 301,677
| —
| —
| —
|
| Receivable for securities lending income
| 2,281
| 27,545
| 108,036
| 230
|
| Other assets
| 8,463
| 195,235
| 66,717
| 9,154
|
| Total assets
| 192,366,735
| 3,432,032,431
| 1,460,828,459
| 205,932,201
|
| Liabilities
|
|
|
|
|
| Unrealized depreciation on forward foreign currency contracts
| 10,284
| —
| —
| —
|
| Payable for futures variation margin
| —
| 1,111,416
| —
| —
|
| Due to custodian
| —
| —
| 206,871
| 48,022
|
| Foreign capital gains tax payable
| —
| 2,558,219
| —
| —
|
| Payable for investments purchased
| 257,469
| —
| 554,665
| 838,978
|
| Payable for fund shares repurchased
| 263,066
| 2,051
| 2,116,379
| 1,252,686
|
| Payable upon return of securities loaned
| —
| 25,223,992
| 19,960,422
| —
|
| Payable to affiliates
|
|
|
|
|
| Accounting and legal services fees
| 9,535
| 199,912
| 73,929
| 9,107
|
| Trustees' fees
| 13
| 280
| 102
| 14
|
| Other liabilities and accrued expenses
| 36,620
| 641,292
| 83,368
| 26,754
|
| Total liabilities
| 576,987
| 29,737,162
| 22,995,736
| 2,175,561
|
| Net assets
| $191,789,748
| $3,402,295,269
| $1,437,832,723
| $203,756,640
|
| Net assets consist of
|
|
|
|
|
| Paid-in capital
| $334,816,193
| $3,627,027,333
| $1,079,151,675
| $198,273,023
|
| Total distributable earnings (loss)
| (143,026,445)
| (224,732,064)
| 358,681,048
| 5,483,617
|
| Net assets
| $191,789,748
| $3,402,295,269
| $1,437,832,723
| $203,756,640
|
| Unaffiliated investments, including repurchase agreements, at cost
| $219,125,568
| $3,462,816,667
| $1,182,775,563
| $176,977,678
|
| Affiliated investments, at cost
| —
| $25,214,069
| $19,936,062
| —
|
| Foreign currency, at cost
| $427,016
| $3,831,107
| —
| $1,188
|
| Collateral held at broker for centrally cleared swaps
| $977,397
| —
| —
| —
|
| Securities loaned, at value
| —
| $23,855,935
| $26,149,522
| $724,944
|
| Net asset value per share
|
|
|
|
|
| The funds have an unlimited number of shares authorized with no par value. Net asset value is calculated by dividing the net
assets of each class of shares by the number of outstanding shares in the class.
|
| Class 1
|
|
|
|
|
| Net assets
| $191,789,748
| —
| —
| —
|
| Shares outstanding
| 27,854,858
| —
| —
| —
|
| Net asset value, offering price and redemption price per share
| $6.89
| —
| —
| —
|
| Class NAV
|
|
|
|
|
| Net assets
| —
| $3,402,295,269
| $1,437,832,723
| $203,756,640
|
| Shares outstanding
| —
| 366,940,153
| 87,551,017
| 121,971,522
|
| Net asset value, offering price and redemption price per share
| —
| $9.27
| $16.42
| $1.67
|
| The accompanying notes are an integral part of the financial statements.
| 83
|
|
John Hancock Funds II
Statements of assets and liabilities
— August 31, 2023
| Assets
| U.S. Sector Rotation Fund
|
| Unaffiliated investments, at value (including securities loaned)
| $3,110,086,752
|
| Affiliated investments, at value
| 65,678,983
|
| Total investments, at value
| 3,175,765,735
|
| Cash
| 35,042
|
| Collateral held at broker for futures contracts
| 4,810,000
|
| Dividends and interest receivable
| 4,998,491
|
| Receivable for securities lending income
| 3,712
|
| Other assets
| 134,464
|
| Total assets
| 3,185,747,444
|
| Liabilities
|
|
| Payable for futures variation margin
| 131,584
|
| Payable upon return of securities loaned
| 672,936
|
| Payable to affiliates
|
|
| Accounting and legal services fees
| 193,797
|
| Trustees' fees
| 272
|
| Other liabilities and accrued expenses
| 192,777
|
| Total liabilities
| 1,191,366
|
| Net assets
| $3,184,556,078
|
| Net assets consist of
|
|
| Paid-in capital
| $3,158,258,704
|
| Total distributable earnings (loss)
| 26,297,374
|
| Net assets
| $3,184,556,078
|
| Unaffiliated investments, including repurchase agreements, at cost
| $2,740,933,468
|
| Affiliated investments, at cost
| $65,666,992
|
| Securities loaned, at value
| $658,360
|
| Net asset value per share
|
|
| The funds have an unlimited number of shares authorized with no par value. Net asset value is calculated by dividing the net assets of each class of
shares by the number of outstanding shares in the class.
|
| Class NAV
|
|
| Net assets
| $3,184,556,078
|
| Shares outstanding
| 331,873,001
|
| Net asset value, offering price and redemption price per share
| $9.60
|
| The accompanying notes are an integral part of the financial statements.
| 84
|
|
John Hancock Funds II
Statements of operations — For the year ended August 31, 2023
| Investment income
| Capital Appreciation Fund
| Capital Appreciation Value Fund
| Core Bond Fund
| Health Sciences Fund
|
| Dividends
| $9,388,900
| $12,672,764
| $2,855,160
| $2,179,659
|
| Interest
| 8,373
| 23,290,975
| 62,006,734
| 284
|
| Securities lending
| 20,668
| 36,748
| 604
| —
|
| Less foreign taxes withheld
| (233,651)
| (104,217)
| (844)
| (12,910)
|
| Total investment income
| 9,184,290
| 35,896,270
| 64,861,654
| 2,167,033
|
| Expenses
|
|
|
|
|
| Investment management fees
| 9,691,100
| 10,001,275
| 9,643,545
| 2,790,980
|
| Distribution and service fees
| 255,707
| —
| 62,845
| —
|
| Accounting and legal services fees
| 278,540
| 246,495
| 341,200
| 61,962
|
| Trustees' fees
| 31,929
| 30,260
| 40,149
| 7,684
|
| Custodian fees
| 135,290
| 150,839
| 199,784
| 48,063
|
| Printing and postage
| 25,114
| 19,688
| 20,214
| 17,964
|
| Professional fees
| 101,758
| 106,573
| 197,210
| 86,778
|
| Other
| 83,954
| 60,588
| 97,368
| 26,298
|
| Total expenses
| 10,603,392
| 10,615,718
| 10,602,315
| 3,039,729
|
| Less expense reductions
| (97,869)
| (526,410)
| (120,291)
| (158,808)
|
| Net expenses
| 10,505,523
| 10,089,308
| 10,482,024
| 2,880,921
|
| Net investment income (loss)
| (1,321,233)
| 25,806,962
| 54,379,630
| (713,888)
|
| Realized and unrealized gain (loss)
|
|
|
|
|
| Net realized gain (loss) on
|
|
|
|
|
| Unaffiliated investments and foreign currency transactions
| 108,591,580
| 5,778,774
| (107,522,389)
| 15,917,926
|
| Affiliated investments
| (2,328)
| (359)
| (205)
| —
|
| Written options
| —
| (1,927,294)
| —
| —
|
|
| 108,589,252
| 3,851,121
| (107,522,594)
| 15,917,926
|
| Change in net unrealized appreciation (depreciation) of
|
|
|
|
|
| Unaffiliated investments and translation of assets and liabilities in foreign currencies
| 209,275,497
| 102,708,913
| 35,339,323
| (663,056)
|
| Affiliated investments
| —
| 1,116
| —
| —
|
| Written options
| —
| (3,043,567)
| —
| —
|
|
| 209,275,497
| 99,666,462
| 35,339,323
| (663,056)
|
| Net realized and unrealized gain (loss)
| 317,864,749
| 103,517,583
| (72,183,271)
| 15,254,870
|
| Increase (decrease) in net assets from operations
| $316,543,516
| $129,324,545
| $(17,803,641)
| $14,540,982
|
| The accompanying notes are an integral part of the financial statements.
| 85
|
|
John Hancock Funds II
Statements of operations — For the year ended August 31, 2023
| Investment income
| High Yield Fund
| International Strategic Equity Allocation Fund
| Mid Value Fund
| Science & Technology Fund
|
| Dividends
| $216,466
| $138,085,134
| $28,715,237
| $1,007,247
|
| Interest
| 14,960,365
| 7,035,861
| 21,198
| 5,792
|
| Securities lending
| 58,121
| 531,719
| 365,732
| 8,990
|
| Less foreign taxes withheld
| (25)
| (13,903,967)
| (255,730)
| (14,645)
|
| Total investment income
| 15,234,927
| 131,748,747
| 28,846,437
| 1,007,384
|
| Expenses
|
|
|
|
|
| Investment management fees
| 1,350,952
| 25,543,548
| 12,270,038
| 1,430,214
|
| Distribution and service fees
| 96,497
| —
| —
| —
|
| Accounting and legal services fees
| 39,524
| 850,320
| 286,990
| 30,826
|
| Trustees' fees
| 4,790
| 104,883
| 34,089
| 3,534
|
| Custodian fees
| 35,895
| 1,458,527
| 162,085
| 39,142
|
| Printing and postage
| 17,764
| 24,494
| 19,893
| 17,673
|
| Professional fees
| 102,240
| 263,929
| 108,783
| 72,333
|
| Other
| 28,605
| 155,644
| 51,252
| 19,046
|
| Total expenses
| 1,676,267
| 28,401,345
| 12,933,130
| 1,612,768
|
| Less expense reductions
| (13,885)
| (5,972,437)
| (673,183)
| (83,089)
|
| Net expenses
| 1,662,382
| 22,428,908
| 12,259,947
| 1,529,679
|
| Net investment income (loss)
| 13,572,545
| 109,319,839
| 16,586,490
| (522,295)
|
| Realized and unrealized gain (loss)
|
|
|
|
|
| Net realized gain (loss) on
|
|
|
|
|
| Unaffiliated investments and foreign currency transactions
| (12,745,034)
| (171,467,227)
| 140,947,585
| 5,549,217
|
| Affiliated investments
| (1,511)
| (14,340)
| (7,025)
| 166
|
| Futures contracts
| (827,606)
| 13,177,630
| —
| —
|
| Forward foreign currency contracts
| 54,750
| —
| —
| —
|
| Swap contracts
| (221,319)
| —
| —
| —
|
| Redemptions in kind
| —
| 100,551,956
| —
| —
|
|
| (13,740,720)
| (57,751,981)
| 140,940,560
| 5,549,383
|
| Change in net unrealized appreciation (depreciation) of
|
|
|
|
|
| Unaffiliated investments and translation of assets and liabilities in foreign currencies
| 12,292,037
| 420,689,332
| 31,091,832
| 39,077,531
|
| Affiliated investments
| 972
| 4,826
| 9,312
| 5
|
| Futures contracts
| 147,173
| 7,024,318
| —
| —
|
| Forward foreign currency contracts
| 14,040
| —
| —
| —
|
| Swap contracts
| (41,468)
| —
| —
| —
|
|
| 12,412,754
| 427,718,476
| 31,101,144
| 39,077,536
|
| Net realized and unrealized gain (loss)
| (1,327,966)
| 369,966,495
| 172,041,704
| 44,626,919
|
| Increase in net assets from operations
| $12,244,579
| $479,286,334
| $188,628,194
| $44,104,624
|
| The accompanying notes are an integral part of the financial statements.
| 86
|
|
John Hancock Funds II
Statements of operations — For the year ended August 31, 2023
| Investment income
| U.S. Sector Rotation Fund
|
| Dividends
| $69,636,978
|
| Income distributions received from affiliated investments
| 5,891,537
|
| Interest
| 135,942
|
| Securities lending
| 37,482
|
| Less foreign taxes withheld
| (16,730)
|
| Total investment income
| 75,685,209
|
| Expenses
|
|
| Investment management fees
| 26,635,329
|
| Accounting and legal services fees
| 887,294
|
| Trustees' fees
| 114,759
|
| Custodian fees
| 655,173
|
| Printing and postage
| 25,486
|
| Professional fees
| 253,812
|
| Other
| 107,834
|
| Total expenses
| 28,679,687
|
| Less expense reductions
| (5,932,549)
|
| Net expenses
| 22,747,138
|
| Net investment income
| 52,938,071
|
| Realized and unrealized gain (loss)
|
|
| Net realized gain (loss) on
|
|
| Unaffiliated investments and foreign currency transactions
| (267,377,054)
|
| Affiliated investments
| (7,970)
|
| Futures contracts
| 10,103,486
|
| Redemptions in kind
| 150,440,341
|
|
| (106,841,197)
|
| Change in net unrealized appreciation (depreciation) of
|
|
| Unaffiliated investments and translation of assets and liabilities in foreign currencies
| 663,383,569
|
| Affiliated investments
| 14,077
|
| Futures contracts
| 5,005,189
|
|
| 668,402,835
|
| Net realized and unrealized gain (loss)
| 561,561,638
|
| Increase in net assets from operations
| $614,499,709
|
| The accompanying notes are an integral part of the financial statements.
| 87
|
|
John Hancock Funds II
Statements of changes in net assets
|
| Capital Appreciation Fund
| Capital Appreciation Value Fund
| Core Bond Fund
|
|
| Year ended
8-31-23
| Year ended
8-31-22
| Year ended
8-31-23
| Year ended
8-31-22
| Year ended
8-31-23
| Year ended
8-31-22
|
| Increase (decrease) in net assets
|
|
|
|
|
|
|
| From operations
|
|
|
|
|
|
|
| Net investment income (loss)
| $(1,321,233)
| $(5,532,826)
| $25,806,962
| $13,314,402
| $54,379,630
| $23,348,292
|
| Net realized gain (loss)
| 108,589,252
| 145,464,507
| 3,851,121
| 168,016,116
| (107,522,594)
| (95,229,555)
|
| Change in net unrealized appreciation (depreciation)
| 209,275,497
| (777,331,675)
| 99,666,462
| (279,577,687)
| 35,339,323
| (145,383,408)
|
| Increase (decrease) in net assets resulting from operations
| 316,543,516
| (637,399,994)
| 129,324,545
| (98,247,169)
| (17,803,641)
| (217,264,671)
|
| Distributions to shareholders
|
|
|
|
|
|
|
| From earnings
|
|
|
|
|
|
|
| Class 1
| (51,623,538)
| (234,037,715)
| —
| —
| (4,071,085)
| (3,151,517)
|
| Class NAV
| (87,259,196)
| (310,779,087)
| (152,535,808)
| (259,582,767)
| (49,179,048)
| (29,676,464)
|
| Total distributions
| (138,882,734)
| (544,816,802)
| (152,535,808)
| (259,582,767)
| (53,250,133)
| (32,827,981)
|
| From fund share transactions
|
|
|
|
|
|
|
| From fund share transactions
| (82,482,263)
| 431,644,019
| (69,593,451)
| 215,270,220
| 257,099,119
| 73,687,525
|
| Total increase (decrease)
| 95,178,519
| (750,572,777)
| (92,804,714)
| (142,559,716)
| 186,045,345
| (176,405,127)
|
| Net assets
|
|
|
|
|
|
|
| Beginning of year
| 1,386,002,450
| 2,136,575,227
| 1,253,235,789
| 1,395,795,505
| 1,611,894,714
| 1,788,299,841
|
| End of year
| $1,481,180,969
| $1,386,002,450
| $1,160,431,075
| $1,253,235,789
| $1,797,940,059
| $1,611,894,714
|
|
| Health Sciences Fund
| High Yield Fund
| International Strategic Equity Allocation Fund
|
|
| Year ended
8-31-23
| Year ended
8-31-22
| Year ended
8-31-23
| Year ended
8-31-22
| Year ended
8-31-23
| Year ended
8-31-22
|
| Increase (decrease) in net assets
|
|
|
|
|
|
|
| From operations
|
|
|
|
|
|
|
| Net investment income (loss)
| $(713,888)
| $(1,160,190)
| $13,572,545
| $13,246,359
| $109,319,839
| $83,982,226
|
| Net realized gain (loss)
| 15,917,926
| 15,163,654
| (13,740,720)
| (16,047,579)
| (57,751,981)
| (22,483,103)
|
| Change in net unrealized appreciation (depreciation)
| (663,056)
| (98,141,793)
| 12,412,754
| (28,694,226)
| 427,718,476
| (832,140,487)
|
| Increase (decrease) in net assets resulting from operations
| 14,540,982
| (84,138,329)
| 12,244,579
| (31,495,446)
| 479,286,334
| (770,641,364)
|
| Distributions to shareholders
|
|
|
|
|
|
|
| From earnings
|
|
|
|
|
|
|
| Class 1
| —
| —
| (13,372,984)
| (13,647,917)
| —
| —
|
| Class NAV
| (8,653,037)
| (56,448,788)
| —
| —
| (92,213,840)
| (91,427,800)
|
| Total distributions
| (8,653,037)
| (56,448,788)
| (13,372,984)
| (13,647,917)
| (92,213,840)
| (91,427,800)
|
| From fund share transactions
|
|
|
|
|
|
|
| From fund share transactions
| (57,564,224)
| 30,275,300
| (14,977,008)
| (26,315,847)
| (947,029,848)
| 3,095,643,495
|
| Total increase (decrease)
| (51,676,279)
| (110,311,817)
| (16,105,413)
| (71,459,210)
| (559,957,354)
| 2,233,574,331
|
| Net assets
|
|
|
|
|
|
|
| Beginning of year
| 316,933,767
| 427,245,584
| 207,895,161
| 279,354,371
| 3,962,252,623
| 1,728,678,292
|
| End of year
| $265,257,488
| $316,933,767
| $191,789,748
| $207,895,161
| $3,402,295,269
| $3,962,252,623
|
| The accompanying notes are an integral part of the financial statements.
| 88
|
|
John Hancock Funds II
Statements of changes in net assets
|
| Mid Value Fund
| Science & Technology Fund
| U.S. Sector Rotation Fund
|
|
| Year ended
8-31-23
| Year ended
8-31-22
| Year ended
8-31-23
| Year ended
8-31-22
| Year ended
8-31-23
| Year ended
8-31-22
|
| Increase (decrease) in net assets
|
|
|
|
|
|
|
| From operations
|
|
|
|
|
|
|
| Net investment income (loss)
| $16,586,490
| $12,842,933
| $(522,295)
| $(1,281,095)
| $52,938,071
| $26,620,084
|
| Net realized gain (loss)
| 140,940,560
| 230,707,565
| 5,549,383
| (393,314)
| (106,841,197)
| (60,403,371)
|
| Change in net unrealized appreciation (depreciation)
| 31,101,144
| (236,462,700)
| 39,077,536
| (68,569,495)
| 668,402,835
| (589,584,401)
|
| Increase (decrease) in net assets resulting from operations
| 188,628,194
| 7,087,798
| 44,104,624
| (70,243,904)
| 614,499,709
| (623,367,688)
|
| Distributions to shareholders
|
|
|
|
|
|
|
| From earnings
|
|
|
|
|
|
|
| Class NAV
| (228,179,709)
| (149,119,105)
| (18,119,628)
| (121,883,322)
| (117,724,841)
| (259,017,769)
|
| Total distributions
| (228,179,709)
| (149,119,105)
| (18,119,628)
| (121,883,322)
| (117,724,841)
| (259,017,769)
|
| From fund share transactions
|
|
|
|
|
|
|
| From fund share transactions
| 100,795,139
| (328,074,061)
| 23,622,210
| 129,167,856
| (1,723,680,714)
| 4,085,740,784
|
| Total increase (decrease)
| 61,243,624
| (470,105,368)
| 49,607,206
| (62,959,370)
| (1,226,905,846)
| 3,203,355,327
|
| Net assets
|
|
|
|
|
|
|
| Beginning of year
| 1,376,589,099
| 1,846,694,467
| 154,149,434
| 217,108,804
| 4,411,461,924
| 1,208,106,597
|
| End of year
| $1,437,832,723
| $1,376,589,099
| $203,756,640
| $154,149,434
| $3,184,556,078
| $4,411,461,924
|
| The accompanying notes are an integral part of the financial statements.
| 89
|
|
John Hancock Funds II
Financial highlights
| Per share operating performance for a share outstanding throughout each period
|
| Ratios and supplemental data
|
|
|
|
|
| Income (loss) from investment operations
|
|
| Less distributions
|
|
|
| Ratios to average net assets
|
|
|
| Period ended
| Net asset
value,
beginning
of period ($)
|
| Net
investment
income
(loss) ($)1
| Net realized and
unrealized
gain (loss)
on investments ($)
| Total from
investment
operations ($)
| From net
investment
income ($)
| From net
realized
gain ($)
| Total
distributions ($)
| Net asset
value,
end of
period ($)
| Total
return
(%)2
| Expenses
before
reductions
(%)
| Expenses
including
reductions
(%)
| Net
investment
income
(loss) (%)
| Net
assets,
end of
period
(in millions)
| Portfolio
turnover
(%)
|
| Capital Appreciation Fund
|
|
| Class 1
|
|
| 08-31-2023
| 11.86
|
| (0.01)
| 2.56
| 2.55
| —
| (1.22)
| (1.22)
| 13.19
| 25.42
| 0.81
| 0.80
| (0.13)
| 586
| 30
|
| 08-31-2022
| 24.06
|
| (0.06)
| (5.69)
| (5.75)
| —
| (6.45)
| (6.45)
| 11.86
| (31.48)
| 0.79
| 0.79
| (0.36)
| 538
| 36
|
| 08-31-2021
| 23.01
|
| (0.10)
| 5.14
| 5.04
| —
| (3.99)
| (3.99)
| 24.06
| 24.71
| 0.79
| 0.78
| (0.46)
| 908
| 45
|
| 08-31-2020
| 15.66
|
| (0.04)
| 9.09
| 9.05
| —
| (1.70)
| (1.70)
| 23.01
| 62.93
| 0.80
| 0.79
| (0.23)
| 810
| 47
|
| 08-31-2019
| 18.80
|
| —3
| (0.46)
| (0.46)
| (0.02)
| (2.66)
| (2.68)
| 15.66
| 0.84
| 0.80
| 0.79
| (0.03)
| 584
| 50
|
| Class NAV
|
|
| 08-31-2023
| 11.95
|
| (0.01)
| 2.59
| 2.58
| —
| (1.22)
| (1.22)
| 13.31
| 25.49
| 0.76
| 0.75
| (0.08)
| 895
| 30
|
| 08-31-2022
| 24.18
|
| (0.05)
| (5.73)
| (5.78)
| —
| (6.45)
| (6.45)
| 11.95
| (31.44)
| 0.74
| 0.74
| (0.29)
| 848
| 36
|
| 08-31-2021
| 23.10
|
| (0.09)
| 5.16
| 5.07
| —
| (3.99)
| (3.99)
| 24.18
| 24.75
| 0.74
| 0.73
| (0.41)
| 1,229
| 45
|
| 08-31-2020
| 15.71
|
| (0.03)
| 9.12
| 9.09
| —3
| (1.70)
| (1.70)
| 23.10
| 63.00
| 0.75
| 0.74
| (0.18)
| 1,373
| 47
|
| 08-31-2019
| 18.85
|
| —3
| (0.45)
| (0.45)
| (0.03)
| (2.66)
| (2.69)
| 15.71
| 0.89
| 0.75
| 0.74
| 0.03
| 1,153
| 50
|
| 1. Based on average daily shares outstanding. 2. Total returns would have been lower had certain expenses not been reduced during the applicable periods. 3. Less than $0.005 per share.
|
|
| Capital Appreciation Value Fund
|
|
| Class NAV
|
|
| 08-31-2023
| 9.36
|
| 0.19
| 0.72
| 0.91
| (0.14)
| (1.03)
| (1.17)
| 9.10
| 11.38
| 0.88
| 0.84
| 2.14
| 1,160
| 88
|
| 08-31-2022
| 12.56
|
| 0.11
| (0.84)
| (0.73)
| (0.13)
| (2.34)
| (2.47)
| 9.36
| (7.56)
| 0.87
| 0.82
| 1.01
| 1,253
| 73
|
| 08-31-2021
| 11.92
|
| 0.12
| 2.63
| 2.75
| (0.14)
| (1.97)
| (2.11)
| 12.56
| 25.84
| 0.86
| 0.82
| 0.98
| 1,396
| 57
|
| 08-31-2020
| 11.75
|
| 0.14
| 1.33
| 1.47
| (0.20)
| (1.10)
| (1.30)
| 11.92
| 13.38
| 0.87
| 0.83
| 1.20
| 1,442
| 79
|
| 08-31-2019
| 12.27
|
| 0.19
| 0.76
| 0.95
| (0.33)
| (1.14)
| (1.47)
| 11.75
| 10.07
| 0.85
| 0.81
| 1.66
| 1,607
| 63
|
| 1. Based on average daily shares outstanding. 2. Total returns would have been lower had certain expenses not been reduced during the applicable periods.
|
|
| Core Bond Fund
|
|
| Class 1
|
|
| 08-31-2023
| 11.35
|
| 0.35
| (0.48)
| (0.13)
| (0.35)
| —
| (0.35)
| 10.87
| (1.11)
| 0.68
| 0.67
| 3.19
| 119
| 238
|
| 08-31-2022
| 13.19
|
| 0.16
| (1.76)
| (1.60)
| (0.24)
| —
| (0.24)
| 11.35
| (12.33)
| 0.67
| 0.66
| 1.32
| 134
| 262
|
| 08-31-2021
| 13.96
|
| 0.11
| (0.08)
| 0.03
| (0.22)
| (0.58)
| (0.80)
| 13.19
| 0.17
| 0.66
| 0.65
| 0.84
| 185
| 310
|
| 08-31-2020
| 13.50
|
| 0.23
| 0.66
| 0.89
| (0.31)
| (0.12)
| (0.43)
| 13.96
| 6.76
| 0.66
| 0.65
| 1.73
| 207
| 347
|
| 08-31-2019
| 12.66
|
| 0.33
| 0.86
| 1.19
| (0.35)
| —
| (0.35)
| 13.50
| 9.59
| 0.66
| 0.65
| 2.60
| 175
| 447
|
| Class NAV
|
|
| 08-31-2023
| 11.33
|
| 0.36
| (0.47)
| (0.11)
| (0.36)
| —
| (0.36)
| 10.86
| (0.97)
| 0.63
| 0.62
| 3.26
| 1,679
| 238
|
| 08-31-2022
| 13.17
|
| 0.17
| (1.77)
| (1.60)
| (0.24)
| —
| (0.24)
| 11.33
| (12.30)
| 0.62
| 0.61
| 1.41
| 1,478
| 262
|
| 08-31-2021
| 13.94
|
| 0.12
| (0.08)
| 0.04
| (0.23)
| (0.58)
| (0.81)
| 13.17
| 0.22
| 0.61
| 0.60
| 0.89
| 1,604
| 310
|
| 08-31-2020
| 13.47
|
| 0.24
| 0.66
| 0.90
| (0.31)
| (0.12)
| (0.43)
| 13.94
| 6.90
| 0.61
| 0.60
| 1.81
| 2,507
| 347
|
| 08-31-2019
| 12.64
|
| 0.34
| 0.84
| 1.18
| (0.35)
| —
| (0.35)
| 13.47
| 9.58
| 0.61
| 0.60
| 2.63
| 2,693
| 447
|
| 1. Based on average daily shares outstanding. 2. Total returns would have been lower had certain expenses not been reduced during the applicable periods.
|
|
| Health Sciences Fund
|
|
| Class NAV
|
|
| 08-31-2023
| 4.75
|
| (0.01)
| 0.23
| 0.22
| —
| (0.14)
| (0.14)
| 4.83
| 4.65
| 1.00
| 0.95
| (0.24)
| 265
| 36
|
| 08-31-2022
| 6.91
|
| (0.02)
| (1.22)
| (1.24)
| —
| (0.92)
| (0.92)
| 4.75
| (19.99)
| 1.03
| 0.97
| (0.32)
| 317
| 30
|
| 08-31-2021
| 5.60
|
| (0.02)
| 1.71
| 1.69
| —
| (0.38)
| (0.38)
| 6.91
| 31.27
| 1.02
| 0.97
| (0.38)
| 427
| 35
|
| 08-31-2020
| 4.53
|
| (0.01)
| 1.27
| 1.26
| —
| (0.19)
| (0.19)
| 5.60
| 28.39
| 1.11
| 1.05
| (0.28)
| 428
| 47
|
| 08-31-2019
| 5.10
|
| (0.01)
| (0.28)
| (0.29)
| —
| (0.28)
| (0.28)
| 4.53
| (4.87)
| 1.11
| 1.05
| (0.17)
| 272
| 42
|
| 1. Based on average daily shares outstanding. 2. Total returns would have been lower had certain expenses not been reduced during the applicable periods.
|
|
| High Yield Fund
|
|
| Class 1
|
|
| 08-31-2023
| 6.91
|
| 0.47
| (0.02)
| 0.45
| (0.47)
| —
| (0.47)
| 6.89
| 6.91
| 0.87
| 0.86
| 7.03
| 192
| 31
|
| 08-31-2022
| 8.31
|
| 0.41
| (1.39)
| (0.98)
| (0.42)
| —
| (0.42)
| 6.91
| (12.21)
| 0.84
| 0.83
| 5.30
| 208
| 43
|
| 08-31-2021
| 7.86
|
| 0.40
| 0.46
| 0.86
| (0.41)
| —
| (0.41)
| 8.31
| 11.30
| 0.84
| 0.83
| 4.91
| 279
| 82
|
| 08-31-2020
| 8.04
|
| 0.43
| (0.14)
| 0.29
| (0.47)
| —
| (0.47)
| 7.86
| 4.01
| 0.85
| 0.84
| 5.54
| 202
| 81
|
| 08-31-2019
| 8.17
|
| 0.46
| (0.10)
| 0.36
| (0.49)
| —
| (0.49)
| 8.04
| 4.32
| 0.82
| 0.81
| 5.77
| 250
| 51
|
| 1. Based on average daily shares outstanding. 2. Total returns would have been lower had certain expenses not been reduced during the applicable periods.
|
|
| The accompanying notes are an integral part of the financial statements.
| 90
|
|
John Hancock Funds II
Financial highlights
| Per share operating performance for a share outstanding throughout each period
|
| Ratios and supplemental data
|
|
|
|
|
| Income (loss) from investment operations
|
|
| Less distributions
|
|
|
| Ratios to average net assets
|
|
|
| Period ended
| Net asset
value,
beginning
of period ($)
|
| Net
investment
income
(loss) ($)1
| Net realized and
unrealized
gain (loss)
on investments ($)
| Total from
investment
operations ($)
| From net
investment
income ($)
| From net
realized
gain ($)
| Total
distributions ($)
| Net asset
value,
end of
period ($)
| Total
return
(%)2
| Expenses
before
reductions
(%)
| Expenses
including
reductions
(%)
| Net
investment
income
(loss) (%)
| Net
assets,
end of
period
(in millions)
| Portfolio
turnover
(%)
|
| International Strategic Equity Allocation Fund
|
|
| Class NAV
|
|
| 08-31-2023
| 8.54
|
| 0.24
| 0.69
| 0.93
| (0.20)
| —
| (0.20)
| 9.27
| 11.14
| 0.70
| 0.56
| 2.71
| 3,402
| 333
|
| 08-31-2022
| 11.48
|
| 0.31
| (2.64)
| (2.33)
| (0.29)
| (0.32)
| (0.61)
| 8.54
| (21.25)
| 0.70
| 0.56
| 3.19
| 3,962
| 783
|
| 08-31-2021
| 9.55
|
| 0.19
| 1.92
| 2.11
| (0.18)
| —
| (0.18)
| 11.48
| 22.25
| 0.69
| 0.56
| 1.81
| 1,729
| 63
|
| 08-31-2020
| 9.01
|
| 0.19
| 0.62
| 0.81
| (0.27)
| —
| (0.27)
| 9.55
| 8.98
| 0.69
| 0.56
| 2.07
| 1,714
| 76
|
| 08-31-2019
| 11.21
|
| 0.26
| (0.85)
| (0.59)
| (0.26)
| (1.35)
| (1.61)
| 9.01
| (3.97)
| 0.69
| 0.56
| 2.74
| 1,634
| 57
|
| 1. Based on average daily shares outstanding. 2. Total returns would have been lower had certain expenses not been reduced during the applicable periods. 3. Excludes in-kind transactions.
|
|
| Mid Value Fund
|
|
| Class NAV
|
|
| 08-31-2023
| 17.35
|
| 0.19
| 1.83
| 2.02
| (0.10)
| (2.85)
| (2.95)
| 16.42
| 13.82
| 0.92
| 0.87
| 1.18
| 1,438
| 55
|
| 08-31-2022
| 19.15
|
| 0.14
| (0.35)
| (0.21)
| (0.15)
| (1.44)
| (1.59)
| 17.35
| (1.38)
| 0.95
| 0.90
| 0.76
| 1,377
| 36
|
| 08-31-2021
| 14.91
|
| 0.13
| 4.70
| 4.83
| (0.21)
| (0.38)
| (0.59)
| 19.15
| 33.10
| 0.99
| 0.93
| 0.76
| 1,847
| 41
|
| 08-31-2020
| 14.27
|
| 0.17
| 0.90
| 1.07
| (0.26)
| (0.17)
| (0.43)
| 14.91
| 7.40
| 0.99
| 0.94
| 1.18
| 1,322
| 45
|
| 08-31-2019
| 17.08
|
| 0.22
| (1.81)
| (1.59)
| (0.15)
| (1.07)
| (1.22)
| 14.27
| (8.82)
| 0.99
| 0.94
| 1.48
| 1,231
| 42
|
| 1. Based on average daily shares outstanding. 2. Total returns would have been lower had certain expenses not been reduced during the applicable periods.
|
|
| Science & Technology Fund
|
|
| Class NAV
|
|
| 08-31-2023
| 1.38
|
| —3
| 0.44
| 0.44
| —
| (0.15)
| (0.15)
| 1.67
| 37.29
| 1.07
| 1.02
| (0.35)
| 204
| 127
|
| 08-31-2022
| 5.53
|
| (0.01)
| (0.89)
| (0.90)
| —
| (3.25)
| (3.25)
| 1.38
| (33.02)
| 1.10
| 1.05
| (0.71)
| 154
| 124
|
| 08-31-2021
| 5.22
|
| (0.03)
| 1.47
| 1.44
| (0.01)
| (1.12)
| (1.13)
| 5.53
| 30.29
| 1.10
| 1.04
| (0.57)
| 217
| 86
|
| 08-31-2020
| 3.87
|
| 0.024
| 1.69
| 1.71
| —
| (0.36)
| (0.36)
| 5.22
| 47.55
| 1.10
| 1.06
| 0.404
| 363
| 116
|
| 08-31-2019
| 5.99
|
| (0.01)
| (0.32)
| (0.33)
| —
| (1.79)
| (1.79)
| 3.87
| 3.19
| 1.10
| 1.06
| (0.36)
| 284
| 110
|
| 1. Based on average daily shares outstanding. 2. Total returns would have been lower had certain expenses not been reduced during the applicable periods. 3. Less than $0.005 per share. 4. Net investment income (loss) per share and ratio of net investment income (loss) to average net assets reflect a special dividend received by the fund, which amounted to $0.04 and 1.00%,
respectively.
|
|
| U.S. Sector Rotation Fund
|
|
| Class NAV
|
|
| 08-31-2023
| 8.56
|
| 0.11
| 1.16
| 1.27
| (0.09)
| (0.14)
| (0.23)
| 9.60
| 15.27
| 0.68
| 0.54
| 1.26
| 3,185
| 683
|
| 08-31-2022
| 12.62
|
| 0.10
| (1.22)
| (1.12)
| (0.11)
| (2.83)
| (2.94)
| 8.56
| (12.17)
| 0.66
| 0.52
| 1.05
| 4,411
| 1183
|
| 08-31-2021
| 10.76
|
| 0.10
| 2.93
| 3.03
| (0.17)
| (1.00)
| (1.17)
| 12.62
| 30.62
| 0.67
| 0.53
| 0.87
| 1,208
| 91
|
| 08-31-2020
| 9.86
|
| 0.16
| 1.79
| 1.95
| (0.19)
| (0.86)
| (1.05)
| 10.76
| 20.74
| 0.67
| 0.54
| 1.63
| 1,295
| 113
|
| 08-31-2019
| 13.13
|
| 0.17
| (0.72)
| (0.55)
| (0.19)
| (2.53)
| (2.72)
| 9.86
| (0.34)
| 0.66
| 0.53
| 1.66
| 1,497
| 92
|
| 1. Based on average daily shares outstanding. 2. Total returns would have been lower had certain expenses not been reduced during the applicable periods. 3. Excludes in-kind transactions.
|
|
| The accompanying notes are an integral part of the financial statements.
| 91
|
|
John Hancock Funds II
Notes to financial statements
1. Organization
John Hancock Funds II (the
Trust) is an open-end management investment company organized as a Massachusetts business trust. The Trust is registered under the Investment Company Act of 1940, as amended (the 1940 Act). It is a series company with
multiple investment series, nine of which are presented in this report (the funds).
The funds may offer
multiple classes of shares. The shares currently offered by a specific fund are detailed in the Statements of assets and liabilities. Class 1 shares are offered only to certain affiliates of Manulife Financial
Corporation. Class NAV shares are offered to John Hancock affiliated funds of funds, retirement plans for employees of John Hancock and/or Manulife Financial Corporation, and certain 529 plans. Shareholders of each
class have exclusive voting rights to matters that affect that class. The distribution and service fees, if any, and transfer agent fees for each class may differ.
2. Significant
accounting policies
The financial statements
have been prepared in conformity with accounting principles generally accepted in the United States of America (US GAAP), which require management to make certain estimates and assumptions as of the date of the
financial statements. Actual results could differ from those estimates and those differences could be significant. The funds qualify as investment companies under Topic 946 of Accounting Standards Codification of US
GAAP.
Events or transactions
occurring after the end of the fiscal period through the date that the financial statements were issued have been evaluated in the preparation of the financial statements. The following summarizes the significant
accounting policies of the funds:
Security valuation. Investments are stated at value as of the scheduled close of regular trading on the New York Stock Exchange (NYSE), normally at 4:00 P.M., Eastern Time. In case of emergency or other
disruption resulting in the NYSE not opening for trading or the NYSE closing at a time other than the regularly scheduled close, the net asset value (NAV) may be determined as of the regularly scheduled close of the
NYSE pursuant to the Advisor's Valuation Policies and Procedures.
In order to value the
securities, the funds use the following valuation techniques: Equity securities, including exchange-traded or closed-end funds, are typically valued at the last sale price or official closing price on the exchange or
principal market where the security trades. In the event there were no sales during the day or closing prices are not available, the securities are valued using the last available bid price. Investments in open-end
mutual funds, including John Hancock Collateral Trust (JHCT), are valued at their respective NAVs each business day. Debt obligations are typically valued based on evaluated prices provided by an independent
pricing vendor. Independent pricing vendors utilize matrix pricing, which takes into account factors such as institutional-size trading in similar groups of securities, yield, quality, coupon rate, maturity, type of
issue, trading characteristics and other market data, as well as broker supplied prices. Exchange-traded options are valued at the mid-price of the last quoted bid and ask prices from the exchange where the option
trades. Unlisted options are generally valued using evaluated prices obtained from an independent pricing vendor. Futures contracts whose settlement prices are determined as of the close of the NYSE are typically
valued based on the settlement price while other futures contracts are typically valued at the last traded price on the exchange on which they trade. Foreign equity index futures that trade in the electronic trading
market subsequent to the close of regular trading may be valued at the last traded price in the electronic trading market as of 4:00 P.M. ET, or may be fair valued based on fair value adjustment factors provided by an
independent pricing vendor in order to adjust for events that may occur between the close of foreign exchanges or markets and the close of the NYSE. Swaps are valued using evaluated prices obtained from an independent
pricing vendor. Forward foreign currency contracts are valued at the prevailing forward rates which are based on foreign currency exchange spot rates and forward points supplied by an independent pricing vendor.
Foreign securities and currencies are valued in U.S. dollars based on foreign currency exchange rates supplied by an independent pricing vendor.
In certain instances, the
Pricing Committee of the Advisor may determine to value equity securities using prices obtained from another exchange or market if trading on the exchange or market on which prices are typically obtained did not open
for trading as scheduled, or if trading closed earlier than scheduled, and trading occurred as normal on another exchange or market.
Other portfolio securities
and assets, for which reliable market quotations are not readily available, are valued at fair value as determined in good faith by the Pricing Committee following procedures established by the Advisor and adopted by
the Board of Trustees. The frequency with which these fair valuation procedures are used cannot be predicted and fair value of securities may differ significantly from the value that would have been used had a ready
market for such securities existed. Trading in foreign securities may be completed before the scheduled daily close of trading on the NYSE. Significant events at the issuer or market level may affect the values of
securities between the time when the valuation of the securities is generally determined and the close of the NYSE. If a significant event occurs, these securities may be fair valued, as determined in good faith by
the Pricing Committee, following procedures established by the Advisor and adopted by the Board of Trustees. The Advisor uses fair value adjustment factors provided by an independent pricing vendor to value certain
foreign securities in order to adjust for events that may occur between the close of foreign exchanges or markets and the close of the NYSE.
The funds use a three tier
hierarchy to prioritize the pricing assumptions, referred to as inputs, used in valuation techniques to measure fair value. Level 1 includes securities valued using quoted prices in active markets for identical
securities, including registered investment companies. Level 2 includes securities valued using other significant observable inputs. Observable inputs may include quoted prices for similar securities, interest rates,
prepayment speeds and credit risk. Prices for securities valued using these inputs are received from independent pricing vendors and brokers and are based on an evaluation of the inputs described. Level 3 includes
securities valued using significant unobservable inputs when market prices are not readily available or reliable, including the Advisor's assumptions in determining the fair value of investments. Factors used in
determining value may include market or issuer specific events or trends, changes in interest rates and credit quality. The inputs or methodology used for valuing securities are not necessarily an indication of the
risks associated with investing in those securities. Changes in valuation techniques and related inputs may result in transfers into or out of an assigned level within the disclosure hierarchy.
The following is a summary
of the values by input classification of the funds' investments as of August 31, 2023, by major security category or type:
Significant accounting policies,
continued
|
| Total
value at
8-31-23
| Level 1
quoted
price
| Level 2
significant
observable
inputs
| Level 3
significant
unobservable
inputs
|
| Capital Appreciation Fund
|
| Investments in securities:
|
|
|
|
|
| Assets
|
|
|
|
|
| Common stocks
|
|
|
|
|
| Communication services
| $152,131,624
| $152,131,624
| —
| —
|
| Consumer discretionary
| 350,008,934
| 318,514,117
| $31,494,817
| —
|
| Consumer staples
| 44,202,155
| 28,739,428
| 15,462,727
| —
|
| Financials
| 128,915,688
| 128,915,688
| —
| —
|
| Health care
| 167,695,753
| 167,695,753
| —
| —
|
| Industrials
| 32,003,426
| 32,003,426
| —
| —
|
| Information technology
| 582,643,960
| 582,643,960
| —
| —
|
| Real estate
| 13,378,696
| 13,378,696
| —
| —
|
| Preferred securities
| 7,537,646
| —
| 7,537,646
| —
|
| Short-term investments
| 5,374,366
| 5,374,366
| —
| —
|
| Total investments in securities
| $1,483,892,248
| $1,429,397,058
| $54,495,190
| —
|
|
|
| Capital Appreciation Value Fund
|
| Investments in securities:
|
|
|
|
|
| Assets
|
|
|
|
|
| Common stocks
| $754,546,192
| $754,546,192
| —
| —
|
| Preferred securities
| 4,520,373
| 4,520,373
| —
| —
|
| U.S. Government and Agency obligations
| 129,108,722
| —
| $129,108,722
| —
|
| Corporate bonds
| 120,329,627
| —
| 120,329,627
| —
|
| Term loans
| 123,763,037
| —
| 123,763,037
| —
|
| Short-term investments
| 30,170,878
| 30,170,878
| —
| —
|
| Total investments in securities
| $1,162,438,829
| $789,237,443
| $373,201,386
| —
|
| Derivatives:
|
|
|
|
|
| Liabilities
|
|
|
|
|
| Written options
| $(6,616,180)
| —
| $(6,616,180)
| —
|
|
|
| Core Bond Fund
|
| Investments in securities:
|
|
|
|
|
| Assets
|
|
|
|
|
| U.S. Government and Agency obligations
| $1,070,043,319
| —
| $1,070,043,319
| —
|
| Foreign government obligations
| 12,740,243
| —
| 12,740,243
| —
|
| Corporate bonds
| 402,178,341
| —
| 402,178,341
| —
|
| Municipal bonds
| 3,675,730
| —
| 3,675,730
| —
|
| Collateralized mortgage obligations
| 211,596,163
| —
| 211,596,163
| —
|
| Asset backed securities
| 183,753,178
| —
| 183,753,178
| —
|
| Short-term investments
| 99,548,456
| $99,548,456
| —
| —
|
| Total investments in securities
| $1,983,535,430
| $99,548,456
| $1,883,986,974
| —
|
| Liabilities
|
|
|
|
|
| Sale commitments outstanding
| $(5,361,328)
| —
| $(5,361,328)
| —
|
|
|
| Health Sciences Fund
|
| Investments in securities:
|
|
|
|
|
| Assets
|
|
|
|
|
| Common stocks
|
|
|
|
|
| Consumer discretionary
| $192,232
| $192,232
| —
| —
|
| Financials
| 46,398
| 46,398
| —
| —
|
| Health care
| 262,501,994
| 256,960,127
| $5,541,867
| —
|
| Materials
| 213,176
| 213,176
| —
| —
|
| Preferred securities
| 1,358,862
| —
| 1,358,862
| —
|
| Warrants
| 1,148
| 1,148
| —
| —
|
Significant accounting policies,
continued
|
| Total
value at
8-31-23
| Level 1
quoted
price
| Level 2
significant
observable
inputs
| Level 3
significant
unobservable
inputs
|
| Health Sciences Fund (continued)
|
| Short-term investments
| $1,567,424
| $1,567,424
| —
| —
|
| Total investments in securities
| $265,881,234
| $258,980,505
| $6,900,729
| —
|
|
|
| High Yield Fund
|
| Investments in securities:
|
|
|
|
|
| Assets
|
|
|
|
|
| Foreign government obligations
| $760,153
| —
| $760,153
| —
|
| Corporate bonds
| 156,877,220
| —
| 156,877,220
| —
|
| Convertible bonds
| 1,390,615
| —
| 1,390,615
| —
|
| Term loans
| 12,378,044
| —
| 11,938,878
| $439,166
|
| Asset backed securities
| 12,447,254
| —
| 12,447,254
| —
|
| Common stocks
| 1,191,244
| $1,162,189
| —
| 29,055
|
| Preferred securities
| 846,784
| 551,426
| —
| 295,358
|
| Escrow certificates
| —
| —
| —
| —
|
| Short-term investments
| 1,663,979
| 1,663,979
| —
| —
|
| Total investments in securities
| $187,555,293
| $3,377,594
| $183,414,120
| $763,579
|
| Derivatives:
|
|
|
|
|
| Assets
|
|
|
|
|
| Futures
| $77,427
| $77,427
| —
| —
|
| Forward foreign currency contracts
| 8,292
| —
| $8,292
| —
|
| Swap contracts
| 76,572
| —
| 76,572
| —
|
| Liabilities
|
|
|
|
|
| Forward foreign currency contracts
| (10,284)
| —
| (10,284)
| —
|
| Swap contracts
| (69,169)
| —
| (69,169)
| —
|
| Level 3 includes securities valued at $0. Refer to Portfolio of Investments.
|
|
|
| International Strategic Equity Allocation Fund
|
| Investments in securities:
|
|
|
|
|
| Assets
|
|
|
|
|
| Common stocks
|
|
|
|
|
| Australia
| $54,838,230
| —
| $54,838,230
| —
|
| Austria
| 3,875,145
| —
| 3,875,145
| —
|
| Belgium
| 16,690,005
| —
| 16,690,005
| —
|
| Brazil
| 33,657,971
| $33,657,971
| —
| —
|
| Canada
| 178,430,432
| 178,430,432
| —
| —
|
| Chile
| 4,174,255
| 3,390,016
| 784,239
| —
|
| China
| 210,971,122
| 11,111,614
| 199,858,974
| $534
|
| Colombia
| 449,090
| 449,090
| —
| —
|
| Czech Republic
| 1,370,789
| —
| 1,370,789
| —
|
| Denmark
| 68,822,144
| —
| 68,822,144
| —
|
| Finland
| 20,086,381
| —
| 20,086,381
| —
|
| France
| 312,814,296
| —
| 312,814,296
| —
|
| Germany
| 208,004,738
| —
| 208,004,738
| —
|
| Hong Kong
| 64,531,016
| 453,496
| 64,077,520
| —
|
| Hungary
| 2,049,097
| —
| 2,049,097
| —
|
| India
| 147,709,310
| —
| 147,709,310
| —
|
| Indonesia
| 17,457,656
| —
| 17,457,656
| —
|
| Ireland
| 30,067,362
| 7,244,504
| 22,822,858
| —
|
| Israel
| 13,904,072
| 5,432,868
| 8,471,204
| —
|
| Italy
| 58,057,812
| —
| 58,057,812
| —
|
| Japan
| 483,750,392
| —
| 483,750,392
| —
|
| Jordan
| 504,289
| —
| 504,289
| —
|
| Luxembourg
| 5,209,836
| —
| 5,209,836
| —
|
| Macau
| 1,131,439
| —
| 1,131,439
| —
|
Significant accounting policies,
continued
|
| Total
value at
8-31-23
| Level 1
quoted
price
| Level 2
significant
observable
inputs
| Level 3
significant
unobservable
inputs
|
| International Strategic Equity Allocation Fund (continued)
|
| Malaysia
| $12,355,239
| —
| $12,355,239
| —
|
| Mexico
| 36,077,990
| $36,077,990
| —
| —
|
| Netherlands
| 104,274,810
| —
| 101,780,974
| $2,493,836
|
| New Zealand
| 4,171,493
| —
| 4,171,493
| —
|
| Norway
| 14,005,211
| —
| 14,005,211
| —
|
| Peru
| 1,547,455
| 1,547,455
| —
| —
|
| Philippines
| 5,390,572
| —
| 5,390,572
| —
|
| Poland
| 7,096,691
| —
| 7,096,691
| —
|
| Portugal
| 3,685,990
| —
| 3,685,990
| —
|
| Qatar
| 7,889,143
| —
| 7,889,143
| —
|
| Saudi Arabia
| 36,502,428
| —
| 36,502,428
| —
|
| Singapore
| 29,966,677
| 3,057,232
| 26,909,445
| —
|
| South Africa
| 20,161,903
| —
| 20,161,903
| —
|
| South Korea
| 100,550,649
| —
| 100,550,649
| —
|
| Spain
| 111,362,086
| —
| 111,362,086
| —
|
| Sweden
| 21,781,931
| —
| 21,781,931
| —
|
| Switzerland
| 333,599,451
| —
| 333,599,451
| —
|
| Taiwan
| 129,092,760
| —
| 129,092,760
| —
|
| Thailand
| 17,537,417
| —
| 17,537,417
| —
|
| Turkey
| 5,965,727
| —
| 5,965,727
| —
|
| United Arab Emirates
| 28,516,146
| —
| 28,516,146
| —
|
| United Kingdom
| 234,956,288
| 1,824,250
| 233,132,038
| —
|
| United States
| 3,313,378
| 1,760,420
| 1,552,958
| —
|
| Preferred securities
|
|
|
|
|
| Brazil
| 12,473,221
| 12,473,221
| —
| —
|
| Chile
| 1,148,134
| 1,148,134
| —
| —
|
| Colombia
| 403,548
| 403,548
| —
| —
|
| Germany
| 12,831,275
| —
| 12,831,275
| —
|
| South Korea
| 5,260,835
| —
| 5,260,835
| —
|
| Warrants
| 70,558
| 70,558
| —
| —
|
| Rights
| 42,949
| 30,742
| 12,207
| —
|
| Short-term investments
| 166,251,405
| 25,218,768
| 141,032,637
| —
|
| Total investments in securities
| $3,406,840,239
| $323,782,309
| $3,080,563,560
| $2,494,370
|
| Derivatives:
|
|
|
|
|
| Assets
|
|
|
|
|
| Futures
| $948,296
| $948,296
| —
| —
|
| Liabilities
|
|
|
|
|
| Futures
| (50,989)
| (50,989)
| —
| —
|
| Level 3 includes securities valued at $0. Refer to Portfolio of Investments.
|
|
|
| Mid Value Fund
|
| Investments in securities:
|
|
|
|
|
| Assets
|
|
|
|
|
| Common stocks
|
|
|
|
|
| Communication services
| $57,573,442
| $57,573,442
| —
| —
|
| Consumer discretionary
| 105,734,108
| 94,707,143
| $11,026,965
| —
|
| Consumer staples
| 108,152,437
| 108,152,437
| —
| —
|
| Energy
| 99,207,955
| 99,207,955
| —
| —
|
| Financials
| 222,624,984
| 222,624,984
| —
| —
|
| Health care
| 144,966,111
| 135,605,439
| 9,360,672
| —
|
| Industrials
| 243,193,495
| 206,454,453
| 36,739,042
| —
|
| Information technology
| 148,205,846
| 148,205,846
| —
| —
|
| Materials
| 80,450,500
| 80,450,500
| —
| —
|
| Real estate
| 90,481,727
| 90,481,727
| —
| —
|
| Utilities
| 92,356,812
| 92,356,812
| —
| —
|
Significant accounting policies,
continued
|
| Total
value at
8-31-23
| Level 1
quoted
price
| Level 2
significant
observable
inputs
| Level 3
significant
unobservable
inputs
|
| Mid Value Fund (continued)
|
| Short-term investments
| $63,654,698
| $63,654,698
| —
| —
|
| Total investments in securities
| $1,456,602,115
| $1,399,475,436
| $57,126,679
| —
|
|
|
| Science & Technology Fund
|
| Investments in securities:
|
|
|
|
|
| Assets
|
|
|
|
|
| Common stocks
|
|
|
|
|
| Communication services
| $29,479,170
| $29,479,170
| —
| —
|
| Consumer discretionary
| 41,381,289
| 27,738,479
| $13,642,810
| —
|
| Financials
| 11,406,666
| 11,406,666
| —
| —
|
| Health care
| 467,488
| 467,488
| —
| —
|
| Industrials
| 1,424,173
| 1,424,173
| —
| —
|
| Information technology
| 109,407,905
| 99,605,027
| 9,802,878
| —
|
| Real estate
| 716,432
| 716,432
| —
| —
|
| Short-term investments
| 10,884,568
| 10,884,568
| —
| —
|
| Total investments in securities
| $205,167,691
| $181,722,003
| $23,445,688
| —
|
|
|
| U.S. Sector Rotation Fund
|
| Investments in securities:
|
|
|
|
|
| Assets
|
|
|
|
|
| Common stocks
|
|
|
|
|
| Communication services
| $312,149,099
| $312,149,099
| —
| —
|
| Consumer discretionary
| 358,630,692
| 358,627,243
| $3,449
| —
|
| Consumer staples
| 169,392,287
| 169,392,287
| —
| —
|
| Energy
| 163,100,954
| 163,100,954
| —
| —
|
| Financials
| 395,013,407
| 395,013,407
| —
| —
|
| Health care
| 384,264,701
| 384,163,092
| —
| $101,609
|
| Industrials
| 267,514,108
| 267,514,108
| —
| —
|
| Information technology
| 915,779,659
| 915,779,659
| —
| —
|
| Materials
| 74,985,698
| 74,985,698
| —
| —
|
| Real estate
| 49,581,980
| 49,581,980
| —
| —
|
| Utilities
| 19,674,167
| 19,674,167
| —
| —
|
| Short-term investments
| 65,678,983
| 65,678,983
| —
| —
|
| Total investments in securities
| $3,175,765,735
| $3,175,660,677
| $3,449
| $101,609
|
| Derivatives:
|
|
|
|
|
| Assets
|
|
|
|
|
| Futures
| $563,596
| $563,596
| —
| —
|
Real estate investment
trusts. The funds may invest in real estate investment trusts (REITs). Distributions from REITs may be recorded as income and subsequently characterized by the REIT at the end of their fiscal year
as a reduction of cost of investments and/or as a realized gain. As a result, the funds will estimate the components of distributions from these securities. Such estimates are revised when the actual components of the
distributions are known.
When-issued/delayed-delivery
securities. The funds may purchase or sell securities on a when-issued or delayed-delivery basis, or in a “To Be Announced” (TBA) or “forward commitment” transaction, with
delivery or payment to occur at a later date beyond the normal settlement period. TBA securities resulting from these transactions are included in the portfolio or in a schedule to the portfolio (Sale Commitments
Outstanding). At the time a fund enters into a commitment to purchase or sell a security, the transaction is recorded and the value of the security is reflected in its NAV. The price of such security and the date that
the security will be delivered and paid for are fixed at the time the transaction is negotiated. The value of the security may vary with market fluctuations. No interest accrues on debt securities until settlement
takes place. At the time that the fund enters into this type of transaction, the fund is required to have sufficient cash and/or liquid securities to cover its commitments.
Certain risks may arise
upon entering into when-issued or delayed-delivery securities transactions, including the potential inability of counterparties to meet the terms of their contracts, and the issuer’s failure to issue the
securities due to political, economic or other factors. Additionally, losses may arise due to changes in the value of the securities purchased or sold prior to settlement date. As a result, the fund has paid
(received) cash collateral to (from) certain counterparties to these transactions, which is recorded as Cash collateral at broker for sale commitments (Payable for collateral on sale commitments), as follows:
Significant accounting policies,
continued
| Fund
| Counterparty
| Collateral Paid/ (Received)
|
| Core Bond Fund
| Goldman Sachs
| $220,000
|
Term loans (Floating rate
loans). The funds may invest in term loans, which are debt securities and are often rated below investment grade at the time of purchase. Term loans are generally subject to legal or contractual
restrictions on resale and generally have longer settlement periods than conventional debt securities. Term loans involve special types of risk, including credit risk, interest-rate risk, counterparty risk, and risk
associated with extended settlement. The liquidity of term loans, including the volume and frequency of secondary market trading in such loans, varies significantly over time and among individual loans. During periods
of infrequent trading, valuing a term loan can be more difficult and buying and selling a term loan at an acceptable price can be more difficult and delayed, which could result in a loss.
The funds' ability to
receive payments of principal, interest and other amounts in connection with term loans will depend primarily on the financial condition of the borrower. The funds' failure to receive scheduled payments on a term loan
due to a default, bankruptcy or other reason would adversely affect the funds' income and would likely reduce the value of its assets. Transactions in loan investments typically take a significant amount of time
(i.e., seven days or longer) to settle. This could pose a liquidity risk to the funds and, if the funds' exposure to such investments is substantial, it could impair the funds' ability to meet redemptions. Because
term loans may not be rated by independent credit rating agencies, a decision to invest in a particular loan could depend exclusively on the subadvisor’s credit analysis of the borrower and/or term loan agents.
There is greater risk that the funds may have limited rights to enforce the terms of an underlying loan than for other types of debt instruments.
Mortgage and asset backed
securities. The funds may invest in mortgage-related securities, such as mortgage-backed securities, and other asset-backed securities, which are debt obligations that represent interests in pools of
mortgages or other income-bearing assets, such as consumer loans or receivables. Such securities often involve risks that are different from the risks associated with investing in other types of debt securities.
Mortgage-backed and other asset-backed securities are subject to changes in the payment patterns of borrowers of the underlying debt. When interest rates fall, borrowers are more likely to refinance or prepay their
debt before its stated maturity. This may result in the funds having to reinvest the proceeds in lower yielding securities, effectively reducing the funds' income. Conversely, if interest rates rise and borrowers
repay their debt more slowly than expected, the time in which the mortgage-backed and other asset-backed securities are paid off could be extended, reducing the funds' cash available for reinvestment in higher
yielding securities. The timely payment of principal and interest of certain mortgage-related securities is guaranteed with the full faith and credit of the U.S. Government. Pools created and guaranteed by
non-governmental issuers, including government-sponsored corporations (e.g. FNMA), may be supported by various forms of insurance or guarantees, but there can be no assurance that private insurers or guarantors can
meet their obligations under the insurance policies or guarantee arrangements. The funds are also subject to risks associated with securities with contractual cash flows including asset-backed and mortgage related
securities such as collateralized mortgage obligations, mortgage pass-through securities and commercial mortgage-backed securities. The value, liquidity and related income of these securities are sensitive to changes
in economic conditions, including real estate value, pre-payments, delinquencies and/or defaults, and may be adversely affected by shifts in the market’s perception of the issuers and changes in interest
rates.
Payment-in-kind bonds. The funds may invest in payment-in-kind bonds (PIK Bonds). PIK Bonds allow the issuer, at its option, to make current interest payments on the bonds either in cash or in additional bonds.
The market prices of PIK Bonds are affected to a greater extent by interest rate changes and thereby tend to be more volatile than securities which pay cash interest periodically. Income on these securities is
computed at the contractual rate specified and is added to the principal balance of the bond. This income is required to be distributed to shareholders. Because no cash is received at the time income accrues on these
securities, the funds may need to sell other investments to make distributions.
Security transactions and
related investment income. Investment security transactions are accounted for on a trade date plus one basis for daily NAV calculations. However, for financial reporting purposes, investment transactions are
reported on trade date. Interest income is accrued as earned. Interest income includes coupon interest and amortization/accretion of premiums/discounts on debt securities. Debt obligations may be placed in a
non-accrual status and related interest income may be reduced by stopping current accruals and writing off interest receivable when the collection of all or a portion of interest has become doubtful. Dividend income
is recorded on ex-date, except for dividends of certain foreign securities where the dividend may not be known until after the ex-date. In those cases, dividend income, net of withholding taxes, is recorded when the
fund becomes aware of the dividends. Non-cash dividends, if any, are recorded at the fair market value of the securities received. Distributions received on securities that represent a tax return of capital and/or
capital gain, if any, are recorded as a reduction of cost of investments and/or as a realized gain, if amounts are estimable. Gains and losses on securities sold are determined on the basis of identified cost and may
include proceeds from litigation. Return of capital distributions from underlying funds, if any, are treated as a reduction of cost.
Securities lending. The funds may lend their securities to earn additional income. The funds receive collateral from the borrower in an amount not less than the market value of the loaned securities. The
funds may invest their cash collateral in John Hancock Collateral Trust (JHCT), an affiliate of the funds, which has a floating NAV and is registered with the Securities and Exchange Commission (SEC) as an investment
company. JHCT is a prime money market fund and invests in short-term money market investments. Each fund will receive the benefit of any gains and bear any losses generated by JHCT with respect to the cash
collateral.
The funds have the right
to recall loaned securities on demand. If a borrower fails to return loaned securities when due, then the lending agent is responsible and indemnifies the funds for the lent securities. The lending agent uses the
collateral received from the borrower to purchase replacement securities of the same issue, type, class and series of the loaned securities. If the value of the collateral is less than the purchase cost of replacement
securities, the lending agent is responsible for satisfying the shortfall but only to the extent that the shortfall is not due to any decrease in the value of JHCT.
Although the risk of loss
on securities lent is mitigated by receiving collateral from the borrower and through lending agent indemnification, the funds could experience a delay in recovering securities or could experience a lower than
expected return if the borrower fails to return the securities on a timely basis. During the existence of the loan, the funds will receive from the borrower amounts equivalent to any dividends, interest or other
distributions on the loaned securities, as well as interest on such amounts. The funds receive compensation for lending their securities by retaining a portion of the return on the investment of the collateral and
compensation from fees earned from borrowers of the securities. Securities lending income received by the funds is net of fees retained by the securities lending agent. Net income received from JHCT is a component of
securities lending income as recorded on the Statements of operations.
Significant accounting policies,
continued
Obligations to repay collateral received by the funds are shown on the Statements of assets and liabilities as Payable upon return of securities loaned and are secured by the
loaned securities. The following table summarizes the values of securities loaned by the funds and the corresponding cash collateral received at August 31, 2023. In addition, non-cash collateral in the form of U.S.
Treasuries was pledged, as indicated below. This non-cash collateral cannot be sold or repledged by the funds, and accordingly, is not reflected in the funds' net assets.
| Fund
| Market value of securities on loan
| Cash collateral received
| Non-cash collateral
|
| Capital Appreciation Value Fund
| $1,976,076
| $2,018,769
| —
|
| International Strategic Equity Allocation Fund
| 23,855,935
| 25,223,992
| —
|
| Mid Value Fund
| 26,149,522
| 19,960,422
| $7,136,094
|
| Science & Technology Fund
| 724,944
| —
| 765,650
|
| U.S. Sector Rotation Fund
| 658,360
| 672,936
| —
|
Foreign investing. Assets, including investments, and liabilities denominated in foreign currencies are translated into U.S. dollar values each day at the prevailing exchange rate. Purchases and sales of
securities, income and expenses are translated into U.S. dollars at the prevailing exchange rate on the date of the transaction. The effect of changes in foreign currency exchange rates on the value of securities is
reflected as a component of the realized and unrealized gains (losses) on investments. Foreign investments are subject to a decline in the value of a foreign currency versus the U.S. dollar, which reduces the dollar
value of securities denominated in that currency.
Funds that invest
internationally generally carry more risk than funds that invest strictly in U.S. securities. These risks are heightened for investments in emerging markets. Risks can result from differences in economic and political
conditions, regulations, market practices (including higher transaction costs), accounting standards and other factors.
There may be unexpected
restrictions on investments or on exposures to investments in companies located in certain foreign countries, such as China. For example, a government may restrict investment in companies or industries considered
important to national interests, or intervene in the financial markets, such as by imposing trading restrictions, or banning or curtailing short selling. As a result of forced sales of a security, or inability to
participate in an investment the manager otherwise believes is attractive, a fund may incur losses.
Trading in certain Chinese
securities through Hong Kong Stock Connect or Bond Connect, mutual market access programs that enable foreign investment in the People's Republic of China, is subject to certain restrictions and risks. Securities
offered through these programs may lose purchase eligibility and any changes in laws, regulations and policies impacting these programs may affect security prices, which could adversely affect the fund's
performance.
Foreign taxes. The funds may be subject to withholding tax on income, capital gains or repatriations imposed by certain countries, a portion of which may be recoverable. Foreign taxes are accrued based
upon the funds' understanding of the tax rules and rates that exist in the foreign markets in which it invests. Taxes are accrued based on gains realized by the funds as a result of certain foreign security sales. In
certain circumstances, estimated taxes are accrued based on unrealized appreciation of such securities. Investment income is recorded net of foreign withholding taxes.
Overdraft. The funds may have the ability to borrow from banks for temporary or emergency purposes, including meeting redemption requests that otherwise might require the untimely sale of securities.
Pursuant to the funds' custodian agreement, the custodian may loan money to the funds to make properly authorized payments. The funds are obligated to repay the custodian for any overdraft, including any related costs
or expenses. The custodian may have a lien, security interest or security entitlement in any fund property that is not otherwise segregated or pledged, to the extent of any overdraft, and to the maximum extent
permitted by law. Overdrafts at period end, if any, are presented under the caption Due to custodian in the Statements of assets and liabilities.
Line of credit. The funds and other affiliated funds have entered into a syndicated line of credit agreement with Citibank, N.A. as the administrative agent that enables them to participate in a $1
billion unsecured committed line of credit. Excluding commitments designated for a certain fund and subject to the needs of all other affiliated funds, a fund can borrow up to an aggregate commitment amount of $750
million, subject to asset coverage and other limitations as specified in the agreement.
Prior to July 13, 2023,
Core Bond Fund and other affiliated funds had entered into an unsecured $50 million line of credit agreement with BNP Paribas.
A commitment fee payable
at the end of each calendar quarter, based on the average daily unused portion of each line of credit, is charged to each participating fund based on a combination of fixed and asset-based allocations and is reflected
in Other expenses on the Statements of operations. For the year ended August 31, 2023, the funds had no borrowings under the line of credit.
Commitment fees for the
year ended August 31, 2023 were as follows:
| Fund
| Commitment fee
|
| Capital Appreciation Fund
| $7,475
|
| Capital Appreciation Value Fund
| 6,886
|
| Core Bond Fund
| 29,991
|
| Health Sciences Fund
| 4,004
|
| High Yield Fund
| 3,663
|
| International Strategic Equity Allocation Fund
| 16,276
|
| Mid Value Fund
| 7,490
|
| Science & Technology Fund
| 3,552
|
| U.S. Sector Rotation Fund
| 16,922
|
Expenses. Within the John Hancock group of funds complex, expenses that are directly attributable to an individual fund are allocated to such fund. Expenses that are not readily attributable to
a specific fund are allocated among all funds in an equitable manner, taking into consideration, among other things, the nature and type of expense and each fund’s relative net assets. Expense estimates are
accrued in the period to which they relate and adjustments are made when actual amounts are known.
Significant accounting policies,
continued
Class allocations. Income, common expenses and realized and unrealized gains (losses) are determined at the fund level and allocated daily to each class of shares based on the
net assets of the class. Class-specific expenses, such as distribution and service fees, if any, and transfer agent fees, for all classes, are charged daily at the class level based on the net assets of each class and
the specific expense rates applicable to each class.
Federal income taxes. Each fund intends to continue to qualify as a regulated investment company by complying with the applicable provisions of the Internal Revenue Code and will not be subject to federal
income tax on taxable income that is distributed to shareholders. Therefore, no federal income tax provision is required.
For federal income tax
purposes, as of August 31, 2023, certain funds have capital loss carryforwards available to offset future net realized capital gains. The following table details the capital loss carryforwards available as of August
31, 2023:
|
| No Expiration Date
|
| Fund
| Short Term
| Long Term
|
| Core Bond Fund
| $126,207,176
| $84,439,793
|
| High Yield Fund
| 5,413,183
| 108,511,055
|
| International Strategic Equity Allocation Fund
| 123,862,759
| 93,428,929
|
| Science & Technology Fund
| —
| 15,751,129
|
| U.S. Sector Rotation Fund
| 106,796,746
| —
|
As of August 31, 2023, the
funds had no uncertain tax positions that would require financial statement recognition, derecognition or disclosure. The funds' federal tax returns are subject to examination by the Internal Revenue Service for a
period of three years.
For federal income tax
purposes, the costs of investments owned on August 31, 2023, including short-term investments, were as follows:
| Fund
| Aggregate
cost
| Unrealized
appreciation
| Unrealized
(depreciation)
| Net unrealized
appreciation/
(depreciation)
|
| Capital Appreciation Fund
| $644,208,305
| $851,237,550
| $(11,553,607)
| $839,683,943
|
| Capital Appreciation Value Fund
| 1,054,272,180
| 123,087,101
| (21,536,632)
| 101,550,469
|
| Core Bond Fund
| 2,074,153,238
| 2,982,150
| (98,961,286)
| (95,979,136)
|
| Health Sciences Fund
| 193,295,046
| 92,298,745
| (19,712,557)
| 72,586,188
|
| High Yield Fund
| 220,096,709
| 2,114,713
| (34,573,291)
| (32,458,578)
|
| International Strategic Equity Allocation Fund
| 3,508,035,321
| 200,482,692
| (300,780,467)
| (100,297,775)
|
| Mid Value Fund
| 1,215,013,793
| 296,985,310
| (55,396,988)
| 241,588,322
|
| Science & Technology Fund
| 183,731,763
| 23,968,690
| (2,532,762)
| 21,435,928
|
| U.S. Sector Rotation Fund
| 3,076,303,130
| 168,894,642
| (68,868,441)
| 100,026,201
|
Distribution of income and
gains. Distributions to shareholders from net investment income and net realized gains, if any, are recorded on the ex-date. Core Bond Fund and High Yield Fund generally declare and pay dividends
from net investment income quarterly. All other funds generally declare and pay dividends from net investment income annually. All funds generally declare and pay capital gain distributions, if any,
annually.
The tax character of
distributions for the year ended August 31, 2023 was as follows:
| Fund
| Ordinary
Income
| Long Term
Capital Gains
| Total
|
| Capital Appreciation Fund
| —
| $138,882,734
| $138,882,734
|
| Capital Appreciation Value Fund
| $23,727,618
| 128,808,190
| 152,535,808
|
| Core Bond Fund
| 53,250,133
| —
| 53,250,133
|
| Health Sciences Fund
| —
| 8,653,037
| 8,653,037
|
| High Yield Fund
| 13,372,984
| —
| 13,372,984
|
| International Strategic Equity Allocation Fund
| 92,213,840
| —
| 92,213,840
|
| Mid Value Fund
| 31,565,079
| 196,614,630
| 228,179,709
|
| Science & Technology Fund
| —
| 18,119,628
| 18,119,628
|
| U.S. Sector Rotation Fund
| 42,857,112
| 74,867,729
| 117,724,841
|
The tax character of
distributions for the year ended August 31, 2022 was as follows:
| Fund
| Ordinary
Income
| Long Term
Capital Gains
| Total
|
| Capital Appreciation Fund
| $15,095,399
| $529,721,403
| $544,816,802
|
| Capital Appreciation Value Fund
| 63,623,495
| 195,959,272
| 259,582,767
|
| Core Bond Fund
| 32,827,981
| —
| 32,827,981
|
| Health Sciences Fund
| 1,460,208
| 54,988,580
| 56,448,788
|
| High Yield Fund
| 13,647,917
| —
| 13,647,917
|
| International Strategic Equity Allocation Fund
| 44,313,581
| 47,114,219
| 91,427,800
|
| Mid Value Fund
| 53,295,313
| 95,823,792
| 149,119,105
|
| Science & Technology Fund
| 39,054,850
| 82,828,472
| 121,883,322
|
| U.S. Sector Rotation Fund
| 42,560,602
| 216,457,167
| 259,017,769
|
Significant accounting policies,
continued
Distributions paid by the funds with respect to each class of shares are calculated in the same manner, at the same time and in the same amount, except for the effect of class
level expenses that may be applied differently to each class. Qualified late year ordinary losses are treated as occurring on September 1, 2023, the first day of the funds' next taxable year. As of August 31, 2023,
the components of distributable earnings on a tax basis were as follows:
| Fund
| Undistributed
Ordinary Income
| Undistributed
Long Term
Capital Gains
|
| Qualified
Late Year
Ordinary Losses
|
| Capital Appreciation Fund
| —
| $47,227,324
|
| $1,002,721
|
| Capital Appreciation Value Fund
| $17,261,710
| 14,237,027
|
| —
|
| Core Bond Fund
| 15,355,964
| —
|
| —
|
| Health Sciences Fund
| —
| 17,157,695
|
| 495,557
|
| High Yield Fund
| 3,365,317
| —
|
| —
|
| International Strategic Equity Allocation Fund
| 95,336,577
| —
|
| —
|
| Mid Value Fund
| 10,674,484
| 106,437,189
|
| —
|
| Science & Technology Fund
| —
| —
|
| 201,064
|
| U.S. Sector Rotation Fund
| 33,067,919
| —
|
| —
|
Such distributions and
distributable earnings, on a tax basis, are determined in conformity with income tax regulations, which may differ from US GAAP. Distributions in excess of tax basis earnings and profits, if any, are reported in the
funds' financial statements as a return of capital.
Capital accounts within
the financial statements are adjusted for permanent book-tax differences. These adjustments have no impact on net assets or the results of operations. Temporary book-tax differences, if any, will reverse in a
subsequent period. Book-tax differences are primarily attributable to net operating losses, foreign currency transactions, investments in passive foreign investment companies, wash sale loss deferrals, derivative
transactions, amortization and accretion on debt securities, in-kind transactions and corporate actions.
3. Derivative
instruments
The funds may invest in
derivatives in order to meet their investment objective. Derivatives include a variety of different instruments that may be traded in the over-the-counter (OTC) market, on a regulated exchange or through a clearing
facility. The risks in using derivatives vary depending upon the structure of the instruments, including the use of leverage, optionality, the liquidity or lack of liquidity of the contract, the creditworthiness of
the counterparty or clearing organization and the volatility of the position. Some derivatives involve risks that are potentially greater than the risks associated with investing directly in the referenced securities
or other referenced underlying instrument. Specifically, the funds are exposed to the risk that the counterparty to an OTC derivatives contract will be unable or unwilling to make timely settlement payments or
otherwise honor its obligations. OTC derivatives transactions typically can only be closed out with the other party to the transaction.
Derivatives which are
typically traded through the OTC market are regulated by the Commodity Futures Trading Commission (the CFTC). Derivative counterparty risk is managed through an ongoing evaluation of the creditworthiness of all
potential counterparties and, if applicable, designated clearing organizations. The funds attempt to reduce their exposure to counterparty risk for derivatives traded in the OTC market, whenever possible, by entering
into an International Swaps and Derivatives Association (ISDA) Master Agreement with each of their OTC counterparties. The ISDA gives each party to the agreement the right to terminate all transactions traded under
the agreement if there is certain deterioration in the credit quality or contractual default of the other party, as defined in the ISDA. Upon an event of default or a termination of the ISDA, the non-defaulting party
has the right to close out all transactions and to net amounts owed.
As defined by the ISDA,
the funds may have collateral agreements with certain counterparties to mitigate counterparty risk on OTC derivatives. Subject to established minimum levels, collateral for OTC transactions is generally determined
based on the net aggregate unrealized gain or loss on contracts with a particular counterparty. Collateral pledged to the funds, if any, are held in a segregated account by a third-party agent or held by the custodian
bank for the benefit of the funds and can be in the form of cash or debt securities issued by the U.S. government or related agencies; collateral posted by the funds, if any, for OTC transactions is held in a
segregated account at the funds' custodian and is noted in the accompanying portfolio of investments, or if cash is posted, on the Statements of assets and liabilities. The funds' risk of loss due to counterparty risk
is equal to the asset value of outstanding contracts offset by collateral received.
Certain derivatives are
traded or cleared on an exchange or central clearinghouse. Exchange-traded or centrally-cleared transactions generally present less counterparty risk to a fund than OTC transactions. The exchange or clearinghouse
stands between the funds and the broker to the contract and therefore, credit risk is generally limited to the failure of the exchange or clearinghouse and the clearing member.
Centrally-cleared swap
contracts are subject to clearinghouse rules, including initial and variation margin requirements, daily settlement of obligations and the clearinghouse guarantee of payments to the broker. There is, however, still
counterparty risk due to the potential insolvency of the broker with respect to any margin held in the brokers’ customer accounts. While clearing members are required to segregate customer assets from their own
assets, in the event of insolvency, there may be a shortfall in the amount of margin held by the broker for its clients. Collateral or margin requirements for centrally-cleared derivatives are set by the broker or
applicable clearinghouse. Margin for centrally-cleared transactions is detailed in the Statements of assets and liabilities as Receivable/Payable for centrally-cleared swaps. Securities pledged by the funds for
centrally-cleared transactions, if any, are identified in the Portfolio of investments.
Futures. A futures contract is a contractual agreement to buy or sell a particular currency or financial instrument at a pre-determined price in the future. Futures are traded on an exchange and
cleared through a central clearinghouse. Risks related to the use of futures contracts include possible illiquidity of the futures markets and contract prices that can be highly volatile and imperfectly correlated to
movements in the underlying financial instrument and potential losses in excess of the amounts recognized on the Statements of assets and liabilities. Use of long futures contracts subjects the funds to the risk of
loss up to the notional value of the futures contracts. Use of short futures contracts subjects the funds to unlimited risk of loss.
Upon entering into a
futures contract, the fund is required to deposit initial margin with the broker in the form of cash or securities. The amount of required margin is set by the broker and is generally based on a percentage of the
contract value. The margin deposit must then be maintained at the established level over the life of the contract. Cash that has been pledged by a fund, if any, is detailed in the Statements of assets and liabilities
as Collateral
Derivative instruments, continued
held at broker for futures contracts. Securities pledged by the funds, if any, are identified in the Portfolio of investments. Subsequent payments, referred to as variation margin, are made or received by a fund
periodically and are based on changes in the market value of open futures contracts. Futures contracts are marked-to-market daily and unrealized gain or loss is recorded by the fund. Receivable/Payable for futures
variation margin is included in the Statements of assets and liabilities. When the contract is closed, a fund records a realized gain or loss equal to the difference between the value of the contract at the time it
was opened and the value at the time it was closed.
The following table details
how the funds used futures contracts during the year ended August 31, 2023. In addition, the table summarizes the range of notional contract amounts held by the funds, as measured at each quarter end:
| Fund
| Reason
| USD Notional range
|
| High Yield Fund
| To manage duration of the fund.
| From $12.5 million to $13.0 million
|
| International Strategic Equity Allocation Fund
| To manage against changes in foreign currency exchange rates, manage against change in certain securities markets and gain exposure to certain securities markets.
| From $165.1 million to $292.4 million
|
| U.S. Sector Rotation Fund
| To manage against change in certain securities markets and gain exposure to certain securities markets.
| From $74.1 million to $203.4 million
|
Forward foreign currency
contracts. A forward foreign currency contract is an agreement between two parties to buy and sell specific currencies at a price that is set on the date of the contract. The forward contract calls
for delivery of the currencies on a future date that is specified in the contract. Forwards are typically traded OTC. Risks related to the use of forwards include the possible failure of counterparties to meet the
terms of the forward agreement, the failure of the counterparties to timely post collateral if applicable, and the risk that currency movements will not favor the funds thereby reducing the funds' total return, and
the potential for losses in excess of the amounts recognized on the Statements of assets and liabilities.
The market value of a
forward foreign currency contract fluctuates with changes in foreign currency exchange rates. Forward foreign currency contracts are marked-to-market daily and the change in value is recorded by the fund as an
unrealized gain or loss. Realized gains or losses, equal to the difference between the value of the contract at the time it was opened and the value at the time it was closed, are recorded upon delivery or receipt of
the currency or settlement with the counterparty.
The following table
details how the funds used forward foreign currency contracts during the year ended August 31, 2023. In addition, the table summarizes the range of notional contract amounts held by the funds, as measured at each
quarter end:
| Fund
| Reason
| USD Notional range
|
| High Yield Fund
| To manage against changes in foreign currency exchange rates and to gain exposure to foreign currencies.
| From $1.1 million to $1.3 million
|
Options. There are two types of options, put options and call options. Options are traded either OTC or on an exchange. A call option gives the purchaser of the option the right to buy (and the
seller the obligation to sell) the underlying asset at the exercise price. A put option gives the purchaser of the option the right to sell (and the writer the obligation to buy) the underlying asset at the exercise
price. Writing puts and buying calls may increase the funds' exposure to changes in the value of the underlying instrument. Buying puts and writing calls may decrease the funds' exposure to such changes. Risks related
to the use of options include the loss of premiums on purchased options, possible illiquidity of the options markets, trading restrictions imposed by an exchange and movements in underlying security values, and for
written options, potential losses in excess of the amounts recognized on the Statements of assets and liabilities. In addition, OTC options are subject to the risks of all OTC derivatives contracts.
Purchased options are
included in the Portfolio of investments and are subsequently “marked-to-market” to reflect current market value. If a purchased option expires, a fund realizes a loss equal to the premium paid for the
option. Premiums paid for purchased options which are exercised or closed are added to the amounts paid or offset against the proceeds on the underlying asset transaction to determine the realized gain (loss). Written
options are included as liabilities in the Statements of assets and liabilities and are “marked-to-market” to reflect the current market value. If the written option expires, a fund realizes a gain equal
to the premium received. Premiums received from writing options which are exercised or closed are added to the proceeds or offset against amounts paid on the underlying asset transaction to determine the realized gain
(loss).
The following table
details how the funds used written options contracts during the year ended August 31, 2023. In addition, the table summarizes the range of market value amounts held by the funds, as measured at each quarter end:
| Fund
| Reason
| Market value range
|
| Capital Appreciation Value Fund
| To manage against changes in certain securities markets, to gain exposure to certain securities markets and to generate
potential income from options premiums.
| From $1.0 million to $13.1 million
|
Swaps. Swap agreements are agreements between the fund and a counterparty to exchange cash flows, assets, foreign currencies or market-linked returns at specified intervals. Swap agreements are
privately negotiated in the OTC market (OTC swaps) or may be executed on a registered commodities exchange (centrally cleared swaps). Swaps are marked-to-market daily and the change in value is recorded as a component
of unrealized appreciation/depreciation of swap contracts. The value of the swap will typically impose collateral posting obligations on the party that is considered out-of-the-money on the swap.
Upfront payments
made/received by the funds, if any, are amortized/accreted for financial reporting purposes, with the unamortized/unaccreted portion included in the Statement of assets and liabilities. A termination payment by the
counterparty or the funds is recorded as realized gain or loss, as well as the net periodic payments received or paid by the funds.
Entering into swap
agreements involves, to varying degrees, elements of credit, market and documentation risk that may provide outcomes that produce losses in excess of the amounts recognized on the Statement of assets and liabilities.
Such risks involve the possibility that there will be no liquid market for the swap, or that a counterparty may default on its obligation or delay payment under the swap terms. The counterparty may disagree or contest
the terms of the swap. In addition to interest rate risk, market risks may also impact the swap. The funds may also suffer losses if it is unable to terminate or assign outstanding swaps or reduce its exposure through
offsetting transactions.
Credit default swaps. Credit default swaps (CDS) involve the exchange of a fixed rate premium (paid by the Buyer), for protection against the loss in value of an underlying debt instrument, referenced entity or
index, in the event of a defined credit event (such as payment default or bankruptcy). Under the terms of the swap, one party acts as a “guarantor” (the Seller), receiving the premium and agreeing to
contingent payments that are specified within the
Derivative instruments, continued
credit default agreement. The funds may enter into CDS in which it may act as either Buyer or Seller. By acting as the Seller, the funds may incur economic leverage since it would be obligated to pay the Buyer the
notional amount of the contract in the event of a default. The amount of loss in such case could be significant, but would typically be reduced by any recovery value on the underlying credit.
Credit default swaps —
Buyer
The following table
details how the funds used credit default swap contracts as the buyer during the year ended August 31, 2023. In addition, the table summarizes the range of notional contract amounts held by the funds, as measured at
each quarter end:
| Fund
| Reason
| USD Notional range
|
| High Yield Fund
| To manage against potential credit events.
| From $1.3 million to $3.3 million
|
Credit default swaps —
Seller
Implied credit spreads are
utilized in determining the market value of CDS agreements in which the fund is the Seller at period end. The implied credit spread generally represents the yield of the instrument above a credit-risk free rate, such
as the U.S. Treasury Bond Yield, and may include upfront payments required to be made to enter into the agreement. It also serves as an indicator of the current status of the payment/performance risk and represents
the likelihood or risk of default for the credit derivative. Wider credit spreads represent a deterioration of the referenced entity’s creditworthiness and an increased risk of default or other credit event
occurring as defined under the terms of the agreement.
For CDS agreements where
implied credit spreads are not reported or available, the average credit rating on the underlying index is shown. A deterioration of the referenced entity’s creditworthiness would indicate a greater likelihood
of a credit event occurring and result in increasing market values, in absolute terms when compared to the notional amount of the swap. The maximum potential amount of future payments (undiscounted) that the fund as
the Seller could be required to make under any CDS agreement equals the notional amount of the agreement.
The following table
details how the funds used credit default swap contracts as the seller during the year ended August 31, 2023. In addition, the table summarizes the range of notional contract amounts held by the funds, as measured at
each quarter end:
| Fund
| Reason
| USD Notional range
|
| High Yield Fund
| To gain credit exposure to an issuer or index.
| up to $1.8 million*
|
* The notional values at the period end are representative of the fund’s exposure throughout the period. No new contracts were entered into or closed during the year ended
August 31, 2023.
Fair value of derivative
instruments by risk category
The table below summarizes
the fair value of derivatives held by the funds at August 31, 2023 by risk category:
| Fund
| Risk
| Statements of
assets and
liabilities location
| Financial
instruments
location
| Assets
derivatives
fair value
| Liabilities
derivatives
fair value
|
| Capital Appreciation Value Fund
| Equity
| Written options, at value
| Written options
| —
| $(6,616,180)
|
| High Yield Fund
| Interest rate
| Receivable/payable for futures variation margin1
| Futures
| $77,427
| —
|
|
| Currency
| Unrealized appreciation (depreciation) on forward foreign currency contracts
| Forward foreign currency contracts
| 8,292
| $(10,284)
|
|
| Credit
| Swap contracts, at value2
| Credit default swaps
| 76,572
| (69,169)
|
|
|
|
|
| $162,291
| $(79,453)
|
| International Strategic Equity Allocation Fund
| Currency
| Receivable/payable for futures variation margin1
| Futures
| —
| $(50,989)
|
|
| Equity
| Receivable/payable for futures variation margin1
| Futures
| $948,296
| —
|
|
|
|
|
| $948,296
| $(50,989)
|
| U.S. Sector Rotation Fund
| Equity
| Receivable/payable for futures variation margin1
| Futures
| $563,596
| —
|
|
|
|
| 1
| Reflects cumulative appreciation/depreciation on open futures as disclosed in the Derivatives section of the Portfolio of investments. Only the year end variation margin
receivable/payable is separately reported on the Statements of assets and liabilities.
|
| 2
| Reflects cumulative value of swap contracts. Receivable/payable for centrally cleared swaps, which includes value and margin, are shown separately on the
Statements of assets and liabilities.
|
For financial reporting
purposes, the funds do not offset OTC derivative assets or liabilities that are subject to master netting arrangements, as defined by the ISDAs, in the Statements of assets and liabilities. In the event of
default by the counterparty or a termination of the agreement, the ISDA allows an offset of amounts across the various transactions between the fund and the applicable counterparty.
Derivative instruments, continued
Effect of derivative instruments on the Statements of operations
The table below summarizes
the net realized gain (loss) included in the net increase (decrease) in net assets from operations, classified by derivative instrument and risk category, for the year ended August 31, 2023:
|
|
| Statements of operations location - Net realized gain (loss) on:
|
|
| Fund
| Risk
| Futures contracts
| Forward foreign
currency contracts
| Written options
| Swap contracts
| Total
|
| Capital Appreciation Value Fund
| Equity
| —
| —
| $(1,927,294)
| —
| $(1,927,294)
|
| High Yield Fund
| Interest rate
| $(827,606)
| —
| —
| —
| $(827,606)
|
|
| Currency
| —
| $54,750
| —
| —
| 54,750
|
|
| Credit
| —
| —
| —
| $(221,319)
| (221,319)
|
|
| Total
| $(827,606)
| $54,750
| —
| $(221,319)
| $(994,175)
|
| International Strategic Equity Allocation Fund
| Currency
| $(1,164,184)
| —
| —
| —
| $(1,164,184)
|
|
| Equity
| 14,341,814
| —
| —
| —
| 14,341,814
|
|
| Total
| $13,177,630
| —
| —
| —
| $13,177,630
|
| U.S. Sector Rotation Fund
| Equity
| $10,103,486
| —
| —
| —
| $10,103,486
|
The table below summarizes
the net change in unrealized appreciation (depreciation) included in the net increase (decrease) in net assets from operations, classified by derivative instrument and risk category, for the year ended August 31,
2023:
|
|
| Statements of operations location - Change in net unrealized appreciation (depreciation) of:
|
|
| Fund
| Risk
| Futures contracts
| Forward foreign
currency contracts
| Written options
| Swap contracts
| Total
|
| Capital Appreciation Value Fund
| Equity
| —
| —
| $(3,043,567)
| —
| $(3,043,567)
|
| High Yield Fund
| Interest rate
| $147,173
| —
| —
| —
| $147,173
|
|
| Currency
| —
| $14,040
| —
| —
| 14,040
|
|
| Credit
| —
| —
| —
| $(41,468)
| (41,468)
|
|
| Total
| $147,173
| $14,040
| —
| $(41,468)
| $119,745
|
| International Strategic Equity Allocation Fund
| Currency
| $341,306
| —
| —
| —
| $341,306
|
|
| Equity
| 6,683,012
| —
| —
| —
| 6,683,012
|
|
| Total
| $7,024,318
| —
| —
| —
| $7,024,318
|
| U.S. Sector Rotation Fund
| Equity
| $5,005,189
| —
| —
| —
| $5,005,189
|
4. Guarantees and
indemnifications
Under the Trust's
organizational documents, its Officers and Trustees are indemnified against certain liabilities arising out of the performance of their duties to the Trust, including the funds. Additionally, in the normal course of
business, the Trust enters into contracts with service providers that contain general indemnification clauses. The Trust's maximum exposure under these arrangements is unknown, as this would involve future claims that
may be made against the Trust that have not yet occurred. The risk of material loss from such claims is considered remote.
5. Fees and
transactions with affiliates
John Hancock Investment
Management LLC (the Advisor) serves as investment advisor for the funds. John Hancock Investment Management Distributors LLC (the Distributor), an affiliate of the Advisor, serves as principal underwriter of the
funds. The Advisor and the Distributor are indirect, principally owned subsidiaries of John Hancock Life Insurance Company (U.S.A.), which in turn is a subsidiary of Manulife Financial Corporation.
Management fee. The funds have an investment management agreement with the Advisor under which the funds pay a daily management fee to the Advisor equivalent on an annual basis as detailed below.
Aggregate net assets generally include the net assets of the funds and the net assets of a similar fund of John Hancock Variable Insurance Trust (JHVIT), unless otherwise noted below. JHVIT portfolios are
advised by an affiliate of the Advisor, John Hancock Variable Trust Advisers LLC, and are distributed by an affiliate of the Advisor, John Hancock Distributors, LLC.
• Capital Appreciation Fund — a) 0.800% of the first $500 million of aggregate net assets; b) 0.700% of the next $500 million of aggregate net assets; and c) 0.670% of the
excess over $1 billion of aggregate net assets.
• Capital Appreciation Value Fund — If aggregate net assets are less than $500 million, then the following fee schedule shall apply: a) 0.950% of the first $250 million of
aggregate net assets; and b) 0.850% of the excess over $250 million of aggregate net assets. If aggregate net assets equal or exceed $500 million but are less than $2 billion, then the following fee schedule shall
apply: a) 0.850% of the first $1 billion of aggregate net assets; and b) 0.800% of the excess over $1 billion of aggregate net assets. If aggregate net assets equal or exceed $2 billion but are less than $3 billion,
then the following fee schedule shall apply: a) 0.850% of the first $500 million of aggregate net assets; and b) 0.800% of the excess over $500 million of aggregate net assets. If aggregate net assets equal or exceed
$3 billion, then the management fee to be paid is 0.800% of aggregate net assets.
• Core Bond Fund — a) 0.690% of the first $200 million of aggregate net assets; b) 0.640% of the next $200 million of aggregate net assets; c) 0.570% of the next $600 million of
aggregate net assets; d) 0.560% of the next $1 billion of aggregate net assets; and e) 0.550% of the excess over $2 billion of aggregate net assets.
• Health Sciences Fund — a) 1.050% of the first $500 million of aggregate net assets; b) 1.000% of the next $250 million of aggregate net assets; c) 0.950% of excess over $750
million of aggregate net assets; d) 0.950% of the next $250 million of aggregate net assets; e) 0.900% of the next $500 million of aggregate net assets; and f) 0.900% of excess over $1.5 billion of aggregate net
assets. If aggregate net assets exceed $750 million, the management fee is
Fees and transactions
with affiliates, continued
0.950% of the first $750 million of aggregate net assets. If aggregate net assets exceed $1.5 billion, the management fee is 0.900% of all aggregate net assets. Aggregate net assets include the fund
and JHVIT Health Sciences Trust and Manulife Healthcare Fund Series I.
• High Yield
Fund — a) 0.700% of the first $500 million of aggregate net assets and b) 0.650% of the excess over $500 million of aggregate net assets.
• International Strategic Equity Allocation Fund and U.S. Sector Rotation Fund — a) 0.675% of the first $2.5 billion of aggregate net assets; b) 0.650% of the next $5 billion of
aggregate net assets; c) 0.625% of the next $2.5 billion of aggregate net assets; d) 0.600% of the next $5 billion of aggregate net assets; e) 0.595% of the next $10 billion of aggregate net assets; and f) 0.590% of
the excess over $25 billion of aggregate net assets. Aggregate net assets include these two funds and JHVIT Strategic Equity Allocation Trust.
• Mid Value Fund — a) 0.950% of the first $1 billion of aggregate net assets and b) 0.875% of the excess over $1 billion of aggregate net assets. When aggregate net assets
exceed $1 billion, then the management fee rate is 0.875% of all aggregate net assets.
• Science & Technology Fund — a) 1.050% of the first $50 million of aggregate net assets; b) 1.025% of the next $50 million of aggregate net assets; c)1.000% of the next
$100 million of aggregate net assets; d) 0.975% of the next $300 million of aggregate net assets; e) 0.950% of the next $500 million of aggregate net assets; and f) 0.925% of aggregate net assets in excess of $1
billion. When aggregate net assets exceed $100 million on any day, the annual rate of advisory fee for that day is 1.000% on the first $100 million of aggregate net assets. When aggregate net assets exceed $200
million on any day, the annual rate of advisory fee for that day is 0.975% on the first $200 million of aggregate net assets. When aggregate net assets exceed $500 million on any day, the annual rate of advisory fee
for that day is 0.950% on the first $500 million of aggregate net assets. Aggregate net assets include the fund and JHVIT Science & Technology Trust and Manulife Technology Fund.
The organizations described
below act as the subadvisors to the Trust and certain of its funds pursuant to Subadvisory Agreements with the Advisor. Fund management is allocated among the following subadvisors:
| Fund
| Subadvisor(s)
|
| Core Bond Fund
| Allspring Global Investments, LLC
|
| Capital Appreciation Fund
| Jennison Associates LLC
|
International Strategic Equity Allocation Fund
U.S. Sector Rotation Fund
| Manulife Investment Management (US) LLC1
|
Capital Appreciation Value Fund
Health Sciences Fund
Mid Value Fund
Science & Technology Fund2
| T. Rowe Price Associates, Inc.
|
| High Yield Fund
| Western Asset Management Company, LLC, (Sub-Subadvisor is Western Asset Management Company Limited)
|
1 An affiliate of the Advisor.
2 Effective June 23, 2022, T. Rowe Price Associates, Inc. became the sole subadvisor to the portfolio and Allianz Global Investors U.S. LLC no longer serves as
subadvisor. Allianz Global Investments U.S. LLC (or one of its affiliates) bore expenses associated with the transition management of the portion of the portfolio they managed, which amounted to approximately $315,000
and is included in Net realized gain (loss) on unaffiliated investments and foreign currency transactions on the Statements of operations.
The funds are not
responsible for payment of the subadvisory fees.
Expense
reimbursements. The Advisor has voluntarily agreed to reduce its management fee or if necessary make payment to each fund in an amount by which certain expenses of the respective funds exceed the
percentage of average net assets as detailed below. Expenses excluded from this waiver are taxes, brokerage commissions, interest expense, litigation and indemnification expenses and other extraordinary expenses not
incurred in the ordinary course of the funds’ business, management fees, class specific expenses, acquired fund fees and short dividend expenses. The Advisor may terminate this voluntary waiver at any time upon
notice to the funds.
| Fund
| Expense
limitation as a
percentage of
average net
assets
|
| Capital Appreciation Fund
| 0.20%
|
| Capital Appreciation Value Fund
| 0.20%
|
| Core Bond Fund
| 0.15%
|
| Health Sciences Fund
| 0.20%
|
| High Yield Fund
| 0.15%
|
| Fund
| Expense
limitation as a
percentage of
average net
assets
|
| International Strategic Equity Allocation Fund
| 0.25%
|
| Mid Value Fund
| 0.20%
|
| Science & Technology Fund
| 0.20%
|
| U.S. Sector Rotation Fund
| 0.20%
|
The Advisor has
contractually agreed to waive a portion of its management fee and/or reimburse expenses for certain funds of the John Hancock group of funds complex, including the funds (the participating portfolios). This waiver is
based upon aggregate net assets of all the participating portfolios. The amount of the reimbursement is calculated daily and allocated among all the participating portfolios in proportion to the daily net assets of
the funds. During the year ended August 31, 2023, this waiver amounted to 0.01% of the funds' average daily net assets. This arrangement expires on July 31, 2025, unless renewed by mutual agreement of the funds and
the Advisor based upon a determination that this is appropriate under the circumstances at that time.
The Advisor has
voluntarily agreed to waive its management fee on International Strategic Equity Allocation Fund, Science & Technology Fund and U.S. Sector Rotation Fund so that the amount retained by the Advisor after payment of
the subadvisory fees for the fund does not exceed 0.45% of the fund’s average net assets. This voluntary waiver may be terminated at any time by the Advisor on notice to the Trust.
Fees and transactions with affiliates,
continued
The Advisor has voluntarily agreed to waive a portion of its management fees for the funds subadvised by T. Rowe Price Associates, Inc. which include Capital Appreciation Value
Fund, Health Sciences Fund, Mid Value Fund, and Science & Technology Fund. This voluntary waiver equals the amount by which the subadvisory fee paid to T. Rowe Price Associates, Inc. is reduced. This voluntary
waiver may terminate at any time.
For the year ended August
31, 2023, the expense reductions described above amounted to the following:
| Expense Reimbursement by Class
|
| Fund
| Class 1
| Class NAV
| Total
|
| Capital Appreciation Fund
| $36,876
| $60,993
| $97,869
|
| Capital Appreciation Value Fund
| —
| 526,410
| 526,410
|
| Core Bond Fund
| 9,038
| 111,253
| 120,291
|
| Health Sciences Fund
| —
| 158,808
| 158,808
|
| High Yield Fund
| 13,885
| —
| 13,885
|
| International Strategic Equity Allocation Fund
| —
| 5,972,437
| 5,972,437
|
| Mid Value Fund
| —
| 673,183
| 673,183
|
| Science & Technology Fund
| —
| 83,089
| 83,089
|
| U.S. Sector Rotation Fund
| —
| 5,932,549
| 5,932,549
|
Expenses waived or
reimbursed in the current fiscal period are not subject to recapture in future fiscal periods.
The investment management
fees, including the impact of the waivers and reimbursements as described above, incurred for the year ended August 31, 2023, were equivalent to a net annual effective rate of the funds' average daily net assets as
follows:
| Fund
| Net Annual Effective Rate
|
| Capital Appreciation Fund
| 0.71%
|
| Capital Appreciation Value Fund
| 0.79%
|
| Core Bond Fund
| 0.57%
|
| Health Sciences Fund
| 0.87%
|
| High Yield Fund
| 0.69%
|
| Fund
| Net Annual Effective Rate
|
| International Strategic Equity Allocation Fund
| 0.48%
|
| Mid Value Fund
| 0.83%
|
| Science & Technology Fund
| 0.89%
|
| U.S. Sector Rotation Fund
| 0.49%
|
Accounting and
legal services. Pursuant to a service agreement, the funds reimburse the Advisor for all expenses associated with providing the administrative, financial, legal, compliance, accounting and
recordkeeping services to the funds, including the preparation of all tax returns, periodic reports to shareholders and regulatory reports, among other services. These expenses are allocated to each share class based
on its relative net assets at the time the expense was incurred. These accounting and legal services fees incurred, for the year ended August 31, 2023, amounted to an annual rate of 0.02% of the funds' average
daily net assets.
Distribution and
service plans. The funds have a distribution agreement with the Distributor. The funds have adopted distribution and service plans for certain classes as detailed below pursuant to Rule 12b-1 under the
1940 Act, to pay the Distributor for services provided as the distributor of shares of the funds. The funds may pay up to the following contractual rates of distribution and service fees under these arrangements,
expressed as an annual percentage of average daily net assets for each class of the funds' shares:
| Class
| Rule 12b-1 Fee
|
| Class 1
| 0.05%
|
Distribution
and service fees for the year ended August 31, 2023 were as follows:
| Fund
| Class
| Distribution and service fees
|
| Capital Appreciation Fund
| Class 1
| $255,707
|
| Core Bond Fund
| Class 1
| $62,845
|
| High Yield Fund
| Class 1
| $96,497
|
Trustee
expenses. The funds compensate each Trustee who is not an employee of the Advisor or its affiliates. The costs of paying Trustee compensation and expenses are allocated to each fund based on their
net assets relative to other funds within the John Hancock group of funds complex.
Interfund lending
program. Pursuant to an Exemptive Order issued by the SEC, the funds, along with certain other funds advised by the Advisor or its affiliates, may participate in an interfund lending program. This
program provides an alternative credit facility allowing the funds to borrow from, or lend money to, other participating affiliated funds. At period end, no interfund loans were outstanding. Interest expense is
included in Other expenses on the Statements of operations. The funds' activity in this program during the period for which loans were outstanding was as follows:
| Fund
| Borrower
or Lender
| Weighted Average
Loan Balance
| Days
Outstanding
| Weighted Average
Interest Rate
| Interest Income
(Expense)
|
| Capital Appreciation Fund
| Borrower
| $10,750,000
| 2
| 5.32%
| $(3,174)
|
| International Strategic Equity Allocation Fund
| Borrower
| 9,300,000
| 1
| 3.31%
| (854)
|
| Capital Appreciation Fund
| Lender
| 12,585,714
| 7
| 3.32%
| 8,135
|
| Capital Appreciation Value Fund
| Lender
| 26,775,000
| 12
| 3.53%
| 31,528
|
| Health Sciences Fund
| Lender
| 3,100,000
| 1
| 3.31%
| 285
|
| Mid Value Fund
| Lender
| 24,128,571
| 7
| 3.51%
| 16,487
|
| Science & Technology Fund
| Lender
| 7,200,000
| 5
| 5.21%
| 5,207
|
6. Fund share
transactions
Transactions in funds'
shares for the years ended August 31, 2023 and 2022 were as follows:
| Capital Appreciation Fund
| Year Ended 8-31-23
| Year Ended 8-31-22
|
|
| Shares
| Amount
| Shares
| Amount
|
| Class 1 shares
|
|
|
|
|
| Sold
| 2,469,272
| $29,614,258
| 1,885,863
| $30,321,585
|
| Distributions reinvested
| 5,428,343
| 51,623,538
| 14,158,361
| 234,037,715
|
| Repurchased
| (8,772,337)
| (97,585,184)
| (8,463,197)
| (134,999,393)
|
| Net increase (decrease)
| (874,722)
| $(16,347,388)
| 7,581,027
| $129,359,907
|
| Class NAV shares
|
|
|
|
|
| Sold
| 6,530,293
| $75,733,143
| 11,002,434
| $154,959,479
|
| Distributions reinvested
| 9,098,978
| 87,259,196
| 18,665,411
| 310,779,087
|
| Repurchased
| (19,334,466)
| (229,127,214)
| (9,511,301)
| (163,454,454)
|
| Net increase (decrease)
| (3,705,195)
| $(66,134,875)
| 20,156,544
| $302,284,112
|
| Total net increase (decrease)
| (4,579,917)
| $(82,482,263)
| 27,737,571
| $431,644,019
|
| Capital Appreciation Value Fund
| Year Ended 8-31-23
| Year Ended 8-31-22
|
|
| Shares
| Amount
| Shares
| Amount
|
| Class NAV shares
|
|
|
|
|
| Sold
| 1,205,496
| $10,558,464
| 13,228,207
| $126,631,864
|
| Distributions reinvested
| 19,043,172
| 152,535,808
| 25,226,702
| 259,582,767
|
| Repurchased
| (26,617,705)
| (232,687,723)
| (15,660,719)
| (170,944,411)
|
| Net increase (decrease)
| (6,369,037)
| $(69,593,451)
| 22,794,190
| $215,270,220
|
| Total net increase (decrease)
| (6,369,037)
| $(69,593,451)
| 22,794,190
| $215,270,220
|
| Core Bond Fund
| Year Ended 8-31-23
| Year Ended 8-31-22
|
|
| Shares
| Amount
| Shares
| Amount
|
| Class 1 shares
|
|
|
|
|
| Sold
| 1,148,133
| $12,703,995
| 558,554
| $6,802,255
|
| Distributions reinvested
| 369,919
| 4,071,085
| 249,654
| 3,151,517
|
| Repurchased
| (2,365,496)
| (25,899,569)
| (3,026,217)
| (37,190,897)
|
| Net decrease
| (847,444)
| $(9,124,489)
| (2,218,009)
| $(27,237,125)
|
| Class NAV shares
|
|
|
|
|
| Sold
| 44,896,771
| $493,988,860
| 19,803,959
| $236,047,635
|
| Distributions reinvested
| 4,476,741
| 49,179,048
| 2,365,347
| 29,676,464
|
| Repurchased
| (25,142,550)
| (276,944,300)
| (13,461,470)
| (164,799,449)
|
| Net increase
| 24,230,962
| $266,223,608
| 8,707,836
| $100,924,650
|
| Total net increase
| 23,383,518
| $257,099,119
| 6,489,827
| $73,687,525
|
| Health Sciences Fund
| Year Ended 8-31-23
| Year Ended 8-31-22
|
|
| Shares
| Amount
| Shares
| Amount
|
| Class NAV shares
|
|
|
|
|
| Sold
| 1,700,843
| $8,217,828
| 4,345,622
| $24,191,656
|
| Distributions reinvested
| 1,817,865
| 8,653,037
| 10,044,268
| 56,448,788
|
| Repurchased
| (15,273,463)
| (74,435,089)
| (9,504,977)
| (50,365,144)
|
| Net increase (decrease)
| (11,754,755)
| $(57,564,224)
| 4,884,913
| $30,275,300
|
| Total net increase (decrease)
| (11,754,755)
| $(57,564,224)
| 4,884,913
| $30,275,300
|
| High Yield Fund
| Year Ended 8-31-23
| Year Ended 8-31-22
|
|
| Shares
| Amount
| Shares
| Amount
|
| Class 1 shares
|
|
|
|
|
| Sold
| 2,137,077
| $14,516,079
| 2,402,969
| $19,413,419
|
| Distributions reinvested
| 2,022,010
| 13,372,984
| 1,776,613
| 13,647,917
|
| Repurchased
| (6,382,314)
| (42,866,071)
| (7,708,801)
| (59,377,183)
|
| Net decrease
| (2,223,227)
| $(14,977,008)
| (3,529,219)
| $(26,315,847)
|
| Total net decrease
| (2,223,227)
| $(14,977,008)
| (3,529,219)
| $(26,315,847)
|
Fund share transactions, continued
| International Strategic Equity Allocation Fund
| Year Ended 8-31-23
| Year Ended 8-31-22
|
|
| Shares
| Amount
| Shares
| Amount
|
| Class NAV shares
|
|
|
|
|
| Sold
| 65,361,245
| $583,011,355
| 323,192,115
| $3,176,965,2421
|
| Distributions reinvested
| 10,797,874
| 92,213,840
| 8,825,077
| 91,427,800
|
| Repurchased
| (173,275,517)
| (1,622,255,043)
| (18,584,550)
| (172,749,547)
|
| Net increase (decrease)
| (97,116,398)
| $(947,029,848)
| 313,432,642
| $3,095,643,495
|
| Total net increase (decrease)
| (97,116,398)
| $(947,029,848)
| 313,432,642
| $3,095,643,495
|
|
|
|
| 1
| Includes in-kind subscriptions of approximately $3.0 billion by affiliates of the fund. The cost basis of the contributed securities is equal to the market value
of the securities on the date of the subscription.
|
| Mid Value Fund
| Year Ended 8-31-23
| Year Ended 8-31-22
|
|
| Shares
| Amount
| Shares
| Amount
|
| Class NAV shares
|
|
|
|
|
| Sold
| 3,445,218
| $53,247,705
| 1,401,916
| $26,684,322
|
| Distributions reinvested
| 15,671,683
| 228,179,709
| 8,266,026
| 149,119,105
|
| Repurchased
| (10,929,609)
| (180,632,275)
| (26,750,313)
| (503,877,488)
|
| Net increase (decrease)
| 8,187,292
| $100,795,139
| (17,082,371)
| $(328,074,061)
|
| Total net increase (decrease)
| 8,187,292
| $100,795,139
| (17,082,371)
| $(328,074,061)
|
| Science & Technology Fund
| Year Ended 8-31-23
| Year Ended 8-31-22
|
|
| Shares
| Amount
| Shares
| Amount
|
| Class NAV shares
|
|
|
|
|
| Sold
| 50,504,165
| $78,522,072
| 15,490,826
| $27,266,486
|
| Distributions reinvested
| 15,894,410
| 18,119,628
| 63,151,980
| 121,883,322
|
| Repurchased
| (56,395,986)
| (73,019,490)
| (5,966,442)
| (19,981,952)
|
| Net increase
| 10,002,589
| $23,622,210
| 72,676,364
| $129,167,856
|
| Total net increase
| 10,002,589
| $23,622,210
| 72,676,364
| $129,167,856
|
| U.S. Sector Rotation Fund
| Year Ended 8-31-23
| Year Ended 8-31-22
|
|
| Shares
| Amount
| Shares
| Amount
|
| Class NAV shares
|
|
|
|
|
| Sold
| 35,681,140
| $307,359,946
| 430,266,464
| $4,186,145,6351
|
| Distributions reinvested
| 14,533,931
| 117,724,841
| 25,953,684
| 259,017,769
|
| Repurchased
| (233,859,337)
| (2,148,765,501)
| (36,414,422)
| (359,422,620)
|
| Net increase (decrease)
| (183,644,266)
| $(1,723,680,714)
| 419,805,726
| $4,085,740,784
|
| Total net increase (decrease)
| (183,644,266)
| $(1,723,680,714)
| 419,805,726
| $4,085,740,784
|
|
|
|
| 1
| Includes in-kind subscriptions of approximately $4.1 billion by affiliates of the fund. The cost basis of the contributed securities is equal to the market value
of the securities on the date of the subscription.
|
Affiliates of the Trust
owned 100% of shares of Class 1 and Class NAV, respectively, with the exception of Capital Appreciation Fund and Core Bond Fund, where affiliates held 70% and 68% of Class NAV, respectively, on August 31, 2023.
Such concentration of shareholders’ capital could have a material effect on the fund if such shareholders redeem from the fund.
On July 14, 2023, there
was a redemption in kind from Class NAV shares of $721,512,220 and $1,174,541,563, which represented approximately 16.1% and 26.3% of International Strategic Equity Allocation Fund and U.S. Sector Rotation Fund,
respectively, on that date. For purposes of US GAAP, this transaction was treated as a sale of securities and the resulting gains and losses were recognized based on the market value of the securities on the date of
the transfer. For tax purposes, no gains or losses were recognized. Net realized gain resulting from such redemption in kind is shown on the Statements of operations.
7. Purchase and sale
of securities
Purchases and sales of
securities, other than short-term investments and in kind transactions, amounted to the following for the year ended August 31, 2023:
|
| Purchases
| Sales
|
| Fund
| U.S. Government
| Other issuers
| U.S. Government
| Other issuers
|
| Capital Appreciation Fund
| —
| $415,863,805
| —
| $625,641,956
|
| Capital Appreciation Value Fund
| $305,858,455
| 707,677,859
| $270,195,981
| 849,290,069
|
| Core Bond Fund
| 2,819,961,585
| 1,545,905,351
| 2,771,260,642
| 1,327,919,917
|
| Health Sciences Fund
| —
| 106,716,163
| —
| 172,225,364
|
| High Yield Fund
| —
| 59,181,883
| —
| 76,074,773
|
| International Strategic Equity Allocation Fund
| —
| 1,266,714,932
| —
| 1,426,840,688
|
| Mid Value Fund
| —
| 740,181,415
| —
| 801,938,243
|
| Science & Technology Fund
| —
| 190,559,531
| —
| 186,387,365
|
Purchase and sale of securities,
continued
|
| Purchases
| Sales
|
| Fund
| U.S. Government
| Other issuers
| U.S. Government
| Other issuers
|
| U.S. Sector Rotation Fund
| —
| $2,731,734,847
| —
| $3,197,825,072
|
8. Industry or sector
risk
Certain funds may invest a
large percentage of their assets in one or more particular industries or sectors of the economy. If a large percentage of a fund's assets are economically tied to a single or small number of industries or sectors of
the economy, the fund will be less diversified than a more broadly diversified fund, and it may cause the fund to underperform if that industry or sector underperforms. In addition, focusing on a particular industry
or sector may make the fund’s NAV more volatile. Further, a fund that invests in particular industries or sectors is particularly susceptible to the impact of market, economic, regulatory and other factors
affecting those industries or sectors. Financial services companies can be hurt by economic declines, changes in interest rates, and regulatory and market impacts.
9. Investment in
affiliated underlying funds
The funds may invest in
affiliated underlying funds that are managed by the Advisor and its affiliates. Information regarding the funds' fiscal year to date purchases and sales of the affiliated underlying funds as well as income and capital
gains earned by the funds, if any, is as follows:
|
|
|
|
|
|
|
| Dividends and distributions
|
| Affiliate
| Ending
share
amount
| Beginning
value
| Cost of
purchases
| Proceeds
from shares
sold
| Realized
gain
(loss)
| Change in
unrealized
appreciation
(depreciation)
| Income
distributions
received
| Capital gain
distributions
received
| Ending
value
|
| Capital Appreciation Fund
|
| John Hancock Collateral Trust*
| —
| —
| $110,385,121
| $(110,382,793)
| $(2,328)
| —
| $20,668
| —
| —
|
| Capital Appreciation Value Fund
|
| John Hancock Collateral Trust*
| 201,946
| $2,077,345
| $73,055,644
| $(73,114,975)
| $(359)
| $1,116
| $36,748
| —
| $2,018,771
|
| Core Bond Fund
|
| John Hancock Collateral Trust*
| —
| —
| $10,932,412
| $(10,932,207)
| $(205)
| —
| $604
| —
| —
|
| High Yield Fund
|
| John Hancock Collateral Trust*
| —
| $2,375,359
| $19,191,960
| $(21,566,780)
| $(1,511)
| $972
| $58,121
| —
| —
|
| International Strategic Equity Allocation Fund
|
| John Hancock Collateral Trust*
| 2,522,734
| $26,922,715
| $565,992,949
| $(567,687,382)
| $(14,340)
| $4,826
| $531,719
| —
| $25,218,768
|
| Mid Value Fund
|
| John Hancock Collateral Trust*
| 1,995,190
| $22,095,028
| $294,128,926
| $(296,281,129)
| $(7,025)
| $9,312
| $365,732
| —
| $19,945,112
|
| Science & Technology Fund
|
| John Hancock Collateral Trust*
| —
| $1,229,283
| $31,074,014
| $(32,303,468)
| $166
| $5
| $8,990
| —
| —
|
| U.S. Sector Rotation Fund
|
| John Hancock Collateral Trust*
| 6,570,132
| $180,838,338
| $1,233,703,761
| $(1,348,869,223)
| $(7,970)
| $14,077
| $5,929,019
| —
| $65,678,983
|
| *
| Refer to the Securities lending note within Note 2 for details regarding this investment.
|
10. Investment by
affiliated funds
Certain investors in the
funds are affiliated funds that are managed by the Advisor and its affiliates. The affiliated funds do not invest in the funds for the purpose of exercising management or control; however, this investment may
represent a significant portion of the funds' net assets. At August 31, 2023, the following fund(s) had an affiliate ownership of 5% or more of the funds' net assets:
| Fund
| Affiliated Concentration
|
| Capital Appreciation Fund
| 42.1%
|
| Capital Appreciation Value Fund
| 98.2%
|
| Core Bond Fund
| 63.8%
|
| Health Sciences Fund
| 100%
|
| International Strategic Equity Allocation Fund
| 100%
|
| Mid Value Fund
| 100%
|
| Science & Technology Fund
| 100%
|
| U.S. Sector Rotation Fund
| 100%
|
11. Interfund
trading
The funds are permitted to
purchase or sell securities from or to certain other affiliated funds, as set forth in Rule 17a-7 of the 1940 Act, under specified conditions outlined in procedures adopted by the Board of Trustees of the Trust. The
procedures have been designed to ensure that any purchase or sale of securities by the funds from or to another fund that is or could be considered an affiliate complies with Rule 17a-7 of the 1940 Act. Further, as
defined under the procedures, each transaction is effected at the current market price. Pursuant to these procedures, for the year ended August 31, 2023, the funds engaged in securities purchases and sales with
affiliated funds, some of which have different fiscal reporting periods, as follows:
| Fund
| Purchases
|
| Capital Appreciation Value Fund
| $265,496
|
12. Restricted
securities
The funds may hold
restricted securities which are restricted as to resale and the funds have limited rights to registration under the Securities Act of 1933. Disposal may involve time-consuming negotiations and expenses, and prompt
sale at an acceptable price may be difficult to achieve. The following table summarizes the restricted securities held at August 31, 2023:
Issuer,
Description
| Original
acquisition date
| Acquisition
cost
| Beginning
share
amount
| Shares
purchased
| Shares
sold
| Ending
share
amount
| Value as a
percentage of
net assets
| Ending
value
|
| High Yield Fund
|
|
|
|
|
|
|
|
|
| KCAD Holdings I, Ltd.
| 3-21-11
| $6,150,520
| 752,218,031
| —
| —
| 752,218,031
| 0.0%1
| $752
|
| MWO Holdings LLC
| 8-30-16
| 1,116,559
| 1,134
| —
| —
| 1,134
| 0.0%1
| 7,053
|
| New Cotai, Inc., Class B
| 4-12-13
| 0
| 11
| —
| —
| 11
| 0.0%
| 0
|
|
|
|
|
|
|
|
|
| $7,805
|
13. LIBOR
discontinuation risk
LIBOR (London Interbank
Offered Rate) is a measure of the average interest rate at which major global banks can borrow from one another. Following allegations of rate manipulation and concerns regarding its thin liquidity, in July 2017, the
U.K. Financial Conduct Authority, which regulates LIBOR, announced that it will stop encouraging banks to provide the quotations needed to sustain LIBOR. As market participants transition away from LIBOR,
LIBOR’s usefulness may deteriorate and these effects could be experienced until the permanent cessation of the majority of U.S. LIBOR rates in 2023. The transition process may lead to increased volatility and
illiquidity in markets that currently rely on LIBOR to determine interest rates. LIBOR’s deterioration may adversely affect the liquidity and/or market value of securities that use LIBOR as a benchmark interest
rate.
The ICE Benchmark
Administration Limited, the administrator of LIBOR, ceased publishing certain LIBOR maturities, including some U.S. LIBOR maturities, on December 31, 2021, and ceased publishing the remaining and most liquid U.S.
LIBOR maturities on June 30, 2023 on a representative basis. The 1-, 3- and 6-month USD LIBOR maturities will continue to be published based on a synthetic methodology through September 30, 2024 and are permitted to
be used in all legacy contracts except cleared derivatives. It is expected that market participants have or will transition to the use of alternative reference or benchmark rates prior to the applicable LIBOR
publication cessation date. Additionally, although regulators have encouraged the development and adoption of alternative rates such as the Secured Overnight Financing Rate ("SOFR"), the future utilization of LIBOR or
of any particular replacement rate remains uncertain.
The impact on the
transition away from LIBOR referenced financial instruments remains uncertain. It is expected that market participants will adopt alternative rates such as SOFR or otherwise amend such financial instruments to include
fallback provisions and other measures that contemplate the discontinuation of LIBOR. Uncertainty and risk remain regarding the willingness and ability of issuers and lenders to include alternative rates and revised
provisions in new and existing contracts or instruments. To facilitate the transition of legacy derivatives contracts referencing LIBOR, the International Swaps and Derivatives Association, Inc. launched a protocol to
incorporate fallback provisions. There are obstacles to converting certain longer term securities to a new benchmark or benchmarks and the effectiveness of one versus multiple alternative reference rates has not been
determined. Certain proposed replacement rates, such as SOFR, are materially different from LIBOR, and will require changes to the applicable spreads. Furthermore, the risks associated with the conversion from LIBOR
may be exacerbated if an orderly transition is not completed in a timely manner.
14. New accounting
pronouncement
In March 2020, the
Financial Accounting Standards Board (FASB) issued an Accounting Standards Update (ASU), ASU 2020-04, Reference Rate Reform (Topic 848), which provides optional, temporary relief with respect to the financial
reporting of contracts subject to certain types of modifications due to the planned discontinuation of the LIBOR and other IBOR-based reference rates as of the end of 2021. In January 2021 and December 2022, the
FASB issued ASU No. 2021-01 and ASU No. 2022-06, with further amendments to Topic 848. The temporary relief provided by ASU 2020-04 is effective for certain reference rate-related contract modifications that occur
during the period March 12, 2020 through December 31, 2024. Management expects that the adoption of the guidance will not have a material impact to the financial statements.
Report of Independent
Registered Public Accounting Firm
To the Board of Trustees
of John Hancock Funds II and Shareholders of Capital Appreciation Fund, Capital Appreciation Value Fund, Core Bond Fund, Health Sciences Fund, High Yield Fund, International Strategic Equity Allocation Fund, Mid Value
Fund, Science & Technology Fund and U.S. Sector Rotation Fund
Opinion on the Financial
Statements
We have audited the
accompanying statements of assets and liabilities, including the portfolio of investments, of Capital Appreciation Fund, Capital Appreciation Value Fund, Core Bond Fund, Health Sciences Fund, High Yield Fund,
International Strategic Equity Allocation Fund, Mid Value Fund, Science & Technology Fund and U.S. Sector Rotation Fund (nine of the funds constituting John Hancock Funds II, hereafter collectively referred to as
the "Funds") as of August 31, 2023, the related statements of operations for the year ended August 31, 2023, the statements of changes in net assets for each of the two years in the period ended August 31, 2023,
including the related notes, and the financial highlights for each of the five years in the period ended August 31, 2023 (collectively referred to as the “financial statements”). In our opinion, the
financial statements present fairly, in all material respects, the financial position of each of the Funds as of August 31, 2023, the results of each of their operations for the year then ended, the changes in each of
their net assets for each of the two years in the period ended August 31, 2023 and each of the financial highlights for each of the five years in the period ended August 31, 2023 in conformity with accounting
principles generally accepted in the United States of America.
Basis for Opinion
These financial
statements are the responsibility of the Funds’ management. Our responsibility is to express an opinion on the Funds’ financial statements based on our audits. We are a public accounting firm registered
with the Public Company Accounting Oversight Board (United States) (PCAOB) and are required to be independent with respect to the Funds in accordance with the U.S. federal securities laws and the applicable rules and
regulations of the Securities and Exchange Commission and the PCAOB.
We conducted our audits
of these financial statements in accordance with the standards of the PCAOB. Those standards require that we plan and perform the audit to obtain reasonable assurance about whether the financial statements are free of
material misstatement, whether due to error or fraud.
Our audits included
performing procedures to assess the risks of material misstatement of the financial statements, whether due to error or fraud, and performing procedures that respond to those risks. Such procedures included examining,
on a test basis, evidence regarding the amounts and disclosures in the financial statements. Our audits also included evaluating the accounting principles used and significant estimates made by management, as well as
evaluating the overall presentation of the financial statements. Our procedures included confirmation of securities owned as of August 31, 2023 by correspondence with the custodians, transfer agents, agent banks and
brokers; when replies were not received from agent banks and brokers, we performed other auditing procedures. We believe that our audits provide a reasonable basis for our opinions.
/s/
PricewaterhouseCoopers LLP
Boston, Massachusetts
October 19, 2023
We have served as the
auditor of one or more investment companies in the John Hancock group of funds since 1988.
John Hancock Funds II
Federal tax information
(Unaudited)
For federal income tax
purposes, the following information is furnished with respect to the distributions of the funds, if any, paid during its taxable year ended August 31, 2023.
Dividend Received
Deduction The funds report the maximum amount allowable of their net taxable income as eligible for the corporate dividends-received deduction.
Qualified Dividend
Income The funds report the maximum amount allowable of their net taxable income as qualified dividend income as provided in the Jobs and Growth Tax Relief Reconciliation Act of 2003.
Each fund reports the
maximum amount allowable as Section 163(j) Interest Dividends.
Each fund reports the
maximum amount allowable of its Section 199A dividends as defined in Proposed Treasury Regulation §1.199A-3(d).
Foreign Tax Credit The following table details the income derived from foreign sources and the amounts the funds intend to pass through as foreign tax credits for the year ended August 31, 2023:
| Fund
| Foreign sourced income
| Foreign tax credit
|
| International Strategic Equity Allocation Fund
| $141,383,121
| $11,591,124
|
Long Term Capital
Gains The funds below paid the following amounts in capital gain dividends.
| Fund
| Long term capital gains
|
| Capital Appreciation Fund
| $138,882,734
|
| Capital Appreciation Value Fund
| 128,808,190
|
| Health Sciences Fund
| 8,653,037
|
| Mid Value Fund
| 196,614,630
|
| Science & Technology Fund
| 18,119,628
|
| U.S. Sector Rotation Fund
| 74,867,729
|
Eligible shareholders will
be mailed a 2023 Form 1099-DIV in early 2024. This will reflect the tax character of all distributions paid in calendar year 2023.
Please consult a tax advisor
regarding the tax consequences of your investment in a fund.
John Hancock Funds II
Evaluation of Advisory and Subadvisory
Agreements by the Board of Trustees
This section describes the evaluation by
the Board of Trustees (the Board) of John Hancock Funds II (the Trust) of the Advisory Agreement (the Advisory Agreement) with John Hancock Investment Management LLC (the Advisor) and each of the Subadvisory
Agreements (collectively, the Subadvisory Agreements) with respect to each of the portfolios of the Trust included in this report (the Funds). The Advisory Agreement and Subadvisory Agreements are collectively
referred to as the Agreements. Prior to the June 26-29, 2023 meeting at which the Agreements were approved, the Board also discussed and considered information regarding the proposed continuation of the
Agreements at a meeting held on May 30-June 1, 2023. The Trustees who are not “interested persons” of the Trust as defined by the Investment Company Act of 1940, as amended (the 1940 Act) (the Independent
Trustees) also met separately to evaluate and discuss the information presented, including with counsel to the Independent Trustees and a third-party consulting firm.
Approval of Advisory and
Subadvisory Agreements
At meetings held on June
26-29, 2023, the Board, including the Trustees who are not parties to any Agreement or considered to be interested persons of the Trust under the 1940 Act, reapproved for an annual period, the continuation of the
Advisory Agreement between the Trust and the Advisor and the applicable Subadvisory Agreements between the Advisor and the investment subadvisors (each, Subadvisor and collectively, the Subadvisors) with respect to
each of the Funds identified below in Appendix A.
In considering the
Advisory Agreement and the Subadvisory Agreements with respect to each Fund, the Board received in advance of the meetings a variety of materials relating to each Fund, the Advisor and each Subadvisor, including
comparative performance, fee and expense information for peer groups of similar funds prepared by an independent third-party provider of fund data; performance information for the Funds’ benchmark indices; and,
with respect to each Subadvisor, comparative performance information for comparably managed accounts, as applicable; and other information provided by the Advisor and the Subadvisors regarding the nature, extent and
quality of services provided by the Advisor and the Subadvisors under their respective Agreements, as well as information regarding the Advisor’s revenues and costs of providing services to the Funds and any
compensation paid to affiliates of the Advisor. At the meetings at which the renewal of the Advisory Agreement and Subadvisory Agreements are considered, particular focus is given to information concerning Fund
performance, comparability of fees and total expenses, and profitability. However, the Board noted that the evaluation process with respect to the Advisor and the Subadvisors is an ongoing one. In this regard, the
Board also took into account discussions with management and information provided to the Board (including its various committees) at prior meetings with respect to the services provided by the Advisor and the
Subadvisors to the Funds, including quarterly performance reports prepared by management containing reviews of investment results, and prior presentations from the Subadvisors with respect to the Funds they manage.
The information received and considered by the Board in connection with the May and June meetings and throughout the year was both written and oral. The Board noted the affiliation of certain of the Subadvisors with
the Advisor, noting any potential conflicts of interest. The Board also considered the nature, quality, and extent of the services, if any, to be provided to the Funds by the Advisor’s affiliates, including
distribution services. The Board considered the Advisory Agreement and the Subadvisory Agreement separately in the course of its review. In doing so, the Board noted the respective roles of the Advisor and
Subadvisor in providing services to the Funds. In addition, although the Board approved the renewal of the Agreements for all the Funds at the June meeting, the Board considered each Fund separately.
Throughout the process,
the Board asked questions of and requested additional information from management. The Board is assisted by counsel for the Trust and the Independent Trustees are also separately assisted by independent legal counsel
throughout the process. The Independent Trustees also received a memorandum from their independent legal counsel discussing the legal standards for their consideration of the proposed continuation of the
Agreements and discussed the proposed
continuation of the Agreements in private sessions with their independent legal counsel at which no representatives of management were present.
Approval of Advisory Agreement
In approving the Advisory
Agreement with respect to each Fund, the Board, including the Independent Trustees, considered a variety of factors, including those discussed below. The Board also considered other factors (including conditions and
trends prevailing generally in the economy, the securities markets and the industry) and did not treat any single factor as determinative, and each Trustee may have attributed different weights to different factors.
The Board’s conclusions may be based in part on its consideration of the advisory and subadvisory arrangements in prior years and on the Board’s ongoing regular review of Fund performance and operations
throughout the year.
Nature, extent, and quality of services. Among the information received by the Board from the Advisor relating to the nature, extent and quality of services provided to the Funds, the Board reviewed information provided by the
Advisor relating to its operations and personnel, descriptions of its organizational and management structure, and information regarding the Advisor's compliance and regulatory history, including its Form ADV. The
Board also noted that on a regular basis it receives and reviews information from the Trust’s Chief Compliance Officer (CCO) regarding the Funds’ compliance policies and procedures established pursuant to
Rule 38a-1 under the 1940 Act. The Board observed that the scope of services provided by the Advisor, and of the undertakings required of the Advisor in connection with those services, including maintaining and
monitoring its own and the fund’s compliance programs, risk management programs, liquidity management programs, derivatives risk management programs, and cybersecurity programs, had expanded over time as a
result of regulatory, market and other developments. The Board considered that the Advisor is responsible for the management of the day-to-day operations of the Funds, including but not limited to, general supervision
of and coordination of the services provided by the Subadvisors, and is also responsible for monitoring and reviewing the activities of the Subadvisors and other third-party service providers. The Board also
considered the significant risk assumed by the Advisor in connection with the services provided to the Funds including entrepreneurial risk in sponsoring new Funds and ongoing risks including investment, operational,
enterprise, litigation, regulatory and compliance risks with respect to all Funds.
In considering the nature,
extent and quality of the services provided by the Advisor, the Trustees also took into account their knowledge of the Advisor’s management and the quality of the performance of the Advisor’s duties,
through Board meetings, discussions and reports during the preceding year and through each Trustee’s experience as a Trustee of the Trust and of the other trusts in the complex (John Hancock Fund Complex).
In the course of their
deliberations regarding the Advisory Agreement, the Board considered, among other things:
(a) the skills and
competency with which the Advisor has in the past managed the Trust’s affairs and its subadvisory relationships, the Advisor’s oversight and monitoring of the Subadvisors’ investment performance and
compliance programs, such as the Subadvisors’ compliance with fund policies and objectives, review of brokerage matters including with respect to trade allocation and best execution, and the Advisor’s
timeliness in responding to performance issues;
(b) the background,
qualifications and skills of the Advisor’s personnel;
(c) the
Advisor’s compliance policies and procedures and its responsiveness to regulatory changes and fund industry developments;
(d) the
Advisor’s administrative capabilities, including its ability to supervise the other service providers for the Funds, as well as the Advisor’s oversight of any securities lending activity, its monitoring of
class action litigation and collection of class action settlements on behalf of the fund, and bringing loss recovery actions on behalf of the Fund;
John Hancock Funds II
Evaluation of Advisory and Subadvisory
Agreements by the Board of Trustees
(e) the financial condition of the
Advisor and whether it has the financial wherewithal to provide a high level and quality of services to the Funds;
(f) the
Advisor’s initiative intended to improve various aspects of the Trust’s operations and investor experience with the Funds; and
(g) the
Advisor’s reputation and experience in serving as an investment adviser to the Trust and the benefit to shareholders of investing in funds that are part of a family of funds offering a variety of investments.
The Board concluded that
the Advisor may reasonably be expected to continue to provide a high quality of services under the Advisory Agreement with respect to the Funds.
Investment performance. In considering each Fund’s performance, the Board noted that it reviews at its regularly scheduled meetings information about the Funds’ performance results. In connection with
the consideration of the Advisory Agreement, the Board:
(a) reviewed
information prepared by management regarding the Funds’ performance;
(b) considered the
comparative performance of each Fund’s respective benchmark index;
(c) considered the
performance of comparable funds, if any, as included in the report prepared by an independent third-party provider of fund data; and
(d) took into
account the Advisor’s analysis of each Fund’s performance and its plans and recommendations regarding the Trust’s subadvisory arrangements generally and with respect to particular Funds.
The Board noted that while
it found the data provided by the independent third-party generally useful it recognized its limitations, including in particular that the data may vary depending on the end date selected and that the results of the
performance comparisons may vary depending on the selection of the peer group. The Board reviewed Fund performance against each Fund’s respective benchmark and peer group median and also concluded that the
performance of each of the Funds has generally been in line with or generally outperformed the historical performance of comparable funds and/or each Fund’s respective benchmark, with certain exceptions noted in
Appendix A. In such cases, the Board concluded that such performance is being monitored and reasonably addressed, where appropriate.
Fees and expenses. The Board reviewed comparative information prepared by an independent third-party provider of fund data including, among other data, each Fund’s contractual and net management
fees (and subadvisory fees, to the extent available) and total expenses as compared to similarly situated investment companies deemed to be comparable to the Fund in light of the nature, extent and quality of the
management and advisory and subadvisory services provided by the Advisor and the Subadvisor. The Board considered each Fund’s ranking within a smaller group of peer funds chosen by the independent third-party
provider, as well as the Fund’s ranking within broader groups of funds. In comparing each Fund’s contractual and net management fees to that of comparable funds, the Board noted that such fees include both
advisory and administrative costs.
The Board took into
account management’s discussion of the Funds’ expenses. The Board took into account management’s discussion with respect to the overall management fee and the fees of the Subadvisor, including the
amount of the advisory fee retained by the Advisor after payment of the subadvisory fee, in each case in light of the services rendered for those amounts and the risks undertaken by the Advisor. The Board also noted
that the Advisor pays the subadvisory fees of the Funds, and that such fees are negotiated at arm’s length with respect to the unaffiliated Subadvisors. The Board also took into account that management had
agreed to implement an overall fee waiver across the complex, which is discussed further below. The Board also noted management’s discussion of the Funds’ expenses, as well as any actions taken over the
past several years to reduce the Funds’ operating expenses. The Board reviewed information provided by the Advisor concerning investment advisory fee charged by the Advisor or one of its advisory affiliates to
other clients
(including other funds in the complex)
having similar investment mandates, if any. The Board considered any differences between the Advisor’s and each Subadvisor’s services to a Fund and the services they provide to other comparable clients or
funds. The Board concluded that the advisory fee paid with respect to each of the Funds is reasonable in light of the nature, extent and quality of the services provided to the Funds under the Advisory Agreement.
Profitability/Indirect benefits. In considering the costs of the services to be provided and the profits to be realized by the Advisor and its affiliates (including the Subadvisors that are affiliated with the Advisor)
from the Advisor’s relationship with the Trust, the Board:
(a) reviewed
financial information of the Advisor;
(b) reviewed and
considered information presented by the Advisor regarding the net profitability to the Advisor and its affiliates, of each Fund;
(c) received and
reviewed profitability information with respect to the John Hancock fund complex as a whole and with respect to each Fund;
(d) received
information with respect to the Advisor’s allocation methodologies used in preparing the profitability data and considered that the Advisor hired an independent third-party consultant to provide an analysis of
the Advisor’s allocation methodologies;
(e) considered that
the John Hancock insurance companies that are affiliates of the Advisor, as shareholders of the Trust directly or through their separate accounts, receive certain tax credits or deductions relating to foreign taxes
paid and dividends received by certain Funds of the Trust and noted that these tax benefits, which are not available to participants in qualified retirement plans under applicable income tax law, are reflected in the
profitability analysis reviewed by the Board;
(f) considered that
the Advisor also provides administrative services to the Funds on a cost basis pursuant to an administrative services agreement;
(g) noted that
certain of the Funds’ Subadvisors are affiliates of the Advisor
(h) noted that
affiliates of the Advisor provide transfer agency services and distribution services to the fund, and that the fund’s distributor also receives Rule 12b-1 payments to support distribution of the Fund;
(i) noted that the
Advisor also derives reputational and other indirect benefits from providing advisory services to the Funds;
(j) noted that the
subadvisory fees for the Funds are paid by the Advisor and are negotiated at arms’ length with respect to the unaffiliated Subadvisors;
(k) considered the
Advisor’s ongoing costs and expenditures necessary to improve services, meet new regulatory and compliance requirements, and adapt to other challenges impacting the fund industry; and
(l) considered that
the Advisor should be entitled to earn a reasonable level of profits in exchange for the level of services it provides to each Fund and the risks that it assumes as Advisor, including entrepreneurial, operational,
reputational, litigation and regulatory risk.
Based upon its review, the
Board concluded that the level of profitability, if any, of the Advisor and its affiliates (including any Subadvisors that are affiliated with the Advisor), from their relationship with each Fund was reasonable and
not excessive.
John Hancock Funds II
Evaluation of Advisory and Subadvisory
Agreements by the Board of Trustees
Economies of scale. In considering the extent to which a Fund may realize any economies of scale and whether fee levels reflect these economies of scale for the benefit of Fund shareholders, the
Board:
(a) considered that
the Advisor has contractually agreed to waive a portion of its management fee for certain funds of the John Hancock Fund Complex, including the Funds (the participating portfolios) or otherwise reimburse the expenses
of the participating portfolios (the reimbursement). This waiver is based upon aggregate net assets of all the participating portfolios. The amount of the reimbursement is calculated daily and allocated among all the
participating portfolios in proportion to the daily net assets of each fund;
(b) reviewed the
Trust’s advisory fee structure and the incorporation therein of any subadvisory fee breakpoints in the advisory fees charged and concluded that (i) most of the Funds’ fee structures contain breakpoints at
the subadvisory fee level and that such breakpoints are reflected as breakpoints in the advisory fees for Funds and (ii) although economies of scale cannot be measured with precision, these arrangements permit
shareholders of Funds with advisory fee breakpoints to benefit from economies of scale if those Funds grow. The Board also took into account management’s discussion of the Funds’ advisory fee
structure; and
(c) considered the
effect of the Funds’ growth in size on their performance and fees. The Board also noted that if the Funds’ assets increase over time, the Funds may realize other economies of scale.Approval of Subadvisory
Agreement
In making its
determination with respect to approval of the Subadvisory Agreement, the Board reviewed:
| (1)
| information relating to each Subadvisor’s business, including current subadvisory services to the Trust (and other funds in the John Hancock family of funds);
|
| (2)
| the historical and current performance of each Fund and comparative performance information relating to the Fund’s benchmark and comparable funds;
|
| (3)
| the subadvisory fee for each Fund, and comparative fee information, where available, prepared by an independent third-party provider of fund data; and
|
| (4)
| information relating to the nature and scope of any material relationships and their significance to the Trust’s Advisor and unaffiliated Subadvisors.
|
Nature, extent, and quality of services. With respect to the services provided by each of the Subadvisors with respect to each Fund, the Board received information provided to the Board by each Subadvisor, including each
Subadvisor’s Form ADV, as well as took into account information presented throughout the past year. The Board considered each Subadvisor’s current level of staffing and its overall resources, as well as
received information relating to a Subadvisor’s compensation program. The Board reviewed each Subadvisor’s history and investment experience, as well as information regarding the qualifications, background
and responsibilities of each Subadvisor’s investment and compliance personnel who provide services to the Funds. The Board also considered, among other things, each Subadvisor’s compliance program and any
disciplinary history. The Board also considered each Subadvisor’s risk assessment and monitoring process. The Board reviewed each Subadvisor’s regulatory history, including whether it was involved in any
regulatory actions or investigations as well as material litigation, and any settlements and amelioratory actions undertaken, as appropriate. The Board noted that the Advisor conducts regular, periodic reviews of each
Subadvisor and its operations, including regarding investment processes and organizational and staffing matters. The Board also noted that the CCO and his staff conduct regular, periodic compliance reviews with each
of the Subadvisors and present reports to the Independent Trustees regarding the same, which includes
evaluating the regulatory compliance
systems of the Subadvisors and procedures reasonably designed by them to assure compliance with the federal securities laws. The Board also took into account the financial condition of each Subadvisor.
The Board considered each
Subadvisor’s investment process and philosophy. The Board took into account that each Subadvisor’s responsibilities include the development and maintenance of an investment program for the applicable Fund
that is consistent with the Fund’s investment objective, the selection of investment securities and the placement of orders for the purchase and sale of such securities, as well as the implementation of
compliance controls related to performance of these services. The Board also received information with respect to each Subadvisor’s brokerage policies and practices, including with respect to best execution and
soft dollars.
Subadvisor compensation. In considering the cost of services to be provided by each Subadvisor and the profitability to that Subadvisor of its relationship with the Fund, the Board noted that the fees under the
Subadvisory Agreements are paid by the Advisor and not the Funds. The Board also received information and took into account any other potential conflicts of interest the Advisor might have in connection with the
Subadvisory Agreements.
The Board also relied on
the ability of the Advisor to negotiate each Subadvisory Agreement with Subadvisors that are not affiliated with the Advisor and the fees thereunder at arm’s length. As a result, the costs of the services to be
provided and the profits to be realized by unaffiliated Subadvisors from their relationship with the Trust were not a material factor in the Board’s consideration of the Subadvisory Agreements.
The Board also received
information regarding the nature and scope (including their significance to the Advisor and its affiliates and to unaffiliated Subadvisors) of any material relationships with respect to the unaffiliated Subadvisors,
which include arrangements in which unaffiliated Subadvisors or their affiliates provide advisory, distribution or management services in connection with financial products sponsored by the Trust’s Advisor or
its affiliates, and may include shares of the Trust, other registered investment companies, a 529 education savings plan, managed separate accounts and exempt group annuity contracts sold to qualified plans.
In addition, the Board
considered other potential indirect benefits that the Subadvisors and their affiliates may receive from a Subadvisor’s relationship with the Fund, such as the opportunity to provide advisory services to
additional funds in the John Hancock fund complex and reputational benefits.
Subadvisory fees. The Board considered that the Fund pays an advisory fee to the Advisor and that, in turn, the Advisor pays subadvisory fees to each Subadvisor. As noted above, the Board also considered, if
available, each Fund’s subadvisory fees as compared to similarly situated investment companies deemed to be comparable to the Fund as included in the report prepared by the independent third-party provider of
fund data, to the extent applicable. The Board noted that the limited size of the Lipper peer group was not sufficient for comparative purposes. The Board also took into account the subadvisory fees paid by the
Advisor to a Subadvisor with respect to the Funds to fees charged by each Fund’s Subadvisor to manage other subadvised portfolios and portfolios not subject to regulation under the 1940 Act, as
applicable.
Subadvisor performance. As noted above, the Board considered each Fund’s performance as compared to the Fund’s respective peer group median and the benchmark index and noted that the Board reviews
information about the Fund’s performance results at its regularly scheduled meetings. The Board noted the Advisor’s expertise and resources in monitoring the performance, investment style, and
risk-adjusted performance of each Subadvisor. The Board was mindful of the Advisor’s focus on each Subadvisor’s performance. The Board also noted each Subadvisor’s long-term performance record for
similar accounts, as applicable.
The Board’s decision
to approve the Subadvisory Agreement was based on a number of determinations, including the following:
John Hancock Funds II
Evaluation of Advisory and Subadvisory
Agreements by the Board of Trustees
| (1)
| each Subadvisor has extensive experience and demonstrated skills as a manager;
|
| (2)
| although not without variation, the performance of each Fund managed by a Subadvisor generally has been in line with or outperformed the historical performance of comparable funds and/or each
Fund’s respective benchmark, with the exceptions noted in Appendix A (with respect to such exceptions, the Board concluded that performance is being monitored and reasonably addressed);
|
| (3)
| the subadvisory fees are reasonable in relation to the level and quality of services being provided under the Subadvisory Agreements; and
|
| (4)
| the subadvisory fees are paid by the Advisor and not the Funds, and that the fee structure for the Funds contains breakpoints, breakpoints are reflected as breakpoints in the advisory
fees for the Funds in order to permit shareholders to benefit from economies of scale if those Funds grow.
|
Additional information relating to each
Fund’s fees and expenses and performance that the Board considered in approving the Advisory Agreement and Subadvisory Agreements for a particular Fund is set forth in Appendix A.
***
Based on the Board’s
evaluation of all factors that the Board deemed to be material, including those factors described above, the Board, including the Independent Trustees, concluded that renewal of the Advisory Agreement and each of the
Subadvisory Agreements with respect to each Fund would be in the best interest of each of the respective Funds and its shareholders. Accordingly, the Board, and the Independent Trustees voting separately, approved the
Advisory Agreement and Subadvisory Agreements with respect to each Fund for an additional one-year period.
John Hancock Funds II
Appendix A
| Portfolio (subadvisors)
| Performance of fund, as of 12.31.2022
| Fees and expenses
| Comments
|
| JHF II Capital Appreciation Fund(Jennison Associates LLC)
| Benchmark Index — The fund underperformed for the three-, five- and ten-year periods.Lipper Category — The fund outperformed the median for the ten-year period and underperformed for the one-, three- and five-year periods.
| Subadvisory fee comparative data not provided due to limited size of Lipper peer group for this purpose.Net management fees for this fund are higher than the peer group median.Total expenses for this fund are lower than the peer group median.
| The Board took into account management’s discussion of the fund’s performance, including the favorable performance relative to the
peer group median for the ten-year period. The Board took into account management's discussion of the factors that contributed to the fund's performance relative to the benchmark index for the one-, three-, five- and
ten-year periods and relative to the peer group median for the one-, three- and five-year periods, including the impact of past and current market conditions on the fund's strategy and management's outlook for the
fund.The Board concluded that the fund's performance is being monitored and reasonably addressed, where appropriate.The Board took into account management’s discussion of the fund’s expenses.
|
| JHF II Capital Appreciation Value Fund(T. Rowe Price Associates, Inc.)
| Benchmark Index — The fund outperformed for the one-, three-, five- and ten-year periods.Lipper Category — The fund outperformed the median for the one-, three-, five- and ten-year periods.
| Subadvisory fee comparative data not provided due to limited size of Lipper peer group for this purpose.Net management fees for this fund are higher than the peer group median.Total expenses for this fund are higher than the peer group median.
| The Board took into account management’s discussion of the fund’s performance, including the favorable performance relative to the benchmark index and
peer group median for the one-, three-, five- and ten-year periods.The Board took into account management’s discussion of the fund’s expenses.
|
John Hancock Funds II
Appendix A
| Portfolio (subadvisors)
| Performance of fund, as of 12.31.2022
| Fees and expenses
| Comments
|
| JHF II Core Bond Fund(Allspring Global Investments)
| Benchmark Index — The fund underperformed for the one-, three-, five- and ten-year periods.Lipper Category — The fund underperformed the median for the one-, three-, five- and ten-year periods.
| Subadvisory fee comparative data not provided due to limited size of Lipper peer group for this purpose.Net management fees for this fund are higher than the peer group median.Total expenses for this fund are lower than the peer group median.
| The Board took into account management’s discussion of the factors that contributed to the fund’s performance relative to the
benchmark index and peer group median for the one-, three-, five- and ten-year periods, including the impact of past and current market conditions on the fund’s strategy and management’s outlook for the
fund. The Board also noted that the fund’s longer term performance, in part, reflects that of the previous subadvisor.The Board concluded that the fund's performance is being monitored and reasonably addressed, where appropriate.The Board took into account management’s discussion of the fund’s expenses.
|
| JHF II Health Sciences Fund(T. Rowe Price Associates, Inc.)
| Benchmark Index — The fund outperformed for the three-, five- and ten-year periods and underperformed for the one-year
period.Lipper Category — The fund outperformed the median for the five- and ten-year periods and underperformed for the one- and three-year periods.
| Subadvisor fee comparative data not provided due to limited size of Lipper peer group for this purpose.Net management fees for this fund are higher than the peer group median.Total expenses for this fund are higher than the peer group median.
| The Board took into account management’s discussion of the fund’s performance, including the favorable performance relative to the
benchmark index for the three-, five- and ten-year periods and relative to the peer group median for the five- and ten-year periods.The Board took into account management’s discussion of the fund’s expenses.
|
| JHF II High Yield Fund(Western Asset Management)
| Benchmark Index — The fund underperformed for the one-, three-, five- and ten-year periods.Lipper Category — The fund underperformed the median for the one-, three-, five- and ten-year periods.
| Subadvisory fee comparative data not provided due to limited size of Lipper peer group for this purpose.Net management fees for this fund are higher than the peer group median.Total expenses for this fund are lower than the peer group median.
| The Board took into account management’s discussion of the factors that contributed to the fund’s performance relative to the benchmark index and peer
group median for the one-, three-, five- and ten-year periods, including the impact of past and current market conditions on the fund’s strategy and management’s outlook for the fund.The Board concluded that the fund's performance is being monitored and reasonably addressed, where appropriate.The Board took into account management’s discussion of the fund’s expenses.
|
John Hancock Funds II
Appendix A
| Portfolio (subadvisors)
| Performance of fund, as of 12.31.2022
| Fees and expenses
| Comments
|
| JHF II International Strategic Equity Allocation Fund(Manulife Investment Management (United States))
| Benchmark Index — The fund underperformed for the one-, three- and five-year periods.Lipper Category — The fund underperformed the median for the one-, three- and five-year periods.
| Subadvisor fee comparative data not provided due to limited size of Lipper peer group for this purpose.Net management fees for this fund are lower than the peer group median.Total expenses for this fund are lower than the peer group median.
| The Board took into account management’s discussion of the factors that contributed to the fund’s performance relative to the
benchmark index and peer group median for the one-, three- and five-year periods, including the impact of past and current market conditions on the fund’s strategy and management’s outlook for the
fund.The Board concluded that the fund's performance is being monitored and reasonably addressed, where appropriate.
|
| JHF II Mid Value Fund(T. Rowe Price Associates, Inc.)
| Benchmark Index — The fund outperformed for the one-, three-, five- and ten-year periods.Lipper Category — The fund outperformed for the one-, three-, five- and ten-year periods.
| Subadvisor fee comparative data not provided due to limited size of Lipper peer group for this purpose.Net management fees for this fund are higher than the peer group median.Total expenses for this fund are higher than the peer group median.
| The Board took into account management’s discussion of the fund’s performance, including the favorable performance relative to the
benchmark index and peer group median for the one-, three-, five- and ten-year periods.The Board took into account management’s discussion of the fund’s expenses.
|
| JHF II Science & Technology Fund(T. Rowe Price Associates, Inc.)
| Benchmark Index — The fund outperformed for the one-year period and underperformed for the three- and five-year periods.Lipper Category — The fund outperformed the median for the one-year period and underperformed for the three- and five-year periods.
| Subadvisor fee comparative data not provided due to limited size of Lipper peer group for this purpose.Net management fees for this fund are lower than the peer group median.Total expenses for this fund are higher than the peer group median.
| The Board took into account management’s discussion of the fund’s performance, including the favorable performance relative to the benchmark index and
peer group median for the one-year period.The Board took into account management’s discussion of the factors that contributed to the fund’s performance relative to the benchmark index and peer group median for
the three- and five-year periods.The Board concluded that the fund's performance is being monitored and reasonably addressed, where appropriate. The Board also noted that the fund's longer term performance, in part,
reflects that of the previous subadvisor.The Board took into account management’s discussion of the fund’s expenses.
|
John Hancock Funds II
Appendix A
| Portfolio (subadvisors)
| Performance of fund, as of 12.31.2022
| Fees and expenses
| Comments
|
| JHF II U.S. Sector Rotation Fund(Manulife Investment Management (United States))
| Benchmark Index — The fund underperformed for the one-, three- and five-year periods.Lipper Category — The fund underperformed the median for the one-, three- and five-year periods.
| Subadvisor fee comparative data not provided due to limited size of Lipper peer group for this purpose.Net management fees for this fund are lower than the peer group median.Total expenses for this fund are lower than the peer group median.
| The Board took into account management’s discussion of the factors that contributed to the fund’s performance relative to the benchmark index and peer
group median for the one-, three- and five-year periods.The Board concluded that the fund's performance is being monitored and reasonably addressed, where appropriate.The Board took into account management’s discussion of the fund’s expenses.
|
John Hancock Funds II
STATEMENT REGARDING LIQUIDITY RISK
MANAGEMENT
Operation of the Liquidity Risk Management
Program
This section describes the
operation and effectiveness of the Liquidity Risk Management Program (LRMP) established in accordance with Rule 22e-4 under the Investment Company Act of 1940, as amended (the Liquidity Rule). The Board of Trustees
(the Board) of each Fund in the John Hancock Group of Funds (each a Fund and collectively, the Funds) that is subject to the requirements of the Liquidity Rule has appointed John Hancock Investment Management LLC and
John Hancock Variable Trust Advisers LLC (together, the Advisor) to serve as Administrator of the LRMP with respect to each of the Funds, including John Hancock Capital Appreciation Fund, John Hancock Capital
Appreciation Value Fund, John Hancock Core Bond Fund, John Hancock Health Sciences Fund, John Hancock High Yield Fund, John Hancock International Strategic Equity Allocation Fund, John Hancock Mid Value Fund, John
Hancock Science & Technology Fund, and John Hancock U.S. Sector Rotation Fund subject to the oversight of the Board. In order to provide a mechanism and process to perform the functions necessary to administer the
LRMP, the Advisor established the Liquidity Risk Management Committee (the Committee). Each Fund’s subadvisor, which is one of Allspring Global Investments, LLC, Jennison Associates LLC, Manulife Investment
Management (US) LLC, T. Rowe Price Associates, Inc., or Western Asset Management Company, LLC (each a Subadvisor), executes the day-to-day investment management and security-level activities of the Fund it manages in
accordance with the requirements of the LRMP, subject to the supervision of the Advisor and the Board.
The Committee receives
monthly reports and holds quarterly in person meetings to: (1) review the day-to-day operations of the LRMP; (2) monitor current market and liquidity conditions and assess liquidity risks; (3) review and approve
month-end liquidity classifications; (4) monitor illiquid investment levels against the 15% limit on illiquid investments and established Highly Liquid Investment Minimums (HLIMs), if any; (5) review quarterly testing
and determinations, as applicable; (6) review redemption-in-kind activities; and (7) review other LRMP related material. The Advisor also conducts daily, monthly, quarterly, and annual quantitative and qualitative
assessments of each subadvisor to a Fund that is subject to the requirements of the Liquidity Rule and is a part of the LRMP to monitor investment performance issues, risks and trends. In addition, the Advisor may
conduct ad-hoc reviews and meetings with subadvisors as issues and trends are identified, including potential liquidity issues. The Committee also monitors global events, such as the ongoing Russian invasion of
Ukraine and related U.S. imposed sanctions on the Russian government, companies and oligarchs, and other amendments to the Office of Foreign Assets Control sanctioned company lists, that could impact the markets and
liquidity of portfolio investments and their classifications. In addition, the Committee monitors macro events and assesses their potential impact on liquidity brought on by fear of contagion (e.g. regional banking
crisis).
The Committee provided the Board at a
meeting held on March 28-30, 2023 with a written report which addressed the Committee’s assessment of the adequacy and effectiveness of the implementation and operation of the LRMP and any material changes to
the LRMP. The report, which covered the period January 1, 2022 through December 31, 2022, included an assessment of important aspects of the LRMP including, but not limited to: (1) Security-level liquidity
classifications; (2) Fund-level liquidity risk assessment; (3) Reasonably Anticipated Trade Size (RATS) determination; (4) HLIM determination and daily monitoring; (5) Daily compliance with the 15% limit on illiquid
investments; (6) Operation of the Fund’s Redemption-In-Kind Procedures; and (7) Review of liquidity management facilities.
The report provided an
update on Committee activities over the previous year. Additionally, the report included a discussion of notable changes and enhancements to the LRMP implemented during 2022 and key initiatives for 2023.
The report also covered
material liquidity matters which occurred or were reported during this period applicable to the Fund, if any, and the Committee’s actions to address such matters.
The report stated, in
relevant part, that during the period covered by the report:
| •
| The Fund’s investment strategy remained appropriate for an open-end fund structure;
|
| •
| The Fund was able to meet requests for redemption without significant dilution of remaining shareholders’ interests in the Fund;
|
| •
| The Fund did not experience any breaches of the 15% limit on illiquid investments, or any applicable HLIM, that would require reporting to the Securities and Exchange Commission;
|
| •
| The Fund continued to qualify as a Primarily Highly Liquid Fund under the Liquidity Rule and therefore is not required to establish a HLIM; and
|
| •
| The Chief Compliance Officer’s office, as a part of their annual Rule 38a-1 assessment of the Fund’s policies and procedures, reviewed the LRMP’s control environment
and deemed it to be operating effectively and in compliance with the Board approved procedures.
|
Adequacy and Effectiveness
Based on the review and
assessment conducted by the Committee, the Committee has determined that the LRMP and its controls have been implemented and are operating in a manner that is adequately and effectively managing the liquidity risk of
the Fund.
John Hancock Funds II
Trustees and officers information
This chart provides
information about the Trustees and Officers of John Hancock Funds II who oversee your John Hancock funds. Officers elected by the Trustees manage the day-to-day operations of the funds and execute policies formulated
by the Trustees.
| INDEPENDENT TRUSTEES
|
|
|
Name, year of birth
Position(s) held with Trust
Principal occupation(s) and other
directorships during past 5 years
| Trustee
of the
Trust
since1
| Number of John
Hancock funds
overseen by
Trustee
|
| Hassell H. McClellan,2 Born: 1945
| 2005
| 186
|
| Trustee and Chairperson of the Board
|
|
|
Director/Trustee, Virtus Funds (2008-2020); Director, The Barnes Group (2010-2021); Associate Professor, The Wallace E. Carroll School of Management,
Boston College (retired 2013). Trustee (since 2005) and Chairperson of the Board (since 2017) of various trusts within the John Hancock Fund Complex.
|
| James R. Boyle, Born: 1959
| 2015
| 183
|
| Trustee
|
|
|
Board Member, United of Omaha Life Insurance Company (since 2022). Board Member, Mutual of Omaha Investor Services, Inc. (since 2022). Foresters
Financial, Chief Executive Officer (2018–2022) and board member (2017–2022). Manulife Financial and John Hancock, more than 20 years, retiring in 2012 as Chief Executive Officer, John Hancock and Senior
Executive Vice President, Manulife Financial. Trustee of various trusts within the John Hancock Fund Complex (2005–2014 and since 2015).
|
| William H. Cunningham,3 Born: 1944
| 2012
| 184
|
| Trustee
|
|
|
Professor, University of Texas, Austin, Texas (since 1971); former Chancellor, University of Texas System and former President of the University of
Texas, Austin, Texas; Director (since 2006), Lincoln National Corporation (insurance); Director, Southwest Airlines (since 2000). Trustee of various trusts within the John Hancock Fund Complex (since 1986).
|
| Noni L. Ellison,* Born: 1971
| 2022
| 183
|
| Trustee
|
|
|
Senior Vice President, General Counsel & Corporate Secretary, Tractor Supply Company (rural lifestyle retailer) (since 2021); General Counsel,
Chief Compliance Officer & Corporate Secretary, Carestream Dental, L.L.C.(2017–2021); Associate General Counsel & Assistant Corporate Secretary, W.W. Grainger, Inc. (global industrial supplier)
(2015–2017); Board Member, Goodwill of North Georgia, 2018 (FY2019)–2020 (FY2021); Board Member, Howard University School of Law Board of Visitors (since 2021); Board Member, University of Chicago Law
School Board of Visitors (since 2016); Board member, Children’s Healthcare of Atlanta Foundation Board (2021–present). Trustee of various trusts within the John Hancock Fund Complex (since 2022).
|
| Grace K. Fey, Born: 1946
| 2008
| 186
|
| Trustee
|
|
|
Chief Executive Officer, Grace Fey Advisors (since 2007); Director and Executive Vice President, Frontier Capital Management Company
(1988–2007); Director, Fiduciary Trust (since 2009). Trustee of various trusts within the John Hancock Fund Complex (since 2008).
|
| Dean C. Garfield,* Born: 1968
| 2022
| 183
|
| Trustee
|
|
|
Vice President, Netflix, Inc. (since 2019); President & Chief Executive Officer, Information Technology Industry Council (2009–2019); NYU
School of Law Board of Trustees (since 2021); Member, U.S. Department of Transportation, Advisory Committee on Automation (since 2021); President of the United States Trade Advisory Council (2010–2018); Board
Member, College for Every Student (2017–2021); Board Member, The Seed School of Washington, D.C. (2012–2017). Trustee of various trusts within the John Hancock Fund Complex (since 2022).
|
| Deborah C. Jackson, Born: 1952
| 2012
| 185
|
| Trustee
|
|
|
President, Cambridge College, Cambridge, Massachusetts (since 2011); Board of Directors, Amwell Corporation (since 2020); Board of Directors,
Massachusetts Women’s Forum (2018-2020); Board of Directors, National Association of Corporate Directors/New England (2015-2020); Chief Executive Officer, American Red Cross of Massachusetts Bay
(2002–2011); Board of Directors of Eastern Bank Corporation (since 2001); Board of Directors of Eastern Bank Charitable Foundation (since 2001); Board of Directors of Boston Stock Exchange (2002–2008);
Board of Directors of Harvard Pilgrim Healthcare (health benefits company) (2007–2011). Trustee of various trusts within the John Hancock Fund Complex (since 2008).
|
| Steven R. Pruchansky, Born: 1944
| 2012
| 183
|
| Trustee and Vice Chairperson of the Board
|
|
|
Managing Director, Pru Realty (since 2017); Chairman and Chief Executive Officer, Greenscapes of Southwest Florida, Inc. (2014-2020); Director and
President, Greenscapes of Southwest Florida, Inc. (until 2000); Member, Board of Advisors, First American Bank (until 2010); Managing Director, Jon James, LLC (real estate) (since 2000); Partner, Right Funding, LLC
(2014-2017); Director, First Signature Bank & Trust Company (until 1991); Director, Mast Realty Trust (until 1994); President, Maxwell Building Corp. (until 1991). Trustee (since 1992), Chairperson of the Board
(2011–2012), and Vice Chairperson of the Board (since 2012) of various trusts within the John Hancock Fund Complex.
|
| Frances G. Rathke,3 Born: 1960
| 2020
| 183
|
| Trustee
|
|
|
Director, Audit Committee Chair, Oatly Group AB (plant-based drink company) (since 2021); Director, Audit Committee Chair and Compensation Committee
Member, Green Mountain Power Corporation (since 2016); Director, Treasurer and Finance & Audit Committee Chair, Flynn Center for Performing Arts (since 2016); Director and Audit Committee Chair, Planet Fitness
(since 2016); Chief Financial Officer and Treasurer, Keurig Green Mountain, Inc. (2003-retired 2015). Trustee of various trusts within the John Hancock Fund Complex (since 2020).
|
John Hancock Funds II
Trustees and officers information
| INDEPENDENT TRUSTEES (continued)
|
|
|
Name, year of birth
Position(s) held with Trust
Principal occupation(s) and other
directorships during past 5 years
| Trustee
of the
Trust
since1
| Number of John
Hancock funds
overseen by
Trustee
|
| Gregory A. Russo, Born: 1949
| 2012
| 183
|
| Trustee
|
|
|
| Director and Audit Committee Chairman (2012-2020), and Member, Audit Committee and Finance Committee (2011-2020), NCH Healthcare System, Inc. (holding
company for multi-entity healthcare system); Director and Member (2012-2018), and Finance Committee Chairman (2014-2018), The Moorings, Inc. (nonprofit continuing care community); Global Vice Chairman, Risk &
Regulatory Matters, KPMG LLP (KPMG) (2002–2006); Vice Chairman, Industrial Markets, KPMG (1998–2002). Trustee of various trusts within the John Hancock Fund Complex (since 2008).
|
| NON-INDEPENDENT TRUSTEES4
|
|
|
Name, year of birth
Position(s) held with Trust
Principal occupation(s) and other
directorships during past 5 years
| Trustee
of the
Trust
since1
| Number of John
Hancock funds
overseen by
Trustee
|
| Andrew G. Arnott, Born: 1971
| 2017
| 184
|
| Non-Independent Trustee
|
|
|
Global Head of Retail for Manulife (since 2022); Head of Wealth and Asset Management, United States and Europe, for John Hancock and Manulife
(2018-2023); Director and Chairman, John Hancock Investment Management LLC (since 2005, including prior positions); Director and Chairman, John Hancock Variable Trust Advisers LLC (since 2006, including prior
positions); Director and Chairman, John Hancock Investment Management Distributors LLC (since 2004, including prior positions); President of various trusts within the John Hancock Fund Complex (2007-2023, including
prior positions). Trustee of various trusts within the John Hancock Fund Complex (since 2017).
|
| Paul Lorentz,† Born: 1968
| 2022
| 183
|
| Non-Independent Trustee
|
|
|
| Global Head, Manulife Wealth and Asset Management (since 2017); General Manager, Manulife, Individual Wealth Management and Insurance
(2013–2017); President, Manulife Investments (2010–2016). Trustee of various trusts within the John Hancock Fund Complex (since 2022).
|
| PRINCIPAL OFFICERS WHO ARE NOT TRUSTEES
|
|
Name, year of birth
Position(s) held with Trust
Principal occupation(s)
during past 5 years
| Current
Position(s)
with the
Trust
since
|
| Kristie M. Feinberg, Born: 1975
| 2023
|
| President
|
|
Head of Wealth and Asset Management, United States and Europe, for John Hancock and Manulife (since 2023); CFO and Global Head of Strategy, Manulife
Investment Management (2021-2023, including prior positions); CFO Americas & Global Head of Treasury, Invesco, Ltd., Invesco US (2019-2020, including prior positions); Senior Vice President, Corporate Treasurer
and Business Controller, Oppenheimer Funds (2001-2019, including prior positions); President of various trusts within the John Hancock Fund Complex (since 2023).
|
| Charles A. Rizzo, Born: 1957
| 2007
|
| Chief Financial Officer
|
|
Vice President, John Hancock Financial Services (since 2008); Senior Vice President, John Hancock Investment Management LLC and John Hancock Variable
Trust Advisers LLC (since 2008); Chief Financial Officer of various trusts within the John Hancock Fund Complex (since 2007).
|
| Salvatore Schiavone, Born: 1965
| 2009
|
| Treasurer
|
|
Assistant Vice President, John Hancock Financial Services (since 2007); Vice President, John Hancock Investment Management LLC and John Hancock
Variable Trust Advisers LLC (since 2007); Treasurer of various trusts within the John Hancock Fund Complex (since 2007, including prior positions).
|
| Christopher (Kit) Sechler, Born: 1973
| 2018
|
| Secretary and Chief Legal Officer
|
|
Vice President and Deputy Chief Counsel, John Hancock Investment Management (since 2015); Assistant Vice President and Senior Counsel
(2009–2015), John Hancock Investment Management; Assistant Secretary of John Hancock Investment Management LLC and John Hancock Variable Trust Advisers LLC (since 2009); Chief Legal Officer and Secretary of
various trusts within the John Hancock Fund Complex (since 2009, including prior positions).
|
| Trevor Swanberg, Born: 1979
| 2020
|
| Chief Compliance Officer
|
|
| Chief Compliance Officer, John Hancock Investment Management LLC and John Hancock Variable Trust Advisers LLC (since 2020); Deputy Chief Compliance
Officer, John Hancock Investment Management LLC and John Hancock Variable Trust Advisers LLC (2019–2020); Assistant Chief Compliance Officer, John Hancock Investment Management LLC and John Hancock Variable
Trust Advisers LLC (2016–2019); Vice President, State Street Global Advisors (2015–2016); Chief Compliance Officer of various trusts within the John Hancock Fund Complex (since 2016, including prior
positions).
|
| 1
| Each Trustee holds office until his or her successor is duly elected and qualified, or until the Trustee’s death, retirement, resignation, or removal. Mr. Boyle has served as Trustee at various
times prior to the date listed in the table.
|
John Hancock Funds II
Trustees and officers information
| 2
| Member of the Audit Committee as of September 26, 2023.
|
| 3
| Member of the Audit Committee.
|
| 4
| The Trustee is a Non-Independent Trustee due to current or former positions with the Advisor and certain affiliates.
|
| *
| Elected to serve as Independent Trustee effective as of September 9, 2022.
|
| †
| Elected to serve as Non-Independent Trustee effective as of September 9, 2022.
|
The business address for all
Trustees and Officers is 200 Berkeley Street, Boston, Massachusetts 02116-5023.
The Statement of Additional
Information of the fund includes additional information about members of the Board of Trustees of the Trust and is available without charge, upon request, by calling 800-225-5291.
John Hancock Funds II
For more information
The Statement of Additional
Information, a separate document with supplemental information not contained in the prospectus, includes additional information on the Board of Trustees and can be obtained without charge by calling 800-344-1029 or on
the Securities and Exchange Commission (SEC) website at www.sec.gov.
PROXY VOTING POLICY A description of the trust’s proxy voting policies and procedures and information regarding how the trust voted proxies relating to portfolio securities during the most recent
twelve-month period ended June 30 is available without charge, upon request, by calling 800-344-1029 or on the SEC website at www.sec.gov.
QUARTERLY PORTFOLIO
DISCLOSURE The Trust’s complete schedule of portfolio holdings as of the end of the third month of every fiscal quarter are filed with the SEC on Form N-PORT within 60 days of the
end of the fiscal quarter. N-PORT filings are available on our website and the SEC’s website, www.sec.gov.
The report is certified
under the Sarbanes-Oxley Act, which requires mutual funds and other public companies to affirm that, to the best of their knowledge, the information in their financial reports is fairly and accurately
stated in all material respects.
Trustees
Hassell H. McClellan,
Chairpersonπ
Steven R. Pruchansky, Vice Chairperson
Andrew G. Arnott†
James R. Boyle
William H. Cunningham*
Grace K. Fey
Noni L. Ellison^
Dean C. Garfield^
Deborah C. Jackson
Patricia Lizarraga*,^,§
Paul Lorentz‡
Frances G. Rathke*
Gregory A. Russo
Investment advisor
John Hancock Investment
Management LLC
Principal distributor
John Hancock Investment
Management Distributors LLC
Custodians
Citibank, N.A.
State Street Bank and Trust Company
Legal counsel
K&L Gates LLP
Independent registered public
accounting firm
PricewaterhouseCoopers LLP
Officers
Kristie M. Feinberg#, President
Charles A. Rizzo, Chief Financial Officer
Salvatore Schiavone, Treasurer
Christopher (Kit) Sechler, Secretary and Chief Legal Officer
Trevor Swanberg, Chief Compliance Officer
π Member of the Audit Committee as of September 26, 2023.
† Non-Independent Trustee
* Member of the Audit Committee
^ Elected to serve as Independent Trustee effective as of September 9, 2022.
§ Effective September 21, 2023, Ms. Lizarraga is no longer a Trustee.
‡ Elected to serve as Non-Independent Trustee effective as of September 9, 2022.
# Effective June 29, 2023.
John Hancock Investment Management
Distributors LLC, Member FINRA, SIPC 200 Berkeley Street, Boston, MA 02116, jhinvestments.com
Manulife, Manulife Investment
Management, Stylized M Design, and Manulife Investment Management & Stylized M Design are trademarks of The Manufacturers Life Insurance Company and are used by it, and by its affiliates under license.
NOT FDIC INSURED. MAY LOSE VALUE. NO
BANK GUARANTEE. NOT INSURED BY ANY GOVERNMENT AGENCY.
ITEM 2. CODE OF ETHICS.
As of the end of the fiscal year, August 31, 2023, the registrant has adopted a code of ethics, as defined in Item 2 of Form N-CSR, that applies to its Chief Executive Officer, Chief Financial Officer and Treasurer (respectively, the principal executive officer, the principal financial officer and the principal accounting officer, the "Covered Officers"). A copy of the code of ethics is filed as an exhibit to this Form N-CSR.
ITEM 3. AUDIT COMMITTEE FINANCIAL EXPERT.
Frances G. Rathke is the audit committee financial expert and is "independent", pursuant to general instructions on Form N-CSR Item 3.
ITEM 4. PRINCIPAL ACCOUNTANT FEES AND SERVICES.
(a) Audit fees:
The aggregate fees billed for professional services rendered by the principal accountant for the audits of the registrant's annual financial statements or services that are normally provided by the accountant in connection with statutory and regulatory filings or engagements amounted to the following for the fiscal years ended August 31, 2023 and 2022. These fees were billed to the registrant and were approved by the registrant's audit committee.
2023: $501,905
2022: $480,868
(b) Audit related fees:
Audit-related fees for assurance and related services by the principal accountant are billed to the registrant or to the registrant's investment adviser (not including any sub-adviser whose role is primarily portfolio management and is subcontracted with or overseen by another investment adviser), and any entity controlling, controlled by, or under common control with the adviser ("control affiliates") that provides ongoing services to the registrant. The nature of the services provided was affiliated service provider internal controls reviews, and reviews related to supplemental regulatory filings. Amounts billed to the registrant for the fiscal years ended August 31, 2023 and 2022 were as follows:
2023: $666
2022: $30,984
Amounts billed to control affiliates were $127,376 and $129,201 for the fiscal years ended August 31, 2023 and 2022, respectively.
(c) Tax fees:
The aggregate fees billed for professional services rendered by the principal accountant for tax compliance, tax advice and tax planning ("tax fees") amounted to the following for the fiscal years ended August 31, 2023 and 2022. The nature of the services comprising the tax fees was the review of the registrant's tax distribution requirements. These fees were billed to the registrant and were approved by the registrant's audit committee.
2023: $4,725
2022: $1,250
(d) All other fees:
The nature of the services comprising all other fees is advisory services provided to the investment manager. Other fees amounted to the following for the fiscal years ended August 31, 2023 and 2022:
2023: $0
2022: $6,209
(e)(1) Audit Committee Pre-Approval Policies and Procedures:
The Trust's Audit Committee must pre-approve all audit and non-audit services provided by the independent registered public accounting firm (the "Auditor") relating to the operations or financial reporting of the funds. Prior to the commencement of any audit or non-audit services to a fund, the Audit Committee reviews the services to determine whether they are appropriate and permissible under applicable law.
The Trust's Audit Committee has adopted policies and procedures to, among other purposes, provide a framework for the Committee's consideration of audit-related and non-audit services by the Auditor. The policies and procedures require that any audit-related and non-audit service provided by the Auditor and any non-audit service provided by the Auditor to a fund service provider that relates directly to the operations and financial reporting of a fund are subject to approval by the Audit Committee before such service is provided. Audit-related services provided by the Auditor that are expected to exceed $25,000 per instance/per fund are subject to specific pre-approval by the Audit Committee. Tax services provided by the Auditor that are expected to exceed $30,000 per instance/per fund are subject to specific pre-approval by the Audit Committee.
All audit services, as well as the audit-related and non-audit services that are expected to exceed the amounts stated above, must be approved in advance of provision of the service by formal resolution of the Audit Committee. At the regularly scheduled Audit Committee meetings, the Committee reviews a report summarizing the services, including fees, provided by the Auditor.
(e)(2) Services approved pursuant to paragraph (c) (7) (i) (C) of Rule 2-01 of Regulation S-X:
Audit-Related Fees, Tax Fees and All Other Fees:
There were no amounts that were approved by the Audit Committee pursuant to the de minimis exception under Rule 2-01 of Regulation S-X.
(f)According to the registrant's principal accountant, for the fiscal year ended August 31, 2023, the percentage of hours spent on the audit of the registrant's financial statements for the most recent fiscal year that were attributed to work performed by persons who were not full-time, permanent employees of principal accountant was less than 50%.
(g)The aggregate non-audit fees billed by the registrant's principal accountant for non-audit services rendered to the registrant and rendered to the registrant's control affiliates were $1,423,642 for the fiscal year ended August 31, 2023 and $796,305 for the fiscal year ended August 31, 2022.
(h)The audit committee of the registrant has considered the non-audit services provided by the registrant's principal accountant to the control affiliates and has determined that the services that were not pre-approved are compatible with maintaining the principal accountant's independence.
(i)Not applicable
(j)Not applicable
ITEM 5. AUDIT COMMITTEE OF LISTED REGISTRANTS
The registrant has a separately-designated standing audit committee comprised of independent trustees. The members of the audit committee are as follows:
Frances G. Rathke – Chairperson
William H. Cunningham
Hassell H. McClellan – Member of the Audit Committee as of September 26, 2023 Patricia Lizarraga – effective September 20, 2022 to September 21, 2023
ITEM 6. SCHEDULE OF INVESTMENTS.
(a)Not Applicable
(b)Not Applicable
ITEM 7. DISCLOSURE OF PROXY VOTING POLICIES AND PROCEDURES FOR CLOSED-END MANAGEMENT INVESTMENT COMPANIES.
Not Applicable
ITEM 8. PORTFOLIO MANAGERS OF CLOSED-END MANAGEMENT INVESTMENT COMPANIES.
Not Applicable
ITEM 9. PURCHASE OF EQUITY SECURITIES BY CLOSED-END MANAGEMENT INVESTMENT COMPANIES AND AFFILIATED PURCHASERS.
Not Applicable
ITEM 10. SUBMISSION OF MATTERS TO A VOTE OF SECURITY HOLDERS.
The registrant has adopted procedures by which shareholders may recommend nominees to the registrant's Board of Trustees. A copy of the procedures is filed as an exhibit to this Form N-CSR. See attached "John Hancock Funds – Nominating and Governance Committee Charter".
ITEM 11. CONTROLS AND PROCEDURES.
(a)Based upon their evaluation of the registrant's disclosure controls and procedures as conducted within
90 days of the filing date of this Form N-CSR, the registrant's principal executive officer and principal financial officer have concluded that those disclosure controls and procedures provide reasonable assurance that the material information required to be disclosed by the registrant on this report is recorded, processed, summarized and reported within the time periods specified in the Securities and Exchange Commission's rules and forms.
(b)There were no changes in the registrant's internal control over financial reporting that occurred during the period covered by this report that have materially affected, or are reasonably likely to materially affect, the registrant's internal control over financial reporting.
ITEM 12. DISCLOSURE OF SECURITIES LENDING ACTIVITIES FOR CLOSED-END MANAGEMENT INVESTMENT COMPANIES.
Not applicable
ITEM 13. EXHIBITS.
(a)(1) Code of Ethics for Covered Officers is attached.
SIGNATURES
Pursuant to the requirements of the Securities Exchange Act of 1934 and the Investment Company Act of 1940, the registrant has duly caused this report to be signed on its behalf by the undersigned, thereunto duly authorized.
JOHN HANCOCK FUNDS II
/s/ Kristie M. Feinberg
_______________________
Kristie M. Feinberg
President
Date: October 19, 2023
Pursuant to the requirements of the Securities Exchange Act of 1934 and the Investment Company Act of 1940, this report has been signed below by the following persons on behalf of the registrant and in the capacities and on the dates indicated.
/s/ Kristie M. Feinberg
_______________________
Kristie M. Feinberg
President
Date: October 19, 2023
/s/ Charles A. Rizzo
_______________________
Charles A. Rizzo
Chief Financial Officer
Date: October 19, 2023

JOHN HANCOCK VARIABLE INSURANCE TRUST
JOHN HANCOCK FUNDS
JOHN HANCOCK FUNDS II
JOHN HANCOCK EXCHANGE-TRADED FUND TRUST
SARBANES-OXLEY CODE OF ETHICS
FOR
PRINCIPAL EXECUTIVE, PRINCIPAL FINANCIAL OFFICER & TREASURER
I.Covered Officers/Purpose of the Code
This code of ethics (this "Code") for John Hancock Variable Insurance Trust, John Hancock Funds1, and John Hancock Funds II, John Hancock Exchange-Traded Fund Trust and, each a registered management investment company under the Investment Company Act of 1940, as amended ("1940 Act"), which may issue shares in separate and distinct series (each investment company and series thereunder to be hereinafter referred to as a "Fund"), applies to each Fund's Principal Executive Officer ("President"), Principal Financial Officer ("Chief Financial Officer") and Treasurer ("Treasurer") (the "Covered Officers" as set forth in Exhibit A) for the purpose of promoting:
honest and ethical conduct, including the ethical handling of actual or apparent conflicts of interest between personal and professional relationships;
full, fair, accurate, timely and understandable disclosure in reports and documents that the Fund files with, or submits to, the Securities and Exchange Commission ("SEC") and in other public communications made by the Fund;
compliance with applicable laws and governmental rules and regulations;
the prompt internal reporting of violations of the Code to an appropriate person or persons identified in the Code; and
accountability for adherence to the Code.
1John Hancock Funds includes the following trusts: John Hancock Financial Opportunities Fund; John Hancock Bond Trust; John Hancock California Tax-Free Income Fund; John Hancock Capital Series; John Hancock Funds III; John Hancock Income Securities Trust; John Hancock Investment Trust; John Hancock Investment Trust II; John Hancock Investors Trust; John Hancock Municipal Securities Trust; John Hancock Premium Dividend Fund ; John Hancock Preferred Income Fund; John Hancock Preferred Income Fund II; John Hancock Preferred Income Fund III; John Hancock Sovereign Bond Fund; John Hancock Strategic Series; John Hancock Tax-Advantaged Dividend Income Fund; John Hancock Tax-Advantaged Global Shareholder Yield Fund; John Hancock Hedged Equity and Income Fund; and John Hancock Collateral Trust.
Each of the Covered Officers should adhere to a high standard of business ethics and should be sensitive to situations that may give rise to actual as well as apparent conflicts of interest.
II.Covered Officers Should Handle Ethically Actual and Apparent Conflicts of Interest Overview
A "conflict of interest" occurs when a Covered Officer's private interest interferes with the interests of, or his service to, the Fund. For example, a conflict of interest would arise if a Covered Officer, or a member of his family, receives improper personal benefits as a result of his position with the Fund. Certain conflicts of interest arise out of the relationships between the Covered Officers and the Fund and already are subject to conflict of interest provisions in the Investment Company Act of 1940, as amended (the "Investment Company Act") and the Investment Advisers Act of 1940, as amended (the "Investment Advisers Act"). For example, Covered Officers may not individually engage in certain transactions (such as the purchase or sale of securities or other property) with the Fund because of their status as "affiliated persons" of the Fund. Each of the Covered Officers is an officer or employee of the investment adviser or a service provider ("Service Provider") to the Fund. The Fund's, the investment adviser's and the Service Provider's compliance programs and procedures are designed to prevent, or identify and correct, violations of these provisions. This Code does not, and is not intended to, repeat or replace these programs and procedures, and such conflicts fall outside of the parameters of this Code.
Although typically not presenting an opportunity for improper personal benefit, conflicts arise from, or as a result of, the contractual relationship between the Fund and the investment adviser and the Service Provider of which the Covered Officers are also officers or employees. As a result, this Code recognizes that the Covered Officers will, in the normal course of their duties (whether formally for the Fund, for the investment adviser or for the Service Provider), be involved in establishing policies and implementing decisions which will have different effects on the investment adviser, the Service Provider and the Fund. The participation of the Covered Officers in such activities is inherent in the contractual relationship between the Fund and the investment adviser and the Service Provider and is consistent with the performance by the Covered Officers of their duties as officers of the Fund. Thus, if such participation is performed in conformity with the provisions of the Investment Company Act and the Investment Advisers Act, it will be deemed to have been handled ethically. In addition, it is recognized by the Fund's Board of Trustees/Directors (the "Board") that the Covered Officers may also be officers or employees of one or more other investment companies covered by other Codes.
Other conflicts of interest are covered by the Code, even if such conflicts of interest are not subject to provisions in the Investment Company Act and the Investment Advisers Act. The following list provides examples of conflicts of interest under the Code, but the Covered Officers should keep in mind that these examples are not exhaustive. The overarching principle is that the personal interest of a Covered Officer should not be placed improperly before the interest of the Fund.
***
2 of 6
Each Covered Officer must:
not use his/her personal influence or personal relationships improperly to influence investment decisions or financial reporting by the Fund whereby the Covered Officer would benefit personally to the detriment of the Fund;
not cause the Fund to take action, or fail to take action, for the individual personal benefit of the Covered Officer rather than for the benefit of the Fund; and
not use material non-public knowledge of portfolio transactions made or contemplated for the Fund to trade personally or cause others to trade personally in contemplation of the market effect of such transactions.
Additionally, conflicts of interest may arise in other situations, the propriety of which may be discussed, if material, with the Fund's Chief Compliance Officer ("CCO"). Examples of these include:
serve as a director/trustee on the board of any public or private company;
the receipt of any non-nominal gifts;
the receipt of any entertainment from any company with which the Fund has current or prospective business dealings unless such entertainment is business-related, reasonable in cost, appropriate as to time and place, and not so frequent as to raise any question of impropriety (or other formulation as the Fund already uses in another code of conduct);
any ownership interest in, or any consulting or employment relationship with, any of the Fund's service providers, other than its investment adviser, any sub-adviser, principal underwriter, administrator or any affiliated person thereof; and
a direct or indirect financial interest in commissions, transaction charges or spreads paid by the Fund for effecting portfolio transactions or for selling or redeeming shares other than an interest arising from the Covered Officer's employment, such as compensation or equity ownership.
III.Disclosure & Compliance
Each Covered Officer should familiarize himself or herself with the disclosure requirements generally applicable to the Fund;
Each Covered Officer should not knowingly misrepresent, or cause others to misrepresent, facts about the Fund to others, whether within or outside the Fund, including to the Fund's directors and auditors, and to governmental regulators and self- regulatory organizations;
3 of 6
Each Covered Officer should, to the extent appropriate within his/her area of responsibility, consult with other officers and employees of the Fund and the Fund's adviser or any sub-adviser with the goal of promoting full, fair, accurate, timely and understandable disclosure in the reports and documents the Fund files with, or submits to, the SEC and in other public communications made by the Fund; and
It is the responsibility of each Covered Officer to promote compliance with the standards and restrictions imposed by applicable laws, rules and regulations.
IV. Reporting & Accountability
Each Covered Officer must:
upon adoption of the Code (or thereafter as applicable, upon becoming an Covered Officer), affirm in writing to the Fund's CCO that he/she has received, read, and understands the Code;
annually thereafter affirm to the Fund's CCO that he/she has complied with the requirements of the Code;
not retaliate against any employee or Covered Officer or their affiliated persons for reports of potential violations that are made in good faith;
notify the Fund's CCO promptly if he/she knows of any violation of this Code (Note: failure to do so is itself a violation of this Code); and
report at least annually any change in his/her affiliations from the prior year.
The Fund's CCO is responsible for applying this Code to specific situations in which questions are presented under it and has the authority to interpret this Code in any particular situation. However, any approvals or waivers sought by the Principal Executive Officer will be considered by the Fund's Board or the Compliance Committee thereof (the "Committee").
The Fund will follow these procedures in investigating and enforcing this Code:
the Fund's CCO will take all appropriate action to investigate any potential violations reported to him/her;
if, after such investigation, the CCO believes that no violation has occurred, the CCO is not required to take any further action;
any matter that the CCO believes is a violation will be reported to the Board or, if applicable, Compliance Committee;
if the Board or, if applicable, Compliance Committee concurs that a violation has occurred, the Board, either upon its determination of a violation or upon
4 of 6
recommendation of the Compliance Committee, if applicable, will consider appropriate action, which may include review of, and appropriate modifications to, applicable policies and procedures; notification to appropriate personnel of the Service Provider or the investment adviser or its board; or a recommendation to dismiss the Registrant's Executive Officer;
the Board, or if applicable the Compliance Committee, will be responsible for granting waivers, as appropriate; and
any changes to or waivers of this Code will, to the extent required, be disclosed as provided by SEC rules.
V.Other Policies & Procedures
This Code shall be the sole code of ethics adopted by the Fund for purposes of Section 406 of the Sarbanes-Oxley Act of 2002 and the rules and forms applicable to registered investment companies thereunder. Insofar as other policies or procedures of the Fund, the Fund's adviser, any sub- adviser, principal underwriter or other service providers govern or purport to govern the behavior or activities of the Covered Officers who are subject to this Code, they are superseded by this Code to the extent that they overlap or conflict with the provisions of this Code. The Fund's and its investment adviser's codes of ethics under Rule 204A-1 under the Investment Advisers Act and Rule 17j-1 under the Investment Company Act, respectively, are separate requirements applying to the Covered Officers and others and are not part of this Code.
VI. Amendments
Any amendments to this Code, other than amendments to Exhibit A, must be approved or ratified by a majority vote of the Fund's Board, including a majority of independent directors.
VII. Confidentiality
All reports and records prepared or maintained pursuant to this Code will be considered confidential and shall be maintained and protected accordingly. Except as otherwise required by law or this Code, such matters shall not be disclosed to anyone other than the Fund's Board and its counsel, the investment adviser and the relevant Service Providers.
VIII. Internal Use
The Code is intended solely for the internal use by the Fund and does not constitute an admission, by or on behalf of the Fund, as to any fact, circumstance, or legal conclusion.
5 of 6
Exhibit A
Persons Covered by this Code of Ethics
(As of June 29, 2023)
John Hancock Variable Insurance Trust
Principal Executive Officer and President – Kristie Feinberg
Principal Financial Officer and Chief Financial Officer – Charles Rizzo
Treasurer – Salvatore Schiavone
John Hancock Funds
Principal Executive Officer and President – Kristie Feinberg
Principal Financial Officer and Chief Financial Officer – Charles Rizzo
Treasurer – Salvatore Schiavone
John Hancock Funds II
Principal Executive Officer and President – Kristie Feinberg
Principal Financial Officer and Chief Financial Officer – Charles Rizzo
Treasurer – Salvatore Schiavone
John Hancock Exchange-Traded Trust
Principal Executive Officer and President – Kristie Feinberg
Principal Financial Officer and Chief Financial Officer – Charles Rizzo
Treasurer – Salvatore Schiavone
6 of 6
I, Kristie M. Feinberg, certify that:
1.I have reviewed this report on Form N-CSR of John Hancock Funds II;
2.Based on my knowledge, this report does not contain any untrue statement of a material fact or omit to state a material fact necessary to make the statements made, in light of the circumstances under which such statements were made, not misleading with respect to the period covered by this report;
3.Based on my knowledge, the financial statements, and other financial information included in this report, fairly present in all material respects the financial conditions, results of operations, changes in net assets, and cash flows (if the financial statements are required to include a statement of cash flows) of the registrant as of, and for, the periods presented in this report;
4.The registrant's other certifying officer(s) and I are responsible for establishing and maintaining disclosure controls and procedures (as defined in Rule 30a-3(c) under the Investment Company Act of 1940) and internal control over financial reporting (as defined in Rule 30a-3(d) under the Investment Company Act of 1940) for the registrant and have:
(a)Designed such disclosure controls and procedures, or caused such disclosure controls and procedures to be designed under our supervision, to ensure that material information relating to the registrant, including its consolidated subsidiaries, is made known to us by others within those entities, particularly during the period in which this report is being prepared;
(b)Designed such internal control over financial reporting, or caused such internal control over financial reporting to be designed under our supervision, to provide reasonable assurance regarding the reliability of financial reporting and the preparation of financial statements for external purposes in accordance with generally accepted accounting principles;
(c)Evaluated the effectiveness of the registrant's disclosure controls and procedures and presented in this report our conclusions about the effectiveness of the disclosure controls and procedures, as of a date within 90 days prior to the filing date of this report based on such evaluation; and
(d)Disclosed in this report any change in the registrant's internal control over financial reporting that occurred during the period covered by this report that has materially affected, or is reasonably likely to materially affect, the registrant's internal control over financial reporting; and
5.The registrant's other certifying officer(s) and I have disclosed to the registrant's auditors and the audit committee of the registrant's board of directors (or persons performing the equivalent functions):
(a)All significant deficiencies and material weaknesses in the design or operation of internal control over financial reporting which are reasonably likely to adversely affect the registrant's ability to record, process, summarize, and report financial information; and
(b)Any fraud, whether or not material, that involves management or other employees who have a significant role in the registrant's internal control over financial reporting.
Date: October 19, 2023 |
/s/ Kristie M. Feinberg |
|
Kristie M. Feinberg |
|
President |
I, Charles A. Rizzo, certify that:
1.I have reviewed this report on Form N-CSR of John Hancock Funds II;
2.Based on my knowledge, this report does not contain any untrue statement of a material fact or omit to state a material fact necessary to make the statements made, in light of the circumstances under which such statements were made, not misleading with respect to the period covered by this report;
3.Based on my knowledge, the financial statements, and other financial information included in this report, fairly present in all material respects the financial conditions, results of operations, changes in net assets, and cash flows (if the financial statements are required to include a statement of cash flows) of the registrant as of, and for, the periods presented in this report;
4.The registrant's other certifying officer(s) and I are responsible for establishing and maintaining disclosure controls and procedures (as defined in Rule 30a-3(c) under the Investment Company Act of 1940) and internal control over financial reporting (as defined in Rule 30a-3(d) under the Investment Company Act of 1940) for the registrant and have:
(a)Designed such disclosure controls and procedures, or caused such disclosure controls and procedures to be designed under our supervision, to ensure that material information relating to the registrant, including its consolidated subsidiaries, is made known to us by others within those entities, particularly during the period in which this report is being prepared;
(b)Designed such internal control over financial reporting, or caused such internal control over financial reporting to be designed under our supervision, to provide reasonable assurance regarding the reliability of financial reporting and the preparation of financial statements for external purposes in accordance with generally accepted accounting principles;
(c)Evaluated the effectiveness of the registrant's disclosure controls and procedures and presented in this report our conclusions about the effectiveness of the disclosure controls and procedures, as of a date within 90 days prior to the filing date of this report based on such evaluation; and
(d)Disclosed in this report any change in the registrant's internal control over financial reporting that occurred during the period covered by this report that has materially affected, or is reasonably likely to materially affect, the registrant's internal control over financial reporting; and
5.The registrant's other certifying officer(s) and I have disclosed to the registrant's auditors and the audit committee of the registrant's board of directors (or persons performing the equivalent functions):
(a)All significant deficiencies and material weaknesses in the design or operation of internal control over financial reporting which are reasonably likely to adversely affect the registrant's ability to record, process, summarize, and report financial information; and
(b)Any fraud, whether or not material, that involves management or other employees who have a significant role in the registrant's internal control over financial reporting.
Date: October 19, 2023 |
/s/ Charles A. Rizzo |
|
_______________________ |
|
Charles A. Rizzo |
|
Chief Financial Officer |
Certification Pursuant to 18 U.S.C. Section 1350, as Adopted Pursuant to Section 906 of
the Sarbanes-Oxley Act of 2002*
In connection with the attached Report of John Hancock Funds II (the "registrant") on Form N- CSR to be filed with the Securities and Exchange Commission (the "Report"), each of the undersigned officers of the registrant does hereby certify that, to the best of such officer's knowledge:
1.The Report fully complies with the requirements of Section 13(a) or 15(d) of the Securities Exchange Act of 1934; and
2.The information contained in the Report fairly presents, in all material respects, the financial condition and results of operations of the registrant as of, and for, the periods presented in the Report.
/s/ Kristie M. Feinberg
--------------------------------
Kristie M. Feinberg President
Dated: October 19, 2023
/s/ Charles A. Rizzo
-------------------------------
Charles A. Rizzo
Chief Financial Officer
Dated: October 19, 2023
A signed original of this written statement, required by Section 906, has been provided to the registrant and will be retained by the registrant and furnished to the Securities and Exchange Commission or its staff upon request.
*These certifications are being furnished solely pursuant to 18 U.S.C. Section 1350 and are not being filed as part of this Form N-CSR or as a separate disclosure document.

JOHN HANCOCK FUNDS1
NOMINATING AND GOVERNANCE COMMITTEE CHARTER
Overall Role and Responsibility
The Nominating and Governance Committee (the "Committee") of each of the Trusts shall (1) make determinations and recommendations to the Board of Trustees (the "Board") regarding issues related to (a) the composition of the Board and (b) corporate governance matters applicable to the Trustees who are not "interested persons" as defined in the Investment Company Act of 1940, as amended (the "1940 Act"), of any of the Trusts, or of any Fund's investment adviser, subadviser or principal underwriter and who are "independent" as defined in the rules of the New York Stock Exchange ("NYSE") (the "Independent Trustees") and (2) discharge such additional duties, responsibilities and functions as are delegated to it from time to time.
Membership
The Nominating and Governance Committee (the "Committee") shall be composed of all of the Independent Trustees of the Board. One member of the Committee shall be appointed by the Board as Chair of the Committee. The chair shall be responsible for leadership of the Committee, including scheduling meetings or reviewing and approving the schedule for them, preparing agendas or reviewing and approving them before meetings, presiding over meetings of the Committee and making reports to the full Board, as appropriate.
Structure, Operations and Governance
Meetings and Actions by Written Consent. The Committee shall meet as often as required or as the Committee deems appropriate, with or without management present. Meetings may be called and notice given by the Committee chair or a majority of the members of the Committee. Members may attend meetings in person or by telephone. The Committee may act by written consent to the extent permitted by law and the Funds' governing documents. The Committee shall report to the Board on any significant action it takes not later than the next following Board meeting.
Required Vote and Quorum. The affirmative vote of a majority of the members of the Committee participating in any meeting of the Committee at which a quorum is present is necessary for the adoption of any resolution. At least a majority of the Committee members present at the meeting in person or by telephone shall constitute a quorum for the transaction of business.
1"John Hancock Funds" includes each trust and series as may be amended from time to time (each individually, a "Trust," and collectively, the "Trusts," and each series thereof, a "Portfolio" or "Fund," and collectively, the "Portfolios" or "Funds").
Delegation to Subcommittees. The Committee may delegate any portion of its authority to a subcommittee of one or more members.
Appropriate Resources and Authority. The Committee shall have the resources and authority appropriate to discharge its responsibilities, including the authority to retain special counsel and other advisers, experts or consultants, at the Funds' expense, as it determines necessary or appropriate to carry out its duties and responsibilities. In addition, the Committee shall have direct access to such officers of and service providers to the Funds as it deems desirable.
Review of Charter. The Committee Charter shall be approved by at least a majority of the Independent Trustees of the Trust. The Committee shall review and assess the adequacy of this Charter periodically and, where necessary or as it deems desirable, will recommend changes to the Board for its approval. The Board may amend this Charter at any time in response to recommendations from the Committee or on its own motion.
Executive Sessions. The Committee may meet privately and may invite non-members to attend such meetings. The Committee may meet with representatives of the Investment Management Services department of the Funds' advisers, internal legal counsel of the Funds' advisers, members of the John Hancock Funds Risk & Investment Operations Committee (the "RIO Committee") and with representatives of the Funds' service providers, including the subadvisers, to discuss matters that relate to the areas for which the Committee has responsibility.
Specific Duties and Responsibilities
The Committee shall have the following duties and powers, to be exercised at such times and in such manner as the Committee shall determine:
1.Except where a Trust is legally required to nominate individuals recommended by another, to identify individuals qualified to serve as Independent Trustees of the Trusts, and to consider and recommend to the full Board nominations of individuals to serve as Trustees.
2.To consider, as it deems necessary or appropriate, the criteria for persons to fill existing or newly created Trustee vacancies. The Committee shall use the criteria and principles set forth in Annex A to guide its Trustee selection process.
3.To consider and recommend changes to the Board regarding the size, structure, and composition of the Board.
4.To evaluate, from time to time, and determine changes to the retirement policies for the Independent Trustees, as appropriate.
5.To periodically review the Board's committee structure and, in collaboration with the Chairs of the various Committees, the charters of the Board's committees, and
recommend to the Board of Trustees changes to the committee structure and charters as it deems appropriate.
6.To retain and terminate any firm(s) to be used to identify or evaluate or assist in identifying or evaluating potential Independent Board nominees, subject to the Board's sole authority to approve the firm's fees and other retention terms.
7.To consider and determine the amount of compensation to be paid by the Trusts to the Independent Trustees, including the compensation of the Chair of the Board or any Vice-Chair of the Board and of Committee Chairs, and to address compensation-related matters. The Chair of the Board has been granted the authority to approve special compensation to Independent Trustees in recognition of any significant amount of additional time and service to the Trusts provided by them, subject to ratification of any such special compensation by the Committee at the next regular meeting of the Committee.
8.To coordinate and administer an annual self-evaluation of the Board, which will include, at a minimum, a review of its effectiveness in overseeing the number of Funds in the Fund complex and the effectiveness of its committee structure.
9.To review the Board Governance Procedures and recommend to the Board of Trustees changes to the Procedures as the Committee deems appropriate.
10.To report its activities to the full Board and to make such recommendations with respect to the matters described above and other matters as the Committee may deem necessary or appropriate.
Additional Responsibilities
The Committee will also perform other tasks assigned to it from time to time by the Chair of the Board or by the Board, and will report findings and recommendations to the Board, as appropriate.
Last revised: December 12, 2018
ANNEX A
The Committee may take into account a wide variety of factors in considering Trustee candidates, including (but not limited to) the criteria set forth below. The Committee may determine that a candidate who does not satisfy these criteria in one or more respects should nevertheless be considered as a nominee if the Committee finds that the criteria satisfied by the candidate and the candidate's other qualifications demonstrate the appropriate level of fitness to serve.
General Criteria
1.Nominees should have a reputation for integrity, honesty and adherence to high ethical standards, and such other personal characteristics as a capacity for leadership and the ability to work well with others.
2.Nominees should have business, professional, academic, financial, accounting or other experience and qualifications which demonstrate that they will make a valuable contribution as Trustees.
3.Nominees should have a commitment to understand the Funds, and the responsibilities of a trustee/director of an investment company and to regularly attend and participate in meetings of the Board and its committees.
4.Nominees should have the ability to understand the sometimes conflicting interests of the various constituencies of the Funds, including shareholders and the investment adviser, and to act in the interests of all shareholders.
5.Nominees should not have, nor appear to have, a conflict of interest that would impair their ability to represent the interests of all the shareholders and to fulfill the responsibilities of a trustee.
6.Nominees should have experience on corporate or other institutional bodies having oversight responsibilities.
It is the intent of the Committee that at least one Independent Trustee be an "audit committee financial expert" as that term is defined in Item 3 of Form N-CSR.
Application of Criteria to Current Trustees
The re-nomination of current Trustees should not be viewed as automatic, but should be based on continuing qualification under the criteria set forth above based on, among other things, the current Trustee's contribution to the Board and any committee on which he or she serves.
Review of Nominations
1.The Committee believes that it is in the best interests of each Trust and its shareholders to obtain highly-qualified candidates to serve as members of the Board.
2.In nominating candidates who would be Independent Trustees, the Committee believes that no particular qualities or skills nor any specific minimum qualifications or disqualifications are controlling or paramount. The Committee shall take into consideration any such factors as it deems appropriate; however, the appropriate mix of skills, expertise and attributes needed to maintain an effective board are sought in the applicant pool as part of every search the Board undertakes for new trustees, including but not limited to the diversity of thought, as well as of gender, race, ethnic background and geographic origin. These factors may also include (but are not limited to) the person's character, integrity, judgment, skill and experience with investment companies and other organizations of comparable purpose, complexity and size and subject to similar legal restrictions and oversight; the interplay of the candidate's experience with the experience of other Board members; and the extent to which the candidate would be a desirable addition to the Board and any Committees thereof. Other factors that the Committee may take into consideration include a person's availability and commitment to attend meetings and perform his or her responsibilities; whether or not the person has or had any relationships that might impair or appear to impair his or her independence, such as any business, financial or family relationships with Fund management, the investment adviser and/or any subadviser of the Funds, as applicable, Fund service providers, or their affiliates or with Fund shareholders. The Committee will strive to achieve a group that reflects a diversity of experiences in respect of industries, professions and other experiences, and that is diversified as to thought, gender, race, ethnic background and geographic origin.
3.While the Committee is solely responsible for the selection and recommendation to the Board of Independent Trustee candidates, the Committee may consider nominees recommended by any source, including shareholders, management, legal counsel and Board members, as it deems appropriate. The Committee may retain a professional search firm or a consultant to assist the Committee in a search for a qualified candidate. Any recommendations from shareholders shall be directed to the Secretary of the relevant Trust at such address as is set forth in the Trust's disclosure documents. Recommendations from management may be submitted to the Committee Chair. All recommendations shall include all information relating to such person that is required to be disclosed in solicitations of proxies for the election of Board members and as specified
in the relevant Trust's By-Laws, and must be accompanied by a written consent of the proposed candidate to stand for election if nominated for the Board and to serve if elected by shareholders.
4.Any shareholder nomination must be submitted in compliance with all of the pertinent provisions of Rule 14a-8 under the Securities Exchange Act of 1934 in order to be considered by the Committee. In evaluating a nominee recommended by a shareholder, the Committee, in addition to the criteria discussed above, may consider the objectives of the shareholder in submitting that nomination and whether such objectives are consistent with the interests of all shareholders. If the Board determines to include a shareholder's candidate among the slate of its designated nominees, the candidate's name will be placed on the Trust's proxy card. If the Board determines not to include such candidate among its designated nominees, and the shareholder has satisfied the requirements of Rule 14a-8, the shareholder's candidate will be treated as a nominee of the shareholder who originally nominated the candidate. In that case, the candidate will not be named on the proxy card distributed with the Trust's proxy statement.
5.As long as a current Independent Trustee continues, in the opinion of the Committee, to satisfy the criteria listed above, the Committee generally would favor the re-nomination of a current Trustee rather than a new candidate. Consequently, while the Committee will consider nominees recommended by shareholders to serve as trustees, the Committee may only act upon such recommendations if there is a vacancy on the Board, or the Committee determines that the selection of a new or additional Trustee is in the best interests of the relevant Trust. In the event that a vacancy arises or a change in Board membership is determined to be advisable, the Committee will, in addition to any shareholder recommendations, consider candidates identified by other means as discussed in this Annex A.
6.With respect to candidates for Independent Trustee, a biography of each candidate shall be acquired and shall be reviewed by counsel to the Independent Trustees and counsel to the Trust to determine the candidate's eligibility to serve as an Independent Trustee.
7.The Committee may from time to time establish specific requirements and/or additional factors to be considered for Independent Trustee candidates as it deems necessary or appropriate.
8.After its consideration of relevant factors, the Committee shall present its recommendation(s) to the full Board for its consideration.