false false00007887840000081033 0000788784 2023-02-21 2023-02-21 0000788784 pseg:PublicServiceElectricAndGasCompanyMember 2023-02-21 2023-02-21 0000788784 us-gaap:CommonStockMember 2023-02-21 2023-02-21 0000788784 pseg:FirstAndRefundingMortgageBondsEightPercentDueTwoThousandThirtySevenMember 2023-02-21 2023-02-21 0000788784 pseg:FirstAndRefundingMortgageBondsFivePercentDueTwoThousandThirtySevenMember 2023-02-21 2023-02-21
SECURITIES AND EXCHANGE COMMISSION
Pursuant to Section 13 or 15(d) of the Securities Exchange Act of 1934
Date of Report (Date of earliest event reported) February 21, 2023
Public Service Enterprise Group Incorporated
(Exact name of registrant as specified in its charter)
| |
|
|
|
|
|
|
|
|
|
(State or other jurisdiction of incorporation) |
|
(Commission File Number) |
|
(I.R.S. Employer Identification Number) |
(Address of principal executive offices) (Zip Code)
(Registrant’s telephone number, including area code)
Public Service Electric and Gas Company
(Exact name of registrant as specified in its charter)
| |
|
|
|
|
|
|
|
|
|
(State or other jurisdiction of incorporation) |
|
(Commission File Number) |
|
(I.R.S. Employer Identification Number) |
(Address of principal executive offices) (Zip Code)
(Registrant’s telephone number, including area code)
Check the appropriate box below if the Form
8-K
filing is intended to simultaneously satisfy the filing obligation of the registrant under any of the following provisions (see General Instruction A.2. below):
☐
Written communications pursuant to Rule 425 under the Securities Act (17 CFR 230.425)
☐ Soliciting material pursuant to Rule
14a-12
under the Exchange Act (17 CFR
240.14a-12)
☐ Pre-commencement
communications pursuant to Rule
14d-2(b)
under the Exchange Act (17 CFR
240.14d-2(b))
☐ Pre-commencement
communications pursuant to Rule
13e-4(c)
under the Exchange Act (17 CFR
240.13e-4(c))
| |
|
|
|
|
Securities registered pursuant to Section 12(b) of the Act: |
| |
|
|
|
|
|
|
|
Public Service Enterprise Group Incorporated |
|
|
|
|
| |
|
|
| Common Stock without par value |
|
PEG |
|
New York Stock Exchange |
| |
|
|
Public Service Electric and Gas Company |
|
|
|
|
| 8.00% First and Refunding Mortgage Bonds, due 2037 |
|
PEG37D |
|
New York Stock Exchange |
| 5.00% First and Refunding Mortgage Bonds, due 2037 |
|
PEG37J |
|
New York Stock Exchange |
Indicate by check mark whether any of the registrants is an emerging growth company as defined in Rule 405 of the Securities Act of 1933 (§230.405 of this chapter) or Rule
12b-2
of the Securities Exchange Act of 1934
(§240.12b-2
of this chapter).
| |
|
|
| Emerging growth company ☐ |
| |
| If an emerging growth company, indicate by check mark if such registrant has elected not to use the extended transition period for complying with any |
| new or revised financial accounting standards provided pursuant to Section 13(a) of the Exchange Act. |
|
☐ |
The information contained in Item 2.02. Results of Operations and Financial Condition in this Form
8-K
is furnished solely for Public Service Enterprise Group Incorporated (PSEG). The information contained in Item 7.01 Regulation FD Disclosure in this combined Form
8-K
is separately furnished, as noted, by PSEG and Public Service Electric and Gas Company (PSE&G). Information contained herein relating to any individual company is provided by such company on its own behalf and in connection with its respective Form
8-K.
PSE&G makes representations only as to itself and makes no other representations whatsoever as to any other company. The materials furnished as Exhibits 99 and 99.1 are available on the corporate.pseg.com website under the investor tab, or at http://investor.pseg.com.
Item 2.02 Results of Operations and Financial Condition
On February 21, 2023, PSEG announced financial results for the three and twelve months ended December 31, 2022. A copy of the earnings release dated February 21, 2023 is furnished as Exhibit 99 to this Form
8-K.
Item 7.01 Regulation FD Disclosure
On February 21, 2023, PSEG conducted an earnings call regarding its results for the three and twelve months ended December 31, 2022. A copy of the slideshow presentation used during the earnings call is furnished as Exhibit 99.1 to this Form
8-K.
Item 9.01 Financial Statements and Exhibits
Exhibit 104 Cover Page Interactive Data File (embedded within the Inline XBRL document).
2
SIGNATURE
Pursuant to the requirements of the Securities Exchange Act of 1934, the registrant has duly caused this report to be signed on its behalf by the undersigned thereunto duly authorized. The signature of the undersigned company shall be deemed to relate only to matters having reference to such company and any subsidiaries thereof.
|
|
|
PUBLIC SERVICE ENTERPRISE GROUP INCORPORATED |
| (Registrant) |
|
|
| By: |
|
/s/ Rose M. Chernick |
|
|
ROSE M. CHERNICK |
|
|
Vice President and Controller |
|
|
(Principal Accounting Officer) |
Date: February 21, 2023
SIGNATURE
Pursuant to the requirements of the Securities Exchange Act of 1934, the registrant has duly caused this report to be signed on its behalf by the undersigned thereunto duly authorized. The signature of the undersigned company shall be deemed to relate only to matters having reference to such company and any subsidiaries thereof.
|
|
|
PUBLIC SERVICE ELECTRIC AND GAS COMPANY |
| (Registrant) |
|
|
| By: |
|
/s/ Rose M. Chernick |
|
|
ROSE M. CHERNICK |
|
|
Vice President and Controller |
|
|
(Principal Accounting Officer) |
Date: February 21, 2023
3
EXHIBIT 99
|
|
|
|
|
| Investor Relations |
|
Public Service Enterprise Group
80 Park Plaza, T4 Newark, NJ
07102 |
|

|
CONTACT:
|
|
|
|
|
| Media Relations |
|
|
|
Investor Relations |
| Marijke.Shugrue@pseg.com |
|
|
|
Carlotta.Chan@pseg.com |
| 908-531-4253 |
|
|
|
973-430-6565 |
PSEG ANNOUNCES 2022 RESULTS
$2.06 PER SHARE NET INCOME
$3.47 PER SHARE
NON-GAAP OPERATING EARNINGS
Narrows Full-Year 2023 non-GAAP
Operating Earnings Guidance Range to $3.40 - $3.50 Per Share
Affirms outlook for 5%-7% long-term
earnings growth through 2027
(February 21, 2023 – Newark, NJ) Public Service Enterprise Group (PSEG) reported full-year 2022 Net Income of
$1,031 million, or $2.06 per share, compared to a Net Loss of $648 million, or $1.29 per share for full-year 2021. Non-GAAP Operating Earnings for 2022 were $1,739 million, or $3.47 per share,
compared to $1,853 million, or $3.65 per share for 2021.
PSEG also reported Net Income for the fourth quarter of 2022 of $788 million, or
$1.58 per share. This compares to Net Income of $445 million, or $0.88 per share in 2021’s fourth quarter. Non-GAAP Operating Earnings for the fourth quarter of 2022 were $318 million, or $0.64
per share, compared to fourth quarter 2021 non-GAAP Operating Earnings of $352 million, or $0.69 per share. Non-GAAP results for the fourth quarter and full year of
2022 and 2021, respectively, exclude items shown in Attachments 8 and 9.
“We are pleased to report strong operating and financial results for
2022, marking the 18th year in a row that PSEG has delivered results within management’s non-GAAP Operating Earnings guidance. The main contributor to
our results, PSE&G, posted an 8.2% annual increase in Net Income, representing approximately 90% of PSEG’s consolidated non-GAAP Operating Earnings,” said Ralph LaRossa – chair, president
and chief executive officer of PSEG.
“PSEG successfully navigated last year’s challenges including inflation, supply chain disruptions,
energy price spikes, and the steep rise in interest rates to deliver financial results above the midpoint of our 2022 non-GAAP Operating Earnings guidance. The Edison Electric Institute recognized PSE&G
with its 2022 Edison Award, the electric power industry’s highest honor for leadership and innovation. We completed the sale of our fossil generating plants in February 2022, which simplified our business mix to approximately 90% regulated, and
completed a $500 million share repurchase in May 2022. The passage of the Inflation Reduction Act last August will help to preserve the financial viability of our carbon-free nuclear fleet into the next decade, and creates valuable incentives
in the near-term for our customers to transition to electric vehicles and advance New Jersey’s decarbonization goals.”
“The
simplified business platform created by the strategic actions PSEG has taken over the past two years now drives our long-term, compound annual earnings growth rate of 5% to 7% through 2027. Moving into
1
this year, we extended our 2022 dividend increase of $0.12 per share to set the 2023 indicative rate at $2.28 per share – a testament to the financial discipline that has enabled us to pay a
common dividend to our shareholders for 116 years.”
“Recognizing the critical importance shareholders place on the predictability and
visibility of our financial results and goals, I have made increasing both factors a key focus of PSEG’s strategic plan. We intend to share the details of this plan at our upcoming investor conference on March 10. I am honored to lead this
company and its 12,500 dedicated employees. Together, we will be guided by PSEG’s longstanding commitment to operational excellence, disciplined investment and financial strength as we continue building a practical path towards decarbonizing
the New Jersey economy,” said LaRossa.
The following tables provide a reconciliation of PSEG’s Net Income/(Loss) to non-GAAP Operating Earnings for the full year and the fourth quarter. See Attachments 8 and 9 for a complete list of items excluded from Net Income/(Loss) in the determination of
non-GAAP Operating Earnings.
PSEG CONSOLIDATED (unaudited)
|
|
|
|
|
|
|
|
|
|
|
|
|
|
|
|
|
| |
|
|
Full-Year
Comparative Results |
|
Income ($ millions) |
|
|
Diluted Earnings
(Per Share) |
|
| |
|
|
|
|
| |
|
|
2022 |
|
|
|
2021 |
|
|
|
2022 |
|
|
|
2021 |
|
| |
|
|
|
|
|
Net Income/(Loss) |
|
|
$1,031 |
|
|
|
$(648) |
|
|
|
$2.06 |
|
|
|
$(1.29) |
|
| |
|
|
|
|
|
Reconciling Items |
|
|
708 |
|
|
|
2,501 |
|
|
|
1.41 |
|
|
|
4.96 |
|
| |
|
|
|
|
|
Share Differential* |
|
|
- |
|
|
|
- |
|
|
|
- |
|
|
|
(0.02) |
|
| |
|
|
|
|
|
Non-GAAP Operating Earnings |
|
|
$1,739 |
|
|
|
$1,853 |
|
|
|
$3.47 |
|
|
|
$3.65 |
|
| |
|
|
|
|
|
Average Shares |
|
|
|
|
|
|
|
|
|
|
501 |
|
|
|
504 |
|
|
| * Approximately three million
potentially dilutive shares were excluded from fully diluted average shares outstanding used to calculate the diluted GAAP loss per share for year ended December 31, 2021 as their impact was antidilutive to GAAP results. For non-GAAP per share calculations, we used fully diluted average shares outstanding of 507 million, including the three million potentially dilutive shares, as they were dilutive to
non-GAAP results. |
|
PSEG CONSOLIDATED (unaudited)
|
|
|
|
|
|
|
|
|
|
|
|
|
|
|
|
|
| |
|
|
Fourth Quarter
Comparative Results |
|
Income ($ millions) |
|
|
Diluted Earnings
(Per Share) |
|
| |
|
|
|
|
| |
|
|
2022 |
|
|
|
2021 |
|
|
|
2022 |
|
|
|
2021 |
|
| |
|
|
|
|
|
Net Income |
|
|
$788 |
|
|
|
$445 |
|
|
|
$1.58 |
|
|
|
$0.88 |
|
| |
|
|
|
|
|
Reconciling Items |
|
|
(470) |
|
|
|
(93) |
|
|
|
(0.94) |
|
|
|
(0.19) |
|
| |
|
|
|
|
|
Non-GAAP Operating Earnings |
|
|
$318 |
|
|
|
$352 |
|
|
|
$0.64 |
|
|
|
$0.69 |
|
| |
|
|
|
|
|
Average Shares |
|
|
|
|
|
|
|
|
|
|
500 |
|
|
|
508 |
|
During 2022, PSE&G invested over $3 billion upgrading its transmission and distribution infrastructure and in
clean energy future programs, and plans to invest over $3.4 billion in these capital programs in 2023. The utility’s 2023-2027 planned capital investment program is $15.5 billion to $18 billion, which is expected to produce 6% to
7.5% compound annual growth in PSE&G’s rate base over the five-year period. We also expect that PSEG’s strong cash flow and solid investment grade ratings will enable us to fund this five-year capital plan through 2027 without the need
to issue new equity.
The following table outlines PSEG’s full-year 2023 non-GAAP Operating Earnings
expectations at the narrowed range of $3.40 to $3.50 per share, from the original range of $3.35 to $3.55 per share initiated in November 2022. The subsidiary ranges for 2023 reflect the impact of actual 2022 investment returns on 2023 pension
calculations and higher expected interest expense, partly offset by operation and maintenance
2
(O&M) expense savings and the recent Board of Public Utilities (BPU) approval of an accounting order that defers PSE&G’s recognition of gains and losses on the pension trust
assets.
PSEG 2023
Non-GAAP Operating Earnings Guidance
and 2022 Non-GAAP
Operating Earnings Results
|
|
|
|
|
|
|
| |
|
|
|
| ($ millions, except EPS) |
|
2023E Narrowed |
|
2023E Original |
|
2022A |
| |
|
|
|
|
PSE&G |
|
$1,500 - $1,525 |
|
$1,490 - $1,540 |
|
$1,565 |
| |
|
|
|
|
Carbon-Free, Infrastructure & Other |
|
200 - 225 |
|
185 - 235 |
|
174 |
| |
|
|
|
|
PSEG non-GAAP Operating Earnings |
|
$1,700 - $1,750 |
|
$1,675 - $1,775 |
|
$1,739 |
| |
|
|
|
|
PSEG Non-GAAP Operating EPS |
|
$3.40 - $3.50 |
|
$3.35 - $3.55 |
|
$3.47 |
Results and Outlook by Operating Subsidiary
PSE&G
Public Service Electric and Gas
Fourth Quarter & Full Year Comparative Results
|
|
|
|
|
|
|
|
|
|
|
|
|
|
|
|
|
| |
|
|
|
|
|
($ millions, except per share amounts) |
|
|
4Q 2022 |
|
|
|
4Q 2021 |
|
|
|
FY 2022 |
|
|
|
FY 2021 |
|
| |
|
|
|
|
|
Net Income |
|
|
$352 |
|
|
|
$271 |
|
|
|
$1,565 |
|
|
|
$1,446 |
|
| |
|
|
|
|
|
Earnings Per Share |
|
|
$0.70 |
|
|
|
$0.53 |
|
|
|
$3.12 |
|
|
|
$2.87 |
|
| |
|
|
|
|
|
Share Differential* |
|
|
- |
|
|
|
- |
|
|
|
- |
|
|
|
(0.02) |
|
| |
|
|
|
|
|
Non-GAAP Operating EPS |
|
|
$0.70 |
|
|
|
$0.53 |
|
|
|
$3.12 |
|
|
|
$2.85 |
|
|
| *Approximately three million
potentially dilutive shares were excluded from fully diluted average shares outstanding used to calculate PSEG’s diluted GAAP loss per share for year ended December 31, 2021, as their impact was antidilutive to PSEG’s consolidated
GAAP results. For non-GAAP per share calculations, we used fully diluted average shares outstanding of 507 million, including the three million potentially dilutive shares, as they were dilutive to non-GAAP results. |
|
For the full-year of 2022, PSE&G Net Income rose by $119 million, over 8% compared with 2021 results.
For the fourth quarter of 2022, net Transmission margin added $0.01 per share compared with the year-earlier quarter, reflecting growth in rate base
partly offset by the timing of O&M recovery. Gas, electric and other margin combined to add $0.07 per share compared with last year’s fourth quarter, reflecting Gas System Modernization Program (GSMP) II
roll-ins, the Conservation Incentive Program (CIP) decoupling for both electric and gas, appliance service and other margin. O&M was flat versus the prior-year quarter. Higher distribution depreciation and
interest expense each reduced results by $0.01 per share, reflecting higher plant in service and investment. Lower pension expense added $0.01 per share versus the year-ago quarter. Flow through taxes, the
impact of lower shares, and other items added $0.10 per share compared to the fourth quarter of 2021, with $0.07 of that amount reversing the timing impact of taxes from prior quarters in 2022.
During 2022, the BPU authorized our $511 million Infrastructure Advancement Program (IAP) to improve the reliability of the “last mile”
of our electric distribution system and address aging substations and gas metering and regulation stations. PSE&G invested over $3 billion in planned capital spending to upgrade transmission and distribution facilities, enhance reliability
and increase resiliency, implement clean energy future programs, and launch the IAP. At year-end 2022, PSE&G’s rate base was approximately $26.4 billion, a 7.7% increase over year-end 2021.
3
The number of Electric and Gas customers, the driver of margin growth under the CIP, rose by
approximately 1% each in 2022. Weather-normalized Electric sales increased by ~2% for the year; with Residential sales flat, while C&I sales increased by ~3%. Weather-normalized Gas sales were flat for the year, with Residential sales down by
~1%, while C&I sales increased by ~2%.
Earlier in February 2023, PSE&G reduced its Basic Gas Supply Service residential rate by $0.15 to
$0.50 cents per therm for the balance of the winter 2022/2023 heating season. This decrease in the pass-through commodity charge will reduce the typical residential winter gas bill by $13 per month, or 11.5%. On the electric side, the BPU recently
completed its annual Basic Generation Service auction for default electric supply rates beginning June 1, 2023. A typical PSE&G residential customer will see this latest BGS auction reflected in an average estimated monthly bill increase of
3.3%.
During 2022, PSE&G was named the most reliable electric utility in the Mid-Atlantic region for
the 21st year in a row by PA Consulting. In addition, PSE&G ranked first in Residential customer satisfaction in the East among large utilities in both the Electric and Gas J.D. Power 2022
Studies.
We have narrowed PSE&G’s forecast of Net Income for 2023 to $1,500 million - $1,525 million, which reflects lower pension
and OPEB income compared to 2022, offset by the benefit of near contemporaneously recovered investments, the predictability of utility margin from the Conservation Incentive Program, as well as the implementation of the pension accounting filing
effective January 1, 2023.
PSEG Carbon-Free, Infrastructure & Other (CFIO)
Carbon-Free, Infrastructure & Other
Fourth Quarter & Full Year Comparative Results
|
|
|
|
|
|
|
|
|
|
|
|
|
|
|
|
|
| |
|
|
|
|
|
($ millions, except per share amounts) |
|
|
4Q 2022 |
|
|
|
4Q 2021 |
|
|
|
FY 2022 |
|
|
|
FY 2021 |
|
| |
|
|
|
|
|
Net Income/(Loss) |
|
|
$436 |
|
|
|
$174 |
|
|
|
$(534) |
|
|
|
$(2,094) |
|
| |
|
|
|
|
|
Earnings/(Loss) Per Share (EPS) |
|
|
$0.88 |
|
|
|
$0.35 |
|
|
|
$(1.06) |
|
|
|
$(4.16) |
|
| |
|
|
|
|
|
Non-GAAP Operating Earnings |
|
|
$(34) |
|
|
|
$81 |
|
|
|
$174 |
|
|
|
$407 |
|
| |
|
|
|
|
|
Non-GAAP EPS (Loss) |
|
|
$(0.06) |
|
|
|
$0.16 |
|
|
|
$0.35 |
|
|
|
$0.80 |
|
For full-year 2022, CFIO’s Net Loss of $534 million reflected higher losses on both mark-to-market transactions and nuclear decommissioning trust (NDT) fund related activity. The Net Loss for full-year 2021 included impairments and debt extinguishment costs
related to the Fossil sale. Non-GAAP Operating Earnings declined to $174 million from $407 million for the full-year 2021, reflecting the absence of Fossil.
For the fourth quarter of 2022, CFIO’s Net Income improved to $436 million, from $174 million in the prior year period, reflecting higher
gains on mark-to market transactions and NDT fund related activity. Net Income for the fourth quarter of 2021 included debt extinguishment costs and other charges related to the Fossil sale. The non-GAAP Operating Earnings of ($34) million compares to non-GAAP Operating Earnings of $81 million for the fourth quarter of 2021, which included the cessation of
depreciation and lower interest costs related to the Fossil sale.
The nuclear fleet operated at an average capacity factor of 85.8% during the
fourth quarter, which included a scheduled refueling at our 100%-owned Hope Creek station, and produced 7.3 TWh of
4
generation. An unplanned outage at Salem unit 2 in late December 2022 occurred during a PJM region-wide generation emergency action and resulted in capacity performance penalties. The net
financial impact of the outage, including replacement power, capacity penalties, as well as bonuses earned by the other operating PSEG units, is not expected to be material.
For the full-year, the nuclear fleet operated at an average capacity factor of 92.2% and produced 31.3 TWh of carbon-free, base load power. PSEG is
forecasting total baseload nuclear generation of approximately 31 TWh for the full year of 2023, hedged 95%-100% at an average price of $31 per MWh – an increase of approximately $4 per MWh compared to
2022. For 2024, total nuclear generation is forecast to be approximately 31 TWh and is 55%-60% hedged at an average price of $32 per MWh.
PSEG Power had net cash collateral postings of $1.5 billion at December 31, primarily related to out-of-the-money hedge positions because of higher energy prices throughout 2022. As of February 17, 2023, net cash collateral postings were approximately
$700 million, reflecting recent declines in power prices.
In January 2023, PSEG announced it would sell its 25% equity interest in the Ocean
Wind 1 offshore wind generation project to Ørsted. The sale is expected to close in the first half of 2023. PSEG has also decided not to exercise its option to purchase 50% of Ørsted’s two Skipjack generating projects in Maryland
or pursue an ownership interest in Ørsted’s Ocean Wind 2 project or other offshore wind generation projects. PSEG is evaluating its options for the potential sale of its 50% interest in Garden State Offshore Energy, which holds rights to
an offshore wind lease area south of New Jersey.
We have narrowed our forecast of non-GAAP Operating
Earnings for Carbon-Free, Infrastructure and Other to $200 million - $225 million from our prior guidance of $185 million - $235 million.
###
PSEG will host a conference call to review its Fourth
Quarter and Full-Year 2022 results with the financial community at 11AM EDT today. You can register to access this event by visiting https://investor.pseg.com/investor-news-and-events.
Public Service Enterprise
Group (PSEG) (NYSE: PEG) is a predominantly regulated infrastructure company focused on a clean energy future. Guided by its Powering Progress vision, PSEG aims to power a future where people use less energy, and it’s cleaner, safer and
delivered more reliably than ever. PSEG’s commitment to ESG and sustainability is demonstrated in our net-zero 2030 climate vision and participation in the U.N. Race to Zero, as well as our inclusion on
the Dow Jones Sustainability North America Index and the list of America’s most JUST Companies. PSEG’s businesses include Public Service Electric and Gas Co. (PSE&G), PSEG Power and PSEG Long Island (https://corporate.pseg.com).
Non-GAAP Financial
Measures
Management uses non-GAAP Operating Earnings in its internal analysis, and in communications
with investors and analysts, as a consistent measure for comparing PSEG’s financial performance to previous financial results. Non-GAAP Operating Earnings exclude the impact of returns (losses) associated
with the Nuclear Decommissioning Trust (NDT), Mark-to-Market (MTM) accounting and material one-time items.
See Attachments 8 and 9 for a complete list of items excluded from Net Income/(Loss) in the determination of
non-GAAP Operating Earnings. The presentation of non-GAAP Operating Earnings is intended to complement, and should not be considered an alternative to the presentation
of Net Income/(Loss), which is an indicator of financial performance determined in accordance with GAAP. In addition, non-GAAP Operating Earnings as presented in this release may not be comparable to similarly
titled measures used by other companies.
Due to the forward-looking nature of non-GAAP Operating Earnings,
PSEG is unable to reconcile this non-GAAP financial measure to the most directly comparable GAAP financial measure because comparable GAAP measures are not reasonably accessible or reliable due to the inherent
difficulty in forecasting and quantifying measures that would be required for such reconciliation. Namely, we are not able to reliably project without unreasonable effort MTM and NDT gains (losses), for
5
future periods due to market volatility. These items are uncertain, depend on various factors, and may have a material impact on our future GAAP results.
Forward-Looking Statements
Certain of
the matters discussed in this report about our and our subsidiaries’ future performance, including, without limitation, future revenues, earnings, strategies, prospects, consequences and all other statements that are not purely historical
constitute “forward-looking statements” within the meaning of the Private Securities Litigation Reform Act of 1995. Such forward-looking statements are subject to risks and uncertainties, which could cause actual results to differ
materially from those anticipated. Such statements are based on management’s beliefs as well as assumptions made by and information currently available to management. When used herein, the words “anticipate,” “intend,”
“estimate,” “believe,” “expect,” “plan,” “should,” “hypothetical,” “potential,” “forecast,” “project,” variations of such words and similar expressions are
intended to identify forward-looking statements. Factors that may cause actual results to differ are often presented with the forward-looking statements themselves. Other factors that could cause actual results to differ materially from those
contemplated in any forward-looking statements made by us herein are discussed in Item 1A. Risk Factors, Item 7. Management’s Discussion and Analysis of Financial Condition and Results of Operations (MD&A), Item 8. Financial Statements and
Supplementary Data—Note 15. Commitments and Contingent Liabilities, and other filings we make with the United States Securities and Exchange Commission (SEC), including our subsequent reports on Form 10-Q
and Form 8-K. These factors include, but are not limited to:
| |
• |
|
any inability to successfully develop, obtain regulatory approval for, or construct transmission and distribution, and other
generation projects; |
| |
• |
|
the physical, financial and transition risks related to climate change, including risks relating to potentially increased
legislative and regulatory burdens changing customer preferences and lawsuits; |
| |
• |
|
any equipment failures, accidents, critical operating technology or business system failures, severe weather events, acts of
war, terrorism or other acts of violence, sabotage, physical attacks or security breaches, cyberattacks or other incidents that may impact our ability to provide safe and reliable service to our customers; |
| |
• |
|
any inability to recover the carrying amount of our long-lived assets; |
| |
• |
|
disruptions or cost increases in our supply chain, including labor shortages; |
| |
• |
|
any inability to maintain sufficient liquidity or access sufficient capital on commercially reasonable terms;
|
| |
• |
|
the impact of cybersecurity attacks or intrusions or other disruptions to our information technology, operational or other
systems; |
| |
• |
|
a material shift away from natural gas toward increased electrification and a reduction in the use of natural gas;
|
| |
• |
|
the impact of the coronavirus pandemic; |
| |
• |
|
failure to attract and retain a qualified workforce; |
| |
• |
|
inflation, including increases in the costs of equipment, materials, fuel and labor; |
| |
• |
|
the impact of our covenants in our debt instruments and credit agreements on our business; |
| |
• |
|
adverse performance of our defined benefit plan trust funds and Nuclear Decommissioning Trust Fund and increases in funding
requirements and pension costs; |
| |
• |
|
fluctuations in wholesale power and natural gas markets, including the potential impacts on the economic viability of our
generation units; |
| |
• |
|
our ability to obtain adequate nuclear fuel supply; |
| |
• |
|
changes in technology related to energy generation, distribution and consumption and changes in customer usage patterns;
|
| |
• |
|
third-party credit risk relating to and purchase of nuclear fuel; |
| |
• |
|
any inability to meet our commitments under forward sale obligations and Regional Transmission Organization rules;
|
| |
• |
|
reliance on transmission facilities to maintain adequate transmission capacity for our nuclear generation fleet;
|
| |
• |
|
the impact of changes in state and federal legislation and regulations on our business, including PSE&G’s ability
to recover costs and earn returns on authorized investments; |
| |
• |
|
PSE&G’s proposed investment programs may not be fully approved by regulators and its capital investment may be
lower than planned; |
| |
• |
|
our ability to advocate for and our receipt of appropriate regulatory guidance to ensure long-term support for our nuclear
fleet; |
| |
• |
|
adverse changes in and non-compliance with energy industry laws, policies,
regulations and standards, including market structures and transmission planning and transmission returns; |
| |
• |
|
risks associated with our ownership and operation of nuclear facilities, including increased nuclear fuel storage costs,
regulatory risks, such as compliance with the Atomic Energy Act and trade control, environmental and other regulations, as well as financial, environmental and health and safety risks; |
| |
• |
|
changes in federal and state environmental laws and regulations and enforcement; |
| |
• |
|
delays in receipt of, or an inability to receive, necessary licenses and permits and siting approvals; and
|
| |
• |
|
changes in tax laws and regulations. |
All of the forward-looking statements made in this report are qualified by these cautionary statements and we cannot assure you that the results or
developments anticipated by management will be realized or even if realized, will have the expected consequences to, or effects on, us or our business, prospects, financial condition, results of operations or cash flows. Readers are cautioned not to
place undue reliance on these forward-looking statements in making any investment decision. Forward-looking statements made in this report apply only as of the date of this report. While we may elect to update forward-looking statements from time to
time, we specifically disclaim any obligation to do so, even in light of new information or future events, unless otherwise required by applicable securities laws.
The forward-looking statements contained in this report are intended to qualify for the safe harbor provisions of Section 27A of the Securities Act
of 1933, as amended, and Section 21E of the Securities Exchange Act of 1934, as amended.
|
| |
|
From time to time, PSEG and PSE&G release important information via postings on their corporate Investor Relations website at https://investor.pseg.com. Investors and other interested parties are encouraged to visit the Investor Relations website to review new postings. You can sign up for automatic email alerts regarding new postings at the
bottom of the webpage at https://investor.pseg.com or by navigating to the Email Alerts webpage at https://investor.pseg.com/resources/email-alerts/default.aspx. |
6
Attachment 1
PUBLIC SERVICE ENTERPRISE GROUP INCORPORATED
Consolidating Statements of Operations
(Unaudited, $ millions, except per share data)
|
|
|
|
|
|
|
|
|
|
|
|
|
|
|
|
|
|
|
|
|
|
Three Months Ended December 31, 2022 |
|
|
|
| |
|
|
|
|
|
|
|
|
| |
|
PSEG |
|
|
Eliminations |
|
|
PSE&G |
|
|
Carbon-Free,
Infrastructure &
Other (CFIO)(a) |
|
|
|
|
|
|
|
|
|
| OPERATING REVENUES |
|
$ |
3,139 |
|
|
$ |
(466 |
) |
|
$ |
2,030 |
|
|
$ |
1,575 |
|
|
|
|
|
|
|
|
|
| OPERATING EXPENSES |
|
|
|
|
|
|
|
|
|
|
|
|
|
|
|
|
|
|
| Energy Costs |
|
|
996 |
|
|
|
(466 |
) |
|
|
881 |
|
|
|
581 |
|
|
|
| Operation and Maintenance |
|
|
868 |
|
|
|
- |
|
|
|
489 |
|
|
|
379 |
|
|
|
| Depreciation and Amortization |
|
|
278 |
|
|
|
- |
|
|
|
238 |
|
|
|
40 |
|
|
|
| Losses on Asset Dispositions and Impairments |
|
|
33 |
|
|
|
- |
|
|
|
1 |
|
|
|
32 |
|
|
|
|
|
|
|
|
|
|
|
|
|
|
|
|
|
|
|
|
|
|
|
|
|
|
|
|
|
|
|
|
|
|
|
|
|
|
|
|
|
| Total Operating Expenses |
|
|
2,175 |
|
|
|
(466 |
) |
|
|
1,609 |
|
|
|
1,032 |
|
|
|
|
|
|
|
|
|
| OPERATING INCOME |
|
|
964 |
|
|
|
- |
|
|
|
421 |
|
|
|
543 |
|
|
|
|
|
|
|
|
|
| Loss from Equity Method Investments |
|
|
(2 |
) |
|
|
- |
|
|
|
- |
|
|
|
(2 |
) |
|
|
| Net Gains (Losses) on Trust Investments |
|
|
87 |
|
|
|
- |
|
|
|
- |
|
|
|
87 |
|
|
|
| Other Income (Deductions) |
|
|
38 |
|
|
|
- |
|
|
|
22 |
|
|
|
16 |
|
|
|
| Net Non-Operating Pension and OPEB Credits (Costs) |
|
|
94 |
|
|
|
- |
|
|
|
70 |
|
|
|
24 |
|
|
|
| Interest Expense |
|
|
(178 |
) |
|
|
- |
|
|
|
(108 |
) |
|
|
(70 |
) |
|
|
|
|
|
|
|
|
|
|
|
|
|
|
|
|
|
|
|
|
|
|
|
|
|
|
|
|
|
|
|
|
|
|
|
|
|
|
|
|
|
|
|
|
|
|
| INCOME BEFORE INCOME TAXES |
|
|
1,003 |
|
|
|
- |
|
|
|
405 |
|
|
|
598 |
|
|
|
|
|
|
|
|
|
| Income Tax Expense |
|
|
(215 |
) |
|
|
- |
|
|
|
(53 |
) |
|
|
(162 |
) |
|
|
|
|
|
|
|
|
|
|
|
|
|
|
|
|
|
|
|
|
|
|
|
|
|
|
|
|
|
|
|
|
|
|
|
|
|
|
|
|
|
|
|
|
|
|
| NET INCOME |
|
$ |
788 |
|
|
$ |
- |
|
|
$ |
352 |
|
|
$ |
436 |
|
|
|
|
|
|
|
|
|
|
|
|
|
|
|
|
|
|
|
|
|
|
|
|
|
|
|
|
| Reconciling Items Excluded from Net Income(b) |
|
|
(470 |
) |
|
|
- |
|
|
|
- |
|
|
|
(470 |
) |
|
|
|
|
|
|
|
|
|
|
|
|
|
|
|
|
|
|
|
|
|
|
|
|
|
|
|
|
|
|
|
|
|
|
|
|
|
|
|
|
| OPERATING EARNINGS (non-GAAP) |
|
$ |
318 |
|
|
$ |
- |
|
|
$ |
352 |
|
|
$ |
(34 |
) |
|
|
|
|
|
|
|
|
|
|
|
|
|
|
|
|
|
|
|
|
|
|
|
|
|
|
|
| Earnings Per Share |
|
|
|
|
|
|
|
|
|
|
|
|
|
|
|
|
|
|
| NET INCOME |
|
$ |
1.58 |
|
|
$ |
- |
|
|
$ |
0.70 |
|
|
$ |
0.88 |
|
|
|
|
|
|
|
|
|
|
|
|
|
|
|
|
|
|
|
|
|
|
| Reconciling Items Excluded from Net Income(b) |
|
|
(0.94 |
) |
|
|
- |
|
|
|
- |
|
|
|
(0.94 |
) |
|
|
|
|
|
|
|
|
|
|
|
|
|
|
|
|
|
|
|
|
|
|
|
|
|
|
|
|
|
|
|
|
|
|
|
|
|
|
|
|
| OPERATING EARNINGS (non-GAAP) |
|
$ |
0.64 |
|
|
$ |
- |
|
|
$ |
0.70 |
|
|
$ |
(0.06 |
) |
|
|
|
|
|
|
|
|
|
|
|
|
|
|
|
|
|
|
|
|
|
|
|
|
|
|
|
|
|
|
|
|
|
|
|
|
|
|
|
|
|
|
|
| |
|
Three Months Ended December 31, 2021 |
|
|
|
| |
|
|
|
|
|
|
|
|
| |
|
PSEG |
|
|
Eliminations |
|
|
PSE&G |
|
|
CFIO(a) |
|
|
|
|
|
|
|
|
|
| OPERATING REVENUES |
|
$ |
3,056 |
|
|
$ |
(363 |
) |
|
$ |
1,715 |
|
|
$ |
1,704 |
|
|
|
|
|
|
|
|
|
| OPERATING EXPENSES |
|
|
|
|
|
|
|
|
|
|
|
|
|
|
|
|
|
|
| Energy Costs |
|
|
1,004 |
|
|
|
(363 |
) |
|
|
632 |
|
|
|
735 |
|
|
|
| Operation and Maintenance |
|
|
858 |
|
|
|
- |
|
|
|
453 |
|
|
|
405 |
|
|
|
| Depreciation and Amortization |
|
|
270 |
|
|
|
- |
|
|
|
230 |
|
|
|
40 |
|
|
|
| Losses on Asset Dispositions and Impairments |
|
|
22 |
|
|
|
- |
|
|
|
- |
|
|
|
22 |
|
|
|
|
|
|
|
|
|
|
|
|
|
|
|
|
|
|
|
|
|
|
|
|
|
|
|
|
|
|
|
|
|
|
|
|
|
|
|
|
|
| Total Operating Expenses |
|
|
2,154 |
|
|
|
(363 |
) |
|
|
1,315 |
|
|
|
1,202 |
|
|
|
|
|
|
|
|
|
| OPERATING INCOME |
|
|
902 |
|
|
|
- |
|
|
|
400 |
|
|
|
502 |
|
|
|
|
|
|
|
|
|
| Income from Equity Method Investments |
|
|
4 |
|
|
|
- |
|
|
|
- |
|
|
|
4 |
|
|
|
| Net Gains (Losses) on Trust Investments |
|
|
70 |
|
|
|
- |
|
|
|
1 |
|
|
|
69 |
|
|
|
| Other Income (Deductions) |
|
|
5 |
|
|
|
- |
|
|
|
16 |
|
|
|
(11 |
) |
|
|
| Net Non-Operating Pension and OPEB Credits (Costs) |
|
|
82 |
|
|
|
- |
|
|
|
65 |
|
|
|
17 |
|
|
|
| Loss on Extinguishment of Debt |
|
|
(298 |
) |
|
|
- |
|
|
|
- |
|
|
|
(298 |
) |
|
|
| Interest Expense |
|
|
(134 |
) |
|
|
- |
|
|
|
(101 |
) |
|
|
(33 |
) |
|
|
|
|
|
|
|
|
|
|
|
|
|
|
|
|
|
|
|
|
|
|
|
|
|
|
|
|
|
|
|
|
|
|
|
|
|
|
|
|
|
|
|
|
|
|
| INCOME BEFORE INCOME TAXES |
|
|
631 |
|
|
|
- |
|
|
|
381 |
|
|
|
250 |
|
|
|
|
|
|
|
|
|
| Income Tax Expense |
|
|
(186 |
) |
|
|
- |
|
|
|
(110 |
) |
|
|
(76 |
) |
|
|
|
|
|
|
|
|
|
|
|
|
|
|
|
|
|
|
|
|
|
|
|
|
|
|
|
|
|
|
|
|
|
|
|
|
|
|
|
|
|
|
|
|
|
|
| NET INCOME |
|
$ |
445 |
|
|
$ |
- |
|
|
$ |
271 |
|
|
$ |
174 |
|
|
|
|
|
|
|
|
|
|
|
|
|
|
|
|
|
|
|
|
|
|
| Reconciling Items Excluded from Net Income(b) |
|
|
(93 |
) |
|
|
- |
|
|
|
- |
|
|
|
(93 |
) |
|
|
|
|
|
|
|
|
|
|
|
|
|
|
|
|
|
|
|
|
|
|
|
|
|
|
|
|
|
|
|
|
|
|
|
|
|
|
|
|
| OPERATING EARNINGS (non-GAAP) |
|
$ |
352 |
|
|
$ |
- |
|
|
$ |
271 |
|
|
$ |
81 |
|
|
|
|
|
|
|
|
|
|
|
|
|
|
|
|
|
|
|
|
|
|
|
|
|
|
|
|
| Earnings Per Share |
|
|
|
|
|
|
|
|
|
|
|
|
|
|
|
|
|
|
|
|
|
|
|
|
| NET INCOME |
|
$ |
0.88 |
|
|
$ |
- |
|
|
$ |
0.53 |
|
|
$ |
0.35 |
|
|
|
|
|
|
|
|
|
|
|
|
|
|
|
|
|
|
|
|
|
|
| Reconciling Items Excluded from Net Income(b) |
|
|
(0.19 |
) |
|
|
- |
|
|
|
- |
|
|
|
(0.19 |
) |
|
|
|
|
|
|
|
|
|
|
|
|
|
|
|
|
|
|
|
|
|
|
|
|
|
|
|
|
|
|
|
|
|
|
|
|
|
|
|
|
| OPERATING EARNINGS (non-GAAP) |
|
$ |
0.69 |
|
|
$ |
- |
|
|
$ |
0.53 |
|
|
$ |
0.16 |
|
|
|
|
|
|
|
|
|
|
|
|
|
|
|
|
|
|
|
|
|
|
|
|
|
|
|
|
|
|
|
|
|
|
|
|
|
|
|
|
|
| |
(a) |
Includes activities at PSEG Power, PSEG Long Island, Energy Holdings, PSEG Services Corporation and the Parent.
|
| |
(b) |
See Attachments 8 and 9 for details of items excluded from Net Income (Loss) to compute Operating Earnings (non-GAAP). |
Attachment 2
PUBLIC SERVICE ENTERPRISE GROUP INCORPORATED
Consolidating Statements of Operations
(Unaudited, $ millions, except per share data)
|
|
|
|
|
|
|
|
|
|
|
|
|
|
|
|
|
|
|
|
|
|
Year Ended December 31, 2022 |
|
|
|
| |
|
|
|
|
|
|
|
|
|
|
|
|
|
|
| |
|
PSEG |
|
|
Eliminations |
|
|
PSE&G |
|
|
CFIO(a) |
|
|
|
|
|
|
|
|
|
| OPERATING REVENUES |
|
$ |
9,800 |
|
|
$ |
(1,401 |
) |
|
$ |
7,935 |
|
|
$ |
3,266 |
|
|
|
|
|
|
|
|
|
| OPERATING EXPENSES |
|
|
|
|
|
|
|
|
|
|
|
|
|
|
|
|
|
|
| Energy Costs |
|
|
4,018 |
|
|
|
(1,401 |
) |
|
|
3,270 |
|
|
|
2,149 |
|
|
|
| Operation and Maintenance |
|
|
3,178 |
|
|
|
- |
|
|
|
1,838 |
|
|
|
1,340 |
|
|
|
| Depreciation and Amortization |
|
|
1,100 |
|
|
|
- |
|
|
|
935 |
|
|
|
165 |
|
|
|
| Losses on Asset Dispositions and Impairments |
|
|
123 |
|
|
|
- |
|
|
|
- |
|
|
|
123 |
|
|
|
|
|
|
|
|
|
|
|
|
|
|
|
|
|
|
|
|
|
|
|
|
|
|
|
|
|
|
|
|
|
|
|
|
|
|
|
|
|
| Total Operating Expenses |
|
|
8,419 |
|
|
|
(1,401 |
) |
|
|
6,043 |
|
|
|
3,777 |
|
|
|
|
|
|
|
|
|
| OPERATING INCOME |
|
|
1,381 |
|
|
|
- |
|
|
|
1,892 |
|
|
|
(511 |
) |
|
|
|
|
|
|
|
|
| Income from Equity Method Investments |
|
|
14 |
|
|
|
- |
|
|
|
- |
|
|
|
14 |
|
|
|
| Net Gains (Losses) on Trust Investments |
|
|
(265 |
) |
|
|
- |
|
|
|
(2 |
) |
|
|
(263 |
) |
|
|
| Other Income (Deductions) |
|
|
124 |
|
|
|
(1 |
) |
|
|
88 |
|
|
|
37 |
|
|
|
| Net Non-Operating Pension and OPEB Credits (Costs) |
|
|
376 |
|
|
|
- |
|
|
|
281 |
|
|
|
95 |
|
|
|
| Interest Expense |
|
|
(628 |
) |
|
|
1 |
|
|
|
(427 |
) |
|
|
(202 |
) |
|
|
|
|
|
|
|
|
|
|
|
|
|
|
|
|
|
|
|
|
|
|
|
|
|
|
|
|
|
|
|
|
|
|
|
|
|
|
|
|
|
|
|
|
|
|
| INCOME (LOSS) BEFORE INCOME TAXES |
|
|
1,002 |
|
|
|
- |
|
|
|
1,832 |
|
|
|
(830 |
) |
|
|
|
|
|
|
|
|
| Income Tax Benefit (Expense) |
|
|
29 |
|
|
|
- |
|
|
|
(267 |
) |
|
|
296 |
|
|
|
|
|
|
|
|
|
|
|
|
|
|
|
|
|
|
|
|
|
|
|
|
|
|
|
|
|
|
|
|
|
|
|
|
|
|
|
|
|
|
|
|
|
|
|
| NET INCOME (LOSS) |
|
$ |
1,031 |
|
|
$ |
- |
|
|
$ |
1,565 |
|
|
$ |
(534 |
) |
|
|
|
|
|
|
|
|
|
|
|
|
|
|
|
|
|
|
|
|
|
| Reconciling Items Excluded from Net Income
(Loss)(b) |
|
|
708 |
|
|
|
- |
|
|
|
- |
|
|
|
708 |
|
|
|
|
|
|
|
|
|
|
|
|
|
|
|
|
|
|
|
|
|
|
|
|
|
|
|
|
|
|
|
|
|
|
|
|
|
|
|
|
|
| OPERATING EARNINGS (non-GAAP) |
|
$ |
1,739 |
|
|
$ |
- |
|
|
$ |
1,565 |
|
|
$ |
174 |
|
|
|
|
|
|
|
|
|
|
|
|
|
|
|
|
|
|
|
|
|
|
|
|
|
|
|
|
| Earnings Per Share |
|
|
|
|
|
|
|
|
|
|
|
|
|
|
|
|
|
|
| NET INCOME (LOSS) |
|
$ |
2.06 |
|
|
$ |
- |
|
|
$ |
3.12 |
|
|
$ |
(1.06 |
) |
|
|
| |
|
|
|
|
|
|
|
|
|
|
|
|
|
|
|
|
|
|
| Reconciling Items Excluded from Net Income (Loss)
(b) |
|
|
1.41 |
|
|
|
- |
|
|
|
- |
|
|
|
1.41 |
|
|
|
|
|
|
|
|
|
|
|
|
|
|
|
|
|
|
|
|
|
|
|
|
|
|
|
|
|
|
|
|
|
|
|
|
|
|
|
|
|
| OPERATING EARNINGS (non-GAAP) |
|
$ |
3.47 |
|
|
$ |
- |
|
|
$ |
3.12 |
|
|
$ |
0.35 |
|
|
|
|
|
|
|
|
|
|
|
|
|
|
|
|
|
|
|
|
|
|
|
|
|
|
|
|
|
|
|
|
|
|
|
|
|
|
|
|
|
|
|
|
|
|
|
|
|
|
|
|
|
|
|
|
|
Year Ended December 31,
2021 |
|
|
|
|
|
|
|
|
|
|
|
|
|
|
|
|
|
|
|
|
|
| |
|
PSEG |
|
|
Eliminations |
|
|
PSE&G |
|
|
CFIO (a) |
|
|
|
| OPERATING REVENUES |
|
$ |
9,722 |
|
|
$ |
(1,167 |
) |
|
$ |
7,122 |
|
|
$ |
3,767 |
|
|
|
| OPERATING EXPENSES |
|
|
|
|
|
|
|
|
|
|
|
|
|
|
|
|
|
|
| Energy Costs |
|
|
3,499 |
|
|
|
(1,167 |
) |
|
|
2,688 |
|
|
|
1,978 |
|
|
|
| Operation and Maintenance |
|
|
3,226 |
|
|
|
- |
|
|
|
1,692 |
|
|
|
1,534 |
|
|
|
| Depreciation and Amortization |
|
|
1,216 |
|
|
|
- |
|
|
|
928 |
|
|
|
288 |
|
|
|
| (Gains) Losses on Asset Dispositions and Impairments |
|
|
2,637 |
|
|
|
- |
|
|
|
(4 |
) |
|
|
2,641 |
|
|
|
|
|
|
|
|
|
|
|
|
|
|
|
|
|
|
|
|
|
|
|
|
|
|
|
|
|
|
|
|
|
|
|
|
|
|
|
|
|
| Total Operating Expenses |
|
|
10,578 |
|
|
|
(1,167 |
) |
|
|
5,304 |
|
|
|
6,441 |
|
|
|
|
|
|
|
|
|
| OPERATING INCOME |
|
|
(856 |
) |
|
|
- |
|
|
|
1,818 |
|
|
|
(2,674 |
) |
|
|
|
|
|
|
|
|
| Income from Equity Method Investments |
|
|
16 |
|
|
|
- |
|
|
|
- |
|
|
|
16 |
|
|
|
| Net Gains (Losses) on Trust Investments |
|
|
194 |
|
|
|
- |
|
|
|
2 |
|
|
|
192 |
|
|
|
| Other Income (Deductions) |
|
|
98 |
|
|
|
- |
|
|
|
88 |
|
|
|
10 |
|
|
|
| Net Non-Operating Pension and OPEB Credits (Costs) |
|
|
328 |
|
|
|
- |
|
|
|
264 |
|
|
|
64 |
|
|
|
| Loss on Extinguishment of Debt |
|
|
(298 |
) |
|
|
- |
|
|
|
- |
|
|
|
(298 |
) |
|
|
| Interest Expense |
|
|
(571 |
) |
|
|
- |
|
|
|
(402 |
) |
|
|
(169 |
) |
|
|
|
|
|
|
|
|
|
|
|
|
|
|
|
|
|
|
|
|
|
|
|
|
|
|
|
|
|
|
|
|
|
|
|
|
|
|
|
|
|
|
|
|
|
|
| INCOME (LOSS) BEFORE INCOME TAXES |
|
|
(1,089 |
) |
|
|
- |
|
|
|
1,770 |
|
|
|
(2,859 |
) |
|
|
| Income Tax Benefit (Expense) |
|
|
441 |
|
|
|
- |
|
|
|
(324 |
) |
|
|
765 |
|
|
|
|
|
|
|
|
|
|
|
|
|
|
|
|
|
|
|
|
|
|
|
|
|
|
|
|
|
|
|
|
|
|
|
|
|
|
|
|
|
|
|
|
|
|
|
| NET INCOME (LOSS) |
|
$ |
(648 |
) |
|
$ |
- |
|
|
$ |
1,446 |
|
|
$ |
(2,094 |
) |
|
|
|
|
|
|
|
|
|
|
|
|
|
|
|
|
|
|
|
|
|
| Reconciling Items Excluded from Net Income
(Loss)(b) |
|
|
2,501 |
|
|
|
- |
|
|
|
- |
|
|
|
2,501 |
|
|
|
|
|
|
|
|
|
|
|
|
|
|
|
|
|
|
|
|
|
|
|
|
|
|
|
|
|
|
|
|
|
|
|
|
|
|
|
|
|
| OPERATING EARNINGS (non-GAAP) |
|
$ |
1,853 |
|
|
$ |
- |
|
|
$ |
1,446 |
|
|
$ |
407 |
|
|
|
|
|
|
|
|
|
|
|
|
|
|
|
|
|
|
|
|
|
|
|
|
|
|
|
|
| Earnings Per Share |
|
|
|
|
|
|
|
|
|
|
|
|
|
|
|
|
|
|
|
|
|
|
|
|
| NET INCOME (LOSS) |
|
$ |
(1.29 |
) |
|
$ |
- |
|
|
$ |
2.87 |
|
|
$ |
(4.16 |
) |
|
|
|
|
|
|
|
|
|
|
|
|
|
|
|
|
|
|
|
|
|
| Reconciling Items Excluded from Net Income
(Loss)(b) |
|
|
4.96 |
|
|
|
- |
|
|
|
- |
|
|
|
4.96 |
|
|
|
| Share Differential(b) |
|
|
(0.02 |
) |
|
|
- |
|
|
|
(0.02 |
) |
|
|
- |
|
|
|
|
|
|
|
|
|
|
|
|
|
|
|
|
|
|
|
|
|
|
|
|
|
|
|
|
|
|
|
|
|
|
|
|
|
|
|
|
|
| OPERATING EARNINGS (non-GAAP) |
|
$ |
3.65 |
|
|
$ |
- |
|
|
$ |
2.85 |
|
|
$ |
0.80 |
|
|
|
|
|
|
|
|
|
|
|
|
|
|
|
|
|
|
|
|
|
|
|
|
|
|
|
|
|
|
|
|
|
|
|
|
|
|
|
|
|
| |
(a) |
Includes activities at PSEG Power, PSEG Long Island, Energy Holdings, PSEG Services Corporation and the Parent.
|
| |
(b) |
See Attachments 8 and 9 for details of items excluded from Net Income (Loss) to compute Operating Earnings (non-GAAP) and the impact of using different share amounts (Share Differential) for calculating earnings per share for PSEG’s consolidated GAAP Net Loss versus consolidated Operating Earnings (non-GAAP). |
Attachment 3
PUBLIC SERVICE ENTERPRISE GROUP INCORPORATED
Capitalization Schedule
(Unaudited, $
millions)
|
|
|
|
|
|
|
|
|
| |
|
December 31, |
|
|
December 31, |
|
| |
|
2022 |
|
|
2021 |
|
| DEBT |
|
|
|
|
|
|
|
|
| Commercial Paper and Loans |
|
$ |
2,200 |
|
|
$ |
3,519 |
|
| Long-Term Debt* |
|
|
18,070 |
|
|
|
15,919 |
|
|
|
|
|
|
|
|
|
|
| Total Debt |
|
|
20,270 |
|
|
|
19,438 |
|
|
|
|
| STOCKHOLDERS’ EQUITY |
|
|
|
|
|
|
|
|
| Common Stock |
|
|
5,065 |
|
|
|
5,045 |
|
| Treasury Stock |
|
|
(1,377 |
) |
|
|
(896 |
) |
| Retained Earnings |
|
|
10,591 |
|
|
|
10,639 |
|
| Accumulated Other Comprehensive Loss |
|
|
(550 |
) |
|
|
(350 |
) |
|
|
|
|
|
|
|
|
|
| Total Stockholders’ Equity |
|
|
13,729 |
|
|
|
14,438 |
|
|
|
|
|
|
|
|
|
|
| Total Capitalization |
|
$ |
33,999 |
|
|
$ |
33,876 |
|
|
|
|
|
|
|
|
|
|
*Includes current portion of Long-Term Debt
Attachment 4
PUBLIC SERVICE ENTERPRISE GROUP INCORPORATED
CONDENSED CONSOLIDATED STATEMENTS OF CASH FLOWS
(Unaudited, $ millions)
|
|
|
|
|
|
|
|
|
| |
|
Year Ended December 31, |
|
| |
|
2022 |
|
|
2021 |
|
| CASH FLOWS FROM OPERATING ACTIVITIES |
|
|
|
|
|
|
|
|
| Net Income (Loss) |
|
$ |
1,031 |
|
|
$ |
(648 |
) |
| Adjustments to Reconcile Net Income(Loss) to Net Cash Flows From Operating Activities |
|
|
472 |
|
|
|
2,384 |
|
|
|
|
|
|
|
|
|
|
| NET CASH PROVIDED BY (USED IN) OPERATING ACTIVITIES |
|
|
1,503 |
|
|
|
1,736 |
|
|
|
|
|
|
|
|
|
|
|
|
|
| NET CASH PROVIDED BY (USED IN) INVESTING ACTIVITIES |
|
|
(1,101 |
) |
|
|
(2,244 |
) |
|
|
|
|
|
|
|
|
|
|
|
|
| NET CASH PROVIDED BY (USED IN) FINANCING ACTIVITIES |
|
|
(754 |
) |
|
|
799 |
|
|
|
|
|
|
|
|
|
|
| Net Change in Cash, Cash Equivalents and Restricted Cash |
|
|
(352 |
) |
|
|
291 |
|
| Cash, Cash Equivalents and Restricted Cash at Beginning of Period |
|
|
863 |
|
|
|
572 |
|
|
|
|
|
|
|
|
|
|
| Cash, Cash Equivalents and Restricted Cash at End of Period |
|
$ |
511 |
|
|
$ |
863 |
|
|
|
|
|
|
|
|
|
|
Attachment 5
PUBLIC SERVICE ELECTRIC & GAS COMPANY
Retail Sales
(Unaudited)
December 31, 2022
|
|
|
|
|
|
|
|
|
|
|
|
|
|
|
|
|
| Electric Sales
|
|
| |
|
|
|
|
|
|
|
|
|
|
|
|
|
|
|
|
| Sales (millions
kWh) |
|
Three Months
Ended |
|
|
Change vs.
2021 |
|
|
Year
Ended |
|
|
Change vs.
2021 |
|
| Residential |
|
|
2,659 |
|
|
|
(5%) |
|
|
|
13,975 |
|
|
|
0% |
|
| Commercial & Industrial |
|
|
6,498 |
|
|
|
4% |
|
|
|
26,508 |
|
|
|
2% |
|
| Other |
|
|
97 |
|
|
|
(2%) |
|
|
|
341 |
|
|
|
(1%) |
|
| |
|
|
|
|
|
|
|
|
|
|
|
|
|
|
|
|
| Total |
|
|
9,254 |
|
|
|
1% |
|
|
|
40,824 |
|
|
|
2% |
|
| |
|
|
|
|
|
|
|
|
|
|
|
|
|
|
|
|
| |
|
|
| Gas Sold and Transported
|
|
| |
|
|
|
|
|
|
|
|
|
|
|
|
|
|
|
|
| Sales (millions
therms) |
|
Three Months
Ended |
|
|
Change vs.
2021 |
|
|
Year
Ended |
|
|
Change vs.
2021 |
|
| Firm Sales |
|
|
|
|
|
|
|
|
|
|
|
|
|
|
|
|
| Residential Sales |
|
|
467 |
|
|
|
17% |
|
|
|
1,497 |
|
|
|
5% |
|
| Commercial & Industrial |
|
|
314 |
|
|
|
19% |
|
|
|
1,070 |
|
|
|
8% |
|
| |
|
|
|
|
|
|
|
|
|
|
|
|
|
|
|
|
| Total Firm Sales |
|
|
781 |
|
|
|
18% |
|
|
|
2,567 |
|
|
|
6% |
|
| |
|
|
|
|
|
|
|
|
|
|
|
|
|
|
|
|
| |
|
|
|
|
|
Non-Firm Sales* |
|
|
|
|
|
|
|
|
|
|
|
|
|
|
|
|
| Commercial & Industrial |
|
|
207 |
|
|
|
(9%) |
|
|
|
973 |
|
|
|
7% |
|
| |
|
|
|
|
|
|
|
|
|
|
|
|
|
|
|
|
| Total
Non-Firm Sales |
|
|
207 |
|
|
|
|
|
|
|
973 |
|
|
|
|
|
| |
|
|
|
|
|
|
|
|
|
|
|
|
|
|
|
|
| |
|
|
|
|
|
|
|
|
|
|
|
|
|
|
|
|
| |
|
|
|
|
|
|
|
|
|
|
|
|
|
|
|
|
| Total Sales |
|
|
988 |
|
|
|
11% |
|
|
|
3,540 |
|
|
|
6% |
|
| |
|
|
|
|
|
|
|
|
|
|
|
|
|
|
|
|
| |
|
|
|
|
|
|
|
|
|
|
|
|
|
|
|
|
| *Contract Service Gas rate included in non-firm
sales |
|
|
|
|
|
|
|
|
|
|
|
|
|
|
| Weather Data* |
|
| |
|
|
|
|
| |
|
|
|
|
|
|
|
|
|
|
|
|
| |
|
Three Months
Ended |
|
|
Change vs.
2021 |
|
|
Year
Ended |
|
|
Change vs.
2021 |
|
| THI Hours - Actual |
|
|
340 |
|
|
|
(58%) |
|
|
|
19,842 |
|
|
|
(7%) |
|
| THI Hours - Normal |
|
|
423 |
|
|
|
|
|
|
|
17,077 |
|
|
|
|
|
| Degree Days - Actual |
|
|
1,520 |
|
|
|
24% |
|
|
|
4,527 |
|
|
|
10% |
|
| Degree Days - Normal |
|
|
1,570 |
|
|
|
|
|
|
|
4,607 |
|
|
|
|
|
| |
|
|
|
|
|
|
|
|
|
|
|
|
|
|
|
|
*Winter weather as defined by heating degree days (HDD) to serve as a measure for the need for heating. For each day, HDD is calculated
as HDD = 65°F – the average hourly daily temperature. Summer weather is measured by the temperature-humidity index (THI), which takes into account both the temperature and the humidity to measure the need for air conditioning. Both measures
use data provided by the National Oceanic and Atmospheric Administration based on readings from Newark Liberty International Airport. Comparisons to normal are based on twenty years of historic data.
Attachment 6
Nuclear Generation Measures
(Unaudited)
|
|
|
|
|
|
|
|
|
|
|
|
|
|
|
|
|
|
|
|
|
|
|
|
|
|
|
|
|
|
|
|
|
|
|
|
|
|
| |
|
GWh Breakdown |
|
|
|
|
|
|
|
|
GWh Breakdown |
|
|
|
|
|
|
| |
|
Three Months Ended
December 31, |
|
|
|
|
|
|
|
|
Year Ended
December 31, |
|
| |
|
|
2022 |
|
|
|
|
|
|
|
2021 |
|
|
|
|
|
|
|
|
|
|
|
2022 |
|
|
|
|
|
|
|
2021 |
|
| Nuclear—NJ |
|
|
4,681 |
|
|
|
|
|
|
|
4,945 |
|
|
|
|
|
|
|
|
|
|
|
20,172 |
|
|
|
|
|
|
|
20,024 |
|
|
Nuclear—PA |
|
|
2,657 |
|
|
|
|
|
|
|
2,617 |
|
|
|
|
|
|
|
|
|
|
|
11,093 |
|
|
|
|
|
|
|
11,134 |
|
| |
|
7,338 |
|
|
|
|
|
7,562 |
|
|
|
|
|
|
|
|
31,265 |
|
|
|
|
|
31,158 |
|
|
|
|
|
|
|
|
|
|
|
|
|
|
|
|
|
|
|
|
|
|
|
|
|
|
|
|
|
|
|
|
|
|
|
|
|
|
|
| |
|
% Generation |
|
|
|
|
|
|
|
|
% Generation |
|
|
|
|
|
|
| |
|
Three Months Ended
December 31, |
|
|
|
|
|
|
|
|
Year Ended
December 31, |
|
| |
|
|
2022 |
|
|
|
|
|
|
|
2021 |
|
|
|
|
|
|
|
|
|
|
|
2022 |
|
|
|
|
|
|
|
2021 |
|
| Nuclear—NJ |
|
|
64 |
% |
|
|
|
|
|
|
65 |
% |
|
|
|
|
|
|
|
|
|
|
65 |
% |
|
|
|
|
|
|
64 |
% |
|
Nuclear—PA |
|
|
36 |
% |
|
|
|
|
|
|
35 |
% |
|
|
|
|
|
|
|
|
|
|
35 |
% |
|
|
|
|
|
|
36 |
% |
|
|
|
100 |
% |
|
|
|
|
|
|
100 |
% |
|
|
|
|
|
|
|
|
|
|
100 |
% |
|
|
|
|
|
|
100 |
% |
Attachment 7
PUBLIC SERVICE ENTERPRISE GROUP INCORPORATED
Statistical Measures
(Unaudited)
|
|
|
|
|
|
|
|
|
|
|
|
|
|
|
|
|
| |
|
Three Months Ended December 31, |
|
|
Year Ended December 31, |
|
| |
|
2022 |
|
|
2021 |
|
|
2022 |
|
|
2021 |
|
| Weighted Average Common Shares Outstanding (millions)* |
|
|
|
|
|
|
|
|
|
|
|
|
|
|
|
|
| Basic |
|
|
497 |
|
|
|
504 |
|
|
|
498 |
|
|
|
504 |
|
| Diluted |
|
|
500 |
|
|
|
508 |
|
|
|
501 |
|
|
|
504 |
|
|
|
|
|
|
| Stock Price at End of Period |
|
|
|
|
|
|
|
|
|
|
$61.27 |
|
|
|
$66.73 |
|
|
|
|
|
|
| Dividends Paid per Share of Common Stock |
|
|
$0.54 |
|
|
|
$0.51 |
|
|
|
$2.16 |
|
|
|
$2.04 |
|
|
|
|
|
|
| Dividend Yield |
|
|
|
|
|
|
|
|
|
|
3.5% |
|
|
|
3.1% |
|
|
|
|
|
|
| Book Value per Common Share |
|
|
|
|
|
|
|
|
|
|
$27.63 |
|
|
|
$28.67 |
|
|
|
|
|
|
| Market Price as a Percent of Book Value |
|
|
|
|
|
|
|
|
|
|
222% |
|
|
|
233% |
|
*Approximately three million potentially dilutive shares were excluded from fully diluted average shares outstanding used to calculate
the diluted GAAP loss per share for the year ended December 31, 2021 as their impact was antidilutive to GAAP results.
Attachment 8
PUBLIC SERVICE ENTERPRISE GROUP INCORPORATED
Consolidated Operating Earnings (non-GAAP) Reconciliation
|
|
|
|
|
|
|
|
|
|
|
|
|
|
|
|
|
| Reconciling Items |
|
Three Months Ended
December 31, |
|
|
Year Ended
December 31, |
|
| |
2022 |
|
|
2021 |
|
|
2022 |
|
|
2021 |
|
| |
|
($ millions, Unaudited) |
|
| |
|
|
|
|
| Net Income
(Loss) |
|
$ |
788 |
|
|
$ |
445 |
|
|
$ |
1,031 |
|
|
$ |
(648 |
) |
| (Gain) Loss on
Nuclear Decommissioning Trust (NDT) Fund Related Activity, pre-tax |
|
|
(85 |
) |
|
|
(62 |
) |
|
|
270 |
|
|
|
(178 |
) |
| (Gain) Loss on Mark-to-Market (MTM), pre-tax(a) |
|
|
(611 |
) |
|
|
(378 |
) |
|
|
635 |
|
|
|
620 |
|
| Plant Retirements,
Dispositions and Impairments, pre-tax(b) |
|
|
14 |
|
|
|
308 |
|
|
|
31 |
|
|
|
2,940 |
|
| Lease Related
Activity, pre-tax |
|
|
25 |
|
|
|
— |
|
|
|
78 |
|
|
|
10 |
|
| Income Taxes related
to Operating Earnings (non-GAAP) reconciling items(c) |
|
|
187 |
|
|
|
39 |
|
|
|
(306 |
) |
|
|
(891 |
) |
| |
|
|
|
|
|
|
|
|
|
|
|
|
|
|
|
|
| Operating
Earnings (non-GAAP) |
|
$ |
318 |
|
|
$ |
352 |
|
|
$ |
1,739 |
|
|
$ |
1,853 |
|
| |
|
|
|
|
|
|
|
|
|
|
|
|
|
|
|
|
| |
|
|
|
|
|
|
|
|
|
|
|
|
|
|
|
|
| PSEG Fully Diluted Average Shares
Outstanding (in millions)(d) |
|
|
500 |
|
|
|
508 |
|
|
|
501 |
|
|
|
504 |
|
| |
|
($ Per Share Impact - Diluted, Unaudited)
|
|
| |
|
|
|
|
| Net Income
(Loss) |
|
$ |
1.58 |
|
|
$ |
0.88 |
|
|
$ |
2.06 |
|
|
$ |
(1.29 |
) |
| (Gain) Loss on NDT
Fund Related Activity, pre-tax |
|
|
(0.17 |
) |
|
|
(0.12 |
) |
|
|
0.54 |
|
|
|
(0.35 |
) |
| (Gain) Loss on MTM, pre-tax(a) |
|
|
(1.22 |
) |
|
|
(0.75 |
) |
|
|
1.27 |
|
|
|
1.23 |
|
| Plant Retirements,
Dispositions and Impairments, pre-tax(b) |
|
|
0.03 |
|
|
|
0.61 |
|
|
|
0.06 |
|
|
|
5.83 |
|
| Lease Related
Activity, pre-tax |
|
|
0.05 |
|
|
|
— |
|
|
|
0.15 |
|
|
|
0.02 |
|
| Income Taxes related
to Operating Earnings (non-GAAP) reconciling items(c) |
|
|
0.37 |
|
|
|
0.07 |
|
|
|
(0.61 |
) |
|
|
(1.77 |
) |
| Share Differential(d) |
|
|
— |
|
|
|
— |
|
|
|
— |
|
|
|
(0.02 |
) |
| |
|
|
|
|
|
|
|
|
|
|
|
|
|
|
|
|
| Operating
Earnings (non-GAAP) |
|
$ |
0.64 |
|
|
$ |
0.69 |
|
|
$ |
3.47 |
|
|
$ |
3.65 |
|
| |
|
|
|
|
|
|
|
|
|
|
|
|
|
|
|
|
| |
|
|
|
|
|
|
|
|
|
|
|
|
|
|
|
|
(a) Includes the financial impact from positions with forward delivery months.
(b) Full year 2022 includes the results for fossil generation sold in February 2022. Fourth quarter and full year 2021 amounts include a pre-tax loss of $298 million for the make-whole premium paid upon the early redemption of PSEG Power’s debt and other non-cash debt extinguishment costs.
(c) Income tax effect calculated at the statutory rate except for qualified NDT related activity, which records an additional 20% trust tax on income
(loss) from qualified NDT Funds, the additional investment tax credit (ITC) recapture related to the sale of PSEG Solar Source in 2021, and leveraged lease related activity, which is calculated at a combined leveraged lease effective tax rate.
(d) Approximately three million potentially dilutive shares were excluded from fully diluted average shares outstanding used to calculate the diluted
GAAP loss per share for the year ended December 31, 2021 as their impact was antidilutive to GAAP results. For non-GAAP per share calculations, we used fully diluted average shares outstanding of
507 million, including the three million potentially dilutive shares as they were dilutive to non-GAAP results. As a result of the use of different denominators for
non-GAAP Operating Earnings and GAAP Net Loss, a reconciling line item “Share Differential,” has been added to the year to date results to reconcile the two EPS calculations.
Attachment 9
CFIO Operating Earnings (non-GAAP) Reconciliation
|
|
|
|
|
|
|
|
|
|
|
|
|
|
|
|
|
| Reconciling Items |
|
Three Months Ended |
|
|
Year Ended |
|
| |
December 31, |
|
|
December 31, |
|
| |
2022 |
|
|
2021 |
|
|
2022 |
|
|
2021 |
|
| |
|
($ millions, Unaudited) |
|
| |
|
|
|
|
| Net Income (Loss) |
|
|
$ 436 |
|
|
|
$ 174 |
|
|
$ |
(534) |
|
|
$ |
(2,094) |
|
| (Gain) Loss on NDT Fund Related Activity, pre-tax |
|
|
(85) |
|
|
|
(62) |
|
|
|
270 |
|
|
|
(178) |
|
| (Gain) Loss on MTM,
pre-tax(a) |
|
|
(611) |
|
|
|
(378) |
|
|
|
635 |
|
|
|
620 |
|
| Plant Retirements, Dispositions and Impairments, pre-tax(b) |
|
|
14 |
|
|
|
308 |
|
|
|
31 |
|
|
|
2,940 |
|
| Lease Related Activity, pre-tax |
|
|
25 |
|
|
|
- |
|
|
|
78 |
|
|
|
10 |
|
| Income Taxes related to Operating Earnings (non-GAAP) reconciling items(c) |
|
|
187 |
|
|
|
39 |
|
|
|
(306) |
|
|
|
(891) |
|
| |
|
|
|
|
|
|
|
|
|
|
|
|
|
|
|
|
| Operating Earnings (non-GAAP) |
|
|
$ (34) |
|
|
|
$ 81 |
|
|
|
$ 174 |
|
|
|
$ 407 |
|
| |
|
|
|
|
|
|
|
|
|
|
|
|
|
|
|
|
| |
|
|
|
|
|
|
|
|
|
|
|
|
|
|
|
|
|
PSEG Fully Diluted Average Shares Outstanding (in millions)(d) |
|
|
500 |
|
|
|
508 |
|
|
|
501 |
|
|
|
504 |
|
(a) Includes the financial impact from positions with forward delivery months.
(b) Full year 2022 includes the results for fossil generation sold in February 2022. Fourth quarter and full year 2021 amounts include a pre-tax loss of $298 million for the make-whole premium paid upon the early redemption of PSEG Power’s debt and other non-cash debt extinguishment costs.
(c) Income tax effect calculated at the statutory rate except for qualified NDT related activity, which records an additional 20% trust tax on income
(loss) from qualified NDT Funds, the additional ITC recapture related to the sale of PSEG Solar Source in 2021, and leveraged lease related activity, which is calculated at a combined leveraged lease effective tax rate.
(d) Approximately three million potentially dilutive shares were excluded from fully diluted average shares outstanding used to calculate the diluted
GAAP loss per share for year ended December 31, 2021 as their impact was antidilutive to GAAP results. For non-GAAP per share calculations, we used fully diluted average shares outstanding of
507 million, including the three million potentially dilutive shares as they were dilutive to non-GAAP results.
Public Service Enterprise Group
Financial Results Presentation February 21, 2023 1st QUARTER 2022 NYSE: PEG 4th QUARTER & FY 2022 NYSE: PEG EXHIBIT 99.1
Certain of the matters discussed in
this presentation about our and our subsidiaries’ future performance, including, without limitation, future revenues, earnings, strategies, prospects, consequences and all other statements that are not purely historical constitute
“forward-looking statements” within the meaning of the Private Securities Litigation Reform Act of 1995. Such forward-looking statements are subject to risks and uncertainties, which could cause actual results to differ materially from
those anticipated. Such statements are based on management’s beliefs as well as assumptions made by and information currently available to management. When used herein, the words “anticipate,” “intend,”
“estimate,” “believe,” “expect,” “plan,” “should,” “hypothetical,” “potential,” “forecast,” “project,” variations of such words and similar
expressions are intended to identify forward-looking statements. Factors that may cause actual results to differ are often presented with the forward-looking statements themselves. Other factors that could cause actual results to differ materially
from those contemplated in any forward-looking statements made by us herein are discussed in filings we make with the United States Securities and Exchange Commission (SEC), including our Annual Report on Form 10-K and subsequent reports on Form
10-Q and Form 8-K. These factors include, but are not limited to: any inability to successfully develop, obtain regulatory approval for, or construct transmission and distribution, and other generation projects; the physical, financial and
transition risks related to climate change, including risks relating to potentially increased legislative and regulatory burdens, changing customer preferences and lawsuits; any equipment failures, accidents, critical operating technology or
business system failures, severe weather events, acts of war, terrorism or other acts of violence, sabotage, physical attacks or security breaches, cyberattacks or other incidents that may impact our ability to provide safe and reliable service to
our customers; any inability to recover the carrying amount of our long-lived assets; disruptions or cost increases in our supply chain, including labor shortages; any inability to maintain sufficient liquidity or access sufficient capital on
commercially reasonable terms; the impact of cybersecurity attacks or intrusions or other disruptions to our information technology, operational or other systems; a material shift away from natural gas toward increased electrification and a
reduction in the use of natural gas; the impact of the coronavirus pandemic; failure to attract and retain a qualified workforce; inflation, including increases in the costs of equipment, materials, fuel and labor; the impact of our covenants in our
debt instruments and credit agreements on our business; adverse performance of our defined benefit plan trust funds and Nuclear Decommissioning Trust Fund and increases in funding requirements and pension costs; fluctuations in wholesale power and
natural gas markets, including the potential impacts on the economic viability of our generation units; our ability to obtain adequate nuclear fuel supply; changes in technology related to energy generation, distribution and consumption and changes
in customer usage patterns; third-party credit risk relating to and purchase of nuclear fuel; any inability to meet our commitments under forward sale obligations and Regional Transmission Organization rules; reliance on transmission facilities to
maintain adequate transmission capacity for our nuclear generation fleet; the impact of changes in state and federal legislation and regulations on our business, including PSE&G’s ability to recover costs and earn returns on authorized
investments; PSE&G’s proposed investment programs may not be fully approved by regulators and its capital investment may be lower than planned; our ability to advocate for and our receipt of appropriate regulatory guidance to ensure
long-term support for our nuclear fleet; adverse changes in and non-compliance with energy industry laws, policies, regulations and standards, including market structures and transmission planning and transmission returns; risks associated with our
ownership and operation of nuclear facilities, including increased nuclear fuel storage costs, regulatory risks, such as compliance with the Atomic Energy Act and trade control, environmental and other regulations, as well as financial,
environmental and health and safety risks; changes in federal and state environmental laws and regulations and enforcement; delays in receipt of, or an inability to receive, necessary licenses and permits and siting approvals; and changes in tax
laws and regulations. All of the forward-looking statements made in this presentation are qualified by these cautionary statements and we cannot assure you that the results or developments anticipated by management will be realized or even if
realized, will have the expected consequences to, or effects on, us or our business, prospects, financial condition, results of operations or cash flows. Readers are cautioned not to place undue reliance on these forward-looking statements in making
any investment decision. Forward-looking statements made in this presentation apply only as of the date of this presentation. While we may elect to update forward-looking statements from time to time, we specifically disclaim any obligation to do
so, even in light of new information or future events, unless otherwise required by applicable securities laws. The forward-looking statements contained in this presentation are intended to qualify for the safe harbor provisions of Section 27A of
the Securities Act of 1933, as amended, and Section 21E of the Securities Exchange Act of 1934, as amended. Forward-Looking Statements
PSEG presents Operating Earnings in
addition to its Net Income/(Loss) reported in accordance with accounting principles generally accepted in the United States (GAAP). Operating Earnings is a non-GAAP financial measure that differs from Net Income/(Loss). Non-GAAP Operating Earnings
exclude the impact of returns (losses) associated with the Nuclear Decommissioning Trust (NDT), Mark-to-Market (MTM) accounting and material one-time items. The last two slides in this presentation (Slides A and B) include a list of items excluded
from Net Income/(Loss) to reconcile to non-GAAP Operating Earnings with a reference to those slides included on each of the slides where the non-GAAP information appears. Management uses non-GAAP Operating Earnings in its internal analysis, and in
communications with investors and analysts, as a consistent measure for comparing PSEG’s financial performance to previous financial results. The presentation of non-GAAP Operating Earnings is intended to complement, and should not be
considered an alternative to, the presentation of Net Income/(Loss), which is an indicator of financial performance determined in accordance with GAAP. In addition, non-GAAP Operating Earnings as presented in this release may not be comparable to
similarly titled measures used by other companies. Due to the forward-looking nature of non-GAAP Operating Earnings, PSEG is unable to reconcile this non-GAAP financial measure to the most directly comparable GAAP financial measure because
comparable GAAP measures are not reasonably accessible or reliable due to the inherent difficulty in forecasting and quantifying measures that would be required for such reconciliation. Namely, we are not able to reliably project without
unreasonable effort MTM and NDT gains (losses), for future periods due to market volatility. These items are uncertain, depend on various factors, and may have a material impact on our future GAAP results. GAAP Disclaimer From time to time, PSEG and
PSE&G release important information via postings on their corporate Investor Relations website at https://investor.pseg.com. Investors and other interested parties are encouraged to visit the Investor Relations website to review new postings.
You can sign up for automatic email alerts regarding new postings at the bottom of the webpage at https://investor.pseg.com or by navigating to the Email Alerts webpage here.
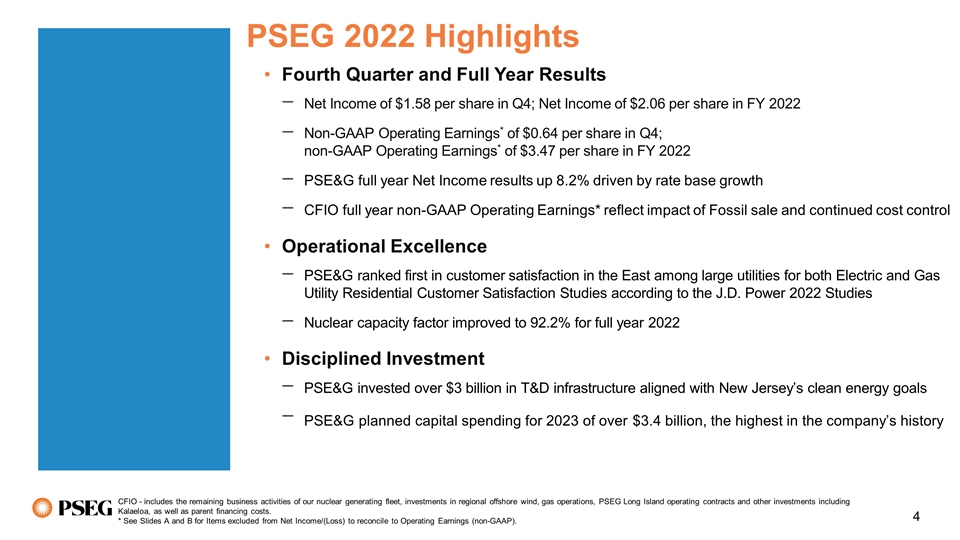
PSEG 2022 Highlights Fourth Quarter and
Full Year Results Net Income of $1.58 per share in Q4; Net Income of $2.06 per share in FY 2022 Non-GAAP Operating Earnings* of $0.64 per share in Q4; non-GAAP Operating Earnings* of $3.47 per share in FY 2022 PSE&G full year Net Income results
up 8.2% driven by rate base growth CFIO full year non-GAAP Operating Earnings* reflect impact of Fossil sale and continued cost control Operational Excellence PSE&G ranked first in customer satisfaction in the East among large utilities for both
Electric and Gas Utility Residential Customer Satisfaction Studies according to the J.D. Power 2022 Studies Nuclear capacity factor improved to 92.2% for full year 2022 Disciplined Investment PSE&G invested over $3 billion in T&D
infrastructure aligned with New Jersey’s clean energy goals PSE&G planned capital spending for 2023 of over $3.4 billion, the highest in the company’s history CFIO - includes the remaining business activities of our nuclear
generating fleet, investments in regional offshore wind, gas operations, PSEG Long Island operating contracts and other investments including Kalaeloa, as well as parent financing costs. * See Slides A and B for Items excluded from Net Income/(Loss)
to reconcile to Operating Earnings (non-GAAP).
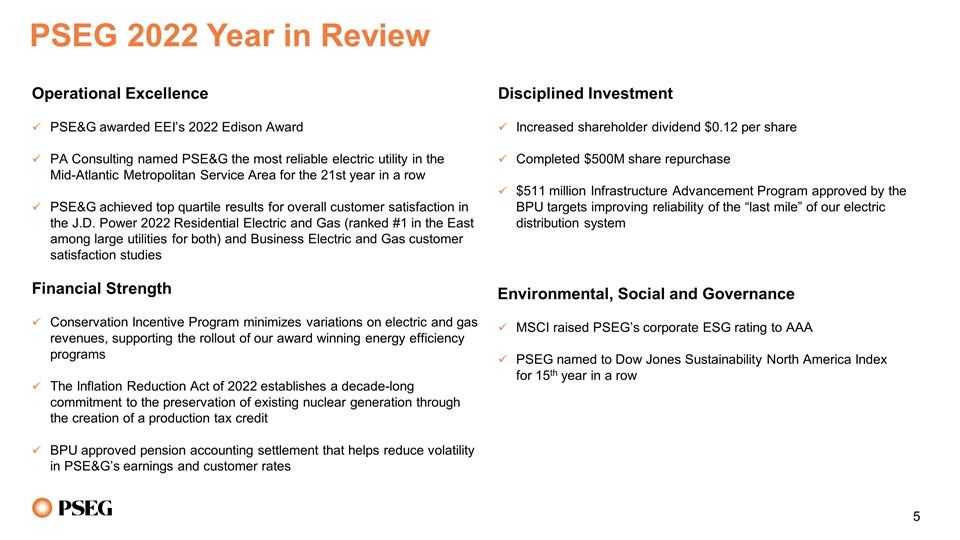
PSEG 2022 Year in Review Operational
Excellence PSE&G awarded EEI’s 2022 Edison Award PA Consulting named PSE&G the most reliable electric utility in the Mid-Atlantic Metropolitan Service Area for the 21st year in a row PSE&G achieved top quartile results for overall
customer satisfaction in the J.D. Power 2022 Residential Electric and Gas (ranked #1 in the East among large utilities for both) and Business Electric and Gas customer satisfaction studies Financial Strength Conservation Incentive Program minimizes
variations on electric and gas revenues, supporting the rollout of our award winning energy efficiency programs The Inflation Reduction Act of 2022 establishes a decade-long commitment to the preservation of existing nuclear generation through the
creation of a production tax credit BPU approved pension accounting settlement that helps reduce volatility in PSE&G’s earnings and customer rates Disciplined Investment Increased shareholder dividend $0.12 per share Completed $500M share
repurchase $511 million Infrastructure Advancement Program approved by the BPU targets improving reliability of the “last mile” of our electric distribution system Environmental, Social and Governance MSCI raised PSEG’s corporate
ESG rating to AAA PSEG named to Dow Jones Sustainability North America Index for 15th year in a row
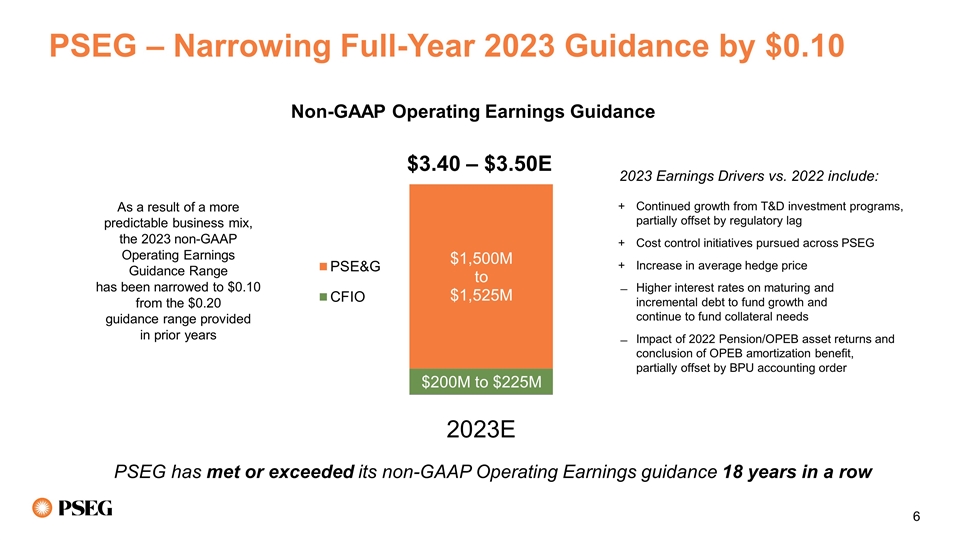
Non-GAAP Operating Earnings Guidance
PSEG – Narrowing Full-Year 2023 Guidance by $0.10 2023 Earnings Drivers vs. 2022 include: Continued growth from T&D investment programs, partially offset by regulatory lag Cost control initiatives pursued across PSEG Increase in average
hedge price Higher interest rates on maturing and incremental debt to fund growth and continue to fund collateral needs Impact of 2022 Pension/OPEB asset returns and conclusion of OPEB amortization benefit, partially offset by BPU accounting order
As a result of a more predictable business mix, the 2023 non-GAAP Operating Earnings Guidance Range has been narrowed to $0.10 from the $0.20 guidance range provided in prior years PSEG has met or exceeded its non-GAAP Operating Earnings guidance 18
years in a row
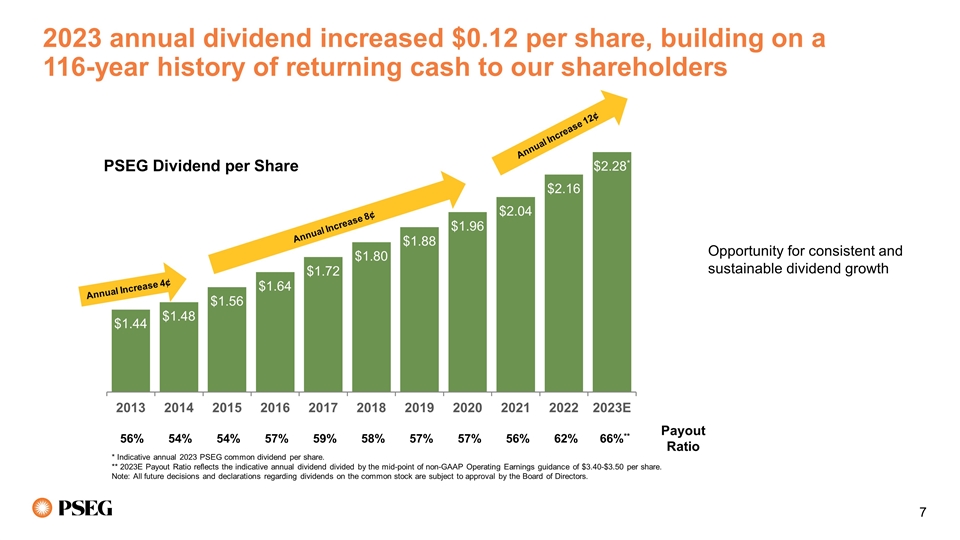
56% 54% 54% 57% 59% 58% 57% 57% 56% 62%
66%** Payout Ratio Annual Increase 12¢ Annual Increase 8¢ Annual Increase 4¢ 2023 annual dividend increased $0.12 per share, building on a 116-year history of returning cash to our shareholders PSEG Dividend per Share Opportunity for
consistent and sustainable dividend growth * Indicative annual 2023 PSEG common dividend per share. ** 2023E Payout Ratio reflects the indicative annual dividend divided by the mid-point of non-GAAP Operating Earnings guidance of $3.40-$3.50 per
share. Note: All future decisions and declarations regarding dividends on the common stock are subject to approval by the Board of Directors.

PSEG Q4 & Full Year 2022
Review
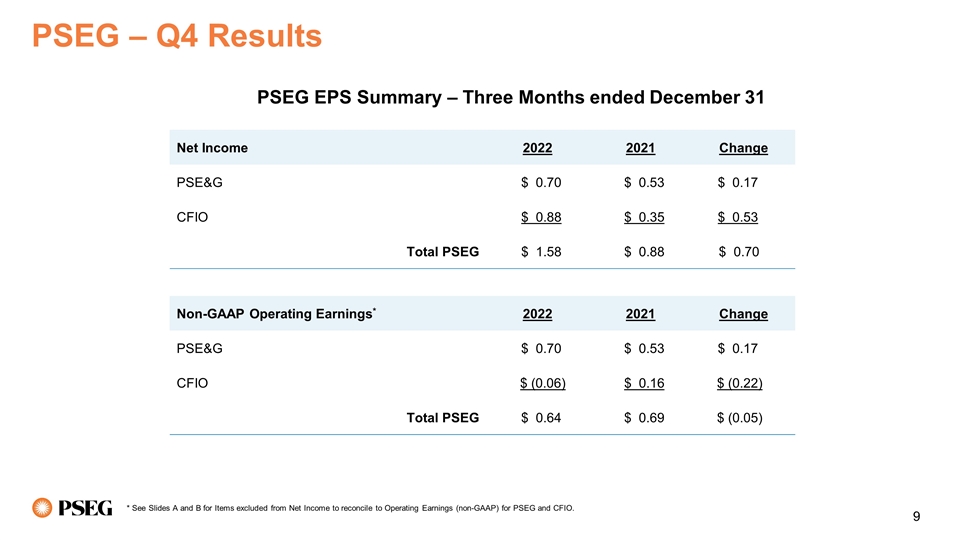
PSEG – Q4 Results Net Income 2022
2021 Change PSE&G $ 0.70 $ 0.53 $ 0.17 CFIO $ 0.88 $ 0.35 $ 0.53 Total PSEG $ 1.58 $ 0.88 $ 0.70 Non-GAAP Operating Earnings* 2022 2021 Change PSE&G $ 0.70 $ 0.53 $ 0.17 CFIO $ (0.06) $ 0.16 $ (0.22) Total PSEG $ 0.64 $ 0.69 $ (0.05) * See
Slides A and B for Items excluded from Net Income to reconcile to Operating Earnings (non-GAAP) for PSEG and CFIO. PSEG EPS Summary – Three Months ended December 31
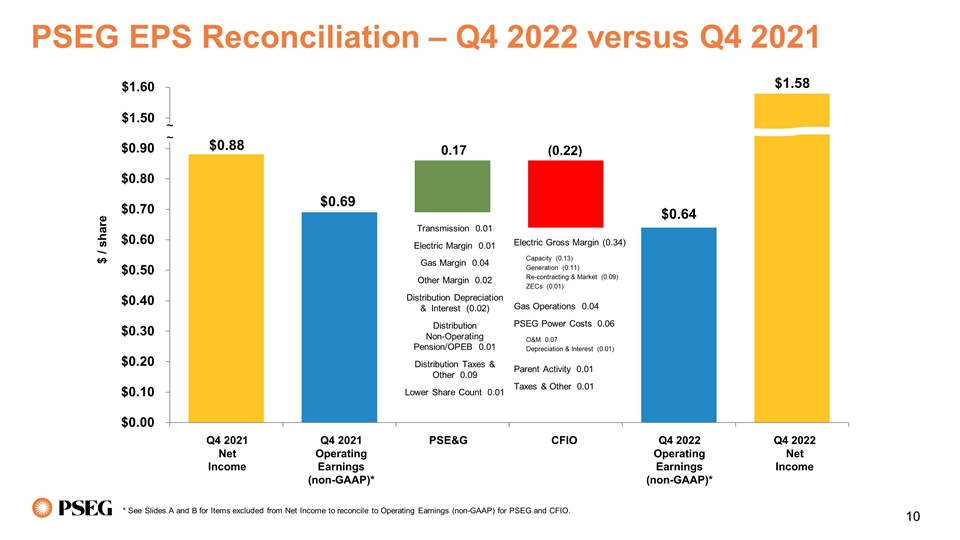
$ / share PSEG EPS Reconciliation
– Q4 2022 versus Q4 2021 Electric Gross Margin (0.34) Capacity (0.13) Generation (0.11) Re-contracting & Market (0.09) ZECs (0.01) Gas Operations 0.04 PSEG Power Costs 0.06 O&M 0.07 Depreciation & Interest (0.01) Parent Activity
0.01 Taxes & Other 0.01 Transmission 0.01 Electric Margin 0.01 Gas Margin 0.04 Other Margin 0.02 Distribution Depreciation & Interest (0.02) Distribution Non-Operating Pension/OPEB 0.01 Distribution Taxes & Other 0.09 Lower Share Count
0.01 Q4 2021 Net Income Q4 2021 Operating Earnings (non-GAAP)* Q4 2022 Net Income Q4 2022 Operating Earnings (non-GAAP)* PSE&G CFIO * See Slides A and B for Items excluded from Net Income to reconcile to Operating Earnings (non-GAAP) for PSEG
and CFIO. $1.50 $1.60 ~ ~
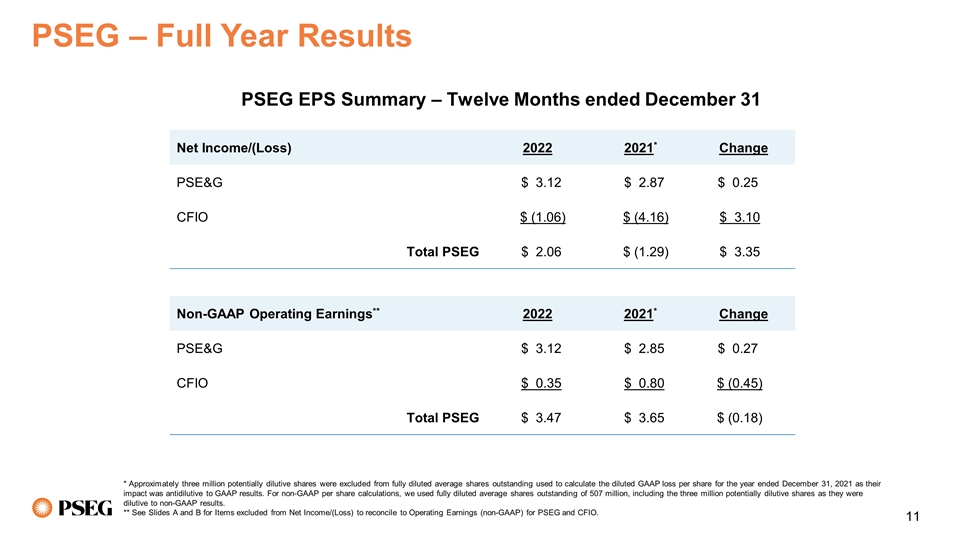
PSEG – Full Year Results Net
Income/(Loss) 2022 2021* Change PSE&G $ 3.12 $ 2.87 $ 0.25 CFIO $ (1.06) $ (4.16) $ 3.10 Total PSEG $ 2.06 $ (1.29) $ 3.35 Non-GAAP Operating Earnings** 2022 2021* Change PSE&G $ 3.12 $ 2.85 $ 0.27 CFIO $ 0.35 $ 0.80 $ (0.45) Total PSEG $
3.47 $ 3.65 $ (0.18) * Approximately three million potentially dilutive shares were excluded from fully diluted average shares outstanding used to calculate the diluted GAAP loss per share for the year ended December 31, 2021 as their impact was
antidilutive to GAAP results. For non-GAAP per share calculations, we used fully diluted average shares outstanding of 507 million, including the three million potentially dilutive shares as they were dilutive to non-GAAP results. ** See Slides A
and B for Items excluded from Net Income/(Loss) to reconcile to Operating Earnings (non-GAAP) for PSEG and CFIO. PSEG EPS Summary – Twelve Months ended December 31
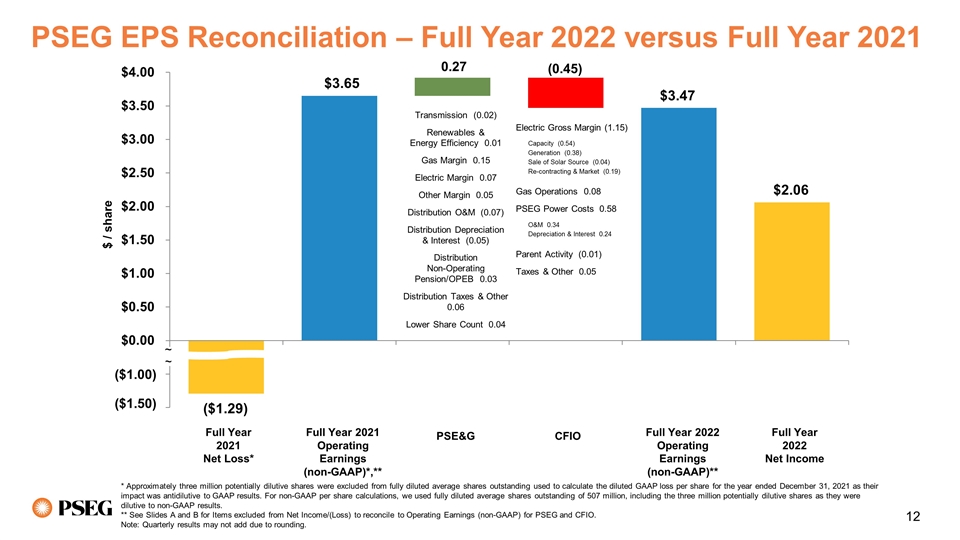
$ / share PSEG EPS Reconciliation
– Full Year 2022 versus Full Year 2021 Transmission (0.02) Renewables & Energy Efficiency 0.01 Gas Margin 0.15 Electric Margin 0.07 Other Margin 0.05 Distribution O&M (0.07) Distribution Depreciation & Interest (0.05) Distribution
Non-Operating Pension/OPEB 0.03 Distribution Taxes & Other 0.06 Lower Share Count 0.04 Full Year 2021 Net Loss* Full Year 2021 Operating Earnings (non-GAAP)*,** Full Year 2022 Net Income Full Year 2022 Operating Earnings (non-GAAP)** PSE&G
CFIO * Approximately three million potentially dilutive shares were excluded from fully diluted average shares outstanding used to calculate the diluted GAAP loss per share for the year ended December 31, 2021 as their impact was antidilutive to
GAAP results. For non-GAAP per share calculations, we used fully diluted average shares outstanding of 507 million, including the three million potentially dilutive shares as they were dilutive to non-GAAP results. ** See Slides A and B for Items
excluded from Net Income/(Loss) to reconcile to Operating Earnings (non-GAAP) for PSEG and CFIO. Note: Quarterly results may not add due to rounding. ($1.50) ~ ~ ($1.00) Electric Gross Margin (1.15) Capacity (0.54) Generation (0.38) Sale of Solar
Source (0.04) Re-contracting & Market (0.19) Gas Operations 0.08 PSEG Power Costs 0.58 O&M 0.34 Depreciation & Interest 0.24 Parent Activity (0.01) Taxes & Other 0.05
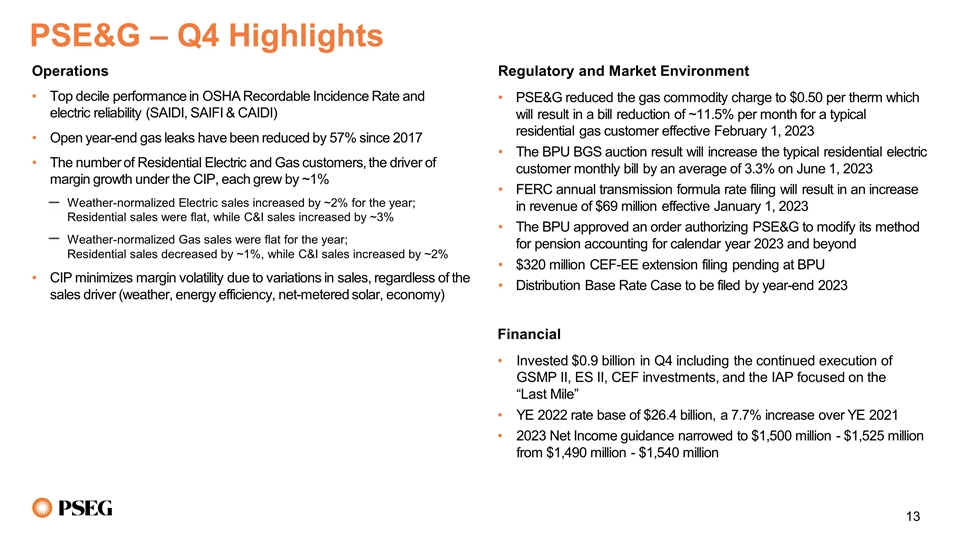
PSE&G – Q4 Highlights
Operations Top decile performance in OSHA Recordable Incidence Rate and electric reliability (SAIDI, SAIFI & CAIDI) Open year-end gas leaks have been reduced by 57% since 2017 The number of Residential Electric and Gas customers, the driver of
margin growth under the CIP, each grew by ~1% Weather-normalized Electric sales increased by ~2% for the year; Residential sales were flat, while C&I sales increased by ~3% Weather-normalized Gas sales were flat for the year; Residential sales
decreased by ~1%, while C&I sales increased by ~2% CIP minimizes margin volatility due to variations in sales, regardless of the sales driver (weather, energy efficiency, net-metered solar, economy) Regulatory and Market Environment PSE&G
reduced the gas commodity charge to $0.50 per therm which will result in a bill reduction of ~11.5% per month for a typical residential gas customer effective February 1, 2023 The BPU BGS auction result will increase the typical residential electric
customer monthly bill by an average of 3.3% on June 1, 2023 FERC annual transmission formula rate filing will result in an increase in revenue of $69 million effective January 1, 2023 The BPU approved an order authorizing PSE&G to modify its
method for pension accounting for calendar year 2023 and beyond $320 million CEF-EE extension filing pending at BPU Distribution Base Rate Case to be filed by year-end 2023 Financial Invested $0.9 billion in Q4 including the continued execution of
GSMP II, ES II, CEF investments, and the IAP focused on the “Last Mile” YE 2022 rate base of $26.4 billion, a 7.7% increase over YE 2021 2023 Net Income guidance narrowed to $1,500 million - $1,525 million from $1,490 million - $1,540
million

PSEG is advancing a predictable
growth platform PSEG has met or exceeded its non-GAAP Operating Earnings guidance for 18 years in a row Narrowing 2023 non-GAAP Operating Earnings guidance by $0.10 to $3.40 - $3.50 per share (from $3.35 - $3.55 per share) PSE&G expected to
contribute ~90% of consolidated 2023 non-GAAP Operating Earnings Long-term EPS growth rate of 5% - 7% from midpoint of 2023 non-GAAP Operating Earnings guidance to 2027 PSE&G Capital Spending of $15.5 billion to $18 billion from 2023 –
2027 drives 6% – 7.5% Rate Base CAGR No new equity needed through 2027 to execute capital spending program PSEG 2023 indicative annual common dividend increased by $0.12 to $2.28* per share PSE&G bills remain lowest among regional peers
for residential gas; below the regional peer average for residential electric PSEG has decided to exit OSW generation with its decision to sell its 25% equity interest in Ocean Wind 1; evaluating options for potential sale of its 50% interest in
Garden State Offshore Energy acreage * All future decisions and declarations regarding dividends on the common stock are subject to approval by the Board of Directors.

APPENDIX
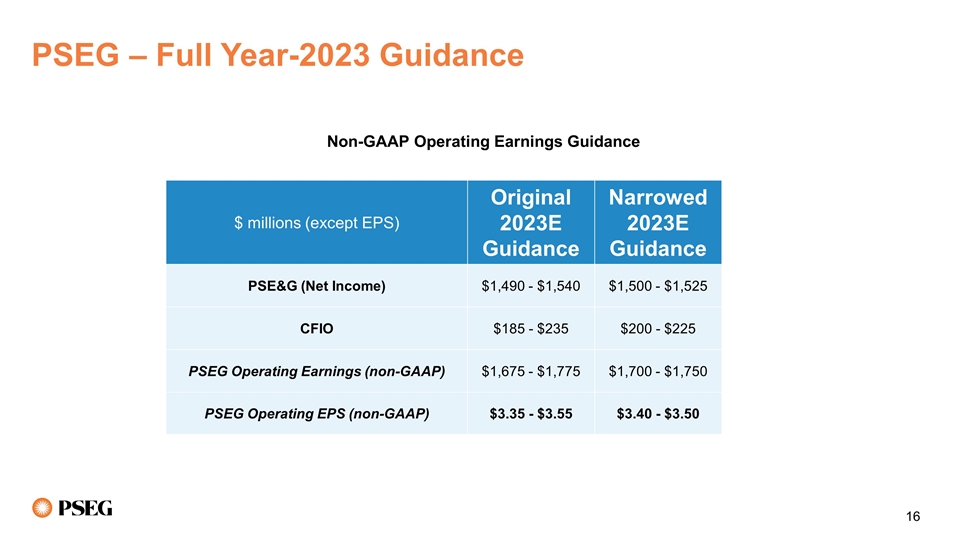
PSEG – Full Year-2023 Guidance
$ millions (except EPS) Original 2023E Guidance Narrowed 2023E Guidance PSE&G (Net Income) $1,490 - $1,540 $1,500 - $1,525 CFIO $185 - $235 $200 - $225 PSEG Operating Earnings (non-GAAP) $1,675 - $1,775 $1,700 - $1,750 PSEG Operating EPS
(non-GAAP) $3.35 - $3.55 $3.40 - $3.50 Non-GAAP Operating Earnings Guidance
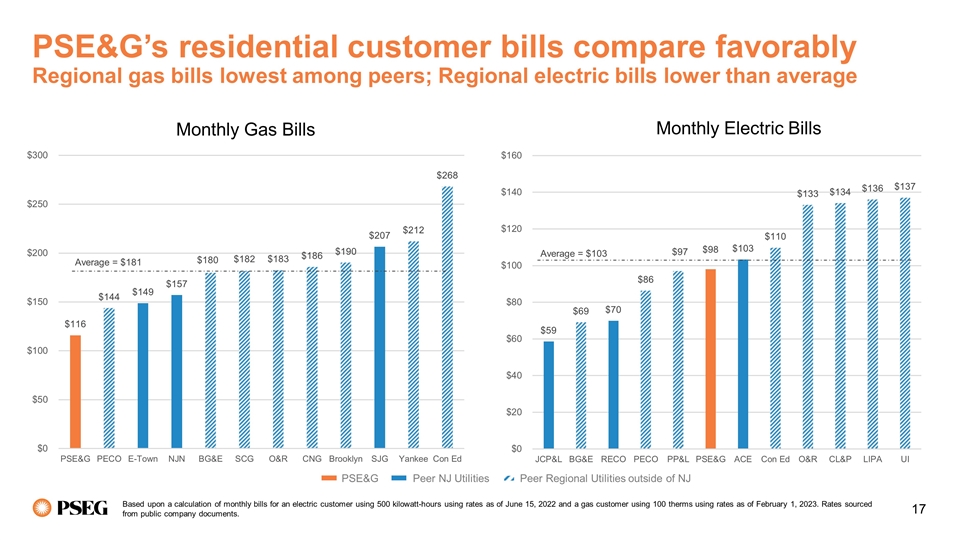
PSE&G’s residential
customer bills compare favorably Regional gas bills lowest among peers; Regional electric bills lower than average Based upon a calculation of monthly bills for an electric customer using 500 kilowatt-hours using rates as of June 15, 2022 and a gas
customer using 100 therms using rates as of February 1, 2023. Rates sourced from public company documents. Monthly Gas Bills Monthly Electric Bills PSE&G Peer NJ Utilities Peer Regional Utilities outside of NJ Average = $103 Average =
$181
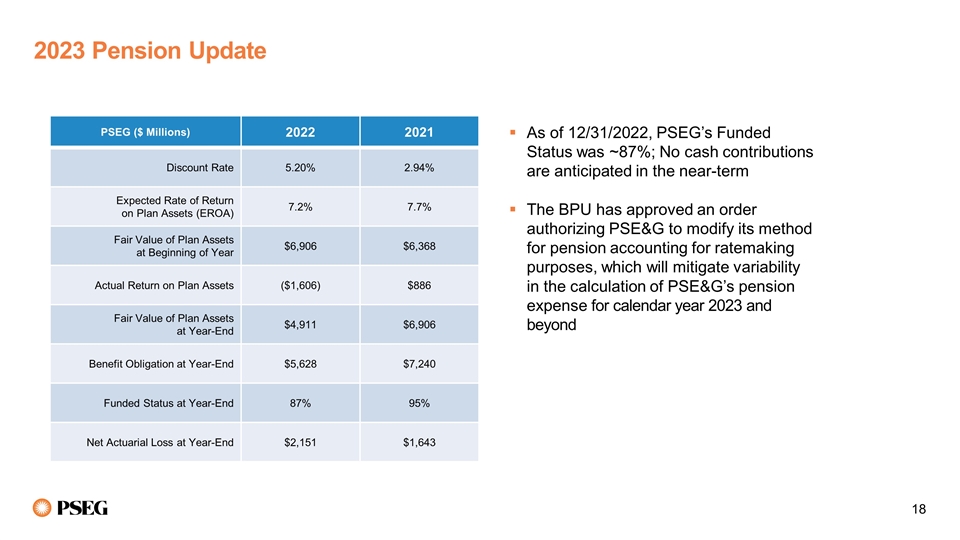
2023 Pension Update PSEG ($
Millions) 2022 2021 Discount Rate 5.20% 2.94% Expected Rate of Return on Plan Assets (EROA) 7.2% 7.7% Fair Value of Plan Assets at Beginning of Year $6,906 $6,368 Actual Return on Plan Assets ($1,606) $886 Fair Value of Plan Assets at Year-End
$4,911 $6,906 Benefit Obligation at Year-End $5,628 $7,240 Funded Status at Year-End 87% 95% Net Actuarial Loss at Year-End $2,151 $1,643 As of 12/31/2022, PSEG’s Funded Status was ~87%; No cash contributions are anticipated in the near-term
The BPU has approved an order authorizing PSE&G to modify its method for pension accounting for ratemaking purposes, which will mitigate variability in the calculation of PSE&G’s pension expense for calendar year 2023 and beyond
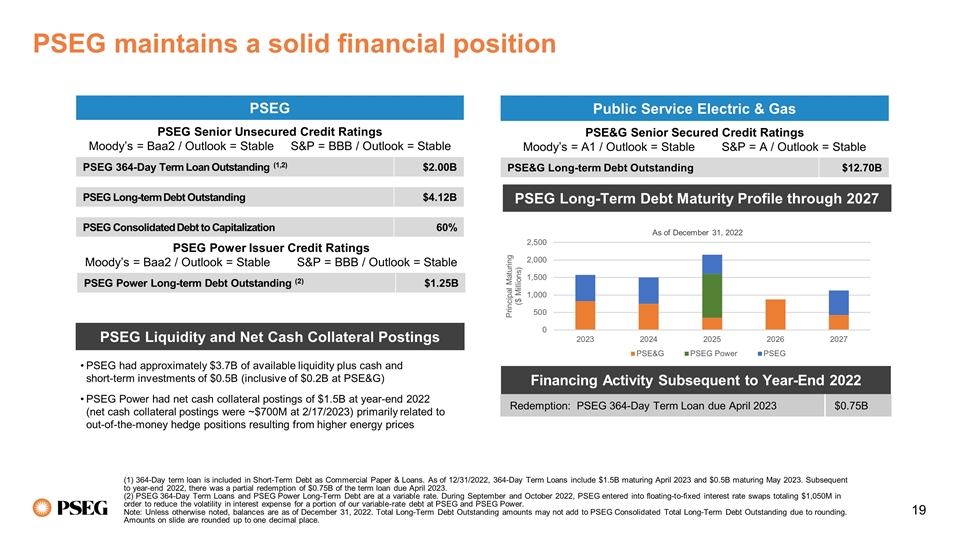
PSEG Power Issuer Credit Ratings
Moody’s = Baa2 / Outlook = Stable S&P = BBB / Outlook = Stable PSEG Power Long-term Debt Outstanding (2) $1.25B PSEG maintains a solid financial position PSEG PSEG Senior Unsecured Credit Ratings Moody’s = Baa2 / Outlook = Stable
S&P = BBB / Outlook = Stable PSEG 364-Day Term Loan Outstanding (1,2) $2.00B PSEG Long-term Debt Outstanding $4.12B PSEG Consolidated Debt to Capitalization 60% (1) 364-Day term loan is included in Short-Term Debt as Commercial Paper &
Loans. As of 12/31/2022, 364-Day Term Loans include $1.5B maturing April 2023 and $0.5B maturing May 2023. Subsequent to year-end 2022, there was a partial redemption of $0.75B of the term loan due April 2023. (2) PSEG 364-Day Term Loans and PSEG
Power Long-Term Debt are at a variable rate. During September and October 2022, PSEG entered into floating-to-fixed interest rate swaps totaling $1,050M in order to reduce the volatility in interest expense for a portion of our variable-rate debt at
PSEG and PSEG Power. Note: Unless otherwise noted, balances are as of December 31, 2022. Total Long-Term Debt Outstanding amounts may not add to PSEG Consolidated Total Long-Term Debt Outstanding due to rounding. Amounts on slide are rounded up to
one decimal place. Public Service Electric & Gas PSE&G Senior Secured Credit Ratings Moody’s = A1 / Outlook = Stable S&P = A / Outlook = Stable PSE&G Long-term Debt Outstanding $12.70B PSEG had approximately $3.7B of available
liquidity plus cash and short-term investments of $0.5B (inclusive of $0.2B at PSE&G) PSEG Power had net cash collateral postings of $1.5B at year-end 2022 (net cash collateral postings were ~$700M at 2/17/2023) primarily related to
out-of-the-money hedge positions resulting from higher energy prices PSEG Liquidity and Net Cash Collateral Postings PSEG Long-Term Debt Maturity Profile through 2027 Financing Activity Subsequent to Year-End 2022 Redemption: PSEG 364-Day Term Loan
due April 2023 $0.75B
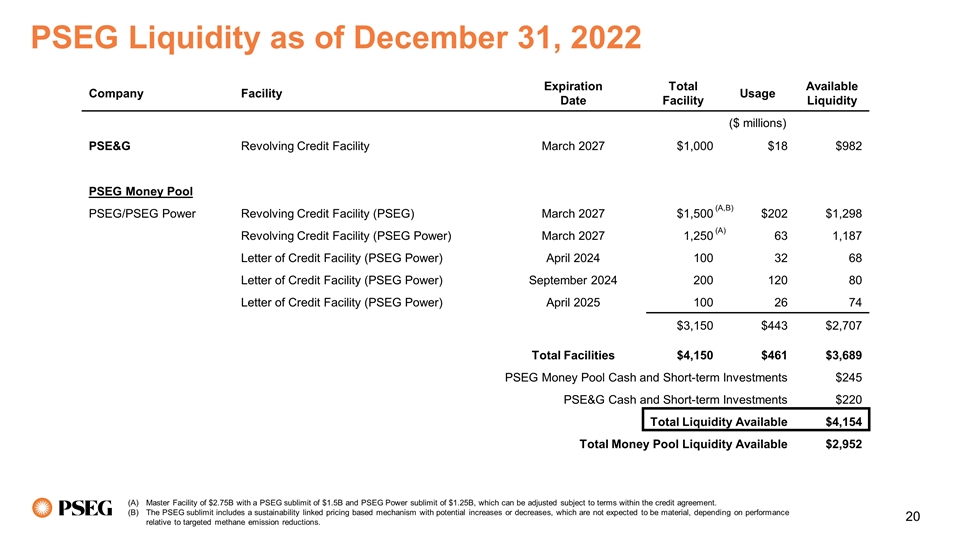
PSEG Liquidity as of December 31,
2022 Company Facility Expiration Date Total Facility Usage Available Liquidity ($ millions) PSE&G Revolving Credit Facility March 2027 $1,000 $18 $982 PSEG Money Pool PSEG/PSEG Power Revolving Credit Facility (PSEG) March 2027 $1,500 $202 $1,298
Revolving Credit Facility (PSEG Power) March 2027 1,250 63 1,187 Letter of Credit Facility (PSEG Power) April 2024 100 32 68 Letter of Credit Facility (PSEG Power) September 2024 200 120 80 Letter of Credit Facility (PSEG Power) April 2025 100 26 74
$3,150 $443 $2,707 Total Facilities $4,150 $461 $3,689 PSEG Money Pool Cash and Short-term Investments $245 PSE&G Cash and Short-term Investments $220 Total Liquidity Available $4,154 Total Money Pool Liquidity Available $2,952 (A,B) (A) Master
Facility of $2.75B with a PSEG sublimit of $1.5B and PSEG Power sublimit of $1.25B, which can be adjusted subject to terms within the credit agreement. The PSEG sublimit includes a sustainability linked pricing based mechanism with potential
increases or decreases, which are not expected to be material, depending on performance relative to targeted methane emission reductions.
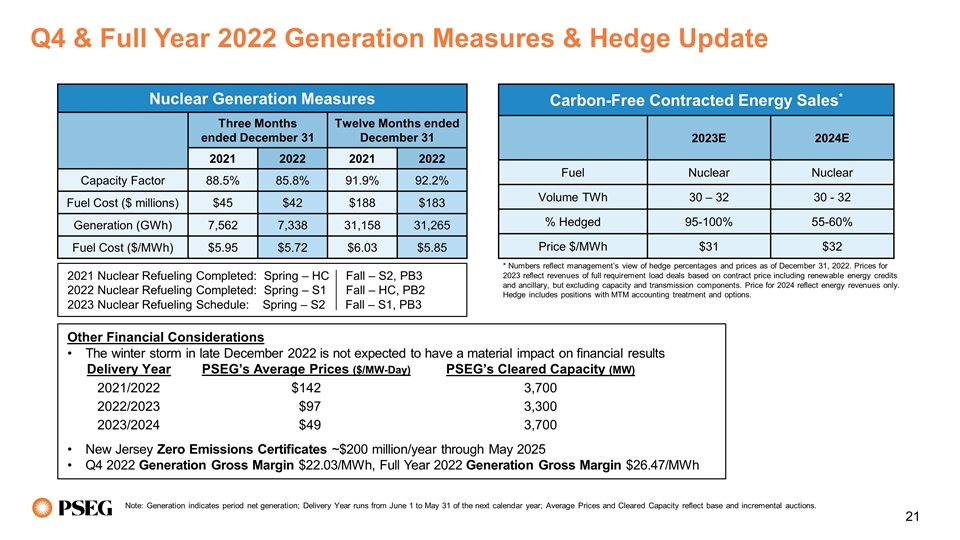
Q4 & Full Year 2022 Generation
Measures & Hedge Update Note: Generation indicates period net generation; Delivery Year runs from June 1 to May 31 of the next calendar year; Average Prices and Cleared Capacity reflect base and incremental auctions. Nuclear Generation Measures
Three Months ended December 31 Twelve Months ended December 31 2021 2022 2021 2022 Capacity Factor 88.5% 85.8% 91.9% 92.2% Fuel Cost ($ millions) $45 $42 $188 $183 Generation (GWh) 7,562 7,338 31,158 31,265 Fuel Cost ($/MWh) $5.95 $5.72 $6.03 $5.85
* Numbers reflect management’s view of hedge percentages and prices as of December 31, 2022. Prices for 2023 reflect revenues of full requirement load deals based on contract price including renewable energy credits and ancillary, but
excluding capacity and transmission components. Price for 2024 reflect energy revenues only. Hedge includes positions with MTM accounting treatment and options. Carbon-Free Contracted Energy Sales* 2023E 2024E Fuel Nuclear Nuclear Volume TWh 30
– 32 30 - 32 % Hedged 95-100% 55-60% Price $/MWh $31 $32 2021 Nuclear Refueling Completed: Spring – HC Fall – S2, PB3 2022 Nuclear Refueling Completed: Spring – S1 Fall – HC, PB2 2023 Nuclear Refueling Schedule: Spring
– S2 Fall – S1, PB3 Other Financial Considerations The winter storm in late December 2022 is not expected to have a material impact on financial results New Jersey Zero Emissions Certificates ~$200 million/year through May 2025 Q4 2022
Generation Gross Margin $22.03/MWh, Full Year 2022 Generation Gross Margin $26.47/MWh Delivery Year PSEG’s Average Prices ($/MW-Day) PSEG’s Cleared Capacity (MW) 2021/2022 $142 3,700 2022/2023 $97 3,300 2023/2024 $49 3,700
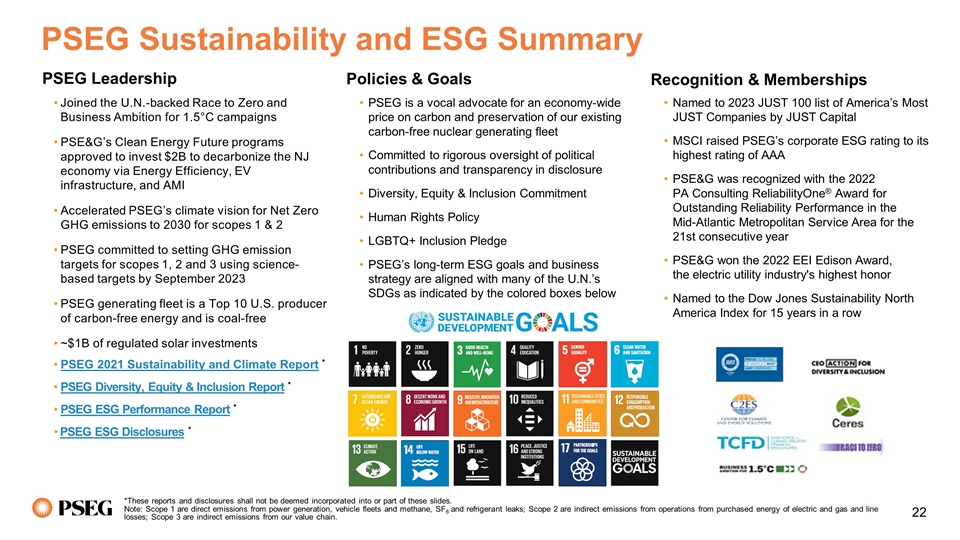
Named to 2023 JUST 100 list of
America’s Most JUST Companies by JUST Capital MSCI raised PSEG’s corporate ESG rating to its highest rating of AAA PSE&G was recognized with the 2022 PA Consulting ReliabilityOne® Award for Outstanding Reliability Performance in
the Mid-Atlantic Metropolitan Service Area for the 21st consecutive year PSE&G won the 2022 EEI Edison Award, the electric utility industry's highest honor Named to the Dow Jones Sustainability North America Index for 15 years in a row Policies
& Goals PSEG Leadership PSEG Sustainability and ESG Summary PSEG is a vocal advocate for an economy-wide price on carbon and preservation of our existing carbon-free nuclear generating fleet Committed to rigorous oversight of political
contributions and transparency in disclosure Diversity, Equity & Inclusion Commitment Human Rights Policy LGBTQ+ Inclusion Pledge PSEG’s long-term ESG goals and business strategy are aligned with many of the U.N.’s SDGs as indicated
by the colored boxes below *These reports and disclosures shall not be deemed incorporated into or part of these slides. Note: Scope 1 are direct emissions from power generation, vehicle fleets and methane, SF6 and refrigerant leaks; Scope 2 are
indirect emissions from operations from purchased energy of electric and gas and line losses; Scope 3 are indirect emissions from our value chain. Joined the U.N.-backed Race to Zero and Business Ambition for 1.5°C campaigns PSE&G’s
Clean Energy Future programs approved to invest $2B to decarbonize the NJ economy via Energy Efficiency, EV infrastructure, and AMI Accelerated PSEG’s climate vision for Net Zero GHG emissions to 2030 for scopes 1 & 2 PSEG committed to
setting GHG emission targets for scopes 1, 2 and 3 using science-based targets by September 2023 PSEG generating fleet is a Top 10 U.S. producer of carbon-free energy and is coal-free ~$1B of regulated solar investments PSEG 2021 Sustainability and
Climate Report * PSEG Diversity, Equity & Inclusion Report * PSEG ESG Performance Report * PSEG ESG Disclosures * Recognition & Memberships
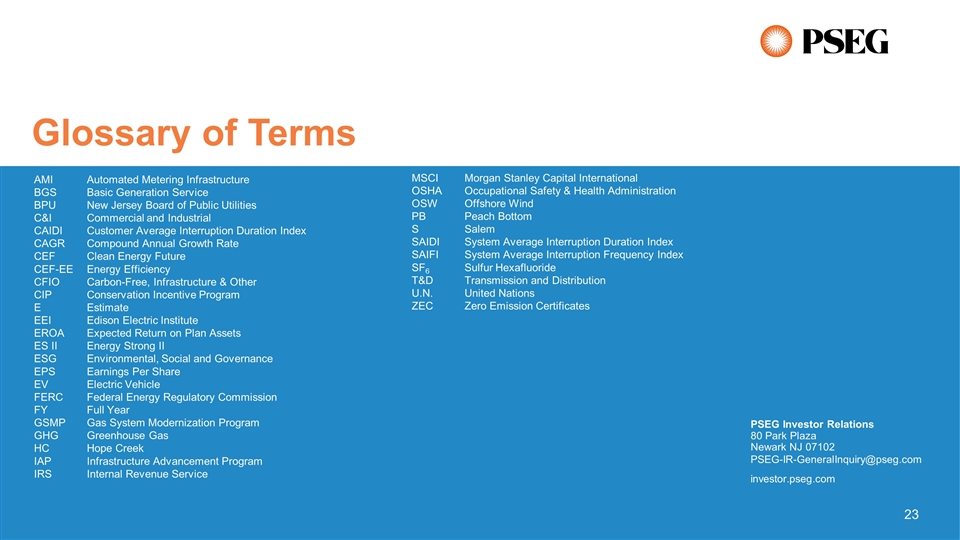
MSCIMorgan Stanley Capital
International OSHAOccupational Safety & Health Administration OSWOffshore Wind PBPeach Bottom SSalem SAIDISystem Average Interruption Duration Index SAIFISystem Average Interruption Frequency Index SF6Sulfur Hexafluoride T&DTransmission and
Distribution U.N.United Nations ZECZero Emission Certificates PSEG Investor Relations 80 Park Plaza Newark NJ 07102 PSEG-IR-GeneralInquiry@pseg.com investor.pseg.com AMIAutomated Metering Infrastructure BGSBasic Generation Service BPUNew Jersey
Board of Public Utilities C&ICommercial and Industrial CAIDICustomer Average Interruption Duration Index CAGRCompound Annual Growth Rate CEF Clean Energy Future CEF-EEEnergy Efficiency CFIOCarbon-Free, Infrastructure & Other CIPConservation
Incentive Program EEstimate EEIEdison Electric Institute EROAExpected Return on Plan Assets ES IIEnergy Strong II ESGEnvironmental, Social and Governance EPSEarnings Per Share EVElectric Vehicle FERCFederal Energy Regulatory Commission FYFull Year
GSMPGas System Modernization Program GHGGreenhouse Gas HCHope Creek IAPInfrastructure Advancement Program IRSInternal Revenue Service
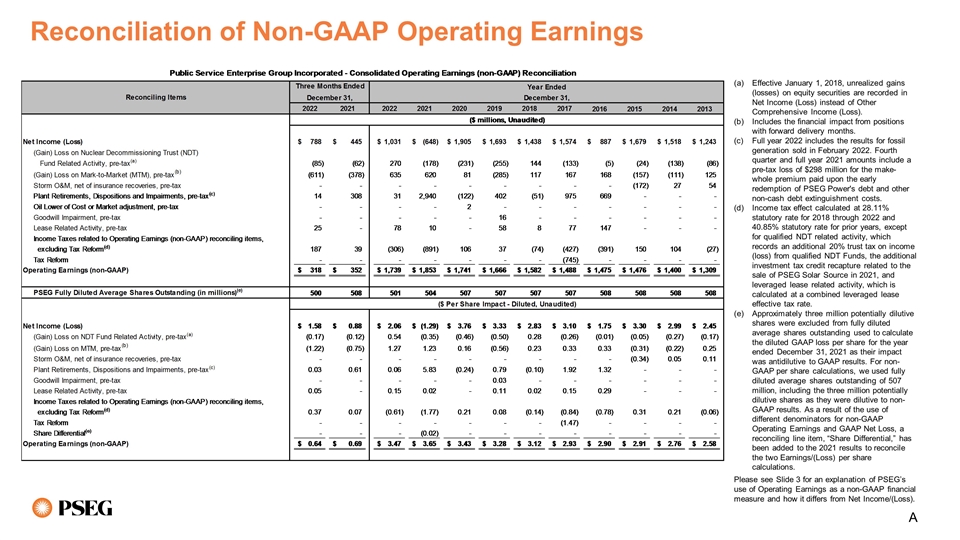
Reconciliation of Non-GAAP Operating
Earnings Please see Slide 3 for an explanation of PSEG’s use of Operating Earnings as a non-GAAP financial measure and how it differs from Net Income/(Loss). Effective January 1, 2018, unrealized gains (losses) on equity securities are
recorded in Net Income (Loss) instead of Other Comprehensive Income (Loss). Includes the financial impact from positions with forward delivery months. Full year 2022 includes the results for fossil generation sold in February 2022. Fourth quarter
and full year 2021 amounts include a pre-tax loss of $298 million for the make-whole premium paid upon the early redemption of PSEG Power's debt and other non-cash debt extinguishment costs. Income tax effect calculated at 28.11% statutory rate for
2018 through 2022 and 40.85% statutory rate for prior years, except for qualified NDT related activity, which records an additional 20% trust tax on income (loss) from qualified NDT Funds, the additional investment tax credit recapture related to
the sale of PSEG Solar Source in 2021, and leveraged lease related activity, which is calculated at a combined leveraged lease effective tax rate. Approximately three million potentially dilutive shares were excluded from fully diluted average
shares outstanding used to calculate the diluted GAAP loss per share for the year ended December 31, 2021 as their impact was antidilutive to GAAP results. For non-GAAP per share calculations, we used fully diluted average shares outstanding of 507
million, including the three million potentially dilutive shares as they were dilutive to non-GAAP results. As a result of the use of different denominators for non-GAAP Operating Earnings and GAAP Net Loss, a reconciling line item, “Share
Differential,” has been added to the 2021 results to reconcile the two Earnings/(Loss) per share calculations. A
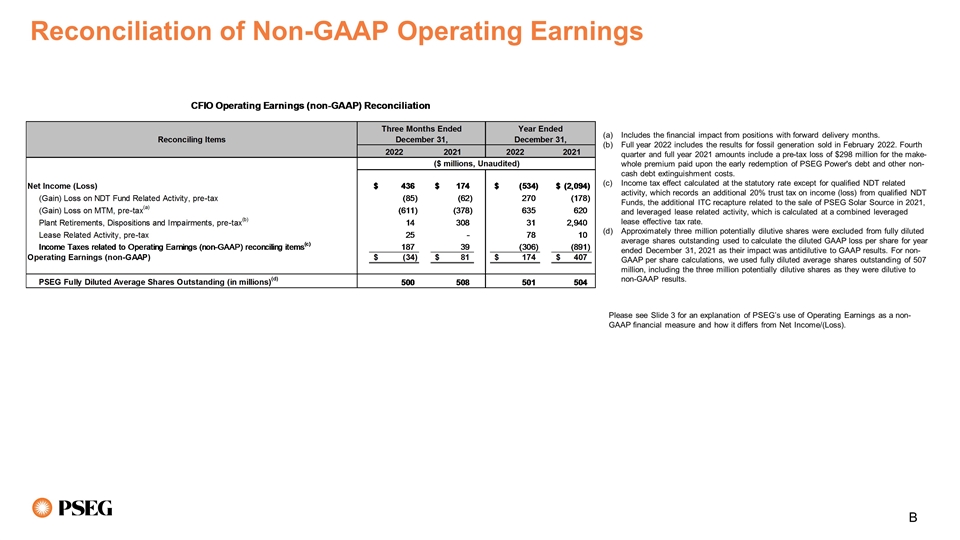
Reconciliation of Non-GAAP Operating
Earnings B Includes the financial impact from positions with forward delivery months. Full year 2022 includes the results for fossil generation sold in February 2022. Fourth quarter and full year 2021 amounts include a pre-tax loss of $298 million
for the make-whole premium paid upon the early redemption of PSEG Power's debt and other non-cash debt extinguishment costs. Income tax effect calculated at the statutory rate except for qualified NDT related activity, which records an additional
20% trust tax on income (loss) from qualified NDT Funds, the additional ITC recapture related to the sale of PSEG Solar Source in 2021, and leveraged lease related activity, which is calculated at a combined leveraged lease effective tax rate.
Approximately three million potentially dilutive shares were excluded from fully diluted average shares outstanding used to calculate the diluted GAAP loss per share for year ended December 31, 2021 as their impact was antidilutive to GAAP results.
For non-GAAP per share calculations, we used fully diluted average shares outstanding of 507 million, including the three million potentially dilutive shares as they were dilutive to non-GAAP results. Please see Slide 3 for an explanation of
PSEG’s use of Operating Earnings as a non-GAAP financial measure and how it differs from Net Income/(Loss).
v3.22.4
Cover Page
|
Feb. 21, 2023 |
| Entity Information [Line Items] |
|
| Document Type |
8-K
|
| Document Period End Date |
Feb. 21, 2023
|
| Entity File Number |
001-09120
|
| Entity Registrant Name |
Public Service Enterprise Group Incorporated
|
| Entity Incorporation, State or Country Code |
NJ
|
| Entity Tax Identification Number |
22-2625848
|
| Entity Address, Address Line One |
80 Park Plaza
|
| Entity Address, City or Town |
Newark
|
| Entity Address, State or Province |
NJ
|
| Entity Address, Postal Zip Code |
07102
|
| City Area Code |
973
|
| Local Phone Number |
430-7000
|
| Entity Emerging Growth Company |
false
|
| Amendment Flag |
false
|
| Entity Central Index Key |
0000788784
|
| Written Communications |
false
|
| Soliciting Material |
false
|
| Pre-commencement Tender Offer |
false
|
| Pre-commencement Issuer Tender Offer |
false
|
| Public Service Electric and Gas Company [Member] |
|
| Entity Information [Line Items] |
|
| Entity File Number |
001-00973
|
| Entity Registrant Name |
Public Service Electric and Gas Company
|
| Entity Incorporation, State or Country Code |
NJ
|
| Entity Tax Identification Number |
22-1212800
|
| Entity Address, Address Line One |
80 Park Plaza
|
| Entity Address, City or Town |
Newark
|
| Entity Address, State or Province |
NJ
|
| Entity Address, Postal Zip Code |
07102
|
| City Area Code |
973
|
| Local Phone Number |
430-7000
|
| Amendment Flag |
false
|
| Entity Central Index Key |
0000081033
|
| Common Stock without par value [Member] |
|
| Entity Information [Line Items] |
|
| Title of 12(b) Security |
Common Stock without par value
|
| Trading Symbol |
PEG
|
| Security Exchange Name |
NYSE
|
| First and Refunding Mortgage Bonds Eight Percent, Due Two Thousand Thirty Seven [Member] |
|
| Entity Information [Line Items] |
|
| Title of 12(b) Security |
8.00% First and Refunding Mortgage Bonds, due 2037
|
| Trading Symbol |
PEG37D
|
| Security Exchange Name |
NYSE
|
| First and Refunding Mortgage Bonds Five Percent, Due Two Thousand Thirty Seven [Member] |
|
| Entity Information [Line Items] |
|
| Title of 12(b) Security |
5.00% First and Refunding Mortgage Bonds, due 2037
|
| Trading Symbol |
PEG37J
|
| Security Exchange Name |
NYSE
|
| X |
- DefinitionBoolean flag that is true when the XBRL content amends previously-filed or accepted submission.
| Name: |
dei_AmendmentFlag |
| Namespace Prefix: |
dei_ |
| Data Type: |
xbrli:booleanItemType |
| Balance Type: |
na |
| Period Type: |
duration |
|
| X |
- DefinitionFor the EDGAR submission types of Form 8-K: the date of the report, the date of the earliest event reported; for the EDGAR submission types of Form N-1A: the filing date; for all other submission types: the end of the reporting or transition period. The format of the date is YYYY-MM-DD.
| Name: |
dei_DocumentPeriodEndDate |
| Namespace Prefix: |
dei_ |
| Data Type: |
xbrli:dateItemType |
| Balance Type: |
na |
| Period Type: |
duration |
|
| X |
- DefinitionThe type of document being provided (such as 10-K, 10-Q, 485BPOS, etc). The document type is limited to the same value as the supporting SEC submission type, or the word 'Other'.
| Name: |
dei_DocumentType |
| Namespace Prefix: |
dei_ |
| Data Type: |
dei:submissionTypeItemType |
| Balance Type: |
na |
| Period Type: |
duration |
|
| X |
- DefinitionAddress Line 1 such as Attn, Building Name, Street Name
| Name: |
dei_EntityAddressAddressLine1 |
| Namespace Prefix: |
dei_ |
| Data Type: |
xbrli:normalizedStringItemType |
| Balance Type: |
na |
| Period Type: |
duration |
|
| X |
- Definition
+ References
+ Details
| Name: |
dei_EntityAddressCityOrTown |
| Namespace Prefix: |
dei_ |
| Data Type: |
xbrli:normalizedStringItemType |
| Balance Type: |
na |
| Period Type: |
duration |
|
| X |
- DefinitionCode for the postal or zip code
| Name: |
dei_EntityAddressPostalZipCode |
| Namespace Prefix: |
dei_ |
| Data Type: |
xbrli:normalizedStringItemType |
| Balance Type: |
na |
| Period Type: |
duration |
|
| X |
- DefinitionName of the state or province.
| Name: |
dei_EntityAddressStateOrProvince |
| Namespace Prefix: |
dei_ |
| Data Type: |
dei:stateOrProvinceItemType |
| Balance Type: |
na |
| Period Type: |
duration |
|
| X |
- DefinitionA unique 10-digit SEC-issued value to identify entities that have filed disclosures with the SEC. It is commonly abbreviated as CIK. Reference 1: http://www.xbrl.org/2003/role/presentationRef
-Publisher SEC
-Name Exchange Act
-Number 240
-Section 12
-Subsection b-2
| Name: |
dei_EntityCentralIndexKey |
| Namespace Prefix: |
dei_ |
| Data Type: |
dei:centralIndexKeyItemType |
| Balance Type: |
na |
| Period Type: |
duration |
|
| X |
- DefinitionIndicate if registrant meets the emerging growth company criteria. Reference 1: http://www.xbrl.org/2003/role/presentationRef
-Publisher SEC
-Name Exchange Act
-Number 240
-Section 12
-Subsection b-2
| Name: |
dei_EntityEmergingGrowthCompany |
| Namespace Prefix: |
dei_ |
| Data Type: |
xbrli:booleanItemType |
| Balance Type: |
na |
| Period Type: |
duration |
|
| X |
- DefinitionCommission file number. The field allows up to 17 characters. The prefix may contain 1-3 digits, the sequence number may contain 1-8 digits, the optional suffix may contain 1-4 characters, and the fields are separated with a hyphen.
| Name: |
dei_EntityFileNumber |
| Namespace Prefix: |
dei_ |
| Data Type: |
dei:fileNumberItemType |
| Balance Type: |
na |
| Period Type: |
duration |
|
| X |
- DefinitionTwo-character EDGAR code representing the state or country of incorporation.
| Name: |
dei_EntityIncorporationStateCountryCode |
| Namespace Prefix: |
dei_ |
| Data Type: |
dei:edgarStateCountryItemType |
| Balance Type: |
na |
| Period Type: |
duration |
|
| X |
- DefinitionThe exact name of the entity filing the report as specified in its charter, which is required by forms filed with the SEC. Reference 1: http://www.xbrl.org/2003/role/presentationRef
-Publisher SEC
-Name Exchange Act
-Number 240
-Section 12
-Subsection b-2
| Name: |
dei_EntityRegistrantName |
| Namespace Prefix: |
dei_ |
| Data Type: |
xbrli:normalizedStringItemType |
| Balance Type: |
na |
| Period Type: |
duration |
|
| X |
- DefinitionThe Tax Identification Number (TIN), also known as an Employer Identification Number (EIN), is a unique 9-digit value assigned by the IRS. Reference 1: http://www.xbrl.org/2003/role/presentationRef
-Publisher SEC
-Name Exchange Act
-Number 240
-Section 12
-Subsection b-2
| Name: |
dei_EntityTaxIdentificationNumber |
| Namespace Prefix: |
dei_ |
| Data Type: |
dei:employerIdItemType |
| Balance Type: |
na |
| Period Type: |
duration |
|
| X |
- DefinitionLocal phone number for entity.
| Name: |
dei_LocalPhoneNumber |
| Namespace Prefix: |
dei_ |
| Data Type: |
xbrli:normalizedStringItemType |
| Balance Type: |
na |
| Period Type: |
duration |
|
| X |
- DefinitionBoolean flag that is true when the Form 8-K filing is intended to satisfy the filing obligation of the registrant as pre-commencement communications pursuant to Rule 13e-4(c) under the Exchange Act. Reference 1: http://www.xbrl.org/2003/role/presentationRef
-Publisher SEC
-Name Exchange Act
-Number 240
-Section 13e
-Subsection 4c
| Name: |
dei_PreCommencementIssuerTenderOffer |
| Namespace Prefix: |
dei_ |
| Data Type: |
xbrli:booleanItemType |
| Balance Type: |
na |
| Period Type: |
duration |
|
| X |
- DefinitionBoolean flag that is true when the Form 8-K filing is intended to satisfy the filing obligation of the registrant as pre-commencement communications pursuant to Rule 14d-2(b) under the Exchange Act. Reference 1: http://www.xbrl.org/2003/role/presentationRef
-Publisher SEC
-Name Exchange Act
-Number 240
-Section 14d
-Subsection 2b
| Name: |
dei_PreCommencementTenderOffer |
| Namespace Prefix: |
dei_ |
| Data Type: |
xbrli:booleanItemType |
| Balance Type: |
na |
| Period Type: |
duration |
|
| X |
- DefinitionTitle of a 12(b) registered security. Reference 1: http://www.xbrl.org/2003/role/presentationRef
-Publisher SEC
-Name Exchange Act
-Number 240
-Section 12
-Subsection b
| Name: |
dei_Security12bTitle |
| Namespace Prefix: |
dei_ |
| Data Type: |
dei:securityTitleItemType |
| Balance Type: |
na |
| Period Type: |
duration |
|
| X |
- DefinitionName of the Exchange on which a security is registered. Reference 1: http://www.xbrl.org/2003/role/presentationRef
-Publisher SEC
-Name Exchange Act
-Number 240
-Section 12
-Subsection d1-1
| Name: |
dei_SecurityExchangeName |
| Namespace Prefix: |
dei_ |
| Data Type: |
dei:edgarExchangeCodeItemType |
| Balance Type: |
na |
| Period Type: |
duration |
|
| X |
- DefinitionBoolean flag that is true when the Form 8-K filing is intended to satisfy the filing obligation of the registrant as soliciting material pursuant to Rule 14a-12 under the Exchange Act. Reference 1: http://www.xbrl.org/2003/role/presentationRef
-Publisher SEC
-Name Exchange Act
-Section 14a
-Number 240
-Subsection 12
| Name: |
dei_SolicitingMaterial |
| Namespace Prefix: |
dei_ |
| Data Type: |
xbrli:booleanItemType |
| Balance Type: |
na |
| Period Type: |
duration |
|
| X |
- DefinitionTrading symbol of an instrument as listed on an exchange.
| Name: |
dei_TradingSymbol |
| Namespace Prefix: |
dei_ |
| Data Type: |
dei:tradingSymbolItemType |
| Balance Type: |
na |
| Period Type: |
duration |
|
| X |
- DefinitionBoolean flag that is true when the Form 8-K filing is intended to satisfy the filing obligation of the registrant as written communications pursuant to Rule 425 under the Securities Act. Reference 1: http://www.xbrl.org/2003/role/presentationRef
-Publisher SEC
-Name Securities Act
-Number 230
-Section 425
| Name: |
dei_WrittenCommunications |
| Namespace Prefix: |
dei_ |
| Data Type: |
xbrli:booleanItemType |
| Balance Type: |
na |
| Period Type: |
duration |
|
| X |
- Details
| Name: |
dei_LegalEntityAxis=pseg_PublicServiceElectricAndGasCompanyMember |
| Namespace Prefix: |
|
| Data Type: |
na |
| Balance Type: |
|
| Period Type: |
|
|
| X |
- Details
| Name: |
us-gaap_StatementClassOfStockAxis=us-gaap_CommonStockMember |
| Namespace Prefix: |
|
| Data Type: |
na |
| Balance Type: |
|
| Period Type: |
|
|
| X |
- Details
| Name: |
us-gaap_StatementClassOfStockAxis=pseg_FirstAndRefundingMortgageBondsEightPercentDueTwoThousandThirtySevenMember |
| Namespace Prefix: |
|
| Data Type: |
na |
| Balance Type: |
|
| Period Type: |
|
|
| X |
- Details
| Name: |
us-gaap_StatementClassOfStockAxis=pseg_FirstAndRefundingMortgageBondsFivePercentDueTwoThousandThirtySevenMember |
| Namespace Prefix: |
|
| Data Type: |
na |
| Balance Type: |
|
| Period Type: |
|
|
{
 "instance": {
  "d296144d8k.htm": {
   "axisCustom": 0,
   "axisStandard": 2,
   "baseTaxonomies": {
    "http://xbrl.sec.gov/dei/2022": 40
   },
   "contextCount": 5,
   "dts": {
    "calculationLink": {
     "local": [
      "pseg-20230221_cal.xml"
     ]
    },
    "definitionLink": {
     "local": [
      "pseg-20230221_def.xml"
     ]
    },
    "inline": {
     "local": [
      "d296144d8k.htm"
     ]
    },
    "labelLink": {
     "local": [
      "pseg-20230221_lab.xml"
     ]
    },
    "presentationLink": {
     "local": [
      "pseg-20230221_pre.xml"
     ]
    },
    "schema": {
     "local": [
      "pseg-20230221.xsd"
     ],
     "remote": [
      "http://www.xbrl.org/2003/xbrl-instance-2003-12-31.xsd",
      "http://www.xbrl.org/2003/xbrl-linkbase-2003-12-31.xsd",
      "http://www.xbrl.org/2003/xl-2003-12-31.xsd",
      "http://www.xbrl.org/2003/xlink-2003-12-31.xsd",
      "http://www.xbrl.org/2005/xbrldt-2005.xsd",
      "http://www.xbrl.org/2006/ref-2006-02-27.xsd",
      "http://www.xbrl.org/lrr/arcrole/factExplanatory-2009-12-16.xsd",
      "http://www.xbrl.org/lrr/role/negated-2009-12-16.xsd",
      "http://www.xbrl.org/lrr/role/net-2009-12-16.xsd",
      "https://www.xbrl.org/2020/extensible-enumerations-2.0.xsd",
      "https://www.xbrl.org/dtr/type/2020-01-21/types.xsd",
      "https://xbrl.fasb.org/srt/2022/elts/srt-2022.xsd",
      "https://xbrl.fasb.org/srt/2022/elts/srt-roles-2022.xsd",
      "https://xbrl.fasb.org/srt/2022/elts/srt-types-2022.xsd",
      "https://xbrl.fasb.org/srt/2022q3/srt-sup-2022q3.xsd",
      "https://xbrl.fasb.org/us-gaap/2022/elts/us-gaap-2022.xsd",
      "https://xbrl.fasb.org/us-gaap/2022/elts/us-roles-2022.xsd",
      "https://xbrl.fasb.org/us-gaap/2022/elts/us-types-2022.xsd",
      "https://xbrl.fasb.org/us-gaap/2022q3/us-gaap-sup-2022q3.xsd",
      "https://xbrl.sec.gov/country/2022/country-2022.xsd",
      "https://xbrl.sec.gov/currency/2022/currency-2022.xsd",
      "https://xbrl.sec.gov/dei/2022/dei-2022.xsd",
      "https://xbrl.sec.gov/exch/2022/exch-2022.xsd",
      "https://xbrl.sec.gov/naics/2022/naics-2022.xsd",
      "https://xbrl.sec.gov/sic/2022/sic-2022.xsd",
      "https://xbrl.sec.gov/stpr/2022/stpr-2022.xsd"
     ]
    }
   },
   "elementCount": 33,
   "entityCount": 1,
   "hidden": {
    "http://xbrl.sec.gov/dei/2022": 4,
    "total": 4
   },
   "keyCustom": 0,
   "keyStandard": 22,
   "memberCustom": 3,
   "memberStandard": 1,
   "nsprefix": "pseg",
   "nsuri": "http://www.pseg.com/20230221",
   "report": {
    "R1": {
     "firstAnchor": {
      "ancestors": [
       "div",
       "div",
       "div",
       "div",
       "div",
       "div",
       "div",
       "div",
       "body",
       "html"
      ],
      "baseRef": "d296144d8k.htm",
      "contextRef": "P02_21_2023To02_21_2023",
      "decimals": null,
      "first": true,
      "lang": "en-US",
      "name": "dei:DocumentType",
      "reportCount": 1,
      "unique": true,
      "unitRef": null,
      "xsiNil": "false"
     },
     "groupType": "document",
     "isDefault": "true",
     "longName": "1001 - Document - Cover Page",
     "menuCat": "Cover",
     "order": "1",
     "role": "http://www.pseg.com/role/CoverPage",
     "shortName": "Cover Page",
     "subGroupType": "",
     "uniqueAnchor": {
      "ancestors": [
       "div",
       "div",
       "div",
       "div",
       "div",
       "div",
       "div",
       "div",
       "body",
       "html"
      ],
      "baseRef": "d296144d8k.htm",
      "contextRef": "P02_21_2023To02_21_2023",
      "decimals": null,
      "first": true,
      "lang": "en-US",
      "name": "dei:DocumentType",
      "reportCount": 1,
      "unique": true,
      "unitRef": null,
      "xsiNil": "false"
     }
    }
   },
   "segmentCount": 4,
   "tag": {
    "dei_AmendmentFlag": {
     "auth_ref": [],
     "lang": {
      "en-us": {
       "role": {
        "documentation": "Boolean flag that is true when the XBRL content amends previously-filed or accepted submission.",
        "label": "Amendment Flag"
       }
      }
     },
     "localname": "AmendmentFlag",
     "nsuri": "http://xbrl.sec.gov/dei/2022",
     "presentation": [
      "http://www.pseg.com/role/CoverPage"
     ],
     "xbrltype": "booleanItemType"
    },
    "dei_CityAreaCode": {
     "auth_ref": [],
     "lang": {
      "en-us": {
       "role": {
        "documentation": "Area code of city",
        "label": "City Area Code"
       }
      }
     },
     "localname": "CityAreaCode",
     "nsuri": "http://xbrl.sec.gov/dei/2022",
     "presentation": [
      "http://www.pseg.com/role/CoverPage"
     ],
     "xbrltype": "normalizedStringItemType"
    },
    "dei_CoverAbstract": {
     "auth_ref": [],
     "lang": {
      "en-us": {
       "role": {
        "documentation": "Cover page.",
        "label": "Cover [Abstract]"
       }
      }
     },
     "localname": "CoverAbstract",
     "nsuri": "http://xbrl.sec.gov/dei/2022",
     "xbrltype": "stringItemType"
    },
    "dei_DocumentPeriodEndDate": {
     "auth_ref": [],
     "lang": {
      "en-us": {
       "role": {
        "documentation": "For the EDGAR submission types of Form 8-K: the date of the report, the date of the earliest event reported; for the EDGAR submission types of Form N-1A: the filing date; for all other submission types: the end of the reporting or transition period.  The format of the date is YYYY-MM-DD.",
        "label": "Document Period End Date"
       }
      }
     },
     "localname": "DocumentPeriodEndDate",
     "nsuri": "http://xbrl.sec.gov/dei/2022",
     "presentation": [
      "http://www.pseg.com/role/CoverPage"
     ],
     "xbrltype": "dateItemType"
    },
    "dei_DocumentType": {
     "auth_ref": [],
     "lang": {
      "en-us": {
       "role": {
        "documentation": "The type of document being provided (such as 10-K, 10-Q, 485BPOS, etc). The document type is limited to the same value as the supporting SEC submission type, or the word 'Other'.",
        "label": "Document Type"
       }
      }
     },
     "localname": "DocumentType",
     "nsuri": "http://xbrl.sec.gov/dei/2022",
     "presentation": [
      "http://www.pseg.com/role/CoverPage"
     ],
     "xbrltype": "submissionTypeItemType"
    },
    "dei_EntitiesTable": {
     "auth_ref": [],
     "lang": {
      "en-us": {
       "role": {
        "documentation": "Container to assemble all relevant information about each entity associated with the document instance",
        "label": "Entities [Table]"
       }
      }
     },
     "localname": "EntitiesTable",
     "nsuri": "http://xbrl.sec.gov/dei/2022",
     "presentation": [
      "http://www.pseg.com/role/CoverPage"
     ],
     "xbrltype": "stringItemType"
    },
    "dei_EntityAddressAddressLine1": {
     "auth_ref": [],
     "lang": {
      "en-us": {
       "role": {
        "documentation": "Address Line 1 such as Attn, Building Name, Street Name",
        "label": "Entity Address, Address Line One"
       }
      }
     },
     "localname": "EntityAddressAddressLine1",
     "nsuri": "http://xbrl.sec.gov/dei/2022",
     "presentation": [
      "http://www.pseg.com/role/CoverPage"
     ],
     "xbrltype": "normalizedStringItemType"
    },
    "dei_EntityAddressCityOrTown": {
     "auth_ref": [],
     "lang": {
      "en-us": {
       "role": {
        "documentation": "Name of the City or Town",
        "label": "Entity Address, City or Town"
       }
      }
     },
     "localname": "EntityAddressCityOrTown",
     "nsuri": "http://xbrl.sec.gov/dei/2022",
     "presentation": [
      "http://www.pseg.com/role/CoverPage"
     ],
     "xbrltype": "normalizedStringItemType"
    },
    "dei_EntityAddressPostalZipCode": {
     "auth_ref": [],
     "lang": {
      "en-us": {
       "role": {
        "documentation": "Code for the postal or zip code",
        "label": "Entity Address, Postal Zip Code"
       }
      }
     },
     "localname": "EntityAddressPostalZipCode",
     "nsuri": "http://xbrl.sec.gov/dei/2022",
     "presentation": [
      "http://www.pseg.com/role/CoverPage"
     ],
     "xbrltype": "normalizedStringItemType"
    },
    "dei_EntityAddressStateOrProvince": {
     "auth_ref": [],
     "lang": {
      "en-us": {
       "role": {
        "documentation": "Name of the state or province.",
        "label": "Entity Address, State or Province"
       }
      }
     },
     "localname": "EntityAddressStateOrProvince",
     "nsuri": "http://xbrl.sec.gov/dei/2022",
     "presentation": [
      "http://www.pseg.com/role/CoverPage"
     ],
     "xbrltype": "stateOrProvinceItemType"
    },
    "dei_EntityCentralIndexKey": {
     "auth_ref": [
      "r1"
     ],
     "lang": {
      "en-us": {
       "role": {
        "documentation": "A unique 10-digit SEC-issued value to identify entities that have filed disclosures with the SEC. It is commonly abbreviated as CIK.",
        "label": "Entity Central Index Key"
       }
      }
     },
     "localname": "EntityCentralIndexKey",
     "nsuri": "http://xbrl.sec.gov/dei/2022",
     "presentation": [
      "http://www.pseg.com/role/CoverPage"
     ],
     "xbrltype": "centralIndexKeyItemType"
    },
    "dei_EntityDomain": {
     "auth_ref": [],
     "lang": {
      "en-us": {
       "role": {
        "documentation": "All the names of the entities being reported upon in a document. Any legal structure used to conduct activities or to hold assets. Some examples of such structures are corporations, partnerships, limited liability companies, grantor trusts, and other trusts. This item does not include business and geographical segments which are included in the geographical or business segments domains.",
        "label": "Entity [Domain]"
       }
      }
     },
     "localname": "EntityDomain",
     "nsuri": "http://xbrl.sec.gov/dei/2022",
     "presentation": [
      "http://www.pseg.com/role/CoverPage"
     ],
     "xbrltype": "domainItemType"
    },
    "dei_EntityEmergingGrowthCompany": {
     "auth_ref": [
      "r1"
     ],
     "lang": {
      "en-us": {
       "role": {
        "documentation": "Indicate if registrant meets the emerging growth company criteria.",
        "label": "Entity Emerging Growth Company"
       }
      }
     },
     "localname": "EntityEmergingGrowthCompany",
     "nsuri": "http://xbrl.sec.gov/dei/2022",
     "presentation": [
      "http://www.pseg.com/role/CoverPage"
     ],
     "xbrltype": "booleanItemType"
    },
    "dei_EntityFileNumber": {
     "auth_ref": [],
     "lang": {
      "en-us": {
       "role": {
        "documentation": "Commission file number. The field allows up to 17 characters. The prefix may contain 1-3 digits, the sequence number may contain 1-8 digits, the optional suffix may contain 1-4 characters, and the fields are separated with a hyphen.",
        "label": "Entity File Number"
       }
      }
     },
     "localname": "EntityFileNumber",
     "nsuri": "http://xbrl.sec.gov/dei/2022",
     "presentation": [
      "http://www.pseg.com/role/CoverPage"
     ],
     "xbrltype": "fileNumberItemType"
    },
    "dei_EntityIncorporationStateCountryCode": {
     "auth_ref": [],
     "lang": {
      "en-us": {
       "role": {
        "documentation": "Two-character EDGAR code representing the state or country of incorporation.",
        "label": "Entity Incorporation, State or Country Code"
       }
      }
     },
     "localname": "EntityIncorporationStateCountryCode",
     "nsuri": "http://xbrl.sec.gov/dei/2022",
     "presentation": [
      "http://www.pseg.com/role/CoverPage"
     ],
     "xbrltype": "edgarStateCountryItemType"
    },
    "dei_EntityInformationLineItems": {
     "auth_ref": [],
     "lang": {
      "en-us": {
       "role": {
        "documentation": "Line items represent financial concepts included in a table. These concepts are used to disclose reportable information associated with domain members defined in one or many axes to the table.",
        "label": "Entity Information [Line Items]"
       }
      }
     },
     "localname": "EntityInformationLineItems",
     "nsuri": "http://xbrl.sec.gov/dei/2022",
     "presentation": [
      "http://www.pseg.com/role/CoverPage"
     ],
     "xbrltype": "stringItemType"
    },
    "dei_EntityRegistrantName": {
     "auth_ref": [
      "r1"
     ],
     "lang": {
      "en-us": {
       "role": {
        "documentation": "The exact name of the entity filing the report as specified in its charter, which is required by forms filed with the SEC.",
        "label": "Entity Registrant Name"
       }
      }
     },
     "localname": "EntityRegistrantName",
     "nsuri": "http://xbrl.sec.gov/dei/2022",
     "presentation": [
      "http://www.pseg.com/role/CoverPage"
     ],
     "xbrltype": "normalizedStringItemType"
    },
    "dei_EntityTaxIdentificationNumber": {
     "auth_ref": [
      "r1"
     ],
     "lang": {
      "en-us": {
       "role": {
        "documentation": "The Tax Identification Number (TIN), also known as an Employer Identification Number (EIN), is a unique 9-digit value assigned by the IRS.",
        "label": "Entity Tax Identification Number"
       }
      }
     },
     "localname": "EntityTaxIdentificationNumber",
     "nsuri": "http://xbrl.sec.gov/dei/2022",
     "presentation": [
      "http://www.pseg.com/role/CoverPage"
     ],
     "xbrltype": "employerIdItemType"
    },
    "dei_LegalEntityAxis": {
     "auth_ref": [],
     "lang": {
      "en-us": {
       "role": {
        "documentation": "The set of legal entities associated with a report.",
        "label": "Legal Entity [Axis]"
       }
      }
     },
     "localname": "LegalEntityAxis",
     "nsuri": "http://xbrl.sec.gov/dei/2022",
     "presentation": [
      "http://www.pseg.com/role/CoverPage"
     ],
     "xbrltype": "stringItemType"
    },
    "dei_LocalPhoneNumber": {
     "auth_ref": [],
     "lang": {
      "en-us": {
       "role": {
        "documentation": "Local phone number for entity.",
        "label": "Local Phone Number"
       }
      }
     },
     "localname": "LocalPhoneNumber",
     "nsuri": "http://xbrl.sec.gov/dei/2022",
     "presentation": [
      "http://www.pseg.com/role/CoverPage"
     ],
     "xbrltype": "normalizedStringItemType"
    },
    "dei_PreCommencementIssuerTenderOffer": {
     "auth_ref": [
      "r3"
     ],
     "lang": {
      "en-us": {
       "role": {
        "documentation": "Boolean flag that is true when the Form 8-K filing is intended to satisfy the filing obligation of the registrant as pre-commencement communications pursuant to Rule 13e-4(c) under the Exchange Act.",
        "label": "Pre-commencement Issuer Tender Offer"
       }
      }
     },
     "localname": "PreCommencementIssuerTenderOffer",
     "nsuri": "http://xbrl.sec.gov/dei/2022",
     "presentation": [
      "http://www.pseg.com/role/CoverPage"
     ],
     "xbrltype": "booleanItemType"
    },
    "dei_PreCommencementTenderOffer": {
     "auth_ref": [
      "r4"
     ],
     "lang": {
      "en-us": {
       "role": {
        "documentation": "Boolean flag that is true when the Form 8-K filing is intended to satisfy the filing obligation of the registrant as pre-commencement communications pursuant to Rule 14d-2(b) under the Exchange Act.",
        "label": "Pre-commencement Tender Offer"
       }
      }
     },
     "localname": "PreCommencementTenderOffer",
     "nsuri": "http://xbrl.sec.gov/dei/2022",
     "presentation": [
      "http://www.pseg.com/role/CoverPage"
     ],
     "xbrltype": "booleanItemType"
    },
    "dei_Security12bTitle": {
     "auth_ref": [
      "r0"
     ],
     "lang": {
      "en-us": {
       "role": {
        "documentation": "Title of a 12(b) registered security.",
        "label": "Title of 12(b) Security"
       }
      }
     },
     "localname": "Security12bTitle",
     "nsuri": "http://xbrl.sec.gov/dei/2022",
     "presentation": [
      "http://www.pseg.com/role/CoverPage"
     ],
     "xbrltype": "securityTitleItemType"
    },
    "dei_SecurityExchangeName": {
     "auth_ref": [
      "r2"
     ],
     "lang": {
      "en-us": {
       "role": {
        "documentation": "Name of the Exchange on which a security is registered.",
        "label": "Security Exchange Name"
       }
      }
     },
     "localname": "SecurityExchangeName",
     "nsuri": "http://xbrl.sec.gov/dei/2022",
     "presentation": [
      "http://www.pseg.com/role/CoverPage"
     ],
     "xbrltype": "edgarExchangeCodeItemType"
    },
    "dei_SolicitingMaterial": {
     "auth_ref": [
      "r5"
     ],
     "lang": {
      "en-us": {
       "role": {
        "documentation": "Boolean flag that is true when the Form 8-K filing is intended to satisfy the filing obligation of the registrant as soliciting material pursuant to Rule 14a-12 under the Exchange Act.",
        "label": "Soliciting Material"
       }
      }
     },
     "localname": "SolicitingMaterial",
     "nsuri": "http://xbrl.sec.gov/dei/2022",
     "presentation": [
      "http://www.pseg.com/role/CoverPage"
     ],
     "xbrltype": "booleanItemType"
    },
    "dei_TradingSymbol": {
     "auth_ref": [],
     "lang": {
      "en-us": {
       "role": {
        "documentation": "Trading symbol of an instrument as listed on an exchange.",
        "label": "Trading Symbol"
       }
      }
     },
     "localname": "TradingSymbol",
     "nsuri": "http://xbrl.sec.gov/dei/2022",
     "presentation": [
      "http://www.pseg.com/role/CoverPage"
     ],
     "xbrltype": "tradingSymbolItemType"
    },
    "dei_WrittenCommunications": {
     "auth_ref": [
      "r6"
     ],
     "lang": {
      "en-us": {
       "role": {
        "documentation": "Boolean flag that is true when the Form 8-K filing is intended to satisfy the filing obligation of the registrant as written communications pursuant to Rule 425 under the Securities Act.",
        "label": "Written Communications"
       }
      }
     },
     "localname": "WrittenCommunications",
     "nsuri": "http://xbrl.sec.gov/dei/2022",
     "presentation": [
      "http://www.pseg.com/role/CoverPage"
     ],
     "xbrltype": "booleanItemType"
    },
    "pseg_FirstAndRefundingMortgageBondsEightPercentDueTwoThousandThirtySevenMember": {
     "auth_ref": [],
     "lang": {
      "en-us": {
       "role": {
        "label": "First And Refunding Mortgage Bonds Eight Percent Due Two Thousand Thirty Seven [Member]",
        "terseLabel": "First and Refunding Mortgage Bonds Eight Percent, Due Two Thousand Thirty Seven [Member]"
       }
      }
     },
     "localname": "FirstAndRefundingMortgageBondsEightPercentDueTwoThousandThirtySevenMember",
     "nsuri": "http://www.pseg.com/20230221",
     "presentation": [
      "http://www.pseg.com/role/CoverPage"
     ],
     "xbrltype": "domainItemType"
    },
    "pseg_FirstAndRefundingMortgageBondsFivePercentDueTwoThousandThirtySevenMember": {
     "auth_ref": [],
     "lang": {
      "en-us": {
       "role": {
        "label": "First And Refunding Mortgage Bonds Five Percent Due Two Thousand Thirty Seven [Member]",
        "terseLabel": "First and Refunding Mortgage Bonds Five Percent, Due Two Thousand Thirty Seven [Member]"
       }
      }
     },
     "localname": "FirstAndRefundingMortgageBondsFivePercentDueTwoThousandThirtySevenMember",
     "nsuri": "http://www.pseg.com/20230221",
     "presentation": [
      "http://www.pseg.com/role/CoverPage"
     ],
     "xbrltype": "domainItemType"
    },
    "pseg_PublicServiceElectricAndGasCompanyMember": {
     "auth_ref": [],
     "lang": {
      "en-us": {
       "role": {
        "label": "Public Service Electric And Gas Company [Member]",
        "terseLabel": "Public Service Electric and Gas Company [Member]"
       }
      }
     },
     "localname": "PublicServiceElectricAndGasCompanyMember",
     "nsuri": "http://www.pseg.com/20230221",
     "presentation": [
      "http://www.pseg.com/role/CoverPage"
     ],
     "xbrltype": "domainItemType"
    },
    "us-gaap_ClassOfStockDomain": {
     "auth_ref": [],
     "lang": {
      "en-us": {
       "role": {
        "label": "Class of Stock [Domain]"
       }
      }
     },
     "localname": "ClassOfStockDomain",
     "nsuri": "http://fasb.org/us-gaap/2022",
     "presentation": [
      "http://www.pseg.com/role/CoverPage"
     ],
     "xbrltype": "domainItemType"
    },
    "us-gaap_CommonStockMember": {
     "auth_ref": [],
     "lang": {
      "en-us": {
       "role": {
        "label": "Common Stock [Member]",
        "verboseLabel": "Common Stock without par value [Member]"
       }
      }
     },
     "localname": "CommonStockMember",
     "nsuri": "http://fasb.org/us-gaap/2022",
     "presentation": [
      "http://www.pseg.com/role/CoverPage"
     ],
     "xbrltype": "domainItemType"
    },
    "us-gaap_StatementClassOfStockAxis": {
     "auth_ref": [],
     "lang": {
      "en-us": {
       "role": {
        "label": "Class of Stock [Axis]"
       }
      }
     },
     "localname": "StatementClassOfStockAxis",
     "nsuri": "http://fasb.org/us-gaap/2022",
     "presentation": [
      "http://www.pseg.com/role/CoverPage"
     ],
     "xbrltype": "stringItemType"
    }
   },
   "unitCount": 0
  }
 },
 "std_ref": {
  "r0": {
   "Name": "Exchange Act",
   "Number": "240",
   "Publisher": "SEC",
   "Section": "12",
   "Subsection": "b",
   "role": "http://www.xbrl.org/2003/role/presentationRef"
  },
  "r1": {
   "Name": "Exchange Act",
   "Number": "240",
   "Publisher": "SEC",
   "Section": "12",
   "Subsection": "b-2",
   "role": "http://www.xbrl.org/2003/role/presentationRef"
  },
  "r2": {
   "Name": "Exchange Act",
   "Number": "240",
   "Publisher": "SEC",
   "Section": "12",
   "Subsection": "d1-1",
   "role": "http://www.xbrl.org/2003/role/presentationRef"
  },
  "r3": {
   "Name": "Exchange Act",
   "Number": "240",
   "Publisher": "SEC",
   "Section": "13e",
   "Subsection": "4c",
   "role": "http://www.xbrl.org/2003/role/presentationRef"
  },
  "r4": {
   "Name": "Exchange Act",
   "Number": "240",
   "Publisher": "SEC",
   "Section": "14d",
   "Subsection": "2b",
   "role": "http://www.xbrl.org/2003/role/presentationRef"
  },
  "r5": {
   "Name": "Exchange Act",
   "Number": "240",
   "Publisher": "SEC",
   "Section": "14a",
   "Subsection": "12",
   "role": "http://www.xbrl.org/2003/role/presentationRef"
  },
  "r6": {
   "Name": "Securities Act",
   "Number": "230",
   "Publisher": "SEC",
   "Section": "425",
   "role": "http://www.xbrl.org/2003/role/presentationRef"
  }
 },
 "version": "2.2"
}


