EQUITY FUND (WAYEX)

| SUMMARY PROSPECTUS | June 28, 2023 |
| WAYCROSS
LONG/SHORT EQUITY FUND (WAYEX) |
|
| Before you invest, you may want to review the Fund’s prospectus and Statement of Additional Information (“SAI”), which contain more information about the Fund and its risks. You can find the Fund’s Prospectus, SAI and other information about the Fund online at http://www.waycrossfunds.com. You can also get this information at no cost by calling 1-866-267-4304 or by sending an email request to Fulfillment@ultimusfundsolutions.com. The current Prospectus and SAI, each dated June 28, 2023, are incorporated by reference into this Summary Prospectus. | |
INVESTMENT OBJECTIVE
The Waycross Long/Short Equity Fund (the “Fund”) seeks long-term capital appreciation with a secondary emphasis on capital preservation.
FEES AND EXPENSES
This table describes the fees and expenses that you may pay if you buy, hold, and sell shares of the Fund. You may pay other fees, such as brokerage commissions and other fees to financial intermediaries, which are not reflected in the table and example.
Shareholder Fees
| (fees paid directly from your investment) | None |
Annual Fund Operating Expenses
(expenses that you pay each year as a percentage of the value of your investment)
| Management Fees | 1.25 | % | ||
| Distribution and/or Service (12b-1) Fees | None | |||
| Other Expenses | ||||
| Dividend expense on securities sold short | 0.77 | % | ||
| Brokerage expenses on securities sold short | 0.00 | % | ||
| Other operating expenses | 0.25 | % | ||
| Total Other Expenses | 1.02 | % | ||
| Acquired Fund Fees and Expenses(1) | 0.01 | % | ||
| Total Annual Fund Operating Expenses | 2.28 | % |
| (1) | Acquired Fund Fees and Expenses are the indirect costs of investing in other investment companies. The operating expenses in this fee table will not correlate to the expense ratio in the Fund’s financial highlights because the financial statements include only the direct operating expenses incurred by the Fund, not the indirect costs of investing in other investment companies. |
Example
This Example is intended to help you compare the cost of investing in the Fund with the cost of investing in other mutual funds. The Example assumes that you invest $10,000 in the Fund for the time periods indicated and then redeem all your shares at the end of those periods. The Example also assumes that your investment has a 5% return each year and the operating expenses of the Fund remain the same during the periods listed below. Although your actual costs may be higher or lower, based on these assumptions your costs would be:
| 1 Year | 3 Years | 5 Years | 10 Years |
| $231 | $712 | $1,220 | $2,615 |
Portfolio Turnover
The Fund pays transaction costs, such as commissions, when it buys and sells securities (or “turns over” its portfolio). A higher portfolio turnover rate may indicate higher transaction costs and may result in higher taxes when Fund shares are held in a taxable account. These costs, which are not reflected in Annual Fund Operating Expenses or in the Example, affect the Fund’s performance. During the most recent fiscal year, the Fund’s portfolio turnover rate was 74% of the average value of its portfolio.
PRINCIPAL INVESTMENT STRATEGIES
The Fund pursues its investment objective by investing under normal circumstances in long and short equity positions. The Fund’s long positions are purchased with the intended goal of benefitting from rising valuations. The Fund’s short positions are purchased with the intended goal of benefitting from declining valuations or as a hedge against long positions. Under normal circumstances, the Fund will invest at least 80% of its net assets (plus the amount of any borrowings for investment purposes) in equity securities traded in the U.S. This investment policy may be changed without shareholder approval upon at least 60 days’ prior written notice to shareholders.
1
The Fund’s long positions will principally consist of common stocks of mid-capitalization and large-capitalization companies with attractive valuations based on the Adviser’s proprietary analysis. The Adviser defines mid-capitalization companies as companies with a total market capitalization of between $1 billion and $10 billion at the time of purchase and large capitalization companies as companies with a total market capitalization of $10 billion or more at the time of purchase. For these positions, the Adviser generates a focus universe of approximately 300 companies traded in the U.S. The Adviser analyzes each investment candidate, evaluating company specific metrics (“key factors”) that the Adviser deems most likely to affect annual earnings, and then ranks the companies based on the Adviser’s assessment of these key factors. The Adviser then employs its proprietary earnings models to determine price target ranges for each stock in the focus universe. Following further analysis, the Adviser buys stocks for the Fund’s portfolio that it determines to have improving key factors that are available at reasonable valuations.
The Fund will establish short positions in common stocks of mid-capitalization and large-capitalization companies. The Fund will typically sell short securities based on the following criteria: 1) to seek to take advantage of companies the Adviser has identified as overvalued; 2) when the Adviser determines that a company’s key factors are weakening; and/or 3) to hedge market exposures from the Fund’s long positions. The Adviser will typically identify securities to sell short during the process of generating the focus universe of investment candidates.
The Adviser will sell a long position when there is a material adverse change in the issuer’s key factors and will cover a short position when there is a material positive change in the issuer’s key factors. Additionally, the Adviser sets a target price for each security in the Fund’s portfolio that is updated periodically (normally at least quarterly) and when a security reaches or exceeds its target price, the Adviser’s strategy typically requires that the security be sold. A security position may also be sold when the Adviser believes other investment opportunities are more attractive or that the security is unlikely to benefit from current business, market, or economic conditions if a long position, or the company’s prospects have improved in the case of a short position.
Under normal market conditions, the Fund expects to maintain a net long exposure (i.e., the market value of the Fund’s long positions minus the market value of the Fund’s short positions) of at most 60%; however, the Adviser seeks to target a net long exposure of approximately 50% over a full market cycle.
PRINCIPAL RISKS
As with any mutual fund investment, there is a risk that you could lose money by investing in the Fund. The success of the Fund’s investment strategy depends upon the Adviser’s skill in selecting securities for purchase and sale by the Fund and there is no assurance that the Fund will achieve its investment objective. Because of the types of securities in which the Fund invests and the investment techniques the Adviser uses, the Fund is designed for investors who are investing for the long term. The Fund may not be appropriate for use as a complete investment program. The principal risks of an investment in the Fund are described below.
Long/Short Strategy Risk. The Adviser expects to employ a “long/short” strategy for the Fund, meaning that the Fund expects to invest in both long positions and short positions. There is the risk that the Fund’s long or short positions will not perform as expected, and losses on one type of position could more than offset gains on the other, or both positions may suffer losses. Additionally, there can be no assurance that the Fund’s short positions will be successful in hedging against portfolio risk.
Short Sales Risk. The Fund expects to sell securities short. The Fund will incur a loss because of a short sale if the price of the security sold short increases in value between the date of the short sale and the date on which the Fund purchases the security to replace the borrowed security. In addition, the lender of the borrowed security may request, or market conditions may dictate, that the securities sold short be returned to the lender on short notice, and, as a result, the Fund may have to buy the securities sold short at an unfavorable time and for an unfavorable price. If this occurs, the Fund’s investment may result in a loss. The Fund’s losses are potentially unlimited in a short sale transaction.
Market Risk. Market risk is the risk that the value of the securities in the Fund’s portfolio may decline due to daily fluctuations in the securities markets that are beyond the Adviser’s control, including fluctuations in interest rates, the quality of the Fund’s investments, economic conditions, and general equity market conditions. Certain market events could increase volatility and exacerbate market risk, such as changes in governments’ economic policies, political turmoil, environmental events, trade disputes, and epidemics, pandemics, or other public health issues. Turbulence in financial markets, and reduced liquidity in equity, credit and fixed income markets may negatively affect many issuers domestically and around the world, and can result in trading halts, any of which could have an adverse impact on the Fund. During periods of market volatility, security prices (including securities held by the Fund) could fall drastically and rapidly, and therefore adversely affect the Fund.
2
Large-Capitalization Company Risk. Large-capitalization companies are more mature and may be unable to respond as quickly as smaller companies to new competitive challenges, such as changes in technology and consumer tastes, and may not be able to attain the high growth rate of successful smaller companies, especially during extended periods of economic expansion.
Mid-Capitalization Company Risk. Investments in mid capitalization companies often involve higher risks than large capitalization companies because these companies may lack the management experience, financial resources, product diversification and competitive strengths of larger companies. Therefore, the securities of mid-capitalization companies may be more susceptible to market downturns and other events, and their prices may be subject to greater price fluctuations. Mid capitalization companies are typically subject to greater changes in earnings and business prospects than larger, more established companies and may not be widely followed by investors, which can lower the demand for their stock.
Management Style Risk. The Adviser’s method of security selection may not be successful, and the Fund may underperform relative to its benchmark index or to other mutual funds that employ similar investment strategies. In addition, the Adviser may select investments that fail to perform as anticipated. The ability of the Fund to meet its investment objective is directly related to the success of the Adviser’s investment process and there is no guarantee that the Adviser’s judgments about the attractiveness, value and potential appreciation of a particular investment for the Fund will be correct or produce the desired results.
Value Stock Risk. Investments in value stocks present the risk that a stock may decline in value or never reach the value the Adviser believes is its full market value, either because the market fails to recognize what the Adviser considers to be the company’s true business value or because the Adviser’s assessment of the company’s prospects was not correct. Issuers of value stocks may have experienced adverse business developments or may be subject to special risks that have caused the stock to be out of favor. In addition, the Fund’s value investment style may go out of favor with investors, negatively affecting the Fund’s performance.
Sector Risk. While the Fund does not have a principal investment strategy to focus its investments in any particular sector, the Fund may have significant exposure to one or more sectors that the Adviser believes offer more growth potential in current market conditions. The Fund may face various risks associated with investing substantially in certain sectors, such as that an individual sector may be more volatile than the broader market, or could perform differently, and that the stocks of multiple companies within a sector could simultaneously decline in price because of an event that affects the entire sector.
PERFORMANCE SUMMARY
The Fund was reorganized as of the close of business on November 17, 2020, from a series of Ultimus Managers Trust, an Ohio business trust (the “Predecessor Fund”), to a series of Waycross Independent Trust, a Delaware statutory trust (the “Reorganization”). While the Fund’s investment objective, principal investment strategies, and risks are identical to the Predecessor Fund and theoretically would have invested in the same portfolio of securities, the Fund’s performance may be different than the performance of the Predecessor Fund due to, among other things, differences in fees and expenses.
The Fund has adopted the performance of the Predecessor Fund, and the performance information presented below for the Fund reflects the performance of the Predecessor Fund for periods prior to November 17, 2020. The bar chart and table that follow provide some indication of the risks of investing in the Fund by showing changes in the Fund’s performance from year to year and by showing how the Fund’s average annual total returns for one year, five years and since inception compare with those of a broad-based securities market index. How the Fund has performed in the past (before and after taxes) is not necessarily an indication of how the Fund will perform in the future. Updated performance information, current through the most recent month end, is available by calling 1-866-267-4304 or by visiting the Fund’s website at http://www.waycrossfunds.com.
Calendar Year Returns
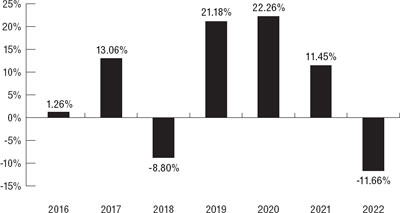
The Fund’s year-to-date return through March 31, 2023 is 3.68%.
Quarterly Returns During This Time Period
| Highest: | 13.91% (quarter ended June 30, 2020) |
| Lowest: | (14.43)% (quarter ended December 31, 2018) |
3
Average Annual Total Returns
(for periods ended December 31, 2022)
| Since | |||
| One | Five | Inception | |
| Year | Years | (April 29, 2015) | |
| Waycross Long/Short Equity Fund | |||
| Return Before Taxes | (11.66)% | 5.87% | 4.96% |
| Return After Taxes on Distributions | (11.66)% | 5.51% | 4.69% |
| Return After Taxes on Distributions and Sale of Fund Shares | (6.90)% | 4.61% | 3.92% |
| S&P 500 Index Total Return Index (reflects no deduction for fees, expenses, or taxes) | (18.11)% | 9.42% | 10.20% |
| S&P 500 Index Total Return Index/Treasury Bill Index (reflects no deduction for fees, expenses, or taxes) | (8.24)% | 5.73% | 5.84% |
After-tax returns are calculated using the historical highest individual federal marginal income tax rates and do not reflect the impact of state and local taxes. Actual after-tax returns depend on an investor’s tax situation and may differ from those shown above. After-tax returns shown are not relevant to investors who hold their shares through tax-deferred arrangements, such as a 401(k) plan or an individual retirement account (“IRA”). Return After Taxes on Distributions and Sale of Fund Shares may be higher than other returns for the same period due to a tax benefit of realizing a capital loss on the sale of Fund shares.
MANAGEMENT OF THE FUND
Waycross Partners, LLC is the Fund’s investment adviser.
| Portfolio Managers |
Investment Experience with the Fund |
Primary
Title with Adviser |
| Benjamin
H. Thomas, CFA |
Manager of the Fund since its inception in 2015 | Founding Principal, Chief Investment Officer, and Portfolio Manager |
| John
W. Ferreby, CFA |
Manager of the Fund since January 2017 | Portfolio Manager |
PURCHASE AND SALE OF FUND SHARES
Minimum Initial Investment
The minimum investment amount is $5,000 for all regular accounts.
Minimum Additional Investment
Once an account is open, additional purchases of Fund shares may be made at any time in any amount.
General Information
You may purchase or redeem (sell) shares of the Fund on each day that the New York Stock Exchange (“NYSE”) is open for business. Transactions may be initiated by written request, by telephone or through your financial intermediary. Written requests to the Fund should be sent to the Waycross Long/Short Equity Fund, c/o Ultimus Fund Solutions, LLC, P.O. Box 46707, Cincinnati, Ohio 45246-0707. For more information about purchasing and redeeming shares, please see “How to Buy Shares” and “How to Redeem Shares” in this Prospectus or call 1-866-267-4304 for assistance.
TAX INFORMATION
The Fund’s distributions are taxed as ordinary income or capital gains, unless you are investing through a tax-deferred arrangement, such as a 401(k) plan or an IRA. Such tax-deferred arrangements may be taxed later upon withdrawal of monies from those arrangements.
PAYMENTS TO BROKER-DEALERS AND OTHER FINANCIAL INTERMEDIARIES
If you purchase the Fund through a broker-dealer or any other financial intermediary (such as a bank), the Fund and its related companies may pay the intermediary for the sale of Fund shares and related services. These payments may create a conflict of interest by influencing the broker-dealer or other intermediary and your salesperson to recommend the Fund over another investment. These payments are sometimes referred to as “revenue sharing.” Ask your salesperson or visit your financial intermediary’s website for more information.
4