
| REIT | Real estate investment trust | ||||
| CPA:18 – Global | Corporate Property Associates 18 – Global Incorporated | ||||
| CESH | Carey European Student Housing Fund I, L.P. | ||||
| WLT | Watermark Lodging Trust, Inc. | ||||
| Managed Programs | CPA:18 – Global (prior to the CPA:18 Merger on August 1, 2022) and CESH | ||||
| U.S. | United States | ||||
| AUM | Assets under management | ||||
| ABR | Contractual minimum annualized base rent | ||||
| SEC | Securities and Exchange Commission | ||||
| ASC | Accounting Standards Codification | ||||
| EUR | Euro | ||||
| EURIBOR | Euro Interbank Offered Rate | ||||
| SOFR | Secured Overnight Financing Rate | ||||
| SONIA | Sterling Overnight Index Average | ||||
| TIBOR | Tokyo Interbank Offered Rate | ||||
| LIBOR | London Interbank Offered Rate | ||||
| CPA:18 Merger | Our merger with CPA:18 – Global, which was completed on August 1, 2022 | ||||
| Table of Contents | |||||
| Overview | |||||
| Financial Results | |||||
| Statements of Income – Last Five Quarters | |||||
| FFO and AFFO – Last Five Quarters | |||||
| Balance Sheets and Capitalization | |||||
| Real Estate | |||||
| Investment Activity | |||||
| Appendix | |||||
Adjusted EBITDA – Last Five Quarters | |||||
| Summary Metrics | |||||
| Financial Results | |||||||||||||||||||||||
| Real Estate Segment | |||||||||||||||||||||||
Total (a) | |||||||||||||||||||||||
| Revenues, including reimbursable costs – consolidated ($000s) | $ | 402,142 | $ | 402,629 | |||||||||||||||||||
| Net income (loss) attributable to W. P. Carey ($000s) | 210,142 | 209,538 | |||||||||||||||||||||
| Net income attributable to W. P. Carey per diluted share | 1.00 | 1.00 | |||||||||||||||||||||
Normalized pro rata cash NOI from real estate ($000s) (b) (c) | 346,170 | 346,170 | |||||||||||||||||||||
Adjusted EBITDA ($000s) (b) (c) | 341,122 | 341,523 | |||||||||||||||||||||
AFFO attributable to W. P. Carey ($000s) (b) (c) | 269,955 | 269,676 | |||||||||||||||||||||
AFFO attributable to W. P. Carey per diluted share (b) (c) | 1.29 | 1.29 | |||||||||||||||||||||
| Dividends declared per share – current quarter | 1.065 | ||||||||||||||||||||||
| Dividends declared per share – current quarter annualized | 4.260 | ||||||||||||||||||||||
| Dividend yield – annualized, based on quarter end share price of $78.15 | 5.5 | % | |||||||||||||||||||||
Dividend payout ratio – for the full year ended December 31, 2022 (d) | 80.2 | % | |||||||||||||||||||||
| Balance Sheet and Capitalization | |||||||||||||||||||||||
| Equity market capitalization – based on quarter end share price of $78.15 ($000s) | $ | 16,460,027 | |||||||||||||||||||||
Pro rata net debt ($000s) (e) | 7,853,988 | ||||||||||||||||||||||
| Enterprise value ($000s) | 24,314,015 | ||||||||||||||||||||||
| Total consolidated debt ($000s) | 7,877,748 | ||||||||||||||||||||||
Gross assets ($000s) (f) | 19,802,421 | ||||||||||||||||||||||
Liquidity ($000s) (g) | 2,221,039 | ||||||||||||||||||||||
Pro rata net debt to enterprise value (c) | 32.3 | % | |||||||||||||||||||||
Pro rata net debt to adjusted EBITDA (annualized) (b) (c) | 5.7x | ||||||||||||||||||||||
| Total consolidated debt to gross assets | 39.8 | % | |||||||||||||||||||||
| Total consolidated secured debt to gross assets | 5.7 | % | |||||||||||||||||||||
Cash interest expense coverage ratio (b) | 6.3x | ||||||||||||||||||||||
Weighted-average interest rate (c) | 3.0 | % | |||||||||||||||||||||
Weighted-average debt maturity (years) (c) | 4.4 | ||||||||||||||||||||||
| Moody's Investors Service – issuer rating | Baa1 (stable) | ||||||||||||||||||||||
Standard & Poor's Ratings Services – issuer rating (h) | BBB+ (stable) | ||||||||||||||||||||||
| Real Estate Portfolio (Pro Rata) | |||||||||||||||||||||||
ABR – total portfolio ($000s) (i) | $ | 1,381,899 | |||||||||||||||||||||
ABR – unencumbered portfolio (% / $000s) (i) (j) | 89.0% / | $ | 1,229,396 | ||||||||||||||||||||
| Number of net-leased properties | 1,449 | ||||||||||||||||||||||
Number of operating properties (k) | 87 | ||||||||||||||||||||||
Number of tenants – net-leased properties | 392 | ||||||||||||||||||||||
| ABR from top ten tenants as a % of total ABR – net-leased properties | 18.1 | % | |||||||||||||||||||||
ABR from investment grade tenants as a % of total ABR – net-leased properties (l) | 31.9 | % | |||||||||||||||||||||
Contractual same store growth (m) | 3.4 | % | |||||||||||||||||||||
| Net-leased properties – square footage (millions) | 176.0 | ||||||||||||||||||||||
| Occupancy – net-leased properties | 98.8 | % | |||||||||||||||||||||
| Weighted-average lease term (years) | 10.8 | ||||||||||||||||||||||
| Investment volume – current quarter ($000s) | $ | 158,520 | |||||||||||||||||||||
| Dispositions – current quarter ($000s) | 67,632 | ||||||||||||||||||||||
| Maximum commitment for capital investments and commitments expected to be completed during 2023 ($000s) | 87,660 | ||||||||||||||||||||||
| Construction loan funding expected to be completed during 2023 ($000s) | 68,719 | ||||||||||||||||||||||
| Total capital investments, commitments and construction loan funding expected to be completed during 2023 ($000s) | 156,379 | ||||||||||||||||||||||
 | Investing for the long runTM | 1 | |||||||
| Investing for the long runTM | 2 | |||||||
Components of Net Asset Value (a) | |||||
| Real Estate | Three Months Ended Dec. 31, 2022 | Annualized | |||||||||||||||
Normalized pro rata cash NOI (b) (c) | $ | 346,170 | $ | 1,384,680 | |||||||||||||
| Components of normalized pro rata cash NOI: | |||||||||||||||||
| Net lease normalized pro rata cash NOI | 328,938 | 1,315,752 | |||||||||||||||
Self-storage and other operating properties normalized pro rata cash NOI (d) | 17,232 | 68,928 | |||||||||||||||
| Balance Sheet – Selected Information (Consolidated Unless Otherwise Stated) | As of Dec. 31, 2022 | ||||||||||||||||
| Assets | |||||||||||||||||
Book value of real estate excluded from normalized pro rata cash NOI (e) | $ | 192,878 | |||||||||||||||
| Cash and cash equivalents | 167,996 | ||||||||||||||||
Las Vegas retail complex construction loan (f) | 196,352 | ||||||||||||||||
| Other secured loans receivable, net | 39,250 | ||||||||||||||||
| Due from affiliates | 919 | ||||||||||||||||
| Other assets, net: | |||||||||||||||||
| Investment in shares of Lineage Logistics (a cold storage REIT) | $ | 404,921 | |||||||||||||||
| Straight-line rent adjustments | 292,336 | ||||||||||||||||
| Deferred charges | 59,581 | ||||||||||||||||
| Non-rent tenant and other receivables | 58,958 | ||||||||||||||||
| Office lease right-of-use assets, net | 56,674 | ||||||||||||||||
| Restricted cash, including escrow | 56,145 | ||||||||||||||||
| Taxes receivable | 43,020 | ||||||||||||||||
| Securities and derivatives | 41,017 | ||||||||||||||||
| Deferred income taxes | 20,451 | ||||||||||||||||
| Leasehold improvements, furniture and fixtures | 14,564 | ||||||||||||||||
| Prepaid expenses | 12,708 | ||||||||||||||||
Rent receivables (g) | 3,423 | ||||||||||||||||
| Other | 15,510 | ||||||||||||||||
| Total other assets, net | $ | 1,079,308 | |||||||||||||||
| Liabilities | |||||||||||||||||
Total pro rata debt outstanding (c) (h) | $ | 8,021,984 | |||||||||||||||
| Dividends payable | 228,257 | ||||||||||||||||
| Deferred income taxes | 178,959 | ||||||||||||||||
| Accounts payable, accrued expenses and other liabilities: | |||||||||||||||||
| Accounts payable and accrued expenses | $ | 173,110 | |||||||||||||||
| Operating lease liabilities | 146,302 | ||||||||||||||||
| Prepaid and deferred rents | 136,742 | ||||||||||||||||
| Tenant security deposits | 62,616 | ||||||||||||||||
| Accrued taxes payable | 46,211 | ||||||||||||||||
| Other | 58,862 | ||||||||||||||||
| Total accounts payable, accrued expenses and other liabilities | $ | 623,843 | |||||||||||||||
| Investing for the long runTM | 3 | |||||||

| Investing for the long runTM | 4 | |||||||
| Consolidated Statements of Income – Last Five Quarters | |||||
| Three Months Ended | |||||||||||||||||||||||||||||
| Dec. 31, 2022 | Sep. 30, 2022 | Jun. 30, 2022 | Mar. 31, 2022 | Dec. 31, 2021 | |||||||||||||||||||||||||
| Revenues | |||||||||||||||||||||||||||||
| Real Estate: | |||||||||||||||||||||||||||||
| Lease revenues | $ | 347,636 | $ | 331,902 | $ | 314,354 | $ | 307,725 | $ | 305,093 | |||||||||||||||||||
| Income from direct financing leases and loans receivable | 17,472 | 20,637 | 17,778 | 18,379 | 15,637 | ||||||||||||||||||||||||
| Operating property revenues | 28,951 | 21,350 | 5,064 | 3,865 | 4,004 | ||||||||||||||||||||||||
Other lease-related income (a) | 8,083 | 8,192 | 2,591 | 14,122 | 45,590 | ||||||||||||||||||||||||
| 402,142 | 382,081 | 339,787 | 344,091 | 370,324 | |||||||||||||||||||||||||
| Investment Management: | |||||||||||||||||||||||||||||
| Asset management and other revenue | 383 | 1,197 | 3,467 | 3,420 | 3,571 | ||||||||||||||||||||||||
| Reimbursable costs from affiliates | 104 | 344 | 1,143 | 927 | 985 | ||||||||||||||||||||||||
| 487 | 1,541 | 4,610 | 4,347 | 4,556 | |||||||||||||||||||||||||
| 402,629 | 383,622 | 344,397 | 348,438 | 374,880 | |||||||||||||||||||||||||
| Operating Expenses | |||||||||||||||||||||||||||||
| Depreciation and amortization | 140,749 | 132,181 | 115,080 | 115,393 | 135,662 | ||||||||||||||||||||||||
| General and administrative | 22,728 | 22,299 | 20,841 | 23,084 | 19,591 | ||||||||||||||||||||||||
| Reimbursable tenant costs | 21,084 | 18,874 | 16,704 | 16,960 | 16,475 | ||||||||||||||||||||||||
| Property expenses, excluding reimbursable tenant costs | 13,879 | 11,244 | 11,851 | 13,779 | 11,466 | ||||||||||||||||||||||||
| Impairment charges — real estate | 12,734 | — | 6,206 | 20,179 | 7,945 | ||||||||||||||||||||||||
| Operating property expenses | 11,719 | 9,357 | 3,191 | 2,787 | 2,887 | ||||||||||||||||||||||||
| Stock-based compensation expense | 9,739 | 5,511 | 9,758 | 7,833 | 6,091 | ||||||||||||||||||||||||
Merger and other expenses (c) | 2,058 | 17,667 | 1,984 | (2,322) | (563) | ||||||||||||||||||||||||
| Reimbursable costs from affiliates | 104 | 344 | 1,143 | 927 | 985 | ||||||||||||||||||||||||
Impairment charges — Investment Management goodwill (b) | — | 29,334 | — | — | — | ||||||||||||||||||||||||
| 234,794 | 246,811 | 186,758 | 198,620 | 200,539 | |||||||||||||||||||||||||
| Other Income and Expenses | |||||||||||||||||||||||||||||
Other gains and (losses) (e) | 97,059 | (15,020) | (21,746) | 35,745 | (28,461) | ||||||||||||||||||||||||
| Interest expense | (67,668) | (59,022) | (46,417) | (46,053) | (47,208) | ||||||||||||||||||||||||
Non-operating income (g) | 6,526 | 9,263 | 5,974 | 8,546 | 3,156 | ||||||||||||||||||||||||
Earnings (losses) from equity method investments (f) | 6,032 | 11,304 | 7,401 | 4,772 | (6,675) | ||||||||||||||||||||||||
| Gain (loss) on sale of real estate, net | 5,845 | (4,736) | 31,119 | 11,248 | 9,511 | ||||||||||||||||||||||||
Gain on change in control of interests (d) | — | 33,931 | — | — | — | ||||||||||||||||||||||||
| 47,794 | (24,280) | (23,669) | 14,258 | (69,677) | |||||||||||||||||||||||||
| Income before income taxes | 215,629 | 112,531 | 133,970 | 164,076 | 104,664 | ||||||||||||||||||||||||
| Provision for income taxes | (6,126) | (8,263) | (6,252) | (7,083) | (5,052) | ||||||||||||||||||||||||
| Net Income | 209,503 | 104,268 | 127,718 | 156,993 | 99,612 | ||||||||||||||||||||||||
| Net loss (income) attributable to noncontrolling interests | 35 | 660 | (40) | 2 | (50) | ||||||||||||||||||||||||
| Net Income Attributable to W. P. Carey | $ | 209,538 | $ | 104,928 | $ | 127,678 | $ | 156,995 | $ | 99,562 | |||||||||||||||||||
| Basic Earnings Per Share | $ | 1.00 | $ | 0.52 | $ | 0.66 | $ | 0.82 | $ | 0.53 | |||||||||||||||||||
| Diluted Earnings Per Share | $ | 1.00 | $ | 0.51 | $ | 0.66 | $ | 0.82 | $ | 0.53 | |||||||||||||||||||
| Weighted-Average Shares Outstanding | |||||||||||||||||||||||||||||
| Basic | 209,281,888 | 203,093,553 | 194,019,451 | 191,911,414 | 187,630,036 | ||||||||||||||||||||||||
| Diluted | 209,822,650 | 204,098,116 | 194,763,695 | 192,416,642 | 188,317,117 | ||||||||||||||||||||||||
| Dividends Declared Per Share | $ | 1.065 | $ | 1.061 | $ | 1.059 | $ | 1.057 | $ | 1.055 | |||||||||||||||||||
| Investing for the long runTM | 5 | |||||||
| Investing for the long runTM | 6 | |||||||
| Statements of Income, Real Estate – Last Five Quarters | |||||
| Three Months Ended | |||||||||||||||||||||||||||||
| Dec. 31, 2022 | Sep. 30, 2022 | Jun. 30, 2022 | Mar. 31, 2022 | Dec. 31, 2021 | |||||||||||||||||||||||||
| Revenues | |||||||||||||||||||||||||||||
| Lease revenues | $ | 347,636 | $ | 331,902 | $ | 314,354 | $ | 307,725 | $ | 305,093 | |||||||||||||||||||
| Income from direct financing leases and loans receivable | 17,472 | 20,637 | 17,778 | 18,379 | 15,637 | ||||||||||||||||||||||||
| Operating property revenues | 28,951 | 21,350 | 5,064 | 3,865 | 4,004 | ||||||||||||||||||||||||
Other lease-related income (a) | 8,083 | 8,192 | 2,591 | 14,122 | 45,590 | ||||||||||||||||||||||||
| 402,142 | 382,081 | 339,787 | 344,091 | 370,324 | |||||||||||||||||||||||||
| Operating Expenses | |||||||||||||||||||||||||||||
| Depreciation and amortization | 140,749 | 132,181 | 115,080 | 115,393 | 135,662 | ||||||||||||||||||||||||
| General and administrative | 22,728 | 22,299 | 20,841 | 23,084 | 19,591 | ||||||||||||||||||||||||
| Reimbursable tenant costs | 21,084 | 18,874 | 16,704 | 16,960 | 16,475 | ||||||||||||||||||||||||
| Property expenses, excluding reimbursable tenant costs | 13,879 | 11,244 | 11,851 | 13,779 | 11,466 | ||||||||||||||||||||||||
| Impairment charges — real estate | 12,734 | — | 6,206 | 20,179 | 7,945 | ||||||||||||||||||||||||
| Operating property expenses | 11,719 | 9,357 | 3,191 | 2,787 | 2,887 | ||||||||||||||||||||||||
| Stock-based compensation expense | 9,739 | 5,511 | 9,758 | 7,833 | 6,091 | ||||||||||||||||||||||||
Merger and other expenses (b) | 2,058 | 17,667 | 1,984 | (2,325) | (599) | ||||||||||||||||||||||||
| 234,690 | 217,133 | 185,615 | 197,690 | 199,518 | |||||||||||||||||||||||||
| Other Income and Expenses | |||||||||||||||||||||||||||||
Other gains and (losses) (c) | 96,846 | (13,960) | (20,155) | 34,418 | (27,131) | ||||||||||||||||||||||||
| Interest expense | (67,668) | (59,022) | (46,417) | (46,053) | (47,208) | ||||||||||||||||||||||||
| Non-operating income | 6,508 | 9,264 | 5,975 | 8,542 | 3,158 | ||||||||||||||||||||||||
Earnings (losses) from equity method investments in real estate (e) | 6,032 | 6,447 | 4,529 | (787) | (9,121) | ||||||||||||||||||||||||
| Gain (loss) on sale of real estate, net | 5,845 | (4,736) | 31,119 | 11,248 | 9,511 | ||||||||||||||||||||||||
Gain on change in control of interests (d) | — | 11,405 | — | — | — | ||||||||||||||||||||||||
| 47,563 | (50,602) | (24,949) | 7,368 | (70,791) | |||||||||||||||||||||||||
| Income before income taxes | 215,015 | 114,346 | 129,223 | 153,769 | 100,015 | ||||||||||||||||||||||||
| Provision for income taxes | (4,908) | (3,631) | (5,955) | (6,913) | (5,331) | ||||||||||||||||||||||||
| Net Income from Real Estate | 210,107 | 110,715 | 123,268 | 146,856 | 94,684 | ||||||||||||||||||||||||
| Net loss (income) attributable to noncontrolling interests | 35 | 660 | (40) | 2 | (50) | ||||||||||||||||||||||||
| Net Income from Real Estate Attributable to W. P. Carey | $ | 210,142 | $ | 111,375 | $ | 123,228 | $ | 146,858 | $ | 94,634 | |||||||||||||||||||
| Basic Earnings Per Share | $ | 1.00 | $ | 0.55 | $ | 0.64 | $ | 0.77 | $ | 0.50 | |||||||||||||||||||
| Diluted Earnings Per Share | $ | 1.00 | $ | 0.54 | $ | 0.64 | $ | 0.77 | $ | 0.50 | |||||||||||||||||||
| Weighted-Average Shares Outstanding | |||||||||||||||||||||||||||||
| Basic | 209,281,888 | 203,093,553 | 194,019,451 | 191,911,414 | 187,630,036 | ||||||||||||||||||||||||
| Diluted | 209,822,650 | 204,098,116 | 194,763,695 | 192,416,642 | 188,317,117 | ||||||||||||||||||||||||
| Investing for the long runTM | 7 | |||||||
| Statements of Income, Investment Management – Last Five Quarters | |||||
| Three Months Ended | |||||||||||||||||||||||||||||
| Dec. 31, 2022 | Sep. 30, 2022 | Jun. 30, 2022 | Mar. 31, 2022 | Dec. 31, 2021 | |||||||||||||||||||||||||
| Revenues | |||||||||||||||||||||||||||||
| Asset management and other revenue | $ | 383 | $ | 1,197 | $ | 3,467 | $ | 3,420 | $ | 3,571 | |||||||||||||||||||
| Reimbursable costs from affiliates | 104 | 344 | 1,143 | 927 | 985 | ||||||||||||||||||||||||
| 487 | 1,541 | 4,610 | 4,347 | 4,556 | |||||||||||||||||||||||||
| Operating Expenses | |||||||||||||||||||||||||||||
| Reimbursable costs from affiliates | 104 | 344 | 1,143 | 927 | 985 | ||||||||||||||||||||||||
Impairment charges — Investment Management goodwill (a) | — | 29,334 | — | — | — | ||||||||||||||||||||||||
| Merger and other expenses | — | — | — | 3 | 36 | ||||||||||||||||||||||||
| 104 | 29,678 | 1,143 | 930 | 1,021 | |||||||||||||||||||||||||
| Other Income and Expenses | |||||||||||||||||||||||||||||
| Other gains and (losses) | 213 | (1,060) | (1,591) | 1,327 | (1,330) | ||||||||||||||||||||||||
| Non-operating income (loss) | 18 | (1) | (1) | 4 | (2) | ||||||||||||||||||||||||
Gain on change in control of interests (b) | — | 22,526 | — | — | — | ||||||||||||||||||||||||
| Earnings from equity method investments in the Managed Programs | — | 4,857 | 2,872 | 5,559 | 2,446 | ||||||||||||||||||||||||
| 231 | 26,322 | 1,280 | 6,890 | 1,114 | |||||||||||||||||||||||||
| Income (loss) before income taxes | 614 | (1,815) | 4,747 | 10,307 | 4,649 | ||||||||||||||||||||||||
| (Provision for) benefit from income taxes | (1,218) | (4,632) | (297) | (170) | 279 | ||||||||||||||||||||||||
| Net (Loss) Income from Investment Management Attributable to W. P. Carey | $ | (604) | $ | (6,447) | $ | 4,450 | $ | 10,137 | $ | 4,928 | |||||||||||||||||||
| Basic (Loss) Earnings Per Share | $ | 0.00 | $ | (0.03) | $ | 0.02 | $ | 0.05 | $ | 0.03 | |||||||||||||||||||
| Diluted (Loss) Earnings Per Share | $ | 0.00 | $ | (0.03) | $ | 0.02 | $ | 0.05 | $ | 0.03 | |||||||||||||||||||
| Weighted-Average Shares Outstanding | |||||||||||||||||||||||||||||
| Basic | 209,281,888 | 203,093,553 | 194,019,451 | 191,911,414 | 187,630,036 | ||||||||||||||||||||||||
| Diluted | 209,822,650 | 204,098,116 | 194,763,695 | 192,416,642 | 188,317,117 | ||||||||||||||||||||||||
| Investing for the long runTM | 8 | |||||||
| FFO and AFFO, Consolidated – Last Five Quarters | |||||
| Three Months Ended | |||||||||||||||||||||||||||||
| Dec. 31, 2022 | Sep. 30, 2022 | Jun. 30, 2022 | Mar. 31, 2022 | Dec. 31, 2021 | |||||||||||||||||||||||||
| Net income attributable to W. P. Carey | $ | 209,538 | $ | 104,928 | $ | 127,678 | $ | 156,995 | $ | 99,562 | |||||||||||||||||||
| Adjustments: | |||||||||||||||||||||||||||||
| Depreciation and amortization of real property | 140,157 | 131,628 | 114,333 | 114,646 | 134,149 | ||||||||||||||||||||||||
| Impairment charges — real estate | 12,734 | — | 6,206 | 20,179 | 7,945 | ||||||||||||||||||||||||
| (Gain) loss on sale of real estate, net | (5,845) | 4,736 | (31,119) | (11,248) | (9,511) | ||||||||||||||||||||||||
Gain on change in control of interests (a) | — | (33,931) | — | — | — | ||||||||||||||||||||||||
Impairment charges — Investment Management goodwill (b) | — | 29,334 | — | — | — | ||||||||||||||||||||||||
Proportionate share of adjustments to earnings from equity method investments (c) (d) | 2,296 | 2,242 | 2,934 | 7,683 | 15,183 | ||||||||||||||||||||||||
Proportionate share of adjustments for noncontrolling interests (e) | (294) | (189) | (4) | (4) | (4) | ||||||||||||||||||||||||
| Total adjustments | 149,048 | 133,820 | 92,350 | 131,256 | 147,762 | ||||||||||||||||||||||||
FFO (as defined by NAREIT) Attributable to W. P. Carey (f) | 358,586 | 238,748 | 220,028 | 288,251 | 247,324 | ||||||||||||||||||||||||
| Adjustments: | |||||||||||||||||||||||||||||
Other (gains) and losses (g) | (97,059) | 15,020 | 21,746 | (35,745) | 28,461 | ||||||||||||||||||||||||
Straight-line and other leasing and financing adjustments (h) | (14,766) | (14,326) | (14,492) | (10,847) | (53,380) | ||||||||||||||||||||||||
| Stock-based compensation | 9,739 | 5,511 | 9,758 | 7,833 | 6,091 | ||||||||||||||||||||||||
Above- and below-market rent intangible lease amortization, net | 8,652 | 11,186 | 10,548 | 11,004 | 15,082 | ||||||||||||||||||||||||
| Amortization of deferred financing costs | 5,705 | 5,223 | 3,147 | 3,128 | 3,239 | ||||||||||||||||||||||||
| Tax (benefit) expense – deferred and other | (3,325) | 1,163 | (355) | (1,242) | (2,507) | ||||||||||||||||||||||||
Merger and other expenses (i) | 2,058 | 17,667 | 1,984 | (2,322) | (563) | ||||||||||||||||||||||||
| Other amortization and non-cash items | 490 | 359 | 530 | 552 | 560 | ||||||||||||||||||||||||
Proportionate share of adjustments to earnings from equity method investments (d) | (319) | (2,156) | 1,486 | (1,781) | 1,303 | ||||||||||||||||||||||||
Proportionate share of adjustments for noncontrolling interests (e) | (85) | (673) | (6) | (5) | (5) | ||||||||||||||||||||||||
| Total adjustments | (88,910) | 38,974 | 34,346 | (29,425) | (1,719) | ||||||||||||||||||||||||
AFFO Attributable to W. P. Carey (f) | $ | 269,676 | $ | 277,722 | $ | 254,374 | $ | 258,826 | $ | 245,605 | |||||||||||||||||||
| Summary | |||||||||||||||||||||||||||||
FFO (as defined by NAREIT) attributable to W. P. Carey (f) | $ | 358,586 | $ | 238,748 | $ | 220,028 | $ | 288,251 | $ | 247,324 | |||||||||||||||||||
FFO (as defined by NAREIT) attributable to W. P. Carey per diluted share (f) | $ | 1.70 | $ | 1.17 | $ | 1.13 | $ | 1.50 | $ | 1.31 | |||||||||||||||||||
AFFO attributable to W. P. Carey (f) | $ | 269,676 | $ | 277,722 | $ | 254,374 | $ | 258,826 | $ | 245,605 | |||||||||||||||||||
AFFO attributable to W. P. Carey per diluted share (f) | $ | 1.29 | $ | 1.36 | $ | 1.31 | $ | 1.35 | $ | 1.30 | |||||||||||||||||||
| Diluted weighted-average shares outstanding | 209,822,650 | 204,098,116 | 194,763,695 | 192,416,642 | 188,317,117 | ||||||||||||||||||||||||
| Investing for the long runTM | 9 | |||||||
| FFO and AFFO, Real Estate – Last Five Quarters | |||||
| Three Months Ended | |||||||||||||||||||||||||||||
| Dec. 31, 2022 | Sep. 30, 2022 | Jun. 30, 2022 | Mar. 31, 2022 | Dec. 31, 2021 | |||||||||||||||||||||||||
| Net income from Real Estate attributable to W. P. Carey | $ | 210,142 | $ | 111,375 | $ | 123,228 | $ | 146,858 | $ | 94,634 | |||||||||||||||||||
| Adjustments: | |||||||||||||||||||||||||||||
| Depreciation and amortization of real property | 140,157 | 131,628 | 114,333 | 114,646 | 134,149 | ||||||||||||||||||||||||
| Impairment charges — real estate | 12,734 | — | 6,206 | 20,179 | 7,945 | ||||||||||||||||||||||||
| (Gain) loss on sale of real estate, net | (5,845) | 4,736 | (31,119) | (11,248) | (9,511) | ||||||||||||||||||||||||
Gain on change in control of interests (a) | — | (11,405) | — | — | — | ||||||||||||||||||||||||
Proportionate share of adjustments to earnings from equity method investments (b) (c) | 2,296 | 2,242 | 2,934 | 7,683 | 15,183 | ||||||||||||||||||||||||
Proportionate share of adjustments for noncontrolling interests (d) | (294) | (189) | (4) | (4) | (4) | ||||||||||||||||||||||||
| Total adjustments | 149,048 | 127,012 | 92,350 | 131,256 | 147,762 | ||||||||||||||||||||||||
FFO (as defined by NAREIT) Attributable to W. P. Carey – Real Estate (e) | 359,190 | 238,387 | 215,578 | 278,114 | 242,396 | ||||||||||||||||||||||||
| Adjustments: | |||||||||||||||||||||||||||||
Other (gains) and losses (h) | (96,846) | 13,960 | 20,155 | (34,418) | 27,131 | ||||||||||||||||||||||||
Straight-line and other leasing and financing adjustments (g) | (14,766) | (14,326) | (14,492) | (10,847) | (53,380) | ||||||||||||||||||||||||
| Stock-based compensation | 9,739 | 5,511 | 9,758 | 7,833 | 6,091 | ||||||||||||||||||||||||
Above- and below-market rent intangible lease amortization, net | 8,652 | 11,186 | 10,548 | 11,004 | 15,082 | ||||||||||||||||||||||||
| Amortization of deferred financing costs | 5,705 | 5,223 | 3,147 | 3,128 | 3,239 | ||||||||||||||||||||||||
| Tax (benefit) – deferred and other | (3,862) | (2,789) | (324) | (1,189) | (1,851) | ||||||||||||||||||||||||
Merger and other expenses (f) | 2,058 | 17,667 | 1,984 | (2,325) | (599) | ||||||||||||||||||||||||
| Other amortization and non-cash items | 490 | 359 | 530 | 552 | 560 | ||||||||||||||||||||||||
Proportionate share of adjustments to earnings from equity method investments (c) | (320) | (938) | 368 | 167 | 325 | ||||||||||||||||||||||||
Proportionate share of adjustments for noncontrolling interests (d) | (85) | (673) | (6) | (5) | (5) | ||||||||||||||||||||||||
| Total adjustments | (89,235) | 35,180 | 31,668 | (26,100) | (3,407) | ||||||||||||||||||||||||
AFFO Attributable to W. P. Carey – Real Estate (e) | $ | 269,955 | $ | 273,567 | $ | 247,246 | $ | 252,014 | $ | 238,989 | |||||||||||||||||||
| Summary | |||||||||||||||||||||||||||||
FFO (as defined by NAREIT) attributable to W. P. Carey – Real Estate (e) | $ | 359,190 | $ | 238,387 | $ | 215,578 | $ | 278,114 | $ | 242,396 | |||||||||||||||||||
FFO (as defined by NAREIT) attributable to W. P. Carey per diluted share – Real Estate (e) | $ | 1.70 | $ | 1.17 | $ | 1.11 | $ | 1.45 | $ | 1.29 | |||||||||||||||||||
AFFO attributable to W. P. Carey – Real Estate (e) | $ | 269,955 | $ | 273,567 | $ | 247,246 | $ | 252,014 | $ | 238,989 | |||||||||||||||||||
AFFO attributable to W. P. Carey per diluted share – Real Estate (e) | $ | 1.29 | $ | 1.34 | $ | 1.27 | $ | 1.31 | $ | 1.27 | |||||||||||||||||||
| Diluted weighted-average shares outstanding | 209,822,650 | 204,098,116 | 194,763,695 | 192,416,642 | 188,317,117 | ||||||||||||||||||||||||
| Investing for the long runTM | 10 | |||||||
| FFO and AFFO, Investment Management – Last Five Quarters | |||||
| Three Months Ended | |||||||||||||||||||||||||||||
| Dec. 31, 2022 | Sep. 30, 2022 | Jun. 30, 2022 | Mar. 31, 2022 | Dec. 31, 2021 | |||||||||||||||||||||||||
| Net (loss) income from Investment Management attributable to W. P. Carey | $ | (604) | $ | (6,447) | $ | 4,450 | $ | 10,137 | $ | 4,928 | |||||||||||||||||||
| Adjustments: | |||||||||||||||||||||||||||||
Impairment charges — Investment Management goodwill (a) | — | 29,334 | — | — | — | ||||||||||||||||||||||||
Gain on change in control of interests (b) | — | (22,526) | — | — | — | ||||||||||||||||||||||||
| Total adjustments | — | 6,808 | — | — | — | ||||||||||||||||||||||||
FFO (as defined by NAREIT) Attributable to W. P. Carey – Investment Management (c) | (604) | 361 | 4,450 | 10,137 | 4,928 | ||||||||||||||||||||||||
| Adjustments: | |||||||||||||||||||||||||||||
| Tax expense (benefit) – deferred and other | 537 | 3,952 | (31) | (53) | (656) | ||||||||||||||||||||||||
| Other (gains) and losses | (213) | 1,060 | 1,591 | (1,327) | 1,330 | ||||||||||||||||||||||||
Merger and other expenses | — | — | — | 3 | 36 | ||||||||||||||||||||||||
Proportionate share of adjustments to earnings from equity method investments (d) | 1 | (1,218) | 1,118 | (1,948) | 978 | ||||||||||||||||||||||||
| Total adjustments | 325 | 3,794 | 2,678 | (3,325) | 1,688 | ||||||||||||||||||||||||
AFFO Attributable to W. P. Carey – Investment Management (c) | $ | (279) | $ | 4,155 | $ | 7,128 | $ | 6,812 | $ | 6,616 | |||||||||||||||||||
| Summary | |||||||||||||||||||||||||||||
FFO (as defined by NAREIT) attributable to W. P. Carey – Investment Management (c) | $ | (604) | $ | 361 | $ | 4,450 | $ | 10,137 | $ | 4,928 | |||||||||||||||||||
FFO (as defined by NAREIT) attributable to W. P. Carey per diluted share – Investment Management (c) | $ | 0.00 | $ | 0.00 | $ | 0.02 | $ | 0.05 | $ | 0.02 | |||||||||||||||||||
AFFO attributable to W. P. Carey – Investment Management (c) | $ | (279) | $ | 4,155 | $ | 7,128 | $ | 6,812 | $ | 6,616 | |||||||||||||||||||
AFFO attributable to W. P. Carey per diluted share – Investment Management (c) | $ | 0.00 | $ | 0.02 | $ | 0.04 | $ | 0.04 | $ | 0.03 | |||||||||||||||||||
| Diluted weighted-average shares outstanding | 209,822,650 | 204,098,116 | 194,763,695 | 192,416,642 | 188,317,117 | ||||||||||||||||||||||||
| Investing for the long runTM | 11 | |||||||
| Elements of Pro Rata Statement of Income and AFFO Adjustments | |||||
Equity Method Investments (a) | Noncontrolling Interests (b) | AFFO Adjustments | ||||||||||||||||||
| Revenues | ||||||||||||||||||||
| Real Estate: | ||||||||||||||||||||
Lease revenues | $ | 5,698 | $ | (476) | $ | (9,023) | (c) | |||||||||||||
| Income from direct financing leases and loans receivable | — | — | 444 | |||||||||||||||||
| Operating property revenues: | ||||||||||||||||||||
| Hotel revenues | — | — | — | |||||||||||||||||
| Self-storage revenues | 2,397 | (21) | — | |||||||||||||||||
| Student housing revenues | — | (159) | — | |||||||||||||||||
| Other lease-related income | 1 | — | — | |||||||||||||||||
Investment Management: | ||||||||||||||||||||
| Asset management and other revenue | — | — | — | |||||||||||||||||
| Reimbursable costs from affiliates | — | — | — | |||||||||||||||||
| Operating Expenses | ||||||||||||||||||||
| Depreciation and amortization | 2,140 | (295) | (142,063) | (d) | ||||||||||||||||
| General and administrative | — | — | — | |||||||||||||||||
Reimbursable tenant costs | 229 | (80) | — | |||||||||||||||||
Property expenses, excluding reimbursable tenant costs | (424) | (32) | (394) | (e) | ||||||||||||||||
| Impairment charges — real estate | — | — | (12,734) | (e) | ||||||||||||||||
| Operating property expenses: | ||||||||||||||||||||
| Hotel expenses | — | — | — | |||||||||||||||||
| Self-storage expenses | 801 | (21) | (27) | |||||||||||||||||
| Student housing expenses | — | (75) | — | |||||||||||||||||
Stock-based compensation expense | — | — | (9,739) | (e) | ||||||||||||||||
| Merger and other expenses | — | — | (2,058) | (f) | ||||||||||||||||
Reimbursable costs from affiliates | — | — | — | |||||||||||||||||
| Other Income and Expenses | ||||||||||||||||||||
| Other gains and (losses) | — | 52 | (97,110) | (g) | ||||||||||||||||
| Interest expense | (108) | 166 | 5,707 | (h) | ||||||||||||||||
| Non-operating income | 1 | (1) | — | |||||||||||||||||
| Earnings from equity method investments: | ||||||||||||||||||||
| Income related to joint ventures | (5,036) | — | 2,044 | (i) | ||||||||||||||||
| Income related to our ownership in the Managed Programs | — | — | — | |||||||||||||||||
| Gain on sale of real estate, net | — | — | (5,845) | |||||||||||||||||
| Provision for income taxes | (207) | (11) | (3,094) | (j) | ||||||||||||||||
| Net loss attributable to noncontrolling interests | — | (53) | — | |||||||||||||||||
| Investing for the long runTM | 12 | |||||||
| Capital Expenditures | |||||
| Tenant Improvements and Leasing Costs | |||||
| Tenant improvements | $ | 4,938 | |||
| Leasing costs | 1,221 | ||||
| Tenant Improvements and Leasing Costs | 6,159 | ||||
| Maintenance Capital Expenditures | |||||
| Net-lease properties | 2,507 | ||||
| Operating properties | 681 | ||||
| Maintenance Capital Expenditures | 3,188 | ||||
| Total: Tenant Improvements and Leasing Costs, and Maintenance Capital Expenditures | $ | 9,347 | |||
| Non-Maintenance Capital Expenditures | |||||
| Net-lease properties | $ | 423 | |||
| Operating properties | — | ||||
| Non-Maintenance Capital Expenditures | $ | 423 | |||
| Other Capital Expenditures | |||||
| Net-lease properties | $ | 1,682 | |||
| Operating properties | — | ||||
| Other Capital Expenditures | $ | 1,682 | |||
| Investing for the long runTM | 13 | |||||||
| Investing for the long runTM | 14 | |||||||
| Consolidated Balance Sheets | |||||
| December 31, | |||||||||||
| 2022 | 2021 | ||||||||||
| Assets | |||||||||||
| Investments in real estate: | |||||||||||
| Land, buildings and improvements — net lease and other | $ | 13,338,857 | $ | 11,791,734 | |||||||
| Land, buildings and improvements — operating properties | 1,095,892 | 83,673 | |||||||||
| Net investments in direct financing leases and loans receivable | 771,761 | 813,577 | |||||||||
In-place lease intangible assets and other | 2,659,750 | 2,386,000 | |||||||||
Above-market rent intangible assets | 833,751 | 843,410 | |||||||||
| Investments in real estate | 18,700,011 | 15,918,394 | |||||||||
Accumulated depreciation and amortization (a) | (3,269,057) | (2,889,294) | |||||||||
| Assets held for sale, net | 57,944 | 8,269 | |||||||||
| Net investments in real estate | 15,488,898 | 13,037,369 | |||||||||
Equity method investments (b) | 327,502 | 356,637 | |||||||||
| Cash and cash equivalents | 167,996 | 165,427 | |||||||||
| Due from affiliates | 919 | 1,826 | |||||||||
| Other assets, net | 1,079,308 | 1,017,842 | |||||||||
| Goodwill | 1,037,412 | 901,529 | |||||||||
| Total assets | $ | 18,102,035 | $ | 15,480,630 | |||||||
| Liabilities and Equity | |||||||||||
| Debt: | |||||||||||
| Senior unsecured notes, net | $ | 5,916,400 | $ | 5,701,913 | |||||||
| Unsecured term loans, net | 552,539 | 310,583 | |||||||||
| Unsecured revolving credit facility | 276,392 | 410,596 | |||||||||
| Non-recourse mortgages, net | 1,132,417 | 368,524 | |||||||||
| Debt, net | 7,877,748 | 6,791,616 | |||||||||
| Accounts payable, accrued expenses and other liabilities | 623,843 | 572,846 | |||||||||
Below-market rent and other intangible liabilities, net | 184,584 | 183,286 | |||||||||
| Deferred income taxes | 178,959 | 145,572 | |||||||||
| Dividends payable | 228,257 | 203,859 | |||||||||
| Total liabilities | 9,093,391 | 7,897,179 | |||||||||
Preferred stock, $0.001 par value, 50,000,000 shares authorized; none issued | — | — | |||||||||
Common stock, $0.001 par value, 450,000,000 shares authorized; 210,620,949 and 190,013,751 shares, respectively, issued and outstanding | 211 | 190 | |||||||||
| Additional paid-in capital | 11,706,836 | 9,977,686 | |||||||||
| Distributions in excess of accumulated earnings | (2,486,633) | (2,224,231) | |||||||||
| Deferred compensation obligation | 57,012 | 49,810 | |||||||||
| Accumulated other comprehensive loss | (283,780) | (221,670) | |||||||||
| Total stockholders' equity | 8,993,646 | 7,581,785 | |||||||||
| Noncontrolling interests | 14,998 | 1,666 | |||||||||
| Total equity | 9,008,644 | 7,583,451 | |||||||||
| Total liabilities and equity | $ | 18,102,035 | $ | 15,480,630 | |||||||
| Investing for the long runTM | 15 | |||||||
| Capitalization | |||||
| Description | Shares | Share Price | Market Value | |||||||||||||||||||||||
| Equity | ||||||||||||||||||||||||||
| Common equity | 210,620,949 | $ | 78.15 | $ | 16,460,027 | |||||||||||||||||||||
| Preferred equity | — | |||||||||||||||||||||||||
| Total Equity Market Capitalization | 16,460,027 | |||||||||||||||||||||||||
Outstanding Balance (a) | ||||||||||||||||||||||||||
| Pro Rata Debt | ||||||||||||||||||||||||||
| Non-recourse mortgages | 1,225,103 | |||||||||||||||||||||||||
| Unsecured term loans (due February 20, 2025) | 554,014 | |||||||||||||||||||||||||
| Unsecured revolving credit facility (due February 20, 2025) | 276,392 | |||||||||||||||||||||||||
| Senior unsecured notes: | ||||||||||||||||||||||||||
| Due April 1, 2024 (USD) | 500,000 | |||||||||||||||||||||||||
| Due July 19, 2024 (EUR) | 533,300 | |||||||||||||||||||||||||
| Due February 1, 2025 (USD) | 450,000 | |||||||||||||||||||||||||
| Due April 9, 2026 (EUR) | 533,300 | |||||||||||||||||||||||||
| Due October 1, 2026 (USD) | 350,000 | |||||||||||||||||||||||||
| Due April 15, 2027 (EUR) | 533,300 | |||||||||||||||||||||||||
| Due April 15, 2028 (EUR) | 533,300 | |||||||||||||||||||||||||
| Due July 15, 2029 (USD) | 325,000 | |||||||||||||||||||||||||
| Due September 28, 2029 (EUR) | 159,990 | |||||||||||||||||||||||||
| Due June 1, 2030 (EUR) | 559,965 | |||||||||||||||||||||||||
| Due February 1, 2031 (USD) | 500,000 | |||||||||||||||||||||||||
| Due February 1, 2032 (USD) | 350,000 | |||||||||||||||||||||||||
| Due September 28, 2032 (EUR) | 213,320 | |||||||||||||||||||||||||
| Due April 1, 2033 (USD) | 425,000 | |||||||||||||||||||||||||
| Total Pro Rata Debt | 8,021,984 | |||||||||||||||||||||||||
| Total Capitalization | $ | 24,482,011 | ||||||||||||||||||||||||
| Investing for the long runTM | 16 | |||||||
| Debt Overview | |||||
| USD-Denominated | EUR-Denominated | Other Currencies (a) | Total | |||||||||||||||||||||||||||||||||||||||||||||||||||||||||||||||||
| Outstanding Balance | ||||||||||||||||||||||||||||||||||||||||||||||||||||||||||||||||||||
| Out-standing Balance (in USD) | Weigh-ted Avg. Interest Rate | Out-standing Balance (in USD) | Weigh-ted Avg. Interest Rate | Out-standing Balance (in USD) | Weigh-ted Avg. Interest Rate | Amount (in USD) | % of Total | Weigh-ted Avg. Interest Rate | Weigh-ted Avg. Maturity (Years) | |||||||||||||||||||||||||||||||||||||||||||||||||||||||||||
Non-Recourse Debt (b) (c) | ||||||||||||||||||||||||||||||||||||||||||||||||||||||||||||||||||||
| Fixed | $ | 648,093 | 4.8 | % | $ | 150,043 | 2.6 | % | $ | 49,815 | 4.2 | % | $ | 847,951 | 10.6 | % | 4.4 | % | 2.0 | |||||||||||||||||||||||||||||||||||||||||||||||||
| Variable: | ||||||||||||||||||||||||||||||||||||||||||||||||||||||||||||||||||||
| Floating | 25,680 | 4.6 | % | 98,789 | 2.3 | % | 83,497 | 6.5 | % | 207,966 | 2.6 | % | 4.3 | % | 0.9 | |||||||||||||||||||||||||||||||||||||||||||||||||||||
| Swapped | 34,918 | 4.7 | % | 123,120 | 2.5 | % | — | — | % | 158,038 | 2.0 | % | 3.0 | % | 1.4 | |||||||||||||||||||||||||||||||||||||||||||||||||||||
| Capped | — | — | % | 11,148 | 3.8 | % | — | — | % | 11,148 | 0.1 | % | 3.8 | % | 0.6 | |||||||||||||||||||||||||||||||||||||||||||||||||||||
Total Pro Rata Non-Recourse Debt | 708,691 | 4.8 | % | 383,100 | 2.5 | % | 133,312 | 5.6 | % | 1,225,103 | 15.3 | % | 4.2 | % | 1.7 | |||||||||||||||||||||||||||||||||||||||||||||||||||||
Recourse Debt (b) (c) | ||||||||||||||||||||||||||||||||||||||||||||||||||||||||||||||||||||
| Fixed – Senior unsecured notes: | ||||||||||||||||||||||||||||||||||||||||||||||||||||||||||||||||||||
| Due April 1, 2024 | 500,000 | 4.6 | % | — | — | % | — | — | % | 500,000 | 6.2 | % | 4.6 | % | 1.3 | |||||||||||||||||||||||||||||||||||||||||||||||||||||
| Due July 19, 2024 | — | — | % | 533,300 | 2.3 | % | — | — | % | 533,300 | 6.6 | % | 2.3 | % | 1.6 | |||||||||||||||||||||||||||||||||||||||||||||||||||||
| Due February 1, 2025 | 450,000 | 4.0 | % | — | — | % | — | — | % | 450,000 | 5.7 | % | 4.0 | % | 2.1 | |||||||||||||||||||||||||||||||||||||||||||||||||||||
| Due April 9, 2026 | — | — | % | 533,300 | 2.3 | % | — | — | % | 533,300 | 6.6 | % | 2.3 | % | 3.3 | |||||||||||||||||||||||||||||||||||||||||||||||||||||
| Due October 1, 2026 | 350,000 | 4.3 | % | — | — | % | — | — | % | 350,000 | 4.4 | % | 4.3 | % | 3.8 | |||||||||||||||||||||||||||||||||||||||||||||||||||||
| Due April 15, 2027 | — | — | % | 533,300 | 2.1 | % | — | — | % | 533,300 | 6.6 | % | 2.1 | % | 4.3 | |||||||||||||||||||||||||||||||||||||||||||||||||||||
| Due April 15, 2028 | — | — | % | 533,300 | 1.4 | % | — | — | % | 533,300 | 6.6 | % | 1.4 | % | 5.3 | |||||||||||||||||||||||||||||||||||||||||||||||||||||
| Due July 15, 2029 | 325,000 | 3.9 | % | — | — | % | — | — | % | 325,000 | 4.1 | % | 3.9 | % | 6.5 | |||||||||||||||||||||||||||||||||||||||||||||||||||||
| Due September 28, 2029 | — | — | % | 159,990 | 3.4 | % | — | — | % | 159,990 | 2.0 | % | 3.4 | % | 6.7 | |||||||||||||||||||||||||||||||||||||||||||||||||||||
| Due June 1, 2030 | — | — | % | 559,965 | 1.0 | % | — | — | % | 559,965 | 7.0 | % | 1.0 | % | 7.4 | |||||||||||||||||||||||||||||||||||||||||||||||||||||
| Due February 1, 2031 | 500,000 | 2.4 | % | — | — | % | — | — | % | 500,000 | 6.2 | % | 2.4 | % | 8.1 | |||||||||||||||||||||||||||||||||||||||||||||||||||||
| Due February 1, 2032 | 350,000 | 2.5 | % | — | — | % | — | — | % | 350,000 | 4.4 | % | 2.5 | % | 9.1 | |||||||||||||||||||||||||||||||||||||||||||||||||||||
| Due September 28, 2032 | — | — | % | 213,320 | 3.7 | % | — | — | % | 213,320 | 2.7 | % | 3.7 | % | 9.8 | |||||||||||||||||||||||||||||||||||||||||||||||||||||
| Due April 1, 2033 | 425,000 | 2.3 | % | — | — | % | — | — | % | 425,000 | 5.3 | % | 2.3 | % | 10.3 | |||||||||||||||||||||||||||||||||||||||||||||||||||||
Total Senior Unsecured Notes | 2,900,000 | 3.4 | % | 3,066,475 | 2.0 | % | — | — | % | 5,966,475 | 74.4 | % | 2.7 | % | 5.3 | |||||||||||||||||||||||||||||||||||||||||||||||||||||
Variable: | ||||||||||||||||||||||||||||||||||||||||||||||||||||||||||||||||||||
Unsecured term loans (due February 20, 2025) (d) | — | — | % | 229,319 | 2.9 | % | 324,695 | 4.3 | % | 554,014 | 6.9 | % | 3.7 | % | 2.1 | |||||||||||||||||||||||||||||||||||||||||||||||||||||
Unsecured revolving credit facility (due February 20, 2025) (e) (f) | — | — | % | 258,117 | 2.7 | % | 18,275 | 0.8 | % | 276,392 | 3.4 | % | 2.6 | % | 2.1 | |||||||||||||||||||||||||||||||||||||||||||||||||||||
| Total Recourse Debt | 2,900,000 | 3.4 | % | 3,553,911 | 2.1 | % | 342,970 | 4.1 | % | 6,796,881 | 84.7 | % | 2.8 | % | 4.9 | |||||||||||||||||||||||||||||||||||||||||||||||||||||
Total Pro Rata Debt Outstanding | $ | 3,608,691 | 3.7 | % | $ | 3,937,011 | 2.1 | % | $ | 476,282 | 4.6 | % | $ | 8,021,984 | 100.0 | % | 3.0 | % | 4.4 | |||||||||||||||||||||||||||||||||||||||||||||||||
| Investing for the long runTM | 17 | |||||||
| Debt Maturity | |||||
| Real Estate | Debt | |||||||||||||||||||||||||||||||||||||
Number of Properties (a) | Weighted-Average Interest Rate | Total Outstanding Balance (b) (c) | % of Total Outstanding Balance | |||||||||||||||||||||||||||||||||||
| Year of Maturity | ABR (a) | Balloon | ||||||||||||||||||||||||||||||||||||
| Non-Recourse Debt | ||||||||||||||||||||||||||||||||||||||
| 2023 | 26 | $ | 59,790 | 3.9 | % | $ | 427,307 | $ | 431,933 | 5.4 | % | |||||||||||||||||||||||||||
| 2024 | 52 | 36,710 | 4.0 | % | 254,997 | 263,583 | 3.3 | % | ||||||||||||||||||||||||||||||
| 2025 | 47 | 36,579 | 4.4 | % | 366,784 | 385,648 | 4.8 | % | ||||||||||||||||||||||||||||||
| 2026 | 20 | 17,651 | 4.9 | % | 96,945 | 116,969 | 1.5 | % | ||||||||||||||||||||||||||||||
| 2027 | 1 | — | 4.3 | % | 21,450 | 21,450 | 0.3 | % | ||||||||||||||||||||||||||||||
| 2031 | 1 | 1,054 | 6.0 | % | — | 2,921 | — | % | ||||||||||||||||||||||||||||||
| 2039 | 1 | 719 | 5.3 | % | — | 2,599 | — | % | ||||||||||||||||||||||||||||||
Total Pro Rata Non-Recourse Debt | 148 | $ | 152,503 | 4.2 | % | $ | 1,167,483 | 1,225,103 | 15.3 | % | ||||||||||||||||||||||||||||
| Recourse Debt | ||||||||||||||||||||||||||||||||||||||
| Fixed – Senior unsecured notes: | ||||||||||||||||||||||||||||||||||||||
| Due April 1, 2024 (USD) | 4.6 | % | 500,000 | 6.2 | % | |||||||||||||||||||||||||||||||||
| Due July 19, 2024 (EUR) | 2.3 | % | 533,300 | 6.6 | % | |||||||||||||||||||||||||||||||||
| Due February 1, 2025 (USD) | 4.0 | % | 450,000 | 5.7 | % | |||||||||||||||||||||||||||||||||
| Due April 9, 2026 (EUR) | 2.3 | % | 533,300 | 6.6 | % | |||||||||||||||||||||||||||||||||
| Due October 1, 2026 (USD) | 4.3 | % | 350,000 | 4.4 | % | |||||||||||||||||||||||||||||||||
| Due April 15, 2027 (EUR) | 2.1 | % | 533,300 | 6.6 | % | |||||||||||||||||||||||||||||||||
| Due April 15, 2028 (EUR) | 1.4 | % | 533,300 | 6.6 | % | |||||||||||||||||||||||||||||||||
| Due July 15, 2029 (USD) | 3.9 | % | 325,000 | 4.1 | % | |||||||||||||||||||||||||||||||||
| Due September 28, 2029 (EUR) | 3.4 | % | 159,990 | 2.0 | % | |||||||||||||||||||||||||||||||||
| Due June 1, 2030 (EUR) | 1.0 | % | 559,965 | 7.0 | % | |||||||||||||||||||||||||||||||||
| Due February 1, 2031 (USD) | 2.4 | % | 500,000 | 6.2 | % | |||||||||||||||||||||||||||||||||
| Due February 1, 2032 (USD) | 2.5 | % | 350,000 | 4.4 | % | |||||||||||||||||||||||||||||||||
| Due September 28, 2032 (EUR) | 3.7 | % | 213,320 | 2.7 | % | |||||||||||||||||||||||||||||||||
| Due April 1, 2033 (USD) | 2.3 | % | 425,000 | 5.3 | % | |||||||||||||||||||||||||||||||||
| Total Senior Unsecured Notes | 2.7 | % | 5,966,475 | 74.4 | % | |||||||||||||||||||||||||||||||||
Variable: | ||||||||||||||||||||||||||||||||||||||
Unsecured term loans (due February 20, 2025) (d) | 3.7 | % | 554,014 | 6.9 | % | |||||||||||||||||||||||||||||||||
Unsecured revolving credit facility (due February 20, 2025) (e) (f) | 2.6 | % | 276,392 | 3.4 | % | |||||||||||||||||||||||||||||||||
| Total Recourse Debt | 2.8 | % | 6,796,881 | 84.7 | % | |||||||||||||||||||||||||||||||||
| Total Pro Rata Debt Outstanding | 3.0 | % | $ | 8,021,984 | 100.0 | % | ||||||||||||||||||||||||||||||||
| Investing for the long runTM | 18 | |||||||
| Senior Unsecured Notes | |||||
| Issuer | Senior Unsecured Notes | |||||||||||||||||||
| Ratings Agency | Rating | Outlook | Rating | |||||||||||||||||
| Moody's | Baa1 | Stable | Baa1 | |||||||||||||||||
Standard & Poor’s (a) | BBB+ | Stable | BBB+ | |||||||||||||||||
| Covenant | Metric | Required | As of Dec. 31, 2022 | |||||||||||||||||
| Limitation on the incurrence of debt | "Total Debt" / "Total Assets" | ≤ 60% | 39.6% | |||||||||||||||||
| Limitation on the incurrence of secured debt | "Secured Debt" / "Total Assets" | ≤ 40% | 5.7% | |||||||||||||||||
Limitation on the incurrence of debt based on consolidated EBITDA to annual debt service charge | "Consolidated EBITDA" / "Annual Debt Service Charge" | ≥ 1.5x | 5.5x | |||||||||||||||||
| Maintenance of unencumbered asset value | "Unencumbered Assets" / "Total Unsecured Debt" | ≥ 150% | 243.4% | |||||||||||||||||
| Investing for the long runTM | 19 | |||||||
| Investing for the long runTM | 20 | |||||||
Investment Activity – Capital Investments and Commitments (a) | |||||
| Primary Transaction Type | Property Type | Expected Completion / Closing Date | Gross Square Footage | Lease Term (Years) (b) | Funded During Three Months Ended Dec. 31, 2022 | Total Funded Through Dec. 31, 2022 | Maximum Commitment / Gross Investment Amount | |||||||||||||||||||||||||||||||||||||||||||||||||||||||
| Tenant | Location | Remaining | Total | |||||||||||||||||||||||||||||||||||||||||||||||||||||||||||
| Berry Global Inc. (2 properties) | Various, USA | Renovation | Industrial | Q1 2023 | N/A | 17 | $ | — | $ | — | $ | 20,000 | $ | 20,000 | ||||||||||||||||||||||||||||||||||||||||||||||||
COOP Danmark A/S (c) (d) | Klarup, Denmark | Purchase Commitment | Retail | Q2 2023 | 11,055 | 15 | — | — | 3,425 | 3,425 | ||||||||||||||||||||||||||||||||||||||||||||||||||||
| Outfront Media, LLC (6 properties) | Various, NJ | Build-to-Suit | Outdoor Advertising | Various | N/A | 30 | 2,288 | 7,272 | 474 | 7,746 | ||||||||||||||||||||||||||||||||||||||||||||||||||||
| Chattem, Inc. | Chattanooga, TN | Expansion | Warehouse | Q3 2023 | 120,000 | 10 | — | — | 26,552 | 26,552 | ||||||||||||||||||||||||||||||||||||||||||||||||||||
| Unchained Labs, LLC | Pleasanton, CA | Redevelopment | Laboratory | Q3 2023 | N/A | 16 | 2,471 | 2,471 | 11,426 | 13,897 | ||||||||||||||||||||||||||||||||||||||||||||||||||||
Hellweg Die Profi-Baumärkte GmbH & Co. KG (2 properties) (c) | Various, Germany | Renovation | Retail | Q3 2023 | N/A | 14 | — | — | 2,240 | 2,240 | ||||||||||||||||||||||||||||||||||||||||||||||||||||
| Hexagon Composites ASA | Salisbury, NC | Expansion | Industrial | Q4 2023 | 113,000 | 15 | — | — | 13,800 | 13,800 | ||||||||||||||||||||||||||||||||||||||||||||||||||||
| Expected Completion Date 2023 Total | 244,055 | 16 | 4,759 | 9,743 | 77,917 | 87,660 | ||||||||||||||||||||||||||||||||||||||||||||||||||||||||
| National Coatings & Supplies, Inc. | Nashville, TN | Expansion | Warehouse | Q1 2024 | 13,500 | 17 | — | — | 2,100 | 2,100 | ||||||||||||||||||||||||||||||||||||||||||||||||||||
Fraikin SAS (c) | Various, France | Renovation | Industrial | Q4 2024 | N/A | 17 | — | — | 7,360 | 7,360 | ||||||||||||||||||||||||||||||||||||||||||||||||||||
| Expected Completion Date 2024 Total | 13,500 | 17 | — | — | 9,460 | 9,460 | ||||||||||||||||||||||||||||||||||||||||||||||||||||||||
| Capital Investments and Commitments Total | 257,555 | 16 | $ | 4,759 | $ | 9,743 | $ | 87,377 | $ | 97,120 | ||||||||||||||||||||||||||||||||||||||||||||||||||||
| Investing for the long runTM | 21 | |||||||
| Investment Activity – Investment Volume | |||||
| Property Type(s) | Closing Date / Asset Completion Date | Gross Investment Amount | Investment Type | Lease Term (Years) (a) | Gross Square Footage | |||||||||||||||||||||||||||||||||||||||
| Tenant / Lease Guarantor | Property Location(s) | |||||||||||||||||||||||||||||||||||||||||||
| 1Q22 | ||||||||||||||||||||||||||||||||||||||||||||
| Balcan Innovations Inc. | Pleasant Prairie, WI | Industrial | Jan-22 | $ | 20,024 | Sale-leaseback | 20 | 175,168 | ||||||||||||||||||||||||||||||||||||
Memora Servicios Funerarios S.L (26 properties) (b) | Various, Spain | Funeral Home | Feb-22 | 146,364 | Sale-leaseback | 30 | 370,204 | |||||||||||||||||||||||||||||||||||||
COOP Danmark A/S (8 properties) (b) | Various, Denmark | Retail | Feb-22 | 33,976 | Sale-leaseback | 15 | 121,263 | |||||||||||||||||||||||||||||||||||||
Metra S.p.A. (b) | Laval, Canada | Industrial | Feb-22 | 21,459 | Sale-leaseback | 25 | 162,600 | |||||||||||||||||||||||||||||||||||||
Chattem, Inc. (c) | Chattanooga, TN | Warehouse | Mar-22 | 43,198 | Acquisition | 7 | 689,450 | |||||||||||||||||||||||||||||||||||||
| Orgill, Inc. | Hurricane, UT | Warehouse | Mar-22 | 20,000 | Expansion | 20 | 427,680 | |||||||||||||||||||||||||||||||||||||
Jumbo Food Groep B.V. (b) | Breda, Netherlands | Warehouse | Mar-22 | 4,721 | Expansion | 14 | 41,893 | |||||||||||||||||||||||||||||||||||||
| 1Q22 Total | 289,742 | 23 | 1,988,258 | |||||||||||||||||||||||||||||||||||||||||
| 2Q22 | ||||||||||||||||||||||||||||||||||||||||||||
| Henkel AG & Co. | Bowling Green, KY | Warehouse | Apr-22 | 69,475 | Renovation | 15 | N/A | |||||||||||||||||||||||||||||||||||||
| Innophos Holdings, Inc. (6 properties) | Various, United States (4 properties), Canada (1 property), and Mexico (1 property) | Industrial | Apr-22; May-22 | 80,595 | Sale-leaseback | 25 | 1,169,654 | |||||||||||||||||||||||||||||||||||||
| Highline Warren LLC (6 properties) | Various, United States | Industrial; Warehouse | May-22 | 110,381 | Sale-leaseback | 24 | 1,578,198 | |||||||||||||||||||||||||||||||||||||
COOP Danmark A/S (10 properties) (b) | Various, Denmark | Retail | Jun-22 | 42,635 | Sale-leaseback | 15 | 163,000 | |||||||||||||||||||||||||||||||||||||
| CentroMotion | Medina, OH | Industrial | Jun-22 | 28,913 | Sale-leaseback | 20 | 368,465 | |||||||||||||||||||||||||||||||||||||
| Turkey Hill, LLC (2 properties) | Searcy, AR and Conestoga, PA | Industrial | Jun-22 | 10,000 | Renovation | 25 | N/A | |||||||||||||||||||||||||||||||||||||
Van Mossel Automotive (5 properties) (b) (d) | Various, Belgium | Retail | Jun-22 | 19,795 | Sale-leaseback | 17 | 125,755 | |||||||||||||||||||||||||||||||||||||
Greenyard NV (b) | Bree, Belgium | Warehouse | Jun-22 | 96,697 | Sale-leaseback | 20 | 1,876,456 | |||||||||||||||||||||||||||||||||||||
| 2Q22 Total | 458,491 | 21 | 5,281,528 | |||||||||||||||||||||||||||||||||||||||||
| 3Q22 | ||||||||||||||||||||||||||||||||||||||||||||
Upfield Group B.V. (b) | Wageningen, Netherlands | Research and Development | Jul-22 | 25,390 | Build-to-Suit | 20 | 63,762 | |||||||||||||||||||||||||||||||||||||
Eroski Sociedad Cooperativa (5 properties) (b) | Various, Spain | Retail | Jul-22 | 19,894 | Sale-leaseback | 15 | 109,179 | |||||||||||||||||||||||||||||||||||||
| Hearthside Food Solutions, LLC (18 properties) | Various, United States | Industrial; Warehouse | Jul-22 | 262,061 | Sale-leaseback | 20 | 3,432,354 | |||||||||||||||||||||||||||||||||||||
COOP Danmark A/S (8 properties) (b) | Various, Denmark | Retail | Aug-22; Sep-22 | 29,644 | Sale-leaseback | 15 | 149,984 | |||||||||||||||||||||||||||||||||||||
Ontex BVBA (b) | Radomsko, Poland | Industrial | Aug-22 | 22,914 | Expansion | 20 | 463,816 | |||||||||||||||||||||||||||||||||||||
| True Value Company, LLC | Westlake, OH | Warehouse | Aug-22 | 29,517 | Sale-leaseback | 20 | 392,400 | |||||||||||||||||||||||||||||||||||||
| Transcendia Holdings, Inc. (3 properties) | Hebron and Strongsville, OH; and Scarborough, Canada | Industrial; Warehouse | Aug-22 | 20,111 | Sale-leaseback | 20 | 389,693 | |||||||||||||||||||||||||||||||||||||
| Bowl New England, Inc. (2 properties) | Clifton Park, NY and West Des Moines, IA | Specialty | Aug-22 | 23,317 | Sale-leaseback | 20 | 87,642 | |||||||||||||||||||||||||||||||||||||
CentroMotion (b) | Orzinuovi, Italy | Industrial | Aug-22 | 14,033 | Sale-leaseback | 20 | 155,355 | |||||||||||||||||||||||||||||||||||||
| 3Q22 Total | 446,881 | 20 | 5,244,185 | |||||||||||||||||||||||||||||||||||||||||
| Investing for the long runTM | 22 | |||||||
| Investment Activity – Investment Volume (continued) | |||||
| Property Type(s) | Closing Date / Asset Completion Date | Gross Investment Amount | Investment Type | Lease Term (Years) (a) | Gross Square Footage | |||||||||||||||||||||||||||||||||||||||
| Tenant / Lease Guarantor | Property Location(s) | |||||||||||||||||||||||||||||||||||||||||||
| 4Q22 | ||||||||||||||||||||||||||||||||||||||||||||
COOP Danmark A/S (4 properties) (b) | Various, Denmark | Retail | Nov-22 | 15,553 | Sale-leaseback | 15 | 45,197 | |||||||||||||||||||||||||||||||||||||
| Alta Enterprises LLC (19 properties) | Various, United States | Industrial | Dec-22 | 63,006 | Acquisition | 15 | 678,507 | |||||||||||||||||||||||||||||||||||||
| FCA US LLC | Romulus, MI | Warehouse | Dec-22 | 36,569 | Acquisition | 10 | 500,023 | |||||||||||||||||||||||||||||||||||||
Hexagon Composites ASA (e) | Salisbury, NC | Industrial | Dec-22 | 16,412 | Sale-leaseback | 15 | 204,142 | |||||||||||||||||||||||||||||||||||||
| Outfront Media, LLC (2 properties) | West Chester, PA and Flemington, NJ | Outdoor Advertising | Various | 2,695 | Acquisition; Build-to-Suit | 30 | N/A | |||||||||||||||||||||||||||||||||||||
| 4Q22 Total | 134,235 | 14 | 1,427,869 | |||||||||||||||||||||||||||||||||||||||||
| Year-to-Date Total | 1,329,349 | 20 | 13,941,840 | |||||||||||||||||||||||||||||||||||||||||
| Property Type(s) | Funded During Current Quarter | Funded Year to Date | Expected Funding Completion Date | Total Funded | Maximum Commitment | |||||||||||||||||||||||||||||||||||||||
| Description | Property Location(s) | |||||||||||||||||||||||||||||||||||||||||||
| Construction Loan | ||||||||||||||||||||||||||||||||||||||||||||
Southwest Corner of Las Vegas Boulevard & Harmon Avenue Retail Complex (f) | Las Vegas, NV | Retail | $ | 24,285 | $ | 89,454 | Q4 2023 | $ | 193,168 | $ | 261,887 | |||||||||||||||||||||||||||||||||
| Total | 89,454 | |||||||||||||||||||||||||||||||||||||||||||
| Year-to-Date Total Investment Volume | $ | 1,418,803 | ||||||||||||||||||||||||||||||||||||||||||
| Investing for the long runTM | 23 | |||||||
| Investment Activity – Dispositions | |||||
| Tenant / Lease Guarantor | Property Location(s) | Gross Sale Price | Closing Date | Property Type(s) | Gross Square Footage | |||||||||||||||||||||||||||
| 1Q22 | ||||||||||||||||||||||||||||||||
| Vacant | Flora, MS | $ | 5,500 | Jan-22 | Warehouse | 102,498 | ||||||||||||||||||||||||||
| Barnes & Noble, Inc. | Braintree, MA | 13,800 | Feb-22 | Retail | 19,661 | |||||||||||||||||||||||||||
Pendragon PLC (3 properties) (a) | Ardrossan, Blackpool and Stourbridge, United Kingdom | 3,234 | Mar-22 | Retail | 36,199 | |||||||||||||||||||||||||||
| Vacant | Anchorage, AK | 4,075 | Mar-22 | Warehouse | 40,512 | |||||||||||||||||||||||||||
| 1Q22 Total | 26,609 | 198,870 | ||||||||||||||||||||||||||||||
| 2Q22 | ||||||||||||||||||||||||||||||||
Pendragon PLC (2 properties) (a) | Livingston and Stoke-on-Trent, United Kingdom | 3,275 | Apr-22 | Retail | 29,678 | |||||||||||||||||||||||||||
Barrett Steel Limited (a) | Newbridge, United Kingdom | 17,444 | Apr-22 | Warehouse | 213,394 | |||||||||||||||||||||||||||
| Plastic Technology Holdings, LLC | Baraboo, WI | 18,650 | Apr-22 | Industrial | 615,048 | |||||||||||||||||||||||||||
| Vacant | Waterford Township, MI | 3,690 | Apr-22 | Retail | 103,018 | |||||||||||||||||||||||||||
Vacant (a) | Kotka, Finland | 1,689 | May-22 | Warehouse | 150,884 | |||||||||||||||||||||||||||
| TNT Crust Parent, LLC (2 properties) | St. Charles, MO and Green Bay, WI | 48,000 | Jun-22 | Industrial | 176,993 | |||||||||||||||||||||||||||
| 2Q22 Total | 92,748 | 1,289,015 | ||||||||||||||||||||||||||||||
| 3Q22 | ||||||||||||||||||||||||||||||||
| Vacant | Pittsburgh, PA | 5,600 | Aug-22 | Industrial | 146,103 | |||||||||||||||||||||||||||
Royal Vopak NV (a) | Rotterdam, Netherlands | 44,855 | Aug-22 | Office | 153,400 | |||||||||||||||||||||||||||
| Vacant | Clinton, NJ | 6,288 | Sep-22 | Office | 292,000 | |||||||||||||||||||||||||||
| 3Q22 Total | 56,743 | 591,503 | ||||||||||||||||||||||||||||||
| 4Q22 | ||||||||||||||||||||||||||||||||
| Vacant | Bedford, TX | 3,424 | Oct-22 | Fitness Facility | 46,658 | |||||||||||||||||||||||||||
Pendragon PLC (2 properties) (a) | Stockton-on-Tees and Kirkcaldy, United Kingdom | 4,462 | Oct-22; Dec-22 | Retail | 38,981 | |||||||||||||||||||||||||||
Vacant (a) | Mauves-sur-Loire, France | 374 | Nov-22 | Industrial | 5,792 | |||||||||||||||||||||||||||
Apply Sorco AS (a) | Stavanger, Norway | 55,572 | Dec-22 | Office | 199,504 | |||||||||||||||||||||||||||
| Vacant | Lenexa, KS | 3,800 | Dec-22 | Industrial | 130,094 | |||||||||||||||||||||||||||
| 4Q22 Total | 67,632 | 421,029 | ||||||||||||||||||||||||||||||
| Year-to-Date Total Dispositions | $ | 243,732 | 2,500,417 | |||||||||||||||||||||||||||||
| Investing for the long runTM | 24 | |||||||
| Joint Ventures | |||||
| Joint Venture or JV (Principal Tenant) | JV Partnership | Consolidated | Pro Rata (a) | |||||||||||||||||||||||||||||||||||
| Asset Type | WPC % | Debt Outstanding (b) | ABR | Debt Outstanding (c) | ABR | |||||||||||||||||||||||||||||||||
Unconsolidated Joint Venture (Equity Method Investment) (d) | ||||||||||||||||||||||||||||||||||||||
| Harmon Retail Corner | Common equity interest | 15.00% | $ | 143,000 | $ | — | $ | 21,450 | $ | — | ||||||||||||||||||||||||||||
Kesko Senukai (e) | Net lease | 70.00% | 105,839 | 13,995 | 74,088 | 9,797 | ||||||||||||||||||||||||||||||||
| Johnson Self Storage | Self-storage operating | 90.00% | — | N/A | — | N/A | ||||||||||||||||||||||||||||||||
| Total Unconsolidated Joint Ventures Post-Merger | 248,839 | 13,995 | 95,538 | 9,797 | ||||||||||||||||||||||||||||||||||
| Consolidated Joint Ventures | ||||||||||||||||||||||||||||||||||||||
Fentonir Trading & Investments Limited (e) | Net lease | 94.90% | 58,669 | 8,193 | 55,677 | 7,775 | ||||||||||||||||||||||||||||||||
COOP Ost SA (e) | Net lease | 90.10% | 55,289 | 6,650 | 49,815 | 5,991 | ||||||||||||||||||||||||||||||||
Swansea, United Kingdom Student Housing (e) | Student housing operating | 97.00% | 42,976 | N/A | 41,687 | N/A | ||||||||||||||||||||||||||||||||
| Austin, TX Student Housing | Student housing operating | 90.00% | 28,533 | N/A | 25,680 | N/A | ||||||||||||||||||||||||||||||||
| State of Iowa Board of Regents | Net lease | 90.00% | 6,205 | 4,258 | 5,585 | 3,833 | ||||||||||||||||||||||||||||||||
| McCoy-Rockford, Inc. | Net lease | 90.00% | — | 932 | — | 839 | ||||||||||||||||||||||||||||||||
| Total Consolidated Joint Ventures | 191,672 | 20,033 | 178,444 | 18,438 | ||||||||||||||||||||||||||||||||||
Total Unconsolidated and Consolidated Joint Ventures | $ | 440,511 | $ | 34,028 | $ | 273,982 | $ | 28,235 | ||||||||||||||||||||||||||||||
| Investing for the long runTM | 25 | |||||||
| Top Ten Tenants | |||||
| Tenant / Lease Guarantor | Description | Number of Properties | ABR | ABR % | Weighted-Average Lease Term (Years) | |||||||||||||||||||||||||||
| U-Haul Moving Partners Inc. and Mercury Partners, LP | Net lease self-storage properties in the U.S. | 78 | $ | 38,751 | 2.8 | % | 1.3 | |||||||||||||||||||||||||
State of Andalucía (a) | Government office properties in Spain | 70 | 29,271 | 2.1 | % | 12.0 | ||||||||||||||||||||||||||
Metro Cash & Carry Italia S.p.A. (a) | Business-to-business wholesale stores in Italy and Germany | 20 | 27,512 | 2.0 | % | 5.8 | ||||||||||||||||||||||||||
Hellweg Die Profi-Baumärkte GmbH & Co. KG (a) | Do-it-yourself retail properties in Germany | 35 | 27,250 | 2.0 | % | 14.2 | ||||||||||||||||||||||||||
| Extra Space Storage, Inc. | Net lease self-storage properties in the U.S. | 27 | 22,957 | 1.7 | % | 21.3 | ||||||||||||||||||||||||||
OBI Group (a) | Do-it-yourself retail properties in Poland | 26 | 22,266 | 1.6 | % | 7.8 | ||||||||||||||||||||||||||
Marriott Corporation (b) | Net lease hotel properties in the U.S. | 18 | 21,350 | 1.6 | % | 1.0 | ||||||||||||||||||||||||||
| Nord Anglia Education, Inc. | K-12 private schools in the U.S. | 3 | 20,981 | 1.5 | % | 20.7 | ||||||||||||||||||||||||||
| Advance Auto Parts, Inc. | Distribution facilities in the U.S. | 29 | 19,851 | 1.4 | % | 10.1 | ||||||||||||||||||||||||||
Eroski Sociedad Cooperativa (a) | Grocery stores and warehouses in Spain | 63 | 19,705 | 1.4 | % | 13.2 | ||||||||||||||||||||||||||
Total (c) | 369 | $ | 249,894 | 18.1 | % | 10.1 | ||||||||||||||||||||||||||
| Investing for the long runTM | 26 | |||||||
| Diversification by Property Type | |||||
| Total Net-Lease Portfolio | ||||||||||||||||||||||||||
| Property Type | ABR | ABR % | Square Footage (a) | Square Footage % | ||||||||||||||||||||||
| U.S. | ||||||||||||||||||||||||||
| Industrial | $ | 293,225 | 21.2 | % | 51,486 | 29.3 | % | |||||||||||||||||||
| Warehouse | 211,138 | 15.3 | % | 42,817 | 24.3 | % | ||||||||||||||||||||
| Office | 150,309 | 10.9 | % | 10,149 | 5.8 | % | ||||||||||||||||||||
Retail (b) | 46,887 | 3.4 | % | 2,800 | 1.6 | % | ||||||||||||||||||||
| Self Storage (net lease) | 61,708 | 4.5 | % | 5,810 | 3.3 | % | ||||||||||||||||||||
Other (c) | 112,226 | 8.1 | % | 5,697 | 3.2 | % | ||||||||||||||||||||
| U.S. Total | 875,493 | 63.4 | % | 118,759 | 67.5 | % | ||||||||||||||||||||
| International | ||||||||||||||||||||||||||
| Industrial | 73,552 | 5.3 | % | 11,035 | 6.3 | % | ||||||||||||||||||||
| Warehouse | 122,575 | 8.8 | % | 20,375 | 11.6 | % | ||||||||||||||||||||
| Office | 89,632 | 6.5 | % | 6,554 | 3.7 | % | ||||||||||||||||||||
Retail (b) | 184,952 | 13.4 | % | 17,490 | 9.9 | % | ||||||||||||||||||||
| Self Storage (net lease) | — | — | % | — | — | % | ||||||||||||||||||||
Other (c) | 35,695 | 2.6 | % | 1,744 | 1.0 | % | ||||||||||||||||||||
| International Total | 506,406 | 36.6 | % | 57,198 | 32.5 | % | ||||||||||||||||||||
| Total | ||||||||||||||||||||||||||
| Industrial | 366,777 | 26.5 | % | 62,521 | 35.6 | % | ||||||||||||||||||||
| Warehouse | 333,713 | 24.1 | % | 63,192 | 35.9 | % | ||||||||||||||||||||
| Office | 239,941 | 17.4 | % | 16,703 | 9.5 | % | ||||||||||||||||||||
Retail (b) | 231,839 | 16.8 | % | 20,290 | 11.5 | % | ||||||||||||||||||||
| Self Storage (net lease) | 61,708 | 4.5 | % | 5,810 | 3.3 | % | ||||||||||||||||||||
Other (c) | 147,921 | 10.7 | % | 7,441 | 4.2 | % | ||||||||||||||||||||
Total (d) | $ | 1,381,899 | 100.0 | % | 175,957 | 100.0 | % | |||||||||||||||||||
| Investing for the long runTM | 27 | |||||||
| Diversification by Tenant Industry | |||||
| Total Net-Lease Portfolio | ||||||||||||||||||||||||||
Industry Type | ABR | ABR % | Square Footage | Square Footage % | ||||||||||||||||||||||
Retail Stores (a) | $ | 283,868 | 20.5 | % | 36,457 | 20.7 | % | |||||||||||||||||||
| Consumer Services | 110,969 | 8.0 | % | 8,067 | 4.6 | % | ||||||||||||||||||||
| Beverage and Food | 105,906 | 7.7 | % | 15,759 | 9.0 | % | ||||||||||||||||||||
| Automotive | 85,966 | 6.2 | % | 13,477 | 7.7 | % | ||||||||||||||||||||
| Grocery | 79,516 | 5.8 | % | 8,363 | 4.8 | % | ||||||||||||||||||||
| Cargo Transportation | 63,473 | 4.6 | % | 9,550 | 5.4 | % | ||||||||||||||||||||
| Hotel and Leisure | 57,132 | 4.1 | % | 3,060 | 1.7 | % | ||||||||||||||||||||
| Healthcare and Pharmaceuticals | 55,806 | 4.0 | % | 5,557 | 3.2 | % | ||||||||||||||||||||
| Capital Equipment | 55,593 | 4.0 | % | 8,459 | 4.8 | % | ||||||||||||||||||||
| Business Services | 48,375 | 3.5 | % | 4,113 | 2.3 | % | ||||||||||||||||||||
| Containers, Packaging, and Glass | 46,942 | 3.4 | % | 8,266 | 4.7 | % | ||||||||||||||||||||
| Durable Consumer Goods | 46,761 | 3.4 | % | 10,300 | 5.9 | % | ||||||||||||||||||||
| Construction and Building | 46,583 | 3.4 | % | 9,235 | 5.2 | % | ||||||||||||||||||||
| Sovereign and Public Finance | 42,578 | 3.1 | % | 3,560 | 2.0 | % | ||||||||||||||||||||
| High Tech Industries | 36,027 | 2.6 | % | 3,574 | 2.0 | % | ||||||||||||||||||||
| Insurance | 30,862 | 2.2 | % | 2,024 | 1.1 | % | ||||||||||||||||||||
| Chemicals, Plastics, and Rubber | 29,935 | 2.2 | % | 5,254 | 3.0 | % | ||||||||||||||||||||
| Non-Durable Consumer Goods | 26,374 | 1.9 | % | 6,244 | 3.5 | % | ||||||||||||||||||||
| Banking | 23,894 | 1.7 | % | 1,426 | 0.8 | % | ||||||||||||||||||||
| Metals | 18,673 | 1.4 | % | 3,259 | 1.9 | % | ||||||||||||||||||||
| Telecommunications | 16,839 | 1.2 | % | 1,686 | 1.0 | % | ||||||||||||||||||||
Other (b) | 69,827 | 5.1 | % | 8,267 | 4.7 | % | ||||||||||||||||||||
Total (c) | $ | 1,381,899 | 100.0 | % | 175,957 | 100.0 | % | |||||||||||||||||||
| Investing for the long runTM | 28 | |||||||
| Diversification by Geography | |||||
| Total Net-Lease Portfolio | ||||||||||||||||||||||||||
| Region | ABR | ABR % | Square Footage (a) | Square Footage % | ||||||||||||||||||||||
| U.S. | ||||||||||||||||||||||||||
| South | ||||||||||||||||||||||||||
| Texas | $ | 115,176 | 8.3 | % | 12,609 | 7.2 | % | |||||||||||||||||||
| Florida | 54,064 | 3.9 | % | 4,544 | 2.6 | % | ||||||||||||||||||||
| Georgia | 28,411 | 2.1 | % | 4,721 | 2.7 | % | ||||||||||||||||||||
| Tennessee | 25,545 | 1.8 | % | 4,136 | 2.3 | % | ||||||||||||||||||||
| Alabama | 20,072 | 1.5 | % | 3,334 | 1.9 | % | ||||||||||||||||||||
Other (b) | 14,529 | 1.1 | % | 2,237 | 1.3 | % | ||||||||||||||||||||
| Total South | 257,797 | 18.7 | % | 31,581 | 18.0 | % | ||||||||||||||||||||
| Midwest | ||||||||||||||||||||||||||
| Illinois | 75,252 | 5.5 | % | 10,864 | 6.2 | % | ||||||||||||||||||||
| Minnesota | 34,977 | 2.5 | % | 3,686 | 2.1 | % | ||||||||||||||||||||
| Indiana | 29,312 | 2.1 | % | 5,222 | 3.0 | % | ||||||||||||||||||||
| Michigan | 28,311 | 2.1 | % | 4,705 | 2.7 | % | ||||||||||||||||||||
| Ohio | 28,303 | 2.0 | % | 6,181 | 3.5 | % | ||||||||||||||||||||
| Wisconsin | 18,126 | 1.3 | % | 3,276 | 1.8 | % | ||||||||||||||||||||
Other (b) | 42,430 | 3.1 | % | 6,230 | 3.5 | % | ||||||||||||||||||||
| Total Midwest | 256,711 | 18.6 | % | 40,164 | 22.8 | % | ||||||||||||||||||||
| East | ||||||||||||||||||||||||||
| North Carolina | 38,333 | 2.8 | % | 8,302 | 4.7 | % | ||||||||||||||||||||
| Pennsylvania | 32,169 | 2.3 | % | 3,527 | 2.0 | % | ||||||||||||||||||||
| New York | 19,373 | 1.4 | % | 2,257 | 1.3 | % | ||||||||||||||||||||
| Kentucky | 18,638 | 1.4 | % | 3,063 | 1.7 | % | ||||||||||||||||||||
| South Carolina | 18,556 | 1.3 | % | 4,949 | 2.8 | % | ||||||||||||||||||||
| Massachusetts | 18,209 | 1.3 | % | 1,387 | 0.8 | % | ||||||||||||||||||||
| New Jersey | 15,735 | 1.1 | % | 943 | 0.5 | % | ||||||||||||||||||||
| Virginia | 14,652 | 1.1 | % | 1,854 | 1.1 | % | ||||||||||||||||||||
Other (b) | 25,029 | 1.8 | % | 3,884 | 2.2 | % | ||||||||||||||||||||
| Total East | 200,694 | 14.5 | % | 30,166 | 17.1 | % | ||||||||||||||||||||
| West | ||||||||||||||||||||||||||
| California | 64,977 | 4.7 | % | 6,417 | 3.6 | % | ||||||||||||||||||||
| Arizona | 30,417 | 2.2 | % | 3,437 | 2.0 | % | ||||||||||||||||||||
Other (b) | 64,897 | 4.7 | % | 6,994 | 4.0 | % | ||||||||||||||||||||
| Total West | 160,291 | 11.6 | % | 16,848 | 9.6 | % | ||||||||||||||||||||
| U.S. Total | 875,493 | 63.4 | % | 118,759 | 67.5 | % | ||||||||||||||||||||
| International | ||||||||||||||||||||||||||
| Germany | 71,304 | 5.2 | % | 7,020 | 4.0 | % | ||||||||||||||||||||
| Spain | 63,779 | 4.6 | % | 5,187 | 3.0 | % | ||||||||||||||||||||
| Poland | 63,552 | 4.6 | % | 8,631 | 4.9 | % | ||||||||||||||||||||
| The Netherlands | 55,666 | 4.0 | % | 7,054 | 4.0 | % | ||||||||||||||||||||
| United Kingdom | 51,977 | 3.8 | % | 4,766 | 2.7 | % | ||||||||||||||||||||
| Italy | 26,884 | 1.9 | % | 2,541 | 1.4 | % | ||||||||||||||||||||
| Denmark | 23,526 | 1.7 | % | 3,039 | 1.7 | % | ||||||||||||||||||||
| France | 19,920 | 1.4 | % | 1,679 | 1.0 | % | ||||||||||||||||||||
| Croatia | 19,475 | 1.4 | % | 2,063 | 1.2 | % | ||||||||||||||||||||
| Canada | 16,337 | 1.2 | % | 2,492 | 1.4 | % | ||||||||||||||||||||
| Norway | 15,533 | 1.1 | % | 753 | 0.4 | % | ||||||||||||||||||||
Other (c) | 78,453 | 5.7 | % | 11,973 | 6.8 | % | ||||||||||||||||||||
| International Total | 506,406 | 36.6 | % | 57,198 | 32.5 | % | ||||||||||||||||||||
Total (d) | $ | 1,381,899 | 100.0 | % | 175,957 | 100.0 | % | |||||||||||||||||||
| Investing for the long runTM | 29 | |||||||
| Contractual Rent Increases | |||||
| Total Net-Lease Portfolio | ||||||||||||||||||||||||||
| Rent Adjustment Measure | ABR | ABR % | Square Footage | Square Footage % | ||||||||||||||||||||||
| Uncapped CPI | $ | 511,987 | 37.1 | % | 55,043 | 31.3 | % | |||||||||||||||||||
| Capped CPI | 254,488 | 18.4 | % | 36,118 | 20.5 | % | ||||||||||||||||||||
| CPI-linked | 766,475 | 55.5 | % | 91,161 | 51.8 | % | ||||||||||||||||||||
| Fixed | 552,719 | 40.0 | % | 78,705 | 44.7 | % | ||||||||||||||||||||
Other (a) | 49,044 | 3.5 | % | 3,373 | 1.9 | % | ||||||||||||||||||||
| None | 13,661 | 1.0 | % | 637 | 0.4 | % | ||||||||||||||||||||
| Vacant | — | — | % | 2,081 | 1.2 | % | ||||||||||||||||||||
Total (b) | $ | 1,381,899 | 100.0 | % | 175,957 | 100.0 | % | |||||||||||||||||||
| Investing for the long runTM | 30 | |||||||
| Same Store Analysis | |||||
| ABR | |||||||||||||||||||||||
| As of | |||||||||||||||||||||||
| Dec. 31, 2022 | Dec. 31, 2021 | Increase | % Increase | ||||||||||||||||||||
| Property Type | |||||||||||||||||||||||
| Industrial | $ | 301,217 | $ | 289,960 | $ | 11,257 | 3.9 | % | |||||||||||||||
| Warehouse | 277,483 | 269,266 | 8,217 | 3.1 | % | ||||||||||||||||||
| Office | 196,898 | 192,527 | 4,371 | 2.3 | % | ||||||||||||||||||
Retail (a) | 214,202 | 206,026 | 8,176 | 4.0 | % | ||||||||||||||||||
| Self Storage (net lease) | 61,708 | 59,438 | 2,270 | 3.8 | % | ||||||||||||||||||
Other (b) | 107,383 | 103,495 | 3,888 | 3.8 | % | ||||||||||||||||||
| Total | $ | 1,158,891 | $ | 1,120,712 | $ | 38,179 | 3.4 | % | |||||||||||||||
| Rent Adjustment Measure | |||||||||||||||||||||||
| Uncapped CPI | $ | 454,124 | $ | 432,560 | $ | 21,564 | 5.0 | % | |||||||||||||||
| Capped CPI | 225,503 | 218,400 | 7,103 | 3.3 | % | ||||||||||||||||||
| CPI-linked | 679,627 | 650,960 | 28,667 | 4.4 | % | ||||||||||||||||||
| Fixed | 416,874 | 409,631 | 7,243 | 1.8 | % | ||||||||||||||||||
Other (c) | 49,044 | 46,775 | 2,269 | 4.9 | % | ||||||||||||||||||
| None | 13,346 | 13,346 | — | — | % | ||||||||||||||||||
| Total | $ | 1,158,891 | $ | 1,120,712 | $ | 38,179 | 3.4 | % | |||||||||||||||
| Geography | |||||||||||||||||||||||
| U.S. | $ | 730,483 | $ | 708,629 | $ | 21,854 | 3.1 | % | |||||||||||||||
| Europe | 405,600 | 390,109 | 15,491 | 4.0 | % | ||||||||||||||||||
Other International (d) | 22,808 | 21,974 | 834 | 3.8 | % | ||||||||||||||||||
| Total | $ | 1,158,891 | $ | 1,120,712 | $ | 38,179 | 3.4 | % | |||||||||||||||
| Same Store Portfolio Summary | |||||||||||||||||||||||
| Number of properties | 1,224 | ||||||||||||||||||||||
| Square footage (in thousands) | 141,885 | ||||||||||||||||||||||
| Investing for the long runTM | 31 | |||||||
| Same Store Pro Rata Rental Income | |||||||||||||||||||||||
| Three Months Ended | |||||||||||||||||||||||
| Dec. 31, 2022 | Dec. 31, 2021 | Increase | % Increase | ||||||||||||||||||||
| Property Type | |||||||||||||||||||||||
| Industrial | $ | 71,959 | $ | 70,999 | $ | 960 | 1.4 | % | |||||||||||||||
| Warehouse | 68,762 | 66,775 | 1,987 | 3.0 | % | ||||||||||||||||||
| Office | 51,326 | 52,605 | (1,279) | (2.4) | % | ||||||||||||||||||
Retail (a) | 48,903 | 47,825 | 1,078 | 2.3 | % | ||||||||||||||||||
| Self Storage (net lease) | 15,401 | 14,834 | 567 | 3.8 | % | ||||||||||||||||||
Other (b) | 30,204 | 30,697 | (493) | (1.6) | % | ||||||||||||||||||
| Total | $ | 286,555 | $ | 283,735 | $ | 2,820 | 1.0 | % | |||||||||||||||
| Rent Adjustment Measure | |||||||||||||||||||||||
| Uncapped CPI | $ | 110,087 | $ | 109,795 | $ | 292 | 0.3 | % | |||||||||||||||
| Capped CPI | 54,357 | 54,710 | (353) | (0.6) | % | ||||||||||||||||||
| CPI-linked | 164,444 | 164,505 | (61) | — | % | ||||||||||||||||||
| Fixed | 106,604 | 104,673 | 1,931 | 1.8 | % | ||||||||||||||||||
Other (c) | 12,011 | 11,432 | 579 | 5.1 | % | ||||||||||||||||||
| None | 3,496 | 3,125 | 371 | 11.9 | % | ||||||||||||||||||
| Total | $ | 286,555 | $ | 283,735 | $ | 2,820 | 1.0 | % | |||||||||||||||
| Geography | |||||||||||||||||||||||
| U.S. | $ | 187,128 | $ | 186,783 | $ | 345 | 0.2 | % | |||||||||||||||
| Europe | 93,280 | 90,995 | 2,285 | 2.5 | % | ||||||||||||||||||
Other International (d) | 6,147 | 5,957 | 190 | 3.2 | % | ||||||||||||||||||
| Total | $ | 286,555 | $ | 283,735 | $ | 2,820 | 1.0 | % | |||||||||||||||
| Same Store Portfolio Summary | |||||||||||||||||||||||
| Number of properties | 1,218 | ||||||||||||||||||||||
| Square footage (in thousands) | 144,915 | ||||||||||||||||||||||
| Investing for the long runTM | 32 | |||||||
| Three Months Ended | |||||||||||
| Dec. 31, 2022 | Dec. 31, 2021 | ||||||||||
| Consolidated Lease Revenues | |||||||||||
| Total lease revenues – as reported | $ | 347,636 | $ | 305,093 | |||||||
| Income from direct financing leases and loans receivable | 17,472 | 15,637 | |||||||||
| Less: Reimbursable tenant costs – as reported | (21,084) | (16,475) | |||||||||
| Less: Income from secured loans receivable | (1,191) | (1,163) | |||||||||
| 342,833 | 303,092 | ||||||||||
| Adjustments for Pro Rata Ownership of Real Estate Joint Ventures: | |||||||||||
| Add: Pro rata share of adjustments from equity method investments | 5,448 | 5,322 | |||||||||
| Less: Pro rata share of adjustments for noncontrolling interests | (395) | (22) | |||||||||
| 5,053 | 5,300 | ||||||||||
| Adjustments for Pro Rata Non-Cash Items: | |||||||||||
| Less: Straight-line and other leasing and financing adjustments | (14,766) | (15,605) | |||||||||
| Add: Above- and below-market rent intangible lease amortization | 8,652 | 15,082 | |||||||||
| Less: Adjustments for pro rata ownership | (2,464) | 30 | |||||||||
| (8,578) | (493) | ||||||||||
Adjustment to normalize for (i) properties not continuously owned since October 1, 2021 and (ii) constant currency presentation for prior year quarter (e) | (52,753) | (24,164) | |||||||||
| Same Store Pro Rata Rental Income | $ | 286,555 | $ | 283,735 | |||||||
| Investing for the long runTM | 33 | |||||||
| Leasing Activity | |||||
Lease Renewals and Extensions (a) | Expected Tenant Improvements ($000s) | Leasing Commissions ($000s) | ||||||||||||||||||||||||||||||||||||||||||||||||
| ABR | ||||||||||||||||||||||||||||||||||||||||||||||||||
| Property Type | Square Feet | Number of Leases | Prior Lease ($000s) | New Lease ($000s) (b) | Rent Recapture | Incremental Lease Term | ||||||||||||||||||||||||||||||||||||||||||||
| Industrial | 1,890,034 | 4 | $ | 7,435 | $ | 9,069 | 122.0 | % | $ | 5,871 | $ | 2,200 | 11.4 years | |||||||||||||||||||||||||||||||||||||
| Warehouse | 895,264 | 2 | 3,691 | 4,176 | 113.1 | % | 206 | 200 | 3.0 years | |||||||||||||||||||||||||||||||||||||||||
| Office | 199,140 | 2 | 3,168 | 2,633 | 83.1 | % | 3,149 | 977 | 7.9 years | |||||||||||||||||||||||||||||||||||||||||
| Retail | 113,570 | 1 | 1,000 | 1,000 | 100.0 | % | — | — | 5.0 years | |||||||||||||||||||||||||||||||||||||||||
| Self Storage (net lease) | — | — | — | — | — | % | — | — | N/A | |||||||||||||||||||||||||||||||||||||||||
| Other | — | — | — | — | — | % | — | — | N/A | |||||||||||||||||||||||||||||||||||||||||
Total / Weighted Average (c) | 3,098,008 | 9 | $ | 15,294 | $ | 16,878 | 110.4 | % | $ | 9,226 | $ | 3,377 | 8.3 years | |||||||||||||||||||||||||||||||||||||
| Q4 Summary | ||||||||||||||||||||||||||||||||||||||||||||||||||
Prior Lease ABR (% of Total Portfolio) | 1.1 | % | ||||||||||||||||||||||||||||||||||||||||||||||||
| Investing for the long runTM | 34 | |||||||
| Lease Expirations | |||||
Year of Lease Expiration (a) | Number of Leases Expiring | Number of Tenants with Leases Expiring | ABR | ABR % | Square Footage | Square Footage % | ||||||||||||||||||||||||||||||||
2023 (b) | 36 | 30 | $ | 54,228 | 3.9 | % | 5,500 | 3.1 | % | |||||||||||||||||||||||||||||
2024 (c) | 41 | 35 | 90,330 | 6.6 | % | 11,230 | 6.4 | % | ||||||||||||||||||||||||||||||
| 2025 | 53 | 32 | 61,241 | 4.4 | % | 7,068 | 4.0 | % | ||||||||||||||||||||||||||||||
| 2026 | 46 | 36 | 64,074 | 4.7 | % | 9,081 | 5.1 | % | ||||||||||||||||||||||||||||||
| 2027 | 57 | 33 | 82,953 | 6.0 | % | 8,906 | 5.1 | % | ||||||||||||||||||||||||||||||
| 2028 | 46 | 28 | 69,298 | 5.0 | % | 5,589 | 3.2 | % | ||||||||||||||||||||||||||||||
| 2029 | 57 | 29 | 68,802 | 5.0 | % | 8,337 | 4.7 | % | ||||||||||||||||||||||||||||||
| 2030 | 34 | 29 | 73,128 | 5.3 | % | 6,165 | 3.5 | % | ||||||||||||||||||||||||||||||
| 2031 | 37 | 21 | 70,249 | 5.1 | % | 8,749 | 5.0 | % | ||||||||||||||||||||||||||||||
| 2032 | 41 | 22 | 44,204 | 3.2 | % | 6,200 | 3.5 | % | ||||||||||||||||||||||||||||||
| 2033 | 31 | 24 | 81,864 | 5.9 | % | 11,377 | 6.5 | % | ||||||||||||||||||||||||||||||
| 2034 | 49 | 18 | 83,347 | 6.0 | % | 8,638 | 4.9 | % | ||||||||||||||||||||||||||||||
| 2035 | 14 | 14 | 29,388 | 2.1 | % | 4,957 | 2.8 | % | ||||||||||||||||||||||||||||||
| 2036 | 49 | 19 | 84,795 | 6.1 | % | 13,524 | 7.7 | % | ||||||||||||||||||||||||||||||
| Thereafter (>2036) | 261 | 107 | 423,998 | 30.7 | % | 58,555 | 33.3 | % | ||||||||||||||||||||||||||||||
| Vacant | — | — | — | — | % | 2,081 | 1.2 | % | ||||||||||||||||||||||||||||||
Total (d) | 852 | $ | 1,381,899 | 100.0 | % | 175,957 | 100.0 | % | ||||||||||||||||||||||||||||||
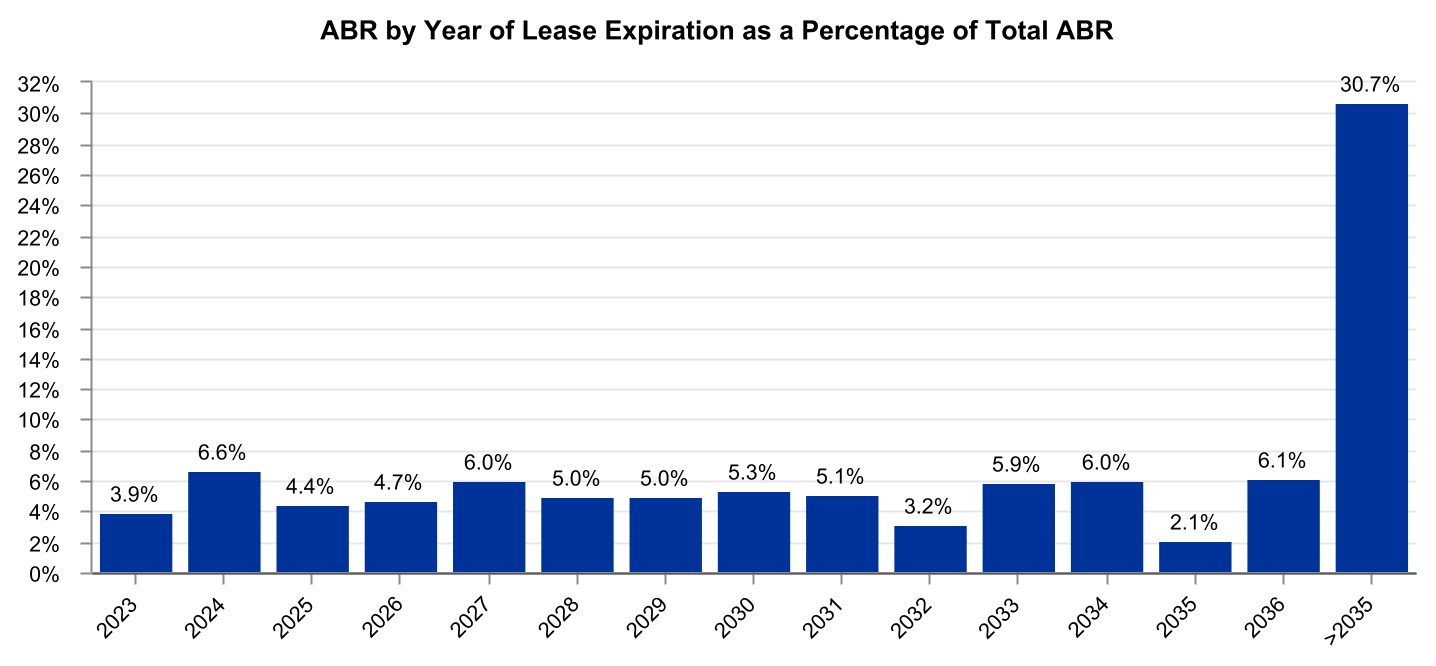
| Investing for the long runTM | 35 | |||||||
| Self Storage Operating Properties Portfolio | |||||
State / District | Number of Properties | Number of Units | Square Footage | Square Footage % | Period End Occupancy | |||||||||||||||||||||||||||
| Florida | 22 | 15,951 | 1,851 | 29.7 | % | 92.1 | % | |||||||||||||||||||||||||
| Texas | 12 | 6,884 | 843 | 13.5 | % | 87.3 | % | |||||||||||||||||||||||||
| California | 10 | 6,582 | 859 | 13.8 | % | 92.9 | % | |||||||||||||||||||||||||
| Illinois | 10 | 4,797 | 665 | 10.7 | % | 88.6 | % | |||||||||||||||||||||||||
| South Carolina | 6 | 3,708 | 412 | 6.6 | % | 93.5 | % | |||||||||||||||||||||||||
| Georgia | 5 | 2,051 | 250 | 4.0 | % | 89.5 | % | |||||||||||||||||||||||||
| North Carolina | 4 | 2,833 | 322 | 5.2 | % | 94.5 | % | |||||||||||||||||||||||||
| Nevada | 3 | 2,422 | 243 | 3.9 | % | 92.4 | % | |||||||||||||||||||||||||
| Delaware | 3 | 1,678 | 241 | 3.9 | % | 94.7 | % | |||||||||||||||||||||||||
| Hawaii | 2 | 956 | 95 | 1.5 | % | 94.2 | % | |||||||||||||||||||||||||
| Washington, DC | 1 | 880 | 67 | 1.1 | % | 95.5 | % | |||||||||||||||||||||||||
| New York | 1 | 792 | 61 | 1.0 | % | 81.3 | % | |||||||||||||||||||||||||
| Kentucky | 1 | 764 | 121 | 1.9 | % | 92.3 | % | |||||||||||||||||||||||||
| Louisiana | 1 | 541 | 59 | 1.0 | % | 76.0 | % | |||||||||||||||||||||||||
| Massachusetts | 1 | 482 | 58 | 0.9 | % | 94.7 | % | |||||||||||||||||||||||||
| Oregon | 1 | 442 | 40 | 0.6 | % | 96.3 | % | |||||||||||||||||||||||||
| Missouri | 1 | 330 | 41 | 0.7 | % | 43.7 | % | |||||||||||||||||||||||||
Total (a) | 84 | 52,093 | 6,228 | 100.0 | % | 91.0 | % | |||||||||||||||||||||||||
| Investing for the long runTM | 36 | |||||||
| Investing for the long runTM | 37 | |||||||
| Normalized Pro Rata Cash NOI | |||||
| Three Months Ended Dec. 31, 2022 | |||||
| Consolidated Lease Revenues | |||||
| Total lease revenues – as reported | $ | 347,636 | |||
| Income from direct financing leases and loans receivable | 17,472 | ||||
| Less: Income from secured loans receivable | (1,191) | ||||
| Less: Consolidated Reimbursable and Non-Reimbursable Property Expenses | |||||
| Reimbursable property expenses – as reported | 21,084 | ||||
| Non-reimbursable property expenses – as reported | 13,879 | ||||
| 328,954 | |||||
| Plus: NOI from Operating Properties | |||||
| Self-storage revenues | 23,280 | ||||
| Self-storage expenses | (7,497) | ||||
| 15,783 | |||||
| Hotel revenues | 2,943 | ||||
| Hotel expenses | (2,547) | ||||
| 396 | |||||
| Student housing and other revenues | 2,728 | ||||
| Student housing and other expenses | (1,675) | ||||
| 1,053 | |||||
| 346,186 | |||||
| Adjustments for Pro Rata Ownership of Real Estate Joint Ventures: | |||||
Add: Pro rata share of NOI from equity method investments (a) | 5,046 | ||||
| Less: Pro rata share of NOI attributable to noncontrolling interests | (488) | ||||
| 4,558 | |||||
| 350,744 | |||||
| Adjustments for Pro Rata Non-Cash Items: | |||||
| Less: Straight-line and other leasing and financing adjustments | (14,766) | ||||
| Add: Above- and below-market rent intangible lease amortization | 8,652 | ||||
| Add: Other non-cash items | 420 | ||||
| (5,694) | |||||
Pro Rata Cash NOI (b) | 345,050 | ||||
Adjustment to normalize for intra-period acquisition volume and dispositions (c) | 1,120 | ||||
Normalized Pro Rata Cash NOI (b) | $ | 346,170 | |||
| Investing for the long runTM | 38 | |||||||
| Three Months Ended Dec. 31, 2022 | |||||
| Net Income from Real Estate Attributable to W. P. Carey | |||||
| Net income from Real Estate attributable to W. P. Carey – as reported | $ | 210,142 | |||
| Adjustments for Consolidated Operating Expenses | |||||
| Add: Operating expenses – as reported | 234,690 | ||||
| Less: Property expenses, excluding reimbursable tenant costs – as reported | (13,879) | ||||
| Less: Operating property expenses – as reported | (11,719) | ||||
| 209,092 | |||||
| Adjustments for Other Consolidated Revenues and Expenses: | |||||
| Less: Other lease-related income – as reported | (8,083) | ||||
| Less: Reimbursable property expenses – as reported | (21,084) | ||||
| Add: Other income and (expenses) | (47,563) | ||||
| Add: Provision for income taxes | 4,908 | ||||
| (71,822) | |||||
| Other Adjustments: | |||||
| Less: Straight-line and other leasing and financing adjustments | (14,766) | ||||
| Add: Above- and below-market rent intangible lease amortization | 8,652 | ||||
| Add: Adjustments for pro rata ownership | 4,546 | ||||
| Less: Income from secured loans receivable | (1,191) | ||||
Adjustment to normalize for intra-period acquisition volume and dispositions (c) | 1,120 | ||||
| Add: Property expenses, excluding reimbursable tenant costs, non-cash | 397 | ||||
| (1,242) | |||||
Normalized Pro Rata Cash NOI (b) | $ | 346,170 | |||
| Investing for the long runTM | 39 | |||||||
| Adjusted EBITDA, Consolidated – Last Five Quarters | |||||
| Three Months Ended | |||||||||||||||||||||||||||||
| Dec. 31, 2022 | Sep. 30, 2022 | Jun. 30, 2022 | Mar. 31, 2022 | Dec. 31, 2021 | |||||||||||||||||||||||||
| Net income | $ | 209,503 | $ | 104,268 | $ | 127,718 | $ | 156,993 | $ | 99,612 | |||||||||||||||||||
Adjustments to Derive Adjusted EBITDA (a) | |||||||||||||||||||||||||||||
| Depreciation and amortization | 140,749 | 132,181 | 115,080 | 115,393 | 135,662 | ||||||||||||||||||||||||
Other (gains) and losses (b) | (97,059) | 15,020 | 21,746 | (35,745) | 28,461 | ||||||||||||||||||||||||
| Interest expense | 67,668 | 59,022 | 46,417 | 46,053 | 47,208 | ||||||||||||||||||||||||
Straight-line and other leasing and financing adjustments (c) (d) | (14,766) | (14,326) | (14,492) | (10,847) | (53,380) | ||||||||||||||||||||||||
| Impairment charges — real estate | 12,734 | — | 6,206 | 20,179 | 7,945 | ||||||||||||||||||||||||
| Stock-based compensation expense | 9,739 | 5,511 | 9,758 | 7,833 | 6,091 | ||||||||||||||||||||||||
| Provision for income taxes | 6,126 | 8,263 | 6,252 | 7,083 | 5,052 | ||||||||||||||||||||||||
| Above- and below-market rent intangible lease amortization | 8,652 | 11,186 | 10,548 | 11,004 | 15,082 | ||||||||||||||||||||||||
| (Gain) loss on sale of real estate, net | (5,845) | 4,736 | (31,119) | (11,248) | (9,511) | ||||||||||||||||||||||||
Merger and other expenses (e) | 2,058 | 17,667 | 1,984 | (2,322) | (563) | ||||||||||||||||||||||||
| Other amortization and non-cash charges | 399 | 349 | 353 | 379 | 385 | ||||||||||||||||||||||||
Gain on change in control of interests (f) | — | (33,931) | — | — | — | ||||||||||||||||||||||||
Impairment charges — Investment Management goodwill (g) | — | 29,334 | — | — | — | ||||||||||||||||||||||||
| 130,455 | 235,012 | 172,733 | 147,762 | 182,432 | |||||||||||||||||||||||||
| Adjustments for Pro Rata Ownership | |||||||||||||||||||||||||||||
| Real Estate Joint Ventures: | |||||||||||||||||||||||||||||
Add: Pro rata share of adjustments for equity method investments (h) | 2,076 | 2,124 | 4,329 | 9,426 | 16,136 | ||||||||||||||||||||||||
Less: Pro rata share of adjustments for amounts attributable to noncontrolling interests | (511) | (308) | (23) | (23) | (23) | ||||||||||||||||||||||||
| 1,565 | 1,816 | 4,306 | 9,403 | 16,113 | |||||||||||||||||||||||||
Equity Method Investment in WLT: (i) | |||||||||||||||||||||||||||||
| Add: Loss from equity method investment in WLT | — | — | — | — | 926 | ||||||||||||||||||||||||
| Add: Distributions received from equity method investment in WLT | — | — | — | — | — | ||||||||||||||||||||||||
| — | — | — | — | 926 | |||||||||||||||||||||||||
Equity Method Investments in the Managed Programs: (j) | |||||||||||||||||||||||||||||
| Less: Income from equity method investments in the Managed Programs | — | (1,512) | (59) | (2,972) | (50) | ||||||||||||||||||||||||
| Add: Distributions received from equity method investments in the Managed Programs | — | 535 | 535 | 520 | 2,142 | ||||||||||||||||||||||||
| — | (977) | 476 | (2,452) | 2,092 | |||||||||||||||||||||||||
Add: Intra-period normalization of CPA:18 Merger (closed August 1, 2022) (k) | — | 7,456 | — | — | — | ||||||||||||||||||||||||
Adjusted EBITDA (l) | $ | 341,523 | $ | 347,575 | $ | 305,233 | $ | 311,706 | $ | 301,175 | |||||||||||||||||||
| Investing for the long runTM | 40 | |||||||
| Investing for the long runTM | 41 | |||||||
| Adjusted EBITDA, Real Estate – Last Five Quarters | |||||
| Three Months Ended | |||||||||||||||||||||||||||||
| Dec. 31, 2022 | Sep. 30, 2022 | Jun. 30, 2022 | Mar. 31, 2022 | Dec. 31, 2021 | |||||||||||||||||||||||||
Net income from Real Estate | $ | 210,107 | $ | 110,715 | $ | 123,268 | $ | 146,856 | $ | 94,684 | |||||||||||||||||||
Adjustments to Derive Adjusted EBITDA (a) | |||||||||||||||||||||||||||||
| Depreciation and amortization | 140,749 | 132,181 | 115,080 | 115,393 | 135,662 | ||||||||||||||||||||||||
Other (gains) and losses (b) | (96,846) | 13,960 | 20,155 | (34,418) | 27,131 | ||||||||||||||||||||||||
| Interest expense | 67,668 | 59,022 | 46,417 | 46,053 | 47,208 | ||||||||||||||||||||||||
Straight-line and other leasing and financing adjustments (c) (d) | (14,766) | (14,326) | (14,492) | (10,847) | (53,380) | ||||||||||||||||||||||||
| Impairment charges — real estate | 12,734 | — | 6,206 | 20,179 | 7,945 | ||||||||||||||||||||||||
| Stock-based compensation expense | 9,739 | 5,511 | 9,758 | 7,833 | 6,091 | ||||||||||||||||||||||||
| Above- and below-market rent intangible lease amortization | 8,652 | 11,186 | 10,548 | 11,004 | 15,082 | ||||||||||||||||||||||||
| Provision for income taxes | 4,908 | 3,631 | 5,955 | 6,913 | 5,331 | ||||||||||||||||||||||||
| (Gain) loss on sale of real estate, net | (5,845) | 4,736 | (31,119) | (11,248) | (9,511) | ||||||||||||||||||||||||
Merger and other expenses (e) | 2,058 | 17,667 | 1,984 | (2,325) | (599) | ||||||||||||||||||||||||
| Other amortization and non-cash charges | 399 | 349 | 353 | 379 | 385 | ||||||||||||||||||||||||
Gain on change in control of interests (f) | — | (11,405) | — | — | — | ||||||||||||||||||||||||
| 129,450 | 222,512 | 170,845 | 148,916 | 181,345 | |||||||||||||||||||||||||
| Adjustments for Pro Rata Ownership | |||||||||||||||||||||||||||||
| Real Estate Joint Ventures: | |||||||||||||||||||||||||||||
Add: Pro rata share of adjustments for equity method investments (g) | 2,076 | 2,124 | 4,329 | 9,426 | 16,136 | ||||||||||||||||||||||||
Less: Pro rata share of adjustments for amounts attributable to noncontrolling interests | (511) | (308) | (23) | (23) | (23) | ||||||||||||||||||||||||
| 1,565 | 1,816 | 4,306 | 9,403 | 16,113 | |||||||||||||||||||||||||
Equity Method Investment in WLT: (h) | |||||||||||||||||||||||||||||
| Add: Loss from equity method investment in WLT | — | — | — | — | 926 | ||||||||||||||||||||||||
| Add: Distributions received from equity method investment in WLT | — | — | — | — | — | ||||||||||||||||||||||||
| — | — | — | — | 926 | |||||||||||||||||||||||||
Add: Intra-period normalization of CPA:18 Merger (closed August 1, 2022) (i) | — | 11,892 | — | — | — | ||||||||||||||||||||||||
Adjusted EBITDA – Real Estate (j) | $ | 341,122 | $ | 346,935 | $ | 298,419 | $ | 305,175 | $ | 293,068 | |||||||||||||||||||
| Investing for the long runTM | 42 | |||||||
| Adjusted EBITDA, Investment Management – Last Five Quarters | |||||
| Three Months Ended | |||||||||||||||||||||||||||||
| Dec. 31, 2022 | Sep. 30, 2022 | Jun. 30, 2022 | Mar. 31, 2022 | Dec. 31, 2021 | |||||||||||||||||||||||||
| Net (loss) income from Investment Management | $ | (604) | $ | (6,447) | $ | 4,450 | $ | 10,137 | $ | 4,928 | |||||||||||||||||||
Adjustments to Derive Adjusted EBITDA (a) | |||||||||||||||||||||||||||||
| Provision for (benefit from) income taxes | 1,218 | 4,632 | 297 | 170 | (279) | ||||||||||||||||||||||||
Other (gains) and losses (b) | (213) | 1,060 | 1,591 | (1,327) | 1,330 | ||||||||||||||||||||||||
Impairment charges — Investment Management goodwill (c) | — | 29,334 | — | — | — | ||||||||||||||||||||||||
Gain on change in control of interests (d) | — | (22,526) | — | — | — | ||||||||||||||||||||||||
| Merger and other expenses | — | — | — | 3 | 36 | ||||||||||||||||||||||||
| 1,005 | 12,500 | 1,888 | (1,154) | 1,087 | |||||||||||||||||||||||||
Adjustments for Pro Rata Ownership | |||||||||||||||||||||||||||||
Equity Method Investments in the Managed Programs: (e) | |||||||||||||||||||||||||||||
| Less: Income from equity method investments in the Managed Programs | — | (1,512) | (59) | (2,972) | (50) | ||||||||||||||||||||||||
| Add: Distributions received from equity method investments in the Managed Programs | — | 535 | 535 | 520 | 2,142 | ||||||||||||||||||||||||
| — | (977) | 476 | (2,452) | 2,092 | |||||||||||||||||||||||||
Add: Intra-period normalization of CPA:18 Merger (closed August 1, 2022) (f) | — | (4,436) | — | — | — | ||||||||||||||||||||||||
Adjusted EBITDA – Investment Management (g) | $ | 401 | $ | 640 | $ | 6,814 | $ | 6,531 | $ | 8,107 | |||||||||||||||||||
| Investing for the long runTM | 43 | |||||||
| Disclosures Regarding Non-GAAP and Other Metrics | |||||
| Investing for the long runTM | 44 | |||||||
| Investing for the long runTM | 45 | |||||||