N-CSRS
false
0000035348
N-1A
Fidelity Hastings Street Trust
0000035348fmr:C000120647Member2025-06-302025-12-310000035348fmr:C000120647Member2025-12-310000035348fmr:C000120647Memberoef:InformationTechnologySectorMember2025-12-310000035348fmr:C000120647Memberoef:IndustrialSectorMember2025-12-310000035348fmr:C000120647Memberfmr:MSFinancialsSectorMember2025-12-310000035348fmr:C000120647Memberoef:CommunicationsSectorMember2025-12-310000035348fmr:C000120647Memberus-gaap:HealthcareSectorMember2025-12-310000035348fmr:C000120647Memberus-gaap:EnergySectorMember2025-12-310000035348fmr:C000120647Memberoef:ConsumerStaplesSectorMember2025-12-310000035348fmr:C000120647Memberoef:ConsumerDiscretionarySectorMember2025-12-310000035348fmr:C000120647Memberoef:MaterialsSectorMember2025-12-310000035348fmr:C000120647Memberoef:UtilitiesSectorMember2025-12-310000035348fmr:C000120647Memberus-gaap:RealEstateSectorMember2025-12-310000035348fmr:C000120647Memberfmr:AACommonStocksMember2025-12-310000035348fmr:C000120647Memberfmr:AAPreferredStocksMember2025-12-310000035348fmr:C000120647Memberfmr:AAShortTermInvestmentsandNetOtherAssetsLiabilitiesMember2025-12-310000035348fmr:C000120647Membercountry:US2025-12-310000035348fmr:C000120647Membercountry:CA2025-12-310000035348fmr:C000120647Membercountry:ZM2025-12-310000035348fmr:C000120647Membercountry:BE2025-12-310000035348fmr:C000120647Membercountry:GB2025-12-310000035348fmr:C000120647Membercountry:DE2025-12-310000035348fmr:C000120647Membercountry:TW2025-12-310000035348fmr:C000120647Membercountry:NL2025-12-310000035348fmr:C000120647Membercountry:FR2025-12-310000035348fmr:C000120647Memberfmr:OtherMember2025-12-310000035348fmr:C000120647Memberfmr:TH0Member2025-12-310000035348fmr:C000120647Memberfmr:TH1Member2025-12-310000035348fmr:C000120647Memberfmr:TH2Member2025-12-310000035348fmr:C000120647Memberfmr:TH3Member2025-12-310000035348fmr:C000120647Memberfmr:TH4Member2025-12-310000035348fmr:C000120647Memberfmr:TH5Member2025-12-310000035348fmr:C000120647Memberfmr:TH6Member2025-12-310000035348fmr:C000120647Memberfmr:TH7Member2025-12-310000035348fmr:C000120647Memberfmr:TH8Member2025-12-310000035348fmr:C000120647Memberfmr:TH9Member2025-12-310000035348fmr:C000019194Member2025-06-302025-12-310000035348fmr:C000019194Member2025-12-310000035348fmr:C000019194Memberoef:InformationTechnologySectorMember2025-12-310000035348fmr:C000019194Memberoef:IndustrialSectorMember2025-12-310000035348fmr:C000019194Memberfmr:MSFinancialsSectorMember2025-12-310000035348fmr:C000019194Memberoef:CommunicationsSectorMember2025-12-310000035348fmr:C000019194Memberus-gaap:EnergySectorMember2025-12-310000035348fmr:C000019194Memberus-gaap:HealthcareSectorMember2025-12-310000035348fmr:C000019194Memberoef:ConsumerStaplesSectorMember2025-12-310000035348fmr:C000019194Memberoef:ConsumerDiscretionarySectorMember2025-12-310000035348fmr:C000019194Memberoef:MaterialsSectorMember2025-12-310000035348fmr:C000019194Memberoef:UtilitiesSectorMember2025-12-310000035348fmr:C000019194Memberus-gaap:RealEstateSectorMember2025-12-310000035348fmr:C000019194Memberfmr:AACommonStocksMember2025-12-310000035348fmr:C000019194Memberfmr:AAShortTermInvestmentsandNetOtherAssetsLiabilitiesMember2025-12-310000035348fmr:C000019194Membercountry:US2025-12-310000035348fmr:C000019194Membercountry:CA2025-12-310000035348fmr:C000019194Membercountry:GB2025-12-310000035348fmr:C000019194Membercountry:TW2025-12-310000035348fmr:C000019194Membercountry:ZM2025-12-310000035348fmr:C000019194Membercountry:BE2025-12-310000035348fmr:C000019194Membercountry:DE2025-12-310000035348fmr:C000019194Membercountry:NL2025-12-310000035348fmr:C000019194Membercountry:FR2025-12-310000035348fmr:C000019194Memberfmr:OtherMember2025-12-310000035348fmr:C000019194Memberfmr:TH0Member2025-12-310000035348fmr:C000019194Memberfmr:TH1Member2025-12-310000035348fmr:C000019194Memberfmr:TH2Member2025-12-310000035348fmr:C000019194Memberfmr:TH3Member2025-12-310000035348fmr:C000019194Memberfmr:TH4Member2025-12-310000035348fmr:C000019194Memberfmr:TH5Member2025-12-310000035348fmr:C000019194Memberfmr:TH6Member2025-12-310000035348fmr:C000019194Memberfmr:TH7Member2025-12-310000035348fmr:C000019194Memberfmr:TH8Member2025-12-310000035348fmr:C000019194Memberfmr:TH9Member2025-12-310000035348fmr:C000130146Member2025-06-302025-12-310000035348fmr:C000130146Member2025-12-310000035348fmr:C000130146Memberoef:InformationTechnologySectorMember2025-12-310000035348fmr:C000130146Memberoef:IndustrialSectorMember2025-12-310000035348fmr:C000130146Memberfmr:MSFinancialsSectorMember2025-12-310000035348fmr:C000130146Memberoef:CommunicationsSectorMember2025-12-310000035348fmr:C000130146Memberus-gaap:EnergySectorMember2025-12-310000035348fmr:C000130146Memberus-gaap:HealthcareSectorMember2025-12-310000035348fmr:C000130146Memberoef:ConsumerStaplesSectorMember2025-12-310000035348fmr:C000130146Memberoef:ConsumerDiscretionarySectorMember2025-12-310000035348fmr:C000130146Memberoef:MaterialsSectorMember2025-12-310000035348fmr:C000130146Memberoef:UtilitiesSectorMember2025-12-310000035348fmr:C000130146Memberus-gaap:RealEstateSectorMember2025-12-310000035348fmr:C000130146Memberfmr:AACommonStocksMember2025-12-310000035348fmr:C000130146Memberfmr:AAShortTermInvestmentsandNetOtherAssetsLiabilitiesMember2025-12-310000035348fmr:C000130146Membercountry:US2025-12-310000035348fmr:C000130146Membercountry:CA2025-12-310000035348fmr:C000130146Membercountry:GB2025-12-310000035348fmr:C000130146Membercountry:TW2025-12-310000035348fmr:C000130146Membercountry:ZM2025-12-310000035348fmr:C000130146Membercountry:BE2025-12-310000035348fmr:C000130146Membercountry:DE2025-12-310000035348fmr:C000130146Membercountry:NL2025-12-310000035348fmr:C000130146Membercountry:FR2025-12-310000035348fmr:C000130146Memberfmr:OtherMember2025-12-310000035348fmr:C000130146Memberfmr:TH0Member2025-12-310000035348fmr:C000130146Memberfmr:TH1Member2025-12-310000035348fmr:C000130146Memberfmr:TH2Member2025-12-310000035348fmr:C000130146Memberfmr:TH3Member2025-12-310000035348fmr:C000130146Memberfmr:TH4Member2025-12-310000035348fmr:C000130146Memberfmr:TH5Member2025-12-310000035348fmr:C000130146Memberfmr:TH6Member2025-12-310000035348fmr:C000130146Memberfmr:TH7Member2025-12-310000035348fmr:C000130146Memberfmr:TH8Member2025-12-310000035348fmr:C000130146Memberfmr:TH9Member2025-12-310000035348fmr:C000059102Member2025-06-302025-12-310000035348fmr:C000059102Member2025-12-310000035348fmr:C000059102Memberoef:InformationTechnologySectorMember2025-12-310000035348fmr:C000059102Memberoef:IndustrialSectorMember2025-12-310000035348fmr:C000059102Memberfmr:MSFinancialsSectorMember2025-12-310000035348fmr:C000059102Memberoef:CommunicationsSectorMember2025-12-310000035348fmr:C000059102Memberus-gaap:EnergySectorMember2025-12-310000035348fmr:C000059102Memberus-gaap:HealthcareSectorMember2025-12-310000035348fmr:C000059102Memberoef:ConsumerStaplesSectorMember2025-12-310000035348fmr:C000059102Memberoef:ConsumerDiscretionarySectorMember2025-12-310000035348fmr:C000059102Memberoef:MaterialsSectorMember2025-12-310000035348fmr:C000059102Memberoef:UtilitiesSectorMember2025-12-310000035348fmr:C000059102Memberus-gaap:RealEstateSectorMember2025-12-310000035348fmr:C000059102Memberfmr:AACommonStocksMember2025-12-310000035348fmr:C000059102Memberfmr:AAShortTermInvestmentsandNetOtherAssetsLiabilitiesMember2025-12-310000035348fmr:C000059102Membercountry:US2025-12-310000035348fmr:C000059102Membercountry:CA2025-12-310000035348fmr:C000059102Membercountry:GB2025-12-310000035348fmr:C000059102Membercountry:TW2025-12-310000035348fmr:C000059102Membercountry:ZM2025-12-310000035348fmr:C000059102Membercountry:BE2025-12-310000035348fmr:C000059102Membercountry:DE2025-12-310000035348fmr:C000059102Membercountry:NL2025-12-310000035348fmr:C000059102Membercountry:FR2025-12-310000035348fmr:C000059102Memberfmr:OtherMember2025-12-310000035348fmr:C000059102Memberfmr:TH0Member2025-12-310000035348fmr:C000059102Memberfmr:TH1Member2025-12-310000035348fmr:C000059102Memberfmr:TH2Member2025-12-310000035348fmr:C000059102Memberfmr:TH3Member2025-12-310000035348fmr:C000059102Memberfmr:TH4Member2025-12-310000035348fmr:C000059102Memberfmr:TH5Member2025-12-310000035348fmr:C000059102Memberfmr:TH6Member2025-12-310000035348fmr:C000059102Memberfmr:TH7Member2025-12-310000035348fmr:C000059102Memberfmr:TH8Member2025-12-310000035348fmr:C000059102Memberfmr:TH9Member2025-12-310000035348fmr:C000059103Member2025-06-302025-12-310000035348fmr:C000059103Member2025-12-310000035348fmr:C000059103Memberoef:InformationTechnologySectorMember2025-12-310000035348fmr:C000059103Memberoef:IndustrialSectorMember2025-12-310000035348fmr:C000059103Memberfmr:MSFinancialsSectorMember2025-12-310000035348fmr:C000059103Memberoef:CommunicationsSectorMember2025-12-310000035348fmr:C000059103Memberus-gaap:EnergySectorMember2025-12-310000035348fmr:C000059103Memberus-gaap:HealthcareSectorMember2025-12-310000035348fmr:C000059103Memberoef:ConsumerStaplesSectorMember2025-12-310000035348fmr:C000059103Memberoef:ConsumerDiscretionarySectorMember2025-12-310000035348fmr:C000059103Memberoef:MaterialsSectorMember2025-12-310000035348fmr:C000059103Memberoef:UtilitiesSectorMember2025-12-310000035348fmr:C000059103Memberus-gaap:RealEstateSectorMember2025-12-310000035348fmr:C000059103Memberfmr:AACommonStocksMember2025-12-310000035348fmr:C000059103Memberfmr:AAShortTermInvestmentsandNetOtherAssetsLiabilitiesMember2025-12-310000035348fmr:C000059103Membercountry:US2025-12-310000035348fmr:C000059103Membercountry:CA2025-12-310000035348fmr:C000059103Membercountry:GB2025-12-310000035348fmr:C000059103Membercountry:TW2025-12-310000035348fmr:C000059103Membercountry:ZM2025-12-310000035348fmr:C000059103Membercountry:BE2025-12-310000035348fmr:C000059103Membercountry:DE2025-12-310000035348fmr:C000059103Membercountry:NL2025-12-310000035348fmr:C000059103Membercountry:FR2025-12-310000035348fmr:C000059103Memberfmr:OtherMember2025-12-310000035348fmr:C000059103Memberfmr:TH0Member2025-12-310000035348fmr:C000059103Memberfmr:TH1Member2025-12-310000035348fmr:C000059103Memberfmr:TH2Member2025-12-310000035348fmr:C000059103Memberfmr:TH3Member2025-12-310000035348fmr:C000059103Memberfmr:TH4Member2025-12-310000035348fmr:C000059103Memberfmr:TH5Member2025-12-310000035348fmr:C000059103Memberfmr:TH6Member2025-12-310000035348fmr:C000059103Memberfmr:TH7Member2025-12-310000035348fmr:C000059103Memberfmr:TH8Member2025-12-310000035348fmr:C000059103Memberfmr:TH9Member2025-12-310000035348fmr:C000059101Member2025-06-302025-12-310000035348fmr:C000059101Member2025-12-310000035348fmr:C000059101Memberoef:InformationTechnologySectorMember2025-12-310000035348fmr:C000059101Memberoef:IndustrialSectorMember2025-12-310000035348fmr:C000059101Memberfmr:MSFinancialsSectorMember2025-12-310000035348fmr:C000059101Memberoef:CommunicationsSectorMember2025-12-310000035348fmr:C000059101Memberus-gaap:EnergySectorMember2025-12-310000035348fmr:C000059101Memberus-gaap:HealthcareSectorMember2025-12-310000035348fmr:C000059101Memberoef:ConsumerStaplesSectorMember2025-12-310000035348fmr:C000059101Memberoef:ConsumerDiscretionarySectorMember2025-12-310000035348fmr:C000059101Memberoef:MaterialsSectorMember2025-12-310000035348fmr:C000059101Memberoef:UtilitiesSectorMember2025-12-310000035348fmr:C000059101Memberus-gaap:RealEstateSectorMember2025-12-310000035348fmr:C000059101Memberfmr:AACommonStocksMember2025-12-310000035348fmr:C000059101Memberfmr:AAShortTermInvestmentsandNetOtherAssetsLiabilitiesMember2025-12-310000035348fmr:C000059101Membercountry:US2025-12-310000035348fmr:C000059101Membercountry:CA2025-12-310000035348fmr:C000059101Membercountry:GB2025-12-310000035348fmr:C000059101Membercountry:TW2025-12-310000035348fmr:C000059101Membercountry:ZM2025-12-310000035348fmr:C000059101Membercountry:BE2025-12-310000035348fmr:C000059101Membercountry:DE2025-12-310000035348fmr:C000059101Membercountry:NL2025-12-310000035348fmr:C000059101Membercountry:FR2025-12-310000035348fmr:C000059101Memberfmr:OtherMember2025-12-310000035348fmr:C000059101Memberfmr:TH0Member2025-12-310000035348fmr:C000059101Memberfmr:TH1Member2025-12-310000035348fmr:C000059101Memberfmr:TH2Member2025-12-310000035348fmr:C000059101Memberfmr:TH3Member2025-12-310000035348fmr:C000059101Memberfmr:TH4Member2025-12-310000035348fmr:C000059101Memberfmr:TH5Member2025-12-310000035348fmr:C000059101Memberfmr:TH6Member2025-12-310000035348fmr:C000059101Memberfmr:TH7Member2025-12-310000035348fmr:C000059101Memberfmr:TH8Member2025-12-310000035348fmr:C000059101Memberfmr:TH9Member2025-12-310000035348fmr:C000059099Member2025-06-302025-12-310000035348fmr:C000059099Member2025-12-310000035348fmr:C000059099Memberoef:InformationTechnologySectorMember2025-12-310000035348fmr:C000059099Memberoef:IndustrialSectorMember2025-12-310000035348fmr:C000059099Memberfmr:MSFinancialsSectorMember2025-12-310000035348fmr:C000059099Memberoef:CommunicationsSectorMember2025-12-310000035348fmr:C000059099Memberus-gaap:EnergySectorMember2025-12-310000035348fmr:C000059099Memberus-gaap:HealthcareSectorMember2025-12-310000035348fmr:C000059099Memberoef:ConsumerStaplesSectorMember2025-12-310000035348fmr:C000059099Memberoef:ConsumerDiscretionarySectorMember2025-12-310000035348fmr:C000059099Memberoef:MaterialsSectorMember2025-12-310000035348fmr:C000059099Memberoef:UtilitiesSectorMember2025-12-310000035348fmr:C000059099Memberus-gaap:RealEstateSectorMember2025-12-310000035348fmr:C000059099Memberfmr:AACommonStocksMember2025-12-310000035348fmr:C000059099Memberfmr:AAShortTermInvestmentsandNetOtherAssetsLiabilitiesMember2025-12-310000035348fmr:C000059099Membercountry:US2025-12-310000035348fmr:C000059099Membercountry:CA2025-12-310000035348fmr:C000059099Membercountry:GB2025-12-310000035348fmr:C000059099Membercountry:TW2025-12-310000035348fmr:C000059099Membercountry:ZM2025-12-310000035348fmr:C000059099Membercountry:BE2025-12-310000035348fmr:C000059099Membercountry:DE2025-12-310000035348fmr:C000059099Membercountry:NL2025-12-310000035348fmr:C000059099Membercountry:FR2025-12-310000035348fmr:C000059099Memberfmr:OtherMember2025-12-310000035348fmr:C000059099Memberfmr:TH0Member2025-12-310000035348fmr:C000059099Memberfmr:TH1Member2025-12-310000035348fmr:C000059099Memberfmr:TH2Member2025-12-310000035348fmr:C000059099Memberfmr:TH3Member2025-12-310000035348fmr:C000059099Memberfmr:TH4Member2025-12-310000035348fmr:C000059099Memberfmr:TH5Member2025-12-310000035348fmr:C000059099Memberfmr:TH6Member2025-12-310000035348fmr:C000059099Memberfmr:TH7Member2025-12-310000035348fmr:C000059099Memberfmr:TH8Member2025-12-310000035348fmr:C000059099Memberfmr:TH9Member2025-12-310000035348fmr:C000019191Member2025-06-302025-12-310000035348fmr:C000019191Member2025-12-310000035348fmr:C000019191Memberoef:InformationTechnologySectorMember2025-12-310000035348fmr:C000019191Memberoef:CommunicationsSectorMember2025-12-310000035348fmr:C000019191Memberoef:ConsumerDiscretionarySectorMember2025-12-310000035348fmr:C000019191Memberfmr:MSFinancialsSectorMember2025-12-310000035348fmr:C000019191Memberus-gaap:HealthcareSectorMember2025-12-310000035348fmr:C000019191Memberoef:IndustrialSectorMember2025-12-310000035348fmr:C000019191Memberoef:MaterialsSectorMember2025-12-310000035348fmr:C000019191Memberoef:ConsumerStaplesSectorMember2025-12-310000035348fmr:C000019191Memberoef:UtilitiesSectorMember2025-12-310000035348fmr:C000019191Memberus-gaap:RealEstateSectorMember2025-12-310000035348fmr:C000019191Memberus-gaap:EnergySectorMember2025-12-310000035348fmr:C000019191Memberfmr:AACommonStocksMember2025-12-310000035348fmr:C000019191Memberfmr:AAPreferredStocksMember2025-12-310000035348fmr:C000019191Memberfmr:AAPreferredSecuritiesMember2025-12-310000035348fmr:C000019191Memberfmr:AABondsMember2025-12-310000035348fmr:C000019191Memberfmr:AAShortTermInvestmentsandNetOtherAssetsLiabilitiesMember2025-12-310000035348fmr:C000019191Membercountry:US2025-12-310000035348fmr:C000019191Membercountry:TW2025-12-310000035348fmr:C000019191Membercountry:CA2025-12-310000035348fmr:C000019191Membercountry:CN2025-12-310000035348fmr:C000019191Membercountry:KR2025-12-310000035348fmr:C000019191Membercountry:BE2025-12-310000035348fmr:C000019191Membercountry:NL2025-12-310000035348fmr:C000019191Membercountry:DE2025-12-310000035348fmr:C000019191Membercountry:BR2025-12-310000035348fmr:C000019191Memberfmr:OtherMember2025-12-310000035348fmr:C000019191Memberfmr:TH0Member2025-12-310000035348fmr:C000019191Memberfmr:TH1Member2025-12-310000035348fmr:C000019191Memberfmr:TH2Member2025-12-310000035348fmr:C000019191Memberfmr:TH3Member2025-12-310000035348fmr:C000019191Memberfmr:TH4Member2025-12-310000035348fmr:C000019191Memberfmr:TH5Member2025-12-310000035348fmr:C000019191Memberfmr:TH6Member2025-12-310000035348fmr:C000019191Memberfmr:TH7Member2025-12-310000035348fmr:C000019191Memberfmr:TH8Member2025-12-310000035348fmr:C000019191Memberfmr:TH9Member2025-12-310000035348fmr:C000064239Member2025-06-302025-12-310000035348fmr:C000064239Member2025-12-310000035348fmr:C000064239Memberoef:InformationTechnologySectorMember2025-12-310000035348fmr:C000064239Memberoef:CommunicationsSectorMember2025-12-310000035348fmr:C000064239Memberoef:ConsumerDiscretionarySectorMember2025-12-310000035348fmr:C000064239Memberfmr:MSFinancialsSectorMember2025-12-310000035348fmr:C000064239Memberus-gaap:HealthcareSectorMember2025-12-310000035348fmr:C000064239Memberoef:IndustrialSectorMember2025-12-310000035348fmr:C000064239Memberoef:MaterialsSectorMember2025-12-310000035348fmr:C000064239Memberoef:ConsumerStaplesSectorMember2025-12-310000035348fmr:C000064239Memberoef:UtilitiesSectorMember2025-12-310000035348fmr:C000064239Memberus-gaap:RealEstateSectorMember2025-12-310000035348fmr:C000064239Memberus-gaap:EnergySectorMember2025-12-310000035348fmr:C000064239Memberfmr:AACommonStocksMember2025-12-310000035348fmr:C000064239Memberfmr:AAPreferredStocksMember2025-12-310000035348fmr:C000064239Memberfmr:AAPreferredSecuritiesMember2025-12-310000035348fmr:C000064239Memberfmr:AABondsMember2025-12-310000035348fmr:C000064239Memberfmr:AAShortTermInvestmentsandNetOtherAssetsLiabilitiesMember2025-12-310000035348fmr:C000064239Membercountry:US2025-12-310000035348fmr:C000064239Membercountry:TW2025-12-310000035348fmr:C000064239Membercountry:CA2025-12-310000035348fmr:C000064239Membercountry:CN2025-12-310000035348fmr:C000064239Membercountry:KR2025-12-310000035348fmr:C000064239Membercountry:BE2025-12-310000035348fmr:C000064239Membercountry:NL2025-12-310000035348fmr:C000064239Membercountry:DE2025-12-310000035348fmr:C000064239Membercountry:BR2025-12-310000035348fmr:C000064239Memberfmr:OtherMember2025-12-310000035348fmr:C000064239Memberfmr:TH0Member2025-12-310000035348fmr:C000064239Memberfmr:TH1Member2025-12-310000035348fmr:C000064239Memberfmr:TH2Member2025-12-310000035348fmr:C000064239Memberfmr:TH3Member2025-12-310000035348fmr:C000064239Memberfmr:TH4Member2025-12-310000035348fmr:C000064239Memberfmr:TH5Member2025-12-310000035348fmr:C000064239Memberfmr:TH6Member2025-12-310000035348fmr:C000064239Memberfmr:TH7Member2025-12-310000035348fmr:C000064239Memberfmr:TH8Member2025-12-310000035348fmr:C000064239Memberfmr:TH9Member2025-12-310000035348fmr:C000019193Member2025-06-302025-12-310000035348fmr:C000019193Member2025-12-310000035348fmr:C000019193Memberoef:InformationTechnologySectorMember2025-12-310000035348fmr:C000019193Memberoef:CommunicationsSectorMember2025-12-310000035348fmr:C000019193Memberfmr:MSFinancialsSectorMember2025-12-310000035348fmr:C000019193Memberoef:ConsumerDiscretionarySectorMember2025-12-310000035348fmr:C000019193Memberus-gaap:HealthcareSectorMember2025-12-310000035348fmr:C000019193Memberoef:IndustrialSectorMember2025-12-310000035348fmr:C000019193Memberoef:ConsumerStaplesSectorMember2025-12-310000035348fmr:C000019193Memberus-gaap:EnergySectorMember2025-12-310000035348fmr:C000019193Memberoef:MaterialsSectorMember2025-12-310000035348fmr:C000019193Memberoef:UtilitiesSectorMember2025-12-310000035348fmr:C000019193Memberus-gaap:RealEstateSectorMember2025-12-310000035348fmr:C000019193Memberfmr:AACommonStocksMember2025-12-310000035348fmr:C000019193Memberfmr:AAPreferredStocksMember2025-12-310000035348fmr:C000019193Memberfmr:AAShortTermInvestmentsandNetOtherAssetsLiabilitiesMember2025-12-310000035348fmr:C000019193Membercountry:US2025-12-310000035348fmr:C000019193Membercountry:CA2025-12-310000035348fmr:C000019193Membercountry:BE2025-12-310000035348fmr:C000019193Membercountry:GB2025-12-310000035348fmr:C000019193Membercountry:NL2025-12-310000035348fmr:C000019193Memberfmr:TH0Member2025-12-310000035348fmr:C000019193Memberfmr:TH1Member2025-12-310000035348fmr:C000019193Memberfmr:TH2Member2025-12-310000035348fmr:C000019193Memberfmr:TH3Member2025-12-310000035348fmr:C000019193Memberfmr:TH4Member2025-12-310000035348fmr:C000019193Memberfmr:TH5Member2025-12-310000035348fmr:C000019193Memberfmr:TH6Member2025-12-310000035348fmr:C000019193Memberfmr:TH7Member2025-12-310000035348fmr:C000019193Memberfmr:TH8Member2025-12-310000035348fmr:C000019193Memberfmr:TH9Member2025-12-310000035348fmr:C000064240Member2025-06-302025-12-310000035348fmr:C000064240Member2025-12-310000035348fmr:C000064240Memberoef:InformationTechnologySectorMember2025-12-310000035348fmr:C000064240Memberoef:CommunicationsSectorMember2025-12-310000035348fmr:C000064240Memberfmr:MSFinancialsSectorMember2025-12-310000035348fmr:C000064240Memberoef:ConsumerDiscretionarySectorMember2025-12-310000035348fmr:C000064240Memberus-gaap:HealthcareSectorMember2025-12-310000035348fmr:C000064240Memberoef:IndustrialSectorMember2025-12-310000035348fmr:C000064240Memberoef:ConsumerStaplesSectorMember2025-12-310000035348fmr:C000064240Memberus-gaap:EnergySectorMember2025-12-310000035348fmr:C000064240Memberoef:MaterialsSectorMember2025-12-310000035348fmr:C000064240Memberoef:UtilitiesSectorMember2025-12-310000035348fmr:C000064240Memberus-gaap:RealEstateSectorMember2025-12-310000035348fmr:C000064240Memberfmr:AACommonStocksMember2025-12-310000035348fmr:C000064240Memberfmr:AAPreferredStocksMember2025-12-310000035348fmr:C000064240Memberfmr:AAShortTermInvestmentsandNetOtherAssetsLiabilitiesMember2025-12-310000035348fmr:C000064240Membercountry:US2025-12-310000035348fmr:C000064240Membercountry:CA2025-12-310000035348fmr:C000064240Membercountry:BE2025-12-310000035348fmr:C000064240Membercountry:GB2025-12-310000035348fmr:C000064240Membercountry:NL2025-12-310000035348fmr:C000064240Memberfmr:TH0Member2025-12-310000035348fmr:C000064240Memberfmr:TH1Member2025-12-310000035348fmr:C000064240Memberfmr:TH2Member2025-12-310000035348fmr:C000064240Memberfmr:TH3Member2025-12-310000035348fmr:C000064240Memberfmr:TH4Member2025-12-310000035348fmr:C000064240Memberfmr:TH5Member2025-12-310000035348fmr:C000064240Memberfmr:TH6Member2025-12-310000035348fmr:C000064240Memberfmr:TH7Member2025-12-310000035348fmr:C000064240Memberfmr:TH8Member2025-12-310000035348fmr:C000064240Memberfmr:TH9Member2025-12-3100000353482025-06-302025-12-31
iso4217:USD
xbrli:pure
xbrli:shares
UNITED STATES
SECURITIES AND EXCHANGE COMMISSION
Washington, D.C. 20549
FORM N-CSR
CERTIFIED SHAREHOLDER REPORT OF REGISTERED
MANAGEMENT INVESTMENT COMPANIES
Investment Company Act file number 811-00215
Fidelity Hastings Street Trust
(Exact name of registrant as specified in charter)
245 Summer St., Boston, MA 02210
(Address of principal executive offices) (Zip code)
Nicole Macarchuk, Secretary
245 Summer St.
Boston, Massachusetts 02210
(Name and address of agent for service)
Registrant's telephone number, including area code:
617-563-7000
| |
Date of fiscal year end:
| June 30
|
| |
Date of reporting period:
| December 31, 2025
|
Item 1.
Reports to Stockholders
|
|
|
|
SEMI-ANNUAL SHAREHOLDER REPORT | AS OF DECEMBER 31, 2025
|
|
|
|
Fidelity® Series Large Cap Stock Fund
Fidelity® Series Large Cap Stock Fund : FGLGX
|
|
|
|
|
This semi-annual shareholder report contains information about Fidelity® Series Large Cap Stock Fund for the period July 1, 2025 to December 31, 2025. You can find additional information about the Fund at fundresearch.fidelity.com/prospectus/sec. You can also request this information by contacting us at 1-800-544-8544.
What were your Fund costs for the last six months?
(based on hypothetical $10,000 investment)
|
Costs of a $10,000 investment
|
Costs paid as a percentage of a $10,000 investment
|
|
Fidelity® Series Large Cap Stock Fund
|
$ 0 A
|
0.00%B
|
|
A Amount represents less than $.50
B Amount represents less than 0.005%
Key Fund Statistics
(as of December 31, 2025)
KEY FACTS
|
|
|
Fund Size
|
$24,355,496,025
|
|
Number of Holdings
|
181
|
|
Portfolio Turnover
|
20%
|
|
What did the Fund invest in?
(as of December 31, 2025)
MARKET SECTORS
(% of Fund's net assets)
|
|
|
Information Technology
|
24.1
|
|
Industrials
|
18.3
|
|
Financials
|
15.1
|
|
Communication Services
|
10.6
|
|
Health Care
|
10.5
|
|
Energy
|
8.2
|
|
Consumer Staples
|
4.6
|
|
Consumer Discretionary
|
3.5
|
|
Materials
|
2.0
|
|
Utilities
|
1.0
|
|
Real Estate
|
0.4
|
|
|
|
Common Stocks
|
98.2
|
Preferred Stocks
|
0.1
|
Short-Term Investments and Net Other Assets (Liabilities)
|
1.7
|
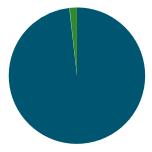
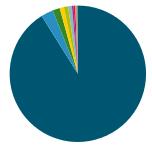
ASSET ALLOCATION (% of Fund's net assets)
|
|
|
|
|
Common Stocks - 98.2
|
|
|
Preferred Stocks - 0.1
|
|
|
Short-Term Investments and Net Other Assets (Liabilities) - 1.7
|
|
|
United States
|
91.0
|
Canada
|
2.0
|
Zambia
|
1.3
|
Belgium
|
1.2
|
United Kingdom
|
1.2
|
Germany
|
0.8
|
Taiwan
|
0.7
|
Netherlands
|
0.7
|
France
|
0.4
|
Others
|
0.7
|
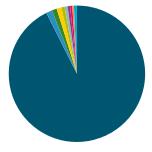
GEOGRAPHIC DIVERSIFICATION (% of Fund's net assets)
|
|
|
|
|
United States - 91.0
|
|
|
Canada - 2.0
|
|
|
Zambia - 1.3
|
|
|
Belgium - 1.2
|
|
|
United Kingdom - 1.2
|
|
|
Germany - 0.8
|
|
|
Taiwan - 0.7
|
|
|
Netherlands - 0.7
|
|
|
France - 0.4
|
|
|
Others - 0.7
|
|
|
|
TOP HOLDINGS
(% of Fund's net assets)
|
|
|
NVIDIA Corp
|
7.5
|
|
Microsoft Corp
|
6.1
|
|
Wells Fargo & Co
|
5.6
|
|
Boeing Co
|
5.0
|
|
GE Aerospace
|
4.5
|
|
GE Vernova Inc
|
4.0
|
|
Exxon Mobil Corp
|
3.7
|
|
Alphabet Inc Class A
|
3.4
|
|
Bank of America Corp
|
2.9
|
|
Alphabet Inc Class C
|
2.9
|
|
|
|
45.6
|
|
Fidelity, the Fidelity Investments Logo and all other Fidelity trademarks or service marks used herein are trademarks or service marks of FMR LLC. Any third-party marks that are used herein are trademarks or service marks of their respective owners. © 2026 FMR LLC. All rights reserved.
|
|
|
|
For additional information about the Fund; including its prospectus, financial information, holdings and proxy information, scan the QR code or visit fundresearch.fidelity.com/prospectus/sec
1.9915162.101 2457-TSRS-0226
|
|
|
|
|
SEMI-ANNUAL SHAREHOLDER REPORT | AS OF DECEMBER 31, 2025
|
|
|
|
Fidelity® Mega Cap Stock Fund
Fidelity® Mega Cap Stock Fund : FGRTX
|
|
|
|
|
This semi-annual shareholder report contains information about Fidelity® Mega Cap Stock Fund for the period July 1, 2025 to December 31, 2025. You can find additional information about the Fund at fundresearch.fidelity.com/prospectus/sec. You can also request this information by contacting us at 1-800-544-8544 or by sending an e-mail to fidfunddocuments@fidelity.com.
What were your Fund costs for the last six months?
(based on hypothetical $10,000 investment)
|
Costs of a $10,000 investment
|
Costs paid as a percentage of a $10,000 investment
|
|
Fidelity® Mega Cap Stock Fund
|
$ 31
|
0.58%
|
|
Key Fund Statistics
(as of December 31, 2025)
KEY FACTS
|
|
|
Fund Size
|
$5,766,775,973
|
|
Number of Holdings
|
116
|
|
Portfolio Turnover
|
10%
|
|
What did the Fund invest in?
(as of December 31, 2025)
MARKET SECTORS
(% of Fund's net assets)
|
|
|
Information Technology
|
26.1
|
|
Industrials
|
15.6
|
|
Financials
|
13.2
|
|
Communication Services
|
11.1
|
|
Energy
|
8.1
|
|
Health Care
|
8.1
|
|
Consumer Staples
|
5.0
|
|
Consumer Discretionary
|
4.1
|
|
Materials
|
0.9
|
|
Utilities
|
0.7
|
|
Real Estate
|
0.3
|
|
|
|
Common Stocks
|
93.2
|
Short-Term Investments and Net Other Assets (Liabilities)
|
6.8
|
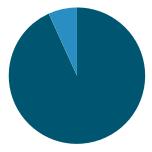
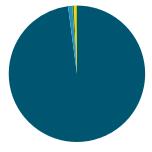
ASSET ALLOCATION (% of Fund's net assets)
|
|
|
|
|
Common Stocks - 93.2
|
|
|
Short-Term Investments and Net Other Assets (Liabilities) - 6.8
|
|
|
United States
|
92.6
|
Canada
|
1.4
|
United Kingdom
|
1.2
|
Taiwan
|
1.1
|
Zambia
|
0.8
|
Belgium
|
0.7
|
Germany
|
0.6
|
Netherlands
|
0.5
|
France
|
0.4
|
Others
|
0.7
|
GEOGRAPHIC DIVERSIFICATION (% of Fund's net assets)
|
|
|
|
|
United States - 92.6
|
|
|
Canada - 1.4
|
|
|
United Kingdom - 1.2
|
|
|
Taiwan - 1.1
|
|
|
Zambia - 0.8
|
|
|
Belgium - 0.7
|
|
|
Germany - 0.6
|
|
|
Netherlands - 0.5
|
|
|
France - 0.4
|
|
|
Others - 0.7
|
|
|
|
TOP HOLDINGS
(% of Fund's net assets)
|
|
|
NVIDIA Corp
|
8.3
|
|
Microsoft Corp
|
6.5
|
|
Boeing Co
|
5.1
|
|
Wells Fargo & Co
|
4.8
|
|
GE Aerospace
|
4.1
|
|
GE Vernova Inc
|
3.8
|
|
Alphabet Inc Class A
|
3.8
|
|
Exxon Mobil Corp
|
3.6
|
|
Apple Inc
|
3.4
|
|
Alphabet Inc Class C
|
3.2
|
|
|
|
46.6
|
|
Fidelity, the Fidelity Investments Logo and all other Fidelity trademarks or service marks used herein are trademarks or service marks of FMR LLC. Any third-party marks that are used herein are trademarks or service marks of their respective owners. © 2026 FMR LLC. All rights reserved.
|
|
|
|
For additional information about the Fund; including its prospectus, financial information, holdings and proxy information, scan the QR code or visit fundresearch.fidelity.com/prospectus/sec
1.9915160.101 361-TSRS-0226
|
|
|
|
|
SEMI-ANNUAL SHAREHOLDER REPORT | AS OF DECEMBER 31, 2025
|
|
|
|
Fidelity® Mega Cap Stock Fund
Fidelity Advisor® Mega Cap Stock Fund Class Z : FZALX
|
|
|
|
|
This semi-annual shareholder report contains information about Fidelity® Mega Cap Stock Fund for the period July 1, 2025 to December 31, 2025. You can find additional information about the Fund at fundresearch.fidelity.com/prospectus/sec. You can also request this information by contacting us at 1-877-208-0098 or by sending an e-mail to fidfunddocuments@fidelity.com.
What were your Fund costs for the last six months?
(based on hypothetical $10,000 investment)
|
Costs of a $10,000 investment
|
Costs paid as a percentage of a $10,000 investment
|
|
Class Z
|
$ 25
|
0.47%
|
|
Key Fund Statistics
(as of December 31, 2025)
KEY FACTS
|
|
|
Fund Size
|
$5,766,775,973
|
|
Number of Holdings
|
116
|
|
Portfolio Turnover
|
10%
|
|
What did the Fund invest in?
(as of December 31, 2025)
MARKET SECTORS
(% of Fund's net assets)
|
|
|
Information Technology
|
26.1
|
|
Industrials
|
15.6
|
|
Financials
|
13.2
|
|
Communication Services
|
11.1
|
|
Energy
|
8.1
|
|
Health Care
|
8.1
|
|
Consumer Staples
|
5.0
|
|
Consumer Discretionary
|
4.1
|
|
Materials
|
0.9
|
|
Utilities
|
0.7
|
|
Real Estate
|
0.3
|
|
|
|
Common Stocks
|
93.2
|
Short-Term Investments and Net Other Assets (Liabilities)
|
6.8
|
ASSET ALLOCATION (% of Fund's net assets)
|
|
|
|
|
Common Stocks - 93.2
|
|
|
Short-Term Investments and Net Other Assets (Liabilities) - 6.8
|
|
|
United States
|
92.6
|
Canada
|
1.4
|
United Kingdom
|
1.2
|
Taiwan
|
1.1
|
Zambia
|
0.8
|
Belgium
|
0.7
|
Germany
|
0.6
|
Netherlands
|
0.5
|
France
|
0.4
|
Others
|
0.7
|
GEOGRAPHIC DIVERSIFICATION (% of Fund's net assets)
|
|
|
|
|
United States - 92.6
|
|
|
Canada - 1.4
|
|
|
United Kingdom - 1.2
|
|
|
Taiwan - 1.1
|
|
|
Zambia - 0.8
|
|
|
Belgium - 0.7
|
|
|
Germany - 0.6
|
|
|
Netherlands - 0.5
|
|
|
France - 0.4
|
|
|
Others - 0.7
|
|
|
|
TOP HOLDINGS
(% of Fund's net assets)
|
|
|
NVIDIA Corp
|
8.3
|
|
Microsoft Corp
|
6.5
|
|
Boeing Co
|
5.1
|
|
Wells Fargo & Co
|
4.8
|
|
GE Aerospace
|
4.1
|
|
GE Vernova Inc
|
3.8
|
|
Alphabet Inc Class A
|
3.8
|
|
Exxon Mobil Corp
|
3.6
|
|
Apple Inc
|
3.4
|
|
Alphabet Inc Class C
|
3.2
|
|
|
|
46.6
|
|
Fidelity, the Fidelity Investments Logo and all other Fidelity trademarks or service marks used herein are trademarks or service marks of FMR LLC. Any third-party marks that are used herein are trademarks or service marks of their respective owners. © 2026 FMR LLC. All rights reserved.
|
|
|
|
For additional information about the Fund; including its prospectus, financial information, holdings and proxy information, scan the QR code or visit fundresearch.fidelity.com/prospectus/sec
1.9915159.101 2537-TSRS-0226
|
|
|
|
|
SEMI-ANNUAL SHAREHOLDER REPORT | AS OF DECEMBER 31, 2025
|
|
|
|
Fidelity® Mega Cap Stock Fund
Fidelity Advisor® Mega Cap Stock Fund Class M : FTGRX
|
|
|
|
|
This semi-annual shareholder report contains information about Fidelity® Mega Cap Stock Fund for the period July 1, 2025 to December 31, 2025. You can find additional information about the Fund at fundresearch.fidelity.com/prospectus/sec. You can also request this information by contacting us at 1-877-208-0098 or by sending an e-mail to fidfunddocuments@fidelity.com.
What were your Fund costs for the last six months?
(based on hypothetical $10,000 investment)
|
Costs of a $10,000 investment
|
Costs paid as a percentage of a $10,000 investment
|
|
Class M
|
$ 60
|
1.11%
|
|
Key Fund Statistics
(as of December 31, 2025)
KEY FACTS
|
|
|
Fund Size
|
$5,766,775,973
|
|
Number of Holdings
|
116
|
|
Portfolio Turnover
|
10%
|
|
What did the Fund invest in?
(as of December 31, 2025)
MARKET SECTORS
(% of Fund's net assets)
|
|
|
Information Technology
|
26.1
|
|
Industrials
|
15.6
|
|
Financials
|
13.2
|
|
Communication Services
|
11.1
|
|
Energy
|
8.1
|
|
Health Care
|
8.1
|
|
Consumer Staples
|
5.0
|
|
Consumer Discretionary
|
4.1
|
|
Materials
|
0.9
|
|
Utilities
|
0.7
|
|
Real Estate
|
0.3
|
|
|
|
Common Stocks
|
93.2
|
Short-Term Investments and Net Other Assets (Liabilities)
|
6.8
|
ASSET ALLOCATION (% of Fund's net assets)
|
|
|
|
|
Common Stocks - 93.2
|
|
|
Short-Term Investments and Net Other Assets (Liabilities) - 6.8
|
|
|
United States
|
92.6
|
Canada
|
1.4
|
United Kingdom
|
1.2
|
Taiwan
|
1.1
|
Zambia
|
0.8
|
Belgium
|
0.7
|
Germany
|
0.6
|
Netherlands
|
0.5
|
France
|
0.4
|
Others
|
0.7
|
GEOGRAPHIC DIVERSIFICATION (% of Fund's net assets)
|
|
|
|
|
United States - 92.6
|
|
|
Canada - 1.4
|
|
|
United Kingdom - 1.2
|
|
|
Taiwan - 1.1
|
|
|
Zambia - 0.8
|
|
|
Belgium - 0.7
|
|
|
Germany - 0.6
|
|
|
Netherlands - 0.5
|
|
|
France - 0.4
|
|
|
Others - 0.7
|
|
|
|
TOP HOLDINGS
(% of Fund's net assets)
|
|
|
NVIDIA Corp
|
8.3
|
|
Microsoft Corp
|
6.5
|
|
Boeing Co
|
5.1
|
|
Wells Fargo & Co
|
4.8
|
|
GE Aerospace
|
4.1
|
|
GE Vernova Inc
|
3.8
|
|
Alphabet Inc Class A
|
3.8
|
|
Exxon Mobil Corp
|
3.6
|
|
Apple Inc
|
3.4
|
|
Alphabet Inc Class C
|
3.2
|
|
|
|
46.6
|
|
Fidelity, the Fidelity Investments Logo and all other Fidelity trademarks or service marks used herein are trademarks or service marks of FMR LLC. Any third-party marks that are used herein are trademarks or service marks of their respective owners. © 2026 FMR LLC. All rights reserved.
|
|
|
|
For additional information about the Fund; including its prospectus, financial information, holdings and proxy information, scan the QR code or visit fundresearch.fidelity.com/prospectus/sec
1.9915157.101 2037-TSRS-0226
|
|
|
|
|
SEMI-ANNUAL SHAREHOLDER REPORT | AS OF DECEMBER 31, 2025
|
|
|
|
Fidelity® Mega Cap Stock Fund
Fidelity Advisor® Mega Cap Stock Fund Class I : FTRIX
|
|
|
|
|
This semi-annual shareholder report contains information about Fidelity® Mega Cap Stock Fund for the period July 1, 2025 to December 31, 2025. You can find additional information about the Fund at fundresearch.fidelity.com/prospectus/sec. You can also request this information by contacting us at 1-877-208-0098 or by sending an e-mail to fidfunddocuments@fidelity.com.
What were your Fund costs for the last six months?
(based on hypothetical $10,000 investment)
|
Costs of a $10,000 investment
|
Costs paid as a percentage of a $10,000 investment
|
|
Class I
|
$ 32
|
0.59%
|
|
Key Fund Statistics
(as of December 31, 2025)
KEY FACTS
|
|
|
Fund Size
|
$5,766,775,973
|
|
Number of Holdings
|
116
|
|
Portfolio Turnover
|
10%
|
|
What did the Fund invest in?
(as of December 31, 2025)
MARKET SECTORS
(% of Fund's net assets)
|
|
|
Information Technology
|
26.1
|
|
Industrials
|
15.6
|
|
Financials
|
13.2
|
|
Communication Services
|
11.1
|
|
Energy
|
8.1
|
|
Health Care
|
8.1
|
|
Consumer Staples
|
5.0
|
|
Consumer Discretionary
|
4.1
|
|
Materials
|
0.9
|
|
Utilities
|
0.7
|
|
Real Estate
|
0.3
|
|
|
|
Common Stocks
|
93.2
|
Short-Term Investments and Net Other Assets (Liabilities)
|
6.8
|
ASSET ALLOCATION (% of Fund's net assets)
|
|
|
|
|
Common Stocks - 93.2
|
|
|
Short-Term Investments and Net Other Assets (Liabilities) - 6.8
|
|
|
United States
|
92.6
|
Canada
|
1.4
|
United Kingdom
|
1.2
|
Taiwan
|
1.1
|
Zambia
|
0.8
|
Belgium
|
0.7
|
Germany
|
0.6
|
Netherlands
|
0.5
|
France
|
0.4
|
Others
|
0.7
|
GEOGRAPHIC DIVERSIFICATION (% of Fund's net assets)
|
|
|
|
|
United States - 92.6
|
|
|
Canada - 1.4
|
|
|
United Kingdom - 1.2
|
|
|
Taiwan - 1.1
|
|
|
Zambia - 0.8
|
|
|
Belgium - 0.7
|
|
|
Germany - 0.6
|
|
|
Netherlands - 0.5
|
|
|
France - 0.4
|
|
|
Others - 0.7
|
|
|
|
TOP HOLDINGS
(% of Fund's net assets)
|
|
|
NVIDIA Corp
|
8.3
|
|
Microsoft Corp
|
6.5
|
|
Boeing Co
|
5.1
|
|
Wells Fargo & Co
|
4.8
|
|
GE Aerospace
|
4.1
|
|
GE Vernova Inc
|
3.8
|
|
Alphabet Inc Class A
|
3.8
|
|
Exxon Mobil Corp
|
3.6
|
|
Apple Inc
|
3.4
|
|
Alphabet Inc Class C
|
3.2
|
|
|
|
46.6
|
|
Fidelity, the Fidelity Investments Logo and all other Fidelity trademarks or service marks used herein are trademarks or service marks of FMR LLC. Any third-party marks that are used herein are trademarks or service marks of their respective owners. © 2026 FMR LLC. All rights reserved.
|
|
|
|
For additional information about the Fund; including its prospectus, financial information, holdings and proxy information, scan the QR code or visit fundresearch.fidelity.com/prospectus/sec
1.9915158.101 2038-TSRS-0226
|
|
|
|
|
SEMI-ANNUAL SHAREHOLDER REPORT | AS OF DECEMBER 31, 2025
|
|
|
|
Fidelity® Mega Cap Stock Fund
Fidelity Advisor® Mega Cap Stock Fund Class C : FGRCX
|
|
|
|
|
This semi-annual shareholder report contains information about Fidelity® Mega Cap Stock Fund for the period July 1, 2025 to December 31, 2025. You can find additional information about the Fund at fundresearch.fidelity.com/prospectus/sec. You can also request this information by contacting us at 1-877-208-0098 or by sending an e-mail to fidfunddocuments@fidelity.com.
What were your Fund costs for the last six months?
(based on hypothetical $10,000 investment)
|
Costs of a $10,000 investment
|
Costs paid as a percentage of a $10,000 investment
|
|
Class C
|
$ 87
|
1.63%
|
|
Key Fund Statistics
(as of December 31, 2025)
KEY FACTS
|
|
|
Fund Size
|
$5,766,775,973
|
|
Number of Holdings
|
116
|
|
Portfolio Turnover
|
10%
|
|
What did the Fund invest in?
(as of December 31, 2025)
MARKET SECTORS
(% of Fund's net assets)
|
|
|
Information Technology
|
26.1
|
|
Industrials
|
15.6
|
|
Financials
|
13.2
|
|
Communication Services
|
11.1
|
|
Energy
|
8.1
|
|
Health Care
|
8.1
|
|
Consumer Staples
|
5.0
|
|
Consumer Discretionary
|
4.1
|
|
Materials
|
0.9
|
|
Utilities
|
0.7
|
|
Real Estate
|
0.3
|
|
|
|
Common Stocks
|
93.2
|
Short-Term Investments and Net Other Assets (Liabilities)
|
6.8
|
ASSET ALLOCATION (% of Fund's net assets)
|
|
|
|
|
Common Stocks - 93.2
|
|
|
Short-Term Investments and Net Other Assets (Liabilities) - 6.8
|
|
|
United States
|
92.6
|
Canada
|
1.4
|
United Kingdom
|
1.2
|
Taiwan
|
1.1
|
Zambia
|
0.8
|
Belgium
|
0.7
|
Germany
|
0.6
|
Netherlands
|
0.5
|
France
|
0.4
|
Others
|
0.7
|
GEOGRAPHIC DIVERSIFICATION (% of Fund's net assets)
|
|
|
|
|
United States - 92.6
|
|
|
Canada - 1.4
|
|
|
United Kingdom - 1.2
|
|
|
Taiwan - 1.1
|
|
|
Zambia - 0.8
|
|
|
Belgium - 0.7
|
|
|
Germany - 0.6
|
|
|
Netherlands - 0.5
|
|
|
France - 0.4
|
|
|
Others - 0.7
|
|
|
|
TOP HOLDINGS
(% of Fund's net assets)
|
|
|
NVIDIA Corp
|
8.3
|
|
Microsoft Corp
|
6.5
|
|
Boeing Co
|
5.1
|
|
Wells Fargo & Co
|
4.8
|
|
GE Aerospace
|
4.1
|
|
GE Vernova Inc
|
3.8
|
|
Alphabet Inc Class A
|
3.8
|
|
Exxon Mobil Corp
|
3.6
|
|
Apple Inc
|
3.4
|
|
Alphabet Inc Class C
|
3.2
|
|
|
|
46.6
|
|
Fidelity, the Fidelity Investments Logo and all other Fidelity trademarks or service marks used herein are trademarks or service marks of FMR LLC. Any third-party marks that are used herein are trademarks or service marks of their respective owners. © 2026 FMR LLC. All rights reserved.
|
|
|
|
For additional information about the Fund; including its prospectus, financial information, holdings and proxy information, scan the QR code or visit fundresearch.fidelity.com/prospectus/sec
1.9915156.101 2036-TSRS-0226
|
|
|
|
|
SEMI-ANNUAL SHAREHOLDER REPORT | AS OF DECEMBER 31, 2025
|
|
|
|
Fidelity® Mega Cap Stock Fund
Fidelity Advisor® Mega Cap Stock Fund Class A : FGTAX
|
|
|
|
|
This semi-annual shareholder report contains information about Fidelity® Mega Cap Stock Fund for the period July 1, 2025 to December 31, 2025. You can find additional information about the Fund at fundresearch.fidelity.com/prospectus/sec. You can also request this information by contacting us at 1-877-208-0098 or by sending an e-mail to fidfunddocuments@fidelity.com.
What were your Fund costs for the last six months?
(based on hypothetical $10,000 investment)
|
Costs of a $10,000 investment
|
Costs paid as a percentage of a $10,000 investment
|
|
Class A
|
$ 46
|
0.86%
|
|
Key Fund Statistics
(as of December 31, 2025)
KEY FACTS
|
|
|
Fund Size
|
$5,766,775,973
|
|
Number of Holdings
|
116
|
|
Portfolio Turnover
|
10%
|
|
What did the Fund invest in?
(as of December 31, 2025)
MARKET SECTORS
(% of Fund's net assets)
|
|
|
Information Technology
|
26.1
|
|
Industrials
|
15.6
|
|
Financials
|
13.2
|
|
Communication Services
|
11.1
|
|
Energy
|
8.1
|
|
Health Care
|
8.1
|
|
Consumer Staples
|
5.0
|
|
Consumer Discretionary
|
4.1
|
|
Materials
|
0.9
|
|
Utilities
|
0.7
|
|
Real Estate
|
0.3
|
|
|
|
Common Stocks
|
93.2
|
Short-Term Investments and Net Other Assets (Liabilities)
|
6.8
|
ASSET ALLOCATION (% of Fund's net assets)
|
|
|
|
|
Common Stocks - 93.2
|
|
|
Short-Term Investments and Net Other Assets (Liabilities) - 6.8
|
|
|
United States
|
92.6
|
Canada
|
1.4
|
United Kingdom
|
1.2
|
Taiwan
|
1.1
|
Zambia
|
0.8
|
Belgium
|
0.7
|
Germany
|
0.6
|
Netherlands
|
0.5
|
France
|
0.4
|
Others
|
0.7
|
GEOGRAPHIC DIVERSIFICATION (% of Fund's net assets)
|
|
|
|
|
United States - 92.6
|
|
|
Canada - 1.4
|
|
|
United Kingdom - 1.2
|
|
|
Taiwan - 1.1
|
|
|
Zambia - 0.8
|
|
|
Belgium - 0.7
|
|
|
Germany - 0.6
|
|
|
Netherlands - 0.5
|
|
|
France - 0.4
|
|
|
Others - 0.7
|
|
|
|
TOP HOLDINGS
(% of Fund's net assets)
|
|
|
NVIDIA Corp
|
8.3
|
|
Microsoft Corp
|
6.5
|
|
Boeing Co
|
5.1
|
|
Wells Fargo & Co
|
4.8
|
|
GE Aerospace
|
4.1
|
|
GE Vernova Inc
|
3.8
|
|
Alphabet Inc Class A
|
3.8
|
|
Exxon Mobil Corp
|
3.6
|
|
Apple Inc
|
3.4
|
|
Alphabet Inc Class C
|
3.2
|
|
|
|
46.6
|
|
Fidelity, the Fidelity Investments Logo and all other Fidelity trademarks or service marks used herein are trademarks or service marks of FMR LLC. Any third-party marks that are used herein are trademarks or service marks of their respective owners. © 2026 FMR LLC. All rights reserved.
|
|
|
|
For additional information about the Fund; including its prospectus, financial information, holdings and proxy information, scan the QR code or visit fundresearch.fidelity.com/prospectus/sec
1.9915155.101 2034-TSRS-0226
|
|
|
|
|
SEMI-ANNUAL SHAREHOLDER REPORT | AS OF DECEMBER 31, 2025
|
|
|
|
Fidelity® Growth Discovery Fund
Fidelity® Growth Discovery Fund : FDSVX
|
|
|
|
|
This semi-annual shareholder report contains information about Fidelity® Growth Discovery Fund for the period July 1, 2025 to December 31, 2025. You can find additional information about the Fund at fundresearch.fidelity.com/prospectus/sec. You can also request this information by contacting us at 1-800-544-8544 or by sending an e-mail to fidfunddocuments@fidelity.com.
What were your Fund costs for the last six months?
(based on hypothetical $10,000 investment)
|
Costs of a $10,000 investment
|
Costs paid as a percentage of a $10,000 investment
|
|
Fidelity® Growth Discovery Fund
|
$ 25
|
0.47%
|
|
Key Fund Statistics
(as of December 31, 2025)
KEY FACTS
|
|
|
Fund Size
|
$6,416,410,117
|
|
Number of Holdings
|
144
|
|
Portfolio Turnover
|
78%
|
|
What did the Fund invest in?
(as of December 31, 2025)
MARKET SECTORS
(% of Fund's net assets)
|
|
|
Information Technology
|
45.8
|
|
Communication Services
|
13.5
|
|
Consumer Discretionary
|
11.3
|
|
Financials
|
8.2
|
|
Health Care
|
8.1
|
|
Industrials
|
7.4
|
|
Materials
|
2.0
|
|
Consumer Staples
|
1.5
|
|
Utilities
|
0.9
|
|
Real Estate
|
0.6
|
|
Energy
|
0.5
|
|
|
|
Common Stocks
|
99.0
|
Preferred Stocks
|
0.8
|
Preferred Securities
|
0.0
|
Bonds
|
0.0
|
Short-Term Investments and Net Other Assets (Liabilities)
|
0.2
|
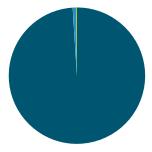
ASSET ALLOCATION (% of Fund's net assets)
|
|
|
|
|
Common Stocks - 99.0
|
|
|
Preferred Stocks - 0.8
|
|
|
Preferred Securities - 0.0
|
|
|
Bonds - 0.0
|
|
|
Short-Term Investments and Net Other Assets (Liabilities) - 0.2
|
|
|
United States
|
91.1
|
Taiwan
|
2.9
|
Canada
|
1.7
|
China
|
1.0
|
Korea (South)
|
1.0
|
Belgium
|
0.9
|
Netherlands
|
0.4
|
Germany
|
0.4
|
Brazil
|
0.4
|
Others
|
0.2
|
GEOGRAPHIC DIVERSIFICATION (% of Fund's net assets)
|
|
|
|
|
United States - 91.1
|
|
|
Taiwan - 2.9
|
|
|
Canada - 1.7
|
|
|
China - 1.0
|
|
|
Korea (South) - 1.0
|
|
|
Belgium - 0.9
|
|
|
Netherlands - 0.4
|
|
|
Germany - 0.4
|
|
|
Brazil - 0.4
|
|
|
Others - 0.2
|
|
|
|
TOP HOLDINGS
(% of Fund's net assets)
|
|
|
NVIDIA Corp
|
13.5
|
|
Microsoft Corp
|
10.0
|
|
Alphabet Inc Class A
|
6.6
|
|
Apple Inc
|
5.4
|
|
Amazon.com Inc
|
5.2
|
|
Broadcom Inc
|
4.8
|
|
Meta Platforms Inc Class A
|
4.1
|
|
Mastercard Inc Class A
|
3.6
|
|
Taiwan Semiconductor Manufacturing Co Ltd ADR
|
2.9
|
|
Eli Lilly & Co
|
2.6
|
|
|
|
58.7
|
|
Fidelity, the Fidelity Investments Logo and all other Fidelity trademarks or service marks used herein are trademarks or service marks of FMR LLC. Any third-party marks that are used herein are trademarks or service marks of their respective owners. © 2026 FMR LLC. All rights reserved.
|
|
|
|
For additional information about the Fund; including its prospectus, financial information, holdings and proxy information, scan the QR code or visit fundresearch.fidelity.com/prospectus/sec
1.9915154.101 339-TSRS-0226
|
|
|
|
|
SEMI-ANNUAL SHAREHOLDER REPORT | AS OF DECEMBER 31, 2025
|
|
|
|
Fidelity® Growth Discovery Fund
Fidelity® Growth Discovery Fund Class K : FGDKX
|
|
|
|
|
This semi-annual shareholder report contains information about Fidelity® Growth Discovery Fund for the period July 1, 2025 to December 31, 2025. You can find additional information about the Fund at fundresearch.fidelity.com/prospectus/sec. You can also request this information by contacting us at 1-800-835-5092 or by sending an e-mail to fidfunddocuments@fidelity.com.
What were your Fund costs for the last six months?
(based on hypothetical $10,000 investment)
|
Costs of a $10,000 investment
|
Costs paid as a percentage of a $10,000 investment
|
|
Class K
|
$ 21
|
0.40%
|
|
Key Fund Statistics
(as of December 31, 2025)
KEY FACTS
|
|
|
Fund Size
|
$6,416,410,117
|
|
Number of Holdings
|
144
|
|
Portfolio Turnover
|
78%
|
|
What did the Fund invest in?
(as of December 31, 2025)
MARKET SECTORS
(% of Fund's net assets)
|
|
|
Information Technology
|
45.8
|
|
Communication Services
|
13.5
|
|
Consumer Discretionary
|
11.3
|
|
Financials
|
8.2
|
|
Health Care
|
8.1
|
|
Industrials
|
7.4
|
|
Materials
|
2.0
|
|
Consumer Staples
|
1.5
|
|
Utilities
|
0.9
|
|
Real Estate
|
0.6
|
|
Energy
|
0.5
|
|
|
|
Common Stocks
|
99.0
|
Preferred Stocks
|
0.8
|
Preferred Securities
|
0.0
|
Bonds
|
0.0
|
Short-Term Investments and Net Other Assets (Liabilities)
|
0.2
|
ASSET ALLOCATION (% of Fund's net assets)
|
|
|
|
|
Common Stocks - 99.0
|
|
|
Preferred Stocks - 0.8
|
|
|
Preferred Securities - 0.0
|
|
|
Bonds - 0.0
|
|
|
Short-Term Investments and Net Other Assets (Liabilities) - 0.2
|
|
|
United States
|
91.1
|
Taiwan
|
2.9
|
Canada
|
1.7
|
China
|
1.0
|
Korea (South)
|
1.0
|
Belgium
|
0.9
|
Netherlands
|
0.4
|
Germany
|
0.4
|
Brazil
|
0.4
|
Others
|
0.2
|
GEOGRAPHIC DIVERSIFICATION (% of Fund's net assets)
|
|
|
|
|
United States - 91.1
|
|
|
Taiwan - 2.9
|
|
|
Canada - 1.7
|
|
|
China - 1.0
|
|
|
Korea (South) - 1.0
|
|
|
Belgium - 0.9
|
|
|
Netherlands - 0.4
|
|
|
Germany - 0.4
|
|
|
Brazil - 0.4
|
|
|
Others - 0.2
|
|
|
|
TOP HOLDINGS
(% of Fund's net assets)
|
|
|
NVIDIA Corp
|
13.5
|
|
Microsoft Corp
|
10.0
|
|
Alphabet Inc Class A
|
6.6
|
|
Apple Inc
|
5.4
|
|
Amazon.com Inc
|
5.2
|
|
Broadcom Inc
|
4.8
|
|
Meta Platforms Inc Class A
|
4.1
|
|
Mastercard Inc Class A
|
3.6
|
|
Taiwan Semiconductor Manufacturing Co Ltd ADR
|
2.9
|
|
Eli Lilly & Co
|
2.6
|
|
|
|
58.7
|
|
Fidelity, the Fidelity Investments Logo and all other Fidelity trademarks or service marks used herein are trademarks or service marks of FMR LLC. Any third-party marks that are used herein are trademarks or service marks of their respective owners. © 2026 FMR LLC. All rights reserved.
|
|
|
|
For additional information about the Fund; including its prospectus, financial information, holdings and proxy information, scan the QR code or visit fundresearch.fidelity.com/prospectus/sec
1.9915153.101 2091-TSRS-0226
|
|
|
|
|
SEMI-ANNUAL SHAREHOLDER REPORT | AS OF DECEMBER 31, 2025
|
|
|
|
Fidelity® Fund
Fidelity® Fund : FFIDX
|
|
|
|
|
This semi-annual shareholder report contains information about Fidelity® Fund for the period July 1, 2025 to December 31, 2025. You can find additional information about the Fund at fundresearch.fidelity.com/prospectus/sec. You can also request this information by contacting us at 1-800-544-8544 or by sending an e-mail to fidfunddocuments@fidelity.com.
What were your Fund costs for the last six months?
(based on hypothetical $10,000 investment)
|
Costs of a $10,000 investment
|
Costs paid as a percentage of a $10,000 investment
|
|
Fidelity® Fund
|
$ 23
|
0.42%
|
|
Key Fund Statistics
(as of December 31, 2025)
KEY FACTS
|
|
|
Fund Size
|
$9,113,136,791
|
|
Number of Holdings
|
88
|
|
Portfolio Turnover
|
53%
|
|
What did the Fund invest in?
(as of December 31, 2025)
MARKET SECTORS
(% of Fund's net assets)
|
|
|
Information Technology
|
24.8
|
|
Communication Services
|
16.9
|
|
Financials
|
16.0
|
|
Consumer Discretionary
|
12.6
|
|
Health Care
|
11.0
|
|
Industrials
|
8.3
|
|
Consumer Staples
|
4.9
|
|
Energy
|
2.8
|
|
Materials
|
0.9
|
|
Utilities
|
0.7
|
|
Real Estate
|
0.5
|
|
|
|
Common Stocks
|
99.3
|
Preferred Stocks
|
0.1
|
Short-Term Investments and Net Other Assets (Liabilities)
|
0.6
|
ASSET ALLOCATION (% of Fund's net assets)
|
|
|
|
|
Common Stocks - 99.3
|
|
|
Preferred Stocks - 0.1
|
|
|
Short-Term Investments and Net Other Assets (Liabilities) - 0.6
|
|
|
United States
|
97.9
|
Canada
|
1.0
|
Belgium
|
0.4
|
United Kingdom
|
0.4
|
Netherlands
|
0.3
|
GEOGRAPHIC DIVERSIFICATION (% of Fund's net assets)
|
|
|
|
|
United States - 97.9
|
|
|
Canada - 1.0
|
|
|
Belgium - 0.4
|
|
|
United Kingdom - 0.4
|
|
|
Netherlands - 0.3
|
|
|
|
TOP HOLDINGS
(% of Fund's net assets)
|
|
|
NVIDIA Corp
|
9.5
|
|
Alphabet Inc Class A
|
9.2
|
|
Microsoft Corp
|
7.3
|
|
Amazon.com Inc
|
5.6
|
|
Meta Platforms Inc Class A
|
5.0
|
|
Apple Inc
|
4.2
|
|
Bank of America Corp
|
3.3
|
|
Mastercard Inc Class A
|
3.2
|
|
Wells Fargo & Co
|
3.1
|
|
Coca-Cola Co/The
|
2.9
|
|
|
|
53.3
|
|
Fidelity, the Fidelity Investments Logo and all other Fidelity trademarks or service marks used herein are trademarks or service marks of FMR LLC. Any third-party marks that are used herein are trademarks or service marks of their respective owners. © 2026 FMR LLC. All rights reserved.
|
|
|
|
For additional information about the Fund; including its prospectus, financial information, holdings and proxy information, scan the QR code or visit fundresearch.fidelity.com/prospectus/sec
1.9915151.101 3-TSRS-0226
|
|
|
|
|
SEMI-ANNUAL SHAREHOLDER REPORT | AS OF DECEMBER 31, 2025
|
|
|
|
Fidelity® Fund
Fidelity® Fund Class K : FFDKX
|
|
|
|
|
This semi-annual shareholder report contains information about Fidelity® Fund for the period July 1, 2025 to December 31, 2025. You can find additional information about the Fund at fundresearch.fidelity.com/prospectus/sec. You can also request this information by contacting us at 1-800-835-5092 or by sending an e-mail to fidfunddocuments@fidelity.com.
What were your Fund costs for the last six months?
(based on hypothetical $10,000 investment)
|
Costs of a $10,000 investment
|
Costs paid as a percentage of a $10,000 investment
|
|
Class K
|
$ 18
|
0.34%
|
|
Key Fund Statistics
(as of December 31, 2025)
KEY FACTS
|
|
|
Fund Size
|
$9,113,136,791
|
|
Number of Holdings
|
88
|
|
Portfolio Turnover
|
53%
|
|
What did the Fund invest in?
(as of December 31, 2025)
MARKET SECTORS
(% of Fund's net assets)
|
|
|
Information Technology
|
24.8
|
|
Communication Services
|
16.9
|
|
Financials
|
16.0
|
|
Consumer Discretionary
|
12.6
|
|
Health Care
|
11.0
|
|
Industrials
|
8.3
|
|
Consumer Staples
|
4.9
|
|
Energy
|
2.8
|
|
Materials
|
0.9
|
|
Utilities
|
0.7
|
|
Real Estate
|
0.5
|
|
|
|
Common Stocks
|
99.3
|
Preferred Stocks
|
0.1
|
Short-Term Investments and Net Other Assets (Liabilities)
|
0.6
|
ASSET ALLOCATION (% of Fund's net assets)
|
|
|
|
|
Common Stocks - 99.3
|
|
|
Preferred Stocks - 0.1
|
|
|
Short-Term Investments and Net Other Assets (Liabilities) - 0.6
|
|
|
United States
|
97.9
|
Canada
|
1.0
|
Belgium
|
0.4
|
United Kingdom
|
0.4
|
Netherlands
|
0.3
|
GEOGRAPHIC DIVERSIFICATION (% of Fund's net assets)
|
|
|
|
|
United States - 97.9
|
|
|
Canada - 1.0
|
|
|
Belgium - 0.4
|
|
|
United Kingdom - 0.4
|
|
|
Netherlands - 0.3
|
|
|
|
TOP HOLDINGS
(% of Fund's net assets)
|
|
|
NVIDIA Corp
|
9.5
|
|
Alphabet Inc Class A
|
9.2
|
|
Microsoft Corp
|
7.3
|
|
Amazon.com Inc
|
5.6
|
|
Meta Platforms Inc Class A
|
5.0
|
|
Apple Inc
|
4.2
|
|
Bank of America Corp
|
3.3
|
|
Mastercard Inc Class A
|
3.2
|
|
Wells Fargo & Co
|
3.1
|
|
Coca-Cola Co/The
|
2.9
|
|
|
|
53.3
|
|
Fidelity, the Fidelity Investments Logo and all other Fidelity trademarks or service marks used herein are trademarks or service marks of FMR LLC. Any third-party marks that are used herein are trademarks or service marks of their respective owners. © 2026 FMR LLC. All rights reserved.
|
|
|
|
For additional information about the Fund; including its prospectus, financial information, holdings and proxy information, scan the QR code or visit fundresearch.fidelity.com/prospectus/sec
1.9915150.101 2088-TSRS-0226
|
Item 2.
Code of Ethics
Not applicable.
Item 3.
Audit Committee Financial Expert
Not applicable.
Item 4.
Principal Accountant Fees and Services
Not applicable.
Item 5.
Audit Committee of Listed Registrants
Not applicable.
Item 6.
Investments
(a)
Not applicable.
(b)
Not applicable
Item 7.
Financial Statements and Financial Highlights for Open-End Management Investment Companies
Fidelity® Series Large Cap Stock Fund
Semi-Annual Report
December 31, 2025
Contents
To view a fund's proxy voting guidelines and proxy voting record for the 12-month period ended June 30, visit http://www.fidelity.com/proxyvotingresults or visit the Securities and Exchange Commission's (SEC) web site at http://www.sec.gov.
You may also call 1-800-544-8544 to request a free copy of the proxy voting guidelines.
Standard & Poor's, S&P and S&P 500 are registered service marks of The McGraw-Hill Companies, Inc. and have been licensed for use by Fidelity Distributors Corporation.
Other third-party marks appearing herein are the property of their respective owners.
All other marks appearing herein are registered or unregistered trademarks or service marks of FMR LLC or an affiliated company. © 2026 FMR LLC. All rights reserved.
This report and the financial statements contained herein are submitted for the general information of the shareholders of the Fund. This report is not authorized for distribution to prospective investors in the Fund unless preceded or accompanied by an effective prospectus.
A fund files its complete schedule of portfolio holdings with the SEC for the first and third quarters of each fiscal year on Form N-PORT. Forms N-PORT are available on the SEC's web site at http://www.sec.gov. A fund's Forms N-PORT may be reviewed and copied at the SEC's Public Reference Room in Washington, DC. Information regarding the operation of the SEC's Public Reference Room may be obtained by calling 1-800-SEC-0330.
For a complete list of a fund's portfolio holdings, view the most recent holdings listing, semiannual report, or annual report on Fidelity's web site at http://www.fidelity.com, http://www.institutional.fidelity.com, or http://www.401k.com, as applicable.
NOT FDIC INSURED •MAY LOSE VALUE •NO BANK GUARANTEE
Neither the Fund nor Fidelity Distributors Corporation is a bank.
Item 7: Financial Statements and Financial Highlights for Open-End Management Investment Companies (Semi-Annual Report)
Fidelity® Series Large Cap Stock Fund
Schedule of Investments December 31, 2025 (Unaudited)
Showing Percentage of Net Assets
Common Stocks - 98.2%
|
|
|
|
Shares
|
Value ($)
|
AUSTRALIA - 0.1%
|
|
|
|
Energy - 0.1%
|
|
|
|
Oil, Gas & Consumable Fuels - 0.1%
|
|
|
|
Santos Ltd
|
|
6,090,843
|
25,079,348
|
BELGIUM - 1.2%
|
|
|
|
Health Care - 1.2%
|
|
|
|
Pharmaceuticals - 1.2%
|
|
|
|
UCB SA
|
|
1,076,100
|
301,741,368
|
CANADA - 2.0%
|
|
|
|
Energy - 1.6%
|
|
|
|
Oil, Gas & Consumable Fuels - 1.6%
|
|
|
|
Athabasca Oil Corp (c)
|
|
7,492,000
|
38,372,926
|
Imperial Oil Ltd (b)
|
|
3,917,400
|
338,439,614
|
TOTAL ENERGY
|
|
|
376,812,540
|
Industrials - 0.4%
|
|
|
|
Aerospace & Defense - 0.4%
|
|
|
|
Bombardier Inc Class B (c)
|
|
596,500
|
101,477,360
|
TOTAL CANADA
|
|
|
478,289,900
|
DENMARK - 0.3%
|
|
|
|
Health Care - 0.3%
|
|
|
|
Pharmaceuticals - 0.3%
|
|
|
|
Novo Nordisk A/S Class B ADR (b)
|
|
1,272,600
|
64,749,888
|
FRANCE - 0.4%
|
|
|
|
Consumer Staples - 0.1%
|
|
|
|
Beverages - 0.1%
|
|
|
|
Pernod Ricard SA
|
|
415,400
|
35,685,818
|
Industrials - 0.3%
|
|
|
|
Aerospace & Defense - 0.3%
|
|
|
|
Airbus SE
|
|
305,900
|
71,037,318
|
TOTAL FRANCE
|
|
|
106,723,136
|
GERMANY - 0.8%
|
|
|
|
Information Technology - 0.8%
|
|
|
|
Software - 0.8%
|
|
|
|
SAP SE ADR
|
|
754,246
|
183,213,896
|
ITALY - 0.1%
|
|
|
|
Consumer Staples - 0.1%
|
|
|
|
Beverages - 0.1%
|
|
|
|
Davide Campari-Milano NV (b)
|
|
3,000,200
|
19,526,075
|
KOREA (SOUTH) - 0.0%
|
|
|
|
Information Technology - 0.0%
|
|
|
|
Semiconductors & Semiconductor Equipment - 0.0%
|
|
|
|
SK Hynix Inc
|
|
21,150
|
9,573,853
|
NETHERLANDS - 0.7%
|
|
|
|
Communication Services - 0.2%
|
|
|
|
Entertainment - 0.2%
|
|
|
|
Universal Music Group NV
|
|
1,970,081
|
51,359,690
|
Health Care - 0.1%
|
|
|
|
Biotechnology - 0.1%
|
|
|
|
Argenx SE ADR (c)
|
|
24,200
|
20,350,990
|
Information Technology - 0.4%
|
|
|
|
Semiconductors & Semiconductor Equipment - 0.4%
|
|
|
|
ASML Holding NV depository receipt
|
|
42,900
|
45,896,994
|
BE Semiconductor Industries NV
|
|
294,212
|
46,245,125
|
TOTAL INFORMATION TECHNOLOGY
|
|
|
92,142,119
|
TOTAL NETHERLANDS
|
|
|
163,852,799
|
SPAIN - 0.1%
|
|
|
|
Communication Services - 0.1%
|
|
|
|
Diversified Telecommunication Services - 0.1%
|
|
|
|
Cellnex Telecom SA (e)(f)
|
|
915,000
|
29,464,522
|
SWEDEN - 0.1%
|
|
|
|
Industrials - 0.1%
|
|
|
|
Machinery - 0.1%
|
|
|
|
Atlas Copco AB A Shares
|
|
1,579,300
|
28,115,612
|
TAIWAN - 0.7%
|
|
|
|
Information Technology - 0.7%
|
|
|
|
Semiconductors & Semiconductor Equipment - 0.7%
|
|
|
|
Taiwan Semiconductor Manufacturing Co Ltd ADR
|
|
587,700
|
178,596,153
|
UNITED KINGDOM - 1.2%
|
|
|
|
Consumer Staples - 0.9%
|
|
|
|
Beverages - 0.2%
|
|
|
|
Diageo PLC ADR (b)
|
|
443,100
|
38,226,237
|
Tobacco - 0.7%
|
|
|
|
British American Tobacco PLC ADR
|
|
2,720,600
|
154,040,372
|
TOTAL CONSUMER STAPLES
|
|
|
192,266,609
|
Financials - 0.0%
|
|
|
|
Capital Markets - 0.0%
|
|
|
|
3i Group PLC
|
|
219,700
|
9,633,589
|
Industrials - 0.3%
|
|
|
|
Aerospace & Defense - 0.3%
|
|
|
|
Rolls-Royce Holdings PLC
|
|
5,217,500
|
80,692,357
|
TOTAL UNITED KINGDOM
|
|
|
282,592,555
|
UNITED STATES - 89.2%
|
|
|
|
Communication Services - 10.3%
|
|
|
|
Entertainment - 0.3%
|
|
|
|
Walt Disney Co/The
|
|
784,393
|
89,240,392
|
Interactive Media & Services - 9.1%
|
|
|
|
Alphabet Inc Class A
|
|
2,614,325
|
818,283,725
|
Alphabet Inc Class C
|
|
2,225,160
|
698,255,208
|
Meta Platforms Inc Class A
|
|
1,045,900
|
690,388,131
|
|
|
|
|
2,206,927,064
|
Media - 0.9%
|
|
|
|
Comcast Corp Class A
|
|
7,024,142
|
209,951,604
|
TOTAL COMMUNICATION SERVICES
|
|
|
2,506,119,060
|
Consumer Discretionary - 3.5%
|
|
|
|
Broadline Retail - 1.2%
|
|
|
|
Amazon.com Inc (c)
|
|
1,208,300
|
278,899,806
|
Hotels, Restaurants & Leisure - 0.7%
|
|
|
|
Booking Holdings Inc
|
|
6,837
|
36,614,391
|
Cava Group Inc (b)(c)
|
|
245,700
|
14,420,133
|
Chipotle Mexican Grill Inc (c)
|
|
328,500
|
12,154,500
|
Marriott International Inc/MD Class A1
|
|
150,400
|
46,660,096
|
Starbucks Corp
|
|
593,400
|
49,970,214
|
Wingstop Inc
|
|
55,837
|
13,316,566
|
|
|
|
|
173,135,900
|
Household Durables - 0.7%
|
|
|
|
Somnigroup International Inc
|
|
1,492,300
|
133,232,544
|
Whirlpool Corp (b)
|
|
360,363
|
25,996,587
|
|
|
|
|
159,229,131
|
Specialty Retail - 0.8%
|
|
|
|
Home Depot Inc/The
|
|
84,800
|
29,179,680
|
Lowe's Cos Inc
|
|
657,207
|
158,492,040
|
RH (c)
|
|
101,593
|
18,200,386
|
|
|
|
|
205,872,106
|
Textiles, Apparel & Luxury Goods - 0.1%
|
|
|
|
Lululemon Athletica Inc (c)
|
|
19,900
|
4,135,419
|
NIKE Inc Class B
|
|
436,000
|
27,777,560
|
|
|
|
|
31,912,979
|
TOTAL CONSUMER DISCRETIONARY
|
|
|
849,049,922
|
Consumer Staples - 3.5%
|
|
|
|
Beverages - 1.4%
|
|
|
|
Brown-Forman Corp Class B
|
|
1,514,986
|
39,480,535
|
Coca-Cola Co/The
|
|
2,270,095
|
158,702,342
|
Keurig Dr Pepper Inc
|
|
5,324,600
|
149,142,046
|
|
|
|
|
347,324,923
|
Consumer Staples Distribution & Retail - 0.8%
|
|
|
|
Performance Food Group Co (c)
|
|
304,600
|
27,389,632
|
Sprouts Farmers Market Inc (c)
|
|
343,408
|
27,359,315
|
Sysco Corp
|
|
487,700
|
35,938,613
|
Target Corp
|
|
707,900
|
69,197,225
|
US Foods Holding Corp (c)
|
|
403,000
|
30,353,960
|
|
|
|
|
190,238,745
|
Food Products - 0.0%
|
|
|
|
Lamb Weston Holdings Inc
|
|
1,891
|
79,214
|
Mondelez International Inc
|
|
131,300
|
7,067,879
|
|
|
|
|
7,147,093
|
Household Products - 0.0%
|
|
|
|
Procter & Gamble Co/The
|
|
96,100
|
13,772,091
|
Personal Care Products - 0.8%
|
|
|
|
Estee Lauder Cos Inc/The Class A
|
|
516,400
|
54,077,408
|
Kenvue Inc
|
|
7,943,411
|
137,023,840
|
|
|
|
|
191,101,248
|
Tobacco - 0.5%
|
|
|
|
Philip Morris International Inc
|
|
702,300
|
112,648,920
|
TOTAL CONSUMER STAPLES
|
|
|
862,233,020
|
Energy - 6.5%
|
|
|
|
Oil, Gas & Consumable Fuels - 6.5%
|
|
|
|
Chevron Corp
|
|
462,300
|
70,459,143
|
ConocoPhillips
|
|
790,300
|
73,979,983
|
Exxon Mobil Corp
|
|
7,574,101
|
911,467,314
|
Murphy Oil Corp
|
|
1,239,000
|
38,718,750
|
Shell PLC ADR
|
|
6,567,700
|
482,594,596
|
TOTAL ENERGY
|
|
|
1,577,219,786
|
Financials - 15.1%
|
|
|
|
Banks - 10.3%
|
|
|
|
Bank of America Corp
|
|
12,704,694
|
698,758,170
|
M&T Bank Corp
|
|
501,520
|
101,046,250
|
PNC Financial Services Group Inc/The
|
|
1,168,721
|
243,947,134
|
Truist Financial Corp
|
|
1,294,600
|
63,707,266
|
US Bancorp
|
|
689,519
|
36,792,734
|
Wells Fargo & Co
|
|
14,593,889
|
1,360,150,455
|
|
|
|
|
2,504,402,009
|
Capital Markets - 1.8%
|
|
|
|
Blue Owl Capital Inc Class A
|
|
3,782,900
|
56,516,526
|
Charles Schwab Corp/The
|
|
437,200
|
43,680,652
|
KKR & Co Inc Class A
|
|
1,512,951
|
192,870,993
|
Moody's Corp
|
|
34,000
|
17,368,900
|
MSCI Inc
|
|
5,500
|
3,155,515
|
Northern Trust Corp
|
|
828,851
|
113,212,758
|
Raymond James Financial Inc
|
|
106,903
|
17,167,553
|
|
|
|
|
443,972,897
|
Financial Services - 2.3%
|
|
|
|
Apollo Global Management Inc
|
|
318,100
|
46,048,156
|
Corpay Inc (c)
|
|
69,600
|
20,944,728
|
Global Payments Inc
|
|
126,400
|
9,783,360
|
Mastercard Inc Class A
|
|
147,489
|
84,198,520
|
PayPal Holdings Inc
|
|
373,900
|
21,828,282
|
Visa Inc Class A
|
|
1,058,693
|
371,294,222
|
|
|
|
|
554,097,268
|
Insurance - 0.7%
|
|
|
|
Arthur J Gallagher & Co
|
|
222,200
|
57,503,138
|
Brown & Brown Inc
|
|
1,065,800
|
84,944,260
|
Chubb Ltd
|
|
89,997
|
28,089,864
|
|
|
|
|
170,537,262
|
TOTAL FINANCIALS
|
|
|
3,673,009,436
|
Health Care - 8.8%
|
|
|
|
Biotechnology - 0.5%
|
|
|
|
Alnylam Pharmaceuticals Inc (c)
|
|
158,850
|
63,166,703
|
Biogen Inc (c)
|
|
72,400
|
12,741,676
|
Gilead Sciences Inc
|
|
140,800
|
17,281,792
|
Nuvalent Inc Class A (c)
|
|
22,300
|
2,243,156
|
Vaxcyte Inc (c)
|
|
432,100
|
19,937,094
|
|
|
|
|
115,370,421
|
Health Care Equipment & Supplies - 1.9%
|
|
|
|
Abbott Laboratories
|
|
175,300
|
21,963,337
|
Alcon AG (United States)
|
|
564,800
|
44,511,888
|
Baxter International Inc
|
|
5,249,500
|
100,317,945
|
Becton Dickinson & Co
|
|
144,706
|
28,083,093
|
Boston Scientific Corp (c)
|
|
2,229,695
|
212,601,419
|
Masimo Corp (c)
|
|
262,700
|
34,166,762
|
Medline Inc Class A
|
|
228,500
|
9,597,000
|
Solventum Corp (c)
|
|
178,118
|
14,114,070
|
|
|
|
|
465,355,514
|
Health Care Providers & Services - 2.8%
|
|
|
|
Cardinal Health Inc
|
|
245,058
|
50,359,419
|
Cigna Group/The
|
|
506,511
|
139,407,023
|
Humana Inc
|
|
351,200
|
89,952,856
|
McKesson Corp
|
|
110,821
|
90,905,358
|
Molina Healthcare Inc (c)
|
|
125,800
|
21,831,332
|
UnitedHealth Group Inc
|
|
814,881
|
269,000,367
|
|
|
|
|
661,456,355
|
Life Sciences Tools & Services - 1.0%
|
|
|
|
Bruker Corp
|
|
1,833,300
|
86,366,763
|
Danaher Corp
|
|
312,200
|
71,468,824
|
Thermo Fisher Scientific Inc
|
|
160,200
|
92,827,890
|
|
|
|
|
250,663,477
|
Pharmaceuticals - 2.6%
|
|
|
|
Eli Lilly & Co (d)
|
|
106,200
|
114,131,016
|
GSK PLC ADR
|
|
4,653,928
|
228,228,629
|
Haleon PLC ADR
|
|
14,872,736
|
150,363,361
|
Johnson & Johnson
|
|
486,077
|
100,593,635
|
Merck & Co Inc
|
|
482,400
|
50,777,424
|
|
|
|
|
644,094,065
|
TOTAL HEALTH CARE
|
|
|
2,136,939,832
|
Industrials - 17.2%
|
|
|
|
Aerospace & Defense - 10.2%
|
|
|
|
Boeing Co (c)
|
|
5,552,186
|
1,205,490,624
|
GE Aerospace
|
|
3,576,006
|
1,101,517,128
|
General Dynamics Corp
|
|
210,660
|
70,920,796
|
Howmet Aerospace Inc
|
|
127,300
|
26,099,046
|
Huntington Ingalls Industries Inc
|
|
215,150
|
73,166,061
|
RTX Corp
|
|
13,600
|
2,494,240
|
Textron Inc
|
|
68,368
|
5,959,639
|
|
|
|
|
2,485,647,534
|
Air Freight & Logistics - 1.0%
|
|
|
|
United Parcel Service Inc Class B
|
|
2,512,256
|
249,190,673
|
Building Products - 0.2%
|
|
|
|
A O Smith Corp
|
|
644,300
|
43,090,784
|
AAON Inc
|
|
38,065
|
2,902,456
|
Trex Co Inc (c)
|
|
253,000
|
8,875,240
|
|
|
|
|
54,868,480
|
Commercial Services & Supplies - 0.0%
|
|
|
|
Veralto Corp
|
|
101,866
|
10,164,189
|
Electrical Equipment - 4.5%
|
|
|
|
Emerson Electric Co
|
|
101,700
|
13,497,623
|
GE Vernova Inc (d)
|
|
1,478,159
|
966,080,378
|
Hubbell Inc
|
|
56,014
|
24,876,378
|
Vertiv Holdings Co Class A
|
|
535,696
|
86,788,109
|
|
|
|
|
1,091,242,488
|
Ground Transportation - 0.2%
|
|
|
|
Knight-Swift Transportation Holdings Inc
|
|
784,015
|
40,988,304
|
Machinery - 1.0%
|
|
|
|
Allison Transmission Holdings Inc
|
|
228,800
|
22,399,520
|
Cummins Inc
|
|
81,600
|
41,652,720
|
Deere & Co
|
|
69,400
|
32,310,558
|
Donaldson Co Inc
|
|
253,600
|
22,484,176
|
Nordson Corp
|
|
73,300
|
17,623,519
|
Otis Worldwide Corp
|
|
288,484
|
25,199,077
|
Stanley Black & Decker Inc
|
|
120,500
|
8,950,740
|
Westinghouse Air Brake Technologies Corp
|
|
367,219
|
78,382,896
|
|
|
|
|
249,003,206
|
Trading Companies & Distributors - 0.1%
|
|
|
|
Watsco Inc
|
|
52,900
|
17,824,655
|
TOTAL INDUSTRIALS
|
|
|
4,198,929,529
|
Information Technology - 22.2%
|
|
|
|
IT Services - 0.0%
|
|
|
|
Gartner Inc (c)
|
|
19,500
|
4,919,460
|
Semiconductors & Semiconductor Equipment - 12.3%
|
|
|
|
Applied Materials Inc
|
|
214,302
|
55,073,471
|
Broadcom Inc
|
|
1,756,600
|
607,959,260
|
First Solar Inc (c)
|
|
53,200
|
13,897,436
|
Lam Research Corp
|
|
551,300
|
94,371,534
|
Marvell Technology Inc
|
|
1,504,385
|
127,842,637
|
Micron Technology Inc
|
|
843,600
|
240,771,876
|
NVIDIA Corp
|
|
9,802,700
|
1,828,203,551
|
Teradyne Inc
|
|
113,800
|
22,027,128
|
|
|
|
|
2,990,146,893
|
Software - 7.1%
|
|
|
|
Adobe Inc (c)
|
|
292,600
|
102,407,074
|
Autodesk Inc (c)
|
|
211,728
|
62,673,605
|
Intuit Inc
|
|
57,000
|
37,757,940
|
Microsoft Corp
|
|
3,058,805
|
1,479,299,274
|
Synopsys Inc (c)
|
|
77,800
|
36,544,216
|
|
|
|
|
1,718,682,109
|
Technology Hardware, Storage & Peripherals - 2.8%
|
|
|
|
Apple Inc
|
|
2,356,614
|
640,669,082
|
Seagate Technology Holdings PLC
|
|
42,800
|
11,786,692
|
Western Digital Corp
|
|
186,300
|
32,093,901
|
|
|
|
|
684,549,675
|
TOTAL INFORMATION TECHNOLOGY
|
|
|
5,398,298,137
|
Materials - 0.7%
|
|
|
|
Chemicals - 0.5%
|
|
|
|
Air Products and Chemicals Inc
|
|
113,300
|
27,987,366
|
Dow Inc
|
|
298,900
|
6,988,282
|
LyondellBasell Industries NV Class A1
|
|
270,700
|
11,721,310
|
Mosaic Co/The
|
|
2,503,400
|
60,306,906
|
Sherwin-Williams Co/The
|
|
13,100
|
4,244,793
|
|
|
|
|
111,248,657
|
Construction Materials - 0.2%
|
|
|
|
James Hardie Industries PLC (c)
|
|
2,513,900
|
52,163,425
|
TOTAL MATERIALS
|
|
|
163,412,082
|
Real Estate - 0.4%
|
|
|
|
Industrial REITs - 0.0%
|
|
|
|
Terreno Realty Corp
|
|
254,600
|
14,947,565
|
Real Estate Management & Development - 0.1%
|
|
|
|
Compass Inc Class A (c)
|
|
3,363,831
|
35,555,694
|
Residential REITs - 0.1%
|
|
|
|
Sun Communities Inc
|
|
159,100
|
19,714,081
|
Specialized REITs - 0.2%
|
|
|
|
American Tower Corp
|
|
275,781
|
48,418,870
|
Equinix Inc
|
|
4,422
|
3,387,960
|
|
|
|
|
51,806,830
|
TOTAL REAL ESTATE
|
|
|
122,024,170
|
Utilities - 1.0%
|
|
|
|
Electric Utilities - 0.9%
|
|
|
|
Duke Energy Corp
|
|
71,400
|
8,368,794
|
Edison International
|
|
241,300
|
14,482,826
|
Entergy Corp
|
|
221,400
|
20,464,002
|
PG&E Corp
|
|
491,300
|
7,895,191
|
Southern Co/The
|
|
1,812,300
|
158,032,560
|
|
|
|
|
209,243,373
|
Independent Power and Renewable Electricity Producers - 0.0%
|
|
|
|
Vistra Corp
|
|
116,600
|
18,811,078
|
Multi-Utilities - 0.1%
|
|
|
|
Sempra
|
|
243,100
|
21,463,299
|
TOTAL UTILITIES
|
|
|
249,517,750
|
TOTAL UNITED STATES
|
|
|
21,736,752,724
|
ZAMBIA - 1.3%
|
|
|
|
Materials - 1.3%
|
|
|
|
Metals & Mining - 1.3%
|
|
|
|
First Quantum Minerals Ltd (c)
|
|
11,605,103
|
311,149,168
|
|
TOTAL COMMON STOCKS
(Cost $11,684,364,667)
|
|
|
23,919,420,997
|
|
|
|
|
|
Convertible Preferred Stocks - 0.1%
|
|
|
|
Shares
|
Value ($)
|
UNITED STATES - 0.1%
|
|
|
|
Health Care - 0.1%
|
|
|
|
Life Sciences Tools & Services - 0.1%
|
|
|
|
Bruker Corp 6.375% Series A
(Cost $21,978,529)
|
|
87,200
|
31,669,295
|
|
|
|
|
|
U.S. Treasury Obligations - 0.2%
|
|
|
|
Yield (%) (g)
|
Principal
Amount (a)
|
Value ($)
|
US Treasury Bills 0% 2/26/2026 (d)
(Cost $49,634,165)
|
|
3.67
|
49,917,000
|
49,643,317
|
|
|
|
|
|
|
Money Market Funds - 2.8%
|
|
|
|
Yield (%)
|
Shares
|
Value ($)
|
Fidelity Cash Central Fund (h)
|
|
3.79
|
509,569,083
|
509,670,996
|
Fidelity Securities Lending Cash Central Fund (h)(i)
|
|
3.77
|
170,091,793
|
170,108,803
|
|
TOTAL MONEY MARKET FUNDS
(Cost $679,782,267)
|
|
|
|
679,779,799
|
|
|
|
|
|
|
|
TOTAL INVESTMENT IN SECURITIES - 101.3%
(Cost $12,435,759,628)
|
24,680,513,408
|
NET OTHER ASSETS (LIABILITIES) - (1.3)%
|
(325,017,383)
|
NET ASSETS - 100.0%
|
24,355,496,025
|
|
|
|
Written Options
|
|
|
Counterparty
|
Number
of Contracts
|
Notional
Amount ($)
|
Exercise
Price ($)
|
Expiration
Date
|
Value ($)
|
Call Options
|
|
|
|
|
|
|
Eli Lilly & Co
|
Chicago Board Options Exchange
|
195
|
20,956,260
|
1,130.00
|
2/2026
|
(670,313)
|
GE Vernova Inc
|
Chicago Board Options Exchange
|
729
|
47,645,253
|
700.00
|
2/2026
|
(1,888,110)
|
GE Vernova Inc
|
Chicago Board Options Exchange
|
730
|
47,710,610
|
740.00
|
2/2026
|
(1,109,600)
|
GE Vernova Inc
|
Chicago Board Options Exchange
|
730
|
47,710,610
|
750.00
|
2/2026
|
(974,550)
|
GE Vernova Inc
|
Chicago Board Options Exchange
|
728
|
47,579,896
|
850.00
|
2/2026
|
(311,220)
|
|
|
|
|
|
|
|
|
|
|
|
|
|
|
|
(4,953,793)
|
Put Options
|
|
|
|
|
|
|
GE Vernova Inc
|
Chicago Board Options Exchange
|
1,000
|
65,357,000
|
480.00
|
2/2026
|
(180,000)
|
|
|
|
|
|
|
|
|
|
|
|
|
|
|
|
(180,000)
|
TOTAL WRITTEN OPTIONS
|
|
|
|
|
|
(5,133,793)
|
Legend
(a)
|
Amount is stated in United States dollars unless otherwise noted.
|
(b)
|
Security or a portion of the security is on loan at period end.
|
(c)
|
Non-income producing.
|
(d)
|
Security or a portion of the security is pledged as collateral for options written. At period end, the value of securities pledged amounted to $216,746,272.
|
(e)
|
Security exempt from registration under Regulation S of the Securities Act of 1933 and may be resold to qualified foreign investors outside of the United States. At the end of the period, the value of securities amounted to $29,464,522 or 0.1% of net assets.
|
(f)
|
Security exempt from registration under Rule 144A of the Securities Act of 1933. These securities may be resold in transactions exempt from registration, normally to qualified institutional buyers. At the end of the period, the value of these securities amounted to $29,464,522 or 0.1% of net assets.
|
(g)
|
Yield represents either the annualized yield at the date of purchase, or the stated coupon rate, or, for floating and adjustable rate securities, the rate at period end.
|
(h)
|
Affiliated fund that is generally available only to investment companies and other accounts managed by Fidelity Investments. The rate quoted is the annualized seven-day yield of the fund at period end. A complete unaudited listing of the fund's holdings as of its most recent quarter end is available upon request. In addition, each Fidelity Central Fund's financial statements are available on the SEC's website or upon request.
|
(i)
|
Investment made with cash collateral received from securities on loan.
|
Affiliated Central Funds
Fiscal year to date information regarding the Fund's investments in Fidelity Central Funds, including the ownership percentage, is presented below.
Affiliate
|
Value,
beginning
of period ($)
|
Purchases ($)
|
Sales
Proceeds ($)
|
Dividend
Income ($)
|
Realized
Gain (loss) ($)
|
Change in
Unrealized
appreciation
(depreciation) ($)
|
Value,
end
of period ($)
|
Shares,
end
of period
|
% ownership,
end
of period
|
Fidelity Cash Central Fund
|
529,076,106
|
1,927,387,600
|
1,946,813,279
|
11,408,569
|
23,037
|
(2,468)
|
509,670,996
|
509,569,083
|
0.9%
|
Fidelity Securities Lending Cash Central Fund
|
126,479,306
|
761,877,132
|
718,245,194
|
460,723
|
(2,441)
|
-
|
170,108,803
|
170,091,793
|
0.6%
|
Total
|
655,555,412
|
2,689,264,732
|
2,665,058,473
|
11,869,292
|
20,596
|
(2,468)
|
679,779,799
|
|
|
|
|
|
|
|
|
|
|
|
|
|
Amounts in the dividend income column in the above table include any capital gain distributions from underlying funds, which are presented in the corresponding line item in the Statement of Operations, if applicable.
Amounts in the dividend income column for Fidelity Securities Lending Cash Central Fund represents the income earned on investing cash collateral, less rebates paid to borrowers and any lending agent fees associated with the loan, plus any premium income received for lending certain types of securities.
Amounts included in the purchases and sales proceeds columns may include in-kind transactions, if applicable.
Investment Valuation
The following is a summary of the inputs used, as of December 31, 2025, involving the Fund's assets and liabilities carried at fair value. The inputs or methodology used for valuing securities may not be an indication of the risk associated with investing in those securities. For more information on valuation inputs, and their aggregation into the levels used below, please refer to the Investment Valuation section in the accompanying Notes to Financial Statements.
Valuation Inputs at Reporting Date:
|
Description
|
Total ($)
|
Level 1 ($)
|
Level 2 ($)
|
Level 3 ($)
|
Investments in Securities:
|
|
|
|
|
|
|
Common Stocks
|
|
|
|
|
Communication Services
|
2,586,943,272
|
2,506,119,060
|
80,824,212
|
-
|
Consumer Discretionary
|
849,049,922
|
849,049,922
|
-
|
-
|
Consumer Staples
|
1,109,711,522
|
1,109,711,522
|
-
|
-
|
Energy
|
1,979,111,674
|
1,979,111,674
|
-
|
-
|
Financials
|
3,682,643,025
|
3,673,009,436
|
9,633,589
|
-
|
Health Care
|
2,523,782,078
|
2,523,782,078
|
-
|
-
|
Industrials
|
4,480,252,176
|
4,300,406,889
|
179,845,287
|
-
|
Information Technology
|
5,861,824,158
|
5,852,250,305
|
9,573,853
|
-
|
Materials
|
474,561,250
|
474,561,250
|
-
|
-
|
Real Estate
|
122,024,170
|
122,024,170
|
-
|
-
|
Utilities
|
249,517,750
|
249,517,750
|
-
|
-
|
|
|
Convertible Preferred Stocks
|
|
|
|
|
Health Care
|
31,669,295
|
-
|
31,669,295
|
-
|
|
|
U.S. Treasury Obligations
|
49,643,317
|
-
|
49,643,317
|
-
|
|
|
Money Market Funds
|
679,779,799
|
679,779,799
|
-
|
-
|
Total Investments in Securities:
|
24,680,513,408
|
24,319,323,855
|
361,189,553
|
-
|
Derivative Instruments:
|
|
|
|
|
|
|
Liabilities
|
|
|
|
|
Written Options
|
(5,133,793)
|
(5,133,793)
|
-
|
-
|
Total Liabilities
|
(5,133,793)
|
(5,133,793)
|
-
|
-
|
Total Derivative Instruments:
|
(5,133,793)
|
(5,133,793)
|
-
|
-
|
|
|
|
|
|
|
|
Net Unrealized Appreciation (Depreciation) on Unfunded Commitments
|
5,024,805
|
5,024,805
|
-
|
-
|
Value of Derivative Instruments
The following table is a summary of the Fund's value of derivative instruments by primary risk exposure as of December 31, 2025. For additional information on derivative instruments, please refer to the Derivative Instruments section in the accompanying Notes to Financial Statements.
Primary Risk Exposure / Derivative Type
|
Value
|
|
Asset ($)
|
Liability ($)
|
Equity Risk
|
|
|
Written Options (a)
|
-
|
(5,133,793)
|
Total Equity Risk
|
-
|
(5,133,793)
|
Total Value of Derivatives
|
-
|
(5,133,793)
|
(a)Gross value is presented in the Statement of Assets and Liabilities in the written options, at value line-item.
Financial Statements (Unaudited)
Statement of Assets and Liabilities
|
|
As of December 31, 2025 (Unaudited)
|
Assets
|
|
|
|
|
Investment in securities, at value (including securities loaned of $173,212,461) - See accompanying schedule:
|
|
|
|
|
Unaffiliated issuers (cost $11,755,977,361)
|
$
|
24,000,733,609
|
|
|
Fidelity Central Funds (cost $679,782,267)
|
|
679,779,799
|
|
|
|
|
|
|
|
|
|
|
|
|
|
|
Total Investment in Securities (cost $12,435,759,628)
|
|
|
$
|
24,680,513,408
|
Cash
|
|
|
|
1,094,293
|
Foreign currency held at value (cost $4,442)
|
|
|
|
4,436
|
Receivable for investments sold
|
|
|
|
31,906,388
|
Unrealized appreciation on unfunded commitments
|
|
|
|
5,024,805
|
Receivable for fund shares sold
|
|
|
|
5,362,926
|
Dividends receivable
|
|
|
|
18,564,886
|
Distributions receivable from Fidelity Central Funds
|
|
|
|
1,760,791
|
Other receivables
|
|
|
|
393,867
|
Total assets
|
|
|
|
24,744,625,800
|
Liabilities
|
|
|
|
|
Payable for investments purchased
|
$
|
1,187,732
|
|
|
Payable for fund shares redeemed
|
|
212,289,212
|
|
|
Written options, at value (premium received $7,987,234)
|
|
5,133,793
|
|
|
Other payables and accrued expenses
|
|
424,605
|
|
|
Collateral on securities loaned
|
|
170,094,433
|
|
|
Total liabilities
|
|
|
|
389,129,775
|
Commitments and contingent liabilities (see Significant Accounting Policies note)
|
|
|
|
|
Net Assets
|
|
|
$
|
24,355,496,025
|
Net Assets consist of:
|
|
|
|
|
Paid in capital
|
|
|
$
|
11,763,852,547
|
Total accumulated earnings (loss)
|
|
|
|
12,591,643,478
|
Net Assets
|
|
|
$
|
24,355,496,025
|
Net Asset Value, offering price and redemption price per share ($24,355,496,025 ÷ 912,115,270 shares)
|
|
|
$
|
26.70
|
Statement of Operations
|
Six months ended December 31, 2025 (Unaudited)
|
Investment Income
|
|
|
|
|
Dividends
|
|
|
$
|
151,976,957
|
Interest
|
|
|
|
169,779
|
Income from Fidelity Central Funds (including $460,723 from security lending)
|
|
|
|
11,869,292
|
Total income
|
|
|
|
164,016,028
|
Expenses
|
|
|
|
|
Custodian fees and expenses
|
$
|
89,472
|
|
|
Independent trustees' fees and expenses
|
|
45,997
|
|
|
Total expenses before reductions
|
|
135,469
|
|
|
Expense reductions
|
|
(71,795)
|
|
|
Total expenses after reductions
|
|
|
|
63,674
|
Net Investment income (loss)
|
|
|
|
163,952,354
|
Realized and Unrealized Gain (Loss)
|
|
|
|
|
Net realized gain (loss) on:
|
|
|
|
|
Investment Securities:
|
|
|
|
|
Unaffiliated issuers
|
|
1,261,634,027
|
|
|
Fidelity Central Funds
|
|
20,596
|
|
|
Foreign currency transactions
|
|
(113,058)
|
|
|
Written options
|
|
15,522,173
|
|
|
Total net realized gain (loss)
|
|
|
|
1,277,063,738
|
Change in net unrealized appreciation (depreciation) on:
|
|
|
|
|
Investment Securities:
|
|
|
|
|
Unaffiliated issuers
|
|
1,550,806,665
|
|
|
Fidelity Central Funds
|
|
(2,468)
|
|
|
Unfunded commitments
|
|
5,024,805
|
|
|
Assets and liabilities in foreign currencies
|
|
(8,490)
|
|
|
Written options
|
|
1,310,190
|
|
|
Total change in net unrealized appreciation (depreciation)
|
|
|
|
1,557,130,702
|
Net gain (loss)
|
|
|
|
2,834,194,440
|
Net increase (decrease) in net assets resulting from operations
|
|
|
$
|
2,998,146,794
|
Statement of Changes in Net Assets
|
|
|
|
|
Six months ended
December 31, 2025
(Unaudited)
|
|
Year ended
June 30, 2025
|
Increase (Decrease) in Net Assets
|
|
|
|
|
Operations
|
|
|
|
|
Net investment income (loss)
|
$
|
163,952,354
|
$
|
302,918,717
|
Net realized gain (loss)
|
|
1,277,063,738
|
|
1,562,888,094
|
Change in net unrealized appreciation (depreciation)
|
|
1,557,130,702
|
|
2,290,439,332
|
Net increase (decrease) in net assets resulting from operations
|
|
2,998,146,794
|
|
4,156,246,143
|
Distributions to shareholders
|
|
(2,245,087,816)
|
|
(1,506,107,434)
|
|
|
|
|
|
|
Share transactions
|
|
|
|
|
Proceeds from sales of shares
|
|
1,579,102,576
|
|
3,650,707,884
|
Reinvestment of distributions
|
|
2,245,087,816
|
|
1,506,107,434
|
Cost of shares redeemed
|
|
(1,841,642,484)
|
|
(4,850,928,137)
|
|
|
|
|
|
|
Net increase (decrease) in net assets resulting from share transactions
|
|
1,982,547,908
|
|
305,887,181
|
Total increase (decrease) in net assets
|
|
2,735,606,886
|
|
2,956,025,890
|
|
|
|
|
|
|
Net Assets
|
|
|
|
|
Beginning of period
|
|
21,619,889,139
|
|
18,663,863,249
|
End of period
|
$
|
24,355,496,025
|
$
|
21,619,889,139
|
|
|
|
|
|
|
Other Information
|
|
|
|
|
Shares
|
|
|
|
|
Sold
|
|
59,666,101
|
|
157,593,314
|
Issued in reinvestment of distributions
|
|
86,628,827
|
|
68,243,065
|
Redeemed
|
|
(69,161,387)
|
|
(204,590,685)
|
Net increase (decrease)
|
|
77,133,541
|
|
21,245,694
|
|
|
|
|
|
|
Financial Highlights
Fidelity® Series Large Cap Stock Fund
|
|
|
|
|
Six months ended
December 31, 2025
(Unaudited)
|
|
Years ended June 30, 2025
|
|
2024
|
|
2023
|
|
2022
|
|
2021
|
Selected Per-Share Data
|
|
|
|
|
|
|
|
|
|
|
|
|
Net asset value, beginning of period
|
$
|
25.89
|
$
|
22.94
|
$
|
18.90
|
$
|
16.37
|
$
|
19.80
|
$
|
14.07
|
Income from Investment Operations
|
|
|
|
|
|
|
|
|
|
|
|
|
Net investment income (loss) A,B
|
|
.19
|
|
.35
|
|
.35
|
|
.34
|
|
.34 C
|
|
.34
|
Net realized and unrealized gain (loss)
|
|
3.25
|
|
4.43
|
|
4.72
|
|
3.27
|
|
(2.02)
|
|
6.27
|
Total from investment operations
|
|
3.44
|
|
4.78
|
|
5.07
|
|
3.61
|
|
(1.68)
|
|
6.61
|
Distributions from net investment income
|
|
(.37)
|
|
(.36)
|
|
(.36)
|
|
(.33)
|
|
(.47)
|
|
(.37)
|
Distributions from net realized gain
|
|
(2.25)
|
|
(1.47)
|
|
(.68)
|
|
(.76)
|
|
(1.28)
|
|
(.52)
|
Total distributions
|
|
(2.63) D
|
|
(1.83)
|
|
(1.03) D
|
|
(1.08) D
|
|
(1.75)
|
|
(.88) D
|
Net asset value, end of period
|
$
|
26.70
|
$
|
25.89
|
$
|
22.94
|
$
|
18.90
|
$
|
16.37
|
$
|
19.80
|
Total Return E,F
|
|
|
|
22.41%
|
|
28.11%
|
|
23.03%
|
|
(9.44)%
|
|
49.05%
|
Ratios to Average Net Assets B,G,H
|
|
|
|
|
|
|
|
|
|
|
|
|
Expenses before reductions I
|
|
-% J
|
|
-%
|
|
-%
|
|
-%
|
|
-%
|
|
-%
|
Expenses net of fee waivers, if any I
|
|
|
|
-%
|
|
-%
|
|
-%
|
|
-%
|
|
-%
|
Expenses net of all reductions, if any I
|
|
-% J
|
|
-%
|
|
-%
|
|
-%
|
|
-%
|
|
-%
|
Net investment income (loss)
|
|
1.41% J
|
|
1.52%
|
|
1.73%
|
|
1.98%
|
|
1.84% C
|
|
2.04%
|
Supplemental Data
|
|
|
|
|
|
|
|
|
|
|
|
|
Net assets, end of period (000 omitted)
|
$
|
24,355,496
|
$
|
21,619,889
|
$
|
18,663,863
|
$
|
15,147,344
|
$
|
12,798,487
|
$
|
14,792,790
|
Portfolio turnover rate K
|
|
|
|
17%
|
|
18%
|
|
12%
|
|
17%
|
|
15%
|
ACalculated based on average shares outstanding during the period.
BNet investment income (loss) is affected by the timing of the declaration of dividends by any underlying mutual funds or exchange-traded funds (ETFs). Net investment income (loss) of any mutual funds or ETFs is not included in the Fund's net investment income (loss) ratio.
CNet investment income per share reflects one or more large, non-recurring dividend(s) which amounted to $.11 per share. Excluding such non-recurring dividend(s), the ratio of net investment income (loss) to average net assets would have been 1.24%.
DTotal distributions per share do not sum due to rounding.
ETotal returns for periods of less than one year are not annualized.
FTotal returns would have been lower if certain expenses had not been reduced during the applicable periods shown.
GFees and expenses of any underlying mutual funds or exchange-traded funds (ETFs) are not included in the Fund's expense ratio. The Fund indirectly bears its proportionate share of these expenses. For additional expense information related to investments in Fidelity Central Funds, please refer to the "Investments in Fidelity Central Funds" note found in the Notes to Financial Statements section of the most recent Annual or Semi-Annual report.
HExpense ratios reflect operating expenses of the class. Expenses before reductions do not reflect amounts reimbursed, waived, or reduced through arrangements with the investment adviser, brokerage services, or other offset arrangements, if applicable, and do not represent the amount paid by the class during periods when reimbursements, waivers or reductions occur.
IAmount represents less than .005%.
JAnnualized.
KAmount does not include the portfolio activity of any underlying mutual funds or exchange-traded funds (ETFs), derivatives or securities that mature within one year from acquisition.
Notes to Financial Statements
(Unaudited)For the period ended December 31, 2025
1. Organization.
Fidelity Series Large Cap Stock Fund (the Fund) is a fund of Fidelity Hastings Street Trust (the Trust) and is authorized to issue an unlimited number of shares. Shares are offered only to certain other Fidelity funds, Fidelity managed 529 plans, and Fidelity managed collective investment trusts. The Trust is registered under the Investment Company Act of 1940, as amended (the 1940 Act), as an open-end management investment company organized as a Massachusetts business trust.
2. Investments in Fidelity Central Funds.
Funds may invest in Fidelity Central Funds, which are open-end investment companies generally available only to other investment companies and accounts managed by the investment adviser and its affiliates. The Schedule of Investments lists any Fidelity Central Funds held as an investment as of period end, but does not include the underlying holdings of each Fidelity Central Fund. An investing fund indirectly bears its proportionate share of the expenses of the underlying Fidelity Central Funds.
Based on its investment objective, each Fidelity Central Fund may invest or participate in various investment vehicles or strategies that are similar to those of the investing fund. These strategies are consistent with the investment objectives of the investing fund and may involve certain economic risks which may cause a decline in value of each of the Fidelity Central Funds and thus a decline in the value of the investing fund.
Fidelity Central Fund
|
Investment Manager
|
Investment Objective
|
Investment Practices
|
Expense RatioA
|
Fidelity Money Market Central Funds
|
Fidelity Management & Research Company LLC (FMR)
|
Each fund seeks to obtain a high level of current income consistent with the preservation of capital and liquidity.
|
Short-term Investments
|
Less than .005%
|
A Expenses expressed as a percentage of average net assets and are as of each underlying Central Fund's most recent annual or semi-annual shareholder report.
A complete unaudited list of holdings for each Fidelity Central Fund is available upon request or at the Securities and Exchange Commission website at www.sec.gov. In addition, the financial statements of the Fidelity Central Funds which contain the significant accounting policies (including investment valuation policies) of those funds, and are not covered by the Report of Independent Registered Public Accounting Firm, are available on the Securities and Exchange Commission website or upon request.
3. Significant Accounting Policies.
The Fund is an investment company and applies the accounting and reporting guidance of the Financial Accounting Standards Board (FASB) Accounting Standards Codification Topic 946 Financial Services - Investment Companies. The financial statements have been prepared in conformity with accounting principles generally accepted in the United States of America (GAAP), which require management to make certain estimates and assumptions at the date of the financial statements. Actual results could differ from those estimates. The Fund operates as a single operating segment. The Fund's income, expenses, assets, and performance are regularly monitored and assessed as a whole by the investment adviser and other individuals responsible for oversight functions of the Trust, using the information presented in the financial statements and financial highlights. Subsequent events, if any, through the date that the financial statements were issued have been evaluated in the preparation of the financial statements. The Fund's Schedule of Investments lists any underlying mutual funds or exchange-traded funds but does not include the underlying holdings of these funds. The following summarizes the significant accounting policies of the Fund:
Investment Valuation. Investments are valued as of 4:00 p.m. Eastern time on the last calendar day of the period. The Board of Trustees (the Board) has designated the Fund's investment adviser as the valuation designee responsible for the fair valuation function and performing fair value determinations as needed. The investment adviser has established a Fair Value Committee (the Committee) to carry out the day-to-day fair valuation responsibilities and has adopted policies and procedures to govern the fair valuation process and the activities of the Committee. In accordance with these fair valuation policies and procedures, which have been approved by the Board, the Fund attempts to obtain prices from one or more third party pricing services or brokers to value its investments. When current market prices, quotations or currency exchange rates are not readily available or reliable, investments will be fair valued in good faith by the Committee, in accordance with the policies and procedures. Factors used in determining fair value vary by investment type and may include market or investment specific events, transaction data, estimated cash flows, and market observations of comparable investments. The frequency that the fair valuation procedures are used cannot be predicted and they may be utilized to a significant extent. The Committee manages the Fund's fair valuation practices and maintains the fair valuation policies and procedures. The Fund's investment adviser reports to the Board information regarding the fair valuation process and related material matters.
The Fund categorizes the inputs to valuation techniques used to value its investments into a disclosure hierarchy consisting of three levels as shown below:
Level 1 - unadjusted quoted prices in active markets for identical investments
Level 2 - other significant observable inputs (including quoted prices for similar investments, interest rates, prepayment speeds, etc.)
Level 3 - unobservable inputs (including the Fund's own assumptions based on the best information available)
Valuation techniques used to value the Fund's investments by major category are as follows:
Equity securities, including restricted securities, for which market quotations are readily available, are valued at the last reported sale price or official closing price as reported by a third party pricing service on the primary market or exchange on which they are traded and are categorized as Level 1 in the hierarchy. In the event there were no sales during the day or closing prices are not available, securities are valued at the last quoted bid price or may be valued using the last available price and are generally categorized as Level 2 in the hierarchy. For foreign equity securities, when market or security specific events arise, comparisons to the valuation of American Depositary Receipts (ADRs), futures contracts, Exchange-Traded Funds (ETFs) and certain indexes as well as quoted prices for similar securities may be used and would be categorized as Level 2 in the hierarchy. For equity securities, including restricted securities, where observable inputs are limited, assumptions about market activity and risk are used and these securities may be categorized as Level 3 in the hierarchy.
Debt securities, including restricted securities, are valued based on evaluated prices received from third party pricing services or from brokers who make markets in such securities. U.S. government and government agency obligations are valued by pricing services who utilize matrix pricing which considers yield or price of bonds of comparable quality, coupon, maturity and type or by broker-supplied prices. When independent prices are unavailable or unreliable, debt securities may be valued utilizing pricing methodologies which consider similar factors that would be used by third party pricing services. Debt securities are generally categorized as Level 2 in the hierarchy but may be Level 3 depending on the circumstances.
Exchange-traded options are valued using the last sale price or, in the absence of a sale, the last offering price and are categorized as Level 1 in the hierarchy. Investments in open-end mutual funds, including the Fidelity Central Funds, are valued at their closing net asset value (NAV) each business day and are categorized as Level 1 in the hierarchy.
Changes in valuation techniques may result in transfers in or out of an assigned level within the disclosure hierarchy. The aggregate value of investments by input level as of December 31, 2025 is included at the end of the Fund's Schedule of Investments.
Foreign Currency. Certain Funds may use foreign currency contracts to facilitate transactions in foreign-denominated securities. Gains and losses from these transactions may arise from changes in the value of the foreign currency or if the counterparties do not perform under the contracts' terms.
Foreign-denominated assets, including investment securities, and liabilities are translated into U.S. dollars at the exchange rates at period end. Purchases and sales of investment securities, income and dividends received, and expenses denominated in foreign currencies are translated into U.S. dollars at the exchange rate in effect on the transaction date.
The effects of exchange rate fluctuations on investments are included with the net realized and unrealized gain (loss) on investment securities. Other foreign currency transactions resulting in realized and unrealized gain (loss) are disclosed separately.
Investment Transactions and Income. For financial reporting purposes, the Fund's investment holdings and NAV include trades executed through the end of the last business day of the period. The NAV per share for processing shareholder transactions is calculated as of the close of business of the New York Stock Exchange (NYSE), normally 4:00 p.m. Eastern time and includes trades executed through the end of the prior business day. Gains and losses on securities sold are determined on the basis of identified cost and include proceeds received from litigation. Commissions paid to certain brokers with whom the investment adviser, or its affiliates, places trades on behalf of a fund include an amount in addition to trade execution, which may be rebated back to a fund. Any such rebates are included in net realized gain (loss) on investments in the Statement of Operations. Dividend income is recorded on the ex-dividend date, except for certain dividends from foreign securities where the ex-dividend date may have passed, which are recorded as soon as the Fund is informed of the ex-dividend date. Non-cash dividends included in dividend income, if any, are recorded at the fair market value of the securities received. Income and capital gain distributions from Fidelity Central Funds, if any, are recorded on the ex-dividend date. Certain distributions received by the Fund represent a return of capital or capital gain. The Fund determines the components of these distributions subsequent to the ex-dividend date, based upon receipt of tax filings or other correspondence relating to the underlying investment. These distributions are recorded as a reduction of cost of investments and/or as a realized gain. Interest income is accrued as earned and includes coupon interest and amortization of premium and accretion of discount on debt securities as applicable. Investment income is recorded net of foreign taxes withheld where recovery of such taxes is uncertain. Funds may file withholding tax reclaims in certain jurisdictions to recover a portion of amounts previously withheld. Any withholding tax reclaims income is included in the Statement of Operations in dividends. Any receivables for withholding tax reclaims are included in the Statement of Assets and Liabilities in dividends receivable.
Expenses. Expenses directly attributable to a fund are charged to that fund. Expenses attributable to more than one fund are allocated among the respective funds on the basis of relative net assets or other appropriate methods. Expenses included in the accompanying financial statements reflect the expenses of that fund and do not include any expenses associated with any underlying mutual funds or exchange-traded funds. Although not included in a fund's expenses, a fund indirectly bears its proportionate share of these expenses through the net asset value of each underlying mutual fund or exchange-traded fund. Expense estimates are accrued in the period to which they relate and adjustments are made when actual amounts are known.
Income Tax Information and Distributions to Shareholders. Each year, the Fund intends to qualify as a regulated investment company under Subchapter M of the Internal Revenue Code, including distributing substantially all of its taxable income and realized gains. As a result, no provision for U.S. Federal income taxes is required. The Fund files a U.S. federal tax return, in addition to state and local tax returns as required. The Fund's federal income tax returns are subject to examination by the Internal Revenue Service (IRS) for a period of three fiscal years after they are filed. State and local tax returns may be subject to examination for an additional fiscal year depending on the jurisdiction. Foreign taxes are provided for based on the Fund's understanding of the tax rules and rates that exist in the foreign markets in which it invests.
Distributions are declared and recorded on the ex-dividend date. Income and capital gain distributions are determined in accordance with income tax regulations, which may differ from GAAP.
Capital accounts within the financial statements are adjusted for permanent book-tax differences. These adjustments have no impact on net assets or the results of operations. Capital accounts are not adjusted for temporary book-tax differences which will reverse in a subsequent period.
Book-tax differences are primarily due to foreign currency transactions, passive foreign investment companies (PFIC), certain corporate actions, and losses deferred due to wash sales and options transactions.
As of period end, the cost and unrealized appreciation (depreciation) in securities, and derivatives if applicable, for federal income tax purposes were as follows:
Gross unrealized appreciation
|
$12,642,072,880
|
Gross unrealized depreciation
|
(411,297,230)
|
Net unrealized appreciation (depreciation)
|
$12,230,775,650
|
Tax cost
|
$12,452,591,199
|
Restricted Securities (including Private Placements). Funds may invest in securities that are subject to legal or contractual restrictions on resale. These securities generally may be resold in transactions exempt from registration or to the public if the securities are registered. Disposal of these securities may involve time-consuming negotiations and expense, and prompt sale at an acceptable price may be difficult. Information regarding restricted securities held at period end is included at the end of the Schedule of Investments, if applicable.
Commitments. A commitment is an agreement to acquire an investment at a future date (subject to conditions) in connection with a potential public or non-public offering. Commitments outstanding at period end are presented in the table below. Unrealized appreciation (depreciation) on any commitments outstanding at period end is separately presented in the Statement of Assets and Liabilities as Unrealized appreciation (depreciation) on unfunded commitments, and any change in unrealized appreciation (depreciation) on unfunded commitments during the period is separately presented in the Statement of Operations, as applicable based on contractual conditions of each commitment.
|
Investment to be Acquired
|
Commitment Amount ($)
|
Unrealized Appreciation (Depreciation)($)
|
Fidelity Series Large Cap Stock Fund
|
CompoSecure, Inc. Class A
|
119,178,073
|
5,024,805
|
4. Derivative Instruments.
Risk Exposures and the Use of Derivative Instruments. The Fund's investment objectives allow for various types of derivative instruments, including options. Derivatives are investments whose value is primarily derived from underlying assets, indices or reference rates and may be transacted on an exchange or over-the-counter (OTC). Derivatives may involve a future commitment to buy or sell a specified asset based on specified terms, to exchange future cash flows at periodic intervals based on a notional principal amount, or for one party to make one or more payments upon the occurrence of specified events in exchange for periodic payments from the other party.
Derivatives were used to increase returns and to manage exposure to certain risks as defined below. The success of any strategy involving derivatives depends on analysis of numerous economic factors, and if the strategies for investment do not work as intended, the objectives may not be achieved.
Derivatives were used to increase or decrease exposure to the following risk(s):
|
|
Equity Risk
|
Equity risk relates to the fluctuations in the value of financial instruments as a result of changes in market prices (other than those arising from interest rate risk or foreign exchange risk), whether caused by factors specific to an individual investment, its issuer, or all factors affecting all instruments traded in a market or market segment.
|
Funds are also exposed to additional risks from investing in derivatives, such as liquidity risk and counterparty credit risk. Liquidity risk is the risk that a fund will be unable to close out the derivative in the open market in a timely manner. Counterparty credit risk is the risk that the counterparty will not be able to fulfill its obligation to a fund. Counterparty credit risk related to exchange-traded contracts may be mitigated by the protection provided by the exchange on which they trade.
Investing in derivatives may involve greater risks than investing in the underlying assets directly and, to varying degrees, may involve risk of loss in excess of any initial investment and collateral received and amounts recognized in the Statement of Assets and Liabilities. In addition, there may be the risk that the change in value of the derivative contract does not correspond to the change in value of the underlying instrument.
Options. Options give the purchaser the right, but not the obligation, to buy (call) or sell (put) an underlying security or financial instrument at an agreed exercise or strike price between or on certain dates. Options obligate the seller (writer) to buy (put) or sell (call) an underlying instrument at the exercise or strike price or cash settle an underlying derivative instrument if the holder exercises the option on or before the expiration date. Exchange-traded and/or OTC options were used to manage exposure to the market.
Upon entering into an options contract, a fund will pay or receive a premium. Premiums paid on purchased options are reflected as cost of investments and premiums received on written options are reflected as a liability on the Statement of Assets and Liabilities. Certain options may be purchased or written with premiums to be paid or received on a future date. Options are valued daily and any unrealized appreciation (depreciation) is reflected in total accumulated earnings (loss) in the Statement of Assets and Liabilities. When an option is exercised, the cost or proceeds of the underlying instrument purchased or sold is adjusted by the amount of the premium. When an option is closed, a gain or loss is realized depending on whether the proceeds or amount paid for the closing sale transaction is greater or less than the premium received or paid. When an option expires, gains and losses are realized to the extent of premiums received and paid, respectively. The net realized and unrealized gains (losses) on purchased options are included in the Statement of Operations in net realized gain (loss) and change in net unrealized appreciation (depreciation) on investment securities. The net realized gain (loss) and change in net unrealized appreciation (depreciation) on written options are presented in the Statement of Operations.
Any open options at period end are presented in the Schedule of Investments under the captions "Purchased Options," "Purchased Swaptions," "Written Options" and "Written Swaptions," as applicable.
Writing puts and buying calls tend to increase exposure to the underlying instrument while buying puts and writing calls tend to decrease exposure to the underlying instrument. For purchased options, risk of loss is limited to the premium paid, and for written options, risk of loss is the change in value in excess of the premium received.
5. Purchases and Sales of Investments.
Purchases and sales of securities, other than short-term securities, U.S. government securities and in-kind transactions, as applicable, are noted in the table below.
|
Purchases ($)
|
Sales ($)
|
Fidelity Series Large Cap Stock Fund
|
2,289,681,121
|
2,595,847,197
|
6. Fees and Other Transactions with Affiliates.
Management Fee. Fidelity Management & Research Company LLC (the investment adviser) and its affiliates provide the Fund with investment management related services for which the Fund does not pay a management fee. Under the management contract, the investment adviser or an affiliate pays all ordinary operating expenses of the Fund, except custody fees, fees and expenses of the independent Trustees, and certain miscellaneous expenses such as proxy and shareholder meeting expenses.
Deferred Trustee Compensation. Under a Deferred Compensation Plan (the Plan) for certain Funds, certain independent Trustees have elected to defer receipt of a portion of their annual compensation. Deferred amounts are invested in affiliated mutual funds, are marked-to-market and remain in a fund until distributed in accordance with the Plan. The investment of deferred amounts and the offsetting payable to the Trustees presented below are included in the accompanying Statement of Assets and Liabilities in other receivables and other payables and accrued expenses, as applicable.
Fidelity Series Large Cap Stock Fund
|
$393,867
|
Brokerage Commissions. A portion of portfolio transactions were placed with brokerage firms which are affiliates of the investment adviser. Brokerage commissions are included in net realized gain (loss) and change in net unrealized appreciation (depreciation) in the Statement of Operations. The commissions paid to these affiliated firms were as follows:
|
Amount ($)
|
Fidelity Series Large Cap Stock Fund
|
30,936
|
Interfund Trades. Funds may purchase from or sell securities to other Fidelity Funds under procedures adopted by the Board of Trustees. The procedures have been designed to ensure these interfund trades are executed in accordance with Rule 17a-7 of the 1940 Act. Any interfund trades are included within the respective purchases and sales amounts shown in the Purchases and Sales of Investments note. Interfund trades during the period are noted in the table below.
|
Purchases ($)
|
Sales ($)
|
Realized Gain (Loss) ($)
|
Fidelity Series Large Cap Stock Fund
|
178,794,591
|
118,198,006
|
64,669,349
|
7. Committed Line of Credit.
Certain Funds participate with other funds managed by the investment adviser or an affiliate in a $4.25 billion credit facility (the "line of credit") to be utilized for temporary or emergency purposes to fund shareholder redemptions or for other short-term liquidity purposes.
Commitment fees are charged based on the unused amount of the line of credit at an annual rate of .10%, and then allocated to each participating fund based on its pro-rata portion of the line of credit. The commitment fees are borne by the investment adviser.
Interest is charged to a participating fund based on its borrowings at an annual rate of .75% plus the highest of (i) daily SOFR plus a .10% spread adjustment, (ii) Federal Funds Effective Rate, or (iii) Overnight Bank Funding Rate. During the period, there were no borrowings on this line of credit.
The line of credit agreement will expire in March 2026 unless extended or renewed.
8. Security Lending.
Funds lend portfolio securities from time to time in order to earn additional income. Lending agents are used, including National Financial Services (NFS), an affiliate of the investment adviser. Pursuant to a securities lending agreement, NFS will receive a fee, which is capped at 9.9% of a fund's daily lending revenue, for its services as lending agent. A fund may lend securities to certain qualified borrowers, including NFS. On the settlement date of the loan, the borrowers provide collateral (in the form of U.S. Treasury obligations, letters of credit and/or cash) against the loaned securities and maintains collateral in an amount not less than 100% of the fair value of the loaned securities during the period of the loan. The fair value of the loaned securities is determined at the close of business of a fund and any additional required collateral is delivered to a fund on the next business day. A fund or borrower may terminate the loan at any time, and if the borrower defaults on its obligation to return the securities loaned because of insolvency or other reasons, a fund may apply collateral received from the borrower against the obligation. A fund may experience delays and costs in recovering the securities loaned or gaining access to non-cash collateral. Any cash collateral received is invested in the Fidelity Securities Lending Cash Central Fund. Any loaned securities are identified as such in the Schedule of Investments, and the value of loaned securities and cash collateral at period end, as applicable, are presented in the Statement of Assets and Liabilities. Security lending income represents the income earned on investing cash collateral less rebates paid to borrowers, plus any premium income received, or for non-cash collateral, fees received from borrowers as compensation for the securities loaned. Securities lending income is reduced by any lending agent fees associated with the loan. Any security lending income earned on investing cash collateral is presented in the Statement of Operations as a component of income from Fidelity Central Funds. Any security lending income earned on non-cash collateral is presented in the Statement of Operations as a component of dividends. Affiliated security lending activity, if any, was as follows:
|
Total Security Lending Fees Paid to NFS ($)
|
Security Lending Income From Securities Loaned to NFS ($)
|
Value of Securities Loaned to NFS at Period End ($)
|
Fidelity Series Large Cap Stock Fund
|
49,776
|
2,151
|
-
|
At period end, the value of any non-cash collateral is presented below. Non-cash collateral is held by a third-party bank for the benefit of a fund and the borrower. A fund is not permitted to sell or re-pledge non-cash collateral except in the event of borrower default, and therefore it is not included in the Schedule of Investments or Statement of Assets and Liabilities.
|
Amount ($)
|
Fidelity Series Large Cap Stock Fund
|
10,736,299
|
9. Expense Reductions.
Through arrangements with the Fund's custodian, credits realized as a result of certain uninvested cash balances were used to reduce the Fund's expenses by $71,795.
10. Other.
A fund's organizational documents provide former and current trustees and officers with a limited indemnification against liabilities arising in connection with the performance of their duties to the fund. In the normal course of business, a fund may also enter into contracts that provide general indemnifications. A fund's maximum exposure under these arrangements is unknown as this would be dependent on future claims that may be made against a fund. The risk of material loss from such claims is considered remote.
At the end of the period, mutual funds and accounts managed by the investment adviser or its affiliates were the owners of record of all of the outstanding shares of the Fund.
11. Risk and Uncertainties.
Many factors affect a fund's performance. Developments that disrupt global economies and financial markets, such as public health emergencies, military conflicts, terrorism, government restrictions, political changes, and environmental disasters, may significantly affect a fund's investment performance. The effects of these developments to a fund will be impacted by the types of securities in which a fund invests, the financial condition, industry, economic sector, and geographic location of an issuer, and a fund's level of investment in the securities of that issuer. Significant concentrations in security types, issuers, industries, sectors, and geographic locations may magnify the factors that affect a fund's performance.
Item 8: Changes in and Disagreements with Accountants for Open-End Management Investment Companies
(Unaudited)
Note: This is not applicable for any fund included in this document.
Item 9: Proxy Disclosures for Open-End Management Investment Companies
(Unaudited)
Note: This is not applicable for any fund included in this document.
Item 10: Remuneration Paid to Directors, Officers, and others of Open-End Management Investment Companies
(Unaudited)
Note: This information is disclosed as part of the financial statements for each Fund as part of Item 7: Financial Statements and Financial Highlights for Open-End Management Investment Companies.
Item 11: Statement Regarding Basis for Approval of Investment Advisory Contract
(Unaudited)
Note: This is not applicable for any fund included in this document.
1.951032.113
MHT-SANN-0226
Fidelity® Mega Cap Stock Fund
Semi-Annual Report
December 31, 2025
Includes Fidelity and Fidelity Advisor share classes
Contents
To view a fund's proxy voting guidelines and proxy voting record for the 12-month period ended June 30, visit http://www.fidelity.com/proxyvotingresults or visit the Securities and Exchange Commission's (SEC) web site at http://www.sec.gov.
You may also call 1-800-544-8544 if you're an individual investing directly with Fidelity, call 1-800-835-5092 if you're a plan sponsor or participant with Fidelity as your recordkeeper or call 1-877-208-0098 on institutional accounts or if you're an advisor or invest through one to request a free copy of the proxy voting guidelines.
Standard & Poor's, S&P and S&P 500 are registered service marks of The McGraw-Hill Companies, Inc. and have been licensed for use by Fidelity Distributors Corporation.
Other third-party marks appearing herein are the property of their respective owners.
All other marks appearing herein are registered or unregistered trademarks or service marks of FMR LLC or an affiliated company. © 2026 FMR LLC. All rights reserved.
This report and the financial statements contained herein are submitted for the general information of the shareholders of the Fund. This report is not authorized for distribution to prospective investors in the Fund unless preceded or accompanied by an effective prospectus.
A fund files its complete schedule of portfolio holdings with the SEC for the first and third quarters of each fiscal year on Form N-PORT. Forms N-PORT are available on the SEC's web site at http://www.sec.gov. A fund's Forms N-PORT may be reviewed and copied at the SEC's Public Reference Room in Washington, DC. Information regarding the operation of the SEC's Public Reference Room may be obtained by calling 1-800-SEC-0330.
For a complete list of a fund's portfolio holdings, view the most recent holdings listing, semiannual report, or annual report on Fidelity's web site at http://www.fidelity.com, http://www.institutional.fidelity.com, or http://www.401k.com, as applicable.
NOT FDIC INSURED •MAY LOSE VALUE •NO BANK GUARANTEE
Neither the Fund nor Fidelity Distributors Corporation is a bank.
Item 7: Financial Statements and Financial Highlights for Open-End Management Investment Companies (Semi-Annual Report)
Fidelity® Mega Cap Stock Fund
Schedule of Investments December 31, 2025 (Unaudited)
Showing Percentage of Net Assets
Common Stocks - 93.2%
|
|
|
|
Shares
|
Value ($)
|
AUSTRALIA - 0.0%
|
|
|
|
Energy - 0.0%
|
|
|
|
Oil, Gas & Consumable Fuels - 0.0%
|
|
|
|
Santos Ltd
|
|
1,760,455
|
7,248,760
|
BELGIUM - 0.7%
|
|
|
|
Health Care - 0.7%
|
|
|
|
Pharmaceuticals - 0.7%
|
|
|
|
UCB SA
|
|
139,500
|
39,116,180
|
CANADA - 1.4%
|
|
|
|
Energy - 1.4%
|
|
|
|
Oil, Gas & Consumable Fuels - 1.4%
|
|
|
|
Imperial Oil Ltd (b)
|
|
924,805
|
79,897,546
|
DENMARK - 0.4%
|
|
|
|
Health Care - 0.4%
|
|
|
|
Pharmaceuticals - 0.4%
|
|
|
|
Novo Nordisk A/S Class B ADR
|
|
424,110
|
21,578,717
|
FRANCE - 0.4%
|
|
|
|
Industrials - 0.4%
|
|
|
|
Aerospace & Defense - 0.4%
|
|
|
|
Airbus SE
|
|
111,400
|
25,869,752
|
GERMANY - 0.6%
|
|
|
|
Information Technology - 0.6%
|
|
|
|
Software - 0.6%
|
|
|
|
SAP SE ADR
|
|
134,500
|
32,671,395
|
NETHERLANDS - 0.5%
|
|
|
|
Communication Services - 0.2%
|
|
|
|
Entertainment - 0.2%
|
|
|
|
Universal Music Group NV
|
|
398,599
|
10,391,411
|
Information Technology - 0.3%
|
|
|
|
Semiconductors & Semiconductor Equipment - 0.3%
|
|
|
|
ASML Holding NV depository receipt
|
|
17,436
|
18,654,079
|
TOTAL NETHERLANDS
|
|
|
29,045,490
|
SWEDEN - 0.3%
|
|
|
|
Industrials - 0.3%
|
|
|
|
Machinery - 0.3%
|
|
|
|
Atlas Copco AB A Shares
|
|
889,300
|
15,831,833
|
TAIWAN - 1.1%
|
|
|
|
Information Technology - 1.1%
|
|
|
|
Semiconductors & Semiconductor Equipment - 1.1%
|
|
|
|
Taiwan Semiconductor Manufacturing Co Ltd ADR
|
|
208,500
|
63,361,065
|
UNITED KINGDOM - 1.2%
|
|
|
|
Consumer Staples - 1.2%
|
|
|
|
Beverages - 0.3%
|
|
|
|
Diageo PLC
|
|
929,662
|
20,032,277
|
Tobacco - 0.9%
|
|
|
|
British American Tobacco PLC ADR
|
|
851,500
|
48,211,930
|
TOTAL UNITED KINGDOM
|
|
|
68,244,207
|
UNITED STATES - 85.8%
|
|
|
|
Communication Services - 10.9%
|
|
|
|
Entertainment - 0.3%
|
|
|
|
Walt Disney Co/The
|
|
174,899
|
19,898,259
|
Interactive Media & Services - 10.0%
|
|
|
|
Alphabet Inc Class A
|
|
688,000
|
215,344,001
|
Alphabet Inc Class C
|
|
595,310
|
186,808,278
|
Meta Platforms Inc Class A
|
|
261,400
|
172,547,526
|
|
|
|
|
574,699,805
|
Media - 0.6%
|
|
|
|
Comcast Corp Class A
|
|
1,231,797
|
36,818,412
|
TOTAL COMMUNICATION SERVICES
|
|
|
631,416,476
|
Consumer Discretionary - 4.1%
|
|
|
|
Broadline Retail - 2.1%
|
|
|
|
Amazon.com Inc (c)
|
|
525,900
|
121,388,238
|
Hotels, Restaurants & Leisure - 0.7%
|
|
|
|
Booking Holdings Inc
|
|
2,038
|
10,914,163
|
Chipotle Mexican Grill Inc (c)
|
|
257,200
|
9,516,400
|
Marriott International Inc/MD Class A1
|
|
19,000
|
5,894,560
|
Starbucks Corp
|
|
166,700
|
14,037,807
|
|
|
|
|
40,362,930
|
Specialty Retail - 1.1%
|
|
|
|
Home Depot Inc/The
|
|
75,900
|
26,117,190
|
Lowe's Cos Inc
|
|
145,311
|
35,043,201
|
|
|
|
|
61,160,391
|
Textiles, Apparel & Luxury Goods - 0.2%
|
|
|
|
Lululemon Athletica Inc (c)
|
|
7,200
|
1,496,231
|
NIKE Inc Class B
|
|
204,500
|
13,028,695
|
|
|
|
|
14,524,926
|
TOTAL CONSUMER DISCRETIONARY
|
|
|
237,436,485
|
Consumer Staples - 3.8%
|
|
|
|
Beverages - 1.5%
|
|
|
|
Coca-Cola Co/The
|
|
501,000
|
35,024,910
|
Keurig Dr Pepper Inc
|
|
1,473,700
|
41,278,337
|
Monster Beverage Corp (c)
|
|
32,100
|
2,461,107
|
PepsiCo Inc
|
|
19,100
|
2,741,232
|
|
|
|
|
81,505,586
|
Consumer Staples Distribution & Retail - 0.4%
|
|
|
|
Target Corp
|
|
224,610
|
21,955,628
|
Food Products - 0.1%
|
|
|
|
Mondelez International Inc
|
|
157,800
|
8,494,374
|
Household Products - 0.2%
|
|
|
|
Procter & Gamble Co/The
|
|
97,120
|
13,918,267
|
Personal Care Products - 1.0%
|
|
|
|
Estee Lauder Cos Inc/The Class A
|
|
162,900
|
17,058,888
|
Kenvue Inc
|
|
2,123,457
|
36,629,633
|
|
|
|
|
53,688,521
|
Tobacco - 0.6%
|
|
|
|
Philip Morris International Inc
|
|
233,000
|
37,373,200
|
TOTAL CONSUMER STAPLES
|
|
|
216,935,576
|
Energy - 6.7%
|
|
|
|
Oil, Gas & Consumable Fuels - 6.7%
|
|
|
|
Chevron Corp
|
|
154,800
|
23,593,068
|
ConocoPhillips
|
|
387,905
|
36,311,787
|
Exxon Mobil Corp
|
|
1,688,109
|
203,147,037
|
Shell PLC
|
|
6,968
|
256,786
|
Shell PLC ADR
|
|
1,658,313
|
121,852,840
|
TOTAL ENERGY
|
|
|
385,161,518
|
Financials - 13.2%
|
|
|
|
Banks - 9.6%
|
|
|
|
Bank of America Corp
|
|
2,931,674
|
161,242,070
|
JPMorgan Chase & Co
|
|
151,330
|
48,761,553
|
PNC Financial Services Group Inc/The
|
|
182,131
|
38,016,204
|
Truist Financial Corp
|
|
456,500
|
22,464,365
|
US Bancorp
|
|
158,112
|
8,436,856
|
Wells Fargo & Co
|
|
2,970,676
|
276,867,003
|
|
|
|
|
555,788,051
|
Capital Markets - 0.6%
|
|
|
|
Charles Schwab Corp/The
|
|
165,200
|
16,505,132
|
CME Group Inc Class A
|
|
9,200
|
2,512,336
|
KKR & Co Inc Class A
|
|
141,214
|
18,001,961
|
|
|
|
|
37,019,429
|
Consumer Finance - 0.1%
|
|
|
|
American Express Co
|
|
13,500
|
4,994,325
|
Financial Services - 2.2%
|
|
|
|
Apollo Global Management Inc
|
|
219,200
|
31,731,392
|
Fiserv Inc (c)
|
|
26,600
|
1,786,722
|
Mastercard Inc Class A
|
|
38,052
|
21,723,126
|
PayPal Holdings Inc
|
|
60,000
|
3,502,800
|
Visa Inc Class A
|
|
193,788
|
67,963,389
|
|
|
|
|
126,707,429
|
Insurance - 0.7%
|
|
|
|
Arthur J Gallagher & Co
|
|
102,900
|
26,629,491
|
Marsh & McLennan Cos Inc
|
|
65,100
|
12,077,352
|
|
|
|
|
38,706,843
|
TOTAL FINANCIALS
|
|
|
763,216,077
|
Health Care - 7.0%
|
|
|
|
Biotechnology - 0.0%
|
|
|
|
Gilead Sciences Inc
|
|
19,700
|
2,417,977
|
Health Care Equipment & Supplies - 1.2%
|
|
|
|
Abbott Laboratories
|
|
119,400
|
14,959,626
|
Alcon AG (United States) (b)
|
|
216,000
|
17,022,960
|
Boston Scientific Corp (c)
|
|
404,517
|
38,570,696
|
|
|
|
|
70,553,282
|
Health Care Providers & Services - 2.1%
|
|
|
|
Cigna Group/The
|
|
79,362
|
21,842,803
|
Humana Inc
|
|
54,700
|
14,010,311
|
UnitedHealth Group Inc
|
|
246,203
|
81,274,073
|
|
|
|
|
117,127,187
|
Life Sciences Tools & Services - 1.0%
|
|
|
|
Danaher Corp
|
|
148,210
|
33,928,233
|
Thermo Fisher Scientific Inc
|
|
44,400
|
25,727,580
|
|
|
|
|
59,655,813
|
Pharmaceuticals - 2.7%
|
|
|
|
Eli Lilly & Co (d)
|
|
28,300
|
30,413,444
|
GSK PLC ADR
|
|
1,048,266
|
51,406,965
|
Haleon PLC ADR
|
|
2,822,833
|
28,538,842
|
Johnson & Johnson
|
|
101,314
|
20,966,932
|
Merck & Co Inc
|
|
196,500
|
20,683,590
|
|
|
|
|
152,009,773
|
TOTAL HEALTH CARE
|
|
|
401,764,032
|
Industrials - 14.9%
|
|
|
|
Aerospace & Defense - 9.4%
|
|
|
|
Boeing Co (c)
|
|
1,319,570
|
286,505,038
|
GE Aerospace
|
|
771,384
|
237,609,414
|
General Dynamics Corp
|
|
17,300
|
5,824,218
|
RTX Corp
|
|
33,500
|
6,143,900
|
|
|
|
|
536,082,570
|
Air Freight & Logistics - 1.1%
|
|
|
|
United Parcel Service Inc Class B
|
|
651,979
|
64,669,797
|
Electrical Equipment - 3.9%
|
|
|
|
Emerson Electric Co
|
|
55,000
|
7,299,600
|
GE Vernova Inc (d)
|
|
334,918
|
218,892,357
|
|
|
|
|
226,191,957
|
Industrial Conglomerates - 0.0%
|
|
|
|
Honeywell International Inc
|
|
8,600
|
1,677,774
|
Machinery - 0.5%
|
|
|
|
Caterpillar Inc
|
|
40,200
|
23,029,374
|
Deere & Co
|
|
17,080
|
7,951,936
|
|
|
|
|
30,981,310
|
TOTAL INDUSTRIALS
|
|
|
859,603,408
|
Information Technology - 24.1%
|
|
|
|
IT Services - 0.1%
|
|
|
|
Accenture PLC Class A
|
|
11,900
|
3,192,770
|
Kyndryl Holdings Inc (c)
|
|
220
|
5,843
|
|
|
|
|
3,198,613
|
Semiconductors & Semiconductor Equipment - 13.1%
|
|
|
|
Applied Materials Inc
|
|
78,674
|
20,218,431
|
Broadcom Inc
|
|
396,605
|
137,264,991
|
Lam Research Corp
|
|
189,200
|
32,387,256
|
Marvell Technology Inc
|
|
230,465
|
19,584,916
|
Micron Technology Inc
|
|
237,700
|
67,841,957
|
NVIDIA Corp
|
|
2,551,750
|
475,901,375
|
|
|
|
|
753,198,926
|
Software - 7.5%
|
|
|
|
Adobe Inc (c)
|
|
63,700
|
22,294,363
|
Autodesk Inc (c)
|
|
29,100
|
8,613,891
|
Intuit Inc
|
|
8,200
|
5,431,844
|
Microsoft Corp
|
|
780,376
|
377,405,441
|
Oracle Corp
|
|
36,000
|
7,016,760
|
Salesforce Inc
|
|
17,300
|
4,582,943
|
Synopsys Inc (c)
|
|
18,500
|
8,689,820
|
|
|
|
|
434,035,062
|
Technology Hardware, Storage & Peripherals - 3.4%
|
|
|
|
Apple Inc
|
|
731,422
|
198,844,385
|
TOTAL INFORMATION TECHNOLOGY
|
|
|
1,389,276,986
|
Materials - 0.1%
|
|
|
|
Chemicals - 0.1%
|
|
|
|
Air Products and Chemicals Inc
|
|
14,600
|
3,606,492
|
Linde PLC
|
|
6,700
|
2,856,813
|
Solstice Advanced Materials Inc
|
|
2,150
|
104,446
|
TOTAL MATERIALS
|
|
|
6,567,751
|
Real Estate - 0.3%
|
|
|
|
Industrial REITs - 0.1%
|
|
|
|
Prologis Inc
|
|
22,800
|
2,910,648
|
Specialized REITs - 0.2%
|
|
|
|
American Tower Corp
|
|
75,510
|
13,257,291
|
TOTAL REAL ESTATE
|
|
|
16,167,939
|
Utilities - 0.7%
|
|
|
|
Electric Utilities - 0.6%
|
|
|
|
Duke Energy Corp
|
|
15,200
|
1,781,592
|
NextEra Energy Inc
|
|
37,900
|
3,042,612
|
Southern Co/The
|
|
304,000
|
26,508,800
|
|
|
|
|
31,333,004
|
Multi-Utilities - 0.1%
|
|
|
|
Sempra
|
|
81,400
|
7,186,806
|
TOTAL UTILITIES
|
|
|
38,519,810
|
TOTAL UNITED STATES
|
|
|
4,946,066,058
|
ZAMBIA - 0.8%
|
|
|
|
Materials - 0.8%
|
|
|
|
Metals & Mining - 0.8%
|
|
|
|
First Quantum Minerals Ltd (c)
|
|
1,769,515
|
47,443,191
|
|
TOTAL COMMON STOCKS
(Cost $3,210,408,203)
|
|
|
5,376,374,194
|
|
|
|
|
|
U.S. Treasury Obligations - 0.2%
|
|
|
|
Yield (%) (e)
|
Principal
Amount (a)
|
Value ($)
|
US Treasury Bills 0% 2/26/2026 (d)
(Cost $11,168,358)
|
|
3.67
|
11,232,000
|
11,170,417
|
|
|
|
|
|
|
Money Market Funds - 8.0%
|
|
|
|
Yield (%)
|
Shares
|
Value ($)
|
Fidelity Cash Central Fund (f)
|
|
3.79
|
376,617,482
|
376,692,806
|
Fidelity Securities Lending Cash Central Fund (f)(g)
|
|
3.77
|
82,711,902
|
82,720,173
|
|
TOTAL MONEY MARKET FUNDS
(Cost $459,415,259)
|
|
|
|
459,412,979
|
|
|
|
|
|
|
|
TOTAL INVESTMENT IN SECURITIES - 101.4%
(Cost $3,680,991,820)
|
5,846,957,590
|
NET OTHER ASSETS (LIABILITIES) - (1.4)%
|
(80,181,617)
|
NET ASSETS - 100.0%
|
5,766,775,973
|
|
|
|
Written Options
|
|
|
Counterparty
|
Number
of Contracts
|
Notional
Amount ($)
|
Exercise
Price ($)
|
Expiration
Date
|
Value ($)
|
Call Options
|
|
|
|
|
|
|
Eli Lilly & Co
|
Chicago Board Options Exchange
|
56
|
6,018,208
|
1,130.00
|
2/2026
|
(192,500)
|
GE Vernova Inc
|
Chicago Board Options Exchange
|
100
|
6,535,700
|
740.00
|
2/2026
|
(152,000)
|
GE Vernova Inc
|
Chicago Board Options Exchange
|
100
|
6,535,700
|
700.00
|
2/2026
|
(259,000)
|
GE Vernova Inc
|
Chicago Board Options Exchange
|
100
|
6,535,700
|
750.00
|
2/2026
|
(133,500)
|
|
|
|
|
|
|
|
|
|
|
|
|
|
|
|
(737,000)
|
Put Options
|
|
|
|
|
|
|
GE Vernova Inc
|
Chicago Board Options Exchange
|
225
|
14,705,325
|
480.00
|
2/2026
|
(40,500)
|
|
|
|
|
|
|
|
|
|
|
|
|
|
|
|
(40,500)
|
TOTAL WRITTEN OPTIONS
|
|
|
|
|
|
(777,500)
|
Legend
(a)
|
Amount is stated in United States dollars unless otherwise noted.
|
(b)
|
Security or a portion of the security is on loan at period end.
|
(c)
|
Non-income producing.
|
(d)
|
Security or a portion of the security is pledged as collateral for options written. At period end, the value of securities pledged amounted to $26,865,471.
|
(e)
|
Yield represents either the annualized yield at the date of purchase, or the stated coupon rate, or, for floating and adjustable rate securities, the rate at period end.
|
(f)
|
Affiliated fund that is generally available only to investment companies and other accounts managed by Fidelity Investments. The rate quoted is the annualized seven-day yield of the fund at period end. A complete unaudited listing of the fund's holdings as of its most recent quarter end is available upon request. In addition, each Fidelity Central Fund's financial statements are available on the SEC's website or upon request.
|
(g)
|
Investment made with cash collateral received from securities on loan.
|
Affiliated Central Funds
Fiscal year to date information regarding the Fund's investments in Fidelity Central Funds, including the ownership percentage, is presented below.
Affiliate
|
Value,
beginning
of period ($)
|
Purchases ($)
|
Sales
Proceeds ($)
|
Dividend
Income ($)
|
Realized
Gain (loss) ($)
|
Change in
Unrealized
appreciation
(depreciation) ($)
|
Value,
end
of period ($)
|
Shares,
end
of period
|
% ownership,
end
of period
|
Fidelity Cash Central Fund
|
281,679,974
|
502,486,550
|
407,472,305
|
7,084,409
|
867
|
(2,280)
|
376,692,806
|
376,617,482
|
0.7%
|
Fidelity Securities Lending Cash Central Fund
|
48,867,560
|
153,410,311
|
119,558,421
|
101,305
|
723
|
-
|
82,720,173
|
82,711,902
|
0.3%
|
Total
|
330,547,534
|
655,896,861
|
527,030,726
|
7,185,714
|
1,590
|
(2,280)
|
459,412,979
|
|
|
|
|
|
|
|
|
|
|
|
|
|
Amounts in the dividend income column in the above table include any capital gain distributions from underlying funds, which are presented in the corresponding line item in the Statement of Operations, if applicable.
Amounts in the dividend income column for Fidelity Securities Lending Cash Central Fund represents the income earned on investing cash collateral, less rebates paid to borrowers and any lending agent fees associated with the loan, plus any premium income received for lending certain types of securities.
Amounts included in the purchases and sales proceeds columns may include in-kind transactions, if applicable.
Investment Valuation
The following is a summary of the inputs used, as of December 31, 2025, involving the Fund's assets and liabilities carried at fair value. The inputs or methodology used for valuing securities may not be an indication of the risk associated with investing in those securities. For more information on valuation inputs, and their aggregation into the levels used below, please refer to the Investment Valuation section in the accompanying Notes to Financial Statements.
Valuation Inputs at Reporting Date:
|
Description
|
Total ($)
|
Level 1 ($)
|
Level 2 ($)
|
Level 3 ($)
|
Investments in Securities:
|
|
|
|
|
|
|
Common Stocks
|
|
|
|
|
Communication Services
|
641,807,887
|
631,416,476
|
10,391,411
|
-
|
Consumer Discretionary
|
237,436,485
|
237,436,485
|
-
|
-
|
Consumer Staples
|
285,179,783
|
265,147,506
|
20,032,277
|
-
|
Energy
|
472,307,824
|
472,051,038
|
256,786
|
-
|
Financials
|
763,216,077
|
763,216,077
|
-
|
-
|
Health Care
|
462,458,929
|
462,458,929
|
-
|
-
|
Industrials
|
901,304,993
|
859,603,408
|
41,701,585
|
-
|
Information Technology
|
1,503,963,525
|
1,503,963,525
|
-
|
-
|
Materials
|
54,010,942
|
54,010,942
|
-
|
-
|
Real Estate
|
16,167,939
|
16,167,939
|
-
|
-
|
Utilities
|
38,519,810
|
38,519,810
|
-
|
-
|
|
|
U.S. Treasury Obligations
|
11,170,417
|
-
|
11,170,417
|
-
|
|
|
Money Market Funds
|
459,412,979
|
459,412,979
|
-
|
-
|
Total Investments in Securities:
|
5,846,957,590
|
5,763,405,114
|
83,552,476
|
-
|
Derivative Instruments:
|
|
|
|
|
|
|
Liabilities
|
|
|
|
|
Written Options
|
(777,500)
|
(777,500)
|
-
|
-
|
Total Liabilities
|
(777,500)
|
(777,500)
|
-
|
-
|
Total Derivative Instruments:
|
(777,500)
|
(777,500)
|
-
|
-
|
|
|
|
|
|
|
|
Net Unrealized Appreciation (Depreciation) on Unfunded Commitments
|
536,223
|
536,223
|
-
|
-
|
Value of Derivative Instruments
The following table is a summary of the Fund's value of derivative instruments by primary risk exposure as of December 31, 2025. For additional information on derivative instruments, please refer to the Derivative Instruments section in the accompanying Notes to Financial Statements.
Primary Risk Exposure / Derivative Type
|
Value
|
|
Asset ($)
|
Liability ($)
|
Equity Risk
|
|
|
Written Options (a)
|
-
|
(777,500)
|
Total Equity Risk
|
-
|
(777,500)
|
Total Value of Derivatives
|
-
|
(777,500)
|
(a)Gross value is presented in the Statement of Assets and Liabilities in the written options, at value line-item.
Financial Statements (Unaudited)
Statement of Assets and Liabilities
|
|
As of December 31, 2025 (Unaudited)
|
Assets
|
|
|
|
|
Investment in securities, at value (including securities loaned of $78,339,275) - See accompanying schedule:
|
|
|
|
|
Unaffiliated issuers (cost $3,221,576,561)
|
$
|
5,387,544,611
|
|
|
Fidelity Central Funds (cost $459,415,259)
|
|
459,412,979
|
|
|
|
|
|
|
|
|
|
|
|
|
|
|
Total Investment in Securities (cost $3,680,991,820)
|
|
|
$
|
5,846,957,590
|
Cash
|
|
|
|
1
|
Foreign currency held at value (cost $6,335)
|
|
|
|
6,326
|
Receivable for investments sold
|
|
|
|
581,636
|
Unrealized appreciation on unfunded commitments
|
|
|
|
536,223
|
Receivable for fund shares sold
|
|
|
|
16,786,571
|
Dividends receivable
|
|
|
|
3,825,229
|
Interest receivable
|
|
|
|
107
|
Distributions receivable from Fidelity Central Funds
|
|
|
|
1,227,087
|
Prepaid expenses
|
|
|
|
3,537
|
Other receivables
|
|
|
|
4,304
|
Total assets
|
|
|
|
5,869,928,611
|
Liabilities
|
|
|
|
|
Payable for investments purchased
|
$
|
10,363,447
|
|
|
Payable for fund shares redeemed
|
|
6,490,364
|
|
|
Accrued management fee
|
|
2,586,233
|
|
|
Distribution and service plan fees payable
|
|
137,075
|
|
|
Written options, at value (premium received $1,171,439)
|
|
777,500
|
|
|
Other payables and accrued expenses
|
|
78,569
|
|
|
Collateral on securities loaned
|
|
82,719,450
|
|
|
Total liabilities
|
|
|
|
103,152,638
|
Commitments and contingent liabilities (see Significant Accounting Policies note)
|
|
|
|
|
Net Assets
|
|
|
$
|
5,766,775,973
|
Net Assets consist of:
|
|
|
|
|
Paid in capital
|
|
|
$
|
3,590,671,386
|
Total accumulated earnings (loss)
|
|
|
|
2,176,104,587
|
Net Assets
|
|
|
$
|
5,766,775,973
|
|
|
|
|
|
|
Net Asset Value and Maximum Offering Price
|
|
|
|
|
Class A :
|
|
|
|
|
Net Asset Value and redemption price per share ($338,349,243 ÷ 11,036,418 shares)(a)
|
|
|
$
|
30.66
|
Maximum offering price per share (100/94.25 of $30.66)
|
|
|
$
|
32.53
|
Class M :
|
|
|
|
|
Net Asset Value and redemption price per share ($46,951,299 ÷ 1,529,211 shares)(a)
|
|
|
$
|
30.70
|
Maximum offering price per share (100/96.50 of $30.70)
|
|
|
$
|
31.81
|
Class C :
|
|
|
|
|
Net Asset Value and offering price per share ($59,626,497 ÷ 1,998,216 shares)(a)
|
|
|
$
|
29.84
|
Mega Cap Stock :
|
|
|
|
|
Net Asset Value, offering price and redemption price per share ($3,374,252,018 ÷ 107,975,409 shares)
|
|
|
$
|
31.25
|
Class I :
|
|
|
|
|
Net Asset Value, offering price and redemption price per share ($819,189,611 ÷ 26,191,023 shares)
|
|
|
$
|
31.28
|
Class Z :
|
|
|
|
|
Net Asset Value, offering price and redemption price per share ($1,128,407,305 ÷ 36,378,550 shares)
|
|
|
$
|
31.02
|
(a)Redemption price per share is equal to net asset value less any applicable contingent deferred sales charge.
|
Statement of Operations
|
Six months ended December 31, 2025 (Unaudited)
|
Investment Income
|
|
|
|
|
Dividends
|
|
|
$
|
31,733,105
|
Interest
|
|
|
|
33,326
|
Income from Fidelity Central Funds (including $101,305 from security lending)
|
|
|
|
7,185,714
|
Total income
|
|
|
|
38,952,145
|
Expenses
|
|
|
|
|
Management fee
|
$
|
13,764,096
|
|
|
Distribution and service plan fees
|
|
763,262
|
|
|
Custodian fees and expenses
|
|
32,534
|
|
|
Independent trustees' fees and expenses
|
|
9,323
|
|
|
Registration fees
|
|
211,042
|
|
|
Audit fees
|
|
31,557
|
|
|
Legal
|
|
5,168
|
|
|
Miscellaneous
|
|
5,939
|
|
|
Total expenses before reductions
|
|
14,822,921
|
|
|
Expense reductions
|
|
(1,508)
|
|
|
Total expenses after reductions
|
|
|
|
14,821,413
|
Net Investment income (loss)
|
|
|
|
24,130,732
|
Realized and Unrealized Gain (Loss)
|
|
|
|
|
Net realized gain (loss) on:
|
|
|
|
|
Investment Securities:
|
|
|
|
|
Unaffiliated issuers
|
|
71,778,547
|
|
|
Fidelity Central Funds
|
|
1,590
|
|
|
Foreign currency transactions
|
|
(54,369)
|
|
|
Written options
|
|
1,028,305
|
|
|
Total net realized gain (loss)
|
|
|
|
72,754,073
|
Change in net unrealized appreciation (depreciation) on:
|
|
|
|
|
Investment Securities:
|
|
|
|
|
Unaffiliated issuers
|
|
511,735,929
|
|
|
Fidelity Central Funds
|
|
(2,280)
|
|
|
Unfunded commitments
|
|
536,223
|
|
|
Assets and liabilities in foreign currencies
|
|
3,616
|
|
|
Written options
|
|
257,730
|
|
|
Total change in net unrealized appreciation (depreciation)
|
|
|
|
512,531,218
|
Net gain (loss)
|
|
|
|
585,285,291
|
Net increase (decrease) in net assets resulting from operations
|
|
|
$
|
609,416,023
|
Statement of Changes in Net Assets
|
|
|
|
|
Six months ended
December 31, 2025
(Unaudited)
|
|
Year ended
June 30, 2025
|
Increase (Decrease) in Net Assets
|
|
|
|
|
Operations
|
|
|
|
|
Net investment income (loss)
|
$
|
24,130,732
|
$
|
38,000,257
|
Net realized gain (loss)
|
|
72,754,073
|
|
135,946,700
|
Change in net unrealized appreciation (depreciation)
|
|
512,531,218
|
|
498,496,616
|
Net increase (decrease) in net assets resulting from operations
|
|
609,416,023
|
|
672,443,573
|
Distributions to shareholders
|
|
(199,362,877)
|
|
(89,177,833)
|
|
|
|
|
|
|
Share transactions - net increase (decrease)
|
|
1,110,275,461
|
|
604,795,252
|
Total increase (decrease) in net assets
|
|
1,520,328,606
|
|
1,188,060,992
|
|
|
|
|
|
|
Net Assets
|
|
|
|
|
Beginning of period
|
|
4,246,447,367
|
|
3,058,386,375
|
End of period
|
$
|
5,766,775,973
|
$
|
4,246,447,367
|
|
|
|
|
|
|
|
|
|
|
|
|
Financial Highlights
Fidelity Advisor® Mega Cap Stock Fund Class A
|
|
|
|
|
Six months ended
December 31, 2025
(Unaudited)
|
|
Years ended June 30, 2025
|
|
2024
|
|
2023
|
|
2022
|
|
2021
|
Selected Per-Share Data
|
|
|
|
|
|
|
|
|
|
|
|
|
Net asset value, beginning of period
|
$
|
28.19
|
$
|
24.18
|
$
|
19.23
|
$
|
16.14
|
$
|
19.05
|
$
|
13.83
|
Income from Investment Operations
|
|
|
|
|
|
|
|
|
|
|
|
|
Net investment income (loss) A,B
|
|
.10
|
|
.21
|
|
.21
|
|
.17
|
|
.14
|
|
.15
|
Net realized and unrealized gain (loss)
|
|
3.51
|
|
4.42
|
|
5.12
|
|
3.61
|
|
(2.17)
|
|
6.31
|
Total from investment operations
|
|
3.61
|
|
4.63
|
|
5.33
|
|
3.78
|
|
(2.03)
|
|
6.46
|
Distributions from net investment income
|
|
(.19)
|
|
(.20)
|
|
(.17)
|
|
(.18)
|
|
(.29)
|
|
(.24)
|
Distributions from net realized gain
|
|
(.95)
|
|
(.42)
|
|
(.21)
|
|
(.51)
|
|
(.59)
|
|
(1.00)
|
Total distributions
|
|
(1.14)
|
|
(.62)
|
|
(.38)
|
|
(.69)
|
|
(.88)
|
|
(1.24)
|
Net asset value, end of period
|
$
|
30.66
|
$
|
28.19
|
$
|
24.18
|
$
|
19.23
|
$
|
16.14
|
$
|
19.05
|
Total Return C,D,E
|
|
|
|
19.63%
|
|
28.13%
|
|
24.10%
|
|
(11.25)% F
|
|
49.60%
|
Ratios to Average Net Assets B,G,H
|
|
|
|
|
|
|
|
|
|
|
|
|
Expenses before reductions
|
|
.86% I
|
|
.86%
|
|
.88%
|
|
.90%
|
|
.90%
|
|
.91%
|
Expenses net of fee waivers, if any
|
|
|
|
.86%
|
|
.88%
|
|
.90%
|
|
.89%
|
|
.91%
|
Expenses net of all reductions, if any
|
|
.86% I
|
|
.86%
|
|
.88%
|
|
.90%
|
|
.89%
|
|
.91%
|
Net investment income (loss)
|
|
.70% I
|
|
.83%
|
|
1.01%
|
|
.99%
|
|
.78%
|
|
.95%
|
Supplemental Data
|
|
|
|
|
|
|
|
|
|
|
|
|
Net assets, end of period (000 omitted)
|
$
|
338,349
|
$
|
271,642
|
$
|
208,007
|
$
|
133,252
|
$
|
88,064
|
$
|
87,302
|
Portfolio turnover rate J
|
|
|
|
15%
|
|
9%
|
|
18%
|
|
13%
|
|
43%
|
ACalculated based on average shares outstanding during the period.
BNet investment income (loss) is affected by the timing of the declaration of dividends by any underlying mutual funds or exchange-traded funds (ETFs). Net investment income (loss) of any mutual funds or ETFs is not included in the Fund's net investment income (loss) ratio.
CTotal returns for periods of less than one year are not annualized.
DTotal returns would have been lower if certain expenses had not been reduced during the applicable periods shown.
ETotal returns do not include the effect of the sales charges.
FAmount includes a reimbursement from the investment adviser for an operational error which amounted to less than $.01 per share. Excluding this reimbursement, the total return would have been (11.29)%.
GFees and expenses of any underlying mutual funds or exchange-traded funds (ETFs) are not included in the Fund's expense ratio. The Fund indirectly bears its proportionate share of these expenses. For additional expense information related to investments in Fidelity Central Funds, please refer to the "Investments in Fidelity Central Funds" note found in the Notes to Financial Statements section of the most recent Annual or Semi-Annual report.
HExpense ratios reflect operating expenses of the class. Expenses before reductions do not reflect amounts reimbursed, waived, or reduced through arrangements with the investment adviser, brokerage services, or other offset arrangements, if applicable, and do not represent the amount paid by the class during periods when reimbursements, waivers or reductions occur.
IAnnualized.
JAmount does not include the portfolio activity of any underlying mutual funds or exchange-traded funds (ETFs), derivatives or securities that mature within one year from acquisition.
Fidelity Advisor® Mega Cap Stock Fund Class M
|
|
|
|
|
Six months ended
December 31, 2025
(Unaudited)
|
|
Years ended June 30, 2025
|
|
2024
|
|
2023
|
|
2022
|
|
2021
|
Selected Per-Share Data
|
|
|
|
|
|
|
|
|
|
|
|
|
Net asset value, beginning of period
|
$
|
28.19
|
$
|
24.17
|
$
|
19.22
|
$
|
16.13
|
$
|
19.03
|
$
|
13.82
|
Income from Investment Operations
|
|
|
|
|
|
|
|
|
|
|
|
|
Net investment income (loss) A,B
|
|
.07
|
|
.15
|
|
.16
|
|
.13
|
|
.10
|
|
.11
|
Net realized and unrealized gain (loss)
|
|
3.50
|
|
4.43
|
|
5.12
|
|
3.61
|
|
(2.17)
|
|
6.31
|
Total from investment operations
|
|
3.57
|
|
4.58
|
|
5.28
|
|
3.74
|
|
(2.07)
|
|
6.42
|
Distributions from net investment income
|
|
(.10)
|
|
(.14)
|
|
(.12)
|
|
(.13)
|
|
(.24)
|
|
(.20)
|
Distributions from net realized gain
|
|
(.95)
|
|
(.42)
|
|
(.21)
|
|
(.51)
|
|
(.59)
|
|
(1.00)
|
Total distributions
|
|
(1.06) C
|
|
(.56)
|
|
(.33)
|
|
(.65) C
|
|
(.83)
|
|
(1.21) C
|
Net asset value, end of period
|
$
|
30.70
|
$
|
28.19
|
$
|
24.17
|
$
|
19.22
|
$
|
16.13
|
$
|
19.03
|
Total Return D,E,F
|
|
|
|
19.34%
|
|
27.81%
|
|
23.76%
|
|
(11.45)% G
|
|
49.19%
|
Ratios to Average Net Assets B,H,I
|
|
|
|
|
|
|
|
|
|
|
|
|
Expenses before reductions
|
|
1.11% J
|
|
1.11%
|
|
1.12%
|
|
1.16%
|
|
1.15%
|
|
1.17%
|
Expenses net of fee waivers, if any
|
|
|
|
1.11%
|
|
1.11%
|
|
1.16%
|
|
1.15%
|
|
1.17%
|
Expenses net of all reductions, if any
|
|
1.11% J
|
|
1.11%
|
|
1.11%
|
|
1.16%
|
|
1.15%
|
|
1.16%
|
Net investment income (loss)
|
|
.45% J
|
|
.58%
|
|
.78%
|
|
.73%
|
|
.52%
|
|
.69%
|
Supplemental Data
|
|
|
|
|
|
|
|
|
|
|
|
|
Net assets, end of period (000 omitted)
|
$
|
46,951
|
$
|
41,900
|
$
|
36,231
|
$
|
30,973
|
$
|
25,617
|
$
|
28,266
|
Portfolio turnover rate K
|
|
|
|
15%
|
|
9%
|
|
18%
|
|
13%
|
|
43%
|
ACalculated based on average shares outstanding during the period.
BNet investment income (loss) is affected by the timing of the declaration of dividends by any underlying mutual funds or exchange-traded funds (ETFs). Net investment income (loss) of any mutual funds or ETFs is not included in the Fund's net investment income (loss) ratio.
CTotal distributions per share do not sum due to rounding.
DTotal returns for periods of less than one year are not annualized.
ETotal returns would have been lower if certain expenses had not been reduced during the applicable periods shown.
FTotal returns do not include the effect of the sales charges.
GAmount includes a reimbursement from the investment adviser for an operational error which amounted to less than $.01 per share. Excluding this reimbursement, the total return would have been (11.49)%.
HFees and expenses of any underlying mutual funds or exchange-traded funds (ETFs) are not included in the Fund's expense ratio. The Fund indirectly bears its proportionate share of these expenses. For additional expense information related to investments in Fidelity Central Funds, please refer to the "Investments in Fidelity Central Funds" note found in the Notes to Financial Statements section of the most recent Annual or Semi-Annual report.
IExpense ratios reflect operating expenses of the class. Expenses before reductions do not reflect amounts reimbursed, waived, or reduced through arrangements with the investment adviser, brokerage services, or other offset arrangements, if applicable, and do not represent the amount paid by the class during periods when reimbursements, waivers or reductions occur.
JAnnualized.
KAmount does not include the portfolio activity of any underlying mutual funds or exchange-traded funds (ETFs), derivatives or securities that mature within one year from acquisition.
Fidelity Advisor® Mega Cap Stock Fund Class C
|
|
|
|
|
Six months ended
December 31, 2025
(Unaudited)
|
|
Years ended June 30, 2025
|
|
2024
|
|
2023
|
|
2022
|
|
2021
|
Selected Per-Share Data
|
|
|
|
|
|
|
|
|
|
|
|
|
Net asset value, beginning of period
|
$
|
27.40
|
$
|
23.53
|
$
|
18.74
|
$
|
15.74
|
$
|
18.58
|
$
|
13.53
|
Income from Investment Operations
|
|
|
|
|
|
|
|
|
|
|
|
|
Net investment income (loss) A,B
|
|
(.01)
|
|
.01
|
|
.05
|
|
.03
|
|
- C
|
|
.03 C
|
Net realized and unrealized gain (loss)
|
|
3.40
|
|
4.32
|
|
4.99
|
|
3.53
|
|
(2.12)
|
|
6.15
|
Total from investment operations
|
|
3.39
|
|
4.33
|
|
5.04
|
|
3.56
|
|
(2.12)
|
|
6.18
|
Distributions from net investment income
|
|
(.01)
|
|
(.04)
|
|
(.04)
|
|
(.04)
|
|
(.15)
|
|
(.13)
|
Distributions from net realized gain
|
|
(.94)
|
|
(.42)
|
|
(.21)
|
|
(.51)
|
|
(.58)
|
|
(1.00)
|
Total distributions
|
|
(.95)
|
|
(.46)
|
|
(.25)
|
|
(.56) D
|
|
(.72) D
|
|
(1.13)
|
Net asset value, end of period
|
$
|
29.84
|
$
|
27.40
|
$
|
23.53
|
$
|
18.74
|
$
|
15.74
|
$
|
18.58
|
Total Return E,F,G
|
|
|
|
18.75%
|
|
27.12%
|
|
23.12%
|
|
(11.90)% H
|
|
48.31%
|
Ratios to Average Net Assets B,I,J
|
|
|
|
|
|
|
|
|
|
|
|
|
Expenses before reductions
|
|
1.63% K
|
|
1.64%
|
|
1.66%
|
|
1.69%
|
|
1.67%
|
|
1.69%
|
Expenses net of fee waivers, if any
|
|
|
|
1.64%
|
|
1.65%
|
|
1.68%
|
|
1.67%
|
|
1.69%
|
Expenses net of all reductions, if any
|
|
1.63% K
|
|
1.63%
|
|
1.65%
|
|
1.68%
|
|
1.67%
|
|
1.69%
|
Net investment income (loss)
|
|
(.07)% K
|
|
.06%
|
|
.24%
|
|
.21%
|
|
-% L
|
|
.17%
|
Supplemental Data
|
|
|
|
|
|
|
|
|
|
|
|
|
Net assets, end of period (000 omitted)
|
$
|
59,626
|
$
|
47,843
|
$
|
34,772
|
$
|
23,061
|
$
|
20,255
|
$
|
27,727
|
Portfolio turnover rate M
|
|
|
|
15%
|
|
9%
|
|
18%
|
|
13%
|
|
43%
|
ACalculated based on average shares outstanding during the period.
BNet investment income (loss) is affected by the timing of the declaration of dividends by any underlying mutual funds or exchange-traded funds (ETFs). Net investment income (loss) of any mutual funds or ETFs is not included in the Fund's net investment income (loss) ratio.
CAmount represents less than $.005 per share.
DTotal distributions per share do not sum due to rounding.
ETotal returns for periods of less than one year are not annualized.
FTotal returns would have been lower if certain expenses had not been reduced during the applicable periods shown.
GTotal returns do not include the effect of the contingent deferred sales charge.
HAmount includes a reimbursement from the investment adviser for an operational error which amounted to less than $.01 per share. Excluding this reimbursement, the total return would have been (11.94)%.
IFees and expenses of any underlying mutual funds or exchange-traded funds (ETFs) are not included in the Fund's expense ratio. The Fund indirectly bears its proportionate share of these expenses. For additional expense information related to investments in Fidelity Central Funds, please refer to the "Investments in Fidelity Central Funds" note found in the Notes to Financial Statements section of the most recent Annual or Semi-Annual report.
JExpense ratios reflect operating expenses of the class. Expenses before reductions do not reflect amounts reimbursed, waived, or reduced through arrangements with the investment adviser, brokerage services, or other offset arrangements, if applicable, and do not represent the amount paid by the class during periods when reimbursements, waivers or reductions occur.
KAnnualized.
LAmount represents less than .005%.
MAmount does not include the portfolio activity of any underlying mutual funds or exchange-traded funds (ETFs), derivatives or securities that mature within one year from acquisition.
Fidelity® Mega Cap Stock Fund
|
|
|
|
|
Six months ended
December 31, 2025
(Unaudited)
|
|
Years ended June 30, 2025
|
|
2024
|
|
2023
|
|
2022
|
|
2021
|
Selected Per-Share Data
|
|
|
|
|
|
|
|
|
|
|
|
|
Net asset value, beginning of period
|
$
|
28.75
|
$
|
24.63
|
$
|
19.58
|
$
|
16.42
|
$
|
19.36
|
$
|
14.04
|
Income from Investment Operations
|
|
|
|
|
|
|
|
|
|
|
|
|
Net investment income (loss) A,B
|
|
.15
|
|
.29
|
|
.28
|
|
.22
|
|
.20
|
|
.20
|
Net realized and unrealized gain (loss)
|
|
3.57
|
|
4.52
|
|
5.20
|
|
3.68
|
|
(2.21)
|
|
6.40
|
Total from investment operations
|
|
3.72
|
|
4.81
|
|
5.48
|
|
3.90
|
|
(2.01)
|
|
6.60
|
Distributions from net investment income
|
|
(.26)
|
|
(.27)
|
|
(.22)
|
|
(.23)
|
|
(.34)
|
|
(.28)
|
Distributions from net realized gain
|
|
(.95)
|
|
(.42)
|
|
(.21)
|
|
(.51)
|
|
(.59)
|
|
(1.00)
|
Total distributions
|
|
(1.22) C
|
|
(.69)
|
|
(.43)
|
|
(.74)
|
|
(.93)
|
|
(1.28)
|
Net asset value, end of period
|
$
|
31.25
|
$
|
28.75
|
$
|
24.63
|
$
|
19.58
|
$
|
16.42
|
$
|
19.36
|
Total Return D,E
|
|
|
|
20.02%
|
|
28.44%
|
|
24.46%
|
|
(10.99)% F
|
|
49.96%
|
Ratios to Average Net Assets B,G,H
|
|
|
|
|
|
|
|
|
|
|
|
|
Expenses before reductions
|
|
.58% I
|
|
.58%
|
|
.61%
|
|
.63%
|
|
.61%
|
|
.63%
|
Expenses net of fee waivers, if any
|
|
|
|
.58%
|
|
.60%
|
|
.62%
|
|
.61%
|
|
.63%
|
Expenses net of all reductions, if any
|
|
.58% I
|
|
.58%
|
|
.60%
|
|
.62%
|
|
.61%
|
|
.63%
|
Net investment income (loss)
|
|
.98% I
|
|
1.11%
|
|
1.29%
|
|
1.27%
|
|
1.06%
|
|
1.23%
|
Supplemental Data
|
|
|
|
|
|
|
|
|
|
|
|
|
Net assets, end of period (000 omitted)
|
$
|
3,374,252
|
$
|
2,534,999
|
$
|
1,973,946
|
$
|
1,203,802
|
$
|
927,217
|
$
|
1,166,988
|
Portfolio turnover rate J
|
|
|
|
15%
|
|
9%
|
|
18%
|
|
13%
|
|
43%
|
ACalculated based on average shares outstanding during the period.
BNet investment income (loss) is affected by the timing of the declaration of dividends by any underlying mutual funds or exchange-traded funds (ETFs). Net investment income (loss) of any mutual funds or ETFs is not included in the Fund's net investment income (loss) ratio.
CTotal distributions per share do not sum due to rounding.
DTotal returns for periods of less than one year are not annualized.
ETotal returns would have been lower if certain expenses had not been reduced during the applicable periods shown.
FAmount includes a reimbursement from the investment adviser for an operational error which amounted to less than $.01 per share. Excluding this reimbursement, the total return would have been (11.03)%.
GFees and expenses of any underlying mutual funds or exchange-traded funds (ETFs) are not included in the Fund's expense ratio. The Fund indirectly bears its proportionate share of these expenses. For additional expense information related to investments in Fidelity Central Funds, please refer to the "Investments in Fidelity Central Funds" note found in the Notes to Financial Statements section of the most recent Annual or Semi-Annual report.
HExpense ratios reflect operating expenses of the class. Expenses before reductions do not reflect amounts reimbursed, waived, or reduced through arrangements with the investment adviser, brokerage services, or other offset arrangements, if applicable, and do not represent the amount paid by the class during periods when reimbursements, waivers or reductions occur.
IAnnualized.
JAmount does not include the portfolio activity of any underlying mutual funds or exchange-traded funds (ETFs), derivatives or securities that mature within one year from acquisition.
Fidelity Advisor® Mega Cap Stock Fund Class I
|
|
|
|
|
Six months ended
December 31, 2025
(Unaudited)
|
|
Years ended June 30, 2025
|
|
2024
|
|
2023
|
|
2022
|
|
2021
|
Selected Per-Share Data
|
|
|
|
|
|
|
|
|
|
|
|
|
Net asset value, beginning of period
|
$
|
28.78
|
$
|
24.66
|
$
|
19.61
|
$
|
16.45
|
$
|
19.39
|
$
|
14.07
|
Income from Investment Operations
|
|
|
|
|
|
|
|
|
|
|
|
|
Net investment income (loss) A,B
|
|
.15
|
|
.28
|
|
.27
|
|
.22
|
|
.19
|
|
.20
|
Net realized and unrealized gain (loss)
|
|
3.57
|
|
4.53
|
|
5.22
|
|
3.68
|
|
(2.21)
|
|
6.42
|
Total from investment operations
|
|
3.72
|
|
4.81
|
|
5.49
|
|
3.90
|
|
(2.02)
|
|
6.62
|
Distributions from net investment income
|
|
(.27)
|
|
(.27)
|
|
(.23)
|
|
(.23)
|
|
(.34)
|
|
(.29)
|
Distributions from net realized gain
|
|
(.95)
|
|
(.42)
|
|
(.21)
|
|
(.51)
|
|
(.59)
|
|
(1.00)
|
Total distributions
|
|
(1.22)
|
|
(.69)
|
|
(.44)
|
|
(.74)
|
|
(.92) C
|
|
(1.30) C
|
Net asset value, end of period
|
$
|
31.28
|
$
|
28.78
|
$
|
24.66
|
$
|
19.61
|
$
|
16.45
|
$
|
19.39
|
Total Return D,E
|
|
|
|
20.00%
|
|
28.45%
|
|
24.43%
|
|
(11.00)% F
|
|
49.97%
|
Ratios to Average Net Assets B,G,H
|
|
|
|
|
|
|
|
|
|
|
|
|
Expenses before reductions
|
|
.59% I
|
|
.59%
|
|
.63%
|
|
.63%
|
|
.65%
|
|
.65%
|
Expenses net of fee waivers, if any
|
|
|
|
.59%
|
|
.62%
|
|
.62%
|
|
.64%
|
|
.65%
|
Expenses net of all reductions, if any
|
|
.59% I
|
|
.59%
|
|
.62%
|
|
.62%
|
|
.64%
|
|
.64%
|
Net investment income (loss)
|
|
.97% I
|
|
1.10%
|
|
1.27%
|
|
1.26%
|
|
1.03%
|
|
1.21%
|
Supplemental Data
|
|
|
|
|
|
|
|
|
|
|
|
|
Net assets, end of period (000 omitted)
|
$
|
819,190
|
$
|
531,235
|
$
|
382,995
|
$
|
132,416
|
$
|
52,884
|
$
|
39,876
|
Portfolio turnover rate J
|
|
|
|
15%
|
|
9%
|
|
18%
|
|
13%
|
|
43%
|
ACalculated based on average shares outstanding during the period.
BNet investment income (loss) is affected by the timing of the declaration of dividends by any underlying mutual funds or exchange-traded funds (ETFs). Net investment income (loss) of any mutual funds or ETFs is not included in the Fund's net investment income (loss) ratio.
CTotal distributions per share do not sum due to rounding.
DTotal returns for periods of less than one year are not annualized.
ETotal returns would have been lower if certain expenses had not been reduced during the applicable periods shown.
FAmount includes a reimbursement from the investment adviser for an operational error which amounted to less than $.01 per share. Excluding this reimbursement, the total return would have been (11.04)%.
GFees and expenses of any underlying mutual funds or exchange-traded funds (ETFs) are not included in the Fund's expense ratio. The Fund indirectly bears its proportionate share of these expenses. For additional expense information related to investments in Fidelity Central Funds, please refer to the "Investments in Fidelity Central Funds" note found in the Notes to Financial Statements section of the most recent Annual or Semi-Annual report.
HExpense ratios reflect operating expenses of the class. Expenses before reductions do not reflect amounts reimbursed, waived, or reduced through arrangements with the investment adviser, brokerage services, or other offset arrangements, if applicable, and do not represent the amount paid by the class during periods when reimbursements, waivers or reductions occur.
IAnnualized.
JAmount does not include the portfolio activity of any underlying mutual funds or exchange-traded funds (ETFs), derivatives or securities that mature within one year from acquisition.
Fidelity Advisor® Mega Cap Stock Fund Class Z
|
|
|
|
|
Six months ended
December 31, 2025
(Unaudited)
|
|
Years ended June 30, 2025
|
|
2024
|
|
2023
|
|
2022
|
|
2021
|
Selected Per-Share Data
|
|
|
|
|
|
|
|
|
|
|
|
|
Net asset value, beginning of period
|
$
|
28.56
|
$
|
24.48
|
$
|
19.46
|
$
|
16.32
|
$
|
19.25
|
$
|
13.97
|
Income from Investment Operations
|
|
|
|
|
|
|
|
|
|
|
|
|
Net investment income (loss) A,B
|
|
.16
|
|
.31
|
|
.30
|
|
.24
|
|
.22
|
|
.22
|
Net realized and unrealized gain (loss)
|
|
3.55
|
|
4.49
|
|
5.17
|
|
3.66
|
|
(2.20)
|
|
6.36
|
Total from investment operations
|
|
3.71
|
|
4.80
|
|
5.47
|
|
3.90
|
|
(1.98)
|
|
6.58
|
Distributions from net investment income
|
|
(.30)
|
|
(.30)
|
|
(.24)
|
|
(.25)
|
|
(.36)
|
|
(.30)
|
Distributions from net realized gain
|
|
(.95)
|
|
(.42)
|
|
(.21)
|
|
(.51)
|
|
(.59)
|
|
(1.00)
|
Total distributions
|
|
(1.25)
|
|
(.72)
|
|
(.45)
|
|
(.76)
|
|
(.95)
|
|
(1.30)
|
Net asset value, end of period
|
$
|
31.02
|
$
|
28.56
|
$
|
24.48
|
$
|
19.46
|
$
|
16.32
|
$
|
19.25
|
Total Return C,D
|
|
|
|
20.14%
|
|
28.59%
|
|
24.62%
|
|
(10.92)% E
|
|
50.14%
|
Ratios to Average Net Assets B,F,G
|
|
|
|
|
|
|
|
|
|
|
|
|
Expenses before reductions
|
|
.47% H
|
|
.47%
|
|
.52%
|
|
.52%
|
|
.51%
|
|
.52%
|
Expenses net of fee waivers, if any
|
|
|
|
.47%
|
|
.51%
|
|
.52%
|
|
.51%
|
|
.52%
|
Expenses net of all reductions, if any
|
|
.47% H
|
|
.47%
|
|
.51%
|
|
.52%
|
|
.51%
|
|
.52%
|
Net investment income (loss)
|
|
1.09% H
|
|
1.22%
|
|
1.38%
|
|
1.37%
|
|
1.16%
|
|
1.34%
|
Supplemental Data
|
|
|
|
|
|
|
|
|
|
|
|
|
Net assets, end of period (000 omitted)
|
$
|
1,128,407
|
$
|
818,829
|
$
|
422,435
|
$
|
192,632
|
$
|
222,146
|
$
|
313,854
|
Portfolio turnover rate I
|
|
|
|
15%
|
|
9%
|
|
18%
|
|
13%
|
|
43%
|
ACalculated based on average shares outstanding during the period.
BNet investment income (loss) is affected by the timing of the declaration of dividends by any underlying mutual funds or exchange-traded funds (ETFs). Net investment income (loss) of any mutual funds or ETFs is not included in the Fund's net investment income (loss) ratio.
CTotal returns for periods of less than one year are not annualized.
DTotal returns would have been lower if certain expenses had not been reduced during the applicable periods shown.
EAmount includes a reimbursement from the investment adviser for an operational error which amounted to less than $.01 per share. Excluding this reimbursement, the total return would have been (10.96)%.
FFees and expenses of any underlying mutual funds or exchange-traded funds (ETFs) are not included in the Fund's expense ratio. The Fund indirectly bears its proportionate share of these expenses. For additional expense information related to investments in Fidelity Central Funds, please refer to the "Investments in Fidelity Central Funds" note found in the Notes to Financial Statements section of the most recent Annual or Semi-Annual report.
GExpense ratios reflect operating expenses of the class. Expenses before reductions do not reflect amounts reimbursed, waived, or reduced through arrangements with the investment adviser, brokerage services, or other offset arrangements, if applicable, and do not represent the amount paid by the class during periods when reimbursements, waivers or reductions occur.
HAnnualized.
IAmount does not include the portfolio activity of any underlying mutual funds or exchange-traded funds (ETFs), derivatives or securities that mature within one year from acquisition.
Notes to Financial Statements
(Unaudited)For the period ended December 31, 2025
1. Organization.
Fidelity Mega Cap Stock Fund (the Fund) is a fund of Fidelity Hastings Street Trust (the Trust) and is authorized to issue an unlimited number of shares. The Trust is registered under the Investment Company Act of 1940, as amended (the 1940 Act), as an open-end management investment company organized as a Massachusetts business trust. The Fund offers Class A, Class M, Class C, Mega Cap Stock, Class I and Class Z shares, each of which has equal rights as to assets and voting privileges. Class A, Class M, Class C, Class I and Class Z are Fidelity Advisor classes. Each class has exclusive voting rights with respect to matters that affect that class. Class C shares will automatically convert to Class A shares after a holding period of eight years from the initial date of purchase, with certain exceptions.
2. Investments in Fidelity Central Funds.
Funds may invest in Fidelity Central Funds, which are open-end investment companies generally available only to other investment companies and accounts managed by the investment adviser and its affiliates. The Schedule of Investments lists any Fidelity Central Funds held as an investment as of period end, but does not include the underlying holdings of each Fidelity Central Fund. An investing fund indirectly bears its proportionate share of the expenses of the underlying Fidelity Central Funds.
Based on its investment objective, each Fidelity Central Fund may invest or participate in various investment vehicles or strategies that are similar to those of the investing fund. These strategies are consistent with the investment objectives of the investing fund and may involve certain economic risks which may cause a decline in value of each of the Fidelity Central Funds and thus a decline in the value of the investing fund.
Fidelity Central Fund
|
Investment Manager
|
Investment Objective
|
Investment Practices
|
Expense RatioA
|
Fidelity Money Market Central Funds
|
Fidelity Management & Research Company LLC (FMR)
|
Each fund seeks to obtain a high level of current income consistent with the preservation of capital and liquidity.
|
Short-term Investments
|
Less than .005%
|
A Expenses expressed as a percentage of average net assets and are as of each underlying Central Fund's most recent annual or semi-annual shareholder report.
A complete unaudited list of holdings for each Fidelity Central Fund is available upon request or at the Securities and Exchange Commission website at www.sec.gov. In addition, the financial statements of the Fidelity Central Funds which contain the significant accounting policies (including investment valuation policies) of those funds, and are not covered by the Report of Independent Registered Public Accounting Firm, are available on the Securities and Exchange Commission website or upon request.
3. Significant Accounting Policies.
The Fund is an investment company and applies the accounting and reporting guidance of the Financial Accounting Standards Board (FASB) Accounting Standards Codification Topic 946 Financial Services - Investment Companies. The financial statements have been prepared in conformity with accounting principles generally accepted in the United States of America (GAAP), which require management to make certain estimates and assumptions at the date of the financial statements. Actual results could differ from those estimates. The Fund operates as a single operating segment. The Fund's income, expenses, assets, and performance are regularly monitored and assessed as a whole by the investment adviser and other individuals responsible for oversight functions of the Trust, using the information presented in the financial statements and financial highlights. Subsequent events, if any, through the date that the financial statements were issued have been evaluated in the preparation of the financial statements. The Fund's Schedule of Investments lists any underlying mutual funds or exchange-traded funds but does not include the underlying holdings of these funds. The following summarizes the significant accounting policies of the Fund:
Investment Valuation. Investments are valued as of 4:00 p.m. Eastern time on the last calendar day of the period. The Board of Trustees (the Board) has designated the Fund's investment adviser as the valuation designee responsible for the fair valuation function and performing fair value determinations as needed. The investment adviser has established a Fair Value Committee (the Committee) to carry out the day-to-day fair valuation responsibilities and has adopted policies and procedures to govern the fair valuation process and the activities of the Committee. In accordance with these fair valuation policies and procedures, which have been approved by the Board, the Fund attempts to obtain prices from one or more third party pricing services or brokers to value its investments. When current market prices, quotations or currency exchange rates are not readily available or reliable, investments will be fair valued in good faith by the Committee, in accordance with the policies and procedures. Factors used in determining fair value vary by investment type and may include market or investment specific events, transaction data, estimated cash flows, and market observations of comparable investments. The frequency that the fair valuation procedures are used cannot be predicted and they may be utilized to a significant extent. The Committee manages the Fund's fair valuation practices and maintains the fair valuation policies and procedures. The Fund's investment adviser reports to the Board information regarding the fair valuation process and related material matters.
The Fund categorizes the inputs to valuation techniques used to value its investments into a disclosure hierarchy consisting of three levels as shown below:
Level 1 - unadjusted quoted prices in active markets for identical investments
Level 2 - other significant observable inputs (including quoted prices for similar investments, interest rates, prepayment speeds, etc.)
Level 3 - unobservable inputs (including the Fund's own assumptions based on the best information available)
Valuation techniques used to value the Fund's investments by major category are as follows:
Equity securities, including restricted securities, for which market quotations are readily available, are valued at the last reported sale price or official closing price as reported by a third party pricing service on the primary market or exchange on which they are traded and are categorized as Level 1 in the hierarchy. In the event there were no sales during the day or closing prices are not available, securities are valued at the last quoted bid price or may be valued using the last available price and are generally categorized as Level 2 in the hierarchy. For foreign equity securities, when market or security specific events arise, comparisons to the valuation of American Depositary Receipts (ADRs), futures contracts, Exchange-Traded Funds (ETFs) and certain indexes as well as quoted prices for similar securities may be used and would be categorized as Level 2 in the hierarchy. For equity securities, including restricted securities, where observable inputs are limited, assumptions about market activity and risk are used and these securities may be categorized as Level 3 in the hierarchy.
Debt securities, including restricted securities, are valued based on evaluated prices received from third party pricing services or from brokers who make markets in such securities. U.S. government and government agency obligations are valued by pricing services who utilize matrix pricing which considers yield or price of bonds of comparable quality, coupon, maturity and type or by broker-supplied prices. When independent prices are unavailable or unreliable, debt securities may be valued utilizing pricing methodologies which consider similar factors that would be used by third party pricing services. Debt securities are generally categorized as Level 2 in the hierarchy but may be Level 3 depending on the circumstances.
Exchange-traded options are valued using the last sale price or, in the absence of a sale, the last offering price and are categorized as Level 1 in the hierarchy. Investments in open-end mutual funds, including the Fidelity Central Funds, are valued at their closing net asset value (NAV) each business day and are categorized as Level 1 in the hierarchy.
Changes in valuation techniques may result in transfers in or out of an assigned level within the disclosure hierarchy. The aggregate value of investments by input level as of December 31, 2025 is included at the end of the Fund's Schedule of Investments.
Foreign Currency. Certain Funds may use foreign currency contracts to facilitate transactions in foreign-denominated securities. Gains and losses from these transactions may arise from changes in the value of the foreign currency or if the counterparties do not perform under the contracts' terms.
Foreign-denominated assets, including investment securities, and liabilities are translated into U.S. dollars at the exchange rates at period end. Purchases and sales of investment securities, income and dividends received, and expenses denominated in foreign currencies are translated into U.S. dollars at the exchange rate in effect on the transaction date.
The effects of exchange rate fluctuations on investments are included with the net realized and unrealized gain (loss) on investment securities. Other foreign currency transactions resulting in realized and unrealized gain (loss) are disclosed separately.
Investment Transactions and Income. For financial reporting purposes, the Fund's investment holdings and NAV include trades executed through the end of the last business day of the period. The NAV per share for processing shareholder transactions is calculated as of the close of business of the New York Stock Exchange (NYSE), normally 4:00 p.m. Eastern time and includes trades executed through the end of the prior business day. Gains and losses on securities sold are determined on the basis of identified cost and include proceeds received from litigation. Commissions paid to certain brokers with whom the investment adviser, or its affiliates, places trades on behalf of a fund include an amount in addition to trade execution, which may be rebated back to a fund. Any such rebates are included in net realized gain (loss) on investments in the Statement of Operations. Dividend income is recorded on the ex-dividend date, except for certain dividends from foreign securities where the ex-dividend date may have passed, which are recorded as soon as the Fund is informed of the ex-dividend date. Non-cash dividends included in dividend income, if any, are recorded at the fair market value of the securities received. Income and capital gain distributions from Fidelity Central Funds, if any, are recorded on the ex-dividend date. Certain distributions received by the Fund represent a return of capital or capital gain. The Fund determines the components of these distributions subsequent to the ex-dividend date, based upon receipt of tax filings or other correspondence relating to the underlying investment. These distributions are recorded as a reduction of cost of investments and/or as a realized gain. Interest income is accrued as earned and includes coupon interest and amortization of premium and accretion of discount on debt securities as applicable. Investment income is recorded net of foreign taxes withheld where recovery of such taxes is uncertain. Funds may file withholding tax reclaims in certain jurisdictions to recover a portion of amounts previously withheld. Any withholding tax reclaims income is included in the Statement of Operations in dividends. Any receivables for withholding tax reclaims are included in the Statement of Assets and Liabilities in dividends receivable.
Class Allocations and Expenses. Investment income, realized and unrealized capital gains and losses, common expenses of a fund, and certain fund-level expense reductions, if any, are allocated daily on a pro-rata basis to each class based on the relative net assets of each class to the total net assets of a fund. Each class differs with respect to transfer agent and distribution and service plan fees incurred, as applicable. Certain expense reductions may also differ by class, if applicable. For the reporting period, the allocated portion of income and expenses to each class as a percent of its average net assets may vary due to the timing of recording these transactions in relation to fluctuating net assets of the classes. Expenses directly attributable to a fund are charged to that fund. Expenses attributable to more than one fund are allocated among the respective funds on the basis of relative net assets or other appropriate methods. Expenses included in the accompanying financial statements reflect the expenses of that fund and do not include any expenses associated with any underlying mutual funds or exchange-traded funds. Although not included in a fund's expenses, a fund indirectly bears its proportionate share of these expenses through the net asset value of each underlying mutual fund or exchange-traded fund. Expense estimates are accrued in the period to which they relate and adjustments are made when actual amounts are known.
Income Tax Information and Distributions to Shareholders. Each year, the Fund intends to qualify as a regulated investment company under Subchapter M of the Internal Revenue Code, including distributing substantially all of its taxable income and realized gains. As a result, no provision for U.S. Federal income taxes is required. The Fund files a U.S. federal tax return, in addition to state and local tax returns as required. The Fund's federal income tax returns are subject to examination by the Internal Revenue Service (IRS) for a period of three fiscal years after they are filed. State and local tax returns may be subject to examination for an additional fiscal year depending on the jurisdiction. Foreign taxes are provided for based on the Fund's understanding of the tax rules and rates that exist in the foreign markets in which it invests.
Distributions are declared and recorded on the ex-dividend date. Income and capital gain distributions are declared separately for each class. Income and capital gain distributions are determined in accordance with income tax regulations, which may differ from GAAP.
Capital accounts within the financial statements are adjusted for permanent book-tax differences. These adjustments have no impact on net assets or the results of operations. Capital accounts are not adjusted for temporary book-tax differences which will reverse in a subsequent period.
Book-tax differences are primarily due to foreign currency transactions, certain corporate actions, losses deferred due to wash sales and options transactions.
As of period end, the cost and unrealized appreciation (depreciation) in securities, and derivatives if applicable, for federal income tax purposes were as follows:
Gross unrealized appreciation
|
$2,258,965,260
|
Gross unrealized depreciation
|
(97,546,585)
|
Net unrealized appreciation (depreciation)
|
$2,161,418,675
|
Tax cost
|
$3,685,932,854
|
Restricted Securities (including Private Placements). Funds may invest in securities that are subject to legal or contractual restrictions on resale. These securities generally may be resold in transactions exempt from registration or to the public if the securities are registered. Disposal of these securities may involve time-consuming negotiations and expense, and prompt sale at an acceptable price may be difficult. Information regarding restricted securities held at period end is included at the end of the Schedule of Investments, if applicable.
Commitments. A commitment is an agreement to acquire an investment at a future date (subject to conditions) in connection with a potential public or non-public offering. Commitments outstanding at period end are presented in the table below. Unrealized appreciation (depreciation) on any commitments outstanding at period end is separately presented in the Statement of Assets and Liabilities as Unrealized appreciation (depreciation) on unfunded commitments, and any change in unrealized appreciation (depreciation) on unfunded commitments during the period is separately presented in the Statement of Operations, as applicable based on contractual conditions of each commitment.
|
Investment to be Acquired
|
Commitment Amount ($)
|
Unrealized Appreciation (Depreciation)($)
|
Fidelity Mega Cap Stock Fund
|
CompoSecure, Inc. Class A
|
12,718,103
|
536,223
|
4. Derivative Instruments.
Risk Exposures and the Use of Derivative Instruments. The Fund's investment objectives allow for various types of derivative instruments, including options. Derivatives are investments whose value is primarily derived from underlying assets, indices or reference rates and may be transacted on an exchange or over-the-counter (OTC). Derivatives may involve a future commitment to buy or sell a specified asset based on specified terms, to exchange future cash flows at periodic intervals based on a notional principal amount, or for one party to make one or more payments upon the occurrence of specified events in exchange for periodic payments from the other party.
Derivatives were used to increase returns and to manage exposure to certain risks as defined below. The success of any strategy involving derivatives depends on analysis of numerous economic factors, and if the strategies for investment do not work as intended, the objectives may not be achieved.
Derivatives were used to increase or decrease exposure to the following risk(s):
|
|
Equity Risk
|
Equity risk relates to the fluctuations in the value of financial instruments as a result of changes in market prices (other than those arising from interest rate risk or foreign exchange risk), whether caused by factors specific to an individual investment, its issuer, or all factors affecting all instruments traded in a market or market segment.
|
Funds are also exposed to additional risks from investing in derivatives, such as liquidity risk and counterparty credit risk. Liquidity risk is the risk that a fund will be unable to close out the derivative in the open market in a timely manner. Counterparty credit risk is the risk that the counterparty will not be able to fulfill its obligation to a fund. Counterparty credit risk related to exchange-traded contracts may be mitigated by the protection provided by the exchange on which they trade.
Investing in derivatives may involve greater risks than investing in the underlying assets directly and, to varying degrees, may involve risk of loss in excess of any initial investment and collateral received and amounts recognized in the Statement of Assets and Liabilities. In addition, there may be the risk that the change in value of the derivative contract does not correspond to the change in value of the underlying instrument.
Options. Options give the purchaser the right, but not the obligation, to buy (call) or sell (put) an underlying security or financial instrument at an agreed exercise or strike price between or on certain dates. Options obligate the seller (writer) to buy (put) or sell (call) an underlying instrument at the exercise or strike price or cash settle an underlying derivative instrument if the holder exercises the option on or before the expiration date. Exchange-traded and/or OTC options were used to manage exposure to the market.
Upon entering into an options contract, a fund will pay or receive a premium. Premiums paid on purchased options are reflected as cost of investments and premiums received on written options are reflected as a liability on the Statement of Assets and Liabilities. Certain options may be purchased or written with premiums to be paid or received on a future date. Options are valued daily and any unrealized appreciation (depreciation) is reflected in total accumulated earnings (loss) in the Statement of Assets and Liabilities. When an option is exercised, the cost or proceeds of the underlying instrument purchased or sold is adjusted by the amount of the premium. When an option is closed, a gain or loss is realized depending on whether the proceeds or amount paid for the closing sale transaction is greater or less than the premium received or paid. When an option expires, gains and losses are realized to the extent of premiums received and paid, respectively. The net realized and unrealized gains (losses) on purchased options are included in the Statement of Operations in net realized gain (loss) and change in net unrealized appreciation (depreciation) on investment securities. The net realized gain (loss) and change in net unrealized appreciation (depreciation) on written options are presented in the Statement of Operations.
Any open options at period end are presented in the Schedule of Investments under the captions "Purchased Options," "Purchased Swaptions," "Written Options" and "Written Swaptions," as applicable.
Writing puts and buying calls tend to increase exposure to the underlying instrument while buying puts and writing calls tend to decrease exposure to the underlying instrument. For purchased options, risk of loss is limited to the premium paid, and for written options, risk of loss is the change in value in excess of the premium received.
5. Purchases and Sales of Investments.
Purchases and sales of securities, other than short-term securities, U.S. government securities and in-kind transactions, as applicable, are noted in the table below.
|
Purchases ($)
|
Sales ($)
|
Fidelity Mega Cap Stock Fund
|
1,075,077,717
|
223,725,058
|
6. Fees and Other Transactions with Affiliates.
Management Fee. Fidelity Management & Research Company LLC (the investment adviser) and its affiliates provide the Fund with investment management related services for which the Fund pays a monthly management fee.
The Fund's management contract incorporates a management fee rate that may vary by class. The investment adviser or an affiliate pays certain expenses of managing and operating the Fund out of each class's management fee. Each class of the Fund pays a management fee to the investment adviser. The management fee is calculated and paid to the investment adviser every month. When determining a class's management fee, a mandate rate is calculated based on the monthly average net assets of a group of funds advised by FMR within a designated asset class. A discount rate is subtracted from the mandate rate once the Fund's monthly average net assets reach a certain level. The mandate rate and discount rate may vary by class. The annual management fee rate for a class of shares of the Fund is the lesser of (1) the class's mandate rate reduced by the class's discount rate (if applicable) or (2) the amount set forth in the following table.
|
Maximum Management Fee Rate %
|
Class A
|
.60
|
Class M
|
.60
|
Class C
|
.62
|
Mega Cap Stock
|
.57
|
Class I
|
.58
|
Class Z
|
.46
|
One-twelfth of the management fee rate for a class is applied to the average net assets of the class for the month, giving a dollar amount which is the management fee for the class for that month. A different management fee rate may be applicable to each class of the Fund. The difference between classes is the result of separate arrangements for class-level services and/or waivers of certain expenses. It is not the result of any difference in advisory or custodial fees or other expenses related to the management of the Fund's assets, which do not vary by class. For the reporting period, the total annualized management fee rates were as follows:
|
Total Management Fee Rate %
|
Class A
|
.60
|
Class M
|
.60
|
Class C
|
.62
|
Mega Cap Stock
|
.57
|
Class I
|
.58
|
Class Z
|
.46
|
Distribution and Service Plan Fees. In accordance with Rule 12b-1 of the 1940 Act, the Fund has adopted separate Distribution and Service Plans for each class of shares. Certain classes pay Fidelity Distributors Company LLC (FDC), an affiliate of the investment adviser, separate Distribution and Service Fees, each of which is based on an annual percentage of each class' average net assets. In addition, FDC may pay financial intermediaries for selling shares of the Fund and providing shareholder support services. For the period, the Distribution and Service Fee rates, total fees and amounts retained by FDC were as follows:
|
Distribution Fee
|
Service Fee
|
Total Fees ($)
|
Retained by FDC ($)
|
Class A
|
- %
|
.25%
|
382,121
|
19,378
|
Class M
|
.25%
|
.25%
|
110,584
|
-
|
Class C
|
.75%
|
.25%
|
270,557
|
81,925
|
|
|
|
763,262
|
101,303
|
Sales Load. FDC may receive a front-end sales charge of up to 5.75% for selling Class A shares and 3.50% for selling Class M shares, some of which is paid to financial intermediaries for selling shares of the Fund. Depending on the holding period, FDC may receive contingent deferred sales charges levied on Class A, Class M and Class C redemptions. The deferred sales charges are 1.00% for Class C shares, 1.00% for certain purchases of Class A shares and .25% for certain purchases of Class M shares.
For the period, sales charge amounts retained by FDC were as follows:
|
Retained by FDC ($)
|
Class A
|
137,829
|
Class M
|
2,240
|
Class CA
|
150
|
|
140,219
|
A When Class C shares are initially sold, FDC pays commissions from its own resources to financial intermediaries through which the sales are made.
Brokerage Commissions. A portion of portfolio transactions were placed with brokerage firms which are affiliates of the investment adviser. Brokerage commissions are included in net realized gain (loss) and change in net unrealized appreciation (depreciation) in the Statement of Operations. The commissions paid to these affiliated firms were as follows:
|
Amount ($)
|
Fidelity Mega Cap Stock Fund
|
6,423
|
Interfund Trades. Funds may purchase from or sell securities to other Fidelity Funds under procedures adopted by the Board of Trustees. The procedures have been designed to ensure these interfund trades are executed in accordance with Rule 17a-7 of the 1940 Act. Any interfund trades are included within the respective purchases and sales amounts shown in the Purchases and Sales of Investments note. Interfund trades during the period are noted in the table below.
|
Purchases ($)
|
Sales ($)
|
Realized Gain (Loss) ($)
|
Fidelity Mega Cap Stock Fund
|
70,076,155
|
22,532,960
|
6,959,674
|
7. Committed Line of Credit.
Certain Funds participate with other funds managed by the investment adviser or an affiliate in a $4.25 billion credit facility (the "line of credit") to be utilized for temporary or emergency purposes to fund shareholder redemptions or for other short-term liquidity purposes.
Commitment fees are charged based on the unused amount of the line of credit at an annual rate of .10%, and then allocated to each participating fund based on its pro-rata portion of the line of credit. The commitment fees are reflected in Miscellaneous expenses on the Statement of Operations, and are listed below.
Interest is charged to a participating fund based on its borrowings at an annual rate of .75% plus the highest of (i) daily SOFR plus a .10% spread adjustment, (ii) Federal Funds Effective Rate, or (iii) Overnight Bank Funding Rate. During the period, there were no borrowings on this line of credit.
The line of credit agreement will expire in March 2026 unless extended or renewed.
|
Amount ($)
|
Fidelity Mega Cap Stock Fund
|
2,385
|
8. Security Lending.
Funds lend portfolio securities from time to time in order to earn additional income. Lending agents are used, including National Financial Services (NFS), an affiliate of the investment adviser. Pursuant to a securities lending agreement, NFS will receive a fee, which is capped at 9.9% of a fund's daily lending revenue, for its services as lending agent. A fund may lend securities to certain qualified borrowers, including NFS. On the settlement date of the loan, the borrowers provide collateral (in the form of U.S. Treasury obligations, letters of credit and/or cash) against the loaned securities and maintains collateral in an amount not less than 100% of the fair value of the loaned securities during the period of the loan. The fair value of the loaned securities is determined at the close of business of a fund and any additional required collateral is delivered to a fund on the next business day. A fund or borrower may terminate the loan at any time, and if the borrower defaults on its obligation to return the securities loaned because of insolvency or other reasons, a fund may apply collateral received from the borrower against the obligation. A fund may experience delays and costs in recovering the securities loaned or gaining access to non-cash collateral. Any cash collateral received is invested in the Fidelity Securities Lending Cash Central Fund. Any loaned securities are identified as such in the Schedule of Investments, and the value of loaned securities and cash collateral at period end, as applicable, are presented in the Statement of Assets and Liabilities. Security lending income represents the income earned on investing cash collateral less rebates paid to borrowers, plus any premium income received, or for non-cash collateral, fees received from borrowers as compensation for the securities loaned. Securities lending income is reduced by any lending agent fees associated with the loan. Any security lending income earned on investing cash collateral is presented in the Statement of Operations as a component of income from Fidelity Central Funds. Any security lending income earned on non-cash collateral is presented in the Statement of Operations as a component of dividends. Affiliated security lending activity, if any, was as follows:
|
Total Security Lending Fees Paid to NFS ($)
|
Security Lending Income From Securities Loaned to NFS ($)
|
Value of Securities Loaned to NFS at Period End ($)
|
Fidelity Mega Cap Stock Fund
|
10,888
|
-
|
-
|
9. Expense Reductions.
Through arrangements with the Fund's custodian, credits realized as a result of certain uninvested cash balances were used to reduce the Fund's expenses. During the period, custodian credits reduced the Fund's expenses by $1,508.
10. Distributions to Shareholders.
Distributions to shareholders of each class were as follows:
|
Six months ended
December 31, 2025
|
Year ended
June 30, 2025
|
Fidelity Mega Cap Stock Fund
|
|
|
Distributions to shareholders
|
|
|
Class A
|
$11,656,881
|
$5,497,190
|
Class M
|
1,553,367
|
831,613
|
Class C
|
1,755,697
|
716,276
|
Mega Cap Stock
|
117,539,238
|
56,920,560
|
Class I
|
27,071,109
|
10,394,212
|
Class Z
|
39,786,585
|
14,817,982
|
Total
|
$199,362,877
|
$89,177,833
|
11. Share Transactions.
Share transactions for each class were as follows and may contain in-kind transactions, automatic conversions between classes or exchanges between affiliated funds:
|
Shares
|
Shares
|
Dollars
|
Dollars
|
|
Six months ended
December 31, 2025
|
Year ended
June 30, 2025
|
Six months ended
December 31, 2025
|
Year ended
June 30, 2025
|
Fidelity Mega Cap Stock Fund
|
|
|
|
|
Class A
|
|
|
|
|
Shares sold
|
1,602,194
|
2,257,768
|
$47,328,905
|
$57,316,050
|
Reinvestment of distributions
|
396,803
|
226,275
|
11,561,811
|
5,446,810
|
Shares redeemed
|
(597,632)
|
(1,452,835)
|
(17,633,190)
|
(36,329,356)
|
Net increase (decrease)
|
1,401,365
|
1,031,208
|
$41,257,526
|
$26,433,504
|
Class M
|
|
|
|
|
Shares sold
|
151,260
|
274,899
|
$4,469,967
|
$7,029,016
|
Reinvestment of distributions
|
53,288
|
34,505
|
1,552,225
|
830,344
|
Shares redeemed
|
(161,712)
|
(322,309)
|
(4,754,250)
|
(8,260,393)
|
Net increase (decrease)
|
42,836
|
(12,905)
|
$1,267,942
|
$(401,033)
|
Class C
|
|
|
|
|
Shares sold
|
370,690
|
613,877
|
$10,623,727
|
$15,117,464
|
Reinvestment of distributions
|
61,969
|
30,558
|
1,752,876
|
714,530
|
Shares redeemed
|
(180,585)
|
(375,984)
|
(5,187,759)
|
(9,195,448)
|
Net increase (decrease)
|
252,074
|
268,451
|
$7,188,844
|
$6,636,546
|
Mega Cap Stock
|
|
|
|
|
Shares sold
|
26,242,083
|
28,871,381
|
$793,090,809
|
$746,504,089
|
Reinvestment of distributions
|
3,599,225
|
2,114,955
|
107,066,791
|
51,888,381
|
Shares redeemed
|
(10,050,748)
|
(22,938,304)
|
(303,300,137)
|
(585,929,361)
|
Net increase (decrease)
|
19,790,560
|
8,048,032
|
$596,857,463
|
$212,463,109
|
Class I
|
|
|
|
|
Shares sold
|
9,676,265
|
10,205,393
|
$292,217,092
|
$264,428,691
|
Reinvestment of distributions
|
897,849
|
414,797
|
26,773,221
|
10,192,705
|
Shares redeemed
|
(2,841,863)
|
(7,691,002)
|
(85,976,816)
|
(195,541,442)
|
Net increase (decrease)
|
7,732,251
|
2,929,188
|
$233,013,497
|
$79,079,954
|
Class Z
|
|
|
|
|
Shares sold
|
8,969,641
|
21,046,412
|
$268,665,039
|
$516,960,294
|
Reinvestment of distributions
|
541,957
|
278,046
|
16,071,557
|
6,781,731
|
Shares redeemed
|
(1,802,770)
|
(9,908,650)
|
(54,046,407)
|
(243,158,853)
|
Net increase (decrease)
|
7,708,828
|
11,415,808
|
$230,690,189
|
$280,583,172
|
12. Other.
A fund's organizational documents provide former and current trustees and officers with a limited indemnification against liabilities arising in connection with the performance of their duties to the fund. In the normal course of business, a fund may also enter into contracts that provide general indemnifications. A fund's maximum exposure under these arrangements is unknown as this would be dependent on future claims that may be made against a fund. The risk of material loss from such claims is considered remote.
13. Risk and Uncertainties.
Many factors affect a fund's performance. Developments that disrupt global economies and financial markets, such as public health emergencies, military conflicts, terrorism, government restrictions, political changes, and environmental disasters, may significantly affect a fund's investment performance. The effects of these developments to a fund will be impacted by the types of securities in which a fund invests, the financial condition, industry, economic sector, and geographic location of an issuer, and a fund's level of investment in the securities of that issuer. Significant concentrations in security types, issuers, industries, sectors, and geographic locations may magnify the factors that affect a fund's performance.
Item 8: Changes in and Disagreements with Accountants for Open-End Management Investment Companies
(Unaudited)
Note: This is not applicable for any fund included in this document.
Item 9: Proxy Disclosures for Open-End Management Investment Companies
(Unaudited)
Note: This is not applicable for any fund included in this document.
Item 10: Remuneration Paid to Directors, Officers, and others of Open-End Management Investment Companies
(Unaudited)
Note: This information is disclosed as part of the financial statements for each Fund as part of Item 7: Financial Statements and Financial Highlights for Open-End Management Investment Companies.
Item 11: Statement Regarding Basis for Approval of Investment Advisory Contract
(Unaudited)
Note: This is not applicable for any fund included in this document.
1.714809.129
GII-SANN-0226
Fidelity® Growth Discovery Fund
Semi-Annual Report
December 31, 2025
Contents
To view a fund's proxy voting guidelines and proxy voting record for the 12-month period ended June 30, visit http://www.fidelity.com/proxyvotingresults or visit the Securities and Exchange Commission's (SEC) web site at http://www.sec.gov.
You may also call 1-800-544-8544 if you're an individual investing directly with Fidelity, call 1-800-835-5092 if you're a plan sponsor or participant with Fidelity as your recordkeeper or call 1-877-208-0098 on institutional accounts or if you're an advisor or invest through one to request a free copy of the proxy voting guidelines.
Standard & Poor's, S&P and S&P 500 are registered service marks of The McGraw-Hill Companies, Inc. and have been licensed for use by Fidelity Distributors Corporation.
Other third-party marks appearing herein are the property of their respective owners.
All other marks appearing herein are registered or unregistered trademarks or service marks of FMR LLC or an affiliated company. © 2026 FMR LLC. All rights reserved.
This report and the financial statements contained herein are submitted for the general information of the shareholders of the Fund. This report is not authorized for distribution to prospective investors in the Fund unless preceded or accompanied by an effective prospectus.
A fund files its complete schedule of portfolio holdings with the SEC for the first and third quarters of each fiscal year on Form N-PORT. Forms N-PORT are available on the SEC's web site at http://www.sec.gov. A fund's Forms N-PORT may be reviewed and copied at the SEC's Public Reference Room in Washington, DC. Information regarding the operation of the SEC's Public Reference Room may be obtained by calling 1-800-SEC-0330.
For a complete list of a fund's portfolio holdings, view the most recent holdings listing, semiannual report, or annual report on Fidelity's web site at http://www.fidelity.com, http://www.institutional.fidelity.com, or http://www.401k.com, as applicable.
NOT FDIC INSURED •MAY LOSE VALUE •NO BANK GUARANTEE
Neither the Fund nor Fidelity Distributors Corporation is a bank.
Item 7: Financial Statements and Financial Highlights for Open-End Management Investment Companies (Semi-Annual Report)
Fidelity® Growth Discovery Fund
Schedule of Investments December 31, 2025 (Unaudited)
Showing Percentage of Net Assets
Common Stocks - 99.0%
|
|
|
|
Shares
|
Value ($)
|
AUSTRALIA - 0.1%
|
|
|
|
Information Technology - 0.1%
|
|
|
|
Software - 0.1%
|
|
|
|
Canva Australia Holdings Pty Ltd Class A (b)(c)(d)
|
|
2,900
|
4,773,806
|
BELGIUM - 0.9%
|
|
|
|
Health Care - 0.9%
|
|
|
|
Pharmaceuticals - 0.9%
|
|
|
|
UCB SA
|
|
206,300
|
57,847,081
|
BRAZIL - 0.4%
|
|
|
|
Consumer Discretionary - 0.1%
|
|
|
|
Broadline Retail - 0.1%
|
|
|
|
MercadoLibre Inc (d)
|
|
2,141
|
4,312,531
|
Financials - 0.1%
|
|
|
|
Banks - 0.1%
|
|
|
|
NU Holdings Ltd/Cayman Islands Class A (d)
|
|
327,900
|
5,489,046
|
Materials - 0.2%
|
|
|
|
Metals & Mining - 0.2%
|
|
|
|
Vale SA ADR
|
|
1,086,000
|
14,150,580
|
TOTAL BRAZIL
|
|
|
23,952,157
|
CANADA - 1.7%
|
|
|
|
Information Technology - 0.7%
|
|
|
|
IT Services - 0.7%
|
|
|
|
Shopify Inc Class A (United States) (d)
|
|
279,800
|
45,039,406
|
Materials - 1.0%
|
|
|
|
Metals & Mining - 1.0%
|
|
|
|
Agnico Eagle Mines Ltd/CA (United States) (e)
|
|
209,500
|
35,516,535
|
Franco-Nevada Corp
|
|
150,400
|
31,175,771
|
TOTAL MATERIALS
|
|
|
66,692,306
|
TOTAL CANADA
|
|
|
111,731,712
|
CHINA - 1.0%
|
|
|
|
Communication Services - 0.8%
|
|
|
|
Interactive Media & Services - 0.8%
|
|
|
|
Tencent Holdings Ltd
|
|
652,735
|
50,093,194
|
Consumer Discretionary - 0.2%
|
|
|
|
Broadline Retail - 0.2%
|
|
|
|
Alibaba Group Holding Ltd ADR
|
|
76,700
|
11,242,686
|
TOTAL CHINA
|
|
|
61,335,880
|
GERMANY - 0.4%
|
|
|
|
Consumer Discretionary - 0.4%
|
|
|
|
Specialty Retail - 0.4%
|
|
|
|
Auto1 Group SE (d)
|
|
866,200
|
27,790,260
|
GRAND CAYMAN (UK OVERSEAS TER) - 0.0%
|
|
|
|
Financials - 0.0%
|
|
|
|
Capital Markets - 0.0%
|
|
|
|
Bullish
|
|
11,200
|
424,144
|
ISRAEL - 0.0%
|
|
|
|
Health Care - 0.0%
|
|
|
|
Biotechnology - 0.0%
|
|
|
|
Gamida Cell Ltd rights (b)(d)(e)
|
|
993,684
|
10
|
KOREA (SOUTH) - 1.0%
|
|
|
|
Information Technology - 1.0%
|
|
|
|
Semiconductors & Semiconductor Equipment - 1.0%
|
|
|
|
SK Hynix Inc
|
|
135,490
|
61,331,513
|
NETHERLANDS - 0.4%
|
|
|
|
Health Care - 0.4%
|
|
|
|
Biotechnology - 0.4%
|
|
|
|
Argenx SE ADR (d)
|
|
33,202
|
27,921,222
|
TAIWAN - 2.9%
|
|
|
|
Information Technology - 2.9%
|
|
|
|
Electronic Equipment, Instruments & Components - 0.0%
|
|
|
|
Chroma ATE Inc
|
|
174,000
|
4,301,161
|
Semiconductors & Semiconductor Equipment - 2.9%
|
|
|
|
Taiwan Semiconductor Manufacturing Co Ltd ADR
|
|
605,801
|
184,096,866
|
TOTAL TAIWAN
|
|
|
188,398,027
|
THAILAND - 0.0%
|
|
|
|
Information Technology - 0.0%
|
|
|
|
Electronic Equipment, Instruments & Components - 0.0%
|
|
|
|
Fabrinet (d)
|
|
6,400
|
2,913,792
|
UNITED KINGDOM - 0.1%
|
|
|
|
Consumer Discretionary - 0.1%
|
|
|
|
Hotels, Restaurants & Leisure - 0.1%
|
|
|
|
Flutter Entertainment PLC (d)
|
|
33,900
|
7,289,856
|
UNITED STATES - 90.1%
|
|
|
|
Communication Services - 12.7%
|
|
|
|
Entertainment - 2.0%
|
|
|
|
Live Nation Entertainment Inc (d)(e)
|
|
118,734
|
16,919,595
|
Netflix Inc (d)
|
|
1,128,297
|
105,789,127
|
ROBLOX Corp Class A (d)
|
|
140,585
|
11,391,603
|
Spotify Technology SA (d)
|
|
900
|
522,638
|
|
|
|
|
134,622,963
|
Interactive Media & Services - 10.7%
|
|
|
|
Alphabet Inc Class A
|
|
1,336,268
|
418,251,884
|
Epic Games Inc (b)(c)(d)
|
|
2,244
|
1,458,802
|
Meta Platforms Inc Class A
|
|
399,536
|
263,729,718
|
|
|
|
|
683,440,404
|
TOTAL COMMUNICATION SERVICES
|
|
|
818,063,367
|
Consumer Discretionary - 10.5%
|
|
|
|
Automobiles - 2.4%
|
|
|
|
Tesla Inc (d)
|
|
344,812
|
155,068,853
|
Broadline Retail - 5.2%
|
|
|
|
Amazon.com Inc (d)
|
|
1,439,812
|
332,337,406
|
Diversified Consumer Services - 0.1%
|
|
|
|
Duolingo Inc Class A (d)(e)
|
|
39,111
|
6,863,981
|
Hotels, Restaurants & Leisure - 1.2%
|
|
|
|
Airbnb Inc Class A (d)
|
|
32,377
|
4,394,206
|
Hilton Worldwide Holdings Inc
|
|
115,021
|
33,039,782
|
Viking Holdings Ltd (d)
|
|
556,735
|
39,756,447
|
|
|
|
|
77,190,435
|
Household Durables - 0.8%
|
|
|
|
Blu Homes Inc (b)(c)(d)
|
|
3,320,224
|
1,029
|
DR Horton Inc
|
|
156,704
|
22,570,077
|
Lennar Corp Class A
|
|
25,500
|
2,621,400
|
SharkNinja Inc (d)
|
|
213,900
|
23,935,410
|
|
|
|
|
49,127,916
|
Specialty Retail - 0.8%
|
|
|
|
AutoZone Inc (d)
|
|
3,400
|
11,531,100
|
Lowe's Cos Inc
|
|
20,007
|
4,824,888
|
Ross Stores Inc
|
|
45,200
|
8,142,328
|
Williams-Sonoma Inc
|
|
153,817
|
27,470,178
|
|
|
|
|
51,968,494
|
TOTAL CONSUMER DISCRETIONARY
|
|
|
672,557,085
|
Consumer Staples - 1.5%
|
|
|
|
Consumer Staples Distribution & Retail - 0.7%
|
|
|
|
Costco Wholesale Corp
|
|
51,100
|
44,065,574
|
Personal Care Products - 0.3%
|
|
|
|
Estee Lauder Cos Inc/The Class A
|
|
231,700
|
24,263,624
|
Tobacco - 0.5%
|
|
|
|
Philip Morris International Inc
|
|
182,700
|
29,305,080
|
TOTAL CONSUMER STAPLES
|
|
|
97,634,278
|
Energy - 0.5%
|
|
|
|
Oil, Gas & Consumable Fuels - 0.5%
|
|
|
|
APA Corp
|
|
467,600
|
11,437,496
|
Cheniere Energy Inc
|
|
71,379
|
13,875,364
|
EQT Corp
|
|
180,200
|
9,658,720
|
TOTAL ENERGY
|
|
|
34,971,580
|
Financials - 8.1%
|
|
|
|
Banks - 0.9%
|
|
|
|
Bank of America Corp
|
|
1,002,900
|
55,159,500
|
US Bancorp
|
|
93,900
|
5,010,504
|
|
|
|
|
60,170,004
|
Capital Markets - 2.4%
|
|
|
|
Cboe Global Markets Inc
|
|
118,100
|
29,643,100
|
Charles Schwab Corp/The
|
|
325,900
|
32,560,669
|
Coinbase Global Inc Class A (d)
|
|
53,800
|
12,166,332
|
Gemini Space Station Inc Class A (e)
|
|
5,300
|
52,576
|
Morgan Stanley
|
|
431,710
|
76,641,476
|
Wealthfront Corp (d)
|
|
46,000
|
625,140
|
|
|
|
|
151,689,293
|
Consumer Finance - 0.6%
|
|
|
|
Capital One Financial Corp
|
|
152,136
|
36,871,681
|
Financial Services - 4.2%
|
|
|
|
Apollo Global Management Inc
|
|
294,200
|
42,588,392
|
Mastercard Inc Class A
|
|
400,438
|
228,602,046
|
|
|
|
|
271,190,438
|
TOTAL FINANCIALS
|
|
|
519,921,416
|
Health Care - 6.8%
|
|
|
|
Biotechnology - 2.0%
|
|
|
|
Adamas Pharmaceuticals Inc rights (b)(d)
|
|
678,800
|
6,788
|
Adamas Pharmaceuticals Inc rights (b)(d)
|
|
678,800
|
7
|
Alnylam Pharmaceuticals Inc (d)
|
|
163,449
|
64,995,495
|
Blueprint Medicines Corp rights (b)(d)
|
|
20,114
|
0
|
Cogent Biosciences Inc (d)
|
|
162,200
|
5,761,344
|
Cytokinetics Inc (d)
|
|
50,201
|
3,189,772
|
Gilead Sciences Inc
|
|
81,102
|
9,954,459
|
Insmed Inc (d)
|
|
219,676
|
38,232,411
|
Legend Biotech Corp ADR (d)
|
|
240,613
|
5,230,927
|
Moderna Inc (d)
|
|
136,800
|
4,034,232
|
|
|
|
|
131,405,435
|
Health Care Equipment & Supplies - 1.7%
|
|
|
|
Edwards Lifesciences Corp (d)
|
|
450,400
|
38,396,600
|
Insulet Corp (d)
|
|
105,400
|
29,958,896
|
Medline Inc Class A
|
|
366,800
|
15,405,600
|
Penumbra Inc (d)
|
|
71,392
|
22,196,487
|
|
|
|
|
105,957,583
|
Health Care Providers & Services - 0.3%
|
|
|
|
CVS Health Corp
|
|
252,700
|
20,054,272
|
Health Care Technology - 0.2%
|
|
|
|
Veeva Systems Inc Class A (d)
|
|
68,800
|
15,358,223
|
Pharmaceuticals - 2.6%
|
|
|
|
Crinetics Pharmaceuticals Inc (d)
|
|
11,300
|
526,015
|
Eli Lilly & Co
|
|
151,056
|
162,336,862
|
|
|
|
|
162,862,877
|
TOTAL HEALTH CARE
|
|
|
435,638,390
|
Industrials - 7.3%
|
|
|
|
Aerospace & Defense - 1.2%
|
|
|
|
Anduril Industries Inc Class B (b)(c)
|
|
800
|
36,528
|
Beta Technologies Inc Class A (d)
|
|
34,600
|
976,066
|
Boeing Co (d)
|
|
196,400
|
42,642,368
|
GE Aerospace
|
|
117,877
|
36,309,652
|
|
|
|
|
79,964,614
|
Air Freight & Logistics - 0.1%
|
|
|
|
CH Robinson Worldwide Inc
|
|
26,301
|
4,228,149
|
Building Products - 0.8%
|
|
|
|
Trane Technologies PLC
|
|
127,910
|
49,782,572
|
Construction & Engineering - 0.5%
|
|
|
|
Dycom Industries Inc (d)
|
|
58,100
|
19,631,990
|
EMCOR Group Inc
|
|
20,900
|
12,786,411
|
|
|
|
|
32,418,401
|
Electrical Equipment - 1.6%
|
|
|
|
GE Vernova Inc
|
|
107,007
|
69,936,565
|
Nextpower Inc Class A (d)
|
|
396,500
|
34,539,115
|
|
|
|
|
104,475,680
|
Machinery - 2.0%
|
|
|
|
Cummins Inc
|
|
77,100
|
39,355,695
|
Deere & Co
|
|
39,779
|
18,519,909
|
Parker-Hannifin Corp
|
|
34,800
|
30,587,808
|
Westinghouse Air Brake Technologies Corp
|
|
187,961
|
40,120,275
|
|
|
|
|
128,583,687
|
Passenger Airlines - 0.1%
|
|
|
|
Delta Air Lines Inc
|
|
115,805
|
8,036,867
|
Trading Companies & Distributors - 1.0%
|
|
|
|
Ferguson Enterprises Inc (United Kingdom)
|
|
176,118
|
39,431,851
|
United Rentals Inc
|
|
28,400
|
22,984,688
|
|
|
|
|
62,416,539
|
TOTAL INDUSTRIALS
|
|
|
469,906,509
|
Information Technology - 40.4%
|
|
|
|
Communications Equipment - 0.6%
|
|
|
|
Arista Networks Inc (d)
|
|
105,500
|
13,823,665
|
Lumentum Holdings Inc (d)
|
|
65,900
|
24,290,081
|
|
|
|
|
38,113,746
|
Electronic Equipment, Instruments & Components - 1.8%
|
|
|
|
Amphenol Corp Class A
|
|
505,074
|
68,255,700
|
Coherent Corp (d)
|
|
195,800
|
36,138,806
|
Corning Inc
|
|
113,200
|
9,911,792
|
|
|
|
|
114,306,298
|
Semiconductors & Semiconductor Equipment - 20.1%
|
|
|
|
Advanced Micro Devices Inc (d)
|
|
65,100
|
13,941,816
|
Broadcom Inc
|
|
878,893
|
304,184,867
|
First Solar Inc (d)
|
|
131,100
|
34,247,253
|
Lam Research Corp
|
|
91,000
|
15,577,380
|
Marvell Technology Inc
|
|
425,300
|
36,141,994
|
Micron Technology Inc
|
|
66,500
|
18,979,765
|
NVIDIA Corp
|
|
4,609,694
|
859,707,932
|
SiTime Corp (d)
|
|
8,800
|
3,108,072
|
|
|
|
|
1,285,889,079
|
Software - 12.5%
|
|
|
|
Asapp Inc warrants 8/28/2028 (b)(c)(d)
|
|
1,014,955
|
588,674
|
Cadence Design Systems Inc (d)
|
|
72,600
|
22,693,308
|
Datadog Inc Class A (d)
|
|
204,700
|
27,837,153
|
Microsoft Corp
|
|
1,318,699
|
637,749,210
|
Oracle Corp
|
|
182,111
|
35,495,255
|
Palantir Technologies Inc Class A (d)
|
|
207,600
|
36,900,900
|
Synopsys Inc (d)
|
|
73,200
|
34,383,504
|
Via Transportation Inc Class A (d)(e)
|
|
6,300
|
182,763
|
|
|
|
|
795,830,767
|
Technology Hardware, Storage & Peripherals - 5.4%
|
|
|
|
Apple Inc
|
|
1,282,644
|
348,699,598
|
TOTAL INFORMATION TECHNOLOGY
|
|
|
2,582,839,488
|
Materials - 0.8%
|
|
|
|
Chemicals - 0.5%
|
|
|
|
Corteva Inc
|
|
330,500
|
22,153,416
|
Sherwin-Williams Co/The
|
|
33,000
|
10,692,990
|
|
|
|
|
32,846,406
|
Construction Materials - 0.1%
|
|
|
|
Vulcan Materials Co
|
|
23,905
|
6,818,184
|
Metals & Mining - 0.2%
|
|
|
|
Alcoa Corp
|
|
193,960
|
10,307,034
|
TOTAL MATERIALS
|
|
|
49,971,624
|
Real Estate - 0.6%
|
|
|
|
Health Care REITs - 0.3%
|
|
|
|
Ventas Inc
|
|
235,200
|
18,199,776
|
Real Estate Management & Development - 0.3%
|
|
|
|
Zillow Group Inc Class C (d)
|
|
256,860
|
17,522,989
|
TOTAL REAL ESTATE
|
|
|
35,722,765
|
Utilities - 0.9%
|
|
|
|
Electric Utilities - 0.7%
|
|
|
|
Constellation Energy Corp
|
|
30,700
|
10,845,389
|
NRG Energy Inc
|
|
203,600
|
32,421,264
|
|
|
|
|
43,266,653
|
Independent Power and Renewable Electricity Producers - 0.2%
|
|
|
|
Vistra Corp
|
|
85,300
|
13,761,449
|
TOTAL UTILITIES
|
|
|
57,028,102
|
TOTAL UNITED STATES
|
|
|
5,774,254,604
|
|
TOTAL COMMON STOCKS
(Cost $4,266,840,448)
|
|
|
6,349,964,064
|
|
|
|
|
|
Convertible Corporate Bonds - 0.0%
|
|
|
|
Principal
Amount (a)
|
Value ($)
|
UNITED STATES - 0.0%
|
|
|
|
Materials - 0.0%
|
|
|
|
Metals & Mining - 0.0%
|
|
|
|
Illuminated Holdings Inc 15% (b)(c)(f)
(Cost $809,600)
|
|
809,600
|
522,272
|
|
|
|
|
|
Convertible Preferred Stocks - 0.8%
|
|
|
|
Shares
|
Value ($)
|
AUSTRALIA - 0.0%
|
|
|
|
Information Technology - 0.0%
|
|
|
|
Software - 0.0%
|
|
|
|
Canva Australia Holdings Pty Ltd Series A (b)(c)(d)
|
|
423
|
696,317
|
Canva Australia Holdings Pty Ltd Series A2 (b)(c)(d)
|
|
77
|
126,753
|
|
|
|
|
|
TOTAL AUSTRALIA
|
|
|
823,070
|
UNITED STATES - 0.8%
|
|
|
|
Financials - 0.0%
|
|
|
|
Financial Services - 0.0%
|
|
|
|
Akeana Series C (b)(c)(d)
|
|
30,000
|
357,600
|
Health Care - 0.0%
|
|
|
|
Biotechnology - 0.0%
|
|
|
|
ElevateBio LLC Series C (b)(c)(d)
|
|
75,700
|
144,587
|
Industrials - 0.1%
|
|
|
|
Aerospace & Defense - 0.1%
|
|
|
|
Anduril Industries Inc Series F (b)(c)(d)
|
|
114,642
|
5,234,554
|
Anduril Industries Inc Series G (b)(c)
|
|
7,400
|
337,884
|
|
|
|
|
5,572,438
|
Air Freight & Logistics - 0.0%
|
|
|
|
Zipline International Inc Series H (b)(c)
|
|
58,100
|
3,268,953
|
TOTAL INDUSTRIALS
|
|
|
8,841,391
|
Information Technology - 0.7%
|
|
|
|
IT Services - 0.3%
|
|
|
|
X.Ai Holdings Corp Series C (b)(c)
|
|
204,100
|
15,401,386
|
Software - 0.4%
|
|
|
|
Anthropic PBC Series F (b)(c)
|
|
25,300
|
5,902,490
|
Asapp Inc Series C (b)(c)(d)
|
|
250,763
|
268,316
|
Asapp Inc Series D (b)(c)(d)
|
|
1,768,998
|
1,503,649
|
Databricks Inc Series K (b)(c)
|
|
23,900
|
4,541,000
|
OpenAI Group Pbc Series A-2 (b)(c)
|
|
18,274
|
8,725,470
|
|
|
|
|
20,940,925
|
TOTAL INFORMATION TECHNOLOGY
|
|
|
36,342,311
|
Materials - 0.0%
|
|
|
|
Metals & Mining - 0.0%
|
|
|
|
Illuminated Holdings Inc Series C2 (b)(c)(d)
|
|
50,974
|
608,120
|
Illuminated Holdings Inc Series C3 (b)(c)(d)
|
|
63,718
|
760,156
|
Illuminated Holdings Inc Series C4 (b)(c)(d)
|
|
18,303
|
218,354
|
Illuminated Holdings Inc Series C5 (b)(c)(d)
|
|
36,887
|
440,062
|
TOTAL MATERIALS
|
|
|
2,026,692
|
TOTAL UNITED STATES
|
|
|
47,712,581
|
|
TOTAL CONVERTIBLE PREFERRED STOCKS
(Cost $36,223,986)
|
|
|
48,535,651
|
|
|
|
|
|
Preferred Securities - 0.0%
|
|
|
|
Principal
Amount (a)
|
Value ($)
|
UNITED STATES - 0.0%
|
|
|
|
Materials - 0.0%
|
|
|
|
Metals & Mining - 0.0%
|
|
|
|
Illuminated Holdings Inc 15% (b)(c)(f)
(Cost $1,098,800)
|
|
1,098,800
|
1,028,367
|
|
|
|
|
|
Money Market Funds - 0.5%
|
|
|
|
Yield (%)
|
Shares
|
Value ($)
|
Fidelity Cash Central Fund (g)
|
|
3.79
|
11,569,987
|
11,572,301
|
Fidelity Securities Lending Cash Central Fund (g)(h)
|
|
3.77
|
20,852,869
|
20,854,954
|
|
TOTAL MONEY MARKET FUNDS
(Cost $32,427,704)
|
|
|
|
32,427,255
|
|
|
|
|
|
|
|
TOTAL INVESTMENT IN SECURITIES - 100.3%
(Cost $4,337,400,538)
|
6,432,477,609
|
NET OTHER ASSETS (LIABILITIES) - (0.3)%
|
(16,067,492)
|
NET ASSETS - 100.0%
|
6,416,410,117
|
|
|
|
Legend
(a)
|
Amount is stated in United States dollars unless otherwise noted.
|
(c)
|
Restricted securities (including private placements) - Investment in securities not registered under the Securities Act of 1933 (excluding 144A issues). At the end of the period, the value of restricted securities (excluding 144A issues) amounted to $56,945,129 or 0.9% of net assets.
|
(d)
|
Non-income producing.
|
(e)
|
Security or a portion of the security is on loan at period end.
|
(f)
|
Security is perpetual in nature with no stated maturity date.
|
(g)
|
Affiliated fund that is generally available only to investment companies and other accounts managed by Fidelity Investments. The rate quoted is the annualized seven-day yield of the fund at period end. A complete unaudited listing of the fund's holdings as of its most recent quarter end is available upon request. In addition, each Fidelity Central Fund's financial statements are available on the SEC's website or upon request.
|
(h)
|
Investment made with cash collateral received from securities on loan.
|
Additional information on each restricted holding is as follows:
|
Security
|
Acquisition Date
|
Acquisition Cost ($)
|
Akeana Series C
|
1/23/2024
|
382,824
|
|
|
|
|
Anduril Industries Inc Class B
|
6/16/2025
|
32,706
|
|
|
|
|
Anduril Industries Inc Series F
|
8/7/2024
|
2,491,927
|
|
|
|
|
Anduril Industries Inc Series G
|
4/17/2025
|
302,533
|
|
|
|
|
Anthropic PBC Series F
|
8/18/2025
|
3,566,480
|
|
|
|
|
Asapp Inc Series C
|
4/30/2021
|
1,654,309
|
|
|
|
|
Asapp Inc Series D
|
8/29/2023
|
6,830,986
|
|
|
|
|
Asapp Inc warrants 8/28/2028
|
8/29/2023
|
1
|
|
|
|
|
Blu Homes Inc
|
5/21/2020
|
5,743
|
|
|
|
|
Canva Australia Holdings Pty Ltd Class A
|
8/19/2025 - 11/12/2025
|
4,773,806
|
|
|
|
|
Canva Australia Holdings Pty Ltd Series A
|
9/22/2023
|
451,198
|
|
|
|
|
Canva Australia Holdings Pty Ltd Series A2
|
9/22/2023
|
82,133
|
|
|
|
|
Databricks Inc Series K
|
9/8/2025
|
3,585,000
|
|
|
|
|
ElevateBio LLC Series C
|
3/9/2021
|
317,561
|
|
|
|
|
Epic Games Inc
|
3/29/2021
|
1,985,940
|
|
|
|
|
Illuminated Holdings Inc 15%
|
6/14/2023
|
809,600
|
|
|
|
|
Illuminated Holdings Inc 15%
|
9/27/2023
|
1,098,800
|
|
|
|
|
Illuminated Holdings Inc Series C2
|
7/7/2020
|
1,274,350
|
|
|
|
|
Illuminated Holdings Inc Series C3
|
7/7/2020
|
1,911,540
|
|
|
|
|
Illuminated Holdings Inc Series C4
|
1/8/2021
|
658,908
|
|
|
|
|
Illuminated Holdings Inc Series C5
|
6/16/2021
|
1,593,518
|
|
|
|
|
OpenAI Group Pbc Series A-2
|
9/30/2024
|
3,433,000
|
|
|
|
|
X.Ai Holdings Corp Series C
|
11/22/2024
|
4,418,765
|
|
|
|
|
Zipline International Inc Series H
|
12/3/2025
|
3,268,954
|
|
|
|
|
Affiliated Central Funds
Fiscal year to date information regarding the Fund's investments in Fidelity Central Funds, including the ownership percentage, is presented below.
Affiliate
|
Value,
beginning
of period ($)
|
Purchases ($)
|
Sales
Proceeds ($)
|
Dividend
Income ($)
|
Realized
Gain (loss) ($)
|
Change in
Unrealized
appreciation
(depreciation) ($)
|
Value,
end
of period ($)
|
Shares,
end
of period
|
% ownership,
end
of period
|
Fidelity Cash Central Fund
|
63,622,227
|
668,879,022
|
720,929,150
|
509,963
|
651
|
(449)
|
11,572,301
|
11,569,987
|
0.0%
|
Fidelity Securities Lending Cash Central Fund
|
186,613,316
|
255,416,704
|
421,176,445
|
316,183
|
1,379
|
-
|
20,854,954
|
20,852,869
|
0.1%
|
Total
|
250,235,543
|
924,295,726
|
1,142,105,595
|
826,146
|
2,030
|
(449)
|
32,427,255
|
|
|
|
|
|
|
|
|
|
|
|
|
|
Amounts in the dividend income column in the above table include any capital gain distributions from underlying funds, which are presented in the corresponding line item in the Statement of Operations, if applicable.
Amounts in the dividend income column for Fidelity Securities Lending Cash Central Fund represents the income earned on investing cash collateral, less rebates paid to borrowers and any lending agent fees associated with the loan, plus any premium income received for lending certain types of securities.
Amounts included in the purchases and sales proceeds columns may include in-kind transactions, if applicable.
Investment Valuation
The following is a summary of the inputs used, as of December 31, 2025, involving the Fund's assets and liabilities carried at fair value. The inputs or methodology used for valuing securities may not be an indication of the risk associated with investing in those securities. For more information on valuation inputs, and their aggregation into the levels used below, please refer to the Investment Valuation section in the accompanying Notes to Financial Statements.
Valuation Inputs at Reporting Date:
|
Description
|
Total ($)
|
Level 1 ($)
|
Level 2 ($)
|
Level 3 ($)
|
Investments in Securities:
|
|
|
|
|
|
|
Common Stocks
|
|
|
|
|
Communication Services
|
868,156,561
|
816,604,565
|
50,093,194
|
1,458,802
|
Consumer Discretionary
|
723,192,418
|
723,191,389
|
-
|
1,029
|
Consumer Staples
|
97,634,278
|
97,634,278
|
-
|
-
|
Energy
|
34,971,580
|
34,971,580
|
-
|
-
|
Financials
|
525,834,606
|
525,834,606
|
-
|
-
|
Health Care
|
521,406,703
|
521,399,898
|
-
|
6,805
|
Industrials
|
469,906,509
|
469,869,981
|
-
|
36,528
|
Information Technology
|
2,885,296,032
|
2,818,602,039
|
61,331,513
|
5,362,480
|
Materials
|
130,814,510
|
130,814,510
|
-
|
-
|
Real Estate
|
35,722,765
|
35,722,765
|
-
|
-
|
Utilities
|
57,028,102
|
57,028,102
|
-
|
-
|
|
|
Convertible Corporate Bonds
|
|
|
|
|
Materials
|
522,272
|
-
|
-
|
522,272
|
|
|
Convertible Preferred Stocks
|
|
|
|
|
Financials
|
357,600
|
-
|
-
|
357,600
|
Health Care
|
144,587
|
-
|
-
|
144,587
|
Industrials
|
8,841,391
|
-
|
-
|
8,841,391
|
Information Technology
|
37,165,381
|
-
|
-
|
37,165,381
|
Materials
|
2,026,692
|
-
|
-
|
2,026,692
|
|
|
Preferred Securities
|
|
|
|
|
Materials
|
1,028,367
|
-
|
-
|
1,028,367
|
|
|
Money Market Funds
|
32,427,255
|
32,427,255
|
-
|
-
|
Total Investments in Securities:
|
6,432,477,609
|
6,264,100,968
|
111,424,707
|
56,951,934
|
Financial Statements (Unaudited)
Statement of Assets and Liabilities
|
|
As of December 31, 2025 (Unaudited)
|
Assets
|
|
|
|
|
Investment in securities, at value (including securities loaned of $20,204,717) - See accompanying schedule:
|
|
|
|
|
Unaffiliated issuers (cost $4,304,972,834)
|
$
|
6,400,050,354
|
|
|
Fidelity Central Funds (cost $32,427,704)
|
|
32,427,255
|
|
|
|
|
|
|
|
|
|
|
|
|
|
|
Total Investment in Securities (cost $4,337,400,538)
|
|
|
$
|
6,432,477,609
|
Foreign currency held at value (cost $233,356)
|
|
|
|
232,878
|
Receivable for investments sold
|
|
|
|
7,700,861
|
Receivable for fund shares sold
|
|
|
|
1,671,721
|
Dividends receivable
|
|
|
|
1,705,644
|
Interest receivable
|
|
|
|
234,709
|
Distributions receivable from Fidelity Central Funds
|
|
|
|
29,754
|
Prepaid expenses
|
|
|
|
5,182
|
Other receivables
|
|
|
|
15,552
|
Total assets
|
|
|
|
6,444,073,910
|
Liabilities
|
|
|
|
|
Payable for fund shares redeemed
|
$
|
4,388,051
|
|
|
Accrued management fee
|
|
2,369,995
|
|
|
Other payables and accrued expenses
|
|
57,977
|
|
|
Collateral on securities loaned
|
|
20,847,770
|
|
|
Total liabilities
|
|
|
|
27,663,793
|
Commitments and contingent liabilities (see Significant Accounting Policies note)
|
|
|
|
|
Net Assets
|
|
|
$
|
6,416,410,117
|
Net Assets consist of:
|
|
|
|
|
Paid in capital
|
|
|
$
|
3,791,300,397
|
Total accumulated earnings (loss)
|
|
|
|
2,625,109,720
|
Net Assets
|
|
|
$
|
6,416,410,117
|
|
|
|
|
|
|
Net Asset Value and Maximum Offering Price
|
|
|
|
|
Growth Discovery :
|
|
|
|
|
Net Asset Value, offering price and redemption price per share ($5,722,017,515 ÷ 81,945,865 shares)
|
|
|
$
|
69.83
|
Class K :
|
|
|
|
|
Net Asset Value, offering price and redemption price per share ($694,392,602 ÷ 9,919,626 shares)
|
|
|
$
|
70.00
|
Statement of Operations
|
Six months ended December 31, 2025 (Unaudited)
|
Investment Income
|
|
|
|
|
Dividends
|
|
|
$
|
15,520,101
|
Interest
|
|
|
|
114,681
|
Income from Fidelity Central Funds (including $316,183 from security lending)
|
|
|
|
826,146
|
Total income
|
|
|
|
16,460,928
|
Expenses
|
|
|
|
|
Management fee
|
|
|
|
|
Basic fee
|
$
|
19,482,236
|
|
|
Performance adjustment
|
|
(4,598,096)
|
|
|
Custodian fees and expenses
|
|
39,365
|
|
|
Independent trustees' fees and expenses
|
|
13,129
|
|
|
Registration fees
|
|
59,329
|
|
|
Audit fees
|
|
45,095
|
|
|
Legal
|
|
5,787
|
|
|
Interest
|
|
34,065
|
|
|
Miscellaneous
|
|
8,760
|
|
|
Total expenses
|
|
|
|
15,089,670
|
Net Investment income (loss)
|
|
|
|
1,371,258
|
Realized and Unrealized Gain (Loss)
|
|
|
|
|
Net realized gain (loss) on:
|
|
|
|
|
Investment Securities:
|
|
|
|
|
Unaffiliated issuers
|
|
(6,469,603)
|
|
|
Redemptions in-kind
|
|
554,951,694
|
|
|
Fidelity Central Funds
|
|
2,030
|
|
|
Foreign currency transactions
|
|
(131,002)
|
|
|
Futures contracts
|
|
1,660,672
|
|
|
Total net realized gain (loss)
|
|
|
|
550,013,791
|
Change in net unrealized appreciation (depreciation) on:
|
|
|
|
|
Investment Securities:
|
|
|
|
|
Unaffiliated issuers
|
|
(25,518,596)
|
|
|
Fidelity Central Funds
|
|
(449)
|
|
|
Assets and liabilities in foreign currencies
|
|
(15,335)
|
|
|
Total change in net unrealized appreciation (depreciation)
|
|
|
|
(25,534,380)
|
Net gain (loss)
|
|
|
|
524,479,411
|
Net increase (decrease) in net assets resulting from operations
|
|
|
$
|
525,850,669
|
Statement of Changes in Net Assets
|
|
|
|
|
Six months ended
December 31, 2025
(Unaudited)
|
|
Year ended
June 30, 2025
|
Increase (Decrease) in Net Assets
|
|
|
|
|
Operations
|
|
|
|
|
Net investment income (loss)
|
$
|
1,371,258
|
$
|
32,348
|
Net realized gain (loss)
|
|
550,013,791
|
|
676,202,460
|
Change in net unrealized appreciation (depreciation)
|
|
(25,534,380)
|
|
(3,389,348)
|
Net increase (decrease) in net assets resulting from operations
|
|
525,850,669
|
|
672,845,460
|
Distributions to shareholders
|
|
(111,294,245)
|
|
(728,368,940)
|
|
|
|
|
|
|
Share transactions - net increase (decrease)
|
|
(311,621,720)
|
|
479,939,387
|
Total increase (decrease) in net assets
|
|
102,934,704
|
|
424,415,907
|
|
|
|
|
|
|
Net Assets
|
|
|
|
|
Beginning of period
|
|
6,313,475,413
|
|
5,889,059,506
|
End of period
|
$
|
6,416,410,117
|
$
|
6,313,475,413
|
|
|
|
|
|
|
|
|
|
|
|
|
Financial Highlights
Fidelity® Growth Discovery Fund
|
|
|
|
|
Six months ended
December 31, 2025
(Unaudited)
|
|
Years ended June 30, 2025
|
|
2024
|
|
2023
|
|
2022
|
|
2021
|
Selected Per-Share Data
|
|
|
|
|
|
|
|
|
|
|
|
|
Net asset value, beginning of period
|
$
|
65.48
|
$
|
66.33
|
$
|
50.18
|
$
|
42.65
|
$
|
58.70
|
$
|
45.22
|
Income from Investment Operations
|
|
|
|
|
|
|
|
|
|
|
|
|
Net investment income (loss) A,B
|
|
.01
|
|
- C
|
|
(.04)
|
|
.18
|
|
(.07)
|
|
(.07)
|
Net realized and unrealized gain (loss)
|
|
5.45
|
|
7.05
|
|
17.56
|
|
8.84
|
|
(8.48)
|
|
18.53
|
Total from investment operations
|
|
5.46
|
|
7.05
|
|
17.52
|
|
9.02
|
|
(8.55)
|
|
18.46
|
Distributions from net investment income
|
|
(.12)
|
|
-
|
|
(.03)
|
|
(.01)
|
|
(.13)
|
|
(.01)
|
Distributions from net realized gain
|
|
(.99)
|
|
(7.90)
|
|
(1.35)
|
|
(1.48)
|
|
(7.37)
|
|
(4.98)
|
Total distributions
|
|
(1.11)
|
|
(7.90)
|
|
(1.37) D
|
|
(1.49)
|
|
(7.50)
|
|
(4.98) D
|
Net asset value, end of period
|
$
|
69.83
|
$
|
65.48
|
$
|
66.33
|
$
|
50.18
|
$
|
42.65
|
$
|
58.70
|
Total Return E,F
|
|
|
|
12.24%
|
|
35.89%
|
|
21.46%
|
|
(17.10)%
|
|
43.10%
|
Ratios to Average Net Assets B,G,H
|
|
|
|
|
|
|
|
|
|
|
|
|
Expenses before reductions
|
|
.47% I
|
|
.62%
|
|
.69%
|
|
.83%
|
|
.77%
|
|
.79%
|
Expenses net of fee waivers, if any
|
|
|
|
.62%
|
|
.69%
|
|
.83%
|
|
.77%
|
|
.79%
|
Expenses net of all reductions, if any
|
|
.47% I
|
|
.62%
|
|
.69%
|
|
.83%
|
|
.77%
|
|
.78%
|
Net investment income (loss)
|
|
.03% I
|
|
(.01)%
|
|
(.08)%
|
|
.40%
|
|
(.14)%
|
|
(.12)%
|
Supplemental Data
|
|
|
|
|
|
|
|
|
|
|
|
|
Net assets, end of period (000 omitted)
|
$
|
5,722,018
|
$
|
5,621,912
|
$
|
5,286,394
|
$
|
3,073,034
|
$
|
2,338,597
|
$
|
2,944,158
|
Portfolio turnover rate J
|
|
|
|
60% K
|
|
41% K
|
|
53%
|
|
45%
|
|
51%
|
ACalculated based on average shares outstanding during the period.
BNet investment income (loss) is affected by the timing of the declaration of dividends by any underlying mutual funds or exchange-traded funds (ETFs). Net investment income (loss) of any mutual funds or ETFs is not included in the Fund's net investment income (loss) ratio.
CAmount represents less than $.005 per share.
DTotal distributions per share do not sum due to rounding.
ETotal returns for periods of less than one year are not annualized.
FTotal returns would have been lower if certain expenses had not been reduced during the applicable periods shown.
GFees and expenses of any underlying mutual funds or exchange-traded funds (ETFs) are not included in the Fund's expense ratio. The Fund indirectly bears its proportionate share of these expenses. For additional expense information related to investments in Fidelity Central Funds, please refer to the "Investments in Fidelity Central Funds" note found in the Notes to Financial Statements section of the most recent Annual or Semi-Annual report.
HExpense ratios reflect operating expenses of the class. Expenses before reductions do not reflect amounts reimbursed, waived, or reduced through arrangements with the investment adviser, brokerage services, or other offset arrangements, if applicable, and do not represent the amount paid by the class during periods when reimbursements, waivers or reductions occur.
IAnnualized.
JAmount does not include the portfolio activity of any underlying mutual funds or exchange-traded funds (ETFs), derivatives or securities that mature within one year from acquisition.
KPortfolio turnover rate excludes securities received or delivered in-kind.
Fidelity® Growth Discovery Fund Class K
|
|
|
|
|
Six months ended
December 31, 2025
(Unaudited)
|
|
Years ended June 30, 2025
|
|
2024
|
|
2023
|
|
2022
|
|
2021
|
Selected Per-Share Data
|
|
|
|
|
|
|
|
|
|
|
|
|
Net asset value, beginning of period
|
$
|
65.66
|
$
|
66.47
|
$
|
50.29
|
$
|
42.71
|
$
|
58.78
|
$
|
45.27
|
Income from Investment Operations
|
|
|
|
|
|
|
|
|
|
|
|
|
Net investment income (loss) A,B
|
|
.04
|
|
.04
|
|
.01
|
|
.22
|
|
(.02)
|
|
(.02)
|
Net realized and unrealized gain (loss)
|
|
5.46
|
|
7.07
|
|
17.59
|
|
8.87
|
|
(8.50)
|
|
18.56
|
Total from investment operations
|
|
5.50
|
|
7.11
|
|
17.60
|
|
9.09
|
|
(8.52)
|
|
18.54
|
Distributions from net investment income
|
|
(.17)
|
|
-
|
|
(.08)
|
|
(.03)
|
|
(.16)
|
|
(.03)
|
Distributions from net realized gain
|
|
(.99)
|
|
(7.92)
|
|
(1.35)
|
|
(1.48)
|
|
(7.40)
|
|
(5.00)
|
Total distributions
|
|
(1.16)
|
|
(7.92)
|
|
(1.42) C
|
|
(1.51)
|
|
(7.55) C
|
|
(5.03)
|
Net asset value, end of period
|
$
|
70.00
|
$
|
65.66
|
$
|
66.47
|
$
|
50.29
|
$
|
42.71
|
$
|
58.78
|
Total Return D,E
|
|
|
|
12.32%
|
|
36.00%
|
|
21.61%
|
|
(17.04)%
|
|
43.25%
|
Ratios to Average Net Assets B,F,G
|
|
|
|
|
|
|
|
|
|
|
|
|
Expenses before reductions
|
|
.40% H
|
|
.54%
|
|
.59%
|
|
.73%
|
|
.68%
|
|
.69%
|
Expenses net of fee waivers, if any
|
|
|
|
.54%
|
|
.59%
|
|
.72%
|
|
.68%
|
|
.69%
|
Expenses net of all reductions, if any
|
|
.40% H
|
|
.54%
|
|
.59%
|
|
.72%
|
|
.68%
|
|
.69%
|
Net investment income (loss)
|
|
.10% H
|
|
.07%
|
|
.02%
|
|
.50%
|
|
(.05)%
|
|
(.03)%
|
Supplemental Data
|
|
|
|
|
|
|
|
|
|
|
|
|
Net assets, end of period (000 omitted)
|
$
|
694,393
|
$
|
691,564
|
$
|
602,666
|
$
|
380,324
|
$
|
429,818
|
$
|
430,141
|
Portfolio turnover rate I
|
|
|
|
60% J
|
|
41% J
|
|
53%
|
|
45%
|
|
51%
|
ACalculated based on average shares outstanding during the period.
BNet investment income (loss) is affected by the timing of the declaration of dividends by any underlying mutual funds or exchange-traded funds (ETFs). Net investment income (loss) of any mutual funds or ETFs is not included in the Fund's net investment income (loss) ratio.
CTotal distributions per share do not sum due to rounding.
DTotal returns for periods of less than one year are not annualized.
ETotal returns would have been lower if certain expenses had not been reduced during the applicable periods shown.
FFees and expenses of any underlying mutual funds or exchange-traded funds (ETFs) are not included in the Fund's expense ratio. The Fund indirectly bears its proportionate share of these expenses. For additional expense information related to investments in Fidelity Central Funds, please refer to the "Investments in Fidelity Central Funds" note found in the Notes to Financial Statements section of the most recent Annual or Semi-Annual report.
GExpense ratios reflect operating expenses of the class. Expenses before reductions do not reflect amounts reimbursed, waived, or reduced through arrangements with the investment adviser, brokerage services, or other offset arrangements, if applicable, and do not represent the amount paid by the class during periods when reimbursements, waivers or reductions occur.
HAnnualized.
IAmount does not include the portfolio activity of any underlying mutual funds or exchange-traded funds (ETFs), derivatives or securities that mature within one year from acquisition.
JPortfolio turnover rate excludes securities received or delivered in-kind.
Notes to Financial Statements
(Unaudited)For the period ended December 31, 2025
1. Organization.
Fidelity Growth Discovery Fund (the Fund) is a non-diversified fund of Fidelity Hastings Street Trust (the Trust) and is authorized to issue an unlimited number of shares. The Trust is registered under the Investment Company Act of 1940, as amended (the 1940 Act), as an open-end management investment company organized as a Massachusetts business trust. The Fund offers Growth Discovery and Class K shares, each of which has equal rights as to assets and voting privileges. Each class has exclusive voting rights with respect to matters that affect that class.
2. Investments in Fidelity Central Funds.
Funds may invest in Fidelity Central Funds, which are open-end investment companies generally available only to other investment companies and accounts managed by the investment adviser and its affiliates. The Schedule of Investments lists any Fidelity Central Funds held as an investment as of period end, but does not include the underlying holdings of each Fidelity Central Fund. An investing fund indirectly bears its proportionate share of the expenses of the underlying Fidelity Central Funds.
Based on its investment objective, each Fidelity Central Fund may invest or participate in various investment vehicles or strategies that are similar to those of the investing fund. These strategies are consistent with the investment objectives of the investing fund and may involve certain economic risks which may cause a decline in value of each of the Fidelity Central Funds and thus a decline in the value of the investing fund.
Fidelity Central Fund
|
Investment Manager
|
Investment Objective
|
Investment Practices
|
Expense RatioA
|
Fidelity Money Market Central Funds
|
Fidelity Management & Research Company LLC (FMR)
|
Each fund seeks to obtain a high level of current income consistent with the preservation of capital and liquidity.
|
Short-term Investments
|
Less than .005%
|
A Expenses expressed as a percentage of average net assets and are as of each underlying Central Fund's most recent annual or semi-annual shareholder report.
A complete unaudited list of holdings for each Fidelity Central Fund is available upon request or at the Securities and Exchange Commission website at www.sec.gov. In addition, the financial statements of the Fidelity Central Funds which contain the significant accounting policies (including investment valuation policies) of those funds, and are not covered by the Report of Independent Registered Public Accounting Firm, are available on the Securities and Exchange Commission website or upon request.
3. Significant Accounting Policies.
The Fund is an investment company and applies the accounting and reporting guidance of the Financial Accounting Standards Board (FASB) Accounting Standards Codification Topic 946 Financial Services - Investment Companies. The financial statements have been prepared in conformity with accounting principles generally accepted in the United States of America (GAAP), which require management to make certain estimates and assumptions at the date of the financial statements. Actual results could differ from those estimates. The Fund operates as a single operating segment. The Fund's income, expenses, assets, and performance are regularly monitored and assessed as a whole by the investment adviser and other individuals responsible for oversight functions of the Trust, using the information presented in the financial statements and financial highlights. Subsequent events, if any, through the date that the financial statements were issued have been evaluated in the preparation of the financial statements. The Fund's Schedule of Investments lists any underlying mutual funds or exchange-traded funds but does not include the underlying holdings of these funds. The following summarizes the significant accounting policies of the Fund:
Investment Valuation. Investments are valued as of 4:00 p.m. Eastern time on the last calendar day of the period. The Board of Trustees (the Board) has designated the Fund's investment adviser as the valuation designee responsible for the fair valuation function and performing fair value determinations as needed. The investment adviser has established a Fair Value Committee (the Committee) to carry out the day-to-day fair valuation responsibilities and has adopted policies and procedures to govern the fair valuation process and the activities of the Committee. In accordance with these fair valuation policies and procedures, which have been approved by the Board, the Fund attempts to obtain prices from one or more third party pricing services or brokers to value its investments. When current market prices, quotations or currency exchange rates are not readily available or reliable, investments will be fair valued in good faith by the Committee, in accordance with the policies and procedures. Factors used in determining fair value vary by investment type and may include market or investment specific events, transaction data, estimated cash flows, and market observations of comparable investments. The frequency that the fair valuation procedures are used cannot be predicted and they may be utilized to a significant extent. The Committee manages the Fund's fair valuation practices and maintains the fair valuation policies and procedures. The Fund's investment adviser reports to the Board information regarding the fair valuation process and related material matters.
The Fund categorizes the inputs to valuation techniques used to value its investments into a disclosure hierarchy consisting of three levels as shown below:
Level 1 - unadjusted quoted prices in active markets for identical investments
Level 2 - other significant observable inputs (including quoted prices for similar investments, interest rates, prepayment speeds, etc.)
Level 3 - unobservable inputs (including the Fund's own assumptions based on the best information available)
Valuation techniques used to value the Fund's investments by major category are as follows:
Equity securities, including restricted securities, for which market quotations are readily available, are valued at the last reported sale price or official closing price as reported by a third party pricing service on the primary market or exchange on which they are traded and are categorized as Level 1 in the hierarchy. In the event there were no sales during the day or closing prices are not available, securities are valued at the last quoted bid price or may be valued using the last available price and are generally categorized as Level 2 in the hierarchy. For foreign equity securities, when market or security specific events arise, comparisons to the valuation of American Depositary Receipts (ADRs), futures contracts, Exchange-Traded Funds (ETFs) and certain indexes as well as quoted prices for similar securities may be used and would be categorized as Level 2 in the hierarchy. For equity securities, including restricted securities, where observable inputs are limited, assumptions about market activity and risk are used and these securities may be categorized as Level 3 in the hierarchy.
Debt securities, including restricted securities, are valued based on evaluated prices received from third party pricing services or from brokers who make markets in such securities. Corporate bonds and preferred securities are valued by pricing services who utilize matrix pricing which considers yield or price of bonds of comparable quality, coupon, maturity and type or by broker-supplied prices. When independent prices are unavailable or unreliable, debt securities may be valued utilizing pricing methodologies which consider similar factors that would be used by third party pricing services. Debt securities are generally categorized as Level 2 in the hierarchy but may be Level 3 depending on the circumstances.
Investments in open-end mutual funds, including the Fidelity Central Funds, are valued at their closing net asset value (NAV) each business day and are categorized as Level 1 in the hierarchy.
Changes in valuation techniques may result in transfers in or out of an assigned level within the disclosure hierarchy. The aggregate value of investments by input level as of December 31, 2025 is included at the end of the Fund's Schedule of Investments.
Foreign Currency. Certain Funds may use foreign currency contracts to facilitate transactions in foreign-denominated securities. Gains and losses from these transactions may arise from changes in the value of the foreign currency or if the counterparties do not perform under the contracts' terms.
Foreign-denominated assets, including investment securities, and liabilities are translated into U.S. dollars at the exchange rates at period end. Purchases and sales of investment securities, income and dividends received, and expenses denominated in foreign currencies are translated into U.S. dollars at the exchange rate in effect on the transaction date.
The effects of exchange rate fluctuations on investments are included with the net realized and unrealized gain (loss) on investment securities. Other foreign currency transactions resulting in realized and unrealized gain (loss) are disclosed separately.
Investment Transactions and Income. For financial reporting purposes, the Fund's investment holdings and NAV include trades executed through the end of the last business day of the period. The NAV per share for processing shareholder transactions is calculated as of the close of business of the New York Stock Exchange (NYSE), normally 4:00 p.m. Eastern time and includes trades executed through the end of the prior business day. Gains and losses on securities sold are determined on the basis of identified cost and include proceeds received from litigation. Commissions paid to certain brokers with whom the investment adviser, or its affiliates, places trades on behalf of a fund include an amount in addition to trade execution, which may be rebated back to a fund. Any such rebates are included in net realized gain (loss) on investments in the Statement of Operations. Dividend income is recorded on the ex-dividend date, except for certain dividends from foreign securities where the ex-dividend date may have passed, which are recorded as soon as the Fund is informed of the ex-dividend date. Non-cash dividends included in dividend income, if any, are recorded at the fair market value of the securities received. Income and capital gain distributions from Fidelity Central Funds, if any, are recorded on the ex-dividend date. Certain distributions received by the Fund represent a return of capital or capital gain. The Fund determines the components of these distributions subsequent to the ex-dividend date, based upon receipt of tax filings or other correspondence relating to the underlying investment. These distributions are recorded as a reduction of cost of investments and/or as a realized gain. Interest income is accrued as earned and includes coupon interest and amortization of premium and accretion of discount on debt securities as applicable. Investment income is recorded net of foreign taxes withheld where recovery of such taxes is uncertain. Funds may file withholding tax reclaims in certain jurisdictions to recover a portion of amounts previously withheld. Any withholding tax reclaims income is included in the Statement of Operations in dividends. Any receivables for withholding tax reclaims are included in the Statement of Assets and Liabilities in dividends receivable.
Class Allocations and Expenses. Investment income, realized and unrealized capital gains and losses, common expenses of a fund, and certain fund-level expense reductions, if any, are allocated daily on a pro-rata basis to each class based on the relative net assets of each class to the total net assets of a fund. Each class differs with respect to transfer agent and distribution and service plan fees incurred, as applicable. Certain expense reductions may also differ by class, if applicable. For the reporting period, the allocated portion of income and expenses to each class as a percent of its average net assets may vary due to the timing of recording these transactions in relation to fluctuating net assets of the classes. Expenses directly attributable to a fund are charged to that fund. Expenses attributable to more than one fund are allocated among the respective funds on the basis of relative net assets or other appropriate methods. Expenses included in the accompanying financial statements reflect the expenses of that fund and do not include any expenses associated with any underlying mutual funds or exchange-traded funds. Although not included in a fund's expenses, a fund indirectly bears its proportionate share of these expenses through the net asset value of each underlying mutual fund or exchange-traded fund. Expense estimates are accrued in the period to which they relate and adjustments are made when actual amounts are known.
Income Tax Information and Distributions to Shareholders. Each year, the Fund intends to qualify as a regulated investment company under Subchapter M of the Internal Revenue Code, including distributing substantially all of its taxable income and realized gains. As a result, no provision for U.S. Federal income taxes is required. The Fund files a U.S. federal tax return, in addition to state and local tax returns as required. The Fund's federal income tax returns are subject to examination by the Internal Revenue Service (IRS) for a period of three fiscal years after they are filed. State and local tax returns may be subject to examination for an additional fiscal year depending on the jurisdiction. Foreign taxes are provided for based on the Fund's understanding of the tax rules and rates that exist in the foreign markets in which it invests.
Distributions are declared and recorded on the ex-dividend date. Income and capital gain distributions are declared separately for each class. Income and capital gain distributions are determined in accordance with income tax regulations, which may differ from GAAP.
Capital accounts within the financial statements are adjusted for permanent book-tax differences. These adjustments have no impact on net assets or the results of operations. Capital accounts are not adjusted for temporary book-tax differences which will reverse in a subsequent period.
Book-tax differences are primarily due to futures contracts, foreign currency transactions, certain foreign taxes, passive foreign investment companies (PFIC), redemptions in-kind, partnerships and losses deferred due to wash sales and excise tax regulations.
As of period end, the cost and unrealized appreciation (depreciation) in securities, and derivatives if applicable, for federal income tax purposes were as follows:
Gross unrealized appreciation
|
$2,253,801,027
|
Gross unrealized depreciation
|
(160,764,056)
|
Net unrealized appreciation (depreciation)
|
$2,093,036,971
|
Tax cost
|
$4,339,440,638
|
Restricted Securities (including Private Placements). Funds may invest in securities that are subject to legal or contractual restrictions on resale. These securities generally may be resold in transactions exempt from registration or to the public if the securities are registered. Disposal of these securities may involve time-consuming negotiations and expense, and prompt sale at an acceptable price may be difficult. Information regarding restricted securities held at period end is included at the end of the Schedule of Investments, if applicable.
Commitments. A commitment is an agreement to acquire an investment at a future date (subject to conditions) in connection with a potential public or non-public offering. Commitments outstanding at period end are presented in the table below. Unrealized appreciation (depreciation) on any commitments outstanding at period end is separately presented in the Statement of Assets and Liabilities as Unrealized appreciation (depreciation) on unfunded commitments, and any change in unrealized appreciation (depreciation) on unfunded commitments during the period is separately presented in the Statement of Operations, as applicable based on contractual conditions of each commitment.
|
Investment to be Acquired
|
Commitment Amount ($)
|
Unrealized Appreciation (Depreciation)($)
|
Fidelity Growth Discovery Fund
|
Space Exploration Technologies Corp. Class A
|
3,057,723
|
-
|
|
Space Exploration Technologies Corp. Class C
|
5,290,286
|
-
|
4. Derivative Instruments.
Risk Exposures and the Use of Derivative Instruments. The Fund's investment objectives allow for various types of derivative instruments, including futures contracts. Derivatives are investments whose value is primarily derived from underlying assets, indices or reference rates and may be transacted on an exchange or over-the-counter (OTC). Derivatives may involve a future commitment to buy or sell a specified asset based on specified terms, to exchange future cash flows at periodic intervals based on a notional principal amount, or for one party to make one or more payments upon the occurrence of specified events in exchange for periodic payments from the other party.
Derivatives were used to increase returns and to manage exposure to certain risks as defined below. The success of any strategy involving derivatives depends on analysis of numerous economic factors, and if the strategies for investment do not work as intended, the objectives may not be achieved.
Derivatives were used to increase or decrease exposure to the following risk(s):
|
|
Equity Risk
|
Equity risk relates to the fluctuations in the value of financial instruments as a result of changes in market prices (other than those arising from interest rate risk or foreign exchange risk), whether caused by factors specific to an individual investment, its issuer, or all factors affecting all instruments traded in a market or market segment.
|
Funds are also exposed to additional risks from investing in derivatives, such as liquidity risk and counterparty credit risk. Liquidity risk is the risk that a fund will be unable to close out the derivative in the open market in a timely manner. Counterparty credit risk is the risk that the counterparty will not be able to fulfill its obligation to a fund. Counterparty credit risk related to exchange-traded contracts may be mitigated by the protection provided by the exchange on which they trade.
Investing in derivatives may involve greater risks than investing in the underlying assets directly and, to varying degrees, may involve risk of loss in excess of any initial investment and collateral received and amounts recognized in the Statement of Assets and Liabilities. In addition, there may be the risk that the change in value of the derivative contract does not correspond to the change in value of the underlying instrument.
Futures Contracts. A futures contract is an agreement between two parties to buy or sell a specified underlying instrument for a fixed price at a specified future date. Futures contracts were used to manage exposure to the stock market.
Upon entering into a futures contract, a fund is required to deposit either cash or securities (initial margin) with a clearing broker in an amount equal to a certain percentage of the face value of the contract. Futures contracts are marked-to-market daily and subsequent daily payments are made or received by a fund depending on the daily fluctuations in the value of the futures contracts and are recorded as unrealized appreciation or (depreciation). This receivable and/or payable, if any, is included in daily variation margin on futures contracts in the Statement of Assets and Liabilities. Realized gain or (loss) is recorded upon the expiration or closing of a futures contract. The net realized gain (loss) and change in net unrealized appreciation (depreciation) on futures contracts during the period is presented in the Statement of Operations.
Any open futures contracts at period end are presented in the Schedule of Investments under the caption "Futures Contracts". The notional amount at value reflects each contract's exposure to the underlying instrument or index at period end, and is representative of volume of activity during the period.
Any securities deposited to meet initial margin requirements are identified in the Schedule of Investments. Any cash deposited to meet initial margin requirements is presented as segregated cash with brokers for derivative instruments in the Statement of Assets and Liabilities.
5. Purchases and Sales of Investments.
Purchases and sales of securities, other than short-term securities and in-kind transactions, as applicable, are noted in the table below.
|
Purchases ($)
|
Sales ($)
|
Fidelity Growth Discovery Fund
|
3,430,686,188
|
2,543,940,186
|
Unaffiliated Redemptions In-Kind. Unaffiliated shareholders that redeemed shares in-kind for investments, including accrued interest and cash, if any, are shown in the table below. The total net realized gain or loss on investments delivered through in-kind redemptions is included in the "Net realized gain (loss) on: Redemptions in-kind" line in the accompanying Statement of Operations. The amount of the in-kind redemptions is included in share transactions in the accompanying Statement of Changes in Net Assets. There was no gain or loss for federal income tax purposes.
|
Shares
|
Net realized gain or loss on Affiliated Issuers ($)
|
Net realized gain or loss on Unaffiliated Issuers ($)
|
Total net realized gain or loss on Investments ($)
|
Total Proceeds ($)
|
Fidelity Growth Discovery Fund
|
19,242,053
|
-
|
554,951,694
|
554,951,694
|
1,284,554,781
|
Prior Fiscal Year Unaffiliated Redemptions In-Kind. Unaffiliated shareholders that redeemed shares in-kind for investments, including accrued interest and cash, if any, are shown in the table below; along with realized gain or loss on investments delivered through in-kind redemptions. The amount of the in-kind redemptions is included in share transactions in the accompanying Statement of Changes in Net Assets. There was no gain or loss for federal income tax purposes.
|
Shares
|
Total net realized gain or loss on Investments ($)
|
Total Proceeds ($)
|
Fidelity Growth Discovery Fund
|
5,541,301
|
268,261,597
|
344,296,738
|
6. Fees and Other Transactions with Affiliates.
Management Fee. Fidelity Management & Research Company LLC (the investment adviser) and its affiliates provide the Fund with investment management related services for which the Fund pays a monthly management fee.
The Fund's management contract incorporates a basic fee rate that may vary by class (subject to a performance adjustment). The investment adviser or an affiliate pays certain expenses of managing and operating the Fund out of each class's management fee. Each class of the Fund pays a management fee to the investment adviser. The management fee is calculated and paid to the investment adviser every month. The management fee is determined by calculating a basic fee and then applying a performance adjustment. When determining a class's basic fee, a mandate rate is calculated based on the monthly average net assets of a group of funds advised by FMR within a designated asset class. A discount rate is subtracted from the mandate rate once the Fund's monthly average net assets reach a certain level. The mandate rate and discount rate may vary by class. The annual basic fee rate for a class of shares of the Fund is the lesser of (1) the class's mandate rate reduced by the class's discount rate (if applicable) or (2) the amount set forth in the following table.
|
Maximum Management Fee Rate %
|
Growth Discovery
|
.66
|
Class K
|
.56
|
One-twelfth of the basic fee rate for a class is applied to the average net assets of the class for the month, giving a dollar amount which is the basic fee for the class for that month. A different management fee rate may be applicable to each class of the Fund. The difference between classes is the result of separate arrangements for class-level services and/or waivers of certain expenses. It is not the result of any difference in advisory or custodial fees or other expenses related to the management of the Fund's assets, which do not vary by class. For the reporting period, the total annualized management fee rates were as follows:
|
Total Management Fee Rate %
|
Growth Discovery
|
.60
|
Class K
|
.53
|
The performance adjustment rate is calculated monthly by comparing over the performance period the Fund's performance to that of the performance adjustment index listed below. Returns for certain performance adjustment indexes are adjusted for tax withholding rates applicable to U.S. based mutual funds.
|
Performance Adjustment Index
|
Fidelity Growth Discovery Fund
|
Russell 3000 Growth Index
|
For the purposes of calculating the performance adjustment for the Fund, the Fund's investment performance is based on the performance of Growth Discovery. To the extent that other classes of the Fund have higher expenses, this could result in those classes bearing a larger positive performance adjustment and smaller negative performance adjustment than would be the case if each class's own performance were considered. The performance period is the most recent 36 month period. The maximum annualized performance adjustment rate is ±.20% of the Fund's average net assets over the performance period. The performance adjustment rate is divided by twelve and multiplied by the Fund's average net assets over the performance period, and the resulting dollar amount is proportionately added to or subtracted from a class's basic fee. For the reporting period, the total annualized performance adjustment was (.14)%.
Brokerage Commissions. A portion of portfolio transactions were placed with brokerage firms which are affiliates of the investment adviser. Brokerage commissions are included in net realized gain (loss) and change in net unrealized appreciation (depreciation) in the Statement of Operations. The commissions paid to these affiliated firms were as follows:
|
Amount ($)
|
Fidelity Growth Discovery Fund
|
46,791
|
Interfund Lending Program. Pursuant to an Exemptive Order issued by the Securities and Exchange Commission (the SEC), the Fund, along with other registered investment companies having management contracts with Fidelity Management & Research Company LLC (FMR), or other affiliated entities of FMR, may participate in an interfund lending program. This program provides an alternative credit facility allowing the Fund to borrow from, or lend money to, other participating affiliated funds at rates that are beneficial to both the borrowing and lending fund. Borrowings under the program are generally for temporary or emergency purposes, including meeting fund shareholder redemptions. The interfund loan rate is determined, as specified in the Exemptive Order, by averaging, (1) the higher of the overnight time deposit rate and the current overnight repurchase agreement rate, and (2) a benchmark rate representing the lowest bank loan rate available to the funds. At period end, there were no interfund loans outstanding. Activity in this program during the period for which loans were outstanding was as follows:
|
Borrower or Lender
|
Average Loan Balance ($)
|
Weighted Average Interest Rate
|
Interest Expense ($)
|
Fidelity Growth Discovery Fund
|
Borrower
|
19,141,714
|
4.58%
|
34,065
|
Interfund Trades. Funds may purchase from or sell securities to other Fidelity Funds under procedures adopted by the Board of Trustees. The procedures have been designed to ensure these interfund trades are executed in accordance with Rule 17a-7 of the 1940 Act. Any interfund trades are included within the respective purchases and sales amounts shown in the Purchases and Sales of Investments note. Interfund trades during the period are noted in the table below.
|
Purchases ($)
|
Sales ($)
|
Realized Gain (Loss) ($)
|
Fidelity Growth Discovery Fund
|
262,094,329
|
205,590,089
|
7,314,417
|
7. Committed Line of Credit.
Certain Funds participate with other funds managed by the investment adviser or an affiliate in a $4.25 billion credit facility (the "line of credit") to be utilized for temporary or emergency purposes to fund shareholder redemptions or for other short-term liquidity purposes.
Commitment fees are charged based on the unused amount of the line of credit at an annual rate of .10%, and then allocated to each participating fund based on its pro-rata portion of the line of credit. The commitment fees are reflected in Miscellaneous expenses on the Statement of Operations, and are listed below.
Interest is charged to a participating fund based on its borrowings at an annual rate of .75% plus the highest of (i) daily SOFR plus a .10% spread adjustment, (ii) Federal Funds Effective Rate, or (iii) Overnight Bank Funding Rate. During the period, there were no borrowings on this line of credit.
The line of credit agreement will expire in March 2026 unless extended or renewed.
|
Amount ($)
|
Fidelity Growth Discovery Fund
|
3,553
|
8. Security Lending.
Funds lend portfolio securities from time to time in order to earn additional income. Lending agents are used, including National Financial Services (NFS), an affiliate of the investment adviser. Pursuant to a securities lending agreement, NFS will receive a fee, which is capped at 9.9% of a fund's daily lending revenue, for its services as lending agent. A fund may lend securities to certain qualified borrowers, including NFS. On the settlement date of the loan, the borrowers provide collateral (in the form of U.S. Treasury obligations, letters of credit and/or cash) against the loaned securities and maintains collateral in an amount not less than 100% of the fair value of the loaned securities during the period of the loan. The fair value of the loaned securities is determined at the close of business of a fund and any additional required collateral is delivered to a fund on the next business day. A fund or borrower may terminate the loan at any time, and if the borrower defaults on its obligation to return the securities loaned because of insolvency or other reasons, a fund may apply collateral received from the borrower against the obligation. A fund may experience delays and costs in recovering the securities loaned or gaining access to non-cash collateral. Any cash collateral received is invested in the Fidelity Securities Lending Cash Central Fund. Any loaned securities are identified as such in the Schedule of Investments, and the value of loaned securities and cash collateral at period end, as applicable, are presented in the Statement of Assets and Liabilities. Security lending income represents the income earned on investing cash collateral less rebates paid to borrowers, plus any premium income received, or for non-cash collateral, fees received from borrowers as compensation for the securities loaned. Securities lending income is reduced by any lending agent fees associated with the loan. Any security lending income earned on investing cash collateral is presented in the Statement of Operations as a component of income from Fidelity Central Funds. Any security lending income earned on non-cash collateral is presented in the Statement of Operations as a component of dividends. Affiliated security lending activity, if any, was as follows:
|
Total Security Lending Fees Paid to NFS ($)
|
Security Lending Income From Securities Loaned to NFS ($)
|
Value of Securities Loaned to NFS at Period End ($)
|
Fidelity Growth Discovery Fund
|
27,389
|
13,423
|
-
|
9. Distributions to Shareholders.
Distributions to shareholders of each class were as follows:
|
Six months ended
December 31, 2025
|
Year ended
June 30, 2025
|
Fidelity Growth Discovery Fund
|
|
|
Distributions to shareholders
|
|
|
Growth Discovery
|
$99,232,719
|
$656,325,543
|
Class K
|
12,061,526
|
72,043,397
|
Total
|
$111,294,245
|
$728,368,940
|
10. Share Transactions.
Share transactions for each class were as follows and may contain in-kind transactions, automatic conversions between classes or exchanges between affiliated funds:
|
Shares
|
Shares
|
Dollars
|
Dollars
|
|
Six months ended
December 31, 2025
|
Year ended
June 30, 2025
|
Six months ended
December 31, 2025
|
Year ended
June 30, 2025
|
Fidelity Growth Discovery Fund
|
|
|
|
|
Growth Discovery
|
|
|
|
|
Shares sold
|
22,633,758
|
25,370,863
|
$1,519,724,009
|
$1,578,561,607
|
Reinvestment of distributions
|
1,292,252
|
10,154,732
|
86,219,060
|
601,890,192
|
Shares redeemed
|
(27,841,485)
|
(29,364,939)
|
(1,874,639,131)
|
(1,791,187,382)
|
Net increase (decrease)
|
(3,915,475)
|
6,160,656
|
$(268,696,062)
|
$389,264,417
|
Class K
|
|
|
|
|
Shares sold
|
482,778
|
3,855,430
|
$33,094,902
|
$238,997,686
|
Reinvestment of distributions
|
180,400
|
1,214,747
|
12,061,526
|
72,043,397
|
Shares redeemed
|
(1,275,440)
|
(3,604,447)
|
(88,082,086)
|
(220,366,113)
|
Net increase (decrease)
|
(612,262)
|
1,465,730
|
$(42,925,658)
|
$90,674,970
|
11. Other.
A fund's organizational documents provide former and current trustees and officers with a limited indemnification against liabilities arising in connection with the performance of their duties to the fund. In the normal course of business, a fund may also enter into contracts that provide general indemnifications. A fund's maximum exposure under these arrangements is unknown as this would be dependent on future claims that may be made against a fund. The risk of material loss from such claims is considered remote.
12. Risk and Uncertainties.
Many factors affect a fund's performance. Developments that disrupt global economies and financial markets, such as public health emergencies, military conflicts, terrorism, government restrictions, political changes, and environmental disasters, may significantly affect a fund's investment performance. The effects of these developments to a fund will be impacted by the types of securities in which a fund invests, the financial condition, industry, economic sector, and geographic location of an issuer, and a fund's level of investment in the securities of that issuer. Significant concentrations in security types, issuers, industries, sectors, and geographic locations may magnify the factors that affect a fund's performance.
Item 8: Changes in and Disagreements with Accountants for Open-End Management Investment Companies
(Unaudited)
Note: This is not applicable for any fund included in this document.
Item 9: Proxy Disclosures for Open-End Management Investment Companies
(Unaudited)
Note: This is not applicable for any fund included in this document.
Item 10: Remuneration Paid to Directors, Officers, and others of Open-End Management Investment Companies
(Unaudited)
Note: This information is disclosed as part of the financial statements for each Fund as part of Item 7: Financial Statements and Financial Highlights for Open-End Management Investment Companies.
Item 11: Statement Regarding Basis for Approval of Investment Advisory Contract
(Unaudited)
Note: This is not applicable for any fund included in this document.
1.714430.127
CII-SANN-0226
Fidelity® Fund
Semi-Annual Report
December 31, 2025
Contents
To view a fund's proxy voting guidelines and proxy voting record for the 12-month period ended June 30, visit http://www.fidelity.com/proxyvotingresults or visit the Securities and Exchange Commission's (SEC) web site at http://www.sec.gov.
You may also call 1-800-544-8544 if you're an individual investing directly with Fidelity, call 1-800-835-5092 if you're a plan sponsor or participant with Fidelity as your recordkeeper or call 1-877-208-0098 on institutional accounts or if you're an advisor or invest through one to request a free copy of the proxy voting guidelines.
Standard & Poor's, S&P and S&P 500 are registered service marks of The McGraw-Hill Companies, Inc. and have been licensed for use by Fidelity Distributors Corporation.
Other third-party marks appearing herein are the property of their respective owners.
All other marks appearing herein are registered or unregistered trademarks or service marks of FMR LLC or an affiliated company. © 2026 FMR LLC. All rights reserved.
This report and the financial statements contained herein are submitted for the general information of the shareholders of the Fund. This report is not authorized for distribution to prospective investors in the Fund unless preceded or accompanied by an effective prospectus.
A fund files its complete schedule of portfolio holdings with the SEC for the first and third quarters of each fiscal year on Form N-PORT. Forms N-PORT are available on the SEC's web site at http://www.sec.gov. A fund's Forms N-PORT may be reviewed and copied at the SEC's Public Reference Room in Washington, DC. Information regarding the operation of the SEC's Public Reference Room may be obtained by calling 1-800-SEC-0330.
For a complete list of a fund's portfolio holdings, view the most recent holdings listing, semiannual report, or annual report on Fidelity's web site at http://www.fidelity.com, http://www.institutional.fidelity.com, or http://www.401k.com, as applicable.
NOT FDIC INSURED •MAY LOSE VALUE •NO BANK GUARANTEE
Neither the Fund nor Fidelity Distributors Corporation is a bank.
Item 7: Financial Statements and Financial Highlights for Open-End Management Investment Companies (Semi-Annual Report)
Schedule of Investments December 31, 2025 (Unaudited)
Showing Percentage of Net Assets
Common Stocks - 99.3%
|
|
|
|
Shares
|
Value ($)
|
BELGIUM - 0.4%
|
|
|
|
Health Care - 0.4%
|
|
|
|
Pharmaceuticals - 0.4%
|
|
|
|
UCB SA
|
|
140,200
|
39,312,461
|
CANADA - 1.0%
|
|
|
|
Energy - 1.0%
|
|
|
|
Oil, Gas & Consumable Fuels - 1.0%
|
|
|
|
Imperial Oil Ltd
|
|
983,708
|
84,986,408
|
Health Care - 0.0%
|
|
|
|
Biotechnology - 0.0%
|
|
|
|
Xenon Pharmaceuticals Inc (a)
|
|
63,900
|
2,863,998
|
TOTAL CANADA
|
|
|
87,850,406
|
NETHERLANDS - 0.3%
|
|
|
|
Health Care - 0.3%
|
|
|
|
Biotechnology - 0.3%
|
|
|
|
Argenx SE ADR (a)
|
|
27,000
|
22,705,650
|
Newamsterdam Pharma Co NV (a)
|
|
243,800
|
8,552,504
|
|
|
|
|
|
TOTAL NETHERLANDS
|
|
|
31,258,154
|
UNITED KINGDOM - 0.4%
|
|
|
|
Financials - 0.2%
|
|
|
|
Insurance - 0.2%
|
|
|
|
Hiscox Ltd
|
|
997,500
|
19,133,375
|
Industrials - 0.2%
|
|
|
|
Aerospace & Defense - 0.2%
|
|
|
|
Rolls-Royce Holdings PLC
|
|
1,167,500
|
18,056,220
|
TOTAL UNITED KINGDOM
|
|
|
37,189,595
|
UNITED STATES - 97.2%
|
|
|
|
Communication Services - 16.9%
|
|
|
|
Diversified Telecommunication Services - 0.8%
|
|
|
|
AT&T Inc
|
|
2,862,600
|
71,106,984
|
Entertainment - 1.9%
|
|
|
|
Netflix Inc (a)
|
|
1,020,200
|
95,653,952
|
Walt Disney Co/The
|
|
679,500
|
77,306,715
|
|
|
|
|
172,960,667
|
Interactive Media & Services - 14.2%
|
|
|
|
Alphabet Inc Class A
|
|
2,668,054
|
835,100,902
|
Meta Platforms Inc Class A
|
|
691,501
|
456,452,895
|
|
|
|
|
1,291,553,797
|
TOTAL COMMUNICATION SERVICES
|
|
|
1,535,621,448
|
Consumer Discretionary - 12.6%
|
|
|
|
Automobiles - 1.6%
|
|
|
|
General Motors Co
|
|
777,297
|
63,209,792
|
Tesla Inc (a)
|
|
184,500
|
82,973,340
|
|
|
|
|
146,183,132
|
Broadline Retail - 5.6%
|
|
|
|
Amazon.com Inc (a)
|
|
2,194,430
|
506,518,333
|
Hotels, Restaurants & Leisure - 3.1%
|
|
|
|
Booking Holdings Inc
|
|
14,400
|
77,116,752
|
Carnival Corp (a)
|
|
1,715,200
|
52,382,208
|
Expedia Group Inc Class A
|
|
179,700
|
50,910,807
|
Viking Holdings Ltd (a)
|
|
1,444,900
|
103,180,309
|
|
|
|
|
283,590,076
|
Household Durables - 0.2%
|
|
|
|
Somnigroup International Inc
|
|
253,100
|
22,596,768
|
Specialty Retail - 2.1%
|
|
|
|
O'Reilly Automotive Inc (a)
|
|
597,200
|
54,470,612
|
Ross Stores Inc
|
|
328,900
|
59,248,046
|
TJX Cos Inc/The
|
|
476,300
|
73,164,443
|
|
|
|
|
186,883,101
|
TOTAL CONSUMER DISCRETIONARY
|
|
|
1,145,771,410
|
Consumer Staples - 4.9%
|
|
|
|
Beverages - 3.3%
|
|
|
|
Coca-Cola Co/The
|
|
3,800,900
|
265,720,919
|
Keurig Dr Pepper Inc
|
|
1,166,000
|
32,659,660
|
|
|
|
|
298,380,579
|
Food Products - 0.5%
|
|
|
|
Mondelez International Inc
|
|
891,300
|
47,978,679
|
Household Products - 0.8%
|
|
|
|
Procter & Gamble Co/The
|
|
494,400
|
70,852,464
|
Personal Care Products - 0.3%
|
|
|
|
Kenvue Inc
|
|
1,890,049
|
32,603,345
|
TOTAL CONSUMER STAPLES
|
|
|
449,815,067
|
Energy - 1.8%
|
|
|
|
Oil, Gas & Consumable Fuels - 1.8%
|
|
|
|
Exxon Mobil Corp
|
|
1,013,085
|
121,914,649
|
Shell PLC ADR
|
|
600,900
|
44,154,132
|
TOTAL ENERGY
|
|
|
166,068,781
|
Financials - 15.8%
|
|
|
|
Banks - 10.3%
|
|
|
|
Bank of America Corp
|
|
5,312,800
|
292,204,000
|
Citigroup Inc
|
|
1,184,900
|
138,265,981
|
M&T Bank Corp
|
|
521,900
|
105,152,412
|
US Bancorp
|
|
2,068,425
|
110,371,158
|
Wells Fargo & Co
|
|
3,052,700
|
284,511,640
|
|
|
|
|
930,505,191
|
Financial Services - 3.2%
|
|
|
|
Mastercard Inc Class A
|
|
510,508
|
291,438,807
|
Insurance - 2.3%
|
|
|
|
Arthur J Gallagher & Co
|
|
822,000
|
212,725,380
|
Reinsurance Group of America Inc
|
|
4,100
|
834,186
|
|
|
|
|
213,559,566
|
TOTAL FINANCIALS
|
|
|
1,435,503,564
|
Health Care - 10.3%
|
|
|
|
Biotechnology - 2.1%
|
|
|
|
AbbVie Inc
|
|
178,500
|
40,785,465
|
Alnylam Pharmaceuticals Inc (a)
|
|
18,600
|
7,396,290
|
Biogen Inc (a)
|
|
102,300
|
18,003,777
|
Cogent Biosciences Inc (a)
|
|
476,900
|
16,939,488
|
Cytokinetics Inc (a)
|
|
151,800
|
9,645,372
|
Gilead Sciences Inc
|
|
477,200
|
58,571,528
|
Insmed Inc (a)
|
|
175,900
|
30,613,636
|
Moderna Inc (a)
|
|
313,900
|
9,256,911
|
Soleno Therapeutics Inc (a)
|
|
48,500
|
2,245,550
|
|
|
|
|
193,458,017
|
Health Care Equipment & Supplies - 3.1%
|
|
|
|
Boston Scientific Corp (a)
|
|
1,565,100
|
149,232,285
|
Edwards Lifesciences Corp (a)
|
|
692,700
|
59,052,675
|
Insulet Corp (a)
|
|
146,800
|
41,726,432
|
Medline Inc Class A
|
|
783,500
|
32,907,000
|
TransMedics Group Inc (a)
|
|
1
|
122
|
|
|
|
|
282,918,514
|
Health Care Providers & Services - 2.2%
|
|
|
|
Cencora Inc
|
|
111,300
|
37,591,575
|
CVS Health Corp
|
|
1,465,000
|
116,262,400
|
Humana Inc
|
|
164,526
|
42,140,044
|
|
|
|
|
195,994,019
|
Life Sciences Tools & Services - 1.2%
|
|
|
|
Danaher Corp
|
|
169,900
|
38,893,508
|
Thermo Fisher Scientific Inc
|
|
123,700
|
71,677,965
|
|
|
|
|
110,571,473
|
Pharmaceuticals - 1.7%
|
|
|
|
Eli Lilly & Co
|
|
145,800
|
156,688,344
|
TOTAL HEALTH CARE
|
|
|
939,630,367
|
Industrials - 8.1%
|
|
|
|
Aerospace & Defense - 3.4%
|
|
|
|
Anduril Industries Inc Class B (b)(c)
|
|
1,799
|
82,142
|
Anduril Industries Inc Class C (b)(c)
|
|
1
|
46
|
Boeing Co (a)
|
|
923,834
|
200,582,839
|
GE Aerospace
|
|
226,400
|
69,737,992
|
Howmet Aerospace Inc
|
|
159,100
|
32,618,682
|
|
|
|
|
303,021,701
|
Air Freight & Logistics - 0.7%
|
|
|
|
FedEx Corp
|
|
215,700
|
62,307,102
|
Building Products - 0.3%
|
|
|
|
Trane Technologies PLC
|
|
77,100
|
30,007,320
|
Construction & Engineering - 0.0%
|
|
|
|
Bowman Consulting Group Ltd (a)
|
|
82,524
|
2,724,942
|
Machinery - 2.0%
|
|
|
|
Parker-Hannifin Corp
|
|
148,600
|
130,613,456
|
Westinghouse Air Brake Technologies Corp
|
|
248,700
|
53,085,015
|
|
|
|
|
183,698,471
|
Passenger Airlines - 0.8%
|
|
|
|
Delta Air Lines Inc
|
|
539,100
|
37,413,540
|
United Airlines Holdings Inc (a)
|
|
332,900
|
37,224,878
|
|
|
|
|
74,638,418
|
Professional Services - 0.5%
|
|
|
|
Leidos Holdings Inc
|
|
251,000
|
45,280,400
|
Trading Companies & Distributors - 0.4%
|
|
|
|
WW Grainger Inc
|
|
36,300
|
36,628,515
|
TOTAL INDUSTRIALS
|
|
|
738,306,869
|
Information Technology - 24.7%
|
|
|
|
IT Services - 1.5%
|
|
|
|
IBM Corporation
|
|
465,500
|
137,885,755
|
Semiconductors & Semiconductor Equipment - 10.7%
|
|
|
|
Broadcom Inc
|
|
327,700
|
113,416,970
|
NVIDIA Corp
|
|
4,569,700
|
852,249,050
|
|
|
|
|
965,666,020
|
Software - 8.3%
|
|
|
|
Autodesk Inc (a)
|
|
326,000
|
96,499,260
|
Microsoft Corp
|
|
1,369,240
|
662,191,849
|
|
|
|
|
758,691,109
|
Technology Hardware, Storage & Peripherals - 4.2%
|
|
|
|
Apple Inc
|
|
1,420,600
|
386,204,316
|
TOTAL INFORMATION TECHNOLOGY
|
|
|
2,248,447,200
|
Materials - 0.9%
|
|
|
|
Chemicals - 0.9%
|
|
|
|
Corteva Inc
|
|
665,000
|
44,574,950
|
Mosaic Co/The
|
|
1,533,500
|
36,942,015
|
TOTAL MATERIALS
|
|
|
81,516,965
|
Real Estate - 0.5%
|
|
|
|
Residential REITs - 0.1%
|
|
|
|
Camden Property Trust
|
|
105,640
|
11,628,851
|
Retail REITs - 0.4%
|
|
|
|
Macerich Co/The
|
|
2,052,377
|
37,886,880
|
TOTAL REAL ESTATE
|
|
|
49,515,731
|
Utilities - 0.7%
|
|
|
|
Electric Utilities - 0.3%
|
|
|
|
Exelon Corp
|
|
717,300
|
31,267,107
|
Multi-Utilities - 0.4%
|
|
|
|
Sempra
|
|
391,600
|
34,574,364
|
TOTAL UTILITIES
|
|
|
65,841,471
|
TOTAL UNITED STATES
|
|
|
8,856,038,873
|
|
TOTAL COMMON STOCKS
(Cost $5,466,254,426)
|
|
|
9,051,649,489
|
|
|
|
|
|
Convertible Preferred Stocks - 0.1%
|
|
|
|
Shares
|
Value ($)
|
UNITED STATES - 0.1%
|
|
|
|
Industrials - 0.0%
|
|
|
|
Aerospace & Defense - 0.0%
|
|
|
|
Anduril Industries Inc Series G (b)(c)
|
|
17,400
|
794,484
|
Information Technology - 0.1%
|
|
|
|
Software - 0.1%
|
|
|
|
OpenAI Group Pbc Series A-2 (b)(c)
|
|
13,233
|
6,318,493
|
TOTAL UNITED STATES
|
|
|
7,112,977
|
|
TOTAL CONVERTIBLE PREFERRED STOCKS
(Cost $3,197,400)
|
|
|
7,112,977
|
|
|
|
|
|
Money Market Funds - 0.0%
|
|
|
|
Yield (%)
|
Shares
|
Value ($)
|
Fidelity Cash Central Fund (d)
|
|
3.79
|
208
|
208
|
Fidelity Securities Lending Cash Central Fund (d)(e)
|
|
3.77
|
9,947
|
9,948
|
|
TOTAL MONEY MARKET FUNDS
(Cost $9,948)
|
|
|
|
10,156
|
|
|
|
|
|
|
|
TOTAL INVESTMENT IN SECURITIES - 99.4%
(Cost $5,469,461,774)
|
9,058,772,622
|
NET OTHER ASSETS (LIABILITIES) - 0.6%
|
54,364,169
|
NET ASSETS - 100.0%
|
9,113,136,791
|
|
|
|
Legend
(a)
|
Non-income producing.
|
(b)
|
Restricted securities (including private placements) - Investment in securities not registered under the Securities Act of 1933 (excluding 144A issues). At the end of the period, the value of restricted securities (excluding 144A issues) amounted to $7,195,165 or 0.1% of net assets.
|
(d)
|
Affiliated fund that is generally available only to investment companies and other accounts managed by Fidelity Investments. The rate quoted is the annualized seven-day yield of the fund at period end. A complete unaudited listing of the fund's holdings as of its most recent quarter end is available upon request. In addition, each Fidelity Central Fund's financial statements are available on the SEC's website or upon request.
|
(e)
|
Investment made with cash collateral received from securities on loan.
|
Additional information on each restricted holding is as follows:
|
Security
|
Acquisition Date
|
Acquisition Cost ($)
|
Anduril Industries Inc Class B
|
6/16/2025
|
73,548
|
|
|
|
|
Anduril Industries Inc Class C
|
6/16/2025
|
41
|
|
|
|
|
Anduril Industries Inc Series G
|
4/17/2025
|
711,361
|
|
|
|
|
OpenAI Group Pbc Series A-2
|
9/30/2024
|
2,486,039
|
|
|
|
|
Affiliated Central Funds
Fiscal year to date information regarding the Fund's investments in Fidelity Central Funds, including the ownership percentage, is presented below.
Affiliate
|
Value,
beginning
of period ($)
|
Purchases ($)
|
Sales
Proceeds ($)
|
Dividend
Income ($)
|
Realized
Gain (loss) ($)
|
Change in
Unrealized
appreciation
(depreciation) ($)
|
Value,
end
of period ($)
|
Shares,
end
of period
|
% ownership,
end
of period
|
Fidelity Cash Central Fund
|
95,235,248
|
1,477,822,514
|
1,573,054,068
|
3,296,701
|
(3,462)
|
(24)
|
208
|
208
|
0.0%
|
Fidelity Securities Lending Cash Central Fund
|
80,332,269
|
239,068,389
|
319,400,658
|
71,749
|
9,948
|
-
|
9,948
|
9,947
|
0.0%
|
Total
|
175,567,517
|
1,716,890,903
|
1,892,454,726
|
3,368,450
|
6,486
|
(24)
|
10,156
|
|
|
|
|
|
|
|
|
|
|
|
|
|
Amounts in the dividend income column in the above table include any capital gain distributions from underlying funds, which are presented in the corresponding line item in the Statement of Operations, if applicable.
Amounts in the dividend income column for Fidelity Securities Lending Cash Central Fund represents the income earned on investing cash collateral, less rebates paid to borrowers and any lending agent fees associated with the loan, plus any premium income received for lending certain types of securities.
Amounts included in the purchases and sales proceeds columns may include in-kind transactions, if applicable.
Investment Valuation
The following is a summary of the inputs used, as of December 31, 2025, involving the Fund's assets and liabilities carried at fair value. The inputs or methodology used for valuing securities may not be an indication of the risk associated with investing in those securities. For more information on valuation inputs, and their aggregation into the levels used below, please refer to the Investment Valuation section in the accompanying Notes to Financial Statements.
Valuation Inputs at Reporting Date:
|
Description
|
Total ($)
|
Level 1 ($)
|
Level 2 ($)
|
Level 3 ($)
|
Investments in Securities:
|
|
|
|
|
|
|
Common Stocks
|
|
|
|
|
Communication Services
|
1,535,621,448
|
1,535,621,448
|
-
|
-
|
Consumer Discretionary
|
1,145,771,410
|
1,145,771,410
|
-
|
-
|
Consumer Staples
|
449,815,067
|
449,815,067
|
-
|
-
|
Energy
|
251,055,189
|
251,055,189
|
-
|
-
|
Financials
|
1,454,636,939
|
1,454,636,939
|
-
|
-
|
Health Care
|
1,013,064,980
|
1,013,064,980
|
-
|
-
|
Industrials
|
756,363,089
|
738,224,681
|
18,056,220
|
82,188
|
Information Technology
|
2,248,447,200
|
2,248,447,200
|
-
|
-
|
Materials
|
81,516,965
|
81,516,965
|
-
|
-
|
Real Estate
|
49,515,731
|
49,515,731
|
-
|
-
|
Utilities
|
65,841,471
|
65,841,471
|
-
|
-
|
|
|
Convertible Preferred Stocks
|
|
|
|
|
Industrials
|
794,484
|
-
|
-
|
794,484
|
Information Technology
|
6,318,493
|
-
|
-
|
6,318,493
|
|
|
Money Market Funds
|
10,156
|
10,156
|
-
|
-
|
Total Investments in Securities:
|
9,058,772,622
|
9,033,521,237
|
18,056,220
|
7,195,165
|
Financial Statements (Unaudited)
Statement of Assets and Liabilities
|
|
As of December 31, 2025 (Unaudited)
|
Assets
|
|
|
|
|
Investment in securities, at value - See accompanying schedule:
|
|
|
|
|
Unaffiliated issuers (cost $5,469,451,826)
|
$
|
9,058,762,466
|
|
|
Fidelity Central Funds (cost $9,948)
|
|
10,156
|
|
|
|
|
|
|
|
|
|
|
|
|
|
|
Total Investment in Securities (cost $5,469,461,774)
|
|
|
$
|
9,058,772,622
|
Receivable for investments sold
|
|
|
|
69,410,891
|
Receivable for fund shares sold
|
|
|
|
1,637,548
|
Dividends receivable
|
|
|
|
3,494,604
|
Distributions receivable from Fidelity Central Funds
|
|
|
|
131,371
|
Prepaid expenses
|
|
|
|
6,920
|
Other receivables
|
|
|
|
27,197
|
Total assets
|
|
|
|
9,133,481,153
|
Liabilities
|
|
|
|
|
Payable to custodian bank
|
$
|
1,722
|
|
|
Payable for investments purchased
|
|
2,002,995
|
|
|
Payable for fund shares redeemed
|
|
2,188,504
|
|
|
Accrued management fee
|
|
3,177,706
|
|
|
Notes payable to affiliates
|
|
12,896,000
|
|
|
Other payables and accrued expenses
|
|
77,435
|
|
|
Total liabilities
|
|
|
|
20,344,362
|
Net Assets
|
|
|
$
|
9,113,136,791
|
Net Assets consist of:
|
|
|
|
|
Paid in capital
|
|
|
$
|
4,387,893,225
|
Total accumulated earnings (loss)
|
|
|
|
4,725,243,566
|
Net Assets
|
|
|
$
|
9,113,136,791
|
|
|
|
|
|
|
Net Asset Value and Maximum Offering Price
|
|
|
|
|
Fidelity Fund :
|
|
|
|
|
Net Asset Value, offering price and redemption price per share ($8,809,047,562 ÷ 78,433,079 shares)
|
|
|
$
|
112.31
|
Class K :
|
|
|
|
|
Net Asset Value, offering price and redemption price per share ($304,089,229 ÷ 2,705,293 shares)
|
|
|
$
|
112.41
|
Statement of Operations
|
Six months ended December 31, 2025 (Unaudited)
|
Investment Income
|
|
|
|
|
Dividends
|
|
|
$
|
31,406,843
|
Interest
|
|
|
|
18,385
|
Income from Fidelity Central Funds (including $71,749 from security lending)
|
|
|
|
3,368,450
|
Total income
|
|
|
|
34,793,678
|
Expenses
|
|
|
|
|
Management fee
|
$
|
18,643,267
|
|
|
Custodian fees and expenses
|
|
61,120
|
|
|
Independent trustees' fees and expenses
|
|
17,742
|
|
|
Registration fees
|
|
40,238
|
|
|
Audit fees
|
|
45,114
|
|
|
Legal
|
|
8,840
|
|
|
Interest
|
|
4,270
|
|
|
Miscellaneous
|
|
11,087
|
|
|
Total expenses
|
|
|
|
18,831,678
|
Net Investment income (loss)
|
|
|
|
15,962,000
|
Realized and Unrealized Gain (Loss)
|
|
|
|
|
Net realized gain (loss) on:
|
|
|
|
|
Investment Securities:
|
|
|
|
|
Unaffiliated issuers (net of foreign taxes of $1,157,619)
|
|
185,082,046
|
|
|
Redemptions in-kind
|
|
1,016,477,964
|
|
|
Fidelity Central Funds
|
|
6,486
|
|
|
Foreign currency transactions
|
|
451,995
|
|
|
Futures contracts
|
|
6,016,330
|
|
|
Total net realized gain (loss)
|
|
|
|
1,208,034,821
|
Change in net unrealized appreciation (depreciation) on:
|
|
|
|
|
Investment Securities:
|
|
|
|
|
Unaffiliated issuers
|
|
(183,723,377)
|
|
|
Fidelity Central Funds
|
|
(24)
|
|
|
Assets and liabilities in foreign currencies
|
|
5,518
|
|
|
Total change in net unrealized appreciation (depreciation)
|
|
|
|
(183,717,883)
|
Net gain (loss)
|
|
|
|
1,024,316,938
|
Net increase (decrease) in net assets resulting from operations
|
|
|
$
|
1,040,278,938
|
Statement of Changes in Net Assets
|
|
|
|
|
Six months ended
December 31, 2025
(Unaudited)
|
|
Year ended
June 30, 2025
|
Increase (Decrease) in Net Assets
|
|
|
|
|
Operations
|
|
|
|
|
Net investment income (loss)
|
$
|
15,962,000
|
$
|
26,749,666
|
Net realized gain (loss)
|
|
1,208,034,821
|
|
1,739,805,867
|
Change in net unrealized appreciation (depreciation)
|
|
(183,717,883)
|
|
(830,051,188)
|
Net increase (decrease) in net assets resulting from operations
|
|
1,040,278,938
|
|
936,504,345
|
Distributions to shareholders
|
|
(107,608,837)
|
|
-
|
|
|
|
|
|
|
Share transactions - net increase (decrease)
|
|
(301,667,625)
|
|
(685,113,318)
|
Total increase (decrease) in net assets
|
|
631,002,476
|
|
251,391,027
|
|
|
|
|
|
|
Net Assets
|
|
|
|
|
Beginning of period
|
|
8,482,134,315
|
|
8,230,743,288
|
End of period
|
$
|
9,113,136,791
|
$
|
8,482,134,315
|
|
|
|
|
|
|
|
|
|
|
|
|
Financial Highlights
|
|
Six months ended
December 31, 2025
(Unaudited)
|
|
Years ended June 30, 2025
|
|
2024
|
|
2023
|
|
2022
|
|
2021
|
Selected Per-Share Data
|
|
|
|
|
|
|
|
|
|
|
|
|
Net asset value, beginning of period
|
$
|
101.22
|
$
|
90.56
|
$
|
69.85
|
$
|
58.06
|
$
|
72.20
|
$
|
54.21
|
Income from Investment Operations
|
|
|
|
|
|
|
|
|
|
|
|
|
Net investment income (loss) A,B
|
|
.19
|
|
.30
|
|
.42
|
|
.44
|
|
.25
|
|
.28
|
Net realized and unrealized gain (loss)
|
|
12.22
|
|
10.36
|
|
22.08
|
|
11.74
|
|
(10.75)
|
|
19.40
|
Total from investment operations
|
|
12.41
|
|
10.66
|
|
22.50
|
|
12.18
|
|
(10.50)
|
|
19.68
|
Distributions from net investment income
|
|
(.45)
|
|
-
|
|
(.49)
|
|
(.39)
|
|
(.21)
|
|
(.32)
|
Distributions from net realized gain
|
|
(.87)
|
|
-
|
|
(1.31)
|
|
-
|
|
(3.44)
|
|
(1.38)
|
Total distributions
|
|
(1.32)
|
|
-
|
|
(1.79) C
|
|
(.39)
|
|
(3.64) C
|
|
(1.69) C
|
Net asset value, end of period
|
$
|
112.31
|
$
|
101.22
|
$
|
90.56
|
$
|
69.85
|
$
|
58.06
|
$
|
72.20
|
Total Return D,E
|
|
|
|
11.77%
|
|
32.89%
|
|
21.06%
|
|
(15.60)%
|
|
36.94%
|
Ratios to Average Net Assets B,F,G
|
|
|
|
|
|
|
|
|
|
|
|
|
Expenses before reductions
|
|
.42% H
|
|
.42%
|
|
.45%
|
|
.46%
|
|
.45%
|
|
.47%
|
Expenses net of fee waivers, if any
|
|
|
|
.42%
|
|
.44%
|
|
.46%
|
|
.45%
|
|
.47%
|
Expenses net of all reductions, if any
|
|
.42% H
|
|
.42%
|
|
.44%
|
|
.46%
|
|
.45%
|
|
.46%
|
Net investment income (loss)
|
|
.35% H
|
|
.32%
|
|
.55%
|
|
.71%
|
|
.35%
|
|
.44%
|
Supplemental Data
|
|
|
|
|
|
|
|
|
|
|
|
|
Net assets, end of period (000 omitted)
|
$
|
8,809,048
|
$
|
8,184,621
|
$
|
7,905,243
|
$
|
6,125,431
|
$
|
5,467,793
|
$
|
6,757,824
|
Portfolio turnover rate I
|
|
|
|
31% J
|
|
25% J
|
|
43% J
|
|
39%
|
|
34% K
|
ACalculated based on average shares outstanding during the period.
BNet investment income (loss) is affected by the timing of the declaration of dividends by any underlying mutual funds or exchange-traded funds (ETFs). Net investment income (loss) of any mutual funds or ETFs is not included in the Fund's net investment income (loss) ratio.
CTotal distributions per share do not sum due to rounding.
DTotal returns for periods of less than one year are not annualized.
ETotal returns would have been lower if certain expenses had not been reduced during the applicable periods shown.
FFees and expenses of any underlying mutual funds or exchange-traded funds (ETFs) are not included in the Fund's expense ratio. The Fund indirectly bears its proportionate share of these expenses. For additional expense information related to investments in Fidelity Central Funds, please refer to the "Investments in Fidelity Central Funds" note found in the Notes to Financial Statements section of the most recent Annual or Semi-Annual report.
GExpense ratios reflect operating expenses of the class. Expenses before reductions do not reflect amounts reimbursed, waived, or reduced through arrangements with the investment adviser, brokerage services, or other offset arrangements, if applicable, and do not represent the amount paid by the class during periods when reimbursements, waivers or reductions occur.
HAnnualized.
IAmount does not include the portfolio activity of any underlying mutual funds or exchange-traded funds (ETFs), derivatives or securities that mature within one year from acquisition.
JPortfolio turnover rate excludes securities received or delivered in-kind.
KThe portfolio turnover rate does not include the assets acquired in the reorganization.
|
|
Six months ended
December 31, 2025
(Unaudited)
|
|
Years ended June 30, 2025
|
|
2024
|
|
2023
|
|
2022
|
|
2021
|
Selected Per-Share Data
|
|
|
|
|
|
|
|
|
|
|
|
|
Net asset value, beginning of period
|
$
|
101.34
|
$
|
90.60
|
$
|
69.88
|
$
|
58.07
|
$
|
72.21
|
$
|
54.20
|
Income from Investment Operations
|
|
|
|
|
|
|
|
|
|
|
|
|
Net investment income (loss) A,B
|
|
.24
|
|
.38
|
|
.48
|
|
.50
|
|
.30
|
|
.33
|
Net realized and unrealized gain (loss)
|
|
12.24
|
|
10.36
|
|
22.09
|
|
11.74
|
|
(10.74)
|
|
19.41
|
Total from investment operations
|
|
12.48
|
|
10.74
|
|
22.57
|
|
12.24
|
|
(10.44)
|
|
19.74
|
Distributions from net investment income
|
|
(.53)
|
|
-
|
|
(.55)
|
|
(.43)
|
|
(.26)
|
|
(.35)
|
Distributions from net realized gain
|
|
(.87)
|
|
-
|
|
(1.31)
|
|
-
|
|
(3.44)
|
|
(1.38)
|
Total distributions
|
|
(1.41) C
|
|
-
|
|
(1.85) C
|
|
(.43)
|
|
(3.70)
|
|
(1.73)
|
Net asset value, end of period
|
$
|
112.41
|
$
|
101.34
|
$
|
90.60
|
$
|
69.88
|
$
|
58.07
|
$
|
72.21
|
Total Return D,E
|
|
|
|
11.85%
|
|
33.00%
|
|
21.18%
|
|
(15.54)%
|
|
37.07%
|
Ratios to Average Net Assets B,F,G
|
|
|
|
|
|
|
|
|
|
|
|
|
Expenses before reductions
|
|
.34% H
|
|
.34%
|
|
.37%
|
|
.38%
|
|
.38%
|
|
.39%
|
Expenses net of fee waivers, if any
|
|
|
|
.34%
|
|
.36%
|
|
.37%
|
|
.37%
|
|
.39%
|
Expenses net of all reductions, if any
|
|
.34% H
|
|
.34%
|
|
.36%
|
|
.37%
|
|
.37%
|
|
.38%
|
Net investment income (loss)
|
|
.43% H
|
|
.40%
|
|
.63%
|
|
.79%
|
|
.43%
|
|
.52%
|
Supplemental Data
|
|
|
|
|
|
|
|
|
|
|
|
|
Net assets, end of period (000 omitted)
|
$
|
304,089
|
$
|
297,513
|
$
|
325,500
|
$
|
237,320
|
$
|
673,876
|
$
|
411,377
|
Portfolio turnover rate I
|
|
|
|
31% J
|
|
25% J
|
|
43% J
|
|
39%
|
|
34% K
|
ACalculated based on average shares outstanding during the period.
BNet investment income (loss) is affected by the timing of the declaration of dividends by any underlying mutual funds or exchange-traded funds (ETFs). Net investment income (loss) of any mutual funds or ETFs is not included in the Fund's net investment income (loss) ratio.
CTotal distributions per share do not sum due to rounding.
DTotal returns for periods of less than one year are not annualized.
ETotal returns would have been lower if certain expenses had not been reduced during the applicable periods shown.
FFees and expenses of any underlying mutual funds or exchange-traded funds (ETFs) are not included in the Fund's expense ratio. The Fund indirectly bears its proportionate share of these expenses. For additional expense information related to investments in Fidelity Central Funds, please refer to the "Investments in Fidelity Central Funds" note found in the Notes to Financial Statements section of the most recent Annual or Semi-Annual report.
GExpense ratios reflect operating expenses of the class. Expenses before reductions do not reflect amounts reimbursed, waived, or reduced through arrangements with the investment adviser, brokerage services, or other offset arrangements, if applicable, and do not represent the amount paid by the class during periods when reimbursements, waivers or reductions occur.
HAnnualized.
IAmount does not include the portfolio activity of any underlying mutual funds or exchange-traded funds (ETFs), derivatives or securities that mature within one year from acquisition.
JPortfolio turnover rate excludes securities received or delivered in-kind.
KThe portfolio turnover rate does not include the assets acquired in the reorganization.
Notes to Financial Statements
(Unaudited)For the period ended December 31, 2025
1. Organization.
Fidelity Fund (the Fund) is a fund of Fidelity Hastings Street Trust (the Trust) and is authorized to issue an unlimited number of shares. The Trust is registered under the Investment Company Act of 1940, as amended (the 1940 Act), as an open-end management investment company organized as a Massachusetts business trust. The Fund offers Fidelity Fund and Class K shares, each of which has equal rights as to assets and voting privileges.
2. Investments in Fidelity Central Funds.
Funds may invest in Fidelity Central Funds, which are open-end investment companies generally available only to other investment companies and accounts managed by the investment adviser and its affiliates. The Schedule of Investments lists any Fidelity Central Funds held as an investment as of period end, but does not include the underlying holdings of each Fidelity Central Fund. An investing fund indirectly bears its proportionate share of the expenses of the underlying Fidelity Central Funds.
Based on its investment objective, each Fidelity Central Fund may invest or participate in various investment vehicles or strategies that are similar to those of the investing fund. These strategies are consistent with the investment objectives of the investing fund and may involve certain economic risks which may cause a decline in value of each of the Fidelity Central Funds and thus a decline in the value of the investing fund.
Fidelity Central Fund
|
Investment Manager
|
Investment Objective
|
Investment Practices
|
Expense RatioA
|
Fidelity Money Market Central Funds
|
Fidelity Management & Research Company LLC (FMR)
|
Each fund seeks to obtain a high level of current income consistent with the preservation of capital and liquidity.
|
Short-term Investments
|
Less than .005%
|
A Expenses expressed as a percentage of average net assets and are as of each underlying Central Fund's most recent annual or semi-annual shareholder report.
A complete unaudited list of holdings for each Fidelity Central Fund is available upon request or at the Securities and Exchange Commission website at www.sec.gov. In addition, the financial statements of the Fidelity Central Funds which contain the significant accounting policies (including investment valuation policies) of those funds, and are not covered by the Report of Independent Registered Public Accounting Firm, are available on the Securities and Exchange Commission website or upon request.
3. Significant Accounting Policies.
The Fund is an investment company and applies the accounting and reporting guidance of the Financial Accounting Standards Board (FASB) Accounting Standards Codification Topic 946 Financial Services - Investment Companies. The financial statements have been prepared in conformity with accounting principles generally accepted in the United States of America (GAAP), which require management to make certain estimates and assumptions at the date of the financial statements. Actual results could differ from those estimates. The Fund operates as a single operating segment. The Fund's income, expenses, assets, and performance are regularly monitored and assessed as a whole by the investment adviser and other individuals responsible for oversight functions of the Trust, using the information presented in the financial statements and financial highlights. Subsequent events, if any, through the date that the financial statements were issued have been evaluated in the preparation of the financial statements. The Fund's Schedule of Investments lists any underlying mutual funds or exchange-traded funds but does not include the underlying holdings of these funds. The following summarizes the significant accounting policies of the Fund:
Investment Valuation. Investments are valued as of 4:00 p.m. Eastern time on the last calendar day of the period. The Board of Trustees (the Board) has designated the Fund's investment adviser as the valuation designee responsible for the fair valuation function and performing fair value determinations as needed. The investment adviser has established a Fair Value Committee (the Committee) to carry out the day-to-day fair valuation responsibilities and has adopted policies and procedures to govern the fair valuation process and the activities of the Committee. In accordance with these fair valuation policies and procedures, which have been approved by the Board, the Fund attempts to obtain prices from one or more third party pricing services or brokers to value its investments. When current market prices, quotations or currency exchange rates are not readily available or reliable, investments will be fair valued in good faith by the Committee, in accordance with the policies and procedures. Factors used in determining fair value vary by investment type and may include market or investment specific events, transaction data, estimated cash flows, and market observations of comparable investments. The frequency that the fair valuation procedures are used cannot be predicted and they may be utilized to a significant extent. The Committee manages the Fund's fair valuation practices and maintains the fair valuation policies and procedures. The Fund's investment adviser reports to the Board information regarding the fair valuation process and related material matters.
The Fund categorizes the inputs to valuation techniques used to value its investments into a disclosure hierarchy consisting of three levels as shown below:
Level 1 - unadjusted quoted prices in active markets for identical investments
Level 2 - other significant observable inputs (including quoted prices for similar investments, interest rates, prepayment speeds, etc.)
Level 3 - unobservable inputs (including the Fund's own assumptions based on the best information available)
Valuation techniques used to value the Fund's investments by major category are as follows:
Equity securities, including restricted securities, for which market quotations are readily available, are valued at the last reported sale price or official closing price as reported by a third party pricing service on the primary market or exchange on which they are traded and are categorized as Level 1 in the hierarchy. In the event there were no sales during the day or closing prices are not available, securities are valued at the last quoted bid price or may be valued using the last available price and are generally categorized as Level 2 in the hierarchy. For foreign equity securities, when market or security specific events arise, comparisons to the valuation of American Depositary Receipts (ADRs), futures contracts, Exchange-Traded Funds (ETFs) and certain indexes as well as quoted prices for similar securities may be used and would be categorized as Level 2 in the hierarchy. For equity securities, including restricted securities, where observable inputs are limited, assumptions about market activity and risk are used and these securities may be categorized as Level 3 in the hierarchy.
Investments in open-end mutual funds, including the Fidelity Central Funds, are valued at their closing net asset value (NAV) each business day and are categorized as Level 1 in the hierarchy.
Changes in valuation techniques may result in transfers in or out of an assigned level within the disclosure hierarchy. The aggregate value of investments by input level as of December 31, 2025 is included at the end of the Fund's Schedule of Investments.
Foreign Currency. Certain Funds may use foreign currency contracts to facilitate transactions in foreign-denominated securities. Gains and losses from these transactions may arise from changes in the value of the foreign currency or if the counterparties do not perform under the contracts' terms.
Foreign-denominated assets, including investment securities, and liabilities are translated into U.S. dollars at the exchange rates at period end. Purchases and sales of investment securities, income and dividends received, and expenses denominated in foreign currencies are translated into U.S. dollars at the exchange rate in effect on the transaction date.
The effects of exchange rate fluctuations on investments are included with the net realized and unrealized gain (loss) on investment securities. Other foreign currency transactions resulting in realized and unrealized gain (loss) are disclosed separately.
Investment Transactions and Income. For financial reporting purposes, the Fund's investment holdings and NAV include trades executed through the end of the last business day of the period. The NAV per share for processing shareholder transactions is calculated as of the close of business of the New York Stock Exchange (NYSE), normally 4:00 p.m. Eastern time and includes trades executed through the end of the prior business day. Gains and losses on securities sold are determined on the basis of identified cost and include proceeds received from litigation. Commissions paid to certain brokers with whom the investment adviser, or its affiliates, places trades on behalf of a fund include an amount in addition to trade execution, which may be rebated back to a fund. Any such rebates are included in net realized gain (loss) on investments in the Statement of Operations. Dividend income is recorded on the ex-dividend date, except for certain dividends from foreign securities where the ex-dividend date may have passed, which are recorded as soon as the Fund is informed of the ex-dividend date. Non-cash dividends included in dividend income, if any, are recorded at the fair market value of the securities received. Income and capital gain distributions from Fidelity Central Funds, if any, are recorded on the ex-dividend date. Certain distributions received by the Fund represent a return of capital or capital gain. The Fund determines the components of these distributions subsequent to the ex-dividend date, based upon receipt of tax filings or other correspondence relating to the underlying investment. These distributions are recorded as a reduction of cost of investments and/or as a realized gain. Interest income is accrued as earned and includes coupon interest and amortization of premium and accretion of discount on debt securities as applicable. Investment income is recorded net of foreign taxes withheld where recovery of such taxes is uncertain. Funds may file withholding tax reclaims in certain jurisdictions to recover a portion of amounts previously withheld. Any withholding tax reclaims income is included in the Statement of Operations in dividends. Any receivables for withholding tax reclaims are included in the Statement of Assets and Liabilities in dividends receivable.
Class Allocations and Expenses. Investment income, realized and unrealized capital gains and losses, common expenses of a fund, and certain fund-level expense reductions, if any, are allocated daily on a pro-rata basis to each class based on the relative net assets of each class to the total net assets of a fund. Each class differs with respect to transfer agent and distribution and service plan fees incurred, as applicable. Certain expense reductions may also differ by class, if applicable. For the reporting period, the allocated portion of income and expenses to each class as a percent of its average net assets may vary due to the timing of recording these transactions in relation to fluctuating net assets of the classes. Expenses directly attributable to a fund are charged to that fund. Expenses attributable to more than one fund are allocated among the respective funds on the basis of relative net assets or other appropriate methods. Expenses included in the accompanying financial statements reflect the expenses of that fund and do not include any expenses associated with any underlying mutual funds or exchange-traded funds. Although not included in a fund's expenses, a fund indirectly bears its proportionate share of these expenses through the net asset value of each underlying mutual fund or exchange-traded fund. Expense estimates are accrued in the period to which they relate and adjustments are made when actual amounts are known.
Income Tax Information and Distributions to Shareholders. Each year, the Fund intends to qualify as a regulated investment company under Subchapter M of the Internal Revenue Code, including distributing substantially all of its taxable income and realized gains. As a result, no provision for U.S. Federal income taxes is required. The Fund files a U.S. federal tax return, in addition to state and local tax returns as required. The Fund's federal income tax returns are subject to examination by the Internal Revenue Service (IRS) for a period of three fiscal years after they are filed. State and local tax returns may be subject to examination for an additional fiscal year depending on the jurisdiction. Foreign taxes are provided for based on the Fund's understanding of the tax rules and rates that exist in the foreign markets in which it invests. The Fund is subject to a tax imposed on capital gains by certain countries in which it invests.
Distributions are declared and recorded on the ex-dividend date. Income and capital gain distributions are declared separately for each class. Income and capital gain distributions are determined in accordance with income tax regulations, which may differ from GAAP.
Capital accounts within the financial statements are adjusted for permanent book-tax differences. These adjustments have no impact on net assets or the results of operations. Capital accounts are not adjusted for temporary book-tax differences which will reverse in a subsequent period.
Book-tax differences are primarily due to futures contracts, foreign currency transactions, redemptions in-kind and losses deferred due to wash sales.
As of period end, the cost and unrealized appreciation (depreciation) in securities, and derivatives if applicable, for federal income tax purposes were as follows:
Gross unrealized appreciation
|
$3,666,474,042
|
Gross unrealized depreciation
|
(77,532,974)
|
Net unrealized appreciation (depreciation)
|
$3,588,941,068
|
Tax cost
|
$5,469,831,554
|
Restricted Securities (including Private Placements). Funds may invest in securities that are subject to legal or contractual restrictions on resale. These securities generally may be resold in transactions exempt from registration or to the public if the securities are registered. Disposal of these securities may involve time-consuming negotiations and expense, and prompt sale at an acceptable price may be difficult. Information regarding restricted securities held at period end is included at the end of the Schedule of Investments, if applicable.
4. Derivative Instruments.
Risk Exposures and the Use of Derivative Instruments. The Fund's investment objectives allow for various types of derivative instruments, including futures contracts. Derivatives are investments whose value is primarily derived from underlying assets, indices or reference rates and may be transacted on an exchange or over-the-counter (OTC). Derivatives may involve a future commitment to buy or sell a specified asset based on specified terms, to exchange future cash flows at periodic intervals based on a notional principal amount, or for one party to make one or more payments upon the occurrence of specified events in exchange for periodic payments from the other party.
Derivatives were used to increase returns and to manage exposure to certain risks as defined below. The success of any strategy involving derivatives depends on analysis of numerous economic factors, and if the strategies for investment do not work as intended, the objectives may not be achieved.
Derivatives were used to increase or decrease exposure to the following risk(s):
Equity Risk
|
Equity risk relates to the fluctuations in the value of financial instruments as a result of changes in market prices (other than those arising from interest rate risk or foreign exchange risk), whether caused by factors specific to an individual investment, its issuer, or all factors affecting all instruments traded in a market or market segment.
|
Funds are also exposed to additional risks from investing in derivatives, such as liquidity risk and counterparty credit risk. Liquidity risk is the risk that a fund will be unable to close out the derivative in the open market in a timely manner. Counterparty credit risk is the risk that the counterparty will not be able to fulfill its obligation to a fund. Counterparty credit risk related to exchange-traded contracts may be mitigated by the protection provided by the exchange on which they trade.
Investing in derivatives may involve greater risks than investing in the underlying assets directly and, to varying degrees, may involve risk of loss in excess of any initial investment and collateral received and amounts recognized in the Statement of Assets and Liabilities. In addition, there may be the risk that the change in value of the derivative contract does not correspond to the change in value of the underlying instrument.
Futures Contracts. A futures contract is an agreement between two parties to buy or sell a specified underlying instrument for a fixed price at a specified future date. Futures contracts were used to manage exposure to the stock market.
Upon entering into a futures contract, a fund is required to deposit either cash or securities (initial margin) with a clearing broker in an amount equal to a certain percentage of the face value of the contract. Futures contracts are marked-to-market daily and subsequent daily payments are made or received by a fund depending on the daily fluctuations in the value of the futures contracts and are recorded as unrealized appreciation or (depreciation). This receivable and/or payable, if any, is included in daily variation margin on futures contracts in the Statement of Assets and Liabilities. Realized gain or (loss) is recorded upon the expiration or closing of a futures contract. The net realized gain (loss) and change in net unrealized appreciation (depreciation) on futures contracts during the period is presented in the Statement of Operations.
Any open futures contracts at period end are presented in the Schedule of Investments under the caption "Futures Contracts". The notional amount at value reflects each contract's exposure to the underlying instrument or index at period end.
Any securities deposited to meet initial margin requirements are identified in the Schedule of Investments. Any cash deposited to meet initial margin requirements is presented as segregated cash with brokers for derivative instruments in the Statement of Assets and Liabilities.
5. Purchases and Sales of Investments.
Purchases and sales of securities, other than short-term securities and in-kind transactions, as applicable, are noted in the table below.
|
Purchases ($)
|
Sales ($)
|
Fidelity Fund
|
3,752,763,022
|
2,319,894,379
|
Unaffiliated Redemptions In-Kind. Unaffiliated shareholders that redeemed shares in-kind for investments, including accrued interest and cash, if any, are shown in the table below. The total net realized gain or loss on investments delivered through in-kind redemptions is included in the "Net realized gain (loss) on: Redemptions in-kind" line in the accompanying Statement of Operations. The amount of the in-kind redemptions is included in share transactions in the accompanying Statement of Changes in Net Assets. There was no gain or loss for federal income tax purposes.
|
Shares
|
Net realized gain or loss on Affiliated Issuers ($)
|
Net realized gain or loss on Unaffiliated Issuers ($)
|
Total net realized gain or loss on Investments ($)
|
Total Proceeds ($)
|
Fidelity Fund
|
16,175,685
|
-
|
1,016,477,964
|
1,016,477,964
|
1,790,557,386
|
Prior Fiscal Year Unaffiliated Redemptions In-Kind. Unaffiliated shareholders that redeemed shares in-kind for investments, including accrued interest and cash, if any, are shown in the table below; along with realized gain or loss on investments delivered through in-kind redemptions. The amount of the in-kind redemptions is included in share transactions in the accompanying Statement of Changes in Net Assets. There was no gain or loss for federal income tax purposes.
|
Shares
|
Total net realized gain or loss on Investments ($)
|
Total Proceeds ($)
|
Fidelity Fund
|
26,276,518
|
1,467,282,026
|
2,399,477,110
|
6. Fees and Other Transactions with Affiliates.
Management Fee. Fidelity Management & Research Company LLC (the investment adviser) and its affiliates provide the Fund with investment management related services for which the Fund pays a monthly management fee.
The Fund's management contract incorporates a management fee rate that may vary by class. The investment adviser or an affiliate pays certain expenses of managing and operating the Fund out of each class's management fee. Each class of the Fund pays a management fee to the investment adviser. The management fee is calculated and paid to the investment adviser every month. When determining a class's management fee, a mandate rate is calculated based on the monthly average net assets of a group of funds advised by FMR within a designated asset class. A discount rate is subtracted from the mandate rate once the Fund's monthly average net assets reach a certain level. The mandate rate and discount rate may vary by class. The annual management fee rate for a class of shares of the Fund is the lesser of (1) the class's mandate rate reduced by the class's discount rate (if applicable) or (2) the amount set forth in the following table.
|
Maximum Management Fee Rate %
|
Fidelity Fund
|
.42
|
Class K
|
.34
|
One-twelfth of the management fee rate for a class is applied to the average net assets of the class for the month, giving a dollar amount which is the management fee for the class for that month. A different management fee rate may be applicable to each class of the Fund. The difference between classes is the result of separate arrangements for class-level services and/or waivers of certain expenses. It is not the result of any difference in advisory or custodial fees or other expenses related to the management of the Fund's assets, which do not vary by class. For the reporting period, the total annualized management fee rates were as follows:
|
Total Management Fee Rate %
|
Fidelity Fund
|
.42
|
Class K
|
.34
|
Deferred Trustee Compensation. Under a Deferred Compensation Plan (the Plan) for certain Funds, certain independent Trustees have elected to defer receipt of a portion of their annual compensation. Deferred amounts are invested in affiliated mutual funds, are marked-to-market and remain in a fund until distributed in accordance with the Plan. The investment of deferred amounts and the offsetting payable to the Trustees presented below are included in the accompanying Statement of Assets and Liabilities in other receivables and other payables and accrued expenses, as applicable.
Brokerage Commissions. A portion of portfolio transactions were placed with brokerage firms which are affiliates of the investment adviser. Brokerage commissions are included in net realized gain (loss) and change in net unrealized appreciation (depreciation) in the Statement of Operations. The commissions paid to these affiliated firms were as follows:
|
Amount ($)
|
Fidelity Fund
|
71,168
|
Interfund Lending Program. Pursuant to an Exemptive Order issued by the Securities and Exchange Commission (the SEC), the Fund, along with other registered investment companies having management contracts with Fidelity Management & Research Company LLC (FMR), or other affiliated entities of FMR, may participate in an interfund lending program. This program provides an alternative credit facility allowing the Fund to borrow from, or lend money to, other participating affiliated funds at rates that are beneficial to both the borrowing and lending fund. Borrowings under the program are generally for temporary or emergency purposes, including meeting fund shareholder redemptions. The interfund loan rate is determined, as specified in the Exemptive Order, by averaging, (1) the higher of the overnight time deposit rate and the current overnight repurchase agreement rate, and (2) a benchmark rate representing the lowest bank loan rate available to the funds. Any open loans, including accrued interest, at period end are presented as Notes payable to affiliates in the Statement of Assets and Liabilities. Activity in this program during the period for which loans were outstanding was as follows:
|
Borrower or Lender
|
Average Loan Balance ($)
|
Weighted Average Interest Rate
|
Interest Expense ($)
|
Fidelity Fund
|
Borrower
|
12,665,000
|
4.05%
|
4,270
|
Interfund Trades. Funds may purchase from or sell securities to other Fidelity Funds under procedures adopted by the Board of Trustees. The procedures have been designed to ensure these interfund trades are executed in accordance with Rule 17a-7 of the 1940 Act. Any interfund trades are included within the respective purchases and sales amounts shown in the Purchases and Sales of Investments note. Interfund trades during the period are noted in the table below.
|
Purchases ($)
|
Sales ($)
|
Realized Gain (Loss) ($)
|
Fidelity Fund
|
596,856,156
|
311,030,456
|
23,393,852
|
7. Committed Line of Credit.
Certain Funds participate with other funds managed by the investment adviser or an affiliate in a $4.25 billion credit facility (the "line of credit") to be utilized for temporary or emergency purposes to fund shareholder redemptions or for other short-term liquidity purposes.
Commitment fees are charged based on the unused amount of the line of credit at an annual rate of .10%, and then allocated to each participating fund based on its pro-rata portion of the line of credit. The commitment fees are reflected in Miscellaneous expenses on the Statement of Operations, and are listed below.
Interest is charged to a participating fund based on its borrowings at an annual rate of .75% plus the highest of (i) daily SOFR plus a .10% spread adjustment, (ii) Federal Funds Effective Rate, or (iii) Overnight Bank Funding Rate. During the period, there were no borrowings on this line of credit.
The line of credit agreement will expire in March 2026 unless extended or renewed.
|
Amount ($)
|
Fidelity Fund
|
4,759
|
8. Security Lending.
Funds lend portfolio securities from time to time in order to earn additional income. Lending agents are used, including National Financial Services (NFS), an affiliate of the investment adviser. Pursuant to a securities lending agreement, NFS will receive a fee, which is capped at 9.9% of a fund's daily lending revenue, for its services as lending agent. A fund may lend securities to certain qualified borrowers, including NFS. On the settlement date of the loan, the borrowers provide collateral (in the form of U.S. Treasury obligations, letters of credit and/or cash) against the loaned securities and maintains collateral in an amount not less than 100% of the fair value of the loaned securities during the period of the loan. The fair value of the loaned securities is determined at the close of business of a fund and any additional required collateral is delivered to a fund on the next business day. A fund or borrower may terminate the loan at any time, and if the borrower defaults on its obligation to return the securities loaned because of insolvency or other reasons, a fund may apply collateral received from the borrower against the obligation. A fund may experience delays and costs in recovering the securities loaned or gaining access to non-cash collateral. Any cash collateral received is invested in the Fidelity Securities Lending Cash Central Fund. Any loaned securities are identified as such in the Schedule of Investments, and the value of loaned securities and cash collateral at period end, as applicable, are presented in the Statement of Assets and Liabilities. Security lending income represents the income earned on investing cash collateral less rebates paid to borrowers, plus any premium income received, or for non-cash collateral, fees received from borrowers as compensation for the securities loaned. Securities lending income is reduced by any lending agent fees associated with the loan. Any security lending income earned on investing cash collateral is presented in the Statement of Operations as a component of income from Fidelity Central Funds. Any security lending income earned on non-cash collateral is presented in the Statement of Operations as a component of dividends. Affiliated security lending activity, if any, was as follows:
|
Total Security Lending Fees Paid to NFS ($)
|
Security Lending Income From Securities Loaned to NFS ($)
|
Value of Securities Loaned to NFS at Period End ($)
|
Fidelity Fund
|
7,196
|
46
|
-
|
9. Distributions to Shareholders.
Distributions to shareholders of each class were as follows:
|
Six months ended
December 31, 2025
|
Year ended
June 30, 2025
|
Fidelity Fund
|
|
|
Distributions to shareholders
|
|
|
Fidelity Fund
|
$103,761,865
|
$ -
|
Class K
|
3,846,972
|
-
|
Total
|
$107,608,837
|
$ -
|
10. Share Transactions.
Share transactions for each class were as follows and may contain in-kind transactions, automatic conversions between classes or exchanges between affiliated funds:
|
Shares
|
Shares
|
Dollars
|
Dollars
|
|
Six months ended
December 31, 2025
|
Year ended
June 30, 2025
|
Six months ended
December 31, 2025
|
Year ended
June 30, 2025
|
Fidelity Fund
|
|
|
|
|
Fidelity Fund
|
|
|
|
|
Shares sold
|
17,013,060
|
29,228,915
|
$1,866,946,028
|
$2,644,849,576
|
Reinvestment of distributions
|
842,256
|
-
|
92,963,395
|
-
|
Shares redeemed
|
(20,283,362)
|
(35,662,230)
|
(2,236,569,371)
|
(3,270,137,564)
|
Net increase (decrease)
|
(2,428,046)
|
(6,433,315)
|
$(276,659,948)
|
$(625,287,988)
|
Class K
|
|
|
|
|
Shares sold
|
75,104
|
346,185
|
$8,041,912
|
$32,047,616
|
Reinvestment of distributions
|
34,903
|
-
|
3,846,972
|
-
|
Shares redeemed
|
(340,497)
|
(1,003,321)
|
(36,896,561)
|
(91,872,946)
|
Net increase (decrease)
|
(230,490)
|
(657,136)
|
$(25,007,677)
|
$(59,825,330)
|
11. Other.
A fund's organizational documents provide former and current trustees and officers with a limited indemnification against liabilities arising in connection with the performance of their duties to the fund. In the normal course of business, a fund may also enter into contracts that provide general indemnifications. A fund's maximum exposure under these arrangements is unknown as this would be dependent on future claims that may be made against a fund. The risk of material loss from such claims is considered remote.
12. Risk and Uncertainties.
Many factors affect a fund's performance. Developments that disrupt global economies and financial markets, such as public health emergencies, military conflicts, terrorism, government restrictions, political changes, and environmental disasters, may significantly affect a fund's investment performance. The effects of these developments to a fund will be impacted by the types of securities in which a fund invests, the financial condition, industry, economic sector, and geographic location of an issuer, and a fund's level of investment in the securities of that issuer. Significant concentrations in security types, issuers, industries, sectors, and geographic locations may magnify the factors that affect a fund's performance.
Item 8: Changes in and Disagreements with Accountants for Open-End Management Investment Companies
(Unaudited)
Note: This is not applicable for any fund included in this document.
Item 9: Proxy Disclosures for Open-End Management Investment Companies
(Unaudited)
Note: This is not applicable for any fund included in this document.
Item 10: Remuneration Paid to Directors, Officers, and others of Open-End Management Investment Companies
(Unaudited)
Note: This information is disclosed as part of the financial statements for each Fund as part of Item 7: Financial Statements and Financial Highlights for Open-End Management Investment Companies.
Item 11: Statement Regarding Basis for Approval of Investment Advisory Contract
(Unaudited)
Note: This is not applicable for any fund included in this document.
1.540016.128
FID-SANN-0226
Item 8.
Changes in and Disagreements with Accountants for Open-End Management Investment Companies
See Item 7.
Item 9.
Proxy Disclosures for Open-End Management Investment Companies
See Item 7.
Item 10.
Remuneration Paid to Directors, Officers, and Others of Open-End Management Investment Companies
See Item 7.
Item 11.
Statement Regarding Basis for Approval of Investment Advisory Contract
See Item 7.
Item 12.
Disclosure of Proxy Voting Policies and Procedures for Closed-End Management Investment Companies
Not applicable.
Item 13.
Portfolio Managers of Closed-End Management Investment Companies
Not applicable.
Item 14.
Purchases of Equity Securities by Closed-End Management Investment Company and Affiliated Purchasers
Not applicable.
Item 15.
Submission of Matters to a Vote of Security Holders
There were no material changes to the procedures by which shareholders may recommend nominees to the Fidelity Hastings Street Trust’s Board of Trustees.
Item 16.
Controls and Procedures
(a)(i) The President and Treasurer and the Chief Financial Officer have concluded that the Fidelity Hastings Street Trust’s (the “Trust”) disclosure controls and procedures (as defined in Rule 30a-3(c) under the Investment Company Act) provide reasonable assurances that material information relating to the Trust is made known to them by the appropriate persons, based on their evaluation of these controls and procedures as of a date within 90 days of the filing date of this report.
(a)(ii) There was no change in the Trust’s internal control over financial reporting (as defined in Rule 30a-3(d) under the Investment Company Act) that occurred during the period covered by this report that has materially affected, or is reasonably likely to materially affect, the Trust’s internal control over financial reporting.
Item 17.
Disclosure of Securities Lending Activities for Closed-End Management Investment Companies
Not applicable.
Item 18.
Recovery of Erroneously Awarded Compensation
(a)
Not applicable.
(b)
Not applicable.
Item 19.
Exhibits
SIGNATURES
Pursuant to the requirements of the Securities Exchange Act of 1934 and the Investment Company Act of 1940, the registrant has duly caused this report to be signed on its behalf by the undersigned, thereunto duly authorized.
Fidelity Hastings Street Trust
| |
| By: | /s/Stacie M. Smith |
| | Stacie M. Smith |
| | President and Treasurer (Principal Executive Officer) |
| | |
| Date: | February 20, 2026 |
Pursuant to the requirements of the Securities Exchange Act of 1934 and the Investment Company Act of 1940, this report has been signed below by the following persons on behalf of the registrant and in the capacities and on the dates indicated.
| |
| By: | /s/Stacie M. Smith |
| | Stacie M. Smith |
| | President and Treasurer (Principal Executive Officer) |
| | |
| Date: | February 20, 2026 |
| |
| By: | /s/Stephanie Caron |
| | Stephanie Caron |
| | Chief Financial Officer (Principal Financial Officer) |
| | |
| Date: | February 20, 2026 |
Exhibit EX-99.CERT
I, Stacie M. Smith, certify that:
1.
I have reviewed this report on Form N-CSR of Fidelity Hastings Street Trust;
2.
Based on my knowledge, this report does not contain any untrue statement of a material fact or omit to state a material fact necessary to make the statements made, in light of the circumstances under which such statements were made, not misleading with respect to the period covered by this report;
3.
Based on my knowledge, the financial statements, and other financial information included in this report, fairly present in all material respects the financial condition, results of operations, changes in net assets, and cash flows (if the financial statements are required to include a statement of cash flows) of the registrant as of, and for, the periods presented in this report;
4.
The registrant's other certifying officer(s) and I are responsible for establishing and maintaining disclosure controls and procedures (as defined in Rule 30a-3(c) under the Investment Company Act of 1940) and internal control over financial reporting (as defined in Rule 30a-3(d) under the Investment Company Act of 1940) for the registrant and have:
a.
Designed such disclosure controls and procedures, or caused such disclosure controls and procedures to be designed under our supervision, to ensure that material information relating to the registrant, including its consolidated subsidiaries, is made known to us by others within those entities, particularly during the period in which this report is being prepared;
b.
Designed such internal control over financial reporting, or caused such internal control over financial reporting to be designed under our supervision, to provide reasonable assurance regarding the reliability of financial reporting and the preparation of financial statements for external purposes in accordance with generally accepted accounting principles;
c.
Evaluated the effectiveness of the registrant's disclosure controls and procedures and presented in this report our conclusions about the effectiveness of the disclosure controls and procedures, as of a date within 90 days prior to the filing date of this report based upon such evaluation; and
d.
Disclosed in this report any change in the registrant’s internal control over financial reporting that occurred during the period covered by this report that has materially affected, or is reasonably likely to materially affect, the registrant’s internal control over financial reporting; and
5.
The registrant's other certifying officer(s) and I have disclosed to the registrant's auditors and the audit committee of the registrant's board of directors (or persons performing the equivalent functions):
a.
All significant deficiencies and material weaknesses in the design or operation of internal control over financial reporting which are reasonably likely to adversely affect the registrant's ability to record, process, summarize, and report financial information; and
b.
Any fraud, whether or not material, that involves management or other employees who have a significant role in the registrant's internal control over financial reporting.
Date:
February 20, 2026
|
/s/Stacie M. Smith
|
Stacie M. Smith
|
President and Treasurer (Principal Executive Officer)
|
I, Stephanie Caron, certify that:
1.
I have reviewed this report on Form N-CSR of Fidelity Hastings Street Trust;
2.
Based on my knowledge, this report does not contain any untrue statement of a material fact or omit to state a material fact necessary to make the statements made, in light of the circumstances under which such statements were made, not misleading with respect to the period covered by this report;
3.
Based on my knowledge, the financial statements, and other financial information included in this report, fairly present in all material respects the financial condition, results of operations, changes in net assets, and cash flows (if the financial statements are required to include a statement of cash flows) of the registrant as of, and for, the periods presented in this report;
4.
The registrant's other certifying officer(s) and I are responsible for establishing and maintaining disclosure controls and procedures (as defined in Rule 30a-3(c) under the Investment Company Act of 1940) and internal control over financial reporting (as defined in Rule 30a-3(d) under the Investment Company Act of 1940) for the registrant and have:
a.
Designed such disclosure controls and procedures, or caused such disclosure controls and procedures to be designed under our supervision, to ensure that material information relating to the registrant, including its consolidated subsidiaries, is made known to us by others within those entities, particularly during the period in which this report is being prepared;
b.
Designed such internal control over financial reporting, or caused such internal control over financial reporting to be designed under our supervision, to provide reasonable assurance regarding the reliability of financial reporting and the preparation of financial statements for external purposes in accordance with generally accepted accounting principles;
c.
Evaluated the effectiveness of the registrant's disclosure controls and procedures and presented in this report our conclusions about the effectiveness of the disclosure controls and procedures, as of a date within 90 days prior to the filing date of this report based upon such evaluation; and
d.
Disclosed in this report any change in the registrant’s internal control over financial reporting that occurred during the period covered by this report that has materially affected, or is reasonably likely to materially affect, the registrant’s internal control over financial reporting; and
5.
The registrant's other certifying officer(s) and I have disclosed to the registrant's auditors and the audit committee of the registrant's board of directors (or persons performing the equivalent functions):
a.
All significant deficiencies and material weaknesses in the design or operation of internal control over financial reporting which are reasonably likely to adversely affect the registrant's ability to record, process, summarize, and report financial information; and
b.
Any fraud, whether or not material, that involves management or other employees who have a significant role in the registrant's internal control over financial reporting.
Date:
February 20, 2026
|
/s/Stephanie Caron
|
Stephanie Caron
|
Chief Financial Officer (Principal Financial Officer)
|
Exhibit EX-99.906CERT
Certification Pursuant to Section 906 of the Sarbanes-Oxley Act of 2002 (subsections (a) and (b) of section 1350, chapter 63 of title 18, United States Code)
In connection with the attached Report of Fidelity Hastings Street Trust (the “Trust”) on Form N-CSR to be filed with the Securities and Exchange Commission (the “Report”), each of the undersigned officers of the Trust does hereby certify that, to the best of such officer’s knowledge:
1.
The Report fully complies with the requirements of 13(a) or 15(d) of the Securities Exchange Act of 1934; and
2.
The information contained in the Report fairly presents, in all material respects, the financial condition and results of operations of the Trust as of, and for, the periods presented in the Report.
Dated: February 20, 2026
|
/s/Stacie M. Smith
|
Stacie M. Smith
|
President and Treasurer (Principal Executive Officer)
|
Dated: February 20, 2026
|
/s/Stephanie Caron
|
Stephanie Caron
|
Chief Financial Officer (Principal Financial Officer)
|
A signed original of this written statement required by Section 906, or other document authenticating, acknowledging, or otherwise adopting the signature that appears in typed form within the electronic version of this written statement required by Section 906, has been provided to the Trust and will be retained by the Trust and furnished to the Securities and Exchange Commission or its staff upon request.
| X |
- DefinitionBoolean flag that is true when the XBRL content amends previously-filed or accepted submission.
| Name: |
dei_AmendmentFlag |
| Namespace Prefix: |
dei_ |
| Data Type: |
xbrli:booleanItemType |
| Balance Type: |
na |
| Period Type: |
duration |
|
| X |
- DefinitionFor the EDGAR submission types of Form 8-K: the date of the report, the date of the earliest event reported; for the EDGAR submission types of Form N-1A: the filing date; for all other submission types: the end of the reporting or transition period. The format of the date is YYYY-MM-DD.
| Name: |
dei_DocumentPeriodEndDate |
| Namespace Prefix: |
dei_ |
| Data Type: |
xbrli:dateItemType |
| Balance Type: |
na |
| Period Type: |
duration |
|
| X |
- DefinitionThe type of document being provided (such as 10-K, 10-Q, 485BPOS, etc). The document type is limited to the same value as the supporting SEC submission type, or the word 'Other'.
| Name: |
dei_DocumentType |
| Namespace Prefix: |
dei_ |
| Data Type: |
dei:submissionTypeItemType |
| Balance Type: |
na |
| Period Type: |
duration |
|
| X |
- DefinitionA unique 10-digit SEC-issued value to identify entities that have filed disclosures with the SEC. It is commonly abbreviated as CIK. Reference 1: http://www.xbrl.org/2003/role/presentationRef
-Publisher SEC
-Name Exchange Act
-Number 240
-Section 12
-Subsection b-2
| Name: |
dei_EntityCentralIndexKey |
| Namespace Prefix: |
dei_ |
| Data Type: |
dei:centralIndexKeyItemType |
| Balance Type: |
na |
| Period Type: |
duration |
|
| X |
- DefinitionOne of: N-1A (Mutual Fund), N-1 (Open-End Separate Account with No Variable Annuities), N-2 (Closed-End Investment Company), N-3 (Separate Account Registered as Open-End Management Investment Company), N-4 (Variable Annuity UIT Separate Account), N-5 (Small Business Investment Company), N-6 (Variable Life UIT Separate Account), S-1 or S-3 (Face Amount Certificate Company), S-6 (UIT, Non-Insurance Product). Reference 1: http://www.xbrl.org/2003/role/presentationRef
-Publisher SEC
-Name Regulation S-T
-Number 232
-Section 313
| Name: |
dei_EntityInvCompanyType |
| Namespace Prefix: |
dei_ |
| Data Type: |
dei:invCompanyType |
| Balance Type: |
na |
| Period Type: |
duration |
|
| X |
- DefinitionThe exact name of the entity filing the report as specified in its charter, which is required by forms filed with the SEC. Reference 1: http://www.xbrl.org/2003/role/presentationRef
-Publisher SEC
-Name Exchange Act
-Number 240
-Section 12
-Subsection b-2
| Name: |
dei_EntityRegistrantName |
| Namespace Prefix: |
dei_ |
| Data Type: |
xbrli:normalizedStringItemType |
| Balance Type: |
na |
| Period Type: |
duration |
|
| X |
- ReferencesReference 1: http://www.xbrl.org/2003/role/presentationRef
-Publisher SEC
-Name Form N-1A
-Section 27A
-Subsection d
-Paragraph 2
-Subparagraph instruction
-Clause 7
| Name: |
oef_ShareholderReportLineItems |
| Namespace Prefix: |
oef_ |
| Data Type: |
xbrli:stringItemType |
| Balance Type: |
na |
| Period Type: |
duration |
|
v3.25.4
Shareholder Report
|
6 Months Ended |
|
Dec. 31, 2025
USD ($)
shares
|
|---|
| Shareholder Report [Line Items] |
|
| Document Type |
N-CSRS
|
| Amendment Flag |
false
|
| Registrant Name |
Fidelity Hastings Street Trust
|
| Entity Central Index Key |
0000035348
|
| Entity Investment Company Type |
N-1A
|
| Document Period End Date |
Dec. 31, 2025
|
| Fidelity Series Large Cap Stock Fund |
|
| Shareholder Report [Line Items] |
|
| Fund Name |
Fidelity® Series Large Cap Stock Fund
|
| Class Name |
Fidelity® Series Large Cap Stock Fund
|
| Trading Symbol |
FGLGX
|
| Annual or Semi-Annual Statement [Text Block] |
This semi-annual shareholder report contains information about Fidelity® Series Large Cap Stock Fund for the period July 1, 2025 to December 31, 2025.
|
| Shareholder Report Annual or Semi-Annual |
semi-annual shareholder report
|
| Additional Information [Text Block] |
You can find additional information about the Fund at fundresearch.fidelity.com/prospectus/sec. You can also request this information by contacting us at 1-800-544-8544.
|
| Additional Information Phone Number |
1-800-544-8544
|
| Additional Information Website |
fundresearch.fidelity.com/prospectus/sec
|
| Expenses [Text Block] |
What were your Fund costs for the last six months?
(based on hypothetical $10,000 investment)
|
Costs of a $10,000 investment
|
Costs paid as a percentage of a $10,000 investment
|
|
Fidelity® Series Large Cap Stock Fund
|
$ 0 A
|
0.00%B
|
|
A Amount represents less than $.50
B Amount represents less than 0.005%
|
| Expenses Paid, Amount |
$ 0
|
| Expense Ratio, Percent |
0.00%
|
| Net Assets |
$ 24,355,496,025
|
| Holdings Count | shares |
181
|
| Investment Company Portfolio Turnover |
20.00%
|
| Additional Fund Statistics [Text Block] |
Key Fund Statistics
(as of December 31, 2025)
KEY FACTS
|
|
|
Fund Size
|
$24,355,496,025
|
|
Number of Holdings
|
181
|
|
Portfolio Turnover
|
20%
|
|
|
| Holdings [Text Block] |
MARKET SECTORS
(% of Fund's net assets)
Information Technology
24.1
Industrials
18.3
Financials
15.1
Communication Services
10.6
Health Care
10.5
Energy
8.2
Consumer Staples
4.6
Consumer Discretionary
3.5
Materials
2.0
Utilities
1.0
Real Estate
0.4
Common Stocks
98.2
Preferred Stocks
0.1
Short-Term Investments and Net Other Assets (Liabilities)
1.7
ASSET ALLOCATION (% of Fund's net assets)
Common Stocks - 98.2
Preferred Stocks - 0.1
Short-Term Investments and Net Other Assets (Liabilities) - 1.7
United States
91.0
Canada
2.0
Zambia
1.3
Belgium
1.2
United Kingdom
1.2
Germany
0.8
Taiwan
0.7
Netherlands
0.7
France
0.4
Others
0.7
GEOGRAPHIC DIVERSIFICATION (% of Fund's net assets)
United States - 91.0
Canada - 2.0
Zambia - 1.3
Belgium - 1.2
United Kingdom - 1.2
Germany - 0.8
Taiwan - 0.7
Netherlands - 0.7
France - 0.4
Others - 0.7
|
| Largest Holdings [Text Block] |
TOP HOLDINGS(% of Fund's net assets)
NVIDIA Corp
7.5
Microsoft Corp
6.1
Wells Fargo & Co
5.6
Boeing Co
5.0
GE Aerospace
4.5
GE Vernova Inc
4.0
Exxon Mobil Corp
3.7
Alphabet Inc Class A
3.4
Bank of America Corp
2.9
Alphabet Inc Class C
2.9
45.6
|
| Fidelity Mega Cap Stock Fund |
|
| Shareholder Report [Line Items] |
|
| Fund Name |
Fidelity® Mega Cap Stock Fund
|
| Class Name |
Fidelity® Mega Cap Stock Fund
|
| Trading Symbol |
FGRTX
|
| Annual or Semi-Annual Statement [Text Block] |
This semi-annual shareholder report contains information about Fidelity® Mega Cap Stock Fund for the period July 1, 2025 to December 31, 2025.
|
| Shareholder Report Annual or Semi-Annual |
semi-annual shareholder report
|
| Additional Information [Text Block] |
You can find additional information about the Fund at fundresearch.fidelity.com/prospectus/sec. You can also request this information by contacting us at 1-800-544-8544 or by sending an e-mail to fidfunddocuments@fidelity.com.
|
| Additional Information Phone Number |
1-800-544-8544
|
| Additional Information Email |
fidfunddocuments@fidelity.com
|
| Additional Information Website |
fundresearch.fidelity.com/prospectus/sec
|
| Expenses [Text Block] |
What were your Fund costs for the last six months?
(based on hypothetical $10,000 investment)
|
Costs of a $10,000 investment
|
Costs paid as a percentage of a $10,000 investment
|
|
Fidelity® Mega Cap Stock Fund
|
$ 31
|
0.58%
|
|
|
| Expenses Paid, Amount |
$ 31
|
| Expense Ratio, Percent |
0.58%
|
| Net Assets |
$ 5,766,775,973
|
| Holdings Count | shares |
116
|
| Investment Company Portfolio Turnover |
10.00%
|
| Additional Fund Statistics [Text Block] |
Key Fund Statistics
(as of December 31, 2025)
KEY FACTS
|
|
|
Fund Size
|
$5,766,775,973
|
|
Number of Holdings
|
116
|
|
Portfolio Turnover
|
10%
|
|
|
| Holdings [Text Block] |
MARKET SECTORS
(% of Fund's net assets)
Information Technology
26.1
Industrials
15.6
Financials
13.2
Communication Services
11.1
Energy
8.1
Health Care
8.1
Consumer Staples
5.0
Consumer Discretionary
4.1
Materials
0.9
Utilities
0.7
Real Estate
0.3
Common Stocks
93.2
Short-Term Investments and Net Other Assets (Liabilities)
6.8
ASSET ALLOCATION (% of Fund's net assets)
Common Stocks - 93.2
Short-Term Investments and Net Other Assets (Liabilities) - 6.8
United States
92.6
Canada
1.4
United Kingdom
1.2
Taiwan
1.1
Zambia
0.8
Belgium
0.7
Germany
0.6
Netherlands
0.5
France
0.4
Others
0.7
GEOGRAPHIC DIVERSIFICATION (% of Fund's net assets)
United States - 92.6
Canada - 1.4
United Kingdom - 1.2
Taiwan - 1.1
Zambia - 0.8
Belgium - 0.7
Germany - 0.6
Netherlands - 0.5
France - 0.4
Others - 0.7
|
| Largest Holdings [Text Block] |
TOP HOLDINGS(% of Fund's net assets)
NVIDIA Corp
8.3
Microsoft Corp
6.5
Boeing Co
5.1
Wells Fargo & Co
4.8
GE Aerospace
4.1
GE Vernova Inc
3.8
Alphabet Inc Class A
3.8
Exxon Mobil Corp
3.6
Apple Inc
3.4
Alphabet Inc Class C
3.2
46.6
|
| Fidelity Advisor Mega Cap Stock Fund - Class Z |
|
| Shareholder Report [Line Items] |
|
| Fund Name |
Fidelity® Mega Cap Stock Fund
|
| Class Name |
Fidelity Advisor® Mega Cap Stock Fund Class Z
|
| Trading Symbol |
FZALX
|
| Annual or Semi-Annual Statement [Text Block] |
This semi-annual shareholder report contains information about Fidelity® Mega Cap Stock Fund for the period July 1, 2025 to December 31, 2025.
|
| Shareholder Report Annual or Semi-Annual |
semi-annual shareholder report
|
| Additional Information [Text Block] |
You can find additional information about the Fund at fundresearch.fidelity.com/prospectus/sec. You can also request this information by contacting us at 1-877-208-0098 or by sending an e-mail to fidfunddocuments@fidelity.com.
|
| Additional Information Phone Number |
1-877-208-0098
|
| Additional Information Email |
fidfunddocuments@fidelity.com
|
| Additional Information Website |
fundresearch.fidelity.com/prospectus/sec
|
| Expenses [Text Block] |
What were your Fund costs for the last six months?
(based on hypothetical $10,000 investment)
|
Costs of a $10,000 investment
|
Costs paid as a percentage of a $10,000 investment
|
|
Class Z
|
$ 25
|
0.47%
|
|
|
| Expenses Paid, Amount |
$ 25
|
| Expense Ratio, Percent |
0.47%
|
| Net Assets |
$ 5,766,775,973
|
| Holdings Count | shares |
116
|
| Investment Company Portfolio Turnover |
10.00%
|
| Additional Fund Statistics [Text Block] |
Key Fund Statistics
(as of December 31, 2025)
KEY FACTS
|
|
|
Fund Size
|
$5,766,775,973
|
|
Number of Holdings
|
116
|
|
Portfolio Turnover
|
10%
|
|
|
| Holdings [Text Block] |
MARKET SECTORS
(% of Fund's net assets)
Information Technology
26.1
Industrials
15.6
Financials
13.2
Communication Services
11.1
Energy
8.1
Health Care
8.1
Consumer Staples
5.0
Consumer Discretionary
4.1
Materials
0.9
Utilities
0.7
Real Estate
0.3
Common Stocks
93.2
Short-Term Investments and Net Other Assets (Liabilities)
6.8
ASSET ALLOCATION (% of Fund's net assets)
Common Stocks - 93.2
Short-Term Investments and Net Other Assets (Liabilities) - 6.8
United States
92.6
Canada
1.4
United Kingdom
1.2
Taiwan
1.1
Zambia
0.8
Belgium
0.7
Germany
0.6
Netherlands
0.5
France
0.4
Others
0.7
GEOGRAPHIC DIVERSIFICATION (% of Fund's net assets)
United States - 92.6
Canada - 1.4
United Kingdom - 1.2
Taiwan - 1.1
Zambia - 0.8
Belgium - 0.7
Germany - 0.6
Netherlands - 0.5
France - 0.4
Others - 0.7
|
| Largest Holdings [Text Block] |
TOP HOLDINGS(% of Fund's net assets)
NVIDIA Corp
8.3
Microsoft Corp
6.5
Boeing Co
5.1
Wells Fargo & Co
4.8
GE Aerospace
4.1
GE Vernova Inc
3.8
Alphabet Inc Class A
3.8
Exxon Mobil Corp
3.6
Apple Inc
3.4
Alphabet Inc Class C
3.2
46.6
|
| Fidelity Advisor Mega Cap Stock Fund - Class M |
|
| Shareholder Report [Line Items] |
|
| Fund Name |
Fidelity® Mega Cap Stock Fund
|
| Class Name |
Fidelity Advisor® Mega Cap Stock Fund Class M
|
| Trading Symbol |
FTGRX
|
| Annual or Semi-Annual Statement [Text Block] |
This semi-annual shareholder report contains information about Fidelity® Mega Cap Stock Fund for the period July 1, 2025 to December 31, 2025.
|
| Shareholder Report Annual or Semi-Annual |
semi-annual shareholder report
|
| Additional Information [Text Block] |
You can find additional information about the Fund at fundresearch.fidelity.com/prospectus/sec. You can also request this information by contacting us at 1-877-208-0098 or by sending an e-mail to fidfunddocuments@fidelity.com.
|
| Additional Information Phone Number |
1-877-208-0098
|
| Additional Information Email |
fidfunddocuments@fidelity.com
|
| Additional Information Website |
fundresearch.fidelity.com/prospectus/sec
|
| Expenses [Text Block] |
What were your Fund costs for the last six months?
(based on hypothetical $10,000 investment)
|
Costs of a $10,000 investment
|
Costs paid as a percentage of a $10,000 investment
|
|
Class M
|
$ 60
|
1.11%
|
|
|
| Expenses Paid, Amount |
$ 60
|
| Expense Ratio, Percent |
1.11%
|
| Net Assets |
$ 5,766,775,973
|
| Holdings Count | shares |
116
|
| Investment Company Portfolio Turnover |
10.00%
|
| Additional Fund Statistics [Text Block] |
Key Fund Statistics
(as of December 31, 2025)
KEY FACTS
|
|
|
Fund Size
|
$5,766,775,973
|
|
Number of Holdings
|
116
|
|
Portfolio Turnover
|
10%
|
|
|
| Holdings [Text Block] |
MARKET SECTORS
(% of Fund's net assets)
Information Technology
26.1
Industrials
15.6
Financials
13.2
Communication Services
11.1
Energy
8.1
Health Care
8.1
Consumer Staples
5.0
Consumer Discretionary
4.1
Materials
0.9
Utilities
0.7
Real Estate
0.3
Common Stocks
93.2
Short-Term Investments and Net Other Assets (Liabilities)
6.8
ASSET ALLOCATION (% of Fund's net assets)
Common Stocks - 93.2
Short-Term Investments and Net Other Assets (Liabilities) - 6.8
United States
92.6
Canada
1.4
United Kingdom
1.2
Taiwan
1.1
Zambia
0.8
Belgium
0.7
Germany
0.6
Netherlands
0.5
France
0.4
Others
0.7
GEOGRAPHIC DIVERSIFICATION (% of Fund's net assets)
United States - 92.6
Canada - 1.4
United Kingdom - 1.2
Taiwan - 1.1
Zambia - 0.8
Belgium - 0.7
Germany - 0.6
Netherlands - 0.5
France - 0.4
Others - 0.7
|
| Largest Holdings [Text Block] |
TOP HOLDINGS(% of Fund's net assets)
NVIDIA Corp
8.3
Microsoft Corp
6.5
Boeing Co
5.1
Wells Fargo & Co
4.8
GE Aerospace
4.1
GE Vernova Inc
3.8
Alphabet Inc Class A
3.8
Exxon Mobil Corp
3.6
Apple Inc
3.4
Alphabet Inc Class C
3.2
46.6
|
| Fidelity Advisor Mega Cap Stock Fund - Class I |
|
| Shareholder Report [Line Items] |
|
| Fund Name |
Fidelity® Mega Cap Stock Fund
|
| Class Name |
Fidelity Advisor® Mega Cap Stock Fund Class I
|
| Trading Symbol |
FTRIX
|
| Annual or Semi-Annual Statement [Text Block] |
This semi-annual shareholder report contains information about Fidelity® Mega Cap Stock Fund for the period July 1, 2025 to December 31, 2025.
|
| Shareholder Report Annual or Semi-Annual |
semi-annual shareholder report
|
| Additional Information [Text Block] |
You can find additional information about the Fund at fundresearch.fidelity.com/prospectus/sec. You can also request this information by contacting us at 1-877-208-0098 or by sending an e-mail to fidfunddocuments@fidelity.com.
|
| Additional Information Phone Number |
1-877-208-0098
|
| Additional Information Email |
fidfunddocuments@fidelity.com
|
| Additional Information Website |
fundresearch.fidelity.com/prospectus/sec
|
| Expenses [Text Block] |
What were your Fund costs for the last six months?
(based on hypothetical $10,000 investment)
|
Costs of a $10,000 investment
|
Costs paid as a percentage of a $10,000 investment
|
|
Class I
|
$ 32
|
0.59%
|
|
|
| Expenses Paid, Amount |
$ 32
|
| Expense Ratio, Percent |
0.59%
|
| Net Assets |
$ 5,766,775,973
|
| Holdings Count | shares |
116
|
| Investment Company Portfolio Turnover |
10.00%
|
| Additional Fund Statistics [Text Block] |
Key Fund Statistics
(as of December 31, 2025)
KEY FACTS
|
|
|
Fund Size
|
$5,766,775,973
|
|
Number of Holdings
|
116
|
|
Portfolio Turnover
|
10%
|
|
|
| Holdings [Text Block] |
MARKET SECTORS
(% of Fund's net assets)
Information Technology
26.1
Industrials
15.6
Financials
13.2
Communication Services
11.1
Energy
8.1
Health Care
8.1
Consumer Staples
5.0
Consumer Discretionary
4.1
Materials
0.9
Utilities
0.7
Real Estate
0.3
Common Stocks
93.2
Short-Term Investments and Net Other Assets (Liabilities)
6.8
ASSET ALLOCATION (% of Fund's net assets)
Common Stocks - 93.2
Short-Term Investments and Net Other Assets (Liabilities) - 6.8
United States
92.6
Canada
1.4
United Kingdom
1.2
Taiwan
1.1
Zambia
0.8
Belgium
0.7
Germany
0.6
Netherlands
0.5
France
0.4
Others
0.7
GEOGRAPHIC DIVERSIFICATION (% of Fund's net assets)
United States - 92.6
Canada - 1.4
United Kingdom - 1.2
Taiwan - 1.1
Zambia - 0.8
Belgium - 0.7
Germany - 0.6
Netherlands - 0.5
France - 0.4
Others - 0.7
|
| Largest Holdings [Text Block] |
TOP HOLDINGS(% of Fund's net assets)
NVIDIA Corp
8.3
Microsoft Corp
6.5
Boeing Co
5.1
Wells Fargo & Co
4.8
GE Aerospace
4.1
GE Vernova Inc
3.8
Alphabet Inc Class A
3.8
Exxon Mobil Corp
3.6
Apple Inc
3.4
Alphabet Inc Class C
3.2
46.6
|
| Fidelity Advisor Mega Cap Stock Fund - Class C |
|
| Shareholder Report [Line Items] |
|
| Fund Name |
Fidelity® Mega Cap Stock Fund
|
| Class Name |
Fidelity Advisor® Mega Cap Stock Fund Class C
|
| Trading Symbol |
FGRCX
|
| Annual or Semi-Annual Statement [Text Block] |
This semi-annual shareholder report contains information about Fidelity® Mega Cap Stock Fund for the period July 1, 2025 to December 31, 2025.
|
| Shareholder Report Annual or Semi-Annual |
semi-annual shareholder report
|
| Additional Information [Text Block] |
You can find additional information about the Fund at fundresearch.fidelity.com/prospectus/sec. You can also request this information by contacting us at 1-877-208-0098 or by sending an e-mail to fidfunddocuments@fidelity.com.
|
| Additional Information Phone Number |
1-877-208-0098
|
| Additional Information Email |
fidfunddocuments@fidelity.com
|
| Additional Information Website |
fundresearch.fidelity.com/prospectus/sec
|
| Expenses [Text Block] |
What were your Fund costs for the last six months?
(based on hypothetical $10,000 investment)
|
Costs of a $10,000 investment
|
Costs paid as a percentage of a $10,000 investment
|
|
Class C
|
$ 87
|
1.63%
|
|
|
| Expenses Paid, Amount |
$ 87
|
| Expense Ratio, Percent |
1.63%
|
| Net Assets |
$ 5,766,775,973
|
| Holdings Count | shares |
116
|
| Investment Company Portfolio Turnover |
10.00%
|
| Additional Fund Statistics [Text Block] |
Key Fund Statistics
(as of December 31, 2025)
KEY FACTS
|
|
|
Fund Size
|
$5,766,775,973
|
|
Number of Holdings
|
116
|
|
Portfolio Turnover
|
10%
|
|
|
| Holdings [Text Block] |
MARKET SECTORS
(% of Fund's net assets)
Information Technology
26.1
Industrials
15.6
Financials
13.2
Communication Services
11.1
Energy
8.1
Health Care
8.1
Consumer Staples
5.0
Consumer Discretionary
4.1
Materials
0.9
Utilities
0.7
Real Estate
0.3
Common Stocks
93.2
Short-Term Investments and Net Other Assets (Liabilities)
6.8
ASSET ALLOCATION (% of Fund's net assets)
Common Stocks - 93.2
Short-Term Investments and Net Other Assets (Liabilities) - 6.8
United States
92.6
Canada
1.4
United Kingdom
1.2
Taiwan
1.1
Zambia
0.8
Belgium
0.7
Germany
0.6
Netherlands
0.5
France
0.4
Others
0.7
GEOGRAPHIC DIVERSIFICATION (% of Fund's net assets)
United States - 92.6
Canada - 1.4
United Kingdom - 1.2
Taiwan - 1.1
Zambia - 0.8
Belgium - 0.7
Germany - 0.6
Netherlands - 0.5
France - 0.4
Others - 0.7
|
| Largest Holdings [Text Block] |
TOP HOLDINGS(% of Fund's net assets)
NVIDIA Corp
8.3
Microsoft Corp
6.5
Boeing Co
5.1
Wells Fargo & Co
4.8
GE Aerospace
4.1
GE Vernova Inc
3.8
Alphabet Inc Class A
3.8
Exxon Mobil Corp
3.6
Apple Inc
3.4
Alphabet Inc Class C
3.2
46.6
|
| Fidelity Advisor Mega Cap Stock Fund - Class A |
|
| Shareholder Report [Line Items] |
|
| Fund Name |
Fidelity® Mega Cap Stock Fund
|
| Class Name |
Fidelity Advisor® Mega Cap Stock Fund Class A
|
| Trading Symbol |
FGTAX
|
| Annual or Semi-Annual Statement [Text Block] |
This semi-annual shareholder report contains information about Fidelity® Mega Cap Stock Fund for the period July 1, 2025 to December 31, 2025.
|
| Shareholder Report Annual or Semi-Annual |
semi-annual shareholder report
|
| Additional Information [Text Block] |
You can find additional information about the Fund at fundresearch.fidelity.com/prospectus/sec. You can also request this information by contacting us at 1-877-208-0098 or by sending an e-mail to fidfunddocuments@fidelity.com.
|
| Additional Information Phone Number |
1-877-208-0098
|
| Additional Information Email |
fidfunddocuments@fidelity.com
|
| Additional Information Website |
fundresearch.fidelity.com/prospectus/sec
|
| Expenses [Text Block] |
What were your Fund costs for the last six months?
(based on hypothetical $10,000 investment)
|
Costs of a $10,000 investment
|
Costs paid as a percentage of a $10,000 investment
|
|
Class A
|
$ 46
|
0.86%
|
|
|
| Expenses Paid, Amount |
$ 46
|
| Expense Ratio, Percent |
0.86%
|
| Net Assets |
$ 5,766,775,973
|
| Holdings Count | shares |
116
|
| Investment Company Portfolio Turnover |
10.00%
|
| Additional Fund Statistics [Text Block] |
Key Fund Statistics
(as of December 31, 2025)
KEY FACTS
|
|
|
Fund Size
|
$5,766,775,973
|
|
Number of Holdings
|
116
|
|
Portfolio Turnover
|
10%
|
|
|
| Holdings [Text Block] |
MARKET SECTORS
(% of Fund's net assets)
Information Technology
26.1
Industrials
15.6
Financials
13.2
Communication Services
11.1
Energy
8.1
Health Care
8.1
Consumer Staples
5.0
Consumer Discretionary
4.1
Materials
0.9
Utilities
0.7
Real Estate
0.3
Common Stocks
93.2
Short-Term Investments and Net Other Assets (Liabilities)
6.8
ASSET ALLOCATION (% of Fund's net assets)
Common Stocks - 93.2
Short-Term Investments and Net Other Assets (Liabilities) - 6.8
United States
92.6
Canada
1.4
United Kingdom
1.2
Taiwan
1.1
Zambia
0.8
Belgium
0.7
Germany
0.6
Netherlands
0.5
France
0.4
Others
0.7
GEOGRAPHIC DIVERSIFICATION (% of Fund's net assets)
United States - 92.6
Canada - 1.4
United Kingdom - 1.2
Taiwan - 1.1
Zambia - 0.8
Belgium - 0.7
Germany - 0.6
Netherlands - 0.5
France - 0.4
Others - 0.7
|
| Largest Holdings [Text Block] |
TOP HOLDINGS(% of Fund's net assets)
NVIDIA Corp
8.3
Microsoft Corp
6.5
Boeing Co
5.1
Wells Fargo & Co
4.8
GE Aerospace
4.1
GE Vernova Inc
3.8
Alphabet Inc Class A
3.8
Exxon Mobil Corp
3.6
Apple Inc
3.4
Alphabet Inc Class C
3.2
46.6
|
| Fidelity Growth Discovery Fund |
|
| Shareholder Report [Line Items] |
|
| Fund Name |
Fidelity® Growth Discovery Fund
|
| Class Name |
Fidelity® Growth Discovery Fund
|
| Trading Symbol |
FDSVX
|
| Annual or Semi-Annual Statement [Text Block] |
This semi-annual shareholder report contains information about Fidelity® Growth Discovery Fund for the period July 1, 2025 to December 31, 2025.
|
| Shareholder Report Annual or Semi-Annual |
semi-annual shareholder report
|
| Additional Information [Text Block] |
You can find additional information about the Fund at fundresearch.fidelity.com/prospectus/sec. You can also request this information by contacting us at 1-800-544-8544 or by sending an e-mail to fidfunddocuments@fidelity.com.
|
| Additional Information Phone Number |
1-800-544-8544
|
| Additional Information Email |
fidfunddocuments@fidelity.com
|
| Additional Information Website |
fundresearch.fidelity.com/prospectus/sec
|
| Expenses [Text Block] |
What were your Fund costs for the last six months?
(based on hypothetical $10,000 investment)
|
Costs of a $10,000 investment
|
Costs paid as a percentage of a $10,000 investment
|
|
Fidelity® Growth Discovery Fund
|
$ 25
|
0.47%
|
|
|
| Expenses Paid, Amount |
$ 25
|
| Expense Ratio, Percent |
0.47%
|
| Net Assets |
$ 6,416,410,117
|
| Holdings Count | shares |
144
|
| Investment Company Portfolio Turnover |
78.00%
|
| Additional Fund Statistics [Text Block] |
Key Fund Statistics
(as of December 31, 2025)
KEY FACTS
|
|
|
Fund Size
|
$6,416,410,117
|
|
Number of Holdings
|
144
|
|
Portfolio Turnover
|
78%
|
|
|
| Holdings [Text Block] |
MARKET SECTORS
(% of Fund's net assets)
Information Technology
45.8
Communication Services
13.5
Consumer Discretionary
11.3
Financials
8.2
Health Care
8.1
Industrials
7.4
Materials
2.0
Consumer Staples
1.5
Utilities
0.9
Real Estate
0.6
Energy
0.5
Common Stocks
99.0
Preferred Stocks
0.8
Preferred Securities
0.0
Bonds
0.0
Short-Term Investments and Net Other Assets (Liabilities)
0.2
ASSET ALLOCATION (% of Fund's net assets)
Common Stocks - 99.0
Preferred Stocks - 0.8
Preferred Securities - 0.0
Bonds - 0.0
Short-Term Investments and Net Other Assets (Liabilities) - 0.2
United States
91.1
Taiwan
2.9
Canada
1.7
China
1.0
Korea (South)
1.0
Belgium
0.9
Netherlands
0.4
Germany
0.4
Brazil
0.4
Others
0.2
GEOGRAPHIC DIVERSIFICATION (% of Fund's net assets)
United States - 91.1
Taiwan - 2.9
Canada - 1.7
China - 1.0
Korea (South) - 1.0
Belgium - 0.9
Netherlands - 0.4
Germany - 0.4
Brazil - 0.4
Others - 0.2
|
| Largest Holdings [Text Block] |
TOP HOLDINGS(% of Fund's net assets)
NVIDIA Corp
13.5
Microsoft Corp
10.0
Alphabet Inc Class A
6.6
Apple Inc
5.4
Amazon.com Inc
5.2
Broadcom Inc
4.8
Meta Platforms Inc Class A
4.1
Mastercard Inc Class A
3.6
Taiwan Semiconductor Manufacturing Co Ltd ADR
2.9
Eli Lilly & Co
2.6
58.7
|
| Fidelity Growth Discovery Fund - Class K |
|
| Shareholder Report [Line Items] |
|
| Fund Name |
Fidelity® Growth Discovery Fund
|
| Class Name |
Fidelity® Growth Discovery Fund Class K
|
| Trading Symbol |
FGDKX
|
| Annual or Semi-Annual Statement [Text Block] |
This semi-annual shareholder report contains information about Fidelity® Growth Discovery Fund for the period July 1, 2025 to December 31, 2025.
|
| Shareholder Report Annual or Semi-Annual |
semi-annual shareholder report
|
| Additional Information [Text Block] |
You can find additional information about the Fund at fundresearch.fidelity.com/prospectus/sec. You can also request this information by contacting us at 1-800-835-5092 or by sending an e-mail to fidfunddocuments@fidelity.com.
|
| Additional Information Phone Number |
1-800-835-5092
|
| Additional Information Email |
fidfunddocuments@fidelity.com
|
| Additional Information Website |
fundresearch.fidelity.com/prospectus/sec
|
| Expenses [Text Block] |
What were your Fund costs for the last six months?
(based on hypothetical $10,000 investment)
|
Costs of a $10,000 investment
|
Costs paid as a percentage of a $10,000 investment
|
|
Class K
|
$ 21
|
0.40%
|
|
|
| Expenses Paid, Amount |
$ 21
|
| Expense Ratio, Percent |
0.40%
|
| Net Assets |
$ 6,416,410,117
|
| Holdings Count | shares |
144
|
| Investment Company Portfolio Turnover |
78.00%
|
| Additional Fund Statistics [Text Block] |
Key Fund Statistics
(as of December 31, 2025)
KEY FACTS
|
|
|
Fund Size
|
$6,416,410,117
|
|
Number of Holdings
|
144
|
|
Portfolio Turnover
|
78%
|
|
|
| Holdings [Text Block] |
MARKET SECTORS
(% of Fund's net assets)
Information Technology
45.8
Communication Services
13.5
Consumer Discretionary
11.3
Financials
8.2
Health Care
8.1
Industrials
7.4
Materials
2.0
Consumer Staples
1.5
Utilities
0.9
Real Estate
0.6
Energy
0.5
Common Stocks
99.0
Preferred Stocks
0.8
Preferred Securities
0.0
Bonds
0.0
Short-Term Investments and Net Other Assets (Liabilities)
0.2
ASSET ALLOCATION (% of Fund's net assets)
Common Stocks - 99.0
Preferred Stocks - 0.8
Preferred Securities - 0.0
Bonds - 0.0
Short-Term Investments and Net Other Assets (Liabilities) - 0.2
United States
91.1
Taiwan
2.9
Canada
1.7
China
1.0
Korea (South)
1.0
Belgium
0.9
Netherlands
0.4
Germany
0.4
Brazil
0.4
Others
0.2
GEOGRAPHIC DIVERSIFICATION (% of Fund's net assets)
United States - 91.1
Taiwan - 2.9
Canada - 1.7
China - 1.0
Korea (South) - 1.0
Belgium - 0.9
Netherlands - 0.4
Germany - 0.4
Brazil - 0.4
Others - 0.2
|
| Largest Holdings [Text Block] |
TOP HOLDINGS(% of Fund's net assets)
NVIDIA Corp
13.5
Microsoft Corp
10.0
Alphabet Inc Class A
6.6
Apple Inc
5.4
Amazon.com Inc
5.2
Broadcom Inc
4.8
Meta Platforms Inc Class A
4.1
Mastercard Inc Class A
3.6
Taiwan Semiconductor Manufacturing Co Ltd ADR
2.9
Eli Lilly & Co
2.6
58.7
|
| Fidelity Fund |
|
| Shareholder Report [Line Items] |
|
| Fund Name |
Fidelity® Fund
|
| Class Name |
Fidelity® Fund
|
| Trading Symbol |
FFIDX
|
| Annual or Semi-Annual Statement [Text Block] |
This semi-annual shareholder report contains information about Fidelity® Fund for the period July 1, 2025 to December 31, 2025.
|
| Shareholder Report Annual or Semi-Annual |
semi-annual shareholder report
|
| Additional Information [Text Block] |
You can find additional information about the Fund at fundresearch.fidelity.com/prospectus/sec. You can also request this information by contacting us at 1-800-544-8544 or by sending an e-mail to fidfunddocuments@fidelity.com.
|
| Additional Information Phone Number |
1-800-544-8544
|
| Additional Information Email |
fidfunddocuments@fidelity.com
|
| Additional Information Website |
fundresearch.fidelity.com/prospectus/sec
|
| Expenses [Text Block] |
What were your Fund costs for the last six months?
(based on hypothetical $10,000 investment)
|
Costs of a $10,000 investment
|
Costs paid as a percentage of a $10,000 investment
|
|
Fidelity® Fund
|
$ 23
|
0.42%
|
|
|
| Expenses Paid, Amount |
$ 23
|
| Expense Ratio, Percent |
0.42%
|
| Net Assets |
$ 9,113,136,791
|
| Holdings Count | shares |
88
|
| Investment Company Portfolio Turnover |
53.00%
|
| Additional Fund Statistics [Text Block] |
Key Fund Statistics
(as of December 31, 2025)
KEY FACTS
|
|
|
Fund Size
|
$9,113,136,791
|
|
Number of Holdings
|
88
|
|
Portfolio Turnover
|
53%
|
|
|
| Holdings [Text Block] |
MARKET SECTORS
(% of Fund's net assets)
Information Technology
24.8
Communication Services
16.9
Financials
16.0
Consumer Discretionary
12.6
Health Care
11.0
Industrials
8.3
Consumer Staples
4.9
Energy
2.8
Materials
0.9
Utilities
0.7
Real Estate
0.5
Common Stocks
99.3
Preferred Stocks
0.1
Short-Term Investments and Net Other Assets (Liabilities)
0.6
ASSET ALLOCATION (% of Fund's net assets)
Common Stocks - 99.3
Preferred Stocks - 0.1
Short-Term Investments and Net Other Assets (Liabilities) - 0.6
United States
97.9
Canada
1.0
Belgium
0.4
United Kingdom
0.4
Netherlands
0.3
GEOGRAPHIC DIVERSIFICATION (% of Fund's net assets)
United States - 97.9
Canada - 1.0
Belgium - 0.4
United Kingdom - 0.4
Netherlands - 0.3
|
| Largest Holdings [Text Block] |
TOP HOLDINGS(% of Fund's net assets)
NVIDIA Corp
9.5
Alphabet Inc Class A
9.2
Microsoft Corp
7.3
Amazon.com Inc
5.6
Meta Platforms Inc Class A
5.0
Apple Inc
4.2
Bank of America Corp
3.3
Mastercard Inc Class A
3.2
Wells Fargo & Co
3.1
Coca-Cola Co/The
2.9
53.3
|
| Fidelity Fund - Class K |
|
| Shareholder Report [Line Items] |
|
| Fund Name |
Fidelity® Fund
|
| Class Name |
Fidelity® Fund Class K
|
| Trading Symbol |
FFDKX
|
| Annual or Semi-Annual Statement [Text Block] |
This semi-annual shareholder report contains information about Fidelity® Fund for the period July 1, 2025 to December 31, 2025.
|
| Shareholder Report Annual or Semi-Annual |
semi-annual shareholder report
|
| Additional Information [Text Block] |
You can find additional information about the Fund at fundresearch.fidelity.com/prospectus/sec. You can also request this information by contacting us at 1-800-835-5092 or by sending an e-mail to fidfunddocuments@fidelity.com.
|
| Additional Information Phone Number |
1-800-835-5092
|
| Additional Information Email |
fidfunddocuments@fidelity.com
|
| Additional Information Website |
fundresearch.fidelity.com/prospectus/sec
|
| Expenses [Text Block] |
What were your Fund costs for the last six months?
(based on hypothetical $10,000 investment)
|
Costs of a $10,000 investment
|
Costs paid as a percentage of a $10,000 investment
|
|
Class K
|
$ 18
|
0.34%
|
|
|
| Expenses Paid, Amount |
$ 18
|
| Expense Ratio, Percent |
0.34%
|
| Net Assets |
$ 9,113,136,791
|
| Holdings Count | shares |
88
|
| Investment Company Portfolio Turnover |
53.00%
|
| Additional Fund Statistics [Text Block] |
Key Fund Statistics
(as of December 31, 2025)
KEY FACTS
|
|
|
Fund Size
|
$9,113,136,791
|
|
Number of Holdings
|
88
|
|
Portfolio Turnover
|
53%
|
|
|
| Holdings [Text Block] |
MARKET SECTORS
(% of Fund's net assets)
Information Technology
24.8
Communication Services
16.9
Financials
16.0
Consumer Discretionary
12.6
Health Care
11.0
Industrials
8.3
Consumer Staples
4.9
Energy
2.8
Materials
0.9
Utilities
0.7
Real Estate
0.5
Common Stocks
99.3
Preferred Stocks
0.1
Short-Term Investments and Net Other Assets (Liabilities)
0.6
ASSET ALLOCATION (% of Fund's net assets)
Common Stocks - 99.3
Preferred Stocks - 0.1
Short-Term Investments and Net Other Assets (Liabilities) - 0.6
United States
97.9
Canada
1.0
Belgium
0.4
United Kingdom
0.4
Netherlands
0.3
GEOGRAPHIC DIVERSIFICATION (% of Fund's net assets)
United States - 97.9
Canada - 1.0
Belgium - 0.4
United Kingdom - 0.4
Netherlands - 0.3
|
| Largest Holdings [Text Block] |
TOP HOLDINGS(% of Fund's net assets)
NVIDIA Corp
9.5
Alphabet Inc Class A
9.2
Microsoft Corp
7.3
Amazon.com Inc
5.6
Meta Platforms Inc Class A
5.0
Apple Inc
4.2
Bank of America Corp
3.3
Mastercard Inc Class A
3.2
Wells Fargo & Co
3.1
Coca-Cola Co/The
2.9
53.3
|
| X |
- DefinitionBoolean flag that is true when the XBRL content amends previously-filed or accepted submission.
| Name: |
dei_AmendmentFlag |
| Namespace Prefix: |
dei_ |
| Data Type: |
xbrli:booleanItemType |
| Balance Type: |
na |
| Period Type: |
duration |
|
| X |
- DefinitionFor the EDGAR submission types of Form 8-K: the date of the report, the date of the earliest event reported; for the EDGAR submission types of Form N-1A: the filing date; for all other submission types: the end of the reporting or transition period. The format of the date is YYYY-MM-DD.
| Name: |
dei_DocumentPeriodEndDate |
| Namespace Prefix: |
dei_ |
| Data Type: |
xbrli:dateItemType |
| Balance Type: |
na |
| Period Type: |
duration |
|
| X |
- DefinitionThe type of document being provided (such as 10-K, 10-Q, 485BPOS, etc). The document type is limited to the same value as the supporting SEC submission type, or the word 'Other'.
| Name: |
dei_DocumentType |
| Namespace Prefix: |
dei_ |
| Data Type: |
dei:submissionTypeItemType |
| Balance Type: |
na |
| Period Type: |
duration |
|
| X |
- DefinitionA unique 10-digit SEC-issued value to identify entities that have filed disclosures with the SEC. It is commonly abbreviated as CIK. Reference 1: http://www.xbrl.org/2003/role/presentationRef
-Publisher SEC
-Name Exchange Act
-Number 240
-Section 12
-Subsection b-2
| Name: |
dei_EntityCentralIndexKey |
| Namespace Prefix: |
dei_ |
| Data Type: |
dei:centralIndexKeyItemType |
| Balance Type: |
na |
| Period Type: |
duration |
|
| X |
- DefinitionOne of: N-1A (Mutual Fund), N-1 (Open-End Separate Account with No Variable Annuities), N-2 (Closed-End Investment Company), N-3 (Separate Account Registered as Open-End Management Investment Company), N-4 (Variable Annuity UIT Separate Account), N-5 (Small Business Investment Company), N-6 (Variable Life UIT Separate Account), S-1 or S-3 (Face Amount Certificate Company), S-6 (UIT, Non-Insurance Product). Reference 1: http://www.xbrl.org/2003/role/presentationRef
-Publisher SEC
-Name Regulation S-T
-Number 232
-Section 313
| Name: |
dei_EntityInvCompanyType |
| Namespace Prefix: |
dei_ |
| Data Type: |
dei:invCompanyType |
| Balance Type: |
na |
| Period Type: |
duration |
|
| X |
- DefinitionThe exact name of the entity filing the report as specified in its charter, which is required by forms filed with the SEC. Reference 1: http://www.xbrl.org/2003/role/presentationRef
-Publisher SEC
-Name Exchange Act
-Number 240
-Section 12
-Subsection b-2
| Name: |
dei_EntityRegistrantName |
| Namespace Prefix: |
dei_ |
| Data Type: |
xbrli:normalizedStringItemType |
| Balance Type: |
na |
| Period Type: |
duration |
|
| X |
- DefinitionTrading symbol of an instrument as listed on an exchange.
| Name: |
dei_TradingSymbol |
| Namespace Prefix: |
dei_ |
| Data Type: |
dei:tradingSymbolItemType |
| Balance Type: |
na |
| Period Type: |
duration |
|
| X |
- ReferencesReference 1: http://www.xbrl.org/2003/role/presentationRef
-Publisher SEC
-Name Form N-1A
-Section 27A
-Subsection e
| Name: |
oef_AddlFundStatisticsTextBlock |
| Namespace Prefix: |
oef_ |
| Data Type: |
dtr-types:textBlockItemType |
| Balance Type: |
na |
| Period Type: |
duration |
|
| X |
- ReferencesReference 1: http://www.xbrl.org/2003/role/presentationRef
-Publisher SEC
-Name Form N-1A
-Section 27A
-Subsection b
-Paragraph instruction
-Subparagraph 2
| Name: |
oef_AddlInfoEmail |
| Namespace Prefix: |
oef_ |
| Data Type: |
xbrli:stringItemType |
| Balance Type: |
na |
| Period Type: |
duration |
|
| X |
- ReferencesReference 1: http://www.xbrl.org/2003/role/presentationRef
-Publisher SEC
-Name Form N-1A
-Section 27A
-Subsection b
-Paragraph instruction
-Subparagraph 2
| Name: |
oef_AddlInfoPhoneNumber |
| Namespace Prefix: |
oef_ |
| Data Type: |
xbrli:stringItemType |
| Balance Type: |
na |
| Period Type: |
duration |
|
| X |
- ReferencesReference 1: http://www.xbrl.org/2003/role/presentationRef
-Publisher SEC
-Name Form N-1A
-Section 27A
-Subsection b
-Paragraph 4
| Name: |
oef_AddlInfoTextBlock |
| Namespace Prefix: |
oef_ |
| Data Type: |
dtr-types:textBlockItemType |
| Balance Type: |
na |
| Period Type: |
duration |
|
| X |
- ReferencesReference 1: http://www.xbrl.org/2003/role/presentationRef
-Publisher SEC
-Name Form N-1A
-Section 27A
-Subsection b
-Paragraph instruction
-Subparagraph 2
| Name: |
oef_AddlInfoWebsite |
| Namespace Prefix: |
oef_ |
| Data Type: |
xbrli:stringItemType |
| Balance Type: |
na |
| Period Type: |
duration |
|
| X |
- ReferencesReference 1: http://www.xbrl.org/2003/role/presentationRef
-Publisher SEC
-Name Form N-1A
-Section 27A
-Subsection b
-Paragraph 3
| Name: |
oef_AnnlOrSemiAnnlStatementTextBlock |
| Namespace Prefix: |
oef_ |
| Data Type: |
dtr-types:textBlockItemType |
| Balance Type: |
na |
| Period Type: |
duration |
|
| X |
- ReferencesReference 1: http://www.xbrl.org/2003/role/presentationRef
-Publisher SEC
-Name Form N-1A
-Section 27A
-Subsection b
-Paragraph instruction
-Subparagraph 2
| Name: |
oef_ClassName |
| Namespace Prefix: |
oef_ |
| Data Type: |
dei:securityTitleItemType |
| Balance Type: |
na |
| Period Type: |
duration |
|
| X |
- ReferencesReference 1: http://www.xbrl.org/2003/role/presentationRef
-Publisher SEC
-Name Form N-1A
-Section 27A
-Subsection c
-Paragraph iii
| Name: |
oef_ExpenseRatioPct |
| Namespace Prefix: |
oef_ |
| Data Type: |
dtr-types:percentItemType |
| Balance Type: |
na |
| Period Type: |
duration |
|
| X |
- ReferencesReference 1: http://www.xbrl.org/2003/role/presentationRef
-Publisher SEC
-Name Form N-1A
-Section 27A
-Subsection c
-Paragraph ii
| Name: |
oef_ExpensesPaidAmt |
| Namespace Prefix: |
oef_ |
| Data Type: |
xbrli:monetaryItemType |
| Balance Type: |
na |
| Period Type: |
duration |
|
| X |
- ReferencesReference 1: http://www.xbrl.org/2003/role/presentationRef
-Publisher SEC
-Name Form N-1A
-Section 27A
-Subsection c
| Name: |
oef_ExpensesTextBlock |
| Namespace Prefix: |
oef_ |
| Data Type: |
dtr-types:textBlockItemType |
| Balance Type: |
na |
| Period Type: |
duration |
|
| X |
- ReferencesReference 1: http://www.xbrl.org/2003/role/presentationRef
-Publisher SEC
-Name Form N-1A
-Section 27A
-Subsection b
-Paragraph 1
| Name: |
oef_FundName |
| Namespace Prefix: |
oef_ |
| Data Type: |
xbrli:normalizedStringItemType |
| Balance Type: |
na |
| Period Type: |
duration |
|
| X |
- ReferencesReference 1: http://www.xbrl.org/2003/role/presentationRef
-Publisher SEC
-Name Form N-1A
-Section 27A
-Subsection e
| Name: |
oef_HoldingsCount |
| Namespace Prefix: |
oef_ |
| Data Type: |
xbrli:integerItemType |
| Balance Type: |
na |
| Period Type: |
instant |
|
| X |
- ReferencesReference 1: http://www.xbrl.org/2003/role/presentationRef
-Publisher SEC
-Name Form N-1A
-Section 27A
-Subsection f
| Name: |
oef_HoldingsTableTextBlock |
| Namespace Prefix: |
oef_ |
| Data Type: |
dtr-types:textBlockItemType |
| Balance Type: |
na |
| Period Type: |
duration |
|
| X |
- ReferencesReference 1: http://www.xbrl.org/2003/role/presentationRef
-Publisher SEC
-Name Form N-1A
-Section 27A
-Subsection f
| Name: |
oef_LargestHoldingsTableTextBlock |
| Namespace Prefix: |
oef_ |
| Data Type: |
dtr-types:textBlockItemType |
| Balance Type: |
na |
| Period Type: |
duration |
|
| X |
- ReferencesReference 1: http://www.xbrl.org/2003/role/presentationRef
-Publisher SEC
-Name Form N-1A
-Section 27A
-Subsection b
-Paragraph 3
| Name: |
oef_ShareholderReportAnnualOrSemiAnnual |
| Namespace Prefix: |
oef_ |
| Data Type: |
oef:shareholderReportTypeItemType |
| Balance Type: |
na |
| Period Type: |
duration |
|
| X |
- ReferencesReference 1: http://www.xbrl.org/2003/role/presentationRef
-Publisher SEC
-Name Form N-1A
-Section 27A
-Subsection d
-Paragraph 2
-Subparagraph instruction
-Clause 7
| Name: |
oef_ShareholderReportLineItems |
| Namespace Prefix: |
oef_ |
| Data Type: |
xbrli:stringItemType |
| Balance Type: |
na |
| Period Type: |
duration |
|
| X |
- DefinitionAmount of net assets (liabilities). Reference 1: http://fasb.org/us-gaap/role/ref/legacyRef
-Name Accounting Standards Codification
-Section 50
-Paragraph 1
-SubTopic 30
-Topic 205
-Publisher FASB
-URI https://asc.fasb.org/1943274/2147479910/205-30-50-1
| Name: |
us-gaap_AssetsNet |
| Namespace Prefix: |
us-gaap_ |
| Data Type: |
xbrli:monetaryItemType |
| Balance Type: |
debit |
| Period Type: |
instant |
|
| X |
- DefinitionPercentage of lesser of purchase or sale of portfolio securities to average value of portfolio securities owned. Reference 1: http://www.xbrl.org/2009/role/commonPracticeRef
-Topic 946
-SubTopic 205
-Name Accounting Standards Codification
-Section 50
-Paragraph 27
-Publisher FASB
-URI https://asc.fasb.org/1943274/2147478494/946-205-50-27
| Name: |
us-gaap_InvestmentCompanyPortfolioTurnover |
| Namespace Prefix: |
us-gaap_ |
| Data Type: |
dtr-types:percentItemType |
| Balance Type: |
na |
| Period Type: |
duration |
|
| X |
- Details
| Name: |
oef_ClassAxis=fmr_C000120647Member |
| Namespace Prefix: |
|
| Data Type: |
na |
| Balance Type: |
|
| Period Type: |
|
|
| X |
- Details
| Name: |
oef_ClassAxis=fmr_C000019194Member |
| Namespace Prefix: |
|
| Data Type: |
na |
| Balance Type: |
|
| Period Type: |
|
|
| X |
- Details
| Name: |
oef_ClassAxis=fmr_C000130146Member |
| Namespace Prefix: |
|
| Data Type: |
na |
| Balance Type: |
|
| Period Type: |
|
|
| X |
- Details
| Name: |
oef_ClassAxis=fmr_C000059102Member |
| Namespace Prefix: |
|
| Data Type: |
na |
| Balance Type: |
|
| Period Type: |
|
|
| X |
- Details
| Name: |
oef_ClassAxis=fmr_C000059103Member |
| Namespace Prefix: |
|
| Data Type: |
na |
| Balance Type: |
|
| Period Type: |
|
|
| X |
- Details
| Name: |
oef_ClassAxis=fmr_C000059101Member |
| Namespace Prefix: |
|
| Data Type: |
na |
| Balance Type: |
|
| Period Type: |
|
|
| X |
- Details
| Name: |
oef_ClassAxis=fmr_C000059099Member |
| Namespace Prefix: |
|
| Data Type: |
na |
| Balance Type: |
|
| Period Type: |
|
|
| X |
- Details
| Name: |
oef_ClassAxis=fmr_C000019191Member |
| Namespace Prefix: |
|
| Data Type: |
na |
| Balance Type: |
|
| Period Type: |
|
|
| X |
- Details
| Name: |
oef_ClassAxis=fmr_C000064239Member |
| Namespace Prefix: |
|
| Data Type: |
na |
| Balance Type: |
|
| Period Type: |
|
|
| X |
- Details
| Name: |
oef_ClassAxis=fmr_C000019193Member |
| Namespace Prefix: |
|
| Data Type: |
na |
| Balance Type: |
|
| Period Type: |
|
|
| X |
- Details
| Name: |
oef_ClassAxis=fmr_C000064240Member |
| Namespace Prefix: |
|
| Data Type: |
na |
| Balance Type: |
|
| Period Type: |
|
|
v3.25.4
| X |
- ReferencesReference 1: http://www.xbrl.org/2003/role/presentationRef
-Publisher SEC
-Name Form N-1A
-Section 27A
-Subsection f
| Name: |
oef_HoldingsLineItems |
| Namespace Prefix: |
oef_ |
| Data Type: |
xbrli:stringItemType |
| Balance Type: |
na |
| Period Type: |
duration |
|
| X |
- ReferencesReference 1: http://www.xbrl.org/2003/role/presentationRef
-Publisher SEC
-Name Form N-1A
-Section 27A
-Subsection f
| Name: |
oef_PctOfNav |
| Namespace Prefix: |
oef_ |
| Data Type: |
dtr-types:percentItemType |
| Balance Type: |
na |
| Period Type: |
instant |
|
| X |
- Details
| Name: |
oef_ClassAxis=fmr_C000120647Member |
| Namespace Prefix: |
|
| Data Type: |
na |
| Balance Type: |
|
| Period Type: |
|
|
| X |
- Details
| Name: |
oef_LargestHoldingAxis=fmr_TH0Member |
| Namespace Prefix: |
|
| Data Type: |
na |
| Balance Type: |
|
| Period Type: |
|
|
| X |
- Details
| Name: |
oef_LargestHoldingAxis=fmr_TH1Member |
| Namespace Prefix: |
|
| Data Type: |
na |
| Balance Type: |
|
| Period Type: |
|
|
| X |
- Details
| Name: |
oef_LargestHoldingAxis=fmr_TH2Member |
| Namespace Prefix: |
|
| Data Type: |
na |
| Balance Type: |
|
| Period Type: |
|
|
| X |
- Details
| Name: |
oef_LargestHoldingAxis=fmr_TH3Member |
| Namespace Prefix: |
|
| Data Type: |
na |
| Balance Type: |
|
| Period Type: |
|
|
| X |
- Details
| Name: |
oef_LargestHoldingAxis=fmr_TH4Member |
| Namespace Prefix: |
|
| Data Type: |
na |
| Balance Type: |
|
| Period Type: |
|
|
| X |
- Details
| Name: |
oef_LargestHoldingAxis=fmr_TH5Member |
| Namespace Prefix: |
|
| Data Type: |
na |
| Balance Type: |
|
| Period Type: |
|
|
| X |
- Details
| Name: |
oef_LargestHoldingAxis=fmr_TH6Member |
| Namespace Prefix: |
|
| Data Type: |
na |
| Balance Type: |
|
| Period Type: |
|
|
| X |
- Details
| Name: |
oef_LargestHoldingAxis=fmr_TH7Member |
| Namespace Prefix: |
|
| Data Type: |
na |
| Balance Type: |
|
| Period Type: |
|
|
| X |
- Details
| Name: |
oef_LargestHoldingAxis=fmr_TH8Member |
| Namespace Prefix: |
|
| Data Type: |
na |
| Balance Type: |
|
| Period Type: |
|
|
| X |
- Details
| Name: |
oef_LargestHoldingAxis=fmr_TH9Member |
| Namespace Prefix: |
|
| Data Type: |
na |
| Balance Type: |
|
| Period Type: |
|
|
| X |
- Details
| Name: |
oef_IndustrySectorAxis=fmr_MSFinancialsSectorMember |
| Namespace Prefix: |
|
| Data Type: |
na |
| Balance Type: |
|
| Period Type: |
|
|
| X |
- Details
| Name: |
oef_IndustrySectorAxis=us-gaap_HealthcareSectorMember |
| Namespace Prefix: |
|
| Data Type: |
na |
| Balance Type: |
|
| Period Type: |
|
|
| X |
- Details
| Name: |
oef_IndustrySectorAxis=us-gaap_RealEstateSectorMember |
| Namespace Prefix: |
|
| Data Type: |
na |
| Balance Type: |
|
| Period Type: |
|
|
| X |
- Details
| Name: |
oef_IndustrySectorAxis=oef_IndustrialSectorMember |
| Namespace Prefix: |
|
| Data Type: |
na |
| Balance Type: |
|
| Period Type: |
|
|
| X |
- Details
| Name: |
oef_IndustrySectorAxis=oef_MaterialsSectorMember |
| Namespace Prefix: |
|
| Data Type: |
na |
| Balance Type: |
|
| Period Type: |
|
|
| X |
- Details
| Name: |
oef_IndustrySectorAxis=oef_ConsumerDiscretionarySectorMember |
| Namespace Prefix: |
|
| Data Type: |
na |
| Balance Type: |
|
| Period Type: |
|
|
| X |
- Details
| Name: |
oef_IndustrySectorAxis=oef_ConsumerStaplesSectorMember |
| Namespace Prefix: |
|
| Data Type: |
na |
| Balance Type: |
|
| Period Type: |
|
|
| X |
- Details
| Name: |
oef_IndustrySectorAxis=oef_CommunicationsSectorMember |
| Namespace Prefix: |
|
| Data Type: |
na |
| Balance Type: |
|
| Period Type: |
|
|
| X |
- Details
| Name: |
oef_IndustrySectorAxis=us-gaap_EnergySectorMember |
| Namespace Prefix: |
|
| Data Type: |
na |
| Balance Type: |
|
| Period Type: |
|
|
| X |
- Details
| Name: |
oef_IndustrySectorAxis=oef_UtilitiesSectorMember |
| Namespace Prefix: |
|
| Data Type: |
na |
| Balance Type: |
|
| Period Type: |
|
|
| X |
- Details
| Name: |
oef_GeographicRegionAxis=country_US |
| Namespace Prefix: |
|
| Data Type: |
na |
| Balance Type: |
|
| Period Type: |
|
|
| X |
- Details
| Name: |
oef_GeographicRegionAxis=country_CA |
| Namespace Prefix: |
|
| Data Type: |
na |
| Balance Type: |
|
| Period Type: |
|
|
| X |
- Details
| Name: |
oef_GeographicRegionAxis=country_ZM |
| Namespace Prefix: |
|
| Data Type: |
na |
| Balance Type: |
|
| Period Type: |
|
|
| X |
- Details
| Name: |
oef_GeographicRegionAxis=country_BE |
| Namespace Prefix: |
|
| Data Type: |
na |
| Balance Type: |
|
| Period Type: |
|
|
| X |
- Details
| Name: |
oef_GeographicRegionAxis=country_GB |
| Namespace Prefix: |
|
| Data Type: |
na |
| Balance Type: |
|
| Period Type: |
|
|
| X |
- Details
| Name: |
oef_GeographicRegionAxis=country_DE |
| Namespace Prefix: |
|
| Data Type: |
na |
| Balance Type: |
|
| Period Type: |
|
|
| X |
- Details
| Name: |
oef_GeographicRegionAxis=country_TW |
| Namespace Prefix: |
|
| Data Type: |
na |
| Balance Type: |
|
| Period Type: |
|
|
| X |
- Details
| Name: |
oef_GeographicRegionAxis=country_NL |
| Namespace Prefix: |
|
| Data Type: |
na |
| Balance Type: |
|
| Period Type: |
|
|
| X |
- Details
| Name: |
oef_GeographicRegionAxis=country_FR |
| Namespace Prefix: |
|
| Data Type: |
na |
| Balance Type: |
|
| Period Type: |
|
|
| X |
- Details
| Name: |
oef_GeographicRegionAxis=fmr_OtherMember |
| Namespace Prefix: |
|
| Data Type: |
na |
| Balance Type: |
|
| Period Type: |
|
|
| X |
- Details
| Name: |
us-gaap_InvestmentTypeAxis=fmr_AACommonStocksMember |
| Namespace Prefix: |
|
| Data Type: |
na |
| Balance Type: |
|
| Period Type: |
|
|
| X |
- Details
| Name: |
us-gaap_InvestmentTypeAxis=fmr_AAPreferredStocksMember |
| Namespace Prefix: |
|
| Data Type: |
na |
| Balance Type: |
|
| Period Type: |
|
|
| X |
- Details
| Name: |
us-gaap_InvestmentTypeAxis=fmr_AAShortTermInvestmentsandNetOtherAssetsLiabilitiesMember |
| Namespace Prefix: |
|
| Data Type: |
na |
| Balance Type: |
|
| Period Type: |
|
|
| X |
- Details
| Name: |
oef_ClassAxis=fmr_C000019194Member |
| Namespace Prefix: |
|
| Data Type: |
na |
| Balance Type: |
|
| Period Type: |
|
|
| X |
- Details
| Name: |
oef_ClassAxis=fmr_C000130146Member |
| Namespace Prefix: |
|
| Data Type: |
na |
| Balance Type: |
|
| Period Type: |
|
|
| X |
- Details
| Name: |
oef_ClassAxis=fmr_C000059102Member |
| Namespace Prefix: |
|
| Data Type: |
na |
| Balance Type: |
|
| Period Type: |
|
|
| X |
- Details
| Name: |
oef_ClassAxis=fmr_C000059103Member |
| Namespace Prefix: |
|
| Data Type: |
na |
| Balance Type: |
|
| Period Type: |
|
|
| X |
- Details
| Name: |
oef_ClassAxis=fmr_C000059101Member |
| Namespace Prefix: |
|
| Data Type: |
na |
| Balance Type: |
|
| Period Type: |
|
|
| X |
- Details
| Name: |
oef_ClassAxis=fmr_C000059099Member |
| Namespace Prefix: |
|
| Data Type: |
na |
| Balance Type: |
|
| Period Type: |
|
|
| X |
- Details
| Name: |
oef_ClassAxis=fmr_C000019191Member |
| Namespace Prefix: |
|
| Data Type: |
na |
| Balance Type: |
|
| Period Type: |
|
|
| X |
- Details
| Name: |
oef_GeographicRegionAxis=country_CN |
| Namespace Prefix: |
|
| Data Type: |
na |
| Balance Type: |
|
| Period Type: |
|
|
| X |
- Details
| Name: |
oef_GeographicRegionAxis=country_KR |
| Namespace Prefix: |
|
| Data Type: |
na |
| Balance Type: |
|
| Period Type: |
|
|
| X |
- Details
| Name: |
oef_GeographicRegionAxis=country_BR |
| Namespace Prefix: |
|
| Data Type: |
na |
| Balance Type: |
|
| Period Type: |
|
|
| X |
- Details
| Name: |
us-gaap_InvestmentTypeAxis=fmr_AAPreferredSecuritiesMember |
| Namespace Prefix: |
|
| Data Type: |
na |
| Balance Type: |
|
| Period Type: |
|
|
| X |
- Details
| Name: |
us-gaap_InvestmentTypeAxis=fmr_AABondsMember |
| Namespace Prefix: |
|
| Data Type: |
na |
| Balance Type: |
|
| Period Type: |
|
|
| X |
- Details
| Name: |
oef_ClassAxis=fmr_C000064239Member |
| Namespace Prefix: |
|
| Data Type: |
na |
| Balance Type: |
|
| Period Type: |
|
|
| X |
- Details
| Name: |
oef_ClassAxis=fmr_C000019193Member |
| Namespace Prefix: |
|
| Data Type: |
na |
| Balance Type: |
|
| Period Type: |
|
|
| X |
- Details
| Name: |
oef_ClassAxis=fmr_C000064240Member |
| Namespace Prefix: |
|
| Data Type: |
na |
| Balance Type: |
|
| Period Type: |
|
|
{
"version": "2.2",
"instance": {
"filing10962.htm": {
"nsprefix": "fmr",
"nsuri": "http://www.fidelity.com/20260228",
"dts": {
"inline": {
"local": [
"filing10962.htm"
]
},
"schema": {
"local": [
"fmr-20260228.xsd"
],
"remote": [
"http://www.xbrl.org/2003/xbrl-instance-2003-12-31.xsd",
"http://www.xbrl.org/2003/xbrl-linkbase-2003-12-31.xsd",
"http://www.xbrl.org/2003/xl-2003-12-31.xsd",
"http://www.xbrl.org/2003/xlink-2003-12-31.xsd",
"http://www.xbrl.org/2005/xbrldt-2005.xsd",
"http://www.xbrl.org/2006/ref-2006-02-27.xsd",
"http://www.xbrl.org/dtr/type/nonNumeric-2009-12-16.xsd",
"http://www.xbrl.org/lrr/arcrole/deprecated-2009-12-16.xsd",
"http://www.xbrl.org/lrr/role/negated-2009-12-16.xsd",
"http://www.xbrl.org/lrr/role/reference-2009-12-16.xsd",
"https://www.xbrl.org/2020/extensible-enumerations-2.0.xsd",
"https://www.xbrl.org/dtr/type/2020-01-21/types.xsd",
"https://www.xbrl.org/dtr/type/2022-03-31/types.xsd",
"https://xbrl.fasb.org/srt/2024/elts/srt-2024.xsd",
"https://xbrl.fasb.org/srt/2024/elts/srt-roles-2024.xsd",
"https://xbrl.fasb.org/srt/2024/elts/srt-types-2024.xsd",
"https://xbrl.fasb.org/us-gaap/2024/elts/us-gaap-2024.xsd",
"https://xbrl.fasb.org/us-gaap/2024/elts/us-roles-2024.xsd",
"https://xbrl.fasb.org/us-gaap/2024/elts/us-types-2024.xsd",
"https://xbrl.sec.gov/country/2024/country-2024.xsd",
"https://xbrl.sec.gov/country/2024/country-2024_def.xsd",
"https://xbrl.sec.gov/dei/2024/dei-2024.xsd",
"https://xbrl.sec.gov/oef/2024q3/oef-2024q3.xsd",
"https://xbrl.sec.gov/oef/2024q3/oef-2024q3_cal.xsd",
"https://xbrl.sec.gov/oef/2024q3/oef-2024q3_lab.xsd",
"https://xbrl.sec.gov/oef/2024q3/oef-sr-2024q3.xsd",
"https://xbrl.sec.gov/stpr/2024/stpr-2024.xsd"
]
}
},
"keyStandard": 25,
"keyCustom": 0,
"axisStandard": 5,
"axisCustom": 0,
"memberStandard": 22,
"memberCustom": 28,
"hidden": {
"total": 5,
"http://xbrl.sec.gov/dei/2024": 5
},
"contextCount": 385,
"entityCount": 1,
"segmentCount": 50,
"elementCount": 182,
"unitCount": 3,
"baseTaxonomies": {
"http://xbrl.sec.gov/oef/2024q3": 526,
"http://xbrl.sec.gov/dei/2024": 27,
"http://fasb.org/us-gaap/2024": 22
},
"report": {
"R1": {
"role": "http://xbrl.sec.gov/oef/role/NcsrCover",
"longName": "030000 - Disclosure - Form N-CSR Cover",
"shortName": "Form N-CSR Cover",
"isDefault": "true",
"groupType": "disclosure",
"subGroupType": "",
"menuCat": "Cover",
"order": "1",
"firstAnchor": {
"contextRef": "Trust",
"name": "dei:DocumentPeriodEndDate",
"unitRef": null,
"xsiNil": "false",
"lang": "en-US",
"decimals": null,
"ancestors": [
"div",
"td",
"tr",
"table",
"div",
"body",
"html"
],
"reportCount": 1,
"baseRef": "filing10962.htm",
"first": true
},
"uniqueAnchor": null
},
"R2": {
"role": "http://xbrl.sec.gov/oef/role/ShareholderReport",
"longName": "030001 - Disclosure - Shareholder Report",
"shortName": "Shareholder Report",
"isDefault": "false",
"groupType": "disclosure",
"subGroupType": "",
"menuCat": "Notes",
"order": "2",
"firstAnchor": {
"contextRef": "Trust",
"name": "dei:DocumentPeriodEndDate",
"unitRef": null,
"xsiNil": "false",
"lang": "en-US",
"decimals": null,
"ancestors": [
"div",
"td",
"tr",
"table",
"div",
"body",
"html"
],
"reportCount": 1,
"baseRef": "filing10962.htm",
"first": true
},
"uniqueAnchor": {
"contextRef": "C000120647_ClassMember",
"name": "oef:FundName",
"unitRef": null,
"xsiNil": "false",
"lang": "en-US",
"decimals": null,
"ancestors": [
"div",
"td",
"tr",
"table",
"div",
"body",
"html"
],
"reportCount": 1,
"baseRef": "filing10962.htm",
"unique": true
}
},
"R3": {
"role": "http://xbrl.sec.gov/oef/role/ShareholderReportHoldingsDetails",
"longName": "040020 - Disclosure - Shareholder Report, Holdings (Details)",
"shortName": "Shareholder Report, Holdings (Details)",
"isDefault": "false",
"groupType": "disclosure",
"subGroupType": "details",
"menuCat": "Details",
"order": "3",
"firstAnchor": {
"contextRef": "C000120647_TH_0_Member",
"name": "oef:PctOfNav",
"unitRef": "pure",
"xsiNil": "false",
"lang": null,
"decimals": "INF",
"ancestors": [
"div",
"td",
"tr",
"table",
"oef:LargestHoldingsTableTextBlock",
"div",
"body",
"html"
],
"reportCount": 1,
"baseRef": "filing10962.htm",
"first": true,
"unique": true
},
"uniqueAnchor": {
"contextRef": "C000120647_TH_0_Member",
"name": "oef:PctOfNav",
"unitRef": "pure",
"xsiNil": "false",
"lang": null,
"decimals": "INF",
"ancestors": [
"div",
"td",
"tr",
"table",
"oef:LargestHoldingsTableTextBlock",
"div",
"body",
"html"
],
"reportCount": 1,
"baseRef": "filing10962.htm",
"first": true,
"unique": true
}
}
},
"tag": {
"fmr_AABondsMember": {
"xbrltype": "domainItemType",
"nsuri": "http://www.fidelity.com/20260228",
"localname": "AABondsMember",
"presentation": [
"http://xbrl.sec.gov/oef/role/ShareholderReportHoldingsDetails"
],
"lang": {
"en-us": {
"role": {
"label": "AABondsMember [Member]",
"verboseLabel": "AABondsMember",
"terseLabel": "AABondsMember"
}
}
},
"auth_ref": []
},
"fmr_AACommonStocksMember": {
"xbrltype": "domainItemType",
"nsuri": "http://www.fidelity.com/20260228",
"localname": "AACommonStocksMember",
"presentation": [
"http://xbrl.sec.gov/oef/role/ShareholderReportHoldingsDetails"
],
"lang": {
"en-us": {
"role": {
"label": "AACommonStocksMember [Member]",
"verboseLabel": "AACommonStocksMember",
"terseLabel": "AACommonStocksMember"
}
}
},
"auth_ref": []
},
"fmr_AAPreferredSecuritiesMember": {
"xbrltype": "domainItemType",
"nsuri": "http://www.fidelity.com/20260228",
"localname": "AAPreferredSecuritiesMember",
"presentation": [
"http://xbrl.sec.gov/oef/role/ShareholderReportHoldingsDetails"
],
"lang": {
"en-us": {
"role": {
"label": "AAPreferredSecuritiesMember [Member]",
"verboseLabel": "AAPreferredSecuritiesMember",
"terseLabel": "AAPreferredSecuritiesMember"
}
}
},
"auth_ref": []
},
"fmr_AAPreferredStocksMember": {
"xbrltype": "domainItemType",
"nsuri": "http://www.fidelity.com/20260228",
"localname": "AAPreferredStocksMember",
"presentation": [
"http://xbrl.sec.gov/oef/role/ShareholderReportHoldingsDetails"
],
"lang": {
"en-us": {
"role": {
"label": "AAPreferredStocksMember [Member]",
"verboseLabel": "AAPreferredStocksMember",
"terseLabel": "AAPreferredStocksMember"
}
}
},
"auth_ref": []
},
"fmr_AAShortTermInvestmentsandNetOtherAssetsLiabilitiesMember": {
"xbrltype": "domainItemType",
"nsuri": "http://www.fidelity.com/20260228",
"localname": "AAShortTermInvestmentsandNetOtherAssetsLiabilitiesMember",
"presentation": [
"http://xbrl.sec.gov/oef/role/ShareholderReportHoldingsDetails"
],
"lang": {
"en-us": {
"role": {
"label": "AAShortTermInvestmentsandNetOtherAssetsLiabilitiesMember [Member]",
"verboseLabel": "AAShortTermInvestmentsandNetOtherAssetsLiabilitiesMember",
"terseLabel": "AAShortTermInvestmentsandNetOtherAssetsLiabilitiesMember"
}
}
},
"auth_ref": []
},
"oef_AccmVal": {
"xbrltype": "monetaryItemType",
"nsuri": "http://xbrl.sec.gov/oef/2024q3",
"localname": "AccmVal",
"presentation": [
"http://xbrl.sec.gov/oef/role/ShareholderReportLineGraphDetails"
],
"lang": {
"en-us": {
"role": {
"label": "Accumulated Value"
}
}
},
"auth_ref": [
"r38"
]
},
"oef_AccountValueLineItems": {
"xbrltype": "stringItemType",
"nsuri": "http://xbrl.sec.gov/oef/2024q3",
"localname": "AccountValueLineItems",
"presentation": [
"http://xbrl.sec.gov/oef/role/ShareholderReportLineGraphDetails"
],
"lang": {
"en-us": {
"role": {
"label": "Account Value [Line Items]"
}
}
},
"auth_ref": [
"r37"
]
},
"oef_AccountValueTable": {
"xbrltype": "stringItemType",
"nsuri": "http://xbrl.sec.gov/oef/2024q3",
"localname": "AccountValueTable",
"presentation": [
"http://xbrl.sec.gov/oef/role/ShareholderReportLineGraphDetails"
],
"lang": {
"en-us": {
"role": {
"label": "Account Value [Table]"
}
}
},
"auth_ref": [
"r37"
]
},
"oef_AccountValueTableAbstract": {
"xbrltype": "stringItemType",
"nsuri": "http://xbrl.sec.gov/oef/2024q3",
"localname": "AccountValueTableAbstract",
"lang": {
"en-us": {
"role": {
"label": "Account Value Table [Abstract]"
}
}
},
"auth_ref": [
"r37"
]
},
"oef_AccountantChngDate": {
"xbrltype": "dateItemType",
"nsuri": "http://xbrl.sec.gov/oef/2024q3",
"localname": "AccountantChngDate",
"presentation": [
"http://xbrl.sec.gov/oef/role/ShareholderReport"
],
"lang": {
"en-us": {
"role": {
"label": "Accountant Change Date"
}
}
},
"auth_ref": [
"r61"
]
},
"oef_AccountantChngDisagreementsTextBlock": {
"xbrltype": "textBlockItemType",
"nsuri": "http://xbrl.sec.gov/oef/2024q3",
"localname": "AccountantChngDisagreementsTextBlock",
"presentation": [
"http://xbrl.sec.gov/oef/role/ShareholderReport"
],
"lang": {
"en-us": {
"role": {
"label": "Accountant Change Disagreements [Text Block]"
}
}
},
"auth_ref": [
"r62"
]
},
"oef_AccountantChngStatementTextBlock": {
"xbrltype": "textBlockItemType",
"nsuri": "http://xbrl.sec.gov/oef/2024q3",
"localname": "AccountantChngStatementTextBlock",
"presentation": [
"http://xbrl.sec.gov/oef/role/ShareholderReport"
],
"lang": {
"en-us": {
"role": {
"label": "Accountant Change Statement [Text Block]"
}
}
},
"auth_ref": [
"r61"
]
},
"oef_AcctVal": {
"xbrltype": "monetaryItemType",
"nsuri": "http://xbrl.sec.gov/oef/2024q3",
"localname": "AcctVal",
"presentation": [
"http://xbrl.sec.gov/oef/role/Deprecated"
],
"lang": {
"en-us": {
"role": {
"label": "Account Value (Deprecated 2024-07-31)"
}
}
},
"auth_ref": [
"r38"
]
},
"oef_AcquiredFundFeesAndExpensesOverAssets": {
"xbrltype": "nonNegativePure4ItemType",
"nsuri": "http://xbrl.sec.gov/oef/2024q3",
"localname": "AcquiredFundFeesAndExpensesOverAssets",
"calculation": {
"http://xbrl.sec.gov/rr/role/OperatingExpensesData": {
"parentTag": "oef_ExpensesOverAssets",
"weight": 1.0,
"order": 5.0
}
},
"lang": {
"en-us": {
"role": {
"label": "Acquired Fund Fees and Expenses"
}
}
},
"auth_ref": [
"r71"
]
},
"oef_AdditionalIndexAxis": {
"xbrltype": "stringItemType",
"nsuri": "http://xbrl.sec.gov/oef/2024q3",
"localname": "AdditionalIndexAxis",
"presentation": [
"http://xbrl.sec.gov/oef/role/ShareholderReportAverageAnnualReturnDetails",
"http://xbrl.sec.gov/oef/role/ShareholderReportLineGraphDetails"
],
"lang": {
"en-us": {
"role": {
"label": "Additional Index [Axis]"
}
}
},
"auth_ref": [
"r37"
]
},
"oef_AdditionalIndexDomain": {
"xbrltype": "domainItemType",
"nsuri": "http://xbrl.sec.gov/oef/2024q3",
"localname": "AdditionalIndexDomain",
"presentation": [
"http://xbrl.sec.gov/oef/role/ShareholderReportAverageAnnualReturnDetails",
"http://xbrl.sec.gov/oef/role/ShareholderReportLineGraphDetails"
],
"lang": {
"en-us": {
"role": {
"label": "Additional Index [Domain]"
}
}
},
"auth_ref": [
"r37"
]
},
"oef_AddlFundStatisticsSignificanceOrLimitsTextBlock": {
"xbrltype": "textBlockItemType",
"nsuri": "http://xbrl.sec.gov/oef/2024q3",
"localname": "AddlFundStatisticsSignificanceOrLimitsTextBlock",
"presentation": [
"http://xbrl.sec.gov/oef/role/ShareholderReport"
],
"lang": {
"en-us": {
"role": {
"label": "Additional Fund Statistics Significance or Limits [Text Block]"
}
}
},
"auth_ref": [
"r51"
]
},
"oef_AddlFundStatisticsTextBlock": {
"xbrltype": "textBlockItemType",
"nsuri": "http://xbrl.sec.gov/oef/2024q3",
"localname": "AddlFundStatisticsTextBlock",
"presentation": [
"http://xbrl.sec.gov/oef/role/ShareholderReport"
],
"lang": {
"en-us": {
"role": {
"label": "Additional Fund Statistics [Text Block]"
}
}
},
"auth_ref": [
"r50"
]
},
"oef_AddlInfoEmail": {
"xbrltype": "stringItemType",
"nsuri": "http://xbrl.sec.gov/oef/2024q3",
"localname": "AddlInfoEmail",
"presentation": [
"http://xbrl.sec.gov/oef/role/ShareholderReport"
],
"lang": {
"en-us": {
"role": {
"label": "Additional Information Email"
}
}
},
"auth_ref": [
"r29"
]
},
"oef_AddlInfoPhoneNumber": {
"xbrltype": "stringItemType",
"nsuri": "http://xbrl.sec.gov/oef/2024q3",
"localname": "AddlInfoPhoneNumber",
"presentation": [
"http://xbrl.sec.gov/oef/role/ShareholderReport"
],
"lang": {
"en-us": {
"role": {
"label": "Additional Information Phone Number"
}
}
},
"auth_ref": [
"r29"
]
},
"oef_AddlInfoTextBlock": {
"xbrltype": "textBlockItemType",
"nsuri": "http://xbrl.sec.gov/oef/2024q3",
"localname": "AddlInfoTextBlock",
"presentation": [
"http://xbrl.sec.gov/oef/role/ShareholderReport"
],
"lang": {
"en-us": {
"role": {
"label": "Additional Information [Text Block]"
}
}
},
"auth_ref": [
"r27"
]
},
"oef_AddlInfoWebsite": {
"xbrltype": "stringItemType",
"nsuri": "http://xbrl.sec.gov/oef/2024q3",
"localname": "AddlInfoWebsite",
"presentation": [
"http://xbrl.sec.gov/oef/role/ShareholderReport"
],
"lang": {
"en-us": {
"role": {
"label": "Additional Information Website"
}
}
},
"auth_ref": [
"r29"
]
},
"oef_AdvisoryFeesPaidAmt": {
"xbrltype": "monetaryItemType",
"nsuri": "http://xbrl.sec.gov/oef/2024q3",
"localname": "AdvisoryFeesPaidAmt",
"presentation": [
"http://xbrl.sec.gov/oef/role/ShareholderReport"
],
"lang": {
"en-us": {
"role": {
"label": "Advisory Fees Paid, Amount"
}
}
},
"auth_ref": [
"r50"
]
},
"dei_AmendmentDescription": {
"xbrltype": "stringItemType",
"nsuri": "http://xbrl.sec.gov/dei/2024",
"localname": "AmendmentDescription",
"presentation": [
"http://xbrl.sec.gov/oef/role/NcsrCover",
"http://xbrl.sec.gov/oef/role/ShareholderReport"
],
"lang": {
"en-us": {
"role": {
"label": "Amendment Description",
"documentation": "Description of changes contained within amended document."
}
}
},
"auth_ref": []
},
"dei_AmendmentFlag": {
"xbrltype": "booleanItemType",
"nsuri": "http://xbrl.sec.gov/dei/2024",
"localname": "AmendmentFlag",
"presentation": [
"http://xbrl.sec.gov/oef/role/NcsrCover",
"http://xbrl.sec.gov/oef/role/ShareholderReport"
],
"lang": {
"en-us": {
"role": {
"label": "Amendment Flag",
"documentation": "Boolean flag that is true when the XBRL content amends previously-filed or accepted submission."
}
}
},
"auth_ref": []
},
"oef_AnnlOrSemiAnnlStatementTextBlock": {
"xbrltype": "textBlockItemType",
"nsuri": "http://xbrl.sec.gov/oef/2024q3",
"localname": "AnnlOrSemiAnnlStatementTextBlock",
"presentation": [
"http://xbrl.sec.gov/oef/role/ShareholderReport"
],
"lang": {
"en-us": {
"role": {
"label": "Annual or Semi-Annual Statement [Text Block]"
}
}
},
"auth_ref": [
"r26"
]
},
"us-gaap_AssetsNet": {
"xbrltype": "monetaryItemType",
"nsuri": "http://fasb.org/us-gaap/2024",
"localname": "AssetsNet",
"crdr": "debit",
"presentation": [
"http://xbrl.sec.gov/oef/role/ShareholderReport"
],
"lang": {
"en-us": {
"role": {
"documentation": "Amount of net assets (liabilities).",
"label": "Net Assets"
}
}
},
"auth_ref": [
"r0"
]
},
"oef_AverageAnnualReturnAbstract": {
"xbrltype": "stringItemType",
"nsuri": "http://xbrl.sec.gov/oef/2024q3",
"localname": "AverageAnnualReturnAbstract",
"lang": {
"en-us": {
"role": {
"label": "Average Annual Return:"
}
}
},
"auth_ref": [
"r73"
]
},
"oef_AverageAnnualReturnLineItems": {
"xbrltype": "stringItemType",
"nsuri": "http://xbrl.sec.gov/oef/2024q3",
"localname": "AverageAnnualReturnLineItems",
"presentation": [
"http://xbrl.sec.gov/oef/role/ShareholderReportAverageAnnualReturnDetails"
],
"lang": {
"en-us": {
"role": {
"label": "Average Annual Return [Line Items]"
}
}
},
"auth_ref": [
"r73"
]
},
"oef_AverageAnnualReturnTable": {
"xbrltype": "stringItemType",
"nsuri": "http://xbrl.sec.gov/oef/2024q3",
"localname": "AverageAnnualReturnTable",
"presentation": [
"http://xbrl.sec.gov/oef/role/ShareholderReportAverageAnnualReturnDetails"
],
"lang": {
"en-us": {
"role": {
"label": "Average Annual Return [Table]"
}
}
},
"auth_ref": [
"r73"
]
},
"oef_AvgAnnlRtrPct": {
"xbrltype": "percentItemType",
"nsuri": "http://xbrl.sec.gov/oef/2024q3",
"localname": "AvgAnnlRtrPct",
"presentation": [
"http://xbrl.sec.gov/oef/role/ShareholderReportAverageAnnualReturnDetails"
],
"lang": {
"en-us": {
"role": {
"label": "Average Annual Return, Percent"
}
}
},
"auth_ref": [
"r44"
]
},
"oef_AvgAnnlRtrTableTextBlock": {
"xbrltype": "textBlockItemType",
"nsuri": "http://xbrl.sec.gov/oef/2024q3",
"localname": "AvgAnnlRtrTableTextBlock",
"presentation": [
"http://xbrl.sec.gov/oef/role/ShareholderReport"
],
"lang": {
"en-us": {
"role": {
"label": "Average Annual Return [Table Text Block]"
}
}
},
"auth_ref": [
"r44"
]
},
"country_BE": {
"xbrltype": "domainItemType",
"nsuri": "http://xbrl.sec.gov/country/2024",
"localname": "BE",
"presentation": [
"http://xbrl.sec.gov/oef/role/ShareholderReportHoldingsDetails"
],
"lang": {
"en-us": {
"role": {
"label": "Belgium",
"terseLabel": "Belgium"
}
}
},
"auth_ref": []
},
"country_BR": {
"xbrltype": "domainItemType",
"nsuri": "http://xbrl.sec.gov/country/2024",
"localname": "BR",
"presentation": [
"http://xbrl.sec.gov/oef/role/ShareholderReportHoldingsDetails"
],
"lang": {
"en-us": {
"role": {
"label": "Brazil",
"terseLabel": "Brazil"
}
}
},
"auth_ref": []
},
"oef_BroadBasedIndexAxis": {
"xbrltype": "stringItemType",
"nsuri": "http://xbrl.sec.gov/oef/2024q3",
"localname": "BroadBasedIndexAxis",
"presentation": [
"http://xbrl.sec.gov/oef/role/ShareholderReportAverageAnnualReturnDetails",
"http://xbrl.sec.gov/oef/role/ShareholderReportLineGraphDetails"
],
"lang": {
"en-us": {
"role": {
"label": "Broad Based Index [Axis]"
}
}
},
"auth_ref": [
"r37"
]
},
"oef_BroadBasedIndexDomain": {
"xbrltype": "domainItemType",
"nsuri": "http://xbrl.sec.gov/oef/2024q3",
"localname": "BroadBasedIndexDomain",
"presentation": [
"http://xbrl.sec.gov/oef/role/ShareholderReportAverageAnnualReturnDetails",
"http://xbrl.sec.gov/oef/role/ShareholderReportLineGraphDetails"
],
"lang": {
"en-us": {
"role": {
"label": "Broad Based Index [Domain]"
}
}
},
"auth_ref": [
"r37"
]
},
"fmr_C000019191Member": {
"xbrltype": "domainItemType",
"nsuri": "http://www.fidelity.com/20260228",
"localname": "C000019191Member",
"presentation": [
"http://xbrl.sec.gov/oef/role/ShareholderReport",
"http://xbrl.sec.gov/oef/role/ShareholderReportAverageAnnualReturnDetails",
"http://xbrl.sec.gov/oef/role/ShareholderReportHoldingsDetails",
"http://xbrl.sec.gov/oef/role/ShareholderReportLineGraphDetails"
],
"lang": {
"en-us": {
"role": {
"label": "C000019191 [Member]",
"verboseLabel": "Fidelity Growth Discovery Fund",
"terseLabel": "Fidelity Growth Discovery Fund"
}
}
},
"auth_ref": []
},
"fmr_C000019193Member": {
"xbrltype": "domainItemType",
"nsuri": "http://www.fidelity.com/20260228",
"localname": "C000019193Member",
"presentation": [
"http://xbrl.sec.gov/oef/role/ShareholderReport",
"http://xbrl.sec.gov/oef/role/ShareholderReportAverageAnnualReturnDetails",
"http://xbrl.sec.gov/oef/role/ShareholderReportHoldingsDetails",
"http://xbrl.sec.gov/oef/role/ShareholderReportLineGraphDetails"
],
"lang": {
"en-us": {
"role": {
"label": "C000019193 [Member]",
"verboseLabel": "Fidelity Fund",
"terseLabel": "Fidelity Fund"
}
}
},
"auth_ref": []
},
"fmr_C000019194Member": {
"xbrltype": "domainItemType",
"nsuri": "http://www.fidelity.com/20260228",
"localname": "C000019194Member",
"presentation": [
"http://xbrl.sec.gov/oef/role/ShareholderReport",
"http://xbrl.sec.gov/oef/role/ShareholderReportAverageAnnualReturnDetails",
"http://xbrl.sec.gov/oef/role/ShareholderReportHoldingsDetails",
"http://xbrl.sec.gov/oef/role/ShareholderReportLineGraphDetails"
],
"lang": {
"en-us": {
"role": {
"label": "C000019194 [Member]",
"verboseLabel": "Fidelity Mega Cap Stock Fund",
"terseLabel": "Fidelity Mega Cap Stock Fund"
}
}
},
"auth_ref": []
},
"fmr_C000059099Member": {
"xbrltype": "domainItemType",
"nsuri": "http://www.fidelity.com/20260228",
"localname": "C000059099Member",
"presentation": [
"http://xbrl.sec.gov/oef/role/ShareholderReport",
"http://xbrl.sec.gov/oef/role/ShareholderReportAverageAnnualReturnDetails",
"http://xbrl.sec.gov/oef/role/ShareholderReportHoldingsDetails",
"http://xbrl.sec.gov/oef/role/ShareholderReportLineGraphDetails"
],
"lang": {
"en-us": {
"role": {
"label": "C000059099 [Member]",
"verboseLabel": "Fidelity Advisor Mega Cap Stock Fund - Class A",
"terseLabel": "Fidelity Advisor Mega Cap Stock Fund - Class A"
}
}
},
"auth_ref": []
},
"fmr_C000059101Member": {
"xbrltype": "domainItemType",
"nsuri": "http://www.fidelity.com/20260228",
"localname": "C000059101Member",
"presentation": [
"http://xbrl.sec.gov/oef/role/ShareholderReport",
"http://xbrl.sec.gov/oef/role/ShareholderReportAverageAnnualReturnDetails",
"http://xbrl.sec.gov/oef/role/ShareholderReportHoldingsDetails",
"http://xbrl.sec.gov/oef/role/ShareholderReportLineGraphDetails"
],
"lang": {
"en-us": {
"role": {
"label": "C000059101 [Member]",
"verboseLabel": "Fidelity Advisor Mega Cap Stock Fund - Class C",
"terseLabel": "Fidelity Advisor Mega Cap Stock Fund - Class C"
}
}
},
"auth_ref": []
},
"fmr_C000059102Member": {
"xbrltype": "domainItemType",
"nsuri": "http://www.fidelity.com/20260228",
"localname": "C000059102Member",
"presentation": [
"http://xbrl.sec.gov/oef/role/ShareholderReport",
"http://xbrl.sec.gov/oef/role/ShareholderReportAverageAnnualReturnDetails",
"http://xbrl.sec.gov/oef/role/ShareholderReportHoldingsDetails",
"http://xbrl.sec.gov/oef/role/ShareholderReportLineGraphDetails"
],
"lang": {
"en-us": {
"role": {
"label": "C000059102 [Member]",
"verboseLabel": "Fidelity Advisor Mega Cap Stock Fund - Class M",
"terseLabel": "Fidelity Advisor Mega Cap Stock Fund - Class M"
}
}
},
"auth_ref": []
},
"fmr_C000059103Member": {
"xbrltype": "domainItemType",
"nsuri": "http://www.fidelity.com/20260228",
"localname": "C000059103Member",
"presentation": [
"http://xbrl.sec.gov/oef/role/ShareholderReport",
"http://xbrl.sec.gov/oef/role/ShareholderReportAverageAnnualReturnDetails",
"http://xbrl.sec.gov/oef/role/ShareholderReportHoldingsDetails",
"http://xbrl.sec.gov/oef/role/ShareholderReportLineGraphDetails"
],
"lang": {
"en-us": {
"role": {
"label": "C000059103 [Member]",
"verboseLabel": "Fidelity Advisor Mega Cap Stock Fund - Class I",
"terseLabel": "Fidelity Advisor Mega Cap Stock Fund - Class I"
}
}
},
"auth_ref": []
},
"fmr_C000064239Member": {
"xbrltype": "domainItemType",
"nsuri": "http://www.fidelity.com/20260228",
"localname": "C000064239Member",
"presentation": [
"http://xbrl.sec.gov/oef/role/ShareholderReport",
"http://xbrl.sec.gov/oef/role/ShareholderReportAverageAnnualReturnDetails",
"http://xbrl.sec.gov/oef/role/ShareholderReportHoldingsDetails",
"http://xbrl.sec.gov/oef/role/ShareholderReportLineGraphDetails"
],
"lang": {
"en-us": {
"role": {
"label": "C000064239 [Member]",
"verboseLabel": "Fidelity Growth Discovery Fund - Class K",
"terseLabel": "Fidelity Growth Discovery Fund - Class K"
}
}
},
"auth_ref": []
},
"fmr_C000064240Member": {
"xbrltype": "domainItemType",
"nsuri": "http://www.fidelity.com/20260228",
"localname": "C000064240Member",
"presentation": [
"http://xbrl.sec.gov/oef/role/ShareholderReport",
"http://xbrl.sec.gov/oef/role/ShareholderReportAverageAnnualReturnDetails",
"http://xbrl.sec.gov/oef/role/ShareholderReportHoldingsDetails",
"http://xbrl.sec.gov/oef/role/ShareholderReportLineGraphDetails"
],
"lang": {
"en-us": {
"role": {
"label": "C000064240 [Member]",
"verboseLabel": "Fidelity Fund - Class K",
"terseLabel": "Fidelity Fund - Class K"
}
}
},
"auth_ref": []
},
"fmr_C000120647Member": {
"xbrltype": "domainItemType",
"nsuri": "http://www.fidelity.com/20260228",
"localname": "C000120647Member",
"presentation": [
"http://xbrl.sec.gov/oef/role/ShareholderReport",
"http://xbrl.sec.gov/oef/role/ShareholderReportAverageAnnualReturnDetails",
"http://xbrl.sec.gov/oef/role/ShareholderReportHoldingsDetails",
"http://xbrl.sec.gov/oef/role/ShareholderReportLineGraphDetails"
],
"lang": {
"en-us": {
"role": {
"label": "C000120647 [Member]",
"verboseLabel": "Fidelity Series Large Cap Stock Fund",
"terseLabel": "Fidelity Series Large Cap Stock Fund"
}
}
},
"auth_ref": []
},
"fmr_C000130146Member": {
"xbrltype": "domainItemType",
"nsuri": "http://www.fidelity.com/20260228",
"localname": "C000130146Member",
"presentation": [
"http://xbrl.sec.gov/oef/role/ShareholderReport",
"http://xbrl.sec.gov/oef/role/ShareholderReportAverageAnnualReturnDetails",
"http://xbrl.sec.gov/oef/role/ShareholderReportHoldingsDetails",
"http://xbrl.sec.gov/oef/role/ShareholderReportLineGraphDetails"
],
"lang": {
"en-us": {
"role": {
"label": "C000130146 [Member]",
"verboseLabel": "Fidelity Advisor Mega Cap Stock Fund - Class Z",
"terseLabel": "Fidelity Advisor Mega Cap Stock Fund - Class Z"
}
}
},
"auth_ref": []
},
"country_CA": {
"xbrltype": "domainItemType",
"nsuri": "http://xbrl.sec.gov/country/2024",
"localname": "CA",
"presentation": [
"http://xbrl.sec.gov/oef/role/ShareholderReportHoldingsDetails"
],
"lang": {
"en-us": {
"role": {
"label": "Canada",
"terseLabel": "Canada"
}
}
},
"auth_ref": []
},
"country_CN": {
"xbrltype": "domainItemType",
"nsuri": "http://xbrl.sec.gov/country/2024",
"localname": "CN",
"presentation": [
"http://xbrl.sec.gov/oef/role/ShareholderReportHoldingsDetails"
],
"lang": {
"en-us": {
"role": {
"label": "China",
"terseLabel": "China"
}
}
},
"auth_ref": []
},
"oef_ClassAxis": {
"xbrltype": "stringItemType",
"nsuri": "http://xbrl.sec.gov/oef/2024q3",
"localname": "ClassAxis",
"presentation": [
"http://xbrl.sec.gov/oef/role/ShareholderReport",
"http://xbrl.sec.gov/oef/role/ShareholderReportAverageAnnualReturnDetails",
"http://xbrl.sec.gov/oef/role/ShareholderReportHoldingsDetails",
"http://xbrl.sec.gov/oef/role/ShareholderReportLineGraphDetails"
],
"lang": {
"en-us": {
"role": {
"label": "Class [Axis]"
}
}
},
"auth_ref": [
"r24"
]
},
"oef_ClassName": {
"xbrltype": "securityTitleItemType",
"nsuri": "http://xbrl.sec.gov/oef/2024q3",
"localname": "ClassName",
"presentation": [
"http://xbrl.sec.gov/oef/role/ShareholderReport"
],
"lang": {
"en-us": {
"role": {
"label": "Class Name"
}
}
},
"auth_ref": [
"r29"
]
},
"oef_CommunicationsSectorMember": {
"xbrltype": "domainItemType",
"nsuri": "http://xbrl.sec.gov/oef/2024q3",
"localname": "CommunicationsSectorMember",
"presentation": [
"http://xbrl.sec.gov/oef/role/ShareholderReportHoldingsDetails"
],
"lang": {
"en-us": {
"role": {
"label": "Communications Sector [Member]",
"terseLabel": "Communications Sector Member"
}
}
},
"auth_ref": [
"r52"
]
},
"oef_Component1OtherExpensesOverAssets": {
"xbrltype": "nonNegativePure4ItemType",
"nsuri": "http://xbrl.sec.gov/oef/2024q3",
"localname": "Component1OtherExpensesOverAssets",
"calculation": {
"http://xbrl.sec.gov/rr/role/OperatingExpensesData": {
"parentTag": "oef_OtherExpensesOverAssets",
"weight": 1.0,
"order": 1.0
}
},
"lang": {
"en-us": {
"role": {
"label": "Component1 Other Expenses"
}
}
},
"auth_ref": [
"r68"
]
},
"oef_Component2OtherExpensesOverAssets": {
"xbrltype": "nonNegativePure4ItemType",
"nsuri": "http://xbrl.sec.gov/oef/2024q3",
"localname": "Component2OtherExpensesOverAssets",
"calculation": {
"http://xbrl.sec.gov/rr/role/OperatingExpensesData": {
"parentTag": "oef_OtherExpensesOverAssets",
"weight": 1.0,
"order": 2.0
}
},
"lang": {
"en-us": {
"role": {
"label": "Component2 Other Expenses"
}
}
},
"auth_ref": [
"r68"
]
},
"oef_Component3OtherExpensesOverAssets": {
"xbrltype": "nonNegativePure4ItemType",
"nsuri": "http://xbrl.sec.gov/oef/2024q3",
"localname": "Component3OtherExpensesOverAssets",
"calculation": {
"http://xbrl.sec.gov/rr/role/OperatingExpensesData": {
"parentTag": "oef_OtherExpensesOverAssets",
"weight": 1.0,
"order": 3.0
}
},
"lang": {
"en-us": {
"role": {
"label": "Component3 Other Expenses"
}
}
},
"auth_ref": [
"r68"
]
},
"oef_ConsumerDiscretionarySectorMember": {
"xbrltype": "domainItemType",
"nsuri": "http://xbrl.sec.gov/oef/2024q3",
"localname": "ConsumerDiscretionarySectorMember",
"presentation": [
"http://xbrl.sec.gov/oef/role/ShareholderReportHoldingsDetails"
],
"lang": {
"en-us": {
"role": {
"label": "Consumer Discretionary Sector [Member]",
"terseLabel": "Consumer Discretionary Sector Member"
}
}
},
"auth_ref": [
"r52"
]
},
"oef_ConsumerStaplesSectorMember": {
"xbrltype": "domainItemType",
"nsuri": "http://xbrl.sec.gov/oef/2024q3",
"localname": "ConsumerStaplesSectorMember",
"presentation": [
"http://xbrl.sec.gov/oef/role/ShareholderReportHoldingsDetails"
],
"lang": {
"en-us": {
"role": {
"label": "Consumer Staples Sector [Member]",
"terseLabel": "Consumer Staples Sector Member"
}
}
},
"auth_ref": [
"r52"
]
},
"dei_CoverAbstract": {
"xbrltype": "stringItemType",
"nsuri": "http://xbrl.sec.gov/dei/2024",
"localname": "CoverAbstract",
"lang": {
"en-us": {
"role": {
"documentation": "Cover page."
}
}
},
"auth_ref": []
},
"oef_CreditQualityAxis": {
"xbrltype": "stringItemType",
"nsuri": "http://xbrl.sec.gov/oef/2024q3",
"localname": "CreditQualityAxis",
"presentation": [
"http://xbrl.sec.gov/oef/role/ShareholderReportHoldingsDetails"
],
"lang": {
"en-us": {
"role": {
"label": "Credit Quality [Axis]"
}
}
},
"auth_ref": [
"r52"
]
},
"oef_CreditQualityDomain": {
"xbrltype": "domainItemType",
"nsuri": "http://xbrl.sec.gov/oef/2024q3",
"localname": "CreditQualityDomain",
"presentation": [
"http://xbrl.sec.gov/oef/role/ShareholderReportHoldingsDetails"
],
"lang": {
"en-us": {
"role": {
"label": "Credit Quality [Domain]"
}
}
},
"auth_ref": [
"r52"
]
},
"oef_CreditQualityExplanationTextBlock": {
"xbrltype": "textBlockItemType",
"nsuri": "http://xbrl.sec.gov/oef/2024q3",
"localname": "CreditQualityExplanationTextBlock",
"presentation": [
"http://xbrl.sec.gov/oef/role/ShareholderReport"
],
"lang": {
"en-us": {
"role": {
"label": "Credit Quality Explanation [Text Block]"
}
}
},
"auth_ref": [
"r52"
]
},
"oef_CreditRatingsSelectionTextBlock": {
"xbrltype": "textBlockItemType",
"nsuri": "http://xbrl.sec.gov/oef/2024q3",
"localname": "CreditRatingsSelectionTextBlock",
"presentation": [
"http://xbrl.sec.gov/oef/role/ShareholderReport"
],
"lang": {
"en-us": {
"role": {
"label": "Credit Ratings Selection [Text Block]"
}
}
},
"auth_ref": [
"r52"
]
},
"country_DE": {
"xbrltype": "domainItemType",
"nsuri": "http://xbrl.sec.gov/country/2024",
"localname": "DE",
"presentation": [
"http://xbrl.sec.gov/oef/role/ShareholderReportHoldingsDetails"
],
"lang": {
"en-us": {
"role": {
"label": "Germany",
"terseLabel": "Germany"
}
}
},
"auth_ref": []
},
"oef_DistOfCapitalTextBlock": {
"xbrltype": "textBlockItemType",
"nsuri": "http://xbrl.sec.gov/oef/2024q3",
"localname": "DistOfCapitalTextBlock",
"presentation": [
"http://xbrl.sec.gov/oef/role/ShareholderReport"
],
"lang": {
"en-us": {
"role": {
"label": "Distribution of Capital [Text Block]"
}
}
},
"auth_ref": [
"r46"
]
},
"oef_DistributionAndService12b1FeesOverAssets": {
"xbrltype": "nonNegativePure4ItemType",
"nsuri": "http://xbrl.sec.gov/oef/2024q3",
"localname": "DistributionAndService12b1FeesOverAssets",
"calculation": {
"http://xbrl.sec.gov/rr/role/OperatingExpensesData": {
"parentTag": "oef_ExpensesOverAssets",
"weight": 1.0,
"order": 2.0
}
},
"lang": {
"en-us": {
"role": {
"label": "Distribution and Service (12b-1) Fees"
}
}
},
"auth_ref": [
"r66"
]
},
"oef_DistributionOrSimilarNon12b1FeesOverAssets": {
"xbrltype": "nonNegativePure4ItemType",
"nsuri": "http://xbrl.sec.gov/oef/2024q3",
"localname": "DistributionOrSimilarNon12b1FeesOverAssets",
"calculation": {
"http://xbrl.sec.gov/rr/role/OperatingExpensesData": {
"parentTag": "oef_ExpensesOverAssets",
"weight": 1.0,
"order": 3.0
}
},
"lang": {
"en-us": {
"role": {
"label": "Distribution or Similar (Non 12b-1) Fees"
}
}
},
"auth_ref": [
"r66"
]
},
"dei_DocumentPeriodEndDate": {
"xbrltype": "dateItemType",
"nsuri": "http://xbrl.sec.gov/dei/2024",
"localname": "DocumentPeriodEndDate",
"presentation": [
"http://xbrl.sec.gov/oef/role/NcsrCover",
"http://xbrl.sec.gov/oef/role/ShareholderReport"
],
"lang": {
"en-us": {
"role": {
"label": "Document Period End Date",
"documentation": "For the EDGAR submission types of Form 8-K: the date of the report, the date of the earliest event reported; for the EDGAR submission types of Form N-1A: the filing date; for all other submission types: the end of the reporting or transition period. The format of the date is YYYY-MM-DD."
}
}
},
"auth_ref": []
},
"dei_DocumentType": {
"xbrltype": "submissionTypeItemType",
"nsuri": "http://xbrl.sec.gov/dei/2024",
"localname": "DocumentType",
"presentation": [
"http://xbrl.sec.gov/oef/role/NcsrCover",
"http://xbrl.sec.gov/oef/role/ShareholderReport"
],
"lang": {
"en-us": {
"role": {
"label": "Document Type",
"documentation": "The type of document being provided (such as 10-K, 10-Q, 485BPOS, etc). The document type is limited to the same value as the supporting SEC submission type, or the word 'Other'."
}
}
},
"auth_ref": []
},
"us-gaap_EnergySectorMember": {
"xbrltype": "domainItemType",
"nsuri": "http://fasb.org/us-gaap/2024",
"localname": "EnergySectorMember",
"presentation": [
"http://xbrl.sec.gov/oef/role/ShareholderReportHoldingsDetails"
],
"lang": {
"en-us": {
"role": {
"terseLabel": "Energy Sector",
"documentation": "Sector of economy consisting of companies engaged in business activity related to energy.",
"label": "Energy Sector [Member]"
}
}
},
"auth_ref": [
"r18",
"r19",
"r20",
"r76",
"r77",
"r78",
"r79"
]
},
"dei_EntityCentralIndexKey": {
"xbrltype": "centralIndexKeyItemType",
"nsuri": "http://xbrl.sec.gov/dei/2024",
"localname": "EntityCentralIndexKey",
"presentation": [
"http://xbrl.sec.gov/oef/role/NcsrCover",
"http://xbrl.sec.gov/oef/role/ShareholderReport"
],
"lang": {
"en-us": {
"role": {
"label": "Entity Central Index Key",
"documentation": "A unique 10-digit SEC-issued value to identify entities that have filed disclosures with the SEC. It is commonly abbreviated as CIK."
}
}
},
"auth_ref": [
"r22"
]
},
"dei_EntityDomain": {
"xbrltype": "domainItemType",
"nsuri": "http://xbrl.sec.gov/dei/2024",
"localname": "EntityDomain",
"presentation": [
"http://xbrl.sec.gov/oef/role/ShareholderReportAverageAnnualReturnDetails"
],
"lang": {
"en-us": {
"role": {
"label": "Series",
"documentation": "All the names of the entities being reported upon in a document. Any legal structure used to conduct activities or to hold assets. Some examples of such structures are corporations, partnerships, limited liability companies, grantor trusts, and other trusts. This item does not include business and geographical segments which are included in the geographical or business segments domains."
}
}
},
"auth_ref": []
},
"dei_EntityInvCompanyType": {
"xbrltype": "invCompanyType",
"nsuri": "http://xbrl.sec.gov/dei/2024",
"localname": "EntityInvCompanyType",
"presentation": [
"http://xbrl.sec.gov/oef/role/NcsrCover",
"http://xbrl.sec.gov/oef/role/ShareholderReport"
],
"lang": {
"en-us": {
"role": {
"label": "Entity Investment Company Type",
"documentation": "One of: N-1A (Mutual Fund), N-1 (Open-End Separate Account with No Variable Annuities), N-2 (Closed-End Investment Company), N-3 (Separate Account Registered as Open-End Management Investment Company), N-4 (Variable Annuity UIT Separate Account), N-5 (Small Business Investment Company), N-6 (Variable Life UIT Separate Account), S-1 or S-3 (Face Amount Certificate Company), S-6 (UIT, Non-Insurance Product)."
}
}
},
"auth_ref": [
"r74"
]
},
"dei_EntityRegistrantName": {
"xbrltype": "normalizedStringItemType",
"nsuri": "http://xbrl.sec.gov/dei/2024",
"localname": "EntityRegistrantName",
"presentation": [
"http://xbrl.sec.gov/oef/role/NcsrCover",
"http://xbrl.sec.gov/oef/role/ShareholderReport"
],
"lang": {
"en-us": {
"role": {
"label": "Registrant Name",
"documentation": "The exact name of the entity filing the report as specified in its charter, which is required by forms filed with the SEC."
}
}
},
"auth_ref": [
"r22"
]
},
"oef_EtfDiscountNumDays": {
"xbrltype": "integerItemType",
"nsuri": "http://xbrl.sec.gov/oef/2024q3",
"localname": "EtfDiscountNumDays",
"presentation": [
"http://xbrl.sec.gov/oef/role/ShareholderReport"
],
"lang": {
"en-us": {
"role": {
"label": "ETF Discount, Number of Days"
}
}
},
"auth_ref": [
"r47"
]
},
"oef_EtfPastPerfTextBlock": {
"xbrltype": "textBlockItemType",
"nsuri": "http://xbrl.sec.gov/oef/2024q3",
"localname": "EtfPastPerfTextBlock",
"presentation": [
"http://xbrl.sec.gov/oef/role/ShareholderReport"
],
"lang": {
"en-us": {
"role": {
"label": "ETF Past Performance [Text Block]"
}
}
},
"auth_ref": [
"r49"
]
},
"oef_EtfPremiumDiscountTextBlock": {
"xbrltype": "textBlockItemType",
"nsuri": "http://xbrl.sec.gov/oef/2024q3",
"localname": "EtfPremiumDiscountTextBlock",
"presentation": [
"http://xbrl.sec.gov/oef/role/ShareholderReport"
],
"lang": {
"en-us": {
"role": {
"label": "ETF Premium Discount [Text Block]"
}
}
},
"auth_ref": [
"r47"
]
},
"oef_EtfPremiumNumDays": {
"xbrltype": "integerItemType",
"nsuri": "http://xbrl.sec.gov/oef/2024q3",
"localname": "EtfPremiumNumDays",
"presentation": [
"http://xbrl.sec.gov/oef/role/ShareholderReport"
],
"lang": {
"en-us": {
"role": {
"label": "ETF Premium, Number of Days"
}
}
},
"auth_ref": [
"r47"
]
},
"oef_EtfPurchaseExplanationTextBlock": {
"xbrltype": "textBlockItemType",
"nsuri": "http://xbrl.sec.gov/oef/2024q3",
"localname": "EtfPurchaseExplanationTextBlock",
"presentation": [
"http://xbrl.sec.gov/oef/role/ShareholderReport"
],
"lang": {
"en-us": {
"role": {
"label": "ETF Purchase Explanation [Text Block]"
}
}
},
"auth_ref": [
"r48"
]
},
"oef_ExpenseRatioPct": {
"xbrltype": "percentItemType",
"nsuri": "http://xbrl.sec.gov/oef/2024q3",
"localname": "ExpenseRatioPct",
"presentation": [
"http://xbrl.sec.gov/oef/role/ShareholderReport"
],
"lang": {
"en-us": {
"role": {
"label": "Expense Ratio, Percent"
}
}
},
"auth_ref": [
"r32"
]
},
"oef_ExpensesExclExtraordinaryExpensesPct": {
"xbrltype": "percentItemType",
"nsuri": "http://xbrl.sec.gov/oef/2024q3",
"localname": "ExpensesExclExtraordinaryExpensesPct",
"presentation": [
"http://xbrl.sec.gov/oef/role/ShareholderReport"
],
"lang": {
"en-us": {
"role": {
"label": "Expenses Excluding Extraordinary Expenses, Percent"
}
}
},
"auth_ref": [
"r35"
]
},
"oef_ExpensesOverAssets": {
"xbrltype": "nonNegativePure4ItemType",
"nsuri": "http://xbrl.sec.gov/oef/2024q3",
"localname": "ExpensesOverAssets",
"calculation": {
"http://xbrl.sec.gov/rr/role/OperatingExpensesData": {
"parentTag": "oef_NetExpensesOverAssets",
"weight": 1.0,
"order": 1.0
}
},
"lang": {
"en-us": {
"role": {
"label": "Expenses (as a percentage of Assets)",
"totalLabel": "Total Expenses"
}
}
},
"auth_ref": [
"r69"
]
},
"oef_ExpensesPaidAmt": {
"xbrltype": "monetaryItemType",
"nsuri": "http://xbrl.sec.gov/oef/2024q3",
"localname": "ExpensesPaidAmt",
"presentation": [
"http://xbrl.sec.gov/oef/role/ShareholderReport"
],
"lang": {
"en-us": {
"role": {
"label": "Expenses Paid, Amount"
}
}
},
"auth_ref": [
"r31"
]
},
"oef_ExpensesRepresentBothMasterAndFeeder": {
"xbrltype": "stringItemType",
"nsuri": "http://xbrl.sec.gov/oef/2024q3",
"localname": "ExpensesRepresentBothMasterAndFeeder",
"presentation": [
"http://xbrl.sec.gov/oef/role/ShareholderReport"
],
"lang": {
"en-us": {
"role": {
"label": "Expenses Represent Both Master and Feeder [Text]"
}
}
},
"auth_ref": [
"r33",
"r63"
]
},
"oef_ExpensesShortPeriodFnTextBlock": {
"xbrltype": "textBlockItemType",
"nsuri": "http://xbrl.sec.gov/oef/2024q3",
"localname": "ExpensesShortPeriodFnTextBlock",
"presentation": [
"http://xbrl.sec.gov/oef/role/ShareholderReport"
],
"lang": {
"en-us": {
"role": {
"label": "Expenses Short Period Footnote [Text Block]"
}
}
},
"auth_ref": [
"r34"
]
},
"oef_ExpensesTextBlock": {
"xbrltype": "textBlockItemType",
"nsuri": "http://xbrl.sec.gov/oef/2024q3",
"localname": "ExpensesTextBlock",
"presentation": [
"http://xbrl.sec.gov/oef/role/ShareholderReport"
],
"lang": {
"en-us": {
"role": {
"label": "Expenses [Text Block]"
}
}
},
"auth_ref": [
"r30"
]
},
"oef_ExposureBasisExplanationTextBlock": {
"xbrltype": "textBlockItemType",
"nsuri": "http://xbrl.sec.gov/oef/2024q3",
"localname": "ExposureBasisExplanationTextBlock",
"presentation": [
"http://xbrl.sec.gov/oef/role/ShareholderReport"
],
"lang": {
"en-us": {
"role": {
"label": "Exposure Basis Explanation [Text Block]"
}
}
},
"auth_ref": [
"r52"
]
},
"oef_ExtraordinaryExpensesFnTextBlock": {
"xbrltype": "textBlockItemType",
"nsuri": "http://xbrl.sec.gov/oef/2024q3",
"localname": "ExtraordinaryExpensesFnTextBlock",
"presentation": [
"http://xbrl.sec.gov/oef/role/ShareholderReport"
],
"lang": {
"en-us": {
"role": {
"label": "Extraordinary Expenses Footnote [Text Block]"
}
}
},
"auth_ref": [
"r35"
]
},
"country_FR": {
"xbrltype": "domainItemType",
"nsuri": "http://xbrl.sec.gov/country/2024",
"localname": "FR",
"presentation": [
"http://xbrl.sec.gov/oef/role/ShareholderReportHoldingsDetails"
],
"lang": {
"en-us": {
"role": {
"label": "France",
"terseLabel": "France"
}
}
},
"auth_ref": []
},
"oef_FactorsAffectingPerfTextBlock": {
"xbrltype": "textBlockItemType",
"nsuri": "http://xbrl.sec.gov/oef/2024q3",
"localname": "FactorsAffectingPerfTextBlock",
"presentation": [
"http://xbrl.sec.gov/oef/role/ShareholderReport"
],
"lang": {
"en-us": {
"role": {
"label": "Factors Affecting Performance [Text Block]"
}
}
},
"auth_ref": [
"r36"
]
},
"oef_FeeWaiverOrReimbursementOverAssets": {
"xbrltype": "percentItemType",
"nsuri": "http://xbrl.sec.gov/oef/2024q3",
"localname": "FeeWaiverOrReimbursementOverAssets",
"calculation": {
"http://xbrl.sec.gov/rr/role/OperatingExpensesData": {
"parentTag": "oef_NetExpensesOverAssets",
"weight": 1.0,
"order": 2.0
}
},
"lang": {
"en-us": {
"role": {
"label": "Fee Waiver or Reimbursement",
"negatedLabel": "Fee Waiver or Reimbursement"
}
}
},
"auth_ref": [
"r70"
]
},
"oef_FundName": {
"xbrltype": "normalizedStringItemType",
"nsuri": "http://xbrl.sec.gov/oef/2024q3",
"localname": "FundName",
"presentation": [
"http://xbrl.sec.gov/oef/role/ShareholderReport"
],
"lang": {
"en-us": {
"role": {
"label": "Fund Name"
}
}
},
"auth_ref": [
"r25"
]
},
"country_GB": {
"xbrltype": "domainItemType",
"nsuri": "http://xbrl.sec.gov/country/2024",
"localname": "GB",
"presentation": [
"http://xbrl.sec.gov/oef/role/ShareholderReportHoldingsDetails"
],
"lang": {
"en-us": {
"role": {
"label": "United Kingdom",
"terseLabel": "United Kingdom"
}
}
},
"auth_ref": []
},
"oef_GeographicRegionAxis": {
"xbrltype": "stringItemType",
"nsuri": "http://xbrl.sec.gov/oef/2024q3",
"localname": "GeographicRegionAxis",
"presentation": [
"http://xbrl.sec.gov/oef/role/ShareholderReportHoldingsDetails"
],
"lang": {
"en-us": {
"role": {
"label": "Geographic Region [Axis]"
}
}
},
"auth_ref": [
"r52"
]
},
"oef_GeographicRegionDomain": {
"xbrltype": "domainItemType",
"nsuri": "http://xbrl.sec.gov/oef/2024q3",
"localname": "GeographicRegionDomain",
"presentation": [
"http://xbrl.sec.gov/oef/role/ShareholderReportHoldingsDetails"
],
"lang": {
"en-us": {
"role": {
"label": "Geographic Region [Domain]"
}
}
},
"auth_ref": [
"r52"
]
},
"us-gaap_HealthcareSectorMember": {
"xbrltype": "domainItemType",
"nsuri": "http://fasb.org/us-gaap/2024",
"localname": "HealthcareSectorMember",
"presentation": [
"http://xbrl.sec.gov/oef/role/ShareholderReportHoldingsDetails"
],
"lang": {
"en-us": {
"role": {
"terseLabel": "Healthcare Sector",
"documentation": "Sector of the economy consisting of companies engaged in healthcare-related business activities.",
"label": "Healthcare Sector [Member]"
}
}
},
"auth_ref": [
"r18",
"r19",
"r20",
"r21",
"r76",
"r77",
"r78",
"r79"
]
},
"oef_HoldingsAbstract": {
"xbrltype": "stringItemType",
"nsuri": "http://xbrl.sec.gov/oef/2024q3",
"localname": "HoldingsAbstract",
"lang": {
"en-us": {
"role": {
"label": "Holdings [Abstract]"
}
}
},
"auth_ref": [
"r52"
]
},
"oef_HoldingsCount": {
"xbrltype": "integerItemType",
"nsuri": "http://xbrl.sec.gov/oef/2024q3",
"localname": "HoldingsCount",
"presentation": [
"http://xbrl.sec.gov/oef/role/ShareholderReport"
],
"lang": {
"en-us": {
"role": {
"label": "Holdings Count"
}
}
},
"auth_ref": [
"r50"
]
},
"oef_HoldingsLineItems": {
"xbrltype": "stringItemType",
"nsuri": "http://xbrl.sec.gov/oef/2024q3",
"localname": "HoldingsLineItems",
"presentation": [
"http://xbrl.sec.gov/oef/role/ShareholderReportHoldingsDetails"
],
"lang": {
"en-us": {
"role": {
"label": "Holdings [Line Items]"
}
}
},
"auth_ref": [
"r52"
]
},
"oef_HoldingsTable": {
"xbrltype": "stringItemType",
"nsuri": "http://xbrl.sec.gov/oef/2024q3",
"localname": "HoldingsTable",
"presentation": [
"http://xbrl.sec.gov/oef/role/ShareholderReportHoldingsDetails"
],
"lang": {
"en-us": {
"role": {
"label": "Holdings [Table]"
}
}
},
"auth_ref": [
"r52"
]
},
"oef_HoldingsTableTextBlock": {
"xbrltype": "textBlockItemType",
"nsuri": "http://xbrl.sec.gov/oef/2024q3",
"localname": "HoldingsTableTextBlock",
"presentation": [
"http://xbrl.sec.gov/oef/role/ShareholderReport"
],
"lang": {
"en-us": {
"role": {
"label": "Holdings [Text Block]"
}
}
},
"auth_ref": [
"r52"
]
},
"oef_InabilityToMeetDistLevelTextBlock": {
"xbrltype": "textBlockItemType",
"nsuri": "http://xbrl.sec.gov/oef/2024q3",
"localname": "InabilityToMeetDistLevelTextBlock",
"presentation": [
"http://xbrl.sec.gov/oef/role/ShareholderReport"
],
"lang": {
"en-us": {
"role": {
"label": "Inability to Meet Distribution Level [Text Block]"
}
}
},
"auth_ref": [
"r46"
]
},
"oef_IndustrialSectorMember": {
"xbrltype": "domainItemType",
"nsuri": "http://xbrl.sec.gov/oef/2024q3",
"localname": "IndustrialSectorMember",
"presentation": [
"http://xbrl.sec.gov/oef/role/ShareholderReportHoldingsDetails"
],
"lang": {
"en-us": {
"role": {
"label": "Industrial Sector [Member]",
"terseLabel": "Industrial Sector Member"
}
}
},
"auth_ref": [
"r52"
]
},
"oef_IndustrySectorAxis": {
"xbrltype": "stringItemType",
"nsuri": "http://xbrl.sec.gov/oef/2024q3",
"localname": "IndustrySectorAxis",
"presentation": [
"http://xbrl.sec.gov/oef/role/ShareholderReportHoldingsDetails"
],
"lang": {
"en-us": {
"role": {
"label": "Industry Sector [Axis]"
}
}
},
"auth_ref": [
"r52"
]
},
"oef_IndustrySectorDomain": {
"xbrltype": "domainItemType",
"nsuri": "http://xbrl.sec.gov/oef/2024q3",
"localname": "IndustrySectorDomain",
"presentation": [
"http://xbrl.sec.gov/oef/role/ShareholderReportHoldingsDetails"
],
"lang": {
"en-us": {
"role": {
"label": "Industry Sector [Domain]"
}
}
},
"auth_ref": [
"r52"
]
},
"oef_InformationTechnologySectorMember": {
"xbrltype": "domainItemType",
"nsuri": "http://xbrl.sec.gov/oef/2024q3",
"localname": "InformationTechnologySectorMember",
"presentation": [
"http://xbrl.sec.gov/oef/role/ShareholderReportHoldingsDetails"
],
"lang": {
"en-us": {
"role": {
"label": "Information Technology Sector [Member]",
"terseLabel": "Information Technology Member"
}
}
},
"auth_ref": [
"r52"
]
},
"us-gaap_InvestmentCompanyPortfolioTurnover": {
"xbrltype": "percentItemType",
"nsuri": "http://fasb.org/us-gaap/2024",
"localname": "InvestmentCompanyPortfolioTurnover",
"presentation": [
"http://xbrl.sec.gov/oef/role/ShareholderReport"
],
"lang": {
"en-us": {
"role": {
"documentation": "Percentage of lesser of purchase or sale of portfolio securities to average value of portfolio securities owned.",
"label": "Investment Company Portfolio Turnover"
}
}
},
"auth_ref": [
"r75"
]
},
"us-gaap_InvestmentTypeAxis": {
"xbrltype": "stringItemType",
"nsuri": "http://fasb.org/us-gaap/2024",
"localname": "InvestmentTypeAxis",
"presentation": [
"http://xbrl.sec.gov/oef/role/ShareholderReportHoldingsDetails"
],
"lang": {
"en-us": {
"role": {
"documentation": "Information by type of investments.",
"label": "Investment Type [Axis]"
}
}
},
"auth_ref": [
"r1",
"r2",
"r3",
"r4",
"r5",
"r6",
"r7",
"r8",
"r9",
"r10",
"r11",
"r12",
"r13",
"r14",
"r15",
"r16",
"r21"
]
},
"us-gaap_InvestmentTypeCategorizationMember": {
"xbrltype": "domainItemType",
"nsuri": "http://fasb.org/us-gaap/2024",
"localname": "InvestmentTypeCategorizationMember",
"presentation": [
"http://xbrl.sec.gov/oef/role/ShareholderReportHoldingsDetails"
],
"lang": {
"en-us": {
"role": {
"documentation": "Asset obtained to generate income or appreciate in value.",
"label": "Investment Type Categorization [Member]"
}
}
},
"auth_ref": [
"r1",
"r2",
"r3",
"r4",
"r5",
"r6",
"r7",
"r8",
"r9",
"r10",
"r11",
"r12",
"r13",
"r14",
"r15",
"r16",
"r21"
]
},
"country_KR": {
"xbrltype": "domainItemType",
"nsuri": "http://xbrl.sec.gov/country/2024",
"localname": "KR",
"presentation": [
"http://xbrl.sec.gov/oef/role/ShareholderReportHoldingsDetails"
],
"lang": {
"en-us": {
"role": {
"label": "Korea, Republic of",
"terseLabel": "Korea, Republic of"
}
}
},
"auth_ref": []
},
"oef_LargestHoldingAxis": {
"xbrltype": "stringItemType",
"nsuri": "http://xbrl.sec.gov/oef/2024q3",
"localname": "LargestHoldingAxis",
"presentation": [
"http://xbrl.sec.gov/oef/role/ShareholderReportHoldingsDetails"
],
"lang": {
"en-us": {
"role": {
"label": "Largest Holding [Axis]"
}
}
},
"auth_ref": [
"r52"
]
},
"oef_LargestHoldingsDomain": {
"xbrltype": "domainItemType",
"nsuri": "http://xbrl.sec.gov/oef/2024q3",
"localname": "LargestHoldingsDomain",
"presentation": [
"http://xbrl.sec.gov/oef/role/ShareholderReportHoldingsDetails"
],
"lang": {
"en-us": {
"role": {
"label": "Largest Holdings [Domain]"
}
}
},
"auth_ref": [
"r52"
]
},
"oef_LargestHoldingsTableTextBlock": {
"xbrltype": "textBlockItemType",
"nsuri": "http://xbrl.sec.gov/oef/2024q3",
"localname": "LargestHoldingsTableTextBlock",
"presentation": [
"http://xbrl.sec.gov/oef/role/ShareholderReport"
],
"lang": {
"en-us": {
"role": {
"label": "Largest Holdings [Text Block]"
}
}
},
"auth_ref": [
"r52"
]
},
"dei_LegalEntityAxis": {
"xbrltype": "stringItemType",
"nsuri": "http://xbrl.sec.gov/dei/2024",
"localname": "LegalEntityAxis",
"presentation": [
"http://xbrl.sec.gov/oef/role/ShareholderReportAverageAnnualReturnDetails"
],
"lang": {
"en-us": {
"role": {
"label": "Series [Axis]",
"documentation": "The set of legal entities associated with a report."
}
}
},
"auth_ref": []
},
"oef_LineGraphAndTableMeasureName": {
"xbrltype": "stringItemType",
"nsuri": "http://xbrl.sec.gov/oef/2024q3",
"localname": "LineGraphAndTableMeasureName",
"presentation": [
"http://xbrl.sec.gov/oef/role/ShareholderReportAverageAnnualReturnDetails",
"http://xbrl.sec.gov/oef/role/ShareholderReportLineGraphDetails"
],
"lang": {
"en-us": {
"role": {
"label": "Line Graph and Table Measure Name"
}
}
},
"auth_ref": [
"r38"
]
},
"oef_LineGraphTableTextBlock": {
"xbrltype": "textBlockItemType",
"nsuri": "http://xbrl.sec.gov/oef/2024q3",
"localname": "LineGraphTableTextBlock",
"presentation": [
"http://xbrl.sec.gov/oef/role/ShareholderReport"
],
"lang": {
"en-us": {
"role": {
"label": "Line Graph [Table Text Block]"
}
}
},
"auth_ref": [
"r37"
]
},
"fmr_MSFinancialsSectorMember": {
"xbrltype": "domainItemType",
"nsuri": "http://www.fidelity.com/20260228",
"localname": "MSFinancialsSectorMember",
"presentation": [
"http://xbrl.sec.gov/oef/role/ShareholderReportHoldingsDetails"
],
"lang": {
"en-us": {
"role": {
"label": "MSFinancialsSectorMember [Member]",
"verboseLabel": "MSFinancialsSectorMember",
"terseLabel": "MSFinancialsSectorMember"
}
}
},
"auth_ref": []
},
"oef_ManagementFeesOverAssets": {
"xbrltype": "nonNegativePure4ItemType",
"nsuri": "http://xbrl.sec.gov/oef/2024q3",
"localname": "ManagementFeesOverAssets",
"calculation": {
"http://xbrl.sec.gov/rr/role/OperatingExpensesData": {
"parentTag": "oef_ExpensesOverAssets",
"weight": 1.0,
"order": 1.0
}
},
"lang": {
"en-us": {
"role": {
"label": "Management Fees (as a percentage of Assets)"
}
}
},
"auth_ref": [
"r65"
]
},
"oef_MaterialChngDate": {
"xbrltype": "dateItemType",
"nsuri": "http://xbrl.sec.gov/oef/2024q3",
"localname": "MaterialChngDate",
"presentation": [
"http://xbrl.sec.gov/oef/role/ShareholderReport"
],
"lang": {
"en-us": {
"role": {
"label": "Material Change Date"
}
}
},
"auth_ref": [
"r42"
]
},
"oef_MaterialChngDescriptionTextBlock": {
"xbrltype": "textBlockItemType",
"nsuri": "http://xbrl.sec.gov/oef/2024q3",
"localname": "MaterialChngDescriptionTextBlock",
"presentation": [
"http://xbrl.sec.gov/oef/role/ShareholderReport"
],
"lang": {
"en-us": {
"role": {
"label": "Material Change Description [Text Block]"
}
}
},
"auth_ref": [
"r42"
]
},
"oef_MaterialFundChngAdviserTextBlock": {
"xbrltype": "textBlockItemType",
"nsuri": "http://xbrl.sec.gov/oef/2024q3",
"localname": "MaterialFundChngAdviserTextBlock",
"presentation": [
"http://xbrl.sec.gov/oef/role/ShareholderReport"
],
"lang": {
"en-us": {
"role": {
"label": "Material Fund Change Adviser [Text Block]"
}
}
},
"auth_ref": [
"r59"
]
},
"oef_MaterialFundChngExpensesTextBlock": {
"xbrltype": "textBlockItemType",
"nsuri": "http://xbrl.sec.gov/oef/2024q3",
"localname": "MaterialFundChngExpensesTextBlock",
"presentation": [
"http://xbrl.sec.gov/oef/role/ShareholderReport"
],
"lang": {
"en-us": {
"role": {
"label": "Material Fund Change Expenses [Text Block]"
}
}
},
"auth_ref": [
"r56"
]
},
"oef_MaterialFundChngNameTextBlock": {
"xbrltype": "textBlockItemType",
"nsuri": "http://xbrl.sec.gov/oef/2024q3",
"localname": "MaterialFundChngNameTextBlock",
"presentation": [
"http://xbrl.sec.gov/oef/role/ShareholderReport"
],
"lang": {
"en-us": {
"role": {
"label": "Material Fund Change Name [Text Block]"
}
}
},
"auth_ref": [
"r54"
]
},
"oef_MaterialFundChngNoticeTextBlock": {
"xbrltype": "textBlockItemType",
"nsuri": "http://xbrl.sec.gov/oef/2024q3",
"localname": "MaterialFundChngNoticeTextBlock",
"presentation": [
"http://xbrl.sec.gov/oef/role/ShareholderReport"
],
"lang": {
"en-us": {
"role": {
"label": "Material Fund Change Notice [Text Block]"
}
}
},
"auth_ref": [
"r28"
]
},
"oef_MaterialFundChngObjectivesTextBlock": {
"xbrltype": "textBlockItemType",
"nsuri": "http://xbrl.sec.gov/oef/2024q3",
"localname": "MaterialFundChngObjectivesTextBlock",
"presentation": [
"http://xbrl.sec.gov/oef/role/ShareholderReport"
],
"lang": {
"en-us": {
"role": {
"label": "Material Fund Change Objectives [Text Block]"
}
}
},
"auth_ref": [
"r55"
]
},
"oef_MaterialFundChngRisksChngTextBlock": {
"xbrltype": "textBlockItemType",
"nsuri": "http://xbrl.sec.gov/oef/2024q3",
"localname": "MaterialFundChngRisksChngTextBlock",
"presentation": [
"http://xbrl.sec.gov/oef/role/ShareholderReport"
],
"lang": {
"en-us": {
"role": {
"label": "Material Fund Change Risks Change [Text Block]"
}
}
},
"auth_ref": [
"r58"
]
},
"oef_MaterialFundChngStrategiesTextBlock": {
"xbrltype": "textBlockItemType",
"nsuri": "http://xbrl.sec.gov/oef/2024q3",
"localname": "MaterialFundChngStrategiesTextBlock",
"presentation": [
"http://xbrl.sec.gov/oef/role/ShareholderReport"
],
"lang": {
"en-us": {
"role": {
"label": "Material Fund Change Strategies [Text Block]"
}
}
},
"auth_ref": [
"r57"
]
},
"oef_MaterialFundChngTextBlock": {
"xbrltype": "textBlockItemType",
"nsuri": "http://xbrl.sec.gov/oef/2024q3",
"localname": "MaterialFundChngTextBlock",
"presentation": [
"http://xbrl.sec.gov/oef/role/ShareholderReport"
],
"lang": {
"en-us": {
"role": {
"label": "Material Fund Change [Text Block]"
}
}
},
"auth_ref": [
"r53"
]
},
"oef_MaterialsSectorMember": {
"xbrltype": "domainItemType",
"nsuri": "http://xbrl.sec.gov/oef/2024q3",
"localname": "MaterialsSectorMember",
"presentation": [
"http://xbrl.sec.gov/oef/role/ShareholderReportHoldingsDetails"
],
"lang": {
"en-us": {
"role": {
"label": "Materials Sector [Member]",
"terseLabel": "Materials Sector Member"
}
}
},
"auth_ref": [
"r52"
]
},
"oef_MaturityAxis": {
"xbrltype": "stringItemType",
"nsuri": "http://xbrl.sec.gov/oef/2024q3",
"localname": "MaturityAxis",
"presentation": [
"http://xbrl.sec.gov/oef/role/ShareholderReportHoldingsDetails"
],
"lang": {
"en-us": {
"role": {
"label": "Maturity [Axis]"
}
}
},
"auth_ref": [
"r52"
]
},
"oef_MaturityDomain": {
"xbrltype": "domainItemType",
"nsuri": "http://xbrl.sec.gov/oef/2024q3",
"localname": "MaturityDomain",
"presentation": [
"http://xbrl.sec.gov/oef/role/ShareholderReportHoldingsDetails"
],
"lang": {
"en-us": {
"role": {
"label": "Maturity [Domain]"
}
}
},
"auth_ref": [
"r52"
]
},
"country_NL": {
"xbrltype": "domainItemType",
"nsuri": "http://xbrl.sec.gov/country/2024",
"localname": "NL",
"presentation": [
"http://xbrl.sec.gov/oef/role/ShareholderReportHoldingsDetails"
],
"lang": {
"en-us": {
"role": {
"label": "Netherlands",
"terseLabel": "Netherlands"
}
}
},
"auth_ref": []
},
"oef_NetExpensesOverAssets": {
"xbrltype": "nonNegativePure4ItemType",
"nsuri": "http://xbrl.sec.gov/oef/2024q3",
"localname": "NetExpensesOverAssets",
"calculation": {
"http://xbrl.sec.gov/rr/role/OperatingExpensesData": {
"parentTag": null,
"weight": null,
"order": null,
"root": true
}
},
"lang": {
"en-us": {
"role": {
"label": "Net Expenses (as a percentage of Assets)",
"totalLabel": "Net Expenses"
}
}
},
"auth_ref": [
"r64"
]
},
"oef_NoDeductionOfTaxesTextBlock": {
"xbrltype": "textBlockItemType",
"nsuri": "http://xbrl.sec.gov/oef/2024q3",
"localname": "NoDeductionOfTaxesTextBlock",
"presentation": [
"http://xbrl.sec.gov/oef/role/ShareholderReport"
],
"lang": {
"en-us": {
"role": {
"label": "No Deduction of Taxes [Text Block]"
}
}
},
"auth_ref": [
"r39"
]
},
"dei_NoTradingSymbolFlag": {
"xbrltype": "trueItemType",
"nsuri": "http://xbrl.sec.gov/dei/2024",
"localname": "NoTradingSymbolFlag",
"presentation": [
"http://xbrl.sec.gov/oef/role/ShareholderReport"
],
"lang": {
"en-us": {
"role": {
"label": "No Trading Symbol Flag",
"documentation": "Boolean flag that is true only for a security having no trading symbol."
}
}
},
"auth_ref": []
},
"oef_OefDeprecatedConceptsAbstract": {
"xbrltype": "stringItemType",
"nsuri": "http://xbrl.sec.gov/oef/2024q3",
"localname": "OefDeprecatedConceptsAbstract",
"lang": {
"en-us": {
"role": {
"label": "Deprecated OEF Concepts [Abstract]"
}
}
},
"auth_ref": []
},
"oef_OtherCategory1Axis": {
"xbrltype": "stringItemType",
"nsuri": "http://xbrl.sec.gov/oef/2024q3",
"localname": "OtherCategory1Axis",
"presentation": [
"http://xbrl.sec.gov/oef/role/ShareholderReportHoldingsDetails"
],
"lang": {
"en-us": {
"role": {
"label": "Other Category 1 [Axis]"
}
}
},
"auth_ref": [
"r52"
]
},
"oef_OtherCategory1Domain": {
"xbrltype": "domainItemType",
"nsuri": "http://xbrl.sec.gov/oef/2024q3",
"localname": "OtherCategory1Domain",
"presentation": [
"http://xbrl.sec.gov/oef/role/ShareholderReportHoldingsDetails"
],
"lang": {
"en-us": {
"role": {
"label": "Other Category 1 [Domain]"
}
}
},
"auth_ref": [
"r52"
]
},
"oef_OtherCategory2Axis": {
"xbrltype": "stringItemType",
"nsuri": "http://xbrl.sec.gov/oef/2024q3",
"localname": "OtherCategory2Axis",
"presentation": [
"http://xbrl.sec.gov/oef/role/ShareholderReportHoldingsDetails"
],
"lang": {
"en-us": {
"role": {
"label": "Other Category 2 [Axis]"
}
}
},
"auth_ref": [
"r52"
]
},
"oef_OtherCategory2Domain": {
"xbrltype": "domainItemType",
"nsuri": "http://xbrl.sec.gov/oef/2024q3",
"localname": "OtherCategory2Domain",
"presentation": [
"http://xbrl.sec.gov/oef/role/ShareholderReportHoldingsDetails"
],
"lang": {
"en-us": {
"role": {
"label": "Other Category 2 [Domain]"
}
}
},
"auth_ref": [
"r52"
]
},
"oef_OtherExpensesOverAssets": {
"xbrltype": "nonNegativePure4ItemType",
"nsuri": "http://xbrl.sec.gov/oef/2024q3",
"localname": "OtherExpensesOverAssets",
"calculation": {
"http://xbrl.sec.gov/rr/role/OperatingExpensesData": {
"parentTag": "oef_ExpensesOverAssets",
"weight": 1.0,
"order": 4.0
}
},
"lang": {
"en-us": {
"role": {
"label": "Other Expenses (as a percentage of Assets):",
"totalLabel": "Other Expenses"
}
}
},
"auth_ref": [
"r67"
]
},
"fmr_OtherMember": {
"xbrltype": "domainItemType",
"nsuri": "http://www.fidelity.com/20260228",
"localname": "OtherMember",
"presentation": [
"http://xbrl.sec.gov/oef/role/ShareholderReportHoldingsDetails"
],
"lang": {
"en-us": {
"role": {
"label": "OtherMember"
}
}
},
"auth_ref": []
},
"oef_PctOfNav": {
"xbrltype": "percentItemType",
"nsuri": "http://xbrl.sec.gov/oef/2024q3",
"localname": "PctOfNav",
"presentation": [
"http://xbrl.sec.gov/oef/role/ShareholderReportHoldingsDetails"
],
"lang": {
"en-us": {
"role": {
"label": "Percent of Net Asset Value"
}
}
},
"auth_ref": [
"r52"
]
},
"oef_PctOfNetLongExposure": {
"xbrltype": "percentItemType",
"nsuri": "http://xbrl.sec.gov/oef/2024q3",
"localname": "PctOfNetLongExposure",
"presentation": [
"http://xbrl.sec.gov/oef/role/ShareholderReportHoldingsDetails"
],
"lang": {
"en-us": {
"role": {
"label": "Percent of Net Long Exposure"
}
}
},
"auth_ref": [
"r52"
]
},
"oef_PctOfNetShortExposure": {
"xbrltype": "percentItemType",
"nsuri": "http://xbrl.sec.gov/oef/2024q3",
"localname": "PctOfNetShortExposure",
"presentation": [
"http://xbrl.sec.gov/oef/role/ShareholderReportHoldingsDetails"
],
"lang": {
"en-us": {
"role": {
"label": "Percent of Net Short Exposure"
}
}
},
"auth_ref": [
"r52"
]
},
"oef_PctOfTotalInv": {
"xbrltype": "percentItemType",
"nsuri": "http://xbrl.sec.gov/oef/2024q3",
"localname": "PctOfTotalInv",
"presentation": [
"http://xbrl.sec.gov/oef/role/ShareholderReportHoldingsDetails"
],
"lang": {
"en-us": {
"role": {
"label": "Percent of Total Investments"
}
}
},
"auth_ref": [
"r52"
]
},
"oef_PctOfTotalLongExposure": {
"xbrltype": "percentItemType",
"nsuri": "http://xbrl.sec.gov/oef/2024q3",
"localname": "PctOfTotalLongExposure",
"presentation": [
"http://xbrl.sec.gov/oef/role/ShareholderReportHoldingsDetails"
],
"lang": {
"en-us": {
"role": {
"label": "Percent of Total Long Exposure"
}
}
},
"auth_ref": [
"r52"
]
},
"oef_PctOfTotalShortExposure": {
"xbrltype": "percentItemType",
"nsuri": "http://xbrl.sec.gov/oef/2024q3",
"localname": "PctOfTotalShortExposure",
"presentation": [
"http://xbrl.sec.gov/oef/role/ShareholderReportHoldingsDetails"
],
"lang": {
"en-us": {
"role": {
"label": "Percent of Total Short Exposure"
}
}
},
"auth_ref": [
"r52"
]
},
"oef_PerfInceptionDate": {
"xbrltype": "dateItemType",
"nsuri": "http://xbrl.sec.gov/oef/2024q3",
"localname": "PerfInceptionDate",
"presentation": [
"http://xbrl.sec.gov/oef/role/ShareholderReport"
],
"lang": {
"en-us": {
"role": {
"label": "Performance Inception Date"
}
}
},
"auth_ref": [
"r38"
]
},
"oef_PerfTableMarketIndexChngdTextBlock": {
"xbrltype": "textBlockItemType",
"nsuri": "http://xbrl.sec.gov/oef/2024q3",
"localname": "PerfTableMarketIndexChngdTextBlock",
"presentation": [
"http://xbrl.sec.gov/oef/role/ShareholderReport"
],
"lang": {
"en-us": {
"role": {
"label": "Performance Table Market Index Changed [Text Block]"
}
}
},
"auth_ref": [
"r45"
]
},
"oef_PerformancePastDoesNotIndicateFuture": {
"xbrltype": "stringItemType",
"nsuri": "http://xbrl.sec.gov/oef/2024q3",
"localname": "PerformancePastDoesNotIndicateFuture",
"presentation": [
"http://xbrl.sec.gov/oef/role/ShareholderReport"
],
"lang": {
"en-us": {
"role": {
"label": "Performance Past Does Not Indicate Future [Text]"
}
}
},
"auth_ref": [
"r40",
"r72"
]
},
"oef_PreviousInvestmentAdviserTextBlock": {
"xbrltype": "textBlockItemType",
"nsuri": "http://xbrl.sec.gov/oef/2024q3",
"localname": "PreviousInvestmentAdviserTextBlock",
"presentation": [
"http://xbrl.sec.gov/oef/role/ShareholderReport"
],
"lang": {
"en-us": {
"role": {
"label": "Previous Investment Adviser [Text Block]"
}
}
},
"auth_ref": [
"r41"
]
},
"oef_PriorMarketIndexComparisonTextBlock": {
"xbrltype": "textBlockItemType",
"nsuri": "http://xbrl.sec.gov/oef/2024q3",
"localname": "PriorMarketIndexComparisonTextBlock",
"presentation": [
"http://xbrl.sec.gov/oef/role/ShareholderReport"
],
"lang": {
"en-us": {
"role": {
"label": "Prior Market Index Comparison [Text Block]"
}
}
},
"auth_ref": [
"r45"
]
},
"us-gaap_RealEstateSectorMember": {
"xbrltype": "domainItemType",
"nsuri": "http://fasb.org/us-gaap/2024",
"localname": "RealEstateSectorMember",
"presentation": [
"http://xbrl.sec.gov/oef/role/ShareholderReportHoldingsDetails"
],
"lang": {
"en-us": {
"role": {
"terseLabel": "Real Estate Sector",
"documentation": "Sector of the economy consisting of companies engaged in real estate business activities.",
"label": "Real Estate Sector [Member]"
}
}
},
"auth_ref": [
"r17",
"r18",
"r76",
"r77",
"r78",
"r79"
]
},
"oef_SalesLoadAxis": {
"xbrltype": "stringItemType",
"nsuri": "http://xbrl.sec.gov/oef/2024q3",
"localname": "SalesLoadAxis",
"presentation": [
"http://xbrl.sec.gov/oef/role/ShareholderReportAverageAnnualReturnDetails"
],
"lang": {
"en-us": {
"role": {
"label": "Sales Load [Axis]"
}
}
},
"auth_ref": [
"r44"
]
},
"dei_SecurityExchangeName": {
"xbrltype": "edgarExchangeCodeItemType",
"nsuri": "http://xbrl.sec.gov/dei/2024",
"localname": "SecurityExchangeName",
"presentation": [
"http://xbrl.sec.gov/oef/role/ShareholderReport"
],
"lang": {
"en-us": {
"role": {
"label": "Security Exchange Name",
"terseLabel": "Exchange",
"documentation": "Name of the Exchange on which a security is registered."
}
}
},
"auth_ref": [
"r23"
]
},
"oef_ShareClassDomain": {
"xbrltype": "domainItemType",
"nsuri": "http://xbrl.sec.gov/oef/2024q3",
"localname": "ShareClassDomain",
"presentation": [
"http://xbrl.sec.gov/oef/role/ShareholderReport",
"http://xbrl.sec.gov/oef/role/ShareholderReportAverageAnnualReturnDetails",
"http://xbrl.sec.gov/oef/role/ShareholderReportHoldingsDetails",
"http://xbrl.sec.gov/oef/role/ShareholderReportLineGraphDetails"
],
"lang": {
"en-us": {
"role": {
"label": "Share Classes"
}
}
},
"auth_ref": [
"r24"
]
},
"oef_ShareholderReportAbstract": {
"xbrltype": "stringItemType",
"nsuri": "http://xbrl.sec.gov/oef/2024q3",
"localname": "ShareholderReportAbstract",
"lang": {
"en-us": {
"role": {
"label": "Shareholder Report [Abstract]"
}
}
},
"auth_ref": [
"r44"
]
},
"oef_ShareholderReportAnnualOrSemiAnnual": {
"xbrltype": "shareholderReportTypeItemType",
"nsuri": "http://xbrl.sec.gov/oef/2024q3",
"localname": "ShareholderReportAnnualOrSemiAnnual",
"presentation": [
"http://xbrl.sec.gov/oef/role/ShareholderReport"
],
"lang": {
"en-us": {
"role": {
"label": "Shareholder Report Annual or Semi-Annual"
}
}
},
"auth_ref": [
"r26"
]
},
"oef_ShareholderReportLineItems": {
"xbrltype": "stringItemType",
"nsuri": "http://xbrl.sec.gov/oef/2024q3",
"localname": "ShareholderReportLineItems",
"presentation": [
"http://xbrl.sec.gov/oef/role/NcsrCover",
"http://xbrl.sec.gov/oef/role/ShareholderReport"
],
"lang": {
"en-us": {
"role": {
"label": "Shareholder Report [Line Items]"
}
}
},
"auth_ref": [
"r44"
]
},
"oef_ShareholderReportTable": {
"xbrltype": "stringItemType",
"nsuri": "http://xbrl.sec.gov/oef/2024q3",
"localname": "ShareholderReportTable",
"presentation": [
"http://xbrl.sec.gov/oef/role/NcsrCover",
"http://xbrl.sec.gov/oef/role/ShareholderReport"
],
"lang": {
"en-us": {
"role": {
"label": "Shareholder Report [Table]"
}
}
},
"auth_ref": [
"r44"
]
},
"oef_SummaryOfChngLegendTextBlock": {
"xbrltype": "textBlockItemType",
"nsuri": "http://xbrl.sec.gov/oef/2024q3",
"localname": "SummaryOfChngLegendTextBlock",
"presentation": [
"http://xbrl.sec.gov/oef/role/ShareholderReport"
],
"lang": {
"en-us": {
"role": {
"label": "Summary of Change Legend [Text Block]"
}
}
},
"auth_ref": [
"r60"
]
},
"fmr_TH0Member": {
"xbrltype": "domainItemType",
"nsuri": "http://www.fidelity.com/20260228",
"localname": "TH0Member",
"presentation": [
"http://xbrl.sec.gov/oef/role/ShareholderReportHoldingsDetails"
],
"lang": {
"en-us": {
"role": {
"label": "TH0Member [Member]",
"verboseLabel": "TH0Member",
"terseLabel": "TH0Member"
}
}
},
"auth_ref": []
},
"fmr_TH1Member": {
"xbrltype": "domainItemType",
"nsuri": "http://www.fidelity.com/20260228",
"localname": "TH1Member",
"presentation": [
"http://xbrl.sec.gov/oef/role/ShareholderReportHoldingsDetails"
],
"lang": {
"en-us": {
"role": {
"label": "TH1Member [Member]",
"verboseLabel": "TH1Member",
"terseLabel": "TH1Member"
}
}
},
"auth_ref": []
},
"fmr_TH2Member": {
"xbrltype": "domainItemType",
"nsuri": "http://www.fidelity.com/20260228",
"localname": "TH2Member",
"presentation": [
"http://xbrl.sec.gov/oef/role/ShareholderReportHoldingsDetails"
],
"lang": {
"en-us": {
"role": {
"label": "TH2Member [Member]",
"verboseLabel": "TH2Member",
"terseLabel": "TH2Member"
}
}
},
"auth_ref": []
},
"fmr_TH3Member": {
"xbrltype": "domainItemType",
"nsuri": "http://www.fidelity.com/20260228",
"localname": "TH3Member",
"presentation": [
"http://xbrl.sec.gov/oef/role/ShareholderReportHoldingsDetails"
],
"lang": {
"en-us": {
"role": {
"label": "TH3Member [Member]",
"verboseLabel": "TH3Member",
"terseLabel": "TH3Member"
}
}
},
"auth_ref": []
},
"fmr_TH4Member": {
"xbrltype": "domainItemType",
"nsuri": "http://www.fidelity.com/20260228",
"localname": "TH4Member",
"presentation": [
"http://xbrl.sec.gov/oef/role/ShareholderReportHoldingsDetails"
],
"lang": {
"en-us": {
"role": {
"label": "TH4Member [Member]",
"verboseLabel": "TH4Member",
"terseLabel": "TH4Member"
}
}
},
"auth_ref": []
},
"fmr_TH5Member": {
"xbrltype": "domainItemType",
"nsuri": "http://www.fidelity.com/20260228",
"localname": "TH5Member",
"presentation": [
"http://xbrl.sec.gov/oef/role/ShareholderReportHoldingsDetails"
],
"lang": {
"en-us": {
"role": {
"label": "TH5Member [Member]",
"verboseLabel": "TH5Member",
"terseLabel": "TH5Member"
}
}
},
"auth_ref": []
},
"fmr_TH6Member": {
"xbrltype": "domainItemType",
"nsuri": "http://www.fidelity.com/20260228",
"localname": "TH6Member",
"presentation": [
"http://xbrl.sec.gov/oef/role/ShareholderReportHoldingsDetails"
],
"lang": {
"en-us": {
"role": {
"label": "TH6Member [Member]",
"verboseLabel": "TH6Member",
"terseLabel": "TH6Member"
}
}
},
"auth_ref": []
},
"fmr_TH7Member": {
"xbrltype": "domainItemType",
"nsuri": "http://www.fidelity.com/20260228",
"localname": "TH7Member",
"presentation": [
"http://xbrl.sec.gov/oef/role/ShareholderReportHoldingsDetails"
],
"lang": {
"en-us": {
"role": {
"label": "TH7Member [Member]",
"verboseLabel": "TH7Member",
"terseLabel": "TH7Member"
}
}
},
"auth_ref": []
},
"fmr_TH8Member": {
"xbrltype": "domainItemType",
"nsuri": "http://www.fidelity.com/20260228",
"localname": "TH8Member",
"presentation": [
"http://xbrl.sec.gov/oef/role/ShareholderReportHoldingsDetails"
],
"lang": {
"en-us": {
"role": {
"label": "TH8Member [Member]",
"verboseLabel": "TH8Member",
"terseLabel": "TH8Member"
}
}
},
"auth_ref": []
},
"fmr_TH9Member": {
"xbrltype": "domainItemType",
"nsuri": "http://www.fidelity.com/20260228",
"localname": "TH9Member",
"presentation": [
"http://xbrl.sec.gov/oef/role/ShareholderReportHoldingsDetails"
],
"lang": {
"en-us": {
"role": {
"label": "TH9Member [Member]",
"verboseLabel": "TH9Member",
"terseLabel": "TH9Member"
}
}
},
"auth_ref": []
},
"country_TW": {
"xbrltype": "domainItemType",
"nsuri": "http://xbrl.sec.gov/country/2024",
"localname": "TW",
"presentation": [
"http://xbrl.sec.gov/oef/role/ShareholderReportHoldingsDetails"
],
"lang": {
"en-us": {
"role": {
"label": "Taiwan",
"terseLabel": "Taiwan"
}
}
},
"auth_ref": []
},
"dei_TradingSymbol": {
"xbrltype": "tradingSymbolItemType",
"nsuri": "http://xbrl.sec.gov/dei/2024",
"localname": "TradingSymbol",
"presentation": [
"http://xbrl.sec.gov/oef/role/ShareholderReport"
],
"lang": {
"en-us": {
"role": {
"label": "Trading Symbol",
"terseLabel": "Ticker",
"documentation": "Trading symbol of an instrument as listed on an exchange."
}
}
},
"auth_ref": []
},
"country_US": {
"xbrltype": "domainItemType",
"nsuri": "http://xbrl.sec.gov/country/2024",
"localname": "US",
"presentation": [
"http://xbrl.sec.gov/oef/role/ShareholderReportHoldingsDetails"
],
"lang": {
"en-us": {
"role": {
"label": "United States",
"terseLabel": "United States"
}
}
},
"auth_ref": []
},
"oef_UpdPerfInfoLocationTextBlock": {
"xbrltype": "textBlockItemType",
"nsuri": "http://xbrl.sec.gov/oef/2024q3",
"localname": "UpdPerfInfoLocationTextBlock",
"presentation": [
"http://xbrl.sec.gov/oef/role/ShareholderReport"
],
"lang": {
"en-us": {
"role": {
"label": "Updated Performance Information Location [Text Block]"
}
}
},
"auth_ref": [
"r43"
]
},
"oef_UpdProspectusEmailAddress": {
"xbrltype": "stringItemType",
"nsuri": "http://xbrl.sec.gov/oef/2024q3",
"localname": "UpdProspectusEmailAddress",
"presentation": [
"http://xbrl.sec.gov/oef/role/ShareholderReport"
],
"lang": {
"en-us": {
"role": {
"label": "Updated Prospectus Email Address"
}
}
},
"auth_ref": [
"r60"
]
},
"oef_UpdProspectusPhoneNumber": {
"xbrltype": "stringItemType",
"nsuri": "http://xbrl.sec.gov/oef/2024q3",
"localname": "UpdProspectusPhoneNumber",
"presentation": [
"http://xbrl.sec.gov/oef/role/ShareholderReport"
],
"lang": {
"en-us": {
"role": {
"label": "Updated Prospectus Phone Number"
}
}
},
"auth_ref": [
"r60"
]
},
"oef_UpdProspectusWebAddress": {
"xbrltype": "stringItemType",
"nsuri": "http://xbrl.sec.gov/oef/2024q3",
"localname": "UpdProspectusWebAddress",
"presentation": [
"http://xbrl.sec.gov/oef/role/ShareholderReport"
],
"lang": {
"en-us": {
"role": {
"label": "Updated Prospectus Web Address"
}
}
},
"auth_ref": [
"r60"
]
},
"oef_UtilitiesSectorMember": {
"xbrltype": "domainItemType",
"nsuri": "http://xbrl.sec.gov/oef/2024q3",
"localname": "UtilitiesSectorMember",
"presentation": [
"http://xbrl.sec.gov/oef/role/ShareholderReportHoldingsDetails"
],
"lang": {
"en-us": {
"role": {
"label": "Utilities Sector [Member]",
"terseLabel": "Utilities Sector Member"
}
}
},
"auth_ref": [
"r52"
]
},
"oef_WithSalesLoadMember": {
"xbrltype": "domainItemType",
"nsuri": "http://xbrl.sec.gov/oef/2024q3",
"localname": "WithSalesLoadMember",
"presentation": [
"http://xbrl.sec.gov/oef/role/ShareholderReportAverageAnnualReturnDetails"
],
"lang": {
"en-us": {
"role": {
"label": "With Sales Load [Member]"
}
}
},
"auth_ref": [
"r44"
]
},
"oef_WithoutSalesLoadMember": {
"xbrltype": "domainItemType",
"nsuri": "http://xbrl.sec.gov/oef/2024q3",
"localname": "WithoutSalesLoadMember",
"presentation": [
"http://xbrl.sec.gov/oef/role/ShareholderReportAverageAnnualReturnDetails"
],
"lang": {
"en-us": {
"role": {
"label": "Without Sales Load [Member]"
}
}
},
"auth_ref": [
"r44"
]
},
"country_ZM": {
"xbrltype": "domainItemType",
"nsuri": "http://xbrl.sec.gov/country/2024",
"localname": "ZM",
"presentation": [
"http://xbrl.sec.gov/oef/role/ShareholderReportHoldingsDetails"
],
"lang": {
"en-us": {
"role": {
"label": "Zambia",
"terseLabel": "Zambia"
}
}
},
"auth_ref": []
}
}
}
},
"std_ref": {
"r0": {
"role": "http://fasb.org/us-gaap/role/ref/legacyRef",
"Name": "Accounting Standards Codification",
"Section": "50",
"Paragraph": "1",
"SubTopic": "30",
"Topic": "205",
"Publisher": "FASB",
"URI": "https://asc.fasb.org/1943274/2147479910/205-30-50-1"
},
"r1": {
"role": "http://www.xbrl.org/2003/role/disclosureRef",
"Topic": "946",
"SubTopic": "210",
"Name": "Accounting Standards Codification",
"Section": "50",
"Paragraph": "1",
"Subparagraph": "(b)(1)",
"Publisher": "FASB",
"URI": "https://asc.fasb.org/1943274/2147478795/946-210-50-1"
},
"r2": {
"role": "http://www.xbrl.org/2003/role/disclosureRef",
"Topic": "946",
"SubTopic": "210",
"Name": "Accounting Standards Codification",
"Section": "50",
"Paragraph": "1",
"Subparagraph": "(c)(1)",
"Publisher": "FASB",
"URI": "https://asc.fasb.org/1943274/2147478795/946-210-50-1"
},
"r3": {
"role": "http://www.xbrl.org/2003/role/disclosureRef",
"Topic": "946",
"SubTopic": "210",
"Name": "Accounting Standards Codification",
"Section": "50",
"Paragraph": "1",
"Subparagraph": "(c)(2)",
"Publisher": "FASB",
"URI": "https://asc.fasb.org/1943274/2147478795/946-210-50-1"
},
"r4": {
"role": "http://www.xbrl.org/2003/role/disclosureRef",
"Topic": "946",
"SubTopic": "210",
"Name": "Accounting Standards Codification",
"Section": "50",
"Paragraph": "6",
"Subparagraph": "(a)(1)",
"Publisher": "FASB",
"URI": "https://asc.fasb.org/1943274/2147478795/946-210-50-6"
},
"r5": {
"role": "http://www.xbrl.org/2003/role/disclosureRef",
"Topic": "946",
"SubTopic": "210",
"Name": "Accounting Standards Codification",
"Section": "50",
"Paragraph": "6",
"Subparagraph": "(c)",
"Publisher": "FASB",
"URI": "https://asc.fasb.org/1943274/2147478795/946-210-50-6"
},
"r6": {
"role": "http://www.xbrl.org/2003/role/disclosureRef",
"Topic": "946",
"SubTopic": "320",
"Name": "Accounting Standards Codification",
"Section": "S99",
"Paragraph": "1",
"Subparagraph": "(SX 210.12-12(Column A)(Footnote 1))",
"Publisher": "FASB",
"URI": "https://asc.fasb.org/1943274/2147477271/946-320-S99-1"
},
"r7": {
"role": "http://www.xbrl.org/2003/role/disclosureRef",
"Topic": "946",
"SubTopic": "320",
"Name": "Accounting Standards Codification",
"Section": "S99",
"Paragraph": "1",
"Subparagraph": "(SX 210.12-12(Column C)(Footnote 5))",
"Publisher": "FASB",
"URI": "https://asc.fasb.org/1943274/2147477271/946-320-S99-1"
},
"r8": {
"role": "http://www.xbrl.org/2003/role/disclosureRef",
"Topic": "946",
"SubTopic": "320",
"Name": "Accounting Standards Codification",
"Section": "S99",
"Paragraph": "2",
"Subparagraph": "(SX 210.12-12A(Column C)(Footnote 4))",
"Publisher": "FASB",
"URI": "https://asc.fasb.org/1943274/2147477271/946-320-S99-2"
},
"r9": {
"role": "http://www.xbrl.org/2003/role/disclosureRef",
"Topic": "946",
"SubTopic": "320",
"Name": "Accounting Standards Codification",
"Section": "S99",
"Paragraph": "3",
"Subparagraph": "(SX 210.12-12B(Column A)(Footnote 7))",
"Publisher": "FASB",
"URI": "https://asc.fasb.org/1943274/2147477271/946-320-S99-3"
},
"r10": {
"role": "http://www.xbrl.org/2003/role/disclosureRef",
"Topic": "946",
"SubTopic": "320",
"Name": "Accounting Standards Codification",
"Section": "S99",
"Paragraph": "3",
"Subparagraph": "(SX 210.12-12B(Column C)(Footnote 2))",
"Publisher": "FASB",
"URI": "https://asc.fasb.org/1943274/2147477271/946-320-S99-3"
},
"r11": {
"role": "http://www.xbrl.org/2003/role/disclosureRef",
"Topic": "946",
"SubTopic": "320",
"Name": "Accounting Standards Codification",
"Section": "S99",
"Paragraph": "5D",
"Subparagraph": "(SX 210.12-13D(Column A)(Footnote 2)(i))",
"Publisher": "FASB",
"URI": "https://asc.fasb.org/1943274/2147477271/946-320-S99-5D"
},
"r12": {
"role": "http://www.xbrl.org/2003/role/disclosureRef",
"Topic": "946",
"SubTopic": "320",
"Name": "Accounting Standards Codification",
"Section": "S99",
"Paragraph": "6",
"Subparagraph": "(SX 210.12-14(Column F)(Footnote 7))",
"Publisher": "FASB",
"URI": "https://asc.fasb.org/1943274/2147477271/946-320-S99-6"
},
"r13": {
"role": "http://www.xbrl.org/2003/role/disclosureRef",
"Topic": "946",
"SubTopic": "320",
"Name": "Accounting Standards Codification",
"Section": "S99",
"Paragraph": "7",
"Subparagraph": "(SX 210.12-15(Column A))",
"Publisher": "FASB",
"URI": "https://asc.fasb.org/1943274/2147477271/946-320-S99-7"
},
"r14": {
"role": "http://www.xbrl.org/2003/role/disclosureRef",
"Topic": "946",
"SubTopic": "320",
"Name": "Accounting Standards Codification",
"Section": "S99",
"Paragraph": "7",
"Subparagraph": "(SX 210.12-15(Column B))",
"Publisher": "FASB",
"URI": "https://asc.fasb.org/1943274/2147477271/946-320-S99-7"
},
"r15": {
"role": "http://www.xbrl.org/2003/role/disclosureRef",
"Topic": "946",
"SubTopic": "320",
"Name": "Accounting Standards Codification",
"Section": "S99",
"Paragraph": "7",
"Subparagraph": "(SX 210.12-15(Column C))",
"Publisher": "FASB",
"URI": "https://asc.fasb.org/1943274/2147477271/946-320-S99-7"
},
"r16": {
"role": "http://www.xbrl.org/2003/role/disclosureRef",
"Topic": "946",
"SubTopic": "320",
"Name": "Accounting Standards Codification",
"Section": "S99",
"Paragraph": "7",
"Subparagraph": "(SX 210.12-15(Column D))",
"Publisher": "FASB",
"URI": "https://asc.fasb.org/1943274/2147477271/946-320-S99-7"
},
"r17": {
"role": "http://www.xbrl.org/2003/role/exampleRef",
"Topic": "326",
"SubTopic": "20",
"Name": "Accounting Standards Codification",
"Section": "55",
"Paragraph": "12",
"Subparagraph": "(c)(1)",
"Publisher": "FASB",
"URI": "https://asc.fasb.org/1943274/2147479294/326-20-55-12"
},
"r18": {
"role": "http://www.xbrl.org/2003/role/exampleRef",
"Topic": "820",
"SubTopic": "10",
"Name": "Accounting Standards Codification",
"Section": "55",
"Paragraph": "100",
"Publisher": "FASB",
"URI": "https://asc.fasb.org/1943274/2147482078/820-10-55-100"
},
"r19": {
"role": "http://www.xbrl.org/2003/role/exampleRef",
"Topic": "820",
"SubTopic": "10",
"Name": "Accounting Standards Codification",
"Section": "55",
"Paragraph": "101",
"Publisher": "FASB",
"URI": "https://asc.fasb.org/1943274/2147482078/820-10-55-101"
},
"r20": {
"role": "http://www.xbrl.org/2003/role/exampleRef",
"Topic": "820",
"SubTopic": "10",
"Name": "Accounting Standards Codification",
"Section": "55",
"Paragraph": "103",
"Publisher": "FASB",
"URI": "https://asc.fasb.org/1943274/2147482078/820-10-55-103"
},
"r21": {
"role": "http://www.xbrl.org/2003/role/exampleRef",
"Topic": "946",
"SubTopic": "210",
"Name": "Accounting Standards Codification",
"Section": "55",
"Paragraph": "1",
"Publisher": "FASB",
"URI": "https://asc.fasb.org/1943274/2147477439/946-210-55-1"
},
"r22": {
"role": "http://www.xbrl.org/2003/role/presentationRef",
"Publisher": "SEC",
"Name": "Exchange Act",
"Number": "240",
"Section": "12",
"Subsection": "b-2"
},
"r23": {
"role": "http://www.xbrl.org/2003/role/presentationRef",
"Publisher": "SEC",
"Name": "Exchange Act",
"Number": "240",
"Section": "12",
"Subsection": "d1-1"
},
"r24": {
"role": "http://www.xbrl.org/2003/role/presentationRef",
"Publisher": "SEC",
"Name": "Form N-1A",
"Section": "1",
"Subsection": "a",
"Paragraph": "1"
},
"r25": {
"role": "http://www.xbrl.org/2003/role/presentationRef",
"Publisher": "SEC",
"Name": "Form N-1A",
"Section": "27A",
"Subsection": "b",
"Paragraph": "1"
},
"r26": {
"role": "http://www.xbrl.org/2003/role/presentationRef",
"Publisher": "SEC",
"Name": "Form N-1A",
"Section": "27A",
"Subsection": "b",
"Paragraph": "3"
},
"r27": {
"role": "http://www.xbrl.org/2003/role/presentationRef",
"Publisher": "SEC",
"Name": "Form N-1A",
"Section": "27A",
"Subsection": "b",
"Paragraph": "4"
},
"r28": {
"role": "http://www.xbrl.org/2003/role/presentationRef",
"Publisher": "SEC",
"Name": "Form N-1A",
"Section": "27A",
"Subsection": "b",
"Paragraph": "5"
},
"r29": {
"role": "http://www.xbrl.org/2003/role/presentationRef",
"Publisher": "SEC",
"Name": "Form N-1A",
"Section": "27A",
"Subsection": "b",
"Paragraph": "instruction",
"Subparagraph": "2"
},
"r30": {
"role": "http://www.xbrl.org/2003/role/presentationRef",
"Publisher": "SEC",
"Name": "Form N-1A",
"Section": "27A",
"Subsection": "c"
},
"r31": {
"role": "http://www.xbrl.org/2003/role/presentationRef",
"Publisher": "SEC",
"Name": "Form N-1A",
"Section": "27A",
"Subsection": "c",
"Paragraph": "ii"
},
"r32": {
"role": "http://www.xbrl.org/2003/role/presentationRef",
"Publisher": "SEC",
"Name": "Form N-1A",
"Section": "27A",
"Subsection": "c",
"Paragraph": "iii"
},
"r33": {
"role": "http://www.xbrl.org/2003/role/presentationRef",
"Publisher": "SEC",
"Name": "Form N-1A",
"Section": "27A",
"Subsection": "c",
"Paragraph": "instruction",
"Sentence": "1",
"Clause": "b"
},
"r34": {
"role": "http://www.xbrl.org/2003/role/presentationRef",
"Publisher": "SEC",
"Name": "Form N-1A",
"Section": "27A",
"Subsection": "c",
"Paragraph": "instruction",
"Subparagraph": "1",
"Clause": "c"
},
"r35": {
"role": "http://www.xbrl.org/2003/role/presentationRef",
"Publisher": "SEC",
"Name": "Form N-1A",
"Section": "27A",
"Subsection": "c",
"Paragraph": "instruction",
"Subparagraph": "1",
"Clause": "d"
},
"r36": {
"role": "http://www.xbrl.org/2003/role/presentationRef",
"Publisher": "SEC",
"Name": "Form N-1A",
"Section": "27A",
"Subsection": "d",
"Paragraph": "1"
},
"r37": {
"role": "http://www.xbrl.org/2003/role/presentationRef",
"Publisher": "SEC",
"Name": "Form N-1A",
"Section": "27A",
"Subsection": "d",
"Paragraph": "2"
},
"r38": {
"role": "http://www.xbrl.org/2003/role/presentationRef",
"Publisher": "SEC",
"Name": "Form N-1A",
"Section": "27A",
"Subsection": "d",
"Paragraph": "2",
"Subparagraph": "i"
},
"r39": {
"role": "http://www.xbrl.org/2003/role/presentationRef",
"Publisher": "SEC",
"Name": "Form N-1A",
"Section": "27A",
"Subsection": "d",
"Paragraph": "2",
"Subparagraph": "iii",
"Clause": "B"
},
"r40": {
"role": "http://www.xbrl.org/2003/role/presentationRef",
"Publisher": "SEC",
"Name": "Form N-1A",
"Section": "27A",
"Subsection": "d",
"Paragraph": "2",
"Subparagraph": "iiii",
"Clause": "A"
},
"r41": {
"role": "http://www.xbrl.org/2003/role/presentationRef",
"Publisher": "SEC",
"Name": "Form N-1A",
"Section": "27A",
"Subsection": "d",
"Paragraph": "2",
"Subparagraph": "instruction",
"Clause": "12"
},
"r42": {
"role": "http://www.xbrl.org/2003/role/presentationRef",
"Publisher": "SEC",
"Name": "Form N-1A",
"Section": "27A",
"Subsection": "d",
"Paragraph": "2",
"Subparagraph": "instruction",
"Clause": "14"
},
"r43": {
"role": "http://www.xbrl.org/2003/role/presentationRef",
"Publisher": "SEC",
"Name": "Form N-1A",
"Section": "27A",
"Subsection": "d",
"Paragraph": "2",
"Subparagraph": "instruction",
"Clause": "15"
},
"r44": {
"role": "http://www.xbrl.org/2003/role/presentationRef",
"Publisher": "SEC",
"Name": "Form N-1A",
"Section": "27A",
"Subsection": "d",
"Paragraph": "2",
"Subparagraph": "instruction",
"Clause": "7"
},
"r45": {
"role": "http://www.xbrl.org/2003/role/presentationRef",
"Publisher": "SEC",
"Name": "Form N-1A",
"Section": "27A",
"Subsection": "d",
"Paragraph": "2",
"Subparagraph": "instruction",
"Clause": "8"
},
"r46": {
"role": "http://www.xbrl.org/2003/role/presentationRef",
"Publisher": "SEC",
"Name": "Form N-1A",
"Section": "27A",
"Subsection": "d",
"Paragraph": "3"
},
"r47": {
"role": "http://www.xbrl.org/2003/role/presentationRef",
"Publisher": "SEC",
"Name": "Form N-1A",
"Section": "27A",
"Subsection": "d",
"Paragraph": "4"
},
"r48": {
"role": "http://www.xbrl.org/2003/role/presentationRef",
"Publisher": "SEC",
"Name": "Form N-1A",
"Section": "27A",
"Subsection": "d",
"Paragraph": "4",
"Subparagraph": "instruction",
"Clause": "3"
},
"r49": {
"role": "http://www.xbrl.org/2003/role/presentationRef",
"Publisher": "SEC",
"Name": "Form N-1A",
"Section": "27A",
"Subsection": "d",
"Paragraph": "4",
"Subparagraph": "instruction",
"Clause": "4"
},
"r50": {
"role": "http://www.xbrl.org/2003/role/presentationRef",
"Publisher": "SEC",
"Name": "Form N-1A",
"Section": "27A",
"Subsection": "e"
},
"r51": {
"role": "http://www.xbrl.org/2003/role/presentationRef",
"Publisher": "SEC",
"Name": "Form N-1A",
"Section": "27A",
"Subsection": "e",
"Paragraph": "instruction",
"Subparagraph": "6"
},
"r52": {
"role": "http://www.xbrl.org/2003/role/presentationRef",
"Publisher": "SEC",
"Name": "Form N-1A",
"Section": "27A",
"Subsection": "f"
},
"r53": {
"role": "http://www.xbrl.org/2003/role/presentationRef",
"Publisher": "SEC",
"Name": "Form N-1A",
"Section": "27A",
"Subsection": "g"
},
"r54": {
"role": "http://www.xbrl.org/2003/role/presentationRef",
"Publisher": "SEC",
"Name": "Form N-1A",
"Section": "27A",
"Subsection": "g",
"Paragraph": "1"
},
"r55": {
"role": "http://www.xbrl.org/2003/role/presentationRef",
"Publisher": "SEC",
"Name": "Form N-1A",
"Section": "27A",
"Subsection": "g",
"Paragraph": "2"
},
"r56": {
"role": "http://www.xbrl.org/2003/role/presentationRef",
"Publisher": "SEC",
"Name": "Form N-1A",
"Section": "27A",
"Subsection": "g",
"Paragraph": "3"
},
"r57": {
"role": "http://www.xbrl.org/2003/role/presentationRef",
"Publisher": "SEC",
"Name": "Form N-1A",
"Section": "27A",
"Subsection": "g",
"Paragraph": "4"
},
"r58": {
"role": "http://www.xbrl.org/2003/role/presentationRef",
"Publisher": "SEC",
"Name": "Form N-1A",
"Section": "27A",
"Subsection": "g",
"Paragraph": "5"
},
"r59": {
"role": "http://www.xbrl.org/2003/role/presentationRef",
"Publisher": "SEC",
"Name": "Form N-1A",
"Section": "27A",
"Subsection": "g",
"Paragraph": "6"
},
"r60": {
"role": "http://www.xbrl.org/2003/role/presentationRef",
"Publisher": "SEC",
"Name": "Form N-1A",
"Section": "27A",
"Subsection": "g",
"Paragraph": "instruction",
"Subparagraph": "2"
},
"r61": {
"role": "http://www.xbrl.org/2003/role/presentationRef",
"Publisher": "SEC",
"Name": "Form N-1A",
"Section": "27A",
"Subsection": "h",
"Paragraph": "1"
},
"r62": {
"role": "http://www.xbrl.org/2003/role/presentationRef",
"Publisher": "SEC",
"Name": "Form N-1A",
"Section": "27A",
"Subsection": "h",
"Paragraph": "2"
},
"r63": {
"role": "http://www.xbrl.org/2003/role/presentationRef",
"Publisher": "SEC",
"Name": "Form N-1A",
"Section": "3",
"Subsection": "instruction",
"Paragraph": "1",
"Subparagraph": "d",
"Sentence": "i"
},
"r64": {
"role": "http://www.xbrl.org/2003/role/presentationRef",
"Publisher": "SEC",
"Name": "Form N-1A",
"Section": "3",
"Subsection": "instruction",
"Paragraph": "3"
},
"r65": {
"role": "http://www.xbrl.org/2003/role/presentationRef",
"Publisher": "SEC",
"Name": "Form N-1A",
"Section": "3",
"Subsection": "instruction",
"Paragraph": "3",
"Subparagraph": "a"
},
"r66": {
"role": "http://www.xbrl.org/2003/role/presentationRef",
"Publisher": "SEC",
"Name": "Form N-1A",
"Section": "3",
"Subsection": "instruction",
"Paragraph": "3",
"Subparagraph": "b"
},
"r67": {
"role": "http://www.xbrl.org/2003/role/presentationRef",
"Publisher": "SEC",
"Name": "Form N-1A",
"Section": "3",
"Subsection": "instruction",
"Paragraph": "3",
"Subparagraph": "c",
"Sentence": "i"
},
"r68": {
"role": "http://www.xbrl.org/2003/role/presentationRef",
"Publisher": "SEC",
"Name": "Form N-1A",
"Section": "3",
"Subsection": "instruction",
"Paragraph": "3",
"Subparagraph": "c",
"Sentence": "iii"
},
"r69": {
"role": "http://www.xbrl.org/2003/role/presentationRef",
"Publisher": "SEC",
"Name": "Form N-1A",
"Section": "3",
"Subsection": "instruction",
"Paragraph": "3",
"Subparagraph": "d"
},
"r70": {
"role": "http://www.xbrl.org/2003/role/presentationRef",
"Publisher": "SEC",
"Name": "Form N-1A",
"Section": "3",
"Subsection": "instruction",
"Paragraph": "3",
"Subparagraph": "e"
},
"r71": {
"role": "http://www.xbrl.org/2003/role/presentationRef",
"Publisher": "SEC",
"Name": "Form N-1A",
"Section": "3",
"Subsection": "instruction",
"Paragraph": "3",
"Subparagraph": "f",
"Sentence": "i"
},
"r72": {
"role": "http://www.xbrl.org/2003/role/presentationRef",
"Publisher": "SEC",
"Name": "Form N-1A",
"Section": "4",
"Subsection": "b",
"Paragraph": "2",
"Subparagraph": "i"
},
"r73": {
"role": "http://www.xbrl.org/2003/role/presentationRef",
"Publisher": "SEC",
"Name": "Form N-1A",
"Section": "4",
"Subsection": "b",
"Paragraph": "2",
"Subparagraph": "iii"
},
"r74": {
"role": "http://www.xbrl.org/2003/role/presentationRef",
"Publisher": "SEC",
"Name": "Regulation S-T",
"Number": "232",
"Section": "313"
},
"r75": {
"role": "http://www.xbrl.org/2009/role/commonPracticeRef",
"Topic": "946",
"SubTopic": "205",
"Name": "Accounting Standards Codification",
"Section": "50",
"Paragraph": "27",
"Publisher": "FASB",
"URI": "https://asc.fasb.org/1943274/2147478494/946-205-50-27"
},
"r76": {
"role": "http://www.xbrl.org/2009/role/commonPracticeRef",
"Topic": "946",
"SubTopic": "320",
"Name": "Accounting Standards Codification",
"Section": "S99",
"Paragraph": "1",
"Subparagraph": "(SX 210.12-12(Column A)(Footnote 2)(ii))",
"Publisher": "FASB",
"URI": "https://asc.fasb.org/1943274/2147477271/946-320-S99-1"
},
"r77": {
"role": "http://www.xbrl.org/2009/role/commonPracticeRef",
"Topic": "946",
"SubTopic": "320",
"Name": "Accounting Standards Codification",
"Section": "S99",
"Paragraph": "2",
"Subparagraph": "(SX 210.12-12A(Column A)(Footnote 2))",
"Publisher": "FASB",
"URI": "https://asc.fasb.org/1943274/2147477271/946-320-S99-2"
},
"r78": {
"role": "http://www.xbrl.org/2009/role/commonPracticeRef",
"Topic": "946",
"SubTopic": "320",
"Name": "Accounting Standards Codification",
"Section": "S99",
"Paragraph": "3",
"Subparagraph": "(SX 210.12-12B(Column A)(Footnote 1)(b))",
"Publisher": "FASB",
"URI": "https://asc.fasb.org/1943274/2147477271/946-320-S99-3"
},
"r79": {
"role": "http://www.xbrl.org/2009/role/commonPracticeRef",
"Topic": "946",
"SubTopic": "320",
"Name": "Accounting Standards Codification",
"Section": "S99",
"Paragraph": "6",
"Subparagraph": "(SX 210.12-14(Column A)(Footnote 2))",
"Publisher": "FASB",
"URI": "https://asc.fasb.org/1943274/2147477271/946-320-S99-6"
}
}
}