UNITED STATES
SECURITIES AND EXCHANGE COMMISSION
Washington, D.C. 20549
Form 6-K
Report of Foreign Private Issuer
Pursuant to Rule 13a-16 or 15d-16
under the Securities Exchange Act of 1934
For the month of January 2023
Commission File Number 001-16139
Wipro Limited
(Exact name of Registrant as specified in its charter)
Not Applicable
(Translation of Registrants name into English)
Karnataka, India
(Jurisdiction of incorporation or organization)
Doddakannelli
Sarjapur Road
Bangalore, Karnataka 560035, India +91-80-2844-0011
(Address of principal executive offices)
Indicate by check mark whether the registrant files or will file annual reports under cover Form 20-F or Form 40-F:
Form 20-F ☒ Form 40-F ☐
Indicate by check mark if the registrant is submitting the Form 6-K in paper as permitted by Regulation S-T Rule 101(b)(1):
Yes ☐ No ☒
Note: Regulation S-T Rule 101(b)(1) only permits the submission in paper of a Form 6-K if submitted solely to provide an attached annual report to security holders.
Indicate by check mark if the registrant is submitting the Form 6-K in paper as permitted by
Regulation S-T Rule 101(b)(7):
Yes ☐ No ☒
Note: Regulation S-T Rule 101(b)(7) only permits the submission in paper of a Form 6-K if submitted to furnish a report or other document that the registrant foreign private issuer must furnish and make public under the laws of the jurisdiction in which the registrant is incorporated, domiciled or legally organized (the registrants home country), or under the rules of the home country exchange on which the registrants securities are traded, as long as the report or other document is not a press release, is not required to be and has not been distributed to the registrants security holders, and, if discussing a material event, has already been the subject of a Form 6-K submission or other Commission filing on EDGAR.
DISCLOSURE OF RESULTS OF OPERATIONS AND FINANCIAL CONDITION
Wipro Limited, a company organized under the laws of the Republic of India (the Company), hereby furnishes the Commission with the following information concerning our public disclosures regarding our results of operations for the quarter ended December 31, 2022. The following information shall not be deemed filed for purposes of Section 18 of the Securities Exchange Act of 1934, as amended (the Exchange Act), or incorporated by reference in any filing under the Securities Act of 1933, as amended, or the Exchange Act, except as shall be expressly set forth by specific reference in such a filing.
On January 13, 2023, we announced our results of operations for the quarter ended December 31, 2022. We issued a press release announcing our results under IFRS, a copy of which is attached to this Form 6-K as Item 99.1.
On January 13, 2023, we held a press conference to announce our results. The presentation made by the registrant at the press conference is attached to this Form 6-K as Item 99.2.
We placed advertisements in certain Indian newspapers concerning our results of operations for the quarter ended December 31, 2022, under IFRS. A copy of the form of this advertisement is attached to this Form 6-K as Item 99.3.
We made available on our website the Condensed Consolidated Interim Financial Statements as of and for the three months ended December 31, 2022, under IFRS. A copy of such financial statements is attached to this Form
6-K as Item 99.4.
We filed with stock exchanges in India a statement of statutorily audited consolidated financial results for the three months ended December 31, 2022, under IFRS. A copy of such financial statements is attached to this Form
6-K as Item 99.5.
We filed with stock exchanges in India a datasheet containing operating metrics for the quarter ended December 31, 2022. A copy of such data sheet is attached to this Form 6-K as Item 99.6.
SIGNATURES
Pursuant to the requirements of the Securities Exchange Act of 1934, the registrant has duly caused this report to be signed on its behalf by the undersigned, thereunto duly organized.
WIPRO LIMITED |
/s/ Jatin Pravinchandra Dalal |
Jatin Pravinchandra Dalal |
Chief Financial Officer |
Dated: January 17, 2023
INDEX TO EXHIBITS
Item |
||
99.1 | IFRS Press Release | |
99.2 | Presentation referred by the Company at the Press Conference on January 13, 2023, | |
99.3 | Form of Advertisement Placed in Indian Newspapers | |
99.4 | Consolidated Interim Financial Statements under IFRS | |
99.5 | Statutorily Audited Consolidated Financial Results filed with stock exchanges in India | |
99.6 | Data sheet containing operating metrics filed with stock exchanges in India |
Exhibit 99.1
FOR IMMEDIATE RELEASE
Wipro Announces Third Quarter Results, Delivers Record Total Bookings
IT Services Revenue for the quarter increased 10.4% YoY
IT Services improves Operating Margin to 16.3%
Total Bookings up by 26% and large deal bookings up by 69% YoY
Operating Cash Flows at 143% of Net Income for the quarter
NEW YORK | BANGALORE, India Jan. 13, 2023: Wipro Limited (NYSE: WIT, BSE: 507685, NSE: WIPRO), a leading technology services and consulting company, announced financial results under International Financial Reporting Standards (IFRS) for the quarter ended December 31, 2022.
Highlights of the Results
Results for the Quarter ended December 31, 2022:
| Gross Revenue reached ₹232.3 billion ($2.8 billion1), an increase of 3.1% QoQ and 14.4% YoY |
| IT Services Segment Revenue increased to $2,803.5 million, an improvement of 6.2% YoY |
| Non-GAAP2 constant currency IT Services segment revenue was up by 0.6% QoQ and 10.4% YoY |
| IT Services Operating Margin3 for the quarter was at 16.3%, an increase of 120bps QoQ |
| Total Bookings4 up by 26% and large deal bookings5 up by 69% YoY |
| Net Income for the quarter was at ₹30.5 billion ($369.1 million1), a growth of 14.8% QoQ and 2.8% YoY |
| Earnings Per Share for the quarter was at ₹5.57 ($0.071), an increase of 14.6% QoQ and 2.6% YoY |
| Operating Cash Flows at 142.5% of Net Income for the quarter was at ₹43.5 billion ($526.0 million1), an increase of 44.7% YoY |
| Voluntary attrition6 moderated 180 bps from previous quarter, landing at 21.2% for the trailing twelve months for the quarter |
| Top 5 clients grew 15.7% YoY and top 10 clients grew 14.7% YoY in constant currency terms, underscoring deepening relationships with top strategic clients |
| Wipro declared an interim dividend of ₹1 ($0.0121) per equity share/ADS |
1
Performance for the Quarter ended December 31, 2022
Thierry Delaporte, CEO and Managing Director, said, I am pleased to report that we have delivered another quarter of double-digit revenue growth. Our Total Bookings were over $4.3 billion, led by solid large deal signings of over $1 billion. We improved our margins by 120 basis points and our attrition moderated for the fourth quarter in a row.
We are continuing to gain market share as a result of deepening client relationships and higher win rates. Clients are turning to us to help them manage an evolving macro environment and balance their transformation goals with cost optimization. Our ability to deliver on client objectives regardless of where they are in their cloud journeys is positioning us favourably in a consolidating market.
As we move ahead, we expect to continue to benefit from these trends and help clients build future-proof, resilient enterprises.
Jatin Dalal, Chief Financial Officer, said, Our Operating margins are now at 16.3%, which is an expansion of 120 basis points from last quarter. This expansion of margins was after absorbing the investments we made in our people by way of salary increases, promotions and long-term incentives for our senior leadership. Margin growth was led by strong operational improvements and automation-led efficiencies. We generated strong operating cash flows at 143% of our net income for the quarter and our EPS increased by 14.6% quarter-over-quarter.
Outlook for the Year ending March 31, 2023
We expect Revenue from our IT Services business for the full year to be in the range of 11.5% to 12.0%, in constant currency terms.
* | Outlook for the year ending March 31, 2023, is based on the following exchange rates: GBP/USD at 1.36, Euro/USD at 1.16, AUD/USD at 0.73, USD/INR at 74.78 and CAD/USD at 0.79 |
1. | For the convenience of the readers, the amounts in Indian Rupees in this release have been translated into United States Dollars at the certified foreign exchange rate of US$1 = ₹82.72, as published by the Federal Reserve Board of Governors on December 31, 2022. However, the realized exchange rate in our IT Services business segment for the quarter ended December 31, 2022 was US$1= ₹82.24 |
2. | Constant currency revenue for a period is the product of volumes in that period times the average actual exchange rate of the corresponding comparative period |
3. | IT Services Operating Margin refers to Segment Results Total as reflected in IFRS financials |
4. | Total Bookings refers to the total contract value of all orders that were booked during the period including new orders, renewals, and changes to existing contracts. Bookings do not reflect subsequent terminations or reductions related to bookings originally recorded in prior fiscal periods. Bookings are recorded using then-existing foreign currency exchange rates and are not subsequently adjusted for foreign currency exchange rate fluctuations. The revenues from these contracts accrue over the tenure of the contract. |
5. | Large deal bookings constitute of deals greater than or equal to $30 million in total contract value terms |
6. | Voluntary attrition is at IT Services excluding DOP measured in trailing twelve months for the quarter |
2
IT Services Large deals
Wipro continued its momentum in winning large deals with our customers as described below:
| A global leader in consumer brands selected Wipro to create a three-year consumer digital & technology transformation roadmap. Wipro is deploying data analytics and AI to help put the consumer at the core of the companys omni-channel direct-to-consumer operating model. The solution will help strengthen the companys brand building, innovation and sales capabilities and achieve its ambition of driving growth and loyalty among customers. |
| Wipro has won a large strategic, multi-year engagement with a leading North American financial institution to modernize and transform their applications portfolio globally. The engagement will focus on digital transformation and automation for enhanced customer experience and business value creation. |
| Wipro has been engaged by a US-based multinational technology conglomerate to build core product platform and design, test and modernize unique silicon chips for its next-generation connected products. The project will tap into Wipros deep domain expertise in helping enterprises deploy high-performance, new-age chip solutions in sync with changing consumer and enterprise needs. This win places Wipro Engineering Edge at the forefront of silicon innovation with low latency, low power, and ultra-reliable applications which will deliver unparalleled experiences for the end-consumers. |
IT Services - Digital services deals
We continue to see increasing traction in digital oriented and other strategic deals as illustrated below:
| A joint Capco and Wipro team is supporting a large UK retail bank with their vision to become the pre-eminent UK digital insurer. Our mission is to drive the end-to-end transformation of the UK General Insurance business, leveraging our deep domain and technological expertise to completely rebuild the customer and employee experience, harnessing the power of data and automation. |
| One of the largest Australia-based energy transmission and distribution services businesses has selected Wipro as its strategic partner to integrate and transform its digital operating model. Wipro will leverage innovation, simplification, and automation to deliver business impact and value through technology investments. In this outcome-based partnership, Wipro will help the customer enhance user experience and improve operational efficiency. |
| Wipro has expanded its relationship with a leading Middle East-based airport management company with an end-to-end strategic partnership deal, which marks our largest deal in the airport domain in the Middle East. Wipro will run the airports end-to-end IT operations, upgrade technology infrastructure and expand digital services, leveraging futuristic technologies. |
| Wipro is helping a large consumer goods company to move to agile ways of working with a scalable contract that provides flexibility to the business. This is in addition to maintaining best-in-class availability and performance for global platforms across 200 countries. The scope also includes modernizing the platforms. |
3
Analyst Recognition
| Wipro was recognized as a Leader in the 2022 Gartner® Magic Quadrant for Managed Network Services |
| Wipro was named as a Leader and a Star Performer in Everest Groups System Integration Capabilities on GCP PEAK Matrix® Assessment 2022 |
| Wipro was positioned as a Leader in IDC MarketScape: EMEA Industrial IoT Service Providers for Oil and Gas Companies 2022 Vendor Assessment (Doc # EUR147586921 October 2022) |
| Wipro was recognized as a Leader in Avasant Manufacturing Digital Services and Utilities Digital Services RadarView 2022 2023 |
| Wipro was rated as a Leader and a Star Performer in Everest Groups Risk & Compliance in BFS IT Services PEAK Matrix® Assessment 2023 |
| Wipro was featured in HFS Horizons: Automation Service Providers, 2022 and Healthcare Payer Service Providers, 2022 |
| Wipro was named as a Leader in ISG Provider Lens Future of Work - Services and Solutions 2022 US and Switzerland (multiple quadrants) |
| Wipro was rated as a Leader in Avasant Oracle Cloud ERP Services and Digital CX Services RadarView 2022 2023 |
| Wipro was rated as a Leader in Everest Groups Workplace Communication and Collaboration (WCC) Services PEAK Matrix® Assessment 2022 |
| Wipro was rated as a Leader in Avasant Property and Casualty Insurance Digital Services and Claims Processing Business Process Transformation RadarView 2022 2023 |
Disclaimer: *Gartner, Magic Quadrant for Managed Network Services , Ted Corbett, et al, 5 December 2022. GARTNER and MAGIC QUADRANT are registered trademarks and service marks of Gartner, Inc. and/or its affiliates in the U.S. and internationally and are used herein with permission. Gartner does not endorse any vendor, product, or service depicted in its research publications, and does not advise technology users to select only those vendors with the highest ratings or other designation. Gartners research publications consist of the opinions of Gartners research organization and should not be construed as statements of fact. Gartner disclaims all warranties, expressed or implied, with respect to this research, including any warranties of merchantability or fitness for a particular purpose.
IT Products
| IT Products segment revenue for the quarter was ₹1.7 billion ($20.8 million1) |
| IT Products segment results for the quarter was a profit of ₹0.04 billion ($0.50 million1) |
India business from State Run Enterprises (ISRE)
| India SRE segment revenue for the quarter was ₹1.4 billion ($17.0 million1) |
| India SRE segment results for the quarter was a profit of ₹0.10 billion ($1.23 million1) |
Please refer to the table on page 11 for reconciliation between IFRS IT Services Revenue and IT Services Revenue on a non-GAAP constant currency basis.
4
About Key Metrics and Non-GAAP Financial Measures
This press release contains key metrics and non-GAAP financial measures within the meaning of Regulation G and Item 10(e) of Regulation S-K. Such non-GAAP financial measures are measures of our historical or future performance, financial position or cash flows that are adjusted to exclude or include amounts that are excluded or included, as the case may be, from the most directly comparable financial measure calculated and presented in accordance with IFRS.
The table on page 11 provides IT Services Revenue on a constant currency basis, which is a non-GAAP financial measure that is calculated by translating IT Services Revenue from the current reporting period into U.S. dollars based on the currency conversion rate in effect for the prior reporting period. We refer to growth rates in constant currency so that business results may be viewed without the impact of fluctuations in foreign currency exchange rates, thereby facilitating period-to-period comparisons of our business performance. Further, in the normal course of business, we may divest a portion of our business which may not be strategic. We refer to the growth rates in both reported and constant currency adjusting for such divestments in order to represent the comparable growth rates.
Our key metrics and non-GAAP financial measures are not based on any comprehensive set of accounting rules or principles and should not be considered a substitute for, or superior to, the most directly comparable financial measure calculated in accordance with IFRS and may be different from non-GAAP measures used by other companies. Our key metrics and non-GAAP financial measures are not comparable to, nor should be substituted for, an analysis of our revenue over time and involve estimates and judgments. In addition to our non-GAAP measures, the financial statements prepared in accordance with IFRS and the reconciliation of these non-GAAP financial measures with the most directly comparable IFRS financial measure should be carefully evaluated.
Results for the Quarter ended December 31, 2022, prepared under IFRS, along with individual business segment reports, are available in the Investors section of our website www.wipro.com
Quarterly Conference Call
We will hold an earnings conference call today at 07:30 p.m. Indian Standard Time (10:00 a.m. U.S. Eastern Time) to discuss our performance for the quarter. The audio from the conference call will be available online through a web-cast and can be accessed at the following link- https://links.ccwebcast.com/?EventId=WIP13012023
An audio recording of the management discussions and the question-and-answer session will be available online and will be accessible in the Investor Relations section of our website at www.wipro.com
5
About Wipro Limited
Wipro Limited (NYSE: WIT, BSE: 507685, NSE: WIPRO) is a leading technology services and consulting company focused on building innovative solutions that address clients most complex digital transformation needs. Leveraging our holistic portfolio of capabilities in consulting, design, engineering, and operations, we help clients realize their boldest ambitions and build future-ready, sustainable businesses. With over 250,000 employees and business partners across 66 countries, we deliver on the promise of helping our customers, colleagues, and communities thrive in an ever-changing world. For additional information, visit us at www.wipro.com
Contact for Investor Relations | Contact for Media & Press | |||
Dipak Kumar Bohra | Abhishek Kumar Jain | Purnima Burman | ||
Phone: +91-80-6142 7201 | Phone: +91-80-6142 6143 | Phone: +91-80-6142 6450 | ||
dipak.bohra@wipro.com | abhishekkumar.jain@wipro.com | purnima.burman@wipro.com |
Forward-Looking Statements
The forward-looking statements contained herein represent Wipros beliefs regarding future events, many of which are by their nature, inherently uncertain and outside Wipros control. Such statements include, but are not limited to, statements regarding Wipros growth prospects, its future financial operating results, and its plans, expectations and intentions. Wipro cautions readers that the forward-looking statements contained herein are subject to risks and uncertainties that could cause actual results to differ materially from the results anticipated by such statements. Such risks and uncertainties include, but are not limited to, risks and uncertainties regarding fluctuations in our earnings, revenue and profits, our ability to generate and manage growth, complete proposed corporate actions, intense competition in IT services, our ability to maintain our cost advantage, wage increases in India, our ability to attract and retain highly skilled professionals, time and cost overruns on fixed-price, fixed-time frame contracts, client concentration, restrictions on immigration, our ability to manage our international operations, reduced demand for technology in our key focus areas, disruptions in telecommunication networks, our ability to successfully complete and integrate potential acquisitions, liability for damages on our service contracts, the success of the companies in which we make strategic investments, withdrawal of fiscal governmental incentives, political instability, war, legal restrictions on raising capital or acquiring companies outside India, unauthorized use of our intellectual property and general economic conditions affecting our business and industry.
Additional risks that could affect our future operating results are more fully described in our filings with the United States Securities and Exchange Commission, including, but not limited to, Annual Reports on Form 20-F. These filings are available at www.sec.gov. We may, from time to time, make additional written and oral forward-looking statements, including statements contained in the companys filings with the Securities and Exchange Commission and our reports to shareholders. We do not undertake to update any forward-looking statement that may be made from time to time by us or on our behalf.
# # #
(Tables to follow)
6
WIPRO LIMITED AND SUBSIDIARIES
INTERIM CONDENSED CONSOLIDATED STATEMENT OF FINANCIAL POSITION
(₹ in millions, except share and per share data, unless otherwise stated)
As at March 31, 2022 | As at December 31, 2022 | |||||||||||
|
|
Convenience translation into US dollar in millions Refer footnote in page 2 |
||||||||||
ASSETS |
||||||||||||
Goodwill |
246,989 | 309,525 | 3,742 | |||||||||
Intangible assets |
43,555 | 45,847 | 554 | |||||||||
Property, plant and equipment |
90,898 | 90,147 | 1,090 | |||||||||
Right-of-Use assets |
18,870 | 19,381 | 234 | |||||||||
Financial assets |
||||||||||||
Derivative assets |
6 | 88 | 1 | |||||||||
Investments |
19,109 | 20,808 | 252 | |||||||||
Trade receivables |
4,765 | 4,626 | 56 | |||||||||
Other financial assets |
6,084 | 6,123 | 74 | |||||||||
Investments accounted for using the equity method |
774 | 782 | 9 | |||||||||
Deferred tax assets |
2,298 | 4,043 | 49 | |||||||||
Non-current tax assets |
10,256 | 11,450 | 138 | |||||||||
Other non-current assets |
14,826 | 14,045 | 170 | |||||||||
|
|
|
|
|
|
|||||||
Total non-current assets |
458,430 | 526,865 | 6,369 | |||||||||
|
|
|
|
|
|
|||||||
Inventories |
1,334 | 2,019 | 24 | |||||||||
Financial assets |
||||||||||||
Derivative assets |
3,032 | 930 | 11 | |||||||||
Investments |
241,655 | 291,743 | 3,527 | |||||||||
Cash and cash equivalents |
103,836 | 87,307 | 1,055 | |||||||||
Trade receivables |
115,219 | 124,761 | 1,510 | |||||||||
Unbilled receivables |
60,809 | 56,316 | 681 | |||||||||
Other financial assets |
42,914 | 9,532 | 115 | |||||||||
Contract assets |
20,647 | 25,181 | 304 | |||||||||
Current tax assets |
2,373 | 4,463 | 54 | |||||||||
Other current assets |
28,933 | 36,123 | 437 | |||||||||
|
|
|
|
|
|
|||||||
Total current assets |
620,752 | 638,375 | 7,718 | |||||||||
|
|
|
|
|
|
|||||||
TOTAL ASSETS |
1,079,182 | 1,165,240 | 14,087 | |||||||||
|
|
|
|
|
|
|||||||
EQUITY |
||||||||||||
Share capital |
10,964 | 10,974 | 133 | |||||||||
Share premium |
1,566 | 3,151 | 38 | |||||||||
Retained earnings |
551,252 | 635,267 | 7,680 | |||||||||
Share-based payment reserve |
5,258 | 6,086 | 74 | |||||||||
Special Economic Zone re-investment reserve |
47,061 | 47,014 | 568 | |||||||||
Other components of equity |
42,057 | 52,382 | 633 | |||||||||
|
|
|
|
|
|
|||||||
Equity attributable to the equity holders of the Company |
658,158 | 754,874 | 9,126 | |||||||||
Non-controlling interests |
515 | 402 | 5 | |||||||||
|
|
|
|
|
|
|||||||
TOTAL EQUITY |
658,673 | 755,276 | 9,131 | |||||||||
|
|
|
|
|
|
|||||||
LIABILITIES |
||||||||||||
Financial liabilities |
||||||||||||
Loans and borrowings |
56,463 | 61,718 | 746 | |||||||||
Lease liabilities |
15,177 | 15,520 | 188 | |||||||||
Derivative liabilities |
48 | 165 | 2 | |||||||||
Other financial liabilities |
2,961 | 2,267 | 27 | |||||||||
Deferred tax liabilities |
12,141 | 13,338 | 161 | |||||||||
Non-current tax liabilities |
17,818 | 21,846 | 264 | |||||||||
Other non-current liabilities |
7,571 | 9,865 | 119 | |||||||||
Provisions |
1 | ^ | ^ | |||||||||
|
|
|
|
|
|
|||||||
Total non-current liabilities |
112,180 | 124,719 | 1,507 | |||||||||
|
|
|
|
|
|
|||||||
Financial liabilities |
||||||||||||
Loans, borrowings and bank overdrafts |
95,233 | 96,511 | 1,167 | |||||||||
Lease liabilities |
9,056 | 9,300 | 112 | |||||||||
Derivative liabilities |
585 | 7,199 | 87 | |||||||||
Trade payables and accrued expenses |
99,034 | 89,613 | 1,084 | |||||||||
Other financial liabilities |
33,110 | 4,341 | 52 | |||||||||
Contract liabilities |
27,915 | 26,903 | 325 | |||||||||
Current tax liabilities |
13,231 | 19,580 | 237 | |||||||||
Other current liabilities |
27,394 | 29,274 | 354 | |||||||||
Provisions |
2,771 | 2,524 | 31 | |||||||||
|
|
|
|
|
|
|||||||
Total current liabilities |
308,329 | 285,245 | 3,449 | |||||||||
|
|
|
|
|
|
|||||||
TOTAL LIABILITIES |
420,509 | 409,964 | 4,956 | |||||||||
|
|
|
|
|
|
|||||||
TOTAL EQUITY AND LIABILITIES |
1,079,182 | 1,165,240 | 14,087 | |||||||||
|
|
|
|
|
|
^ | Value is less than 1 |
7
WIPRO LIMITED AND SUBSIDIARIES
INTERIM CONDENSED CONSOLIDATED STATEMENT OF INCOME
(₹ in millions, except share and per share data, unless otherwise stated)
Three months ended December 31, | Nine months ended December 31, | |||||||||||||||||||||||
2021 | 2022 | 2022 | 2021 | 2022 | 2022 | |||||||||||||||||||
|
|
Convenience translation into US dollar in millions Refer footnote in page 2 |
|
|
Convenience translation into US dollar in millions Refer footnote in page 2 |
|||||||||||||||||||
Revenues |
203,136 | 232,290 | 2,808 | 582,334 | 672,973 | 8,136 | ||||||||||||||||||
Cost of revenues |
(142,778 | ) | (163,273 | ) | (1,974 | ) | (407,907 | ) | (482,708 | ) | (5,836 | ) | ||||||||||||
|
|
|
|
|
|
|
|
|
|
|
|
|||||||||||||
Gross profit |
60,358 | 69,017 | 834 | 174,427 | 190,265 | 2,300 | ||||||||||||||||||
Selling and marketing expenses |
(13,988 | ) | (17,752 | ) | (215 | ) | (40,857 | ) | (48,251 | ) | (583 | ) | ||||||||||||
General and administrative expenses |
(12,036 | ) | (15,020 | ) | (181 | ) | (33,854 | ) | (43,467 | ) | (525 | ) | ||||||||||||
Foreign exchange gains/(losses), net |
1,187 | 1,391 | 17 | 3,280 | 3,482 | 42 | ||||||||||||||||||
Other operating income |
14 | | | 2,179 | | | ||||||||||||||||||
|
|
|
|
|
|
|
|
|
|
|
|
|||||||||||||
Results from operating activities |
35,535 | 37,636 | 455 | 105,175 | 102,029 | 1,234 | ||||||||||||||||||
Finance expenses |
(1,403 | ) | (2,902 | ) | (35 | ) | (3,608 | ) | (7,217 | ) | (87 | ) | ||||||||||||
Finance and other income |
3,578 | 4,992 | 61 | 12,311 | 12,722 | 154 | ||||||||||||||||||
Share of net profit/ (loss) of associates accounted for using the equity method |
76 | 26 | ^ | 73 | (61 | ) | (1 | ) | ||||||||||||||||
|
|
|
|
|
|
|
|
|
|
|
|
|||||||||||||
Profit before tax |
37,786 | 39,752 | 481 | 113,951 | 107,473 | 1,300 | ||||||||||||||||||
Income tax expense |
(8,063 | ) | (9,102 | ) | (110 | ) | (22,547 | ) | (24,743 | ) | (299 | ) | ||||||||||||
|
|
|
|
|
|
|
|
|
|
|
|
|||||||||||||
Profit for the period |
29,723 | 30,650 | 371 | 91,404 | 82,730 | 1,001 | ||||||||||||||||||
|
|
|
|
|
|
|
|
|
|
|
|
|||||||||||||
Profit attributable to: |
||||||||||||||||||||||||
Equity holders of the Company |
29,690 | 30,529 | 370 | 91,318 | 82,755 | 1,001 | ||||||||||||||||||
Non-controlling interests |
33 | 121 | 1 | 86 | (25 | ) | ^ | |||||||||||||||||
|
|
|
|
|
|
|
|
|
|
|
|
|||||||||||||
Profit for the period |
29,723 | 30,650 | 371 | 91,404 | 82,730 | 1,001 | ||||||||||||||||||
|
|
|
|
|
|
|
|
|
|
|
|
|||||||||||||
Earnings per equity share: |
||||||||||||||||||||||||
Attributable to equity holders of the Company |
||||||||||||||||||||||||
Basic |
5.43 | 5.57 | 0.07 | 16.71 | 15.12 | 0.18 | ||||||||||||||||||
Diluted |
5.42 | 5.56 | 0.07 | 16.67 | 15.08 | 0.18 | ||||||||||||||||||
Weighted average number of equity shares used in computing earnings per equity share |
||||||||||||||||||||||||
Basic |
5,467,954,878 | 5,480,138,169 | 5,480,138,169 | 5,465,359,077 | 5,475,982,068 | 5,475,982,068 | ||||||||||||||||||
Diluted |
5,481,204,821 | 5,486,025,875 | 5,486,025,875 | 5,478,766,612 | 5,487,483,177 | 5,487,483,177 |
^ | Value is less than 1 |
8
Additional Information:
Three months ended | Nine months ended | Year ended | ||||||||||||||||||||||
December 31, 2022 |
September 30, 2022 |
December 31, 2021 |
December 31, 2022 |
December 31, 2021 |
March 31, 2022 |
|||||||||||||||||||
Particulars |
Audited | Audited | Audited | Audited | Audited | Audited | ||||||||||||||||||
Revenue |
||||||||||||||||||||||||
IT Services |
||||||||||||||||||||||||
Americas 1 |
67,788 | 65,350 | 56,644 | 194,840 | 159,532 | 217,874 | ||||||||||||||||||
Americas 2 |
71,168 | 70,030 | 61,076 | 207,811 | 175,441 | 239,404 | ||||||||||||||||||
Europe |
66,323 | 62,684 | 59,620 | 189,283 | 172,700 | 233,443 | ||||||||||||||||||
APMEA |
25,278 | 25,565 | 23,596 | 75,100 | 67,543 | 91,103 | ||||||||||||||||||
|
|
|
|
|
|
|
|
|
|
|
|
|||||||||||||
Total of IT Services |
230,557 | 223,629 | 200,936 | 667,034 | 575,216 | 781,824 | ||||||||||||||||||
IT Products |
1,721 | 1,249 | 1,767 | 4,916 | 4,972 | 6,173 | ||||||||||||||||||
ISRE |
1,403 | 1,576 | 1,623 | 4,505 | 5,427 | 7,295 | ||||||||||||||||||
Reconciling Items |
| | (3 | ) | | (1 | ) | (3 | ) | |||||||||||||||
|
|
|
|
|
|
|
|
|
|
|
|
|||||||||||||
Total Revenue |
233,681 | 226,454 | 204,323 | 676,455 | 585,614 | 795,289 | ||||||||||||||||||
|
|
|
|
|
|
|
|
|
|
|
|
|||||||||||||
Other operating income |
||||||||||||||||||||||||
IT Services |
| | 14 | | 2,179 | 2,186 | ||||||||||||||||||
|
|
|
|
|
|
|
|
|
|
|
|
|||||||||||||
Total Other operating income |
| | 14 | | 2,179 | 2,186 | ||||||||||||||||||
|
|
|
|
|
|
|
|
|
|
|
|
|||||||||||||
Segment Result |
||||||||||||||||||||||||
IT Services |
||||||||||||||||||||||||
Americas 1 |
12,986 | 12,358 | 11,390 | 36,374 | 31,290 | 42,820 | ||||||||||||||||||
Americas 2 |
14,776 | 14,219 | 12,057 | 41,449 | 35,226 | 47,376 | ||||||||||||||||||
Europe |
9,485 | 7,875 | 9,172 | 24,734 | 26,683 | 35,739 | ||||||||||||||||||
APMEA |
2,476 | 2,194 | 2,483 | 6,274 | 8,577 | 10,523 | ||||||||||||||||||
Unallocated |
(2,219 | ) | (2,845 | ) | 173 | (5,694 | ) | 73 | 434 | |||||||||||||||
Other operating income |
| | 14 | | 2,179 | 2,186 | ||||||||||||||||||
|
|
|
|
|
|
|
|
|
|
|
|
|||||||||||||
Total of IT Services |
37,504 | 33,801 | 35,289 | 103,137 | 104,028 | 139,078 | ||||||||||||||||||
IT Products |
41 | (103 | ) | 96 | (117 | ) | 137 | 115 | ||||||||||||||||
ISRE |
102 | 146 | 134 | 421 | 1,002 | 1,173 | ||||||||||||||||||
Reconciling Items |
(11 | ) | (1,341 | ) | 16 | (1,412 | ) | 8 | (80 | ) | ||||||||||||||
|
|
|
|
|
|
|
|
|
|
|
|
|||||||||||||
Total Segment result |
37,636 | 32,503 | 35,535 | 102,029 | 105,175 | 140,286 | ||||||||||||||||||
Finance expenses |
(2,902 | ) | (2,270 | ) | (1,403 | ) | (7,217 | ) | (3,608 | ) | (5,325 | ) | ||||||||||||
Finance and Other Income |
4,992 | 4,040 | 3,578 | 12,722 | 12,311 | 16,257 | ||||||||||||||||||
Share of net profit/ (loss) of associates accounted for using the equity method |
26 | (72 | ) | 76 | (61 | ) | 73 | 57 | ||||||||||||||||
|
|
|
|
|
|
|
|
|
|
|
|
|||||||||||||
Profit before tax |
39,752 | 34,201 | 37,786 | 107,473 | 113,951 | 151,275 | ||||||||||||||||||
|
|
|
|
|
|
|
|
|
|
|
|
9
The Company is organized into the following operating segments: IT Services, IT Products and India State Run Enterprise segment (ISRE).
IT Services: As announced on November 12, 2020, effective January 1, 2021, the Company re-organized IT Services segment.to four Strategic Market Units (SMUs) - Americas 1, Americas 2, Europe and Asia Pacific Middle East Africa (APMEA).
Americas 1 and Americas 2 are primarily organized by industry sector, while Europe and APMEA are organized by countries.
Americas 1 includes Healthcare and Medical Devices, Consumer Goods and Lifesciences, Retail, Transportation and Services, Communications, Media and Information services, Technology Products and Platforms, in the United States of America and entire business of Latin America (LATAM). Americas 2 includes Banking, Financial Services and Insurance, Manufacturing, Hi-tech, Energy and Utilities industry sectors in the United States of America and entire business of Canada. Europe consists of United Kingdom and Ireland, Switzerland, Germany, Benelux, Nordics and Southern Europe. APMEA consists of Australia and New Zealand, India, Middle East, South East Asia, Japan and Africa.
IT Products: The Company is a value-added reseller of desktops, servers, notebooks, storage products, networking solutions and packaged software for leading international brands. In certain total outsourcing contracts of the IT Services segment, the Company delivers hardware, software products and other related deliverables. Revenue relating to the above items is reported as revenue from the sale of IT Products.
India State Run Enterprise segment (ISRE): This segment consists of IT Services offerings to entities/ departments owned or controlled by the Government of India and/ or any State Governments.
10
Outlook for the Quarter and Year ending March 31, 2023
We expect Revenue from our IT Services business for the full year to be in the range of 11.5% to 12.0%, in constant currency terms. This translates into the growth rate of -0.6% to 1.0% sequentially in constant currency terms for quarter ending March 31, 2023.
* | Outlook for the quarter ending March 31, 2023, is based on the following exchange rates: GBP/USD at 1.19, Euro/USD at 1.02, AUD/USD at 0.66, USD/INR at 83.07 and CAD/USD at 0.72 |
Reconciliation of selected GAAP measures to Non-GAAP measures
Reconciliation of Non-GAAP Constant Currency IT Services Revenue to IT Services Revenue as per IFRS ($Mn)
Three Months ended December 31, 2022
IT Services Revenue as per IFRS |
$ | 2,803.5 | ||
Effect of Foreign currency exchange movement |
$ | 12.2 | ||
|
|
|||
Non-GAAP Constant Currency IT Services Revenue based on previous quarter exchange rates |
$ | 2,815.7 |
Three Months ended December 31, 2022
IT Services Revenue as per IFRS |
$ | 2,803.5 | ||
Effect of Foreign currency exchange movement |
$ | 109.5 | ||
|
|
|||
Non-GAAP Constant Currency IT Services Revenue based on exchange rates of comparable period in previous year |
$ | 2,913.0 |
Reconciliation of Free Cash Flow for three months and nine months ended December 31, 2022
Amount in INR Mn | ||||||||
Three months ended December 31, 2022 |
Nine months ended December 31, 2022 |
|||||||
Net Income for the period [A] |
30,529 | 82,755 | ||||||
Computation of Free Cash Flow |
||||||||
Net cash generated from operating activities [B] |
43,510 | 93,303 | ||||||
Add/ (deduct) cash inflow/ (outflow)on: |
||||||||
Purchase of property, plant and equipment |
(3,082 | ) | (11,819 | ) | ||||
Proceeds from sale of property, plant and equipment |
268 | 449 | ||||||
|
|
|
|
|||||
Free Cash Flow [C] |
40,696 | 81,933 | ||||||
|
|
|
|
|||||
Operating Cash Flow as percentage of Net Income [B/A] |
142.5 | % | 112.7 | % | ||||
|
|
|
|
|||||
Free Cash Flow as percentage of Net Income [C/A] |
133.3 | % | 99.0 | % | ||||
|
|
|
|
11
Financial Performance for the Quarter ended December 31, 2022 Jatin Dalal Chief Financial Officer Wipro Limited Exhibit 99.2
IT services Growth on Constant Currency Basis: QoQ: 0.6% YoY: 10.4% $ Mn INR Mn
INR Mn QoQ growth IT services OM: 120bps
QoQ growth Net Income: 14.8% EPS: 14.6% INR Mn INR
Operating Cash Flow is at 142.5% of Net Income Free Cash Flow is at 133.3% of Net Income Refer annexure for Non-GAAP measures walk OCF to Net Income FCF to Net Income
Other highlights Record Total bookings of over $4.3 billion in TCV terms grew 26% YoY for the quarter Closed 11 large deals resulting in a TCV of over $1 billion, grew by 69% YoY in Q3’23 Top 5 clients grew 15.7% YoY and top 10 clients grew 14.7% YoY in constant currency terms, underscoring deepening relationships with top strategic clients Voluntary attrition moderated 180 bps from previous quarter, landing at 21.2% for the trailing twelve months for the quarter
We expect Revenue from our IT Services business for the full year to be in the range of 11.5% to 12.0%, in constant currency terms * Outlook for the year ending March 31, 2023, is based on the following exchange rates: GBP/USD at 1.36, Euro/USD at 1.16, AUD/USD at 0.73, USD/INR at 74.78 and CAD/USD at 0.79
Annexures
Reconciliation of selected GAAP measures to Non-GAAP measures (1/2) Reconciliation of Gross Cash and Net Cash as of December 31, 2022 Reconciliation of Free Cash Flow for three months and nine months ended December 31, 2022 Notes: For the convenience of the readers, the amounts in Indian Rupees in this release have been translated into United States Dollars at the certified foreign exchange rate of US$1 = ₹82.72, as published by the Federal Reserve Board of Governors on December 31, 2022.
Reconciliation of selected GAAP measures to Non-GAAP measures (2/2) Reconciliation of Non-GAAP Constant Currency IT Services Revenue to IT Services Revenue as per IFRS ($Mn): Three Months ended December 31, 2022 IT Services Revenue as per IFRS $2,803.5 Effect of Foreign currency exchange movement $ 12.2 Non-GAAP Constant Currency IT Services Revenue based on $2,815.7 previous quarter exchange rates Three Months ended December 31, 2022 IT Services Revenue as per IFRS $2,803.5 Effect of Foreign currency exchange movement $ 109.5 Non-GAAP Constant Currency IT Services Revenue based on $2,913.0 exchange rates of comparable period in previous year
Segment Information As announced on November 12, 2020, in order to broad base our growth, effective January 1, 2021, the Company re-organized IT Services segment to four Strategic Market Units (“SMUs”) - Americas 1, Americas 2, Europe and Asia Pacific Middle East Africa (“APMEA”). Americas 1 and Americas 2 are primarily organized by industry sector, while Europe and APMEA are organized by countries. Americas 1 includes Healthcare and Medical Devices, Consumer Goods and Lifesciences, Retail, Transportation and Services, Communications, Media and Information services, Technology Products and Platforms, in the United States of America and entire business of Latin America (“LATAM") Americas 2 includes Banking, Financial Services and Insurance, Manufacturing, Hi-tech, Energy and Utilities industry sectors in the United States of America and entire business of Canada Europe consists of United Kingdom and Ireland, Switzerland, Germany, Benelux, Nordics and Southern Europe APMEA consists of Australia and New Zealand, India, Middle East, South East Asia, Japan and Africa The two Global Business Lines: iDEAS (Integrated Digital, Engineering & Application Services) will include the following Service Lines - Domain and Consulting, Applications & Data, Wipro Engineering and Wipro Digital iCORE (Cloud Infrastructure, Digital Operations, Risk & Enterprise Cyber Security Services) will include Integrated Cloud Infrastructure (CIS),Digital Operations (DOP) and Risk and Enterprise Cybersecurity Services (CRS)
Exhibit 99.3
Wipro Limited
Extract of audited financial results of Wipro Limited and its subsidiaries for the quarter ended December 31, 2022
Consolidated Audited Financial Results of Wipro Limited under IFRS
(₹ in millions, except per share data, unless otherwise stated)
Particulars |
Quarter ended December 31, 2022 |
Nine months ended December 31, 2022 |
Quarter ended December 31, 2021 |
|||||||||
Total income from operations (net) |
233,681 | 676,455 | 204,337 | |||||||||
Net Profit / (Loss) before tax and exceptional items |
39,752 | 107,473 | 37,786 | |||||||||
Net Profit / (Loss) before tax but after exceptional items |
39,752 | 107,473 | 37,786 | |||||||||
Net Profit / (Loss) after tax and exceptional items |
30,650 | 82,730 | 29,723 | |||||||||
Total Comprehensive Income after tax |
36,352 | 93,105 | 31,495 | |||||||||
Equity Share Capital |
10,974 | 10,974 | 10,962 | |||||||||
Reserves (excluding Revaluation Reserve)1 as shown in the Audited Statement of Financial Position |
647,194 | 647,194 | 542,137 | |||||||||
Earnings Per Share (of ₹ 2/- each) Basic: Diluted: |
|
5.57 5.56 |
|
|
15.12 15.08 |
|
|
5.43 5.42 |
|
1 | Balance for the quarter ended December 31, 2022 and nine months ended December 31, 2022 represent balances as per the audited Statement of Financial Position for the year ended March 31, 2022 and balance for the quarter ended December 31, 2021 represent balances as per the audited Statement of Financial Position for the year ended March 31, 2021, as required by the SEBI (Listing Obligations and Disclosure Requirements) Regulations, 2015. |
The audited interim consolidated financial results of the Company for the three and nine months ended December 31, 2022 have been approved by the Board of Directors of the Company at its meeting held on January 13, 2023. The statutory auditors have expressed an unmodified audit opinion.
Financial Results of Wipro Limited under Ind AS
The interim condensed financial results are prepared in accordance with Indian Accounting Standards (Ind AS), the provisions of the Companies Act, 2013 (the Companies Act), as applicable and guidelines issued by the Securities and Exchange Board of India (SEBI). The Ind AS are prescribed under Section 133 of the Act read with Rule 3 of the Companies (Indian Accounting Standards) Rules, 2015 and amendment rules issued thereafter.
Consolidated Audited Financial Results of Wipro Limited under Ind AS
Particulars |
Quarter ended December 31, 2022 |
Nine months ended December 31, 2022 |
Quarter ended December 31, 2021 |
|||||||||
Total income from operations (net) |
232,290 | 672,973 | 203,150 | |||||||||
Net Profit / (Loss) before tax and exceptional items |
39,752 | 107,473 | 37,786 | |||||||||
Net Profit / (Loss) before tax but after exceptional items |
39,752 | 107,473 | 37,786 | |||||||||
Net Profit / (Loss) after tax and exceptional items |
30,650 | 82,730 | 29,723 | |||||||||
Total Comprehensive Income after tax |
36,275 | 92,718 | 31,489 | |||||||||
Equity Share Capital |
10,974 | 10,974 | 10,962 | |||||||||
Reserves (excluding Revaluation Reserve)1 as shown in the Audited Balance Sheet |
643,066 | 643,066 | 538,052 | |||||||||
Earnings Per Share (of ₹ 2/- each) Basic: Diluted: |
|
5.57 5.56 |
|
|
15.12 15.08 |
|
|
5.43 5.42 |
|
1 | Balance for the quarter ended December 31, 2022 and nine months ended December 31, 2022 represent balances as per the audited Balance sheet for the year ended March 31, 2022 and balance for the quarter ended December 31, 2021 represent balances as per the audited Balance sheet for the year ended March 31, 2020, as required by the SEBI (Listing Obligations and Disclosure Requirements) Regulations, 2015. |
CIN: L32102KA1945PLC020800; Registered Office: Wipro Limited, Doddakannelli, Sarjapur Road, Bengaluru-560035, India
Website: www.wipro.com; Email Id- info@wipro.com; Tel: +91-80-2844 0011; Fax: +91-80-2844 0054
The audited interim consolidated financial results (under Ind AS) of the Company for the three and nine months ended December 31, 2022 have been approved by the Board of Directors of the Company at its meeting held on January 13, 2023. The statutory auditors have expressed an unmodified audit opinion.
Standalone Audited Financial Results of Wipro Limited under Ind AS
Particulars |
Quarter ended December 31, 2022 |
Nine months ended December 31, 2022 |
Quarter ended December 31, 2021 |
|||||||||
Total income from operations (net) |
170,787 | 502,761 | 152,787 | |||||||||
Net Profit / (Loss) before tax and exceptional items |
32,271 | 91,264 | 31,326 | |||||||||
Net Profit / (Loss) before tax but after exceptional items |
32,271 | 91,264 | 31,326 | |||||||||
Net Profit / (Loss) after tax and exceptional items |
24,131 | 69,126 | 24,650 | |||||||||
Total Comprehensive Income after tax |
21,670 | 61,037 | 24,198 |
The audited interim standalone financial results (under Ind AS) of the Company for the three and nine months ended December 31, 2022 have been approved by the Board of Directors of the Company at its meeting held on January 13, 2023. The statutory auditors have expressed an unmodified audit opinion.
Note:
1. | The above is an extract of the detailed format of Quarterly Financial Results filed with the Stock Exchanges under Regulation 33 of the SEBI (Listing and Other Disclosure Requirements) Regulations, 2015. The full format of the Quarterly Financial Results are available on the Bombay Stock Exchange website (URL: www.bseindia.com), the National Stock Exchange website (URL: www.nseindia.com) and on the Companys website (URL: www.wipro.com). |
2. | The Board of Directors in their meeting held on January 13, 2023, declared an interim dividend of ₹ 1/- (USD 0.01) per equity share and ADR (50% on an equity share of par value of ₹ 2/-). |
By Order of the Board, | ||||||
For Wipro Limited | ||||||
Place: Bengaluru | Rishad A. Premji | |||||
Date: January 13, 2023 | Chairman |
CIN: L32102KA1945PLC020800; Registered Office: Wipro Limited, Doddakannelli, Sarjapur Road, Bengaluru-560035, India
Website: www.wipro.com; Email Id- info@wipro.com; Tel: +91-80-2844 0011; Fax: +91-80-2844 0054
Exhibit 99.4
WIPRO LIMITED AND SUBSIDIARIES
INTERIM CONDENSED CONSOLIDATED FINANCIAL STATEMENTS UNDER IFRS
AS AT AND FOR THE THREE AND NINE MONTHS ENDED DECEMBER 31, 2022
WIPRO LIMITED AND SUBSIDIARIES
INTERIM CONDENSED CONSOLIDATED STATEMENT OF FINANCIAL POSITION
(₹ in millions, except share and per share data, unless otherwise stated)
As at March 31, 2022 |
As at December 31, 2022 | |||||||||||||||
Notes |
|
Convenience translation into US dollar in millions (unaudited) Refer to Note 2(iii) |
||||||||||||||
ASSETS |
||||||||||||||||
Goodwill |
6 | 246,989 | 309,525 | 3,742 | ||||||||||||
Intangible assets |
6 | 43,555 | 45,847 | 554 | ||||||||||||
Property, plant and equipment |
4 | 90,898 | 90,147 | 1,090 | ||||||||||||
Right-of-Use assets |
5 | 18,870 | 19,381 | 234 | ||||||||||||
Financial assets |
||||||||||||||||
Derivative assets |
17 | 6 | 88 | 1 | ||||||||||||
Investments |
8 | 19,109 | 20,808 | 252 | ||||||||||||
Trade receivables |
4,765 | 4,626 | 56 | |||||||||||||
Other financial assets |
11 | 6,084 | 6,123 | 74 | ||||||||||||
Investments accounted for using the equity method |
774 | 782 | 9 | |||||||||||||
Deferred tax assets |
2,298 | 4,043 | 49 | |||||||||||||
Non-current tax assets |
10,256 | 11,450 | 138 | |||||||||||||
Other non-current assets |
12 | 14,826 | 14,045 | 170 | ||||||||||||
|
|
|
|
|
|
|||||||||||
Total non-current assets |
458,430 | 526,865 | 6,369 | |||||||||||||
|
|
|
|
|
|
|||||||||||
Inventories |
9 | 1,334 | 2,019 | 24 | ||||||||||||
Financial assets |
||||||||||||||||
Derivative assets |
17 | 3,032 | 930 | 11 | ||||||||||||
Investments |
8 | 241,655 | 291,743 | 3,527 | ||||||||||||
Cash and cash equivalents |
10 | 103,836 | 87,307 | 1,055 | ||||||||||||
Trade receivables |
115,219 | 124,761 | 1,510 | |||||||||||||
Unbilled receivables |
60,809 | 56,316 | 681 | |||||||||||||
Other financial assets |
11 | 42,914 | 9,532 | 115 | ||||||||||||
Contract assets |
20,647 | 25,181 | 304 | |||||||||||||
Current tax assets |
2,373 | 4,463 | 54 | |||||||||||||
Other current assets |
12 | 28,933 | 36,123 | 437 | ||||||||||||
|
|
|
|
|
|
|||||||||||
Total current assets |
620,752 | 638,375 | 7,718 | |||||||||||||
|
|
|
|
|
|
|||||||||||
|
|
|
|
|
|
|||||||||||
TOTAL ASSETS |
1,079,182 | 1,165,240 | 14,087 | |||||||||||||
|
|
|
|
|
|
|||||||||||
EQUITY |
||||||||||||||||
Share capital |
10,964 | 10,974 | 133 | |||||||||||||
Share premium |
1,566 | 3,151 | 38 | |||||||||||||
Retained earnings |
551,252 | 635,267 | 7,680 | |||||||||||||
Share-based payment reserve |
5,258 | 6,086 | 74 | |||||||||||||
Special Economic Zone re-investment reserve |
47,061 | 47,014 | 568 | |||||||||||||
Other components of equity |
42,057 | 52,382 | 633 | |||||||||||||
|
|
|
|
|
|
|||||||||||
Equity attributable to the equity holders of the Company |
658,158 | 754,874 | 9,126 | |||||||||||||
Non-controlling interests |
515 | 402 | 5 | |||||||||||||
|
|
|
|
|
|
|||||||||||
TOTAL EQUITY |
658,673 | 755,276 | 9,131 | |||||||||||||
|
|
|
|
|
|
|||||||||||
LIABILITIES |
||||||||||||||||
Financial liabilities |
||||||||||||||||
Loans and borrowings |
13 | 56,463 | 61,718 | 746 | ||||||||||||
Lease liabilities |
15,177 | 15,520 | 188 | |||||||||||||
Derivative liabilities |
17 | 48 | 165 | 2 | ||||||||||||
Other financial liabilities |
14 | 2,961 | 2,267 | 27 | ||||||||||||
Deferred tax liabilities |
12,141 | 13,338 | 161 | |||||||||||||
Non-current tax liabilities |
17,818 | 21,846 | 264 | |||||||||||||
Other non-current liabilities |
15 | 7,571 | 9,865 | 119 | ||||||||||||
Provisions |
16 | 1 | ^ | ^ | ||||||||||||
|
|
|
|
|
|
|||||||||||
Total non-current liabilities |
112,180 | 124,719 | 1,507 | |||||||||||||
|
|
|
|
|
|
|||||||||||
Financial liabilities |
||||||||||||||||
Loans, borrowings and bank overdrafts |
13 | 95,233 | 96,511 | 1,167 | ||||||||||||
Lease liabilities |
9,056 | 9,300 | 112 | |||||||||||||
Derivative liabilities |
17 | 585 | 7,199 | 87 | ||||||||||||
Trade payables and accrued expenses |
99,034 | 89,613 | 1,084 | |||||||||||||
Other financial liabilities |
14 | 33,110 | 4,341 | 52 | ||||||||||||
Contract liabilities |
27,915 | 26,903 | 325 | |||||||||||||
Current tax liabilities |
13,231 | 19,580 | 237 | |||||||||||||
Other current liabilities |
15 | 27,394 | 29,274 | 354 | ||||||||||||
Provisions |
16 | 2,771 | 2,524 | 31 | ||||||||||||
|
|
|
|
|
|
|||||||||||
Total current liabilities |
308,329 | 285,245 | 3,449 | |||||||||||||
|
|
|
|
|
|
|||||||||||
TOTAL LIABILITIES |
420,509 | 409,964 | 4,956 | |||||||||||||
|
|
|
|
|
|
|||||||||||
TOTAL EQUITY AND LIABILITIES |
1,079,182 | 1,165,240 | 14,087 | |||||||||||||
|
|
|
|
|
|
^ | Value is less than 1 |
The accompanying notes form an integral part of these interim condensed consolidated financial statements
As per our report of even date attached For and on behalf of the Board of Directors
for Deloitte Haskins & Sells LLP | Rishad A. Premji | Deepak M. Satwalekar | Thierry Delaporte | |||
Chartered Accountants | Chairman | Director | Chief Executive Officer and | |||
Firm Registration No: 117366W/W - 100018 | Managing Director | |||||
Anand Subramanian | Jatin Pravinchandra Dalal | M. Sanaulla Khan | ||||
Partner | Chief Financial Officer | Company Secretary | ||||
Membership No. 110815 | ||||||
Bengaluru | ||||||
January 13, 2023 |
1
WIPRO LIMITED AND SUBSIDIARIES
INTERIM CONDENSED CONSOLIDATED STATEMENT OF INCOME
(₹ in millions, except share and per share data, unless otherwise stated)
Three months ended December 31, | Nine months ended December 31, | |||||||||||||||||||||||||||
Notes | 2021 | 2022 | 2022 | 2021 | 2022 | 2022 | ||||||||||||||||||||||
|
|
Convenience translation into US dollar in millions (unaudited) Refer to Note 2(iii) |
|
|
Convenience translation into US dollar in millions (unaudited) Refer to Note 2(iii) |
|||||||||||||||||||||||
Revenues |
20 | 203,136 | 232,290 | 2,808 | 582,334 | 672,973 | 8,136 | |||||||||||||||||||||
Cost of revenues |
21 | (142,778 | ) | (163,273 | ) | (1,974 | ) | (407,907 | ) | (482,708 | ) | (5,836 | ) | |||||||||||||||
|
|
|
|
|
|
|
|
|
|
|
|
|||||||||||||||||
Gross profit |
60,358 | 69,017 | 834 | 174,427 | 190,265 | 2,300 | ||||||||||||||||||||||
Selling and marketing expenses |
21 | (13,988 | ) | (17,752 | ) | (215 | ) | (40,857 | ) | (48,251 | ) | (583 | ) | |||||||||||||||
General and administrative expenses |
21 | (12,036 | ) | (15,020 | ) | (181 | ) | (33,854 | ) | (43,467 | ) | (525 | ) | |||||||||||||||
Foreign exchange gains/(losses), net |
23 | 1,187 | 1,391 | 17 | 3,280 | 3,482 | 42 | |||||||||||||||||||||
Other operating income |
26 | 14 | | | 2,179 | | | |||||||||||||||||||||
|
|
|
|
|
|
|
|
|
|
|
|
|||||||||||||||||
Results from operating activities |
35,535 | 37,636 | 455 | 105,175 | 102,029 | 1,234 | ||||||||||||||||||||||
Finance expenses |
22 | (1,403 | ) | (2,902 | ) | (35 | ) | (3,608 | ) | (7,217 | ) | (87 | ) | |||||||||||||||
Finance and other income |
23 | 3,578 | 4,992 | 61 | 12,311 | 12,722 | 154 | |||||||||||||||||||||
Share of net profit/ (loss) of associates accounted for using the equity method |
76 | 26 | ^ | 73 | (61 | ) | (1 | ) | ||||||||||||||||||||
|
|
|
|
|
|
|
|
|
|
|
|
|||||||||||||||||
Profit before tax |
37,786 | 39,752 | 481 | 113,951 | 107,473 | 1,300 | ||||||||||||||||||||||
Income tax expense |
19 | (8,063 | ) | (9,102 | ) | (110 | ) | (22,547 | ) | (24,743 | ) | (299 | ) | |||||||||||||||
|
|
|
|
|
|
|
|
|
|
|
|
|||||||||||||||||
Profit for the period |
29,723 | 30,650 | 371 | 91,404 | 82,730 | 1,001 | ||||||||||||||||||||||
|
|
|
|
|
|
|
|
|
|
|
|
|||||||||||||||||
Profit attributable to: |
||||||||||||||||||||||||||||
Equity holders of the Company |
29,690 | 30,529 | 370 | 91,318 | 82,755 | 1,001 | ||||||||||||||||||||||
Non-controlling interests |
33 | 121 | 1 | 86 | (25 | ) | ^ | |||||||||||||||||||||
|
|
|
|
|
|
|
|
|
|
|
|
|||||||||||||||||
Profit for the period |
29,723 | 30,650 | 371 | 91,404 | 82,730 | 1,001 | ||||||||||||||||||||||
|
|
|
|
|
|
|
|
|
|
|
|
|||||||||||||||||
Earnings per equity share: |
24 | |||||||||||||||||||||||||||
Attributable to equity holders of the Company |
||||||||||||||||||||||||||||
Basic |
5.43 | 5.57 | 0.07 | 16.71 | 15.12 | 0.18 | ||||||||||||||||||||||
Diluted |
5.42 | 5.56 | 0.07 | 16.67 | 15.08 | 0.18 | ||||||||||||||||||||||
Weighted average number of equity shares used in computing earnings per equity share |
||||||||||||||||||||||||||||
Basic |
5,467,954,878 | 5,480,138,169 | 5,480,138,169 | 5,465,359,077 | 5,475,982,068 | 5,475,982,068 | ||||||||||||||||||||||
Diluted |
5,481,204,821 | 5,486,025,875 | 5,486,025,875 | 5,478,766,612 | 5,487,483,177 | 5,487,483,177 |
^ | Value is less than 1 |
The accompanying notes form an integral part of these interim condensed consolidated financial statements
As per our report of even date attached For and on behalf of the Board of Directors
for Deloitte Haskins & Sells LLP | Rishad A. Premji | Deepak M. Satwalekar | Thierry Delaporte | |||
Chartered Accountants | Chairman | Director | Chief Executive Officer and | |||
Firm Registration No: 117366W/W - 100018 | Managing Director | |||||
Anand Subramanian | Jatin Pravinchandra Dalal | M. Sanaulla Khan | ||||
Partner | Chief Financial Officer | Company Secretary | ||||
Membership No. 110815 | ||||||
Bengaluru | ||||||
January 13, 2023 |
2
WIPRO LIMITED AND SUBSIDIARIES
INTERIM CONDENSED CONSOLIDATED STATEMENT OF COMPREHENSIVE INCOME
(₹ in millions, except share and per share data, unless otherwise stated)
Three months ended December 31, | Nine months ended December 31, | |||||||||||||||||||||||
2021 | 2022 | 2022 | 2021 | 2022 | 2022 | |||||||||||||||||||
|
|
Convenience translation into US dollar in millions (unaudited) Refer to Note 2(iii) |
|
|
Convenience translation into US dollar in millions (unaudited) Refer to Note 2(iii) |
|||||||||||||||||||
Profit for the period |
29,723 | 30,650 | 371 | 91,404 | 82,730 | 1,001 | ||||||||||||||||||
Other comprehensive income (OCI) |
||||||||||||||||||||||||
Items that will not be reclassified to profit or loss in subsequent periods |
||||||||||||||||||||||||
Remeasurements of the defined benefit plans, net |
104 | (230 | ) | (3 | ) | (675 | ) | 377 | 5 | |||||||||||||||
Net change in fair value of investment in equity instruments measured at fair value through OCI |
2,643 | (503 | ) | (6 | ) | 8,248 | 1,010 | 12 | ||||||||||||||||
|
|
|
|
|
|
|
|
|
|
|
|
|||||||||||||
2,747 | (733 | ) | (9 | ) | 7,573 | 1,387 | 17 | |||||||||||||||||
|
|
|
|
|
|
|
|
|
|
|
|
|||||||||||||
Items that will be reclassified to profit or loss in subsequent periods |
||||||||||||||||||||||||
Foreign currency translation differences |
(303 | ) | 8,765 | 106 | (163 | ) | 17,423 | 211 | ||||||||||||||||
Reclassification of foreign currency translation differences on sale of investment in associates and liquidation of subsidiaries to statement of income |
(116 | ) | (93 | ) | (1 | ) | (151 | ) | (116 | ) | (1 | ) | ||||||||||||
Net change in time value of option contracts designated as cash flow hedges |
107 | (718 | ) | (9 | ) | 165 | (1,019 | ) | (12 | ) | ||||||||||||||
Net change in intrinsic value of option contracts designated as cash flow hedges |
13 | 232 | 3 | (77 | ) | (95 | ) | (1 | ) | |||||||||||||||
Net change in fair value of forward contracts designated as cash flow hedges |
126 | (2,350 | ) | (28 | ) | 777 | (3,850 | ) | (47 | ) | ||||||||||||||
Net change in fair value of investment in debt instruments measured at fair value through OCI |
(802 | ) | 599 | 7 | (995 | ) | (3,355 | ) | (41 | ) | ||||||||||||||
|
|
|
|
|
|
|
|
|
|
|
|
|||||||||||||
(975 | ) | 6,435 | 78 | (444 | ) | 8,988 | 109 | |||||||||||||||||
|
|
|
|
|
|
|
|
|
|
|
|
|||||||||||||
Total other comprehensive income, net of taxes |
1,772 | 5,702 | 69 | 7,129 | 10,375 | 126 | ||||||||||||||||||
|
|
|
|
|
|
|
|
|
|
|
|
|||||||||||||
|
|
|
|
|
|
|
|
|
|
|
|
|||||||||||||
Total comprehensive income for the period |
31,495 | 36,352 | 440 | 98,533 | 93,105 | 1,127 | ||||||||||||||||||
|
|
|
|
|
|
|
|
|
|
|
|
|||||||||||||
Total comprehensive income attributable to: |
||||||||||||||||||||||||
Equity holders of the Company |
31,459 | 36,217 | 438 | 98,421 | 93,080 | 1,127 | ||||||||||||||||||
Non-controlling interests |
36 | 135 | 2 | 112 | 25 | ^ | ||||||||||||||||||
|
|
|
|
|
|
|
|
|
|
|
|
|||||||||||||
31,495 | 36,352 | 440 | 98,533 | 93,105 | 1,127 |
^ | Value is less than 1 |
The accompanying notes form an integral part of these interim condensed consolidated financial statements
As per our report of even date attached For and on behalf of the Board of Directors
for Deloitte Haskins & Sells LLP | Rishad A. Premji | Deepak M. Satwalekar | Thierry Delaporte | |||
Chartered Accountants | Chairman | Director | Chief Executive Officer and | |||
Firm Registration No: 117366W/W - 100018 | Managing Director | |||||
Anand Subramanian | Jatin Pravinchandra Dalal | M. Sanaulla Khan | ||||
Partner | Chief Financial Officer | Company Secretary | ||||
Membership No. 110815 | ||||||
Bengaluru | ||||||
January 13, 2023 |
3
WIPRO LIMITED AND SUBSIDIARIES
INTERIM CONDENSED CONSOLIDATED STATEMENT OF CHANGES IN EQUITY
(₹ in millions, except share and per share data, unless otherwise stated)
Special Economic Zone re- investment reserve |
Other components of equity | Equity attributable to the equity holders of the Company |
Non- controlling interests |
Total equity | ||||||||||||||||||||||||||||||||||||||||||||
Particulars |
Number of shares (1) |
Share capital, fully paid-up |
Share premium |
Retained earnings |
Share- based payment reserve |
Foreign currency translation reserve (2) |
Cash flow hedging reserve |
Other reserves (2) |
||||||||||||||||||||||||||||||||||||||||
As at April 1, 2021 |
5,479,138,555 | 10,958 | 714 | 466,692 | 3,071 | 41,154 | 22,936 | 1,730 | 5,840 | 553,095 | 1,498 | 554,593 | ||||||||||||||||||||||||||||||||||||
Comprehensive income for the period |
||||||||||||||||||||||||||||||||||||||||||||||||
Profit for the period |
| | 91,318 | | | | | | 91,318 | 86 | 91,404 | |||||||||||||||||||||||||||||||||||||
Other comprehensive income |
| | | | | (340 | ) | 865 | 6,578 | 7,103 | 26 | 7,129 | ||||||||||||||||||||||||||||||||||||
|
|
|
|
|
|
|
|
|
|
|
|
|
|
|
|
|
|
|
|
|
|
|
|
|||||||||||||||||||||||||
Total comprehensive income for the period |
| | 91,318 | | | (340 | ) | 865 | 6,578 | 98,421 | 112 | 98,533 | ||||||||||||||||||||||||||||||||||||
|
|
|
|
|
|
|
|
|
|
|
|
|
|
|
|
|
|
|
|
|
|
|
|
|||||||||||||||||||||||||
Issue of equity shares on exercise of options |
2,144,656 | 4 | 590 | | (590 | ) | | | | | 4 | | 4 | |||||||||||||||||||||||||||||||||||
Issue of shares by controlled trust on exercise of options (1) |
| | | 785 | (785 | ) | | | | | | | | |||||||||||||||||||||||||||||||||||
Compensation cost related to employee share-based payment |
| | | 7 | 2,398 | | | | | 2,405 | | 2,405 | ||||||||||||||||||||||||||||||||||||
Transferred to special economic zone reinvestment reserve |
| | | (3,013 | ) | | 3,013 | | | | | | | |||||||||||||||||||||||||||||||||||
Dividend |
| | | | | | | | | | (1,135 | ) | (1,135 | ) | ||||||||||||||||||||||||||||||||||
Others |
| | | | | | | | | | (29 | ) | (29 | ) | ||||||||||||||||||||||||||||||||||
|
|
|
|
|
|
|
|
|
|
|
|
|
|
|
|
|
|
|
|
|
|
|
|
|||||||||||||||||||||||||
Other transactions for the period |
2,144,656 | 4 | 590 | (2,221 | ) | 1,023 | 3,013 | | | | 2,409 | (1,164 | ) | 1,245 | ||||||||||||||||||||||||||||||||||
|
|
|
|
|
|
|
|
|
|
|
|
|
|
|
|
|
|
|
|
|
|
|
|
|||||||||||||||||||||||||
As at December 31, 2021 |
5,481,283,211 | 10,962 | 1,304 | 555,789 | 4,094 | 44,167 | 22,596 | 2,595 | 12,418 | 653,925 | 446 | 654,371 | ||||||||||||||||||||||||||||||||||||
|
|
|
|
|
|
|
|
|
|
|
|
|
|
|
|
|
|
|
|
|
|
|
|
(1) | Includes 15,752,068 treasury shares held as at December 31, 2021 by a controlled trust. 3,649,147 shares have been transferred by the controlled trust to eligible employees on exercise of options during the nine months ended December 31, 2021. |
(2) | Refer to Note 18 |
4
WIPRO LIMITED AND SUBSIDIARIES
INTERIM CONDENSED CONSOLIDATED STATEMENT OF CHANGES IN EQUITY
(₹ in millions, except share and per share data, unless otherwise stated)
Special Economic Zone re- investment reserve |
Other components of equity | Equity attributable to the equity holders of the Company |
Non-controlling interests |
Total equity | ||||||||||||||||||||||||||||||||||||||||||||
Particulars |
Number of shares (1) |
Share capital, fully paid- up |
Share premium |
Retained earnings |
Share- based payment reserve |
Foreign currency translation reserve (2) |
Cash flow hedging reserve |
Other reserves (2) |
||||||||||||||||||||||||||||||||||||||||
As at April 1, 2022 |
5,482,070,115 | 10,964 | 1,566 | 551,252 | 5,258 | 47,061 | 26,850 | 1,477 | 13,730 | 658,158 | 515 | 658,673 | ||||||||||||||||||||||||||||||||||||
Adjustment on adoption of amendments to IAS 37 |
| | (51 | ) | | | | | | (51 | ) | | (51 | ) | ||||||||||||||||||||||||||||||||||
|
|
|
|
|
|
|
|
|
|
|
|
|
|
|
|
|
|
|
|
|
|
|
|
|||||||||||||||||||||||||
Adjusted balance as at April 1, 2022 |
5,482,070,115 | 10,964 | 1,566 | 551,201 | 5,258 | 47,061 | 26,850 | 1,477 | 13,730 | 658,107 | 515 | 658,622 | ||||||||||||||||||||||||||||||||||||
|
|
|
|
|
|
|
|
|
|
|
|
|
|
|
|
|
|
|
|
|
|
|
|
|||||||||||||||||||||||||
Comprehensive income for the period |
||||||||||||||||||||||||||||||||||||||||||||||||
Profit for the period |
| | 82,755 | | | | | | 82,755 | (25 | ) | 82,730 | ||||||||||||||||||||||||||||||||||||
Other comprehensive income |
| | | | | 17,257 | (4,964 | ) | (1,968 | ) | 10,325 | 50 | 10,375 | |||||||||||||||||||||||||||||||||||
|
|
|
|
|
|
|
|
|
|
|
|
|
|
|
|
|
|
|
|
|
|
|
|
|||||||||||||||||||||||||
Total comprehensive income for the period |
| | 82,755 | | | 17,257 | (4,964 | ) | (1,968 | ) | 93,080 | 25 | 93,105 | |||||||||||||||||||||||||||||||||||
|
|
|
|
|
|
|
|
|
|
|
|
|
|
|
|
|
|
|
|
|
|
|
|
|||||||||||||||||||||||||
Issue of equity shares on exercise of options |
4,692,551 | 10 | 1,585 | | (1,585 | ) | | | | | 10 | | 10 | |||||||||||||||||||||||||||||||||||
Issue of shares by controlled trust on exercise of options (1) |
| | 1,256 | (1,256 | ) | | | | | | | | ||||||||||||||||||||||||||||||||||||
Compensation cost related to employee share-based payment |
| | 8 | 3,669 | | | | | 3,677 | | 3,677 | |||||||||||||||||||||||||||||||||||||
Transferred from special economic zone re-investment reserve |
| | 47 | | (47 | ) | | | | | | | ||||||||||||||||||||||||||||||||||||
Others |
| | | | | | | | | (138 | ) | (138 | ) | |||||||||||||||||||||||||||||||||||
|
|
|
|
|
|
|
|
|
|
|
|
|
|
|
|
|
|
|
|
|
|
|
|
|||||||||||||||||||||||||
Other transactions for the period |
4,692,551 | 10 | 1,585 | 1,311 | 828 | (47 | ) | | | | 3,687 | (138 | ) | 3,549 | ||||||||||||||||||||||||||||||||||
|
|
|
|
|
|
|
|
|
|
|
|
|
|
|
|
|
|
|
|
|
|
|
|
|||||||||||||||||||||||||
As at December 31, 2022 |
5,486,762,666 | 10,974 | 3,151 | 635,267 | 6,086 | 47,014 | 44,107 | (3,487 | ) | 11,762 | 754,874 | 402 | 755,276 | |||||||||||||||||||||||||||||||||||
|
|
|
|
|
|
|
|
|
|
|
|
|
|
|
|
|
|
|
|
|
|
|
|
|||||||||||||||||||||||||
Convenience translation into US dollar in millions (unaudited) Refer to Note 2(iii) |
133 | 38 | 7,680 | 74 | 568 | 533 | (42 | ) | 142 | 9,126 | 5 | 9,131 |
(1) | Includes 10,518,721 treasury shares held as at December 31, 2022 by a controlled trust. 4,171,008 shares have been transferred by the controlled trust to eligible employees on exercise of options during the nine months ended December 31, 2022. |
(2) | Refer to Note 18 |
The accompanying notes form an integral part of these interim condensed consolidated financial statements
As per our report of even date attached For and on behalf of the Board of Directors
for Deloitte Haskins & Sells LLP | Rishad A. Premji | Deepak M. Satwalekar | Thierry Delaporte | |||
Chartered Accountants | Chairman | Director | Chief Executive Officer and | |||
Firm Registration No: 117366W/W - 100018 | Managing Director | |||||
Anand Subramanian | Jatin Pravinchandra Dalal | M. Sanaulla Khan | ||||
Partner | Chief Financial Officer | Company Secretary | ||||
Membership No. 110815 | ||||||
Bengaluru | ||||||
January 13, 2023 |
5
WIPRO LIMITED AND SUBSIDIARIES
INTERIM CONDENSED CONSOLIDATED STATEMENT OF CASH FLOWS
(₹ in millions, except share and per share data, unless otherwise stated)
Nine months ended December 31, | ||||||||||||
2021 | 2022 | 2022 | ||||||||||
|
|
Convenience translation into US dollar in millions (unaudited) Refer to Note 2(iii) |
||||||||||
Cash flows from operating activities |
||||||||||||
Profit for the period |
91,404 | 82,730 | 1,001 | |||||||||
Adjustments to reconcile profit for the period to net cash generated from operating activities |
||||||||||||
Gain on sale of property, plant and equipment, net |
(421 | ) | (230 | ) | (3 | ) | ||||||
Depreciation, amortization and impairment expense |
23,566 | 24,936 | 301 | |||||||||
Unrealized exchange (gain)/loss, net and exchange (gain)/loss on borrowings |
(1,994 | ) | 2,647 | 32 | ||||||||
Share-based compensation expense |
2,398 | 3,669 | 44 | |||||||||
Share of net (profit)/loss of associates accounted for using equity method |
(73 | ) | 61 | 1 | ||||||||
Income tax expense |
22,547 | 24,743 | 299 | |||||||||
Finance and other income, net of finance expenses |
(7,218 | ) | (5,505 | ) | (67 | ) | ||||||
Gain from sale of business and investment accounted for using the equity method |
(2,179 | ) | | | ||||||||
Gain on derecognition of contingent consideration payable |
| (1,284 | ) | (16 | ) | |||||||
Loss on sale of business |
| 9 | ^ | |||||||||
Changes in operating assets and liabilities, net of effects from acquisitions |
||||||||||||
Trade receivables |
(16,660 | ) | (3,075 | ) | (37 | ) | ||||||
Unbilled receivables and contract assets |
(6,141 | ) | 3,556 | 43 | ||||||||
Inventories |
43 | (666 | ) | (8 | ) | |||||||
Other assets |
(2,146 | ) | (3,563 | ) | (41 | ) | ||||||
Trade payables, accrued expenses, other liabilities and provisions |
(3,685 | ) | (9,792 | ) | (118 | ) | ||||||
Contract liabilities |
4,289 | (2,280 | ) | (28 | ) | |||||||
|
|
|
|
|
|
|||||||
Cash generated from operating activities before taxes |
103,730 | 115,956 | 1,403 | |||||||||
Income taxes paid, net |
(16,248 | ) | (22,653 | ) | (274 | ) | ||||||
|
|
|
|
|
|
|||||||
Net cash generated from operating activities |
87,482 | 93,303 | 1,129 | |||||||||
|
|
|
|
|
|
|||||||
Cash flows from investing activities |
||||||||||||
Payment for purchase of property, plant and equipment |
(15,965 | ) | (11,819 | ) | (143 | ) | ||||||
Proceeds from disposal of property, plant and equipment |
704 | 449 | 5 | |||||||||
Payment for purchase of investments |
(771,180 | ) | (582,035 | ) | (7,036 | ) | ||||||
Proceeds from sale of investments |
715,040 | 532,692 | 6,441 | |||||||||
Proceeds from restricted interim dividend account |
| 27,410 | 331 | |||||||||
Payment for business acquisitions including deposits and escrow, net of cash acquired |
(129,760 | ) | (45,566 | ) | (551 | ) | ||||||
Proceeds from sale of investment accounted for using the equity method |
1,636 | | | |||||||||
Proceeds from sale of business, net of cash |
| 11 | ^ | |||||||||
Interest received |
10,240 | 9,942 | 120 | |||||||||
Dividend received |
2 | 3 | ^ | |||||||||
|
|
|
|
|
|
|||||||
Net cash used in investing activities |
(189,283 | ) | (68,913 | ) | (833 | ) | ||||||
|
|
|
|
|
|
|||||||
Cash flows from financing activities |
||||||||||||
Proceeds from issuance of equity shares and shares pending allotment |
4 | 10 | ^ | |||||||||
Repayment of loans and borrowings |
(149,830 | ) | (108,431 | ) | (1,311 | ) | ||||||
Proceeds from loans and borrowings |
201,877 | 107,350 | 1,298 | |||||||||
Payment of lease liabilities |
(7,414 | ) | (7,330 | ) | (89 | ) | ||||||
Payment for deferred contingent consideration |
(117 | ) | (1,251 | ) | (15 | ) | ||||||
Interest and finance expenses paid |
(3,976 | ) | (6,536 | ) | (79 | ) | ||||||
Payment of dividend |
| (27,337 | ) | (330 | ) | |||||||
Payment of dividend to non-controlling interests holders |
(1,135 | ) | | | ||||||||
|
|
|
|
|
|
|||||||
Net cash generated from/(used in) financing activities |
39,409 | (43,525 | ) | (526 | ) | |||||||
|
|
|
|
|
|
|||||||
Net decrease in cash and cash equivalents during the period |
(62,392 | ) | (19,135 | ) | (231 | ) | ||||||
Effect of exchange rate changes on cash and cash equivalents |
173 | 2,597 | 31 | |||||||||
Cash and cash equivalents at the beginning of the period |
169,663 | 103,833 | 1,255 | |||||||||
|
|
|
|
|
|
|||||||
Cash and cash equivalents at the end of the period (Note 10) |
107,444 | 87,295 | 1,055 | |||||||||
|
|
|
|
|
|
^ | Value is less than 1 |
The accompanying notes form an integral part of these interim condensed consolidated financial statements
As per our report of even date attached For and on behalf of the Board of Directors
for Deloitte Haskins & Sells LLP | Rishad A. Premji | Deepak M. Satwalekar | Thierry Delaporte | |||
Chartered Accountants | Chairman | Director | Chief Executive Officer and | |||
Firm Registration No: 117366W/W - 100018 | Managing Director | |||||
Anand Subramanian | Jatin Pravinchandra Dalal | M. Sanaulla Khan | ||||
Partner | Chief Financial Officer | Company Secretary | ||||
Membership No. 110815 | ||||||
Bengaluru | ||||||
January 13, 2023 |
6
WIPRO LIMITED AND SUBSIDIARIES
NOTES TO THE INTERIM CONDENSED CONSOLIDATED FINANCIAL STATEMENTS
(₹ in millions, except share and per share data, unless otherwise stated)
1. The Company overview
Wipro Limited (Wipro or the Parent Company), together with its subsidiaries and controlled trusts (collectively, we, us, our, the Company or the Group) is a global information technology (IT), consulting and business process services (BPS) company.
Wipro is a public limited company incorporated and domiciled in India. The address of its registered office is Wipro Limited, Doddakannelli, Sarjapur Road, Bengaluru 560 035, Karnataka, India. The Company has its primary listing with BSE Ltd. and National Stock Exchange of India Ltd. The Companys American Depository Shares (ADS) representing equity shares are also listed on the New York Stock Exchange.
The Companys Board of Directors authorized these interim condensed consolidated financial statements for issue on January 13, 2023.
2. Basis of preparation of interim condensed consolidated financial statements
(i) Statement of compliance and basis of preparation
These interim condensed consolidated financial statements have been prepared in compliance with IAS 34, Interim Financial Reporting, as issued by the International Accounting Standards Board (IASB). Selected explanatory notes are included to explain events and transactions that are significant to understand the changes in financial position and performance of the Company since the last annual consolidated financial statements as at and for the year ended March 31, 2022. These interim condensed consolidated financial statements do not include all the information required for full annual financial statements prepared in accordance with International Financial Reporting Standards and its interpretations (IFRS).
The interim condensed consolidated financial statements correspond to the classification provisions contained in IAS 1 (revised), Presentation of Financial Statements. For clarity, various items are aggregated in the interim condensed consolidated statements of income and interim condensed consolidated statements of financial position. These items are disaggregated separately in the notes to the financial statement, where applicable. The accounting policies have been consistently applied to all periods presented in these interim condensed consolidated financial statements except for the adoption of new accounting standards, amendments and interpretations effective from April 1, 2022.
All amounts included in the interim condensed consolidated financial statements are reported in millions of Indian rupees (₹ in millions) except share and per share data, unless otherwise stated. Due to rounding off, the numbers presented throughout the document may not add up precisely to the totals and percentages may not precisely reflect the absolute figures. Previous year figures have been regrouped/rearranged, wherever necessary.
(ii) Basis of measurement
These interim condensed consolidated financial statements have been prepared on a historical cost convention and on an accrual basis, except for the following material items which have been measured at fair value as required by relevant IFRS:
a. | Derivative financial instruments; |
b. | Financial instruments classified as fair value through other comprehensive income or fair value through profit or loss; |
c. | The defined benefit liability/(asset) recognized as the present value of defined benefit obligation less fair value of plan assets; and |
d. | Contingent consideration. |
(iii) Convenience translation (unaudited)
The accompanying interim condensed consolidated financial statements have been prepared and reported in Indian rupees, the functional currency of the Parent Company. Solely for the convenience of the readers, the interim condensed consolidated financial statements as at and for the three and nine months ended December 31, 2022, have been translated into United States dollars at the certified foreign exchange rate of US$1 = ₹ 82.72 as published by Federal Reserve Board of Governors on December 31, 2022. No representation is made that the Indian rupee amounts have been, could have been or could be converted into United States dollars at such a rate or any other rate. Due to rounding off, the translated numbers presented throughout the document may not add up precisely to the totals.
(iv) Use of estimates and judgment
The preparation of the interim condensed consolidated financial statements in conformity with IFRS requires the management to make judgments, accounting estimates and assumptions that affect the application of accounting policies and the reported amounts of assets, liabilities, income and expenses. Accounting estimates are monetary amounts in the interim condensed consolidated financial statements that are subject to measurement uncertainty. An accounting policy may require items in the interim condensed consolidated financial statements to be measured at monetary amounts that cannot be observed directly and must instead be estimated. In such a case, management develops an accounting estimate to achieve the objective set out by the accounting policy. Developing accounting estimates involves the use of judgements or assumptions based on the latest available and reliable information. Actual results may differ from those accounting estimates.
7
Accounting estimates and underlying assumptions are reviewed on an ongoing basis. Changes to accounting estimates are recognized in the period in which the estimates are changed and in any future periods affected. In particular, information about material areas of estimation, uncertainty and critical judgments in applying accounting policies that have material effect on the amounts recognized in the interim condensed consolidated financial statements are included in the following notes:
a) | Revenue recognition: The Company applies judgement to determine whether each product or service promised to a customer is capable of being distinct, and is distinct in the context of the contract, if not, the promised product or service is combined and accounted as a single performance obligation. The Company allocates the arrangement consideration to separately identifiable performance obligation deliverables based on their relative stand-alone selling price. In cases where the Company is unable to determine the stand-alone selling price the Company uses expected cost-plus margin approach in estimating the stand-alone selling price. The Company uses the percentage of completion method using the input (cost expended) method to measure progress towards completion in respect of fixed price contracts. Percentage of completion method accounting relies on estimates of total expected contract revenue and costs. This method is followed when reasonably dependable estimates of the revenues and costs applicable to various elements of the contract can be made. Key factors that are reviewed in estimating the future costs to complete include estimates of future labor costs and productivity efficiencies. Because the financial reporting of these contracts depends on estimates that are assessed continually during the term of these contracts, revenue recognized, profit and timing of revenue for remaining performance obligations are subject to revisions as the contract progresses to completion. When estimates indicate that a loss will be incurred, the loss is provided for in the period in which the loss becomes probable. Volume discounts are recorded as a reduction of revenue. When the amount of discount varies with the levels of revenue, volume discount is recorded based on estimate of future revenue from the customer. |
b) | Impairment testing: Goodwill and intangible assets with indefinite useful life recognized on business combination are tested for impairment at least annually and when events occur or changes in circumstances indicate that the recoverable amount of an asset or a cash generating unit to which an asset pertains is less than the carrying value. The Company assesses acquired intangible assets with finite useful life for impairment whenever events or changes in circumstances indicate that the carrying amount may not be recoverable. The recoverable amount of an asset or a cash generating unit is higher of value-in-use and fair value less cost of disposal. The calculation of value in use of an asset or a cash generating unit involves use of significant estimates and assumptions which include turnover, growth rates and net margins used to calculate projected future cash flows, risk-adjusted discount rate, future economic and market conditions. |
c) | Income taxes: The major tax jurisdictions for the Company are India and the United States of America. |
Significant judgments are involved in determining the provision for income taxes including judgment on whether tax positions are probable of being sustained in tax assessments. A tax assessment can involve complex issues, which can only be resolved over extended time periods.
Deferred tax is recorded on temporary differences between the tax bases of assets and liabilities and their carrying amounts, at the rates that have been enacted or substantively enacted at the reporting date. The ultimate realization of deferred tax assets is dependent upon the generation of future taxable profits during the periods in which those temporary differences and tax loss carry-forwards become deductible. The Company considers expected reversal of deferred tax liabilities and projected future taxable income in making this assessment. The amount of deferred tax assets considered realizable, however, could reduce in the near term if estimates of future taxable income during the carry-forward period are reduced.
d) | Business combinations: In accounting for business combinations, judgment is required to assess whether an identifiable intangible asset is to be recorded separately from goodwill. Additionally, estimating the acquisition date fair value of the identifiable assets acquired (including useful life estimates), liabilities assumed, and contingent consideration assumed involves management judgment. These measurements are based on information available at the acquisition date and are based on expectations and assumptions that have been deemed reasonable by management. Changes in these judgments, estimates, and assumptions can materially affect the results of operations. |
e) | Defined benefit plans and compensated absences: The cost of the defined benefit plans, compensated absences and the present value of the defined benefit obligations are based on actuarial valuation using the projected unit credit method. An actuarial valuation involves making various assumptions that may differ from actual developments in the future. These include the determination of the discount rate, future salary increases and mortality rates. Due to the complexities involved in the valuation and its long-term nature, a defined benefit obligation is highly sensitive to changes in these assumptions. All assumptions are reviewed at each reporting date. |
f) | Expected credit losses on financial assets: The impairment provisions of financial assets are based on assumptions about risk of default and expected timing of collection. The Company uses judgment in making these assumptions and selecting the inputs to the expected credit loss calculation based on the Companys history of collections, customers creditworthiness, existing market conditions as well as forward looking estimates at the end of each reporting period. |
g) | Provisions and contingent liabilities: The Company estimates the provisions that have present obligations as a result of past events and it is probable that outflow of resources will be required to settle the obligations. These provisions are reviewed at the end of each reporting date and are adjusted to reflect the current best estimates. |
The Company uses significant judgement to disclose contingent liabilities. Contingent liabilities are disclosed when there is a possible obligation arising from past events, the existence of which will be confirmed only by the occurrence or non-occurrence of one or more uncertain future events not wholly within the control of the Company or a present obligation that arises from past events where it is either not probable that an outflow of resources will be required to settle the obligation or a reliable estimate of the amount cannot be made. Contingent assets are neither recognized nor disclosed in the financial statements.
8
h) | Uncertainty relating to the global health pandemic on COVID-19: In assessing the recoverability of receivables including unbilled receivables, contract assets and contract costs, goodwill, intangible assets, and certain investments, the Company has considered internal and external information up to the date of approval of these interim condensed consolidated financial statements including credit reports and economic forecasts. Based on the current indicators of future economic conditions, the Company expects to recover the carrying amount of these assets. |
The Company bases its assessment on the belief that the probability of occurrence of forecasted transactions is not impacted by COVID-19. The Company has considered the effect of changes, if any, in both counterparty credit risk and its own credit risk while assessing hedge effectiveness and measuring hedge ineffectiveness and continues to believe that COVID-19 has no impact on effectiveness of its hedges.
The impact of COVID-19 may be different from what we have estimated as of the date of approval of these interim condensed consolidated financial statements and the Company will continue to closely monitor any material changes to future economic conditions.
3. Material accounting policy information
Please refer to the Companys Annual report for the year ended March 31, 2022, for a discussion of the Companys other material accounting policy information except for the adoption of new accounting standards, amendments and interpretations effective on or after April 1, 2022.
New amendment adopted by the Company effective from April 1, 2022:
Amendments to IAS 37 Onerous Contracts Cost of Fulfilling a Contract
On May 14, 2020, the IASB issued Onerous Contracts Cost of Fulfilling a Contract (Amendments to IAS 37), amending the standard regarding costs a company should include as the cost of fulfilling a contract when assessing whether a contract is onerous. The amendment specifies that the cost of fulfilling a contract comprises the costs that relate directly to the contract. Costs that relate directly to a contract can either be incremental costs of fulfilling that contract or an allocation of other costs that relate directly to fulfilling contracts. The adoption of this amendment has resulted in a reduction of ₹ 51 in opening retained earnings, primarily due to allocation of other costs that relate directly to fulfilling contracts.
New amendments not yet adopted:
Certain new standards, amendments to standards and interpretations are not yet effective for annual periods beginning after April 1, 2022 and have not been applied in preparing these interim condensed consolidated financial statements. New standards, amendments to standards and interpretations that could have potential impact on the interim condensed consolidated financial statements of the Company are:
Amendments to IAS 12 Income Taxes
On May 7, 2021, the IASB amended IAS 12 Income Taxes and published Deferred Tax related to Assets and Liabilities arising from a Single Transaction (Amendments to IAS 12) that clarify how companies account for deferred tax on transactions such as leases and decommissioning obligations. In specified circumstances, companies are exempt from recognizing deferred tax when they recognize assets or liabilities for the first time. The amendments clarify that this exemption does not apply to transactions such as leases and decommissioning obligations and companies are required to recognize deferred tax on such transactions. These amendments are effective for annual reporting periods beginning on or after January 1, 2023 and are to be applied retrospectively, with earlier application permitted. The Company is currently evaluating the impact of amendments to IAS 12 on the interim condensed consolidated financial statements.
Amendments to IAS 1 Presentation of Financial Statements
On January 23, 2020, the IASB issued Classification of liabilities as Current or Non-Current (Amendments to IAS 1) providing a more general approach to the classification of liabilities under IAS 1 based on the contractual arrangement in place at the reporting date. The amendments aim to promote consistency in applying the requirements by helping companies to determine whether, in the statement of financial position, debt and other liabilities with an uncertain settlement date should be classified as current (due or potentially due to be settled within one year) or non-current. The amendments also clarified the classification requirements for debt a company might settle by converting it into equity. These amendments are effective for annual reporting periods beginning on or after January 1, 2023, and are to be applied retrospectively, with earlier application permitted. The adoption of amendments to IAS 1 is not expected to have any material impact on the interim condensed consolidated financial statements.
Amendments to IAS 1 Presentation of Financial Statements
On October 31, 2022, IASB issued Non-current Liabilities with Covenants (Amendments to IAS 1).The amendments specify that covenants to be complied with after the reporting date do not affect the classification of debt as current or non-current at the reporting date. Instead, the amendments require a company to disclose information about these covenants in the notes to the financial statements. The amendments are effective for reporting periods beginning on or after January 1, 2024, with earlier application permitted. The adoption of these amendments to IAS 1 are not expected to have any material impact on the interim condensed consolidated financial statements.
9
4. Property, plant and equipment
Land | Buildings | Plant and equipment * |
Furniture fixtures and equipment |
Vehicles | Total | |||||||||||||||||||
Gross carrying value: |
||||||||||||||||||||||||
As at April 1, 2021 |
₹ | 3,815 | ₹ | 39,414 | ₹ | 110,855 | ₹ | 20,692 | ₹ | 418 | ₹ | 175,194 | ||||||||||||
Additions |
961 | 494 | 11,333 | 1,485 | 3 | 14,276 | ||||||||||||||||||
Additions through business combinations |
| | 372 | 337 | 3 | 712 | ||||||||||||||||||
Disposals |
(30 | ) | (240 | ) | (3,572 | ) | (632 | ) | (112 | ) | (4,586 | ) | ||||||||||||
Translation adjustment |
(3 | ) | (1 | ) | 89 | 7 | 1 | 93 | ||||||||||||||||
|
|
|
|
|
|
|
|
|
|
|
|
|||||||||||||
As at December 31, 2021 |
₹ | 4,743 | ₹ | 39,667 | ₹ | 119,077 | ₹ | 21,889 | ₹ | 313 | ₹ | 185,689 | ||||||||||||
Accumulated depreciation/ impairment: |
|
|||||||||||||||||||||||
As at April 1, 2021 |
₹ | | ₹ | 8,785 | ₹ | 85,040 | ₹ | 15,089 | ₹ | 397 | ₹ | 109,311 | ||||||||||||
Depreciation and impairment |
| 1,190 | 9,062 | 1,592 | 7 | 11,851 | ||||||||||||||||||
Disposals |
| (239 | ) | (3,195 | ) | (564 | ) | (109 | ) | (4,107 | ) | |||||||||||||
Translation adjustment |
| 1 | 97 | 12 | 1 | 111 | ||||||||||||||||||
|
|
|
|
|
|
|
|
|
|
|
|
|||||||||||||
As at December 31, 2021 |
₹ | | ₹ | 9,737 | ₹ | 91,004 | ₹ | 16,129 | ₹ | 296 | ₹ | 117,166 | ||||||||||||
Capital work-in-progress |
₹ | 21,725 | ||||||||||||||||||||||
|
|
|||||||||||||||||||||||
Net carrying value including Capital work-in-progress as at December 31, 2021 |
|
₹ | 90,248 | |||||||||||||||||||||
|
|
|||||||||||||||||||||||
Gross carrying value: |
||||||||||||||||||||||||
As at April 1, 2021 |
₹ | 3,815 | ₹ | 39,414 | ₹ | 110,855 | ₹ | 20,692 | ₹ | 418 | ₹ | 175,194 | ||||||||||||
Additions |
1,031 | 1,676 | 19,411 | 2,384 | 7 | 24,509 | ||||||||||||||||||
Additions through business combinations |
| | 370 | 335 | 3 | 708 | ||||||||||||||||||
Disposals |
(30 | ) | (440 | ) | (7,863 | ) | (826 | ) | (115 | ) | (9,274 | ) | ||||||||||||
Translation adjustment |
(3 | ) | 36 | 698 | 60 | 4 | 795 | |||||||||||||||||
|
|
|
|
|
|
|
|
|
|
|
|
|||||||||||||
As at March 31, 2022 |
₹ | 4,813 | ₹ | 40,686 | ₹ | 123,471 | ₹ | 22,645 | ₹ | 317 | ₹ | 191,932 | ||||||||||||
Accumulated depreciation/ impairment: |
|
|||||||||||||||||||||||
As at April 1, 2021 |
₹ | | ₹ | 8,785 | ₹ | 85,040 | ₹ | 15,089 | ₹ | 397 | ₹ | 109,311 | ||||||||||||
Depreciation and impairment |
| 1,536 | 12,305 | 2,141 | 10 | 15,992 | ||||||||||||||||||
Disposals |
| (346 | ) | (7,451 | ) | (725 | ) | (112 | ) | (8,634 | ) | |||||||||||||
Translation adjustment |
| 28 | 571 | 52 | 2 | 653 | ||||||||||||||||||
|
|
|
|
|
|
|
|
|
|
|
|
|||||||||||||
As at March 31, 2022 |
₹ | | ₹ | 10,003 | ₹ | 90,465 | ₹ | 16,557 | ₹ | 297 | ₹ | 117,322 | ||||||||||||
Capital work-in-progress |
₹ | 16,288 | ||||||||||||||||||||||
|
|
|||||||||||||||||||||||
Net carrying value including Capital work-in-progress as at March 31, 2022 |
|
₹ | 90,898 | |||||||||||||||||||||
|
|
|||||||||||||||||||||||
Gross carrying value: |
||||||||||||||||||||||||
As at April 1, 2022 |
₹ | 4,813 | ₹ | 40,686 | ₹ | 123,471 | ₹ | 22,645 | ₹ | 317 | ₹ | 191,932 | ||||||||||||
Additions |
40 | 5,030 | 9,382 | 3,018 | 4 | 17,474 | ||||||||||||||||||
Additions through business combinations |
| 7 | 357 | 6 | 3 | 373 | ||||||||||||||||||
Disposals |
(3 | ) | (84 | ) | (2,635 | ) | (737 | ) | (5 | ) | (3,464 | ) | ||||||||||||
Translation adjustment |
8 | 130 | 1,718 | 151 | 1 | 2,008 | ||||||||||||||||||
|
|
|
|
|
|
|
|
|
|
|
|
|||||||||||||
As at December 31, 2022 |
₹ | 4,858 | ₹ | 45,769 | ₹ | 132,293 | ₹ | 25,083 | ₹ | 320 | ₹ | 208,323 | ||||||||||||
Accumulated depreciation/ impairment: |
|
|||||||||||||||||||||||
As at April 1, 2022 |
₹ | | ₹ | 10,003 | ₹ | 90,465 | ₹ | 16,557 | ₹ | 297 | ₹ | 117,322 | ||||||||||||
Depreciation and impairment |
| 941 | 10,061 | 1,713 | 7 | 12,722 | ||||||||||||||||||
Disposals |
| (77 | ) | (2,428 | ) | (584 | ) | (4 | ) | (3,093 | ) | |||||||||||||
Translation adjustment |
| 82 | 1,410 | 111 | 1 | 1,604 | ||||||||||||||||||
|
|
|
|
|
|
|
|
|
|
|
|
|||||||||||||
As at December 31, 2022 |
₹ | | ₹ | 10,949 | ₹ | 99,508 | ₹ | 17,797 | ₹ | 301 | ₹ | 128,555 | ||||||||||||
Capital work-in-progress |
₹ | 10,379 | ||||||||||||||||||||||
|
|
|||||||||||||||||||||||
Net carrying value including Capital work-in-progress as at December 31, 2022 |
|
₹ | 90,147 | |||||||||||||||||||||
|
|
* | Including net carrying value of computer equipment and software amounting to ₹21,139, ₹25,162 and ₹23,466, as at December 31, 2021, March 31, 2022 and December 31, 2022, respectively. |
10
5. Right-of-Use assets
Category of Right-of-Use asset |
|
|||||||||||||||||||
Land | Buildings | Plant and equipment * |
Vehicles | Total | ||||||||||||||||
Gross carrying value: |
||||||||||||||||||||
As at April 1, 2021 |
₹ | 2,082 | ₹ | 18,844 | ₹ | 3,918 | ₹ | 926 | ₹ | 25,770 | ||||||||||
Additions |
15 | 5,352 | 432 | 92 | 5,891 | |||||||||||||||
Additions through business combinations |
| 2,922 | | 36 | 2,958 | |||||||||||||||
Disposals |
(801 | ) | (2,385 | ) | (1,091 | ) | (136 | ) | (4,413 | ) | ||||||||||
Translation adjustment |
| (126 | ) | 10 | (13 | ) | (129 | ) | ||||||||||||
|
|
|
|
|
|
|
|
|
|
|||||||||||
As at December 31, 2021 |
₹ | 1,296 | ₹ | 24,607 | ₹ | 3,269 | ₹ | 905 | ₹ | 30,077 | ||||||||||
Accumulated depreciation: |
||||||||||||||||||||
As at April 1, 2021 |
₹ | 55 | ₹ | 6,703 | ₹ | 2,157 | ₹ | 435 | ₹ | 9,350 | ||||||||||
Depreciation |
19 | 4,208 | 709 | 206 | 5,142 | |||||||||||||||
Disposals |
(20 | ) | (1,967 | ) | (746 | ) | (109 | ) | (2,842 | ) | ||||||||||
Translation adjustment |
| (23 | ) | 12 | (7 | ) | (18 | ) | ||||||||||||
|
|
|
|
|
|
|
|
|
|
|||||||||||
As at December 31, 2021 |
₹ | 54 | ₹ | 8,921 | ₹ | 2,132 | ₹ | 525 | ₹ | 11,632 | ||||||||||
|
|
|||||||||||||||||||
Net carrying value as at December 31, 2021 |
₹ | 18,445 | ||||||||||||||||||
|
|
|||||||||||||||||||
Gross carrying value: |
||||||||||||||||||||
As at April 1, 2021 |
₹ | 2,082 | ₹ | 18,844 | ₹ | 3,918 | ₹ | 926 | ₹ | 25,770 | ||||||||||
Additions |
15 | 7,517 | 429 | 105 | 8,066 | |||||||||||||||
Additions through business combinations |
| 2,920 | | 36 | 2,956 | |||||||||||||||
Disposals |
(819 | ) | (3,360 | ) | (1,861 | ) | (149 | ) | (6,189 | ) | ||||||||||
Translation adjustment |
| 72 | 25 | (14 | ) | 83 | ||||||||||||||
|
|
|
|
|
|
|
|
|
|
|||||||||||
As at March 31, 2022 |
₹ | 1,278 | ₹ | 25,993 | ₹ | 2,511 | ₹ | 904 | ₹ | 30,686 | ||||||||||
Accumulated depreciation: |
||||||||||||||||||||
As at April 1, 2021 |
₹ | 55 | ₹ | 6,703 | ₹ | 2,157 | ₹ | 435 | ₹ | 9,350 | ||||||||||
Depreciation |
24 | 5,572 | 849 | 264 | 6,709 | |||||||||||||||
Disposals |
(21 | ) | (2,667 | ) | (1,518 | ) | (121 | ) | (4,327 | ) | ||||||||||
Translation adjustment |
| 68 | 24 | (8 | ) | 84 | ||||||||||||||
|
|
|
|
|
|
|
|
|
|
|||||||||||
As at March 31, 2022 |
₹ | 58 | ₹ | 9,676 | ₹ | 1,512 | ₹ | 570 | ₹ | 11,816 | ||||||||||
|
|
|||||||||||||||||||
Net carrying value as at March 31, 2022 |
₹ | 18,870 | ||||||||||||||||||
|
|
|||||||||||||||||||
Gross carrying value: |
||||||||||||||||||||
As at April 1, 2022 |
₹ | 1,278 | ₹ | 25,993 | ₹ | 2,511 | ₹ | 904 | ₹ | 30,686 | ||||||||||
Additions |
| 5,175 | 403 | 137 | 5,715 | |||||||||||||||
Additions through business combinations |
| 201 | | | 201 | |||||||||||||||
Disposals |
| (3,084 | ) | (4 | ) | (242 | ) | (3,330 | ) | |||||||||||
Translation adjustment |
| 790 | 129 | 31 | 950 | |||||||||||||||
|
|
|
|
|
|
|
|
|
|
|||||||||||
As at December 31, 2022 |
₹ | 1,278 | ₹ | 29,075 | ₹ | 3,039 | ₹ | 830 | ₹ | 34,222 | ||||||||||
Accumulated depreciation: |
||||||||||||||||||||
As at April 1, 2022 |
₹ | 58 | ₹ | 9,676 | ₹ | 1,512 | ₹ | 570 | ₹ | 11,816 | ||||||||||
Depreciation |
14 | 4,255 | 419 | 179 | 4,867 | |||||||||||||||
Disposals |
| (2,101 | ) | (1 | ) | (203 | ) | (2,305 | ) | |||||||||||
Translation adjustment |
| 351 | 92 | 20 | 463 | |||||||||||||||
|
|
|
|
|
|
|
|
|
|
|||||||||||
As at December 31, 2022 |
₹ | 72 | ₹ | 12,181 | ₹ | 2,022 | ₹ | 566 | ₹ | 14,841 | ||||||||||
|
|
|||||||||||||||||||
Net carrying value as at December 31, 2022 |
₹ | 19,381 | ||||||||||||||||||
|
|
* | Including net carrying value of computer equipment and software amounting to ₹7, ₹6 and ₹5, as at December 31, 2021, March 31, 2022 and December 31, 2022, respectively |
6. Goodwill and intangible assets
The movement in goodwill balance is given below:
For the period ended | ||||||||
March 31, 2022 | December 31, 2022 | |||||||
Balance at the beginning of the period |
₹ | 139,127 | ₹ | 246,989 | ||||
Translation adjustment |
5,293 | 21,949 | ||||||
Acquisition through business combinations(1) (Refer to Note 7) |
102,569 | 40,627 | ||||||
Disposals (Refer to Note 31) |
| (40 | ) | |||||
Balance at the end of the period |
₹ | 246,989 | ₹ | 309,525 | ||||
|
|
|
|
(1) | Acquisition through business combinations for the year ended March 31, 2022 and nine months ended December 31, 2022 is after considering the impact of ₹116 and ₹57 towards measurement period changes in purchase price allocation of acquisitions made during the year ended March 31, 2021 and 2022, respectively. |
11
The movement in intangible assets is given below:
Intangible assets | ||||||||||||
Customer-related | Marketing- related |
Total | ||||||||||
Gross carrying value: |
||||||||||||
As at April 1, 2021 |
₹ | 26,326 | ₹ | 1,611 | ₹ | 27,937 | ||||||
Acquisition through business combinations |
27,857 | 9,822 | 37,679 | |||||||||
Deductions/adjustments |
(11,695 | ) | (215 | ) | (11,910 | ) | ||||||
Translation adjustment |
322 | (3 | ) | 319 | ||||||||
|
|
|
|
|
|
|||||||
As at December 31, 2021 |
₹ | 42,810 | ₹ | 11,215 | ₹ | 54,025 | ||||||
Accumulated amortization/ impairment: |
||||||||||||
As at April 1, 2021 |
₹ | 14,248 | ₹ | 604 | ₹ | 14,852 | ||||||
Amortization and impairment |
5,636 | 937 | 6,573 | |||||||||
Deductions/Adjustments |
(11,695 | ) | (215 | ) | (11,910 | ) | ||||||
Translation adjustment |
189 | 1 | 190 | |||||||||
|
|
|
|
|
|
|||||||
As at December 31, 2021 |
₹ | 8,378 | ₹ | 1,327 | ₹ | 9,705 | ||||||
|
|
|
|
|
|
|||||||
Net carrying value as at December 31, 2021 |
₹ | 34,432 | ₹ | 9,888 | ₹ | 44,320 | ||||||
|
|
|
|
|
|
|||||||
Gross carrying value: |
||||||||||||
As at April 1, 2021 |
₹ | 26,326 | ₹ | 1,611 | ₹ | 27,937 | ||||||
Acquisition through business combinations |
27,834 | 9,814 | 37,648 | |||||||||
Deductions/adjustments |
(11,984 | ) | (215 | ) | (12,199 | ) | ||||||
Translation adjustment |
1,190 | 218 | 1,408 | |||||||||
|
|
|
|
|
|
|||||||
As at March 31, 2022 |
₹ | 43,366 | ₹ | 11,428 | ₹ | 54,794 | ||||||
Accumulated amortization/ impairment: |
||||||||||||
As at April 1, 2021 |
₹ | 14,248 | ₹ | 604 | ₹ | 14,852 | ||||||
Amortization and impairment |
6,872 | 1,338 | 8,210 | |||||||||
Deductions/adjustments |
(11,984 | ) | (215 | ) | (12,199 | ) | ||||||
Translation adjustment |
347 | 29 | 376 | |||||||||
|
|
|
|
|
|
|||||||
As at March 31, 2022 |
₹ | 9,483 | ₹ | 1,756 | ₹ | 11,239 | ||||||
|
|
|
|
|
|
|||||||
Net carrying value as at March 31, 2022 |
₹ | 33,883 | ₹ | 9,672 | ₹ | 43,555 | ||||||
|
|
|
|
|
|
|||||||
Gross carrying value: |
||||||||||||
As at April 1, 2022 |
₹ | 43,366 | ₹ | 11,428 | ₹ | 54,794 | ||||||
Acquisition through business combinations (Refer to Note 7) |
5,480 | 482 | 5,962 | |||||||||
Deductions/adjustments (1) |
(1,570 | ) | | (1,570 | ) | |||||||
Translation adjustment |
3,734 | 1,004 | 4,738 | |||||||||
|
|
|
|
|
|
|||||||
As at December 31, 2022 |
₹ | 51,010 | ₹ | 12,914 | ₹ | 63,924 | ||||||
Accumulated amortization/ impairment: |
||||||||||||
As at April 1, 2022 |
₹ | 9,483 | ₹ | 1,756 | ₹ | 11,239 | ||||||
Amortization and impairment (2) |
5,638 | 1,709 | 7,347 | |||||||||
Deductions/adjustments |
(1,534 | ) | | (1,534 | ) | |||||||
Translation adjustment |
817 | 208 | 1,025 | |||||||||
|
|
|
|
|
|
|||||||
As at December 31, 2022 |
₹ | 14,404 | ₹ | 3,673 | ₹ | 18,077 | ||||||
|
|
|
|
|
|
|||||||
Net carrying value as at As at December 31, 2022 |
₹ | 36,606 | ₹ | 9,241 | ₹ | 45,847 | ||||||
|
|
|
|
|
|
(1) | Includes ₹36 towards measurement period adjustment in customer-related intangible in an acquisition completed during the year ended March 31, 2022. |
(2) | During the nine months ended December 31, 2022, decline in the revenue and earnings estimates led to revision of recoverable value of customer-relationship intangible assets and marketing related intangible assets recognized on business combinations. Consequently, the Company has recognized impairment charge ₹1,166 for the three and nine months ended December 31, 2022, as part of amortization and impairment. |
Amortization expense on intangible assets is included in selling and marketing expenses in the interim condensed consolidated statement of income.
12
7. Business combinations
Summary of acquisitions during the nine months ended December 31, 2022 is given below:
During the nine months ended December 31, 2022, the Company has completed two business combinations by acquiring 100% equity interest in:
(a) | Convergence Acceleration Solutions, LLC (CAS Group), a US-based consulting and program management company that specializes in driving large-scale business and technology transformation for Fortune 100 communications service providers. The acquisition advances the Companys strategic consulting capabilities as we help our clients drive large scale business and technology transformation. The acquisition was consummated on April 11, 2022, for total consideration (upfront cash to acquire control and contingent consideration) of ₹ 5,587. |
(b) | Rizing Intermediate Holdings, Inc and its subsidiaries (Rizing), a global SAP consulting firm with industry expertise and consulting capabilities in enterprise asset management, consumer industries, and human experience management. Rizing complements the Company in capabilities (EAM, HCM and S/4HANA), in industries such as Energy and Utilities, Retail and Consumer Products, Manufacturing and Hi Tech in geographies across North America, Europe, Asia, and Australia. The acquisition was consummated on May 20, 2022, for a total cash consideration of ₹ 43,845. |
The following table presents the purchase price allocation:
Description | CAS Group | Rizing | ||||||
Net assets |
₹ | 524 | ₹ | 4,114 | ||||
Fair value of customer-related intangibles |
1,617 | 3,863 | ||||||
Fair value of marketing-related intangibles |
| 482 | ||||||
Deferred tax liabilities on intangible assets |
| (1,738 | ) | |||||
|
|
|
|
|||||
Total |
₹ | 2,141 | ₹ | 6,721 | ||||
|
|
|
|
|||||
Goodwill |
3,446 | 37,124 | ||||||
|
|
|
|
|||||
Total purchase price |
₹ | 5,587 | ₹ | 43,845 | ||||
|
|
|
|
|||||
Net Assets include: |
||||||||
Cash and cash equivalents |
₹ | 127 | ₹ | 2,114 | ||||
Fair value of acquired trade receivables included in net assets |
₹ | 451 | ₹ | 3,228 | ||||
Gross contractual amount of acquired trade receivables |
₹ | 451 | ₹ | 3,241 | ||||
Less: Allowance for lifetime expected credit loss |
| (13 | ) | |||||
Transaction costs included in general and administrative expenses |
₹ | 19 | ₹ | 99 |
The purchase price allocation for CAS Group and Rizing is provisional and will be finalized as soon as practicable within the measurement period, but in no event later than one year following the date of acquisition.
The goodwill of ₹ 40,570 comprises value of acquired workforce and expected synergies arising from the business combination. Goodwill is allocated to IT Services segment and is not deductible for income tax purposes except for CAS group in the United States of America.
The total consideration of CAS Group includes a contingent consideration linked to achievement of revenues and earnings over a period of 3 years ending December 31, 2024, and range of contingent consideration payable is between ₹ Nil and ₹ 2,277. The fair value of the contingent consideration is estimated by applying the discounted cash-flow approach considering discount rate of 4.58% and probability adjusted revenue and earnings estimates. The undiscounted fair value of contingent consideration is ₹ 1,804 as at the date of acquisition. The discounted fair value of contingent consideration of ₹ 1,662 is recorded as part of provisional purchase price allocation.
The pro-forma effects of acquisition during the three and nine months ended December 31, 2022, on the Companys results were not material.
8. Investments
As at | ||||||||
March 31, 2022 | December 31, 2022 | |||||||
Non-current |
||||||||
Financial instruments at FVTPL |
||||||||
Equity instruments |
₹ | 1,976 | ₹ | 3,795 | ||||
Fixed maturity plan mutual funds |
513 | 1,277 | ||||||
Financial instruments at FVTOCI |
||||||||
Equity instruments |
14,963 | 15,736 | ||||||
Financial instruments at amortized cost |
||||||||
Inter corporate and term deposits |
1,657 | ^ | ||||||
|
|
|
|
|||||
₹ | 19,109 | ₹ | 20,808 | |||||
Current |
||||||||
Financial instruments at FVTPL |
||||||||
Short-term mutual funds |
₹ | 15,550 | ₹ | 24,668 | ||||
Financial instruments at FVTOCI |
||||||||
Non-convertible debentures, government securities, commercial papers, certificate of deposit and bonds |
204,839 | 256,262 | ||||||
Financial instruments at amortized cost |
||||||||
Inter corporate and term deposits (1) |
21,266 | 10,813 | ||||||
|
|
|
|
|||||
₹ | 241,655 | ₹ | 291,743 | |||||
|
|
|
|
|||||
₹ | 260,764 | ₹ | 312,551 | |||||
|
|
|
|
(1) | These deposits earn a fixed rate of interest. Term deposits include current deposits in lien with banks primarily on account of term deposits held as margin money deposits against guarantees amounting to ₹ 641 (March 31, 2022: Term deposits current of ₹ 654). |
13
9. Inventories
As at | ||||||||
March 31, 2022 | December 31, 2022 | |||||||
Stores and spare parts |
₹ | 28 | ₹ | 26 | ||||
Finished and traded goods |
1,306 | 1,993 | ||||||
|
|
|
|
|||||
₹ | 1,334 | ₹ | 2,019 | |||||
|
|
|
|
10. | Cash and cash equivalents |
As at | ||||||||
March 31, 2022 | December 31, 2022 | |||||||
Cash and bank balances |
₹ | 61,882 | ₹ | 67,265 | ||||
Demand deposits with banks (1) |
41,954 | 20,042 | ||||||
|
|
|
|
|||||
₹ | 103,836 | ₹ | 87,307 | |||||
|
|
|
|
(1) These deposits can be withdrawn by the Company at any time without prior notice and without any penalty on the principal.
Cash and cash equivalents consist of the following for the purpose of the statement of cash flows:
As at | ||||||||
December 31, 2021 | December 31, 2022 | |||||||
Cash and cash equivalents |
₹ | 107,458 | ₹ | 87,307 | ||||
Bank overdrafts |
(14 | ) | (12 | ) | ||||
|
|
|
|
|||||
₹ | 107,444 | ₹ | 87,295 | |||||
|
|
|
|
11. Other financial assets
As at | ||||||||
March 31, 2022 | December 31, 2022 | |||||||
Non-current |
||||||||
Security deposits |
₹ | 1,396 | ₹ | 1,528 | ||||
Finance lease receivables |
4,262 | 4,563 | ||||||
Others |
426 | 32 | ||||||
|
|
|
|
|||||
₹ | 6,084 | ₹ | 6,123 | |||||
Current |
||||||||
Security deposits |
₹ | 1,513 | ₹ | 1,660 | ||||
Dues from officers and employees |
1,301 | 1,076 | ||||||
Interest receivables |
1,835 | 235 | ||||||
Finance lease receivables |
5,065 | 6,172 | ||||||
Deposit in interim dividend account |
27,410 | | ||||||
Others |
5,790 | 389 | ||||||
|
|
|
|
|||||
₹ | 42,914 | ₹ | 9,532 | |||||
|
|
|
|
|||||
₹ | 48,998 | ₹ | 15,655 | |||||
|
|
|
|
12. Other assets
As at | ||||||||
March 31, 2022 | December 31, 2022 | |||||||
Non-current |
||||||||
Prepaid expenses |
₹ | 7,079 | ₹ | 5,779 | ||||
Costs to obtain contract (1) |
3,128 | 3,173 | ||||||
Costs to fulfil contract (2) |
295 | 278 | ||||||
Others |
4,324 | 4,815 | ||||||
|
|
|
|
|||||
₹ | 14,826 | ₹ | 14,045 | |||||
Current |
||||||||
Prepaid expenses |
₹ | 15,839 | ₹ | 18,001 | ||||
Dues from officers and employees |
251 | 1,137 | ||||||
Advance to suppliers |
3,179 | 5,723 | ||||||
Balance with GST and other authorities |
7,566 | 8,078 | ||||||
Costs to obtain contract (1) |
820 | 964 | ||||||
Costs to fulfil contract (2) |
55 | 119 | ||||||
Others |
1,223 | 2,101 | ||||||
|
|
|
|
|||||
₹ | 28,933 | ₹ | 36,123 | |||||
|
|
|
|
|||||
₹ | 43,759 | ₹ | 50,168 | |||||
|
|
|
|
(1) | Costs to obtain contract amortization is ₹ 222 and ₹ 224 during the three months ended December 31, 2021 and 2022 respectively, ₹ 674 and ₹ 664 during the nine months ended December 31, 2021 and 2022 respectively. |
(2) | Costs to fulfil contract amortization is ₹ 14 and ₹ 15 during the three months ended December 31, 2021 and 2022 respectively, ₹ 40 and ₹ 43 during the nine months ended December 31, 2021 and 2022 respectively. |
14
13. Loans, borrowings and bank overdrafts
As at | ||||||||
March 31, 2022 | December 31, 2022 | |||||||
Non-current |
||||||||
Unsecured Notes 2026 |
₹ | 56,403 | ₹ | 61,661 | ||||
Loans from institutions other than banks |
60 | 57 | ||||||
|
|
|
|
|||||
₹ | 56,463 | ₹ | 61,718 | |||||
Current |
||||||||
Borrowings from Banks |
₹ | 95,143 | ₹ | 96,490 | ||||
Loans from institutions other than banks |
87 | 9 | ||||||
Bank overdrafts |
3 | 12 | ||||||
|
|
|
|
|||||
₹ | 95,233 | ₹ | 96,511 | |||||
|
|
|
|
|||||
₹ | 151,696 | ₹ | 158,229 | |||||
|
|
|
|
14. Other financial liabilities
As at | ||||||||
March 31, 2022 | December 31, 2022 | |||||||
Non-current |
||||||||
Contingent consideration (Refer to Note 17) |
₹ | 2,423 | ₹ | 1,851 | ||||
Cash Settled ADS RSUs |
2 | | ||||||
Deposits and others |
536 | 416 | ||||||
|
|
|
|
|||||
₹ | 2,961 | ₹ | 2,267 | |||||
Current |
||||||||
Contingent consideration (Refer to Note 17) |
₹ | 1,906 | ₹ | 2,126 | ||||
Advance from customers |
1,582 | 971 | ||||||
Cash Settled ADS RSUs |
18 | 6 | ||||||
Interim dividend payable |
27,337 | | ||||||
Capital Creditors |
626 | 381 | ||||||
Deposits and others |
1,641 | 857 | ||||||
|
|
|
|
|||||
₹ | 33,110 | ₹ | 4,341 | |||||
|
|
|
|
|||||
₹ | 36,071 | ₹ | 6,608 | |||||
|
|
|
|
15. Other liabilities
As at | ||||||||
March 31, 2022 | December 31, 2022 | |||||||
Non-current |
||||||||
Employee benefits obligations |
₹ | 2,720 | ₹ | 4,038 | ||||
Others |
4,851 | 5,827 | ||||||
|
|
|
|
|||||
₹ | 7,571 | ₹ | 9,865 | |||||
Current |
||||||||
Employee benefits obligations |
₹ | 15,310 | ₹ | 14,869 | ||||
Statutory and other liabilities |
10,933 | 12,804 | ||||||
Advance from customers |
629 | 1,071 | ||||||
Others |
522 | 530 | ||||||
|
|
|
|
|||||
₹ | 27,394 | ₹ | 29,274 | |||||
|
|
|
|
|||||
₹ | 34,965 | ₹ | 39,139 | |||||
|
|
|
|
15
16. Provisions
As at | ||||||||
March 31, 2022 | December 31, 2022 | |||||||
Non-current |
||||||||
Provision for warranty |
₹ | 1 | ^ | |||||
|
|
|
|
|||||
₹ | 1 | ₹ | ^ | |||||
Current |
||||||||
Provision for warranty |
₹ | 294 | ₹ | 362 | ||||
Provision for onerous contracts |
1,946 | 1,654 | ||||||
Others |
531 | 508 | ||||||
|
|
|
|
|||||
₹ | 2,771 | ₹ | 2,524 | |||||
|
|
|
|
|||||
₹ | 2,772 | ₹ | 2,524 | |||||
|
|
|
|
^ Value is less than ₹ 1
17. | Financial instruments: |
Derivative assets and liabilities:
The Company is exposed to currency fluctuations on foreign currency assets / liabilities, forecasted cash flows denominated in foreign currency and net investment in foreign operations. The company is also exposed to interest rate fluctuations on investments in floating rate financial assets. The Company follows established risk management policies, including the use of derivatives to hedge foreign currency assets / liabilities, interest rates, foreign currency forecasted cash flows and net investment in foreign operations. The counter parties in these derivative instruments are primarily banks and the Company considers the risks of non-performance by the counterparty as non-material.
The following table presents the aggregate contracted principal amounts of the Companys derivative contracts outstanding:
(in millions)
As at | ||||||||||||||||||||||||
March 31, 2022 | December 31, 2022 | |||||||||||||||||||||||
Notional | Fair value | Notional | Fair value | |||||||||||||||||||||
Designated derivative instruments |
||||||||||||||||||||||||
Sell: Forward contracts |
USD | 1,413 | ₹ | 509 | USD | 1,016 | ₹ | (2,687 | ) | |||||||||||||||
| 191 | ₹ | 668 | | 127 | ₹ | (361 | ) | ||||||||||||||||
£ | 173 | ₹ | 645 | £ | 139 | ₹ | (310 | ) | ||||||||||||||||
AUD | 170 | ₹ | (217 | ) | AUD | 109 | ₹ | (7 | ) | |||||||||||||||
Range forward option contracts |
USD | 493 | ₹ | 217 | USD | 1,095 | ₹ | (1,010 | ) | |||||||||||||||
| 6 | ₹ | 8 | | 55 | ₹ | (131 | ) | ||||||||||||||||
£ | 28 | ₹ | 119 | £ | 65 | ₹ | 18 | |||||||||||||||||
AUD | 11 | ₹ | (6 | ) | AUD | 38 | ₹ | 37 | ||||||||||||||||
Interest Rate Swaps |
INR | | ₹ | | INR | 4,750 | ₹ | (112 | ) | |||||||||||||||
USD | | ₹ | | USD | 200 | ₹ | 165 | |||||||||||||||||
Non-designated derivative instruments |
||||||||||||||||||||||||
Sell: Forward contracts * |
USD | 1,452 | ₹ | 536 | USD | 1,456 | ₹ | (1,161 | ) | |||||||||||||||
| 109 | ₹ | 1 | | 190 | ₹ | (268 | ) | ||||||||||||||||
£ | 91 | ₹ | 81 | £ | 100 | ₹ | (186 | ) | ||||||||||||||||
AUD | 47 | ₹ | (122 | ) | AUD | 57 | ₹ | (83 | ) | |||||||||||||||
SGD | 4 | ₹ | (1 | ) | SGD | 12 | ₹ | (20 | ) | |||||||||||||||
ZAR | 8 | ₹ | ^ | ZAR | 43 | ₹ | (3 | ) | ||||||||||||||||
CAD | 47 | ₹ | (25 | ) | CAD | 70 | ₹ | 43 | ||||||||||||||||
SAR | 33 | ₹ | (1 | ) | SAR | 135 | ₹ | ^ | ||||||||||||||||
PLN | 14 | ₹ | (2 | ) | PLN | 29 | ₹ | (14 | ) | |||||||||||||||
CHF | 5 | ₹ | (5 | ) | CHF | 2 | ₹ | (10 | ) | |||||||||||||||
QAR | 11 | ₹ | (4 | ) | QAR | 4 | ₹ | (2 | ) | |||||||||||||||
TRY | 30 | ₹ | 6 | TRY | 30 | ₹ | (7 | ) | ||||||||||||||||
NOK | 13 | ₹ | (3 | ) | NOK | 13 | ₹ | (4 | ) | |||||||||||||||
OMR | 2 | ₹ | ^ | OMR | 1 | ₹ | ^ | |||||||||||||||||
SEK | 17 | ₹ | (2 | ) | SEK | 3 | ₹ | ^ | ||||||||||||||||
JPY | 513 | ₹ | 20 | JPY | 1,984 | ₹ | (42 | ) | ||||||||||||||||
DKK | 2 | ₹ | ^ | DKK | 26 | ₹ | (2 | ) | ||||||||||||||||
AED | | ₹ | | AED | 19 | ₹ | ^ | |||||||||||||||||
CNH | | ₹ | | CNH | 1 | ₹ | ^ |
16
Buy: Forward contracts |
SEK | 22 | ₹ | 2 | SEK | | ₹ | | ||||||||||||||||
DKK | 16 | ₹ | (2 | ) | DKK | | ₹ | | ||||||||||||||||
CHF | 2 | ₹ | (1 | ) | CHF | | ₹ | | ||||||||||||||||
AED | 26 | ₹ | ^ | AED | 5 | ₹ | ^ | |||||||||||||||||
JPY | 447 | ₹ | (18 | ) | JPY | | ₹ | | ||||||||||||||||
CNH | 11 | ₹ | ^ | CNH | | ₹ | | |||||||||||||||||
NOK | 12 | ₹ | (1 | ) | NOK | 12 | ₹ | ^ | ||||||||||||||||
QAR | | ₹ | | QAR | 4 | ₹ | 2 | |||||||||||||||||
ZAR | | ₹ | | ZAR | 7 | ₹ | 1 | |||||||||||||||||
Range forward option contracts |
USD | | ₹ | | USD | 305 | ₹ | (192 | ) | |||||||||||||||
£ | | ₹ | | £ | 20 | ₹ | 2 | |||||||||||||||||
| | ₹ | | | 40 | ₹ | (2 | ) | ||||||||||||||||
Interest Rate Swaps |
INR | 4,750 | ₹ | 3 | INR | | ₹ | | ||||||||||||||||
|
|
|
|
|||||||||||||||||||||
₹ | 2,405 | ₹ | (6,346 | ) | ||||||||||||||||||||
|
|
|
|
^ Value is less than ₹ 1
* USD 1,452 and USD 1,456 includes USD/PHP sell forward of USD 86 and USD 46 as at March 31, 2022 and December 31, 2022, respectively.
Hedge effectiveness is determined at the inception of the hedge relationship, and through periodic prospective effectiveness assessments to ensure that an economic relationship exists between the hedged item and hedging instrument, including whether the hedging instrument is expected to offset changes in cash flows of hedged items.
The following table summarizes activity in the cash flow hedging reserve within equity related to all derivative instruments classified as cash flow hedges:
Nine months ended December 31, | ||||||||
2021 | 2022 | |||||||
Balance as at the beginning of the period |
₹ | 2,182 | ₹ | 1,943 | ||||
Changes in fair value of effective portion of derivatives |
4,128 | (5,854 | ) | |||||
Net (gain)/loss reclassified to statement of income on occurrence of hedged transactions (1) |
(2,874 | ) | (487 | ) | ||||
|
|
|
|
|||||
Gain/(loss) on cash flow hedging derivatives, net |
₹ | 1,254 | ₹ | (6,341 | ) | |||
Translation (gain)/loss |
| (6 | ) | |||||
|
|
|
|
|||||
Balance as at the end of the period |
₹ | 3,436 | ₹ | (4,404 | ) | |||
Deferred tax thereon |
(841 | ) | 917 | |||||
|
|
|
|
|||||
Balance as at the end of the period, net of deferred tax |
₹ | 2,595 | ₹ | (3,487 | ) |
(1) | Includes net (gain)/loss reclassified to revenue of ₹ (3,583) and ₹ 646 for the nine months ended December 31, 2021, and 2022, respectively and net (gain)/loss reclassified to cost of revenues of ₹ 709 and ₹ (1,133) for the nine months ended December 31, 2021, and 2022, respectively. |
As at December 31, 2021 and 2022, there were no significant gains or losses on derivative transactions or portions thereof that have become ineffective as hedges or associated with an underlying exposure that did not occur.
Fair value:
Financial assets and liabilities include cash and cash equivalents, trade receivables, unbilled receivables, finance lease receivables, employee and other advances, eligible current and non-current assets, loans, borrowings and bank overdrafts, trade payables and accrued expenses, and eligible current liabilities and non-current liabilities.
The fair value of cash and cash equivalents, trade receivables, unbilled receivables, loans, borrowings and bank overdrafts, trade payables and accrued expenses, other current financial assets and liabilities approximate their carrying amount largely due to the short-term nature of these instruments. The Companys long-term debt has been contracted at market rates of interest. Accordingly, the carrying value of such long-term debt approximates fair value. Further, finance lease receivables are periodically evaluated based on individual credit worthiness of customers. Based on this evaluation, the Company records allowance for estimated losses on these receivables. As at March 31, 2022 and December 31, 2022, the carrying value of such receivables, net of allowances approximates the fair value.
Investments in short-term mutual funds and fixed maturity plan mutual funds, which are classified as FVTPL are measured using net asset values at the reporting date multiplied by the quantity held. Fair value of investments in non-convertible debentures, government securities, commercial papers, certificate of deposit and bonds classified as FVTOCI is determined based on the indicative quotes of price and yields prevailing in the market at the reporting date. Fair value of investments in equity instruments classified as FVTOCI or FVTPL is determined using market multiples method.
The fair value of derivative financial instruments is determined based on observable market inputs including currency spot and forward rates, yield curves, currency volatility etc.
17
Fair value hierarchy
The table below analyses financial instruments carried at fair value, by valuation method. The different levels have been defined as follows:
Level 1 Quoted prices (unadjusted) in active markets for identical assets or liabilities.
Level 2 Inputs other than quoted prices included within Level 1 that are observable for the asset or liability, either directly (i.e. as prices) or indirectly (i.e. derived from prices).
Level 3 Inputs for the assets or liabilities that are not based on observable market data (unobservable inputs).
The following table presents fair value hierarchy of assets and liabilities measured at fair value on a recurring basis:
Particular | As at March 31, 2022 | As at December 31, 2022 | ||||||||||||||||||||||||||||||
Fair value measurements at reporting date | Fair value measurements at reporting date | |||||||||||||||||||||||||||||||
Total | Level 1 | Level 2 | Level 3 | Total | Level 1 | Level 2 | Level 3 | |||||||||||||||||||||||||
Assets |
||||||||||||||||||||||||||||||||
Derivative instruments: |
||||||||||||||||||||||||||||||||
Cash flow hedges |
₹ | 2,242 | ₹ | | ₹ | 2,242 | ₹ | | ₹ | 799 | ₹ | | ₹ | 799 | ₹ | | ||||||||||||||||
Others |
796 | | 796 | | 219 | | 219 | | ||||||||||||||||||||||||
Investments: |
||||||||||||||||||||||||||||||||
Short-term mutual funds |
15,550 | 15,550 | | | 24,668 | 24,668 | | | ||||||||||||||||||||||||
Fixed maturity plan mutual funds |
513 | | 513 | | 1,277 | | 1,277 | | ||||||||||||||||||||||||
Equity instruments |
16,939 | 41 | 574 | 16,324 | 19,531 | 135 | | 19,396 | ||||||||||||||||||||||||
Non-convertible debentures, government securities, commercial papers, certificate of deposit and bonds |
204,839 | 1,251 | 203,588 | | 256,262 | 1,227 | 255,035 | | ||||||||||||||||||||||||
Liabilities |
||||||||||||||||||||||||||||||||
Derivative instruments: |
||||||||||||||||||||||||||||||||
Cash flow hedges |
₹ | (299 | ) | ₹ | | ₹ | (299 | ) | ₹ | | ₹ | (5,197 | ) | ₹ | | ₹ | (5,197 | ) | ₹ | | ||||||||||||
Others |
(334 | ) | | (334 | ) | | (2,167 | ) | | (2,167 | ) | | ||||||||||||||||||||
Contingent consideration |
(4,329 | ) | | | (4,329 | ) | (3,977 | ) | | | (3,977 | ) |
The following methods and assumptions were used to estimate the fair value of the level 2 financial instruments included in the above table.
Derivative instruments (assets and liabilities): The Company enters into derivative financial instruments with various counterparties, primarily banks with investment grade credit ratings. Derivatives valued using valuation techniques with market observable inputs are mainly interest rate swaps, foreign exchange forward contracts and foreign exchange option contracts. The most frequently applied valuation techniques include forward pricing, swap models and Black Scholes models (for option valuation), using present value calculations. The models incorporate various inputs including the credit quality of counterparties, foreign exchange spot and forward rates, interest rate curves and forward rate curves of the underlying. As at December 31, 2022, the changes in counterparty credit risk had no material effect on the hedge effectiveness assessment for derivatives designated in hedge relationships and other financial instruments recognized at fair value.
Investment in Non-convertible debentures, government securities, commercial papers, certificate of deposit and bonds: Fair value of these instruments is derived based on the indicative quotes of price and yields prevailing in the market as at reporting date.
Investment in equity instruments and fixed maturity plan mutual funds: Fair value of these instruments is derived based on the indicative quotes of price prevailing in the market as at reporting date.
The following methods and assumptions were used to estimate the fair value of the level 3 financial instruments included in the above table.
Investment in equity instruments: Fair value of these instruments is determined using market multiples method.
18
Details of assets and liabilities considered under Level 3 classification
As at | ||||||||
Investment in equity instruments | March 31, 2022 | December 31, 2022 | ||||||
Balance at the beginning of the period |
₹ | 10,227 | ₹ | 16,324 | ||||
Additions |
3,973 | 1,733 | ||||||
Disposals |
(7,697 | ) | (611 | ) | ||||
Unrealized gain recognized in statement of income |
40 | 26 | ||||||
Gain recognized in other comprehensive income |
9,423 | 602 | ||||||
Translation adjustment |
358 | 1,322 | ||||||
|
|
|
|
|||||
Balance at the end of the period |
₹ | 16,324 | ₹ | 19,396 | ||||
|
|
|
|
As at | ||||||||
Contingent consideration | March 31, 2022 | December 31, 2022 | ||||||
Balance at the beginning of the period |
₹ | (2,293 | ) | ₹ | (4,329 | ) | ||
Additions |
(2,533 | ) | (1,662 | ) | ||||
Reversals (1) |
468 | 1,284 | ||||||
Payouts |
309 | 1,251 | ||||||
Finance expense recognized in statement of income |
(117 | ) | (107 | ) | ||||
Translation adjustment |
(163 | ) | (414 | ) | ||||
|
|
|
|
|||||
Balance at the end of the period |
₹ | (4,329 | ) | ₹ | (3,977 | ) | ||
|
|
|
|
(1) | Towards change in fair value of earn-out liability as a result of changes in estimates of revenue and earnings over the earn-out period. |
18. Foreign currency translation reserve and Other reserves
The movement in foreign currency translation reserve attributable to equity holders of the Company is summarized below:
Nine months ended December 31, | ||||||||
2021 | 2022 | |||||||
Balance at the beginning of the period |
₹ | 22,936 | ₹ | 26,850 | ||||
Translation difference related to foreign operations, net |
(189 | ) | 17,373 | |||||
Reclassification of foreign currency translation differences on sale of investment in associates and liquidation of subsidiaries to statement of income |
(151 | ) | (116 | ) | ||||
|
|
|
|
|||||
Balance at the end of the period |
₹ | 22,596 | ₹ | 44,107 | ||||
|
|
|
|
The movement in other reserves is summarized below:
Other Reserves | ||||||||||||||||
Particulars | Remeasurements of the defined benefit plans |
Investment in debt instruments measured at fair value through OCI |
Investment in equity instruments measured at fair value through OCI |
Capital Redemption Reserve |
||||||||||||
As at April 1, 2021 |
₹ | (897 | ) | ₹ | 4,237 | ₹ | 1,378 | ₹ | 1,122 | |||||||
Other comprehensive income |
(675 | ) | (995 | ) | 8,248 | | ||||||||||
As at December 31, 2021 |
₹ | (1,572 | ) | ₹ | 3,242 | ₹ | 9,626 | ₹ | 1,122 | |||||||
As at April 1, 2022 |
₹ | (498 | ) | ₹ | 3,018 | ₹ | 10,088 | ₹ | 1,122 | |||||||
Other comprehensive income |
377 | (3,355 | ) | 1,010 | | |||||||||||
As at December 31, 2022 |
₹ | (121 | ) | ₹ | (337 | ) | ₹ | 11,098 | ₹ | 1,122 |
19. Income taxes
Three months ended December 31, |
Nine months ended December 31, |
|||||||||||||||
2021 | 2022 | 2021 | 2022 | |||||||||||||
Income tax expense as per the interim condensed consolidated statement of income |
₹ | 8,063 | ₹ | 9,102 | ₹ | 22,547 | ₹ | 24,743 | ||||||||
Income tax included in other comprehensive income on: |
|
|||||||||||||||
Gains/(losses) on investment securities |
(194 | ) | 66 | 658 | (341 | ) | ||||||||||
Gains/(losses) on cash flow hedging derivatives |
28 | (776 | ) | 389 | (1,383 | ) | ||||||||||
Remeasurements of the defined benefit plans |
52 | (50 | ) | (216 | ) | 99 | ||||||||||
|
|
|
|
|
|
|
|
|||||||||
₹ | 7,949 | ₹ | 8,342 | ₹ | 23,378 | ₹ | 23,118 | |||||||||
|
|
|
|
|
|
|
|
Income tax expense consists of the following:
Three months ended December 31, |
Nine months ended December 31, |
|||||||||||||||
2021 | 2022 | 2021 | 2022 | |||||||||||||
Current taxes |
₹ | 7,735 | ₹ | 8,717 | ₹ | 23,150 | ₹ | 26,316 | ||||||||
Deferred taxes |
328 | 385 | ₹ | (603 | ) | (1,573 | ) | |||||||||
|
|
|
|
|
|
|
|
|||||||||
₹ | 8,063 | ₹ | 9,102 | ₹ | 22,547 | ₹ | 24,743 | |||||||||
|
|
|
|
|
|
|
|
19
Income tax expenses are net of (provision recorded)/reversal of taxes pertaining to earlier periods, amounting to ₹ 548 and ₹ 463 for the three months ended December 31, 2021 and 2022, and ₹ 3,768 and ₹ 755 for the nine months ended December 31, 2021 and 2022.
20. Revenues
The tables below present disaggregated revenue from contracts with customers by business segment, sector and nature of contract. The Company believes that the below disaggregation best depicts the nature, amount, timing and uncertainty of revenue and cash flows from economic factors.
20
Information on disaggregation of revenues for the three months ended December 31, 2021 is as follows:
IT Services | IT Products | ISRE | Total | |||||||||||||||||||||||||||||
Americas 1 | Americas 2 | Europe | APMEA | Total | ||||||||||||||||||||||||||||
A. Revenue |
||||||||||||||||||||||||||||||||
Rendering of services |
₹ | 56,356 | ₹ | 60,727 | ₹ | 59,232 | ₹ | 23,429 | ₹ | 199,744 | ₹ | | ₹ | 1,623 | ₹ | 201,367 | ||||||||||||||||
Sale of products |
| | | | | 1,769 | | 1,769 | ||||||||||||||||||||||||
|
|
|
|
|
|
|
|
|
|
|
|
|
|
|
|
|||||||||||||||||
₹ | 56,356 | ₹ | 60,727 | ₹ | 59,232 | ₹ | 23,429 | ₹ | 199,744 | ₹ | 1,769 | ₹ | 1,623 | ₹ | 203,136 | |||||||||||||||||
|
|
|
|
|
|
|
|
|
|
|
|
|
|
|
|
|||||||||||||||||
B. Revenue by sector |
||||||||||||||||||||||||||||||||
Banking, Financial Services and Insurance |
₹ | 923 | ₹ | 37,710 | ₹ | 23,724 | ₹ | 7,870 | ₹ | 70,227 | ||||||||||||||||||||||
Health |
18,871 | 37 | 3,790 | 918 | 23,616 | |||||||||||||||||||||||||||
Consumer |
23,354 | 680 | 8,003 | 3,280 | 35,317 | |||||||||||||||||||||||||||
Communications |
2,608 | 301 | 3,287 | 3,802 | 9,998 | |||||||||||||||||||||||||||
Energy, Natural Resources and Utilities |
176 | 8,482 | 9,919 | 4,808 | 23,385 | |||||||||||||||||||||||||||
Manufacturing |
63 | 6,731 | 5,808 | 809 | 13,411 | |||||||||||||||||||||||||||
Technology |
10,361 | 6,786 | 4,701 | 1,942 | 23,790 | |||||||||||||||||||||||||||
|
|
|
|
|
|
|
|
|
|
|
|
|
|
|
|
|||||||||||||||||
₹ | 56,356 | ₹ | 60,727 | ₹ | 59,232 | ₹ | 23,429 | ₹ | 199,744 | ₹ | 1,769 | ₹ | 1,623 | ₹ | 203,136 | |||||||||||||||||
|
|
|
|
|
|
|
|
|
|
|
|
|
|
|
|
|||||||||||||||||
C. Revenue by nature of contract |
||||||||||||||||||||||||||||||||
Fixed price and volume based |
₹ | 31,075 | ₹ | 33,931 | ₹ | 35,575 | ₹ | 14,386 | ₹ | 114,967 | ₹ | | ₹ | 1,262 | ₹ | 116,229 | ||||||||||||||||
Time and materials |
25,281 | 26,796 | 23,657 | 9,043 | 84,777 | | 361 | 85,138 | ||||||||||||||||||||||||
Products |
| | | | | 1,769 | | 1,769 | ||||||||||||||||||||||||
|
|
|
|
|
|
|
|
|
|
|
|
|
|
|
|
|||||||||||||||||
₹ | 56,356 | ₹ | 60,727 | ₹ | 59,232 | ₹ | 23,429 | ₹ | 199,744 | ₹ | 1,769 | ₹ | 1,623 | ₹ | 203,136 | |||||||||||||||||
|
|
|
|
|
|
|
|
|
|
|
|
|
|
|
|
Information on disaggregation of revenues for the three months ended December 31, 2022 is as follows:
IT Services | IT Products | ISRE | Total | |||||||||||||||||||||||||||||
Americas 1 | Americas 2 | Europe | APMEA | Total | ||||||||||||||||||||||||||||
A. Revenue |
||||||||||||||||||||||||||||||||
Rendering of services |
₹ | 67,436 | ₹ | 70,746 | ₹ | 65,882 | ₹ | 25,102 | ₹ | 229,166 | ₹ | | ₹ | 1,403 | ₹ | 230,569 | ||||||||||||||||
Sale of products |
| | | | | 1,721 | | 1,721 | ||||||||||||||||||||||||
|
|
|
|
|
|
|
|
|
|
|
|
|
|
|
|
|||||||||||||||||
₹ | 67,436 | ₹ | 70,746 | ₹ | 65,882 | ₹ | 25,102 | ₹ | 229,166 | ₹ | 1,721 | ₹ | 1,403 | ₹ | 232,290 | |||||||||||||||||
|
|
|
|
|
|
|
|
|
|
|
|
|
|
|
|
|||||||||||||||||
B. Revenue by sector |
||||||||||||||||||||||||||||||||
Banking, Financial Services and Insurance |
₹ | 1,360 | ₹ | 43,779 | ₹ | 26,806 | ₹ | 8,217 | ₹ | 80,162 | ||||||||||||||||||||||
Health |
21,461 | 65 | 4,756 | 1,091 | 27,373 | |||||||||||||||||||||||||||
Consumer |
28,556 | 1,032 | 9,538 | 4,197 | 43,323 | |||||||||||||||||||||||||||
Communications |
3,417 | 358 | 3,457 | 3,402 | 10,634 | |||||||||||||||||||||||||||
Energy, Natural Resources and Utilities |
159 | 10,014 | 10,224 | 5,712 | 26,109 | |||||||||||||||||||||||||||
Manufacturing |
65 | 8,531 | 6,301 | 895 | 15,792 | |||||||||||||||||||||||||||
Technology |
12,418 | 6,967 | 4,800 | 1,588 | 25,773 | |||||||||||||||||||||||||||
|
|
|
|
|
|
|
|
|
|
|
|
|
|
|
|
|||||||||||||||||
₹ | 67,436 | ₹ | 70,746 | ₹ | 65,882 | ₹ | 25,102 | ₹ | 229,166 | ₹ | 1,721 | ₹ | 1,403 | ₹ | 232,290 | |||||||||||||||||
|
|
|
|
|
|
|
|
|
|
|
|
|
|
|
|
|||||||||||||||||
C. Revenue by nature of contract |
||||||||||||||||||||||||||||||||
Fixed price and volume based |
₹ | 38,871 | ₹ | 36,334 | ₹ | 37,683 | ₹ | 14,659 | ₹ | 127,547 | ₹ | | ₹ | 1,121 | ₹ | 128,668 | ||||||||||||||||
Time and materials |
28,565 | 34,412 | 28,199 | 10,443 | 101,619 | | 282 | 101,901 | ||||||||||||||||||||||||
Products |
| | | | | 1,721 | | 1,721 | ||||||||||||||||||||||||
|
|
|
|
|
|
|
|
|
|
|
|
|
|
|
|
|||||||||||||||||
₹ | 67,436 | ₹ | 70,746 | ₹ | 65,882 | ₹ | 25,102 | ₹ | 229,166 | ₹ | 1,721 | ₹ | 1,403 | ₹ | 232,290 | |||||||||||||||||
|
|
|
|
|
|
|
|
|
|
|
|
|
|
|
|
21
Information on disaggregation of revenues for the nine months ended December 31, 2021 is as follows:
IT Services | IT Products | ISRE | Total | |||||||||||||||||||||||||||||
Americas 1 | Americas 2 | Europe | APMEA | Total | ||||||||||||||||||||||||||||
A. Revenue |
||||||||||||||||||||||||||||||||
Rendering of services |
₹ | 158,764 | ₹ | 174,469 | ₹ | 171,624 | ₹ | 67,076 | ₹ | 571,933 | ₹ | | ₹ | 5,427 | ₹ | 577,360 | ||||||||||||||||
Sale of products |
| | | | | 4,974 | | 4,974 | ||||||||||||||||||||||||
|
|
|
|
|
|
|
|
|
|
|
|
|
|
|
|
|||||||||||||||||
₹ | 158,764 | ₹ | 174,469 | ₹ | 171,624 | ₹ | 67,076 | ₹ | 571,933 | ₹ | 4,974 | ₹ | 5,427 | ₹ | 582,334 | |||||||||||||||||
|
|
|
|
|
|
|
|
|
|
|
|
|
|
|
|
|||||||||||||||||
B. Revenue by sector |
||||||||||||||||||||||||||||||||
Banking, Financial Services and Insurance |
₹ | 1,665 | ₹ | 105,518 | ₹ | 68,034 | ₹ | 22,033 | ₹ | 197,250 | ||||||||||||||||||||||
Health |
54,446 | 82 | 10,365 | 2,510 | 67,403 | |||||||||||||||||||||||||||
Consumer |
65,509 | 1,852 | 23,330 | 9,036 | 99,727 | |||||||||||||||||||||||||||
Communications |
6,941 | 898 | 9,651 | 11,276 | 28,766 | |||||||||||||||||||||||||||
Energy, Natural Resources and Utilities |
498 | 26,863 | 29,004 | 14,359 | 70,724 | |||||||||||||||||||||||||||
Manufacturing |
170 | 19,054 | 17,391 | 2,303 | 38,918 | |||||||||||||||||||||||||||
Technology |
29,535 | 20,202 | 13,849 | 5,559 | 69,145 | |||||||||||||||||||||||||||
|
|
|
|
|
|
|
|
|
|
|
|
|
|
|
|
|||||||||||||||||
₹ | 158,764 | ₹ | 174,469 | ₹ | 171,624 | ₹ | 67,076 | ₹ | 571,933 | ₹ | 4,974 | ₹ | 5,427 | ₹ | 582,334 | |||||||||||||||||
|
|
|
|
|
|
|
|
|
|
|
|
|
|
|
|
|||||||||||||||||
C. Revenue by nature of contract |
||||||||||||||||||||||||||||||||
Fixed price and volume based |
₹ | 86,788 | ₹ | 98,557 | ₹ | 103,967 | ₹ | 42,047 | ₹ | 331,359 | ₹ | | ₹ | 4,305 | ₹ | 335,664 | ||||||||||||||||
Time and materials |
71,976 | 75,912 | 67,657 | 25,029 | 240,574 | | 1,122 | 241,696 | ||||||||||||||||||||||||
Products |
| | | | | 4,974 | | 4,974 | ||||||||||||||||||||||||
|
|
|
|
|
|
|
|
|
|
|
|
|
|
|
|
|||||||||||||||||
₹ | 158,764 | ₹ | 174,469 | ₹ | 171,624 | ₹ | 67,076 | ₹ | 571,933 | ₹ | 4,974 | ₹ | 5,427 | ₹ | 582,334 | |||||||||||||||||
|
|
|
|
|
|
|
|
|
|
|
|
|
|
|
|
Information on disaggregation of revenues for the nine months ended December 31, 2022 is as follows:
IT Services | IT Products | ISRE | Total | |||||||||||||||||||||||||||||
Americas 1 | Americas 2 | Europe | APMEA | Total | ||||||||||||||||||||||||||||
A. Revenue |
||||||||||||||||||||||||||||||||
Rendering of services |
₹ | 193,956 | ₹ | 206,756 | ₹ | 188,197 | ₹ | 74,643 | ₹ | 663,552 | ₹ | | ₹ | 4,505 | ₹ | 668,057 | ||||||||||||||||
Sale of products |
| | | | | 4,916 | | 4,916 | ||||||||||||||||||||||||
|
|
|
|
|
|
|
|
|
|
|
|
|
|
|
|
|||||||||||||||||
₹ | 193,956 | ₹ | 206,756 | ₹ | 188,197 | ₹ | 74,643 | ₹ | 663,552 | ₹ | 4,916 | ₹ | 4,505 | ₹ | 672,973 | |||||||||||||||||
|
|
|
|
|
|
|
|
|
|
|
|
|
|
|
|
|||||||||||||||||
B. Revenue by sector |
||||||||||||||||||||||||||||||||
Banking, Financial Services and Insurance |
₹ | 3,746 | ₹ | 127,925 | ₹ | 76,543 | ₹ | 25,102 | ₹ | 233,316 | ||||||||||||||||||||||
Health |
60,909 | 176 | 13,180 | 2,997 | 77,262 | |||||||||||||||||||||||||||
Consumer |
82,009 | 2,924 | 27,516 | 11,873 | 124,322 | |||||||||||||||||||||||||||
Communications |
10,090 | 1,062 | 9,957 | 10,907 | 32,016 | |||||||||||||||||||||||||||
Energy, Natural Resources and Utilities |
571 | 28,955 | 29,104 | 16,033 | 74,663 | |||||||||||||||||||||||||||
Manufacturing |
132 | 24,874 | 17,859 | 2,560 | 45,425 | |||||||||||||||||||||||||||
Technology |
36,499 | 20,840 | 14,038 | 5,171 | 76,548 | |||||||||||||||||||||||||||
|
|
|
|
|
|
|
|
|
|
|
|
|
|
|
|
|||||||||||||||||
₹ | 193,956 | ₹ | 206,756 | ₹ | 188,197 | ₹ | 74,643 | ₹ | 663,552 | ₹ | 4,916 | ₹ | 4,505 | ₹ | 672,973 | |||||||||||||||||
|
|
|
|
|
|
|
|
|
|
|
|
|
|
|
|
|||||||||||||||||
C. Revenue by nature of contract |
||||||||||||||||||||||||||||||||
Fixed price and volume based |
₹ | 112,067 | ₹ | 105,314 | ₹ | 106,536 | ₹ | 43,428 | ₹ | 367,345 | ₹ | | ₹ | 3,484 | ₹ | 370,829 | ||||||||||||||||
Time and materials |
81,889 | 101,442 | 81,661 | 31,215 | 296,207 | | 1,021 | 297,228 | ||||||||||||||||||||||||
Products |
| | | | | 4,916 | | 4,916 | ||||||||||||||||||||||||
|
|
|
|
|
|
|
|
|
|
|
|
|
|
|
|
|||||||||||||||||
₹ | 193,956 | ₹ | 206,756 | ₹ | 188,197 | ₹ | 74,643 | ₹ | 663,552 | ₹ | 4,916 | ₹ | 4,505 | ₹ | 672,973 | |||||||||||||||||
|
|
|
|
|
|
|
|
|
|
|
|
|
|
|
|
22
21. Expenses by nature
Three months ended December 31, | Nine months ended December 31, | |||||||||||||||
2021 | 2022 | 2021 | 2022 | |||||||||||||
Employee compensation |
₹ | 114,860 | ₹ | 136,173 | ₹ | 328,773 | ₹ | 399,568 | ||||||||
Sub-contracting and technical fees |
28,190 | 28,486 | 80,086 | 87,071 | ||||||||||||
Cost of hardware and software |
1,705 | 1,967 | 5,083 | 5,438 | ||||||||||||
Travel |
2,281 | 3,773 | 5,361 | 9,880 | ||||||||||||
Facility expenses |
6,352 | 8,018 | 18,222 | 24,072 | ||||||||||||
Depreciation, amortization and impairment (1) |
7,459 | 9,229 | 23,566 | 24,936 | ||||||||||||
Communication |
1,391 | 1,467 | 4,371 | 4,506 | ||||||||||||
Legal and professional fees |
2,015 | 2,091 | 5,942 | 5,663 | ||||||||||||
Rates, taxes and insurance |
1,175 | 1,741 | 3,208 | 4,440 | ||||||||||||
Marketing and brand building |
499 | 679 | 1,434 | 2,223 | ||||||||||||
Lifetime expected credit loss/ (write-back) |
(203 | ) | 101 | (408 | ) | ^ | ||||||||||
Miscellaneous expenses (2) |
3,078 | 2,320 | 6,980 | 6,629 | ||||||||||||
|
|
|
|
|
|
|
|
|||||||||
Total cost of revenues, selling and marketing expenses and general and administrative expenses |
₹ | 168,802 | ₹ | 196,045 | ₹ | 482,618 | ₹ | 574,426 | ||||||||
|
|
|
|
|
|
|
|
^ | Value is less than 1 |
(1) | Includes impairment charge of ₹ 1,166 for the three and nine months ended December 31, 2022, on account of revision in recoverable value of customer-relationship intangible assets and marketing related intangible assets recognized on business combinations, due to decline in revenue and earnings estimates. (Refer to Note 6) |
22. Finance expenses
Three months ended December 31, | Nine months ended December 31, | |||||||||||||||
2021 | 2022 | 2021 | 2022 | |||||||||||||
Interest expense |
₹ | 1,403 | ₹ | 2,902 | ₹ | 3,608 | ₹ | 7,217 | ||||||||
|
|
|
|
|
|
|
|
|||||||||
₹ | 1,403 | ₹ | 2,902 | ₹ | 3,608 | ₹ | 7,217 | |||||||||
|
|
|
|
|
|
|
|
23. Finance and other income and Foreign exchange gains/(losses), net
Three months ended December 31, | Nine months ended December 31, | |||||||||||||||
2021 | 2022 | 2021 | 2022 | |||||||||||||
Interest income |
₹ | 3,185 | ₹ | 4,570 | ₹ | 9,493 | ₹ | 11,900 | ||||||||
Dividend income |
| 1 | 2 | 3 | ||||||||||||
Exchange fluctuation gain on foreign currency borrowings |
| | 1,485 | | ||||||||||||
Net gain from investments classified as FVTPL |
392 | 422 | 965 | 836 | ||||||||||||
Net gain/(loss) from investments classified as FVTOCI |
1 | (1 | ) | 366 | (17 | ) | ||||||||||
|
|
|
|
|
|
|
|
|||||||||
Finance and other income |
₹ | 3,578 | ₹ | 4,992 | ₹ | 12,311 | ₹ | 12,722 | ||||||||
|
|
|
|
|
|
|
|
|||||||||
Foreign exchange gains/(losses), net, on financial instruments measured at FVTPL |
₹ | 1,224 | ₹ | (3,396 | ) | ₹ | 1,549 | ₹ | (5,716 | ) | ||||||
Other foreign exchange gains/(losses), net |
(37 | ) | 4,787 | 1,731 | 9,198 | |||||||||||
|
|
|
|
|
|
|
|
|||||||||
Foreign exchange gains/(losses), net |
₹ | 1,187 | ₹ | 1,391 | ₹ | 3,280 | ₹ | 3,482 | ||||||||
|
|
|
|
|
|
|
|
24. Earnings per share:
A reconciliation of profit for the period and equity shares used in the computation of basic and diluted earnings per equity share is set out below:
Basic: Basic earnings per share is calculated by dividing the profit attributable to equity shareholders of the Company by the weighted average number of equity shares outstanding during the period, excluding equity shares purchased by the Company and held as treasury shares.
Three months ended December 31, | Nine months ended December 31, | |||||||||||||||
2021 | 2022 | 2021 | 2022 | |||||||||||||
Profit attributable to equity holders of the Company |
₹ | 29,690 | ₹ | 30,529 | ₹ | 91,318 | ₹ | 82,755 | ||||||||
Weighted average number of equity shares outstanding |
5,467,954,878 | 5,480,138,169 | 5,465,359,077 | 5,475,982,068 | ||||||||||||
|
|
|
|
|
|
|
|
|||||||||
Basic earnings per share |
₹ | 5.43 | ₹ | 5.57 | ₹ | 16.71 | ₹ | 15.12 | ||||||||
|
|
|
|
|
|
|
|
Diluted: Diluted earnings per share is calculated by adjusting the weighted average number of equity shares outstanding during the period for assumed conversion of all dilutive potential equity shares. Employee share options are dilutive potential equity shares for the Company.
23
The calculation is performed in respect of share options to determine the number of shares that could have been acquired at fair value (determined as the average market price of the Companys shares during the period). The number of shares calculated as above is compared with the number of shares that would have been issued assuming the exercise of the share options.
Three months ended December 31, | Nine months ended December 31, | |||||||||||||||
2021 | 2022 | 2021 | 2022 | |||||||||||||
Profit attributable to equity holders of the Company |
₹ | 29,690 | ₹ | 30,529 | ₹ | 91,318 | ₹ | 82,755 | ||||||||
Weighted average number of equity shares outstanding |
5,467,954,878 | 5,480,138,169 | 5,465,359,077 | 5,475,982,068 | ||||||||||||
Effect of dilutive equivalent share options |
13,249,943 | 5,887,706 | 13,407,535 | 11,501,109 | ||||||||||||
|
|
|
|
|
|
|
|
|||||||||
Weighted average number of equity shares for diluted earnings per share |
5,481,204,821 | 5,486,025,875 | 5,478,766,612 | 5,487,483,177 | ||||||||||||
|
|
|
|
|
|
|
|
|||||||||
Diluted earnings per share |
₹ | 5.42 | ₹ | 5.56 | ₹ | 16.67 | ₹ | 15.08 | ||||||||
|
|
|
|
|
|
|
|
25. Employee compensation
Three months ended December 31, | Nine months ended December 31, | |||||||||||||||
2021 | 2022 | 2021 | 2022 | |||||||||||||
Salaries and bonus |
₹ | 110,094 | ₹ | 130,325 | ₹ | 314,754 | ₹ | 381,767 | ||||||||
Employee benefits plans |
3,961 | 4,754 | 11,585 | 14,140 | ||||||||||||
Share-based compensation* |
805 | 1,094 | 2,434 | 3,661 | ||||||||||||
|
|
|
|
|
|
|
|
|||||||||
₹ | 114,860 | ₹ | 136,173 | ₹ | 328,773 | ₹ | 399,568 | |||||||||
|
|
|
|
|
|
|
|
* | Includes ₹ 36 and ₹ (8) for the nine months ended December 31, 2021, and 2022 respectively, towards cash settled ADS RSUs. |
The employee benefit cost is recognized in the following line items in the interim condensed consolidated statement of income:
Three months ended December 31, | Nine months ended December 31, | |||||||||||||||
2021 | 2022 | 2021 | 2022 | |||||||||||||
Cost of revenues |
₹ | 97,347 | ₹ | 116,079 | ₹ | 279,119 | ₹ | 340,461 | ||||||||
Selling and marketing expenses |
10,897 | 12,289 | 30,541 | 34,807 | ||||||||||||
General and administrative expenses |
6,616 | 7,805 | 19,113 | 24,300 | ||||||||||||
|
|
|
|
|
|
|
|
|||||||||
₹ | 114,860 | ₹ | 136,173 | ₹ | 328,773 | ₹ | 399,568 | |||||||||
|
|
|
|
|
|
|
|
The Company has granted 2,223,845 and 2,506,860 options under RSU option plan during the three and nine months ended December 31, 2022 (1,235,938 and 1,316,899 for the three and nine months December 31, 2021); 6,234,477 and 7,877,090 options under ADS option plan during the three and nine months ended December 31, 2022 (2,831,623 and 3,649,391 for the three and nine months ended December 31, 2021).
The Company has also granted Nil Performance based stock options (RSU) during the three and nine months ended December 31, 2022, respectively (1,134,173 for the three and nine months ended December 31, 2021); Nil Performance based stock options (ADS) during the three and nine months ended December 31, 2022, respectively (2,121,329 for three and nine months ended December 31, 2021).
The RSU grants were issued under Wipro Employee Restricted Stock Unit plan 2007 (WSRUP 2007 plan) and the ADS grants were issued under Wipro ADS Restricted Stock Unit Plan (WARSUP 2004 plan).
26. Other operating income
During the nine months ended December 31, 2021, as a result of acquisition by another investor, the Company sold its investment in Ensono Holdings, LLC for a consideration of ₹ 5,614 and recognized a cumulative gain of ₹ 1,249 (net of tax ₹ 429) in other comprehensive income being profit on sale of investment designated as FVTOCI. The Company also recognized ₹ 1,230 for the nine months ended December 31, 2021 under other operating income/(loss), net towards change in fair value of callable units pertaining to achievement of cumulative business targets.
During the nine months ended December 31, 2021, as a result of acquisition of by another investor, the Company sold its investment in Denim Group, Ltd. and Denim Group Management, LLC (Denim Group), accounted for using the equity method, for a consideration of ₹ 1,648 and recognized a cumulative gain of ₹ 949 in other operating income/(loss), net including reclassification of exchange differences on foreign currency translation.
27. Commitments and contingencies
Capital commitments: As at March 31, 2022 and December 31, 2022 the Company had committed to spend ₹ 11,376 and ₹ 8,055 respectively, under agreements to purchase/ construct property and equipment. These amounts are net of capital advances paid in respect of these purchases.
Guarantees: As at March 31, 2022 and December 31,2022, guarantees provided by banks on behalf of the Company to the Indian Government, customers and certain other agencies aggregate to ₹ 17,094 and ₹ 16,469 respectively, as part of the bank line of credit.
Contingencies and lawsuits: The Company is subject to legal proceedings and claims resulting from tax assessment orders/ penalty notices issued under the Income Tax Act, 1961, which have arisen in the ordinary course of its business. Some of the claims involve complex issues and it is not possible to make a reasonable estimate of the expected financial effect, if any, that will result from ultimate resolution of such proceedings. However, the resolution of these legal proceedings is not likely to have a material and adverse effect on the results of operations or the financial position of the Company.
24
The Companys assessments are completed for the years up to March 31, 2019. The Company has received demands on multiple tax issues. These claims are primarily arising out of denial of deduction under section 10A of the Income Tax Act, 1961 in respect of profit earned by the Companys undertaking in Software Technology Park at Bengaluru, the appeals filed against the said demand before the Appellate authorities have been allowed in favor of the Company by the second appellate authority for the years up to March 31, 2008 which either has been or may be contested by the Income tax authorities before the Honble Supreme Court of India. Other claims relate to disallowance of tax benefits on profits earned from Software Technology Park and Special Economic Zone units, capitalization of research and development expenses, transfer pricing adjustments on intercompany / inter unit transactions and other issues.
Income tax claims against the Company amounting to ₹ 92,476 and ₹ 94,230 are not acknowledged as debt as at March 31, 2022 and December 31, 2022, respectively. These matters are pending before various Appellate Authorities and the management expects its position will likely be upheld on ultimate resolution and will not have a material adverse effect on the Companys financial position and results of operations.
The contingent liability in respect of disputed demands for excise duty, custom duty, sales tax and other matters amounting to ₹ 12,092 and ₹ 12,001 as of March 31, 2022, and December 31, 2022, respectively. However, the resolution of these disputed demands is not likely to have a material and adverse effect on the results of operations or the financial position of the Company.
The Honble Supreme Court of India, through a ruling in February 2019, provided interpretation on the components of Salary on which the Company and its employees are to contribute towards Provident Fund under the Employees Provident Fund Act. Based on the current evaluation, the Company believes it is not probable that certain components of Salary paid by the Company will be subject to contribution towards Provident Fund due to the Honble Supreme Court order. The Company will continue to monitor and evaluate its position based on future events and developments.
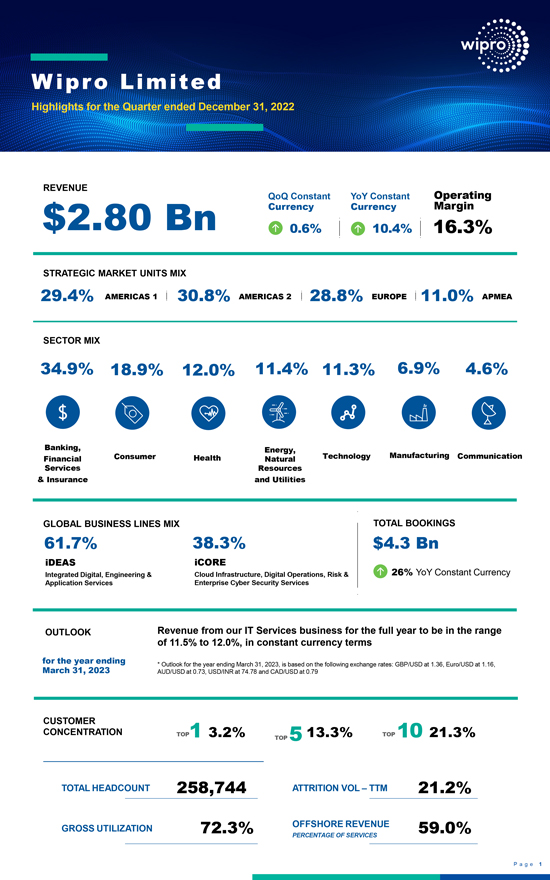
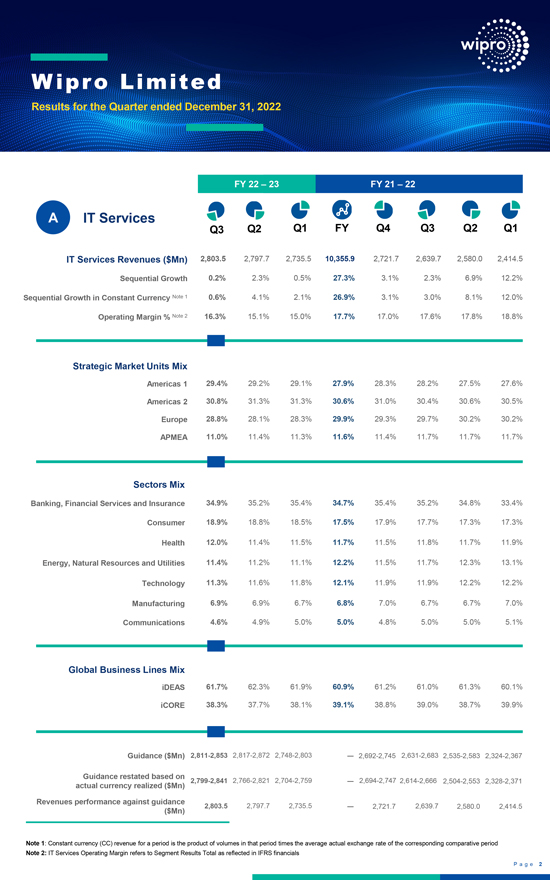
28. Segment information
The Company is organized into the following operating segments: IT Services, IT Products and India State Run Enterprise segment (ISRE).
IT Services: The IT Services segment primarily consists of IT services offerings to customers organized by four Strategic Market Units (SMUs) - Americas 1, Americas 2, Europe and Asia Pacific Middle East Africa (APMEA). Americas 1 and Americas 2 are primarily organized by industry sector, while Europe and APMEA are organized by countries.
Americas 1 includes the entire business of Latin America (LATAM) and the following industry sectors in the United States of America: healthcare and medical devices, consumer goods and life sciences, retail, transportation and services, communications, media and information services, technology products and platforms. Americas 2 includes the entire business in Canada and the following industry sectors in the United States of America: banking, financial services and insurance, manufacturing, hi-tech, energy and utilities. Europe consists of the United Kingdom and Ireland, Switzerland, Germany, Benelux, the Nordics and Southern Europe. APMEA consists of Australia and New Zealand, India, Middle East, South East Asia, Japan and Africa.
Revenue from each customer is attributed to the respective SMUs based on the location of the customers primary buying center of such services. With respect to certain strategic global customers, revenue may be generated from multiple countries based on such customers buying centers, but the total revenue related to these strategic global customers are attributed to a single SMU based on the geographical location of key decision makers.
Our IT Services segment provides a range of IT and IT enabled services which include digital strategy advisory, customer centric design, technology consulting, IT consulting, custom application design, development, re-engineering and maintenance, systems integration, package implementation, cloud and infrastructure services, business process services, cloud, mobility and analytics services, research and development and hardware and software design.
IT Products: The Company is a value-added reseller of security, packaged and SaaS software for leading international brands. In certain total outsourcing contracts of the IT Services segment, the Company delivers hardware, software products and other related deliverables. Revenue relating to these items is reported as revenue from the sale of IT Products.
ISRE: This segment consists of IT Services offerings to entities and/or departments owned or controlled by Government of India and/or any State Governments.
The Chairman of the Company has been identified as the Chief Operating Decision Maker (CODM) as defined by IFRS 8, Operating Segments. The Chairman of the Company evaluates the segments based on their revenue growth and operating income.
Assets and liabilities used in the Companys business are not identified to any of the operating segments, as these are used interchangeably between segments. Management believes that it is currently not practicable to provide segment disclosures relating to total assets and liabilities since a meaningful segregation of the available data is onerous.
25
Information on reportable segments for the three months ended December 31, 2021, is as follows:
IT Services | IT Products | ISRE | Reconciling Items |
Total | ||||||||||||||||||||||||||||||||
Americas 1 | Americas 2 | Europe | APMEA | Total | ||||||||||||||||||||||||||||||||
Revenue |
₹ | 56,644 | ₹ | 61,076 | ₹ | 59,620 | ₹ | 23,596 | ₹ | 200,936 | ₹ | 1,767 | ₹ | 1,623 | ₹ | (3 | ) | ₹ | 204,323 | |||||||||||||||||
Other operating income |
| | | | 14 | | | | 14 | |||||||||||||||||||||||||||
Segment Result |
11,390 | 12,057 | 9,172 | 2,483 | 35,102 | 96 | 134 | 16 | 35,348 | |||||||||||||||||||||||||||
Unallocated |
173 | | | | 173 | |||||||||||||||||||||||||||||||
|
|
|
|
|
|
|
|
|
|
|||||||||||||||||||||||||||
Segment Result Total |
₹ | 35,289 | ₹ | 96 | ₹ | 134 | ₹ | 16 | ₹ | 35,535 | ||||||||||||||||||||||||||
Finance expenses |
(1,403 | ) | ||||||||||||||||||||||||||||||||||
Finance and other income |
3,578 | |||||||||||||||||||||||||||||||||||
Share of net profit/(loss) of associates accounted for using the equity method |
76 | |||||||||||||||||||||||||||||||||||
|
|
|||||||||||||||||||||||||||||||||||
Profit before tax |
₹ | 37,786 | ||||||||||||||||||||||||||||||||||
Income tax expense |
(8,063 | ) | ||||||||||||||||||||||||||||||||||
|
|
|||||||||||||||||||||||||||||||||||
Profit for the period |
₹ | 29,723 | ||||||||||||||||||||||||||||||||||
|
|
|||||||||||||||||||||||||||||||||||
Depreciation, amortization and impairment |
₹ | 7,459 | ||||||||||||||||||||||||||||||||||
|
|
Information on reportable segments for the three months ended December 31, 2022, is as follows:
IT Services | IT Products | ISRE | Reconciling Items |
Total | ||||||||||||||||||||||||||||||||
Americas 1 | Americas 2 | Europe | APMEA | Total | ||||||||||||||||||||||||||||||||
Revenue |
₹ | 67,788 | ₹ | 71,168 | ₹ | 66,323 | ₹ | 25,278 | ₹ | 230,557 | ₹ | 1,721 | ₹ | 1,403 | ₹ | | ₹ | 233,681 | ||||||||||||||||||
Other operating income |
| | | | | | | | | |||||||||||||||||||||||||||
Segment Result |
12,986 | 14,776 | 9,485 | 2,476 | 39,723 | 41 | 102 | (11 | ) | 39,855 | ||||||||||||||||||||||||||
Unallocated |
(2,219 | ) | | | | (2,219 | ) | |||||||||||||||||||||||||||||
|
|
|
|
|
|
|
|
|
|
|||||||||||||||||||||||||||
Segment Result Total |
₹ | 37,504 | ₹ | 41 | ₹ | 102 | ₹ | (11 | ) | ₹ | 37,636 | |||||||||||||||||||||||||
Finance expenses |
(2,902 | ) | ||||||||||||||||||||||||||||||||||
Finance and other income |
4,992 | |||||||||||||||||||||||||||||||||||
Share of net profit/(loss) of associates accounted for using the equity method |
26 | |||||||||||||||||||||||||||||||||||
|
|
|||||||||||||||||||||||||||||||||||
Profit before tax |
₹ | 39,752 | ||||||||||||||||||||||||||||||||||
Income tax expense |
(9,102 | ) | ||||||||||||||||||||||||||||||||||
|
|
|||||||||||||||||||||||||||||||||||
Profit for the period |
₹ | 30,650 | ||||||||||||||||||||||||||||||||||
|
|
|||||||||||||||||||||||||||||||||||
Depreciation, amortization and impairment |
₹ | 9,229 | ||||||||||||||||||||||||||||||||||
|
|
26
Information on reportable segments for the nine months ended December 31, 2021, is as follows:
IT Services | IT Products | ISRE | Reconciling Items |
Total | ||||||||||||||||||||||||||||||||
Americas 1 | Americas 2 | Europe | APMEA | Total | ||||||||||||||||||||||||||||||||
Revenue |
₹ | 159,532 | ₹ | 175,441 | ₹ | 172,700 | ₹ | 67,543 | ₹ | 575,216 | ₹ | 4,972 | ₹ | 5,427 | ₹ | (1 | ) | ₹ | 585,614 | |||||||||||||||||
Other operating income/(loss), net |
| | | | 2,179 | | | | 2,179 | |||||||||||||||||||||||||||
Segment Result |
31,290 | 35,226 | 26,683 | 8,577 | 101,776 | 137 | 1,002 | 8 | 102,923 | |||||||||||||||||||||||||||
Unallocated |
73 | | | | 73 | |||||||||||||||||||||||||||||||
|
|
|
|
|
|
|
|
|
|
|||||||||||||||||||||||||||
Segment Result Total |
₹ | 104,028 | ₹ | 137 | ₹ | 1,002 | ₹ | 8 | ₹ | 105,175 | ||||||||||||||||||||||||||
Finance expense |
(3,608 | ) | ||||||||||||||||||||||||||||||||||
Finance and other income |
12,311 | |||||||||||||||||||||||||||||||||||
Share of net profit/(loss) of associates accounted for using the equity method |
73 | |||||||||||||||||||||||||||||||||||
|
|
|||||||||||||||||||||||||||||||||||
Profit before tax |
₹ | 113,951 | ||||||||||||||||||||||||||||||||||
Income tax expense |
(22,547 | ) | ||||||||||||||||||||||||||||||||||
|
|
|||||||||||||||||||||||||||||||||||
Profit for the period |
₹ | 91,404 | ||||||||||||||||||||||||||||||||||
|
|
|||||||||||||||||||||||||||||||||||
Depreciation, amortization and impairment |
₹ | 23,566 | ||||||||||||||||||||||||||||||||||
|
|
Information on reportable segments for the nine months ended December 31, 2022, is as follows:
IT Services | IT Products | ISRE | Reconciling Items |
Total | ||||||||||||||||||||||||||||||||
Americas 1 | Americas 2 | Europe | APMEA | Total | ||||||||||||||||||||||||||||||||
Revenue |
₹ | 194,840 | ₹ | 207,811 | ₹ | 189,283 | ₹ | 75,100 | ₹ | 667,034 | ₹ | 4,916 | ₹ | 4,505 | ₹ | | ₹ | 676,455 | ||||||||||||||||||
Other operating income/(loss), net |
| | | | | | | | | |||||||||||||||||||||||||||
Segment Result |
36,374 | 41,449 | 24,734 | 6,274 | 108,831 | (117 | ) | 421 | (1,412 | ) | 107,723 | |||||||||||||||||||||||||
Unallocated |
(5,694 | ) | | | | (5,694 | ) | |||||||||||||||||||||||||||||
|
|
|
|
|
|
|
|
|
|
|||||||||||||||||||||||||||
Segment Result Total |
₹ | 103,137 | ₹ | (117 | ) | ₹ | 421 | ₹ | (1,412 | ) | ₹ | 102,029 | ||||||||||||||||||||||||
Finance expense |
(7,217 | ) | ||||||||||||||||||||||||||||||||||
Finance and other income |
12,722 | |||||||||||||||||||||||||||||||||||
Share of net profit/(loss) of associates accounted for using the equity method |
(61 | ) | ||||||||||||||||||||||||||||||||||
|
|
|||||||||||||||||||||||||||||||||||
Profit before tax |
₹ | 107,473 | ||||||||||||||||||||||||||||||||||
Income tax expense |
(24,743 | ) | ||||||||||||||||||||||||||||||||||
|
|
|||||||||||||||||||||||||||||||||||
Profit for the period |
₹ | 82,730 | ||||||||||||||||||||||||||||||||||
|
|
|||||||||||||||||||||||||||||||||||
Depreciation, amortization and impairment |
₹ | 24,936 | ||||||||||||||||||||||||||||||||||
|
|
27
Revenues from India, being Companys country of domicile, is ₹ 6,620 and ₹ 6,267 for three months ended December 31, 2021, and 2022, respectively and ₹ 19,143 and ₹ 18,936 for nine months ended December 31, 2021, and 2022, respectively.
Revenues from United States of America and United Kingdom contributed more than 10% of Companys total revenues as per table below:
Three months ended December 31, |
Nine months ended December 31, |
|||||||||||||||
2021 | 2022 | 2021 | 2022 | |||||||||||||
United States of America |
₹ | 110,731 | ₹ | 130,648 | ₹ | 312,380 | ₹ | 378,447 | ||||||||
United Kingdom |
26,135 | 29,278 | 74,514 | ₹ | 83,637 | |||||||||||
|
|
|
|
|
|
|
|
|||||||||
₹ | 136,866 | ₹ | 159,926 | ₹ | 386,894 | ₹ | 462,084 | |||||||||
|
|
|
|
|
|
|
|
No customer individually accounted for more than 10% of the revenues during the three and nine months ended December 31, 2021, and 2022.
Management believes that it is currently not practicable to provide disclosure of geographical location wise assets, since the meaningful segregation of the available information is onerous.
Notes:
a) | Reconciling items includes elimination of inter-segment transactions and other corporate activities. |
b) | Revenue from sale of Company owned intellectual properties is reported as part of IT Services revenues. |
c) | For the purpose of segment reporting, the Company has included the impact of foreign exchange gains/(losses), net in revenues (which is reported as a part of operating profit in the interim condensed consolidated statement of income). |
d) | Other operating income of ₹ 14 and ₹ Nil is included as part of IT Services segment results for three months ended December 31, 2021 and 2022 respectively and ₹ 2,179 and ₹ Nil is included as part of IT Services segment results for nine months ended December 31, 2021 and 2022 respectively. (Refer to Note 26) |
e) | Restructuring cost of ₹ Nil and ₹ 29 is included under Reconciling items for the three months ended December 31, 2021 and 2022 respectively and ₹ Nil and ₹ 1,389 for the nine months ended December 31, 2021 and 2022 respectively. |
f) | Segment results of IT Services segment are after recognition of share-based compensation expense ₹ 805 and ₹ 1,094 for the three months ended December 31, 2021 and 2022, respectively and ₹ 2,434 and ₹ 3,661 for the nine months ended December 31, 2021 and 2022 respectively. |
29. List of subsidiaries and investments accounted for using equity method as at December 31, 2022 is provided below:
Subsidiaries |
Subsidiaries |
Subsidiaries |
Country of | |||
Attune Consulting India Private Limited | India | |||||
Capco Technologies Private Limited | India | |||||
Encore Theme Technologies Private Limited | India | |||||
Wipro Chengdu Limited | China | |||||
Wipro Holdings (UK) Limited | UK | |||||
Designit A/S | Denmark | |||||
Designit Denmark A/S | Denmark | |||||
Designit Germany GmbH | Germany | |||||
Designit Oslo A/S | Norway | |||||
Designit Spain Digital, S.L.U | Spain | |||||
Designit Sweden AB | Sweden | |||||
Designit T.L.V Ltd. | Israel | |||||
Wipro 4C NV | Belgium | |||||
Wipro 4C Consulting France SAS | France | |||||
Wipro 4C Danmark ApS | Denmark | |||||
Wipro 4C Nederland B.V | Netherlands | |||||
Wipro Weare4C UK Limited (1) | UK | |||||
Wipro Bahrain Limited Co. W.L.L | Bahrain | |||||
Wipro Financial Outsourcing Services Limited (Formerly known as Wipro Europe Limited) | UK | |||||
Wipro UK Limited | UK | |||||
Wipro Financial Services UK Limited | UK | |||||
Wipro Gulf LLC | Sultanate of Oman | |||||
Wipro IT Services S.R.L. | Romania |
28
Wipro HR Services India Private Limited | India | |||||
Wipro IT Services Bangladesh Limited | Bangladesh | |||||
Wipro IT Services UK Societas | UK | |||||
Grove Holdings 2 S.á.r.l | Luxembourg | |||||
Capco Brasil Serviços E Consultoria Em Informática Ltda | Brazil | |||||
The Capital Markets Company BV (3) | Belgium | |||||
PT. WT Indonesia | Indonesia | |||||
Rainbow Software LLC | Iraq | |||||
Wipro Arabia Limited (2) | Saudi Arabia | |||||
Womens Business Park Technologies Limited (2) | Saudi Arabia | |||||
Wipro Doha LLC | Qatar | |||||
Wipro Holdings Hungary Korlátolt Felelősségű Társaság | Hungary | |||||
Wipro Holdings Investment Korlátolt Felelősségű Társaság | Hungary | |||||
Wipro Information Technology Egypt SAE | Egypt | |||||
Wipro Information Technology Netherlands BV. | Netherlands | |||||
Wipro do Brasil Technologia Ltda (1) | Brazil | |||||
Wipro Information Technology Kazakhstan LLP | Kazakhstan | |||||
Wipro Outsourcing Services (Ireland) Limited | Ireland | |||||
Wipro Portugal S.A. (1) | Portugal | |||||
Wipro Solutions Canada Limited | Canada | |||||
Wipro Technologies Limited | Russia | |||||
Wipro Technologies Peru SAC | Peru | |||||
Wipro Technologies W.T. Sociedad Anonima | Costa Rica | |||||
Wipro Technology Chile SPA | Chile | |||||
Wipro IT Service Ukraine, LLC | Ukraine | |||||
Wipro IT Services Poland SP Z.O.O | Poland | |||||
Wipro Technologies Australia Pty Ltd | Australia | |||||
Wipro Ampion Holdings Pty Ltd (1) (Formerly known as Ampion Holdings Pty Ltd) | Australia | |||||
Wipro Technologies SA | Argentina | |||||
Wipro Technologies SA DE CV | Mexico | |||||
Wipro Technologies South Africa (Proprietary) Limited | South Africa | |||||
Wipro Technologies Nigeria Limited | Nigeria | |||||
Wipro Technologies SRL | Romania | |||||
Wipro (Thailand) Co. Limited | Thailand | |||||
Wipro Japan KK | Japan | |||||
Designit Tokyo Co., Ltd. | Japan | |||||
Wipro Networks Pte Limited | Singapore | |||||
Wipro (Dalian) Limited | China | |||||
Wipro Technologies SDN BHD | Malaysia | |||||
Wipro Overseas IT Services Private Limited | India | |||||
Wipro Philippines, Inc. | Philippines | |||||
Wipro Shanghai Limited | China | |||||
Wipro Trademarks Holding Limited | India | |||||
Wipro Travel Services Limited | India | |||||
Wipro VLSI Design Services India Private Limited | India | |||||
Wipro, LLC | USA |
29
Wipro Gallagher Solutions, LLC | USA | |||||
Wipro Insurance Solutions, LLC | USA | |||||
Wipro IT Services, LLC | USA | |||||
Cardinal US Holdings, Inc.(1) | USA | |||||
Convergence Acceleration Solutions, LLC | USA | |||||
Designit North America, Inc. | USA | |||||
Edgile, LLC | USA | |||||
HealthPlan Services, Inc. (1) | USA | |||||
Infocrossing, LLC | USA | |||||
International TechneGroup Incorporated (1) | USA | |||||
LeanSwift Solutions, Inc.(1) | USA | |||||
Rizing Intermediate Holdings, Inc. (1) | USA | |||||
Wipro Appirio, Inc. (1) | USA | |||||
Wipro Designit Services, Inc. (1) | USA | |||||
Wipro VLSI Design Services, LLC | USA |
The Company controls The Wipro SA Broad Based Ownership Scheme Trust, Wipro SA Broad Based Ownership Scheme SPV (RF) (PTY) LTD incorporated in South Africa and Wipro Foundation in India.
(2) | All the above direct subsidiaries are 100% held by the Company except that the Company holds 66.67% of the equity securities of Wipro Arabia Limited and 55% of the equity securities of Womens Business Park Technologies Limited are held by Wipro Arabia Limited. |
(1) | Step Subsidiary details of Wipro Ampion Holdings Pty Ltd, Cardinal US Holdings, Inc., HealthPlan Services, Inc., International TechneGroup Incorporated, LeanSwift Solutions, Inc., Rizing Intermediate Holdings, Inc., Wipro Appirio, Inc., Wipro Designit Services, Inc., Wipro do Brasil Technologia Ltda, Wipro Portugal S.A and Wipro Weare4C UK Limited are as follows: |
Subsidiaries |
Subsidiaries |
Subsidiaries |
Country of | |||
Wipro Ampion Holdings Pty Ltd (Formerly known as Ampion Holdings Pty Ltd) | Australia | |||||
Wipro Ampion Pty Ltd (Formerly known as Ampion Pty Ltd) | Australia | |||||
Wipro Iris Holdco Pty Ltd (3) (Formerly known as Iris Holdco Pty Ltd) | Australia | |||||
Wipro Revolution IT Pty Ltd (Formerly known as Revolution IT Pty Ltd) | Australia | |||||
Crowdsprint Pty Ltd | Australia | |||||
Wipro Shelde Australia Pty Ltd (Formerly known as Shelde Pty Ltd) | Australia | |||||
Cardinal US Holdings, Inc. | USA | |||||
ATOM Solutions LLC | USA | |||||
Capco Consulting Services LLC | USA | |||||
Capco RISC Consulting LLC | USA | |||||
The Capital Markets Company LLC | USA | |||||
HealthPlan Services, Inc. | USA | |||||
HealthPlan Services Insurance Agency, LLC | USA | |||||
International TechneGroup Incorporated | USA | |||||
International TechneGroup Ltd. | UK | |||||
ITI Proficiency Ltd | Israel | |||||
Wipro Italia S.R.L. | Italy | |||||
MechWorks S.R.L. | Italy | |||||
LeanSwift Solutions, Inc. | USA | |||||
LeanSwift AB | Sweden | |||||
LeanSwift Solutions, LLC | USA | |||||
Rizing Intermediate Holdings, Inc. | USA | |||||
Attune Lanka (Pvt) Ltd | Sri Lanka | |||||
Attune Netherlands B.V. (3) | Netherlands |
30
Rizing Intermediate LLC (3) | USA | |||||
Wipro Appirio, Inc. | USA | |||||
Wipro Appirio (Ireland) Limited | Ireland | |||||
Wipro Appirio UK Limited | UK | |||||
Wipro Appirio, K.K. | Japan | |||||
Topcoder, LLC. | USA | |||||
Wipro Designit Services, Inc. | USA | |||||
Wipro Designit Services Limited | Ireland | |||||
Wipro do Brasil Technologia Ltda | Brazil | |||||
Wipro do Brasil Servicos Ltda | Brazil | |||||
Wipro Do Brasil Sistemetas De Informatica Ltd | Brazil | |||||
Wipro Portugal S.A. | Portugal | |||||
Wipro Technologies GmbH | Germany | |||||
Wipro Business Solutions GmbH (3) | Germany | |||||
Wipro IT Services Austria GmbH | Austria | |||||
Wipro Weare4C UK Limited | UK | |||||
CloudSocius DMCC | United Arab Emirates | |||||
(3) Step Subsidiary details of Attune Netherlands B.V., Wipro Iris Holdco Pty Ltd, Rizing Intermediate LLC, The Capital Markets Company BV and Wipro Business Solutions GmbH are as follows:
| ||||||
Subsidiaries |
Subsidiaries |
Subsidiaries |
Country of Incorporation | |||
Attune Netherlands B.V. | Netherlands | |||||
Attune Australia Pty Ltd | Australia | |||||
Attune Consulting USA, Inc. | USA | |||||
Attune Germany GmbH | Germany | |||||
Attune Italia S.R.L | Italy | |||||
Attune Management LLC | USA | |||||
Attune UK Ltd. | UK | |||||
Wipro Iris Holdco Pty Ltd (Formerly known as Iris Holdco Pty Ltd) | Australia | |||||
Wipro Iris Bidco Pty Ltd (Formerly known as Iris Bidco Pty Ltd) | Australia | |||||
Rizing Intermediate LLC | USA | |||||
Rizing Canada Holdings Corp. | Canada | |||||
Rizing Solutions Canada Inc. | Canada | |||||
Rizing LLC (4) | USA | |||||
The Capital Markets Company BV | Belgium | |||||
CapAfric Consulting (Pty) Ltd | South Africa | |||||
Capco Belgium BV | Belgium | |||||
Capco Consultancy (Malaysia) Sdn. Bhd | Malaysia | |||||
Capco Consultancy (Thailand) Ltd | Thailand | |||||
Capco Consulting Singapore Pte. Ltd | Singapore | |||||
Capco Greece Single Member P.C | Greece | |||||
Capco Poland sp. z.o.o | Poland | |||||
The Capital Markets Company (UK) Ltd | UK | |||||
Capco (UK) 1, Limited | UK | |||||
The Capital Markets Company BV | Netherlands | |||||
The Capital Markets Company GmbH | Germany | |||||
Capco Austria GmbH | Austria | |||||
The Capital Markets Company Limited | Hong Kong | |||||
Capco Consulting Services (Guangzhou) Company Limited | China |
31
The Capital Markets Company Limited | Canada | |||||
Capco (Canada) GP ULC | Canada | |||||
The Capital Markets Company S.á.r.l | Switzerland | |||||
Andrion AG | Switzerland | |||||
The Capital Markets Company S.A.S | France | |||||
The Capital Markets Company s.r.o | Slovakia | |||||
Wipro Business Solutions GmbH | Germany | |||||
Wipro Technology Solutions S.R.L | Romania |
(4) | Step Subsidiary details of Rizing LLC is as follows: |
Subsidiaries |
Subsidiaries |
Subsidiaries |
Country of | |||
Rizing LLC | USA | |||||
Aasonn Philippines Inc. | Philippines | |||||
Rizing B.V. | Netherlands | |||||
Rizing Consulting Ireland Limited | Ireland | |||||
Rizing Consulting Pty Ltd. | Australia | |||||
Rizing Geospatial LLC | USA | |||||
Rizing GmbH | Germany | |||||
Rizing Limited | UK | |||||
Rizing Middle East DMCC | United Arab Emirates | |||||
Rizing Pte Ltd. | Singapore | |||||
Rizing New Zealand Ltd. | New Zealand | |||||
Rizing Philippines Inc. | Philippines | |||||
Rizing SDN BHD | Malaysia | |||||
Rizing Solutions Pty Ltd | Australia | |||||
Synchrony Global SDN BHD | Malaysia | |||||
Vesta Middle East FZE | United Arab Emirates |
As at December 31, 2022, the Company held 43.7% interest in Drivestream Inc., accounted for using the equity method.
The list of controlled trusts and firms are:
Name of the entity |
Country of incorporation | |
Capco (Canada) LP (5) | Canada | |
Wipro Equity Reward Trust | India | |
Wipro Foundation | India | |
(5) The Capital Markets Company Limited (Canada) and Capco (Canada) GP ULC act as Limited and General Partners, respectively. |
30. | The Indian Parliament has approved the Code on Social Security, 2020 which would impact the contributions by the Company towards Provident Fund and Gratuity. The Ministry of Labour and Employment has released draft rules for the Code on Social Security, 2020 on November 13, 2020, and has invited suggestions from stake holders which are under active consideration by the Ministry. Based on an initial assessment by the Company and its Indian subsidiaries, the additional impact on Provident Fund contributions by the Company and its Indian subsidiaries is not expected to be material, whereas, the likely additional impact on Gratuity liability / contributions by the Company and its Indian subsidiaries could be material. The Company and its Indian subsidiaries will complete their evaluation once the subject rules are notified and will give appropriate impact in the financial statements in the period in which, the Code becomes effective and the related rules to determine the financial impact are published. |
31. | On December 21, 2022, the Company sold 100% membership interests in Wipro Opus Risk Solutions LLC for upfront cash consideration of ₹ 53 and recognized a loss of ₹ 9 on disposal. |
32
32. | Events after the reporting period |
The Board of Directors in their meeting held on January 13, 2023, declared an interim dividend of ₹ 1 /- (USD 0.01) per equity share and ADR (50% on an equity share of par value of ₹ 2 /-)
As per our report of even date attached | For and on behalf of the Board of Directors | |||||
for Deloitte Haskins & Sells LLP | Rishad A. Premji | Deepak M. Satwalekar | Thierry Delaporte | |||
Chartered Accountants | Chairman | Director | Chief Executive Officer and | |||
Firm Registration No: 117366W/W - 100018 | Managing Director | |||||
Anand Subramanian | Jatin Pravinchandra Dalal | M. Sanaulla Khan | ||||
Partner | Chief Financial Officer | Company Secretary | ||||
Membership No. 110815 | ||||||
Bengaluru | ||||||
January 13, 2023 |
33
Exhibit 99.5
WIPRO LIMITED
CIN: L32102KA1945PLC020800 ; Registered Office : Wipro Limited, Doddakannelli, Sarjapur Road, Bengaluru - 560035, India
Website: www.wipro.com ; Email id info@wipro.com ; Tel: +91-80-2844 0011 ; Fax: +91-80-2844 0054
STATUTORILY AUDITED CONSOLIDATED FINANCIAL RESULTS FOR THE THREE AND NINE MONTHS ENDED
DECEMBER 31, 2022 UNDER IFRS (IASB)
(₹ in millions, except share and per share data, unless otherwise stated)
Particulars |
Three months ended | Nine months ended | Year ended | |||||||||||||||||||||||
December 31, 2022 |
September 30, 2022 |
December 31, 2021 |
December 31, 2022 |
December 31, 2021 |
March 31, 2022 |
|||||||||||||||||||||
Income from operations |
||||||||||||||||||||||||||
a) Revenue |
232,290 | 225,397 | 203,136 | 672,973 | 582,334 | 790,934 | ||||||||||||||||||||
b) Other operating income |
| | 14 | | 2,179 | 2,186 | ||||||||||||||||||||
c) Foreign exchange gains/(losses), net |
1,391 | 1,057 | 1,187 | 3,482 | 3,280 | 4,355 | ||||||||||||||||||||
|
|
|
|
|
|
|
|
|
|
|
|
|||||||||||||||
I |
Total income from operations |
233,681 | 226,454 | 204,337 | 676,455 | 587,793 | 797,475 | |||||||||||||||||||
|
|
|
|
|
|
|
|
|
|
|
|
|||||||||||||||
Expenses |
||||||||||||||||||||||||||
a) Purchases of stock-in-trade |
1,968 | 1,678 | 2,031 | 6,133 | 5,096 | 6,735 | ||||||||||||||||||||
b) Changes in inventories of finished goods and stock-in-trade |
(6 | ) | (333 | ) | (285 | ) | (685 | ) | (69 | ) | (369 | ) | ||||||||||||||
c) Employee benefits expense |
136,173 | 137,261 | 114,860 | 399,568 | 328,773 | 450,075 | ||||||||||||||||||||
d) Depreciation, amortization and impairment expense |
9,229 | 7,969 | 7,459 | 24,936 | 23,566 | 30,911 | ||||||||||||||||||||
e) Sub-contracting and technical fees |
28,486 | 29,131 | 28,190 | 87,071 | 80,086 | 108,589 | ||||||||||||||||||||
f) Facility expenses |
8,018 | 8,178 | 6,352 | 24,072 | 18,222 | 25,269 | ||||||||||||||||||||
g) Travel |
3,773 | 3,037 | 2,281 | 9,880 | 5,361 | 7,320 | ||||||||||||||||||||
h) Communication |
1,467 | 1,496 | 1,391 | 4,506 | 4,371 | 5,760 | ||||||||||||||||||||
i) Legal and professional fees |
2,091 | 2,025 | 2,015 | 5,663 | 5,942 | 7,561 | ||||||||||||||||||||
j) Marketing and brand building |
679 | 644 | 499 | 2,223 | 1,434 | 2,010 | ||||||||||||||||||||
k) Lifetime expected credit loss/ (write-back) |
101 | (79 | ) | (203 | ) | ^ | (408 | ) | (797 | ) | ||||||||||||||||
l) Other expenses |
4,066 | 2,944 | 4,212 | 11,059 | 10,244 | 14,125 | ||||||||||||||||||||
|
|
|
|
|
|
|
|
|
|
|
|
|||||||||||||||
II |
Total expenses |
196,045 | 193,951 | 168,802 | 574,426 | 482,618 | 657,189 | |||||||||||||||||||
|
|
|
|
|
|
|
|
|
|
|
|
|||||||||||||||
III |
Finance expenses |
2,902 | 2,270 | 1,403 | 7,217 | 3,608 | 5,325 | |||||||||||||||||||
IV |
Finance and other Income |
4,992 | 4,040 | 3,578 | 12,722 | 12,311 | 16,257 | |||||||||||||||||||
V |
Share of net profit/ (loss) of associates accounted for using the equity method |
26 | (72 | ) | 76 | (61 | ) | 73 | 57 | |||||||||||||||||
VI |
Profit before tax [I-II-III+IV+V] |
39,752 | 34,201 | 37,786 | 107,473 | 113,951 | 151,275 | |||||||||||||||||||
VII |
Tax expense |
9,102 | 7,710 | 8,063 | 24,743 | 22,547 | 28,946 | |||||||||||||||||||
VIII |
Profit for the period [VI-VII] |
30,650 | 26,491 | 29,723 | 82,730 | 91,404 | 122,329 | |||||||||||||||||||
|
|
|
|
|
|
|
|
|
|
|
|
|||||||||||||||
IX |
Total other comprehensive income for the period |
5,702 | 2,934 | 1,772 | 10,375 | 7,129 | 11,600 | |||||||||||||||||||
|
|
|
|
|
|
|
|
|
|
|
|
|||||||||||||||
Total comprehensive income for the period [VIII+IX] |
36,352 | 29,425 | 31,495 | 93,105 | 98,533 | 133,929 | ||||||||||||||||||||
|
|
|
|
|
|
|
|
|
|
|
|
|||||||||||||||
X |
Profit for the period attributable to: |
|||||||||||||||||||||||||
Equity holders of the Company |
30,529 | 26,590 | 29,690 | 82,755 | 91,318 | 122,191 | ||||||||||||||||||||
Non-controlling interests |
121 | (99 | ) | 33 | (25 | ) | 86 | 138 | ||||||||||||||||||
|
|
|
|
|
|
|
|
|
|
|
|
|||||||||||||||
30,650 | 26,491 | 29,723 | 82,730 | 91,404 | 122,329 | |||||||||||||||||||||
|
|
|
|
|
|
|
|
|
|
|
|
|||||||||||||||
Total comprehensive income for the period attributable to: |
||||||||||||||||||||||||||
Equity holders of the Company |
36,217 | 29,512 | 31,459 | 93,080 | 98,421 | 133,742 | ||||||||||||||||||||
Non-controlling interests |
135 | (87 | ) | 36 | 25 | 112 | 187 | |||||||||||||||||||
|
|
|
|
|
|
|
|
|
|
|
|
|||||||||||||||
36,352 | 29,425 | 31,495 | 93,105 | 98,533 | 133,929 | |||||||||||||||||||||
|
|
|
|
|
|
|
|
|
|
|
|
|||||||||||||||
XI |
Paid up equity share capital (Par value ₹ 2 per share) |
10,974 | 10,971 | 10,962 | 10,974 | 10,962 | 10,964 | |||||||||||||||||||
XII |
Reserves excluding revaluation reserves and Non-controlling interests as per balance sheet |
647,194 | ||||||||||||||||||||||||
XIII |
Earnings per share (EPS) | |||||||||||||||||||||||||
(Equity shares of par value of ₹ 2/- each) | ||||||||||||||||||||||||||
(EPS for the three and nine months ended periods is not annualized) |
||||||||||||||||||||||||||
Basic (in ₹) |
5.57 | 4.86 | 5.43 | 15.12 | 16.71 | 22.35 | ||||||||||||||||||||
Diluted (in ₹) |
5.56 | 4.85 | 5.42 | 15.08 | 16.67 | 22.29 |
^ Value is less than 1
1
1. | The audited consolidated financial results of the Company for the three and nine months ended December 31, 2022, have been approved by the Board of Directors of the Company at its meeting held on January 13, 2023. The Company confirms that its statutory auditors, Deloitte Haskins & Sells LLP have issued an audit report with unmodified opinion on the consolidated financial results. |
2. | The above consolidated financial results have been prepared on the basis of the audited interim condensed consolidated financial statements which are prepared in accordance with International Financial Reporting Standards and its interpretations (IFRS), as issued by the International Accounting Standards Board (IASB). All amounts included in the consolidated financial results (including notes) are reported in millions of Indian rupees (₹ in millions) except share and per share data, unless otherwise stated. |
3. | Estimation uncertainty relating to the global health pandemic on COVID-19 |
In assessing the recoverability of receivables including unbilled receivables, contract assets and contract costs, goodwill, intangible assets, and certain investments, the Company has considered internal and external information up to the date of approval of these consolidated financial results including credit reports and economic forecasts. Based on the current indicators of future economic conditions, the Company expects to recover the carrying amount of these assets.
The Company basis its assessment believes that the probability of the occurrence of forecasted transactions is not impacted by COVID-19. The Company has also considered the effect of changes, if any, in both counterparty credit risk and own credit risk while assessing hedge effectiveness and measuring hedge ineffectiveness and continues to believe that there is no impact on effectiveness of its hedges.
The impact of COVID-19 may be different from what we have estimated as of the date of approval of these consolidated financial results and the Company will continue to closely monitor any material changes to future economic conditions.
4. | List of subsidiaries and investments accounted for using equity method as at December 31, 2022 are provided in the table below: |
Subsidiaries |
Subsidiaries |
Subsidiaries |
Country of | |||
Attune Consulting India Private Limited | India | |||||
Capco Technologies Private Limited | India | |||||
Encore Theme Technologies Private Limited | India | |||||
Wipro Chengdu Limited | China | |||||
Wipro Holdings (UK) Limited | UK | |||||
Designit A/S | Denmark | |||||
Designit Denmark A/S | Denmark | |||||
Designit Germany GmbH | Germany | |||||
Designit Oslo A/S | Norway | |||||
Designit Spain Digital, S.L.U | Spain | |||||
Designit Sweden AB | Sweden | |||||
Designit T.L.V Ltd. | Israel | |||||
Wipro 4C NV | Belgium | |||||
Wipro 4C Consulting France SAS | France | |||||
Wipro 4C Danmark ApS | Denmark | |||||
Wipro 4C Nederland B.V | Netherlands | |||||
Wipro Weare4C UK Limited (1) | UK | |||||
Wipro Bahrain Limited Co. W.L.L | Bahrain | |||||
Wipro Financial Outsourcing Services Limited (Formerly known as Wipro Europe Limited) | UK | |||||
Wipro UK Limited | UK | |||||
Wipro Financial Services UK Limited | UK | |||||
Wipro Gulf LLC | Sultanate of Oman | |||||
Wipro IT Services S.R.L. | Romania | |||||
Wipro HR Services India Private Limited | India | |||||
Wipro IT Services Bangladesh Limited | Bangladesh | |||||
Wipro IT Services UK Societas | UK | |||||
Grove Holdings 2 S.á.r.l | Luxembourg | |||||
Capco Brasil Serviços E Consultoria Em Informática Ltda | Brazil | |||||
The Capital Markets Company BV (3) | Belgium |
2
PT. WT Indonesia | Indonesia | |||||
Rainbow Software LLC | Iraq | |||||
Wipro Arabia Limited (2) | Saudi Arabia | |||||
Womens Business Park Technologies Limited (2) | Saudi Arabia | |||||
Wipro Doha LLC | Qatar | |||||
Wipro Holdings Hungary Korlátolt Felelősségű Társaság | Hungary | |||||
Wipro Holdings Investment Korlátolt Felelősségű Társaság | Hungary | |||||
Wipro Information Technology Egypt SAE | Egypt | |||||
Wipro Information Technology Netherlands BV. | Netherlands | |||||
Wipro do Brasil Technologia Ltda (1) | Brazil | |||||
Wipro Information Technology Kazakhstan LLP | Kazakhstan | |||||
Wipro Outsourcing Services (Ireland) Limited | Ireland | |||||
Wipro Portugal S.A. (1) | Portugal | |||||
Wipro Solutions Canada Limited | Canada | |||||
Wipro Technologies Limited | Russia | |||||
Wipro Technologies Peru SAC | Peru | |||||
Wipro Technologies W.T. Sociedad Anonima | Costa Rica | |||||
Wipro Technology Chile SPA | Chile | |||||
Wipro IT Service Ukraine, LLC | Ukraine | |||||
Wipro IT Services Poland SP Z.O.O | Poland | |||||
Wipro Technologies Australia Pty Ltd | Australia | |||||
Wipro Ampion Holdings Pty Ltd (1) (Formerly known as Ampion Holdings Pty Ltd) | Australia | |||||
Wipro Technologies SA | Argentina | |||||
Wipro Technologies SA DE CV | Mexico | |||||
Wipro Technologies South Africa (Proprietary) Limited | South Africa | |||||
Wipro Technologies Nigeria Limited | Nigeria | |||||
Wipro Technologies SRL | Romania | |||||
Wipro (Thailand) Co. Limited | Thailand | |||||
Wipro Japan KK | Japan | |||||
Designit Tokyo Co., Ltd. | Japan | |||||
Wipro Networks Pte Limited | Singapore | |||||
Wipro (Dalian) Limited | China | |||||
Wipro Technologies SDN BHD | Malaysia | |||||
Wipro Overseas IT Services Private Limited | India | |||||
Wipro Philippines, Inc. | Philippines | |||||
Wipro Shanghai Limited | China | |||||
Wipro Trademarks Holding Limited | India | |||||
Wipro Travel Services Limited | India | |||||
Wipro VLSI Design Services India Private Limited | India | |||||
Wipro, LLC | USA | |||||
Wipro Gallagher Solutions, LLC | USA | |||||
Wipro Insurance Solutions, LLC | USA | |||||
Wipro IT Services, LLC | USA | |||||
Cardinal US Holdings, Inc.(1) | USA | |||||
Convergence Acceleration Solutions, LLC | USA | |||||
Designit North America, Inc. | USA | |||||
Edgile, LLC | USA | |||||
HealthPlan Services, Inc. (1) | USA | |||||
Infocrossing, LLC | USA | |||||
International TechneGroup Incorporated (1) | USA | |||||
LeanSwift Solutions, Inc.(1) | USA | |||||
Rizing Intermediate Holdings, Inc. (1) | USA | |||||
Wipro Appirio, Inc. (1) | USA | |||||
Wipro Designit Services, Inc. (1) | USA | |||||
Wipro VLSI Design Services, LLC | USA |
3
The Company controls The Wipro SA Broad Based Ownership Scheme Trust, Wipro SA Broad Based Ownership Scheme SPV (RF) (PTY) LTD incorporated in South Africa and Wipro Foundation in India.
(2) | All the above direct subsidiaries are 100% held by the Company except that the Company holds 66.67% of the equity securities of Wipro Arabia Limited and 55% of the equity securities of Womens Business Park Technologies Limited are held by Wipro Arabia Limited. |
(1) | Step Subsidiary details of Wipro Ampion Holdings Pty Ltd, Cardinal US Holdings, Inc., HealthPlan Services, Inc., International TechneGroup Incorporated, LeanSwift Solutions, Inc., Rizing Intermediate Holdings, Inc., Wipro Appirio, Inc., Wipro Designit Services, Inc., Wipro do Brasil Technologia Ltda, Wipro Portugal S.A and Wipro Weare4C UK Limited are as follows: |
Subsidiaries |
Subsidiaries |
Subsidiaries |
Country of | |||
Wipro Ampion Holdings Pty Ltd (Formerly known as Ampion Holdings Pty Ltd) | Australia | |||||
Wipro Ampion Pty Ltd (Formerly known as Ampion Pty Ltd) | Australia | |||||
Wipro Iris Holdco Pty Ltd (3) (Formerly known as Iris Holdco Pty Ltd) | Australia | |||||
Wipro Revolution IT Pty Ltd (Formerly known as Revolution IT Pty Ltd) | Australia | |||||
Crowdsprint Pty Ltd | Australia | |||||
Wipro Shelde Australia Pty Ltd (Formerly known as Shelde Pty Ltd) | Australia | |||||
Cardinal US Holdings, Inc. | USA | |||||
ATOM Solutions LLC | USA | |||||
Capco Consulting Services LLC | USA | |||||
Capco RISC Consulting LLC | USA | |||||
The Capital Markets Company LLC | USA | |||||
HealthPlan Services, Inc. | USA | |||||
HealthPlan Services Insurance Agency, LLC | USA | |||||
International TechneGroup Incorporated | USA | |||||
International TechneGroup Ltd. | UK | |||||
ITI Proficiency Ltd | Israel | |||||
Wipro Italia S.R.L. | Italy | |||||
MechWorks S.R.L. | Italy | |||||
LeanSwift Solutions, Inc. | USA | |||||
LeanSwift AB | Sweden | |||||
LeanSwift Solutions, LLC | USA | |||||
Rizing Intermediate Holdings, Inc. | USA | |||||
Attune Lanka (Pvt) Ltd | Sri Lanka | |||||
Attune Netherlands B.V. (3) | Netherlands | |||||
Rizing Intermediate LLC (3) | USA | |||||
Wipro Appirio, Inc. | USA | |||||
Wipro Appirio (Ireland) Limited | Ireland | |||||
Wipro Appirio UK Limited | UK | |||||
Wipro Appirio, K.K. | Japan | |||||
Topcoder, LLC. | USA | |||||
Wipro Designit Services, Inc. | USA | |||||
Wipro Designit Services Limited | Ireland | |||||
Wipro do Brasil Technologia Ltda | Brazil | |||||
Wipro do Brasil Servicos Ltda | Brazil | |||||
Wipro Do Brasil Sistemetas De Informatica Ltd | Brazil | |||||
Wipro Portugal S.A. | Portugal | |||||
Wipro Technologies GmbH | Germany | |||||
Wipro Business Solutions GmbH (3) | Germany | |||||
Wipro IT Services Austria GmbH | Austria | |||||
Wipro Weare4C UK Limited | UK | |||||
CloudSocius DMCC | United Arab Emirates |
4
(3) | Step Subsidiary details of Attune Netherlands B.V., Wipro Iris Holdco Pty Ltd, Rizing Intermediate LLC, The Capital Markets Company BV and Wipro Business Solutions GmbH are as follows: |
Subsidiaries |
Subsidiaries |
Subsidiaries |
Country of | |||
Attune Netherlands B.V. | Netherlands | |||||
Attune Australia Pty Ltd | Australia | |||||
Attune Consulting USA, Inc. | USA | |||||
Attune Germany GmbH | Germany | |||||
Attune Italia S.R.L | Italy | |||||
Attune Management LLC | USA | |||||
Attune UK Ltd. | UK | |||||
Wipro Iris Holdco Pty Ltd (Formerly known as Iris Holdco Pty Ltd) | Australia | |||||
Wipro Iris Bidco Pty Ltd (Formerly known as Iris Bidco Pty Ltd) | Australia | |||||
Rizing Intermediate LLC | USA | |||||
Rizing Canada Holdings Corp. | Canada | |||||
Rizing Solutions Canada Inc. | Canada | |||||
Rizing LLC (4) | USA | |||||
The Capital Markets Company BV | Belgium | |||||
CapAfric Consulting (Pty) Ltd | South Africa | |||||
Capco Belgium BV | Belgium | |||||
Capco Consultancy (Malaysia) Sdn. Bhd | Malaysia | |||||
Capco Consultancy (Thailand) Ltd | Thailand | |||||
Capco Consulting Singapore Pte. Ltd | Singapore | |||||
Capco Greece Single Member P.C | Greece | |||||
Capco Poland sp. z.o.o | Poland | |||||
The Capital Markets Company (UK) Ltd | UK | |||||
Capco (UK) 1, Limited | UK | |||||
The Capital Markets Company BV | Netherlands | |||||
The Capital Markets Company GmbH | Germany | |||||
Capco Austria GmbH | Austria | |||||
The Capital Markets Company Limited | Hong Kong | |||||
Capco Consulting Services (Guangzhou) Company Limited | China | |||||
The Capital Markets Company Limited | Canada | |||||
Capco (Canada) GP ULC | Canada | |||||
The Capital Markets Company S.á.r.l | Switzerland | |||||
Andrion AG | Switzerland | |||||
The Capital Markets Company S.A.S | France | |||||
The Capital Markets Company s.r.o | Slovakia | |||||
Wipro Business Solutions GmbH | Germany | |||||
Wipro Technology Solutions S.R.L | Romania |
5
(4) | Step Subsidiary details of Rizing LLC is as follows: |
Subsidiaries |
Subsidiaries |
Subsidiaries |
Country of | |||
Rizing LLC | USA | |||||
Aasonn Philippines Inc. | Philippines | |||||
Rizing B.V. | Netherlands | |||||
Rizing Consulting Ireland Limited | Ireland | |||||
Rizing Consulting Pty Ltd. | Australia | |||||
Rizing Geospatial LLC | USA | |||||
Rizing GmbH | Germany | |||||
Rizing Limited | UK | |||||
Rizing Middle East DMCC | United Arab Emirates | |||||
Rizing Pte Ltd. | Singapore | |||||
Rizing New Zealand Ltd. | New Zealand | |||||
Rizing Philippines Inc. | Philippines | |||||
Rizing SDN BHD | Malaysia | |||||
Rizing Solutions Pty Ltd | Australia | |||||
Synchrony Global SDN BHD | Malaysia | |||||
Vesta Middle East FZE | United Arab Emirates |
As at December 31, 2022, the Company held 43.7% interest in Drivestream Inc., accounted for using the equity method.
The list of controlled trusts and firms are:
|
||
Name of the entity |
Country of incorporation | |
Capco (Canada) LP (5) | Canada | |
Wipro Equity Reward Trust | India | |
Wipro Foundation | India |
(5) | The Capital Markets Company Limited (Canada) and Capco (Canada) GP ULC act as Limited and General Partners, respectively. |
5. | Segment Information |
The Company is organized into the following operating segments: IT Services, IT Products and India State Run Enterprise segment (ISRE).
IT Services: The IT services segment primarily consists of IT services offerings to customers organized by four Strategic Market Units (SMUs) - Americas 1, Americas 2, Europe and Asia Pacific Middle East Africa (APMEA). Americas 1 and Americas 2 are primarily organized by industry sector, while Europe and APMEA are organized by countries.
Americas 1 includes the entire business of Latin America (LATAM) and the following industry sectors in the United States of America: healthcare and medical devices, consumer goods and life sciences, retail, transportation and services, communications, media and information services, technology products and platforms. Americas 2 includes the entire business in Canada and the following industry sectors in the United States of America: banking, financial services and insurance, manufacturing, hi-tech, energy and utilities. Europe consists of the United Kingdom and Ireland, Switzerland, Germany, Benelux, the Nordics and Southern Europe. APMEA consists of Australia and New Zealand, India, Middle East, South East Asia, Japan and Africa.
Revenue from each customer is attributed to the respective SMUs based on the location of the customers primary buying center of such services. With respect to certain strategic global customers, revenue may be generated from multiple countries based on such customers buying centers, but the total revenue related to these strategic global customers are attributed to a single SMU based on the geographical location of key decision makers.
Our IT Services segment provides a range of IT and IT enabled services which include digital strategy advisory, customer centric design, technology consulting, IT consulting, custom application design, development, re-engineering and maintenance, systems integration, package implementation, cloud and infrastructure services, business process services, cloud, mobility and analytics services, research and development and hardware and software design.
IT Products: The Company is a value-added reseller of security, packaged and SaaS software for leading international brands. In certain total outsourcing contracts of the IT Services segment, the Company delivers hardware, software products and other related deliverables. Revenue relating to these items is reported as revenue from the sale of IT Products.
ISRE: This segment consists of IT Services offerings to entities and/or departments owned or controlled by Government of India and/or any State Governments.
The Chairman of the Company has been identified as the Chief Operating Decision Maker (CODM) as defined by IFRS 8, Operating Segments. The Chairman of the Company evaluates the segments based on their revenue growth and operating income.
Assets and liabilities used in the Companys business are not identified to any of the operating segments, as these are used interchangeably between segments. Management believes that it is currently not practicable to provide segment disclosures relating to total assets and liabilities since a meaningful segregation of the available data is onerous.
6
Information on reportable segments for the three months ended December 31, 2022, September 30, 2022, and December 31, 2021, nine months ended December 31, 2022, December 31, 2021 and year ended March 31, 2022 are as follows:
Particulars |
Three months ended | Nine months ended | Year ended | |||||||||||||||||||||
December 31, 2022 |
September 30, 2022 |
December 31, 2021 |
December 31, 2022 |
December 31, 2021 |
March 31, 2022 |
|||||||||||||||||||
Audited | Audited | Audited | Audited | Audited | Audited | |||||||||||||||||||
Revenue |
||||||||||||||||||||||||
IT Services |
||||||||||||||||||||||||
Americas 1 |
67,788 | 65,350 | 56,644 | 194,840 | 159,532 | 217,874 | ||||||||||||||||||
Americas 2 |
71,168 | 70,030 | 61,076 | 207,811 | 175,441 | 239,404 | ||||||||||||||||||
Europe |
66,323 | 62,684 | 59,620 | 189,283 | 172,700 | 233,443 | ||||||||||||||||||
APMEA |
25,278 | 25,565 | 23,596 | 75,100 | 67,543 | 91,103 | ||||||||||||||||||
|
|
|
|
|
|
|
|
|
|
|
|
|||||||||||||
Total of IT Services |
230,557 | 223,629 | 200,936 | 667,034 | 575,216 | 781,824 | ||||||||||||||||||
IT Products |
1,721 | 1,249 | 1,767 | 4,916 | 4,972 | 6,173 | ||||||||||||||||||
ISRE |
1,403 | 1,576 | 1,623 | 4,505 | 5,427 | 7,295 | ||||||||||||||||||
Reconciling Items |
| | (3 | ) | | (1 | ) | (3 | ) | |||||||||||||||
|
|
|
|
|
|
|
|
|
|
|
|
|||||||||||||
Total Revenue |
233,681 | 226,454 | 204,323 | 676,455 | 585,614 | 795,289 | ||||||||||||||||||
|
|
|
|
|
|
|
|
|
|
|
|
|||||||||||||
Other operating income |
||||||||||||||||||||||||
IT Services |
| | 14 | | 2,179 | 2,186 | ||||||||||||||||||
|
|
|
|
|
|
|
|
|
|
|
|
|||||||||||||
Total Other operating income |
| | 14 | | 2,179 | 2,186 | ||||||||||||||||||
|
|
|
|
|
|
|
|
|
|
|
|
|||||||||||||
Segment Result |
||||||||||||||||||||||||
IT Services |
||||||||||||||||||||||||
Americas 1 |
12,986 | 12,358 | 11,390 | 36,374 | 31,290 | 42,820 | ||||||||||||||||||
Americas 2 |
14,776 | 14,219 | 12,057 | 41,449 | 35,226 | 47,376 | ||||||||||||||||||
Europe |
9,485 | 7,875 | 9,172 | 24,734 | 26,683 | 35,739 | ||||||||||||||||||
APMEA |
2,476 | 2,194 | 2,483 | 6,274 | 8,577 | 10,523 | ||||||||||||||||||
Unallocated |
(2,219 | ) | (2,845 | ) | 173 | (5,694 | ) | 73 | 434 | |||||||||||||||
Other operating income |
| | 14 | | 2,179 | 2,186 | ||||||||||||||||||
|
|
|
|
|
|
|
|
|
|
|
|
|||||||||||||
Total of IT Services |
37,504 | 33,801 | 35,289 | 103,137 | 104,028 | 139,078 | ||||||||||||||||||
IT Products |
41 | (103 | ) | 96 | (117 | ) | 137 | 115 | ||||||||||||||||
ISRE |
102 | 146 | 134 | 421 | 1,002 | 1,173 | ||||||||||||||||||
Reconciling Items |
(11 | ) | (1,341 | ) | 16 | (1,412 | ) | 8 | (80 | ) | ||||||||||||||
|
|
|
|
|
|
|
|
|
|
|
|
|||||||||||||
Total Segment result |
37,636 | 32,503 | 35,535 | 102,029 | 105,175 | 140,286 | ||||||||||||||||||
Finance expenses |
(2,902 | ) | (2,270 | ) | (1,403 | ) | (7,217 | ) | (3,608 | ) | (5,325 | ) | ||||||||||||
Finance and Other Income |
4,992 | 4,040 | 3,578 | 12,722 | 12,311 | 16,257 | ||||||||||||||||||
Share of net profit/ (loss) of associates accounted for using the equity method |
26 | (72 | ) | 76 | (61 | ) | 73 | 57 | ||||||||||||||||
|
|
|
|
|
|
|
|
|
|
|
|
|||||||||||||
Profit before tax |
39,752 | 34,201 | 37,786 | 107,473 | 113,951 | 151,275 | ||||||||||||||||||
|
|
|
|
|
|
|
|
|
|
|
|
Notes:
a) | Reconciling items includes elimination of inter-segment transactions and other corporate activities. |
b) | Revenue from sale of Company owned intellectual properties is reported as part of IT Services revenues. |
c) | For the purpose of segment reporting, the Company has included the net impact of foreign exchange in revenues amounting to ₹ 1,391, ₹ 1,057 and ₹ 1,187 for the three months ended December 31, 2022, September 30, 2022, and December 31, 2021 respectively, ₹ 3,482 and ₹ 3,280 for the nine months ended December 31, 2022, December 31, 2021, and ₹ 4,355 for the year ended March 31, 2022, which is reported under foreign exchange gains/(losses), net in the consolidated financial results. |
d) | Other operating income of ₹ Nil, ₹ Nil and ₹ 14 is included as part of IT Services segment results for three months ended December 31, 2022, September 30, 2022, and December 31, 2021 respectively, ₹ Nil and ₹ 2,179 is included as part of IT Services segment results for nine months ended December 31, 2022, December 31, 2021 and ₹ 2,186 for the year ended March 31, 2022 respectively. |
e) | Restructuring cost of ₹ 29, ₹ 1,360 and ₹ Nil is included under Reconciling items for the three months ended December 31, 2022, September 30, 2022 and December 31, 2021 respectively, ₹ 1,389 and ₹ Nil for the nine months ended December 31, 2022, December 31, 2021 respectively, and ₹ Nil for the year ended March 31, 2022. |
f) | Segment results of IT Services segment are after recognition of share-based compensation expense ₹ 1,094, ₹ 1,122 and ₹ 805 for the three months ended December 31, 2022, September 30, 2022, and December 31, 2021, respectively, ₹ 3,661 and ₹ 2,434 for the nine months ended December 31, 2022, December 31, 2021, and ₹ 4,164 for the year ended March 31, 2022 respectively. |
7
6. | Business combinations |
Summary of acquisitions during the nine months ended December 31, 2022 is given below:
During the nine months ended December 31, 2022, the Company has completed two business combinations by acquiring 100% equity interest in:
(a) Convergence Acceleration Solutions, LLC (CAS Group), a US based consulting and program management company that specialises in driving large-scale business and technology transformation for Fortune 100 communications service providers. The acquisition advances the Companys strategic consulting capabilities as we help our clients drive large scale business and technology transformation. The acquisition was consummated on April 11, 2022, for a total consideration (upfront cash to acquire control and contingent consideration) of ₹ 5,587.
(b) Rizing Intermediate Holdings, Inc and its subsidiaries (Rizing), a global SAP consulting firm with industry expertise and consulting capabilities in enterprise asset management, consumer industries, and human experience management. Rizing complements the Company in capabilities (EAM, HCM and S/4HANA), in industries such as Energy and Utilities, Retail and Consumer Products, Manufacturing and Hi Tech in geographies across North America, Europe, Asia, and Australia. The acquisition was consummated on May 20, 2022, for a total cash consideration of ₹ 43,845.
7. | During the nine months ended December 31, 2022, decline in the revenue and earnings estimates led to revision of recoverable value of customer-relationship intangible assets and marketing related intangible assets recognized on business combinations. Consequently, the Company has recognized impairment charge ₹ 1,166 for the three months and nine months ended December 31, 2022, as part of amortization and impairment. |
8. | On December 21, 2022, the Company sold 100% membership interests in Wipro Opus Risk Solutions LLC for upfront cash consideration of ₹ 53 and recognized a loss of ₹ 9 on disposal. |
9. | Events after the reporting period |
The Board of Directors in their meeting held on January 13, 2023, declared an interim dividend of ₹ 1 /- (USD 0.01) per equity share and ADR (50% on an equity share of par value of ₹ 2 /-)
By order of the Board, |
For, Wipro Limited | |
Place: Bengaluru Date: January 13, 2023 |
Rishad A. Premji Chairman |
8
Exhibit 99.6
Wipro Limited Highlights for the Quarter ended December 31, 2022 REVENUE QoQ Constant YoY Constant Operating $2.80 Bn Currency Currency Margin 0.6% 10.4% 16.3% STRATEGIC MARKET UNITS MIX 29.4% AMERICAS 1 30.8% AMERICAS 2 28.8% EUROPE 11.0% APMEA SECTOR MIX 34.9% 18.9% 12.0% 11.4% 11.3% 6.9% 4.6% Banking, Energy, Manufacturing Financial Consumer Health Natural Technology Communication Services Resources & Insurance and Utilities GLOBAL BUSINESS LINES MIX TOTAL BOOKINGS 61.7% 38.3% $4.3 Bn iDEAS iCORE Integrated Digital, Engineering & Cloud Infrastructure, Digital Operations, Risk & 26% YoY Constant Currency Application Services Enterprise Cyber Security Services OUTLOOK Revenue from our IT Services business for the full year to be in the range of 11.5% to 12.0%, in constant currency terms for the year ending * Outlook for the year ending March 31, 2023, is based on the following exchange rates: GBP/USD at 1.36, Euro/USD at 1.16, March 31, 2023 AUD/USD at 0.73, USD/INR at 74.78 and CAD/USD at 0.79 CUSTOMER CONCENTRATION TOP1 3.2% 13.3% TOP 10 21.3% TOP 5 TOTAL HEADCOUNT 258,744 ATTRITION VOL TTM 21.2% GROSS UTILIZATION 72.3% OFFSHORE REVENUE 59.0% PERCENTAGE OF SERVICES P age 1
Wipro Limited Results for the Quarter ended December 31, 2022 FY 22 23 FY 21 22 A IT Services Q3 Q2 Q1 FY Q4 Q3 Q2 Q1 IT Services Revenues ($Mn) 2,803.5 2,797.7 2,735.5 10,355.9 2,721.7 2,639.7 2,580.0 2,414.5 Sequential Growth 0.2% 2.3% 0.5% 27.3% 3.1% 2.3% 6.9% 12.2% Sequential Growth in Constant Currency Note 1 0.6% 4.1% 2.1% 26.9% 3.1% 3.0% 8.1% 12.0% Operating Margin % Note 2 16.3% 15.1% 15.0% 17.7% 17.0% 17.6% 17.8% 18.8% Strategic Market Units Mix Americas 1 29.4% 29.2% 29.1% 27.9% 28.3% 28.2% 27.5% 27.6% Americas 2 30.8% 31.3% 31.3% 30.6% 31.0% 30.4% 30.6% 30.5% Europe 28.8% 28.1% 28.3% 29.9% 29.3% 29.7% 30.2% 30.2% APMEA 11.0% 11.4% 11.3% 11.6% 11.4% 11.7% 11.7% 11.7% Sectors Mix Banking, Financial Services and Insurance 34.9% 35.2% 35.4% 34.7% 35.4% 35.2% 34.8% 33.4% Consumer 18.9% 18.8% 18.5% 17.5% 17.9% 17.7% 17.3% 17.3% Health 12.0% 11.4% 11.5% 11.7% 11.5% 11.8% 11.7% 11.9% Energy, Natural Resources and Utilities 11.4% 11.2% 11.1% 12.2% 11.5% 11.7% 12.3% 13.1% Technology 11.3% 11.6% 11.8% 12.1% 11.9% 11.9% 12.2% 12.2% Manufacturing 6.9% 6.9% 6.7% 6.8% 7.0% 6.7% 6.7% 7.0% Communications 4.6% 4.9% 5.0% 5.0% 4.8% 5.0% 5.0% 5.1% Global Business Lines Mix iDEAS 61.7% 62.3% 61.9% 60.9% 61.2% 61.0% 61.3% 60.1% iCORE 38.3% 37.7% 38.1% 39.1% 38.8% 39.0% 38.7% 39.9% Guidance ($Mn) 2,811-2,853 2,817-2,872 2,748-2,803 2,692-2,745 2,631-2,683 2,535-2,583 2,324-2,367 Guidance restated based on 2,799-2,841 2,766-2,821 2,704-2,759 2,694-2,747 2,614-2,666 2,504-2,553 2,328-2,371 actual currency realized ($Mn) Revenues performance against guidance 2,803.5 2,797.7 2,735.5 2,721.7 2,639.7 2,580.0 2,414.5 ($Mn) Note 1: Constant currency (CC) revenue for a period is the product of volumes in that period times the average actual exchange rate of the corresponding comparative period Note 2: IT Services Operating Margin refers to Segment Results Total as reflected in IFRS financials P age 2
FY 22 23 FY 21 22 Q3 Q2 Q1 FY Q4 Q3 Q2 Q1 Customer size distribution (TTM) > $100Mn 19 19 20 19 19 17 15 13 > $75Mn 29 29 30 29 29 29 28 27 > $50Mn 52 52 50 50 50 47 44 42 > $20Mn 119 122 120 117 117 110 100 95 > $10Mn 202 198 195 194 194 189 182 176 > $5Mn 307 308 306 297 297 286 279 273 > $3Mn 431 425 417 410 410 399 390 361 > $1Mn 739 729 703 679 679 661 623 601 Revenue from Existing customers % 96.9% 97.4% 98.7% 95.2% 93.7% 94.9% 95.1% 97.2% Number of new customers 80 128 164 428 116 67 116 129 Total Number of active customers 1,484 1,471 1,433 1,369 1,369 1,315 1,284 1,229 Customer Concentration Top customer 3.2% 3.2% 3.2% 3.2% 3.2% 3.2% 3.1% 3.1% Top 5 13.3% 13.1% 13.0% 12.5% 12.9% 12.7% 12.5% 12.1% Top 10 21.3% 21.0% 20.9% 20.0% 20.5% 20.2% 20.1% 19.8% % of Revenue USD 62% 62% 62% 59% 60% 60% 59% 58% GBP 10% 10% 10% 11% 11% 11% 12% 12% EUR 10% 9% 9% 10% 9% 10% 10% 10% INR 4% 4% 4% 5% 5% 5% 4% 4% AUD 4% 5% 5% 5% 5% 5% 5% 5% CAD 3% 3% 3% 3% 3% 3% 4% 4% Others 7% 7% 7% 7% 7% 6% 6% 7% Closing Employee Count 258,744 259,179 258,574 243,128 243,128 231,671 221,365 209,890 Sales & Support Staff (IT Services) 17,076 16,647 17,806 17,691 17,691 17,595 17,051 16,689 Utilization Note 3 Gross Utilization 72.3% 72.3% 72.7% 76.8% 75.8% 75.6% 78.1% 77.7% Net Utilization (Excluding Trainees) 79.7% 79.8% 83.8% 86.8% 85.2% 85.8% 89.2% 86.8% Attrition Voluntary TTM (IT Services excl. DOP) 21.2% 23.0% 23.3% 23.8% 23.8% 22.7% 20.5% 15.5% DOP % Post Training Quarterly 8.7% 10.3% 11.4% 9.0% 9.0% 10.0% 8.7% 8.0% Note 3: IT Services excl. DOP, Designit, Cellent, Cooper, Topcoder, Rational, ITI, IVIA, 4C, Eximius, Encore, Capco, Ampion, Edgile, LeanSwift, CAS and Rizing P age 3
IT Services (Excluding DOP, Designit, Cellent, Appirio, Cooper, Topcoder, Rational, ITI, IVIA, 4C, Eximius, Encore, Capco, Ampion, Edgile, LeanSwift, CAS & Rizing) Revenue from FPP 59.4% 58.7% 59.8% 62.8% 62.2% 63.2% 62.6% 63.1% Offshore Revenue % of Services 59.0% 58.9% 58.7% 56.1% 58.3% 56.3% 55.6% 54.0% C Growth Metrics for the Quarter ended December 31, 2022 Note 1 Q323 Q323 Q323 Q323 Reported Reported CC CC QoQ% YoY% QoQ% YoY% IT Services 0.2% 6.2% 0.6% 10.4% Strategic Market Units Americas 1 1.1% 10.8% 1.3% 11.0% Americas 2 -1.4% 7.8% -0.9% 9.4% Europe 2.8% 3.0% 2.4% 12.0% APMEA -4.0% -0.7% -1.2% 7.0% Sectors Banking, Financial Services and Insurance -0.6% 5.3% -0.2% 9.6% Consumer 0.5% 13.6% 0.6% 16.8% Health 4.7% 7.3% 4.7% 8.9% Energy, Natural Resources and Utilities 1.9% 3.5% 2.8% 10.1% Technology -2.3% 0.7% -1.3% 4.0% Manufacturing 0.4% 9.7% 0.6% 14.4% Communications -4.2% -1.1% -2.6% 6.4% Global Business Lines iDEAS -0.7% 7.4% -0.4% 11.8% iCORE 1.8% 4.4% 2.3% 8.0% D Annexure to Datasheet Segment-wise breakup of Q3 FY22-23 (INR Mn) Cost of Revenues, S&M and G&A Reconciling Particulars IT Services IT Products ISRE Total Items Cost of revenues 160,103 1,723 1,456 (9) 163,273 Selling and marketing expenses 17,649 38 24 41 17,752 General and administrative expenses 15,301 (81) (179) (21) 15,020 Total 193,053 1,680 1,301 11 196,045 P a g e 4