UNITED
STATES
SECURITIES
AND EXCHANGE COMMISSION
Washington,
D.C. 20549
FORM
N-CSR
CERTIFIED
SHAREHOLDER REPORT
OF
REGISTERED
MANAGEMENT INVESTMENT COMPANIES
Investment
Company Act file number: 811-02968-99
| Name of
Registrant: |
Vanguard Trustees’ Equity Fund |
| Address of Registrant: |
P.O.
Box 2600 |
| |
Valley
Forge, PA 19482 |
| Name
and address of agent for service: |
Anne
E. Robinson, Esquire |
| |
P.O.
Box 876 |
| |
Valley
Forge, PA 19482 |
Registrant’s
telephone number, including area code: (610) 669-1000
Date of fiscal
year end: October 31
Date of reporting
period: November 1, 2022—October 31, 2023
Item
1: Reports to Shareholders
Annual Report | October 31, 2023
Vanguard
International Value Fund
See the inside front cover
for important information about your fund’s annual and semiannual shareholder reports.
Important information about shareholder
reports
Beginning in July 2024,
amendments adopted by the Securities and Exchange Commission will substantially impact the design, content, and transmission of shareholder reports. Shareholder reports will provide key fund information in a clear and
concise format and must be mailed to each shareholder that has not elected to receive the reports electronically. Financial statements will no longer be included in the shareholder report but will be available at
vanguard.com, can be mailed upon request, or can be accessed on the SEC’s website at www.sec.gov.
You may elect to receive
shareholder reports and other communications from the fund electronically by contacting your financial intermediary (such as a broker-dealer or bank) or, if you invest directly with the fund, by calling Vanguard at
one of the phone numbers on the back cover of this report or by logging on to vanguard.com.
Contents
Please note: The
opinions expressed in this report are just that—informed opinions. They should not be considered promises or advice. Also, please keep in mind that the information and opinions cover the period through the date
on the front of this report. Of course, the risks of investing in your fund are spelled out in the prospectus.
Your Fund’s Performance at a Glance
| •
| For the 12 months ended October 31, 2023, Vanguard International Value Fund returned 13.97%, outperforming the 12.07% return of its benchmark, the MSCI All Country World Index ex USA.
|
| •
| Early on, inflation in many developed markets eased off multidecade highs amid ongoing interest rate hikes by central banks. Unexpected resilience in labor markets and consumer spending helped dial back expectations
of a sustained global recession, but the prospect of higher interest rates for longer and heightened geopolitical tensions weighed on market sentiment toward the close of the period.
|
| •
| Eight of the fund’s 11 sectors posted double-digit returns. Overall, the advisors’ selections in materials and energy helped performance relative to the benchmark. Selections in industrials and consumer
staples detracted.
|
| •
| Returns were positive across all regions and were strongest in Europe, which represents nearly half of the fund’s holdings. Pacific stocks helped relative performance primarily through security selection in
South Korea and Hong Kong. Emerging market stocks detracted.
|
| •
| For the 10 years ended October 31, the fund’s average annual return was 2.74%, outpacing the 2.54% return of its benchmark.
|
Market Barometer
|
| Average Annual Total Returns
Periods Ended October 31, 2023
|
|
| One Year
| Three Years
| Five Years
|
| Stocks
|
|
|
|
| Russell 1000 Index (Large-caps)
| 9.48%
| 9.53%
| 10.71%
|
| Russell 2000 Index (Small-caps)
| -8.56
| 3.95
| 3.31
|
| Russell 3000 Index (Broad U.S. market)
| 8.38
| 9.19
| 10.23
|
| FTSE All-World ex US Index (International)
| 12.35
| 3.51
| 3.88
|
| Bonds
|
|
|
|
Bloomberg U.S. Aggregate Float Adjusted Index
(Broad taxable market)
| 0.53%
| -5.51%
| 0.03%
|
Bloomberg Municipal Bond Index
(Broad tax-exempt market)
| 2.64
| -2.48
| 1.00
|
| FTSE Three-Month U.S. Treasury Bill Index
| 4.94
| 1.93
| 1.80
|
| CPI
|
|
|
|
| Consumer Price Index
| 3.24%
| 5.72%
| 4.00%
|
For the 12 months ended October 31, 2023,
Vanguard International Value Fund returned 13.97%, well ahead of the 12.07% return of its benchmark, the MSCI All Country World Index ex USA.
Your fund is managed by three
independent advisors, a strategy that enhances its diversification by providing exposure to distinct yet complementary investment approaches. It’s not uncommon for different advisors to have different views
about individual securities or the broader investment environment.
The accompanying table lists
the advisors, the amount and percentage of fund assets each manages, and brief descriptions of their investment strategies.
The advisors have provided the
following assessment of the investment environment during the past 12 months and the notable successes and shortfalls in their portfolios. These comments were prepared on November 15, 2023.
Lazard Asset Management LLC
Portfolio Managers:
Michael G. Fry, Managing
Director
Michael A. Bennett, CPA,
Managing Director
For most of the period,
earnings were much more resilient than anticipated, resulting in positive equity returns. This was somewhat interrupted during the third quarter of 2023 when consensus
international earnings estimates were revised
modestly lower and investors grew concerned about the lagged effects of substantially higher interest rates. Chinese equities underperformed developed markets as enthusiasm for their economic reopening faded. The
global semiconductor industry saw a boost in demand for artificial intelligence (AI)-related chips in the spring of 2023, which helped offset the weaker-than- expected recovery in China.
For the period, our portfolio
lagged the benchmark on a net-of-fees basis. Outperformance from various semiconductor investments was offset by underperformance from direct and indirect exposure to China. While the major internet and
e-commerce-related companies we own (Tencent and Alibaba) performed well, our renewables investments (China Longyuan, Wuxi Lead, and Sungrow Power) fell significantly, as did athleisure apparel company Li Ning and ENN
Energy.
Several semiconductor stocks
helped to offset the portfolio’s negatives from China. These stocks benefited from AI news in the spring and from the easing of an inventory glut that followed COVID-19- related shortages. One name in particular
rose more than 100% during the period: DISCO. The Japanese company manufactures semiconductor capital equipment that provides dicers for cutting semiconductor chips from wafers, along with grinders and polishers that
shave silicon wafers to the correct thickness.
We believe that the market is
transitioning from one driven by style extremes— expansive growth from 2019 to 2020, then low quality from 2021 to 2022—to one once again driven by fundamentals. For much of the decade leading up to the
COVID-19 pandemic, we experienced a more normal, fundamentally led market, where the influence of style was not significant and stock selection was able to bubble up and drive performance. We believe we had mostly
good stock selection for that decade. Over the last 12 months, stock selection was challenged; our investments in China underperformed primarily under the weight of macroeconomic weakness relative to expectations.
Sprucegrove Investment
Management Ltd.
Portfolio Managers:
Arjun Kumar, CFA,
Chief Executive Officer and Managing
Director
Shirley Woo, CFA, Managing
Director
The gain for international
equity markets for the 12 months is attributable to the recovery in the fourth quarter of 2022 into early 2023. Since then, markets have been on a downward trend as the initial relief that a recession may be avoided
began to fade. While the cycle of rate hikes appears to be nearing its end, investors are now expecting higher rates for longer.
In the last few months of the
period, bond yields and energy prices rose. At the same time, softer earnings expectations were reflected in valuations in the broader market, which created a narrow set of winners and put our portion of the fund out
of favor based on short-term factors. For the coming period, signs of subsiding inflation should ease upward pressure on interest rates and the U.S. dollar, which should create more favorable conditions for the
portfolio to outperform.
Negative stock selection in
the financial and industrial sectors drove underperformance, which offset positive selection in materials, utilities, and energy. Within financials, emerging markets holdings lagged the performance of European and
Japanese diversified financials and banks that the portfolio does not own due to quality. Stock selection in industrials trailed; this was due, in part, to lack of exposure to Japanese industrial conglomerates.
Japanese equities, particularly financials and industrials, have been one of the strongest developed markets this year. They were supported by cyclical favorable conditions and initiatives by the Tokyo Stock Exchange
to bolster companies with low book value.
It is essential to understand
how the portfolio is positioned today. Our bottom-up, fundamental approach has been consistently applied over the decades as we continue to focus on constructing portfolios of quality companies at attractive
valuations. Over the last 12 months, we have added new
names to the portfolio and augmented several
existing positions as opportunities presented themselves.
At the end of the period, the
portfolio represented higher-quality securities that are lower risk (as gauged by financial leverage) and are more attractively valued than those of the benchmark. These characteristics are critical to our quest to
achieve superior investment returns through a complete market cycle.
ARGA Investment Management,
LP
Portfolio Managers:
A. Rama Krishna, CFA, Founder
and
Chief Investment Officer
Steven Morrow, CFA, Director
of Research
International equities
performed well for the 12 months ended October 31, 2023. However, volatility was high; investors reacted—and overreacted—to news around global events. China, for example, drove markets up after easing its
restrictive COVID-19 policy, then down on macroeconomic and property market weakness. Ebbs and flows in recession fear also drove market swings.
Market volatility can benefit
value investors. While fear and uncertainty can lead some investors to overreact, more disciplined investors can exploit resulting pricing opportunities. Such exploitation continued to play out in the ARGA- managed
portfolio, which outperformed the broader market.
ARGA’s goal is to own
deeply underpriced equities with substantial upside. The year’s turmoil highlights the importance of adhering to a consistent investment process devoid of emotion. ARGA’s global research team follows a
systematized process to identify stressed companies priced at discounted market valuations. Mandatory stress tests evaluate companies’ ability to survive prolonged stress and emerge stronger. Strict sell
discipline guards against overenthusiasm when stress fades.
Portfolio results show this
process discipline can work in good and bad times, in up and down markets. During the 12-month period, nine of 11 sectors and all nine regions made positive contributions to relative results. While impacts of specific
factors such as interest rates varied, the underlying performance driver was the same: Valuations of many undervalued holdings recovered over time.
Going forward, ARGA expects
continued market volatility as investors react to new global threats, such as the Middle East war. The ARGA international equity portfolio will continue to take advantage of resulting valuation opportunities. While
many gains have been realized already, many remain embedded in the portfolio, specifically in undervalued areas such as lodging and gaming, Chinese internet, and semiconductors—which should benefit from AI and
autonomous driving. A burgeoning area of opportunity is climate transition, as decarbonization investments
may substantially create or diminish company
values.
The keys to realizing these
and other value opportunities are discipline and patience.
Vanguard International Value
Fund Investment Advisors
|
| Fund Assets Managed
|
|
| Investment Advisor
| %
| $ Million
| Investment Strategy
|
| Lazard Asset Management LLC
| 40
| 4,940
| The advisor uses a research-driven, bottom-up, relative-value approach in selecting stocks. The goal is to
identify individual stocks that offer an appropriate trade-off between low relative valuation and high financial productivity.
|
| Sprucegrove Investment Management Ltd.
| 34
| 4,226
| The advisor employs a concentrated, low-turnover, value-oriented investment approach that results in a
portfolio of companies with good long-term prospects and below-market price/earnings ratios. In-depth fundamental research on industries and companies is central to this investment process.
|
| ARGA Investment Management, LP
| 25
| 3,092
| The advisor invests in deeply undervalued securities with long-term upside. Its valuation discipline is
based on fundamental research and present value, with full integration of ESG risks and opportunities.
|
| Cash Investments
| 1
| 164
| These short-term reserves are invested by Vanguard in equity index products to simulate investments in
stocks. Each advisor may also maintain a modest cash position.
|
About Your Fund’s Expenses
As a shareholder of the fund,
you incur ongoing costs, which include costs for portfolio management, administrative services, and shareholder reports (like this one), among others. Operating expenses, which are deducted from a fund’s gross
income, directly reduce the investment return of the fund.
A fund‘s expenses are
expressed as a percentage of its average net assets. This figure is known as the expense ratio. The following examples are intended to help you understand the ongoing costs (in dollars) of investing in your fund and
to compare these costs with those of other mutual funds. The examples are based on an investment of $1,000 made at the beginning of the period shown and held for the entire period.
The accompanying table
illustrates your fund’s costs in two ways:
| •
| Based on actual fund return. This section helps you to estimate the actual expenses that you paid over the period. The ”Ending Account Value“ shown is derived from the fund’s actual return, and the
third column shows the dollar amount that would have been paid by an investor who started with $1,000 in the fund. You may use the information here, together with the amount you invested, to estimate the expenses that
you paid over the period.
|
To do so, simply divide your
account value by $1,000 (for example, an $8,600 account value divided by $1,000 = 8.6), then multiply the result by the number given for your fund under the heading ”Expenses Paid During Period.“
| •
| Based on hypothetical 5% yearly return. This section is intended to help you compare your fund‘s costs with those of other mutual funds. It assumes that the fund had a yearly return of 5% before expenses, but that the
expense ratio is unchanged. In this case—because the return used is not the fund’s actual return—the results do not apply to your investment. The example is useful in making comparisons because the
Securities and Exchange Commission requires all mutual funds to calculate expenses based on a 5% return. You can assess your fund’s costs by comparing this hypothetical example with the hypothetical examples
that appear in shareholder reports of other funds.
|
Note that the expenses shown
in the table are meant to highlight and help you compare ongoing costs only and do not reflect transaction costs incurred by the fund for buying and selling securities. Further, the expenses do not include any purchase, redemption, or
account service fees described in the fund prospectus. If such fees were applied to your account, your costs would be higher. Your fund does not carry a “sales load.”
The calculations assume no
shares were bought or sold during the period. Your actual costs may have been higher or lower, depending on the amount of your investment and the timing of any purchases or redemptions.
You can find more information
about the fund’s expenses, including annual expense ratios, in the Financial Statements section of this report. For additional information on operating expenses and other shareholder costs, please refer to your
fund’s current prospectus.
| Six Months Ended October 31, 2023
|
|
|
|
| International Value Fund
| Beginning
Account Value
4/30/2023
| Ending
Account Value
10/31/2023
| Expenses
Paid During
Period
|
| Based on Actual Fund Return
| $1,000.00
| $928.60
| $1.90
|
| Based on Hypothetical 5% Yearly Return
| 1,000.00
| 1,023.24
| 1.99
|
The calculations are
based on expenses incurred in the most recent six-month period. The fund's annualized six-month expense ratio for that period is 0.39%. The dollar amounts shown as ”Expenses Paid” are equal to the
annualized expense ratio multiplied by the average account value over the period, multiplied by the number of days in the most recent six-month period, then divided by the number of days in the most recent 12-month
period (184/365).
All of the returns in this
report represent past performance, which is not a guarantee of future results that may be achieved by the fund. (Current performance may be lower or higher than the performance data cited. For performance data current
to the most recent month-end, visit our website at vanguard.com/performance.) Note, too, that both investment returns and principal value can fluctuate widely, so an investor’s shares, when sold, could be worth
more or less than their original cost. The returns shown do not reflect taxes that a shareholder would pay on fund distributions or on the sale of fund shares.
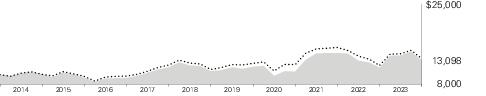
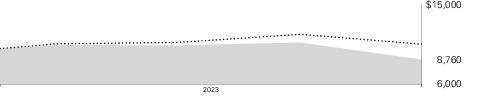
Cumulative Performance: October
31, 2013, Through October 31, 2023
Initial Investment of
$10,000
|
|
| Average Annual Total Returns
Periods Ended October 31, 2023
|
|
|
|
| One
Year
| Five
Years
| Ten
Years
| Final Value
of a $10,000
Investment
|

| International Value Fund
| 13.97%
| 4.00%
| 2.74%
| $13,098
|

| MSCI All Country World Index ex USA
| 12.07
| 3.46
| 2.54
| 12,854
|
See Financial
Highlights for dividend and capital gains information.
|
|
| United Kingdom
| 14.9%
|
| Japan
| 11.1
|
| France
| 8.8
|
| Germany
| 7.5
|
| China
| 6.9
|
| Switzerland
| 6.3
|
| Netherlands
| 6.1
|
| Hong Kong
| 5.3
|
| Brazil
| 3.7
|
| India
| 3.3
|
| Canada
| 3.2
|
| United States
| 2.9
|
| Ireland
| 2.6
|
| South Korea
| 2.4
|
| Taiwan
| 2.2
|
| Singapore
| 2.0
|
| Indonesia
| 1.9
|
| Denmark
| 1.7
|
| Finland
| 1.3
|
| Other
| 5.9
|
The table reflects the fund’s
investments, except for short-term investments and derivatives.
The fund files its complete
schedule of portfolio holdings with the Securities and Exchange Commission (SEC) for the first and third quarters of each fiscal year as an exhibit to its reports on Form N-PORT. The fund’s Form N-PORT reports
are available on the SEC’s website at www.sec.gov.
|
|
|
|
|
| Shares
| Market
Value•
($000)
|
| Common Stocks (92.8%)
|
| Australia (0.6%)
|
|
| National Australia Bank Ltd.
| 2,029,400
| 36,355
|
|
| QBE Insurance Group Ltd.
| 1,765,216
| 17,504
|
| *
| Adbri Ltd.
| 13,390,194
| 16,822
|
|
|
|
|
|
|
| 70,681
|
| Belgium (0.4%)
|
|
| KBC Group NV
| 846,711
| 46,599
|
| Brazil (1.9%)
|
|
| Banco Bradesco SA ADR
| 38,829,974
| 108,336
|
|
| Ambev SA ADR
| 26,553,800
| 67,181
|
|
| Banco do Brasil SA
| 3,133,800
| 30,053
|
|
| JBS SA
| 3,454,000
| 13,722
|
|
| Petroleo Brasileiro SA ADR
| 757,150
| 11,357
|
|
|
|
|
|
|
| 230,649
|
| Canada (3.0%)
|
|
| Suncor Energy Inc.
| 4,169,426
| 135,027
|
|
| Nutrien Ltd.
| 1,081,610
| 58,091
|
|
| Stella-Jones Inc.
| 815,400
| 42,712
|
|
| Great-West Lifeco Inc.
| 1,442,415
| 39,962
|
|
| Saputo Inc.
| 1,666,949
| 33,658
|
|
| North West Co. Inc.
| 1,135,211
| 28,946
|
|
| Alimentation Couche-Tard Inc.
| 470,100
| 25,591
|
|
| Toronto-Dominion Bank
| 263,900
| 14,736
|
|
|
|
|
|
|
| 378,723
|
| China (6.6%)
|
| *
| Alibaba Group Holding Ltd.
| 25,799,900
| 265,612
|
|
| Tencent Holdings Ltd.
| 5,091,300
| 188,423
|
|
| Ping An Insurance Group Co. of China Ltd. Class H
| 12,665,500
| 64,245
|
|
| ENN Energy Holdings Ltd.
| 7,549,400
| 57,188
|
|
| Sungrow Power Supply Co. Ltd. Class A
| 3,593,953
| 41,415
|
|
| Li Ning Co. Ltd.
| 12,537,500
| 38,420
|
|
|
|
|
|
| Shares
| Market
Value•
($000)
|
|
| Autohome Inc. ADR
| 1,112,003
| 29,746
|
| *
| Alibaba Group Holding Ltd. ADR
| 334,409
| 27,601
|
|
| Shandong Weigao Group Medical Polymer Co. Ltd. Class H
| 25,992,000
| 24,126
|
|
| Hengan International Group Co. Ltd.
| 7,179,500
| 24,046
|
|
| Wuxi Lead Intelligent Equipment Co. Ltd. Class A
| 5,994,938
| 22,984
|
| *
| Trip.com Group Ltd. ADR
| 603,258
| 20,511
|
|
| Weibo Corp. ADR
| 1,156,924
| 13,686
|
|
|
|
|
|
|
| 818,003
|
| Denmark (1.6%)
|
|
| Novo Nordisk A/S Class B
| 1,526,838
| 147,303
|
|
| Carlsberg A/S Class B
| 449,863
| 53,612
|
|
|
|
|
|
|
| 200,915
|
| Egypt (0.2%)
|
|
| Commercial International Bank Egypt SAE (Registered) GDR
| 24,883,498
| 28,320
|
| Finland (1.3%)
|
|
| Nokia OYJ
| 20,115,499
| 66,999
|
|
| Sampo OYJ Class A
| 1,571,237
| 61,795
|
|
| Nokian Renkaat OYJ
| 3,679,749
| 27,828
|
|
|
|
|
|
|
| 156,622
|
| France (8.4%)
|
|
| Airbus SE
| 1,443,615
| 193,554
|
|
| Air Liquide SA
| 851,695
| 145,940
|
|
| Engie SA
| 8,409,958
| 133,759
|
|
| Thales SA
| 567,781
| 83,792
|
|
| Pernod Ricard SA
| 398,313
| 70,731
|
|
| Bureau Veritas SA
| 2,962,936
| 67,489
|
|
| TotalEnergies SE
| 1,006,606
| 67,299
|
|
| Legrand SA
| 672,121
| 58,143
|
|
| Kering SA
| 142,136
| 57,807
|
|
| Accor SA
| 1,633,993
| 52,129
|
|
| Capgemini SE
| 290,764
| 51,386
|
|
|
|
|
|
| Shares
| Market
Value•
($000)
|
|
| Bouygues SA
| 952,603
| 33,512
|
|
| ArcelorMittal SA
| 1,204,465
| 26,652
|
|
|
|
|
|
|
| 1,042,193
|
| Germany (5.9%)
|
|
| BASF SE
| 2,551,424
| 117,894
|
|
| SAP SE
| 857,153
| 114,972
|
|
| Fresenius Medical Care AG & Co. KGaA
| 1,937,870
| 64,388
|
|
| Continental AG
| 959,511
| 62,646
|
|
| Merck KGaA
| 388,917
| 58,741
|
|
| Henkel AG & Co. KGaA
| 804,040
| 50,816
|
| 1
| Siemens Healthineers AG
| 1,029,148
| 50,631
|
|
| Bayerische Motoren Werke AG
| 533,870
| 49,652
|
| *,1
| Covestro AG
| 832,771
| 42,190
|
|
| Infineon Technologies AG
| 1,365,548
| 39,888
|
|
| MTU Aero Engines AG
| 152,798
| 28,719
|
|
| Fresenius SE & Co. KGaA
| 1,071,944
| 27,574
|
|
| FUCHS SE
| 606,100
| 20,355
|
|
|
|
|
|
|
| 728,466
|
| Hong Kong (5.1%)
|
|
| AIA Group Ltd.
| 20,426,200
| 177,377
|
| *
| Sands China Ltd.
| 44,212,800
| 119,023
|
| *
| Melco Resorts & Entertainment Ltd. ADR
| 8,831,144
| 74,535
|
|
| Jardine Matheson Holdings Ltd.
| 1,058,200
| 42,880
|
|
| Galaxy Entertainment Group Ltd.
| 7,365,000
| 41,402
|
|
| Xinyi Glass Holdings Ltd.
| 26,092,557
| 29,981
|
|
| Techtronic Industries Co. Ltd.
| 3,135,000
| 28,621
|
| 1
| ESR Group Ltd.
| 18,994,000
| 24,405
|
|
| Sun Hung Kai Properties Ltd.
| 2,353,500
| 24,167
|
| 1
| WH Group Ltd.
| 38,320,243
| 22,886
|
|
| CK Asset Holdings Ltd.
| 3,309,500
| 16,542
|
|
| Yue Yuen Industrial Holdings Ltd.
| 12,157,000
| 14,214
|
|
| Hongkong Land Holdings Ltd.
| 4,386,600
| 13,913
|
|
|
|
|
|
|
| 629,946
|
| India (3.2%)
|
|
| ICICI Bank Ltd. ADR
| 4,855,982
| 107,754
|
|
| Adani Ports & Special Economic Zone Ltd.
| 9,407,767
| 88,751
|
|
| HDFC Bank Ltd.
| 4,340,972
| 77,029
|
| *
| Zee Entertainment Enterprises Ltd.
| 23,967,023
| 74,623
|
|
| UPL Ltd.
| 7,530,784
| 48,897
|
|
|
|
|
|
|
| 397,054
|
| Indonesia (1.8%)
|
|
| Bank Mandiri Persero Tbk. PT
| 219,186,600
| 78,305
|
|
|
|
|
|
| Shares
| Market
Value•
($000)
|
|
| Astra International Tbk. PT
| 202,829,700
| 73,785
|
|
| Telkom Indonesia Persero Tbk. PT ADR
| 1,567,073
| 34,476
|
|
| Selamat Sempurna Tbk. PT
| 164,317,700
| 22,437
|
|
| Telkom Indonesia Persero Tbk. PT
| 69,300,200
| 15,192
|
|
|
|
|
|
|
| 224,195
|
| Ireland (2.5%)
|
| *
| Ryanair Holdings plc ADR
| 1,751,871
| 153,639
|
|
| CRH plc
| 1,444,361
| 77,514
|
| *
| ICON plc
| 304,712
| 74,338
|
|
|
|
|
|
|
| 305,491
|
| Italy (0.4%)
|
| *
| Brembo SpA
| 4,410,073
| 47,451
|
| Japan (10.7%)
|
|
| Nitori Holdings Co. Ltd.
| 855,500
| 92,646
|
|
| Nomura Research Institute Ltd.
| 3,252,200
| 85,370
|
|
| Daiwa Securities Group Inc.
| 13,582,400
| 78,323
|
|
| Nidec Corp.
| 2,072,500
| 76,022
|
|
| Toyota Motor Corp.
| 4,333,500
| 75,809
|
|
| Nitto Denko Corp.
| 1,091,600
| 70,633
|
|
| Denso Corp.
| 4,324,800
| 63,861
|
|
| Daikin Industries Ltd.
| 431,600
| 62,228
|
|
| Hoya Corp.
| 629,300
| 60,582
|
|
| Nihon Kohden Corp.
| 2,341,300
| 55,299
|
|
| Disco Corp.
| 270,300
| 47,735
|
|
| ITOCHU Corp.
| 1,310,100
| 47,191
|
|
| Suzuki Motor Corp.
| 1,063,800
| 41,288
|
|
| Kubota Corp.
| 3,068,400
| 41,268
|
|
| Bandai Namco Holdings Inc.
| 1,853,700
| 38,406
|
|
| Recruit Holdings Co. Ltd.
| 1,335,500
| 38,292
|
|
| Omron Corp.
| 917,610
| 32,875
|
|
| Shimano Inc.
| 227,500
| 32,739
|
|
| Subaru Corp.
| 1,876,700
| 32,486
|
|
| Makita Corp.
| 1,246,300
| 32,213
|
|
| Ain Holdings Inc.
| 1,108,900
| 31,353
|
| *
| Renesas Electronics Corp.
| 2,273,800
| 29,868
|
|
| Koito Manufacturing Co. Ltd.
| 1,985,800
| 29,753
|
|
| Kansai Electric Power Co. Inc.
| 2,154,600
| 27,587
|
|
| Nomura Holdings Inc.
| 6,973,200
| 26,940
|
|
| Seria Co. Ltd.
| 1,937,500
| 26,855
|
|
| Komatsu Ltd.
| 931,000
| 21,391
|
|
| Daito Trust Construction Co. Ltd.
| 160,200
| 17,184
|
|
| FANUC Corp.
| 414,500
| 10,286
|
|
|
|
|
|
|
| 1,326,483
|
|
|
|
|
|
| Shares
| Market
Value•
($000)
|
| Malaysia (0.2%)
|
|
| Westports Holdings Bhd.
| 38,481,000
| 27,129
|
| Mexico (0.7%)
|
|
| Grupo Financiero Banorte SAB de CV
| 11,158,700
| 90,562
|
| Netherlands (5.8%)
|
|
| Universal Music Group NV
| 3,647,420
| 89,321
|
| *
| Prosus NV
| 3,178,870
| 89,116
|
|
| ASM International NV
| 178,840
| 73,804
|
|
| Aegon Ltd.
| 13,401,722
| 65,176
|
|
| Akzo Nobel NV
| 861,325
| 57,782
|
|
| Coca-Cola Europacific Partners plc
| 937,292
| 54,677
|
|
| DSM-Firmenich AG
| 561,313
| 50,886
|
|
| ING Groep NV
| 3,903,893
| 50,050
|
|
| Wolters Kluwer NV
| 341,051
| 43,759
|
|
| Koninklijke Vopak NV
| 1,109,090
| 37,395
|
|
| IMCD NV
| 278,274
| 33,503
|
| *
| AerCap Holdings NV
| 530,331
| 32,944
|
|
| SBM Offshore NV
| 2,272,520
| 28,303
|
| 1
| ABN AMRO Bank NV
| 979,952
| 13,199
|
|
|
|
|
|
|
| 719,915
|
| Norway (0.3%)
|
|
| Bakkafrost P/F
| 778,787
| 35,154
|
| Panama (0.6%)
|
|
| Copa Holdings SA Class A
| 942,053
| 76,919
|
| Philippines (0.3%)
|
|
| Puregold Price Club Inc.
| 43,303,300
| 20,685
|
|
| Universal Robina Corp.
| 9,706,600
| 18,713
|
|
|
|
|
|
|
| 39,398
|
| Singapore (1.9%)
|
|
| United Overseas Bank Ltd.
| 3,637,800
| 71,755
|
|
| DBS Group Holdings Ltd.
| 2,224,400
| 53,437
|
|
| Venture Corp. Ltd.
| 5,893,900
| 50,324
|
|
| Singapore Telecommunications Ltd.
| 21,871,700
| 38,006
|
|
| Sembcorp Industries Ltd.
| 8,653,300
| 29,031
|
|
|
|
|
|
|
| 242,553
|
| South Korea (2.3%)
|
|
| Samsung Electronics Co. Ltd.
| 2,350,492
| 116,995
|
| 1
| Samsung Electronics Co. Ltd. GDR
| 82,490
| 103,196
|
|
| SK Hynix Inc.
| 675,713
| 58,680
|
| *
| SK Square Co. Ltd.
| 309,162
| 9,769
|
|
|
|
|
|
|
| 288,640
|
|
|
|
|
|
| Shares
| Market
Value•
($000)
|
| Spain (0.7%)
|
|
| Banco Santander SA
| 17,602,140
| 64,739
|
|
| Industria de Diseno Textil SA
| 832,978
| 28,753
|
|
|
|
|
|
|
| 93,492
|
| Sweden (0.4%)
|
|
| Assa Abloy AB Class B
| 2,514,156
| 53,589
|
| Switzerland (6.0%)
|
|
| Roche Holding AG
| 629,539
| 162,238
|
|
| Holcim AG
| 2,451,769
| 151,587
|
|
| Novartis AG (Registered)
| 1,416,867
| 132,647
|
|
| Cie Financiere Richemont SA (Registered) Class A
| 806,337
| 95,128
|
|
| UBS Group AG (Registered)
| 3,333,642
| 78,329
|
|
| ABB Ltd. (Registered)
| 1,726,224
| 57,997
|
|
| Swatch Group AG
| 116,950
| 29,936
|
|
| Adecco Group AG (Registered)
| 786,649
| 29,770
|
| *
| Sandoz Group AG
| 283,373
| 7,368
|
|
|
|
|
|
|
| 745,000
|
| Taiwan (2.1%)
|
|
| Taiwan Semiconductor Manufacturing Co. Ltd.
| 11,275,000
| 184,149
|
|
| Taiwan Semiconductor Manufacturing Co. Ltd. ADR
| 706,735
| 60,998
|
|
| King Slide Works Co. Ltd.
| 949,000
| 20,712
|
|
|
|
|
|
|
| 265,859
|
| United Kingdom (14.3%)
|
|
| BP plc
| 34,737,063
| 212,105
|
|
| RELX plc
| 4,626,748
| 161,602
|
|
| Compass Group plc
| 4,774,264
| 120,366
|
|
| HSBC Holdings plc
| 15,870,476
| 114,592
|
|
| Unilever plc
| 2,049,036
| 97,044
|
|
| Berkeley Group Holdings plc
| 1,916,528
| 94,210
|
|
| Anglo American plc
| 3,529,991
| 89,943
|
|
| HSBC Holdings plc (XHKG)
| 11,214,000
| 80,573
|
|
| Prudential plc
| 7,458,287
| 77,987
|
|
| Smiths Group plc
| 3,849,200
| 75,505
|
|
| IMI plc
| 4,226,990
| 75,490
|
|
| Smith & Nephew plc
| 6,362,483
| 71,203
|
|
| Shell plc
| 2,012,650
| 64,861
|
|
| Taylor Wimpey plc
| 38,336,418
| 51,779
|
|
| Weir Group plc
| 2,454,760
| 50,987
|
|
| RS Group plc
| 5,499,045
| 45,380
|
|
| Travis Perkins plc
| 4,642,103
| 41,826
|
|
| London Stock Exchange Group plc
| 410,915
| 41,459
|
|
| Victrex plc
| 2,240,170
| 37,531
|
|
| Spectris plc
| 890,650
| 33,655
|
|
| Whitbread plc
| 751,265
| 30,462
|
|
| Croda International plc
| 546,804
| 29,143
|
|
|
|
|
|
| Shares
| Market
Value•
($000)
|
|
| Renishaw plc
| 734,299
| 27,589
|
|
| Kingfisher plc
| 10,496,980
| 26,804
|
|
| Lloyds Banking Group plc
| 29,916,882
| 14,561
|
| *
| easyJet plc
| 2,644,536
| 11,797
|
|
|
|
|
|
|
| 1,778,454
|
| United States (2.8%)
|
|
| Aon plc Class A
| 416,187
| 128,768
|
|
| RenaissanceRe Holdings Ltd.
| 383,167
| 84,140
|
|
| NXP Semiconductors NV
| 392,463
| 67,672
|
|
| Linde plc
| 161,680
| 61,772
|
|
|
|
|
|
|
| 342,352
|
| Vietnam (0.8%)
|
|
| Vietnam Dairy Products JSC
| 19,975,400
| 55,324
|
|
| Phu Nhuan Jewelry JSC
| 14,542,400
| 42,689
|
|
|
|
|
|
|
| 98,013
|
Total Common Stocks
(Cost $11,507,137)
| 11,528,820
|
| Preferred Stocks (3.0%)
|
|
| Petroleo Brasileiro SA Preference Shares
| 14,889,100
| 102,593
|
|
| Itau Unibanco Holding SA Preference Shares
| 10,767,700
| 57,280
|
|
| Gerdau SA Preference Shares
| 11,975,460
| 51,709
|
|
| Henkel AG & Co. KGaA Preference Shares
| 965,047
| 69,614
|
|
| FUCHS SE Preference Shares
| 1,349,387
| 54,805
|
|
|
|
|
|
| Shares
| Market
Value•
($000)
|
|
| Jungheinrich AG Preference Shares
| 1,517,112
| 40,727
|
Total Preferred Stocks
(Cost $364,526)
| 376,728
|
| Temporary Cash Investments (3.9%)
|
| Money Market Fund (3.9%)
|
| 2
| Vanguard Market Liquidity Fund, 5.420% (Cost $479,253)
| 4,794,491
| 479,401
|
Total Investments (99.7%)
(Cost $12,350,916)
|
| 12,384,949
|
| Other Assets and Liabilities—Net (0.3%)
|
| 36,987
|
| Net Assets (100%)
|
| 12,421,936
|
| •
| See Note A in Notes to Financial Statements.
|
| *
| Non-income-producing security.
|
| 1
| Security exempt from registration under Rule 144A of the Securities Act of 1933. Such securities may be sold in transactions exempt from registration, normally to qualified
institutional buyers. At October 31, 2023, the aggregate value was $256,507,000, representing 2.1% of net assets.
|
| 2
| Affiliated money market fund available only to Vanguard funds and certain trusts and accounts managed by Vanguard. Rate shown is the 7-day yield.
|
|
| ADR—American Depositary Receipt.
|
|
| GDR—Global Depositary Receipt.
|
Derivative Financial
Instruments Outstanding as of Period End
| Futures Contracts
|
|
|
|
| ($000)
|
|
| Expiration
| Number of
Long (Short)
Contracts
| Notional
Amount
| Value and
Unrealized
Appreciation
(Depreciation)
|
| Long Futures Contracts
|
| MSCI EAFE Index
| December 2023
| 1,254
| 123,776
| (8,045)
|
| MSCI Emerging Market Index
| December 2023
| 1,102
| 50,648
| (3,649)
|
|
|
|
|
| (11,694)
|
See accompanying
Notes, which are an integral part of the Financial Statements.
Statement of Assets and Liabilities
|
|
| ($000s, except shares, footnotes, and per-share amounts)
| Amount
|
| Assets
|
|
| Investments in Securities, at Value
|
|
| Unaffiliated Issuers (Cost $11,871,663)
| 11,905,548
|
| Affiliated Issuers (Cost $479,253)
| 479,401
|
| Total Investments in Securities
| 12,384,949
|
| Investment in Vanguard
| 453
|
| Foreign Currency, at Value (Cost $9,021)
| 8,740
|
| Cash Collateral Pledged—Futures Contracts
| 5,182
|
| Receivables for Investment Securities Sold
| 113,815
|
| Receivables for Accrued Income
| 54,740
|
| Receivables for Capital Shares Issued
| 3,019
|
| Variation Margin Receivable—Futures Contracts
| 34
|
| Total Assets
| 12,570,932
|
| Liabilities
|
|
| Due to Custodian
| 11
|
| Payables for Investment Securities Purchased
| 128,689
|
| Payables for Capital Shares Redeemed
| 6,494
|
| Payables to Investment Advisor
| 5,571
|
| Payables to Vanguard
| 2,238
|
| Deferred Foreign Capital Gains Taxes
| 5,993
|
| Total Liabilities
| 148,996
|
| Net Assets
| 12,421,936
|
At October 31, 2023, net assets consisted of:
|
|
|
|
|
| Paid-in Capital
| 12,133,179
|
| Total Distributable Earnings (Loss)
| 288,757
|
| Net Assets
| 12,421,936
|
|
|
|
| Net Assets
|
|
Applicable to 339,890,036 outstanding $.001 par value shares of
beneficial interest (unlimited authorization)
| 12,421,936
|
| Net Asset Value Per Share
| $36.55
|
See accompanying Notes, which are an
integral part of the Financial Statements.
|
|
|
| Year Ended
October 31, 2023
|
|
| ($000)
|
| Investment Income
|
|
| Income
|
|
| Dividends1
| 389,546
|
| Interest2
| 25,163
|
| Securities Lending—Net
| 796
|
| Total Income
| 415,505
|
| Expenses
|
|
| Investment Advisory Fees—Note B
|
|
| Basic Fee
| 21,838
|
| Performance Adjustment
| 693
|
| The Vanguard Group—Note C
|
|
| Management and Administrative
| 25,882
|
| Marketing and Distribution
| 802
|
| Custodian Fees
| 988
|
| Auditing Fees
| 45
|
| Shareholders’ Reports
| 199
|
| Trustees’ Fees and Expenses
| 7
|
| Other Expenses
| 1,818
|
| Total Expenses
| 52,272
|
| Net Investment Income
| 363,233
|
| Realized Net Gain (Loss)
|
|
| Investment Securities Sold2,3
| 255,229
|
| Futures Contracts
| 17,153
|
| Foreign Currencies
| (501)
|
| Realized Net Gain (Loss)
| 271,881
|
| Change in Unrealized Appreciation (Depreciation)
|
|
| Investment Securities2,4
| 1,002,782
|
| Futures Contracts
| 4,925
|
| Foreign Currencies
| 59
|
| Change in Unrealized Appreciation (Depreciation)
| 1,007,766
|
| Net Increase (Decrease) in Net Assets Resulting from Operations
| 1,642,880
|
| 1
| Dividends are net of foreign withholding taxes of $22,790,000.
|
| 2
| Interest income, realized net gain (loss), capital gain distributions received, and change in unrealized appreciation (depreciation) from an affiliated company of the fund were
$24,784,000, $61,000, $2,000, and $13,000, respectively. Purchases and sales are for temporary cash investment purposes.
|
| 3
| Realized Gain (Loss) is net of foreign capital gains taxes of $8,313,000.
|
| 4
| The change in unrealized appreciation (depreciation) is net of the change in deferred foreign capital gains taxes of ($7,524,000).
|
See accompanying Notes, which are an
integral part of the Financial Statements.
Statement of Changes in Net Assets
|
|
|
| Year Ended October 31,
|
|
| 2023
($000)
| 2022
($000)
|
| Increase (Decrease) in Net Assets
|
|
|
| Operations
|
|
|
| Net Investment Income
| 363,233
| 365,829
|
| Realized Net Gain (Loss)
| 271,881
| (314,479)
|
| Change in Unrealized Appreciation (Depreciation)
| 1,007,766
| (3,259,520)
|
| Net Increase (Decrease) in Net Assets Resulting from Operations
| 1,642,880
| (3,208,170)
|
| Distributions
|
|
|
| Total Distributions
| (341,585)
| (633,591)
|
| Capital Share Transactions
|
|
|
| Issued
| 1,777,129
| 2,352,101
|
| Issued in Lieu of Cash Distributions
| 304,194
| 576,930
|
| Redeemed
| (2,693,213)
| (2,573,910)
|
| Net Increase (Decrease) from Capital Share Transactions
| (611,890)
| 355,121
|
| Total Increase (Decrease)
| 689,405
| (3,486,640)
|
| Net Assets
|
|
|
| Beginning of Period
| 11,732,531
| 15,219,171
|
| End of Period
| 12,421,936
| 11,732,531
|
See accompanying Notes, which are an
integral part of the Financial Statements.
For a Share Outstanding
Throughout Each Period
| Year Ended October 31,
|
| 2023
| 2022
| 2021
| 2020
| 2019
|
| Net Asset Value, Beginning of Period
| $32.96
| $43.76
| $32.48
| $36.63
| $35.86
|
| Investment Operations
|
|
|
|
|
|
| Net Investment Income1
| 1.045
| 1.019
| 1.091
| .684
| 1.104
|
| Net Realized and Unrealized Gain (Loss) on Investments
| 3.528
| (10.011)
| 10.824
| (3.723)
| 1.669
|
| Total from Investment Operations
| 4.573
| (8.992)
| 11.915
| (3.039)
| 2.773
|
| Distributions
|
|
|
|
|
|
| Dividends from Net Investment Income
| (.983)
| (1.087)
| (.635)
| (1.111)
| (.943)
|
| Distributions from Realized Capital Gains
| —
| (.721)
| —
| —
| (1.060)
|
| Total Distributions
| (.983)
| (1.808)
| (.635)
| (1.111)
| (2.003)
|
| Net Asset Value, End of Period
| $36.55
| $32.96
| $43.76
| $32.48
| $36.63
|
| Total Return2
| 13.97%
| -21.28%
| 36.91%
| -8.69%
| 8.48%
|
| Ratios/Supplemental Data
|
|
|
|
|
|
| Net Assets, End of Period (Millions)
| $12,422
| $11,733
| $15,219
| $9,408
| $10,360
|
| Ratio of Total Expenses to Average Net Assets3
| 0.39%
| 0.38%
| 0.36%
| 0.35%
| 0.37%
|
| Ratio of Net Investment Income to Average Net Assets
| 2.72%
| 2.68%
| 2.56%
| 2.05%
| 3.15%
|
| Portfolio Turnover Rate
| 29%
| 37%
| 33%
| 72%
| 38%
|
| 1
| Calculated based on average shares outstanding.
|
| 2
| Total returns do not include account service fees that may have applied in the periods shown. Fund prospectuses provide information about any applicable account service fees.
|
| 3
| Includes performance-based investment advisory fee increases (decreases) of 0.01%, 0.00%, (0.01%), (0.02%), and (0.01%).
|
See accompanying Notes, which are an
integral part of the Financial Statements.
Notes to Financial Statements
Vanguard International Value
Fund is registered under the Investment Company Act of 1940 as an open-end investment company, or mutual fund.
A. The following significant accounting policies conform to generally accepted accounting principles for U.S. investment companies. The fund consistently follows such policies in preparing its
financial statements.
1. Security Valuation:
Securities are valued as of the close of trading on the New York Stock Exchange (generally 4 p.m., Eastern time) on the valuation date. Equity securities are valued at the latest quoted sales prices or official
closing prices taken from the primary market in which each security trades; such securities not traded on the valuation date are valued at the mean of the latest quoted bid and asked prices. Securities for which
market quotations are not readily available, or whose values have been affected by events occurring before the fund’s pricing time but after the close of the securities’ primary markets, are valued by
methods deemed by the valuation designee to represent fair value and subject to oversight by the board of trustees. These procedures include obtaining quotations from an independent pricing service, monitoring news to
identify significant market- or security-specific events, and evaluating changes in the values of foreign market proxies (for example, ADRs, futures contracts, or exchange-traded funds), between the time the foreign
markets close and the fund’s pricing time. When fair-value pricing is employed, the prices of securities used by a fund to calculate its net asset value may differ from quoted or published prices for the same
securities. Investments in Vanguard Market Liquidity Fund are valued at that fund's net asset value.
2. Foreign Currency:
Securities and other assets and liabilities denominated in foreign currencies are translated into U.S. dollars using exchange rates obtained from an independent third party as of the fund’s pricing time on the
valuation date. Realized gains (losses) and unrealized appreciation (depreciation) on investment securities include the effects of changes in exchange rates since the securities were purchased, combined with the
effects of changes in security prices. Fluctuations in the value of other assets and liabilities resulting from changes in exchange rates are recorded as unrealized foreign currency gains (losses) until the assets or
liabilities are settled in cash, at which time they are recorded as realized foreign currency gains (losses).
3. Futures Contracts:
The fund uses index futures contracts to a limited extent, with the objective of maintaining full exposure to the stock market while maintaining liquidity. The fund may purchase or sell futures contracts to achieve a
desired level of investment, whether to accommodate portfolio turnover or cash flows from capital share transactions. The primary risks associated with the use of futures contracts are imperfect correlation between
changes in market values of stocks held by the fund and the prices of futures contracts, and the possibility of an illiquid market. Counterparty risk involving futures is mitigated because a regulated clearinghouse is
the counterparty instead of the clearing broker. To further mitigate counterparty risk, the fund trades futures contracts on an exchange, monitors the financial strength of its clearing brokers and clearinghouse, and
has entered into clearing agreements with its clearing brokers. The clearinghouse imposes initial margin requirements to secure the fund’s performance and requires daily settlement of variation margin
representing changes in the market value of each contract. Any securities pledged as initial margin for open contracts are noted in the Schedule of Investments.
Futures contracts are valued
at their quoted daily settlement prices. The notional amounts of the contracts are not recorded in the Statement of Assets and Liabilities. Fluctuations in the value of the contracts are recorded in the Statement of
Assets and Liabilities as an asset (liability) and in
the Statement of Operations as unrealized
appreciation (depreciation) until the contracts are closed, when they are recorded as realized gains (losses) on futures contracts.
During the year ended October
31, 2023, the fund’s average investments in long and short futures contracts represented 2% and 0% of net assets, respectively, based on the average of the notional amounts at each quarter-end during the
period.
4. Federal Income Taxes:
The fund intends to continue to qualify as a regulated investment company and distribute virtually all of its taxable income. The fund’s tax returns are open to examination by the relevant tax authorities until
expiration of the applicable statute of limitations, which is generally three years after the filing of the tax return. Management has analyzed the fund’s tax positions taken for all open federal and state
income tax years, and has concluded that no provision for income tax is required in the fund’s financial statements.
5. Distributions:
Distributions to shareholders are recorded on the ex-dividend date. Distributions are determined on a tax basis at the fiscal year-end and may differ from net investment income and realized capital gains for financial
reporting purposes.
6. Securities Lending:
To earn additional income, the fund lends its securities to qualified institutional borrowers. Security loans are subject to termination by the fund at any time, and are required to be secured at all times by
collateral in an amount at least equal to the market value of securities loaned. Daily market fluctuations could cause the value of loaned securities to be more or less than the value of the collateral received. When
this occurs, the collateral is adjusted and settled before the opening of the market on the next business day. The fund further mitigates its counterparty risk by entering into securities lending transactions only
with a diverse group of prequalified counterparties, monitoring their financial strength, and entering into master securities lending agreements with its counterparties. The master securities lending agreements
provide that, in the event of a counterparty’s default (including bankruptcy), the fund may terminate any loans with that borrower, determine the net amount owed, and sell or retain the collateral up to the net
amount owed to the fund; however, such actions may be subject to legal proceedings. While collateral mitigates counterparty risk, in the event of a default, the fund may experience delays and costs in recovering the
securities loaned. The fund invests cash collateral received in Vanguard Market Liquidity Fund, and records a liability in the Statement of Assets and Liabilities for the return of the collateral, during the period
the securities are on loan. Collateral investments in Vanguard Market Liquidity Fund are subject to market appreciation or depreciation. Securities lending income represents fees charged to borrowers plus income
earned on invested cash collateral, less expenses associated with the loan. During the term of the loan, the fund is entitled to all distributions made on or in respect of the loaned securities.
7. Credit Facilities and
Interfund Lending Program: The fund and certain other funds managed by The Vanguard Group ("Vanguard") participate in a $4.3 billion committed credit facility provided by a syndicate of lenders pursuant to a credit
agreement and an uncommitted credit facility provided by Vanguard. Both facilities may be renewed annually. Each fund is individually liable for its borrowings, if any, under the credit facilities. Borrowings may be
utilized for temporary or emergency purposes and are subject to the fund’s regulatory and contractual borrowing restrictions. With respect to the committed credit facility, the participating funds are charged
administrative fees and an annual commitment fee of 0.10% of the undrawn committed amount of the facility, which are allocated to the funds based on a method approved by the fund’s board of trustees and included
in Management and Administrative expenses on the fund’s Statement of Operations. Any borrowings under either facility bear interest at an agreed-upon spread plus the
higher of the federal funds effective rate,
the overnight bank funding rate, or the Daily Simple Secured Overnight Financing Rate inclusive of an additional agreed-upon spread. However, borrowings under the uncommitted credit facility may bear interest based
upon an alternate rate agreed to by the fund and Vanguard.
In accordance with an
exemptive order (the “Order”) from the SEC, the fund may participate in a joint lending and borrowing program that allows registered open-end Vanguard funds to borrow money from and lend money to each
other for temporary or emergency purposes (the “Interfund Lending Program”), subject to compliance with the terms and conditions of the Order, and to the extent permitted by the fund’s investment
objective and investment policies. Interfund loans and borrowings normally extend overnight but can have a maximum duration of seven days. Loans may be called on one business day’s notice. The interest rate to
be charged is governed by the conditions of the Order and internal procedures adopted by the board of trustees. The board of trustees is responsible for overseeing the Interfund Lending Program.
For the year ended October 31,
2023, the fund did not utilize the credit facilities or the Interfund Lending Program.
8. Other: Dividend
income is recorded on the ex-dividend date. Non-cash dividends included in income, if any, are recorded at the fair value of the securities received. Interest income includes income distributions received from
Vanguard Market Liquidity Fund and is accrued daily. Security transactions are accounted for on the date securities are bought or sold. Costs used to determine realized gains (losses) on the sale of investment
securities are those of the specific securities sold.
Taxes on foreign dividends and
capital gains have been provided for in accordance with the applicable countries’ tax rules and rates. Deferred foreign capital gains tax, if any, is accrued daily based upon net unrealized gains. The fund has
filed tax reclaims for previously withheld taxes on dividends earned in certain European Union countries. These filings are subject to various administrative and judicial proceedings within these countries. Amounts
related to these reclaims are recorded when there are no significant uncertainties as to the ultimate resolution of proceedings, the likelihood of receipt of these reclaims, and the potential timing of
payment. Such tax reclaims and related professional fees, if any, are included in dividend income and other expenses, respectively.
B. The investment advisory firms Lazard Asset Management LLC, Sprucegrove Investment Management Ltd., and ARGA Investment Management, LP each provide investment advisory services to a portion
of the fund for a fee calculated at an annual percentage rate of average net assets managed by the advisor. The basic fees of Lazard Asset Management LLC and ARGA Investment Management, LP, are subject to quarterly
adjustments based on performance relative to the MSCI All Country World Index ex USA for the preceding five years. The basic fee of Sprucegrove Investment Management Ltd. is subject to quarterly adjustments based on
performance relative to the MSCI All Country World Index ex USA since October 31, 2020.
Vanguard manages the cash
reserves of the fund as described below.
For the year ended October 31,
2023, the aggregate investment advisory fee paid to all advisors represented an effective annual basic rate of 0.16% of the fund’s average net assets, before a net increase of $693,000 (0.01%) based on
performance.
C. In accordance with the terms of a Funds’ Service Agreement (the “FSA”) between Vanguard and the fund, Vanguard furnishes to the fund corporate management, administrative,
marketing, distribution, and cash management services at Vanguard’s cost of operations (as defined by the FSA). These costs of operations are allocated to the fund based on methods and guidelines approved by the
board of trustees and are generally settled twice a month.
Upon the request of Vanguard,
the fund may invest up to 0.40% of its net assets as capital in Vanguard. At October 31, 2023, the fund had contributed to Vanguard capital in the amount of $453,000, representing less than 0.01% of the fund’s
net assets and 0.18% of Vanguard’s capital received pursuant to the FSA. The fund’s trustees and officers are also directors and employees, respectively, of Vanguard.
D. Various inputs may be used to determine the value of the fund’s investments and derivatives. These inputs are summarized in three broad levels for financial statement purposes. The
inputs or methodologies used to value securities are not necessarily an indication of the risk associated with investing in those securities.
Level 1—Quoted prices in active markets for identical securities.
Level 2—Other significant observable inputs (including quoted prices for similar securities, interest rates, prepayment speeds, credit risk, etc.).
Level 3—Significant unobservable inputs (including the fund’s own assumptions used to determine the fair value of investments). Any investments and derivatives valued with significant
unobservable inputs are noted on the Schedule of Investments.
The following table summarizes
the market value of the fund's investments and derivatives as of October 31, 2023, based on the inputs used to value them:
|
| Level 1
($000)
| Level 2
($000)
| Level 3
($000)
| Total
($000)
|
| Investments
|
|
|
|
|
| Assets
|
|
|
|
|
| Common Stocks—North and South America
| 1,057,433
| 61,772
| —
| 1,119,205
|
| Common Stocks—Other
| 630,228
| 9,779,387
| —
| 10,409,615
|
| Preferred Stocks
| 211,582
| 165,146
| —
| 376,728
|
| Temporary Cash Investments
| 479,401
| —
| —
| 479,401
|
| Total
| 2,378,644
| 10,006,305
| —
| 12,384,949
|
|
|
|
|
|
|
| Derivative Financial Instruments
|
|
|
|
|
| Liabilities
|
|
|
|
|
| Futures Contracts1
| 11,694
| —
| —
| 11,694
|
| 1
| Includes cumulative appreciation (depreciation) on futures contracts and centrally cleared swaps, if any, as reported in the Schedule of Investments.
Only current day’s variation margin is reported within the Statement of Assets and Liabilities.
|
E. Permanent differences between book-basis and tax-basis components of net assets are reclassified among capital accounts in the financial statements to reflect their tax character. These
reclassifications have no effect on net assets or net asset value per share. As of period end, permanent differences primarily attributable to the accounting for applicable foreign currency transactions and tax
expense on capital gains were reclassified between the individual components of total distributable earnings (loss).
Temporary differences between
book-basis and tax-basis components of total distributable earnings (loss) arise when certain items of income, gain, or loss are recognized in different periods for financial statement and tax purposes; these
differences will reverse at some time in the future. The differences are primarily related to capital loss carryforwards; the deferral of losses from wash sales; the recognition of unrealized gains or losses from
certain derivative contracts; and the recognition of unrealized gains from passive foreign investment companies. As of period end, the tax-basis components of total distributable earnings (loss) are detailed in the
table as follows:
|
| Amount
($000)
|
| Undistributed Ordinary Income
| 315,576
|
| Undistributed Long-Term Gains
| —
|
| Net Unrealized Gains (Losses)
| (14,245)
|
| Capital Loss Carryforwards
| (17,498)
|
| Qualified Late-Year Losses
| —
|
| Other Temporary Differences
| 4,924
|
| Total
| 288,757
|
The tax character of
distributions paid was as follows:
|
| Year Ended October 31,
|
|
| 2023
Amount
($000)
| 2022
Amount
($000)
|
| Ordinary Income*
| 341,585
| 633,591
|
| Long-Term Capital Gains
| —
| —
|
| Total
| 341,585
| 633,591
|
| *
| Includes short-term capital gains, if any.
|
As of October 31, 2023, gross
unrealized appreciation and depreciation for investments and derivatives based on cost for U.S. federal income tax purposes were as follows:
|
| Amount
($000)
|
| Tax Cost
| 12,391,381
|
| Gross Unrealized Appreciation
| 1,653,427
|
| Gross Unrealized Depreciation
| (1,659,859)
|
| Net Unrealized Appreciation (Depreciation)
| (6,432)
|
F. During the year ended October 31, 2023, the fund purchased $3,680,065,000 of investment securities and sold $4,137,391,000 of investment securities, other than temporary cash
investments.
G. Capital shares issued and redeemed were:
|
| Year Ended October 31,
|
|
| 2023
Shares
(000)
| 2022
Shares
(000)
|
| Issued
| 46,674
| 61,320
|
| Issued in Lieu of Cash Distributions
| 8,593
| 14,416
|
| Redeemed
| (71,293)
| (67,638)
|
| Net Increase (Decrease) in Shares Outstanding
| (16,026)
| 8,098
|
H. Significant market disruptions, such as those caused by pandemics (e.g., COVID-19 pandemic), natural or environmental disasters, war (e.g., Russia’s invasion of Ukraine), acts
of terrorism, or other events, can adversely affect local and global markets and normal market operations. Any such disruptions could have an adverse impact on the value of the fund’s investments and fund
performance.
To the extent the fund’s
investment portfolio reflects concentration in a particular market, industry, sector, country or asset class, the fund may be adversely affected by the performance of these concentrations and may be subject to
increased price volatility and other risks.
The use of derivatives may
expose the fund to various risks. Derivatives can be highly volatile, and any initial investment is generally small relative to the notional amount so that transactions may be leveraged in terms of market exposure. A
relatively small market movement may have a potentially larger impact on derivatives than on standard securities. Leveraged derivatives positions can, therefore, increase volatility. Additional information regarding
the fund’s use of derivative(s) and the specific risks associated is described under significant accounting policies.
I. Management has determined that no events or transactions occurred subsequent to October 31, 2023, that would require recognition or disclosure in these financial statements.
Report of Independent Registered
Public Accounting Firm
To the Board of Trustees of Vanguard
Trustees' Equity Fund and Shareholders of Vanguard International Value Fund
Opinion on the Financial
Statements
We have audited the
accompanying statement of assets and liabilities, including the schedule of investments, of Vanguard International Value Fund (one of the funds constituting Vanguard Trustees' Equity Fund, referred to hereafter as the
"Fund") as of October 31, 2023, the related statement of operations for the year ended October 31, 2023, the statement of changes in net assets for each of the two years in the period ended October 31, 2023, including the related notes, and the financial highlights for each of the five years in the period ended October 31, 2023 (collectively referred to as the "financial statements"). In our opinion, the financial
statements present fairly, in all material respects, the financial position of the Fund as of October 31, 2023, the results of its operations for the year then ended, the changes in its net assets for each of the two
years in the period ended October 31, 2023 and the financial highlights for each of the five years in the period ended October 31, 2023 in conformity with accounting principles generally accepted in the United States
of America.
Basis for Opinion
These financial statements are
the responsibility of the Fund’s management. Our responsibility is to express an opinion on the Fund’s financial statements based on our audits. We are a public accounting firm registered with the Public
Company Accounting Oversight Board (United States) (PCAOB) and are required to be independent with respect to the Fund in accordance with the U.S. federal securities laws and the applicable rules and regulations of
the Securities and Exchange Commission and the PCAOB.
We conducted our audits of
these financial statements in accordance with the standards of the PCAOB. Those standards require that we plan and perform the audit to obtain reasonable assurance about whether the financial statements are free of
material misstatement, whether due to error or fraud.
Our audits included performing
procedures to assess the risks of material misstatement of the financial statements, whether due to error or fraud, and performing procedures that respond to those risks. Such procedures included examining, on a test
basis, evidence regarding the amounts and disclosures in the financial statements. Our audits also included evaluating the accounting principles used and significant estimates made by management, as well as evaluating
the overall presentation of the financial statements. Our procedures included confirmation of securities owned as of October 31, 2023 by correspondence with the custodian, transfer agent and brokers; when replies were
not received from brokers, we performed other auditing procedures. We believe that our audits provide a reasonable basis for our opinion.
/s/PricewaterhouseCoopers
LLP
Philadelphia, Pennsylvania
December 19, 2023
We have served as the auditor
of one or more investment companies in The Vanguard Group of Funds since 1975.
Tax information
(unaudited)
The fund hereby designates
$299,672,000, or if subsequently determined to be different, the maximum amount allowable by law, as qualified dividend income for individual shareholders for the fiscal year.
The fund hereby designates
$6,375,000, or if subsequently determined to be different, the maximum amount allowable by law, of interest earned from obligations of the U.S. government which is generally exempt from state income tax.
The fund designates to
shareholders foreign source income of $412,270,000 and foreign taxes paid of $26,024,000, or if subsequently determined to be different, the maximum amounts allowable by law. Form 1099-DIV reports calendar-year
amounts that can be included on the income tax return of shareholders.
This page intentionally left blank.
The People Who Govern Your Fund
The trustees of your mutual
fund are there to see that the fund is operated and managed in your best interests since, as a shareholder, you are a part owner of the fund. Your fund’s trustees also serve on the board of directors of The
Vanguard Group, Inc., which is owned by the Vanguard funds and provides services to them.
A majority of Vanguard’s
board members are independent, meaning that they have no affiliation with Vanguard or the funds they oversee, apart from the sizable personal investments they have made as private individuals. The independent board
members have distinguished backgrounds in business, academia, and public service. Each of the trustees and executive officers oversees 205 Vanguard funds.
Information for each trustee
and executive officer of the fund appears below. That information, as well as the Vanguard fund count, is as of the date on the cover of this fund report. The mailing address of the trustees and officers is P.O. Box
876, Valley Forge, PA 19482. More information about the trustees is in the Statement of Additional Information, which can be obtained, without charge, by contacting Vanguard at 800-662-7447, or online at vanguard.com.
Interested Trustee1
Mortimer J. Buckley
Born in 1969. Trustee since January 2018.
Principal occupation(s) during the past five years and other experience: chairman of the board (2019–present) of Vanguard and of each of the investment companies served by Vanguard; chief executive officer
(2018–present) of Vanguard; chief executive officer, president, and trustee (2018–present) of each of the investment companies served by Vanguard; president and director (2017–present) of Vanguard;
and president (2018–present) of Vanguard Marketing Corporation. Chief investment officer (2013–2017), managing director (2002–2017), head of the Retail Investor Group (2006–2012), and chief
information officer (2001–2006) of Vanguard. Member of the board of governors of the Investment Company Institute and the board of governors of FINRA.
Independent Trustees
Tara Bunch
Born in 1962. Trustee since November 2021.
Principal occupation(s) during the past five years and other experience: head of global operations at Airbnb (2020–present). Vice president of AppleCare (2012–2020). Member of the board of directors of Out
& Equal, the advisory board of the University of California, Berkeley School of Engineering, and the advisory board of Santa Clara University’s Leavey School of Business.
Emerson U. Fullwood
Born in 1948. Trustee since January 2008.
Principal occupation(s) during the past five years and other experience: executive chief staff and marketing officer for North America and corporate vice president (retired 2008) of Xerox Corporation (document
management products and services). Former president of the Worldwide Channels Group, Latin America, and Worldwide Customer Service and executive chief staff officer of Developing Markets of Xerox. Executive in
residence and 2009–2010 Distinguished Minett Professor at the Rochester Institute of Technology. Member of the board of directors of the University of Rochester Medical Center, the Monroe Community College
Foundation, the United Way of Rochester, North Carolina A&T University, Roberts Wesleyan College, and the Rochester Philharmonic Orchestra. Trustee of the University of Rochester.
F. Joseph Loughrey
Born in 1949. Trustee since October 2009.
Principal occupation(s) during the past five years and other experience: president and chief operating officer (retired 2009) and vice chairman of the board (2008–2009) of Cummins Inc. (industrial
machinery). Director of the V Foundation. Member of the advisory council for the College of Arts and Letters at the University of Notre Dame. Chairman of the board of Saint Anselm College.
1 Mr.
Buckley is considered an “interested person,” as defined in the Investment Company Act of 1940, because he is an officer of the Vanguard funds.
Mark Loughridge
Born in 1953. Trustee since March 2012.
Principal occupation(s) during the past five years and other experience: senior vice president and chief financial officer (retired 2013) of IBM (information technology services). Fiduciary member of IBM’s
Retirement Plan Committee (2004–2013), senior vice president and general manager (2002–2004) of IBM Global Financing, vice president and controller (1998–2002) of IBM, and a variety of other prior
management roles at IBM. Member of the Council on Chicago Booth.
Scott C. Malpass
Born in 1962. Trustee since March 2012.
Principal occupation(s) during the past five years and other experience: chief investment officer (retired 2020) and vice president (retired 2020) of the University of Notre Dame. Chair of the board of
Catholic Investment Services, Inc. (investment advisors). Member of the board of superintendence of the Institute for the Works of Religion, the Notre Dame 403(b) Investment Committee, and the
board of directors of Paxos Trust Company (finance).
Deanna Mulligan
Born in 1963. Trustee since January 2018.
Principal occupation(s) during the past five years and other experience: chief executive officer of Purposeful (advisory firm for CEOs and C-level executives; 2021–present). Board chair (2020), chief executive
officer (2011–2020), and president (2010–2019) of The Guardian Life Insurance Company of America. Chief operating officer (2010–2011) and executive vice president (2008–2010) of Individual Life
and Disability of the Guardian Life Insurance Company of America. Director of DuPont. Member of the board of the Economic Club of New York. Trustee of the Partnership for New York City (business leadership), Chief
Executives for Corporate Purpose, and the NewYork-Presbyterian Hospital.
André F. Perold
Born in 1952. Trustee since December 2004.
Principal occupation(s) during the past five years and other experience: George Gund Professor of Finance and Banking, Emeritus at the Harvard Business School (retired 2011). Chief investment officer and partner of
HighVista Strategies (private investment firm). Member of the board of RIT Capital Partners (investment firm).
Sarah Bloom Raskin
Born in 1961. Trustee since January 2018.
Principal occupation(s) during the past five years and other experience: deputy secretary (2014–2017) of the United States Department of the Treasury. Governor (2010–2014) of the Federal
Reserve Board. Commissioner (2007–2010) of financial regulation for the State of Maryland. Colin W. Brown Distinguished Professor of the Practice of Law, Duke Law School (2021–present);
Rubenstein Fellow, Duke University (2017–2020); Distinguished Fellow of the Global Financial Markets Center, Duke Law School (2020–2022); and Senior Fellow, Duke Center on Risk
(2020–present). Partner of Kaya Partners (climate policy advisory services). Member of the board of directors of Arcadia (energy solution technology).
Grant Reid
Born in 1959. Trustee since July 2023.
Principal occupation(s) during the past five years and other experience: chief executive officer and president (2014–2022) and member of the board of directors (2015–2022) of Mars, Incorporated
(multinational manufacturer). Member of the board of directors of Marriott International, Inc. Chair of Agribusiness Task Force, Sustainable Markets Initiative.
David Thomas
Born in 1956. Trustee since July 2021.
Principal occupation(s) during the past five years and other experience: president of Morehouse College (2018–present). Professor of business administration, emeritus at Harvard University (2017–2018).
Dean (2011–2016) and professor of management (2016–2017) at the Georgetown University McDonough School of Business. Director of DTE Energy Company. Trustee of Common Fund.
Peter F. Volanakis
Born in 1955. Trustee since July 2009.
Principal occupation(s) during the past five years and other experience: president and chief operating officer (retired 2010) of Corning Incorporated (communications equipment) and director of Corning Incorporated
(2000–2010) and Dow Corning (2001–2010). Director (2012) of SPX Corporation (multi-industry manufacturing). Overseer of the Amos Tuck School of Business Administration, Dartmouth College (2001–2013).
Member of the BMW Group Mobility Council.
Executive Officers
Jacqueline Angell
Born in 1974. Principal occupation(s) during
the past five years and other experience: principal of Vanguard. Chief compliance officer (November 2022–present) of Vanguard and of each of the investment companies served by Vanguard. Chief
compliance officer (2018–2022) and deputy chief compliance officer (2017–2019) of State Street.
Christine M. Buchanan
Born in 1970. Principal occupation(s) during
the past five years and other experience: principal of Vanguard. Chief financial officer (2021–present) and treasurer (2017–2022) of each of the investment companies served by Vanguard. Partner
(2005–2017) at KPMG (audit, tax, and advisory services).
John Galloway
Born in 1973. Principal occupation(s) during
the past five years and other experience: principal of Vanguard. Investment stewardship officer (September 2020–present) of each of the investment companies served by Vanguard. Head of Investor Advocacy
(February 2020–present) and head of Marketing Strategy and Planning (2017–2020) at Vanguard. Special assistant to the President of the United States (2015).
Ashley Grim
Born in 1984. Principal occupation(s) during
the past five years and other experience: treasurer (February 2022–present) of each of the investment companies served by Vanguard. Fund transfer agent controller (2019–2022) and director of Audit
Services (2017–2019) at Vanguard. Senior manager (2015–2017) at PriceWaterhouseCoopers (audit and assurance, consulting, and tax services).
Jodi Miller
Born in 1980. Principal occupation(s) during
the past five years and other experience: principal of Vanguard. Finance director (2022–present) of each of the investment companies served by Vanguard. Head of Enterprise Investment Services
(2020–present), head of Retail Client Services and Operations (2020–2022), and head of Retail Strategic Support (2018–2020) at Vanguard.
Anne E. Robinson
Born in 1970. Principal occupation(s) during
the past five years and other experience: general counsel (2016–present) of Vanguard. Secretary (2016–present) of Vanguard and of each of the investment companies served by Vanguard. Managing director
(2016–present) of Vanguard. Managing director and general counsel of Global Cards and Consumer Services (2014–2016) at Citigroup. Counsel (2003–2014) at American Express. Nonexecutive director
(2022–present) of the board of National Grid (energy).
Michael Rollings
Born in 1963. Principal occupation(s) during
the past five years and other experience: finance director (2017–present) and treasurer (2017) of each of the investment companies served by Vanguard. Managing director (2016–present) of Vanguard. Chief
financial officer (2016–present) of Vanguard. Director (2016–present) of Vanguard Marketing Corporation. Executive vice president and chief financial officer (2006–2016) of MassMutual Financial
Group.
Vanguard Senior Management
Team
| Matthew Benchener
| Thomas M. Rampulla
|
| Joseph Brennan
| Karin A. Risi
|
| Mortimer J. Buckley
| Anne E. Robinson
|
| Gregory Davis
| Michael Rollings
|
| John James
| Nitin Tandon
|
| Chris D. McIsaac
| Lauren Valente
|
Connect with
Vanguard®>vanguard.com
Fund Information > 800-662-7447
Direct Investor Account
Services > 800-662-2739
Institutional Investor
Services > 800-523-1036
Text Telephone for People
Who Are Deaf or Hard of Hearing > 800-749-7273
This material may be used in
conjunction with the offering of shares of any Vanguard fund only if preceded or accompanied by the fund’s current prospectus.
All comparative mutual
fund data are from Morningstar, Inc., unless otherwise noted.
You can obtain a free
copy of Vanguard’s proxy voting guidelines by visiting vanguard.com/proxyreporting or by calling Vanguard at 800-662-2739. The guidelines are also available from the SEC’s website, www.sec.gov. In
addition, you may obtain a free report on how your fund voted the proxies for securities it owned during the 12 months ended June 30. To get the report, visit either vanguard.com/proxyreporting or www.sec.gov.
You can review
information about your fund on the SEC’s website, and you can receive copies of this information, for a fee, by sending a request via email addressed to publicinfo@sec.gov.
Source for Bloomberg indexes:
Bloomberg Index Services Limited. Copyright 2023, Bloomberg. All rights reserved.
CFA® is a registered trademark owned by CFA Institute.
© 2023 The Vanguard Group,
Inc.
All rights reserved.
Vanguard Marketing Corporation, Distributor.
Q460 122023
Annual Report | October 31, 2023
Vanguard
Diversified Equity Fund
See the inside front cover
for important information about your fund’s annual and semiannual shareholder reports.
Important information about shareholder
reports
Beginning in July 2024,
amendments adopted by the Securities and Exchange Commission will substantially impact the design, content, and transmission of shareholder reports. Shareholder reports will provide key fund information in a clear and
concise format and must be mailed to each shareholder that has not elected to receive the reports electronically. Financial statements will no longer be included in the shareholder report but will be available at
vanguard.com, can be mailed upon request, or can be accessed on the SEC’s website at www.sec.gov.
You may elect to receive
shareholder reports and other communications from the fund electronically by contacting your financial intermediary (such as a broker-dealer or bank) or, if you invest directly with the fund, by calling Vanguard at
one of the phone numbers on the back cover of this report or by logging on to vanguard.com.
Contents
Please note: The
opinions expressed in this report are just that—informed opinions. They should not be considered promises or advice. Also, please keep in mind that the information and opinions cover the period through the date
on the front of this report. Of course, the risks of investing in your fund are spelled out in the prospectus.
Your Fund’s Performance at a Glance
| •
| For the 12 months ended October 31, 2023, Vanguard Diversified Equity Fund returned 7.88%, lagging the 8.51% return of its benchmark, the MSCI US Broad Market Index.
|
| •
| Early on, inflation continued to ease amid ongoing interest rate hikes by the Federal Reserve. Unexpected resilience in the labor market and consumer spending helped dial back expectations of a sustained recession,
but the prospect of higher interest rates for longer and heightened geopolitical tensions weighed on market sentiment toward the close of the period.
|
| •
| Vanguard Diversified Equity Fund is a fund of funds, investing in six actively managed Vanguard funds selected to provide broad exposure to all segments of the U.S. equity market. Together, the funds cover the style
and capitalization spectrum.
|
| •
| Returns of the underlying funds ranged from about –2% for Vanguard Explorer Fund to more than 15% for Vanguard U.S. Growth Fund. Three of the funds outpaced their benchmark
indexes and three lagged. The underperforming funds accounted for roughly half the fund’s assets.
|
Market Barometer
|
| Average Annual Total Returns
Periods Ended October 31, 2023
|
|
| One Year
| Three Years
| Five Years
|
| Stocks
|
|
|
|
| Russell 1000 Index (Large-caps)
| 9.48%
| 9.53%
| 10.71%
|
| Russell 2000 Index (Small-caps)
| -8.56
| 3.95
| 3.31
|
| Russell 3000 Index (Broad U.S. market)
| 8.38
| 9.19
| 10.23
|
| FTSE All-World ex US Index (International)
| 12.35
| 3.51
| 3.88
|
| Bonds
|
|
|
|
Bloomberg U.S. Aggregate Float Adjusted Index
(Broad taxable market)
| 0.53%
| -5.51%
| 0.03%
|
Bloomberg Municipal Bond Index
(Broad tax-exempt market)
| 2.64
| -2.48
| 1.00
|
| FTSE Three-Month U.S. Treasury Bill Index
| 4.94
| 1.93
| 1.80
|
| CPI
|
|
|
|
| Consumer Price Index
| 3.24%
| 5.72%
| 4.00%
|
About Your Fund’s Expenses
As a shareholder of the fund,
you incur ongoing costs, which include costs for portfolio management, administrative services, and shareholder reports (like this one), among others. Operating expenses, which are deducted from a fund’s gross
income, directly reduce the investment return of the fund.
A fund’s expenses are
expressed as a percentage of its average net assets. The Diversified Equity Fund has no direct expenses, but bears its proportionate share of the costs for the underlying funds in which it invests. These indirect
expenses make up the acquired fund fees and expenses, also expressed as a percentage of average net assets. The following examples are intended to help you understand the ongoing costs (in dollars) of investing in
your fund and to compare these costs with those of other mutual funds. The examples are based on an investment of $1,000 made at the beginning of the period shown and held for the entire period. The costs were
calculated using the acquired fund fees and expenses for the Diversified Equity Fund.
The accompanying table
illustrates your fund’s costs in two ways:
| •
| Based on actual fund return. This section helps you to estimate the actual expenses that you paid over the period. The ”Ending Account Value“ shown is derived from the fund’s actual return, and the
third column shows the dollar amount that would have been paid by an investor who started with $1,000 in the fund. You may use the information here, together with the amount you invested, to estimate the expenses that
you paid over the period.
|
To do so, simply divide your
account value by $1,000 (for example, an $8,600 account value divided by $1,000 = 8.6), then multiply the result by the number given for your fund under the heading ”Expenses Paid During Period.“
| •
| Based on hypothetical 5% yearly return. This section is intended to help you compare your fund‘s costs with those of other mutual funds. It assumes that the fund had a yearly return of 5% before expenses, but that the
expense ratio is unchanged. In this case—because the return used is not the fund’s actual return—the results do not apply to your investment. The example is useful in making comparisons because the
Securities and Exchange Commission requires all mutual funds to calculate expenses based on a 5% return. You can assess your fund’s costs by comparing this hypothetical example with the hypothetical examples
that appear in shareholder reports of other funds.
|
Note that the expenses shown
in the table are meant to highlight and help you compare ongoing costs only. Further, the expenses do not include any purchase, redemption, or account service fees described in the fund prospectus. If such fees were applied to your account,
your costs would be higher. Your fund does not carry a “sales load.”
The calculations assume no
shares were bought or sold during the period. Your actual costs may have been higher or lower, depending on the amount of your investment and the timing of any purchases or redemptions.
You can find more information
about the fund’s expenses in the Financial Statements section of this report. For additional information on operating expenses and other shareholder costs, please refer to your fund’s current
prospectus.
| Six Months Ended October 31, 2023
|
|
|
|
| Diversified Equity Fund
| Beginning
Account Value
4/30/2023
| Ending
Account Value
10/31/2023
| Expenses
Paid During
Period
|
| Based on Actual Fund Return
| $1,000.00
| $1,004.80
| $1.77
|
| Based on Hypothetical 5% Yearly Return
| 1,000.00
| 1,023.44
| 1.79
|
The calculations are
based on acquired fund fees and expenses for the most recent six-month period. The underlying funds' annualized expense figure for that period is 0.35%. The dollar amounts shown as ”Expenses Paid” are
equal to the annualized average weighted expense ratio for the underlying funds multiplied by the average account value over the period, multiplied by the number of days in the most recent six-month period, then
divided by the number of days in the most recent 12-month period (184/365).
All of the returns in this
report represent past performance, which is not a guarantee of future results that may be achieved by the fund. (Current performance may be lower or higher than the performance data cited. For performance data current
to the most recent month-end, visit our website at vanguard.com/performance.) Note, too, that both investment returns and principal value can fluctuate widely, so an investor’s shares, when sold, could be worth
more or less than their original cost. The returns shown do not reflect taxes that a shareholder would pay on fund distributions or on the sale of fund shares.
Cumulative Performance: October
31, 2013, Through October 31, 2023
Initial Investment of
$10,000
|
|
| Average Annual Total Returns
Periods Ended October 31, 2023
|
|
|
|
| One
Year
| Five
Years
| Ten
Years
| Final Value
of a $10,000
Investment
|

| Diversified Equity Fund
| 7.88%
| 10.02%
| 10.09%
| $26,149
|

| MSCI US Broad Market Index
| 8.51
| 10.35
| 10.60
| 27,394
|
See Financial
Highlights for dividend and capital gains information.
Underlying Vanguard Funds
| Vanguard U.S. Growth Fund Investor Shares
| 30.1%
|
| Vanguard Growth and Income Fund Investor Shares
| 20.3
|
| Vanguard WindsorTM Fund Investor Shares
| 20.0
|
| Vanguard Windsor II Fund Investor Shares
| 15.2
|
| Vanguard ExplorerTM Fund Investor Shares
| 9.7
|
| Vanguard Mid-Cap Growth Fund
| 4.7
|
The table reflects the fund's
investments, except for short-term investments.
The fund files its complete
schedule of portfolio holdings with the Securities and Exchange Commission (SEC) for the first and third quarters of each fiscal year as an exhibit to its reports on Form N-PORT. The fund’s Form N-PORT reports
are available on the SEC’s website at www.sec.gov.
|
|
|
|
|
| Shares
| Market
Value•
($000)
|
| Investment Companies (100.1%)
|
| U.S. Stock Funds (100.1%)
|
|
| Vanguard U.S. Growth Fund Investor Shares
| 14,202,594
| 676,186
|
|
| Vanguard Growth and Income Fund Investor Shares
| 8,671,500
| 456,381
|
|
| Vanguard Windsor Fund Investor Shares
| 22,285,386
| 450,611
|
|
| Vanguard Windsor II Fund Investor Shares
| 8,691,871
| 340,982
|
|
| Vanguard Explorer Fund Investor Shares
| 2,352,435
| 217,835
|
|
| Vanguard Mid-Cap Growth Fund
| 5,484,992
| 106,299
|
| Total Investment Companies (Cost $1,679,080)
| 2,248,294
|
| Temporary Cash Investments (0.0%)
|
| Money Market Fund (0.0%)
|
| 1
| Vanguard Market Liquidity Fund, 5.420% (Cost $—)
| 1
| —
|
| Total Investments (100.1%) (Cost $1,679,080)
|
| 2,248,294
|
| Other Assets and Liabilities—Net (-0.1%)
|
| (2,130)
|
| Net Assets (100%)
|
| 2,246,164
|
| •
| See Note A in Notes to Financial Statements.
|
| 1
| Affiliated money market fund available only to Vanguard funds and certain trusts and accounts managed by Vanguard. Rate shown is the 7-day yield.
|
See accompanying
Notes, which are an integral part of the Financial Statements.
Statement of Assets and Liabilities
|
|
| ($000s, except shares, footnotes, and per-share amounts)
| Amount
|
| Assets
|
|
| Investments in Securities, at Value—Affiliated Funds (Cost $1,679,080)
| 2,248,294
|
| Receivables for Investment Securities Sold
| 66
|
| Receivables for Capital Shares Issued
| 367
|
| Total Assets
| 2,248,727
|
| Liabilities
|
|
| Due to Custodian
| 247
|
| Payables for Capital Shares Redeemed
| 2,316
|
| Total Liabilities
| 2,563
|
| Net Assets
| 2,246,164
|
At October 31, 2023, net assets consisted of:
|
|
|
|
|
| Paid-in Capital
| 1,596,706
|
| Total Distributable Earnings (Loss)
| 649,458
|
| Net Assets
| 2,246,164
|
|
|
|
| Net Assets
|
|
Applicable to 56,939,767 outstanding $.001 par value shares of
beneficial interest (unlimited authorization)
| 2,246,164
|
| Net Asset Value Per Share
| $39.45
|
See accompanying Notes, which are an
integral part of the Financial Statements.
|
|
|
| Year Ended
October 31, 2023
|
|
| ($000)
|
| Investment Income
|
|
| Income
|
|
| Income Distributions Received from Affiliated Funds
| 22,497
|
| Net Investment Income—Note B
| 22,497
|
| Realized Net Gain (Loss)
|
|
| Capital Gain Distributions Received from Affiliated Funds
| 111,577
|
| Affiliated Funds Sold
| (27,502)
|
| Realized Net Gain (Loss)
| 84,075
|
| Change in Unrealized Appreciation (Depreciation) from Affiliated Funds
| 58,510
|
| Net Increase (Decrease) in Net Assets Resulting from Operations
| 165,082
|
See accompanying Notes, which are an
integral part of the Financial Statements.
Statement of Changes in Net Assets
|
|
|
| Year Ended October 31,
|
|
| 2023
($000)
| 2022
($000)
|
| Increase (Decrease) in Net Assets
|
|
|
| Operations
|
|
|
| Net Investment Income
| 22,497
| 19,185
|
| Realized Net Gain (Loss)
| 84,075
| 327,658
|
| Change in Unrealized Appreciation (Depreciation)
| 58,510
| (967,703)
|
| Net Increase (Decrease) in Net Assets Resulting from Operations
| 165,082
| (620,860)
|
| Distributions
|
|
|
| Total Distributions
| (242,790)
| (196,729)
|
| Capital Share Transactions
|
|
|
| Issued
| 220,636
| 293,317
|
| Issued in Lieu of Cash Distributions
| 224,491
| 182,595
|
| Redeemed
| (301,556)
| (443,391)
|
| Net Increase (Decrease) from Capital Share Transactions
| 143,571
| 32,521
|
| Total Increase (Decrease)
| 65,863
| (785,068)
|
| Net Assets
|
|
|
| Beginning of Period
| 2,180,301
| 2,965,369
|
| End of Period
| 2,246,164
| 2,180,301
|
See accompanying Notes, which are an
integral part of the Financial Statements.
For a Share Outstanding
Throughout Each Period
| Year Ended October 31,
|
| 2023
| 2022
| 2021
| 2020
| 2019
|
| Net Asset Value, Beginning of Period
| $41.38
| $56.40
| $40.98
| $37.95
| $35.88
|
| Investment Operations
|
|
|
|
|
|
| Net Investment Income1
| .398
| .356
| .385
| .452
| .455
|
| Capital Gain Distributions Received1
| 1.973
| 6.162
| 2.294
| 1.866
| 3.087
|
| Net Realized and Unrealized Gain (Loss) on Investments
| .358
| (17.785)
| 15.438
| 3.447
| .575
|
| Total from Investment Operations
| 2.729
| (11.267)
| 18.117
| 5.765
| 4.117
|
| Distributions
|
|
|
|
|
|
| Dividends from Net Investment Income
| (.256)
| (.317)
| (.346)
| (.369)
| (.383)
|
| Distributions from Realized Capital Gains
| (4.403)
| (3.436)
| (2.351)
| (2.366)
| (1.664)
|
| Total Distributions
| (4.659)
| (3.753)
| (2.697)
| (2.735)
| (2.047)
|
| Net Asset Value, End of Period
| $39.45
| $41.38
| $56.40
| $40.98
| $37.95
|
| Total Return2
| 7.88%
| -21.42%
| 45.67%
| 15.73%
| 12.82%
|
| Ratios/Supplemental Data
|
|
|
|
|
|
| Net Assets, End of Period (Millions)
| $2,246
| $2,180
| $2,965
| $1,919
| $1,789
|
| Ratio of Total Expenses to Average Net Assets
| —
| —
| —
| —
| —
|
| Acquired Fund Fees and Expenses
| 0.35%
| 0.35%
| 0.35%
| 0.35%
| 0.35%
|
| Ratio of Net Investment Income to Average Net Assets
| 0.99%
| 0.77%
| 0.76%
| 1.19%
| 1.27%
|
| Portfolio Turnover Rate
| 7%
| 12%
| 6%
| 14%
| 9%
|
| 1
| Calculated based on average shares outstanding.
|
| 2
| Total returns do not include account service fees that may have applied in the periods shown. Fund prospectuses provide information about any applicable account
service fees.
|
See accompanying Notes, which are an
integral part of the Financial Statements.
Notes to Financial Statements
Vanguard Diversified Equity
Fund is registered under the Investment Company Act of 1940 as an open-end investment company, or mutual fund. The fund invests in selected Vanguard actively managed U.S. Stock Funds. Financial Statements and other
information about each underlying fund are available on www.vanguard.com.
A. The following significant accounting policies conform to generally accepted accounting principles for U.S. investment companies. The fund consistently follows such policies in preparing its
financial statements.
1. Security Valuation:
Investments are valued at the net asset value of each underlying Vanguard fund determined as of the close of the New York Stock Exchange (generally 4 p.m., Eastern time) on the valuation date.
2. Federal Income Taxes:
The fund intends to continue to qualify as a regulated investment company and distribute virtually all of its taxable income. The fund’s tax returns are open to examination by the relevant tax authorities until
expiration of the applicable statute of limitations, which is generally three years after the filing of the tax return. Management has analyzed the fund’s tax positions taken for all open federal and state
income tax years, and has concluded that no provision for income tax is required in the fund’s financial statements.
3. Distributions:
Distributions to shareholders are recorded on the ex-dividend date. Distributions are determined on a tax basis at the fiscal year-end and may differ from net investment income and realized capital gains for financial
reporting purposes.
4. Credit Facilities and
Interfund Lending Program: The fund and certain other funds managed by The Vanguard Group ("Vanguard") participate in a $4.3 billion committed credit facility provided by a syndicate of lenders pursuant to a credit
agreement and an uncommitted credit facility provided by Vanguard. Both facilities may be renewed annually. Each fund is individually liable for its borrowings, if any, under the credit facilities. Borrowings may be
utilized for temporary or emergency purposes and are subject to the fund’s regulatory and contractual borrowing restrictions. With respect to the committed credit facility, the participating funds are charged
administrative fees and an annual commitment fee of 0.10% of the undrawn committed amount of the facility, which are allocated to the funds based on a method approved by the fund’s board of trustees and borne by
the funds in which the fund invests (see Note B). Any borrowings under either facility bear interest at an agreed-upon spread plus the higher of the federal funds effective rate, the overnight bank funding rate, or
the Daily Simple Secured Overnight Financing Rate inclusive of an additional agreed-upon spread. However, borrowings under the uncommitted credit facility may bear interest based upon an alternate rate agreed to by
the fund and Vanguard.
In accordance with an
exemptive order (the “Order”) from the SEC, the fund may participate in a joint lending and borrowing program that allows registered open-end Vanguard funds to borrow money from and lend money to each
other for temporary or emergency purposes (the “Interfund Lending Program”), subject to compliance with the terms and conditions of the Order, and to the extent permitted by the fund’s investment
objective and investment policies. Interfund loans and borrowings normally extend overnight but can have a maximum duration of seven days. Loans may be called on one business day’s notice. The interest rate to
be charged is governed by the conditions of the Order and internal procedures adopted by the board of trustees. The board of trustees is responsible for overseeing the Interfund Lending Program.
For the year ended October 31,
2023, the fund did not utilize the credit facilities or the Interfund Lending Program.
5. Other: Income and
capital gain distributions received are recorded on the ex-dividend date.
Security transactions are accounted for on
the date securities are bought or sold. Costs used to determine realized gains (losses) on the sale of investment securities are those of the specific securities sold.
B. In accordance with the terms of a Funds’ Service Agreement (the “FSA”) between Vanguard and the fund, Vanguard furnishes to the fund investment advisory, corporate
management, administrative, marketing, and distribution services at Vanguard’s cost of operations (as defined by the FSA). These costs of operations are allocated to the fund based on methods and guidelines
approved by the board of trustees. The FSA provides that expenses otherwise allocable to Vanguard funds-of-funds may be reduced or eliminated to the extent of savings realized by the underlying Vanguard funds by
virtue of being part of a fund-of-funds. Accordingly, all expenses for services provided by Vanguard to the fund and all other expenses incurred by the fund during the year ended October 31, 2023, were borne by the
underlying Vanguard funds in which the fund invests. The fund's trustees and officers are also trustees and officers, respectively, of the underlying Vanguard funds, as well as directors and employees, respectively,
of Vanguard.
C. Various inputs may be used to determine the value of the fund’s investments. These inputs are summarized in three broad levels for financial statement purposes. The inputs or
methodologies used to value securities are not necessarily an indication of the risk associated with investing in those securities.
Level 1—Quoted prices in active markets for identical securities.
Level 2—Other significant observable inputs (including quoted prices for similar securities, interest rates, prepayment speeds, credit risk, etc.).
Level 3—Significant unobservable inputs (including the fund’s own assumptions used to determine the fair value of investments). Any investments valued with significant unobservable
inputs are noted on the Schedule of Investments.
At October 31, 2023, 100% of
the market value of the fund's investments was determined based on Level 1 inputs.
D. Permanent differences between book-basis and tax-basis components of net assets are reclassified among capital accounts in the financial statements to reflect their tax character. These
reclassifications have no effect on net assets or net asset value per share. As of period end, permanent differences primarily attributable to the accounting for applicable distributions in connection with fund share
redemptions were reclassified between the following accounts:
|
| Amount
($000)
|
| Paid-in Capital
| 9,192
|
| Total Distributable Earnings (Loss)
| (9,192)
|
Temporary differences between
book-basis and tax-basis components of total distributable earnings (loss) arise when certain items of income, gain, or loss are recognized in different periods for financial statement and tax purposes; these
differences will reverse at some time in the future.
The differences are primarily related to the
deferral of losses from wash sales. As of period end, the tax-basis components of total distributable earnings (loss) are detailed in the table as follows:
|
| Amount
($000)
|
| Undistributed Ordinary Income
| 7,194
|
| Undistributed Long-Term Gains
| 78,098
|
| Net Unrealized Gains (Losses)
| 564,166
|
| Capital Loss Carryforwards
| —
|
| Qualified Late-Year Losses
| —
|
| Other Temporary Differences
| —
|
| Total
| 649,458
|
The tax character of
distributions paid was as follows:
|
| Year Ended October 31,
|
|
| 2023
Amount
($000)
| 2022
Amount
($000)
|
| Ordinary Income*
| 13,657
| 100,746
|
| Long-Term Capital Gains
| 229,133
| 95,983
|
| Total
| 242,790
| 196,729
|
| *
| Includes short-term capital gains, if any.
|
As of October 31, 2023, gross
unrealized appreciation and depreciation for investments based on cost for U.S. federal income tax purposes were as follows:
|
| Amount
($000)
|
| Tax Cost
| 1,684,128
|
| Gross Unrealized Appreciation
| 647,669
|
| Gross Unrealized Depreciation
| (83,503)
|
| Net Unrealized Appreciation (Depreciation)
| 564,166
|
E. Capital shares issued and redeemed were:
|
| Year Ended October 31,
|
|
| 2023
Shares
(000)
| 2022
Shares
(000)
|
| Issued
| 5,424
| 6,163
|
| Issued in Lieu of Cash Distributions
| 6,342
| 3,454
|
| Redeemed
| (7,518)
| (9,499)
|
| Net Increase (Decrease) in Shares Outstanding
| 4,248
| 118
|
F. Transactions during the period in affiliated underlying Vanguard funds were as follows:
|
|
| Current Period Transactions
|
|
|
| Oct. 31, 2022
Market Value
($000)
| Purchases
at Cost
($000)
| Proceeds
from
Securities
Sold
($000)
| Realized
Net Gain
(Loss)
($000)
| Change in
Unrealized
App. (Dep.)
($000)
| Income
($000)
| Capital Gain
Distributions
Received
($000)
| Oct. 31, 2023
Market Value
($000)
|
| Vanguard Explorer Fund
| 219,915
| 28,430
| 14,078
| (1,890)
| (14,542)
| 794
| 9,689
| 217,835
|
| Vanguard Growth and Income Fund
| 440,104
| 38,407
| 21,150
| (1,501)
| 521
| 6,565
| 31,843
| 456,381
|
| Vanguard Market Liquidity Fund
| —
| NA1
| NA1
| —
| —
| 4
| —
| —
|
| Vanguard Mid-Cap Growth Fund
| 107,541
| 275
| 2,451
| (1,865)
| 2,799
| 275
| —
| 106,299
|
| Vanguard U.S. Growth Fund
| 638,320
| 8,268
| 66,575
| (23,641)
| 119,814
| 2,215
| —
| 676,186
|
| Vanguard Windsor Fund
| 443,595
| 89,251
| 34,285
| 1,105
| (49,055)
| 7,201
| 52,563
| 450,611
|
| Vanguard Windsor II Fund
| 331,267
| 26,417
| 15,965
| 290
| (1,027)
| 5,443
| 17,482
| 340,982
|
| Total
| 2,180,742
| 191,048
| 154,504
| (27,502)
| 58,510
| 22,497
| 111,577
| 2,248,294
|
| 1
| Not applicable—purchases and sales are for temporary cash investment purposes.
|
G. Significant market disruptions, such as those caused by pandemics (e.g., COVID-19 pandemic), natural or environmental disasters, war (e.g., Russia’s invasion of Ukraine), acts
of terrorism, or other events, can adversely affect local and global markets and normal market operations. Any such disruptions could have an adverse impact on the value of the fund’s investments and fund
performance.
To the extent the fund’s
investment portfolio reflects concentration in a particular market, industry, sector, country or asset class, the fund may be adversely affected by the performance of these concentrations and may be subject to
increased price volatility and other risks.
H. Management has determined that no events or transactions occurred subsequent to October 31, 2023, that would require recognition or disclosure in these financial statements.
Report of Independent Registered
Public Accounting Firm
To the Board of Trustees of Vanguard
Trustees' Equity Fund and Shareholders of Vanguard Diversified Equity Fund
Opinion on the Financial
Statements
We have audited the
accompanying statement of assets and liabilities, including the schedule of investments, of Vanguard Diversified Equity Fund (one of the funds constituting Vanguard Trustees' Equity Fund, referred to hereafter as the
"Fund") as of October 31, 2023, the related statement of operations for the year ended October 31, 2023, the statement of changes in net assets for each of the two years in the period ended October 31, 2023, including
the related notes, and the financial highlights for each of the five years in the period ended October 31, 2023 (collectively referred to as the "financial statements"). In our opinion, the financial
statements present fairly, in all material respects, the financial position of the Fund as of October 31, 2023, the results of its operations for the year then ended, the changes in its net assets for each of the two
years in the period ended October 31, 2023 and the financial highlights for each of the five years in the period ended October 31, 2023 in conformity with accounting principles generally accepted in the United States
of America.
Basis for Opinion
These financial statements are
the responsibility of the Fund’s management. Our responsibility is to express an opinion on the Fund’s financial statements based on our audits. We are a public accounting firm registered with the Public
Company Accounting Oversight Board (United States) (PCAOB) and are required to be independent with respect to the Fund in accordance with the U.S. federal securities laws and the applicable rules and regulations of
the Securities and Exchange Commission and the PCAOB.
We conducted our audits of
these financial statements in accordance with the standards of the PCAOB. Those standards require that we plan and perform the audit to obtain reasonable assurance about whether the financial statements are free of
material misstatement, whether due to error or fraud.
Our audits included performing
procedures to assess the risks of material misstatement of the financial statements, whether due to error or fraud, and performing procedures that respond to those risks. Such procedures included examining, on a test
basis, evidence regarding the amounts and disclosures in the financial statements. Our audits also included evaluating the accounting principles used and significant estimates made by management, as well as evaluating
the overall presentation of the financial statements. Our procedures included confirmation of securities owned as of October 31, 2023 by correspondence with the transfer agent. We believe that our audits provide a
reasonable basis for our opinion.
/s/PricewaterhouseCoopers
LLP
Philadelphia, Pennsylvania
December 19, 2023
We have served as the auditor
of one or more investment companies in The Vanguard Group of Funds since 1975.
Tax information
(unaudited)
For corporate shareholders,
87.2%, or if subsequently determined to be different, the maximum percentage allowable by law, of ordinary income (dividend income plus short-term gains, if any) for the fiscal year qualified for the
dividends-received deduction.
The fund hereby designates
$13,379,000, or if subsequently determined to be different, the maximum amount allowable by law, as qualified dividend income for individual shareholders for the fiscal year.
The fund hereby designates
$173,000, or if subsequently determined to be different, the maximum amount allowable by law, of interest earned from obligations of the U.S. government which is generally exempt from state income tax.
For nonresident alien
shareholders, 100% of short-term capital gain dividends distributed by the fund for the fiscal year are qualified short-term capital gains.
The fund distributed
$236,342,000 as capital gain dividends (20% rate gain distributions) to shareholders during the fiscal year.
This page intentionally left blank.
The People Who Govern Your Fund
The trustees of your mutual
fund are there to see that the fund is operated and managed in your best interests since, as a shareholder, you are a part owner of the fund. Your fund’s trustees also serve on the board of directors of The
Vanguard Group, Inc., which is owned by the Vanguard funds and provides services to them.
A majority of Vanguard’s
board members are independent, meaning that they have no affiliation with Vanguard or the funds they oversee, apart from the sizable personal investments they have made as private individuals. The independent board
members have distinguished backgrounds in business, academia, and public service. Each of the trustees and executive officers oversees 205 Vanguard funds.
Information for each trustee
and executive officer of the fund appears below. That information, as well as the Vanguard fund count, is as of the date on the cover of this fund report. The mailing address of the trustees and officers is P.O. Box
876, Valley Forge, PA 19482. More information about the trustees is in the Statement of Additional Information, which can be obtained, without charge, by contacting Vanguard at 800-662-7447, or online at vanguard.com.
Interested Trustee1
Mortimer J. Buckley
Born in 1969. Trustee since January 2018.
Principal occupation(s) during the past five years and other experience: chairman of the board (2019–present) of Vanguard and of each of the investment companies served by Vanguard; chief executive officer
(2018–present) of Vanguard; chief executive officer, president, and trustee (2018–present) of each of the investment companies served by Vanguard; president and director (2017–present) of Vanguard;
and president (2018–present) of Vanguard Marketing Corporation. Chief investment officer (2013–2017), managing director (2002–2017), head of the Retail Investor Group (2006–2012), and chief
information officer (2001–2006) of Vanguard. Member of the board of governors of the Investment Company Institute and the board of governors of FINRA.
Independent Trustees
Tara Bunch
Born in 1962. Trustee since November 2021.
Principal occupation(s) during the past five years and other experience: head of global operations at Airbnb (2020–present). Vice president of AppleCare (2012–2020). Member of the board of directors of Out
& Equal, the advisory board of the University of California, Berkeley School of Engineering, and the advisory board of Santa Clara University’s Leavey School of Business.
Emerson U. Fullwood
Born in 1948. Trustee since January 2008.
Principal occupation(s) during the past five years and other experience: executive chief staff and marketing officer for North America and corporate vice president (retired 2008) of Xerox Corporation (document
management products and services). Former president of the Worldwide Channels Group, Latin America, and Worldwide Customer Service and executive chief staff officer of Developing Markets of Xerox. Executive in
residence and 2009–2010 Distinguished Minett Professor at the Rochester Institute of Technology. Member of the board of directors of the University of Rochester Medical Center, the Monroe Community College
Foundation, the United Way of Rochester, North Carolina A&T University, Roberts Wesleyan College, and the Rochester Philharmonic Orchestra. Trustee of the University of Rochester.
F. Joseph Loughrey
Born in 1949. Trustee since October 2009.
Principal occupation(s) during the past five years and other experience: president and chief operating officer (retired 2009) and vice chairman of the board (2008–2009) of Cummins Inc. (industrial
machinery). Director of the V Foundation. Member of the advisory council for the College of Arts and Letters at the University of Notre Dame. Chairman of the board of Saint Anselm College.
1 Mr.
Buckley is considered an “interested person,” as defined in the Investment Company Act of 1940, because he is an officer of the Vanguard funds.
Mark Loughridge
Born in 1953. Trustee since March 2012.
Principal occupation(s) during the past five years and other experience: senior vice president and chief financial officer (retired 2013) of IBM (information technology services). Fiduciary member of IBM’s
Retirement Plan Committee (2004–2013), senior vice president and general manager (2002–2004) of IBM Global Financing, vice president and controller (1998–2002) of IBM, and a variety of other prior
management roles at IBM. Member of the Council on Chicago Booth.
Scott C. Malpass
Born in 1962. Trustee since March 2012.
Principal occupation(s) during the past five years and other experience: chief investment officer (retired 2020) and vice president (retired 2020) of the University of Notre Dame. Chair of the board of
Catholic Investment Services, Inc. (investment advisors). Member of the board of superintendence of the Institute for the Works of Religion, the Notre Dame 403(b) Investment Committee, and the
board of directors of Paxos Trust Company (finance).
Deanna Mulligan
Born in 1963. Trustee since January 2018.
Principal occupation(s) during the past five years and other experience: chief executive officer of Purposeful (advisory firm for CEOs and C-level executives; 2021–present). Board chair (2020), chief executive
officer (2011–2020), and president (2010–2019) of The Guardian Life Insurance Company of America. Chief operating officer (2010–2011) and executive vice president (2008–2010) of Individual Life
and Disability of the Guardian Life Insurance Company of America. Director of DuPont. Member of the board of the Economic Club of New York. Trustee of the Partnership for New York City (business leadership), Chief
Executives for Corporate Purpose, and the NewYork-Presbyterian Hospital.
André F. Perold
Born in 1952. Trustee since December 2004.
Principal occupation(s) during the past five years and other experience: George Gund Professor of Finance and Banking, Emeritus at the Harvard Business School (retired 2011). Chief investment officer and partner of
HighVista Strategies (private investment firm). Member of the board of RIT Capital Partners (investment firm).
Sarah Bloom Raskin
Born in 1961. Trustee since January 2018.
Principal occupation(s) during the past five years and other experience: deputy secretary (2014–2017) of the United States Department of the Treasury. Governor (2010–2014) of the Federal
Reserve Board. Commissioner (2007–2010) of financial regulation for the State of Maryland. Colin W. Brown Distinguished Professor of the Practice of Law, Duke Law School (2021–present);
Rubenstein Fellow, Duke University (2017–2020); Distinguished Fellow of the Global Financial Markets Center, Duke Law School (2020–2022); and Senior Fellow, Duke Center on Risk
(2020–present). Partner of Kaya Partners (climate policy advisory services). Member of the board of directors of Arcadia (energy solution technology).
Grant Reid
Born in 1959. Trustee since July 2023.
Principal occupation(s) during the past five years and other experience: chief executive officer and president (2014–2022) and member of the board of directors (2015–2022) of Mars, Incorporated
(multinational manufacturer). Member of the board of directors of Marriott International, Inc. Chair of Agribusiness Task Force, Sustainable Markets Initiative.
David Thomas
Born in 1956. Trustee since July 2021.
Principal occupation(s) during the past five years and other experience: president of Morehouse College (2018–present). Professor of business administration, emeritus at Harvard University (2017–2018).
Dean (2011–2016) and professor of management (2016–2017) at the Georgetown University McDonough School of Business. Director of DTE Energy Company. Trustee of Common Fund.
Peter F. Volanakis
Born in 1955. Trustee since July 2009.
Principal occupation(s) during the past five years and other experience: president and chief operating officer (retired 2010) of Corning Incorporated (communications equipment) and director of Corning Incorporated
(2000–2010) and Dow Corning (2001–2010). Director (2012) of SPX Corporation (multi-industry manufacturing). Overseer of the Amos Tuck School of Business Administration, Dartmouth College (2001–2013).
Member of the BMW Group Mobility Council.
Executive Officers
Jacqueline Angell
Born in 1974. Principal occupation(s) during
the past five years and other experience: principal of Vanguard. Chief compliance officer (November 2022–present) of Vanguard and of each of the investment companies served by Vanguard. Chief
compliance officer (2018–2022) and deputy chief compliance officer (2017–2019) of State Street.
Christine M. Buchanan
Born in 1970. Principal occupation(s) during
the past five years and other experience: principal of Vanguard. Chief financial officer (2021–present) and treasurer (2017–2022) of each of the investment companies served by Vanguard. Partner
(2005–2017) at KPMG (audit, tax, and advisory services).
John Galloway
Born in 1973. Principal occupation(s) during
the past five years and other experience: principal of Vanguard. Investment stewardship officer (September 2020–present) of each of the investment companies served by Vanguard. Head of Investor Advocacy
(February 2020–present) and head of Marketing Strategy and Planning (2017–2020) at Vanguard. Special assistant to the President of the United States (2015).
Ashley Grim
Born in 1984. Principal occupation(s) during
the past five years and other experience: treasurer (February 2022–present) of each of the investment companies served by Vanguard. Fund transfer agent controller (2019–2022) and director of Audit
Services (2017–2019) at Vanguard. Senior manager (2015–2017) at PriceWaterhouseCoopers (audit and assurance, consulting, and tax services).
Jodi Miller
Born in 1980. Principal occupation(s) during
the past five years and other experience: principal of Vanguard. Finance director (2022–present) of each of the investment companies served by Vanguard. Head of Enterprise Investment Services
(2020–present), head of Retail Client Services and Operations (2020–2022), and head of Retail Strategic Support (2018–2020) at Vanguard.
Anne E. Robinson
Born in 1970. Principal occupation(s) during
the past five years and other experience: general counsel (2016–present) of Vanguard. Secretary (2016–present) of Vanguard and of each of the investment companies served by Vanguard. Managing director
(2016–present) of Vanguard. Managing director and general counsel of Global Cards and Consumer Services (2014–2016) at Citigroup. Counsel (2003–2014) at American Express. Nonexecutive director
(2022–present) of the board of National Grid (energy).
Michael Rollings
Born in 1963. Principal occupation(s) during
the past five years and other experience: finance director (2017–present) and treasurer (2017) of each of the investment companies served by Vanguard. Managing director (2016–present) of Vanguard. Chief
financial officer (2016–present) of Vanguard. Director (2016–present) of Vanguard Marketing Corporation. Executive vice president and chief financial officer (2006–2016) of MassMutual Financial
Group.
Vanguard Senior Management
Team
| Matthew Benchener
| Thomas M. Rampulla
|
| Joseph Brennan
| Karin A. Risi
|
| Mortimer J. Buckley
| Anne E. Robinson
|
| Gregory Davis
| Michael Rollings
|
| John James
| Nitin Tandon
|
| Chris D. McIsaac
| Lauren Valente
|
Connect with
Vanguard®>vanguard.com
Fund Information > 800-662-7447
Direct Investor Account
Services > 800-662-2739
Institutional Investor
Services > 800-523-1036
Text Telephone for People
Who Are Deaf or Hard of Hearing > 800-749-7273
This material may be used in
conjunction with the offering of shares of any Vanguard fund only if preceded or accompanied by the fund’s current prospectus.
All comparative mutual
fund data are from Morningstar, Inc., unless otherwise noted.
You can obtain a free
copy of Vanguard’s proxy voting guidelines by visiting vanguard.com/proxyreporting or by calling Vanguard at 800-662-2739. The guidelines are also available from the SEC’s website, www.sec.gov. In
addition, you may obtain a free report on how your fund voted the proxies for securities it owned during the 12 months ended June 30. To get the report, visit either vanguard.com/proxyreporting or www.sec.gov.
You can review
information about your fund on the SEC’s website, and you can receive copies of this information, for a fee, by sending a request via email addressed to publicinfo@sec.gov.
Source for Bloomberg
indexes: Bloomberg Index Services Limited. Copyright 2023, Bloomberg. All rights reserved.
© 2023 The Vanguard Group,
Inc.
All rights reserved.
Vanguard Marketing Corporation, Distributor.
Q6080 122023
Annual Report | October 31, 2023
Vanguard Emerging
Markets Select Stock Fund
See the inside front cover
for important information about your fund’s annual and semiannual shareholder reports.
Important information about shareholder
reports
Beginning in July 2024,
amendments adopted by the Securities and Exchange Commission will substantially impact the design, content, and transmission of shareholder reports. Shareholder reports will provide key fund information in a clear and
concise format and must be mailed to each shareholder that has not elected to receive the reports electronically. Financial statements will no longer be included in the shareholder report but will be available at
vanguard.com, can be mailed upon request, or can be accessed on the SEC’s website at www.sec.gov.
You may elect to receive
shareholder reports and other communications from the fund electronically by contacting your financial intermediary (such as a broker-dealer or bank) or, if you invest directly with the fund, by calling Vanguard at
one of the phone numbers on the back cover of this report or by logging on to vanguard.com.
Contents
Your Fund’s Performance at a Glance
| 1
|
Advisors’ Report
| 2
|
About Your Fund’s Expenses
| 7
|
Performance Summary
| 9
|
Financial Statements
| 11
|
Please note: The
opinions expressed in this report are just that—informed opinions. They should not be considered promises or advice. Also, please keep in mind that the information and opinions cover the period through the date
on the front of this report. Of course, the risks of investing in your fund are spelled out in the prospectus.
Your Fund’s Performance at a Glance
| •
| For the 12 months ended October 31, 2023, Vanguard Emerging Markets Select Stock Fund returned 15.10%, outpacing the 10.96% return of its benchmark, the FTSE Emerging Index.
|
| •
| Early on, inflation in many developed markets eased off multidecade highs amid ongoing interest rate hikes by central banks. Unexpected resilience in labor markets and consumer spending helped dial back expectations
of a sustained global recession, but the prospect of higher interest rates for longer and heightened geopolitical tensions weighed on market sentiment toward the close of the period.
|
| •
| On a geographic basis, the fund benefited from both market selection—overweighting strong performers or underweighting laggards—and security selection. Among the largest contributors were holdings in
Hong Kong and South Korea, which are excluded from the index but recorded strong double-digit advances. These holdings totaled roughly 11% of the fund, on average. An underweight stake in China and underperforming
holdings there crimped performance.
|
| •
| The fund’s holdings outperformed those of the index in 10 of 11 sectors. Only its consumer staples holdings lagged. The effect on the fund was negligible, however, as the
advisor allocated less than 5% of fund assets to the sector, which trailed the weighting of the overall index.
|
Market Barometer
|
| Average Annual Total Returns
Periods Ended October 31, 2023
|
|
| One Year
| Three Years
| Five Years
|
| Stocks
|
|
|
|
| Russell 1000 Index (Large-caps)
| 9.48%
| 9.53%
| 10.71%
|
| Russell 2000 Index (Small-caps)
| -8.56
| 3.95
| 3.31
|
| Russell 3000 Index (Broad U.S. market)
| 8.38
| 9.19
| 10.23
|
| FTSE All-World ex US Index (International)
| 12.35
| 3.51
| 3.88
|
| Bonds
|
|
|
|
Bloomberg U.S. Aggregate Float Adjusted Index
(Broad taxable market)
| 0.53%
| -5.51%
| 0.03%
|
Bloomberg Municipal Bond Index
(Broad tax-exempt market)
| 2.64
| -2.48
| 1.00
|
| FTSE Three-Month U.S. Treasury Bill Index
| 4.94
| 1.93
| 1.80
|
| CPI
|
|
|
|
| Consumer Price Index
| 3.24%
| 5.72%
| 4.00%
|
For the 12 months ended October 31, 2023,
Vanguard Emerging Markets Select Stock Fund returned 15.10%. Your fund is managed by four independent advisors, a strategy that enhances the fund’s diversification by providing exposure to distinct yet
complementary investment approaches. It’s not uncommon for different advisors to have different views about individual securities or the broader investment environment.
The advisors, the percentage
of fund assets each manages, and brief descriptions of their investment strategies are presented in the accompanying table. The advisors have also prepared a discussion of the investment environment that existed
during the fiscal year and of how portfolio positioning reflects this assessment.
These comments were prepared
on November 15, 2023.
Pzena Investment Management,
LLC
Portfolio Managers:
Rakesh Bordia, Principal
Caroline Cai, CFA, Managing
Principal
Allison Fisch, Managing
Principal
Akhil Subramanian,
Principal
Emerging markets rebounded in
the fourth quarter of 2022 following concerns over global growth, inflation, and COVID-19 restrictions in China. China’s reopening propelled markets higher through the first quarter of 2023. However, soft
Chinese economic data and
property market weakness in recent months
tempered optimism somewhat. The portfolio rose markedly, and outpaced the MSCI Emerging Markets Index, with the information technology and financial sectors contributing most to absolute performance. Consumer staples
was the only sector to weigh on performance.
Top performer Elite Material,
a Taiwanese producer of copper-clad laminate (CCL), which is used in circuit boards, rose along with the wider tech sector on artificial intelligence (AI) enthusiasm. The company also recently reported an earnings
beat driven mainly by higher-margin AI server CCLs. South Korean metals company POSCO advanced on improving steel demand from China’s reopening and optimism around its lithium assets in Argentina. Trip.com, a
Chinese online travel agency, climbed as Chinese COVID-19 restrictions were lifted.
The portfolio’s largest
detractor, Sasol, a South African energy and chemical company, declined as oil prices fell from 2022 highs, and the company managed through coal-quality issues in its mining operations. Retail bank China Merchants
Bank (CMB) declined despite reporting in-line 2Q23 results. Net interest margin fell amid lower asset yields, driven by falling interest rates and customer preference for more expensive time deposits. New loan growth
in China also fell sharply. However, non-performing loans (excluding property developers) were broadly stable and private banking assets grew. Indonesian lender Bank Rakyat (BRI) declined as non-performing
loans (NPLs) rose in the micro and small and
medium enterprise segments. Ultimately, BRI’s full-year risk cost guidance remains unchanged, and the company has already set aside provisions amounting to more than double the current sum of NPLs.
Recessionary fears, concerns
over interest rates and inflation, and dispersion among countries and sectors all continue to create attractive investments. We are finding cheap company valuations when assessed against fundamentals and are excited
by the opportunity set in emerging markets.
Baillie Gifford Overseas
Ltd.
Portfolio Managers:
Mike Gush
Andrew Stobart
Investors could be forgiven
for losing patience with an asset class that has produced plenty of volatility but little in the way of excess returns over the last decade. In times like these, it becomes harder to exercise patience, but that is
exactly when our investment edge is at its strongest. We firmly believe that investing over the long term remains the best way to invest in some of the world’s most promising regions.
Over the year, performance has
been led by energy, materials, and information technology. In energy, our investment in Petrobras is driven by the expectation of moderate oil production growth, combined with the eventual realization by
the market that, even in a decarbonizing
world, there remains a place for one of the world’s lowest-cost, least-carbon-intensive major oil assets.
From a macro perspective, 2023
continued to be a volatile year for Chinese markets. One of the near-term detractors over the period was Silergy, a leading player in China’s semiconductor industry, as shorter-term concerns regarding the
semiconductor cycle dominated the narrative. As we move into a U.S. presidential election year in 2024, we expect U.S.-China tensions to continue to ebb and flow, but we continue to ask ourselves: Is China perhaps
clouding investors’ judgement on the rest of emerging markets?
Having pursued orthodox
monetary policies and more stringent fiscal policies, emerging markets economies are looking increasingly robust, while the investment universe continues to broaden and deepen. There are many attractive emerging
markets companies that are under-owned and arguably undervalued. With this in mind, we continue to search for those rare businesses with exceptional and underappreciated growth potential that sit at the forefront of
important global trends.
Oaktree Fund Advisors, LLC
Portfolio Managers:
Frank J. Carroll III,
Managing Director and Co-Head
of Emerging Markets Equities
Janet Wang,
Managing Director
Emerging markets (EM) equities
rose during the 12 months ended October 31, 2023. Although the asset class generated a gain, performance was volatile throughout the period. Stocks performed well through the end of 2022 and into 2023, primarily due
to optimism about the broad reopening of China’s economy. However, EM equities later weakened as the actual pace of recovery failed to meet market expectations.
Against this backdrop, our
portfolio outpaced its benchmark during the period, before fees and expenses. At the country level, our stock selection in Taiwan, Indonesia, South Africa, and India contributed the most to our relative results. Our
underweight exposures to Saudi Arabia, Qatar, and the UAE also contributed positively, as did our overweight allocations to Greece and Korea. Meanwhile, our stock selection in China, Brazil, Thailand, and Peru
detracted from our relative performance, as did our underweight exposure to Taiwan and our overweight exposures to Indonesia and Brazil.
By sector, our stock selection
among materials, health care, communication services, and industrials boosted our relative returns, while our selection among financials, consumer staples, consumer discretionary, utilities, and real estate detracted.
Our underweight exposures to financials and utilities contributed positively to our relative performance, as did our overweight
allocation to energy. Our overweight exposure
to materials and our underweight allocation to communication services had a negative impact.
As markets have remained
volatile, we’ve remained patient and diligent in our investment process. We expect that we’ll be able to continue taking advantage of the market turbulence by buying the equities of high-quality,
fundamentally sound companies at discounted prices. We believe this will leave us well positioned to generate strong returns.
Wellington Management Company
llp
Portfolio Manager:
Mary Pryshlak, CFA,
Senior Managing Director and
Head of Investment Research
Emerging markets equities rose
during the trailing 12-month period. Nearly all sectors in the index posted positive returns, led by the information technology, communication services, and energy sectors. Utilities declined during the period.
Emerging markets were
pressured by persistent inflation, rising interest rates, a strengthening U.S. dollar, and slowing global growth, which we believe will continue to create volatility. However, performance dispersion remains wide, and
pockets of strength are prevalent across the asset class.
In this environment, our
portion of the Emerging Markets Select Stock Fund outperformed the FTSE All World
Emerging Markets Index. Notably, security
selection in consumer discretionary, financials, and consumer staples contributed most to relative results. Stock selection in information technology had the largest detraction from relative performance over the
period. On a regional basis, strong stock selection in Hong Kong and Mexico aided relative performance, while selection in China and Brazil detracted.
At the security level,
entertainment and casino gaming operators Sands China and Melco Resorts & Entertainment were top relative contributors, while China Longyuan Power, a China-based utilities
company, and Yunnan Energy New Material, a
China-based materials company, partially offset relative outperformance.
Our global industry analysts
will continue to focus on identifying companies with the potential to emerge from this period of volatility stronger than their peers. We believe the team’s deep fundamental research, experience managing in a
variety of market environments, and long-term orientation will be critical in navigating today’s market environment. We maintain conviction that we will be able to generate alpha for Vanguard shareholders over
the long term.
Vanguard Emerging Markets
Select Stock Fund Investment Advisors
|
|
|
| Fund Assets Managed
|
|
| Investment Advisor
| %
| $ Million
| Investment Strategy
|
| Pzena Investment Management, LLC
| 26
| 181
| Uses a deep-value approach that focuses on the most undervalued companies based on price-to-normalized
earnings. The firm believes that this value philosophy works well globally and is especially effective in emerging markets because of generally wider valuation spreads.
|
| Baillie Gifford Overseas Ltd.
| 24
| 169
| Believes that companies that can sustainably grow their business and increase earnings faster than market
average will perform best. Stock selection is driven by bottom-up, fundamental analysis, focusing on a company’s potential over a meaningful time period, typically three to five years and beyond.
|
| Oaktree Fund Advisors, LLC
| 24
| 167
| Seeks securities that have been undervalued by investors. Oaktree’s investment process is driven by
bottom-up research, which includes extensive travel to meet company management and maintaining in-house models focused on deriving reliable cash-flow projections.
|
| Wellington Management Company llp
| 23
| 167
| Allocates the assets in its portion of the fund to a team of global analysts who seek to add value through
in-depth fundamental research and understanding of their industries. By covering the same companies over a period of many years, these investment professionals gain comprehensive insight to guide decisions for their
subportfolios.
|
| Cash Investments
| 3
| 25
| These short-term reserves are invested by Vanguard in equity index products to simulate investment in
stocks. Each advisor may also maintain a modest cash position.
|
About Your Fund’s Expenses
As a shareholder of the fund,
you incur ongoing costs, which include costs for portfolio management, administrative services, and shareholder reports (like this one), among others. Operating expenses, which are deducted from a fund’s gross
income, directly reduce the investment return of the fund.
A fund’s expenses are
expressed as a percentage of its average net assets. This figure is known as the expense ratio. The following examples are intended to help you understand the ongoing costs (in dollars) of investing in your fund and
to compare these costs with those of other mutual funds. The examples are based on an investment of $1,000 made at the beginning of the period shown and held for the entire period.
The accompanying table
illustrates your fund’s costs in two ways:
| •
| Based on actual fund return. This section helps you to estimate the actual expenses that you paid over the period. The ”Ending Account Value“ shown is derived from the fund‘s actual return, and the
third column shows the dollar amount that would have been paid by an investor who started with $1,000 in the fund. You may use the information here, together with the amount you invested, to estimate the expenses that
you paid over the period.
|
To do so, simply divide your
account value by $1,000 (for example, an $8,600 account value divided by $1,000 = 8.6), then multiply the result by the number given for your fund under the heading ”Expenses Paid During Period.“
| •
| Based on hypothetical 5% yearly return. This section is intended to help you compare your fund‘s costs with those of other mutual funds. It assumes that the fund had a yearly return of 5% before expenses, but that the
expense ratio is unchanged. In this case—because the return used is not the fund’s actual return—the results do not apply to your investment. The example is useful in making comparisons because the
Securities and Exchange Commission requires all mutual funds to calculate expenses based on a 5% return. You can assess your fund’s costs by comparing this hypothetical example with the hypothetical examples
that appear in shareholder reports of other funds.
|
Note that the expenses shown
in the table are meant to highlight and help you compare ongoing costs only and do not reflect transaction costs incurred by the fund for buying and selling securities. Further, the expenses do not include any purchase, redemption, or
account service fees described in the fund prospectus. If such fees were applied to your account, your costs would be higher. Your fund does not carry a “sales load.”
The calculations assume no
shares were bought or sold during the period. Your actual costs may have been higher or lower, depending on the amount of your investment and the timing of any purchases or redemptions.
You can find more information
about the fund’s expenses, including annual expense ratios, in the Financial Statements section of this report. For additional information on operating expenses and other shareholder costs, please refer to your
fund’s current prospectus.
| Six Months Ended October 31, 2023
|
|
|
|
| Emerging Markets Select Stock Fund
| Beginning
Account Value
4/30/2023
| Ending
Account Value
10/31/2023
| Expenses
Paid During
Period
|
| Based on Actual Fund Return
| $1,000.00
| $958.80
| $3.90
|
| Based on Hypothetical 5% Yearly Return
| 1,000.00
| 1,021.22
| 4.02
|
The calculations are
based on expenses incurred in the most recent six-month period. The fund’s annualized six-month expense ratio for that period is 0.79%. The dollar amounts shown as “Expenses Paid” are equal to the
annualized expense ratio multiplied by the average account value over the period, multiplied by the number of days in the most recent six-month period, then divided by the number of days in the most recent 12-month
period (184/365).
Emerging Markets Select Stock Fund
All of the returns in this
report represent past performance, which is not a guarantee of future results that may be achieved by the fund. (Current performance may be lower or higher than the performance data cited. For performance data current
to the most recent month-end, visit our website at vanguard.com/performance.) Note, too, that both investment returns and principal value can fluctuate widely, so an investor’s shares, when sold, could be worth
more or less than their original cost. The returns shown do not reflect taxes that a shareholder would pay on fund distributions or on the sale of fund shares.
Cumulative Performance: October
31, 2013, Through October 31, 2023
Initial Investment of
$10,000
|
|
| Average Annual Total Returns
Periods Ended October 31, 2023
|
|
|
|
| One
Year
| Five
Years
| Ten
Years
| Final Value
of a $10,000
Investment
|

| Emerging Markets Select Stock Fund
| 15.10%
| 2.90%
| 1.86%
| $12,027
|

| FTSE Emerging Index
| 10.96
| 2.62
| 1.85
| 12,012
|

| MSCI All Country World Index ex USA
| 12.07
| 3.46
| 2.54
| 12,854
|
See Financial
Highlights for dividend and capital gains information.
Emerging Markets Select Stock Fund
| China
| 29.5%
|
| India
| 13.7
|
| Brazil
| 11.5
|
| Taiwan
| 11.0
|
| South Korea
| 6.3
|
| United States
| 4.9
|
| Hong Kong
| 4.4
|
| Thailand
| 3.0
|
| South Africa
| 2.2
|
| Mexico
| 2.2
|
| Indonesia
| 2.1
|
| United Kingdom
| 1.4
|
| Saudi Arabia
| 1.4
|
| Other
| 6.4
|
The table reflects the fund’s
investments, except for short-term investments and derivatives.
Emerging Markets Select Stock Fund
The fund files its complete
schedule of portfolio holdings with the Securities and Exchange Commission (SEC) for the first and third quarters of each fiscal year as an exhibit to its reports on Form N-PORT. The fund’s Form N-PORT reports
are available on the SEC’s website at www.sec.gov.
|
|
| Shares
| Market
Value•
($000)
|
| Common Stocks (92.3%)
|
| Brazil (8.7%)
|
|
| Petroleo Brasileiro SA ADR (XNYS)
| 785,288
| 11,779
|
|
| Vale SA ADR
| 589,506
| 8,082
|
|
| Banco Bradesco SA ADR
| 2,437,315
| 6,800
|
|
| Ambev SA
| 2,201,766
| 5,616
|
|
| Cia de Saneamento Basico do Estado de Sao Paulo
| 249,547
| 2,889
|
|
| Neoenergia SA
| 763,100
| 2,652
|
|
| Centrais Eletricas Brasileiras SA
| 379,218
| 2,621
|
|
| Banco Do Brasil SA
| 262,600
| 2,518
|
|
| B3 SA - Brasil Bolsa Balcao
| 1,086,700
| 2,392
|
|
| TIM SA
| 754,789
| 2,271
|
|
| Petroleo Brasileiro SA ADR
| 162,039
| 2,241
|
|
| Itau Unibanco Holding SA ADR
| 417,129
| 2,215
|
|
| Localiza Rent a Car SA (BVMF)
| 219,494
| 2,215
|
| *
| Natura & Co. Holding SA
| 639,500
| 1,617
|
|
| Petroleo Brasileiro SA
| 180,939
| 1,358
|
|
| Lojas Renner SA
| 550,196
| 1,338
|
|
| Vale SA
| 66,800
| 914
|
|
| Weg SA
| 132,700
| 869
|
|
| Raia Drogasil SA
| 97,024
| 497
|
| *,1
| Hapvida Participacoes e Investimentos SA
| 288,262
| 211
|
| *
| Magazine Luiza SA
| 665,520
| 176
|
| 1
| Rede D'Or Sao Luiz SA
| 35,600
| 153
|
|
| Brpr Corporate Offices Fdo De Inv Imob
| 1,557
| 19
|
|
|
|
| 61,443
|
| Canada (0.9%)
|
|
| Parex Resources Inc.
| 120,542
| 2,310
|
|
| First Quantum Minerals Ltd.
| 171,622
| 1,989
|
|
| Lundin Mining Corp.
| 177,373
| 1,108
|
| *
| Valeura Energy Inc.
| 264,800
| 750
|
|
|
|
| 6,157
|
|
|
| Shares
| Market
Value•
($000)
|
| Chile (0.4%)
|
| 2
| Sociedad Quimica y Minera de Chile SA ADR
| 29,277
| 1,417
|
|
| Banco De Chile
| 11,148,490
| 1,145
|
|
|
|
| 2,562
|
| China (28.1%)
|
| *
| Alibaba Group Holding Ltd.
| 2,172,395
| 22,365
|
|
| Tencent Holdings Ltd.
| 553,244
| 20,475
|
|
| China Merchants Bank Co. Ltd. Class H
| 2,169,938
| 8,231
|
|
| Weichai Power Co. Ltd. Class H
| 5,417,864
| 8,110
|
|
| Haier Smart Home Co. Ltd. Class H
| 2,398,200
| 6,840
|
|
| Ping An Insurance Group Co. of China Ltd. Class H
| 1,134,994
| 5,757
|
|
| Zijin Mining Group Co. Ltd. Class H
| 3,694,628
| 5,715
|
|
| China Construction Bank Corp. Class H
| 8,566,677
| 4,845
|
| *
| Baidu Inc. Class A
| 331,500
| 4,352
|
|
| ANTA Sports Products Ltd.
| 379,225
| 4,289
|
|
| China Overseas Land & Investment Ltd.
| 2,246,319
| 4,239
|
|
| Anhui Conch Cement Co. Ltd. Class H
| 1,608,356
| 4,003
|
|
| Aluminum Corp. of China Ltd. Class H
| 7,378,126
| 3,947
|
| 1
| WuXi AppTec Co. Ltd. Class H
| 309,176
| 3,715
|
| *,1
| Meituan Class B
| 250,602
| 3,552
|
|
| Shenzhou International Group Holdings Ltd.
| 356,000
| 3,497
|
|
| Contemporary Amperex Technology Co. Ltd. Class A (XSHE)
| 128,551
| 3,264
|
|
| China Mengniu Dairy Co. Ltd.
| 988,173
| 3,227
|
|
| Kweichow Moutai Co. Ltd. Class A
| 13,700
| 3,155
|
|
| Industrial & Commercial Bank of China Ltd. Class H
| 5,972,724
| 2,862
|
| *
| Trip.com Group Ltd. ADR
| 81,637
| 2,776
|
|
| KE Holdings Inc. ADR
| 172,775
| 2,541
|
Emerging Markets Select Stock Fund
|
|
| Shares
| Market
Value•
($000)
|
|
| GF Securities Co. Ltd. Class H
| 1,948,400
| 2,537
|
|
| Geely Automobile Holdings Ltd.
| 2,225,403
| 2,527
|
|
| Zhejiang Longsheng Group Co. Ltd. Class A
| 1,933,100
| 2,352
|
|
| JD.com Inc. ADR
| 80,612
| 2,049
|
| *
| Trip.com Group Ltd.
| 59,622
| 2,032
|
|
| ENN Energy Holdings Ltd.
| 254,374
| 1,927
|
|
| Brilliance China Automotive Holdings Ltd.
| 4,186,000
| 1,924
|
|
| CITIC Securities Co. Ltd. Class H
| 966,551
| 1,881
|
|
| Midea Group Co. Ltd. Class A (XSEC)
| 255,794
| 1,850
|
|
| PICC Property & Casualty Co. Ltd. Class H
| 1,592,000
| 1,818
|
|
| China Resources Land Ltd.
| 464,480
| 1,739
|
|
| Sunny Optical Technology Group Co. Ltd.
| 205,380
| 1,721
|
|
| Anker Innovations Technology Co. Ltd. Class A
| 128,400
| 1,645
|
|
| China Longyuan Power Group Corp. Ltd. Class H
| 1,931,350
| 1,635
|
| *
| Daqo New Energy Corp. ADR
| 62,994
| 1,604
|
|
| CIMC Enric Holdings Ltd.
| 1,810,000
| 1,536
|
|
| JD.com Inc. Class A
| 117,851
| 1,498
|
| 1
| China Tourism Group Duty Free Corp. Ltd. Class H
| 130,307
| 1,472
|
|
| Minth Group Ltd.
| 610,000
| 1,362
|
|
| Nine Dragons Paper Holdings Ltd.
| 2,389,888
| 1,360
|
| *
| Shanghai International Airport Co. Ltd. Class A
| 257,857
| 1,312
|
|
| KE Holdings Inc. Class A
| 264,770
| 1,304
|
|
| Midea Group Co. Ltd. Class A
| 177,486
| 1,284
|
|
| Muyuan Foods Co. Ltd.Class A
| 245,369
| 1,265
|
|
| Sinoma Science & Technology Co. Ltd. Class A
| 494,300
| 1,169
|
| 1
| Longfor Group Holdings Ltd.
| 790,760
| 1,151
|
|
| Yunnan Energy New Material Co. Ltd. Class A
| 121,600
| 1,116
|
|
| BYD Co. Ltd. Class H
| 36,500
| 1,110
|
|
| Ping An Bank Co. Ltd. Class A
| 768,940
| 1,100
|
|
| Bank of Ningbo Co. Ltd. Class A
| 306,900
| 1,048
|
|
| China Tourism Group Duty Free Corp. Ltd. Class A
| 76,611
| 991
|
| *
| Tencent Music Entertainment Group ADR
| 132,550
| 962
|
| *
| BeiGene Ltd.
| 66,950
| 961
|
|
| China National Building Material Co. Ltd. Class H
| 1,883,983
| 897
|
|
|
| Shares
| Market
Value•
($000)
|
| *,1
| Wuxi Biologics Cayman Inc.
| 143,500
| 892
|
|
| Li Ning Co. Ltd.
| 289,000
| 886
|
|
| Suofeiya Home Collection Co. Ltd. Class A
| 354,790
| 873
|
| *
| Baidu Inc. ADR
| 8,144
| 855
|
|
| Proya Cosmetics Co. Ltd. Class A
| 57,980
| 823
|
|
| Tsingtao Brewery Co. Ltd. Class H
| 102,000
| 773
|
| 1
| CSC Financial Co. Ltd. Class H
| 813,157
| 732
|
|
| Ping An Insurance Group Co. of China Ltd. Class A
| 117,700
| 731
|
|
| Zoomlion Heavy Industry Science and Technology Co. Ltd. Class A
| 721,750
| 633
|
| *
| Kanzhun Ltd. ADR
| 42,179
| 624
|
| *,1
| Kuaishou Technology
| 95,900
| 618
|
|
| Suofeiya Home Collection Co. Ltd. Class A (XSHE)
| 207,445
| 511
|
|
| Sinopharm Group Co. Ltd. Class H
| 205,600
| 492
|
|
| Anker Innovations Technology Co. Ltd. Class A (XSHE)
| 36,300
| 465
|
| *
| Zai Lab Ltd.
| 171,600
| 438
|
| *
| Sichuan Kelun-Biotech Biopharmaceutical Co. Ltd.
| 35,100
| 374
|
|
| WuXi AppTec Co. Ltd. Class A
| 30,600
| 362
|
|
| Shenzhen Mindray Bio-Medical Electronics Co. Ltd. Class A
| 8,100
| 317
|
| *
| H World Group Ltd. ADR
| 7,898
| 297
|
|
| Zhongsheng Group Holdings Ltd.
| 119,500
| 276
|
| *
| Zai Lab Ltd. ADR
| 10,745
| 271
|
|
| Aluminum Corp of China Ltd. Class A
| 317,594
| 269
|
|
| Shandong Weigao Group Medical Polymer Co. Ltd. Class H
| 276,718
| 257
|
|
| Shanghai Pharmaceuticals Holding Co. Ltd. Class A
| 97,700
| 241
|
|
| Lufax Holding Ltd. ADR
| 245,187
| 234
|
| *
| BeiGene Ltd. ADR
| 1,152
| 215
|
|
| Yuexiu Property Co. Ltd.
| 190,000
| 198
|
| 1
| Yadea Group Holdings Ltd.
| 106,000
| 193
|
|
| Amoy Diagnostics Co. Ltd. Class A (XSHE)
| 53,080
| 158
|
|
| China Vanke Co. Ltd. Class H
| 156,500
| 146
|
| *,1
| Remegen Co. Ltd. Class H
| 22,859
| 130
|
|
| Asymchem Laboratories Tianjin Co. Ltd. Class A
| 6,260
| 129
|
|
| Amoy Diagnostics Co. Ltd. Class A
| 37,094
| 110
|
Emerging Markets Select Stock Fund
|
|
| Shares
| Market
Value•
($000)
|
| 1
| Asymchem Laboratories Tianjin Co. Ltd. Class H
| 6,691
| 87
|
| *
| GDS Holdings Ltd. ADR
| 7,756
| 80
|
| *
| Alibaba Group Holding Ltd. ADR
| 860
| 71
|
|
| Changzhou Xingyu Automotive Lighting Systems Co. Ltd. Class A
| 3,500
| 70
|
|
| Shenzhen Mindray Bio-Medical Electronics Co. Ltd. Class A (XSHE)
| 1,700
| 66
|
| *
| Grand Baoxin Auto Group Ltd.
| 2,010,500
| 50
|
|
|
|
| 198,843
|
| Egypt (0.0%)
|
|
| Commercial International Bank Egypt SAE GDR (Registered)
| 2
| —
|
| Greece (0.4%)
|
| *
| Alpha Services and Holdings SA
| 2,182,259
| 3,267
|
| Hong Kong (4.2%)
|
|
| Galaxy Entertainment Group Ltd.
| 1,424,591
| 8,008
|
|
| Pacific Basin Shipping Ltd.
| 20,973,846
| 6,069
|
|
| Lenovo Group Ltd.
| 3,878,000
| 4,513
|
| 1
| WH Group Ltd.
| 5,093,000
| 3,042
|
|
| Yue Yuen Industrial Holdings Ltd.
| 2,357,500
| 2,757
|
|
| AIA Group Ltd.
| 217,104
| 1,885
|
| *
| Sands China Ltd.
| 599,224
| 1,613
|
|
| Orient Overseas International Ltd.
| 113,462
| 1,431
|
|
| Wharf Holdings Ltd.
| 70,500
| 179
|
|
|
|
| 29,497
|
| Hungary (0.8%)
|
|
| OTP Bank Nyrt
| 141,164
| 5,254
|
|
| MOL Hungarian Oil & Gas plc
| 87,031
| 693
|
|
|
|
| 5,947
|
| India (13.0%)
|
|
| Reliance Industries Ltd.
| 580,409
| 15,960
|
|
| HDFC Bank Ltd.
| 554,137
| 9,833
|
|
| Larsen & Toubro Ltd.
| 167,725
| 5,902
|
|
| Shriram Finance Ltd.
| 217,942
| 4,918
|
|
| Bharti Airtel Ltd. (XNSE)
| 369,648
| 4,060
|
| 2
| Infosys Ltd. ADR
| 237,016
| 3,892
|
|
| UltraTech Cement Ltd.
| 37,002
| 3,745
|
|
| Aurobindo Pharma Ltd.
| 361,278
| 3,687
|
|
| Tata Consultancy Services Ltd.
| 83,242
| 3,370
|
|
| ICICI Bank Ltd. ADR
| 141,175
| 3,133
|
|
| Axis Bank Ltd.
| 236,797
| 2,794
|
| 1
| HDFC Life Insurance Co. Ltd.
| 348,422
| 2,588
|
|
| Tech Mahindra Ltd.
| 171,428
| 2,336
|
| *
| Jio Financial Services Ltd.
| 808,359
| 2,126
|
|
| Hindustan Unilever Ltd.
| 55,967
| 1,670
|
| *
| Godrej Consumer Products Ltd.
| 131,729
| 1,570
|
|
| Kotak Mahindra Bank Ltd.
| 70,943
| 1,483
|
|
|
| Shares
| Market
Value•
($000)
|
|
| Oil & Natural Gas Corp. Ltd.
| 652,067
| 1,459
|
|
| Adani Ports & Special Economic Zone Ltd.
| 154,519
| 1,458
|
|
| Ambuja Cements Ltd.
| 261,126
| 1,332
|
|
| Bajaj Auto Ltd.
| 20,605
| 1,314
|
|
| Varun Beverages Ltd.
| 108,154
| 1,180
|
| *
| Delhivery Ltd.
| 230,116
| 1,142
|
|
| Tata Consumer Products Ltd.
| 104,092
| 1,126
|
| 1
| SBI Life Insurance Co. Ltd.
| 67,051
| 1,101
|
|
| Colgate-Palmolive India Ltd.
| 37,717
| 958
|
| *
| Amber Enterprises India Ltd.
| 25,224
| 890
|
|
| Jubilant Foodworks Ltd.
| 127,889
| 770
|
|
| Container Corp. of India Ltd.
| 91,586
| 757
|
|
| Glenmark Pharmaceuticals Ltd.
| 83,109
| 747
|
| *
| Zomato Ltd.
| 539,900
| 683
|
|
| ICICI Bank Ltd.
| 55,389
| 609
|
|
| Apollo Hospitals Enterprise Ltd.
| 10,352
| 599
|
|
| Cipla Ltd.
| 41,184
| 594
|
|
| Maruti Suzuki India Ltd.
| 4,684
| 585
|
|
| Mahindra & Mahindra Ltd.
| 27,753
| 486
|
|
| HDFC Bank Ltd. ADR
| 7,366
| 417
|
|
| Eicher Motors Ltd.
| 9,842
| 390
|
|
| Tata Steel Ltd.
| 192,112
| 274
|
|
| Fortis Healthcare Ltd.
| 63,272
| 245
|
|
| Hero MotoCorp Ltd.
| 2,151
| 80
|
|
|
|
| 92,263
|
| Indonesia (2.0%)
|
|
| Bank Rakyat Indonesia Persero Tbk PT
| 40,036,042
| 12,519
|
|
| Telkom Indonesia Persero Tbk PT
| 7,428,664
| 1,628
|
|
|
|
| 14,147
|
| Kenya (0.1%)
|
|
| Equity Group Holdings plc
| 2,797,214
| 698
|
| Mexico (2.1%)
|
|
| Grupo Financiero Banorte SAB de CV Class O
| 642,993
| 5,218
|
|
| Wal-Mart de Mexico SAB de CV
| 900,534
| 3,223
|
|
| Fomento Economico Mexicano SAB de CV ADR
| 17,208
| 1,952
|
| *
| Cemex SAB de CV ADR
| 243,638
| 1,455
|
|
| America Movil SAB de CV ADR
| 77,575
| 1,288
|
|
| Qualitas Controladora SAB de CV
| 118,414
| 978
|
|
| Grupo Mexico SAB de CV Series B
| 105,863
| 432
|
|
| Corp. Inmobiliaria Vesta SAB de CV
| 67,100
| 210
|
|
|
|
| 14,756
|
| Other (0.4%)
|
| 3
| Vanguard FTSE Emerging Markets ETF
| 69,223
| 2,626
|
Emerging Markets Select Stock Fund
|
|
| Shares
| Market
Value•
($000)
|
| Philippines (0.3%)
|
|
| Bdo Unibank Inc.
| 750,153
| 1,689
|
|
| Ayala Land Inc.
| 461,800
| 227
|
|
|
|
| 1,916
|
| Poland (0.3%)
|
| *,1
| Allegro.eu SA
| 147,294
| 1,057
|
|
| KGHM Polska Miedz SA
| 34,440
| 919
|
|
|
|
| 1,976
|
| Romania (0.2%)
|
|
| Banca Transilvania SA
| 265,270
| 1,258
|
| Russia (0.0%)
|
| *,4
| MMC Norilsk Nickel PJSC ADR
| 200,203
| —
|
| 4
| Sberbank of Russia PJSC
| 1,473,153
| —
|
| *,4
| Mobile TeleSystems PJSC ADR
| 93,946
| —
|
| 4
| Moscow Exchange MICEX-RTS PJSC
| 536,630
| —
|
| *,4
| MMC Norilsk Nickel PJSC
| 1,247
| —
|
| *,4
| Sberbank of Russia PJSC ADR
| 476,234
| —
|
| *,4
| LUKOIL PJSC ADR
| 102,385
| —
|
| *,4
| Novatek PJSC GDR (Registered)
| 6,724
| —
|
| *,2,4
| Ozon Holdings plc ADR
| 35,000
| —
|
| *,4
| Gazprom PJSC
| 926,846
| —
|
|
|
|
| —
|
| Saudi Arabia (1.3%)
|
| 1
| Saudi Arabian Oil Co.
| 495,859
| 4,405
|
|
| Saudi Awwal Bank
| 251,544
| 2,246
|
|
| Al Rajhi Bank
| 91,085
| 1,631
|
|
| Saudi Telecom Co.
| 67,821
| 695
|
|
| Mouwasat Medical Services Co.
| 10,024
| 267
|
|
|
|
| 9,244
|
| Singapore (0.6%)
|
|
| Wilmar International Ltd.
| 1,612,000
| 4,191
|
| South Africa (2.1%)
|
| 2
| Anglogold Ashanti plc
| 258,722
| 4,616
|
|
| Sasol Ltd.
| 342,139
| 4,325
|
|
| Impala Platinum Holdings Ltd.
| 310,240
| 1,292
|
|
| FirstRand Ltd.
| 315,005
| 1,039
|
|
| Mr Price Group Ltd.
| 115,117
| 832
|
|
| Discovery Ltd.
| 100,531
| 693
|
| *
| Naspers Ltd. Class N
| 3,878
| 606
|
|
| Harmony Gold Mining Co. Ltd.
| 131,116
| 601
|
|
| Thungela Resources Ltd.
| 58,639
| 520
|
|
| Gold Fields Ltd.
| 38,082
| 502
|
|
|
|
| 15,026
|
| South Korea (5.6%)
|
|
| Samsung Electronics Co. Ltd. (XKRX)
| 296,238
| 14,745
|
|
| SK Hynix Inc.
| 79,807
| 6,931
|
|
| Hankook Tire & Technology Co. Ltd.
| 136,687
| 3,878
|
|
| LG Chem Ltd. (XKRX)
| 9,293
| 3,046
|
|
| Hyundai Motor Co.
| 23,036
| 2,902
|
|
| DB Insurance Co. Ltd.
| 43,341
| 2,820
|
|
| Shinhan Financial Group Co. Ltd.
| 53,870
| 1,385
|
|
|
| Shares
| Market
Value•
($000)
|
|
| Samsung SDI Co. Ltd. (XKRX)
| 3,915
| 1,240
|
|
| WONIK IPS Co. Ltd.
| 52,731
| 1,179
|
|
| KB Financial Group Inc.
| 26,800
| 1,021
|
|
| NAVER Corp.
| 4,531
| 633
|
|
|
|
| 39,780
|
| Spain (0.2%)
|
|
| Banco Bilbao Vizcaya Argentaria SA. ADR
| 224,508
| 1,758
|
| Taiwan (10.4%)
|
|
| Taiwan Semiconductor Manufacturing Co. Ltd. (XTAI)
| 2,709,627
| 44,255
|
|
| Hon Hai Precision Industry Co. Ltd.
| 1,870,685
| 5,583
|
|
| MediaTek Inc.
| 180,227
| 4,704
|
|
| Accton Technology Corp.
| 206,000
| 3,192
|
|
| United Integrated Services Co. Ltd.
| 409,000
| 3,036
|
|
| Compal Electronics Inc.
| 2,531,000
| 2,202
|
|
| Nanya Technology Corp.
| 1,013,000
| 2,031
|
|
| E Ink Holdings Inc.
| 303,000
| 1,576
|
|
| Silergy Corp.
| 146,000
| 1,305
|
|
| ASPEED Technology Inc.
| 16,284
| 1,301
|
|
| Chroma ATE Inc.
| 191,144
| 1,292
|
|
| Airtac International Group
| 38,799
| 1,276
|
|
| Evergreen Marine Corp. Taiwan Ltd.
| 344,348
| 1,146
|
|
| Realtek Semiconductor Corp.
| 79,000
| 985
|
|
|
|
| 73,884
|
| Thailand (2.8%)
|
|
| PTT Exploration & Production PCL
| 1,122,210
| 5,125
|
|
| SCB X PCL
| 1,640,500
| 4,498
|
|
| Charoen Pokphand Foods PCL
| 5,819,800
| 3,027
|
|
| Bangkok Bank PCL NVDR
| 469,100
| 2,055
|
|
| Kasikornbank PCL NVDR
| 455,579
| 1,666
|
|
| Indorama Ventures PCL NVDR
| 2,082,900
| 1,372
|
|
| Bangkok Bank PCL (Registered)
| 215,800
| 946
|
|
| Kasikornbank PCL
| 197,153
| 721
|
|
| Bangkok Dusit Medical Services PCL Class F
| 349,600
| 258
|
|
| Central Pattana PCL
| 100,470
| 175
|
|
|
|
| 19,843
|
| Turkey (0.3%)
|
|
| Akbank TAS
| 2,133,100
| 2,222
|
| United Arab Emirates (0.7%)
|
|
| Abu Dhabi Commercial Bank PJSC
| 1,587,605
| 3,469
|
|
| Emirates NBD Bank PJSC
| 226,034
| 1,043
|
|
| Emaar Properties PJSC
| 255,038
| 465
|
|
|
|
| 4,977
|
| United Kingdom (1.3%)
|
|
| Standard Chartered plc
| 727,225
| 5,576
|
| 1
| Airtel Africa plc
| 1,076,448
| 1,483
|
|
| Fresnillo plc
| 201,336
| 1,355
|
|
| Anglo American plc
| 38,737
| 987
|
Emerging Markets Select Stock Fund
|
|
| Shares
| Market
Value•
($000)
|
|
| Hikma Pharmaceuticals plc
| 7,962
| 184
|
|
|
|
| 9,585
|
| United States (4.7%)
|
| *
| MercadoLibre Inc.
| 5,567
| 6,907
|
|
| Credicorp Ltd.
| 49,655
| 6,205
|
|
| Freeport-McMoRan Inc.
| 126,596
| 4,276
|
|
| Cognizant Technology Solutions Corp. Class A
| 51,280
| 3,306
|
| *
| Flex Ltd.
| 84,985
| 2,186
|
| *
| Coupang Inc.
| 126,396
| 2,149
|
|
| Ternium SA ADR
| 41,505
| 1,556
|
|
| Copa Holdings SA Class A
| 18,416
| 1,504
|
| *
| Sea Ltd. ADR
| 32,952
| 1,374
|
| *
| Fabrinet
| 8,584
| 1,331
|
| *
| MakeMyTrip Ltd.
| 24,309
| 941
|
| *
| WNS Holdings Ltd. ADR
| 14,106
| 766
|
|
| Patria Investments Ltd. Class A
| 48,769
| 629
|
|
|
|
| 33,130
|
| Vietnam (0.4%)
|
|
| Vietnam Dairy Products JSC
| 1,137,100
| 3,149
|
| *,1
| Vinhomes JSC
| 38,300
| 61
|
|
|
|
| 3,210
|
Total Common Stocks
(Cost $684,130)
| 654,206
|
| Preferred Stocks (2.7%)
|
|
| Cia Energetica de Minas Gerais Preference Shares
| 1,657,065
| 3,859
|
|
| Petroleo Brasileiro SA Preference Shares
| 490,700
| 3,381
|
|
| Raizen SA Preference Shares
| 4,460,835
| 3,212
|
|
| Banco Bradesco SA Preference Shares
| 1,027,100
| 2,850
|
|
| Samsung Electronics Co. Ltd. Preference Shares
| 69,261
| 2,765
|
|
|
| Shares
| Market
Value•
($000)
|
|
| Itau Unibanco Holding SA Preference Shares
| 419,200
| 2,230
|
| *
| Braskem SA Preference Shares Class A
| 183,937
| 586
|
| Total Preferred Stocks (Cost $19,779)
| 18,883
|
| Temporary Cash Investments (5.8%)
|
| Money Market Fund (5.8%)
|
| 5,6
| Vanguard Market Liquidity Fund, 5.420% (Cost $40,936)
| 409,473
| 40,943
|
| Total Investments (100.8%) (Cost $744,845)
| 714,032
|
Other Assets and Liabilities—
Net (-0.8%)
| (5,460)
|
| Net Assets (100%)
| 708,572
|
| Cost is in $000.
|
| •
| See Note A in Notes to Financial Statements.
|
| *
| Non-income-producing security.
|
| 1
| Security exempt from registration under Rule 144A of the Securities Act of 1933. Such securities may be sold in transactions exempt from registration, normally to qualified
institutional buyers. At October 31, 2023, the aggregate value was $26,643,000, representing 3.8% of net assets.
|
| 2
| Includes partial security positions on loan to broker-dealers. The total value of securities on loan is $5,210,000.
|
| 3
| Considered an affiliated company of the fund as the issuer is another member of The Vanguard Group.
|
| 4
| Security value determined using significant unobservable inputs.
|
| 5
| Affiliated money market fund available only to Vanguard funds and certain trusts and accounts managed by Vanguard. Rate shown is the 7-day yield.
|
| 6
| Collateral of $6,026,000 was received for securities on loan.
|
|
| ADR—American Depositary Receipt.
|
|
| GDR—Global Depositary Receipt.
|
|
| NVDR—Non-Voting Depository Receipt.
|
Derivative
Financial Instruments Outstanding as of Period End
| Futures Contracts
|
|
|
|
| ($000)
|
|
| Expiration
| Number of
Long (Short)
Contracts
| Notional
Amount
| Value and
Unrealized
Appreciation
(Depreciation)
|
| Long Futures Contracts
|
|
|
|
|
| MSCI Emerging Markets Index
| December 2023
| 588
| 27,024
| (1,769)
|
See
accompanying Notes, which are an integral part of the Financial Statements.
Emerging Markets Select Stock Fund
Statement of Assets and Liabilities
|
|
| ($000s, except shares, footnotes, and per-share amounts)
| Amount
|
| Assets
|
|
| Investments in Securities, at Value1
|
|
| Unaffiliated Issuers (Cost $701,231)
| 670,463
|
| Affiliated Issuers (Cost $43,614)
| 43,569
|
| Total Investments in Securities
| 714,032
|
| Investment in Vanguard
| 26
|
| Cash
| 2,627
|
| Cash Collateral Pledged—Futures Contracts
| 797
|
| Foreign Currency, at Value (Cost $471)
| 509
|
| Receivables for Investment Securities Sold
| 741
|
| Receivables for Accrued Income
| 2,059
|
| Receivables for Capital Shares Issued
| 174
|
| Total Assets
| 720,965
|
| Liabilities
|
|
| Payables for Investment Securities Purchased
| 3,353
|
| Collateral for Securities on Loan
| 6,026
|
| Payables to Investment Advisor
| 910
|
| Payables for Capital Shares Redeemed
| 219
|
| Payables to Vanguard
| 94
|
| Variation Margin Payable—Futures Contracts
| 179
|
| Foreign Capital Gain Taxes Payable
| 3
|
| Deferred Foreign Capital Gains Taxes
| 1,609
|
| Total Liabilities
| 12,393
|
| Net Assets
| 708,572
|
| 1 Includes $5,210,000 of securities on loan.
|
|
| At October 31, 2023, net assets consisted of:
|
|
|
|
|
| Paid-in Capital
| 799,676
|
| Total Distributable Earnings (Loss)
| (91,104)
|
| Net Assets
| 708,572
|
|
|
| Net Assets
|
|
Applicable to 36,655,025 outstanding $.001 par value shares of
beneficial interest (unlimited authorization)
| 708,572
|
| Net Asset Value Per Share
| $19.33
|
See accompanying
Notes, which are an integral part of the Financial Statements.
Emerging Markets Select Stock Fund
|
|
|
| Year Ended
October 31, 2023
|
|
| ($000)
|
| Investment Income
|
|
| Income
|
|
| Dividends—Unaffiliated Issuers1
| 24,889
|
| Dividends—Affiliated Issuers
| 218
|
| Non-Cash Dividends
| 1,444
|
| Interest—Unaffiliated Issuers
| 48
|
| Interest—Affiliated Issuers
| 1,920
|
| Securities Lending—Net
| 55
|
| Total Income
| 28,574
|
| Expenses
|
|
| Investment Advisory Fees—Note B
|
|
| Basic Fee
| 3,895
|
| Performance Adjustment
| (103)
|
| The Vanguard Group—Note C
|
|
| Management and Administrative
| 1,954
|
| Marketing and Distribution
| 45
|
| Custodian Fees
| 160
|
| Auditing Fees
| 38
|
| Shareholders’ Reports
| 40
|
| Trustees’ Fees and Expenses
| —
|
| Other Expenses
| 23
|
| Total Expenses
| 6,052
|
| Expenses Paid Indirectly
| (1)
|
| Net Expenses
| 6,051
|
| Net Investment Income
| 22,523
|
| Realized Net Gain (Loss)
|
|
| Capital Gains Distributions Received – Affiliated Issuers
| —
|
| Investment Securities Sold—Unaffiliated Issuers2
| (11,158)
|
| Investment Securities Sold—Affiliated Issuers
| (489)
|
| Futures Contracts
| (286)
|
| Forward Currency Contracts
| 12
|
| Foreign Currencies
| (349)
|
| Realized Net Gain (Loss)
| (12,270)
|
Emerging Markets Select Stock Fund
| Statement of Operations (continued)
|
|
| Year Ended
October 31, 2023
|
|
| ($000)
|
| Change in Unrealized Appreciation (Depreciation)
|
|
Investment Securities—Unaffiliated
Issuers3
| 82,396
|
| Investment Securities—Affiliated Issuers
| 1,141
|
| Futures Contracts
| 245
|
| Foreign Currencies
| 21
|
| Change in Unrealized Appreciation (Depreciation)
| 83,803
|
| Net Increase (Decrease) in Net Assets Resulting from Operations
| 94,056
|
| 1
| Dividends are net of foreign withholding taxes of $2,757,000.
|
| 2
| Realized gain (loss) is net of foreign capital gain taxes of $1,221,000.
|
| 3
| The change in unrealized appreciation (depreciation) is net of the change in deferred foreign capital gains taxes of $105,000.
|
See accompanying
Notes, which are an integral part of the Financial Statements.
Emerging Markets Select Stock Fund
Statement of Changes in Net Assets
|
|
|
| Year Ended October 31,
|
|
| 2023
($000)
| 2022
($000)
|
|
|
|
|
| Increase (Decrease) in Net Assets
|
|
|
| Operations
|
|
|
| Net Investment Income
| 22,523
| 26,378
|
| Realized Net Gain (Loss)
| (12,270)
| (59,867)
|
| Change in Unrealized Appreciation (Depreciation)
| 83,803
| (261,612)
|
| Net Increase (Decrease) in Net Assets Resulting from Operations
| 94,056
| (295,101)
|
| Distributions
|
|
|
| Total Distributions
| (25,482)
| (59,107)
|
| Capital Share Transactions
|
|
|
| Issued
| 141,225
| 179,568
|
| Issued in Lieu of Cash Distributions
| 21,665
| 50,609
|
| Redeemed
| (152,294)
| (220,976)
|
| Net Increase (Decrease) from Capital Share Transactions
| 10,596
| 9,201
|
| Total Increase (Decrease)
| 79,170
| (345,007)
|
| Net Assets
|
|
|
| Beginning of Period
| 629,402
| 974,409
|
| End of Period
| 708,572
| 629,402
|
See accompanying
Notes, which are an integral part of the Financial Statements.
Emerging Markets Select Stock Fund
For a Share Outstanding
Throughout Each Period
| Year Ended October 31,
|
| 2023
| 2022
| 2021
| 2020
| 2019
|
| Net Asset Value, Beginning of Period
| $17.42
| $27.09
| $22.18
| $21.87
| $19.68
|
| Investment Operations
|
|
|
|
|
|
| Net Investment Income1
| .606
| .715
| .457
| .298
| .4742
|
| Net Realized and Unrealized Gain (Loss) on Investments
| 2.019
| (8.724)
| 4.729
| .483
| 2.208
|
| Total from Investment Operations
| 2.625
| (8.009)
| 5.186
| .781
| 2.682
|
| Distributions
|
|
|
|
|
|
| Dividends from Net Investment Income
| (.715)
| (.486)
| (.276)
| (.471)
| (.492)
|
| Distributions from Realized Capital Gains
| —
| (1.175)
| —
| —
| —
|
| Total Distributions
| (.715)
| (1.661)
| (.276)
| (.471)
| (.492)
|
| Net Asset Value, End of Period
| $19.33
| $17.42
| $27.09
| $22.18
| $21.87
|
| Total Return3
| 15.10%
| -31.16%
| 23.44%
| 3.51%
| 13.96%
|
| Ratios/Supplemental Data
|
|
|
|
|
|
| Net Assets, End of Period (Millions)
| $709
| $629
| $974
| $670
| $702
|
| Ratio of Total Expenses to Average Net Assets4
| 0.80%5
| 0.78%
| 0.84%
| 0.85%
| 0.93%
|
| Ratio of Net Investment Income to Average Net Assets
| 2.99%
| 3.26%
| 1.65%
| 1.43%
| 2.25%2
|
| Portfolio Turnover Rate
| 43%
| 41%
| 48%
| 52%
| 46%
|
| 1
| Calculated based on average shares outstanding.
|
| 2
| Net investment income per share and the ratio of net investment income to average net assets include $0.071 and 0.34%, respectively, resulting from a special dividend from Naspers
Ltd. in September 2019.
|
| 3
| Total returns do not include account service fees that may have applied in the periods shown. Fund prospectuses provide information about any applicable account service fees.
|
| 4
| Includes performance-based investment advisory fee increases (decreases) of (0.01%), (0.04%), 0.02%, (0.01%), and 0.07%.
|
| 5
| The ratio of expenses to average net assets for the period net of reduction from broker commission abatement arrangements was 0.80%.
|
See accompanying
Notes, which are an integral part of the Financial Statements.
Emerging Markets Select Stock Fund
Notes to Financial Statements
Vanguard Emerging Markets
Select Stock Fund is registered under the Investment Company Act of 1940 as an open-end investment company, or mutual fund.
| A.
| The following significant accounting policies conform to generally accepted accounting principles for U.S. investment companies. The fund consistently follows such policies in preparing its financial statements.
|
1. Security Valuation:
Securities are valued as of the close of trading on the New York Stock Exchange (generally 4 p.m., Eastern time) on the valuation date. Equity securities are valued at the latest quoted sales prices or official
closing prices taken from the primary market in which each security trades; such securities not traded on the valuation date are valued at the mean of the latest quoted bid and asked prices. Securities for which
market quotations are not readily available, or whose values have been affected by events occurring before the fund’s pricing time but after the close of the securities’ primary markets, are valued by
methods deemed by the valuation designee to represent fair value and subject to oversight by the board of trustees. These procedures include obtaining quotations from an independent pricing service, monitoring news to
identify significant market- or security-specific events, and evaluating changes in the values of foreign market proxies (for example, ADRs, futures contracts, or exchange-traded funds), between the time the foreign
markets close and the fund’s pricing time. When fair-value pricing is employed, the prices of securities used by a fund to calculate its net asset value may differ from quoted or published prices for the same
securities. Investments in Vanguard Market Liquidity Fund are valued at that fund's net asset value. Other temporary cash investments are valued using the latest bid prices or using valuations based on a matrix system
(which considers such factors as security prices, yields, maturities, and ratings), both as furnished by independent pricing services.
2. Foreign Currency:
Securities and other assets and liabilities denominated in foreign currencies are translated into U.S. dollars using exchange rates obtained from an independent third party as of the fund’s pricing time on the
valuation date. Realized gains (losses) and unrealized appreciation (depreciation) on investment securities include the effects of changes in exchange rates since the securities were purchased, combined with the
effects of changes in security prices. Fluctuations in the value of other assets and liabilities resulting from changes in exchange rates are recorded as unrealized foreign currency gains (losses) until the assets or
liabilities are settled in cash, at which time they are recorded as realized foreign currency gains (losses).
3. Futures Contracts:
The fund uses index futures contracts to a limited extent, with the objective of maintaining full exposure to the stock market while maintaining liquidity. The fund may purchase or sell futures contracts to achieve a
desired level of investment, whether to accommodate portfolio turnover or cash flows from capital share transactions. The primary risks associated with the use of futures contracts are imperfect correlation between
changes in market values of stocks held by the fund and the prices of futures contracts, and the possibility of an illiquid market. Counterparty risk involving futures is mitigated because a regulated clearinghouse is
the counterparty instead of the clearing broker. To further mitigate counterparty risk, the fund trades futures contracts on an exchange, monitors the financial strength of its clearing brokers and clearinghouse, and
has entered into clearing agreements with its clearing brokers. The clearinghouse imposes initial margin requirements to secure the fund’s performance and requires daily settlement of variation margin
representing changes in the market value of each contract. Any securities pledged as initial margin for open contracts are noted in the Schedule of Investments.
Futures contracts are valued
at their quoted daily settlement prices. The notional amounts of the contracts are not recorded in the Statement of Assets and Liabilities. Fluctuations in the value of
Emerging Markets Select Stock Fund
the contracts are recorded in the Statement
of Assets and Liabilities as an asset (liability) and in the Statement of Operations as unrealized appreciation (depreciation) until the contracts are closed, when they are recorded as realized gains (losses) on
futures contracts.
During the year ended October
31, 2023, the fund’s average investments in long and short futures contracts represented 4% and 0% of net assets, respectively, based on the average of the notional amounts at each quarter-end during the
period.
4. Forward Currency
Contracts: The fund enters into forward currency contracts to protect the value of securities and related receivables and payables against changes in future foreign exchange rates. The fund’s risks in using
these contracts include movement in the values of the foreign currencies relative to the U.S. dollar and the ability of the counterparties to fulfill their obligations under the contracts. The fund mitigates its
counterparty risk by entering into forward currency contracts only with a diverse group of prequalified counterparties, monitoring their financial strength, entering into master netting arrangements with its
counterparties, and requiring its counterparties to transfer collateral as security for their performance. In the absence of a default, the collateral pledged or received by the fund cannot be repledged, resold, or
rehypothecated. The master netting arrangements provide that, in the event of a counterparty’s default (including bankruptcy), the fund may terminate the forward currency contracts, determine the net amount owed
by either party in accordance with its master netting arrangements, and sell or retain any collateral held up to the net amount owed to the fund under the master netting arrangements. The forward currency contracts
contain provisions whereby a counterparty may terminate open contracts if the fund’s net assets decline below a certain level, triggering a payment by the fund if the fund is in a net liability position at the
time of the termination. The payment amount would be reduced by any collateral the fund has pledged. Any securities pledged as collateral for open contracts are noted in the Schedule of Investments. The value of
collateral received or pledged is compared daily to the value of the forward currency contracts exposure with each counterparty, and any difference, if in excess of a specified minimum transfer amount, is adjusted and
settled within two business days.
Forward currency contracts are
valued at their quoted daily prices obtained from an independent third party, adjusted for currency risk based on the expiration date of each contract. The notional amounts of the contracts are not recorded in the
Statement of Assets and Liabilities. Fluctuations in the value of the contracts are recorded in the Statement of Assets and Liabilities as an asset (liability) and in the Statement of Operations as unrealized
appreciation (depreciation) until the contracts are closed, when they are recorded as realized gains (losses) on forward currency contracts.
During the year ended October
31, 2023, the fund’s average investment in forward currency contracts represented less than 1% of net assets, based on the average of the notional amounts at each quarter-end during the period. The fund had no
open forward currency contracts at October 31, 2023.
5. Federal Income Taxes:
The fund intends to continue to qualify as a regulated investment company and distribute virtually all of its taxable income. The fund’s tax returns are open to examination by the relevant tax authorities until
expiration of the applicable statute of limitations, which is generally three years after the filing of the tax return. Management has analyzed the fund’s tax positions taken for all open federal and state
income tax years, and has concluded that no provision for income tax is required in the fund’s financial statements.
Emerging Markets Select Stock Fund
6. Distributions:
Distributions to shareholders are recorded on the ex-dividend date. Distributions are determined on a tax basis at the fiscal year-end and may differ from net investment income and realized capital gains for financial
reporting purposes.
7. Securities Lending:
To earn additional income, the fund lends its securities to qualified institutional borrowers. Security loans are subject to termination by the fund at any time, and are required to be secured at all times by
collateral in an amount at least equal to the market value of securities loaned. Daily market fluctuations could cause the value of loaned securities to be more or less than the value of the collateral received. When
this occurs, the collateral is adjusted and settled before the opening of the market on the next business day. The fund further mitigates its counterparty risk by entering into securities lending transactions only
with a diverse group of prequalified counterparties, monitoring their financial strength, and entering into master securities lending agreements with its counterparties. The master securities lending agreements
provide that, in the event of a counterparty’s default (including bankruptcy), the fund may terminate any loans with that borrower, determine the net amount owed, and sell or retain the collateral up to the net
amount owed to the fund; however, such actions may be subject to legal proceedings. While collateral mitigates counterparty risk, in the event of a default, the fund may experience delays and costs in recovering the
securities loaned. The fund invests cash collateral received in Vanguard Market Liquidity Fund, and records a liability in the Statement of Assets and Liabilities for the return of the collateral, during the period
the securities are on loan. Collateral investments in Vanguard Market Liquidity Fund are subject to market appreciation or depreciation. Securities lending income represents fees charged to borrowers plus income
earned on invested cash collateral, less expenses associated with the loan. During the term of the loan, the fund is entitled to all distributions made on or in respect of the loaned securities.
8. Credit Facilities and
Interfund Lending Program: The fund and certain other funds managed by The Vanguard Group ("Vanguard") participate in a $4.3 billion committed credit facility provided by a syndicate of lenders pursuant to a credit
agreement and an uncommitted credit facility provided by Vanguard. Both facilities may be renewed annually. Each fund is individually liable for its borrowings, if any, under the credit facilities. Borrowings may be
utilized for temporary or emergency purposes and are subject to the fund’s regulatory and contractual borrowing restrictions. With respect to the committed credit facility, the participating funds are charged
administrative fees and an annual commitment fee of 0.10% of the undrawn committed amount of the facility, which are allocated to the funds based on a method approved by the fund’s board of trustees and included
in Management and Administrative expenses on the fund’s Statement of Operations. Any borrowings under either facility bear interest at an agreed-upon spread plus the higher of the federal funds effective rate,
the overnight bank funding rate, or the Daily Simple Secured Overnight Financing Rate inclusive of an additional agreed-upon spread. However, borrowings under the uncommitted credit facility may bear interest based
upon an alternate rate agreed to by the fund and Vanguard.
In accordance with an
exemptive order (the “Order”) from the SEC, the fund may participate in a joint lending and borrowing program that allows registered open-end Vanguard funds to borrow money from and lend money to each
other for temporary or emergency purposes (the “Interfund Lending Program”), subject to compliance with the terms and conditions of the Order, and to the extent permitted by the fund’s investment
objective and investment policies. Interfund loans and borrowings normally extend overnight but can have a maximum duration of seven days. Loans may be called on one business day’s notice. The interest rate to
be charged is governed by the conditions of the Order and internal procedures adopted by the board of trustees. The board of trustees is responsible for overseeing the Interfund Lending Program.
Emerging Markets Select Stock Fund
For the year ended October 31,
2023, the fund did not utilize the credit facilities or the Interfund Lending Program.
9. Other: Dividend
income is recorded on the ex-dividend date. Non-cash dividends included in income, if any, are recorded at the fair value of the securities received. Interest income includes income distributions received from
Vanguard Market Liquidity Fund and is accrued daily. Security transactions are accounted for on the date securities are bought or sold. Costs used to determine realized gains (losses) on the sale of investment
securities are those of the specific securities sold.
Taxes on foreign dividends and
capital gains have been provided for in accordance with the applicable countries’ tax rules and rates. Deferred foreign capital gains tax, if any, is accrued daily based upon net unrealized gains.
| B.
| The investment advisory firms Pzena Investment Management, LLC, Baillie Gifford Overseas Ltd., Oaktree Fund Advisors, LLC, and Wellington Management Company llp, each provide investment advisory services to a portion of the fund for a fee calculated at an annual percentage rate of average net assets managed by the advisor. The basic
fees of Pzena Investment Management, LLC, Baillie Gifford Overseas Ltd., Oaktree Fund Advisors, LLC, and Wellington Management Company llp, are subject to quarterly adjustments based on performance relative to the FTSE Emerging Index for the preceding three years.
|
Vanguard manages the cash
reserves of the fund as described below.
For the year ended October 31,
2023, the aggregate investment advisory fee paid to all advisors represented an effective annual basic rate of 0.52% of the fund’s average net assets, before a net decrease of $103,000 (0.01%) based on
performance.
| C.
| In accordance with the terms of a Funds' Service Agreement (the “FSA”) between Vanguard and the fund, Vanguard furnishes to the fund corporate management, administrative, marketing, distribution and cash
management services at Vanguard’s cost of operations (as defined by the FSA). These costs of operations are allocated to the fund based on methods and guidelines approved by the board of trustees and are
generally settled twice a month.
|
Upon the request of Vanguard,
the fund may invest up to 0.40% of its net assets as capital in Vanguard. At October 31, 2023, the fund had contributed to Vanguard capital in the amount of $26,000, representing less than 0.01% of the fund’s
net assets and 0.01% of Vanguard’s capital received pursuant to the FSA. The fund’s trustees and officers are also directors and employees, respectively, of Vanguard.
| D.
| The fund has asked its investment advisors to direct certain security trades, subject to obtaining the best price and execution, to brokers who have agreed to rebate to the fund part of the commissions generated.
Such rebates are used solely to reduce the fund’s management and administrative expenses. For the year ended October 31, 2023, these arrangements reduced the fund’s expenses by $1,000 (an annual rate of
less than 0.01% of average net assets).
|
| E.
| Various inputs may be used to determine the value of the fund’s investments and derivatives. These inputs are summarized in three broad levels for financial statement purposes.
The inputs or methodologies used to value securities are not necessarily an indication of the risk associated with investing in those securities.
|
Level 1—Quoted prices in active markets for identical securities.
Emerging Markets Select Stock Fund
Level 2—Other significant observable inputs (including quoted prices for similar securities, interest rates, prepayment speeds, credit risk, etc.).
Level 3—Significant unobservable inputs (including the fund’s own assumptions used to determine the fair value of investments). Any investments and derivatives valued with significant
unobservable inputs are noted on the Schedule of Investments.
The following table summarizes
the market value of the fund’s investments and derivatives as of October 31, 2023, based on the inputs used to value them:
|
| Level 1
($000)
| Level 2
($000)
| Level 3
($000)
| Total
($000)
|
| Investments
|
|
|
|
|
| Assets
|
|
|
|
|
| Common Stocks—North and South America
| 116,903
| 1,145
| —
| 118,048
|
| Common Stocks—Other
| 29,021
| 507,137
| —
| 536,158
|
| Preferred Stocks
| 16,118
| 2,765
| —
| 18,883
|
| Temporary Cash Investments
| 40,943
| —
| —
| 40,943
|
| Total
| 202,985
| 511,047
| —
| 714,032
|
| Derivative Financial Instruments
|
|
|
|
|
| Liabilities
|
|
|
|
|
| Futures Contracts1
| 1,769
| —
| —
| 1,769
|
| 1
| Includes cumulative appreciation (depreciation) on futures contracts and centrally cleared swaps, if any, as reported in the Schedule of Investments. Only current
day’s variation margin is reported within the Statement of Assets and Liabilities.
|
| F.
| At October 31, 2023, the fair values of derivatives were reflected in the Statement of Assets and Liabilities as follows:
|
| Statement of Assets and Liabilities
| Equity
Contracts
($000)
| Foreign
Exchange
Contracts
($000)
| Total
($000)
|
| Unrealized Depreciation—Futures Contracts1
| 1,769
| —
| 1,769
|
| 1
| Includes cumulative appreciation (depreciation) on futures contracts and centrally cleared swaps, if any, as reported in the Schedule of Investments. Only current
day’s variation margin is reported within the Statement of Assets and Liabilities.
|
Realized net gain (loss) and
the change in unrealized appreciation (depreciation) on derivatives for the year ended October 31, 2023, were:
| Realized Net Gain (Loss) on Derivatives
| Equity
Contracts
($000)
| Foreign
Exchange
Contracts
($000)
| Total
($000)
|
| Futures Contracts
| (286)
| —
| (286)
|
| Forward Currency Contracts
| —
| 12
| 12
|
| Realized Net Gain (Loss) on Derivatives
| (286)
| 12
| (274)
|
| Change in Unrealized Appreciation (Depreciation) on Derivatives
|
|
|
|
| Futures Contracts
| 245
| —
| 245
|
Emerging Markets Select Stock Fund
| G.
| Permanent differences between book-basis and tax-basis components of net assets are reclassified among capital accounts in the financial statements to reflect their tax character. These reclassifications have no
effect on net assets or net asset value per share. As of period end, permanent differences primarily attributable to the accounting for applicable foreign currency transactions, passive foreign investment companies,
and tax expense on capital gains were reclassified between the individual components of total distributable earnings (loss).
|
Temporary differences between
book-basis and tax-basis components of total distributable earnings (loss) arise when certain items of income, gain, or loss are recognized in different periods for financial statement and tax purposes; these
differences will reverse at some time in the future. The differences are primarily related to capital loss carryforwards; the deferral of losses from wash sales; the recognition of unrealized gains or losses from
certain derivative contracts; and the recognition of unrealized gains from passive foreign investment companies. As of period end, the tax-basis components of total distributable earnings (loss) are detailed in the
table as follows:
|
| Amount
($000)
|
| Undistributed Ordinary Income
| 19,302
|
| Undistributed Long-Term Gains
| —
|
| Net Unrealized Gains (Losses)
| (46,223)
|
| Capital Loss Carryforwards
| (64,183)
|
| Qualified Late-Year Losses
| —
|
| Other Temporary Differences
| —
|
| Total
| (91,104)
|
The tax character of
distributions paid was as follows:
|
| Year Ended October 31,
|
|
| 2023
Amount
($000)
| 2022
Amount
($000)
|
| Ordinary Income*
| 25,482
| 32,782
|
| Long-Term Capital Gains
| —
| 26,325
|
| Total
| 25,482
| 59,107
|
| *
| Includes short-term capital gains, if any.
|
As of October 31, 2023, gross
unrealized appreciation and depreciation for investments and derivatives based on cost for U.S. federal income tax purposes were as follows:
|
| Amount
($000)
|
| Tax Cost
| 758,681
|
| Gross Unrealized Appreciation
| 101,044
|
| Gross Unrealized Depreciation
| (145,694)
|
| Net Unrealized Appreciation (Depreciation)
| (44,650)
|
| H.
| During the year ended October 31, 2023, the fund purchased $304,537,000 of investment securities and sold $301,069,000 of investment securities, other than temporary cash investments.
|
Emerging Markets Select Stock Fund
The fund purchased securities
from and sold securities to other funds or accounts managed by its investment advisors or their affiliates, in accordance with procedures adopted by the board of trustees in compliance with Rule 17a-7 of the
Investment Company Act of 1940. For the year ended October 31, 2023, such purchases were $0 and sales were $59,000, resulting in net realized gain (loss) of $0; these amounts, other than temporary cash investments,
are included in the purchases and sales of investment securities noted above.
| I.
| Capital shares issued and redeemed were:
|
|
| Year Ended October 31,
|
|
| 2023
Shares
(000)
| 2022
Shares
(000)
|
|
|
|
|
| Issued
| 6,947
| 8,139
|
| Issued in Lieu of Cash Distributions
| 1,130
| 2,150
|
| Redeemed
| (7,545)
| (10,131)
|
| Net Increase (Decrease) in Shares Outstanding
| 532
| 158
|
| J.
| Transactions during the period in investments where the issuer is another member of The Vanguard Group were as follows:
|
|
|
| Current Period Transactions
|
|
|
| Oct. 31,
2022
Market
Value
($000)
| Purchases
at Cost
($000)
| Proceeds
from
Securities
Sold
($000)
| Realized
Net
Gain
(Loss)
($000)
| Change in
Unrealized
App. (Dep.)
($000)
| Income
($000)
| Capital Gain
Distributions
Received
($000)
| Oct. 31,
2023
Market
Value
($000)
|
| Vanguard FTSE Emerging Markets ETF
| 5,342
| 14,034
| 17,399
| (491)
| 1,140
| 218
| —
| 2,626
|
| Vanguard Market Liquidity Fund
| 27,141
| NA1
| NA1
| 2
| 1
| 1,920
| —
| 40,943
|
| Total
| 32,483
| 14,034
| 17,399
| (489)
| 1,141
| 2,138
| —
| 43,569
|
| 1
| Not applicable—purchases and sales are for temporary cash investment purposes.
|
| K.
| Significant market disruptions, such as those caused by pandemics (e.g., COVID-19 pandemic), natural or environmental disasters, war (e.g., Russia’s invasion of Ukraine), acts of terrorism, or other events,
can adversely affect local and global markets and normal market operations. Any such disruptions could have an adverse impact on the value of the fund’s investments and fund performance.
|
To the extent the fund’s
investment portfolio reflects concentration in a particular market, industry, sector, country or asset class, the fund may be adversely affected by the performance of these concentrations and may be subject to
increased price volatility and other risks.
The use of derivatives may
expose the fund to various risks. Derivatives can be highly volatile, and any initial investment is generally small relative to the notional amount so that transactions may be leveraged in terms of market exposure. A
relatively small market movement may have a potentially larger impact on derivatives than on standard securities. Leveraged derivatives positions can,
Emerging Markets Select Stock Fund
therefore, increase volatility. Additional
information regarding the fund’s use of derivative(s) and the specific risks associated is described under significant accounting policies.
| L.
| Management has determined that no events or transactions occurred subsequent to October 31, 2023, that would require recognition or disclosure in these financial statements.
|
Report of Independent Registered Public Accounting
Firm
To the Board of Trustees of Vanguard
Trustees' Equity Fund and Shareholders of Vanguard Emerging Markets Select Stock Fund
Opinion on the Financial
Statements
We have audited the
accompanying statement of assets and liabilities, including the schedule of investments, of Vanguard Emerging Markets Select Stock Fund (one of the funds constituting Vanguard Trustees' Equity Fund, referred to
hereafter as the "Fund") as of October 31, 2023, the related statement of operations for the year ended October 31, 2023, the statement of changes in net assets for each of the two years in the period ended October 31, 2023, including the related notes, and the financial highlights for each of the five years in the period ended October 31, 2023 (collectively referred to as the "financial statements"). In our opinion, the
financial statements present fairly, in all material respects, the financial position of the Fund as of October 31, 2023, the results of its operations for the year then ended, the changes in its net assets for each
of the two years in the period ended October 31, 2023 and the financial highlights for each of the five years in the period ended October 31, 2023 in conformity with accounting principles generally accepted in the
United States of America.
Basis for Opinion
These financial statements are
the responsibility of the Fund’s management. Our responsibility is to express an opinion on the Fund’s financial statements based on our audits. We are a public accounting firm registered with the Public
Company Accounting Oversight Board (United States) (PCAOB) and are required to be independent with respect to the Fund in accordance with the U.S. federal securities laws and the applicable rules and regulations of
the Securities and Exchange Commission and the PCAOB.
We conducted our audits of
these financial statements in accordance with the standards of the PCAOB. Those standards require that we plan and perform the audit to obtain reasonable assurance about whether the financial statements are free of
material misstatement, whether due to error or fraud.
Our audits included performing
procedures to assess the risks of material misstatement of the financial statements, whether due to error or fraud, and performing procedures that respond to those risks. Such procedures included examining, on a test
basis, evidence regarding the amounts and disclosures in the financial statements. Our audits also included evaluating the accounting principles used and significant estimates made by management, as well as evaluating
the overall presentation of the financial statements. Our procedures included confirmation of securities owned as of October 31, 2023 by correspondence with the custodian, transfer agent and brokers; when replies were
not received from brokers, we performed other auditing procedures. We believe that our audits provide a reasonable basis for our opinion.
/s/PricewaterhouseCoopers
LLP
Philadelphia, Pennsylvania
December 19, 2023
We have served as the auditor
of one or more investment companies in The Vanguard Group of Funds since 1975.
Tax information
(unaudited)
The fund hereby designates
$15,406,000, or if subsequently determined to be different, the maximum amount allowable by law, as qualified dividend income for individual shareholders for the fiscal year.
The fund hereby designates
$349,000, or if subsequently determined to be different, the maximum amount allowable by law, of interest earned from obligations of the U.S. government which is generally exempt from state income tax.
The fund designates to
shareholders foreign source income of $28,944,000 and foreign taxes paid of $3,889,000, or if subsequently determined to be different, the maximum amounts allowable by law. Form 1099-DIV reports calendar-year amounts
that can be included on the income tax return of shareholders.
This page intentionally left blank.
The People Who Govern Your Fund
The trustees of your mutual
fund are there to see that the fund is operated and managed in your best interests since, as a shareholder, you are a part owner of the fund. Your fund’s trustees also serve on the board of directors of The
Vanguard Group, Inc., which is owned by the Vanguard funds and provides services to them.
A majority of Vanguard’s
board members are independent, meaning that they have no affiliation with Vanguard or the funds they oversee, apart from the sizable personal investments they have made as private individuals. The independent board
members have distinguished backgrounds in business, academia, and public service. Each of the trustees and executive officers oversees 205 Vanguard funds.
Information for each trustee
and executive officer of the fund appears below. That information, as well as the Vanguard fund count, is as of the date on the cover of this fund report. The mailing address of the trustees and officers is P.O. Box
876, Valley Forge, PA 19482. More information about the trustees is in the Statement of Additional Information, which can be obtained, without charge, by contacting Vanguard at 800-662-7447, or online at vanguard.com.
Interested Trustee1
Mortimer J. Buckley
Born in 1969. Trustee since January 2018.
Principal occupation(s) during the past five years and other experience: chairman of the board (2019–present) of Vanguard and of each of the investment companies served by Vanguard; chief executive officer
(2018–present) of Vanguard; chief executive officer, president, and trustee (2018–present) of each of the investment companies served by Vanguard; president and director (2017–present) of Vanguard;
and president (2018–present) of Vanguard Marketing Corporation. Chief investment officer (2013–2017), managing director (2002–2017), head of the Retail Investor Group (2006–2012), and chief
information officer (2001–2006) of Vanguard. Member of the board of governors of the Investment Company Institute and the board of governors of FINRA.
Independent Trustees
Tara Bunch
Born in 1962. Trustee since November 2021.
Principal occupation(s) during the past five years and other experience: head of global operations at Airbnb (2020–present). Vice president of AppleCare (2012–2020). Member of the board of directors of Out
& Equal, the advisory board of the University of California, Berkeley School of Engineering, and the advisory board of Santa Clara University’s Leavey School of Business.
Emerson U. Fullwood
Born in 1948. Trustee since January 2008.
Principal occupation(s) during the past five years and other experience: executive chief staff and marketing officer for North America and corporate vice president (retired 2008) of Xerox Corporation (document
management products and services). Former president of the Worldwide Channels Group, Latin America, and Worldwide Customer Service and executive chief staff officer of Developing Markets of Xerox. Executive in
residence and 2009–2010 Distinguished Minett Professor at the Rochester Institute of Technology. Member of the board of directors of the University of Rochester Medical Center, the Monroe Community College
Foundation, the United Way of Rochester, North Carolina A&T University, Roberts Wesleyan College, and the Rochester Philharmonic Orchestra. Trustee of the University of
Rochester.
F. Joseph Loughrey
Born in 1949. Trustee since October 2009.
Principal occupation(s) during the past five years and other experience: president and chief operating officer (retired 2009) and vice chairman of the board (2008–2009) of Cummins Inc. (industrial machinery).
Director of the V Foundation. Member of the advisory council for the College of Arts and Letters at the University of Notre Dame. Chairman of the board of Saint Anselm College.
Mark Loughridge
Born in 1953. Trustee since March 2012.
Principal occupation(s) during the past five years and other experience: senior vice president and chief financial
1 Mr. Buckley is considered an “interested
person,” as defined in the Investment Company Act of 1940, because he is an officer of the Vanguard funds.
officer (retired 2013) of IBM (information
technology services). Fiduciary member of IBM’s Retirement Plan Committee (2004–2013), senior vice president and general manager (2002–2004) of IBM Global Financing, vice president and controller
(1998–2002) of IBM, and a variety of other prior management roles at IBM. Member of the Council on Chicago Booth.
Scott C. Malpass
Born in 1962. Trustee since March 2012.
Principal occupation(s) during the past five years and other experience: chief investment officer (retired 2020) and vice president (retired 2020) of the University of Notre Dame. Chair of the board of Catholic
Investment Services, Inc. (investment advisors). Member of the board of superintendence of the Institute for the Works of Religion, the Notre Dame 403(b) Investment Committee, and the board of directors of Paxos Trust
Company (finance).
Deanna Mulligan
Born in 1963. Trustee since January 2018.
Principal occupation(s) during the past five years and other experience: chief executive officer of Purposeful (advisory firm for CEOs and C-level executives; 2021–present). Board chair (2020), chief executive
officer (2011–2020), and president (2010–2019) of The Guardian Life Insurance Company of America. Chief operating officer (2010–2011) and executive vice president (2008–2010) of Individual Life
and Disability of the Guardian Life Insurance Company of America. Director of DuPont. Member of the board of the Economic Club of New York. Trustee of the Partnership for New York City (business leadership), Chief
Executives for Corporate Purpose, and the NewYork-Presbyterian Hospital.
André F. Perold
Born in 1952. Trustee since December 2004.
Principal occupation(s) during the past five years and other experience: George Gund Professor of Finance and Banking, Emeritus at the Harvard Business School (retired 2011). Chief investment officer and partner of
HighVista Strategies (private investment firm). Member of the board of RIT Capital Partners (investment firm).
Sarah Bloom Raskin
Born in 1961. Trustee since January 2018.
Principal occupation(s) during the past five years and other experience: deputy secretary (2014–2017) of the United States Department of the Treasury. Governor (2010–2014) of the Federal Reserve Board.
Commissioner (2007–2010) of financial regulation for the State of Maryland. Colin W. Brown Distinguished Professor of the Practice of Law, Duke Law School (2021–present); Rubenstein Fellow, Duke University
(2017–2020); Distinguished Fellow of the Global Financial Markets Center, Duke Law School (2020–2022); and Senior Fellow, Duke Center on Risk
(2020–present). Partner of Kaya
Partners (climate policy advisory services). Member of the board of directors of Arcadia (energy solution technology).
Grant Reid
Born in 1959. Trustee since July 2023.
Principal occupation(s) during the past five years and other experience: chief executive officer and president (2014–2022) and member of the board of directors (2015–2022) of Mars, Incorporated
(multinational manufacturer). Member of the board of directors of Marriott International, Inc. Chair of Agribusiness Task Force, Sustainable Markets Initiative.
David Thomas
Born in 1956. Trustee since July 2021.
Principal occupation(s) during the past five years and other experience: president of Morehouse College (2018–present). Professor of business administration, emeritus at Harvard University (2017–2018).
Dean (2011–2016) and professor of management (2016–2017) at the Georgetown University McDonough School of Business. Director of DTE Energy Company. Trustee of Common Fund.
Peter F. Volanakis
Born in 1955. Trustee since July 2009.
Principal occupation(s) during the past five years and other experience: president and chief operating officer (retired 2010) of Corning Incorporated (communications equipment) and director of Corning Incorporated
(2000–2010) and Dow Corning (2001–2010). Director (2012) of SPX Corporation (multi-industry manufacturing). Overseer of the Amos Tuck School of Business Administration, Dartmouth College (2001–2013).
Member of the BMW Group Mobility Council.
Executive Officers
Jacqueline Angell
Born in 1974. Principal occupation(s) during
the past five years and other experience: principal of Vanguard. Chief compliance officer (November 2022–present) of Vanguard and of each of the investment companies served by Vanguard. Chief compliance officer
(2018–2022) and deputy chief compliance officer (2017–2019) of State Street.
Christine M. Buchanan
Born in 1970. Principal occupation(s) during
the past five years and other experience: principal of Vanguard. Chief financial officer (2021–present) and treasurer (2017–2022) of each of the investment companies served by Vanguard. Partner
(2005–2017) at KPMG (audit, tax, and advisory services).
John Galloway
Born in 1973. Principal occupation(s) during
the past five years and other experience: principal of Vanguard. Investment stewardship officer (September 2020–present) of each of the investment companies served by Vanguard. Head of Investor Advocacy
(February 2020–present) and head of Marketing Strategy and Planning (2017–2020) at Vanguard. Special assistant to the President of the United States (2015).
Ashley Grim
Born in 1984. Principal occupation(s) during
the past five years and other experience: treasurer (February 2022–present) of each of the investment companies served by Vanguard. Fund transfer agent controller (2019–2022) and director of Audit Services
(2017–2019) at Vanguard. Senior manager (2015–2017) at PriceWaterhouseCoopers (audit and assurance, consulting, and tax services).
Jodi Miller
Born in 1980. Principal occupation(s) during
the past five years and other experience: principal of Vanguard. Finance director (2022–present) of each of the investment companies served by Vanguard. Head of Enterprise Investment Services
(2020–present), head of Retail Client Services and Operations (2020–2022), and head of Retail Strategic Support (2018–2020) at Vanguard.
Anne E. Robinson
Born in 1970. Principal occupation(s) during
the past five years and other experience: general counsel (2016–present) of Vanguard. Secretary (2016–present) of Vanguard and of each of the investment companies served by Vanguard. Managing director
(2016–present) of Vanguard. Managing director and general counsel of Global Cards and Consumer Services (2014–2016) at Citigroup. Counsel (2003–2014) at American Express. Nonexecutive director
(2022–present) of the board of National Grid (energy).
Michael Rollings
Born in 1963. Principal occupation(s) during
the past five years and other experience: finance director (2017–present) and treasurer (2017) of each of the investment companies served by Vanguard. Managing director (2016–present) of Vanguard. Chief
financial officer (2016–present) of Vanguard. Director (2016–present) of Vanguard Marketing Corporation. Executive vice president and chief financial officer (2006–2016) of MassMutual Financial
Group.
Vanguard Senior Management
Team
| Matthew Benchener
| Thomas M. Rampulla
|
| Joseph Brennan
| Karin A. Risi
|
| Mortimer J. Buckley
| Anne E. Robinson
|
| Gregory Davis
| Michael Rollings
|
| John James
| Nitin Tandon
|
| Chris D. Mclsaac
| Lauren Valente
|
Connect with
Vanguard®>vanguard.com
Fund Information > 800-662-7447
Direct Investor Account
Services > 800-662-2739
Institutional Investor
Services > 800-523-1036
Text Telephone for People Who
Are Deaf or Hard of Hearing > 800-749-7273
This material may be used in
conjunction with the offering of shares of any Vanguard fund only if preceded or accompanied by the fund’s current prospectus.
All comparative mutual
fund data are from Morningstar, Inc., unless otherwise noted.
You can obtain a free
copy of Vanguard’s proxy voting guidelines by visiting vanguard.com/proxyreporting or by calling Vanguard at 800-662-2739. The guidelines are also available from the SEC’s website, www.sec.gov. In
addition, you may obtain a free report on how your fund voted the proxies for securities it owned during the 12 months ended June 30. To get the report, visit either vanguard.com/proxyreporting or www.sec.gov.
You can review
information about your fund on the SEC’s website, and you can receive copies of this information, for a fee, by sending a request via email addressed to publicinfo@sec.gov.
Source for Bloomberg
indexes: Bloomberg Index Services Limited. Copyright 2023, Bloomberg. All rights reserved.
CFA® is a registered trademark owned by CFA Institute.
© 2023 The Vanguard Group,
Inc.
All rights reserved.
Vanguard Marketing Corporation, Distributor.
Q7520 122023
Annual Report | October 31, 2023
Vanguard
Commodity Strategy Fund
See the inside front cover
for important information about your fund’s annual and semiannual shareholder reports.
Important information about shareholder
reports
Beginning in July 2024,
amendments adopted by the Securities and Exchange Commission will substantially impact the design, content, and transmission of shareholder reports. Shareholder reports will provide key fund information in a clear and
concise format and must be mailed to each shareholder that has not elected to receive the reports electronically. Financial statements will no longer be included in the shareholder report but will be available at
vanguard.com, can be mailed upon request, or can be accessed on the SEC’s website at www.sec.gov.
You may elect to receive
shareholder reports and other communications from the fund electronically by contacting your financial intermediary (such as a broker-dealer or bank) or, if you invest directly with the fund, by calling Vanguard at
one of the phone numbers on the back cover of this report or by logging on to vanguard.com.
Contents
Your Fund’s Performance at a Glance
| 1
|
Advisors' Report
| 2
|
About Your Fund’s Expenses
| 4
|
Performance Summary
| 6
|
Consolidated Financial Statements
| 8
|
Please note: The
opinions expressed in this report are just that—informed opinions. They should not be considered promises or advice. Also, please keep in mind that the information and opinions cover the period through the date
on the front of this report. Of course, the risks of investing in your fund are spelled out in the prospectus.
Your Fund’s Performance at a Glance
| •
| For the 12 months ended October 31, 2023, Vanguard Commodity Strategy Fund returned –3.03%, just short of the –2.97% return of its benchmark, the Bloomberg Commodity Index Total Return.
|
| •
| Early on, inflation in many developed markets eased off multidecade highs amid ongoing interest rate hikes by central banks. Unexpected resilience in labor markets and consumer spending helped dial back expectations
of a sustained global recession, but the prospect of higher interest rates for longer and heightened geopolitical tensions weighed on market sentiment toward the close of the period.
|
| •
| The performance of commodities was mixed. West Texas Intermediate Crude and most grain prices fell. Gold and other precious metals rose.
|
| •
| The fund underperformed largely because of its exposure to short-term Treasury Inflation-Protected Securities as the market continued to price in higher inflation and real yields rose.
|
| •
| The fund uses derivatives to obtain its exposure to commodities. Its holdings of commodity index futures and swaps had a net negative impact on returns.
|
Market Barometer
|
| Average Annual Total Returns
Periods Ended October 31, 2023
|
|
| One Year
| Three Years
| Five Years
|
| Stocks
|
|
|
|
| Russell 1000 Index (Large-caps)
| 9.48%
| 9.53%
| 10.71%
|
| Russell 2000 Index (Small-caps)
| -8.56
| 3.95
| 3.31
|
| Russell 3000 Index (Broad U.S. market)
| 8.38
| 9.19
| 10.23
|
| FTSE All-World ex US Index (International)
| 12.35
| 3.51
| 3.88
|
| Bonds
|
|
|
|
Bloomberg U.S. Aggregate Float Adjusted Index
(Broad taxable market)
| 0.53%
| -5.51%
| 0.03%
|
Bloomberg Municipal Bond Index
(Broad tax-exempt market)
| 2.64
| -2.48
| 1.00
|
| FTSE Three-Month U.S. Treasury Bill Index
| 4.94
| 1.93
| 1.80
|
| CPI
|
|
|
|
| Consumer Price Index
| 3.24%
| 5.72%
| 4.00%
|
For the 12 months ended October 31, 2023,
Vanguard Commodity Strategy Fund returned –3.03%. It underperformed its benchmark, the Bloomberg Commodity Index Total Return, which returned –2.97%.
Investment objective and
strategy
The Commodity Strategy Fund is designed to
serve investors as a potential hedge against inflation risk and as further diversification for a traditional stock/bond portfolio. It invests in commodity-linked derivative investments, such as commodity futures and
swaps, collateralized by a mix of short-term U.S. Treasury Inflation-Protected Securities (TIPS) and U.S. Treasury bills. This blend of investments is expected to offer a controlled approach with the potential to
enhance returns over time without taking on excessive risk.
The fund uses multiple
strategies to enhance commodity returns, such as commodity curve positioning and overweighting and underweighting securities. It also takes advantage of roll schedules, a practice that involves rolling over commodity
futures before or after the Bloomberg Commodity Index Total Return, rolls shorter-term futures contracts into longer-term contracts.
Investment environment
At the beginning of the period, inflation
eased off multidecade highs amid ongoing interest rate hikes by central banks. Unexpected resilience in labor markets and consumer spending helped dial back expectations of a sustained global
recession, but the prospect of higher rates
for longer and heightened geopolitical tensions weighed on market sentiment toward the close of the period.
The environment for
commodities was mixed. Prices for West Texas Intermediate Crude fell more than 6%, while natural gas fell by more than a third. Gold and silver prices soared and platinum prices also rose as investors flocked to these
safe-haven commodities because of uncertainty over the economy and inflation. Prices for corn, soybeans, and wheat fell, as did livestock prices. Soft commodities such as sugar and cotton generally rose.
Successes and shortfalls
Our positions in commodities produced about
150 basis points of outperformance. (A basis point is one-hundredth of a percentage point.) Within the commodity portion of our portfolio, our positions in the energy sector most boosted relative performance, while
results in other sectors were more mixed.
Our exposure to short-term
TIPS held back relative performance as the market began to price in high inflation and as inflation expectations modified. This development, along with the spike in real yields, created challenges for inflation-linked
bonds.
The fund continued to fulfill
its mandate of providing further diversification for a stock/bond portfolio as correlations with other asset classes remained low.
Although markets can be
unpredictable, we are confident that our team of experienced managers and analysts can find opportunities to produce competitive returns without taking excessive risks.
Portfolio Managers:
Fei Xu, CFA
Vanguard Quantitative Equity Group
Joshua C. Barrickman, CFA,
Principal
Vanguard Fixed Income Group
November 15, 2023
About Your Fund’s Expenses
As a shareholder of the fund,
you incur ongoing costs, which include costs for portfolio management, administrative services, and shareholder reports (like this one), among others. Operating expenses, which are deducted from a fund’s gross
income, directly reduce the investment return of the fund.
A fund’s expenses are
expressed as a percentage of its average net assets. This figure is known as the expense ratio. The following examples are intended to help you understand the ongoing costs (in dollars) of investing in your fund and
to compare these costs with those of other mutual funds. The examples are based on an investment of $1,000 made at the beginning of the period shown and held for the entire period.
The accompanying table
illustrates your fund’s costs in two ways:
| •
| Based on actual fund return. This section helps you to estimate the actual expenses that you paid over the period. The ”Ending Account Value“ shown is derived from the fund‘s actual return, and the
third column shows the dollar amount that would have been paid by an investor who started with $1,000 in the fund. You may use the information here, together with the amount you invested, to estimate the expenses that
you paid over the period.
|
To do so, simply divide your
account value by $1,000 (for example, an $8,600 account value divided by $1,000 = 8.6), then multiply the result by the number given for your fund under the heading ”Expenses Paid During Period.“
| •
| Based on hypothetical 5% yearly return. This section is intended to help you compare your fund‘s costs with those of other mutual funds. It assumes that the fund had a yearly return of 5% before expenses, but that the
expense ratio is unchanged. In this case—because the return used is not the fund’s actual return—the results do not apply to your investment. The example is useful in making comparisons because the
Securities and Exchange Commission requires all mutual funds to calculate expenses based on a 5% return. You can assess your fund’s costs by comparing this hypothetical example with the hypothetical examples
that appear in shareholder reports of other funds.
|
Note that the expenses shown
in the table are meant to highlight and help you compare ongoing costs only and do not reflect transaction costs incurred by the fund for buying and selling securities. Further, the expenses do not include any purchase, redemption, or
account service fees described in the fund prospectus. If such fees were applied to your account, your costs would be higher. Your fund does not carry a “sales load.”
The calculations assume no
shares were bought or sold during the period. Your actual costs may have been higher or lower, depending on the amount of your investment and the timing of any purchases or redemptions.
You can find more information
about the fund’s expenses, including annual expense ratios, in the Consolidated Financial Statements section of this report. For additional information on operating expenses and other shareholder costs, please
refer to your fund’s current prospectus.
| Six Months Ended October 31, 2023
|
|
|
|
| Commodity Strategy Fund
| Beginning
Account Value
4/30/2023
| Ending
Account Value
10/31/2023
| Expenses
Paid During
Period
|
| Based on Actual Fund Return
| $1,000.00
| $994.60
| $1.06
|
| Based on Hypothetical 5% Yearly Return
| 1,000.00
| 1,024.15
| 1.07
|
The calculations are
based on expenses incurred in the most recent six-month period. The fund’s annualized six-month expense ratio for that period is 0.21%. The dollar amounts shown as “Expenses Paid” are equal to the
annualized expense ratio multiplied by the average account value over the period, multiplied by the number of days in the most recent six-month period, then divided by the number of days in the most recent 12-month
period (184/365).
All of the returns in this
report represent past performance, which is not a guarantee of future results that may be achieved by the fund. (Current performance may be lower or higher than the performance data cited. For performance data current
to the most recent month-end, visit our website at vanguard.com/performance.) Note, too, that both investment returns and principal value can fluctuate widely, so an investor’s shares, when sold, could be worth
more or less than their original cost. The returns shown do not reflect taxes that a shareholder would pay on fund distributions or on the sale of fund shares.
Cumulative Performance: June
25, 2019, Through October 31, 2023
Initial Investment of
$50,000
|
|
| Average Annual Total Returns
Periods Ended October 31, 2023
|
|
|
|
| One
Year
| Since
Inception
(6/25/2019)
| Final Value
of a $50,000
Investment
|

| Commodity Strategy Fund
| -3.03%
| 11.20%
| $79,352
|

| Bloomberg Commodity Index Total Return
| -2.97
| 8.32
| 70,780
|
"Since Inception" performance is
calculated from the fund’s inception date for both the fund and its comparative standard(s).
See Financial
Highlights for dividend and capital gains information.
| U.S. Government Securities
| 100.0%
|
The table reflects the fund’s
investments, except for short-term investments and derivatives. The agency and mortgage-backed securities may include issues from government-sponsored enterprises; such issues are generally not backed by the full
faith and credit of the U.S. government.
Consolidated Financial Statements
Consolidated Schedule of Investments
The fund files its complete
schedule of portfolio holdings with the Securities and Exchange Commission (SEC) for the first and third quarters of each fiscal year as an exhibit to its reports on Form N-PORT. The fund’s Form N-PORT reports
are available on the SEC’s website at www.sec.gov.
|
|
|
| Coupon
| Maturity
Date
| Face
Amount
($000)
| Market
Value•
($000)
|
| U.S. Government and Agency Obligations (74.3%)
|
| U.S. Government Securities (74.3%)
|
|
| United States Treasury Inflation Indexed Bonds
| 0.625%
| 1/15/24
| 70,224
| 69,588
|
|
| United States Treasury Inflation Indexed Bonds
| 0.500%
| 4/15/24
| 39,432
| 38,767
|
|
| United States Treasury Inflation Indexed Bonds
| 0.125%
| 7/15/24
| 63,761
| 62,296
|
|
| United States Treasury Inflation Indexed Bonds
| 0.125%
| 10/15/24
| 56,875
| 55,187
|
|
| United States Treasury Inflation Indexed Bonds
| 0.250%
| 1/15/25
| 58,308
| 56,149
|
|
| United States Treasury Inflation Indexed Bonds
| 2.375%
| 1/15/25
| 39,743
| 39,252
|
|
| United States Treasury Inflation Indexed Bonds
| 0.125%
| 4/15/25
| 46,591
| 44,487
|
|
| United States Treasury Inflation Indexed Bonds
| 0.375%
| 7/15/25
| 63,939
| 61,251
|
|
| United States Treasury Inflation Indexed Bonds
| 0.125%
| 10/15/25
| 56,684
| 53,770
|
|
| United States Treasury Inflation Indexed Bonds
| 0.625%
| 1/15/26
| 53,832
| 51,208
|
|
| United States Treasury Inflation Indexed Bonds
| 2.000%
| 1/15/26
| 25,650
| 25,141
|
|
| United States Treasury Inflation Indexed Bonds
| 0.125%
| 4/15/26
| 43,779
| 40,933
|
|
| United States Treasury Inflation Indexed Bonds
| 0.125%
| 7/15/26
| 53,655
| 50,159
|
|
| United States Treasury Inflation Indexed Bonds
| 0.125%
| 10/15/26
| 60,588
| 56,309
|
|
| United States Treasury Inflation Indexed Bonds
| 0.375%
| 1/15/27
| 49,966
| 46,421
|
|
| United States Treasury Inflation Indexed Bonds
| 2.375%
| 1/15/27
| 24,799
| 24,543
|
|
| United States Treasury Inflation Indexed Bonds
| 0.125%
| 4/15/27
| 61,893
| 56,671
|
|
| United States Treasury Inflation Indexed Bonds
| 0.375%
| 7/15/27
| 55,086
| 50,929
|
|
| United States Treasury Inflation Indexed Bonds
| 1.625%
| 10/15/27
| 62,066
| 59,971
|
|
| United States Treasury Inflation Indexed Bonds
| 0.500%
| 1/15/28
| 56,255
| 51,623
|
|
| United States Treasury Inflation Indexed Bonds
| 1.750%
| 1/15/28
| 23,314
| 22,520
|
|
| United States Treasury Inflation Indexed Bonds
| 1.250%
| 4/15/28
| 61,293
| 57,921
|
|
| United States Treasury Inflation Indexed Bonds
| 3.625%
| 4/15/28
| 23,869
| 24,880
|
|
| United States Treasury Inflation Indexed Bonds
| 0.750%
| 7/15/28
| 48,963
| 45,291
|
|
| United States Treasury Inflation Indexed Bonds
| 2.375%
| 10/15/28
| 32,778
| 32,671
|
| Total U.S. Government and Agency Obligations (Cost $1,250,259)
| 1,177,938
|
|
|
|
|
|
| Shares
|
|
| Temporary Cash Investments (24.3%)
|
| Money Market Fund (4.9%)
|
| 1
| Vanguard Market Liquidity Fund
| 5.420%
|
| 781,312
| 78,123
|
|
|
|
| Coupon
| Maturity
Date
| Face
Amount
($000)
| Market
Value•
($000)
|
| U.S. Government and Agency Obligations (19.4%)
|
| 2
| United States Treasury Bill
| 5.228%
| 11/2/23
| 19,400
| 19,397
|
| 2
| United States Treasury Bill
| 5.141%
| 11/14/23
| 7,400
| 7,386
|
| 2
| United States Treasury Bill
| 5.366%
| 11/24/23
| 35,000
| 34,882
|
| 2
| United States Treasury Bill
| 5.342%–5.387%
| 11/30/23
| 47,400
| 47,198
|
| 2
| United States Treasury Bill
| 5.370%
| 12/12/23
| 14,900
| 14,810
|
| 2,3
| United States Treasury Bill
| 5.383%
| 12/19/23
| 27,100
| 26,908
|
| 2
| United States Treasury Bill
| 5.405%
| 12/21/23
| 51,000
| 50,624
|
| 2
| United States Treasury Bill
| 5.423%
| 12/28/23
| 2,200
| 2,181
|
| 2,3
| United States Treasury Bill
| 5.462%
| 1/9/24
| 56,400
| 55,829
|
| 2,3
| United States Treasury Bill
| 5.416%
| 1/18/24
| 31,000
| 30,643
|
| 2,3
| United States Treasury Bill
| 5.389%
| 1/25/24
| 16,700
| 16,490
|
|
|
|
|
|
|
| 306,348
|
| Total Temporary Cash Investments (Cost $384,451)
| 384,471
|
| Total Investments (98.6%) (Cost $1,634,710)
| 1,562,409
|
| Other Assets and Liabilities—Net (1.4%)
| 21,487
|
| Net Assets (100%)
| 1,583,896
|
| Cost is in $000.
|
|
|
|
| •
| See Note A in Notes to Consolidated Financial Statements.
|
| 1
| Affiliated money market fund available only to Vanguard funds and certain trusts and accounts managed by Vanguard. Rate shown is the 7-day yield.
|
| 2
| Security is owned by the Vanguard CSF Portfolio, which is a wholly owned subsidiary of the Commodity Strategy Fund.
|
| 3
| Securities with a value of $4,527,000 have been segregated as collateral for open over-the-counter swap contracts.
|
Derivative Financial
Instruments Outstanding as of Period End
| Over-the-Counter Total Return Swaps
|
| Reference Entity
| Termination
Date
| Counterparty
| Notional
Amount
($000)
| Fixed
Interest Rate
Received
(Paid)1
(%)
| Value and
Unrealized
Appreciation
($000)
| Value and
Unrealized
(Depreciation)
($000)
|
| Bloomberg Commodity Index2
| 11/2/23
| BANA
| 105,000
| (0.060)
| 3,064
| —
|
| Bloomberg Commodity Index2
| 11/16/23
| BARC
| 10,000
| (0.100)
| —
| (138)
|
| Bloomberg Commodity Index 2 Month Forward2
| 11/16/23
| BARC
| 140,000
| (0.110)
| —
| (1,701)
|
| Bloomberg Commodity Index 3 Month Forward2
| 11/21/23
| GSI
| 20,000
| (0.120)
| 13
| —
|
| BofA Merrill Lynch Commodity MLBXAKSV Excess Return Strategy2,3
| 11/2/23
| BANA
| 50,000
| (0.170)
| 864
| —
|
| BofA Merrill Lynch Commodity MLBXSTGV Excess Return Strategy2,3
| 11/2/23
| BANA
| 230,000
| (0.110)
| 6,714
| —
|
| BofA Merrill Lynch Commodity MLCILP3E Excess Return Strategy2,3
| 11/2/23
| BANA
| 240,000
| (0.140)
| 6,736
| —
|
| Over-the-Counter Total Return Swaps (continued)
|
| Reference Entity
| Termination
Date
| Counterparty
| Notional
Amount
($000)
| Fixed
Interest Rate
Received
(Paid)1
(%)
| Value and
Unrealized
Appreciation
($000)
| Value and
Unrealized
(Depreciation)
($000)
|
| CIBC Commodity CIBZC51EC Excess Return Strategy2,3
| 11/2/23
| CIBC
| 170,000
| (0.160)
| 4,957
| —
|
| Goldman Sachs Commodity i-Select Strategy 11292,3
| 11/21/23
| GSI
| 220,000
| (0.120)
| 140
| —
|
| Macquarie Commodity MQCP170E Excess Return Strategy2,3
| 11/16/23
| MACQ
| 100,000
| (0.150)
| —
| (1,214)
|
| Modified Strategy DBS18 on the Bloomberg Commodity Index2,3
| 11/21/23
| GSI
| 30,000
| (0.120)
| 6
| —
|
RBC Commodity RBCACB23 Excess
Return Strategy2,3
| 11/16/23
| RBC
| 80,000
| (0.130)
| —
| (897)
|
RBC Commodity RBCSVBW1 Excess
Return Strategy2,3
| 11/16/23
| RBC
| 45,000
| (0.160)
| —
| (174)
|
Societe Generale Commodity SGIXCSB1 Excess
Return Strategy2,3
| 11/2/23
| SOCG
| 130,000
| (0.170)
| 3,941
| —
|
|
|
|
|
|
| 26,435
| (4,124)
|
| 1
| Fixed interest payment received/paid monthly.
|
| 2
| Security is owned by the subsidiary.
|
| 3
| Information on the components of the reference entity is available on www.vanguard.com.
|
|
| BANA—Bank of America, N.A.
|
|
| BARC—Barclays Bank plc.
|
|
| CIBC—Canadian Imperial Bank of Commerce.
|
|
| GSI—Goldman Sachs International.
|
|
| MACQ—Macquarie Bank Ltd.
|
|
| RBC—Royal Bank of Canada.
|
|
| SOCG—Société Generale.
|
At October 31, 2023, the
counterparties had deposited in segregated accounts securities with a value of $26,308,000 in connection with open over-the-counter swap contracts.
See accompanying
Notes, which are an integral part of the Financial Statements.
Consolidated Statement of Assets and Liabilities
|
|
| ($000s, except shares, footnotes, and per-share amounts)
| Amount
|
| Assets
|
|
| Investments in Securities, at Value
|
|
| Unaffiliated Issuers (Cost $1,556,606)
| 1,484,286
|
| Affiliated Issuers (Cost $78,104)
| 78,123
|
| Total Investments in Securities
| 1,562,409
|
| Investment in Vanguard
| 55
|
| Cash
| 133
|
| Receivables for Investment Securities Sold
| 31,323
|
| Receivables for Accrued Income
| 2,023
|
| Receivables for Capital Shares Issued
| 734
|
| Unrealized Appreciation—Over-the-Counter Swap Contracts
| 26,435
|
| Total Assets
| 1,623,112
|
| Liabilities
|
|
| Payables for Investment Securities Purchased
| 33,118
|
| Payables for Capital Shares Redeemed
| 1,815
|
| Payables to Vanguard
| 159
|
| Unrealized Depreciation—Over-the-Counter Swap Contracts
| 4,124
|
| Total Liabilities
| 39,216
|
| Net Assets
| 1,583,896
|
| At October 31, 2023, net assets consisted of:
|
|
|
|
|
| Paid-in Capital
| 1,678,449
|
| Total Distributable Earnings (Loss)
| (94,553)
|
| Net Assets
| 1,583,896
|
|
|
| Net Assets
|
|
Applicable to 60,876,048 outstanding $.001 par value shares of
beneficial interest (unlimited authorization)
| 1,583,896
|
| Net Asset Value Per Share
| $26.02
|
See accompanying
Notes, which are an integral part of the Financial Statements.
Consolidated Statement of Operations
|
|
|
| Year Ended
October 31, 2023
|
|
| ($000)
|
| Investment Income
|
|
| Income
|
|
| Interest1
| 58,648
|
| Total Income
| 58,648
|
| Expenses
|
|
| The Vanguard Group—Note B
|
|
| Investment Advisory Services
| 152
|
| Management and Administrative
| 3,255
|
| Marketing and Distribution
| 98
|
| Custodian Fees
| 46
|
| Auditing Fees
| 52
|
| Shareholders’ Reports
| 59
|
| Trustees’ Fees and Expenses—Note B
| 15
|
| Other Expenses
| 15
|
| Total Expenses
| 3,692
|
| Expenses Paid Indirectly
| (24)
|
| Net Expenses
| 3,668
|
| Net Investment Income
| 54,980
|
| Realized Net Gain (Loss)
|
|
| Investment Securities Sold1
| (33,642)
|
| Futures Contracts
| (24)
|
| Swap Contracts
| (159,258)
|
| Realized Net Gain (Loss)
| (192,924)
|
| Change in Unrealized Appreciation (Depreciation)
|
|
| Investment Securities1
| 33,534
|
| Swap Contracts
| 44,859
|
| Change in Unrealized Appreciation (Depreciation)
| 78,393
|
| Net Increase (Decrease) in Net Assets Resulting from Operations
| (59,551)
|
| 1
| Interest income, realized net gain (loss), capital gain distributions received, and change in unrealized appreciation (depreciation) from an affiliated company of
the fund were $5,621,000, ($15,000), $1,000, and $7,000, respectively. Purchases and sales are for temporary cash investment purposes.
|
See accompanying
Notes, which are an integral part of the Financial Statements.
Consolidated Statement of Changes in Net Assets
|
|
|
| Year Ended October 31,
|
|
| 2023
($000)
| 2022
($000)
|
|
|
|
|
| Increase (Decrease) in Net Assets
|
|
|
| Operations
|
|
|
| Net Investment Income
| 54,980
| 94,414
|
| Realized Net Gain (Loss)
| (192,924)
| 131,973
|
| Change in Unrealized Appreciation (Depreciation)
| 78,393
| (123,543)
|
| Net Increase (Decrease) in Net Assets Resulting from Operations
| (59,551)
| 102,844
|
| Distributions
|
|
|
| Total Distributions
| (244,178)
| (390,043)
|
| Capital Share Transactions
|
|
|
| Issued
| 780,178
| 1,800,077
|
| Issued in Lieu of Cash Distributions
| 186,091
| 271,967
|
| Redeemed
| (1,072,899)
| (1,476,116)
|
| Net Increase (Decrease) from Capital Share Transactions
| (106,630)
| 595,928
|
| Total Increase (Decrease)
| (410,359)
| 308,729
|
| Net Assets
|
|
|
| Beginning of Period
| 1,994,255
| 1,685,526
|
| End of Period
| 1,583,896
| 1,994,255
|
See accompanying
Notes, which are an integral part of the Financial Statements.
Consolidated Financial Highlights
For a Share Outstanding
Throughout Each Period
| June 25
20191to
October 31,
2019
| Year Ended October 31,
|
| 2023
| 2022
| 2021
| 2020
|
|
| Net Asset Value, Beginning of Period
| $30.69
| $36.85
| $24.32
| $24.83
| $25.00
|
| Investment Operations
|
|
|
|
|
|
| Net Investment Income2
| .826
| 1.474
| .890
| .265
| .143
|
| Net Realized and Unrealized Gain (Loss) on Investments
| (1.612)
| .751
| 11.774
| (.620)
| (.313)
|
| Total from Investment Operations
| (.786)
| 2.225
| 12.664
| (.355)
| (.170)
|
| Distributions
|
|
|
|
|
|
| Dividends from Net Investment Income
| (3.884)
| (8.385)
| (.134)
| (.155)
| —
|
| Distributions from Realized Capital Gains
| —
| —
| —
| —
| —
|
| Total Distributions
| (3.884)
| (8.385)
| (.134)
| (.155)
| —
|
| Net Asset Value, End of Period
| $26.02
| $30.69
| $36.85
| $24.32
| $24.83
|
| Total Return3
| -3.03%
| 9.80%
| 52.30%
| -1.45%
| -0.68%
|
| Ratios/Supplemental Data
|
|
|
|
|
|
| Net Assets, End of Period (Millions)
| $1,584
| $1,994
| $1,686
| $373
| $207
|
| Ratio of Total Expenses to Average Net Assets
| 0.21%4
| 0.21%4
| 0.20%
| 0.20%
| 0.20%5
|
| Ratio of Net Investment Income to Average Net Assets
| 3.08%
| 4.47%
| 2.79%
| 1.15%
| 1.65%5
|
| Portfolio Turnover Rate
| 30%
| 47%
| 15%
| 38%
| 7%
|
| 1
| Inception.
|
| 2
| Calculated based on average shares outstanding.
|
| 3
| Total returns do not include account service fees that may have applied in the periods shown. Fund prospectuses provide information about any applicable account service fees.
|
| 4
| The ratio of expenses to average net assets for the period net of reduction from custody fee offset arrangements was 0.21%.
|
| 5
| Annualized.
|
|
|
|
See accompanying
Notes, which are an integral part of the Financial Statements.
Notes to Consolidated Financial Statements
Vanguard Commodity Strategy
Fund is registered under the Investment Company Act of 1940 as an open-end investment company, or mutual fund.
The Consolidated Financial
Statements include Vanguard CSF Portfolio which commenced operations on June 25, 2019. The subsidiary is wholly owned by the fund and is a unit trust established in the Cayman Islands under the Trusts Law (2011
Revision) of the Cayman Islands, which is organized to invest in certain commodity-linked investments on behalf of the fund, consistent with the fund's investment objectives and policies. The commodity-linked
investments and other investments held by the subsidiary are subject to the same risks that apply to similar investments if held directly by the fund. As of October 31, 2023, the subsidiary comprises $328,762,000, or
21%, of the fund's net assets. All inter-fund transactions and balances (including the fund's investment in the subsidiary) have been eliminated, and the Consolidated Financial Statements include all investments and
other accounts of the subsidiary as if held directly by the fund.
| A.
| The following significant accounting policies conform to generally accepted accounting principles for U.S. investment companies. The fund consistently follows such policies in preparing its financial statements.
|
1. Security Valuation:
Securities are valued as of the close of trading on the New York Stock Exchange (generally 4 p.m., Eastern time) on the valuation date. Bonds and other temporary cash investments are valued using the latest bid prices
or using valuations based on a matrix system (which considers such factors as security prices, yields, maturities, and ratings), both as furnished by independent pricing services. Investments in Vanguard Market
Liquidity Fund are valued at that fund's net asset value. Securities for which market quotations are not readily available, or whose values have been affected by events occurring before the fund’s pricing time
but after the close of the securities’ primary markets, are valued by methods deemed by the valuation designee to represent fair value and subject to oversight by the board of trustees.
2. Futures Contracts:
The fund uses futures contracts to invest in fixed income asset classes with greater efficiency and lower cost than is possible through direct investment, to add value when these instruments are attractively priced,
or to adjust sensitivity to changes in interest rates. The primary risks associated with the use of futures contracts are imperfect correlation between changes in market values of bonds held by the fund and the prices
of futures contracts, and the possibility of an illiquid market. Counterparty risk involving futures is mitigated because a regulated clearinghouse is the counterparty instead of the clearing broker. To further
mitigate counterparty risk, the fund trades futures contracts on an exchange, monitors the financial strength of its clearing brokers and clearinghouse, and has entered into clearing agreements with its clearing
brokers. The clearinghouse imposes initial margin requirements to secure the fund’s performance and requires daily settlement of variation margin representing changes in the market value of each contract. Any
securities pledged as initial margin for open contracts are noted in the Schedule of Investments.
Futures contracts are valued
at their quoted daily settlement prices. The notional amounts of the contracts are not recorded in the Consolidated Statement of Assets and Liabilities. Fluctuations in the value of the contracts are recorded in the
Consolidated Statement of Assets and Liabilities as an asset (liability) and in the Consolidated Statement of Operations as unrealized appreciation (depreciation) until the contracts are closed, when they are recorded
as realized gains (losses) on futures contracts.
During the year ended October
31, 2023, the fund’s average investments in long and short futures contracts represented less than 1% and 0% of net assets, respectively, based on the average of the notional amounts at each quarter-end during
the period. The fund had no open futures contracts at October 31, 2023.
3. Swap Contracts: The
fund gains exposure to commodities through the subsidiary's investment in swaps that earn the total return on a specified commodity index. Under the terms of the swaps, the subsidiary receives the total return on the
specified index (receiving the increase or paying the decrease in the value of the specified index), applied to a notional amount. The subsidiary also pays a fixed rate applied to the notional amount. At the same
time, the fund invests an amount approximating the notional amount of the swaps in inflation-linked investments and high-quality temporary cash investments.
A risk associated with all
types of swaps is the possibility that a counterparty may default on its obligation to pay net amounts due to the subsidiary. The subsidiary’s maximum amount subject to counterparty risk is the unrealized
appreciation on the swap contract. The subsidiary mitigates its counterparty risk by entering into swaps only with a diverse group of prequalified counterparties, monitoring their financial strength, entering into
master netting arrangements with its counterparties, and requiring its counterparties to transfer collateral as security for their performance. In the absence of a default, the collateral pledged or received by the
subsidiary cannot be repledged, resold, or rehypothecated. In the event of a counterparty’s default (including bankruptcy), the subsidiary may terminate any swap contracts with that counterparty, determine the
net amount owed by either party in accordance with its master netting arrangements, and sell or retain any collateral held up to the net amount owed to the subsidiary under the master netting arrangements. The swap
contracts contain provisions whereby a counterparty may terminate open contracts if the subsidiary's net assets decline below a certain level, triggering a payment by the subsidiary if the subsidiary is in a net
liability position at the time of the termination. The payment amount would be reduced by any collateral the subsidiary has pledged. Any securities pledged as collateral for open contracts are noted in the
Consolidated Schedule of Investments. The value of collateral received or pledged is compared daily to the value of the swap contracts exposure with each counterparty, and any difference, if in excess of a specified
minimum transfer amount, is adjusted and settled within two business days.
The notional amounts of swap
contracts are not recorded in the Consolidated Statement of Assets and Liabilities. Swaps are valued daily based on market quotations received from independent pricing services or recognized dealers and the change in
value is recorded in the Consolidated Statement of Assets and Liabilities as an asset (liability) and in the Consolidated Statement of Operations as unrealized appreciation (depreciation) until periodic payments are
made or the termination of the swap, at which time realized gain (loss) is recorded.
During the year ended October
31, 2023, the fund’s average amounts of investments in total return swaps represented 99% of net assets, based on the average of notional amounts at each quarter-end during the period.
The following table summarizes
the fund’s derivative assets and liabilities by counterparty for derivatives subject to arrangements that provide for offsetting assets and liabilities.
|
| Assets
Reflected in
Consolidated
Statement of
Assets and
Liabilities1
($000)
| Liabilities
Reflected in
Consolidated
Statement of
Assets and
Liabilities1
($000)
| Net Amount
Receivable
(Payable)
($000)
| Amounts Not Offset in
the Consolidated
Statement of Assets
and Liabilities
| Net
Exposure3
(Not Less
Than $0)
($000)
|
|
| Collateral
Pledged2
($000)
| Collateral
Received2
($000)
|
Derivatives Subject to
Offsetting Arrangements, by Counterparty
|
|
|
|
|
|
|
| Bank of America, N.A.
| 17,378
| —
| 17,378
| —
| 17,554
| —
|
| Barclays Bank plc
| —
| (1,839)
| (1,839)
| 2,035
| —
| —
|
| Canadian Imperial Bank of Commerce
| 4,957
| —
| 4,957
| —
| 5,019
| —
|
| Goldman Sachs International
| 159
| —
| 159
| 112
| —
| 159
|
| Macquarie Bank Ltd.
| —
| (1,214)
| (1,214)
| 1,344
| —
| —
|
| Royal Bank of Canada
| —
| (1,071)
| (1,071)
| 1,036
| —
| —
|
| Société Generale
| 3,941
| —
| 3,941
| —
| 3,735
| 206
|
| Total
| 26,435
| (4,124)
| 22,311
| 4,527
| 26,308
| 365
|
1 Absent an event of default or early termination, derivative assets and liabilities are presented gross and not offset in the Consolidated Statement of Assets and Liabilities.
2 Securities or other assets pledged as collateral are noted in the Consolidated Schedule of Investments and Consolidated Statement of Assets and Liabilities. Securities or other
assets received as collateral are held in a segregated account and not included in the fund’s security holdings in the Consolidated Schedule of Investments.
3 Net Exposure represents the net amount receivable from the counterparty in the event of default. Counterparties are not required to exchange collateral if amount is below a
specified minimum transfer amount.
4. Federal Income Taxes:
The fund intends to continue to qualify as a regulated investment company and distribute virtually all of its taxable income. The subsidiary is classified as a foreign corporation for U.S. tax purposes, and because it
does not carry on a U.S. trade or business, is generally not subject to U.S. federal income tax. The subsidiary also complies with the Foreign Account Tax Compliance Act ("FATCA") and thus will not be subject to 30%
withholding under FATCA on any income from U.S. investments. In addition, the subsidiary is not subject to Cayman Islands income tax. The subsidiary is not required to distribute any earnings and profits to the fund.
The fund’s tax returns are open to examination by the relevant tax authorities until expiration of the applicable statute of limitations, which is generally three years after filing the tax return. Management
has analyzed the fund’s tax positions taken for all open federal and state income tax years, and has concluded that no provision for income tax is required in the fund’s financial statements.
5. Distributions:
Distributions to shareholders are recorded on the ex-dividend date. Distributions are determined on a tax basis at the fiscal year-end and may differ from net investment income and realized capital gains for financial
reporting purposes.
6. Credit Facilities and
Interfund Lending Program: The fund and certain other funds managed by The Vanguard Group ("Vanguard") participate in a $4.3 billion committed credit facility provided by a syndicate of lenders pursuant to a credit
agreement and an uncommitted credit facility provided by Vanguard. Both facilities may be renewed annually. Each fund is individually liable for its borrowings, if any, under the credit facilities. Borrowings may be
utilized for temporary or emergency purposes and are subject to the fund’s regulatory and contractual borrowing
restrictions. With respect to the committed
credit facility, the participating funds are charged administrative fees and an annual commitment fee of 0.10% of the undrawn committed amount of the facility, which are allocated to the funds based on a method
approved by the fund’s board of trustees and included in Management and Administrative expenses on the fund’s Consolidated Statement of Operations. Any borrowings under either facility bear interest at an
agreed-upon spread plus the higher of the federal funds effective rate, the overnight bank funding rate, or the Daily Simple Secured Overnight Financing Rate inclusive of an additional agreed-upon spread. However,
borrowings under the uncommitted credit facility may bear interest based upon an alternate rate agreed to by the fund and Vanguard.
In accordance with an
exemptive order (the “Order”) from the SEC, the fund may participate in a joint lending and borrowing program that allows registered open-end Vanguard funds to borrow money from and lend money to each
other for temporary or emergency purposes (the “Interfund Lending Program”), subject to compliance with the terms and conditions of the Order, and to the extent permitted by the fund’s investment
objective and investment policies. Interfund loans and borrowings normally extend overnight but can have a maximum duration of seven days. Loans may be called on one business day’s notice. The interest rate to
be charged is governed by the conditions of the Order and internal procedures adopted by the board of trustees. The board of trustees is responsible for overseeing the Interfund Lending Program.
For the year ended October 31,
2023, the fund did not utilize the credit facilities or the Interfund Lending Program.
7. Other: Interest
income includes income distributions received from Vanguard Market Liquidity Fund and is accrued daily. Premiums and discounts on debt securities are amortized and accreted, respectively, to interest income over the
lives of the respective securities, except for premiums on certain callable debt securities that are amortized to the earliest call date. Inflation adjustments to the face amount of inflation-indexed securities are
included in interest income. Security transactions are accounted for on the date securities are bought or sold. Costs used to determine realized gains (losses) on the sale of investment securities are those of the
specific securities sold.
| B.
| In accordance with the terms of a Funds' Service Agreement (the “FSA”) between Vanguard and the fund, Vanguard furnishes to the fund investment advisory, corporate management, administrative, marketing,
and distribution services at Vanguard’s cost of operations (as defined by the FSA). These costs of operations are allocated to the fund based on methods and guidelines approved by the board of trustees and are
generally settled twice a month.
|
Under a separate agreement,
Vanguard provides corporate management and administrative services to the subsidiary for an annual fee of 0.10% of average net assets of the subsidiary, generally settled once a month. In addition, the subsidiary pays
an unaffiliated third party, VGMF I (Cayman) Limited, an affiliate of Maples Trustee Services (Cayman) Limited, a fee plus reasonable additional expenses for trustee services. All of the subsidiary’s expenses
are reflected in the Consolidated Statement of Operations and in the Ratio of Total Expenses to Average Net Assets in the Consolidated Financial Highlights.
Upon the request of Vanguard,
the fund may invest up to 0.40% of its net assets as capital in Vanguard. At October 31, 2023, the fund had contributed to Vanguard capital in the amount of $55,000, representing less than 0.01% of the fund’s
net assets and 0.02% of Vanguard’s capital
received pursuant to the FSA. The
fund’s trustees and officers are also directors and employees, respectively, of Vanguard.
| C.
| The fund’s custodian bank has agreed to reduce its fees when the fund maintains cash on deposit in the non-interest-bearing custody account. For the year ended October 31, 2023, custodian fee offset
arrangements reduced the fund’s expenses by $24,000 (an annual rate of less than 0.01% of average net assets).
|
| D.
| Various inputs may be used to determine the value of the fund’s investments and derivatives. These inputs are summarized in three broad levels for financial statement purposes.
The inputs or methodologies used to value securities are not necessarily an indication of the risk associated with investing in those securities.
|
Level 1—Quoted prices in active markets for identical securities.
Level 2—Other significant observable inputs (including quoted prices for similar securities, interest rates, prepayment speeds, credit risk, etc.).
Level 3—Significant unobservable inputs (including the fund’s own assumptions used to determine the fair value of investments). Any investments and derivatives valued with significant
unobservable inputs are noted on the Consolidated Schedule of Investments.
The following table summarizes
the market value of the fund’s investments and derivatives as of October 31, 2023, based on the inputs used to value them:
|
| Level 1
($000)
| Level 2
($000)
| Level 3
($000)
| Total
($000)
|
| Investments
|
|
|
|
|
| Assets
|
|
|
|
|
| U.S. Government and Agency Obligations
| —
| 1,177,938
| —
| 1,177,938
|
| Temporary Cash Investments
| 78,123
| 306,348
| —
| 384,471
|
| Total
| 78,123
| 1,484,286
| —
| 1,562,409
|
| Derivative Financial Instruments
|
|
|
|
|
| Assets
|
|
|
|
|
| Swap Contracts
| —
| 26,435
| —
| 26,435
|
| Liabilities
|
|
|
|
|
| Swap Contracts
| —
| 4,124
| —
| 4,124
|
| E.
| At October 31, 2023, the fair values of derivatives were reflected in the Consolidated Statement of Assets and Liabilities as follows:
|
| Consolidated Statement of Assets and Liabilities Caption
| Commodity
Contracts
($000)
| Interest Rate
Contracts
($000)
| Total
($000)
|
Unrealized Appreciation—
Over-the-Counter Swap Contracts
| 26,435
| —
| 26,435
|
|
|
|
|
|
Unrealized Depreciation—
Over-the-Counter Swap Contracts
| 4,124
| —
| 4,124
|
Realized net gain (loss) and
the change in unrealized appreciation (depreciation) on derivatives for the year ended October 31, 2023, were:
| Realized Net Gain (Loss) on Derivatives
| Commodity
Contracts
($000)
| Interest Rate
Contracts
($000)
| Total
($000)
|
| Futures Contracts
| —
| (24)
| (24)
|
| Swap Contracts
| (159,258)
| —
| (159,258)
|
| Realized Net Gain (Loss) on Derivatives
| (159,258)
| (24)
| (159,282)
|
| Change in Unrealized Appreciation (Depreciation) on Derivatives
|
|
|
|
| Swap Contracts
| 44,859
| —
| 44,859
|
| F.
| Permanent differences between book-basis and tax-basis components of net assets are reclassified among capital accounts in the financial statements to reflect their tax character. These reclassifications have no
effect on net assets or net asset value per share. As of period end, permanent differences primarily attributable to the accounting for applicable operations of the subsidiary were reclassified between the following
accounts:
|
|
| Amount
($000)
|
| Paid-in Capital
| (99,965)
|
| Total Distributable Earnings (Loss)
| 99,965
|
Temporary differences between
book-basis and tax-basis components of total distributable earnings (loss) arise when certain items of income, gain, or loss are recognized in different periods for financial statement and tax purposes; these
differences will reverse at some time in the future. The differences are primarily related to capital loss carryforwards; the deferral of losses from wash sales; and operations of the subsidiary. As of period end, the
tax-basis components of total distributable earnings (loss) are detailed in the table as follows:
|
| Amount
($000)
|
| Undistributed Ordinary Income
| 34,135
|
| Undistributed Long-Term Gains
| —
|
| Net Unrealized Gains (Losses)
| (72,385)
|
| Capital Loss Carryforwards
| (56,303)
|
| Qualified Late-Year Losses
| —
|
| Other Temporary Differences
| —
|
| Total
| (94,553)
|
The tax character of
distributions paid was as follows:
|
| Year Ended October 31,
|
|
| 2023
Amount
($000)
| 2022
Amount
($000)
|
| Ordinary Income*
| 244,178
| 390,043
|
| Long-Term Capital Gains
| —
| —
|
| Total
| 244,178
| 390,043
|
| *
| Includes short-term capital gains, if any.
|
As of October 31, 2023, gross
unrealized appreciation and depreciation for investments and derivatives based on cost for U.S. federal income tax purposes were as follows:
|
| Amount
($000)
|
| Tax Cost
| 1,634,795
|
| Gross Unrealized Appreciation
| 36,996
|
| Gross Unrealized Depreciation
| (109,381)
|
| Net Unrealized Appreciation (Depreciation)
| (72,385)
|
| G.
| During the year ended October 31, 2023, the fund purchased $399,638,000 of investment securities and sold $756,615,000 of investment securities, other than temporary cash investments.
|
| H.
| Capital shares issued and redeemed were:
|
|
| Year Ended October 31,
|
|
| 2023
Shares
(000)
| 2022
Shares
(000)
|
|
|
|
|
| Issued
| 28,765
| 54,611
|
| Issued in Lieu of Cash Distributions
| 6,887
| 10,325
|
| Redeemed
| (39,756)
| (45,700)
|
| Net Increase (Decrease) in Shares Outstanding
| (4,104)
| 19,236
|
| I.
| Significant market disruptions, such as those caused by pandemics (e.g., COVID-19 pandemic), natural or environmental disasters, war (e.g., Russia’s invasion of Ukraine), acts of terrorism, or other events,
can adversely affect local and global markets and normal market operations. Any such disruptions could have an adverse impact on the value of the fund’s investments and fund performance.
|
To the extent the fund’s
investment portfolio reflects concentration in a particular market, industry, sector, country or asset class, the fund may be adversely affected by the performance of these concentrations and may be subject to
increased price volatility and other risks.
Credit risk is the risk that a
counterparty to a transaction or an issuer of a financial instrument will fail to pay interest and principal when due, or that perceptions of the issuer’s ability to make such
payments will cause the price of an
investment to decline. Investment in debt securities will generally increase credit risk.
The use of derivatives may
expose the fund to various risks. Derivatives can be highly volatile, and any initial investment is generally small relative to the notional amount so that transactions may be leveraged in terms of market exposure. A
relatively small market movement may have a potentially larger impact on derivatives than on standard securities. Leveraged derivatives positions can, therefore, increase volatility. Additional information regarding
the fund’s use of derivative(s) and the specific risks associated is described under significant accounting policies.
| J.
| Management has determined that no events or transactions occurred subsequent to October 31, 2023, that would require recognition or disclosure in these financial statements.
|
Report of Independent Registered Public Accounting
Firm
To the Board of Trustees of Vanguard
Trustees' Equity Fund and Shareholders of Vanguard Commodity Strategy Fund
Opinion on the Financial
Statements
We have audited the
accompanying consolidated statement of assets and liabilities, including the consolidated schedule of investments, of Vanguard Commodity Strategy Fund and its subsidiary (one of the funds constituting Vanguard
Trustees' Equity Fund, referred to hereafter as the "Fund") as of October 31, 2023, the related consolidated statement of operations for the year ended October 31, 2023, the consolidated statement of changes in net
assets for each of the two years in the period ended October 31, 2023, including the related notes, and the consolidated financial highlights for each of the four years in the period ended October 31, 2023 and for the
period June 25, 2019 (inception) through October 31, 2019 (collectively referred to as the "consolidated financial statements"). In our opinion, the consolidated financial statements present fairly, in all material
respects, the financial position of the Fund as of October 31, 2023, the results of its operations for the year then ended, the changes in its net assets for each of the two years in the period ended October 31, 2023
and the financial highlights for each of the four years in the period ended October 31, 2023 and for the period June 25, 2019 (inception) through October 31, 2019 in conformity with accounting principles generally
accepted in the United States of America.
Basis for Opinion
These consolidated financial
statements are the responsibility of the Fund’s management. Our responsibility is to express an opinion on the Fund’s consolidated financial statements based on our audits. We are a public accounting firm
registered with the Public Company Accounting Oversight Board (United States) (PCAOB) and are required to be independent with respect to the Fund in accordance with the U.S. federal securities laws and the applicable
rules and regulations of the Securities and Exchange Commission and the PCAOB.
We conducted our audits of
these consolidated financial statements in accordance with the standards of the PCAOB. Those standards require that we plan and perform the audit to obtain reasonable assurance about whether the consolidated financial
statements are free of material misstatement, whether due to error or fraud.
Our audits included performing
procedures to assess the risks of material misstatement of the consolidated financial statements, whether due to error or fraud, and performing procedures that respond to those risks. Such procedures included
examining, on a test basis, evidence regarding the amounts and disclosures in the consolidated financial statements. Our audits also included evaluating the accounting principles used and significant estimates made by
management, as well as evaluating the overall presentation of the consolidated financial statements. Our procedures included confirmation of securities owned as of October 31, 2023 by correspondence with the
custodian, transfer agent and brokers; when replies were not received from brokers, we performed other auditing procedures. We believe that our audits provide a reasonable basis for our opinion.
/s/PricewaterhouseCoopers
LLP
Philadelphia, Pennsylvania
December 19, 2023
We have served as the auditor
of one or more investment companies in The Vanguard Group of Funds since 1975.
Tax information
(unaudited)
The fund hereby designates
$36,703,000, or if subsequently determined to be different, the maximum amount allowable by law, of interest earned from obligations of the U.S. government which is generally exempt from state income tax.
The fund hereby designates
16.5%, or if subsequently determined to be different, the maximum percentage allowable by law, of ordinary income dividends eligible to be treated as interest income for purposes of Section 163(j) and the regulations
thereunder for the fiscal year.
This page intentionally left blank.
The People Who Govern Your Fund
The trustees of your mutual
fund are there to see that the fund is operated and managed in your best interests since, as a shareholder, you are a part owner of the fund. Your fund’s trustees also serve on the board of directors of The
Vanguard Group, Inc., which is owned by the Vanguard funds and provides services to them.
A majority of Vanguard’s
board members are independent, meaning that they have no affiliation with Vanguard or the funds they oversee, apart from the sizable personal investments they have made as private individuals. The independent board
members have distinguished backgrounds in business, academia, and public service. Each of the trustees and executive officers oversees 205 Vanguard funds.
Information for each trustee
and executive officer of the fund appears below. That information, as well as the Vanguard fund count, is as of the date on the cover of this fund report. The mailing address of the trustees and officers is P.O. Box
876, Valley Forge, PA 19482. More information about the trustees is in the Statement of Additional Information, which can be obtained, without charge, by contacting Vanguard at 800-662-7447, or online at vanguard.com.
Interested Trustee1
Mortimer J. Buckley
Born in 1969. Trustee since January 2018.
Principal occupation(s) during the past five years and other experience: chairman of the board (2019–present) of Vanguard and of each of the investment companies served by Vanguard; chief executive officer
(2018–present) of Vanguard; chief executive officer, president, and trustee (2018–present) of each of the investment companies served by Vanguard; president and director (2017–present) of Vanguard;
and president (2018–present) of Vanguard Marketing Corporation. Chief investment officer (2013–2017), managing director (2002–2017), head of the Retail Investor Group (2006–2012), and chief
information officer (2001–2006) of Vanguard. Member of the board of governors of the Investment Company Institute and the board of governors of FINRA.
Independent Trustees
Tara Bunch
Born in 1962. Trustee since November 2021.
Principal occupation(s) during the past five years and other experience: head of global operations at Airbnb (2020–present). Vice president of AppleCare (2012–2020). Member of the board of directors of Out
& Equal, the advisory board of the University of California, Berkeley School of Engineering, and the advisory board of Santa Clara University’s Leavey School of Business.
Emerson U. Fullwood
Born in 1948. Trustee since January 2008.
Principal occupation(s) during the past five years and other experience: executive chief staff and marketing officer for North America and corporate vice president (retired 2008) of Xerox Corporation (document
management products and services). Former president of the Worldwide Channels Group, Latin America, and Worldwide Customer Service and executive chief staff officer of Developing Markets of Xerox. Executive in
residence and 2009–2010 Distinguished Minett Professor at the Rochester Institute of Technology. Member of the board of directors of the University of Rochester Medical Center, the Monroe Community College
Foundation, the United Way of Rochester, North Carolina A&T University, Roberts Wesleyan College, and the Rochester Philharmonic Orchestra. Trustee of the University of
Rochester.
F. Joseph Loughrey
Born in 1949. Trustee since October 2009.
Principal occupation(s) during the past five years and other experience: president and chief operating officer (retired 2009) and vice chairman of the board (2008–2009) of Cummins Inc. (industrial machinery).
Director of the V Foundation. Member of the advisory council for the College of Arts and Letters at the University of Notre Dame. Chairman of the board of Saint Anselm College.
Mark Loughridge
Born in 1953. Trustee since March 2012.
Principal occupation(s) during the past five years and other experience: senior vice president and chief financial
1 Mr. Buckley is considered an “interested
person,” as defined in the Investment Company Act of 1940, because he is an officer of the Vanguard funds.
officer (retired 2013) of IBM (information
technology services). Fiduciary member of IBM’s Retirement Plan Committee (2004–2013), senior vice president and general manager (2002–2004) of IBM Global Financing, vice president and controller
(1998–2002) of IBM, and a variety of other prior management roles at IBM. Member of the Council on Chicago Booth.
Scott C. Malpass
Born in 1962. Trustee since March 2012.
Principal occupation(s) during the past five years and other experience: chief investment officer (retired 2020) and vice president (retired 2020) of the University of Notre Dame. Chair of the board of Catholic
Investment Services, Inc. (investment advisors). Member of the board of superintendence of the Institute for the Works of Religion, the Notre Dame 403(b) Investment Committee, and the board of directors of Paxos Trust
Company (finance).
Deanna Mulligan
Born in 1963. Trustee since January 2018.
Principal occupation(s) during the past five years and other experience: chief executive officer of Purposeful (advisory firm for CEOs and C-level executives; 2021–present). Board chair (2020), chief executive
officer (2011–2020), and president (2010–2019) of The Guardian Life Insurance Company of America. Chief operating officer (2010–2011) and executive vice president (2008–2010) of Individual Life
and Disability of the Guardian Life Insurance Company of America. Director of DuPont. Member of the board of the Economic Club of New York. Trustee of the Partnership for New York City (business leadership), Chief
Executives for Corporate Purpose, and the NewYork-Presbyterian Hospital.
André F. Perold
Born in 1952. Trustee since December 2004.
Principal occupation(s) during the past five years and other experience: George Gund Professor of Finance and Banking, Emeritus at the Harvard Business School (retired 2011). Chief investment officer and partner of
HighVista Strategies (private investment firm). Member of the board of RIT Capital Partners (investment firm).
Sarah Bloom Raskin
Born in 1961. Trustee since January 2018.
Principal occupation(s) during the past five years and other experience: deputy secretary (2014–2017) of the United States Department of the Treasury. Governor (2010–2014) of the Federal Reserve Board.
Commissioner (2007–2010) of financial regulation for the State of Maryland. Colin W. Brown Distinguished Professor of the Practice of Law, Duke Law School (2021–present); Rubenstein Fellow, Duke University
(2017–2020); Distinguished Fellow of the Global Financial Markets Center, Duke Law School (2020–2022); and Senior Fellow, Duke Center on Risk
(2020–present). Partner of Kaya
Partners (climate policy advisory services). Member of the board of directors of Arcadia (energy solution technology).
Grant Reid
Born in 1959. Trustee since July 2023.
Principal occupation(s) during the past five years and other experience: chief executive officer and president (2014–2022) and member of the board of directors (2015–2022) of Mars, Incorporated
(multinational manufacturer). Member of the board of directors of Marriott International, Inc. Chair of Agribusiness Task Force, Sustainable Markets Initiative.
David Thomas
Born in 1956. Trustee since July 2021.
Principal occupation(s) during the past five years and other experience: president of Morehouse College (2018–present). Professor of business administration, emeritus at Harvard University (2017–2018).
Dean (2011–2016) and professor of management (2016–2017) at the Georgetown University McDonough School of Business. Director of DTE Energy Company. Trustee of Common Fund.
Peter F. Volanakis
Born in 1955. Trustee since July 2009.
Principal occupation(s) during the past five years and other experience: president and chief operating officer (retired 2010) of Corning Incorporated (communications equipment) and director of Corning Incorporated
(2000–2010) and Dow Corning (2001–2010). Director (2012) of SPX Corporation (multi-industry manufacturing). Overseer of the Amos Tuck School of Business Administration, Dartmouth College (2001–2013).
Member of the BMW Group Mobility Council.
Executive Officers
Jacqueline Angell
Born in 1974. Principal occupation(s) during
the past five years and other experience: principal of Vanguard. Chief compliance officer (November 2022–present) of Vanguard and of each of the investment companies served by Vanguard. Chief compliance officer
(2018–2022) and deputy chief compliance officer (2017–2019) of State Street.
Christine M. Buchanan
Born in 1970. Principal occupation(s) during
the past five years and other experience: principal of Vanguard. Chief financial officer (2021–present) and treasurer (2017–2022) of each of the investment companies served by Vanguard. Partner
(2005–2017) at KPMG (audit, tax, and advisory services).
John Galloway
Born in 1973. Principal occupation(s) during
the past five years and other experience: principal of Vanguard. Investment stewardship officer (September 2020–present) of each of the investment companies served by Vanguard. Head of Investor Advocacy
(February 2020–present) and head of Marketing Strategy and Planning (2017–2020) at Vanguard. Special assistant to the President of the United States (2015).
Ashley Grim
Born in 1984. Principal occupation(s) during
the past five years and other experience: treasurer (February 2022–present) of each of the investment companies served by Vanguard. Fund transfer agent controller (2019–2022) and director of Audit Services
(2017–2019) at Vanguard. Senior manager (2015–2017) at PriceWaterhouseCoopers (audit and assurance, consulting, and tax services).
Jodi Miller
Born in 1980. Principal occupation(s) during
the past five years and other experience: principal of Vanguard. Finance director (2022–present) of each of the investment companies served by Vanguard. Head of Enterprise Investment Services
(2020–present), head of Retail Client Services and Operations (2020–2022), and head of Retail Strategic Support (2018–2020) at Vanguard.
Anne E. Robinson
Born in 1970. Principal occupation(s) during
the past five years and other experience: general counsel (2016–present) of Vanguard. Secretary (2016–present) of Vanguard and of each of the investment companies served by Vanguard. Managing director
(2016–present) of Vanguard. Managing director and general counsel of Global Cards and Consumer Services (2014–2016) at Citigroup. Counsel (2003–2014) at American Express. Nonexecutive director
(2022–present) of the board of National Grid (energy).
Michael Rollings
Born in 1963. Principal occupation(s) during
the past five years and other experience: finance director (2017–present) and treasurer (2017) of each of the investment companies served by Vanguard. Managing director (2016–present) of Vanguard. Chief
financial officer (2016–present) of Vanguard. Director (2016–present) of Vanguard Marketing Corporation. Executive vice president and chief financial officer (2006–2016) of MassMutual Financial
Group.
Vanguard Senior Management
Team
| Matthew Benchener
| Thomas M. Rampulla
|
| Joseph Brennan
| Karin A. Risi
|
| Mortimer J. Buckley
| Anne E. Robinson
|
| Gregory Davis
| Michael Rollings
|
| John James
| Nitin Tandon
|
| Chris D. Mclsaac
| Lauren Valente
|
Connect with
Vanguard®>vanguard.com
Fund Information > 800-662-7447
Direct Investor Account
Services > 800-662-2739
Institutional Investor
Services > 800-523-1036
Text Telephone for People Who
Are Deaf or Hard of Hearing > 800-749-7273
This material may be used in
conjunction with the offering of shares of any Vanguard fund only if preceded or accompanied by the fund’s current prospectus.
All comparative mutual
fund data are from Morningstar, Inc., unless otherwise noted.
You can obtain a free
copy of Vanguard’s proxy voting guidelines by visiting vanguard.com/proxyreporting or by calling Vanguard at 800-662-2739. The guidelines are also available from the SEC’s website, www.sec.gov. In
addition, you may obtain a free report on how your fund voted the proxies for securities it owned during the 12 months ended June 30. To get the report, visit either vanguard.com/proxyreporting or www.sec.gov.
You can review
information about your fund on the SEC’s website, and you can receive copies of this information, for a fee, by sending a request via email addressed to publicinfo@sec.gov.
Source for Bloomberg
indexes: Bloomberg Index Services Limited. Copyright 2023, Bloomberg. All rights reserved.
CFA® is a registered trademark owned by CFA Institute.
© 2023 The Vanguard Group,
Inc.
All rights reserved.
Vanguard Marketing Corporation, Distributor.
Q5170 122023
Annual Report | October 31, 2023
Vanguard Global
Environmental Opportunities Stock Fund
See the inside front cover
for important information about your fund’s annual and semiannual shareholder reports.
Important information about shareholder
reports
Beginning in July 2024,
amendments adopted by the Securities and Exchange Commission will substantially impact the design, content, and transmission of shareholder reports. Shareholder reports will provide key fund information in a clear and
concise format and must be mailed to each shareholder that has not elected to receive the reports electronically. Financial statements will no longer be included in the shareholder report but will be available at
vanguard.com, can be mailed upon request, or can be accessed on the SEC’s website at www.sec.gov.
You may elect to receive
shareholder reports and other communications from the fund electronically by contacting your financial intermediary (such as a broker-dealer or bank) or, if you invest directly with the fund, by calling Vanguard at
one of the phone numbers on the back cover of this report or by logging on to vanguard.com.
Contents
Your Fund’s Performance at a Glance
| 1
|
Advisors' Report
| 2
|
About Your Fund’s Expenses
| 6
|
Performance Summary
| 8
|
Financial Statements
| 10
|
Please note: The
opinions expressed in this report are just that—informed opinions. They should not be considered promises or advice. Also, please keep in mind that the information and opinions cover the period through the date
on the front of this report. Of course, the risks of investing in your fund are spelled out in the prospectus.
Your Fund’s Performance at a Glance
| •
| From its inception on November 16, 2022, through October 31, 2023, Vanguard Global Environmental Opportunities Stock Fund returned –12.40% for Investor Shares and –12.28% for Admiral Shares. The fund
significantly lagged its benchmark, the MSCI All Country World Index, which returned 5.01% for the same time period.
|
| •
| The fund is a concentrated stock fund focused on broader environmental opportunities with an emphasis on decarbonization.
|
| •
| Early on, inflation in many developed markets eased off multidecade highs amid ongoing interest rate hikes by central banks. Unexpected resilience in labor markets and consumer spending helped dial back expectations
of a sustained global recession, but the prospect of higher interest rates for longer and heightened geopolitical tensions weighed on market sentiment toward the close of the period.
|
| •
| Five of the fund’s 11 sectors contributed positively to performance. Health care, financials, and consumer staples produced the strongest results. Information technology,
industrials, and utilities were the biggest detractors.
|
Market Barometer
|
| Average Annual Total Returns
Periods Ended October 31, 2023
|
|
| One Year
| Three Years
| Five Years
|
| Stocks
|
|
|
|
| Russell 1000 Index (Large-caps)
| 9.48%
| 9.53%
| 10.71%
|
| Russell 2000 Index (Small-caps)
| -8.56
| 3.95
| 3.31
|
| Russell 3000 Index (Broad U.S. market)
| 8.38
| 9.19
| 10.23
|
| FTSE All-World ex US Index (International)
| 12.35
| 3.51
| 3.88
|
| Bonds
|
|
|
|
Bloomberg U.S. Aggregate Float Adjusted Index
(Broad taxable market)
| 0.53%
| -5.51%
| 0.03%
|
Bloomberg Municipal Bond Index
(Broad tax-exempt market)
| 2.64
| -2.48
| 1.00
|
| FTSE Three-Month U.S. Treasury Bill Index
| 4.94
| 1.93
| 1.80
|
| CPI
|
|
|
|
| Consumer Price Index
| 3.24%
| 5.72%
| 4.00%
|
From Vanguard Global Environmental
Opportunities Stock Fund’s inception on November 16, 2022, through October 31, 2023, the economic environment was challenging for companies focused on combating climate change. This environment led to our
portfolio returning –12.40% for Investor Shares and –12.28% for Admiral Shares. We significantly underperformed our benchmark, the MSCI All Country World Index, which returned 5.01% for the period.
Regardless, we remain optimistic that the fund is well positioned for the long term.
Investment objective and
strategy
We concentrate our investments in securities
whose principal business activities are in climate change-related industries. Our portfolio is composed of approximately 25 companies with the potential to outperform the fund’s benchmark over the long term.
We use an integrated
investment approach that selects investments pursuant to an initial proprietary screening process, a fundamental research process, an assessment of the overall portfolio, and ongoing monitoring of positions.
Market environment
The period was challenging for many of the
companies that are contributing to sustainable decarbonization, particularly toward the end of the period. In comparison, global equities achieved positive returns, which were mostly driven by a small number of U.S.
technology firms. The “Magnificent Seven” stocks (Microsoft, Apple, Alphabet, Amazon,
Tesla, Meta Platforms, and Nvidia)
contributed about 90% of the return of MSCI All Country World Index.
Within the universe of
companies we consider, utilities shares were hurt by rising interest rates. More broadly, rising rates caused a downturn in sentiment toward clean technologies: There was a rise in expectations that higher capital
costs would make the investment required for the energy transition less affordable. However, although capital costs are important, the transition to clean energy generally involves up-front spending to save money
later. Renewable energy remained cheaper than fossil fuels almost everywhere globally.
Despite the negative
sentiment, growth remained strong across clean-tech sectors, whether measured by wind and solar installation rates, electric vehicle (EV) sales, or energy-efficiency metrics. Overall, spending on clean technologies
remained on track to reach the forecasted $1.7 trillion that will be invested in clean technologies in 2023, versus $1.1 trillion in fossil fuels.
Regionally, as economic growth
fell short of expectations, there were weaker share-price performances by decarbonization-linked companies in China, which is home to some global-market-leading clean-tech businesses.
More positively, companies
that are contributing to decarbonization via energy and resource efficiency generally performed well. Their services were in
demand as persistent inflation in many
countries increased costs for businesses and households, giving additional momentum to the longer-term trend toward more efficient solutions.
Our successes and shortfalls
Relative performance was hurt by our exposure
to China, given the weaker macroeconomic backdrop. Another difficulty was the fund’s lack of exposure to the strongest-performing U.S. mega-capitalization technology companies. These companies do not have
decarbonization as a material driver of performance, and we do not expect the majority of their future growth to be driven by climate solutions, so the fund does not invest in them. Finally, rising interest rates hurt
the shares of the portfolio’s clean-energy-focused utilities.
At the individual stock level,
the main detractors were:
•
Xinyi Solar, the world’s largest producer of solar glass. It underperformed because of lower solar glass profitability, disappointing earnings, and weak sentiment toward Chinese stocks. We see the
company’s long-term prospects being bolstered by strong structural growth in solar demand and Xinyi’s industry-leading profitability and production expertise.
•
Wuxi Lead Intelligent Equipment, which sells battery production equipment and services to leading EV and EV battery manufacturers. It underperformed because of concerns over lithium-ion battery overcapacity in China,
slower EV growth expectations, and weak sentiment
toward Chinese stocks in general. We believe
that the company is well positioned to benefit from global EV growth; most of Wuxi’s competitors lack the scale required to support EV businesses’ ambitious expansion plans.
•
Orsted, a global leader in developing, constructing, and operating offshore wind farms. Its performance was affected by factors that include higher interest rates, cost inflation, and concerns about offshore wind
production in the U.S. Although our structural-growth thesis for Orsted remains intact—the world will need to build significant offshore wind to meet net-zero emissions targets—we have been disappointed
with the size of the company’s U.S. write-down and management’s strategy execution.
Positive contributors
included:
•
Power Grid Corporation of India, which we added during the first quarter of 2023. The company is a leading electricity transmission business in India, where we are seeing strong growth in power demand and ambitious
plans to decarbonize the energy sector. Power Grid has a leading market share and a cost-of-capital advantage. Its shares outperformed largely because of strong performance by the business over the third quarter. The
stock was also supported by expectations of significant capital expenditure on the integration of renewables in India.
•
Ansys, which develops software solutions that help to accelerate product time-to-market, reduce production costs,
and improve engineering processes. It
benefited from solid earnings results that reflected growth across regions and industries.
•
Analog Devices, a leading global analog semiconductor supplier for end-markets directly driven by decarbonization. The company generally benefited from solid business performance and positive sentiment toward the
semiconductor sector. The share price reached our target; we exited the position during the third quarter of 2023.
Positioning and outlook
We remain focused on companies that we
believe will benefit from the need for decarbonization via a high-conviction investment approach.
The sentiment toward
renewables is as negative as we have experienced. However, we believe that the long-term structural case for businesses that are positively exposed to decarbonization, including select renewables, remains very much
intact. Despite recent unfavorable market moves, we believe we are well positioned for the long term; trends in climate finance remain a strong growth driver for companies that are helping the world decarbonize.
However, climate spending remains well below the level required to achieve the world’s net-zero ambitions.
As noted, the recent rapid
increase in long-term U.S. interest rates has had a significant, negative impact on sector sentiment. However, even at current
cost-of-capital levels, clean energy is still
markedly cheaper than energy generated by fossil fuels in almost every market.
Not every part of the world is
as worried about rising inflation and interest rates as the U.S., including China. From a longer-term perspective, we believe that the decarbonization-linked opportunities in China remain very broad; there are a good
number of companies that meet our criteria for sustainable returns, structural-growth potential, and competitive advantages.
The structural economic trends
driving climate solutions remain intact. Demand for wind and solar power continues to rise, underpinning the long-term growth potential of companies supporting the shift to renewable energy. For example, 2022 saw a
50% increase in solar demand. Globally, more than seven million EVs and hybrids were sold in the first seven months of 2023, accounting for 23% of all new vehicle sales. The clean energy industry benefits from
structural demand drivers for resource-efficiency solutions, which include tighter building regulations and ways to address rising global temperatures.
The period has underscored the
fact that the energy transition will be a bumpy ride—but the destination remains an exciting one. For all its ups and downs, this year has strengthened our conviction that decarbonization is the
structural-growth opportunity of our generation. It has also confirmed our view that our highly selective investment approach, with a focus on leading
businesses across sectors that are making a
positive contribution to decarbonization, is the right one to take.
Deirdre Cooper
Portfolio Manager
Graeme Baker
Portfolio Manager
Ninety One North America,
Inc.
November 10, 2023
About Your Fund’s Expenses
As a shareholder of the fund,
you incur ongoing costs, which include costs for portfolio management, administrative services, and shareholder reports (like this one), among others. Operating expenses, which are deducted from a fund’s gross
income, directly reduce the investment return of the fund.
A fund’s expenses are
expressed as a percentage of its average net assets. This figure is known as the expense ratio. The following examples are intended to help you understand the ongoing costs (in dollars) of investing in your fund and
to compare these costs with those of other mutual funds. The examples are based on an investment of $1,000 made at the beginning of the period shown and held for the entire period.
The accompanying table
illustrates your fund’s costs in two ways:
| •
| Based on actual fund return. This section helps you to estimate the actual expenses that you paid over the period. The ”Ending Account Value“ shown is derived from the fund‘s actual return, and the
third column shows the dollar amount that would have been paid by an investor who started with $1,000 in the fund. You may use the information here, together with the amount you invested, to estimate the expenses that
you paid over the period.
|
To do so, simply divide your
account value by $1,000 (for example, an $8,600 account value divided by $1,000 = 8.6), then multiply the result by the number given for your fund under the heading ”Expenses Paid During Period.“
| •
| Based on hypothetical 5% yearly return. This section is intended to help you compare your fund‘s costs with those of other mutual funds. It assumes that the fund had a yearly return of 5% before expenses, but that the
expense ratio is unchanged. In this case—because the return used is not the fund’s actual return—the results do not apply to your investment. The example is useful in making comparisons because the
Securities and Exchange Commission requires all mutual funds to calculate expenses based on a 5% return. You can assess your fund’s costs by comparing this hypothetical example with the hypothetical examples
that appear in shareholder reports of other funds.
|
Note that the expenses shown
in the table are meant to highlight and help you compare ongoing costs only and do not reflect transaction costs incurred by the fund for buying and selling securities. Further, the expenses do not include any purchase, redemption, or
account service fees described in the fund prospectus. If such fees were applied to your account, your costs would be higher. Your fund does not carry a “sales load.”
The calculations assume no
shares were bought or sold during the period. Your actual costs may have been higher or lower, depending on the amount of your investment and the timing of any purchases or redemptions.
You can find more information
about the fund’s expenses, including annual expense ratios, in the Financial Statements section of this report. For additional information on operating expenses and other shareholder costs, please refer to your
fund’s current prospectus.
| Six Months Ended October 31, 2023
|
|
|
|
|
| Beginning
Account Value
11/16/2022
| Ending
Account Value
10/31/2023
| Expenses
Paid During
Period
|
| Based on Actual Fund Return
|
|
|
|
| Global Environmental Opportunities Stock Fund
|
|
|
|
| Investor Shares
| $1,000.00
| $844.70
| $3.49
|
| Admiral™ Shares
| 1,000.00
| 845.40
| 2.79
|
| Based on Hypothetical 5% Yearly Return
|
|
|
|
| Global Environmental Opportunities Stock Fund
|
|
|
|
| Investor Shares
| $1,000.00
| $1,021.43
| $3.82
|
| Admiral Shares
| 1,000.00
| 1,022.18
| 3.06
|
The calculations are
based on expenses incurred in the most recent six-month period. The fund’s annualized six-month expense ratios for that period are 0.75% for Investor Shares and 0.60% for Admiral Shares. The dollar amounts shown
as “Expenses Paid” are equal to the annualized expense ratio multiplied by the average account value over the period, multiplied by the number of days in the most recent six-month period, then divided by
the number of days in the most recent 12-month period (184/365).
Global Environmental Opportunities Stock Fund
All of the returns in this
report represent past performance, which is not a guarantee of future results that may be achieved by the fund. (Current performance may be lower or higher than the performance data cited. For performance data current
to the most recent month-end, visit our website at vanguard.com/performance.) Note, too, that both investment returns and principal value can fluctuate widely, so an investor’s shares, when sold, could be worth
more or less than their original cost. The returns shown do not reflect taxes that a shareholder would pay on fund distributions or on the sale of fund shares.
Cumulative Performance:
November 16, 2022, Through October 31, 2023
Initial Investment of
$10,000
|
|
| Total Returns
Period Ended October 31, 2023
|
|
|
|
| Since
Inception
(11/16/2022)
| Final Value
of a $10,000
Investment
|

| Global Environmental Opportunities Stock Fund Investor Shares
| -12.40%
| $8,760
|

| MSCI All Country World Index
| 5.01
| 10,501
|
“Since Inception”
performance is calculated from the Investor Shares’ inception date for both the fund and its comparative standard(s).
|
|
|
|
|
|
|
| Since
Inception
(11/16/2022)
| Final Value
of a $50,000
Investment
|
| Global Environmental Opportunities Stock Fund Admiral Shares
| -12.28%
| $43,860
|
| MSCI All Country World Index
| 5.01
| 52,505
|
“Since Inception”
performance is calculated from the Admiral Shares’ inception date for both the fund and its comparative standard(s).
See Financial
Highlights for dividend and capital gains information.
Global Environmental Opportunities Stock
Fund
| United States
| 42.0%
|
| China
| 20.5
|
| Denmark
| 12.5
|
| Spain
| 6.0
|
| India
| 4.8
|
| United Kingdom
| 3.7
|
| Germany
| 3.6
|
| France
| 3.4
|
| Taiwan
| 2.7
|
| Other
| 0.8
|
The table reflects the fund’s
investments, except for short-term investments.
Global Environmental Opportunities Stock
Fund
The fund files its complete
schedule of portfolio holdings with the Securities and Exchange Commission (SEC) for the first and third quarters of each fiscal year as an exhibit to its reports on Form N-PORT. The fund’s Form N-PORT reports
are available on the SEC’s website at www.sec.gov.
|
|
| Shares
| Market
Value•
($000)
|
| Common Stocks (99.2%)
|
| China (20.3%)
|
|
| Wuxi Lead Intelligent Equipment Co. Ltd. Class A
| 598,627
| 2,288
|
|
| Contemporary Amperex Technology Co. Ltd. Class A
| 75,628
| 1,914
|
|
| Xinyi Solar Holdings Ltd.
| 2,700,000
| 1,589
|
|
| Sungrow Power Supply Co. Ltd. Class A
| 134,809
| 1,548
|
|
| Zhejiang Sanhua Intelligent Controls Co. Ltd. Class A
| 420,535
| 1,534
|
|
|
|
| 8,873
|
| Denmark (12.4%)
|
| *
| Vestas Wind Systems A/S
| 90,068
| 1,952
|
|
| Novozymes A/S Class B
| 41,502
| 1,865
|
| 1
| Orsted A/S
| 33,461
| 1,617
|
|
|
|
| 5,434
|
| France (3.4%)
|
|
| Schneider Electric SE
| 9,715
| 1,495
|
| Germany (3.6%)
|
|
| Infineon Technologies AG
| 53,690
| 1,568
|
| India (4.8%)
|
|
| Power Grid Corp. of India Ltd.
| 864,805
| 2,100
|
| Italy (0.8%)
|
|
| Industrie De Nora SpA
| 24,588
| 347
|
| Spain (5.9%)
|
|
| Iberdrola SA (XMAD)
| 232,113
| 2,582
|
| Taiwan (2.7%)
|
|
| Voltronic Power Technology Corp.
| 29,000
| 1,163
|
| United Kingdom (3.7%)
|
|
| Croda International plc
| 30,374
| 1,619
|
| United States (41.6%)
|
|
| Waste Management Inc.
| 21,437
| 3,523
|
|
| NextEra Energy Inc.
| 42,995
| 2,506
|
| *
| ANSYS Inc.
| 8,274
| 2,302
|
|
| TE Connectivity Ltd.
| 18,156
| 2,140
|
| *
| Autodesk Inc.
| 10,692
| 2,113
|
| *
| Aptiv plc
| 22,232
| 1,939
|
|
| Rockwell Automation Inc.
| 6,128
| 1,610
|
|
| Carlisle Cos. Inc.
| 5,906
| 1,501
|
|
| Trane Technologies plc
| 2,985
| 568
|
|
|
|
| 18,202
|
| Total Common Stocks (Cost $50,533)
| 43,383
|
Global Environmental Opportunities Stock
Fund
|
|
| Shares
| Market
Value•
($000)
|
| Temporary Cash Investments (0.4%)
|
| Money Market Fund (0.4%)
|
| 2
| Vanguard Market Liquidity Fund, 5.420% (Cost $176)
| 1,766
| 177
|
| Total Investments (99.6%) (Cost $50,709)
| 43,560
|
| Other Assets and Liabilities—Net (0.4%)
| 154
|
| Net Assets (100%)
| 43,714
|
| Cost is in $000.
|
| •
| See Note A in Notes to Financial Statements.
|
| *
| Non-income-producing security.
|
| 1
| Security exempt from registration under Rule 144A of the Securities Act of 1933. Such securities may be sold in transactions exempt from registration, normally to qualified
institutional buyers. At October 31, 2023, the aggregate value was $1,617,000, representing 3.7% of net assets.
|
| 2
| Affiliated money market fund available only to Vanguard funds and certain trusts and accounts managed by Vanguard. Rate shown is the 7-day yield.
|
See accompanying
Notes, which are an integral part of the Financial Statements.
Global Environmental Opportunities Stock
Fund
Statement of Assets and Liabilities
|
|
| ($000s, except shares, footnotes, and per-share amounts)
| Amount
|
| Assets
|
|
| Investments in Securities, at Value
|
|
| Unaffiliated Issuers (Cost $50,533)
| 43,383
|
| Affiliated Issuers (Cost $176)
| 177
|
| Total Investments in Securities
| 43,560
|
| Investment in Vanguard
| 2
|
| Foreign Currency, at Value (Cost $79)
| 77
|
| Receivables for Investment Securities Sold
| 44
|
| Receivables for Accrued Income
| 14
|
| Receivables for Capital Shares Issued
| 107
|
| Total Assets
| 43,804
|
| Liabilities
|
|
| Payables for Investment Securities Purchased
| 4
|
| Payables to Investment Advisor
| 42
|
| Payables for Capital Shares Redeemed
| 7
|
| Payables to Vanguard
| 6
|
| Deferred Foreign Capital Gains Taxes
| 31
|
| Total Liabilities
| 90
|
| Net Assets
| 43,714
|
| At October 31, 2023, net assets consisted of:
|
|
|
|
|
| Paid-in Capital
| 50,807
|
| Total Distributable Earnings (Loss)
| (7,093)
|
| Net Assets
| 43,714
|
|
|
| Investor Shares—Net Assets
|
|
Applicable to 998,207 outstanding $.001 par value shares of
beneficial interest (unlimited authorization)
| 17,485
|
| Net Asset Value Per Share—Investor Shares
| $17.52
|
|
|
| Admiral Shares—Net Assets
|
|
Applicable to 1,196,250 outstanding $.001 par value shares of
beneficial interest (unlimited authorization)
| 26,229
|
| Net Asset Value Per Share—Admiral Shares
| $21.93
|
See accompanying
Notes, which are an integral part of the Financial Statements.
Global Environmental Opportunities Stock
Fund
|
|
|
| November 2, 20221 to
October 31, 2023
|
|
| ($000)
|
| Investment Income
|
|
| Income
|
|
| Dividends2
| 519
|
| Non-Cash Dividends
| 94
|
| Interest3
| 61
|
| Total Income
| 674
|
| Expenses
|
|
| Investment Advisory Fees—Note B
| 135
|
| The Vanguard Group—Note C
|
|
| Management and Administrative—Investor Shares
| 8
|
| Management and Administrative—Admiral Shares
| 8
|
| Custodian Fees
| 24
|
| Auditing Fees
| 35
|
| Shareholders’ Reports—Investor Shares
| 22
|
| Shareholders’ Reports—Admiral Shares
| 2
|
| Trustees’ Fees and Expenses
| —
|
| Professional Services
| 24
|
| Total Expenses
| 258
|
| Expenses Paid Indirectly
| (5)
|
| Net Expenses
| 253
|
| Net Investment Income
| 421
|
| Realized Net Gain (Loss)
|
|
| Investment Securities Sold3
| (252)
|
| Foreign Currencies
| (9)
|
| Realized Net Gain (Loss)
| (261)
|
| Change in Unrealized Appreciation (Depreciation)
|
|
| Investment Securities3,4
| (7,180)
|
| Foreign Currencies
| (2)
|
| Change in Unrealized Appreciation (Depreciation)
| (7,182)
|
| Net Increase (Decrease) in Net Assets Resulting from Operations
| (7,022)
|
| 1
| Commencement of subscription period for the fund.
|
| 2
| Dividends are net of foreign withholding taxes of $44,000.
|
| 3
| Interest income, realized net gain (loss), capital gain distributions received, and change in unrealized appreciation (depreciation) from an affiliated company of the fund were
$61,000, ($1,000), less than $1,000, and $1,000, respectively. Purchases and sales are for temporary cash investment purposes.
|
| 4
| The change in unrealized appreciation (depreciation) is net of the change in deferred foreign capital gains taxes of $31,000.
|
See accompanying
Notes, which are an integral part of the Financial Statements.
Global Environmental Opportunities Stock
Fund
Statement of Changes in Net Assets
|
|
|
| November 2, 20221 to
October 31, 2023
|
|
| ($000)
|
| Increase (Decrease) in Net Assets
|
|
| Operations
|
|
| Net Investment Income
| 421
|
| Realized Net Gain (Loss)
| (261)
|
| Change in Unrealized Appreciation (Depreciation)
| (7,182)
|
| Net Increase (Decrease) in Net Assets Resulting from Operations
| (7,022)
|
| Distributions
|
|
| Investor Shares
| —
|
| Admiral Shares
| —
|
| Total Distributions
| —
|
| Capital Share Transactions
|
|
| Investor Shares
| 20,111
|
| Admiral Shares
| 30,625
|
| Net Increase (Decrease) from Capital Share Transactions
| 50,736
|
| Total Increase (Decrease)
| 43,714
|
| Net Assets
|
|
| Beginning of Period
| —
|
| End of Period
| 43,714
|
| 1
| Commencement of subscription period for the fund.
|
See accompanying
Notes, which are an integral part of the Financial Statements.
Global Environmental Opportunities Stock
Fund
| Investor Shares
|
|
For a Share Outstanding
Throughout Each Period
| November 2,
20221 to
October 31, 2023
|
| Net Asset Value, Beginning of Period
| $20.00
|
| Investment Operations
|
|
| Net Investment Income2
| .188
|
| Net Realized and Unrealized Gain (Loss) on Investments
| (2.668)
|
| Total from Investment Operations
| (2.480)
|
| Distributions
|
|
| Dividends from Net Investment Income
| —
|
| Distributions from Realized Capital Gains
| —
|
| Total Distributions
| —
|
| Net Asset Value, End of Period
| $17.52
|
| Total Return3
| -12.40%
|
| Ratios/Supplemental Data
|
|
| Net Assets, End of Period (Millions)
| $17
|
| Ratio of Total Expenses to Average Net Assets
| 0.77%4,5
|
| Ratio of Net Investment Income to Average Net Assets
| 0.98%4
|
| Portfolio Turnover Rate
| 35%
|
| 1
| The subscription period for the fund was November 2, 2022, to November 15, 2022, during which time all assets were held in cash. Performance measurement began November 16, 2022, the
first business day after the subscription period, at a net asset value of $20.00.
|
| 2
| Calculated based on average shares outstanding.
|
| 3
| Total returns do not include account service fees that may have applied in the periods shown. Fund prospectuses provide information about any applicable account service fees.
|
| 4
| Annualized.
|
| 5
| The ratio of expenses to average net assets for the period net of reduction from custody fee offset arrangements was 0.75%.
|
See accompanying
Notes, which are an integral part of the Financial Statements.
Global Environmental Opportunities Stock
Fund
| Admiral Shares
|
|
For a Share Outstanding
Throughout Each Period
| November 2,
20221 to
October 31, 2023
|
| Net Asset Value, Beginning of Period
| $25.00
|
| Investment Operations
|
|
| Net Investment Income2
| .279
|
| Net Realized and Unrealized Gain (Loss) on Investments
| (3.349)
|
| Total from Investment Operations
| (3.070)
|
| Distributions
|
|
| Dividends from Net Investment Income
| —
|
| Distributions from Realized Capital Gains
| —
|
| Total Distributions
| —
|
| Net Asset Value, End of Period
| $21.93
|
| Total Return3
| -12.28%
|
| Ratios/Supplemental Data
|
|
| Net Assets, End of Period (Millions)
| $26
|
| Ratio of Total Expenses to Average Net Assets
| 0.62%4,5
|
| Ratio of Net Investment Income to Average Net Assets
| 1.16%4
|
| Portfolio Turnover Rate
| 35%
|
| 1
| The subscription period for the fund was November 2, 2022, to November 15, 2022, during which time all assets were held in cash. Performance measurement began November 16, 2022, the
first business day after the subscription period, at a net asset value of $25.00.
|
| 2
| Calculated based on average shares outstanding.
|
| 3
| Total returns do not include account service fees that may have applied in the periods shown. Fund prospectuses provide information about any applicable account service fees.
|
| 4
| Annualized.
|
| 5
| The ratio of expenses to average net assets for the period net of reduction from custody fee offset arrangements was 0.60%.
|
See accompanying
Notes, which are an integral part of the Financial Statements.
Global Environmental Opportunities Stock
Fund
Notes to Financial Statements
Vanguard Global Environmental
Opportunities Stock Fund is registered under the Investment Company Act of 1940 as an open-end investment company, or mutual fund. The fund offers two classes of shares: Investor Shares and Admiral Shares. Each of the
share classes has different eligibility and minimum purchase requirements, and is designed for different types of investors.
The fund invests in securities of foreign
issuers, which may subject it to investment risks not normally associated with investing in securities of U.S. corporations.
| A.
| The following significant accounting policies conform to generally accepted accounting principles for U.S. investment companies. The fund consistently follows such policies in preparing its financial statements.
|
1. Security Valuation:
Securities are valued as of the close of trading on the New York Stock Exchange (generally 4 p.m., Eastern time) on the valuation date. Equity securities are valued at the latest quoted sales prices or official
closing prices taken from the primary market in which each security trades; such securities not traded on the valuation date are valued at the mean of the latest quoted bid and asked prices. Securities for which
market quotations are not readily available, or whose values have been affected by events occurring before the fund’s pricing time but after the close of the securities’ primary markets, are valued by
methods deemed by the valuation designee to represent fair value and subject to oversight by the board of trustees. These procedures include obtaining quotations from an independent pricing service, monitoring news to
identify significant market- or security-specific events, and evaluating changes in the values of foreign market proxies (for example, ADRs, futures contracts, or exchange-traded funds), between the time the foreign
markets close and the fund’s pricing time. When fair-value pricing is employed, the prices of securities used by a fund to calculate its net asset value may differ from quoted or published prices for the same
securities. Investments in Vanguard Market Liquidity Fund are valued at that fund's net asset value.
2. Foreign Currency:
Securities and other assets and liabilities denominated in foreign currencies are translated into U.S. dollars using exchange rates obtained from an independent third party as of the fund’s pricing time on the
valuation date. Realized gains (losses) and unrealized appreciation (depreciation) on investment securities include the effects of changes in exchange rates since the securities were purchased, combined with the
effects of changes in security prices. Fluctuations in the value of other assets and liabilities resulting from changes in exchange rates are recorded as unrealized foreign currency gains (losses) until the assets or
liabilities are settled in cash, at which time they are recorded as realized foreign currency gains (losses).
3. Federal Income Taxes:
The fund intends to qualify as a regulated investment company and distribute virtually all of its taxable income. The fund’s tax returns are open to examination by the relevant tax authorities until expiration
of the applicable statute of limitations, which is generally three years after the filing of the tax return. Management has analyzed the fund’s tax positions taken for all open federal and state income tax
years, and has concluded that no provision for income tax is required in the fund’s financial statements.
4. Distributions:
Distributions to shareholders are recorded on the ex-dividend date. Distributions are determined on a tax basis at the fiscal year-end and may differ from net investment income and realized capital gains for financial
reporting purposes.
5. Credit Facility and
Interfund Lending Program: The fund and certain other funds managed by The Vanguard Group ("Vanguard") participate in a $4.3 billion committed credit facility provided by a syndicate of lenders pursuant to a credit
agreement and uncommitted credit facility provided by
Global Environmental Opportunities Stock
Fund
Vanguard, which may be renewed annually. Each
fund is individually liable for its borrowings, if any, under the credit facility. Borrowings may be utilized for temporary or emergency purposes and are subject to the fund’s regulatory and contractual
borrowing restrictions. With respect to the committed credit facility, the participating funds are charged administrative fees and an annual commitment fee of 0.10% of the undrawn committed amount of the facility,
which are allocated to the funds based on a method approved by the fund’s board of trustees and included in Management and Administrative expenses on the fund’s Statement of Operations. Any borrowings
under the facility bear interest at an agreed-upon spread plus the higher of the federal funds effective rate, the overnight bank funding rate, or the Daily Simple Secured Overnight Financing Rate inclusive of an
additional agreed-upon spread, or based upon an alternate rate agreed to by the fund and Vanguard.
In accordance with an
exemptive order (the “Order”) from the SEC, the fund may participate in a joint lending and borrowing program that allows registered open-end Vanguard funds to borrow money from and lend money to each
other for temporary or emergency purposes (the “Interfund Lending Program”), subject to compliance with the terms and conditions of the Order, and to the extent permitted by the fund’sinvestment
objective and investment policies. Interfund loans and borrowings normally extend overnight, but can have a maximum duration of seven days. Loans may be called on one business day’s notice. The interest rate to
be charged is governed by the conditions of the Order and internal procedures adopted by the board of trustees. The board of trustees is responsible for overseeing the Interfund Lending Program.
For the period ended October
31, 2023, the fund did not utilize the credit facility or the Interfund Lending Program.
6. Other: Dividend
income is recorded on the ex-dividend date. Non-cash dividends included in income, if any, are recorded at the fair value of the securities received. Interest income includes income distributions received from
Vanguard Market Liquidity Fund and is accrued daily. Security transactions are accounted for on the date securities are bought or sold. Costs used to determine realized gains (losses) on the sale of investment
securities are those of the specific securities sold.
| B.
| Ninety One North America, Inc. provides investment advisory services to the fund for a fee calculated at an annual percentage rate of average net assets. For the period ended October 31, 2023, the investment
advisory fee represented an effective annual basic rate of 0.34% of the fund’s average net assets.
|
| C.
| In accordance with the terms of a Funds' Service Agreement (the “FSA”) between Vanguard and the fund, Vanguard furnishes to the fund corporate management, administrative,
marketing, distribution and cash management services at Vanguard’s cost of operations (as defined by the FSA). These costs of operations are allocated to the fund based on methods and guidelines approved by the
board of trustees and are generally settled twice a month.
|
Upon the request of Vanguard,
the fund may invest up to 0.40% of its net assets as capital in Vanguard. At October 31, 2023, the fund had contributed to Vanguard capital in the amount of $2,000, representing less than 0.01% of the fund’s net
assets and less than 0.01% of Vanguard’s capital received pursuant to the FSA. The fund’s trustees and officers are also directors and employees, respectively, of Vanguard.
Global Environmental Opportunities Stock
Fund
| D.
| The fund’s custodian bank has agreed to reduce its fees when the fund maintains cash on deposit in the non-interest-bearing custody account. For the period ended October 31, 2023, custodian fee offset
arrangements reduced the fund’s expenses by $5,000 (an annual rate of 0.01% of average net assets).
|
| E.
| Various inputs may be used to determine the value of the fund’s investments. These inputs are summarized in three broad levels for financial statement purposes. The inputs or
methodologies used to value securities are not necessarily an indication of the risk associated with investing in those securities.
|
Level 1—Quoted prices in active markets for identical securities.
Level 2—Other significant observable inputs (including quoted prices for similar securities, interest rates, prepayment speeds, credit risk, etc.).
Level 3—Significant unobservable inputs (including the fund’s own assumptions used to determine the fair value of investments). Any investments valued with significant unobservable
inputs are noted on the Schedule of Investments.
The following table summarizes
the market value of the fund’s investments as of October 31, 2023, based on the inputs used to value them:
|
| Level 1
($000)
| Level 2
($000)
| Level 3
($000)
| Total
($000)
|
| Investments
|
|
|
|
|
| Assets
|
|
|
|
|
| Common Stocks—North and South America
| 18,202
| —
| —
| 18,202
|
| Common Stocks—Other
| —
| 25,181
| —
| 25,181
|
| Temporary Cash Investments
| 177
| —
| —
| 177
|
| Total
| 18,379
| 25,181
| —
| 43,560
|
| F.
| Permanent differences between book-basis and tax-basis components of net assets are reclassified among capital accounts in the financial statements to reflect their tax character. These reclassifications have no
effect on net assets or net asset value per share. As of period end, permanent differences primarily attributable to the accounting for applicable foreign currency transactions and distributions in connection with
fund share redemptions were reclassified between the following accounts:
|
|
| Amount
($000)
|
| Paid-in Capital
| 71
|
| Total Distributable Earnings (Loss)
| (71)
|
Temporary differences between
book-basis and tax-basis components of total distributable earnings (loss) arise when certain items of income, gain, or loss are recognized in different periods for financial statement and tax purposes; these
differences will reverse at some time in the future.
Global Environmental Opportunities Stock
Fund
The differences are primarily related to the
deferral of losses from wash sales. As of period end, the tax-basis components of total distributable earnings (loss) are detailed in the table as follows:
|
| Amount
($000)
|
| Undistributed Ordinary Income
| 740
|
| Undistributed Long-Term Gains
| —
|
| Net Unrealized Gains (Losses)
| (7,833)
|
| Capital Loss Carryforwards
| —
|
| Qualified Late-Year Losses
| —
|
| Other Temporary Differences
| —
|
| Total
| (7,093)
|
The tax character of
distributions paid was as follows:
|
| Period Ended October 31,
|
|
| 2023
Amount
($000)
|
| Ordinary Income
| —
|
| Long-Term Capital Gains
| —
|
As of October 31, 2023, gross
unrealized appreciation and depreciation for investments based on cost for U.S. federal income tax purposes were as follows:
|
| Amount
($000)
|
| Tax Cost
| 51,361
|
| Gross Unrealized Appreciation
| 920
|
| Gross Unrealized Depreciation
| (8,721)
|
| Net Unrealized Appreciation (Depreciation)
| (7,801)
|
| G.
| During the period ended October 31, 2023, the fund purchased $64,494,000 of investment securities and sold $13,805,000 of investment securities, other than temporary cash investments.
|
| H.
| Capital share transactions for each class of shares were:
|
|
| November 2, 20221 to October 31, 2023
|
|
| Amount
($000)
| Shares
(000)
|
| Investor Shares
|
|
|
| Issued
| 26,143
| 1,298
|
| Issued in Lieu of Cash Distributions
| —
| —
|
| Redeemed
| (6,032)
| (300)
|
| Net Increase (Decrease)—Investor Shares
| 20,111
| 998
|
Global Environmental Opportunities Stock
Fund
|
| November 2, 20221 to October 31, 2023
|
|
| Amount
($000)
| Shares
(000)
|
| Admiral Shares
|
|
|
| Issued
| 37,053
| 1,468
|
| Issued in Lieu of Cash Distributions
| —
| —
|
| Redeemed
| (6,428)
| (272)
|
| Net Increase (Decrease)—Admiral Shares
| 30,625
| 1,196
|
| 1
| Commencement of subscription period for the fund.
|
| I.
| Significant market disruptions, such as those caused by pandemics (e.g., COVID-19 pandemic), natural or environmental disasters, war (e.g., Russia’s invasion of Ukraine), acts of terrorism, or other events,
can adversely affect local and global markets and normal market operations. Any such disruptions could have an adverse impact on the value of the fund’s investments and fund performance.
|
To the extent the fund’s
investment portfolio reflects concentration in a particular market, industry, sector, country or asset class, the fund may be adversely affected by the performance of these concentrations and may be subject to
increased price volatility and other risks.
| J.
| Management has determined that no events or transactions occurred subsequent to October 31, 2023, that would require recognition or disclosure in these financial statements.
|
Report of Independent Registered Public Accounting
Firm
To the Board of Trustees of Vanguard
Trustees’ Equity Fund and Shareholders of Vanguard Global Environmental Opportunities Stock Fund
Opinion on the Financial
Statements
We have audited the
accompanying statement of assets and liabilities, including the schedule of investments, of Vanguard Global Environmental Opportunities Stock Fund (one of the funds constituting Vanguard Trustees’ Equity Fund,
referred to hereafter as the "Fund") as of October 31, 2023, and the related statements of operations and changes in net assets, including the related notes, and the financial highlights for the period November 2,
2022 (commencement of subscription period) through October 31, 2023 (collectively referred to as the “financial statements”). In our opinion, the financial statements present fairly, in all material
respects, the financial position of the Fund as of October 31, 2023, and the results of its operations, changes in its net assets, and the financial highlights for the period November 2, 2022 (commencement of
subscription period) through October 31, 2023 in conformity with accounting principles generally accepted in the United States of America.
Basis for Opinion
These financial statements are
the responsibility of the Fund’s management. Our responsibility is to express an opinion on the Fund’s financial statements based on our audit. We are a public accounting firm registered with the Public
Company Accounting Oversight Board (United States) (PCAOB) and are required to be independent with respect to the Fund in accordance with the U.S. federal securities laws and the applicable rules and regulations of
the Securities and Exchange Commission and the PCAOB.
We conducted our audit of
these financial statements in accordance with the standards of the PCAOB. Those standards require that we plan and perform the audit to obtain reasonable assurance about whether the financial statements are free of
material misstatement, whether due to error or fraud.
Our audit included performing
procedures to assess the risks of material misstatement of the financial statements, whether due to error or fraud, and performing procedures that respond to those risks. Such procedures included examining, on a test
basis, evidence regarding the amounts and disclosures in the financial statements. Our audit also included evaluating the accounting principles used and significant estimates made by management, as well as evaluating
the overall presentation of the financial statements. Our procedures included confirmation of securities owned as of October 31, 2023 by correspondence with the custodian, transfer agent and brokers; when replies were
not received from brokers, we performed other auditing procedures. We believe that our audit provides a reasonable basis for our opinion.
/s/PricewaterhouseCoopers
LLP
Philadelphia, Pennsylvania
December 19, 2023
We have served as the auditor
of one or more investment companies in The Vanguard Group of Funds since 1975.
Tax information
(unaudited)
For corporate shareholders,
14.9%, or if subsequently determined to be different, the maximum percentage allowable by law, of ordinary income (dividend income plus short-term gains, if any) for the fiscal year qualified for the
dividends-received deduction.
The fund hereby designates
$11,000, or if subsequently determined to be different, the maximum amount allowable by law, of interest earned from obligations of the U.S. government which is generally exempt from state income tax.
For nonresident alien
shareholders, 100% of short-term capital gain dividends distributed by the fund for the fiscal year are qualified short-term capital gains.
This page intentionally left blank.
The People Who Govern Your Fund
The trustees of your mutual
fund are there to see that the fund is operated and managed in your best interests since, as a shareholder, you are a part owner of the fund. Your fund’s trustees also serve on the board of directors of The
Vanguard Group, Inc., which is owned by the Vanguard funds and provides services to them.
A majority of Vanguard’s
board members are independent, meaning that they have no affiliation with Vanguard or the funds they oversee, apart from the sizable personal investments they have made as private individuals. The independent board
members have distinguished backgrounds in business, academia, and public service. Each of the trustees and executive officers oversees 205 Vanguard funds.
Information for each trustee
and executive officer of the fund appears below. That information, as well as the Vanguard fund count, is as of the date on the cover of this fund report. The mailing address of the trustees and officers is P.O. Box
876, Valley Forge, PA 19482. More information about the trustees is in the Statement of Additional Information, which can be obtained, without charge, by contacting Vanguard at 800-662-7447, or online at vanguard.com.
Interested Trustee1
Mortimer J. Buckley
Born in 1969. Trustee since January 2018.
Principal occupation(s) during the past five years and other experience: chairman of the board (2019–present) of Vanguard and of each of the investment companies served by Vanguard; chief executive officer
(2018–present) of Vanguard; chief executive officer, president, and trustee (2018–present) of each of the investment companies served by Vanguard; president and director (2017–present) of Vanguard;
and president (2018–present) of Vanguard Marketing Corporation. Chief investment officer (2013–2017), managing director (2002–2017), head of the Retail Investor Group (2006–2012), and chief
information officer (2001–2006) of Vanguard. Member of the board of governors of the Investment Company Institute and the board of governors of FINRA.
Independent Trustees
Tara Bunch
Born in 1962. Trustee since November 2021.
Principal occupation(s) during the past five years and other experience: head of global operations at Airbnb (2020–present). Vice president of AppleCare (2012–2020). Member of the board of directors of Out
& Equal, the advisory board of the University of California, Berkeley School of Engineering, and the advisory board of Santa Clara University’s Leavey School of Business.
Emerson U. Fullwood
Born in 1948. Trustee since January 2008.
Principal occupation(s) during the past five years and other experience: executive chief staff and marketing officer for North America and corporate vice president (retired 2008) of Xerox Corporation (document
management products and services). Former president of the Worldwide Channels Group, Latin America, and Worldwide Customer Service and executive chief staff officer of Developing Markets of Xerox. Executive in
residence and 2009–2010 Distinguished Minett Professor at the Rochester Institute of Technology. Member of the board of directors of the University of Rochester Medical Center, the Monroe Community College
Foundation, the United Way of Rochester, North Carolina A&T University, Roberts Wesleyan College, and the Rochester Philharmonic Orchestra. Trustee of the University of
Rochester.
F. Joseph Loughrey
Born in 1949. Trustee since October 2009.
Principal occupation(s) during the past five years and other experience: president and chief operating officer (retired 2009) and vice chairman of the board (2008–2009) of Cummins Inc. (industrial machinery).
Director of the V Foundation. Member of the advisory council for the College of Arts and Letters at the University of Notre Dame. Chairman of the board of Saint Anselm College.
Mark Loughridge
Born in 1953. Trustee since March 2012.
Principal occupation(s) during the past five years and other experience: senior vice president and chief financial
1 Mr. Buckley is considered an “interested
person,” as defined in the Investment Company Act of 1940, because he is an officer of the Vanguard funds.
officer (retired 2013) of IBM (information
technology services). Fiduciary member of IBM’s Retirement Plan Committee (2004–2013), senior vice president and general manager (2002–2004) of IBM Global Financing, vice president and controller
(1998–2002) of IBM, and a variety of other prior management roles at IBM. Member of the Council on Chicago Booth.
Scott C. Malpass
Born in 1962. Trustee since March 2012.
Principal occupation(s) during the past five years and other experience: chief investment officer (retired 2020) and vice president (retired 2020) of the University of Notre Dame. Chair of the board of Catholic
Investment Services, Inc. (investment advisors). Member of the board of superintendence of the Institute for the Works of Religion, the Notre Dame 403(b) Investment Committee, and the board of directors of Paxos Trust
Company (finance).
Deanna Mulligan
Born in 1963. Trustee since January 2018.
Principal occupation(s) during the past five years and other experience: chief executive officer of Purposeful (advisory firm for CEOs and C-level executives; 2021–present). Board chair (2020), chief executive
officer (2011–2020), and president (2010–2019) of The Guardian Life Insurance Company of America. Chief operating officer (2010–2011) and executive vice president (2008–2010) of Individual Life
and Disability of the Guardian Life Insurance Company of America. Director of DuPont. Member of the board of the Economic Club of New York. Trustee of the Partnership for New York City (business leadership), Chief
Executives for Corporate Purpose, and the NewYork-Presbyterian Hospital.
André F. Perold
Born in 1952. Trustee since December 2004.
Principal occupation(s) during the past five years and other experience: George Gund Professor of Finance and Banking, Emeritus at the Harvard Business School (retired 2011). Chief investment officer and partner of
HighVista Strategies (private investment firm). Member of the board of RIT Capital Partners (investment firm).
Sarah Bloom Raskin
Born in 1961. Trustee since January 2018.
Principal occupation(s) during the past five years and other experience: deputy secretary (2014–2017) of the United States Department of the Treasury. Governor (2010–2014) of the Federal Reserve Board.
Commissioner (2007–2010) of financial regulation for the State of Maryland. Colin W. Brown Distinguished Professor of the Practice of Law, Duke Law School (2021–present); Rubenstein Fellow, Duke University
(2017–2020); Distinguished Fellow of the Global Financial Markets Center, Duke Law School (2020–2022); and Senior Fellow, Duke Center on Risk
(2020–present). Partner of Kaya
Partners (climate policy advisory services). Member of the board of directors of Arcadia (energy solution technology).
Grant Reid
Born in 1959. Trustee since July 2023.
Principal occupation(s) during the past five years and other experience: chief executive officer and president (2014–2022) and member of the board of directors (2015–2022) of Mars, Incorporated
(multinational manufacturer). Member of the board of directors of Marriott International, Inc. Chair of Agribusiness Task Force, Sustainable Markets Initiative.
David Thomas
Born in 1956. Trustee since July 2021.
Principal occupation(s) during the past five years and other experience: president of Morehouse College (2018–present). Professor of business administration, emeritus at Harvard University (2017–2018).
Dean (2011–2016) and professor of management (2016–2017) at the Georgetown University McDonough School of Business. Director of DTE Energy Company. Trustee of Common Fund.
Peter F. Volanakis
Born in 1955. Trustee since July 2009.
Principal occupation(s) during the past five years and other experience: president and chief operating officer (retired 2010) of Corning Incorporated (communications equipment) and director of Corning Incorporated
(2000–2010) and Dow Corning (2001–2010). Director (2012) of SPX Corporation (multi-industry manufacturing). Overseer of the Amos Tuck School of Business Administration, Dartmouth College (2001–2013).
Member of the BMW Group Mobility Council.
Executive Officers
Jacqueline Angell
Born in 1974. Principal occupation(s) during
the past five years and other experience: principal of Vanguard. Chief compliance officer (November 2022–present) of Vanguard and of each of the investment companies served by Vanguard. Chief compliance officer
(2018–2022) and deputy chief compliance officer (2017–2019) of State Street.
Christine M. Buchanan
Born in 1970. Principal occupation(s) during
the past five years and other experience: principal of Vanguard. Chief financial officer (2021–present) and treasurer (2017–2022) of each of the investment companies served by Vanguard. Partner
(2005–2017) at KPMG (audit, tax, and advisory services).
John Galloway
Born in 1973. Principal occupation(s) during
the past five years and other experience: principal of Vanguard. Investment stewardship officer (September 2020–present) of each of the investment companies served by Vanguard. Head of Investor Advocacy
(February 2020–present) and head of Marketing Strategy and Planning (2017–2020) at Vanguard. Special assistant to the President of the United States (2015).
Ashley Grim
Born in 1984. Principal occupation(s) during
the past five years and other experience: treasurer (February 2022–present) of each of the investment companies served by Vanguard. Fund transfer agent controller (2019–2022) and director of Audit Services
(2017–2019) at Vanguard. Senior manager (2015–2017) at PriceWaterhouseCoopers (audit and assurance, consulting, and tax services).
Jodi Miller
Born in 1980. Principal occupation(s) during
the past five years and other experience: principal of Vanguard. Finance director (2022–present) of each of the investment companies served by Vanguard. Head of Enterprise Investment Services
(2020–present), head of Retail Client Services and Operations (2020–2022), and head of Retail Strategic Support (2018–2020) at Vanguard.
Anne E. Robinson
Born in 1970. Principal occupation(s) during
the past five years and other experience: general counsel (2016–present) of Vanguard. Secretary (2016–present) of Vanguard and of each of the investment companies served by Vanguard. Managing director
(2016–present) of Vanguard. Managing director and general counsel of Global Cards and Consumer Services (2014–2016) at Citigroup. Counsel (2003–2014) at American Express. Nonexecutive director
(2022–present) of the board of National Grid (energy).
Michael Rollings
Born in 1963. Principal occupation(s) during
the past five years and other experience: finance director (2017–present) and treasurer (2017) of each of the investment companies served by Vanguard. Managing director (2016–present) of Vanguard. Chief
financial officer (2016–present) of Vanguard. Director (2016–present) of Vanguard Marketing Corporation. Executive vice president and chief financial officer (2006–2016) of MassMutual Financial
Group.
Vanguard Senior Management
Team
| Matthew Benchener
| Thomas M. Rampulla
|
| Joseph Brennan
| Karin A. Risi
|
| Mortimer J. Buckley
| Anne E. Robinson
|
| Gregory Davis
| Michael Rollings
|
| John James
| Nitin Tandon
|
| Chris D. Mclsaac
| Lauren Valente
|
Connect with
Vanguard®>vanguard.com
Fund Information > 800-662-7447
Direct Investor Account
Services > 800-662-2739
Institutional Investor
Services > 800-523-1036
Text Telephone for People Who
Are Deaf or Hard of Hearing > 800-749-7273
This material may be used in
conjunction with the offering of shares of any Vanguard fund only if preceded or accompanied by the fund’s current prospectus.
All comparative mutual
fund data are from Morningstar, Inc., unless otherwise noted.
You can obtain a free
copy of Vanguard’s proxy voting guidelines by visiting vanguard.com/proxyreporting or by calling Vanguard at 800-662-2739. The guidelines are also available from the SEC’s website, www.sec.gov. In
addition, you may obtain a free report on how your fund voted the proxies for securities it owned during the 12 months ended June 30. To get the report, visit either vanguard.com/proxyreporting or www.sec.gov.
You can review
information about your fund on the SEC’s website, and you can receive copies of this information, for a fee, by sending a request via email addressed to publicinfo@sec.gov.
© 2023 The Vanguard Group,
Inc.
All rights reserved.
Vanguard Marketing Corporation, Distributor.
QV0120 122023
Item
2: Code of Ethics.
The Registrant
has adopted a code of ethics that applies to the Registrant’s principal executive officer, principal financial officer, principal
accounting officer or controller or persons performing similar functions. The Code of Ethics was amended during the reporting period
covered by this report to make certain technical, non-material changes.
Item
3: Audit Committee Financial Expert.
All members
of the Audit Committee have been determined by the Registrant’s Board of Trustees to be Audit Committee Financial Experts and to
be independent: F. Joseph Loughrey, Mark Loughridge, Sarah Bloom Raskin, and Peter F. Volanakis.
Item
4: Principal Accountant Fees and Services.
Audit Fees
of the Registrant.
Fiscal Year
Ended October 31, 2023: $135,000
Fiscal Year Ended October 31, 2022: $192,000
Aggregate
Audit Fees of Registered Investment Companies in the Vanguard Group.
Fiscal Year
Ended October 31, 2023: $9,326,156
Fiscal Year Ended October 31, 2022: $10,494,508
Includes fees
billed in connection with audits of the Registrant, other registered investment companies in the Vanguard complex, The Vanguard Group,
Inc., and Vanguard Marketing Corporation.
Fiscal Year
Ended October 31, 2023: $3,295,934
Fiscal Year Ended October 31, 2022: $2,757,764
Includes fees
billed in connection with assurance and related services provided to the Registrant, other registered investment companies in the Vanguard
complex, The Vanguard Group, Inc., and Vanguard Marketing Corporation.
Fiscal Year
Ended October 31, 2023: $1,678,928
Fiscal Year Ended October 31, 2022: $5,202,689
Includes fees
billed in connection with tax compliance, planning, and advice services provided to the Registrant, other registered investment companies
in the Vanguard complex, The Vanguard Group, Inc., and Vanguard Marketing Corporation.
Fiscal Year
Ended October 31, 2023: $25,000
Fiscal Year Ended October 31, 2022: $298,000
Includes fees
billed for services related to tax reported information provided to the Registrant, other registered investment companies in the Vanguard
complex, The Vanguard Group, Inc., and Vanguard Marketing Corporation.
(e) (1)
Pre-Approval Policies. The policy of the Registrant’s Audit Committee is to consider, and, if appropriate, approve before the principal
accountant is engaged for such services, all specific audit and non-audit services provided to: the Registrant, other registered investment
companies in the Vanguard complex, The Vanguard Group, Inc., and entities
controlled by The Vanguard Group, Inc. that provide ongoing services to the Registrant. In making a determination, the Audit Committee
considers whether the services are consistent with maintaining the principal accountant’s independence.
In
the event of a contingency situation in which the principal accountant is needed to provide services in between scheduled Audit Committee
meetings, the Chairman of the Audit Committee would be called on to consider and, if appropriate, pre-approve audit or permitted non-audit
services in an amount sufficient to complete services through the next Audit Committee meeting, and to determine if such services would
be consistent with maintaining the accountant’s independence. At the next scheduled Audit Committee meeting, services and fees
would be presented to the Audit Committee for formal consideration, and, if appropriate, approval by the entire Audit Committee. The
Audit Committee would again consider whether such services and fees are consistent with maintaining the principal accountant’s
independence.
The
Registrant’s Audit Committee is informed at least annually of all audit and non-audit services provided by the principal accountant
to the Vanguard complex, whether such services are provided to: the Registrant, other registered investment companies in the Vanguard
complex, The Vanguard Group, Inc., or other entities controlled by The
Vanguard Group, Inc. that provide ongoing services to the Registrant.
(2)
No percentage of the principal accountant’s fees or services were approved pursuant to the waiver provision of paragraph (c)(7)(i)(C)
of Rule 2-01 of Regulation S-X.
(f) For
the most recent fiscal year, over 50% of the hours worked under the principal accountant’s engagement were not performed
by persons other than full-time, permanent employees of the principal accountant.
(g) Aggregate
Non-Audit Fees.
Fiscal Year
Ended October 31, 2023: $1,703,928
Fiscal Year Ended October 31, 2022: $5,500,689
Includes fees
billed for non-audit services provided to the Registrant, other registered investment companies in the Vanguard complex, The Vanguard
Group, Inc., and Vanguard Marketing Corporation.
(h) For
the most recent fiscal year, the Audit Committee has determined that the provision of all non-audit services was consistent with maintaining
the principal accountant’s independence.
Item
5: Audit Committee of Listed Registrants.
The
Registrant is a listed issuer as defined in rule 10A-3 under the Securities Exchange Act of 1934 (“Exchange Act”). The Registrant
has a separately-designated standing audit committee established in accordance with Section 3(a)(58)(A) of the Exchange Act. The Registrant’s
audit committee members are: F. Joseph Loughrey, Mark Loughridge, Sarah
Bloom Raskin, and Peter F. Volanakis.
Item
6: Investments.
Not applicable.
The complete schedule of investments is included as part of the report to shareholders filed under Item 1 of this Form.
Item
7: Disclosure of Proxy Voting Policies and Procedures for Closed-End
Management Investment Companies.
Not applicable.
Item
8: Portfolio Managers of Closed-End Management Investment Companies.
Not applicable.
Item
9: Purchase of Equity Securities by Closed-End Management Investment
Company and Affiliated Purchasers.
Not applicable.
Item
10: Submission of Matters to a Vote of Security Holders.
Not applicable.
Item
11: Controls and Procedures.
(a)
Disclosure Controls and Procedures. The Principal Executive and Financial Officers concluded that the Registrant’s
Disclosure Controls and Procedures are effective based on their evaluation of the Disclosure Controls and Procedures as of a date within
90 days of the filing date of this report.
(b)
Internal Control Over Financial Reporting. There were no significant changes in the
Registrant’s Internal Control Over Financial Reporting or in other factors that could significantly affect this control during
the period covered by this report, including any corrective actions with regard to significant deficiencies and material weaknesses.
Item
12: Disclosure of Securities Lending Activities for Closed-End Management
Investment Companies.
Not applicable.
Item
13: Exhibits.
Pursuant to
the requirements of the Securities Exchange Act of 1934 and the Investment Company Act of 1940, the registrant has duly caused this report
to be signed on its behalf by the undersigned, thereunto duly authorized.
| |
VANGUARD
TRUSTEES’ EQUITY FUND |
| |
|
|
| BY: |
/s/
MORTIMER J. BUCKLEY* |
|
| |
MORTIMER
J. BUCKLEY |
|
| |
CHIEF
EXECUTIVE OFFICER |
|
Date: December
21, 2023
Pursuant to
the requirements of the Securities Exchange Act of 1934 and the Investment Company Act of 1940, this report has been signed below by
the following persons on behalf of the registrant and in the capacities and on the dates indicated.
| |
VANGUARD
TRUSTEES’ EQUITY FUND |
| |
|
|
| BY: |
/s/
MORTIMER J. BUCKLEY* |
|
| |
MORTIMER
J. BUCKLEY |
|
| |
CHIEF
EXECUTIVE OFFICER |
|
| |
|
|
| Date: December
21, 2023 |
| |
|
|
| |
VANGUARD
TRUSTEES’ EQUITY FUND |
| |
|
|
| BY: |
/s/
CHRISTINE BUCHANAN* |
|
| |
CHRISTINE
BUCHANAN |
|
| |
CHIEF
FINANCIAL OFFICER |
|
Date: December
21, 2023
| * By: |
/s/
Anne E. Robinson |
|
Anne E. Robinson,
pursuant to a Power
of Attorney filed on July 21, 2023 (see File Number 33-53683) and to a Power
of Attorney filed on March 29, 2023 (see File Number 2-11444), Incorporated by Reference.
Exhibit
99.CODEETH

|
Access Person Code of Conduct
Effective
Date: 01 March 2022 | Contact: Code_of_Ethics@vanguard.com
|
Background – Why This Access Person Code of Conduct Matters
Vanguard was founded with a singular focus
on clients and serving their best interests, and this has been the foundation of our strong ethical culture. One way in which we consistently
seek to earn and maintain the trust and loyalty of our clients is by adhering to the highest standards of ethical behavior. Acting with
integrity and complying with applicable laws and regulations necessarily extends to your conduct in general and to your personal investing
and trading activities in particular.
Some crew and contingent workers at Vanguard, by virtue of their
role or department, are designated as an “Access Person” (i.e., an Advisor Access Person, Fund Access Person, or Investment
Access Person) because they or their department are authorized to know about present or future transactions by Vanguard funds, or have
the authority to influence those transactions, or otherwise have access to sensitive market or client activity. Because of that knowledge,
authority, and access, Access Persons are subject to additional standards of business conduct, stricter personal investment rules, and
greater oversight, among other things. These standards and rules, as set forth in this Access Person Code of Conduct (APCC)1,
have been adopted with the goals of ensuring we comply with applicable law and avoiding conflicts of interest or the appearance of conflicts
of interest. This is especially true regarding any potential conflicts of interest that could arise between the securities trading that
Vanguard undertakes on behalf of the Vanguard funds or our clients and the personal securities trading by crew, contingent workers, and
their household or family members.
Policy Coverage
To Whom Does the APCC Apply?
This policy2 applies to all crew members and contingent
workers globally who are in a role that has been designated as an “Access Person” role. Certain provisions of this
policy also apply to Associated Persons.
Are you an Access Person? Visit Appendix A to learn
whether the role you’re in is an Access Person role, and if so, which Access Person “designation” applies.
What
about Non-Access Persons? Any crew member or contingent worker who is not in a role that has been designated as an Access
Person role is a “Non-Access Person” and must comply with the Personal Investment Activity Policy for Non-Access Persons,
not this policy.
Are you a contingent worker? A “contingent
worker” is any person other than a crew member who provides services to or on behalf of Vanguard through staffing firms, consulting
1 The APCC constitutes
the code of ethics that the Vanguard funds have adopted in compliance with U.S. SEC Rules 17j-1 and 204A-1.
2 The APCC is a policy
that has been created and approved, and is governed, similar to other policies at Vanguard. As used herein, references to “this
policy” mean the APCC.
firms,
service providers, or as independent contractors. Like crew, a contingent worker can be in either an Access Person or Non-Access Person
role.
What
about Associated Persons? For U.S. crew and contingent workers who are Associated Persons (to reiterate, not Access Persons, but Associated
Persons) under FINRA rules and regulations, please note you have additional investment-related obligations under the FINRA Licensing
Policy, including the Securities Account Reporting Obligations
for Associated Persons. Please review and comply with those
documents, as well.
Policy Overview
There are four primary sections to this policy:
Section 1
– Standards of Business Conduct, sets forth rules and expectations regarding your behavior and conduct.
Section 2
– Personal Investment Activities, contains rules on how you and your Household or Family Members may own and trade securities
for your own personal benefit. Note that some of these rules differ based on your Access Person designation. While the details are set
forth in Section 2, at a high level there are four subsections applicable to you and your personal investment activities:
A – Reminders on who is covered
B – Brokerage firms you may use
C – Disclosure obligations
D – Investment and trading restrictions
Section 3
– Penalties and Sanctions, describes how violations of this policy are addressed and enforced.
Section 4
– Defined terms, provides definitions for the capitalized terms used in this policy.
Please carefully read the rest of this policy and ensure you understand
and comply with its terms. Understanding and following this policy is one of the most important ways we can ensure our clients’
interests always come first.
Be sure you are familiar with the following other Vanguard policies
that relate to your ethical conduct and personal investment activities:
·
Standards of Conduct Policy
·
Conflicts of Interest Policy
·
Insider Trading Policy
·
Outside Business Activity Policy
Please
also ensure you are familiar with Vanguard’s Code of Ethical Conduct.
Policy Requirements
Section 1 – Standards of Business Conduct
Everyone at Vanguard is expected to promote high standards of integrity
and manage the company’s affairs honestly and ethically. We all have a personal responsibility to conduct ourselves
in a manner that reflects a commitment to ethics and compliance with
all applicable laws and regulations. Doing so is part and parcel of Vanguard’s mission to “take a stand for all investors,
to treat them fairly, and to give them the best chance for investment success.”
Putting
these values into practice means having and adhering to expected standards of business conduct. The Vanguard policy that explains
these standards is the Standards of Conduct Policy,
which is incorporated herein by reference. You must comply with that policy, including the following standards of conduct that are
explained therein:
| 1. | Always put Vanguard clients’ interests first and
treat them fairly. |
| 2. | Avoid conflicts of interest. |
| 3. | Be candid and clear with clients and provide them with
accurate information. |
| 4. | Comply with applicable laws, rules, regulations, and policies. |
| 5. | Comply with applicable professional standards. |
| 6. | Complete mandatory training and regularly certify that
you are compliant with our policies. |
| 7. | Maintain accurate, timely, and complete business records. |
At Vanguard, you are expected to always do
the right thing. It sounds simple and it’s usually very clear what doing the right thing entails. But sometimes it isn’t.
How do you make the best choice when facing difficult or unclear circumstances? How do you navigate an ethical dilemma?
In those situations, you should pause and
reflect, and then work through the following “ethical decision-making guide.” This guide will help you consider important
questions before deciding whether or how to proceed with an action. It is not a substitute for this or any policy, and it may not tell
you exactly what to do in every situation, but it can be used as a tool to help guide you when you face an ethical dilemma or a complex
situation where the answer might not be clear.
If you’re still in doubt as you work through the decision-making
guide, err on the side of caution—ask questions, elevate the issue, and enlist the help of others to ensure we reach the right
answer every time for Vanguard and our clients.
Speaking Up – As mentioned above, you are encouraged
to help protect our clients, crew, and Vanguard by reporting concerns about ethics, financial or business integrity, information security
and privacy, workplace practices, or alleged violations of policy, regulation, or law. Indeed, speaking up is one of the most effective
ways to help ensure Vanguard maintains its high standards for ethics and compliance. To that end, if you become aware that you or anyone
else violated any of the terms of this policy, you must contact Compliance immediately.
Likewise, it is your responsibility to know whether the role you are
in is designated as an Access Person, and if so, which Access Person designation applies to you (visit the Appendix A to learn more).
It is also your responsibility to know the policies and trading restrictions that apply to you accordingly, and to ask questions if you
are unsure.
Section 2 – Personal Investment Activities
Introduction
Vanguard recognizes the importance to crew and contingent workers
of being able to manage and develop their own financial resources through long-term investments and strategies. With that in mind, the
rules and requirements set forth in this policy have been adopted with the goals of (1) ensuring we comply with all applicable laws and
regulations, and (2) avoiding any conflicts of interest, or any appearances of conflicts of interest, between the securities trading that
Vanguard undertakes on behalf of Vanguard funds or our clients and the personal securities trading or investing by crew, contingent workers,
or their Household or Family Members (defined in Section 4, below). Our industry and Vanguard have implemented certain standards and limitations
designed to minimize these conflicts and help ensure that we focus on meeting our duty to clients.
Granted, the rules in this policy are demanding and strict and they
may feel like an imposition. But at Vanguard, we take our ethical obligations very seriously, and the rules in this policy are intended
to ensure that trading on behalf of Vanguard funds and clients are given priority over trading for your personal accounts, and that trades
for your personal accounts do not adversely affect trades for our funds or clients.
Similarly, keep in mind that you must comply with applicable securities
laws and must avoid taking personal advantage of your knowledge of securities activity in Vanguard funds or client accounts.
This policy includes specific restrictions on personal investing but
cannot anticipate every fact pattern or situation. You should adhere to the spirit, and not just the letter, of this policy.
Compliance will keep all records relating to personal account trading
as confidential as necessary. Information will be accessible within Compliance and may be reported to senior management or HR. Records
may also need to be made available to Internal Audit and/or any regulator. All non-U.S. crew and contingent workers are required to sign
a data consent / data privacy notice.
The Compliance Department reserves the right to monitor any and all
investment or trading activity by you or by any Household or Family Member based on any information or system to which it has access.
Checklist
Given the complexity of this policy and the steps you must take to
ensure you remain in compliance with it, we have created this brief checklist to help you keep track of your obligations. This is merely
a summary, so be sure to comply with the full terms of this policy as well.
| Checklist item |
Where this topic is covered in this policy |
| ¨ I
know my Access Person “designation,” and I am aware that this policy applies not only to me but also to my Household
or Family Members |
Subsection
2-A – Who Is Covered Under this Policy |
| ¨ For the region where I work, I know what brokerage firm I and my Household or Family Members may use to maintain the accounts where I or they hold and trade Reportable Securities |
Subsection
2-B – Brokerage Firms You May Use |
| ¨ For
my Access Person designation, I know the initial and ongoing account and holdings disclosure obligations that apply to me and
my Household or Family Members |
Subsection
2-C – Disclosure Obligations |
| ¨ For
my Access Person designation, I know the rules and limitations for transacting securities in my personal accounts and
those of my Household or Family Members |
Subsections
2-D-1 and 2-D-2 – Investment and Trading Restrictions |
| ¨ For Fund Access Person and Investment Access Person designations, I know how to seek trade preclearance |
Subsection
2-D-3 – How to Seek and Abide by Preclearance
Requirements |
| ¨ I know the penalties and sanctions that may apply for violations of any of the requirements under this policy |
Section
3 – Penalties and Sanctions |
| ¨ I understand the meaning of the defined terms used in this policy |
Section
4 – Defined Terms |
|
Quick Tip:
The rules in this policy cover most of the personal investing situations
you are likely to find. Yet it’s always possible you will encounter a situation that isn’t fully addressed by the rules. If
that happens, you need to know what to do. The easiest way to make sure you are making the right decision is to follow these three principles:
1. Know the policy. If you think your situation isn’t
covered, check again. It never hurts to take a second look at the rules.
2.
Seek guidance. Asking questions is always appropriate. Talk with your manager or contact Compliance if
you’re not sure about the policy requirements or how they apply to your situation.
3. Use sound judgment. Analyze the situation and weigh the
options. Think about how your decision would look to someone outside of Vanguard.
|
Note
for crew in China:
Because
you may not have access to MCO, different systems and procedures are in place for you to disclose accounts and holdings. Please consult
with your manager or the China Compliance team to learn more. |
Subsection
2-A – Who Is Covered Under this Policy
As
stated in the introduction to this policy, above, this policy applies to all crew members and contingent workers globally who are in
a role that has been designated as an “Access Person” role.
Access
Persons are covered – This policy applies to crew and contingent worker Access Persons and, in certain instances, to their
Household or Family Members.
| o | Access
Persons – Please note that the specific trading prohibitions and reporting requirements
vary depending on your Access Person “designation,” meaning Advisor Access
Person, Fund Access Person, or Investment Access Person. To learn the Access
Person designation that applies to your role, visit Appendix A. Note further that, regardless
of your designation, the Compliance Department has the authority, with appropriate notice
to you, to apply to you any or all of the trading restrictions within this policy |
| o | Household
or Family Members – Certain aspects of this policy apply not only to you but to
your Household or Family Members, as well. Why? Doing so is required by applicable law and
regulations in many jurisdictions. It is also consistent with industry best practices and
helps Vanguard ensure we are effectively monitoring and guarding against conflicts of interest
and other issues. See Section 4, below, for the definition of Household or Family Members
in the region where you work. |
Non-Access
Persons are not covered – If the role you are in is not an Access Person role, you do not need to comply with this policy;
instead, with regard to your personal investments, you must comply with the Personal Investment Activity Policy for Non-Access Persons
(and other applicable policies). Note, however, that in the event a Non-Access Person is a Household or Family Member of an Access Person,
then the terms of this policy will apply to the Non-Access Person as a Household or Family Member hereunder and any conflicting terms
of this policy will take precedence over the Personal Investment Activity Policy for Non-Access Persons.
Associated
Persons also have obligations under other policies and documents – For U.S. crew and contingent workers who are deemed to be
Associated Persons (to reiterate, not Access Persons, but Associated Persons) under the FINRA Licensing Policy, you have certain
obligations under this policy and have additional investment-related obligations under the FINRA Licensing Policy and the Securities
Account Reporting Obligations for Associated Persons.
Your
designation may change – Keep in mind that your Access Person designation may change over time, for instance if you change
roles, if there are changes made in your department, or if the Compliance Department determines a designation change is appropriate.
You are advised to regularly consult the My Ethics and Compliance Resource Center available on CrewNet to check your designation.
Subsection
2-B – Brokerage Firms You May Use
The
terms of Subsection 2-B apply to all Access Person designations.
The
following requirements and restrictions on which brokerage firms you may use to hold and transact Reportable Securities apply to you
based on whether you are a crew member or contingent worker and where you work:
| U.S. Crew: |
Crew who are Access Persons employed in the U.S., and their Household or Family Members (parts (a) and (b) of that defined term only), must maintain and trade all Reportable Securities in a Vanguard Brokerage Account (VBA). This obligation does not apply to any Household or Family Members covered under part (c) of that defined term. See the Defined Terms in Section 4, below, for all definitions. Securities or investments that are not “Reportable Securities” may be held in a brokerage account at the firm of your choice. Employer-sponsored retirement accounts (e.g., 401(k) and 403(b)), 529 college savings plans, and Compliance-approved accounts (e.g., Approved Managed Accounts) may be held in a brokerage account at the firm of your choice. However, if you hold any Reportable Securities through any of those accounts, then such accounts are considered Covered Accounts under this policy and you are required to disclose them to Compliance under Subsection 2-C of this policy. Newly hired U.S. crew who are Access Persons, and their Household or Family Members (parts (a) and (b) of that defined term only), must transfer any existing applicable Reportable Securities to a VBA by submitting a request or other applicable paperwork with Vanguard and each firm at which you have an existing applicable brokerage account within 60 days of your joining Vanguard. Visit Vanguard.com > Personal Investors > Open an Account to transfer assets from another firm to Vanguard. For a more detailed list of Securities that must be held in a VBA, as well as Securities that may be held elsewhere, visit the Appendices C-F. |
| Ex-U.S. Crew: |
Crew who are Access Persons employed outside the U.S., and their Household or Family Members, may maintain Reportable Securities (as well as Securities or investments that are not Reportable Securities) in a brokerage account or other type of account at the firm of their choice.
|
| Contingent Workers, Globally |
Contingent workers who are Access Persons may maintain Reportable Securities (as well as Securities or investments that are not Reportable Securities) in a brokerage account at the firm of their choice. |
Subsection
2-C – Disclosure Obligations
The
terms of this Subsection 2-C apply to all Access Person designations and to all Associated Persons.
This
policy requires the disclosure of a variety of account and holdings information to the Compliance Department for monitoring and oversight.
This policy requires (1) an initial disclosure of information, and (2) periodic ongoing disclosures. Even if you do not have any personal
brokerage
account
holdings or do not trade in Reportable Securities, you are still required to complete the necessary initial and periodic disclosures.
1.
Initial Disclosure of Accounts and Holdings
Within
ten (10) calendar days of joining Vanguard, or if applicable within ten (10) calendar days of moving from a Non-Access Person role at
Vanguard into an Access Person role, all Access Persons and Associated Persons must disclose the following to Compliance:
(a)
All Covered Accounts and all Reportable Securities held by you or a Household or Family Member;
(b)
All Covered Accounts in which you exercise Investment Discretion;
(c)
All Covered Accounts over which you exercise control (e.g., agent authority (full or limited), trustee, power of attorney authority,
etc.);
(d)
All accounts in which you have, or will acquire, Beneficial Ownership of Securities; and
(e)
All accounts held by you and any Household or Family Member in which there are college saving plan products (including, in the U.S.,
529 plans), annuity products, or other insurance products that, in turn, hold or invest in Vanguard Funds.
This
includes Brokerage Accounts held at Vanguard, as well as those held at another financial institution. For clarity, you do not need to
disclose an account or submit transaction confirmations or statements if the account does not have the ability to hold Securities –
for example, a traditional checking, savings, or deposit account with a bank, credit union, or building society for holding cash would
not need to be disclosed.
This
information must be current as of no more than 45 calendar days before joining Vanguard.
To
make this initial disclosure, you will receive an Initial Certification assignment by email to complete which will include a section
to disclose Covered Accounts and all Reportable Securities by including account information in the “Account Attestation”
section of the assignment and uploading corresponding account statements via MCO. You must
complete and submit the Initial Certification within ten (10) calendar days of receiving it; the failure to do so may be considered a
violation of this policy.
| Note: We
use an application called MyComplianceOffice, or MCO, to help manage this policy. You may use MCO to disclose accounts and holdings,
and to secure trading permissions, if those obligations apply to you. Visit My Ethics and Compliance Resource Center on CrewNet for
resources on how to access and use MCO |
2.
Ongoing Disclosure of Accounts, Transactions, and Duplicate Statements
After
the Initial Disclosure, Access Persons and Associated Persons may need to disclose account and transaction information to Compliance
on a periodic basis regarding Covered Accounts and any transactions in Reportable Securities made by you and your Household or Family
Members.
Further,
if at any time you or a Household or Family Member subsequently:
| · | open,
or intend to open, a Covered Account with a financial institution (e.g., broker, dealer,
advisor, or any other professional money manager), or |
| · | acquire
holdings in Reportable Securities, or |
| · | have
a preexisting Covered Account (including a Vanguard Brokerage Account) that becomes associated
with you or a Household or Family Member (such as through marriage or inheritance or some
other life event), |
or
there becomes an account in which you acquire Beneficial Ownership of Securities, then you must notify Compliance as soon as possible
(and in any event within 10 calendar days) and disclose these Covered Accounts and Reportable Securities by listing them and including
associated information in the Accounts tab in MCO.
For
U.S. crew, keep in mind that, as explained in Section 2-B of this policy above, you and your Household or Family Members (parts (a) and
(b) of that defined term only) must maintain Reportable Securities in a VBA.
What
and how to disclose this information:
| · | For
VBAs disclosed by U.S. crew as required under this policy, Compliance will receive transaction
confirmations automatically. No additional action by you is needed to disclose transactions
of Reportable Securities in VBAs you have disclosed. |
| · | For
Covered Accounts and holdings of Reportable Securities held outside of Vanguard (including
in any account that would require disclosure under Section 2-C(1) of this policy), it is
your responsibility to ensure that duplicate statements and transaction confirmations
are available to or delivered to Compliance: |
| o | Because
Vanguard has file feed contracts in place with many brokerage firms worldwide, for many Covered
Accounts you disclose the holdings and transactions information will be sent to Compliance
electronically with no additional action needed by you. |
| o | For
Covered Accounts held at firms where Vanguard does not have a file feed in place, you must
do the following: |
| § | Contact
the firm where your Covered Account is held and take steps to send duplicate statements and
daily transaction confirmations (electronic or paper) to Vanguard. You do this often by making
Vanguard Compliance an interested party and having duplicate statements and confirmations
sent to the third party scanning service Vanguard uses, called “Earth Class Mail”
at this address: Vanguard, c/o TerraNua, 9450 SW Gemini Drive #37880, Beaverton, OR, 97008-7105. |
| § | If
the firm where your Covered Account is held is not able to send statements and daily transaction
confirmations (electronic or paper) to Vanguard, you are required to scan and upload copies
into the Trading Documents folder in MCO immediately after you receive them, unless you receive
an exemption from this requirement from Compliance. You must ensure the documents you upload
clearly show the firm/institution at which the account is held, the account number or ID,
the account owner, and the account type. |
| · | If
Compliance does not receive the information automatically via a file feed, you will receive
email notifications on a calendar quarterly basis to complete a Quarterly Securities Transaction
Report and thereby disclose Covered Accounts and Reportable Securities, via MCO. You must
complete and submit that assignment within 30 calendar days; the failure to do so may be
considered a violation of this policy. |
| · | On
an annual basis (usually in January or February), you will receive an assignment from Compliance
in which you must certify, among other things, that all Covered Accounts and Reportable Securities
are recorded accurately in MCO. |
3.
Additional notes related to disclosures under this policy:
| · | For
clarity, you do not need to disclose an account or submit transaction confirmations or statements
if the account does not have the ability to hold Securities (for example, a traditional checking,
savings, or deposit account with a bank, credit union, or building society for holding cash
would not need to be disclosed). |
| · | As
stated above, U.S. crew and contingent workers who are Associated Persons are also required
to comply with and are subject to the FINRA Licensing Policy and Securities Account Reporting
Obligations. |
| · | The
Compliance Department will keep personal trading information confidential, but please note
that such information may be accessible to authorized personnel within Compliance and may
be reported to or summarized for senior management, HR, or the OGC for investigative purposes.
Applicable records may also be provided to internal or external auditors and/or to any regulator
if required. All ex-U.S. crew and contingent workers are required to sign a data consent
/ data privacy notice. |
| · | Please
note that crew and contingent workers in Australia are required to disclose all transactions
in VIA funds in MCO in the same manner as is required for Reportable Securities. |
Subsection
2-D – Investment and Trading Restrictions
This
Subsection 2-D contains three segments:
Segment
2-D-1 applies to all Access Person designations.
Segment
2-D-2 has terms and requirements that differ based on your Access Person designation.
| o | Segment
2-D-2(a): Advisor Access Person requirements |
| o | Segment
2-D-2(b): Fund Access Person requirements |
| o | Segment
2-D-2(c): Investment Access Person requirements |
Segment
2-D-3 explains how to seek and abide by preclearance requirements, if applicable to your activity.
Segment
2-D-1: Rules and Limitations applicable to all Access Person designations
The
terms of this Segment 2-D-1 apply to all Access Person designations.
| (1) | You
must comply with all applicable securities-related rules and laws. |
| (2) | You
may not engage in conduct that is deceitful, fraudulent, or manipulative, or that involves
false or misleading statements, in connection with the purchase or sale of a Security by
a Vanguard Fund or Vanguard Client account or otherwise. |
| (3) | You
may not intentionally, recklessly, or negligently circulate false information or rumors that
may affect the securities markets or may be perceived as market manipulation. |
| (1) | You
may not take personal advantage of knowledge of recent, impending, or planned Securities
activities of the Vanguard Funds or their investment advisors or any Vanguard Client. You
are prohibited from purchasing or selling—directly or indirectly—any Security
or Related Security when you know that the Security is being purchased or sold, or considered
for purchase or sale, by a Vanguard Fund (with the exception of an index fund) or by a Vanguard
Client. |
| (2) | You
are subject to and must comply with the Insider Trading Policy and/or any similar policy
of the Vanguard affiliate or region for which you work. Each of these policies is considered
an integral part of your obligations under this policy. Each policy prohibits you from buying
or selling any Security while in possession of material, nonpublic information about the
issuer of the Security. The policies also prohibit you from communicating any nonpublic information
about any Security or issuer of Securities to third parties. |
| (3) | You
must comply with the Confidential Information Policy, including that you may not share information
with any third party about any planned, upcoming, or recently executed trading activity by
any Vanguard Fund or Vanguard Client unless such information is publicly available through
no action by you. |
| iii) | Fund
policies and excessive trading: |
| (1) | When
purchasing, exchanging, or redeeming shares of a Vanguard Fund, you must adhere to the policies
and standards set forth in the fund’s prospectus, or offering document, including policies
on market-timing and frequent trading. |
| (2) | Excessive
trading in Covered Accounts is strongly discouraged. The Compliance Department reserves the
right to monitor trading across all of your Covered Accounts, and may conduct scrutiny of
any trades in your Covered Accounts where such trading may appear excessive in nature (including,
but not limited to, if the number of trades is so frequent as to potentially impact your
ability to carry out your assigned responsibilities or the trades involve positions that
are disproportionate to your net assets). If Compliance in its sole discretion determines
you have engaged in excessive trading, then Compliance may limit the number of trades allowed
in your Covered Accounts during a given period. This Section 2-D-1(a)(iii)(2) does not apply
to transactions in an Approved Managed Account. |
| iv) | Beneficial
ownership and discretion: |
| (1) | The
terms and restrictions of this policy apply to all Securities in which you have acquired
or will acquire Beneficial Ownership. |
| (2) | You
must comply with these investment and trading restrictions with respect to any account you
own as well as any account over which you have Investment Discretion or in which you have
the authority to transact. |
| v) | No
circumvention – You are not permitted to assist,
aid, or enable any other person in doing anything that you are prohibited from doing under
this policy. |
| (1) | The
Chief Compliance Officer may grant exceptions to this policy, including preclearance, other
trading restrictions, and certain reporting requirements on a case-by-case basis if it is
determined that (1) the proposed conduct involves no opportunity for abuse, (2) the proposed
conduct does not conflict with Vanguard’s interests, and (3) not granting an exception
would result in an unfair or unjust outcome. |
| (2) | The
Chief Compliance Officer may waive the applicability of this policy for a contingent worker
if the policy’s requirements are covered through the applicable service provider’s
contract with Vanguard. |
| (b) | Rules
regarding specific investments or investment types: |
| (1) | You
and your Household or Family Members may not use a derivative to avoid or circumvent a rule
or requirement set forth in this policy. If something is prohibited by these rules, then
it is also against these rules to effectively accomplish the same thing by using a derivative.
This includes futures, options, and other types of derivatives. |
| (2) | You
and your Household or Family Members are permitted to trade futures or options on commodities. |
| (1) | You
and your Household or Family Members are prohibited from acquiring Securities in an Initial
Public Offering (IPO) or Secondary Offering. |
| (2) | You
and your Household or Family Members are prohibited from participating in an Initial Coin
Offering (ICO). |
| (1) | You
and your Household or Family Members are not permitted to invest in securities offered to
potential investors in a Private Placement or other limited investment offering without first
obtaining preclearance from Compliance. |
| (2) | You
must provide documentation describing the investment (e.g., offering memorandum, subscription
documents, etc.) so as to enable Compliance to conduct a thorough review of the investment.
|
| (3) | Approval
by Compliance may be granted or denied after a review of the facts and circumstances, including
whether: |
| · | An
investment in the securities is likely to result in future conflicts with Vanguard Client
accounts. |
| · | You
are being offered the opportunity due to your employment at, or association with, Vanguard. |
| (4) | If
you or your Household or Family Members receive approval to purchase Securities in a Private
Placement, you must immediately inform Compliance if that Security goes to public offer or
is pending listing on an exchange. |
| (5) | To
initiate the process for obtaining preclearance of a Private Placement, complete the Outside
Business Activity request form (the form for U.S. crew is in LARS, and for ex-U.S. crew
is in MCO). |
iv)
SPACs – You and your Household or Family Members are prohibited from acquiring a SPAC at any
stage of its lifecycle (i.e., pre-IPO, IPO, pre-merger, post-merger).
v)
Short-Selling – You are prohibited from selling short any Security that you do not own or from
otherwise engaging in short-selling activities.
vi)
Limit Orders – Same-day limit orders are permitted; however, good 'til cancelled orders (such
as limit orders that stay open over the course of multiple trading days until a security reaches a specified market price) are not permitted.
vii)
Digital Currencies and Related Investments – Refer to the Trading and Reporting Requirements
for Digital Currency Investments and Activities for details on which digital currency account and product
types are permitted, and what must be disclosed, under this policy.
| (c) | Short
term trading in a Vanguard Fund (other than Vanguard ETFs): |
i)
Compliance may monitor trading in Vanguard Funds, other than Vanguard ETFs, and will review situations
where Vanguard Fund shares are redeemed within 30 calendar days of purchase (a “short-term trade”). You may be required to
relinquish to Vanguard any profit made on a short-term trade and will be subject to disciplinary action if Compliance determines the
short-term trade was detrimental to a Vanguard Fund or a Vanguard Client or that there is a history of frequent trading by you or your
Household or Family Members. For purposes of this paragraph:
| (1) | A
redemption includes a redemption by any means, including an exchange out of a Vanguard Fund. |
| (2) | This
policy does not cover purchases and redemptions/sales (i) into or out of Vanguard money market
funds, Vanguard short-term bond funds, or (ii) through an Automatic Investment Program. |
ii)
Nothing in this section is intended to replace, nullify, or modify any requirements imposed by a Vanguard
Fund.
Segment
2-D-2: Specific Limitations and Prohibitions that Apply Based on Access Person Designation
The
terms and requirements of this Segment 2-D-2 are in addition to the terms and requirement of Segment 2-D-1, and you must
comply with the portions of this Segment 2-D-2 that apply to your Access Person designation. Note, an Access Person designation can apply
to crew members or contingent workers.
Segment
2-D-2(a): Advisor Access Person requirements
The
following terms and requirements apply to Advisor Access Persons only and are in addition to the terms and requirements of Segment
2-D-1:
| Securities transactions for which you must obtain preclearance (meaning, approval from Compliance before transacting) |
None.
You are not required to obtain preclearance of any Covered Securities transactions by you or your Household or Family Members,
except Private Placements as described above. |
| Prohibited Securities transactions |
In addition to Segment 2-D-1, you are subject to the following restrictions with respect to any transaction in which you will acquire any direct or indirect Beneficial Ownership: · Short-Term Trading. You are prohibited from purchasing and then selling any Covered Security at a profit, as well as selling and then repurchasing a Covered Security at a lower price, within 60 calendar days. A last-in/first-out accounting methodology will be applied to a series of Security purchases when applying this rule. (Note, as stated, this is based on last-in/first-out accounting regardless of how you placed the trade or plan to report it for tax purposes.) If you realize profits on short-term trades, you will be required to relinquish the profits to Vanguard (exclusive of commissions). In addition, the trade will be recorded as a violation of this policy. For example: you would not be permitted to sell a Covered Security at $12 that you purchased within the prior 60 days for $10. Similarly, you would not be permitted to purchase a Covered Security at $10 that you had sold within the prior 60 days for $12. ·
Short-term trading on options. You may hold options on a Covered Security until you exercise the options or the options expire.
However, you may not otherwise close any open positions within 60 calendar days. If you realize profits on such short-term trades, you
must relinquish such profits to Vanguard (exclusive of commissions). In addition, the trade will be recorded as a violation of this policy. Note:
These types of transactions can have unintended consequences. |
| |
For example, your call option could be assigned, causing the underlying Security to be called away within sixty (60) calendar days following the purchase of the Covered Security.
|
| |
Visit
the Appendix C for a table summarizing the trading and reporting requirements for Advisor Access Persons. |
Segment
2-D-2(b): Fund Access Person requirements
The
following terms and requirements apply to Fund Access Persons only and are in addition to the terms and requirements of Segment
2-D-1:
| Securities transactions for which you must obtain preclearance (meaning, approval from Compliance before transacting) |
Yes, you must obtain, for yourself and on behalf of your Household or Family Members, preclearance for any transaction of a Covered Security by you or any Household or Family Member. See
Segment 2-D-3, below, for instructions on how to seek preclearance. |
| Securities transactions that do not require preclearance |
You are not required to obtain preclearance for the following:
·
Purchases or sales of Vanguard Funds.
·
Purchases or sales where the person requesting preclearance has no direct or indirect influence or control over the account (e.g., you
have a trust in your name but you are not the trustee who places the transaction, provided you have granted Investment Discretion to
the trustee and there has been no prior communication between you and the trustee regarding the transaction).
·
Corporate actions in Covered Securities such as stock dividends, stock splits, mergers, consolidations, spin-offs, or other similar corporate
reorganizations or distributions.
·
Purchases or sales made as a part of an Automatic Investment Program.
·
Purchases effected upon the exercise of Rights which were issued by an issuer pro rata to all holders of a class of its Securities, to
the extent such Rights were acquired from such issuer.
· Acquisitions of Covered Securities
through gifts or bequests.
Visit the Appendix D for a table summarizing the trading and reporting requirements for Fund
Access Persons. |
| Is preclearance required for trades in an Approved Managed Account? |
No, you are not required to seek preclearance of a transaction in a Covered Security in an Approved Managed Account so long as you have no prior communication with the portfolio manager of that account in connection with that transaction. Note,
Vanguard PAS accounts generally do not qualify as Approved Managed Accounts because PAS account owners generally retain some level
of investment discretion. Further, any |
| |
trades of Covered Securities in a PAS account must be precleared under this policy. |
“Blackout
period” restrictions that may apply to personal trading in Covered Securities
|
You may be subject to certain restrictions if you purchase or sell a Covered Security within seven (7) days before or after a Vanguard Fund purchases or sells the same Covered Security or a Related Security (the “blackout period”). Purchasing or selling before a Vanguard Fund: · If you purchase a Covered Security within seven days before a Vanguard Fund purchases the same Covered Security or a Related Security, you may be required to hold the Covered Security for 6 months before being permitted to sell the Covered Security for a profit. · If you sell a Covered Security within seven days before a Vanguard Fund sells the same Covered Security or a Related Security, you may be required to relinquish to Vanguard any profits earned from your sale of the Covered Security (exclusive of commissions), where profits are calculated based on the price that the Vanguard Fund received for selling the Covered Security or a Related Security. Note: Compliance will review your sale to determine if the relinquishment is required. This decision will be based on several factors, such as your role, access to fund trades, and the Covered Security sold. Purchasing or selling after a Vanguard Fund: · In general, you will not receive preclearance to purchase a Covered Security within seven days after a Vanguard Fund trades the same Covered Security or a Related Security. If you execute the transaction without receiving preclearance, you will have violated this policy and must immediately sell the Covered Security and relinquish all profits received from the sale to Vanguard (exclusive of commissions). · In general, you will not receive preclearance to sell a Covered Security within seven days after a Vanguard Fund trades the same Covered Security or a Related Security. If you execute the transaction without receiving preclearance, you will have violated this policy and must relinquish to Vanguard the difference (exclusive of commissions) between the sale price you received and the Vanguard Fund's sale price (as long as your sales price is higher), multiplied by the number of shares you sold. In addition to these restrictions, local law may dictate the extent to which any gains must be relinquished. Compliance
may exempt from these restrictions certain trades during blackout periods that coincide with trading by certain Vanguard Funds (e.g.,
index funds). |
| |
The
blackout period restrictions set forth above will not apply
to a Fund Access Person’s sale of stock of any issuer which has a market capitalization
that exceeds US$5 billion (or local currency equivalent), provided that the total value of
any sales of the Security by the Fund Access Person do not exceed US$10,000 (or local currency
equivalent) in any 30-day rolling period. Sales of securities of issuers with market capitalizations
below US$5 billion, or that exceed US$10,000 in any 30-day rolling period, will continue
to be subject to the blackout periods unless Compliance grants a waiver.
Compliance may waive
the blackout period as it applies to the sale of a Covered Security if the Chief Compliance
Officer determines its application creates a significant hardship to you (e.g., you need
cash for a home purchase or to cover a major medical expense) and, in the opinion of the
Chief Compliance Officer, satisfies the requirements for a waiver in the Waivers paragraph
of Segment 2-D-1, above. Request and complete a Hardship Waiver Request Form. |
| Prohibited
Securities transactions |
In
addition to Segment 2-D-1, you are subject to the following restrictions with respect to
any transaction in which you will acquire any direct or indirect Beneficial Ownership: ·
Futures and Options. You are prohibited from entering into, acquiring, or selling
any Futures contract (including single stock futures) or any Option on any Security (including
Options on ETFs, Digital Utility Tokens, Digital Security Tokens, and Digital Currencies). ·
Short-Term Trading. You are prohibited from purchasing and then selling any Covered
Security at a profit, as well as selling and then repurchasing a Covered Security at a lower
price, within 60 calendar days. A last-in/first-out accounting methodology will be applied
to a series of Security purchases when applying this rule. (Note, as stated, this is based
on last-in/first-out accounting regardless of how you placed the trade or plan to report
it for tax purposes.) If you realize profits on short-term trades, you will be required to
relinquish the profits to Vanguard (exclusive of commissions). In addition, the trade will
be recorded as a violation of this policy. Example: You are not permitted to sell
a security at $12 that you purchased within the prior 60 days for $10. Similarly, you are
not permitted to purchase a security at $10 that you sold within the prior 60 days for $12. ·
Spread Bets. You are prohibited from participating in Spread Betting on Securities,
indexes, interest rates, currencies, or commodities. |
Segment 2-D-2(c): Investment Access Person requirements
The following terms and requirements apply to Investment
Access Persons only and are in addition to the terms and requirements of Segment 2-D-1:
| Securities transactions for which you must obtain preclearance (meaning, approval from Compliance before transacting) |
Yes, you must obtain, for yourself and on behalf
of your Household or Family Members, preclearance for any transaction of (i) a Covered Security, or (ii) a Vanguard ETF, by you or
any Household or Family Member.
See Segment 2-D-3, below, for instructions on how to seek
preclearance.
|
| Securities transactions that do not require preclearance |
You are not required to obtain preclearance for the following:
· Purchases
or sales of Vanguard Funds. (Reminder: The purchase or sale of Vanguard ETFs does require preclearance.)
·
Purchases or sales where the person requesting preclearance
has no direct or indirect influence or control over the Covered Security (e.g., you have a trust in your name but you are not the trustee
who places the transaction, provided you have granted Investment Discretion to the trustee and there has been no prior communication between
you and the trustee regarding the transaction).
·
Corporate actions in Covered Securities such as stock
dividends, stock splits, mergers, consolidations, spin-offs, or other similar corporate reorganizations or distributions.
·
Purchases or sales made as a part of an Automatic Investment
Program.
·
Purchases effected upon the exercise of Rights which
were issued by an issuer pro rata to all holders of a class of its Securities, to the extent such Rights were acquired from such issuer.
·
Acquisitions of Covered Securities through gifts or
bequests.
Visit the Appendix for a table summarizing the trading and
reporting requirements for Investment Access Persons.
|
| Is preclearance required for trades in an Approved Managed Account? |
No, you are not required to seek preclearance of a transaction
in a Covered Security in an Approved Managed Account so long as you have no prior communication with the portfolio manager of that account
in connection with that transaction.
Note, Vanguard PAS accounts generally do not qualify
as Approved Managed Accounts because PAS account owners generally retain some level of investment discretion. Further, any trades of Covered
Securities (but not trades of Vanguard ETFs) in a PAS account must be precleared under this policy.
|
|
“Blackout period” restrictions that may apply to
personal trading in Covered Securities |
You may be subject to certain restrictions if you purchase
or sell a Covered Security within seven (7) days before or after a Vanguard Fund purchases or sells the same Covered Security or a Related
Security (the “blackout period”).
Purchasing or selling before a Vanguard Fund:
·
If you purchase a Covered Security
within seven days before a Vanguard Fund purchases the same Covered Security or a Related Security, you may be required to hold the Covered
Security for 6 months before being permitted to sell the Covered Security for a profit.
·
If you sell a Covered Security within
seven days before a Vanguard Fund sells the same Covered Security or a Related Security, you may be required to relinquish to Vanguard
any profits earned from your sale of the Covered Security (exclusive of commissions), where profits are calculated based on the price
that the Vanguard Fund received for selling the Covered Security or a Related Security.
Purchasing or selling after a Vanguard Fund:
·
In general, you will not receive preclearance to purchase a
Covered Security within seven days after a Vanguard Fund trades the same Covered Security or a Related Security. If you execute the transaction
without receiving preclearance, you will have violated this policy and must immediately sell the Covered Security and relinquish all profits
received from the sale to Vanguard (exclusive of commissions).
·
In general, you will not receive preclearance to sell a
Covered Security within seven days after a Vanguard Fund trades the same Covered Security or a Related Security. If you execute the transaction
without receiving preclearance, you will have violated this policy and must relinquish to Vanguard the difference (exclusive of commissions)
between the sale price you received and the Vanguard Fund’s sale price (as long as your sales price is higher), multiplied by the
number of shares you sold.
In addition to these restrictions, local law may dictate
the extent to which any gains must be relinquished.
Compliance may exempt from these restrictions certain trades
during blackout periods that coincide with trading by certain Vanguard Funds (e.g., index funds).
Compliance may waive
the blackout period as it applies to the sale of a Covered Security if the Chief Compliance Officer determines its application creates
a significant hardship to you (e.g., you need cash for a home purchase or to cover a major medical expense) and, in the opinion of the
Chief Compliance Officer, satisfies the requirements for a waiver in the Waivers |
| |
paragraph of Segment D-1, above. Request and complete a Hardship Waiver Request Form.
|
| Prohibited Securities transactions |
In addition to Segment 2-D-1, you are subject to the
following restrictions with respect to any transaction in which you will acquire any direct or indirect Beneficial Ownership:
Futures
and Options. You are prohibited from entering into, acquiring, or selling any Futures contract (including single stock futures)
or any Option on any Security (including Options on ETFs, Digital Utility Tokens, Digital Security Tokens, and Digital Currencies).
Short-Term
Trading. You are prohibited from purchasing and then selling any Covered Security or a Vanguard ETF at a profit, as well
as selling and then repurchasing a Covered Security or a Vanguard ETF at a lower price, within 60 calendar days. A last-in/first-out
accounting methodology will be applied to a series of Security purchases when applying this rule. (Note, as stated, this is based
on last-in/first-out accounting regardless of how you placed the trade or plan to report it for tax purposes.) If you realize profits
on short-term trades, you will be required to relinquish the profits to Vanguard (exclusive of commissions). In addition, the trade
will be recorded as a violation of this policy. Example: You are not permitted to sell a security at $12 that you purchased
within the prior 60 days for $10. Similarly, you are not permitted to purchase a security at $10 that you sold within the prior 60
days for $12.
Spread
Bets. You are prohibited from participating in Spread Betting on Securities, indexes, interest rates, currencies, or commodities.
|
Segment 2-D-3: How to Seek and Abide by Preclearance
Requirements
If you are required to obtain preclearance of any trade or transaction
under this policy, then the terms of this Segment 2-D-3 apply to that trade or transaction.
Preclearance representations.
By seeking preclearance, you will be deemed to be advising
and representing to Compliance that you:
| · | Do not possess any material, nonpublic information relating
to the security. |
| · | Do not use knowledge of any proposed trade or investment
program relating to the Vanguard Funds for personal benefit. |
| · | Believe the proposed trade is available to any market participant
on the same terms. |
How do I obtain preclearance?
Preclearance must be obtained via the “Personal Trade
Pre-Clearance” path in MCO. Once the required information is submitted, your preclearance request will usually be approved
or denied
immediately. Transactions in Covered Securities (including,
for Investment Access Persons, transactions in Vanguard ETFs) may not be executed before you receive approval.
As a reminder, preclearance of Private Placements is addressed
in Segment 2-D-1 of this policy, above.
Attempting to gain approval after the transaction has occurred
is not permitted. Completing a personal trade before receiving approval or after the approval window expires constitutes a violation of
this policy. See Section 3 of this policy for more information regarding the sanctions that may be imposed as a result of a violation.
How long is my preclearance approval valid?
In the U.S.: Preclearance approval will expire
at the end of the trading day on which it is issued (e.g., if you receive approval for a trade on Monday, it is effective until the market
closes on that Monday). Preclearance for permitted limit orders is good for transactions on the same day that approval is granted
only. If you receive approval for a limit order, it must be executed or expire at the close of regular trading on the same business
day for which approval was granted. If you wish to execute the limit order after the close of regular trading on the day you received
approval, you must submit a new preclearance request for the day you wish to execute the trade.
Outside the U.S.: If you receive approval,
transactions must be executed no later than the end of trading on the next business day after the preclearance is granted. If the transaction
is not placed within that time, you must submit a new request for approval before placing the transaction. If you preclear a limit order,
that limit order must either be executed or expire at the end of the next business day. If you want to execute the order after the next
business day period expires, you must resubmit your preclearance request.
Section 3 – Penalties and Sanctions
How we enforce this policy
The Compliance Department regularly reviews the forms, reports, and
other information it receives. If these reviews turn up information that is incomplete, questionable, or potentially in violation of this
policy, the Compliance Department will investigate the matter and may contact you. If it is determined that you or any of your Household
or Family Members have violated this policy, the Compliance Department or another appropriate party may take action.
Violations
If
the Compliance Department determines that there has been a violation, you may be subject to penalties and sanctions as described in this
policy and otherwise as described in the Disciplinary Action Policy and,
for crew and contingent workers in Australia, the Managing Misconduct Policy. The Compliance Department will generally utilize a rolling
24-month period when evaluating whether and how to sanction a violation. Any violation of this policy may result in disciplinary
action up to and including termination of employment.
Vanguard takes all policy violations seriously and at times provides
the Vanguard Funds’ board with a summary of actions taken in response to material violations of this policy and other policies.
You should be aware that other securities laws and regulations not addressed by this policy may also apply to you, depending upon your
role at Vanguard.
Exceptions
The Chief Compliance Officer or designee retains the discretion to
interpret and grant exceptions to this policy and to decide how the rules apply to any given situation for the purpose of protecting the
funds and being consistent with the general principles of this policy and the Code of Ethical Conduct.
In cases where exceptions to this policy are noted and you may qualify
for them, you need to get prior written approval from the Compliance Department. If you believe that you have a situation that warrants
an exception that is not discussed in this policy, you may submit a written request to the Compliance Department, which will consider
your request and notify you of the outcome.
Section 4 – Defined Terms
The following definitions apply throughout this policy:
| Access Person |
Any person designated as an Investment Access Person, Fund Access Person, or Advisor Access Person. |
| Approved Managed Account |
An investment account where (i) the account is owned by an investor and overseen by a hired professional money manager, (ii) the investor has no trading discretion on the account, and (iii) Compliance has approved it as an Approved Managed Account. |
| Associated Person |
Any person who conducts securities business on behalf of Vanguard Marketing Corporation (VMC). This includes all FINRA-licensed contingent workers, as well as non-licensed contingent workers who perform certain operational and administrative functions for VMC. |
| Automatic Investment Program |
A program in which regular periodic purchases (or withdrawals) are made automatically in (or from) Investment accounts, according to a predetermined schedule and allocation. An Automatic Investment Program includes a dividend reinvestment plan. |
| Bankers’ Acceptance |
A time draft drawn on a commercial bank by a borrower usually in connection with an international commercial transaction. Bankers’ Acceptances are usually guaranteed by the bank. |
| Beneficial Ownership |
The opportunity to directly or indirectly—through
any contract, arrangement, understanding, relationship, or otherwise—share at any time in any economic interest or profit derived
from an ownership of or a transaction in a Security. For clarity, what you are deemed to have Beneficial Ownership of includes the following:
·
Any Security owned individually by you.
·
Any Security owned by a Household or Family Member.
·
Any Security owned in joint tenancy, as tenants in common,
or in other joint ownership arrangements.
·
Any Security in which a Household or Family Member has
Beneficial Ownership if the Security is held in a Covered Account over which you have decision making authority (for example, you act
as a trustee, executor, or guardian or you provide Investment advice).
·
Your interest as a general partner or manager/member
in Securities held by a general or limited partnership or limited liability company.
|
| |
· Your interest as a member of an Investment club or an organization that is formed for the purpose of investing in a pool of monies or Securities.
· Your ownership of Securities as a trustee of a trust in which either you or a Household or Family Member has a vested interest in the principal or income of the trust or your ownership of a vested interest in a trust.
· Securities owned by a corporation which is directly or indirectly controlled by, or under common control with, such person. |
| Bond |
A debt obligation issued by a corporation, government, or government agency that entails repayment of the principal amount of the obligation at a future date, usually with interest. |
| Certificate |
In Germany, a right or obligation issued by a bank where the payout profile or benefit of ownership depends upon or is tied to the performance of an agreed-upon underlying asset or security. |
| Certificate of Deposit (CD) |
An insured, interest-bearing deposit at a bank that requires the depositor to keep the money invested for a specified period. |
| Commercial Paper |
A promissory note issued by a large company in need of short-term financing. |
| Covered Account |
Any Vanguard Fund account, any brokerage account, and any other type of account that holds, or is capable of holding, Reportable Securities. |
| Covered Security |
Any Security (including through an IPO), but not
including any:
·
Direct Obligations of a Government;
·
Bankers' Acceptances, Certificates of Deposit (CD),
Commercial Paper, and High-Quality Short-Term Debt Instruments, including Repurchase Agreements;
·
Shares issued by Open-End Funds (although for European
subsidiaries, this is limited to UCITS schemes, a non-UCITS retail scheme, or another fund subject to supervision under the law of an
European Economic Area (EEA) state which is an index fund or which requires an equivalent level of risk spreading in their assets);
·
Life policies;
·
ETFs;
·
ETNs; or
·
Digital Currencies. |
| Debenture |
An unsecured debt obligation backed only by the general credit of the borrower. |
| Digital Currency |
A digital asset that: (1) serves solely as a store of value, a medium of exchange, or a unit of account; (2) is not issued or guaranteed by any jurisdiction, central bank, or public authority; (3) relies on algorithmic techniques to regulate the generation of new units of the digital asset; and (4) has transactions involving the digital asset recorded on a decentralized network or distributed ledger (e.g., blockchain). Common examples of a Digital Currency are Bitcoin and Ether. A Digital Currency is distinguishable from a Digital Security Token or a Digital Utility Token. |
| Digital Security Token |
Any digital asset that is not a Digital Currency or
Digital Utility Token. In general, a Digital Security Token may: (1) derive its value primarily from, or represent an interest in, a
separate asset or pool of assets; or (2) represent an interest in an enterprise or venture. A Digital Security Token may provide owners
or holders with voting rights, rights to distributions, or other rights associated with ownership. Digital Security |
| |
Tokens
are generally held for speculative investment purposes and not to provide holders with access to a particular network, product, or service.
Digital Security Tokens, like other investments, are generally not used as a medium of exchange.
Note, whether or not an asset is a Digital Security Token depends on specific facts and circumstances. Merely referring to an asset as a Digital Currency or Digital Utility Token does not prevent the asset from being a Digital Security Token. Furthermore, an asset may be a Digital Security Token even if it has some purported utility. Please contact Compliance if you have any questions regarding whether an asset is a Digital Security Token. |
| Digital Utility Token |
A digital asset that (1) provides access to a particular network, product, or service; (2) derives its value primarily from providing access to a particular network, product, or service; and (3) does not function as a Digital Currency or Digital Security Token. |
| Direct Obligation of a Government |
A debt that is backed by the full taxing power of any government. These Securities are generally considered to be of the very highest quality. |
| ETF or Exchange-Traded Fund |
An investment with characteristics of both mutual funds and individual stocks. Many ETFs track an index, a commodity, or a basket of assets. Unlike mutual funds, ETFs can be traded throughout the day. ETFs often have lower expense ratios but must be purchased and sold through a broker, which means you may incur commissions. |
| ETN or Exchange-Traded Note |
A senior, unsecured, unsubordinated debt Security issued by a financial institution, whose returns are based on the performance of an underlying index and backed only by the credit of the issuer. ETNs have a maturity date, but typically pay no periodic coupon interest and offer no principal protection. At maturity an ETN investor receives a cash payment linked to the performance of the corresponding index, less fees. |
| Futures / Futures Contract |
A contract to buy or sell specific amounts of a commodity or financial instrument (such as grain, a currency, including foreign currencies and Digital Currencies (e.g., Bitcoin), a Digital Security Token, or an index) for an agreed-upon price at a certain time in the future. Sometimes the arrangements in a contract prescribe that settlements are made through cash payments, rather than the delivery of physical goods or Securities; this is called Contract for Difference. |
| High-Quality Short-Term Debt Instrument |
An instrument that has a maturity at issuance of less than 366 days and is rated in one of the two highest ratings categories by a nationally recognized statistical rating organization, or an instrument that is unrated but determined by Vanguard to be of comparable quality. |
| Household or Family Member (U.S., Australia, Canada, China, Hong Kong, and Mexico) |
For the U.S., Australia, Canada, China, Hong Kong, and Mexico
regions, the term “Household or Family Member” includes:
a)
Your spouse or domestic partner (an unrelated adult
with whom you share your home and contribute to each other's support);
b)
Any child of yours or of your spouse or domestic partner,
provided that the child resides in the same household as or is financially dependent upon you; or
c)
Any other individual over whose accounts you have control
(e.g., agent authority (full or limited), trustee, power of attorney authority) and to whose financial support you materially contribute.
|
| |
For purposes of parts (a) and (b) of this definition, those
persons may not be deemed Household or Family Members under this policy if you demonstrate, to the satisfaction of the Compliance Department,
that you derive no economic benefit from, and exercise no control over, that person’s accounts. |
| Household or Family Member (Europe) |
For Europe crew members, the term “Household or Family Member” includes your spouse, domestic partner (an unrelated adult with whom you share your home and contribute to each other's support), and minor children, as well as relatives whether by blood, adoption, or marriage (e.g., children, grandchildren, siblings, parents, parents-in-law, stepchildren) residing in the same household for at least one year prior to the date of the personal transaction. |
| Initial Coin Offering (ICO) |
An initial offer or sale of Digital Currencies or Digital Security Tokens. Note, whether or not an offering is an ICO depends on specific facts and circumstances. Please contact Compliance before participating in an initial offering of a Digital Currency, Digital Security Token, or Digital Utility Token |
| Initial Public Offering (IPO) |
A corporation's first offering of common stock to the public. |
| Investment Contract |
Any contract, transaction, or scheme whereby a person invests money in a common enterprise and is led to expect profits solely from the efforts of the promoter or third party. |
| Investment Discretion |
The authority an individual may exercise, with respect to investment control or trading discretion, on another person's account (e.g., executor, trustee, power of attorney). |
| Non-Access Person |
Any person in a role that has not been designated as an Access Person role. |
| Note |
A financial security that generally has a longer term than a bill, but a shorter term than a Bond. However, the duration of a note can vary significantly and may not always fall neatly into this categorization. Notes are similar to Bonds in that they are sold at, above, or below face (par) value; make regular interest payments; and have a specified term until maturity. |
| Open-End Fund |
A mutual fund that has an unlimited number of shares available for purchase. |
| Option |
The right, but not the obligation, to buy (for a call option) or sell (for a put option) a specific amount of a given stock, commodity, currency, including foreign currencies and Digital Currencies (e.g., Bitcoin), index, or debt, at a specified price (the strike price) during a specified period or on one particular date. |
| Private Placement |
A Security that is not registered or required to be registered under applicable securities laws. Private Placements are generally sold to a relatively small number of select investors (as opposed to a public issue, in which Securities are made available for sale on the open market) in order to raise capital. Private Placements may include, among others, interests in hedge funds (including limited partnership interests) and shares of private companies. Investors in Private Placements are usually banks, mutual funds, insurance companies, pension funds, hedge funds, and high net worth individuals. Private Placements are typically held or maintained outside of Vanguard. |
| Related Security |
Any
Security or instrument that provides economic exposure to the same company or entity—provided, however, that equity instruments
will |
| |
generally not be considered related to fixed income instruments (other than convertible Bonds) and vice versa. For example, all of the following instruments would be related to the common Stock of Company X: Options, Futures, Rights, and Warrants on Company X common Stock; preferred Stock issued by Company X; and Bonds convertible into Company X common Stock. Similarly, different Bonds issued by Company X would be related to one another. |
| Reportable Security |
Any Covered Security, ETF, ETN, or Digital Security Token. |
| Repurchase Agreement |
An arrangement by which the seller of an asset agrees, at the time of the sale, to buy back the asset at a specific price and, typically, on a given date (normally the next day). |
| Right |
A Security giving stockholders entitlement to purchase new shares issued by the corporation issuer at a predetermined price (normally at a discount to the current market price) in proportion to the number of shares already owned. Rights are issued only for a short period of time, after which they expire. |
| Secondary Offering |
The sale of new or closely held shares by a company that has already made an Initial Public Offering. |
| Security |
Any Stock, Bond, money market instrument, Note, evidence of indebtedness, Debenture, Warrant, Option, Right, Investment Contract, ETF, ETN, Digital Currency that has been deemed to be a security by the US Securities and Exchange Commission, Certificate, or any other investment or interest commonly known as a Security. |
| SPAC (Special Purpose Acquisition Company) |
A shell company or company with no commercial operations that is formed strictly to raise capital through an Initial Public Offering (IPO) for the purpose of acquiring an existing company. |
| Spread Betting |
A way of trading that enables you to profit from movements in a wide range of markets from Securities to currencies, including foreign currencies and Digital Currencies, Digital Security Tokens, commodities, and interest rates. Spread betting allows you to trade on whether the price quoted for these financial instruments will go up or down. |
| Stock |
A Security that represents part ownership, or equity, in a corporation. Each share of stock is a proportional stake in the corporation's assets and profits, some of which could be paid out as dividends. |
| UCITS (Undertakings for the Collective Investment of Transferable Securities) |
A regulatory framework of the European Commission that creates a harmonized regime throughout Europe for the management and sale of mutual funds. UCITS funds can be registered in Europe and sold to investors worldwide using unified regulatory and investor protection requirements. |
| Vanguard Client |
The clients of VGI, or any of the International Subsidiaries, and investors in the Vanguard Funds, including the Vanguard Funds themselves. |
| Vanguard Fund |
Vanguard mutual funds, Vanguard managed funds, Vanguard UCITS funds, Vanguard ETFs, and any other accounts sponsored or managed by Vanguard. This includes, but is not limited to, separately managed accounts and collective trusts. |
| Warrant |
An entitlement to purchase a certain amount of common Stock at a set price (usually higher than the current price) during an extended period of time. Usually issued with a fixed-income security to enhance its marketability, a Warrant can be transferred, traded, or exercised by the holder. |
Policy Compliance
Questions regarding this policy may be submitted to Code_of_Ethics@vanguard.com.
Please be aware of and comply with any supplemental policies that
may apply to your role, department, or geographic region. Check with your manager for more information.
If you believe you may have breached this policy, you should immediately
report it to your manager, notify the policy contact for your region, and work with them to take swift corrective action. Alternatively,
you may report concerns regarding this policy via the Anonymous Reporting channel that Vanguard has arranged for your region. You are
expected to cooperate with any research or investigation into conduct regarding this policy.
The
Compliance Department is the owner of this policy. Any violations or potential violations of this policy may be investigated by the Compliance
Department, and if it is determined that there has been a violation, you may be subject to penalties and sanctions as described in the
Disciplinary Action Policy and, for crew and contingent workers
in Australia, the Managing Misconduct Policy. Any violation of this policy may result in disciplinary action up to and including termination
of employment.
Refer
to the Policy Disclaimer Statement for more information.
Appendix
Appendix A
Am I an Access Person, and if
so, which Access Person “designation” applies?
Appendix B
What accounts must be disclosed?
Appendix C
Trading and Reporting Requirements for Advisor Access Persons
Appendix D
Trading and Reporting Requirements for Fund Access Persons
Appendix E
Trading and Reporting Requirements for Fund Access Persons
Appendices Endnotes
Clarifications and explanations to the content within the appendices
APPENDIX A
Am I an Access Person, and if so, which Access Person
“designation” applies?
To determine if you are designated as an Access Person, review your
offer letter for specifics. If you are unsure, ask your recruiter to confirm for you which designation you fall under. They can look up
your designation by referencing our internal Access Person Code of Conduct policy. Your designation will be one of the following:
| 4. | Non-Access (If this is your designation,
this packet does not apply to you.) |
APPENDIX B
What accounts must be disclosed?
This list provides a snapshot of what accounts you will need to disclose.
Come prepared knowing how to access the statements for these accounts. Please note, this is list is subject to change.
| Common Account Types |
Access
Person
disclosure
required? |
| |
|
|
Employer sponsored retirement plans (plan doesn't have
the ability to hold Vanguard funds)
Examples: 401k, 403b, 457b, Employee
Stock Options Plan (ESOP), Employee Stock Purchase Plan (ESPP), and pension plans |
No |
| |
|
|
Employer sponsored retirement plans (plan does have
the ability to hold Vanguard funds)
Examples: 401k, 403b, 457b, Employee
Stock Options Plan (ESOP), Employee Stock Purchase Plan (ESPP), and pension plans |
Yes |
| |
|
| 529 Plans (plan doesn't have the ability to hold Vanguard funds) |
No |
| |
|
| 529 plans (plan does have the ability to hold Vanguard funds) |
Yes |
| |
|
| Health Savings Account (plan doesn't have the ability to hold Vanguard funds) |
No |
| |
|
| Health Savings Account (plan does have the ability to hold Vanguard funds) - Including Vanguard's HSA |
Yes |
| |
|
|
Vanguard personal accountsi
Examples: Vanguard Brokerage Accounts,
Transfer Agent Accounts (Mutual Fund Only account) |
Yes |
| |
|
|
Outside brokerage accounts (including retirement
accounts not listed above)3
Please Note: Accounts that are open
but have a $0 balance also must be reported because they still have the ability to hold securities. |
Yes |
| |
|
| Bank accounts - checking and savings |
No |
| |
|
| Annuities |
No |
| |
|
| Fully managed accountsii |
Yes2 |
APPENDIX C
Trading and Reporting Requirements for Advisor Access
Persons
| Securities
and Activities |
Can
I Trade |
60
Day Hold |
Reportableiii |
| American Depository Receipts (ADRs) |
Yes |
Yes |
Yes |
| Annuities and Insurance Products |
Yes |
No |
No |
| Bankers' Acceptances, Certificates of Deposits, and Commercial Paper |
Yes |
No |
No |
| Bonds (municipal and corporate) |
Yes |
Yes |
Yes |
| Cash |
No |
No |
No |
| Closed-End Funds |
Yes |
Yes |
Yes |
| Commodities (ex: futures & options) |
Yes |
No |
No |
| Currencies |
Yes |
No |
No |
| Debentures |
Yes |
Yes |
Yes |
| Digital Currency |
Yes |
No |
No |
| Digital Utility Tokens |
Yes |
No |
Yes |
| Digital Security Tokens |
Yes |
No |
Yes |
| Direct Obligations |
Yes |
No |
No |
| Non-Vanguard ETFs and ETNs |
Yes |
No |
Yes |
| Evidence of Indebtedness |
Yes |
Yes |
Yes |
| Government bonds |
Yes |
No |
No |
| High Quality Short Term Debt Instruments |
Yes |
No |
Yes |
| Investment Contracts |
Yes |
Yes |
Yes |
| IPOs (and ICOs) |
Prohibited |
| Money market instruments (non-Vanguard) |
Yes |
No |
No |
| Money market instruments (Vanguard) |
Yes |
No |
Yes |
| Open-End funds (non-Vanguard) |
Yes |
No |
No |
| Notes |
Yes |
Yes |
Yes |
| Options on Covered Securities |
Yes |
Yesiv |
Yes |
| Private placements (unlisted securities) |
Yesv |
No |
Yes |
| Rights |
Yes |
Yes |
Yes |
| Real Estate Investment Trusts |
Yes |
Yes |
Yes |
| Security Futures |
Prohibited |
| Short Positions |
Prohibited |
| SPACs |
Prohibited |
| Stocks |
Yes |
Yes |
Yes |
| Unit Investment Trusts |
Yes |
Yes |
Yes |
| Securities
and Activities |
Can
I Trade |
60
Day Hold |
Reportableiii |
| UCITs Funds (non-Vanguard) |
Yes |
No |
No |
| Vanguard Annuities and Insurance Products |
Yes |
No |
Yes |
| Vanguard ETFs |
Yes |
No |
Yes |
| Vanguard Funds |
Yes |
No |
Yes |
| Warrants |
Yes |
Yes |
Yes |
APPENDIX D
Trading and Reporting Requirements for Fund Access
Persons
| Securities
and Activities |
Can
I Trade |
Preclear |
7
Day Blackout |
60
Day Hold |
Reportableiii |
| American Depository Receipts (ADRs) |
Yes |
Yes |
Yes |
Yes |
Yes |
| Annuities and Insurance Products |
Yes |
No |
No |
No |
No |
| Bankers' Acceptances, Certificates of Deposits, and Commercial Paper |
Yes |
No |
No |
No |
No |
| Bonds (municipal and corporate) |
Yes |
Yes |
Yes |
Yes |
Yes |
| Cash |
No |
No |
No |
No |
No |
| Closed-End Funds |
Yes |
Yes |
No |
Yes |
Yes |
| Commodities (ex: futures & options) |
Yes |
No |
No |
No |
No |
| Currencies |
Yes |
No |
No |
No |
No |
| Debentures |
Yes |
Yes |
Yes |
Yes |
Yes |
| Digital Currency |
Yes |
No |
No |
No |
No |
| Digital Utility Tokens |
Yes |
No |
No |
No |
Yes |
| Digital Security Tokens |
Yes |
No |
No |
No |
Yes |
| Direct Obligations |
Yes |
No |
No |
No |
No |
| Non-Vanguard ETFs and ETNs |
Yes |
No |
No |
No |
Yes |
| Evidence of Indebtedness |
Yes |
Yes |
Yes |
Yes |
Yes |
| Government bonds |
Yes |
No |
No |
No |
No |
| High Quality Short Term Debt Instruments |
Yes |
No |
No |
No |
Yes |
| Investment Contracts |
Yes |
Yes |
Yes |
Yes |
Yes |
| IPOs (and ICOs) |
Prohibited |
| Money market instruments (non-Vanguard) |
Yes |
No |
No |
No |
No |
| Money market instruments (Vanguard) |
Yes |
No |
No |
No |
Yes |
| Open-End funds (non-Vanguard) |
Yes |
No |
No |
No |
No |
| Notes |
Yes |
Yes |
Yes |
Yes |
Yes |
| Options on Securities |
Prohibited |
| Private placements (unlisted securities) |
Yesv |
Yes |
No |
No |
Yes |
| Rights |
Yes |
Yes |
Yes |
Yes |
Yes |
| Real Estate Investment Trusts |
Yes |
Yes |
Yes |
Yes |
Yes |
| Security Futures |
Prohibited |
| Short Positions |
Prohibited |
| Securities
and Activities |
Can
I Trade |
Preclear |
7
Day Blackout |
60
Day Hold |
Reportableiii |
| SPACs |
Prohibited |
| Stocks |
Yes |
Yes |
Yesvi |
Yes |
Yes |
| Unit Investment Trusts |
Yes |
Yes |
Yes |
Yes |
Yes |
| UCIT Funds (non-Vanguard) |
Yes |
No |
No |
No |
No |
| Vanguard Annuities and Insurance Products |
Yes |
No |
No |
No |
Yes |
| Vanguard ETFs |
Yes |
No |
No |
No |
Yes |
| Vanguard Funds |
Yes |
No |
No |
No |
Yes |
| Warrants |
Yes |
Yes |
Yes |
Yes |
Yes |
APPENDIX E
Trading and Reporting Requirements
for Investment Access Persons
| Securities and Activities |
Can I Trade |
Preclear |
7 Day Blackout |
60 Day Hold |
Reportableiii |
| American Depository Receipts (ADRs) |
Yes |
Yes |
Yes |
Yes |
Yes |
| Annuities and Insurance Products |
Yes |
No |
No |
No |
No |
| Bankers' Acceptances, Certificates of Deposits, and Commercial Paper |
Yes |
No |
No |
No |
No |
| Bonds (municipal and corporate) |
Yes |
Yes |
Yes |
Yes |
Yes |
| Cash |
No |
No |
No |
No |
No |
| Closed-End Funds |
Yes |
Yes |
No |
Yes |
Yes |
| Commodities (ex: futures & options) |
Yes |
No |
No |
No |
No |
| Currencies |
Yes |
No |
No |
No |
No |
| Debentures |
Yes |
Yes |
Yes |
Yes |
Yes |
| Digital Currency |
Yes |
No |
No |
No |
No |
| Digital Utility Tokens |
Yes |
No |
No |
No |
Yes |
| Digital Security Tokens |
Yes |
No |
No |
No |
Yes |
| Direct Obligations |
Yes |
No |
No |
No |
No |
| Non-Vanguard ETFs and ETNs |
Yes |
No |
No |
No |
Yes |
| Evidence of Indebtedness |
Yes |
Yes |
Yes |
Yes |
Yes |
| Government bonds |
Yes |
No |
No |
No |
No |
| High Quality Short Term Debt Instruments |
Yes |
No |
No |
No |
Yes |
| Investment Contracts |
Yes |
Yes |
Yes |
Yes |
Yes |
| IPOs (and ICOs) |
Prohibited |
| Money market instruments (non-Vanguard) |
Yes |
No |
No |
No |
No |
| Money market instruments (Vanguard) |
Yes |
No |
No |
No |
Yes |
| Open-End funds (non-Vanguard) |
Yes |
No |
No |
No |
No |
| Notes |
Yes |
Yes |
Yes |
Yes |
Yes |
| Options on Securities |
Prohibited |
| Private placements (unlisted securities) |
Yesv |
Yes |
No |
No |
Yes |
| Rights |
Yes |
Yes |
Yes |
Yes |
Yes |
| Real Estate Investment Trusts |
Yes |
Yes |
Yes |
Yes |
Yes |
| Security Futures |
Prohibited |
| Short Positions |
Prohibited |
| Securities
and Activities |
Can
I Trade |
Preclear |
7
Day Blackout |
60
Day Hold |
Reportableiii |
| SPACs |
Prohibited |
| Stocks |
Yes |
Yes |
Yes |
Yes |
Yes |
| Unit Investment Trusts |
Yes |
Yes |
Yes |
Yes |
Yes |
| UCITs Funds (non-Vanguard) |
Yes |
No |
No |
No |
No |
| Vanguard Annuities and Insurance Products |
Yes |
No |
No |
No |
Yes |
| Vanguard ETFs |
Yes |
Yes |
No |
Yes |
Yes |
| Vanguard Funds |
Yes |
Novii |
No |
Noviii |
Yes |
| Warrants |
Yes |
Yes |
Yes |
Yes |
Yes |
APPENDICES ENDNOTES
Clarifications and explanations
to the content within the appendices
i
Accounts you share ownership with will need to be disclosed, e.g., a joint account
ii Fully managed accounts can be
maintained outside of Vanguard with review and approval from the Code team. Please provide one of the following documents for review:
| · | A
signed discretionary/advisory agreement from the outside firm, or |
| · | A
signed letter from your advisor on their firm's letterhead. |
This documentation should include the following
information:
| · | The account number(s) for any account considered fully managed |
| · | The name of your advisor or the name of the program in
which the account is enrolled |
| · | A statement that you have no discretion/trading authority
over your managed account(s) |
iii
Reportable on Initial Holdings Report or when acquired. All Crew and Contingent Workers deemed Associated Persons must report their accounts,
holdings, and transactions through My Compliance Office (MCO).
iv
Options on Covered Securities include trades that are exercised or assigned involuntarily by the crew member.
v
Prohibited from acquiring Securities in a Private Placement without prior approval from Compliance.
vi
Permitted to sell stock with a market cap above US $5 billion, so long as, over a rolling 30 day period, their total value aggregate
sales of the stock does not exceed $10,000.
vii
Vanguard ETFs require preclearance.
viii
Vanguard ETFs require a 60 day hold.
Exhibit 99.CERT
CERTIFICATIONS
I, Mortimer J. Buckley, certify that:
1. I have reviewed this report on Form N-CSR of Vanguard Trustees’ Equity Fund;
2. Based on my knowledge, this report does not contain any untrue statement
of a material fact or omit to state a material fact necessary to make the statements made, in light of the circumstances under which such
statements were made, not misleading with respect to the period covered by this report;
3. Based on my knowledge, the financial statements, and other financial
information included in this report, fairly present in all material respects the financial condition, results of operations, changes in
net assets, and cash flows (if the financial statements are required to include a statement of cash flows) of the registrant as of, and
for, the periods presented in this report;
4. The registrant’s other certifying officer(s) and I are responsible
for establishing and maintaining disclosure controls and procedures (as defined in Rule 30a-3(c) under the Investment Company Act of 1940)
and internal control over financial reporting (as defined in Rule 30a-3(d) under the Investment Company Act of 1940) for the registrant
and have:
(a) Designed such disclosure controls and procedures, or caused such
disclosure controls and procedures to be designed under our supervision, to ensure that material information relating to the registrant,
including its consolidated subsidiaries, is made known to us by others within those entities, particularly during the period in which
this report is being prepared;
(b) Designed such internal control over financial reporting, or caused
such internal control over financial reporting to be designed under our supervision, to provide reasonable assurance regarding the reliability
of financial reporting and the preparation of financial statements for external purposes in accordance with generally accepted accounting
principles;
(c) Evaluated the effectiveness of the registrant’s disclosure
controls and procedures and presented in this report our conclusions about the effectiveness of the disclosure controls and procedures,
as of a date within 90 days prior to the filing date of this report based on such evaluation; and
(d) Disclosed in this report any change in the registrant’s internal
control over financial reporting that occurred during the period covered by this report that has materially affected, or is reasonably
likely to materially affect, the registrant’s internal control over financial reporting; and
5. The registrant’s other certifying officer(s) and I have disclosed
to the registrant’s auditors and the audit committee of the registrant’s board of directors (or persons performing the equivalent
functions):
(a) All significant deficiencies and material weaknesses in the design
or operation of internal control over financial reporting which are reasonably likely to adversely affect the registrant’s ability
to record, process, summarize, and report financial information; and
(b) Any fraud, whether or not material, that involves management or
other employees who have a significant role in the registrant’s internal control over financial reporting.
Date: December 21, 2023
| |
/s/ Mortimer J. Buckley |
| |
Mortimer J. Buckley |
| |
Chief Executive Officer |
CERTIFICATIONS
I, Christine Buchanan, certify that:
1. I have reviewed this report on Form N-CSR of Vanguard Trustees’ Equity Fund;
2. Based on my knowledge, this report does not contain any untrue statement
of a material fact or omit to state a material fact necessary to make the statements made, in light of the circumstances under which such
statements were made, not misleading with respect to the period covered by this report;
3. Based on my knowledge, the financial statements, and other financial
information included in this report, fairly present in all material respects the financial condition, results of operations, changes in
net assets, and cash flows (if the financial statements are required to include a statement of cash flows) of the registrant as of, and
for, the periods presented in this report;
4. The registrant’s other certifying officer(s) and I are responsible
for establishing and maintaining disclosure controls and procedures (as defined in Rule 30a-3(c) under the Investment Company Act of 1940)
and internal control over financial reporting (as defined in Rule 30a-3(d) under the Investment Company Act of 1940) for the registrant
and have:
(a) Designed such disclosure controls and procedures, or caused such
disclosure controls and procedures to be designed under our supervision, to ensure that material information relating to the registrant,
including its consolidated subsidiaries, is made known to us by others within those entities, particularly during the period in which
this report is being prepared;
(b) Designed such internal control over financial reporting, or caused
such internal control over financial reporting to be designed under our supervision, to provide reasonable assurance regarding the reliability
of financial reporting and the preparation of financial statements for external purposes in accordance with generally accepted accounting
principles;
(c) Evaluated the effectiveness of the registrant’s disclosure
controls and procedures and presented in this report our conclusions about the effectiveness of the disclosure controls and procedures,
as of a date within 90 days prior to the filing date of this report based on such evaluation; and
(d) Disclosed in this report any change in the registrant’s internal
control over financial reporting that occurred during the period covered by this report that has materially affected, or is reasonably
likely to materially affect, the registrant’s internal control over financial reporting; and
5. The registrant’s other certifying officer(s) and I have disclosed
to the registrant’s auditors and the audit committee of the registrant’s board of directors (or persons performing the equivalent
functions):
(a) All significant deficiencies and material weaknesses in the design
or operation of internal control over financial reporting which are reasonably likely to adversely affect the registrant’s ability
to record, process, summarize, and report financial information; and
(b) Any fraud, whether or not material, that involves management or
other employees who have a significant role in the registrant’s internal control over financial reporting.
Date: December 21, 2023
| |
/s/ Christine Buchanan |
| |
Christine Buchanan |
| |
Chief Financial Officer |
Exhibit 99.906CERT
Certification Pursuant to 18 U.S.C. Section
1350,
As Adopted Pursuant to
Section 906 of the Sarbanes-Oxley Act of 2002
Name of Issuer: Vanguard Trustees’ Equity Fund
In connection with the Report on Form N-CSR of
the above-named issuer that is accompanied by this certification, the undersigned hereby certifies, to his knowledge, that:
| 1. | The Report fully complies with the requirements of Section 13(a) or 15(d) of the Securities Exchange Act of 1934; and |
| 2. | The information contained in the Report fairly presents, in all material respects, the financial condition and results of operations
of the issuer. |
Date: December 21, 2023
| |
/s/ Mortimer J. Buckley |
| |
Mortimer J. Buckley |
| |
Chief Executive Officer |
Certification Pursuant to 18 U.S.C. Section
1350,
As Adopted Pursuant to
Section 906 of the Sarbanes-Oxley Act of 2002
Name of Issuer: Vanguard Trustees’ Equity Fund
In connection with the Report on Form N-CSR of
the above-named issuer that is accompanied by this certification, the undersigned hereby certifies, to her knowledge, that:
| 1. | The Report fully complies with the requirements of Section 13(a) or 15(d) of the Securities Exchange Act of 1934; and |
| 2. | The information contained in the Report fairly presents, in all material respects, the financial condition and results of operations
of the issuer. |
Date: December 21, 2023
| |
/s/
Christine Buchanan |
| |
Christine
Buchanan |
| |
Chief
Financial Officer |