11
UNITED STATES
SECURITIES AND EXCHANGE COMMISSION
Washington, D.C. 20549
Form 6-K
REPORT OF FOREIGN PRIVATE ISSUER
PURSUANT TO RULE 13a-16 OR 15d-16 UNDER
THE SECURITIES EXCHANGE ACT OF 1934
For the month of August 2024
Commission File Number: 001-31811
Woori Financial Group Inc.
(Translation of registrant’s name into English)
51, Sogong-ro, Jung-gu, Seoul, 04632, Korea
(Address of principal executive office)
Indicate by check mark whether the registrant files or will file annual reports under cover of Form 20-F or Form 40-F.
Form 20-F ☒ Form 40-F ☐
Summary of 2024 First Half Business Report
3
Except where indicated otherwise, financial information contained in this document (including the attached financial statements) has been prepared in accordance with the Korean equivalent of International Financial Reporting Standards (“Korean IFRS”), which differ in certain important respects from generally accepted accounting principles in the United States.
All references to “Woori Financial Group,” “we,” “us,” “the Group” or the “Company” are to Woori Financial Group Inc. and, unless the context requires otherwise, its subsidiaries. In addition, all references to “Won” or “KRW” in this document are to the currency of the Republic of Korea.
4
| I. | Introduction of the Company |
| 1. | Overview of the Company |
| a. | History |
| January 11, 2019 | Establishment of the Company pursuant to a comprehensive stock transfer, by which Woori Bank, Woori FIS, Woori Finance Research Institute, Woori Credit Information, Woori Fund Services and Woori Private Equity Asset Management became wholly-owned subsidiaries of the Company. | |||
| February 13, 2019 | Listed on the Korea Exchange (KRX). | |||
| April 5, 2019 | Entered into share purchase agreements to acquire Tongyang Asset Management Corp. and ABL Global Asset Management Co., Ltd. | |||
| June 21, 2019 | Entered into a purchase agreement with Woori Bank to acquire the common shares of Woori Investment Bank Co., Ltd. (“Woori Investment Bank”) and integrate Woori Investment Bank as a first-tier subsidiary of the Company (Buyer: Woori Financial Group, Seller: Woori Bank) | |||
| July 3, 2019 | Entered into a stock exchange agreement between the Company and Woori Card Co., Ltd (“Woori Card”) to integrate Woori Card as a first-tier subsidiary of the Company | |||
| July 25, 2019 | Entered into a share purchase agreement to acquire Kukje Asset Trust, Ltd. | |||
| August 1, 2019 | Integrated Woori Asset Management Corp. (formerly known as Tongyang Asset Management Co., Ltd.) as a first-tier subsidiary of the Company. | |||
| September 10, 2019 | Integrated Woori Card and Woori Investment Bank as first-tier subsidiaries of the Company. | |||
| September 26, 2019 | Disposed 4% of common shares of the Company held by Woori Bank to a Taiwanese company, Fubon Life Insurance Co., Ltd. | |||
| December 6, 2019 | Integrated Woori Global Asset Management Corp. as a first-tier subsidiary of the Company | |||
| December 30, 2019 | Integrated Woori Asset Trust Ltd. as a first-tier subsidiary of the Company | |||
| March 25, 2020 | Held the first annual general meeting of shareholders of Woori Financial Group; reappointed the Chief Executive Officer | |||
5
| October 26, 2020 | Entered into a share purchase agreement to acquire Aju Capital Co., Ltd. | |||
| December 10, 2020 | Integrated Woori Financial Capital Co., Ltd., (formerly known as Aju Capital Co., Ltd.) as a first-tier subsidiary of the Company | |||
| Integrated Woori Savings Bank (formerly known as Aju Savings Bank) as a second-tier subsidiary of the Company | ||||
| January 15, 2021 | Joined the Carbon Disclosure Project (CDP), announced support for the Task force on Climate related Financial Disclosure (TCFD) and established the ESG management principles of Woori Financial Group | |||
| March 5, 2021 | Established the Board ESG Management Committee | |||
| March 12, 2021 | Integrated Woori Savings Bank as a first-tier subsidiary of the Company | |||
| April 9, 2021 | After-hours trading of a 2% stake in Woori Financial Group held by the Korea Deposit Insurance Corporation | |||
| April 15, 2021 | Purchased additional equity shares of Woori Financial Capital Co., Ltd., increasing the Company’s equity ownership by 12.9% | |||
| May 13, 2021 | Participated in the capital increase of Woori Savings Bank (KRW 100 billion) | |||
| May 24, 2021 | Purchased 3.6% of Woori Financial Capital Co., Ltd. in treasury shares | |||
| June 4, 2021 | Entered into a stock exchange agreement to acquire the remaining shares of Woori Financial Capital Co., Ltd. | |||
| August 10, 2021 | Integrated Woori Financial Capital Co., Ltd., as a wholly-owned subsidiary of the Company (Completion of stock exchange) | |||
| September 9, 2021 | Announcement of contemplated sales of the remaining stake in Woori Financial Group held by the Korea Deposit Insurance Corporation | |||
| October 8, 2021 | Joined the SBTi (Science Based Targets initiative) as part of the roadmap for achieving carbon neutrality | |||
| November 2, 2021 | Obtained regulatory approval for using the IRB (Internal Rating Based) approach | |||
| November 9, 2021 | Obtained ‘AA’ rating from MSCI ESG assessment (2 grades higher than the previous year), ‘A’ rating from KCGS(Korea Corporate Governance Service)(1 grade higher than the previous year) | |||
6
| November 17, 2021 | Included newly in Asia Pacific Index of DJSI (Dow Jones Sustainability Indices) | |||
| December 9, 2021 | Achieved practically full privatization through the decrease of the KDIC’S stake in us from 15.1% to 5.8%, changing the largest shareholder from the KDIC to the Employee Stock Ownership Association of Woori Financial Group | |||
| December 26, 2021 | Launched the Group integrated car finance platform “Woori WON Car” | |||
| January 7, 2022 | Officially launched the NPL investment company Woori Financial F&I Inc. | |||
| January 13, 2022 | Joined the global environment initiative Taskforce on Nature-related Financial Disclosures (TNFD) | |||
| February 4, 2022 | Recognized as an ‘Industry Mover’ in a sustainability assessment by S&P Global for 2022 | |||
| February 10, 2022 | Disposal by the Korea Deposit Insurance Corporation of a 2.2% stake in Woori Financial Group (reducing the KDIC’s stake in Woori Financial Group from 5.8% to 3.6%) | |||
| May 11, 2022 | Became the first company in the world to join the launch of the ‘Business for Land (B4L) Initiative’ for the protection of sustainable forests and the recovery of land degradation | |||
| May 18, 2022 | Disposal by the Korea Deposit Insurance Corporation of a 2.3% stake in Woori Financial Group (reducing the KDIC’s stake in Woori Financial Group from 3.6% to 1.3%) | |||
| June 19, 2022 | Held the inaugural meeting of Woori Financial Future Foundation | |||
| August 22, 2022 | Joined the ‘Partnership for Biodiversity Accounting Financials(PBAF)’ as the first Asian company | |||
| November 7, 2022 | Held the global conference ‘Sustainable Finance for a Better World’ | |||
| December 14, 2022 | Signatory of Statement from the Financial Sector at the Conference of the Parties to the ‘UN Convention on Biological Diversity(UN CBD)’ | |||
7
| December 29, 2022 | Received ‘AA’ rating from MSCI ESG Research for 2 consecutive years | |||
| January 16, 2023 | Completed the establishment of the ‘WON Synergy’ system to create effective synergy within group companies | |||
| January 26, 2023 | Became the first financial company in Korea to join the ‘Finance Leadership Group on Plastics’ hosted by ‘UN Environment Programme Finance Initiative (UNEP FI)’ | |||
| February 27, 2023 | Entered into a stock purchase agreement to acquire Daol Investment (52% ownership) | |||
| March 23, 2023 | Daol Investment, re-named Woori Venture Partners, incorporated as a subsidiary into Woori Financial Holdings | |||
| March 24, 2023 | Jong-Yong Yim appointed as the 9th chairman of Woori Financial Group (4th annual general meeting of shareholders of Woori Financial Group) | |||
| April 21, 2023 | Resolved to repurchase and cancel treasury shares, a first-time since the transition to a holding company | |||
| June 01, 2023 | Entered into a comprehensive stock exchange agreement with Woori Investment Bank and Woori Venture Partners | |||
| August 08, 2023 | Woori Investment Bank and Woori Venture Partners to each become a wholly-owned subsidiary of Woori Financial Group | |||
| August 24, 2023 | Group Carbon Emission Reduction Target validated by SBTi (Science Based Targets initiative) | |||
| October 05, 2023 | Entered into a memorandum of understanding with the Korea Deposit Insurance Corporation to purchase its remaining stake in Woori Financial Group (1.2%) | |||
| December 22, 2023 | A capital increase of KRW 500 billion conducted by Woori Investment Bank (to enhance competitiveness) | |||
| December 26, 2023 | Obtained an ‘AAA’ rating from MSCI ESG assessment | |||
| January 29, 2024 | Merged Woori Global Asset Management with and into Woori Asset Management | |||
8
| March 13, 2024 | Resolved to acquire and cancel the remaining shares owned by the Korea Deposit Insurance Corporation | |||
| August 1, 2024 | Established ‘Woori Investment Securities’ as a new direct subsidiary | |||
| b. | Affiliated Companies |
| (1) | Overview of Business Group |
| 1. | Name of business group: Woori Financial Group Inc. |
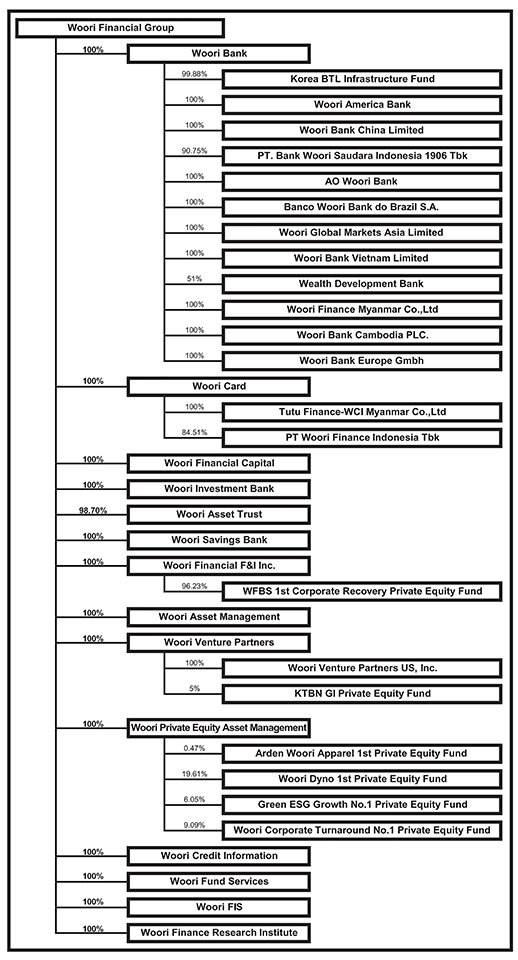
| (2) | Affiliated companies within the business group |
As of June 30, 2024
| Type |
Name of Company | |
| Listed company (3 companies) |
Woori Financial Group | |
| PT Bank Woori Saudara Indonesia 1906 Tbk | ||
| PT Woori Finance Indonesia Tbk | ||
| Unlisted company (33 companies) |
Woori Bank | |
| Woori Card | ||
| Woori Financial Capital | ||
| Woori Investment Bank | ||
| Woori Asset Trust | ||
| Woori Savings Bank | ||
| Woori Asset Management | ||
| Woori Venture Partners | ||
| Woori Financial F&I Inc. | ||
| Woori Credit Information | ||
| Woori Fund Services | ||
| Woori Private Equity Asset Management | ||
| Woori FIS | ||
| Woori Finance Research Institute | ||
| Korea BTL Infrastructure Fund | ||
| Woori America Bank | ||
| Woori Bank China Limited | ||
| AO Woori Bank | ||
| Banco Woori Bank do Brazil S.A. | ||
| Woori Global Markets Asia Limited | ||
9
| Type |
Name of Company | |
| Woori Bank Vietnam Limited | ||
| Wealth Development Bank | ||
| Woori Finance Myanmar Co., Ltd. | ||
| Woori Bank (Cambodia) PLC. | ||
| Woori Bank Europe Gmbh | ||
| Tutu Finance-WCI Myanmar Co., Ltd. | ||
| WFBS 1st Corporate Recovery Private Equity Fund | ||
| Woori Venture Partners US, Inc. | ||
| KTBN GI Private Equity Fund | ||
| Arden Woori Apparel 1st Private Equity Fund | ||
| Woori Dyno 1st Private Equity Fund | ||
| Green ESG Growth No.1 Private Equity Fund | ||
| Woori Corporate Turnaround No.1 Private Equity Fund |
Note 1) Includes first-tier and second-tier subsidiaries under the Financial Holding Company Act
10
11
| 2. | Capital Structure (Changes in Capital) |
| (units: Won, shares) | ||||||||||||||
| Date |
Item |
Type | ||||||||||||
| Common Shares | Preferred Shares | Others | ||||||||||||
| June 30, 2024 |
Number of issued shares | 742,591,501 | — | — | ||||||||||
| Par Value | 5,000 | — | — | |||||||||||
| Capital Stock | 3,802,676,300,000 | — | — | |||||||||||
| December 31, 2023 |
Number of issued shares | 751,949,461 | ||||||||||||
| Par Value | 5,000 | |||||||||||||
| Capital Stock | 3,802,676,300,000 | |||||||||||||
| December 31, 2022 |
Number of issued shares | 728,060,549 | — | — | ||||||||||
| Par Value | 5,000 | — | — | |||||||||||
| Capital Stock | 3,640,302,745,000 | — | — | |||||||||||
| December 31, 2021 |
Number of issued shares | 728,060,549 | — | — | ||||||||||
| Par Value | 5,000 | — | — | |||||||||||
| Capital Stock | 3,640,302,745,000 | — | — | |||||||||||
| December 31, 2020 |
Number of issued shares | 722,267,683 | — | — | ||||||||||
| Par Value | 5,000 | — | — | |||||||||||
| Capital Stock | 3,611,338,415,000 | — | — | |||||||||||
Note 1) Our common shares of 680,164,306 were issued in January 2019 upon our establishment and the number of our common shares increased by 42,103,377 as a result of a comprehensive stock exchange that took place between Woori Financial Group and Woori Card in September 2019.
Note 2) The number of our common shares increased by 5,792,866 on August 10, 2021 due to a comprehensive stock exchange to integrate Woori Financial Capital as a wholly-owned subsidiary.
Note 3) The number of our common shares increased by 32,474,711 as a result of a comprehensive stock exchange that took place on August 8, 2023 to convert Woori Investment Bank and Woori Venture Partners as our wholly-owned subsidiaries.
Note 4) On October 30, 2023, the number of our common shares was reduced by 8,585,799 due to the cancellation of our treasury shares acquired through a trust agreement.
- Our paid-in capital does not match the par value of our total issued shares at year-end because our cancellation of treasury shares constitutes the cancellation of treasury shares acquired within the limits of profits available for dividends, which means that there would be no reduction in the paid-in capital of Woori Financial Group.
Note 5) On March 22, 2024, the number of our common shares was reduced by 9,357,960 due to the cancellation of the treasury shares that we acquired from KDIC.
Note 6) As the cancellation of treasury shares in October 2023 and March 2024 was carried out within the scope of distributable profits, there was no decrease in capital stock. As such, Woori Financial Group’s capital stock as of June 30, 2024 and December 31, 2023 does not match the face value of the total number of issued shares.
12
| As of June 30, 2024 | (units: Won, shares) | |||||||||||||||||||||
| Date |
Category | Stock Decrease/Increase | ||||||||||||||||||||
| Type | Quantity | Par Value | Issue price | Note | ||||||||||||||||||
| January 11, 2019 |
— | Common | 680,164,306 | 5,000 | 26,415 | Establishment (comprehensive stock transfer) | ||||||||||||||||
| September 10, 2019 |
— | Common | 42,103,377 | 5,000 | 12,350 | Comprehensive stock exchange Stock increase ratio: 6.19018% | ||||||||||||||||
| August 10, 2021 |
— | Common | 5,792,866 | 5,000 | 11,100 | Comprehensive stock exchange Stock increase ratio: 0.80204% | ||||||||||||||||
| August 8, 2023 |
— | Common | 32,474,711 | 5,000 | 11,520 | Comprehensive stock exchange Stock increase ratio: 4.46044% | ||||||||||||||||
| October 30, 2023 |
— | Common | (8,585,799 | ) | 5,000 | — | Cancellation of treasury shares | |||||||||||||||
| March 22, 2024 |
— | Common | (9,357,960 | ) | 5,000 | — | Cancellation of treasury shares | |||||||||||||||
Note 1) Due to Woori Financial Group’s establishment through a comprehensive stock transfer, the issue price was calculated by dividing the total equity from its financial statements at the time of establishment (Won 17,966,458,911,689) by the total number of issued shares (680,164,306).
Note 2) Our capital changed in September 2019 and August 2021 due to a comprehensive stock exchanges. The issue prices were based on the closing stock price on the comprehensive stock exchange date.
Note 3) On October 30, 2023, we canceled our treasury shares (8,585,799 common shares) acquired through a trust agreement. This share cancellation falls under the provision of Article 343, Paragraph 1 of the Commercial Code, and as it involves the cancellation of treasury shares acquired within the limits of distributable profits, the paid-in capital remains unchanged despite the decrease in the number of the total issued shares (common shares).
Note 4) On March 22, 2024, Woori Financial Group cancelled 9,357,960 shares, which were acquired from the remaining shares previously held by KDIC. This cancellation was carried out in accordance with Article 343, Paragraph 1 of the Commercial Act. Since the retirement of these shares was done within the scope of distributable profits, the total number of issued shares (common stock) decreased, but there was no change in capital stock.
13
| 3. | Total Number of Authorized Shares |
| As of June 30, 2024 | (unit: shares) |
| Items |
Type | Notes | ||||||||
| Common Shares | Total | |||||||||
| Number of authorized shares |
4,000,000,000 | 4,000,000,000 | — | |||||||
| Number of issued shares |
760,535,260 | 760,535,260 | — | |||||||
| Number of decreased shares |
17,943,759 | 17,943,759 | Cancellation of Treasury Shares Note 1) | |||||||
| Number of treasury shares |
53,945 | 53,945 | Note 2) | |||||||
| Number of outstanding shares |
742,537,556 | 742,537,556 | — | |||||||
Note 1) Cancellation of treasury shares : 8,585,799 shares in October 2023, 9,357,960 shares in March 2024
Note 2) Acquired from the issuance of fractional shares (2,322 new fractional shares were added in August 2021 due to the comprehensive stock exchange between Woori Financial Group and Woori Financial Capital. 51,621 shares from comprehensive stock exchange between Woori Financial Group-Woori Investment Bank and Woori Financial Group-Woori Venture Partners, etc.)
| II. | Business Overview |
| 1. | Results of Operations |
| (unit: billions of Won) | ||||||
| Type |
2024 1H | 2023 | 2022 | |||||||||
| Operating income |
2,404 | 3,499 | 4,431 | |||||||||
| Net non-operating income (expense) |
(13 | ) | 18 | 55 | ||||||||
| Income before income tax |
2,391 | 3,517 | 4,485 | |||||||||
| Income tax expense |
590 | 891 | 1,161 | |||||||||
| Net income |
1,800 | 2,627 | 3,324 | |||||||||
| Controlling Interest |
1,755 | 2,506 | 3,142 | |||||||||
| Non-controlling Interest |
45 | 121 | 182 | |||||||||
Note 1) Based on K-IFRS consolidated financial statements
14
| 2. | Funding Sources and Uses of Funds |
| a. | Sources of Funds |
| For the periods indicated other than as noted below | (units: millions of Won, %) |
| Classification |
Funding Source | 2024 1H | 2023 | 2022 | ||||||||||||||||||||||||||||||||||
| Average Balance |
Interest Rate |
Proportion | Average Balance |
Interest Rate |
Proportion | Average Balance |
Interest Rate |
Proportion | ||||||||||||||||||||||||||||||
| Source |
Deposits | 343,814,061 | 2.91 | 70.15 | 324,824,465 | 2.83 | 68.98 | 313,019,768 | 1.45 | 68.21 | ||||||||||||||||||||||||||||
| Borrowings | 28,295,821 | 4.25 | 5.77 | 28,052,983 | 4.02 | 5.96 | 27,296,742 | 1.99 | 5.95 | |||||||||||||||||||||||||||||
| Debentures | 41,679,131 | 4.13 | 8.50 | 42,458,653 | 3.55 | 9.02 | 45,945,392 | 2.26 | 10.01 | |||||||||||||||||||||||||||||
| Others | 42,172,997 | — | 8.60 | 42,829,998 | — | 9.09 | 42,537,152 | — | 9.27 | |||||||||||||||||||||||||||||
| Total Liabilities | 455,962,010 | — | 93.03 | 438,166,099 | — | 93.05 | 428,799,054 | — | 93.44 | |||||||||||||||||||||||||||||
| Total Equity |
34,156,482 | — | 6.97 | 32,708,219 | — | 6.95 | 30,082,662 | — | 6.56 | |||||||||||||||||||||||||||||
| Total Liabilities & Equity |
490,118,492 | — | 100.00 | 470,874,318 | — | 100.00 | 458,881,716 | — | 100.00 | |||||||||||||||||||||||||||||
Note 1) Average Balance : the simple average of the balances at the start of the fiscal year and at the end of each quarter
Note 2) Based on K-IFRS consolidated financial statements
| b. | Use of Funds |
| For the periods indicated other than as noted below | (units: millions of Won, %) |
| Type |
Managed Item |
2024 1H | 2023 | 2022 | ||||||||||||||||||||||||||||||||||
| Average Balance |
Interest Rate |
Proportion | Average Balance |
Interest Rate |
Proportion | Average Balance |
Interest Rate |
Proportion | ||||||||||||||||||||||||||||||
| Use |
Cash & Due from Banks | 17,171,955 | 3.59 | 3.50 | 16,692,268 | 3.26 | 3.54 | 16,097,533 | 1.52 | 3.51 | ||||||||||||||||||||||||||||
| Marketable securities | 77,344,582 | 3.18 | 15.78 | 75,522,522 | 3.61 | 16.04 | 68,661,882 | 1.50 | 14.96 | |||||||||||||||||||||||||||||
| Loans | 352,829,186 | 5.03 | 71.99 | 334,205,508 | 5.08 | 70.98 | 326,710,683 | 3.73 | 71.20 | |||||||||||||||||||||||||||||
| Loans in local currency | 303,061,878 | 4.76 | 61.83 | 287,312,990 | 4.84 | 61.02 | 280,414,033 | 3.53 | 61.12 | |||||||||||||||||||||||||||||
| Loans in foreign currency | 33,329,625 | 6.65 | 6.80 | 31,215,114 | 6.64 | 6.63 | 30,916,107 | 4.54 | 6.74 | |||||||||||||||||||||||||||||
| Guarantee payments | 13,925 | 1.93 | 0.00 | 14,567 | 2.28 | 0.00 | 21,260 | 2.67 | 0.00 | |||||||||||||||||||||||||||||
| Credit card receivables | 12,056,633 | 7.05 | 2.46 | 11,215,186 | 6.85 | 2.38 | 10,026,037 | 7.24 | 2.18 | |||||||||||||||||||||||||||||
| Foreign bills bought | 4,367,125 | 5.81 | 0.89 | 4,447,651 | 5.33 | 0.95 | 5,333,246 | 2.58 | 1.16 | |||||||||||||||||||||||||||||
| Bad debt expense (Δ) | 3,106,695 | 0.63 | 2,609,403 | — | 0.55 | 2,128,867 | — | 0.46 | ||||||||||||||||||||||||||||||
| Others | 45,879,464 | 9.36 | 47,063,423 | — | 9.99 | 49,540,485 | — | 10.79 | ||||||||||||||||||||||||||||||
| Total Assets |
490,118,492 | 100.00 | 470,874,318 | — | 100.00 | 458,881,716 | — | 100.00 | ||||||||||||||||||||||||||||||
Note 1) Average Balance : the simple average of the balances at the start of the fiscal year and at the end of each quarter
Note 2) Based on K-IFRS consolidated financial statements
15
| 3. | Other Information Necessary for Making Investment Decisions |
| a. | Capital Adequacy Ratios |
Group BIS Capital Adequacy Ratios
| As of the end of the period indicated | (units: billions of Won, % ) | |||||||||||
| Type |
2024 1H | 2023 | 2022 | |||||||||
| Equity capital (A) |
36,763 | 34,756 | 31,404 | |||||||||
| Risk weighted assets (B) |
230,812 | 219,792 | 205,307 | |||||||||
| BIS(Capital adequacy) ratio (A/B) |
15.93 | 15.81 | 15.30 | |||||||||
Note 1) BIS (Bank for International Settlements) Capital Adequacy Ratios = Equity capital / Risk weighted assets * 100
Note 2) Based on K-IFRS consolidated financial statements and Basel III standards
Note 3) 2024 1H figures are estimates only and are subject to change
Capital Adequacy Ratios for Significant Subsidiaries and Consolidated Companies
| As of the end of the periods indicated | (units: millions of Won, % ) | |||||||||||||||
| Name of Company |
Type |
2024 1H | 2023 | 2022 | ||||||||||||
| Woori Bank Note 2) |
BIS ratio Note 1) |
Equity capital (A) | 30,326,300 | 28,237,929 | 26,119,135 | |||||||||||
| Risk weighted assets (B) | 187,957,223 | 176,073,743 | 167,432,214 | |||||||||||||
| Capital adequacy ratio (A/B) | 16.13 | 16.04 | 15.60 | |||||||||||||
| Woori Card Note 3) |
Adjusted capital ratio |
17.41 | 16.03 | 16.54 | ||||||||||||
| Tangible common equity ratio |
11.87 | 10.97 | 11.28 | |||||||||||||
| Woori Financial Capital Note 3) |
Adjusted capital ratio |
14.12 | 14.35 | 13.78 | ||||||||||||
| Tangible common equity ratio |
11.55 | 11.48 | 10.66 | |||||||||||||
| Woori Investment Bank Note 4) |
BIS ratio Note 1) |
Equity capital (A) | 1,120,633 | 1,127,425 | 674,082 | |||||||||||
| Risk weighted assets (B) | 4,113,945 | 4,664,162 | 4,448,524 | |||||||||||||
| Capital adequacy ratio (A/B) | 27.24 | 24.17 | 15.15 | |||||||||||||
| Woori Asset Trust Note 5) |
Operating capital ratio |
3,219.51 | 1,284.26 | 1,189.77 | ||||||||||||
| Woori Asset Management Note 3) |
Minimum operating capital ratio |
710.84 | 650.26 | 681.18 | ||||||||||||
| Woori Venture Partners Note 6) |
Tangible common equity ratio |
87.21 | 90.82 | 90.92 | ||||||||||||
| Woori Savings Bank Note 7) |
BIS Capital adequacy ratio Note1) |
19.82 | 13.21 | 18.06 | ||||||||||||
| Woori Private Equity Asset Management Note 3) |
Minimum operating capital ratio |
8,560.29 | 8,618.79 | 8,937.76 | ||||||||||||
Note 1) BIS (Bank for International Settlements) Capital Adequacy Ratio : Equity capital / Risk weighted assets * 100
Note 2) Figures for Woori Bank are based on the K-IFRS consolidated financial statements and Basel III standards. 2024 1H figures are estimates only and are subject to change
Note 3) Figures for Woori Card, Woori Financial Capital, Woori Asset Management and Woori Private Equity Asset Management are based on the applicable standards for business reports submitted to the Financial Supervisory Service and our K-IFRS separate financial statements
16
Note 4) Figures for Woori Investment Bank are based on the applicable standards for business reports submitted to the Financial Supervisory Service and our K-IFRS consolidated financial statements
Note 5) Figures for Woori Asset Trust are based on K-IFRS separate financial statements
Note 6) Figures for Woori Venture Partners are based on K-IFRS consolidated financial statements
Note 7) Figures for Woori Savings Bank are based on K-GAAP
| b. | Liquidity Ratios |
Won Liquidity Ratios
| As of the end of the periods indicated | (units: millions of Won, % ) | |||||||||||||||||||||||||||||||||||
| Type |
2024 1H | 2023 | 2022 | |||||||||||||||||||||||||||||||||
| Won Liquidity Assets |
Won Liquidity Liabilities |
Won Liquidity Ratio |
Won Liquidity Assets |
Won Liquidity Liabilities |
Won Liquidity Ratio |
Won Liquidity Assets |
Won Liquidity Liabilities |
Won Liquidity Ratio |
||||||||||||||||||||||||||||
| Woori Financial Group Note 1) |
572,342 | 19,733 | 2,900.4 | 111,895 | 8,155 | 1,372.1 | 316,876 | 7,656 | 4,138.9 | |||||||||||||||||||||||||||
| Woori Card Note 2) |
8,731,521 | 3,560,245 | 245.25 | 9,119,265 | 2,454,480 | 371.54 | 8,282,745 | 1,832,484 | 452.0 | |||||||||||||||||||||||||||
| Woori Financial Capital Note 2) |
2,022,045 | 1,519,283 | 133.1 | 1,919,083 | 1,245,067 | 154.1 | 2,468,298 | 1,205,067 | 204.8 | |||||||||||||||||||||||||||
| Woori Investment Bank Note 2) |
4,657,991 | 1,777,204 | 262.1 | 4,032,290 | 1,926,080 | 209.4 | 3,128,499 | 1,802,149 | 173.6 | |||||||||||||||||||||||||||
| Woori Asset Trust Note 2) |
320,459 | 8,364 | 3,831.6 | 171,860 | 18,555 | 926.2 | 232,036 | 32,755 | 708.4 | |||||||||||||||||||||||||||
| Woori Savings Bank Note 2), Note 3) |
439,645 | 198,166 | 221.86 | 434,495 | 231,003 | 188.09 | 534,678 | 384,493 | 139.1 | |||||||||||||||||||||||||||
| Woori Venture Partners Note 2) |
174,307 | 41,930 | 415.7 | 103,367 | 7,210 | 1,433.6 | 109,432 | 10,707 | 1,022.1 | |||||||||||||||||||||||||||
| Woori Private Equity Asset Management Note 2) |
31,287 | 895 | 3,493.7 | 27,506 | 2,396 | 1,147.8 | 23,226 | 1,897 | 1,224.4 | |||||||||||||||||||||||||||
Note 1) Based on current assets and liabilities within one month of maturity
Note 2) Based on current assets and liabilities within 90 days of maturity
Note 3) Based on K-GAAP
Foreign Currency (FC) Liquidity Ratios
| As of the end of the periods indicated | (units: millions of Won, % ) | |||||||||||||||||||||||||||||||||||
| Type |
2024 1H | 2023 | 2022 | |||||||||||||||||||||||||||||||||
| FC Liquidity Assets |
FC Liquidity Liabilities |
FC Liquidity Ratio |
FC Liquidity Assets |
FC Liquidity Liabilities |
FC Liquidity Ratio |
FC Liquidity Assets |
FC Liquidity Liabilities |
FC Liquidity Ratio |
||||||||||||||||||||||||||||
| Woori Investment Bank Note 1) |
1,851 | 210 | 881.24 | 9,450 | 7,362 | 128.36 | 65,102 | 63,365 | 102.74 | |||||||||||||||||||||||||||
Note 1) Based on current assets and liabilities within three months of maturity
17
Liquidity Coverage Ratios (LCR)
| (unit: % ) | ||||||||||||||
| Name of Company |
Type |
2024 1H | 2023 | 2022 | ||||||||||
| Woori Bank |
Liquidity coverage ratio Note 1) | 101.17 | 101.26 | 102.40 | ||||||||||
| Foreign currency liquidity coverage ratio Note 2) | 140.24 | 162.75 | 143.11 | |||||||||||
| Ratio of business purpose premises and equipment | 9.93 | 10.20 | 11.04 | |||||||||||
Note 1) The LCR is calculated as the average of daily ratios during the applicable period (same as the calculation method used for business disclosures). The applicable LCR requirements for banks were 95.0%, 95.0%, and 92.5% as of June 30, 2024, December 31,2023, and December 31, 2022, respectively.
Note 2) The foreign currency LCR is calculated based on averages of the amount of each category (same as the calculation method used for business disclosures). The applicable foreign currency LCR requirements for banks were 80% for all applicable periods.
| c. | Profitability Ratio |
| Type |
2024 1H | 2023 | 2022 | |||||||||||||||||||||
| ROA | ROE | ROA | ROE | ROA | ROE | |||||||||||||||||||
| Woori Financial Group |
||||||||||||||||||||||||
| Including non-controlling interests |
0.71 | 11.10 | 0.54 | 8.65 | 0.70 | 12.21 | ||||||||||||||||||
| Excluding non-controlling interests |
0.70 | 10.82 | 0.52 | 8.25 | 0.66 | 11.54 | ||||||||||||||||||
Note 1) On an annualized basis based on the applicable standards for business reports submitted to the Financial Supervisory Service.
Note 2) Total assets and total equity : the simple average of the balances at the start of the fiscal year and at the end of each quarter
18
| d. | Asset Quality |
Group Asset Quality
| (units: billions of Won, % ) | ||||||||||||
| Type |
2024 1H | 2023 | 2022 | |||||||||
| Total loans |
380,367 | 365,780 | 343,821 | |||||||||
| Substandard and below loans |
2,148 | 1,357 | 1,082 | |||||||||
| Substandard and below loans ratio |
0.56 | 0.37 | 0.31 | |||||||||
| Non-performing loans |
1,843 | 1,299 | 997 | |||||||||
| NPL ratio |
0.48 | 0.36 | 0.29 | |||||||||
| Substandard and below coverage ratio (A/B) |
149.7 | 220.1 | 217.6 | |||||||||
| Loan loss reserve (A) |
3,215 | 2,986 | 2,354 | |||||||||
| Substandard and below loans (B) |
2,148 | 1,357 | 1,082 | |||||||||
Note 1) Based on the applicable standards for financial holding company business reports submitted to the Financial Supervisory Service
Asset Quality for Significant Subsidiaries and Consolidated Companies
| (units: % ) | ||||||||||||||||||||||||||||||||||||
| Type |
2024 1H | 2023 | 2022 | |||||||||||||||||||||||||||||||||
| Substandard and below ratio |
NPL ratio | Substandard and below coverage ratio |
Substandard and below ratio |
NPL ratio | Substandard and below coverage ratio |
Substandard and below ratio |
NPL ratio | Substandard and below coverage ratio |
||||||||||||||||||||||||||||
| Woori Bank |
0.23 | 0.17 | 249.82 | 0.18 | 0.17 | 320.84 | 0.19 | 0.16 | 263.43 | |||||||||||||||||||||||||||
| Woori Card |
1.44 | — | 105.23 | 0.97 | — | 104.92 | 0.8 | — | 104.92 | |||||||||||||||||||||||||||
| Woori Financial Capital |
2.39 | — | 107.98 | 2.37 | — | 113.21 | 1.22 | — | 198.56 | |||||||||||||||||||||||||||
| Woori Investment Bank |
5.96 | 2.02 | 69.62 | 0.55 | 0.55 | 578.29 | 0.63 | 0.58 | 151.81 | |||||||||||||||||||||||||||
| Woori Asset Trust |
70.37 | — | — | 32.11 | — | — | 32.23 | — | — | |||||||||||||||||||||||||||
| Woori Savings Bank |
9.54 | — | 66.37 | 3.53 | — | 101.66 | 3.22 | — | 97.54 | |||||||||||||||||||||||||||
Note 1) Based on the applicable standards for business reports submitted to the Financial Supervisory Service
Note 2) Figures for Woori Savings Bank are based on K-GAAP
19
| III. | Financial Information |
| 1. | Condensed Financial Statements (Consolidated) |
Summary Consolidated Statement of Financial Position
| (The Company and its Consolidated Subsidiaries, as of the end of the periods indicated) | (unit: millions of Won) |
| Classification |
2024 1H | 2023 | 2022 | |||||||||
| ASSETS |
||||||||||||
| Cash and cash equivalents |
25,471,632 | 30,556,618 | 34,219,148 | |||||||||
| Financial assets at fair value through profit or loss (“FVTPL”) |
23,309,282 | 21,544,756 | 19,860,573 | |||||||||
| Financial assets at fair value through other comprehensive income |
38,875,628 | 37,891,495 | 33,085,080 | |||||||||
| Securities at amortized cost |
22,408,759 | 23,996,172 | 28,268,516 | |||||||||
| Loans and other financial assets at amortized cost |
387,374,084 | 373,148,148 | 355,760,729 | |||||||||
| Investments in joint ventures and associates |
1,899,281 | 1,795,370 | 1,305,636 | |||||||||
| Investment properties |
495,032 | 472,768 | 387,707 | |||||||||
| Premises and equipment |
3,306,955 | 3,176,759 | 3,142,930 | |||||||||
| Intangible assets and goodwill |
1,025,291 | 996,842 | 849,114 | |||||||||
| Assets held for sale |
35,333 | 20,345 | 13,772 | |||||||||
| Net defined benefit asset |
111,599 | 240,260 | 319,280 | |||||||||
| Current tax assets |
69,325 | 203,542 | 53,274 | |||||||||
| Deferred tax assets |
49,904 | 93,366 | 109,299 | |||||||||
| Derivative assets (designated for hedging) |
85,106 | 26,708 | 37,786 | |||||||||
| Other assets |
4,263,954 | 3,841,787 | 3,061,552 | |||||||||
| Total assets |
508,781,165 | 498,004,936 | 480,474,396 | |||||||||
| LIABILITIES |
||||||||||||
| Financial liabilities at FVTPL |
7,515,789 | 6,138,313 | 8,952,399 | |||||||||
| Deposits due to customers |
359,302,549 | 357,784,297 | 342,105,209 | |||||||||
| Borrowings |
30,315,001 | 30,986,746 | 28,429,603 | |||||||||
| Debentures |
42,102,432 | 41,239,245 | 44,198,486 | |||||||||
| Provisions |
634,578 | 806,031 | 545,865 | |||||||||
| Net defined benefit liability |
4,375 | 6,939 | 35,202 | |||||||||
| Current tax liabilities |
145,887 | 103,655 | 843,555 | |||||||||
| Deferred tax liabilities |
653,876 | 470,311 | 31,799 | |||||||||
| Derivative liabilities (designated for hedging) |
150,585 | 153,007 | 202,911 | |||||||||
| Other financial liabilities |
32,033,007 | 26,115,005 | 22,811,868 | |||||||||
| Other liabilities |
775,472 | 803,897 | 690,157 | |||||||||
| Total liabilities |
473,633,551 | 464,607,446 | 448,847,054 | |||||||||
| EQUITY |
||||||||||||
| Owners’ equity: |
33,466,569 | 31,666,881 | 28,761,897 | |||||||||
| Capital stock |
3,802,676 | 3,802,676 | 3,640,303 | |||||||||
| Hybrid securities |
4,409,042 | 3,611,129 | 3,112,449 | |||||||||
| Capital surplus |
937,826 | 935,563 | 682,385 | |||||||||
| Other equity |
(1,598,997 | ) | (1,668,957 | ) | (2,423,392 | ) | ||||||
| Retained earnings |
25,916,022 | 24,986,470 | 23,750,152 | |||||||||
| Non-controlling interests |
1,681,045 | 1,730,609 | 2,865,445 | |||||||||
| Total equity |
35,147,614 | 33,397,490 | 31,627,342 | |||||||||
|
|
|
|
|
|
|
|||||||
| Total liabilities and equity |
508,781,165 | 498,004,936 | 480,474,396 | |||||||||
|
|
|
|
|
|
|
|||||||
| Number of Consolidated Subsidiaries (excluding holding company) |
184 | 179 | 167 | |||||||||
20
Summary Consolidated Statement of Comprehensive Income
| (The Company and its Consolidated Subsidiaries, for the periods indicated) | (unit: millions of Won, except per share amounts) | |||||||||||||||
| Classification |
2024 1H | 2023 1H | 2023 | 2022 | ||||||||||||
| Operating income |
2,404,009 | 2,147,438 | 3,499,029 | 4,430,524 | ||||||||||||
| Net interest income |
4,395,099 | 4,412,993 | 8,742,540 | 8,696,579 | ||||||||||||
| Net fees and commissions income |
1,058,166 | 842,265 | 1,720,481 | 1,710,170 | ||||||||||||
| Dividend income |
152,738 | 92,005 | 240,293 | 159,982 | ||||||||||||
| Net gain or loss on financial instruments at FVTPL |
902,118 | 360,517 | 488,486 | 238,502 | ||||||||||||
| Net gain or loss on financial assets at FVTOCI |
38,515 | (398 | ) | (37,641 | ) | (21,498 | ) | |||||||||
| Net gain or loss arising on financial assets at amortized cost |
165,645 | 115,708 | 203,942 | 74,204 | ||||||||||||
| Impairment losses due to credit loss |
(775,492 | ) | (817,815 | ) | (1,894,916 | ) | (885,272 | ) | ||||||||
| General and administrative expenses |
(2,100,987 | ) | (2,057,916 | ) | (4,443,433 | ) | (4,529,890 | ) | ||||||||
| Other net operating expenses |
(1,431,793 | ) | (799,921 | ) | (1,520,723 | ) | (1,012,253 | ) | ||||||||
| Non-operating income (expense) |
(13,150 | ) | 1,095 | 18,424 | 54,850 | |||||||||||
| Net income before income tax expense |
2,390,859 | 2,148,533 | 3,517,453 | 4,485,374 | ||||||||||||
| Income tax expense |
(590,439 | ) | (534,721 | ) | (890,559 | ) | (1,161,392 | ) | ||||||||
| Net income |
1,800,420 | 1,613,812 | 2,626,894 | 3,323,982 | ||||||||||||
| Net income attributable to owners |
1,755,496 | 1,538,876 | 2,506,296 | 3,141,680 | ||||||||||||
| Net income attributable to the non-controlling interests |
44,924 | 74,936 | 120,598 | 182,302 | ||||||||||||
| Other comprehensive income (loss), net of tax |
66,598 | 382,460 | 663,537 | (239,819 | ) | |||||||||||
| Items that will not be reclassified to profit or loss |
(136,151 | ) | 72,019 | 122,334 | 216,767 | |||||||||||
| Items that may be reclassified to profit or loss |
202,749 | 310,441 | 541,203 | (456,586 | ) | |||||||||||
| Total comprehensive income |
1,867,018 | 1,996,272 | 3,290,431 | 3,084,163 | ||||||||||||
| Comprehensive income attributable to the owners |
1,819,493 | 1,907,895 | 3,164,464 | 2,909,053 | ||||||||||||
| Comprehensive income attributable to non-controlling interests |
47,525 | 88,377 | 125,967 | 175,110 | ||||||||||||
| Net income per share: |
||||||||||||||||
| Basic and diluted loss per share (in Korean Won) |
2,262 | 2,028 | 3,230 | 4,191 | ||||||||||||
21
| 2. | Condensed Financial Statements (Separate) |
Summary Statement of Financial Position
| (The Company, as of the end of the period indicated) | (unit: millions of Won) |
| Classification |
2024 1H | 2023 | 2022 | |||||||||
| ASSETS |
||||||||||||
| Cash and cash equivalents |
225,281 | 289,507 | 313,361 | |||||||||
| Financial assets at fair value through profit or loss |
— | — | 689 | |||||||||
| Financial assets at fair value through other comprehensive income |
545,153 | 539,709 | 312,771 | |||||||||
| Loans and other financial assets at amortized cost |
1,952,420 | 1,104,815 | 2,041,877 | |||||||||
| Investments in subsidiaries |
24,144,282 | 23,670,476 | 22,394,915 | |||||||||
| Premises and equipment |
4,447 | 6,609 | 11,052 | |||||||||
| Intangible assets |
3,710 | 4,052 | 4,859 | |||||||||
| Net defined benefit asset |
— | 3,941 | 5,947 | |||||||||
| Current tax assets |
51,046 | 158,951 | 14,350 | |||||||||
| Deferred tax assets |
5,736 | 7,478 | 13,433 | |||||||||
| Other assets |
294 | 484 | 322 | |||||||||
| Total assets |
26,932,369 | 25,786,022 | 25,113,576 | |||||||||
| LIABILITIES |
||||||||||||
| Debentures |
1,588,028 | 1,587,659 | 1,447,762 | |||||||||
| Provisions |
1,230 | 1,227 | 487 | |||||||||
| Net defined benefit liability |
563 | — | — | |||||||||
| Current tax liabilities |
103,298 | 32,125 | 721,795 | |||||||||
| Other financial liabilities |
106,048 | 163,621 | 46,039 | |||||||||
| Other liabilities |
333 | 392 | 591 | |||||||||
| Total liabilities |
1,799,500 | 1,785,024 | 2,216,674 | |||||||||
| EQUITY |
||||||||||||
| Capital stock |
3,802,676 | 3,802,676 | 3,640,303 | |||||||||
| Hybrid securities |
4,408,867 | 3,610,953 | 3,112,273 | |||||||||
| Capital surplus |
11,120,236 | 11,120,236 | 10,909,281 | |||||||||
| Other equity |
(4,846 | ) | (7,871 | ) | (26,186 | ) | ||||||
| Retained Earnings |
5,805,936 | 5,475,004 | 5,261,231 | |||||||||
|
|
|
|
|
|
|
|||||||
| Total equity |
25,132,869 | 24,000,998 | 22,896,902 | |||||||||
|
|
|
|
|
|
|
|||||||
| Total liabilities and equity |
26,932,369 | 25,786,022 | 25,113,576 | |||||||||
|
|
|
|
|
|
|
|||||||
22
Summary Statement of Comprehensive Income
| (The Company, for the period indicated) | (unit: millions of Won, except per share amounts) | |||
| Classification |
2024 1H | 2023 1H | 2023 | 2022 | ||||||||||||
| Operating income: |
1,158,218 | 1,445,324 | 1,424,670 | 1,185,627 | ||||||||||||
| Net interest expense |
6,181 | 15,692 | 27,495 | (5,030 | ) | |||||||||||
| Interest income |
28,748 | 32,068 | 64,592 | 25,614 | ||||||||||||
| Interest expense |
(22,567 | ) | (16,376 | ) | (37,097 | ) | (30,644 | ) | ||||||||
| Net fees and commissions loss |
(8,848 | ) | (8,755 | ) | (20,097 | ) | (15,059 | ) | ||||||||
| Fees and commissions income |
813 | 798 | 1,625 | 1,596 | ||||||||||||
| Fees and commissions expense |
(9,661 | ) | (9,553 | ) | (21,722 | ) | (16,655 | ) | ||||||||
| Dividend income |
1,195,721 | 1,472,869 | 1,482,956 | 1,272,393 | ||||||||||||
| Net gain or loss on financial instruments at FVTPL |
— | 2,023 | 2,023 | 1,018 | ||||||||||||
| Reversal of (Provisions for) impairment losses due to credit loss |
(442 | ) | (978 | ) | (348 | ) | (244 | ) | ||||||||
| General and administrative expenses |
(34,394 | ) | (35,527 | ) | (67,359 | ) | (67,451 | ) | ||||||||
| Non-operating income (expense) |
(63 | ) | 9 | (1,043 | ) | (1,363 | ) | |||||||||
| Net income before income tax expense |
1,158,155 | 1,445,333 | 1,423,627 | 1,184,264 | ||||||||||||
| Income tax benefit (expense) |
(658 | ) | 96 | 881 | (1,015 | ) | ||||||||||
| Net income |
1,157,497 | 1,445,429 | 1,424,508 | 1,183,249 | ||||||||||||
| Other comprehensive income (loss), net of tax |
3,025 | 7,885 | 18,916 | (22,312 | ) | |||||||||||
| Items that will not be reclassified to profit or loss |
3,025 | 7,885 | 18,916 | (22,312 | ) | |||||||||||
| Net gain or loss on valuation of equity securities at FVTOCI |
4,008 | 8,826 | 19,789 | (24,676 | ) | |||||||||||
| Remeasurement of the net defined benefit liability |
(983 | ) | (941 | ) | (873 | ) | 2,364 | |||||||||
| Total comprehensive income |
1,160,522 | 1,453,314 | 1,443,424 | 1,160,937 | ||||||||||||
| Net income per share: |
||||||||||||||||
| Basic and diluted income per share (in Korean Won) |
1,450 | 1,899 | 1,754 | 1,499 | ||||||||||||
23
| 3. | Dividend Information |
As a financial holding company, we depend on receiving dividends from our subsidiaries to pay dividends, and our subsidiaries pay us dividends within the limits of their distributable profits after deducting the necessary internal reserves required to maintain the adequate regulatory capital imposed by the financial authorities by sector. Therefore, the levels of our dividend payouts take into holistic consideration the current and future asset growth of Woori Financial Group and its subsidiaries and surplus funds after maintaining the appropriate capital adequacy ratios, among other factors.
In February 2023, we disclosed our “Shareholder Return Policy and Group Capital Management Plan considering the Total Shareholder Return Rate (including dividends and share buybacks and cancellations).” In our 2023 fiscal year business report, we amended our existing shareholder return policy by increasing the CET1 ratio benchmark from 12% to 13%, taking into consideration the strengthened regulations on capital, our expanded loss-absorbing capacity, and the shareholder return levels of our competitors.
Accordingly, in 2023, we achieved a total shareholder return (“TSR”) of approximately 33.8% through the payment of quarterly dividends (Won 180 per share for each of the 2nd and 3rd quarters), our first-ever buyback and cancellation of treasury shares worth Won 100 billion , and the payment of year-end dividends of Won 640 per share. In 2024, we repurchased and canceled all of the remaining shares that had been held by KDIC (9,357,960 shares), which amounted to approximately Won 136.6 billion and paid out quarterly dividends from the first quarter onwards (Won 180 per share for the 1st and 2nd quarters).
On July 25, 2024 we became the first financial group in Korea to disclose the “Corporate Value Enhancement Plan” as our guide to enhance corporate value by increasing shareholder returns based on the CET1 ratio. (For more details, please refer to the materials posted on our website (https://www.woorifg.com))
Some of the highlights of the shareholder return direction and the plan are as follows: Note 1)
① Concurrently paying out dividends and buying back and canceling treasury shares while gradually increasing their amounts (continually increasing the DPS)
② CET1 Ratio Tiered to enhance sustainability and visibility
| Tier 1 | Tier 2 | Tier 3 | Tier 4 | |||||||||||||
| CET1 Ratio |
~ 11.5 | % | 11.5 ~ 12.5 | % | 12.5 ~ 13.0 | % | 13.0 | % ~ | ||||||||
| Total Shareholder Return |
~ 30 | % | ~ 35 | % | ~ 40 | % | ~ 50 | % | ||||||||
Note 1) The TSR and DPS may vary depending on macroeconomic conditions, regulatory policies/guidelines and management purposes (including one-off events such as M&As)
24
Note 2) The determination of the CET1 ratio tier is applied on a year-end basis
③When the TSR is within 40%, maintain a dividend payout ratio of approximately 30%, while buying back and cancelling as treasury shares the excess amount
When the TSR is over 40%, maintain a balance of dividend payments and share buybacks and cancellation
We will continue our efforts to enhance our shareholder value and ensure the predictability of our shareholder return policy. If there are any changes to the shareholder return policy, we will actively communicate with our stakeholders through notices and disclosures.
Key information regarding dividends:
| Items |
2024 1H | 2023 | 2022 | |||||||||||
| Par value per share (Won) |
5,000 | 5,000 | 5,000 | |||||||||||
| Net profit (Millions of Won) |
1,755,496 | 2,506,296 | 3,141,680 | |||||||||||
| Earnings per share (Won) |
2,262 | 3,230 | 4,191 | |||||||||||
| Total cash dividends (Millions of Won) |
267,314 | 747,302 | 822,706 | |||||||||||
| Total stock dividends (Millions of Won) |
— | — | — | |||||||||||
| Cash dividend payout ratio (%) |
15.23 | 29.82 | 26.19 | |||||||||||
| Cash dividend yield (%) |
Common Shares | 2.5 | 6.7 | 8.8 | ||||||||||
| Preferred Shares | — | — | — | |||||||||||
| Stock dividend yield (%) |
Common Shares | — | — | — | ||||||||||
| Preferred Shares | — | — | — | |||||||||||
| Cash dividend per share (Won) |
Common Shares | 360 | 1,000 | 1,130 | ||||||||||
| Preferred Shares | — | — | — | |||||||||||
| Stock dividend per share (Share) |
Common Shares | — | — | — | ||||||||||
| Preferred Shares | — | — | — | |||||||||||
Note 1) The dividends for 1H 2024include first quarter dividends of Won 133,657 million (Won 180 per share) and second quarter dividends of Won 133,657 million (Won 180 per share through a board resolution on July 25, 2024)
Note 2) The dividends for FY2023 include second quarter dividends of Won 130,748 million (Won 180 per share) and third quarter dividends of Won 135,341 million (Won 180 per share)
Note 3) The dividends for FY2022 include an interim dividend of Won 109,209 million (Won 150 per share)
Note 4) The above cash dividend yield is calculated as the percentage of dividend per share to the arithmetic average price formed in the stock market during the past week, starting from two trading days before the record date. The percentage is rounded to the first decimal place.
25
| IV. | Independent Auditor’s Opinion |
| 1. | Independent Auditor’s Opinion |
| 2024 1H |
2023 |
2022 | ||||
| Auditor | KPMG Samjong Accounting Corp. | KPMG Samjong Accounting Corp. | Samil PricewaterhouseCoopers | |||
| Auditor’s Opinion | Note 1) | Note 2) | Note 3) |
Note 1) In its review report attached to this report, KPMG Samjong Accounting Corp. has stated that nothing had come to their attention that caused them to believe that the accompanying consolidated and separate interim financial statements of Woori Financial Group are not presented fairly in all material respects, in accordance with Korean IFRS.
Note 2) In its audit report, KPMG Samjong Accounting Corp. has stated that the financial statements present fairly, in all material respects, the financial position of Woori Financial Group as of December 31, 2023, and its financial performance and its cash flows for the year then ended in accordance with Korean IFRS
Note 3) In its audit report, Samil PricewaterhouseCoopers has stated that the financial statements present fairly, in all material respects, the financial position of Woori Financial Group as of December 31, 2022, and its financial performance and its cash flows for the year then ended in accordance with Korean IFRS.
| 2. | Compensation to the Independent Auditor |
| a. | Audit Services |
| Term |
Auditor |
Description |
Contract |
Actual | ||||||||
| Fee |
Time |
Fee |
Time | |||||||||
| 2024 1H |
KPMG Samjong Accounting Corp. |
1Q/1H/3Q Review Closing audit (including internal accounting management system) |
KRW 1,037 million | 9,930 hours | KRW 350 million | 3,840 hours | ||||||
| 2023 |
KPMG Samjong Accounting Corp. |
1Q/1H/3Q Review Closing audit (including internal accounting management system) |
KRW 964 million | 9,380 hours | KRW 964 million |
9,613 hours | ||||||
| 2022 |
Samil PricewaterhouseCoopers |
1Q/1H/3Q Review Closing audit (including internal accounting management system) |
KRW 1,068 million | 9,380 hours | KRW 1,068 million |
8,714 hours | ||||||
| Note | 1) Fee excludes VAT |
| Note | 2) Time includes planning time up until the commencement of the applicable services |
26
| b. | Other Audit Services |
None.
| c. | Current Status of Audit Service Agreements with the Independent Auditor Relating to U.S. Listing |
| Term |
Auditor |
Description |
Fee | |||
| 2024 1H | KPMG Samjong Accounting Corp. |
U.S. PCAOB standard audit of consolidated financial statements and internal control over financial reporting (for FY2024) | KRW 2,015 million | |||
| 2023 | KPMG Samjong Accounting Corp. |
U.S. PCAOB standard audit of consolidated financial statements and internal control over financial reporting (for FY2023) | KRW 1,891 million | |||
| 2022 | Samil PricewaterhouseCoopers | U.S. PCAOB standard audit of consolidated financial statements and internal control over financial reporting (for FY2022) | KRW 2,240 million | |||
Note 1) Fee excludes VAT
| d. | Non-Audit Services |
| Term |
Date of Execution of Agreement |
Description of Service |
Service Term |
Fees | ||||
| 2023 1H | March 31, 2024 | Tax adjustment (including review relating to application of consolidated tax) | April 1, 2024 ~ June 2, 2025 | KRW 68 million | ||||
| 2023 | March 31, 2023 | Tax adjustment (including review relating to application of consolidated tax) | April 1, 2023 ~ May 31, 2024 | KRW 64 million | ||||
| 2022 | March 30, 2022 | Tax adjustment (including review relating to application of consolidated tax) | April 1, 2022 ~ May 31, 2023 | KRW 64 million | ||||
Note 1) Fee excludes VAT
27
| V. | Corporate Governance |
| 1. | About the Board of Directors |
| a. | Composition of the Board of Directors |
As of June 30, 2024, our board of directors consisted of eight directors in total, including seven outside directors and one standing director.
On March 22, 2024, at the annual general meeting of shareholders, five outside directors were appointed.
- New outside directors (2): Eun-Ju Lee, Sunyoung Park
- Reappointed outside directors (3): Chan-Hyoung Chung, In-Sub Yoon, Yo-Hwan Shin
On March 22, 2024, one outside director completed her term.
- Retired outside director (1): Soo-Young Song
The board of directors operates a total of six standing committees: the Audit Committee, the Risk Management Committee, the Compensation Committee, the Officer Candidates Recommendation Committee, the Subsidiary Representative Director Candidate Recommendation Committee and the ESG Management Committee.
On March 22, 2024, Chan-Hyoung Chung, an outside director, was appointed as the chair of the board of directors. Chan-Hyoung Chung, a former CEO of a finance company, has outstanding insight into, and experience in, the financial and accounting sectors. He has demonstrated leadership and responsibility as an outside director of Woori Financial Group (from January 11, 2019 to present) and as the chair of the Audit Committee (from January 11, 2019 to March 24, 2023), which led to his appointment as the chair of our board of directors based on unanimous consent from all of the directors. The chair of the board of directors does not concurrently hold the position of representative director.
| b. | Committees under the Board of Directors |
We currently have the following committees serving under the board of directors:
| (a) | Audit Committee |
| (b) | Risk Management Committee |
| (c) | Compensation Committee |
| (d) | Officer Candidate Recommendation Committee |
| (e) | Subsidiary Representative Director Candidate Recommendation Committee |
| (f) | ESG Management Committee |
28
(As of June 30, 2024)
| Name of Committee |
Composition |
Names of Members | ||
| Audit Committee | Four outside directors | (Chair) Su-Young Yun (outside director) Chan-Hyoung Chung (outside director) Yo-Hwan Shin (outside director) Sung-Bae Ji (outside director) | ||
| Risk Management Committee | Three outside directors | (Chair) In-Sub Yoon (outside director) Eun-Ju Lee (outside director) Sunyoung Park (outside director) | ||
| Compensation Committee | Four outside directors | (Chair) Yo-Hwan Shin (outside director) In-Sub Yoon (outside director) Chan-Hyoung Chung (outside director) Su-Young Yun (outside director) | ||
| Officer Candidate Recommendation Committee | Seven outside directors | (Chair) Sung-Bae Ji (outside director) In-Sub Yoon (outside director) Chan-Hyoung Chung (outside director) Su-Young Yun (outside director) Yo-Hwan Shin (outside director) Eun-Ju Lee (outside director) Sunyoung Park (outside director) | ||
| Subsidiary Representative Director Candidate Recommendation Committee |
Seven outside directors One standing director |
(Chair) Jong-Yong Yim (standing director) In-Sub Yoon (outside director) Chan-Hyoung Chung (outside director) Su-Young Yun (outside director) Yo-Hwan Shin (outside director) Sung-Bae Ji (outside director) Eun-Ju Lee (outside director) Sunyoung Park (outside director) | ||
| ESG Management Committee | Seven outside directors One standing director |
(Chair) Eun-Ju Lee (outside director) In-Sub Yoon (outside director) Chan-Hyoung Chung (outside director) Su-Young Yun (outside director) Yo-Hwan Shin (outside director) Sung-Bae Ji (outside director) Sunyoung Park (outside director) Jong-Yong Yim (standing director) | ||
29
| 2. | Shareholder’s Meeting |
| a. | Voting Rights |
| As of June 30, 2024 | (unit: shares) | |||||||||||
| Items |
Number of shares | Notes | ||||||||||
| Number of issued shares |
Common Shares | 742,591,501 | — | |||||||||
| Preferred Shares | — | — | ||||||||||
| Number of shares without voting rights |
Common Shares | 3,082,264 | Note 1 | ) | ||||||||
| Preferred Shares | — | — | ||||||||||
| Number of shares for which voting rights are excluded pursuant to the articles of incorporation |
Common Shares | — | — | |||||||||
| Preferred Shares | — | — | ||||||||||
| Number of shares for which voting rights are limited by law |
Common Shares | — | — | |||||||||
| Preferred Shares | — | — | ||||||||||
| Number of shares for which voting rights have been restored |
Common Shares | — | — | |||||||||
| Preferred Shares | — | — | ||||||||||
| Number of shares for which voting rights may be exercised |
Common Shares | 739,509,237 | — | |||||||||
| Preferred Shares | — | — | ||||||||||
Note 1) Treasury shares acquired from the issuance of fractional shares and purchased through a trust agreement, and shares in mutual ownership (pursuant to Article 369 of the Commercial Act)
| b. | Summary of the Shareholder’s Meeting Minutes |
| Agenda |
Result | |||
| Annual General Meeting of Shareholders for FY2020 (March 26, 2021) |
1. Approval of financial statements for the fiscal year 2020 | Approved as submitted | ||
|
2. Approval of amendments to the Articles of Incorporation |
Approved as submitted | |||
|
3. Approval of reduction of Capital Reserve |
Approved as submitted | |||
|
4. Appointment of directors (1 standing director, 4 outside directors)
- 4-1 Candidate for standing director : Won-Duk Lee
- 4-2 Candidate for outside director : Sung-Tae Ro
- 4-3 Candidate for outside director : Sang-Yong Park
- 4-4 Candidate for outside director : Zhiping Tian
- 4-5 Candidate for outside director : Dong-Woo Chang |
Approved as submitted | |||
| 5. Appointment of outside director who will serve as an Audit Committee Member
- Candidate for outside director who will serve as an Audit Committee Member : Chan-Hyoung Chung |
Approved as submitted | |||
30
| 6. Appointment of Audit Committee Members who are outside directors
- 6-1 Candidate for Audit Committee Member who is an outside director : Sung-Tae Ro
- 6-2 Candidate for Audit Committee Member who is an outside director : Dong-Woo Chang
|
Approved as submitted | |||
| 7. Approval of the maximum limit on directors’ compensation
|
Approved as submitted | |||
| Extraordinary General Meeting of Shareholder in 2022 (January 27, 2022) |
1. Appointment of directors (2 outside directors)
- 1-1 Candidate for outside director : In-Sub Yoon
- 1-2 Candidate for outside director : Yo-Hwan Shin
|
Approved as submitted | ||
| Annual General Meeting of Shareholders for FY2021 (March 25, 2022) |
1. Approval of financial statements for the fiscal year 2021
|
Approved as submitted | ||
| 2. Approval of amendments to the Articles of Incorporation
|
Approved as submitted | |||
| 3. Appointment of directors (4 outside directors, 1 non-standing director)
- 3-1 Candidate for outside director : Soo-Young Song
- 3-2 Candidate for outside director : Sung-Tae Ro
- 3-3 Candidate for outside director : Sang-Yong Park
- 3-4 Candidate for outside director : Dong-Woo Chang
- 3-5 Candidate for non-standing director : Won-Duk Lee
|
Approved as submitted | |||
| 4. Appointment of outside director who will serve as an Audit Committee Member
- Candidate for outside director who will serve as an Audit Committee Member : Chan-Hyoung Chung
|
Approved as submitted | |||
| 5. Appointment of Audit Committee Members who are outside directors
- 5-1 Candidate for Audit Committee Member who is an outside director : Sung-Tae Ro
- 5-2 Candidate for Audit Committee Member who is an outside director : Dong-Woo Chang
|
Approved as submitted | |||
| 6. Approval of the maximum limit on directors’ compensation
|
Approved as submitted | |||
| Annual General Meeting of Shareholders for FY2022 (March 24, 2023) |
1. Approval of financial statements for the fiscal year 2022 (Jan. 1, 2022 – Dec.31, 2022)
|
Approved as submitted | ||
| 2. Approval of amendments to the Articles of Incorporation
|
Approved as submitted | |||
| 3. Election of directors (2 outside directors, 1 standing director)
- 3-1 Candidate for outside director : Chan-Hyoung Chung
- 3-2 Candidate for outside director : Su-Young Yun
- 3-3 Candidate for standing director : Jong-Yong Yim
|
Approved as submitted | |||
| 4. Election of outside director who will serve as an Audit Committee Member
- Candidate for outside director who will serve as an Audit Committee Member : Sung-Bae Ji |
Approved as submitted |
31
| 5. Election of Audit Committee Members who are outside directors
- 5-1 Candidate for Audit Committee Member who is an Outside director : Chan-Hyoung Chung
- 5-2 Candidate for Audit Committee Member who is an Outside director : Su-Young Yun
- 5-3 Candidate for Audit Committee Member who is an Outside director : Yo-Hwan Shin
|
Approved as submitted | |||
| 6. Approval of maximum limit on directors’ compensation
|
Approved as submitted | |||
| Annual General Meeting of Shareholders for FY2023 (March 22, 2024) |
1. Approval of separate financial statements (including statements of appropriations of retained earnings) and consolidated financial statements for the fiscal year 2023 (Jan. 1, 2023 – Dec. 31, 2023)
|
Approved as submitted | ||
| 2. Election of directors (5 outside directors)
- 2-1 Candidate for outside director : Chan-Hyoung Chung
- 2-2 Candidate for outside director : In-Sub Yoon
- 2-3 Candidate for outside director : Yo-Hwan Shin
- 2-4 Candidate for outside director : Eun-Ju Lee
- 2-5 Candidate for outside director : Sunyoung Park
|
Approved as submitted | |||
| 3. Election of Audit Committee Members who are outside directors (2 directors)
- 3-1 Candidate for Audit Committee Member who is an outside director : Chan-Hyoung Chung
- 3-2 Candidate for Audit Committee Member who is an outside director : Yo-Hwan Shin
|
Approved as submitted | |||
| 4. Approval of maximum limit on directors’ compensation | Approved as submitted |
32
| VI. | Shareholder Information |
| 1. | Share Distribution |
| a. | Share Information of the Largest Shareholder and Specially Related Parties |
| As of June 30, 2024 | (units: shares, %) | |||||||||||||||||||||||
| Name |
Relation |
Type |
Shares Held | Notes | ||||||||||||||||||||
| Beginning balance | Ending balance | |||||||||||||||||||||||
| Number | Share | Number | Share | |||||||||||||||||||||
| Employee Stock Ownership Association of Woori Financial Group |
The largest shareholder | Common | 43,990,091 | 5.85 | 44,341,714 | 5.97 | — | |||||||||||||||||
| Employee Stock Ownership Association of Woori Bank |
Specially related party of the largest shareholder | Common | 25,040,007 | 3.33 | 21,710,856 | 2.92 | — | |||||||||||||||||
| Total |
Common | 69,030,098 | 9.18 | 66,052,570 | 8.89 | — | ||||||||||||||||||
| Others | — | — | — | — | — | |||||||||||||||||||
| b. | Changes in the largest shareholder |
| As of June 30, 2024 | (units: shares, %) | |||||||
| Change of Date |
Largest Shareholder |
Number Held |
Share |
Notes | ||||
| December 9, 2021 |
Employee Stock Ownership Association of Woori Financial Group and others 1 | 71,346,178 | 9.80 | Purchased 1.00% of the KDIC’s remaining shares of Woori Financial Group (8.80% share already held) Note 1) |
Note 1) Refer to the prior disclosure on Form 6-K on December 10, 2021, “Changes in the Largest Shareholder” for further details.
33
| c. | Share Ownership of More Than 5% |
| As of June 30, 2024 | (units: shares, %) | |||||||
| Name | Shares | Notes | ||||||
| No. of shares | Percentage of shareholding | |||||||
| Share ownership of more than 5% |
Blackrock Fund Advisors | 45,100,755 | 6.07 | Note 1) | ||||
| National Pension Service | 44,760,871 | 6.03 | — | |||||
| Employee Stock Ownership Association |
66,052,570 | 8.89 | The largest shareholder Note 2) | |||||
Note 1) Based on the disclosure of Blackrock Fund Advisors on June 10, 2024
Note 2) Total shares of the employee stock ownership association of Woori Financial Group and Woori Bank
| 2. | Stock Price and Stock Market Performance |
| a. | Domestic Stock Market |
(units: Won, shares)
| Period |
|
January 2024 |
February 2024 |
March 2024 |
April 2024 |
May 2024 |
June 2024 |
|||||||||||||||||||
| Common Shares |
High | 13,920 | 15,060 | 15,290 | 14,350 | 14,870 | 14,690 | |||||||||||||||||||
| Low | 12,450 | 14,020 | 14,250 | 13,170 | 13,980 | 13,950 | ||||||||||||||||||||
| Average | 12,782 | 14,636 | 14,721 | 13,875 | 14,413 | 14,246 | ||||||||||||||||||||
| Monthly Trade Volume |
High | 3,552,141 | 6,674,144 | 19,050,010 | 3,245,321 | 3,595,365 | 4,197,495 | |||||||||||||||||||
| Low | 668,847 | 1,763,594 | 2,059,724 | 880,023 | 877,182 | 788,061 | ||||||||||||||||||||
| Monthly Total | 34,163,534 | 75,043,442 | 89,864,427 | 39,996,589 | 33,335,824 | 32,771,976 | ||||||||||||||||||||
Note 1) Source: KRX KOSPI Market
Note 2) Share prices are based on closing prices.
34
| b. | Foreign Stock Market (NYSE) |
(units: US Dollars, Won, ADSs)
| Period |
January 2024 |
February 2024 |
March 2024 |
April 2024 |
May 2024 |
June 2024 |
||||||||||||||||||||
| ADS |
High | 31.01 | 34.02 | 35.74 | 31.61 | 33.25 | 32.04 | |||||||||||||||||||
| Low | 28.15 | 31.39 | 32.43 | 28.84 | 31.03 | 30.65 | ||||||||||||||||||||
| Average | 29.10 | 33.01 | 34.18 | 30.53 | 32.02 | 31.28 | ||||||||||||||||||||
| Won Conversion |
High | 41,261.91 | 45,280.62 | 47,066.01 | 42,572.35 | 45,093.65 | 44,509.97 | |||||||||||||||||||
| Low | 37,411.35 | 41,660.81 | 43,644.29 | 40,240.45 | 42,759.34 | 42,229.57 | ||||||||||||||||||||
| Average | 38,519.04 | 43,964.73 | 45,481.33 | 41,764.2 | 43,722.27 | 43,173.37 | ||||||||||||||||||||
| Monthly Trade Volume |
High | 200,578 | 104,306 | 87,949 | 99,002 | 177,795 | 80,392 | |||||||||||||||||||
| Low | 29,465 | 18,841 | 17,132 | 27,679 | 21,667 | 27,983 | ||||||||||||||||||||
| Monthly Total | 1,270,198 | 885,499 | 878,343 | 1,138,232 | 1,117,898 | 885,535 | ||||||||||||||||||||
Note 1) Source: standard trading rate (daily and monthly average) (Seoul Money Brokerage, www.smbs.biz)
Note 2) One ADS represents three common shares.
Note 3) Share prices are based on closing prices.
35
| VII. | Directors and Employee Information |
| 1. | Directors and Executives |
As of June 30, 2024
| Position |
Name | Common Shares Owned |
Term Commencement Date |
Expiration of Term | ||||||||
| Chief Executive Officer |
Registered | Jong-Yong Yim | 10,000 | March 24, 2023 | Note 1) | |||||||
| Outside Director |
Registered | In-Sub Yoon | — | January 27, 2022 | Note 2) | |||||||
| Outside Director |
Registered | Chan-Hyoung Chung | 10,532 | January 11, 2019 | Note 2) | |||||||
| Outside Director |
Registered | Su-Young Yun | — | March 24, 2023 | Note 2) | |||||||
| Outside Director |
Registered | Yo-Hwan Shin | — | January 27, 2022 | Note 2) | |||||||
| Outside Director |
Registered | Sung-Bae Ji | — | March 24, 2023 | Note 2) | |||||||
| Outside Director |
Registered | Eun-Ju Lee | — | March 28, 2024 | Note 1) | |||||||
| Outside Director |
Registered | Sunyoung Park | — | March 26, 2024 | Note 1) | |||||||
| Deputy President |
Non-Registered | Sung-Wook Lee | 16,000 | February 25, 2022 | February 10,2025 | |||||||
| Deputy President |
Non-Registered | Gwang-Ik Jang | 1,200 | April 3, 2023 | April 2, 2025 | |||||||
| Deputy President |
Non-Registered | Il-Jin Ouk | 4,000 | December 8, 2023 | November 30, 2024 | |||||||
| Deputy President |
Non-Registered | Jang-Keun Park | 2,000 | December 8, 2023 | March 6, 2025 | |||||||
| Deputy President |
Non-Registered | Jung-Soo Lee | 6,890 | December 8, 2023 | March 6, 2025 | |||||||
| Deputy President |
Non-Registered | Chan-Ho Jeong | 7,492 | December 8, 2023 | November 30, 2025 | |||||||
| Deputy President |
Non-Registered | Yoon-Hong Song | — | December 8, 2023 | November 30, 2025 | |||||||
| Deputy President |
Non-Registered | Jae-Hwa Jeon | 7,872 | December 8, 2023 | March 6, 2025 Note 5) | |||||||
| Deputy President |
Non-Registered | Kyu-Hwang Jeong | 11,741 | December 8, 2023 | November 30, 2025 Note 6) | |||||||
| Managing Director |
Non-Registered | Hae-Kwang Lee | — | December 8, 2023 | December 22, 2024 | |||||||
Note 1) Until the end of the annual general meeting of shareholders for FY2025.
Note 2) Until the end of the annual general meeting of shareholders for FY2024.
Note 3) Term commencement date: date of inauguration for registered officers or directors / date of appointment for non-registered officers or directors
Note 4) Common shares owned are as of the date of submission of this report, and those owned by executives exclude the shares owned through the Employee Stock Ownership Association.
Note 5) Resigned from Woori Financial Group after June 30, 2024: Jae-Hwa Jeon (July 5, 2024)
Note 6) Changes in term expiration dates after June 30, 2024: Kyu-Hwang Jeong (July 4, 2026)
36
| 2. | Employee Status |
| As of June 30, 2024 | (units: persons, millions of Won) |
| Number of Employees | Average Tenure |
Total Compensation |
Average Compensation Per Person |
Note | ||||||||||||||||||||||||||||||
| Regular | Contract | Total | ||||||||||||||||||||||||||||||||
| Total | (Short time worker) |
Total | (Short time worker) |
|||||||||||||||||||||||||||||||
| Total |
77 | — | 32 | — | 109 | 3 years 6 months (14 years 9 months) |
10,760 | 97 | — | |||||||||||||||||||||||||
Note 1) Average tenure: term in ( ) includes tenure at affiliated companies
Note 2) Contract employees include non-registered executives
| 3. | Directors’ Compensation |
| As of June 30, (units: persons, millions of Won) |
| Items |
Number of Persons |
Total Compensation |
Average Compensation Per Director |
Note | ||||||||||||
| Registered Directors (excludes outside directors and audit committee members) |
1 | 712 | 712 | — | ||||||||||||
| Outside Directors (excludes audit committee members) |
3 | 104 | 42 | — | ||||||||||||
| Audit Committee Members |
4 | 134 | 33 | — | ||||||||||||
| Auditor |
— | — | — | — | ||||||||||||
Note 1) Number of persons is as of June 30, 2024
Note 2) Total compensation is the amount paid from January to June 2024
Note 3) Average compensation per director was calculated by dividing the total compensation by the average number of persons
Note 4) Registered directors and audit committee members include uncompensated directors
Note 5) Only the compensation amount paid by Woori Financial Group is included for the executives concurrently employed by Woori Bank
37
| 4. | Stock-based Compensation |
The Company operates a performance-based stock-linked compensation system, pursuant to the standards established by the shareholders at the shareholders’ meeting and the Compensation Committee. The Company initially determines, for each recipient, the maximum share amounts that can be granted under the system, and then determines the final share amounts based on an evaluation of the long-term performance indices over four years (including the current year). The compensation is then paid in cash, based on the final share amount and the share price at the time the compensation is granted. The long-term performance indices include relative shareholder return, return on equity, profit for the period, cost-to-income ratio, non-performing loan ratio and individual performance evaluations. For further information, please refer to the notes to the financial statements.
(Unit: shares, except number of recipients)
| Items |
2024 | 2023 | 2022 | |||||||||
| Number of Recipients |
9 | 21 | 20 | |||||||||
| Maximum Amount of Shares |
100,914 | 160,929 | 223,176 | |||||||||
| Shares Paid during the Period |
164,164 | 68,746 | — | |||||||||
| (Adjustments) |
(19,554 | ) | (8,982 | ) | — | |||||||
| Cumulative Shares Paid |
232,910 | 68,746 | — | |||||||||
| Unpaid Shares |
730,369 | 813,173 | 729,972 | |||||||||
38
SIGNATURES
Pursuant to the requirements of the Securities Exchange Act of 1934, the registrant has duly caused this report to be signed on its behalf by the undersigned, thereunto duly authorized.
| Woori Financial Group Inc. | ||||||
| (Registrant) | ||||||
| Date: August 14, 2024 |
||||||
| By:
|
/s/ Sung-Wook Lee | |||||
| (Signature) | ||||||
| Name: Sung-Wook Lee | ||||||
| Title: Deputy President | ||||||
39
Exhibit 99.1
WOORI FINANCIAL GROUP INC. AND SUBSIDIARIES
CONSOLIDATED INTERIM FINANCIAL STATEMENTS
AS OF AND FOR THE THREE-MONTH AND SIX-MONTH PERIODS ENDED JUNE 30, 2024 AND 2023
| Page(s) | ||
| Independent Auditor’s Review Report | 1-2 | |
| Consolidated Interim Financial Statements | ||
| Consolidated Interim Statements of Financial Position | 4 | |
| Consolidated Interim Statements of Comprehensive Income | 5-6 | |
| Consolidated Interim Statements of Changes in Equity | 7 | |
| Consolidated Interim Statements of Cash Flows | 8-9 | |
| Notes to the Consolidated Interim Financial Statements | 10-146 | |
Independent Auditor’s Review Report
Based on a report originally issued in Korean
To the Board of Directors and Shareholders of Woori Financial Group Inc.
Reviewed Financial Statements
We have reviewed the accompanying condensed consolidated interim financial statements of Woori Financial Group Inc. and its subsidiaries (collectively the “Group”), which comprise the consolidated interim statement of financial position as of June 30, 2024, the consolidated interim statements of comprehensive income for the three-month and six-month periods ended June 30, 2024, the consolidated interim statement of changes in equity and cash flows for the six-month periods ended June 30, 2024 and 2023 and notes, comprising of material accounting policy information and other explanatory information.
Management’s Responsibility
Management is responsible for the preparation and fair presentation of these condensed consolidated interim financial statements in accordance with Korean International Financial Reporting Standards (“K-IFRS”) No.1034 Interim Financial Reporting, and for such internal control as management determines is necessary to enable the preparation of the condensed consolidated interim financial statements that are free from material misstatement, whether due to fraud or error.
Auditor’s Review Responsibility
Our responsibility is to issue a report on these condensed consolidated interim financial statements based on our review.
We conducted our reviews in accordance with the Review Standards for Quarterly and Semiannual Financial Statements established by the Securities and Futures Commission of the Republic of Korea. A review of interim financial information consists of making inquiries, primarily of persons responsible for financial and accounting matters, and applying analytical and other review procedures. A review is substantially less in scope than an audit conducted in accordance with Korean Standards on Auditing and consequently does not enable us to obtain assurance that we would become aware of all significant matters that might be identified in an audit. Accordingly, we do not express an audit opinion.
Conclusion
Based on our review, nothing has come to our attention that causes us to believe that the accompanying condensed consolidated interim financial statements referred to above do not present fairly, in all material respects, in accordance with K-IFRS No.1034 Interim Financial Reporting.
- 1 -
Other Matters
The procedures and practices utilized in the Republic of Korea to review such condensed consolidated interim financial statements may differ from those generally accepted and applied in other countries.
The consolidated statement of financial position of the Group as of December 31, 2023, and the related consolidated statements of comprehensive income, changes in equity and cash flows for the year then ended, which are not accompanying this report, were audited by us in accordance with Korean Standards on Auditing and their report thereon, dated March 6, 2024, expressed an unqualified opinion. The accompanying consolidated statement of financial position of the Group as of December 31, 2023, presented for comparative purposes, is not different from that audited by us from which it was derived in all material respects.
/s/ KPMG Samjong Accounting Corp.
Seoul, Korea
August 14, 2024
This report is effective as of August 14, 2024, the review report date. Certain subsequent events or circumstances, which may occur between the review report date and the time of reading this report, could have a material impact on the accompanying condensed consolidated interim financial statements and notes thereto. Accordingly, the readers of the review report should understand that the above review report has not been updated to reflect the impact of such subsequent events or circumstances, if any.
- 2 -
WOORI FINANCIAL GROUP INC. AND SUBSIDIARIES
CONSOLIDATED INTERIM FINANCIAL STATEMENTS
AS OF AND FOR THE THREE-MONTH AND SIX-MONTH PERIODS
ENDED JUNE 30, 2024 AND 2023
The accompanying consolidated interim financial statements including
all footnote disclosures were prepared by, and are the responsibility of, the management of
Woori Financial Group Inc.
Jong Yong Yim
President and Chief Executive Officer
Main Office Address: (Address) 51, Sogong-ro, Jung-gu, Seoul
(Phone Number) 02-2125-2000
- 3 -
WOORI FINANCIAL GROUP INC. AND SUBSIDIARIES
CONSOLIDATED INTERIM STATEMENTS OF FINANCIAL POSITION
AS OF JUNE 30, 2024 (UNAUDITED) AND DECEMBER 31, 2023
| June 30, 2024 |
December 31, 2023 |
|||||||
| (Korean Won in millions) | ||||||||
| ASSETS |
||||||||
| Cash and cash equivalents (Notes 4 and 6) |
25,471,632 | 30,556,618 | ||||||
| Financial assets at fair value through profit or loss (“FVTPL”) (Notes 4, 7, 11, and 24) |
23,309,282 | 21,544,756 | ||||||
| Financial assets at fair value through other comprehensive income (“FVTOCI”) (Notes 4, 8, and 11) |
38,875,628 | 37,891,495 | ||||||
| Securities at amortized cost (Notes 4, 9, and 11) |
22,408,759 | 23,996,172 | ||||||
| Loans and other financial assets at amortized cost (Notes 4, 10, 11, and 39) |
387,374,084 | 373,148,148 | ||||||
| Investments in joint ventures and associates (Note 12) |
1,899,281 | 1,795,370 | ||||||
| Investment properties (Notes 13) |
495,032 | 472,768 | ||||||
| Premises and equipment (Notes 14) |
3,306,955 | 3,176,759 | ||||||
| Intangible assets (Note 15) |
1,025,291 | 996,842 | ||||||
| Assets held for sale (Note 16) |
35,333 | 20,345 | ||||||
| Net defined benefit asset (Note 22) |
111,599 | 240,260 | ||||||
| Current tax assets |
69,325 | 203,542 | ||||||
| Deferred tax assets |
49,904 | 93,366 | ||||||
| Derivative assets (Designated for hedging) (Notes 4, 11 and 24) |
85,106 | 26,708 | ||||||
| Other assets (Notes 17, 39 and 40) |
4,263,954 | 3,841,787 | ||||||
|
|
|
|
|
|||||
| Total assets |
508,781,165 | 498,004,936 | ||||||
|
|
|
|
|
|||||
| LIABILITIES |
||||||||
| Financial liabilities at fair value through profit or loss (“FVTPL”) (Notes 4, 11, 18 and 24) |
7,515,789 | 6,138,313 | ||||||
| Deposits due to customers (Notes 4, 11, 19 and 39) |
359,302,549 | 357,784,297 | ||||||
| Borrowings (Notes 4, 11 and 20) |
30,315,001 | 30,986,746 | ||||||
| Debentures (Notes 4, 11 and 20) |
42,102,432 | 41,239,245 | ||||||
| Provisions (Notes 21, 38 and 39) |
634,578 | 806,031 | ||||||
| Net defined benefit liability (Note 22) |
4,375 | 6,939 | ||||||
| Current tax liabilities |
145,887 | 103,655 | ||||||
| Deferred tax liabilities |
653,876 | 470,311 | ||||||
| Derivative liabilities (Designated for hedging) (Notes 4, 11 and 24) |
150,585 | 153,007 | ||||||
| Other financial liabilities (Notes 4, 11, 23, 39 and 40) |
32,033,007 | 26,115,005 | ||||||
| Other liabilities (Notes 23 and 39) |
775,472 | 803,897 | ||||||
|
|
|
|
|
|||||
| Total liabilities |
473,633,551 | 464,607,446 | ||||||
|
|
|
|
|
|||||
| EQUITY |
||||||||
| Owners’ equity (Note 26) |
||||||||
| Capital stock |
3,802,676 | 3,802,676 | ||||||
| Hybrid securities |
4,409,042 | 3,611,129 | ||||||
| Capital surplus |
937,826 | 935,563 | ||||||
| Other equity |
(1,598,997 | ) | (1,668,957 | ) | ||||
| Retained earnings |
25,916,022 | 24,986,470 | ||||||
|
|
|
|
|
|||||
| 33,466,569 | 31,666,881 | |||||||
|
|
|
|
|
|||||
| Non-controlling interests |
1,681,045 | 1,730,609 | ||||||
|
|
|
|
|
|||||
| Total equity |
35,147,614 | 33,397,490 | ||||||
|
|
|
|
|
|||||
| Total liabilities and equity |
508,781,165 | 498,004,936 | ||||||
|
|
|
|
|
|||||
The accompanying notes are part of this consolidated financial statements.
- 4 -
WOORI FINANCIAL GROUP INC. AND SUBSIDIARIES
CONSOLIDATED INTERIM STATEMENTS OF COMPREHENSIVE INCOME
FOR THE THREE-MONTH AND SIX-MONTH PERIODS ENDED JUNE 30, 2024 AND 2023 (UNAUDITED)
| Periods ended June 30, 2024 | Periods ended June 30, 2023 | |||||||||||||||
| Three-month | Six-month | Three-month | Six-month | |||||||||||||
| (Korean Won in millions, except per share data) | ||||||||||||||||
| Interest income |
5,418,375 | 10,887,876 | 5,048,739 | 9,977,877 | ||||||||||||
| Financial assets at FVTPL |
57,213 | 114,866 | 47,642 | 91,617 | ||||||||||||
| Financial assets at FVTOCI |
322,136 | 626,636 | 228,548 | 436,796 | ||||||||||||
| Financial assets at amortized cost |
5,039,026 | 10,146,374 | 4,772,549 | 9,449,464 | ||||||||||||
| Interest expense |
(3,221,479 | ) | (6,492,777 | ) | (2,854,567 | ) | (5,564,884 | ) | ||||||||
|
|
|
|
|
|
|
|
|
|||||||||
| Net interest income (Notes 11, 28 and 39) |
2,196,896 | 4,395,099 | 2,194,172 | 4,412,993 | ||||||||||||
| Fees and commissions income |
743,509 | 1,433,183 | 642,016 | 1,261,278 | ||||||||||||
| Fees and commissions expense |
(188,274 | ) | (375,017 | ) | (217,845 | ) | (419,013 | ) | ||||||||
|
|
|
|
|
|
|
|
|
|||||||||
| Net fees and commissions income (Notes 11, 29 and 39) |
555,235 | 1,058,166 | 424,171 | 842,265 | ||||||||||||
| Dividend income (Notes 11, 30 and 39) |
85,956 | 152,738 | 42,925 | 92,005 | ||||||||||||
| Net gain on financial instruments at FVTPL (Notes 11, 31 and 39) |
386,511 | 902,118 | 122,019 | 360,517 | ||||||||||||
| Net gain(loss) on financial assets at FVTOCI (Notes 11 and 32) |
18,039 | 38,515 | (729 | ) | (398 | ) | ||||||||||
| Net gain arising on financial assets at amortized cost (Note 11) |
119,526 | 165,645 | 51,402 | 115,708 | ||||||||||||
| Impairment losses due to credit loss (Notes 11, 33 and 39) |
(408,980 | ) | (775,492 | ) | (556,242 | ) | (817,815 | ) | ||||||||
| General and administrative expense (Notes 34 and 39) |
(1,069,320 | ) | (2,100,987 | ) | (1,020,936 | ) | (2,057,916 | ) | ||||||||
| Other net operating expense (Notes 11, 24, 34 and 39) |
(630,543 | ) | (1,431,793 | ) | (361,344 | ) | (799,921 | ) | ||||||||
|
|
|
|
|
|
|
|
|
|||||||||
| Operating income |
1,253,320 | 2,404,009 | 895,438 | 2,147,438 | ||||||||||||
| Share of gain of joint ventures and associates (Note 12) |
34,122 | 39,631 | 63,841 | 70,983 | ||||||||||||
| Other non-operating income and expense |
(40,540 | ) | (52,781 | ) | (81,067 | ) | (69,888 | ) | ||||||||
|
|
|
|
|
|
|
|
|
|||||||||
| Non-operating income and expense (Note 35) |
(6,418 | ) | (13,150 | ) | (17,226 | ) | 1,095 | |||||||||
| Net income before income tax expense |
1,246,902 | 2,390,859 | 878,212 | 2,148,533 | ||||||||||||
| Income tax expense (Note 36) |
(285,393 | ) | (590,439 | ) | (211,022 | ) | (534,721 | ) | ||||||||
| Net income |
961,509 | 1,800,420 | 667,190 | 1,613,812 | ||||||||||||
|
|
|
|
|
|
|
|
|
|||||||||
| Net gain (loss) on valuation of equity securities at FVTOCI |
(30,182 | ) | (85,934 | ) | 50,369 | 130,792 | ||||||||||
| Net gain on credit risk fluctuation of financial liabilities designated to be measured at FVTPL |
391 | 837 | — | — | ||||||||||||
| Changes in capital due to equity method |
(129 | ) | (1,562 | ) | (743 | ) | 2,957 | |||||||||
| Remeasurement gain (loss) related to defined benefit plan |
(30,991 | ) | (49,492 | ) | 32,137 | (61,730 | ) | |||||||||
|
|
|
|
|
|
|
|
|
|||||||||
| Items that will not be reclassified to profit or loss: |
(60,911 | ) | (136,151 | ) | 81,763 | 72,019 | ||||||||||
|
|
|
|
|
|
|
|
|
|||||||||
| Net gain (loss) on valuation of debt securities at FVTOCI |
64,962 | 45,769 | (46,135 | ) | 190,920 | |||||||||||
| Changes in capital due to equity method |
875 | (4,955 | ) | (2,055 | ) | (667 | ) | |||||||||
| Net gain (loss) on foreign currency translation of foreign operations |
91,896 | 219,154 | (15,560 | ) | 159,990 | |||||||||||
| Net loss on valuation of hedges of net investments in foreign operations |
(26,961 | ) | (63,449 | ) | (5,724 | ) | (28,929 | ) | ||||||||
| Net gain (loss) on valuation of cash flow hedge |
549 | 6,230 | (540 | ) | (10,873 | ) | ||||||||||
|
|
|
|
|
|
|
|
|
|||||||||
| Items that may be reclassified to profit or loss: |
131,321 | 202,749 | (70,014 | ) | 310,441 | |||||||||||
| Other comprehensive income, net of tax |
70,410 | 66,598 | 11,749 | 382,460 | ||||||||||||
| Total comprehensive income |
1,031,919 | 1,867,018 | 678,939 | 1,996,272 | ||||||||||||
|
|
|
|
|
|
|
|
|
|||||||||
(Continued)
- 5 -
WOORI FINANCIAL GROUP INC. AND SUBSIDIARIES
CONSOLIDATED INTERIM STATEMENTS OF COMPREHENSIVE INCOME
FOR THE THREE-MONTH AND SIX-MONTH PERIODS ENDED JUNE 30, 2024 AND 2023 (UNAUDITED)
| Periods ended June 30, 2024 | Periods ended June 30, 2023 | |||||||||||||||
| Three-month | Six-month | Three-month | Six-month | |||||||||||||
| (Korean Won in millions, except per share data) | ||||||||||||||||
| Net income attributable to: |
961,509 | 1,800,420 | 667,190 | 1,613,812 | ||||||||||||
| Net income attributable to owners |
931,495 | 1,755,496 | 625,190 | 1,538,876 | ||||||||||||
| Net income attributable to non-controlling interests |
30,014 | 44,924 | 42,000 | 74,936 | ||||||||||||
| Total comprehensive income attributable to: |
1,031,919 | 1,867,018 | 678,939 | 1,996,272 | ||||||||||||
| Comprehensive income attributable to owners |
1,002,724 | 1,819,493 | 635,199 | 1,907,895 | ||||||||||||
| Comprehensive income attributable to non-controlling interests |
29,195 | 47,525 | 43,740 | 88,377 | ||||||||||||
| Earnings per share (Note 37) |
||||||||||||||||
| Basic and diluted earnings per share (Unit: In Korean Won) |
1,206 | 2,262 | 814 | 2,028 | ||||||||||||
The accompanying notes are part of these consolidated financial statements.
- 6 -
WOORI FINANCIAL GROUP INC. AND SUBSIDIARIES
CONSOLIDATED INTERIM STATEMENTS OF CHANGES IN EQUITY
FOR THE SIX-MONTH PERIODS ENDED JUNE 30, 2024 AND 2023 (UNAUDITED)
| Capital Stock |
Hybrid securities |
Capital surplus |
Other equity |
Retained earnings |
Owners’ equity in total |
Non-controlling interests |
Total equity |
|||||||||||||||||||||||||
| (Korean Won in millions) | ||||||||||||||||||||||||||||||||
| January 1, 2023 |
3,640,303 | 3,112,449 | 682,385 | (2,423,392 | ) | 23,750,152 | 28,761,897 | 2,865,445 | 31,627,342 | |||||||||||||||||||||||
| Total comprehensive income |
||||||||||||||||||||||||||||||||
| Net income |
— | — | — | — | 1,538,876 | 1,538,876 | 74,936 | 1,613,812 | ||||||||||||||||||||||||
| Net gain on valuation of financial instruments at FVTOCI |
— | — | — | 321,529 | — | 321,529 | 183 | 321,712 | ||||||||||||||||||||||||
| Net gain(loss) due to disposal of equity securities at FVTOCI |
— | — | — | (149 | ) | 149 | — | — | — | |||||||||||||||||||||||
| Changes in capital due to equity method |
— | — | — | 2,321 | (50 | ) | 2,271 | 19 | 2,290 | |||||||||||||||||||||||
| Gain on foreign currency translation of foreign operations |
— | — | — | 146,735 | — | 146,735 | 13,255 | 159,990 | ||||||||||||||||||||||||
| Loss on valuation of hedges of net investments in foreign operations |
— | — | — | (28,929 | ) | — | (28,929 | ) | — | (28,929 | ) | |||||||||||||||||||||
| Loss on valuation of cash flow hedge |
— | — | — | (10,873 | ) | — | (10,873 | ) | — | (10,873 | ) | |||||||||||||||||||||
| Remeasurement loss related to defined benefit plan |
— | — | — | (61,714 | ) | — | (61,714 | ) | (16 | ) | (61,730 | ) | ||||||||||||||||||||
| Transactions with owners and others |
||||||||||||||||||||||||||||||||
| Dividends to common stocks |
— | — | — | — | (713,111 | ) | (713,111 | ) | (11,489 | ) | (724,600 | ) | ||||||||||||||||||||
| Acquisition of treasury stocks |
— | — | — | (23,637 | ) | — | (23,637 | ) | — | (23,637 | ) | |||||||||||||||||||||
| Issuance of hybrid securities |
— | 299,227 | — | — | — | 299,227 | — | 299,227 | ||||||||||||||||||||||||
| Dividends to hybrid securities |
— | — | — | — | (63,153 | ) | (63,153 | ) | (55,319 | ) | (118,472 | ) | ||||||||||||||||||||
| Redemption of hybrid securities |
— | — | — | (525 | ) | — | (525 | ) | (499,287 | ) | (499,812 | ) | ||||||||||||||||||||
| Changes in subsidiaries’ capital |
— | — | (1,869 | ) | 60,491 | (60,491 | ) | (1,869 | ) | (79,613 | ) | (81,482 | ) | |||||||||||||||||||
| Changes in non-controlling interests related to business combinations |
— | — | 4,911 | 73,037 | — | 77,948 | 138,478 | 216,426 | ||||||||||||||||||||||||
| Others |
— | — | — | 248 | (248 | ) | — | — | — | |||||||||||||||||||||||
|
|
|
|
|
|
|
|
|
|
|
|
|
|
|
|
|
|||||||||||||||||
| June 30, 2023 (Unaudited) |
3,640,303 | 3,411,676 | 685,427 | (1,944,858 | ) | 24,452,124 | 30,244,672 | 2,446,592 | 32,691,264 | |||||||||||||||||||||||
|
|
|
|
|
|
|
|
|
|
|
|
|
|
|
|
|
|||||||||||||||||
| January 1, 2024 |
3,802,676 | 3,611,129 | 935,563 | (1,668,957 | ) | 24,986,470 | 31,666,881 | 1,730,609 | 33,397,490 | |||||||||||||||||||||||
| Total comprehensive income |
||||||||||||||||||||||||||||||||
| Net income |
— | — | — | — | 1,755,496 | 1,755,496 | 44,924 | 1,800,420 | ||||||||||||||||||||||||
| Net loss on valuation of financial instruments at FVTOCI |
— | — | — | (40,051 | ) | — | (40,051 | ) | (114 | ) | (40,165 | ) | ||||||||||||||||||||
| Net gain(loss) due to disposal of equity securities at FVTOCI |
— | — | — | 436 | (436 | ) | — | — | — | |||||||||||||||||||||||
| Net gain on credit risk fluctuation of financial liabilities designated to be measured at FVTPL |
— | — | — | 837 | — | 837 | — | 837 | ||||||||||||||||||||||||
| Changes in capital due to equity method |
— | — | — | (6,517 | ) | — | (6,517 | ) | — | (6,517 | ) | |||||||||||||||||||||
| Gain on foreign currency translation of foreign operations |
— | — | — | 216,431 | — | 216,431 | 2,723 | 219,154 | ||||||||||||||||||||||||
| Loss on valuation of hedges of net investments in foreign operations |
— | — | — | (63,449 | ) | — | (63,449 | ) | — | (63,449 | ) | |||||||||||||||||||||
| Gain on valuation of cash flow hedge |
— | — | — | 6,230 | — | 6,230 | — | 6,230 | ||||||||||||||||||||||||
| Remeasurement loss related to defined benefit plan |
— | — | — | (49,484 | ) | — | (49,484 | ) | (8 | ) | (49,492 | ) | ||||||||||||||||||||
| Transactions with owners and others |
||||||||||||||||||||||||||||||||
| Dividends to common stocks |
— | — | — | — | (612,107 | ) | (612,107 | ) | (3,468 | ) | (615,575 | ) | ||||||||||||||||||||
| Net increase(decrease) of treasury stocks |
— | — | 993 | 3,832 | (136,688 | ) | (131,863 | ) | — | (131,863 | ) | |||||||||||||||||||||
| Issuance of hybrid securities |
— | 797,913 | — | — | — | 797,913 | — | 797,913 | ||||||||||||||||||||||||
| Dividends to hybrid securities |
— | — | — | — | (75,007 | ) | (75,007 | ) | (38,294 | ) | (113,301 | ) | ||||||||||||||||||||
| Changes in subsidiaries’ capital |
— | — | 12,256 | 1,695 | (1,695 | ) | 12,256 | (12,488 | ) | (232 | ) | |||||||||||||||||||||
| Others |
— | — | (10,986 | ) | — | (11 | ) | (10,997 | ) | (42,839 | ) | (53,836 | ) | |||||||||||||||||||
|
|
|
|
|
|
|
|
|
|
|
|
|
|
|
|
|
|||||||||||||||||
| June 30, 2024 (Unaudited) |
3,802,676 | 4,409,042 | 937,826 | (1,598,997 | ) | 25,916,022 | 33,466,569 | 1,681,045 | 35,147,614 | |||||||||||||||||||||||
|
|
|
|
|
|
|
|
|
|
|
|
|
|
|
|
|
|||||||||||||||||
The accompanying notes are part of these consolidated financial statements.
- 7 -
WOORI FINANCIAL GROUP INC. AND SUBSIDIARIES
CONSOLIDATED INTERIM STATEMENTS OF CASH FLOWS
FOR THE SIX-MONTH PERIODS ENDED JUNE 30, 2024 AND 2023 (UNAUDITED)
| For the six-month periods ended June 30 |
||||||||
| 2024 | 2023 | |||||||
| (Korean Won in millions) | ||||||||
| Cash flows from operating activities : |
||||||||
| Net income |
1,800,420 | 1,613,812 | ||||||
| Adjustments to net income: |
||||||||
| Income tax expense |
590,439 | 534,721 | ||||||
| Interest income |
(10,887,876 | ) | (9,977,877 | ) | ||||
| Interest expense |
6,492,777 | 5,564,884 | ||||||
| Dividend income |
(152,738 | ) | (92,005 | ) | ||||
|
|
|
|
|
|||||
| (3,957,398 | ) | (3,970,277 | ) | |||||
|
|
|
|
|
|||||
| Additions of expenses not involving cash outflows: |
||||||||
| Loss on financial assets at FVTOCI |
345 | 7,160 | ||||||
| Impairment loss due to credit loss |
775,492 | 817,815 | ||||||
| Loss on other provisions |
20,650 | 59,768 | ||||||
| Retirement benefit |
64,350 | 56,429 | ||||||
| Depreciation and amortization |
564,151 | 489,010 | ||||||
| Net loss on foreign currency translation |
753,333 | 400,189 | ||||||
| Loss on derivatives (designated for hedge) |
44,299 | 31,384 | ||||||
| Loss on fair value hedge |
29,253 | 10,033 | ||||||
| Loss on valuation of investments in joint ventures and associates |
12,250 | 3,609 | ||||||
| Loss on disposal of investments in joint ventures and associates |
438 | — | ||||||
| Loss on disposal of Premises and equipment, intangible assets and other assets |
1,313 | 1,174 | ||||||
| Impairment loss on Premises and equipment, intangible assets and other assets |
1,362 | 6 | ||||||
|
|
|
|
|
|||||
| 2,267,236 | 1,876,577 | |||||||
|
|
|
|
|
|||||
| Deductions of income not involving cash inflows: |
||||||||
| Gain on financial instruments at FVTPL |
440,690 | 366,972 | ||||||
| Gain on financial assets at FVTOCI |
38,860 | 6,762 | ||||||
| Gain on other provisions |
11,893 | 2,596 | ||||||
| Gain on derivatives (designated for hedge) |
83,926 | 62,328 | ||||||
| Gain on fair value hedge |
42,020 | 28,071 | ||||||
| Gain on valuation of investments in joint ventures and associates |
51,881 | 74,592 | ||||||
| Gain on disposal of investments in joint ventures and associates |
671 | 22,985 | ||||||
| Gain on disposal of Premises and equipment, intangible assets and other assets |
2,611 | 3,372 | ||||||
| Reversal of impairment loss on Premises and equipment, intangible assets and other assets |
23 | 263 | ||||||
| Other incomes |
— | 16,972 | ||||||
|
|
|
|
|
|||||
| 672,575 | 584,913 | |||||||
|
|
|
|
|
|||||
| Changes in operating assets and liabilities: |
||||||||
| Financial instruments at FVTPL |
253,255 | (499,873 | ) | |||||
| Loans and other financial assets at amortized cost |
(12,358,725 | ) | (12,469,043 | ) | ||||
| Other assets |
(778,289 | ) | (407,581 | ) | ||||
| Deposits due to customers |
(1,170,406 | ) | (9,604,576 | ) | ||||
| Provisions |
(173,798 | ) | (9,347 | ) | ||||
| Net defined benefit liability |
(3,029 | ) | (118,778 | ) | ||||
| Other financial liabilities |
4,865,450 | 8,706,870 | ||||||
| Other liabilities |
(38,840 | ) | (31,945 | ) | ||||
|
|
|
|
|
|||||
| (9,404,382 | ) | (14,434,273 | ) | |||||
|
|
|
|
|
|||||
| Interest income received |
10,801,148 | 9,843,046 | ||||||
| Interest expense paid |
(5,817,727 | ) | (4,409,693 | ) | ||||
| Dividends received |
137,822 | 92,229 | ||||||
| Income tax paid |
(121,314 | ) | (925,629 | ) | ||||
|
|
|
|
|
|||||
| 4,999,929 | 4,599,953 | |||||||
|
|
|
|
|
|||||
| Net cash outflow from operating activities |
(4,966,770 | ) | (10,899,121 | ) | ||||
|
|
|
|
|
|||||
(Continued)
- 8 -
WOORI FINANCIAL GROUP INC. AND SUBSIDIARIES
CONSOLIDATED INTERIM STATEMENTS OF CASH FLOWS
FOR THE SIX-MONTH PERIODS ENDED JUNE 30, 2024 AND 2023 (UNAUDITED)
| For the six-month periods ended June 30 |
||||||||
| 2024 | 2023 | |||||||
| (Korean Won in millions) | ||||||||
| Cash flows from investing activities |
||||||||
| Net cash inflows from acquisition of control |
— | (209,643 | ) | |||||
| Disposal of financial instruments at FVTPL |
6,777,738 | 5,987,268 | ||||||
| Acquisition of financial instruments at FVTPL |
(6,681,541 | ) | (6,860,470 | ) | ||||
| Disposal of financial assets at FVTOCI |
13,859,312 | 10,728,661 | ||||||
| Acquisition of financial assets at FVTOCI |
(14,325,052 | ) | (11,628,165 | ) | ||||
| Redemption of securities at amortized cost |
2,245,188 | 4,842,587 | ||||||
| Acquisition of securities at amortized cost |
(502,738 | ) | (2,333,300 | ) | ||||
| Net cash outflows from changes in subsidiaries |
(307,882 | ) | (228,760 | ) | ||||
| Disposal of investments in joint ventures and associates |
823,909 | 132,913 | ||||||
| Acquisition of investments in joint ventures and associates |
(740,003 | ) | (144,822 | ) | ||||
| Acquisition of investment properties |
— | (99,234 | ) | |||||
| Disposal of premises and equipment |
2,278 | 12,399 | ||||||
| Acquisition of premises and equipment |
(92,039 | ) | (53,755 | ) | ||||
| Disposal of intangible assets |
4,205 | 186 | ||||||
| Acquisition of intangible assets |
(106,888 | ) | (109,196 | ) | ||||
| Disposal of assets held for sale |
3,300 | 3,238 | ||||||
| Net increase in other assets |
9,217 | 7,814 | ||||||
|
|
|
|
|
|||||
| Net cash inflow from investing activities |
969,004 | 47,721 | ||||||
|
|
|
|
|
|||||
| Cash flows from financing activities: |
||||||||
| Net cash inflow (outflow) from hedging activities |
(17,295 | ) | 200 | |||||
| Net increase(decrease) in borrowings |
(1,777,921 | ) | 1,460,163 | |||||
| Issuance of debentures |
15,073,775 | 14,247,045 | ||||||
| Redemption of debentures |
(14,798,992 | ) | (16,116,250 | ) | ||||
| Redemption of lease liabilities |
(115,104 | ) | (47,793 | ) | ||||
| Net increase(decrease) of other liabilities |
(17,082 | ) | 423 | |||||
| Acquisition of treasury stocks |
(136,711 | ) | — | |||||
| Disposal of treasury stocks |
4,847 | (23,637 | ) | |||||
| Dividends paid |
(612,107 | ) | (713,111 | ) | ||||
| Issuance of hybrid securities |
797,913 | 299,227 | ||||||
| Redemption of hybrid securities |
— | (500,011 | ) | |||||
| Dividends paid to hybrid securities |
(113,301 | ) | (118,472 | ) | ||||
| Dividends paid to non-controlling interest |
(3,468 | ) | (11,489 | ) | ||||
| Changes in non-controlling interests |
(41,606 | ) | (180,514 | ) | ||||
| Net increase(decrease) in non-controlling equity liabilities |
(1,589 | ) | 1,216 | |||||
|
|
|
|
|
|||||
| Net cash outflow from financing activities |
(1,758,641 | ) | (1,703,003 | ) | ||||
|
|
|
|
|
|||||
| Effects of exchange rate changes on cash and cash equivalents |
671,421 | 25,616 | ||||||
| Net decrease in cash and cash equivalents |
(5,084,986 | ) | (12,528,787 | ) | ||||
| Cash and cash equivalents, beginning of the period |
30,556,618 | 34,219,148 | ||||||
|
|
|
|
|
|||||
| Cash and cash equivalents, end of the Period (Note 6) |
25,471,632 | 21,690,361 | ||||||
|
|
|
|
|
|||||
The accompanying notes are part of these consolidated financial statements.
- 9 -
WOORI FINANCIAL GROUP INC. AND SUBSIDIARIES
NOTES TO CONSOLIDATED INTERIM FINANCIAL STATEMENTS
AS OF JUNE 30, 2024 AND 2023 (UNAUDITED)
| 1. | GENERAL |
| (1) | Summary of the Parent company |
Woori Financial Group, Inc. (hereinafter referred to as the “Parent company”) is primarily aimed at controlling subsidiaries that operate in the financial industry or those that are closely related to the financial industry through the ownership of shares and was established on January 11, 2019 under the Financial Holding Company Act through the comprehensive transfer with shareholders of Woori Bank (hereinafter referred to as the “Bank”), Woori FIS Co., Ltd., Woori Finance Research Institute Co., Ltd., Woori Credit Information Co., Ltd., Woori Fund Services Co., Ltd. and Woori Private Equity Asset Management Co. Ltd. The headquarters of the Parent company is located at 51, Sogong-ro, Jung-gu, Seoul, Korea, and the capital stock is 3,802,676 million Won. The Parent company’s stocks were listed on the Korea Exchange on February 13, 2019, and its American Depository Shares (“ADS”) are also being traded as the underlying common stock on the New York Stock Exchange since the same date.
The details of stock transfer between the Parent company and subsidiaries as of Incorporation are as follows (Unit: Number of shares)
| Stock transfer company |
Total number of issued shares |
Exchange ratio per share |
Number of Parent company’s stocks |
|||||||||
| Woori Bank |
676,000,000 | 1.0000000 | 676,000,000 | |||||||||
| Woori FIS Co., Ltd. |
4,900,000 | 0.2999708 | 1,469,857 | |||||||||
| Woori Finance Research Institute Co., Ltd. |
600,000 | 0.1888165 | 113,289 | |||||||||
| Woori Credit Information Co., Ltd. |
1,008,000 | 1.1037292 | 1,112,559 | |||||||||
| Woori Fund Service Co., Ltd. |
2,000,000 | 0.4709031 | 941,806 | |||||||||
| Woori Private Equity Asset Management Co., Ltd. |
6,000,000 | 0.0877992 | 526,795 | |||||||||
As of August 1, 2019, the Parent company acquired a 73% interest in Tongyang Asset Management Co., Ltd. and changed the name to Woori Asset Management Corp. Also, as of August 1, 2019, the Parent company gained 100% control of ABL Global Asset Management Co., Ltd., added it as a consolidated subsidiary and changed the name to Woori Global Asset Management Co., Ltd. on December 6, 2019.
The Parent company paid 598,391 million Won in cash and 42,103,377 new shares of the Parent company to acquire 100% interest of Woori Card Co., Ltd. from its subsidiary, Woori Bank, on September 10, 2019. On the same date, the Parent company also acquired 59.8% interest of Woori Investment Bank Co., Ltd. from Woori Bank with 392,795 million Won in cash.
As of December 30, 2019, the Parent company acquired a 67.2% interest (excluding treasury stocks, 51% interest including treasury stocks) in Woori Asset Trust Co., Ltd. (formerly Kukje Asset Trust Co., Ltd.) and added it as a consolidated subsidiary at the end of 2019. As of March 31, 2023, it acquired an additional 28.1% interests (excluding treasury stock, 21.3% in the case of including treasury stock).
The Parent company acquired 76.8% (excluding treasury stocks, 74.0% interest including treasury stocks) interest in Woori Financial Capital Co., Ltd. (formerly Aju Capital Co., Ltd.) on December 10, 2020. In addition, as of April 15, 2021, the Parent company acquired 13.3% interests (excluding treasury stock, 12.9% when including treasury stock) in Woori Financial Capital Co., Ltd., and as of May 24, 2021, the Parent company additionally acquired treasury stock (3.6%) which Woori Financial Capital Co., Ltd. possessed.
The Parent company paid 113,238 million Won in cash to acquire 100% interest of Woori Savings Bank from its subsidiary, Woori Financial Capital Co., Ltd., on March 12, 2021.
As of August 10, 2021, the Parent company paid 5,792,866 new shares of the Parent company to the shareholders of Woori Financial Capital Co., Ltd. (excluding the Parent company) through comprehensive stock exchange and acquired residual interest (9.5%) of Woori Financial Capital Co., Ltd., to make it a wholly owned subsidiary.
As of January 7, 2022, the Parent company established Woori Financial F&I Co., Ltd., an investment company for non-performing loans and restructuring companies (100% interest, 200 billion Won in stock payments) and included it as a subsidiary.
- 10 -
WOORI FINANCIAL GROUP INC. AND SUBSIDIARIES
NOTES TO CONSOLIDATED INTERIM FINANCIAL STATEMENTS
AS OF JUNE 30, 2024 AND 2023 (UNAUDITED)
As of March 23, 2023, the Parent company acquired a 53.9% interest (excluding treasury stocks, 52.0% interest including treasury stocks) in Woori Venture Partners Co., Ltd. (formerly Daol Investment Co., Ltd.), and added it as a consolidated subsidiary. As of May 30, 2023, the Parent company additionally acquired treasury stock (3.5%) which Woori Venture Partners Co., Ltd. possessed.
As of August 8, 2023, the Parent company paid 22,541,465 new shares of the Parent company to the shareholders of Woori Investment Bank Co., Ltd. (excluding the Parent company) through comprehensive stock exchange and acquired residual interest (41.3%) of Woori Investment Bank Co., Ltd., to make it a wholly owned subsidiary. In addition, on the same day, the Parent company paid 9,933,246 new shares of the Parent company to the shareholders of Woori Venture Partners Co., Ltd. (excluding the Parent company) through comprehensive stock exchange and acquired residual interest (44.5%) of Woori Venture Partners Co., Ltd., to make it a wholly owned subsidiary.
The Parent company’s percentage of ownership in Woori Asset Management Corp. after the merger between Woori Asset Management Corp. (the surviving company) and Woori Global Asset Management Co., Ltd. (the merged company) is 77.5%. On March 29, 2024, the Parent company acquired the remaining shares (22.5%) of Woori Asset Management Corp., pursuant to which Woori Asset Management Corp. became a wholly-owned subsidiary of the parent company.
On March 25, 2024, the Parent company participated in the capital increase amount and acquired the 1,062,045 shares (96.7% after acquiring shares, 79.4% including treasury shares) of Woori Asset Trust Co., Ltd. Additionally, on March 29, 2024, Woori Asset Trust Co., Ltd. conducted a complete retirement of its 738,000 treasury shares. In addition, as of April 8, 2024, the Parent company additionally acquired minority interests (2.0%) of Woori Asset Trust Co., Ltd.
| (2) | Details of the Parent company and subsidiaries (hereinafter ‘Group’) as of June 30, 2024 and December 31, 2023 are as follows: |
| Percentage of ownership (%) |
Location | Financial statements date |
||||||||||||||||
| Subsidiaries |
Main business | June 30, 2024 | December 31, 2023 |
|||||||||||||||
| Held by Woori Financial Group Inc. |
||||||||||||||||||
| Woori Bank |
Bank | 100.0 | 100.0 | Korea | June 30 | |||||||||||||
| Woori Card Co., Ltd. |
Finance | 100.0 | 100.0 | Korea | June 30 | |||||||||||||
| Woori Financial Capital Co., Ltd. |
Finance | 100.0 | 100.0 | Korea | June 30 | |||||||||||||
| Woori Investment Bank Co., Ltd |
|
Other credit finance business |
|
100.0 | 100.0 | Korea | June 30 | |||||||||||
| Woori Asset Trust Co., Ltd (*1) |
Real estate trust | 98.7 | 95.3 | Korea | June 30 | |||||||||||||
| Woori Savings Bank |
Mutual saving bank | 100.0 | 100.0 | Korea | June 30 | |||||||||||||
| Woori Financial F&I Co., Ltd. |
Finance | 100.0 | 100.0 | Korea | June 30 | |||||||||||||
| Woori Asset Management Corp. (*1) |
Finance | 100.0 | 73.0 | Korea | June 30 | |||||||||||||
| Woori Venture Partners |
Other financial services | 100.0 | 100.0 | Korea | June 30 | |||||||||||||
| Woori Global Asset Management Co., Ltd. (*1) |
Finance | — | 100.0 | Korea | — | |||||||||||||
| Woori Private Equity Asset Management Co., Ltd. |
Finance | 100.0 | 100.0 | Korea | June 30 | |||||||||||||
| Woori Credit Information Co., Ltd. |
Credit information | 100.0 | 100.0 | Korea | June 30 | |||||||||||||
| Woori Fund Service Co., Ltd. |
|
Financial support service business |
|
100.0 | 100.0 | Korea | June 30 | |||||||||||
| Woori FIS Co., Ltd. |
|
System software development & maintenance |
|
100.0 | 100.0 | Korea | June 30 | |||||||||||
| Woori Finance Research Institute Co., Ltd. |
Other service business | 100.0 | 100.0 | Korea | June 30 | |||||||||||||
| Held by Woori Bank |
||||||||||||||||||
| Woori America Bank |
Finance | 100.0 | 100.0 | America | June 30 | |||||||||||||
| Woori Global Markets Asia Limited |
Finance | 100.0 | 100.0 | Hong Kong |
June 30 | |||||||||||||
| Woori Bank China Limited |
Finance | 100.0 | 100.0 | China | June 30 | |||||||||||||
| AO Woori Bank (*7) |
Finance | 100.0 | 100.0 | Russia | June 30 | |||||||||||||
| PT Bank Woori Saudara Indonesia 1906 Tbk |
Finance | 90.8 | 84.2 | Indonesia | June 30 | |||||||||||||
- 11 -
WOORI FINANCIAL GROUP INC. AND SUBSIDIARIES
NOTES TO CONSOLIDATED INTERIM FINANCIAL STATEMENTS
AS OF JUNE 30, 2024 AND 2023 (UNAUDITED)
| Percentage of ownership (%) |
Location | Financial statements date | ||||||||||||
| Subsidiaries |
Main business | June 30, 2024 | December 31, 2023 |
|||||||||||
| Banco Woori Bank do Brasil S.A. |
Finance | 100.0 | 100.0 | Brazil | June 30 | |||||||||
| Korea BTL Infrastructure Fund |
Finance | 99.9 | 99.9 | Korea | June 30 | |||||||||
| Woori Finance Myanmar Co., Ltd. |
Finance | 100.0 | 100.0 | Myanmar | June 30 | |||||||||
| Wealth Development Bank |
Finance | 51.0 | 51.0 | Philippines | June 30 | |||||||||
| Woori Bank Vietnam Limited |
Finance | 100.0 | 100.0 | Vietnam | June 30 | |||||||||
| Woori Bank (Cambodia) PLC |
Finance | 100.0 | 100.0 | Cambodia | June 30 | |||||||||
| Woori Bank Europe |
Finance | 100.0 | 100.0 | Germany | June 30 | |||||||||
| KAMCO Value Recreation First Securitization Specialty Co., Ltd. (*2) |
Asset securitization | 15.0 | 15.0 | Korea | June 30 | |||||||||
| Jeonju Iwon Ltd. (*2) |
Asset securitization | — | — | Korea | June 30 | |||||||||
| Wonju I one Inc. (*2) |
Asset securitization | — | — | Korea | June 30 | |||||||||
| Heitz Third Co., Ltd. (*2) |
Asset securitization | — | — | Korea | June 30 | |||||||||
| Woori hansoop 1st Co., Ltd. (*2) |
Asset securitization | — | — | Korea | June 30 | |||||||||
| Woori International First Co., Ltd. (*2) (*5) |
Asset securitization | — | — | Korea | — | |||||||||
| Woori QS 1st Co., Ltd. (*2) |
Asset securitization | — | — | Korea | June 30 | |||||||||
| Woori Display 2nd Co., Ltd. (*2) |
Asset securitization | — | — | Korea | June 30 | |||||||||
| Woori Dream 2nd Co., Ltd. (*2) |
Asset securitization | — | — | Korea | June 30 | |||||||||
| Woori K 1st Co., Ltd. (*2) |
Asset securitization | — | — | Korea | June 30 | |||||||||
| Woori S 1st Co., Ltd. (*2) |
Asset securitization | — | — | Korea | June 30 | |||||||||
| Woori Display 3rd Co., Ltd. (*2) |
Asset securitization | — | — | Korea | June 30 | |||||||||
| TY 1st Co., Ltd. (*2) (*5) |
Asset securitization | — | — | Korea | — | |||||||||
| Quantum Jump the 2nd Co., Ltd. (*2) |
Asset securitization | — | — | Korea | June 30 | |||||||||
| Woori Gongdeok First Co., Ltd. (*2) |
Asset securitization | — | — | Korea | June 30 | |||||||||
| Woori HW 1st Co., Ltd. (*2) |
Asset securitization | — | — | Korea | June 30 | |||||||||
| Woori Dream 3rd Co., Ltd. (*2) |
Asset securitization | — | — | Korea | June 30 | |||||||||
| Woori SJS 1st Co., Ltd. (*2) |
Asset securitization | — | — | Korea | June 30 | |||||||||
| Woori Steel 1st Co., Ltd (*2) (*5) |
Asset securitization | — | — | Korea | — | |||||||||
| SPG the 1st Co., Ltd. (*2) |
Asset securitization | — | — | Korea | June 30 | |||||||||
| Woori-HWC 1st Co., Ltd. (*2) |
Asset securitization | — | — | Korea | June 30 | |||||||||
| Woori HC 3rd Co., Ltd. (*2) |
Asset securitization | — | — | Korea | June 30 | |||||||||
| Woori Park I 1st co., Ltd (*2) |
Asset securitization | — | — | Korea | June 30 | |||||||||
| Woori DS 1st co., Ltd (*2) (*5) |
Asset securitization | — | — | Korea | — | |||||||||
| Woori HC 4th Co., Ltd. (*2) |
Asset securitization | — | — | Korea | June 30 | |||||||||
| Woori SKR 1st Co., Ltd. (*2) |
Asset securitization | — | — | Korea | June 30 | |||||||||
| Woori H chemical 1st Co.,Ltd (*2) |
Asset securitization | — | — | Korea | June 30 | |||||||||
| HE the 1st Co.,Ltd. (*2) |
Asset securitization | — | — | Korea | June 30 | |||||||||
| Woori Hub The 1st Co., Ltd. (*2) |
Asset securitization | — | — | Korea | June 30 | |||||||||
| Woori K The 3rd Co., Ltd. (*2) |
Asset securitization | — | — | Korea | June 30 | |||||||||
| Woori KF 1st Co., Ltd. (*2) |
Asset securitization | — | — | Korea | June 30 | |||||||||
| WooriI TS 1st Co., Ltd. (*2) |
Asset securitization | — | — | Korea | June 30 | |||||||||
| Woori H Square 1st Co., Ltd. (*2) |
Asset securitization | — | — | Korea | June 30 | |||||||||
| Woori L Yongsan 1st Co., Ltd. (*2) |
Asset securitization | — | — | Korea | June 30 | |||||||||
| Woori HC 5th Co., Ltd. (*2) |
Asset securitization | — | — | Korea | June 30 | |||||||||
| Woori Ladena 1st Co., Ltd. (*2) |
Asset securitization | — | — | Korea | June 30 | |||||||||
| Woori HR 1st Co., Ltd. (*2) |
Asset securitization | — | — | Korea | June 30 | |||||||||
| Woori Lotte Dongtan 1st Co., Ltd. (*2) |
Asset securitization | — | — | Korea | June 30 | |||||||||
| Woori HC 6th Co., Ltd. (*2) |
Asset securitization | — | — | Korea | June 30 | |||||||||
| Woori HO 1st Co., Ltd. (*2) |
Asset securitization | — | — | Korea | June 30 | |||||||||
| Woori ESG 1st Co., Ltd. (*2) |
Asset securitization | — | — | Korea | June 30 | |||||||||
| Woori Osiria 1st Co., Ltd. (*2) |
Asset securitization | — | — | Korea | June 30 | |||||||||
| Woori Eco 2nd Co., Ltd. (*2)(*5) |
Asset securitization | — | — | Korea | — | |||||||||
| Gangnam Landmark 2nd Co., Ltd(*2) |
Asset securitization | — | — | Korea | June 30 | |||||||||
| Woori HP the 1st co., Ltd. (*2) |
Asset securitization | — | — | Korea | June 30 | |||||||||
| Woori KF 2nd Co., Ltd.(*2) |
Asset securitization | — | — | Korea | June 30 | |||||||||
| Woori HD 1st co., Ltd.(*2) |
Asset securitization | — | — | Korea | June 30 | |||||||||
| Woori ST 1st co., Ltd.(*2) |
Asset securitization | — | — | Korea | June 30 | |||||||||
| Woori High End 1st co., Ltd.(*2) |
Asset securitization | — | — | Korea | June 30 | |||||||||
| Woori HW 2nd co., Ltd.(*2) |
Asset securitization | — | — | Korea | June 30 | |||||||||
| Woori Mirae 1st co., Ltd.(*2) |
Asset securitization | — | — | Korea | June 30 | |||||||||
- 12 -
WOORI FINANCIAL GROUP INC. AND SUBSIDIARIES
NOTES TO CONSOLIDATED INTERIM FINANCIAL STATEMENTS
AS OF JUNE 30, 2024 AND 2023 (UNAUDITED)
| Percentage of ownership (%) |
Location | Financial statements date |
||||||||||||||
| Subsidiaries |
Main business | June 30, 2024 | December 31, 2023 |
|||||||||||||
| Woori HR 2nt Co., Ltd. (*2)(*10) |
Asset securitization | — | — | Korea | June 30 | |||||||||||
| Woori QS 2nt Co., Ltd. (*2) (*10) |
Asset securitization | — | — | Korea | June 30 | |||||||||||
| Woori Plasma 1st Co., Ltd. (*2) (*10) |
Asset securitization | — | — | Korea | June 30 | |||||||||||
| Woori EUGENE 1st Co.,Ltd (*2) (*10) |
Asset securitization | — | — | Korea | June 30 | |||||||||||
| Heungkuk Global Private Placement Investment Trust No. 1 (*3) |
Securities investment and others |
98.8 | 98.8 | Korea | June 30 | |||||||||||
| AI Partners UK Water Supply Private Placement Investment Trust No.2 (*3) |
Securities investment and others |
97.3 | 97.3 | England | June 30 | |||||||||||
| Multi Asset Global Real Estate Investment Trust No. 5-2 (*3) |
Securities investment and others |
99.0 | 99.0 | Korea | June 30 | |||||||||||
| IGIS Australia Investment Trust No. 209-1 (*3) |
Securities investment and others |
99.4 | 99.4 | Korea | June 30 | |||||||||||
| Woori Global Secondary Private Placement Investment Trust No. 1 (*3) |
Securities investment and others |
98.6 | 98.6 | Korea | June 30 | |||||||||||
| JB Airline Private Placement Investment Trust No.8 (*3) |
Securities investment and others |
97.0 | 97.0 | Korea | June 30 | |||||||||||
| Kiwoom Harmony Private Placement Investment Trust No. 2 (*3) |
Securities investment and others |
97.3 | 97.2 | Korea | June 30 | |||||||||||
| Kiwoom Harmony Private Placement Investment Trust No. 1 (*3) |
Securities investment and others |
97.4 | 97.4 | Korea | June 30 | |||||||||||
| Kiwoom Harmony Private Placement Investment Trust No. 4 (*3) |
Securities investment and others |
96.2 | 96.2 | Korea | June 30 | |||||||||||
| Principal Guaranteed Trust (*4) |
Trust | — | — | Korea | June 30 | |||||||||||
| Principal and Interest Guaranteed Trust (*4) |
Trust | — | — | Korea | June 30 | |||||||||||
| Held by Multi Asset Global Real Estate Investment Trust No. 5-2 MAGI No.5 LuxCo S.a.r.l. |
Asset securitization | 54.6 | 54.6 | Luxembourg | June 30 | |||||||||||
| Held by MAGI No.5 LuxCo S.a.r.l. ADP 16 Brussels |
Asset securitization | 100.0 | 100.0 | Belgium | June 30 | |||||||||||
| Held by Woori ESG Infrastructure Development General Private Investment Trust No. 1: |
||||||||||||||||
| Woori Global Infrastructure Development Co., Ltd. (*10) |
Other financial services |
100.0 | — | Korea | June 30 | |||||||||||
| Namyangju Resource Circulation Facility Development Co., Ltd. (*10) |
Other professional services |
100.0 | — | Korea | June 30 | |||||||||||
| Held by Woori Card Co., Ltd. |
||||||||||||||||
| TUTU Finance –WCI Myanmar Co., Ltd. |
Finance | 100.0 | 100.0 | Myanmar | June 30 | |||||||||||
| PT Woori Finance Indonesia Tbk. |
Finance | 84.5 | 84.5 | Indonesia | June 30 | |||||||||||
| Woori Card 2020-1 Asset Securitization Specialty Co., Ltd. (*2) (*5) |
Asset securitization | — | 0.5 | Korea | — | |||||||||||
| Woori Card 2021-1 Asset Securitization Specialty Co., Ltd. (*2) |
Asset securitization | 0.5 | 0.5 | Korea | June 30 | |||||||||||
| Woori Card 2022-1 Asset Securitization Specialty Co., Ltd. (*2) |
Asset securitization | 0.5 | 0.5 | Korea | June 30 | |||||||||||
| Woori Card 2022-2 Asset Securitization Specialty Co., Ltd. (*2) |
Asset securitization | 0.5 | 0.5 | Korea | June 30 | |||||||||||
- 13 -
WOORI FINANCIAL GROUP INC. AND SUBSIDIARIES
NOTES TO CONSOLIDATED INTERIM FINANCIAL STATEMENTS
AS OF JUNE 30, 2024 AND 2023 (UNAUDITED)
| Percentage of ownership (%) |
Location | Financial statements date |
||||||||||||||
| Subsidiaries |
Main business | June 30, 2024 | December 31, 2023 |
|||||||||||||
| Woori Card 2023-1 Asset Securitization Specialty Co., Ltd. (*2) |
Asset securitization | 0.5 | 0.5 | Korea | June 30 | |||||||||||
| Woori Card 2023-2 Asset Securitization Specialty Co., Ltd. (*2) |
Asset securitization | 0.5 | 0.5 | Korea | June 30 | |||||||||||
| Held by Woori Financial Capital Co., Ltd. |
||||||||||||||||
| Specified Money Market Trust |
Trust | 100.0 | 100.0 | Korea | June 30 | |||||||||||
| Held by Woori Investment Bank Co., Ltd. |
||||||||||||||||
| Seari Second Securitization Specialty Co., Ltd. (*2) |
Asset securitization | 5.0 | 5.0 | Korea | June 30 | |||||||||||
| Namjong 1st Securitization Specialty Co., Ltd. (*2) |
Asset securitization | 5.0 | 5.0 | Korea | June 30 | |||||||||||
| Bukgeum First Securitization Specialty Co., Ltd. (*2) |
Asset securitization | 5.0 | 5.0 | Korea | June 30 | |||||||||||
| Bukgeum Second Securitization Specialty Co., Ltd. (*2) |
Asset securitization | 5.0 | 5.0 | Korea | June 30 | |||||||||||
| WS1909 Securitization Specialty Co., Ltd. (*2) |
Asset securitization | 5.0 | 5.0 | Korea | June 30 | |||||||||||
| WS2003 Securitization Specialty Co., Ltd. (*2) |
Asset securitization | 5.0 | 5.0 | Korea | June 30 | |||||||||||
| WS2006 Securitization Specialty Co., Ltd. (*2) |
Asset securitization | 5.0 | 5.0 | Korea | June 30 | |||||||||||
| WH2103 Securitization Specialty Co., Ltd. (*2) |
Asset securitization | 5.0 | 5.0 | Korea | June 30 | |||||||||||
| WN2103 Securitization Specialty Co., Ltd. (*2) |
Asset securitization | 5.0 | 5.0 | Korea | June 30 | |||||||||||
| WH2106 Securitization Specialty Co., Ltd. (*2) |
Asset securitization | 5.0 | 5.0 | Korea | June 30 | |||||||||||
| Held by Woori Asset Management Corp. |
||||||||||||||||
| Woori China Convertible Bond Hedging feeder Investment Trust H (debt-oriented hybrid) (*3) |
Securities investment and others |
86.4 | 84.7 | Korea | June 30 | |||||||||||
| Woori Together TDF 2025 (*3) (*5) |
Securities investment and others |
— | 30.1 | Korea | — | |||||||||||
| Woori Together TDF 2035 (*3) |
Securities investment and others |
44.7 | 48.0 | Korea | June 30 | |||||||||||
| Woori Together TDF 2040 (*3) |
Securities investment and others |
41.2 | 49.2 | Korea | June 30 | |||||||||||
| Woori Together TDF 2045 (*3) |
Securities investment and others |
59.0 | 61.0 | Korea | June 30 | |||||||||||
| Woori Together TDF 2050 (*3) |
Securities investment and others |
43.3 | 48.9 | Korea | June 30 | |||||||||||
| Woori K-New Opening Target Return Securities Investment Trust(Equity) (*3) (*10) |
Securities investment and others |
40.7 | — | Korea | June 30 | |||||||||||
| Woori Franklin Technology Master Fund (USD) (*3) (*5) (*8) |
Securities investment and others |
— | 67.3 | Korea | — | |||||||||||
| Woori Franklin Technology Feeder Fund (H) (*3) (*5) |
Securities investment and others |
— | 31.4 | Korea | — | |||||||||||
| Woori High Graded Bond Target Return Fund 1 (*3) (*5) |
Securities investment and others |
— | 87.4 | Korea | — | |||||||||||
| Woori Global Multi Asset Income Private Placement Investment Trust_Class Cs (*3) (*5) |
Securities investment and others |
— | 37.7 | Korea | — | |||||||||||
| Held by Woori Financial F&I Co., Ltd. |
||||||||||||||||
| WI2203 Securitization Specialty Co., Ltd. (*2) |
Asset securitization | 5.0 | 5.0 | Korea | June 30 | |||||||||||
| WM2203 Asset Securitization Specialty Co., Ltd. (*2) |
Asset securitization | 5.0 | 5.0 | Korea | June 30 | |||||||||||
- 14 -
WOORI FINANCIAL GROUP INC. AND SUBSIDIARIES
NOTES TO CONSOLIDATED INTERIM FINANCIAL STATEMENTS
AS OF JUNE 30, 2024 AND 2023 (UNAUDITED)
| Percentage of ownership (%) |
Location | Financial statements date | ||||||||||||
| Subsidiaries |
Main business | June 30, 2024 | December 31, 2023 |
|||||||||||
| WNI2206 Asset Securitization Specialty Co., Ltd. (*2) |
Asset securitization | 5.0 | 5.0 | Korea | June 30 | |||||||||
| WI2209 Securitization Specialty Co., Ltd. (*2) |
Asset securitization | 5.0 | 5.0 | Korea | June 30 | |||||||||
| WN2212 Asset Securitization Specialty Co., Ltd. (*2) |
Asset securitization | 5.0 | 5.0 | Korea | June 30 | |||||||||
| WK2212 Asset Securitization Specialty Co., Ltd. (*2) |
Asset securitization | 5.0 | 5.0 | Korea | June 30 | |||||||||
| WH2306 Securitization Specialty Co., Ltd.(*2) |
Asset securitization | 5.0 | 5.0 | Korea | June 30 | |||||||||
| WN2306 Securitization Specialty Co., Ltd.(*2) |
Asset securitization | 5.0 | 5.0 | Korea | June 30 | |||||||||
| WNKN2309 Securitization Specialty Co., Ltd.(*2) |
Asset securitization | 5.0 | 5.0 | Korea | June 30 | |||||||||
| WB2309 Securitization Specialty Co., Ltd.(*2) |
Asset securitization | 5.0 | 5.0 | Korea | June 30 | |||||||||
| WI2311 Securitization Specialty Co., Ltd. (*2) |
Asset securitization | 5.0 | 5.0 | Korea | June 30 | |||||||||
| WSB2312 Securitization Specialty Co., Ltd. (*2) |
Asset securitization | 5.0 | 5.0 | Korea | June 30 | |||||||||
| WK2312 Asset Securitization Specialty Co., Ltd. (*2) |
Asset securitization | 5.0 | 5.0 | Korea | June 30 | |||||||||
| WBS2312 Securitization Specialty Co., Ltd. (*2) |
Asset securitization | 5.0 | 5.0 | Korea | June 30 | |||||||||
| WK2403 Asset Securitization Specialty Co., Ltd. (*2) (*10) |
Asset securitization | 5.0 | — | Korea | June 30 | |||||||||
| WH2403 Securitization Specialty Co., Ltd.(*2) (*10) |
Asset securitization | 5.0 | — | Korea | June 30 | |||||||||
| WSB2406 Securitization Specialty Co., Ltd.(*2) (*10) |
Asset securitization | 5.0 | — | Korea | June 30 | |||||||||
| WK2406 Securitization Specialty Co., Ltd.(*2) (*10) |
Asset securitization | 5.0 | — | Korea | June 30 | |||||||||
| WI2406 Securitization Specialty Co., Ltd.(*2) (*10) |
Asset securitization | 5.0 | — | Korea | June 30 | |||||||||
| WKN2406 Securitization Specialty Co., Ltd.(*2) (*10) |
Asset securitization | 5.0 | — | Korea | June 30 | |||||||||
| VOGO DL General Private Equity Investment Trust 1(*3) |
Securities investment and others |
99.0 | 99.0 | Korea | June 30 | |||||||||
| WFBS 1st Corporate Recovery Private Equity Fund (*10) |
Finance | 92.7 | — | Korea | June 30 | |||||||||
| Held by Woori Venture Partners Co.,Ltd. (*1) |
||||||||||||||
| Woori Venture Partners US |
Other financial services |
100.0 | 100.0 | America | June 30 | |||||||||
| Held by Woori Bank, Woori Financial Capital Co., Ltd., and Woori Private Equity Asset Management Co., Ltd. (*6) |
||||||||||||||
| Green ESG Growth No.1 Private Equity Fund(*3) |
Securities investment and others |
30.3 | 30.3 | Korea | June 30 | |||||||||
| Woori New Growth Credit Fund 1(*3) |
Securities investment and others |
100.0 | 100.0 | Korea | June 30 | |||||||||
| Woori PE Secondary Fund 1 (*3) |
Securities investment and others |
100.0 | 100.0 | Korea | June 30 | |||||||||
| Held by Woori Financial Capital Co., Ltd., Woori Private Equity Asset Management Co., Ltd. and Woori Investment Bank Co., Ltd. (*6) |
||||||||||||||
| Japanese Hotel Real Estate Private Equity Fund 1 (*3) |
Securities investment and others |
100.0 | 100.0 | Korea | June 30 | |||||||||
- 15 -
WOORI FINANCIAL GROUP INC. AND SUBSIDIARIES
NOTES TO CONSOLIDATED INTERIM FINANCIAL STATEMENTS
AS OF JUNE 30, 2024 AND 2023 (UNAUDITED)
| Percentage of ownership (%) |
Location | Financial statements date |
||||||||||||||||||
| Subsidiaries |
Main business | June 30, 2024 | December 31, 2023 |
|||||||||||||||||
| Held by Woori Bank, Woori Financial Capital Co., Ltd., Woori Investment Bank Co., Ltd., Woori Savings Bank and Woori Private Equity Asset Management Co., Ltd. (*6) |
||||||||||||||||||||
| Woori Innovative Growth Professional Investment Type Private Investment Trust No.1 (*3) |
|
Securities investment and others |
|
90.0 | 90.0 | Korea | June 30 | |||||||||||||
| Held by Woori Bank, Woori Financial Capital Co., Ltd., Woori Investment Bank Co., Ltd. and Woori Private Equity Asset Management Co., Ltd. (*6) |
||||||||||||||||||||
| Woori Innovative Growth Professional Investment Type Private Investment Trust No.2 (*3) |
|
Securities investment and others |
|
85.0 | 85.0 | Korea | June 30 | |||||||||||||
| Woori Innovative Growth New Deal Private Investment Trust No.3 (*3) |
|
Securities investment and others |
|
94.3 | 94.3 | Korea | June 30 | |||||||||||||
| Held by Woori Bank, Woori Financial Capital Co., Ltd., and Woori Investment Bank Co., Ltd. (*6) |
||||||||||||||||||||
| Woori GP Commitment Loan General Type Private Investment Trust No.1 (*3) |
|
Securities investment and others |
|
100.0 | 100.0 | Korea | June 30 | |||||||||||||
| Woori Equity Bridge Loan General Type Private Investment Trust No.1 (*3) |
|
Securities investment and others |
|
80.0 | 80.0 | Korea | June 30 | |||||||||||||
| Woori GP Commitment Loan General Type Private Investment Trust No.2 (*3) |
|
Securities investment and others |
|
100.0 | 100.0 | Korea | June 30 | |||||||||||||
| Woori GP Commitment Loan General Type Private Investment Trust No.3 (*3) |
|
Securities investment and others |
|
100.0 | 100.0 | Korea | June 30 | |||||||||||||
| Held by Woori Bank, Woori Financial Capital Co., Ltd., and Woori Asset Trust Co., Ltd. (*6) |
||||||||||||||||||||
| Woori New Deal(Infrastructure) Policy Fund No.1(*3) |
|
Securities investment and others |
|
70.0 | 70.0 | Korea | June 30 | |||||||||||||
| Held by Woori bank and Woori Investment Bank Co., Ltd. (*6) |
||||||||||||||||||||
| Woori Global Development Infrastructure Synergy Company Private Placement Investment Trust No.1 (*3) |
|
Securities investment and others |
|
100.0 | 100.0 | Korea | June 30 | |||||||||||||
| Woori NorthAmerica Infra Private Placement Investment Trust No. 1 (*3) |
|
Securities investment and others |
|
100.0 | 100.0 | Korea | June 30 | |||||||||||||
| Woori Infrastructure New Deal Specialized Investment Private Equity Investment Trust No. 1 (*3) |
|
Securities investment and others |
|
100.0 | 100.0 | Korea | June 30 | |||||||||||||
| Woori General Type Private Real Estate Investment Trust No.2 (*3) |
|
Securities investment and others |
|
30.1 | 30.1 | Korea | June 30 | |||||||||||||
| Woori ESG Infrastructure Development General Type Private Investment Trust No.1 (*3) |
|
Securities investment and others |
|
100.0 | 100.0 | Korea | June 30 | |||||||||||||
| Held by Woori bank (*6) |
||||||||||||||||||||
| Woori WooriBank Partners General Type Private Investment Trust No.1 (*3) |
|
Securities investment and others |
|
92.6 | 92.6 | Korea | June 30 | |||||||||||||
- 16 -
WOORI FINANCIAL GROUP INC. AND SUBSIDIARIES
NOTES TO CONSOLIDATED INTERIM FINANCIAL STATEMENTS
AS OF JUNE 30, 2024 AND 2023 (UNAUDITED)
| Percentage of ownership (%) |
Location | Financial statements date |
||||||||||||||
| Subsidiaries |
Main business | June 30, 2024 | December 31, 2023 |
|||||||||||||
| Woori General Type Private Real Estate Investment Trust No.1 (*3) |
Securities investment and others |
84.5 | 84.3 | Korea | June 30 | |||||||||||
| Woori Global Mid-market Secondary General Type Private Investment Trust No.1 (*3) |
Securities investment and others |
80.0 | 80.0 | Korea | June 30 | |||||||||||
| Woori Woori Bank Partners Professional Type Private Investment Trust No. 2 (*3) |
Securities investment and others |
90.9 | 90.9 | Korea | June 30 | |||||||||||
| Woori General Type Private Real Estate Investment Trust No.5 (*3) |
Securities investment and others |
87.0 | 87.0 | Korea | June 30 | |||||||||||
| Woori Senior Loan General Type Private Investment Trust No.2(*3) |
Securities investment and others |
50.0 | 50.0 | Korea | June 30 | |||||||||||
| Woori Japan General Type Private Real Estate Feeder Investment Trust No.1-2 (*3) |
Securities investment and others |
98.8 | 98.8 | Korea | June 30 | |||||||||||
| Woori Japan Blind General Type Private Real Estate Feeder Investment Trust No.1 (*3) |
Securities investment and others |
99.9 | 99.9 | Korea | June 30 | |||||||||||
| WooriG Clean Energy General Type Private Investment Trust No.2 (*3) |
Securities investment and others |
30.8 | 30.8 | Korea | June 30 | |||||||||||
| Woori Together Institutional USD MMF No.1 C-F(*3) |
Securities investment and others |
54.0 | 63.4 | Korea | June 30 | |||||||||||
| Woori ESG Infrastructure Development General Type Private Investment Trust No.2 (*3) |
Securities investment and others |
50.0 | 50.0 | Korea | June 30 | |||||||||||
| Woori Dongbu Underground Expressway General type Private Special Asset Investment Trust (*3) |
Securities investment and others |
— | 40.0 | Korea | June 30 | |||||||||||
| Woori Partners General Private Investment Trust No. 3 (*3) (*10) |
Securities investment and others |
90.9 | — | Korea | June 30 | |||||||||||
| Woori General Private Equity Investment Trust 1 (*3) (*5) (*10) |
Securities investment and others |
— | — | Korea | — | |||||||||||
| Held by Woori Bank and Woori Financial Capital Co., Ltd. (*6) |
||||||||||||||||
| Woori Renewable New Deal Fund No.1 (*3) |
Securities investment and others |
60.0 | 60.0 | Korea | June 30 | |||||||||||
| Woori Equity Investment General Type Private Investment Trust No.1 (*3) |
Securities investment and others |
100.0 | 100.0 | Korea | June 30 | |||||||||||
| Woori Busan Logistics Infra Private Placement Special Asset Investment Trust (*3) |
Securities investment and others |
100.0 | 100.0 | Korea | June 30 | |||||||||||
| Held by Woori Financial Capital Co., Ltd.(*6) |
||||||||||||||||
| Woori Japan Private Placement Real Estate Feeder Investment Trust No.1-1 (*3) |
Securities investment and others |
63.2 | 63.2 | Korea | June 30 | |||||||||||
| Held by Woori Bank and Woori Asset Trust Co., Ltd (*6) |
||||||||||||||||
| Woori General Type Private Real Estate Investment Trust No.6 (*3) |
Securities investment and others |
85.8 | 85.8 | Korea | June 30 | |||||||||||
| WooriG Innovation Growth(Infrastructure) General Type Private Investment Trust No.2 (*3) |
Securities investment and others |
46.4 | 46.4 | Korea | June 30 | |||||||||||
- 17 -
WOORI FINANCIAL GROUP INC. AND SUBSIDIARIES
NOTES TO CONSOLIDATED INTERIM FINANCIAL STATEMENTS
AS OF JUNE 30, 2024 AND 2023 (UNAUDITED)
| Percentage of ownership (%) |
Location | Financial statements date |
||||||||||||||||||
| Subsidiaries |
Main business | June 30, 2024 | December 31, 2023 |
|||||||||||||||||
| Held by Woori bank, Woori Investment Bank Co., Ltd., and Woori Asset Trust Co., Ltd. (*6) |
||||||||||||||||||||
| Woori Real Estate Financial Stabilization General Private Investment Trust No. 1 (*3) (*10) |
|
Securities investment and others |
|
100.0 | — | Korea | June 30 | |||||||||||||
| Held by Woori Bank, Woori Card Co., Woori Financial Capital Co., Ltd. and Woori Investment Bank Co., Ltd. (*6) |
||||||||||||||||||||
| Woori FG Digital Investment Fund 1st (*3) |
|
Securities investment and others |
|
100.0 | 100.0 | Korea | June 30 | |||||||||||||
| Woori Financial Dino Lab Investment Association No. 1 (*3)(*10) |
|
Securities investment and others |
|
100.0 | — | Korea | June 30 | |||||||||||||
| Held by Woori Japan Private Placement Real Estate Feeder Investment Trust No.1-1 and Woori G Japan Investment Trust No. 1-2(*6) |
||||||||||||||||||||
| Woori Japan Private Placement Real Estate Master Investment Trust No.1 (*3)(*8) |
|
Securities investment and others |
|
100.0 | 100.0 | Korea | June 30 | |||||||||||||
| Held by Woori Financial Capital Co., Ltd. and Woori Investment Bank Co., Ltd. (*6) |
||||||||||||||||||||
| Woori Japan Private Placement Real Estate Master Investment Trust No.2-1 (*3) |
|
Securities investment and others |
|
100.0 | 100.0 | Korea | June 30 | |||||||||||||
| Held by Woori Bank and Woori Private Equity Asset Management Co., Ltd. (*6) |
||||||||||||||||||||
| Woori Corporate Turnaround No.1 Private Equity Fund (*3) |
|
Securities investment and others |
|
36.4 | 36.4 | Korea | June 30 | |||||||||||||
| Held by Woori Japan Blind General Type Private Real Estate Feeder Investment Trust No.1 and Woori Japan General Type Private Real Estate Feeder Investment Trust No.2-1(*6) |
||||||||||||||||||||
| Woori Japan Private Placement Real Estate Master Investment Trust No.2 (*3) (*8) |
|
Securities investment and others |
|
100.0 | 100.0 | Korea | June 30 | |||||||||||||
| Held by Woori Japan Private Placement Real Estate Master Investment Trust No.1 |
||||||||||||||||||||
| GK OK Chatan (*3) |
|
Other financial services |
|
99.0 | 99.9 | Japan | |
April 30 (*9) |
| |||||||||||
| Held by Woori Japan Blind General Type Private Real Estate Feeder Investment Trust No.1 (*6) |
||||||||||||||||||||
| Woori Private Placement Investment Trust No. 3 (*3)(*8) |
|
Securities investment and others |
|
76.5 | 76.5 | Korea | June 30 | |||||||||||||
| Held by Woori Private Placement Investment Trust No. 3 |
||||||||||||||||||||
| GK Woorido(*3) |
|
Other financial services |
|
100.0 | 100.0 | Japan | March 31 (*9) | |||||||||||||
| Held by Woori Infrastructure New Deal General Type Private Investment Trust (*6) |
||||||||||||||||||||
| Woori Seoul- Chuncheon Highway Private Placement Special Asset Investment Trust No.1 (*3) |
|
Securities investment and others |
|
48.0 | 48.0 | Korea | June 30 | |||||||||||||
- 18 -
WOORI FINANCIAL GROUP INC. AND SUBSIDIARIES
NOTES TO CONSOLIDATED INTERIM FINANCIAL STATEMENTS
AS OF JUNE 30, 2024 AND 2023 (UNAUDITED)
| (*1) | The Company acquired additional shares of Woori Asset Management Corp. during the six-month period ended June 30, 2024. Additionally, Woori Asset Management Corp. merged with Woori Global Management Co., Ltd. through a business combination. Additionally, The Company acquired additional shares of Woori Asset Trust Co., Ltd. during the six-month period ended June 30, 2024. |
| (*2) | The entity is a structured entity for the purpose of asset securitization. Although the Group is not a majority shareholder, the Group 1) has the power over the investee, 2) is exposed to or has rights to variable returns from its involvement with the investee, and 3) has the ability to use its power to affect its returns. |
| (*3) | The entity is a structured entity for the purpose of investment in securities. Although the Group is not a majority shareholder, the Group 1) has the power over the investee, 2) is exposed to or has rights to variable returns from its involvement with the investee, and 3) has the ability to use its power to affect its returns. |
| (*4) | The entity is a ‘money trust’ under the Financial Investment Services and Capital Markets Act. Although the Group is not a majority shareholder, the Group 1) has the power over the investee, 2) is exposed to or has rights to variable returns from its involvement with the investee, and 3) has the ability to use its power to affect its returns. |
| (*5) | Companies are excluded from the consolidation as of June 30, 2024. |
| (*6) | Determined that the Group controls the investees, considering the Group 1) has the power over the investee, 2) is exposed to or has rights to variable returns from its involvement with the investee, and 3) has the ability to use its power to affect its returns, by two or more subsidiaries’ investment or operation. |
| (*7) | The Russia – Ukraine conflict has been escalated in February 2022, and international sanctions were imposed on Russia. Due to the sanctions, the Group may experience situations such as a decrease in value of financial assets or operating assets owned by the Group regarding the conflict, an increase in receivable payment terms, limitation to transfer funds, decrease in the profit. As of June 30, 2024, the Group expects such conflict and sanctions would have financial impacts on the business of AO Woori Bank, one of the subsidiaries, in the future. However, the Group cannot reasonably predict the financial impacts. |
| (*8) | As a master-feeder fund, it is the percentage of the feeder fund’s ownership in the master fund. |
| (*9) | As the financial statements for the end of the reporting period were not available, the most recent financial statements available from the date of settlement were used. |
| (*10) | Companies are included in the consolidation during the six-month period ended June 30, 2024. |
| (3) | The Group has not consolidated the following entities as of June 30, 2024 and December 31, 2023 despite having more than 50% ownership interest: |
| As of June 30, 2024 | ||||||||
| Subsidiaries |
Location | Main Business | Percentage of ownership (%) |
|||||
| Mirae Asset Maps Clean Water Private Equity Investment Trust 7th (*1) |
Korea | Securities Investment | 59.7 | |||||
| Kiwoom Yonsei Private Equity Investment Trust (*1) |
Korea | Securities Investment | 88.9 | |||||
| IGIS Europe Private Placement Real Estate Fund No. 163-2 (*2) |
Korea | Securities Investment | 97.8 | |||||
| IGIS Global Private Placement Real Estate Fund No. 148-1 (*1) |
Korea | Securities Investment | 75.0 | |||||
| IGIS Global Private Placement Real Estate Fund No. 148-2 (*1) |
Korea | Securities Investment | 75.0 | |||||
| Mirae Asset Seoul Ring Expressway Private Special Asset Fund No. 1 (*1) |
Korea | Securities Investment | 66.7 | |||||
| Hangkang Sewage Treatment Plant Fund (*1) |
Korea | Securities Investment | 55.6 | |||||
| Korea Investment Pocheon Hwado Expressway Professional Investment Fund (*1) |
Korea | Securities Investment | 55.2 | |||||
| Midas Global Private Placement Real Estate Investment Trust No. 7-2 (*1) |
Korea | Securities Investment | 58.3 | |||||
| Together-Korea Government Private Pool Private Securities Investment Trust No.3 (*3) |
Korea | Securities Investment | 100.0 | |||||
| INMARK France Private Placement Investment Trust No. 18-1 (*1) |
Korea | Securities Investment | 93.8 | |||||
| Kiwoom Vibrato Private Placement Investment Trust 1-W(EUR) (*2) |
Korea | Securities Investment | 99.5 | |||||
| KOTAM Global Infra Private Fund 1-4 (*2) |
Korea | Securities Investment | 99.7 | |||||
| UBSHana Class 1 Special Asset Investment Trust 3 Class C 2 (*1) |
Korea | Securities Investment | 51.0 | |||||
| Consus GyeongJu Green Specialized Private Special Asset Investment Trust 1 (*1) |
Korea | Securities Investment | 50.0 | |||||
| Kiwoom Harmony Private Placement Investment Trust No. 3 (*1) |
Korea | Securities Investment | 77.4 | |||||
| Consus Solar Energy Private Placement Investment Truns No.1(*1) |
Korea | Securities Investment | 50.0 | |||||
| IGIS ESG General Private Investment Trust No.1 (*1) |
Korea | Securities Investment | 60.0 | |||||
| Kiwoom Aurora Geneal Type Private Placement Investment Trust No. 2 (*1) |
Korea | Securities Investment | 60.0 | |||||
- 19 -
WOORI FINANCIAL GROUP INC. AND SUBSIDIARIES
NOTES TO CONSOLIDATED INTERIM FINANCIAL STATEMENTS
AS OF JUNE 30, 2024 AND 2023 (UNAUDITED)
| As of June 30, 2024 | ||||||||
| Subsidiaries |
Location | Main Business | Percentage of ownership (%) |
|||||
| NH-Amundi WSCP VIII Private Fund 2 (*1) |
Korea | Securities Investment | 65.2 | |||||
| AI Partners Global Infrastructure Specialized Privately Placed Feeder Fund Trust No. 2 (*2) |
Korea | Securities Investment | 100.0 | |||||
| Hangang new deal infra BTL fund 4 (HNBF4) (*1) |
Korea | Securities Investment | 60.0 | |||||
| IGIS Global Private Placement Real Estate Fund No. 316-1(*2) |
Korea | Securities Investment | 99.3 | |||||
| INMARK Spain Private Placement Real Estate Investment Trust No. 26-2 (*2) |
Korea | Securities Investment | 97.7 | |||||
| Woori Asset Global Partnership Fund No.5(*4) |
Korea | Securities Investment | 57.7 | |||||
| Kiwoom Harmony Private Placement Investment Trust No. 6 (*1) |
Korea | Securities Investment | 76.9 | |||||
| Project Chile PMGD Solar (*1) |
Korea | Securities Investment | 75.2 | |||||
| Rifa Qualified Investors Private Real Estate Investment Trust No.40 (*2) |
Korea | Securities Investment | 55.0 | |||||
| (*1) | The Group does not have power over the discretionary fund because the fund manager has the sole authority to decide the relevant activities of the investee. The fund manager’s delegated power is exercised not only for the Group, but also for other investors as well. The Group does not have the power over the fund’s activities even though it holds more than 50% of ownership interest. |
| (*2) | The Group does not have power over the fund of funds because the Group cannot decide the relevant activities of the fund through the related contract. The Group does not have the power over the fund’s activities even though it holds more than 50% of ownership interest. The Group does not have the power over the fund’s activities even though the Group holds ownership interest. |
| (*3) | The Group does not have power over the stock market stabilization fund as the fund’s relevant activities are determined by the management committee, over which the Group does not have substantial control. The Group does not have the power over the fund’s activities even though it holds more than 50% of ownership interest. |
| (*4) | In this fund, one of the parties holds substantive removal rights and can remove the collective investment business operator without any cause. Consequently, the Group have no controls as it exercises decision-making rights as agent. |
| As of December 31, 2023 | ||||||||
| Subsidiaries |
Location | Main Business | Percentage of ownership (%) |
|||||
| Mirae Asset Maps Clean Water Private Equity Investment Trust 7th (*1) |
Korea | Securities Investment | 59.7 | |||||
| Kiwoom Yonsei Private Equity Investment Trust (*1) |
Korea | Securities Investment | 88.9 | |||||
| IGIS Europe Private Placement Real Estate Fund No. 163-2 (*2) |
Korea | Securities Investment | 97.9 | |||||
| IGIS Global Private Placement Real Estate Fund No. 148-1 (*1) |
Korea | Securities Investment | 75.0 | |||||
| IGIS Global Private Placement Real Estate Fund No. 148-2 (*1) |
Korea | Securities Investment | 75.0 | |||||
| Mirae Asset Seoul Ring Expressway Private Special Asset Fund No. 1 (*1) |
Korea | Securities Investment | 66.7 | |||||
| Hangkang Sewage Treatment Plant Fund (*1) |
Korea | Securities Investment | 55.6 | |||||
| Korea Investment Pocheon Hwado Expressway Professional Investment Fund (*1) |
Korea | Securities Investment | 55.1 | |||||
| Midas Global Private Placement Real Estate Investment Trust No. 7-2 (*1) |
Korea | Securities Investment | 58.3 | |||||
| Together-Korea Government Private Pool Private Securities Investment Trust No.3 (*3) |
Korea | Securities Investment | 100.0 | |||||
| INMARK France Private Placement Investment Trust No. 18-1 (*1) |
Korea | Securities Investment | 93.8 | |||||
| Kiwoom Vibrato Private Placement Investment Trust 1-W(EUR) (*2) |
Korea | Securities Investment | 99.5 | |||||
| KOTAM Global Infra Private Fund 1-4 (*2) |
Korea | Securities Investment | 99.7 | |||||
| UBSHana Class 1 Special Asset Investment Trust 3 Class C 2 (*1) |
Korea | Securities Investment | 51.0 | |||||
| Consus GyeongJu Green Specialized Private Special Asset Investment Trust 1 (*1) |
Korea | Securities Investment | 50.0 | |||||
| Kiwoom Harmony Private Placement Investment Trust No. 3 (*1) |
Korea | Securities Investment | 77.3 | |||||
| Consus Solar Energy Private Placement Investment Truns No.1(*1) |
Korea | Securities Investment | 50.0 | |||||
| IGIS ESG General Private Investment Trust No.1(*1) |
Korea | Securities Investment | 60.0 | |||||
| Kiwoom Aurora Geneal Type Private Placement Investment Trust No. 2(*1) |
Korea | Securities Investment | 60.0 | |||||
| NH-Amundi WSCP VIII Private Fund 2 (*1) |
Korea | Securities Investment | 65.2 | |||||
| AI Partners Global Infrastructure Specialized Privately Placed Feeder Fund Trust No. 2 (*2) |
Korea | Securities Investment | 100.0 | |||||
| Hangang new deal infra BTL fund 4 (HNBF4) (*1) |
Korea | Securities Investment | 60.0 | |||||
| IGIS Global Private Placement Real Estate Fund No. 316-1(*2) |
Korea | Securities Investment | 99.3 | |||||
| INMARK Spain Private Placement Real Estate Investment Trust No. 26-2 (*2) |
Korea | Securities Investment | 97.7 | |||||
| Woori Asset Global Partnership Fund No.5(*4) |
Korea | Securities Investment | 57.7 | |||||
| Kiwoom Harmony Private Placement Investment Trust No. 6 (*1) |
Korea | Securities Investment | 76.9 | |||||
| Rifa Qualified Investors Private Real Estate Investment Trust No.40 (*2) |
Korea | Securities Investment | 55.0 | |||||
| (*1) | The Group does not have power over the discretionary fund because the fund manager has the sole authority to decide the relevant activities of the investee. The fund manager’s delegated power is exercised not only for the Group, but also for other investors as well. The Group does not have the power over the fund’s activities even though it holds more than 50% of ownership interest. |
- 20 -
WOORI FINANCIAL GROUP INC. AND SUBSIDIARIES
NOTES TO CONSOLIDATED INTERIM FINANCIAL STATEMENTS
AS OF JUNE 30, 2024 AND 2023 (UNAUDITED)
| (*2) | The Group does not have power over the fund of funds because the Group cannot decide the relevant activities of the fund through the related contract. The Group does not have the power over the fund’s activities even though it holds more than 50% of ownership interest. |
| (*3) | The Group does not have power over the stock market stabilization fund as the fund’s relevant activities are determined by the management committee, over which the Group does not have substantial control. The Group does not have the power over the fund’s activities even though it holds more than 50% of ownership interest. |
| (*4) | In this fund, one of the parties holds substantive removal rights and can remove the collective investment business operator without any cause. Consequently, the Group have no controls as it exercises decision-making rights as agent. |
| (4) | The summarized financial information of the major subsidiaries are as follows. The financial information of each subsidiary was prepared on the basis of consolidated financial statements. (Unit: Korean Won in millions): |
| As of June 30, 2024 | For the six-month period ended June 30, 2024 | |||||||||||||||||||
| Subsidiaries |
Assets | Liabilities | Operating revenue |
Net income(loss) attributable to owners |
Comprehensive income(loss) attributable to owners |
|||||||||||||||
| Woori Bank |
468,915,086 | 441,651,445 | 21,367,085 | 1,673,512 | 1,727,153 | |||||||||||||||
| Woori Card Co., Ltd. |
16,571,401 | 13,852,526 | 1,124,497 | 83,807 | 87,732 | |||||||||||||||
| Woori Financial Capital Co., Ltd. |
12,564,864 | 10,894,300 | 861,689 | 79,854 | 79,960 | |||||||||||||||
| Woori Investment Bank Co., Ltd. |
6,676,326 | 5,566,870 | 215,330 | 3,822 | 7,719 | |||||||||||||||
| Woori Asset Trust Co., Ltd. |
524,210 | 57,052 | 58,264 | 9,010 | 8,959 | |||||||||||||||
| Woori Savings Bank |
1,730,149 | 1,478,793 | 69,280 | (27,797 | ) | (27,797 | ) | |||||||||||||
| Woori Financial F&I Co., Ltd. |
1,352,667 | 1,023,032 | 34,947 | 5,367 | 5,367 | |||||||||||||||
| Woori Asset Management Corp. |
187,452 | 29,678 | 28,666 | 4,743 | 4,700 | |||||||||||||||
| Woori Venture Partners Co., Ltd. |
375,212 | 48,006 | 49,709 | 29,086 | 29,413 | |||||||||||||||
| Woori Private Equity Asset Management Co., Ltd. |
99,144 | 4,347 | 5,385 | 3,323 | 3,209 | |||||||||||||||
| Woori Credit Information Co., Ltd. |
43,420 | 6,207 | 21,357 | 1,205 | 1,035 | |||||||||||||||
| Woori Fund Service Co., Ltd. |
28,577 | 2,389 | 8,929 | 2,480 | 2,480 | |||||||||||||||
| Woori FIS Co., Ltd. |
59,170 | 14,594 | 90,830 | (3,764 | ) | (3,683 | ) | |||||||||||||
| Woori Finance Research Institute Co., Ltd. |
5,850 | 2,149 | 4,248 | (125 | ) | (140 | ) | |||||||||||||
| As of December 31, 2023 | For the six-month period ended June 30, 2023 | |||||||||||||||||||
| Subsidiaries |
Assets | Liabilities | Operating revenue |
Net income(loss) attributable to owners |
Comprehensive income(loss) attributable to owners |
|||||||||||||||
| Woori Bank |
458,017,067 | 431,313,615 | 21,251,376 | 1,471,973 | 1,852,380 | |||||||||||||||
| Woori Card Co., Ltd. |
17,491,193 | 14,830,408 | 1,063,560 | 81,900 | 72,280 | |||||||||||||||
| Woori Financial Capital Co., Ltd. |
12,417,338 | 10,796,683 | 755,079 | 71,278 | 70,838 | |||||||||||||||
| Woori Investment Bank Co., Ltd. |
6,375,625 | 5,273,890 | 222,858 | 12,167 | 12,162 | |||||||||||||||
| Woori Asset Trust Co., Ltd. |
337,976 | 79,747 | 68,778 | 38,404 | 38,324 | |||||||||||||||
| Woori Savings Bank |
1,938,948 | 1,759,489 | 61,566 | (25,955 | ) | (25,955 | ) | |||||||||||||
| Woori Financial F&I Co., Ltd. |
877,702 | 673,265 | 9,939 | 527 | 527 | |||||||||||||||
| Woori Asset Management Corp. |
161,868 | 32,780 | 22,110 | 3,806 | 3,774 | |||||||||||||||
| Woori Venture Partners Co., Ltd.(*) |
328,782 | 30,190 | 6,294 | 2,410 | 3,052 | |||||||||||||||
| Woori Global Asset Management Co., Ltd. |
37,512 | 13,526 | 7,030 | 369 | 369 | |||||||||||||||
| Woori Private Equity Asset Management Co., Ltd. |
96,006 | 4,418 | 5,236 | 1,014 | 976 | |||||||||||||||
| Woori Credit Information Co., Ltd. |
45,662 | 7,981 | 21,152 | 1,968 | 1,750 | |||||||||||||||
| Woori Fund Service Co., Ltd. |
27,526 | 2,758 | 8,416 | 2,102 | 2,102 | |||||||||||||||
| Woori FIS Co., Ltd. |
80,563 | 32,304 | 161,507 | (11,140 | ) | (11,622 | ) | |||||||||||||
| Woori Finance Research Institute Co., Ltd. |
6,444 | 2,603 | 3,447 | (40 | ) | (85 | ) | |||||||||||||
| (*) | Additional investment occurred and added it as a consolidated subsidiary during the six-month period ended June 30, 2023. |
- 21 -
WOORI FINANCIAL GROUP INC. AND SUBSIDIARIES
NOTES TO CONSOLIDATED INTERIM FINANCIAL STATEMENTS
AS OF JUNE 30, 2024 AND 2023 (UNAUDITED)
| (5) | The financial support that the Group provides to consolidated structured entities is as follows: |
| • | Structured entity for asset securitization |
The structured entity which is established for the purpose of securitization of project financing loans, corporate bonds, and other financial assets. The Group is involved with the structured entity through provision of credit facility over asset-backed commercial papers issued by the entity, originating loans directly to the structured entity, or purchasing 100% of the subordinated debts issued by the structured entity.
| • | Structured entity for the investments in securities |
The structured entity is established for the purpose of investments in securities. The Group acquires beneficiary certificates through its contribution of funding to the structured entity by the Group, and it is exposed to the risk that it may not be able to recover its fund depending on the result of investment performance of asset managers of the structured entity.
| • | Money trust under the Financial Investment Services and Capital Markets Act |
The Group provides with financial guarantee of principal and interest or solely principal to some of its trust products. Due to the financial guarantees, the Group may be obliged when the principal and interest or principal of the trust product sold is short of the guaranteed amount depending on the result of investment performance of the trust product.
As of June 30, 2024 and December 31, 2023, the Group provides 2,540,306 million Won and 2,445,644 million Won of credit facilities, respectively, for the structured entities mentioned above. As of June 30, 2024 and December 31, 2023, the purchase commitment amounts to 2,598,085 million Won and 2,848,921 million Won, respectively.
| (6) | The Group has entered into various agreements with structured entities such as asset securitization, structured finance, investment fund, and trust contract. The characteristics of interests and the nature of risks related to unconsolidated structured entities over which the Group does not have control in accordance with K-IFRS 1110 are as follows: |
The interests in unconsolidated structured entities that the Group hold are classified into asset securitization, structured finance, investment fund and real-estate trust, based on the nature and the purpose of each structured entity.
Unconsolidated structured entities classified as ‘asset securitization’ are entities that issue asset-backed securities, pay the principal and interest or distributes dividends on asset-backed securities through borrowings or profits from the management, operation and sale of securitized assets. The Group has been purchasing commitments of asset-backed securities or issuing asset-backed securities through credit grants, and recognizes related interest or fee revenue. There are entities that provide additional funding and conditional debt acquisition commitments before the Group’s financial support, but the Group is still exposed to losses arising from the purchase of financial assets issued by the structured entities when it fails to renew the securities.
Unconsolidated structured entities classified as ‘structured finance’ include real estate project financing investment vehicle, social overhead capital companies, and special purpose companies for ship (aircraft) financing. Each entity is incorporated as a separate company with a limited purpose in order to efficiently pursue business goals and the fund is raised by equity investment or loans from financial institutions and participating institutions. ‘Structured financing’ is a financing method for large-scale risky business, with investments made based on feasibility of the specific business or project, instead of credit of business owner or physical collaterals. The investors receive profits from the operation of the business. The Group recognizes interest revenue, profit or loss from assessment or transactions of financial instruments, or dividend income. With regard to uncertainties involving structured financing, there are entities that provide financial support such as additional fund, guarantees and prioritized credit grants prior to the Group’s intervention, but the Group is exposed to possible losses due to loss of principal from reduction in investment value or irrecoverable loans arising from failure to collect scheduled cash flows and cessation of projects.
- 22 -
WOORI FINANCIAL GROUP INC. AND SUBSIDIARIES
NOTES TO CONSOLIDATED INTERIM FINANCIAL STATEMENTS
AS OF JUNE 30, 2024 AND 2023 (UNAUDITED)
Unconsolidated structured entities classified as ‘investment funds’ include investment trusts and private equity funds. An investment trust orders the investment and operation of funds to the trust manager in accordance with trust contract with profits distributed to the investors. Private equity funds finances money required to acquire equity securities to enable direction of management and/or improvement of ownership structure, with profit distributed to the investors. The Group recognizes pro rata amount of dividend income as an investor in the same way as ‘structured finance’, and may be exposed to losses due to reduction in investment value. Investments in MMF(Money Market Funds) as of June 30, 2024 and December 31, 2023 are 477,977 million Won and 1,451,874 million Won, respectively, and there is no additional commitments for MMF.
‘Real estate trust’ is to be entrusted the underlying property for the purpose of managing, disposing, operating or developing from the consignor who owns the property and distributes the proceeds achieved through the trust to the beneficiary. When the consignee does not fulfill his or her important obligations in the trust contract or it is, in fact, difficult to run the business, the Group may be exposed to the threat of compensating the loss.
The total assets of the unconsolidated structured entity held by the Group, the carrying amount of the items recognized in the consolidated financial statements, the maximum loss exposure, and the losses from the unconsolidated structured entity are as follows. The maximum loss exposure includes the amount of investment recognized in the consolidated financial statements and the amount that is likely to be confirmed in the future when satisfies certain conditions by contracts such as purchase commitments, credit offerings.
| (unit : Korean Won in millions) | ||||||||||||||||
| June 30, 2024 | ||||||||||||||||
| Asset securitization | Structured Finance | Investment Fund | Real-estate trust | |||||||||||||
| Total asset of the unconsolidated structured entities |
12,192,042 | 116,181,794 | 251,222,610 | 1,881,375 | ||||||||||||
| Assets recognized in the consolidated financial statements related to the unconsolidated structured entities |
8,152,028 | 5,344,140 | 7,703,503 | 138,111 | ||||||||||||
| Financial assets at FVTPL |
61,486 | 97,051 | 6,652,295 | 12,745 | ||||||||||||
| Financial assets at FVTOCI |
2,116,399 | 45,067 | — | — | ||||||||||||
| Financial assets at amortized cost |
5,974,143 | 5,201,473 | — | 125,366 | ||||||||||||
| Investments in joint ventures and associates |
— | — | 1,048,354 | — | ||||||||||||
| Derivative assets |
— | 549 | 2,854 | — | ||||||||||||
| Liabilities recognized in the consolidated financial statements related to the unconsolidated structured entities |
448 | 2,843 | — | 23,224 | ||||||||||||
| Derivative liabilities |
— | 826 | — | — | ||||||||||||
| Other liabilities (provisions) |
448 | 2,017 | — | 23,224 | ||||||||||||
| The maximum exposure to risks |
8,260,520 | 6,250,969 | 11,933,645 | 281,794 | ||||||||||||
| Investment assets |
8,152,028 | 5,344,140 | 7,703,503 | 138,111 | ||||||||||||
| Purchase commitment |
— | — | 4,228,929 | — | ||||||||||||
| Credit offerings and others |
108,492 | 906,829 | 1,213 | 143,683 | ||||||||||||
| Loss recognized on unconsolidated structured entities |
— | 52,864 | 20,543 | 25,995 | ||||||||||||
- 23 -
WOORI FINANCIAL GROUP INC. AND SUBSIDIARIES
NOTES TO CONSOLIDATED INTERIM FINANCIAL STATEMENTS
AS OF JUNE 30, 2024 AND 2023 (UNAUDITED)
| (unit : Korean Won in millions) | ||||||||||||||||
| December 31, 2023 | ||||||||||||||||
| Asset securitization | Structured Finance | Investment Fund | Real-estate trust | |||||||||||||
| Total asset of the unconsolidated structured entities |
14,595,681 | 99,568,859 | 189,034,319 | 1,604,210 | ||||||||||||
| Assets recognized in the consolidated financial statements related to the unconsolidated structured entities |
9,256,063 | 5,414,037 | 6,884,658 | 93,222 | ||||||||||||
| Financial assets at FVTPL |
205,449 | 118,026 | 6,000,877 | 8,297 | ||||||||||||
| Financial assets at FVTOCI |
2,802,592 | 43,696 | — | — | ||||||||||||
| Financial assets at amortized cost |
6,248,022 | 5,252,191 | 66 | 84,925 | ||||||||||||
| Investments in joint ventures and associates |
— | — | 881,531 | — | ||||||||||||
| Derivative assets |
— | 124 | 2,184 | — | ||||||||||||
| Liabilities recognized in the consolidated financial statements related to the unconsolidated structured entities |
248 | 3,251 | 2,006 | 28,838 | ||||||||||||
| Derivative liabilities |
— | 1,243 | 2,006 | — | ||||||||||||
| Other liabilities (provisions) |
248 | 2,008 | — | 28,838 | ||||||||||||
| The maximum exposure to risks |
9,333,448 | 6,444,559 | 11,069,599 | 206,651 | ||||||||||||
| Investment assets |
9,256,063 | 5,414,037 | 6,884,658 | 93,222 | ||||||||||||
| Purchase commitment |
— | — | 4,181,631 | — | ||||||||||||
| Credit offerings and others |
77,385 | 1,030,522 | 3,310 | 113,429 | ||||||||||||
| Loss recognized on unconsolidated structured entities |
149 | 83,885 | 63,372 | 19,337 | ||||||||||||
| (7) | As of June 30, 2024 and December 31, 2023, the share of non-controlling interests on the net income and equity of subsidiaries in which non-controlling interests are significant are as follows: (Unit: Korean Won in millions): |
| 1) | Accumulated non-controlling interests at the end of the reporting period |
| June 30, 2024 | December 31, 2023 | |||||||
| Woori Bank (*1) |
1,546,447 | 1,546,447 | ||||||
| Woori Asset Trust Co., Ltd. (*2) |
6,149 | 12,517 | ||||||
| Woori Asset Management Corp (*3) |
— | 35,638 | ||||||
| PT Bank Woori Saudara Indonesia 1906 Tbk |
93,508 | 103,176 | ||||||
| Wealth Development Bank |
22,471 | 21,142 | ||||||
| PT Woori Finance Indonesia Tbk. |
14,412 | 13,631 | ||||||
| (*1) | Hybrid securities issued by Woori Bank |
| (*2) | The non-controlling interests decreased by 6,671 million Won in accordance with paid-in capital increase and stock retirement and additional acquisition of minority interests during the six-month periods ended June 30, 2024. |
| (*3) | The non-controlling interests decreased by 36,169 million Won in accordance with merger with Woori Global Asset Management Co., Ltd. and acquisition of shares of Yuanta Securities Korea Co., Ltd. during the six-month periods ended June 30, 2024. |
- 24 -
WOORI FINANCIAL GROUP INC. AND SUBSIDIARIES
NOTES TO CONSOLIDATED INTERIM FINANCIAL STATEMENTS
AS OF JUNE 30, 2024 AND 2023 (UNAUDITED)
| 2) | Net income attributable to non-controlling interests |
| For the six-month periods ended June 30 | ||||||||
| 2024 | 2023 | |||||||
| Woori Bank (*) |
38,294 | 55,320 | ||||||
| Woori Investment Bank Co., Ltd. |
— | 5,255 | ||||||
| Woori Asset Trust Co., Ltd. |
304 | 6,144 | ||||||
| Woori Asset Management Corp |
531 | 962 | ||||||
| Woori Venture Partners Co., Ltd. |
— | 880 | ||||||
| PT Bank Woori Saudara Indonesia 1906 Tbk |
4,368 | 5,449 | ||||||
| Wealth Development Bank |
919 | 460 | ||||||
| PT Woori Finance Indonesia Tbk. |
490 | 447 | ||||||
| (*) | Distribution of the hybrid securities issued by Woori Bank |
| 3) | Dividends to non-controlling interests |
| For the six-month periods ended June 30 | ||||||||
| 2024 | 2023 | |||||||
| Woori Bank (*) |
38,294 | 55,320 | ||||||
| Woori Investment Bank Co., Ltd. |
— | 8,302 | ||||||
| Woori Asset Trust Co., Ltd |
— | 365 | ||||||
| PT Bank Woori Saudara Indonesia 1906 Tbk |
3,450 | 2,802 | ||||||
| Korea BTL Infrastructure Fund |
18 | — | ||||||
| (*) | Distribution of the hybrid securities issued by Woori Bank |
- 25 -
WOORI FINANCIAL GROUP INC. AND SUBSIDIARIES
NOTES TO CONSOLIDATED INTERIM FINANCIAL STATEMENTS
AS OF JUNE 30, 2024 AND 2023 (UNAUDITED)
| 2. | BASIS OF PREPARATION AND MATERIAL ACCOUNTING POLICIES |
The Group maintains its accounting records in Korean Won and prepares statutory financial statements in the Korean language (Hangul) in accordance with International Financial Reporting Standards as adopted by the Republic of Korea (K-IFRS). The accompanying consolidated interim financial statements have been condensed, restructured and translated into English from the Korean language financial statements. The Group’s condensed consolidated interim financial statements are condensed interim financial statements prepared in applying International Financial Reporting Standards as adopted by the Republic of Korea (“K-IFRS”) 1034 Interim Finance Reporting for some of periods in which the annual consolidated financial statements belong. It is necessary to use the Group’s annual consolidated financial statements for the year ended December 31, 2023 for understanding of the accompanying condensed consolidated interim financial statements.
| (1) | From the accounting period beginning on January 1, 2024, the Group has newly applied the following standards and interpretations. |
1) Amendments to Korean IFRS 1001 Presentation of Financial Statements – Classification of Liabilities as Current or Non-current, Non-current Liabilities with Covenants
The amendments clarify that liabilities are classified as either current or non-current, depending on the substantive rights that exist at the end of the reporting period. Classification is unaffected by the likelihood that an entity will exercise right to defer settlement of the liability or the expectations of management. Also, the settlement of liability includes the transfer of the entity’s own equity instruments, however, it would be excluded if an option to settle them by the entity’s own equity instruments if compound financial instruments is met the definition of equity instruments and recognized separately from the liability. In addition, covenants that an entity is required to comply with after the end of the reporting period would not affect classification of a liability as current or non-current at the reporting date. When an entity classifies a liability that is subject to the covenants which an entity is required to comply with within twelve months of the reporting date as non-current at the end of the reporting period, the entity shall disclose information in the notes to understand the risk that non-current liabilities with covenants could become repayable within twelve months after the reporting period. The amendments do not have a significant impact on the consolidated interim financial statements.
2) Amendments to Korean IFRS 1007 Statement of Cash Flows, Korean IFRS 1107 Financial Instruments: Disclosures – Supplier finance arrangements
When applying supplier finance arrangements, an entity shall disclose information about its supplier finance arrangements that enables users of financial statements to assess the effects of those arrangements on the entity’s liabilities and cash flows and on the entity’s exposure to liquidity risk. The amendments should be applied for annual periods beginning on or after January 1, 2024, and earlier application is permitted. There is no impact on the consolidated interim financial statements in accordance with the transitional provision that does not require to disclose the relevant information during the interim reporting period within the fiscal year in which these amendments are first applied.
3) Amendments to Korean IFRS 1116 Leases – Lease Liability in a Sale and Leaseback
When subsequently measuring lease liabilities arising from a sale and leaseback, a seller-lessee shall determine lease payments or revised lease payments in a way that the seller-lessee would not recognize any amount of the gain or loss that relates to the right of use retained by the seller-lessee. The amendments do not have a significant impact on the consolidated interim financial statements.
- 26 -
WOORI FINANCIAL GROUP INC. AND SUBSIDIARIES
NOTES TO CONSOLIDATED INTERIM FINANCIAL STATEMENTS
AS OF JUNE 30, 2024 AND 2023 (UNAUDITED)
4) Amendments to Korean IFRS 1001 Presentation of Financial Statements – Disclosure of Cryptographic Assets
The amendments require an additional disclosure if an entity holds cryptographic assets, or holds cryptographic assets on behalf of the customer, or issues cryptographic assets. The amendments do not have a significant impact on the consolidated interim financial statements.
5) Amendments to K-IFRS No.1012 ‘Income Taxes’ - International Tax Reform – Pillar Two Model Rules
The amendments provide a temporary relief from the accounting for deferred taxes arising from legislation enacted to implement the Pillar Two model rules, which aim to reform international corporate taxation for multinational enterprises, and require disclosure of related current tax effects, etc. The Group applies the exception to recognizing and disclosing information about deferred tax assets and liabilities related to Pillar Two income taxes. The Pillar Two legislation took effect on January 1, 2024. The amendments do not have a significant impact on the consolidated interim financial statements.
| (2) | The details of K-IFRSs that have been issued and published since January 1, 2024 but have not yet reached the effective date are as follows: |
1) Amendments to Korean IFRS 1021 The Effects of Changes in Foreign Exchange Rates and 1101 First-time Adoption of International Financial Reporting Standards – Lack of Exchangeability
When an entity estimates a spot exchange rate because exchangeability between two currencies is lacking, the entity shall disclose related information. The amendments should be applied for annual periods beginning on or after January 1, 2025, and earlier application is permitted. The Group is in review for the impact of these amendments on the consolidated interim financial statements.
| (3) | Material accounting policies and method of computation used in the preparation of the condensed interim financial statements are consistent with those of the annual financial statements for the year ended December 31, 2023, except for the one described below. |
| • | Income tax expense |
Income tax expense for the interim period is recognized based on management’s best estimate of the weighted average annual income tax rate expected for the full financial year. The estimated average annual tax rate is applied to the pre-tax income.
| 3. | MATERIAL ACCOUNTING ESTIMATES AND ASSUMPTIONS |
Material accounting estimates and assumptions are continuously evaluated based on a number of factors, including historical experience and expectations of future events that are considered reasonably probable. Accounting estimates calculated based on these definitions may not match actual results.
In preparing interim financial statements, management must apply accounting policies and make judgments, estimates and assumptions that affect assets/liabilities and income/expenses. Therefore, actual results may differ from these estimates.
The significant judgments made by management in applying the accounting policies and key sources of estimation uncertainty for the preparation of interim financial statements are consistent with those made for the annual consolidated financial statements for the year ended December 31, 2023.
- 27 -
WOORI FINANCIAL GROUP INC. AND SUBSIDIARIES
NOTES TO CONSOLIDATED INTERIM FINANCIAL STATEMENTS
AS OF JUNE 30, 2024 AND 2023
| 4. | RISK MANAGEMENT |
The Group is exposed to various risks that may arise from its operating activities and the main types of risks are credit risk, market risk, liquidity risk and etc. The Risk Management Organization analyzes and assesses the level of complex risks in order to manage the risks and the risk management standards such as policies, regulations, management systems and decision-making have been established and operated for sound management of the Group.
The risk management organization is operated by Risk Management Committee, Chief Risk Officer(CRO), and Risk Management Department. The Board of Directors operates a Risk Management Committee comprised of outside directors for professional risk management. The Risk Management Committee plays a role as the top decision-making body in risk management by establishing basic policies for risk management that are in line with the Group’s management strategy and determining the risk level that the Group is willing to take.
The Chief Risk Officer (CRO) assists the Risk Management Committee and operates a Group Risk Management Council comprised of risk management managers of subsidiaries to periodically check and improve the risk burden of external environments and the Group. The risk management department is independent and is in charge of risk management of the Group. It also supports reporting and decision-making of key risk-related issues.
| (1) | Credit risk |
Credit risk represents the possibility of financial losses incurred due to the refusal of the transaction or when the counterparty fails to fulfill its contractual obligations. The goal of credit risk management is to maintain the Group’s credit risk exposure to a permissible degree and to optimize its rate of return considering such credit risk.
1) Credit risk management
To measure credit risk, the Group considers the possibility of failure in performing the obligation by the counterparties, credit exposure to the counterparty, the related default risk and the rate of default loss. The Group uses the credit rating model to assess the possibility of counterparty’s default risk; and when assessing the obligor’s credit rating, other than quantitative methods utilizing financial statements and others, and assessor’s judgement, the Group utilizes credit rating derived using statistical methods.
In order to manage credit risk limit, the Group establishes the appropriate credit line per obligor, company or industry by monitoring obligor’s credit line, total exposures and loan portfolios when approving the loan.
The Group mitigates credit risk resulting from the obligor’s credit condition by using financial and physical collateral, guarantees, netting agreements and purchase of credit derivatives that have low correlation with the obligor’s credit status. The Group has adopted the comprehensive method to mitigate its credit risk. Credit risk mitigation is reflected in qualifying financial collateral, trade receivables, guarantees, residential and commercial real estate and other collaterals. The Group regularly performs a revaluation of collateral reflecting such credit risk mitigation.
- 28 -
WOORI FINANCIAL GROUP INC. AND SUBSIDIARIES
NOTES TO CONSOLIDATED INTERIM FINANCIAL STATEMENTS
AS OF JUNE 30, 2024 AND 2023
2) Measurement of expected credit loss
K-IFRS 1109 requires entities to measure loss allowance equal to 12-month expected credit losses or lifetime expected credit losses after classifying financial assets into one of the three stages, depending on the degree of increase in credit risk since their initial recognition.
| Classification |
Stage 1 |
Stage 2 |
Stage 3 | |||
| Definition | No significant increase in credit risk after initial recognition (*) | Significant increase in credit risk after initial recognition | Credit- impaired | |||
| Loss allowance |
12-month expected credit losses: | Lifetime expected credit losses: | ||||
|
Expected credit losses that result from those default events on the financial instrument that are possible within 12 months after the reporting date |
Expected credit losses that result from all possible default events over the life of the financial instrument | |||||
| (*) | If the financial instrument has low credit risk at the end of the reporting period, the Group may assume that the credit risk has not increased significantly since initial recognition. |
At the end of each reporting period the Group assesses whether credit risk has significantly been increased since the date of initial recognition. The Group assesses whether the credit risk has increased significantly since initial recognition by using credit rating, asset quality level, early warning system, days past due and others. For financial assets whose contractual cash flows have been modified, the Group assesses whether there is a significant increase in credit risk on the same basis.
The Group performs the below assessment to both corporate and retail exposures, and indicators of significant increase in credit risk are as follows:
| Corporate Exposures |
Retail Exposures | |
| Asset quality level ‘Precautionary’ or lower | Asset quality level ‘Precautionary’ or lower | |
| More than 30 days past due | More than 30 days past due | |
| ‘Warning’ level in early warning system | Significant decrease in credit rating(*) | |
| Debtor experiencing financial difficulties (Capital impairment, Adverse opinion or Disclaimer of opinion by external auditors) |
Deferment of repayment of principal and interest | |
| Significant decrease in credit rating (*) | Deferment of interest | |
| Deferment of repayment of principal and interest | ||
| Deferment of interest | ||
| (*) | The Group has applied the below indicators of significant decrease in credit rating since initial recognition as follows, and the estimation method is regularly being monitored. |
| Credit rating |
Significant increased indicator of the credit rating | |||
| Corporate | AAA ~ A+ | More than or equal to 4 steps | ||
| A- ~ BBB | More than or equal to 3 steps | |||
| BBB- ~ BB+ | More than or equal to 2 steps | |||
| BB ~ BB- | More than or equal to 1 step | |||
| Retail | 1 ~ 3 | More than or equal to 3 steps | ||
| 4 ~ 5 | More than or equal to 2 steps | |||
| 6 ~ 9 | More than or equal to 1 step |
The Group determined that there is no significant increase in credit risk after initial recognition for debt securities, etc. with a credit rating of A + or higher, which are deemed to have low credit risk at the end of the reporting period.
- 29 -
WOORI FINANCIAL GROUP INC. AND SUBSIDIARIES
NOTES TO CONSOLIDATED INTERIM FINANCIAL STATEMENTS
AS OF JUNE 30, 2024 AND 2023
The Group concludes that credit is impaired when financial assets are under conditions stated below:
| • | When principal and interest of loan is overdue for 90 days or longer due to significant deterioration in credit |
| • | For loans overdue for less than 90 days, when it is determined that not even a portion of the loan will be recovered unless claim actions such as disposal of collaterals are taken |
| • | When other objective indicators of impairment have been noted for the financial asset. |
The Group has estimated the allowance for expected credit losses using an estimation model that additionally reflects the forward looking information based on the past experience loss rate data.
Loss allowance is calculated by applying PD (Probability of Default) and LGD (Loss Given Default) estimated for each financial asset in consideration of factors such as obligor type, credit rating and portfolio. The estimates are regularly being reviewed in order to reduce discrepancies with actual losses.
In measuring the expected credit losses, the Group is also using reasonable and supportable macroeconomic indicators such as GDP growth rate, Personal consumption expenditures increase/decrease rate and Won-dollar exchange rate in order to forecast future economic conditions.
The Group is conducting the following procedures to estimate and apply future economic forecast information.
| • | Development of estimation models by analyzing the correlation between default rates of corporate and retail exposures per year and macroeconomic indicators |
| Major macroeconomic indicators |
Correlation between credit risk and
macroeconomic | |
| GDP growth rate | Negative(-) Correlation | |
| Personal consumption expenditures increase/decrease rate | Negative(-) Correlation | |
| Won-dollar exchange rate | Positive(+) Correlation | |
| • | Calculation of estimated default rate incorporating forward looking by applying estimated macroeconomic indicators provided by verified institutions such as Bank of Korea and National Assembly Budget Office to the estimation model developed |
| • | Forecast of macroeconomic variables |
a) Probability weight
As of June 30, 2024, the probability weights applied to the scenarios of the forecasts of macroeconomic variables is as follows (Unit: %):
| Base Scenario |
Upside Scenario |
Downside Scenario |
Worst Scenario |
|||||||||||||
| Probability weight |
44.36 | 9.41 | 26.23 | 20 | ||||||||||||
- 30 -
WOORI FINANCIAL GROUP INC. AND SUBSIDIARIES
NOTES TO CONSOLIDATED INTERIM FINANCIAL STATEMENTS
AS OF JUNE 30, 2024 AND 2023
| b) | Economic forecast of each major macroeconomic variables by scenario (prospect period: 2024) As of June 30, 2024, the forecasts of major macroeconomic variables by scenario is as follows (Unit: Won, %): |
| Base Scenario |
Upside Scenario |
Downside Scenario |
Worst Scenario |
|||||||||||||
| GDP growth rate |
2.1 | 2.29 | 1.76 | (-) 5.10 | ||||||||||||
| Personal consumption expenditures increase/decrease rate |
1.9 | 2.27 | 1.23 | (-) 12.22 | ||||||||||||
| Won-dollar exchange rate |
1,263 | 1,255 | 1,277 | 1,560 | ||||||||||||
Considering internal and external uncertainties, The Group additionally applied the Worst scenario to the three macroeconomic variable scenarios: Base, Upside, and Downside. If the probability weight of the basic, upside, and downside scenarios excluding the worst scenario is assumed to be 100%, and if the probability weight of the worst scenario is assumed to be 100%, the impact on the expected credit loss allowance is as follows (Unit: Korean Won in millions):
| Scenario | Applied probability weight | Difference from book value assuming 100% |
||||||
| Base, Upside, Downside |
80.00 | % | (444,662 | ) | ||||
| Worst |
20.00 | % | 1,778,739 | |||||
| • | The increase rate of the predicted default rate is used as a forward looking adjustment coefficient and reflected to the applicable estimate for the current year. |
- 31 -
WOORI FINANCIAL GROUP INC. AND SUBSIDIARIES
NOTES TO CONSOLIDATED INTERIM FINANCIAL STATEMENTS
AS OF JUNE 30, 2024 AND 2023
| 3) | Maximum exposure |
The Group’s maximum exposure to credit risk shows the uncertainties related to the maximum possible variation of financial assets’ net value as a result of changes in the specific risk factors, prior to the consideration of collaterals that are recorded at net carrying amount after allowances and other credit enhancements. However, the maximum exposure is the fair value amount (recorded on the books) for derivatives, maximum contractual obligation for payment guarantees and unused amount of commitments for loan commitment.
The maximum exposure to credit risk as of June 30, 2024 and December 31, 2023 is as follows (Unit: Korean Won in millions):
| June 30, 2024 |
December 31, 2023 |
|||||||||
| Loans and other financial assets at amortized cost (*1) |
Korean treasury and government agencies | 1,570,318 | 2,297,088 | |||||||
| Banks |
23,583,349 | 21,996,558 | ||||||||
| Corporates |
173,845,415 | 159,343,530 | ||||||||
| Consumers |
188,375,002 | 189,510,972 | ||||||||
|
|
|
|
|
|||||||
| Sub-total |
387,374,084 | 373,148,148 | ||||||||
|
|
|
|
|
|||||||
| Financial assets at FVTPL (*2) |
Deposits | 49,518 | 39,241 | |||||||
| Debt securities |
5,994,986 | 6,307,238 | ||||||||
| Loans |
1,376,768 | 782,716 | ||||||||
| Derivative assets |
7,514,608 | 5,798,329 | ||||||||
| Others |
2,627 | 2,585 | ||||||||
|
|
|
|
|
|||||||
| Sub-total |
14,938,507 | 12,930,109 | ||||||||
|
|
|
|
|
|||||||
| Financial assets at FVTOCI |
Debt securities and others | 37,778,035 | 36,694,111 | |||||||
| Securities at amortized cost |
Debt securities | 22,408,759 | 23,996,172 | |||||||
| Derivative assets |
Derivative assets (Designated for hedging) | 85,106 | 26,708 | |||||||
| Off-balance accounts |
Payment guarantees (*3) | 14,976,801 | 13,793,301 | |||||||
| Loan commitments |
127,594,961 | 126,829,192 | ||||||||
|
|
|
|
|
|||||||
| Sub-total | 142,571,762 | 140,622,493 | ||||||||
|
|
|
|
|
|||||||
| Total |
605,156,253 | 587,417,741 | ||||||||
|
|
|
|
|
|||||||
| (*1) | Cash and cash equivalents are not included. |
| (*2) | Puttable financial instruments are not included. |
| (*3) | As of June 30, 2024 and December 31, 2023, the financial guarantee amount of 3,977,082 million Won and 3,661,656 million Won are included, respectively. |
- 32 -
WOORI FINANCIAL GROUP INC. AND SUBSIDIARIES
NOTES TO CONSOLIDATED INTERIM FINANCIAL STATEMENTS
AS OF JUNE 30, 2024 AND 2023
| a) | Credit risk exposure by geographical areas |
The following tables analyze credit risk exposure by geographical areas (Unit: Korean Won in millions):
| June 30, 2024 | ||||||||||||||||||||||||||||
| Korea | China | USA | UK | Japan | Others (*) | Total | ||||||||||||||||||||||
| Loans and other financial assets at amortized cost |
357,774,757 | 5,879,619 | 6,040,327 | 383,176 | 671,721 | 16,624,484 | 387,374,084 | |||||||||||||||||||||
| Securities at amortized cost |
21,307,387 | 186,276 | 605,539 | — | — | 309,557 | 22,408,759 | |||||||||||||||||||||
| Financial assets at FVTPL |
11,530,372 | 40 | 1,712,224 | 395,110 | 252,604 | 1,048,157 | 14,938,507 | |||||||||||||||||||||
| Financial assets at FVTOCI |
32,894,778 | 808,099 | 2,799,538 | 121,716 | 34,422 | 1,119,482 | 37,778,035 | |||||||||||||||||||||
| Derivative assets (Designated for hedging) |
81,805 | — | — | — | 3,301 | — | 85,106 | |||||||||||||||||||||
| Off-balance accounts |
137,385,863 | 1,000,044 | 1,059,199 | 17,316 | 13,721 | 3,095,619 | 142,571,762 | |||||||||||||||||||||
|
|
|
|
|
|
|
|
|
|
|
|
|
|
|
|||||||||||||||
| Total |
560,974,962 | 7,874,078 | 12,216,827 | 917,318 | 975,769 | 22,197,299 | 605,156,253 | |||||||||||||||||||||
|
|
|
|
|
|
|
|
|
|
|
|
|
|
|
|||||||||||||||
| (*) | Others consist of financial assets in Indonesia, Hong Kong, Germany, Australia, and other countries. |
| December 31, 2023 | ||||||||||||||||||||||||||||
| Korea | China | USA | UK | Japan | Others (*) | Total | ||||||||||||||||||||||
| Loans and other financial assets at amortized cost |
345,748,021 | 5,068,801 | 5,527,208 | 260,834 | 617,188 | 15,926,096 | 373,148,148 | |||||||||||||||||||||
| Securities at amortized cost |
22,529,414 | 111,832 | 1,049,669 | — | — | 305,257 | 23,996,172 | |||||||||||||||||||||
| Financial assets at FVTPL |
10,103,182 | 519 | 1,507,518 | 355,478 | 143,229 | 820,183 | 12,930,109 | |||||||||||||||||||||
| Financial assets at FVTOCI |
32,422,652 | 724,786 | 2,367,997 | 7 | 32,194 | 1,146,475 | 36,694,111 | |||||||||||||||||||||
| Derivative assets (Designated for hedging) |
26,010 | — | — | — | 698 | — | 26,708 | |||||||||||||||||||||
| Off-balance accounts |
136,287,485 | 921,904 | 745,832 | 20,045 | 26,351 | 2,620,876 | 140,622,493 | |||||||||||||||||||||
|
|
|
|
|
|
|
|
|
|
|
|
|
|
|
|||||||||||||||
| Total |
547,116,764 | 6,827,842 | 11,198,224 | 636,364 | 819,660 | 20,818,887 | 587,417,741 | |||||||||||||||||||||
|
|
|
|
|
|
|
|
|
|
|
|
|
|
|
|||||||||||||||
| (*) | Others consist of financial assets in Indonesia, Hong Kong, Germany, Australia, and other countries. |
- 33 -
WOORI FINANCIAL GROUP INC. AND SUBSIDIARIES
NOTES TO CONSOLIDATED INTERIM FINANCIAL STATEMENTS
AS OF JUNE 30, 2024 AND 2023
| b) | Credit risk exposure by industries |
The following tables analyze credit risk exposure by industries, which are service, manufacturing, finance and insurance, construction, individuals and others in accordance with the Korea Standard Industrial Classification Code as of June 30, 2024 and December 31, 2023 (Unit: Korean Won in millions):
| June 30, 2024 | ||||||||||||||||||||||||||||
| Service | Manufacturing | Finance and insurance |
Construction | Individuals | Others | Total | ||||||||||||||||||||||
| Loans and other financial assets at amortized cost |
88,793,520 | 49,870,896 | 31,466,495 | 6,377,990 | 184,289,787 | 26,575,396 | 387,374,084 | |||||||||||||||||||||
| Securities at amortized cost |
169,250 | — | 13,471,935 | 59,793 | — | 8,707,781 | 22,408,759 | |||||||||||||||||||||
| Financial assets at FVTPL |
378,457 | 94,940 | 8,831,569 | 7,909 | — | 5,625,632 | 14,938,507 | |||||||||||||||||||||
| Financial assets at FVTOCI |
405,868 | 408,602 | 24,295,925 | 423,877 | — | 12,243,763 | 37,778,035 | |||||||||||||||||||||
| Derivative assets (Designated for hedging) |
— | — | 85,106 | — | — | — | 85,106 | |||||||||||||||||||||
| Off-balance accounts |
23,458,940 | 24,045,256 | 13,880,455 | 3,093,437 | 72,784,984 | 5,308,690 | 142,571,762 | |||||||||||||||||||||
|
|
|
|
|
|
|
|
|
|
|
|
|
|
|
|||||||||||||||
| Total |
113,206,035 | 74,419,694 | 92,031,485 | 9,963,006 | 257,074,771 | 58,461,262 | 605,156,253 | |||||||||||||||||||||
|
|
|
|
|
|
|
|
|
|
|
|
|
|
|
|||||||||||||||
| December 31, 2023 | ||||||||||||||||||||||||||||
| Service | Manufacturing | Finance and insurance |
Construction | Individuals | Others | Total | ||||||||||||||||||||||
| Loans and other financial assets at amortized cost |
84,704,246 | 44,591,685 | 30,388,823 | 5,583,281 | 185,083,452 | 22,796,661 | 373,148,148 | |||||||||||||||||||||
| Securities at amortized cost |
189,193 | — | 14,151,799 | 69,720 | — | 9,585,460 | 23,996,172 | |||||||||||||||||||||
| Financial assets at FVTPL |
330,193 | 233,528 | 7,184,371 | 81,731 | 2,600 | 5,097,686 | 12,930,109 | |||||||||||||||||||||
| Financial assets at FVTOCI |
453,694 | 408,377 | 25,832,327 | 290,856 | — | 9,708,857 | 36,694,111 | |||||||||||||||||||||
| Derivative assets (Designated for hedging) |
— | — | 26,708 | — | — | — | 26,708 | |||||||||||||||||||||
| Off-balance accounts |
22,561,220 | 22,897,412 | 13,804,163 | 2,826,738 | 73,042,394 | 5,490,566 | 140,622,493 | |||||||||||||||||||||
|
|
|
|
|
|
|
|
|
|
|
|
|
|
|
|||||||||||||||
| Total |
108,238,546 | 68,131,002 | 91,388,191 | 8,852,326 | 258,128,446 | 52,679,230 | 587,417,741 | |||||||||||||||||||||
|
|
|
|
|
|
|
|
|
|
|
|
|
|
|
|||||||||||||||
- 34 -
WOORI FINANCIAL GROUP INC. AND SUBSIDIARIES
NOTES TO CONSOLIDATED INTERIM FINANCIAL STATEMENTS
AS OF JUNE 30, 2024 AND 2023
| 4) | Credit risk exposure |
| a) | Financial assets |
The maximum exposure to credit risk by asset quality, except for financial assets at FVTPL and derivative asset (designated for hedging) as of June 30, 2024 and December 31, 2023 is as follows (Unit: Korean Won in millions):
| June 30, 2024 | ||||||||||||||||||||||||||||||||||||
| Stage 1 | Stage 2 | |||||||||||||||||||||||||||||||||||
| Above appropriate credit rating (*1) |
Less than a limited credit rating (*2) |
Above appropriate credit rating (*1) |
Less than a limited credit rating (*2) |
Stage 3 | Credit impairment model |
Total | Loss allowance |
Total, net | ||||||||||||||||||||||||||||
| Loans and other financial assets at amortized cost |
333,958,196 | 26,252,518 | 13,205,076 | 13,387,836 | 2,683,793 | 1,287,639 | 390,775,058 | (3,400,974 | ) | 387,374,084 | ||||||||||||||||||||||||||
| Korean treasury and government agencies |
1,571,898 | 18 | — | — | — | — | 1,571,916 | (1,598 | ) | 1,570,318 | ||||||||||||||||||||||||||
| Banks |
23,478,154 | 107,548 | 27,023 | — | 25,355 | — | 23,638,080 | (54,731 | ) | 23,583,349 | ||||||||||||||||||||||||||
| Corporates |
145,219,798 | 19,120,794 | 3,135,869 | 5,692,975 | 1,494,227 | 1,287,639 | 175,951,302 | (2,105,887 | ) | 173,845,415 | ||||||||||||||||||||||||||
| General business |
96,992,979 | 10,272,691 | 2,366,280 | 3,810,357 | 817,269 | — | 114,259,576 | (1,251,035 | ) | 113,008,541 | ||||||||||||||||||||||||||
| Small- and medium-sized enterprise |
37,054,429 | 8,189,407 | 614,885 | 1,595,731 | 366,079 | — | 47,820,531 | (551,988 | ) | 47,268,543 | ||||||||||||||||||||||||||
| Project financing and others |
11,172,390 | 658,696 | 154,704 | 286,887 | 310,879 | 1,287,639 | 13,871,195 | (302,864 | ) | 13,568,331 | ||||||||||||||||||||||||||
| Consumers |
163,688,346 | 7,024,158 | 10,042,184 | 7,694,861 | 1,164,211 | — | 189,613,760 | (1,238,758 | ) | 188,375,002 | ||||||||||||||||||||||||||
| Securities at amortized cost |
22,421,952 | — | — | — | — | — | 22,421,952 | (13,193 | ) | 22,408,759 | ||||||||||||||||||||||||||
| Financial assets at FVTOCI (*3) |
37,608,775 | 169,260 | — | — | — | — | 37,778,035 | (27,947 | ) | 37,778,035 | ||||||||||||||||||||||||||
|
|
|
|
|
|
|
|
|
|
|
|
|
|
|
|
|
|
|
|||||||||||||||||||
| Total |
393,988,923 | 26,421,778 | 13,205,076 | 13,387,836 | 2,683,793 | 1,287,639 | 450,975,045 | (3,442,114 | ) | 447,560,878 | ||||||||||||||||||||||||||
|
|
|
|
|
|
|
|
|
|
|
|
|
|
|
|
|
|
|
|||||||||||||||||||
| June 30, 2024 | ||||||||||||||||||||
| Collateral value | ||||||||||||||||||||
| Stage1 | Stage2 | Stage3 | Credit impairment model |
Total | ||||||||||||||||
| Loans and other financial assets at amortized cost |
230,725,916 | 21,534,440 | 1,130,747 | 1,287,372 | 254,678,475 | |||||||||||||||
| Korean treasury and government agencies |
61,411 | — | — | — | 61,411 | |||||||||||||||
| Banks |
2,450,339 | — | — | — | 2,450,339 | |||||||||||||||
| Corporates |
97,589,439 | 6,527,937 | 637,753 | 1,287,372 | 106,042,501 | |||||||||||||||
| General business |
56,007,014 | 5,002,325 | 305,898 | — | 61,315,237 | |||||||||||||||
| Small- and medium-sized enterprise |
34,332,536 | 1,482,488 | 238,825 | — | 36,053,849 | |||||||||||||||
| Project financing and others |
7,249,889 | 43,124 | 93,030 | 1,287,372 | 8,673,415 | |||||||||||||||
| Consumers |
130,624,727 | 15,006,503 | 492,994 | — | 146,124,224 | |||||||||||||||
| Securities at amortized cost |
— | — | — | — | — | |||||||||||||||
| Financial assets at FVTOCI (*3) |
— | — | — | — | — | |||||||||||||||
|
|
|
|
|
|
|
|
|
|
|
|||||||||||
| Total |
230,725,916 | 21,534,440 | 1,130,747 | 1,287,372 | 254,678,475 | |||||||||||||||
|
|
|
|
|
|
|
|
|
|
|
|||||||||||
| (*1) | Credit grade of corporates are AAA ~ BBB, and consumers are grades 1 ~ 6. |
| (*2) | Credit grade of corporates are BBB- ~ C, and consumers are grades 7 ~ 10. |
| (*3) | Financial assets at FVTOCI has been disclosed as the amount before deducting loss allowance because loss allowance does not reduce the carrying amount. |
- 35 -
WOORI FINANCIAL GROUP INC. AND SUBSIDIARIES
NOTES TO CONSOLIDATED INTERIM FINANCIAL STATEMENTS
AS OF JUNE 30, 2024 AND 2023
| December 31, 2023 | ||||||||||||||||||||||||||||||||||||
| Stage 1 | Stage 2 | |||||||||||||||||||||||||||||||||||
| Above appropriate credit rating (*1) |
Less than a limited credit rating (*2) |
Above appropriate credit rating (*1) |
Less than a limited credit rating (*2) |
Stage 3 | Credit impairment model |
Total | Loss allowance |
Total, net | ||||||||||||||||||||||||||||
| Loans and other financial assets at amortized cost |
321,115,435 | 26,073,686 | 12,728,437 | 13,702,855 | 1,906,434 | 768,487 | 376,295,334 | (3,147,186 | ) | 373,148,148 | ||||||||||||||||||||||||||
| Korean treasury and government agencies |
2,299,323 | 21 | — | — | — | — | 2,299,344 | (2,256 | ) | 2,297,088 | ||||||||||||||||||||||||||
| Banks |
21,880,151 | 122,383 | 21,771 | — | 15,295 | — | 22,039,600 | (43,042 | ) | 21,996,558 | ||||||||||||||||||||||||||
| Corporates |
132,702,723 | 18,890,349 | 2,630,918 | 5,411,611 | 882,459 | 768,487 | 161,286,547 | (1,943,017 | ) | 159,343,530 | ||||||||||||||||||||||||||
| General business |
87,551,345 | 10,147,028 | 1,773,713 | 3,150,829 | 548,169 | — | 103,171,084 | (1,161,824 | ) | 102,009,260 | ||||||||||||||||||||||||||
| Small- and medium-sized enterprise |
36,220,660 | 8,182,558 | 753,275 | 1,587,473 | 225,463 | — | 46,969,429 | (508,736 | ) | 46,460,693 | ||||||||||||||||||||||||||
| Project financing and others |
8,930,718 | 560,763 | 103,930 | 673,309 | 108,827 | 768,487 | 11,146,034 | (272,457 | ) | 10,873,577 | ||||||||||||||||||||||||||
| Consumers |
164,233,238 | 7,060,933 | 10,075,748 | 8,291,244 | 1,008,680 | — | 190,669,843 | (1,158,871 | ) | 189,510,972 | ||||||||||||||||||||||||||
| Securities at amortized cost |
24,010,113 | — | — | — | — | — | 24,010,113 | (13,941 | ) | 23,996,172 | ||||||||||||||||||||||||||
| Financial assets at FVTOCI (*3) |
36,481,028 | 213,083 | — | — | — | — | 36,694,111 | (27,379 | ) | 36,694,111 | ||||||||||||||||||||||||||
|
|
|
|
|
|
|
|
|
|
|
|
|
|
|
|
|
|
|
|||||||||||||||||||
| Total |
381,606,576 | 26,286,769 | 12,728,437 | 13,702,855 | 1,906,434 | 768,487 | 436,999,558 | (3,188,506 | ) | 433,838,431 | ||||||||||||||||||||||||||
|
|
|
|
|
|
|
|
|
|
|
|
|
|
|
|
|
|
|
|||||||||||||||||||
| December 31, 2023 | ||||||||||||||||||||
| Collateral value | ||||||||||||||||||||
| Stage1 | Stage2 | Stage3 | Credit impairment model |
Total | ||||||||||||||||
| Loans and other financial assets at amortized cost |
224,611,919 | 21,235,346 | 767,731 | 768,275 | 247,383,271 | |||||||||||||||
| Korean treasury and government agencies |
39,199 | — | — | — | 39,199 | |||||||||||||||
| Banks |
2,136,530 | — | — | — | 2,136,530 | |||||||||||||||
| Corporates |
92,544,712 | 5,915,710 | 382,605 | 768,275 | 99,611,302 | |||||||||||||||
| General business |
52,951,331 | 4,058,593 | 169,855 | — | 57,179,779 | |||||||||||||||
| Small- and medium-sized enterprise |
33,580,230 | 1,590,947 | 112,117 | — | 35,283,294 | |||||||||||||||
| Project financing and others |
6,013,151 | 266,170 | 100,633 | 768,275 | 7,148,229 | |||||||||||||||
| Consumers |
129,891,478 | 15,319,636 | 385,126 | — | 145,596,240 | |||||||||||||||
| Securities at amortized cost |
— | — | — | — | — | |||||||||||||||
| Financial assets at FVTOCI (*3) |
— | — | — | — | — | |||||||||||||||
|
|
|
|
|
|
|
|
|
|
|
|||||||||||
| Total |
224,611,919 | 21,235,346 | 767,731 | 768,275 | 247,383,271 | |||||||||||||||
|
|
|
|
|
|
|
|
|
|
|
|||||||||||
| (*1) | Credit grade of corporates are AAA ~ BBB, and consumers are grades 1 ~ 6. |
| (*2) | Credit grade of corporates are BBB- ~ C, and consumers are grades 7 ~ 10. |
| (*3) | Financial assets at FVTOCI has been disclosed as the amount before deducting loss allowance because loss allowance does not reduce the carrying amount. |
- 36 -
WOORI FINANCIAL GROUP INC. AND SUBSIDIARIES
NOTES TO CONSOLIDATED INTERIM FINANCIAL STATEMENTS
AS OF JUNE 30, 2024 AND 2023
| b) | Payment Guarantees and commitments |
The credit quality of the payment guarantees and loan commitments as of June 30, 2024 and December 31, 2023 are as follows (Unit: Korean Won in millions):
| June 30, 2024 | ||||||||||||||||||||||||
| Financial assets |
Stage 1 | Stage 2 | Stage3 | Total | ||||||||||||||||||||
| Above appropriate credit rating (*1) |
Less than a limited credit rating (*2) |
Above appropriate credit rating (*1) |
Less than a limited credit rating (*2) |
|||||||||||||||||||||
| Off-balance accounts: |
||||||||||||||||||||||||
| Payment Guarantees |
13,919,438 | 893,337 | 65,540 | 77,564 | 20,922 | 14,976,801 | ||||||||||||||||||
| Loan Commitments |
121,563,209 | 3,134,835 | 2,266,624 | 573,074 | 57,219 | 127,594,961 | ||||||||||||||||||
|
|
|
|
|
|
|
|
|
|
|
|
|
|||||||||||||
| Total |
135,482,647 | 4,028,172 | 2,332,164 | 650,638 | 78,141 | 142,571,762 | ||||||||||||||||||
|
|
|
|
|
|
|
|
|
|
|
|
|
|||||||||||||
| (*1) | Credit grade of corporates are AAA ~ BBB, and consumers are grades 1 ~ 6. |
| (*2) | Credit grade of corporate are BBB- ~ C, and consumers are grades 7 ~ 10. |
| December 31, 2023 | ||||||||||||||||||||||||
| Financial assets |
Stage 1 | Stage 2 | Stage3 | Total | ||||||||||||||||||||
| Above appropriate credit rating (*1) |
Less than a limited credit rating (*2) |
Above appropriate credit rating (*1) |
Less than a limited credit rating (*2) |
|||||||||||||||||||||
| Off-balance accounts: |
||||||||||||||||||||||||
| Payment Guarantees |
12,515,536 | 1,150,185 | 73,192 | 40,890 | 13,498 | 13,793,301 | ||||||||||||||||||
| Loan Commitments |
120,623,982 | 3,512,099 | 2,166,380 | 496,824 | 29,907 | 126,829,192 | ||||||||||||||||||
|
|
|
|
|
|
|
|
|
|
|
|
|
|||||||||||||
| Total |
133,139,518 | 4,662,284 | 2,239,572 | 537,714 | 43,405 | 140,622,493 | ||||||||||||||||||
|
|
|
|
|
|
|
|
|
|
|
|
|
|||||||||||||
| (*1) | Credit grade of corporates are AAA ~ BBB, and consumers are grades 1 ~ 6. |
| (*2) | Credit grade of corporate are BBB- ~ C, and consumers are grades 7 ~ 10. |
| 5) | Collateral and other credit enhancements |
For the six-month period ended June 30, 2024 and for the year ended December 31, 2023, there have been no significant changes in the value of collateral or other credit enhancements held by the Group and there have been no significant changes in collateral or other credit enhancements due to changes in the collateral policy of the Group.
| (2) | Market risk |
Market risk is the possible risk of loss arising from trading position and non-trading position as a result of the volatility of market factors such as interest rates, stock prices and foreign exchange rates.
| 1) | Market risk management |
Market risk management refers to the process of making and implementing decisions for the avoidance, acceptance or mitigation of risks by identifying the underlying source of the risks, measuring its level, and evaluating the appropriateness of the level of accepted market risks for both trading and non-trading activities.
| a) | Trading activities |
The Group uses the standard method and the internally developed model (the Bank) in measuring market risk for trading positions, and allocates market risk capital through the Risk Management Committee. Risk management departments of the Group and its subsidiaries manage limits in detail including those on risk and loss with their management result regularly reported to the Risk Management Committee.
- 37 -
WOORI FINANCIAL GROUP INC. AND SUBSIDIARIES
NOTES TO CONSOLIDATED INTERIM FINANCIAL STATEMENTS
AS OF JUNE 30, 2024 AND 2023
Subsidiaries such as Woori Bank manage market internal capital limits using the Basel III standard approach, and other subsidiaries manage market risks by applying the simple method.
The Basel III standard approach consists of a sensitivity method that measures linear and nonlinear losses that may occur due to unfavorable fluctuations in market risk factors, bankruptcy risks that may occur due to sudden bankruptcy, and residual risk-bearing equity capital for other losses.
Woori Bank, a major subsidiary subject to Basel III standard approach of market risk management, has the following equity capital required for market risk.(Unit : Korean Won in millions)
| Risk Group |
June 30, 2024 | December 31, 2023 | ||||||||
| Sensitivity-based risk |
General interest rate risk | 47,775 | 37,832 | |||||||
| Equity risk | 20,708 | 9,376 | ||||||||
| Commodity risk | 15 | 12 | ||||||||
| Foreign exchange risk | 296,841 | 249,044 | ||||||||
| Non-securitization credit spread risk | 21,159 | 27,371 | ||||||||
| Securitization (excluding CTP (Correlation Trading Portfolio)) credit spread risk | — | — | ||||||||
| CTP credit spread risk | — | — | ||||||||
| Default risk |
Non-Securitization bankruptcy risk | 645 | — | |||||||
| Securitization (excluding CTP) default risk | — | — | ||||||||
| CTP default risk | — | — | ||||||||
| Residual risk |
Residual risk | 1,154 | 692 | |||||||
|
|
|
|
|
|||||||
| Total |
388,297 | 324,327 | ||||||||
|
|
|
|
|
|||||||
| b) | Non-trading activities |
From the end of 2019 for the Bank and the beginning of 2021 for non-banking subsidiaries, the Bank and its subsidiaries manage and measure interest risk for non-trading activities through ΔNII(Change in Net Interest Income) and ΔEVE(Change in Economic Value of Equity) in accordance with IRRBB(Interest Rate Risk in the Banking Book).
ΔNII represents a change in net interest income that may occur over a certain period (e.g. one year) due to changes in interest rates, and ΔEVE indicates the economic value changes in equity capital that could be caused by changes in interest rates affecting the present value of asset, liabilities, and off-balance accounts.
- 38 -
WOORI FINANCIAL GROUP INC. AND SUBSIDIARIES
NOTES TO CONSOLIDATED INTERIM FINANCIAL STATEMENTS
AS OF JUNE 30, 2024 AND 2023
ΔEVE and ΔNII calculated on interest risk in banking book(IRRBB) basis for assets and liabilities by subsidiary as of June 30, 2024 and December 31, 2023 are as follows(Unit: Korean Won in millions):
| June 30, 2024 | December 31, 2023 | |||||||||||||||
| ΔEVE (*1) | ΔNII (*2) | ΔEVE (*1) | ΔNII (*2) | |||||||||||||
| Woori Bank |
404,585 | 435,486 | 683,660 | 743,489 | ||||||||||||
| Woori Card Co., Ltd. |
48,734 | 54,845 | 80,720 | 76,846 | ||||||||||||
| Woori Financial Capital Co., Ltd. |
52,941 | 2,754 | 48,523 | 17,585 | ||||||||||||
| Woori Investment Bank Co., Ltd. |
9,181 | 6,605 | 4,464 | 15,303 | ||||||||||||
| Woori Asset Trust Co., Ltd. |
2,701 | 12,036 | 1,210 | 7,018 | ||||||||||||
| Woori Asset Management Corp. |
506 | 2,629 | 832 | 2,154 | ||||||||||||
| Woori Savings Bank |
11,774 | 6,519 | 7,347 | 11,077 | ||||||||||||
| Woori Private Equity Asset Management Co., Ltd. |
56 | 687 | 80 | 775 | ||||||||||||
| Woori Global Asset Management Co., Ltd. |
— | — | 536 | 269 | ||||||||||||
| Woori Financial F&I Co., Ltd. |
109,411 | 7,515 | 63,852 | 3,961 | ||||||||||||
| Woori Venture Partners Co., Ltd. |
859 | 4,423 | 340 | 2,782 | ||||||||||||
| (*1) | ΔEVE: change in Economic Value of Equity |
| (*2) | ΔNII: change in Net Interest Income |
- 39 -
WOORI FINANCIAL GROUP INC. AND SUBSIDIARIES
NOTES TO CONSOLIDATED INTERIM FINANCIAL STATEMENTS
AS OF JUNE 30, 2024 AND 2023
At the interest rate re-pricing date, cash flows (both principal and interest) of interest bearing assets and liabilities, which is the basis of non-trading position interest rate risk management are as follows: (Unit: Korean Won in millions):
| June 30, 2024 | ||||||||||||||||||||||||||||
| Within 3 months |
4 to 6 months |
7 to 9 months |
10 to 12 months |
1 to 5 years |
Over 5 years |
Total | ||||||||||||||||||||||
| Asset: |
||||||||||||||||||||||||||||
| Loans and other financial assets at amortized cost |
241,041,908 | 47,255,466 | 20,596,576 | 21,183,139 | 62,156,126 | 4,084,328 | 396,317,543 | |||||||||||||||||||||
| Financial assets at FVTPL |
1,991,214 | 47,225 | 55,090 | 47,899 | 39,512 | 49 | 2,180,989 | |||||||||||||||||||||
| Financial assets at FVTOCI |
4,531,044 | 2,844,246 | 2,958,485 | 4,574,199 | 23,775,649 | 1,179,512 | 39,863,135 | |||||||||||||||||||||
| Securities at amortized cost |
3,788,010 | 1,485,143 | 897,562 | 1,567,579 | 13,913,577 | 2,004,784 | 23,656,655 | |||||||||||||||||||||
|
|
|
|
|
|
|
|
|
|
|
|
|
|
|
|||||||||||||||
| Total |
251,352,176 | 51,632,080 | 24,507,713 | 27,372,816 | 99,884,864 | 7,268,673 | 462,018,322 | |||||||||||||||||||||
|
|
|
|
|
|
|
|
|
|
|
|
|
|
|
|||||||||||||||
| Liability: |
||||||||||||||||||||||||||||
| Deposits due to customers |
160,184,280 | 78,270,212 | 38,880,345 | 21,975,253 | 63,650,603 | 100,242 | 363,060,935 | |||||||||||||||||||||
| Borrowings |
18,583,361 | 3,922,182 | 2,006,155 | 2,117,566 | 3,253,818 | 490,109 | 30,373,191 | |||||||||||||||||||||
| Debentures |
6,656,948 | 6,839,242 | 4,112,885 | 5,203,094 | 19,033,724 | 3,280,636 | 45,126,529 | |||||||||||||||||||||
|
|
|
|
|
|
|
|
|
|
|
|
|
|
|
|||||||||||||||
| Total |
185,424,589 | 89,031,636 | 44,999,385 | 29,295,913 | 85,938,145 | 3,870,987 | 438,560,655 | |||||||||||||||||||||
|
|
|
|
|
|
|
|
|
|
|
|
|
|
|
|||||||||||||||
| December 31, 2023 | ||||||||||||||||||||||||||||
| Within 3 months |
4 to 6 months |
7 to 9 months |
10 to 12 months |
1 to 5 years |
Over 5 years |
Total | ||||||||||||||||||||||
| Asset: |
||||||||||||||||||||||||||||
| Loans and other financial assets at amortized cost |
245,179,685 | 55,105,699 | 17,928,072 | 12,101,395 | 55,840,540 | 3,594,287 | 389,749,678 | |||||||||||||||||||||
| Financial assets at FVTPL |
2,155,339 | 178,206 | 37,672 | 22,719 | 52,341 | 90 | 2,446,367 | |||||||||||||||||||||
| Financial assets at FVTOCI |
5,976,531 | 3,489,341 | 2,425,700 | 3,008,905 | 22,852,783 | 756,272 | 38,509,532 | |||||||||||||||||||||
| Securities at amortized cost |
1,451,409 | 1,230,486 | 3,335,565 | 1,416,082 | 15,907,380 | 2,171,914 | 25,512,836 | |||||||||||||||||||||
|
|
|
|
|
|
|
|
|
|
|
|
|
|
|
|||||||||||||||
| Total |
254,762,964 | 60,003,732 | 23,727,009 | 16,549,101 | 94,653,044 | 6,522,563 | 456,218,413 | |||||||||||||||||||||
|
|
|
|
|
|
|
|
|
|
|
|
|
|
|
|||||||||||||||
| Liability: |
||||||||||||||||||||||||||||
| Deposits due to customers |
169,127,109 | 52,395,270 | 32,948,424 | 47,030,448 | 60,621,757 | 34,406 | 362,157,414 | |||||||||||||||||||||
| Borrowings |
20,147,327 | 5,157,330 | 1,933,137 | 2,575,993 | 4,112,788 | 437,839 | 34,364,414 | |||||||||||||||||||||
| Debentures |
7,741,466 | 5,188,081 | 4,104,309 | 5,168,597 | 18,443,853 | 3,223,255 | 43,869,561 | |||||||||||||||||||||
|
|
|
|
|
|
|
|
|
|
|
|
|
|
|
|||||||||||||||
| Total |
197,015,902 | 62,740,681 | 38,985,870 | 54,775,038 | 83,178,398 | 3,695,500 | 440,391,389 | |||||||||||||||||||||
|
|
|
|
|
|
|
|
|
|
|
|
|
|
|
|||||||||||||||
2) Currency risk
Currency risk arises from the financial instruments denominated in foreign currencies other than the functional currency. Therefore, no currency risk arises from non-monetary items or financial instruments denominated in the functional currency.
- 40 -
WOORI FINANCIAL GROUP INC. AND SUBSIDIARIES
NOTES TO CONSOLIDATED INTERIM FINANCIAL STATEMENTS
AS OF JUNE 30, 2024 AND 2023
Financial instruments in foreign currencies exposed to currency risk as of June 30, 2024 and December 31, 2023 are as follows (Unit: USD in millions, JPY in millions, CNY in millions, EUR in millions, and Korean Won in millions):
| June 30, 2024 | ||||||||||||||||||||||||||||||||||||||||||
| USD | JPY | CNY | EUR | Others | Total | |||||||||||||||||||||||||||||||||||||
| Foreign currency |
Korean Won equivalent |
Foreign currency |
Korean Won equivalent |
Foreign currency |
Korean Won equivalent |
Foreign currency |
Korean Won equivalent |
Korean Won equivalent |
Korean Won equivalent |
|||||||||||||||||||||||||||||||||
| Asset |
Cash and cash equivalents | 4,433 | 6,157,816 | 93,312 | 806,507 | 1,355 | 257,951 | 247 | 367,684 | 1,135,885 | 8,725,843 | |||||||||||||||||||||||||||||||
| Loans and other financial assets at amortized cost |
23,828 | 33,101,236 | 117,653 | 1,016,942 | 26,906 | 5,123,800 | 2,613 | 3,885,364 | 8,028,385 | 51,155,727 | ||||||||||||||||||||||||||||||||
| Financial assets at FVTPL |
931 | 1,292,796 | 3,421 | 29,565 | 17 | 3,318 | 203 | 301,839 | 50,603 | 1,678,121 | ||||||||||||||||||||||||||||||||
| Financial assets at FVTOCI |
3,502 | 4,865,388 | — | — | 4,224 | 804,417 | 12 | 17,695 | 701,067 | 6,388,567 | ||||||||||||||||||||||||||||||||
| Securities at amortized cost |
691 | 959,988 | — | — | 979 | 186,493 | 61 | 91,440 | 208,806 | 1,446,727 | ||||||||||||||||||||||||||||||||
|
|
|
|
|
|
|
|
|
|
|
|
|
|
|
|
|
|
|
|
|
|||||||||||||||||||||||
| Total |
33,385 | 46,377,224 | 214,386 | 1,853,014 | 33,481 | 6,375,979 | 3,136 | 4,664,022 | 10,124,746 | 69,394,985 | ||||||||||||||||||||||||||||||||
|
|
|
|
|
|
|
|
|
|
|
|
|
|
|
|
|
|
|
|
|
|||||||||||||||||||||||
| Liability |
Financial liabilities at FVTPL | 174 | 242,256 | 6,413 | 55,430 | — | — | 97 | 143,782 | 23,602 | 465,070 | |||||||||||||||||||||||||||||||
| Deposits due to customers |
19,750 | 27,436,047 | 299,220 | 2,586,225 | 30,616 | 5,830,292 | 2,416 | 3,592,229 | 5,653,028 | 45,097,821 | ||||||||||||||||||||||||||||||||
| Borrowings |
8,242 | 11,449,898 | 35,425 | 306,185 | 912 | 173,678 | 533 | 793,168 | 2,330,289 | 15,053,218 | ||||||||||||||||||||||||||||||||
| Debentures |
4,184 | 5,812,211 | — | — | — | — | 195 | 289,651 | — | 6,101,862 | ||||||||||||||||||||||||||||||||
| Other financial liabilities |
4,468 | 6,207,330 | 16,057 | 138,783 | 2,332 | 444,086 | 244 | 362,954 | 719,639 | 7,872,792 | ||||||||||||||||||||||||||||||||
|
|
|
|
|
|
|
|
|
|
|
|
|
|
|
|
|
|
|
|
|
|||||||||||||||||||||||
| Total |
36,818 | 51,147,742 | 357,115 | 3,086,623 | 33,860 | 6,448,056 | 3,485 | 5,181,784 | 8,726,558 | 74,590,763 | ||||||||||||||||||||||||||||||||
|
|
|
|
|
|
|
|
|
|
|
|
|
|
|
|
|
|
|
|
|
|||||||||||||||||||||||
| Off-balance accounts |
8,067 | 11,206,643 | 23,034 | 199,081 | 2,034 | 387,297 | 803 | 1,194,001 | 1,587,232 | 14,574,254 | ||||||||||||||||||||||||||||||||
|
|
|
|
|
|
|
|
|
|
|
|
|
|
|
|
|
|
|
|
|
|||||||||||||||||||||||
| December 31, 2023 | ||||||||||||||||||||||||||||||||||||||||||
| USD | JPY | CNY | EUR | Others | Total | |||||||||||||||||||||||||||||||||||||
| Foreign currency |
Korean Won equivalent |
Foreign currency |
Korean Won equivalent |
Foreign currency |
Korean Won equivalent |
Foreign currency |
Korean Won equivalent |
Korean Won equivalent |
Korean Won equivalent |
|||||||||||||||||||||||||||||||||
| Asset |
Cash and cash equivalents | 8,540 | 11,011,576 | 108,421 | 989,519 | 1,377 | 248,965 | 641 | 914,960 | 1,145,464 | 14,310,484 | |||||||||||||||||||||||||||||||
| Loans and other financial assets at amortized cost |
24,463 | 31,542,764 | 138,242 | 1,261,674 | 30,536 | 5,522,075 | 1,791 | 2,554,897 | 4,585,588 | 45,466,998 | ||||||||||||||||||||||||||||||||
| Financial assets at FVTPL |
884 | 1,140,110 | 49,640 | 453,047 | — | — | 280 | 399,828 | 72,351 | 2,065,336 | ||||||||||||||||||||||||||||||||
| Financial assets at FVTOCI |
3,136 | 4,044,155 | — | — | 3,882 | 701,938 | 6 | 8,549 | 738,710 | 5,493,352 | ||||||||||||||||||||||||||||||||
| Securities at amortized cost |
1,223 | 1,576,690 | — | — | 618 | 111,839 | 68 | 97,393 | 184,938 | 1,970,860 | ||||||||||||||||||||||||||||||||
|
|
|
|
|
|
|
|
|
|
|
|
|
|
|
|
|
|
|
|
|
|||||||||||||||||||||||
| Total |
38,246 | 49,315,295 | 296,303 | 2,704,240 | 36,413 | 6,584,817 | 2,786 | 3,975,627 | 6,727,051 | 69,307,030 | ||||||||||||||||||||||||||||||||
|
|
|
|
|
|
|
|
|
|
|
|
|
|
|
|
|
|
|
|
|
|||||||||||||||||||||||
- 41 -
WOORI FINANCIAL GROUP INC. AND SUBSIDIARIES
NOTES TO CONSOLIDATED INTERIM FINANCIAL STATEMENTS
AS OF JUNE 30, 2024 AND 2023
| December 31, 2023 | ||||||||||||||||||||||||||||||||||||||||||
| USD | JPY | CNY | EUR | Others | Total | |||||||||||||||||||||||||||||||||||||
| Foreign currency |
Korean Won equivalent |
Foreign currency |
Korean Won equivalent |
Foreign currency |
Korean Won equivalent |
Foreign currency |
Korean Won equivalent |
Korean Won equivalent |
Korean Won equivalent |
|||||||||||||||||||||||||||||||||
| Liability |
Financial liabilities at FVTPL | 350 | 451,700 | 23,806 | 217,266 | — | — | 209 | 297,521 | 98,885 | 1,065,372 | |||||||||||||||||||||||||||||||
| Deposits due to customers |
23,962 | 30,896,247 | 279,377 | 2,549,759 | 23,162 | 4,188,690 | 2,122 | 3,027,521 | 5,531,242 | 46,193,459 | ||||||||||||||||||||||||||||||||
| Borrowings |
9,339 | 12,041,139 | 70,741 | 645,621 | 1,658 | 299,748 | 225 | 321,529 | 2,632,379 | 15,940,416 | ||||||||||||||||||||||||||||||||
| Debentures |
4,811 | 6,202,675 | — | — | — | — | 195 | 277,871 | — | 6,480,546 | ||||||||||||||||||||||||||||||||
| Other financial liabilities |
3,448 | 4,446,194 | 26,977 | 246,206 | 7,752 | 1,401,956 | 99 | 141,404 | 387,310 | 6,623,070 | ||||||||||||||||||||||||||||||||
|
|
|
|
|
|
|
|
|
|
|
|
|
|
|
|
|
|
|
|
|
|||||||||||||||||||||||
| Total |
41,910 | 54,037,955 | 400,901 | 3,658,852 | 32,572 | 5,890,394 | 2,850 | 4,065,846 | 8,649,816 | 76,302,863 | ||||||||||||||||||||||||||||||||
|
|
|
|
|
|
|
|
|
|
|
|
|
|
|
|
|
|
|
|
|
|||||||||||||||||||||||
| Off-balance accounts |
7,748 | 9,990,349 | 30,143 | 275,101 | 2,043 | 369,483 | 796 | 1,135,845 | 568,935 | 12,339,713 | ||||||||||||||||||||||||||||||||
|
|
|
|
|
|
|
|
|
|
|
|
|
|
|
|
|
|
|
|
|
|||||||||||||||||||||||
| (3) | Liquidity risk |
Liquidity risk refers to the risk that the Group may encounter difficulties in meeting obligations from its financial liabilities.
| 1) | Liquidity risk management |
Liquidity risk management is to prevent potential cash shortages as a result of mismatching maturity of assets and liabilities or unexpected cash outflows. The consolidated financial liabilities that are relevant to liquidity risk are incorporated within the scope of risk management. Derivatives instruments are excluded from those financial liabilities as they reflect expected cash flows for a pre-determined period.
Assets and liabilities are grouped by account under Asset Liability Management (“ALM”) in accordance with the characteristics of the account. The Group manages liquidity risk by identifying the maturity gap and such gap ratio through various cash flows analysis (i.e. based on remaining maturity and contract period, etc.), while maintaining the gap ratio at or below the target limit.
| 2) | Maturity analysis of non-derivative financial liabilities |
| a) | Cash flows of principals and interests by remaining contractual maturities of non-derivative financial liabilities as of June 30, 2024 and December 31, 2023 are as follows (Unit: Korean Won in millions): |
| June 30, 2024 | ||||||||||||||||||||||||||||
| Within 3 months |
4 to 6 months |
7 to 9 months |
10 to 12 months |
1 to 5 years |
Over 5 years |
Total | ||||||||||||||||||||||
| Financial liabilities at FVTPL |
49,773 | 19,913 | 14,547 | 111,442 | — | — | 195,675 | |||||||||||||||||||||
| Deposits due to customers |
227,265,619 | 65,905,646 | 28,313,753 | 24,192,723 | 19,090,808 | 1,552,981 | 366,321,530 | |||||||||||||||||||||
| Borrowings |
13,064,964 | 5,184,984 | 3,532,405 | 4,647,837 | 3,659,253 | 490,110 | 30,579,553 | |||||||||||||||||||||
| Debentures |
5,653,859 | 7,709,338 | 4,114,266 | 5,354,445 | 19,033,724 | 3,280,636 | 45,146,268 | |||||||||||||||||||||
| Lease liabilities |
55,373 | 45,787 | 42,695 | 35,419 | 282,016 | 63,074 | 524,364 | |||||||||||||||||||||
| Other financial liabilities(*) |
19,925,497 | 128,152 | 28,032 | 88,479 | 1,085,162 | 4,124,420 | 25,379,742 | |||||||||||||||||||||
|
|
|
|
|
|
|
|
|
|
|
|
|
|
|
|||||||||||||||
| Total |
266,015,085 | 78,993,820 | 36,045,698 | 34,430,345 | 43,150,963 | 9,511,221 | 468,147,132 | |||||||||||||||||||||
|
|
|
|
|
|
|
|
|
|
|
|
|
|
|
|||||||||||||||
| December 31, 2023 | ||||||||||||||||||||||||||||
| Within 3 months |
4 to 6 months |
7 to 9 months |
10 to 12 months |
1 to 5 years |
Over 5 years |
Total | ||||||||||||||||||||||
| Financial liabilities at FVTPL |
39,524 | 89,287 | — | — | 10,256 | 56,221 | 195,288 | |||||||||||||||||||||
| Deposits due to customers |
236,125,560 | 39,103,357 | 22,776,074 | 50,089,672 | 16,898,791 | 1,549,490 | 366,542,944 | |||||||||||||||||||||
| Borrowings |
11,415,214 | 6,626,722 | 4,345,143 | 4,579,032 | 4,331,196 | 437,839 | 31,735,146 | |||||||||||||||||||||
| Debentures |
5,510,096 | 5,328,382 | 5,383,741 | 6,035,590 | 18,439,577 | 3,223,255 | 43,920,641 | |||||||||||||||||||||
| Lease liabilities |
74,228 | 42,106 | 58,241 | 33,679 | 151,127 | 25,172 | 384,553 | |||||||||||||||||||||
| Other financial liabilities(*) |
15,059,935 | 233,081 | 21,356 | 26,403 | 1,025,252 | 4,195,930 | 20,561,957 | |||||||||||||||||||||
|
|
|
|
|
|
|
|
|
|
|
|
|
|
|
|||||||||||||||
| Total |
268,224,557 | 51,422,935 | 32,584,555 | 60,764,376 | 40,856,199 | 9,487,907 | 463,340,529 | |||||||||||||||||||||
|
|
|
|
|
|
|
|
|
|
|
|
|
|
|
|||||||||||||||
| (*) | Lease liabilities are excluded. |
- 42 -
WOORI FINANCIAL GROUP INC. AND SUBSIDIARIES
NOTES TO CONSOLIDATED INTERIM FINANCIAL STATEMENTS
AS OF JUNE 30, 2024 AND 2023
| b) | Cash flows of principals and interests by expected maturities of non-derivative financial liabilities as of June 30, 2024 and December 31, 2023 are as follows (Unit: Korean Won in millions): |
| June 30, 2024 | ||||||||||||||||||||||||||||
| Within 3 months |
4 to 6 months |
7 to 9 months |
10 to 12 months |
1 to 5 years |
Over 5 years |
Total | ||||||||||||||||||||||
| Financial liabilities at FVTPL |
49,773 | 19,913 | 14,547 | 111,442 | — | — | 195,675 | |||||||||||||||||||||
| Deposits due to customers |
233,032,756 | 65,875,083 | 27,385,929 | 22,151,569 | 16,673,332 | 567,357 | 365,686,026 | |||||||||||||||||||||
| Borrowings |
13,064,964 | 5,184,984 | 3,532,405 | 4,647,837 | 3,659,253 | 490,110 | 30,579,553 | |||||||||||||||||||||
| Debentures |
5,653,859 | 7,709,338 | 4,114,266 | 5,354,445 | 19,033,724 | 3,280,636 | 45,146,268 | |||||||||||||||||||||
| Lease liabilities |
56,736 | 47,165 | 43,004 | 36,808 | 292,562 | 63,240 | 539,515 | |||||||||||||||||||||
| Other financial liabilities(*) |
19,925,497 | 128,152 | 28,032 | 88,479 | 1,085,162 | 4,124,420 | 25,379,742 | |||||||||||||||||||||
|
|
|
|
|
|
|
|
|
|
|
|
|
|
|
|||||||||||||||
| Total |
271,783,585 | 78,964,635 | 35,118,183 | 32,390,580 | 40,744,033 | 8,525,763 | 467,526,779 | |||||||||||||||||||||
|
|
|
|
|
|
|
|
|
|
|
|
|
|
|
|||||||||||||||
| December 31, 2023 | ||||||||||||||||||||||||||||
| Within 3 months |
4 to 6 months |
7 to 9 months |
10 to 12 months |
1 to 5 years |
Over 5 years |
Total | ||||||||||||||||||||||
| Financial liabilities at FVTPL |
39,524 | 89,287 | — | — | 10,256 | 56,221 | 195,288 | |||||||||||||||||||||
| Deposits due to customers |
241,935,362 | 41,132,677 | 23,468,344 | 44,082,420 | 14,717,842 | 505,146 | 365,841,791 | |||||||||||||||||||||
| Borrowings |
11,419,501 | 6,630,868 | 4,346,740 | 4,579,314 | 4,331,196 | 437,839 | 31,745,458 | |||||||||||||||||||||
| Debentures |
5,512,545 | 5,330,733 | 5,386,014 | 6,037,688 | 18,443,853 | 3,223,255 | 43,934,088 | |||||||||||||||||||||
| Lease liabilities |
74,228 | 43,350 | 59,604 | 35,057 | 162,874 | 25,834 | 400,947 | |||||||||||||||||||||
| Other financial liabilities(*) |
15,059,935 | 233,081 | 21,356 | 26,403 | 1,025,252 | 4,195,930 | 20,561,957 | |||||||||||||||||||||
|
|
|
|
|
|
|
|
|
|
|
|
|
|
|
|||||||||||||||
| Total |
274,041,095 | 53,459,996 | 33,282,058 | 54,760,882 | 38,691,273 | 8,444,225 | 462,679,529 | |||||||||||||||||||||
|
|
|
|
|
|
|
|
|
|
|
|
|
|
|
|||||||||||||||
| (*) | Lease liabilities are excluded. |
| 3) | Maturity analysis of derivative financial liabilities |
Derivatives held for trading purpose are not managed in accordance with their contractual maturity, since the Group holds such financial instruments with the purpose of disposing or redemption before their maturity. As such, those derivatives are incorporated as “within 3 months” in the table below. Derivatives designated for hedging purpose are estimated by offsetting cash inflows and cash outflows.
The cash flow by the maturity of derivative financial liabilities as of June 30, 2024 and December 31, 2023 is as follows (Unit: Korean Won in millions):
| Remaining maturity | ||||||||||||||||||||||||||||||
| Within 3 months |
4 to 6 months |
7 to 9 months |
10 to 12 months |
1 to 5 years |
Over 5 years |
Total | ||||||||||||||||||||||||
| June 30, 2024 |
Cash flow risk hedge | (38 | ) | 24 | 33 | 37 | — | — | 56 | |||||||||||||||||||||
| Fair value risk hedge | (4,027 | ) | 59,784 | (5,979 | ) | 53,216 | 54,213 | — | 157,207 | |||||||||||||||||||||
| Trading purpose | 6,990,132 | — | — | — | — | — | 6,990,132 | |||||||||||||||||||||||
| December 31, 2023 |
Cash flow risk hedge | (1,223 | ) | (875 | ) | (590 | ) | (302 | ) | 13,689 | — | 10,699 | ||||||||||||||||||
| Fair value risk hedge | 29,176 | 34,370 | 157 | 35,272 | 30,241 | — | 129,216 | |||||||||||||||||||||||
| Trading purpose | 5,943,024 | — | — | — | — | — | 5,943,024 | |||||||||||||||||||||||
- 43 -
WOORI FINANCIAL GROUP INC. AND SUBSIDIARIES
NOTES TO CONSOLIDATED INTERIM FINANCIAL STATEMENTS
AS OF JUNE 30, 2024 AND 2023
| 4) | Maturity analysis of off-balance accounts (Payment guarantees, commitments, and etcs) |
A payment guarantee represents an irrevocable undertaking that the Group should meet a customer’s obligations to third parties if the customer fails to do so. The loan commitment represents the limit if the Group has promised a credit to the customer. Loan commitments include commercial standby facilities and credit lines, liquidity facilities to commercial paper conduits and utilized overdraft facilities. The maximum limit to be paid by the Group in accordance with guarantees and loan commitment only applies to principal amounts. There are contractual maturities for payment guarantees, such as financial guarantees for debentures issued or loans, unused loan commitments, and other credits, however, under the terms of the guarantees and unused loan commitments, funds should be paid upon demand from the counterparty. Details of off-balance accounts as of June 30, 2024 and December 31, 2023 are as follows (Unit: Korean Won in millions):
| June 30, 2024 | December 31, 2023 | |||||||
| Payment guarantees |
14,976,801 | 13,793,301 | ||||||
| Loan commitments |
127,594,961 | 126,829,192 | ||||||
| Other commitments |
4,978,395 | 4,854,099 | ||||||
| (4) | Operational risk |
The Group defines the operational risk that could cause a negative effect on capital resulting from inadequate internal process, labor work and systematic problem or external factors.
| 1) | Operational risk management |
The Group has established and operated a group operational risk management system to cope with new Basel III global regulations, which is implemented since 2023, and the management of operational risks follows the procedures for risk recognition, evaluation, measurement, monitoring and reporting, risk control and mitigation.
| 2) | Operational risk measurement |
The Group measures operational risk capital using the Basel III standardized approach. This approach calculates the required operational risk capital by multiplying the Business Indicator Component (BIC), which represents the scale of operations, with the Internal Loss Multiplier (ILM), which reflects the magnitude of actual historical internal losses relative to the scale of operations.
Operational risk limits are set with the approval of the Risk Management Committee. The Group regularly calculates the operational risk capital and reports any limit breaches to the management and the Risk Management Committee.
Since a reduction in the size of internal loss events leads to a decrease in operational risk capital, it is important to prevent loss events in advance. Accordingly, the Group conducts operational risk management activities using tools such as Risk Control Self-Assessment (RCSA), Key Risk Indicators (KRI), and loss data. Additionally, to ensure continuity of operations in emergency situations such as disasters, the Bank has established a Business Continuity Plan (BCP) and conducts annual simulation drills.
- 44 -
WOORI FINANCIAL GROUP INC. AND SUBSIDIARIES
NOTES TO CONSOLIDATED INTERIM FINANCIAL STATEMENTS
AS OF JUNE 30, 2024 AND 2023
| 5. | OPERATING SEGMENTS |
In evaluating the results of the Group and allocating resources, the Group’s Chief Operation Decision Maker (“CODM”) utilizes the method of disclosing the financial information of the segments based on the organization of the Group. This financial information of the segments in this note is regularly reviewed by the CODM.
| (1) | Segment by type of organization |
The Group’s reporting segments consist of banking, credit card, capital, comprehensive finance and other sectors, and the composition of such reporting segments was divided based on internal report data periodically reviewed by the management to evaluate the performance of the segment and make decisions on the resources to be distributed.
| Operational scope | ||
| Banking | Loans/deposits and relevant services for customers of Woori Bank | |
| Credit card | Credit card, cash services, card loans and accompanying business of Woori Card Co., Ltd. | |
| Capital | Installments, loans including lease financing, and accompanying business of Woori Financial Capital Co., Ltd. | |
| Investment Banking | Securities operation, sale of financial instruments, project financing and other related activities for comprehensive financing of Woori Investment bank Co., Ltd. | |
| Others | Woori Financial Group Inc., Woori Asset Trust Co., Ltd., Woori Asset Management Corp., Ltd., Woori Financial F&I Co., Ltd., Woori Savings Bank., Woori Credit Information Co., Ltd., Woori Fund Services Co., Ltd., Woori Private Equity Asset Management Co., Ltd., Woori FIS Co., Ltd. and Woori Finance Research Institute, Woori Venture Partners Co., Ltd. | |
- 45 -
WOORI FINANCIAL GROUP INC. AND SUBSIDIARIES
NOTES TO CONSOLIDATED INTERIM FINANCIAL STATEMENTS
AS OF JUNE 30, 2024 AND 2023
| (2) | The composition of each organization’s sectors for the six-month periods ended June 30, 2024 and 2023 are as follows (Unit: Korean Won in millions): |
| For the six-month period ended June 30, 2024 | ||||||||||||||||||||||||||||||||||||||||
| Banking(*1) | Credit card | Capital | Investment banking |
Others (*2) | Sub-total | Other adjustments (*3) |
Internal adjustments (*4) |
Consolidated Adjustments (*5) |
Total | |||||||||||||||||||||||||||||||
| Net interest income |
3,253,705 | 335,018 | 123,355 | 59,052 | 58,929 | 3,830,059 | 58,989 | 507,964 | (1,913 | ) | 4,395,099 | |||||||||||||||||||||||||||||
| Non-interest income(expense) |
1,016,000 | 85,129 | 65,238 | 23,999 | 1,407,518 | 2,597,884 | 57,799 | (329,335 | ) | (1,440,959 | ) | 885,389 | ||||||||||||||||||||||||||||
| Impairment losses due to credit loss |
(273,762 | ) | (168,515 | ) | (38,943 | ) | (50,072 | ) | (65,751 | ) | (597,043 | ) | — | (178,993 | ) | 544 | (775,492 | ) | ||||||||||||||||||||||
| General and administrative expense |
(1,761,374 | ) | (141,517 | ) | (44,429 | ) | (27,855 | ) | (218,004 | ) | (2,193,179 | ) | (625 | ) | — | 92,817 | (2,100,987 | ) | ||||||||||||||||||||||
|
|
|
|
|
|
|
|
|
|
|
|
|
|
|
|
|
|
|
|
|
|||||||||||||||||||||
| Net operating income(expense) |
2,234,569 | 110,115 | 105,221 | 5,124 | 1,182,692 | 3,637,721 | 116,163 | (364 | ) | (1,349,511 | ) | 2,404,009 | ||||||||||||||||||||||||||||
|
|
|
|
|
|
|
|
|
|
|
|
|
|
|
|
|
|
|
|
|
|||||||||||||||||||||
| Share of gain of associates |
24,387 | — | (725 | ) | 117 | (3,393 | ) | 20,386 | (31 | ) | — | 19,276 | 39,631 | |||||||||||||||||||||||||||
| Other non-operating expense |
(48,218 | ) | (2,156 | ) | (39 | ) | (278 | ) | 13,401 | (37,290 | ) | 1,943 | 364 | (17,798 | ) | (52,781 | ) | |||||||||||||||||||||||
|
|
|
|
|
|
|
|
|
|
|
|
|
|
|
|
|
|
|
|
|
|||||||||||||||||||||
| Non-operating income(expense) |
(23,831 | ) | (2,156 | ) | (764 | ) | (161 | ) | 10,008 | (16,904 | ) | 1,912 | 364 | 1,478 | (13,150 | ) | ||||||||||||||||||||||||
|
|
|
|
|
|
|
|
|
|
|
|
|
|
|
|
|
|
|
|
|
|||||||||||||||||||||
| Net income(expense) before tax |
2,210,738 | 107,959 | 104,457 | 4,963 | 1,192,700 | 3,620,817 | 118,075 | — | (1,348,033 | ) | 2,390,859 | |||||||||||||||||||||||||||||
| Tax expense |
(531,922 | ) | (23,660 | ) | (24,603 | ) | (1,141 | ) | (11,676 | ) | (593,002 | ) | — | — | 2,563 | (590,439 | ) | |||||||||||||||||||||||
|
|
|
|
|
|
|
|
|
|
|
|
|
|
|
|
|
|
|
|
|
|||||||||||||||||||||
| Net income(loss) |
1,678,816 | 84,299 | 79,854 | 3,822 | 1,181,024 | 3,027,815 | 118,075 | — | (1,345,470 | ) | 1,800,420 | |||||||||||||||||||||||||||||
|
|
|
|
|
|
|
|
|
|
|
|
|
|
|
|
|
|
|
|
|
|||||||||||||||||||||
| Total assets |
468,915,086 | 16,571,401 | 12,564,864 | 6,676,326 | 31,338,220 | 536,065,897 | 3,272,162 | — | (30,556,894 | ) | 508,781,165 | |||||||||||||||||||||||||||||
|
|
|
|
|
|
|
|
|
|
|
|
|
|
|
|
|
|
|
|
|
|||||||||||||||||||||
| Investment in associate |
1,033,906 | — | 33,988 | 4,538 | 24,324,264 | 25,396,696 | 24,180 | — | (23,521,595 | ) | 1,899,281 | |||||||||||||||||||||||||||||
| Other assets |
467,881,180 | 16,571,401 | 12,530,876 | 6,671,788 | 7,013,956 | 510,669,201 | 3,247,982 | — | (7,035,299 | ) | 506,881,884 | |||||||||||||||||||||||||||||
|
|
|
|
|
|
|
|
|
|
|
|
|
|
|
|
|
|
|
|
|
|||||||||||||||||||||
| Total liabilities |
441,651,445 | 13,852,526 | 10,894,300 | 5,566,870 | 4,465,747 | 476,430,888 | 115,984 | — | (2,913,321 | ) | 473,633,551 | |||||||||||||||||||||||||||||
|
|
|
|
|
|
|
|
|
|
|
|
|
|
|
|
|
|
|
|
|
|||||||||||||||||||||
| (*1) | The banking sector includes banks and their consolidated subsidiaries (such as overseas subsidiaries). |
| (*2) | Other segments includes gains and losses from Woori Financial Group Inc., Woori Asset Trust Co., Ltd., Woori Savings Bank, Woori Asset Management Corp., Woori Financial F&I Co., Ltd., Woori Credit Information Co., Ltd., Woori Fund Service Co., Ltd., Woori Private Equity Asset Management Co., Ltd., Woori FIS Co., Ltd., Woori Finance Research Institute and Woori Venture Partners Co., Ltd. |
| (*3) | Other segments includes the funds subject to Group’s consolidation not included in the reporting segment. |
| (*4) | Internal reconciliation includes the adjustment of deposit insurance premiums of 247,185 million Won and fund contribution fees of 261,000 million Won from net interest income expenses to non-interest income expenses in order to present the profit and loss adjustment between reporting divisions in accordance with management accounting standards as profit and loss in accordance with accounting standards. |
| (*5) | Consolidation adjustments include the elimination of 90,726 million Won of internal transactions between Woori FIS Co., Ltd., the group’s IT service agency, and affiliates, and the removal of 1,195,721 million Won of dividends received by the holding company from its subsidiaries. |
- 46 -
WOORI FINANCIAL GROUP INC. AND SUBSIDIARIES
NOTES TO CONSOLIDATED INTERIM FINANCIAL STATEMENTS
AS OF JUNE 30, 2024 AND 2023
| For the six-month period ended June 30, 2023 | ||||||||||||||||||||||||||||||||||||||||
| Banking(*1) | Credit card | Capital | Investment banking |
Others (*2) | Sub-total | Other adjustments (*3) |
Internal adjustments (*4) |
Consolidated Adjustments (*5) |
Total | |||||||||||||||||||||||||||||||
| Net interest income |
3,324,229 | 338,200 | 169,105 | 48,129 | 56,767 | 3,936,430 | 38,739 | 440,929 | (3,105 | ) | 4,412,993 | |||||||||||||||||||||||||||||
| Non-interest income(expense) |
766,099 | 51,564 | 61,015 | 25,247 | 1,730,003 | 2,633,928 | 6,896 | (326,341 | ) | (1,704,307 | ) | 610,176 | ||||||||||||||||||||||||||||
| Impairment losses due to credit loss |
(391,534 | ) | (145,831 | ) | (97,705 | ) | (31,871 | ) | (36,939 | ) | (703,880 | ) | — | (115,072 | ) | 1,137 | (817,815 | ) | ||||||||||||||||||||||
| General and administrative expense |
(1,742,049 | ) | (138,382 | ) | (42,097 | ) | (25,613 | ) | (274,534 | ) | (2,222,675 | ) | (356 | ) | — | 165,115 | (2,057,916 | ) | ||||||||||||||||||||||
|
|
|
|
|
|
|
|
|
|
|
|
|
|
|
|
|
|
|
|
|
|||||||||||||||||||||
| Net operating income(expense) |
1,956,745 | 105,551 | 90,318 | 15,892 | 1,475,297 | 3,643,803 | 45,279 | (484 | ) | (1,541,160 | ) | 2,147,438 | ||||||||||||||||||||||||||||
|
|
|
|
|
|
|
|
|
|
|
|
|
|
|
|
|
|
|
|
|
|||||||||||||||||||||
| Share of gain(loss) of joint ventures and associates |
61,878 | — | 261 | 124 | 744 | 63,007 | (125 | ) | — | 8,101 | 70,983 | |||||||||||||||||||||||||||||
| Other non-operating expense |
(67,474 | ) | (914 | ) | (14 | ) | (9 | ) | 941 | (67,470 | ) | 1,370 | 484 | (4,272 | ) | (69,888 | ) | |||||||||||||||||||||||
|
|
|
|
|
|
|
|
|
|
|
|
|
|
|
|
|
|
|
|
|
|||||||||||||||||||||
| Non-operating income(expense) |
(5,596 | ) | (914 | ) | 247 | 115 | 1,685 | (4,463 | ) | 1,245 | 484 | 3,829 | 1,095 | |||||||||||||||||||||||||||
|
|
|
|
|
|
|
|
|
|
|
|
|
|
|
|
|
|
|
|
|
|||||||||||||||||||||
| Net income(expense) before tax |
1,951,149 | 104,637 | 90,565 | 16,007 | 1,476,982 | 3,639,340 | 46,524 | — | (1,537,331 | ) | 2,148,533 | |||||||||||||||||||||||||||||
| Tax expense |
(473,248 | ) | (22,289 | ) | (19,286 | ) | (3,841 | ) | (18,089 | ) | (536,753 | ) | — | — | 2,032 | (534,721 | ) | |||||||||||||||||||||||
|
|
|
|
|
|
|
|
|
|
|
|
|
|
|
|
|
|
|
|
|
|||||||||||||||||||||
| Net income(loss) |
1,477,901 | 82,348 | 71,279 | 12,166 | 1,458,893 | 3,102,587 | 46,524 | — | (1,535,299 | ) | 1,613,812 | |||||||||||||||||||||||||||||
|
|
|
|
|
|
|
|
|
|
|
|
|
|
|
|
|
|
|
|
|
|||||||||||||||||||||
| Total assets |
445,294,200 | 16,504,719 | 12,304,348 | 5,407,267 | 28,770,391 | 508,280,925 | 2,530,629 | — | (27,899,935 | ) | 482,911,619 | |||||||||||||||||||||||||||||
|
|
|
|
|
|
|
|
|
|
|
|
|
|
|
|
|
|
|
|
|
|||||||||||||||||||||
| Investment to joint ventures and associates |
977,694 | — | 37,486 | 4,065 | 22,978,920 | 23,998,165 | 27,451 | — | (22,403,946 | ) | 1,621,670 | |||||||||||||||||||||||||||||
| Other assets |
444,316,506 | 16,504,719 | 12,266,862 | 5,403,202 | 5,791,471 | 484,282,760 | 2,503,178 | — | (5,495,989 | ) | 481,289,949 | |||||||||||||||||||||||||||||
|
|
|
|
|
|
|
|
|
|
|
|
|
|
|
|
|
|
|
|
|
|||||||||||||||||||||
| Total liabilities |
419,597,515 | 14,050,995 | 10,733,981 | 4,740,429 | 3,602,487 | 452,725,407 | 126,621 | — | (2,631,673 | ) | 450,220,355 | |||||||||||||||||||||||||||||
|
|
|
|
|
|
|
|
|
|
|
|
|
|
|
|
|
|
|
|
|
|||||||||||||||||||||
| (*1) | The banking sector includes banks and their consolidated subsidiaries(such as overseas subsidiaries). |
| (*2) | Other segments include Woori Financial Group Inc., Woori Asset Trust Co., Ltd., Woori Savings Bank, Woori Asset Management Corp., Woori Financial F&I Co., Ltd., Woori Credit Information Co., Ltd., Woori Fund Service Inc., Woori Private Equity Asset Management Co., Ltd., Woori Global Asset Management Co., Ltd., Woori FIS Co., Ltd., Woori Finance Research Institute., and Woori Venture Partners Co.,Ltd |
| (*3) | Other Adjustments are composed of group-consolidated funds that are not included in the reporting segment. |
| (*4) | Internal adjustment includes adjustment of 227,083 million Won in deposit insurance premiums and 214,394 million Won in fund contribution fees from net interest income to non-interest income to present income adjustment between reporting sectors in accordance with management accounting standards. |
| (*5) | Consolidation adjustments include the elimination of 163,610 million Won of internal transactions between Woori FIS Co., Ltd., the group’s IT service agency, and affiliates, and the removal of 1,472,869 million Won of dividends received by the holding company from its subsidiaries. |
- 47 -
WOORI FINANCIAL GROUP INC. AND SUBSIDIARIES
NOTES TO CONSOLIDATED INTERIM FINANCIAL STATEMENTS
AS OF JUNE 30, 2024 AND 2023
| (3) | Operating profit or loss from external customers for the six-month periods ended June 30, 2024 and 2023 are as follows (Unit: Korean Won in millions): |
| For the six-month periods ended June 30 | ||||||||
| Details | 2024 | 2023 | ||||||
| Domestic |
2,162,080 | 1,911,303 | ||||||
| Foreign |
241,929 | 236,135 | ||||||
|
|
|
|
|
|||||
| Total |
2,404,009 | 2,147,438 | ||||||
|
|
|
|
|
|||||
| (4) | Major non-current assets as of June 30, 2024 and December 31, 2023 are as follows (Unit: Korean Won in millions): |
| Details (*) | June 30, 2024 | December 31, 2023 | ||||||
| Domestic |
6,093,326 | 5,804,919 | ||||||
| Foreign |
633,233 | 636,820 | ||||||
|
|
|
|
|
|||||
| Total |
6,726,559 | 6,441,739 | ||||||
|
|
|
|
|
|||||
| (*) | Major non-current assets included joint ventures and related business investments, investment properties, Premises and equipment, and intangible assets. |
| (5) | Information about major customers |
The Group does not have any single customer that generates 10% or more of the Group’s total revenue for the six-month periods ended June 30, 2024 and 2023.
- 48 -
WOORI FINANCIAL GROUP INC. AND SUBSIDIARIES
NOTES TO CONSOLIDATED INTERIM FINANCIAL STATEMENTS
AS OF JUNE 30, 2024 AND 2023
| 6. | CASH AND CASH EQUIVALENTS |
| (1) | Details of cash and cash equivalents are as follows (Unit: Korean Won in millions): |
| June 30, 2024 | December 31, 2023 | |||||||
| Cash |
1,554,682 | 1,464,606 | ||||||
| Foreign currencies |
681,727 | 715,495 | ||||||
| Demand deposits |
23,139,761 | 28,248,420 | ||||||
| Time deposits |
95,462 | 128,097 | ||||||
|
|
|
|
|
|||||
| Total |
25,471,632 | 30,556,618 | ||||||
|
|
|
|
|
|||||
| (2) | Details of restricted cash and cash equivalents are as follows (Unit: Korean Won in millions) |
| Counterparty | June 30, 2024 | Reason of restriction | ||||||||||
| Due from banks in local currency: |
||||||||||||
| Due from BOK |
BOK | 12,819,561 | |
Reserve deposits under the BOK Act |
||||||||
|
|
|
|||||||||||
| Due from banks in foreign currencies: |
|
|||||||||||
| Due from banks on demand |
Bank of Japan and others | 891,094 | Reserve deposits, etc. | |||||||||
|
|
|
|||||||||||
| Total |
|
13,710,655 | ||||||||||
|
|
|
|||||||||||
| Counterparty | December 31, 2023 | Reason of restriction | ||||||||||
| Due from banks in local currency: |
||||||||||||
| Due from BOK |
BOK | 13,420,310 | |
Reserve deposits under the BOK Act |
||||||||
|
|
|
|||||||||||
| Due from banks in foreign currencies: |
|
|||||||||||
| Due from banks on demand |
Bank of Japan and others | 957,627 | Reserve deposits etc | |||||||||
|
|
|
|||||||||||
| Total |
|
14,377,937 | ||||||||||
|
|
|
|||||||||||
- 49 -
WOORI FINANCIAL GROUP INC. AND SUBSIDIARIES
NOTES TO CONSOLIDATED INTERIM FINANCIAL STATEMENTS
AS OF JUNE 30, 2024 AND 2023
| 7. | FINANCIAL ASSETS AT FVTPL |
| (1) | Details of financial assets at FVTPL as of June 30, 2024 and December 31, 2023 are as follows (Unit: Korean Won in millions): |
| June 30, 2024 | December 31, 2023 | |||||||
| Financial assets at fair value through profit or loss |
23,309,282 | 21,544,756 | ||||||
| (2) | Financial assets at fair value through profit or loss as of June 30, 2024 and December 31, 2023 are as follows (Unit: Korean Won in millions): |
| June 30, 2024 | December 31, 2023 | |||||||
| Deposits: |
||||||||
| Gold banking asset |
49,518 | 39,241 | ||||||
| Securities: |
||||||||
| Debt securities |
||||||||
| Korean treasury and government agencies |
4,173,223 | 4,310,612 | ||||||
| Financial institutions |
747,364 | 778,832 | ||||||
| Corporates |
348,340 | 433,488 | ||||||
| Securities loaned |
481,666 | 625,398 | ||||||
| Others |
244,393 | 158,908 | ||||||
| Equity securities |
444,177 | 421,989 | ||||||
| Capital contributions |
2,659,555 | 2,459,646 | ||||||
| Beneficiary certificates |
5,033,286 | 5,509,915 | ||||||
| Others |
189,069 | 181,691 | ||||||
|
|
|
|
|
|||||
| Sub-total |
14,321,073 | 14,880,479 | ||||||
|
|
|
|
|
|||||
| Loans |
1,376,768 | 782,716 | ||||||
| Derivatives assets |
7,514,608 | 5,798,329 | ||||||
| Other financial assets |
47,315 | 43,991 | ||||||
|
|
|
|
|
|||||
| Total |
23,309,282 | 21,544,756 | ||||||
|
|
|
|
|
|||||
The Group does not have financial assets at fair value through profit or loss designated as upon initial recognition as of June 30, 2024 and December 31, 2023.
- 50 -
WOORI FINANCIAL GROUP INC. AND SUBSIDIARIES
NOTES TO CONSOLIDATED INTERIM FINANCIAL STATEMENTS
AS OF JUNE 30, 2024 AND 2023
| 8. | FINANCIAL ASSETS AT FVTOCI |
| (1) | Details of financial assets at FVTOCI as of June 30, 2024 and December 31, 2023 are as follows (Unit: Korean Won in millions): |
| June 30, 2024 | December 31, 2023 | |||||||
| Debt securities: |
||||||||
| Korean treasury and government agencies |
8,117,387 | 5,728,241 | ||||||
| Financial institutions |
19,536,831 | 20,885,924 | ||||||
| Corporates |
3,554,764 | 3,994,432 | ||||||
| Bond denominated in foreign currencies |
6,338,147 | 5,493,295 | ||||||
| Securities loaned |
180,545 | 592,219 | ||||||
|
|
|
|
|
|||||
| Sub-total |
37,727,674 | 36,694,111 | ||||||
|
|
|
|
|
|||||
| Equity securities |
1,097,593 | 1,197,384 | ||||||
| Loans |
50,361 | — | ||||||
|
|
|
|
|
|||||
| Total |
38,875,628 | 37,891,495 | ||||||
|
|
|
|
|
|||||
| (2) | Details of equity securities designated as financial assets at FVTOCI as of June 30, 2024 and December 31, 2023 are as follows (Unit: Korean Won in millions): |
| Purpose of acquisition |
June 30, 2024 | December 31, 2023 |
Remarks | |||||||||
| Investment for strategic business partnership purpose |
911,070 | 1,039,203 | ||||||||||
| Debt-equity swap |
186,517 | 158,175 | ||||||||||
| Others |
6 | 6 | |
Insurance for mutual aid association, etc. |
||||||||
|
|
|
|
|
|||||||||
| Total |
1,097,593 | 1,197,384 | ||||||||||
|
|
|
|
|
|||||||||
| (3) | Changes in the loss allowance and gross carrying amount of financial assets at FVTOCI are as follows (Unit: Korean Won in millions): |
| 1) | Loss allowance |
| For the six-month period ended June 30, 2024 | ||||||||||||||||
| Stage 1 | Stage 2 | Stage 3 | Total | |||||||||||||
| Beginning balance |
(27,379 | ) | — | — | (27,379 | ) | ||||||||||
| Transfer to 12-month expected credit losses |
— | — | — | — | ||||||||||||
| Transfer to lifetime expected credit losses |
— | — | — | — | ||||||||||||
| Transfer to credit-impaired financial assets |
— | — | — | — | ||||||||||||
| Provision of loss allowance |
(3,482 | ) | — | — | (3,482 | ) | ||||||||||
| Disposal |
2,760 | — | — | 2,760 | ||||||||||||
| Others (*) |
154 | — | — | 154 | ||||||||||||
|
|
|
|
|
|
|
|
|
|||||||||
| Ending balance |
(27,947 | ) | — | — | (27,947 | ) | ||||||||||
|
|
|
|
|
|
|
|
|
|||||||||
| (*) | Others consist of foreign currencies translation, etc. |
| For the six-month period ended June 30, 2023 | ||||||||||||||||
| Stage 1 | Stage 2 | Stage 3 | Total | |||||||||||||
| Beginning balance |
(11,805 | ) | — | — | (11,805 | ) | ||||||||||
| Transfer to 12-month expected credit losses |
— | — | — | — | ||||||||||||
| Transfer to lifetime expected credit losses |
— | — | — | — | ||||||||||||
| Transfer to credit-impaired financial assets |
— | — | — | — | ||||||||||||
| Provision of loss allowance |
(12,163 | ) | — | — | (12,163 | ) | ||||||||||
| Disposal |
432 | — | — | 432 | ||||||||||||
| Others (*) |
(1,499 | ) | — | — | (1,499 | ) | ||||||||||
|
|
|
|
|
|
|
|
|
|||||||||
| Ending balance |
(25,035 | ) | — | — | (25,035 | ) | ||||||||||
|
|
|
|
|
|
|
|
|
|||||||||
| (*) | Others consist of foreign currencies translation, etc. |
- 51 -
WOORI FINANCIAL GROUP INC. AND SUBSIDIARIES
NOTES TO CONSOLIDATED INTERIM FINANCIAL STATEMENTS
AS OF JUNE 30, 2024 AND 2023
| 2) | Gross carrying amount |
| For the six-month period ended June 30, 2024 | ||||||||||||||||
| Stage 1 | Stage 2 | Stage 3 | Total | |||||||||||||
| Beginning balance |
36,694,111 | — | — | 36,694,111 | ||||||||||||
| Transfer to 12-month expected credit losses |
— | — | — | — | ||||||||||||
| Transfer to lifetime expected credit losses |
— | — | — | — | ||||||||||||
| Transfer to credit-impaired financial assets |
— | — | — | — | ||||||||||||
| Acquisition |
14,525,101 | — | — | 14,525,101 | ||||||||||||
| Disposal / Recovery |
(13,971,840 | ) | — | — | (13,971,840 | ) | ||||||||||
| Gain on valuation |
58,565 | — | — | 58,565 | ||||||||||||
| Amortization based on effective interest method |
67,560 | — | — | 67,560 | ||||||||||||
| Others (*) |
404,538 | — | — | 404,538 | ||||||||||||
|
|
|
|
|
|
|
|
|
|||||||||
| Ending balance |
37,778,035 | — | — | 37,778,035 | ||||||||||||
|
|
|
|
|
|
|
|
|
|||||||||
| (*) | Others consist of foreign currencies translation, etc. |
| For the six-month period ended June 30, 2023 | ||||||||||||||||
| Stage 1 | Stage 2 | Stage 3 | Total | |||||||||||||
| Beginning balance |
32,145,758 | — | — | 32,145,758 | ||||||||||||
| Transfer to 12-month expected credit losses |
— | — | — | — | ||||||||||||
| Transfer to lifetime expected credit losses |
— | — | — | — | ||||||||||||
| Transfer to credit-impaired financial assets |
— | — | — | — | ||||||||||||
| Acquisition |
11,877,503 | — | — | 11,877,503 | ||||||||||||
| Disposal / Recovery |
(10,783,130 | ) | — | — | (10,783,130 | ) | ||||||||||
| Gain (loss) on valuation |
248,239 | — | — | 248,239 | ||||||||||||
| Amortization based on effective interest method |
80,514 | — | — | 80,514 | ||||||||||||
| Others (*) |
222,279 | — | — | 222,279 | ||||||||||||
|
|
|
|
|
|
|
|
|
|||||||||
| Ending balance |
33,791,163 | — | — | 33,791,163 | ||||||||||||
|
|
|
|
|
|
|
|
|
|||||||||
| (*) | Others consist of foreign currencies translation, etc. |
| (4) | During six-month periods ended June 30, 2024 and 2023, the Group sold its equity securities., designated as financial assets at FVTOCI in accordance with decision of disposal by the creditors, and the fair values at disposal dates were 1,437 million Won and 2,593 million Won respectively, and cumulative gains or losses at disposal dates were (674) million Won and 203 million Won respectively. |
- 52 -
WOORI FINANCIAL GROUP INC. AND SUBSIDIARIES
NOTES TO CONSOLIDATED INTERIM FINANCIAL STATEMENTS
AS OF JUNE 30, 2024 AND 2023
| 9. | SECURITIES AT AMORTIZED COST |
| (1) | Details of securities at amortized cost as of June 30, 2024 and December 31, 2023 are as follows (Unit: Korean Won in millions): |
| June 30, 2024 | December 31, 2023 | |||||||
| Korean treasury and government agencies |
7,663,921 | 8,143,585 | ||||||
| Financial institutions |
6,371,376 | 6,660,465 | ||||||
| Corporates |
6,939,928 | 7,235,202 | ||||||
| Bond denominated in foreign currencies |
1,446,727 | 1,970,861 | ||||||
| Allowance for credit losses |
(13,193 | ) | (13,941 | ) | ||||
|
|
|
|
|
|||||
| Total |
22,408,759 | 23,996,172 | ||||||
|
|
|
|
|
|||||
| (2) | Changes in the loss allowance and gross carrying amount of securities at amortized cost are as follows (Unit: Korean Won in millions): |
| 1) | Loss allowance |
| For the six-month period ended June 30, 2024 | ||||||||||||||||
| Stage 1 | Stage 2 | Stage 3 | Total | |||||||||||||
| Beginning balance |
(13,941 | ) | — | — | (13,941 | ) | ||||||||||
| Transfer to 12-month expected credit losses |
— | — | — | — | ||||||||||||
| Transfer to lifetime expected credit losses |
— | — | — | — | ||||||||||||
| Transfer to credit-impaired financial assets |
— | — | — | — | ||||||||||||
| Net Reversal of loss allowance |
811 | — | — | 811 | ||||||||||||
| Others (*) |
(63 | ) | — | — | (63 | ) | ||||||||||
|
|
|
|
|
|
|
|
|
|||||||||
| Ending balance |
(13,193 | ) | — | — | (13,193 | ) | ||||||||||
|
|
|
|
|
|
|
|
|
|||||||||
| (*) | Others consist of foreign currencies translation, etc. |
| For the six-month period ended June 30, 2023 | ||||||||||||||||
| Stage 1 | Stage 2 | Stage 3 | Total | |||||||||||||
| Beginning balance |
(8,385 | ) | — | — | (8,385 | ) | ||||||||||
| Transfer to 12-month expected credit losses |
— | — | — | — | ||||||||||||
| Transfer to lifetime expected credit losses |
— | — | — | — | ||||||||||||
| Transfer to credit-impaired financial assets |
— | — | — | — | ||||||||||||
| Net provision of loss allowance |
(6,019 | ) | — | — | (6,019 | ) | ||||||||||
| Others (*) |
(18 | ) | — | — | (18 | ) | ||||||||||
|
|
|
|
|
|
|
|
|
|||||||||
| Ending balance |
(14,422 | ) | — | — | (14,422 | ) | ||||||||||
|
|
|
|
|
|
|
|
|
|||||||||
| (*) | Others consist of foreign currencies translation, etc. |
- 53 -
WOORI FINANCIAL GROUP INC. AND SUBSIDIARIES
NOTES TO CONSOLIDATED INTERIM FINANCIAL STATEMENTS
AS OF JUNE 30, 2024 AND 2023
| 2) | Gross carrying amount |
| For the six-month period ended June 30, 2024 | ||||||||||||||||
| Stage 1 | Stage 2 | Stage 3 | Total | |||||||||||||
| Beginning balance |
24,010,113 | — | — | 24,010,113 | ||||||||||||
| Transfer to 12-month expected credit losses |
— | — | — | — | ||||||||||||
| Transfer to lifetime expected credit losses |
— | — | — | — | ||||||||||||
| Transfer to credit-impaired financial assets |
— | — | — | — | ||||||||||||
| Acquisition |
502,737 | — | — | 502,737 | ||||||||||||
| Disposal / Recovery |
(2,245,188 | ) | — | — | (2,245,188 | ) | ||||||||||
| Amortization based on effective interest method |
39,473 | — | — | 39,473 | ||||||||||||
| Others (*) |
114,817 | — | — | 114,817 | ||||||||||||
|
|
|
|
|
|
|
|
|
|||||||||
| Ending balance |
22,421,952 | — | — | 22,421,952 | ||||||||||||
|
|
|
|
|
|
|
|
|
|||||||||
| (*) | Others consist of foreign currencies translation, etc. |
| For the six-month period ended June 30, 2023 | ||||||||||||||||
| Stage 1 | Stage 2 | Stage 3 | Total | |||||||||||||
| Beginning balance |
28,276,901 | — | — | 28,276,901 | ||||||||||||
| Transfer to 12-month expected credit losses |
— | — | — | — | ||||||||||||
| Transfer to lifetime expected credit losses |
— | — | — | — | ||||||||||||
| Transfer to credit-impaired financial assets |
— | — | — | — | ||||||||||||
| Acquisition |
2,333,300 | — | — | 2,333,300 | ||||||||||||
| Disposal / Recovery |
(4,842,587 | ) | — | — | (4,842,587 | ) | ||||||||||
| Amortization based on effective interest method |
104,732 | — | — | 104,732 | ||||||||||||
| Others (*) |
91,696 | — | — | 91,696 | ||||||||||||
|
|
|
|
|
|
|
|
|
|||||||||
| Ending balance |
25,964,042 | — | — | 25,964,042 | ||||||||||||
|
|
|
|
|
|
|
|
|
|||||||||
| (*) | Others consist of foreign currencies translation, etc. |
- 54 -
WOORI FINANCIAL GROUP INC. AND SUBSIDIARIES
NOTES TO CONSOLIDATED INTERIM FINANCIAL STATEMENTS
AS OF JUNE 30, 2024 AND 2023
| 10. | LOANS AND OTHER FINANCIAL ASSETS AT AMORTIZED COST |
| (1) | Details of loans and other financial assets at amortized cost as of June 30, 2024 and December 31, 2023 are as follows (Unit: Korean Won in millions): |
| June 30, 2024 | December 31, 2023 | |||||||
| Due from banks |
2,730,581 | 1,950,573 | ||||||
| Loans |
370,745,214 | 358,577,179 | ||||||
| Other financial assets |
13,898,289 | 12,620,396 | ||||||
|
|
|
|
|
|||||
| Total |
387,374,084 | 373,148,148 | ||||||
|
|
|
|
|
|||||
| (2) | Details of due from banks are as follows (Unit: Korean Won in millions): |
| June 30, 2024 | December 31, 2023 | |||||||
| Due from banks in local currency: |
||||||||
| Due from depository banks |
347,640 | 108,344 | ||||||
| Due from non-depository institutions |
39,526 | 136 | ||||||
| Due from the Korea Exchange |
— | 68 | ||||||
| Others |
137,436 | 135,390 | ||||||
| Loss allowance |
(173 | ) | (59 | ) | ||||
|
|
|
|
|
|||||
| Sub-total |
524,429 | 243,879 | ||||||
|
|
|
|
|
|||||
| Due from banks in foreign currencies: |
||||||||
| Due from banks on demand |
283,591 | 221,292 | ||||||
| Due from banks on time |
255,307 | 366,117 | ||||||
| Others |
1,682,918 | 1,135,072 | ||||||
| Loss allowance |
(15,664 | ) | (15,787 | ) | ||||
|
|
|
|
|
|||||
| Sub-total |
2,206,152 | 1,706,694 | ||||||
|
|
|
|
|
|||||
| Total |
2,730,581 | 1,950,573 | ||||||
|
|
|
|
|
|||||
| (3) | Details of restricted due from banks are as follows (Unit: Korean Won in millions): |
| Counterparty |
June 30, 2024 | Reason of restriction | ||||||
| Due from banks in local currency: |
||||||||
| Others |
Korea Federation of Savings Bank and others | 80,372 | Domestic currency exchange and collateral related to promissory notes and others | |||||
|
|
|
|||||||
| Sub-total |
80,372 | |||||||
|
|
|
|||||||
| Due from banks in foreign currencies: |
||||||||
| Due from banks on demand |
National Bank of Cambodia and others | 275,744 | Reserve deposits and others | |||||
| Due from banks on time |
National Bank of Cambodia | 333 | Usage deposits for fund settlement system | |||||
| Others |
People’s Bank of China and others | 885,601 | Reserve deposits and others | |||||
|
|
|
|||||||
| Sub-total |
1,161,678 | |||||||
|
|
|
|||||||
| Total |
1,242,050 | |||||||
|
|
|
|||||||
- 55 -
WOORI FINANCIAL GROUP INC. AND SUBSIDIARIES
NOTES TO CONSOLIDATED INTERIM FINANCIAL STATEMENTS
AS OF JUNE 30, 2024 AND 2023
| Counterparty |
December 31, 2023 | Reason of restriction | ||||||
| Due from banks in local currency: |
||||||||
| Due from KSFC |
KB Securities Co., Ltd. and SI SECURITIES CORPORATION |
68 | Futures margin | |||||
| Others |
Korea Federation of Savings Bank and others |
129,974 | Domestic currency exchange promissory notes and others | |||||
|
|
|
|||||||
| Sub-total |
130,042 | |||||||
|
|
|
|||||||
| Due from banks in foreign currencies: |
||||||||
| Due from banks on demand |
National Bank of Cambodia and others |
216,147 | Reserve deposits and others | |||||
| Due from banks on time |
National Bank of Cambodia |
321 | Usage deposits for fund settlement system | |||||
| Others |
People’s Bank of China and others |
1,062,130 | Reserve deposits and others | |||||
|
|
|
|||||||
| Sub-total |
1,278,598 | |||||||
|
|
|
|||||||
| Total |
1,408,640 | |||||||
|
|
|
|||||||
| (4) | Changes in the loss allowance and gross carrying amount of due from banks are as follows (Unit: Korean Won in millions): |
| 1) | Allowance for credit losses |
| For the six-month period ended June 30, 2024 | ||||||||||||||||
| Stage 1 | Stage 2 | Stage 3 | Total | |||||||||||||
| Beginning balance |
(15,846 | ) | — | — | (15,846 | ) | ||||||||||
| Transfer to 12-month expected credit losses |
— | — | — | — | ||||||||||||
| Transfer to lifetime expected credit losses |
— | — | — | — | ||||||||||||
| Transfer to credit-impaired financial assets |
— | — | — | — | ||||||||||||
| Reversal for allowance for credit loss |
1,335 | — | — | 1,335 | ||||||||||||
| Others (*) |
(1,326 | ) | — | — | (1,326 | ) | ||||||||||
|
|
|
|
|
|
|
|
|
|||||||||
| Ending balance |
(15,837 | ) | — | — | (15,837 | ) | ||||||||||
|
|
|
|
|
|
|
|
|
|||||||||
| (*) | Changes due to foreign currencies translation, etc. |
| For the six-month period ended June 30, 2023 | ||||||||||||||||
| Stage 1 | Stage 2 | Stage 3 | Total | |||||||||||||
| Beginning balance |
(12,317 | ) | — | — | (12,317 | ) | ||||||||||
| Transfer to 12-month expected credit losses |
— | — | — | — | ||||||||||||
| Transfer to lifetime expected credit losses |
— | — | — | — | ||||||||||||
| Transfer to credit-impaired financial assets |
— | — | — | — | ||||||||||||
| Provision for allowance for credit loss |
(5,831 | ) | — | — | (5,831 | ) | ||||||||||
| Others (*) |
995 | — | — | 995 | ||||||||||||
|
|
|
|
|
|
|
|
|
|||||||||
| Ending balance |
(17,153 | ) | — | — | (17,153 | ) | ||||||||||
|
|
|
|
|
|
|
|
|
|||||||||
| (*) | Changes due to foreign currencies translation, etc. |
- 56 -
WOORI FINANCIAL GROUP INC. AND SUBSIDIARIES
NOTES TO CONSOLIDATED INTERIM FINANCIAL STATEMENTS
AS OF JUNE 30, 2024 AND 2023
| 2) | Gross carrying amount |
| For the six-month period ended June 30, 2024 | ||||||||||||||||
| Stage 1 | Stage 2 | Stage 3 | Total | |||||||||||||
| Beginning balance |
1,966,419 | — | — | 1,966,419 | ||||||||||||
| Transfer to 12-month expected credit losses |
— | — | — | — | ||||||||||||
| Transfer to lifetime expected credit losses |
— | — | — | — | ||||||||||||
| Transfer to credit-impaired financial assets |
— | — | — | — | ||||||||||||
| Net increase |
715,187 | — | — | 715,187 | ||||||||||||
| Others (*) |
64,812 | — | — | 64,812 | ||||||||||||
|
|
|
|
|
|
|
|
|
|||||||||
| Ending balance |
2,746,418 | — | — | 2,746,418 | ||||||||||||
|
|
|
|
|
|
|
|
|
|||||||||
| (*) | Changes due to foreign currencies translation, etc. |
| For the six-month period ended June 30, 2023 | ||||||||||||||||
| Stage 1 | Stage 2 | Stage 3 | Total | |||||||||||||
| Beginning balance |
3,006,989 | — | — | 3,006,989 | ||||||||||||
| Transfer to 12-month expected credit losses |
— | — | — | — | ||||||||||||
| Transfer to lifetime expected credit losses |
— | — | — | — | ||||||||||||
| Transfer to credit-impaired financial assets |
— | — | — | — | ||||||||||||
| Net decrease |
(877,876 | ) | — | — | (877,876 | ) | ||||||||||
| Changes due to business combinations |
113,000 | — | — | 113,000 | ||||||||||||
| Others (*) |
886,826 | — | — | 886,826 | ||||||||||||
|
|
|
|
|
|
|
|
|
|||||||||
| Ending balance |
3,128,939 | — | — | 3,128,939 | ||||||||||||
|
|
|
|
|
|
|
|
|
|||||||||
| (*) | Changes due to foreign currencies translation, etc. |
| (5) | Details of loans are as follows (Unit: Korean Won in millions): |
| June 30, 2024 | December 31, 2023 | |||||||
| Loans in local currency |
306,750,688 | 298,157,823 | ||||||
| Loans in foreign currencies |
32,010,699 | 28,585,389 | ||||||
| Domestic banker’s usance |
3,138,909 | 2,726,633 | ||||||
| Credit card accounts |
11,893,756 | 12,531,620 | ||||||
| Bills bought in foreign currencies |
4,692,681 | 4,215,956 | ||||||
| Bills bought in local currency |
167,026 | 496,148 | ||||||
| Factoring receivables |
7,863 | 8,712 | ||||||
| Advances for customers on guarantees |
30,584 | 9,996 | ||||||
| Private placement bonds |
561,063 | 688,437 | ||||||
| Securitized loans |
3,817,039 | 3,203,135 | ||||||
| Call loans |
2,353,959 | 2,719,546 | ||||||
| Bonds purchased under resale agreements |
3,659,420 | 3,356,392 | ||||||
| Financial lease receivables |
1,265,177 | 1,362,279 | ||||||
| Installment financial bond |
2,732,139 | 2,635,720 | ||||||
| Others |
110 | 119 | ||||||
| Loan origination costs and fees |
877,934 | 865,694 | ||||||
| Discounted present value |
(6,562 | ) | (11,360 | ) | ||||
| Allowance for credit losses |
(3,207,271 | ) | (2,975,060 | ) | ||||
|
|
|
|
|
|||||
| Total |
370,745,214 | 358,577,179 | ||||||
|
|
|
|
|
|||||
- 57 -
WOORI FINANCIAL GROUP INC. AND SUBSIDIARIES
NOTES TO CONSOLIDATED INTERIM FINANCIAL STATEMENTS
AS OF JUNE 30, 2024 AND 2023
| (6) | Changes in the loss allowance of loans are as follows (Unit: Korean Won in millions): |
| For the six-month period ended June 30, 2024 | ||||||||||||||||||||||||||||
| Consumers | Corporates | |||||||||||||||||||||||||||
| Stage 1 | Stage 2 | Stage 3 | Stage 1 | Stage 2 | Stage 3 | Credit impairment model |
||||||||||||||||||||||
| Beginning balance |
(196,845 | ) | (134,002 | ) | (220,845 | ) | (947,688 | ) | (762,644 | ) | (363,703 | ) | (89 | ) | ||||||||||||||
| Transfer to 12-month expected credit losses |
(27,353 | ) | 25,393 | 1,960 | (64,492 | ) | 64,102 | 390 | — | |||||||||||||||||||
| Transfer to lifetime expected credit losses |
15,387 | (19,003 | ) | 3,616 | 37,586 | (40,216 | ) | 2,630 | — | |||||||||||||||||||
| Transfer to credit-impaired financial assets |
5,986 | 21,917 | (27,903 | ) | 47,005 | 128,542 | (175,547 | ) | — | |||||||||||||||||||
| Net reversal(provision) of allowance for credit losses |
3,645 | (25,332 | ) | (205,013 | ) | (43,224 | ) | (74,014 | ) | (232,323 | ) | (612 | ) | |||||||||||||||
| Recovery |
— | — | (35,896 | ) | — | — | (18,356 | ) | — | |||||||||||||||||||
| Charge-off |
— | — | 140,360 | — | — | 110,062 | 178 | |||||||||||||||||||||
| Disposal |
9 | 314 | 34,047 | 17 | 1,981 | 121,409 | 256 | |||||||||||||||||||||
| Interest income from impaired loans |
— | — | 7,343 | — | — | 10,839 | — | |||||||||||||||||||||
| Others |
(944 | ) | 280 | 23,850 | (4,104 | ) | 462 | 432 | — | |||||||||||||||||||
|
|
|
|
|
|
|
|
|
|
|
|
|
|
|
|||||||||||||||
| Ending balance |
(200,115 | ) | (130,433 | ) | (278,481 | ) | (974,900 | ) | (681,787 | ) | (544,167 | ) | (267 | ) | ||||||||||||||
|
|
|
|
|
|
|
|
|
|
|
|
|
|
|
|||||||||||||||
| For the six-month period ended June 30, 2024 | ||||||||||||||||||||||||||||
| Credit card accounts | Total | |||||||||||||||||||||||||||
| Stage 1 | Stage 2 | Stage 3 | Stage 1 | Stage 2 | Stage 3 | Credit impairment model |
||||||||||||||||||||||
| Beginning balance |
(97,734 | ) | (118,112 | ) | (133,398 | ) | (1,242,267 | ) | (1,014,758 | ) | (717,946 | ) | (89 | ) | ||||||||||||||
| Transfer to 12-month expected credit losses |
(28,441 | ) | 28,352 | 89 | (120,286 | ) | 117,847 | 2,439 | — | |||||||||||||||||||
| Transfer to lifetime expected credit losses |
9,527 | (10,164 | ) | 637 | 62,500 | (69,383 | ) | 6,883 | — | |||||||||||||||||||
| Transfer to credit-impaired financial assets |
2,340 | 10,118 | (12,458 | ) | 55,331 | 160,577 | (215,908 | ) | — | |||||||||||||||||||
| Net reversal(provision) of allowance for credit losses |
13,723 | (27,166 | ) | (174,691 | ) | (25,856 | ) | (126,512 | ) | (612,027 | ) | (612 | ) | |||||||||||||||
| Recovery |
— | — | (13,339 | ) | — | — | (67,591 | ) | — | |||||||||||||||||||
| Charge-off |
— | — | 125,773 | — | — | 376,195 | 178 | |||||||||||||||||||||
| Disposal |
— | — | 27,823 | 26 | 2,295 | 183,279 | 256 | |||||||||||||||||||||
| Interest income from impaired loans |
— | — | — | — | — | 18,182 | — | |||||||||||||||||||||
| Others |
— | — | — | (5,048 | ) | 742 | 24,282 | — | ||||||||||||||||||||
|
|
|
|
|
|
|
|
|
|
|
|
|
|
|
|||||||||||||||
| Ending balance |
(100,585 | ) | (116,972 | ) | (179,564 | ) | (1,275,600 | ) | (929,192 | ) | (1,002,212 | ) | (267 | ) | ||||||||||||||
|
|
|
|
|
|
|
|
|
|
|
|
|
|
|
|||||||||||||||
- 58 -
WOORI FINANCIAL GROUP INC. AND SUBSIDIARIES
NOTES TO CONSOLIDATED INTERIM FINANCIAL STATEMENTS
AS OF JUNE 30, 2024 AND 2023
| For the six-month period ended June 30, 2023 | ||||||||||||||||||||||||||||
| Consumers | Corporates | |||||||||||||||||||||||||||
| Stage 1 | Stage 2 | Stage 3 | Stage 1 | Stage 2 | Stage 3 | Credit impairment model |
||||||||||||||||||||||
| Beginning balance |
(147,876 | ) | (128,089 | ) | (241,942 | ) | (453,621 | ) | (818,234 | ) | (241,465 | ) | (27 | ) | ||||||||||||||
| Transfer to 12-month expected credit losses |
(22,606 | ) | 21,968 | 638 | (71,867 | ) | 71,114 | 753 | — | |||||||||||||||||||
| Transfer to lifetime expected credit losses |
10,968 | (13,300 | ) | 2,332 | 25,444 | (34,718 | ) | 9,274 | — | |||||||||||||||||||
| Transfer to credit-impaired financial assets |
4,167 | 21,237 | (25,404 | ) | 7,385 | 28,537 | (35,922 | ) | — | |||||||||||||||||||
| Net reversal(provision) of allowance for credit losses |
(44,811 | ) | (40,932 | ) | (146,892 | ) | (222,927 | ) | 14,917 | (164,241 | ) | (711 | ) | |||||||||||||||
| Recovery |
— | — | (31,758 | ) | — | — | (28,827 | ) | — | |||||||||||||||||||
| Charge-off |
— | — | 130,288 | — | — | 107,439 | 457 | |||||||||||||||||||||
| Disposal |
3,823 | 6,505 | 54,858 | 262 | 152 | 52,793 | — | |||||||||||||||||||||
| Interest income from impaired loans |
— | — | 10,233 | — | — | 9,340 | — | |||||||||||||||||||||
| Others |
7,607 | (8 | ) | 1,603 | (25,166 | ) | (1,911 | ) | 25 | — | ||||||||||||||||||
|
|
|
|
|
|
|
|
|
|
|
|
|
|
|
|||||||||||||||
| Ending balance |
(188,728 | ) | (132,619 | ) | (246,044 | ) | (740,490 | ) | (740,143 | ) | (290,831 | ) | (281 | ) | ||||||||||||||
|
|
|
|
|
|
|
|
|
|
|
|
|
|
|
|||||||||||||||
| For the six-month period ended June 30, 2023 | ||||||||||||||||||||||||||||
| Credit card receivables | Total | |||||||||||||||||||||||||||
| Stage 1 | Stage 2 | Stage 3 | Stage 1 | Stage 2 | Stage 3 | Credit impairment model |
||||||||||||||||||||||
| Beginning balance |
(71,139 | ) | (127,814 | ) | (103,946 | ) | (672,636 | ) | (1,074,137 | ) | (587,353 | ) | (27 | ) | ||||||||||||||
| Transfer to 12-month expected credit losses |
(29,518 | ) | 29,464 | 54 | (123,991 | ) | 122,546 | 1,445 | — | |||||||||||||||||||
| Transfer to lifetime expected credit losses |
7,031 | (7,557 | ) | 526 | 43,443 | (55,575 | ) | 12,132 | — | |||||||||||||||||||
| Transfer to credit-impaired financial assets |
960 | 4,554 | (5,514 | ) | 12,512 | 54,328 | (66,840 | ) | — | |||||||||||||||||||
| Net reversal(provision) of allowance for credit losses |
12,570 | (8,793 | ) | (167,464 | ) | (255,168 | ) | (34,808 | ) | (478,597 | ) | (711 | ) | |||||||||||||||
| Recovery |
— | — | (19,146 | ) | — | — | (79,731 | ) | — | |||||||||||||||||||
| Charge-off |
— | — | 158,963 | — | — | 396,690 | 457 | |||||||||||||||||||||
| Disposal |
— | — | 27,840 | 4,085 | 6,657 | 135,491 | — | |||||||||||||||||||||
| Interest income from impaired loans |
— | — | — | — | — | 19,573 | — | |||||||||||||||||||||
| Others |
(2 | ) | — | — | (17,561 | ) | (1,919 | ) | 1,628 | — | ||||||||||||||||||
|
|
|
|
|
|
|
|
|
|
|
|
|
|
|
|||||||||||||||
| Ending balance |
(80,098 | ) | (110,146 | ) | (108,687 | ) | (1,009,316 | ) | (982,908 | ) | (645,562 | ) | (281 | ) | ||||||||||||||
|
|
|
|
|
|
|
|
|
|
|
|
|
|
|
|||||||||||||||
- 59 -
WOORI FINANCIAL GROUP INC. AND SUBSIDIARIES
NOTES TO CONSOLIDATED INTERIM FINANCIAL STATEMENTS
AS OF JUNE 30, 2024 AND 2023
| (7) | Changes in the gross carrying amount of loans are as follows (Unit: Korean Won in millions): |
| For the six-month period ended June 30, 2024 | ||||||||||||||||||||||||||||
| Consumers | Corporates | |||||||||||||||||||||||||||
| Stage 1 | Stage 2 | Stage 3 | Stage 1 | Stage 2 | Stage 3 | Credit impairment model |
||||||||||||||||||||||
| Beginning balance |
132,812,981 | 14,714,396 | 642,086 | 188,612,028 | 10,621,387 | 856,844 | 768,487 | |||||||||||||||||||||
| Transfer to 12-month expected credit losses |
4,345,099 | (4,334,165 | ) | (10,934 | ) | 2,227,211 | (2,225,117 | ) | (2,094 | ) | — | |||||||||||||||||
| Transfer to lifetime expected credit losses |
(5,638,033 | ) | 5,670,778 | (32,745 | ) | (4,086,235 | ) | 4,093,977 | (7,742 | ) | — | |||||||||||||||||
| Transfer to credit-impaired financial assets |
(177,639 | ) | (204,885 | ) | 382,524 | (516,214 | ) | (624,092 | ) | 1,140,306 | — | |||||||||||||||||
| Charge-off |
— | — | (140,360 | ) | — | — | (110,062 | ) | (178 | ) | ||||||||||||||||||
| Disposal |
(35 | ) | (9,139 | ) | (136,405 | ) | (82 | ) | (8,197 | ) | (396,057 | ) | (112,665 | ) | ||||||||||||||
| Net increase(decrease) |
2,049,586 | (1,160,853 | ) | 37,799 | 13,541,684 | (1,119,187 | ) | (35,816 | ) | 631,995 | ||||||||||||||||||
|
|
|
|
|
|
|
|
|
|
|
|
|
|
|
|||||||||||||||
| Ending balance |
133,391,959 | 14,676,132 | 741,965 | 199,778,392 | 10,738,771 | 1,445,379 | 1,287,639 | |||||||||||||||||||||
|
|
|
|
|
|
|
|
|
|
|
|
|
|
|
|||||||||||||||
| For the six-month period ended June 30, 2024 | ||||||||||||||||||||||||||||
| Credit card accounts | Total | |||||||||||||||||||||||||||
| Stage 1 | Stage 2 | Stage 3 | Stage 1 | Stage 2 | Stage 3 | Credit impairment model |
||||||||||||||||||||||
| Beginning balance |
11,287,068 | 983,611 | 253,351 | 332,712,077 | 26,319,394 | 1,752,281 | 768,487 | |||||||||||||||||||||
| Transfer to 12-month expected credit losses |
303,339 | (303,209 | ) | (130 | ) | 6,875,649 | (6,862,491 | ) | (13,158 | ) | — | |||||||||||||||||
| Transfer to lifetime expected credit losses |
(545,213 | ) | 546,135 | (922 | ) | (10,269,481 | ) | 10,310,890 | (41,409 | ) | — | |||||||||||||||||
| Transfer to credit-impaired financial assets |
(76,382 | ) | (55,380 | ) | 131,762 | (770,235 | ) | (884,357 | ) | 1,654,592 | — | |||||||||||||||||
| Charge-off |
— | — | (125,773 | ) | — | — | (376,195 | ) | (178 | ) | ||||||||||||||||||
| Disposal |
— | — | (53,742 | ) | (117 | ) | (17,336 | ) | (586,204 | ) | (112,665 | ) | ||||||||||||||||
| Net increase(decrease) |
(436,667 | ) | (115,285 | ) | 99,685 | 15,154,603 | (2,395,325 | ) | 101,668 | 631,995 | ||||||||||||||||||
| Changes due to business combinations |
— | — | — | — | — | — | — | |||||||||||||||||||||
|
|
|
|
|
|
|
|
|
|
|
|
|
|
|
|||||||||||||||
| Ending balance |
10,532,145 | 1,055,872 | 304,231 | 343,702,496 | 26,470,775 | 2,491,575 | 1,287,639 | |||||||||||||||||||||
|
|
|
|
|
|
|
|
|
|
|
|
|
|
|
|||||||||||||||
- 60 -
WOORI FINANCIAL GROUP INC. AND SUBSIDIARIES
NOTES TO CONSOLIDATED INTERIM FINANCIAL STATEMENTS
AS OF JUNE 30, 2024 AND 2023
| For the six-month period ended June 30, 2023 | ||||||||||||||||||||||||||||
| Consumers | Corporates | |||||||||||||||||||||||||||
| Stage 1 | Stage 2 | Stage 3 | Stage 1 | Stage 2 | Stage 3 | Credit impairment model |
||||||||||||||||||||||
| Beginning balance |
131,328,377 | 14,020,582 | 564,057 | 179,552,435 | 9,486,297 | 625,998 | 313,717 | |||||||||||||||||||||
| Transfer to 12-month expected credit losses |
3,612,969 | (3,605,588 | ) | (7,381 | ) | 1,691,048 | (1,682,828 | ) | (8,220 | ) | — | |||||||||||||||||
| Transfer to lifetime expected credit losses |
(5,726,077 | ) | 5,742,982 | (16,905 | ) | (3,797,604 | ) | 3,818,983 | (21,379 | ) | — | |||||||||||||||||
| Transfer to credit-impaired financial assets |
(180,533 | ) | (172,537 | ) | 353,070 | (333,745 | ) | (253,004 | ) | 586,749 | — | |||||||||||||||||
| Charge-off |
— | — | (130,288 | ) | — | — | (107,439 | ) | (457 | ) | ||||||||||||||||||
| Disposal |
(35,722 | ) | (16,354 | ) | (113,596 | ) | (18,132 | ) | (475 | ) | (251,831 | ) | (32,074 | ) | ||||||||||||||
| Net increase(decrease) |
(781,825 | ) | (1,473,186 | ) | 46,978 | 10,693,140 | (1,352,834 | ) | (165,483 | ) | 107,880 | |||||||||||||||||
| Changes due to business combinations |
1,144 | — | — | — | — | — | — | |||||||||||||||||||||
|
|
|
|
|
|
|
|
|
|
|
|
|
|
|
|||||||||||||||
| Ending balance |
128,218,333 | 14,495,899 | 695,935 | 187,787,142 | 10,016,139 | 658,395 | 389,066 | |||||||||||||||||||||
|
|
|
|
|
|
|
|
|
|
|
|
|
|
|
|||||||||||||||
| For the six-month period ended June 30, 2023 | ||||||||||||||||||||||||||||
| Credit card receivables | Total | |||||||||||||||||||||||||||
| Stage 1 | Stage 2 | Stage 3 | Stage 1 | Stage 2 | Stage 3 | Credit impairment model |
||||||||||||||||||||||
| Beginning balance |
9,115,460 | 1,066,380 | 179,410 | 319,996,272 | 24,573,259 | 1,369,465 | 313,717 | |||||||||||||||||||||
| Transfer to 12-month expected credit losses |
349,541 | (349,465 | ) | (76 | ) | 5,653,558 | (5,637,881 | ) | (15,677 | ) | — | |||||||||||||||||
| Transfer to lifetime expected credit losses |
(357,592 | ) | 358,354 | (762 | ) | (9,881,273 | ) | 9,920,319 | (39,046 | ) | — | |||||||||||||||||
| Transfer to credit-impaired financial assets |
(41,753 | ) | (34,059 | ) | 75,812 | (556,031 | ) | (459,600 | ) | 1,015,631 | — | |||||||||||||||||
| Charge-off |
— | — | (158,963 | ) | — | — | (396,690 | ) | (457 | ) | ||||||||||||||||||
| Disposal |
— | — | (54,403 | ) | (53,854 | ) | (16,829 | ) | (419,830 | ) | (32,074 | ) | ||||||||||||||||
| Net increase(decrease) |
866,202 | (136,480 | ) | 160,252 | 10,777,517 | (2,962,500 | ) | 41,747 | 107,880 | |||||||||||||||||||
| Changes due to business combinations |
— | — | — | 1,144 | — | — | — | |||||||||||||||||||||
|
|
|
|
|
|
|
|
|
|
|
|
|
|
|
|||||||||||||||
| Ending balance |
9,931,858 | 904,730 | 201,270 | 325,937,333 | 25,416,768 | 1,555,600 | 389,066 | |||||||||||||||||||||
|
|
|
|
|
|
|
|
|
|
|
|
|
|
|
|||||||||||||||
- 61 -
WOORI FINANCIAL GROUP INC. AND SUBSIDIARIES
NOTES TO CONSOLIDATED INTERIM FINANCIAL STATEMENTS
AS OF JUNE 30, 2024 AND 2023
| (8) | Details of other financial assets are as follows (Unit: Korean Won in millions): |
| June 30, 2024 | December 31, 2023 | |||||||
| Cash Management Account asset (CMA asset) |
110,000 | 91,000 | ||||||
| Receivables |
10,415,048 | 9,061,936 | ||||||
| Accrued income |
2,138,612 | 1,972,330 | ||||||
| Telex and telephone subscription rights and refundable deposits |
794,956 | 793,510 | ||||||
| Domestic exchange settlement debit |
176,750 | 446,570 | ||||||
| Other assets |
440,790 | 411,330 | ||||||
| Allowance for credit losses |
(177,867 | ) | (156,280 | ) | ||||
|
|
|
|
|
|||||
| Total |
13,898,289 | 12,620,396 | ||||||
|
|
|
|
|
|||||
| (9) | Changes in the allowances for credit losses on other financial assets are as follows (Unit: Korean Won in millions): |
| For the six-month period ended June 30, 2024 | ||||||||||||||||
| Stage 1 | Stage 2 | Stage 3 | Total | |||||||||||||
| Beginning balance |
(9,019 | ) | (17,062 | ) | (130,199 | ) | (156,280 | ) | ||||||||
| Transfer to 12-month expected credit losses |
(464 | ) | 445 | 19 | — | |||||||||||
| Transfer to lifetime expected credit losses |
293 | (343 | ) | 50 | — | |||||||||||
| Transfer to credit-impaired financial assets |
1,711 | 6,463 | (8,174 | ) | — | |||||||||||
| Provision of loss allowance |
(184 | ) | (1,837 | ) | (13,753 | ) | (15,774 | ) | ||||||||
| Charge-off |
— | — | 2,447 | 2,447 | ||||||||||||
| Disposal |
— | — | 1,115 | 1,115 | ||||||||||||
| Others |
24 | (4 | ) | (9,395 | ) | (9,375 | ) | |||||||||
|
|
|
|
|
|
|
|
|
|||||||||
| Ending balance |
(7,639 | ) | (12,338 | ) | (157,890 | ) | (177,867 | ) | ||||||||
|
|
|
|
|
|
|
|
|
|||||||||
| For the six-month period ended June 30, 2023 | ||||||||||||||||
| Stage 1 | Stage 2 | Stage 3 | Total | |||||||||||||
| Beginning balance |
(4,178 | ) | (9,133 | ) | (125,869 | ) | (139,180 | ) | ||||||||
| Transfer to 12-month expected credit losses |
(291 | ) | 273 | 18 | — | |||||||||||
| Transfer to lifetime expected credit losses |
194 | (228 | ) | 34 | — | |||||||||||
| Transfer to credit-impaired financial assets |
94 | 716 | (810 | ) | — | |||||||||||
| Provision of loss allowance |
(1,696 | ) | (701 | ) | (2,555 | ) | (4,952 | ) | ||||||||
| Charge-off |
— | — | 1,429 | 1,429 | ||||||||||||
| Disposal |
— | — | 906 | 906 | ||||||||||||
| Others |
(1,511 | ) | 9 | (248 | ) | (1,750 | ) | |||||||||
|
|
|
|
|
|
|
|
|
|||||||||
| Ending balance |
(7,388 | ) | (9,064 | ) | (127,095 | ) | (143,547 | ) | ||||||||
|
|
|
|
|
|
|
|
|
|||||||||
- 62 -
WOORI FINANCIAL GROUP INC. AND SUBSIDIARIES
NOTES TO CONSOLIDATED INTERIM FINANCIAL STATEMENTS
AS OF JUNE 30, 2024 AND 2023
| (10) | Changes in the gross carrying amount of other financial assets are as follows (Unit: Korean Won in millions): |
| For the six-month period ended June 30, 2024 | ||||||||||||||||
| Stage 1 | Stage 2 | Stage 3 | Total | |||||||||||||
| Beginning balance |
12,510,625 | 111,898 | 154,153 | 12,776,676 | ||||||||||||
| Transfer to 12-month expected credit losses |
18,447 | (18,413 | ) | (34 | ) | — | ||||||||||
| Transfer to lifetime expected credit losses |
(30,468 | ) | 30,533 | (65 | ) | — | ||||||||||
| Transfer to credit-impaired financial assets |
(7,344 | ) | (19,533 | ) | 26,877 | — | ||||||||||
| Charge-off |
— | — | (2,447 | ) | (2,447 | ) | ||||||||||
| Disposal |
— | (3 | ) | (1,497 | ) | (1,500 | ) | |||||||||
| Net increase |
1,270,544 | 17,653 | 15,230 | 1,303,427 | ||||||||||||
|
|
|
|
|
|
|
|
|
|||||||||
| Ending balance |
13,761,804 | 122,135 | 192,217 | 14,076,156 | ||||||||||||
|
|
|
|
|
|
|
|
|
|||||||||
| For the six-month period ended June 30, 2023 | ||||||||||||||||
| Stage 1 | Stage 2 | Stage 3 | Total | |||||||||||||
| Beginning balance |
8,886,721 | 21,454 | 78,502 | 8,986,677 | ||||||||||||
| Transfer to 12-month expected credit losses |
13,297 | (13,277 | ) | (20 | ) | — | ||||||||||
| Transfer to lifetime expected credit losses |
(24,835 | ) | 24,878 | (43 | ) | — | ||||||||||
| Transfer to credit-impaired financial assets |
(1,804 | ) | (3,011 | ) | 4,815 | — | ||||||||||
| Charge-off |
— | — | (1,429 | ) | (1,429 | ) | ||||||||||
| Disposal |
— | — | (1,044 | ) | (1,044 | ) | ||||||||||
| Net increase |
6,130,974 | 87,621 | 171,248 | 6,389,843 | ||||||||||||
| Changes due to business combinations |
13,240 | — | — | 13,240 | ||||||||||||
|
|
|
|
|
|
|
|
|
|||||||||
| Ending balance |
15,017,593 | 117,665 | 252,029 | 15,387,287 | ||||||||||||
|
|
|
|
|
|
|
|
|
|||||||||
- 63 -
WOORI FINANCIAL GROUP INC. AND SUBSIDIARIES
NOTES TO CONSOLIDATED INTERIM FINANCIAL STATEMENTS
AS OF JUNE 30, 2024 AND 2023
| 11. | FAIR VALUE OF FINANCIAL ASSETS AND LIABILITIES |
| (1) | The fair value hierarchy |
The fair value hierarchy for financial instruments is determined by the amount of observable market data. The specific financial instruments characteristics and market condition such as the existence of the transactions among market participants and transparency are reflected to the market observable inputs. The fair value hierarchy gives the highest priority to quoted prices (unadjusted) in active markets for identical assets or liabilities. The Group maximizes the use of observable inputs and minimizes the use of unobservable inputs when measuring fair value of its financial assets and financial liabilities. Fair value is measured based on the perspective of a market participant. As such, even when market assumptions are not readily available, the Group’s own assumptions reflect those that market participants would use for measuring the assets or liabilities at the measurement date.
The fair value measurement is described in the one of the following three levels used to classify fair value measurements:
| • | Level 1 - fair value measurements are those derived from quoted prices (unadjusted) in active markets for identical assets or liabilities. The types of financial assets or liabilities generally included in Level 1 are publicly traded equity securities, derivatives, and debt securities issued by governmental bodies. |
| • | Level 2 - fair value measurements are those derived from inputs other than quoted prices included within Level 1 that are observable for the asset or liability, either directly (i.e. prices) or indirectly (i.e. derived from prices). The types of financial assets or liabilities generally included in Level 2 are debt securities not traded in active markets and derivatives traded in OTC but not required significant judgment. |
| • | Level 3 - fair value measurements are those derived from valuation technique that include inputs for the assets or liabilities that are not based on observable market data (unobservable inputs). The types of financial assets or liabilities generally included in Level 3 are non-public securities and derivatives and debt securities of which valuation techniques require significant judgments and subjectivity. |
The inputs used to measure fair value may fall into different levels of the fair value hierarchy. In such cases, the level within the fair value hierarchy is based on the lowest level of input that is significant to the fair value measurement. The Group’s assessment of the significance of a particular input to a fair value measurement in its entirety requires judgment and consideration of inherent factors of the asset or liability.
- 64 -
WOORI FINANCIAL GROUP INC. AND SUBSIDIARIES
NOTES TO CONSOLIDATED INTERIM FINANCIAL STATEMENTS
AS OF JUNE 30, 2024 AND 2023
| (2) | Fair value hierarchy of financial assets and liabilities measured at fair value are as follows (Unit: Korean Won in millions): |
| June 30, 2024 | ||||||||||||||||
| Level 1 (*) | Level 2 (*) | Level 3 | Total | |||||||||||||
| Financial assets: |
||||||||||||||||
| Financial assets at FVTPL |
||||||||||||||||
| Deposits |
49,518 | — | — | 49,518 | ||||||||||||
| Debt securities |
4,344,243 | 1,649,364 | 1,379 | 5,994,986 | ||||||||||||
| Equity securities |
39,181 | — | 404,996 | 444,177 | ||||||||||||
| Capital contributions |
— | — | 2,659,555 | 2,659,555 | ||||||||||||
| Beneficiary certificates |
157,079 | 2,932,388 | 1,943,819 | 5,033,286 | ||||||||||||
| Loans |
— | 1,328,282 | 48,486 | 1,376,768 | ||||||||||||
| Derivative assets |
— | 7,507,788 | 6,820 | 7,514,608 | ||||||||||||
| Other financial assets in foreign currency |
— | — | 45,689 | 45,689 | ||||||||||||
| Others |
— | — | 190,695 | 190,695 | ||||||||||||
|
|
|
|
|
|
|
|
|
|||||||||
| Sub-total |
4,590,021 | 13,417,822 | 5,301,439 | 23,309,282 | ||||||||||||
|
|
|
|
|
|
|
|
|
|||||||||
| Financial assets at FVTOCI |
||||||||||||||||
| Debt securities |
15,142,169 | 22,585,505 | — | 37,727,674 | ||||||||||||
| Equity securities |
574,237 | — | 523,356 | 1,097,593 | ||||||||||||
| Loans |
— | — | 50,361 | 50,361 | ||||||||||||
|
|
|
|
|
|
|
|
|
|||||||||
| Sub-total |
15,716,406 | 22,585,505 | 573,717 | 38,875,628 | ||||||||||||
|
|
|
|
|
|
|
|
|
|||||||||
| Derivative assets (designated for hedging) |
— | 85,106 | — | 85,106 | ||||||||||||
|
|
|
|
|
|
|
|
|
|||||||||
| Total |
20,306,427 | 36,088,433 | 5,875,156 | 62,270,016 | ||||||||||||
|
|
|
|
|
|
|
|
|
|||||||||
| Financial liabilities: |
||||||||||||||||
| Financial liabilities at FVTPL |
||||||||||||||||
| Deposits due to customers |
49,773 | — | — | 49,773 | ||||||||||||
| Derivative liabilities |
— | 6,973,140 | 16,991 | 6,990,131 | ||||||||||||
| Securities sold |
145,902 | — | — | 145,902 | ||||||||||||
|
|
|
|
|
|
|
|
|
|||||||||
| Sub-total |
195,675 | 6,973,140 | 16,991 | 7,185,806 | ||||||||||||
| Financial instruments designated to be measured at FVTPL |
||||||||||||||||
| Deposits due to customers |
— | 329,983 | — | 329,983 | ||||||||||||
| Derivative liabilities (designated for hedging) |
— | 150,585 | — | 150,585 | ||||||||||||
|
|
|
|
|
|
|
|
|
|||||||||
| Total |
195,675 | 7,453,708 | 16,991 | 7,666,374 | ||||||||||||
|
|
|
|
|
|
|
|
|
|||||||||
| (*) | There were no transfers between Level 1 and Level 2 of financial assets and liabilities measured at fair value. The Group recognizes transfers among levels at the end of reporting period in which events have occurred or conditions have changed. |
- 65 -
WOORI FINANCIAL GROUP INC. AND SUBSIDIARIES
NOTES TO CONSOLIDATED INTERIM FINANCIAL STATEMENTS
AS OF JUNE 30, 2024 AND 2023
| December 31, 2023 | ||||||||||||||||
| Level 1 (*) | Level 2 (*) | Level 3 | Total | |||||||||||||
| Financial assets: |
||||||||||||||||
| Financial assets at FVTPL |
||||||||||||||||
| Deposits |
39,241 | — | — | 39,241 | ||||||||||||
| Debt securities |
4,414,956 | 1,888,052 | 4,230 | 6,307,238 | ||||||||||||
| Equity securities |
68,691 | 19 | 353,279 | 421,989 | ||||||||||||
| Capital contributions |
— | — | 2,459,646 | 2,459,646 | ||||||||||||
| Beneficiary certificates |
169,012 | 3,634,938 | 1,705,965 | 5,509,915 | ||||||||||||
| Loans |
— | 726,714 | 56,002 | 782,716 | ||||||||||||
| Derivative assets |
113 | 5,669,078 | 129,138 | 5,798,329 | ||||||||||||
| Other financial assets in foreign currency |
— | — | 42,408 | 42,408 | ||||||||||||
| Others |
— | — | 183,274 | 183,274 | ||||||||||||
|
|
|
|
|
|
|
|
|
|||||||||
| Sub-total |
4,692,013 | 11,918,801 | 4,933,942 | 21,544,756 | ||||||||||||
|
|
|
|
|
|
|
|
|
|||||||||
| Financial assets at FVTOCI |
||||||||||||||||
| Debt securities |
12,392,117 | 24,301,994 | — | 36,694,111 | ||||||||||||
| Equity securities |
649,220 | — | 548,164 | 1,197,384 | ||||||||||||
|
|
|
|
|
|
|
|
|
|||||||||
| Sub-total |
13,041,337 | 24,301,994 | 548,164 | 37,891,495 | ||||||||||||
|
|
|
|
|
|
|
|
|
|||||||||
| Derivative assets (designated for hedging) |
— | 26,708 | — | 26,708 | ||||||||||||
|
|
|
|
|
|
|
|
|
|||||||||
| Total |
17,733,350 | 36,247,503 | 5,482,106 | 59,462,959 | ||||||||||||
|
|
|
|
|
|
|
|
|
|||||||||
| Financial liabilities: |
||||||||||||||||
| Financial liabilities at FVTPL |
||||||||||||||||
| Deposits due to customers |
39,524 | — | — | 39,524 | ||||||||||||
| Derivative liabilities |
8,303 | 5,932,727 | 1,994 | 5,943,024 | ||||||||||||
| Securities sold |
155,765 | — | — | 155,765 | ||||||||||||
|
|
|
|
|
|
|
|
|
|||||||||
| Sub-total |
203,592 | 5,932,727 | 1,994 | 6,138,313 | ||||||||||||
|
|
|
|
|
|
|
|
|
|||||||||
| Derivative liabilities (designated for hedging) |
— | 153,007 | — | 153,007 | ||||||||||||
|
|
|
|
|
|
|
|
|
|||||||||
| Total |
203,592 | 6,085,734 | 1,994 | 6,291,320 | ||||||||||||
|
|
|
|
|
|
|
|
|
|||||||||
| (*) | Among financial assets and financial liabilities measured at fair value, There is no amount transferred between Level 2 and Level 1. The Group recognizes transfers among levels at the end of reporting period in which events have occurred or conditions have changed. |
- 66 -
WOORI FINANCIAL GROUP INC. AND SUBSIDIARIES
NOTES TO CONSOLIDATED INTERIM FINANCIAL STATEMENTS
AS OF JUNE 30, 2024 AND 2023
Financial assets and liabilities at FVTPL, financial liabilities at FVTPL designated as upon initial recognition, financial assets at FVTOCI, and derivative assets and liabilities are recognized at fair value. Fair value is the amount that would be received to sell an asset, or paid to transfer a liability, in an orderly transaction between market participants at the measurement date.
Financial instruments are measured at fair value using a quoted market price in active markets. If there is no active market for a financial instrument, the Group determines the fair value using valuation methods. Valuation methods and input variables for each type of financial instruments are as follows:
| 1) | Valuation methods and input variables for each type of financial instrument classified into level 2 as of June 30, 2024 and December 31, 2023 are as follows: |
| Valuation methods |
Input variables | |||
| Debt securities | Fair value is measured by discounting the future cash flows of debt securities applying the risk-free market rate with credit spread and LSMC and Hull-White model. | Risk-free market rate, credit spread, discount rate originated from credit grade, volatility of stock and volatility of interest rate | ||
| Equity securities and beneficiary certificates | The beneficiary certificates are measured at net asset value method, DCF model(Discounted Cash Flow Model), Binomial Tree model and T-F model. | Values of underlying assets such as bond, discount rate, volatility of stock, terminal growth rate etc. | ||
| Derivatives | Fair value is measured by models such as option model. | Discount rate, volatility, exchange rate, stock prices, fair value originated from forward price etc. | ||
| Loans | The future cash flows of debt instruments are measured at a discount by applying the market interest rate applied to entities with similar creditworthiness to the debtor. | Risk-free market rate and credit spread | ||
| Deposits due to customers | Fair value is measured by Hull-White model. | Swaption Volume etc. | ||
| 2) | Valuation methods and input variables for each type of financial instrument classified into level 3 as of June 30, 2024 and December 31, 2023 are as follows: |
| Valuation methods |
Input variables | |||
| Loans | Fair value is measured by using the DCF model (Discounted Cash Flow Model) and LSMC(Hull-White) etc. which is a valuation technique commonly used in the market taking into account values and volatility of underlying assets. | Values of underlying assets, volatility, discount rate, volatility of stock, volatility of interest rate | ||
| Debt securities | Fair value is measured by models such as LSMC(Least-Squares Monte Carlo), Hull-White model. | Discount rate originated from credit grade, volatility of stocks , volatility of interest rate etc. | ||
| Stocks, capital contributions and Beneficiary certificates | Among DCF (Discounted Cash Flow) Model, FCFE (Free Cash Flow to Equity) Model, Comparable Company Analysis, Dividend Discount Model, Risk-adjusted Rate of Return Method, Net Asset Value Method, LSMC, Binomial Tree Model, Hull-White and Precedent Transactions model, one or more methods are used given the characteristic of the subject of fair value measurement. | Risk-free market rate, market risk premium, corporate Beta, stock prices, volatility of underlying asset, discount rate originated from credit grade, volatility of interest rate, volatility of real estate value, terminal growth rate, PBR, PSR etc. | ||
| Derivatives | Fair value is measured by models such as option model. | Correlation, etc. | ||
| Others | The fair value of the underlying asset, after calculating the fair value using the DCF model, etc., considering the price and volatility of the calculated underlying asset, is calculated using the binomial tree, which is commonly used valuation techniques in the market. | Stock price, volatility of underlying assets, etc. | ||
- 67 -
WOORI FINANCIAL GROUP INC. AND SUBSIDIARIES
NOTES TO CONSOLIDATED INTERIM FINANCIAL STATEMENTS
AS OF JUNE 30, 2024 AND 2023
Valuation methods of financial assets and liabilities measured at fair value and classified into Level 3 and significant but unobservable inputs are as follows:
| June 30, 2024 | ||||||||||
| Fair value |
Type |
Significant |
Range | Impact of changes in significant | ||||||
| Loans |
DCF model and others | Discount rate | 0.70%~6.46% | Fair value increases as discount rate decreases. | ||||||
| LMSC(Hull-White) | Volatility of index | 14.08%~24.11% | Variation of fair value increases as volatility increases. | |||||||
| Derivative assets |
Option valuation model and others | Equity related |
Correlation coefficient | 0.29~0.60 | Variation of fair value increases as correlation coefficient increases. | |||||
| Derivative liabilities |
Option valuation model and others | Equity related |
Correlation coefficient | 0.29~0.60 | Variation of fair value increases as correlation coefficient increases. | |||||
| Stocks, capital contributions, and Beneficiary certificates |
Binomial Tree | Stock prices, Volatility of underlying asset | 18.52%~25.16% | Variation of fair value increases as volatility of underlying asset and stock price increases. | ||||||
| DCF model and others | Discount rate | 5.14%~24.03% | Fair value increases as discount rate decreases. | |||||||
| Terminal growth rate |
0.00%~2.00% | Fair value increases as terminal growth rate increases. | ||||||||
| Liquidation value |
-1.00%~1.00% | Fair value increases as liquidation value increases. | ||||||||
| LMSC(Hull-White) | Volatility | 11.82%~19.33% | Variation of fair value increases as volatility increases. | |||||||
| Discount rate |
7.01% | Fair value increases as discount rate decreases. | ||||||||
| Others |
Binomial Tree | Stock prices, Volatility of underlying asset | 18.14%~53.77% | Variation of fair value increases as volatility of underlying asset and stock price increases. | ||||||
- 68 -
WOORI FINANCIAL GROUP INC. AND SUBSIDIARIES
NOTES TO CONSOLIDATED INTERIM FINANCIAL STATEMENTS
AS OF JUNE 30, 2024 AND 2023
| December 31, 2023 | ||||||||||
| Fair value |
Type |
Significant unobservable inputs |
Range | Impact of changes in significant | ||||||
| Loans |
DCF model and others | Discount rate | 4.05%~6.58% | Fair value increases as discount rate decreases. | ||||||
| LSMC(Hull-White) | Volatility of stock | 0.19%~0.24% | Fair value increases as volatility of stock increases. | |||||||
| Volatility of interest rate |
0.47%~0.91% | Fair value increases as volatility of interest rate increases. | ||||||||
| Volatility of index |
13.78%~21.92% | Variation of fair value increases as volatility increases. | ||||||||
| Derivative assets |
Option valuation model and others | Equity related | Correlation coefficient | 0.32~0.68 | Variation of fair value increases as correlation coefficient increases. | |||||
| Derivative liabilities |
Option valuation model and others | Equity related | Correlation coefficient | 0.32~0.68 | Variation of fair value increases as correlation coefficient increases. | |||||
| Stocks, capital contributions, and beneficiary certificates |
Binomial Tree | Discount rate | 3.58% | Fair value increases as discount rate decreases. | ||||||
| Stock prices, Volatility of underlying asset, Volatility of stocks |
27.34%~76.22% | Variation of fair value increases as volatility of underlying asset and stock price increases. | ||||||||
| Risk-adjusted discount rate method (Tsiveriotis-Fernandes) | Discount rate | 6.98% | Fair value increases as discount rate decreases. | |||||||
| Volatility of stock |
34.6% | Variation of fair value increases as volatility of stock increases. | ||||||||
| DCF model and others | Discount rate | 5.08%~19.90% | Fair value increases as discount rate decreases. | |||||||
| Terminal growth rate |
0.00%, 1.00% | Fair value increases as terminal growth rate increases. | ||||||||
| Liquidation value |
-1.00%~1.00% | Fair value increases as liquidation value increases. | ||||||||
| LSMC(Hull-White) | Discount rate | 5.06%~6.86% | Fair value increases as discount rate decreases. | |||||||
| Others |
Binomial Tree | Stock prices, Volatility of underlying asset | 15.48%~76.22% | Variation of fair value increases as volatility of underlying asset and stock price increases. | ||||||
| Discount rate |
10.42% | Fair value increases as discount rate decreases. | ||||||||
| Growth rate |
0.00% | Fair value increases as terminal growth rate increases | ||||||||
Fair value of financial assets and liabilities classified into Level 3 is measured by the Group using its own valuation methods or using external specialists. Unobservable inputs used in the fair value measurements are produced by the internal system of the Group and the appropriateness of inputs is reviewed regularly.
-69-
WOORI FINANCIAL GROUP INC. AND SUBSIDIARIES
NOTES TO CONSOLIDATED INTERIM FINANCIAL STATEMENTS
AS OF JUNE 30, 2024 AND 2023
| (3) | Changes in financial assets and liabilities measured at fair value classified into Level 3 are as follows (Unit: Korean Won in millions): |
| For the six-month period ended June 30, 2024 | ||||||||||||||||||||||||||||
| Beginning balance |
Net income (loss) (*1) |
Other comprehensive income |
Purchases/ issuances |
Disposals / settlements |
Transfer to or out of Level 3 (*2) |
Ending balance |
||||||||||||||||||||||
| Financial assets: |
||||||||||||||||||||||||||||
| Financial assets at FVTPL |
||||||||||||||||||||||||||||
| Debt securities |
4,230 | (251 | ) | — | — | (2,600 | ) | — | 1,379 | |||||||||||||||||||
| Equity securities |
353,279 | 5,219 | — | 44,875 | (324 | ) | 1,947 | 404,996 | ||||||||||||||||||||
| Capital contributions |
2,459,648 | 54,051 | — | 269,666 | (123,810 | ) | — | 2,659,555 | ||||||||||||||||||||
| Beneficiary certificates |
1,705,966 | 31,503 | — | 213,549 | (1,596 | ) | (5,603 | ) | 1,943,819 | |||||||||||||||||||
| Loans |
56,002 | 497 | — | 324,502 | (332,515 | ) | — | 48,486 | ||||||||||||||||||||
| Derivative assets |
129,136 | (5,296 | ) | — | 275 | (117,295 | ) | — | 6,820 | |||||||||||||||||||
| Other foreign currency financial assets |
42,406 | 3,283 | — | — | — | — | 45,689 | |||||||||||||||||||||
| Others |
183,274 | 4,267 | — | 9,565 | (6,411 | ) | — | 190,695 | ||||||||||||||||||||
|
|
|
|
|
|
|
|
|
|
|
|
|
|
|
|||||||||||||||
| Sub-total |
4,933,941 | 93,273 | — | 862,432 | (584,551 | ) | (3,656 | ) | 5,301,439 | |||||||||||||||||||
|
|
|
|
|
|
|
|
|
|
|
|
|
|
|
|||||||||||||||
| Financial assets at FVTOCI |
||||||||||||||||||||||||||||
| Equity securities |
548,164 | — | (28,348 | ) | 76 | — | 3,464 | 523,356 | ||||||||||||||||||||
| Loans |
— | — | 41 | 204,666 | (154,346 | ) | — | 50,361 | ||||||||||||||||||||
|
|
|
|
|
|
|
|
|
|
|
|
|
|
|
|||||||||||||||
| Sub-total |
548,164 | — | (28,307 | ) | 204,742 | (154,346 | ) | 3,464 | 573,717 | |||||||||||||||||||
|
|
|
|
|
|
|
|
|
|
|
|
|
|
|
|||||||||||||||
| Total |
5,482,105 | 93,273 | (28,307 | ) | 1,067,174 | (738,897 | ) | (192 | ) | 5,875,156 | ||||||||||||||||||
|
|
|
|
|
|
|
|
|
|
|
|
|
|
|
|||||||||||||||
| Financial liabilities: |
||||||||||||||||||||||||||||
| Financial liabilities at FVTPL |
||||||||||||||||||||||||||||
| Derivative liabilities |
1,994 | 16,315 | — | — | (1,318 | ) | — | 16,991 | ||||||||||||||||||||
|
|
|
|
|
|
|
|
|
|
|
|
|
|
|
|||||||||||||||
| Total |
1,994 | 16,315 | — | — | (1,318 | ) | — | 16,991 | ||||||||||||||||||||
|
|
|
|
|
|
|
|
|
|
|
|
|
|
|
|||||||||||||||
| (*1) | For financial liabilities, positive numbers represent losses that increase balance and negative numbers represent gains that decrease balance. The gain amounting to 84,063 million Won for the six-month period ended June 30, 2024, which is from financial assets and liabilities that the Group holds as at the end of the year. |
| (*2) | The Group recognizes transfers among levels at the end of reporting period in which events have occurred or conditions have changed. |
- 70 -
WOORI FINANCIAL GROUP INC. AND SUBSIDIARIES
NOTES TO CONSOLIDATED INTERIM FINANCIAL STATEMENTS
AS OF JUNE 30, 2024 AND 2023
| For the six-month period ended June 30, 2023 | ||||||||||||||||||||||||||||||||
| Beginning balance |
Business combination |
Net income (loss) (*1) |
Other comprehensive income |
Purchases/ issuances |
Disposals / settlements |
Transfer to or out of Level 3 (*2) |
Ending balance |
|||||||||||||||||||||||||
| Financial assets: |
||||||||||||||||||||||||||||||||
| Financial assets at FVTPL |
||||||||||||||||||||||||||||||||
| Debt securities |
1,078 | — | (1 | ) | — | 4,000 | — | — | 5,077 | |||||||||||||||||||||||
| Equity securities |
307,851 | 8,334 | 5,346 | — | 38,185 | (31,964 | ) | — | 327,752 | |||||||||||||||||||||||
| Capital contributions |
1,976,474 | 11,503 | 66,249 | — | 292,880 | (130,977 | ) | — | 2,216,129 | |||||||||||||||||||||||
| Beneficiary certificates |
1,458,776 | — | 43,391 | — | 154,783 | (29,149 | ) | — | 1,627,801 | |||||||||||||||||||||||
| Loans |
104,505 | — | 747 | — | 327,789 | (363,636 | ) | — | 69,405 | |||||||||||||||||||||||
| Derivative assets |
93,970 | — | (9,139 | ) | — | 10 | (4,449 | ) | — | 80,392 | ||||||||||||||||||||||
| Other foreign currency financial assets |
41,679 | — | 1,496 | — | — | — | — | 43,175 | ||||||||||||||||||||||||
| Others |
144,840 | — | 7,321 | — | 18,038 | (997 | ) | — | 169,202 | |||||||||||||||||||||||
|
|
|
|
|
|
|
|
|
|
|
|
|
|
|
|
|
|||||||||||||||||
| Sub-total |
4,129,173 | 19,837 | 115,410 | — | 835,685 | (561,172 | ) | — | 4,538,933 | |||||||||||||||||||||||
|
|
|
|
|
|
|
|
|
|
|
|
|
|
|
|
|
|||||||||||||||||
| Financial assets at FVTOCI |
||||||||||||||||||||||||||||||||
| Equity securities |
557,065 | — | — | (14,306 | ) | 138 | (2,086 | ) | (23 | ) | 540,788 | |||||||||||||||||||||
| Loans |
— | — | — | — | 39,698 | (8,891 | ) | — | 30,807 | |||||||||||||||||||||||
| Sub-total |
557,065 | — | — | (14,306 | ) | 39,836 | (10,977 | ) | (23 | ) | 571,595 | |||||||||||||||||||||
|
|
|
|
|
|
|
|
|
|
|
|
|
|
|
|
|
|||||||||||||||||
| Total |
4,686,238 | 19,837 | 115,410 | (14,306 | ) | 875,521 | (572,149 | ) | (23 | ) | 5,110,528 | |||||||||||||||||||||
|
|
|
|
|
|
|
|
|
|
|
|
|
|
|
|
|
|||||||||||||||||
| Financial liabilities: |
||||||||||||||||||||||||||||||||
| Financial liabilities at FVTPL |
||||||||||||||||||||||||||||||||
| Derivative liabilities |
9,450 | — | 2,859 | — | 10 | (9,449 | ) | — | 2,870 | |||||||||||||||||||||||
|
|
|
|
|
|
|
|
|
|
|
|
|
|
|
|
|
|||||||||||||||||
| Total |
9,450 | — | 2,859 | — | 10 | (9,449 | ) | — | 2,870 | |||||||||||||||||||||||
|
|
|
|
|
|
|
|
|
|
|
|
|
|
|
|
|
|||||||||||||||||
| (*1) | For financial liabilities, positive numbers represent losses that increase balance and negative numbers represent gains that decrease balance. The gain amounting to 162,982 million Won for the six- month period ended June 30, 2023, which is from financial assets and liabilities that the Group holds as at the end of the year. |
| (*2) | The Group recognizes transfers among levels at the end of reporting period in which events have occurred or conditions have changed. |
- 71 -
WOORI FINANCIAL GROUP INC. AND SUBSIDIARIES
NOTES TO CONSOLIDATED INTERIM FINANCIAL STATEMENTS
AS OF JUNE 30, 2024 AND 2023
| (4) | Sensitivity analysis results on reasonable fluctuation of the significant unobservable input variables for the fair value of Level 3 financial instruments are as follows. |
The sensitivity analysis of the financial instruments has been performed by classifying with favorable and unfavorable changes based on how changes in unobservable assumptions would have effects on the fluctuations of financial instruments’ value. When the fair value of a financial instrument is affected by more than one unobservable assumption, the below table reflects the most favorable or the most unfavorable changes which resulted from varying the assumptions individually. The sensitivity analysis was performed for two types of level 3 financial instruments: (1) interest rate related derivatives, currency related derivatives, equity related derivatives, equity-linked securities beneficiary certificates and loans of which fair value changes are recognized as net income; (2) equity securities of which fair value changes are recognized as other comprehensive income.
Meanwhile, among the financial instruments that are classified as Level 3 amounting to 5,892,145 million Won and 5,484,098 million Won as of June 30, 2024 and December 31, 2023, respectively, equity instruments of 4,676,686 million Won and 4,704,747 million Won whose carrying amount are considered to represent the reasonable approximation of fair value are excluded from the sensitivity analysis.
The sensitivity on fluctuation of input variables by financial instruments as of June 30, 2024 and December 31, 2023 is as follows (Unit: Korean Won in millions):
| June 30, 2024 | ||||||||||||||||
| Net income (loss) | Other comprehensive income (loss) |
|||||||||||||||
| Favorable | Unfavorable | Favorable | Unfavorable | |||||||||||||
| Financial assets: |
||||||||||||||||
| Financial assets at FVTPL |
||||||||||||||||
| Derivative assets (*1) |
38 | (38 | ) | — | — | |||||||||||
| Loans (*2) |
146 | (144 | ) | — | — | |||||||||||
| Equity securities (*2) (*3) (*4) (*5) |
10,350 | (8,584 | ) | — | — | |||||||||||
| Beneficiary certificates (*5) |
722 | (722 | ) | — | — | |||||||||||
| Others (*3) (*5) |
4,283 | (4,042 | ) | — | — | |||||||||||
| Financial assets at FVTOCI |
||||||||||||||||
| Equity securities (*4) (*5) (*6) |
— | — | 25,373 | (20,611 | ) | |||||||||||
|
|
|
|
|
|
|
|
|
|||||||||
| Total |
15,539 | (13,530 | ) | 25,373 | (20,611 | ) | ||||||||||
|
|
|
|
|
|
|
|
|
|||||||||
| Financial liabilities: |
||||||||||||||||
| Financial liabilities at FVTPL |
||||||||||||||||
| Derivative liabilities (*1) |
— | (10 | ) | — | — | |||||||||||
|
|
|
|
|
|
|
|
|
|||||||||
| Total |
— | (10 | ) | — | — | |||||||||||
|
|
|
|
|
|
|
|
|
|||||||||
| (*1) | Fair value changes of equity related derivatives assets and liabilities and equity-linked securities are calculated by increasing or decreasing correlation, which is major unobservable variables, by 10%, respectively. |
| (*2) | Fair value changes of equity securities are calculated by increasing or decreasing growth rate (0%p~1%p) and discount rate or liquidation value (-1%p~1%p), which are major unobservable variables. |
| (*3) | Fair value changes of equity securities are calculated by increasing or decreasing stock price (-10%p~10%p) and volatility (-10%p~10%p), which are major unobservable variables. |
| (*4) | Fair value changes of equity securities are calculated by increasing or decreasing terminal growth rate (-0.5%p~0.5%p) and discount rate (-1%p~1%p) or liquidation value (-1%p~1%p), which are major unobservable variables. |
| (*5) | Even if the sensitivity analysis of the capital contributions and beneficiary certificates is not possible in practice, fair value changes of beneficiary certificates and other securities whose major unobservable variables are composed of the real estate are calculated by increasing or decreasing price fluctuation rate of real estate which is underlying assets and discount rate by 1%. |
| (*6) | Fair value changes of equity securities are calculated by increasing or decreasing correlation between growth rate and discount rate, which are major unobservable variables. |
- 72 -
WOORI FINANCIAL GROUP INC. AND SUBSIDIARIES
NOTES TO CONSOLIDATED INTERIM FINANCIAL STATEMENTS
AS OF JUNE 30, 2024 AND 2023
| December 31, 2023 | ||||||||||||||||
| Net income (loss) | Other comprehensive income (loss) |
|||||||||||||||
| Favorable | Unfavorable | Favorable | Unfavorable | |||||||||||||
| Financial assets: |
||||||||||||||||
| Financial assets at FVTPL |
||||||||||||||||
| Derivative assets (*1) |
88 | (95 | ) | — | — | |||||||||||
| Loans (*2) |
202 | (199 | ) | — | — | |||||||||||
| Debt securities |
21 | (22 | ) | — | — | |||||||||||
| Equity securities (*2) (*3) (*4) |
11,562 | (8,953 | ) | — | — | |||||||||||
| Beneficiary certificates (*4) |
722 | (722 | ) | — | — | |||||||||||
| Others (*2) |
4,098 | (3,921 | ) | — | — | |||||||||||
| Financial assets at FVTOCI |
||||||||||||||||
| Equity securities (*3) (*4) |
— | — | 28,020 | (22,302 | ) | |||||||||||
|
|
|
|
|
|
|
|
|
|||||||||
| Total |
16,693 | (13,912 | ) | 28,020 | (22,302 | ) | ||||||||||
|
|
|
|
|
|
|
|
|
|||||||||
| Financial liabilities: |
||||||||||||||||
| Financial liabilities at FVTPL |
||||||||||||||||
| Derivative liabilities (*1) |
10 | (7 | ) | — | — | |||||||||||
|
|
|
|
|
|
|
|
|
|||||||||
| Total |
10 | (7 | ) | — | — | |||||||||||
|
|
|
|
|
|
|
|
|
|||||||||
| (*1) | Fair value changes of equity related derivatives assets and liabilities and equity-linked securities are calculated by increasing or decreasing historical volatility of the stock price and correlation, which are major unobservable variables, by 10%, respectively. In the case of interest rate related derivative assets and liabilities, fair value changes are calculated by increasing or decreasing the volatility of interest rate, which are major unobservable variables, by 10%. |
| (*2) | Fair value changes of equity securities are calculated by increasing or decreasing stock prices (-10%~10%) and volatility (-10~10%). The stock prices and volatility are major unobservable variables. |
| (*3) | Fair value changes of equity securities are calculated by increasing or decreasing terminal growth rate (-0.5%~1%) and discount rate (-1~1%) or liquidation value (-1~1%). The growth rate, discount rate, and liquidation value are major unobservable variables. |
| (*4) | Even if the sensitivity analysis of the capital contributions and beneficiary certificates is not possible in practice, fair value changes of beneficiary certificates and other securities whose major unobservable variables are composed of the real estate are calculated by increasing or decreasing price fluctuation rate of real estate which is underlying assets and discount rate by 1%. |
- 73 -
WOORI FINANCIAL GROUP INC. AND SUBSIDIARIES
NOTES TO CONSOLIDATED INTERIM FINANCIAL STATEMENTS
AS OF JUNE 30, 2024 AND 2023
| (5) | Fair value and carrying amount of financial assets and liabilities that are recorded at amortized cost are as follows (Unit: Korean Won in millions): |
| June 30, 2024 | ||||||||||||||||||||
| Fair value | Carrying amount |
|||||||||||||||||||
| Level 1 | Level 2 | Level 3 | Total | |||||||||||||||||
| Financial assets: |
||||||||||||||||||||
| Securities at amortized cost |
1,908,201 | 20,266,833 | — | 22,175,034 | 22,408,759 | |||||||||||||||
| Loans and other financial assets at amortized cost |
— | 11,581,462 | 378,612,474 | 390,193,936 | 387,374,084 | |||||||||||||||
| Financial liabilities: |
||||||||||||||||||||
| Deposits due to customers |
— | 359,930,084 | — | 359,930,084 | 359,302,549 | |||||||||||||||
| Borrowings |
— | 29,074,526 | 1,219,693 | 30,294,219 | 30,315,001 | |||||||||||||||
| Debentures |
— | 41,866,751 | — | 41,866,751 | 42,102,432 | |||||||||||||||
| Other financial liabilities (*) |
— | 30,112,561 | 706,487 | 30,819,048 | 31,536,943 | |||||||||||||||
| (*) | Lease liabilities are excluded as of June 30, 2024. |
| December 31, 2023 | ||||||||||||||||||||
| Fair value | Carrying amount |
|||||||||||||||||||
| Level 1 | Level 2 | Level 3 | Total | |||||||||||||||||
| Financial assets: |
||||||||||||||||||||
| Securities at amortized cost |
2,361,627 | 21,303,099 | — | 23,664,726 | 23,996,172 | |||||||||||||||
| Loans and other financial assets at amortized cost |
— | 9,905,518 | 364,211,207 | 374,116,725 | 373,148,148 | |||||||||||||||
| Financial liabilities: |
||||||||||||||||||||
| Deposits due to customers |
— | 360,186,521 | — | 360,186,521 | 357,784,297 | |||||||||||||||
| Borrowings |
— | 31,065,237 | 87,342 | 31,152,579 | 30,986,746 | |||||||||||||||
| Debentures |
— | 40,504,019 | — | 40,504,019 | 41,239,245 | |||||||||||||||
| Other financial liabilities (*) |
— | 24,584,447 | 609,620 | 25,194,067 | 25,780,550 | |||||||||||||||
| (*) | Lease liabilities are excluded as of December 31, 2023 |
The fair values of financial instruments are measured using quoted market price in active markets. In case there is no active market for financial instruments, the Group determines the fair value by using valuation methods. Valuation methods and input variables for financial assets and liabilities that are measured at amortized cost are given as follows:
| Valuation methods |
Input variables | |||
| Securities at amortized cost |
The fair value is measured by discounting the projected cash flows of debt securities by applying risk-free market rate with credit spread. |
Risk-free market rate and credit spread | ||
| Loans and other financial assets at amortized cost |
The fair value is measured by discounting the projected cash flows of loan products by applying the market discount rate that has been applied to a proxy company that has similar credit rating to the debtor. |
Risk-free market rate, credit spread and prepayment rate | ||
| Deposits due to customers, borrowings, debentures and other financial liabilities |
The fair value is measured by discounting the projected cash flows of debt products by applying the market discount rate that is reflecting credit rating of the Group. |
Risk-free market rate, credit spread | ||
- 74 -
WOORI FINANCIAL GROUP INC. AND SUBSIDIARIES
NOTES TO CONSOLIDATED INTERIM FINANCIAL STATEMENTS
AS OF JUNE 30, 2024 AND 2023
| (6) | Financial instruments by category |
Carrying amounts of financial assets and liabilities by each category are as follows (Unit: Korean Won in millions):
| June 30, 2024 | ||||||||||||||||||||
| Financial assets | Financial assets at FVTPL |
Financial assets at FVTOCI |
Financial assets at amortized cost |
Derivatives assets (designated for hedging) |
Total | |||||||||||||||
| Deposits |
49,518 | — | 2,730,581 | — | 2,780,099 | |||||||||||||||
| Securities |
14,321,073 | 38,825,267 | 22,408,759 | — | 75,555,099 | |||||||||||||||
| Loans |
1,376,768 | 50,361 | 370,745,214 | — | 372,172,343 | |||||||||||||||
| Derivative assets |
7,514,608 | — | — | 85,106 | 7,599,714 | |||||||||||||||
| Other financial assets |
47,315 | — | 13,898,289 | — | 13,945,604 | |||||||||||||||
|
|
|
|
|
|
|
|
|
|
|
|||||||||||
| Total |
23,309,282 | 38,875,628 | 409,782,843 | 85,106 | 472,052,859 | |||||||||||||||
|
|
|
|
|
|
|
|
|
|
|
|||||||||||
| June 30, 2024 | ||||||||||||||||||||
| Financial liabilities | Financial liabilities at FVTPL |
Financial liabilites designated to be measured at FVTPL |
Financial assets at amortized cost |
Derivatives liabilities (designated for hedging) |
Total | |||||||||||||||
| Deposits due to customers |
49,773 | 329,983 | 359,302,549 | — | 359,682,305 | |||||||||||||||
| Borrowings |
145,902 | — | 30,315,001 | — | 30,460,903 | |||||||||||||||
| Debentures |
— | — | 42,102,432 | — | 42,102,432 | |||||||||||||||
| Derivative liabilities |
6,990,131 | — | — | 150,585 | 7,140,716 | |||||||||||||||
| Other financial liabilities (*) |
— | — | 31,536,943 | — | 31,536,943 | |||||||||||||||
|
|
|
|
|
|
|
|
|
|
|
|||||||||||
| Total |
7,185,806 | 329,983 | 463,256,925 | 150,585 | 470,923,299 | |||||||||||||||
|
|
|
|
|
|
|
|
|
|
|
|||||||||||
| (*) | Lease liabilities are excluded as of June 30, 2024. |
| December 31, 2023 | ||||||||||||||||||||
| Financial assets | Financial assets at FVTPL |
Financial assets at FVTOCI |
Financial assets at amortized cost |
Derivatives assets (designated for hedging) |
Total | |||||||||||||||
| Deposits |
39,241 | — | 1,950,573 | — | 1,989,814 | |||||||||||||||
| Securities |
14,880,479 | 37,891,495 | 23,996,172 | — | 76,768,146 | |||||||||||||||
| Loans |
782,716 | — | 358,577,179 | — | 359,359,895 | |||||||||||||||
| Derivative assets |
5,798,329 | — | — | 26,708 | 5,825,037 | |||||||||||||||
| Other financial assets |
43,991 | — | 12,620,396 | — | 12,664,387 | |||||||||||||||
|
|
|
|
|
|
|
|
|
|
|
|||||||||||
| Total |
21,544,756 | 37,891,495 | 397,144,320 | 26,708 | 456,607,279 | |||||||||||||||
|
|
|
|
|
|
|
|
|
|
|
|||||||||||
| December 31, 2023 | ||||||||||||||||
| Financial liabilities | Financial liabilities at FVTPL |
Financial liabilities at amortized cost |
Derivatives liabilities (designated for hedging) |
Total | ||||||||||||
| Deposits due to customers |
39,524 | 357,784,297 | — | 357,823,821 | ||||||||||||
| Borrowings |
155,765 | 30,986,746 | — | 31,142,511 | ||||||||||||
| Debentures |
— | 41,239,245 | — | 41,239,245 | ||||||||||||
| Derivative liabilities |
5,943,024 | — | 153,007 | 6,096,031 | ||||||||||||
| Other financial liabilities (*) |
— | 25,780,550 | — | 25,780,550 | ||||||||||||
|
|
|
|
|
|
|
|
|
|||||||||
| Total |
6,138,313 | 455,790,838 | 153,007 | 462,082,158 | ||||||||||||
|
|
|
|
|
|
|
|
|
|||||||||
| (*) | Lease liabilities are excluded as of December 31, 2023. |
- 75 -
WOORI FINANCIAL GROUP INC. AND SUBSIDIARIES
NOTES TO CONSOLIDATED INTERIM FINANCIAL STATEMENTS
AS OF JUNE 30, 2024 AND 2023
| (7) | Income or expense from financial instruments by category |
Income or expense from financial assets and liabilities by each category during the six-month periods ended June 30, 2024 and 2023 are as follows (Unit: Korean Won in millions):
| For the six-month period ended June 30, 2024 | ||||||||||||||||||||||||
| Interest income (expense) |
Fees and commissions income (expense) |
Reversal (provision) of credit loss |
Gain or loss on transactions and valuation |
Dividends, etc. |
Total | |||||||||||||||||||
| Financial instruments at FVTPL |
114,866 | 755 | — | 903,237 | 137,721 | 1,156,579 | ||||||||||||||||||
| Financial instruments designated to be measured at FVTPL (*) |
— | — | — | (1,119 | ) | — | (1,119 | ) | ||||||||||||||||
| Financial assets at FVTOCI |
626,636 | 694 | (3,482 | ) | 38,515 | 15,017 | 677,380 | |||||||||||||||||
| Securities at amortized cost |
343,472 | — | 811 | — | — | 344,283 | ||||||||||||||||||
| Loans and other financial assets at amortized cost |
9,802,902 | 279,110 | (779,448 | ) | 165,645 | — | 9,468,209 | |||||||||||||||||
| Financial liabilities at amortized cost |
(6,483,393 | ) | 51 | — | — | — | (6,483,342 | ) | ||||||||||||||||
| Net derivatives (designated for hedging) |
— | — | — | 52,394 | — | 52,394 | ||||||||||||||||||
|
|
|
|
|
|
|
|
|
|
|
|
|
|||||||||||||
| Total |
4,404,483 | 280,610 | (782,119 | ) | 1,158,672 | 152,738 | 5,214,384 | |||||||||||||||||
|
|
|
|
|
|
|
|
|
|
|
|
|
|||||||||||||
| (*) | The amounts recognized in profit or loss and other comprehensive income related to financial liabilities designated to be measured at FVTPL are 837 million Won during the six-month periods ended June 30, 2024. |
| For the six-month period ended June 30, 2023 | ||||||||||||||||||||||||
| Interest Income (expense) |
Fees and Commissions Income (expense) |
Provision of credit loss |
Gain or loss on transactions and valuation |
Dividends, etc. |
Total | |||||||||||||||||||
| Financial instruments at FVTPL |
91,617 | (63 | ) | — | 360,517 | 78,299 | 530,370 | |||||||||||||||||
| Financial assets at FVTOCI |
436,796 | 456 | (12,163 | ) | (398 | ) | 13,706 | 438,397 | ||||||||||||||||
| Securities at amortized cost |
405,262 | — | (6,019 | ) | — | — | 399,243 | |||||||||||||||||
| Loans and other financial assets at amortized cost |
9,044,202 | 299,513 | (780,194 | ) | 115,708 | — | 8,679,229 | |||||||||||||||||
| Financial liabilities at amortized cost |
(5,559,178 | ) | 694 | — | — | — | (5,558,484 | ) | ||||||||||||||||
| Net derivatives (designated for hedging) |
— | — | — | 48,982 | — | 48,982 | ||||||||||||||||||
|
|
|
|
|
|
|
|
|
|
|
|
|
|||||||||||||
| Total |
4,418,699 | 300,600 | (798,376 | ) | 524,809 | 92,005 | 4,537,737 | |||||||||||||||||
|
|
|
|
|
|
|
|
|
|
|
|
|
|||||||||||||
- 76 -
WOORI FINANCIAL GROUP INC. AND SUBSIDIARIES
NOTES TO CONSOLIDATED INTERIM FINANCIAL STATEMENTS
AS OF JUNE 30, 2024 AND 2023
| 12. | INVESTMENTS IN JOINT VENTURES AND ASSOCIATES |
| (1) | Investments in joint ventures and associates accounted for using the equity method of accounting are as follows: |
| Percentage of ownership (%) | ||||||||||||||||||
| Joint ventures and associates |
Main business | June 30, 2024 |
December 31, 2023 |
Location | Financial statements as of |
|||||||||||||
| Woori Bank |
||||||||||||||||||
| W Service Networks Co., Ltd. (*1)(*4) |
Freight & staffing services | 4.9 | 4.9 | Korea | 2024-05-31 | |||||||||||||
| Korea Credit Bureau Co., Ltd. (*2) |
Credit information | 9.9 | 9.9 | Korea | 2024-06-30 | |||||||||||||
| Korea Finance Security Co., Ltd. (*2) (*4) |
Security service | 15.0 | 15.0 | Korea | 2024-05-31 | |||||||||||||
| Wongwang Co., Ltd. (*3) |
Wholesale and real estate | 29.0 | 29.0 | Korea | — | |||||||||||||
| Sejin Construction Co., Ltd. (*3) |
Construction | 29.6 | 29.6 | Korea | — | |||||||||||||
| ARES-TECH Co., Ltd. (*3) |
Electronic component manufacturing |
23.4 | 23.4 | Korea | — | |||||||||||||
| Beomgyo., Ltd. (*3) |
Telecommunication equipment retail sales |
23.1 | 23.1 | Korea | — | |||||||||||||
| NK Eng Co., Ltd. (*3) |
Manufacturing | 23.1 | 23.1 | Korea | — | |||||||||||||
| K BANK Co., Ltd. (*2)(*4) |
Finance | 12.6 | 12.6 | Korea | 2024-05-31 | |||||||||||||
| Partner One Value Up I Private Equity Fund |
Other financial services | 23.3 | 23.3 | Korea | 2024-06-30 | |||||||||||||
| IBK KIP Seongjang Dideemdol 1st Private Investment Limited Partnership |
Other financial services | 20.0 | 20.0 | Korea | 2024-06-30 | |||||||||||||
| Crevisse Raim Impact 1st Startup Venture Specialist Private Equity Fund |
Other financial services | 25.0 | 25.0 | Korea | 2024-06-30 | |||||||||||||
| LOTTE CARD Co., Ltd. (*4) |
Credit card and installment financing |
20.0 | 20.0 | Korea | 2024-03-31 | |||||||||||||
| Union Technology Finance Investment Association |
Other financial services | 29.7 | 29.7 | Korea | 2024-06-30 | |||||||||||||
| Dicustody Co., Ltd.(*2) |
Other information technology and computer operation related services |
1.0 | 1.0 | Korea | 2024-06-30 | |||||||||||||
| Orient Shipyard Co., Ltd. (*3)(*4) |
Manufacture of sections for ships |
22.7 | 22.7 | Korea | 2024-03-31 | |||||||||||||
| Joongang Network Solution Co., Ltd. (*3)(*4) |
Other information technology and computer operation related services |
25.3 | 25.3 | Korea | 2024-03-31 | |||||||||||||
| Win Mortgage Co., LTd. (*1)(*4) |
Other financial services | 4.5 | 4.5 | Korea | 2024-03-31 | |||||||||||||
| Together-Korea Government Private Pool Private Securities Investment Trust No. 3 |
Other financial services | 100.0 | 100.0 | Korea | 2024-06-30 | |||||||||||||
| BTS 2nd Private Equity Fund |
Other financial services | 20.0 | 20.0 | Korea | 2024-06-30 | |||||||||||||
| STASSETS FUND III |
Other financial services | 28.3 | 28.3 | Korea | 2024-06-30 | |||||||||||||
| SF CREDIT PARTNERS, LLC(*2) |
Other financial services | 10.0 | 10.0 | Korea | 2024-06-30 | |||||||||||||
| Woori Bank (*5) |
||||||||||||||||||
| Japanese Hotel Real Estate Private Equity Fund No.2 |
Other financial services | 19.9 | 19.9 | Korea | 2024-06-30 | |||||||||||||
- 77 -
WOORI FINANCIAL GROUP INC. AND SUBSIDIARIES
NOTES TO CONSOLIDATED INTERIM FINANCIAL STATEMENTS
AS OF JUNE 30, 2024 AND 2023
| Percentage of ownership (%) | ||||||||||||||||||
| Joint ventures and associates |
Main business | June 30, 2024 |
December 31, 2023 |
Location | Financial statements as of |
|||||||||||||
| Woori Seoul Beltway Private Special Asset Fund No.1 |
Trust and collective investment |
25.0 | 25.0 | Korea | 2024-06-30 | |||||||||||||
| Woori General Private Securities Investment Trust (Bond) No.1 (*7) |
Collective investment business |
— | 25.0 | Korea | — | |||||||||||||
| Woori Short-term Bond Securities Investment Trust (Bond) Class C-F |
Collective investment business |
7.2 | 15.0 | Korea | 2024-06-30 | |||||||||||||
| Woori Safe Plus General Type Private Investment Trust S-8 (Bond) (*7) |
Collective investment business |
— | 9.1 | Korea | — | |||||||||||||
| Woori General Private Securities Investment Trust (Bond) No.2 (*7) |
Collective investment business |
— | 27.3 | Korea | — | |||||||||||||
| Woori Smart General Private Equity Investment Trust 1 (Bond) |
Collective investment business |
28.6 | 28.6 | Korea | 2024-06-30 | |||||||||||||
| Woori General Private Securities Investment Trust (Bond) No.3 |
Collective investment business |
29.3 | 27.8 | Korea | 2024-06-30 | |||||||||||||
| Woori Asset Global Partnership Fund No. 5 |
Collective investment business |
57.7 | 57.7 | Korea | 2024-06-30 | |||||||||||||
| Woori Short Term Government and Special Bank Bond Active ETF(*7) |
Collective investment business |
— | 20.8 | Korea | — | |||||||||||||
| Woori 25-09 Corporate Bond(AA- or higher) Active ETF |
Collective investment business |
29.0 | 29.3 | Korea | 2024-06-30 | |||||||||||||
| Woori General Private Securities Investment Trust No. 5 (Bond) (*11) |
Collective investment business |
28.6 | — | Korea | 2024-06-30 | |||||||||||||
| Woori Big Satisfaction General Private Securities Investment Trust No. 3 (Bond) (*11) |
Collective investment business |
9.1 | — | Korea | 2024-06-30 | |||||||||||||
| Woori General Private Securities Investment Trust No. 6 (Bond) (*11) |
Collective investment business |
28.6 | — | Korea | 2024-06-30 | |||||||||||||
| Woori Big Satisfaction Corporation MMF No. 1 (Government Bond) (*11) |
Collective investment business |
1.8 | — | Korea | 2024-06-30 | |||||||||||||
| Woori General Private Securities Investment Trust No. 7 (Bond) (*11) |
Collective investment business |
28.6 | — | Korea | 2024-06-30 | |||||||||||||
| Woori Financial Capital Co., Ltd. |
||||||||||||||||||
| WOORI TAERIM 1st Fund |
Other financial services | 25.6 | 25.6 | Korea | 2024-06-30 | |||||||||||||
| Portone-Cape Fund No.1 |
Other financial services | 20.0 | 20.0 | Korea | 2024-06-30 | |||||||||||||
| DeepDive WOORI 2021-1 Financial Investment Fund (*6) |
Other financial services | 11.9 | 11.9 | Korea | 2024-06-30 | |||||||||||||
| Darwin Green Packaging Private Equity Fund |
Other financial services | 20.4 | 20.4 | Korea | 2024-06-30 | |||||||||||||
| Koreawide partners 2nd Private Equity Fund |
Other financial services | 26.7 | 26.7 | Korea | 2024-06-30 | |||||||||||||
| Woori Investment Bank Co., Ltd. |
||||||||||||||||||
| Woori FirstValue Private Real Estate Fund No.2 |
Real estate business | 12.0 | 12.0 | Korea | 2024-06-30 | |||||||||||||
| WooriG Real Infrastructure Blind General Type Private Placement Investment Trust (*7) |
Investment trust and discretionary investment business |
— | 0.1 | Korea | — | |||||||||||||
- 78 -
WOORI FINANCIAL GROUP INC. AND SUBSIDIARIES
NOTES TO CONSOLIDATED INTERIM FINANCIAL STATEMENTS
AS OF JUNE 30, 2024 AND 2023
| Percentage of ownership (%) | ||||||||||||||||||||
| Joint ventures and associates |
Main business | June 30, 2024 |
December 31, 2023 |
Location | Financial statements as of |
|||||||||||||||
| Woori Asset Management Co. Ltd. |
||||||||||||||||||||
| Woori Together TDF 2025(*11) |
|
Collective investment business |
|
28.6 | — | Korea | 2024-06-30 | |||||||||||||
| Woori Together TDF 2030 |
|
Collective investment business |
|
26.8 | 28.0 | Korea | 2024-06-30 | |||||||||||||
| Woori Together OCIO Target Return Feeder fund (Balance Bond) (*7) |
|
Collective investment business |
|
— | 20.4 | Korea | — | |||||||||||||
| Woori Private Equity Asset Management Co., Ltd. |
||||||||||||||||||||
| Australia Green Energy 1st PEF(*2) |
Other financial services | 4.0 | 4.0 | Korea | 2024-06-30 | |||||||||||||||
| Aarden Woori Apparel 1st Private Equity Fund (*2) |
Other financial services | 0.5 | 0.5 | Korea | 2024-06-30 | |||||||||||||||
| Woori Dyno 1st Private Equity Fund (*2) |
Other financial services | 19.6 | 19.6 | Korea | 2024-06-30 | |||||||||||||||
| Woori Venture Partners Co., Ltd. |
||||||||||||||||||||
| KTB-KORUS FUND (*8) |
Asset Management | 37.5 | 37.5 | Korea | 2024-06-30 | |||||||||||||||
| KTB China Platform Fund (*7)(*10) |
Asset Management | — | 18.7 | Korea | — | |||||||||||||||
| KTBN Venture Fund No.7 (*7)(*9) |
Asset Management | — | 20.1 | Korea | — | |||||||||||||||
| KTBN Venture Fund No.8 (*9) |
Asset Management | 21.7 | 21.7 | Korea | 2024-06-30 | |||||||||||||||
| KTBN Digital Contents Korea Fund No.9 (*9) |
Asset Management | 30.0 | 30.0 | Korea | 2024-06-30 | |||||||||||||||
| KTBN Media Contents Fund (*10) |
Asset Management | 15.0 | 15.0 | Korea | 2024-06-30 | |||||||||||||||
| KTB China Synergy Fund (*10) |
Asset Management | 15.1 | 15.1 | Korea | 2024-06-30 | |||||||||||||||
| NAVER-KTB Audio Contents Fund (*10) |
Asset Management | 1.0 | 1.0 | Korea | 2024-06-30 | |||||||||||||||
| KTBN Venture Fund No.13 (*10) |
Asset Management | 19.6 | 19.6 | Korea | 2024-06-30 | |||||||||||||||
| KTBN Future Contents Fund (*10) |
Asset Management | 13.3 | 13.3 | Korea | 2024-06-30 | |||||||||||||||
| KTBN Venture Fund No.16 (*10) |
Asset Management | 10.3 | 10.3 | Korea | 2024-06-30 | |||||||||||||||
| KTBN Venture Fund No.18 (*10) |
Asset Management | 10.1 | 10.1 | Korea | 2024-06-30 | |||||||||||||||
| KB-KTB Technology Venture Fund (*10) |
Asset Management | 18.2 | 18.2 | Korea | 2024-06-30 | |||||||||||||||
| Woori 2022 Scaleup Venture Fund |
Asset Management | 20.0 | 20.0 | Korea | 2024-06-30 | |||||||||||||||
| Woori 2022 Start-up Venture Fund |
Asset Management | 30.1 | 30.1 | Korea | 2024-06-30 | |||||||||||||||
| KTB-NHN China Private Equity Fund (*7) |
Asset Management | — | 33.3 | Korea | — | |||||||||||||||
| KTBN GI Private Equity Fund (*10) |
Asset Management | 5.0 | 5.0 | Korea | 2024-06-30 | |||||||||||||||
| Chirochem (*4) |
|
Medical material Manufacturing |
|
28.6 | 28.6 | Korea | 2023-12-31 | |||||||||||||
| Daishin Balance No.18 Special Purpose Acquisition Company (*11) |
Other financial services | 42.6 | — | Korea | 2024-06-30 | |||||||||||||||
| Japanese Hotel Real Estate Private Equity Fund 1 |
||||||||||||||||||||
| Godo Kaisha Oceanos 1 (*4) |
Other financial services | 47.8 | 47.8 | Japan | 2024-04-30 | |||||||||||||||
- 79 -
WOORI FINANCIAL GROUP INC. AND SUBSIDIARIES
NOTES TO CONSOLIDATED INTERIM FINANCIAL STATEMENTS
AS OF JUNE 30, 2024 AND 2023
| Percentage of ownership (%) | ||||||||||||||||||
| Joint ventures and associates |
Main business |
June 30, 2024 |
December 31, 2023 |
Location | Financial statements as of |
|||||||||||||
| Woori G Japan Private Placement Real Estate Master Investment Trust No.2 |
||||||||||||||||||
| Woori Zip 1(*4) |
Other financial services | 62.3 | 62.4 | Japan | 2024-03-31 | |||||||||||||
| Woori Zip 2 (*4) |
Other financial services | 62.7 | 62.8 | Japan | 2024-03-31 | |||||||||||||
| Woori bank and Woori card Co., Ltd. (*5) |
||||||||||||||||||
| Dongwoo C & C Co., Ltd. (*3) |
Construction | 24.5 | 24.5 | Korea | — | |||||||||||||
| SJCO Co., Ltd. (*3) |
Aggregate transportation and wholesale | 29.8 | 29.8 | Korea | — | |||||||||||||
| G2 Collection Co., Ltd. (*3) |
Wholesale and retail sales | 29.2 | 29.2 | Korea | — | |||||||||||||
| KG Fashion Co., Ltd. (*3) (*4) |
Manufacturing | 20.8 | 20.8 | Korea | 2024-05-31 | |||||||||||||
| Kyesan Engineering Co., Ltd. (*3) |
Construction | 23.3 | 23.3 | Korea | — | |||||||||||||
| Good Software Lap Co., Ltd. (*3) |
Service | 29.4 | 29.4 | Korea | — | |||||||||||||
| DAEA SNC Co., Ltd. (*3) |
Wholesale and retail sales | 25.5 | 25.5 | Korea | — | |||||||||||||
| PREXCO Co., Ltd. (*3) |
Manufacturing | 28.1 | 28.1 | Korea | — | |||||||||||||
| JiWon Plating Co., Ltd. (*3) |
Plating | 20.8 | 20.8 | Korea | — | |||||||||||||
| Youngdong Sea Food Co., Ltd. (*3) |
Processed sea food manufacturing | 24.5 | 24.5 | Korea | — | |||||||||||||
| KUM HWA Co., Ltd. (*3) |
Telecommunication equipment retail sales | 20.1 | 20.1 | Korea | 2024-06-30 | |||||||||||||
| Jinmyung Plus Co., Ltd. (*3) (*4) |
Manufacturing | 21.3 | 21.3 | Korea | 2024-03-31 | |||||||||||||
| Rea Company (*3) |
Other financial services | 26.1 | 24.5 | Korea | — | |||||||||||||
| ARAM CMC Co.,Ltd. (*3) (*4) |
Other financial services | 20.1 | 20.0 | Korea | 2024-05-31 | |||||||||||||
| Woori bank and Woori Financial Capital Co., Ltd. (*5) |
||||||||||||||||||
| JC Assurance No.2 Private Equity Fund |
Other financial services | 23.4 | 23.5 | Korea | 2024-06-30 | |||||||||||||
| Dream Company Growth no.1 PEF (*7) |
Other financial services | — | 27.8 | Korea | — | |||||||||||||
| HMS-Oriens 1st Fund |
Other financial services | 22.8 | 22.8 | Korea | 2024-06-30 | |||||||||||||
| Woori Senior Loan Private Placement Investment Trust No.1 |
Collective investment business | 21.6 | 21.7 | Korea | 2024-06-30 | |||||||||||||
| Genesis Eco No.1 Private Equity Fund |
Other financial services | 29.0 | 29.0 | Korea | 2024-06-30 | |||||||||||||
| Paratus Woori Material Component Equipment joint venture company |
Other financial services | 29.9 | 29.9 | Korea | 2024-06-30 | |||||||||||||
| Midas No. 8 Private Equity Joint Venture Company |
Other financial services | 28.5 | 28.5 | Korea | 2024-06-30 | |||||||||||||
| Orchestra Private Equity Fund IV |
Other financial services | 28.2 | 28.2 | Korea | 2024-06-30 | |||||||||||||
| Synaptic Green No.1 PEF |
Other financial services | 21.1 | 21.1 | Korea | 2024-06-30 | |||||||||||||
| IGEN2022No. 1 Private Equity Fund |
Other financial services | 24.8 | 24.8 | Korea | 2024-06-30 | |||||||||||||
| PCC-Woori LP Secondary Fund |
Other financial services | 38.8 | 38.9 | Korea | 2024-06-30 | |||||||||||||
- 80 -
WOORI FINANCIAL GROUP INC. AND SUBSIDIARIES
NOTES TO CONSOLIDATED INTERIM FINANCIAL STATEMENTS
AS OF JUNE 30, 2024 AND 2023
| Percentage of ownership (%) | ||||||||||||||||||
| Joint ventures and associates |
Main business |
June 30, 2024 |
December 31, 2023 |
Location | Financial statements as of |
|||||||||||||
| Synaptic Future Growth Private Equity Fund 1 |
Other financial investment | 23.8 | 23.8 | Korea | 2024-06-30 | |||||||||||||
| Woori Bank and Woori Asset Management Co. Ltd. (*5) |
||||||||||||||||||
| Woori BIG2 Plus Securities Investment Trust(Balanced Bond) |
Collective investment business | 8.4 | 14.1 | Korea | 2024-06-30 | |||||||||||||
| Woorinara New Growth TOP 20 Securities Investment Trust No. 1 (Stocks) (*7)(*11) |
Collective investment business | — | — | Korea | — | |||||||||||||
| Woorinara Short-Term Bond Securities Investment Trust (Bond) (*11) |
Collective investment business | 17.5 | — | Korea | 2024-06-30 | |||||||||||||
| Woori Investment Bank Co., Ltd. and Woori Asset Management Co., Ltd. (*5) |
||||||||||||||||||
| Woori Oncorp Corporate support of Major Industry General Type Private Investment Trust 2 (*11) |
Collective investment business | 2.1 | — | Korea | 2024-06-30 | |||||||||||||
| Woori Bank and Woori Private Equity Asset Management Co., Ltd. (*5) |
||||||||||||||||||
| Woori-Q Corporate Restructuring Private Equity Fund(*12) |
Other financial services | 34.2 | 32.4 | Korea | 2024-06-30 | |||||||||||||
| Woori Bank, Woori Financial Capital Co., Ltd., Woori Investment Bank Co., Ltd. and Woori Private Equity Asset Management Co., Ltd. (*5) |
||||||||||||||||||
| Woori-Shinyoung Growth-Cap Private Equity Fund I |
Other financial services | 35.0 | 35.0 | Korea | 2024-06-30 | |||||||||||||
| NH Woori Newdeal Growth Alpha Private Equity Fund 1 |
Other financial services | 33.0 | 32.7 | Korea | 2024-06-30 | |||||||||||||
| (*1) | Most of the significant business transactions of associates are with the Group as of June 30, 2024 and December 31, 2023. |
| (*2) | The Group can participate in decision-making body and exercise significant influence over financial policies and operational policies decision making of the associates. |
| (*3) | There is no investment balance as of June 30, 2024 and December 31, 2023. |
| (*4) | The equity method was applied using the most recent financial statements available from the settlement date because no financial statements were available at the end of the reporting period and the significant transactions or events that occurred between the end of the reporting period of the associate and the end of the reporting period of the subsidiary were duly reflected. |
| (*5) | Two or more subsidiaries may invest or operate to exert significant influence on the decision-making process for activities related to the investee. |
| (*6) | The Group can participate as a co-operator to exert significant influence. |
| (*7) | It was excluded from associates in current period. |
| (*8) | It has been liquidating as of June 30, 2024. |
| (*9) | It was excluded from associates during the period. |
| (*10) | The Group classified it as an associate because it has significant influence as a general partner of the investment association. |
| (*11) | It was added to associates in current period. |
| (*12) | It was classified as an associate due to holding of voting rights according to the initial investment agreement ratio. |
- 81 -
WOORI FINANCIAL GROUP INC. AND SUBSIDIARIES
NOTES TO CONSOLIDATED INTERIM FINANCIAL STATEMENTS
AS OF JUNE 30, 2024 AND 2023
| (2) | Changes in the carrying value of investments in joint ventures and associates accounted for using the equity method of accounting are as follows (Unit: Korean Won in millions): |
| For the six-month period ended June 30, 2024 | ||||||||||||||||||||||||||||||||
| Acquisition cost |
January 1, 2024 |
Share of profits(losses) and others |
Acquisition | Disposal/ Reclassification |
Dividends | Change in capital |
June 30, 2024 |
|||||||||||||||||||||||||
| W Service Networks Co., Ltd. |
108 | 216 | (32 | ) | — | — | (5 | ) | — | 179 | ||||||||||||||||||||||
| Korea Credit Bureau Co., Ltd. |
3,313 | 6,433 | 1,425 | — | — | (90 | ) | — | 7,768 | |||||||||||||||||||||||
| Korea Finance Security Co., Ltd. |
3,267 | 3,285 | 220 | — | — | — | — | 3,505 | ||||||||||||||||||||||||
| K BANK Co., Ltd. |
236,232 | 260,052 | 5,052 | — | — | — | 802 | 265,906 | ||||||||||||||||||||||||
| Partner One Value Up I Private Equity Fund |
5,039 | 3,230 | 334 | — | — | — | — | 3,564 | ||||||||||||||||||||||||
| IBK KIP Seongjang Dideemdol 1st Private Investment Limited Partnership |
3,396 | 8,247 | 1,254 | — | (960 | ) | — | — | 8,541 | |||||||||||||||||||||||
| Crevisse Raim Impact 1st Startup Venture Specialist Private Equity Fund |
4,482 | 4,437 | — | 45 | — | — | — | 4,482 | ||||||||||||||||||||||||
| LOTTE CARD Co., Ltd. |
346,810 | 587,392 | 4,807 | — | — | (15,591 | ) | (8,566 | ) | 568,042 | ||||||||||||||||||||||
| Union Technology Finance Investment Association |
13,449 | 12,270 | (310 | ) | — | — | — | — | 11,960 | |||||||||||||||||||||||
| Dicustody Co., Ltd. |
1 | 1 | — | — | — | — | — | 1 | ||||||||||||||||||||||||
| Orient Shipyard Co., Ltd.(*) |
— | — | — | — | — | — | — | — | ||||||||||||||||||||||||
| Joongang Network Solution Co., Ltd. |
— | 88 | 95 | — | — | — | (87 | ) | 96 | |||||||||||||||||||||||
| Win Mortgage Co., LTd. |
23 | 105 | (7 | ) | — | — | (2 | ) | — | 96 | ||||||||||||||||||||||
| Together-Korea Government Private Pool Private Securities Investment Trust No.3 |
10,000 | 10,540 | 155 | — | — | — | — | 10,695 | ||||||||||||||||||||||||
| BTS 2nd Private Equity Fund |
8,146 | 4,838 | 2 | 2,920 | — | — | — | 7,760 | ||||||||||||||||||||||||
| STASSETS FUND III |
10,500 | 8,406 | (130 | ) | 1,500 | — | — | — | 9,776 | |||||||||||||||||||||||
| SF CREDIT PARTNERS, LLC |
13,059 | 12,845 | 737 | — | — | — | 975 | 14,557 | ||||||||||||||||||||||||
| ARAM CMC Co., Ltd. (*) |
— | — | — | — | — | — | — | — | ||||||||||||||||||||||||
| Japanese Hotel Real Estate Private Equity Fund No.2 |
3,174 | 2,688 | 82 | — | — | (90 | ) | (143 | ) | 2,537 | ||||||||||||||||||||||
| Woori Seoul Beltway Private Special Asset Fund No.1 |
14,179 | 12,590 | 270 | 1,724 | — | (268 | ) | — | 14,316 | |||||||||||||||||||||||
| Woori General Private Securities Investment Trust(Bond) No.1 |
— | 51,686 | 586 | — | (50,102 | ) | (2,170 | ) | — | — | ||||||||||||||||||||||
| Woori Short-term Bond Securities Investment Trust(Bond) Class C-F |
100,000 | 105,564 | 345 | — | — | (4,202 | ) | — | 101,707 | |||||||||||||||||||||||
| Woori Safe Plus General Type Private Investment Trust S-8(Bond) |
— | 10,330 | 102 | — | (10,003 | ) | (429 | ) | — | — | ||||||||||||||||||||||
| Woori General Private Securities Investment Trust(Bond) No.2 |
— | 30,829 | 370 | — | (31,199 | ) | — | — | — | |||||||||||||||||||||||
| Woori Smart General Private Equity Investment Trust 1(Bond) |
40,000 | 41,135 | 1,273 | — | — | (1,795 | ) | — | 40,613 | |||||||||||||||||||||||
| Woori General Private Securities Investment Trust(Bond) No.3 |
28,988 | 51,205 | 626 | — | (21,510 | ) | — | — | 30,321 | |||||||||||||||||||||||
| Woori Asset Global Partnership Fund No.5 |
37,500 | 22,071 | 527 | 15,000 | — | — | — | 37,598 | ||||||||||||||||||||||||
| WOORI TAERIM 1st Fund |
1,100 | 988 | — | — | — | — | — | 988 | ||||||||||||||||||||||||
| Portone-Cape Fund No.1 |
340 | 445 | (210 | ) | — | — | — | — | 235 | |||||||||||||||||||||||
| DeepDive WOORI 2021-1 Financial Investment Fund |
8 | 1,236 | (543 | ) | — | (214 | ) | (325 | ) | — | 154 | |||||||||||||||||||||
| Darwin Green Packaging Private Equity Fund |
4,000 | 3,957 | (33 | ) | — | — | — | — | 3,924 | |||||||||||||||||||||||
| Koreawide partners 2nd Private Equity Fund |
20,000 | 19,235 | — | — | — | — | — | 19,235 | ||||||||||||||||||||||||
| Woori FirstValue Private Real Estate Fund No.2 |
9,000 | 560 | 3 | — | — | — | — | 563 | ||||||||||||||||||||||||
| WooriG Real Infrastructure Blind General Type Private Placement Investment Trust |
— | 55 | — | — | (55 | ) | — | — | — | |||||||||||||||||||||||
| Woori Together TDF 2025 |
3,000 | — | 151 | — | 3,245 | — | — | 3,396 | ||||||||||||||||||||||||
| Woori Together TDF 2030 |
3,000 | 3,324 | 195 | — | — | — | — | 3,519 | ||||||||||||||||||||||||
| Woori Together OCIO Target Return Feeder fund (Balance Bond) |
— | 10,376 | — | — | (10,376 | ) | — | — | — | |||||||||||||||||||||||
| Australia Green Energy 1st PEF |
4,913 | 4,811 | (22 | ) | — | — | — | — | 4,789 | |||||||||||||||||||||||
| Aarden Woori Apparel 1st Private Equity Fund |
100 | 133 | (38 | ) | — | — | — | — | 95 | |||||||||||||||||||||||
| Woori Dyno 1st Private Equity Fund |
2,000 | 2,358 | (2 | ) | — | — | — | — | 2,356 | |||||||||||||||||||||||
| KTB-KORUS FUND |
3,626 | 3,359 | — | — | — | — | — | 3,359 | ||||||||||||||||||||||||
| KTB China Platform Fund |
17,023 | 16,059 | (2,164 | ) | — | — | (13,895 | ) | — | — | ||||||||||||||||||||||
| KTBN Venture Fund No.7 |
16,972 | 16,044 | (2,641 | ) | — | — | (13,403 | ) | — | — | ||||||||||||||||||||||
| KTBN Venture Fund No.8 |
194 | 2,511 | (145 | ) | — | — | (569 | ) | — | 1,797 | ||||||||||||||||||||||
| KTBN Digital Contents Korea Fund No.9 |
5,329 | 5,597 | (26 | ) | — | — | — | — | 5,571 | |||||||||||||||||||||||
| KTBN Media Contents Fund |
330 | 283 | 1 | — | — | — | — | 284 | ||||||||||||||||||||||||
| KTB China Synergy Fund |
21,629 | 20,405 | (1,167 | ) | — | — | (3,296 | ) | — | 15,942 | ||||||||||||||||||||||
| NAVER-KTB Audio Contents Fund |
284 | 288 | — | — | — | — | — | 288 | ||||||||||||||||||||||||
- 82 -
WOORI FINANCIAL GROUP INC. AND SUBSIDIARIES
NOTES TO CONSOLIDATED INTERIM FINANCIAL STATEMENTS
AS OF JUNE 30, 2024 AND 2023
| For the six-month period ended June 30, 2024 | ||||||||||||||||||||||||||||||||
| Acquisition cost |
January 1, 2024 |
Share of profits(losses) and others |
Acquisition | Disposal/ Reclassification |
Dividends | Change in capital |
June 30, 2024 |
|||||||||||||||||||||||||
| KTBN Venture Fund No.13 |
13,279 | 14,158 | (122 | ) | — | — | (1,801 | ) | — | 12,235 | ||||||||||||||||||||||
| KTBN Future Contents Fund |
3,892 | 4,561 | (29 | ) | — | — | — | — | 4,532 | |||||||||||||||||||||||
| KTBN Venture Fund No.16 |
17,546 | 18,561 | (403 | ) | — | — | (4,200 | ) | — | 13,958 | ||||||||||||||||||||||
| KTBN Venture Fund No.18 |
26,308 | 26,970 | (197 | ) | — | — | — | — | 26,773 | |||||||||||||||||||||||
| KB-KTB Technology Venture Fund |
7,755 | 7,600 | (56 | ) | — | — | — | — | 7,544 | |||||||||||||||||||||||
| WOORI 2022 Scaleup Venture Fund |
14,000 | 13,578 | (237 | ) | — | — | — | — | 13,341 | |||||||||||||||||||||||
| WOORI 2022 Start-up Venture Fund |
7,804 | 2,433 | (86 | ) | 5,240 | — | — | — | 7,587 | |||||||||||||||||||||||
| KTB-NHN China Private Equity Fund |
1,272 | 3 | (1 | ) | — | — | (2 | ) | — | — | ||||||||||||||||||||||
| KTBN GI Private Equity Fund |
189 | 617 | 138 | — | — | (718 | ) | (36 | ) | 1 | ||||||||||||||||||||||
| Chirochem |
102 | 102 | 2 | — | — | — | — | 104 | ||||||||||||||||||||||||
| Daishin Balance No.18 Special Purpose Acquisition Company |
600 | — | (10 | ) | 600 | — | — | 105 | 695 | |||||||||||||||||||||||
| Godo Kaisha Oceanos 1 |
10,800 | 7,978 | 15 | — | — | (320 | ) | (75 | ) | 7,598 | ||||||||||||||||||||||
| Woori Zip 1 |
8,445 | 7,629 | (38 | ) | — | (262 | ) | — | (415 | ) | 6,914 | |||||||||||||||||||||
| Woori Zip 2 |
11,641 | 10,695 | (8 | ) | — | (443 | ) | — | (576 | ) | 9,668 | |||||||||||||||||||||
| KG Fashion Co., Ltd.(*) |
— | — | — | — | — | — | — | — | ||||||||||||||||||||||||
| KUM HWA Co., Ltd. (*) |
— | — | — | — | — | — | — | — | ||||||||||||||||||||||||
| Jinmyung Plus Co., Ltd. |
— | 14 | (4 | ) | — | — | — | — | 10 | |||||||||||||||||||||||
| JC Assurance No.2 Private Equity Fund(*) |
29,349 | — | — | — | — | — | — | — | ||||||||||||||||||||||||
| Dream Company Growth no.1 PEF |
— | 7,809 | (1 | ) | — | (7,551 | ) | (257 | ) | — | — | |||||||||||||||||||||
| HMS-Oriens 1st Fund |
12,000 | 14,030 | 424 | — | — | — | — | 14,454 | ||||||||||||||||||||||||
| Woori Senior Loan Private Placement Investment Trust No.1 |
31,004 | 75,590 | 1,349 | — | (44,509 | ) | (1,516 | ) | — | 30,914 | ||||||||||||||||||||||
| Genesis Eco No.1 Private Equity Fund |
12,000 | 10,942 | 173 | — | — | — | — | 11,115 | ||||||||||||||||||||||||
| Paratus Woori Material Component Equipment joint venture company |
17,700 | 16,979 | (133 | ) | — | — | — | — | 16,846 | |||||||||||||||||||||||
| Midas No. 8 Private Equity Joint Venture Company |
18,419 | 18,465 | 403 | — | — | (530 | ) | — | 18,338 | |||||||||||||||||||||||
| Orchestra Private Equity Fund IV |
9,700 | 9,555 | 125 | — | — | — | — | 9,680 | ||||||||||||||||||||||||
| Synaptic Green No.1 PEF |
8,000 | 7,611 | (38 | ) | — | — | — | — | 7,573 | |||||||||||||||||||||||
| IGEN2022No. 1 Private Equity Fund |
7,422 | 7,983 | 231 | — | — | (151 | ) | — | 8,063 | |||||||||||||||||||||||
| PCC-Woori LP Secondary Fund |
10,435 | 10,530 | (150 | ) | — | — | — | — | 10,380 | |||||||||||||||||||||||
| Synaptic Future Growth Private Equity Fund |
6,437 | 7,069 | 6,174 | 970 | (1,657 | ) | (3,867 | ) | — | 8,689 | ||||||||||||||||||||||
| Woori-Q Corporate Restructuring Private Equity Fund |
25,890 | 20,283 | 229 | 8,449 | — | — | — | 28,961 | ||||||||||||||||||||||||
| Woori-Shinyoung Growth-Cap Private Equity Fund I |
17,018 | 33,481 | (3,090 | ) | — | — | (197 | ) | — | 30,194 | ||||||||||||||||||||||
| NH Woori Newdeal Growth Alpha Private Equity Fund 1 |
29,807 | 32,987 | 17,638 | — | (4,303 | ) | (9,078 | ) | — | 37,244 | ||||||||||||||||||||||
| Woori BIG2 Plus Securities Investment Trust(Balanced Bond) |
3,200 | 2,543 | (111 | ) | 1,005 | 229 | (70 | ) | — | 3,596 | ||||||||||||||||||||||
| Woori Short Term Government and Special Bank Bond Active ETF |
— | 12,286 | 118 | — | (12,404 | ) | — | — | — | |||||||||||||||||||||||
| Woori 25-09 Corporate Bond(AA- or higher) Active ETF |
29,001 | 29,821 | 799 | — | — | — | — | 30,620 | ||||||||||||||||||||||||
| Woori General Private Securities Investment Trust No. 5 (Bond) |
60,000 | — | 1,473 | 60,000 | — | — | — | 61,473 | ||||||||||||||||||||||||
| Woori Big Satisfaction General Private Securities Investment Trust No. 3 (Bond) |
10,000 | — | 212 | 10,000 | — | — | — | 10,212 | ||||||||||||||||||||||||
| Woori General Private Securities Investment Trust No. 6 (Bond) |
40,000 | — | 847 | 40,000 | — | — | — | 40,847 | ||||||||||||||||||||||||
| Woori Big Satisfaction Corporation MMF No. 1 (Government Bond) |
100,000 | — | 2,261 | 500,000 | (397,238 | ) | — | — | 105,023 | |||||||||||||||||||||||
| Woorinara New Growth TOP 20 Securities Investment Trust No. 1 (Stocks) |
— | — | 31 | 1,000 | (1,031 | ) | — | — | — | |||||||||||||||||||||||
| Woori Oncorp Corporate support of Major Industry General Type Private Investment Trust 2 |
2,847 | — | 63 | 1,355 | 1,493 | (3 | ) | — | 2,908 | |||||||||||||||||||||||
| Woorinara Short-Term Bond Securities Investment Trust (Bond) |
50,200 | — | 341 | 50,200 | — | — | — | 50,541 | ||||||||||||||||||||||||
| Woori General Private Securities Investment Trust No. 7 (Bond) |
40,000 | — | 135 | 40,000 | — | — | — | 40,135 | ||||||||||||||||||||||||
|
|
|
|
|
|
|
|
|
|
|
|
|
|
|
|
|
|||||||||||||||||
| 1,688,576 | 1,795,370 | 39,609 | 740,008 | (588,850 | ) | (78,840 | ) | (8,016 | ) | 1,899,281 | ||||||||||||||||||||||
|
|
|
|
|
|
|
|
|
|
|
|
|
|
|
|
|
|||||||||||||||||
| (*) | The amount for which no loss was recognized for associates due to discontinuation of the equity method was zero for KUM HWA Co., Ltd., 10 million Won for Orient Shipyard Co.,Ltd., 20 million Won in KG FASHION CO., LTD., 19 million Won in ARAM CMC Co.,Ltd., 289 million Won in JC Assurance No.2 Private Equity Fund and the accumulated amount is 4 million Won for KUM HWA Co., Ltd., 38 million Won for Orient Shipyard Co.,Ltd., 140 million Won in KG FASHION CO., LTD., 19 million Won in ARAM CMC Co.,Ltd., 660 million Won in JC Assurance No.2 Private Equity Fund. |
- 83 -
WOORI FINANCIAL GROUP INC. AND SUBSIDIARIES
NOTES TO CONSOLIDATED INTERIM FINANCIAL STATEMENTS
AS OF JUNE 30, 2024 AND 2023
| For the six-month period ended June 30, 2023 | ||||||||||||||||||||||||||||||||||||
| Acquisition cost |
January 1, 2023 |
Share of profits(losses) and others |
Acquisition | Business combination |
Disposal/ Reclassification |
Dividends | Change in capital |
June 30, 2023 |
||||||||||||||||||||||||||||
| W Service Networks Co., Ltd. |
108 | 208 | (1 | ) | — | — | — | (5 | ) | — | 202 | |||||||||||||||||||||||||
| Korea Credit Bureau Co., Ltd. |
3,313 | 5,709 | 1,284 | — | — | — | (90 | ) | (429 | ) | 6,474 | |||||||||||||||||||||||||
| Korea Finance Security Co., Ltd. |
3,267 | 2,374 | (113 | ) | — | — | — | — | 1,010 | 3,271 | ||||||||||||||||||||||||||
| Woori Growth Partnerships New Technology Private Equity Fund |
12,942 | 10,889 | (51 | ) | — | — | — | — | — | 10,838 | ||||||||||||||||||||||||||
| 2016KIF-IMM Woori Bank Technology Venture Fund |
— | 9,474 | 111 | — | — | (9,585 | ) | — | — | — | ||||||||||||||||||||||||||
| K BANK Co., Ltd. |
236,232 | 247,789 | 1,486 | — | — | — | — | 4,558 | 253,833 | |||||||||||||||||||||||||||
| Woori Bank-Company K Korea Movie Asset Fund |
— | 239 | 31 | — | — | — | — | — | 270 | |||||||||||||||||||||||||||
| Partner One Value Up I Private Equity Fund |
5,039 | 4,278 | (3 | ) | — | — | — | — | — | 4,275 | ||||||||||||||||||||||||||
| IBK KIP Seongjang Dideemdol 1st Private Investment Limited Partnership |
7,556 | 10,285 | 456 | — | — | — | — | — | 10,741 | |||||||||||||||||||||||||||
| Crevisse Raim Impact 1st Startup Venture Specialist Private Equity Fund |
4,392 | 4,355 | — | 38 | — | — | — | — | 4,393 | |||||||||||||||||||||||||||
| LOTTE CARD Co., Ltd. |
346,810 | 514,131 | 58,988 | — | — | — | (13,199 | ) | (3,600 | ) | 556,320 | |||||||||||||||||||||||||
| Force TEC Co., Ltd. |
— | — | — | — | — | — | — | — | — | |||||||||||||||||||||||||||
| Together-Korea Government Private Pool Private Securities Investment Trust No.3 |
10,000 | 10,243 | 142 | — | — | — | — | — | 10,385 | |||||||||||||||||||||||||||
| Union Technology Finance Investment Association |
13,449 | 14,462 | (260 | ) | — | — | (1,188 | ) | — | — | 13,014 | |||||||||||||||||||||||||
| KUM HWA Co., Ltd. (*) |
— | — | — | — | — | — | — | — | — | |||||||||||||||||||||||||||
| Dicustody Co., Ltd. |
1 | 1 | — | — | — | — | — | — | 1 | |||||||||||||||||||||||||||
| Jinmyung Plus Co., Ltd. |
— | 10 | 4 | — | — | — | — | — | 14 | |||||||||||||||||||||||||||
| Orient Shipyard Co., Ltd.(*) |
— | — | — | — | — | — | — | — | — | |||||||||||||||||||||||||||
| BTS 2nd Private Equity Fund |
5,226 | 2,881 | (130 | ) | 2,200 | — | — | — | — | 4,951 | ||||||||||||||||||||||||||
| Joongang Network Solution Co., Ltd. |
— | — | 17 | — | — | — | — | 87 | 104 | |||||||||||||||||||||||||||
| STASSETS FUND III |
1,500 | 1,230 | (159 | ) | — | — | — | — | — | 1,071 | ||||||||||||||||||||||||||
| KG Fashion Co., Ltd.(*) |
— | — | — | — | — | — | — | — | — | |||||||||||||||||||||||||||
| Win Mortgage Co., LTd. |
23 | — | 70 | 23 | — | — | (2 | ) | — | 91 | ||||||||||||||||||||||||||
| NH Woori Newdeal Growth Alpha Private Equity Fund 1 |
10,692 | — | (167 | ) | 10,692 | — | — | — | — | 10,525 | ||||||||||||||||||||||||||
| Woori-Q Corporate Restructuring Private Equity Fund |
27,063 | 27,536 | 1,160 | — | — | — | — | — | 28,696 | |||||||||||||||||||||||||||
| Aarden Woori Apparel 1st Private Equity Fund |
100 | 97 | 36 | — | — | — | — | — | 133 | |||||||||||||||||||||||||||
| Woori Dyno 1st Private Equity Fund |
2,000 | 1,994 | — | — | — | — | — | — | 1,994 | |||||||||||||||||||||||||||
| Australia Green Energy 1st PEF |
4,913 | 4,858 | (24 | ) | — | — | — | — | — | 4,834 | ||||||||||||||||||||||||||
| Woori BIG2 Plus Securities Investment Trust(Balanced Bond) |
1,700 | 1,074 | 95 | 1,000 | — | (443 | ) | — | — | 1,726 | ||||||||||||||||||||||||||
| Woori Together TDF 2030 |
2,000 | 2,033 | 138 | — | — | — | — | — | 2,171 | |||||||||||||||||||||||||||
| Woori Together TDF 2025 |
2,000 | 1,990 | 120 | — | — | — | — | — | 2,110 | |||||||||||||||||||||||||||
| Woori Star50 feeder fund(H) |
200 | 126 | 7 | — | — | — | — | — | 133 | |||||||||||||||||||||||||||
| Portone-Cape Fund No.1 |
340 | 464 | (181 | ) | — | — | — | — | — | 283 | ||||||||||||||||||||||||||
| WOORI TAERIM 1st Fund |
1,100 | 988 | — | — | — | — | — | — | 988 | |||||||||||||||||||||||||||
| KIWOOM WOORI Financial 1st Fund |
545 | 953 | (8 | ) | — | — | (455 | ) | — | — | 490 | |||||||||||||||||||||||||
| DeepDive WOORI 2021-1 Financial Investment Fund |
327 | 878 | 225 | — | — | (574 | ) | (74 | ) | — | 455 | |||||||||||||||||||||||||
| PCC-Woori LP Secondary Fund |
10,435 | 12,984 | 59 | — | — | (4 | ) | — | — | 13,039 | ||||||||||||||||||||||||||
| DS Power Semicon Private Equity Fund |
3,000 | 2,976 | 211 | — | — | — | (218 | ) | — | 2,969 | ||||||||||||||||||||||||||
| Koreawide partners 2nd Private Equity Fund |
20,000 | 20,000 | (244 | ) | — | — | — | — | — | 19,756 | ||||||||||||||||||||||||||
| Darwin Green Packaging Private Equity Fund |
4,000 | 3,945 | 123 | — | — | — | (80 | ) | — | 3,988 | ||||||||||||||||||||||||||
- 84 -
WOORI FINANCIAL GROUP INC. AND SUBSIDIARIES
NOTES TO CONSOLIDATED INTERIM FINANCIAL STATEMENTS
AS OF JUNE 30, 2024 AND 2023
| For the six-month period ended June 30, 2023 | ||||||||||||||||||||||||||||||||||||
| Acquisition cost |
January 1, 2023 |
Share of profits(losses) and others |
Acquisition | Business combination |
Disposal/ Reclassification |
Dividends | Change in capital |
June 30, 2023 |
||||||||||||||||||||||||||||
| Japanese Hotel Real Estate Private Equity Fund No.2 |
3,174 | 2,855 | 28 | — | — | — | (77 | ) | (135 | ) | 2,671 | |||||||||||||||||||||||||
| Woori Seoul Beltway Private Special Asset Fund No.1 |
10,925 | 9,874 | 208 | 1,158 | — | — | (203 | ) | — | 11,037 | ||||||||||||||||||||||||||
| Woori Short-term Bond Securities Investment Trust(Bond) ClassC-F |
110,000 | 112,025 | 4,511 | — | — | — | (3,779 | ) | — | 112,757 | ||||||||||||||||||||||||||
| Woori Safe Plus General Type Private Investment Trust S-8(Bond) |
10,000 | 10,182 | 261 | — | — | — | (359 | ) | — | 10,084 | ||||||||||||||||||||||||||
| Woori General Private Securities Investment Trust(Bond) No.2 |
30,000 | — | 56 | 30,000 | — | — | — | — | 30,056 | |||||||||||||||||||||||||||
| Woori Smart General Private Equity Investment Trust 1(Bond) |
40,000 | — | 86 | 40,000 | — | — | — | — | 40,086 | |||||||||||||||||||||||||||
| Woori FirstValue Private Real Estate Fund No.2 |
9,000 | 558 | (1 | ) | — | — | — | — | — | 557 | ||||||||||||||||||||||||||
| WooriG Real Infrastructure Blind General Type Private Placement Investment Trust |
100 | 102 | 2 | — | — | (48 | ) | (2 | ) | — | 54 | |||||||||||||||||||||||||
| JC Assurance No.2 Private Equity Fund |
29,349 | — | — | — | — | — | — | — | — | |||||||||||||||||||||||||||
| Dream Company Growth no.1 PEF |
7,412 | 7,861 | (26 | ) | — | — | — | — | — | 7,835 | ||||||||||||||||||||||||||
| HMS-Oriens 1st Fund |
12,000 | 13,252 | 386 | — | — | — | — | — | 13,638 | |||||||||||||||||||||||||||
| Woori G Senior Loan Private Placement Investment Trust No.1 |
77,505 | 81,861 | 1,829 | — | — | (2,218 | ) | (1,829 | ) | — | 79,643 | |||||||||||||||||||||||||
| Genesis Eco No.1 Private Equity Fund |
12,000 | 11,216 | (91 | ) | — | — | — | — | — | 11,125 | ||||||||||||||||||||||||||
| Paratus Woori Material Component Equipment joint venture company |
17,700 | 17,250 | (132 | ) | — | — | — | — | — | 17,118 | ||||||||||||||||||||||||||
| Midas No. 8 Private Equity Joint Venture Company |
18,537 | 18,713 | 409 | — | — | — | (530 | ) | — | 18,592 | ||||||||||||||||||||||||||
| Orchestra Private Equity Fund IV |
9,878 | 9,698 | (73 | ) | — | — | — | — | — | 9,625 | ||||||||||||||||||||||||||
| Synaptic Green No.1 PEF |
8,000 | 7,793 | (109 | ) | — | — | — | — | — | 7,684 | ||||||||||||||||||||||||||
| Woori-Shinyoung Growth-Cap Private Equity Fund I |
17,018 | 43,274 | (1,380 | ) | — | — | — | — | — | 41,894 | ||||||||||||||||||||||||||
| IGEN2022No. 1 Private Equity Fund |
7,822 | 8,010 | 398 | — | — | — | (363 | ) | — | 8,045 | ||||||||||||||||||||||||||
| Woori General Private Securities Investment Trust(Bond) No.1 |
50,000 | — | 446 | 50,000 | — | — | — | — | 50,446 | |||||||||||||||||||||||||||
| KTB-KORUS FUND |
3,626 | — | — | — | 3,626 | — | — | — | 3,626 | |||||||||||||||||||||||||||
| KTB China Platform Fund |
17,023 | — | — | — | 17,023 | — | — | — | 17,023 | |||||||||||||||||||||||||||
| KTBN Venture Fund No.7 |
16,972 | — | (44 | ) | — | 16,972 | — | (703 | ) | — | 16,225 | |||||||||||||||||||||||||
| KTBN Venture Fund No.8 |
3,325 | — | 35 | — | 3,325 | — | — | — | 3,360 | |||||||||||||||||||||||||||
| KTBN Digital Contents Korea Fund No.9 |
5,329 | — | 32 | — | 5,329 | — | — | — | 5,361 | |||||||||||||||||||||||||||
| KTBN Media Contents Fund |
330 | — | 12 | — | 330 | — | — | — | 342 | |||||||||||||||||||||||||||
| KTB China Synergy Fund |
21,629 | — | 77 | — | 21,629 | — | — | — | 21,706 | |||||||||||||||||||||||||||
| NAVER-KTB Audio Contents Fund |
284 | — | (2 | ) | — | 284 | — | — | — | 282 | ||||||||||||||||||||||||||
| KTBN Venture Fund No.13 |
13,279 | — | 45 | — | 13,279 | — | — | — | 13,324 | |||||||||||||||||||||||||||
| KTBN Future Contents Fund |
3,892 | — | 1 | — | 3,892 | — | — | — | 3,893 | |||||||||||||||||||||||||||
| KTBN Venture Fund No.16 |
17,546 | — | 800 | — | 17,546 | — | — | — | 18,346 | |||||||||||||||||||||||||||
| KTBN Venture Fund No.18 |
23,458 | — | (101 | ) | 2,850 | 23,458 | — | — | — | 26,207 | ||||||||||||||||||||||||||
| KB-KTB Technology Venture Fund |
5,755 | — | (48 | ) | — | 5,755 | — | — | — | 5,707 | ||||||||||||||||||||||||||
| DAOL 2022 Scaleup Venture Fund |
355 | — | (175 | ) | 6,861 | 355 | — | — | — | 7,041 | ||||||||||||||||||||||||||
| DAOL 2022 Start-up Venture Fund |
2,564 | — | (42 | ) | — | 2,564 | — | — | — | 2,522 | ||||||||||||||||||||||||||
| KTB-NHN China Private Equity Fund |
1,272 | — | (37 | ) | — | 1,272 | — | — | 44 | 1,279 | ||||||||||||||||||||||||||
- 85 -
WOORI FINANCIAL GROUP INC. AND SUBSIDIARIES
NOTES TO CONSOLIDATED INTERIM FINANCIAL STATEMENTS
AS OF JUNE 30, 2024 AND 2023
| For the six-month period ended June 30, 2023 | ||||||||||||||||||||||||||||||||||||
| Acquisition cost |
January 1, 2023 |
Share of profits(losses) and others |
Acquisition | Business combination |
Disposal/ Reclassification |
Dividends | Change in capital |
June 30, 2023 |
||||||||||||||||||||||||||||
| KTBN GI Private Equity Fund |
189 | — | 155 | — | 189 | — | — | 46 | 390 | |||||||||||||||||||||||||||
| Chirochem |
102 | — | — | — | 102 | — | — | — | 102 | |||||||||||||||||||||||||||
| Woori Zip 1 |
9,021 | 8,690 | (83 | ) | — | — | (234 | ) | — | (425 | ) | 7,948 | ||||||||||||||||||||||||
| Woori Zip 2 |
12,518 | 12,180 | (64 | ) | — | — | (410 | ) | — | (593 | ) | 11,113 | ||||||||||||||||||||||||
| Godo Kaisha Oceanos 1 |
10,800 | 8,788 | 21 | — | — | — | (330 | ) | (91 | ) | 8,388 | |||||||||||||||||||||||||
|
|
|
|
|
|
|
|
|
|
|
|
|
|
|
|
|
|
|
|||||||||||||||||||
| 1,389,962 | 1,305,636 | 70,812 | 144,822 | 136,930 | (15,159 | ) | (21,843 | ) | 472 | 1,621,670 | ||||||||||||||||||||||||||
|
|
|
|
|
|
|
|
|
|
|
|
|
|
|
|
|
|
|
|||||||||||||||||||
| (*) | The amount for which no loss was recognized for associates due to discontinuation of the equity method was 2 million Won for KUM HWA Co., Ltd., 6 million Won for Orient Shipyard Co.,Ltd., 34 million Won in KG FASHION CO., LTD. and the accumulated amount is 4 million Won for KUM HWA Co., Ltd., 6 million Won for Orient Shipyard Co.,Ltd., 34 million Won in KG FASHION CO., LTD. |
- 86 -
WOORI FINANCIAL GROUP INC. AND SUBSIDIARIES
NOTES TO CONSOLIDATED INTERIM FINANCIAL STATEMENTS
AS OF JUNE 30, 2024 AND 2023
| (3) | Summary financial information relating to investments in joint ventures and associates accounted for using the equity method of accounting is as follows (Unit: Korean Won in millions): |
| June 30, 2024 | ||||||||||||||||||||||||
| Assets | Liabilities | Operating revenue |
Net income (loss) |
Other comprehensive income(loss) |
Total comprehensive income(loss) |
|||||||||||||||||||
| W Service Networks Co., Ltd. |
6,181 | 2,529 | 7,865 | 245 | — | 245 | ||||||||||||||||||
| Korea Credit Bureau Co., Ltd. |
140,253 | 64,380 | 85,000 | 14,148 | — | 14,148 | ||||||||||||||||||
| Korea Finance Security Co., Ltd. |
36,301 | 12,939 | 19,907 | 952 | — | 952 | ||||||||||||||||||
| K BANK Co., Ltd. |
24,624,702 | 22,682,508 | 449,353 | 77,215 | (1,959 | ) | 75,256 | |||||||||||||||||
| Partner One Value Up I Private Equity Fund |
15,813 | 488 | 1,640 | 1,438 | — | 1,438 | ||||||||||||||||||
| IBK KIP Seongjang Dideemdol 1st Private Investment Limited Partnership |
43,027 | 328 | 6,885 | 6,270 | — | 6,270 | ||||||||||||||||||
| Crevisse Raim Impact 1st Startup Venture Specialist Private Equity Fund |
15,737 | 94 | — | (191 | ) | — | (191 | ) | ||||||||||||||||
| LOTTE CARD Co., Ltd.(*) |
23,353,857 | 20,090,529 | 705,059 | 24,194 | 7,091 | 31,285 | ||||||||||||||||||
| Union Technology Finance Investment Association |
40,274 | 7 | 9 | (7 | ) | — | (7 | ) | ||||||||||||||||
| Dicustody Co., Ltd. |
92 | — | — | — | — | — | ||||||||||||||||||
| Orient Shipyard Co., Ltd. |
7,064 | 23,626 | — | (37 | ) | — | (37 | ) | ||||||||||||||||
| Joongang Network Solution Co., Ltd. |
1,370 | 2,648 | 1,463 | 48 | — | 48 | ||||||||||||||||||
| Win Mortgage Co., LTd. |
3,840 | 1,735 | 3,674 | 119 | — | 119 | ||||||||||||||||||
| Together-Korea Government Private Pool Private Securities Investment Trust No.3 |
10,698 | 1 | 72 | 71 | — | 71 | ||||||||||||||||||
| BTS 2nd Private Equity Fund |
39,299 | 494 | — | (662 | ) | — | (662 | ) | ||||||||||||||||
| STASSETS FUND III |
34,728 | 185 | 9 | (455 | ) | — | (455 | ) | ||||||||||||||||
| SF CREDIT PARTNERS, LLC |
150,296 | 10,010 | 19,897 | 8,423 | 6,931 | 15,354 | ||||||||||||||||||
| ARAM CMC Co., Ltd. |
541 | 453 | 717 | (31 | ) | — | (31 | ) | ||||||||||||||||
| Japanese Hotel Real Estate Private Equity Fund No.2 |
12,783 | 12 | 55 | 411 | (718 | ) | (307 | ) | ||||||||||||||||
| Woori Seoul Beltway Private Special Asset Fund No.1 |
57,268 | 2 | 1,111 | 1,080 | — | 1,080 | ||||||||||||||||||
| Woori Short-term Bond Securities Investment Trust(Bond) Class C-F |
1,607,402 | 194,630 | 27,102 | 23,585 | — | 23,585 | ||||||||||||||||||
| Woori Smart General Private Equity Investment Trust 1(Bond) |
250,310 | 108,162 | 6,790 | 4,456 | — | 4,456 | ||||||||||||||||||
| Woori General Private Securities Investment Trust(Bond) No.3 |
300,902 | 197,381 | 6,618 | 2,584 | — | 2,584 | ||||||||||||||||||
| Woori Asset Global Partnership Fund No.5 |
65,979 | 810 | 1,722 | 913 | — | 913 | ||||||||||||||||||
| WOORI TAERIM 1st Fund |
4,045 | 183 | — | — | — | — | ||||||||||||||||||
| Portone-Cape Fund No.1 |
1,327 | 150 | — | 97 | — | 97 | ||||||||||||||||||
| DeepDive WOORI 2021-1 Financial Investment Fund |
1,296 | 5 | 2,718 | (3,988 | ) | — | (3,988 | ) | ||||||||||||||||
| Darwin Green Packaging Private Equity Fund |
19,229 | — | — | (161 | ) | — | (161 | ) | ||||||||||||||||
| Koreawide partners 2nd Private Equity Fund |
75,026 | 2,894 | — | — | — | — | ||||||||||||||||||
| Woori FirstValue Private Real Estate Fund No.2 |
67,051 | 62,357 | 28 | 28 | — | 28 | ||||||||||||||||||
| Woori Together TDF 2025 |
13,190 | 1,309 | 552 | 546 | — | 546 | ||||||||||||||||||
| Woori Together TDF 2030 |
13,121 | 13 | 731 | 723 | — | 723 | ||||||||||||||||||
| Australia Green Energy 1st PEF |
120,886 | 23 | 279 | (568 | ) | — | (568 | ) | ||||||||||||||||
| Aarden Woori Apparel 1st Private Equity Fund |
20,251 | 95 | — | (7,973 | ) | — | (7,973 | ) | ||||||||||||||||
| Woori Dyno 1st Private Equity Fund |
12,058 | 42 | 115 | 29 | — | 29 | ||||||||||||||||||
| KTB-KORUS FUND |
8,957 | 1 | — | — | — | — | ||||||||||||||||||
| KTBN Venture Fund No.8 |
8,266 | — | 16 | (668 | ) | — | (668 | ) | ||||||||||||||||
| KTBN Digital Contents Korea Fund No.9 |
20,202 | 1,630 | 275 | (86 | ) | — | (86 | ) | ||||||||||||||||
| KTBN Media Contents Fund |
1,896 | — | 9 | 9 | — | 9 | ||||||||||||||||||
| KTB China Synergy Fund |
115,328 | 9,474 | 1,007 | (7,751 | ) | — | (7,751 | ) | ||||||||||||||||
| NAVER-KTB Audio Contents Fund |
29,413 | 649 | 2 | (4 | ) | — | (4 | ) | ||||||||||||||||
| KTBN Venture Fund No.13 |
62,729 | 330 | 230 | (625 | ) | — | (625 | ) | ||||||||||||||||
| KTBN Future Contents Fund |
34,223 | 231 | 13 | (218 | ) | — | (218 | ) | ||||||||||||||||
| KTBN Venture Fund No.16 |
136,907 | 813 | 7,116 | (3,931 | ) | — | (3,931 | ) | ||||||||||||||||
| KTBN Venture Fund No.18 |
265,239 | 1,269 | 1,127 | (1,940 | ) | — | (1,940 | ) | ||||||||||||||||
| KB-KTB Technology Venture Fund |
41,861 | 371 | 64 | (310 | ) | — | (310 | ) | ||||||||||||||||
| WOORI 2022 Scaleup Venture Fund |
67,427 | 811 | 429 | (1,184 | ) | — | (1,184 | ) | ||||||||||||||||
| WOORI 2022 Start-up Venture Fund |
25,355 | 160 | 27 | (286 | ) | — | (286 | ) | ||||||||||||||||
| KTBN GI Private Equity Fund |
30 | 4 | 3,369 | 2,746 | (712 | ) | 2,034 | |||||||||||||||||
| Chirochem |
556 | 190 | 226 | 8 | — | 8 | ||||||||||||||||||
| Daishin Balance No.18 Special Purpose Acquisition Company |
2,391 | 759 | — | (23 | ) | — | (23 | ) | ||||||||||||||||
| Godo Kaisha Oceanos 1 |
60,975 | 45,083 | 1,298 | 32 | — | 32 | ||||||||||||||||||
| Woori Zip 1 |
41,655 | 30,032 | 1,003 | (62 | ) | — | (62 | ) | ||||||||||||||||
| Woori Zip 2 |
58,675 | 42,664 | 1,508 | (9 | ) | — | (9 | ) | ||||||||||||||||
| KG Fashion Co., Ltd. |
2,250 | 2,810 | 312 | (108 | ) | — | (108 | ) | ||||||||||||||||
| KUM HWA Co., Ltd. |
4 | 167 | — | — | — | — | ||||||||||||||||||
| Jinmyung Plus Co., Ltd. |
510 | 465 | 42 | (28 | ) | — | (28 | ) | ||||||||||||||||
| JC Assurance No.2 Private Equity Fund |
121,557 | 986 | — | (621 | ) | — | (621 | ) | ||||||||||||||||
| HMS-Oriens 1st Fund |
63,365 | 6 | — | 1,861 | — | 1,861 | ||||||||||||||||||
| Woori Senior Loan Private Placement Investment Trust No.1 |
142,803 | 8 | 6,641 | 6,253 | — | 6,253 | ||||||||||||||||||
| Genesis Eco No.1 Private Equity Fund |
38,662 | 313 | — | (321 | ) | — | (321 | ) | ||||||||||||||||
| Paratus Woori Material Component Equipment joint venture company |
58,288 | 1,944 | — | (445 | ) | — | (445 | ) | ||||||||||||||||
| Midas No. 8 Private Equity Joint Venture Company |
64,619 | 244 | 1,893 | 1,414 | — | 1,414 | ||||||||||||||||||
| Orchestra Private Equity Fund IV |
34,363 | — | 700 | 444 | — | 444 | ||||||||||||||||||
| Synaptic Green No.1 PEF |
35,975 | 6 | 1 | 351 | — | 351 | ||||||||||||||||||
- 87 -
WOORI FINANCIAL GROUP INC. AND SUBSIDIARIES
NOTES TO CONSOLIDATED INTERIM FINANCIAL STATEMENTS
AS OF JUNE 30, 2024 AND 2023
| June 30, 2024 | ||||||||||||||||||||||||
| Assets | Liabilities | Operating revenue |
Net income (loss) |
Other comprehensive income(loss) |
Total comprehensive income(loss) |
|||||||||||||||||||
| IGEN2022No. 1 Private Equity Fund |
32,462 | 7 | 1,055 | 931 | — | 931 | ||||||||||||||||||
| PCC-Woori LP Secondary Fund |
27,061 | 343 | 41 | (310 | ) | — | (310 | ) | ||||||||||||||||
| Synaptic Future Growth Private Equity Fund |
36,863 | 294 | 24,397 | 23,826 | — | 23,826 | ||||||||||||||||||
| Woori-Q Corporate Restructuring Private Equity Fund |
85,544 | 981 | 78 | (517 | ) | — | (517 | ) | ||||||||||||||||
| Woori-Shinyoung Growth-Cap Private Equity Fund I |
86,485 | 140 | 2,678 | (8,836 | ) | — | (8,836 | ) | ||||||||||||||||
| NH Woori Newdeal Growth Alpha Private Equity Fund 1 |
113,898 | 3,096 | 40,663 | 38,993 | — | 38,993 | ||||||||||||||||||
| Woori BIG2 Plus Securities Investment Trust(Balanced Bond) |
42,546 | 51 | 2,572 | 2,572 | — | 2,572 | ||||||||||||||||||
| Woori 25-09 Corporate Bond(AA- or higher) Active ETF |
126,616 | 20,923 | 3,215 | 2,783 | — | 2,783 | ||||||||||||||||||
| Woori General Private Securities Investment Trust No. 5 (Bond) |
366,637 | 151,483 | 6,917 | 5,154 | — | 5,154 | ||||||||||||||||||
| Woori Big Satisfaction General Private Securities Investment Trust No. 3 (Bond) |
151,076 | 38,749 | 2,758 | 2,327 | — | 2,327 | ||||||||||||||||||
| Woori General Private Securities Investment Trust No. 6 (Bond) |
319,729 | 176,765 | 4,457 | 2,964 | — | 2,964 | ||||||||||||||||||
| Woori Big Satisfaction Corporation MMF No. 1 (Government Bond) |
5,800,137 | 48 | 127,888 | 127,282 | — | 127,282 | ||||||||||||||||||
| Woori Oncorp Corporate support of Major Industry General Type Private Investment Trust 2 |
137,165 | — | 2,783 | 2,780 | — | 2,780 | ||||||||||||||||||
| Woorinara Short-Term Bond Securities Investment Trust (Bond) |
288,031 | 2 | 1,528 | 1,467 | — | 1,467 | ||||||||||||||||||
| Woori General Private Securities Investment Trust No. 7 (Bond) |
140,485 | 11 | 485 | 473 | — | 473 | ||||||||||||||||||
| (*) | The amount is after reflecting the fair value adjustment that occurred when acquiring the shares and the adjustments that occurred by difference of accounting policies with the Group. |
| December 31, 2023 | ||||||||||||||||||||||||
| Assets | Liabilities | Operating revenue |
Net income (loss) |
Other comprehensive income(loss) |
Total comprehensive income(loss) |
|||||||||||||||||||
| W Service Networks Co., Ltd. |
6,887 | 2,496 | 19,350 | 1,069 | — | 1,069 | ||||||||||||||||||
| Korea Credit Bureau Co., Ltd. |
131,164 | 68,756 | 163,707 | 8,012 | — | 8,012 | ||||||||||||||||||
| Korea Finance Security Co., Ltd. |
36,185 | 14,287 | 44,709 | (464 | ) | 6,730 | 6,266 | |||||||||||||||||
| K BANK Co., Ltd. |
20,799,599 | 18,903,298 | 826,894 | 49,853 | 47,885 | 97,738 | ||||||||||||||||||
| Partner One Value Up I Private Equity Fund |
14,182 | 293 | (4,107 | ) | (4,505 | ) | — | (4,505 | ) | |||||||||||||||
| IBK KIP Seongjang Dideemdol 1st Private Investment Limited Partnership |
41,533 | 305 | 6,501 | 5,823 | — | 5,823 | ||||||||||||||||||
| Crevisse Raim Impact 1st Startup Venture Specialist Private Equity Fund |
15,754 | 100 | 2 | (388 | ) | — | (388 | ) | ||||||||||||||||
| LOTTE CARD Co., Ltd. (*) |
22,329,308 | 19,191,007 | 1,937,383 | 363,673 | (19,888 | ) | 343,785 | |||||||||||||||||
| Union Technology Finance Investment Association |
41,543 | 233 | 2,261 | (838 | ) | — | (838 | ) | ||||||||||||||||
| Dicustody Co., Ltd. |
92 | — | — | (3 | ) | — | (3 | ) | ||||||||||||||||
| Orient Shipyard Co., Ltd. |
10,708 | 27,225 | — | (124 | ) | — | (124 | ) | ||||||||||||||||
| Joongang Network Solution Co., Ltd. |
1,505 | 3,156 | 5,758 | 5 | — | 5 | ||||||||||||||||||
| Win Mortgage Co., LTd. |
3,518 | 1,197 | 9,309 | 378 | — | 378 | ||||||||||||||||||
| Together-Korea Government Private Pool Private Securities Investment Trust No. 3 |
10,543 | 1 | 227 | 222 | — | 222 | ||||||||||||||||||
| BTS 2nd Private Equity Fund |
25,030 | 837 | 4 | (1,213 | ) | — | (1,213 | ) | ||||||||||||||||
| STASSETS FUND III |
30,014 | 312 | 95 | (1,145 | ) | — | (1,145 | ) | ||||||||||||||||
| SF CREDIT PARTNERS, LLC |
149,157 | 25,996 | 7,618 | (4,610 | ) | (2,819 | ) | (7,429 | ) | |||||||||||||||
| Rea Company |
2,248 | 3,736 | 802 | (694 | ) | — | (694 | ) | ||||||||||||||||
| ARAM CMC Co., Ltd. |
669 | 485 | 1,005 | (254 | ) | — | (254 | ) | ||||||||||||||||
| Japanese Hotel Real Estate Private Equity Fund No.2 |
13,541 | 12 | 54 | 46 | (602 | ) | (556 | ) | ||||||||||||||||
| Woori Seoul Beltway Private Special Asset Fund No.1 |
50,362 | 2 | 1,858 | 1,805 | — | 1,805 | ||||||||||||||||||
| Woori General Private Securities Investment Trust(Bond) No.1 |
414,760 | 208,014 | 12,617 | 6,746 | — | 6,746 | ||||||||||||||||||
| Woori Short-term Bond Securities Investment Trust(Bond) Class C-F |
828,793 | 126,879 | 34,607 | 31,283 | — | 31,283 | ||||||||||||||||||
| Woori Safe Plus General Type Private Investment Trust S-8(Bond) |
113,413 | 6 | 4,774 | 4,542 | — | 4,542 | ||||||||||||||||||
| Woori General Private Securities Investment Trust(Bond) No.2 |
224,205 | 111,165 | 5,767 | 3,040 | — | 3,040 | ||||||||||||||||||
- 88 -
WOORI FINANCIAL GROUP INC. AND SUBSIDIARIES
NOTES TO CONSOLIDATED INTERIM FINANCIAL STATEMENTS
AS OF JUNE 30, 2024 AND 2023
| December 31, 2023 | ||||||||||||||||||||||||
| Assets | Liabilities | Operating revenue |
Net income (loss) |
Other comprehensive income(loss) |
Total comprehensive income(loss) |
|||||||||||||||||||
| Woori Smart General Private Equity Investment Trust 1(Bond) |
289,553 | 145,580 | 7,373 | 3,973 | — | 3,973 | ||||||||||||||||||
| Woori General Private Securities Investment Trust(Bond) No.3 |
532,139 | 347,809 | 9,304 | 4,342 | — | 4,342 | ||||||||||||||||||
| Woori Asset Global Partnership Fund No.5 |
38,537 | 281 | — | (744 | ) | — | (744 | ) | ||||||||||||||||
| WOORI TAERIM 1st Fund |
4,045 | 183 | — | — | — | — | ||||||||||||||||||
| Portone-Cape Fund No.1 |
2,324 | 100 | — | (103 | ) | — | (103 | ) | ||||||||||||||||
| DeepDive WOORI 2021-1 Financial Investment Fund |
10,400 | 19 | 9,607 | 9,467 | — | 9,467 | ||||||||||||||||||
| Darwin Green Packaging Private Equity Fund |
19,390 | — | 759 | 451 | — | 451 | ||||||||||||||||||
| Koreawide partners 2nd Private Equity Fund |
75,064 | 2,931 | — | (2,831 | ) | — | (2,831 | ) | ||||||||||||||||
| Woori FirstValue Private Real Estate Fund No.2 |
67,024 | 62,357 | 32 | 18 | — | 18 | ||||||||||||||||||
| WooriG Real Infrastructure Blind General Type Private Placement Investment Trust |
114,909 | 92 | 6,053 | 4,892 | — | 4,892 | ||||||||||||||||||
| Woori Together TDF 2030 |
11,944 | 61 | 2,528 | 1,017 | — | 1,017 | ||||||||||||||||||
| Woori Together OCIO Target Return Feeder fund (Balance Bond) |
50,831 | 1 | 2,446 | 2,444 | — | 2,444 | ||||||||||||||||||
| Australia Green Energy 1st PEF |
121,454 | 24 | 508 | (1,189 | ) | — | (1,189 | ) | ||||||||||||||||
| Aarden Woori Apparel 1st Private Equity Fund |
28,219 | 90 | 1 | (332 | ) | — | (332 | ) | ||||||||||||||||
| Woori Dyno 1st Private Equity Fund |
12,068 | 43 | 2,053 | 1,886 | — | 1,886 | ||||||||||||||||||
| KTB-KORUS FUND |
8,957 | 1 | 127 | (712 | ) | — | (712 | ) | ||||||||||||||||
| KTB China Platform Fund |
85,909 | 13 | 2,411 | (5,160 | ) | — | (5,160 | ) | ||||||||||||||||
| KTBN Venture Fund No.7 |
79,871 | — | 6,420 | 508 | — | 508 | ||||||||||||||||||
| KTBN Venture Fund No.8 |
11,758 | 207 | 2,359 | (4,559 | ) | — | (4,559 | ) | ||||||||||||||||
| KTBN Digital Contents Korea Fund No.9 |
20,257 | 1,599 | 3,030 | (1,142 | ) | — | (1,142 | ) | ||||||||||||||||
| KTBN Media Contents Fund |
1,887 | — | 199 | (35 | ) | — | (35 | ) | ||||||||||||||||
| KTB China Synergy Fund |
145,464 | 9,977 | 23,055 | (8,686 | ) | — | (8,686 | ) | ||||||||||||||||
| NAVER-KTB Audio Contents Fund |
29,419 | 652 | 1,017 | 237 | — | 237 | ||||||||||||||||||
| KTBN Venture Fund No.13 |
72,943 | 737 | 21,662 | 18,507 | — | 18,507 | ||||||||||||||||||
| KTBN Future Contents Fund |
34,696 | 486 | 7,394 | 4,776 | — | 4,776 | ||||||||||||||||||
| KTBN Venture Fund No.16 |
182,850 | 1,875 | 40,201 | 11,133 | — | 11,133 | ||||||||||||||||||
| KTBN Venture Fund No.18 |
268,437 | 2,526 | 31,543 | 8,036 | — | 8,036 | ||||||||||||||||||
| KB-KTB Technology Venture Fund |
42,046 | 246 | 2,055 | (1,076 | ) | — | (1,076 | ) | ||||||||||||||||
| WOORI 2022 Scaleup Venture Fund |
68,626 | 826 | 504 | (2,758 | ) | — | (2,758 | ) | ||||||||||||||||
| WOORI 2022 Start-up Venture Fund |
8,237 | 156 | 42 | (576 | ) | — | (576 | ) | ||||||||||||||||
| KTB-NHN China Private Equity Fund |
16 | 7 | 946 | (315 | ) | (319 | ) | (634 | ) | |||||||||||||||
| KTBN GI Private Equity Fund |
12,391 | 45 | — | 7,146 | 712 | 7,858 | ||||||||||||||||||
| Chirochem |
732 | 375 | 4,215 | 148 | — | 148 | ||||||||||||||||||
| Godo Kaisha Oceanos 1 |
62,021 | 45,334 | 2,765 | 192 | — | 192 | ||||||||||||||||||
| Woori Zip 1 |
44,448 | 31,702 | 2,066 | (198 | ) | — | (198 | ) | ||||||||||||||||
| Woori Zip 2 |
62,642 | 45,012 | 3,023 | (167 | ) | — | (167 | ) | ||||||||||||||||
| KG Fashion Co., Ltd. |
2,559 | 3,022 | 943 | (569 | ) | — | (569 | ) | ||||||||||||||||
| KUM HWA Co., Ltd. |
4 | 167 | — | — | — | — | ||||||||||||||||||
| Jinmyung Plus Co., Ltd. |
519 | 454 | 146 | (3 | ) | — | (3 | ) | ||||||||||||||||
| JC Assurance No.2 Private Equity Fund |
121,596 | 8 | — | (628 | ) | — | (628 | ) | ||||||||||||||||
| Dream Company Growth no.1 PEF |
28,366 | 255 | 1,490 | 1,300 | — | 1,300 | ||||||||||||||||||
| HMS-Oriens 1st Fund |
61,498 | 1 | 3,957 | 3,408 | — | 3,408 | ||||||||||||||||||
| Woori G Senior Loan Private Placement Investment Trust No.1 |
349,154 | 22 | 17,759 | 16,726 | — | 16,726 | ||||||||||||||||||
| Genesis Eco No.1 Private Equity Fund |
38,064 | 314 | — | (947 | ) | — | (947 | ) | ||||||||||||||||
| Paratus Woori Material Component Equipment joint venture company |
58,298 | 1,510 | — | (906 | ) | — | (906 | ) | ||||||||||||||||
| Midas No. 8 Private Equity Joint Venture Company |
65,063 | 242 | 1,956 | 1,002 | — | 1,002 | ||||||||||||||||||
| Orchestra Private Equity Fund IV |
34,041 | 122 | 1,680 | 1,172 | — | 1,172 | ||||||||||||||||||
| Synaptic Green No.1 PEF |
36,325 | 175 | 4 | (867 | ) | — | (867 | ) | ||||||||||||||||
| IGEN2022No. 1 Private Equity Fund |
32,255 | 124 | 1,847 | 1,350 | — | 1,350 | ||||||||||||||||||
| PCC-Woori LP Secondary Fund |
27,773 | 668 | 908 | (6,350 | ) | — | (6,350 | ) | ||||||||||||||||
- 89 -
WOORI FINANCIAL GROUP INC. AND SUBSIDIARIES
NOTES TO CONSOLIDATED INTERIM FINANCIAL STATEMENTS
AS OF JUNE 30, 2024 AND 2023
| December 31, 2023 | ||||||||||||||||||||||||
| Assets | Liabilities | Operating revenue |
Net income (loss) |
Other comprehensive income(loss) |
Total comprehensive income(loss) |
|||||||||||||||||||
| Synaptic Future Growth Private Equity Fund 1 |
30,049 | 301 | 2 | (951 | ) | — | (951 | ) | ||||||||||||||||
| Woori-Q Corporate Restructuring Private Equity Fund |
63,265 | 456 | 4,945 | 3,018 | — | 3,018 | ||||||||||||||||||
| Woori-Shinyoung Growth-Cap Private Equity Fund I |
97,265 | 1,522 | (26,435 | ) | (27,768 | ) | — | (27,768 | ) | |||||||||||||||
| NH Woori Newdeal Growth Alpha Private Equity Fund 1 |
100,215 | 1,588 | 2 | (3,605 | ) | — | (3,605 | ) | ||||||||||||||||
| Woori BIG2 Plus Securities Investment Trust(Balanced Bond) |
16,630 | 5 | 1,383 | 1,383 | — | 1,383 | ||||||||||||||||||
| Woori 25-09 Corporate Bond(AA- or higher) Active ETF |
133,729 | 32,028 | 3,006 | 2,831 | — | 2,831 | ||||||||||||||||||
| Woori Short Term Government and Special Bank Bond Active ETF |
62,185 | 3,212 | 1,222 | 978 | — | 978 | ||||||||||||||||||
| (*) | The amount is after reflecting the fair value adjustment that occurred when acquiring the shares and the adjustments that occurred by difference of accounting policies with the Group |
| (4) | The entities that the Group has not applied equity method of accounting although the Group’s ownership interest is more than 20% as of June 30, 2024 and December 31, 2023 are as follows: |
| June 30, 2024 | ||||||||
| Associate (*) |
Number of shares owned | Ownership (%) | ||||||
| CL Tech Co., Ltd. |
10,191 | 28.6 | ||||||
| Market & Farm Co., Ltd. |
14,694 | 23.7 | ||||||
| SAMJI TEXTILE CO., LTD. |
61,559 | 29.4 | ||||||
| TH International Co., Ltd. |
31,618 | 21.3 | ||||||
| (*) | Although the Group’s ownership interest of the entity is more than 20%, the Group does not have significant influence over the entity since it is going through work-out process under receivership, accordingly it is excluded from the investment in joint ventures and associates. |
| December 31, 2023 | ||||||||
| Associate (*) |
Number of shares owned | Ownership (%) | ||||||
| CL Tech Co., Ltd. |
10,191 | 28.6 | ||||||
| (*) | Although the Group’s ownership interest of the entity is more than 20%, the Group does not have significant influence over the entity since it is going through work-out process under receivership, accordingly it is excluded from the investment in joint ventures and associates. |
- 90 -
WOORI FINANCIAL GROUP INC. AND SUBSIDIARIES
NOTES TO CONSOLIDATED INTERIM FINANCIAL STATEMENTS
AS OF JUNE 30, 2024 AND 2023
| (5) | As of June 30, 2024 and December 31, 2023, the reconciliations from the net assets of the associates to the book value of the shares of the investment in joint ventures and associates are as follows (Unit: Korean Won in millions except for ownership): |
| June 30, 2024 | ||||||||||||||||||||||||||||
| Total net asset |
Ownership (%) |
Ownership portion of net assets |
Basis difference |
Impairment | Intercompany transaction |
Book value |
||||||||||||||||||||||
| W Service Networks Co., Ltd. |
3,653 | 4.9 | 179 | — | — | — | 179 | |||||||||||||||||||||
| Korea Credit Bureau Co., Ltd. |
75,873 | 9.9 | 7,521 | 247 | — | — | 7,768 | |||||||||||||||||||||
| Korea Finance Security Co., Ltd. |
23,362 | 15.0 | 3,505 | — | — | — | 3,505 | |||||||||||||||||||||
| K BANK Co., Ltd. (*) |
1,940,343 | 12.6 | 244,012 | 21,894 | — | — | 265,906 | |||||||||||||||||||||
| Partner One Value Up I Private Equity Fund |
15,325 | 23.3 | 3,564 | — | — | — | 3,564 | |||||||||||||||||||||
| IBK KIP Seongjang Dideemdol 1st Private Investment Limited Partnership |
42,699 | 20.0 | 8,541 | — | — | — | 8,541 | |||||||||||||||||||||
| Crevisse Raim Impact 1st Startup Venture Specialist Private Equity Fund |
15,643 | 25.0 | 3,911 | — | — | 571 | 4,482 | |||||||||||||||||||||
| LOTTE CARD Co., Ltd.(*) |
2,840,220 | 20.0 | 568,042 | — | — | — | 568,042 | |||||||||||||||||||||
| Union Technology Finance Investment Association |
40,267 | 29.7 | 11,960 | — | — | — | 11,960 | |||||||||||||||||||||
| Dicustody Co., Ltd. |
92 | 1.0 | 1 | — | — | — | 1 | |||||||||||||||||||||
| Orient Shipyard Co., Ltd. |
(16,561 | ) | 22.7 | (3,764 | ) | — | — | 3,764 | — | |||||||||||||||||||
| Joongang Network Solution Co., Ltd. |
(1,277 | ) | 25.3 | (324 | ) | — | — | 420 | 96 | |||||||||||||||||||
| Win Mortgage Co., LTd. |
2,105 | 4.5 | 96 | — | — | — | 96 | |||||||||||||||||||||
| Together-Korea Government Private Pool Private Securities Investment Trust No.3 |
10,697 | 100.0 | 10,695 | — | — | — | 10,695 | |||||||||||||||||||||
| BTS 2nd Private Equity Fund |
38,804 | 20.0 | 7,760 | — | — | — | 7,760 | |||||||||||||||||||||
| STASSETS FUND III |
34,543 | 28.3 | 9,776 | — | — | — | 9,776 | |||||||||||||||||||||
| SF CREDIT PARTNERS, LLC |
140,285 | 10.0 | 14,028 | — | — | 529 | 14,557 | |||||||||||||||||||||
| ARAM CMC Co., Ltd. |
88 | 20.1 | 18 | — | — | (18 | ) | — | ||||||||||||||||||||
| Japanese Hotel Real Estate Private Equity Fund No.2 |
12,771 | 19.9 | 2,537 | — | — | — | 2,537 | |||||||||||||||||||||
| Woori Seoul Beltway Private Special Asset Fund No.1 |
57,265 | 25.0 | 14,316 | — | — | — | 14,316 | |||||||||||||||||||||
| Woori Short-term Bond Securities Investment Trust(Bond) Class C-F |
1,412,772 | 7.2 | 101,707 | — | — | — | 101,707 | |||||||||||||||||||||
| Woori Smart General Private Equity Investment Trust 1(Bond) |
142,147 | 28.6 | 40,613 | — | — | — | 40,613 | |||||||||||||||||||||
| Woori General Private Securities Investment Trust(Bond) No.3 |
103,521 | 29.3 | 30,321 | — | — | — | 30,321 | |||||||||||||||||||||
| Woori Asset Global Partnership Fund No.5 |
65,169 | 57.7 | 37,598 | — | — | — | 37,598 | |||||||||||||||||||||
| WOORI TAERIM 1st Fund |
3,862 | 25.6 | 988 | — | — | — | 988 | |||||||||||||||||||||
| Portone-Cape Fund No.1 |
1,177 | 20.0 | 235 | — | — | — | 235 | |||||||||||||||||||||
| DeepDive WOORI 2021-1 Financial Investment Fund |
1,291 | 11.9 | 154 | — | — | — | 154 | |||||||||||||||||||||
| Darwin Green Packaging Private Equity Fund |
19,229 | 20.4 | 3,924 | — | — | — | 3,924 | |||||||||||||||||||||
| Koreawide partners 2nd Private Equity Fund |
72,132 | 26.7 | 19,235 | — | — | — | 19,235 | |||||||||||||||||||||
| Woori FirstValue Private Real Estate Fund No.2 |
4,694 | 12.0 | 563 | — | — | — | 563 | |||||||||||||||||||||
| Woori Together TDF 2025 |
11,881 | 28.6 | 3,396 | — | — | — | 3,396 | |||||||||||||||||||||
| Woori Together TDF 2030 |
13,108 | 26.8 | 3,519 | — | — | — | 3,519 | |||||||||||||||||||||
- 91 -
WOORI FINANCIAL GROUP INC. AND SUBSIDIARIES
NOTES TO CONSOLIDATED INTERIM FINANCIAL STATEMENTS
AS OF JUNE 30, 2024 AND 2023
| June 30, 2024 | ||||||||||||||||||||||||||||
| Total net asset |
Ownership (%) |
Ownership portion of net assets |
Basis difference |
Impairment | Intercompany transaction |
Book value |
||||||||||||||||||||||
| Australia Green Energy 1st PEF |
120,862 | 4.0 | 4,789 | — | — | — | 4,789 | |||||||||||||||||||||
| Aarden Woori Apparel 1st Private Equity Fund |
20,156 | 0.5 | 95 | — | — | — | 95 | |||||||||||||||||||||
| Woori Dyno 1st Private Equity Fund |
12,016 | 19.6 | 2,356 | — | — | — | 2,356 | |||||||||||||||||||||
| KTB-KORUS FUND |
8,957 | 37.5 | 3,359 | — | — | — | 3,359 | |||||||||||||||||||||
| KTBN Venture Fund No.8 |
8,266 | 21.7 | 1,797 | — | — | — | 1,797 | |||||||||||||||||||||
| KTBN Digital Contents Korea Fund No.9 |
18,571 | 30.0 | 5,571 | — | — | — | 5,571 | |||||||||||||||||||||
| KTBN Media Contents Fund |
1,896 | 15.0 | 284 | — | — | — | 284 | |||||||||||||||||||||
| KTB China Synergy Fund |
105,853 | 15.1 | 15,942 | — | — | — | 15,942 | |||||||||||||||||||||
| NAVER-KTB Audio Contents Fund |
28,764 | 1.0 | 288 | — | — | — | 288 | |||||||||||||||||||||
| KTBN Venture Fund No.13 |
62,398 | 19.6 | 12,235 | — | — | — | 12,235 | |||||||||||||||||||||
| KTBN Future Contents Fund |
33,992 | 13.3 | 4,532 | — | — | — | 4,532 | |||||||||||||||||||||
| KTBN Venture Fund No.16 |
136,093 | 10.3 | 13,958 | — | — | — | 13,958 | |||||||||||||||||||||
| KTBN Venture Fund No.18 |
263,970 | 10.1 | 26,773 | — | — | — | 26,773 | |||||||||||||||||||||
| KB-KTB Technology Venture Fund |
41,490 | 18.2 | 7,544 | — | — | — | 7,544 | |||||||||||||||||||||
| WOORI 2022 Scaleup Venture Fund |
66,616 | 20.0 | 13,341 | — | — | — | 13,341 | |||||||||||||||||||||
| WOORI 2022 Start-up Venture Fund |
25,195 | 30.1 | 7,587 | — | — | — | 7,587 | |||||||||||||||||||||
| KTBN GI Private Equity Fund |
27 | 5.0 | 1 | — | — | — | 1 | |||||||||||||||||||||
| Chirochem |
365 | 28.6 | 104 | — | — | — | 104 | |||||||||||||||||||||
| Daishin Balance No.18 Special Purpose Acquisition Company |
1,632 | 42.6 | 695 | — | — | — | 695 | |||||||||||||||||||||
| Godo Kaisha Oceanos 1 |
15,893 | 47.8 | 7,598 | — | — | — | 7,598 | |||||||||||||||||||||
| Woori Zip 1 |
11,622 | 62.3 | 6,914 | — | — | — | 6,914 | |||||||||||||||||||||
| Woori Zip 2 |
16,011 | 62.7 | 9,668 | — | — | — | 9,668 | |||||||||||||||||||||
| KG Fashion Co., Ltd. |
(560 | ) | 20.8 | (116 | ) | — | — | 116 | — | |||||||||||||||||||
| KUM HWA Co., Ltd. |
(163 | ) | 20.1 | (33 | ) | — | — | 33 | — | |||||||||||||||||||
| Jinmyung Plus Co., Ltd. |
44 | 21.3 | 10 | — | — | — | 10 | |||||||||||||||||||||
| JC Assurance No.2 Private Equity Fund |
120,571 | 23.4 | — | — | — | — | — | |||||||||||||||||||||
| HMS-Oriens 1st Fund |
63,358 | 22.8 | 14,454 | — | — | — | 14,454 | |||||||||||||||||||||
| Woori Senior Loan Private Placement Investment Trust No.1 |
142,795 | 21.6 | 30,914 | — | — | — | 30,914 | |||||||||||||||||||||
| Genesis Eco No.1 Private Equity Fund |
38,348 | 29.0 | 11,115 | — | — | — | 11,115 | |||||||||||||||||||||
| Paratus Woori Material Component Equipment joint venture company |
56,343 | 29.9 | 16,846 | — | — | — | 16,846 | |||||||||||||||||||||
| Midas No. 8 Private Equity Joint Venture Company |
64,375 | 28.5 | 18,338 | — | — | — | 18,338 | |||||||||||||||||||||
| Orchestra Private Equity Fund IV |
34,363 | 28.2 | 9,680 | — | — | — | 9,680 | |||||||||||||||||||||
| Synaptic Green No.1 PEF |
35,969 | 21.1 | 7,573 | — | — | — | 7,573 | |||||||||||||||||||||
| IGEN2022No. 1 Private Equity Fund |
32,455 | 24.8 | 8,063 | — | — | — | 8,063 | |||||||||||||||||||||
| PCC-Woori LP Secondary Fund |
26,719 | 38.8 | 10,380 | — | — | — | 10,380 | |||||||||||||||||||||
| Synaptic Future Growth Private Equity Fund |
36,569 | 23.8 | 8,689 | — | — | — | 8,689 | |||||||||||||||||||||
| Woori-Q Corporate Restructuring Private Equity Fund |
84,563 | 34.2 | 28,961 | — | — | — | 28,961 | |||||||||||||||||||||
- 92 -
WOORI FINANCIAL GROUP INC. AND SUBSIDIARIES
NOTES TO CONSOLIDATED INTERIM FINANCIAL STATEMENTS
AS OF JUNE 30, 2024 AND 2023
| June 30, 2024 | ||||||||||||||||||||||||||||
| Total net asset |
Ownership (%) |
Ownership portion of net assets |
Basis difference |
Impairment | Intercompany transaction |
Book value |
||||||||||||||||||||||
| Woori-Shinyoung Growth-Cap Private Equity Fund I |
86,345 | 35.0 | 30,194 | — | — | — | 30,194 | |||||||||||||||||||||
| NH Woori Newdeal Growth Alpha Private Equity Fund 1 |
110,802 | 33.0 | 37,244 | — | — | — | 37,244 | |||||||||||||||||||||
| Woori BIG2 Plus Securities Investment Trust(Balanced Bond) |
42,495 | 8.4 | 3,596 | — | — | — | 3,596 | |||||||||||||||||||||
| Woori 25-09 Corporate Bond(AA- or higher) Active ETF |
105,693 | 29.0 | 30,620 | — | — | — | 30,620 | |||||||||||||||||||||
| Woori General Private Securities Investment Trust No. 5 (Bond) |
215,154 | 28.6 | 61,473 | — | — | — | 61,473 | |||||||||||||||||||||
| Woori Big Satisfaction General Private Securities Investment Trust No. 3 (Bond) |
112,327 | 9.1 | 10,212 | — | — | — | 10,212 | |||||||||||||||||||||
| Woori General Private Securities Investment Trust No. 6 (Bond) |
142,964 | 28.6 | 40,847 | — | — | — | 40,847 | |||||||||||||||||||||
| Woori Big Satisfaction Corporation MMF No. 1 (Government Bond) |
5,800,089 | 1.8 | 105,023 | — | — | — | 105,023 | |||||||||||||||||||||
| Woori Oncorp Corporate support of Major Industry General Type Private Investment Trust 2 |
137,165 | 2.1 | 2,908 | — | — | — | 2,908 | |||||||||||||||||||||
| Woorinara Short-Term Bond Securities Investment Trust (Bond) |
288,354 | 17.5 | 50,541 | — | — | — | 50,541 | |||||||||||||||||||||
| Woori General Private Securities Investment Trust No. 7 (Bond) |
140,473 | 28.6 | 40,135 | — | — | — | 40,135 | |||||||||||||||||||||
| (*) | Total net asset and ownership portion of net assets amount is after the non-controlling etc. |
- 93 -
WOORI FINANCIAL GROUP INC. AND SUBSIDIARIES
NOTES TO CONSOLIDATED INTERIM FINANCIAL STATEMENTS
AS OF JUNE 30, 2024 AND 2023
| December 31, 2023 | ||||||||||||||||||||||||||||
| Total net asset |
Ownership (%) |
Ownership portion of net assets |
Basis difference |
Impairment | Intercompany transaction |
Book value |
||||||||||||||||||||||
| W Service Networks Co., Ltd. |
4,391 | 4.9 | 216 | — | — | — | 216 | |||||||||||||||||||||
| Korea Credit Bureau Co., Ltd. |
62,408 | 9.9 | 6,186 | 247 | — | — | 6,433 | |||||||||||||||||||||
| Korea Finance Security Co., Ltd. |
21,898 | 15.0 | 3,285 | — | — | — | 3,285 | |||||||||||||||||||||
| K BANK Co., Ltd. (*) |
1,893,785 | 12.6 | 238,158 | 21,894 | — | — | 260,052 | |||||||||||||||||||||
| Partner One Value Up I Private Equity Fund |
13,889 | 23.3 | 3,230 | — | — | — | 3,230 | |||||||||||||||||||||
| IBK KIP Seongjang Dideemdol 1st Private Investment Limited Partnership |
41,228 | 20.0 | 8,247 | — | — | — | 8,247 | |||||||||||||||||||||
| Crevisse Raim Impact 1st Startup Venture Specialist Private Equity Fund |
15,654 | 25.0 | 3,914 | — | — | 523 | 4,437 | |||||||||||||||||||||
| LOTTE CARD Co., Ltd. (*) |
2,936,964 | 20.0 | 587,392 | — | — | — | 587,392 | |||||||||||||||||||||
| Union Technology Finance Investment Association |
41,310 | 29.7 | 12,270 | — | — | — | 12,270 | |||||||||||||||||||||
| Dicustody Co., Ltd. |
92 | 1.0 | 1 | — | — | — | 1 | |||||||||||||||||||||
| Orient Shipyard Co., Ltd. |
(16,517 | ) | 22.7 | (3,754 | ) | — | — | 3,754 | — | |||||||||||||||||||
| Joongang Network Solution Co., Ltd. |
(1,651 | ) | 25.3 | (419 | ) | — | — | 507 | 88 | |||||||||||||||||||
| Win Mortgage Co., LTd. |
2,321 | 4.5 | 105 | — | — | — | 105 | |||||||||||||||||||||
| Together-Korea Government Private Pool Private Securities Investment Trust No. 3 |
10,542 | 100.0 | 10,540 | — | — | — | 10,540 | |||||||||||||||||||||
| BTS 2nd Private Equity Fund |
24,193 | 20.0 | 4,838 | — | — | — | 4,838 | |||||||||||||||||||||
| STASSETS FUND III |
29,702 | 28.3 | 8,406 | — | — | — | 8,406 | |||||||||||||||||||||
| SF CREDIT PARTNERS, LLC |
123,161 | 10.0 | 12,316 | — | — | 529 | 12,845 | |||||||||||||||||||||
| Rea Company |
(1,488 | ) | 24.5 | (365 | ) | — | — | 365 | — | |||||||||||||||||||
| ARAM CMC Co., Ltd. |
184 | 20.0 | 37 | — | — | (37 | ) | — | ||||||||||||||||||||
| Japanese Hotel Real Estate Private Equity Fund No.2 |
13,529 | 19.9 | 2,688 | — | — | — | 2,688 | |||||||||||||||||||||
| Woori Seoul Beltway Private Special Asset Fund No.1 |
50,360 | 25.0 | 12,590 | — | — | — | 12,590 | |||||||||||||||||||||
| Woori General Private Securities Investment Trust(Bond) No.1 |
206,746 | 25.0 | 51,686 | — | — | — | 51,686 | |||||||||||||||||||||
| Woori Short-term Bond Securities Investment Trust(Bond) ClassC-F |
701,914 | 15.0 | 105,564 | — | — | — | 105,564 | |||||||||||||||||||||
| Woori Safe Plus General Type Private Investment Trust S-8(Bond) |
113,407 | 9.1 | 10,330 | — | — | — | 10,330 | |||||||||||||||||||||
| Woori General Private Securities Investment Trust(Bond) No.2 |
113,040 | 27.3 | 30,829 | — | — | — | 30,829 | |||||||||||||||||||||
| Woori Smart General Private Equity Investment Trust 1(Bond) |
143,973 | 28.6 | 41,135 | — | — | — | 41,135 | |||||||||||||||||||||
| Woori General Private Securities Investment Trust(Bond) No.3 |
184,330 | 27.8 | 51,205 | — | — | — | 51,205 | |||||||||||||||||||||
| Woori Asset Global Partnership Fund No.5 |
38,256 | 57.7 | 22,071 | — | — | — | 22,071 | |||||||||||||||||||||
| WOORI TAERIM 1st Fund |
3,862 | 25.6 | 988 | — | — | — | 988 | |||||||||||||||||||||
| Portone-Cape Fund No.1 |
2,224 | 20.0 | 445 | — | — | — | 445 | |||||||||||||||||||||
| DeepDive WOORI 2021-1 Financial Investment Fund |
10,381 | 11.9 | 1,236 | — | — | — | 1,236 | |||||||||||||||||||||
| Darwin Green Packaging Private Equity Fund |
19,390 | 20.4 | 3,957 | — | — | — | 3,957 | |||||||||||||||||||||
| Koreawide partners 2nd Private Equity Fund |
72,133 | 26.7 | 19,235 | — | — | — | 19,235 | |||||||||||||||||||||
- 94 -
WOORI FINANCIAL GROUP INC. AND SUBSIDIARIES
NOTES TO CONSOLIDATED INTERIM FINANCIAL STATEMENTS
AS OF JUNE 30, 2024 AND 2023
| December 31, 2023 | ||||||||||||||||||||||||||||
| Total net asset |
Ownership (%) |
Ownership portion of net assets |
Basis difference |
Impairment | Intercompany transaction |
Book value |
||||||||||||||||||||||
| Woori FirstValue Private Real Estate Fund No.2 |
4,667 | 12.0 | 560 | — | — | — | 560 | |||||||||||||||||||||
| WooriG Real Infrastructure Blind General Type Private Placement Investment Trust |
114,817 | 0.1 | 55 | — | — | — | 55 | |||||||||||||||||||||
| Woori Together TDF 2030 |
11,894 | 28.0 | 3,324 | — | — | — | 3,324 | |||||||||||||||||||||
| Woori Together OCIO Target Return Feeder fund (Balance Bond) |
50,837 | 20.4 | 10,376 | — | — | — | 10,376 | |||||||||||||||||||||
| Australia Green Energy 1st PEF |
121,430 | 4.0 | 4,811 | — | — | — | 4,811 | |||||||||||||||||||||
| Aarden Woori Apparel 1st Private Equity Fund |
28,129 | 0.5 | 133 | — | — | — | 133 | |||||||||||||||||||||
| Woori Dyno 1st Private Equity Fund |
12,025 | 19.6 | 2,358 | — | — | — | 2,358 | |||||||||||||||||||||
| KTB-KORUS FUND |
8,956 | 37.5 | 3,359 | — | — | — | 3,359 | |||||||||||||||||||||
| KTB China Platform Fund |
85,895 | 18.7 | 16,059 | — | — | — | 16,059 | |||||||||||||||||||||
| KTBN Venture Fund No.7 |
79,871 | 20.1 | 16,044 | — | — | — | 16,044 | |||||||||||||||||||||
| KTBN Venture Fund No.8 |
11,551 | 21.7 | 2,511 | — | — | — | 2,511 | |||||||||||||||||||||
| KTBN Digital Contents Korea Fund No.9 |
18,658 | 30.0 | 5,597 | — | — | — | 5,597 | |||||||||||||||||||||
| KTBN Media Contents Fund |
1,887 | 15.0 | 283 | — | — | — | 283 | |||||||||||||||||||||
| KTB China Synergy Fund |
135,487 | 15.1 | 20,405 | — | — | — | 20,405 | |||||||||||||||||||||
| NAVER-KTB Audio Contents Fund |
28,767 | 1.0 | 288 | — | — | — | 288 | |||||||||||||||||||||
| KTBN Venture Fund No.13 |
72,206 | 19.6 | 14,158 | — | — | — | 14,158 | |||||||||||||||||||||
| KTBN Future Contents Fund |
34,210 | 13.3 | 4,561 | — | — | — | 4,561 | |||||||||||||||||||||
| KTBN Venture Fund No.16 |
180,975 | 10.3 | 18,561 | — | — | — | 18,561 | |||||||||||||||||||||
| KTBN Venture Fund No.18 |
265,911 | 10.1 | 26,970 | — | — | — | 26,970 | |||||||||||||||||||||
| KB-KTB Technology Venture Fund |
41,800 | 18.2 | 7,600 | — | — | — | 7,600 | |||||||||||||||||||||
| WOORI 2022 Scaleup Venture Fund |
67,800 | 20.0 | 13,578 | — | — | — | 13,578 | |||||||||||||||||||||
| WOORI 2022 Start-up Venture Fund |
8,081 | 30.1 | 2,433 | — | — | — | 2,433 | |||||||||||||||||||||
| KTB-NHN China Private Equity Fund |
9 | 33.3 | 3 | — | — | — | 3 | |||||||||||||||||||||
| KTBN GI Private Equity Fund |
12,346 | 5.0 | 617 | — | — | — | 617 | |||||||||||||||||||||
| Chirochem |
357 | 28.6 | 102 | — | — | — | 102 | |||||||||||||||||||||
| Godo Kaisha Oceanos 1 |
16,687 | 47.8 | 7,978 | — | — | — | 7,978 | |||||||||||||||||||||
| Woori Zip 1 |
12,746 | 62.4 | 7,629 | — | — | — | 7,629 | |||||||||||||||||||||
| Woori Zip 2 |
17,630 | 62.8 | 10,695 | — | — | — | 10,695 | |||||||||||||||||||||
| KG Fashion Co., Ltd. |
(463 | ) | 20.8 | (96 | ) | — | — | 96 | — | |||||||||||||||||||
| KUM HWA Co., Ltd. |
(163 | ) | 20.1 | (33 | ) | — | — | 33 | — | |||||||||||||||||||
| Jinmyung Plus Co., Ltd. |
65 | 21.3 | 14 | — | — | — | 14 | |||||||||||||||||||||
| JC Assurance No.2 Private Equity Fund |
121,588 | 23.5 | 28,610 | — | (28,610 | ) | — | — | ||||||||||||||||||||
| Dream Company Growth no.1 PEF |
28,111 | 27.8 | 7,809 | — | — | — | 7,809 | |||||||||||||||||||||
| HMS-Oriens 1st Fund |
61,497 | 22.8 | 14,030 | — | — | — | 14,030 | |||||||||||||||||||||
| Woori G Senior Loan Private Placement Investment Trust No.1 |
349,132 | 21.7 | 75,590 | — | — | — | 75,590 | |||||||||||||||||||||
| Genesis Eco No.1 Private Equity Fund |
37,750 | 29.0 | 10,942 | — | — | — | 10,942 | |||||||||||||||||||||
| Paratus Woori Material Component Equipment joint venture company |
56,788 | 29.9 | 16,979 | — | — | — | 16,979 | |||||||||||||||||||||
| Midas No. 8 Private Equity Joint Venture Company |
64,821 | 28.5 | 18,465 | — | — | — | 18,465 | |||||||||||||||||||||
- 95 -
WOORI FINANCIAL GROUP INC. AND SUBSIDIARIES
NOTES TO CONSOLIDATED INTERIM FINANCIAL STATEMENTS
AS OF JUNE 30, 2024 AND 2023
| December 31, 2023 | ||||||||||||||||||||||||||||
| Total net asset |
Ownership (%) |
Ownership portion of net assets |
Basis difference |
Impairment | Intercompany transaction |
Book value |
||||||||||||||||||||||
| Orchestra Private Equity Fund IV |
33,919 | 28.2 | 9,555 | — | — | — | 9,555 | |||||||||||||||||||||
| Synaptic Green No.1 PEF |
36,150 | 21.1 | 7,611 | — | — | — | 7,611 | |||||||||||||||||||||
| IGEN2022No. 1 Private Equity Fund |
32,131 | 24.8 | 7,983 | — | — | — | 7,983 | |||||||||||||||||||||
| PCC-Woori LP Secondary Fund |
27,105 | 38.9 | 10,530 | — | — | — | 10,530 | |||||||||||||||||||||
| Synaptic Future Growth Private Equity Fund 1 |
29,748 | 23.8 | 7,069 | — | — | — | 7,069 | |||||||||||||||||||||
| Woori-Q Corporate Restructuring Private Equity Fund |
62,809 | 32.4 | 20,283 | — | — | — | 20,283 | |||||||||||||||||||||
| Woori-Shinyoung Growth-Cap Private Equity Fund I |
95,743 | 35.0 | 33,481 | — | — | — | 33,481 | |||||||||||||||||||||
| NH Woori Newdeal Growth Alpha Private Equity Fund 1 |
98,627 | 32.7 | 32,987 | — | — | — | 32,987 | |||||||||||||||||||||
| Woori BIG2 Plus Securities Investment Trust(Balanced Bond) |
16,625 | 14.1 | 2,543 | — | — | — | 2,543 | |||||||||||||||||||||
| Woori 25-09 Corporate Bond (AA- or higher) Active ETF |
101,701 | 29.3 | 29,821 | — | — | — | 29,821 | |||||||||||||||||||||
| Woori Short Term Government and Special Bank Bond Active ETF |
58,973 | 20.8 | 12,286 | — | — | — | 12,286 | |||||||||||||||||||||
| (*) | The net asset equity amount is after the debt-for-equity swap, non-controlling etc. |
- 96 -
WOORI FINANCIAL GROUP INC. AND SUBSIDIARIES
NOTES TO CONSOLIDATED INTERIM FINANCIAL STATEMENTS
AS OF JUNE 30, 2024 AND 2023
| 13. | INVESTMENT PROPERTIES |
| (1) | Details of investment properties are as follows (Unit: Korean Won in millions): |
| June 30, 2024 | December 31, 2023 | |||||||
| Acquisition cost |
538,662 | 510,990 | ||||||
| Accumulated depreciation |
(43,544 | ) | (38,136 | ) | ||||
| Accumulated impairment losses |
(86 | ) | (86 | ) | ||||
|
|
|
|
|
|||||
| Net carrying value |
495,032 | 472,768 | ||||||
|
|
|
|
|
|||||
| (2) | Changes in investment properties are as follows (Unit: Korean Won in millions): |
| For the six-month periods ended June 30 | ||||||||
| 2024 | 2023 | |||||||
| Beginning balance |
472,768 | 387,707 | ||||||
| Acquisition |
— | 99,234 | ||||||
| Depreciation |
(5,332 | ) | (2,580 | ) | ||||
| Transfer |
33,514 | (1,730 | ) | |||||
| Foreign currencies translation adjustments |
(5,918 | ) | (8,298 | ) | ||||
|
|
|
|
|
|||||
| Ending balance |
495,032 | 474,333 | ||||||
|
|
|
|
|
|||||
- 97 -
WOORI FINANCIAL GROUP INC. AND SUBSIDIARIES
NOTES TO CONSOLIDATED INTERIM FINANCIAL STATEMENTS
AS OF JUNE 30, 2024 AND 2023
| 14. | PREMISES AND EQUIPMENT |
| (1) | Details of premises and equipment as of June 30, 2024 and December 31, 2023 are as follows (Unit: Korean Won in millions): |
| June 30, 2024 | ||||||||||||||||||||||||||||
| Land | Building | Properties for business use |
Leasehold improvement |
Construction in progress |
Structures | Total | ||||||||||||||||||||||
| Premises and equipment (owned) |
1,679,798 | 692,052 | 270,716 | 62,454 | 54,092 | — | 2,759,112 | |||||||||||||||||||||
| Right-of-use asset |
— | 522,886 | 24,957 | — | — | — | 547,843 | |||||||||||||||||||||
|
|
|
|
|
|
|
|
|
|
|
|
|
|
|
|||||||||||||||
| Carrying value |
1,679,798 | 1,214,938 | 295,673 | 62,454 | 54,092 | — | 3,306,955 | |||||||||||||||||||||
|
|
|
|
|
|
|
|
|
|
|
|
|
|
|
|||||||||||||||
| December 31, 2023 | ||||||||||||||||||||||||||||
| Land | Building | Properties for business use |
Leasehold improvement |
Construction in progress |
Structures | Total | ||||||||||||||||||||||
| Premises and equipment (owned) |
1,709,712 | 719,738 | 265,064 | 61,369 | 37,194 | — | 2,793,077 | |||||||||||||||||||||
| Right-of-use asset |
— | 362,702 | 20,980 | — | — | — | 383,682 | |||||||||||||||||||||
|
|
|
|
|
|
|
|
|
|
|
|
|
|
|
|||||||||||||||
| Carrying value |
1,709,712 | 1,082,440 | 286,044 | 61,369 | 37,194 | — | 3,176,759 | |||||||||||||||||||||
|
|
|
|
|
|
|
|
|
|
|
|
|
|
|
|||||||||||||||
| (2) | Details of premises and equipment (owned) as of June 30, 2024 and December 31, 2023 are as follows (Unit: Korean Won in millions): |
| June 30, 2024 | ||||||||||||||||||||||||||||
| Land | Building | Properties for business use |
Leasehold improvement |
Construction in progress |
Structures | Total | ||||||||||||||||||||||
| Acquisition cost |
1,680,458 | 1,085,597 | 1,265,362 | 492,806 | 54,092 | 20 | 4,578,335 | |||||||||||||||||||||
| Accumulated depreciation |
— | (393,545 | ) | (994,646 | ) | (430,352 | ) | — | (20 | ) | (1,818,563 | ) | ||||||||||||||||
| Accumulated impairment losses |
(660 | ) | — | — | — | — | — | (660 | ) | |||||||||||||||||||
|
|
|
|
|
|
|
|
|
|
|
|
|
|
|
|||||||||||||||
| Net carrying value |
1,679,798 | 692,052 | 270,716 | 62,454 | 54,092 | — | 2,759,112 | |||||||||||||||||||||
|
|
|
|
|
|
|
|
|
|
|
|
|
|
|
|||||||||||||||
| December 31, 2023 | ||||||||||||||||||||||||||||
| Land | Building | Properties for business use |
Leasehold improvement |
Construction in progress |
Structures | Total | ||||||||||||||||||||||
| Acquisition cost |
1,710,372 | 1,098,682 | 1,229,740 | 486,763 | 37,194 | 20 | 4,562,771 | |||||||||||||||||||||
| Accumulated depreciation |
— | (378,944 | ) | (964,676 | ) | (425,394 | ) | — | (20 | ) | (1,769,034 | ) | ||||||||||||||||
| Accumulated impairment losses |
(660 | ) | — | — | — | — | — | (660 | ) | |||||||||||||||||||
|
|
|
|
|
|
|
|
|
|
|
|
|
|
|
|||||||||||||||
| Net carrying value |
1,709,712 | 719,738 | 265,064 | 61,369 | 37,194 | — | 2,793,077 | |||||||||||||||||||||
|
|
|
|
|
|
|
|
|
|
|
|
|
|
|
|||||||||||||||
| (3) | Details of changes in premises and equipment (owned) are as follows (Unit: Korean Won in millions): |
| For the six-month period ended June 30, 2024 | ||||||||||||||||||||||||||||
| Land | Building | Properties for business use |
Leasehold improvement |
Construction in progress |
Structures | Total | ||||||||||||||||||||||
| Beginning balance |
1,709,712 | 719,738 | 265,064 | 61,369 | 37,194 | — | 2,793,077 | |||||||||||||||||||||
| Acquisitions |
— | 10,366 | 52,567 | 10,091 | 19,032 | — | 92,056 | |||||||||||||||||||||
| Disposals |
(344 | ) | — | (1,566 | ) | (849 | ) | — | — | (2,759 | ) | |||||||||||||||||
| Depreciation |
— | (16,406 | ) | (49,371 | ) | (10,766 | ) | — | — | (76,543 | ) | |||||||||||||||||
| Classified as held-for-sale |
(9,530 | ) | (9,200 | ) | — | — | — | — | (18,730 | ) | ||||||||||||||||||
| Transfer |
(20,397 | ) | (13,117 | ) | 2,082 | 384 | (2,466 | ) | — | (33,514 | ) | |||||||||||||||||
| Foreign currencies translation adjustments |
357 | 121 | 1,794 | 1,686 | 332 | — | 4,290 | |||||||||||||||||||||
| Others |
— | 550 | 146 | 539 | — | — | 1,235 | |||||||||||||||||||||
|
|
|
|
|
|
|
|
|
|
|
|
|
|
|
|||||||||||||||
| Ending balance |
1,679,798 | 692,052 | 270,716 | 62,454 | 54,092 | — | 2,759,112 | |||||||||||||||||||||
|
|
|
|
|
|
|
|
|
|
|
|
|
|
|
|||||||||||||||
- 98 -
WOORI FINANCIAL GROUP INC. AND SUBSIDIARIES
NOTES TO CONSOLIDATED INTERIM FINANCIAL STATEMENTS
AS OF JUNE 30, 2024 AND 2023
| For the six-month period ended June 30, 2023 | ||||||||||||||||||||||||||||
| Land | Building | Properties for business use |
Leasehold improvement |
Construction in progress |
Structures | Total | ||||||||||||||||||||||
| Beginning balance |
1,695,357 | 730,676 | 261,278 | 58,352 | 32,184 | — | 2,777,847 | |||||||||||||||||||||
| Acquisitions |
124 | 4,468 | 36,436 | 10,469 | 2,291 | — | 53,788 | |||||||||||||||||||||
| Disposals |
(14 | ) | (11 | ) | (12,476 | ) | (401 | ) | (200 | ) | — | (13,102 | ) | |||||||||||||||
| Depreciation |
— | (16,318 | ) | (49,817 | ) | (10,363 | ) | — | — | (76,498 | ) | |||||||||||||||||
| Classified as held-for-sale |
(1,356 | ) | (2,886 | ) | — | — | — | — | (4,242 | ) | ||||||||||||||||||
| Transfer |
5,147 | (3,417 | ) | — | — | — | — | 1,730 | ||||||||||||||||||||
| Foreign currencies translation adjustments |
1,575 | 768 | 1,417 | 685 | 58 | — | 4,503 | |||||||||||||||||||||
| Changes due to business combinations |
9,530 | 9,530 | 318 | — | — | — | 19,378 | |||||||||||||||||||||
| Others |
3 | (80 | ) | 6 | (88 | ) | (111 | ) | — | (270 | ) | |||||||||||||||||
|
|
|
|
|
|
|
|
|
|
|
|
|
|
|
|||||||||||||||
| Ending balance |
1,710,366 | 722,730 | 237,162 | 58,654 | 34,222 | — | 2,763,134 | |||||||||||||||||||||
|
|
|
|
|
|
|
|
|
|
|
|
|
|
|
|||||||||||||||
| (4) | Details of right-of-use assets as of June 30, 2024 and December 31, 2023 are as follows (Unit: Korean Won in millions): |
| June 30, 2024 | ||||||||||||
| Building | Properties for business use | Total | ||||||||||
| Acquisition cost |
954,689 | 42,834 | 997,523 | |||||||||
| Accumulated depreciation |
(431,803 | ) | (17,877 | ) | (449,680 | ) | ||||||
|
|
|
|
|
|
|
|||||||
| Net carrying value |
522,886 | 24,957 | 547,843 | |||||||||
|
|
|
|
|
|
|
|||||||
| December 31, 2023 | ||||||||||||
| Building | Properties for business use | Total | ||||||||||
| Acquisition cost |
735,396 | 40,389 | 775,785 | |||||||||
| Accumulated depreciation |
(372,694 | ) | (19,409 | ) | (392,103 | ) | ||||||
|
|
|
|
|
|
|
|||||||
| Net carrying value |
362,702 | 20,980 | 383,682 | |||||||||
|
|
|
|
|
|
|
|||||||
| (5) | Details of changes in right-of-use assets for the six-month periods ended June 30, 2024 and 2023 are as follows (Unit: Korean Won in millions): |
| For the six-month period ended June 30, 2024 | ||||||||||||
| Building | Properties for business use | Total | ||||||||||
| Beginning balance |
362,702 | 20,980 | 383,682 | |||||||||
| New contracts |
263,121 | 10,632 | 273,753 | |||||||||
| Changes in contract |
18,741 | 2 | 18,743 | |||||||||
| Termination |
(8,269 | ) | (1,434 | ) | (9,703 | ) | ||||||
| Depreciation |
(115,073 | ) | (6,711 | ) | (121,784 | ) | ||||||
| Changes due to business combinations |
— | — | — | |||||||||
| Others |
1,664 | 1,488 | 3,152 | |||||||||
|
|
|
|
|
|
|
|||||||
| Ending balance |
522,886 | 24,957 | 547,843 | |||||||||
|
|
|
|
|
|
|
|||||||
| For the six-month period ended June 30, 2023 | ||||||||||||
| Building | Properties for business use | Total | ||||||||||
| Beginning balance |
349,494 | 15,589 | 365,083 | |||||||||
| New contracts |
104,162 | 8,063 | 112,225 | |||||||||
| Changes in contract |
6,162 | 68 | 6,230 | |||||||||
| Termination |
(15,529 | ) | (639 | ) | (16,168 | ) | ||||||
| Depreciation |
(99,044 | ) | (5,935 | ) | (104,979 | ) | ||||||
| Changes due to business combinations |
674 | 272 | 946 | |||||||||
| Others |
6,277 | 467 | 6,744 | |||||||||
|
|
|
|
|
|
|
|||||||
| Ending balance |
352,196 | 17,885 | 370,081 | |||||||||
|
|
|
|
|
|
|
|||||||
- 99 -
WOORI FINANCIAL GROUP INC. AND SUBSIDIARIES
NOTES TO CONSOLIDATED INTERIM FINANCIAL STATEMENTS
AS OF JUNE 30, 2024 AND 2023
| 15. | INTANGIBLE ASSETS |
| (1) | Details of intangible assets are as follows (Unit: Korean Won in millions): |
| June 30, 2024 | ||||||||||||||||||||||||||||
| Goodwill | Industrial property rights |
Development cost |
Other intangible assets |
Membership deposit |
Construction in progress |
Total | ||||||||||||||||||||||
| Acquisition cost |
451,766 | 2,342 | 907,081 | 1,420,946 | 55,008 | 19,497 | 2,856,640 | |||||||||||||||||||||
| Accumulated amortization |
— | (1,880 | ) | (650,427 | ) | (1,142,403 | ) | — | — | (1,794,710 | ) | |||||||||||||||||
| Accumulated impairment losses |
— | — | — | (33,552 | ) | (3,087 | ) | — | (36,639 | ) | ||||||||||||||||||
|
|
|
|
|
|
|
|
|
|
|
|
|
|
|
|||||||||||||||
| Net carrying value |
451,766 | 462 | 256,654 | 244,991 | 51,921 | 19,497 | 1,025,291 | |||||||||||||||||||||
|
|
|
|
|
|
|
|
|
|
|
|
|
|
|
|||||||||||||||
| December 31, 2023 | ||||||||||||||||||||||||||||
| Goodwill | Industrial property rights |
Development cost |
Other intangible assets |
Membership deposit |
Construction in progress |
Total | ||||||||||||||||||||||
| Acquisition cost |
445,093 | 2,292 | 859,678 | 1,388,397 | 50,857 | 8,142 | 2,754,459 | |||||||||||||||||||||
| Accumulated amortization |
— | (1,783 | ) | (617,587 | ) | (1,101,688 | ) | — | — | (1,721,058 | ) | |||||||||||||||||
| Accumulated impairment losses |
— | — | — | (33,553 | ) | (3,006 | ) | — | (36,559 | ) | ||||||||||||||||||
|
|
|
|
|
|
|
|
|
|
|
|
|
|
|
|||||||||||||||
| Net carrying value |
445,093 | 509 | 242,091 | 253,156 | 47,851 | 8,142 | 996,842 | |||||||||||||||||||||
|
|
|
|
|
|
|
|
|
|
|
|
|
|
|
|||||||||||||||
| (2) | Details of changes in intangible assets are as follows (Unit: Korean Won in millions): |
| For the six-month period ended June 30, 2024 | ||||||||||||||||||||||||||||
| Goodwill | Industrial property rights |
Development cost |
Other intangible assets |
Membership deposit |
Construction in progress |
Total | ||||||||||||||||||||||
| Beginning balance |
445,093 | 509 | 242,091 | 253,156 | 47,851 | 8,142 | 996,842 | |||||||||||||||||||||
| Acquisitions |
— | 16 | 51,025 | 34,113 | 6,598 | 15,956 | 107,708 | |||||||||||||||||||||
| Disposal |
— | — | (113 | ) | (1,681 | ) | (2,464 | ) | — | (4,258 | ) | |||||||||||||||||
| Amortization(*) |
— | (97 | ) | (36,347 | ) | (44,635 | ) | — | — | (81,079 | ) | |||||||||||||||||
| Impairment losses |
— | — | — | — | (209 | ) | — | (209 | ) | |||||||||||||||||||
| Transfer |
— | 34 | — | 2,129 | — | (2,163 | ) | — | ||||||||||||||||||||
| Foreign currencies translation adjustments |
6,673 | — | (2 | ) | 1,732 | 162 | 385 | 8,950 | ||||||||||||||||||||
| Others |
— | — | — | 177 | (17 | ) | (2,823 | ) | (2,663 | ) | ||||||||||||||||||
|
|
|
|
|
|
|
|
|
|
|
|
|
|
|
|||||||||||||||
| Ending balance |
451,766 | 462 | 256,654 | 244,991 | 51,921 | 19,497 | 1,025,291 | |||||||||||||||||||||
|
|
|
|
|
|
|
|
|
|
|
|
|
|
|
|||||||||||||||
| (*) | Amortization of other intangible assets amounting to 13,080 million Won is included in other operating expenses. |
| For the six-month period ended June 30, 2023 | ||||||||||||||||||||||||||||
| Goodwill | Industrial property rights |
Development cost |
Other intangible assets |
Membership deposit |
Construction in progress |
Total | ||||||||||||||||||||||
| Beginning balance |
397,527 | 643 | 212,627 | 192,373 | 42,917 | 3,027 | 849,114 | |||||||||||||||||||||
| Acquisitions |
— | 33 | 47,825 | 92,814 | 279 | 4,397 | 145,348 | |||||||||||||||||||||
| Disposal |
— | — | — | — | (177 | ) | — | (177 | ) | |||||||||||||||||||
| Amortization(*) |
— | (105 | ) | (43,175 | ) | (41,828 | ) | — | — | (85,108 | ) | |||||||||||||||||
| Reversal of impairment losses |
— | — | — | — | 157 | — | 157 | |||||||||||||||||||||
| Transfer |
— | — | — | 289 | — | (289 | ) | — | ||||||||||||||||||||
| Changes due to business combinations |
41,527 | — | — | 18,882 | 2,565 | — | 62,974 | |||||||||||||||||||||
| Foreign currencies translation adjustments |
14,517 | — | — | 2,660 | 22 | 147 | 17,346 | |||||||||||||||||||||
| Others |
— | — | — | 709 | (25 | ) | (862 | ) | (178 | ) | ||||||||||||||||||
|
|
|
|
|
|
|
|
|
|
|
|
|
|
|
|||||||||||||||
| Ending balance |
453,571 | 571 | 217,277 | 265,899 | 45,738 | 6,420 | 989,476 | |||||||||||||||||||||
|
|
|
|
|
|
|
|
|
|
|
|
|
|
|
|||||||||||||||
| (*) | Amortization of other intangible assets amounting to 10,093 million Won is included in other operating expenses. |
- 100 -
WOORI FINANCIAL GROUP INC. AND SUBSIDIARIES
NOTES TO CONSOLIDATED INTERIM FINANCIAL STATEMENTS
AS OF JUNE 30, 2024 AND 2023
| 16. | ASSETS HELD FOR SALE |
Assets held for sale are as follows (Unit: Korean Won in millions):
| Assets(*) |
June 30,2024 | December 31, 2023 | ||||||
| Premises and equipment |
11,573 | 11,573 | ||||||
| Others |
23,760 | 8,772 | ||||||
|
|
|
|
|
|||||
| Total |
35,333 | 20,345 | ||||||
|
|
|
|
|
|||||
| (*) | The Group classifies assets as held for sale that are highly likely to be sold within one year from June 30, 2024, and December 31, 2023. |
The Group measured assets held for sale at the lower of fair value less costs to sell and carrying amount.
The Group has decided to sell some of the premises and equipment through internal consultation during the current period and classifies the premises as non-current assets held for sale. On the other hand, other assets that are expected to be sold as of the end of the current period are classified as assets that are expected to be sold within one year due to the possibility of being sold as buildings and land acquired through auction.
| 17. | OTHER ASSETS |
| Details | of other assets are as follows (Unit: Korean Won in millions): |
| June 30, 2024 | December 31, 2023 | |||||||
| Lease assets |
3,752,538 | 3,306,464 | ||||||
| Prepaid expenses |
373,627 | 345,202 | ||||||
| Advance payments |
57,973 | 95,025 | ||||||
| Assets for non-business use |
42,122 | 34,625 | ||||||
| Others |
37,694 | 60,471 | ||||||
|
|
|
|
|
|||||
| Total |
4,263,954 | 3,841,787 | ||||||
|
|
|
|
|
|||||
| 18. | FINANCIAL LIABILITIES AT FVTPL |
| (1) | Financial liabilities at FVTPL are as follows (Unit: Korean Won in millions): |
| June 30, 2024 | December 31, 2023 | |||||||
| Financial instruments at fair value through profit or loss |
7,185,806 | 6,138,313 | ||||||
| Financial liabilities designated to be measured at FVTPL |
329,983 | — | ||||||
|
|
|
|
|
|||||
| Total |
7,515,789 | 6,138,313 | ||||||
|
|
|
|
|
|||||
| (2) | Financial liabilities at fair value through profit or loss are as follows (Unit: Korean Won in millions): |
| June 30, 2024 | December 31, 2023 | |||||||
| Deposits due to customers |
||||||||
| Gold banking liabilities |
49,773 | 39,524 | ||||||
| Borrowings |
||||||||
| Securities sold |
145,902 | 155,765 | ||||||
| Derivative liabilities |
6,990,131 | 5,943,024 | ||||||
|
|
|
|
|
|||||
| Total |
7,185,806 | 6,138,313 | ||||||
|
|
|
|
|
|||||
- 101 -
WOORI FINANCIAL GROUP INC. AND SUBSIDIARIES
NOTES TO CONSOLIDATED INTERIM FINANCIAL STATEMENTS
AS OF JUNE 30, 2024 AND 2023
| (3) | Financial liabilities designated to be measured at FVTPL are as follows (Unit: Korean Won in millions): |
| June 30, 2024 | December 31, 2023 | |||||||
| Deposits due to customers |
||||||||
| Time deposits |
329,983 | — | ||||||
These contracts are designated as financial liabilities at fair value through profit or loss because these contracts contain one or more embedded derivatives and are hybrid (combined) contracts in accordance with K-IFRS 1109 Financial Instrument
| (4) | Changes in fair value due to change in credit risk reflected in financial liabilities designated to be measured at FVTPL are as follows (Unit: Korean Won in millions): |
| For the six-month period ended June 30, 2024 |
For the six-month period ended June 30, 2023 |
|||||||
| Financial liabilities designated to be measured at FVTPL as of June 30, 2024 |
329,983 | — | ||||||
| Changes in fair value due to change in credit risk |
1,137 | — | ||||||
| Accumulated change in fair value due to change in credit risk |
1,137 | — | ||||||
The adjustment to reflect Group’s credit risk is considered in measuring the fair value of Deposits due to customers. The Group’s credit risk is determined by adjusting credit spread observed in credit rating of Group.
| (5) | The difference between carrying amount and nominal amount at maturity of financial liabilities designated to be measured at FVTPL are as follows (Unit: Korean Won in millions): |
| June 30, 2024 | December 31, 2023 | |||||||
| Carrying amount |
329,983 | — | ||||||
| Nominal amount at maturity |
330,000 | — | ||||||
| Difference |
(17 | ) | — | |||||
| 19. | DEPOSITS DUE TO CUSTOMERS |
Details of deposits due to customers by type are as follows (Unit: Korean Won in millions):
| June 30, 2024 | December 31, 2023 | |||||||
| Deposits in local currency: |
||||||||
| Deposits on demand |
8,831,752 | 8,803,962 | ||||||
| Deposits at termination |
287,565,223 | 282,846,971 | ||||||
| Mutual installment |
21,004 | 21,602 | ||||||
| Deposits on notes payables |
4,258,668 | 4,119,801 | ||||||
| Deposits on Cash Management Account |
110,433 | 95,237 | ||||||
| Certificate of deposits |
12,468,733 | 14,767,307 | ||||||
| Other deposits |
1,072,860 | 1,117,673 | ||||||
|
|
|
|
|
|||||
| Sub-total |
314,328,673 | 311,772,553 | ||||||
|
|
|
|
|
|||||
| Deposits in foreign currencies: |
||||||||
| Deposits in foreign currencies |
45,101,511 | 46,196,650 | ||||||
| Present value discount |
(127,635 | ) | (184,906 | ) | ||||
|
|
|
|
|
|||||
| Total |
359,302,549 | 357,784,297 | ||||||
|
|
|
|
|
|||||
- 102 -
WOORI FINANCIAL GROUP INC. AND SUBSIDIARIES
NOTES TO CONSOLIDATED INTERIM FINANCIAL STATEMENTS
AS OF JUNE 30, 2024 AND 2023
| 20. | BORROWINGS AND DEBENTURES |
| (1) | Details of borrowings are as follows (Unit: Korean Won in millions): |
| June 30, 2024 |
||||||||||
| Lenders |
Interest rate (%) | Amount | ||||||||
| Borrowings in local currency |
||||||||||
| Borrowings from BOK |
BOK | 2.0 | 2,381,377 | |||||||
| Borrowings from government funds |
Small Enterprise And Market Service and others | 0.0 ~ 3.5 | 2,176,393 | |||||||
| Others |
The Korea Development Bank and others | 0.0 ~ 5.9 | 9,618,715 | |||||||
|
|
|
|||||||||
| Sub-total |
14,176,485 | |||||||||
|
|
|
|||||||||
| Borrowings in foreign currencies |
||||||||||
| Borrowings in foreign currencies |
Export-Import Bank of Korea and others | 0.0 ~ 10.6 | 13,726,098 | |||||||
| Bills sold |
Others | 0.0 ~ 2.7 | 3,797 | |||||||
| Call money |
Bank and others | 1.9 ~ 6.6 | 1,436,641 | |||||||
| Bonds sold under repurchase agreements |
Other financial institutions | 1.0 ~ 10.4 | 985,707 | |||||||
| Present value discount |
(13,727 | ) | ||||||||
|
|
|
|||||||||
| Total |
30,315,001 | |||||||||
|
|
|
|||||||||
- 103 -
WOORI FINANCIAL GROUP INC. AND SUBSIDIARIES
NOTES TO CONSOLIDATED INTERIM FINANCIAL STATEMENTS
AS OF JUNE 30, 2024 AND 2023
| December 31, 2023 |
||||||||||
| Lenders |
Interest rate (%) | Amount | ||||||||
| Borrowings in local currency: |
||||||||||
| Borrowings from The BOK |
The BOK | 2.0 | 1,565,444 | |||||||
| Borrowings from government funds |
Small Enterprise and Market Service and others | 0.0 ~ 3.4 | 1,996,579 | |||||||
| Others |
The Korea Development Bank and others | 0.0 ~ 6.7 | 11,206,471 | |||||||
|
|
|
|||||||||
| Sub-total |
14,768,494 | |||||||||
|
|
|
|||||||||
| Borrowings in foreign currencies: |
||||||||||
| Borrowings in foreign currencies |
The Export-Import Bank of Korea and others | 0.0 ~ 10.0 | 14,006,644 | |||||||
| Bills sold |
Others | 0.0 ~ 2.7 | 6,325 | |||||||
| Call money |
Bank and others | 4.1 ~ 6.6 | 1,115,923 | |||||||
| Bonds sold under repurchase agreements |
Other financial institutions | 1.0 ~ 11.7 | 1,119,991 | |||||||
| Present value discount |
(30,631 | ) | ||||||||
|
|
|
|||||||||
| Total |
30,986,746 | |||||||||
|
|
|
|||||||||
| (2) | Details of debentures are as follows (Unit: Korean Won in millions): |
| June 30, 2024 | December 31, 2023 | |||||||||||||||
| Interest rate (%) |
Amount | Interest rate (%) |
Amount | |||||||||||||
| Face value of bond (*): |
||||||||||||||||
| Ordinary bonds |
0.8 ~ 7.5 | 36,132,241 | 0.8 ~ 7.5 | 34,393,418 | ||||||||||||
| Subordinated bonds |
1.9 ~ 5.1 | 4,394,860 | 1.9 ~ 5.1 | 5,241,848 | ||||||||||||
| Other bonds |
3.7 ~ 17.0 | 1,716,581 | 1.6 ~ 17.0 | 1,667,895 | ||||||||||||
|
|
|
|
|
|||||||||||||
| Sub-total |
42,243,682 | 41,303,161 | ||||||||||||||
|
|
|
|
|
|||||||||||||
| Discounts on bonds |
(141,250 | ) | (63,916 | ) | ||||||||||||
|
|
|
|
|
|||||||||||||
| Total |
42,102,432 | 41,239,245 | ||||||||||||||
|
|
|
|
|
|||||||||||||
| (*) | Included debentures under fair value hedge amounting to 3,834,069 million Won and 3,943,224 million Won as of June 30, 2024 and December 31, 2023 respectively. Also, debentures under cash flow hedge amounting to 941,712 million Won and 932,392 million Won are included as of June 30, 2024 and December 31, 2023 respectively. |
- 104 -
WOORI FINANCIAL GROUP INC. AND SUBSIDIARIES
NOTES TO CONSOLIDATED INTERIM FINANCIAL STATEMENTS
AS OF JUNE 30, 2024 AND 2023
| 21. | PROVISIONS |
| (1) | Details of provisions are as follows (Unit: Korean Won in millions): |
| June 30, 2024 | December 31, 2023 | |||||||
| Asset retirement obligation |
96,393 | 95,179 | ||||||
| Provisions for guarantees(*1) |
77,199 | 80,703 | ||||||
| Provisions for unused loan commitments |
135,144 | 135,335 | ||||||
| Other provisions(*2) |
325,842 | 494,814 | ||||||
|
|
|
|
|
|||||
| Total |
634,578 | 806,031 | ||||||
|
|
|
|
|
|||||
| (*1) | Provisions for guarantees includes provision for financial guarantee of 51,994 million Won and 50,125 million Won as of June 30, 2024 and December 31, 2023, respectively. |
| (*2) | Other provisions consist of provision for litigation, loss compensation and others. |
| (2) | Changes in provisions for guarantees and unused loan commitments are as follows (Unit: Korean Won in millions): |
| 1) | Provisions for guarantees |
| For the six-month period ended June 30, 2024 |
||||||||||||||||
| Stage1 | Stage2 | Stage3 | Total | |||||||||||||
| Beginning balance |
70,678 | 2,800 | 7,225 | 80,703 | ||||||||||||
| Transfer to 12-month expected credit loss |
428 | (428 | ) | — | — | |||||||||||
| Transfer to expected credit loss for the entire period |
(313 | ) | 313 | — | — | |||||||||||
| Transfer to credit-impaired financial assets |
(22 | ) | — | 22 | — | |||||||||||
| Net provision(reversal) |
(6,783 | ) | 209 | 1,110 | (5,464 | ) | ||||||||||
| Others(*) |
1,956 | 3 | 1 | 1,960 | ||||||||||||
|
|
|
|
|
|
|
|
|
|||||||||
| Ending balance |
65,944 | 2,897 | 8,358 | 77,199 | ||||||||||||
|
|
|
|
|
|
|
|
|
|||||||||
| (*) | Effect of initial recognition of new financial guarantee contract that is measured at fair value. |
| For the six-month period ended June 30, 2023 | ||||||||||||||||
| Stage1 | Stage2 | Stage3 | Total | |||||||||||||
| Beginning balance |
44,496 | 24,327 | 7,685 | 76,508 | ||||||||||||
| Transfer to 12-month expected credit loss |
19,568 | (19,568 | ) | — | — | |||||||||||
| Transfer to expected credit loss for the entire period |
(564 | ) | 564 | — | — | |||||||||||
| Transfer to credit-impaired financial assets |
(30 | ) | (4 | ) | 34 | — | ||||||||||
| Net provision(reversal) |
(2,813 | ) | 162 | 1,117 | (1,534 | ) | ||||||||||
| Others(*) |
3,520 | (2 | ) | — | 3,518 | |||||||||||
|
|
|
|
|
|
|
|
|
|||||||||
| Ending balance |
64,177 | 5,479 | 8,836 | 78,492 | ||||||||||||
|
|
|
|
|
|
|
|
|
|||||||||
| (*) | Effect of initial recognition of new financial guarantee contract that is measured at fair value. |
- 105 -
WOORI FINANCIAL GROUP INC. AND SUBSIDIARIES
NOTES TO CONSOLIDATED INTERIM FINANCIAL STATEMENTS
AS OF JUNE 30, 2024 AND 2023
| 2) | Provisions for unused loan commitment |
| For the six-month period ended June 30, 2024 | ||||||||||||||||
| Stage1 | Stage2 | Stage3 | Total | |||||||||||||
| Beginning balance |
108,775 | 26,328 | 232 | 135,335 | ||||||||||||
| Transfer to 12-month expected credit loss |
9,023 | (9,002 | ) | (21 | ) | — | ||||||||||
| Transfer to expected credit loss for the entire period |
(3,135 | ) | 3,144 | (9 | ) | — | ||||||||||
| Transfer to credit-impaired financial assets |
(290 | ) | (377 | ) | 667 | — | ||||||||||
| Net provision(reversal) |
(9,288 | ) | 8,135 | (10 | ) | (1,163 | ) | |||||||||
| Others |
631 | 133 | 208 | 972 | ||||||||||||
|
|
|
|
|
|
|
|
|
|||||||||
| Ending balance |
105,716 | 28,361 | 1,067 | 135,144 | ||||||||||||
|
|
|
|
|
|
|
|
|
|||||||||
| For the six-month period ended June 30, 2023 | ||||||||||||||||
| Stage1 | Stage2 | Stage3 | Total | |||||||||||||
| Beginning balance |
67,640 | 38,188 | 205 | 106,033 | ||||||||||||
| Transfer to 12-month expected credit loss |
14,241 | (14,197 | ) | (44 | ) | — | ||||||||||
| Transfer to expected credit loss for the entire period |
(2,228 | ) | 2,229 | (1 | ) | — | ||||||||||
| Transfer to credit-impaired financial assets |
(140 | ) | (249 | ) | 389 | — | ||||||||||
| Net provision(reversal) |
17,027 | 4,153 | (207 | ) | 20,973 | |||||||||||
| Others |
121 | — | — | 121 | ||||||||||||
|
|
|
|
|
|
|
|
|
|||||||||
| Ending balance |
96,661 | 30,124 | 342 | 127,127 | ||||||||||||
|
|
|
|
|
|
|
|
|
|||||||||
| (3) | Changes in asset retirement obligation for the six-month periods ended June 30, 2024 and 2023, are as follows (Unit: Korean Won in millions): |
| For the six-month periods ended June 30 | ||||||||
| 2024 | 2023 | |||||||
| Beginning balance |
95,179 | 82,717 | ||||||
| Provisions provided |
3,584 | 3,099 | ||||||
| Provisions used |
(3,303 | ) | (1,187 | ) | ||||
| Reversal of provisions unused |
(839 | ) | (118 | ) | ||||
| Amortization |
729 | 707 | ||||||
| Increase in restoration costs and others |
1,043 | 5,685 | ||||||
|
|
|
|
|
|||||
| Ending balance |
96,393 | 90,903 | ||||||
|
|
|
|
|
|||||
The amount of the asset retirement obligation is the present value of the best estimate of future expected expenditure to settle the obligation – arising from leased premises as of June 30, 2024, discounted by appropriate discount rate. The restoration cost is expected to occur by the end of each premise’s lease period, and the Group has used average lease period of each category of leases terminated during the past years in order to rationally estimate the lease period. In addition, the Group used average amount of actual recovery cost for the past 3 years and the inflation rate for last year in order to estimate future recovery cost.
- 106 -
WOORI FINANCIAL GROUP INC. AND SUBSIDIARIES
NOTES TO CONSOLIDATED INTERIM FINANCIAL STATEMENTS
AS OF JUNE 30, 2024 AND 2023
| (4) | Changes in other provisions for the six-month periods ended June 30, 2024 and 2023, are as follows (Unit: Korean Won in millions): |
| For the six-month periods ended June 30 | ||||||||
| 2024 | 2023 | |||||||
| Beginning balance |
494,814 | 280,607 | ||||||
| Provisions provided |
14,178 | 59,272 | ||||||
| Provisions used |
(176,461 | ) | (25,079 | ) | ||||
| Reversal of provisions unused |
(11,054 | ) | (2,596 | ) | ||||
| Foreign currencies translation adjustments |
90 | 563 | ||||||
| Others |
4,275 | 22 | ||||||
|
|
|
|
|
|||||
| Ending balance |
325,842 | 312,789 | ||||||
|
|
|
|
|
|||||
| (5) | Others |
| 1) | The Group recognized the estimated amount of compensation related to incomplete sales of Derivative Linked Fund (DLF) in 2019 and provisions for fines expected to be imposed by the Financial Services Commission as the best estimate of expenditure required to fulfil its current obligations at the end of the period. |
| 2) | The Group recognized provisions for estimated compensation amounts related to the prepayment arising from the delay in the redemption of funds in prior fiscal year and the dispute settlement as the best estimate of the expenditure amounting to 237.8 billion Won. In addition, The Group recognized provision amounting to 3.1 billion Won for estimated compensation of expected customer loss related to equity-linked securities during the current period. |
- 107 -
WOORI FINANCIAL GROUP INC. AND SUBSIDIARIES
NOTES TO CONSOLIDATED INTERIM FINANCIAL STATEMENTS
AS OF JUNE 30, 2024 AND 2023
| 22. | NET DEFINED BENEFIT LIABILITY(ASSET) |
The retirement benefit of the consolidated company is based on the defined benefit retirement pension plan. Employees and directors with one or more years of service are entitled to receive a payment upon termination of their employment, based on their length of service and rate of salary at the time of termination. The assets of the plans are measured at their fair value at the end of reporting date. The plan liabilities are measured using the projected unit method, which takes account of projected earnings increases, using actuarial assumptions that give the best estimate of the future cash flows that will arise under the plan liabilities.
The Group is exposed to various risks through defined benefit retirement pension plan, and the most significant risks are as follows:
| Volatility of asset | The defined benefit obligation was estimated with an discount rate calculated based on blue chip corporate bonds earnings. A deficit may occur if the rate of return of plan assets falls short of the discount rate. | |||
| Decrease in profitability of high quality bonds | A decrease in profitability of blue chip bonds will be offset by some increase in the value of debt securities that the employee benefit plan owns but will bring an increase in the defined benefit obligation. | |||
| Risk of inflation | Defined benefit obligations are related to inflation rate; the higher the inflation rate is, the higher the level of liabilities. Therefore, deficit occurs in the system if an inflation rate increases. | |||
| (1) | Details of net defined benefit liability(asset) are as follows (Unit: Korean Won in millions): |
| June 30, 2024 | December 31, 2023 | |||||||
| Present value of defined benefit obligation |
1,650,905 | 1,574,087 | ||||||
| Fair value of plan assets |
(1,758,129 | ) | (1,807,408 | ) | ||||
|
|
|
|
|
|||||
| Net defined benefit liabilities(asset)(*) |
(107,224 | ) | (233,321 | ) | ||||
|
|
|
|
|
|||||
| (*) | Net defined benefit asset amount of 107,224 million Won as of June 30, 2024 is net amount of defined benefit liability of 4,375 million Won and defined benefit asset of 111,599 million Won. Also, net defined benefit assets of 232,321 million Won as of December 31, 2023 are the subtracted amount of the net defined benefit liability of 6,939 million Won from the net defined benefit assets of 240,260 million Won. |
| (2) | Changes in the carrying value of defined benefit obligation are as follows (Unit: Korean Won in millions): |
| For the six-month periods ended June 30 | ||||||||||
| 2024 | 2023 | |||||||||
| Beginning balance |
1,574,087 | 1,377,545 | ||||||||
| Current service cost |
71,314 | 65,858 | ||||||||
| Interest cost |
35,499 | 36,333 | ||||||||
| Remeasurements |
Financial assumption | 19,769 | 20,488 | |||||||
| Demographic assumptions | (42 | ) | — | |||||||
| Experience adjustments | 39,141 | 47,060 | ||||||||
| Retirement benefit paid |
(84,447 | ) | (81,596 | ) | ||||||
| Foreign currencies translation adjustments |
68 | 15 | ||||||||
| Others |
(4,484 | ) | (759 | ) | ||||||
|
|
|
|
|
|||||||
| Ending balance |
1,650,905 | 1,464,944 | ||||||||
|
|
|
|
|
|||||||
- 108 -
WOORI FINANCIAL GROUP INC. AND SUBSIDIARIES
NOTES TO CONSOLIDATED INTERIM FINANCIAL STATEMENTS
AS OF JUNE 30, 2024 AND 2023
| (3) | Changes in the plan assets are as follows (Unit: Korean Won in millions): |
| For the six-month periods ended June 30 | ||||||||
| 2024 | 2023 | |||||||
| Beginning balance |
1,807,408 | 1,661,623 | ||||||
| Interest income |
42,464 | 45,762 | ||||||
| Remeasurements |
(8,875 | ) | (16,325 | ) | ||||
| Employer’s contributions |
251 | 122,126 | ||||||
| Retirement benefit paid |
(81,171 | ) | (84,943 | ) | ||||
| Others |
(1,948 | ) | (441 | ) | ||||
|
|
|
|
|
|||||
| Ending balance |
1,758,129 | 1,727,802 | ||||||
|
|
|
|
|
|||||
| (4) | Fair value of plan assets as of June 30, 2024 and December 31, 2023 is as follows (Unit: Korean Won in millions): |
| June 30, 2024 | December 31, 2023 | |||||||
| Cash and due from banks, etc. |
1,758,129 | 1,807,408 | ||||||
Meanwhile, among plan assets, realized returns on plan assets amount to 33,589 million Won and 29,437 million Won for the six-month periods ended June 30, 2024 and 2023, respectively.
| (5) | The amounts recognized in net income and total comprehensive income in relation to defined benefit plans are as follows:(Unit: Korean Won in millions): |
| For the six-month periods ended June 30 | ||||||||
| 2024 | 2023 | |||||||
| Current service cost |
71,314 | 65,858 | ||||||
| Net interest income |
(6,964 | ) | (9,429 | ) | ||||
|
|
|
|
|
|||||
| Cost recognized in net income |
64,350 | 56,429 | ||||||
| Remeasurements(*) |
67,742 | 83,873 | ||||||
|
|
|
|
|
|||||
| Cost recognized in total comprehensive income |
132,092 | 140,302 | ||||||
|
|
|
|
|
|||||
| (*) | Amount before tax |
Meanwhile, retirement benefits related to defined contribution plans recognized as expenses are 2,644 million Won and 2,605 million Won for the six-month periods ended June 30, 2024 and 2023, respectively.
- 109 -
WOORI FINANCIAL GROUP INC. AND SUBSIDIARIES
NOTES TO CONSOLIDATED INTERIM FINANCIAL STATEMENTS
AS OF JUNE 30, 2024 AND 2023
| 23. | OTHER FINANCIAL LIABILITIES AND OTHER LIABILITIES |
Other financial liabilities and other liabilities are as follows (Unit: Korean Won in millions):
| June 30, 2024 | December 31, 2023 | |||||||
| Other financial liabilities: |
||||||||
| Accounts payable |
11,552,919 | 10,188,192 | ||||||
| Accrued expenses |
4,587,957 | 4,339,314 | ||||||
| Borrowings from trust accounts |
5,840,199 | 5,207,791 | ||||||
| Agency business revenue |
357,906 | 271,946 | ||||||
| Foreign exchange payables |
611,497 | 887,817 | ||||||
| Domestic exchange settlement credits |
5,089,114 | 1,386,697 | ||||||
| Lease liabilities |
496,063 | 334,456 | ||||||
| Other miscellaneous financial liabilities |
3,514,093 | 3,520,039 | ||||||
| Present value discount |
(16,741 | ) | (21,247 | ) | ||||
|
|
|
|
|
|||||
| Sub-total |
32,033,007 | 26,115,005 | ||||||
|
|
|
|
|
|||||
| Other liabilities: |
||||||||
| Unearned income |
404,320 | 390,455 | ||||||
| Other miscellaneous liabilities |
371,152 | 413,442 | ||||||
|
|
|
|
|
|||||
| Sub-total |
775,472 | 803,897 | ||||||
|
|
|
|
|
|||||
| Total |
32,808,479 | 26,918,902 | ||||||
|
|
|
|
|
|||||
- 110 -
WOORI FINANCIAL GROUP INC. AND SUBSIDIARIES
NOTES TO CONSOLIDATED INTERIM FINANCIAL STATEMENTS
AS OF JUNE 30, 2024 AND 2023
| 24. | DERIVATIVES |
| (1) | Derivative assets and derivative liabilities are as follows (Unit: Korean Won in millions): |
| June 30, 2024 | ||||||||||||||||||||||||||||
| Assets | Liabilities | |||||||||||||||||||||||||||
| Nominal amount |
For cash flow hedge |
For fair value hedge |
For trading |
For cash flow hedge |
For fair value hedge |
For trading | ||||||||||||||||||||||
| Interest rate: |
||||||||||||||||||||||||||||
| Futures |
404,925 | — | — | — | — | — | — | |||||||||||||||||||||
| Forwards |
3,910,000 | — | — | 107,286 | — | — | 129,840 | |||||||||||||||||||||
| Swaps |
143,694,699 | — | 3,301 | 335,452 | 53 | 150,532 | 230,725 | |||||||||||||||||||||
| Purchase options |
50,000 | — | — | 146 | — | — | — | |||||||||||||||||||||
| Written options |
290,000 | — | — | — | — | — | 7,963 | |||||||||||||||||||||
| Currency: |
||||||||||||||||||||||||||||
| Futures |
292 | — | — | — | — | — | — | |||||||||||||||||||||
| Forwards |
108,700,988 | — | — | 3,357,480 | — | — | 946,967 | |||||||||||||||||||||
| Swaps |
84,174,821 | 81,805 | — | 3,450,572 | — | — | 5,294,708 | |||||||||||||||||||||
| Purchase options |
381,792 | — | — | 3,295 | — | — | — | |||||||||||||||||||||
| Written options |
530,557 | — | — | — | — | — | 3,600 | |||||||||||||||||||||
| Equity: |
||||||||||||||||||||||||||||
| Futures |
78,841 | — | — | — | — | — | — | |||||||||||||||||||||
| Forwards |
489 | — | — | 316 | — | — | — | |||||||||||||||||||||
| Swaps |
158,562 | — | — | 2,900 | — | — | 16,991 | |||||||||||||||||||||
| Purchase options |
4,442,927 | — | — | 257,161 | — | — | — | |||||||||||||||||||||
| Written options |
4,483,130 | — | — | — | — | — | 359,337 | |||||||||||||||||||||
|
|
|
|
|
|
|
|
|
|
|
|
|
|
|
|||||||||||||||
| Total |
351,302,023 | 81,805 | 3,301 | 7,514,608 | 53 | 150,532 | 6,990,131 | |||||||||||||||||||||
|
|
|
|
|
|
|
|
|
|
|
|
|
|
|
|||||||||||||||
| December 31, 2023 | ||||||||||||||||||||||||||||
| Assets | Liabilities | |||||||||||||||||||||||||||
| Nominal amount |
For cash flow hedge |
For fair value hedge |
For trading |
For cash flow hedge |
For fair value hedge |
For trading | ||||||||||||||||||||||
| Interest rate: |
||||||||||||||||||||||||||||
| Futures |
317,018 | — | — | — | — | — | — | |||||||||||||||||||||
| Forwards |
3,960,000 | — | — | 83,198 | — | — | 169,527 | |||||||||||||||||||||
| Swaps |
138,734,758 | — | 698 | 367,333 | 512 | 135,263 | 213,885 | |||||||||||||||||||||
| Purchase options |
150,000 | — | — | 6,556 | — | — | — | |||||||||||||||||||||
| Written options |
400,000 | — | — | — | — | — | 15,359 | |||||||||||||||||||||
| Currency: |
||||||||||||||||||||||||||||
| Futures |
1,728 | — | — | — | — | — | — | |||||||||||||||||||||
| Forwards |
97,713,561 | — | — | 1,935,832 | — | — | 885,870 | |||||||||||||||||||||
| Swaps |
79,160,356 | 26,010 | — | 2,669,550 | 17,232 | — | 3,643,463 | |||||||||||||||||||||
| Purchase options |
139,309 | — | — | 1,500 | — | — | — | |||||||||||||||||||||
| Written options |
122,696 | — | — | — | — | — | 585 | |||||||||||||||||||||
| Equity: |
||||||||||||||||||||||||||||
| Futures |
480,311 | — | — | — | — | — | — | |||||||||||||||||||||
| Forwards |
137 | — | — | 36 | — | — | — | |||||||||||||||||||||
| Swaps |
461,112 | — | — | 126,028 | — | — | 1,994 | |||||||||||||||||||||
| Purchase options |
16,444,709 | — | — | 608,296 | — | — | — | |||||||||||||||||||||
| Written options |
16,887,247 | — | — | — | — | — | 1,012,341 | |||||||||||||||||||||
|
|
|
|
|
|
|
|
|
|
|
|
|
|
|
|||||||||||||||
| Total |
354,972,942 | 26,010 | 698 | 5,798,329 | 17,744 | 135,263 | 5,943,024 | |||||||||||||||||||||
|
|
|
|
|
|
|
|
|
|
|
|
|
|
|
|||||||||||||||
Derivatives held for trading are classified into financial assets at FVTPL (Note 7) and financial liabilities at FVTPL (Note 18), and derivatives designated for hedging are presented as a separate line item in the consolidated statements of financial position.
- 111 -
WOORI FINANCIAL GROUP INC. AND SUBSIDIARIES
NOTES TO CONSOLIDATED INTERIM FINANCIAL STATEMENTS
AS OF JUNE 30, 2024 AND 2023
| (2) | Overview of the Group’s hedge accounting |
| 1) | Fair value hedge |
As of June 30, 2024, the Group has applied fair value hedge on fixed interest rate foreign currency denominated debentures amounting to 3,531,468 million Won, and local currency debentures amounting to 302,601 million Won. The purpose of the hedging is to avoid fair value volatility risk of fixed interest rate foreign and local currency denominated debentures derived from fluctuations of market interest rate, and as such the Group entered into interest rate swap agreements designated as hedging instruments.
Pursuant to the interest rate swap agreement, by swapping the calculated difference between the fixed interest rate and floating interest rate applied to the nominal value, the fair value fluctuation risk is hedged as the foreign currency denominated debentures fixed interest rate terms are converted to floating interest rate. Pursuant to the interest rate swap agreement, hedge ratio is determined by matching the nominal value of hedging instrument to the face value of the hedged item.
In this hedging relationship, only the market interest rate fluctuation, which is the most significant part of the fair value change of the hedged item, is designated as the hedged risk, and other risk factors including credit risk are not included in the hedged risk. Therefore, the ineffective portion of the hedge could arise from fluctuations in the timing of the cash flow of the hedged item, price margin set by counterparty of hedging instrument, and unilateral change in credit risk of any party of hedging instrument.
The interest rate swap agreements and the hedged items are subject to fluctuations in the underlying market rate of interest and the Group expects the fair value of the interest rate swap contract and the value of the hedged item to generally change in the opposite direction.
The fair value of the interest rate swap at the end of the reporting period is determined by discounting future cash flows estimated by using the yield curve at the end of the reporting period and the credit risk embedded in the contract and the average interest rate is determined based on the outstanding balance at the end of the reporting period. The variable interest rate applied to the interest rate swap is Compounding SOFR and CD plus spread. In accordance with the terms of each interest rate swap contract designated as a hedging instrument, the Group receives interest at a fixed interest rate and pays interest at a variable interest rate.
- 112 -
WOORI FINANCIAL GROUP INC. AND SUBSIDIARIES
NOTES TO CONSOLIDATED INTERIM FINANCIAL STATEMENTS
AS OF JUNE 30, 2024 AND 2023
| 2) | Cash Flow Hedge |
As of the June 30, 2024, the Group has applied cash flow hedge debentures on local currency amounting to 139,966 million Won, debentures on foreign currency amounting to 801,746 million Won. The Group’s hedging strategies are to ① Mitigate risks of cash flow fluctuation from variable interest rate debentures on local currency due to changes in market interest rate by entering into an interest rate swap contract and thereby designating it as hedging instrument; ② Mitigate the risks of cash flow fluctuation from principal and interest of variable interest rate debentures denominated in foreign currency due to changes in foreign exchange rates and interest rates; ③ Mitigate the risks of cash flow fluctuation from principal and interest of fixed interest rate debentures denominated in foreign currency due to changes in foreign exchange rates and ④ Mitigate the risks of cash flow fluctuation in variable interest rate foreign currency borrowings resulting from changes in market interest rates and designate it as a hedging instrument through entering into currency swap contracts and interest rate swap contracts.
This means exchanging a predetermined nominal amount as set forth in the interest rate swap contract adjusted by the differences between the fixed and variable interest rates, which results in the conversion of interest rates of debentures in local currency from variable interest into fixed interest, eliminating the cash flow fluctuation risk.
In addition, this also means a payment of predetermined principal amount as set forth in the currency swap adjusted by fixed interest rate, an exchange of an amount calculated by applying variable interest rate to USD or applying fixed interest rate to USD, and an exchange of the principal denominated in KRW and principal denominated in foreign currency at maturity eliminating cash flow fluctuation risk on principal and interest.
The hedge ratio is determined by matching the nominal amount of the hedging instrument to the face amount of the hedged item in accordance with interest rate swap and currency swap.
Only interest rate and foreign exchange rate fluctuation risks, which are the most significant factor in the cash flow fluctuation of the hedged item, are addressed in this hedging relationship, and other risk factors such as credit risk are not subject to hedging.
Accordingly, hedge ineffectiveness may arise from price margin set by the counterparty of hedging instruments and unilateral change in credit risk of any party in the transaction.
The interest rate swap, currency swap contract and the hedged item are all affected by the changes in market interest rate and foreign exchange rates which are basic factors. The Group expects that the value of interest rate swap contract, currency swap contract and value of the hedged item will generally fluctuate in opposite direction.
| 3) | Hedges of Net Investment in Foreign Operations |
Foreign currency exposure arises from the Group’s net investments in Woori America Bank, Woori Bank(Cambodia) PLC. Woori Global Markets Asia Limited, which use USD as their functional currency. The risk arises from fluctuations in the spot exchange rate between USD and KRW. This may result in different net investment amounts.
The risk hedged in the net investment hedging is the weakness of KRW against USD, which may reduce the carrying amount of the Group’s net investments in Woori America Bank, Woori Bank(Cambodia) PLC. and and Woori Global Markets Asia Limited.
A portion of the Group’s net investments in Woori America Bank, Woori Bank(Cambodia) PLC. and Woori Global Markets Asia Limited are hedged in USD denominated foreign currency bonds(Carrying amount as of June 30, 2024: USD 863,959,317) and mitigate foreign exchange risk arising from the net assets of subsidiaries. The loan has been designated as a hedging instrument for the value change of net investments, which arises from fluctuation in the spot exchange rate between USD and KRW.
- 113 -
WOORI FINANCIAL GROUP INC. AND SUBSIDIARIES
NOTES TO CONSOLIDATED INTERIM FINANCIAL STATEMENTS
AS OF JUNE 30, 2024 AND 2023
To evaluate the effectiveness of the hedge, the Group determines the economic relationship between the hedging instrument and hedged item by comparing(offsetting) changes in the amount of foreign investments due to spot exchange rate fluctuation and in the carrying amount of the liabilities due to spot exchange rate fluctuation. The Group’s policy is to hedge the net investment amount only within the principal range of the liabilities.
| (3) | The nominal amounts of the hedging instrument are as follows (Unit: USD, EUR and Korean Won in millions): |
| June 30, 2024 | ||||||||||||||||
| 1 year or less | 1 year to 5 years |
More than 5 years |
Total | |||||||||||||
| Fair value hedge |
||||||||||||||||
| Interest rate risk |
||||||||||||||||
| Interest rate swap (USD) |
25,000,000 | 2,650,000,000 | — | 2,675,000,000 | ||||||||||||
| Interest rate swap (KRW) |
140,000 | — | 160,000 | 300,000 | ||||||||||||
| Cash flow hedge |
||||||||||||||||
| Interest rate risk |
||||||||||||||||
| Interest rate swap (KRW) |
140,000 | — | — | 140,000 | ||||||||||||
| Foreign currencies translation risk and interest rate risk |
||||||||||||||||
| Currency swap (USD) |
— | 470,000,000 | — | 470,000,000 | ||||||||||||
| Foreign currencies translation risk |
||||||||||||||||
| Currency swap (USD) |
— | 100,000,000 | — | 100,000,000 | ||||||||||||
| Currency swap (EUR) |
— | 194,780,000 | — | 194,780,000 | ||||||||||||
| Hedges of net investment in foreign operations |
||||||||||||||||
| Foreign exchange risk |
||||||||||||||||
| Foreign currency denominated debentures (USD) |
191,568,880 | 672,390,437 | — | 863,959,317 | ||||||||||||
| December 31, 2023 | ||||||||||||||||
| 1 year or less | 1 year to 5 years |
More than 5 years |
Total | |||||||||||||
| Fair value hedge |
||||||||||||||||
| Interest rate risk |
||||||||||||||||
| Interest rate swap (USD) |
1,000,000,000 | 1,975,000,000 | — | 2,975,000,000 | ||||||||||||
| Interest rate swap (KRW) |
240,000 | — | 20,000 | 260,000 | ||||||||||||
| Cash flow hedge |
||||||||||||||||
| Interest rate risk |
||||||||||||||||
| Interest rate swap (KRW) |
— | 140,000 | — | 140,000 | ||||||||||||
| Foreign currencies translation risk and interest rate risk |
||||||||||||||||
| Currency swap (USD) |
— | 270,000,000 | — | 270,000,000 | ||||||||||||
| Foreign currencies translation risk |
||||||||||||||||
| Currency swap (USD) |
— | 100,000,000 | — | 100,000,000 | ||||||||||||
| Currency swap (EUR) |
— | 194,780,000 | — | 194,780,000 | ||||||||||||
| Hedges of net investment in foreign operations |
||||||||||||||||
| Exchange risk |
||||||||||||||||
| Foreign currency denominated debentures (USD) |
400,000,000 | 463,959,317 | — | 863,959,317 | ||||||||||||
- 114 -
WOORI FINANCIAL GROUP INC. AND SUBSIDIARIES
NOTES TO CONSOLIDATED INTERIM FINANCIAL STATEMENTS
AS OF JUNE 30, 2024 AND 2023
| (4) | The average interest rate and average currency rate of the hedging instrument as of June 30, 2024 and December 31, 2023 are as follows: |
| June 30, 2024 | ||
| Average interest rate and average exchange rate | ||
| Fair value hedge |
||
| Interest rate risk |
||
| Interest rate swap (USD) |
Fixed 3.47% receipt and (C.SOFR) + 1.06% paid | |
| Interest rate swap (KRW) |
Fixed 4.39% receipt and CD 3M paid | |
| Cash flow hedge |
||
| Interest rate risk |
||
| Interest rate swap (KRW) |
KRW CMS 5Y+0.46% receipt, KRW 3.65% paid | |
| Foreign currencies translation risk and interest rate risk |
||
| Currency swap (USD) |
USD 1M SOFR+1.12% receipt, KRW 4.37% paid, USD/KRW = 1,293.97 | |
| Foreign currencies translation risk |
||
| Currency swap (USD) |
USD 1.75% receipt, KRW 1.63% paid, USD/KRW = 1,138.50 | |
| Currency swap (EUR) |
EUR 1.98% receipt, KRW 3.40% paid, EUR/KRW = 1,344.08 | |
| Hedges of net investment |
||
| Foreign exchange risk |
||
| Foreign currency denominated debentures(USD/KRW) |
1,349.49 |
| December 31, 2023 | ||
| Average interest rate and average exchange rate | ||
| Fair value hedge |
||
| Interest rate risk |
||
| Interest rate swap (USD) |
Fixed 3.60% receipt and (C.SOFR) + 1.47% paid | |
| Interest rate swap (KRW) |
Fixed 4.13% receipt and CD 3M paid | |
| Cash flow hedge |
||
| Interest rate risk |
||
| Interest rate swap (KRW) |
KRW CMS 5Y+0.46% receipt, 3.65% paid | |
| Foreign currencies translation risk and interest rate risk |
||
| Currency swap (USD) |
USD 1M SOFR+1.12% receipt, KRW 4.37% paid, USD/KRW = 1,293.97 | |
| Foreign currencies translation risk |
||
| Currency swap (USD) |
USD 1.75% receipt, KRW 1.63% paid, USD/KRW = 1,138.50 | |
| Currency swap (EUR) |
EUR 1.98% receipt, KRW 3.40% paid, EUR/KRW = 1,344.08 | |
| Hedges of net investment |
||
| Exchanging rate risk |
||
| Foreign currency denominated debentures(USD/KRW) |
1,306.12 |
- 115 -
WOORI FINANCIAL GROUP INC. AND SUBSIDIARIES
NOTES TO CONSOLIDATED INTERIM FINANCIAL STATEMENTS
AS OF JUNE 30, 2024 AND 2023
| (5) | The amounts related to items designated as hedging instruments are as follows (Unit: USD, AUD, EUR and Korean Won in millions): |
| June 30, 2024 | ||||||||||||||||||||
| Nominal amounts of the hedging instrument |
Carrying amount of the hedging instrument |
Line item in the statement of financial position where the hedging instrument is located |
Changing in fair value used for calculating hedge ineffectiveness |
|||||||||||||||||
| Assets | Liabilities | |||||||||||||||||||
| Fair value hedge |
||||||||||||||||||||
| Interest rate risk |
||||||||||||||||||||
| Interest rate Swap(USD) |
2,675,000,000 | |
Derivative assets (designated for hedging) |
|
||||||||||||||||
| Interest rate Swap(KRW) |
300,000 | 3,301 | 150,532 | |
Derivative liabilities (designated for hedging) |
|
(42,098 | ) | ||||||||||||
| Cash flow hedge |
||||||||||||||||||||
| Interest rate risk |
||||||||||||||||||||
| Interest rate swap(KRW) |
140,000 | — | 53 | |
Derivative assets (designated for hedging) |
|
338 | |||||||||||||
| Foreign currency translation risk and interest rate risk |
||||||||||||||||||||
| Currency swap(USD) |
470,000,000 | 42,498 | — | |
Derivative assets (designated for hedging) Derivative liabilities (designated for hedging) |
|
49,780 | |||||||||||||
| Foreign currency translation risk |
||||||||||||||||||||
| Currency swap(USD) |
100,000,000 | 20,500 | — | |
Derivative assets (designated for hedging) |
|
9,191 | |||||||||||||
| Currency swap(EUR) |
194,780,000 | 18,807 | — | |
Derivative assets (designated for hedging) |
|
10,086 | |||||||||||||
| Hedges of net investment in foreign operations |
||||||||||||||||||||
| Exchange rate risk |
||||||||||||||||||||
| Foreign currency denominated debentures (USD) |
863,959,317 | — | 1,200,212 | |
Foreign currency denominated debentures |
|
(86,208 | ) | ||||||||||||
- 116 -
WOORI FINANCIAL GROUP INC. AND SUBSIDIARIES
NOTES TO CONSOLIDATED INTERIM FINANCIAL STATEMENTS
AS OF JUNE 30, 2024 AND 2023
| December 31, 2023 | ||||||||||||||||||
| Nominal amounts of the hedging instrument |
Carrying amount of the hedging instrument |
Line item in the located |
Changing in fair value used for calculating hedge ineffectiveness |
|||||||||||||||
| Assets | Liabilities | |||||||||||||||||
| Fair value hedge |
||||||||||||||||||
| Interest rate risk |
||||||||||||||||||
| Interest rate Swap(USD) |
2,975,000,000 | Derivative assets (designated for hedging) |
||||||||||||||||
| Interest rate Swap(KRW) |
260,000 | 698 | 135,263 | Derivative liabilities (designated for hedging) |
55,651 | |||||||||||||
| Cash flow hedge |
||||||||||||||||||
| Interest rate risk |
||||||||||||||||||
| Interest rate swap(KRW) |
140,000 | — | 512 | Derivative liabilities (designated for hedging) |
(2,433 | ) | ||||||||||||
| Foreign currency translation risk and interest rate risk |
||||||||||||||||||
| Currency swap(USD) |
270,000,000 | 7,356 | 17,232 | Derivative assets (designated for hedging) Derivative liabilities (designated for hedging) |
(913 | ) | ||||||||||||
| Foreign currency translation risk |
||||||||||||||||||
| Currency swap(USD) |
100,000,000 | 10,956 | — | Derivative assets (designated for hedging) |
(5,644 | ) | ||||||||||||
| Currency swap(EUR) |
194,780,000 | 7,698 | — | Derivative assets (designated for hedging) |
19,063 | |||||||||||||
| Hedges of net investment in foreign operations |
||||||||||||||||||
| Exchange rate risk |
||||||||||||||||||
| Foreign currency denominated debentures (USD) |
863,959,317 | — | 1,113,989 | Foreign currency denominated debentures | (19,088 | ) | ||||||||||||
- 117 -
WOORI FINANCIAL GROUP INC. AND SUBSIDIARIES
NOTES TO CONSOLIDATED INTERIM FINANCIAL STATEMENTS
AS OF JUNE 30, 2024 AND 2023
| (6) | Details of carrying amount to hedge and amount due to hedge accounting are as follows (Unit: Korean Won in millions): |
| June 30, 2024 | ||||||||||||||||||||||||||||
|
Carrying amount of the |
Accumulated amount of fair value hedge adjustments on the hedged item included in the carrying amount of the hedged item |
Line item in the statement of financial position in which the hedged item is included |
Changing in fair value used for calculating hedge ineffectiveness |
hedge reserve (*2) |
||||||||||||||||||||||||
| Assets | Liabilities | Assets | Liabilities | |||||||||||||||||||||||||
| Fair value hedge |
||||||||||||||||||||||||||||
| Interest rate risk |
||||||||||||||||||||||||||||
| Debentures(*1) |
— | 3,834,069 | — | 169,507 | Debentures | 35,463 | — | |||||||||||||||||||||
| Cash flow hedge |
||||||||||||||||||||||||||||
| Interest rate risk |
||||||||||||||||||||||||||||
| Debentures |
— | 139,966 | — | — | Debentures | (338 | ) | (40 | ) | |||||||||||||||||||
| Foreign currencies translation risk and interest rate risk |
||||||||||||||||||||||||||||
| Debentures |
— | 373,744 | — | — | Debentures | (49,780 | ) | (3,352 | ) | |||||||||||||||||||
| Foreign currencies translation risk |
||||||||||||||||||||||||||||
| Debentures |
— | 428,002 | — | — | Debentures | (19,277 | ) | (12,408 | ) | |||||||||||||||||||
| Hedges of net investment in foreign operations |
||||||||||||||||||||||||||||
| Exchange rate risk |
||||||||||||||||||||||||||||
| Foreign operations net asset |
— | 1,200,212 | — | — | |
Foreign operations net asset |
|
86,208 | (98,199 | ) | ||||||||||||||||||
| (*1) | The accumulated profit on debentures on foreign currency amounted to 166,906 million Won, and the accumulated loss on debentures on local currency amounted to 2,601 million Won, as of June 30, 2024. |
| (*2) | After tax amount. |
- 118 -
WOORI FINANCIAL GROUP INC. AND SUBSIDIARIES
NOTES TO CONSOLIDATED INTERIM FINANCIAL STATEMENTS
AS OF JUNE 30, 2024 AND 2023
| December 31, 2023 | ||||||||||||||||||||||||||
|
Carrying amount of the |
Accumulated amount of fair value hedge adjustments on the hedged item included in the carrying amount of the hedged item |
Line item in the statement of financial position in which the hedged item is included |
Changing in fair value used for calculating hedge ineffectiveness |
Cash flow hedge reserve (*2) |
||||||||||||||||||||||
| Assets | Liabilities | Assets | Liabilities | |||||||||||||||||||||||
| Fair value hedge |
||||||||||||||||||||||||||
| Interest rate risk |
||||||||||||||||||||||||||
| Debentures(*1) |
— | 3,943,224 | — | 142,902 | Debentures | (58,306 | ) | — | ||||||||||||||||||
| Cash flow hedge |
||||||||||||||||||||||||||
| Interest rate risk |
||||||||||||||||||||||||||
| Debentures |
— | 179,945 | — | — | Debentures | 2,433 | 25 | |||||||||||||||||||
| Foreign currencies translation risk and interest rate risk |
||||||||||||||||||||||||||
| Debentures |
— | 346,388 | — | — | Debentures | 22,914 | (8,819 | ) | ||||||||||||||||||
| Foreign currencies translation risk |
||||||||||||||||||||||||||
| Debentures |
— | 406,059 | — | — | Debentures | (13,419 | ) | (11,416 | ) | |||||||||||||||||
| Hedges of net investment in foreign operations |
||||||||||||||||||||||||||
| Exchange rate risk |
||||||||||||||||||||||||||
| Foreign operations net asset |
— | 1,113,989 | — | — | Foreign operations net asset |
19,088 | (34,750 | ) | ||||||||||||||||||
| (*1) | The accumulated profit on debentures on foreign currency amounted to 141,818 million Won, and the accumulated loss on debentures on local currency amounted to 1,084 million Won, as of December 31, 2023. |
| (*2) | After tax amount. |
| (7) | Amounts recognized in profit or loss due to the ineffective portion of fair value hedges are as follows (Unit: Korean Won in millions): |
| For the six-month period ended June 30, 2024 | ||||||||
| Hedge ineffectiveness recognized in profit or loss |
Line item in the profit or loss that includes hedge ineffectiveness | |||||||
| Fair value hedge |
Interest rate risk | (6,635 | ) | Other net operating income | ||||
| For the six-month period ended June 30, 2023 | ||||||||
| Hedge ineffectiveness recognized in profit or loss |
Line item in the profit or loss that includes hedge ineffectiveness | |||||||
| Fair value hedge |
Interest rate risk | (4,611 | ) | Other net operating expense | ||||
- 119 -
WOORI FINANCIAL GROUP INC. AND SUBSIDIARIES
NOTES TO CONSOLIDATED INTERIM FINANCIAL STATEMENTS
AS OF JUNE 30, 2024 AND 2023
| (8) | Reclassification of profit or loss from other comprehensive income and equity related to cash flow hedges are as follows (Unit: Korean Won in millions): |
| For the six-month period ended June 30, 2024 | ||||||||||||||||||||||
| Changes in the value of hedging instruments recognized in OCI |
Hedge ineffectiveness recognized in profit or loss |
Changes in the value of foreign basis spread recognized in OCI |
Line item recognized in the profit or loss |
Amounts reclassified from cash flow hedge reserve to profit or loss |
Line item affected in profit or loss due to reclassification | |||||||||||||||||
| Cash flow hedge |
Interest rate risk | 338 | — | — | Other net operating income(expense) |
— | Other net operating income(expense) | |||||||||||||||
| Foreign currencies translation risk and interest rate risk | 49,780 | — | 2,593 | Other net operating expense |
(46,906 | ) | Other net operating expense | |||||||||||||||
| Foreign currencies translation risk | 19,277 | — | 1,376 | Other net operating expense |
(21,760 | ) | Other net operating expense | |||||||||||||||
| For the six-month period ended June 30, 2023 | ||||||||||||||||||||||
| Changes in the value of hedging instruments recognized in OCI |
Hedge ineffectiveness recognized in profit or loss |
Changes in the value of foreign basis spread recognized in OCI |
Line item recognized in the profit or loss |
Amounts reclassified from cash flow hedge reserve to profit or loss |
Line item affected in profit or loss due to reclassification | |||||||||||||||||
| Cash flow hedge |
Interest rate risk | (1,071 | ) | — | — | Other net operating income(expense) |
— | Other net operating income(expense) | ||||||||||||||
| Foreign currencies translation risk and interest rate risk | 27,858 | — | (4,582 | ) | Other net operating expense |
(30,726 | ) | Other net operating expense | ||||||||||||||
| Foreign currencies translation risk | 20,484 | — | (416 | ) | Other net operating expense |
(22,867 | ) | Other net operating expense | ||||||||||||||
- 120 -
WOORI FINANCIAL GROUP INC. AND SUBSIDIARIES
NOTES TO CONSOLIDATED INTERIM FINANCIAL STATEMENTS
AS OF JUNE 30, 2024 AND 2023
| (9) | The amounts recognized in profit or loss and other comprehensive income related to the hedging of net investments in foreign operations are as follows. (Unit: Korean Won in millions): |
| For the six-month period ended June 30, 2024 | ||||||||||||||
| Profit or loss recognized in OCI |
Hedge ineffectiveness recognized in profit or loss |
Line item which recognized the hedge ineffectiveness |
||||||||||||
| Hedges of net investment in foreign operation |
Exchange rate risk | (86,208 | ) | 22,759 | (63,449 | ) | ||||||||
| For the six-month period ended June 30, 2024 | ||||||||||
| Hedge ineffectiveness recognized in profit or loss |
Account recognized for Hedge ineffectiveness |
|||||||||
| Hedges of net investment in foreign operation |
Exchange rate risk | — | — | |||||||
| For the six-month period ended June 30, 2023 | ||||||||||||||
| Profit or loss recognized in OCI |
Hedge ineffectiveness recognized in profit or loss |
Line item which recognized the hedge ineffectiveness |
||||||||||||
| Hedges of net investment in foreign operation |
Exchange rate risk | (39,305 | ) | 10,377 | (28,928 | ) | ||||||||
| For the six-month period ended June 30, 2023 | ||||||||||
| Hedge ineffectiveness recognized in profit or loss |
Account recognized for Hedge ineffectiveness |
|||||||||
| Hedges of net investment in foreign operation |
Exchange rate risk | — | — | |||||||
No amount was reclassified from reserve of hedges of net investment in foreign operations to profit or loss.
25. DEFERRED DAY 1 PROFITS OR LOSSES
Changes in deferred day 1 profits or losses are as follows (Unit: Korean Won in millions):
| For the six-month periods ended June 30 | ||||||||
| 2024 | 2023 | |||||||
| Beginning balance |
7,848 | 17,964 | ||||||
| Amounts recognized in losses |
(6,860 | ) | (4,956 | ) | ||||
|
|
|
|
|
|||||
| Ending balance |
988 | 13,008 | ||||||
|
|
|
|
|
|||||
In case some variables to measure fair values of financial instruments are not observable in the market, valuation methods are utilized to evaluate such financial instruments. Those financial instruments are recorded the transaction price as at the time of acquisition, even though there are difference noted between the transaction price and the fair value. The table above presents the difference yet to be realized as profit or loss for the six-month periods ended June 30, 2024 and 2023.
- 121 -
WOORI FINANCIAL GROUP INC. AND SUBSIDIARIES
NOTES TO CONSOLIDATED INTERIM FINANCIAL STATEMENTS
AS OF JUNE 30, 2024 AND 2023
| 26. | EQUITY |
| (1) | Details of equity as of June 30, 2024 and December 31, 2023 are as follows (Unit: Korean Won in millions): |
| June 30, 2024 | December 31, 2023 | |||||||
| Capital |
||||||||
| Common stock capital |
3,802,676 | 3,802,676 | ||||||
| Hybrid securities |
4,409,042 | 3,611,129 | ||||||
| Capital surplus |
||||||||
| Capital in excess of par value |
854,499 | 854,499 | ||||||
| Others |
83,327 | 81,064 | ||||||
|
|
|
|
|
|||||
| Sub-total |
937,826 | 935,563 | ||||||
|
|
|
|
|
|||||
| Capital adjustments |
||||||||
| Treasury stocks |
(35,517 | ) | (39,348 | ) | ||||
| Other adjustments(*1) |
(1,646,839 | ) | (1,648,535 | ) | ||||
|
|
|
|
|
|||||
| Sub-total |
(1,682,356 | ) | (1,687,883 | ) | ||||
|
|
|
|
|
|||||
| Accumulated other comprehensive income |
||||||||
| Net gain on credit risk fluctuation of financial liabilities designated to be measured at FVTPL |
837 | — | ||||||
| Financial assets at FVTOCI |
40,079 | 79,694 | ||||||
| Changes in capital due to equity method |
(3,046 | ) | 3,471 | |||||
| Gain (loss) on foreign currency translation of foreign operations |
232,010 | 15,579 | ||||||
| Gain (loss) on hedges of net investment in foreign operations |
(98,199 | ) | (34,750 | ) | ||||
| Remeasurements of defined benefit plan |
(73,746 | ) | (24,262 | ) | ||||
| Loss on valuation of cash flow hedge |
(14,576 | ) | (20,806 | ) | ||||
|
|
|
|
|
|||||
| Sub-total |
83,359 | 18,926 | ||||||
|
|
|
|
|
|||||
| Retained earnings(*2)(*3) |
25,916,022 | 24,986,470 | ||||||
| Non-controlling interest(*4) |
1,681,045 | 1,730,609 | ||||||
|
|
|
|
|
|||||
| Total |
35,147,614 | 33,397,490 | ||||||
|
|
|
|
|
|||||
| (*1) | Included 178,060 million Won in capital transaction gains and losses recognized by Woori Bank and (formerly) Woori Financial Group in 2014 and 2,238,228 million Won due to the spin-off of Kyongnam Bank and Gwangju Bank. |
| (*2) | The regulatory reserve for credit losses in retained earnings amounted to 2,392,542 million Won and 2,839,475 million Won as of June 30, 2024 and December 31, 2023, respectively in accordance with the relevant article. |
| (*3) | The earned surplus reserve in retained earnings amounted to 442,650 million Won and 300,190 million Won as of June 30, 2024 and December 31, 2023 in accordance with the Article 53 of the Financial Holding Company Act. |
| (*4) | The hybrid securities issued by Woori Bank amounting to 1,546,447 million Won and 1,546,447 million Won as of June 30, 2024 and December 31, 2023, respectively, are recognized as non-controlling interests. 38,294 million Won and 55,320 million Won of dividends for the hybrid securities issued by Woori Bank are allocated to net profit and loss of the non-controlling interests for the six-month periods ended June 30, 2024 and 2023. |
| (2) | The number of authorized shares and others of the Group are as follows: |
| June 30, 2024 | December 31, 2023 | |||||||
| Shares of common stock authorized |
4,000,000,000 Shares | 4,000,000,000 Shares | ||||||
| Par value |
5,000 Won | 5,000 Won | ||||||
| Shares of common stock issued |
742,591,501 Shares | 751,949,461 Shares | ||||||
| Capital stock(*) |
3,802,676 million Won | 3,802,676 million Won | ||||||
| (*) | The capital stock is not equal to the total face value of issued shares due to the retirement of earnings. |
- 122 -
WOORI FINANCIAL GROUP INC. AND SUBSIDIARIES
NOTES TO CONSOLIDATED INTERIM FINANCIAL STATEMENTS
AS OF JUNE 30, 2024 AND 2023
| (3) | Hybrid securities |
The bond-type hybrid securities classified as owner’s equity are as follows (Unit: Korean Won in millions):
| Issue date | Maturity | Interest rate (%) | June 30, 2024 |
December 31, 2023 |
||||||||||||||||
| Securities in local currency |
2019-07-18 | — | 3.49 | 500,000 | 500,000 | |||||||||||||||
| Securities in local currency |
2019-10-11 | — | 3.32 | 500,000 | 500,000 | |||||||||||||||
| Securities in local currency |
2020-02-06 | — | 3.34 | 400,000 | 400,000 | |||||||||||||||
| Securities in local currency |
2020-06-12 | — | 3.23 | 300,000 | 300,000 | |||||||||||||||
| Securities in local currency |
2020-10-23 | — | 3.00 | 200,000 | 200,000 | |||||||||||||||
| Securities in local currency |
2021-04-08 | — | 3.15 | 200,000 | 200,000 | |||||||||||||||
| Securities in local currency |
2021-10-14 | — | 3.60 | 200,000 | 200,000 | |||||||||||||||
| Securities in local currency |
2022-02-17 | — | 4.10 | 300,000 | 300,000 | |||||||||||||||
| Securities in local currency |
2022-07-28 | — | 4.99 | 300,000 | 300,000 | |||||||||||||||
| Securities in local currency |
2022-10-25 | — | 5.97 | 220,000 | 220,000 | |||||||||||||||
| Securities in local currency |
2023-02-10 | — | 4.65 | 300,000 | 300,000 | |||||||||||||||
| Securities in local currency |
2023-09-07 | — | 5.04 | 200,000 | 200,000 | |||||||||||||||
| Securities in local currency |
2024-02-07 | — | 4.49 | 400,000 | — | |||||||||||||||
| Securities in local currency |
2024-06-19 | — | 4.27 | 400,000 | — | |||||||||||||||
| Issuance cost |
|
(10,958 | ) | (8,871 | ) | |||||||||||||||
|
|
|
|
|
|||||||||||||||||
| Total |
|
4,409,042 | 3,611,129 | |||||||||||||||||
|
|
|
|
|
|||||||||||||||||
The hybrid securities mentioned above do not have maturity date but are redeemable after 5 years from date of issuance.
- 123 -
WOORI FINANCIAL GROUP INC. AND SUBSIDIARIES
NOTES TO CONSOLIDATED INTERIM FINANCIAL STATEMENTS
AS OF JUNE 30, 2024 AND 2023
| (4) | Accumulated other comprehensive income |
Changes in the accumulated other comprehensive income are as follows (Unit: Korean Won in millions):
| For the six-month period ended June 30, 2024 | ||||||||||||||||||||
| Beginning balance |
Increase (decrease) (*) |
Reclassification adjustments |
Income tax effect |
Ending Balance |
||||||||||||||||
| Net gain(loss) on valuation of financial assets at FVTOCI |
79,694 | (75,615 | ) | 12,594 | 23,406 | 40,079 | ||||||||||||||
| Net gain on credit risk fluctuation of financial liabilities designated to be measured at FVTPL |
— | 1,137 | — | (300 | ) | 837 | ||||||||||||||
| Changes in capital due to equity method |
3,471 | (8,873 | ) | — | 2,356 | (3,046 | ) | |||||||||||||
| Gain(loss) on foreign currency translation of foreign operations |
15,579 | 224,035 | — | (7,604 | ) | 232,010 | ||||||||||||||
| Gain(loss) on hedges of net investment in foreign operations |
(34,750 | ) | (86,208 | ) | — | 22,759 | (98,199 | ) | ||||||||||||
| Remeasurement gain(loss) related to defined benefit plan |
(24,262 | ) | (67,743 | ) | — | 18,259 | (73,746 | ) | ||||||||||||
| Gain(loss) on valuation of derivatives designated as cash flow hedges |
(20,806 | ) | 7,079 | (461 | ) | (388 | ) | (14,576 | ) | |||||||||||
|
|
|
|
|
|
|
|
|
|
|
|||||||||||
| Total |
18,926 | (6,188 | ) | 12,133 | 58,488 | 83,359 | ||||||||||||||
|
|
|
|
|
|
|
|
|
|
|
|||||||||||
| (*) | The increase and decrease of financial asset valuation profit or loss at fair value through other comprehensive income is a change due to the period evaluation, and the reclassification adjustments to retained earnings, amounting to 436 million Won are due to disposal of equity securities at FVTOCI, are included. |
| For the six-month period ended June 30, 2023 | ||||||||||||||||||||
| Beginning balance |
Increase (decrease) (*) |
Reclassification adjustments |
Income tax effect |
Ending balance |
||||||||||||||||
| Net gain(loss) on valuation of financial assets at FVTOCI |
(645,731 | ) | 434,400 | 398 | (113,419 | ) | (324,352 | ) | ||||||||||||
| Changes in capital due to equity method |
475 | (2,427 | ) | — | 4,748 | 2,796 | ||||||||||||||
| Gain(loss) on foreign currency translation of foreign operations |
(24,202 | ) | 152,117 | — | (5,382 | ) | 122,533 | |||||||||||||
| Gain(loss) on hedges of net investment in foreign operations |
(20,701 | ) | (39,306 | ) | — | 10,377 | (49,630 | ) | ||||||||||||
| Remeasurement gain(loss) related to defined benefit plan |
55,235 | (83,917 | ) | — | 22,203 | (6,479 | ) | |||||||||||||
| Gain(loss) on valuation of derivatives designated as cash flow hedges |
(4,282 | ) | (10,743 | ) | (476 | ) | 346 | (15,155 | ) | |||||||||||
|
|
|
|
|
|
|
|
|
|
|
|||||||||||
| Total |
(639,206 | ) | 450,124 | (78 | ) | (81,127 | ) | (270,287 | ) | |||||||||||
|
|
|
|
|
|
|
|
|
|
|
|||||||||||
| (*) | The increase and decrease of financial asset valuation profit or loss at fair value through other comprehensive income and capital related to noncurrent assets held for sale is a change due to the period evaluation and the reclassification adjustments to retained earnings, amounting to 149 million Won, (50) million Won are due to disposal of equity securities at FVTOCI and assets held for sale, are included. |
- 124 -
WOORI FINANCIAL GROUP INC. AND SUBSIDIARIES
NOTES TO CONSOLIDATED INTERIM FINANCIAL STATEMENTS
AS OF JUNE 30, 2024 AND 2023
| (5) | Regulatory Reserve for Credit Loss |
In accordance with Article 26 ~ 28 of the Financial Holding Company Supervision Regulations, the Group calculates and discloses the regulatory reserve for credit loss.
| 1) | Balance of the regulatory reserve for credit loss |
Balance of the planned regulatory reserve for credit loss is as follows (Unit: Korean Won in millions):
| June 30, 2024 |
December 31, 2023 |
|||||||
| Beginning balance |
2,392,542 | 2,839,475 | ||||||
| Planned provision(reversal) of regulatory reserve for credit loss |
150,244 | (446,933 | ) | |||||
|
|
|
|
|
|||||
| Ending balance |
2,542,786 | 2,392,542 | ||||||
|
|
|
|
|
|||||
| 2) | Provision of regulatory reserve for credit loss, adjusted income after the provision of regulatory reserve and others |
Planned reserves provided, adjusted net income after the planned reserves provided and adjusted EPS after the planned reserves provided are as follows (Unit: Korean Won in millions, except for EPS amount):
| Period ended June 30, 2024 | Period ended June 30, 2023 | |||||||||||||||
| Three-month | Six-month | Three-month | Six-month | |||||||||||||
| Net income before regulatory reserve |
961,509 | 1,800,420 | 667,190 | 1,613,812 | ||||||||||||
| Provision(reversal) of regulatory reserve for credit loss |
94,286 | 150,244 | (212,909 | ) | (268,122 | ) | ||||||||||
| Adjusted net income after the provision of regulatory reserve |
867,223 | 1,650,176 | 880,099 | 1,881,934 | ||||||||||||
| Dividends to hybrid securities |
(39,748 | ) | (75,007 | ) | (32,738 | ) | (63,152 | ) | ||||||||
| Adjusted net income after regulatory reserve and dividends to hybrid securities |
827,475 | 1,575,169 | 847,361 | 1,818,782 | ||||||||||||
| Adjusted EPS after regulatory reserve and the dividends to hybrid securities (Unit: Korean Won) |
1,119 | 2,120 | 1,165 | 2,500 | ||||||||||||
| (6) | Details of changes in treasury stock are as follows (Unit: Korean Won in millions, number of shares): |
| For the six-month period ended June 30, 2024 | ||||||||||||||||
| Beginning balance | Acquisition | Retirement | Ending balance | |||||||||||||
| Number of shares |
3,427,497 | 9,359,792 | (9,705,025 | ) | 3,082,264 | |||||||||||
| Book value |
39,348 | 136,711 | (140,542 | ) | 35,517 | |||||||||||
| For the six-month period ended June 30, 2023 | ||||||||||||||||
| Beginning balance | Acquisition | Retirement | Ending balance | |||||||||||||
| Number of shares |
343,991 | 1,981,565 | — | 2,325,556 | ||||||||||||
| Book value |
3,819 | 23,637 | — | 27,456 | ||||||||||||
| 27. | DIVIDENDS |
| (1) | Dividends per share and the total dividends for the fiscal year ending December 31, 2023 were 640 Won and 481,213 million Won, respectively, and the dividends were approved at the regular general shareholders’ meeting held on March 22, 2024 and fixed record date as February 29, 2024. Dividends were paid in April 2024. |
| (2) | At the Board of Directors meeting held on April 26, 2024, it was approved to pay a quarterly dividend of 180 Won per share (total dividends are 133,657 million Won) with a record date of March 31, 2024. The dividends were paid in May 2024. |
- 125 -
WOORI FINANCIAL GROUP INC. AND SUBSIDIARIES
NOTES TO CONSOLIDATED INTERIM FINANCIAL STATEMENTS
AS OF JUNE 30, 2024 AND 2023
| 28. | NET INTEREST INCOME |
| (1) | Details of interest income recognized are as follows (Unit: Korean Won in millions): |
| Period ended June 30, 2024 | Period ended June 30, 2023 | |||||||||||||||
| Three-month | Six-month | Three-month | Six-month | |||||||||||||
| Financial assets at FVTPL |
57,213 | 114,866 | 47,642 | 91,617 | ||||||||||||
| Financial assets at FVTOCI |
322,136 | 626,636 | 228,548 | 436,796 | ||||||||||||
| Financial assets at amortized cost |
||||||||||||||||
| Securities at amortized cost |
169,068 | 343,472 | 200,056 | 405,262 | ||||||||||||
| Loans and other financial assets at amortized cost |
||||||||||||||||
| Interest on due from banks |
139,911 | 306,611 | 134,011 | 265,158 | ||||||||||||
| Interest on loans |
4,704,327 | 9,446,138 | 4,418,333 | 8,741,473 | ||||||||||||
| Interest of other receivables |
25,720 | 50,153 | 20,149 | 37,571 | ||||||||||||
|
|
|
|
|
|
|
|
|
|||||||||
| Subtotal |
4,869,958 | 9,802,902 | 4,572,493 | 9,044,202 | ||||||||||||
|
|
|
|
|
|
|
|
|
|||||||||
| Total |
5,418,375 | 10,887,876 | 5,048,739 | 9,977,877 | ||||||||||||
|
|
|
|
|
|
|
|
|
|||||||||
| (2) | Details of interest expense recognized are as follows (Unit: Korean Won in millions): |
| Period ended June 30, 2024 | Period ended June 30, 2023 | |||||||||||||||
| Three-month | Six-month | Three-month | Six-month | |||||||||||||
| Interest on deposits due to customers |
2,348,884 | 4,720,103 | 2,086,270 | 4,084,520 | ||||||||||||
| Interest on borrowings |
339,039 | 705,604 | 318,066 | 605,529 | ||||||||||||
| Interest on debentures |
428,125 | 856,906 | 367,334 | 701,589 | ||||||||||||
| Other interest expense |
99,663 | 201,487 | 80,258 | 168,239 | ||||||||||||
| Interest on lease liabilities |
5,768 | 8,677 | 2,639 | 5,007 | ||||||||||||
|
|
|
|
|
|
|
|
|
|||||||||
| Total |
3,221,479 | 6,492,777 | 2,854,567 | 5,564,884 | ||||||||||||
|
|
|
|
|
|
|
|
|
|||||||||
- 126 -
WOORI FINANCIAL GROUP INC. AND SUBSIDIARIES
NOTES TO CONSOLIDATED INTERIM FINANCIAL STATEMENTS
AS OF JUNE 30, 2024 AND 2023
| 29. | NET FEES AND COMMISSIONS INCOME |
| (1) | Details of fees and commissions income recognized are as follows (Unit: Korean Won in millions): |
| Period ended June 30, 2024 | Period ended June 30, 2023 | |||||||||||||||
| Three-month | Six-month | Three-month | Six-month | |||||||||||||
| Fees and commission received for brokerage |
35,515 | 84,374 | 35,376 | 77,040 | ||||||||||||
| Fees and commission received related to credit |
45,254 | 89,743 | 49,903 | 94,658 | ||||||||||||
| Fees and commission received for electronic finance |
31,890 | 63,424 | 31,006 | 62,129 | ||||||||||||
| Fees and commission received on foreign exchange handling |
14,592 | 28,721 | 13,832 | 27,435 | ||||||||||||
| Fees and commission received on foreign exchange |
28,496 | 56,145 | 26,759 | 46,599 | ||||||||||||
| Fees and commission received for guarantee |
23,961 | 47,729 | 21,783 | 41,148 | ||||||||||||
| Fees and commission received on credit card |
160,568 | 311,277 | 159,642 | 308,833 | ||||||||||||
| Fees and commission received on securities business |
15,314 | 30,140 | 16,859 | 31,753 | ||||||||||||
| Fees and commission from trust management |
65,612 | 126,327 | 68,936 | 133,465 | ||||||||||||
| Fees and commission received on credit information |
2,559 | 5,174 | 2,931 | 5,406 | ||||||||||||
| Fees and commission received related to lease |
218,374 | 424,081 | 168,020 | 331,756 | ||||||||||||
| Other fees |
101,374 | 166,048 | 46,969 | 101,056 | ||||||||||||
|
|
|
|
|
|
|
|
|
|||||||||
| Total |
743,509 | 1,433,183 | 642,016 | 1,261,278 | ||||||||||||
|
|
|
|
|
|
|
|
|
|||||||||
| (2) | Details of fees and commissions expense incurred are as follows (Unit: Korean Won in millions): |
| Period ended June 30, 2024 | Period ended June 30, 2023 | |||||||||||||||
| Three-month | Six-month | Three-month | Six-month | |||||||||||||
| Fees and commissions paid |
80,403 | 156,166 | 86,521 | 165,514 | ||||||||||||
| Credit card commission |
102,663 | 209,803 | 126,845 | 244,986 | ||||||||||||
| Brokerage commission |
276 | 596 | 436 | 780 | ||||||||||||
| Others |
4,932 | 8,452 | 4,043 | 7,733 | ||||||||||||
|
|
|
|
|
|
|
|
|
|||||||||
| Total |
188,274 | 375,017 | 217,845 | 419,013 | ||||||||||||
|
|
|
|
|
|
|
|
|
|||||||||
| 30. | DIVIDEND INCOME |
| (1) | Details of dividend income recognized are as follows (Unit: Korean Won in millions): |
| Period ended June 30, 2024 | Period ended June 30, 2023 | |||||||||||||||
| Three-month | Six-month | Three-month | Six-month | |||||||||||||
| Dividend income related to financial assets at FVTPL |
83,357 | 137,721 | 40,534 | 78,299 | ||||||||||||
| Dividend income related to financial assets at FVTOCI |
2,599 | 15,017 | 2,391 | 13,706 | ||||||||||||
|
|
|
|
|
|
|
|
|
|||||||||
| Total |
85,956 | 152,738 | 42,925 | 92,005 | ||||||||||||
|
|
|
|
|
|
|
|
|
|||||||||
| (2) | Details of dividends related to financial assets at FVTOCI are as follows (Unit: Korean Won in millions): |
| Period ended June 30, 2024 | Period ended June 30, 2023 | |||||||||||||||
| Three-month | Six-month | Three-month | Six-month | |||||||||||||
| Dividend income recognized from assets held |
||||||||||||||||
| Equity securities |
2,599 | 15,017 | 2,391 | 13,706 | ||||||||||||
- 127 -
WOORI FINANCIAL GROUP INC. AND SUBSIDIARIES
NOTES TO CONSOLIDATED INTERIM FINANCIAL STATEMENTS
AS OF JUNE 30, 2024 AND 2023
| 31. | NET GAIN OR LOSS ON FINANCIAL INSTRUMENTS AT FAIR VALUE THROUGH PROFIT OR LOSS MANDATORILY MEASURED AT FAIR VALUE |
| (1) | Details of gain or loss related to financial instruments at FVTPL are as follows (Unit: Korean Won in millions): |
| Period ended June 30, 2024 | Period ended June 30, 2023 | |||||||||||||||
| Three-month | Six-month | Three-month | Six-month | |||||||||||||
| Gain on financial instruments at FVTPL |
387,185 | 903,237 | 122,019 | 360,517 | ||||||||||||
| Loss on financial instruments designated to be measured at FVTPL |
(674 | ) | (1,119 | ) | — | — | ||||||||||
|
|
|
|
|
|
|
|
|
|||||||||
| Total |
386,511 | 902,118 | 122,019 | 360,517 | ||||||||||||
|
|
|
|
|
|
|
|
|
|||||||||
| (2) | Details of net gain or loss on financial instruments at fair value through profit or loss and financial instruments held for trading are as follows (Unit: Korean Won in millions): |
| Period ended June 30, 2024 | Period ended June 30, 2023 | |||||||||||||||||||
| Three-month | Six-month | Three-month | Six-month | |||||||||||||||||
| Financial assets at FVTPL |
Securities | Gain on transactions and valuation | 159,677 | 317,636 | (2,725 | ) | 287,207 | |||||||||||||
| Loss on transactions and valuation | 27,989 | (240,587 | ) | (33,925 | ) | (102,508 | ) | |||||||||||||
|
|
|
|
|
|
|
|
|
|||||||||||||
| Sub-total |
187,666 | 77,049 | (36,650 | ) | 184,699 | |||||||||||||||
|
|
|
|
|
|
|
|
|
|||||||||||||
| Loans | Gain on transactions and valuation | 12,241 | 13,754 | 710 | 4,562 | |||||||||||||||
| Loss on transactions and valuation | 168 | (587 | ) | (42 | ) | (1,742 | ) | |||||||||||||
|
|
|
|
|
|
|
|
|
|||||||||||||
| Sub-total |
12,409 | 13,167 | 668 | 2,820 | ||||||||||||||||
|
|
|
|
|
|
|
|
|
|||||||||||||
| Other financial assets | Gain on transactions and valuation | 2,713 | 6,436 | 4,023 | 7,207 | |||||||||||||||
| Loss on transactions and valuation | (4,755 | ) | (8,091 | ) | (2,184 | ) | (7,398 | ) | ||||||||||||
|
|
|
|
|
|
|
|
|
|||||||||||||
| Sub-total |
(2,042 | ) | (1,655 | ) | 1,839 | (191 | ) | |||||||||||||
|
|
|
|
|
|
|
|
|
|||||||||||||
| Sub-total |
198,033 | 88,561 | (34,143 | ) | 187,328 | |||||||||||||||
|
|
|
|
|
|
|
|
|
|||||||||||||
| Derivatives (Held for trading) |
Interest rates derivatives | Gain on transactions and valuation | 593,467 | 1,389,936 | 2,103,949 | 3,399,512 | ||||||||||||||
| Loss on transactions and valuation | (627,745 | ) | (1,145,697 | ) | (1,773,604 | ) | (3,223,790 | ) | ||||||||||||
|
|
|
|
|
|
|
|
|
|||||||||||||
| Sub-total |
(34,278 | ) | 244,239 | 330,345 | 175,722 | |||||||||||||||
|
|
|
|
|
|
|
|
|
|||||||||||||
| Currency derivatives | Gain on transactions and valuation | 3,370,956 | 7,770,653 | 1,666,912 | 5,255,412 | |||||||||||||||
| Loss on transactions and valuation | (3,158,942 | ) | (7,191,586 | ) | (1,739,004 | ) | (5,147,724 | ) | ||||||||||||
|
|
|
|
|
|
|
|
|
|||||||||||||
| Sub-total |
212,014 | 579,067 | (72,092 | ) | 107,688 | |||||||||||||||
|
|
|
|
|
|
|
|
|
|||||||||||||
| Equity derivatives | Gain on transactions and valuation | 118,035 | 1,076,504 | 985,723 | 2,073,732 | |||||||||||||||
| Loss on transactions and valuation | (106,619 | ) | (1,085,139 | ) | (1,087,820 | ) | (2,183,928 | ) | ||||||||||||
|
|
|
|
|
|
|
|
|
|||||||||||||
| Sub-total |
11,416 | (8,635 | ) | (102,097 | ) | (110,196 | ) | |||||||||||||
|
|
|
|
|
|
|
|
|
|||||||||||||
| Other derivatives | Gain on transactions and valuation | — | 5 | — | — | |||||||||||||||
| Loss on transactions and valuation | — | — | 6 | (25 | ) | |||||||||||||||
|
|
|
|
|
|
|
|
|
|||||||||||||
| Sub-total |
— | 5 | 6 | (25 | ) | |||||||||||||||
|
|
|
|
|
|
|
|
|
|||||||||||||
| Sub-total |
189,152 | 814,676 | 156,162 | 173,189 | ||||||||||||||||
|
|
|
|
|
|
|
|
|
|||||||||||||
| Net, total |
387,185 | 903,237 | 122,019 | 360,517 | ||||||||||||||||
|
|
|
|
|
|
|
|
|
|||||||||||||
- 128 -
WOORI FINANCIAL GROUP INC. AND SUBSIDIARIES
NOTES TO CONSOLIDATED INTERIM FINANCIAL STATEMENTS
AS OF JUNE 30, 2024 AND 2023
| (3) | Details of loss on financial instruments designated to be measured at FVTPL are as follows (Unit: Korean Won in millions): |
| Period ended June 30, 2024 | Period ended June 30, 2023 | |||||||||||||||
| Three-month | Six-month | Three-month | Six-month | |||||||||||||
| Net loss on Deposits due to customers |
||||||||||||||||
| Net loss on valuation of Time Deposits |
(674 | ) | (1,119 | ) | — | — | ||||||||||
| 32. | NET GAIN OR LOSS ON FINANCIAL ASSETS AT FVTOCI |
Details of net gain or loss on financial assets at FVTOCI recognized are as follows (Unit: Korean Won in millions):
| Period ended June 30, 2024 | Period ended June 30, 2023 | |||||||||||||||
| Three-month | Six-month | Three-month | Six-month | |||||||||||||
| Gain(loss) on redemption of securities |
— | — | 67 | 105 | ||||||||||||
| Gain(loss) on transactions of securities |
18,039 | 38,515 | (796 | ) | (503 | ) | ||||||||||
|
|
|
|
|
|
|
|
|
|||||||||
| Total |
18,039 | 38,515 | (729 | ) | (398 | ) | ||||||||||
|
|
|
|
|
|
|
|
|
|||||||||
| 33. | REVERSAL OF (PROVISION FOR) IMPAIRMENT LOSSES DUE TO CREDIT LOSS |
Reversal of (provision for) impairment losses due to credit loss are as follows (Unit: Korean Won in millions):
| Period ended June 30, 2024 | Period ended June 30, 2023 | |||||||||||||||
| Three-month | Six-month | Three-month | Six-month | |||||||||||||
| Provision for impairment loss due to credit loss on financial assets at FVTOCI |
(3,741 | ) | (3,482 | ) | (11,750 | ) | (12,163 | ) | ||||||||
| Reversal of (provision for) impairment loss due to credit loss on securities at amortized cost |
283 | 811 | (6,143 | ) | (6,019 | ) | ||||||||||
| Provision for impairment loss due to credit loss on loan and other financial assets at amortized cost |
(416,020 | ) | (779,448 | ) | (517,794 | ) | (780,194 | ) | ||||||||
| Reversal of (provision for) provision on guarantee |
7,911 | 5,464 | (865 | ) | 1,534 | |||||||||||
| Reversal of (provision for) unused loan commitment |
2,587 | 1,163 | (19,690 | ) | (20,973 | ) | ||||||||||
|
|
|
|
|
|
|
|
|
|||||||||
| Total |
(408,980 | ) | (775,492 | ) | (556,242 | ) | (817,815 | ) | ||||||||
|
|
|
|
|
|
|
|
|
|||||||||
- 129 -
WOORI FINANCIAL GROUP INC. AND SUBSIDIARIES
NOTES TO CONSOLIDATED INTERIM FINANCIAL STATEMENTS
AS OF JUNE 30, 2024 AND 2023
| 34. | GENERAL AND ADMINISTRATIVE EXPENSES AND OTHER NET OPERATING INCOME(EXPENSES) |
| (1) | Details of general and administrative expenses recognized are as follows (Unit: Korean Won in millions): |
| Period ended June 30, 2024 | Period ended June 30, 2023 | |||||||||||||||||||
| Three-month | Six-month | Three-month | Six-month | |||||||||||||||||
| Employee benefits |
Short-term employee benefits | Salaries | 443,845 | 878,236 | 431,716 | 850,340 | ||||||||||||||
| Employee fringe benefits | 156,346 | 319,745 | 156,230 | 307,757 | ||||||||||||||||
| Share based payment |
3,527 | 12,283 | 3,829 | 3,460 | ||||||||||||||||
| Retirement benefit service costs |
33,523 | 66,994 | 29,633 | 59,034 | ||||||||||||||||
| Termination |
— | (3,503 | ) | — | 6,488 | |||||||||||||||
|
|
|
|
|
|
|
|
|
|||||||||||||
| Sub-total |
637,241 | 1,273,755 | 621,408 | 1,227,079 | ||||||||||||||||
|
|
|
|
|
|
|
|
|
|||||||||||||
| Depreciation and amortization |
136,440 | 266,324 | 124,927 | 256,566 | ||||||||||||||||
| Other general and administrative expenses |
Rent | 27,430 | 58,707 | 29,682 | 58,476 | |||||||||||||||
| Taxes and public dues |
59,727 | 113,882 | 60,441 | 108,466 | ||||||||||||||||
| Service charges |
63,971 | 124,658 | 61,316 | 120,254 | ||||||||||||||||
| Computer and IT related |
32,861 | 61,861 | 35,780 | 66,476 | ||||||||||||||||
| Telephone and communication |
21,774 | 43,775 | 20,904 | 41,809 | ||||||||||||||||
| Operating promotion |
12,080 | 24,299 | 11,572 | 23,843 | ||||||||||||||||
| Advertising |
41,861 | 65,949 | 30,083 | 45,481 | ||||||||||||||||
| Printing |
1,153 | 2,435 | 1,251 | 2,532 | ||||||||||||||||
| Traveling |
3,317 | 6,323 | 3,162 | 6,220 | ||||||||||||||||
| Supplies |
1,810 | 4,063 | 1,841 | 3,787 | ||||||||||||||||
| Insurance premium |
3,203 | 6,901 | 3,363 | 7,056 | ||||||||||||||||
| Maintenance |
5,951 | 11,999 | 5,382 | 11,433 | ||||||||||||||||
| Water, light, and heating |
4,149 | 9,775 | 3,809 | 9,658 | ||||||||||||||||
| Vehicle maintenance |
3,644 | 7,083 | 3,636 | 6,877 | ||||||||||||||||
| Others(*) |
12,708 | 19,198 | 2,379 | 61,903 | ||||||||||||||||
|
|
|
|
|
|
|
|
|
|||||||||||||
| Sub-total | 295,639 | 560,908 | 274,601 | 574,271 | ||||||||||||||||
|
|
|
|
|
|
|
|
|
|||||||||||||
| Total |
1,069,320 | 2,100,987 | 1,020,936 | 2,057,916 | ||||||||||||||||
|
|
|
|
|
|
|
|
|
|||||||||||||
| (*) | It includes 40,047 million Won in in-house welfare fund contributions for the six-month periods ended June 30, 2023. |
| (2) | Details of other operating income recognized are as follows (Unit: Korean Won in millions): |
| Period ended June 30, 2024 | Period ended June 30, 2023 | |||||||||||||||
| Three-month | Six-month | Three-month | Six-month | |||||||||||||
| Gain(loss) on transactions of foreign exchange |
95,066 | 163,320 | 205,189 | 635,264 | ||||||||||||
| Gain(loss) related to derivatives (Designated for hedging) |
37,138 | 83,926 | (7,552 | ) | 62,328 | |||||||||||
| Gain(loss) on fair value hedged items |
2,130 | 42,020 | 22,431 | 28,071 | ||||||||||||
| Others |
88,869 | 161,590 | 64,136 | 154,247 | ||||||||||||
|
|
|
|
|
|
|
|
|
|||||||||
| Total |
223,203 | 450,856 | 284,204 | 879,910 | ||||||||||||
|
|
|
|
|
|
|
|
|
|||||||||
| (3) | Details of other operating expenses recognized are as follows (Unit: Korean Won in millions): |
| Period ended June 30, 2024 | Period ended June 30, 2023 | |||||||||||||||
| Three-month | Six-month | Three-month | Six-month | |||||||||||||
| Loss on transactions of foreign exchange |
278,705 | 748,355 | 208,060 | 790,825 | ||||||||||||
| KDIC deposit insurance premium |
126,317 | 247,185 | 115,023 | 227,083 | ||||||||||||
| Contribution to miscellaneous funds |
126,492 | 261,000 | 110,503 | 214,394 | ||||||||||||
| Loss on derivatives (Designated for hedging) |
983 | 44,299 | 25,975 | 31,384 | ||||||||||||
| Loss(Gain) on fair value hedged items |
20,305 | 29,253 | (18,173 | ) | 10,033 | |||||||||||
| Others (*) |
300,944 | 552,557 | 204,160 | 406,112 | ||||||||||||
|
|
|
|
|
|
|
|
|
|||||||||
| Total |
853,746 | 1,882,649 | 645,548 | 1,679,831 | ||||||||||||
|
|
|
|
|
|
|
|
|
|||||||||
| (*) | Other expense includes 13,080 million Won and 10,093 million Won for intangible asset amortization cost and 279,416 million Won and 219,772 million Won for lease depreciation cost for the six-month periods ended June 30, 2024 and 2023, respectively. |
- 130 -
WOORI FINANCIAL GROUP INC. AND SUBSIDIARIES
NOTES TO CONSOLIDATED INTERIM FINANCIAL STATEMENTS
AS OF JUNE 30, 2024 AND 2023
| (4) | Share-based payment |
Details of performance condition share-based payment granted to executives as of June 30, 2024 and December 31, 2023 are as follows.
| 1) | Performance condition share-based payment |
| Subject to |
Shares granted for the year 2020(*3) | |||
| Type of payment |
Cash-settled | |||
| Vesting period |
January 1, 2020 ~ December 31, 2023 | |||
| Date of payment |
2024-01-01 | |||
| Fair value (*1) |
— | |||
| Valuation method |
— | |||
| Expected dividend rate |
— | |||
| Expected maturity date |
— | |||
| Number of shares remaining |
As of June 30, 2024 | — | ||
| As of December 31, 2023 | 944,343 shares | |||
| Number of shares granted (*2) |
As of June 30, 2024 | — | ||
| As of December 31, 2023 | 944,343 shares | |||
| Subject to |
Shares granted for the year 2021 | |||
| Type of payment |
Cash-settled | |||
| Vesting period |
January 1, 2021 ~ December 31, 2024 | |||
| Date of payment |
2025-01-01 | |||
| Fair value (*1) |
13,921 Won | |||
| Valuation method |
Black-Scholes Model | |||
| Expected dividend rate |
6.48% | |||
| Expected maturity date |
0.50 years | |||
| Number of shares remaining |
As of June 30, 2024 | 1,105,292 shares | ||
| As of December 31, 2023 | 1,105,515 shares | |||
| Number of shares granted (*2) |
As of June 30, 2024 | 1,105,292 shares | ||
| As of December 31, 2023 | 1,105,515 shares | |||
| Subject to |
Shares granted for the year 2022 | |||
| Type of payment |
Cash-settled | |||
| Vesting period |
January 1, 2022 ~ December 31, 2025 | |||
| Date of payment |
2026-01-01 | |||
| Fair value (*1) |
13,049 Won | |||
| Valuation method |
Black-Scholes Model | |||
| Expected dividend rate |
6.48% | |||
| Expected maturity date |
1.50 years | |||
| Number of shares remaining |
As of June 30, 2024 | 960,777 shares | ||
| As of December 31, 2023 | 968,119 shares | |||
| Number of shares granted (*2) |
As of June 30, 2024 | 960,777 shares | ||
| As of December 31, 2023 | 968,119 shares | |||
| Subject to |
Shares granted for the year 2023 | |||
| Type of payment |
Cash-settled | |||
| Vesting period |
January 1, 2023 ~ December 31, 2026 | |||
| Date of payment |
2027-01-01 | |||
| Fair value (*1) |
12,231 Won | |||
| Valuation method |
Black- Scholes Model | |||
| Expected dividend rate |
6.48% | |||
| Expected maturity date |
2.50 years | |||
| Number of shares remaining |
As of June 30, 2024 | 916,849 shares | ||
| As of December 31, 2023 | 924,077 shares | |||
| Number of shares granted (*2) |
As of June 30, 2024 | 916,849 shares | ||
| As of December 31, 2023 | 924,077 shares | |||
- 131 -
WOORI FINANCIAL GROUP INC. AND SUBSIDIARIES
NOTES TO CONSOLIDATED INTERIM FINANCIAL STATEMENTS
AS OF JUNE 30, 2024 AND 2023
| Subject to |
Shares granted for the year 2024 | |||
| Type of payment |
Cash-settled | |||
| Vesting period |
January 1, 2024 ~ December 31, 2027 | |||
| Date of payment |
2028-01-01 | |||
| Fair value (*1) |
11,464 Won | |||
| Valuation method |
Black-Scholes Model | |||
| Expected dividend rate |
6.48% | |||
| Expected maturity date |
3.50 years | |||
| Number of shares remaining |
As of June 30, 2024 | 702,609 shares | ||
| As of December 31, 2023 | — | |||
| Number of shares granted (*2) |
As of June 30, 2024 | 702,609 shares | ||
| As of December 31, 2023 | — | |||
| (*1) | As the amount of payment varies according to the base price (the arithmetic average of the weighted average stock price of transactions in the past one week, the past one month, and the past two months) at the date of payment, the fair value is calculated to measure the liability according to the Black Scholes model based on the base price at the time of each settlement. |
| (*2) | The number of payable stocks is granted at the initial contract date and the payment rate is determined based on the achievement of the pre-determined performance targets. Performance is evaluated as long-term performance indication including relative shareholder return, net income, return on equity (ROE), C/I ratio, non-performing loan ratio and job performance. |
| (*3) | Payment was completed in current period. |
| 2) | The Group accounts for performance condition share-based payments according to the cash-settled method and the fair value of the liabilities is reflected in the compensation costs by re-measuring every closing period. As of June 30, 2024 and December 31, 2023, the carrying amount of the liabilities related to the performance condition share-based payments recognized by the Group amounts to 47,193 million Won and 46,741 million Won, respectively, including the carrying amount of liabilities related to key management of 10,481 million Won and 19,924 million Won, respectively. |
- 132 -
WOORI FINANCIAL GROUP INC. AND SUBSIDIARIES
NOTES TO CONSOLIDATED INTERIM FINANCIAL STATEMENTS
AS OF JUNE 30, 2024 AND 2023
| 35. | NON-OPERATING INCOME(EXPENSES) |
| (1) | Details of gains or losses on valuation of investments in joint ventures and associates are as follows (Unit: Korean Won in millions): |
| Period ended June 30, 2024 | Period ended June 30, 2023 | |||||||||||||||
| Three-month | Six-month | Three-month | Six-month | |||||||||||||
| Gain on valuation of investments in joint ventures and associates |
37,032 | 51,881 | 64,571 | 74,592 | ||||||||||||
| Loss on valuation of investments in joint ventures and associates |
(2,910 | ) | (12,250 | ) | (731 | ) | (3,609 | ) | ||||||||
|
|
|
|
|
|
|
|
|
|||||||||
| Total |
34,122 | 39,631 | 63,840 | 70,983 | ||||||||||||
|
|
|
|
|
|
|
|
|
|||||||||
| (2) | Details of other non-operating income and expenses recognized are as follows (Unit: Korean Won in millions): |
| Period ended June 30, 2024 | Period ended June 30, 2023 | |||||||||||||||
| Three-month | Six-month | Three-month | Six-month | |||||||||||||
| Other non-operating income |
17,850 | 29,596 | 39,182 | 60,755 | ||||||||||||
| Other non-operating expenses |
(58,390 | ) | (82,377 | ) | (120,249 | ) | (130,643 | ) | ||||||||
|
|
|
|
|
|
|
|
|
|||||||||
| Total |
(40,540 | ) | (52,781 | ) | (81,067 | ) | (69,888 | ) | ||||||||
|
|
|
|
|
|
|
|
|
|||||||||
| (3) | Details of other non-operating income recognized are as follows (Unit: Korean Won in millions): |
| Period ended June 30, 2024 | Period ended June 30, 2023 | |||||||||||||||
| Three-month | Six-month | Three-month | Six-month | |||||||||||||
| Rental fee income |
5,065 | 9,446 | 6,122 | 10,554 | ||||||||||||
| Gain on disposal of investments in joint ventures and associates |
359 | 671 | 22,985 | 22,985 | ||||||||||||
| Gain on disposal of premises and equipment, intangible assets and other assets |
2,312 | 2,611 | 3,135 | 3,372 | ||||||||||||
| Reversal of impairment loss of premises and equipment, intangible assets and other assets |
3 | 23 | 126 | 263 | ||||||||||||
| Others (*) |
10,111 | 16,845 | 6,814 | 23,581 | ||||||||||||
|
|
|
|
|
|
|
|
|
|||||||||
| Total |
17,850 | 29,596 | 39,182 | 60,755 | ||||||||||||
|
|
|
|
|
|
|
|
|
|||||||||
| (*) | Other special gains related to other provisions for the six-month period ended June 30, 2024 and 2023 are 2,517 million Won and 158 million Won, respectively. |
| (4) | Details of other non-operating expenses recognized are as follows (Unit: Korean Won in millions): |
| Period ended June 30, 2024 | Period ended June 30, 2023 | |||||||||||||||
| Three-month | Six-month | Three-month | Six-month | |||||||||||||
| Depreciation on investment properties |
1,553 | 5,332 | 1,431 | 2,580 | ||||||||||||
| Operating expenses on investment properties |
531 | 1,142 | 496 | 974 | ||||||||||||
| Losses on disposal of investments in joint ventures and associates |
429 | 438 | — | — | ||||||||||||
| Losses on disposal of premises and equipment, intangible assets and other assets |
470 | 1,313 | 735 | 1,174 | ||||||||||||
| Impairment losses of premises and equipment, intangible assets and other assets |
91 | 1,362 | 6 | 6 | ||||||||||||
| Donation |
40,086 | 42,259 | 9,331 | 10,897 | ||||||||||||
| Others (*) |
15,230 | 30,531 | 108,250 | 115,012 | ||||||||||||
|
|
|
|
|
|
|
|
|
|||||||||
| Total |
58,390 | 82,377 | 120,249 | 130,643 | ||||||||||||
|
|
|
|
|
|
|
|
|
|||||||||
| (*) | Other special losses related to other provisions for the six-month periods ended June 30, 2024 and 2023 are 17,846 million Won and 55,460 million Won, respectively. |
- 133 -
WOORI FINANCIAL GROUP INC. AND SUBSIDIARIES
NOTES TO CONSOLIDATED INTERIM FINANCIAL STATEMENTS
AS OF JUNE 30, 2024 AND 2023
| 36. | INCOME TAX EXPENSE |
Details of income tax expenses are as follows (Unit: Korean Won in millions):
| For the six-month periods ended June 30 |
||||||||
| 2024 | 2023 | |||||||
| Current tax expense |
||||||||
| Current tax expense with respect to the current period |
338,908 | 258,528 | ||||||
| Adjustments recognized in the current period in relation to the tax expense of prior periods |
(35,023 | ) | (19,816 | ) | ||||
| Income tax expense directly attributable to other equity |
22,760 | 7,295 | ||||||
|
|
|
|
|
|||||
| Sub-total |
326,645 | 246,007 | ||||||
|
|
|
|
|
|||||
| Deferred tax expense |
||||||||
| Change in deferred tax assets (liabilities) due to temporary differences |
227,027 | 384,870 | ||||||
| Income tax expense (income) directly attributable to equity |
35,729 | (96,769 | ) | |||||
| Others |
1,038 | 613 | ||||||
|
|
|
|
|
|||||
| Sub-total |
263,794 | 288,714 | ||||||
|
|
|
|
|
|||||
| Income tax expense |
590,439 | 534,721 | ||||||
|
|
|
|
|
|||||
Income tax expense was recognized based on the best estimate of the weighted average annual effective tax rate expected for the interim period. The weighted average annual effective tax rate for the June 30, 2024, is 24.7% (The weighted average annual effective tax rate for the June 30, 2023, is 24.9%).
The Group is conducting an impact analysis on corporate taxes in relation to the global minimum tax regime. It is anticipated that there will be no significant impact on the current corporate tax expense of the Group as of June 30, 2024.
- 134 -
WOORI FINANCIAL GROUP INC. AND SUBSIDIARIES
NOTES TO CONSOLIDATED INTERIM FINANCIAL STATEMENTS
AS OF JUNE 30, 2024 AND 2023
| 37. | EARNINGS PER SHARE (“EPS”) |
| (1) | Basic EPS is calculated by dividing net income attributable to common shareholders by weighted-average number of common shares outstanding (Unit: Korean Won in millions, except for EPS and number of shares): |
| Period ended June 30, 2024 | Period ended June 30, 2023 | |||||||||||||||
| Three-month | Six-month | Three-month | Six-month | |||||||||||||
| Net profit attributable to Owners |
931,495 | 1,755,496 | 625,190 | 1,538,876 | ||||||||||||
| Dividends to hybrid securities |
(39,748 | ) | (75,007 | ) | (32,738 | ) | (63,152 | ) | ||||||||
| Net income attributable to common shareholders |
891,747 | 1,680,489 | 592,452 | 1,475,724 | ||||||||||||
| Weighted average number of common shares outstanding (Unit: million shares) |
739 | 743 | 728 | 728 | ||||||||||||
| Basic EPS (Unit: Korean Won) |
1,206 | 2,262 | 814 | 2,028 | ||||||||||||
| (2) | The weighted average number of common shares outstanding is as follows (Unit: number of shares, days) |
| For the period ended June 30, 2024 | ||||||||
| Number of shares | Accumulated number of shares outstanding during period |
|||||||
| Common shares issued at the beginning of the period |
751,949,461 | 136,854,801,902 | ||||||
| Treasury stocks |
(3,427,497 | ) | (623,804,454 | ) | ||||
| Acquisition and retirement of treasury stock |
(9,359,792 | ) | (1,020,278,209 | ) | ||||
| Disposal of treasury stock |
347,065 | 25,555,012 | ||||||
|
|
|
|||||||
| Sub-total (①) |
|
135,236,274,251 | ||||||
|
|
|
|||||||
| Weighted average number of common shares outstanding (②=①/182) |
|
743,056,452 | ||||||
|
|
|
|||||||
| For the period ended June 30, 2023 | ||||||||
| Number of shares | Accumulated number of shares outstanding during period |
|||||||
| Common shares issued at the beginning of the period |
728,060,549 | 131,778,959,369 | ||||||
| Treasury stocks |
(343,991 | ) | (62,262,371 | ) | ||||
| Acquisition of treasury stock |
(1,981,565 | ) | (28,658,738 | ) | ||||
|
|
|
|||||||
| Sub-total (①) |
|
131,688,038,260 | ||||||
|
|
|
|||||||
| Weighted average number of common shares outstanding (②=①/181) |
|
727,558,222 | ||||||
|
|
|
|||||||
Diluted EPS is equal to basic EPS because there is no dilution effect for the six-month periods ended June 30, 2024 and 2023.
- 135 -
WOORI FINANCIAL GROUP INC. AND SUBSIDIARIES
NOTES TO CONSOLIDATED INTERIM FINANCIAL STATEMENTS
AS OF JUNE 30, 2024 AND 2023
| 38. | CONTINGENT LIABILITIES AND COMMITMENTS |
| (1) | Details of guarantees are as follows (Unit: Korean Won in millions): |
| June 30, 2024 (*) | December 31, 2023 (*) | |||||||
| Confirmed guarantees Guarantee for loans |
60,344 | 58,205 | ||||||
| Acceptances |
511,917 | 467,964 | ||||||
| Guarantees in acceptances of imported goods |
57,545 | 74,916 | ||||||
| Other confirmed guarantees |
9,187,804 | 8,050,815 | ||||||
|
|
|
|
|
|||||
| Sub-total |
9,817,610 | 8,651,900 | ||||||
|
|
|
|
|
|||||
| Unconfirmed guarantees Local letters of credit |
205,068 | 161,608 | ||||||
| Letters of credit |
2,999,162 | 2,873,350 | ||||||
| Other unconfirmed guarantees |
1,357,425 | 1,516,585 | ||||||
|
|
|
|
|
|||||
| Sub-total |
4,561,655 | 4,551,543 | ||||||
|
|
|
|
|
|||||
| Commercial paper purchase commitments and others |
597,536 | 589,858 | ||||||
|
|
|
|
|
|||||
| Total |
14,976,801 | 13,793,301 | ||||||
|
|
|
|
|
|||||
| (*) | Includes financial guarantees of 3,977,082 million Won and 3,661,656 million Won as of June 30, 2024 and December 31, 2023, respectively. |
| (2) | Details of loan commitments and others are as follows (Unit: Korean Won in millions): |
| June 30, 2024 | December 31, 2023 | |||||||
| Loan commitments |
127,594,961 | 126,829,192 | ||||||
| Other commitments (*) |
8,567,687 | 7,339,952 | ||||||
| (*) | As of June 30, 2024 and December 31, 2023, the amount of unsecured bills (purchase bills sales) and discounts on electronic short-term bond sales (purchase) are 3,589,292 million Won and 2,485,853 million Won, respectively. |
| (3) | Litigation case |
As of June 30, 2024 and December 31, 2023, the contents of the litigation case are as follows.
Litigation case that the key Group is a defendant in a lawsuit pending (excluding fraud lawsuits and those lawsuits that are filed only to extend the statute of limitation, etc.) are 716 cases (litigation value of 661,843 million Won) and 603 cases (litigation value of 513,863 million Won) as of June 30, 2024 and December 31, 2023 respectively, and provisions for litigations are 27,381 million Won and 28,581 million Won.
- 136 -
WOORI FINANCIAL GROUP INC. AND SUBSIDIARIES
NOTES TO CONSOLIDATED INTERIM FINANCIAL STATEMENTS
AS OF JUNE 30, 2024 AND 2023
| (4) | Other commitments |
| 1) | As of As of June 30, 2024, Woori FIS Co., Ltd, a subsidiary, has been provided with a payment guarantee limit of 6,457 million Won in relation to bid guarantees and contract/defect guarantees from the Korean Software Financial Cooperative, but there is no committed amount. In relation to the guarantee, the capital contributions to the Korean Software Financial Cooperative are provided as collateral. |
| 2) | As of June 30, 2024, Woori FIS Co., Ltd, a subsidiary agreed with Shinhan Bank for short-term borrowings of 20 billion Won for one year (2023.11.16.~2024.11.16.), and balance of short-term borrowings is 6.5 billion Won as of June 30, 2024. |
| 3) | As of June 30, 2024, Woori Savings bank is provided with a guarantee of 2,838 million Won from Seoul Guarantee Insurance Company in relation to provisional attachment for recovery of loans, etc. |
| 4) | As of June 30, 2024, Woori Asset Trust, a subsidiary, has committed to fulfill responsibility for the completion of 24 projects, including a Urban Residential Housing in Daechi-dong, Gangnam-gu, Seoul. Responsible completion type management land trust is a trust that bears the obligation of responsible completion when the construction company fails to fulfill the obligation of responsible completion, and the obligation to compensate losses to the lending financial institution if Woori Asset Trust fails to fulfill the obligation of responsible completion. As of June 30, 2024, the total amount of PF(Project Financing) loans from PF lending financial institutions invested in the responsible completion type management land trust business is 1,320,082 million Won. Meanwhile, Woori Asset Trust Co., Ltd. has failed to fulfill the responsibility of the completion of 7 projects including the Officetel in Hwagok-dong, Gangseo-gu, Seoul. The total amount of PF limit from PF lending financial institutions invested in projects is 485,900 million Won and the amount of PF loans is 282,263 million Won. The PF limit may be subject to change during the project progress due to reasons such as limit deductions. As of June 30, 2024, Woori Asset Trust has two cases, such as the commercial facility in Gyeongan-dong, Gwangju, Gyeonggi, where our company’s guaranteed completion deadlines have passed. Although additional losses may occur in relation to these contracts for liability obligations, these effects were not reflected in the financial statements at the end of the current period because the possibility is not high and the amount of losses cannot be reliably estimated. As of June 30, 2024, the total PF limit of the PF loan financial institutions invested in the concerned project is 88,500 million Won and the PF loan amount is 27,500 million Won. The PF limit may be subject to change during the project progress due to reasons such as limit deductions. |
| 5) | Also, as of June 30, 2024, Woori Asset Trust, a subsidiary, may lend a trust account for a part of the total project cost in relation to 28 debt-type land trust contracts including Busan Haeundae Udong Beautique Terrace Hotel and responsible completion management land trust contracts in Gyeongseo-dong, Seo-gu, Incheon, and additional business sites in progress. The maximum loan amount (unused limit) is 143,683 million Won. Whether or not Woori Asset Trust lends a trust account in relation to the relevant businesses is not an unconditional payment obligation, and it is determined by considering overall matters such as the unique account and the fund balance plan of each trust business. |
| 6) | Pursuant to some contracts related to asset securitization, as of June 30, 2024, Woori Card, a subsidiary, utilizes various prerequisites as triggering events causing early redemption, limiting risks that investors bear due to change in asset quality. Breach of such triggering clause leads to an early redemption of the securitized bonds. |
| 7) | During the prior period, there was an investigation by Fair Trade Commission regarding Loan-To-Value ratio. Woori Bank, a subsidiary, received the review report in January 2024, but cannot reasonably estimate its impact on consolidated interim financial statements. |
- 137 -
WOORI FINANCIAL GROUP INC. AND SUBSIDIARIES
NOTES TO CONSOLIDATED INTERIM FINANCIAL STATEMENTS
AS OF JUNE 30, 2024 AND 2023
| 39. | RELATED PARTY TRANSACTIONS |
Related parties of the Group as of June 30, 2024 and December 31, 2023, and assets and liabilities recognized, guarantees and commitments, major transactions with related parties and compensation to key management for the six-month periods ended June 30, 2024 and 2023 are as follows. Please see Note 12 for the details of joint ventures and associates.
| (1) | Assets and liabilities from transactions with related parties are as follows (Unit: Korean Won in millions): |
| Related parties |
Account title |
June 30, 2024 |
December 31, 2023 |
|||||||||
| Associates |
W Service Networks Co., Ltd. | Loans |
26 | 108 | ||||||||
| Deposits due to customers |
2,973 | 3,245 | ||||||||||
| Accrued expenses |
7 | 7 | ||||||||||
| Other liabilities |
50 | 100 | ||||||||||
| Korea Credit Bureau Co., Ltd. | Loans |
— | 1 | |||||||||
| Deposits due to customers |
934 | 771 | ||||||||||
| Accrued expenses |
2 | 1 | ||||||||||
| Korea Finance Security Co., Ltd. | Loans |
2,326 | 3,228 | |||||||||
| Loss allowance |
(34 | ) | (71 | ) | ||||||||
| Deposits due to customers |
1,119 | 1,323 | ||||||||||
| Other liabilities |
10 | 6 | ||||||||||
| LOTTE CARD Co. Ltd. | Loans |
163,892 | 12,209 | |||||||||
| Account receivables |
39 | 31 | ||||||||||
| Loss allowance |
(341 | ) | (269 | ) | ||||||||
| Other assets |
112 | 2 | ||||||||||
| Deposits due to customers |
66,360 | 62,587 | ||||||||||
| Other liabilities |
210 | 289 | ||||||||||
| K BANK Co., Ltd. | Loans |
21 | 54 | |||||||||
| Account receivables |
13 | 13 | ||||||||||
| Other assets |
22 | 18 | ||||||||||
| Other liabilities |
135,276 | 214,135 | ||||||||||
| Others (*1) | Loans |
61,764 | 65,558 | |||||||||
| Loss allowance |
(260 | ) | (61 | ) | ||||||||
| Other assets |
63,474 | 47,828 | ||||||||||
| Deposits due to customers |
18,917 | 4,212 | ||||||||||
| Other liabilities |
1,551 | 992 | ||||||||||
| (*1) | Others include IBK KIP Seongjang Dideemdol 1st Private Investment Limited Partnership and etc., as of June 30, 2024 and December 31, 2023. |
- 138 -
WOORI FINANCIAL GROUP INC. AND SUBSIDIARIES
NOTES TO CONSOLIDATED INTERIM FINANCIAL STATEMENTS
AS OF JUNE 30, 2024 AND 2023
| (2) | Major gain or loss from transactions with related parties are as follows (Unit: Korean Won in millions): |
| For the six-month periods ended June 30 |
||||||||||||
| Related parties |
Account title |
2024 | 2023 | |||||||||
| Associates |
W Service Network Co., Ltd. | Interest expenses |
19 | 14 | ||||||||
| Fees expenses |
264 | 266 | ||||||||||
| Other expenses |
527 | 869 | ||||||||||
| Korea Credit Bureau Co., Ltd. | Interest expenses |
— | 9 | |||||||||
| Fees expenses |
2,047 | 1,881 | ||||||||||
| Other expenses |
79 | 73 | ||||||||||
| Korea Finance Security Co., Ltd. | Interest income |
72 | 105 | |||||||||
| Interest expenses |
2 | 1 | ||||||||||
| Provision (Reversal) of allowance for credit loss |
(34 | ) | 14 | |||||||||
| Other expenses |
13 | 18 | ||||||||||
| LOTTE CARD Co., Ltd. | Interest income |
459 | 7 | |||||||||
| Fees income |
2,058 | 2,108 | ||||||||||
| Interest expenses |
2,179 | 2,892 | ||||||||||
| Provision (Reversal) of allowance for credit loss |
(8 | ) | 153 | |||||||||
| K BANK Co., Ltd. | Fees income |
97 | 109 | |||||||||
| Fees expenses |
— | 248 | ||||||||||
| Others (*) | Interest income |
416 | 339 | |||||||||
| Fees income |
47,468 | 2,613 | ||||||||||
| Dividend income |
3,192 | 372 | ||||||||||
| Other income |
1,298 | 632 | ||||||||||
| Interest expenses |
7,334 | 8 | ||||||||||
| Other expenses |
(777 | ) | — | |||||||||
| Reversal of allowance for credit loss |
199 | 16 | ||||||||||
| (*) | Others include IBK KIP Seongjang Dideemdol 1st Private Investment Limited Partnership and etc., as of June 30, 2024 and 2023. |
- 139 -
WOORI FINANCIAL GROUP INC. AND SUBSIDIARIES
NOTES TO CONSOLIDATED INTERIM FINANCIAL STATEMENTS
AS OF JUNE 30, 2024 AND 2023
| (3) | Major loan transactions with related parties for the six-month periods ended June 30, 2024 and 2023 are as follows (Unit: Korean Won in millions): |
| For the six-month period ended June 30, 2024 | ||||||||||||||||||||||
| Related parties |
Beginning balance |
Loan | Collection | Foreign currency exchange, etc. |
Ending balance (*) |
|||||||||||||||||
| Associates |
W Service Network Co., Ltd. | 108 | 260 | 342 | — | 26 | ||||||||||||||||
| Korea Credit Bureau Co., Ltd. | 1 | — | 1 | — | — | |||||||||||||||||
| Korea Finance Security Co., Ltd. | 3,228 | 1,096 | 1,998 | — | 2,326 | |||||||||||||||||
| LOTTE CARD Co., Ltd. | 12,209 | 263,306 | 112,209 | 586 | 163,892 | |||||||||||||||||
| K BANK Co., Ltd. | 54 | 172 | 205 | — | 21 | |||||||||||||||||
| Win Mortgage Co., Ltd. | 15 | 106 | 109 | — | 12 | |||||||||||||||||
| ARAM CMC CO.LTD | 41 | — | — | — | 41 | |||||||||||||||||
| Godo Kaisha Oceanos 1 | 38,121 | — | — | (2,339 | ) | 35,782 | ||||||||||||||||
| Woori ZIP 1 | 11,317 | — | — | (600 | ) | 10,717 | ||||||||||||||||
| Woori ZIP 2 | 16,063 | — | — | (851 | ) | 15,212 | ||||||||||||||||
| (*) | Payments that occurred for business reasons among related parties are excluded and net increase or decrease was used for limited credit loan. |
| For the six-month period ended June 30, 2023 | ||||||||||||||||||||||
| Related parties |
Beginning balance |
Loan | Collection | Foreign currency exchange, etc. |
Ending balance (*) |
|||||||||||||||||
| Associates |
W Service Network Co., Ltd. | 120 | 147 | 240 | — | 27 | ||||||||||||||||
| Korea Credit Bureau Co., Ltd. | 2 | 6 | 4 | — | 4 | |||||||||||||||||
| Korea Finance Security Co., Ltd. | 3,433 | 225 | 1,023 | — | 2,635 | |||||||||||||||||
| LOTTE CARD Co., Ltd. | 50,000 | — | 50,000 | — | — | |||||||||||||||||
| K BANK Co., Ltd. | 3 | 11 | 13 | — | 1 | |||||||||||||||||
| Win Mortgage Co., Ltd. | — | 139 | 128 | — | 11 | |||||||||||||||||
| Godo Kaisha Oceanos 1 | 39,814 | — | — | (1,930 | ) | 37,884 | ||||||||||||||||
| Woori ZIP 1 | 11,819 | — | — | (573 | ) | 11,246 | ||||||||||||||||
| Woori ZIP 2 | 16,776 | — | — | (813 | ) | 15,963 | ||||||||||||||||
| Joongang Network Solution Co.,Ltd. | 251 | — | — | — | 251 | |||||||||||||||||
| (*) | Payments that occurred for business reasons among related parties are excluded and net increase or decrease was used for limited credit loan. |
| (4) | Details of changes in major deposits due to customers with related parties for the six-month periods ended June 30, 2024 and 2023 are as follows (Unit: Korean Won in millions): |
| For the six-month period ended June 30, 2024 | ||||||||||||||||||
| Related parties |
Beginning balance |
Increase | Decrease | Ending balance (*) |
||||||||||||||
| Associates |
W Service Networks Co., Ltd | 1,000 | 1,000 | 1,000 | 1,000 | |||||||||||||
| Win Mortgage Co., Ltd. | 600 | 500 | 600 | 500 | ||||||||||||||
| (*) | Details of payment between related parties, demand deposit due to customers and etc. are excluded. |
| For the six-month period ended June 30, 2023 | ||||||||||||||||||
| Related parties |
Beginning balance |
Increase | Decrease | Ending balance (*) |
||||||||||||||
| Associates |
W Service Networks Co., Ltd | 1,200 | 1,000 | 1,200 | 1,000 | |||||||||||||
| Partner One Value Up I Private Equity Fund | 100 | — | 100 | — | ||||||||||||||
| Korea Credit Bureau Co., Ltd. | 3,000 | — | 3,000 | — | ||||||||||||||
| Win Mortgage Co., Ltd. | — | 600 | 300 | 300 | ||||||||||||||
| (*) | Details of payment between related parties, demand deposit due to customers and etc. are excluded. |
| (5) | There are no major borrowing transactions with related parties for the six-month periods ended June 30, 2024 and 2023. |
- 140 -
WOORI FINANCIAL GROUP INC. AND SUBSIDIARIES
NOTES TO CONSOLIDATED INTERIM FINANCIAL STATEMENTS
AS OF JUNE 30, 2024 AND 2023
| (6) | Guarantees provided to the related parties are as follows (Unit: Korean Won in millions): |
| Warrantee |
June 30, 2024 | December 31, 2023 | Warranty | |||||||
| Korea Finance Security Co., Ltd. |
1,534 | 632 | Unused loan commitment | |||||||
| Korea Credit Bureau Co., Ltd. |
35 | 34 | Unused loan commitment | |||||||
| W Service Network Co., Ltd. |
154 | 72 | Unused loan commitment | |||||||
| K BANK Co., Ltd. |
279 | 246 | Unused loan commitment | |||||||
| LOTTE CARD Co. Ltd. |
348,400 | 498,400 | Unused loan commitment | |||||||
| Win Mortgage Co., Ltd. |
38 | 34 | Unused loan commitment | |||||||
As of June 30, 2024 and December 31, 2023, the Provisions recognized are 219 million Won and 294 million Won, respectively, in relation to the guarantees provided to the related parties above.
| (7) | Amount of commitments with the related parties |
| Warrantee |
June 30, 2024 | December 31, 2023 | Warranty | |||||||
| IBK KIP Seongjang Dideemdol 1st Private Investment Limited Partnership |
4,664 | 4,664 | Securities purchase commitment | |||||||
| Woori Seoul Beltway Private Special Asset Fund No.1 |
32,713 | 34,437 | Securities purchase commitment | |||||||
| Woori-Q Corporate Restructuring Private Equity Fund |
3,737 | 12,186 | Securities purchase commitment | |||||||
| JC Assurance No.2 Private Equity Fund |
1,351 | 1,351 | Securities purchase commitment | |||||||
| Crevisse Raim Impact 1st Startup Venture Specialist Private Equity Fund |
198 | 243 | Securities purchase commitment | |||||||
| Woori Oncorp Corporate support of Major Industry General Type Private Investment Trust 2 |
1,005 | — | Securities purchase commitment | |||||||
| BTS 2nd Private Equity Fund |
1,854 | 4,774 | Securities purchase commitment | |||||||
| STASSETS FUND III |
4,500 | 6,000 | Securities purchase commitment | |||||||
| Together Korea Government Private Securities Investment Trust No.3 |
990,000 | 990,000 | Securities purchase commitment | |||||||
| NH Woori Newdeal Growth Alpha Private Equity Fund 1 |
36,941 | 36,941 | Securities purchase commitment | |||||||
| Synaptic Future Growth Private Equity Fund 1 |
4,736 | 4,389 | Securities purchase commitment | |||||||
| Woori Asset Global Partnership Fund No.5 |
112,500 | 127,500 | Securities purchase commitment | |||||||
| Korea Investment 2022 Fund |
1,286 | — | Securities purchase commitment | |||||||
- 141 -
WOORI FINANCIAL GROUP INC. AND SUBSIDIARIES
NOTES TO CONSOLIDATED INTERIM FINANCIAL STATEMENTS
AS OF JUNE 30, 2024 AND 2023
| (8) | Major investment and Recovery transactions |
There are no major investment and recovery transactions with related parties for the six-month periods ended 2024 and 2023. Investment and recovery transactions of associates that are not treated as financial assets at fair value through profit or loss are described in Note 12.(2)
| (9) | Compensation for key management is as follows (Unit: Korean Won in millions): |
| For the six-month periods ended June 30 | ||||||||
| 2024 | 2023 | |||||||
| Short-term employee salaries |
11,917 | 10,734 | ||||||
| Retirement benefit service costs |
653 | 519 | ||||||
| Share-based compensation |
4,330 | 1,445 | ||||||
|
|
|
|
|
|||||
| Total |
16,900 | 12,698 | ||||||
|
|
|
|
|
|||||
Key management includes executives and directors of Woori Financial Group and major subsidiaries, and also includes CEO of other subsidiaries. Outstanding assets from transactions with key management amount to 3,280 million Won and 3,932 million Won, as of June 30, 2024 and December 31, 2023, respectively and with respect to the assets, the Group has not recognized any allowance nor related impairment loss due to credit losses. Also, liabilities from transaction with key management amount to 75,938 million Won and 34,054 million Won, respectively, as of June 30, 2024 and December 31, 2023.
- 142 -
WOORI FINANCIAL GROUP INC. AND SUBSIDIARIES
NOTES TO CONSOLIDATED INTERIM FINANCIAL STATEMENTS
AS OF JUNE 30, 2024 AND 2023
| 40. | LEASES |
| (1) | Lessor |
| 1) | Finance lease |
| ① | The total investment in finance lease and the present value of the minimum lease payments to be recovered are as follows (Unit: Korean Won in millions): |
| June 30, 2024 | ||||||||
| Total investment in lease | Net investment in lease | |||||||
| Within one year |
254,851 | 236,441 | ||||||
| After one year but within two years |
386,022 | 360,540 | ||||||
| After two years but within three years |
417,370 | 382,015 | ||||||
| After three years but within four years |
210,997 | 186,764 | ||||||
| After four years but within five years |
114,054 | 98,954 | ||||||
| After five years |
— | — | ||||||
|
|
|
|
|
|||||
| Total |
1,383,294 | 1,264,714 | ||||||
|
|
|
|
|
|||||
| December 31, 2023 | ||||||||
| Total investment in lease | Net investment in lease | |||||||
| Within one year |
226,242 | 208,121 | ||||||
| After one year but within two years |
330,524 | 308,793 | ||||||
| After two years but within three years |
446,742 | 412,015 | ||||||
| After three years but within four years |
364,917 | 323,331 | ||||||
| After four years but within five years |
127,001 | 109,675 | ||||||
| After five years |
24 | 24 | ||||||
|
|
|
|
|
|||||
| Total |
1,495,450 | 1,361,959 | ||||||
|
|
|
|
|
|||||
| ② | The unrealized interest income of the finance lease is as follows (Unit: Korean Won in millions): |
| June 30, 2024 | December 31, 2023 | |||||||
| Total investment in lease |
1,383,294 | 1,495,450 | ||||||
| Net investment in lease |
1,264,714 | 1,361,959 | ||||||
| Present value of minimum lease payments |
1,264,714 | 1,361,959 | ||||||
|
|
|
|
|
|||||
| Unearned interest income |
118,580 | 133,491 | ||||||
|
|
|
|
|
|||||
- 143 -
WOORI FINANCIAL GROUP INC. AND SUBSIDIARIES
NOTES TO CONSOLIDATED INTERIM FINANCIAL STATEMENTS
AS OF JUNE 30, 2024 AND 2023
| 2) | Operating lease |
| ① | The details of prepaid lease assets and operating lease assets are as follows (Unit: Korean Won in millions): |
| June 30, 2024 | December 31, 2023 | |||||||
| Prepaid lease assets |
27,454 | 20,538 | ||||||
| Operating lease assets |
||||||||
| Acquisition cost |
4,785,154 | 4,199,535 | ||||||
| Accumulated depreciation |
(1,060,070 | ) | (913,609 | ) | ||||
| Net carrying value |
3,725,084 | 3,285,926 | ||||||
|
|
|
|
|
|||||
| Total |
3,752,538 | 3,306,464 | ||||||
|
|
|
|
|
|||||
| ② | The details of changes in operating lease assets for the six-month periods ended June 30, 2024 and 2023 are as follows (Unit: Korean Won in millions): |
| For the six-month periods ended June 30 | ||||||||
| 2024 | 2023 | |||||||
| Beginning balance |
3,285,926 | 2,590,457 | ||||||
| Acquisition |
808,004 | 443,068 | ||||||
| Disposal |
(115,520 | ) | (101,538 | ) | ||||
| Depreciation |
(279,416 | ) | (219,772 | ) | ||||
| Others |
26,090 | (4,350 | ) | |||||
|
|
|
|
|
|||||
| Ending balance |
3,725,084 | 2,707,865 | ||||||
|
|
|
|
|
|||||
| ③ | The future lease payments to be received under the lease contracts are as follows (Unit: Korean Won in millions): |
| June 30, 2024 | December 31, 2023 | |||||||
| Within one year |
829,067 | 748,283 | ||||||
| After one year but within two years |
739,210 | 681,591 | ||||||
| After two years but within three years |
536,790 | 517,967 | ||||||
| After three years but within four years |
272,924 | 286,677 | ||||||
| After four years but within five years |
30,681 | 121,621 | ||||||
|
|
|
|
|
|||||
| Total |
2,408,672 | 2,356,139 | ||||||
|
|
|
|
|
|||||
| ④ | There are no adjusted lease payments recognized as profit or loss for the six-month periods ended June 30, 2024 and 2023. |
- 144 -
WOORI FINANCIAL GROUP INC. AND SUBSIDIARIES
NOTES TO CONSOLIDATED INTERIM FINANCIAL STATEMENTS
AS OF JUNE 30, 2024 AND 2023
| (2) | Lessee |
| 1) | The future lease payments under the lease contracts are as follows (Unit: Korean Won in millions): |
| June 30, 2024 | December 31, 2023 | |||||||
| Lease payments |
||||||||
| Within one year |
177,635 | 206,798 | ||||||
| After one year but within five years |
278,370 | 146,755 | ||||||
| After five years |
63,074 | 25,356 | ||||||
|
|
|
|
|
|||||
| Total |
519,079 | 378,909 | ||||||
|
|
|
|
|
|||||
| 2) | Total cash outflows from lease are as follows (Unit: Korean Won in millions): |
| For the six-month periods ended June 30 | ||||||||
| 2024 | 2023 | |||||||
| Total cash outflows from lease |
115,841 | 104,691 | ||||||
| 3) | Details of lease payments that are not included in the measurement of lease liabilities due to the fact that they are short-term leases or leases for which the underlying asset is of low value are as follows (Unit: Korean Won in millions): |
| For the six-month periods ended June 30 | ||||||||
| 2024 | 2023 | |||||||
| Lease payments for short-term leases |
169 | 429 | ||||||
| Lease payments for which the underlying asset is of low value |
568 | 704 | ||||||
|
|
|
|
|
|||||
| Total |
737 | 1,133 | ||||||
|
|
|
|
|
|||||
Variable lease payments that were not included in the measurement of lease liabilities for the periods ended June 30, 2024 and 2023 were 12,525 million Won and 15,030 million Won.
- 145 -
WOORI FINANCIAL GROUP INC. AND SUBSIDIARIES
NOTES TO CONSOLIDATED INTERIM FINANCIAL STATEMENTS
AS OF JUNE 30, 2024 AND 2023
| 41. | EVENTS AFTER THE REPORTING PERIOD |
| (1) | On May 3, 2024, Woori Investment Bank Co., Ltd. (dissolution company), the subsidiary of the Company, and Korea Foss Securities Co., Ltd. (surviving company) entered into a merger agreement. Accordingly, on August 1, 2024, Woori Investment Bank Co., Ltd. was merged into Korea Foss Securities Co., Ltd., and was included as a subsidiary of the holding company. The name of merged company was changed to Woori Investment Securities Co., Ltd. |
- 146 -
Exhibit 99.2
WOORI FINANCIAL GROUP INC.
SEPARATE INTERIM FINANCIAL STATEMENTS
AS OF AND FOR THE THREE-MONTH AND SIX-MONTH PERIODS ENDED JUNE 30, 2024 AND 2023
Independent Auditor’s Review Report
Based on a report originally issued in Korean
To the Board of Directors and Shareholders of Woori Financial Group Inc.
Reviewed Financial Statements
We have reviewed the accompanying condensed separate interim financial statements of Woori Financial Group Inc. (the “Company”), which comprise the separate interim statement of financial position as of June 30, 2024, the separate interim statement of comprehensive income for the three-month and six-month periods ended June 30, 2024, the separate interim statement of changes in equity and cash flows for the six-month periods ended June 30, 2024 and 2023 and notes, comprising of material accounting policy information and other explanatory information.
Management’s Responsibility
Management is responsible for the preparation and fair presentation of these condensed separate interim financial statements in accordance with Korean International Financial Reporting Standards (“K-IFRS”) No.1034 Interim Financial Reporting, and for such internal control as management determines is necessary to enable the preparation of the condensed separate interim financial statements that are free from material misstatement, whether due to fraud or error.
Auditor’s Review Responsibility
Our responsibility is to issue a report on these condensed separate interim financial statements based on our reviews.
We conducted our reviews in accordance with the Review Standards for Quarterly and Semiannual Financial Statements established by the Securities and Futures Commission of the Republic of Korea. A review of interim financial information consists of making inquiries, primarily of persons responsible for financial and accounting matters, and applying analytical and other review procedures. A review is substantially less in scope than an audit conducted in accordance with Korean Standards on Auditing and consequently does not enable us to obtain assurance that we would become aware of all significant matters that might be identified in an audit. Accordingly, we do not express an audit opinion.
Conclusion
Based on our review, nothing has come to our attention that causes us to believe the accompanying condensed separate interim financial statements referred to above do not present fairly, in all material respects, in accordance with K-IFRS No.1034 Interim Financial Reporting.
Other Matters
The procedures and practices utilized in the Republic of Korea to review such condensed separate interim financial statements may differ from those generally accepted and applied in other countries.
The separate statement of financial position of the Company as of December 31, 2023, and the related separate statements of comprehensive income, changes in equity and cash flows for the year then ended, which are not accompanying this report, were audited by us in accordance with Korean Standards on Auditing and their report thereon, dated March 6, 2024, expressed an unqualified opinion. The accompanying separate statement of financial position of the Company as of December 31, 2023, presented for comparative purposes, is not different from that audited by us from which it was derived in all material respects.
/s/ KPMG Samjong Accounting Corp.
Seoul, Korea
August 14, 2024
This report is effective as of August 14, 2024, the review report date. Certain subsequent events or circumstances, which may occur between the review report date and the time of reading this report, could have a material impact on the accompanying condensed separate interim financial statements and notes thereto. Accordingly, the readers of the review report should understand that the above review report has not been updated to reflect the impact of such subsequent events or circumstances, if any.
WOORI FINANCIAL GROUP INC.
SEPARATE INTERIM FINANCIAL STATEMENTS
AS OF AND FOR THE THREE-MONTH AND SIX-MONTH PERIODS ENDED JUNE 30, 2024 AND 2023
The accompanying separate financial statements including all footnote disclosures were prepared by, and are the responsibility of, the management of Woori Financial Group Inc.
Jong Yong Yim
President and Chief Executive Officer
Main Office Address: (Road Name Address) 51, Sogong-ro, Jung-gu, Seoul
(Phone Number) 02-2125-2000
- 3 -
WOORI FINANCIAL GROUP INC.
SEPARATE INTERIM STATEMENTS OF FINANCIAL POSITION
AS OF JUNE 30, 2024 (UNAUDITED) AND DECEMBER 31, 2023
| June 30, 2024 |
December 31, 2023 |
|||||||
| (Korean Won in millions) | ||||||||
| ASSETS | ||||||||
| Cash and cash equivalents (Notes 5 and 31) |
225,281 | 289,507 | ||||||
| Financial assets at fair value through other comprehensive income (“FVTOCI”) (Notes 4, 7 and 9) |
545,153 | 539,709 | ||||||
| Loans and other financial assets at amortized cost (Notes 4, 8, 9 and 31) |
1,952,420 | 1,104,815 | ||||||
| Investments in subsidiaries (Notes 10 and 31) |
24,144,282 | 23,670,476 | ||||||
| Premises and equipment (Notes 11 and 31) |
4,447 | 6,609 | ||||||
| Intangible assets (Note 12) |
3,710 | 4,052 | ||||||
| Net defined benefit asset (Note 16) |
— | 3,941 | ||||||
| Current tax assets (Note 28) |
51,046 | 158,951 | ||||||
| Deferred tax assets (Note 28) |
5,736 | 7,478 | ||||||
| Other assets (Note 13) |
294 | 484 | ||||||
|
|
|
|
|
|||||
| Total assets |
26,932,369 | 25,786,022 | ||||||
|
|
|
|
|
|||||
| LIABILITIES | ||||||||
| Debentures (Notes 4, 9 and 14) |
1,588,028 | 1,587,659 | ||||||
| Provisions (Note 15) |
1,230 | 1,227 | ||||||
| Net defined benefit liability (Note 16) |
563 | — | ||||||
| Current tax liabilities (Note 28) |
103,298 | 32,125 | ||||||
| Other financial liabilities (Notes 4, 9, 17, 31 and 32) |
106,048 | 163,621 | ||||||
| Other liabilities (Note 17) |
333 | 392 | ||||||
|
|
|
|
|
|||||
| Total liabilities |
1,799,500 | 1,785,024 | ||||||
|
|
|
|
|
|||||
| EQUITY (Note 19) | ||||||||
| Capital stock |
3,802,676 | 3,802,676 | ||||||
| Hybrid securities |
4,408,867 | 3,610,953 | ||||||
| Capital surplus |
11,120,236 | 11,120,236 | ||||||
| Other equity |
(4,846 | ) | (7,871 | ) | ||||
| Retained earnings |
5,805,936 | 5,475,004 | ||||||
|
|
|
|
|
|||||
| Total equity |
25,132,869 | 24,000,998 | ||||||
|
|
|
|
|
|||||
| Total liabilities and equity |
26,932,369 | 25,786,022 | ||||||
|
|
|
|
|
|||||
The accompanying notes are part of this interim financial statements.
- 4 -
WOORI FINANCIAL GROUP INC.
SEPARATE INTERIM STATEMENTS OF COMPREHENSIVE INCOME
FOR THE THREE-MONTH AND SIX-MONTH PERIODS ENDED JUNE 30, 2024 AND 2023
(UNAUDITED)
| Periods ended June 30, 2024 | Periods ended June 30, 2023 | |||||||||||||||
| Three-month | Six-month | Three-month | Six-month | |||||||||||||
| (Korean Won in millions, except for earnings per share data) | ||||||||||||||||
| Interest income |
16,113 | 28,748 | 18,362 | 32,068 | ||||||||||||
| Interest expense |
(11,251 | ) | (22,567 | ) | (8,352 | ) | (16,376 | ) | ||||||||
|
|
|
|
|
|
|
|
|
|||||||||
| Net interest income (Notes 9, 21 and 31) |
4,862 | 6,181 | 10,010 | 15,692 | ||||||||||||
| Fees and commissions income |
406 | 813 | 399 | 798 | ||||||||||||
| Fees and commissions expense |
(5,409 | ) | (9,661 | ) | (5,817 | ) | (9,553 | ) | ||||||||
|
|
|
|
|
|
|
|
|
|||||||||
| Net fees and commissions loss (Notes 22 and 31) |
(5,003 | ) | (8,848 | ) | (5,418 | ) | (8,755 | ) | ||||||||
| Dividend income (Notes 23 and 31) |
6,388 | 1,195,721 | 3,578 | 1,472,869 | ||||||||||||
| Net gain on financial instruments at FVTPL (Notes 9 and 24) |
— | — | — | 2,023 | ||||||||||||
| Reversal (Provision) of impairment losses due to credit loss (Notes 9, 25 and 31) |
18 | (442 | ) | (937 | ) | (978 | ) | |||||||||
| General and administrative expenses (Notes 26 and 31) |
(16,897 | ) | (34,394 | ) | (19,082 | ) | (35,527 | ) | ||||||||
|
|
|
|
|
|
|
|
|
|||||||||
| Operating income (expense) |
(10,632 | ) | 1,158,218 | (11,849 | ) | 1,445,324 | ||||||||||
| Non-operating income (expense) (Note 27) |
(45 | ) | (63 | ) | 18 | 9 | ||||||||||
| Net income (expense) before income tax expense |
(10,677 | ) | 1,158,155 | (11,831 | ) | 1,445,333 | ||||||||||
| Income tax income (expense) (Note 28) |
385 | (658 | ) | 881 | 96 | |||||||||||
| Net income (loss) |
(10,292 | ) | 1,157,497 | (10,950 | ) | 1,445,429 | ||||||||||
|
|
|
|
|
|
|
|
|
|||||||||
| Net gain (loss) on valuation of equity securities at FVTOCI |
3,889 | 4,008 | (198 | ) | 8,826 | |||||||||||
| Remeasurement gain(loss) related to defined benefit plan |
(297 | ) | (983 | ) | 405 | (941 | ) | |||||||||
|
|
|
|
|
|
|
|
|
|||||||||
| Items that will not be reclassified to profit or loss: |
3,592 | 3,025 | 207 | 7,885 | ||||||||||||
|
|
|
|
|
|
|
|
|
|||||||||
| Other comprehensive income, net of tax |
3,592 | 3,025 | 207 | 7,885 | ||||||||||||
| Total comprehensive income (loss) |
(6,700 | ) | 1,160,522 | (10,743 | ) | 1,453,314 | ||||||||||
|
|
|
|
|
|
|
|
|
|||||||||
| Earnings (Loss) per share (Note 29) |
||||||||||||||||
| Basic and diluted earnings (loss) per share (Unit: In Korean Won) |
(67 | ) | 1,450 | (60 | ) | 1,899 | ||||||||||
The accompanying notes are part of this interim financial statements.
- 5 -
WOORI FINANCIAL GROUP INC.
SEPARATE INTERIM STATEMENTS OF CHANGES IN EQUITY
FOR THE SIX-MONTH PERIODS ENDED JUNE 30, 2024 AND 2023 (UNAUDITED)
| Capital stock |
Capital surplus |
Hybrid securities |
Other equity |
Retained earnings |
Total equity |
|||||||||||||||||||
| (Korean Won in millions) | ||||||||||||||||||||||||
| January 01, 2023 |
3,640,303 | 10,909,281 | 3,112,273 | (26,186 | ) | 5,261,231 | 22,896,902 | |||||||||||||||||
| Total comprehensive income |
||||||||||||||||||||||||
| Net income |
— | — | — | — | 1,445,429 | 1,445,429 | ||||||||||||||||||
| Net gain on valuation of equity securities at FVTOCI |
— | — | — | 8,826 | — | 8,826 | ||||||||||||||||||
| Remeasurement loss related to defined benefit plan |
— | — | — | (941 | ) | — | (941 | ) | ||||||||||||||||
| Transactions with owners |
||||||||||||||||||||||||
| Dividends to common stocks |
— | — | — | — | (713,497 | ) | (713,497 | ) | ||||||||||||||||
| Issuance of hybrid securities |
— | — | 299,228 | — | — | 299,228 | ||||||||||||||||||
| Dividends to hybrid securities |
— | — | — | — | (63,152 | ) | (63,152 | ) | ||||||||||||||||
| Acquisition of treasury stock |
— | — | — | (23,638 | ) | — | (23,638 | ) | ||||||||||||||||
|
|
|
|
|
|
|
|
|
|
|
|
|
|||||||||||||
| June 30, 2023 (Unaudited) |
3,640,303 | 10,909,281 | 3,411,501 | (41,939 | ) | 5,930,011 | 23,849,157 | |||||||||||||||||
|
|
|
|
|
|
|
|
|
|
|
|
|
|||||||||||||
| January 01, 2024 |
3,802,676 | 11,120,236 | 3,610,953 | (7,871 | ) | 5,475,004 | 24,000,998 | |||||||||||||||||
| Total comprehensive income |
||||||||||||||||||||||||
| Net income |
— | — | — | — | 1,157,497 | 1,157,497 | ||||||||||||||||||
| Net gain on valuation of equity securities at FVTOCI |
— | — | — | 4,008 | — | 4,008 | ||||||||||||||||||
| Remeasurement loss related to defined benefit plan |
— | — | — | (983 | ) | — | (983 | ) | ||||||||||||||||
| Transactions with owners |
||||||||||||||||||||||||
| Dividends to common stocks |
— | — | — | — | (614,870 | ) | (614,870 | ) | ||||||||||||||||
| Issuance of hybrid securities |
— | — | 797,914 | — | — | 797,914 | ||||||||||||||||||
| Dividends to hybrid securities |
— | — | — | — | (75,007 | ) | (75,007 | ) | ||||||||||||||||
| Acquisition of treasury stocks |
— | — | — | (136,688 | ) | — | (136,688 | ) | ||||||||||||||||
| Retirement of treasury stocks |
— | — | — | 136,688 | (136,688 | ) | — | |||||||||||||||||
|
|
|
|
|
|
|
|
|
|
|
|
|
|||||||||||||
| June 30, 2024 (Unaudited) |
3,802,676 | 11,120,236 | 4,408,867 | (4,846 | ) | 5,805,936 | 25,132,869 | |||||||||||||||||
|
|
|
|
|
|
|
|
|
|
|
|
|
|||||||||||||
The accompanying notes are part of this interim financial statements.
- 6 -
WOORI FINANCIAL GROUP INC.
SEPARATE STATEMENTS OF CASH FLOWS
FOR THE SIX-MONTH PERIODS ENDED JUNE 30, 2024 AND 2023 (UNAUDITED)
| For the six-month periods ended June 30 | ||||||||
| 2024 | 2023 | |||||||
| (Korean Won in millions) | ||||||||
| Cash flows from operating activities: |
||||||||
| Net income |
1,157,497 | 1,445,429 | ||||||
| Adjustments to net income: |
||||||||
| Income tax expense(income) |
658 | (96 | ) | |||||
| Interest income |
(28,748 | ) | (32,068 | ) | ||||
| Interest expense |
22,567 | 16,376 | ||||||
| Dividend income |
(1,195,721 | ) | (1,472,869 | ) | ||||
|
|
|
|
|
|||||
| (1,201,244 | ) | (1,488,657 | ) | |||||
|
|
|
|
|
|||||
| Adjustments for profit/loss items not involving cash flows: |
||||||||
| Provision of impairment losses due to credit loss |
442 | 978 | ||||||
| Gain on valuation of financial instruments at FVTPL |
— | (2,023 | ) | |||||
| Retirement benefit |
1,956 | 1,672 | ||||||
| Depreciation and amortization |
3,080 | 3,631 | ||||||
| Gain on disposal of premises and equipment, intangible assets and other assets |
(5 | ) | — | |||||
|
|
|
|
|
|||||
| 5,473 | 4,258 | |||||||
|
|
|
|
|
|||||
| Changes in operating assets and liabilities: |
||||||||
| Loans and other financial assets at amortized cost |
(58,739 | ) | 872 | |||||
| Other assets |
191 | 90 | ||||||
| Net defined benefit liability |
1,213 | 1,035 | ||||||
| Other financial liabilities |
53,744 | (3,836 | ) | |||||
| Other liabilities |
(59 | ) | (200 | ) | ||||
|
|
|
|
|
|||||
| (3,650 | ) | (2,039 | ) | |||||
|
|
|
|
|
|||||
| Interest income received |
30,553 | 28,907 | ||||||
| Interest expense paid |
(22,236 | ) | (15,686 | ) | ||||
| Dividends received |
1,195,747 | 1,472,866 | ||||||
| Income tax paid |
(1,967 | ) | (1,085 | ) | ||||
|
|
|
|
|
|||||
| 1,202,097 | 1,485,002 | |||||||
|
|
|
|
|
|||||
| Net cash provided by operating activities |
1,160,173 | 1,443,993 | ||||||
|
|
|
|
|
|||||
| Cash flows from investing activities: |
||||||||
| Net increase on other investment assets |
(720,000 | ) | (829,888 | ) | ||||
| Acquisition of investments in subsidiaries |
(473,807 | ) | (398,740 | ) | ||||
| Acquisition of premises and equipment |
(177 | ) | (56 | ) | ||||
| Acquisition of intangible assets |
(303 | ) | (350 | ) | ||||
| Decrease on guarantee deposits for leases |
37 | — | ||||||
|
|
|
|
|
|||||
| (1,194,250 | ) | (1,229,034 | ) | |||||
|
|
|
|
|
|||||
| Cash flows from financing activities: |
||||||||
| Issuance of debentures |
— | 149,646 | ||||||
| Issuance of hybrid securities |
797,914 | 299,228 | ||||||
| Acquisition of treasury stocks |
(136,688 | ) | (23,638 | ) | ||||
| Redemption of lease liabilities |
(1,498 | ) | (1,589 | ) | ||||
| Dividends paid to hybrid securities |
(75,007 | ) | (63,152 | ) | ||||
| Dividends paid |
(614,870 | ) | (713,497 | ) | ||||
|
|
|
|
|
|||||
| (30,149 | ) | (353,002 | ) | |||||
|
|
|
|
|
|||||
| Net decrease in cash and cash equivalents |
(64,226 | ) | (138,043 | ) | ||||
| Cash and cash equivalents, beginning of the period |
289,507 | 313,361 | ||||||
|
|
|
|
|
|||||
| Cash and cash equivalents, end of the period (Note 5) |
225,281 | 175,318 | ||||||
|
|
|
|
|
|||||
The accompanying notes are part of this interim financial statements.
- 7 -
WOORI FINANCIAL GROUP INC.
NOTES TO SEPARATE INTERIM FINANCIAL STATEMENTS
AS OF JUNE 30, 2024 AND 2023 (UNAUDITED)
| 1. | GENERAL |
| (1) | Summary of the parent company |
Woori Financial Group, Inc. (hereinafter referred to as the “Company”) is primarily aimed at controlling subsidiaries that operate in the financial industry or those that are closely related to the financial industry through the ownership of shares and was established on January 11, 2019 under the Financial Holding Company Act through the comprehensive transfer with shareholders of Woori Bank, Woori FIS Co., Ltd., Woori Finance Research Institute Co., Ltd., Woori Credit Information Co., Ltd., Woori Fund Services Co., Ltd. and Woori Private Equity Asset Management Co., Ltd. The headquarters of the Company is located at 51, Sogong-ro, Jung-gu, Seoul, Korea, and the capital is 3,802,676 million Won as of June 30. The Company’s stocks were listed on the Korea Exchange on February 13, 2019, and its American Depository Shares (“ADS”) are also being traded as the underlying common stock on the New York Stock Exchange since the same date.
The details of stock transfer from the Company and subsidiaries as of incorporation are as follows (Unit: Number of shares):
| Stock transfer company |
Total number of issued shares |
Exchange ratio per share |
Number of Parent company’s stocks |
|||||||||
| Woori Bank |
676,000,000 | 1.0000000 | 676,000,000 | |||||||||
| Woori FIS Co., Ltd. |
4,900,000 | 0.2999708 | 1,469,857 | |||||||||
| Woori Finance Research Institute Co., Ltd. |
600,000 | 0.1888165 | 113,289 | |||||||||
| Woori Credit Information Co., Ltd. |
1,008,000 | 1.1037292 | 1,112,559 | |||||||||
| Woori Fund Service Co., Ltd. |
2,000,000 | 0.4709031 | 941,806 | |||||||||
| Woori Private Equity Asset Management Co., Ltd. |
6,000,000 | 0.0877992 | 526,795 | |||||||||
As of August 1, 2019, the Company acquired a 73% interest in Tongyang Asset Management Co., Ltd. and changed the name to Woori Asset Management Corp. Also, as of August 1, 2019, the Company gained 100% control of ABL Global Asset Management Co., Ltd., added it as a consolidated subsidiary and changed the name to Woori Global Asset Management Co., Ltd. on December 6, 2019.
The Company paid 598,391 million Won in cash and 42,103,377 new shares of the Company to acquire 100% interest of Woori Card Co., Ltd. from its subsidiary Woori Bank on September 10, 2019. On the same date, the Company also acquired 59.8% interest of Woori Investment Bank Co., Ltd. from Woori Bank with 392,795 million Won in cash.
As of December 30, 2019, the Company acquired 67.2% interests (excluding treasury stock, 51.0% when including treasury stock) in Woori Asset Trust Co. (formerly Kukje Asset Trust Co.) In addition, as of March 31, 2023, the Company acquired an additional 28.1% interests in Woori Asset Trust Co. (excluding treasury stock, 21.3% when including treasury stock).
As of December 10, 2020, the Company acquired 76.8% interests (excluding treasury stock, 74.0% when including treasury stock) in Woori Financial Capital Co., Ltd. (formerly Aju Capital Co., Ltd.). In addition, as of April 15, 2021, the Company acquired an additional 13.3% interests in Woori Financial Capital Co., Ltd. (excluding treasury stock, 12.9% in the case of including treasury stock), and as of May 24, 2021, the Company additionally acquired treasury stock(3.6%) which Woori Financial Capital possessed.
As of March 12, 2021, the Company paid 113,238 million Won in cash to acquire 100% interests on Woori Savings Bank from Woori Financial Capital Co., Ltd., our subsidiary.
As of August 10, 2021, the Company paid 5,792,866 new shares of the Company to the shareholders of Woori Financial Capital Co., Ltd. (excluding the Company) through comprehensive stock exchange and acquired residual interest (9.5%) of Woori Financial Capital Co., Ltd., to make it a wholly owned subsidiary.
As of January 7, 2022, Woori Financial F&I Co., Ltd., an investment company for non-performing loans and restructuring companies, was established (100% stock, 200 billion Won in stock payments) and incorporated as a subsidiary.
- 8 -
WOORI FINANCIAL GROUP INC.
NOTES TO SEPARATE INTERIM FINANCIAL STATEMENTS
AS OF JUNE 30, 2024 AND 2023 (UNAUDITED)
As of March 23, 2023, the Company acquired 53.9% interests in Woori Venture Partners Co., Ltd. (formerly Daol Investment Co., Ltd.) (excluding treasury stock, 52.0% in the case of including treasury stock). In addition, as of May 30, 2023, the Company additionally acquired treasury stock held by Woori Venture Partners Co., Ltd. (3.5%).
As of August 8, 2023, the Company paid 22,541,465 new shares of the Company to the shareholders of Woori Investment Bank Co., Ltd. (excluding the Company) through comprehensive stock exchange and acquired residual interest (41.3%) of Woori Investment Bank Co., Ltd., to make it a wholly owned subsidiary. In addition, on the same day, the Company paid 9,933,246 new shares of the Company to the shareholders of Woori Venture Partners Co., Ltd. (excluding the Company) through comprehensive stock exchange and acquired residual interest (44.5%) of Woori Venture Partners Co., Ltd., to make it a wholly owned subsidiary.
As of January 29, 2024, the Company owned interest (77.5%) of Woori Asset Management Corp, as a result of merger with Woori Asset Management Corp (surviving company) and Woori Global Asset Management Co., Ltd. (dissolution company), which was liquidated. As of March 29, 2024, the Company acquired residual interest(22.5%) of Woori Asset Management Corp, to make it a wholly owned subsidiary.
On March 25, 2024, the Company participated in the capital increase and acquired the 1,062,045 shares (96.7% after acquiring shares, 79.4% including treasury shares) of Woori Asset Trust Co., Ltd.. Additionally, on March 29, 2024, Woori Asset Trust Co., Ltd. conducted a complete retirement of its 738,000 treasury shares. In addition, as of April 8, 2024, the Company additionally acquired minority interests (2.0%) of Woori Asset Trust Co., Ltd..
| 2. | BASIS OF PREPARATION AND MATERIAL ACCOUNTING POLICIES |
The Company’s financial statements are condensed interim financial statements prepared in accordance with Korean IFRS 1034, Interim Financial Reporting for some of periods in which the annual separate financial statements belong. They are also separate financial statements prepared in accordance with Korean IFRS 1027 Separate Financial Statements. It is necessary to use the Company’s annual separate financial statements for the year ended December 31, 2023 for understanding of the accompanying condensed interim financial statements.
| (1) | Except for the impacts on the newly adopted standards and interpretations explained below, the accounting policies applied in preparing the accompanying condensed interim financial statements have been applied consistently with the annual financial statements as of and for the year ended December 31, 2023. |
| 1) | Amendments to K-IFRS No.1001 ‘Presentation of Financial Statements’ – Classification of Liabilities as Current or Non-current, Non-current Liabilities with Covenants |
The amendments clarify that liabilities are classified as either current or non-current, depending on the substantive rights that exist at the end of the reporting period. Classification is unaffected by the likelihood that an entity will exercise right to defer settlement of the liability or the expectations of management. Also, the settlement of liability includes the transfer of the entity’s own equity instruments, however, it would be excluded if an option to settle them by the entity’s own equity instruments if compound financial instruments is met the definition of equity instruments and recognized separately from the liability. In addition, covenants that an entity is required to comply with after the end of the reporting period would not affect classification of a liability as current or non-current at the reporting date. When an entity classifies a liability that is subject to the covenants which an entity is required to comply with within twelve months of the reporting date as non-current at the end of the reporting period, the entity shall disclose information in the notes to understand the risk that non-current liabilities with covenants could become repayable within twelve months after the reporting period. The amendments do not have a significant impact on the financial statements.
- 9 -
WOORI FINANCIAL GROUP INC.
NOTES TO SEPARATE INTERIM FINANCIAL STATEMENTS
AS OF JUNE 30, 2024 AND 2023 (UNAUDITED)
| 2) | Amendments to K-IFRS 1007 ‘Statement of Cash Flows’, K-IFRS 1107 ‘Financial Instruments’ : Disclosures- Supplier Finance Arrangements |
When applying supplier finance arrangements, an entity shall disclose information about its supplier finance arrangements that enables users of financial statements to assess the effects of those arrangements on the entity’s liabilities and cash flows and on the entity’s exposure to liquidity risk. There is no impact on the interim financial statements in accordance with the transitional provision that does not require to disclose the relevant information during the interim reporting period within the fiscal year in which these amendments are first applied.
| 3) | Amendments to K-IFRS 1116 ‘Lease’ – Lease Liability in a Sale and Leaseback |
When subsequently measuring lease liabilities arising from a sale and leaseback, a seller-lessee shall determine lease payments or revised lease payments in a way that the seller-lessee would not recognize any amount of the gain or loss that relates to the right of use retained by the seller-lessee. The amendments do not have a significant impact on the financial statements.
| 4) | Amendments to K-IFRS 1001 ‘Presentation of Financial Statements’ – Disclosure of Cryptographic Assets |
The amendments require an additional disclosure if an entity holds cryptographic assets, or holds cryptographic assets on behalf of the customer, or issues cryptographic assets. The amendments do not have a significant impact on the financial statements.
| (2) | The details of K-IFRSs that have been issued and published since January 1, 2024 but have not yet reached the effective date are as follows: |
Amendments to K-IFRS 1021 ‘The Effects of Changes in Foreign Exchange Rates’ and K-IFRS 1101 ‘First-time Adoption of International Financial Reporting Standards’ – Lack of Exchangeability
When an entity estimates a spot exchange rate because exchangeability between two currencies is lacking, the entity shall disclose related information. The amendments should be applied for annual periods beginning on or after January 1, 2025, and earlier application is permitted. The amendments do not have a significant impact on the financial statements.
The above enacted or amended standards will not have a significant impact on the Company.
| (3) | Material accounting policies and method of computation used in the preparation of the condensed interim financial statements are consistent with those of the annual financial statements for the year ended December 31, 2023, except for the one described below. |
| • | Income tax expense |
Income tax expense for the interim period is recognized based on weighted average annual income tax rate expected for the expected gross annual profit. The estimated average annual tax rate is applied to the pre-tax income.
| 3. | MATERIAL ACCOUNTING ESTIMATES AND ASSUMPTIONS |
The management shall make judgements, estimates and assumptions that affect the application of accounting policies and assets, liabilities, revenues and expenses in preparing condensed interim financial statements. Therefore, the actual results may differ from these estimates.
The important judgements by the management on accounting policies and the main sources of estimation uncertainty for preparing condensed interim financial statements are identical to ones used in the Company’s annual separate financial statements for the year ended December 31, 2023.
- 10 -
WOORI FINANCIAL GROUP INC.
NOTES TO SEPARATE INTERIM FINANCIAL STATEMENTS
AS OF JUNE 30, 2024 AND 2023 (UNAUDITED)
| 4. | RISK MANAGEMENT |
The Company is exposed to various risks that may arise from its operating activities and credit risk, market risk and liquidity risk are the main types of risks. In order to manage such risks, the Risk Management Department analyzes, assesses, and establishes risk management standards, including policies, guidelines, management systems and decision-making to ensure sound management of the Company.
The Risk Management Committee, Chief Risk Officer (“CRO”) and the Risk Management Department are operated as risk management organizations. The board of directors operates the Risk Management Committee, composed of nonexecutive directors for professional risk management. The Risk Management Committee performs as the top decision-making body for risk management by establishing fundamental risk management policies that are consistent with the Company’s management strategy and by determining the Company’s acceptable level of risk.
CRO assists the Risk Management Committee and operates the Company Risk Management Council, which is composed of the risk management managers of the subsidiaries, to periodically check and improve the external environment and the Company’s risk burden. The Risk Management Department which is independently structured, controls the risk management matter of the Company and reports key risks and assists decision-making.
| (1) | Credit risk |
Credit risk represents the possibility of financial losses incurred due to the refusal of the transaction or when the counterparty fails to fulfill its contractual obligations. The goal of credit risk management is to maintain the Company’s credit risk exposure to a permissible degree and to optimize its rate of return considering such credit risk.
| 1) | Credit risk management |
The Company measures expected loss on assets subject to credit risk management and uses it as a management indicator.
| 2) | Maximum exposure |
The maximum exposure to credit risk is as follows (Unit: Korean Won in millions):
| June 30, 2024 | December 31, 2023 | |||||||||||
| Loans and other financial assets at amortized cost |
Banks | 1,899,897 | 1,095,274 | |||||||||
| Corporates | 52,523 | 9,541 | ||||||||||
|
|
|
|
|
|||||||||
| Total | 1,952,420 | 1,104,815 | ||||||||||
| a) | Credit risk exposure by geographical areas |
The following tables analyze credit risk exposure by geographical areas (Unit: Korean Won in millions):
| June 30, 2024 | December 31, 2023 | |||||||
| Korea | Korea | |||||||
| Loans and other financial assets at amortized cost |
1,952,420 | 1,104,815 | ||||||
- 11 -
WOORI FINANCIAL GROUP INC.
NOTES TO SEPARATE INTERIM FINANCIAL STATEMENTS
AS OF JUNE 30, 2024 AND 2023 (UNAUDITED)
| b) | Credit risk exposure by industries |
The following tables analyze credit risk exposure by industries, which are finance and insurance, and others in accordance with the Korea Standard Industrial Classification Code as of June 30, 2024 and December 31, 2023 (Unit: Korean Won in millions):
| June 30, 2024 | ||||||||||||
| Finance and insurance |
Others | Total | ||||||||||
| Loans and other financial assets at amortized cost |
1,951,391 | 1,029 | 1,952,420 | |||||||||
| December 31, 2023 | ||||||||||||
| Finance and insurance |
Others | Total | ||||||||||
| Loans and other financial assets at amortized cost |
1,103,460 | 1,355 | 1,104,815 | |||||||||
| 3) | Credit risk exposure |
The maximum exposure to credit risk by asset quality as of June 30, 2024 and December 31, 2023 is as follows (Unit: Korean Won in millions):
| June 30, 2024 | ||||||||||||||||||||||||||||||||
| Stage 1 | Stage 2 | Stage 3 | Total | Loss allowance |
Total, net | |||||||||||||||||||||||||||
| Financial assets | Above appropriate credit rating (*1) |
Less than a limited credit rating (*2) |
Above appropriate credit rating (*1) |
Less than a limited credit rating (*2) |
||||||||||||||||||||||||||||
| Loans and other financial assets at amortized cost |
1,953,525 | — | — | — | — | 1,953,525 | (1,105 | ) | 1,952,420 | |||||||||||||||||||||||
| Banks |
1,901,002 | — | — | — | — | 1,901,002 | (1,105 | ) | 1,899,897 | |||||||||||||||||||||||
| Corporates |
52,523 | — | — | — | — | 52,523 | — | 52,523 | ||||||||||||||||||||||||
| General business |
52,523 | — | — | — | — | 52,523 | — | 52,523 | ||||||||||||||||||||||||
|
|
|
|
|
|
|
|
|
|
|
|
|
|
|
|
|
|||||||||||||||||
| Total |
1,953,525 | — | — | — | — | 1,953,525 | (1,105 | ) | 1,952,420 | |||||||||||||||||||||||
|
|
|
|
|
|
|
|
|
|
|
|
|
|
|
|
|
|||||||||||||||||
| (*1) | Credit grade of corporates is AAA ~ BBB. |
| (*2) | Credit grade of corporates is BBB- ~ C. |
| December 31, 2023 | ||||||||||||||||||||||||||||||||
| Stage 1 | Stage 2 | Stage 3 | Total | Loss allowance |
Total, net | |||||||||||||||||||||||||||
| Financial assets | Above appropriate credit rating (*1) |
Less than a limited credit rating (*2) |
Above appropriate credit rating (*1) |
Less than a limited credit rating (*2) |
||||||||||||||||||||||||||||
| Loans and other financial assets at amortized cost |
1,105,478 | — | — | — | — | 1,105,478 | (663 | ) | 1,104,815 | |||||||||||||||||||||||
| Banks |
1,095,937 | — | — | — | — | 1,095,937 | (663 | ) | 1,095,274 | |||||||||||||||||||||||
| Corporates |
9,541 | — | — | — | — | 9,541 | — | 9,541 | ||||||||||||||||||||||||
| General business |
9,541 | — | — | — | — | 9,541 | — | 9,541 | ||||||||||||||||||||||||
|
|
|
|
|
|
|
|
|
|
|
|
|
|
|
|
|
|||||||||||||||||
| Total |
1,105,478 | — | — | — | — | 1,105,478 | (663 | ) | 1,104,815 | |||||||||||||||||||||||
|
|
|
|
|
|
|
|
|
|
|
|
|
|
|
|
|
|||||||||||||||||
| (*1) | Credit grade of corporates is AAA ~ BBB. |
| (*2) | Credit grade of corporates is BBB- ~ C. |
- 12 -
WOORI FINANCIAL GROUP INC.
NOTES TO SEPARATE INTERIM FINANCIAL STATEMENTS
AS OF JUNE 30, 2024 AND 2023 (UNAUDITED)
| (2) | Market risk |
Market risk is the possible risk of loss arising from trading position and non-trading position as a result of the volatility of market factors such as interest rates, stock prices and foreign exchange rates, and the Company’s main market risk is interest rate risk.
The Company estimates and manages risks related to changes in interest rate due to the difference in the maturities of interest-bearing assets and liabilities and discrepancies in the terms of interest rates. Cash flows (both principal and interest), interest bearing assets and liabilities, presented by each re-pricing date, are as follows (Unit: Korean Won in millions):
| June 30, 2024 | ||||||||||||||||||||||||||||
| Within 3 months (*1) |
4 to 6 months |
7 to 9 months |
10 to 12 months |
1 to 5 years |
Over 5 years |
Total | ||||||||||||||||||||||
| Asset: |
||||||||||||||||||||||||||||
| Loans and other financial assets at amortized cost (*1) |
970,105 | 1,079,640 | — | — | — | — | 2,049,745 | |||||||||||||||||||||
| Financial assets at FVTOCI (*2) |
— | — | — | — | — | 545,153 | 545,153 | |||||||||||||||||||||
|
|
|
|
|
|
|
|
|
|
|
|
|
|
|
|||||||||||||||
| Sub-total |
970,105 | 1,079,640 | — | — | — | 545,153 | 2,594,898 | |||||||||||||||||||||
|
|
|
|
|
|
|
|
|
|
|
|
|
|
|
|||||||||||||||
| Liability: |
||||||||||||||||||||||||||||
| Debentures |
160,840 | 10,192 | 10,192 | 109,940 | 833,802 | 616,654 | 1,741,620 | |||||||||||||||||||||
| December 31, 2023 | ||||||||||||||||||||||||||||
| Within 3 months (*1) |
4 to 6 months |
7 to 9 months |
10 to 12 months |
1 to 5 years |
Over 5 years |
Total | ||||||||||||||||||||||
| Asset: |
||||||||||||||||||||||||||||
| Loans and other financial assets at amortized cost (*1) |
762,823 | 587,227 | — | 41,580 | — | — | 1,391,630 | |||||||||||||||||||||
| Financial assets at FVTOCI (*2) |
— | — | — | — | — | 539,709 | 539,709 | |||||||||||||||||||||
|
|
|
|
|
|
|
|
|
|
|
|
|
|
|
|||||||||||||||
| Sub-total |
762,823 | 587,227 | — | 41,580 | — | 539,709 | 1,931,339 | |||||||||||||||||||||
|
|
|
|
|
|
|
|
|
|
|
|
|
|
|
|||||||||||||||
| Liability: |
||||||||||||||||||||||||||||
| Debentures |
11,118 | 11,118 | 160,834 | 10,192 | 643,664 | 926,872 | 1,763,798 | |||||||||||||||||||||
| (*1) | The principal and interest cash flows of cash and cash equivalents are included in the cash flows within three months, with 225,980 million Won and 762,823 million Won as of June 30, 2024 and December 31, 2023, respectively. |
| (*2) | Due to the uncertain timing of the sale, it is included in the section for over 5 years in accordance with the expiration of the remaining contract. |
| (3) | Liquidity risk |
Liquidity risk refers to the risk that the Company may encounter difficulties in meeting obligations from its financial liabilities.
| 1) | Liquidity risk management |
Liquidity risk management is to prevent damages from potential liquidity shortages with effective risk management that could arise from mismatching the maturity of assets and liabilities or unexpected cash outflows. The financial liabilities in the statement of financial position that are relevant to liquidity risk are incorporated within the scope of risk management.
The Company manages liquidity risk through various cash flows analysis (i.e. based on remaining maturity and contract period, etc.).
- 13 -
WOORI FINANCIAL GROUP INC.
NOTES TO SEPARATE INTERIM FINANCIAL STATEMENTS
AS OF JUNE 30, 2024 AND 2023 (UNAUDITED)
| 2) | Maturity analysis of non-derivative financial liabilities |
| a) | Cash flows of principals and interests by remaining contractual maturities of non-derivative financial liabilities are as follows (Unit: Korean Won in millions): |
| June 30, 2024 | ||||||||||||||||||||||||||||
| Within 3 months |
4 to 6 months |
7 to 9 months |
10 to 12 months |
1 to 5 years |
Over 5 years |
Total | ||||||||||||||||||||||
| Debentures |
160,840 | 10,192 | 10,192 | 109,940 | 833,802 | 616,654 | 1,741,620 | |||||||||||||||||||||
| Lease liabilities |
745 | 745 | 138 | 61 | 229 | — | 1,918 | |||||||||||||||||||||
| Other financial liabilities(*) |
23,308 | 275 | 455 | 69,150 | 10,979 | — | 104,167 | |||||||||||||||||||||
|
|
|
|
|
|
|
|
|
|
|
|
|
|
|
|||||||||||||||
| Total |
184,893 | 11,212 | 10,785 | 179,151 | 845,010 | 616,654 | 1,847,705 | |||||||||||||||||||||
|
|
|
|
|
|
|
|
|
|
|
|
|
|
|
|||||||||||||||
| December 31, 2023 | ||||||||||||||||||||||||||||
| Within 3 months |
4 to 6 months |
7 to 9 months |
10 to 12 months |
1 to 5 years |
Over 5 years |
Total | ||||||||||||||||||||||
| Debentures |
11,118 | 11,118 | 160,834 | 10,192 | 643,664 | 926,872 | 1,763,798 | |||||||||||||||||||||
| Lease liabilities |
746 | 741 | 741 | 741 | 323 | — | 3,292 | |||||||||||||||||||||
| Other financial liabilities(*) |
11,744 | 136,062 | — | 278 | 12,334 | — | 160,418 | |||||||||||||||||||||
|
|
|
|
|
|
|
|
|
|
|
|
|
|
|
|||||||||||||||
| Total |
23,608 | 147,921 | 161,575 | 11,211 | 656,321 | 926,872 | 1,927,508 | |||||||||||||||||||||
|
|
|
|
|
|
|
|
|
|
|
|
|
|
|
|||||||||||||||
| (*) | It does not include lease liabilities. |
| b) | Cash flows of principals and interests by expected maturities of non-derivative financial liabilities are as follows (Unit: Korean Won in millions): |
| June 30, 2024 | ||||||||||||||||||||||||||||
| Within 3 months |
4 to 6 months |
7 to 9 months |
10 to 12 months |
1 to 5 years |
Over 5 years |
Total | ||||||||||||||||||||||
| Debentures |
160,840 | 10,192 | 10,192 | 109,940 | 833,802 | 616,654 | 1,741,620 | |||||||||||||||||||||
| Lease liabilities |
745 | 745 | 138 | 61 | 229 | — | 1,918 | |||||||||||||||||||||
| Other financial liabilities (*) |
23,308 | 275 | 455 | 69,150 | 10,979 | — | 104,167 | |||||||||||||||||||||
|
|
|
|
|
|
|
|
|
|
|
|
|
|
|
|||||||||||||||
| Total |
184,893 | 11,212 | 10,785 | 179,151 | 845,010 | 616,654 | 1,847,705 | |||||||||||||||||||||
|
|
|
|
|
|
|
|
|
|
|
|
|
|
|
|||||||||||||||
| December 31, 2023 | ||||||||||||||||||||||||||||
| Within 3 months |
4 to 6 months |
7 to 9 months |
10 to 12 months |
1 to 5 years |
Over 5 years |
Total | ||||||||||||||||||||||
| Debentures |
11,118 | 11,118 | 160,834 | 10,192 | 643,664 | 926,872 | 1,763,798 | |||||||||||||||||||||
| Lease liabilities |
746 | 741 | 741 | 741 | 323 | — | 3,292 | |||||||||||||||||||||
| Other financial liabilities (*) |
11,744 | 136,062 | — | 278 | 12,334 | — | 160,418 | |||||||||||||||||||||
|
|
|
|
|
|
|
|
|
|
|
|
|
|
|
|||||||||||||||
| Total |
23,608 | 147,921 | 161,575 | 11,211 | 656,321 | 926,872 | 1,927,508 | |||||||||||||||||||||
|
|
|
|
|
|
|
|
|
|
|
|
|
|
|
|||||||||||||||
| (*) | It does not include lease liabilities. |
| 3) | Maturity analysis of derivative financial liabilities |
There are no derivative financial liabilities measured at fair value through profit or loss as of June 30, 2024 and December 31, 2023.
- 14 -
WOORI FINANCIAL GROUP INC.
NOTES TO SEPARATE INTERIM FINANCIAL STATEMENTS
AS OF JUNE 30, 2024 AND 2023 (UNAUDITED)
| 5. | CASH AND CASH EQUIVALENTS |
| (1) | Details of cash and cash equivalents are as follows (Unit: Korean Won in millions): |
| June 30, 2024 | December 31, 2023 | |||||||
| Demand deposits |
129,281 | 9,507 | ||||||
| Fixed deposits |
96,000 | 280,000 | ||||||
|
|
|
|
|
|||||
| Total |
225,281 | 289,507 | ||||||
|
|
|
|
|
|||||
| (2) | Significant transactions of investing activities and financing activities not involving cash inflows and outflows are as follows (Unit: Korean Won in millions): |
| For the six-month periods ended June 30 | ||||||||
| 2024 | 2023 | |||||||
| Changes in other comprehensive income related to valuation of financial assets at FVTOCI |
4,007 | 8,826 | ||||||
| Increase in account payables related to acquisition of premises and equipment |
— | 104 | ||||||
| Changes in right-of-use assets due to new contract |
144 | 465 | ||||||
| Changes in lease liabilities due to new contract |
144 | 465 | ||||||
| Change in bond discount issuance differences due to bond issuance |
— | 353 | ||||||
| Change in accounts payables related to acquisition of treasury stock |
— | 3,525 | ||||||
| 6. | FINANCIAL ASSETS AT FVTPL |
There are no financial assets measured at fair value through profit or loss as of June 30, 2024 and December 31, 2023.
| 7. | FINANCIAL ASSETS AT FVTOCI |
| (1) | Details of financial assets at FVTOCI as of June 30, 2024 and December 31, 2023 are as follows (Unit: Korean Won in millions): |
| June 30, 2024 | December 31, 2023 | |||||||
| Hybrid securities |
545,153 | 539,709 | ||||||
| (2) | Details of equity securities designated as financial assets at FVTOCI as of June 30, 2024 and December 31, 2023 are as follows (Unit: Korean Won in millions): |
| Purpose of acquisition |
June 30, 2024 | December 31, 2023 | ||||||
| Investment for political purpose |
545,153 | 539,709 | ||||||
| 8. | LOANS AND OTHER FINANCIAL ASSETS AT AMORTIZED COST |
| (1) | Details of loans and other financial assets at amortized cost as of June 30, 2024 and December 31, 2023 are as follows (Unit: Korean Won in millions): |
| June 30, 2024 | December 31, 2023 | |||||||
| Due from banks |
1,792,904 | 1,073,346 | ||||||
| Other financial assets |
159,516 | 31,469 | ||||||
|
|
|
|
|
|||||
| Total |
1,952,420 | 1,104,815 | ||||||
|
|
|
|
|
|||||
- 15 -
WOORI FINANCIAL GROUP INC.
NOTES TO SEPARATE INTERIM FINANCIAL STATEMENTS
AS OF JUNE 30, 2024 AND 2023 (UNAUDITED)
| (2) | Details of due from banks are as follows (Unit: Korean Won in millions): |
| June 30, 2024 | December 31, 2023 | |||||||
| Due from banks in local currency: |
||||||||
| Due from depository banks |
1,794,000 | 1,074,000 | ||||||
| Loss allowance |
(1,096 | ) | (654 | ) | ||||
|
|
|
|
|
|||||
| Total |
1,792,904 | 1,073,346 | ||||||
|
|
|
|
|
|||||
| (3) | Changes in the allowance for credit losses and gross carrying amount of due from banks are as follows (Unit: Korean Won in millions): |
| 1) | Allowance for credit losses |
| For the six-month period ended June 30, 2024 | ||||||||||||||||
| Stage 1 | Stage 2 | Stage 3 | Total | |||||||||||||
| Beginning balance |
(654 | ) | — | — | (654 | ) | ||||||||||
| Provision of allowance for credit loss |
(442 | ) | — | — | (442 | ) | ||||||||||
|
|
|
|
|
|
|
|
|
|||||||||
| Ending balance |
(1,096 | ) | — | — | (1,096 | ) | ||||||||||
|
|
|
|
|
|
|
|
|
|||||||||
| For the six-month period ended June 30, 2023 | ||||||||||||||||
| Stage 1 | Stage 2 | Stage 3 | Total | |||||||||||||
| Beginning balance |
(313 | ) | — | — | (313 | ) | ||||||||||
| Provision of allowance for credit loss |
(971 | ) | — | — | (971 | ) | ||||||||||
|
|
|
|
|
|
|
|
|
|||||||||
| Ending balance |
(1,284 | ) | — | — | (1,284 | ) | ||||||||||
|
|
|
|
|
|
|
|
|
|||||||||
| 2) | Gross carrying amount |
| For the six-month period ended June 30, 2024 | ||||||||||||||||
| Stage 1 | Stage 2 | Stage 3 | Total | |||||||||||||
| Beginning balance |
1,074,000 | — | — | 1,074,000 | ||||||||||||
| Net increase |
720,000 | — | — | 720,000 | ||||||||||||
|
|
|
|
|
|
|
|
|
|||||||||
| Ending balance |
1,794,000 | — | — | 1,794,000 | ||||||||||||
|
|
|
|
|
|
|
|
|
|||||||||
| For the six-month period ended June 30, 2023 | ||||||||||||||||
| Stage 1 | Stage 2 | Stage 3 | Total | |||||||||||||
| Beginning balance |
1,300,000 | — | — | 1,300,000 | ||||||||||||
| Net increase |
829,888 | — | — | 829,888 | ||||||||||||
|
|
|
|
|
|
|
|
|
|||||||||
| Ending balance |
2,129,888 | — | — | 2,129,888 | ||||||||||||
|
|
|
|
|
|
|
|
|
|||||||||
| (4) | Details of other financial assets are as follows (Unit: Korean Won in millions): |
| June 30, 2024 | December 31, 2023 | |||||||
| Receivables |
140,265 | 9,541 | ||||||
| Accrued income |
17,136 | 19,829 | ||||||
| Lease deposits |
2,124 | 2,108 | ||||||
| Loss allowance |
(9 | ) | (9 | ) | ||||
|
|
|
|
|
|||||
| Total |
159,516 | 31,469 | ||||||
|
|
|
|
|
|||||
- 16 -
WOORI FINANCIAL GROUP INC.
NOTES TO SEPARATE INTERIM FINANCIAL STATEMENTS
AS OF JUNE 30, 2024 AND 2023 (UNAUDITED)
| (5) | Changes in the allowances for credit losses and gross carrying amount of other financial assets are as follows (Unit: Korean Won in millions): |
| 1) | Allowance for credit losses |
| For the six-month period ended June 30, 2024 | ||||||||||||||||
| Stage 1 | Stage 2 | Stage 3 | Total | |||||||||||||
| Beginning balance |
(9 | ) | — | — | (9 | ) | ||||||||||
| Provision of allowance for credit loss |
— | — | — | — | ||||||||||||
|
|
|
|
|
|
|
|
|
|||||||||
| Ending balance |
(9 | ) | — | — | (9 | ) | ||||||||||
|
|
|
|
|
|
|
|
|
|||||||||
| For the six-month period ended June 30, 2023 | ||||||||||||||||
| Stage 1 | Stage 2 | Stage 3 | Total | |||||||||||||
| Beginning balance |
(3 | ) | — | — | (3 | ) | ||||||||||
| Provision of allowance for credit loss |
(7 | ) | — | — | (7 | ) | ||||||||||
|
|
|
|
|
|
|
|
|
|||||||||
| Ending balance |
(10 | ) | — | — | (10 | ) | ||||||||||
|
|
|
|
|
|
|
|
|
|||||||||
| 2) | Gross carrying amount |
| For the six-month period ended June 30, 2024 | ||||||||||||||||
| Stage 1 | Stage 2 | Stage 3 | Total | |||||||||||||
| Beginning balance |
31,478 | — | — | 31,478 | ||||||||||||
| Net increase |
128,047 | — | — | 128,047 | ||||||||||||
|
|
|
|
|
|
|
|
|
|||||||||
| Ending balance |
159,525 | — | — | 159,525 | ||||||||||||
|
|
|
|
|
|
|
|
|
|||||||||
| For the six-month period ended June 30, 2023 | ||||||||||||||||
| Stage 1 | Stage 2 | Stage 3 | Total | |||||||||||||
| Beginning balance |
742,193 | — | — | 742,193 | ||||||||||||
| Net decrease |
(637,759 | ) | — | — | (637,759 | ) | ||||||||||
|
|
|
|
|
|
|
|
|
|||||||||
| Ending balance |
104,434 | — | — | 104,434 | ||||||||||||
|
|
|
|
|
|
|
|
|
|||||||||
- 17 -
WOORI FINANCIAL GROUP INC.
NOTES TO SEPARATE INTERIM FINANCIAL STATEMENTS
AS OF JUNE 30, 2024 AND 2023 (UNAUDITED)
| 9. | FAIR VALUE OF FINANCIAL ASSETS AND LIABILITIES |
| (1) | The fair value hierarchy |
The fair value hierarchy is determined by the levels of judgment involved in estimating fair values of financial assets and liabilities. The specific financial instruments characteristics and market condition such as volume of transactions and transparency are reflected to the market observable inputs. The fair value hierarchy gives the highest priority to quoted prices (unadjusted) in active markets for identical assets or liabilities. The Company maximizes the use of observable inputs and minimizes the use of unobservable inputs when measuring fair value of its financial assets and financial liabilities. Fair value is measured based on the perspective of a market participant. As such, even when market assumptions are not readily available, the Company’s own assumptions reflect those that market participants would use for measuring the assets or liabilities at the measurement date.
The fair value measurement is described in the one of the following three levels used to classify fair value measurements:
| • | Level 1—fair value measurements are those derived from quoted prices (unadjusted) in active markets for identical assets or liabilities. The types of financial assets or liabilities generally included in Level 1 are publicly traded equity securities, derivatives, and debt securities issued by governmental bodies. |
| • | Level 2— fair value measurements are those derived from inputs other than quoted prices included within Level 1 that are observable for the asset or liability, either directly (i.e. prices) or indirectly (i.e. derived from prices). The types of financial assets or liabilities generally included in Level 2 are debt securities not traded in active markets and derivatives traded in OTC but not required significant judgment. |
| • | Level 3— fair value measurements are those derived from valuation technique that include inputs for the assets or liabilities that are not based on observable market data (unobservable inputs). The types of financial assets or liabilities generally included in Level 3 are non-public securities and derivatives and debt securities of which valuation techniques require significant judgments and subjectivity. |
The inputs used to measure fair value may fall into different levels of the fair value hierarchy. In such cases, the level within the fair value hierarchy is based on the lowest level of input that is significant to the fair value measurement. The Company’s assessment of the significance of a particular input to a fair value measurement in its entirety requires judgment and consideration of inherent factors of the asset or liability.
- 18 -
WOORI FINANCIAL GROUP INC.
NOTES TO SEPARATE INTERIM FINANCIAL STATEMENTS
AS OF JUNE 30, 2024 AND 2023 (UNAUDITED)
| (2) | Fair value hierarchy of financial assets and liabilities measured at fair value are as follows (Unit: Korean Won in millions): |
| June 30, 2024 | ||||||||||||||||
| Level 1 | Level 2 | Level 3 | Total | |||||||||||||
| Financial assets: |
||||||||||||||||
| Financial assets at FVTOCI |
||||||||||||||||
| Hybrid securities |
— | — | 545,153 | 545,153 | ||||||||||||
| December 31, 2023 | ||||||||||||||||
| Level 1 | Level 2 | Level 3 | Total | |||||||||||||
| Financial assets: |
||||||||||||||||
| Financial assets at FVTOCI |
||||||||||||||||
| Hybrid securities |
— | — | 539,709 | 539,709 | ||||||||||||
Financial assets measured at FVTPL and financial assets measured at FVTOCI are recognized at fair value. Fair value is the amount that would be received to sell an asset, or paid to transfer a liability, in an orderly transaction between market participants at the measurement date.
Financial instruments are measured at fair value using a quoted market price in active markets. If there is no active market for a financial instrument, the Company determines the fair value using valuation methods. Valuation methods and input variables for each type of financial instruments are as follows:
| Valuation methods |
Input variables | |||
| Hybrid securities | The fair value is measured using the Hull and White model and the Monte Carlo Simulations. | YTM Matrix, Additive spread by grade, Risk spread by entity, Effective Credit rating, Issuing information by item, Interest rate volatility estimate |
Valuation methods of financial assets and liabilities measured at fair value and classified into Level 3 and significant but unobservable inputs are as follows:
| Fair value |
Type |
Significant |
Range |
Impact of changes in significant unobservable inputs on fair value measurement | ||||||
| Hybrid securities | Hull and White, Monte Carlo Simulation | Hybrid securities related | Interest rate volatility estimate, Discount rate | Interest rate volatility estimate 0.57% Discount rate 4.15% ~ 6.45% |
Variation of fair value increases as variation of interest rate volatility estimate increases. |
The fair value of financial assets classified as level 3 uses external valuation figures.
- 19 -
WOORI FINANCIAL GROUP INC.
NOTES TO SEPARATE INTERIM FINANCIAL STATEMENTS
AS OF JUNE 30, 2024 AND 2023 (UNAUDITED)
| (3) | Changes in financial assets and liabilities measured at fair value classified into Level 3 are as follows. (Unit: Korean Won in millions): |
| For the six-month period ended June 30, 2024 | ||||||||||||||||||||||||||||
| Beginning balance |
Net Income |
Other comprehensive income |
Purchases/ issuances |
Disposals/ settlements |
Transfer to or out of Level 3 |
Ending balance |
||||||||||||||||||||||
| Financial assets: |
||||||||||||||||||||||||||||
| Financial assets at FVTPL Derivative assets |
— | — | — | — | — | — | — | |||||||||||||||||||||
| Financial assets at FVTOCI Hybrid securities |
539,709 | — | 5,444 | — | — | — | 545,153 | |||||||||||||||||||||
| For the six-month period ended June 30, 2023 | ||||||||||||||||||||||||||||
| Beginning balance |
Net Income |
Other comprehensive income |
Purchases/ issuances |
Disposals/ settlements |
Transfer to or out of Level 3 |
Ending balance |
||||||||||||||||||||||
| Financial assets: |
||||||||||||||||||||||||||||
| Financial assets at FVTPL Derivative assets |
689 | 2,023 | — | — | (2,712 | ) | — | — | ||||||||||||||||||||
| Financial assets at FVTOCI Hybrid securities |
312,771 | — | 12,043 | — | — | — | 324,814 | |||||||||||||||||||||
| (4) | Sensitivity analysis results on reasonable fluctuation of the significant unobservable input variables for the fair value of Level 3 financial instruments are as follows. |
The sensitivity analysis on financial instruments shows how changes in unobservable inputs affect changes in fair value of the instruments through favorable and unfavorable changes. When the fair value of a financial instrument is affected by more than one unobservable assumption, the below table reflects the most favorable or the most unfavorable changes which resulted from varying the assumptions individually. The sensitivity analysis was performed for hybrid securities of which fair value changes are recognized as other comprehensive income among level 3 financial instruments.
- 20 -
WOORI FINANCIAL GROUP INC.
NOTES TO SEPARATE INTERIM FINANCIAL STATEMENTS
AS OF JUNE 30, 2024 AND 2023 (UNAUDITED)
The following table presents the sensitivity analysis to disclose the effect of reasonably possible volatility.(Unit: Korean Won in millions):
| June 30, 2024 | ||||||||||||||||
| Net income | Other comprehensive income (loss) |
|||||||||||||||
| Favorable | Unfavorable | Favorable | Unfavorable | |||||||||||||
| Financial assets: |
||||||||||||||||
| Financial assets at FVTOCI Hybrid securities (*) |
— | — | 14,221 | (13,766 | ) | |||||||||||
| (*) | Fair value changes of hybrid securities are calculated by increasing or decreasing discount rate, which is the major unobservable variable, by 1%, respectively. |
| December 31, 2023 | ||||||||||||||||
| Net income | Other comprehensive income (loss) |
|||||||||||||||
| Favorable | Unfavorable | Favorable | Unfavorable | |||||||||||||
| Financial assets: |
||||||||||||||||
| Financial assets at FVTOCI Hybrid securities (*) |
— | — | 16,476 | (15,888 | ) | |||||||||||
| (*) | Fair value changes of hybrid securities are calculated by increasing or decreasing discount rate, which is the major unobservable variable, by 1%, respectively. |
| (5) | Fair value and carrying amount of financial assets and liabilities that are recorded at amortized cost are as follows (Unit: Korean Won in millions): |
| June 30, 2024 | ||||||||||||||||||||
| Fair value | Carrying amount |
|||||||||||||||||||
| Level 1 | Level 2 | Level 3 | Total | |||||||||||||||||
| Financial assets: |
||||||||||||||||||||
| Loans and other financial assets at amortized cost (*1) |
— | — | 1,952,420 | 1,952,420 | 1,952,420 | |||||||||||||||
| Financial liabilities: |
||||||||||||||||||||
| Debentures |
— | 1,538,983 | — | 1,538,983 | 1,588,028 | |||||||||||||||
| Other financial liabilities (*1,2) |
— | — | 104,167 | 104,167 | 104,167 | |||||||||||||||
| (*1) | The carrying amount is disclosed at fair value considering the carrying amount as an approximation of fair value. |
| (*2) | It does not include lease liabilities. |
| December 31, 2023 | ||||||||||||||||||||
| Fair value | Carrying amount |
|||||||||||||||||||
| Level 1 | Level 2 | Level 3 | Total | |||||||||||||||||
| Financial assets: |
||||||||||||||||||||
| Loans and other financial assets at amortized cost (*1) |
— | — | 1,104,815 | 1,104,815 | 1,104,815 | |||||||||||||||
| Financial liabilities: |
||||||||||||||||||||
| Debentures |
— | 1,518,440 | — | 1,518,440 | 1,587,659 | |||||||||||||||
| Other financial liabilities (*1,2) |
— | — | 160,418 | 160,418 | 160,418 | |||||||||||||||
| (*1) | The carrying amount is disclosed at fair value considering the carrying amount as an approximation of fair value. |
| (*2) | It does not include lease liabilities. |
- 21 -
WOORI FINANCIAL GROUP INC.
NOTES TO SEPARATE INTERIM FINANCIAL STATEMENTS
AS OF JUNE 30, 2024 AND 2023 (UNAUDITED)
The fair values of financial instruments are measured using quoted market price in active markets. In case there is no active market for financial instruments, the Company determines the fair value using valuation methods. For the disclosed items in which book value is considered to be the approximate value of fair value, valuation techniques and input variables are not disclosed. Valuation techniques and input variables for the fair value of financial liabilities that are recorded at amortized cost are as follows:
| Valuation methods |
Input variables | |||
| Debentures | The fair value is measured by discounting the projected cash flows of debt products by applying the market discount rate that is reflecting credit rating of the Company. | Risk-free market rate, etc. |
| (6) | Financial instruments by category |
Carrying amounts of financial assets and liabilities by each category are as follows (Unit: Korean Won in millions):
| 1) | Financial assets |
| June 30, 2024 | ||||||||||||||||
| Financial assets | Financial assets at FVTPL |
Financial assets at FVTOCI |
Financial assets at amortized cost |
Total | ||||||||||||
| Due from banks |
— | — | 1,792,904 | 1,792,904 | ||||||||||||
| Hybrid securities |
— | 545,153 | — | 545,153 | ||||||||||||
| Other financial assets |
— | — | 159,516 | 159,516 | ||||||||||||
|
|
|
|
|
|
|
|
|
|||||||||
| Total |
— | 545,153 | 1,952,420 | 2,497,573 | ||||||||||||
|
|
|
|
|
|
|
|
|
|||||||||
| December 31, 2023 | ||||||||||||||||
| Financial assets | Financial assets at FVTPL |
Financial assets at FVTOCI |
Financial assets at amortized cost |
Total | ||||||||||||
| Due from banks |
— | — | 1,073,346 | 1,073,346 | ||||||||||||
| Hybrid securities |
— | 539,709 | — | 539,709 | ||||||||||||
| Other financial assets |
— | — | 31,469 | 31,469 | ||||||||||||
|
|
|
|
|
|
|
|
|
|||||||||
| Total |
— | 539,709 | 1,104,815 | 1,644,524 | ||||||||||||
|
|
|
|
|
|
|
|
|
|||||||||
| 2) | Financial liabilities |
| June 30, 2024 | December 31, 2023 | |||||||||||||||
| Financial liabilities | Financial liabilities at FVTPL |
Financial liabilities at amortized cost |
Financial liabilities at FVTPL |
Financial liabilities at amortized cost |
||||||||||||
| Debentures |
— | 1,588,028 | — | 1,587,659 | ||||||||||||
| Other financial liabilities (*) |
— | 104,167 | — | 160,418 | ||||||||||||
|
|
|
|
|
|
|
|
|
|||||||||
| Total |
— | 1,692,195 | — | 1,748,077 | ||||||||||||
|
|
|
|
|
|
|
|
|
|||||||||
| (*) | It does not include lease liabilities. |
- 22 -
WOORI FINANCIAL GROUP INC.
NOTES TO SEPARATE INTERIM FINANCIAL STATEMENTS
AS OF JUNE 30, 2024 AND 2023 (UNAUDITED)
| (7) | Income or expense from financial instruments by category |
Income or expense from financial assets and liabilities by each category for the six-month periods ended June 30, 2024 and 2023 are as follows (Unit: Korean Won in millions):
| For the six-month period ended June 30, 2024 | ||||||||||||||||||||
| Interest income (expense) |
Provision of credit loss |
Gain on transactions and valuation |
Dividends | Total | ||||||||||||||||
| Financial assets at FVTPL |
— | — | — | — | — | |||||||||||||||
| Financial assets at FVTOCI |
— | — | — | 12,744 | 12,744 | |||||||||||||||
| Loans and other financial assets at amortized cost (*) |
28,748 | (442 | ) | — | — | 28,306 | ||||||||||||||
| Financial liabilities at amortized cost |
(22,482 | ) | — | — | — | (22,482 | ) | |||||||||||||
|
|
|
|
|
|
|
|
|
|
|
|||||||||||
| Total |
6,266 | (442 | ) | — | 12,744 | 18,568 | ||||||||||||||
|
|
|
|
|
|
|
|
|
|
|
|||||||||||
| (*) | 3,874 million Won interest income of cash and cash equivalents are included. |
| For the six-month period ended June 30, 2023 | ||||||||||||||||||||
| Interest income (expense) |
Provision of credit loss |
Gain on transactions and valuation |
Dividends | Total | ||||||||||||||||
| Financial assets at FVTPL |
— | — | 2,023 | — | 2,023 | |||||||||||||||
| Financial assets at FVTOCI |
— | — | — | 7,044 | 7,044 | |||||||||||||||
| Loans and other financial assets at amortized cost (*) |
32,068 | (978 | ) | — | — | 31,090 | ||||||||||||||
| Financial liabilities at amortized cost |
(16,234 | ) | — | — | — | (16,234 | ) | |||||||||||||
|
|
|
|
|
|
|
|
|
|
|
|||||||||||
| Total |
15,834 | (978 | ) | 2,023 | 7,044 | 23,923 | ||||||||||||||
|
|
|
|
|
|
|
|
|
|
|
|||||||||||
| (*) | 6,999 million Won interest income of cash and cash equivalents are included. |
- 23 -
WOORI FINANCIAL GROUP INC.
NOTES TO SEPARATE INTERIM FINANCIAL STATEMENTS
AS OF JUNE 30, 2024 AND 2023 (UNAUDITED)
| 10. | INVESTMENTS IN SUBSIDIARIES |
| (1) | Details of Investments in subsidiaries are as follows (Unit: Korean Won in millions and number of shares): |
| Subsidiaries (*1) |
Location | Capital stock |
Main business | |||||||
| Woori Bank |
Korea | 3,581,400 | Bank | |||||||
| Woori Card Co., Ltd. |
Korea | 896,300 | Finance | |||||||
| Woori Financial Capital Co., Ltd. |
Korea | 373,800 | Finance | |||||||
| Woori Investment Bank Co., Ltd. |
Korea | 691,400 | Other credit finance business | |||||||
| Woori Asset Trust Co., Ltd. |
Korea | 16,900 | Real estate trust | |||||||
| Woori Savings Bank |
Korea | 187,400 | Mutual saving bank | |||||||
| Woori F&I Co., Ltd. |
Korea | 31,500 | Finance | |||||||
| Woori Asset Management Corp |
Korea | 24,000 | Finance | |||||||
| Woori Venture Partners Co., Ltd. |
Korea | 50,000 | Other financial services | |||||||
| Woori Private Equity Asset Management Co., Ltd. |
Korea | 80,000 | Finance | |||||||
| Woori Credit Information Co., Ltd. |
Korea | 5,000 | Credit information | |||||||
| Woori Fund Service Co., Ltd. |
Korea | 10,000 | Financial support service business | |||||||
| Woori FIS Co., Ltd. |
Korea | 24,500 | System software development & maintenance | |||||||
| Woori Finance Research Institute Co., Ltd. |
Korea | 3,000 | Other service business | |||||||
| Woori Global Asset Management Co., Ltd. |
Korea | — | Finance | |||||||
| June 30, 2024 | December 31, 2023 | |||||||||||||||||||
| Subsidiaries (*1) |
Number of shares | Percentage of ownership (%) (*2) |
Financial statements date of use |
Number of shares | Percentage of ownership (%) (*2) |
Financial statements date of use | ||||||||||||||
| Woori Bank |
716,000,000 | 100.0 | June 30, 2024 | 716,000,000 | 100.0 | December 31, 2023 | ||||||||||||||
| Woori Card Co., Ltd. |
179,266,200 | 100.0 | June 30, 2024 | 179,266,200 | 100.0 | December 31, 2023 | ||||||||||||||
| Woori Financial Capital Co., Ltd. |
74,757,594 | 100.0 | June 30, 2024 | 74,757,594 | 100.0 | December 31, 2023 | ||||||||||||||
| Woori Investment Bank Co., Ltd. |
1,382,850,405 | 100.0 | June 30, 2024 | 1,382,850,405 | 100.0 | December 31, 2023 | ||||||||||||||
| Woori Asset Trust Co., Ltd. |
3,338,645 | 98.7 | June 30, 2024 | 2,210,600 | 95.3 | December 31, 2023 | ||||||||||||||
| Woori Savings Bank |
37,476,895 | 100.0 | June 30, 2024 | 24,802,623 | 100.0 | December 31, 2023 | ||||||||||||||
| Woori F&I Co., Ltd. |
6,298,895 | 100.0 | June 30, 2024 | 4,000,000 | 100.0 | December 31, 2023 | ||||||||||||||
| Woori Asset Management Corp |
4,797,154 | 100.0 | June 30, 2024 | 2,920,000 | 73.0 | December 31, 2023 | ||||||||||||||
| Woori Venture Partners Co., Ltd. |
100,000,000 | 100.0 | June 30, 2024 | 100,000,000 | 100.0 | December 31, 2023 | ||||||||||||||
| Woori Private Equity Asset Management Co., Ltd. |
16,000,000 | 100.0 | June 30, 2024 | 16,000,000 | 100.0 | December 31, 2023 | ||||||||||||||
| Woori Credit Information Co., Ltd. |
1,008,000 | 100.0 | June 30, 2024 | 1,008,000 | 100.0 | December 31, 2023 | ||||||||||||||
| Woori Fund Service Co., Ltd. |
2,000,000 | 100.0 | June 30, 2024 | 2,000,000 | 100.0 | December 31, 2023 | ||||||||||||||
| Woori FIS Co., Ltd. |
4,900,000 | 100.0 | June 30, 2024 | 4,900,000 | 100.0 | December 31, 2023 | ||||||||||||||
| Woori Finance Research Institute Co., Ltd. |
600,000 | 100.0 | June 30, 2024 | 600,000 | 100.0 | December 31, 2023 | ||||||||||||||
| Woori Global Asset Management Co., Ltd. |
— | — | — | 4,000,000 | 100.0 | December 31, 2023 | ||||||||||||||
| (*1) | Only subsidiaries invested directly by the Company are included. |
| (*2) | The percentage is based on the effective shareholding rate relative to the number of stocks outstanding. |
- 24 -
WOORI FINANCIAL GROUP INC.
NOTES TO SEPARATE INTERIM FINANCIAL STATEMENTS
AS OF JUNE 30, 2024 AND 2023 (UNAUDITED)
| (2) | Changes in the carrying value of investments in subsidiaries are as follows (Unit: Korean Won in millions): |
| For the six-month period ended June 30, 2024 | ||||||||||||||||
| Beginning balance | Acquisition | Disposal | Ending balance | |||||||||||||
| Woori Bank |
18,921,151 | — | — | 18,921,151 | ||||||||||||
| Woori Card Co., Ltd. |
1,118,367 | — | — | 1,118,367 | ||||||||||||
| Woori Financial Capital Co., Ltd. |
1,003,206 | — | — | 1,003,206 | ||||||||||||
| Woori Investment Bank Co., Ltd. |
1,207,351 | — | — | 1,207,351 | ||||||||||||
| Woori Asset Trust Co., Ltd.(*1) |
403,642 | 212,430 | — | 616,072 | ||||||||||||
| Woori Savings Bank(*2) |
213,238 | 100,000 | — | 313,238 | ||||||||||||
| Woori F&I Co., Ltd.(*3) |
200,000 | 120,000 | — | 320,000 | ||||||||||||
| Woori Asset Management Corp(*4) |
122,449 | 74,376 | — | 196,825 | ||||||||||||
| Woori Venture Partners Co., Ltd. |
336,439 | — | — | 336,439 | ||||||||||||
| Woori Private Equity Asset Management Co., Ltd. |
57,797 | — | — | 57,797 | ||||||||||||
| Woori Credit Information Co., Ltd. |
16,466 | — | — | 16,466 | ||||||||||||
| Woori Fund Service Co., Ltd. |
13,939 | — | — | 13,939 | ||||||||||||
| Woori FIS Co., Ltd. |
21,754 | — | — | 21,754 | ||||||||||||
| Woori Finance Research Institute Co., Ltd. |
1,677 | — | — | 1,677 | ||||||||||||
| Woori Global Asset Management Co., Ltd.(*5) |
33,000 | — | 33,000 | — | ||||||||||||
|
|
|
|
|
|
|
|
|
|||||||||
| Total |
23,670,476 | 506,806 | 33,000 | 24,144,282 | ||||||||||||
|
|
|
|
|
|
|
|
|
|||||||||
| (*1) | The capital increase amount of 200,000 million Won was made in March 2024, and the Company additionally acquired minority interests of 1.95% in April 2024. |
| (*2) | The Capital increase amount of 100,000 million Won was made in June 2024. |
| (*3) | The Capital increase amount of 120,000 million Won was made in May 2024. |
| (*4) | On January 29, 2024, Woori Asset Management Corp merged with Woori Global Asset Management Co., Ltd. and the Company acquired residual interest (22.5%) of Woori Asset Management Corp, to make it wholly subordinated on March 29, 2024. |
| (*5) | On January 29, 2024, it was merged into Woori Asset Management Corp and excluded from our subsidiaries. |
| For the six-month period ended June 30, 2023 | ||||||||||||||||
| Beginning balance | Acquisition | Disposal | Ending balance | |||||||||||||
| Woori Bank |
18,921,151 | — | — | 18,921,151 | ||||||||||||
| Woori Card Co., Ltd. |
1,118,367 | — | — | 1,118,367 | ||||||||||||
| Woori Financial Capital Co., Ltd. |
1,003,206 | — | — | 1,003,206 | ||||||||||||
| Woori Investment Bank Co., Ltd. |
447,673 | — | — | 447,673 | ||||||||||||
| Woori Asset Trust Co., Ltd. (*1) |
224,198 | 179,444 | — | 403,642 | ||||||||||||
| Woori Savings Bank |
213,238 | — | — | 213,238 | ||||||||||||
| Woori F&I Co., Ltd. |
200,000 | — | — | 200,000 | ||||||||||||
| Woori Asset Management Corp |
122,449 | — | — | 122,449 | ||||||||||||
| Woori Venture Partners Co., Ltd (*2) |
— | 222,008 | — | 222,008 | ||||||||||||
| Woori Global Asset Management Co., Ltd. |
33,000 | — | — | 33,000 | ||||||||||||
| Woori Private Equity Asset Management Co., Ltd. |
57,797 | — | — | 57,797 | ||||||||||||
| Woori Credit Information Co., Ltd. |
16,466 | — | — | 16,466 | ||||||||||||
| Woori Fund Service Co., Ltd. |
13,939 | — | — | 13,939 | ||||||||||||
| Woori FIS Co., Ltd. |
21,754 | — | — | 21,754 | ||||||||||||
| Woori Finance Research Institute Co., Ltd. |
1,677 | — | — | 1,677 | ||||||||||||
|
|
|
|
|
|
|
|
|
|||||||||
| Total |
22,394,915 | 401,452 | — | 22,796,367 | ||||||||||||
|
|
|
|
|
|
|
|
|
|||||||||
| (*1) | The Company additionally acquired 28.1% (excluding treasury stocks) interests of Woori Asset Trust Co Ltd on March 31, 2023. In the case of including treasury stocks, the share ratio was 21.3%. |
| (*2) | The Company additionally acquired 53.9% interests of Daol Investment Co Ltd (excluding treasury stocks) on March 23, 2023 (In the case of including treasury stocks, the share ratio was 52.0%) and the Company name was changed to Woori Venture Partners Co., Ltd.. The Company additionally acquired treasury stocks held by Woori Venture Partners Co., Ltd. (3.5% interests) on May 30, 2023. |
- 25 -
WOORI FINANCIAL GROUP INC.
NOTES TO SEPARATE INTERIM FINANCIAL STATEMENTS
AS OF JUNE 30, 2024 AND 2023 (UNAUDITED)
| 11. | PREMISES AND EQUIPMENT |
| (1) | Details of premises and equipment as of June 30, 2024 and December 31, 2023 are as follows (Unit: Korean Won in millions): |
| June 30, 2024 | ||||||||||||||||
| Building | Equipment and Vehicles |
Leasehold improvements |
Total | |||||||||||||
| Premises and equipment (owned) |
— | 784 | 1,727 | 2,511 | ||||||||||||
| Right-of-use asset |
1,456 | 480 | — | 1,936 | ||||||||||||
|
|
|
|
|
|
|
|
|
|||||||||
| Total |
1,456 | 1,264 | 1,727 | 4,447 | ||||||||||||
|
|
|
|
|
|
|
|
|
|||||||||
| December 31, 2023 | ||||||||||||||||
| Building | Equipment and Vehicles |
Leasehold improvements |
Total | |||||||||||||
| Premises and equipment (owned) |
— | 1,078 | 2,053 | 3,131 | ||||||||||||
| Right-of-use asset |
2,970 | 508 | — | 3,478 | ||||||||||||
|
|
|
|
|
|
|
|
|
|||||||||
| Total |
2,970 | 1,586 | 2,053 | 6,609 | ||||||||||||
|
|
|
|
|
|
|
|
|
|||||||||
| (2) | Details of premises and equipment (owned) as of June 30, 2024 and December 31, 2023 are as follows (Unit: Korean Won in millions): |
| June 30, 2024 | ||||||||||||
| Equipment and Vehicles | Leasehold improvements | Total | ||||||||||
| Acquisition cost |
6,387 | 6,431 | 12,818 | |||||||||
| Accumulated depreciation |
(5,603 | ) | (4,704 | ) | (10,307 | ) | ||||||
|
|
|
|
|
|
|
|||||||
| Net carrying amount |
784 | 1,727 | 2,511 | |||||||||
|
|
|
|
|
|
|
|||||||
| December 31, 2023 | ||||||||||||
| Equipment and Vehicles | Leasehold improvements | Total | ||||||||||
| Acquisition cost |
6,370 | 6,272 | 12,642 | |||||||||
| Accumulated depreciation |
(5,292 | ) | (4,219 | ) | (9,511 | ) | ||||||
|
|
|
|
|
|
|
|||||||
| Net carrying amount |
1,078 | 2,053 | 3,131 | |||||||||
|
|
|
|
|
|
|
|||||||
| (3) | Details of changes in premises and equipment (owned) are as follows (Unit: Korean Won in millions): |
| For the six-month period ended June 30, 2024 | ||||||||||||
| Equipment and Vehicles | Leasehold improvements | Total | ||||||||||
| Beginning balance |
1,078 | 2,053 | 3,131 | |||||||||
| Acquisitions |
18 | 159 | 177 | |||||||||
| Depreciation |
(312 | ) | (485 | ) | (797 | ) | ||||||
|
|
|
|
|
|
|
|||||||
| Ending balance |
784 | 1,727 | 2,511 | |||||||||
|
|
|
|
|
|
|
|||||||
| For the six-month period ended June 30, 2023 | ||||||||||||
| Equipment and Vehicles | Leasehold improvements | Total | ||||||||||
| Beginning balance |
1,944 | 3,125 | 5,069 | |||||||||
| Acquisitions |
48 | 112 | 160 | |||||||||
| Depreciation |
(603 | ) | (613 | ) | (1,216 | ) | ||||||
|
|
|
|
|
|
|
|||||||
| Ending balance |
1,389 | 2,624 | 4,013 | |||||||||
|
|
|
|
|
|
|
|||||||
- 26 -
WOORI FINANCIAL GROUP INC.
NOTES TO SEPARATE INTERIM FINANCIAL STATEMENTS
AS OF JUNE 30, 2024 AND 2023 (UNAUDITED)
| (4) | Details of right-of-use assets as of June 30, 2024 and December 31, 2023 are as follows (Unit: Korean Won in millions): |
| June 30, 2024 | ||||||||||||
| Building | Equipment and Vehicles | Total | ||||||||||
| Acquisition cost |
5,029 | 967 | 5,996 | |||||||||
| Accumulated depreciation |
(3,573 | ) | (487 | ) | (4,060 | ) | ||||||
|
|
|
|
|
|
|
|||||||
| Net carrying amount |
1,456 | 480 | 1,936 | |||||||||
|
|
|
|
|
|
|
|||||||
| December 31, 2023 | ||||||||||||
| Building | Equipment and Vehicles | Total | ||||||||||
| Acquisition cost |
5,295 | 928 | 6,223 | |||||||||
| Accumulated depreciation |
(2,325 | ) | (420 | ) | (2,745 | ) | ||||||
|
|
|
|
|
|
|
|||||||
| Net carrying amount |
2,970 | 508 | 3,478 | |||||||||
|
|
|
|
|
|
|
|||||||
| (5) | Details of changes in right-of-use assets for the six-month periods ended June 30, 2024 and 2023 are as follows (Unit: Korean Won in millions): |
| For the six-month period ended June 30, 2024 | ||||||||||||
| Building | Equipment and Vehicles | Total | ||||||||||
| Beginning balance |
2,970 | 508 | 3,478 | |||||||||
| New contracts |
— | 144 | 144 | |||||||||
| Modification |
(38 | ) | — | (38 | ) | |||||||
| Termination |
— | (9 | ) | (9 | ) | |||||||
| Depreciation |
(1,476 | ) | (163 | ) | (1,639 | ) | ||||||
|
|
|
|
|
|
|
|||||||
| Ending balance |
1,456 | 480 | 1,936 | |||||||||
|
|
|
|
|
|
|
|||||||
| For the six-month period ended June 30, 2023 | ||||||||||||
| Building | Equipment and Vehicles | Total | ||||||||||
| Beginning balance |
5,462 | 521 | 5,983 | |||||||||
| New contracts |
755 | 465 | 1,220 | |||||||||
| Termination |
— | (36 | ) | (36 | ) | |||||||
| Depreciation |
(1,554 | ) | (205 | ) | (1,759 | ) | ||||||
|
|
|
|
|
|
|
|||||||
| Ending balance |
4,663 | 745 | 5,408 | |||||||||
|
|
|
|
|
|
|
|||||||
| 12. | INTANGIBLE ASSETS |
| (1) | Details of intangible assets are as follows (Unit: Korean Won in millions): |
| June 30, 2024 | ||||||||||||||||
| Software | Development cost | Membership deposit | Total | |||||||||||||
| Acquisition cost |
4,631 | 3,622 | 2,371 | 10,624 | ||||||||||||
| Accumulated amortization |
(4,137 | ) | (2,777 | ) | — | (6,914 | ) | |||||||||
|
|
|
|
|
|
|
|
|
|||||||||
| Net carrying amount |
494 | 845 | 2,371 | 3,710 | ||||||||||||
|
|
|
|
|
|
|
|
|
|||||||||
| December 31, 2023 | ||||||||||||||||
| Software | Development cost | Membership deposit | Total | |||||||||||||
| Acquisition cost |
4,328 | 3,622 | 2,371 | 10,321 | ||||||||||||
| Accumulated amortization |
(3,841 | ) | (2,428 | ) | — | (6,269 | ) | |||||||||
|
|
|
|
|
|
|
|
|
|||||||||
| Net carrying amount |
487 | 1,194 | 2,371 | 4,052 | ||||||||||||
|
|
|
|
|
|
|
|
|
|||||||||
- 27 -
WOORI FINANCIAL GROUP INC.
NOTES TO SEPARATE INTERIM FINANCIAL STATEMENTS
AS OF JUNE 30, 2024 AND 2023 (UNAUDITED)
| (2) | Details of changes in intangible assets are as follows (Unit: Korean Won in millions): |
| For the six-month period ended June 30, 2024 | ||||||||||||||||||||
| Software | Development cost | Membership deposit |
Construction in progress |
Total | ||||||||||||||||
| Beginning balance |
487 | 1,194 | 2,371 | — | 4,052 | |||||||||||||||
| Acquisitions |
303 | — | — | — | 303 | |||||||||||||||
| Amortization |
(296 | ) | (349 | ) | — | — | (645 | ) | ||||||||||||
|
|
|
|
|
|
|
|
|
|
|
|||||||||||
| Ending balance |
494 | 845 | 2,371 | — | 3,710 | |||||||||||||||
|
|
|
|
|
|
|
|
|
|
|
|||||||||||
| For the six-month period ended June 30, 2023 | ||||||||||||||||||||
| Software | Development cost | Membership deposit |
Construction in progress |
Total | ||||||||||||||||
| Beginning balance |
704 | 1,784 | 2,371 | — | 4,859 | |||||||||||||||
| Acquisitions |
— | — | — | 350 | 350 | |||||||||||||||
| Amortization |
(306 | ) | (350 | ) | — | — | (656 | ) | ||||||||||||
| Transfer |
289 | — | — | (289 | ) | — | ||||||||||||||
|
|
|
|
|
|
|
|
|
|
|
|||||||||||
| Ending balance |
687 | 1,434 | 2,371 | 61 | 4,553 | |||||||||||||||
|
|
|
|
|
|
|
|
|
|
|
|||||||||||
| 13. | OTHER ASSETS |
Details of other assets are as follows (Unit: Korean Won in millions):
| June 30, 2024 | December 31, 2023 | |||||||
| Prepaid expenses |
294 | 484 | ||||||
| 14. | DEBENTURES |
Details of debentures are as follows (Unit: Korean Won in millions):
| June 30, 2024 | December 31, 2023 | |||||||||||||||
| Interest rate (%) | Amount | Interest rate (%) | Amount | |||||||||||||
| Face value of bonds: |
||||||||||||||||
| General bonds |
1.70~4.25 | 640,000 | 1.70~4.25 | 640,000 | ||||||||||||
| Subordinated bonds |
2.13~2.55 | 950,000 | 2.13~2.55 | 950,000 | ||||||||||||
|
|
|
|
|
|||||||||||||
| Sub-total |
1,590,000 | 1,590,000 | ||||||||||||||
| Deducted item: |
||||||||||||||||
| Discounts on bonds |
(1,972 | ) | (2,341 | ) | ||||||||||||
|
|
|
|
|
|||||||||||||
| Total |
1,588,028 | 1,587,659 | ||||||||||||||
|
|
|
|
|
|||||||||||||
- 28 -
WOORI FINANCIAL GROUP INC.
NOTES TO SEPARATE INTERIM FINANCIAL STATEMENTS
AS OF JUNE 30, 2024 AND 2023 (UNAUDITED)
| 15. | PROVISIONS |
| (1) | Details of provisions are as follows (Unit: Korean Won in millions): |
| June 30, 2024 | December 31, 2023 | |||||||
| Asset retirement obligation |
1,230 | 1,227 | ||||||
| (2) | Changes in asset retirement obligation are as follows (Unit: Korean Won in millions): |
| For the six-month periods ended June 30 | ||||||||
| 2024 | 2023 | |||||||
| Beginning balance |
1,227 | 487 | ||||||
| Increase | — | 754 | ||||||
| Amortization | 24 | 25 | ||||||
| Modification | (21 | ) | — | |||||
|
|
|
|
|
|||||
| Ending balance |
1,230 | 1,266 | ||||||
|
|
|
|
|
|||||
| 16. | NET DEFINED BENEFIT LIABILITY(ASSET) |
The Company’s pension plan is based on the defined benefit retirement pension plan. Employees and directors with one or more years of service are entitled to receive a payment upon termination of their employment, based on their length of service and rate of salary at the time of termination. The assets of the plans are measured at their fair value at the end of reporting date. The plan liabilities are measured using the projected unit method, which takes into account of projected earnings’ increase, using actuarial assumptions that give the best estimate of the future cash flows that will arise under the plan liabilities.
The Company is exposed to various risks through defined benefit retirement pension plan, and the most significant risks are as follows:
| Volatility of asset |
The defined benefit obligation was estimated with an interest rate calculated based on blue chip corporate bonds earnings. A deficit may occur if the rate of return of plan assets falls short of the interest rate. | |
| Decrease in profitability of blue chip bonds |
A decrease in profitability of blue chip bonds will be offset by some increase in the value of debt securities that the employee benefit plan owns but will bring an increase in the defined benefit obligation. | |
| Risk of inflation |
Defined benefit obligations are related to inflation rate; the higher the inflation rate is, the higher the level of liabilities. Therefore, deficit occurs in the system if an inflation rate increases. | |
| (1) | Details of net defined benefit liability (asset) are as follows (Unit: Korean Won in millions): |
| June 30, 2024 | December 31, 2023 | |||||||
| Present value of defined benefit obligation |
15,352 | 13,280 | ||||||
| Fair value of plan assets |
(14,789 | ) | (17,221 | ) | ||||
|
|
|
|
|
|||||
| Net defined benefit liability (asset) |
563 | (3,941 | ) | |||||
|
|
|
|
|
|||||
- 29 -
WOORI FINANCIAL GROUP INC.
NOTES TO SEPARATE INTERIM FINANCIAL STATEMENTS
AS OF JUNE 30, 2024 AND 2023 (UNAUDITED)
| (2) | Changes in the carrying value of defined benefit obligation are as follows (Unit: Korean Won in millions): |
| For the six-month periods ended June 30 | ||||||||||
| 2024 | 2023 | |||||||||
| Beginning balance |
13,280 | 18,660 | ||||||||
| Transfer-in / out |
(3 | ) | (4,778 | ) | ||||||
| Current service cost |
2,060 | 1,854 | ||||||||
| Interest cost |
293 | 484 | ||||||||
| Remeasurements |
Financial assumption |
223 | 202 | |||||||
| Demographic assumptions |
(23 | ) | — | |||||||
| Experience adjustment |
1,019 | 753 | ||||||||
| Retirement benefit paid |
(72 | ) | (1,519 | ) | ||||||
| Others |
(1,425 | ) | (920 | ) | ||||||
|
|
|
|
|
|||||||
| Ending balance |
15,352 | 14,736 | ||||||||
|
|
|
|
|
|||||||
| (3) | Changes in the plan assets are as follows (Unit: Korean Won in millions): |
| For the six-month periods ended June 30 | ||||||||
| 2024 | 2023 | |||||||
| Beginning balance | 17,221 | 24,607 | ||||||
| Transfer-in / out | (2,376 | ) | (6,207 | ) | ||||
| Interest income | 397 | 667 | ||||||
| Remeasurements | (116 | ) | (323 | ) | ||||
| Retirement benefit paid | (337 | ) | (2,046 | ) | ||||
|
|
|
|
|
|||||
| Ending balance |
14,789 | 16,698 | ||||||
|
|
|
|
|
|||||
| (4) | The fair value of plan assets as of June 30, 2024 and December 31, 2023 is as follows (Unit: Korean Won in millions): |
| June 30, 2024 | December 31, 2023 | |||||||
| Cash and due from banks etc. |
14,789 | 17,221 | ||||||
Meanwhile, the actual revenue of plan assets for the six-month periods ended June 30, 2024 and 2023 is 281 million Won and 344 million Won, respectively.
| (5) | The amount recognized in profit or loss and total comprehensive income related to the defined benefit plan for the six-month periods ended June 30, 2024 and 2023 is as follows (Unit: Korean Won in millions): |
| For the six-month periods ended June 30 | ||||||||
| 2024 | 2023 | |||||||
| Current service cost |
2,060 | 1,854 | ||||||
| Net interest expense(income) |
(104 | ) | (182 | ) | ||||
|
|
|
|
|
|||||
| Cost recognized in net income |
1,956 | 1,672 | ||||||
|
|
|
|
|
|||||
| Remeasurements (*) |
1,335 | 1,278 | ||||||
|
|
|
|
|
|||||
| Cost recognized in total comprehensive income |
3,291 | 2,950 | ||||||
|
|
|
|
|
|||||
| (*) | The amount is before income tax effect. |
- 30 -
WOORI FINANCIAL GROUP INC.
NOTES TO SEPARATE INTERIM FINANCIAL STATEMENTS
AS OF JUNE 30, 2024 AND 2023 (UNAUDITED)
| 17. | OTHER FINANCIAL LIABILITIES AND OTHER LIABILITIES |
Other financial liabilities and other liabilities are as follows (Unit: Korean Won in millions):
| June 30, 2024 | December 31, 2023 | |||||||
| Other financial liabilities: |
||||||||
| Accounts payable |
86,265 | 140,592 | ||||||
| Accrued expenses |
17,902 | 19,826 | ||||||
| Lease liabilities |
1,881 | 3,203 | ||||||
|
|
|
|
|
|||||
| Sub-total |
106,048 | 163,621 | ||||||
|
|
|
|
|
|||||
| Other liabilities: |
||||||||
| Other miscellaneous liabilities |
333 | 392 | ||||||
|
|
|
|
|
|||||
| Total |
106,381 | 164,013 | ||||||
|
|
|
|
|
|||||
| 18. | DERIVATIVES |
There are no derivative assets(liabilities) as of June 30, 2024 and December 31, 2023.
| 19. | EQUITY |
| (1) | Details of equity as of June 30, 2024 and December 31, 2023 are as follows (Unit: Korean Won in millions): |
| June 30, 2024 | December 31, 2023 | |||||||||
| Capital |
3,802,676 | 3,802,676 | ||||||||
| Hybrid securities |
4,408,867 | 3,610,953 | ||||||||
| Capital surplus |
11,120,236 | 11,120,236 | ||||||||
| Other equity |
Treasury stock | (628 | ) | (628 | ) | |||||
| Accumulated other comprehensive income | (4,218 | ) | (7,243 | ) | ||||||
| Sub-total | (4,846 | ) | (7,871 | ) | ||||||
|
|
|
|
|
|||||||
| Retained earnings (*1) (*2) |
5,805,936 | 5,475,004 | ||||||||
|
|
|
|
|
|||||||
| Total |
25,132,869 | 24,000,998 | ||||||||
|
|
|
|
|
|||||||
| (*1) | The regulatory reserve for credit loss in retained earnings amounted to 137 million Won and 3,697 million Won as of June 30, 2024 and December 31, 2023 in accordance with the relevant regulation. |
| (*2) | The earned surplus reserve in retained earnings amounted to 442,650 million Won and 300,190 million Won as of June 30, 2024 and December 31, 2023 in accordance with the Article 53 of the Financial Holding Company Act. |
| (2) | The number of authorized shares and others of the Company are as follows: |
| June 30, 2024 |
December 31, 2023 | |||
| Shares of common stock authorized |
4,000,000,000 Shares | 4,000,000,000 Shares | ||
| Par value | 5,000 Won | 5,000 Won | ||
| Shares of common stock issued* |
742,591,501 Shares | 751,949,461 Shares | ||
| Capital stock |
3,802,676 million Won | 3,802,676 million Won |
| (*) | Due to retirement of earnings, total par value of the shares issued and paid-in capital are different. |
- 31 -
WOORI FINANCIAL GROUP INC.
NOTES TO SEPARATE INTERIM FINANCIAL STATEMENTS
AS OF JUNE 30, 2024 AND 2023 (UNAUDITED)
| (3) | Hybrid securities |
The bond-type hybrid securities classified as owner’s equity are as follows (Unit: Korean Won in millions):
| Issue date | Maturity | Interest rate (%) | June 30, 2024 |
December 31, 2023 |
||||||||||||||||
| Securities in local currency |
2019-07-18 | — | 3.49 | 500,000 | 500,000 | |||||||||||||||
| Securities in local currency |
2019-10-11 | — | 3.32 | 500,000 | 500,000 | |||||||||||||||
| Securities in local currency |
2020-02-06 | — | 3.34 | 400,000 | 400,000 | |||||||||||||||
| Securities in local currency |
2020-06-12 | — | 3.23 | 300,000 | 300,000 | |||||||||||||||
| Securities in local currency |
2020-10-23 | — | 3.00 | 200,000 | 200,000 | |||||||||||||||
| Securities in local currency |
2021-04-08 | — | 3.15 | 200,000 | 200,000 | |||||||||||||||
| Securities in local currency |
2021-10-14 | — | 3.60 | 200,000 | 200,000 | |||||||||||||||
| Securities in local currency |
2022-02-17 | — | 4.10 | 300,000 | 300,000 | |||||||||||||||
| Securities in local currency |
2022-07-28 | — | 4.99 | 300,000 | 300,000 | |||||||||||||||
| Securities in local currency |
2022-10-25 | — | 5.97 | 220,000 | 220,000 | |||||||||||||||
| Securities in local currency |
2023-02-10 | — | 4.65 | 300,000 | 300,000 | |||||||||||||||
| Securities in local currency |
2023-09-07 | — | 5.04 | 200,000 | 200,000 | |||||||||||||||
| Securities in local currency |
2024-02-07 | — | 4.49 | 400,000 | — | |||||||||||||||
| Securities in local currency |
2024-06-19 | — | 4.27 | 400,000 | — | |||||||||||||||
| Issuance cost |
|
(11,133 | ) | (9,047 | ) | |||||||||||||||
|
|
|
|
|
|||||||||||||||||
| Total |
|
4,408,867 | 3,610,953 | |||||||||||||||||
|
|
|
|
|
|||||||||||||||||
The hybrid securities mentioned above do not have maturity date but are redeemable after 5 years from the date of issuance.
| (4) | Accumulated other comprehensive income |
Changes in the accumulated other comprehensive income are as follows (Unit: Korean Won in millions):
| For the six-month period ended June 30, 2024 | ||||||||||||||||
| Beginning balance |
Increase (decrease) |
Income tax effect |
Ending balance |
|||||||||||||
| Net gain (loss) on valuation of financial assets at FVTOCI |
(7,575 | ) | 5,445 | (1,437 | ) | (3,567 | ) | |||||||||
| Remeasurements of defined benefit plan |
332 | (1,335 | ) | 352 | (651 | ) | ||||||||||
|
|
|
|
|
|
|
|
|
|||||||||
| Total |
(7,243 | ) | 4,110 | (1,085 | ) | (4,218 | ) | |||||||||
|
|
|
|
|
|
|
|
|
|||||||||
| For the six-month period ended June 30, 2023 | ||||||||||||||||
| Beginning balance |
Increase (decrease) |
Income tax effect |
Ending balance |
|||||||||||||
| Net gain (loss) on valuation of financial assets at FVTOCI |
(27,364 | ) | 12,042 | (3,216 | ) | (18,538 | ) | |||||||||
| Remeasurements of defined benefit plan |
1,204 | (1,278 | ) | 337 | 263 | |||||||||||
|
|
|
|
|
|
|
|
|
|||||||||
| Total |
(26,160 | ) | 10,764 | (2,879 | ) | (18,275 | ) | |||||||||
|
|
|
|
|
|
|
|
|
|||||||||
- 32 -
WOORI FINANCIAL GROUP INC.
NOTES TO SEPARATE INTERIM FINANCIAL STATEMENTS
AS OF JUNE 30, 2024 AND 2023 (UNAUDITED)
| (5) | Regulatory Reserve for Credit Loss |
In accordance with Article 26 ~ 28 of the Financial holding company Supervision Regulations, the Company calculates and discloses the regulatory reserve for credit loss.
| 1) | Balance of the regulatory reserve for credit loss |
Balance of the planned regulatory reserve for credit loss is as follows (Unit: Korean Won in millions):
| June 30, 2024 | December 31, 2023 | |||||||
| Beginning balance |
137 | 3,697 | ||||||
| Planned provision (reversal) of regulatory reserve for credit loss |
641 | (3,560 | ) | |||||
|
|
|
|
|
|||||
| Ending balance |
778 | 137 | ||||||
|
|
|
|
|
|||||
| 2) | Provision of regulatory reserve for credit loss, adjusted net income after the provision of regulatory reserve and others |
Planned reserves provided, adjusted net income after the planned reserves provided and adjusted EPS after the planned reserves provided are as follows (Unit: Korean Won in millions, except for EPS amount):
| Periods ended June 30, 2024 | Periods ended June 30, 2023 | |||||||||||||||
| Three-month | Six-month | Three-month | Six-month | |||||||||||||
| Net income (loss) before regulatory reserve |
(10,292 | ) | 1,157,497 | (10,950 | ) | 1,445,429 | ||||||||||
| Provision (reversal) of regulatory reserve for credit loss |
584 | 641 | (3,485 | ) | (3,196 | ) | ||||||||||
| Adjusted net income (loss) after the provision of regulatory reserve |
(10,876 | ) | 1,156,856 | (7,465 | ) | 1,448,625 | ||||||||||
| Dividends to hybrid securities |
(39,749 | ) | (75,007 | ) | (32,738 | ) | (63,152 | ) | ||||||||
| Adjusted net income (loss) after regulatory reserve and dividends to hybrid securities |
(50,625 | ) | 1,081,849 | (40,203 | ) | 1,385,473 | ||||||||||
| Adjusted EPS (Loss Per Share) after regulatory reserve and dividends to hybrid securities (Unit: Korean Won) |
(68 | ) | 1,450 | (55 | ) | 1,903 | ||||||||||
| (6) | Changes in treasury stocks are as follows (Unit: Korean Won in millions): |
| For the six-month period ended June 30, 2024 | ||||||||||||||||
| Beginning | Acquisition | Retirement | Ending | |||||||||||||
| Number of shares |
53,945 | 9,357,960 | (9,357,960 | ) | 53,945 | |||||||||||
| Carrying amount |
628 | 136,688 | (136,688 | ) | 628 | |||||||||||
| For the six-month period ended June 30, 2023 | ||||||||||||||||
| Beginning | Acquisition | Retirement | Ending | |||||||||||||
| Number of shares |
2,324 | 1,981,565 | — | 1,983,889 | ||||||||||||
| Carrying amount |
26 | 23,638 | — | 23,664 | ||||||||||||
- 33 -
WOORI FINANCIAL GROUP INC.
NOTES TO SEPARATE INTERIM FINANCIAL STATEMENTS
AS OF JUNE 30, 2024 AND 2023 (UNAUDITED)
| 20. | DIVIDENDS |
| (1) | Dividends per share and the total dividends for the fiscal year ending December 31, 2023 were 640 Won and 481,213 million Won, respectively, approved at the regular general shareholder’s meeting held on March 22, 2024, with February 29, 2024 as the dividend record date, and were paid in April 2024. |
| (2) | On April 26, 2024, the Board of Directors has declared a quarterly dividend of 180 Won per share (133,657 million Won in total) and fixed record date as March 31, 2024. Dividends were paid in May 2024. |
| 21. | NET INTEREST INCOME |
| (1) | Details of interest income recognized are as follows (Unit: Korean Won in millions): |
| Periods ended June 30, 2024 | Periods ended June 30, 2023 | |||||||||||||||
| Three-month | Six-month | Three-month | Six-month | |||||||||||||
| Interest on due from banks |
16,088 | 28,698 | 18,336 | 32,023 | ||||||||||||
| Other interest income |
25 | 50 | 26 | 45 | ||||||||||||
|
|
|
|
|
|
|
|
|
|||||||||
| Total |
16,113 | 28,748 | 18,362 | 32,068 | ||||||||||||
|
|
|
|
|
|
|
|
|
|||||||||
| (2) | Details of interest expense recognized are as follows (Unit: Korean Won in millions): |
| Periods ended June 30, 2024 | Periods ended June 30, 2023 | |||||||||||||||
| Three-month | Six-month | Three-month | Six-month | |||||||||||||
| Interest on debentures |
11,213 | 22,482 | 8,279 | 16,234 | ||||||||||||
| Other interest expense |
12 | 25 | 13 | 25 | ||||||||||||
| Interest on lease liabilities |
26 | 60 | 60 | 117 | ||||||||||||
|
|
|
|
|
|
|
|
|
|||||||||
| Total |
11,251 | 22,567 | 8,352 | 16,376 | ||||||||||||
|
|
|
|
|
|
|
|
|
|||||||||
| 22. | NET FEES AND COMMISSIONS INCOME |
| (1) | Details of fees and commissions income incurred are as follows (Unit: Korean Won in millions): |
| Periods ended June 30, 2024 | Periods ended June 30, 2023 | |||||||||||||||
| Three-month | Six-month | Three-month | Six-month | |||||||||||||
| Fees and commissions income |
406 | 813 | 399 | 798 | ||||||||||||
| (2) | Details of fees and commissions expense incurred are as follows (Unit: Korean Won in millions): |
| Periods ended June 30, 2024 | Periods ended June 30, 2023 | |||||||||||||||
| Three-month | Six-month | Three-month | Six-month | |||||||||||||
| Fees and commissions paid |
2,573 | 3,939 | 3,434 | 4,701 | ||||||||||||
| Others |
2,836 | 5,722 | 2,383 | 4,852 | ||||||||||||
|
|
|
|
|
|
|
|
|
|||||||||
| Total |
5,409 | 9,661 | 5,817 | 9,553 | ||||||||||||
|
|
|
|
|
|
|
|
|
|||||||||
- 34 -
WOORI FINANCIAL GROUP INC.
NOTES TO SEPARATE INTERIM FINANCIAL STATEMENTS
AS OF JUNE 30, 2024 AND 2023 (UNAUDITED)
| 23. | DIVIDEND INCOME |
Details of dividend income recognized are as follows (Unit: Korean Won in millions):
| Periods ended June 30, 2024 | Periods ended June 30, 2023 | |||||||||||||||
| Three-month | Six-month | Three-month | Six-month | |||||||||||||
| Dividend income recognized from investments in subsidiaries |
— | 1,182,977 | — | 1,465,825 | ||||||||||||
| Dividend income recognized from FVTOCI |
6,388 | 12,744 | 3,578 | 7,044 | ||||||||||||
|
|
|
|
|
|
|
|
|
|||||||||
| Total |
6,388 | 1,195,721 | 3,578 | 1,472,869 | ||||||||||||
|
|
|
|
|
|
|
|
|
|||||||||
| 24. | NET GAIN OR LOSS ON FINANCIAL INSTRUMENTS AT FVTPL |
| (1) | Details of net gain or loss on financial instruments at FVTPL are as follows (Unit: Korean Won in millions): |
| Periods ended June 30, 2024 | Periods ended June 30, 2023 | |||||||||||||||
| Three-month | Six-month | Three-month | Six-month | |||||||||||||
| Gains and losses on financial instruments at FVTPL mandatorily measured at fair value |
— | — | — | 2,023 | ||||||||||||
| (2) | Details of net gain or loss on financial instrument at FVTPL are as follows (Unit: Korean Won in millions): |
| Periods ended June 30, 2024 |
Periods ended June 30, 2023 |
|||||||||||
| Derivatives (Held for trading) |
Equity derivatives | Gain on transactions and valuation |
— | 2,023 | ||||||||
| 25. | REVERSAL (PROVISION) OF IMPAIRMENT LOSSES DUE TO CREDIT LOSS |
Details of reversal (provision) of impairment losses due to credit loss recognized are as follows (Unit: Korean Won in millions):
| Periods ended June 30, 2024 | Periods ended June 30, 2023 | |||||||||||||||
| Three-month | Six-month | Three-month | Six-month | |||||||||||||
| Reversal (Provision) of impairment losses due to credit loss on loans and other financial assets at amortized cost |
18 | (442 | ) | (937 | ) | (978 | ) | |||||||||
- 35 -
WOORI FINANCIAL GROUP INC.
NOTES TO SEPARATE INTERIM FINANCIAL STATEMENTS
AS OF JUNE 30, 2024 AND 2023 (UNAUDITED)
| 26. | GENERAL AND ADMINISTRATIVE EXPENSES |
| (1) | Details of general and administrative expenses recognized are as follows (Unit: Korean Won in millions): |
| Periods ended June 30, 2024 | Periods ended June 30, 2023 | |||||||||||||||||||
| Three-month | Six-month | Three-month | Six-month | |||||||||||||||||
| Employee benefits |
Short-term | Salaries | 8,133 | 15,698 | 7,665 | 14,907 | ||||||||||||||
| Employee benefits | Employee fringe benefits | 2,784 | 4,978 | 3,951 | 6,654 | |||||||||||||||
| Retirement benefit service costs | 728 | 1,956 | 764 | 1,672 | ||||||||||||||||
| Share based payments | 642 | 1,879 | 693 | 523 | ||||||||||||||||
|
|
|
|
|
|
|
|
|
|||||||||||||
| Sub-total |
12,287 | 24,511 | 13,073 | 23,756 | ||||||||||||||||
|
|
|
|
|
|
|
|
|
|||||||||||||
| Depreciation and amortization |
1,405 | 3,080 | 1,847 | 3,631 | ||||||||||||||||
| Other general and administrative expenses |
Rent | 410 | 823 | 433 | 885 | |||||||||||||||
| Taxes and public dues | 127 | 346 | 133 | 339 | ||||||||||||||||
| Service charges | 264 | 703 | 1,097 | 1,752 | ||||||||||||||||
| Computer and IT related | 1,539 | 3,166 | 1,557 | 3,155 | ||||||||||||||||
| Telephone and communication | 107 | 311 | 126 | 246 | ||||||||||||||||
| Operating promotion | 354 | 638 | 194 | 620 | ||||||||||||||||
| Advertising | 1 | 29 | 14 | 39 | ||||||||||||||||
| Printing | 15 | 40 | 23 | 38 | ||||||||||||||||
| Traveling | 93 | 153 | 38 | 111 | ||||||||||||||||
| Supplies | 22 | 50 | 39 | 73 | ||||||||||||||||
| Insurance premium | 50 | 101 | 50 | 100 | ||||||||||||||||
| Reimbursement | 161 | 332 | 396 | 659 | ||||||||||||||||
| Vehicle maintenance | 56 | 99 | 55 | 110 | ||||||||||||||||
| Others | 6 | 12 | 7 | 13 | ||||||||||||||||
|
|
|
|
|
|
|
|
|
|||||||||||||
| Sub-total |
3,205 | 6,803 | 4,162 | 8,140 | ||||||||||||||||
|
|
|
|
|
|
|
|
|
|||||||||||||
| Total |
16,897 | 34,394 | 19,082 | 35,527 | ||||||||||||||||
|
|
|
|
|
|
|
|
|
|||||||||||||
| (2) | Share-based payment |
Details of performance condition share-based payment granted to executives as of June 30, 2024 and 2023 are as follows.
| 1) | Performance condition share-based payment |
| Subject to |
Shares granted for the year 2020 (*3) | |||
| Type of payment |
Cash-settled | |||
| Vesting period |
January 1, 2020 ~ December 31, 2023 | |||
| Date of payment |
2024-01-01 | |||
| Fair value (*1) |
— | |||
| Valuation method |
— | |||
| Expected dividend rate |
— | |||
| Expected maturity date |
— | |||
| Number of shares remaining |
As of June 30, 2024 | — | ||
| As of December 31, 2023 | 189,270 shares | |||
| Number of shares granted (*2) |
As of June 30, 2024 | — | ||
| As of December 31, 2023 | 189,270 shares |
- 36 -
WOORI FINANCIAL GROUP INC.
NOTES TO SEPARATE INTERIM FINANCIAL STATEMENTS
AS OF JUNE 30, 2024 AND 2023 (UNAUDITED)
| Subject to |
Shares granted for the year 2021 | |||
| Type of payment |
Cash-settled | |||
| Vesting period |
January 1, 2021 ~ December 31, 2024 | |||
| Date of payment |
2025-01-01 | |||
| Fair value (*1) |
13,921 Won | |||
| Valuation method |
Black-Scholes Model | |||
| Expected dividend rate |
6.48% | |||
| Expected maturity date |
0.50 years | |||
| Number of shares remaining |
As of June 30, 2024 | 239,798 shares | ||
| As of December 31, 2023 | 239,798 shares | |||
| Number of shares granted (*2) |
As of June 30, 2024 | 239,798 shares | ||
| As of December 31, 2023 | 239,798 shares |
| Subject to |
Shares granted for the year 2022 | |||
| Type of payment |
Cash-settled | |||
| Vesting period |
January 1, 2022 ~ December 31, 2025 | |||
| Date of payment |
2026-01-01 | |||
| Fair value (*1) |
13,049 Won | |||
| Valuation method |
Black-Scholes Model | |||
| Expected dividend rate |
6.48% | |||
| Expected maturity date |
1.50 years | |||
| Number of shares remaining |
As of June 30, 2024 | 223,176 shares | ||
| As of December 31, 2023 | 223,176 shares | |||
| Number of shares granted (*2) |
As of June 30, 2024 | 223,176 shares | ||
| As of December 31, 2023 | 223,176 shares |
| Subject to |
Shares granted for the year 2023 | |||
| Type of payment |
Cash-settled | |||
| Vesting period |
January 1, 2023 ~ December 31, 2026 | |||
| Date of payment |
2027-01-01 | |||
| Fair value (*1) |
12,231 Won | |||
| Valuation method |
Black-Scholes Model | |||
| Expected dividend rate |
6.48% | |||
| Expected maturity date |
2.50 years | |||
| Number of shares remaining |
As of June 30, 2024 | 160,929 shares | ||
| As of December 31, 2023 | 160,929 shares | |||
| Number of shares granted (*2) |
As of June 30, 2024 | 160,929 shares | ||
| As of December 31, 2023 | 160,929 shares |
| Subject to |
Shares granted for the year 2024 | |||
| Type of payment |
Cash-settled | |||
| Vesting period |
January 1, 2024 ~ December 31, 2027 | |||
| Date of payment |
2028-01-01 | |||
| Fair value (*1) |
11,464 Won | |||
| Valuation method |
Black-Scholes Model | |||
| Expected dividend rate |
6.48% | |||
| Expected maturity date |
3.50 years | |||
| Number of shares remaining |
As of June 30, 2024 | 100,914 shares | ||
| As of December 31, 2023 | — | |||
| Number of shares granted (*2) |
As of June 30, 2024 | 100,914 shares | ||
| As of December 31, 2023 | — |
| (*1) | As the amount of payment varies according to the base price (the arithmetic average of the weighted average stock price of transactions in the past one week, the past one month, and the past two months) at the date of payment, the fair value is calculated and used to measure the liability according to the Black-Scholes Model based on the base price at the time of each settlement. |
| (*2) | This system involves determining the maximum allocation quantity at the initial grant date and confirming the payment quantity based on the evaluation results of long-term performance metrics over a total of four years, including the current year. The compensation is made in cash by reflecting the base stock price at the time of payment. Long-term performance metrics include relative shareholder return, return on equity, net income, general and administrative expense ratio, non-performing loan ratio and job performance. |
- 37 -
WOORI FINANCIAL GROUP INC.
NOTES TO SEPARATE INTERIM FINANCIAL STATEMENTS
AS OF JUNE 30, 2024 AND 2023 (UNAUDITED)
| (*3) | Payment was completed in current period. |
| 2) | The Company accounts for performance condition share-based payments according to the cash-settled method and the fair value of the liabilities is reflected in the compensation costs by re-measuring every closing period. As of June 30, 2024 and December 31, 2023 the book value of the liabilities related to the performance condition share-based payments recognized by the Company is 9,376 million Won and 9,598 million Won. |
| 27. | NON-OPERATING INCOME (EXPENSES) |
| (1) | Details of non-operating income and expenses recognized are as follows (Unit: Korean Won in millions): |
| Periods ended June 30, 2024 | Periods ended June 30, 2023 | |||||||||||||||
| Three-month | Six-month | Three-month | Six-month | |||||||||||||
| Other non-operating income |
25 | 28 | 50 | 51 | ||||||||||||
| Other non-operating expense |
(70 | ) | (91 | ) | (32 | ) | (42 | ) | ||||||||
|
|
|
|
|
|
|
|
|
|||||||||
| Total |
(45 | ) | (63 | ) | 18 | 9 | ||||||||||
|
|
|
|
|
|
|
|
|
|||||||||
| (2) | Details of other non-operating income recognized are as follows (Unit: Korean Won in millions): |
| Periods ended June 30, 2024 | Periods ended June 30, 2023 | |||||||||||||||
| Three-month | Six-month | Three-month | Six-month | |||||||||||||
| Lease change cancellation income |
4 | 5 | 4 | 4 | ||||||||||||
| Others |
21 | 23 | 46 | 47 | ||||||||||||
|
|
|
|
|
|
|
|
|
|||||||||
| Total |
25 | 28 | 50 | 51 | ||||||||||||
|
|
|
|
|
|
|
|
|
|||||||||
| (3) | Details of other non-operating expenses recognized are as follows (Unit: Korean Won in millions): |
| Periods ended June 30, 2024 | Periods ended June 30, 2023 | |||||||||||||||
| Three-month | Six-month | Three-month | Six-month | |||||||||||||
| Donations |
70 | 85 | 30 | 40 | ||||||||||||
| Lease change cancellation loss |
— | — | 2 | 2 | ||||||||||||
| Others |
— | 6 | — | — | ||||||||||||
|
|
|
|
|
|
|
|
|
|||||||||
| Total |
70 | 91 | 32 | 42 | ||||||||||||
|
|
|
|
|
|
|
|
|
|||||||||
| 28. | INCOME TAX EXPENSE (INCOME) |
| A. | Details of income tax expense(income) are as follows (Unit: Korean Won in millions): |
| For the six-month periods ended June 30 | ||||||||
| 2024 | 2023 | |||||||
| Current tax expense |
||||||||
| Current tax expense with respect to the current period |
— | — | ||||||
|
|
|
|
|
|||||
| Deferred tax expense (income) |
||||||||
| Change in deferred tax assets (liabilities) due to temporary differences |
1,743 | 2,783 | ||||||
| Tax expense (income) directly attributable to equity |
(1,085 | ) | (2,879 | ) | ||||
|
|
|
|
|
|||||
| Sub-total |
658 | (96 | ) | |||||
|
|
|
|
|
|||||
| Income tax expense (income) |
658 | (96 | ) | |||||
|
|
|
|
|
|||||
| B. | The Company is in the process of analyzing the impact on income tax in relation to the global minimum tax system, and it is expected that there will be no significant impact on the company’s current income tax expense as of June 30, 2024. |
- 38 -
WOORI FINANCIAL GROUP INC.
NOTES TO SEPARATE INTERIM FINANCIAL STATEMENTS
AS OF JUNE 30, 2024 AND 2023 (UNAUDITED)
| 29. | EARNINGS PER SHARE (“EPS”) |
| (1) | Basic EPS is calculated by dividing net income attributable to common shareholders by weighted-average number of common shares outstanding (Unit: Korean Won in millions, except for EPS and number of shares): |
| Periods ended June 30, 2024 | Periods ended June 30, 2023 | |||||||||||||||
| Three-month | Six-month | Three-month | Six-month | |||||||||||||
| Net profit (loss) attributable to Owners |
(10,292 | ) | 1,157,497 | (10,950 | ) | 1,445,429 | ||||||||||
| Dividends to hybrid securities |
(39,749 | ) | (75,007 | ) | (32,738 | ) | (63,152 | ) | ||||||||
| Net income attributable to common shareholders |
(50,041 | ) | 1,082,490 | (43,688 | ) | 1,382,277 | ||||||||||
| Weighted average number of common shares outstanding (Unit: million shares) |
743 | 746 | 728 | 728 | ||||||||||||
| Basic EPS (Loss Per Share) (Unit: Korean Won) |
(67 | ) | 1,450 | (60 | ) | 1,899 | ||||||||||
| (2) | The weighted average number of common shares outstanding is as follows: (Unit: number of shares) |
| For the six-month period ended June 30, 2024 | ||||||||
| Number of shares |
Accumulated number of shares outstanding during period |
|||||||
| Common shares issued at the beginning of the period |
751,949,461 | 136,854,801,902 | ||||||
| Treasury stock |
(53,945 | ) | (9,817,990 | ) | ||||
| Acquisition and retirement of treasury stock |
(9,357,960 | ) | (1,020,017,640 | ) | ||||
|
|
|
|||||||
| Sub-total (①) |
|
135,824,966,272 | ||||||
|
|
|
|||||||
| Weighted average number of common shares outstanding (②=①/182) |
|
746,291,023 | ||||||
|
|
|
|||||||
| For the six-month period ended June 30, 2023 | ||||||||
| Number of shares |
Accumulated number of shares outstanding during period |
|||||||
| Common shares issued at the beginning of the period |
728,060,549 | 131,778,959,369 | ||||||
| Treasury stock |
(2,324 | ) | (420,644 | ) | ||||
| Acquisition of treasury stock |
(1,981,565 | ) | (28,658,738 | ) | ||||
|
|
|
|||||||
| Sub-total (①) |
|
131,749,879,987 | ||||||
|
|
|
|||||||
| Weighted average number of common shares outstanding (②=①/181) |
|
727,899,889 | ||||||
|
|
|
|||||||
Diluted EPS is equal to basic EPS because there is no dilution effect for the six-month periods ended June 30, 2024 and 2023.
- 39 -
WOORI FINANCIAL GROUP INC.
NOTES TO SEPARATE INTERIM FINANCIAL STATEMENTS
AS OF JUNE 30, 2024 AND 2023 (UNAUDITED)
| 30. | CONTINGENT LIABILITIES AND COMMITMENTS |
| (1) | Litigation case |
As of June 30, the company currently has one lawsuit as a defendant related to Woori Asset Trust Co., Ltd. stock trading payments. The lawsuit is in the first trial stage, with a claim amount of 13,305 million Won. It is not possible to reasonably estimate the potential impact on the company’s financial statements as of June 30.
| (2) | Details of loan commitments with financial institutions are as follows (Unit: Korean Won in millions): |
| June 30, 2024 | December 31, 2023 | |||||||||||||||||||
| Financial institutions | Line of credit | Loan balance | Line of credit | Loan balance | ||||||||||||||||
| Loans |
Standard Chartered Bank Korea Ltd. | 100,000 | — | 100,000 | — | |||||||||||||||
- 40 -
WOORI FINANCIAL GROUP INC.
NOTES TO SEPARATE INTERIM FINANCIAL STATEMENTS
AS OF JUNE 30, 2024 AND 2023 (UNAUDITED)
| 31. | RELATED PARTY TRANSACTIONS |
Related parties of the Company as of June 30, 2024 and December 31, 2023, and assets and liabilities recognized, guarantees and commitments, major transactions with related parties and compensation to key management for the six-month periods ended June 30, 2024 and 2023 are as follows:
| (1) | Assets and liabilities from transactions with related parties are as follows (Unit: Korean Won in millions): |
| Related parties |
Title of account |
June 30, 2024 | December 31, 2023 | |||||||
| Subsidiaries |
||||||||||
| Woori Bank |
Cash and cash equivalents | 225,281 | 289,507 | |||||||
| Other financial assets | 1,899,726 | 1,094,635 | ||||||||
| Allowance for credit losses | (1,105 | ) | (663 | ) | ||||||
| Other financial liabilities | 52,409 | 131,397 | ||||||||
| Woori Card Co., Ltd. |
Other financial assets | 25,316 | 8,597 | |||||||
| Other financial liabilities | 17,812 | 225 | ||||||||
| Woori Financial Capital Co., Ltd. |
Other financial assets | 14,962 | 816 | |||||||
| Other financial liabilities | 189 | 4,430 | ||||||||
| Woori Investment Bank Co., Ltd. |
Other financial assets | 1 | — | |||||||
| Other financial liabilities | 12,784 | — | ||||||||
| Woori Asset Trust Co., Ltd. |
Other financial assets | 1,243 | — | |||||||
| Woori Savings Bank |
Other financial liabilities | 1,112 | 1,271 | |||||||
| Woori Financial F&I Co., Ltd. |
Other financial liabilities | 3,302 | 1,650 | |||||||
| Woori Asset Management Corp (*) |
Other financial liabilities | — | 46 | |||||||
| Woori Venture Partners Co., Ltd. |
Other financial assets | 11,232 | — | |||||||
| Woori Private Equity Asset Management Co. Ltd. |
Other financial assets | 17 | 76 | |||||||
| Woori Credit Information Co., Ltd. |
Other financial assets | 297 | 744 | |||||||
| Woori Fund Service Co., Ltd. |
Other financial assets | 701 | 436 | |||||||
| Woori FIS Co., Ltd. |
Other financial assets | 1 | — | |||||||
| Other financial liabilities | 438 | 1,540 | ||||||||
| Woori Finance Research Institute Co., Ltd. |
Other financial assets | 30 | 175 | |||||||
| Other financial liabilities | — | 2,590 | ||||||||
| Associates of subsidiaries |
||||||||||
| W Service Networks Co., Ltd. |
Other financial liabilities | 25 | 48 | |||||||
| (*) | Other financial liabilities of Woori Global Asset Management Co., Ltd. are included due to merger during the current period. |
- 41 -
WOORI FINANCIAL GROUP INC.
NOTES TO SEPARATE INTERIM FINANCIAL STATEMENTS
AS OF JUNE 30, 2024 AND 2023 (UNAUDITED)
| (2) | Gain or loss from transactions with related parties are as follows (Unit: Korean Won in millions): |
| For the six-month periods ended June 30 |
||||||||||
| Related parties |
Title of account |
2024 | 2023 | |||||||
| Subsidiaries |
||||||||||
| Woori Bank |
Interest income | 28,748 | 31,521 | |||||||
| Fees and commissions income | 813 | 798 | ||||||||
| Dividend income | 1,131,996 | 1,372,572 | ||||||||
| Interest expenses (*2) | 49 | 107 | ||||||||
| Fees and commissions expense | 9 | 10 | ||||||||
| Provision of impairment loss due to credit loss | 442 | 827 | ||||||||
| General and administrative expenses (*2) | 2,259 | 2,358 | ||||||||
| Woori Card Co., Ltd. |
Dividend income | 30,309 | 43,432 | |||||||
| Woori Financial Capital Co., Ltd. |
Dividend income | 30,051 | 41,190 | |||||||
| Interest expenses (*2) | 4 | — | ||||||||
| General and administrative expenses (*2) | 50 | — | ||||||||
| Woori Investment Bank Co., Ltd. (*1) |
Dividend income | — | 11,803 | |||||||
| Woori Asset Trust Co., Ltd |
Dividend income | — | 780 | |||||||
| Woori Savings Bank |
Dividend income | — | 1,383 | |||||||
| Woori Venture Partners Co., Ltd. |
Dividend income | 800 | — | |||||||
| Woori Credit Information Co., Ltd. |
Dividend income | 1,504 | 535 | |||||||
| Woori Fund Service Co., Ltd. |
Dividend income | 1,060 | 1,174 | |||||||
| Woori FIS Co., Ltd. |
General and administrative expenses | 2,871 | 2,869 | |||||||
| Woori Finance Research Institute Co., Ltd. |
Fees and commissions expenses | 4,200 | 3,400 | |||||||
| Associates of subsidiaries |
||||||||||
| W Service Networks Co., Ltd. |
General and administrative expenses | 173 | 458 | |||||||
| (*1) | The Company has issued hybrid capital securities amount of 800,000 million Won during the current period and Woori Investment Bank Co., Ltd purchased 20,000 million Won out of 800,000 million Won issued. The underwriting fee amount of 34 million Won is included in the issuance cost. |
| (*2) | The depreciation of right-of-use assets and interest expense of lease liabilities arising from lease transactions during the current term and prior term are included. |
- 42 -
WOORI FINANCIAL GROUP INC.
NOTES TO SEPARATE INTERIM FINANCIAL STATEMENTS
AS OF JUNE 30, 2024 AND 2023 (UNAUDITED)
| (3) | The details of the right-of-use assets and lease liabilities due to lease transactions with related parties as of June 30, 2024 and December 31, 2023 are as follows (Unit: Korean Won in millions): |
| Related parties |
Title of account |
June 30, 2024 | December 31, 2023 | |||||||||
| Subsidiaries |
Woori Bank | Right-of-use assets | 1,456 | 2,970 | ||||||||
| Lease liabilities (*) | 1,363 | 2,658 | ||||||||||
| Woori Financial Capital Co., Ltd. | Right-of-use assets | 176 | 226 | |||||||||
| Lease liabilities (*) | 189 | 238 | ||||||||||
| (*) | Cash outflows of lease liabilities redemption for the years ended June 30, 2024 and 2023 are 1,380 million Won and 1,397 million Won, respectively. |
| (4) | The details of loan and borrowing transactions with related party for the six-month periods ended June 30, 2024 and 2023 are as follows (Unit: Korean Won in millions): |
| For the six-month period ended June 30, 2024 | ||||||||||||||||||||
| Related party (*1) |
Title of account |
Beginning balance |
Increase | Decrease | Ending balance |
|||||||||||||||
| Subsidiary |
Woori Bank | Due from banks (*2) | 1,354,000 | 2,391,000 | 1,855,000 | 1,890,000 | ||||||||||||||
| (*1) | For the 800,000 million Won of hybrid securities issued during the current period, 20,000 million Won was purchased by Woori Investment Bank Co., Ltd and the entire amount was sold to the market on the date of issuance. |
| (*2) | Excludes due from banks without withdrawal limitations. |
| For the six-month period ended June 30, 2023 | ||||||||||||||||||||
| Related party |
Title of account |
Beginning balance |
Increase | Decrease | Ending balance |
|||||||||||||||
| Subsidiary |
Woori Bank | Deposit (*) | 1,595,000 | 3,230,000 | 2,620,000 | 2,205,000 | ||||||||||||||
| (*) | Excludes due from banks without withdrawal limitations. |
- 43 -
WOORI FINANCIAL GROUP INC.
NOTES TO SEPARATE INTERIM FINANCIAL STATEMENTS
AS OF JUNE 30, 2024 AND 2023 (UNAUDITED)
| (5) | The details of equity-related transactions with related parties are as follows (Unit: Korean Won in million) |
| For the six-month period ended June 30, 2024 |
||||||
| Related parties |
Acquisition of interests | |||||
| Subsidiary |
Woori Asset Trust Co Ltd (*1) | 212,430 | ||||
| Subsidiary |
Woori Asset Management Corp (*2) | 41,376 | ||||
| Subsidiary |
Woori Savings Bank (*3) | 100,000 | ||||
| Subsidiary |
Woori Financial F&I Co., Ltd. (*4) | 120,000 | ||||
| (*1) | During the current period, the capital increase amount of 200,000 million Won was made. Afterward, the Company additionally acquired minority interests of 1.95%. |
| (*2) | The Company acquired interest (22.5%) of Woori Asset Management Corp to make it wholly owned subsidiary. |
| (*3) | During the current period, the capital increase amount of 100,000 million Won was made. |
| (*4) | During the current period, the capital increase amount of 120,000 million Won was made. |
| For the six-month period ended June 30, 2023 |
||||||
| Related parties |
Acquisition of interests | |||||
| Subsidiary |
Woori Asset Trust Co Ltd (*1) | 179,444 | ||||
| Subsidiary |
Woori Venture Partners Co., Ltd. (*2) | 222,008 | ||||
| (*1) | During the prior period, the Company additionally acquired 28.1% (excluding treasury stocks) interests of Woori Asset Trust Co Ltd on March 31, 2023. In the case of including treasury stocks, the share ratio was 21.3% |
| (*2) | During the prior period, the Company additionally acquired 53.9% (excluding treasury stocks) interests of Woori Venture Partners Co., Ltd., which was included in subsidiaries. In the case of including treasury stocks, the share ratio was 52.0%. Afterward, the Company additionally acquired treasury stocks held by Woori Venture Partners Co., Ltd. (3.5% interests) in May. |
| (6) | There are no guarantees provided to the related party. The unused commitments and payment guarantees provided from the related party are as follows (Unit: Korean Won in millions): |
| Related party |
June 30, 2024 | December 31, 2023 | Warranty | |||||||||||
| Subsidiary |
Woori Card Co., Ltd. | 19,116 | 715 | Unused loan commitment | ||||||||||
| (7) | Compensation for key management is as follows (Unit: Korean Won in millions): |
| For the six-month periods ended June 30 | ||||||||
| 2024 | 2023 | |||||||
| Short-term employee salaries |
2,582 | 2,722 | ||||||
| Retirement benefit service costs |
89 | 83 | ||||||
| Share-based compensation |
1,703 | 453 | ||||||
|
|
|
|
|
|||||
| Total |
4,374 | 3,258 | ||||||
|
|
|
|
|
|||||
Key management includes registered executives and non-registered executives. The Company has not recognized any outstanding assets, allowance and related impairment loss due to credit losses from transaction with key management as of June 30, 2024 and December 31, 2023. Liabilities related to key management compensation are 9,769 million Won and 10,457 million Won as of June 30, 2024 and December 31, 2023, respectively.
- 44 -
WOORI FINANCIAL GROUP INC.
NOTES TO SEPARATE INTERIM FINANCIAL STATEMENTS
AS OF JUNE 30, 2024 AND 2023 (UNAUDITED)
| 32. | LEASES |
| (1) | The future lease payments under the lease contracts are as follows (Unit: Korean Won in millions): |
| June 30, 2024 | December 31, 2023 | |||||||
| Lease payments: |
||||||||
| Within one year |
1,689 | 2,969 | ||||||
| After one year but within five years |
229 | 323 | ||||||
|
|
|
|
|
|||||
| Total |
1,918 | 3,292 | ||||||
|
|
|
|
|
|||||
| (2) | Total cash outflows from lease are as follows (Unit: Korean Won in millions): |
| For the six-month periods ended June 30 | ||||||||
| 2024 | 2023 | |||||||
| Cash outflows from lease |
1,556 | 1,684 | ||||||
| (3) | Details of lease payments that are not included in the measurement of lease liabilities due to the fact that they are short-term leases or leases for which the underlying asset is of low value are as follows (Unit: Korean Won in millions): |
| For the six-month periods ended June 30 | ||||||||
| 2024 | 2023 | |||||||
| Lease payments for which the underlying short-term lease payments |
— | 20 | ||||||
| asset is of low value |
58 | 75 | ||||||
| 33. | EVENTS AFTER THE REPORTING PERIOD |
| (1) | On May 3, 2024, Woori Investment Bank Co., Ltd. (dissolution company), the subsidiary of the Company, and Korea Foss Securities Co., Ltd. (surviving company) entered into a merger agreement. Accordingly, as of August 1, 2024, Woori Investment Bank Co., Ltd. merged with Korea Foss Securities Co., Ltd., and was added as a subsidiary of the holding company, and changed its name to Woori Investment Securities Co., Ltd. |
| (2) | On July 25, 2024, the Board of Directors has declared a quarterly dividend of 180 Won per share (133,657 million Won in total) and fixed record date as June 30, 2024. Dividends were paid in August 2024. |
- 45 -