UNITED STATES
SECURITIES AND EXCHANGE COMMISSION
Washington, D.C. 20549
FORM N-CSR
CERTIFIED SHAREHOLDER REPORT OF REGISTERED
MANAGEMENT
INVESTMENT COMPANIES
Investment Company Act file
number: 811-03364
EMPOWER FUNDS, INC.
(Exact name of registrant as specified in charter)
8515 E. Orchard Road, Greenwood Village, Colorado 80111
(Address of principal executive offices)
Jonathan
Kreider
President and Chief Executive Officer
Empower Funds,
Inc.
8515 E. Orchard Road
Greenwood Village, Colorado 80111
(Name and address of agent for service)
Registrant's telephone number, including area code: (866)
831-7129
Date of fiscal year end: December 31
Date of reporting period: December 31, 2022
Item 1. REPORTS TO STOCKHOLDERS
EMPOWER FUNDS, INC.
Empower High Yield Bond Fund (Formerly Great-West High Yield
Bond Fund)
(Institutional Class and Investor Class)
Annual Report
December 31, 2022
This report and the financial statements attached are
submitted for general information and are not authorized for distribution to prospective investors unless preceded or accompanied by an effective prospectus. Nothing herein is to be considered an offer of the sale of shares of the Fund. Such
offering is made only by the prospectus of the Fund, which includes details as to offering price and other information.
Management Discussion
The Fund’s sub-adviser is Putnam Investment Management,
LLC (“Putnam”)
Fund Performance
For the twelve-month period ended December 31, 2022, the
Fund (Investor Class shares) returned -11.80%, relative to a -10.48% return for the J.P. Morgan Developed High Yield Index, and a 12.72% return for its composite index (an 80% weighting to the ICE BofA U.S. High Yield Index and a 20% weighting to
the ICE BofA All U.S. Convertible Index), the Fund’s benchmark indexes.
Putnam
Commentary
The first quarter kicked off 2022
with significant news flow, leaving investors to consider what may come in the year ahead. Russia invaded Ukraine on February 24th, only adding to already troubling inflation, and the Federal Reserve (the “Fed”) began their hiking cycle
in March. These broader macro implications weighed significantly on risk assets. The S&P 500® Index and Dow Jones Industrial Average both ended the quarter down over 4%, while technology stocks fared significantly worse with the Nasdaq
closing the quarter down roughly 9%. Treasuries sold-off and the curve flattened as the Fed raised rates 25 basis points (“bps”) at their mid-March meeting, The 2s/10s U.S. Treasury curve ended the quarter flat and moved into marginally
negative territory as April began. In this environment, high yield posted negative returns for the quarter.
The second quarter closed out one of the weakest first
halves of a year in history. Ultimately, there was no place to hide as both equity and bond markets saw broad-based losses due to stubbornly high inflation, increasingly hawkish central bank rhetoric, and geopolitical tensions stemming from
Russia’s invasion of Ukraine. Similar to the first quarter, Treasury rates sold off and the curve flattened as the Fed raised rates by 50 bps at their May meeting and 75 bps at their June meeting, the largest rate hike since 1994. The 2s/10s
U.S. Treasury curve briefly inverted at the beginning of the quarter, but ultimately ended the quarter +6 bps. Higher interest rates and geopolitical tensions continued to weigh on the corporate credit market with high yield corporate spreads
widening 220 bps. As a result, high yield posted negative returns for the quarter.
The volatility experienced in the first half of the year
carried over to the third quarter, as markets moved in dramatic fashion. The first half of the quarter began on positive footing with market participants comforted by a belief that inflation had peaked, while markets began to price in the
probability of rate cuts in 2023. However, the sentiment began to shift following Fed Chair Powell’s comments at the Jackson Hole symposium in late August. Risk assets sold off once again and Treasury rates rose meaningfully across the curve
as the risk of a recession ratcheted up further. The Fed continued to hike at an aggressive pace, raising rates by 75 bps at their July and September meetings. Given the Fed’s continued hawkish rhetoric, Treasury rates sold-off significantly,
the curve flattened and inverted, and the 10-year reached above 4% intra-day for the first time since 2010. In this environment, high yield posted marginally negative returns for the quarter.
Fixed income markets eked out a modest gain in the fourth
quarter, as optimism grew that the pace of Fed policy tightening would slow into 2023. Optimism improved in early November when the September consumer price index report showed a larger than expected decline in the pace of inflation and the Fed
signaled it was considering slowing the pace of future interest rate hikes while measuring the impact of previous hikes. Meanwhile, the European Central Bank continued its hiking cycle, and the Bank of England also raised its benchmark rate. In
December, the Fed scaled back its monetary tightening with
a 50 bps rate hike after four 75 bps hikes. Still, Fed Chair Jerome Powell
noted that rate hikes would continue in 2023. Amid this backdrop most bond indices produced modest positive gains in the final quarter of the year. High yield corporate credit fared better in the quarter, as credit spreads tightened.
The U.S. high yield default rate (including distressed
exchanges) ended the year at 1.65% (+129 bps year-over-year). Total high yield new issue supply in 2022 only amounted to $106.5 billion (down almost 80%), while high yield funds reported an outflow of -$47 billion from the asset class. Given
expected further tightening of monetary policy and higher interest rates, volatility may continue in fixed income markets.
On an absolute basis, both the high yield and convertible
allocations generated negative returns but each outperformed their respective benchmarks on a gross basis. At the sector level, top contributors to relative returns included security selection within technology, diversified media, and services. On
the other hand, overweight positioning and security selection within broadcasting, plus underweight exposure and security selection within metals & mining and telecommunications, detracted from relative returns. At the issuer level, overweight
positioning to Antero Resources contributed to relative returns on the heels of rising oil prices throughout the first half of the year. Additionally, avoidance of Ligado Networks and overweight positioning to EQT contributed to relative returns. On
the other hand, positioning to Ford Motor was the largest detractor from relative returns due to declining auto sales and the negative impacts of continued inflation on the auto industry. Overweight positioning to Apollo Global Management (Embarq)
and Audacy detracted from relative returns as well.
The views and opinions in this report were current as of
December 31, 2022 and are subject to change at any time. They are not guarantees of performance or investment results and should not be taken as investment advice. Fund holdings are subject to change at any time. Fund returns are net of fees unless
otherwise noted.
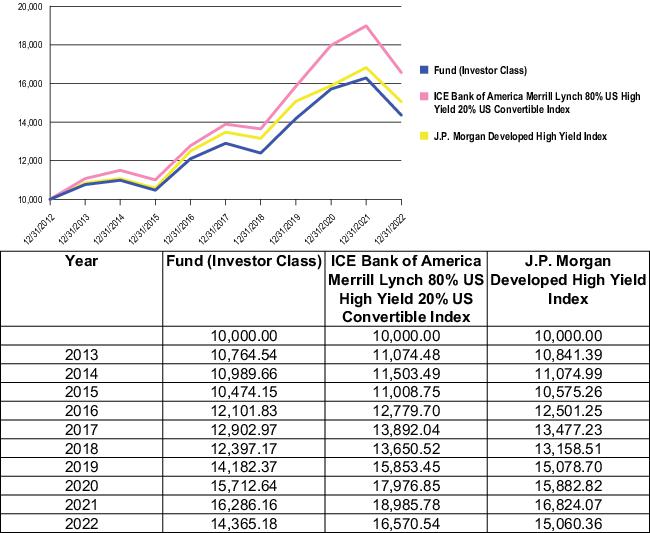
Growth of $10,000
(unaudited)
This graph compares the value of a
hypothetical $10,000 investment in the Fund over the past 10 fiscal year periods or since inception (for funds lacking 10-year records) with the performance of the Fund’s benchmark index. Results include the reinvestment of all dividends and
capital gains distributions. Past performance is no guarantee of future results. The graph does not reflect the deduction of taxes that a shareholder would pay on Fund distributions or the redemption of Fund shares. Performance does not include any
fees or expenses of variable insurance contracts, individual retirement accounts (“IRA(s)”), qualified retirement plans or college savings programs. If such fees and expenses were included, returns would be lower.
Note: Performance for the Institutional Class shares may vary
due to their differing fee structure. See returns table below.
Average Annual Total Returns for the Periods Ended December 31,
2022 (unaudited)
| |
One
Year |
Five
Year |
Ten
Year / Since
Inception(a) |
| Institutional
Class |
-11.61%
|
2.51%
|
3.43%
|
| Investor
Class |
-11.80%
|
2.17%
|
3.69%
|
| (a)
Institutional Class inception date was May 1, 2015. |
Results include the reinvestment of all dividends and
capital gains distributions. Past performance is no guarantee of future results. The table does not reflect the deduction of taxes that a shareholder would pay on Fund distributions or the redemption of Fund shares. Performance does not include any
fees or expenses of variable insurance contracts, IRAs, qualified retirement plans or college savings programs. If such fees and expenses were included, returns would be lower.
Summary of Investments by Ratings as of December 31, 2022
(unaudited)
| Rating
|
Percentage
of
Fund Investments |
| A3
|
0.24%
|
| Baa1
|
0.62
|
| Baa2
|
0.44
|
| Baa3
|
3.89
|
| Ba1
|
6.05
|
| Ba2
|
13.15
|
| Ba3
|
12.08
|
| B1
|
12.62
|
| B2
|
10.66
|
| B3
|
9.74
|
| CCC,
CC, C |
0.87
|
| Equities
|
3.38
|
| Not
Rated |
19.09
|
| Short
Term Investments |
7.17
|
| Total
|
100.00%
|
Shareholder Expense Example
(unaudited)
As a shareholder of the Fund, you incur
two types of costs: (1) transaction costs, and (2) ongoing costs, including management fees and other Fund expenses. This Example is intended to help you understand your ongoing costs (in dollars) of investing in the Fund and to compare these costs
with the ongoing costs of investing in other mutual funds.
The Example is based on an investment of $1,000 invested at
the beginning of the period and held for the entire period (July 1, 2022 to December 31, 2022).
Actual Expenses
The first row of the table below provides information about
actual account values and actual expenses. You may use the information in this row, together with the amount you invested, to estimate the expenses that you paid over the period. Simply divide your account value by $1,000 (for example, an $8,600
account value divided by $1,000 = 8.6), then multiply the result by the number in the first row under the heading entitled “Expenses Paid During Period” to estimate the expenses you paid on your account during this period.
Hypothetical Example for Comparison Purposes
The second row of the table below provides information
about hypothetical account values and hypothetical expenses based on the Fund’s actual expense ratio and an assumed rate of return of 5% per year before expenses, which is not the Fund’s actual return. The hypothetical account values and
expenses may not be used to estimate the actual ending account balance or expenses you paid for the period. You may use this information to compare the ongoing costs of investing in the Fund and other funds. To do so, compare this 5% hypothetical
example with the 5% hypothetical examples that appear in the shareholder reports of the other funds.
Please note that the expenses shown in the table are meant
to highlight your ongoing costs only and do not reflect any transactional costs. Therefore, the second row of the table is useful in comparing ongoing costs only, and will not help you determine the relative total costs of owning different funds. In
addition, if these transactional costs were included, your costs would have been higher.
| |
Beginning
Account Value |
|
Ending
Account Value |
|
Expenses
Paid
During Period* |
| |
(07/01/22)
|
|
(12/31/22)
|
|
(07/01/22
– 12/31/22) |
| Institutional
Class |
|
|
|
|
|
| Actual
|
$1,000.00
|
|
$1,031.72
|
|
$3.79
|
Hypothetical
(5% return before expenses) |
$1,000.00
|
|
$1,021.48
|
|
$3.77
|
| Investor
Class |
|
|
|
|
|
| Actual
|
$1,000.00
|
|
$1,031.99
|
|
$5.58
|
Hypothetical
(5% return before expenses) |
$1,000.00
|
|
$1,019.71
|
|
$5.55
|
| *
Expenses are equal to the Fund's annualized expense ratio of 0.74% for the Institutional Class shares and 1.09% for the Investor Class shares, multiplied by the average account value over the period, multiplied by 184/365 days to reflect the
one-half year period. Performance does not include any fees or expenses of variable insurance contracts, IRAs, qualified retirement plans or college savings programs, if applicable. If such fees or expenses
were included, returns would be lower. |
EMPOWER FUNDS, INC.
EMPOWER HIGH YIELD BOND FUND
Schedule of Investments
As of December 31, 2022
| Principal
Amount(a) |
|
Fair
Value |
| BANK
LOANS |
| $ 334,900
|
Adient
US LLC(b)
7.63%, 04/08/2028
1-mo. LIBOR + 3.24% |
$ 330,365
|
| 1,200,000
|
American
Airlines Inc(b)
8.99%, 04/20/2028
3-mo. LIBOR + 4.22% |
1,192,950
|
| |
Asurion
LLC(b) |
|
| 403,835
|
7.63%,07/31/2027
1-mo. LIBOR + 3.24% |
399,796
|
| 935,000
|
9.63%,01/20/2029
1-mo. LIBOR + 5.24% |
721,509
|
|
936,732 |
BMC
Software Inc(b)
8.13%, 10/02/2025
1-mo. LIBOR + 3.74% |
894,579 |
| 2,226,978
|
Brand
Industrial Services Inc(b)
8.03%, 06/21/2024
3-mo. LIBOR + 3.27% |
2,009,291
|
| |
Cengage
Learning Inc(b) |
|
| 759,263
|
9.87%,07/13/2026
6-mo. LIBOR + 2.68% |
681,167
|
| 460,007
|
9.87%,07/14/2026
6-mo. LIBOR + 2.67% |
412,692
|
| 995,273
|
Clarios
Global LP(b)
7.63%, 04/30/2026
1-mo. LIBOR + 3.24% |
952,228
|
| 1,285,431
|
Clear
Channel Outdoor Holdings Inc(b)
7.91%, 08/21/2026
3-mo. LIBOR + 3.14% |
1,164,279
|
| 741,910
|
CP
Atlas Buyer Inc(b)
7.88%, 11/23/2027
1-mo. LIBOR + 3.49% |
647,913
|
| 951,562
|
CQP
Holdco LP(b)
8.48%, 06/05/2028
3-mo. LIBOR + 3.71% |
946,011
|
| 292,050
|
Diamond
BC BV(b)
7.16%, 09/29/2028
3-mo. LIBOR + 2.40% |
281,974
|
| 1,673,068
|
DirectV
Financing LLC(b)
9.38%, 08/02/2027
1-mo. LIBOR + 4.99% |
1,622,615
|
| 715,000
|
Entercom
Media Corp \ CBS Radio(b)(c)
6.84%, 11/17/2024
1-mo. LIBOR + 2.45% |
504,075
|
| 138,600
|
Filtration
Group Corp(b)
7.88%, 10/21/2028
1-mo. LIBOR + 3.49% |
135,853
|
| 267,956
|
Garda
World Security Corp(b)
8.93%, 10/30/2026
3-mo. LIBOR + 4.16% |
260,084
|
| 304,423
|
GFL
Environmental Inc(b)
7.41%, 05/30/2025
3-mo. LIBOR + 2.65% |
304,233
|
| 330,750
|
Global
Medical Response Inc(b)
8.42%, 10/02/2025
1-mo. LIBOR + 4.03% |
231,250
|
| 676,782
|
Granite
US Holdings Corp(b)
8.75%, 09/30/2026
3-mo. LIBOR + 3.98% |
675,513
|
| Principal
Amount(a) |
|
Fair
Value |
| Bank
Loans — (continued) |
| $ 309,488
|
Greeneden
Holdings II LLC(b)
8.38%, 12/01/2027
1-mo. LIBOR + 3.99% |
$ 296,489
|
| |
iHeartCommunications
Inc(b) |
|
| 146,371
|
7.38%,05/01/2026
1-mo. LIBOR + 2.99% |
133,838
|
| 1,295,190
|
7.63%,05/01/2026
1-mo. LIBOR + 3.24% |
1,191,979
|
|
674,777 |
Klockner
Pentaplast of America Inc(b)
8.26%, 02/04/2026
6-mo. LIBOR + 3.12% |
596,335 |
|
916,304 |
LBM
Acquisition LLC(b)
7.12%, 12/17/2027
6-mo. LIBOR + 1.98% |
790,948 |
| 2,307,323
|
MajorDrive
Holdings IV LLC(b)
8.81%, 06/01/2028
3-mo. LIBOR + 4.04% |
2,163,115
|
| 1,913,095
|
Mauser
Packaging Solutions Holding Co(b)
7.37%, 04/03/2024
1-mo. LIBOR + 2.98% |
1,864,584
|
| 610,000
|
Neptune
Bidco US Inc(b)
5.50%, 04/11/2029
3-mo. SOFR + 0.91% |
547,475
|
| 975,150
|
Olympus
Water US Holding Corp(b)
8.50%, 11/09/2028
3-mo. LIBOR + 3.73% |
933,977
|
| 244,352
|
One
Call Corp(b)
9.88%, 04/22/2027
3-mo. LIBOR + 5.11% |
200,979
|
| 2,418,213
|
PECF
USS Intermediate Holding III Corp(b)
8.63%, 12/15/2028
1-mo. LIBOR + 4.24% |
2,009,131
|
| 2,340,899
|
PetsMart
LLC(b)
8.13%, 02/11/2028
1-mo. LIBOR + 3.74% |
2,289,692
|
| 529,650
|
Polaris
Newco LLC(b)
8.73%, 06/02/2028
3-mo. LIBOR + 3.96% |
482,171
|
| 852,841
|
Precisely
Software Inc(b)
8.36%, 04/24/2028
3-mo. LIBOR + 3.59% |
705,726
|
| 635,000
|
Proofpoint
Inc(b)
10.98%, 08/31/2029
3-mo. LIBOR + 6.21% |
607,484
|
| 2,426,539
|
Rocket
Software Inc(b)
8.63%, 11/28/2025
1-mo. LIBOR + 4.24% |
2,328,466
|
| 459,604
|
Starfruit
Finco BV(b)
7.16%, 10/01/2025
3-mo. LIBOR + 2.40% |
452,480
|
| 1,923,790
|
Terrier
Media Buyer Inc(b)
8.23%, 12/17/2026
3-mo. LIBOR + 3.46% |
1,797,026
|
| 775,000
|
TIBCO
Software Inc(b)
9.18%, 03/30/2029
3-mo. SOFR + 4.59% |
712,516
|
| |
UKG
Inc(b) |
|
| 727,151
|
7.00%,05/03/2026
3-mo. LIBOR + 2.23% |
689,521
|
See Notes to Financial Statements.
Annual Report - December 31, 2022
EMPOWER FUNDS, INC.
EMPOWER HIGH YIELD BOND FUND
Schedule of Investments
As of December 31, 2022
| Principal
Amount(a) |
|
Fair
Value |
| Bank
Loans — (continued) |
| $ 403,878
|
7.00%,05/04/2026
3-mo. LIBOR + 2.23% |
$ 383,684
|
| 1,243,161
|
United
AirLines Inc(b)
8.11%, 04/21/2028
3-mo. LIBOR + 3.34% |
1,223,478
|
|
486,906 |
Vertiv
Group Corp(b)
6.89%, 03/02/2027
1-mo. LIBOR + 2.50% |
468,890 |
|
313,630 |
White
Cap Buyer LLC(b)
8.07%, 10/19/2027
1-mo. SOFR + 3.71% |
302,697
|
TOTAL
BANK LOANS — 7.47%
(Cost $39,459,408) |
$
37,541,058 |
| CORPORATE
BONDS AND NOTES |
| Basic
Materials — 4.71% |
| 1,640,000
|
ArcelorMittal
SA
7.00%, 10/15/2039
|
1,664,338
|
| 140,000
|
ATI
Inc
5.88%, 12/01/2027
|
133,880
|
| 240,000
|
Avient
Corp(d)
7.13%, 08/01/2030
|
234,608
|
| 990,000
|
Axalta
Coating Systems LLC(d)(e)
3.38%, 02/15/2029
|
816,914
|
| 504,000
|
Big
River Steel LLC / BRS Finance Corp(d)
6.63%, 01/31/2029
|
480,174
|
| |
Celanese
US Holdings LLC |
|
| 490,000
|
6.17%,
07/15/2027 |
483,300
|
| 1,185,000
|
6.33%,
07/15/2029 |
1,151,395
|
| |
Commercial
Metals Co |
|
| 465,000
|
4.13%,
01/15/2030 |
411,458
|
| 1,410,000
|
4.38%,
03/15/2032 |
1,226,596
|
| |
Compass
Minerals International Inc(d) |
|
| 235,000
|
4.88%,
07/15/2024 |
225,894
|
| 1,015,000
|
6.75%,
12/01/2027 |
974,400
|
| 845,000
|
Constellium
SE(d)
5.63%, 06/15/2028
|
780,966
|
| 1,540,000
|
First
Quantum Minerals Ltd(d)
6.88%, 03/01/2026
|
1,458,413
|
| 1,550,000
|
Freeport-McMoRan
Inc
5.45%, 03/15/2043
|
1,398,162
|
| 1,010,000
|
Herens
Holdco SARL(d)
4.75%, 05/15/2028
|
754,884
|
| 700,000
|
Ingevity
Corp(d)
3.88%, 11/01/2028
|
601,906
|
| 990,000
|
Mercer
International Inc
5.13%, 02/01/2029
|
827,650
|
| |
Novelis
Corp(d) |
|
| 740,000
|
4.75%,
01/30/2030 |
656,058
|
| 1,180,000
|
3.88%,
08/15/2031 |
963,343
|
| 1,125,000
|
Olympus
Water US Holding Corp(d)
4.25%, 10/01/2028
|
913,335
|
| 1,725,000
|
SCIH
Salt Holdings Inc(d)
4.88%, 05/01/2028
|
1,480,179
|
| Principal
Amount(a) |
|
Fair
Value |
| Basic
Materials — (continued) |
| $1,815,000
|
Sylvamo
Corp(d)
7.00%, 09/01/2029
|
$
1,727,543 |
|
865,000 |
Trinseo
Materials Operating SCA / Trinseo Materials Finance Inc(d)
5.13%, 04/01/2029
|
560,278 |
| 1,125,000
|
Tronox
Inc(d)
4.63%, 03/15/2029
|
935,156 |
| |
WR
Grace Holdings LLC(d) |
|
| 1,080,000
|
5.63%,
10/01/2024 |
1,063,800
|
| 1,495,000
|
4.88%,
06/15/2027 |
1,324,764
|
|
500,000 |
5.63%,
08/15/2029 |
403,635
|
| |
|
23,653,029
|
| Communications
— 11.36% |
| 250,000
|
Altice
Financing SA(d)
5.00%, 01/15/2028
|
201,250
|
| |
Altice
France SA(d) |
|
| 665,000
|
5.50%,
01/15/2028 |
520,775
|
| 560,000
|
5.13%,
07/15/2029 |
419,856
|
| 2,140,000
|
5.50%,
10/15/2029 |
1,631,814
|
| 2,840,000
|
Arches
Buyer Inc(d)
4.25%, 06/01/2028
|
2,221,168
|
| |
CCO
Holdings LLC / CCO Holdings Capital Corp |
|
| 2,710,000
|
5.38%,
06/01/2029(d) |
2,450,572
|
| 1,540,000
|
4.75%,
03/01/2030(d) |
1,328,119
|
| 590,000
|
4.25%,
02/01/2031(d) |
473,248
|
| 1,665,000
|
4.50%,
05/01/2032 |
1,325,340
|
| 1,935,000
|
Clear
Channel Outdoor Holdings Inc(d)
5.13%, 08/15/2027
|
1,676,677
|
| 180,000
|
CommScope
Inc(d)
6.00%, 03/01/2026
|
166,120
|
| 2,660,000
|
CSC
Holdings LLC(d)
5.38%, 02/01/2028
|
2,144,625
|
| 1,215,000
|
Directv
Financing LLC / Directv Financing Co-Obligor Inc(d)
5.88%, 08/15/2027
|
1,087,012
|
| |
DISH
DBS Corp |
|
| 310,000
|
5.88%,
11/15/2024 |
288,063
|
| 520,000
|
7.75%,
07/01/2026 |
419,323
|
| 1,570,000
|
5.25%,
12/01/2026(d) |
1,322,466
|
| 810,000
|
5.75%,
12/01/2028(d) |
646,481
|
| 855,000
|
5.13%,
06/01/2029 |
551,569
|
| |
Frontier
Communications Holdings LLC(d) |
|
| 2,290,000
|
5.88%,
10/15/2027 |
2,126,425
|
| 1,160,000
|
8.75%,
05/15/2030 |
1,179,429
|
| 470,000
|
Gen
Digital Inc(d)
6.75%, 09/30/2027
|
460,600
|
| 2,515,000
|
Gray
Escrow II Inc(d)
5.38%, 11/15/2031
|
1,812,435
|
| |
iHeartCommunications
Inc |
|
| 252
|
8.38%,
05/01/2027(e) |
214
|
| 1,720,000
|
5.25%,
08/15/2027(d) |
1,456,983
|
| |
Level
3 Financing Inc(d) |
|
| 770,000
|
4.63%,
09/15/2027 |
641,025
|
| 1,570,000
|
4.25%,
07/01/2028 |
1,236,689
|
See Notes to Financial Statements.
Annual Report - December 31, 2022
EMPOWER FUNDS, INC.
EMPOWER HIGH YIELD BOND FUND
Schedule of Investments
As of December 31, 2022
| Principal
Amount(a) |
|
Fair
Value |
| Communications
— (continued) |
| $1,050,000
|
Lumen
Technologies Inc(d)(e)
4.50%, 01/15/2029
|
$ 724,722
|
| |
Match
Group Holdings II LLC(d) |
|
| 1,187,000
|
5.00%,
12/15/2027 |
1,092,040
|
| 910,000
|
4.63%,
06/01/2028 |
811,229
|
| 160,000
|
4.13%,
08/01/2030(e) |
130,619
|
| 1,410,000
|
3.63%,
10/01/2031(e) |
1,081,278
|
| 2,875,000
|
McGraw-Hill
Education Inc(d)
5.75%, 08/01/2028
|
2,416,064
|
| 325,000
|
Millennium
Escrow Corp(d)
6.63%, 08/01/2026
|
208,017
|
| |
Netflix
Inc |
|
| 45,000
|
5.88%,
02/15/2025 |
45,567
|
| 385,000
|
4.88%,
04/15/2028 |
371,751
|
| 1,330,000
|
5.88%,
11/15/2028 |
1,347,995
|
| |
News
Corp(d) |
|
| 1,240,000
|
3.88%,
05/15/2029 |
1,075,564
|
| 720,000
|
5.13%,
02/15/2032 |
655,200
|
| |
Scripps
Escrow II Inc(d) |
|
| 1,745,000
|
3.88%,
01/15/2029 |
1,400,363
|
| 480,000
|
5.38%,
01/15/2031(e) |
384,724
|
| |
Sirius
XM Radio Inc(d) |
|
| 2,415,000
|
4.00%,
07/15/2028 |
2,101,774
|
| 315,000
|
4.13%,
07/01/2030 |
259,941
|
| 1,810,000
|
3.88%,
09/01/2031 |
1,412,106
|
| 965,000
|
Spanish
Broadcasting System Inc(d)
9.75%, 03/01/2026
|
554,875
|
| 2,760,000
|
Sprint
Capital Corp
6.88%, 11/15/2028
|
2,864,714
|
| 1,260,000
|
Sprint
LLC
7.63%, 03/01/2026
|
1,325,906
|
| 1,479,000
|
T-Mobile
USA Inc
2.88%, 02/15/2031
|
1,222,139
|
| 1,250,000
|
Townsquare
Media Inc(d)
6.88%, 02/01/2026
|
1,109,377
|
| 1,335,000
|
TripAdvisor
Inc(d)
7.00%, 07/15/2025
|
1,319,027
|
| |
Univision
Communications Inc(d) |
|
| 990,000
|
6.63%,
06/01/2027 |
955,162
|
| 595,000
|
7.38%,
06/30/2030 |
568,642
|
| 1,310,000
|
Urban
One Inc(d)
7.38%, 02/01/2028
|
1,107,356
|
| 1,435,000
|
Virgin
Media Finance PLC(d)
5.00%, 07/15/2030
|
1,150,956
|
| 905,000
|
VZ
Secured Financing BV(d)
5.00%, 01/15/2032
|
735,422
|
| 940,000
|
Ziggo
Bond Co BV(d)
6.00%, 01/15/2027
|
874,595
|
| |
|
57,095,403
|
| Consumer,
Cyclical — 12.68% |
| |
1011778
BC Unlimited Liability Co / New Red Finance Inc(d) |
|
| 555,000
|
3.88%,
01/15/2028 |
496,473
|
| 260,000
|
4.38%,
01/15/2028 |
232,806
|
| 2,150,000
|
4.00%,
10/15/2030 |
1,741,092
|
| Principal
Amount(a) |
|
Fair
Value |
| Consumer,
Cyclical — (continued) |
| |
Allison
Transmission Inc(d) |
|
| $ 720,000
|
4.75%,
10/01/2027 |
$ 667,684
|
| 1,660,000
|
3.75%,
01/30/2031 |
1,365,350
|
| |
American
Airlines Inc / AAdvantage Loyalty IP Ltd(d) |
|
| 405,000
|
5.50%,
04/20/2026 |
389,467
|
| 405,000
|
5.75%,
04/20/2029 |
370,152
|
| |
American
Builders & Contractors Supply Co Inc(d) |
|
| 780,000
|
4.00%,
01/15/2028 |
695,916
|
| 835,000
|
3.88%,
11/15/2029 |
682,571
|
| |
Asbury
Automotive Group Inc(d) |
|
| 180,000
|
4.63%,
11/15/2029 |
151,675
|
| 90,000
|
5.00%,
02/15/2032 |
74,043
|
| |
Bath
& Body Works Inc |
|
| 47,000
|
9.38%,
07/01/2025(d) |
50,064
|
| 885,000
|
7.50%,
06/15/2029(e) |
873,672
|
| 900,000
|
6.63%,
10/01/2030(d) |
844,563
|
| 910,000
|
6.75%,
07/01/2036 |
799,799
|
| |
Beacon
Roofing Supply Inc(d) |
|
| 225,000
|
4.50%,
11/15/2026(e) |
210,168
|
| 740,000
|
4.13%,
05/15/2029 |
614,934
|
| |
Boyd
Gaming Corp |
|
| 635,000
|
4.75%,
12/01/2027(e) |
591,426
|
| 1,540,000
|
4.75%,
06/15/2031(d) |
1,339,800
|
| 1,960,000
|
Caesars
Resort Collection LLC / CRC Finco Inc(d)
5.75%, 07/01/2025
|
1,918,656
|
| |
Carnival
Corp(d) |
|
| 1,070,000
|
10.50%,
02/01/2026 |
1,075,093
|
| 1,210,000
|
5.75%,
03/01/2027 |
863,988
|
| 1,465,000
|
CDI
Escrow Issuer Inc(d)
5.75%, 04/01/2030
|
1,313,269
|
| |
Cinemark
USA Inc(d) |
|
| 75,000
|
8.75%,
05/01/2025 |
75,736
|
| 1,040,000
|
5.88%,
03/15/2026 |
866,275
|
| 971,000
|
Clarios
Global LP(d)
6.75%, 05/15/2025
|
973,244
|
| 1,440,000
|
Delta
Air Lines Inc / SkyMiles IP Ltd(d)
4.75%, 10/20/2028
|
1,353,561
|
| 860,000
|
Everi
Holdings Inc(d)
5.00%, 07/15/2029
|
738,711
|
| 1,205,000
|
Fertitta
Entertainment LLC / Fertitta Entertainment Finance Co Inc(d)
4.63%, 01/15/2029
|
1,019,713
|
| 1,070,000
|
Ford
Motor Co(e)
7.45%, 07/16/2031
|
1,093,660
|
| |
Ford
Motor Credit Co LLC |
|
| 1,000,000
|
5.13%,
06/16/2025 |
961,342
|
| 1,000,000
|
5.11%,
05/03/2029(e) |
905,545
|
| 8,410,000
|
4.00%,
11/13/2030 |
6,903,264
|
| 760,000
|
Hanesbrands
Inc(d)
4.63%, 05/15/2024
|
736,081
|
| 1,915,000
|
Hilton
Domestic Operating Co Inc
4.88%, 01/15/2030
|
1,735,392
|
See Notes to Financial Statements.
Annual Report - December 31, 2022
EMPOWER FUNDS, INC.
EMPOWER HIGH YIELD BOND FUND
Schedule of Investments
As of December 31, 2022
| Principal
Amount(a) |
|
Fair
Value |
| Consumer,
Cyclical — (continued) |
| $2,120,000
|
Hilton
Worldwide Finance LLC / Hilton Worldwide Finance Corp
4.88%, 04/01/2027
|
$
2,017,875 |
|
865,000 |
IRB
Holding Corp(d)
7.00%, 06/15/2025
|
862,838 |
|
115,000 |
KFC
Holding Co / Pizza Hut Holdings LLC / Taco Bell of America LLC(d)
4.75%, 06/01/2027
|
110,400 |
| 1,655,000
|
Kontoor
Brands Inc(d)
4.13%, 11/15/2029
|
1,350,662
|
| 2,190,000
|
Levi
Strauss & Co(d)
3.50%, 03/01/2031
|
1,738,181
|
| |
Live
Nation Entertainment Inc(d) |
|
| 985,000
|
5.63%,
03/15/2026 |
931,503
|
| 1,030,000
|
6.50%,
05/15/2027 |
1,007,907
|
| 70,000
|
4.75%,
10/15/2027(e) |
62,323
|
| |
Macy's
Retail Holdings LLC(d) |
|
| 110,000
|
5.88%,
03/15/2030 |
95,450
|
| 440,000
|
6.13%,
03/15/2032 |
369,833
|
| |
Mattel
Inc(d) |
|
| 80,000
|
3.38%,
04/01/2026 |
73,552
|
| 385,000
|
5.88%,
12/15/2027 |
377,647
|
| 1,410,000
|
3.75%,
04/01/2029 |
1,238,438
|
| 400,000
|
NCL
Corp Ltd(d)
5.88%, 02/15/2027
|
346,520
|
| |
Newell
Brands Inc |
|
| 220,000
|
4.88%,
06/01/2025 |
213,950
|
| 2,260,000
|
4.45%,
04/01/2026 |
2,126,197
|
| 1,245,000
|
Penn
Entertainment Inc(d)
5.63%, 01/15/2027
|
1,128,891
|
| 500,000
|
PetSmart
Inc / PetSmart Finance Corp(d)
4.75%, 02/15/2028
|
452,754
|
| 140,000
|
Raptor
Acquisition Corp / Raptor Co-Issuer LLC(d)
4.88%, 11/01/2026
|
124,376
|
| |
Royal
Caribbean Cruises Ltd(d) |
|
| 805,000
|
5.50%,
08/31/2026 |
677,206
|
| 230,000
|
9.25%,
01/15/2029 |
236,348
|
| |
Scotts
Miracle-Gro Co(e) |
|
| 750,000
|
4.50%,
10/15/2029 |
607,500
|
| 1,700,000
|
4.38%,
02/01/2032 |
1,281,290
|
| 2,060,000
|
Staples
Inc(d)
7.50%, 04/15/2026
|
1,773,001
|
| |
Station
Casinos LLC(d) |
|
| 1,225,000
|
4.50%,
02/15/2028 |
1,064,993
|
| 985,000
|
4.63%,
12/01/2031 |
790,141
|
| 1,130,000
|
Sugarhouse
HSP Gaming Prop Mezz LP / Sugarhouse HSP Gaming Finance Corp(d)
5.88%, 05/15/2025
|
1,054,830
|
| |
United
Airlines Inc(d) |
|
| 170,000
|
4.38%,
04/15/2026 |
157,577
|
| 375,000
|
4.63%,
04/15/2029 |
326,511
|
| 490,000
|
Univar
Solutions USA Inc(d)
5.13%, 12/01/2027
|
464,692
|
| 1,610,000
|
Victoria's
Secret & Co(d)(e)
4.63%, 07/15/2029
|
1,264,011
|
| Principal
Amount(a) |
|
Fair
Value |
| Consumer,
Cyclical — (continued) |
| $1,110,000
|
Wynn
Las Vegas LLC / Wynn Las Vegas Capital Corp(d)(e)
5.25%, 05/15/2027
|
$
1,001,743 |
| |
Wynn
Resorts Finance LLC / Wynn Resorts Capital Corp(d) |
|
| 115,000
|
7.75%,
04/15/2025 |
114,362
|
| 1,365,000
|
5.13%,
10/01/2029 |
1,169,982
|
| |
Yum!
Brands Inc |
|
| 2,115,000
|
4.75%,
01/15/2030(d) |
1,940,512
|
| 195,000
|
3.63%,
03/15/2031 |
163,508
|
| 305,000
|
5.38%,
04/01/2032(e) |
282,506
|
| |
|
63,725,195
|
| Consumer,
Non-Cyclical — 10.89% |
| 204,000
|
1375209
BC Ltd(d)
9.00%, 01/30/2028
|
198,645
|
| 325,000
|
180
Medical Inc(d)
3.88%, 10/15/2029
|
279,403
|
| 1,880,000
|
ADT
Security Corp(d)
4.13%, 08/01/2029
|
1,598,857
|
| |
Albertsons
Cos Inc / Safeway Inc / New Albertsons LP / Albertsons LLC(d) |
|
| 390,000
|
7.50%,
03/15/2026 |
398,245
|
| 2,705,000
|
4.88%,
02/15/2030 |
2,414,104
|
| 1,405,000
|
Allied
Universal Holdco LLC / Allied Universal Finance Corp / Atlas Luxco 4 SARL
4.63%, 06/01/2028(d) |
1,157,395
|
| |
Bausch
Health Cos Inc(d) |
|
| 1,125,000
|
6.13%,
02/01/2027 |
775,834
|
| 1,725,000
|
4.88%,
06/01/2028 |
1,097,172
|
| 363,000
|
11.00%,
09/30/2028 |
283,084
|
| 72,000
|
14.00%,
10/15/2030 |
42,743
|
| 1,545,000
|
Block
Inc(e)
3.50%, 06/01/2031
|
1,232,794
|
| 1,000,000
|
Carriage
Services Inc(d)
4.25%, 05/15/2029
|
794,098
|
| |
Centene
Corp |
|
| 925,000
|
4.63%,
12/15/2029 |
845,298
|
| 785,000
|
3.00%,
10/15/2030 |
643,503
|
| |
Charles
River Laboratories International Inc(d) |
|
| 395,000
|
3.75%,
03/15/2029 |
349,338
|
| 1,180,000
|
4.00%,
03/15/2031 |
1,020,700
|
| |
CHS
/ Community Health Systems Inc(d) |
|
| 210,000
|
8.00%,
03/15/2026 |
191,187
|
| 155,000
|
5.63%,
03/15/2027 |
132,906
|
| 2,415,000
|
6.00%,
01/15/2029 |
2,020,099
|
| 1,370,000
|
5.25%,
05/15/2030 |
1,033,031
|
| 1,245,000
|
Elanco
Animal Health Inc
6.40%, 08/28/2028
|
1,184,630
|
| 1,295,000
|
Garda
World Security Corp(d)
4.63%, 02/15/2027
|
1,143,459
|
| |
Gartner
Inc(d) |
|
| 1,140,000
|
3.63%,
06/15/2029 |
1,001,741
|
| 650,000
|
3.75%,
10/01/2030(e) |
560,279
|
See Notes to Financial Statements.
Annual Report - December 31, 2022
EMPOWER FUNDS, INC.
EMPOWER HIGH YIELD BOND FUND
Schedule of Investments
As of December 31, 2022
| Principal
Amount(a) |
|
Fair
Value |
| Consumer,
Non-Cyclical — (continued) |
| |
HCA
Inc |
|
| $ 855,000
|
5.38%,
09/01/2026 |
$ 845,490
|
| 630,000
|
5.63%,
09/01/2028 |
626,429
|
| 1,405,000
|
3.50%,
09/01/2030 |
1,211,779
|
| 1,475,000
|
Herc
Holdings Inc(d)
5.50%, 07/15/2027
|
1,375,806
|
| 2,190,000
|
Jazz
Securities Designated Activity Co(d)
4.38%, 01/15/2029
|
1,951,618
|
| |
Lamb
Weston Holdings Inc(d) |
|
| 975,000
|
4.88%,
05/15/2028 |
923,813
|
| 975,000
|
4.13%,
01/31/2030 |
861,120
|
| 2,415,000
|
Medline
Borrower LP(d)
3.88%, 04/01/2029
|
1,946,393
|
| 1,690,000
|
Neptune
Bidco US Inc(d)(e)
9.29%, 04/15/2029
|
1,592,825
|
| 1,825,000
|
NESCO
Holdings II Inc(d)
5.50%, 04/15/2029
|
1,596,875
|
| 255,000
|
Option
Care Health Inc(d)
4.38%, 10/31/2029
|
223,051
|
| |
Organon
& Co / Organon Foreign Debt Co-Issuer BV(d) |
|
| 1,255,000
|
4.13%,
04/30/2028 |
1,111,177
|
| 200,000
|
5.13%,
04/30/2031 |
173,176
|
| |
Owens
& Minor Inc(d) |
|
| 1,175,000
|
4.50%,
03/31/2029(e) |
936,828
|
| 1,260,000
|
6.63%,
04/01/2030 |
1,082,844
|
| |
Prime
Security Services Borrower LLC / Prime Finance Inc(d) |
|
| 200,000
|
3.38%,
08/31/2027 |
172,637
|
| 365,000
|
6.25%,
01/15/2028 |
332,208
|
| |
Sabre
GLBL Inc(d) |
|
| 1,240,000
|
9.25%,
04/15/2025 |
1,235,197
|
| 250,000
|
7.38%,
09/01/2025 |
240,260
|
| |
Service
Corp International |
|
| 290,000
|
7.50%,
04/01/2027 |
295,455
|
| 710,000
|
5.13%,
06/01/2029 |
665,643
|
| 145,000
|
3.38%,
08/15/2030 |
117,872
|
| 2,110,000
|
4.00%,
05/15/2031 |
1,777,096
|
| 1,150,000
|
Shift4
Payments LLC / Shift4 Payments Finance Sub Inc(d)
4.63%, 11/01/2026
|
1,086,509
|
| 965,000
|
Spectrum
Brands Inc(d)
5.00%, 10/01/2029
|
835,136
|
| |
Tenet
Healthcare Corp |
|
| 149,000
|
4.63%,
07/15/2024 |
145,313
|
| 1,230,000
|
4.88%,
01/01/2026(d) |
1,163,141
|
| 1,855,000
|
5.13%,
11/01/2027(d) |
1,725,595
|
| 3,010,000
|
4.25%,
06/01/2029(d) |
2,607,563
|
| 1,820,000
|
6.13%,
06/15/2030(d) |
1,734,096
|
| |
Teva
Pharmaceutical Finance Netherlands III BV |
|
| 245,000
|
6.00%,
04/15/2024 |
240,120
|
| 1,725,000
|
6.75%,
03/01/2028(e) |
1,681,875
|
| 2,015,000
|
5.13%,
05/09/2029(e) |
1,794,452
|
| |
|
54,707,937
|
| Principal
Amount(a) |
|
Fair
Value |
| Energy
— 12.71% |
| $ 345,000
|
Antero
Midstream Partners LP / Antero Midstream Finance Corp(d)
7.88%, 05/15/2026
|
$ 349,232
|
| 1,446,000
|
Antero
Resources Corp(d)
7.63%, 02/01/2029
|
1,453,962
|
| |
Apache
Corp |
|
| 1,045,000
|
4.38%,
10/15/2028 |
940,564
|
| 1,095,000
|
5.10%,
09/01/2040 |
907,440
|
| |
Buckeye
Partners LP |
|
| 805,000
|
3.95%,
12/01/2026 |
720,233
|
| 750,000
|
4.50%,
03/01/2028(d) |
659,247
|
| 445,000
|
5.85%,
11/15/2043 |
331,560
|
| 2,775,000
|
Callon
Petroleum Co(d)(e)
7.50%, 06/15/2030
|
2,539,125
|
| |
Cheniere
Energy Partners LP |
|
| 760,000
|
4.00%,
03/01/2031 |
647,034
|
| 570,000
|
3.25%,
01/31/2032 |
452,983
|
| 1,965,000
|
Chord
Energy Corp(d)
6.38%, 06/01/2026
|
1,913,772
|
| |
Comstock
Resources Inc(d) |
|
| 1,020,000
|
6.75%,
03/01/2029 |
920,550
|
| 665,000
|
5.88%,
01/15/2030 |
571,700
|
| |
Continental
Resources Inc |
|
| 520,000
|
4.50%,
04/15/2023 |
518,742
|
| 375,000
|
5.75%,
01/15/2031(d) |
349,073
|
| |
DCP
Midstream Operating LP |
|
| 485,000
|
5.63%,
07/15/2027 |
481,101
|
| 1,170,000
|
6.75%,
09/15/2037(d) |
1,179,346
|
| |
Devon
Energy Corp |
|
| 390,000
|
7.88%,
09/30/2031 |
440,090
|
| 275,000
|
7.95%,
04/15/2032 |
312,102
|
| 1,540,000
|
Encino
Acquisition Partners Holdings LLC(d)
8.50%, 05/01/2028
|
1,407,545
|
| 3,345,000
|
Endeavor
Energy Resources LP / EER Finance Inc(d)
5.75%, 01/30/2028
|
3,202,904
|
| 2,120,000
|
Energy
Transfer LP(f)
6.63%, Perpetual
|
1,574,100
|
| 2,110,000
|
EnLink
Midstream LLC(d)
5.63%, 01/15/2028
|
2,009,771
|
| 930,000
|
EQT
Corp(e)
7.00%, 02/01/2030
|
964,522
|
| |
Hess
Midstream Operations LP(d) |
|
| 1,010,000
|
5.63%,
02/15/2026 |
983,826
|
| 510,000
|
5.13%,
06/15/2028 |
471,595
|
| 1,240,000
|
4.25%,
02/15/2030 |
1,060,102
|
| 480,000
|
5.50%,
10/15/2030 |
439,131
|
| 1,610,000
|
Holly
Energy Partners LP / Holly Energy Finance Corp(d)
5.00%, 02/01/2028
|
1,465,915
|
| 100,000
|
Kinder
Morgan Inc
7.80%, 08/01/2031
|
111,514
|
| 1,315,000
|
Kinetik
Holdings LP(d)
5.88%, 06/15/2030
|
1,233,185
|
| 2,309,000
|
Nabors
Industries Inc(d)
9.00%, 02/01/2025
|
2,337,836
|
See Notes to Financial Statements.
Annual Report - December 31, 2022
EMPOWER FUNDS, INC.
EMPOWER HIGH YIELD BOND FUND
Schedule of Investments
As of December 31, 2022
| Principal
Amount(a) |
|
Fair
Value |
| Energy
— (continued) |
| |
Occidental
Petroleum Corp |
|
| $1,830,000
|
6.63%,
09/01/2030 |
$ 1,891,085
|
| 1,385,000
|
6.13%,
01/01/2031 |
1,397,728
|
| 4,460,000
|
6.45%,
09/15/2036 |
4,549,200
|
| 2,610,000
|
6.20%,
03/15/2040 |
2,554,135
|
| 1,145,000
|
Patterson-UTI
Energy Inc
5.15%, 11/15/2029
|
1,026,228
|
| |
Permian
Resources Operating LLC(d) |
|
| 502,000
|
5.38%,
01/15/2026 |
456,963
|
| 2,870,000
|
6.88%,
04/01/2027 |
2,704,223
|
| |
Precision
Drilling Corp(d) |
|
| 2,235,000
|
7.13%,
01/15/2026 |
2,162,362
|
| 105,000
|
6.88%,
01/15/2029 |
97,756
|
| 2,235,000
|
Rockcliff
Energy II LLC(d)
5.50%, 10/15/2029
|
2,044,913
|
| 225,000
|
Seventy
Seven Energy Inc(g)(h)(i)
6.63%, 11/15/2025
|
23
|
| |
SM
Energy Co |
|
| 865,000
|
5.63%,
06/01/2025 |
830,392
|
| 1,435,000
|
6.75%,
09/15/2026 |
1,393,170
|
| 210,000
|
6.50%,
07/15/2028(e) |
201,342
|
| |
Southwestern
Energy Co |
|
| 1,455,000
|
5.38%,
02/01/2029 |
1,348,872
|
| 1,690,000
|
5.38%,
03/15/2030 |
1,541,312
|
| 470,000
|
4.75%,
02/01/2032 |
401,657
|
| |
Tallgrass
Energy Partners LP / Tallgrass Energy Finance Corp(d) |
|
| 1,958,000
|
5.50%,
01/15/2028 |
1,736,433
|
| 315,000
|
6.00%,
12/31/2030 |
272,390
|
| |
USA
Compression Partners LP / USA Compression Finance Corp |
|
| 915,000
|
6.88%,
04/01/2026 |
877,750
|
| 390,000
|
6.88%,
09/01/2027 |
364,650
|
| |
Venture
Global Calcasieu Pass LLC(d) |
|
| 740,000
|
3.88%,
08/15/2029 |
647,500
|
| 1,945,000
|
3.88%,
11/01/2033 |
1,588,870
|
| 885,000
|
Viper
Energy Partners LP(d)
5.38%, 11/01/2027
|
840,317
|
| |
|
63,879,073
|
| Financial
— 5.07% |
| 345,000
|
AG
Issuer LLC(d)
6.25%, 03/01/2028
|
317,040
|
| 1,360,000
|
Alliant
Holdings Intermediate LLC / Alliant Holdings Co-Issuer(d)
4.25%, 10/15/2027
|
1,218,054
|
| |
Ally
Financial Inc |
|
| 110,000
|
5.75%,
11/20/2025 |
106,562
|
| 1,780,000
|
8.00%,
11/01/2031(e) |
1,837,576
|
| 655,000
|
AmWINS
Group Inc(d)
4.88%, 06/30/2029
|
555,536
|
| 1,275,000
|
Cobra
AcquisitionCo LLC(d)
6.38%, 11/01/2029
|
752,250
|
| Principal
Amount(a) |
|
Fair
Value |
| Financial
— (continued) |
| $ 200,000
|
Credit
Suisse Group AG(d)(f)
6.38%, Perpetual
|
$ 143,334
|
|
230,000 |
Dresdner
Funding Trust I(d)
8.15%, 06/30/2031
|
236,900 |
| |
Freedom
Mortgage Corp(d) |
|
| 330,000
|
8.13%,
11/15/2024 |
303,600
|
| 1,149,000
|
8.25%,
04/15/2025 |
1,033,499
|
| 730,000
|
6.63%,
01/15/2027 |
568,123
|
| |
goeasy
Ltd(d) |
|
| 130,000
|
5.38%,
12/01/2024 |
124,709
|
| 1,060,000
|
4.38%,
05/01/2026 |
938,100
|
| |
Icahn
Enterprises LP / Icahn Enterprises Finance Corp |
|
| 745,000
|
6.25%,
05/15/2026 |
715,868
|
| 2,505,000
|
5.25%,
05/15/2027 |
2,293,578
|
| 195,000
|
4.38%,
02/01/2029 |
164,902
|
| |
iStar
Inc REIT |
|
| 1,110,000
|
4.25%,
08/01/2025 |
1,087,716
|
| 2,120,000
|
5.50%,
02/15/2026 |
2,114,552
|
| |
Ladder
Capital Finance Holdings LLLP / Ladder Capital Finance Corp REIT(d) |
|
| 110,000
|
5.25%,
10/01/2025 |
103,349
|
| 1,270,000
|
4.25%,
02/01/2027 |
1,066,837
|
| 1,015,000
|
4.75%,
06/15/2029 |
819,470
|
| 393,000
|
Lloyds
Banking Group PLC(f)
7.50%, Perpetual
|
380,896
|
| |
Nationstar
Mortgage Holdings Inc(d) |
|
| 1,415,000
|
5.50%,
08/15/2028 |
1,153,807
|
| 1,170,000
|
5.75%,
11/15/2031 |
909,675
|
| |
OneMain
Finance Corp |
|
| 240,000
|
7.13%,
03/15/2026 |
228,211
|
| 1,190,000
|
6.63%,
01/15/2028 |
1,095,788
|
| 1,760,000
|
5.38%,
11/15/2029(e) |
1,439,505
|
| |
PennyMac
Financial Services Inc(d) |
|
| 380,000
|
5.38%,
10/15/2025 |
342,465
|
| 1,035,000
|
5.75%,
09/15/2031 |
820,770
|
| 1,515,000
|
PHH
Mortgage Corp(d)
7.88%, 03/15/2026
|
1,345,827
|
| 805,000
|
Realogy
Group LLC / Realogy Co-Issuer Corp(d)
5.75%, 01/15/2029
|
608,894
|
| 140,000
|
Service
Properties Trust REIT
7.50%, 09/15/2025
|
133,410
|
| |
Societe
Generale SA(d)(f) |
|
| 330,000
|
4.75%,
Perpetual(e) |
279,707
|
| 295,000
|
5.38%,
Perpetual |
238,990
|
| |
|
25,479,500
|
| Industrial
— 8.99% |
| |
Amsted
Industries Inc(d) |
|
| 320,000
|
5.63%,
07/01/2027 |
303,571
|
| 845,000
|
4.63%,
05/15/2030 |
720,362
|
See Notes to Financial Statements.
Annual Report - December 31, 2022
EMPOWER FUNDS, INC.
EMPOWER HIGH YIELD BOND FUND
Schedule of Investments
As of December 31, 2022
| Principal
Amount(a) |
|
Fair
Value |
| Industrial
— (continued) |
| |
Ardagh
Metal Packaging Finance USA LLC / Ardagh Metal Packaging Finance PLC(d)(e) |
|
| $ 275,000
|
3.25%,
09/01/2028 |
$ 233,597
|
| 1,765,000
|
4.00%,
09/01/2029 |
1,398,811
|
|
600,000 |
Ardagh
Packaging Finance PLC / Ardagh Holdings USA Inc(d)
4.13%, 08/15/2026
|
519,722 |
| 1,000,000
|
Ball
Corp
EUR, 1.50%, 03/15/2027
|
944,669 |
|
305,000 |
Berry
Global Inc(d)
5.63%, 07/15/2027
|
297,540 |
|
750,000 |
Boise
Cascade Co(d)
4.88%, 07/01/2030
|
652,783 |
| |
Bombardier
Inc(d) |
|
| 450,000
|
7.50%,
03/15/2025 |
445,641
|
| 1,780,000
|
7.88%,
04/15/2027(e) |
1,726,557
|
| |
Builders
FirstSource Inc(d) |
|
| 915,000
|
4.25%,
02/01/2032 |
741,816
|
| 425,000
|
6.38%,
06/15/2032 |
399,180
|
| 375,000
|
Camelot
Return Merger Sub Inc(d)
8.75%, 08/01/2028
|
344,111
|
| |
Chart
Industries Inc(d) |
|
| 765,000
|
7.50%,
01/01/2030 |
769,047
|
| 150,000
|
9.50%,
01/01/2031 |
153,842
|
| 1,630,000
|
Covanta
Holding Corp(d)
4.88%, 12/01/2029
|
1,335,410
|
| 666,000
|
Crown
Cork & Seal Co Inc
7.38%, 12/15/2026
|
685,654
|
| |
GFL
Environmental Inc(d) |
|
| 1,665,000
|
4.00%,
08/01/2028 |
1,423,575
|
| 670,000
|
3.50%,
09/01/2028 |
589,039
|
| 115,000
|
4.75%,
06/15/2029 |
100,654
|
| 1,175,000
|
Graphic
Packaging International LLC(d)
3.75%, 02/01/2030
|
998,725
|
| 1,855,000
|
Great
Lakes Dredge & Dock Corp(d)
5.25%, 06/01/2029
|
1,442,077
|
| 1,710,000
|
Howmet
Aerospace Inc
3.00%, 01/15/2029
|
1,453,500
|
| 2,500,000
|
Imola
Merger Corp(d)
4.75%, 05/15/2029
|
2,169,034
|
| 630,000
|
Intelligent
Packaging Ltd Finco Inc / Intelligent Packaging Ltd Co-Issuer LLC(d)
6.00%, 09/15/2028
|
507,761
|
| 700,000
|
JELD-WEN
Inc(d)(e)
4.88%, 12/15/2027
|
526,869
|
| 935,000
|
Louisiana-Pacific
Corp(d)
3.63%, 03/15/2029
|
807,696
|
| 1,690,000
|
Madison
IAQ LLC(d)
4.13%, 06/30/2028
|
1,413,229
|
| |
Masonite
International Corp(d) |
|
| 170,000
|
5.38%,
02/01/2028 |
157,184
|
| 1,440,000
|
3.50%,
02/15/2030 |
1,164,854
|
| Principal
Amount(a) |
|
Fair
Value |
| Industrial
— (continued) |
| |
Mauser
Packaging Solutions Holding Co(d) |
|
| $ 215,000
|
5.50%,
04/15/2024 |
$ 209,055
|
| 450,000
|
8.50%,
04/15/2024 |
440,981
|
|
495,000 |
MIWD
Holdco II LLC / MIWD Finance Corp(d)
5.50%, 02/01/2030
|
394,094 |
| 1,565,000
|
Roller
Bearing Co of America Inc(d)
4.38%, 10/15/2029
|
1,353,255
|
| |
Sensata
Technologies BV(d) |
|
| 2,560,000
|
4.00%,
04/15/2029 |
2,208,000
|
| 280,000
|
5.88%,
09/01/2030 |
265,363
|
| 1,285,000
|
Sensata
Technologies Inc(d)
3.75%, 02/15/2031
|
1,057,092
|
| |
Standard
Industries Inc(d) |
|
| 870,000
|
5.00%,
02/15/2027 |
802,778
|
| 1,250,000
|
4.75%,
01/15/2028 |
1,124,862
|
| 820,000
|
4.38%,
07/15/2030 |
668,238
|
| 590,000
|
3.38%,
01/15/2031 |
443,977
|
| 905,000
|
Terex
Corp(d)
5.00%, 05/15/2029
|
813,369
|
| 695,000
|
TK
Elevator Midco GmbH
EUR, 4.38%, 07/15/2027
|
658,181
|
| |
TransDigm
Inc |
|
| 1,255,000
|
6.25%,
03/15/2026(d) |
1,237,668
|
| 175,000
|
6.38%,
06/15/2026(e) |
170,267
|
| 1,135,000
|
5.50%,
11/15/2027 |
1,065,822
|
| 780,000
|
4.63%,
01/15/2029 |
685,831
|
| 2,775,000
|
4.88%,
05/01/2029 |
2,420,494
|
| 1,435,000
|
TTM
Technologies Inc(d)(e)
4.00%, 03/01/2029
|
1,230,577
|
| 2,080,000
|
Vertiv
Group Corp(d)
4.13%, 11/15/2028
|
1,768,000
|
| |
WESCO
Distribution Inc(d) |
|
| 460,000
|
7.13%,
06/15/2025 |
465,756
|
| 1,230,000
|
7.25%,
06/15/2028 |
1,245,958
|
| |
|
45,156,128
|
| Technology
— 2.63% |
| 1,195,000
|
Boxer
Parent Co Inc(d)
7.13%, 10/02/2025
|
1,162,151
|
| 1,065,000
|
CDW
LLC / CDW Finance Corp
3.25%, 02/15/2029
|
907,050
|
| 640,000
|
Central
Parent Inc / Central Merger Sub Inc(d)(e)
7.25%, 06/15/2029
|
625,998
|
| 1,195,000
|
Clarivate
Science Holdings Corp(d)
3.88%, 07/01/2028
|
1,035,343
|
| 2,005,000
|
Cloud
Software Group Holdings Inc(d)
6.50%, 03/31/2029
|
1,688,774
|
| 2,010,000
|
Crowdstrike
Holdings Inc
3.00%, 02/15/2029
|
1,695,967
|
| 1,835,000
|
NCR
Corp(d)
5.13%, 04/15/2029
|
1,534,653
|
| |
Twilio
Inc |
|
| 2,005,000
|
3.63%,
03/15/2029(e) |
1,628,862
|
See Notes to Financial Statements.
Annual Report - December 31, 2022
EMPOWER FUNDS, INC.
EMPOWER HIGH YIELD BOND FUND
Schedule of Investments
As of December 31, 2022
| Principal
Amount(a) |
|
Fair
Value |
| Technology
— (continued) |
| $ 410,000
|
3.88%,
03/15/2031 |
$ 325,276
|
| 3,135,000
|
ZoomInfo
Technologies LLC / ZoomInfo Finance Corp(d)
3.88%, 02/01/2029
|
2,634,599
|
| |
|
13,238,673
|
| Utilities
— 1.33% |
| |
Calpine
Corp(d) |
|
| 1,890,000
|
4.50%,
02/15/2028 |
1,685,839
|
| 470,000
|
4.63%,
02/01/2029 |
403,285
|
| 155,000
|
5.00%,
02/01/2031 |
130,030
|
| |
NRG
Energy Inc |
|
| 190,000
|
3.75%,
06/15/2024(d) |
182,996
|
| 196,000
|
6.63%,
01/15/2027 |
194,344
|
| 730,000
|
5.25%,
06/15/2029(d) |
644,400
|
| 1,365,000
|
3.88%,
02/15/2032(d) |
1,025,183
|
| 185,000
|
Pacific
Gas & Electric Co(h)
2.95%, 03/01/2026
|
169,553
|
| 390,000
|
Vistra
Corp(d)(f)
7.00%, Perpetual
|
354,874
|
| |
Vistra
Operations Co LLC(d) |
|
| 1,875,000
|
5.00%,
07/31/2027 |
1,740,175
|
| 190,000
|
4.30%,
07/15/2029 |
171,161
|
| |
|
6,701,840
|
TOTAL
CORPORATE BONDS AND NOTES — 70.37%
(Cost $399,420,487) |
$353,636,778
|
| CONVERTIBLE
BONDS |
| Communications
— 3.54% |
| 1,674,000
|
Airbnb
Inc(j)
6.70%, 03/15/2026
|
1,377,702
|
| 941,000
|
Booking
Holdings Inc(e)
0.75%, 05/01/2025
|
1,253,322
|
| |
DISH
Network Corp |
|
| 699,000
|
19.18%,
12/15/2025(j) |
445,962
|
| 696,000
|
3.38%,
08/15/2026 |
436,044
|
| 1,523,000
|
Etsy
Inc
0.25%, 06/15/2028
|
1,300,337
|
| 756,000
|
Fiverr
International Ltd(j)
8.46%, 11/01/2025
|
609,663
|
| |
Liberty
Media Corp |
|
| 370,000
|
1.38%,
10/15/2023 |
455,655
|
| 657,000
|
2.75%,
12/01/2049(d)(e) |
598,856
|
| 676,000
|
0.50%,
12/01/2050(d) |
674,145
|
| 773,000
|
Liberty
Media Corp / Liberty Formula One(d)
2.25%, 08/15/2027
|
738,601
|
| 924,000
|
Match
Group Financeco 2 Inc(d)
0.88%, 06/15/2026
|
818,318
|
| 1,733,000
|
Okta
Inc
0.38%, 06/15/2026
|
1,455,720
|
| 1,552,000
|
Palo
Alto Networks Inc
0.38%, 06/01/2025
|
2,291,528
|
| 877,000
|
Perficient
Inc
0.13%, 11/15/2026
|
677,482
|
| Principal
Amount(a) |
|
Fair
Value |
| Communications
— (continued) |
| $1,396,000
|
Snap
Inc(j)
9.96%, 05/01/2027
|
$ 975,106
|
|
765,000 |
Spotify
USA Inc(j)
7.55%, 03/15/2026
|
615,825 |
|
628,000 |
TechTarget
Inc(d)(j)
8.02%, 12/15/2026
|
476,652 |
| 1,319,000
|
Uber
Technologies Inc(e)(j)
6.33%, 12/15/2025
|
1,110,936
|
|
697,000 |
Upwork
Inc(e)
0.25%, 08/15/2026
|
522,652 |
|
663,000 |
Wayfair
Inc
0.63%, 10/01/2025
|
428,630 |
|
553,000 |
Zillow
Group Inc
2.75%, 05/15/2025
|
525,903
|
| |
|
17,789,039
|
| Consumer,
Cyclical — 2.38% |
| 458,000
|
Burlington
Stores Inc(e)
2.25%, 04/15/2025
|
526,700
|
| 984,000
|
Cheesecake
Factory Inc
0.38%, 06/15/2026
|
806,265
|
| 964,000
|
DraftKings
Holdings Inc(j)
11.84%, 03/15/2028
|
596,234
|
| 1,432,000
|
Ford
Motor Co(j)
1.87%, 03/15/2026
|
1,351,092
|
| 890,000
|
IMAX
Corp
0.50%, 04/01/2026
|
750,637
|
| 587,000
|
JetBlue
Airways Corp
0.50%, 04/01/2026
|
427,968
|
| 1,149,000
|
Liberty
TripAdvisor Holdings Inc(d)
0.50%, 06/30/2051
|
823,833
|
| 333,000
|
National
Vision Holdings Inc
2.50%, 05/15/2025
|
456,904
|
| |
NCL
Corp Ltd |
|
| 431,000
|
5.38%,
08/01/2025 |
434,664
|
| 1,094,000
|
2.50%,
02/15/2027(d) |
784,945
|
| 671,000
|
Patrick
Industries Inc
1.75%, 12/01/2028
|
543,510
|
| 557,000
|
Royal
Caribbean Cruises Ltd(d)
6.00%, 08/15/2025
|
699,592
|
| 1,187,000
|
Shake
Shack Inc(j)
10.05%, 03/01/2028
|
781,194
|
| 1,542,000
|
Southwest
Airlines Co(e)
1.25%, 05/01/2025
|
1,851,942
|
| 1,213,000
|
Vail
Resorts Inc(j)
2.60%, 01/01/2026
|
1,125,057
|
| |
|
11,960,537
|
| Consumer,
Non-Cyclical — 3.29% |
| 634,000
|
Alnylam
Pharmaceuticals Inc(d)
1.00%, 09/15/2027
|
686,305
|
| 442,000
|
Ascendis
Pharma A/S(d)
2.25%, 04/01/2028
|
452,180
|
| 722,000
|
Beauty
Health Co(d)(e)
1.25%, 10/01/2026
|
545,832
|
| |
Block
Inc |
|
| 547,000
|
0.13%,
03/01/2025 |
520,334
|
| 1,062,000
|
0.25%,
11/01/2027 |
800,482
|
See Notes to Financial Statements.
Annual Report - December 31, 2022
EMPOWER FUNDS, INC.
EMPOWER HIGH YIELD BOND FUND
Schedule of Investments
As of December 31, 2022
| Principal
Amount(a) |
|
Fair
Value |
| Consumer,
Non-Cyclical — (continued) |
| $ 707,000
|
Brookdale
Senior Living Inc
2.00%, 10/15/2026
|
$ 528,924
|
|
842,000 |
Chegg
Inc(j)
7.49%, 09/01/2026
|
660,465 |
|
532,000 |
CONMED
Corp(d)
2.25%, 06/15/2027
|
484,652 |
| 1,647,000
|
Dexcom
Inc(e)
0.25%, 11/15/2025
|
1,791,112
|
| 1,425,000
|
Exact
Sciences Corp
0.38%, 03/01/2028
|
1,116,915
|
|
333,000 |
Guardant
Health Inc(j)
12.47%, 11/15/2027
|
207,093 |
| |
Halozyme
Therapeutics Inc |
|
| 852,000
|
0.25%,
03/01/2027(e) |
824,843
|
| 192,000
|
1.00%,
08/15/2028(d) |
226,200
|
| 688,000
|
Innoviva
Inc
2.50%, 08/15/2025
|
700,728
|
| 544,000
|
Insmed
Inc
0.75%, 06/01/2028
|
448,800
|
| 497,000
|
Insulet
Corp
0.38%, 09/01/2026
|
701,764
|
| 928,000
|
Ironwood
Pharmaceuticals Inc
1.50%, 06/15/2026
|
1,012,100
|
| 634,000
|
Jazz
Investments I Ltd
2.00%, 06/15/2026
|
753,667
|
| 833,000
|
Lantheus
Holdings Inc(d)
2.63%, 12/15/2027
|
838,748
|
| 637,000
|
Pacira
BioSciences Inc
0.75%, 08/01/2025
|
573,698
|
| 126,000
|
Repligen
Corp
0.38%, 07/15/2024
|
201,991
|
| |
Sarepta
Therapeutics Inc |
|
| 231,000
|
1.50%,
11/15/2024 |
431,508
|
| 368,000
|
1.25%,
09/15/2027(d) |
424,120
|
| 860,000
|
Shift4
Payments Inc(j)
0.32%, 12/15/2025
|
851,937
|
| 975,000
|
Teladoc
Health Inc(e)
1.25%, 06/01/2027
|
748,990
|
| |
|
16,533,388
|
| Energy
— 1.06% |
| 746,000
|
Enphase
Energy Inc(j)
(2.80%), 03/01/2028
|
872,372
|
| 331,000
|
EQT
Corp
1.75%, 05/01/2026
|
768,582
|
| 775,000
|
NextEra
Energy Partners LP(d)(j)
0.21%, 11/15/2025
|
770,350
|
| 565,000
|
Northern
Oil & Gas Inc(d)
3.63%, 04/15/2029
|
607,375
|
| 620,000
|
Pioneer
Natural Resources Co
0.25%, 05/15/2025
|
1,445,840
|
| 699,000
|
SolarEdge
Technologies Inc(e)(j)
(7.18%), 09/15/2025
|
867,809
|
| |
|
5,332,328
|
| Financial
— 0.14% |
| 1,020,629
|
SoFi
Technologies Inc(d)(j)
12.16%, 10/15/2026
|
698,621
|
| Principal
Amount(a) |
|
Fair
Value |
| Industrial
— 0.44% |
| $ 701,000
|
Axon
Enterprise Inc(d)
0.50%, 12/15/2027
|
$ 694,691
|
| 1,043,000
|
John
Bean Technologies Corp
0.25%, 05/15/2026
|
895,415 |
|
505,000 |
Middleby
Corp
1.00%, 09/01/2025
|
593,628
|
| |
|
2,183,734
|
| Technology
— 3.37% |
|
822,000 |
3D
Systems Corp(j)
12.03%, 11/15/2026
|
560,604 |
| 1,145,000
|
Akamai
Technologies Inc
0.38%, 09/01/2027
|
1,102,635
|
| 1,142,000
|
Bentley
Systems Inc
0.38%, 07/01/2027
|
929,588
|
| |
Bill.com
Holdings Inc(j) |
|
| 486,000
|
(2.42%),
12/01/2025 |
497,178
|
| 627,000
|
6.23%,
04/01/2027 |
495,644
|
| 461,000
|
Box
Inc(j)
(7.81%), 01/15/2026
|
604,602
|
| 537,000
|
Ceridian
HCM Holding Inc
0.25%, 03/15/2026
|
470,681
|
| 1,109,000
|
Cloudflare
Inc(j)
6.26%, 08/15/2026
|
903,835
|
| 230,000
|
Confluent
Inc(j)
8.02%, 01/15/2027
|
173,650
|
| 802,000
|
CyberArk
Software Ltd(j)
(2.93%), 11/15/2024
|
848,654
|
| 579,000
|
Datadog
Inc
0.13%, 06/15/2025
|
631,834
|
| 540,000
|
DigitalOcean
Holdings Inc(j)
8.62%, 12/01/2026
|
403,650
|
| 702,000
|
Envestnet
Inc
0.75%, 08/15/2025
|
633,555
|
| 834,000
|
Everbridge
Inc(j)
5.55%, 03/15/2026
|
707,899
|
| 332,000
|
HubSpot
Inc
0.38%, 06/01/2025
|
409,024
|
| 531,000
|
Impinj
Inc
1.13%, 05/15/2027
|
637,200
|
| 803,000
|
Lumentum
Holdings Inc
0.50%, 12/15/2026
|
688,572
|
| 581,000
|
MongoDB
Inc
0.25%, 01/15/2026
|
681,222
|
| 694,000
|
ON
Semiconductor Corp(j)
(5.66%), 05/01/2027
|
919,550
|
| 959,000
|
RingCentral
Inc(j)
7.58%, 03/01/2025
|
823,541
|
| 1,498,000
|
Splunk
Inc(e)
1.13%, 06/15/2027
|
1,264,012
|
| 675,000
|
Tyler
Technologies Inc
0.25%, 03/15/2026
|
627,075
|
| 891,000
|
Unity
Software Inc(j)
8.67%, 11/15/2026
|
666,913
|
| 720,000
|
Wolfspeed
Inc(d)
1.88%, 12/01/2029
|
648,360
|
| 576,000
|
Zscaler
Inc
0.13%, 07/01/2025
|
604,800
|
| |
|
16,934,278
|
See Notes to Financial Statements.
Annual Report - December 31, 2022
EMPOWER FUNDS, INC.
EMPOWER HIGH YIELD BOND FUND
Schedule of Investments
As of December 31, 2022
| Principal
Amount(a) |
|
Fair
Value |
| Utilities
— 0.13% |
| $ 668,000
|
NRG
Energy Inc
2.75%, 06/01/2048
|
$ 660,318
|
TOTAL
CONVERTIBLE BONDS — 14.35%
(Cost $79,836,588) |
$
72,092,243 |
| Shares
|
|
|
| COMMON
STOCK |
| Communications
— 0.07% |
| 14,260
|
Frontier
Communications Parent Inc(k) |
363,345
|
| Consumer,
Cyclical — 0.04% |
| 5,800
|
Penn
Entertainment Inc(k) |
172,260
|
| Energy
— 0.20% |
| 32,575
|
Antero
Resources Corp(k) |
1,009,499
|
| Financial
— 0.06% |
| 9,069
|
OneMain
Holdings Inc |
302,088
|
| Utilities
— 0.01% |
| 338
|
Genon
Energy Inc(i)(k) |
56,481
|
TOTAL
COMMON STOCK — 0.38%
(Cost $1,874,649) |
$
1,903,673 |
| CONVERTIBLE
PREFERRED STOCK |
| Communications
— 0.30% |
| 1,337
|
2020
Cash Mandatory Exchangeable Trust 5.25%(d) |
1,529,555
|
| Consumer,
Cyclical — 0.11% |
| 5,026
|
Aptiv
PLC 5.50% |
539,635
|
| Consumer,
Non-Cyclical — 0.92% |
| 14,940
|
Becton
Dickinson & Co 6.00% |
748,494
|
| 11,921
|
Boston
Scientific Corp 5.50% |
1,369,156
|
| 1,286
|
Danaher
Corp 5.00%(e) |
1,745,521
|
| 9,052
|
Sabre
Corp 6.50% |
759,191
|
| |
|
4,622,362
|
| Financial
— 0.54% |
| 1,676
|
Bank
of America Corp 7.25% |
1,944,160
|
| 13,721
|
KKR
& Co Inc 6.00% |
787,174
|
| |
|
2,731,334
|
| Industrial
— 0.22% |
| 10,286
|
Chart
Industries Inc 6.75% |
520,472
|
| 5,824
|
RBC
Bearings Inc 5.00% |
598,881
|
| |
|
1,119,353
|
| Shares
|
|
Fair
Value |
| Utilities
— 1.03% |
| 11,878
|
AES
Corp 6.88% |
$ 1,213,219 |
| 9,490
|
American
Electric Power Co Inc 6.13%(e) |
492,721
|
| 46,404
|
NextEra
Energy Inc 5.28% |
2,346,186
|
| 7,628
|
PG&E
Corp 5.50% |
1,101,228
|
| |
|
5,153,354
|
TOTAL
CONVERTIBLE PREFERRED STOCK — 3.12%
(Cost $16,493,827) |
$
15,695,593 |
| RIGHTS
|
| Utilities
— 0.00%(l) |
| 18,138
|
Texas
Competitive Electric Holdings(i)(k) |
22,672
|
TOTAL
RIGHTS — 0.00%(l)
(Cost $20,531)— |
$
22,672 |
| WARRANTS
|
| Financial
— 0.00%(l) |
| 132
|
Guaranteed
Rate Inc(i)(k) |
7
|
TOTAL
WARRANTS — 0.00%(l)
(Cost $27,672) |
$
7 |
| GOVERNMENT
MONEY MARKET MUTUAL FUNDS |
| 2,243,000
|
Dreyfus
Institutional Preferred Government Plus Money Market Fund Class SL(m), 4.36%(n) |
2,243,000
|
TOTAL
GOVERNMENT MONEY MARKET MUTUAL FUNDS — 0.45%
(Cost $2,243,000) |
$
2,243,000 |
See Notes to Financial Statements.
Annual Report - December 31, 2022
EMPOWER FUNDS, INC.
EMPOWER HIGH YIELD BOND FUND
Schedule of Investments
As of December 31, 2022
| Principal
Amount |
|
Fair
Value |
| SHORT
TERM INVESTMENTS |
| U.S.
Treasury Bonds and Notes — 0.19% |
| $ 959,000
|
U.S.
Treasury Bills(j)
3.91%, 01/17/2023 |
$ 957,234
|
| Repurchase
Agreements — 7.23% |
| 8,857,742
|
Undivided
interest of 10.85% in a repurchase agreement (principal amount/value $81,850,151 with a maturity value of $81,889,257) with Credit Agricole Securities (USA) Inc, 4.30%, dated 12/31/22 to be repurchased at $8,857,742 on 1/3/23 collateralized by
Government National Mortgage Association securities, 3.00% - 4.00%, 11/20/48 - 8/20/52, with a value of $83,487,154.(m) |
8,857,742
|
| 9,167,774
|
Undivided
interest of 30.45% in a repurchase agreement (principal amount/value $30,227,575 with a maturity value of $30,242,017) with Bank of Montreal, 4.30%, dated 12/31/22 to be repurchased at $9,167,774 on 1/3/23 collateralized by Federal National
Mortgage Association securities, 1.50% - 6.50%, 8/1/36 - 12/1/52, with a value of $30,832,126.(m) |
9,167,774
|
| 9,167,774
|
Undivided
interest of 8.38% in a repurchase agreement (principal amount/value $109,701,194 with a maturity value of $109,753,607) with RBC Capital Markets Corp, 4.30%, dated 12/31/22 to be repurchased at $9,167,774 on 1/3/23 collateralized by various U.S.
Government Agency securities, 2.00% - 6.00%, 9/1/24 - 10/20/52, with a value of $111,895,218.(m) |
9,167,774
|
| Principal
Amount |
|
Fair
Value |
| Repurchase
Agreements — (continued) |
| $9,167,774
|
Undivided
interest of 8.44% in a repurchase agreement (principal amount/value $108,937,825 with a maturity value of $108,989,873) with Bank of America Securities Inc, 4.30%, dated 12/31/22 to be repurchased at $9,167,774 on 1/3/23 collateralized by Federal
National Mortgage Association securities, 1.50% - 6.50%, 5/1/37 - 5/1/58, with a value of $111,116,581.(m) |
$
9,167,774 |
| |
|
36,361,064
|
TOTAL
SHORT TERM INVESTMENTS — 7.42%
(Cost $37,318,298) |
$
37,318,298 |
TOTAL
INVESTMENTS — 103.56%
(Cost $576,694,460) |
$520,453,322
|
| OTHER
ASSETS & LIABILITIES, NET — (3.56)% |
$
(17,907,990) |
| TOTAL
NET ASSETS — 100.00% |
$502,545,332
|
See Notes to Financial Statements.
Annual Report - December 31, 2022
EMPOWER FUNDS, INC.
EMPOWER HIGH YIELD BOND FUND
Schedule of Investments
As of December 31, 2022
|
(a) |
Amount
is stated in U.S. dollars unless otherwise noted. |
|
(b) |
Adjustable
rate security; interest rate is subject to change. Interest rate shown reflects the rate in effect at December 31, 2022. |
|
(c) |
All
or a portion of this position has not settled as of December 31, 2022. The interest rate shown represents the stated spread over the LIBOR floor; the Fund will not accrue interest until the settlement date, at which point the LIBOR will be
established. |
|
(d) |
Represents
securities sold under Rule 144A, which are exempt from registration under the Securities Act of 1933, as amended. |
|
(e) |
All or a
portion of the security is on loan at December 31, 2022. |
|
(f) |
Security
has no contractual maturity date and pays an indefinite stream of interest. |
|
(g) |
Security
in bankruptcy. |
|
(h) |
Security
in default. |
|
(i) |
Security
is fair valued using significant unobservable inputs. |
|
(j) |
Zero
coupon bond; the interest rate shown is the effective yield on date of purchase. |
|
(k) |
Non-income
producing security. |
|
(l) |
Represents
less than 0.005% of net assets. |
|
(m) |
Collateral
received for securities on loan. |
|
(n) |
Rate
shown is the 7-day yield as of December 31, 2022. |
|
LIBOR |
London
Interbank Offered Rate is the interest rate banks charge each other for short-term loans. |
|
LP |
Limited
Partnership |
|
REIT |
Real
Estate Investment Trust |
|
SOFR |
Secured
Overnight Financing Rate is the secured interbank overnight interest rate and reference rate established as an alternative to LIBOR. |
At December 31, 2022, the Fund held the following
over-the-counter (OTC) forward foreign currency contracts:
| Counterparty
|
Currency
Purchased |
Quantity
of
Currency
Purchased |
Currency
Sold |
Quantity
of
Currency
Sold |
Settlement
Date |
Net
Unrealized
Depreciation |
| MS
|
USD
|
274,568
|
EUR
|
259,800
|
March
15, 2023 |
$(5,034)
|
| RBS
|
USD
|
312,852
|
EUR
|
295,900
|
March
15, 2023 |
(5,602)
|
| SSB
|
USD
|
975,491
|
EUR
|
923,600
|
March
15, 2023 |
(18,507)
|
| |
|
|
|
|
Net
Depreciation |
$(29,143)
|
| Counterparty
Abbreviations: |
|
| MS
|
Morgan
Stanley & Co LLC |
| RBS
|
Royal
Bank of Scotland |
| SSB
|
State
Street Bank |
| Currency
Abbreviations |
|
| EUR
|
Euro
Dollar |
| USD
|
U.S.
Dollar |
See Notes to Financial Statements.
Annual Report - December 31, 2022
EMPOWER FUNDS, INC.
Statement of Assets and Liabilities
As of December 31, 2022
| |
Empower
High Yield Bond Fund |
| ASSETS:
|
|
| Investments
in securities, fair value (including $37,041,882 of securities on loan)(a) |
$484,092,258
|
| Repurchase
agreements, fair value(b) |
36,361,064
|
| Cash
|
14,127,038
|
| Cash
pledged on centrally cleared swaps |
421,039
|
| Dividends
and interest receivable |
6,311,055
|
| Subscriptions
receivable |
465,191
|
| Receivable
for investments sold |
2,892,402
|
| Variation
margin on centrally cleared swaps |
3,591
|
| Total
Assets |
544,673,638
|
| LIABILITIES:
|
|
| Payable
for director fees |
8,131
|
| Payable
for investments purchased |
986,517
|
| Payable
for other accrued fees |
105,512
|
| Payable
for shareholder services fees |
92,030
|
| Payable
to investment adviser |
337,134
|
| Payable
upon return of securities loaned |
38,604,064
|
| Redemptions
payable |
1,965,775
|
| Unrealized
depreciation on forward foreign currency contracts |
29,143
|
| Total
Liabilities |
42,128,306
|
| NET
ASSETS |
$502,545,332
|
| NET
ASSETS REPRESENTED BY: |
|
| Capital
stock, $0.10 par value |
$6,383,235
|
| Paid-in
capital in excess of par |
576,857,076
|
| Undistributed/accumulated
deficit |
(80,694,979)
|
| NET
ASSETS |
$502,545,332
|
| NET
ASSETS BY CLASS |
|
| Investor
Class |
$277,799,433
|
| Institutional
Class |
$224,745,899
|
| CAPITAL
STOCK: |
|
| Authorized
|
|
| Investor
Class |
160,000,000
|
| Institutional
Class |
170,000,000
|
| Issued
and Outstanding |
|
| Investor
Class |
38,827,484
|
| Institutional
Class |
25,004,863
|
| NET
ASSET VALUE, REDEMPTION PRICE AND OFFERING PRICE PER SHARE: |
|
| Investor
Class |
$7.15
|
| Institutional
Class |
$8.99
|
|
(a) Cost of investments |
$540,333,396
|
|
(b) Cost of repurchase agreements |
$36,361,064
|
See Notes to Financial Statements.
Annual Report - December 31, 2022
EMPOWER FUNDS, INC.
Statement of Operations
For the fiscal year ended December 31, 2022
| |
Empower
High Yield Bond Fund |
| INVESTMENT
INCOME: |
|
| Interest
|
$20,110,005
|
| Income
from securities lending |
232,342
|
| Dividends
|
1,020,151
|
| Total
Income |
21,362,498
|
| EXPENSES:
|
|
| Management
fees |
3,872,790
|
| Shareholder
services fees – Investor Class |
1,032,049
|
| Audit
and tax fees |
72,012
|
| Custodian
fees |
50,729
|
| Directors
fees |
34,044
|
| Legal
fees |
10,169
|
| Pricing
fees |
65,774
|
| Registration
fees |
92,973
|
| Shareholder
report fees |
40,145
|
| Transfer
agent fees |
8,224
|
| Other
fees |
14,178
|
| Total
Expenses |
5,293,087
|
| Less
amount waived by investment adviser |
227,011
|
| Net
Expenses |
5,066,076
|
| NET
INVESTMENT INCOME |
16,296,422
|
| NET
REALIZED AND UNREALIZED GAIN (LOSS): |
|
| Net
realized loss on investments and foreign currency transactions |
(21,556,138)
|
| Net
realized gain on credit default swaps |
375,200
|
| Net
realized loss on forward foreign currency contracts |
(78,641)
|
| Net
Realized Loss |
(21,259,579)
|
| Net
change in unrealized depreciation on investments and foreign currency translations |
(67,714,788)
|
| Net
change in unrealized depreciation on forward foreign currency contracts |
(29,143)
|
| Net
Change in Unrealized Depreciation |
(67,743,931)
|
| Net
Realized and Unrealized Loss |
(89,003,510)
|
| NET
DECREASE IN NET ASSETS RESULTING FROM OPERATIONS |
$(72,707,088)
|
See Notes to Financial Statements.
Annual Report - December 31, 2022
EMPOWER FUNDS, INC.
Statement of Changes in Net Assets
For the fiscal years ended December 31, 2022 and December 31, 2021
| Empower
High Yield Bond Fund |
2022
|
|
2021
|
| OPERATIONS:
|
|
|
|
| Net
investment income |
$16,296,422
|
|
$9,880,366
|
| Net
realized gain (loss) |
(21,259,579)
|
|
11,530,766
|
| Net
change in unrealized depreciation |
(67,743,931)
|
|
(11,150,574)
|
| Net
Increase (Decrease) in Net Assets Resulting from Operations |
(72,707,088)
|
|
10,260,558
|
| DISTRIBUTIONS
TO SHAREHOLDERS: |
|
|
|
| From
net investment income and net realized gains |
|
|
|
| Investor
Class |
(9,777,391)
|
|
(3,584,474)
|
| Institutional
Class |
(6,704,062)
|
|
(6,165,544)
|
| From
Net Investment Income and Net Realized Gains |
(16,481,453)
|
|
(9,750,018)
|
| CAPITAL
SHARE TRANSACTIONS: |
|
|
|
| Shares
sold |
|
|
|
| Investor
Class |
191,879,707
|
|
297,794,960
|
| Institutional
Class |
24,697,577
|
|
62,281,345
|
| Shares
issued in reinvestment of distributions |
|
|
|
| Investor
Class |
9,777,391
|
|
3,584,474
|
| Institutional
Class |
6,704,062
|
|
6,165,544
|
| Shares
redeemed |
|
|
|
| Investor
Class |
(166,072,590)
|
|
(13,027,315)
|
| Institutional
Class |
(59,165,874)
|
|
(47,524,998)
|
| Net
Increase in Net Assets Resulting from Capital Share Transactions |
7,820,273
|
|
309,274,010
|
| Total
Increase (Decrease) in Net Assets |
(81,368,268)
|
|
309,784,550
|
| NET
ASSETS: |
|
|
|
| Beginning
of year |
583,913,600
|
|
274,129,050
|
| End
of year |
$502,545,332
|
|
$583,913,600
|
| CAPITAL
SHARE TRANSACTIONS - SHARES: |
|
|
|
| Shares
sold |
|
|
|
| Investor
Class |
25,308,433
|
|
34,896,051
|
| Institutional
Class |
2,573,983
|
|
5,949,315
|
| Shares
issued in reinvestment of distributions |
|
|
|
| Investor
Class |
1,364,405
|
|
426,606
|
| Institutional
Class |
746,178
|
|
590,148
|
| Shares
redeemed |
|
|
|
| Investor
Class |
(22,431,167)
|
|
(1,534,926)
|
| Institutional
Class |
(6,333,576)
|
|
(4,536,800)
|
| Net
Increase |
1,228,256
|
|
35,790,394
|
See Notes to Financial Statements.
Annual Report - December 31, 2022
EMPOWER FUNDS, INC.
EMPOWER HIGH YIELD BOND FUND
Financial Highlights
Selected data for a share of capital stock of the Fund throughout the periods
indicated.
| |
|
Income
(Loss) from Investment Operations: |
|
Less
Distributions: |
|
|
| |
Net
asset value,
beginning of year |
Net
investment
income(a) |
Net
realized
and unrealized
gain (loss) |
Total
from
investment
operations |
|
From
return
of capital |
From
net
investment
income |
From
net
realized
gains |
Total
Distributions |
Net
asset value,
end of year |
Total
Return (b)(c) |
| Investor
Class |
|
| 12/31/2022
|
$
8.40 |
0.21
|
(1.21)
|
(1.00)
|
|
-
|
(0.25)
|
-
|
(0.25)
|
$
7.15 |
(11.80%)
|
| 12/31/2021
|
$
8.36 |
0.16
|
0.14
|
0.30
|
|
-
|
(0.26)
|
-
|
(0.26)
|
$
8.40 |
3.65%
|
| 12/31/2020
|
$
7.84 |
0.26
|
0.57
|
0.83
|
|
-
|
(0.31)
|
-
|
(0.31)
|
$
8.36 |
10.79%
|
| 12/31/2019
|
$
7.23 |
0.34
|
0.69
|
1.03
|
|
(0.00)
(d) |
(0.42)
|
-
|
(0.42)
|
$
7.84 |
14.40%
|
| 12/31/2018
|
$
8.13 |
0.43
|
(0.74)
|
(0.31)
|
|
-
|
(0.59)
|
-
|
(0.59)
|
$
7.23 |
(3.92%)
|
| Institutional
Class |
|
| 12/31/2022
|
$10.47
|
0.30
|
(1.52)
|
(1.22)
|
|
-
|
(0.26)
|
-
|
(0.26)
|
$
8.99 |
(11.61%)
|
| 12/31/2021
|
$10.28
|
0.31
|
0.10
|
0.41
|
|
-
|
(0.22)
|
-
|
(0.22)
|
$10.47
|
4.03%
|
| 12/31/2020
|
$
9.56 |
0.35
|
0.71
|
1.06
|
|
-
|
(0.34)
|
-
|
(0.34)
|
$10.28
|
11.27%
|
| 12/31/2019
|
$
8.74 |
0.44
|
0.84
|
1.28
|
|
(0.00)
(d) |
(0.46)
|
-
|
(0.46)
|
$
9.56 |
14.73%
|
| 12/31/2018
|
$
9.69 |
0.55
|
(0.89)
|
(0.34)
|
|
-
|
(0.61)
|
-
|
(0.61)
|
$
8.74 |
(3.58%)
|
| |
Net
assets,
end of year
(000) |
Ratio
of expenses
to average net assets
(before reimbursement
and/or waiver, if applicable) |
Ratio
of expenses
to average net assets
(after reimbursement
and/or waiver, if applicable) |
|
Ratio
of net investment income
to average net assets
(after reimbursement
and/or waiver, if applicable) |
Portfolio
turnover
rate(e) |
| Supplemental
Data and Ratios |
| Investor
Class |
| 12/31/2022
|
$277,799
|
1.14%
|
1.09%
|
|
2.84%
|
49%
|
| 12/31/2021
|
$290,677
|
1.20%
|
1.10%
|
|
1.88%
|
58%
|
| 12/31/2020
|
$
6,675 |
1.56%
|
1.10%
|
|
3.37%
|
61%
|
| 12/31/2019
|
$
7,642 |
1.48%
|
1.10%
|
|
4.35%
|
64%
|
| 12/31/2018
|
$
8,299 |
1.39%
|
1.10%
|
|
5.41%
|
40%
|
| Institutional
Class |
| 12/31/2022
|
$224,746
|
0.76%
|
0.74%
|
|
3.13%
|
49%
|
| 12/31/2021
|
$293,237
|
0.78%
|
0.75%
|
|
2.94%
|
58%
|
| 12/31/2020
|
$267,454
|
0.79%
|
0.75%
|
|
3.71%
|
61%
|
| 12/31/2019
|
$262,043
|
0.78%
|
0.75%
|
|
4.66%
|
64%
|
| 12/31/2018
|
$239,618
|
0.79%
|
0.75%
|
|
5.76%
|
40%
|
|
(a) |
Per share
amounts are based upon average shares outstanding. |
|
(b) |
Total
return does not include any fees or expenses of variable insurance contracts, if applicable. If such fees or expenses were included, the return shown would have been lower. |
|
(c) |
Total
return shown net of expenses reimbursed and/or waived, if applicable. Without the expense reimbursement and/or waiver, the return shown would have been lower. |
|
(d) |
Amount was
less than $0.01 per share. |
|
(e) |
Portfolio
turnover is calculated at the Fund level. |
See Notes to Financial Statements.
Annual Report - December 31, 2022
EMPOWER FUNDS, INC.
EMPOWER HIGH YIELD BOND FUND
Notes to Financial Statements
1. ORGANIZATION AND SIGNIFICANT ACCOUNTING
POLICIES
Empower Funds, Inc. (Empower Funds), a
Maryland corporation, was organized on December 7, 1981 and is registered under the Investment Company Act of 1940 (the 1940 Act) as an open-end management investment company. Empower Funds presently consists of forty-five funds. Interests in the
Empower High Yield Bond Fund (the Fund) are included herein.
The
investment objective of the Fund is to seek to obtain high current income with capital appreciation as a secondary objective when consistent with the primary objective. The Fund is diversified as defined in the 1940 Act. The Fund is available as an
investment option to insurance company separate accounts for certain variable annuity contracts and variable life insurance policies, to individual retirement account custodians or trustees, to plan sponsors of qualified retirement plans, to college
savings programs, and to asset allocation funds that are a series of Empower Funds.
The Fund offers two share classes, referred to as Investor
Class and Institutional Class shares. All shares of the Fund represent an equal pro rata interest in the net assets of the class to which such shares belong, and have identical voting, dividend, liquidation and other rights and the same terms and
conditions, except for class specific expenses and exclusive rights to vote on matters affecting only individual classes. Income, expenses (other than those attributable to a specific class) and realized and unrealized gains and losses are
allocated daily to each class of shares based on the relative proportion of net assets represented by such class. Operating expenses directly attributable to a specific class are charged against operations of that class. Expenses incurred by Empower
Funds, which are not Fund specific, are allocated based on relative net assets or other appropriate allocation methods.
The preparation of financial statements in conformity with
accounting principles generally accepted in the United States of America (U.S. GAAP) requires management to make estimates and assumptions that affect the reported amounts of assets and liabilities and disclosure of contingent assets and liabilities
at the date of the financial statements and the reported amounts of revenue and expenses during the reporting period. Actual results could differ from those estimates. The Fund is also an investment company and accordingly follows the investment
company accounting and reporting guidance of the Financial Accounting Standards Board ("FASB") Accounting Standards Codification Topic 946, Financial Services - Investment Companies. The following is a summary of the significant accounting
policies of the Fund.
Security Valuation
The Board of Directors of the Fund has adopted policies and
procedures for the valuation of the Fund’s securities and assets, and has appointed the Fair Value Pricing Committee of the investment adviser, Empower Capital Management, LLC (ECM or the Adviser), to complete valuation determinations under
those policies and procedures. Effective September 8, 2022, pursuant to Rule 2a-5 under the 1940 Act, the Board of Directors approved the Adviser as the Fund’s valuation designee to make all fair value determinations with respect to the
Fund’s investments, subject to oversight by the Board of Directors.
The Fund generally values its securities based on market
prices determined at the close of regular trading on the New York Stock Exchange (NYSE) on each day the NYSE is open for trading. The net asset value (NAV) of each class of the Fund's shares is determined by dividing the net assets attributable to
each class of shares of the Fund by the number of issued and outstanding shares of each class of the Fund on each valuation date.
For securities that are traded on only one exchange, the
last sale price as of the close of business of that exchange will be used. If the closing price is not available, the current bid as of the close of business will be used. For securities traded on more than one exchange, or upon one or more
exchanges and in the over-the-counter (OTC) market, the last sale price as of the close of business on the market which the security is traded most extensively will be used. If the closing price is not available, the current bid as of the close of
business will be used. For securities that principally trade on the NASDAQ National Market System, the NASDAQ official closing price will be used.
For private equity securities that are not traded on an
exchange, an appropriate source, which may include the use of an internally developed or approved valuation model, a different external pricing vendor, or sourcing a price from a broker will be used. Valuation of these securities will be reviewed
regularly by the Fair Value Pricing Committee.
Annual Report - December 31, 2022
Short term securities purchased with less than 60 days
remaining until maturity and all U.S. Treasury Bills are valued on the basis of amortized cost, which has been determined to approximate fair value. Short term securities purchased with more than 60 days remaining until maturity are valued using
pricing services, or in the event a price is not available from a pricing service, may be priced using other methodologies approved by the Board of Directors, including model pricing or pricing on the basis of quotations from brokers or dealers, and
will continue to be priced until final maturity.
Fixed income investments, including bank loans, are valued
using evaluated bid prices from approved pricing services when available and appropriate based on the conditions of the market. If a price cannot be located from either the primary or secondary sources, or if the market is determined to be illiquid
or inactive, other appropriate sources, which may include the use of an internally developed valuation model, another external pricing vendor or sourcing a price from a broker, may be used.
Investments in shares of the underlying mutual funds are
valued at the net asset value as reported by the underlying mutual fund, which may be obtained from pricing services or other pricing sources.
Foreign equity securities are generally valued using an
adjusted systematic fair value price from an independent pricing service. Foreign exchange rates are determined at a time that corresponds to the closing of the NYSE.
For derivatives that are traded on an exchange, the last
sale price as of the close of business of the exchange will be used. For derivatives traded over-the-counter (OTC), independent pricing services will be utilized when possible. If a price cannot be located from the primary source, other appropriate
sources, which may include the use of an internally developed valuation model, another external pricing vendor or sourcing a price from a broker, may be used.
Independent pricing services are approved by the Board of
Directors and are utilized for all investment types when available. In some instances valuations from independent pricing services are not available or do not reflect events in the market between the time the market closed and the valuation time and
therefore fair valuation procedures are implemented. The fair value for some securities may be obtained from pricing services or other pricing sources. The inputs used by the pricing services are reviewed quarterly or when the pricing vendor issues
updates to its pricing methodologies. Broker quotes are analyzed through an internal review process, which includes a review of known market conditions and other relevant data. Developments that might trigger fair value pricing could be natural
disasters, government actions or fluctuations in domestic and foreign markets.
The following table provides examples of the inputs that are
commonly used for valuing particular classes of securities. These classifications are not exclusive, and any inputs may be used to value any other security class.
|
Class |
Inputs |
| Bank Loans
|
Broker quotes, Loan
Syndications and Trading Association daily marks, loan analytics and market news. |
| Corporate
Bonds and Notes |
Benchmark yields, reported
trades, broker/dealer quotes, issuer spreads, two-sided markets, benchmark securities, bids, evaluated bids, offers and reference data including market research publications. Inputs also may include observations of equity and credit default swap
curves related to issuer. |
| Convertible
Bonds, Convertible Preferred Stock |
Benchmark yields, reported
trades, broker/dealer quotes, issuer spreads, two-sided markets, benchmark securities, bids, evaluated bids, offers and reference data including market research publications. Inputs also may include exchange prices. |
| Common Stock
|
Exchange traded close price,
bids, evaluated bids, open and close price of the local exchange, exchange rates, fair values based on significant market movement and various index data. |
| Rights,
Warrants |
Exchange traded close price,
bids and evaluated bids. |
| Government
Money Market Mutual Funds |
Net asset value of underlying
mutual fund. |
| Short Term
Investments |
Maturity date, credit quality
and interest rates. |
| Forward
Foreign Currency Contracts |
Foreign
currency spot and forward rates. |
The Fund classifies its valuations into three levels based
upon the observability of inputs to the valuation of the Fund’s investments. The valuation levels are not necessarily an indication of the risk or liquidity associated with the underlying investment. Classification is based on the lowest level
of input significant to the fair value measurement. The three levels are defined as follows:
Annual Report - December 31, 2022
Level 1 – Unadjusted quoted prices for identical
securities in active markets.
Level 2 – Inputs
other than quoted prices included in Level 1 that are observable either directly or indirectly. These may include quoted prices for similar assets in active markets.
Level 3 – Unobservable inputs to the extent
observable inputs are not available and may include prices obtained from single broker quotes. Unobservable inputs reflect the Fund’s own assumptions and would be based on the best information available under the circumstances.
As of December 31, 2022, the inputs used to value the
Fund’s investments are detailed in the following table. More information regarding the sector classifications, as applicable, are included in the Schedule of Investments.
| |
Level
1 |
|
Level
2 |
|
Level
3 |
|
Total
|
| Assets
|
|
|
|
|
|
|
|
| Investments,
at fair value: |
|
|
|
|
|
|
|
| Bank
Loans |
$
— |
|
$
37,541,058 |
|
$
— |
|
$
37,541,058 |
| Corporate
Bonds and Notes |
—
|
|
353,636,755
|
|
23
|
|
353,636,778
|
| Convertible
Bonds |
—
|
|
72,092,243
|
|
—
|
|
72,092,243
|
| Common
Stock |
1,847,192
|
|
—
|
|
56,481
|
|
1,903,673
|
| Convertible
Preferred Stock |
|
|
|
|
|
|
|
| Communications
|
1,529,555
|
|
—
|
|
—
|
|
1,529,555
|
| Consumer,
Cyclical |
—
|
|
539,635
|
|
—
|
|
539,635
|
| Consumer,
Non-cyclical |
748,494
|
|
3,873,868
|
|
—
|
|
4,622,362
|
| Financial
|
1,944,160
|
|
787,174
|
|
—
|
|
2,731,334
|
| Industrial
|
—
|
|
1,119,353
|
|
—
|
|
1,119,353
|
| Utilities
|
—
|
|
5,153,354
|
|
—
|
|
5,153,354
|
| |
4,222,209
|
|
11,473,384
|
|
—
|
|
15,695,593
|
| Rights
|
—
|
|
—
|
|
22,672
|
|
22,672
|
| Warrants
|
—
|
|
—
|
|
7
|
|
7
|
| Government
Money Market Mutual Funds |
2,243,000
|
|
—
|
|
—
|
|
2,243,000
|
| Short
Term Investments |
—
|
|
37,318,298
|
|
—
|
|
37,318,298
|
| Total
Assets |
$
8,312,401 |
|
$
512,061,738 |
|
$
79,183 |
|
$
520,453,322 |
| Liabilities
|
|
|
|
|
|
|
|
| Other
Financial Investments: |
|
|
|
|
|
|
|
| Forward
Foreign Currency Contracts(a) |
—
|
|
(29,143)
|
|
—
|
|
(29,143)
|
| Total
Liabilities |
$
0 |
|
$
(29,143) |
|
$
— |
|
$
(29,143) |
|
(a) |
Forward
Foreign Currency Contracts are reported at the security’s unrealized appreciation/(depreciation), which represents the change in the contract’s value from trade date |
Repurchase Agreements
The Fund may engage in repurchase agreement transactions
with institutions that the Fund’s investment adviser has determined are creditworthy. The Fund will purchase securities at a specified price with an agreement to sell the securities to the same counterparty at a specified time, price and
interest rate. The Fund’s custodian and/or securities lending agent receives delivery of the underlying securities collateralizing a repurchase agreement. Collateral is at least equal to the value of the repurchase obligation including
interest. A repurchase agreement transaction involves certain risks in the event of default or insolvency of the counterparty. These risks include possible delays or restrictions upon a Fund’s ability to dispose of the underlying securities
and a possible decline in the value of the underlying securities during the period while the Fund seeks to assert its rights.
Foreign Currency
Translations and Transactions
The accounting
records of the Fund are maintained in U.S. dollars. Investment securities, and other assets and liabilities denominated in a foreign currency are translated into U.S. dollars at the current exchange rate. Purchases and sales of securities, income
receipts and expense payments are translated into U.S. dollars at the exchange rate on the dates of the transactions.
Annual Report - December 31, 2022
The Fund does not isolate the portion of the results of
operations resulting from changes in foreign exchange rates on investments from the fluctuations arising from changes in market prices of securities held. Such fluctuations are included with the net realized and unrealized gain or loss.
Net realized foreign exchange gains or losses arise from
sales of foreign currencies, currency gains or losses realized between the trade and settlement dates on securities transactions, and the difference between the amounts of dividends, interest, and foreign withholding taxes recorded by the Fund and
the U.S. dollar equivalent of the amounts actually received or paid. Net unrealized foreign exchange gains and losses arise from changes in the fair values of assets and liabilities, other than investments in securities at fiscal period end,
resulting from changes in exchange rates. These gains and losses are included in net realized gain or loss and change in net unrealized appreciation or depreciation on the Statement of Operations.
Security
Transactions
Security transactions are
accounted for on the date the security is purchased or sold (trade date). Realized gains and losses from investments sold are determined on a specific lot selection. Dividend income for the Fund is accrued as of the ex-dividend date and interest
income, including amortization of discounts and premiums, is recorded daily.
Federal Income Taxes
and Distributions to Shareholders
The Fund
intends to comply with provisions under Subchapter M of the Internal Revenue Code applicable to regulated investment companies and to distribute substantially all of its net taxable income, including any net realized gain on investments not offset
by capital loss carryforwards, if any, to shareholders. Therefore, no federal income or excise tax provision is required. The Fund files income tax returns in U.S. federal and applicable state jurisdictions. The statute of limitations on the
Fund’s tax return filings generally remains open for the three preceding fiscal reporting period ends. State tax returns may remain open for an additional fiscal year.
Distributions to shareholders from net investment income of
the Fund, if any, are declared and paid semi-annually. Capital gain distributions of the Fund, if any, are declared and paid at least annually. Distributions are reinvested in additional shares of the Fund at net asset value and are declared
separately for each class. Distributions are determined in accordance with income tax regulations, which may differ from U.S. generally accepted accounting principles.
The tax character of distributions paid during the years ended
December 31, 2022 and 2021 were as follows:
| |
2022
|
|
2021
|
| Ordinary
income |
$16,481,453
|
|
$9,750,018
|
| |
$16,481,453
|
|
$9,750,018
|
Net investment income (loss) and
net realized gain (loss) for federal income tax purposes may differ from those reported on the financial statements because of temporary and permanent book-tax basis differences. Book-tax differences may include but are not limited to the following:
wash sales, distribution adjustments, foreign currency adjustments and adjustments for real estate investment trusts.
Capital accounts within the financial statements are
adjusted for permanent book-tax differences, and are not adjusted for temporary book-tax differences which will reverse in a subsequent period. Accordingly, the Fund has reclassified $6,104 from Paid-in capital to Undistributed/accumulated earnings
for December 31, 2022. Net assets of the Fund were unaffected by the reclassifications.
Annual Report - December 31, 2022
The tax components of capital shown in the following table
represent distribution requirements the Fund must satisfy under the income tax regulations, losses the Fund may be able to offset against income and gains realized in future years and unrealized appreciation or depreciation for federal income tax
purposes. At December 31, 2022, the components of distributable earnings on a tax basis were as follows:
| Undistributed
net investment income |
$1,183,212
|
| Undistributed
long-term capital gains |
—
|
| Capital
loss carryforwards |
(18,306,695)
|
| Post-October
losses |
(6,468,432)
|
| Net
unrealized depreciation |
(57,103,064)
|
| Tax
composition of capital |
$(80,694,979)
|
At December 31, 2022, the Fund
had capital loss carryforwards available to offset future realized capital gains, if any, and thereby reduce future taxable gain distributions. Capital loss carryforwards with no expiration, if any, must be utilized prior to those with expiration
dates. During the year ended December 31, 2022, the Fund did not utilize any capital loss carryforwards. Details of the capital loss carryforwards as of December 31, 2022, were as follows:
| No
Expiration |
$(18,306,695)
|
| Total
|
(18,306,695)
|
The Fund has elected to defer to
the next fiscal year the following Post-October losses:
| Post-October
Ordinary Losses |
|
Post-October
Capital Losses |
| $(394,470)
|
|
$(6,073,962)
|
The aggregate cost of securities
and other investments and the composition of unrealized appreciation and depreciation for federal income tax purposes as of December 31, 2022 were as follows:
| Federal
tax cost of investments |
$577,527,243
|
| Gross
unrealized appreciation on investments |
4,326,196
|
| Gross
unrealized depreciation on investments |
(61,429,260)
|
| Net
unrealized depreciation on investments |
$(57,103,064)
|
2. DERIVATIVE FINANCIAL
INSTRUMENTS
The Fund's investment objective allows
the Fund to enter into various types of derivative contracts, including forward foreign currency contracts and credit default swaps. Derivatives are investments whose value is primarily derived from underlying assets, indices or reference
rates.
In pursuit of the Fund's investment objectives,
the Fund may seek to use derivatives to increase or decrease its exposure to the following market risks:
Foreign Exchange Risk - The risk that adverse fluctuations in
exchange rates between the U.S. Dollar and other currencies may cause the Fund to lose money on investments denominated in foreign currencies.
The Fund is also exposed to additional risks from investing
in derivatives, such as liquidity and counterparty credit risk. Liquidity risk is the risk that the Fund will be unable to sell or close out the derivative in the open market in a timely manner. Counterparty credit risk is the risk that the
counterparty will not be able to fulfill its obligations to the Fund. Investing in derivatives may also involve greater risks than investing directly in the underlying assets, such as losses in excess of any initial investment and collateral
received. In addition, there may be the risk that the change in value of the derivative contract does not correspond to the change in value of the underlying instrument.
The Fund is subject to enforceable master netting
agreements, or netting arrangements, with certain counterparties.These agreements govern the terms of certain transactions, and reduce the counterparty risk associated with relevant transactions by specifying offsetting mechanisms and collateral
posting arrangements, if any, at pre-arranged exposure levels. Collateral or margin requirements, if any, are set by the broker or exchange clearing house for exchanged traded derivatives while collateral terms are contract specific for OTC traded
derivatives.
Annual Report - December 31, 2022
Derivative counterparty credit risk is managed through an
evaluation of the creditworthiness of all potential counterparties. The Fund attempts to reduce its exposure to counterparty credit risk on OTC derivatives, whenever possible, by entering into International Swaps and Derivatives Association (ISDA)
master agreements with certain counterparties. These agreements contain various provisions, including but not limited to collateral requirements (if any), events of default, or early termination. OTC derivative assets and liabilities are presented
gross and not offset in the Statement of Assets and Liabilities. Early termination by the counterparty may result in an immediate payment by the Fund of any net liability owed to that counterparty under the ISDA agreement.
Forward Foreign
Currency Contracts
The Fund enters into OTC
forward foreign currency contracts (forward contracts) primarily to capture potential returns from changes in currency exchange rates or to reduce the risk of undesired currency exposure. A forward contract is a commitment to purchase or sell a
foreign currency at a future date at a negotiated rate.
Forward contracts are reported in a table following the
Schedule of Investments. The unrealized appreciation or depreciation is reported on the Statement of Assets and Liabilities and on the Statement of Operations within the net change in unrealized appreciation or depreciation. Upon the closing of such
contract the difference between the U.S. dollar cost of the original contract and the value of the foreign currency in U.S. dollars is recorded as net realized gain or loss on the Statement of Operations. The Fund held an average foreign currency
contracts notional amount of $435,221 in forward contracts for the reporting period.
Credit Default
Swaps
The Fund enters into credit default swap
contracts to gain exposure on individual names and/or baskets of securities. A credit default swap is an agreement between the Fund and a counterparty that enables the Fund to buy or sell protection against a credit event related to a particular
issuer. One party, acting as a protection buyer, makes periodic payments to the other party, a protection seller, in exchange for a promise by the protection seller to make a payment to the protection buyer if a negative credit event (such as a
delinquent payment or default) occurs with respect to a referenced bond or group of bonds. Credit default swaps may also be structured based on the debt of a basket of issuers, rather than a single issuer, and may be customized with respect to the
number of defaults event that triggers purchase or other factors (for example, the Nth default within a basket, or defaults by a particular combination of issuers within the basket, may trigger a payment obligation). These agreements may be
privately negotiated in the over-the-counter market (OTC credit default swaps) or may be executed on a registered exchange (centrally cleared credit default swaps).
Credit default swaps, if any, are reported in a table
following the Schedule of Investments. For centrally cleared credit default swaps, required initial margin deposits of cash or securities are pledged by the Fund. Subsequent payments, known as variation margin, are made or received by the Fund,
depending on fluctuations in the value of the centrally cleared credit default swaps. Such variation margin is accounted for as a payable or receivable on the Statement of Assets and Liabilities and settled daily until the contract is closed, at
which time the gains or losses are realized. Any upfront premiums paid or received upon entering into a swap are capitalized and amortized to income ratably over the term of the swap. Upfront premiums are disclosed as upfront premiums paid/received
in a table following the Schedule of Investments. The Fund accrues for the interim payments on swap contracts on a daily basis, with the net amount recorded within variation margin on the Statement of Assets and Liabilities. Upon the termination of
swap contracts, the net gain or loss is recorded as net realized gain or loss on credit default swaps on the Statement of Operations.
Credit default swaps may involve greater risks than if the
Fund had invested in the referenced obligation directly. The Fund held credit default swaps for 29 days in one month of the reporting period. For the reporting period, the Fund held an average notional amount of $0 in credit default swaps. As
of December 31, 2022, there were no credit default swaps held.
Derivative Financial
Instruments Categorized by Risk Exposure
Valuation of derivative investments as of December 31, 2022 is
as follows:
| |
|
Liability
Derivatives |
| Risk
Exposure |
|
Statement
of Assets and Liabilities Location |
|
Fair
Value |
| Foreign
exchange contracts (forwards) |
|
Unrealized
depreciation on forward foreign currency contracts |
|
$(29,143)
|
Annual Report - December 31, 2022
The effect of derivative investments for the year ended
December 31, 2022 is as follows:
| |
|
Realized
Gain or (Loss) |
|
Change
in Unrealized Appreciation or (Depreciation) |
| Risk
Exposure |
|
Statement
of Operations Location |
|
Statement
of Operations Location |
| Credit
contracts (swaps) |
|
Net
realized gain on credit default swaps |
$375,200
|
|
|
|
| Foreign
exchange contracts (forwards) |
|
Net
realized loss on forward foreign currency contracts |
$
(78,641) |
|
Net
change in unrealized depreciation on forward foreign currency contracts |
$(29,143)
|
3. OFFSETTING ASSETS
AND LIABILITIES
The Fund enters into derivative
transactions with several approved counterparties. Certain transactions are effected under agreements which include master netting arrangements which provide for the netting of payment obligations and/or netting in situations of counterparty
default. The following table summarizes the Fund's financial investments that are subject to an enforceable master netting arrangement at December 31, 2022.
| Investments:
|
Gross
Amount
Presented
in the Statement of
Assets and
Liabilities (a) |
Financial
Instruments
Available for
Offset |
Financial
Instruments
Collateral
Received |
Cash
Collateral
Pledged
(Received) |
Net
Amount |
| Derivative
Liabilities (forward contracts) |
$(29,143)
|
$—
|
$—
|
$—
|
$(29,143)
|
| (a)
OTC derivatives are reported gross on the Statement of Assets and Liabilities. |
| |
|
|
|
|
|
4. INVESTMENT ADVISORY AGREEMENT AND OTHER
TRANSACTIONS WITH AFFILIATES
Empower Funds entered
into an investment advisory agreement with ECM, a wholly-owned subsidiary of Empower Annuity Insurance Company of America (Empower of America). Effective April 29, 2022, as compensation for its services to Empower Funds, the Adviser receives monthly
compensation at the annual rate of 0.70% of the Fund’s average daily net assets up to $1 billion dollars, 0.65% of the Fund’s average daily net assets over $1 billion dollars and 0.60% of the Fund’s average daily net assets over $2
billion dollars. Certain administration and accounting services fees for the Fund are included in the investment advisory agreement. Prior to that date, as compensation for its services to Empower Funds, the Adviser received monthly compensation at
the annual rate of 0.72% of the Fund’s average daily net assets up to $1 billion dollars, 0.67% of the Fund’s average daily net assets over $1 billion dollars and 0.62% of the Fund’s average daily net assets over $2 billion
dollars. Certain administration and accounting services fees for the Fund are included in the investment advisory agreement.
Effective April 29, 2022, the Adviser contractually agreed
to waive fees or reimburse expenses that exceed an annual rate of 0.73% of the Fund’s average daily net assets attributable to each Class, including management fees and expenses paid directly by the Fund, excluding shareholder service fees and
certain extraordinary expenses (the “Expense Limit”). Prior to that date, the Adviser contractually agreed to waive fees or reimburse expenses that exceeded an annual rate of 0.75% of the Fund’s average daily net assets
attributable to each class. The agreement’s current term ends on April 30, 2023 and automatically renews for one-year unless terminated upon written notice within 90 days of the end of the current term or upon termination of the investment
advisory agreement. The amount waived or reimbursed, if any, is reflected in the Statement of Operations.
The Adviser is permitted upon approval by the Board of
Directors to recoup amounts waived or reimbursed by the Fund in future periods, not exceeding three years following the particular waiver/reimbursement, provided the total annual operating expenses of each Class of the Fund plus such recoupment do
not exceed the lesser of the Expense Limit that was in place at the time of the waiver/reimbursement or the Expense Limit in place at the time of recoupment. At December 31, 2022, the amounts subject to recoupment were as follows:
| Expires
December 31, 2023 |
|
Expires
December 31, 2024 |
|
Expires
December 31, 2025 |
|
Recoupment
of
Past Reimbursed Fees
by the Adviser |
| $130,578
|
|
$156,428
|
|
$227,011
|
|
$0
|
Annual Report - December 31, 2022
The Adviser and Empower Funds have entered into a
sub-advisory agreement with Putnam Investment Management, LLC (Putnam), an affiliate of the Adviser and Empower of America. The Adviser is responsible for compensating the Sub-Adviser for its services.
The Adviser is responsible for compensating Putnam, which
receives monthly compensation for its services at the annual rate of 0.35% of the average daily net asset value.
Empower Funds entered into a shareholder services agreement
with Empower Retirement, LLC (Empower), an affiliate of ECM and subsidiary of Empower of America. Pursuant to the shareholder services agreement, Empower provides various recordkeeping, administrative and shareholder services to shareholders and
receives from the Investor Class shares of the Fund a fee equal to 0.35% of the average daily net asset value of the share class.
Empower Financial Services, Inc. (the Distributor), is a
wholly-owned subsidiary of Empower of America and the principal underwriter to distribute and market the Fund.
Certain officers of Empower Funds are also directors and/or
officers of Empower of America or its subsidiaries. No officer or interested director of Empower Funds receives any compensation directly from Empower Funds. The total compensation paid to the independent directors with respect to all forty-five
funds for which they serve as directors was $1,258,500 for the fiscal year ended December 31, 2022.
5. PURCHASES AND SALES OF INVESTMENTS
For the year ended December 31, 2022, the aggregate cost of
purchases and proceeds from sales of investments (excluding all U.S. Government securities and short-term securities) were $288,339,801 and $247,017,896, respectively. For the same period, there were no purchases or sales of long-term U.S.
Government securities.
6. SECURITIES
LOANED
The Fund has entered into a securities lending
agreement with its custodian as securities lending agent. Under the terms of the agreement the Fund receives income after deductions of other amounts payable to the securities lending agent or to the borrower from lending transactions. In exchange
for such fees, the securities lending agent is authorized to loan securities on behalf of the Fund against receipt of cash collateral at least equal in value at all times to the value of the securities loaned plus accrued interest. The fair value of
the loaned securities is determined daily at the close of business of the Fund and necessary collateral adjustments are made between the Fund and its counterparties on the next business day through the delivery or receipt of additional collateral.
The Fund also continues to receive interest or dividends on the securities loaned. Cash collateral is invested in securities approved by the Board of Directors. The Fund bears the risk of any deficiency in the amount of collateral available for
return to a borrower due to a loss in an approved investment. As of December 31, 2022, the Fund had securities on loan valued at $37,041,882 and received collateral as reported on the Statement of Assets and Liabilities of $38,604,064 for such loan
which was invested in Repurchase Agreements collateralized by U.S. Government or U.S. Government Agency securities and Government Money Market Mutual Funds. The Repurchase Agreements can be jointly purchased with other lending agent clients and in
the event of a default by the counterparty, all lending agent clients would share ratably in the collateral.
Under the securities lending agreement, the collateral
pledged is, by definition, the securities loaned against the cash borrowed. The following table summarizes the cash collateral liability under the securities lending agreement by class of securities loaned as of December 31, 2022. Additional
information regarding the Fund's securities on loan is included in the Schedule of Investments.
| Security
lending transactions |
Total
(a) |
| Corporate
Bonds and Notes |
$26,227,809
|
| Convertible
Bonds |
10,412,441
|
| Convertible
Preferred Stock |
1,963,814
|
| Total
secured borrowings |
$38,604,064
|
|
(a) |
The
remaining contractual maturity of all of the securities lending transactions is overnight and continuous. |
Annual Report - December 31, 2022
7. INDEMNIFICATIONS
The Fund’s organizational documents provide current
and former officers and directors with a limited indemnification against liabilities arising in connection with the performance of their duties to the Fund. In the normal course of business, the Fund may also enter into contracts that provide
general indemnifications. The Fund’s maximum exposure under these arrangements is unknown as this would be dependent on future claims that may be made against the Fund. The risk of material loss from such claims is considered remote.
8. SUBSEQUENT EVENTS
Management has reviewed all events subsequent to December
31, 2022, including the estimates inherent in the process of preparing these financial statements through the date the financial statements were issued. No subsequent events requiring adjustments or disclosures have occurred.
Annual Report - December 31, 2022
REPORT OF INDEPENDENT REGISTERED PUBLIC ACCOUNTING FIRM
To the Shareholders and the Board of Directors of Empower
Funds, Inc.
Opinion on the Financial Statements and
Financial Highlights
We have audited the accompanying
statement of assets and liabilities, including the schedule of investments, of the Empower High Yield Bond Fund (the “Fund”), one of the funds of Empower Funds, Inc., as of December 31, 2022, the related statement of operations for the
year then ended, the statements of changes in net assets for each of the two years in the period then ended, the financial highlights for each of the five years in the period then ended, and the related notes. In our opinion, the financial
statements and financial highlights present fairly, in all material respects, the financial position of the Fund as of December 31, 2022, and the results of its operations for the year then ended, the changes in its net assets for each of the two
years in the period then ended, and the financial highlights for each of the five years in the period then ended in conformity with accounting principles generally accepted in the United States of America.
Basis for Opinion
These financial statements and financial highlights are the
responsibility of the Fund's management. Our responsibility is to express an opinion on the Fund's financial statements and financial highlights based on our audits. We are a public accounting firm registered with the Public Company Accounting
Oversight Board (United States) (PCAOB) and are required to be independent with respect to the Fund in accordance with the U.S. federal securities laws and the applicable rules and regulations of the Securities and Exchange Commission and the
PCAOB.
We conducted our audits in accordance with the
standards of the PCAOB. Those standards require that we plan and perform the audit to obtain reasonable assurance about whether the financial statements and financial highlights are free of material misstatement, whether due to error or fraud. The
Fund is not required to have, nor were we engaged to perform, an audit of its internal control over financial reporting. As part of our audits we are required to obtain an understanding of internal control over financial reporting but not for the
purpose of expressing an opinion on the effectiveness of the Fund’s internal control over financial reporting. Accordingly, we express no such opinion.
Our audits included performing procedures to assess the
risks of material misstatement of the financial statements and financial highlights, whether due to error or fraud, and performing procedures that respond to those risks. Such procedures included examining, on a test basis, evidence regarding the
amounts and disclosures in the financial statements and financial highlights. Our audits also included evaluating the accounting principles used and significant estimates made by management, as well as evaluating the overall presentation of the
financial statements and financial highlights. Our procedures included confirmation of securities owned as of December 31, 2022, by correspondence with the custodian, agent banks, and brokers; when replies were not received from agent banks or
brokers, we performed other auditing procedures. We believe that our audits provide a reasonable basis for our opinion.
DELOITTE & TOUCHE LLP
Denver, Colorado
February 23, 2023
We have served as the auditor of one or more Empower
investment companies since 1982.
TAX INFORMATION (unaudited)
Dividends paid by the Fund from net investment income and
distributions of net realized short-term capital gains are, for federal income tax purposes, taxable as ordinary income to shareholders. Of the ordinary income distributions declared for the year ended December 31, 2022, 14% qualifies for the
dividend received deduction available to the Fund’s corporate shareholders.
Fund Directors and Officers
Empower Funds is organized under Maryland law, and is
governed by the Board of Directors. The following table provides information about each of the Directors and executive officers of Empower Funds.
| Independent
Directors* |
Name,
Address,
and Age |
Positions(s)
Held with
Empower
Funds |
Term
of Office
and Length of
Time Served** |
Principal
Occupation(s)
During Past 5 Years |
Number
of
Funds in Fund
Complex
Overseen by
Director |
Other
Directorships
Held by Director |
Gail
H. Klapper
8515 East Orchard Road,
Greenwood Village, CO
80111
79 |
Chair
&
Independent Director |
Since
2016 (as Chair)
Since 2007 (as Independent Director) |
Managing
Attorney, Klapper Law Firm; Member/Director, The Colorado Forum; Director, Gold, Inc; Member, Colorado State Fair Board Authority; Manager, 6K Ranch, LLC; and former Director, Guaranty Bancorp |
45
|
N/A
|
James
A. Hillary***
8515 East Orchard Road,
Greenwood Village, CO
80111
59 |
Independent
Director |
Since
2017 |
Principal
and Founding Partner, Fios Capital, LLC; Member, Fios Partners LLC, Fios Holdings LLC; Sole Member, Fios Companies LLC, Resolute Capital Asset Partners LLC; Manager, Applejack Holdings, LLC; and Manager and Member, Prestige Land Holdings, LLC |
45
|
N/A
|
R.
Timothy Hudner****
8515 East Orchard Road,
Greenwood Village, CO
80111
63 |
Independent
Director |
Since
2017 |
Director,
Colorado State Housing Board; and former Director, Grand Junction Housing Authority; Counseling and Education Center |
45
|
N/A
|
Steven
A. Lake
8515 East Orchard Road,
Greenwood Village, CO
80111
68 |
Independent
Director |
Since
2017 |
Managing
Member, Lake Advisors, LLC; Member, Gart Capital Partners, LLC; and Executive Member, Sage Enterprise Holdings, LLC |
45
|
N/A
|
| Independent
Directors* |
Name,
Address,
and Age |
Positions(s)
Held with
Empower
Funds |
Term
of Office
and Length of
Time Served** |
Principal
Occupation(s)
During Past 5 Years |
Number
of
Funds in Fund
Complex
Overseen by
Director |
Other
Directorships
Held by Director |
Stephen
G. McConahey
8515 East Orchard Road,
Greenwood Village, CO
80111
79 |
Independent
Director & Audit Committee Chair |
Since
2011 (as
Independent Director)
Since 2015 (as
Audit Committee Chair) |
Chairman,
SGM Capital, LLC; Partner, Iron Gate Capital, LLC; Director, The IMA Financial Group, Inc.; and former Director, Guaranty Bancorp |
45
|
N/A
|
| Interested
Director***** |
Name,
Address,
and Age |
Positions(s)
Held
with Empower
Funds |
Term
of Office
and Length of
Time Served |
Principal
Occupation(s)
During Past 5 Years |
Number
of Funds
in Fund Complex
Overseen by
Director |
Other
Directorships
Held by Director |
Jonathan
D. Kreider
8515 East Orchard Road,
Greenwood Village, CO
80111
39 |
Director,
President &
Chief Executive Officer |
Since
2020 |
Senior
Vice President & Head of Empower Investments, Empower, Empower of America and Empower Life & Annuity Insurance Company of New York (“Empower of NY”); President, Chief Executive Officer & Manager, ECM; formerly, Vice
President, Empower Funds Investment Products and Empower Advisory Group, LLC (“EAG”) |
45
|
N/A
|
| Officers
|
Name,
Address,
and Age |
Positions(s)
Held with
Empower Funds |
Term
of Office
and Length of
Time Served |
Principal
Occupation(s)
During Past 5 Years |
Number
of
Fund in Fund
Complex
Overseen by
Director |
Other
Directorships
Held by Director |
Jonathan
D. Kreider
8515 East Orchard Road,
Greenwood Village, CO
80111
39 |
Director,
President &
Chief Executive Officer |
Since
2020 |
Senior
Vice President & Head of Empower Investments, Empower, Empower of America and Empower of NY; President, Chief Executive Officer & Manager, ECM; formerly, Vice President, Empower Funds Investment Products and Empower Advisory Group, LLC
(“EAG”) |
45
|
N/A
|
Katherine
Stoner
8515 East Orchard Road,
Greenwood Village, CO
80111
66 |
Chief
Compliance Officer |
Since
2016 |
Head
of Compliance, Empower Investments, Empower; Chief Compliance Officer, ECM and EAG |
N/A
|
N/A
|
| Officers
|
Name,
Address,
and Age |
Positions(s)
Held with
Empower Funds |
Term
of Office
and Length of
Time Served |
Principal
Occupation(s)
During Past 5 Years |
Number
of
Fund in Fund
Complex
Overseen by
Director |
Other
Directorships
Held by Director |
Ryan
L. Logsdon
8515 East Orchard Road,
Greenwood Village, CO
80111
48 |
Chief
Legal Officer
& Secretary |
Since
2010
(as Secretary)
Since 2021
(as Chief Legal Officer) |
Deputy
General Counsel, Empower; Vice President and Counsel, ECM; Secretary, Empower of America; Corporate Secretary, Empower of NY; formerly, Vice President & Counsel, Empower Funds; Vice President, Counsel & Secretary, EAG & EFSI |
N/A
|
N/A
|
Kelly
B. New
8515 East Orchard Road,
Greenwood Village, CO
80111
47 |
Treasurer
|
Since
2016
(Assistant Treasurer)
Since 2021
(as Treasurer) |
Vice
President, Fund Administration, Empower; Treasurer, ECM; Vice President & Treasurer, Empower Trust Company, LLC (“ETC”); formerly, Assistant Treasurer Empower Funds & ETC |
N/A
|
N/A
|
John
A. Clouthier
8515 East Orchard Road,
Greenwood Village,
CO 80111
55 |
Assistant
Treasurer |
Since
2007 |
Assistant
Vice President, Investment Administration, Empower; Assistant Treasurer, ECM; Assistant Vice President and Assistant Treasurer, ETC |
N/A
|
N/A
|
Abhijit
Dande
8515 East Orchard Road,
Greenwood Village,
CO 80111
42 |
Derivatives
Risk
Manager |
Since
2022 |
Assistant
Vice President, Financial Risk Management, Empower; Derivatives Risk Manager, ECM |
N/A
|
N/A
|
* A Director who is not an
“interested person” of Empower Funds (as defined in Section 2(a)(19) of the 1940 Act, as amended) is referred to as an “Independent Director.”
** Each Director serves until the next shareholders’
meeting (and until the election and qualification of a successor), or until death, resignation, removal or retirement which takes effect no later than May 1 following his or her 75th birthday unless otherwise determined by the remaining directors.
The remaining Independent Directors determined that Ms. Klapper and Mr. McConahey should continue on the Board until at least May 1, 2024. Officers are elected by the Board on an annual basis to serve until their successors have been elected and
qualified.
*** Mr. Hillary is the sole member of
Resolute Capital Asset Partners LLC, which is the general partner for Resolute Capital Asset Partners Fund I LP. Goldman Sachs & Co. LLC, the clearing agent and custodian for Resolute Capital Asset Partners Fund I LP, is the parent company of
Goldman Sachs Asset Management, LP, the Sub-Adviser of the Empower Core Strategies: Inflation-Protected
Securities, Empower Inflation-Protected Securities and Empower Mid Cap
Value Funds; and a Sub-Adviser of the Empower Core Bond Fund. Mr. Hillary has personal banking accounts with an affiliate of J.P. Morgan Investment Management Inc., a Sub-Adviser of the Empower Core Strategies: U.S. Equity, Empower International
Growth and Empower Large Cap Growth Funds. Mr. Hillary receives no special treatment due to the relationship.
**** Mr. Hudner’s daughter is employed by JP Morgan
Chase, N.A., an affiliate of J.P. Morgan Investment Management Inc., a Sub-Adviser of the Empower Core Strategies: U.S. Equity, Empower International Growth and Empower Large Cap Growth Funds. Mr. Hudner has personal investments in the following:
(1) a mutual fund advised by Massachusetts Financial Services Company, a Sub-Adviser of the Empower International Value Fund, (2) a mutual fund advised by Virtus Investment Advisers, Inc., an affiliate of Virtus Fixed Income Advisers, LLC, a
Sub-Adviser of the Empower Multi-Sector Bond Fund, and (3) a mutual fund advised by Lazard Asset Management LLC, a Sub-Adviser of the Empower Emerging Markets Equity Fund. Mr. Hudner receives no special treatment due to his ownership of such mutual
funds.
***** An “Interested Director” refers
to a Director who is an “interested person” of Empower Funds (as defined in Section 2(a)(19) of the 1940 Act, as amended) by virtue of their affiliation with ECM.
There are no arrangements or understandings between any
Director or officer and any other person(s) pursuant to which s/he was elected as Director or officer.
Additional information about Empower Funds and its
Directors is available in the Empower Funds’ Statement of Additional Information (“SAI”), which can be obtained free of charge upon request to: Secretary, Empower Funds, Inc., 8525 East Orchard Road, Greenwood Village, Colorado
80111; (866) 831-7129. The SAI is also available on the Fund’s web site at https://www.greatwestinvestments.com.
Availability of Quarterly Portfolio Schedule
Empower Funds files its complete schedule of portfolio
holdings with the Securities and Exchange Commission for the first and third quarters of each fiscal year as an exhibit on Form N-PORT. Empower Funds’ Forms N-PORT are available on the Commission’s website at http://www.sec.gov.
Availability of Proxy Voting Policies and Procedures
A description of the policies and procedures that Empower
Funds uses to determine how to vote proxies relating to portfolio securities is available without charge, upon request, by calling (866) 831-7129, and of the Securities and Exchange Commission’s website at http://www.sec.gov.
Availability of Proxy Voting Record
Information regarding how Empower Funds voted proxies
relating to portfolio securities during the most recent 12-month period ended June 30 is available without charge, upon request, by calling (866) 831-7129, and on the Securities and Exchange Commission’s website at http://www.sec.gov.
ITEM 2. CODE OF
ETHICS.
(a)
As of the end of the period covered by this report, the registrant has adopted a Code of Ethics (the “Code of Ethics”) that applies to the registrant's principal executive officer, principal financial officer, principal accounting
officer or controller, or persons performing similar functions, regardless of whether these individuals are employed by the registrant or a third party.
(b)
For purposes of this Item, "code of ethics" means written standards that are reasonably designed to deter wrongdoing and to promote:
(1) Honest and
ethical conduct, including the ethical handling of actual or apparent conflicts of interest between personal and professional relationships;
(2) Full,
fair, accurate, timely, and understandable disclosure in reports and documents that a registrant files with, or submits to, the Commission and in other public communications made by the registrant;
(3) Compliance with applicable
governmental laws, rules, and regulations;
(4) The prompt
internal reporting of violations of the code to an appropriate person or persons identified in the code; and
(5) Accountability for adherence to the
code.
(c)
During the period covered by this report, there have been no amendments to the registrant’s Code of Ethics.
(d)
During the period covered by this report, the registrant has not granted any express or implicit waivers from the provisions of the Code of Ethics.
(e) Registrant’s Code of Ethics is attached
hereto.
ITEM 3.
AUDIT COMMITTEE FINANCIAL EXPERT.
Mr. Stephen A. Lake is
the audit committee financial expert and is "independent," pursuant to general instructions on Form N-CSR, Item 3.
An “audit committee financial expert” is not an
“expert” for any purpose, including for purposes of Section 11 of the Securities Act of 1933, as a result of being designated as an “audit committee financial expert.” Further, the designation of a person as an “audit
committee financial expert” does not mean that the person has any greater duties, obligations, or liability than those imposed on the person without the “audit committee financial expert” designation. Similarly, the designation of
a person as an “audit committee financial expert” does not affect the duties, obligations, or liability of any other member of the Audit Committee or Board of Directors.
ITEM 4. PRINCIPAL
ACCOUNTANT FEES AND SERVICES.
(a)
Audit Fees. The aggregate fees billed for each of the last two fiscal years for professional services rendered by the principal accountant for the audit of the registrant’s annual financial
statements or services that are normally provided by the accountant in connection with statutory and regulatory filings or engagements for those fiscal years were: $996,300 for fiscal year 2021 and $1,031,500 for fiscal year 2022.
(b)
Audit-Related Fees. The aggregate fees billed in each of the last two fiscal years for assurance and related services by the principal accountant that are reasonably related to the performance of
the audit of the registrant’s financial statements and are not reported under paragraph (a) of this Item were: $40,000 for fiscal year 2021 and $42,000 for fiscal year 2022. The nature of the services comprising the fees disclosed under this
category involved performance of 17f-2 (self-custody) audits and administrative services related to the audit.
(c)
Tax Fees. The aggregate fees billed in each of the last two fiscal years for professional services rendered by the principal accountant for tax compliance, tax advice, and tax planning were: $0
for fiscal year 2021 and $0 for fiscal year 2022.
(d)
All Other Fees. There were no fees billed in each of the last two fiscal years for products and services provided by the principal accountant, other than the services reported in paragraphs ((a)
through (c) of this Item).
(e) (1) Audit Committee’s Pre-Approval Policies and Procedures.
Pre-Approval of Audit Services. The Audit Committee must approve prior to retention all audit, review or attest engagements required under the securities laws that are provided to Empower Funds by its
independent auditors. The Audit Committee will not grant such approval to any auditors that are proposed to perform an audit for Empower Funds if a chief executive officer, controller, chief financial officer, chief accounting officer or any person
serving in an equivalent position for Empower Funds that is responsible for the financial reporting or operations of Empower Funds was employed by those auditors and participated in any capacity in an audit of Empower Funds during the year period
(or such other period proscribed under SEC rules) preceding the date of initiation of such audit.
Pre-Approval of Non-Audit Services. The Audit Committee must pre-approve any non-audit services, including tax services, to be provided to Empower Funds by its independent auditors (except those within
applicable de minimis statutory or regulatory exceptions)1 provided that Empower Funds’ auditors will not provide the following non-audit services to Empower Funds: (a)
bookkeeping or other services related to the accounting records or financial statements of Empower Funds; (b) financial information systems design and implementation; (c) appraisal or valuation services, fairness opinions, or contribution-in-kind
reports; (d) actuarial services; (e) internal audit outsourcing services; (f) management functions or human resources; (g) broker-dealer, investment adviser, or investment banking services; (h) legal services; (i) expert services unrelated to the
audit; and (j) any other service that the
1No pre-approval is required as to non-audit services provided to Empower Funds if: (a) the aggregate amount of all non-audit services
provided to Empower Funds constitute not more than 5% of the total amount of revenues paid by Empower Funds to the independent auditors during the fiscal year in which the services are provided; (b) these services were not recognized by Empower
Funds at the time of the engagement to be non-audit services; and (c) the services are promptly brought to the attention of the Audit Committee and approved by the Audit Committee prior to the completion of the audit.
Public Company Accounting Oversight Board determines, by
regulation, is impermissible. 2
Pre-approval with respect to Non-Empower Funds Entities. The Audit Committee must pre-approve any non-audit services that relate directly to the operations and financial reporting of Empower Funds (except
those within applicable de minimis statutory or regulatory exceptions)3 to be provided by Empower Funds’ auditors to (a) Empower Funds’ investment adviser; and (b)
any entity controlling, controlled by, or under common control with the investment adviser if that entity provides ongoing services to Empower Funds.4 The Audit Committee may
approve audit and non-audit services on a case-by-case basis or adopt pre-approval policies and procedures that are detailed as to a particular service, provided that the Audit Committee is informed promptly of each service, or use a combination of
these approaches.
Delegation. The Audit Committee may delegate pre-approval authority to one or more of the Audit Committee's members. Any member or members to whom such pre-approval authority is delegated must report any
pre-approval decisions to the Audit Committee at its next scheduled meeting.
(f)
(2) 100% of the services described pursuant to paragraphs (b) through (d) of this Item 4 of Form N-CSR were approved by the Audit Committee, and no such services were approved by the Audit Committee pursuant to paragraph (c)(7)(i)(C) of Rule
2-01 of Regulation S-X.
(g) Not
Applicable.
(h)
The aggregate non-audit fees billed by the registrant’s accountant for services rendered to the registrant, and rendered to the registrant’s investment adviser (not including any sub-adviser whose role is primarily portfolio
management and is subcontracted with or overseen by another investment adviser), and any entity controlling, controlled by, or under common control with the adviser that provides ongoing services to the registrant for fiscal year 2021 equaled
$2,255,405 and for fiscal year 2022 equaled $1,022,840.
(i)
The registrant’s Audit Committee of the Board of Directors has considered whether the provision of non-audit services that were rendered to the registrant’s investment adviser (not including any subadviser whose role is primarily
portfolio management and is subcontracted with or overseen by
2With respect to the prohibitions on (a) bookkeeping; (b) financial information systems design and implementation; (c) appraisal,
valuation, fairness opinions, or contribution-in-kind reports; (d) actuarial; and (e) internal audit outsourcing, such services are permitted to be provided if it is reasonable to conclude that the results of these services will not be subject to
audit procedures during an audit of the audit client's financial statements.
3For non-audit services provided to the adviser and entities in a control relationship with the adviser, no pre-approval is required
if: (a) the aggregate amount of all non-audit services provided constitute not more than 5% of the total amount of revenues paid to the independent auditors during the fiscal year in which the services are provided to Empower Funds, Empower
Funds’ investment adviser, and any entity controlling, controlled by, or under common control with the investment adviser if that entity provides ongoing services to Empower Funds; (b) these services were not recognized by Empower Funds at the
time of the engagement to be non-audit services; and (c) the services are promptly brought to the attention of the Audit Committee and approved by the Audit Committee prior to the completion of the audit.
4No pre-approval is required by the Audit Committee as to non-audit services provided to any Empower Funds sub-adviser that primarily
provides portfolio management services and is under the direction of another investment adviser and is not affiliated with Empower Funds’ primary investment adviser.
another investment adviser), and any entity
controlling, controlled by, or under common control with the investment adviser that provides ongoing services to the registrant that were not pre-approved pursuant to paragraph (c)(7)(ii) of Rule 2-01 of Regulation S-X is compatible with
maintaining the principal accountant’s independence.
ITEM 5. AUDIT COMMITTEE OF
LISTED REGISTRANTS.
Not applicable.
ITEM 6. INVESTMENTS.
(a) The schedule is included as part of the report
to shareholders filed under Item 1 of this Form.
(b) Not applicable.
ITEM 7. DISCLOSURE OF
PROXY VOTING POLICIES AND PROCEDURES FOR CLOSED-END MANAGEMENT INVESTMENT COMPANIES.
Not applicable.
ITEM 8. PORTFOLIO MANAGERS
OF CLOSED-END MANAGEMENT INVESTMENT COMPANIES.
Not
applicable.
ITEM 9.
PURCHASE OF EQUITY SECURITIES BY CLOSED-END MANAGEMENT INVESTMENT COMPANY AND AFFILIATED PURCHASERS.
Not applicable.
ITEM 10. SUBMISSION OF
MATTERS TO A VOTE OF SECURITY HOLDERS.
There have
been no material changes to the procedures by which shareholders may recommend nominees to the registrant’s board of directors that were implemented after the registrant last provided disclosure in response to this Item.
ITEM 11. CONTROLS AND
PROCEDURES.
(a)
The registrant's principal executive officer and principal financial officer have concluded, based upon their evaluation of the registrant's disclosure controls and procedures as conducted within 90 days of the filing date of this report, that
these disclosure controls and procedures provide reasonable assurance that material information required to be disclosed by the registrant in the report it files or submits on Form N-CSR is recorded, processed, summarized and reported, within the
time periods specified in the commission's rules and forms and that such material information is accumulated and communicated to the registrant's management, including its principal executive officer and principal financial officer, as appropriate,
in order to allow timely decisions regarding required disclosure.
(b)
The registrant's principal executive officer and principal financial officer are aware of no changes in the registrant's internal control over financial reporting that occurred during the registrant's most recent fiscal half-year that has
materially affected, or is reasonably likely to materially affect, the registrant's internal control over financial reporting.
ITEM 12. DISCLOSURE OF
LENDING ACTIVITES FOR CLOSED-END MANAGEMENT INVESTMENT COMPANIES.
(a) Not applicable.
ITEM 13. EXHIBITS.
(3) Not applicable.
(4) Not applicable.
SIGNATURES
Pursuant to the requirements of the Securities Exchange Act
of 1934 and the Investment Company Act of 1940, the registrant has duly caused this report to be signed on its behalf by the undersigned, thereunto duly authorized.
EMPOWER FUNDS, INC.
| By:
|
/s/ Jonathan D. Kreider
|
Jonathan D. Kreider
President & Chief Executive
Officer
Date:February 23,
2023
Pursuant to the requirements of the Securities
Exchange Act of 1934 and the Investment Company Act of 1940, this report has been signed below by the following persons on behalf of the registrant and in the capacities and on the dates indicated.
| By:
|
/s/ Jonathan D. Kreider
|
Jonathan D. Kreider
President & Chief Executive
Officer
Date:February 23,
2023
Kelly B. New
Treasurer
Date:February 23,
2023
EMPOWER FUNDS, INC.
CODE OF ETHICS FOR PRINCIPAL EXECUTIVE AND SENIOR FINANCIAL OFFICERS
Introduction
The Board
of Directors of Empower Funds, Inc. (the “Fund”), formerly named Great-West Funds, Inc., which is an open-end management investment company registered under the Investment Company Act of 1940, as
amended (the “1940 Act”), has adopted this Code of Ethics (the “Code”) pursuant to Section 406 of the Sarbanes-Oxley Act of 2002 and the rules and forms of the Securities and Exchange Commission (the “Commission”)
thereunder. This Code establishes rules of conduct for “Principal Executive” and “Senior Financial” officers (“Covered Officers”) of the Fund and is designed to implement a high standard of business conduct and ethics
regarding actual or apparent conflicts of interest.
| 1. |
Relationship to Codes of Ethics Under Rule 17j-1
|
The Fund is subject to and has adopted a code of ethics pursuant to Rule
17j-1 under the 1940 Act, which is also applicable to the Fund’s investment adviser, Empower Capital Management, LLC (“ECM”), a wholly owned subsidiary of Empower Annuity Insurance Company of
America. The Fund’s principal underwriter Empower Financial Services, Inc. also adopted a code of ethics under Rule 17j-1 (together with the Fund and ECM’s code, the “Rule 17j-1 Codes”).
The Rule 17j-1 Codes impose reporting and
disclosure requirements on covered persons relating to their personal investment transactions in securities, as well as substantively regulate such transactions, as the Board of Directors has determined to be reasonably necessary in order to prevent
fraud, deceit or manipulative practices by such persons in connection with the purchase or sale, directly or indirectly, by the person of a security held or to be acquired by a portfolio.
The requirements of this Code are in addition to, not in substitution for, the provisions of the 17j-1
Codes that are applicable to Covered Officers. Accordingly, it shall be the responsibility of each Covered Officer to comply with the reporting, disclosure and pre-approval requirements of the Rule 17j-1 Codes as applicable to his or her personal securities investments. No personal securities investment transaction by a Covered Officer that complies with the procedural, reporting, disclosure and other
provisions of the applicable Rule 17j-1 Codes shall be deemed to be a violation or constitute a waiver of any requirement of this Code.
For purposes of this Code, the term “Covered Officer” shall mean each person who occupies the position of principal executive
officer, managing director, principal financial officer, controller or principal accounting officer, each of whom are set forth in attached Exhibit A (as amended from time to time) for the purpose of promoting:
| |
a. |
honest and ethical conduct, including the ethical handling of actual or apparent conflicts of interest between
personal and professional relationships; |
| |
b. |
full, fair, accurate, timely and understandable disclosure in reports and documents that a registrant files
with, or submits to, the Commission and in other public communications made by the Fund; |
| |
c. |
compliance with applicable laws and governmental rules and regulations; |
| |
d. |
the prompt internal reporting of violations of the Code to an appropriate person or persons identified in the
Code; and |
| |
e. |
accountability for adherence to the Code. |
| 3. |
Substantive Requirements |
| |
a. |
Honest and ethical conduct, including ethical handling of actual or apparent conflicts of interest between
personal and professional relationships. |
It shall be the responsibility of each Covered Officer to comply with the
reporting, disclosure and pre-approval requirements of the Rule 17j-1 Codes as may be applicable to his or her personal securities investments.
No personal securities investment transaction by a Covered Officer that complies with the procedural, reporting, disclosure and other
provisions of the applicable Rule 17j-1 Codes shall be deemed to be a violation or constitute a waiver of any requirement of this Code.
No Covered Officer shall derive any improper personal financial or other benefit of a substantial nature as a result of his or her position as
the principal executive officer, principal financial officer, controller or principal accounting officer, as the case may be, through or from the Fund, or through or from any person or entity doing business or seeking to do business with the Fund,
including, without limitation, gifts or gratuities (other than customary business gifts, meals or business entertainment that are not extravagant), preferred investment opportunities, or cash payments of any amount.
Certain conflicts of interest arise out of the relationships between Covered Officers and the Fund and already are subject to conflict of
interest provisions in the 1940 Act and the Investment Advisers Act of 1940 (“Investment Advisers Act”).
| 4. |
Examples of Conflicts of Interest |
Each Covered Officer:
| |
a. |
Shall not use his personal influence or personal relationships improperly to influence investment decisions or
financial reporting by the Fund whereby the Covered Officer would benefit personally to the detriment of the Fund. |
| |
b. |
Shall not cause the Fund to take actions, or fail to take actions, for the individual personal benefit of the
Covered Officer rather than for the benefit of the Fund. |
| |
c. |
Shall not use material non-public knowledge of portfolio transactions
made or contemplated for the Fund to trade personally or cause others to trade personally in contemplation of the market effect of such transactions. |
| |
d. |
Shall not retaliate against any other Covered Officer or any employee of the Fund or their affiliated persons
for reports of potential Violations that are made in good faith. |
The list provided above provides examples of conflicts
of interest under this Code; Covered Officers should contact the Chief Compliance Officer regarding questions or other situations which may involve a conflict of interest. The Fund and ECM’s compliance programs and procedures are designed to
prevent, or identify and correct, violations of these provisions. This Code does not, and is not intended to, repeat or replace these programs and procedures, and such conflicts fall outside of the parameters of this Code.
Although typically not presenting an opportunity for improper personal benefit, conflicts arise from, or as a result of, the contractual
relationship between the Fund and ECM both of which the Covered Officers may be officers or employees. As a result, this Code recognizes that the Covered Officers will, in the normal course of their duties (whether formally for the Fund or for ECM
or for both), be involved
in establishing policies and implementing decisions that will have different effects on ECM and the Fund. The participation of the Covered Officers in such activities is inherent in the
contractual relationship between the Fund and ECM and is consistent with the performance by the Covered Officers of their duties as officers of the Fund. Thus, if performed in conformity with the provisions of the 1940 Act and the Investment
Advisers Act, such activities will be deemed to have been handled ethically.
The employment of a member of the immediate family of a
Covered Officer by an entity doing business, or seeking to do business, with the Fund shall not be deemed a violation of this Code if the Covered Officer discloses such employment to the Board of Directors of the Fund.
Any Covered Officer who shall, in his or her capacity as principal executive officer, principal financial officer, controller or principal
accounting officer, receive or be offered any personal financial or other benefit that is or may be proscribed by this Code promptly shall report same to the Fund’s Chief Compliance Officer. The Chief Compliance Officer shall be, and hereby is,
authorized to determine whether the receipt of such financial or other benefit is or would be proscribed by this Code. If the Chief Compliance Officer shall determine the receipt of any such personal financial or other benefit is or would be
proscribed by this Code, then the Chief Compliance Officer may direct that such benefit be refused or, if already received, that such benefit anonymously be donated to a charitable organization. Upon such donation, no violation of this Code shall be
deemed to have occurred by reason of the Covered Officer having received such personal financial or other benefit. The Chief Compliance Officer’s determination that the offer to or receipt by a Covered Officer of a benefit is not a violation of
this Code shall not be deemed a waiver of any provision of this Code.
The Chief Compliance Officer shall maintain a record of reports, if
any, by Covered Officers of the receipt or offer of personal financial or other benefits, and the Chief Compliance Officer’s determinations and directions with respect to such reports.
| |
a. |
Full, fair, accurate, timely and understandable disclosure in reports and documents the Fund files with, or
submits to, the Commission and in other public communications made by the Fund. |
Each Covered Officer is responsible for
the full, fair, accurate, timely and understandable disclosure in reports and documents the Fund files with, or submits to, the Commission and in other public communications made by the Fund, insofar as such disclosure or communication relates to
matters within the scope of such Covered Officer’s responsibilities of office. Without limiting the generality of the foregoing, no Covered Officer willfully shall cause or permit any such disclosure or communication regarding a matter within
the scope of his or her responsibility to: misstate a material fact; or omit to state a material fact necessary to make any statement made in any such disclosure or communication, in light of the circumstances in which such statement is made, not
misleading.
| |
b. |
Compliance with applicable governmental laws, rules and regulations. |
A Covered Officer promptly shall report to the Chief Compliance Officer any non-compliance or apparent non-compliance by the Fund with applicable governmental laws, rules and regulations including, without limitation, federal securities laws, regarding any matter that is within the scope of office of such Covered
Officer, and shall take such action, if any, as may be directed by the Chief Compliance Officer with respect to the investigation or cure of such non-compliance or apparent
non-compliance.
The fact that a violation of applicable governmental laws, rules or regulations
has, or may have, occurred shall not itself be deemed violation of this Code. A determination by the Chief Compliance Officer that a violation of applicable governmental laws, rules or regulations has, or has not, occurred shall not be deemed a
waiver of any provision of this Code.
| |
c. |
Prompt internal reporting of violations of this Code. |
It is the responsibility of each Covered Officer to promptly to report to the Chief Compliance Officer any violation or apparent violation of
this Code by any Covered Officer. The Chief Compliance Officer shall maintain a record of the reports, if any, of violations or apparent violations of this Code by any Covered Officer.
The Chief Compliance Officer shall determine, in response to any such report, whether or not a violation of this Code has occurred. The Chief
Compliance Officer, in carrying out his or her duties under the Code, may consult with outside counsel to the Fund with respect to violations and potential violations of the Code or applicable legal requirements. In the event the Chief Compliance
Officer shall determine that a violation has occurred, he or she shall report such violation to the Board of Directors of the Fund. If after due investigation the Chief Compliance Officer determines that no violation has occurred, no further action
is necessary.
| |
d. |
Accountability for adherence to this Code. |
Compliance with the requirements of this Code is a condition of office of each Covered Officer. In the event of violation of the requirements
of this Code by a Covered Officer, the Board of Directors of the Fund may take such action, as it deems appropriate, including, but not limited to, removal from office of the Covered Officer.
All reports and records prepared or maintained pursuant to this Code shall be considered confidential and maintained and protected accordingly.
The Code is intended solely for the internal use of the Fund and does not constitute an admission, by or on behalf of the Fund, as to any fact, circumstance, or legal conclusion.
Each Covered Officer shall acknowledge in writing his or her receipt of a copy of this Code, and his or her agreement that adherence to this
Code is a condition of office.
| 5. |
Other Policies and Procedures |
This Code shall be the sole code of ethics adopted by the Fund for purposes of Section 406 of the Sarbanes-Oxley Act and the rules and
forms applicable to registered investment companies thereunder. Insofar as other policies or procedures of the Fund, ECM, or other service providers govern or purport to govern the behavior or activities of the Covered Officers who are subject to
this Code, they are superseded by this Code to the extent that they overlap or conflict with the provisions of this Code. The Fund and ECM’s codes of ethics under Rule 17j-1 of the Investment Company Act
and ECM’s more detailed policies and procedures set forth in the Fund’s compliance manuals are separate requirements applying to the Covered Officers and others and are not part of this Code.
Any changes or waivers of this Code will, to the extent required, be disclosed as provided by Commission Rules. Any amendments to this Code,
other than amendments to Exhibit A, must be approved by a majority of the Directors, including a majority of the Independent Directors.
All reports and records prepared or maintained pursuant to this Code will be considered confidential and shall be maintained and protected
accordingly. Except as otherwise required by law or this Code, such matters shall not be disclosed to anyone other than the Board of Directors of the Fund, its counsel, and ECM.
The Code is intended solely for the internal use by the Fund and does not constitute an admission, by or on behalf of any Fund, as to any fact,
circumstance, or legal conclusion.
Amended and Restated as Adopted by the Board of Directors of Great-West Funds, Inc. on April 18, 2013.
EXHIBIT A
Covered Officers
Jonathan Kreider, Chief Executive
Officer & President
Kelly B. New, Treasurer
Chief Compliance Officer
Katherine Stoner, Chief
Compliance Officer
CERTIFICATIONS
I, Jonathan D. Kreider, certify that:
1. I have reviewed this
report on Form N-CSR of Empower Funds, Inc.;
2. Based on my knowledge, this report does not contain any untrue
statement of a material fact or omit to state a material fact necessary to make the statements made, in light of the circumstances under which such statements were made, not misleading with respect to the period covered by this report;
3. Based on my knowledge, the financial statements, and other financial information included in this report, fairly present in all material respects the
financial condition, results of operations, changes in net assets, and cash flows (if the financial statements are required to include a statement of cash flows) of the registrant as of, and for, the periods presented in this report;
4. The registrant’s other certifying officer and I are responsible for establishing and maintaining disclosure controls and procedures (as defined in
rule 30a-3(c) under the Investment Company Act of 1940) and internal control over financial reporting (as defined in Rule 30a-3(d) under the Investment Company Act of
1940) for the registrant and have:
a) Designed such disclosure controls and procedures, or caused such disclosure controls and procedures
to be designed under our supervision, to ensure that material information relating to the registrant, including its consolidated subsidiaries, is made known to us by others within those entities, particularly during the period in which this report
is being prepared;
b) Designed such internal control over financial reporting, or caused such internal control over financial reporting to
be designed under our supervision, to provide reasonable assurance regarding the reliability of financial reporting and the preparation of financial statements for external purposes in accordance with generally accepted account principles;
c) Evaluated the effectiveness of the registrant’s disclosure controls and procedures and presented in this report our conclusions about
the effectiveness of the disclosure controls and procedures, as of a date within 90 days prior to the filing date of this report based on such evaluation; and
d) Disclosed in this report any change in the registrant’s internal control over financial reporting that occurred during the
registrant’s most recent fiscal half-year (the registrant’s second fiscal half-year in the case of an annual report) that has materially affected, or is reasonably likely to materially affect, the registrant’s internal control over
financial reporting; and
5. The registrant’s other certifying officer and I have disclosed to the registrant’s auditors and the audit committee
of the registrant’s board of trustees (or persons performing the equivalent functions):
a) All significant deficiencies and material
weaknesses in the design or operation of internal control over financial reporting which are reasonably likely to adversely affect the registrant’s ability to record, process, summarize, and report financial information; and
b) Any fraud, whether or not material, that involves management or other employees who have a significant role in the registrant’s
internal control over financial reporting.
|
|
|
| Date: |
|
February 23, 2023 |
|
|
| By: |
|
/s/ Jonathan D. Kreider |
|
|
Jonathan D. Kreider |
|
|
President & Chief Executive Officer |
I, Kelly B. New, certify that:
1. I have reviewed this report on Form N-CSR of Empower Funds, Inc.;
2. Based on my knowledge, this report does not contain any untrue statement of a material fact or omit to state a material fact necessary to make the
statements made, in light of the circumstances under which such statements were made, not misleading with respect to the period covered by this report;
3. Based on my knowledge, the financial statements, and other financial information included in this report, fairly present in all material respects the
financial condition, results of operations, changes in net assets, and cash flows (if the financial statements are required to include a statement of cash flows) of the registrant as of, and for, the periods presented in this report;
4. The registrant’s other certifying officer and I are responsible for establishing and maintaining disclosure controls and procedures (as defined in
rule 30a-3(c) under the Investment Company Act of 1940) and internal control over financial reporting (as defined in Rule 30a-3(d) under the Investment Company Act of
1940) for the registrant and have:
a) Designed such disclosure controls and procedures, or caused such disclosure controls and procedures
to be designed under our supervision, to ensure that material information relating to the registrant, including its consolidated subsidiaries, is made known to us by others within those entities, particularly during the period in which this report
is being prepared;
b) Designed such internal control over financial reporting, or caused such internal control over financial reporting to
be designed under our supervision, to provide reasonable assurance regarding the reliability of financial reporting and the preparation of financial statements for external purposes in accordance with generally accepted account principles;
c) Evaluated the effectiveness of the registrant’s disclosure controls and procedures and presented in this report our conclusions about
the effectiveness of the disclosure controls and procedures, as of a date within 90 days prior to the filing date of this report based on such evaluation; and
d) Disclosed in this report any change in the registrant’s internal control over financial reporting that occurred during the
registrant’s most recent fiscal half-year (the registrant’s second fiscal half-year in the case of an annual report) that has materially affected, or is reasonably likely to materially affect, the registrant’s internal control over
financial reporting; and
5. The registrant’s other certifying officer and I have disclosed to the registrant’s auditors and the audit committee
of the registrant’s board of trustees (or persons performing the equivalent functions):
a) All significant deficiencies and material
weaknesses in the design or operation of internal control over financial reporting which are reasonably likely to adversely affect the registrant’s ability to record, process, summarize, and report financial information; and
b) Any fraud, whether or not material, that involves management or other employees who have a significant role in the registrant’s
internal control over financial reporting.
|
|
|
| Date: |
|
February 23, 2023 |
|
|
| By: |
|
/s/ Kelly B. New |
|
|
Kelly B. New |
|
|
Treasurer |
CERTIFICATION UNDER SECTION 906 OF SARBANES-OXLEY ACT OF 2002
(18 U.S.C. 1350)
In connection with the
Annual Report of Empower Funds, Inc. (the “Registrant”) on Form N-CSR for the period ended December 31, 2022 (the “Report”), the undersigneds hereby certify, to the best of their
knowledge, that:
1. The Report fully complies with the requirements of Section 13(a) or 15(d) of the Securities Exchange Act of 1934;
2. The information contained in the Report fairly presents, in all material respects, the financial condition and results of operations of the Registrant.
|
|
|
| Date: |
|
February 23, 2023 |
|
|
| By: |
|
/s/ Jonathan D. Kreider |
|
|
Jonathan D. Kreider |
|
|
President & Chief Executive Officer |
|
|
| Date: |
|
February 23, 2023 |
|
|
| By: |
|
/s/ Kelly B. New |
|
|
Kelly B. New |
|
|
Treasurer |
This certification is being furnished solely pursuant to Section 906 of the Sarbanes-Oxley Act of 2002 and is not being filed as part of the report or as
a separate disclosure document.
A signed original of this written statement required by Section 906 has been provided to the Registrant and will be
retained by the Registrant and furnished to the Securities and Exchange Commission or its staff upon request.