
UNITED STATES
SECURITIES AND EXCHANGE COMMISSION
Washington, D.C. 20549
FORM N-CSR
CERTIFIED SHAREHOLDER REPORT OF REGISTERED
MANAGEMENT INVESTMENT COMPANIES
Investment Company Act file number: 811-01735
fpa NEW Income, inc.
(Exact name of registrant as specified in charter)
11601 WILSHIRE BLVD., STE. 1200
LOS ANGELES, CALIFORNIA 90025
(Address of principal executive offices)(Zip code)
| (Name and Address of Agent for Service) |
Copy to:
|
|
J. RICHARD ATWOOD, PRESIDENT FPA NEW INCOME, INC. 11601 WILSHIRE BLVD., STE. 1200 LOS ANGELES, CALIFORNIA 90025 |
MARK D. PERLOW, ESQ. DECHERT LLP ONE BUSH STREET, STE. 1600 SAN FRANCISCO, CA 94104 |
Registrant’s telephone number, including area code: (310) 473-0225
Date of fiscal year end: September 30
Date of reporting period: September 30, 2022
Item 1: Report to Shareholders.
| (a) | The Report to Shareholders is attached herewith. |
Distributor:
UMB DISTRIBUTION SERVICES, LLC
235 West Galena Street
Milwaukee, Wisconsin 53212
Annual Report
September 30, 2022
FPA New Income, Inc.
FPA NEW INCOME, INC.
LETTER TO SHAREHOLDERS
Dear Fellow Shareholders,
FPA New Income, Inc. (the "Fund") returned -0.96% in the third quarter of 2022 and -3.68% year-to-date through September 30, 2022.
|
Sector |
As of 9/30/2022 |
||||||
|
Yield-to-worst1 |
5.70 |
% |
|||||
|
Effective Duration |
1.71 years | ||||||
|
High Quality Exposure2 |
90.3 |
% |
|||||
|
Credit Exposure3 |
9.7 |
% |
|||||
As of September 30, 2022, the portfolio had a yield-to-worst of 5.70% and an effective duration of 1.71 years. Inflation remains at 40-year highs and well above the Federal Reserve's target of 2%. In response, the Federal Reserve further tightened monetary policy during the quarter with two additional 75 basis point (bps) increases in the Fed Funds rate. Moreover, Federal Reserve Chairman Jerome Powell publicly committed to tight monetary policy until there is "compelling evidence that inflation is moving down."4 Consequently, Treasury yields continued to increase during the quarter, with yields on 1- to 5-year maturity Treasuries increasing by approximately 145-170 bps, bringing the year-to-date increase to 260-370 bps and the increase over the last 12 months to 300-400 bps. The increase in risk-free rates over the last 12 months represents the largest 12-month increase in risk-free rates since 1981.5 At the same time, longer maturity Treasury yields have also increased, but to a lesser extent. That led to a significant inversion of the Treasury yield curve, where 10-year maturity Treasuries yields are less than 2-year maturity Treasury yields. Historically, such inversions have presaged economic recessions.
In combination with extremely low starting yields in 2021, this year's increase in risk-free rates has led to significant declines in bond prices and the worst performing bond market in generations, if not ever. During this time, the Fund has experienced limited drawdowns and we believe has done a relatively good job of preserving capital, as evidenced by the Fund's year-to-date (thru 9/30/2022) return of -3.68% versus -4.58%, -6.35%, and -14.61% for the Bloomberg U.S. Aggregate 1-3 Year Bond Index, Morningstar Short-term Bond Category and Bloomberg U.S. Aggregate Bond Index, respectively.
On the other hand, the worst bond market in generations, while painful to endure, has created what we believe to be the most attractive bond market we have seen in at least a decade. In sympathy with the increase in risk-free rates, yields on investment grade bonds also increased during the quarter and year-to-date. Though spreads on investment grade bonds have increased as well, most of the yield increase in investment grade bonds
1 Yield to Worst ("YTW") is presented gross of fees and reflects the lowest possible yield on a callable bond without the issuer defaulting. It does not represent the yield an investor should expect to receive. As of September 30, 2022, the Fund's subsidized/unsubsidized 30-day SEC standardized yield ("SEC Yield") was 3.23%/3.06% respectively. The SEC Yield calculation is an annualized measure of the Fund's dividend and interest payments for the last 30 days, less the Fund expenses. Subsidized yield reflects fee waivers and/or expense reimbursements during the period. Without waivers and/or reimbursements, yields would be reduced. Unsubsidized yield does not adjust for any fee waivers and/or expense reimbursements in effect. The SEC Yield calculation shows investors what they would earn in yield over the course of a 12-month period if the fund continued earning the same rate for the rest of the year.
2 Represents the Fund's exposure to investments rated A or higher, Treasuries, and cash and equivalents.
3 Represents the Fund's exposure to investments rated BBB or lower.
4 Source: The Federal Reserve, September 21, 2022 https://www.federalreserve.gov/mediacenter/files/FOMCpresconf20220921.pdf.
5 Bloomberg as of 9/30/2022.
Past performance is no guarantee, nor is it indicative, of future results.
1
FPA NEW INCOME, INC.
LETTER TO SHAREHOLDERS
(Continued)
is due to higher risk-free rates with spreads still within historical norms. Similarly, looking to the high-yield market as a proxy for credit markets, high-yield bond yields increased meaningfully during the quarter and year-to-date, though the majority of the increase is attributable to an increase in risk-free rates as high-yield bond spreads also remain within historical norms.
Consistent with our past practice, we continue to take advantage of the higher yield environment to buy incrementally longer duration, high-quality bonds (rated single-A or higher) since we believe these bonds now offer sufficient compensation for the duration risk (i.e., duration is cheaper). We anticipate these investments will improve the long-term return profile of the Fund while preserving capital over the next 12 months if risk-free rates were to increase by a further 100 bps or more. While we believe Treasuries are valuable to own, higher spreads increase the opportunity cost of owning Treasuries, enhancing the appeal of high-quality bonds other than Treasuries. Meanwhile, higher spreads and yields have also made credit (investments rated BBB or lower) more attractive. We are selectively investing in credit as we remain cautious due to concerns about credit risk (particularly in the face of a possible recession) and near-term mark-to-market risk.
Cash and equivalents represented 0.6% of the portfolio at September 30, 2022 versus 1.0% on June 30, 2022. In addition, 9.0% of the Fund was held in Treasuries at the end of the quarter.
Portfolio Attribution6
The largest contributors to performance during the quarter were non-agency commercial mortgage-backed securities, predominantly due to holdings of collateralized loan obligations (CLOs) backed by commercial real estate. These high-quality (rated single-A or higher) commercial real estate CLOs have floating rate coupons and thus their prices were not meaningfully impacted directly by the increase in risk-free rates during the quarter. Further, these CLOs also benefited from an increase in their floating coupons related to increases in the Fed Funds rate.
The second-largest contributors to performance during the quarter were CLOs backed by broadly syndicated or middle market corporate loans. Nearly all of these high-quality CLO holdings are floating rate, and thus their prices were not meaningfully impacted directly by the increase in risk-free rates during the quarter, although they did experience lower prices as a result of an increase in spreads. However, these price declines were more than offset by coupon payments. These bonds benefited from an increase in their coupons during the quarter related to increases in the Fed Funds rate.
While there were other individual bonds that contributed to performance during the quarter, there were no other meaningful contributors at the sector level.
The largest detractors from performance during the quarter were fixed rate Treasury bonds, which experienced lower prices due to an increase in risk-free rates. The second-largest detractors from performance were fixed rate asset-backed securities (ABS) backed by equipment. Prices on these mostly high-quality ABS were also negatively impacted by an increase in risk-free rates.
The third-largest detractors from performance during the quarter were the corporate holdings, where higher spreads led to lower prices on floating rate bank loans and higher risk-free rates led to lower high-yield bond prices. Lastly, lower market-wide equity valuations negatively impacted prices of the common stock holdings. Common stock represented approximately 1.3% of the portfolio, on average, during the quarter.
Despite the Fund's overall negative return during the quarter, we believe the portfolio continues to perform well relative to the overall bond market and relevant indices.
6 This information is not a recommendation for a specific security or sector and these securities/sectors may not be in the Fund at the time you receive this report. The information provided does not reflect all positions purchased, sold or recommended by FPA during the quarter. The portfolio holdings as of the most recent quarter-end may be obtained at www.fpa.com.
2
FPA NEW INCOME, INC.
LETTER TO SHAREHOLDERS
(Continued)
Portfolio Activity7
The table below shows the portfolio's sector-level exposures of September 30, 2022 compared to June 30, 2022:
| Sector |
% Portfolio 9/30/2022 |
% Portfolio 6/30/2022 |
|||||||||
|
ABS |
66.3 |
64.9 |
|||||||||
|
Mortgage Backed (CMO)8 |
5.2 |
5.7 |
|||||||||
|
Stripped Mortgage-backed |
0.4 |
0.4 |
|||||||||
|
Corporate |
5.8 |
5.4 |
|||||||||
|
CMBS8 |
10.7 |
8.4 |
|||||||||
|
Mortgage Pass-through |
2.0 |
2.2 |
|||||||||
|
U.S. Treasury |
9.0 |
12.0 |
|||||||||
|
Cash and equivalents |
0.6 |
1.0 |
|||||||||
|
Total |
100.0 |
% |
100.0 |
% | |||||||
|
Yield-to-worst9 |
5.70 |
% |
4.41 |
% |
|||||||
|
Effective Duration (years) |
1.71 |
1.60 |
|||||||||
|
Average Life (years) |
2.44 |
2.29 |
|||||||||
As yields have increased (see below for more details), we have been actively buying longer duration, high-quality bonds rated single-A or higher. The duration of these investments has been guided by our 100 bps duration stress test, which seeks to identify the longest bonds that we expect will produce at least a breakeven return over a 12 month period if we assume the yield on a bond increases by 100 bps during that 12 month period. In line with this test, in addition to extending the duration of our Treasury holdings, we bought high-quality bonds including agency guaranteed commercial mortgage-backed securities, equipment asset-backed securities, utility cost recovery bonds, prime auto loan asset-backed securities, asset-backed securities backed by insurance premium loans, investment grade corporate bonds and non-agency commercial mortgage-backed securities that, on average, had a duration of 3.7 years and yield-to-worst of 4.99%.10 In addition, we bought BBB-rated corporate bonds that had an average duration of 3.9 years and yield-to-worst of 8.09%.10 We include these BBB bonds within our credit holdings. These investments were funded with a combination of cash and proceeds from maturing investments and selling short duration, high-quality bonds and Treasuries.
7 Portfolio composition will change due to ongoing management of the Fund.
8 Collateralized mortgage obligations ("CMO") are mortgage-backed bonds that separate mortgage pools into different maturity classes. Commercial mortgage-backed securities ("CMBS") are securities backed by commercial mortgages rather than residential mortgages.
9 Yield to Worst ("YTW") is presented gross of fees and reflects the lowest possible yield on a callable bond without the issuer defaulting. It does not represent the yield an investor should expect to receive. As of September 30, 2022, the Fund's subsidized/unsubsidized 30-day SEC standardized yield ("SEC Yield") was 3.23%/3.06% respectively. The SEC Yield calculation is an annualized measure of the Fund's dividend and interest payments for the last 30 days, less the Fund expenses. Subsidized yield reflects fee waivers and/or expense reimbursements during the period. Without waivers and/or reimbursements, yields would be reduced. Unsubsidized yield does not adjust for any fee waivers and/or expense reimbursements in effect. The SEC Yield calculation shows investors what they would earn in yield over the course of a 12-month period if the fund continued earning the same rate for the rest of the year.
10 Based on quarter-end pricing.
Past performance is no guarantee, nor is it indicative, of future results.
3
FPA NEW INCOME, INC.
LETTER TO SHAREHOLDERS
(Continued)
Floating rate investments represented 30% of the Fund's holdings at September 30, 2022. We believe these floating rate investments could support higher returns in a rising rate environment.
Market Commentary
We are in one of the worst bond markets in generations, possibly ever. As one measure, the chart below shows that the Bloomberg Aggregate Bond Index's year-to-date return of -14.61% puts this index on track for its worst performance since its inception in 1976.
Year-to-Date Total Return for the Bloomberg U.S. Aggregate Index
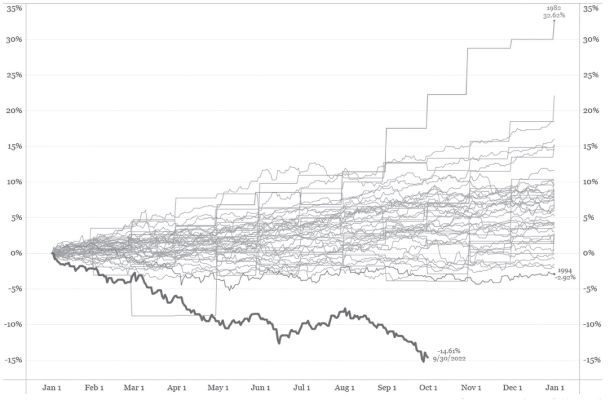
Source: Bloomberg. Data for calendar years 1976-2021 and 2022 through 9/30/2022.
Until this year, the Bloomberg Aggregate Bond Index's return of -2.92% in 1994 was the reigning champion of negative returns. It's striking how poor 2022 has been in comparison.
The driver of this year's poor bond market returns has been inflation, and specifically the Federal Reserve's efforts to combat inflation. As shown below, inflation excluding food and energy prices is at 40-year highs.
4
FPA NEW INCOME, INC.
LETTER TO SHAREHOLDERS
(Continued)
CPI Urban Consumers less Food and Energy
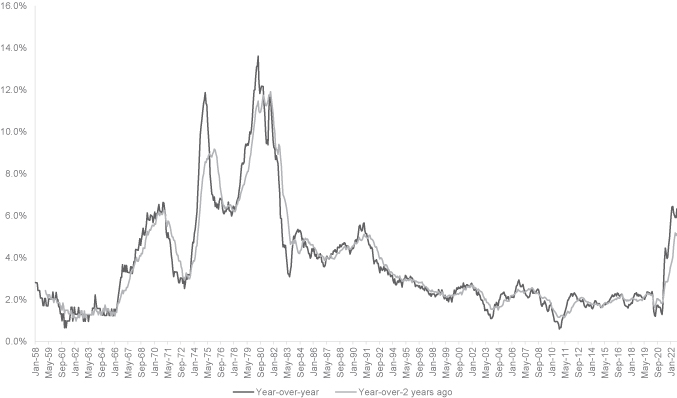
Source: US Department of Labor. As of 8/31/2022. The Consumer Price Index, or CPI, reflects the average change over time in prices paid by urban consumers for a market basket of consumer goods and services.
In response, the Federal Reserve has been aggressively tightening monetary policy. The Federal Reserve instituted two 75 bps increases in the Fed Funds rate in the third quarter alone, bringing the year-to-date increase in the Fed Funds rate to 300 bps. As of September 30, 2022 the market expected an additional 116 bps of Fed Funds rate increases by the end of the year, with more to come next year. The market's expectation was that the Fed Funds rate would peak around 4.5% sometime next year. But as the macroeconomic data changes, the market's expectations change and, with that, rates have risen further since the end of September.
5
FPA NEW INCOME, INC.
LETTER TO SHAREHOLDERS
(Continued)
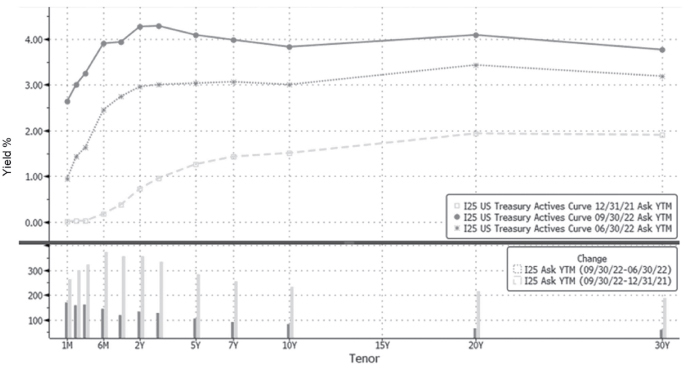
With a significant tightening of monetary policy has come a dramatic shift in the yield curve:
Treasury Yield
|
Maturity |
|||||||||||||||||||||||||||||||||||
|
1Y |
2Y |
3Y |
5Y |
7Y |
10Y |
20Y |
30Y |
||||||||||||||||||||||||||||
|
Q3 2022 change in yields (bps) |
119 |
133 |
128 |
105 |
91 |
82 |
65 |
59 |
|||||||||||||||||||||||||||
|
YTD 2022 change in yields (bps) |
356 |
355 |
333 |
283 |
255 |
232 |
216 |
187 |
|||||||||||||||||||||||||||
Source: Bloomberg. Chart data as of the dates shown.
6
FPA NEW INCOME, INC.
LETTER TO SHAREHOLDERS
(Continued)
Significantly higher yields across the yield curve, with a greater increase in 1- to 5-year maturity Treasuries has resulted in an inversion of the yield curve — where 10-year maturity bond yields are less than 2-year maturity bond yields. Inverted yield curves have historically portended economic recessions:
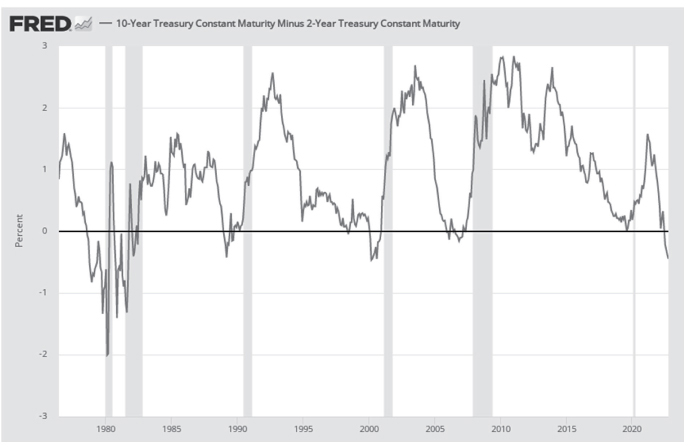
Source: Federal Reserve Bank of St. Louis. Data through 9/30/22. Shaded areas reflect recessions.
Treasury yields now sit at levels last seen 15 years ago in 2007. Normally, we suspect investors would be excited about risk-free rates greater than 4%. However, today's yields have come about after Treasury yields were at historical lows not too long ago in 2020 and 2021. The rapid increase in yields in a short period of time has led to historically poor bond market returns this year. To help explain why bond returns have been so extraordinarily poor, the chart below plots annual changes in the Fed Funds rate since 1972 against the yield on the 3-year Treasury at the start of each year. The red dot shows the year-to-date change in the Fed Funds rate through September 2022, and the red square shows the expected change in the Fed Funds rate for the full calendar year — assuming that the market's expectations for Fed Funds rate increases for the rest of the year end up being correct. The red dot and red square sit at the extremes of the lower right quadrant.
7
FPA NEW INCOME, INC.
LETTER TO SHAREHOLDERS
(Continued)
Starting 3-Year Treasury Yield and annual change in Fed Funds rate since 1972
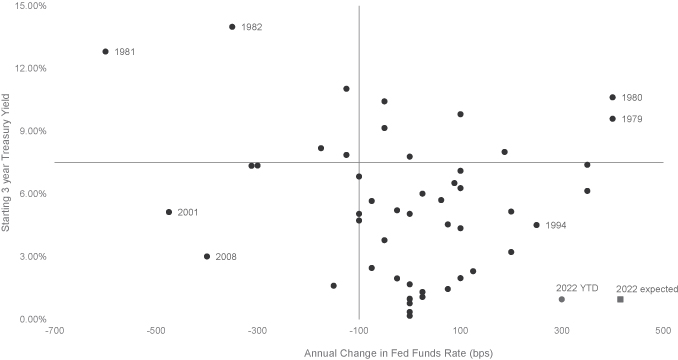
Source: Bloomberg.
After only nine months, we have already experienced one of the largest annual increases in Fed Funds rates in 50 years and the year isn't even over yet. If the market's expectations for the rest of this year prove to be correct, 2022 would match or exceed the largest increase in the Fed Funds rate in 50 years. However, while there have been years in the past where Fed Funds increased by 300 bps or more — for example in 1980 or 1979 — it has never been the case that this magnitude of increase has happened when starting yields were so low, practically near zero. When yields are low, bond prices are more sensitive to change in yields. Because yields were so low to start 2022, bond prices were unusually sensitive to changes in yield. Once an unusually large increase in yield was applied to these conditions, that led to an unusually large decline in bond prices. Exacerbating lower bond prices is the fact that, because starting yields were so low, there has not been much coupon or income to offset the decline in prices this year. In contrast, when Fed Funds increased by 250 bps in 1994, starting Treasury yields were at 4.5%, offering meaningfully more coupon to offset price declines that occurred when yields rose in 1994. Of note, price declines in 1994 were less severe than they have been this year, all things being equal, because higher yields then meant that duration was lower and bond prices were less sensitive to changes in yield.
As a consequence of significantly higher yields this year, nearly every part of the fixed income market has lost money year-to-date, as shown below. Even TIPS (Treasury inflation-protected securities), which were supposed to be a panacea for an inflationary environment, have lost 5-14%, depending on the maturity. One-year Treasury Bills have also lost money year-to-date. The only part of the fixed income market, defined loosely, that has not lost money this year was 3- to 6-month Treasury Bills, which is essentially cash (though cash and equivalents have lost money on a real basis).
8
FPA NEW INCOME, INC.
LETTER TO SHAREHOLDERS
(Continued)
U.S. Fixed Income Total Returns (% YTD as of 9/30/22)
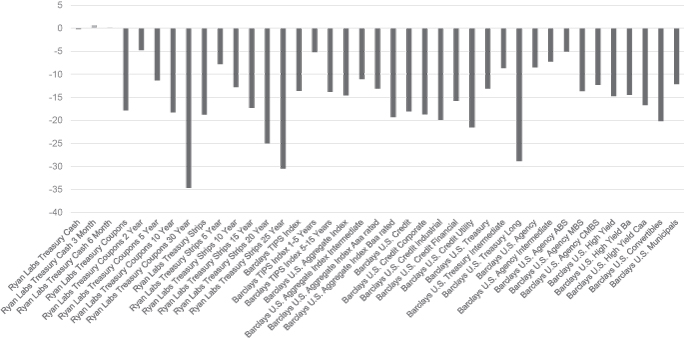
Source: Ryan Labs, Bloomberg, Barclays. Ryan Labs Treasury Cash: Equal-weighted total-return average of the Treasury yield curve from 3 to 12 month maturities. Ryan Labs Treasury Coupons: Equal-weighted total-return average of the Treasury yield curve from 2 to 30 year maturities. Ryan Labs Treasury Strips: Equal-weighted total-return average of Treasury Strips from 1 year to 30 years.
In a sea of poor performance, we believe that the Fund has held up relatively well. The table below shows that the Fund returned -3.68% year-to-date, better than the Bloomberg 1-3 year U.S. Aggregate Bond Index and much better than the Bloomberg U.S. Aggregate Bond Index.
|
As of Date: 9/30/22 |
QTD |
YTD |
1 Year |
3 Years |
5 Years |
10 Years |
|||||||||||||||||||||
|
FPA New Income, Inc. ("Fund") |
-0.96% |
-3.68% |
-3.87% |
0.00% |
1.21% |
1.31% |
|||||||||||||||||||||
|
Bloomberg U.S. Agg 1-3 Year |
-1.50% |
-4.58% |
-5.11% |
-0.52% |
0.64% |
0.78% |
|||||||||||||||||||||
|
Bloomberg U.S. Agg Bond Index |
-4.75% |
-14.61% |
-14.60% |
-3.26% |
-0.27% |
0.89% |
|||||||||||||||||||||
|
CPI + 100 |
0.74% |
6.73% |
9.30% |
6.02% |
4.83% |
3.56% |
|||||||||||||||||||||
|
Morningstar Short-Term Bond |
Top 4% |
Top 18% |
Top 14% |
Top 19% |
|||||||||||||||||||||||
Source: Morningstar Direct. As of 9/30/2022. Fund Inception is July 11, 1984. Morningstar Short-Term Bond Category ("Category") Rankings are as of September 30, 2022 and are based on total returns. The Category returns for the periods noted through September 30, 2022 were: 1-year: -6.80%; 3-year: -0.61%; 5-year: 0.66%;
9
FPA NEW INCOME, INC.
LETTER TO SHAREHOLDERS
(Continued)
and 10-year: 0.94%. Time periods greater than one-year are annualized. As of September 30, 2022, there were the following number of funds in the Category: 1 year: 582; 3 year: 544; 5-year: 481, and 10 year: 338. Source: Morningstar. Past performance is no guarantee, nor is it indicative, of future results.
Over the last year, the Fund's performance is in the top 4% of the Morningstar Short-Term Bond Category. Longer-term, the Fund's performance ranks in the top 14-19% of the category over the last 3 to 10 years. The goal of investing is to make money and the Fund has made more money for its investors over the last 10 years versus what investors could have earned if they had owned the short-term bond category, generically, the Bloomberg 1-3 year U.S. Aggregate Bond Index or the Bloomberg U.S. Aggregate Bond Index.11 Moreover, these higher long-term returns have been accomplished with lower volatility as evidenced by the Fund's higher Sharpe and Sortino ratios and lower maximum drawdown.
| 10/1/2012-9/30/2022 |
Sharpe Ratio |
Sortino Ratio |
Max Drawdown |
||||||||||||
|
FPA New Income |
0.45 |
0.57 |
-3.87 |
% |
|||||||||||
|
Morningstar US Fund Short-Term Bond |
0.09 |
0.12 |
-6.99 |
% |
|||||||||||
|
Bloomberg U.S. 1-3 yr Aggregate Bond Index |
0.07 |
0.08 |
-5.19 |
% |
|||||||||||
Source: Morningstar Direct. As of 9/30/2022. FPNIX Inception is July 11, 1984.
Of course, in addition to our stated goal of positive returns over a rolling 12-month period, our other goal is to deliver positive real returns over the long term (specifically, CPI+100 bps over rolling five-year periods). We believe the Fund is one of the few fixed income funds with that as a goal, but it is consistent with our absolute return investment philosophy. We are not shy about the fact that we have not beaten inflation over the last five years. The following chart shows rolling 5-year, inflation-adjusted returns for the Fund, the Bloomberg Aggregate Bond Index, the Bloomberg 1-3 year Aggregate Bond Index and the Morningstar Short-Term Bond Category. None of these have beaten inflation over the last five years, but the Fund has come the closest. Not even TIPS12 have beaten inflation over the last five years.
11 Comparison to the indices and the Category is for illustrative purposes only. An investor cannot invest directly in an index or in the Morningstar Short-Term Bond Category. Past results are no guarantee of future results.
12 As measured by the iShares TIPS ETF which had annualized nominal return of 1.76% for the 5-year period ending 9/30/22. TIPS is Treasury Inflation Protected Securities..
10
FPA NEW INCOME, INC.
LETTER TO SHAREHOLDERS
(Continued)
Rolling 5-Year Real Total Return (%)
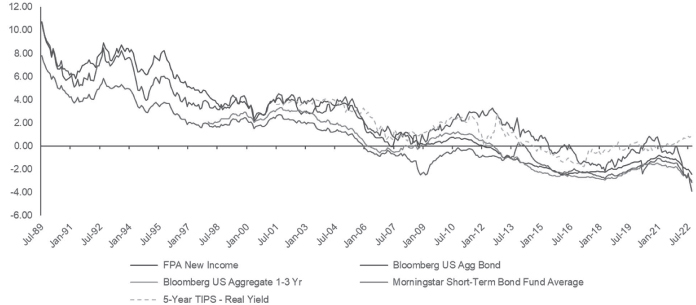
Chart covers the period July 31, 1985 through September 30, 2022. Source: Morningstar Direct. Comparison to the indices and the Morningstar US Short-Term Bond category is for illustrative purposes only. FPNIX does not include outperformance of any index or peer group in its investment objectives. An investor cannot invest directly in an index or Morningstar category. Real Return is nominal return minus inflation.
Given that we are currently dealing with inflation of approximately 8%, we are not surprised that the Fund is not beating inflation. The reason we are not surprised is that, as we have stated in the past, the first step in beating inflation long-term is not losing money in nominal terms. Had we invested with the sole objective of beating inflation in the short term, that would have required taking on a lot of duration risk and/or credit risk in an attempt to get more nominal yield, especially if one were trying to solve for 8% inflation. If we had done that, then the Fund might have a year-to-date return that's similar to the -14.61% year-to-date return of the longer duration Bloomberg U.S. Aggregate Bond Index or the -14.74% year-to-date return of the lower credit quality Bloomberg High Yield Index rather than the Fund's actual year-to-date return of -3.68%. Moreover, if we had taken on more duration risk and/or credit risk, we still would not have beaten inflation over the long-term. In fact, because we focused on capital preservation in nominal terms, the Fund has a higher return than the Bloomberg U.S. Aggregate Bond Index on a nominal and real basis over the last five years. While the Bloomberg High Yield Index has returned an annualized 36 bps more per year than the Fund over the last five years (on a nominal basis) while taking on significantly more credit risk, that Index was still unable to beat inflation over a five-year period.13
13 Source: Bloomberg. The Bloomberg High Yield Index annualized 5-year nominal returns were 1.57% through Sept 30, 2022.
Past performance is no guarantee, nor is it indicative, of future results.
11
FPA NEW INCOME, INC.
LETTER TO SHAREHOLDERS
(Continued)
The dashed green line in the chart above shows the real yield on five-year maturity TIPS but with a five-year lag. Historically, when real yields were negative, subsequent five-year real returns tended to be negative and when real yields were positive, subsequent real returns tended to be positive. When nominal yields were historically low in 2021 and real yields were negative, we focused on capital preservation, which entailed lower duration risk and lower credit risk. Though the Fund's defensive posturing was not enough to prevent nominal losses year-to-date this year, we have been able to achieve much lower losses compared to others and have done a better job than others of preserving capital. We believe that puts the Fund in a good position to achieve inflation-beating returns going forward, especially because real yields are now positive. Finally, we would add that it may be premature to pass judgement on our inflation-adjusted returns because we are in the middle of an interest rate cycle. It seems to us that we're only partway through this cycle, and we believe we're already ahead in the game given our better relative performance.
With so much discussion about bond market losses, it's worthwhile to define "loss." Losses on bonds are typically not permanent losses, particularly for investment grade bonds. As long as one believes that a bond will ultimately be repaid in full at its maturity, and holds to maturity, then the losses that bond investors are experiencing this year, and we believe that the Fund is experiencing, are temporary. Losses become permanent if a bond is not repaid in full or if bonds are sold prior to maturity such that investors receive today's price rather than par. With this in mind, we have always tried to be thoughtful about duration risk and credit risk. By avoiding uncompensated risk, we can have lower drawdowns when the market sells off, which we expect will then put us in a good position to redeploy capital closer to par into more attractively priced bonds, which is the situation we find ourselves in today. Ultimately, we expect this approach to lead to better and lower volatility long-term returns for the Fund's investors, as has been the case in the past.
That leads us to the exciting part: we believe this is the most attractive bond market we have seen in at least a decade! For reference, the charts below show the yield and spread on the Bloomberg U.S. Aggregate Bond Index and Bloomberg 1-3 year U.S. Aggregate Bond Index. Yields on investment grade bonds are now at levels we haven't seen since 2007. Most of the increase in yield through September 2022 has been due to higher risk-free rates, with a smaller component due to higher spreads.
12
FPA NEW INCOME, INC.
LETTER TO SHAREHOLDERS
(Continued)
Bloomberg U.S. Aggregate Bond Index
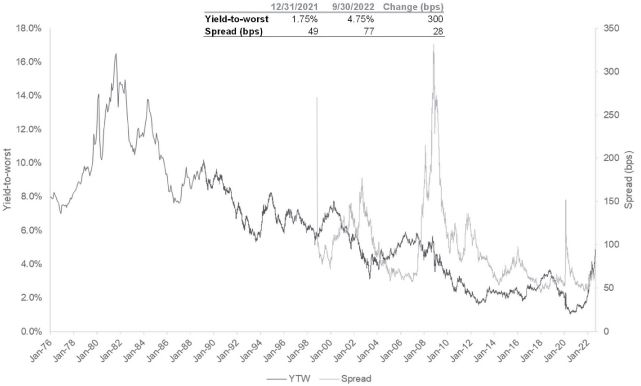
Source: Bloomberg. As of 9/30/2022. YTW is Yield-to-Worst. Spread reflects the quoted spread of a bond that is relative to the security off which it is priced, typically an on the-run treasury.
13
FPA NEW INCOME, INC.
LETTER TO SHAREHOLDERS
(Continued)
Bloomberg 1-3 year U.S. Aggregate Bond Index
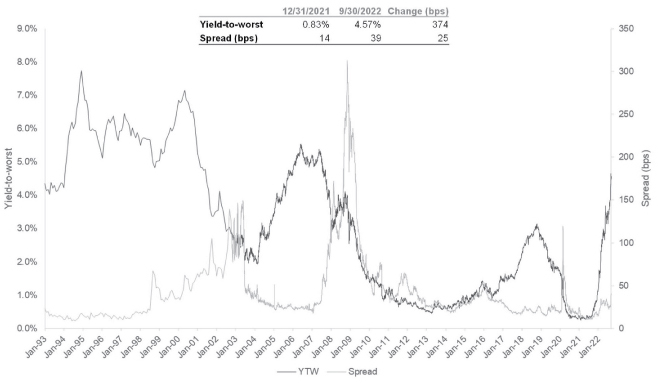
Source: Bloomberg. As of 9/30/2022. YTW is Yield-to-Worst. Spread reflects the quoted spread of a bond that is relative to the security off which it is priced, typically an on the-run treasury.
Elsewhere, credit markets have also become cheaper, but it's important to think about price relative to risk. The following chart shows the yield and spread on the BB component of the high-yield index excluding energy, an index we monitor to give us what we believe is a better indication of high yield bond pricing because it excludes noise related to changes in ratings composition found in the overall high-yield index over time and the more volatile energy sector. Also shown below is a similar chart for the leveraged loan index. In both cases, overall yields are higher, mostly due to higher risk-free rates, though spreads have increased meaningfully this year.
14
FPA NEW INCOME, INC.
LETTER TO SHAREHOLDERS
(Continued)
Bloomberg U.S. High Yield BB excl. Energy
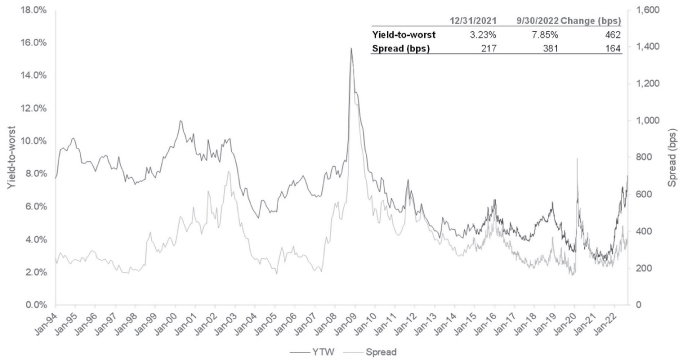
Source: Bloomberg. As of 9/30/2022. YTW is Yield-to-Worst. Spread reflects the quoted spread of a bond that is relative to the security off which it is priced, typically an on the-run treasury.
15
FPA NEW INCOME, INC.
LETTER TO SHAREHOLDERS
(Continued)
JP Morgan BB/B Leveraged Loan Index
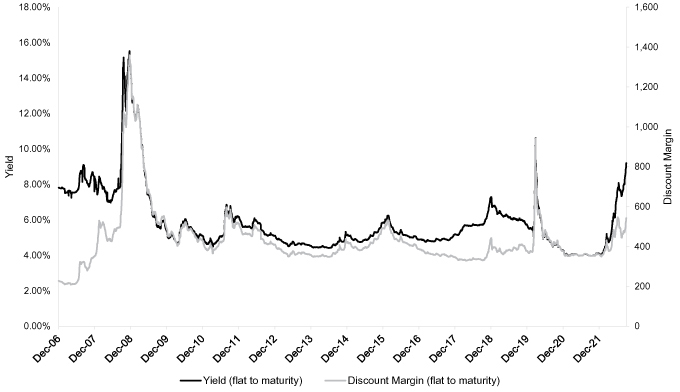
Source: JPMorgan. As of 9/30/2022. Yield is Yield-to-Maturity.
We have long viewed credit as an episodic asset class that is periodically attractive. On a prospective return or yield basis, today we view credit markets as certainly cheaper and more attractive than they have been in a long time, but not everything in high yield is a buying opportunity because of the risk versus reward. To own high yield-rated debt, we need sufficient absolute yield because we believe that compensates us for the possibility of permanent impairment of capital. We also need sufficient spread because we need to be compensated for the extra credit risk we are taking over and above the risk of investment grade alternatives. The difficulty with high yield-rated debt these days is that the credit quality is concerning to us. We see increased leverage at high yield-rated borrowers and weaker protections for lenders (i.e., bond and loan investors like us). Both are symptoms of the historically expensive market in prior years. Looking at the risk-versus-reward equation, we see that the yield (or reward) is higher, but so is the risk, which is why we think that high yield-rated debt is not that enticing even though it is more attractive from a yield perspective than it has been in a long time. Having said that, we don't like to paint markets with a broad brush. We're always looking for attractively-priced investments, and we have found attractive credit investments here and there.
As a general statement, we believe that the best investment opportunity these days is in investment-grade bonds. Specifically, as yields increase, we try to buy longer duration investment-grade bonds. We do this based on risk and reward and upside versus downside. We do not do this based on macroeconomic views because we are not macroeconomic investors. We don't know where rates are going to go or when. We don't tweet about
16
FPA NEW INCOME, INC.
LETTER TO SHAREHOLDERS
(Continued)
what we think the bond market is going to do, and we don't speculate on which parts of the market are going to outperform. Instead, we focus on absolute value investing. In other words, we strive to be bond investors, not bond speculators. To that end, we determine the duration of our investments by following our aforementioned 100 bps duration test which is illustrated below using Treasuries.
Hypothetical 12-month Treasury Returns
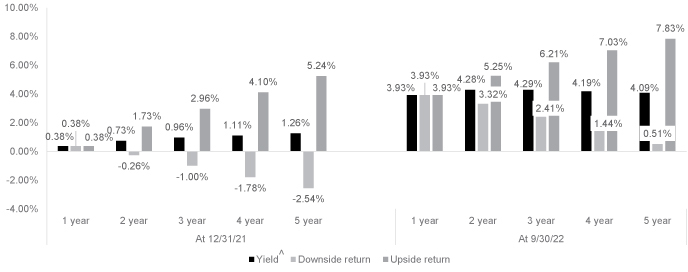
Source: Bloomberg. ^ Yield-to-Maturity is the total return anticipated on a bond if the bond is held until it matures and assumes all payments are made as scheduled and are reinvested at the same rate. The expected return assumes no change in interest rates over the next 12 months. Upside return estimates the 12-month total return assuming yields decline by 100 bps over 12 months. Downside return estimates the 12-month total return assuming yields increase by 100 bps over 12 months. Simulated 12-month total return scenarios assume 100 basis point gradual increase or decrease in interest rates over 12 months. The hypothetical stress test data provided herein is for illustrative and informational purposes only, and is intended to demonstrate the mathematical impact of a change in interest rates on Treasury yields. No representation is being made that any account, product or strategy will or is likely to achieve profits, losses, or results similar to those shown. Hypothetical results do not reflect trading in actual accounts, and does not reflect the impact that economic, market or other factors may have on the management of the account. Hypothetical results have certain inherent limitations and are designed with the benefit of hindsight. There are frequently sharp differences between simulated results and the actual results subsequently achieved by any particular account, product or strategy.
Past performance is no guarantee, nor is it indicative, of future results.
The left-hand side of the chart above represents our opportunity set as of the end of 2021 and the right-hand side represents our opportunity set as of the end of September 2022. The dark blue bars on each side show the yield on Treasury maturities of 1 to 5 years. The green bars show the results of our 100 bps duration test. For example, at the end of 2021, a 2-year Treasury purchased at a yield of 0.73% would produce a return of -0.26% if yields increased by 100 bps over 12 months. Based on this analysis, in 2021, we focused our investment activity on bonds with a duration between 1 and 2 years, which is where our duration test would breakeven.
17
FPA NEW INCOME, INC.
LETTER TO SHAREHOLDERS
(Continued)
The light blue bars show the upside return potential that's available if yields were to decrease by 100 bps over 12 months. Using the 2-year treasury at the end of 2021 again as an example, if the yield were to decrease by 100 bps, the 2-year Treasury would have a potential upside return of 1.73%. It's hard to contemplate that upside being realized because a 100 bps decrease in yield results in a meaningfully negative yield. Negative yields are or were possible, but that outcome highlights the leap of faith one has to make to realize upside return in a really expensive market.
At the end of September 2022, a 5-year Treasury purchased at a yield of 4.09% would generate a downside return of 0.51% if that bond's yield increased by 100 bps over the next 12 months. On the other hand, if yields on the 5-year Treasury were to decline by 100 bps over the next 12 months, the potential upside return is 7.83%. Because yields have risen so much, we now have on our menu not only the opportunities of a short-duration fund but also the opportunities of a core bond fund. Higher yields on longer duration bonds allow us to maintain our downside protection against rates rising an additional 100 bps from today while significantly improving the upside return potential if yields decline. We believe that over time, this investment approach of maintaining downside protection while opportunistically buying better upside potential will help us deliver an attractive return with less volatility, much as we have done in the past.14 With that in mind, we have been actively buying incrementally longer duration bonds and gradually increasing the duration of the portfolio.
Because of our active management, higher yields and our efforts to take advantage of the current environment, the Fund's yield-to-worst is higher than it has been in years, without significantly extending the Fund's duration and without meaningfully increasing its credit exposure.15
FPA New Income Yield-to-worst
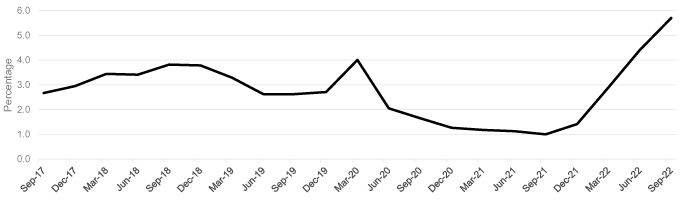
Source: FactSet. As of September 30, 2022. Portfolio composition will change due to ongoing management of FPNIX. Yield-to-Worst ("YTW") is presented gross of fees and expenses and reflects the lowest possible yield on a callable bond without the issuer defaulting. It does not represent the yield an investor should expect to receive. As of September 30, 2022, the FPNIX subsidized/unsubsidized 30-day standardized SEC yield ("SEC Yield") was 3.23%/3.06% respectively. The SEC Yield calculation is an annualized measure of FPNIX's dividend and
14 Past performance is no guarantee, nor is it indicative, of future results.
15 Over the past five years, the Fund's exposure to credit sensitive (BBB & below) securities ranged from 5.2%-11.5%. As of September 30, 2022, the exposure was 9.7%, which is within that range. Over the past five years, the Fund's effective duration ranged from 1.1-1.9 years. As of September 30, 2022, the Fund had duration of 1.7 years, which is within that range.
18
FPA NEW INCOME, INC.
LETTER TO SHAREHOLDERS
(Continued)
interest payments for the last 30 days, less FPNIX expenses. Subsidized yield reflects fee waivers and/or expense reimbursements during the period. Without waivers and/or reimbursements, yields would be reduced. Unsubsidized yield does not adjust for any fee waivers and/or expense reimbursements in effect. The SEC Yield calculation is based on the price of FPNIX at the beginning of the month. The SEC Yield calculation shows investors what they would earn in yield over the course of a 12-month period if FPNIX continued earning the same rate for the rest of the year.
Past performance is no guarantee, nor is it indicative, of future results.
With that said, investors are understandably concerned about yields rising further and may be wondering whether it's better to own short maturity Treasury bonds rather than other investment-grade bonds or the Fund. Investors may think they cannot go wrong or cannot be faulted for owning short maturity Treasury bonds. On the contrary, we believe that investors can indeed make a mistake by only owning short maturity Treasuries.
First, it's worth noting that Treasuries, like any other bond, can lose money over short periods of time. 1-year and 2-year Treasury bonds have experienced mark-to-market losses year-to-date. It's also worth noting that the Fund's returns year-to-date have been better than 2-year Treasury bonds, even after fees (see two charts below).16
Second, we believe there is an opportunity cost to owning short maturity Treasuries. Owning short maturity Treasuries means giving up the extra yield that is available on other highly rated bonds like AAA-rated asset-backed securities, agency guaranteed mortgages, investment grade corporates, etc. As a measure of this extra yield, the chart below shows the difference between the yield-to-worst on New Income and the 2-year Treasury over time. The extra yield available in New Income — or the opportunity cost of owning Treasuries — is the highest it has been in five years, excluding the COVID-induced selloff in March 2020. The reason the Fund has this yield advantage is because of our security selection, predominantly in investment-grade bonds.
FPA New Income Yield Advantage over 2-Year Treasury (%)
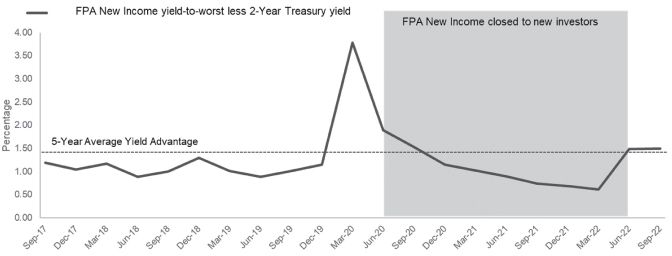
Source: Factset, Bloomberg. Data from 9/30/2017-9/30/2022. Shaded areas reflect when FPNIX was soft-closed, August 2020 through June 2022.
16 Year-to-date through 9/30/2022, the Fund's return after fees was -3.37% and 2-year Treasury return was -4.76%.
19
FPA NEW INCOME, INC.
LETTER TO SHAREHOLDERS
(Continued)
(As an aside, the grey highlighted area in this chart marks the time period where the Fund was soft-closed. We had soft-closed the Fund in 2020 because we didn't see a lot of value in bonds and we didn't think there was a great opportunity to earn more than Treasuries. Indeed, the Fund had a below-average yield advantage for much of the time that it was soft-closed. The opportunity set is much more attractive now which is why the Fund was re-opened earlier this year.)
The opportunity cost of owning Treasuries can also be seen when comparing potential returns under various interest rate scenarios. Short maturity Treasuries do not have the upside return potential that longer bonds can offer when yields decline but, at the same time, short maturity Treasuries also do not offer as much downside protection when yields increase.
The chart below compares potential returns for the Fund over the next 12 months versus the potential returns from owning a 1-year Treasury or a 2-year Treasury. We believe the 2-year Treasury is the more appropriate comparison to the Fund given that the Fund has a duration closer to 2 years than 1 year. For each change in risk-free rates — not spreads — shown on the X-axis, the bars show the expected total return over the next 12 months before and after fees, assuming that yields change in a gradual and parallel manner over 12 months, bonds or not bought or sold and maturing bonds are not reinvested. The 1-year Treasury return equals the yield under all scenarios because a 1-year Treasury is expected to mature at par. We observe:
• From a downside perspective, the Fund could endure a 600 bps increase in yield and have a positive return after fees. A 1-year Treasury would have a higher return in this scenario. A two-year Treasury would lose money, giving New Income a nearly 1.5% return advantage after fees.
• When comparing the 1-year Treasury and the Fund, the breakeven point occurs around a 125 bps increase in yields, which is where an investor would be indifferent between New Income and a 1-year Treasury. In other words, if you feel strongly that yields will rise by more than 125 bps, own a 1-year Treasury.
• If yields increase by 100 bps, the Fund could return more than the one-year Treasury after fees. Compared to the 2-year Treasury, the Fund could return 74 bps more after fees, a greater than 20% improvement over the Treasury return.
• From an upside perspective, if yields decline by 100 bps over the next 12 months, the Fund could have a return advantage after fees of 200 bps over the 1-year Treasury. Under the same scenario, the Fund could have a nearly 70 bps return advantage over the 2-year Treasury after fees, a greater than 10% improvement over the Treasury return.
20
FPA NEW INCOME, INC.
LETTER TO SHAREHOLDERS
(Continued)
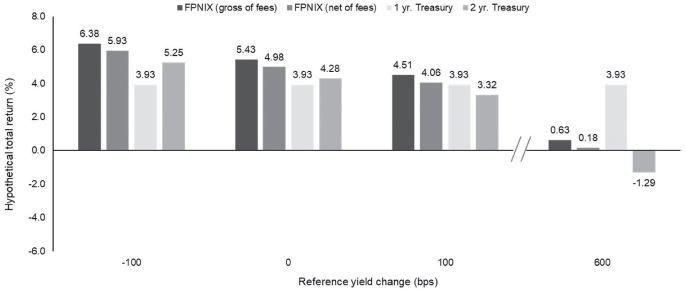
As of 9/30/2022. Fees of 0.45% are used for net of fee calculation. The Chart shows the hypothetical impact of rate changes on the portfolio's performance in one year as of the month end noted assuming: (i) a gradual shift in yield over a 12-month period; (ii) zero reinvestment rate; (iii) new securities are not purchased to replace securities that mature within the 12 months. The hypothetical performance is presented gross of investment management fees, transactions costs, and operating expenses, which if included, would reduce the returns presented. Stress Test data is hypothetical and provided for illustrative purposes only, and is intended to demonstrate the mathematical impact of changes in yield. No representation is being made that FPNIX will or is likely to achieve results similar to those shown. Hypothetical results do not reflect trading in actual accounts, and does not reflect the impact that economic or market factors might have on the results shown. Hypothetical results have certain inherent limitations. There are frequently sharp differences between simulated results and the actual results subsequently achieved by any particular account, product or strategy.
In today's market, we think Treasuries are attractive. However, we do not own short maturity Treasuries because we think the upside-versus-downside in longer Treasuries is too compelling. We also do not limit ourselves to Treasuries because we think the Fund's investors will ultimately be better off also owning other investment grade bonds which are also compelling. In summary, by adding duration in a disciplined manner, we believe that New Income offers a lot of downside protection while also offering upside return that short maturity Treasuries don't offer.
We understand that investors may be shell-shocked by the mark-to-market losses that they may have experienced on their fixed income investments this year. Over the past 30 to 40 years, bonds usually made money and, when they have lost money, those losses have paled in comparison to this year's bond market losses. As such, this year has been hard for investors to fathom. There is a temptation to climb into a hole and wait for things to get better, but the danger in doing that is missing the opportunity to make attractive long-term investments.
21
FPA NEW INCOME, INC.
LETTER TO SHAREHOLDERS
(Continued)
There's also a temptation to try to bet on what's going to happen with inflation and where rates are going to go. Macroeconomic forecasting is hard. Even the Fed can't get it right despite the resources at its disposal. That's not a criticism; that's just a recognition of how hard it is to forecast the economy and markets. We repeat what we have said many times before: if investors truly believe they can see the future and have a lot of conviction about when rates are going to move, in what direction and by how much, then investors should not own our funds or any other bond funds because we believe investors can make more money trading Treasuries themselves, owning more or less duration depending on their views. For those who believe they fall into this camp, we encourage an honest self-assessment — were you prescient enough to predict this year's rate increases, act accordingly and make money?
We cannot see the future nor do we try to. We can merely see the numbers in front of us, which tell us that, from an absolute return perspective, bonds are more attractive than they have been in at least a decade. There's a lot not to like in the world, but history shows that some of the best buying opportunities come when everyone else is pessimistic. To be clear, we are not calling a market bottom. No one can do that. No one is going to ring a bell and tell us now is the time to buy. Bonds are appealing to us because ultimately the investment boils down to the math, particularly for investment-grade bonds. Assuming that we will be repaid at par on our bonds, then we can see today what our return will be and we can measure the mark-to-market risk. Of course, yields can go higher and prices can go lower, but we think we can buy bonds today at yields and prices that will still result in positive returns over short periods of time even if yields rise further, within reason. There may be some short-term mark-to-market losses due to lower prices if yields rise further but, at today's yields, we believe that pain is mitigated (maybe even avoided) because now there is meaningfully more yield available to offset potential price declines and we are set up for potentially attractive long-term returns. That investment thesis is not based on a speculative bet on rates; that's just the math of bonds.
In summary, bonds have had a historically bad year thus far, but the silver lining is that yields and potential future returns are more attractive than they have been in a long time. We do not like to lose money, even temporarily. While we are disappointed that our returns have not met our high standards so far this year, investors should be pleased about their decision to invest in the Fund given that the Fund's relative performance is better year-to-date than its comparative indices, and better than the Morningstar Short-Term Bond Category, generally, over the past one-year. What matters now is whether investors take advantage of the opportunities in front of them. Low yields may have been nice because they drove up prices in the short term, but they reduced long-term prospective returns. Going forward, though the process of getting to higher yields is painful, we believe investors are ultimately better off long-term with higher yields.
Those who have known us for a long time know that we don't get excited about anything. Our glass is always half empty and about to break. This is the first time in over a decade that we are excited about the investing opportunities we see. With the higher yields and increased volatility that we are seeing this year, we are reminded of some advice from a very wealthy individual who once told us that getting rich is easy: just buy when everyone else is selling. Right now, everyone is selling. We think it's a good time to buy.
22
FPA NEW INCOME, INC.
LETTER TO SHAREHOLDERS
(Continued)
Appendix: Attribution and portfolio activity for the fiscal year ending September 30, 2022
Portfolio Attribution17
Largest contributors to performance:
• Asset-backed securities (ABS) backed by servicer advances
• Ginne Mae project loan interest only bonds
There were other individual bonds that contributed to performance during the fiscal year but there were no other meaningful contributors at the sector level.
Largest detractors from performance:
• Treasuries
• ABS backed by auto loans or leases
• ABS backed by equipment
Portfolio Activity
|
% Portfolio 9/30/2022 |
% Portfolio 9/30/2021 |
||||||||||
|
ABS |
66.3 |
52.3 |
|||||||||
|
Mortgage Backed (CMO) |
5.2 |
5.9 |
|||||||||
|
Stripped Mortgage-backed |
0.4 |
0.5 |
|||||||||
|
Corporate |
5.8 |
3.8 |
|||||||||
|
CMBS |
10.7 |
8.7 |
|||||||||
|
Mortgage Pass-through |
2.0 |
0.1 |
|||||||||
|
U.S. Treasury |
9.0 |
28.3 |
|||||||||
|
Cash and equivalents |
0.6 |
0.4 |
|||||||||
|
Total |
100.0 |
% |
100.0 |
% | |||||||
|
Yield-to-worst18 |
5.70 |
% |
1.00 |
% |
|||||||
|
Effective Duration (years) |
1.71 |
1.32 |
|||||||||
|
Average Life (years) |
2.44 |
1.63 |
|||||||||
Important Disclosures
This Commentary is for informational and discussion purposes only and does not constitute, and should not be construed as, an offer or solicitation for the purchase or sale of any securities, products or services discussed, and neither does it provide investment advice. Any such offer or solicitation shall only be made pursuant to the Fund's Prospectus, which supersedes the information contained herein in its entirety.
17 This information is not a recommendation for a specific security or sector and these securities/sectors may not be in the Fund at the time you receive this report. The information provided does not reflect all positions purchased, sold or recommended by FPA during the fiscal year ending September 30, 2022. The portfolio holdings as of the most recent quarter-end may be obtained at www.fpa.com.
18 Please refer to Footnote 1 for important information regarding Yield-to-Worst and SEC Yield.
Past performance is no guarantee, nor is it indicative, of future results.
23
FPA NEW INCOME, INC.
LETTER TO SHAREHOLDERS
(Continued)
The views expressed herein and any forward-looking statements are as of the date of the publication and are those of the portfolio management team. Future events or results may vary significantly from those expressed and are subject to change at any time in response to changing circumstances and industry developments. This information and data has been prepared from sources believed reliable, but the accuracy and completeness of the information cannot be guaranteed and is not a complete summary or statement of all available data. You should not construe the contents of this document as legal, tax, accounting, investment or other advice or recommendations.
Abhijeet Patwardhan has been portfolio manager for the Fund since November 2015. Thomas Atteberry managed/co-managed the Fund from November 2004 through June 2022. Effective July 1, 2022, Mr. Atteberry transitioned to a Senior Advisory role. There were no material changes to the investment process due to this transition.
Portfolio composition will change due to ongoing management of the Fund. References to individual securities or sectors are for informational purposes only and should not be construed as recommendations by the Fund, the portfolio manager, the Adviser, or the distributor. It should not be assumed that future investments will be profitable or will equal the performance of the security or sector examples discussed. The portfolio holdings as of the most recent quarter-end may be obtained at www.fpa.com.
The statements made herein may be forward-looking and/or based on current expectations, projections, and/or information currently available. Actual results may differ from those anticipated. The portfolio manager and/or FPA cannot assure future results and disclaims any obligation to update or alter any statistical data and/or references thereto, as well as any forward-looking statements, whether as a result of new information, future events, or otherwise. Such statements may or may not be accurate over the long-term.
Investments, including investments in mutual funds, carry risks and investors may lose principal value. Capital markets are volatile and can decline significantly in response to adverse issuer, political, regulatory, market, or economic developments. The Fund may purchase foreign securities, including American Depository Receipts (ADRs) and other depository receipts, which are subject to interest rate, currency exchange rate, economic and political risks; this may be enhanced when investing in emerging markets. Foreign investments, especially those of companies in emerging markets, can be riskier, less liquid, harder to value, and more volatile than investments in the United States. The securities of smaller, less well-known companies can be more volatile than those of larger companies.
The return of principal in a bond fund is not guaranteed. Bond funds have the same issuer, interest rate, inflation and credit risks that are associated with underlying bonds owned by the Fund. Lower rated bonds, convertible securities and other types of debt obligations involve greater risks than higher rated bonds.
Interest rate risk is the risk that when interest rates go up, the value of fixed income instruments, such as bonds, typically go down and investors may lose principal value. Credit risk is the risk of loss of principal due to the issuer's failure to repay a loan. Generally, the lower the quality rating of a fixed income instrument, the greater the risk that the issuer will fail to pay interest fully and return principal in a timely manner. If an issuer defaults the fixed income instrument may lose some or all of its value.
Mortgage securities and collateralized mortgage obligations (CMOs) are subject to prepayment risk and the risk of default on the underlying mortgages or other assets; such derivatives may increase volatility. Convertible securities are generally not investment grade and are subject to greater credit risk than higher-rated investments. High yield securities can be volatile and subject to much higher instances of default.
24
FPA NEW INCOME, INC.
LETTER TO SHAREHOLDERS
(Continued)
Collateralized debt obligations ("CDOs"), which include collateralized loan obligations ("CLOs"), collateralized bond obligations ("CBOs"), and other similarly structured securities, carry additional risks in addition to interest rate risk and default risk. This includes, but is not limited to: (i) distributions from the underlying collateral may not be adequate to make interest or other payments; (ii) the quality of the collateral may decline in value or default; and (iii) the complex structure of the security may not be fully understood at the time of investment and may produce disputes with the issuer or unexpected investment results. Investments in CDOs are also more difficult to value than other investments.
Value style investing presents the risk that the holdings or securities may never reach their full market value because the market fails to recognize what the portfolio management team considers the true business value or because the portfolio management team has misjudged those values. In addition, value style investing may fall out of favor and underperform growth or other styles of investing during given periods.
The ratings agencies that provide ratings are Standard and Poor's, Moody's, and Fitch. Credit ratings range from AAA (highest) to D (lowest). Bonds rated BBB or above are considered investment grade. Credit ratings of BB and below are lower-rated securities (junk bonds). High-yielding, non-investment grade bonds (junk bonds) involve higher risks than investment grade bonds. Bonds with credit ratings of CCC or below have high default risk.
Please refer to the Fund's Prospectus for a complete overview of the primary risks associated with the Fund.
The Fund is not authorized for distribution unless preceded or accompanied by a current prospectus. The prospectus can be accessed at: https://fpa.com/request-funds-literature.
Index / Category Definitions
Comparison to any index is for illustrative purposes only and should not be relied upon as a fully accurate measure of comparison. The Fund will be less diversified than the indices noted herein and may hold non-index securities or securities that are not comparable to those contained in an index. Indices will hold positions that are not within the Fund's investment strategy. Indices are unmanaged, do not reflect any commissions, fees or expenses which would be incurred by an investor purchasing the underlying securities. The Fund does not include outperformance of any index or benchmark in its investment objectives. Investors cannot invest directly in an index.
Bloomberg U.S. Aggregate Bond Index provides a measure of the performance of the U.S. investment grade bonds market, which includes investment grade U.S. Government bonds, investment grade corporate bonds, mortgage pass-through securities and asset-backed securities that are publicly offered for sale in the United States. The securities in the Index must have at least 1 year remaining in maturity. In addition, the securities must be denominated in U.S. dollars and must be fixed rate, nonconvertible, and taxable.
Bloomberg U.S. Aggregate 1-3 Year Bond Index provides a measure of the performance of the U.S. investment grade bonds market, which includes investment grade U.S. Government bonds, investment grade corporate bonds, mortgage pass-through securities and asset-backed securities that are publicly offered for sale in the United States. The securities in the Index must have a remaining maturity of 1 to 3 years. In addition, the securities must be denominated in U.S. dollars and must be fixed rate, nonconvertible, and taxable.
Bloomberg U.S. High Yield Index measures the market of USD-denominated, non-investment grade, fixed-rate, taxable corporate bonds.
25
FPA NEW INCOME, INC.
LETTER TO SHAREHOLDERS
(Continued)
The Consumer Price Index (CPI) is an unmanaged index representing the rate of the inflation of U.S. consumer prices as determined by the U.S. Department of Labor Statistics. There can be no guarantee that the CPI will reflect the exact level of inflation at any given time. This index reflects non-seasonally adjusted returns.
CPI + 100 bps is the measure of the CPI plus an additional 100 basis points.
JPM Leveraged Loan Index is designed to mirror the investable universe of U.S. dollar institutional leveraged loans, including U.S. and international borrowers (issuers from developed countries are included; issuers from developing countries are excluded). The index is composed of all fully funded term loan facilities trading the syndicated loan market.
Morningstar Short-term Bond Category portfolios invest primarily in corporate and other investment-grade U.S. fixed-income issues and typically have durations of 1.0 to 3.5 years. These portfolios are attractive to fairly conservative investors, because they are less sensitive to interest rates than portfolios with longer durations. Morningstar calculates monthly breakpoints using the effective duration of the Morningstar Core Bond Index in determining duration assignment. Short-term is defined as 25% to 75% of the three-year average effective duration of the Morningstar Core Bond Index. As of September 30, 2022, there were 603 funds in this category.
Other Definitions
Basis Point (bps) is equal to one hundredth of one percent, or 0.01%. 100 basis points = 1%.
Coupon or coupon payment is the annual interest rate paid on a bond, expressed as a percentage of the face value and paid from issue date until maturity.
Corporate holdings include bank debt, corporate bonds and common stock.
Credit Spread or Spread is the difference in yield between a U.S. Treasury bond and another debt security of the same maturity but different credit quality
A discount margin to maturity is the average expected return of a floating-rate security (typically a bond) that's earned in addition to the index underlying, or reference rate of, the security. The size of the discount margin depends on the price of the floating- or variable-rate security.
Effective Duration (years) is the duration calculation for bonds with embedded options. Effective duration takes into account that expected cash flows will fluctuate as interest rates change.
Mark-to-market is a method of measuring the fair value of accounts that can fluctuate over time, such as assets and liabilities.
Maximum drawdown is the maximum observed loss from a peak to a trough of a portfolio, before a new peak is attained. Maximum drawdown is an indicator of downside risk over a specified time period.
The nominal rate of return is the amount of money generated by an investment before factoring in expenses such as taxes, investment fees, and inflation.
Nominal yield is the coupon rate on a bond.
A bond premium occurs when the price of the bond has increased in the secondary market. A bond might trade at a premium because its interest rate is higher than current rates in the market.
Real return is what is earned on an investment after accounting for taxes and inflation.
Real yield is the nominal yield of a bond minus the rate of inflation
26
FPA NEW INCOME, INC.
LETTER TO SHAREHOLDERS
(Continued)
Reflation is a fiscal or monetary policy designed to expand output, stimulate spending, and curb the effects of deflation, which usually occurs after a period of economic uncertainty or a recession.
Repo (Repurchase Agreement) is a form of short-term borrowing for dealers in government securities.
The risk-free rate reflects the yield of the Treasury bond matching the investment's duration.
Sharpe Ratio measures risk-adjusted performance. The Sharpe ratio is calculated by subtracting the risk-free rate — such as that of the 10-year U.S. Treasury bond — from the rate of return for a portfolio and dividing the result by the standard deviation of the portfolio returns.
Sortino Ratio differentiates between good and bad volatility in the Sharpe ratio. This differentiation of upwards and downwards volatility allows the calculation to provide a risk-adjusted measure of a security or fund's performance without penalizing it for upward price changes.
Weighted Average Life (years) is the average length of time that each dollar of unpaid principal on a loan, a mortgage or an amortizing bond remains outstanding.
Yield to Maturity is the rate of return anticipated on a bond if held until the end of its lifetime. YTM is considered a long-term bond yield expressed as an annual rate. The YTM calculation takes into account the bond's current market price, par value, coupon interest rate and time to maturity. It is also assumed that all coupon payments are reinvested at the same rate as the bond's current yield.
©2022 Morningstar, Inc. All Rights Reserved. The information contained herein: (1) is proprietary to Morningstar and/or its content providers; (2) may not be copied or distributed; and (3) is not warranted by Morningstar to be accurate, complete or timely. Neither Morningstar nor its content providers are responsible for any damages or losses arising from any use of this information. Past performance is no guarantee of future results.
The FPA Funds are distributed by UMB Distribution Services, LLC, ("UMBDS"), 235 W. Galena Street, Milwaukee, WI, 53212. UMBDS is not affiliated with FPA.
27
FPA NEW INCOME, INC.
LETTER TO SHAREHOLDERS
(Continued)
The discussions of Fund investments represent the views of the Fund's managers at the time of this report and are subject to change without notice. References to individual securities are for informational purposes only and should not be construed as recommendations to purchase or sell individual securities.
FUND RISKS
Investments in mutual funds carry risks and investors may lose principal value. Stock markets are volatile and can decline significantly in response to adverse issuer, political, regulatory, market, or economic developments. The funds may purchase foreign securities which are subject to interest rate, currency exchange rate, economic and political risks: this may be enhanced when investing in emerging markets. The securities of smaller, less well-known companies can be more volatile than those of larger companies. The return of principal in a bond fund is not guaranteed. Bond funds have the same issuer, interest rate, inflation and credit risks that are associated with underlying bonds owned by the fund. Lower rated bonds, convertible securities and other types of debt obligations involve greater risks than higher rated bonds. Mortgage securities and collateralized mortgage obligations (CMOs) are subject to prepayment risk and the risk of default on the underlying mortgages or other assets; derivatives may increase volatility. High yield securities can be volatile and subject to much higher instances of default.
FORWARD LOOKING STATEMENT DISCLOSURE
As mutual fund managers, one of our responsibilities is to communicate with shareholders in an open and direct manner. Insofar as some of our opinions and comments in our letters to shareholders are based on our current expectations, they are considered "forward-looking statements" which may or may not prove to be accurate over the long term. While we believe we have a reasonable basis for our comments and we have confidence in our opinions, actual results may differ materially from those we anticipate. You can identify forward-looking statements by words such as "believe," "expect," "may," "anticipate," and other similar expressions when discussing prospects for particular portfolio holdings and/or the markets, generally. We cannot, however, assure future results and disclaim any obligation to update or alter any forward-looking statements, whether as a result of new information, future events, or otherwise. Further, information provided in this report should not be construed as a recommendation to purchase or sell any particular security.
28
FPA NEW INCOME, INC.
HISTORICAL PERFORMANCE
(Unaudited)
Change in Value of a $10,000 Investment in FPA New Income, Inc. vs. Barclays U.S. Aggregate Index and Consumer Price Index + 100 Basis Points from October 1, 2012 to September 30, 2022. The Average Annual Total Return table and Growth of Assumed $10,000 Investment graph do not reflect the deduction of taxes that a shareholder would pay on Fund distributions or the redemption of Fund shares.
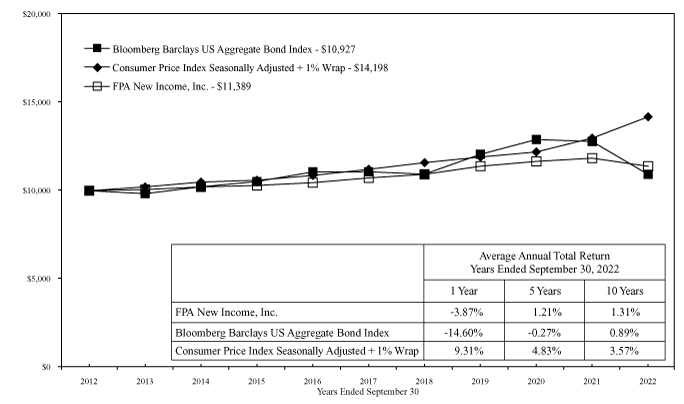
Past performance is not indicative of future performance. The Bloomberg Barclays U.S. Aggregate Bond Index a broad-based unmanaged composite of four major subindexes: U.S. Government Index; U.S. Credit Index; U.S. Mortgage-Backed Securities Index; and U.S. Asset-Backed Securities Index. The index holds investment quality bonds. The Consumer Price Index is an unmanaged index representing the rate of inflation of U.S. consumer prices as determined by the US Department of Labor Statistics. The performance of the Fund and of the Averages is computed on a total return basis which includes reinvestment of all distributions.
Past performance is no guarantee of future results, and current performance may be higher or lower than the performance shown. This data represents past performance, and investors should understand that investment returns and principal values fluctuate, so that when you redeem your investment it may be worth more or less than its original cost. The returns shown do not reflect the deduction of taxes that a shareholder would pay on Fund distributions or on the redemptions of Fund shares. Current month-end performance data can be obtained by visiting the website at www.fpa.com or by calling toll-free, 1-800-982-4372. Information regarding the Fund's expense ratio and redemption fees can be found in the Financial Highlights section of this report.
The Prospectus details the Fund's objective and policies, charges, and other matters of interest to prospective investors. Please read the prospectus carefully before investing. The Prospectus may be obtained by visiting the website at www.fpa.com, by email at crm@fpa.com, toll-free by calling 1-800-982-4372 or by contacting the Fund in writing.
29
FPA NEW INCOME, INC.
PORTFOLIO SUMMARY
September 30, 2022
|
Common Stocks |
1.2 |
% |
|||||||||
|
Energy |
0.5 |
% |
|||||||||
|
Industrials |
0.6 |
% |
|||||||||
|
Retailing |
0.1 |
% |
|||||||||
|
Bonds & Debentures |
98.2 |
% |
|||||||||
|
Asset-Backed Securities |
66.3 |
% |
|||||||||
|
Commercial Mortgage-Backed Securities |
11.1 |
% |
|||||||||
|
U.S. Treasuries |
9.0 |
% |
|||||||||
|
Residential Mortgage-Backed Securities |
7.2 |
% |
|||||||||
|
Corporate Bank Debt |
2.5 |
% |
|||||||||
|
Corporate Bonds & Notes |
2.1 |
% |
|||||||||
|
Short-term Investments |
0.7 |
% |
|||||||||
|
Other Assets And Liabilities, Net |
(0.1 |
)% |
|||||||||
|
Net Assets |
100.0 |
% |
|||||||||
30
FPA NEW INCOME, INC.
PORTFOLIO OF INVESTMENTS
September 30, 2022
|
COMMON STOCKS |
Shares or Principal Amount |
Fair Value |
|||||||||
|
ENERGY — 0.5% |
|||||||||||
|
PHI Group, Inc., Restricted(a)(b)(c)(m) |
3,806,420 |
$ |
47,580,250 |
||||||||
|
$ |
47,580,250 |
||||||||||
|
INDUSTRIALS — 0.6% |
|||||||||||
|
Boart Longyear Group Ltd.(d)(m) |
43,018,605 |
$ |
60,537,070 |
||||||||
|
$ |
60,537,070 |
||||||||||
|
RETAILING — 0.1% |
|||||||||||
|
Copper Earn Out Trust(a)(b)(c) |
69,361 |
$ |
381,486 |
||||||||
|
Copper Property CTL Pass Through Trust(a)(b)(c) |
520,208 |
6,762,704 |
|||||||||
|
$ |
7,144,190 |
||||||||||
| TOTAL COMMON STOCKS — 1.2% (Cost $139,264,410) |
$ |
115,261,510 |
|||||||||
|
BONDS & DEBENTURES |
|||||||||||
|
COMMERCIAL MORTGAGE-BACKED SECURITIES — 11.1% |
|||||||||||
|
AGENCY — 3.1% |
|||||||||||
|
Federal Home Loan Mortgage Corp. K057 A2 — 2.570% 7/25/2026 |
$ |
87,324,000 |
$ |
81,197,479 |
|||||||
|
Federal Home Loan Mortgage Corp. K058 A2 — 2.653% 8/25/2026 |
13,173,000 |
12,239,941 |
|||||||||
|
Federal Home Loan Mortgage Corp. K054 A2 — 2.745% 1/25/2026 |
3,600,000 |
3,405,051 |
|||||||||
|
Federal Home Loan Mortgage Corp. K066 A2 — 3.117% 6/25/2027 |
7,223,000 |
6,775,983 |
|||||||||
|
Federal Home Loan Mortgage Corp. K065 A2 — 3.243% 4/25/2027 |
9,702,802 |
9,192,060 |
|||||||||
|
Federal Home Loan Mortgage Corp. K051 A2 — 3.308% 9/25/2025 |
38,614,000 |
37,175,327 |
|||||||||
|
Federal Home Loan Mortgage Corp. K061 A2 — 3.347% 11/25/2026 |
78,855,000 |
75,067,815 |
|||||||||
|
Federal Home Loan Mortgage Corp. K073 A2 — 3.350% 1/25/2028 |
2,600,000 |
2,448,870 |
|||||||||
|
Federal Home Loan Mortgage Corp. K062 A2 — 3.413% 12/25/2026 |
41,061,276 |
39,131,589 |
|||||||||
|
Federal Home Loan Mortgage Corp. K063 A2 — 3.430% 1/25/2027 |
16,539,000 |
15,766,341 |
|||||||||
|
Federal Home Loan Mortgage Corp. K072 A2 — 3.444% 12/25/2027 |
11,587,000 |
10,971,680 |
|||||||||
|
$ |
293,372,136 |
||||||||||
|
AGENCY STRIPPED — 0.4% |
|||||||||||
|
Government National Mortgage Association 2012-25 IO — 0.000% 8/16/2052(e) |
$ |
11,743,715 |
$ |
55 |
|||||||
|
Government National Mortgage Association 2012-45 IO — 0.000% 4/16/2053(e) |
1,114,031 |
4 |
|||||||||
|
Government National Mortgage Association 2013-45 IO — 0.093% 12/16/2053(e) |
22,996,479 |
55,447 |
|||||||||
|
Government National Mortgage Association 2012-125 IO — 0.172% 2/16/2053(e) |
38,957,248 |
182,558 |
|||||||||
|
Government National Mortgage Association 2014-157 IO — 0.192% 5/16/2055(e) |
25,227,866 |
249,574 |
|||||||||
31
FPA NEW INCOME, INC.
PORTFOLIO OF INVESTMENTS (Continued)
September 30, 2022
|
BONDS & DEBENTURES — Continued |
Principal Amount |
Fair Value |
|||||||||
|
Government National Mortgage Association 2013-125 IO — 0.206% 10/16/2054(e) |
$ |
9,222,771 |
$ |
116,926 |
|||||||
|
Government National Mortgage Association 2015-169 IO — 0.262% 7/16/2057(e) |
46,115,987 |
748,822 |
|||||||||
|
Government National Mortgage Association 2014-110 IO — 0.271% 1/16/2057(e) |
18,772,232 |
287,936 |
|||||||||
|
Government National Mortgage Association 2015-19 IO — 0.282% 1/16/2057(e) |
28,649,772 |
487,189 |
|||||||||
|
Government National Mortgage Association 2015-41 IO — 0.292% 9/16/2056(e) |
7,487,900 |
124,442 |
|||||||||
|
Government National Mortgage Association 2015-108 IO — 0.322% 10/16/2056(e) |
1,557,741 |
38,859 |
|||||||||
|
Government National Mortgage Association 2014-153 IO — 0.327% 4/16/2056(e) |
40,660,068 |
621,400 |
|||||||||
|
Government National Mortgage Association 2015-150 IO — 0.364% 9/16/2057(e) |
7,762,212 |
194,111 |
|||||||||
|
Government National Mortgage Association 2012-79 IO — 0.388% 3/16/2053(e) |
47,384,848 |
418,413 |
|||||||||
|
Government National Mortgage Association 2012-150 IO — 0.487% 11/16/2052(e) |
18,030,548 |
141,370 |
|||||||||
|
Government National Mortgage Association 2016-65 IO — 0.507% 1/16/2058(e) |
31,049,309 |
806,810 |
|||||||||
|
Government National Mortgage Association 2015-7 IO — 0.514% 1/16/2057(e) |
19,957,071 |
428,077 |
|||||||||
|
Government National Mortgage Association 2014-175 IO — 0.561% 4/16/2056(e) |
71,552,398 |
1,632,554 |
|||||||||
|
Government National Mortgage Association 2014-138 IO — 0.579% 4/16/2056(e) |
6,007,593 |
127,657 |
|||||||||
|
Government National Mortgage Association 2014-77 IO — 0.607% 12/16/2047(e) |
13,970,952 |
171,526 |
|||||||||
|
Government National Mortgage Association 2012-114 IO — 0.621% 1/16/2053(e) |
17,413,614 |
255,484 |
|||||||||
|
Government National Mortgage Association 2014-187 IO — 0.628% 5/16/2056(e) |
74,596,142 |
1,828,038 |
|||||||||
|
Government National Mortgage Association 2016-125 IO — 0.828% 12/16/2057(e) |
60,821,931 |
2,340,738 |
|||||||||
|
Government National Mortgage Association 2020-75 IO — 0.871% 2/16/2062(e) |
102,242,273 |
6,726,765 |
|||||||||
|
Government National Mortgage Association 2020-42 IO — 0.937% 3/16/2062(e) |
128,704,971 |
8,802,699 |
|||||||||
32
FPA NEW INCOME, INC.
PORTFOLIO OF INVESTMENTS (Continued)
September 30, 2022
|
BONDS & DEBENTURES — Continued |
Principal Amount |
Fair Value |
|||||||||
|
Government National Mortgage Association 2016-106 IO — 0.978% 9/16/2058(e) |
$ |
89,025,383 |
$ |
3,940,112 |
|||||||
|
Government National Mortgage Association 2020-71 IO — 1.087% 1/16/2062(e) |
56,511,141 |
4,179,592 |
|||||||||
|
Government National Mortgage Association 2020-43 IO — 1.260% 11/16/2061(e) |
43,215,922 |
3,406,720 |
|||||||||
|
$ |
38,313,878 |
||||||||||
|
NON-AGENCY — 7.6% |
|||||||||||
|
A10 Bridge Asset Financing 2021-D A1FX — 2.589% 10/1/2038(f) |
$ |
9,411,850 |
$ |
8,907,715 |
|||||||
|
A10 Bridge Asset Financing LLC 2020-C A — 2.021% 8/15/2040(f) |
1,229,928 |
1,215,953 |
|||||||||
|
ACRE Commercial Mortgage Ltd. 2021-FL4 A, 1M USD LIBOR + 0.830% — 3.823% 12/18/2037(e)(f) |
11,562,681 |
11,441,622 |
|||||||||
|
ACRES Commercial Realty Ltd. 2021-FL1 A, 1M USD LIBOR + 1.200% — 4.139% 6/15/2036(e)(f) |
59,792,000 |
58,714,255 |
|||||||||
|
ACRES Commercial Realty Ltd. 2021-FL2 A, 1M USD LIBOR + 1.400% — 4.339% 1/15/2037(e)(f) |
13,444,000 |
12,986,689 |
|||||||||
|
Arbor Realty Commercial Real Estate Notes Ltd. 2022-FL1 A, SOFR30A + 1.450% — 3.735% 1/15/2037(e)(f) |
57,822,000 |
56,763,395 |
|||||||||
|
Arbor Realty Commercial Real Estate Notes Ltd. 2021-FL1 A, 1M USD LIBOR + 0.970% — 3.788% 12/15/2035(e)(f) |
54,525,000 |
53,522,362 |
|||||||||
|
Arbor Realty Commercial Real Estate Notes Ltd. 2021-FL2 A, 1M USD LIBOR + 1.100% — 3.918% 5/15/2036(e)(f) |
45,859,000 |
44,965,038 |
|||||||||
|
Arbor Realty Commercial Real Estate Notes Ltd. 2021-FL4 A, 1M USD LIBOR + 1.350% — 4.168% 11/15/2036(e)(f) |
59,062,000 |
58,146,592 |
|||||||||
|
Arbor Realty Commercial Real Estate Notes Ltd. 2022-FL2 A, 1M TSFR + 1.850% — 4.695% 5/15/2037(e)(f) |
35,540,000 |
35,042,596 |
|||||||||
|
AREIT Trust 2019-CRE3 A, 1M TSFR + 1.384% — 4.306% 9/14/2036(e)(f) |
1,259,110 |
1,247,148 |
|||||||||
|
BBCMS Trust 2015-SRCH A1 — 3.312% 8/10/2035(f) |
12,789,482 |
11,948,350 |
|||||||||
|
BDS Ltd. 2021-FL8 A, 1M USD LIBOR + 0.920% — 3.913% 1/18/2036(e)(f) |
17,846,464 |
17,407,206 |
|||||||||
|
BDS Ltd. 2019-FL4 AS, 1M USD LIBOR + 1.400% — 4.339% 8/15/2036(e)(f) |
6,613,000 |
6,568,500 |
|||||||||
|
BX Commercial Mortgage Trust 2021-VOLT E, 1M USD LIBOR + 2.000% — 4.818% 9/15/2036(e)(f) |
28,900,000 |
26,652,846 |
|||||||||
|
COMM Mortgage Trust 2014-CR20 A3 — 3.326% 11/10/2047 |
9,279,100 |
8,890,978 |
|||||||||
|
HERA Commercial Mortgage Ltd. 2021-FL1 A, 1M USD LIBOR + 1.050% — 4.043% 2/18/2038(e)(f) |
54,659,000 |
53,120,316 |
|||||||||
|
Independence Plaza Trust 2018-INDP A — 3.763% 7/10/2035(f) |
11,081,000 |
10,405,378 |
|||||||||
33
FPA NEW INCOME, INC.
PORTFOLIO OF INVESTMENTS (Continued)
September 30, 2022
|
BONDS & DEBENTURES — Continued |
Principal Amount |
Fair Value |
|||||||||
|
JPMBB Commercial Mortgage Securities Trust 2015-C30 ASB — 3.559% 7/15/2048 |
$ |
3,769,323 |
$ |
3,673,840 |
|||||||
|
JPMBB Commercial Mortgage Securities Trust 2015-C31 A3 — 3.801% 8/15/2048 |
7,598,510 |
7,227,902 |
|||||||||
|
KREF Ltd. 2021-FL2 A, 1M USD LIBOR + 1.070% — 4.009% 2/15/2039(e)(f) |
19,179,000 |
18,645,883 |
|||||||||
|
LCCM Trust 2021-FL2 A, 1M USD LIBOR + 1.200% — 4.018% 12/13/2038(e)(f) |
9,154,000 |
8,904,367 |
|||||||||
|
LoanCore Issuer Ltd. 2021-CRE4 A, SOFR30A + 0.914% — 3.200% 7/15/2035(e)(f) |
12,677,103 |
12,511,039 |
|||||||||
|
LoanCore Issuer Ltd. 2021-CRE5 A, 1M USD LIBOR + 1.300% — 4.118% 7/15/2036(e)(f) |
8,879,000 |
8,589,841 |
|||||||||
|
MF1 Ltd. 2020-FL4 A, 1M TSFR + 1.814% — 4.660% 11/15/2035(e)(f) |
12,610,646 |
12,550,114 |
|||||||||
|
Progress Residential Trust 2021-SFR10 A — 2.393% 12/17/2040(f) |
57,458,000 |
48,050,361 |
|||||||||
|
Ready Capital Mortgage Financing LLC 2021-FL5 A, 1M USD LIBOR + 1.000% — 4.084% 4/25/2038(e)(f) |
20,726,683 |
20,431,628 |
|||||||||
|
Shelter Growth CRE Issuer Ltd. 2021-FL3 A, 1M USD LIBOR + 1.080% — 3.898% 9/15/2036(e)(f) |
11,877,096 |
11,569,534 |
|||||||||
|
STWD Ltd. 2021-FL2, 1M USD LIBOR + 1.200% — 4.139% 4/18/2038(e)(f) |
33,755,000 |
33,072,703 |
|||||||||
|
TRTX Issuer Ltd. 2022-FL5 A, SOFR30A + 1.650% — 3.935% 2/15/2039(e)(f) |
37,857,000 |
37,095,628 |
|||||||||
|
VMC Finance LLC 2021-HT1 A, 3M USD LIBOR + 1.650% — 4.643% 1/18/2037(e)(f) |
20,143,100 |
19,516,537 |
|||||||||
|
$ |
719,786,316 |
||||||||||
|
TOTAL COMMERICAL MORTGAGE-BACKED SECURITIES (Cost $1,103,889,641) |
$ |
1,051,472,330 |
|||||||||
|
RESIDENTIAL MORTGAGE-BACKED SECURITIES — 7.2% |
|||||||||||
|
AGENCY COLLATERALIZED MORTGAGE OBLIGATION — 0.1% |
|||||||||||
|
Federal Home Loan Mortgage Corp. 4170 QE — 2.000% 5/15/2032 |
$ |
769,542 |
$ |
758,788 |
|||||||
|
Federal Home Loan Mortgage Corp. 3979 HD — 2.500% 12/15/2026 |
539,193 |
535,778 |
|||||||||
|
Federal Home Loan Mortgage Corp. 4304 DA — 2.500% 1/15/2027 |
167,935 |
167,243 |
|||||||||
|
Federal Home Loan Mortgage Corp. 4010 DE — 2.500% 2/15/2027 |
642,865 |
638,361 |
|||||||||
|
Federal Home Loan Mortgage Corp. 3914 MA — 3.000% 6/15/2026 |
497,455 |
496,846 |
|||||||||
|
Federal Home Loan Mortgage Corp. 3862 MB — 3.500% 5/15/2026 |
4,413,904 |
4,438,031 |
|||||||||
|
Federal Home Loan Mortgage Corp. 3828 VE — 4.500% 1/15/2024 |
283,878 |
285,776 |
|||||||||
|
Federal National Mortgage Association 2014-21 ED — 2.250% 4/25/2029 |
88,843 |
88,230 |
|||||||||
34
FPA NEW INCOME, INC.
PORTFOLIO OF INVESTMENTS (Continued)
September 30, 2022
|
BONDS & DEBENTURES — Continued |
Principal Amount |
Fair Value |
|||||||||
|
Federal National Mortgage Association 2013-135 KM — 2.500% 3/25/2028 |
$ |
211,499 |
$ |
210,577 |
|||||||
|
Federal National Mortgage Association 2017-30 G — 3.000% 7/25/2040 |
25,706 |
25,698 |
|||||||||
|
Federal National Mortgage Association 2013-93 PJ — 3.000% 7/25/2042 |
758,694 |
729,304 |
|||||||||
|
Federal National Mortgage Association 2011-80 KB — 3.500% 8/25/2026 |
2,987,389 |
2,997,796 |
|||||||||
|
Federal National Mortgage Association 144 PD — 3.500% 4/25/2042 |
1,570,605 |
1,510,039 |
|||||||||
|
Federal National Mortgage Association 2010-43 MK — 5.500% 5/25/2040 |
542,740 |
544,851 |
|||||||||
|
$ |
13,427,318 |
||||||||||
|
AGENCY POOL ADJUSTABLE RATE — 0.0% |
|||||||||||
|
Federal National Mortgage Association 865963, 12M USD LIBOR + 1.906% — 2.499% 3/1/2036(e) |
$ |
278,027 |
$ |
282,386 |
|||||||
|
AGENCY POOL FIXED RATE — 2.0% |
|||||||||||
|
Federal Home Loan Mortgage Corp. ZA2796 — 2.500% 11/1/2027 |
$ |
2,195,892 |
$ |
2,023,812 |
|||||||
|
Federal Home Loan Mortgage Corp. J22472 — 2.500% 2/1/2028 |
1,627,049 |
1,500,886 |
|||||||||
|
Federal Home Loan Mortgage Corp. ZS8495 — 2.500% 8/1/2028 |
784,383 |
722,670 |
|||||||||
|
Federal Home Loan Mortgage Corp. J32374 — 2.500% 11/1/2028 |
87,986,719 |
81,136,610 |
|||||||||
|
Federal Home Loan Mortgage Corp. G15169 — 4.500% 9/1/2026 |
332,654 |
331,554 |
|||||||||
|
Federal Home Loan Mortgage Corp. G15272 — 4.500% 9/1/2026 |
85,515 |
85,342 |
|||||||||
|
Federal Home Loan Mortgage Corp. G15875 — 4.500% 9/1/2026 |
402,867 |
401,968 |
|||||||||
|
Federal Home Loan Mortgage Corp. G15036 — 5.000% 6/1/2024 |
12,686 |
12,692 |
|||||||||
|
Federal Home Loan Mortgage Corp. G13667 — 5.000% 8/1/2024 |
203 |
203 |
|||||||||
|
Federal Home Loan Mortgage Corp. G15173 — 5.000% 6/1/2026 |
25,627 |
25,639 |
|||||||||
|
Federal Home Loan Mortgage Corp. G15407 — 5.000% 6/1/2026 |
158,723 |
158,822 |
|||||||||
|
Federal Home Loan Mortgage Corp. G15230 — 5.500% 12/1/2024 |
42,473 |
42,583 |
|||||||||
|
Federal Home Loan Mortgage Corp. G15458 — 5.500% 12/1/2024 |
7,272 |
7,286 |
|||||||||
|
Federal Home Loan Mortgage Corp. G14460 — 6.000% 1/1/2024 |
1,767 |
1,775 |
|||||||||
|
Federal National Mortgage Association AQ9360 — 2.500% 1/1/2028 |
893,488 |
823,470 |
|||||||||
|
Federal National Mortgage Association FS0499 — 2.500% 11/1/2030 |
46,523,786 |
43,430,443 |
|||||||||
|
Federal National Mortgage Association FS0452 — 2.500% 10/1/2031 |
5,527,059 |
5,093,934 |
|||||||||
|
Federal National Mortgage Association FS0494 — 2.500% 2/1/2035 |
55,391,667 |
51,033,617 |
|||||||||
|
Federal National Mortgage Association FM1102 — 4.000% 3/1/2031 |
2,620,347 |
2,552,529 |
|||||||||
|
Federal National Mortgage Association AL4056 — 5.000% 6/1/2026 |
38,702 |
38,683 |
|||||||||
|
Federal National Mortgage Association AL5867 — 5.500% 8/1/2023 |
2,366 |
2,368 |
|||||||||
|
Federal National Mortgage Association AL0471 — 5.500% 7/1/2025 |
6,116 |
6,134 |
|||||||||
|
Federal National Mortgage Association AL4433 — 5.500% 9/1/2025 |
9,985 |
10,035 |
|||||||||
|
Federal National Mortgage Association AL4901 — 5.500% 9/1/2025 |
7,066 |
7,075 |
|||||||||
|
Federal National Mortgage Association 890225 — 6.000% 5/1/2023 |
6,971 |
6,982 |
|||||||||
|
Government National Mortgage Association 782281 — 6.000% 3/15/2023 |
13,576 |
13,580 |
|||||||||
|
$ |
189,470,692 |
||||||||||
35
FPA NEW INCOME, INC.
PORTFOLIO OF INVESTMENTS (Continued)
September 30, 2022
|
BONDS & DEBENTURES — Continued |
Principal Amount |
Fair Value |
|||||||||
|
AGENCY STRIPPED — 0.0% |
|||||||||||
|
Federal Home Loan Mortgage Corp. 217 PO — 2.246% 1/1/2032(g) |
$ |
73,251 |
$ |
59,634 |
|||||||
|
Federal Home Loan Mortgage Corp. 3917 AI — 4.500% 7/15/2026 |
534,518 |
3,952 |
|||||||||
|
Federal Home Loan Mortgage Corp. 217 IO — 6.500% 1/1/2032 |
70,533 |
14,137 |
|||||||||
|
Federal National Mortgage Association 2010-25 NI — 5.000% 3/25/2025 |
72 |
1 |
|||||||||
|
Federal National Mortgage Association 2003-64 XI — 5.000% 7/25/2033 |
195,770 |
34,475 |
|||||||||
|
$ |
112,199 |
||||||||||
|
NON-AGENCY COLLATERALIZED MORTGAGE OBLIGATION — 5.1% |
|||||||||||
|
Cascade Funding Mortgage Trust 2021-HB6 A — 0.898% 6/25/2036(f) |
$ |
15,378,017 |
$ |
14,941,912 |
|||||||
|
CFMT LLC 2021-HB5 A — 0.801% 2/25/2031(f) |
28,664,485 |
27,565,669 |
|||||||||
|
CFMT LLC 2020-HB4 A — 0.946% 12/26/2030(f) |
7,627,248 |
7,396,081 |
|||||||||
|
CFMT LLC 2021-HB7 A — 1.151% 10/27/2031(f) |
18,350,155 |
17,243,184 |
|||||||||
|
CFMT LLC 2021-HB7 M1 — 2.125% 10/27/2031(f) |
15,406,000 |
14,104,484 |
|||||||||
|
Citigroup Mortgage Loan Trust, Inc. 2014-A A — 4.000% 1/25/2035(e)(f) |
2,780,578 |
2,570,362 |
|||||||||
|
PRET LLC 2021-NPL5 A1 — 2.487% 10/25/2051(f)(h) |
64,538,227 |
59,723,675 |
|||||||||
|
Pretium Mortgage Credit Partners I LLC 2021-NPL2 A1 — 1.992% 6/27/2060(f)(h) |
27,962,368 |
25,781,303 |
|||||||||
|
Pretium Mortgage Credit Partners I LLC 2021-NPL4 A1 — 2.363% 10/27/2060(f)(h) |
46,366,355 |
43,167,077 |
|||||||||
|
Pretium Mortgage Credit Partners I LLC 2021-NPL6 A1 — 2.487% 7/25/2051(f)(h) |
19,736,214 |
18,325,074 |
|||||||||
|
PRPM LLC 2021-2 A1 — 2.115% 3/25/2026(e)(f) |
20,009,062 |
18,888,880 |
|||||||||
|
PRPM LLC 2021-9 A1 — 2.363% 10/25/2026(f)(h) |
22,808,185 |
21,208,604 |
|||||||||
|
PRPM LLC 2021-10 A1 — 2.487% 10/25/2026(f)(h) |
29,034,415 |
26,299,219 |
|||||||||
|
PRPM LLC 2021-11 A1 — 2.487% 11/25/2026(f)(h) |
35,750,675 |
33,295,269 |
|||||||||
|
RCO VII Mortgage LLC 2021-2 A1 — 2.116% 9/25/2026(f)(h) |
20,495,585 |
19,039,613 |
|||||||||
|
Towd Point Mortgage Trust 2018-2 A1 — 3.250% 3/25/2058(e)(f) |
25,591,963 |
24,747,244 |
|||||||||
|
Towd Point Mortgage Trust 2018-5 A1A — 3.250% 7/25/2058(e)(f) |
14,658,963 |
14,307,727 |
|||||||||
|
VCAT LLC 2021 NPL2 A1 — 2.115% 3/27/2051(f)(h) |
20,812,856 |
19,650,492 |
|||||||||
|
VCAT LLC 2021-NPL1 A1 — 2.289% 12/26/2050(f)(h) |
4,384,629 |
4,201,864 |
|||||||||
|
VOLT C LLC 2021-NPL9 — 1.992% 5/25/2051(f)(h) |
18,764,901 |
17,455,111 |
|||||||||
|
VOLT XCIV LLC 2021-NPL3 A1 — 2.240% 2/27/2051(f)(h) |
25,299,494 |
23,892,842 |
|||||||||
|
VOLT XCV LLC 2021-NPL4 — 2.240% 3/27/2051(f)(h) |
25,735,807 |
24,382,103 |
|||||||||
|
$ |
478,187,789 |
||||||||||
|
TOTAL RESIDENTIAL MORTGAGE-BACKED SECURITIES (Cost $729,915,863) |
$ |
681,480,384 |
|||||||||
36
FPA NEW INCOME, INC.
PORTFOLIO OF INVESTMENTS (Continued)
September 30, 2022
|
BONDS & DEBENTURES — Continued |
Principal Amount |
Fair Value |
|||||||||
|
ASSET-BACKED SECURITIES — 66.3% |
|||||||||||
|
AUTO — 20.9% |
|||||||||||
|
American Credit Acceptance Receivables Trust 2021-2 C — 0.970% 7/13/2027(f) |
$ |
55,165,000 |
$ |
53,811,643 |
|||||||
|
American Credit Acceptance Receivables Trust 2021-3 C — 0.980% 11/15/2027(f) |
40,171,000 |
38,884,644 |
|||||||||
|
American Credit Acceptance Receivables Trust 2021-4 C — 1.320% 2/14/2028(f) |
36,195,000 |
34,822,138 |
|||||||||
|
American Credit Acceptance Receivables Trust 2022-1 B — 1.680% 9/14/2026(f) |
22,408,000 |
21,778,886 |
|||||||||
|
American Credit Acceptance Receivables Trust 2022-1 C — 2.120% 3/13/2028(f) |
45,613,000 |
42,894,899 |
|||||||||
|
AmeriCredit Automobile Receivables Trust 2021-3 A3 — 0.760% 8/18/2026 |
21,998,000 |
21,037,026 |
|||||||||
|
AmeriCredit Automobile Receivables Trust 2020-2 C — 1.480% 2/18/2026 |
6,808,000 |
6,527,930 |
|||||||||
|
BMW Vehicle Lease Trust 2022-1 A4 — 1.230% 5/27/2025 |
30,512,000 |
28,781,796 |
|||||||||
|
BMW Vehicle Owner Trust 2022-A A4 — 3.440% 12/26/2028 |
25,298,000 |
24,184,498 |
|||||||||
|
Capital One Prime Auto Receivables Trust 2022-2 A4 — 3.690% 12/15/2027 |
15,513,000 |
14,892,331 |
|||||||||
|
CarMax Auto Owner Trust 2022-1 A3 — 1.470% 12/15/2026 |
61,620,000 |
59,405,309 |
|||||||||
|
CarMax Auto Owner Trust 2020-3 C — 1.690% 4/15/2026 |
1,064,000 |
1,015,753 |
|||||||||
|
CarMax Auto Owner Trust 2022-3 A4 — 4.060% 2/15/2028 |
63,819,000 |
61,879,668 |
|||||||||
|
CarMax Auto Owner Trust 2022-3 B — 4.690% 2/15/2028 |
19,152,000 |
18,528,819 |
|||||||||
|
Drive Auto Receivables Trust 2021-2 C — 0.870% 10/15/2027 |
51,629,000 |
49,646,643 |
|||||||||
|
Drive Auto Receivables Trust 2021-3 B — 1.110% 5/15/2026 |
72,790,000 |
69,190,396 |
|||||||||
|
Drive Auto Receivables Trust 2021-3 C — 1.470% 1/15/2027 |
72,790,000 |
69,377,685 |
|||||||||
|
DT Auto Owner Trust 2021-3A C — 0.870% 5/17/2027(f) |
18,106,000 |
17,031,581 |
|||||||||
|
DT Auto Owner Trust 2021-4A B — 1.020% 5/15/2026(f) |
13,540,000 |
12,977,037 |
|||||||||
|
DT Auto Owner Trust 2021-4A C — 1.500% 9/15/2027(f) |
13,540,000 |
12,713,887 |
|||||||||
|
DT Auto Owner Trust 2022-1A C — 2.960% 11/15/2027(f) |
18,926,000 |
17,947,365 |
|||||||||
|
Exeter Automobile Receivables Trust 2021-4A C — 1.460% 10/15/2027 |
41,400,000 |
39,300,618 |
|||||||||
|
Exeter Automobile Receivables Trust 2022-1A B — 2.180% 6/15/2026 |
94,894,000 |
91,819,283 |
|||||||||
|
Exeter Automobile Receivables Trust 2022-1A C — 2.560% 6/15/2028 |
49,707,000 |
47,160,331 |
|||||||||
|
Flagship Credit Auto Trust 2021-2 C — 1.270% 6/15/2027(f) |
17,609,000 |
16,495,428 |
|||||||||
|
Flagship Credit Auto Trust 2021-4 B — 1.490% 2/15/2027(f) |
8,567,000 |
8,035,014 |
|||||||||
|
Ford Credit Auto Lease Trust 2021-B B — 0.660% 1/15/2025 |
22,156,000 |
20,907,175 |
|||||||||
|
Ford Credit Auto Lease Trust 2021-B C — 0.900% 5/15/2026 |
21,928,000 |
20,748,462 |
|||||||||
|
Ford Credit Auto Owner Trust 2020-B B — 1.190% 1/15/2026 |
400,000 |
382,127 |
|||||||||
|
Ford Credit Auto Owner Trust 2022-A A3 — 1.290% 6/15/2026 |
33,165,000 |
31,720,107 |
|||||||||
37
FPA NEW INCOME, INC.
PORTFOLIO OF INVESTMENTS (Continued)
September 30, 2022
|
BONDS & DEBENTURES — Continued |
Principal Amount |
Fair Value |
|||||||||
|
GM Financial Automobile Leasing Trust 2021-2 B — 0.690% 5/20/2025 |
$ |
4,991,000 |
$ |
4,775,684 |
|||||||
|
GM Financial Automobile Leasing Trust 2022-1 A3 — 1.900% 3/20/2025 |
91,758,000 |
89,112,103 |
|||||||||
|
GM Financial Automobile Leasing Trust 2022-1 A4 — 1.960% 2/20/2026 |
43,831,000 |
42,003,063 |
|||||||||
|
GM Financial Automobile Leasing Trust 2022-1 B — 2.230% 2/20/2026 |
12,446,000 |
11,891,118 |
|||||||||
|
GM Financial Automobile Leasing Trust 2022-1 C — 2.640% 2/20/2026 |
32,069,000 |
30,370,206 |
|||||||||
|
GM Financial Consumer Automobile Receivables Trust 2022-1 A3 — 1.260% 11/16/2026 |
29,166,000 |
27,948,763 |
|||||||||
|
GM Financial Consumer Automobile Receivables Trust 2020-3 C — 1.370% 1/16/2026 |
2,760,000 |
2,607,438 |
|||||||||
|
GM Financial Consumer Automobile Receivables Trust 2022-3 A4 — 3.710% 12/16/2027 |
25,555,000 |
24,754,812 |
|||||||||
|
Honda Auto Receivables Owner Trust 2022-2 A4 — 3.760% 12/18/2028 |
6,350,000 |
6,178,560 |
|||||||||
|
Honda Auto Receivables Owner Trust 2021-4 A3 — 0.880% 1/21/2026 |
44,179,000 |
41,817,116 |
|||||||||
|
Hyundai Auto Lease Securitization Trust 2022-A A3 — 1.160% 1/15/2025(f) |
59,677,000 |
57,583,883 |
|||||||||
|
Hyundai Auto Lease Securitization Trust 2022-A A4 — 1.320% 12/15/2025(f) |
35,890,000 |
34,185,957 |
|||||||||
|
Hyundai Auto Receivables Trust 2021-C A3 — 0.740% 5/15/2026 |
29,067,000 |
27,424,037 |
|||||||||
|
Hyundai Auto Receivables Trust 2022-B A4 — 3.800% 8/15/2028 |
14,340,000 |
13,982,746 |
|||||||||
|
Nissan Auto Receivables Owner Trust 2022-B — 4.450% 11/15/2029 |
13,366,000 |
13,178,737 |
|||||||||
|
Prestige Auto Receivables Trust 2021-1A B — 1.190% 4/15/2026(f) |
37,756,000 |
35,749,397 |
|||||||||
|
Prestige Auto Receivables Trust 2021-1A C — 1.530% 2/15/2028(f) |
13,545,000 |
12,552,678 |
|||||||||
|
Santander Drive Auto Receivables Trust 2021-4 C — 1.260% 2/16/2027 |
63,342,000 |
60,667,802 |
|||||||||
|
Santander Drive Auto Receivables Trust 2022-1 B — 2.360% 8/17/2026 |
99,413,000 |
96,795,684 |
|||||||||
|
Santander Drive Auto Receivables Trust 2022-1 C — 2.560% 4/17/2028 |
33,202,000 |
31,799,720 |
|||||||||
|
Santander Retail Auto Lease Trust 2021-A C — 1.140% 3/20/2026(f) |
1,886,000 |
1,782,337 |
|||||||||
|
Santander Retail Auto Lease Trust 2022-A A3 — 1.340% 7/21/2025(f) |
34,544,000 |
32,829,208 |
|||||||||
|
Santander Retail Auto Lease Trust 2022-A A4 — 1.420% 1/20/2026(f) |
18,847,000 |
17,624,384 |
|||||||||
|
Santander Retail Auto Lease Trust 2022-A B — 1.610% 1/20/2026(f) |
10,319,000 |
9,557,955 |
|||||||||
|
Toyota Auto Receivables Owner Trust 2022-C A4 — 3.770% 2/15/2028 |
10,600,000 |
10,348,466 |
|||||||||
|
Volkswagen Auto Loan Enhanced Trust 2021-1 A3 — 1.020% 6/22/2026 |
52,430,000 |
49,739,230 |
|||||||||
|
Westlake Automobile Receivables Trust 2021-2A C — 0.890% 7/15/2026(f) |
50,584,000 |
48,015,785 |
|||||||||
|
Westlake Automobile Receivables Trust 2021-3A B — 1.290% 1/15/2027(f) |
69,723,000 |
66,845,385 |
|||||||||
|
Westlake Automobile Receivables Trust 2021-3A C — 1.580% 1/15/2027(f) |
69,605,000 |
65,480,758 |
|||||||||
|
Westlake Automobile Receivables Trust 2022-1A C — 3.110% 3/15/2027(f) |
52,910,000 |
50,146,130 |
|||||||||
|
World Omni Auto Receivables Trust 2020-C C — 1.390% 5/17/2027 |
3,415,000 |
3,199,552 |
|||||||||
|
$ |
1,974,847,173 |
||||||||||
38
FPA NEW INCOME, INC.
PORTFOLIO OF INVESTMENTS (Continued)
September 30, 2022
|
BONDS & DEBENTURES — Continued |
Principal Amount |
Fair Value |
|||||||||
|
COLLATERALIZED LOAN OBLIGATION — 19.5% |
|||||||||||
|
ABPCI Direct Lending Fund CLO X LP 2020-10A A1A, 3M USD LIBOR + 1.950% — 4.660% 1/20/2032(e)(f) |
$ |
19,397,000 |
$ |
18,905,907 |
|||||||
|
ABPCI Direct Lending Fund IX LLC 2020-9A A1R, 3M USD LIBOR + 1.400% — 4.169% 11/18/2031(e)(f) |
43,972,000 |
42,398,902 |
|||||||||
|
Barings CLO Ltd. 2018-III 2018-3A A1, 3M USD LIBOR + 0.950% — 3.660% 7/20/2029(e)(f) |
19,098,223 |
18,846,776 |
|||||||||
|
Blackrock Mount Adams CLO IX LP 2021-9A A1, 3M USD LIBOR + 1.370% — 4.972% 9/22/2031(e)(f) |
31,531,000 |
30,546,192 |
|||||||||
|
Brightwood Capital MM CLO Ltd. 2021-2A A, 3M USD LIBOR + 1.650% — 4.162% 11/15/2030(e)(f) |
85,599,000 |
83,986,914 |
|||||||||
|
BTC Holdings Fund I LLC — 5.500% 1/28/2027(b)(c) |
4,787,445 |
4,787,445 |
|||||||||
|
BTC Offshore Holdings Fund, 3M USD LIBOR + 2.650% — 5.400% 10/20/2029(b)(c) |
18,000,000 |
18,000,000 |
|||||||||
|
Cerberus Loan Funding XXIX LP 2020-2A A, 3M USD LIBOR + 1.900% — 4.412% 10/15/2032(e)(f) |
82,252,000 |
80,655,077 |
|||||||||
|
Cerberus Loan Funding XXV LP 2018-4RA A1TR, 3M USD LIBOR + 1.530% — 4.042% 10/15/2030(e)(f) |
18,629,000 |
18,329,427 |
|||||||||
|
Cerberus Loan Funding XXVI LP 2019-1A AR, 3M USD LIBOR + 1.500% — 4.012% 4/15/2031(e)(f) |
10,764,000 |
10,481,596 |
|||||||||
|
Cerberus Loan Funding XXVIII LP 2020-1A A, 3M USD LIBOR + 1.850% — 4.362% 10/15/2031(e)(f) |
70,979,000 |
70,032,708 |
|||||||||
|
Cerberus Loan Funding XXXI LP 2021-1A A, 3M USD LIBOR + 1.500% — 4.012% 4/15/2032(e)(f) |
45,931,000 |
44,761,321 |
|||||||||
|
Fortress Credit Opportunities IX CLO Ltd. 2017-9A A1TR, 3M USD LIBOR + 1.550% — 4.062% 10/15/2033(e)(f) |
118,776,000 |
112,842,664 |
|||||||||
|
Fortress Credit Opportunities XI CLO Ltd. 2018-11A A1T, 3M USD LIBOR + 1.300% — 3.812% 4/15/2031(e)(f) |
37,820,000 |
36,716,753 |
|||||||||
|
Fortress Credit Opportunities XVII CLO Ltd. 2022-17A A, 3M TSFR + 1.370% — 3.698% 1/15/2030(e)(f) |
54,880,702 |
53,657,027 |
|||||||||
|
Galaxy XXIII CLO Ltd. 2017-23A AR, 3M USD LIBOR + 0.870% — 3.653% 4/24/2029(e)(f) |
40,158,435 |
39,384,422 |
|||||||||
|
Golub Capital Partners CLO 36m Ltd. 2018-36A A, 3M USD LIBOR + 1.300% — 4.132% 2/5/2031(e)(f) |
67,200,000 |
65,391,648 |
|||||||||
|
Golub Capital Partners CLO 42M Ltd. 2019-42A A2, 3M USD LIBOR + 2.000% — 4.710% 4/20/2031(e)(f) |
13,772,000 |
13,285,063 |
|||||||||
|
Lake Shore MM CLO III LLC 2019-2A A2R — 2.525% 10/17/2031(f) |
11,083,000 |
9,813,742 |
|||||||||
|
Lake Shore MM CLO III LLC 2019-2A A1R, 3M USD LIBOR + 1.480% — 4.220% 10/17/2031(e)(f) |
23,662,000 |
22,861,680 |
|||||||||
39
FPA NEW INCOME, INC.
PORTFOLIO OF INVESTMENTS (Continued)
September 30, 2022
|
BONDS & DEBENTURES — Continued |
Principal Amount |
Fair Value |
|||||||||
|
Lake Shore MM CLO IV Ltd. 2021-1A X, 3M USD LIBOR + 1.180% — 1.312% 10/15/2033(e)(f) |
$ |
14,987,266 |
$ |
14,558,076 |
|||||||
|
LCM XX LP 20A AR, 3M USD LIBOR + 1.040% — 3.750% 10/20/2027(e)(f) |
2,879,905 |
2,850,259 |
|||||||||
|
Madison Park Funding XI Ltd. 2013-11A, 3M USD LIBOR + 0.900% — 3.683% 7/23/2029(e)(f) |
93,624,416 |
91,918,298 |
|||||||||
|
Madison Park Funding XXIII Ltd. 2017-23A AR, 3M USD LIBOR + 0.970% — 3.739% 7/27/2031(e)(f) |
81,487,000 |
80,068,963 |
|||||||||
|
Madison Park Funding XXV Ltd. 2017-25A, 3M USD LIBOR + 0.970% — 3.753% 4/25/2029(e)(f) |
73,670,474 |
72,361,571 |
|||||||||
|
Nassau Ltd. 2017-IA A1AS, 3M USD LIBOR + 1.150% — 3.662% 10/15/2029(e)(f) |
20,700,926 |
20,349,238 |
|||||||||
|
Neuberger Berman CLO XV 2013-15A A1R2, 3M USD LIBOR + 0.920% — 3.432% 10/15/2029(e)(f) |
67,786,000 |
66,434,212 |
|||||||||
|
OCP CLO Ltd. 2017-13A A1AR, 3M USD LIBOR + 0.960% — 3.472% 7/15/2030(e)(f) |
72,247,000 |
70,307,168 |
|||||||||
|
Octagon Investment Partners 35 Ltd. 2018-1A A1A, 3M USD LIBOR + 1.060% — 3.770% 1/20/2031(e)(f) |
44,563,000 |
43,740,412 |
|||||||||
|
Octagon Investment Partners XV Ltd. 2013-1A A1RR, 3M USD LIBOR + 0.970% — 3.708% 7/19/2030(e)(f) |
108,749,000 |
106,755,304 |
|||||||||
|
OFSI BSL VIII Ltd. 2017-1A AR, 3M USD LIBOR + 1.000% — 3.740% 8/16/2029(e)(f) |
57,077,274 |
55,920,432 |
|||||||||
|
Owl Rock CLO VI Ltd. 2021-6A A, 3M USD LIBOR + 1.450% — 4.977% 6/21/2032(e)(f) |
66,692,000 |
64,039,326 |
|||||||||
|
Palmer Square Loan Funding Ltd. 2021-1A A1, 3M USD LIBOR + 0.900% — 3.610% 4/20/2029(e)(f) |
44,323,821 |
43,644,736 |
|||||||||
|
Parliament CLO II Ltd. 2021-2A A, 3M USD LIBOR + 1.350% — 4.334% 8/20/2032(e)(f) |
40,733,000 |
39,342,335 |
|||||||||
|
Parliament Funding II Ltd. 2020-1A AR, 3M USD LIBOR + 1.250% — 3.960% 10/20/2031(e)(f) |
40,598,000 |
39,536,728 |
|||||||||
|
Saranac CLO III Ltd. 2014-3A ALR, 3M USD LIBOR + 1.600% — 5.202% 6/22/2030(e)(f) |
25,257,231 |
24,776,864 |
|||||||||
|
TICP CLO III-2 Ltd. 2018-3R A, 3M USD LIBOR + 0.840% — 3.550% 4/20/2028(e)(f) |
2,779,742 |
2,751,157 |
|||||||||
|
VCP CLO II Ltd. 2021-2A A1, 3M USD LIBOR + 1.670% — 4.182% 4/15/2031(e)(f) |
101,155,000 |
99,010,919 |
|||||||||
|
Venture XXV CLO Ltd. 2016-25A ARR, 3M USD LIBOR + 1.020% — 3.730% 4/20/2029(e)(f) |
18,102,570 |
17,787,368 |
|||||||||
|
Woodmont Trust 2019-6A A1R, 3M USD LIBOR + 1.480% — 3.992% 7/15/2031(e)(f) |
62,588,000 |
60,909,202 |
|||||||||
40
FPA NEW INCOME, INC.
PORTFOLIO OF INVESTMENTS (Continued)
September 30, 2022
|
BONDS & DEBENTURES — Continued |
Principal Amount |
Fair Value |
|||||||||
|
Woodmont Trust 2019-6A A1R2, 3M USD LIBOR + 1.480% — 3.992% 7/15/2031(e)(f) |
$ |
16,952,000 |
$ |
16,497,296 |
|||||||
|
Zais CLO 7 Ltd. 2017-2A A, 3M USD LIBOR + 1.290% — 3.802% 4/15/2030(e)(f) |
14,844,393 |
14,488,751 |
|||||||||
|
$ |
1,843,733,879 |
||||||||||
|
CREDIT CARD — 1.1% |
|||||||||||
|
American Express Credit Account Master Trust 2022-2 A — 3.390% 5/15/2027 |
$ |
53,566,000 |
$ |
51,864,010 |
|||||||
|
Discover Card Execution Note Trust 2022-A2 A — 3.320% 5/15/2027 |
50,645,000 |
49,351,213 |
|||||||||
|
$ |
101,215,223 |
||||||||||
|
EQUIPMENT — 11.5% |
|||||||||||
|
ARI Fleet Lease Trust 2022-A A3 — 3.430% 1/15/2031(f) |
$ |
10,094,000 |
$ |
9,721,532 |
|||||||
|
Avis Budget Rental Car Funding AESOP LLC 2021-2A A — 1.660% 2/20/2028(f) |
4,211,000 |
3,589,957 |
|||||||||
|
Avis Budget Rental Car Funding AESOP LLC 2019-3A A — 2.360% 3/20/2026(f) |
8,591,000 |
8,055,909 |
|||||||||
|
CNH Equipment Trust 2022-B A4 — 3.910% 3/15/2028 |
7,414,000 |
7,137,728 |
|||||||||
|
CNH Equipment Trust 2021-B A3 — 0.440% 8/17/2026 |
2,000,000 |
1,885,931 |
|||||||||
|
CNH Equipment Trust 2022-A A3 — 2.940% 7/15/2027 |
19,831,000 |
19,108,644 |
|||||||||
|
Coinstar Funding LLC 2017-1A A2 — 5.216% 4/25/2047(f) |
12,152,635 |
11,795,334 |
|||||||||
|
Dell Equipment Finance Trust 2021-2 A3 — 0.530% 12/22/2026(f) |
50,627,000 |
48,826,481 |
|||||||||
|
Dell Equipment Finance Trust 2021-2 C — 0.940% 12/22/2026(f) |
11,180,000 |
10,631,908 |
|||||||||
|
Dell Equipment Finance Trust 2020-2 D — 1.920% 3/23/2026(f) |
5,444,000 |
5,354,646 |
|||||||||
|
Dell Equipment Finance Trust 2022-1 A3 — 2.490% 8/23/2027(f) |
110,213,000 |
107,464,122 |
|||||||||
|
Dell Equipment Finance Trust 2022-1 B — 2.720% 8/23/2027(f) |
17,115,000 |
16,412,185 |
|||||||||
|
Dell Equipment Finance Trust 2022-1 C — 2.940% 8/23/2027(f) |
17,567,000 |
16,824,524 |
|||||||||
|
Dell Equipment Finance Trust 2022-2 B — 4.400% 7/22/2027(f) |
5,100,000 |
4,934,104 |
|||||||||
|
Dell Equipment Finance Trust 2022-2 C — 4.740% 7/22/2027(f) |
4,700,000 |
4,562,409 |
|||||||||
|
Enterprise Fleet Financing LLC 2022-3 A3 — 4.290% 7/20/2029(f) |
9,703,000 |
9,370,197 |
|||||||||
|
Enterprise Fleet Financing LLC 2022-2 — 4.790% 5/21/2029(f) |
32,246,000 |
31,846,756 |
|||||||||
|
Enterprise Fleet Funding LLC 2021-1 A3 — 0.700% 12/21/2026(f) |
2,050,000 |
1,900,057 |
|||||||||
|
Ford Credit Floorplan Master Owner Trust A 2020-2 A — 1.060% 9/15/2027 |
5,070,000 |
4,543,450 |
|||||||||
|
GMF Floorplan Owner Revolving Trust 2019-2 A — 2.900% 4/15/2026(f) |
30,866,000 |
29,990,341 |
|||||||||
|
Hertz Vehicle Financing III LP 2021-2A A — 1.680% 12/27/2027(f) |
44,631,000 |
38,188,622 |
|||||||||
|
Hertz Vehicle Financing LLC 2021-1A A — 1.210% 12/26/2025(f) |
73,571,000 |
67,275,515 |
|||||||||
|
Hertz Vehicle Financing LLC 2022-4A A — 3.730% 9/25/2026(f) |
80,995,000 |
77,216,097 |
|||||||||
|
HPEFS Equipment Trust 2022-1A A3 — 1.380% 5/21/2029(f) |
65,430,000 |
62,567,379 |
|||||||||
|
HPEFS Equipment Trust 2022-1A B — 1.790% 5/21/2029(f) |
26,862,000 |
25,252,953 |
|||||||||
|
HPEFS Equipment Trust 2022-1A C — 1.960% 5/21/2029(f) |
17,858,000 |
16,585,700 |
|||||||||
41
FPA NEW INCOME, INC.
PORTFOLIO OF INVESTMENTS (Continued)
September 30, 2022
|
BONDS & DEBENTURES — Continued |
Principal Amount |
Fair Value |
|||||||||
|
HPEFS Equipment Trust 2022-2A B — 4.200% 9/20/2029(f) |
$ |
9,732,000 |
$ |
9,433,415 |
|||||||
|
HPEFS Equipment Trust 2022-2A C — 4.430% 9/20/2029(f) |
5,634,000 |
5,449,921 |
|||||||||
|
John Deere Owner Trust 2022 2022-A A3 — 2.320% 9/16/2026 |
39,342,000 |
37,827,479 |
|||||||||
|
John Deere Owner Trust 2022-B 2022-B A4 — 3.800% 5/15/2029 |
17,226,000 |
16,639,782 |
|||||||||
|
Kubota Credit Owner Trust 2022-1A A3 — 2.670% 10/15/2026(f) |
88,222,000 |
84,212,610 |
|||||||||
|
Kubota Credit Owner Trust 2022-2A A4 — 4.170% 6/15/2028(f) |
34,050,000 |
32,859,037 |
|||||||||
|
NextGear Floorplan Master Owner Trust 2021-1A A — 0.850% 7/15/2026(f) |
3,947,000 |
3,682,133 |
|||||||||
|
NextGear Floorplan Master Owner Trust 2022-1A A2 — 2.800% 3/15/2027(f) |
72,271,000 |
68,255,002 |
|||||||||
|
Pawneee Equipment Receivables LLC 2021-1 A2 — 1.100% 7/15/2027(f) |
19,141,790 |
18,355,053 |
|||||||||
|
Prop 2017-1A — 5.300% 3/15/2042(b) |
17,054,509 |
14,837,423 |
|||||||||
|
Verizon Master Trust 2022-4 A — 3.400% 11/20/2028(h) |
77,914,000 |
74,914,381 |
|||||||||
|
Verizon Master Trust 2022-4 B — 3.640% 11/20/2028(h) |
34,616,000 |
33,235,060 |
|||||||||
|
Verizon Master Trust 2022-4 C — 3.890% 11/20/2028(h) |
8,987,000 |
8,624,064 |
|||||||||
|
Verizon Master Trust 2022-6 A — 3.670% 1/22/2029(h) |
37,943,000 |
36,926,048 |
|||||||||
|
Wheels SPV 2 LLC 2020-1A A3 — 0.620% 8/20/2029(f) |
6,513,000 |
6,221,833 |
|||||||||
|
$ |
1,092,515,722 |
||||||||||
|
OTHER — 13.3% |
|||||||||||
|
ABPCI Direct Lending Fund ABS I Ltd. 2020-1A A — 3.199% 12/20/2030(f) |
$ |
37,774,000 |
$ |
34,227,059 |
|||||||
|
ABPCI Direct Lending Fund ABS II LLC 2022-2A A1, 3M TSFR + 2.100% — 4.629% 3/1/2032(e)(f) |
26,204,000 |
25,853,390 |
|||||||||
|
Cleco Securitization I LLC — 4.016% 3/1/2033 |
22,389,000 |
21,545,248 |
|||||||||
|
Cologix Data Centers US Issuer LLC 2021-1A A2 — 3.300% 12/26/2051(f) |
58,068,000 |
51,939,770 |
|||||||||
|
DataBank Issuer 2021-1A A2 — 2.060% 2/27/2051(f) |
14,750,000 |
12,673,330 |
|||||||||
|
Elm Trust 2020-4A A2 — 2.286% 10/20/2029(f) |
9,925,000 |
9,282,554 |
|||||||||
|
Elm Trust 2020-3A A2 — 2.954% 8/20/2029(f) |
11,435,000 |
10,929,085 |
|||||||||
|
FCI Funding LLC 2021-1A A — 1.130% 4/15/2033(f) |
7,901,045 |
7,661,408 |
|||||||||
|
Golub Capital Partners ABS Funding Ltd. 2021-1A A2 — 2.773% 4/20/2029(f) |
56,366,000 |
52,195,818 |
|||||||||
|
Golub Capital Partners ABS Funding Ltd. 2021-2A A — 2.944% 10/19/2029(f) |
95,445,000 |
86,878,811 |
|||||||||
|
Golub Capital Partners ABS Funding Ltd. 2020-1A A2 — 3.208% 1/22/2029(f) |
44,967,000 |
41,142,557 |
|||||||||
|
Gracie Point International Funding 2021-1A, 1M USD LIBOR + 0.750% — 3.314% 11/1/2023(e)(f) |
23,479,970 |
23,314,401 |
|||||||||
42
FPA NEW INCOME, INC.
PORTFOLIO OF INVESTMENTS (Continued)
September 30, 2022
|
BONDS & DEBENTURES — Continued |
Principal Amount |
Fair Value |
|||||||||
|
Louisiana Local Government Environmental Facilities & Community Development Auth Rev., (TXBL-LA ULT RESTORATION CORP P), — 3.615% 2/1/2029 |
$ |
48,703,000 |
$ |
47,227,557 |
|||||||
|
Monroe Capital ABS Funding Ltd. 2021-1A A2 — 2.815% 4/22/2031(f) |
45,379,000 |
41,453,717 |
|||||||||
|
Oasis Securitization Funding LLC 2021-1A A — 2.579% 2/15/2033(f) |
2,527,898 |
2,493,059 |
|||||||||
|
Oklahoma Development Finance Authority — 3.877% 5/1/2037 |
26,761,000 |
25,596,731 |
|||||||||
|
Oklahoma Development Finance Authority — 4.135% 12/1/2033 |
30,374,000 |
29,152,911 |
|||||||||
|
Oklahoma Development Finance Authority — 4.285% 2/1/2034 |
11,541,000 |
11,133,247 |
|||||||||
|
Oportun Funding XIV LLC 2021-A — 1.210% 3/8/2028(f) |
10,137,000 |
9,455,493 |
|||||||||
|
Oportun Issuance Trust 2021-C A — 2.180% 10/8/2031(f) |
64,181,000 |
56,716,300 |
|||||||||
|
Owl Rock Technology Financing LLC 2020-1A A, 3M USD LIBOR + 2.950% — 5.462% 1/15/2031(e)(f) |
85,004,000 |
81,071,715 |
|||||||||
|
PFS Financing Corp. 2021-A A — 0.710% 4/15/2026(f) |
42,758,000 |
40,025,276 |
|||||||||
|
PFS Financing Corp. 2021-B A — 0.770% 8/15/2026(f) |
52,919,000 |
47,974,783 |
|||||||||
|
PFS Financing Corp. 2021-A B — 0.960% 4/15/2026(f) |
5,986,000 |
5,611,118 |
|||||||||
|
PFS Financing Corp. 2020-G A — 0.970% 2/15/2026(f) |
63,808,000 |
60,330,387 |
|||||||||
|
PFS Financing Corp. 2021-B B — 1.090% 8/15/2026(f) |
11,978,000 |
10,856,700 |
|||||||||
|
PFS Financing Corp. 2020-G B — 1.570% 2/15/2026(f) |
3,303,000 |
3,144,532 |
|||||||||
|
PFS Financing Corp. 2022-A A — 2.470% 2/15/2027(f) |
105,379,000 |
99,231,010 |
|||||||||
|
PFS Financing Corp. 2022-A B — 2.770% 2/15/2027(f) |
21,651,000 |
20,195,774 |
|||||||||
|
PFS Financing Corp. 2022-C A — 3.890% 5/15/2027(f) |
77,233,000 |
74,958,488 |
|||||||||
|
PFS Financing Corp. 2022-D A — 4.270% 8/15/2027(f) |
71,781,000 |
69,437,042 |
|||||||||
|
PFS Financing Corp. 2022-C B — 4.390% 5/15/2027(f) |
11,913,000 |
11,297,580 |
|||||||||
|
PG&E Wildfire Recovery Funding LLC — 4.022% 6/1/2031 |
53,606,000 |
51,448,444 |
|||||||||
|
SBA Tower Trust — 1.631% 11/15/2026(f) |
5,410,000 |
4,601,525 |
|||||||||
|
SpringCastle America Funding LLC 2020-AA A — 1.970% 9/25/2037(f) |
19,550,687 |
17,772,419 |
|||||||||
|
TVEST LLC 2020-A A — 4.500% 7/15/2032(f) |
4,404,511 |
4,330,583 |
|||||||||
|
Vantage Data Centers Issuer LLC 2020-1A A2, 1M USD LIBOR + 1.650% — 1.645% 9/15/2045(f) |
19,214,000 |
16,925,982 |
|||||||||
|
VCP RRL ABS I Ltd. 2021-1A A — 2.152% 10/20/2031(f) |
44,235,643 |
40,657,776 |
|||||||||
|
$ |
1,260,743,580 |
||||||||||
| TOTAL ASSET-BACKED SECURITIES (Cost $6,540,582,702) |
$ |
6,273,055,577 |
|||||||||
|
CORPORATE BONDS & NOTES — 2.1% |
|||||||||||
|
COMMUNICATIONS — 0.3% |
|||||||||||
|
Amazon.com, Inc. — 1.650% 5/12/2028 |
$ |
22,427,000 |
$ |
19,054,062 |
|||||||
|
Frontier Communications Holdings LLC — 5.875% 10/15/2027(f) |
5,925,000 |
5,304,119 |
|||||||||
|
$ |
24,358,181 |
||||||||||
43
FPA NEW INCOME, INC.
PORTFOLIO OF INVESTMENTS (Continued)
September 30, 2022
|
BONDS & DEBENTURES — Continued |
Principal Amount |
Fair Value |
|||||||||
|
FINANCIAL — 1.8% |
|||||||||||
|
Ares Capital Corp. — 3.250% 7/15/2025 |
$ |
37,309,000 |
$ |
34,022,865 |
|||||||
|
Blackstone Private Credit Fund — 4.700% 3/24/2025 |
12,460,000 |
11,798,279 |
|||||||||
|
OWL Rock Core Income Corp. — 4.700% 2/8/2027 |
40,949,000 |
35,842,381 |
|||||||||
|
OWL Rock Core Income Corp. — 5.500% 3/21/2025 |
45,959,000 |
43,398,252 |
|||||||||
|
OWL Rock Core Income Corp. — 7.750% 9/16/2027(f) |
49,529,000 |
48,741,395 |
|||||||||
|
$ |
173,803,172 |
||||||||||
| TOTAL CORPORATE BONDS & NOTES (Cost $208,804,267) |
$ |
198,161,353 |
|||||||||
|
CORPORATE BANK DEBT — 2.5% |
|||||||||||
|
ABG Intermediate Holdings 2 LLC, 1M USD LIBOR + 3.250% — 6.365% 9/29/2024(c)(e)(i) |
$ |
38,164,232 |
$ |
37,234,169 |
|||||||
|
Applied Systems, Inc., 3M USD LIBOR + 2.000% — 3.000% — 5.500% — 6.674% 9/19/2024(c)(e)(i) |
22,953,311 |
22,890,190 |
|||||||||
|
Asurion LLC, 1M USD LIBOR + 3.000% — 6.115% 11/3/2024(c)(e)(i) |
58,708,647 |
54,794,542 |
|||||||||
|
Axiom Global, Inc., 1M USD LIBOR + 5.500% — 7.506% 10/12/2026(c)(e)(i) |
22,954,578 |
21,979,008 |
|||||||||
|
Capstone Acquisition Holdings, Inc. 2020 Delayed Draw Term Loan, 1M USD LIBOR + 4.750% — 7.865% 11/12/2027(c)(e)(i)(j) |
1,083,675 |
1,044,391 |
|||||||||
|
Capstone Acquisition Holdings, Inc. 2020 Term Loan, 1M USD LIBOR + 4.750% — 7.865% 11/12/2027(c)(e)(i) |
18,629,889 |
18,164,142 |
|||||||||
|
Frontier Communications Corp., 3M USD LIBOR + 3.750% — 7.438% 5/1/2028(c)(e)(i) |
23,442,015 |
21,742,469 |
|||||||||
|
Heartland Dental LLC, 1M USD LIBOR + 4.000% — 7.084% 4/30/2025(c)(e)(i) |
38,507,113 |
35,426,544 |
|||||||||
|
JC Penney Corp., Inc., 1M USD LIBOR + 9.500% — 9.500% 6/23/2023(c)(e)(i) |
27,218,054 |
2,722 |
|||||||||
|
McDermott Super Senior Exit LC — 0.500% 6/30/2024(c)(e)(i)(j)(k) |
16,770,000 |
(3,354,000 |
) |
||||||||
|
Mediaco Holding, Inc. Class A, 1M USD LIBOR + 6.400% — 9.480% 11/25/2024(a)(b)(c)(e)(i) |
11,462,570 |
10,660,190 |
|||||||||
|
Windstream Services LLC, 1M USD LIBOR + 6.250% — 9.365% 9/21/2027(c)(e)(i) |
13,167,745 |
12,180,164 |
|||||||||
| TOTAL CORPORATE BANK DEBT (Cost $247,350,056) |
$ |
232,764,531 |
|||||||||
44
FPA NEW INCOME, INC.
PORTFOLIO OF INVESTMENTS (Continued)
September 30, 2022
|
BONDS & DEBENTURES — Continued |
Principal Amount |
Fair Value |
|||||||||
|
U.S. TREASURIES — 9.0% |
|||||||||||
|
U.S. Treasury Notes — 2.750% 7/31/2027 |
$ |
795,254,000 |
$ |
748,532,827 |
|||||||
|
U.S. Treasury Notes — 4.125% 9/30/2027 |
105,558,000 |
105,794,978 |
|||||||||
| TOTAL U.S. TREASURIES (Cost $871,179,587) |
$ |
854,327,805 |
|||||||||
| TOTAL BONDS & DEBENTURES — 98.2% (Cost $9,701,722,116) |
$ |
9,291,261,980 |
|||||||||
|
TOTAL INVESTMENT SECURITIES — 99.4% (Cost $9,840,986,526) |
$ |
9,406,523,490 |
|||||||||
|
SHORT-TERM INVESTMENTS — 0.7% |
|||||||||||
|
State Street Bank Repurchase Agreement — 0.83% 10/3/2022 (Dated 09/30/2022, repurchase price of $65,779,549, collateralized by $52,804,200 principal amount U.S. Treasury Notes — 0.125% 2023, fair value $67,090,584)(l) |
$ |
65,775,000 |
$ |
65,775,000 |
|||||||
| TOTAL SHORT-TERM INVESTMENTS (Cost $65,775,000) |
$ |
65,775,000 |
|||||||||
| TOTAL INVESTMENTS — 100.1% (Cost $9,906,761,526) |
$ |
9,472,298,490 |
|||||||||
|
Other Assets and Liabilities, net — (0.1)% |
(6,633,900 |
) |
|||||||||
|
NET ASSETS — 100.0% |
$ |
9,465,664,590 |
|||||||||
45
FPA NEW INCOME, INC.
PORTFOLIO OF INVESTMENTS (Continued)
September 30, 2022
(a) These securities have been valued in good faith under policies adopted by authority of the Board of Trustees in accordance with the Fund's fair value procedures. These securities constituted 0.69% of total net assets at September 30, 2022.
(b) Investments categorized as valued using a significant unobservable input (Level 3) (See Note 6 of the Notes to Financial Statements).
(c) Restricted securities. These restricted securities constituted 3.28% of total net assets at September 30, 2022, most of which are considered liquid by the Adviser. These securities are not registered and may not be sold to the public. There are legal and/or contractual restrictions on resale. The Fund does not have the right to demand that such securities be registered. The values of these securities are determined by valuations provided by pricing services, brokers, dealers, market makers, or in good faith under policies adopted by authority of the Fund's Board of Directors.
(d) Non-income producing security.
(e) Variable/Floating Rate Security — The rate shown is based on the latest available information as of September 30, 2022. For Corporate Bank Debt, the rate shown may represent a weighted average interest rate. Certain variable rate securities are not based on a published rate and spread but are determined by the issuer or agent and are based on current market conditions. These securities do not indicate a reference rate and spread in their description.
(f) Security exempt from registration under Rule 144A of the Securities Act of 1933. These securities may be resold in transactions exempt from registration, typically only to qualified institutional buyers. Unless otherwise indicated, these securities are not considered to be illiquid.
(g) Zero coupon bond. Coupon amount represents effective yield to maturity.
(h) Step Coupon — Coupon rate increases in increments to maturity. Rate disclosed is as of September 30, 2022.
(i) For corporate bank debt, the rate shown may represent a weighted average interest rate.
(j) As of September 30, 2022, the Fund had entered into commitments to fund various delayed draw debt-related investments. Such commitments are subject to the satisfaction of certain conditions set forth in the documents governing those investments and there can be no assurance that such conditions will be satisified. At September 30, 2022, unfunded commitments totaled $16,770,000.
(k) All or a portion of this holding is subject to unfunded loan commitments. The stated interest rate reflects the weighted average of the reference rate and spread for the funded portion, if any, and the commitment fees on the portion of the loan that is unfunded.
(l) Security pledged as collateral (See Note 7 of the Notes to Financial Statements).
(m) Affiliated Security.
46
FPA NEW INCOME, INC.
PORTFOLIO OF INVESTMENTS — RESTRICTED SECURITIES
September 30, 2022
|
Issuer |
Acquisition Date (s) |
Cost |
Fair Value |
Fair Value as a % of Net Assets |
|||||||||||||||
|
ABG Intermediate Holdings 2 LLC, 1M USD LIBOR + 3.250% — 6.365% 9/29/2024 |
02/28/2022, 03/01/2022 |
$ |
37,928,598 |
$ |
37,234,169 |
0.39 |
% |
||||||||||||
|
Applied Systems, Inc., 3M USD LIBOR + 2.000% — 3.000% — 5.500% — 6.674% 9/19/2024 |
07/28/2021, 08/03/2021, 08/04/2021 |
22,914,732 |
22,890,190 |
0.24 |
% |
||||||||||||||
|
Asurion LLC, 1M USD LIBOR + 3.000% — 6.115% 11/3/2024 |
08/17/2021 |
58,418,173 |
54,794,542 |
0.58 |
% |
||||||||||||||
|
Axiom Global, Inc., 1M USD LIBOR + 5.500% — 7.506% 10/12/2026 |
11/18/2021, 11/19/2021 |
22,759,692 |
21,979,008 |
0.23 |
% |
||||||||||||||
|
BTC Holdings Fund I LLC — 5.500% 1/28/2027 |
09/01/2021 |
4,787,445 |
4,787,445 |
0.05 |
% |
||||||||||||||
|
BTC Offshore Holdings Fund, 3M USD LIBOR + 2.650% — 5.400% 10/20/2029 |
10/25/2021, 01/20/2022 |
18,000,000 |
18,000,000 |
0.19 |
% |
||||||||||||||
|
Capstone Acquisition Holdings, Inc. 2020 Delayed Draw Term Loan, 1M USD LIBOR + 4.750% — 7.865% 11/12/2027 |
04/30/2021 |
1,079,702 |
1,044,391 |
0.01 |
% |
||||||||||||||
|
Capstone Acquisition Holdings, Inc. 2020 Term Loan 2020 Term Loan, 1M USD LIBOR + 4.750% — 7.865% 11/12/2027 |
04/30/2021 |
18,502,924 |
18,164,142 |
0.19 |
% |
||||||||||||||
|
Copper Earn Out Trust |
12/07/2020 |
— |
381,486 |
0.01 |
% |
||||||||||||||
|
Copper Property CTL Pass Through Trust |
10/05/2017, 10/06/2017, 10/11/2017, 11/19/2018, 11/27/2018, 01/11/2019, 02/08/2019, 03/11/2019, 05/29/2019, 06/08/2020 |
25,752,396 |
6,762,704 |
0.07 |
% |
||||||||||||||
|
Frontier Communications Corp., 3M USD LIBOR + 3.750% — 7.438% 5/1/2028 |
04/09/2021 |
23,252,333 |
21,742,469 |
0.23 |
% |
||||||||||||||
|
Heartland Dental LLC, 1M USD LIBOR + 4.000% — 7.084% 4/30/2025 |
08/02/2021, 08/03/2021, 08/12/2021 |
38,364,439 |
35,426,544 |
0.38 |
% |
||||||||||||||
47
FPA NEW INCOME, INC.
PORTFOLIO OF INVESTMENTS — RESTRICTED SECURITIES (Continued)
September 30, 2022
|
Issuer |
Acquisition Date (s) |
Cost |
Fair Value |
Fair Value as a % of Net Assets |
|||||||||||||||
|
JC Penney Corp., Inc., 1M USD LIBOR + 9.500% — 0.000% 6/23/2023 |
02/03/2021 |
$ |
— |
$ |
2,722 |
0.00 |
% |
||||||||||||
|
McDermott Super Senior Exit LC — 0.500% 6/30/2024 |
02/28/2020 |
(69,064 |
) |
(3,354,000 |
) |
(0.03 |
)% |
||||||||||||
|
Mediaco Holding, Inc. Class A, 8.400%, PIK — 9.480% 11/25/2024 |
10/01/2021, 11/01/2021, 12/01/2021, 01/01/2022, 02/01/2022, 03/01/2022, 04/01/2022, 05/01/2022 |
11,407,210 |
10,660,190 |
0.11 |
% |
||||||||||||||
|
PHI Group, Inc., Restricted |
08/19/2019 |
31,131,405 |
47,580,250 |
0.50 |
% |
||||||||||||||
|
Windstream Services LLC, 1M USD LIBOR + 6.250% — 9.365% 9/21/2027 |
08/11/2020 |
12,791,317 |
12,180,164 |
0.13 |
% |
||||||||||||||
|
TOTAL RESTRICTED SECURITIES |
$ |
327,021,302 |
$ |
310,276,416 |
3.28 |
% |
|||||||||||||
See accompanying Notes to Financial Statements.
48
FPA NEW INCOME, INC.
STATEMENT OF ASSETS AND LIABILITIES
September 30, 2022
|
ASSETS |
|||||||
| Investment securities — at fair value (identified cost $9,727,474,512) |
$ |
9,298,406,170 |
|||||
|
Investments in affiliates — at fair value (identified cost $113,512,014) |
108,117,320 |
||||||
|
Short-term investments — repurchase agreements |
65,775,000 |
||||||
|
Cash |
1,954,639 |
||||||
|
Receivable for: |
|||||||
|
Investment securities sold |
53,224,437 |
||||||
|
Interest |
30,927,756 |
||||||
|
Capital Stock sold |
5,916,086 |
||||||
|
Prepaid expenses and other assets |
27,936 |
||||||
|
Total assets |
9,564,349,344 |
||||||
|
LIABILITIES |
|||||||
|
Payable for: |
|||||||
|
Investment securities purchased |
74,497,343 |
||||||
|
Capital Stock repurchased |
19,541,196 |
||||||
|
Advisory fees |
2,615,545 |
||||||
|
Accrued expenses and other liabilities |
2,030,670 |
||||||
|
Other commitments and contingencies — Note 8 |
|||||||
|
Total liabilities |
98,684,754 |
||||||
|
NET ASSETS |
$ |
9,465,664,590 |
|||||
|
SUMMARY OF SHAREHOLDERS' EQUITY |
|||||||
|
Capital Stock — par value $0.01 per share; authorized 1,500,000,000 shares; outstanding 998,360,571 shares |
$ |
9,983,606 |
|||||
|
Additional Paid-in Capital |
10,449,200,498 |
||||||
|
Distributable earnings |
(993,519,514 |
) |
|||||
|
NET ASSETS |
$ |
9,465,664,590 |
|||||
|
NET ASSET VALUE |
|||||||
|
Offering and redemption price per share |
$ |
9.48 |
|||||
See accompanying Notes to Financial Statements.
49
FPA NEW INCOME, INC.
STATEMENT OF OPERATIONS
For the Year Ended September 30, 2022
|
INVESTMENT INCOME |
|||||||
|
Interest |
$ |
200,696,189 |
|||||
| Dividends |
10,289,549 |
||||||
|
Dividend income from affiliated investments |
7,807,476 |
||||||
| Total investment income |
218,793,214 |
||||||
|
EXPENSES |
|||||||
|
Advisory fees |
54,252,355 |
||||||
|
Transfer agent fees and expenses |
6,623,039 |
||||||
|
Filing fees |
614,193 |
||||||
|
Reports to shareholders |
529,503 |
||||||
|
Administrator fees |
485,177 |
||||||
|
Other professional fees |
430,284 |
||||||
|
Director fees and expenses |
269,636 |
||||||
|
Custodian fees |
155,912 |
||||||
|
Legal fees |
85,829 |
||||||
|
Audit and tax services fees |
48,700 |
||||||
|
Other |
102,305 |
||||||
|
Total expenses |
63,596,933 |
||||||
|
Reimbursement from Adviser |
(13,628,620 |
) |
|||||
|
Net expenses |
49,968,313 |
||||||
| Net investment income |
168,824,901 |
||||||
|
NET REALIZED AND UNREALIZED GAIN (LOSS) |
|||||||
|
Net realized gain (loss) on: |
|||||||
| Investments |
(166,885,511 |
) |
|||||
|
Net change in unrealized appreciation (depreciation) of: |
|||||||
| Investments |
(402,134,761 |
) |
|||||
|
Investments in affiliates |
(20,549,035 |
) |
|||||
| Net realized and unrealized loss |
(589,569,307 |
) |
|||||
|
NET DECREASE IN NET ASSETS RESULTING FROM OPERATIONS |
$ |
(420,744,406 |
) |
||||
See accompanying Notes to Financial Statements.
50
FPA NEW INCOME, INC.
STATEMENTS OF CHANGES IN NET ASSETS
|
Year Ended September 30, 2022 |
Year Ended September 30, 2021 |
||||||||||
|
INCREASE (DECREASE) IN NET ASSETS |
|||||||||||
|
Operations: |
|||||||||||
|
Net investment income |
$ |
168,824,901 |
$ |
134,721,248 |
|||||||
| Net realized gain (loss) |
(166,885,511 |
) |
5,012,330 |
||||||||
|
Net change in unrealized appreciation (depreciation) |
(422,683,796 |
) |
12,648,319 |
||||||||
|
Net increase (decrease) in net assets resulting from operations |
(420,744,406 |
) |
152,381,897 |
||||||||
|
Distributions to shareholders |
(167,625,868 |
) |
(140,308,667 |
) |
|||||||
|
Capital Stock transactions: |
|||||||||||
|
Proceeds from Capital Stock sold |
4,152,249,227 |
6,759,358,095 |
|||||||||
|
Proceeds from shares issued to shareholders upon reinvestment of dividends and distributions |
145,427,559 |
121,733,658 |
|||||||||
|
Cost of Capital Stock repurchased |
(6,187,832,799 |
) |
(3,595,882,725 |
) |
|||||||
|
Net increase (decrease) from Capital Stock transactions |
(1,890,156,013 |
) |
3,285,209,028 |
||||||||
|
Total change in net assets |
(2,478,526,287 |
) |
3,297,282,258 |
||||||||
|
NET ASSETS |
|||||||||||
|
Beginning of Year |
11,944,190,877 |
8,646,908,619 |
|||||||||
|
End of Year |
$ |
9,465,664,590 |
$ |
11,944,190,877 |
|||||||
|
CHANGE IN CAPITAL STOCK OUTSTANDING |
|||||||||||
|
Shares of Capital Stock sold |
422,004,794 |
674,770,411 |
|||||||||
|
Shares issued to shareholders upon reinvestment of dividends and distributions |
14,933,014 |
12,160,026 |
|||||||||
|
Shares of Capital Stock repurchased |
(630,833,675 |
) |
(358,947,128 |
) |
|||||||
|
Change in Capital Stock outstanding |
(193,895,867 |
) |
327,983,309 |
||||||||
See accompanying Notes to Financial Statements.
51
FPA NEW INCOME, INC.
FINANCIAL HIGHLIGHTS
Selected Data for Each Share of Capital Stock Outstanding Throughout Each Year
|
Year Ended September 30, |
|||||||||||||||||||||||
|
2022 |
2021 |
2020 |
2019 |
2018 |
|||||||||||||||||||
|
Per share operating performance: |
|||||||||||||||||||||||
|
Net asset value at beginning of year |
$ |
10.02 |
$ |
10.00 |
$ |
10.00 |
$ |
9.94 |
$ |
10.05 |
|||||||||||||
|
Income from investment operations: |
|||||||||||||||||||||||
| Net investment income(a) |
0.15 |
0.13 |
0.23 |
0.28 |
0.29 |
||||||||||||||||||
|
Net realized and unrealized gain (loss) on investment securities |
(0.53 |
) |
0.03 |
0.01 |
(b) |
0.13 |
(0.18 |
) |
|||||||||||||||
|
Total from investment operations |
(0.38 |
) |
0.16 |
0.24 |
0.41 |
0.11 |
|||||||||||||||||
|
Less distributions: |
|||||||||||||||||||||||
|
Dividends from net investment income |
(0.16 |
) |
(0.14 |
) |
(0.24 |
) |
(0.35 |
) |
(0.22 |
) |
|||||||||||||
|
Net asset value at end of year |
$ |
9.48 |
$ |
10.02 |
$ |
10.00 |
$ |
10.00 |
$ |
9.94 |
|||||||||||||
|
Total investment return(c) |
(3.87 |
)% |
1.56 |
% |
2.41 |
% |
4.20 |
% |
1.91 |
% |
|||||||||||||
|
Ratios/supplemental data: |
|||||||||||||||||||||||
|
Net assets, end of year (in 000's) |
$ |
9,465,665 |
$ |
11,944,191 |
$ |
8,646,909 |
$ |
7,327,404 |
$ |
5,704,624 |
|||||||||||||
|
Ratio of expenses to average net assets: |
|||||||||||||||||||||||
|
Before reimbursement from Adviser |
0.59 |
% |
0.58 |
% |
0.57 |
% |
0.57 |
% |
0.58 |
% |
|||||||||||||
|
After reimbursement from Adviser |
0.46 |
% |
0.48 |
% |
0.49 |
%(d) |
0.50 |
% |
0.49 |
% |
|||||||||||||
|
Ratio of net investment income to average net assets: |
|||||||||||||||||||||||
| Before reimbursement from Adviser |
1.43 |
% |
1.18 |
% |
2.24 |
% |
2.73 |
% |
2.88 |
% |
|||||||||||||
| After reimbursement from Adviser |
1.56 |
% |
1.28 |
% |
2.32 |
%(e) |
2.80 |
% |
2.96 |
% |
|||||||||||||
|
Portfolio turnover rate |
103 |
% |
81 |
% |
54 |
% |
25 |
% |
29 |
% |
|||||||||||||
(a) Per share amount is based on average shares outstanding.
(b) Due to timing of sales and repurchase of capital shares, the net realized and unrealized gain (loss) per share is not in accordance with the Fund's change in net realized and unrealized gain (loss) on investment transactions for the period.
(c) Return is based on net asset value per share, adjusted for reinvestment of distributions, and does not reflect deduction of the sales charge.
(d) Includes voluntary fee waiver which reduced the ratio of expenses to average net assets after reimbursement from Adviser by 0.01%.
(e) Includes voluntary fee waiver which increased the ratio of net investment income to average net assets after reimbursement from Adviser by 0.01%.
See accompanying Notes to Financial Statements.
52
FPA NEW INCOME, INC.
NOTES TO FINANCIAL STATEMENTS
September 30, 2022
NOTE 1 — Significant Accounting Policies
FPA New Income, Inc. (the "Fund") is registered under the Investment Company Act of 1940, as a diversified, open-end, management investment company. The Fund's primary investment objective is to seek current income and long-term total return. Capital preservation is also a consideration. The Fund qualifies as an investment company pursuant to Financial Accounting Standard Board (FASB) Accounting Standards Codification (ASC) No. 946, Financial Services — Investment Companies. The following is a summary of significant accounting policies consistently followed by the Fund in the preparation of its financial statements.
A. Security Valuation
The Fund's investments are reported at fair value as defined by accounting principles generally accepted in the United States of America, ("U.S. GAAP"). The Fund generally determines its net asset value as of approximately 4:00 p.m. New York time each day the New York Stock Exchange is open. Further discussion of valuation methods, inputs and classifications can be found under Disclosure of Fair Value Measurements.
B. Securities Transactions and Related Investment Income
Securities transactions are accounted for on the date the securities are purchased or sold. Dividend income and distributions to shareholders are recorded on the ex-dividend date. Interest income and expenses are recorded on an accrual basis. Market discounts and premiums on fixed income securities are amortized over the expected life of the securities using the effective interest rate method. Realized gains or losses are based on the specific identification method. The books and records of the Fund are maintained in U.S. dollars as follows: (1) the foreign currency fair value of investment securities, and other assets and liabilities stated in foreign currencies, are translated using the daily spot rate; and (2) purchases, sales, income and expenses are translated at the rate of exchange prevailing on the respective dates of such transactions. The resultant exchange gains and losses are included in net realized or net unrealized gain (loss) in the statement of operations.
C. Use of Estimates
The preparation of the financial statements in accordance with U.S. GAAP requires management to make estimates and assumptions that affect the amounts reported. Actual results could differ from those estimates.
D. Recent Accounting Pronouncements
In March 2020, the FASB issued ASU 2020-04, Reference Rate Reform (Topic 848) Facilitation of the Effects of Reference Rate Reform on Financial Reporting, which provides optional expedients and exceptions for applying U.S. GAAP to contracts, hedging relationships, and other transaction to ease the potential burden in accounting for (or recognizing the effects of) reference rate reform on financial reporting if certain criteria are met. The guidance is effective from March 12, 2020 through December 31, 2022.
In June 2022, the FASB issued Accounting Standards Update No. 2022-03, Fair Value Measurement of Equity Securities Subject to Contractual Sale Restrictions ("ASU 2022-03"). ASU 2022-03 clarifies the guidance in ASC 820, related to the measurement of the fair value of an equity security subject to contractual sale restrictions, where it eliminates the ability to apply a discount to fair value of these securities, and introduces disclosure requirements related to such equity securities. The guidance is effective for fiscal years, and interim periods within those fiscal years, beginning after December 15, 2023, and allows for early adoption. Management is currently evaluating the impact of applying this update.
53
FPA NEW INCOME, INC.
NOTES TO FINANCIAL STATEMENTS (Continued)
NOTE 2 — Risk Considerations
Investing in the Fund may involve certain risks including, but not limited to, those described below.
Market Risk: Because the values of the Fund's investments will fluctuate with market conditions, so will the value of your investment in the Fund. You could lose money on your investment in the Fund or the Fund could underperform other investments.
Interest Rate and Credit Risk: The values of, and the income generated by, most debt securities held by the Fund may be affected by changing interest rates and by changes in the effective maturities and credit rating of these securities. For example, the value of debt securities in the Fund's portfolio generally will decline when interest rates rise and increase when interest rates fall. In addition, falling interest rates may cause an issuer to redeem, call or refinance a security before its stated maturity, which may result in the Fund having to reinvest the proceeds in lower yielding securities.
Mortgage-Backed and Other Asset-Backed Securities Risk: The values of some mortgage-backed and other asset-backed securities may expose the Fund to a lower rate of return upon reinvestment of principal. When interest rates rise, the value of mortgage-related securities generally will decline; however, when interest rates are declining, the value of mortgage related-securities with prepayment features may not increase as much as other fixed income securities. The rate of prepayments on underlying mortgages will affect the price and volatility of a mortgage-related security and may shorten or extend the effective maturity of the security beyond what was anticipated at the time of purchase. If an unanticipated rate of prepayment on underlying mortgages increases the effective maturity of a mortgage-related security, the volatility of the security can be expected to increase. The value of these securities may also fluctuate in response to the market's perception of the creditworthiness of the issuers. Additionally, although mortgages and mortgage-related securities are generally supported by some form of government or private guarantee and/or insurance, there is no assurance that private guarantors or insurers will meet their obligations.
Stripped Mortgage-Backed Interest Only ("I/O") and Principal Only ("P/O") Securities: Stripped mortgage- backed securities are usually structured with two classes that receive different proportions of the interest and principal distributions on a pool of mortgage assets. In certain cases, one class will receive all of the interest payments on the underlying mortgages (the I/O class), while the other class will receive all of the principal payments (the P/O class). The Fund currently has investments in I/O securities. The yield to maturity on I/Os is sensitive to the rate of principal repayments (including prepayments) on the related underlying mortgage assets, and principal payments may have a material effect on yield-to-maturity. If the underlying mortgage assets experience greater than anticipated prepayments of principal, a Fund may not fully recoup its initial investment in I/Os.
Credit Risk: Debt securities are subject to credit risk, meaning that the issuer of the debt security may default or fail to make timely payments of principal or interest. The values of any of the Fund's investments may also decline in response to events affecting the issuer or its credit rating. The lower rated debt securities in which the Fund may invest are considered speculative and are generally subject to greater volatility and risk of loss than investment grade securities, particularly in deteriorating economic conditions. The Fund invests a significant portion of its assets in securities of issuers that hold mortgage-and asset-backed securities and direct investments in securities backed by commercial and residential mortgage loans and other financial assets. The value and related income of these securities is sensitive to changes in economic conditions, including delinquencies and/or defaults. Continuing shifts in the market's perception of credit quality on securities backed by commercial and
54
FPA NEW INCOME, INC.
NOTES TO FINANCIAL STATEMENTS (Continued)
residential mortgage loans and other financial assets may result in increased volatility of market price and periods of illiquidity that can negatively impact the valuation of certain securities held by the Fund.
Repurchase Agreements: Repurchase agreements permit the Fund to maintain liquidity and earn income over periods of time as short as overnight. Repurchase agreements held by the Fund are fully collateralized by U.S. Government securities, or securities issued by U.S. Government agencies, or securities that are within the three highest credit categories assigned by established rating agencies (Aaa, Aa, or A by Moody's or AAA, AA or A by Standard & Poor's) or, if not rated by Moody's or Standard & Poor's, are of equivalent investment quality as determined by the Adviser. Such collateral is in the possession of the Fund's custodian. The collateral is evaluated daily to ensure its fair value equals or exceeds the current fair value of the repurchase agreements including accrued interest. In the event of default on the obligation to repurchase, the Fund has the right to liquidate the collateral and apply the proceeds in satisfaction of the obligation.
The Fund may enter into repurchase agreements, under the terms of a Master Repurchase Agreement ("MRA"). The MRA permits the Fund, under certain circumstances including an event of default (such as bankruptcy or insolvency), to offset payables and/or receivables under the MRA with collateral held and/or posted to the counterparty and create one single net payment due to or from the Fund. However, bankruptcy or insolvency laws of a particular jurisdiction may impose restrictions on or prohibitions against such a right of offset in the event of a MRA counterparty's bankruptcy or insolvency. Pursuant to the terms of the MRA, the Fund receives securities as collateral with a fair value in excess of the repurchase price to be received by the Fund upon the maturity of the repurchase transaction. Upon a bankruptcy or insolvency of the MRA counterparty, the Fund recognizes a liability with respect to such excess collateral to reflect the Fund's obligation under bankruptcy law to return the excess to the counterparty. Repurchase agreements outstanding at the end of the period are listed in the Fund's Portfolio of Investments.
Many countries have experienced outbreaks of infectious illnesses in recent decades, including swine flu, avian influenza, SARS and, more recently, COVID-19. The global outbreak of COVID-19 in early 2020 has resulted in various disruptions, including travel and border restrictions, quarantines, supply chain disruptions, lower consumer demand and general market uncertainty. The full effects, duration and costs of the COVID-19 pandemic are impossible to predict, and the circumstances surrounding the COVID-19 pandemic will continue to evolve, including the risk of future increased rates of infection due to low vaccination rates and/or the lack of effectiveness of current vaccines against new variants. Similar consequences could arise as a result of the spread of other infectious diseases. Management will continue to monitor the impact COVID-19 has on the Fund and reflect the consequences as appropriate in the Fund's accounting and financial reporting.
NOTE 3 — Purchases and Sales of Investment Securities
Cost of purchases of investment securities (excluding short-term investments) aggregated $10,762,156,251 for the year ended September 30, 2022. The proceeds and cost of securities sold resulting in net realized loss of $177,159,151 aggregated $11,440,023,430 and $11,617,182,581, respectively, for the year ended September 30, 2022.
NOTE 4 — Advisory Fees and Other Affiliated Transactions
Pursuant to an Investment Advisory Agreement (the "Agreement"), advisory fees were paid by the Fund to First Pacific Advisors, LP (the "Adviser"). Under the terms of this Agreement, the Fund pays the Adviser a monthly fee calculated at the annual rate of 0.50% of the Fund's average daily net assets. In addition, as of March 31, 2022, the Adviser has contractually agreed to reimburse expenses in excess of 0.45% of the average
55
FPA NEW INCOME, INC.
NOTES TO FINANCIAL STATEMENTS (Continued)
daily net assets of the Fund (excluding interest, taxes, brokerage fees and commissions payable by the Fund in connection with the purchase or sale of portfolio securities, and extraordinary expenses, including litigation expenses not incurred in the Fund's ordinary course of business) through March 31, 2023. Prior to March 31, 2022 the Adviser had contractually agreed to reimburse expenses in excess of 0.47% of the average daily net assets of the Fund (excluding interest, taxes, brokerage fees and commissions payable by the Fund in connection with the purchase or sale of portfolio securities, and extraordinary expenses, including litigation expenses not incurred in the Fund's ordinary course of business).
The Agreement obligates the Adviser to reduce its fee to the extent necessary to reimburse the Fund for any annual expenses (exclusive of interest, taxes, the cost of any supplemental statistical and research information, and extraordinary expenses such as litigation) in excess of 1.50% of the first $15 million and 1.00% of the remaining average net assets of the Fund for the year. This agreement may only be terminated earlier by the Fund's Board of Directors (the "Board") or upon termination of the Advisory Agreement.
For the year ended September 30, 2022, the Fund paid aggregate fees and expenses of $269,636 to all Directors who are not affiliated persons of the Adviser. Certain officers of the Fund are also officers of the Adviser.
NOTE 5 — Federal Income Tax
No provision for federal income tax is required because the Fund has elected to be taxed as a "regulated investment company" under the Internal Revenue Code (the "Code") and intends to maintain this qualification and to distribute each year to its shareholders, in accordance with the minimum distribution requirements of the Code, its taxable net investment income and taxable net realized gains on investments.
Distributions paid to shareholders are based on net investment income and net realized gains determined on a tax reporting basis, which may differ from financial reporting. For federal income tax purposes, the Fund had the following components of distributable earnings at September 30, 2022:
|
Undistributed Net Investment Income |
$ |
2,608,543 |
|||||
|
Unrealized Depreciation |
(434,890,208 |
) |
|||||
|
Late Year Deferrals |
— |
||||||
|
Capital Loss Carryover |
(561,237,849 |
) |
|||||
The tax status of distributions paid during the fiscal years ended September 30, 2022 and 2021 were as follows:
|
2022 |
2021 |
||||||||||
|
Dividends from ordinary income |
$ |
167,625,868 |
$ |
140,308,667 |
|||||||
The Fund utilizes the provisions of federal income tax laws that provide for the carryforward of capital losses for prior years, offsetting such losses against any future realized capital gains. Under the Regulated Investment Company Act of 2010 (the "Act"), net capital losses recognized for fiscal years beginning after December 22, 2010 may be carried forward indefinitely, and their character is retained as short-term and/or long-term losses.
As of September 30, 2022, the fund had $268,356,693 of short-term capital losses and $292,881,156 of long-term capital losses available to offset possible future capital gains.
56
FPA NEW INCOME, INC.
NOTES TO FINANCIAL STATEMENTS (Continued)
The cost of investment securities held at September 30, 2022 was $9,907,188,698 for federal income tax purposes. Gross unrealized appreciation and depreciation for all investment at September 30, 2022, for federal income tax purposes was $17,749,636 and $452,639,844, respectively resulting in net unrealized depreciation of $434,890,208. As of and during the year ended September 30, 2022, the Fund did not have any liability for unrecognized tax benefits. The Fund recognizes interest and penalties, if any, related to unrecognized tax benefits as income tax expense in the Statement of Operations. During the year, the Fund did not incur any interest or penalties. The statute of limitations remains open for the last 3 years, once a return is filed. No examinations are in progress at this time.
NOTE 6 — Disclosure of Fair Value Measurements
The Fund uses the following methods and inputs to establish the fair value of its assets and liabilities. Use of particular methods and inputs may vary over time based on availability and relevance as market and economic conditions evolve.
Equity securities are generally valued each day at the official closing price of, or the last reported sale price on, the exchange or market on which such securities principally are traded, as of the close of business on that day. If there have been no sales that day, equity securities are generally valued at the last available bid price. Securities that are unlisted and fixed-income and convertible securities listed on a national securities exchange for which the over-the-counter ("OTC") market more accurately reflects the securities' value in the judgment of the Fund's officers, are valued at the most recent bid price. However, most fixed income securities are generally valued at prices obtained from pricing vendors and brokers.
Vendors value such securities based on one or more of the following inputs: transactions, bids, offers quotations from dealers and trading systems, spreads and other relationships observed in the markets among comparable securities, benchmarks, underlying equity of the issuer, and proprietary pricing models such as cash flows, financial or collateral performance and other reference data (includes prepayments, defaults, collateral, credit enhancements, and interest rate volatility). Short-term corporate notes with maturities of 60 days or less at the time of purchase are valued at amortized cost.
Securities for which representative market quotations are not readily available or are considered unreliable by the Adviser are valued as determined in good faith under procedures adopted by the authority of the Fund's Board of Directors. Various inputs may be reviewed in order to make a good faith determination of a security's value. These inputs include, but are not limited to, the type and cost of the security; contractual or legal restrictions on resale of the security; relevant financial or business developments of the issuer; actively traded similar or related securities; conversion or exchange rights on the security; related corporate actions; significant events occurring after the close of trading in the security; and changes in overall market conditions. Fair valuations and valuations of investments that are not actively trading involve judgment and may differ materially from valuations of investments that would have been used had greater market activity occurred.
The Fund classifies its assets based on three valuation methodologies. Level 1 values are based on quoted market prices in active markets for identical assets. Level 2 values are based on significant observable market inputs, such as quoted prices for similar assets and quoted prices in inactive markets or other market observable inputs as noted above including spreads, cash flows, financial performance, prepayments, defaults, collateral, credit enhancements, and interest rate volatility. Level 3 values are based on significant unobservable inputs that reflect the Fund's determination of assumptions that market participants might reasonably use in valuing the assets. The valuation levels are not necessarily an indication of the risk associated with investing in those securities.
57
FPA NEW INCOME, INC.
NOTES TO FINANCIAL STATEMENTS (Continued)
The following table presents the valuation levels of the Fund's investments as of September 30, 2022:
|
Investments |
Level 1 |
Level 2 |
Level 3 |
Total |
|||||||||||||||
|
Common Stocks |
|||||||||||||||||||
|
Energy |
— |
— |
$ |
47,580,250 |
$ |
47,580,250 |
|||||||||||||
|
Industrials |
$ |
60,537,070 |
— |
— |
60,537,070 |
||||||||||||||
|
Retailing |
— |
— |
7,144,190 |
7,144,190 |
|||||||||||||||
|
Commercial Mortgage-Backed Securities |
|||||||||||||||||||
|
Agency |
— |
$ |
293,372,136 |
— |
293,372,136 |
||||||||||||||
|
Agency Stripped |
— |
38,313,878 |
— |
38,313,878 |
|||||||||||||||
|
Non-Agency |
— |
719,786,316 |
— |
719,786,316 |
|||||||||||||||
|
Residential Mortgage-Backed Securities |
|||||||||||||||||||
|
Agency Collateralized Mortgage Obligation |
— |
13,427,318 |
— |
13,427,318 |
|||||||||||||||
|
Agency Pool Adjustable Rate |
— |
282,386 |
— |
282,386 |
|||||||||||||||
|
Agency Pool Fixed Rate |
— |
189,470,692 |
— |
189,470,692 |
|||||||||||||||
|
Agency Stripped |
— |
112,199 |
— |
112,199 |
|||||||||||||||
|
Non-Agency Collateralized Mortgage Obligation |
— |
478,187,789 |
— |
478,187,789 |
|||||||||||||||
|
Asset-Backed Securities |
|||||||||||||||||||
|
Auto |
— |
1,974,847,173 |
— |
1,974,847,173 |
|||||||||||||||
|
Collateralized Loan Obligation |
— |
1,820,946,434 |
22,787,445 |
1,843,733,879 |
|||||||||||||||
|
Credit Card |
— |
101,215,223 |
— |
101,215,223 |
|||||||||||||||
|
Equipment |
— |
1,077,678,299 |
14,837,423 |
1,092,515,722 |
|||||||||||||||
|
Other |
— |
1,260,743,580 |
— |
1,260,743,580 |
|||||||||||||||
|
Corporate Bonds & Notes |
— |
198,161,353 |
— |
198,161,353 |
|||||||||||||||
|
Corporate Bank Debt |
— |
222,104,341 |
10,660,190 |
232,764,531 |
|||||||||||||||
|
U.S. Treasuries |
— |
854,327,805 |
— |
854,327,805 |
|||||||||||||||
|
Short-Term Investments |
— |
65,775,000 |
— |
65,775,000 |
|||||||||||||||
|
$ |
60,537,070 |
$ |
9,308,751,922 |
$ |
103,009,498 |
$ |
9,472,298,490 |
||||||||||||
58
FPA NEW INCOME, INC.
NOTES TO FINANCIAL STATEMENTS (Continued)
The following table summarizes the Fund's Level 3 investment securities and related transactions during the year ended September 30, 2022:
|
Investments |
Beginning Value at September 30, 2021 |
Net Realized and Unrealized Gains (Losses)(a) |
Purchases |
(Sales) |
Gross Transfers In/(Out) |
Ending Value at September 30, 2022 |
Net Change in Unrealized Appreciation (Depreciation) related to Investments held at September 30, 2022 |
||||||||||||||||||||||||
|
Common Stocks |
$ |
93,664,143 |
$ |
(25,982,883 |
) |
— |
— |
$ |
(12,956,820 |
) |
$ |
54,724,440 |
$ |
(3,793,183 |
) |
||||||||||||||||
|
Residential Mortgage- Backed Securities Non-Agency Collateralized Mortgage Obligation |
35,620,000 |
(1,455,972 |
) |
$ |
(15,124,415 |
) |
(19,039,613 |
) |
— |
— |
|||||||||||||||||||||
|
Asset-Backed Securities Collateralized Loan Obligation |
17,800,000 |
— |
$ |
18,000,000 |
(13,012,555 |
) |
— |
22,787,445 |
— |
||||||||||||||||||||||
|
Asset-Backed Securities Equipment |
18,223,505 |
(1,053,884 |
) |
— |
(2,332,198 |
) |
— |
14,837,423 |
(1,057,408 |
) |
|||||||||||||||||||||
|
Corporate Bank Debt |
17,737,844 |
(15,412 |
) |
78,941 |
(7,141,183 |
) |
— |
10,660,190 |
(6,639 |
) |
|||||||||||||||||||||
|
$ |
183,045,492 |
$ |
(28,508,151 |
) |
$ |
18,078,941 |
$ |
(37,610,351 |
) |
$ |
(31,996,433 |
) |
$ |
103,009,498 |
$ |
(4,857,230 |
) |
||||||||||||||
(a) Net realized and unrealized gains (losses) are included in the related amounts in the statement of operations.
Transfers of investments between different levels of the fair value hierarchy are recorded at fair value as of the end of the reporting period. There were transfers of $19,039,613 out of Level 3 into Level 2, $60,537,070 out of Level 3 into Level 1 and $47,580,250 out of Level 1 into Level 3. Transfers out of Level 3 were due to change in valuation technique from recent trade activity to vendor priced. Transfers into Level 3 were due to change in valuation technique from vendor priced to a pricing model based on last executed trade.
59
FPA NEW INCOME, INC.
NOTES TO FINANCIAL STATEMENTS (Continued)
The following table summarizes the quantitative inputs and assumptions used for items categorized as Level 3 of the fair value hierarchy as of September 30, 2022:
|
Financial Assets |
Fair Value at September 30, 2022 |
Valuation Technique(s) |
Unobservable Inputs |
Price/Range |
Weighted Average Price |
||||||||||||||||||
|
Common Stocks |
$ |
7,144,190 |
Pricing Model (a) |
Quotes/Prices |
$ |
5.50-$13.00 |
$ |
12.60 |
|||||||||||||||
|
$ |
47,580,250 |
Pricing Model (b) |
Last Executed Trade |
$ |
12.50 |
$ |
12.50 |
||||||||||||||||
|
Asset-Backed Securities — Collateralized Loan Obligation |
$ |
22,787,445 |
Third-Party Broker Quote (c) |
Quotes/Prices |
$ |
100.00 |
$ |
100.00 |
|||||||||||||||
|
Asset-Backed Securities — Equipment |
$ |
14,837,423 |
Third-Party Broker Quote (c) |
Quotes/Prices |
$ |
87.00 |
$ |
87.00 |
|||||||||||||||
|
Corporate Bank Debt |
$ |
10,660,190 |
Pricing Model (d) |
Discounted External Valuation |
14.0 |
% |
14.0 |
% |
|||||||||||||||
(a) The Pricing Model technique for Level 3 securities involves recently quoted funding prices of the security.
(b) The Pricing Model technique for Level 3 securities involves the last reported trade in the security.
(c) The Third Party Broker Quote technique involves obtaining an independent third-party broker quote for the security.
(d) The Pricing Model technique for Level 3 securities involves external valuation by an independent third party who utilized a discounted cash flow model.
NOTE 7 — Collateral Requirements
FASB Accounting Standards Update No. 2011-11, Disclosures about Offsetting Assets and Liabilities, requires disclosures to make financial statements that are prepared under U.S. GAAP more comparable to those prepared under International Financial Reporting Standards. Under this guidance the Fund discloses both gross and net information about instruments and transactions eligible for offset such as instruments and transactions subject to an agreement similar to a master netting arrangement. In addition, the Fund discloses collateral received and posted in connection with master netting agreements or similar arrangements.
The following table presents the Fund's repurchase agreements by counterparty net of amounts available for offset under an ISDA Master agreement or similar agreements and net of the related collateral received or pledged by the Fund as of September 30, 2022, are as follows:
|
Gross Amounts Not Offset in the Statement of Assets and Liabilities |
|||||||||||||||||||
|
Counterparty |
Gross Assets (Liabilities) in the Statement of Assets and Liabilities |
Security Collateral (Received) Pledged |
Assets (Liabilities) Available for Offset |
Net Amount of Assets (Liabilities)(a) |
|||||||||||||||
|
State Street Bank and Trust Company: |
|||||||||||||||||||
|
Repurchase Agreement |
$ |
65,775,000 |
$ |
(65,775,000 |
)(b) |
— |
— |
||||||||||||
(a) Represents the net amount receivable from the counterparty in the event of default.
(b) Collateral with a value of $67,090,584 has been received in connection with a master repurchase agreement. Excess of collateral received from the individual master repurchase agreement is not shown for financial reporting purposes.
60
FPA NEW INCOME, INC.
NOTES TO FINANCIAL STATEMENTS (Continued)
NOTE 8 — Commitments and Contingencies
In the normal course of business, the Fund's investment activities involve executions, settlement and financing of various transactions resulting in receivables from, and payables to, brokers, dealers and the Fund's custodian. These activities may expose the Fund to risk in the event that such parties are unable to fulfill contractual obligations. Management does not anticipate any material losses from counterparties with whom it conducts business. Consistent with standard business practice, the Fund enters into contracts that contain a variety of indemnifications. The maximum exposure of the Fund under these arrangements and activities is unknown.
Commitments to extend credit or invest capital include loan or debt-related proceeds the Fund is obligated to advance, such as delayed draws or revolving credit arrangements, or delayed draws of investments in limited partnerships. Commitments generally have fixed expiration dates or other termination clauses. Unrealized gains or losses associated with unfunded commitments are recorded in the consolidated financial statements and reflected as an adjustment to the fair value of the related security in the Consolidated Schedule of Investments. The paramount of the unfunded commitments is not recognized by the Fund until it becomes funded. As of September 30, 2022, the value of loans disclosed in the Schedule of Investments does not include unfunded commitments and the Fund was liable for the following unfunded commitments:
|
Asset Class |
Unfunded Commitment |
||||||
|
Corporate Bank Debt |
$ |
16,770,000 |
|||||
NOTE 9 — Affiliated Investments
A company is considered an affiliate of the Fund under the Investment Company Act of 1940 if the Fund's holdings in that company represent 5% or more of the outstanding voting shares of that company. Further details on such holdings and related transactions during the year ended September 30, 2022, appear below:
|
Shares Held as of September 30, 2021 |
Beginning Value as of September 30, 2021 |
Purchases at Cost |
Proceeds from Sales |
Net Realized Gain/(Loss) sales of Affiliated Investments |
Change in Unrealized Appreciation/ Depreciation |
Transfers In (Out) |
Ending Value as of September 30, 2022 |
Shares as of September 30, 2022 |
Dividend Income from Affiliated Investments |
||||||||||||||||||||||||||||||||||
|
Common Stocks — 1.1% |
|||||||||||||||||||||||||||||||||||||||||||
|
Energy — 0.5% |
|||||||||||||||||||||||||||||||||||||||||||
|
PHI Group, Inc., Restricted(a)(b)(c) |
2,602,492 |
$ |
36,434,888 |
— |
— |
— |
$ |
1,640,666 |
$ |
9,504,696 |
$ |
47,580,250 |
3,806,420 |
$ |
7,807,476 |
||||||||||||||||||||||||||||
|
Industrials — 0.6% |
|||||||||||||||||||||||||||||||||||||||||||
|
Boart Longyear Group Ltd.(d) |
43,018,605 |
82,726,771 |
— |
— |
— |
(22,189,701 |
) |
— |
60,537,070 |
43,018,605 |
— |
||||||||||||||||||||||||||||||||
|
Total Affiliate Investments — 1.1% |
$ |
119,161,659 |
— |
— |
— |
$ |
(20,549,035 |
) |
$ |
9,504,696 |
$ |
108,117,320 |
$ |
7,807,476 |
|||||||||||||||||||||||||||||
(a) These securities have been valued in good faith under policies adopted by authority of the Board of Trustees in accordance with the Fund's fair value procedures. These securities constituted 0.69% of total net assets at September 30, 2022.
(b) Investments categorized as a significant unobservable input (Level 3) (See Note 6 of the Notes to Financial Statements).
61
FPA NEW INCOME, INC.
NOTES TO FINANCIAL STATEMENTS (Continued)
(c) Restricted securities. These restricted securities constituted 3.28% of total net assets at September 30, 2022, most of which are considered liquid by the Adviser. These securities are not registered and may not be sold to the public. There are legal and/or contractual restrictions on resale. The Fund does not have the right to demand that such securities be registered. The values of these securities are determined by valuations provided by pricing services, brokers, dealers, market makers, or in good faith under policies adopted by authority of the Fund's Board of Directors.
(d) Non-income producing security.
62
FPA NEW INCOME, INC.
REPORT OF INDEPENDENT REGISTERED
PUBLIC ACCOUNTING FIRM
TO THE SHAREHOLDERS AND
BOARD OF DIRECTORS OF FPA NEW INCOME, INC.
Opinion on the Financial Statements
We have audited the accompanying statement of assets and liabilities of FPA New Income, Inc. (the "Fund"), including the portfolio of investments, as of September 30, 2022, and the related statement of operations for the year then ended, the statement of changes in net assets for each of the two years in the period then ended, and the financial highlights for each of the five years in the period then ended and the related notes (collectively referred to as the "financial statements"). In our opinion, the financial statements present fairly, in all material respects, the financial position of the Fund at September 30, 2022, the results of its operations for the year then ended, the changes in its net assets for each of the two years in the period then ended and its financial highlights for each of the five years in the period then ended, in conformity with U.S. generally accepted accounting principles.
Basis for Opinion
These financial statements are the responsibility of the Fund's management. Our responsibility is to express an opinion on the Fund's financial statements based on our audits. We are a public accounting firm registered with the Public Company Accounting Oversight Board (United States) ("PCAOB") and are required to be independent with respect to the Fund in accordance with the U.S. federal securities laws and the applicable rules and regulations of the Securities and Exchange Commission and the PCAOB.
We conducted our audits in accordance with the standards of the PCAOB. Those standards require that we plan and perform the audit to obtain reasonable assurance about whether the financial statements are free of material misstatement, whether due to error or fraud. The Fund is not required to have, nor were we engaged to perform, an audit of the Fund's internal control over financial reporting. As part of our audits, we are required to obtain an understanding of internal control over financial reporting but not for the purpose of expressing an opinion on the effectiveness of the Fund's internal control over financial reporting. Accordingly, we express no such opinion.
Our audits included performing procedures to assess the risks of material misstatement of the financial statements, whether due to error or fraud, and performing procedures that respond to those risks. Such procedures included examining, on a test basis, evidence regarding the amounts and disclosures in the financial statements. Our procedures included confirmation of securities owned as of September 30, 2022, by correspondence with the custodian, brokers, and others; when replies were not received from brokers and others, we performed other auditing procedures.
Our audits also included evaluating the accounting principles used and significant estimates made by management, as well as evaluating the overall presentation of the financial statements. We believe that our audits provide a reasonable basis for our opinion.

We have served as the auditor of one or more investment companies in the FPA family of funds since 2018.
Los Angeles, CA
November 28, 2022
63
FPA NEW INCOME, INC.
SHAREHOLDER EXPENSE EXAMPLE
September 30, 2022 (Unaudited)
Fund Expenses
Mutual fund shareholders generally incur two types of costs: (1) transaction costs, and (2) ongoing costs, including advisory and administrative fees; shareholder service fees; and other Fund expenses. The Example is intended to help you understand your ongoing costs (in dollars) of investing in the Fund and to compare these costs with the ongoing costs of investing in other mutual funds. The Example is based on an investment of $1,000 invested at the beginning of the year and held for the entire year.
Actual Expenses
The information in the table under the heading "Actual Performance" provides information about actual account values and actual expenses. You may use the information in this column, together with the amount you invested, to estimate the expenses that you paid over the period. Simply divide your account value by $1,000 (for example, an $8,600 account value divided by $1,000 = 8.6), then multiply the result by the number in the first column in the row entitled "Expenses Paid During Period" to estimate the expenses you paid on your account during this period.
Hypothetical Example for Comparison Purposes
The information in the table under the heading "Hypothetical Performance (5% return before expenses)" provides information about hypothetical account values and hypothetical expenses based on the Fund's actual expense ratio and an assumed rate of return of 5% per year before expenses, which is not the Fund's actual return. The hypothetical account values and expenses may not be used to estimate the actual ending account balance or expenses you paid for the period. You may use this information to compare the ongoing costs of investing in the Fund and other funds. To do so, compare this 5% hypothetical example with the 5% hypothetical examples that appear in the shareholder reports of other funds.
Please note that the expenses shown in the table are meant to highlight your ongoing costs only and do not reflect any transactional costs. Therefore, the information under the heading "Hypothetical Performance (5% return before expenses)" is useful in comparing ongoing costs only, and will not help you determine the relative total costs of owning different funds. In addition, if these transactional costs were included, your costs would have been higher. Even though the Fund does not charge transaction fees, if you purchase shares through a broker, the broker may charge you a fee. You should evaluate other mutual funds' transaction fees and any applicable broker fees to assess the total cost of ownership for comparison purposes.
|
Actual Performance |
Hypothetical Performance (5% return before expenses) |
||||||||||
|
Beginning Account Value March 31, 2022 |
$ |
1,000.00 |
$ |
1,000.00 |
|||||||
|
Ending Account Value September 30, 2022 |
$ |
980.20 |
$ |
1,022.81 |
|||||||
|
Expenses Paid During Period(a) |
$ |
2.23 |
$ |
2.28 |
|||||||
(a) Expenses are equal to the Fund's annualized expense ratio of 0.45%, multiplied by the average account value over the period and prorated for the six-months ended September 30, 2022 (183/365 days).
64
FPA NEW INCOME, INC.
APPROVAL OF INVESTMENT ADVISORY AGREEMENT
(Unaudited)
Approval of the Advisory Agreement. At a meeting of the Board of Directors held on August 8, 2022, the Board approved the continuation of the advisory agreement between the Fund and the Adviser (the "Advisory Agreement") for an additional one-year period through September 30, 2023, on the recommendation of the Independent Directors, who met in executive session on August 8, 2022 prior to the Board meeting to review and discuss the proposed continuation of the Advisory Agreement. The Board had also met on July 11, 2022, with the Independent Directors meeting separately prior to the Meeting in executive session with the management of the Adviser and then separately with independent counsel to evaluate the renewal of the Advisory Agreement. Prior to their July 11 meeting, the Independent Directors, through their independent counsel, had requested and received extensive materials prepared in connection with the review of the Advisory Agreements. The materials provided a broad range of information regarding the Fund, including a description of, among other matters, the terms of the Advisory Agreement; the services provided by the Adviser; the experience of the relevant investment personnel; the Fund's performance in absolute terms and as compared to the performance of peers and appropriate benchmark(s); the fees and expenses of the Fund in absolute terms and as compared to peers; and the profitability of the Adviser from serving as adviser to the Fund.
In addition to the executive sessions, the Board, acting directly or through its committees, met regularly throughout the year and received information on a variety of topics that were relevant to their annual consideration of the renewal of the Advisory Agreement including, among other matters, Fund investment performance, compliance, risk management, liquidity, valuation, trade execution, service provider oversight and other matters relating to Fund operations. The Independent Directors also had met with management of the Adviser (including key investment personnel) at their quarterly meetings as well as with management at other times between the quarterly meetings throughout the year. The materials specifically provided in connection with the annual review of the Advisory Agreements supplement the information received throughout the year.
At their regular Board meetings and executive sessions, the Independent Directors were also advised by independent legal counsel. In addition to the materials provided by the Adviser, the Independent Directors received a legal memorandum from independent counsel that outlined, among other matters: the duties of the Independent Directors and relevant requirements under the 1940 Act; the general principles under state law relevant to considering the approval of advisory contracts; an adviser's fiduciary duty with respect to advisory agreements and compensation; the standards used by courts in determining whether investment advisers and investment company boards of trustees have fulfilled their duties; and factors to be considered by the Independent Directors when voting on advisory agreements. During both executive sessions, independent legal counsel reviewed with Independent Directors these duties, standards and factors summarized in the legal memorandum described above. The following paragraphs summarize the material information and factors considered by the Board and the Independent Directors, as well as the Directors' conclusions relative to such factors.
Nature, Extent and Quality of Services. The Board and the Independent Directors considered information provided by the Adviser in response to their requests, as well as information provided throughout the year regarding: the Adviser and its staffing in connection with the Fund, including the Fund's portfolio manager and the senior analysts supporting him; the scope of services supervised and provided by the Adviser; and the absence of any significant service problems reported to the Board. The Board and the Independent Directors noted the experience, length of service and the outstanding reputation of the Fund's portfolio manager: Abhijeet V. Patwardhan, who joined the Adviser in 2010 and has served as portfolio manager since 2015. After discussion, the Board and the Independent Directors concluded that the nature, extent and quality of services provided by the Adviser have benefited and should continue to benefit the Fund and its shareholders.
65
FPA NEW INCOME, INC.
APPROVAL OF INVESTMENT ADVISORY AGREEMENT (Continued)
(Unaudited)
Investment Performance. The Board and the Independent Directors reviewed the overall investment performance of the Fund. The Directors also received information from an independent consultant, Broadridge, regarding the Fund's performance relative to a peer group of alternative credit focus funds selected by Broadridge (the "Peer Group"). The Board and the Independent Directors considered the Adviser's representation that the Fund's investment style, as evidenced by the short-term duration of most of its portfolio securities, as well as the Fund's flexibility to invest in a variety of areas, complicated Peer Group comparisons in that the Fund is managed in a more conservative style than the typical fixed income fund and the funds in the Peer Group. The Board and the Independent Directors noted the Fund's absolute investment results and its long-term investment performance when compared to the Peer Group. The Board and the Independent Directors noted the Fund outperformed its Peer Group median for the one- and five-year periods ended March 31, 2022, and underperformed its Peer Group for the three- and ten-year periods ended March 31, 2022. The Board and the Independent Directors also noted that the Fund outperformed the comparative Bloomberg Barclays U.S. Aggregate Index for the one-year period ended March 31, 2022, but underperformed for the three-, five-, and ten-year periods ended March 31, 2022. They also noted that Morningstar has continued to give the Fund a "Bronze" Analyst Rating. After discussion, the Board and the Independent Directors determined that the Fund's investment results were reasonable in light of the Fund's objectives and concluded that the Adviser's continued management of the Fund should benefit the Fund and its shareholders.
Advisory Fees and Fund Expenses; Comparison with Peer Group and Institutional Fees. The Board and the Independent Directors considered information provided by the Adviser regarding the Fund's advisory fees and total expense levels. The Board and the Independent Directors reviewed comparative information regarding fees and expenses for the Peer Group. The Board and the Independent Directors noted that the Fund's advisory fee was higher than the Peer Group median and its overall net expense ratio was equal to that of the Peer Group median. In addition, the Directors noted that the fee rate charged to the Fund is higher than institutional accounts managed in a similar style by the portfolio managers but considered the Adviser's discussion of the differences between the services provided by the Adviser to the Fund and those provided by the Adviser to the institutional accounts. The Board and the Independent Directors concluded that the continued payment of advisory fees and expenses by the Fund to the Adviser was fair and reasonable and should continue to benefit the Fund and its shareholders.
Adviser Profitability and Costs. The Board and the Independent Directors considered information provided by the Adviser regarding the Adviser's costs in providing services to the Fund, the profitability of the Adviser and the benefits to the Adviser from its relationship to the Fund. They reviewed and considered the Adviser's representations regarding its assumptions and methods of allocating certain costs, such as personnel costs, which constitute the Adviser's largest operating cost, overhead and trading costs with respect to the provision of investment advisory services. The Independent Directors discussed with the Adviser the general process through which individuals' compensation is determined and then reviewed by the management committee of the Adviser, as well as the Adviser's methods for determining that its compensation levels are set at appropriate levels to attract and retain the personnel necessary to provide high quality professional investment advice. In evaluating the Adviser's profitability, they excluded certain distribution and marketing-related expenses. The Board and the Independent Directors recognized that the Adviser is entitled under the law to earn a reasonable level of profits for the services that it provides to the Fund. The Board and the Independent Directors concluded that the Adviser's level of profitability from its relationship with the Fund did not indicate that the Adviser's compensation was unreasonable or excessive.
66
FPA NEW INCOME, INC.
APPROVAL OF INVESTMENT ADVISORY AGREEMENT (Continued)
(Unaudited)
Economies of Scale and Sharing of Economies of Scale. The Board and the Independent Directors considered whether there have been economies of scale with respect to the management of the Fund, whether the Fund has appropriately benefited from any economies of scale, and whether the fee rate is reasonable in relation to the Fund's asset levels and any economies of scale that may exist. The Board and the Independent Directors considered the Adviser's representation that its internal costs of providing investment management services to the Fund have significantly increased in recent years as a result of a number of factors, including the Adviser's substantial investment in additional professional resources and staffing. The Board and the Independent Directors considered both quantitative and qualitative information regarding the Adviser's representation that it has also made significant investments in: (1) the portfolio manager, five analysts, traders and other investment personnel who assist with the management of the Fund; (2) new compliance, operations, and administrative personnel; (3) information technology, portfolio accounting and trading systems; and (4) office space, each of which enhances the quality of services provided to the Fund. The Board and the Independent Directors also considered the Adviser's willingness to close funds to new investors when it believed that a fund may have limited capacity to grow or that it otherwise would benefit fund shareholders. The Board noted that the Fund does not charge sales loads.
The Board and the Independent Directors recognized that the advisory fee rate schedule for the Fund does not have breakpoints. They considered that many mutual funds have breakpoints in the advisory fee structure as a means by which to share in the benefits of potential economies of scale as a fund's assets grow. They also considered that not all funds have breakpoints in their fee structures and that breakpoints are not the exclusive means of sharing potential economies of scale. The Board and the Independent Directors considered the Adviser's statement that it believes that breakpoints currently remain inappropriate for the Fund given the ongoing investments the Adviser is making in its business for the benefit of the Fund, uncertainties regarding the direction of the economy, rising inflation, increasing costs for personnel and systems, and growth or contraction in the Fund's assets, all of which could negatively impact the profitability of the Adviser. The Board and the Independent Directors also noted that the Adviser has contractually agreed to reimburse the Fund for Total Annual Fund Operating Expenses in excess of 0.45% of the average daily net assets of the Fund (excluding brokerage fees and commissions, interest, taxes, shareholder service fees, fees and expenses of other funds in which the Fund invests, and extraordinary expenses) through March 31, 2023. The Board and the Independent Directors concluded that the Fund is benefitting from the ongoing investments made by the Adviser in its team of personnel serving the Fund and in the Adviser's service infrastructure, and that in light of these investments, the addition of breakpoints in the Fund's advisory fee structure was not warranted at current asset levels.
Ancillary Benefits. The Board and the Independent Directors considered other actual and potential benefits to the Adviser from managing the Fund, including the acquisition and use of research services with commissions generated by the Fund, in concluding that the contractual advisory and other fees are fair and reasonable for the Fund. They noted that the Adviser does not have any affiliates that benefit from the Adviser's relationship to the Fund.
Conclusions. The Board and the Independent Directors determined that the Fund continues to benefit from the services of the Adviser's highly experienced portfolio management team, which has produced reasonable long-term returns. In addition, the Board and the Independent Directors agreed that the Fund continues to receive high quality services from the Adviser. The Board and the Independent Directors concluded that the current advisory fee rate is reasonable and fair to the Fund and its shareholders in light of the nature and quality of the services provided by the Adviser and the Adviser's profitability and costs. The Board and the Independent
67
FPA NEW INCOME, INC.
APPROVAL OF INVESTMENT ADVISORY AGREEMENT (Continued)
(Unaudited)
Directors also noted their intention to continue monitoring the factors relevant to the Adviser's compensation, such as changes in the Fund's asset levels, changes in portfolio management personnel and the cost and quality of the services provided by the Adviser to the Fund. On the basis of the foregoing, and without assigning particular weight to any single factor, none of which was dispositive, the Board and the Independent Directors concluded that it would be in the best interests of the Fund to continue to be advised and managed by the Adviser and determined to approve the continuation of the current Advisory Agreement for another one-year period through September 30, 2023.
68
FPA NEW INCOME, INC.
LIQUIDITY RISK MANAGEMENT PROGRAM
(Unaudited)
In compliance with SEC Rule 22e-4 under the U.S. Investment Company Act of 1940 (the "Liquidity Rule"), the Fund has adopted and implemented a written liquidity risk management program (the "Program"). The Fund's Board of Trustees have also designated the Adviser to serve as the administrator of the Program.
The Liquidity Rule requires that the Program be reasonably designed to assess and manage each Fund's liquidity risk. A Fund's "liquidity risk" is the risk that the Fund could not meet requests to redeem shares issued by the Fund without significant dilution of the remaining investors' interests in the Fund. The Program includes a number of elements that support the assessment, management and review of liquidity risk. In accordance with the Program, each Fund's liquidity risk is assessed no less frequently than annually taking into consideration a variety of factors, including, as applicable, the Fund's investment strategy and liquidity of portfolio investments, cash flow projections, and holdings of cash and cash equivalents, as well as borrowing arrangements and other funding sources. Certain factors are considered under both normal and reasonably foreseeable stressed conditions. There is no guarantee that the Program will achieve its objective under all circumstances.
Under the Program, each Fund portfolio investment is classified into one of four liquidity categories based on a determination of the number of days it is reasonably expected to take to convert the investment to cash, or sell or dispose of the investment, in current market conditions without significantly changing the investment's market value. The Program is reasonably designed to meet Liquidity Rule requirements relating to "highly liquid investment minimums" (i.e., the minimum amount of Fund net assets to be invested in highly liquid investments that are assets) and to monitor compliance with the Liquidity Rule's limitations on a Fund's investments in illiquid investments. Under the Liquidity Rule, a Fund is prohibited from acquiring any illiquid investment if, immediately after the acquisition, the Fund would have invested more than 15% of its net assets in illiquid investments that are assets.
During the period covered by this shareholder report, the Fund's Board of Trustees received reports prepared by the Adviser addressing the Program's operation and assessing the adequacy and effectiveness of its implementation for the period from October 1, 2021 to September 30, 2022. The reports concluded that the Program operated effectively, the Program had been and continued to be reasonably designed to assess and manage each Fund's liquidity risk, and the Program has been adequately and effectively implemented to monitor and respond to the Funds' liquidity developments, as applicable.
69
FPA NEW INCOME, INC.
PRIVACY POLICY
(Unaudited)
The following is the privacy notice of the mutual funds managed by First Pacific Advisors, LP ("FPA", and the mutual funds, the "FPA Funds"). A complete list of funds is provided below.
The FPA Funds take privacy seriously and consider privacy to be a fundamental aspect of its relationships with its former, prospective, and current investors. The FPA Funds are committed to maintaining the confidentiality, integrity and security of its former, current, and prospective investors' non-public personal information and other personal information. This privacy policy describes our privacy practices surrounding the collection and sharing of non-public personal information of current, former, and prospective investors.
Sources and Collection of Non-Public Personal Information. While providing investors and/or prospective investors (collectively, "investors") with products and services, the FPA Funds, and certain service providers, such as the FPA Fund's Transfer Agents and/or Administrators, may obtain non-public personal information about such investors, which may come directly from the investor or their intermediaries from sources such as: (i) account applications, subscription agreements and other forms, (ii) written, electronic or verbal correspondence, (iii) investor transactions, (iv) an investor's brokerage or financial advisory firm, financial advisor or consultant, and/or (v) from information captured on applicable websites, including information you may voluntarily provide when you subscribe to receive FPA's quarterly updates or request us to mail you information about the FPA Funds. In addition, the FPA Funds may collect additional non-public personal information from different sources, such as: (i) affiliates or their service providers; (ii) public websites or other publicly available sources such as government records; and/or (iii) from credit reporting agencies, sanctions screening databases, or from sources designed to detect and prevent fraud.
The non-public personal information collected about an investor may include: (i) identifiers and similar information such as the investor's name, address, tax identification number, birth date, driver's license number, and potentially email address and phone number (if provided); (ii) commercial information like an investment selection, beneficiary information, or transaction and account history with the FPA Funds; (iii) internet or other electronic network activity like interactions with the FPA website; and (iv) professional or employment-related information like an investor's occupation and job title.
Purpose for Collecting Non-Public Personal Information. We may collect or use all or a few of these categories of non-public personal information listed above for the following business or commercial purposes: (i) performing services on behalf of FPA or the FPA Funds, including, for example, maintaining or servicing accounts, providing customer service, processing transactions, verifying information, processing payments, or providing similar services; (ii) performing our contractual obligations, including providing updates on FPA Funds performance and other operational matters; (iii) detecting security incidents, protecting against malicious, deceptive, fraudulent, or illegal activity, including, preventing fraud and conducting "Know Your Client," anti-money laundering, terrorist financing, and conflict checks; or (iv) enabling or effecting commercial transactions, including, using bank account details to remit funds and process distributions.
Disclosure of Non-Public Personal Information. The FPA Funds do not disclose any non-public personal information provided by investors or gathered by the FPA Funds to third parties, except as required or permitted by law or as necessary for such third parties to perform their agreements with respect to the FPA Funds. Non-affiliated companies may from time to time be used to provide certain services, such as maintaining investor accounts, preparing and mailing prospectuses, reports, account statements and other information, conducting Know Your Client reviews, performing checks against sanctions lists, and gathering shareholder proxies. In many instances, the investor will be a client of a third party, but the FPA Funds may also provide an investor's non-public
70
FPA NEW INCOME, INC.
PRIVACY POLICY (Continued)
(Unaudited)
personal information and account information to the investor's respective custodian, brokerage or financial advisory firm and/or financial advisor or consultant.
Sharing Information with Third Parties. The FPA Funds reserve the right to report or disclose non-public personal information or account information to third parties in circumstances where the FPA Funds believe in good faith that disclosure is required or permitted under law, to cooperate with regulators or law enforcement authorities, to protect their rights or property, or upon reasonable request by the FPA Funds in which an investor has invested. In addition, the FPA Funds may disclose information about an investor or an investor's accounts to a third party at the investor's request or direction or with the consent of the investor.
Rights to Limited Sharing. Federal law gives you the right to limit some but not all sharing of your nonpublic personal information. We do not: (i) share non-public personal information with non-affiliates to market to you; (ii) engage in joint marketing with non-affiliates; (iii) share non-public personal information with affiliates to market to you; or (iv) share non-public personal information about your creditworthiness with affiliates.
Procedures to Safeguard Private Information. The FPA Funds will take reasonable steps and use security measures appropriate to the nature of the information and that comply with applicable laws to protect investors' non-public personal information against unauthorized access and exfiltration, acquisition, theft, or disclosure. In addition to this policy, the FPA Funds have implemented internal procedures that are designed to help guard investors' personal data. Given the nature of information security, there is no guarantee that such safeguards will always be successful.
Changes to the Privacy Policy. From time to time, the FPA Funds may update or revise this privacy policy. If there are changes to the terms of this privacy policy, documents containing the revised policy will be updated.
FPA Funds. FPA Crescent Fund, FPA New Income, Inc., FPA Flexible Fixed Income Fund, FPA U.S. Core Equity Fund, Inc., FPA Queens Road Value Fund, FPA Queens Road Small Cap Value Fund, Source Capital, Inc.
Contact Us. Questions, comments, and requests regarding this privacy policy are welcomed and should be addressed to dataprotection@fpa.com.
Revised: January 2022
71
FPA NEW INCOME, INC.
DIRECTOR AND OFFICER INFORMATION
(Unaudited)
Sandra Brown, Mark L. Lipson, Alfred E. Osborne, Jr., and Robert F. Goldrich are all Directors of the Fund who are not "interested persons" of the Fund, as that term is defined in the 1940 Act (collectively, the "Independent Directors"). Directors serve until their resignation, removal or retirement. The Statement of Additional Information includes additional information about the Directors and is available, without charge, upon request by calling (800) 982-4372.
|
Name, Address(1) and Year of Birth |
Position(s) Held with the Fund |
Year First Elected as Director of the Fund |
Principal Occupation(s) During the Past Five Years |
Number of FPA Funds Overseen by Director |
Other Directorships Held by Director During the Past Five Years |
||||||||||||||||||
|
Independent Directors |
|||||||||||||||||||||||
|
Sandra Brown, 1955 |
Director |
2016 |
Consultant (since 2009). Formerly, CEO and President of Transamerica Financial Advisers, Inc. (1999-2009); President, Transamerica Securities Sales Corp. (1998-2009); Vice President, Bank of America Mutual Fund Administration (1990-1998). Director/Trustee of each FPA Fund (Bragg Capital Trust since 2020). |
7 |
None |
||||||||||||||||||
|
Robert F. Goldrich, 1962 |
Director |
2022 |
Former President/CFO of the Leon Levy Foundation. Director/Trustee of each FPA Fund (since 2022). |
7 |
Uluru, Inc (2015-2017) |
||||||||||||||||||
|
Mark L. Lipson, 1949 |
Director & Chairman |
2015 |
Managing Member, ML2 Advisors, LLC (since 2014). Formerly Managing Director, Bessemer Trust (2007-2014) and US Trust (2003-2006); Chairman and CEO of the Northstar Mutual Funds (1993-2001); and President and CEO of the National Mutual Funds (1988-1993). Director/Trustee of each FPA Fund (Bragg Capital Trust since 2020). |
7 |
None |
||||||||||||||||||
|
Alfred E. Osborne, Jr., 1944 |
Director |
1999 |
Formerly UCLA professor, retired effective July 2022. Dr. Osborne served at UCLA's John E. Anderson School of Management in several capacities for 50 years. He was formerly Senior Associate Dean, (July 2003-June 2022), Interim Dean (July 2018-June 2019), Professor (July 1972-June 2022) and Faculty Director, Price Center for Entrepreneurship and Innovation (July 1984-June 2022). Director/Trustee of each FPA Fund (Bragg Capital Trust since 2020). |
7 |
Kaiser Aluminum, Wedbush Capital and Waverley Capital Acquisition Corporation |
||||||||||||||||||
72
FPA NEW INCOME, INC.
DIRECTOR AND OFFICER INFORMATION (Continued)
(Unaudited)
|
Name, Address(1) and Year of Birth |
Position(s) Held with the Fund |
Year First Elected as Director of the Fund |
Principal Occupation(s) During the Past Five Years |
Number of FPA Funds Overseen by Director |
Other Directorships Held by Director During the Past Five Years |
||||||||||||||||||
|
"Interested" Director(2) |
|||||||||||||||||||||||
|
J. Richard Atwood, 1960 |
Director |
2016 |
Director and President of FPA GP, Inc., the General Partner of the Adviser (since 2018). Director/Trustee of each FPA Fund (Bragg Capital Trust since 2020). President of each FPA Fund (Bragg Capital Trust since 2020). Formerly, Managing Partner of FPA (2006-2018). |
7 |
None |
||||||||||||||||||
(1) The address of each Director is 11601 Wilshire Boulevard, Suite 1200, Los Angeles, California 90025.
(2) "Interested person" within the meaning of the 1940 Act by virtue of their affiliation with the Fund's Adviser.
73
FPA NEW INCOME, INC.
DIRECTOR AND OFFICER INFORMATION (Continued)
(Unaudited)
Officers of the Fund. Officers of the Fund are elected annually by the Board.
|
Name, Address(1) and Year of Birth |
Position with Fund |
Year First Elected as Officer of the Fund |
Principal Occupation(s) During the Past Five Years |
||||||||||||
|
Abhijeet Patwardhan, 1979 |
Vice President and Portfolio Manager |
2015 |
Partner (since 2017) and a Director of Research (since 2015) of FPA; Managing Director of FPA from 2015 to 2017, Senior Vice President of FPA from 2014 to 2015; Analyst and Vice President of FPA from 2010 to 2013. Vice President and Portfolio Manager of FPA Flexible Fixed Income Fund (since 2018). |
||||||||||||
|
J. Richard Atwood, 1960 |
President |
1997 |
Director and President of FPA GP, Inc., the General Partner of FPA (since 2018). Director/Trustee (except Bragg Capital Trust since 2020) and President (except Bragg Capital Trust since 2020) of each FPA Fund. Formerly, Managing Partner of FPA (2006-2018). |
||||||||||||
|
Karen E. Richards, 1969 |
Chief Compliance Officer |
2019 |
Chief Compliance Officer of FPA (since 2018); and Chief Compliance Officer of each FPA Fund (since 2019, except Bragg Capital Trust since 2020). Formerly, Deputy Chief Compliance Officer of First Republic Investment Management, LLC (from 2016 to 2018), and Vice President, Senior Compliance Officer of Pacific Investment Management Company (from 2010 to 2016). |
||||||||||||
|
E. Lake Setzler III, 1967 |
Treasurer |
2006 |
Managing Director and CFO (since 2022) of FPA; and Treasurer of each FPA Fund (except Bragg Capital Trust since 2020). Formerly, Senior Vice President and Controller of FPA. |
||||||||||||
|
Rebecca D. Gilding, 1979 |
Secretary |
2019 |
Vice President and Counsel, State Street Bank and Trust Company (since 2016); and Secretary of each FPA Fund (since 2019, except Bragg Capital Trust since 2020). Formerly, Assistant Vice President and Associate Counsel, Brown Brothers Harriman & Co. (2013 to 2016). |
||||||||||||
(1) The address for each Officer (except Ms. Gilding) is 11601 Wilshire Boulevard, Suite 1200, Los Angeles, California 90025. Ms. Gilding's address is State Street Bank and Trust Company, One Lincoln Street, Boston, Massachusetts 02111.
74
FPA NEW INCOME, INC.
(Unaudited)
INVESTMENT ADVISER
First Pacific Advisors, LP
11601 Wilshire Boulevard, Suite 1200
Los Angeles, CA 90025
TRANSFER & SHAREHOLDER SERVICE AGENT
UMB Fund Services, Inc.
P.O. Box 2175
Milwaukee, WI 53201-2175
or
235 West Galena Street
Milwaukee, WI 53212-3948
(800) 638-3060
CUSTODIAN AND ADMINISTRATOR
State Street Bank and Trust Company
One Lincoln Street
Boston, Massachusetts 02111
TICKER SYMBOL: FPNIX
CUSIP: 302544101
DISTRIBUTOR
UMB Distribution Services, LLC
235 West Galena Street
Milwaukee, Wisconsin 53212-3948
LEGAL COUNSEL
Dechert LLP
One Bush Street, Suite 1600
San Francisco, California 94104
INDEPENDENT REGISTERED PUBLIC ACCOUNTING FIRM
Ernst & Young LLP
725 South Figueroa Street
Los Angeles, California 90017
This report has been prepared for the information of shareholders of FPA NEW INCOME, INC., and is not authorized for distribution to prospective investors unless preceded or accompanied by an effective prospectus.
A description of the policies and procedures that the Adviser uses to vote proxies related to the Fund's portfolio securities is set forth in the Fund's Statement of Additional Information which is available without charge, upon request, on the Fund's website at www.fpa.com or by calling (800) 982-4372 and on the Securities and Exchange Commission's website at www.sec.gov.
The Fund's complete proxy voting record for the 12 months ended June 30, 2022 is available without charge, upon request by calling (800) 982-4372 and on the SEC's website at www.sec.gov.
The Fund's schedule of portfolio holdings, filed the first and third quarter of the Fund's fiscal year on Form N-PORT with the SEC, is available on the SEC's website at www.sec.gov.
Additional information about the Fund is available online at www.fpa.com. This information includes, among other things, holdings, top sectors, and performance, and is updated on or about the 15th business day after the end of each quarter.
| (b) | Not applicable. |
Item 2. Code of Ethics.
(a) The registrant has adopted a code of ethics that applies to the registrant’s principal executive and financial officers.
(b) Not applicable.
(c) During the period covered by this report, there were no amendments to the provisions of the code of ethics in 2(a) above.
(d) During the period covered by this report, there were not any implicit or explicit waivers to the provisions of the code of ethics adopted in 2(a).
(e) Not applicable.
(f) A copy of the registrant’s code of ethics is filed as an exhibit to this Form N-CSR.
Item 3. Audit Committee Financial Expert.
The registrant’s board of directors has determined that Sandra Brown, who is a member of the registrant’s audit committee and board of directors, is an “audit committee financial expert” and is “independent,” as those terms are defined in this Item. This designation will not increase the designee’s duties, obligations or liability as compared to her duties, obligations or liability as a member of the audit committee and of the board of directors. This designation does not affect the duties, obligations or liability of any other member of the audit committee or the board of directors.
Item 4. Principal Accountant Fees and Services.
| 2021 | 2022 | |||||||
| (a) Audit Fees | $ | 36,500 | $ | 38,325 | ||||
| (b) Audit Related Fees | $ | -0- | $ | -0- | ||||
| (c) Tax Fees(1) | $ | 6,800 | $ | 7,140 | ||||
| (d) All Other Fees | $ | -0- | $ | -0- | ||||
(1) Tax Fees are for the preparation of the Fund’s tax return(s).
| (e)(1) | The audit committee shall pre-approve all audit and permissible non-audit services that the committee considers compatible with maintaining the independent auditors’ independence. The pre-approval requirement will extend to all non-audit services provided to the registrant, the adviser, and any entity controlling, controlled by, or under common control with the adviser that provides ongoing services to the registrant, if the engagement relates directly to the operations and financial reporting of the registrant; provided, however, that an engagement of the registrant’s independent auditors to perform attest services for the registrant, the adviser or its affiliates required by generally accepted auditing standards to complete the examination of the registrant’s financial statements (such as an examination conducted in accordance with Statement on Standards for Attestation Engagements Number 16, or a Successor Statement, issued by the American Institute of Certified Public Accountants), will be deem pre-approved if: |
| (i) | the registrant’s independent auditors inform the audit committee of the engagement, |
| (ii) | the registrant’s independent auditors advise the audit committee at least annually that the performance of this engagement will not impair the independent auditor’s independence with respect to the registrant, and |
| (iii) | the audit committee receives a copy of the independent auditor’s report prepared in connection with such services. The committee may delegate to one or more committee members the authority to review and pre-approve audit and permissible non-audit services. Actions taken under any such delegation will be reported to the full committee at its next meeting. |
| (e)(2) | 0% of the services provided to the registrant described in paragraphs b—d of this Item were approved by the Audit Committee pursuant to paragraph (c)(7)(i)(C) of Rule 2-01 of Regulation S-X. There were no services provided to the investment adviser or any entity controlling, controlled by or under common control with the adviser described in paragraphs (b) — (d) of this Item that were required to be pre-approved by the audit committee. |
| (f) | For the fiscal year ended September 30, 2022, if greater than 50%, specify the percentage of hours spent on the audit of the registrant's financial statements for the most recent fiscal year that were attributed to work performed by persons who are not full-time, permanent employees of the principal accountant Ernst & Young LLP (“EY”). According to EY, such amount was below 50%; therefore disclosure item not applicable to this filing. |
| (g) | For the fiscal years ended September 30, 2021 and September 30, 2022, the aggregate non-audit fees billed by EY for services rendered to the investment advisor were $46,200 and $41,932 respectively. |
| (h) | The registrant's Audit Committee has considered whether the provision of non-audit services that were rendered to the registrant's investment advisor, which were not pre-approved (not requiring pre-approval), is compatible with maintaining EY's independence. |
| (i) | Not applicable. |
| (j) | Not applicable. |
Item 5. Audit Committee of Listed Registrants.
Not applicable to this semi-annual report.
Item 6. Investments.
| (a) | Schedule of Investments is included as a part of the report to shareholders filed under Item 1 of this Form N-CSR. |
| (b) | Not applicable. |
Item 7. Disclosure of Proxy Voting Policies and Procedures for Closed-End Management Investment Companies.
Not applicable.
Item 8. Portfolio Managers of Closed-End Management Investment Companies.
Not applicable.
Item 9. Purchases of Equity Securities by Closed-End Management Investment Company and Affiliated Purchasers.
Not applicable.
Item 10. Submission of Matters to a Vote of Security Holders.
There have been no material changes to the procedures by which the shareholders may recommend nominees to the registrant’s board of directors.
Item 11. Controls and Procedures.
| (a) | The principal executive officer and principal financial officer of the registrant have concluded that the registrant’s disclosure controls and procedures (as defined in Rule 30a-3(c) under the Investment Company Act of 1940) are effective based on their evaluation of the disclosure controls and procedures as of a date within 90 days of the filing date of this report. |
| (b) | There have been no significant changes in the registrant’s internal controls over financial reporting (as defined in Rule 30a-3(d) under the Investment Company Act of 1940) that occurred during the period covered by this report that have materially affected, or is reasonably likely to materially affect, the registrant’s internal controls over financial reporting. |
Item 12. Disclosure of Securities Lending Activities for Closed-End Management Investment Companies
Not applicable.
Item 13. Exhibits.
| (a)(1) | Code of ethics as applies to the registrant’s principal executive and financial officers is attached hereto. |
| (a)(2) | The certifications required by Rule 30a-2(a) under the Investment Company Act of 1940 are attached hereto. |
| (a)(3) | Not applicable. |
| (a)(4) | Not applicable. |
| (b) | The certifications required by Rule 30a-2(b) under the Investment Company Act of 1940 and Section 906 of the Sarbanes-Oxley Act of 2002 are attached hereto. |
SIGNATURES
Pursuant to the requirements of the Securities Exchange Act of 1934 and the Investment Company Act of 1940, the registrant has duly caused this report to be signed on its behalf by the undersigned, thereunto duly authorized.
| FPA NEW INCOME, INC. | ||
| By: | /s/ J. Richard Atwood | |
| J. Richard Atwood | ||
| President (principal executive officer) | ||
Date: December 6, 2022
Pursuant to the requirements of the Securities Exchange Act of 1934 and the Investment Company Act of 1940, this report has been signed below by the following persons on behalf of the registrant and in the capacities and on the dates indicated.
| By: | /s/ J. Richard Atwood | |
| J. Richard Atwood | ||
| President (principal executive officer) |
Date: December 6, 2022
| By: | /s/ E. Lake Setzler III | |
| E. Lake Setzler III | ||
| Treasurer (principal financial officer) |
Date: December 6, 2022
Exhibit 99.CODEETH
FPA Funds
Code
Of Ethics For Principal Executive And
Senior Financial Officers
February 8, 2021
I. Covered Officers / Purpose of the Code
This Code of Ethics (the “Code”) shall apply to the Principal Executive Officer and Principal Financial Officer (the “Covered Officers,” each of whom is named in Exhibit A attached hereto, as it may be amended from time to time to cover other officers performing similar functions) of FPA Funds Trust, with respect to its series, FPA Crescent Fund and FPA Flexible Fixed Income Fund, FPA New Income, Inc., FPA U.S. Core Equity Fund, Inc. (formerly, FPA U.S. Value Fund, Inc. and prior to that, FPA Perennial Fund, Inc.), Bragg Capital Trust, with respect to its series, FPA Queens Road Value Fund and FPA Queens Road Small Cap Value Fund, and Source Capital, Inc. (each a “Fund” and collectively, the “Funds”), consistent with and in furtherance of their fiduciary duties, and for the purpose of promoting:
| · | honest and ethical conduct, including the ethical handling of actual or apparent conflicts of interest between personal and professional relationships; |
| · | full, fair, accurate, timely and understandable disclosure in reports and documents that a registrant files with, or submits to, the Securities and Exchange Commission (“SEC”) and in other public communications made by the Company; |
| · | compliance with applicable laws and governmental rules and regulations; |
| · | the prompt internal reporting of violations of the Code to an appropriate person or persons identified in the Code; and |
| · | accountability for adherence to the Code. |
Each Covered Officer should adhere to a high standard of business ethics and should be sensitive to situations that may give rise to actual as well as apparent conflicts of interest.
| II. | Covered Officers Should Handle Ethically Actual and Apparent Conflicts of Interest |
Overview. A “conflict of interest” occurs when a Covered Officer’s private interest interferes with the interests of, or his service to, the Funds. For example, a conflict of interest would arise if a Covered Officer, or a member of his family, receives improper personal benefits as a result of his position with the Funds.
Certain conflicts of interest arise out of the relationships between Covered Officers and the Funds and already are subject to conflict of interest provisions in the Investment Company Act of 1940 (“Investment Company Act”) and the Investment Advisers Act of 1940 (“Investment Advisers Act”). For example, Covered Officers may not individually engage in certain transactions (such as the purchase or sale of securities or other property) with the Funds because of their status as “affiliated persons” of the Funds. The Funds’ and the investment adviser’s compliance programs and procedures are designed to prevent, or identify and correct, violations of these provisions. This Code does not, and is not intended to, repeat or replace these programs and procedures, and such conflicts fall outside of the parameters of this Code.
Although typically not presenting an opportunity for improper personal benefit, conflicts arise from, or as a result of, the contractual relationship between the Funds and the investment adviser of which the Covered Officers are also officers or employees. As a result, this Code recognizes that the Covered Officers will, in the normal course of their duties (whether formally for the Funds or for the adviser, or for both), be involved in establishing policies and implementing decisions that will have different effects on the adviser and the Funds. The participation of the Covered Officers in such activities is inherent in the contractual relationship between the Funds and the adviser and is consistent with the performance by the Covered Officers of their duties as officers of the Funds. Thus, if performed in conformity with the provisions of the Investment Company Act and the Investment Advisers Act, such activities will be deemed to have been handled ethically.
Other conflicts of interest are covered by the Code, even if such conflicts of interest are not subject to provisions in the Investment Company Act and the Investment Advisers Act. The following list provides examples of conflicts of interest under the Code, but Covered Officers should keep in mind that these examples are not exhaustive. The overarching principle is that the personal interest of a Covered Officer should not be placed improperly before the interest of the Funds.
Each Covered Officer must:
| · | not use his personal influence or personal relationships improperly to influence investment decisions or financial reporting by the Funds whereby the Covered Officer would benefit personally to the detriment of the Funds; |
| · | not cause the Funds to take action, or fail to take action, for the individual personal benefit of the Covered Officer rather than the benefit the Funds; |
| · | not use material non-public knowledge of portfolio transactions made or contemplated for the Funds to trade personally or cause others to trade personally in contemplation of the market effect of such transactions; |
Each Covered Officer must discuss certain material conflict of interest situations with the relevant FPA Fund’s Audit Committee. Examples of such situations include:
| · | service as a director on the board of a public company; |
| · | accepting directly or indirectly gifts and entertainment from individuals conducting or seeking to conduct business with the Funds or the Funds’ investment adviser as set forth in the adviser’s Business Gifts and Entertainment Policy and Procedures. For example, under the adviser’s policy and procedures, Covered Officers may accept gifts from a single giver in aggregate amounts not exceeding $100 per year, and may attend business meals and other entertainment events at the expense of a giver as long as such entertainment is business related, the expense is reasonable and both the giver(s) and the Covered Officer(s) are present, and not so frequent as to raise any question of impropriety; |
| · | any ownership interest in, or any consulting or employment relationship with, any of the Funds’ service providers, other than its investment adviser, principal underwriter, administrator or any affiliated person thereof; |
| · | a direct or indirect financial interest in commissions, transaction charges or spreads paid by the Funds for effecting portfolio transactions or for selling or redeeming shares other than an interest arising from the Covered Officer’s employment, such as compensation or equity ownership. |
| III. | Disclosure and Compliance |
| · | Each Covered Officer should familiarize himself with the disclosure requirements generally applicable to the Funds; |
| · | each Covered Officer should not knowingly misrepresent, or cause others to misrepresent, facts about the Funds to others, whether within or outside the Funds, including to the Funds’ directors and auditors, and to governmental regulators and self-regulatory organizations; |
| · | each Covered Officer should, to the extent appropriate within his area of responsibility, consult with other officers and employees of the Funds and the adviser with the goal of promoting full, fair, accurate, timely and understandable disclosure in the reports and documents the Funds file with, or submit to, the SEC and in other public communications made by the Funds; and |
| · | it is the responsibility of each Covered Officer to promote compliance with the standards and restrictions imposed by applicable laws, rules and regulations. |
| IV. | Reporting and Accountability |
Each Covered Officer must:
| · | upon adoption of the Code (or thereafter as applicable, upon becoming a Covered Officer), affirm in writing to the Board that he has received, read, and understands the Code; |
| · | annually thereafter affirm to the Board that he has complied with the requirements of the Code; |
| · | not retaliate against any other Covered Officer or any employee of the Funds or their affiliated persons for reports of potential violations that are made in good faith; and |
| · | notify the Audit Committee promptly if he knows of any violation of this Code. Failure to do so is itself a violation of this Code. |
The Audit Committee is responsible for applying this Code to specific situations in which questions are presented under it and has the authority to interpret this Code in any particular situation.
The Funds will follow these procedures in investigating and enforcing this Code:
| · | the Audit Committee and/or its designated representative(s) will take all appropriate action to investigate any reported potential violations ; |
| · | if the Audit Committee determines that a violation has occurred, it will inform and make a recommendation to the Board, which will consider appropriate action, which may include review of, and appropriate modifications to, applicable policies and procedures; a reprimand; a suspension; or a recommendation to dismiss the Covered Officer; |
| · | the Audit Committee will be responsible for granting waivers, as appropriate; and |
| · | any changes to or waivers of this Code will, to the extent required, be disclosed as provided by SEC rules. |
| V. | Other Policies and Procedures |
This Code shall be the sole code of ethics adopted by the Funds for purposes of Section 406 of the Sarbanes-Oxley Act and the rules and forms applicable to registered investment companies thereunder. Insofar as other policies or procedures of the Funds, the Funds’ adviser, principal underwriter, or other service providers govern or purport to govern the behavior or activities of the Covered Officers who are subject to this Code, they are superseded by this Code to the extent that they overlap or conflict with the provisions of this Code. The Funds’ and their investment adviser’s Code of ethics under Rule 17j-1 under the Investment Company Act are separate requirements applying to the Covered Officers and others, and are not part of this Code.
| VI. | Amendments |
Any amendments to this Code, other than amendments to Exhibit A, must be approved or ratified by a majority vote of the Board, including a majority of independent directors.
| VII. | Confidentiality |
All reports and records prepared or maintained pursuant to this Code will be considered confidential and shall be maintained and protected accordingly. Except as otherwise required by law or this Code, such matters shall not be disclosed to anyone other than the Funds’ Board, its counsel, and FPA’s Management Committee.
| VIII. | Internal Use |
The Code is intended solely for the internal use by the Funds and does not constitute an admission, by or on behalf of any Fund, as to any fact, circumstance, or legal conclusion.
| Adopted: | December 31, 2013 |
| Amended: | June 3, 2015 |
| Amended: | February 8, 2021 |
Exhibit A
COVERED OFFICERS
J. Richard Atwood (Principal Executive Officer)
E. Lake Setzler, III (Principal Financial Officer)
EXHIBIT B
Initial Certification Form
By signing below, I certify that I have received, read, understood, abided by, and will continue to abide by FPA Funds Code of Ethics for Principal Executive and Senior Financial Officers dated [ ], and that I recognize that I am subject to the provisions thereof and will comply with the policy and procedures stated therein.
Print Name:
Signature:
Date:
EXHIBIT C
Annual Certification Form
By signing below, I certify that I have received, read, understood, abided by, and will continue to abide by FPA Funds Code of Ethics for Principal Executive and Senior Financial Officers dated [ ] (the “Code”), and that I recognize that I am subject to the provisions thereof and will comply with the policy and procedures stated therein.
This is to further certify that I have complied with the requirements of the Code during the period of through .
Print Name:
Signature:
Date:
Exhibit 99.CERT
I, J. Richard Atwood, President of FPA New Income, Inc., certify that:
| 1. | I have reviewed this report on Form N-CSR of FPA New Income, Inc.; |
| 2. | Based on my knowledge, this report does not contain any untrue statement of a material fact or omit to state a material fact necessary to make the statements made, in light of the circumstances under which such statements were made, not misleading with respect to the period covered by this report; |
| 3. | Based on my knowledge, the financial statements, and other financial information included in this report, fairly present in all material respects the financial condition, results of operations, changes in net assets, and cash flows (if the financial statements are required to include a statement of cash flows) of the registrant as of, and for, the periods presented in this report; |
| 4. | The registrant’s other certifying officer and I are responsible for establishing and maintaining disclosure controls and procedures (as defined in Rule 30a-3(c) under the Investment Company Act of 1940) and internal control over financial reporting (as defined in Rule 30a-3(d) under the Investment Company Act of 1940) for the registrant and have: |
| (a) | Designed such disclosure controls and procedures, or caused such disclosure controls and procedures to be designed under our supervision, to ensure that material information relating to the registrant, including its consolidated subsidiaries, is made known to us by others within those entities, particularly during the period in which this report is being prepared; |
| (b) | Designed such internal control over financial reporting, or caused such internal control over financial reporting to be designed under our supervision, to provide reasonable assurance regarding the reliability of financial reporting and the preparation of financial statements for external purposes in accordance with generally accepted accounting principles; |
| (c) | Evaluated the effectiveness of the registrant’s disclosure controls and procedures and presented in this report our conclusions about the effectiveness of the disclosure controls and procedures, as of a date within 90 days prior to the filing date of this report based on such evaluation; and |
| (d) | Disclosed in this report any change in the registrant's internal control over financial reporting that occurred during the period covered by this report that has materially affected, or is reasonably likely to materially affect, the registrant's internal control over financial reporting; and |
| 5. | The registrant’s other certifying officer and I have disclosed to the registrant’s auditors and the audit committee of the registrant’s board of directors (or persons performing the equivalent functions): |
| (a) | All significant deficiencies and material weaknesses in the design or operation of internal control over financial reporting which are reasonably likely to adversely affect the registrant’s ability to record, process, summarize, and report financial information; and |
| (b) | Any fraud, whether or not material, that involves management or other employees who have a significant role in the registrant’s internal control over financial reporting. |
Date: December 6, 2022
| By: | /s/ J. Richard Atwood | |
| J. Richard Atwood | ||
| President (principal executive officer) |
I, E. Lake Setzler III, Treasurer of FPA New Income, Inc., certify that:
| 1. | I have reviewed this report on Form N-CSR of FPA New Income, Inc.; |
| 2. | Based on my knowledge, this report does not contain any untrue statement of a material fact or omit to state a material fact necessary to make the statements made, in light of the circumstances under which such statements were made, not misleading with respect to the period covered by this report; |
| 3. | Based on my knowledge, the financial statements, and other financial information included in this report, fairly present in all material respects the financial condition, results of operations, changes in net assets, and cash flows (if the financial statements are required to include a statement of cash flows) of the registrant as of, and for, the periods presented in this report; |
| 4. | The registrant’s other certifying officer and I are responsible for establishing and maintaining disclosure controls and procedures (as defined in Rule 30a-3(c) under the Investment Company Act of 1940) and internal control over financial reporting (as defined in Rule 30a-3(d) under the Investment Company Act of 1940) for the registrant and have: |
| (a) | Designed such disclosure controls and procedures, or caused such disclosure controls and procedures to be designed under our supervision, to ensure that material information relating to the registrant, including its consolidated subsidiaries, is made known to us by others within those entities, particularly during the period in which this report is being prepared; |
| (b) | Designed such internal control over financial reporting, or caused such internal control over financial reporting to be designed under our supervision, to provide reasonable assurance regarding the reliability of financial reporting and the preparation of financial statements for external purposes in accordance with generally accepted accounting principles; |
| (c) | Evaluated the effectiveness of the registrant’s disclosure controls and procedures and presented in this report our conclusions about the effectiveness of the disclosure controls and procedures, as of a date within 90 days prior to the filing date of this report based on such evaluation; and |
| (d) | Disclosed in this report any change in the registrant's internal control over financial reporting that occurred during the period covered by this report that has materially affected, or is reasonably likely to materially affect, the registrant's internal control over financial reporting; and |
| 5. | The registrant’s other certifying officer and I have disclosed to the registrant’s auditors and the audit committee of the registrant’s board of directors (or persons performing the equivalent functions): |
| (a) | All significant deficiencies and material weaknesses in the design or operation of internal control over financial reporting which are reasonably likely to adversely affect the registrant’s ability to record, process, summarize, and report financial information; and |
| (b) | Any fraud, whether or not material, that involves management or other employees who have a significant role in the registrant’s internal control over financial reporting. |
Date: December 6, 2022
| By: | /s/ E. Lake Setzler III | |
| E. Lake Setzler III | ||
| Treasurer (principal financial officer) | ||
Exhibit 99.906 CERT
Pursuant to Section 906 of the Sarbanes-Oxley Act of 2002 (subsections (a) and (b) of section 1350, chapter 63 of title 18, United States Code) I, J. Richard Atwood, President of FPA New Income, Inc., (the “Fund”), do hereby certify, to my knowledge, that:
| 1. | The Form N-CSR of the Fund for the period ended September 30, 2022 (the “Report”) fully complies with the requirements of Section 13(a) or 15(d) of the Securities Exchange Act of 1934; and |
| 2. | The information contained in the Report fairly presents, in all material respects, the financial condition and results of operations of the Fund. |
| By: | /s/ J. Richard Atwood | |
| J. Richard Atwood | ||
| President (principal executive officer) |
Date: December 6, 2022
Pursuant to Section 906 of the Sarbanes-Oxley Act of 2002 (subsections (a) and (b) of section 1350, chapter 63 of title 18, United States Code) I, E. Lake Setzler III, Treasurer of FPA New Income, Inc., (the “Fund”), do hereby certify, to my knowledge, that:
| 1. | The Form N-CSR of the Fund for the period ended September 30, 2022 (the “Report”) fully complies with the requirements of Section 13(a) or 15(d) of the Securities Exchange Act of 1934; and |
| 2. | The information contained in the Report fairly presents, in all material respects, the financial condition and results of operations of the Fund. |
| By: | /s/ E. Lake Setzler III | |
| E. Lake Setzler III | ||
| Treasurer (principal financial officer) |
Date: December 6, 2022
A signed original of this written statement required by Section 906 has been provided by the Fund and will be retained by the Fund and furnished to the Securities and Exchange Commission or its staff upon request.