Semiannual Report
April 30, 2025
MFS® Multimarket
Income Trust
Income Trust

MMT-SEM
UNITED STATES
SECURITIES AND EXCHANGE COMMISSION Washington, D.C. 20549
FORM N-CSR
CERTIFIED SHAREHOLDER REPORT OF REGISTERED MANAGEMENT INVESTMENT COMPANIES
Investment Company Act file number 811-04975
MFS MULTIMARKET INCOME TRUST
(Exact name of registrant as specified in charter)
111 Huntington Avenue, Boston, Massachusetts 02199 (Address of principal executive offices) (Zip code)
Christopher R. Bohane
Massachusetts Financial Services Company
111Huntington Avenue Boston, Massachusetts 02199
(Name and address of agents for service)
Registrant’s telephone number, including area code: (617) 954-5000
Date of fiscal year end: October 31
Date of reporting period: April 30, 2025
ITEM 1. REPORTS TO STOCKHOLDERS.
Item 1(a):
| 1 | |
| 4 | |
| 5 | |
| 6 | |
| 40 | |
| 42 | |
| 44 | |
| 45 | |
| 46 | |
| 48 | |
| 63 | |
| 64 | |
| 64 | |
| 64 | |
| 64 |
| back cover |
| AAA | 4.5% |
| AA | 3.8% |
| A | 16.0% |
| BBB | 31.2% |
| BB | 36.3% |
| B | 26.3% |
| CCC | 7.8% |
| CC | 0.5% |
| C (o) | 0.0% |
| U.S. Government | 5.3% |
| Not Rated | (21.3)% |
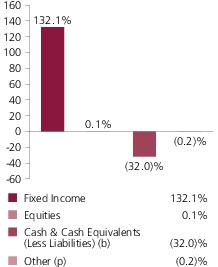
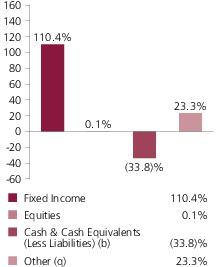
| Non-Fixed Income | 0.1% |
| Cash & Cash Equivalents (Less Liabilities) (b) | (33.8)% |
| Other (q) | 23.3% |
| (a) | For all securities other than those specifically described below, ratings are assigned to underlying securities utilizing ratings from Moody’s, Fitch, and Standard & Poor’s rating agencies and applying the following hierarchy: If all three agencies provide a rating, the middle rating (after dropping the highest and lowest ratings) is assigned; if two of the three agencies rate a security, the lower of the two is assigned. If none of the 3 rating agencies above assign a rating, but the security is rated by DBRS Morningstar, then the DBRS Morningstar rating is assigned. If none of the 4 rating agencies listed above rate the security, but the security is rated by the Kroll Bond Rating Agency (KBRA), then the KBRA rating is assigned. Ratings are shown in the S&P and Fitch scale (e.g., AAA). Securities rated BBB or higher are considered investment grade. All ratings are subject to change. U.S. Government includes securities issued by the U.S. Department of the Treasury. Not Rated includes fixed income securities and fixed income derivatives that have not been rated by any rating agency. |
| (b) | Cash & Cash Equivalents (Less Liabilities) includes any cash, investments in money market funds, short-term securities, and other assets less liabilities. Liabilities include the value of outstanding borrowings made by the fund for leverage transactions. Cash & Cash Equivalents (Less Liabilities) is negative due to these borrowings. Please see the Statement of Assets and Liabilities for additional information related to the fund’s cash position and other assets and liabilities. Please see Note 6 in the Notes to Financial Statements for more information on the fund's outstanding borrowings. |
| (d) | Duration is a measure of how much a bond’s price is likely to fluctuate with general changes in interest rates, e.g., if rates rise 1.00%, a bond with a 5-year duration is likely to lose about 5.00% of its value due to the interest rate move. The Average Duration calculation reflects the impact of the equivalent exposure of derivative positions, if any. |
| (i) | For purposes of this presentation, the components include the value of securities, and reflect the impact of the equivalent exposure of derivative positions, if any. These amounts may be negative from time to time. Equivalent exposure is a calculated amount that translates the derivative position into a reasonable approximation of the amount of the underlying asset that the portfolio would have to hold at a given point in time to have the same price sensitivity that results from the portfolio’s ownership of the derivative contract. When dealing with derivatives, equivalent exposure is a more representative measure of the potential impact of a position on portfolio performance than value. The bond component will include any accrued interest amounts. |
| (m) | In determining each instrument’s effective maturity for purposes of calculating the fund’s dollar-weighted average effective maturity, MFS uses the instrument’s stated maturity or, if applicable, an earlier date on which MFS believes it is probable that a maturity-shortening feature (such as a put, pre-refunding or prepayment) will cause the instrument to be repaid. Such an earlier date can be substantially shorter than the instrument’s stated maturity. |
| (o) | Less than 0.1%. |
| (p) | For purposes of the presentation of Portfolio structure at value, Other includes market value from currency derivatives and may be negative. |
| (q) | For purposes of this presentation, Other includes equivalent exposure from currency derivatives and/or any offsets to derivative positions and may be negative. |
| (v) | For purposes of this presentation, market value of fixed income and/or equity derivatives, if any, is included in Cash & Cash Equivalents (Less Liabilities). |
| Portfolio Manager | Primary Role | Since | Title and Five Year History |
| Robert Spector | Lead Portfolio Manager | 2017 | Investment Officer of MFS; employed in the investment management area of MFS since 2011. |
| Neeraj Arora | Emerging Markets Debt Instruments Portfolio Manager | 2023 | Investment Officer of MFS; employed in the investment management area of MFS since 2011. |
| Ward Brown | Emerging Markets Debt Instruments Portfolio Manager | 2012 | Investment Officer of MFS; employed in the investment management area of MFS since 2005. |
| David Cole | Below Investment Grade Debt Instruments Portfolio Manager | 2006 | Investment Officer of MFS; employed in the investment management area of MFS since 2004. |
| Pilar Gomez-Bravo | Debt Instruments Portfolio Manager | 2013 | Co-Chief Investment Officer-Global Fixed Income of MFS; employed in the investment management area of MFS since 2013. |
| Andy Li | Investment Grade Debt Instruments Portfolio Manager | 2019 | Investment Officer of MFS; employed in the investment management area of MFS since 2018. |
| John Mitchell | Investment Grade Debt Instruments Portfolio Manager | 2023 | Investment Officer of MFS; employed in the investment management area of MFS since 2003. |
| Michael Skatrud | Below Investment Grade Debt Instruments Portfolio Manager | 2018 | Investment Officer of MFS; employed in the investment management area of MFS since 2013. |
| Issuer | Shares/Par | Value ($) | ||
| Bonds – 132.1% | ||||
| Aerospace & Defense – 2.5% | ||||
| Axon Enterprise, Inc., 6.125%, 3/15/2030 (n) | $ | 494,000 | $502,597 | |
| Boeing Co., 6.388%, 5/01/2031 | 134,000 | 142,987 | ||
| Boeing Co., 5.805%, 5/01/2050 | 1,213,000 | 1,136,961 | ||
| Bombardier, Inc., 7.5%, 2/01/2029 (n) | 314,000 | 323,449 | ||
| Bombardier, Inc., 8.75%, 11/15/2030 (n) | 238,000 | 255,020 | ||
| Bombardier, Inc., 7.25%, 7/01/2031 (n) | 252,000 | 258,011 | ||
| Bombardier, Inc., 7%, 6/01/2032 (n) | 253,000 | 255,968 | ||
| F-Brasile S.p.A./F-Brasile U.S. LLC, 7.375%, 8/15/2026 (n) | 405,000 | 404,028 | ||
| Huntington Ingalls Industries, Inc., 4.2%, 5/01/2030 | 230,000 | 221,965 | ||
| Huntington Ingalls Industries, Inc., 5.749%, 1/15/2035 | 286,000 | 291,429 | ||
| Moog, Inc., 4.25%, 12/15/2027 (n) | 459,000 | 442,775 | ||
| TransDigm, Inc., 5.5%, 11/15/2027 | 464,000 | 461,791 | ||
| TransDigm, Inc., 6.75%, 8/15/2028 (n) | 309,000 | 315,209 | ||
| TransDigm, Inc., 4.625%, 1/15/2029 | 554,000 | 532,855 | ||
| TransDigm, Inc., 6.375%, 3/01/2029 (n) | 302,000 | 307,651 | ||
| TransDigm, Inc., 6.875%, 12/15/2030 (n) | 861,000 | 887,134 | ||
| $6,739,830 | ||||
| Apparel Manufacturers – 0.2% | ||||
| LVMH Moet Hennessy Louis Vuitton SE, 2.625%, 3/07/2029 (w) | EUR | 400,000 | $453,100 | |
| Asset-Backed & Securitized – 3.9% | ||||
| 3650R Commercial Mortgage Trust, 2021-PF1, “XA”, 1.113%, 11/15/2054 (i) | $ | 3,666,126 | $147,184 | |
| AA Bond Co. Ltd., 6.85%, 7/31/2050 | GBP | 220,000 | 300,824 | |
| AmeriCredit Automobile Receivables Trust, 2024-1, “A”, 5.61%, 1/12/2027 (n) | $ | 1,990 | 1,991 | |
| Angel Oak Mortgage Trust, 2024-13, “A1”, 5.464%, 12/26/2069 (n) | 301,010 | 300,938 | ||
| Arbor Realty Trust, Inc., CLO, 2022-FL1, “D”, FLR, 7.345% (SOFR - 30 day + 3%), 1/15/2037 (n) | 600,000 | 599,399 | ||
| AREIT 2022-CRE6 Trust, “D”, FLR, 7.2% (SOFR - 30 day + 2.85%), 1/20/2037 (n) | 126,000 | 125,419 | ||
| ARI Fleet Lease Trust, 2023-B, “A2”, 6.05%, 7/15/2032 (n) | 60,775 | 61,252 | ||
| Bain Capital Credit CLO Ltd., 2021-7A, “BR”, FLR, 5.772% (SOFR - 3mo. + 1.5%), 1/22/2035 (n) | 390,025 | 384,819 | ||
| Bayview Financial Revolving Mortgage Loan Trust, FLR, 6.034% ((SOFR - 1mo. + 0.11448%) + 1.6%), 12/28/2040 (n) | 223,448 | 435,218 | ||
| Issuer | Shares/Par | Value ($) | ||
| Bonds – continued | ||||
| Asset-Backed & Securitized – continued | ||||
| BBCMS Mortgage Trust, 2020-C7, “XA”, 1.711%, 4/15/2053 (i) | $ | 955,945 | $48,120 | |
| BBCMS Mortgage Trust, 2021-C10, “XA”, 1.334%, 7/15/2054 (i) | 918,577 | 49,975 | ||
| BBCMS Mortgage Trust, 2021-C9, “XA”, 1.704%, 2/15/2054 (i) | 6,411,165 | 447,351 | ||
| Benchmark 2021-B23 Mortgage Trust, “XA”, 1.363%, 2/15/2054 (i) | 3,996,067 | 207,462 | ||
| Benchmark 2021-B24 Mortgage Trust, “XA”, 1.254%, 3/15/2054 (i) | 2,028,680 | 89,303 | ||
| Benchmark 2021-B26 Mortgage Trust, “XA”, 0.994%, 6/15/2054 (i) | 7,085,503 | 255,283 | ||
| Benchmark 2021-B27 Mortgage Trust, “XA”, 1.35%, 7/15/2054 (i) | 6,933,296 | 376,865 | ||
| Benchmark 2022-B36 Mortgage Trust, “XA”, 0.809%, 7/15/2055 (i) | 8,708,503 | 367,833 | ||
| BSPRT 2021-FL7 Issuer Ltd., “C”, FLR, 6.736% ((SOFR - 1mo. + 0.11448%) + 2.3%), 12/15/2038 (n) | 100,000 | 98,966 | ||
| Business Jet Securities LLC, 2024-1A, “B”, 6.924%, 5/15/2039 (n) | 85,093 | 86,153 | ||
| Business Jet Securities LLC, 2024-2A, “A”, 5.364%, 9/15/2039 (n) | 144,545 | 143,540 | ||
| CF Hippolyta Issuer LLC, 2020-1, “B1”, 2.28%, 7/15/2060 (n) | 89,945 | 88,552 | ||
| Chesapeake Funding II LLC, 2023-1A, “A1”, 5.65%, 5/15/2035 (n) | 99,305 | 99,879 | ||
| Colt Funding LLC, 2024-1, “A2”, 5.987%, 2/25/2069 (n) | 100,549 | 100,738 | ||
| Colt Funding LLC, 2024-6, “A1”, 5.39%, 11/25/2069 (n) | 252,796 | 253,258 | ||
| Commercial Mortgage Pass-Through Certificates, 2021-BN32, “XA”, 0.872%, 4/15/2054 (i) | 3,591,613 | 116,593 | ||
| Crest Ltd., CDO, 7% (0.001% Cash or 7% PIK), 1/28/2040 (a)(p) | 4,586,320 | 46 | ||
| ELM Trust, 2024-ELM, “D10”, 6.626%, 6/10/2039 (n) | 100,000 | 100,615 | ||
| Enterprise Fleet Financing 2024-3 LLC, “A2”, 5.31%, 4/20/2027 (n) | 94,843 | 95,157 | ||
| EQT Trust, 2024-EXTR, “B”, 5.654%, 7/05/2041 (n) | 169,941 | 172,068 | ||
| LoanCore 2021-CRE5 Ltd., “B”, FLR, 6.436% ((SOFR - 1mo. + 0.11448%) + 2.0%), 7/15/2036 (n) | 464,500 | 462,367 | ||
| LoanCore 2025-CRE8 Ltd., “B”, FLR, 6.169% (SOFR - 1mo. + 1.8412%), 8/17/2042 (n) | 300,000 | 294,742 | ||
| M&T Bank Auto Receivables Trust, 2025-1, “A-2A”, 4.63%, 5/15/2028 (n) | 176,000 | 176,158 | ||
| Issuer | Shares/Par | Value ($) | ||
| Bonds – continued | ||||
| Asset-Backed & Securitized – continued | ||||
| MF1 2021-FL5 Ltd., “C”, FLR, 6.142% ((SOFR - 1mo. + 0.11448%) + 1.7%), 7/15/2036 (n) | $ | 401,500 | $399,928 | |
| MF1 2021-FL5 Ltd., “D”, FLR, 6.943% ((SOFR - 1mo. + 0.11448%) + 2.5%), 7/15/2036 (n) | 745,000 | 741,833 | ||
| MF1 2021-FL6 Ltd., “B”, FLR, 6.084% ((SOFR - 1mo. + 0.11448%) + 1.65%), 7/16/2036 (n) | 1,000,000 | 981,261 | ||
| MF1 2024-FL14 LLC, “A”, FLR, 6.056% (SOFR - 1mo. + 1.737%), 3/19/2039 (n) | 200,000 | 200,208 | ||
| MF1 2024-FL14 LLC, “AS”, FLR, 6.56% (SOFR - 1mo. + 2.24%), 3/19/2039 (n) | 100,000 | 100,124 | ||
| MF1 2024-FL14 LLC, “B”, FLR, 7.009% (SOFR - 1mo. + 2.689%), 3/19/2039 (n) | 328,594 | 329,334 | ||
| Morgan Stanley Capital I Trust, 2021-L5, “XA”, 1.402%, 5/15/2054 (i) | 1,805,830 | 92,585 | ||
| Morgan Stanley Capital I Trust, 2021-L6, “XA”, 1.288%, 6/15/2054 (i) | 2,656,390 | 119,919 | ||
| Navistar Financial Dealer Note Master Owner Trust, 2023-1, “A”, 6.18%, 8/25/2028 (n) | 239,000 | 239,950 | ||
| Navistar Financial Dealer Note Master Owner Trust, 2023-1, “B”, 6.48%, 8/25/2028 (n) | 56,000 | 56,222 | ||
| OBX Trust, 2024-NQM1, “A1”, 5.928%, 11/25/2063 (n) | 91,086 | 91,392 | ||
| OBX Trust, 2024-NQM1, “A2”, 6.253%, 11/25/2063 (n) | 75,802 | 76,157 | ||
| TPG Real Estate Finance, 2021-FL4, “B”, FLR, 6.292% ((SOFR - 1mo. + 0.11448%) + 1.85%), 3/15/2038 (n) | 340,000 | 338,467 | ||
| Wells Fargo Commercial Mortgage Trust, 2021-C59, “XA”, 1.628%, 4/15/2054 (i) | 2,268,927 | 145,038 | ||
| Wells Fargo Commercial Mortgage Trust, 2021-C60, “XA”, 1.619%, 8/15/2054 (i) | 1,926,535 | 130,069 | ||
| $10,530,555 | ||||
| Automotive – 1.3% | ||||
| Adient Global Holdings Ltd., 7.5%, 2/15/2033 (n) | $ | 248,000 | $234,999 | |
| Allison Transmission, Inc., 3.75%, 1/30/2031 (n) | 906,000 | 813,939 | ||
| Dealer Tire LLC/DT Issuer LLC, 8%, 2/01/2028 (n) | 404,000 | 391,913 | ||
| Dornoch Debt Merger Sub, Inc., 6.625%, 10/15/2029 (n) | 555,000 | 383,548 | ||
| Ford Motor Co., 6.1%, 8/19/2032 | 65,000 | 62,344 | ||
| Ford Motor Credit Co. LLC, 6.95%, 6/10/2026 | 281,000 | 283,947 | ||
| Ford Motor Credit Co. LLC, 5.8%, 3/08/2029 | 400,000 | 392,721 | ||
| Hyundai Capital America, 6.375%, 4/08/2030 (n) | 228,000 | 238,381 | ||
| Real Hero Merger Sub 2, Inc., 6.25%, 2/01/2029 (n) | 422,000 | 314,818 | ||
| Wabash National Corp., 4.5%, 10/15/2028 (n) | 543,000 | 457,280 | ||
| $3,573,890 | ||||
| Issuer | Shares/Par | Value ($) | ||
| Bonds – continued | ||||
| Broadcasting – 1.3% | ||||
| Banijay Group S.A.S., 8.125%, 5/01/2029 (n) | $ | 600,000 | $614,883 | |
| Discovery Communications LLC, 4.125%, 5/15/2029 | 127,000 | 118,743 | ||
| Gray Media, Inc., 10.5%, 7/15/2029 (n) | 197,000 | 202,217 | ||
| Midas OpCo Holdings LLC, 5.625%, 8/15/2029 (n) | 543,000 | 512,385 | ||
| Prosus N.V., 3.061%, 7/13/2031 (n) | 325,000 | 280,565 | ||
| Sinclair Television Group, Inc., 8.125%, 2/15/2033 (n) | 448,000 | 443,457 | ||
| Univision Communications, Inc., 8%, 8/15/2028 (n) | 304,000 | 295,290 | ||
| Univision Communications, Inc., 8.5%, 7/31/2031 (n) | 548,000 | 517,464 | ||
| WarnerMedia Holdings, Inc., 4.279%, 3/15/2032 | 131,000 | 112,173 | ||
| WMG Acquisition Corp., 3.75%, 12/01/2029 (n) | 213,000 | 196,943 | ||
| WMG Acquisition Corp., 3.875%, 7/15/2030 (n) | 236,000 | 217,020 | ||
| $3,511,140 | ||||
| Brokerage & Asset Managers – 2.2% | ||||
| AG TTMT Escrow Issuer LLC, 8.625%, 9/30/2027 (n) | $ | 620,000 | $638,648 | |
| Aretec Escrow Issuer 2, Inc., 10%, 8/15/2030 (n) | 505,000 | 543,760 | ||
| Aretec Escrow Issuer, Inc., 7.5%, 4/01/2029 (n) | 214,000 | 209,230 | ||
| Charles Schwab Corp., 6.136% to 8/24/2033, FLR (SOFR - 1 day + 2.01%) to 8/24/2034 | 576,000 | 612,025 | ||
| Hightower Holding LLC, 6.75%, 4/15/2029 (n) | 371,000 | 354,750 | ||
| Hightower Holding LLC, 9.125%, 1/31/2030 (n) | 224,000 | 229,040 | ||
| Jane Street Group/JSG Finance, Inc., 6.125%, 11/01/2032 (n) | 1,445,000 | 1,420,261 | ||
| Low Income Investment Fund, 3.386%, 7/01/2026 | 185,000 | 181,509 | ||
| Low Income Investment Fund, 3.711%, 7/01/2029 | 490,000 | 465,927 | ||
| LPL Holdings, Inc., 4%, 3/15/2029 (n) | 630,000 | 606,426 | ||
| LPL Holdings, Inc., 5.65%, 3/15/2035 | 332,000 | 328,294 | ||
| LSEG US Financial Corp., 5.297%, 3/28/2034 (n) | 272,000 | 276,177 | ||
| $5,866,047 | ||||
| Building – 3.4% | ||||
| ABC Supply Co., Inc., 3.875%, 11/15/2029 (n) | $ | 427,000 | $394,160 | |
| AmeriTex Holdco Intermediate LLC, 10.25%, 10/15/2028 (n) | 497,000 | 511,978 | ||
| BCPE Ulysses Intermediate, Inc., 7.75% (7.75% Cash or 8.5% PIK), 4/01/2027 (n)(p) | 197,000 | 191,121 | ||
| Cornerstone Building Brands, Inc., 6.125%, 1/15/2029 (n) | 419,000 | 281,052 | ||
| Cornerstone Building Brands, Inc., 9.5%, 8/15/2029 (n) | 197,000 | 171,393 | ||
| Crh Finance (U.K.) PLC, 4.125%, 12/02/2029 | GBP | 370,000 | 481,467 | |
| Ferguson Enterprises, Inc., 5%, 10/03/2034 | $ | 369,000 | 357,096 | |
| Foundation Building Materials LLC, 6%, 3/01/2029 (n) | 610,000 | 514,162 | ||
| GYP Holding III Corp., 4.625%, 5/01/2029 (n) | 795,000 | 747,609 | ||
| Holcim Finance US LLC, 4.95%, 4/07/2030 (n) | 169,000 | 170,754 | ||
| Holcim Finance US LLC, 5.4%, 4/07/2035 (n) | 112,000 | 111,944 | ||
| Knife River Corp., 7.75%, 5/01/2031 (n) | 604,000 | 631,794 | ||
| Issuer | Shares/Par | Value ($) | ||
| Bonds – continued | ||||
| Building – continued | ||||
| LBM Acquisition LLC, 6.25%, 1/15/2029 (n) | $ | 369,000 | $323,348 | |
| Miter Brands Acquisition Holdco, Inc., 6.75%, 4/01/2032 (n) | 152,000 | 152,109 | ||
| MIWD Holdco II LLC/MIWD Finance Co., 5.5%, 2/01/2030 (n) | 604,000 | 544,307 | ||
| New Enterprise Stone & Lime Co., Inc., 5.25%, 7/15/2028 (n) | 363,000 | 352,374 | ||
| New Enterprise Stone & Lime Co., Inc., 9.75%, 7/15/2028 (n) | 193,000 | 193,040 | ||
| Patrick Industries, Inc., 6.375%, 11/01/2032 (n) | 735,000 | 713,559 | ||
| Quikrete Holdings Inc., 6.375%, 3/01/2032 (n) | 497,000 | 499,801 | ||
| Standard Building Solutions, Inc., 6.5%, 8/15/2032 (n) | 312,000 | 315,886 | ||
| Standard Industries, Inc., 4.75%, 1/15/2028 (n) | 338,000 | 330,781 | ||
| Standard Industries, Inc., 4.375%, 7/15/2030 (n) | 522,000 | 486,825 | ||
| Vulcan Materials Co., 5.7%, 12/01/2054 | 207,000 | 197,824 | ||
| White Cap Buyer LLC, 6.875%, 10/15/2028 (n) | 669,000 | 651,840 | ||
| $9,326,224 | ||||
| Business Services – 2.7% | ||||
| Accenture Capital, Inc., 4.25%, 10/04/2031 | $ | 311,000 | $307,674 | |
| Accenture Capital, Inc., 4.5%, 10/04/2034 | 288,000 | 277,584 | ||
| ams OSRAM AG, 10.5%, 3/30/2029 | EUR | 360,000 | 404,768 | |
| athenahealth, Inc., 6.5%, 2/15/2030 (n) | $ | 547,000 | 522,851 | |
| Engineering Ingegneria Informatica S.p.A., 11.125%, 5/15/2028 | EUR | 180,000 | 215,240 | |
| Engineering Ingegneria Informatica S.p.A., 8.625%, 2/15/2030 | 100,000 | 117,037 | ||
| Euronet Worldwide, Inc., 1.375%, 5/22/2026 | 420,000 | 466,614 | ||
| Experian Finance PLC, 3.51%, 12/15/2033 | 350,000 | 397,338 | ||
| Fiserv Funding ULC, 3.5%, 6/15/2032 (w) | 370,000 | 417,624 | ||
| Fiserv, Inc., 4.4%, 7/01/2049 | $ | 508,000 | 398,933 | |
| Global Payments, Inc., 4.875%, 3/17/2031 | EUR | 310,000 | 367,236 | |
| Iron Mountain, Inc., 4.875%, 9/15/2027 (n) | $ | 320,000 | 315,489 | |
| Iron Mountain, Inc., 5.25%, 3/15/2028 (n) | 460,000 | 452,912 | ||
| Iron Mountain, Inc., 5.625%, 7/15/2032 (n) | 421,000 | 408,295 | ||
| Iron Mountain, Inc., 6.25%, 1/15/2033 (n) | 346,000 | 345,367 | ||
| Mastercard, Inc., 4.55%, 1/15/2035 | 308,000 | 300,857 | ||
| Mastercard, Inc., 3.85%, 3/26/2050 | 150,000 | 117,111 | ||
| Paychex, Inc., 5.1%, 4/15/2030 | 151,000 | 153,259 | ||
| Paychex, Inc., 5.35%, 4/15/2032 | 239,000 | 242,771 | ||
| Shift4 Payments LLC/Shift4 Payments Finance Sub, Inc., 6.75%, 8/15/2032 (n) | 449,000 | 455,397 | ||
| Visa, Inc., 3.875%, 5/15/2044 (w) | EUR | 210,000 | 235,046 | |
| Issuer | Shares/Par | Value ($) | ||
| Bonds – continued | ||||
| Business Services – continued | ||||
| Wolters Kluwer N.V., 3.375%, 3/20/2032 | EUR | 300,000 | $345,166 | |
| $7,264,569 | ||||
| Cable TV – 3.9% | ||||
| Cable One, Inc., 4%, 11/15/2030 (n) | $ | 683,000 | $555,545 | |
| CCO Holdings LLC/CCO Holdings Capital Corp., 4.75%, 3/01/2030 (n) | 1,670,000 | 1,576,539 | ||
| CCO Holdings LLC/CCO Holdings Capital Corp., 4.5%, 8/15/2030 (n) | 1,164,000 | 1,080,872 | ||
| CCO Holdings LLC/CCO Holdings Capital Corp., 4.5%, 5/01/2032 | 344,000 | 305,637 | ||
| CCO Holdings LLC/CCO Holdings Capital Corp., 4.25%, 1/15/2034 (n) | 476,000 | 400,977 | ||
| Charter Communications Operating LLC/Charter Communications Operating Capital Corp., 6.1%, 6/01/2029 | 581,000 | 601,673 | ||
| Charter Communications Operating LLC/Charter Communications Operating Capital Corp., 4.8%, 3/01/2050 | 233,000 | 173,556 | ||
| CSC Holdings LLC, 5.375%, 2/01/2028 (n) | 700,000 | 611,721 | ||
| CSC Holdings LLC, 5.75%, 1/15/2030 (n) | 800,000 | 401,231 | ||
| CSC Holdings LLC, 4.125%, 12/01/2030 (n) | 250,000 | 171,342 | ||
| DIRECTV Financing LLC, 8.875%, 2/01/2030 (n) | 227,000 | 216,599 | ||
| DIRECTV Holdings LLC / DIRECTV Financing Co., Inc., 10%, 2/15/2031 (n) | 149,000 | 141,102 | ||
| DISH DBS Corp., 7.75%, 7/01/2026 | 330,000 | 286,837 | ||
| DISH DBS Corp., 5.125%, 6/01/2029 | 316,000 | 197,852 | ||
| DISH Network Corp., 11.75%, 11/15/2027 (n) | 325,000 | 341,558 | ||
| EchoStar Corp., 10.75%, 11/30/2029 | 497,194 | 525,799 | ||
| Videotron Ltd., 3.625%, 6/15/2029 (n) | 511,000 | 483,554 | ||
| Videotron Ltd., 5.7%, 1/15/2035 (n) | 183,000 | 182,054 | ||
| Virgin Media Finance PLC, 5%, 7/15/2030 (n) | 715,000 | 626,847 | ||
| Virgin Media Vendor Financing Notes IV DAC, 5%, 7/15/2028 (n) | 769,000 | 743,738 | ||
| Ziggo Bond Finance B.V., 5.125%, 2/28/2030 (n) | 1,095,000 | 970,743 | ||
| $10,595,776 | ||||
| Chemicals – 1.5% | ||||
| Arkema S.A., 3.5%, 9/12/2034 | EUR | 300,000 | $332,536 | |
| Cerdia Finanz GmbH, 9.375%, 10/03/2031 (n) | $ | 437,000 | 439,731 | |
| Chemours Co., 4.625%, 11/15/2029 (n) | 735,000 | 615,472 | ||
| Chemours Co., 8%, 1/15/2033 (n) | 199,000 | 179,323 | ||
| Consolidated Energy Finance S.A., 6.5%, 5/15/2026 (n) | 150,000 | 144,589 | ||
| Consolidated Energy Finance S.A., 5.625%, 10/15/2028 (n) | 550,000 | 428,032 | ||
| DSM B.V., 3.375%, 2/25/2036 | EUR | 160,000 | 177,587 | |
| PPG Industries, Inc., 3.25%, 3/04/2032 | 280,000 | 314,324 | ||
| Issuer | Shares/Par | Value ($) | ||
| Bonds – continued | ||||
| Chemicals – continued | ||||
| SCIH Salt Holdings, Inc., 6.625%, 5/01/2029 (n) | $ | 696,000 | $676,010 | |
| SNF Group SACA, 3.375%, 3/15/2030 (n) | 709,000 | 640,958 | ||
| $3,948,562 | ||||
| Computer Software – 0.8% | ||||
| Amentum Escrow Corp., 7.25%, 8/01/2032 (n) | $ | 501,000 | $509,636 | |
| Cloud Software Group, Inc., 8.25%, 6/30/2032 (n) | 597,000 | 622,742 | ||
| Microsoft Corp., 2.525%, 6/01/2050 | 529,000 | 327,715 | ||
| Neptune Bidco U.S., Inc., 9.29%, 4/15/2029 (n) | 462,000 | 411,180 | ||
| Oracle Corp., 4%, 7/15/2046 | 319,000 | 239,471 | ||
| Sage Group PLC, 2.875%, 2/08/2034 | GBP | 100,000 | 109,158 | |
| $2,219,902 | ||||
| Computer Software - Systems – 0.8% | ||||
| Sabre GLBL, Inc., 8.625%, 6/01/2027 (n) | $ | 283,000 | $270,973 | |
| Sabre GLBL, Inc., 10.75%, 11/15/2029 (n) | 184,000 | 175,260 | ||
| SS&C Technologies Holdings, Inc., 5.5%, 9/30/2027 (n) | 855,000 | 850,784 | ||
| Virtusa Corp., 7.125%, 12/15/2028 (n) | 317,000 | 302,204 | ||
| Zebra Technologies Corp., “A”, 6.5%, 6/01/2032 (n) | 475,000 | 477,209 | ||
| $2,076,430 | ||||
| Conglomerates – 2.0% | ||||
| Amsted Industries, Inc., 6.375%, 3/15/2033 (n) | $ | 370,000 | $371,666 | |
| BWX Technologies, Inc., 4.125%, 6/30/2028 (n) | 311,000 | 298,763 | ||
| BWX Technologies, Inc., 4.125%, 4/15/2029 (n) | 858,000 | 815,796 | ||
| Emerald Debt Merger, 6.625%, 12/15/2030 (n) | 688,000 | 697,707 | ||
| Gates Corp., 6.875%, 7/01/2029 (n) | 399,000 | 404,837 | ||
| Grupo KUO S.A.B. de C.V., 5.75%, 7/07/2027 (n) | 358,000 | 347,319 | ||
| Husky Injection Molding Systems Ltd., 9%, 2/15/2029 (n) | 404,000 | 410,113 | ||
| Regal Rexnord Corp., 6.05%, 4/15/2028 | 667,000 | 684,185 | ||
| Regal Rexnord Corp., 6.3%, 2/15/2030 | 224,000 | 231,352 | ||
| SPX Flow, Inc., 8.75%, 4/01/2030 (n) | 499,000 | 503,148 | ||
| Veralto Corp., 4.15%, 9/19/2031 | EUR | 273,000 | 319,641 | |
| Westinghouse Air Brake Technologies Corp., 5.611%, 3/11/2034 | $ | 215,000 | 220,850 | |
| $5,305,377 | ||||
| Construction – 0.7% | ||||
| Beazer Homes USA, Inc., 7.5%, 3/15/2031 (n) | $ | 393,000 | $379,708 | |
| Empire Communities Corp., 9.75%, 5/01/2029 (n) | 556,000 | 542,489 | ||
| Mattamy Group Corp., 5.25%, 12/15/2027 (n) | 108,000 | 104,909 | ||
| Mattamy Group Corp., 4.625%, 3/01/2030 (n) | 391,000 | 357,685 | ||
| Issuer | Shares/Par | Value ($) | ||
| Bonds – continued | ||||
| Construction – continued | ||||
| Weekley Homes LLC/Weekley Finance Corp., 4.875%, 9/15/2028 (n) | $ | 418,000 | $390,954 | |
| $1,775,745 | ||||
| Consumer Products – 1.9% | ||||
| Acushnet Co., 7.375%, 10/15/2028 (n) | $ | 507,000 | $524,635 | |
| Amer Sports Co., 6.75%, 2/16/2031 (n) | 569,000 | 575,511 | ||
| CD&R Smokey Buyer, Inc./Radio Systems Corp., 9.5%, 10/15/2029 (n) | 396,000 | 339,838 | ||
| Champ Acquisition Corp., 8.375%, 12/01/2031 (n) | 349,000 | 367,663 | ||
| Kenvue, Inc., 5.05%, 3/22/2053 | 314,000 | 291,483 | ||
| MajorDrive Holdings IV LLC, 6.375%, 6/01/2029 (n) | 99,000 | 72,829 | ||
| Newell Brands, Inc., 6.375%, 5/15/2030 | 546,000 | 497,021 | ||
| Newell Brands, Inc., 6.625%, 5/15/2032 | 299,000 | 268,048 | ||
| Opal Bidco S.A.S., 5.5%, 3/31/2032 (n) | EUR | 240,000 | 270,745 | |
| Opal Bidco S.A.S., 6.5%, 3/31/2032 (n) | $ | 254,000 | 254,064 | |
| Perrigo Finance Unlimited Co., 6.125%, 9/30/2032 | 698,000 | 692,865 | ||
| Prestige Consumer Healthcare, Inc., 5.125%, 1/15/2028 (n) | 529,000 | 524,597 | ||
| Prestige Consumer Healthcare, Inc., 3.75%, 4/01/2031 (n) | 500,000 | 451,401 | ||
| $5,130,700 | ||||
| Consumer Services – 2.4% | ||||
| Allied Universal Holdco LLC, 9.75%, 7/15/2027 (n) | $ | 351,000 | $352,246 | |
| Allied Universal Holdco LLC, 6%, 6/01/2029 (n) | 400,000 | 375,110 | ||
| Allied Universal Holdco LLC, 7.875%, 2/15/2031 (n) | 172,000 | 175,674 | ||
| Arches Buyer, Inc., 6.125%, 12/01/2028 (n) | 573,000 | 512,322 | ||
| Emeria S.A.S.U., 7.75%, 3/31/2028 | EUR | 297,000 | 302,818 | |
| Garda World Security Corp., 8.375%, 11/15/2032 (n) | $ | 543,000 | 535,628 | |
| GoDaddy, Inc., 3.5%, 3/01/2029 (n) | 726,000 | 676,286 | ||
| Meituan, 4.5%, 4/02/2028 (n) | 332,000 | 330,722 | ||
| Raven Acquisition Holdings LLC, 6.875%, 11/15/2031 (n) | 498,000 | 485,722 | ||
| Realogy Group LLC/Realogy Co-Issuer Corp., 5.75%, 1/15/2029 (n) | 213,000 | 168,207 | ||
| Realogy Group LLC/Realogy Co-Issuer Corp., 5.25%, 4/15/2030 (n) | 419,000 | 307,827 | ||
| Securitas AB, 3.375%, 5/20/2032 | EUR | 190,000 | 213,808 | |
| Service Corp. International, 5.75%, 10/15/2032 | $ | 832,000 | 821,383 | |
| Toll Road Investors Partnership II LP, Capital Appreciation, NPFG, 0%, 2/15/2027 (n) | 353,000 | 316,510 | ||
| TriNet Group, Inc., 3.5%, 3/01/2029 (n) | 540,000 | 492,553 | ||
| TriNet Group, Inc., 7.125%, 8/15/2031 (n) | 100,000 | 101,784 | ||
| WASH Multi-Family Acquisition, Inc., 5.75%, 4/15/2026 (n) | 467,000 | 462,309 | ||
| $6,630,909 | ||||
| Issuer | Shares/Par | Value ($) | ||
| Bonds – continued | ||||
| Containers – 1.0% | ||||
| Ball Corp., 6%, 6/15/2029 | $ | 242,000 | $246,936 | |
| Ball Corp., 2.875%, 8/15/2030 | 796,000 | 704,777 | ||
| Clydesdale Acquisition Holdings, Inc., 8.75%, 4/15/2030 (n) | 508,000 | 523,404 | ||
| Clydesdale Acquisition Holdings, Inc., 6.75%, 4/15/2032 (n) | 146,000 | 149,285 | ||
| Owens-Brockway Glass Container, Inc., 7.25%, 5/15/2031 (n) | 395,000 | 392,253 | ||
| Trivium Packaging Finance B.V., 8.5%, 8/15/2027 (n) | 611,000 | 603,902 | ||
| $2,620,557 | ||||
| Electrical Equipment – 0.2% | ||||
| Arrow Electronics, Inc., 5.875%, 4/10/2034 | $ | 238,000 | $239,265 | |
| CommScope Technologies LLC, 5%, 3/15/2027 (n) | 249,000 | 216,685 | ||
| $455,950 | ||||
| Electronics – 0.6% | ||||
| Broadcom, Inc., 4.55%, 2/15/2032 | $ | 502,000 | $491,996 | |
| Diebold Nixdorf, Inc., 7.75%, 3/31/2030 (n) | 299,000 | 311,295 | ||
| Entegris, Inc., 4.375%, 4/15/2028 (n) | 213,000 | 205,842 | ||
| Entegris, Inc., 3.625%, 5/01/2029 (n) | 227,000 | 209,006 | ||
| Entegris, Inc., 5.95%, 6/15/2030 (n) | 150,000 | 149,687 | ||
| Intel Corp., 5.7%, 2/10/2053 | 258,000 | 229,804 | ||
| Tyco Electronics Group S.A., 2.5%, 5/06/2028 (w) | EUR | 110,000 | 124,398 | |
| $1,722,028 | ||||
| Emerging Market Quasi-Sovereign – 5.7% | ||||
| Abu Dhabi Developmental Holding Co. PJSC, 5.5%, 5/08/2034 (n) | $ | 944,000 | $980,176 | |
| Bank Gospodarstwa Krajowego (Republic of Poland), 5.75%, 7/09/2034 (n) | 940,000 | 960,746 | ||
| CEZ A.S. (Czech Republic), 4.125%, 4/30/2033 | EUR | 370,000 | 418,761 | |
| Chile Electricity Lux MPC II S.à r.l., 5.58%, 10/20/2035 (n) | $ | 507,325 | 503,901 | |
| Corporacion Financiera de Desarrollo S.A. (Republic of Peru), 5.5%, 5/06/2030 (n)(w) | 200,000 | 200,492 | ||
| Development Bank of Kazakhstan JSC, 5.25%, 10/23/2029 (n) | 200,000 | 197,908 | ||
| Empresa Nacional del Petroleo (Republic of Chile), 5.95%, 7/30/2034 (n) | 425,000 | 429,137 | ||
| Eskom Holdings SOC Ltd. (Republic of South Africa), 6.35%, 8/10/2028 (n) | 1,052,000 | 1,037,567 | ||
| Export-Import Bank of India, 3.375%, 8/05/2026 | 1,366,000 | 1,345,041 | ||
| Indian Railway Finance Corp., 2.8%, 2/10/2031 (n) | 700,000 | 624,599 | ||
| Ipoteka Bank (Republic of Uzbekistan), 5.5%, 11/19/2025 | 1,000,000 | 990,000 | ||
| Magyar Export-Import Bank PLC (Republic of Hungary), 6.125%, 12/04/2027 (n) | 490,000 | 498,755 | ||
| Issuer | Shares/Par | Value ($) | ||
| Bonds – continued | ||||
| Emerging Market Quasi-Sovereign – continued | ||||
| Navoi Mining & Metallurgical Co. (Republic of Uzbekistan), 6.7%, 10/17/2028 | $ | 268,000 | $273,119 | |
| Office Cherifien des Phosphates S.A. (Kingdom of Morocco), 6.75%, 5/02/2034 (n) | 285,000 | 287,707 | ||
| Office Cherifien des Phosphates S.A. (Kingdom of Morocco), 6.875%, 4/25/2044 (n) | 373,000 | 349,855 | ||
| Office Cherifien des Phosphates S.A. (Kingdom of Morocco), 5.125%, 6/23/2051 (n) | 600,000 | 439,500 | ||
| Petroleos Mexicanos, 6.49%, 1/23/2027 | 904,000 | 883,304 | ||
| Petroleos Mexicanos, 6.7%, 2/16/2032 | 499,000 | 427,723 | ||
| Petroleos Mexicanos, 6.75%, 9/21/2047 | 634,000 | 425,810 | ||
| PETRONAS Capital Ltd. (Federation of Malaysia), 4.95%, 1/03/2031 (n) | 534,000 | 541,847 | ||
| PETRONAS Capital Ltd. (Federation of Malaysia), 5.34%, 4/03/2035 (n) | 462,000 | 469,352 | ||
| PT Perusahaan Listrik Negara (Republic of Indonesia), 4%, 6/30/2050 (n) | 488,000 | 338,115 | ||
| Qatar Petroleum, 3.125%, 7/12/2041 | 355,000 | 260,780 | ||
| Saudi Arabian Oil Co., 5.75%, 7/17/2054 (n) | 410,000 | 380,890 | ||
| Southern Gas Corridor CJSC (Republic of Azerbaijan), 6.875%, 3/24/2026 | 767,000 | 774,670 | ||
| State Oil Company of the Azerbaijan Republic, 6.95%, 3/18/2030 | 1,152,000 | 1,198,080 | ||
| Uzbek Industrial and Construction Bank ATB (Republic of Uzbekistan), 8.95%, 7/24/2029 (n) | 388,000 | 396,924 | ||
| $15,634,759 | ||||
| Emerging Market Sovereign – 8.3% | ||||
| Dominican Republic, 5.5%, 2/22/2029 (n) | $ | 747,000 | $735,608 | |
| Dominican Republic, 5.875%, 1/30/2060 (n) | 927,000 | 762,040 | ||
| Federal Republic of Nigeria, 7.875%, 2/16/2032 | 320,000 | 277,216 | ||
| Kingdom of Morocco, 1.375%, 3/30/2026 | EUR | 758,000 | 843,090 | |
| Kingdom of Morocco, 3%, 12/15/2032 (n) | $ | 448,000 | 369,394 | |
| Kingdom of Saudi Arabia, 5.125%, 1/13/2028 (n) | 363,000 | 368,607 | ||
| Oriental Republic of Uruguay, 8.25%, 5/21/2031 | UYU | 11,700,000 | 260,232 | |
| Oriental Republic of Uruguay, 9.75%, 7/20/2033 | 10,000,000 | 238,605 | ||
| Republic of Albania, 4.75%, 2/14/2035 (n) | EUR | 171,000 | 184,620 | |
| Republic of Angola, 8.25%, 5/09/2028 | $ | 491,000 | 416,417 | |
| Republic of Angola, 9.375%, 5/08/2048 | 400,000 | 280,336 | ||
| Republic of Argentina, 4.125%, 7/09/2035 | 1,047,289 | 698,420 | ||
| Republic of Bulgaria, 5%, 3/05/2037 | 408,000 | 394,685 | ||
| Republic of Chile, 3.1%, 1/22/2061 | 672,000 | 396,816 | ||
| Republic of Costa Rica, 7.3%, 11/13/2054 | 391,000 | 397,820 | ||
| Issuer | Shares/Par | Value ($) | ||
| Bonds – continued | ||||
| Emerging Market Sovereign – continued | ||||
| Republic of Cote d'Ivoire, 5.25%, 3/22/2030 | EUR | 802,000 | $849,945 | |
| Republic of Guatemala, 6.05%, 8/06/2031 (n) | $ | 420,000 | 417,547 | |
| Republic of Guatemala, 6.125%, 6/01/2050 (n) | 564,000 | 499,845 | ||
| Republic of Hungary, 5.5%, 6/16/2034 (n) | 970,000 | 935,298 | ||
| Republic of India, 7.18%, 8/14/2033 | INR | 58,000,000 | 720,046 | |
| Republic of Korea, 1.375%, 6/10/2030 | KRW | 8,300,000,000 | 5,537,180 | |
| Republic of Paraguay, 5.6%, 3/13/2048 | $ | 1,049,000 | 919,365 | |
| Republic of Peru, 5.375%, 2/08/2035 | 422,000 | 415,485 | ||
| Republic of Philippines, 3.556%, 9/29/2032 | 327,000 | 299,490 | ||
| Republic of Serbia, 1.65%, 3/03/2033 | EUR | 115,000 | 103,437 | |
| Republic of Serbia, 6%, 6/12/2034 (n) | $ | 689,000 | 680,346 | |
| Republic of Serbia, 2.05%, 9/23/2036 (n) | EUR | 456,000 | 376,452 | |
| Republic of South Africa, 7.1%, 11/19/2036 (n) | $ | 475,000 | 452,753 | |
| Republic of South Africa, 7.3%, 4/20/2052 | 396,000 | 339,620 | ||
| Republic of Turkey, 4.75%, 1/26/2026 | 521,000 | 518,395 | ||
| Republic of Turkey, 7.625%, 5/15/2034 | 540,000 | 537,837 | ||
| Republic of Turkey, 6.5%, 1/03/2035 | 308,000 | 281,842 | ||
| Sultanate of Oman, 6%, 8/01/2029 | 406,000 | 418,242 | ||
| Sultanate of Oman, 7%, 1/25/2051 | 600,000 | 624,159 | ||
| United Mexican States, 4.75%, 4/27/2032 | 736,000 | 688,873 | ||
| United Mexican States, 3.771%, 5/24/2061 | 430,000 | 244,226 | ||
| $22,484,289 | ||||
| Energy - Independent – 3.7% | ||||
| Chord Energy Corp., 6.75%, 3/15/2033 (n) | $ | 299,000 | $291,043 | |
| Civitas Resources, Inc., 8.375%, 7/01/2028 (n) | 307,000 | 301,610 | ||
| Civitas Resources, Inc., 8.625%, 11/01/2030 (n) | 177,000 | 170,592 | ||
| Civitas Resources, Inc., 8.75%, 7/01/2031 (n) | 390,000 | 370,706 | ||
| CNX Resources Corp., 7.25%, 3/01/2032 (n) | 399,000 | 398,775 | ||
| Comstock Resources, Inc., 6.75%, 3/01/2029 (n) | 781,000 | 744,441 | ||
| Diamondback Energy, Inc., 5.75%, 4/18/2054 | 178,000 | 159,052 | ||
| Encino Acquisition Partners Holdings LLC, 8.75%, 5/01/2031 (n) | 554,000 | 564,081 | ||
| Gulfport Energy Corp., 6.75%, 9/01/2029 (n) | 598,000 | 589,322 | ||
| Magnolia Oil & Gas Operating LLC/Magnolia Oil & Gas Finance Corp., 6.875%, 12/01/2032 (n) | 547,000 | 529,620 | ||
| Matador Resources Co., 6.875%, 4/15/2028 (n) | 561,000 | 557,881 | ||
| Matador Resources Co., 6.5%, 4/15/2032 (n) | 227,000 | 218,651 | ||
| Occidental Petroleum Corp., 6.45%, 9/15/2036 | 351,000 | 341,937 | ||
| Permian Resources Operating LLC, 5.875%, 7/01/2029 (n) | 524,000 | 511,718 | ||
| Permian Resources Operating LLC, 7%, 1/15/2032 (n) | 333,000 | 335,228 | ||
| Permian Resources Operating LLC, 6.25%, 2/01/2033 (n) | 203,000 | 198,513 | ||
| Pioneer Natural Resources Co., 2.15%, 1/15/2031 | 410,000 | 359,771 | ||
| Issuer | Shares/Par | Value ($) | ||
| Bonds – continued | ||||
| Energy - Independent – continued | ||||
| Santos Finance Ltd., 6.875%, 9/19/2033 (n) | $ | 276,000 | $290,861 | |
| Sitio Royalties Operating Partnership LP, 7.875%, 11/01/2028 (n) | 588,000 | 604,278 | ||
| Tengizchevroil Finance Co. International Ltd., 4%, 8/15/2026 (n) | 422,000 | 413,782 | ||
| Tengizchevroil Finance Co. International Ltd., 4%, 8/15/2026 | 1,025,000 | 1,005,038 | ||
| Viper Energy, Inc., 7.375%, 11/01/2031 (n) | 198,000 | 205,550 | ||
| Vital Energy, Inc., 7.875%, 4/15/2032 (n) | 567,000 | 440,498 | ||
| Wildfire Intermediate Holdings LLC, 7.5%, 10/15/2029 (n) | 499,000 | 456,585 | ||
| $10,059,533 | ||||
| Energy - Integrated – 0.8% | ||||
| BP Capital Markets America, Inc., 4.812%, 2/13/2033 | $ | 243,000 | $238,494 | |
| BP Capital Markets B.V., 0.933%, 12/04/2040 | EUR | 190,000 | 135,423 | |
| BP Capital Markets PLC, 6%, 2/19/2173 | GBP | 280,000 | 369,517 | |
| Exxon Mobil Corp., 1.408%, 6/26/2039 | EUR | 450,000 | 368,519 | |
| Orlen S.A., 6%, 1/30/2035 | $ | 542,000 | 547,703 | |
| TotalEnergies Capital International S.A., 3.16%, 3/03/2033 | EUR | 400,000 | 449,144 | |
| $2,108,800 | ||||
| Entertainment – 2.6% | ||||
| Carnival Corp., 5.75%, 1/15/2030 | EUR | 200,000 | $237,899 | |
| Carnival Corp., 5.75%, 3/15/2030 (n) | $ | 498,000 | 494,496 | |
| Carnival Corp., 6.125%, 2/15/2033 (n) | 249,000 | 246,894 | ||
| Life Time, Inc., 6%, 11/15/2031 (n) | 548,000 | 546,282 | ||
| Lindblad Expeditions Holdings, Inc., 9%, 5/15/2028 (n) | 501,000 | 514,884 | ||
| Motion Bondco DAC, 6.625%, 11/15/2027 (n) | 404,000 | 382,065 | ||
| NCL Corp. Ltd., 5.875%, 3/15/2026 (n) | 49,000 | 48,750 | ||
| NCL Corp. Ltd., 6.25%, 3/01/2030 (n) | 505,000 | 492,602 | ||
| NCL Corp. Ltd., 6.75%, 2/01/2032 (n) | 325,000 | 317,343 | ||
| Royal Caribbean Cruises Ltd., 5.375%, 7/15/2027 (n) | 430,000 | 429,498 | ||
| Royal Caribbean Cruises Ltd., 5.5%, 4/01/2028 (n) | 436,000 | 435,553 | ||
| Royal Caribbean Cruises Ltd., 5.625%, 9/30/2031 (n) | 253,000 | 251,055 | ||
| Royal Caribbean Cruises Ltd., 6%, 2/01/2033 (n) | 1,025,000 | 1,027,822 | ||
| Six Flags Entertainment Corp., 6.625%, 5/01/2032 (n) | 692,000 | 698,207 | ||
| Viking Cruises Ltd. Co., 5.875%, 9/15/2027 (n) | 192,000 | 191,610 | ||
| Viking Ocean Cruises Ship VII Ltd., 5.625%, 2/15/2029 (n) | 656,000 | 649,421 | ||
| $6,964,381 | ||||
| Issuer | Shares/Par | Value ($) | ||
| Bonds – continued | ||||
| Financial Institutions – 4.3% | ||||
| Avation Capital S.A., 8.25% (8.25% Cash or 9% PIK), 10/31/2026 (n)(p) | $ | 626,867 | $609,628 | |
| Avolon Holdings Funding Ltd., 4.375%, 5/01/2026 (n) | 388,000 | 385,065 | ||
| Azorra Finance Ltd., 7.75%, 4/15/2030 (n) | 746,000 | 740,241 | ||
| Corporacion Inmobiliaria Vesta S.A.B. de C.V., 3.625%, 5/13/2031 | 320,000 | 277,199 | ||
| Credit Acceptance Corp., 9.25%, 12/15/2028 (n) | 243,000 | 256,805 | ||
| Credit Acceptance Corp., 6.625%, 3/15/2030 (n) | 392,000 | 384,634 | ||
| CTP N.V., 3.875%, 11/21/2032 | EUR | 230,000 | 255,428 | |
| Fastighets AB Balder, 4%, 2/19/2032 | 440,000 | 491,270 | ||
| Freedom Mortgage Corp., 7.625%, 5/01/2026 (n) | $ | 387,000 | 385,965 | |
| Freedom Mortgage Holdings LLC, 9.25%, 2/01/2029 (n) | 455,000 | 463,504 | ||
| FTAI Aviation Ltd., 5.5%, 5/01/2028 (n) | 568,000 | 557,808 | ||
| FTAI Aviation Ltd., 7.875%, 12/01/2030 (n) | 383,000 | 400,408 | ||
| Heimstaden Bostad AB, 8.375%, 1/29/2030 | EUR | 270,000 | 303,270 | |
| Icahn Enterprises LP/Icahn Enterprises Finance Corp., 9.75%, 1/15/2029 | $ | 384,000 | 379,008 | |
| Icahn Enterprises LP/Ichan Enterprises Finance Corp., 10%, 11/15/2029 (n) | 199,000 | 194,587 | ||
| Jefferson Capital Holdings LLC, 8.25%, 5/15/2030 (n)(w) | 394,000 | 396,504 | ||
| Macquarie AirFinance Holdings Ltd., 5.15%, 3/17/2030 (n) | 86,000 | 84,395 | ||
| Macquarie AirFinance Holdings Ltd., 6.5%, 3/26/2031 (n) | 381,000 | 391,362 | ||
| Muthoot Finance Ltd., 7.125%, 2/14/2028 (n) | 226,000 | 224,574 | ||
| Nationstar Mortgage Holdings, Inc., 6%, 1/15/2027 (n) | 615,000 | 615,269 | ||
| Nationstar Mortgage Holdings, Inc., 6.5%, 8/01/2029 (n) | 400,000 | 406,557 | ||
| OneMain Finance Corp., 6.625%, 5/15/2029 | 497,000 | 498,449 | ||
| OneMain Finance Corp., 5.375%, 11/15/2029 | 317,000 | 303,036 | ||
| OneMain Finance Corp., 7.5%, 5/15/2031 | 187,000 | 189,639 | ||
| PennyMac Financial Services, Inc., 6.875%, 2/15/2033 (n) | 744,000 | 742,962 | ||
| Shriram Finance Ltd., 6.15%, 4/03/2028 (n) | 731,000 | 718,371 | ||
| Shurgard Luxembourg S.à r.l., 3.625%, 10/22/2034 | EUR | 400,000 | 440,362 | |
| Truenoord Ltd., 8.75%, 3/01/2030 (n) | $ | 299,000 | 305,423 | |
| Walker & Dunlop, Inc., 6.625%, 4/01/2033 (n) | 395,000 | 401,778 | ||
| $11,803,501 | ||||
| Food & Beverages – 5.1% | ||||
| Anheuser-Busch InBev Worldwide, Inc., 4.375%, 4/15/2038 | $ | 260,000 | $237,621 | |
| Anheuser-Busch InBev Worldwide, Inc., 5.55%, 1/23/2049 | 331,000 | 327,533 | ||
| B&G Foods, Inc., 8%, 9/15/2028 (n) | 449,000 | 445,469 | ||
| Bacardi Ltd., 5.15%, 5/15/2038 (n) | 530,000 | 480,088 | ||
| Bacardi-Martini B.V., 5.4%, 6/15/2033 (n) | 325,000 | 315,620 | ||
| Barry Callebaut Services N.V., 4.25%, 8/19/2031 | EUR | 200,000 | 226,394 | |
| Bunge Ltd. Finance Corp., 4.65%, 9/17/2034 | $ | 187,000 | 181,379 | |
| Issuer | Shares/Par | Value ($) | ||
| Bonds – continued | ||||
| Food & Beverages – continued | ||||
| Carlsberg Breweries A.S., 3.25%, 2/28/2032 | EUR | 350,000 | $396,689 | |
| Central American Bottling Corp., 5.25%, 4/27/2029 (n) | $ | 691,000 | 661,261 | |
| Chobani LLC/Chobani Finance Corp., 7.625%, 7/01/2029 (n) | 429,000 | 449,333 | ||
| Constellation Brands, Inc., 2.25%, 8/01/2031 | 290,000 | 248,152 | ||
| Fiesta Purchaser, Inc., 7.875%, 3/01/2031 (n) | 339,000 | 355,123 | ||
| Fiesta Purchaser, Inc., 9.625%, 9/15/2032 (n) | 317,000 | 331,465 | ||
| Flora Food Management B.V., 6.875%, 7/02/2029 | EUR | 210,000 | 245,396 | |
| Flowers Foods, Inc., 5.75%, 3/15/2035 | $ | 384,000 | 387,436 | |
| Flowers Foods, Inc., 6.2%, 3/15/2055 | 220,000 | 218,984 | ||
| Gruma S.A.B. de C.V., 5.39%, 12/09/2034 (n) | 200,000 | 197,600 | ||
| JBS USA Lux S.A./JBS USA Food Co./JBS USA Finance, Inc., 3.625%, 1/15/2032 | 1,000,000 | 904,745 | ||
| JBS USA Lux S.A./JBS USA Food Co./JBS USA Finance, Inc., 6.5%, 12/01/2052 | 241,000 | 248,113 | ||
| Kraft Heinz Foods Co., 4.375%, 6/01/2046 | 549,000 | 444,756 | ||
| Mars, Inc., 4.8%, 3/01/2030 (n) | 251,000 | 254,064 | ||
| Mars, Inc., 5.2%, 3/01/2035 (n) | 577,000 | 579,264 | ||
| Mars, Inc., 5.7%, 5/01/2055 (n) | 387,000 | 381,451 | ||
| Nestle Finance International Ltd., 3.5%, 1/14/2045 | EUR | 280,000 | 300,954 | |
| Performance Food Group Co., 5.5%, 10/15/2027 (n) | $ | 678,000 | 672,442 | |
| Performance Food Group Co., 6.125%, 9/15/2032 (n) | 338,000 | 338,100 | ||
| Pernod Ricard S.A., 3.25%, 3/03/2032 | EUR | 600,000 | 669,093 | |
| Post Holdings, Inc., 4.625%, 4/15/2030 (n) | $ | 788,000 | 742,773 | |
| Post Holdings, Inc., 6.25%, 10/15/2034 (n) | 219,000 | 217,182 | ||
| Primo Water Holdings Inc./Triton Water Holdings, 4.375%, 4/30/2029 (n) | 875,000 | 830,213 | ||
| U.S. Foods Holding Corp., 4.75%, 2/15/2029 (n) | 813,000 | 789,620 | ||
| U.S. Foods Holding Corp., 5.75%, 4/15/2033 (n) | 131,000 | 128,316 | ||
| Viking Baked Goods Acquisition Corp., 8.625%, 11/01/2031 (n) | 395,000 | 375,209 | ||
| Viterra Finance B.V., 3.2%, 4/21/2031 (n) | 263,000 | 238,547 | ||
| $13,820,385 | ||||
| Forest & Paper Products – 1.1% | ||||
| Graphic Packaging International LLC, 1.512%, 4/15/2026 (n) | $ | 521,000 | $503,224 | |
| Graphic Packaging International LLC, 6.375%, 7/15/2032 (n) | 753,000 | 756,706 | ||
| Mondi Finance PLC, 3.75%, 5/18/2033 | EUR | 390,000 | 443,358 | |
| Smurfit Kappa Treasury Co., 7.5%, 11/20/2025 | $ | 350,000 | 353,860 | |
| Stora Enso Oyj, 7.25%, 4/15/2036 (n) | 444,000 | 468,021 | ||
| Veritiv Operating Co., 10.5%, 11/30/2030 (n) | 448,000 | 467,958 | ||
| $2,993,127 | ||||
| Issuer | Shares/Par | Value ($) | ||
| Bonds – continued | ||||
| Gaming & Lodging – 3.1% | ||||
| CCM Merger, Inc., 6.375%, 5/01/2026 (n) | $ | 541,000 | $541,631 | |
| CDI Escrow Issuer, Inc., 5.75%, 4/01/2030 (n) | 1,025,000 | 1,002,430 | ||
| Flutter Treasury DAC, 6.375%, 4/29/2029 (n) | 514,000 | 525,189 | ||
| Hilton Domestic Operating Co., Inc., 4.875%, 1/15/2030 | 1,016,000 | 995,622 | ||
| Hilton Domestic Operating Co., Inc., 3.625%, 2/15/2032 (n) | 585,000 | 517,482 | ||
| Las Vegas Sands Corp., 6.2%, 8/15/2034 | 363,000 | 355,697 | ||
| Marriott International, Inc., 2.85%, 4/15/2031 | 405,000 | 362,090 | ||
| Melco Resorts Finance Limited, 5.375%, 12/04/2029 | 856,000 | 772,433 | ||
| Sands China Ltd., 4.375%, 6/18/2030 | 520,000 | 481,484 | ||
| Whitbread Group PLC, 5.5%, 5/31/2032 | GBP | 157,000 | 206,602 | |
| Wyndham Hotels & Resorts, Inc., 4.375%, 8/15/2028 (n) | $ | 788,000 | 756,890 | |
| Wynn Macau Ltd., 5.625%, 8/26/2028 (n) | 1,319,000 | 1,258,991 | ||
| Wynn Resorts Finance LLC/Wynn Resorts Capital Corp., 5.125%, 10/01/2029 (n) | 637,000 | 614,154 | ||
| Wynn Resorts Finance LLC/Wynn Resorts Capital Corp., 7.125%, 2/15/2031 (n) | 133,000 | 137,198 | ||
| $8,527,893 | ||||
| Industrial – 1.4% | ||||
| Albion Financing 2 S.à r.l., 8.75%, 4/15/2027 (n) | $ | 640,000 | $646,015 | |
| APi Escrow Corp., 4.75%, 10/15/2029 (n) | 874,000 | 821,894 | ||
| Arcadis N.V., 4.875%, 2/28/2028 | EUR | 258,000 | 303,508 | |
| Booz Allen Hamilton, Inc., 5.95%, 4/15/2035 | $ | 392,000 | 389,512 | |
| Brundage-Bone Concrete Pumping Holdings, Inc., 7.5%, 2/01/2032 (n) | 199,000 | 194,192 | ||
| Investor AB, 3.5%, 3/31/2034 | EUR | 120,000 | 137,080 | |
| Prysmian S.p.A., 3.625%, 11/28/2028 | 280,000 | 321,877 | ||
| Trustees of the University of Pennsylvania, 2.396%, 10/01/2050 | $ | 966,000 | 549,754 | |
| WSP Global, Inc., 5.548%, 11/22/2030 | CAD | 695,000 | 540,372 | |
| $3,904,204 | ||||
| Insurance – 0.9% | ||||
| Allianz SE, 3.2% to 4/30/2028, FLR (CMT - 5yr. + 2.165%) to 4/30/2171 (n) | $ | 600,000 | $504,109 | |
| Corebridge Financial, Inc., 4.35%, 4/05/2042 | 351,000 | 286,411 | ||
| Corebridge Financial, Inc., 6.875% to 12/15/2027, FLR (CMT - 5yr. + 3.846%) to 12/15/2052 | 236,000 | 238,618 | ||
| MetLife, Inc., 5.3%, 12/15/2034 | 419,000 | 425,651 | ||
| Nippon Life Insurance Co., 4.114% to 1/23/2035, FLR (EUR ICE Swap Rate - 5yr. + 2.6%) to 1/23/2055 | EUR | 170,000 | 188,024 | |
| Sammons Financial Group, Inc., 6.875%, 4/15/2034 (n) | $ | 446,000 | 465,832 | |
| Issuer | Shares/Par | Value ($) | ||
| Bonds – continued | ||||
| Insurance – continued | ||||
| Swiss Life Finance I AG, 3.75%, 3/24/2035 | EUR | 380,000 | $431,360 | |
| $2,540,005 | ||||
| Insurance - Health – 0.6% | ||||
| Elevance Health, Inc., 5.375%, 6/15/2034 | $ | 292,000 | $295,719 | |
| Humana, Inc., 5.55%, 5/01/2035 | 531,000 | 526,888 | ||
| UnitedHealth Group, Inc., 5.15%, 7/15/2034 | 573,000 | 574,836 | ||
| UnitedHealth Group, Inc., 4.625%, 7/15/2035 | 294,000 | 283,459 | ||
| $1,680,902 | ||||
| Insurance - Property & Casualty – 3.0% | ||||
| Acrisure LLC/Acrisure Finance, Inc., 8.25%, 2/01/2029 (n) | $ | 397,000 | $406,201 | |
| Acrisure LLC/Acrisure Finance, Inc., 6%, 8/01/2029 (n) | 447,000 | 423,480 | ||
| Alliant Holdings Intermediate LLC/Alliant Holdings Co-Issuer, 5.875%, 11/01/2029 (n) | 410,000 | 395,790 | ||
| Alliant Holdings Intermediate LLC/Alliant Holdings Co-Issuer, 7%, 1/15/2031 (n) | 400,000 | 405,959 | ||
| Alliant Holdings Intermediate LLC/Alliant Holdings Co-Issuer, 6.5%, 10/01/2031 (n) | 758,000 | 756,446 | ||
| American International Group, Inc., 5.125%, 3/27/2033 | 356,000 | 355,644 | ||
| AmWINS Group Benefits, Inc., 6.375%, 2/15/2029 (n) | 249,000 | 251,967 | ||
| AmWINS Group Benefits, Inc., 4.875%, 6/30/2029 (n) | 357,000 | 340,838 | ||
| Arthur J. Gallagher & Co., 5%, 2/15/2032 | 79,000 | 79,314 | ||
| Arthur J. Gallagher & Co., 6.5%, 2/15/2034 | 109,000 | 118,217 | ||
| Arthur J. Gallagher & Co., 5.75%, 3/02/2053 | 238,000 | 228,114 | ||
| Baldwin Insurance Group Holdings LLC, 7.125%, 5/15/2031 (n) | 729,000 | 741,752 | ||
| Brown & Brown, Inc., 5.65%, 6/11/2034 | 104,000 | 105,173 | ||
| Fairfax Financial Holdings Ltd., 4.25%, 12/06/2027 | CAD | 672,000 | 495,898 | |
| Fairfax Financial Holdings Ltd., 6.35%, 3/22/2054 | $ | 402,000 | 402,779 | |
| Hub International Ltd., 5.625%, 12/01/2029 (n) | 255,000 | 249,103 | ||
| Hub International Ltd., 7.25%, 6/15/2030 (n) | 760,000 | 788,305 | ||
| Hub International Ltd., 7.375%, 1/31/2032 (n) | 208,000 | 214,290 | ||
| Marsh & McLennan Cos., Inc., 4.85%, 11/15/2031 | 302,000 | 305,323 | ||
| Marsh & McLennan Cos., Inc., 5.4%, 3/15/2055 | 319,000 | 303,658 | ||
| Panther Escrow Issuer, 7.125%, 6/01/2031 (n) | 772,000 | 790,910 | ||
| $8,159,161 | ||||
| Interactive Media Services – 0.1% | ||||
| Snap, Inc., 6.875%, 3/01/2033 (n) | $ | 347,000 | $346,561 | |
| Issuer | Shares/Par | Value ($) | ||
| Bonds – continued | ||||
| International Market Quasi-Sovereign – 1.9% | ||||
| Electricite de France S.A., 4.625%, 5/07/2045 (w) | EUR | 100,000 | $111,396 | |
| Electricite de France S.A., 6.5%, 11/08/2064 | GBP | 300,000 | 375,566 | |
| EnBW International Finance B.V. (Federal Republic of Germany), 4.3%, 5/23/2034 | EUR | 215,000 | 256,928 | |
| EnBW International Finance B.V. (Federal Republic of Germany), 3.75%, 11/20/2035 | 280,000 | 317,043 | ||
| ESB Finance DAC (Republic of Ireland), 1.875%, 6/14/2031 | 305,000 | 323,509 | ||
| Eustream A.S. (Slovak Republic), 1.625%, 6/25/2027 | 510,000 | 552,395 | ||
| Islandsbanki hf. (Republic of Iceland), 3.875%, 9/20/2030 | 310,000 | 353,989 | ||
| Landsbankinn hf. (Republic of Iceland), 3.75%, 10/08/2029 | 435,000 | 498,536 | ||
| Ontario Teachers' Cadillac Fairview Properties, 2.5%, 10/15/2031 (n) | $ | 425,000 | 370,511 | |
| P3 Group S.à r.l. (Grand Duchy of Luxembourg), 1.625%, 1/26/2029 | EUR | 270,000 | 286,009 | |
| P3 Group S.à r.l. (Grand Duchy of Luxembourg), 4%, 4/19/2032 | 280,000 | 316,053 | ||
| RTE Reseau de Transport d'Electricite (Republic of France), 3.5%, 10/02/2036 | 500,000 | 566,233 | ||
| Swisscom Finance, 3.5%, 11/29/2031 | 500,000 | 582,065 | ||
| Wolf Midstream Canada LP, 6.4%, 7/18/2029 (n) | CAD | 519,000 | 386,822 | |
| $5,297,055 | ||||
| International Market Sovereign – 4.5% | ||||
| Commonwealth of Australia, 3.75%, 4/21/2037 | AUD | 7,638,000 | $4,653,816 | |
| Government of Bermuda, 2.375%, 8/20/2030 (n) | $ | 239,000 | 207,399 | |
| Government of Bermuda, 5%, 7/15/2032 (n) | 731,000 | 718,710 | ||
| Government of Canada, 3.25%, 12/01/2034 | CAD | 4,313,000 | 3,173,775 | |
| Kingdom of Spain, 3.45%, 10/31/2034 (n) | EUR | 1,400,000 | 1,634,197 | |
| Republic of Italy, 4.15%, 10/01/2039 (n) | 1,585,000 | 1,839,915 | ||
| $12,227,812 | ||||
| Internet – 0.1% | ||||
| Alphabet, Inc., 4%, 5/06/2054 (w) | EUR | 199,000 | $223,238 | |
| Local Authorities – 0.3% | ||||
| Alliander N.V., 3.5%, 5/06/2037 (w) | EUR | 290,000 | $328,509 | |
| Province of Alberta, 1.65%, 6/01/2031 | CAD | 553,000 | 368,195 | |
| Province of British Columbia, 2.95%, 6/18/2050 | 405,000 | 227,609 | ||
| $924,313 | ||||
| Issuer | Shares/Par | Value ($) | ||
| Bonds – continued | ||||
| Machinery & Tools – 0.6% | ||||
| AGCO Corp., 5.8%, 3/21/2034 | $ | 219,000 | $217,539 | |
| Manitowoc Co., Inc., 9.25%, 10/01/2031 (n) | 354,000 | 358,867 | ||
| Ritchie Bros Holdings, Inc., 7.75%, 3/15/2031 (n) | 1,014,000 | 1,063,163 | ||
| $1,639,569 | ||||
| Major Banks – 6.4% | ||||
| Bank of America Corp., 5.202% to 4/25/2028, FLR (SOFR - 1 day + 1.63%) to 4/25/2029 | $ | 349,000 | $356,490 | |
| Bank of America Corp., 2.687% to 4/22/2031, FLR (SOFR - 1 day + 1.32%) to 4/22/2032 | 409,000 | 361,749 | ||
| Bank of America Corp., 5.425% to 8/15/2034, FLR (SOFR - 1 day + 1.913%) to 8/15/2035 | 361,000 | 353,333 | ||
| Barclays PLC, 5.746% to 7/31/2031, FLR (SONIA + 1.614%) to 7/31/2032 | GBP | 550,000 | 738,898 | |
| BNP Paribas S.A., 5.283% to 11/19/2029, FLR (SOFR - 1 day + 1.28%) to 11/19/2030 (n) | $ | 467,000 | 472,257 | |
| Commonwealth Bank of Australia, 2.688%, 3/11/2031 (n) | 688,000 | 605,777 | ||
| Danske Bank A.S., 1.549%, 9/10/2027 (n) | 361,000 | 346,983 | ||
| Danske Bank A.S., 4.613% to 10/02/2029, FLR (CMT - 1yr. + 1.1%) to 10/02/2030 (n) | 390,000 | 386,200 | ||
| Danske Bank A.S., 3.25% to 1/14/2032, FLR (EUR ICE Swap Rate - 1yr. + 0.9%) to 1/14/2033 | EUR | 430,000 | 488,247 | |
| Deutsche Bank AG, 5.373% to 1/10/2028, FLR (SOFR - 1 day + 1.21%) to 1/10/2029 | $ | 440,000 | 445,898 | |
| Erste Group Bank AG, 3.25% to 1/14/2032, FLR (EURIBOR - 3mo. +0.98%) to 1/14/2033 | EUR | 600,000 | 674,865 | |
| Goldman Sachs Group, Inc., 4.692% to 10/23/2029, FLR (SOFR - 1 day + 1.135%) to 10/23/2030 | $ | 216,000 | 215,472 | |
| Goldman Sachs Group, Inc., 5.016% to 10/23/2034, FLR (SOFR - 1 day + 1.42%) to 10/23/2035 | 495,000 | 479,637 | ||
| HSBC Holdings PLC, 2.099% to 6/04/2025, FLR (SOFR - 1 day + 1.929%) to 6/04/2026 | 271,000 | 270,275 | ||
| HSBC Holdings PLC, 5.13% to 3/03/2030, FLR (SOFR - 1 day + 1.29%) to 3/03/2031 | 347,000 | 349,767 | ||
| ING Groep N.V., 3.375%, 11/19/2032 | EUR | 300,000 | 338,522 | |
| JPMorgan Chase & Co., 5.581% to 4/22/2029, FLR (SOFR - 1 day + 1.16%) to 4/22/2030 | $ | 343,000 | 355,436 | |
| JPMorgan Chase & Co., 4.603% to 10/22/2029, FLR (SOFR - 1 day + 1.04%) to 10/22/2030 | 546,000 | 545,631 | ||
| JPMorgan Chase & Co., 1.953% to 2/04/2031, FLR (SOFR - 1 day + 1.065%) to 2/04/2032 | 639,000 | 548,625 | ||
| JPMorgan Chase & Co., 3.588%, 1/23/2036 | EUR | 400,000 | 444,037 | |
| Issuer | Shares/Par | Value ($) | ||
| Bonds – continued | ||||
| Major Banks – continued | ||||
| mBank S.A., 4.034% to 9/27/2029, FLR (EURIBOR - 3mo. + 1.75%) to 9/27/2030 | EUR | 400,000 | $454,273 | |
| Mitsubishi UFJ Financial Group, Inc., 2.494% to 10/13/2031, FLR (CMT - 1yr. + 0.97%) to 10/13/2032 | $ | 550,000 | 477,087 | |
| Morgan Stanley, 1.593% to 5/04/2026, FLR (SOFR - 1 day + 0.879%) to 5/04/2027 | 312,000 | 302,930 | ||
| Morgan Stanley, 3.622% to 4/01/2030, FLR (SOFR - 1 day + 3.12%) to 4/01/2031 | 550,000 | 521,925 | ||
| Morgan Stanley, 5.424% to 7/21/2033, FLR (SOFR - 1 day + 1.88%) to 7/21/2034 | 222,000 | 224,335 | ||
| Morgan Stanley, 5.213%, 10/24/2035 | GBP | 560,000 | 727,434 | |
| Nationwide Building Society, 5.532% to 1/13/2032, FLR (BPISDS01 + 1.474%) to 1/13/2033 | 600,000 | 803,040 | ||
| Nationwide Building Society, 4%, 7/30/2035 | EUR | 320,000 | 363,010 | |
| NatWest Group PLC, 3.673% to 8/05/2030, FLR (EURIBOR - 3mo. + 1.097%) to 8/05/2031 | 170,000 | 196,078 | ||
| NatWest Markets PLC, 3.125%, 1/10/2030 | 510,000 | 581,030 | ||
| PNC Financial Services Group, Inc., 5.676% to 1/22/2034, FLR (SOFR - 1 day + 1.902%) to 1/22/2035 | $ | 287,000 | 292,521 | |
| PNC Financial Services Group, Inc., 5.575% to 1/29/2035, FLR (SOFR - 1 day + 1.394%) to 1/29/2036 | 176,000 | 178,146 | ||
| Société Générale S.A., 3.75% to 7/15/2030, FLR (EURIBOR - 3mo. + 1.45%) to 7/15/2031 | EUR | 200,000 | 228,205 | |
| Société Générale S.A., 3.75%, 5/17/2035 | 300,000 | 334,064 | ||
| UBS Group AG, 2.746% to 2/11/2032, FLR (CMT - 1yr. + 1.1%) to 2/11/2033 (n) | $ | 1,356,000 | 1,160,677 | |
| UniCredit S.p.A., 2.569% to 9/22/2025, FLR (CMT - 1yr. + 2.3%) to 9/22/2026 (n) | 530,000 | 525,065 | ||
| UniCredit S.p.A., 3.8% to 1/16/2032, FLR (EURIBOR - 3mo. +1.4%) to 1/16/2033 | EUR | 660,000 | 753,957 | |
| Wells Fargo & Co., 5.244% to 1/24/2030, FLR (SOFR - 1 day + 1.11%) to 1/24/2031 | $ | 262,000 | 267,433 | |
| Wells Fargo & Co., 3.35% to 3/02/2032, FLR (SOFR - 1 day + 1.5%) to 3/02/2033 | 268,000 | 240,631 | ||
| $17,409,940 | ||||
| Medical & Health Technology & Services – 3.7% | ||||
| 180 Medical, Inc., 3.875%, 10/15/2029 (n) | $ | 765,000 | $716,402 | |
| Acadia Healthcare Co., Inc., 7.375%, 3/15/2033 (n) | 395,000 | 394,657 | ||
| Bausch & Lomb Escrow Corp., 8.375%, 10/01/2028 (n) | 427,000 | 443,568 | ||
| Charles River Laboratories International, Inc., 3.75%, 3/15/2029 (n) | 525,000 | 480,610 | ||
| CHS/Community Health Systems, Inc., 8%, 12/15/2027 (n) | 356,000 | 356,177 | ||
| Issuer | Shares/Par | Value ($) | ||
| Bonds – continued | ||||
| Medical & Health Technology & Services – continued | ||||
| CHS/Community Health Systems, Inc., 6.125%, 4/01/2030 (n) | $ | 295,000 | $201,159 | |
| CHS/Community Health Systems, Inc., 5.25%, 5/15/2030 (n) | 1,190,000 | 1,015,251 | ||
| Concentra, Inc., 6.875%, 7/15/2032 (n) | 531,000 | 543,636 | ||
| Encompass Health Corp., 5.75%, 9/15/2025 | 52,000 | 51,875 | ||
| Encompass Health Corp., 4.75%, 2/01/2030 | 643,000 | 624,780 | ||
| Encompass Health Corp., 4.625%, 4/01/2031 | 202,000 | 192,301 | ||
| HCA, Inc., 5.45%, 9/15/2034 | 131,000 | 129,984 | ||
| HCA, Inc., 5.125%, 6/15/2039 | 235,000 | 216,722 | ||
| IQVIA, Inc., 5%, 5/15/2027 (n) | 654,000 | 648,785 | ||
| IQVIA, Inc., 6.5%, 5/15/2030 (n) | 400,000 | 406,411 | ||
| Lifepoint Health, Inc., 9.875%, 8/15/2030 (n) | 293,000 | 311,671 | ||
| Lifepoint Health, Inc., 11%, 10/15/2030 (n) | 322,000 | 352,476 | ||
| Lifepoint Health, Inc., 10%, 6/01/2032 (n) | 212,000 | 205,640 | ||
| New York Society for the Relief of the Ruptured & Crippled, 2.667%, 10/01/2050 | 318,000 | 190,055 | ||
| ProMedica Toledo Hospital, “B”, AGM, 6.015%, 11/15/2048 | 205,000 | 198,611 | ||
| Surgery Center Holdings, Inc., 7.25%, 4/15/2032 (n) | 408,000 | 407,074 | ||
| Tenet Healthcare Corp., 6.125%, 10/01/2028 | 329,000 | 328,213 | ||
| Tenet Healthcare Corp., 6.125%, 6/15/2030 | 888,000 | 891,045 | ||
| Thermo Fisher Scientific Finance I B.V., 2%, 10/18/2051 | EUR | 330,000 | 242,083 | |
| U.S. Acute Care Solutions LLC, 9.75%, 5/15/2029 (n) | $ | 491,000 | 498,454 | |
| $10,047,640 | ||||
| Medical Equipment – 0.8% | ||||
| Insulet Corp., 6.5%, 4/01/2033 (n) | $ | 346,000 | $352,991 | |
| Medline Borrower LP, 3.875%, 4/01/2029 (n) | 256,000 | 238,802 | ||
| Medline Borrower LP, 5.25%, 10/01/2029 (n) | 727,000 | 690,386 | ||
| Medline Borrower LP/Medline Co-Issuer, Inc., 6.25%, 4/01/2029 (n) | 354,000 | 356,709 | ||
| Stryker Corp., 5.2%, 2/10/2035 | 468,000 | 471,656 | ||
| $2,110,544 | ||||
| Metals & Mining – 2.0% | ||||
| Anglo American Capital PLC, 5.625%, 4/01/2030 (n) | $ | 371,000 | $380,389 | |
| Baffinland Iron Mines Corp./Baffinland Iron Mines LP, 8.75%, 7/15/2026 (n) | 533,000 | 468,351 | ||
| Cleveland-Cliffs, Inc., 7%, 3/15/2032 (n) | 348,000 | 326,941 | ||
| FMG Resources Ltd., 4.375%, 4/01/2031 (n) | 1,511,000 | 1,367,503 | ||
| Mineral Resources Ltd., 9.25%, 10/01/2028 (n) | 199,000 | 188,197 | ||
| Novelis, Inc., 4.75%, 1/30/2030 (n) | 576,000 | 535,614 | ||
| Novelis, Inc., 6.875%, 1/30/2030 (n) | 300,000 | 304,322 | ||
| Novelis, Inc., 3.875%, 8/15/2031 (n) | 315,000 | 271,871 | ||
| Issuer | Shares/Par | Value ($) | ||
| Bonds – continued | ||||
| Metals & Mining – continued | ||||
| Petra Diamonds US$ Treasury PLC, 9.75%, 3/08/2026 (n) | $ | 263,919 | $142,545 | |
| Rio Tinto Finance (USA) PLC, 5%, 3/14/2032 | 656,000 | 660,426 | ||
| Samarco Mineracao S.A., 9% PIK to 12/30/2025, (4% Cash + 5% PIK) to 12/30/2026, (5.5% Cash + 3.5% PIK) to 12/30/2027, 9.25% Cash to 12/30/2029, 9.5% Cash to 6/30/2031 (p) | 430,472 | 405,149 | ||
| Taseko Mines Ltd., 8.25%, 5/01/2030 (n) | 494,000 | 498,795 | ||
| $5,550,103 | ||||
| Midstream – 5.5% | ||||
| Buckeye Partners LP, 6.75%, 2/01/2030 (n) | $ | 300,000 | $305,252 | |
| Buckeye Partners LP, 5.85%, 11/15/2043 | 147,000 | 123,424 | ||
| Columbia Pipelines Operating Co. LLC, 6.036%, 11/15/2033 (n) | 169,000 | 174,624 | ||
| Columbia Pipelines Operating Co. LLC, 6.544%, 11/15/2053 (n) | 379,000 | 386,010 | ||
| Delek Logistics Partners LP/Delek Logistics Corp., 8.625%, 3/15/2029 (n) | 602,000 | 617,991 | ||
| DT Midstream, Inc., 4.125%, 6/15/2029 (n) | 566,000 | 531,207 | ||
| DT Midstream, Inc., 4.375%, 6/15/2031 (n) | 769,000 | 708,278 | ||
| Eastern Energy Gas Holdings LLC, 5.65%, 10/15/2054 | 396,000 | 372,583 | ||
| Energy Transfer LP, 5.95%, 5/15/2054 | 250,000 | 227,277 | ||
| Galaxy Pipeline Assets Bidco Ltd., 2.16%, 3/31/2034 (n) | 388,462 | 342,046 | ||
| Genesis Energy LP/Genesis Energy Finance Corp., 8.25%, 1/15/2029 | 548,000 | 556,938 | ||
| Kinetik Holdings, Inc., 5.875%, 6/15/2030 (n) | 517,000 | 505,135 | ||
| NFE Financing LLC, 12%, 11/15/2029 (n) | 348,036 | 239,564 | ||
| NuStar Logistics LP, 6.375%, 10/01/2030 | 599,000 | 608,166 | ||
| Pembina Pipeline Corp., 4.81%, 3/25/2044 | CAD | 617,000 | 415,076 | |
| Peru LNG, 5.375%, 3/22/2030 | $ | 872,570 | 789,035 | |
| Plains All American Pipeline LP, 5.7%, 9/15/2034 | 409,000 | 404,509 | ||
| Prairie Acquiror LP, 9%, 8/01/2029 (n) | 448,000 | 451,454 | ||
| Rockies Express Pipeline LLC, 4.95%, 7/15/2029 (n) | 59,000 | 56,399 | ||
| Rockies Express Pipeline LLC, 6.75%, 3/15/2033 (n) | 194,000 | 197,111 | ||
| Rockies Express Pipeline LLC, 7.5%, 7/15/2038 (n) | 203,000 | 199,188 | ||
| Rockies Express Pipeline LLC, 6.875%, 4/15/2040 (n) | 581,000 | 548,473 | ||
| Sunoco LP, 7.25%, 5/01/2032 (n) | 612,000 | 634,653 | ||
| Tallgrass Energy Partners LP, 5.5%, 1/15/2028 (n) | 849,000 | 825,427 | ||
| Tallgrass Energy Partners LP, 7.375%, 2/15/2029 (n) | 334,000 | 332,784 | ||
| Targa Resources Corp., 4.2%, 2/01/2033 | 131,000 | 119,630 | ||
| Targa Resources Corp., 4.95%, 4/15/2052 | 325,000 | 261,719 | ||
| TransMontaigne Partners LLC, 8.5%, 6/15/2030 (n) | 298,000 | 299,933 | ||
| Venture Global Calcasieu Pass LLC, 3.875%, 8/15/2029 (n) | 242,000 | 221,630 | ||
| Issuer | Shares/Par | Value ($) | ||
| Bonds – continued | ||||
| Midstream – continued | ||||
| Venture Global Calcasieu Pass LLC, 4.125%, 8/15/2031 (n) | $ | 945,000 | $848,944 | |
| Venture Global LNG, Inc., 8.125%, 6/01/2028 (n) | 441,000 | 437,946 | ||
| Venture Global LNG, Inc., 9.5%, 2/01/2029 (n) | 542,000 | 561,638 | ||
| Venture Global LNG, Inc., 7%, 1/15/2030 (n) | 254,000 | 239,268 | ||
| Venture Global LNG, Inc., 8.375%, 6/01/2031 (n) | 740,000 | 713,594 | ||
| Venture Global LNG, Inc., 9% to 9/30/2029, FLR (CMT - 5yr. + 5.44%) to 3/30/2173 (n) | 622,000 | 534,631 | ||
| Venture Global Plaquemines LNG LLC, 7.5%, 5/01/2033 (n) | 174,000 | 178,508 | ||
| $14,970,045 | ||||
| Municipals – 0.5% | ||||
| Massachusetts Educational Financing Authority, Education Loan Rev., Taxable, “A”, 2.641%, 7/01/2037 | $ | 435,000 | $403,807 | |
| Michigan Finance Authority Hospital Rev., Taxable (Trinity Health Credit Group), 3.384%, 12/01/2040 | 605,000 | 496,646 | ||
| National Finance Authority, NH, Utility Refunding Rev., Taxable (Wheeling Power Co. Project), “A”, 6.89%, 4/01/2034 | 355,000 | 368,308 | ||
| $1,268,761 | ||||
| Natural Gas - Distribution – 0.6% | ||||
| Boston Gas Co., 5.843%, 1/10/2035 (n) | $ | 594,000 | $611,699 | |
| Engie S.A., 1.375%, 2/28/2029 | EUR | 300,000 | 322,568 | |
| Vier Gas Transport GmbH, 3.375%, 11/11/2031 | 500,000 | 564,834 | ||
| $1,499,101 | ||||
| Natural Gas - Pipeline – 0.4% | ||||
| APA Infrastructure Ltd., 5.125%, 9/16/2034 (n) | $ | 362,000 | $350,314 | |
| APA Infrastructure Ltd., 2.5%, 3/15/2036 | GBP | 740,000 | 716,417 | |
| APA Infrastructure Ltd., 5.75%, 9/16/2044 (n) | $ | 136,000 | 130,645 | |
| $1,197,376 | ||||
| Network & Telecom – 0.8% | ||||
| Altice Financing S.A., 5.75%, 8/15/2029 (n) | $ | 240,000 | $177,005 | |
| Frontier Communications Holdings LLC, 6.75%, 5/01/2029 (n) | 601,000 | 603,522 | ||
| Iliad Holding S.A.S., 7%, 10/15/2028 (n) | 640,000 | 647,803 | ||
| Iliad Holding S.A.S., 5.375%, 4/15/2030 (n) | EUR | 100,000 | 115,695 | |
| Iliad Holding S.A.S., 6.875%, 4/15/2031 (n) | 233,000 | 281,455 | ||
| Orange S.A., 1.375%, 9/04/2049 | 200,000 | 149,061 | ||
| TDC Net A/S, 5%, 8/09/2032 (w) | 100,000 | 114,132 | ||
| Windstream Services, LLC / Windstream Escrow, 8.25%, 10/01/2031 (n) | $ | 199,000 | 203,720 | |
| $2,292,393 | ||||
| Issuer | Shares/Par | Value ($) | ||
| Bonds – continued | ||||
| Oil Services – 0.4% | ||||
| Nabors Industries, Inc., 8.875%, 8/15/2031 (n) | $ | 545,000 | $369,640 | |
| U.S.A. Compression Partners LP/Finance Co., 7.125%, 3/15/2029 (n) | 601,000 | 606,824 | ||
| Valaris Ltd., 8.375%, 4/30/2030 (n) | 247,000 | 231,436 | ||
| $1,207,900 | ||||
| Oils – 0.3% | ||||
| Marathon Petroleum Corp., 5.7%, 3/01/2035 | $ | 491,000 | $480,122 | |
| Raizen Fuels Finance S.A., 6.45%, 3/05/2034 (n) | 402,000 | 399,501 | ||
| $879,623 | ||||
| Other Banks & Diversified Financials – 2.4% | ||||
| AIB Group PLC, 6.608% to 9/13/2028, FLR (SOFR - 1 day + 2.33%) to 9/13/2029 (n) | $ | 621,000 | $656,630 | |
| AIB Group PLC, 3.75% to 3/20/2032, FLR (EUR ICE Swap Rate - 1yr. + 1.25%) to 3/20/2033 | EUR | 750,000 | 849,043 | |
| AIB Group PLC, 5.871% to 3/28/2034, FLR (SOFR - 1 day + 1.91%) to 3/28/2035 (n) | $ | 400,000 | 407,964 | |
| AIB Group PLC, 6% to 1/14/2032, FLR (EUR ICE Swap Rate - 5yr. + 3.705%) to 7/14/2173 | EUR | 420,000 | 457,120 | |
| BPCE S.A., 2.277% to 1/20/2031, FLR (SOFR - 1 day + 1.312%) to 1/20/2032 (n) | $ | 500,000 | 424,214 | |
| BPCE S.A., 3.875% to 2/26/2035, FLR (EURIBOR - 3mo. + 1.45%) to 2/26/2036 | EUR | 200,000 | 223,199 | |
| CaixaBank S.A., 3.75%, 1/27/2036 | 300,000 | 337,983 | ||
| Commerzbank AG, 3.625%, 1/14/2032 | 300,000 | 340,535 | ||
| Coventry Building Society, 3.125%, 10/29/2029 | 220,000 | 249,817 | ||
| Deutsche Bank AG, 3.375% to 2/13/2030, FLR (EURIBOR - 3mo. + 1.25%) to 2/13/2031 | 200,000 | 225,115 | ||
| Deutsche Bank AG, 7.125% to 4/30/2031, FLR (EUR ICE Swap Rate - 5yr. + 4.6%) to 4/30/2173 | 400,000 | 437,564 | ||
| Intesa Sanpaolo S.p.A., 7.2%, 11/28/2033 (n) | $ | 318,000 | 352,522 | |
| Intesa Sanpaolo S.p.A., 7.8%, 11/28/2053 (n) | 209,000 | 235,656 | ||
| M&T Bank Corp., 6.082% to 3/13/2031, FLR (SOFR - 1 day + 2.26%) to 3/13/2032 | 172,000 | 178,973 | ||
| Manufacturers and Traders Trust Co., 4.7%, 1/27/2028 | 359,000 | 360,828 | ||
| PKO Bank Polski S.A., 3.875% to 9/12/2026, FLR (EURIBOR - 3mo. + 1.4%) to 9/12/2027 | EUR | 340,000 | 388,196 | |
| Truist Financial Corp., 5.435% to 1/24/2029, FLR (SOFR - 1 day + 1.62%) to 1/24/2030 | $ | 239,000 | 244,194 | |
| Truist Financial Corp., 5.711% to 1/24/2034, FLR (SOFR - 1 day + 1.922%) to 1/24/2035 | 174,000 | 177,003 | ||
| $6,546,556 | ||||
| Issuer | Shares/Par | Value ($) | ||
| Bonds – continued | ||||
| Pharmaceuticals – 1.3% | ||||
| 1261229 B.C. Ltd., 10%, 4/15/2032 (n) | $ | 400,000 | $391,670 | |
| AbbVie, Inc., 4.875%, 3/15/2030 | 243,000 | 248,349 | ||
| AbbVie, Inc., 5.35%, 3/15/2044 | 226,000 | 218,587 | ||
| AbbVie, Inc., 5.4%, 3/15/2054 | 282,000 | 270,200 | ||
| Bausch Health Co., Inc., 4.875%, 6/01/2028 (n) | 386,000 | 313,490 | ||
| Bausch Health Co., Inc., 5.25%, 1/30/2030 (n) | 214,000 | 125,275 | ||
| Bristol-Myers Squibb Co., 5.5%, 2/22/2044 | 188,000 | 184,294 | ||
| Eli Lilly & Co., 5.5%, 2/12/2055 | 418,000 | 419,090 | ||
| Grifols S.A., 3.875%, 10/15/2028 | EUR | 250,000 | 265,512 | |
| Johnson & Johnson, 3.05%, 2/26/2033 | 220,000 | 249,649 | ||
| Organon Finance 1 LLC, 4.125%, 4/30/2028 (n) | $ | 580,000 | 547,038 | |
| Sandoz Finance B.V., 4%, 3/26/2035 | EUR | 210,000 | 239,224 | |
| $3,472,378 | ||||
| Pollution Control – 0.5% | ||||
| GFL Environmental, Inc., 4%, 8/01/2028 (n) | $ | 530,000 | $504,856 | |
| GFL Environmental, Inc., 3.5%, 9/01/2028 (n) | 179,000 | 169,743 | ||
| GFL Environmental, Inc., 6.75%, 1/15/2031 (n) | 349,000 | 362,786 | ||
| Wrangler Holdco Corp., 6.625%, 4/01/2032 (n) | 238,000 | 244,314 | ||
| $1,281,699 | ||||
| Precious Metals & Minerals – 0.8% | ||||
| Coeur Mining, Inc., 5.125%, 2/15/2029 (n) | $ | 198,000 | $187,835 | |
| Eldorado Gold Corp., 6.25%, 9/01/2029 (n) | 608,000 | 599,308 | ||
| IAMGOLD Corp., 5.75%, 10/15/2028 (n) | 552,000 | 546,821 | ||
| New Gold, Inc., 6.875%, 4/01/2032 (n) | 394,000 | 402,968 | ||
| Northern Star Resources Ltd. Co., 6.125%, 4/11/2033 (n) | 346,000 | 356,071 | ||
| $2,093,003 | ||||
| Printing & Publishing – 0.2% | ||||
| News Corp., 3.875%, 5/15/2029 (n) | $ | 520,000 | $489,250 | |
| Railroad & Shipping – 0.1% | ||||
| Burlington Northern Sante Fe LLC, 5.5%, 3/15/2055 | $ | 397,000 | $389,859 | |
| Real Estate - Healthcare – 0.2% | ||||
| MPT Operating Partnership LP/MPT Finance Corp., REIT, 5%, 10/15/2027 | $ | 194,000 | $171,401 | |
| MPT Operating Partnership LP/MPT Finance Corp., REIT, 8.5%, 2/15/2032 (n) | 350,000 | 355,594 | ||
| $526,995 | ||||
| Issuer | Shares/Par | Value ($) | ||
| Bonds – continued | ||||
| Real Estate - Office – 0.8% | ||||
| Alexandrite Monnet UK Holdco PLC, 10.5%, 5/15/2029 | EUR | 390,000 | $484,877 | |
| Boston Properties LP, REIT, 3.65%, 2/01/2026 | $ | 363,000 | 359,263 | |
| Boston Properties LP, REIT, 2.75%, 10/01/2026 | 204,000 | 197,784 | ||
| Corporacion Inmobiliaria Vesta S.A.B. de C.V., 3.25%, 1/22/2030 | EUR | 200,000 | 227,685 | |
| Corporate Office Property LP, REIT, 2.25%, 3/15/2026 | $ | 245,000 | 239,035 | |
| Corporate Office Property LP, REIT, 2%, 1/15/2029 | 95,000 | 85,022 | ||
| Corporate Office Property LP, REIT, 2.75%, 4/15/2031 | 208,000 | 180,208 | ||
| Cousins Properties, Inc., REIT, 5.875%, 10/01/2034 | 451,000 | 451,290 | ||
| $2,225,164 | ||||
| Real Estate - Other – 0.9% | ||||
| EPR Properties, REIT, 3.6%, 11/15/2031 | $ | 630,000 | $556,966 | |
| Park Intermediate Holdings LLC, 4.875%, 5/15/2029 (n) | 508,000 | 475,573 | ||
| RHP Hotel Properties LP/RHP Finance Corp., 7.25%, 7/15/2028 (n) | 859,000 | 882,793 | ||
| XHR LP, REIT, 4.875%, 6/01/2029 (n) | 637,000 | 598,755 | ||
| $2,514,087 | ||||
| Real Estate - Retail – 0.7% | ||||
| Choice Properties, REIT, 5.03%, 2/28/2031 | CAD | 639,000 | $484,061 | |
| Hammerson PLC, 5.875%, 10/08/2036 | GBP | 138,000 | 176,150 | |
| STORE Capital Corp., REIT, 2.75%, 11/18/2030 | $ | 347,000 | 304,632 | |
| STORE Capital Corp., REIT, 2.7%, 12/01/2031 | 266,000 | 225,166 | ||
| WEA Finance LLC, 4.125%, 9/20/2028 (n) | 322,000 | 315,237 | ||
| WEA Finance LLC, REIT, 2.875%, 1/15/2027 (n) | 400,000 | 388,083 | ||
| $1,893,329 | ||||
| Restaurants – 0.5% | ||||
| 1011778 B.C. ULC/New Red Finance, Inc., 6.125%, 6/15/2029 (n) | $ | 383,000 | $389,057 | |
| 1011778 B.C. ULC/New Red Finance, Inc., 4%, 10/15/2030 (n) | 358,000 | 325,792 | ||
| Fertitta Entertainment LLC, 6.75%, 1/15/2030 (n) | 549,000 | 480,324 | ||
| New Red Finance, Inc., 5.625%, 9/15/2029 (n) | 251,000 | 250,169 | ||
| $1,445,342 | ||||
| Retailers – 1.5% | ||||
| Hanesbrands, Inc., 9%, 2/15/2031 (n) | $ | 199,000 | $206,163 | |
| Home Depot, Inc., 4.875%, 2/15/2044 | 129,000 | 117,941 | ||
| Home Depot, Inc., 3.625%, 4/15/2052 | 379,000 | 274,100 | ||
| L Brands, Inc., 6.625%, 10/01/2030 (n) | 649,000 | 660,426 | ||
| Macy's Retail Holdings LLC, 5.875%, 4/01/2029 (n) | 488,000 | 462,776 | ||
| Mavis Tire Express Services Corp., 6.5%, 5/15/2029 (n) | 351,000 | 323,648 | ||
| Issuer | Shares/Par | Value ($) | ||
| Bonds – continued | ||||
| Retailers – continued | ||||
| Maxeda DIY Holding B.V., 5.875%, 10/01/2026 | EUR | 310,000 | $288,603 | |
| Parkland Corp., 4.625%, 5/01/2030 (n) | $ | 876,000 | 824,512 | |
| Parkland Corp., 6.625%, 8/15/2032 (n) | 102,000 | 101,530 | ||
| Penske Automotive Group Co., 3.75%, 6/15/2029 | 655,000 | 607,262 | ||
| Saks Global Enterprises, 11%, 12/15/2029 (n) | 250,000 | 151,634 | ||
| $4,018,595 | ||||
| Specialty Chemicals – 0.6% | ||||
| International Flavors & Fragrances, Inc., 1.832%, 10/15/2027 (n) | $ | 257,000 | $240,125 | |
| International Flavors & Fragrances, Inc., 4.375%, 6/01/2047 | 448,000 | 337,638 | ||
| International Flavors & Fragrances, Inc., 5%, 9/26/2048 | 411,000 | 341,937 | ||
| Linde PLC, 1.625%, 3/31/2035 | EUR | 300,000 | 289,020 | |
| Linde PLC, 3.25%, 2/18/2037 | 500,000 | 554,062 | ||
| $1,762,782 | ||||
| Specialty Stores – 0.9% | ||||
| Carvana Co., 9% (9% Cash or 12% PIK) to 8/15/2025, 9% Cash to 12/01/2028 (n)(p) | $ | 173,602 | $178,471 | |
| Carvana Co., 14% (9% Cash or 14% PIK) to 8/15/2025, 9% Cash to 6/01/2031 (n)(p) | 641,425 | 721,959 | ||
| DICK'S Sporting Goods, 4.1%, 1/15/2052 | 427,000 | 292,570 | ||
| Michael Cos., Inc., 5.25%, 5/01/2028 (n) | 287,000 | 149,550 | ||
| Michael Cos., Inc., 7.875%, 5/01/2029 (n) | 322,000 | 110,662 | ||
| PetSmart, Inc./PetSmart Finance Corp., 7.75%, 2/15/2029 (n) | 815,000 | 759,071 | ||
| Richemont International S.A., 1.625%, 5/26/2040 | EUR | 210,000 | 178,471 | |
| $2,390,754 | ||||
| Supermarkets – 1.1% | ||||
| Albertsons Cos., LLC / Safeway, Inc., 6.25%, 3/15/2033 (n) | $ | 986,000 | $1,000,343 | |
| KeHE Distributors LLC/KeHE Finance Corp., 9%, 2/15/2029 (n) | 677,000 | 692,572 | ||
| Kroger Co., 5.5%, 9/15/2054 | 328,000 | 306,814 | ||
| Ocado Group PLC, 10.5%, 8/08/2029 | GBP | 300,000 | 400,310 | |
| Tesco Corporate Treasury Services PLC, 3.375%, 5/06/2032 (w) | EUR | 220,000 | 247,193 | |
| Tesco Corporate Treasury Services PLC, 5.125%, 5/22/2034 | GBP | 200,000 | 252,513 | |
| $2,899,745 | ||||
| Issuer | Shares/Par | Value ($) | ||
| Bonds – continued | ||||
| Telecommunications - Wireless – 1.7% | ||||
| Altice France S.A., 5.5%, 1/15/2028 (n) | $ | 683,000 | $565,452 | |
| Altice France S.A., 5.125%, 7/15/2029 (n) | 200,000 | 163,177 | ||
| American Tower Corp., 5.45%, 2/15/2034 | 464,000 | 471,329 | ||
| Millicom International Cellular S.A., 4.5%, 4/27/2031 (n) | 625,000 | 556,650 | ||
| SBA Communications Corp., 3.125%, 2/01/2029 | 779,000 | 721,724 | ||
| Telefónica Celular del Paraguay S.A., 5.875%, 4/15/2027 (n) | 576,000 | 571,398 | ||
| T-Mobile USA, Inc., 3.875%, 4/15/2030 | 126,000 | 121,578 | ||
| T-Mobile USA, Inc., 5.75%, 1/15/2034 | 113,000 | 117,480 | ||
| T-Mobile USA, Inc., 3.5%, 2/11/2037 | EUR | 350,000 | 378,745 | |
| Vodafone Group PLC, 5.625%, 2/10/2053 | $ | 360,000 | 333,913 | |
| Zegona Finance PLC, 6.75%, 7/15/2029 (n) | EUR | 100,000 | 119,686 | |
| Zegona Finance PLC, 8.625%, 7/15/2029 (n) | $ | 531,000 | 564,676 | |
| $4,685,808 | ||||
| Telephone Services – 0.8% | ||||
| Deutsche Telekom AG, 3.625%, 2/03/2045 | EUR | 220,000 | $232,212 | |
| Koninklijke KPN N.V., 3.375%, 2/17/2035 | 400,000 | 445,076 | ||
| Level 3 Financing, Inc., 11%, 11/15/2029 (n) | $ | 299,781 | 335,005 | |
| Level 3 Financing, Inc., 3.875%, 10/15/2030 (n) | 324,763 | 256,141 | ||
| TELUS Corp., 2.85%, 11/13/2031 | CAD | 912,000 | 616,860 | |
| Uniti Group/CSL Capital Co., 6.5%, 2/15/2029 (n) | $ | 395,000 | 361,358 | |
| $2,246,652 | ||||
| Tobacco – 0.9% | ||||
| B.A.T. International Finance PLC, 4.125%, 4/12/2032 | EUR | 540,000 | $624,467 | |
| Imperial Brands Finance PLC, 5.5%, 2/01/2030 (n) | $ | 445,000 | 457,304 | |
| Japan Tobacco, Inc., 5.25%, 6/15/2030 (n) | 416,000 | 430,185 | ||
| Philip Morris International, Inc., 4.75%, 11/01/2031 | 440,000 | 441,570 | ||
| Turning Point Brands, Inc., 7.625%, 3/15/2032 (n) | 395,000 | 410,469 | ||
| $2,363,995 | ||||
| Transportation - Services – 1.2% | ||||
| Aeroporti Di Roma S.p.A, 3.625%, 6/15/2032 (w) | EUR | 420,000 | $473,737 | |
| Avis Budget Finance PLC, 7.25%, 7/31/2030 (n) | 447,000 | 500,687 | ||
| Cofiroute S.A., 3.125%, 3/06/2033 | 200,000 | 223,760 | ||
| DSV Finance B.V., 3.25%, 11/06/2030 | 100,000 | 114,421 | ||
| DSV Finance B.V., 3.375%, 11/06/2032 | 100,000 | 113,922 | ||
| DSV Finance B.V., 3.375%, 11/06/2034 | 100,000 | 111,204 | ||
| Element Fleet Management Corp., 6.271%, 6/26/2026 (n) | $ | 238,000 | 242,064 | |
| Element Fleet Management Corp., 6.319%, 12/04/2028 (n) | 111,000 | 116,761 | ||
| Element Fleet Management Corp., 5.037%, 3/25/2030 (n) | 409,000 | 406,993 | ||
| Heathrow Funding Ltd., 6%, 3/05/2032 | GBP | 300,000 | 398,752 | |
| Issuer | Shares/Par | Value ($) | ||
| Bonds – continued | ||||
| Transportation - Services – continued | ||||
| Heathrow Funding Ltd., 3.875%, 1/16/2038 | EUR | 420,000 | $473,669 | |
| $3,175,970 | ||||
| U.S. Treasury Obligations – 5.2% | ||||
| U.S. Treasury Bonds, 2.375%, 2/15/2042 (f) | $ | 9,432,000 | $6,915,203 | |
| U.S. Treasury Bonds, 4.625%, 5/15/2054 (f) | 3,890,000 | 3,834,841 | ||
| U.S. Treasury Notes, 4.625%, 2/15/2035 | 3,304,000 | 3,427,900 | ||
| $14,177,944 | ||||
| Utilities - Electric Power – 6.5% | ||||
| Adani Electricity Mumbai Ltd., 3.949%, 2/12/2030 (n) | $ | 720,000 | $622,700 | |
| Berkshire Hathaway Energy Co., 5.15%, 11/15/2043 | 94,000 | 87,578 | ||
| Berkshire Hathaway Energy Co., 4.6%, 5/01/2053 | 79,000 | 64,510 | ||
| Bruce Power LP, 2.68%, 12/21/2028 | CAD | 264,000 | 186,370 | |
| Bruce Power LP, 4.7%, 6/21/2031 | 238,000 | 179,845 | ||
| Bruce Power LP, 4.27%, 12/21/2034 | 594,000 | 426,193 | ||
| Calpine Corp., 4.5%, 2/15/2028 (n) | $ | 570,000 | 557,510 | |
| Centrais Eletricas Brasileiras S.A., 6.5%, 1/11/2035 (n) | 207,000 | 203,218 | ||
| Clearway Energy Operating LLC, 3.75%, 2/15/2031 (n) | 1,153,000 | 1,026,485 | ||
| Clearway Energy Operating LLC, 3.75%, 1/15/2032 (n) | 173,000 | 150,028 | ||
| Duke Energy Florida LLC, 6.2%, 11/15/2053 | 366,000 | 384,006 | ||
| E.ON International Finance B.V., 5.875%, 10/30/2037 | GBP | 300,000 | 400,690 | |
| Edison International, 4.7%, 8/15/2025 | $ | 420,000 | 419,097 | |
| Enel Finance International N.V., 2.5%, 7/12/2031 (n) | 284,000 | 246,823 | ||
| Enel Finance International N.V., 3.875%, 1/23/2035 | EUR | 320,000 | 367,370 | |
| Enel Finance International N.V., 3.5%, 2/24/2036 | 320,000 | 352,036 | ||
| Enel S.p.A., 4.5% to 1/14/2033, FLR (EUR ICE Swap Rate - 5yr. + 2.196%) to 1/14/2038, FLR (EUR ICE Swap Rate - 5yr. + 2.446%) to 1/14/2053, FLR (EUR ICE Swap Rate - 5yr. + 3.446%) to 1/14/2174 | 460,000 | 508,083 | ||
| ENGIE Energia Chile S.A., 6.375%, 4/17/2034 (n) | $ | 200,000 | 206,221 | |
| Entergy Corp., 0.9%, 9/15/2025 | 561,000 | 553,027 | ||
| Eversource Energy, 5.5%, 1/01/2034 | 472,000 | 472,052 | ||
| Georgia Power Co., 4.95%, 5/17/2033 | 363,000 | 362,077 | ||
| Hydro One, Inc., 4.25%, 1/04/2035 | CAD | 728,000 | 536,928 | |
| Jersey Central Power & Light Co., 2.75%, 3/01/2032 (n) | $ | 186,000 | 160,479 | |
| Jersey Central Power & Light Co., 5.1%, 1/15/2035 (n) | 519,000 | 511,515 | ||
| National Grid PLC, 3.875%, 1/16/2029 | EUR | 560,000 | 658,970 | |
| NextEra Energy Capital Holdings, Inc., 5.749%, 9/01/2025 | $ | 409,000 | 410,277 | |
| Northern States Power Co. of Minnesota, 5.05%, 5/15/2035 (w) | 349,000 | 350,184 | ||
| Oncor Electric Delivery Co. LLC, 5.35%, 4/01/2035 (n) | 332,000 | 336,157 | ||
| Pacific Gas & Electric Co., 6.1%, 1/15/2029 | 170,000 | 175,684 | ||
| Pacific Gas & Electric Co., 6.4%, 6/15/2033 | 164,000 | 169,572 | ||
| Issuer | Shares/Par | Value ($) | ||
| Bonds – continued | ||||
| Utilities - Electric Power – continued | ||||
| Pacific Gas & Electric Co., 5.9%, 10/01/2054 | $ | 229,000 | $209,582 | |
| PG&E Corp., 5.25%, 7/01/2030 | 856,000 | 824,740 | ||
| PG&E Corp., 7.375% to 3/15/2030, FLR (CMT - 5yr. + 3.883%) to 3/15/2055 | 249,000 | 241,727 | ||
| PPL Electric Utilities Corp. 1st Mortgage, 5.25%, 5/15/2053 | 512,000 | 483,400 | ||
| Southern California Edison Co., 5.45%, 3/01/2035 | 261,000 | 253,375 | ||
| SSE PLC, 3.5%, 3/18/2032 | EUR | 310,000 | 357,015 | |
| Star Energy Geothermal (Wayang Windu) Ltd., 6.75%, 4/24/2033 | $ | 587,986 | 587,995 | |
| Terna Rete Elettrica Nazionale S.p.A., 3.125%, 2/17/2032 | EUR | 460,000 | 516,525 | |
| TerraForm Global Operating LLC, 6.125%, 3/01/2026 (n) | $ | 189,000 | 184,788 | |
| TerraForm Power Operating LLC, 5%, 1/31/2028 (n) | 687,000 | 669,139 | ||
| TerraForm Power Operating LLC, 4.75%, 1/15/2030 (n) | 541,000 | 509,906 | ||
| Xcel Energy, Inc., 4.6%, 6/01/2032 | 237,000 | 228,279 | ||
| Xcel Energy, Inc., 5.5%, 3/15/2034 | 184,000 | 184,386 | ||
| Xcel Energy, Inc., 5.6%, 4/15/2035 | 58,000 | 58,565 | ||
| XPLR Infrastructure Operating Partners LP, 4.5%, 9/15/2027 (n) | 423,000 | 399,920 | ||
| XPLR Infrastructure Operating Partners LP, 7.25%, 1/15/2029 (n) | 561,000 | 555,213 | ||
| XPLR Infrastructure Operating Partners LP, 8.375%, 1/15/2031 (n) | 259,000 | 259,951 | ||
| XPLR Infrastructure Operating Partners LP, 8.625%, 3/15/2033 (n) | 122,000 | 121,743 | ||
| $17,731,934 | ||||
| Utilities - Gas – 0.4% | ||||
| EP Infrastructure A.S., 2.045%, 10/09/2028 | EUR | 1,123,000 | $1,194,358 | |
| Utilities - Water – 0.1% | ||||
| Severn Trent Water Ltd., 3.875%, 8/04/2035 | EUR | 340,000 | $383,827 | |
| Total Bonds (Identified Cost, $367,112,114) | $359,430,231 | |||
| Common Stocks – 0.1% | ||||
| Oil Services – 0.0% | ||||
| LTRI Holdings LP (a)(u) | 520 | $142,100 | ||
| Telecom Services – 0.1% | ||||
| Intelsat Emergence S.A. (a) | 5,426 | $214,327 | ||
| Total Common Stocks (Identified Cost, $632,367) | $356,427 | |||
| Issuer | Strike Price | First Exercise | Shares/Par | Value ($) |
| Warrants – 0.0% | ||||
| Other Banks & Diversified Financials – 0.0% | ||||
| Avation Capital S.A. (1 share for 1 warrant, Expiration 10/31/26) (a) (Identified Cost, $0) | GBP 1.14 | N/A | 7,000 | $3,218 |
| Mutual Funds (h) – 0.5% | ||||
| Money Market Funds – 0.5% | ||||
| MFS Institutional Money Market Portfolio, 4.36% (v) (Identified Cost, $1,223,946) | 1,223,949 | $1,223,949 | ||
| Underlying/Expiration Date/Exercise Price | Put/Call | Counterparty | Notional Amount | Par Amount/ Number of Contracts | |
| Purchased Options – 0.0% | |||||
| Market Index Securities – 0.0% | |||||
| iTraxx Europe Crossover Series 43 Index Credit Default Swap - Fund pays 5%, Fund receives notional amount upon a defined credit event of an index constituent – June 2025 @ 4.25% (Premiums Paid, $70,841) | Put | Citibank N.A. | $ 6,802,123 | EUR 5,610,000 | $28,660 |
| Other Assets, Less Liabilities – (32.7)% | (88,916,915) | |||
| Net Assets – 100.0% | $272,125,570 | |||
| (a) | Non-income producing security. | |||
| (f) | All or a portion of the security has been segregated as collateral for open futures contracts. | |||
| (h) | An affiliated issuer, which may be considered one in which the fund owns 5% or more of the outstanding voting securities, or a company which is under common control. At period end, the aggregate values of the fund's investments in affiliated issuers and in unaffiliated issuers were $1,223,949 and $359,818,536, respectively. | |||
| (i) | Interest only security for which the fund receives interest on notional principal (Par amount). Par amount shown is the notional principal and does not reflect the cost of the security. | |||
| (n) | Securities exempt from registration under Rule 144A of the Securities Act of 1933. These securities may be sold in the ordinary course of business in transactions exempt from registration, normally to qualified institutional buyers. At period end, the aggregate value of these securities was $198,309,255, representing 72.9% of net assets. | |||
| (p) | Payment-in-kind (PIK) security for which interest income may be received in additional securities and/or cash. | |||
| (u) | The security was valued using significant unobservable inputs and is considered level 3 under the fair value hierarchy. For further information about the fund’s level 3 holdings, please see Note 2 in the Notes to Financial Statements. |
| (v) | Affiliated issuer that is available only to investment companies managed by MFS. The rate quoted for the MFS Institutional Money Market Portfolio is the annualized seven-day yield of the fund at period end. | |||
| (w) | When-issued security. |
| The following abbreviations are used in this report and are defined: | |
| AGM | Assured Guaranty Municipal |
| BPISDS01 | 1-year SONIA linked ICE Swap Rate |
| CDO | Collateralized Debt Obligation |
| CLO | Collateralized Loan Obligation |
| CMT | Constant Maturity Treasury |
| EURIBOR | Euro Interbank Offered Rate |
| FLR | Floating Rate. Interest rate resets periodically based on the parenthetically disclosed reference rate plus a spread (if any). The period-end rate reported may not be the current rate. All reference rates are USD unless otherwise noted. |
| ICE | Intercontinental Exchange |
| NPFG | National Public Finance Guarantee Corp. |
| REIT | Real Estate Investment Trust |
| SOFR | Secured Overnight Financing Rate |
| SONIA | Sterling Overnight Index Average |
| Abbreviations indicate amounts shown in currencies other than the U.S. dollar. All amounts are stated in U.S. dollars unless otherwise indicated. A list of abbreviations is shown below: | |
| AUD | Australian Dollar |
| BRL | Brazilian Real |
| CAD | Canadian Dollar |
| CHF | Swiss Franc |
| CLP | Chilean Peso |
| CNH | Chinese Yuan Renminbi (Offshore) |
| CZK | Czech Koruna |
| EUR | Euro |
| GBP | British Pound |
| HUF | Hungarian Forint |
| IDR | Indonesian Rupiah |
| INR | Indian Rupee |
| JPY | Japanese Yen |
| KRW | South Korean Won |
| MXN | Mexican Peso |
| NOK | Norwegian Krone |
| NZD | New Zealand Dollar |
| PEN | Peruvian Nuevo Sol |
| SEK | Swedish Krona |
| SGD | Singapore Dollar |
| UYU | Uruguayan Peso |
| ZAR | South African Rand |
| Forward Foreign Currency Exchange Contracts | ||||||
| Currency Purchased | Currency Sold | Counterparty | Settlement Date | Unrealized Appreciation (Depreciation) | ||
| Asset Derivatives | ||||||
| AUD | 1,056,841 | USD | 673,456 | Deutsche Bank AG | 7/18/2025 | $4,102 |
| AUD | 6,771,376 | USD | 4,286,800 | State Street Corp. | 7/18/2025 | 54,445 |
| BRL | 2,098,221 | USD | 356,241 | Goldman Sachs International | 6/02/2025 | 10,853 |
| BRL | 3,851,458 | USD | 669,237 | JPMorgan Chase Bank N.A. | 6/02/2025 | 4,594 |
| CAD | 4,141,768 | USD | 2,993,572 | Citibank N.A. | 7/18/2025 | 22,531 |
| CAD | 86,824 | USD | 62,905 | State Street Corp. | 7/18/2025 | 321 |
| CAD | 2,714,331 | USD | 1,964,914 | UBS AG | 7/18/2025 | 11,705 |
| CNH | 5,899,874 | USD | 815,661 | JPMorgan Chase Bank N.A. | 7/18/2025 | 471 |
| CZK | 16,183,771 | USD | 722,006 | Citibank N.A. | 7/18/2025 | 14,053 |
| EUR | 203,410 | USD | 225,790 | HSBC Bank | 7/18/2025 | 5,705 |
| EUR | 923,258 | USD | 1,022,724 | State Street Corp. | 7/18/2025 | 28,013 |
| GBP | 1,091,182 | USD | 1,424,554 | Deutsche Bank AG | 7/18/2025 | 30,090 |
| JPY | 619,585,752 | USD | 4,349,817 | State Street Corp. | 7/18/2025 | 20,910 |
| MXN | 27,717,876 | USD | 1,344,735 | JPMorgan Chase Bank N.A. | 7/18/2025 | 54,958 |
| NOK | 43,591,066 | USD | 4,096,411 | Deutsche Bank AG | 7/18/2025 | 93,690 |
| NZD | 153,817 | USD | 89,479 | Citibank N.A. | 7/18/2025 | 2,107 |
| PEN | 140,575 | USD | 37,872 | Deutsche Bank AG | 7/24/2025 | 377 |
| SEK | 7,174,513 | USD | 735,801 | State Street Corp. | 7/18/2025 | 9,810 |
| SGD | 925,891 | USD | 698,396 | State Street Corp. | 7/18/2025 | 13,426 |
| USD | 600,959 | CHF | 484,280 | Deutsche Bank AG | 7/18/2025 | 8,913 |
| USD | 633,047 | CHF | 510,346 | State Street Corp. | 7/18/2025 | 9,134 |
| USD | 1,040,043 | EUR | 906,530 | HSBC Bank | 7/18/2025 | 8,344 |
| USD | 1,114,189 | EUR | 972,997 | JPMorgan Chase Bank N.A. | 7/18/2025 | 6,846 |
| USD | 779,212 | EUR | 680,540 | State Street Corp. | 7/18/2025 | 4,707 |
| USD | 913,215 | EUR | 799,772 | UBS AG | 7/18/2025 | 3,014 |
| USD | 1,697,516 | JPY | 240,036,153 | JPMorgan Chase Bank N.A. | 7/18/2025 | 4,235 |
| USD | 627,526 | NOK | 6,521,331 | JPMorgan Chase Bank N.A. | 7/18/2025 | 677 |
| USD | 670,278 | SEK | 6,437,837 | Goldman Sachs International | 7/18/2025 | 1,226 |
| $429,257 | ||||||
| Liability Derivatives | ||||||
| CHF | 390,729 | USD | 485,059 | HSBC Bank | 7/18/2025 | $(7,382) |
| CHF | 594,562 | USD | 739,045 | UBS AG | 7/18/2025 | (12,176) |
| CLP | 634,207,011 | USD | 674,704 | Goldman Sachs International | 7/11/2025 | (5,217) |
| EUR | 336,885 | USD | 383,981 | HSBC Bank | 7/18/2025 | (581) |
| EUR | 1,802,927 | USD | 2,060,769 | Merrill Lynch International | 7/18/2025 | (8,901) |
| EUR | 414,084 | USD | 473,571 | State Street Corp. | 7/18/2025 | (2,313) |
| IDR | 106,020,558 | USD | 6,529 | Citibank N.A. | 5/05/2025 | (142) |
| ZAR | 7,604,596 | USD | 406,576 | State Street Corp. | 7/18/2025 | (115) |
| USD | 8,587,485 | AUD | 13,861,066 | State Street Corp. | 7/18/2025 | (299,081) |
| USD | 346,130 | BRL | 2,047,056 | Goldman Sachs International | 6/02/2025 | (12,012) |
| USD | 3,828,269 | CAD | 5,288,984 | BNP Paribas S.A. | 7/18/2025 | (23,254) |
| USD | 3,926,185 | CAD | 5,423,313 | Goldman Sachs International | 7/18/2025 | (23,158) |
| USD | 5,383,872 | CAD | 7,432,705 | Merrill Lynch International | 7/18/2025 | (28,744) |
| Forward Foreign Currency Exchange Contracts - continued | ||||||
| Currency Purchased | Currency Sold | Counterparty | Settlement Date | Unrealized Appreciation (Depreciation) | ||
| Liability Derivatives - continued | ||||||
| USD | 1,316,672 | CNH | 9,579,706 | Goldman Sachs International | 7/18/2025 | $(8,494) |
| USD | 1,524,354 | CNH | 11,092,265 | HSBC Bank | 7/18/2025 | (10,045) |
| USD | 704,417 | CZK | 15,547,814 | JPMorgan Chase Bank N.A. | 7/18/2025 | (2,718) |
| USD | 10,285,348 | EUR | 9,064,451 | Barclays Bank PLC | 7/18/2025 | (30,678) |
| USD | 782,595 | EUR | 688,158 | HSBC Bank | 7/18/2025 | (581) |
| USD | 13,856,217 | EUR | 12,213,178 | JPMorgan Chase Bank N.A. | 7/18/2025 | (43,297) |
| USD | 19,200,945 | EUR | 16,907,701 | State Street Corp. | 7/18/2025 | (41,288) |
| USD | 6,925,493 | GBP | 5,298,411 | JPMorgan Chase Bank N.A. | 7/18/2025 | (137,766) |
| USD | 796,456 | GBP | 600,000 | Merrill Lynch International | 7/18/2025 | (3,398) |
| USD | 487,519 | GBP | 365,713 | State Street Corp. | 7/18/2025 | (10) |
| USD | 3,199 | HUF | 1,159,878 | Goldman Sachs International | 7/18/2025 | (38) |
| USD | 6,306 | IDR | 106,020,558 | Citibank N.A. | 5/05/2025 | (80) |
| USD | 682,828 | INR | 59,355,245 | Citibank N.A. | 8/07/2025 | (15,339) |
| USD | 4,289,725 | KRW | 6,072,866,222 | Barclays Bank PLC | 7/24/2025 | (3,815) |
| USD | 2,633,690 | KRW | 3,731,939,022 | Goldman Sachs International | 7/24/2025 | (4,805) |
| USD | 1,347,189 | MXN | 27,761,602 | State Street Corp. | 7/18/2025 | (54,711) |
| USD | 801,096 | NOK | 8,400,238 | Deutsche Bank AG | 7/18/2025 | (6,360) |
| USD | 1,342,926 | NOK | 14,378,208 | Goldman Sachs International | 7/18/2025 | (39,150) |
| USD | 82,374 | NZD | 141,584 | State Street Corp. | 7/18/2025 | (1,927) |
| USD | 749,174 | SEK | 7,296,951 | Deutsche Bank AG | 7/18/2025 | (9,161) |
| USD | 701,191 | SGD | 917,466 | Goldman Sachs International | 7/18/2025 | (4,153) |
| USD | 385,963 | ZAR | 7,565,269 | Citibank N.A. | 7/18/2025 | (18,396) |
| $(859,286) | ||||||
| Futures Contracts | ||||||
| Description | Long/ Short | Currency | Contracts | Notional Amount | Expiration Date | Value/Unrealized Appreciation (Depreciation) |
| Asset Derivatives | ||||||
| Interest Rate Futures | ||||||
| Euro-Bobl 5 yr | Long | EUR | 5 | $677,615 | June – 2025 | $15,678 |
| U.S. Treasury Bond 30 yr | Long | USD | 38 | 4,431,750 | June – 2025 | 21,195 |
| U.S. Treasury Note 2 yr | Long | USD | 23 | 4,787,414 | June – 2025 | 31,972 |
| U.S. Treasury Ultra Bond 30 yr | Short | USD | 27 | 3,267,844 | June – 2025 | 52,022 |
| $120,867 | ||||||
| Liability Derivatives | ||||||
| Interest Rate Futures | ||||||
| Canadian Treasury Bond 10 yr | Short | CAD | 14 | $1,255,796 | June – 2025 | $(5,119) |
| Euro-Bund 10 yr | Short | EUR | 59 | 8,807,935 | June – 2025 | (47,592) |
| Euro-Buxl 30 yr | Short | EUR | 12 | 1,687,041 | June – 2025 | (81,593) |
| Euro-Schatz 2 yr | Short | EUR | 217 | 26,443,778 | June – 2025 | (179,183) |
| Long Gilt 10 yr | Short | GBP | 5 | 623,171 | June – 2025 | (2,150) |
| U.S. Treasury Note 10 yr | Short | USD | 48 | 5,386,500 | June – 2025 | (117,552) |
| U.S. Treasury Note 5 yr | Short | USD | 175 | 19,109,180 | June – 2025 | (379,884) |
| Futures Contracts - continued | ||||||
| Description | Long/ Short | Currency | Contracts | Notional Amount | Expiration Date | Value/Unrealized Appreciation (Depreciation) |
| Liability Derivatives - continued | ||||||
| Interest Rate Futures - continued | ||||||
| U.S. Treasury Ultra Note 10 yr | Short | USD | 48 | $5,507,250 | June – 2025 | $(81,051) |
| $(894,124) | ||||||
| Assets | |
| Investments in unaffiliated issuers, at value (identified cost, $367,815,322) | $359,818,536 |
| Investments in affiliated issuers, at value (identified cost, $1,223,946) | 1,223,949 |
| Cash | 8,294 |
| Foreign currency, at value (identified cost, $3,498) | 3,491 |
| Restricted cash for | |
| Forward foreign currency exchange contracts | 840,000 |
| Receivables for | |
| Forward foreign currency exchange contracts | 429,257 |
| Investments sold | 5,025,605 |
| Interest | 4,956,254 |
| Other assets | 36,767 |
| Total assets | $372,342,153 |
| Liabilities | |
| Notes payable | $95,000,000 |
| Payables for | |
| Distributions | 169,542 |
| Forward foreign currency exchange contracts | 859,286 |
| Net daily variation margin on open futures contracts | 71,576 |
| Investments purchased | 117,911 |
| When-issued investments purchased | 3,665,720 |
| Payable to affiliates | |
| Investment adviser | 12,031 |
| Administrative services fee | 250 |
| Transfer agent and dividend disbursing costs | 4,526 |
| Payable for independent Trustees' compensation | 1,190 |
| Accrued interest expense | 42,117 |
| Deferred foreign capital gains tax expense payable | 121,861 |
| Accrued expenses and other liabilities | 150,573 |
| Total liabilities | $100,216,583 |
| Net assets | $272,125,570 |
| Net assets consist of | |
| Paid-in capital | $327,051,394 |
| Total distributable earnings (loss) | (54,925,824) |
| Net assets | $272,125,570 |
| Shares of beneficial interest outstanding (unlimited number of shares authorized) | 54,946,365 |
| Net asset value per share (net assets of $272,125,570 / 54,946,365 shares of beneficial interest outstanding) | $4.95 |
| Net investment income (loss) | |
| Income | |
| Interest | $10,831,495 |
| Dividends from affiliated issuers | 127,137 |
| Dividends from unaffiliated issuers | 47,381 |
| Other | 279 |
| Foreign taxes withheld | (4,766) |
| Total investment income | $11,001,526 |
| Expenses | |
| Management fee | $1,070,876 |
| Transfer agent and dividend disbursing costs | 47,665 |
| Administrative services fee | 24,091 |
| Independent Trustees' compensation | 5,633 |
| Stock exchange fee | 26,756 |
| Custodian fee | 29,076 |
| Shareholder communications | 67,082 |
| Audit and tax fees | 50,820 |
| Legal fees | 2,062 |
| Interest expense and fees | 2,610,805 |
| Miscellaneous | 27,503 |
| Total expenses | $3,962,369 |
| Net investment income (loss) | $7,039,157 |
| Realized and unrealized gain (loss) | |
| Realized gain (loss) (identified cost basis) | |
| Unaffiliated issuers | $(923,693) |
| Affiliated issuers | (1,190) |
| Written options | 67,946 |
| Futures contracts | 1,264,567 |
| Swap agreements | 58,528 |
| Forward foreign currency exchange contracts | (82,461) |
| Foreign currency | (6,912) |
| Net realized gain (loss) | $376,785 |
| Change in unrealized appreciation or depreciation | |
| Unaffiliated issuers (includes $3,281 increase in deferred foreign capital gains tax) | $(627,169) |
| Affiliated issuers | (46) |
| Written options | (59,489) |
| Futures contracts | (1,424,883) |
| Swap agreements | (35,445) |
| Forward foreign currency exchange contracts | (1,014,464) |
| Translation of assets and liabilities in foreign currencies | 37,929 |
| Net unrealized gain (loss) | $(3,123,567) |
| Net realized and unrealized gain (loss) | $(2,746,782) |
| Change in net assets from operations | $4,292,375 |
| Six months ended | Year ended | |
| 4/30/25 (unaudited) | 10/31/24 | |
| Change in net assets | ||
| From operations | ||
| Net investment income (loss) | $7,039,157 | $13,754,502 |
| Net realized gain (loss) | 376,785 | (5,950,030) |
| Net unrealized gain (loss) | (3,123,567) | 37,426,471 |
| Change in net assets from operations | $4,292,375 | $45,230,943 |
| Distributions to shareholders | $(5,178,197) | $(12,663,993) |
| Tax return of capital distributions to shareholders | $— | $(9,679,669) |
| Distributions from other sources | $(5,990,000)(a) | $— |
| Change in net assets from fund share transactions | $(1,618,592) | $(6,722,168) |
| Total change in net assets | $(8,494,414) | $16,165,113 |
| Net assets | ||
| At beginning of period | 280,619,984 | 264,454,871 |
| At end of period | $272,125,570 | $280,619,984 |
| (a) | Estimated tax return of capital. All or a portion of this amount may be redesignated as ordinary income and/or capital gains at fiscal year end when the tax character of distributions is determined. Please refer to “Tax Matters and Distributions” under Note 2 of the Notes to Financial Statements for additional information regarding the tax character of the fund’s distributions. |
| Cash flows from operating activities: | |
| Change in net assets from operations | $4,292,375 |
| Adjustments to reconcile change in net assets from operations to net cash provided by operating activities: | |
| Purchase of investment securities | (130,302,050) |
| Proceeds from disposition of investment securities | 131,510,346 |
| Proceeds from disposition of short-term investments, net | 5,994,247 |
| Realized gain/loss on investments | 938,244 |
| Unrealized appreciation/depreciation on investments | 623,934 |
| Unrealized appreciation/depreciation on foreign currency contracts | 1,014,464 |
| Unrealized appreciation/depreciation on swaps | 35,445 |
| Net amortization/accretion of income | (784,674) |
| Increase in interest receivable | (97,198) |
| Decrease in accrued expenses and other liabilities | (28,671) |
| Decrease in receivable for net daily variation margin on open futures contracts | 66,852 |
| Increase in payable for net daily variation margin on open futures contracts | 71,576 |
| Increase in other assets | (27,742) |
| Decrease in interest payable | (18,236) |
| Net cash provided by operating activities | $13,288,912 |
| Cash flows from financing activities: | |
| Distributions paid in cash | $(11,174,294) |
| Repurchase of shares of beneficial interest | (1,618,592) |
| Net cash used by financing activities | $(12,792,886) |
| Net increase in cash and restricted cash | $496,026 |
| Cash and restricted cash: | |
| Beginning of period (including foreign currency of $21,250) | $355,759 |
| End of period (including foreign currency of $3,491) | $851,785 |
| Six months ended | Year ended | |||||
| 4/30/25 (unaudited) | 10/31/24 | 10/31/23 | 10/31/22 | 10/31/21 | 10/31/20 | |
| Net asset value, beginning of period | $5.07 | $4.66 | $4.73 | $6.12 | $6.19 | $6.37 |
| Income (loss) from investment operations | ||||||
| Net investment income (loss) (d) | $0.13 | $0.25 | $0.26 | $0.25 | $0.28 | $0.29 |
| Net realized and unrealized gain (loss) | (0.05) | 0.55 | 0.04 | (1.21) | 0.15 | (0.01) |
| Total from investment operations | $0.08 | $0.80 | $0.30 | $(0.96) | $0.43 | $0.28 |
| Less distributions declared to shareholders | ||||||
| From net investment income | $(0.09) | $(0.23) | $(0.23) | $(0.39) | $(0.30) | $(0.34) |
| From tax return of capital | — | (0.17) | (0.16) | (0.05) | (0.20) | (0.15) |
| From other sources | (0.11)(b) | — | — | — | — | — |
| Total distributions declared to shareholders | $(0.20) | $(0.40) | $(0.39) | $(0.44) | $(0.50) | $(0.49) |
| Net increase from repurchase of capital shares | $0.00(w) | $0.01 | $0.02 | $0.01 | $— | $0.03 |
| Net asset value, end of period (x) | $4.95 | $5.07 | $4.66 | $4.73 | $6.12 | $6.19 |
| Market value, end of period | $4.61 | $4.76 | $4.22 | $4.32 | $6.58 | $5.67 |
| Total return at market value (%) | 1.10(n) | 22.85 | 6.53 | (28.43) | 25.80 | 2.77 |
| Total return at net asset value (%) (j)(s)(x) | 1.92(n) | 18.50 | 7.44 | (15.74) | 7.18 | 5.86 |
| Ratios (%) (to average net assets) and Supplemental data: | ||||||
| Expenses | 2.88(a) | 3.17 | 2.92 | 1.40 | 1.01 | 1.17 |
| Net investment income (loss) | 5.12(a) | 4.89 | 5.21 | 4.57 | 4.40 | 4.63 |
| Portfolio turnover rate | 34(n) | 78 | 67 | 56 | 70 | 78 |
| Net assets at end of period (000 omitted) | $272,126 | $280,620 | $264,455 | $281,814 | $369,818 | $372,635 |
| Supplemental Ratios (%): | ||||||
| Ratios of expenses to average net assets excluding interest expense and fees | 0.98(a) | 0.98 | 0.99 | 0.86 | 0.81 | 0.84 |
| Senior Securities: | ||||||
| Total notes payable outstanding (000 omitted) | $95,000 | $95,000 | $95,000 | $100,000 | $100,000 | $100,000 |
| Asset coverage per $1,000 of indebtedness (k) | $3,864 | $3,954 | $3,784 | $3,818 | $4,698 | $4,726 |
| (a) | Annualized. |
| (b) | Estimated tax return of capital. All or a portion of this amount may be redesignated as ordinary income and/or capital gains at fiscal year end when the tax character of distributions is determined. Please refer to “Tax Matters and Distributions” under Note 2 of the Notes to Financial Statements for additional information regarding the tax character of the fund’s distributions. |
| (d) | Per share data is based on average shares outstanding. |
| (j) | Total return at net asset value is calculated using the net asset value of the fund, not the publicly traded price and therefore may be different than the total return at market value. |
| (k) | Calculated by subtracting the fund's total liabilities (not including notes payable) from the fund's total assets and dividing this number by the notes payable outstanding and then multiplying by 1,000. |
| (n) | Not annualized. |
| (s) | From time to time the fund may receive proceeds from litigation settlements, without which performance would be lower. |
| (w) | Per share amount was less than $0.01. |
| (x) | The net asset values and total returns at net asset value have been calculated on net assets which include adjustments made in accordance with U.S. generally accepted accounting principles required at period end for financial reporting purposes. |
| Financial Instruments | Level 1 | Level 2 | Level 3 | Total |
| Equity Securities: | ||||
| Luxembourg | $— | $214,327 | $— | $214,327 |
| United States | — | — | 142,100 | 142,100 |
| United Kingdom | — | 3,218 | — | 3,218 |
| U.S. Treasury Bonds & U.S. Government Agencies & Equivalents | — | 14,177,944 | — | 14,177,944 |
| Non - U.S. Sovereign Debt | — | 55,643,915 | — | 55,643,915 |
| Municipal Bonds | — | 1,268,761 | — | 1,268,761 |
| U.S. Corporate Bonds | — | 189,642,258 | — | 189,642,258 |
| Residential Mortgage-Backed Securities | — | 1,257,701 | — | 1,257,701 |
| Commercial Mortgage-Backed Securities | — | 4,133,443 | — | 4,133,443 |
| Asset-Backed Securities (including CDOs) | — | 5,139,411 | — | 5,139,411 |
| Foreign Bonds | — | 88,195,458 | — | 88,195,458 |
| Investment Companies | 1,223,949 | — | — | 1,223,949 |
| Total | $1,223,949 | $359,676,436 | $142,100 | $361,042,485 |
| Other Financial Instruments | ||||
| Futures Contracts – Assets | $120,867 | $— | $— | $120,867 |
| Futures Contracts – Liabilities | (894,124) | — | — | (894,124) |
| Forward Foreign Currency Exchange Contracts – Assets | — | 429,257 | — | 429,257 |
| Forward Foreign Currency Exchange Contracts – Liabilities | — | (859,286) | — | (859,286) |
| Equity Securities | |
| Balance as of 10/31/24 | $118,336 |
| Change in unrealized appreciation or depreciation | 23,764 |
| Balance as of 4/30/25 | $142,100 |
| Fair Value (a) | |||
| Risk | Derivative Contracts | Asset Derivatives | Liability Derivatives |
| Credit | Purchased Option Contracts | $28,660 | $— |
| Interest Rate | Futures Contracts | 120,867 | (894,124) |
| Foreign Exchange | Forward Foreign Currency Exchange Contracts | 429,257 | (859,286) |
| Total | $578,784 | $(1,753,410) | |
| (a) | The value of purchased options outstanding is included in investments in unaffiliated issuers, at value, within the Statement of Assets and Liabilities. Values presented in this table for futures contracts correspond to the values reported in the Portfolio of Investments. Only the current day net variation margin for futures contracts is reported separately within the Statement of Assets and Liabilities. |
| Risk | Futures Contracts | Swap Agreements | Forward Foreign Currency Exchange Contracts | Unaffiliated Issuers (Purchased Options) | Written Options |
| Interest Rate | $1,264,567 | $— | $— | $— | $— |
| Foreign Exchange | — | — | (82,461) | — | — |
| Credit | — | 58,528 | — | (168,129) | 67,946 |
| Total | $1,264,567 | $58,528 | $(82,461) | $(168,129) | $67,946 |
| Risk | Futures Contracts | Swap Agreements | Forward Foreign Currency Exchange Contracts | Unaffiliated Issuers (Purchased Options) | Written Options |
| Interest Rate | $(1,424,883) | $— | $— | $— | $— |
| Foreign Exchange | — | — | (1,014,464) | — | — |
| Credit | — | (35,445) | — | 150,726 | (59,489) |
| Total | $(1,424,883) | $(35,445) | $(1,014,464) | $150,726 | $(59,489) |
| 4/30/25 | |
| Cash | $11,785 |
| Restricted cash | 840,000 |
| Restricted cash included in deposits with brokers | — |
| Total cash and restricted cash in the Statement of Cash Flows | $851,785 |
| Year ended 10/31/24 | |
| Ordinary income (including any short-term capital gains) | $12,663,993 |
| Tax return of capital (b) | 9,679,669 |
| Total distributions | $22,343,662 |
| (b) | Distributions in excess of tax basis earnings and profits are reported in the financial statements as a tax return of capital. |
| As of 4/30/25 | |
| Cost of investments | $368,526,749 |
| Gross appreciation | 8,006,409 |
| Gross depreciation | (15,490,673) |
| Net unrealized appreciation (depreciation) | $(7,484,264) |
| As of 10/31/24 | |
| Capital loss carryforwards | (37,872,706) |
| Other temporary differences | (317,911) |
| Net unrealized appreciation (depreciation) | (9,859,385) |
| Short-Term | $(946,715) |
| Long-Term | (36,925,991) |
| Total | $(37,872,706) |
| Purchases | Sales | |
| U.S. Government securities | $5,232,262 | $4,514,128 |
| Non-U.S. Government securities | 117,856,810 | 126,135,901 |
| Six months ended 4/30/25 | Year ended 10/31/24 | ||||
| Shares | Amount | Shares | Amount | ||
| Capital shares repurchased | (355,350) | $(1,618,592) | (1,471,211) | $(6,722,168) | |
| Affiliated Issuers | Beginning Value | Purchases | Sales Proceeds | Realized Gain (Loss) | Change in Unrealized Appreciation or Depreciation | Ending Value |
| MFS Institutional Money Market Portfolio | $7,218,242 | $68,648,762 | $74,641,819 | $(1,190) | $(46) | $1,223,949 |
| Affiliated Issuers | Dividend Income | Capital Gain Distributions |
| MFS Institutional Money Market Portfolio | $127,137 | $— |
Item 1(b):
A copy of the notice transmitted to the Registrant’s shareholders in reliance on Rule 30e-3 of the Investment Company Act of 1940, as amended that contains disclosure specified by paragraph (c)(3) of Rule 30e-3 is attached hereto as EX-99.30e-3Notice.
ITEM 2. CODE OF ETHICS.
During the period covered by this report, the Registrant has not amended any provision in its Code of Ethics (the “Code”) that relates to an element of the Code’s definition enumerated in paragraph (b) of Item 2 of this Form N-CSR. During the period covered by this report, the Registrant did not grant a waiver, including an implicit waiver, from any provision of the Code.
ITEM 3. AUDIT COMMITTEE FINANCIAL EXPERT.
Not applicable for semi-annual reports.
ITEM 4. PRINCIPAL ACCOUNTANT FEES AND SERVICES.
Not applicable for semi-annual reports.
ITEM 5. AUDIT COMMITTEE OF LISTED REGISTRANTS.
Not applicable for semi-annual reports.
ITEM 6. INVESTMENTS
A schedule of investments of the Registrant is included as part of the report to shareholders of the Registrant under Item 1(a) of this Form N-CSR.
ITEM 7. FINANCIAL STATEMENTS AND FINANCIAL HIGHLIGHTS FOR OPEN-END MANAGEMENT INVESTMENT COMPANIES.
Not applicable to the Registrant.
ITEM 8. CHANGES IN AND DISAGREEMENTS WITH ACCOUNTANTS FOR OPEN-END MANAGEMENT INVESTMENT COMPANIES.
Not applicable to the Registrant.
ITEM 9. PROXY DISCLOSURES FOR OPEN-END MANAGEMENT INVESTMENT COMPANIES.
Not applicable to the Registrant.
ITEM 10. RENUMERATION PAID TO DIRECTORS, OFFICERS, AND OTHERS OF OPEN-END MANAGEMENT INVESTMENT COMPANIES.
Not applicable to the Registrant.
ITEM 11. STATEMENT REGARDING BASES FOR APPROVAL OF INVESTMENT ADVISORY CONTRACT.
Not applicable.
ITEM 12. DISCLOSURE OF PROXY VOTING POLICIES AND PROCEDURES FOR CLOSED-END MANAGEMENT INVESTMENT COMPANIES.
Not applicable for semi-annual reports.
ITEM 13. PORTFOLIO MANAGERS OF CLOSED-END MANAGEMENT INVESTMENT COMPANIES.
There were no changes during the period.

ITEM 14. PURCHASES OF EQUITY SECURITIES BY CLOSED-END MANAGEMENT INVESTMENT COMPANY AND AFFILIATED PURCHASERS.
MFS Multimarket Income Trust
|
|
|
|
|
(c) Total |
(d) Maximum |
|
|
|
|
|
Number of |
Number (or |
|
|
|
(a) Total number |
(b) |
Shares |
Approximate |
|
|
Period |
of Shares |
Average |
Purchased as |
Dollar Value) of |
|
|
|
Purchased |
Price |
Part of Publicly |
Shares that May |
|
|
|
|
Paid per |
Announced |
Yet Be Purchased |
|
|
|
|
Share |
Plans or |
under the Plans |
|
|
|
|
|
Programs |
or Programs |
|
|
|
|
|
|
|
|
|
11/01/24-11/30/24 |
37,439 |
4.67 |
37,439 |
5,492,732 |
|
|
12/01/24-12/31/24 |
128,457 |
4.63 |
128,457 |
5,364,275 |
|
|
01/01/25-01/31/25 |
22,000 |
4.66 |
22,000 |
5,342,275 |
|
|
02/01/25-02/28/25 |
0 |
N/A |
0 |
5,342,275 |
|
|
03/01/25-03/31/25 |
0 |
N/A |
0 |
5,342,275 |
|
|
04/01/25-04/30/25 |
167,454 |
4.46 |
167,454 |
5,174,821 |
|
|
Total |
355,350 |
4.55 |
355,350 |
|
|
|
|
|
|
|
|
Note: The Board approved procedures to repurchase shares and reviews the results periodically. The notification to shareholders of the program is part of the semi-annual and annual reports sent to shareholders. These annual programs begin on October 1st of each year. The programs conform to the conditions of Rule 10b-18 of the Securities Exchange Act of 1934 and limit the aggregate number of shares that may be purchased in each annual period (October 1 through the following September 30) to 10% of the Registrant’s outstanding shares as of the first day of the plan year (October 1). The aggregate number of shares available for purchase for the October 1, 2024 plan year is 5,530,171.
ITEM 15. SUBMISSION OF MATTERS TO A VOTE OF SECURITY HOLDERS.
There were no material changes to the procedures by which shareholders may send recommendations to the Board for nominees to the Registrant’s Board since the Registrant last provided disclosure as to such procedures in response to the requirements of Item 407 (c)(2)(iv) of Regulation S-K or this Item.
ITEM 16. CONTROLS AND PROCEDURES.
(a)Based upon their evaluation of the effectiveness of the registrant’s disclosure controls and procedures (as defined in Rule 30a-3(c) under the Investment Company Act of 1940 (the “Act”)) as conducted within 90 days of the filing date of this report on Form N-CSR, the Registrant’s principal financial officer and principal executive officer have concluded that those disclosure controls and procedures provide reasonable assurance that the material information required to be disclosed by the Registrant on this report is recorded, processed, summarized and reported within the time periods specified in the Securities and Exchange Commission’s rules and forms.
(b)There were no changes in the Registrant’s internal controls over financial reporting (as defined in Rule 30a-3(d) under the Act) that occurred during the period covered by the report that have materially affected, or are reasonably likely to materially affect, the Registrant’s internal control over financial reporting.
ITEM 17. DISCLOSURE OF SECURITIES LENDING ACTIVITIES FOR CLOSED-END MANAGEMENT INVESTMENT COMPANIES.
Not applicable for semi-annual reports.
ITEM 18. RECOVERY OF ERRONEOUSLY AWARDED COMPENSATION.
Not applicable.
ITEM 19. EXHIBITS.
(a)(1) Any code of ethics, or amendment thereto, that is the subject of the disclosure required by Item 2, to the extent that the registrant intends to satisfy the Item 2 requirements through filing of an exhibit: Not applicable.
(2)A separate certification for each principal executive officer and principal financial officer of the registrant as required by Rule 30a-2(a) under the Act (17 CFR 270.30a-2): Attached hereto as EX-99.302CERT.
(3)Any written solicitation to purchase securities under Rule 23c-1 under the Act (17 CFR 270.23c-1) sent or given during the period covered by the report by or on behalf of the registrant to 10 or more persons. Not applicable.
(4)Change in the registrant’s independent public accountant. Not applicable.
(b)If the report is filed under Section 13(a) or 15(d) of the Exchange Act, provide the certifications required by Rule 30a-2(b) under the Act (17 CFR 270.30a-2(b)), Rule 13a-14(b) or Rule 15d-14(b) under the Exchange Act (17 CFR 240.13a-14(b) or 240.15d-14(b)) and Section 1350 of Chapter 63 of Title 18 of the United States Code (18 U.S.C. 1350) as an exhibit. A certification furnished pursuant to this paragraph will not be deemed “filed” for the purposes of Section 18 of the Exchange Act (15 U.S.C. 78r), or otherwise subject to the liability of that section. Such certification will not be deemed to be incorporated by reference into any filing under the Securities Act of 1933 or the Exchange Act, except to the extent that the registrant specifically incorporates it by reference. Attached hereto as EX-99.906CERT.
(c)Registrant’s Rule 30e-3 Notice pursuant to Item 1(b) of Form N-CSR. Attached hereto as EX-99.30e-3Notice.
(d)Notices to Trust’s common shareholders in accordance with Investment Company Act Section 19(a) and Rule 19a-1. Attached hereto as Ex-99.19a-1.
Notice
A copy of the Amended and Restated Declaration of Trust, as amended, of the Registrant is on file with the Secretary of State of The Commonwealth of Massachusetts and notice is hereby given that this instrument is executed on behalf of the Registrant by an officer of the Registrant as an officer and not individually and the obligations of or arising out of this instrument are not binding upon any of the Trustees or shareholders individually, but are binding only upon the assets and property of the respective constituent series of the Registrant.
SIGNATURES
Pursuant to the requirements of the Securities Exchange Act of 1934 and the Investment Company Act of 1940, the registrant has duly caused this report to be signed on its behalf by the undersigned, thereunto duly authorized.
(Registrant) MFS MULTIMARKET INCOME TRUST
By (Signature and Title)*
/S/ DAVID L. DILORENZO
David L. DiLorenzo, President
Date: June 13, 2025
Pursuant to the requirements of the Securities Exchange Act of 1934 and the Investment Company Act of 1940, this report has been signed below by the following persons on behalf of the registrant and in the capacities and on the dates indicated.
By (Signature and Title)*
/S/ DAVID L. DILORENZO
David L. DiLorenzo, President (Principal Executive Officer)
Date: June 13, 2025
By (Signature and Title)*
/S/ KASEY L. PHILLIPS
Kasey L. Phillips, Treasurer (Principal Financial Officer and Accounting Officer) Date: June 13, 2025
* Print name and title of each signing officer under his or her signature.
EX-99.302CERT
MFS MULTIMARKET INCOME TRUST
Certification Pursuant to Section 302 of the Sarbanes-Oxley Act
I, Kasey L. Phillips, certify that:
1.I have reviewed this report on Form N-CSR of MFS Multimarket Income Trust;
2.Based on my knowledge, this report does not contain any untrue statement of a material fact or omit to state a material fact necessary to make the statements made, in light of the circumstances under which such statements were made, not misleading with respect to the period covered by this report;
3.Based on my knowledge, the financial statements, and other financial information included in this report, fairly present in all material respects the financial condition, results of operations, changes in net assets, and cash flows (if the financial statements are required to include a statement of cash flows) of the registrant as of, and for, the periods presented in this report;
4.The registrant’s other certifying officer and I are responsible for establishing and maintaining disclosure controls and procedures (as defined in Rule 30a-3(c) under the Investment Company Act of 1940) and internal control over financial reporting (as defined in Rule 30a-3(d) under the Investment Company Act of 1940) for the registrant and have:
a.Designed such disclosure controls and procedures, or caused such disclosure controls and procedures to be designed under our supervision, to ensure that material information relating to the registrant, including its consolidated subsidiaries, is made known to us by others within those entities, particularly during the period in which this report is being prepared;
b.Designed such internal control over financial reporting, or caused such internal control over financial reporting to be designed under our supervision, to provide reasonable assurance regarding the reliability of financial reporting and the preparation of financial statements for external purposes in accordance with generally accepted accounting principles;
c.Evaluated the effectiveness of the registrant’s disclosure controls and procedures and presented in this report our conclusions about the effectiveness of the disclosure controls and procedures as of a date within 90 days prior to the filing date of this report based on such evaluation; and
d.Disclosed in this report any change in the registrant’s internal control over financial reporting that occurred during the period covered by the report that has materially affected, or is reasonably likely to materially affect, the registrant’s internal control over financial reporting; and
5.The registrant’s other certifying officer and I have disclosed to the registrant’s auditors and the audit committee of the registrant’s board of directors (or persons performing the equivalent functions):
a.All significant deficiencies and material weaknesses in the design or operation of internal control over financial reporting which are reasonably likely to adversely affect the registrant’s ability to record, process, summarize, and report financial information; and
b.Any fraud, whether or not material, that involves management or other employees who have a significant role in the registrant’s internal control over financial reporting.
Date: June 13, 2025
/S/ KASEY L. PHILLIPS
Kasey L. Phillips
Treasurer (Principal Financial Officer and Accounting Officer)
EX-99.302CERT
MFS MULTIMARKET INCOME TRUST
Certification Pursuant to Section 302 of the Sarbanes-Oxley Act
I, David L. DiLorenzo, certify that:
1.I have reviewed this report on Form N-CSR of MFS Multimarket Income Trust;
2.Based on my knowledge, this report does not contain any untrue statement of a material fact or omit to state a material fact necessary to make the statements made, in light of the circumstances under which such statements were made, not misleading with respect to the period covered by this report;
3.Based on my knowledge, the financial statements, and other financial information included in this report, fairly present in all material respects the financial condition, results of operations, changes in net assets, and cash flows (if the financial statements are required to include a statement of cash flows) of the registrant as of, and for, the periods presented in this report;
4.The registrant’s other certifying officer and I are responsible for establishing and maintaining disclosure controls and procedures (as defined in Rule 30a-3(c) under the Investment Company Act of 1940) and internal control over financial reporting (as defined in Rule 30a-3(d) under the Investment Company Act of 1940) for the registrant and have:
a.Designed such disclosure controls and procedures, or caused such disclosure controls and procedures to be designed under our supervision, to ensure that material information relating to the registrant, including its consolidated subsidiaries, is made known to us by others within those entities, particularly during the period in which this report is being prepared;
b.Designed such internal control over financial reporting, or caused such internal control over financial reporting to be designed under our supervision, to provide reasonable assurance regarding the reliability of financial reporting and the preparation of financial statements for external purposes in accordance with generally accepted accounting principles;
c.Evaluated the effectiveness of the registrant’s disclosure controls and procedures and presented in this report our conclusions about the effectiveness of the disclosure controls and procedures as of a date within 90 days prior to the filing date of this report based on such evaluation; and
d.Disclosed in this report any change in the registrant’s internal control over financial reporting that occurred during the period covered by the report that has materially affected, or is reasonably likely to materially affect, the registrant’s internal control over financial reporting; and
5.The registrant’s other certifying officer and I have disclosed to the registrant’s auditors and the audit committee of the registrant’s board of directors (or persons performing the equivalent functions):
a.All significant deficiencies and material weaknesses in the design or operation of internal control over financial reporting which are reasonably likely to adversely affect the registrant’s ability to record, process, summarize, and report financial information; and
b.Any fraud, whether or not material, that involves management or other employees who have a significant role in the registrant’s internal control over financial reporting.
Date: June 13, 2025
/S/ DAVID L. DILORENZO
David L. DiLorenzo
President (Principal Executive Officer)
EX-99.906CERT
MFS MULTIMARKET INCOME TRUST
Certification Pursuant to Section 906 of the Sarbanes-Oxley Act
I, Kasey L. Phillips, certify that, to my knowledge:
1.The Form N-CSR (the “Report”) of MFS Multimarket Income Trust (the “Registrant”) fully complies for the period covered by the Report with the requirements of Section 13(a) or 15(d) of the Securities Exchange Act of 1934; and
2.The information contained in the Report fairly presents, in all material respects, the financial condition and results of operations of the Registrant.
Date: June 13, 2025
/S/ KASEY L. PHILLIPS
Kasey L. Phillips
Treasurer (Principal Financial Officer and Accounting Officer)
A signed original of this written statement required by Section 906 has been provided to the Registrant and will be retained by the Registrant and furnished to the Securities and Exchange Commission or its staff upon request.
EX-99.906CERT
MFS MULTIMARKET INCOME TRUST
Certification Pursuant to Section 906 of the Sarbanes-Oxley Act
I, David L. DiLorenzo, certify that, to my knowledge:
1.The Form N-CSR (the “Report”) of MFS Multimarket Income Trust (the “Registrant”) fully complies for the period covered by the Report with the requirements of Section 13(a) or 15(d) of the Securities Exchange Act of 1934; and
2.The information contained in the Report fairly presents, in all material respects, the financial condition and results of operations of the Registrant.
Date: June 13, 2025
/S/ DAVID L. DILORENZO
David L. DiLorenzo
President (Principal Executive Officer)
A signed original of this written statement required by Section 906 has been provided to the Registrant and will be retained by the Registrant and furnished to the Securities and Exchange Commission or its staff upon request.
EX-99.30e-3Notice

MFS Multimarket Income Trust
Thank you for being a shareholder. You are encouraged to access and review this important report containing information about the fund, including portfolio holdings and financial statements.
The report is available at:
closedendfunds.mfs.com
This report is available by mail or email upon request free of charge. Reports for the prior reporting period and the fund’s portfolio holdings for its most recent fi rst and third fiscal quarters are also available online and in print by request.
Current and future report delivery requests can be submitted at any time using the options in the right panel.
Why am I receiving this Notice?
The Securities and Exchange Commission adopted new rule 30e-3, which, among other things, allows mutual fund companies to deliver shareholder reports by making such reports accessible at a website address. You still may elect to receive a paper copy of the current report and/or any future reports by following the instructions on the panel on the right-hand side.
001CD80003 : CCS-Letter-75GSM-Plain-white-20/50#
An Important Report to Shareholders is Now Available Online and In Print by Request
Scan this code with your
smartphone to access your report:
Or download your report
using the link in the left panel.
Prefer a copy by mail or email?
Within USA, US Territories & Canada
800-637-2304
Outside USA, US Territories & Canada
(781) 575-2879
Sign up to get future
Fund Reports by email
Sign in to computershare.com/investor
Select My Profile >
Communications Preferences
and choose your preferred method

Please contact us with any questions:
Website
www.computershare.com/mfs
Phone
Within USA, US Territories & Canada
800-637-2304
Outside USA, US Territories & Canada
(781) 575-2879
Regular Mail
Computershare Trust Company, N.A.
P.O. Box 505005
Louisville, KY 40233-5005
In accordance with Section 23(c) of the Investment Company Act of 1940, the fund hereby gives notice that it may from time to time repurchase shares of the fund in the open market at the option of the Board of Trustees and on such terms as the Trustees shall determine.
03DCCB
EX-99.19a-1

MFS® Multimarket Income Trust
P.O. Box 43078
Providence, RI 02940-3078
Notice to shareholders — Source of distribution
Distribution period |
April-2025 |
Distribution amount per share |
$0.03347 |
The following table sets forth the estimated amounts of the current distribution and the cumulative distributions paid this fiscal year to date from the following sources: net investment income, net realized short-term capital gains, net realized long-term capital gains and return of capital or other capital source. The fund’s fiscal year begins each November 1st. All amounts are expressed per common share.
|
Current |
% Breakdown of |
Total cumulative |
% Breakdown of the total |
|||
|
distributions for the |
cumulative distributions |
|||||
|
distribution |
current distribution |
fiscal year to date |
for the fiscal year to date |
|||
Net Investment Income |
0.00000 |
0% |
0.14375 |
|
71% |
|
|
Net Realized ST Cap Gains |
0.00000 |
0% |
0.00000 |
|
0% |
|
|
Net Realized LT Cap Gains |
0.00000 |
0% |
0.00000 |
|
0% |
|
|
Return of Capital or |
0.03347 |
100% |
0.05871 |
|
29% |
|
|
Other Capital Source |
|
|
|||||
Total (per common share) |
0.03347 |
100% |
0.20246 |
|
100% |
|
|
Average annual total return (in relation to NAV) for the five years ended 3-31-2025 |
|
|
6.63% |
|
|||
Annualized current distribution rate expressed as a percentage of month end NAV as of 3-31-2025 |
|
8.05% |
|
||||
Cumulative total return (in relation to NAV) for the fiscal year through 3-31-2025 |
|
|
1.80% |
|
|||
Cumulative fiscal year distributions as a percentage of NAV as of 3-31-2025 |
|
|
4.06% |
|
|||
You should not draw any conclusions about the fund's investment performance from the amount of this distribution or from the terms of the fund's managed distribution plan.
The fund estimates that it has distributed more than its income and capital gains; therefore, a portion of your distribution may be a return of capital. A return of capital may occur, for example, when some or all of the money that you invested in the fund is paid back to you. A return of capital distribution does not necessarily reflect the fund's investment performance and should not be confused with "yield" or "income."
The amounts and sources of distributions reported in this notice are only estimates and are not being provided for tax- reporting purposes. The actual amounts and sources of the amounts for tax-reporting purposes will depend upon the fund's investment experience during the remainder of its fiscal year and may be subject to changes based on tax regulations. The fund will send you a Form 1099-DIV for the calendar year that will tell you how to report these distributions for federal income tax purposes.
If you have any questions regarding this information, please call our fund service department at 1-800-637-2304 any business day from 9 a.m. to 5 p.m. Eastern time.
MMTSN-0425

MFS® Multimarket Income Trust
P.O. Box 43078
Providence, RI 02940-3078
Notice to shareholders — Source of distribution
Distribution period |
March-2025 |
Distribution amount per share |
$0.03369 |
The following table sets forth the estimated amounts of the current distribution and the cumulative distributions paid this fiscal year to date from the following sources: net investment income, net realized short-term capital gains, net realized long-term capital gains and return of capital or other capital source. The fund’s fiscal year begins each November 1st. All amounts are expressed per common share.
|
Current |
% Breakdown of |
Total cumulative |
% Breakdown of the total |
|||
|
distributions for the |
cumulative distributions |
|||||
|
distribution |
current distribution |
fiscal year to date |
for the fiscal year to date |
|||
Net Investment Income |
0.03335 |
99% |
0.16899 |
|
100% |
|
|
Net Realized ST Cap Gains |
0.00000 |
0% |
0.00000 |
|
0% |
|
|
Net Realized LT Cap Gains |
0.00000 |
0% |
0.00000 |
|
0% |
|
|
Return of Capital or |
0.00034 |
1% |
0.00000 |
|
0% |
|
|
Other Capital Source |
|
|
|||||
Total (per common share) |
0.03369 |
100% |
0.16899 |
|
100% |
|
|
Average annual total return (in relation to NAV) for the five years ended 2-28-2025 |
|
|
4.23% |
|
|||
Annualized current distribution rate expressed as a percentage of month end NAV as of 2-28-2025 |
|
7.96% |
|
||||
Cumulative total return (in relation to NAV) for the fiscal year through 2-28-2025 |
|
|
2.90% |
|
|||
Cumulative fiscal year distributions as a percentage of NAV as of 2-28-2025 |
|
|
3.33% |
|
|||
You should not draw any conclusions about the fund's investment performance from the amount of this distribution or from the terms of the fund's managed distribution plan.
The fund estimates that it has distributed more than its income and capital gains; therefore, a portion of your distribution may be a return of capital. A return of capital may occur, for example, when some or all of the money that you invested in the fund is paid back to you. A return of capital distribution does not necessarily reflect the fund's investment performance and should not be confused with "yield" or "income."
The amounts and sources of distributions reported in this notice are only estimates and are not being provided for tax- reporting purposes. The actual amounts and sources of the amounts for tax-reporting purposes will depend upon the fund's investment experience during the remainder of its fiscal year and may be subject to changes based on tax regulations. The fund will send you a Form 1099-DIV for the calendar year that will tell you how to report these distributions for federal income tax purposes.
If you have any questions regarding this information, please call our fund service department at 1-800-637-2304 any business day from 9 a.m. to 5 p.m. Eastern time.
MMTSN-0325

MFS® Multimarket Income Trust
P.O. Box 43078
Providence, RI 02940-3078
Notice to shareholders — Source of distribution
Distribution period |
February-2025 |
Distribution amount per share |
$0.03344 |
The following table sets forth the estimated amounts of the current distribution and the cumulative distributions paid this fiscal year to date from the following sources: net investment income, net realized short-term capital gains, net realized long-term capital gains and return of capital or other capital source. The fund’s fiscal year begins each November 1st. All amounts are expressed per common share.
|
Current |
% Breakdown of |
Total cumulative |
% Breakdown of the total |
|||
|
distributions for the |
cumulative distributions |
|||||
|
distribution |
current distribution |
fiscal year to date |
for the fiscal year to date |
|||
Net Investment Income |
0.03344 |
100% |
0.13530 |
|
100% |
|
|
Net Realized ST Cap Gains |
0.00000 |
0% |
0.00000 |
|
0% |
|
|
Net Realized LT Cap Gains |
0.00000 |
0% |
0.00000 |
|
0% |
|
|
Return of Capital or |
0.00000 |
0% |
0.00000 |
|
0% |
|
|
Other Capital Source |
|
|
|||||
Total (per common share) |
0.03344 |
100% |
0.13530 |
|
100% |
|
|
Average annual total return (in relation to NAV) for the five years ended 1-31-2025 |
|
|
3.81% |
|
|||
Annualized current distribution rate expressed as a percentage of month end NAV as of 1-31-2025 |
|
7.95% |
|
||||
Cumulative total return (in relation to NAV) for the fiscal year through 1-31-2025 |
|
|
1.57% |
|
|||
Cumulative fiscal year distributions as a percentage of NAV as of 1-31-2025 |
|
|
2.68% |
|
|||
You should not draw any conclusions about the fund's investment performance from the amount of this distribution or from the terms of the fund's managed distribution plan.
The fund estimates that it has distributed more than its income and capital gains; therefore, a portion of your distribution may be a return of capital. A return of capital may occur, for example, when some or all of the money that you invested in the fund is paid back to you. A return of capital distribution does not necessarily reflect the fund's investment performance and should not be confused with "yield" or "income."
The amounts and sources of distributions reported in this notice are only estimates and are not being provided for tax- reporting purposes. The actual amounts and sources of the amounts for tax-reporting purposes will depend upon the fund's investment experience during the remainder of its fiscal year and may be subject to changes based on tax regulations. The fund will send you a Form 1099-DIV for the calendar year that will tell you how to report these distributions for federal income tax purposes.
If you have any questions regarding this information, please call our fund service department at 1-800-637-2304 any business day from 9 a.m. to 5 p.m. Eastern time.
MMTSN-0225

MFS® Multimarket Income Trust
P.O. Box 43078
Providence, RI 02940-3078
Notice to shareholders — Source of distribution
Distribution period |
January-2025 |
Distribution amount per share |
$0.03383 |
The following table sets forth the estimated amounts of the current distribution and the cumulative distributions paid this fiscal year to date from the following sources: net investment income, net realized short-term capital gains, net realized long-term capital gains and return of capital or other capital source. The fund’s fiscal year begins each November 1st. All amounts are expressed per common share.
|
Current |
% Breakdown of |
Total cumulative |
% Breakdown of the total |
|||
|
distributions for the |
cumulative distributions |
|||||
|
distribution |
current distribution |
fiscal year to date |
for the fiscal year to date |
|||
Net Investment Income |
0.03383 |
100% |
0.10186 |
100% |
|
|
|
Net Realized ST Cap Gains |
0.00000 |
0% |
0.00000 |
0% |
|
|
|
Net Realized LT Cap Gains |
0.00000 |
0% |
0.00000 |
0% |
|
|
|
Return of Capital or |
0.00000 |
0% |
0.00000 |
0% |
|
|
|
Other Capital Source |
|
|
|||||
Total (per common share) |
0.03383 |
100% |
0.10186 |
100% |
|
|
|
Average annual total return (in relation to NAV) for the five years ended 12-31-2024 |
|
|
3.72% |
|
|||
Annualized current distribution rate expressed as a percentage of month end NAV as of 12-31-2024 |
8.09% |
|
|||||
Cumulative total return (in relation to NAV) for the fiscal year through 12-31-2024 |
|
|
0.25% |
|
|||
Cumulative fiscal year distributions as a percentage of NAV as of 12-31-2024 |
|
|
2.03% |
|
|||
You should not draw any conclusions about the fund's investment performance from the amount of this distribution or from the terms of the fund's managed distribution plan.
The fund estimates that it has distributed more than its income and capital gains; therefore, a portion of your distribution may be a return of capital. A return of capital may occur, for example, when some or all of the money that you invested in the fund is paid back to you. A return of capital distribution does not necessarily reflect the fund's investment performance and should not be confused with "yield" or "income."
The amounts and sources of distributions reported in this notice are only estimates and are not being provided for tax- reporting purposes. The actual amounts and sources of the amounts for tax-reporting purposes will depend upon the fund's investment experience during the remainder of its fiscal year and may be subject to changes based on tax regulations. The fund will send you a Form 1099-DIV for the calendar year that will tell you how to report these distributions for federal income tax purposes.
If you have any questions regarding this information, please call our fund service department at 1-800-637-2304 any business day from 9 a.m. to 5 p.m. Eastern time.
MMTSN-0125

MFS® Multimarket Income Trust
P.O. Box 43078
Providence, RI 02940-3078
Notice to shareholders — Source of distribution
Distribution period |
December-2024 |
Distribution amount per share |
$0.03385 |
The following table sets forth the estimated amounts of the current distribution and the cumulative distributions paid this fiscal year to date from the following sources: net investment income, net realized short-term capital gains, net realized long-term capital gains and return of capital or other capital source. The fund’s fiscal year begins each November 1st. All amounts are expressed per common share.
|
Current |
% Breakdown of |
Total cumulative |
% Breakdown of the total |
|||
|
distributions for the |
cumulative distributions |
|||||
|
distribution |
current distribution |
fiscal year to date |
for the fiscal year to date |
|||
Net Investment Income |
0.03385 |
100% |
0.06803 |
100% |
|
|
|
Net Realized ST Cap Gains |
0.00000 |
0% |
0.00000 |
0% |
|
|
|
Net Realized LT Cap Gains |
0.00000 |
0% |
0.00000 |
0% |
|
|
|
Return of Capital or |
0.00000 |
0% |
0.00000 |
0% |
|
|
|
Other Capital Source |
|
|
|||||
Total (per common share) |
0.03385 |
100% |
0.06803 |
100% |
|
|
|
Average annual total return (in relation to NAV) for the five years ended 11-30-2024 |
|
|
4.24% |
|
|||
Annualized current distribution rate expressed as a percentage of month end NAV as of 11-30-2024 |
7.95% |
|
|||||
Cumulative total return (in relation to NAV) for the fiscal year through 11-30-2024 |
|
|
1.32% |
|
|||
Cumulative fiscal year distributions as a percentage of NAV as of 11-30-2024 |
|
|
1.33% |
|
|||
You should not draw any conclusions about the fund's investment performance from the amount of this distribution or from the terms of the fund's managed distribution plan.
The fund estimates that it has distributed more than its income and capital gains; therefore, a portion of your distribution may be a return of capital. A return of capital may occur, for example, when some or all of the money that you invested in the fund is paid back to you. A return of capital distribution does not necessarily reflect the fund's investment performance and should not be confused with "yield" or "income."
The amounts and sources of distributions reported in this notice are only estimates and are not being provided for tax- reporting purposes. The actual amounts and sources of the amounts for tax-reporting purposes will depend upon the fund's investment experience during the remainder of its fiscal year and may be subject to changes based on tax regulations. The fund will send you a Form 1099-DIV for the calendar year that will tell you how to report these distributions for federal income tax purposes.
If you have any questions regarding this information, please call our fund service department at 1-800-637-2304 any business day from 9 a.m. to 5 p.m. Eastern time.
MMTSN-1224

MFS® Multimarket Income Trust
P.O. Box 43078
Providence, RI 02940-3078
Notice to shareholders — Source of distribution
Distribution period |
November-2024 |
Distribution amount per share |
$0.03418 |
The following table sets forth the estimated amounts of the current distribution and the cumulative distributions paid this fiscal year to date from the following sources: net investment income, net realized short-term capital gains, net realized long-term capital gains and return of capital or other capital source. The fund’s fiscal year begins each November 1st. All amounts are expressed per common share.
|
Current |
% Breakdown of |
Total cumulative |
% Breakdown of the total |
|||
|
distributions for the |
cumulative distributions |
|||||
|
distribution |
current distribution |
fiscal year to date |
for the fiscal year to date |
|||
Net Investment Income |
0.03418 |
100% |
0.03418 |
100% |
|
|
|
Net Realized ST Cap Gains |
0.00000 |
0% |
0.00000 |
0% |
|
|
|
Net Realized LT Cap Gains |
0.00000 |
0% |
0.00000 |
0% |
|
|
|
Return of Capital or |
0.00000 |
0% |
0.00000 |
0% |
|
|
|
Other Capital Source |
|
|
|||||
Total (per common share) |
0.03418 |
100% |
0.03418 |
100% |
|
|
|
Average annual total return (in relation to NAV) for the five years ended 10-31-2024 |
|
|
4.02% |
|
|||
Annualized current distribution rate expressed as a percentage of month end NAV as of 10-31-2024 |
|
8.07% |
|
||||
Cumulative total return (in relation to NAV) for the fiscal year through 10-31-2024 |
18.73% |
|
|||||
Cumulative fiscal year distributions as a percentage of NAV as of 10-31-2024 |
|
|
0.67% |
|
|||
You should not draw any conclusions about the fund's investment performance from the amount of this distribution or from the terms of the fund's managed distribution plan.
The fund estimates that it has distributed more than its income and capital gains; therefore, a portion of your distribution may be a return of capital. A return of capital may occur, for example, when some or all of the money that you invested in the fund is paid back to you. A return of capital distribution does not necessarily reflect the fund's investment performance and should not be confused with "yield" or "income."
The amounts and sources of distributions reported in this notice are only estimates and are not being provided for tax- reporting purposes. The actual amounts and sources of the amounts for tax-reporting purposes will depend upon the fund's investment experience during the remainder of its fiscal year and may be subject to changes based on tax regulations. The fund will send you a Form 1099-DIV for the calendar year that will tell you how to report these distributions for federal income tax purposes.
If you have any questions regarding this information, please call our fund service department at 1-800-637-2304 any business day from 9 a.m. to 5 p.m. Eastern time.
MMTSN-1124