 | EXHIBIT 99.1 | |||||||||||||
2Q 2025 Earnings Release | ||||||||||||||
| FOR IMMEDIATE RELEASE | August 1, 2025 | |||||||||||||
| (State or other jurisdiction of incorporation) | (Commission File Number) | (IRS Employer Identification No.) | ||||||
| (Former name or former address, if changed since last report) | ||
| Name of Each Exchange | ||||||||
| Title of Each Class | Trading Symbol | on Which Registered | ||||||
| Item 2.02 | Results of Operations and Financial Condition | ||||
| Item 7.01 | Regulation FD Disclosure | ||||
| The following information is furnished pursuant to both Item 2.02 and Item 7.01. | |||||
The Registrant hereby furnishes the information set forth in its News Release, dated August 1, 2025, announcing second quarter 2025 results, a copy of which is included as Exhibit 99.1, and furnishes the information in the related 2Q25 Investor Relations Data Summary, a copy of which is included as Exhibit 99.2. Material available by hyperlink from the News Release is not deemed to be furnished herewith or included in this filing. | |||||
| Exhibit No. | Description | ||||
Exxon Mobil Corporation News Release, dated August 1, 2025, announcing second quarter 2025 results. | |||||
2Q25 Investor Relations Data Summary. | |||||
| 104 | Cover Page Interactive Data File (formatted as Inline XBRL). | ||||
| EXXON MOBIL CORPORATION | ||||||||
Date: August 1, 2025 | By: | /s/ LEN M. FOX | ||||||
| Len M. Fox | ||||||||
| Vice President, Controller and Tax (Principal Accounting Officer) | ||||||||
| EXHIBIT 99.1 | |||||||||||||
2Q 2025 Earnings Release | ||||||||||||||
| FOR IMMEDIATE RELEASE | August 1, 2025 | |||||||||||||
| Results Summary | ||||||||||||||||||||
| 2Q25 | 1Q25 | Change vs 1Q25 | Dollars in millions (except per share data) | YTD 2025 | YTD 2024 | Change vs YTD 2024 | ||||||||||||||
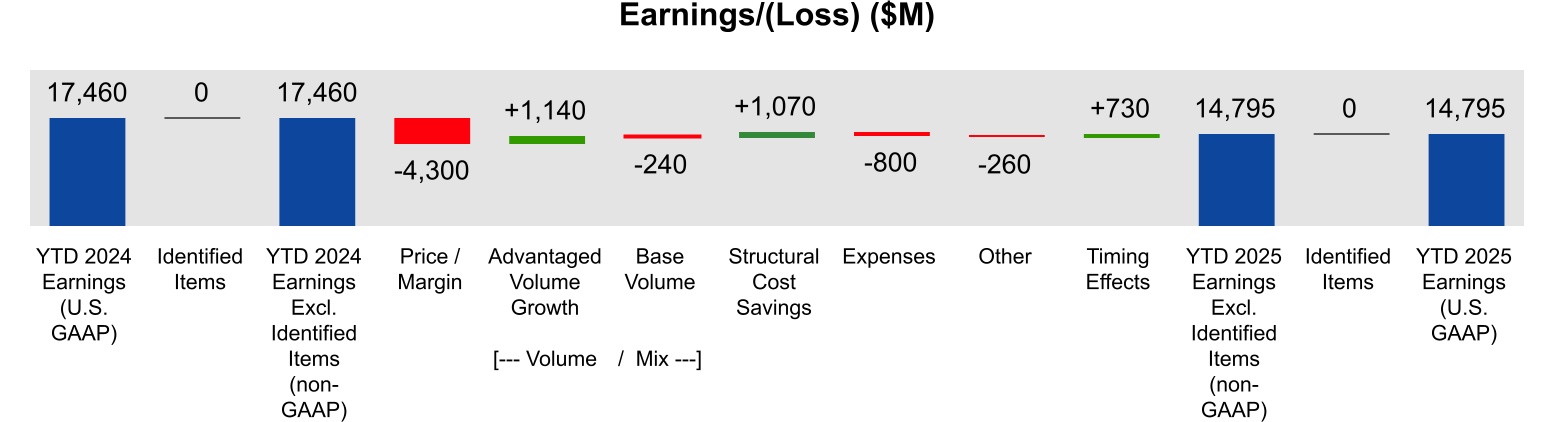
| 7,082 | 7,713 | -631 | Earnings (U.S. GAAP) | 14,795 | 17,460 | -2,665 | ||||||||||||||
| 7,082 | 7,713 | -631 | Earnings Excluding Identified Items (non-GAAP) | 14,795 | 17,460 | -2,665 | ||||||||||||||
| 1.64 | 1.76 | -0.12 | Earnings Per Common Share ³ | 3.40 | 4.20 | -0.80 | ||||||||||||||
| 1.64 | 1.76 | -0.12 | Earnings Excluding Identified Items Per Common Share (non-GAAP) ³ | 3.40 | 4.20 | -0.80 | ||||||||||||||
Year-to-date Earnings Driver Analysis | ||||||||||||||||||||||||||
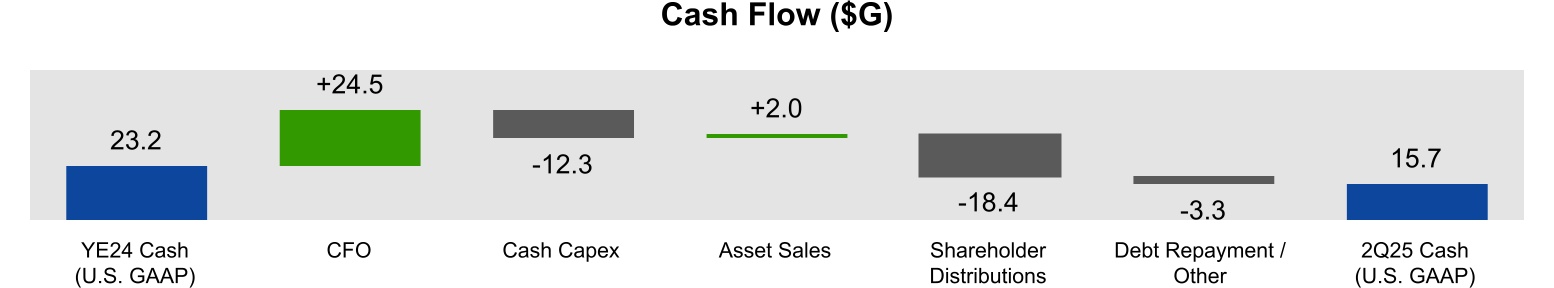
YE24 Cash (U.S. GAAP) to 2Q25 Cash Flow | ||||||||||||||||||||||||||
| ||||||||||||||
EARNINGS AND VOLUME SUMMARY BY SEGMENT | ||||||||||||||
Upstream | ||||||||||||||
| 2Q25 | 1Q25 | Dollars in millions (unless otherwise noted) | YTD 2025 | YTD 2024 | ||||||||||
| Earnings/(Loss) (U.S. GAAP) | ||||||||||||||
| 1,212 | 1,870 | United States | 3,082 | 3,484 | ||||||||||
| 4,190 | 4,886 | Non-U.S. | 9,076 | 9,250 | ||||||||||
| 5,402 | 6,756 | Worldwide | 12,158 | 12,734 | ||||||||||
| Earnings/(Loss) Excluding Identified Items (non-GAAP) | ||||||||||||||
| 1,212 | 1,870 | United States | 3,082 | 3,484 | ||||||||||
| 4,190 | 4,886 | Non-U.S. | 9,076 | 9,250 | ||||||||||
| 5,402 | 6,756 | Worldwide | 12,158 | 12,734 | ||||||||||
| 4,630 | 4,551 | Production (koebd) | 4,591 | 4,071 | ||||||||||
Energy Products | ||||||||||||||
| 2Q25 | 1Q25 | Dollars in millions (unless otherwise noted) | YTD 2025 | YTD 2024 | ||||||||||
| Earnings/(Loss) (U.S. GAAP) | ||||||||||||||
| 825 | 297 | United States | 1,122 | 1,286 | ||||||||||
| 541 | 530 | Non-U.S. | 1,071 | 1,036 | ||||||||||
| 1,366 | 827 | Worldwide | 2,193 | 2,322 | ||||||||||
| Earnings/(Loss) Excluding Identified Items (non-GAAP) | ||||||||||||||
| 825 | 297 | United States | 1,122 | 1,286 | ||||||||||
| 541 | 530 | Non-U.S. | 1,071 | 1,036 | ||||||||||
| 1,366 | 827 | Worldwide | 2,193 | 2,322 | ||||||||||
| 5,588 | 5,283 | Energy Products Sales (kbd) | 5,436 | 5,276 | ||||||||||
Chemical Products | ||||||||||||||
| 2Q25 | 1Q25 | Dollars in millions (unless otherwise noted) | YTD 2025 | YTD 2024 | ||||||||||
| Earnings/(Loss) (U.S. GAAP) | ||||||||||||||
| 255 | 255 | United States | 510 | 1,030 | ||||||||||
| 38 | 18 | Non-U.S. | 56 | 534 | ||||||||||
| 293 | 273 | Worldwide | 566 | 1,564 | ||||||||||
| Earnings/(Loss) Excluding Identified Items (non-GAAP) | ||||||||||||||
| 255 | 255 | United States | 510 | 1,030 | ||||||||||
| 38 | 18 | Non-U.S. | 56 | 534 | ||||||||||
| 293 | 273 | Worldwide | 566 | 1,564 | ||||||||||
| 5,264 | 4,776 | Chemical Products Sales (kt) | 10,040 | 9,927 | ||||||||||
Specialty Products | ||||||||||||||
| 2Q25 | 1Q25 | Dollars in millions (unless otherwise noted) | YTD 2025 | YTD 2024 | ||||||||||
| Earnings/(Loss) (U.S. GAAP) | ||||||||||||||
| 291 | 322 | United States | 613 | 851 | ||||||||||
| 489 | 333 | Non-U.S. | 822 | 661 | ||||||||||
| 780 | 655 | Worldwide | 1,435 | 1,512 | ||||||||||
| Earnings/(Loss) Excluding Identified Items (non-GAAP) | ||||||||||||||
| 291 | 322 | United States | 613 | 851 | ||||||||||
| 489 | 333 | Non-U.S. | 822 | 661 | ||||||||||
| 780 | 655 | Worldwide | 1,435 | 1,512 | ||||||||||
| 2,004 | 1,936 | Specialty Products Sales (kt) | 3,940 | 3,893 | ||||||||||
Corporate and Financing | ||||||||||||||
| 2Q25 | 1Q25 | Dollars in millions (unless otherwise noted) | YTD 2025 | YTD 2024 | ||||||||||
| (759) | (798) | Earnings/(Loss) (U.S. GAAP) | (1,557) | (672) | ||||||||||
| (759) | (798) | Earnings/(Loss) Excluding Identified Items (non-GAAP) | (1,557) | (672) | ||||||||||
| ||||||||||||||
CASH FLOW FROM OPERATIONS AND ASSET SALES EXCLUDING WORKING CAPITAL | ||||||||||||||
| 2Q25 | 1Q25 | Dollars in millions (unless otherwise noted) | YTD 2025 | YTD 2024 | ||||||||||
| 7,354 | 8,033 | Net income/(loss) including noncontrolling interests | 15,387 | 18,137 | ||||||||||
| 6,101 | 5,702 | Depreciation and depletion (includes impairments) | 11,803 | 10,599 | ||||||||||
| (3,970) | (878) | Changes in operational working capital, excluding cash and debt | (4,848) | (2,608) | ||||||||||
| 2,065 | 96 | Other | 2,161 | (904) | ||||||||||
| 11,550 | 12,953 | Cash Flow from Operating Activities (U.S. GAAP) | 24,503 | 25,224 | ||||||||||
| 176 | 1,823 | Proceeds from asset sales and returns of investments | 1,999 | 1,629 | ||||||||||
| 11,726 | 14,776 | Cash Flow from Operations and Asset Sales (non-GAAP) | 26,502 | 26,853 | ||||||||||
| 3,970 | 878 | Less: Changes in operational working capital, excluding cash and debt | 4,848 | 2,608 | ||||||||||
| 15,696 | 15,654 | Cash Flow from Operations and Asset Sales excluding Working Capital (non-GAAP) | 31,350 | 29,461 | ||||||||||
| (176) | (1,823) | Less: Proceeds from asset sales and returns of investments | (1,999) | (1,629) | ||||||||||
| 15,520 | 13,831 | Cash Flow from Operations excluding Working Capital (non-GAAP) | 29,351 | 27,832 | ||||||||||
FREE CASH FLOW | ||||||||||||||
| 2Q25 | 1Q25 | Dollars in millions (unless otherwise noted) | YTD 2025 | YTD 2024 | ||||||||||
| 11,550 | 12,953 | Cash Flow from Operating Activities (U.S. GAAP) | 24,503 | 25,224 | ||||||||||
| (6,283) | (5,898) | Additions to property, plant and equipment | (12,181) | (11,309) | ||||||||||
| (319) | (153) | Additional investments and advances | (472) | (744) | ||||||||||
| 246 | 93 | Other investing activities including collection of advances | 339 | 224 | ||||||||||
| 176 | 1,823 | Proceeds from asset sales and returns of investments | 1,999 | 1,629 | ||||||||||
| 23 | 22 | Inflows from noncontrolling interest for major projects | 45 | 12 | ||||||||||
| 5,393 | 8,840 | Free Cash Flow (non-GAAP) | 14,233 | 15,036 | ||||||||||
| ||||||||||||||
CASH CAPITAL EXPENDITURES | ||||||||||||||
| 2Q25 | 1Q25 | Dollars in millions (unless otherwise noted) | YTD 2025 | YTD 2024 | ||||||||||
| 6,283 | 5,898 | Additions to property, plant and equipment | 12,181 | 11,309 | ||||||||||
| 319 | 153 | Additional investments and advances | 472 | 744 | ||||||||||
| (246) | (93) | Other investing activities including collection of advances | (339) | (224) | ||||||||||
| (23) | (22) | Inflows from noncontrolling interests for major projects | (45) | (12) | ||||||||||
| 6,333 | 5,936 | Total Cash Capital Expenditures (non-GAAP) | 12,269 | 11,817 | ||||||||||
| 2Q25 | 1Q25 | Dollars in millions (unless otherwise noted) | YTD 2025 | YTD 2024 | ||||||||||
| Upstream | ||||||||||||||
| 3,407 | 2,983 | United States | 6,390 | 5,251 | ||||||||||
| 2,262 | 2,010 | Non-U.S. | 4,272 | 4,205 | ||||||||||
| 5,669 | 4,993 | Total | 10,662 | 9,456 | ||||||||||
| Energy Products | ||||||||||||||
| 154 | 127 | United States | 281 | 297 | ||||||||||
| 8 | 251 | Non-U.S. | 259 | 687 | ||||||||||
| 162 | 378 | Total | 540 | 984 | ||||||||||
| Chemical Products | ||||||||||||||
| 171 | 154 | United States | 325 | 228 | ||||||||||
| 108 | 137 | Non-U.S. | 245 | 579 | ||||||||||
| 279 | 291 | Total | 570 | 807 | ||||||||||
| Specialty Products | ||||||||||||||
| 43 | 52 | United States | 95 | 24 | ||||||||||
| 54 | 58 | Non-U.S. | 112 | 139 | ||||||||||
| 97 | 110 | Total | 207 | 163 | ||||||||||
| Other | ||||||||||||||
| 126 | 164 | Other | 290 | 407 | ||||||||||
| 6,333 | 5,936 | Worldwide | 12,269 | 11,817 | ||||||||||
| CALCULATION OF STRUCTURAL COST SAVINGS | ||||||||||||||||||||
| Dollars in billions (unless otherwise noted) | Twelve Months Ended December 31, | Six Months Ended June 30, | ||||||||||||||||||
| 2019 | 2024 | 2024 | 2025 | |||||||||||||||||
| Components of Operating Costs | ||||||||||||||||||||
| From ExxonMobil’s Consolidated Statement of Income (U.S. GAAP) | ||||||||||||||||||||
| Production and manufacturing expenses | 36.8 | 39.6 | 18.9 | 20.2 | ||||||||||||||||
| Selling, general and administrative expenses | 11.4 | 10.0 | 5.1 | 5.1 | ||||||||||||||||
| Depreciation and depletion (includes impairments) | 19.0 | 23.4 | 10.6 | 11.8 | ||||||||||||||||
| Exploration expenses, including dry holes | 1.3 | 0.8 | 0.3 | 0.3 | ||||||||||||||||
| Non-service pension and postretirement benefit expense | 1.2 | 0.1 | 0.1 | 0.2 | ||||||||||||||||
| Subtotal | 69.7 | 74.0 | 34.9 | 37.6 | ||||||||||||||||
| ExxonMobil’s share of equity company expenses (non-GAAP) | 9.1 | 9.6 | 4.7 | 5.2 | ||||||||||||||||
| Total Adjusted Operating Costs (non-GAAP) | 78.8 | 83.6 | 39.6 | 42.8 | ||||||||||||||||
| Total Adjusted Operating Costs (non-GAAP) | 78.8 | 83.6 | 39.6 | 42.8 | ||||||||||||||||
| Less: | ||||||||||||||||||||
| Depreciation and depletion (includes impairments) | 19.0 | 23.4 | 10.6 | 11.8 | ||||||||||||||||
| Non-service pension and postretirement benefit expense | 1.2 | 0.1 | 0.1 | 0.2 | ||||||||||||||||
| Other adjustments (includes equity company depreciation and depletion) | 3.6 | 3.7 | 1.7 | 2.4 | ||||||||||||||||
| Total Cash Operating Expenses (Cash Opex) (non-GAAP) | 55.0 | 56.4 | 27.2 | 28.4 | ||||||||||||||||
| Energy and production taxes (non-GAAP) | 11.0 | 13.9 | 6.8 | 7.6 | ||||||||||||||||
| Total Cash Operating Expenses (Cash Opex) excluding Energy and Production Taxes (non-GAAP) | 44.0 | 42.5 | 20.4 | 20.8 | ||||||||||||||||
| Change vs 2019 | Change vs 2024 | Estimated Cumulative vs 2019 | ||||||||||||||||||
| Total Cash Operating Expenses (Cash Opex) excluding Energy and Production Taxes (non-GAAP) | -1.5 | +0.4 | ||||||||||||||||||
| Market | +4.0 | +0.3 | ||||||||||||||||||
| Activity / Other | +6.6 | +1.5 | ||||||||||||||||||
| Structural Cost Savings | -12.1 | -1.4 | -13.5 | |||||||||||||||||
| ATTACHMENT I-a | |||||||||||||
CONDENSED CONSOLIDATED STATEMENT OF INCOME | ||||||||||||||
| (Preliminary) | ||||||||||||||
Dollars in millions (unless otherwise noted) | Three Months Ended June 30, | Six Months Ended June 30, | ||||||||||||
| 2025 | 2024 | 2025 | 2024 | |||||||||||
| Revenues and other income | ||||||||||||||
| Sales and other operating revenue | 79,477 | 89,986 | 160,535 | 170,397 | ||||||||||
| Income from equity affiliates | 1,462 | 1,744 | 2,831 | 3,586 | ||||||||||
| Other income | 567 | 1,330 | 1,270 | 2,160 | ||||||||||
| Total revenues and other income | 81,506 | 93,060 | 164,636 | 176,143 | ||||||||||
| Costs and other deductions | ||||||||||||||
| Crude oil and product purchases | 45,327 | 54,199 | 92,115 | 101,800 | ||||||||||
| Production and manufacturing expenses | 10,102 | 9,804 | 20,185 | 18,895 | ||||||||||
| Selling, general and administrative expenses | 2,528 | 2,568 | 5,068 | 5,063 | ||||||||||
| Depreciation and depletion (includes impairments) | 6,101 | 5,787 | 11,803 | 10,599 | ||||||||||
| Exploration expenses, including dry holes | 251 | 153 | 315 | 301 | ||||||||||
| Non-service pension and postretirement benefit expense | 90 | 34 | 203 | 57 | ||||||||||
| Interest expense | 145 | 271 | 350 | 492 | ||||||||||
| Other taxes and duties | 6,257 | 6,579 | 12,292 | 12,902 | ||||||||||
| Total costs and other deductions | 70,801 | 79,395 | 142,331 | 150,109 | ||||||||||
| Income/(Loss) before income taxes | 10,705 | 13,665 | 22,305 | 26,034 | ||||||||||
| Income tax expense/(benefit) | 3,351 | 4,094 | 6,918 | 7,897 | ||||||||||
| Net income/(loss) including noncontrolling interests | 7,354 | 9,571 | 15,387 | 18,137 | ||||||||||
| Net income/(loss) attributable to noncontrolling interests | 272 | 331 | 592 | 677 | ||||||||||
| Net income/(loss) attributable to ExxonMobil | 7,082 | 9,240 | 14,795 | 17,460 | ||||||||||
| OTHER FINANCIAL DATA | ||||||||||||||
| Dollars in millions (unless otherwise noted) | Three Months Ended June 30, | Six Months Ended June 30, | ||||||||||||
| 2025 | 2024 | 2025 | 2024 | |||||||||||
Earnings per common share (U.S. dollars) | 1.64 | 2.14 | 3.40 | 4.20 | ||||||||||
Earnings per common share - assuming dilution (U.S. dollars) | 1.64 | 2.14 | 3.40 | 4.20 | ||||||||||
| Dividends on common stock | ||||||||||||||
| Total | 4,288 | 4,285 | 8,623 | 8,093 | ||||||||||
Per common share (U.S. dollars) | 0.99 | 0.95 | 1.98 | 1.90 | ||||||||||
| Millions of common shares outstanding | ||||||||||||||
| Average - assuming dilution | 4,331 | 4,317 | 4,351 | 4,158 | ||||||||||
| Taxes | ||||||||||||||
| Income taxes | 3,351 | 4,094 | 6,918 | 7,897 | ||||||||||
| Total other taxes and duties | 7,204 | 7,531 | 14,270 | 14,691 | ||||||||||
| Total taxes | 10,555 | 11,625 | 21,188 | 22,588 | ||||||||||
| Sales-based taxes | 5,289 | 6,339 | 10,759 | 11,888 | ||||||||||
| Total taxes including sales-based taxes | 15,844 | 17,964 | 31,947 | 34,476 | ||||||||||
| ExxonMobil share of income taxes of equity companies (non-GAAP) | 486 | 907 | 1,143 | 1,905 | ||||||||||
| ATTACHMENT I-b | |||||||||||||
| CONDENSED CONSOLIDATED BALANCE SHEET | ||||||||||||||
| (Preliminary) | ||||||||||||||
| Dollars in millions (unless otherwise noted) | June 30, 2025 | December 31, 2024 | ||||||
| ASSETS | ||||||||
| Current assets | ||||||||
| Cash and cash equivalents | 14,352 | 23,029 | ||||||
| Cash and cash equivalents – restricted | 1,359 | 158 | ||||||
| Notes and accounts receivable – net | 41,792 | 43,681 | ||||||
| Inventories | ||||||||
| Crude oil, products and merchandise | 21,364 | 19,444 | ||||||
| Materials and supplies | 4,007 | 4,080 | ||||||
| Other current assets | 2,234 | 1,598 | ||||||
| Total current assets | 85,108 | 91,990 | ||||||
| Investments, advances and long-term receivables | 46,092 | 47,200 | ||||||
| Property, plant and equipment – net | 295,356 | 294,318 | ||||||
| Other assets, including intangibles – net | 21,041 | 19,967 | ||||||
| Total Assets | 447,597 | 453,475 | ||||||
| LIABILITIES | ||||||||
| Current liabilities | ||||||||
| Notes and loans payable | 5,419 | 4,955 | ||||||
| Accounts payable and accrued liabilities | 59,725 | 61,297 | ||||||
| Income taxes payable | 3,017 | 4,055 | ||||||
| Total current liabilities | 68,161 | 70,307 | ||||||
| Long-term debt | 33,570 | 36,755 | ||||||
| Postretirement benefits reserves | 10,352 | 9,700 | ||||||
| Deferred income tax liabilities | 39,368 | 39,042 | ||||||
| Long-term obligations to equity companies | 1,113 | 1,346 | ||||||
| Other long-term obligations | 25,071 | 25,719 | ||||||
| Total Liabilities | 177,635 | 182,869 | ||||||
| EQUITY | ||||||||
| Common stock without par value | ||||||||
(9,000 million shares authorized, 8,019 million shares issued) | 46,629 | 46,238 | ||||||
| Earnings reinvested | 477,061 | 470,903 | ||||||
| Accumulated other comprehensive income | (12,436) | (14,619) | ||||||
| Common stock held in treasury | ||||||||
(3,756 million shares at June 30, 2025, and 3,666 million shares at December 31, 2024) | (248,661) | (238,817) | ||||||
| ExxonMobil share of equity | 262,593 | 263,705 | ||||||
| Noncontrolling interests | 7,369 | 6,901 | ||||||
| Total Equity | 269,962 | 270,606 | ||||||
| Total Liabilities and Equity | 447,597 | 453,475 | ||||||
| ATTACHMENT I-c | |||||||||||||
| CONDENSED CONSOLIDATED STATEMENT OF CASH FLOWS | ||||||||||||||
| (Preliminary) | ||||||||||||||
| Dollars in millions (unless otherwise noted) | Six Months Ended June 30, | |||||||
| 2025 | 2024 | |||||||
| CASH FLOWS FROM OPERATING ACTIVITIES | ||||||||
| Net income/(loss) including noncontrolling interests | 15,387 | 18,137 | ||||||
| Depreciation and depletion (includes impairments) | 11,803 | 10,599 | ||||||
| Changes in operational working capital, excluding cash and debt | (4,848) | (2,608) | ||||||
| All other items – net | 2,161 | (904) | ||||||
| Net cash provided by operating activities | 24,503 | 25,224 | ||||||
| CASH FLOWS FROM INVESTING ACTIVITIES | ||||||||
| Additions to property, plant and equipment | (12,181) | (11,309) | ||||||
| Proceeds from asset sales and returns of investments | 1,999 | 1,629 | ||||||
| Additional investments and advances | (472) | (744) | ||||||
| Other investing activities including collection of advances | 339 | 224 | ||||||
| Cash acquired from mergers and acquisitions | — | 754 | ||||||
| Net cash used in investing activities | (10,315) | (9,446) | ||||||
| CASH FLOWS FROM FINANCING ACTIVITIES | ||||||||
Additions to long-term debt | 883 | 217 | ||||||
| Reductions in long-term debt | (13) | (1,142) | ||||||
| Additions to short-term debt | 172 | — | ||||||
| Reductions in short-term debt | (4,676) | (2,771) | ||||||
| Additions/(Reductions) in debt with three months or less maturity | 257 | (6) | ||||||
| Contingent consideration payments | (79) | (27) | ||||||
| Cash dividends to ExxonMobil shareholders | (8,623) | (8,093) | ||||||
| Cash dividends to noncontrolling interests | (452) | (397) | ||||||
| Changes in noncontrolling interests | (10) | 4 | ||||||
| Inflows from noncontrolling interests for major projects | 45 | 12 | ||||||
| Common stock acquired | (9,768) | (8,337) | ||||||
| Net cash provided by (used in) financing activities | (22,264) | (20,540) | ||||||
| Effects of exchange rate changes on cash | 600 | (318) | ||||||
| Increase/(Decrease) in cash and cash equivalents (including restricted) | (7,476) | (5,080) | ||||||
| Cash and cash equivalents at beginning of period (including restricted) | 23,187 | 31,568 | ||||||
| Cash and cash equivalents at end of period (including restricted) | 15,711 | 26,488 | ||||||
| ATTACHMENT II-a | |||||||||||||
KEY FIGURES: IDENTIFIED ITEMS | ||||||||||||||
| 2Q25 | 1Q25 | Dollars in millions (unless otherwise noted) | YTD 2025 | YTD 2024 | ||||||||||
| 7,082 | 7,713 | Earnings/(Loss) (U.S. GAAP) | 14,795 | 17,460 | ||||||||||
| — | — | Total Identified Items | — | — | ||||||||||
| 7,082 | 7,713 | Earnings/(Loss) Excluding Identified Items (non-GAAP) | 14,795 | 17,460 | ||||||||||
| 2Q25 | 1Q25 | Dollars per common share | YTD 2025 | YTD 2024 | ||||||||||
| 1.64 | 1.76 | Earnings/(Loss) Per Common Share (U.S. GAAP) ¹ | 3.40 | 4.20 | ||||||||||
| — | — | Total Identified Items Per Common Share ¹ | — | — | ||||||||||
| 1.64 | 1.76 | Earnings/(Loss) Excluding Identified Items Per Common Share (non-GAAP) ¹ | 3.40 | 4.20 | ||||||||||
| ¹ Assuming dilution. | ||||||||||||||
| ATTACHMENT II-b | |||||||||||||
KEY FIGURES: IDENTIFIED ITEMS BY SEGMENT | ||||||||||||||
| Second Quarter 2025 | Upstream | Energy Products | Chemical Products | Specialty Products | Corporate & Financing | Total | ||||||||||||||||||||||||||
| Dollars in millions (unless otherwise noted) | U.S. | Non-U.S. | U.S. | Non-U.S. | U.S. | Non-U.S. | U.S. | Non-U.S. | ||||||||||||||||||||||||
| Earnings/(Loss) (U.S. GAAP) | 1,212 | 4,190 | 825 | 541 | 255 | 38 | 291 | 489 | (759) | 7,082 | ||||||||||||||||||||||
| Total Identified Items | — | — | — | — | — | — | — | — | — | — | ||||||||||||||||||||||
| Earnings/(Loss) Excl. Identified Items (non-GAAP) | 1,212 | 4,190 | 825 | 541 | 255 | 38 | 291 | 489 | (759) | 7,082 | ||||||||||||||||||||||
| First Quarter 2025 | Upstream | Energy Products | Chemical Products | Specialty Products | Corporate & Financing | Total | ||||||||||||||||||||||||||
| Dollars in millions (unless otherwise noted) | U.S. | Non-U.S. | U.S. | Non-U.S. | U.S. | Non-U.S. | U.S. | Non-U.S. | ||||||||||||||||||||||||
| Earnings/(Loss) (U.S. GAAP) | 1,870 | 4,886 | 297 | 530 | 255 | 18 | 322 | 333 | (798) | 7,713 | ||||||||||||||||||||||
| Total Identified Items | — | — | — | — | — | — | — | — | — | — | ||||||||||||||||||||||
| Earnings/(Loss) Excl. Identified Items (non-GAAP) | 1,870 | 4,886 | 297 | 530 | 255 | 18 | 322 | 333 | (798) | 7,713 | ||||||||||||||||||||||
| YTD 2025 | Upstream | Energy Products | Chemical Products | Specialty Products | Corporate & Financing | Total | ||||||||||||||||||||||||||
| Dollars in millions (unless otherwise noted) | U.S. | Non-U.S. | U.S. | Non-U.S. | U.S. | Non-U.S. | U.S. | Non-U.S. | ||||||||||||||||||||||||
| Earnings/(Loss) (U.S. GAAP) | 3,082 | 9,076 | 1,122 | 1,071 | 510 | 56 | 613 | 822 | (1,557) | 14,795 | ||||||||||||||||||||||
| Total Identified Items | — | — | — | — | — | — | — | — | — | — | ||||||||||||||||||||||
| Earnings/(Loss) Excl. Identified Items (non-GAAP) | 3,082 | 9,076 | 1,122 | 1,071 | 510 | 56 | 613 | 822 | (1,557) | 14,795 | ||||||||||||||||||||||
| YTD 2024 | Upstream | Energy Products | Chemical Products | Specialty Products | Corporate & Financing | Total | ||||||||||||||||||||||||||
| Dollars in millions (unless otherwise noted) | U.S. | Non-U.S. | U.S. | Non-U.S. | U.S. | Non-U.S. | U.S. | Non-U.S. | ||||||||||||||||||||||||
| Earnings/(Loss) (U.S. GAAP) | 3,484 | 9,250 | 1,286 | 1,036 | 1,030 | 534 | 851 | 661 | (672) | 17,460 | ||||||||||||||||||||||
| Total Identified Items | — | — | — | — | — | — | — | — | — | — | ||||||||||||||||||||||
| Earnings/(Loss) Excl. Identified Items (non-GAAP) | 3,484 | 9,250 | 1,286 | 1,036 | 1,030 | 534 | 851 | 661 | (672) | 17,460 | ||||||||||||||||||||||
| ATTACHMENT III | |||||||||||||
KEY FIGURES: UPSTREAM VOLUMES | ||||||||||||||
| 2Q25 | 1Q25 | Net production of crude oil, natural gas liquids, bitumen and synthetic oil, thousand barrels per day (kbd) | YTD 2025 | YTD 2024 | ||||||||||
| 1,494 | 1,418 | United States | 1,456 | 1,038 | ||||||||||
| 797 | 760 | Canada/Other Americas | 779 | 767 | ||||||||||
| 3 | 4 | Europe | 4 | 4 | ||||||||||
| 139 | 137 | Africa | 138 | 220 | ||||||||||
| 801 | 796 | Asia | 799 | 712 | ||||||||||
| 25 | 24 | Australia/Oceania | 25 | 30 | ||||||||||
| 3,259 | 3,139 | Worldwide | 3,201 | 2,771 | ||||||||||
| 2Q25 | 1Q25 | Net natural gas production available for sale, million cubic feet per day (mcfd) | YTD 2025 | YTD 2024 | ||||||||||
| 3,313 | 3,266 | United States | 3,290 | 2,570 | ||||||||||
| 24 | 42 | Canada/Other Americas | 33 | 104 | ||||||||||
| 312 | 331 | Europe | 321 | 354 | ||||||||||
| 106 | 118 | Africa | 112 | 158 | ||||||||||
| 3,206 | 3,457 | Asia | 3,331 | 3,380 | ||||||||||
| 1,258 | 1,256 | Australia/Oceania | 1,257 | 1,236 | ||||||||||
| 8,219 | 8,470 | Worldwide | 8,344 | 7,802 | ||||||||||
| 4,630 | 4,551 | Oil-equivalent production (koebd) ¹ | 4,591 | 4,071 | ||||||||||
1 Natural gas is converted to an oil-equivalent basis at six million cubic feet per one thousand barrels. | ||||||||||||||
| ATTACHMENT IV | |||||||||||||
KEY FIGURES: MANUFACTURING THROUGHPUT AND SALES | ||||||||||||||
| 2Q25 | 1Q25 | Refinery throughput, thousand barrels per day (kbd) | YTD 2025 | YTD 2024 | ||||||||||
| 1,969 | 1,789 | United States | 1,880 | 1,823 | ||||||||||
| 376 | 397 | Canada | 387 | 397 | ||||||||||
| 969 | 986 | Europe | 977 | 970 | ||||||||||
| 442 | 447 | Asia Pacific | 444 | 424 | ||||||||||
| 180 | 191 | Other | 185 | 177 | ||||||||||
| 3,936 | 3,810 | Worldwide | 3,873 | 3,791 | ||||||||||
| 2Q25 | 1Q25 | Energy Products sales, thousand barrels per day (kbd) | YTD 2025 | YTD 2024 | ||||||||||
| 2,906 | 2,728 | United States | 2,817 | 2,607 | ||||||||||
| 2,682 | 2,555 | Non-U.S. | 2,619 | 2,669 | ||||||||||
| 5,588 | 5,283 | Worldwide | 5,436 | 5,276 | ||||||||||
| 2,294 | 2,162 | Gasolines, naphthas | 2,229 | 2,210 | ||||||||||
| 1,808 | 1,724 | Heating oils, kerosene, diesel | 1,766 | 1,730 | ||||||||||
| 387 | 366 | Aviation fuels | 376 | 342 | ||||||||||
| 247 | 158 | Heavy fuels | 203 | 197 | ||||||||||
| 852 | 873 | Other energy products | 862 | 797 | ||||||||||
| 5,588 | 5,283 | Worldwide | 5,436 | 5,276 | ||||||||||
| 2Q25 | 1Q25 | Chemical Products sales, thousand metric tons (kt) | YTD 2025 | YTD 2024 | ||||||||||
| 1,771 | 1,706 | United States | 3,477 | 3,649 | ||||||||||
| 3,493 | 3,070 | Non-U.S. | 6,563 | 6,278 | ||||||||||
| 5,264 | 4,776 | Worldwide | 10,040 | 9,927 | ||||||||||
| 2Q25 | 1Q25 | Specialty Products sales, thousand metric tons (kt) | YTD 2025 | YTD 2024 | ||||||||||
| 504 | 473 | United States | 977 | 1,001 | ||||||||||
| 1,500 | 1,463 | Non-U.S. | 2,963 | 2,892 | ||||||||||
| 2,004 | 1,936 | Worldwide | 3,940 | 3,893 | ||||||||||
| ATTACHMENT V | |||||||||||||
KEY FIGURES: EARNINGS/(LOSS) | ||||||||||||||
| Results Summary | ||||||||||||||||||||
| 2Q25 | 1Q25 | Change vs 1Q25 | Dollars in millions (except per share data) | YTD 2025 | YTD 2024 | Change vs YTD 2024 | ||||||||||||||
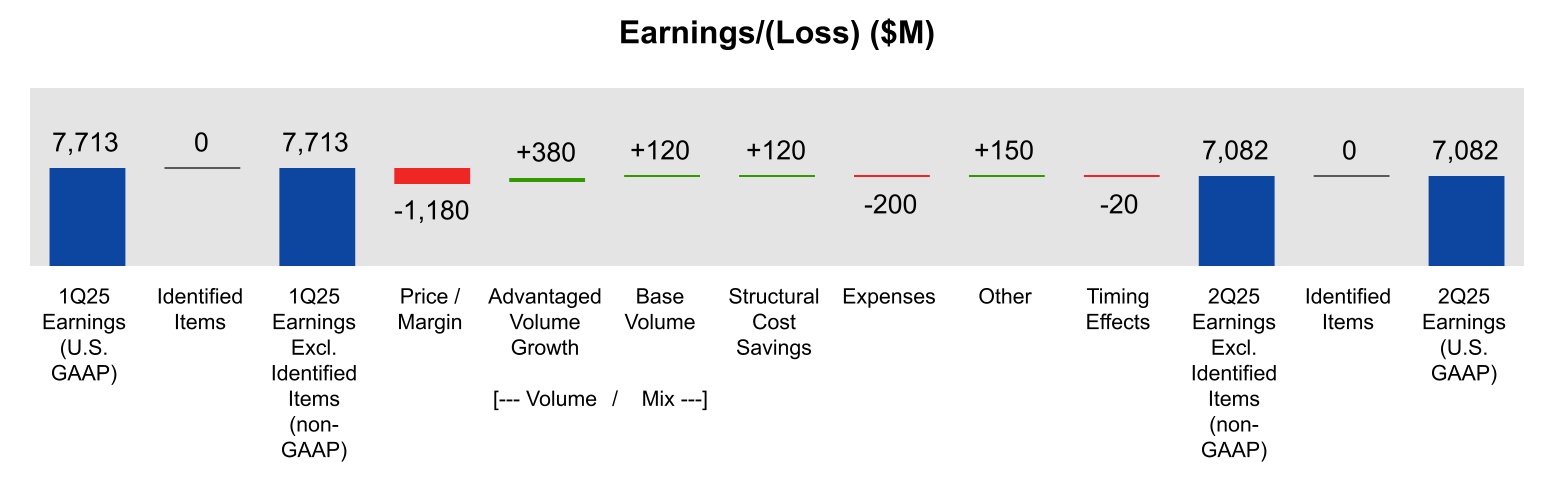
| 7,082 | 7,713 | -631 | Earnings (U.S. GAAP) | 14,795 | 17,460 | -2,665 | ||||||||||||||
| 7,082 | 7,713 | -631 | Earnings Excluding Identified Items (non-GAAP) | 14,795 | 17,460 | -2,665 | ||||||||||||||
| 1.64 | 1.76 | -0.12 | Earnings Per Common Share ¹ | 3.40 | 4.20 | -0.80 | ||||||||||||||
| 1.64 | 1.76 | -0.12 | Earnings Excluding Identified Items Per Common Share (non-GAAP) ¹ | 3.40 | 4.20 | -0.80 | ||||||||||||||
| ¹ Assuming dilution. | ||||||||||||||||||||
1Q25 to 2Q25 Earnings Driver Analysis | ||||||||||||||
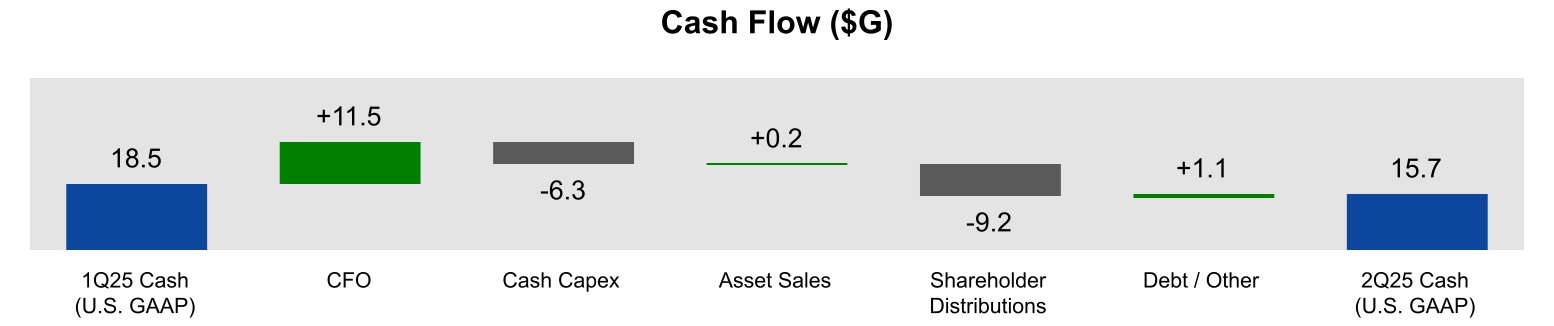
1Q25 to 2Q25 Cash Flow | ||||||||||||||
| ATTACHMENT VI | ||||||||||||||||
KEY FIGURES: EARNINGS/(LOSS) BY QUARTER | |||||||||||||||||
| Dollars in millions (unless otherwise noted) | 2025 | 2024 | 2023 | 2022 | 2021 | ||||||||||||
| First Quarter | 7,713 | 8,220 | 11,430 | 5,480 | 2,730 | ||||||||||||
| Second Quarter | 7,082 | 9,240 | 7,880 | 17,850 | 4,690 | ||||||||||||
| Third Quarter | — | 8,610 | 9,070 | 19,660 | 6,750 | ||||||||||||
| Fourth Quarter | — | 7,610 | 7,630 | 12,750 | 8,870 | ||||||||||||
| Full Year | — | 33,680 | 36,010 | 55,740 | 23,040 | ||||||||||||
| Dollars per common share¹ | 2025 | 2024 | 2023 | 2022 | 2021 | ||||||||||||
| First Quarter | 1.76 | 2.06 | 2.79 | 1.28 | 0.64 | ||||||||||||
| Second Quarter | 1.64 | 2.14 | 1.94 | 4.21 | 1.10 | ||||||||||||
| Third Quarter | — | 1.92 | 2.25 | 4.68 | 1.57 | ||||||||||||
| Fourth Quarter | — | 1.72 | 1.91 | 3.09 | 2.08 | ||||||||||||
| Full Year | — | 7.84 | 8.89 | 13.26 | 5.39 | ||||||||||||
1 Computed using the average number of shares outstanding during each period; assuming dilution. | |||||||||||||||||
 | EXHIBIT 99.2 | ||||||||||||||||
To assist investors in assessing 2Q25 results, the following disclosures have been made available in the 8-K filing: | |||||||||||||||||
2Q25 INVESTOR RELATIONS DATA SUMMARY (PAGE 1 of 1) | |||||||||||||||||
| Effective Income Tax Rate | 2Q25 | 1Q25 | 4Q24 | 3Q24 | ||||||||||
| Effective Income Tax Rate, % | 34 | % | 34 | % | 24 | % | 35 | % | ||||||
| Common Shares Outstanding, millions | 2Q25 | 1Q25 | 4Q24 | 3Q24 | ||||||||||
| At quarter end | 4,263 | 4,310 | 4,353 | 4,395 | ||||||||||
| Weighted-average - assuming dilution | 4,331 | 4,372 | 4,413 | 4,462 | ||||||||||
| Upstream Volume Driver Analysis, koebd | 2Q25 vs 1Q25 | 2025 vs 2024 (YTD) | ||||||||||||
| Prior Period | 4,551 | 4,071 | ||||||||||||
| Entitlements - Net Interest | (18) | (27) | ||||||||||||
| Entitlements - Price / Spend / Other | (10) | 29 | ||||||||||||
| Government Mandates | 5 | (2) | ||||||||||||
| Divestments | (44) | (144) | ||||||||||||
| Growth / Other | 146 | 664 | ||||||||||||
| Current Period | 4,630 | 4,591 | ||||||||||||
| Upstream Realization Data | 2Q25 | 1Q25 | 4Q24 | 3Q24 | ||||||||||
| United States | ||||||||||||||
| ExxonMobil | ||||||||||||||
| Crude ($/b) | 62.58 | 69.41 | 67.58 | 72.94 | ||||||||||
| Natural Gas ($/kcf) | 2.41 | 3.38 | 2.09 | 1.16 | ||||||||||
| Marker Benchmarks | ||||||||||||||
| WTI ($/b) | 63.87 | 71.46 | 70.35 | 75.19 | ||||||||||
| Henry Hub ($/mbtu) | 3.44 | 3.65 | 2.79 | 2.15 | ||||||||||
| Non-U.S. | ||||||||||||||
| ExxonMobil | ||||||||||||||
| Crude ($/b) | 62.01 | 68.12 | 67.58 | 73.07 | ||||||||||
| Natural Gas ($/kcf) | 10.23 | 10.17 | 10.77 | 10.13 | ||||||||||
| Marker Benchmarks | ||||||||||||||
| Brent ($/b) | 67.82 | 75.66 | 74.69 | 80.18 | ||||||||||
| TTF ($/mbtu) | 12.40 | 14.64 | 12.77 | 11.35 | ||||||||||
The above numbers reflect ExxonMobil’s current estimate of volumes and realizations given data available as of the end of the second quarter of 2025. Volumes and realizations may be adjusted when full statements on joint venture operations are received from outside operators. ExxonMobil management assumes no duty to update these estimates. | ||||||||||||||
| Product Solutions Marker Benchmark Data | 2Q25 | 1Q25 | 4Q24 | 3Q24 | ||||||||||
| Energy Products | ||||||||||||||
| Indicative Refining Margin ($/b) | 13.6 | 11.5 | 9.5 | 10.5 | ||||||||||
| Chemical Products | ||||||||||||||
| North American Polyethylene ($/T) | 821 | 879 | 842 | 907 | ||||||||||
| Asia Pacific Polyethylene ($/T) | 837 | 856 | 886 | 895 | ||||||||||
| Asia Pacific LVN ($/T) | 576 | 658 | 652 | 672 | ||||||||||
| USGC Ethane ($/T) | 178 | 202 | 162 | 117 | ||||||||||
The above markers reflect the average prices from the quarter. Indicative Refining Margin, NA PE, AP PE, AP LVN, and USGC Ethane from Platts, part of S&P Global Commodity Insights. NA PE, AP PE, AP LVN, and USGC Ethane historical prices were updated to reflect simple averages. Marker associated sensitivities developed for forward-looking analysis and in relation to full-year results. For any given period, the accuracy of the earnings sensitivity will be dependent on the price movements of individual types of crude oil, natural gas, or products, results of trading activities, project start-up timing, maintenance timing, taxes and other government take impacts, price adjustment lags in long-term gas contracts, and crude and gas production volumes. Accordingly, changes in benchmark prices only provide broad indicators of changes in the earnings experienced in any particular period. Refer to "Modeling Toolkit" tab on the Investor Relations page of our website at www.exxonmobil.com for more information. | ||||||||||||||
{
 "version": "2.2",
 "instance": {
  "xom-20250801.htm": {
   "nsprefix": "xom",
   "nsuri": "http://www.exxonmobil.com/20250801",
   "dts": {
    "inline": {
     "local": [
      "xom-20250801.htm"
     ]
    },
    "schema": {
     "local": [
      "xom-20250801.xsd"
     ],
     "remote": [
      "http://www.xbrl.org/2003/xbrl-instance-2003-12-31.xsd",
      "http://www.xbrl.org/2003/xbrl-linkbase-2003-12-31.xsd",
      "http://www.xbrl.org/2003/xl-2003-12-31.xsd",
      "http://www.xbrl.org/2003/xlink-2003-12-31.xsd",
      "http://www.xbrl.org/2005/xbrldt-2005.xsd",
      "http://www.xbrl.org/2006/ref-2006-02-27.xsd",
      "http://www.xbrl.org/lrr/role/negated-2009-12-16.xsd",
      "http://www.xbrl.org/lrr/role/net-2009-12-16.xsd",
      "https://www.xbrl.org/2020/extensible-enumerations-2.0.xsd",
      "https://www.xbrl.org/dtr/type/2020-01-21/types.xsd",
      "https://www.xbrl.org/dtr/type/2024-01-31/types.xsd",
      "https://xbrl.fasb.org/srt/2025/elts/srt-2025.xsd",
      "https://xbrl.fasb.org/srt/2025/elts/srt-roles-2025.xsd",
      "https://xbrl.fasb.org/srt/2025/elts/srt-types-2025.xsd",
      "https://xbrl.fasb.org/us-gaap/2025/elts/us-gaap-2025.xsd",
      "https://xbrl.fasb.org/us-gaap/2025/elts/us-roles-2025.xsd",
      "https://xbrl.fasb.org/us-gaap/2025/elts/us-types-2025.xsd",
      "https://xbrl.sec.gov/country/2025/country-2025.xsd",
      "https://xbrl.sec.gov/dei/2025/dei-2025.xsd",
      "https://xbrl.sec.gov/stpr/2025/stpr-2025.xsd"
     ]
    },
    "definitionLink": {
     "local": [
      "xom-20250801_def.xml"
     ]
    },
    "labelLink": {
     "local": [
      "xom-20250801_lab.xml"
     ]
    },
    "presentationLink": {
     "local": [
      "xom-20250801_pre.xml"
     ]
    }
   },
   "keyStandard": 22,
   "keyCustom": 0,
   "axisStandard": 1,
   "axisCustom": 0,
   "memberStandard": 1,
   "memberCustom": 3,
   "hidden": {
    "total": 2,
    "http://xbrl.sec.gov/dei/2025": 2
   },
   "contextCount": 5,
   "entityCount": 1,
   "segmentCount": 4,
   "elementCount": 31,
   "unitCount": 0,
   "baseTaxonomies": {
    "http://xbrl.sec.gov/dei/2025": 31
   },
   "report": {
    "R1": {
     "role": "http://www.exxonmobil.com/role/DocumentandEntityInformationDocument",
     "longName": "0000001 - Document - Document and Entity Information Document",
     "shortName": "Document and Entity Information Document",
     "isDefault": "true",
     "groupType": "document",
     "subGroupType": "",
     "menuCat": "Cover",
     "order": "1",
     "firstAnchor": {
      "contextRef": "c-1",
      "name": "dei:DocumentType",
      "unitRef": null,
      "xsiNil": "false",
      "lang": "en-US",
      "decimals": null,
      "ancestors": [
       "span",
       "div",
       "body",
       "html"
      ],
      "reportCount": 1,
      "baseRef": "xom-20250801.htm",
      "first": true,
      "unique": true
     },
     "uniqueAnchor": {
      "contextRef": "c-1",
      "name": "dei:DocumentType",
      "unitRef": null,
      "xsiNil": "false",
      "lang": "en-US",
      "decimals": null,
      "ancestors": [
       "span",
       "div",
       "body",
       "html"
      ],
      "reportCount": 1,
      "baseRef": "xom-20250801.htm",
      "first": true,
      "unique": true
     }
    }
   },
   "tag": {
    "dei_AmendmentFlag": {
     "xbrltype": "booleanItemType",
     "nsuri": "http://xbrl.sec.gov/dei/2025",
     "localname": "AmendmentFlag",
     "presentation": [
      "http://www.exxonmobil.com/role/DocumentandEntityInformationDocument"
     ],
     "lang": {
      "en-us": {
       "role": {
        "terseLabel": "Amendment Flag",
        "label": "Amendment Flag",
        "documentation": "Boolean flag that is true when the XBRL content amends previously-filed or accepted submission."
       }
      }
     },
     "auth_ref": []
    },
    "dei_CityAreaCode": {
     "xbrltype": "normalizedStringItemType",
     "nsuri": "http://xbrl.sec.gov/dei/2025",
     "localname": "CityAreaCode",
     "presentation": [
      "http://www.exxonmobil.com/role/DocumentandEntityInformationDocument"
     ],
     "lang": {
      "en-us": {
       "role": {
        "terseLabel": "City Area Code",
        "label": "City Area Code",
        "documentation": "Area code of city"
       }
      }
     },
     "auth_ref": []
    },
    "us-gaap_ClassOfStockDomain": {
     "xbrltype": "domainItemType",
     "nsuri": "http://fasb.org/us-gaap/2025",
     "localname": "ClassOfStockDomain",
     "presentation": [
      "http://www.exxonmobil.com/role/DocumentandEntityInformationDocument"
     ],
     "lang": {
      "en-us": {
       "role": {
        "terseLabel": "Class of Stock [Domain]",
        "label": "Class of Stock [Domain]"
       }
      }
     },
     "auth_ref": []
    },
    "us-gaap_CommonStockMember": {
     "xbrltype": "domainItemType",
     "nsuri": "http://fasb.org/us-gaap/2025",
     "localname": "CommonStockMember",
     "presentation": [
      "http://www.exxonmobil.com/role/DocumentandEntityInformationDocument"
     ],
     "lang": {
      "en-us": {
       "role": {
        "terseLabel": "Common Stock, without par value",
        "label": "Common Stock [Member]"
       }
      }
     },
     "auth_ref": []
    },
    "dei_CoverAbstract": {
     "xbrltype": "stringItemType",
     "nsuri": "http://xbrl.sec.gov/dei/2025",
     "localname": "CoverAbstract",
     "lang": {
      "en-us": {
       "role": {
        "terseLabel": "Cover [Abstract]",
        "label": "Cover [Abstract]",
        "documentation": "Cover page."
       }
      }
     },
     "auth_ref": []
    },
    "dei_DocumentPeriodEndDate": {
     "xbrltype": "dateItemType",
     "nsuri": "http://xbrl.sec.gov/dei/2025",
     "localname": "DocumentPeriodEndDate",
     "presentation": [
      "http://www.exxonmobil.com/role/DocumentandEntityInformationDocument"
     ],
     "lang": {
      "en-us": {
       "role": {
        "terseLabel": "Document Period End Date",
        "label": "Document Period End Date",
        "documentation": "For the EDGAR submission types of Form 8-K: the date of the report, the date of the earliest event reported; for the EDGAR submission types of Form N-1A: the filing date; for all other submission types: the end of the reporting or transition period. The format of the date is YYYY-MM-DD."
       }
      }
     },
     "auth_ref": []
    },
    "dei_DocumentType": {
     "xbrltype": "submissionTypeItemType",
     "nsuri": "http://xbrl.sec.gov/dei/2025",
     "localname": "DocumentType",
     "presentation": [
      "http://www.exxonmobil.com/role/DocumentandEntityInformationDocument"
     ],
     "lang": {
      "en-us": {
       "role": {
        "terseLabel": "Document Type",
        "label": "Document Type",
        "documentation": "The type of document being provided (such as 10-K, 10-Q, 485BPOS, etc). The document type is limited to the same value as the supporting SEC submission type, or the word 'Other'."
       }
      }
     },
     "auth_ref": []
    },
    "dei_EntitiesTable": {
     "xbrltype": "stringItemType",
     "nsuri": "http://xbrl.sec.gov/dei/2025",
     "localname": "EntitiesTable",
     "presentation": [
      "http://www.exxonmobil.com/role/DocumentandEntityInformationDocument"
     ],
     "lang": {
      "en-us": {
       "role": {
        "terseLabel": "Entities [Table]",
        "label": "Entities [Table]",
        "documentation": "Container to assemble all relevant information about each entity associated with the document instance"
       }
      }
     },
     "auth_ref": []
    },
    "dei_EntityAddressAddressLine1": {
     "xbrltype": "normalizedStringItemType",
     "nsuri": "http://xbrl.sec.gov/dei/2025",
     "localname": "EntityAddressAddressLine1",
     "presentation": [
      "http://www.exxonmobil.com/role/DocumentandEntityInformationDocument"
     ],
     "lang": {
      "en-us": {
       "role": {
        "terseLabel": "Entity Address, Address Line One",
        "label": "Entity Address, Address Line One",
        "documentation": "Address Line 1 such as Attn, Building Name, Street Name"
       }
      }
     },
     "auth_ref": []
    },
    "dei_EntityAddressCityOrTown": {
     "xbrltype": "normalizedStringItemType",
     "nsuri": "http://xbrl.sec.gov/dei/2025",
     "localname": "EntityAddressCityOrTown",
     "presentation": [
      "http://www.exxonmobil.com/role/DocumentandEntityInformationDocument"
     ],
     "lang": {
      "en-us": {
       "role": {
        "terseLabel": "Entity Address, City or Town",
        "label": "Entity Address, City or Town",
        "documentation": "Name of the City or Town"
       }
      }
     },
     "auth_ref": []
    },
    "dei_EntityAddressPostalZipCode": {
     "xbrltype": "normalizedStringItemType",
     "nsuri": "http://xbrl.sec.gov/dei/2025",
     "localname": "EntityAddressPostalZipCode",
     "presentation": [
      "http://www.exxonmobil.com/role/DocumentandEntityInformationDocument"
     ],
     "lang": {
      "en-us": {
       "role": {
        "terseLabel": "Entity Address, Postal Zip Code",
        "label": "Entity Address, Postal Zip Code",
        "documentation": "Code for the postal or zip code"
       }
      }
     },
     "auth_ref": []
    },
    "dei_EntityAddressStateOrProvince": {
     "xbrltype": "stateOrProvinceItemType",
     "nsuri": "http://xbrl.sec.gov/dei/2025",
     "localname": "EntityAddressStateOrProvince",
     "presentation": [
      "http://www.exxonmobil.com/role/DocumentandEntityInformationDocument"
     ],
     "lang": {
      "en-us": {
       "role": {
        "terseLabel": "Entity Address, State or Province",
        "label": "Entity Address, State or Province",
        "documentation": "Name of the state or province."
       }
      }
     },
     "auth_ref": []
    },
    "dei_EntityCentralIndexKey": {
     "xbrltype": "centralIndexKeyItemType",
     "nsuri": "http://xbrl.sec.gov/dei/2025",
     "localname": "EntityCentralIndexKey",
     "presentation": [
      "http://www.exxonmobil.com/role/DocumentandEntityInformationDocument"
     ],
     "lang": {
      "en-us": {
       "role": {
        "terseLabel": "Entity Central Index Key",
        "label": "Entity Central Index Key",
        "documentation": "A unique 10-digit SEC-issued value to identify entities that have filed disclosures with the SEC. It is commonly abbreviated as CIK."
       }
      }
     },
     "auth_ref": [
      "r1"
     ]
    },
    "dei_EntityEmergingGrowthCompany": {
     "xbrltype": "booleanItemType",
     "nsuri": "http://xbrl.sec.gov/dei/2025",
     "localname": "EntityEmergingGrowthCompany",
     "presentation": [
      "http://www.exxonmobil.com/role/DocumentandEntityInformationDocument"
     ],
     "lang": {
      "en-us": {
       "role": {
        "terseLabel": "Entity Emerging Growth Company",
        "label": "Entity Emerging Growth Company",
        "documentation": "Indicate if registrant meets the emerging growth company criteria."
       }
      }
     },
     "auth_ref": [
      "r1"
     ]
    },
    "dei_EntityFileNumber": {
     "xbrltype": "fileNumberItemType",
     "nsuri": "http://xbrl.sec.gov/dei/2025",
     "localname": "EntityFileNumber",
     "presentation": [
      "http://www.exxonmobil.com/role/DocumentandEntityInformationDocument"
     ],
     "lang": {
      "en-us": {
       "role": {
        "terseLabel": "Entity File Number",
        "label": "Entity File Number",
        "documentation": "Commission file number. The field allows up to 17 characters. The prefix may contain 1-3 digits, the sequence number may contain 1-8 digits, the optional suffix may contain 1-4 characters, and the fields are separated with a hyphen."
       }
      }
     },
     "auth_ref": []
    },
    "dei_EntityIncorporationStateCountryCode": {
     "xbrltype": "edgarStateCountryItemType",
     "nsuri": "http://xbrl.sec.gov/dei/2025",
     "localname": "EntityIncorporationStateCountryCode",
     "presentation": [
      "http://www.exxonmobil.com/role/DocumentandEntityInformationDocument"
     ],
     "lang": {
      "en-us": {
       "role": {
        "terseLabel": "Entity Incorporation, State or Country Code",
        "label": "Entity Incorporation, State or Country Code",
        "documentation": "Two-character EDGAR code representing the state or country of incorporation."
       }
      }
     },
     "auth_ref": []
    },
    "dei_EntityInformationLineItems": {
     "xbrltype": "stringItemType",
     "nsuri": "http://xbrl.sec.gov/dei/2025",
     "localname": "EntityInformationLineItems",
     "presentation": [
      "http://www.exxonmobil.com/role/DocumentandEntityInformationDocument"
     ],
     "lang": {
      "en-us": {
       "role": {
        "terseLabel": "Entity Information [Line Items]",
        "label": "Entity Information [Line Items]",
        "documentation": "Line items represent financial concepts included in a table. These concepts are used to disclose reportable information associated with domain members defined in one or many axes to the table."
       }
      }
     },
     "auth_ref": []
    },
    "dei_EntityRegistrantName": {
     "xbrltype": "normalizedStringItemType",
     "nsuri": "http://xbrl.sec.gov/dei/2025",
     "localname": "EntityRegistrantName",
     "presentation": [
      "http://www.exxonmobil.com/role/DocumentandEntityInformationDocument"
     ],
     "lang": {
      "en-us": {
       "role": {
        "terseLabel": "Entity Registrant Name",
        "label": "Entity Registrant Name",
        "documentation": "The exact name of the entity filing the report as specified in its charter, which is required by forms filed with the SEC."
       }
      }
     },
     "auth_ref": [
      "r1"
     ]
    },
    "dei_EntityTaxIdentificationNumber": {
     "xbrltype": "employerIdItemType",
     "nsuri": "http://xbrl.sec.gov/dei/2025",
     "localname": "EntityTaxIdentificationNumber",
     "presentation": [
      "http://www.exxonmobil.com/role/DocumentandEntityInformationDocument"
     ],
     "lang": {
      "en-us": {
       "role": {
        "terseLabel": "Entity Tax Identification Number",
        "label": "Entity Tax Identification Number",
        "documentation": "The Tax Identification Number (TIN), also known as an Employer Identification Number (EIN), is a unique 9-digit value assigned by the IRS."
       }
      }
     },
     "auth_ref": [
      "r1"
     ]
    },
    "dei_LocalPhoneNumber": {
     "xbrltype": "normalizedStringItemType",
     "nsuri": "http://xbrl.sec.gov/dei/2025",
     "localname": "LocalPhoneNumber",
     "presentation": [
      "http://www.exxonmobil.com/role/DocumentandEntityInformationDocument"
     ],
     "lang": {
      "en-us": {
       "role": {
        "terseLabel": "Local Phone Number",
        "label": "Local Phone Number",
        "documentation": "Local phone number for entity."
       }
      }
     },
     "auth_ref": []
    },
    "xom_OnePointFourZeroEightPercentNotesDue2039Member": {
     "xbrltype": "domainItemType",
     "nsuri": "http://www.exxonmobil.com/20250801",
     "localname": "OnePointFourZeroEightPercentNotesDue2039Member",
     "presentation": [
      "http://www.exxonmobil.com/role/DocumentandEntityInformationDocument"
     ],
     "lang": {
      "en-us": {
       "role": {
        "terseLabel": "1.408% Notes due 2039",
        "label": "One Point Four Zero Eight Percent Notes Due 2039 [Member]",
        "documentation": "One Point Four Zero Eight Percent Notes Due 2039"
       }
      }
     },
     "auth_ref": []
    },
    "dei_PreCommencementIssuerTenderOffer": {
     "xbrltype": "booleanItemType",
     "nsuri": "http://xbrl.sec.gov/dei/2025",
     "localname": "PreCommencementIssuerTenderOffer",
     "presentation": [
      "http://www.exxonmobil.com/role/DocumentandEntityInformationDocument"
     ],
     "lang": {
      "en-us": {
       "role": {
        "terseLabel": "Pre-commencement Issuer Tender Offer",
        "label": "Pre-commencement Issuer Tender Offer",
        "documentation": "Boolean flag that is true when the Form 8-K filing is intended to satisfy the filing obligation of the registrant as pre-commencement communications pursuant to Rule 13e-4(c) under the Exchange Act."
       }
      }
     },
     "auth_ref": [
      "r3"
     ]
    },
    "dei_PreCommencementTenderOffer": {
     "xbrltype": "booleanItemType",
     "nsuri": "http://xbrl.sec.gov/dei/2025",
     "localname": "PreCommencementTenderOffer",
     "presentation": [
      "http://www.exxonmobil.com/role/DocumentandEntityInformationDocument"
     ],
     "lang": {
      "en-us": {
       "role": {
        "terseLabel": "Pre-commencement Tender Offer",
        "label": "Pre-commencement Tender Offer",
        "documentation": "Boolean flag that is true when the Form 8-K filing is intended to satisfy the filing obligation of the registrant as pre-commencement communications pursuant to Rule 14d-2(b) under the Exchange Act."
       }
      }
     },
     "auth_ref": [
      "r5"
     ]
    },
    "dei_Security12bTitle": {
     "xbrltype": "securityTitleItemType",
     "nsuri": "http://xbrl.sec.gov/dei/2025",
     "localname": "Security12bTitle",
     "presentation": [
      "http://www.exxonmobil.com/role/DocumentandEntityInformationDocument"
     ],
     "lang": {
      "en-us": {
       "role": {
        "terseLabel": "Title of 12(b) Security",
        "label": "Title of 12(b) Security",
        "documentation": "Title of a 12(b) registered security."
       }
      }
     },
     "auth_ref": [
      "r0"
     ]
    },
    "dei_SecurityExchangeName": {
     "xbrltype": "edgarExchangeCodeItemType",
     "nsuri": "http://xbrl.sec.gov/dei/2025",
     "localname": "SecurityExchangeName",
     "presentation": [
      "http://www.exxonmobil.com/role/DocumentandEntityInformationDocument"
     ],
     "lang": {
      "en-us": {
       "role": {
        "terseLabel": "Security Exchange Name",
        "label": "Security Exchange Name",
        "documentation": "Name of the Exchange on which a security is registered."
       }
      }
     },
     "auth_ref": [
      "r2"
     ]
    },
    "dei_SolicitingMaterial": {
     "xbrltype": "booleanItemType",
     "nsuri": "http://xbrl.sec.gov/dei/2025",
     "localname": "SolicitingMaterial",
     "presentation": [
      "http://www.exxonmobil.com/role/DocumentandEntityInformationDocument"
     ],
     "lang": {
      "en-us": {
       "role": {
        "terseLabel": "Soliciting Material",
        "label": "Soliciting Material",
        "documentation": "Boolean flag that is true when the Form 8-K filing is intended to satisfy the filing obligation of the registrant as soliciting material pursuant to Rule 14a-12 under the Exchange Act."
       }
      }
     },
     "auth_ref": [
      "r4"
     ]
    },
    "us-gaap_StatementClassOfStockAxis": {
     "xbrltype": "stringItemType",
     "nsuri": "http://fasb.org/us-gaap/2025",
     "localname": "StatementClassOfStockAxis",
     "presentation": [
      "http://www.exxonmobil.com/role/DocumentandEntityInformationDocument"
     ],
     "lang": {
      "en-us": {
       "role": {
        "terseLabel": "Class of Stock [Axis]",
        "label": "Class of Stock [Axis]"
       }
      }
     },
     "auth_ref": []
    },
    "dei_TradingSymbol": {
     "xbrltype": "tradingSymbolItemType",
     "nsuri": "http://xbrl.sec.gov/dei/2025",
     "localname": "TradingSymbol",
     "presentation": [
      "http://www.exxonmobil.com/role/DocumentandEntityInformationDocument"
     ],
     "lang": {
      "en-us": {
       "role": {
        "terseLabel": "Trading Symbol",
        "label": "Trading Symbol",
        "documentation": "Trading symbol of an instrument as listed on an exchange."
       }
      }
     },
     "auth_ref": []
    },
    "dei_WrittenCommunications": {
     "xbrltype": "booleanItemType",
     "nsuri": "http://xbrl.sec.gov/dei/2025",
     "localname": "WrittenCommunications",
     "presentation": [
      "http://www.exxonmobil.com/role/DocumentandEntityInformationDocument"
     ],
     "lang": {
      "en-us": {
       "role": {
        "terseLabel": "Written Communications",
        "label": "Written Communications",
        "documentation": "Boolean flag that is true when the Form 8-K filing is intended to satisfy the filing obligation of the registrant as written communications pursuant to Rule 425 under the Securities Act."
       }
      }
     },
     "auth_ref": [
      "r6"
     ]
    },
    "xom_ZeroPointFiveTwoFourPercentNotesDue2028Member": {
     "xbrltype": "domainItemType",
     "nsuri": "http://www.exxonmobil.com/20250801",
     "localname": "ZeroPointFiveTwoFourPercentNotesDue2028Member",
     "presentation": [
      "http://www.exxonmobil.com/role/DocumentandEntityInformationDocument"
     ],
     "lang": {
      "en-us": {
       "role": {
        "terseLabel": "0.524% Notes due 2028",
        "label": "Zero Point Five Two Four Percent Notes Due 2028 [Member]",
        "documentation": "Zero Point Five Two Four Percent Notes Due 2028"
       }
      }
     },
     "auth_ref": []
    },
    "xom_ZeroPointFiveTwoFourPercentNotesDue2032Member": {
     "xbrltype": "domainItemType",
     "nsuri": "http://www.exxonmobil.com/20250801",
     "localname": "ZeroPointFiveTwoFourPercentNotesDue2032Member",
     "presentation": [
      "http://www.exxonmobil.com/role/DocumentandEntityInformationDocument"
     ],
     "lang": {
      "en-us": {
       "role": {
        "terseLabel": "0.835% Notes due 2032",
        "label": "Zero Point Five Two Four Percent Notes Due 2032 [Member]",
        "documentation": "Zero Point Five Two Four Percent Notes Due 2032"
       }
      }
     },
     "auth_ref": []
    }
   }
  }
 },
 "std_ref": {
  "r0": {
   "role": "http://www.xbrl.org/2003/role/presentationRef",
   "Publisher": "SEC",
   "Name": "Exchange Act",
   "Number": "240",
   "Section": "12",
   "Subsection": "b"
  },
  "r1": {
   "role": "http://www.xbrl.org/2003/role/presentationRef",
   "Publisher": "SEC",
   "Name": "Exchange Act",
   "Number": "240",
   "Section": "12",
   "Subsection": "b-2"
  },
  "r2": {
   "role": "http://www.xbrl.org/2003/role/presentationRef",
   "Publisher": "SEC",
   "Name": "Exchange Act",
   "Number": "240",
   "Section": "12",
   "Subsection": "d1-1"
  },
  "r3": {
   "role": "http://www.xbrl.org/2003/role/presentationRef",
   "Publisher": "SEC",
   "Name": "Exchange Act",
   "Number": "240",
   "Section": "13e",
   "Subsection": "4c"
  },
  "r4": {
   "role": "http://www.xbrl.org/2003/role/presentationRef",
   "Publisher": "SEC",
   "Name": "Exchange Act",
   "Number": "240",
   "Section": "14a",
   "Subsection": "12"
  },
  "r5": {
   "role": "http://www.xbrl.org/2003/role/presentationRef",
   "Publisher": "SEC",
   "Name": "Exchange Act",
   "Number": "240",
   "Section": "14d",
   "Subsection": "2b"
  },
  "r6": {
   "role": "http://www.xbrl.org/2003/role/presentationRef",
   "Publisher": "SEC",
   "Name": "Securities Act",
   "Number": "230",
   "Section": "425"
  }
 }
}