| QUEENSLAND
BUDGET UPDATE 2023–24
|
|
EXHIBIT (c)(xv)
2023-24 Budget Update
FORWARD-LOOKING STATEMENTS
This exhibit contains forward-looking statements. Statements that are not historical facts, including statements about the State of Queensland’s (the “State” or “Queensland”) beliefs and expectations, are forward-looking statements. These statements are based on current plans, budgets, estimates and projections and therefore you should not place undue reliance on them. The words “believe”, “may”, “will”, “should”, “estimate”, “continue”, “anticipate”, “intend”, “expect”, “forecast” and similar words are intended to identify forward-looking statements. Forward-looking statements speak only as of the date they are made, and neither the Queensland Treasury Corporation nor the State undertake any obligation to update publicly any of them in light of new information or future events.
Forward-looking statements are based on current plans, estimates and projections and, therefore, undue reliance should not be placed on them. Although the Queensland Treasury Corporation and the State believe that the beliefs and expectations reflected in such forward-looking statements are reasonable, no assurance can be given that such beliefs and expectations will prove to have been correct. Forward-looking statements involve inherent risks and uncertainties. We caution you that actual results may differ materially from those contained in any forward-looking statements.
A number of important factors could cause actual results to differ materially from those expressed in any forward-looking statement. Factors that could cause the actual outcomes to differ materially from those expressed or implied in forward-looking statements include:
| • | the international and Australian economies, and in particular the rates of growth (or contraction) of the State’s major trading partners; |
| • | the effects, both internationally and in Australia, of any subsequent economic downturn, as well as the effect of ongoing economic, banking and sovereign debt risk; |
| • | the effect of natural disasters, epidemics and geopolitical events, such as the novel coronavirus (COVID-19) pandemic, the Russia-Ukraine conflict and the Israel-Hamas conflict; |
| • | increases or decreases in international and Australian domestic interest rates; |
| • | changes in and increased volatility in currency exchange rates; |
| • | changes in the State’s domestic consumption; |
| • | changes in the State’s labor force participation and productivity; |
| • | downgrades in the credit ratings of the State and Australia; |
| • | changes in the rate of inflation in the State; |
| • | changes in environmental and other regulation; and |
| • | changes in the distribution of revenue from the Commonwealth of Australia Government to the State. |
(c)(xv)-1
| QUEENSLAND
BUDGET UPDATE 2023–24
|
|
First Nations acknowledgement
Queensland Treasury acknowledges Aboriginal peoples and Torres Strait Islander peoples as the Traditional Owners and custodians of the land. We recognise their connection to land, sea and community, and pay our respects to Elders past, present and emerging.
© The State of Queensland (Queensland Treasury) 2023
This publication is protected by the Copyright Act 1968
This document is licensed by the State of Queensland (Queensland Treasury) under a Creative Commons Attribution (CC BY 4.0) International licence.

In essence, you are free to copy, communicate and adapt this publication, as long as you attribute the work to the State of Queensland (Queensland Treasury). To view a copy of this licence, visit http://creativecommons.org/licenses/by/4.0/
Content from the 2023–24 Budget Update should be attributed to:
© The State of Queensland (Queensland Treasury) 2023–24 Budget Update.
The Queensland Government is committed to providing accessible services to Queenslanders from all cultural and linguistic backgrounds. If you have difficulty in understanding this publication, you can contact us on telephone (07) 3035 3503 and we will arrange an interpreter to effectively communicate the report to you.
BUDGET UPDATE 2023–24
| 2 | ||||
| 3 | ||||
| 4 | ||||
| 7 | ||||
| 8 | ||||
| 10 | ||||
| 13 | ||||
| 17 | ||||
| 18 | ||||
| 19 | ||||
| 24 | ||||
| 26 | ||||
| 28 | ||||
| 30 | ||||
| 33 | ||||
| 42 | ||||
| 45 | ||||
1
|
|
The 2023–24 Budget Update showcases the continuing strength of Queensland’s growing economy, against a backdrop of subdued global economic conditions and cost-of-living pressures affecting households. |
Queensland’s economy has continued to outperform most other states and territories, with strong growth in population, employment, wages, and exports.
This strength, combined with robust fiscal management has enabled the Government to continue to address national cost-of-living pressures for Queenslanders.
Building on the record $8.224 billion in concessions outlined in the 2023–24 Budget, we are providing more support to families and businesses facing cost-of-living pressures, including:
| • | boosting the First Home Owner Grant to $30,000, the equal highest in the nation, until June 2025 |
| • | freezing the registration fee and traffic improvement fee components of Motor Vehicle Registration Costs in 2024–25 |
| • | freezing public transport fares in 2024 |
| • | maintaining critical investment for both financial counselling and resilience services, and food relief and emergency relief. |
We’ve delivered nation-leading rebates and concessions, while also funding investment in critical infrastructure and services that support long-term growth.
Against a backdrop of subdued global economic conditions, Queensland’s strong labour market and population growth, combined with significant public investment, have supported solid domestic activity.
The Queensland economy grew 2.3 per cent in 2022–23 and growth is forecast to strengthen to 3 per cent in both 2023–24 and 2024–25. Our economy has rebounded since the COVID-19 pandemic to be 9.8 per cent larger than it was in 2018–19, highlighting the resilience of the state’s diversified economic base.
Queensland’s labour market continues to perform strongly.
In October 2023, employment in Queensland was 286,900 persons, or 11.1 per cent, above its pre-COVID level of March 2020. That jobs growth is the equivalent to more than the population of Ipswich. It is the second strongest rate of jobs growth of any state or territory, and accounted for one quarter of national job gains over that period.
And our regions are benefiting from strong employment conditions, with Toowoomba, Townsville, and Logan—Beaudesert all seeing employment growth of over 20 per cent since pre-COVID levels in March 2020.
Queensland recorded an unemployment rate averaging 3.7 per cent in 2022–23, the lowest year-average unemployment rate since 2007–08 and the second lowest on record since 1978.
The improved revenue outlook in 2023–24 primarily reflects upward revisions to coal and petroleum royalties, due to higher-than-expected global metallurgical coal prices, and higher oil prices.
The record 2022–23 net operating surplus and improved fiscal position in 2023–24, both of which are driven by the temporary and unprecedented strength in coal royalties and introduction of progressive coal royalties, provides Queensland with the capacity to deliver additional cost-of-living measures, while also supporting the state’s record capital program over the next 4 years.
The 2023–24 Budget Update includes a current capital program of $96.2 billion over the 4 years to 2026–27. The government is delivering productivity-enhancing economic and social infrastructure needed to support a growing Queensland. The Big Build capital program is supporting the state’s economic and energy transformation and improving the liveability and sustainability of Queensland communities.
These investments will support the growth of Queensland’s traditional and emerging industries and create more jobs across the state.
With a focus on growing the Queensland economy, we’ll continue to invest in the future for families and businesses across the state.

The Honourable Cameron Dick MP
Treasurer
Minister for Trade and Investment
2 BUDGET UPDATE 2023–24
The 2023–24 Budget Update incorporates the changes to the state’s economic and fiscal position since the 2023–24 Queensland Budget.
The fundamentals of the budget and economy remain strong with highlights including the state recording:
| • | economic growth of 9.8 per cent since the pre-COVID level in 2018–19 – stronger than national GDP growth of 9.3 per cent over the same period |
| • | unemployment rate averaging 3.7 per cent in 2022–23, the lowest year-average unemployment rate since 2007–08 and the second lowest on record since 1978 |
| • | employment in October 2023 being 286,900 persons (or 11.1 per cent) above its pre-COVID level of March 2020, accounting for one quarter of national job gains over the period |
| • | a small net operating deficit of $138 million is forecast for 2023–24, which is a $2.044 billion improvement on the deficit projected in the 2023–24 Budget |
| • | the improvement in 2023–24 follows on from Queensland’s record General Government Sector net operating surpluses of $13.93 billion for 2022–23 and $4.3 billion in 2021–22 which benefitted from high coal prices and from June 2022 the introduction of new progressive coal royalty tiers |
| • | modest surpluses are still forecast from 2024–25 onwards, as commodity prices normalise, consistent with previous updates |
| • | General Government Sector net debt is estimated to be $14.676 billion by 30 June 2024, which is $1.514 billion lower than projected in the 2023–24 Queensland Budget. |
Queensland’s ongoing strong economic recovery and performance following the COVID-19 pandemic continues to highlight the resilience of the state’s diversified economy.
The strong labour market and population growth, combined with significant public investment, have supported solid domestic activity. After growing by 2.3 per cent in 2022–23, overall economic growth is forecast to strengthen to 3 per cent in both 2023–24 and 2024–25.
The government’s economic strategy is continuing to support Queensland’s transition to a more sustainable and diversified economy, by focussing on key enablers of growth. These include infrastructure investment, a skilled workforce, a competitive investment and trade environment, innovation, and technology, and enhancing the state’s strong Environmental, Social and Governance (ESG) credentials.
General Government Sector revenue in 2023–24 is estimated to be $3.7 billion higher than estimated at the time of the 2023–24 Queensland Budget. The improved revenue outlook in 2023–24 primarily reflects upward revisions to coal and petroleum royalties, due to higher-than-expected global metallurgical coal and oil prices being received by Queensland’s key commodity producers.
The record 2022–23 net operating surplus and improved fiscal position in 2023–24 provides Queensland with the capacity to deliver additional cost-of-living measures, while also supporting the state’s record capital program over the next four years.
Building on the record $8.224 billion in concessions outlined in the 2023–24 Budget, the government is providing more support to families and businesses facing cost-of-living pressures, including:
| • | boosting the First Home Owner Grant until June 2025 |
| • | freezing the registration fee and traffic improvement fee components of Motor Vehicle Registration Costs in 2024–25 |
| • | freezing public transport fares in 2024. |
The government is delivering productivity-enhancing economic and social infrastructure needed to support a growing Queensland. The 2023–24 Budget Update includes a current capital program of $96.2 billion over the 4 years to 2026–27. Enhancements that have been incorporated into the capital program in recent budgets include delivering increased health system capacity, decarbonisation of the state’s energy system, improving water security and preparing for the Brisbane 2032 Olympic and Paralympic Games. The government is keenly aware of cost pressures and continues to work closely with the Australian government on its Infrastructure Investment Program review.
3
Delivering for Queenslanders
Queensland’s strong economic performance is enabling the Queensland Government to continue to address the challenges facing Queenslanders today, while also laying a solid foundation for future growth and prosperity.
Despite subdued global economic conditions, the Queensland economy grew by 2.3 per cent in 2022–23. In October 2023, employment in Queensland was 286,900 persons, or 11.1 per cent, above its pre-COVID level of March 2020.
This strong economic and labour market performance, and the impact of high coal prices, has enabled the Queensland Government to deliver nation-leading cost-of-living support to Queensland households and businesses, while also funding investments in critical infrastructure and services that support long-term growth.
As outlined in the 2023–24 Budget, the government is providing a record $8.224 billion in concessions in 2023–24 to support families and businesses facing cost-of-living pressures, an increase of more than 21 per cent from 2022–23. Since then, the government has announced further significant support for Queenslanders facing cost-of-living pressures, including to help address housing affordability challenges by boosting the First Home Owner Grant.
As well as addressing immediate challenges, the government’s economic strategy is continuing to support Queensland’s transition to a more sustainable and diversified economy, by focussing on key enablers of growth including infrastructure investment, a skilled workforce, a competitive investment and trade environment, innovation and technology, and enhancing the state’s strong Environmental, Social and Governance (ESG) credentials.
The government is delivering the productivity-enhancing economic and social infrastructure needed to support a growing Queensland. This includes the Big Build capital program which is supporting the state’s economic and energy transformation and improving the liveability and sustainability of Queensland communities.
These investments will support the growth of Queensland’s traditional and emerging industries and create more jobs across the state.
To capitalise on these opportunities, the government is also investing in the growth and development of Queensland’s workforce. Queensland’s Clean Energy Workforce Roadmap, released in October 2023, builds on the Good people. Good Jobs: Queensland Workforce Strategy 2022–2032 and sets out a $30 million roadmap to create a skilled, job-ready workforce to deliver Queensland’s clean energy transformation.
Box 1: Cost-of-living relief for Queenslanders
The global inflationary environment since the COVID-19 pandemic drove up the cost of living around the world and nationally. However, as global and domestic supply chains have responded and tighter interest rate settings have curbed demand, the inflation rate, while still high, is moderating.
Annual Consumer Price Index (CPI) growth in Queensland has clearly peaked, having now fallen for four consecutive quarters from a peak of 7.9 per cent in September quarter 2022. The latest quarterly CPI data show Brisbane’s headline CPI rose 0.7 per cent in September quarter 2023, to be 5.2 per cent higher over the year.
The key contributors to CPI growth over the year to September quarter 2023 in Brisbane were housing (including rents), food and automotive fuel costs. Housing was up 5.3 per cent, food and non-alcoholic beverages up 4.6 per cent and fuel up 9.0 per cent over the year.
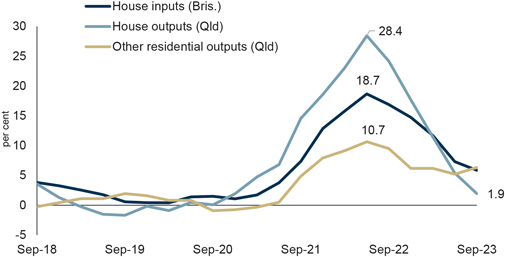
However, there are clear signs that growth in construction costs is stabilising following an extended period of material and labour supply constraints, which saw construction costs surge in 2022 (Chart 1). Annual growth in residential construction costs in Queensland in September quarter 2023 had fallen to 1.9 per cent, compared with the peak of 28.4 per cent growth recorded a year earlier.
4 BUDGET UPDATE 2023–24
Chart 1: Residential construction input and output cost inflation
(original, quarterly, annual per cent change)
The Queensland Government is acutely aware of the challenges Queenslanders are currently facing in terms of national cost-of-living pressures. That is why in the 2023–24 Budget, the government provided a record $8.224 billion in concessions to Queensland families and businesses.
In particular, the Budget delivered $1.483 billion for additional electricity bill support to households and small businesses facing cost-of-living pressures. As part of the package, all Queensland households are automatically receiving a $550 Cost of Living Rebate on their electricity bill in 2023–24, while around 600,000 vulnerable households will benefit from a higher $700 Cost of Living Rebate.
In addition, vulnerable households will continue to receive the existing $372 rebate under the Queensland Electricity Rebate Scheme, bringing total support for this group to $1,072 in 2023–24.
The first instalment of this package has had an immediate impact on lowering inflation, with Brisbane electricity prices falling by 10.2 per cent in the September quarter. In comparison, the ABS estimated that electricity prices would have increased by 21.5 per cent in the absence of the government’s overall energy bill relief.
The 2023–24 Budget also provided increased funding of $1.1 billion for the delivery and supply of social housing across Queensland through the Housing and Homelessness Action Plan 2021-2025, including to meet higher construction costs and to boost the QuickStarts Queensland program target by 500 homes, bringing it to 3,265 social housing commencements by 30 June 2025.
The Budget also committed over $150 million over 5 years to provide temporary accommodation and extend and enhance housing and homelessness services. In addition, the Queensland Government is actioning key reforms, including limiting rent increases to once a year to give a fairer go to Queenslanders who rent.
The government is also providing $64.3 million for the Remote Community Freight Contracts – Northern Peninsula, Torres Strait and Gulf region, to be delivered through a freight retail discount scheme applied at the cash register on eligible essential goods at participating retailers, to assist those living in the Cape York, Torres Strait and Gulf regions.
Since the 2023–24 Budget, including in this Budget Update, the Queensland Government has announced further significant support for Queenslanders facing cost-of-living pressures.
5
Boost to First Home Owner Grant
The government has temporarily doubled the First Home Owner Grant for eligible first home buyers to $30,000, estimated to support around 12,000 Queenslanders to unlock their first home by 30 June 2025, when the boost is set to expire. This increase means Queenslanders will now have access to the equal highest First Home Owner Grant in Australia, and triple the grants available in New South Wales, Victoria and Western Australia.
Freeze on motor vehicle registration costs
To further alleviate cost of living pressures on Queenslanders, the Government has frozen the registration fee and traffic improvement fee components of Motor Vehicle Registration Costs for 2024–25.
Freeze on public transport fare increases
Fare increases on Queensland public transport services will be frozen in 2024.
Other cost of living support for vulnerable Queenslanders
The Budget Update also provides $557,000 in 2023–24 and $1.1 million in 2024–25 to maintain critical investment in financial counselling and resilience services until 31 December 2024, and $1.95 million in 2024–25 to maintain critical funding for food relief and emergency relief until 31 December 2024.
6 BUDGET UPDATE 2023–24
Domestic economic developments have largely played out as expected since the 2023–24 Queensland Budget. However, the outlook for the global economy remains subdued, with risks skewed to the downside.
The International Monetary Fund (IMF) projects global economic growth to slow from 3.5 per cent in 2022 to 3.0 per cent in 2023 and 2.9 per cent 2024, weaker than the 3.8 per cent per annum historical average.
National economic growth is expected to slow in 2023–24, weighed down by subdued growth in consumption and a slowdown in exports, according to the Reserve Bank of Australia (RBA). After growing 3.0 per cent in 2022–23, the RBA forecasts national GDP growth to slow to 13⁄4 per cent in 2023–24 before picking up to 2 per cent in 2024–25.
In Queensland, household budgets continue to be constrained by the substantial increases in lending rates and other cost-of-living pressures, which are expected to result in slower household spending growth in 2023–24. However, household consumption growth is expected to recover somewhat in 2024–25 as easing inflationary pressures help support real disposable incomes.
With supply constraints continuing to ease, new housing construction activity in Queensland’s has rebounded recently. As capacity constraints unwind further and the substantial pipeline of construction work progresses, dwelling investment is forecast to rebound strongly in 2023–24 and grow at a modest rate in 2024–25.
After growing by 2.7 per cent in 2022–23, Queensland’s state final demand growth is expected to remain steady at 23⁄4 per cent in 2023–24, before strengthening to 3 per cent in 2024–25.
Despite the weaker global outlook tempering demand, an unwinding in supply constraints across the Queensland resources sector is expected to boost coal, LNG, and metals export volumes in the near term, while drier conditions are expected to increase short-term beef exports as processing rates increase. Services exports are also forecast to grow strongly as airline capacity increases. Further, goods imports are expected to moderate, in line with the softening in household spending and a sustained low A$ making imports relatively more expensive.
The combination of these factors means that, after detracting from overall economic growth for 3 consecutive years, in real terms the overseas trade sector is forecast to make a solid contribution to overall economic growth in 2023–24. In 2024–25, the contribution from the trade sector is forecast to largely return to balance, as services export growth moderates.
After growing by 2.3 per cent in 2022–23, overall economic growth is forecast to strengthen to 3 per cent in both 2023–24 and 2024–25. This profile is consistent with the outlook published in the 2023–24 Queensland Budget.
Softer household consumption in 2023–24 is expected to see year-average employment growth slow, from the strong 3.7 per cent in 2022–23 to 13⁄4 per cent in 2023–24, before growing a further 11⁄4 per cent in 2024–25.
Reflecting the strength of Queensland’s labour market, the state’s unemployment rate averaged 3.7 per cent in 2022–23, in line with the Budget forecast. This was Queensland’s lowest year-average unemployment rate since 2007–08 and the second lowest on record since monthly ABS Labour Force estimates began in 1978.
Queensland’s unemployment rate is forecast to edge slightly higher, from a low of 3.7 per cent in 2022–23 to 41⁄4 per cent in 2023–24 and 41⁄2 per cent in 2024–25. However, these are still relatively low unemployment rates historically, compared with an annual average of 5.6 per cent over the previous 2 decades.
Consistent with national trends, inflation appears to have peaked, with annual growth in Brisbane’s Consumer Price Index slowing from 7.9 per cent in September quarter 2022 to 5.2 per cent a year later. However, reflecting higher fuel prices and a weaker A$, inflationary pressures, particularly for goods, are expected to persist for longer than anticipated at Budget. Consequently, after having peaked at 7.3 per cent in 2022–23, Brisbane’s year-average inflation is now expected to be 41⁄4 per cent in 2023–24, before moderating to 3 per cent in 2024–25.
7
Queensland’s Wage Price Index grew by 3.6 per cent in 2022–23, marginally below the 33⁄4 per cent forecast at Budget. Following strong growth in September quarter 2023, wages growth is expected to pick up to 43⁄4 per cent in 2023–24, before moderating in 2024–25 to 31⁄2 per cent as capacity constraints in the labour market begin to ease.
Combined, these forecasts for year-average wages growth and inflation imply that real wages will grow by half a percentage point in both 2023–24 and 2024–25.
Queensland’s population growth is expected to have strengthened to 21⁄4 per cent in 2022–23, reflecting strong overseas migration as departures have temporarily lagged arrivals. With interstate migration forecast to stabilise at around pre-COVID levels and net overseas migration to remain elevated, Queensland’s population is forecast to grow a further 2 per cent in 2023–24 before easing back to growth of 11⁄2 per cent in 2024–25.
Table 1: Queensland economic forecasts1
| 2022–23 | 2023–24 | 2024–25 | ||||||||
| Actuals | Budget | Update | Budget | Update | ||||||
| Gross state product2 |
2.3 | 3 | 3 | 3 | 3 | |||||
| State final demand |
2.7 | 21⁄2 | 23⁄4 | 31⁄4 | 3 | |||||
| Employment |
3.7 | 1 | 13⁄4 | 11⁄2 | 11⁄4 | |||||
| Unemployment rate3 |
3.7 | 41⁄4 | 41⁄4 | 41⁄2 | 41⁄2 | |||||
| Inflation4 |
7.3 | 33⁄4 | 41⁄4 | 3 | 3 | |||||
| Wage Price Index |
3.6 | 4 | 43⁄4 | 31⁄2 | 31⁄2 | |||||
|
Population |
21⁄4 | 13⁄4 | 2 | 11⁄2 | 11⁄2 | |||||
| Notes: |
|
1. Unless otherwise stated, all figures are annual percentage changes. 2. Chain volume measure (CVM), 2021–22 reference year. 3. Per cent, year-average. 4. Brisbane, per cent, year-average. |
| Sources: ABS Annual State Accounts, Labour Force, Consumer Price Index, Wage Price Index and National, State and Territory Population, and Queensland Treasury. |
International
Global economic growth has slowed in 2023, with a slowing in growth across major advanced economies weighed down by a synchronised rapid tightening of monetary policy globally.
The IMF is forecasting global economic growth to slow from 3.5 per cent in 2022 to 3.0 per cent in 2023 and 2.9 per cent in 2024, although the risk of a significant global economic downturn is now considered less likely than previously anticipated.
While world economic output in coming years is now forecast to be slightly stronger than expected at Budget, it is still weaker than the 3.8 per cent per annum average over the 2 decades prior to COVID-19.
Since Budget, long term government bond yields have risen further, including in the United States where economic activity has been particularly resilient.
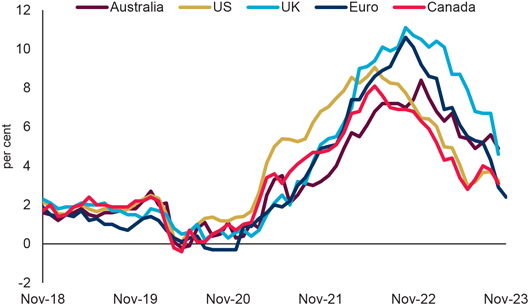
Globally, inflation has moderated from multi-decade highs but remains above-target and a key challenge in most advanced economies, particularly for services. The IMF forecasts global headline inflation to fall from its peak of 8.7 per cent in 2022 to 6.9 per cent in 2023 and 5.8 per cent in 2024.
While interest rates increasingly appear to be near their peak in most advanced economies, labour markets generally remain resilient, supporting demand, while core measures of inflation are proving sticky.
Further, rising energy prices have temporarily halted the inflation slowdown in recent months in many economies, including in Australia, with global oil prices in October being 21 per cent higher than they were in May, as supply cuts by major producers were extended.
8 BUDGET UPDATE 2023–24
Chart 2: Consumer price inflation in major economies1
Note:
1. Monthly, annual per cent change.
Source: Refinitiv.
In China, which regained its place as Queensland’s top export market in the year to October 2023, economic growth has moderated since re-opening from COVID-19 lockdowns. A range of economic data since the Budget point to a weakening in China’s economy, including in the property sector, and authorities have responded with policy stimulus aimed at the property and household sectors, as well as lower interest rates. China’s economy, which is now forecast to grow by 5.0 per cent in 2023 and 4.2 per cent in 2024, remains a key risk to the outlook.
On balance, given these factors, risks to the global outlook remain skewed to the downside. The conflict in the Middle East has so far had only modest impacts on financial and commodity markets, but a broadening in the conflict could impact oil supply and have broader spillover effects.
While overall global economic activity has evolved broadly as expected, the outlook for industrial production across Queensland’s major trading partners has deteriorated. Trade tensions and restrictions have continued, including between the US and China. For 2023, industrial production is forecast to contract in Japan, Korea, Singapore, Taiwan, and the Eurozone, while growth in China has also been downgraded.
Weaker growth or declines in industrial production in key trading partners suggests softer demand for Queensland’s commodities, including metallurgical coal. Commodity prices are generally lower than at Budget, although ongoing supply constraints have made metallurgical coal and oil prices notable exceptions.
Despite the weaker global outlook tempering demand, an unwinding in supply constraints across the Queensland resources sector is expected to boost coal, LNG, and metals export volumes in the near term, while drier conditions are expected to increase short-term beef export volumes as processing rates increase.
Table 2: Industrial Production growth Forecasts
| 2022 | 2023 | 2024 | ||||||||
| Actual | Budget | Current | Budget | Current | ||||||
| China |
3.6 | 5.2 | 4.3 | 5.0 | 4.7 | |||||
| India |
5.3 | 3.5 | 5.5 | 5.4 | 5.4 | |||||
| Japan |
0.0 | 0.0 | -1.4 | 2.4 | 1.0 | |||||
| Korea |
1.4 | -1.8 | -3.2 | 3.3 | 3.8 | |||||
| Singapore |
2.7 | -0.7 | -5.3 | 2.5 | 2.1 | |||||
| Taiwan |
-1.8 | -2.0 | -11.6 | 3.8 | 6.1 | |||||
| US |
3.4 | -0.9 | 0.3 | -0.8 | 0.0 | |||||
| UK |
-3.3 | -1.2 | 0.9 | 0.7 | -0.2 | |||||
|
Euro zone |
2.1 | 0.6 | -2.0 | 1.6 | 0.1 | |||||
| Source: Consensus Economics. |
9
National economy
The Australian economy has remained robust amid a slowing global economy and geopolitical uncertainty, with GDP growing by 3.0 per cent in 2022–23.
Solid economic growth during the post-pandemic recovery has sustained a tight labour market in Australia, with the national unemployment rate remaining under 4 per cent since March 2022.
Inflation in Australia is moderating, but it has fallen at a slower rate than expected due to growth in automotive fuel prices and persistent services inflation. The RBA expects inflation to return to the top end of its 2 to 3 per cent target range by the end of 2025.
The RBA has tightened monetary policy substantially since May 2022. From the “emergency low” of 0.1 per cent during the COVID-19 pandemic, the cash rate had been raised 425-basis points to 4.35 per cent — the highest rate since November 2011. Market pricing currently suggests the cash rate is at its peak and may begin declining by late 2024.
National house prices in November 2023 rebounded 8.3 per cent since the recent low in January 2023. While the increase in house prices has been broad-based across capital cities and regions, the rate of growth nationally appears to have moderated in recent months, driven by slowdowns in Sydney and Melbourne.
National household consumption and dwelling investment has been weak with high inflation and increased mortgage repayments weighing on household disposable incomes.
The RBA revised up its near-term economic growth outlook in its latest November 2023 Statement on Monetary Policy due to stronger-than-expected momentum in the economy over the first half of 2023. The RBA forecasts national year average GDP growth of 13⁄4 per cent in 2023–24 before picking up to 2 per cent in 2024–25.
The Queensland economy grew a further 2.3 per cent in 2022–23, broadly in line with the 2023–24 Queensland Budget forecast of 2 per cent. The strong labour market and population growth, combined with significant public investment, have supported domestic activity.
Overall, the outlook for Queensland economic growth is unchanged from Budget, with gross state product forecast to grow by 3 per cent in both 2023–24 and 2024–25.
Household consumption
Strong growth in labour income, a pick-up in population growth and the substantial savings accumulated during the pandemic led to real household consumption growing by a solid 3.0 per cent in 2022–23. However, this was a slowing of growth from the strong 41⁄2 per cent per annum averaged across the 2 previous years, as households reduced discretionary spending in response to higher borrowing costs and other cost-of-living pressures.
Consumption patterns that had altered during the COVID-pandemic continued to normalise during 2023, with a rebalancing towards spending on services appearing to have now mostly run its course.
Notwithstanding the wealth boost from the sharper and earlier than expected rebound in dwelling prices, elevated inflation and the lagged impact of higher interest rates are expected to continue to weigh on household budgets in the near-term and lead to a further slowing in real consumption growth in 2023–24.
As inflationary pressures subside, growth in real household consumption is forecast to regain momentum in 2024–25.
Dwelling investment
Following 2 years of strong growth, dwelling investment in Queensland fell 6.1 per cent in 2022–23. Residential construction activity in 2022 was constrained significantly by material and labour supply shortages, poor weather and flooding, and several construction company insolvencies.
10 BUDGET UPDATE 2023–24
However, there are clear signs that supply constraints are beginning to ease, particularly for materials, with new and used construction in September quarter 2023 12.2 per cent above its trough in June quarter 2022. Conversely, renovation activity, which is traditionally more discretionary in nature, has trended lower as higher interest rates impact household budgets.
Record low interest rates and substantial government stimulus drove strong increases in building approvals and lending indicators throughout 2020–21. However, given the supply constraints faced by the sector across 2021 and 2022, there remains a near-record value of residential building work in the pipeline.
Supported by the continued easing of supply constraints, dwelling investment is expected to rebound strongly in 2023–24, followed by further moderate growth in 2024–25.
Business investment
Following declines in the 3 years to 2020–21, business investment recovered strongly in the subsequent 2 years as the economy rebounded from the COVID-19 pandemic, interest rates remained low and the labour market strengthened. Business investment grew by 9.3 per cent in 2021–22 and a further 5.2 per cent in 2022–23.
Over that period, strong business conditions and confidence, high commodity prices and capacity utilisation constraints all supported business investment, with these factors more than offsetting the impacts of the rapid growth in construction costs.
Consistent with the outlook at Budget, modest growth in business investment is still expected in 2023–24. While construction cost growth has moderated, indicators suggest that business confidence, conditions and capacity utilisation rates have eased over the past year. Higher interest rates and the anticipated continuation of commodity price softening will also moderate the outlook.
Public final demand
Public final demand rose a further 4.5 per cent in 2022–23, its eighth consecutive year of solid growth, with public final demand growth averaging 4.9 per cent per annum over this period. Growth in public final demand is expected to remain robust in 2023–24 and 2024–25.
Public final demand will continue to be supported by the Queensland Government’s Big Build capital program, committing $96 billion over 4 years to essential economic and social infrastructure investment across the state, including substantial investment across regional Queensland.
Overseas exports
High prices for Queensland’s key commodity exports have boosted the nominal value of Queensland’s goods and services exports which nearly doubled in 2021–22, before rising a further 11 per cent in 2022–23 to a record high of $144 billion.
Overseas exports declined in real terms, falling by 1.7 per cent in 2022–23, reflecting a 5.4 per cent decline in goods exports, caused by unscheduled LNG maintenance and weather-related supply constraints impacting coal volumes. This more than offset strong growth in services exports, as they recover from the impacts of the pandemic.
Overseas exports are expected to grow in 2023–24, as supply constraints previously affecting goods exports unwind and services exports continue to recover towards pre-COVID-19 levels.
Coal
The volume of Queensland’s coal exports rose 1.0 per cent in 2022–23, stronger than the 1⁄2 per cent decline expected in the 2023–24 Budget, reflecting very strong exports in June quarter 2023.
Since Budget, forecasts for industrial production growth in the majority of Queensland’s primary coal export destinations have been downgraded. As a result, demand for Queensland’s metallurgical coal is expected to be lower than anticipated at Budget in both 2023–24 and 2024–25. Partly offsetting this, thermal coal exports, to China in particular, have been stronger than forecast at Budget. Some of this strength is expected to continue into 2023–24 and 2024–25.
11
Overall, reflecting the continued unwinding of supply constraints experienced in recent years, Queensland’s coal exports are forecast to grow 5 per cent in 2023–24 and a further 81⁄4 per cent in 2024–25.
Premium hard coking coal spot prices increased strongly in September 2023, rising from US$268/t to US$333/t across the month, much stronger than anticipated at Budget. The surge in coal prices occurred following news of suspended truck operations at the Peak Downs mine. BHP also reported lower coal production in September quarter 2023 at its Goonyella mine, reflecting wash plant maintenance. As supply normalises, prices will adjust towards medium term anchors.
PCI (pulverised coal injection) spot prices traded at an historic high relative to premium hard coking coal spot prices in 2022–23, following Russia’s invasion of Ukraine restricting demand for Russian PCI coal. At Budget, it was assumed PCI prices would remain elevated, relative to their historic discount to hard coking coal, over the forward estimates as demand for Russian coal remained constrained. However, across July and August, the PCI spot price fell sharply, towards its average discount to premium hard coking coal. PCI prices are now expected to remain lower than expected at Budget over the forecast period.
Thermal coal prices have moved broadly as expected since Budget and forecast prices are largely unchanged, with thermal coal prices expected to continue to ease across 2023–24 but remain above their historical long-run average price across the forecast period.
LNG
The volume of Queensland’s LNG exports fell 5.8 per cent in 2022–23, largely due to maintenance issues at one of the LNG plants on Curtis Island and tightness in the domestic market. However, the Australian Competition and Consumer Commission is forecasting adequate supply in the East Coast Domestic Gas Market in 2023–24, which should support a rebound in LNG export volumes.
Most of Queensland’s LNG exports are sold under long-term contracts linked to global oil prices, with several months’ lag. Elevated oil prices in recent years have driven the value of LNG exports to record highs, growing by 24 per cent to $24.1 billion in 2022–23, following growth of 104 per cent the previous year. The value of LNG exports is expected to decline gradually over coming years, in line with moderating global oil prices.
However, there is considerable upside risk to oil prices if the conflict in the Middle East escalates or broadens and results in any significant impact on oil producing countries in the region.
Metals
Metals production rebounded in September quarter 2023, with most operations returning to normal production levels following lower production volumes early in the year. With several processors also increasing output, including from the Sun Metals zinc refinery expansion, the volume of metals exports is expected to rebound strongly in 2023–24.
As noted at Budget, anticipated zinc/lead and copper mine depletions are reflected in the forecast profile from 2025 onwards, including the closure of Glencore’s Lady Loretta and Mount Isa copper mining activities. However, Glencore recently confirmed it intends to extend the life of the Mount Isa smelter and Townsville refinery beyond 2026, with these assets reliant on third-party feedstock from within Queensland and elsewhere.
With several projects awaiting approval and substantial exploration expenditure, particularly for copper, these factors could provide some support to metals exports in coming years. In addition, increasing activity in critical minerals is providing opportunities beyond Queensland’s traditional industrial metals, although the timing and extent to which specific projects proceed, and output is exported, remains uncertain.
Agriculture
The volume of Queensland’s agriculture exports rose by 4 per cent in 2022–23, driven by an increase in cotton and crops exports, as higher than average rainfall during late 2022 and early 2023 boosted production. Agriculture exports are expected to grow further in 2023–24, driven by beef as drier weather conditions associated with the onset of the El–Niño weather pattern incentivises farmers to sell cattle quickly and increase processing rates.
Looking ahead, growth in overall agriculture exports is predicted to slow to 1 per cent in 2024–25, as drier conditions inhibit production and exports, particularly for water sensitive commodities such as cotton and crops, despite continuing to encourage further beef processing and exports.
12 BUDGET UPDATE 2023–24
Services
Following the re-opening of international borders, both tourist arrivals and commencements of international students have risen strongly. The relaxation of travel restrictions in China from January 2023 has also seen that key market start to recover.
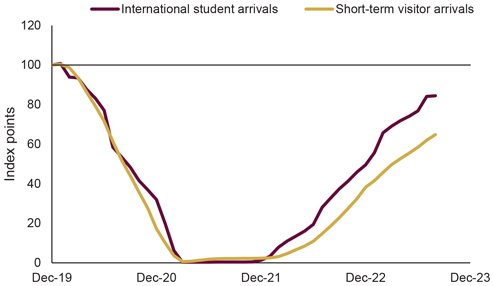
The recovery has been especially pronounced in the education export sector, with international student arrivals now close to 2019 levels, while student commencements now exceed pre-COVID levels. However, tourist arrivals have continued to face capacity constraints and higher airfares which have, so far, prevented a full recovery to pre-COVID levels (Chart 3).
Chart 3: Overseas arrivals¹, Queensland
Note:
1. Rolling 12-month sum, indexed to 100 in 2019.
Source: ABS Overseas Arrivals and Departures.
Consistent with the outlook at Budget time, the ongoing gradual increase in airline capacity is expected to underpin continued recovery in tourist arrivals. However, this does appear to be taking somewhat longer than expected and, together with continued global economic instability, has led to a small downward revision in the forecast growth rate of tourist arrivals.
At the same time, the recovery in new student commencements will flow through into growth in the number of student enrolments and the overall outlook remains for continued strong growth in services exports.
Queensland’s employment grew 3.7 per cent in 2022–23, above the Budget forecast of 31⁄4 per cent. The stronger than forecast growth primarily reflected revisions to ABS civilian population estimates, which resulted in higher employment estimates.
The unemployment rate averaged 3.7 per cent in 2022–23, in line with the Budget forecasts. This was Queensland’s lowest year-average unemployment rate since 2007–08 and the second lowest on record since monthly ABS Labour Force estimates began in 1978.
Partially reflecting stronger growth in population and domestic economic activity in 2023–24 than was forecast at Budget, and the historical ABS revisions that have been implemented since Budget, employment is now forecast to grow by 13⁄4 per cent in 2023–24 (compared with 1 per cent at Budget) and 11⁄4 per cent in 2024–25 (compared with 11⁄2 per cent at Budget).
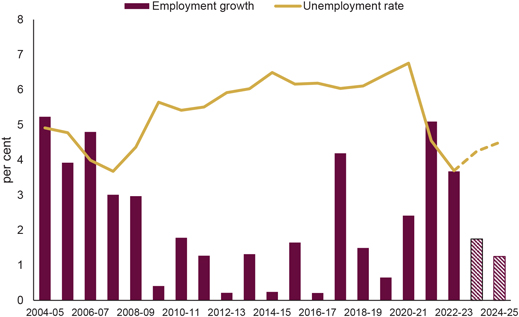
The unemployment rate is expected to increase from its record low level, as the impacts of interest rate rises are fully felt, and household consumption slows, but remain low by historical standards (Chart 4). The unemployment rate is forecast to be 41⁄4 per cent in 2023–24 and 41⁄2 per cent in 2024–25.
13
Chart 4: Labour market forecasts1, Queensland
Note:
1. Year-average. 2023–24 and 2024–25 are forecasts.
Sources: ABS Labour Force and Queensland Treasury.
The participation rate is expected to moderate slightly from its elevated level of 66.6 per cent in 2022–23, to 661⁄4 per cent in 2023–24 and 66 per cent in 2024–25.
The strength of the labour market is clearly evident across the state, including across regional Queensland. The unemployment rate in regional Queensland was 3.9 per cent in 2022–23, which was the lowest unemployment rate in the regions since estimates began in the late 1990’s. Employment in regional Queensland grew by 5.1 per cent in 2022–23, the strongest regional employment growth since 2004–05.
Regional labour market conditions going forward are expected to move broadly in line with the state as a whole.
Queensland’s Wage Price Index (WPI) grew by 3.6 per cent in 2022–23. Following strong growth of 2.3 per cent in September quarter 2023 (4.7 per cent over the year), wages growth is expected to pick up to 43⁄4 per cent in 2023–24 (compared with 4 per cent forecast at Budget). Wages growth will then moderate in 2024–25 to 31⁄2 per cent as capacity constraints in the labour market begin to ease.
Combined, these forecasts for year-average wages and inflation imply that real wages will grow by half a percentage point in both 2023–24 and 2024–25.
As indicated above, the strong growth in employment has been supported by the ongoing strength in Queensland’s population growth, which is expected to have increased to 21⁄4 per cent in 2022–23, reflecting a surge in overseas migration as departures have temporarily lagged arrivals.
With interstate migration forecast to stabilise at around pre-COVID levels and net overseas migration to be maintained at elevated levels, Queensland’s population is forecast to grow a further 2 per cent in 2023–24 before easing back to growth of 11⁄2 per cent in 2024–25.
14 BUDGET UPDATE 2023–24
Box 2: Queensland’s strong economic recovery continues
Queensland’s ongoing strong economic recovery and performance following the COVID-19 pandemic continues to highlight the resilience of the state’s diversified economy.
Consistent with the strong economic and labour market performance outlined in the 2023–24 Budget, Queensland has continued to outperform the national average in a range of key indicators, as outlined below.
| • | As of September quarter 2023, Queensland’s state final demand was 12.2 per cent above its pre-COVID level of March quarter 2020, above the 12.0 per cent growth recorded in the rest of Australia over that period. |
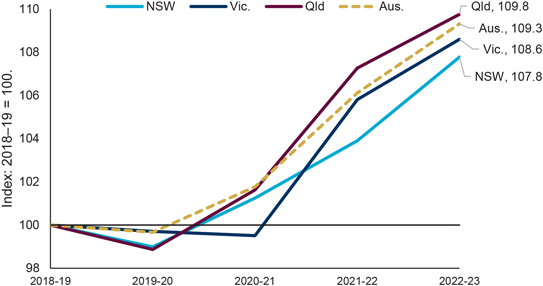
| • | After surging 5.5 per cent in 2021–22, Queensland Gross State Product rose a further 2.3 percent in 2022–23, to be 9.8 percent above the pre-COVID level in 2018–19. This compares favourably with economic growth of 9.3 per cent nationally and the 8.6 per cent and 7.8 per cent growth in Victoria and New South Wales respectively over that period (Chart 5). |
Chart 5: Economic growth1 since 2018–19
Note:
1. Real Gross State Product.
Source: ABS Annual State Accounts.
| • | In October 2023, employment in Queensland was 286,900 persons (or 11.1 per cent) above its pre-COVID level of March 2020, the second strongest growth rate of any state or territory and accounting for one quarter of national job gains over the period. |
| • | In September quarter 2023, the Queensland WPI grew 2.3 per cent, the strongest wages growth of any state and the highest quarterly growth since commencement of the WPI series in 1997. Annual growth in Queensland’s WPI in the year to September quarter 2023 accelerated to 4.7 per cent, well above national growth of 4.0 per cent and the strongest of all the states and territories. |
| • | Since the onset of the pandemic, Queensland has welcomed nearly 120,000 net interstate migrants, more than triple than the next closest state, Western Australia (Chart 6). |
15
Chart 6: Net interstate migration since March quarter1 2020
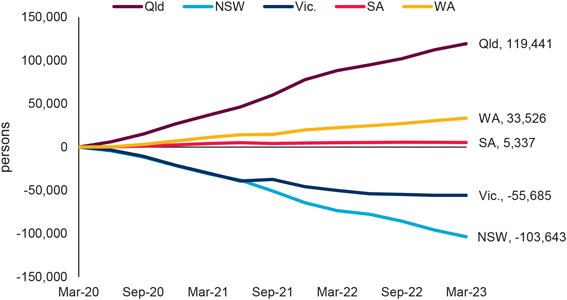
Note:
1. Original, quarterly.
Source: ABS National, state and territory population.
Risks to the outlook
While international supply chain disruptions have largely eased, the ongoing war in Ukraine, as well as the conflict in the Middle East represent the major geopolitical risks to the outlook, especially in relation to key commodity prices such as oil and therefore energy costs. Recent weakness in the Chinese economy also presents a potential risk to the outlook.
In addition, both at the national and international level, the combination of high inflation and monetary policy tightening pose ongoing downside risks to economic growth. While inflation rates have trended downwards and expectations are that the peak in interest rates is close, it will take some time for these risks to fully dissipate.
Domestically, the recent declaration of an El–Niño weather event in Australia poses a significant downside risk to agricultural output and exports over the forecast period.
16 BUDGET UPDATE 2023–24
The key fiscal aggregates of the General Government Sector are outlined in Table 3.
Table 3: Key fiscal aggregates1
| 2022–23 Actual $ million |
2023–24 Budget $ million |
2023–24 Update $ million |
2024–25 Projection $ million |
2025–26 Projection $ million |
2026–27 Projection $ million |
|||||||||||||||||||
| General Government Sector |
|
|||||||||||||||||||||||
| Revenue |
89,810 | 82,079 | 85,788 | 84,131 | 84,378 | 87,486 | ||||||||||||||||||
| Expenses |
75,880 | 84,261 | 85,926 | 84,009 | 84,287 | 86,865 | ||||||||||||||||||
| Net operating balance |
13,930 | (2,182 | ) | (138 | ) | 122 | 91 | 621 | ||||||||||||||||
| PNFA2 |
9,899 | 9,347 | 11,332 | 13,205 | 12,491 | 12,055 | ||||||||||||||||||
| Fiscal balance |
8,092 | (6,716 | ) | (6,709 | ) | (8,853 | ) | (6,965 | ) | (5,461 | ) | |||||||||||||
| Borrowing |
53,726 | 65,479 | 63,373 | 76,841 | 86,388 | 96,758 | ||||||||||||||||||
|
Net debt |
2,615 | 16,190 | 14,676 | 28,256 | 38,034 | 47,392 | ||||||||||||||||||
Notes:
| 1. | Numbers may not add due to rounding. |
| 2. | PNFA: Purchases of non–financial assets. |
17
Queensland achieved a record surplus of $13.9 billion in 2022–23 following on from the prior record surplus of $4.3 billion in the previous year. Stronger revenue, primarily driven by continued high commodity prices, has improved the fiscal outlook for 2023–24.
A General Government Sector net operating deficit of $138 million is forecast for 2023–24, an improvement of $2.044 billion compared to the operating deficit of $2.182 billion forecast at the time of the 2023–24 Budget.
Modest operating surpluses are forecast for the General Government Sector across the remainder of the forward estimates as coal prices continue to normalise and the impact of higher royalty revenue in the near-term impacts Queensland’s share of GST in later years.
Key revenues are stronger than forecast in the 2023–24 Budget driven by royalties in 2023–24 and stronger transfer duty and land tax from 2024–25 onwards. Supported by the improved revenue outlook, the government has expanded its range of cost-of-living measures providing a temporary boost to the First Home Owner Grant and in 2024–25, freezing the registration fee and traffic improvement fee components of motor vehicle registration costs and freezing public transport fares in 2024.
Reconciliation with 2023–24 Budget
Table 4 provides a breakdown of the movements in the net operating balance since the 2023–24 Queensland Budget.
Table 4: Reconciliation of net operating balance, 2023–24 Budget to 2023–24 Budget Update1
| 2023–24 Update $ million |
2024–25 Projection $ million |
2025–26 Projection $ million |
2026–27 Projection $ million |
|||||||||||||
| 2023–24 Budget net operating balance |
(2,182 | ) | 135 | 206 | 377 | |||||||||||
| Royalty and land rents revisions2 |
4,256 | 542 | 180 | (192 | ) | |||||||||||
| Taxation revisions |
272 | 591 | 857 | 1,013 | ||||||||||||
| GST revisions |
(202 | ) | (289 | ) | (358 | ) | 634 | |||||||||
| Net flows from the PNFC and PFC sector entities |
86 | 327 | (96 | ) | (214 | ) | ||||||||||
| Natural disaster revisions (DRFA3) |
(566 | ) | 228 | 161 | (15 | ) | ||||||||||
| Revenue and Expense measures4 |
(605 | ) | (972 | ) | (644 | ) | (516 | ) | ||||||||
| Other parameter adjustments5 |
(1,197 | ) | (440 | ) | (215 | ) | (466 | ) | ||||||||
| 2023–24 Budget Update net operating balance |
(138 | ) | 122 | 91 | 621 | |||||||||||
Notes:
| 1. | Numbers may not add due to rounding |
| 2. | Revisions include both royalties and land rents and therefore will not align with other sections focused only on royalties. |
| 3. | Disaster Recovery Funding Arrangements |
| 4. | Reflects net operating balance impact of government decisions made since the 2023–24 Budget. |
| 5. | Refers to adjustments largely of a non–policy nature, primarily changes in interest paid on borrowings, actuarial adjustments to superannuation liabilities, depreciation, swaps, and deferrals. |
18 BUDGET UPDATE 2023–24
Overview
Total key state revenues (royalties, taxes, and GST) in 2023–24 are estimated to be $4.248 billion (7.4 per cent) lower than in 2022–23 but $4.336 billion (8.9 per cent) higher than estimated at the time of the 2023–24 Queensland Budget.
Over the later years of the forecast period, total key revenues have also been revised upwards, but more modestly, by $854 million in 2024–25, $690 million in 2025–26 and $1.468 billion in 2026–27.
Reflecting this, total General Government Sector revenue in 2023–24 is estimated to be $4.022 billion (4.5 per cent) lower than in 2022–23 but $3.709 billion (4.5 per cent) higher than estimated at the time of the 2023–24 Queensland Budget.
The improved revenue outlook in 2023–24 primarily reflects upward revisions to coal and petroleum royalties, due to higher-than-expected global metallurgical coal and oil prices being received by Queensland’s key commodity producers.
In addition, given key commodity exports are traded globally in $US terms, a weaker than expected Australian dollar has contributed to the increased revenues.
Taxation revenue in 2023–24 and across the forecast period is also now expected to be somewhat stronger than anticipated at the time of the 2023–24 Budget. The improved outlook is due to stronger than anticipated collections across a number of taxes but, in particular, the sharper and earlier than expected turnaround in dwelling prices has led to upward revisions for transfer duty and land tax.
Beyond 2023–24, the upward revision to key revenues compared with the 2023–24 Budget estimates is more modest, reflecting the expected return of coal and oil prices to more sustainable levels over time, although the lower $A exchange rate is expected to continue to support revenues across 2024–25 and 2025–26 as it gradually returns to its medium-term level.
The stronger than expected dwelling prices, and the expectation of resulting increases in land values, have led to solid upward revisions to transfer duty and land tax collections across the forward estimates, while the outlook in general for most other taxes remains largely consistent with that expected at the time of the 2023–24 Budget.
The higher-than-expected royalty revenue in the near-term will flow through to Queensland’s GST share in later years. Queensland’s GST revenue is expected to be lower than previously forecast in both 2024–25 and 2025–26. However, the impact on GST revenues is partially offset by the expected increases in tax revenues in other major states as reflected in their latest published budget forecasts.
When combined with Australian Government grants and other revenue sources, total General Government Sector revenue forecasts over the later years of the forecast period have been revised upwards by $2.029 billion in 2024–25, $1.520 billion in 2025–26 and $1.895 billion in 2026–27.
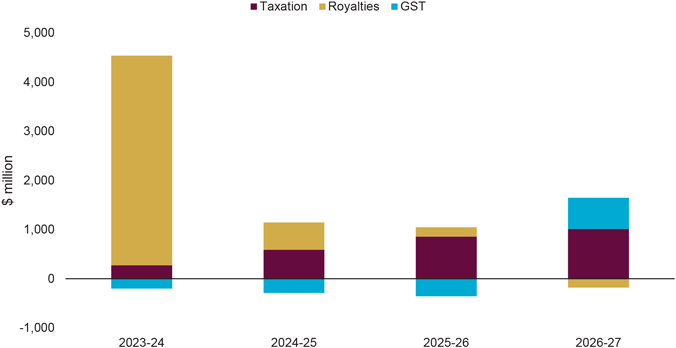
Chart 7 outlines the revisions to forecasts in key revenues (i.e. taxes, royalties and GST) since the 2023–24 Queensland Budget.
19
Chart 7: Revisions in key revenues since 2023–24 Budget
Taxation
Taxation revenue is estimated to total $22.210 billion in 2023–24, $1.609 billion (7.8 per cent) higher than received in 2022–23 and $272 million (1.2 per cent) higher than estimated in the 2023–24 Queensland Budget. This modest revision to in tax revenues in 2023–24 reflects stronger than anticipated collections across a number of tax streams including payroll tax and duties.
Tax revenue is then expected to grow, on average, by around 5.9 per cent per annum over the 3 years ending 2026–27, reflecting broad-based growth across most key taxes.
This reflects the ongoing strength of the Queensland economy and labour market more broadly, while the unexpected strength in the property market is expected to support moderate upward revisions to transfer duty and land tax across the forward estimates period compared with the 2023–24 Budget.
Overall, compared with the 2023–24 Budget estimates, there have been upward revisions to total taxation revenue totalling $2.733 billion over the 4 years to 2026–27.
Royalties
Royalty revenue is expected to total $11.388 billion in 2023–24, $6.826 billion (37.5 per cent) lower than in 2022–23 but $4.265 billion higher than forecast at the 2023–24 Budget.
This uplift in royalties in 2023–24 is primarily driven by stronger than expected coal royalties, reflecting the ongoing high coal prices being received by Queensland’s coal producers.
As outlined at Budget, global coal prices are still expected to moderate from the exceptionally high levels experienced in 2022–23. However, the latest forecast recognises the continued strength in hard coking coal (HCC) prices since mid-2023 as well as the impacts of the continued weakness in the $A/$US exchange rate.
HCC prices have traded much higher in recent months than previously expected. Premium HCC spot prices averaged US$264/t across the September quarter 2023. The recent increase in HCC prices has been driven by a range of largely temporary factors impacting production and resulting in supply tightness, evidenced in weaker export volumes of coking coal from Queensland.
However, the recent high coal prices are considered unsustainable with prices still expected to moderate substantially in 2024, as the current drivers of higher prices diminish, and international markets continue to adjust.
20 BUDGET UPDATE 2023–24
The HCC price is now expected to return to medium term levels of US$175/t by December 2024, slightly later than the 2023–24 Budget expectation of returning to this level by March quarter 2024, thereby also supporting slightly higher coal royalty revenues than previously forecast in 2024–25.
There is a general consensus among most forecasters that coal prices will decline significantly over the coming years, although there are differences around the expected timing and magnitude of this decline.
The 2023–24 Budget Update forecasts reflect a slightly quicker adjustment of HCC prices to medium term levels than some forecasters, but the forecast prices across the forward estimates period are consistently higher than those currently forecast by the Commonwealth Treasury. A comparison of HCC price forecasts with other key forecasters is shown below (Chart 8).
Chart 8: Comparison of hard coking coal forecasts
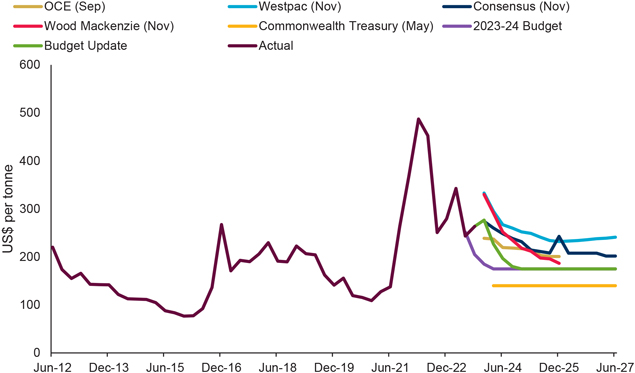
Notes:
1. Actual prices up to September quarter 2023, estimates/forecasts for December quarter 2023 onwards
2. Spot prices used where possible. Where spot prices are unavailable, contract prices have been used.
Sources: Commonwealth Treasury, Consensus Economics, OCE, Westpac, Wood Mackenzie and Queensland Treasury
Conversely, PCI (pulverised coal injection) coal prices fell by more than anticipated, with PCI spot prices averaging US$168/t (A$257/t) across September quarter 2023, due to Russian PCI coal re-entering the global market more quickly than expected.
In terms of volumes, a slightly weaker outlook for industrial production of Queensland’s major trading partners since the 2023–24 Budget has resulted in a downward revision to metallurgical coal export volumes across the later years of the forecast period. However, in contrast, thermal coal export volumes have been upgraded slightly, reflecting increased thermal coal exports to China.
Thermal coal prices have tracked broadly in line with Budget forecasts since mid-2023 and are still expected to reach a mid-term anchor of US$120/t by September 2024, as forecast in the 2023–24 Budget.
The new progressive coal royalty rates, introduced on 1 July 2022, generated additional royalty revenue of around $5.8 billion in 2022–23, reflecting the impacts of the sustained high global prices during the year, with coal producers also enjoying the benefits of exceptionally high revenues.
21
The recent strength in HCC prices is estimated to result in a revenue uplift due to the new progressive coal royalty rates of around $2.8 billion in 2023–24 (compared to $783 million expected in the 2023–24 Budget). As coal prices moderate beyond 2023–24, the revenue attributed to the new tiers is forecast to be around $280 million per annum on average across the 3 years to 2026–27 (slightly above the average of $235 million per annum forecast at Budget).
Revenue from petroleum royalties is forecast to total $1.650 billion in 2023–24, $699 million (29.8 per cent) lower than 2022–23 but $375 million higher than expected at the 2023–24 Budget.
This expected decline from 2022–23 levels is consistent with 2023–24 Budget expectations that oil prices, and therefore LNG prices, would unwind from recent highs. However, while global oil prices are still expected to moderate, this has not occurred as quickly as anticipated, leading to higher-than-expected petroleum royalties.
The long-term nature of LNG contracts mean LNG prices are expected to remain elevated for longer, leading to an upward revision of 13.8 per cent in petroleum royalties in 2024–25 compared to Budget, which is also supported by the lower $A. LNG prices and petroleum royalties are then expected to decline across the forecast period.
As discussed earlier in terms of the economic outlook, the current conflict in the Middle East could pose a potential risk to global oil prices going forward, and any material or sustained change in oil prices would flow through to LNG prices and, therefore, petroleum royalties.
GST
Queensland’s GST revenue is estimated to total $19.275 billion in 2023–24, $969 million (5.3 per cent) higher than in 2022–23 but $202 million (1.0 per cent) lower than forecast at Budget.
This increase compared to the previous year is primarily driven by forecast growth in the national GST pool. However, the downward revision from Budget reflects the expectation that GST collections across 2023–24 will be lower than previously anticipated.
GST revenue is forecast to be $18.238 billion in 2024–25 and remain more subdued at $18.570 billion in 2025–26, reflecting the flow-on impacts of the higher state revenues in the near term on Queensland’s GST share in the later years.
Given the higher-than-expected royalties revenue in 2023–24, Queensland’s GST revenue is now forecast to be slightly lower in 2024–25 and 2025–26 than forecast in the Budget.
However, GST revenue is forecast to rebound solidly in 2026–27, growing by 11.5 per cent to $20.704 billion, driven by ongoing growth in the national GST pool and the expectation that the impact on Queensland’s GST share from the high coal royalties in recent years will begin to subside.
In early 2024, the Commonwealth Grants Commission is expected to deliver its recommended relativities for distributing the GST among states and territories for the 2024–25 financial year.
Box 3: Investing Queensland’s resources windfall
Since mid-2021, Queensland’s coal producers have enjoyed unprecedented benefits from an exceptional surge in global coal prices.
ABS data shows the value of Queensland coal exports totalled $71.6 billion in 2021–22, almost triple the $24.7 billion in coal exports in 2020–21. Coal producers continued to enjoy the benefits of exceptionally high global coal prices in 2022–23, with the value of Queensland coal exports totalling $72.4 billion.
The new coal royalty tiers announced by the Queensland Government in the 2022–23 Budget have meant that Queenslanders are getting a fair and reasonable return for the use of the state’s valuable and limited resources in a period when coal mining companies are generating extraordinary revenues and profits.
The new progressive coal royalty rates, introduced on 1 July 2022, generated additional royalty revenue of around $5.8 billion in 2022–23, reflecting the impacts of the sustained high global prices during the year, with coal producers also enjoying the benefits of exceptionally high revenues.
The recent strength in hard coking coal prices is estimated to result in a revenue uplift due to the new progressive tiers of around $2.8 billion in 2023–24. As coal prices moderate beyond 2023–24, the revenue from the new tiers is forecast to average around $280 million per annum across the 3 years to 2026–27.
22 BUDGET UPDATE 2023–24
In the 2023–24 Budget, the government outlined how the additional royalty revenue due to the extended period of high prices had allowed the investment of more than $16 billion towards economic and social infrastructure and essential services across all regions of the state, including coal-producing regions.
The increased revenues from progressive coal royalties have also given the government the fiscal capacity to deliver nation-leading cost-of-living support to Queensland households through electricity rebates and free kindergarten.
Since the 2023–24 Budget, including announcements in the 2023–24 Budget Update, the ongoing strength in coal prices and resulting royalties from the new progressive coal royalty tiers has enabled the government to provide substantial additional investment across Queensland’s regions, including:
| • | an additional $30 million Backing Bush Communities Fund for workforce training and invasive species management and community projects |
| • | an additional $79.1 million for a new mental health facility in Rockhampton |
| • | up to $30 million to accelerate development of resource projects in the North West Minerals Province in the next 5 years |
| • | up to $20 million for an economic structural adjustment package for Mount Isa and North West Queensland |
| • | $1.4 million for Regional Job Expos to showcase current and future employment opportunities in regions. |
The uplift in coal royalty revenue is also supporting the expansion and continuation of existing programs such as:
| • | $100 million to boost the upcoming 2024–27 Works for Queensland round for a total round of $300 million so regional councils can deliver more local infrastructure |
| • | $18.8 million to continue the Abandoned Mine Land Program |
| • | $70 million to increase the Queensland Critical Mineral and Battery Technology Fund to support the development of the critical mineral and battery technology industries |
| • | $7 million for drought preparedness grants. |
The Queensland Government is also utilising the revenue uplift from coal royalties to support several significant statewide programs, including:
| • | $210 million to temporarily double the First Home Owner Grant to $30,000 for eligible first home purchases |
| • | $23 million in funding for emergency housing support |
| • | $7.1 million for the Manufacturing Energy Efficient Grant program. |
23
In 2023–24, General Government expenses are estimated to be $85.926 billion, compared to the 2023–24 Budget estimate of $84.261 billion. The increase largely arises from technical adjustments such as increased depreciation following revaluations of infrastructure in 2022–23, as well as around $600 million for a range of measures such as disaster relief, housing and support for victims of crime.
The 2023–24 Budget included a substantial increase in expenses in 2023–24 for largely temporary factors including significant Disaster Recovery Funding Arrangements expenses for the South East Queensland rainfall and flooding event in the summer of 2022, Cost of Living Adjustment (COLA) payments for public sector enterprise bargaining agreements and $1.483 billion in additional electricity support to households and small businesses facing cost-of-living pressures.
General Government Sector expenses are expected to decline by 2.2 per cent in 2024–25 as most of the cost-of-living measures announced in the 2023–24 Budget are targeted to addressing inflationary pressures within 2023–24.
Across the forward estimates, General Government expenses have increased since the 2023–24 Budget, supported by the stronger than expected revenue outlook. The government has expanded the range of cost-of-living measures available to Queensland families and small businesses to include: boosting the First Home Owner Grant, freezing the registration fee and traffic improvement fee components of Motor Vehicle Registration costs in 2024–25, and freezing public transport fares in 2024.
Other key policy measures increasing expenses across the forward estimates include:
| • | a support package for educational engagement for a range of students, including those needing additional support to remain engaged or become re-engaged in learning and those involved in youth justice. |
| • | strengthening support for victims of crime |
| • | advancing Queensland’s Quantum and Advanced Technologies Strategy |
| • | extending support to non-government organisations and community programs that provide services to keep Queenslanders safe |
| • | a support package for workers impacted by the closure of Glencore’s Mount Isa Copper Operations and Lady Loretta Zinc Mine |
| • | implementing the Service Queensland Action Plan (2023 to 2028) to create a digital wallet, provide ongoing support for the Digital Licence App, facilitate customer movement to the Queensland Digital Identify platform and to prepare for modernising the transport registration. |
General Government expenses are estimated to grow at an average annual rate of 3.4 per cent over the 4 years to 2026–27. Excluding royalty revenue, revenue is forecast to grow at an average annual rate consistent with expenses growth.
Emerging Fiscal Pressures
Beyond general uncertainties related to budget parameter assumptions key emerging fiscal issues include:
| • | Risks to the longer–term outlook for Queensland’s GST revenue beyond 2029–30 resulting from the changes made to the system of GST revenue distribution by the Australian Government in 2018. The outcomes from the Commonwealth Grant Commission’s 2025 Methodology Review will also impact GST shares from 2025–26. |
| • | Queensland’s fiscal position is exposed to decisions made by the Australian Government, including not renewing funding for National Partnership payments where there are ongoing community service needs that must be met. The high-level outcomes of the National Cabinet Meeting of 6 December, with respect to a boost to health funding and additional State contribution on the National Disability Insurance Scheme, still need to be detailed and assessed. The full implications of the Commonwealth’s Infrastructure Review will also need to be assessed as details are confirmed and further dialogue with the Australian Government continues. |
| • | Adverse weather events which are likely to occur in future with the resulting damage expected to impact on the delivery of state initiatives, noting disaster–related expenses are shared with the Australian Government under Disaster Recovery Funding Arrangements (DRFA). |
24 BUDGET UPDATE 2023–24
| • | Challenges arising from delivering significant capital investment in the medium term, including the transformation of the energy system away from reliance on coal-fired generation, meeting future water demand, and preparing to host the Brisbane 2032 Olympic and Paralympic Games. |
| • | The government has a potential liability with respect to compensation arising from acts that have extinguished or impaired native title since 1975. |
25
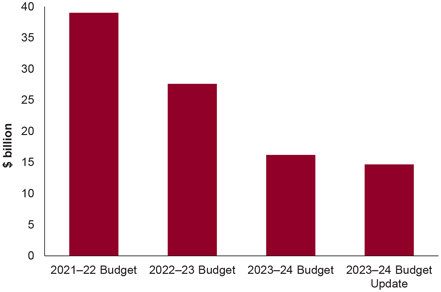
Box 4: Net debt
Net debt is a key metric for examining the soundness of a government’s fiscal position. The net debt measure is the preferred metric for governments, including the Australian Government. Queensland’s disciplined fiscal strategy is establishing the path to stabilising its net debt burden and returning to operating surpluses.
Net debt forecasts for 2023–24 have improved from $39.2 billion in the 2021–22 Budget to $16.2 billion in the 2023–24 Budget. Further improvement is forecast in the 2023–24 Budget Update with net debt dropping to $14.7 billion (Chart 9).
Chart 9: Net debt for 2023–24
Queensland’s General Government net debt relative to revenue compares favourably to New South Wales and Victoria (Chart 10). For example, Queensland’s net debt ratio of 54 per cent in 2026–27 compares to 93 per cent in New South Wales and 172 per cent in Victoria.
Chart 10: Net debt to revenue of major states 1, 2
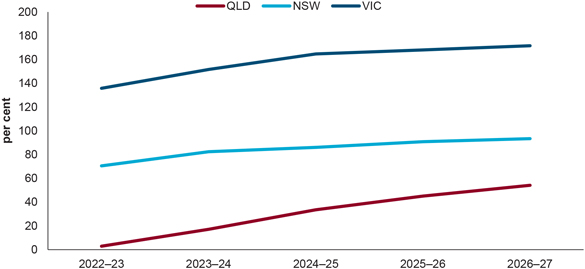
Notes:
1. Source: Budget Paper No. 1 – Budget Statement – Budget 2023–24
2. Source: Victoria 2023–24 State Budget - Strategy and Outlook
26 BUDGET UPDATE 2023–24
General Government Sector Debt
Net debt is expected to reach $14.676 billion by 30 June 2024, which is $1.514 billion lower than anticipated at the 2023–24 Queensland Budget. The improvement in net debt arises mainly from the improved operating cash flows in 2022–23 which lowered net debt rolling forward from the 2022–23 outcome.
General Government Sector borrowing is estimated to be $63.373 billion by 30 June 2024, which is $2.1 billion lower than projected in the Budget.
Borrowings are expected to increase over the forward estimates to fund the state’s large and transformative capital program. This will also see net debt rise over time.
Significant equity funding is being provided from the General Government Sector to the Public Non-financial Corporations Sector, primarily for the Queensland Energy and Jobs Plan and water infrastructure as projects come online.
Public Non–financial Corporations Sector Debt
Public Non-financial Corporations (PNFC) Sector debt is primarily held by government–owned operations and is supported by income–generating assets including key pieces of economic infrastructure.
Borrowing with Queensland Treasury Corporation (QTC) of $44.316 billion is projected for 30 June 2024 in the PNFC Sector, $1.353 billion higher than the 2023–24 Budget, largely due to the timing of capital purchases.
Along with leases and other similar arrangements of $687 million and securities and derivatives of $1.526 billion (impacted by electricity prices), total PNFC Sector borrowing is expected to be $46.528 billion by 30 June 2024.
Borrowing with QTC will also fund the projected capital spending of government–owned corporations for the Queensland Energy and Jobs Plan.
Capital Program
The Non-financial Public Sector (NFPS) capital program for the period 2023–24 to 2026–27 is $96.220 billion. The capital program comprises $82.516 billion of purchases of non-financial assets (PNFA), $11.475 billion of capital grant expenses, and acquisitions of non-financial assets under finance leases and similar arrangements of $2.229 billion.
Changes to the NFPS capital program since the 2023–24 Budget include a provision for replacing the existing bus fleet with Zero Emission Buses, acceleration of the Queensland Train Manufacturing Program and delivery of the Australian Government funded Housing Acceleration Program. The roll out of the Queensland Energy and Jobs Plan continues, with $19 billion of renewable energy projects budgeted over the forward estimates.
The impact of the Australian Government’s Infrastructure Investment Program review continues to be assessed. It is expected that the outcome will, in the medium term, significantly reduce the Australian Government’s share of funding for Queensland’s future transport infrastructure. Indications are the Australian Government will move from funding 80 per cent of regional transport infrastructure to a 50:50 funding basis with the state.
27
FINANCIAL RELATIONS
Australian Government payments
Australian Government payments contribute to Queensland’s ability to meet its service delivery and infrastructure responsibilities. The 2 main forms of payment are ‘Payments for specific purposes’ and ‘General revenue assistance’. Together, Australian Government payments make up around 48 per cent of Queensland’s total revenue.
Payments for specific purpose are arranged through Commonwealth-State agreements and cover a wide range of policy purposes. Major agreements include the National Health Reform Agreement, National Disability Insurance Scheme, National Housing and Homelessness Agreement, National School Reform Agreement and the National Skills Agreement. The main source of general revenue assistance is the distribution of goods and services tax (GST) revenue.
In the 2023–24 Federal Budget delivered in May 2023, the Australian Government estimated the Queensland Government would receive $39.3 billion in 2023–24 comprising: $18.6 billion in payments for specific purposes; $1.2 billion in other Australian Government grants (including payments to Queensland Government agencies for Australian Government own-purpose expenditure); and $19.5 billion in payments for general purposes.
Changes to the Infrastructure Investment Program
On 16 November 2023, the Australian Government released the outcomes of its Independent Strategic Review of the Infrastructure Investment Program (the Review), including a summary of changes to funding for projects.
Initial analysis on the outcomes of the Review suggests a negative financial impact for Queensland due to various factors, such as, the Australian Government moving away from funding 80 per cent of projects in regional areas, introducing caps on road corridors, categorising a number of existing project commitments to be subject to further planning, and proposing to cancel federal funding for some projects entirely.
While the Australian Government has released the Review outcomes, release of the Federal Mid-Year Economic and Fiscal Outlook (MYEFO) is yet to occur. Release of the Australian Government’s MYEFO will allow for further dialogue with the Australian Government. The Queensland Government will then be better positioned to more fully consider and respond to the ongoing financial implications for Queensland’s transport capital program.
28 BUDGET UPDATE 2023–24
Box 5: Australian Government changes to Horizontal Fiscal Equalisation (HFE) and extension of the No Worse off Guarantee
Each year, the Commonwealth Grants Commission recommends to the Australian Government how GST should be distributed to states and territories for horizontal fiscal equalisation (HFE). The HFE methodology allocates a varying amount of GST to each state and territory depending on its fiscal capacity to deliver a similar standard of services and infrastructure to its population, no matter where they live.
In 2018, the previous Australian Government legislated changes to HFE, including: that states will equalise to the stronger of New South Wales or Victoria, rather than the state with the greatest fiscal capacity; that a relativity floor would be introduced; and that the Australian Government would provide a permanent boost to the GST pool. These changes are being gradually introduced over a 6-year transition period from 2021–22 to 2026–27.
Given the potentially significant implications of these changes for the GST received by individual states in any given year, the Australian Government also introduced a “No Worse Off Guarantee” (NWOG) over the transition period, which provides supplementary payments to any state that receives less GST under the new system than it would have received under the previous system.
The 2023–24 Federal Budget estimated Queensland’s NWOG payment for 2023–24 will be $1.121 billion.
Under the new arrangements, the NWOG was scheduled to end in 2026-27, which would have resulted in most states and territories, including Queensland, facing significant revenue reductions from 2027–28 onwards.
However, on 6 December 2023, National Cabinet agreed to extend the NWOG payments by a further 3 years, to 2029–2030.
The agreement by the Australian Government to a temporary extension of the NWOG was welcomed and is beneficial in providing greater GST revenue certainty to states and territories for an extended period.
The extension of the NWOG was also critical to provide ongoing funding certainty to states and territories in order to allow time for the scheduled Australian Productivity Commission review of GST arrangements to be completed.
Queensland will continue to engage with the Australian Government and other jurisdictions in an effort to establish the NWOG as a permanent arrangement, to ensure that the changes introduced by the previous Australian Government do not result in any significant decrease in ongoing revenue over the longer term.
29
The government’s fiscal strategy is guided by the Charter of Fiscal Responsibility (the Charter) fiscal principles and objective measures supporting the restoration of fiscal buffers. An update of progress towards achievement of medium-term goals is outlined below.
Principle 1 – Stabilise the General Government Sector net debt to revenue ratio at sustainable levels in the medium term, and target reductions in the net debt to revenue ratio in the long term
Stabilising debt at a sustainable level is key to having capacity to invest in infrastructure and respond to future external shocks.
Since the development of the current Charter as part of the 2021–22 Budget, significant progress has been made against Fiscal Principle 1. Revenue strength in 2022–23 resulted in a lower debt requirement in that year with a net debt to revenue ratio outcome of 3 per cent, a significant reduction from the 15 per cent outcome for 2021–22.
The downwards revisions to net debt since the 2021–22 Budget are the result of the prudent management of the unprecedented, but short term, revenue uplifts experienced over successive budget cycles. This has allowed the establishment of a buffer to accommodate additional borrowings over later years to fund Queensland’s large capital program.
The 2023–24 Budget Update results in the ratio being broadly consistent with the 2023–24 Budget. It is expected to be 17 per cent in 2023–24 and is forecast to reach 54 per cent in 2026–27.
Chart 11: Ratio of General Government net debt to revenue
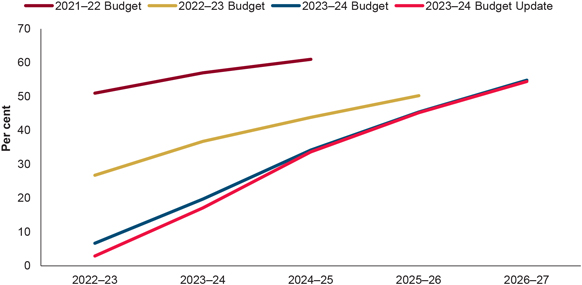
Queensland’s net debt to revenue ratio of 17 per cent in 2023–24 compares favourably to that of its peers. Based on 2023–24 Budget estimates, the net debt to revenue ratio in 2023–24 is 82 per cent for New South Wales and 152 per cent for Victoria.
30 BUDGET UPDATE 2023–24
Principle 2 – Ensure that average annual growth in General Government Sector expenditure in the medium term is below the average annual growth in General Government Sector revenue to deliver fiscally sustainable net operating surpluses
Maintaining a lower rate of expenses growth than revenue growth will in general ensure the restoration of an operating surplus and assist debt stabilisation.
Revenue growth over the forward estimates continues to reflect significant volatility driven by some temporary factors. While royalties have been boosted in the last few years from high commodity prices, they are expected to normalise at much lower levels.
With royalties continuing to be a very volatile source of revenue, an adjusted measure removing royalties is reported to better reflect underlying growth. Excluding royalties revenue, revenue and expenses are expected to grow at a consistent average annual rate of 3.4 per cent over the 4 years to 2026–27. Across the 5 years to 2026–27, average revenue growth is expected to be 4.6 per cent, compared to expenses growth of 4.4 per cent.
Principle 3 – Target continual improvements in net operating surpluses to ensure that, in the medium term, net cash flows from investments in non-financial assets (capital) will be funded primarily from net cash inflows from operating activities. The capital program will focus on supporting a productive economy, jobs, and ensuring a pipeline of infrastructure that responds to population growth
Capital investment supporting jobs and enhances productivity remains a key priority. The 2023–24 Budget Update includes a current capital program of $96.2 billion over the 4 years to 2026–27. The capital program supports service delivery and the productive flow of goods and services to the community and economy. Enhancements that have been incorporated into the capital program in recent budgets include delivering increased health system capacity, decarbonisation of the state’s energy system, improving water security and preparing for the Brisbane 2032 Olympic and Paralympic Games.
Funding a large capital program primarily through operating cash surpluses rather than additional borrowings is key to stabilising net debt. However, volatility in revenue growth combined with the profile of capital expenditure, which is uneven by nature, means a degree of volatility can be expected in the outcomes for Fiscal Principle 3 on an individual year basis.
In 2022–23, net cash inflows from operating activities greatly exceeded investments in non-financial assets. In 2023–24 the ratio is expected to reduce to 35 per cent and then reach 47 per cent in 2026–27.
On average across the period 2022–23 to 2026–27, 66 per cent of the capital program will be funded from net cash inflows from operating activities.
Chart 12: Share of General Government Sector investments in non-financial assets
funded from operating cash surpluses
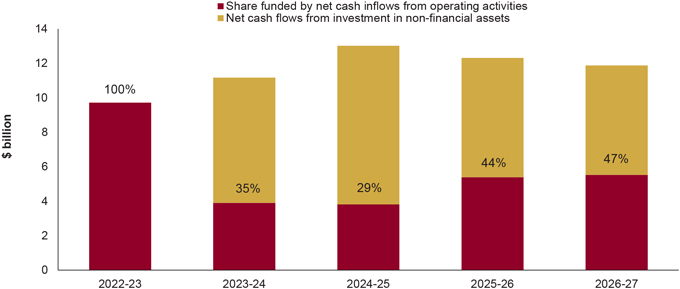
31
Principle 4 – Maintain competitive taxation by ensuring that, on a per capita basis, Queensland has lower taxation than the average of other states
This principle directly measures Queensland’s competitiveness relative to other jurisdictions, providing a meaningful indication of the comparative impact of Queensland’s tax regime and policies.
Based on the latest available outcomes, Queensland’s taxation per capita was $708 less than the average of other jurisdictions in 2021–22. On average, Queenslanders paid $1,073 less tax than New South Wales residents and $919 less than Victorian residents.
Using the latest forecasts, Queensland’s taxation per capita of $4,048 in 2023–24 compares favourably to the average of other jurisdictions of $4,821 per capita. Chart 13 demonstrates that Queensland is expected to maintain a highly competitive tax environment.
Chart 13: Taxation per capita, Queensland and other states and territories
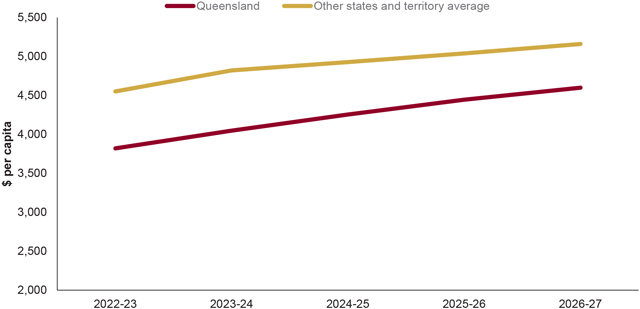
Principle 5 – Target the full funding of long-term liabilities such as superannuation and workers’ compensation in accordance with actuarial advice
The full funding of superannuation and other long-term liabilities is a long-standing Queensland Government priority and a key element of Queensland’s financial management.
The triennial actuarial investigation of the Defined Benefit Fund as at 30 June 2021 found it to be in surplus. As at 30 June 2023, WorkCover Queensland was fully funded.
32 BUDGET UPDATE 2023–24
UNIFORM PRESENTATION FRAMEWORK
Table 5: General Government Sector Operating Statement1
| 2022-23 | 2023-24 | 2023-24 | 2024-25 | 2025-26 | 2026-27 | |||||||||||||||||||||
| Outcome | Budget | Update | Projection | Projection | Projection | |||||||||||||||||||||
| $ million | $ million | $ million | $ million | $ million | $ million | |||||||||||||||||||||
| Revenue from Transactions | ||||||||||||||||||||||||||
| Taxation revenue | 20,601 | 21,938 | 22,210 | 23,716 | 25,142 | 26,400 | ||||||||||||||||||||
| Grants revenue | 38,335 | 39,643 | 38,401 | 39,149 | 39,107 | 41,429 | ||||||||||||||||||||
| Sales of goods and services | 6,483 | 6,921 | 7,090 | 7,140 | 7,228 | 7,033 | ||||||||||||||||||||
| Interest income | 3,226 | 3,206 | 3,376 | 3,366 | 3,352 | 3,407 | ||||||||||||||||||||
| Dividend and income tax equivalent income | 1,007 | 1,521 | 1,674 | 2,280 | 1,838 | 1,823 | ||||||||||||||||||||
| Other revenue | 20,160 | 8,850 | 13,038 | 8,480 | 7,710 | 7,394 | ||||||||||||||||||||
| Total Revenue from Transactions | 89,810 | 82,079 | 85,788 | 84,131 | 84,378 | 87,486 | ||||||||||||||||||||
| Less |
Expenses from Transactions | |||||||||||||||||||||||||
| Employee expenses | 30,557 | 32,175 | 32,541 | 33,088 | 34,155 | 35,239 | ||||||||||||||||||||
| Superannuation expenses | ||||||||||||||||||||||||||
| Superannuation interest cost | 776 | 721 | 788 | 755 | 684 | 635 | ||||||||||||||||||||
| Other superannuation expenses | 3,756 | 4,188 | 4,245 | 4,307 | 4,435 | 4,549 | ||||||||||||||||||||
| Other operating expenses |
20,014 | 22,969 | 23,912 | 21,831 | 21,652 | 22,282 | ||||||||||||||||||||
| Depreciation and amortisation |
5,018 | 5,039 | 5,285 | 5,401 | 5,607 | 5,936 | ||||||||||||||||||||
| Other interest expenses |
1,688 | 1,974 | 1,978 | 2,614 | 3,265 | 3,936 | ||||||||||||||||||||
| Grants expenses |
14,072 | 17,195 | 17,178 | 16,014 | 14,489 | 14,289 | ||||||||||||||||||||
| Total Expenses from Transactions |
75,880 | 84,261 | 85,926 | 84,009 | 84,287 | 86,865 | ||||||||||||||||||||
|
|
||||||||||||||||||||||||||
| Equals |
Net Operating Balance | 13,930 | (2,182 | ) | (138 | ) | 122 | 91 | 621 | |||||||||||||||||
| Plus |
Other economic flows - included in operating result |
198 | (40 | ) | (61 | ) | (249 | ) | (201 | ) | (144 | ) | ||||||||||||||
| Equals |
Operating Result | 14,128 | (2,222 | ) | (199 | ) | (127 | ) | (110 | ) | 477 | |||||||||||||||
| Plus |
Other economic flows - other movements in equity |
40,221 | 3,785 | 4,259 | 2,753 | 2,951 | 3,028 | |||||||||||||||||||
| Equals |
Comprehensive Result - Total Change In Net Worth | 54,349 | 1,563 | 4,060 | 2,626 | 2,841 | 3,505 | |||||||||||||||||||
| KEY FISCAL AGGREGATES |
||||||||||||||||||||||||||
| Net Operating Balance |
13,930 | (2,182 | ) | (138 | ) | 122 | 91 | 621 | ||||||||||||||||||
| Less |
Net Acquisition of Non-financial Assets |
|||||||||||||||||||||||||
| Purchases of non-financial assets |
9,899 | 9,347 | 11,332 | 13,205 | 12,491 | 12,055 | ||||||||||||||||||||
| Less Sales of non-financial assets |
181 | 276 | 163 | 185 | 180 | 177 | ||||||||||||||||||||
| Less Depreciation |
5,018 | 5,039 | 5,285 | 5,401 | 5,607 | 5,936 | ||||||||||||||||||||
| Plus Change in inventories |
79 | (35 | ) | (27 | ) | 50 | 1 | (47 | ) | |||||||||||||||||
| Plus Other movements in non-financial assets |
1,058 | 538 | 712 | 1,306 | 352 | 186 | ||||||||||||||||||||
| Equals Total Net Acquisition of Non-financial Assets |
5,838 | 4,534 | 6,570 | 8,975 | 7,056 | 6,082 | ||||||||||||||||||||
|
|
||||||||||||||||||||||||||
|
Equals |
Fiscal Balance | 8,092 | (6,716 | ) | (6,709 | ) | (8,853 | ) | (6,965 | ) | (5,461 | ) | ||||||||||||||
|
|
||||||||||||||||||||||||||
|
Note: |
||||||||||||||||||||||||||
|
1. Numbers may not add due to rounding. |
| |||||||||||||||||||||||||
33
Table 6: Public Non-financial Corporations Sector Operating Statement1
| 2022-23 | 2023-24 | 2023-24 | 2024-25 | 2025-26 | 2026-27 | |||||||||||||||||||||
| Outcome | Budget | Update | Projection | Projection | Projection | |||||||||||||||||||||
| $ million | $ million | $ million | $ million | $ million | $ million | |||||||||||||||||||||
| Revenue from Transactions | ||||||||||||||||||||||||||
| Grants revenue | 912 | 805 | 855 | 815 | 791 | 753 | ||||||||||||||||||||
| Sales of goods and services | 14,735 | 13,664 | 13,525 | 14,686 | 15,682 | 16,966 | ||||||||||||||||||||
| Interest income | 117 | 94 | 139 | 129 | 110 | 79 | ||||||||||||||||||||
| Other revenue | 506 | 1,183 | 876 | 635 | 306 | 256 | ||||||||||||||||||||
| Total Revenue from Transactions | 16,270 | 15,746 | 15,396 | 16,265 | 16,889 | 18,054 | ||||||||||||||||||||
| Less |
Expenses from Transactions | |||||||||||||||||||||||||
| Employee expenses | 2,532 | 2,692 | 2,722 | 2,936 | 3,025 | 3,055 | ||||||||||||||||||||
| Superannuation expenses | ||||||||||||||||||||||||||
| Superannuation interest cost | (17 | ) | — | — | — | — | — | |||||||||||||||||||
| Other superannuation expenses | 308 | 320 | 347 | 385 | 403 | 417 | ||||||||||||||||||||
| Other operating expenses | 7,608 | 6,575 | 6,793 | 6,113 | 5,984 | 6,239 | ||||||||||||||||||||
| Depreciation and amortisation |
2,720 | 3,195 | 3,112 | 3,354 | 3,731 | 4,045 | ||||||||||||||||||||
| Other interest expenses |
1,675 | 1,807 | 1,848 | 2,008 | 2,284 | 2,556 | ||||||||||||||||||||
| Grants expenses |
29 | 25 | 27 | 27 | 21 | 21 | ||||||||||||||||||||
| Other property expenses |
369 | 502 | 442 | 600 | 498 | 498 | ||||||||||||||||||||
| Total Expenses from Transactions |
15,222 | 15,116 | 15,291 | 15,424 | 15,946 | 16,831 | ||||||||||||||||||||
| Equals |
Net Operating Balance | 1,048 | 630 | 105 | 841 | 943 | 1,223 | |||||||||||||||||||
| Plus |
Other economic flows - included in operating result |
(574 | ) | 691 | 725 | 433 | (64 | ) | (452 | ) | ||||||||||||||||
| Equals |
Operating Result | 474 | 1,320 | 831 | 1,275 | 879 | 770 | |||||||||||||||||||
| Plus |
Other economic flows - other movements in equity |
3,316 | 2,378 | 3,944 | 2,688 | 1,908 | 2,422 | |||||||||||||||||||
| Equals |
Comprehensive Result - Total Change In Net Worth | 3,790 | 3,698 | 4,775 | 3,963 | 2,787 | 3,193 | |||||||||||||||||||
| KEY FISCAL AGGREGATES |
||||||||||||||||||||||||||
| Net Operating Balance |
1,048 | 630 | 105 | 841 | 943 | 1,223 | ||||||||||||||||||||
| Less |
Net Acquisition of Non-financial Assets |
|||||||||||||||||||||||||
| Purchases of non-financial assets |
4,497 | 5,849 | 6,587 | 8,186 | 8,745 | 9,966 | ||||||||||||||||||||
| Less Sales of non-financial assets |
63 | 5 | 11 | 10 | 18 | 7 | ||||||||||||||||||||
| Less Depreciation |
2,720 | 3,195 | 3,112 | 3,354 | 3,731 | 4,045 | ||||||||||||||||||||
| Plus Change in inventories |
129 | (37 | ) | 49 | — | 2 | 3 | |||||||||||||||||||
| Plus Other movements in non-financial assets |
108 | 795 | 825 | 85 | 83 | 85 | ||||||||||||||||||||
| Equals Total Net Acquisition of Non-financial Assets |
1,952 | 3,408 | 4,339 | 4,907 | 5,081 | 6,002 | ||||||||||||||||||||
| Equals |
Fiscal Balance | (904 | ) | (2,778 | ) | (4,234 | ) | (4,066 | ) | (4,138 | ) | (4,779 | ) | |||||||||||||
|
Note: |
||||||||||||||||||||||||||
|
1. Numbers may not add due to rounding. |
| |||||||||||||||||||||||||
34 BUDGET UPDATE 2023–24
Table 7: Non-financial Public Sector Operating Statement1
| 2022-23 | 2023-24 | 2023-24 | 2024-25 | 2025-26 | 2026-27 | |||||||||||||||||||||
| Outcome | Budget | Update | Projection | Projection | Projection | |||||||||||||||||||||
| $ million | $ million | $ million | $ million | $ million | $ million | |||||||||||||||||||||
| Revenue from Transactions | ||||||||||||||||||||||||||
| Taxation revenue | 20,189 | 21,553 | 21,803 | 23,278 | 24,662 | 25,890 | ||||||||||||||||||||
| Grants revenue | 38,352 | 39,693 | 38,462 | 39,222 | 39,162 | 41,472 | ||||||||||||||||||||
| Sales of goods and services | 18,161 | 17,557 | 17,587 | 18,575 | 19,646 | 21,160 | ||||||||||||||||||||
| Interest income | 3,312 | 3,279 | 3,459 | 3,455 | 3,450 | 3,474 | ||||||||||||||||||||
| Dividend and income tax equivalent income | 164 | 179 | 175 | 210 | 188 | 201 | ||||||||||||||||||||
| Other revenue | 20,644 | 9,664 | 13,545 | 9,113 | 8,014 | 7,648 | ||||||||||||||||||||
| Total Revenue from Transactions | 100,821 | 91,924 | 95,032 | 93,852 | 95,122 | 99,846 | ||||||||||||||||||||
| Less |
Expenses from Transactions | |||||||||||||||||||||||||
| Employee expenses | 32,925 | 34,711 | 35,090 | 35,834 | 36,980 | 38,087 | ||||||||||||||||||||
| Superannuation expenses | ||||||||||||||||||||||||||
| Superannuation interest cost | 759 | 721 | 788 | 755 | 684 | 635 | ||||||||||||||||||||
| Other superannuation expenses | 4,063 | 4,507 | 4,592 | 4,692 | 4,838 | 4,966 | ||||||||||||||||||||
| Other operating expenses |
24,544 | 26,499 | 27,661 | 24,677 | 24,356 | 25,666 | ||||||||||||||||||||
| Depreciation and amortisation |
7,737 | 8,234 | 8,397 | 8,755 | 9,338 | 9,980 | ||||||||||||||||||||
| Other interest expenses |
3,107 | 3,551 | 3,554 | 4,352 | 5,275 | 6,197 | ||||||||||||||||||||
| Grants expenses |
13,206 | 16,098 | 16,044 | 15,299 | 13,774 | 13,600 | ||||||||||||||||||||
| Total Expenses from Transactions |
86,341 | 94,320 | 96,126 | 94,363 | 95,244 | 99,130 | ||||||||||||||||||||
|
|
||||||||||||||||||||||||||
| Equals |
Net Operating Balance | 14,480 | (2,397 | ) | (1,094 | ) | (511 | ) | (122 | ) | 716 | |||||||||||||||
| Plus |
Other economic flows - included in operating result |
(466 | ) | 580 | 664 | 185 | (265 | ) | (597 | ) | ||||||||||||||||
| Equals |
Operating Result | 14,014 | (1,816 | ) | (430 | ) | (326 | ) | (387 | ) | 120 | |||||||||||||||
| Plus |
Other economic flows - other movements in equity |
40,333 | 3,379 | 4,490 | 2,953 | 3,228 | 3,385 | |||||||||||||||||||
| Equals |
Comprehensive Result - Total Change In Net Worth | 54,347 | 1,563 | 4,060 | 2,626 | 2,841 | 3,505 | |||||||||||||||||||
| KEY FISCAL AGGREGATES |
||||||||||||||||||||||||||
| Net Operating Balance |
14,480 | (2,397 | ) | (1,094 | ) | (511 | ) | (122 | ) | 716 | ||||||||||||||||
| Less |
Net Acquisition of Non-financial Assets |
|||||||||||||||||||||||||
| Purchases of non-financial assets |
14,300 | 15,231 | 17,945 | 21,381 | 21,214 | 21,976 | ||||||||||||||||||||
| Less Sales of non-financial assets |
243 | 281 | 174 | 195 | 197 | 183 | ||||||||||||||||||||
| Less Depreciation |
7,737 | 8,234 | 8,397 | 8,755 | 9,338 | 9,980 | ||||||||||||||||||||
| Plus Change in inventories |
208 | (72 | ) | 23 | 50 | 2 | (45 | ) | ||||||||||||||||||
| Plus Other movements in non-financial assets |
1,167 | 1,333 | 1,537 | 1,391 | 435 | 271 | ||||||||||||||||||||
| Equals Total Net Acquisition of Non-financial Assets |
7,694 | 7,977 | 10,934 | 13,872 | 12,116 | 12,038 | ||||||||||||||||||||
| Equals |
Fiscal Balance | 6,786 | (10,373 | ) | (12,028 | ) | (14,383 | ) | (12,238 | ) | (11,322 | ) | ||||||||||||||
|
Note: |
||||||||||||||||||||||||||
|
1. Numbers may not add due to rounding. |
| |||||||||||||||||||||||||
35
Table 8: General Government Sector Balance Sheet1
| 2022-23 | 2023-24 | 2023-24 | 2024-25 | 2025-26 | 2026-27 | |||||||||||||||||||
| Outcome | Budget | Update | Projection | Projection | Projection | |||||||||||||||||||
| $ million | $ million | $ million | $ million | $ million | $ million | |||||||||||||||||||
| Assets |
||||||||||||||||||||||||
| Financial Assets |
||||||||||||||||||||||||
| Cash and deposits |
2,357 | 846 | 976 | 801 | 763 | 779 | ||||||||||||||||||
| Advances paid |
1,239 | 1,540 | 1,540 | 1,656 | 1,710 | 1,775 | ||||||||||||||||||
| Investments, loans and placements |
49,426 | 48,638 | 48,495 | 47,825 | 48,540 | 49,562 | ||||||||||||||||||
| Receivables |
4,320 | 4,744 | 5,086 | 5,673 | 5,387 | 5,118 | ||||||||||||||||||
| Equity |
||||||||||||||||||||||||
| Investments in other public sector entities |
24,414 | 28,415 | 29,189 | 33,152 | 35,939 | 39,132 | ||||||||||||||||||
| Investments - other |
175 | 165 | 175 | 175 | 175 | 175 | ||||||||||||||||||
| Total Financial Assets |
81,930 | 84,347 | 85,460 | 89,281 | 92,515 | 96,541 | ||||||||||||||||||
|
Non-financial Assets |
||||||||||||||||||||||||
| Land and other fixed assets |
322,812 | 296,744 | 331,485 | 342,686 | 351,863 | 360,175 | ||||||||||||||||||
| Other non-financial assets |
9,743 | 7,568 | 10,327 | 10,730 | 11,129 | 11,567 | ||||||||||||||||||
| Total Non-financial Assets |
332,554 | 304,312 | 341,812 | 353,417 | 362,992 | 371,742 | ||||||||||||||||||
| Total Assets |
414,484 | 388,659 | 427,272 | 442,697 | 455,506 | 468,283 | ||||||||||||||||||
| Liabilities |
||||||||||||||||||||||||
| Payables |
5,921 | 5,328 | 5,605 | 5,693 | 5,703 | 5,757 | ||||||||||||||||||
| Superannuation liability |
20,913 | 20,827 | 20,062 | 19,698 | 18,868 | 17,887 | ||||||||||||||||||
| Other employee benefits |
10,419 | 10,028 | 10,691 | 11,252 | 11,786 | 11,728 | ||||||||||||||||||
| Advances received |
1,909 | 1,734 | 2,314 | 1,696 | 2,660 | 2,751 | ||||||||||||||||||
| Borrowing2 |
53,726 | 65,479 | 63,373 | 76,841 | 86,388 | 96,758 | ||||||||||||||||||
| Other liabilities |
17,622 | 14,489 | 17,195 | 16,858 | 16,601 | 16,398 | ||||||||||||||||||
| Total Liabilities |
110,511 | 117,886 | 119,239 | 132,038 | 142,006 | 151,278 | ||||||||||||||||||
|
Net Worth |
303,973 | 270,774 | 308,033 | 310,659 | 313,500 | 317,004 | ||||||||||||||||||
| Net Financial Worth |
(28,581 | ) | (33,538 | ) | (33,779 | ) | (42,757 | ) | (49,492 | ) | (54,738 | ) | ||||||||||||
| Net Financial Liabilities |
52,995 | 61,953 | 62,968 | 75,909 | 85,431 | 93,869 | ||||||||||||||||||
| Net Debt |
2,615 | 16,190 | 14,676 | 28,256 | 38,034 | 47,392 | ||||||||||||||||||
|
Notes: |
||||||||||||||||||||||||
| 1. Numbers may not add due to rounding. |
||||||||||||||||||||||||
| 2. Borrowing line comprised of: |
||||||||||||||||||||||||
|
Borrowing with QTC |
46,166 | 57,494 | 55,403 | 68,570 | 79,253 | 89,993 | ||||||||||||||||||
|
Leases and other similar arrangements |
7,519 | 7,892 | 7,930 | 8,231 | 7,094 | 6,724 | ||||||||||||||||||
|
Securities and derivatives |
41 | 93 | 41 | 41 | 41 | 41 | ||||||||||||||||||
| 53,726 | 65,479 | 63,373 | 76,841 | 86,388 | 96,758 | |||||||||||||||||||
36 BUDGET UPDATE 2023–24
Table 9: Public Non-financial Corporations Sector Balance Sheet1
| 2022-23 | 2023-24 | 2023-24 | 2024-25 | 2025-26 | 2026-27 | |||||||||||||||||||
| Outcome | Budget | Update | Projection | Projection | Projection | |||||||||||||||||||
| $ million | $ million | $ million | $ million | $ million | $ million | |||||||||||||||||||
| Assets |
||||||||||||||||||||||||
| Financial Assets |
||||||||||||||||||||||||
| Cash and deposits |
1,031 | 950 | 1,620 | 1,420 | 1,037 | 1,020 | ||||||||||||||||||
| Advances paid |
1,675 | 1,598 | 2,178 | 1,534 | 2,347 | 2,627 | ||||||||||||||||||
| Investments, loans and placements |
6,194 | 2,739 | 2,724 | 1,742 | 1,579 | 1,520 | ||||||||||||||||||
| Receivables |
2,742 | 2,419 | 2,906 | 3,085 | 3,229 | 3,313 | ||||||||||||||||||
| Equity |
||||||||||||||||||||||||
| Investments - other |
— | 66 | 4 | 4 | 4 | 4 | ||||||||||||||||||
| Total Financial Assets |
11,642 | 7,772 | 9,432 | 7,786 | 8,196 | 8,484 | ||||||||||||||||||
|
Non-financial Assets |
||||||||||||||||||||||||
| Land and other fixed assets |
68,176 | 73,250 | 73,857 | 79,871 | 86,010 | 93,000 | ||||||||||||||||||
| Other non-financial assets |
4,707 | 1,470 | 4,436 | 4,182 | 3,926 | 3,826 | ||||||||||||||||||
| Total Non-financial Assets |
72,883 | 74,720 | 78,293 | 84,053 | 89,936 | 96,826 | ||||||||||||||||||
| Total Assets |
84,526 | 82,492 | 87,725 | 91,839 | 98,132 | 105,310 | ||||||||||||||||||
| Liabilities |
||||||||||||||||||||||||
| Payables |
2,105 | 2,717 | 2,816 | 3,502 | 3,149 | 3,331 | ||||||||||||||||||
| Superannuation liability |
(354 | ) | (400 | ) | (354 | ) | (354 | ) | (354 | ) | (354 | ) | ||||||||||||
| Other employee benefits |
1,040 | 1,015 | 1,093 | 1,193 | 1,260 | 1,325 | ||||||||||||||||||
| Deposits held |
14 | 11 | 14 | 14 | 14 | 14 | ||||||||||||||||||
| Advances received |
25 | 3 | 24 | 24 | 23 | 22 | ||||||||||||||||||
| Borrowing2 |
49,101 | 45,166 | 46,528 | 45,551 | 49,031 | 52,390 | ||||||||||||||||||
| Other liabilities |
11,185 | 8,596 | 11,420 | 11,762 | 12,075 | 12,455 | ||||||||||||||||||
| Total Liabilities |
63,117 | 57,109 | 61,541 | 61,692 | 65,198 | 69,182 | ||||||||||||||||||
| Net Worth |
21,409 | 25,383 | 26,184 | 30,147 | 32,934 | 36,127 | ||||||||||||||||||
| Net Financial Worth |
(51,474 | ) | (49,338 | ) | (52,109 | ) | (53,906 | ) | (57,001 | ) | (60,699 | ) | ||||||||||||
| Net Debt |
40,240 | 39,893 | 40,044 | 40,892 | 44,104 | 47,260 | ||||||||||||||||||
|
Notes: |
||||||||||||||||||||||||
| 1. Numbers may not add due to rounding. |
||||||||||||||||||||||||
| 2. Borrowing line comprised of: |
||||||||||||||||||||||||
|
Borrowing with QTC |
43,276 | 42,963 | 44,316 | 44,642 | 48,400 | 51,876 | ||||||||||||||||||
|
Leases and other similar arrangements |
367 | 653 | 687 | 626 | 556 | 486 | ||||||||||||||||||
|
Securities and derivatives |
5,458 | 1,550 | 1,526 | 283 | 74 | 29 | ||||||||||||||||||
| 49,101 | 45,166 | 46,528 | 45,551 | 49,031 | 52,390 | |||||||||||||||||||
37
Table 10: Non-financial Public Sector Balance Sheet1
| 2022-23 | 2023-24 | 2023-24 | 2024-25 | 2025-26 | 2026-27 | |||||||||||||||||||
| Outcome | Budget | Update | Projection | Projection | Projection | |||||||||||||||||||
| $ million | $ million | $ million | $ million | $ million | $ million | |||||||||||||||||||
| Assets |
||||||||||||||||||||||||
| Financial Assets |
||||||||||||||||||||||||
| Cash and deposits |
3,388 | 1,796 | 2,596 | 2,221 | 1,799 | 1,799 | ||||||||||||||||||
| Advances paid |
1,215 | 1,542 | 1,567 | 1,683 | 1,539 | 1,742 | ||||||||||||||||||
| Investments, loans and placements |
55,619 | 51,377 | 51,218 | 49,567 | 50,120 | 51,082 | ||||||||||||||||||
| Receivables |
6,256 | 5,760 | 6,544 | 6,804 | 7,001 | 6,778 | ||||||||||||||||||
| Equity |
||||||||||||||||||||||||
| Investments in other public sector entities |
3,006 | 3,033 | 3,006 | 3,006 | 3,006 | 3,006 | ||||||||||||||||||
| Investments - other |
174 | 231 | 179 | 179 | 179 | 179 | ||||||||||||||||||
| Total Financial Assets |
69,657 | 63,738 | 65,109 | 63,460 | 63,643 | 64,585 | ||||||||||||||||||
|
Non-financial Assets |
||||||||||||||||||||||||
| Land and other fixed assets |
390,987 | 369,993 | 405,341 | 422,556 | 437,873 | 453,174 | ||||||||||||||||||
| Other non-financial assets |
1,229 | 1,205 | 1,275 | 1,210 | 1,163 | 1,139 | ||||||||||||||||||
| Total Non-financial Assets |
392,216 | 371,198 | 406,617 | 423,766 | 439,035 | 454,314 | ||||||||||||||||||
| Total Assets |
461,873 | 434,937 | 471,726 | 487,226 | 502,679 | 518,899 | ||||||||||||||||||
| Liabilities |
||||||||||||||||||||||||
| Payables |
7,275 | 6,699 | 7,031 | 7,301 | 7,298 | 7,496 | ||||||||||||||||||
| Superannuation liability |
20,559 | 20,427 | 19,708 | 19,343 | 18,514 | 17,533 | ||||||||||||||||||
| Other employee benefits |
11,460 | 11,044 | 11,784 | 12,445 | 13,046 | 13,053 | ||||||||||||||||||
| Deposits held |
14 | 11 | 14 | 14 | 14 | 14 | ||||||||||||||||||
| Advances received |
235 | 142 | 187 | 213 | 164 | 113 | ||||||||||||||||||
| Borrowing2 |
102,821 | 110,638 | 109,894 | 122,385 | 135,412 | 149,141 | ||||||||||||||||||
| Other liabilities |
15,537 | 15,203 | 15,076 | 14,865 | 14,731 | 14,544 | ||||||||||||||||||
| Total Liabilities |
157,900 | 164,163 | 163,693 | 176,567 | 189,179 | 201,894 | ||||||||||||||||||
| Net Worth |
303,973 | 270,774 | 308,033 | 310,659 | 313,500 | 317,004 | ||||||||||||||||||
| Net Financial Worth |
(88,243 | ) | (100,424 | ) | (98,584 | ) | (113,107 | ) | (125,536 | ) | (137,309 | ) | ||||||||||||
| Net Financial Liabilities |
91,249 | 103,458 | 101,589 | 116,113 | 128,541 | 140,315 | ||||||||||||||||||
|
Net Debt |
42,848 | 56,077 | 54,714 | 69,141 | 82,132 | 94,645 | ||||||||||||||||||
| Notes: |
||||||||||||||||||||||||
| 1. Numbers may not add due to rounding. |
||||||||||||||||||||||||
| 2. Borrowing line comprised of: |
||||||||||||||||||||||||
|
Borrowing with QTC |
89,442 | 100,457 | 99,718 | 113,212 | 127,653 | 141,869 | ||||||||||||||||||
|
Leases and other similar arrangements |
7,887 | 8,545 | 8,616 | 8,857 | 7,651 | 7,210 | ||||||||||||||||||
|
Securities and derivatives |
5,491 | 1,636 | 1,560 | 317 | 108 | 62 | ||||||||||||||||||
| 102,821 | 110,638 | 109,894 | 122,385 | 135,412 | 149,141 | |||||||||||||||||||
38 BUDGET UPDATE 2023–24
Table 11: General Government Sector Cash Flow Statement1
| 2022-23 | 2023-24 | 2023-24 | 2024-25 | 2025-26 | 2026-27 | |||||||||||||||||||
| Outcome | Budget | Update | Projection | Projection | Projection | |||||||||||||||||||
| $ million | $ million | $ million | $ million | $ million | $ million | |||||||||||||||||||
| Cash Receipts from Operating Activities |
||||||||||||||||||||||||
| Taxes received |
20,410 | 21,936 | 22,208 | 23,714 | 25,140 | 26,399 | ||||||||||||||||||
| Grants and subsidies received |
38,684 | 39,641 | 38,410 | 39,147 | 39,107 | 41,429 | ||||||||||||||||||
| Sales of goods and services |
6,886 | 7,196 | 7,616 | 7,541 | 7,681 | 7,762 | ||||||||||||||||||
| Interest receipts |
3,201 | 3,203 | 3,373 | 3,364 | 3,350 | 3,405 | ||||||||||||||||||
| Dividends and income tax equivalents |
922 | 1,080 | 989 | 1,755 | 2,185 | 1,731 | ||||||||||||||||||
| Other receipts |
22,502 | 9,790 | 15,314 | 10,336 | 10,044 | 9,743 | ||||||||||||||||||
| Total Operating Receipts |
92,604 | 82,846 | 87,910 | 85,856 | 87,508 | 90,470 | ||||||||||||||||||
| Cash Payments for Operating Activities |
||||||||||||||||||||||||
| Payments for employees |
(34,232 | ) | (37,332 | ) | (37,991 | ) | (38,395 | ) | (39,595 | ) | (41,418 | ) | ||||||||||||
| Payments for goods and services |
(23,090 | ) | (24,872 | ) | (27,163 | ) | (25,180 | ) | (24,929 | ) | (25,426 | ) | ||||||||||||
| Grants and subsidies |
(13,777 | ) | (16,689 | ) | (16,954 | ) | (15,948 | ) | (14,434 | ) | (14,243 | ) | ||||||||||||
| Interest paid |
(1,616 | ) | (1,892 | ) | (1,897 | ) | (2,516 | ) | (3,155 | ) | (3,857 | ) | ||||||||||||
| Other payments |
(4 | ) | — | — | — | — | — | |||||||||||||||||
| Total Operating Payments |
(72,719 | ) | (80,786 | ) | (84,006 | ) | (82,039 | ) | (82,113 | ) | (84,944 | ) | ||||||||||||
| Net Cash Inflows from Operating Activities |
19,885 | 2,060 | 3,905 | 3,818 | 5,395 | 5,526 | ||||||||||||||||||
| Cash Flows from Investments in Non-Financial Assets |
||||||||||||||||||||||||
| Purchases of non-financial assets |
(9,899 | ) | (9,347 | ) | (11,332 | ) | (13,205 | ) | (12,491 | ) | (12,055 | ) | ||||||||||||
| Sales of non-financial assets |
181 | 276 | 163 | 185 | 180 | 177 | ||||||||||||||||||
| Net Cash Flows from Investments in Non-financial Assets |
(9,718 | ) | (9,071 | ) | (11,170 | ) | (13,020 | ) | (12,311 | ) | (11,879 | ) | ||||||||||||
| Net Cash Flows from Investments in Financial Assets for Policy Purposes |
(766 | ) | (2,264 | ) | (3,538 | ) | (3,433 | ) | (2,434 | ) | (2,770 | ) | ||||||||||||
| Net Cash Flows from Investments in Financial Assets for Liquidity Purposes |
(8,035 | ) | 4,657 | 6,219 | 789 | (640 | ) | (990 | ) | |||||||||||||||
| Receipts from Financing Activities |
||||||||||||||||||||||||
| Advances received (net) |
598 | (46 | ) | 406 | (616 | ) | 965 | 93 | ||||||||||||||||
| Borrowing (net) |
(1,318 | ) | 4,437 | 2,796 | 12,288 | 8,985 | 10,037 | |||||||||||||||||
| Net Cash Flows from Financing Activities |
(719 | ) | 4,391 | 3,203 | 11,672 | 9,951 | 10,130 | |||||||||||||||||
| Net Increase/(Decrease) in Cash held |
647 | (226 | ) | (1,381 | ) | (175 | ) | (38 | ) | 17 | ||||||||||||||
| Net cash from operating activities |
19,885 | 2,060 | 3,905 | 3,818 | 5,395 | 5,526 | ||||||||||||||||||
| Net cash flows from investments in non-financial assets |
(9,718 | ) | (9,071 | ) | (11,170 | ) | (13,020 | ) | (12,311 | ) | (11,879 | ) | ||||||||||||
| Surplus/(Deficit) |
10,167 | (7,010 | ) | (7,265 | ) | (9,202 | ) | (6,916 | ) | (6,353 | ) | |||||||||||||
| Derivation of ABS GFS Cash Surplus/Deficit |
||||||||||||||||||||||||
| Cash surplus/(deficit) |
10,167 | (7,010 | ) | (7,265 | ) | (9,202 | ) | (6,916 | ) | (6,353 | ) | |||||||||||||
| Acquisitions under finance leases and similar arrangements |
(849 | ) | (814 | ) | (992 | ) | (647 | ) | (180 | ) | (5 | ) | ||||||||||||
| ABS GFS Cash Surplus/(Deficit) Including Finance Leases and Similar Arrangements | 9,318 | (7,824 | ) | (8,258 | ) | (9,849 | ) | (7,096 | ) | (6,359 | ) | |||||||||||||
| Note: |
||||||||||||||||||||||||
|
1. Numbers may not add due to rounding. |
||||||||||||||||||||||||
39
Table 12: Public Non-financial Corporations Sector Cash Flow Statement1
| 2022-23 | 2023-24 | 2023-24 | 2024-25 | 2025-26 | 2026-27 | |||||||||||||||||||
| Outcome | Budget | Update | Projection | Projection | Projection | |||||||||||||||||||
| $ million | $ million | $ million | $ million | $ million | $ million | |||||||||||||||||||
| Cash Receipts from Operating Activities |
||||||||||||||||||||||||
| Grants and subsidies received |
841 | 799 | 918 | 802 | 779 | 739 | ||||||||||||||||||
| Sales of goods and services |
17,092 | 15,616 | 15,656 | 16,707 | 17,789 | 19,218 | ||||||||||||||||||
| Interest receipts |
106 | 94 | 137 | 131 | 110 | 79 | ||||||||||||||||||
| Other receipts |
402 | 687 | 184 | 540 | 221 | 193 | ||||||||||||||||||
| Total Operating Receipts |
18,442 | 17,195 | 16,895 | 18,181 | 18,899 | 20,229 | ||||||||||||||||||
| Cash Payments for Operating Activities |
||||||||||||||||||||||||
| Payments for employees |
(2,750 | ) | (2,953 | ) | (3,016 | ) | (3,221 | ) | (3,361 | ) | (3,408 | ) | ||||||||||||
| Payments for goods and services |
(9,727 | ) | (8,331 | ) | (9,070 | ) | (8,240 | ) | (8,279 | ) | (8,360 | ) | ||||||||||||
| Grants and subsidies |
(29 | ) | (25 | ) | (27 | ) | (27 | ) | (21 | ) | (21 | ) | ||||||||||||
| Interest paid |
(1,671 | ) | (1,793 | ) | (1,831 | ) | (1,986 | ) | (2,231 | ) | (2,527 | ) | ||||||||||||
| Other payments |
(1,149 | ) | (976 | ) | (778 | ) | (733 | ) | (784 | ) | (680 | ) | ||||||||||||
| Total Operating Payments |
(15,325 | ) | (14,078 | ) | (14,722 | ) | (14,207 | ) | (14,676 | ) | (14,997 | ) | ||||||||||||
| Net Cash Inflows from Operating Activities |
3,117 | 3,117 | 2,172 | 3,974 | 4,223 | 5,233 | ||||||||||||||||||
| Cash Flows from Investments in Non-Financial Assets |
||||||||||||||||||||||||
| Purchases of non-financial assets |
(4,497 | ) | (5,849 | ) | (6,587 | ) | (8,186 | ) | (8,745 | ) | (9,966 | ) | ||||||||||||
| Sales of non-financial assets |
63 | 5 | 11 | 10 | 18 | 7 | ||||||||||||||||||
| Net Cash Flows from Investments in Non-financial Assets |
(4,434 | ) | (5,844 | ) | (6,577 | ) | (8,176 | ) | (8,727 | ) | (9,959 | ) | ||||||||||||
| Net Cash Flows from Investments in Financial Assets for Policy Purposes |
(711 | ) | (80 | ) | (508 | ) | 644 | (813 | ) | (280 | ) | |||||||||||||
| Net Cash Flows from Investments in Financial Assets for Liquidity Purposes |
463 | 10 | 67 | (29 | ) | (22 | ) | (33 | ) | |||||||||||||||
| Receipts from Financing Activities |
||||||||||||||||||||||||
| Advances received (net) |
(1 | ) | (1 | ) | (1 | ) | (1 | ) | (1 | ) | (1 | ) | ||||||||||||
| Borrowing (net) |
2,202 | 521 | 1,384 | 517 | 3,740 | 3,406 | ||||||||||||||||||
| Dividends paid |
(246 | ) | (474 | ) | (453 | ) | (1,061 | ) | (1,474 | ) | (1,156 | ) | ||||||||||||
| Deposits received (net) |
3 | — | — | — | — | — | ||||||||||||||||||
| Other financing (net) |
(523 | ) | 2,850 | 4,504 | 3,932 | 2,691 | 2,773 | |||||||||||||||||
| Net Cash Flows from Financing Activities |
1,435 | 2,896 | 5,435 | 3,387 | 4,956 | 5,022 | ||||||||||||||||||
| Net Increase/(Decrease) in Cash held |
(130 | ) | 99 | 589 | (200 | ) | (383 | ) | (17 | ) | ||||||||||||||
| Net cash from operating activities |
3,117 | 3,117 | 2,172 | 3,974 | 4,223 | 5,233 | ||||||||||||||||||
| Net cash flows from investments in non-financial assets |
(4,434 | ) | (5,844 | ) | (6,577 | ) | (8,176 | ) | (8,727 | ) | (9,959 | ) | ||||||||||||
| Dividends paid |
(246 | ) | (474 | ) | (453 | ) | (1,061 | ) | (1,474 | ) | (1,156 | ) | ||||||||||||
| Surplus/(Deficit) |
(1,563 | ) | (3,201 | ) | (4,857 | ) | (5,264 | ) | (5,978 | ) | (5,883 | ) | ||||||||||||
| Derivation of ABS GFS Cash Surplus/Deficit |
||||||||||||||||||||||||
| Cash surplus/(deficit) |
(1,563 | ) | (3,201 | ) | (4,857 | ) | (5,264 | ) | (5,978 | ) | (5,883 | ) | ||||||||||||
| Acquisitions under finance leases and similar arrangements |
(49 | ) | (360 | ) | (386 | ) | (8 | ) | (5 | ) | (6 | ) | ||||||||||||
| ABS GFS Cash Surplus/(Deficit) Including Finance Leases and Similar Arrangements | (1,613 | ) | (3,562 | ) | (5,242 | ) | (5,272 | ) | (5,983 | ) | (5,889 | ) | ||||||||||||
| Note: |
||||||||||||||||||||||||
|
1. Numbers may not add due to rounding. |
||||||||||||||||||||||||
40 BUDGET UPDATE 2023–24
Table 13: Non-financial Public Sector Cash Flow Statement1
| 2022-23 | 2023-24 | 2023-24 | 2024-25 | 2025-26 | 2026-27 | |||||||||||||||||||
| Outcome | Budget | Update | Projection | Projection | Projection | |||||||||||||||||||
| $ million | $ million | $ million | $ million | $ million | $ million | |||||||||||||||||||
| Cash Receipts from Operating Activities |
||||||||||||||||||||||||
| Taxes received |
20,002 | 21,552 | 21,802 | 23,277 | 24,661 | 25,889 | ||||||||||||||||||
| Grants and subsidies received |
38,701 | 39,679 | 38,466 | 39,208 | 39,151 | 41,461 | ||||||||||||||||||
| Sales of goods and services |
20,825 | 19,401 | 19,849 | 20,586 | 21,786 | 23,727 | ||||||||||||||||||
| Interest receipts |
3,279 | 3,276 | 3,456 | 3,453 | 3,448 | 3,473 | ||||||||||||||||||
| Dividends and income tax equivalents |
101 | 169 | 156 | 186 | 204 | 192 | ||||||||||||||||||
| Other receipts |
22,843 | 10,511 | 15,522 | 10,864 | 10,240 | 9,889 | ||||||||||||||||||
| Total Operating Receipts |
105,752 | 94,588 | 99,252 | 97,574 | 99,490 | 104,631 | ||||||||||||||||||
| Cash Payments for Operating Activities |
||||||||||||||||||||||||
| Payments for employees |
(36,818 | ) | (40,129 | ) | (40,834 | ) | (41,425 | ) | (42,756 | ) | (44,619 | ) | ||||||||||||
| Payments for goods and services |
(29,729 | ) | (29,776 | ) | (32,796 | ) | (29,744 | ) | (29,507 | ) | (30,518 | ) | ||||||||||||
| Grants and subsidies |
(12,984 | ) | (15,955 | ) | (16,121 | ) | (15,233 | ) | (13,720 | ) | (13,557 | ) | ||||||||||||
| Interest paid |
(3,036 | ) | (3,455 | ) | (3,458 | ) | (4,231 | ) | (5,112 | ) | (6,089 | ) | ||||||||||||
| Other payments |
(554 | ) | (534 | ) | (393 | ) | (220 | ) | (272 | ) | (292 | ) | ||||||||||||
| Total Operating Payments |
(83,120 | ) | (89,849 | ) | (93,603 | ) | (90,854 | ) | (91,367 | ) | (95,074 | ) | ||||||||||||
| Net Cash Inflows from Operating Activities |
22,631 | 4,738 | 5,649 | 6,720 | 8,123 | 9,557 | ||||||||||||||||||
| Cash Flows from Investments in Non-Financial Assets |
||||||||||||||||||||||||
| Purchases of non-financial assets |
(14,300 | ) | (15,231 | ) | (17,945 | ) | (21,381 | ) | (21,214 | ) | (21,976 | ) | ||||||||||||
| Sales of non-financial assets |
243 | 281 | 174 | 195 | 197 | 183 | ||||||||||||||||||
| Net Cash Flows from Investments in Non-financial Assets |
(14,056 | ) | (14,950 | ) | (17,771 | ) | (21,186 | ) | (21,017 | ) | (21,793 | ) | ||||||||||||
| Net Cash Flows from Investments in Financial Assets for Policy Purposes |
56 | (314 | ) | (344 | ) | (108 | ) | 156 | (192 | ) | ||||||||||||||
| Net Cash Flows from Investments in Financial Assets for Liquidity Purposes |
(7,573 | ) | 4,667 | 6,286 | 760 | (661 | ) | (1,023 | ) | |||||||||||||||
| Receipts from Financing Activities |
||||||||||||||||||||||||
| Advances received (net) |
(28 | ) | (47 | ) | (47 | ) | 28 | (48 | ) | (48 | ) | |||||||||||||
| Borrowing (net) |
885 | 4,958 | 4,181 | 12,804 | 12,725 | 13,443 | ||||||||||||||||||
| Deposits received (net) |
3 | — | — | — | — | — | ||||||||||||||||||
| Other financing (net) |
(1,401 | ) | 820 | 1,254 | 607 | 300 | 56 | |||||||||||||||||
| Net Cash Flows from Financing Activities |
(542 | ) | 5,731 | 5,388 | 13,439 | 12,977 | 13,451 | |||||||||||||||||
| Net Increase/(Decrease) in Cash held |
516 | (127 | ) | (791 | ) | (375 | ) | (422 | ) | — | ||||||||||||||
| Net cash from operating activities |
22,631 | 4,738 | 5,649 | 6,720 | 8,123 | 9,557 | ||||||||||||||||||
| Net cash flows from investments in non-financial assets |
(14,056 | ) | (14,950 | ) | (17,771 | ) | (21,186 | ) | (21,017 | ) | (21,793 | ) | ||||||||||||
| Surplus/(Deficit) |
8,575 | (10,211 | ) | (12,122 | ) | (14,466 | ) | (12,894 | ) | (12,236 | ) | |||||||||||||
| Derivation of ABS GFS Cash Surplus/Deficit |
||||||||||||||||||||||||
| Cash surplus/(deficit) |
8,575 | (10,211 | ) | (12,122 | ) | (14,466 | ) | (12,894 | ) | (12,236 | ) | |||||||||||||
| Acquisitions under finance leases and similar arrangements |
(899 | ) | (1,174 | ) | (1,378 | ) | (655 | ) | (185 | ) | (11 | ) | ||||||||||||
| ABS GFS Cash Surplus/(Deficit) Including Finance Leases and Similar Arrangements |
7,676 | (11,386 | ) | (13,500 | ) | (15,121 | ) | (13,079 | ) | (12,247 | ) | |||||||||||||
| Note: |
| |||||||||||||||||||||||
| 1. Numbers may not add due to rounding. |
| |||||||||||||||||||||||
41
REVENUE ASSUMPTIONS
The 2023-24 Budget Update is based in part on assumptions made about parameters, both internal and external to Queensland, which can impact directly on economic and fiscal forecasts.
The forward estimates in the 2023-24 Budget Update are framed on a no-policy-change basis. That is, the expenditure and revenue policies in place at the time of the Budget Update (including those announced in the Budget Update) are applied consistently throughout the forward estimates period.
Key economic assumptions
Key economic assumptions underpinning the 2023-24 Budget Update include:
| • | Consistent with IMF projections, international economic growth is assumed to slow over the forecast horizon and be below the pre-COVID decade average. |
| • | Interest rates are assumed to plateau at the current level in early 2024 for this monetary tightening cycle before starting to gradually ease thereafter. |
| • | The A$/US$ exchange rate is assumed to trend gradually higher, reaching around US$0.70 by mid-2025 and move towards the medium-term anchor of US$0.75 thereafter. |
| • | Brent oil prices to remain elevated in the near term and gradually ease towards a medium-term level of US$75/bbl by the end of the forecast period. |
| • | Residential property prices in Brisbane are expected to maintain modest growth over the forecast horizon. |
| • | Consistent with historical trends, the drier than average conditions resulting from the current El-Niño weather pattern are generally expected persist in the near-term. A return to normal seasonal rainfall patterns is assumed thereafter. |
42 BUDGET UPDATE 2023–24
Taxation and royalty revenue
Table 14 shows the main components of taxation and royalty revenue, and the forecast revenues for each component across the forward estimates.
Table 14: Taxation and royalty revenue1
| 2022–23 | 2023–24 | 2023–24 | 2024–25 | 2025–26 | 2026–27 | |||||||||||||||||||
| Actual | Budget | Update | Projection | Projection | Projection | |||||||||||||||||||
| $ million | $ million | $ million | $ million | $ million | $ million | |||||||||||||||||||
| Payroll tax and mental health levy |
5,850 | 6,524 | 6,590 | 6,980 | 7,384 | 7,809 | ||||||||||||||||||
| Transfer duty |
5,240 | 5,385 | 5,402 | 5,921 | 6,380 | 6,754 | ||||||||||||||||||
| Other duties |
2,232 | 2,255 | 2,424 | 2,529 | 2,637 | 2,749 | ||||||||||||||||||
| Gambling taxes and levies |
1,911 | 2,015 | 2,000 | 2,096 | 2,182 | 2,271 | ||||||||||||||||||
| Land tax |
1,732 | 2,031 | 2,032 | 2,327 | 2,508 | 2,613 | ||||||||||||||||||
| Motor vehicle registration |
2,226 | 2,301 | 2,334 | 2,362 | 2,465 | 2,547 | ||||||||||||||||||
| Other taxes |
1,409 | 1,426 | 1,429 | 1,501 | 1,587 | 1,658 | ||||||||||||||||||
| Total tax revenue |
20,601 | 21,938 | 22,210 | 23,716 | 25,142 | 26,400 | ||||||||||||||||||
| Royalties |
||||||||||||||||||||||||
| Coal |
15,360 | 5,345 | 9,188 | 4,342 | 4,272 | 4,149 | ||||||||||||||||||
| Petroleum2 |
2,350 | 1,275 | 1,650 | 1,391 | 1,222 | 1,053 | ||||||||||||||||||
| Other royalties3 |
504 | 503 | 550 | 549 | 524 | 497 | ||||||||||||||||||
| Total royalties |
18,214 | 7,123 | 11,388 | 6,282 | 6,018 | 5,698 | ||||||||||||||||||
| Land rents |
181 | 195 | 186 | 189 | 193 | 198 | ||||||||||||||||||
| Total royalties and land rents |
18,395 | 7,318 | 11,574 | 6,471 | 6,211 | 5,895 | ||||||||||||||||||
| Notes: |
|
1. Numbers may not add due to rounding. |
|
2. Includes liquefied natural gas (LNG). |
|
3. Includes base and precious metal and other mineral royalties. |
43
Royalty assumptions
Table 15 below provides the 2023–24 Budget Update assumptions regarding coal royalties, which represent the bulk of Queensland’s royalty revenue.
Table 15: Royalty assumptions
| 2022–23
Actual |
2023–24
Update |
2024–25
Projection |
2025–26
Projection |
2026–27
Projection | ||||||
| Tonnages – crown export1 coal (Mt) |
190 | 200 | 214 | 225 | 233 | |||||
| Exchange rate $US per $A2 |
0.67 | 0.66 | 0.69 | 0.72 | 0.75 | |||||
| Year average coal prices ($US per tonne)3 |
||||||||||
| Hard coking |
279 | 241 | 176 | 175 | 175 | |||||
| Semi–soft |
259 | 142 | 123 | 123 | 123 | |||||
| Thermal |
304 | 138 | 120 | 120 | 120 | |||||
| Year average oil price |
||||||||||
|
Brent ($US per barrel)4 |
102 | 83 | 80 | 77 | 75 | |||||
| Notes: |
|
1. Excludes coal produced for domestic consumption and coal where royalties are not paid to the Government (i.e. private royalties). The 2023–24 estimate for domestic coal volume is approximately 25.5 Mt and private coal is 4.1 Mt. |
|
2. Year average. |
|
3. Estimated year-average spot prices for highest quality coking and thermal coal. Lower quality coal can be sold below this price with indicative average prices for 2023–24 as follows: Hard coking US$220 per tonne and thermal US$114 per tonne. |
|
4. Published Brent oil prices are lagged by 4 months to better align with royalty revenue. |
Exchange rate and commodity prices and volumes
Estimates of mining royalties are sensitive to movements in the A$-US$ exchange rate and commodity prices and volumes.
Contracts for the supply of commodities are generally written in US dollars. Accordingly, a change in the exchange rate impacts on the Australian dollar price of commodities and, therefore, expected royalty collections.
Interest rates
The majority of General Government Sector debt is held under fixed interest rates and, therefore, the impact of interest rate variations on debt servicing costs in 2023–24 would be relatively modest, with the impact occurring progressively across the forward estimates.
44 BUDGET UPDATE 2023–24
| 2015–16 | 2016–17 | 2017–18 | 2018–19 | 2019–20 | 2020–21 | 2021–22 | 2022–23 | 2023–24 | 2024–25 | 2025–26 | 2026–27 | |||||||||||||||||||||||||||||||||||||
| Actual1 | Actual1 | Actual1 | Actual1 | Actual1 | Actual1 | Actual1 | Actual | Update | Projection | Projection | Projection | |||||||||||||||||||||||||||||||||||||
| $ million | $ million | $ million | $ million | $ million | $ million | $ million | $ million | $ million | $ million | $ million | $ million | |||||||||||||||||||||||||||||||||||||
| General Government |
| |||||||||||||||||||||||||||||||||||||||||||||||
| Total revenue |
50,780 | 56,194 | 58,087 | 59,828 | 57,778 | 62,791 | 74,185 | 89,810 | 85,788 | 84,131 | 84,378 | 87,486 | ||||||||||||||||||||||||||||||||||||
| Tax revenue |
12,547 | 12,919 | 13,244 | 14,165 | 14,585 | 16,249 | 20,011 | 20,601 | 22,210 | 23,716 | 25,142 | 26,400 | ||||||||||||||||||||||||||||||||||||
| Total expenses |
50,112 | 53,369 | 56,337 | 58,843 | 63,505 | 63,706 | 69,902 | 75,880 | 85,926 | 84,009 | 84,287 | 86,865 | ||||||||||||||||||||||||||||||||||||
| Employee expenses |
20,045 | 21,258 | 22,681 | 24,019 | 25,662 | 26,385 | 28,068 | 30,557 | 32,541 | 33,088 | 34,155 | 35,239 | ||||||||||||||||||||||||||||||||||||
| Net operating balance |
668 | 2,825 | 1,750 | 985 | (5,728 | ) | (915 | ) | 4,284 | 13,930 | (138 | ) | 122 | 91 | 621 | |||||||||||||||||||||||||||||||||
| Capital purchases |
4,044 | 4,620 | 5,126 | 5,764 | 6,306 | 6,682 | 7,878 | 9,899 | 11,332 | 13,205 | 12,491 | 12,055 | ||||||||||||||||||||||||||||||||||||
| Net capital purchases |
1,163 | 2,265 | 2,337 | 3,192 | 3,436 | 3,942 | 4,356 | 5,838 | 6,570 | 8,975 | 7,056 | 6,082 | ||||||||||||||||||||||||||||||||||||
| Fiscal balance |
(495 | ) | 560 | (587 | ) | (2,207 | ) | (9,164 | ) | (4,857 | ) | (72 | ) | 8,092 | (6,709 | ) | (8,853 | ) | (6,965 | ) | (5,461 | ) | ||||||||||||||||||||||||||
| Borrowing with QTC |
34,200 | 31,358 | 29,256 | 29,468 | 37,570 | 46,153 | 49,000 | 46,166 | 55,403 | 68,570 | 79,253 | 89,993 | ||||||||||||||||||||||||||||||||||||
| Leases and similar arrangements2 |
1,286 | 1,882 | 2,142 | 2,612 | 6,485 | 7,703 | 7,671 | 7,519 | 7,930 | 8,231 | 7,094 | 6,724 | ||||||||||||||||||||||||||||||||||||
| Securities and Derivatives |
(0 | ) | (0 | ) | 122 | 121 | 198 | 220 | 93 | 41 | 41 | 41 | 41 | 41 | ||||||||||||||||||||||||||||||||||
| Net debt |
654 | (355 | ) | (509 | ) | (198 | ) | 14,036 | 11,344 | 10,997 | 2,615 | 14,676 | 28,256 | 38,034 | 47,392 | |||||||||||||||||||||||||||||||||
| Non-financial Public Sector |
| |||||||||||||||||||||||||||||||||||||||||||||||
| Total revenue |
57,393 | 64,855 | 66,164 | 68,329 | 66,171 | 71,318 | 85,485 | 100,821 | 95,032 | 93,852 | 95,122 | 99,846 | ||||||||||||||||||||||||||||||||||||
| Capital purchases |
6,852 | 7,291 | 7,643 | 8,460 | 9,482 | 9,877 | 11,130 | 14,300 | 17,945 | 21,381 | 21,214 | 21,976 | ||||||||||||||||||||||||||||||||||||
| Borrowing with QTC |
71,160 | 69,107 | 66,964 | 67,576 | 76,464 | 85,901 | 90,851 | 89,442 | 99,718 | 113,212 | 127,653 | 141,869 | ||||||||||||||||||||||||||||||||||||
| Leases and similar arrangements2 |
1,316 | 1,882 | 2,142 | 2,612 | 6,977 | 8,157 | 8,028 | 7,887 | 8,616 | 8,857 | 7,651 | 7,210 | ||||||||||||||||||||||||||||||||||||
|
Securities and Derivatives |
446 | 895 | 405 | 720 | 1,503 | 1,570 | 17,374 | 5,491 | 1,560 | 317 | 108 | 62 | ||||||||||||||||||||||||||||||||||||
| Notes: |
||||||||||||||||||||||||||||||||||||||||||||||||
| 1. With the implementation of the latest GFS Manual (AGFS15), some categories have been restated to ensure comparability.
|
| |||||||||||||||||||||||||||||||||||||||||||||||
|
2. Approximately $2.2 billion increase in General Government and $2.6 billion in NFPS in 2019–20 on adoption of the new lease accounting standard AASB 16.
|
| |||||||||||||||||||||||||||||||||||||||||||||||
45
| 2015–16 | 2016–17 | 2017–18 | 2018–19 | 2019–20 | 2020–21 | 2021–22 | 2022–23 | 2023–24 | 2024–25 | 2025–26 | 2026–27 | |||||||||||||||||||||||||||||||||||||
| Actual1 | Actual1 | Actual1 | Actual1 | Actual1 | Actual1 | Actual1 | Actual | Update | Projection | Projection | Projection | |||||||||||||||||||||||||||||||||||||
| % | % | % | % | % | % | % | % | % | % | % | % | |||||||||||||||||||||||||||||||||||||
| General Government |
| |||||||||||||||||||||||||||||||||||||||||||||||
| Revenue/GSP |
16.9 | 17.1 | 16.6 | 16.3 | 16.0 | 17.1 | 16.3 | 17.8 | 16.9 | 16.1 | 15.5 | 15.4 | ||||||||||||||||||||||||||||||||||||
| Tax/GSP |
4.2 | 3.9 | 3.8 | 3.9 | 4.0 | 4.4 | 4.4 | 4.1 | 4.4 | 4.5 | 4.6 | 4.6 | ||||||||||||||||||||||||||||||||||||
| Own source revenue/GSP |
9.0 | 8.8 | 8.6 | 8.6 | 8.4 | 8.1 | 8.8 | 10.2 | 9.3 | 8.6 | 8.3 | 8.1 | ||||||||||||||||||||||||||||||||||||
| Expenses/GSP |
16.6 | 16.3 | 16.1 | 16.1 | 17.6 | 17.3 | 15.4 | 15.1 | 16.9 | 16.1 | 15.5 | 15.3 | ||||||||||||||||||||||||||||||||||||
| Employee expenses/GSP |
6.7 | 6.5 | 6.5 | 6.6 | 7.1 | 7.2 | 6.2 | 6.1 | 6.4 | 6.3 | 6.3 | 6.2 | ||||||||||||||||||||||||||||||||||||
| Net operating balance/GSP |
0.2 | 0.9 | 0.5 | 0.3 | (1.6 | ) | (0.2 | ) | 0.9 | 2.8 | (0.0 | ) | 0.0 | 0.0 | 0.1 | |||||||||||||||||||||||||||||||||
| Capital purchases/GSP |
1.3 | 1.4 | 1.5 | 1.6 | 1.7 | 1.8 | 1.7 | 2.0 | 2.2 | 2.5 | 2.3 | 2.1 | ||||||||||||||||||||||||||||||||||||
| Net cash inflows from operating activities/Net cash flows from investments in non-financial assets | 122.9 | 134.2 | 107.0 | 105.5 | (2.5 | ) | 0.7 | 136.9 | 204.6 | 35.0 | 29.3 | 43.8 | 46.5 | |||||||||||||||||||||||||||||||||||
| Fiscal balance/GSP |
(0.2 | ) | 0.2 | (0.2 | ) | (0.6 | ) | (2.5 | ) | (1.3 | ) | (0.0 | ) | 1.6 | (1.3 | ) | (1.7 | ) | (1.3 | ) | (1.0 | ) | ||||||||||||||||||||||||||
| Total borrowings/GSP |
11.8 | 10.1 | 9.0 | 8.8 | 12.3 | 14.7 | 12.5 | 10.7 | 12.5 | 14.7 | 15.9 | 17.0 | ||||||||||||||||||||||||||||||||||||
| Total Borrowings/Revenue |
69.9 | 59.2 | 54.3 | 53.8 | 76.6 | 86.1 | 76.5 | 59.8 | 73.9 | 91.3 | 102.4 | 110.6 | ||||||||||||||||||||||||||||||||||||
| Lease and other liabilities/revenue |
2.5 | 3.3 | 3.7 | 4.4 | 11.2 | 12.3 | 10.3 | 8.4 | 9.2 | 9.8 | 8.4 | 7.7 | ||||||||||||||||||||||||||||||||||||
| Net debt/revenue |
1.3 | (0.6 | ) | (0.9 | ) | (0.3 | ) | 24.3 | 18.1 | 14.8 | 2.9 | 17.1 | 33.6 | 45.1 | 54.2 | |||||||||||||||||||||||||||||||||
| Revenue growth |
1.6 | 10.7 | 3.4 | 3.0 | (3.4 | ) | 8.7 | 18.1 | 21.1 | (4.5 | ) | (1.9 | ) | 0.3 | 3.7 | |||||||||||||||||||||||||||||||||
| Tax growth |
(0.4 | ) | 3.0 | 2.5 | 7.0 | 3.0 | 11.4 | 23.1 | 2.9 | 7.8 | 6.8 | 6.0 | 5.0 | |||||||||||||||||||||||||||||||||||
| Expenses growth |
1.1 | 6.5 | 5.6 | 4.4 | 7.9 | 0.3 | 9.7 | 8.6 | 13.2 | (2.2 | ) | 0.3 | 3.1 | |||||||||||||||||||||||||||||||||||
| Employee expenses growth |
7.8 | 6.1 | 6.7 | 5.9 | 6.8 | 2.8 | 6.4 | 8.9 | 6.5 | 1.7 | 3.2 | 3.2 | ||||||||||||||||||||||||||||||||||||
| Non-Financial Public Sector |
| |||||||||||||||||||||||||||||||||||||||||||||||
| Capital purchases/GSP |
2.3 | 2.2 | 2.2 | 2.3 | 2.6 | 2.7 | 2.5 | 2.8 | 3.5 | 4.1 | 3.9 | 3.9 | ||||||||||||||||||||||||||||||||||||
| Total borrowings/GSP |
24.2 | 21.9 | 19.9 | 19.4 | 23.5 | 26.0 | 25.6 | 20.4 | 21.6 | 23.4 | 24.9 | 26.2 | ||||||||||||||||||||||||||||||||||||
| Total Borrowings/Revenue |
127.1 | 110.8 | 105.1 | 103.8 | 128.4 | 134.1 | 136.0 | 102.0 | 115.6 | 130.4 | 142.4 | 149.4 | ||||||||||||||||||||||||||||||||||||
|
Net financial liabilities/revenue |
127.4 | 111.2 | 111.5 | 114.9 | 158.3 | 142.5 | 117.8 | 90.5 | 106.9 | 123.7 | 135.1 | 140.5 | ||||||||||||||||||||||||||||||||||||
| Notes: | ||||||||||||||||||||||||||||||||||||||||||||||||
|
1. With the implementation of the latest GFS Manual (AGFS15), some categories have been restated to ensure comparability. GSP figures reflect 2022–23 ABS National Accounts: State Accounts and Queensland Treasury forecasts.
|
| |||||||||||||||||||||||||||||||||||||||||||||||
46 BUDGET UPDATE 2023–24